United States
Securities and Exchange Commission
Washington, D.C. 20549
FORM 6-K
Report of Foreign Private Issuer
Pursuant to Rule 13a-16 or 15d-16
of the
Securities Exchange Act of 1934
For the month of
April 2026
Vale S.A.
Praia de Botafogo nº 186, 18º andar,
Botafogo
22250-145 Rio de Janeiro, RJ, Brazil
(Address of principal executive office)
(Indicate by check mark whether the registrant files or will file annual reports under cover of Form 20-F or Form 40-F.)
(Check One) Form 20-F x Form 40-F ¨
Rio de Janeiro, April 28th, 2026 Vale’s performance in 1Q26 “We delivered a solid start to 2026, reflecting our disciplined execution, operational excellence, and the continued development of strategic projects across our portfolio. During the quarter, we achieved production records across multiple assets, demonstrating the strength of our operations. Our flexible portfolio allowed us to capture opportunities in a robust market environment, while our persistent pursuit of cost efficiencies continues to preserve competitiveness and build resilience amid ongoing external pressures. At VBM, we continue to reap benefits of our asset optimization initiatives, yielding higher output and lower costs, while our copper and nickel assets also enjoy benefits from their polymetallic nature. Safety is a core value at Vale and remains embedded in everything we do. In Q1, we safely removed two additional structures from any emergency level, reaching an 80% reduction since 2020. We continue to innovate, highlighted by the announcement of our first ethanol powered Guaibamax vessels, advancing decarbonization while strengthening energy security across our supply chain. These achievements reinforce our confidence in the year ahead and our commitment to generating long term, sustainable returns for our shareholders.“, commented Gustavo Pimenta, CEO Selected financial indicators US$ million 1Q26 1Q25 Δ y/y 4Q25 Δ q/q Net operating revenues 9,258 8,119 14% 11,060 -16% Total costs and expenses (ex-Brumadinho and dams decharacterization)¹ (6,698) (5,970) 12% (7,667) -13% Expenses related to Brumadinho and dams decharacterization (65) (97) -33% (246) -74% Adjusted EBIT 2,985 2,411 24% 3,728 -20% Adjusted EBITDA 3,830 3,115 23% 4,588 -17% Proforma EBITDA1 3,895 3,212 21% 4,834 -19% Proforma EBITDA margin (%) 42% 40% 2 p.p. 44% -2 p.p. Free cash flow 813 504 61% 1,688 -52% Recurring free cash flow 813 504 61% 1,688 -52% Attributable net income 1,893 1,394 36% (3,844) n.a. Attributable proforma net income 1,893 1,471 29% 1,464 29% Net debt2 13,558 12,198 11% 11,236 21% Expanded net debt 17,792 18,242 -2% 15,579 14% Capital expenditures 1,089 1,174 -7% 2,030 -46% 1 Excluding expenses related to Brumadinho and non-recurring items. 2 Including leases (IFRS 16). Results Highlights • Sales performance improved across all business segments. Iron ore, copper, and nickel sales increased by 4% (+3 Mt), 11% (+9 kt), and 15% (+6 kt) y/y, respectively. • Average realized iron ore fines price was 0.4% higher q/q and up 5.5% y/y at 95.8 US$ /t. Realized copper prices rose 19% q/ q and 48% y/y to US$ 13,143/t. Realized nickel prices increased by 13% q/q and 6% y/y to US$ 17,015/t. • Iron ore C1 cash cost totaled US$ 23.6/t, 12% higher y/y, mainly impacted by the BRL appreciation. Iron ore all-in costs reached US$ 55.4/t, 8% higher y/y. • Copper all-in costs improved to US$ -642/t in the quarter, and nickel all-in costs declined 48% y/y to US$ 8,184/t, mainly driven by strong by-product revenues and significant continued cost improvements in the nickel segment. • Proforma EBITDA totaled US$ 3.9 billion, up 21% y/y and 19% lower q/q, largely reflecting the impact of sales volumes and prices. • Capital expenditures amounted to US$ 1.1 billion, in line with the 2026 annual guidance of US$ 5.4-5.7 billion. • Recurring Free Cash Flow totaled US$ 813 million, US$ 309 million higher y/y, driven by stronger Proforma EBITDA. • Expanded net debt reached US$ 17.8 billion at quarter-end, US$ 2.2 billion higher q/q, driven by US$ 2.7 billion paid in dividends and interest on capital in the quarter and partially offset by free cash flow generation. • US$ 74 million in shares repurchased in the quarter, representing approximately 4.98 million shares, as part of the ongoing share buyback program announced in February 2025. -1- Business Highlights Iron Ore Solutions • Serra Sul +20 project construction continues to advance, having 86% physical progress. Load testing of the conveyor belt started in March. The Compact Crushing project construction is 91% complete, and civil works have been completed. Both projects are on track to start-up in 2H26. Vale Base Metals • Vale Base Metals (VBM) has entered into an agreement to form a consortium for Thompson operations, concluding the strategic review of the asset. VBM will retain an 18.9% interest, while consortium partners have committed up to US$ 200 million to support the long-term sustainability of the operations. In addition, VBM has secured an offtake agreement for nickel concentrate, preserving its strategic position in Canadian nickel production. Closing is expected by year-end 2026, subject to regulatory approvals. • In March, VBM published a suite of disclosures to enhance transparency, including technical reports for its assets, its inaugural Sustainability Report, and its 2025 financial statements. These materials are available on the company’s website at www.valebasemetals.com. Risk Management • As part of the company’s risk management strategy, approximately 70% of the forecasted bunker oil consumption for 2026 is currently hedged through Brent crude oil contracts. These hedges, hired in 2025, are intended to mitigate exposure to tail risks through the use of zero-cost collar instruments, and provide Brent crude oil price protection above US$ 80 per barrel. Contracts are settled monthly based on average prices. ESG Tailings dams • The Maravilhas II and North Laranjeiras dams had their emergency level statuses lifted, following the approval by ANM. The structures received a positive Declaration of Stability Condition, confirming their structural safety. Since 2020, 28 dams have been removed from emergency level status, representing an 80% reduction. Decarbonization • Vale entered into an agreement with Shandong Shipping Corporation for chartering ethanol-powered Guaibamax vessels. The vessels are expected to begin operations in 2029 and can reduce greenhouse gas emissions up to 90% compared to heavy fuel oil. This initiative is consistent with Vale's decarbonization objectives and evolving international maritime regulatory standards. Circularity • Circular mining program continues to advance with the implementation of a tailings reprocessing project at the Gongo Soco site in Minas Gerais. The initiative allows iron ore production from legacy tailings generated by a suspended operation, contributing to waste reduction, improved safety and more efficient use of mineral resources. The project includes the installation of a processing plant with an expected capacity of approximately 2 Mtpy of iron ore. Transparency • Vale has published its first Annual Report for the year of 2025, available here. A document that brings together financial, operational, environmental, social, and governance information. The report reflects the evolution of the Integrated Report, and links financial results to safety, climate, people, and community. Reparation Brumadinho • The execution of the Brumadinho Integral Reparation Agreement continues to progress, with approximately 81% of the agreed-upon commitments completed by 1Q26 and in accordance with the deadlines outlined in the settlement. Mariana • The Samarco reparation program continues to advance, with R$ 74.7 billion disbursed as of March 31, 2026. -2- Financials US$ million 1Q26 1Q25 Δ y/y 4Q25 Δ q/q Proforma EBITDA Net operating revenues 9,258 8,119 14% 11,060 -16% COGS (6,173) (5,451) 13% (6,779) -9% SG&A (152) (145) 5% (207) -27% Research and development (131) (123) 7% (260) -50% Pre-operating and stoppage expenses (49) (90) -46% (57) -14% Brumadinho & decharacterization of dams¹ (65) (97) -33% (246) -74% Other operational expenses (excluding non-recurring expenses) (193) (161) 20% (364) -47% Streaming 257 167 54% 295 -13% EBITDA from associates and JV's 233 192 21% 286 -19% Adjusted EBIT 2,985 2,411 24% 3,728 -20% Depreciation, amortization & depletion 845 704 20% 860 -2% Adjusted EBITDA 3,830 3,115 23% 4,588 -17% Proforma EBITDA² 3,895 3,212 21% 4,834 -19% Reconciliation of Proforma EBITDA to Net Income Proforma EBITDA² 3,895 3,212 21% 4,834 -19% Brumadinho & decharacterization of dams¹ and non-recurring items (65) (97) -33% (246) -74% Impairment and gains (losses) on disposal of non-current assets, net (120) (253) -53% (3,844) -97% Streaming (257) (167) 54% (295) -13% EBITDA from associates and JV's (233) (192) 21% (286) -19% Equity results on associates and JV's and other results 36 59 -39% (369) n.a. Financial results 34 185 -82% (1,039) n.a. Income taxes (505) (647) -22% (2,138) -76% Depreciation, depletion & amortization (845) (704) 20% (860) -2% Net income 1,940 1,396 39% (4,243) n.a. Net income attributable to noncontrolling interests 47 2 2250% (399) n.a. Net income attributable to Vale's shareholders 1,893 1,394 36% (3,844) n.a. Non-recurring items³ — 77 -100% 5,308 -100% Proforma net income attributable to Vale’s shareholders 1,893 1,471 29% 1,464 29% 1 Find more information about expenses in Annex 4: Brumadinho & Decharacterization. 2 Excluding expenses related to Brumadinho and non-recurring items. 3 Includes impairments, non-recurring expenses and tax effects related to these items. Proforma EBITDA and Proforma net income attributable to Vale's shareholders – Reporting practice To enhance transparency and comparability, Vale reports: • Proforma EBITDA - a metric that provides a clearer view of operational performance across periods. It comprises: (i) Adjusted EBITDA as defined in note 3 to Vale’s Interim Financial Statements, which is a required disclosure under IFRS 8 – Operating Segments; excluding (ii) Brumadinho-related and dam decharacterization effects, and (iii) non-recurring items. This metric is disclosed consistently and in compliance with CVM Resolution 156. For the reconciliation of EBITDA Proforma to Net Income, please refer to the table above. • Proforma net income attributable to Vale's shareholders - a metric that provides a clearer view of earnings performance across periods. It excludes non-recurring items, such as asset impairments, as well as the related income tax effects. Financial Results -3- EBITDA Proforma EBITDA was US$ 3.9 billion in 1Q26, 21% higher y/y, mainly driven by (i) stronger reference prices as well as improved price realization across all business segments, and (ii) higher sales volumes of iron ore, copper and nickel. These effects were partially offset by (i) the negative impact of the BRL appreciation, and (ii) higher operating costs and expenses, including higher costs related to third-party acquisition, increased iron ore C1 cash cost, and costs associated with operational restrictions. Proforma EBITDA 1Q26 vs. 1Q25 - US$ million 3,21 2 81 7 1 77 (235) (1 00) 24 3,895 Proforma EBITDA 1Q25¹ Price Volume FX effect Costs & Expenses² Others³ Proforma EBITDA 1Q26¹ 1 Excluding Brumadinho expenses. 2 Including iron ore freight costs. 3 Including Associates and JVs EBITDA and others. Net Income Proforma net income totaled US$ 1.9 billion in 1Q26, 29% higher y/y, mainly driven by (i) a US$ 683 million increase in Proforma EBITDA, (ii) the absence of US$ 135 million in tax effects from the divestment of energy assets in 1Q25 reported under Income tax. These positive effects were partially offset by (i) a US$ -314 million variation of mark-tomarket valuation of shareholder debentures and derivatives and (ii) higher Depreciation, depletion and amortization, explained by higher sales in 1Q26. Net income attributable to Vale’s shareholders also totaled US$ 1.9 billion, an increase of 36% y/y, driven by stronger Proforma EBITDA as well as the absence of non-recurring items reported in 1Q26. Proforma net income 1Q26 vs. 1Q25 – US$ million 1 ,471 683 1 82 (1 51 ) (1 41 ) (1 51 ) 1 ,893 Proforma Net Income attributable 1Q25 Proforma EBITDA Income tax¹ Financial results² Depreciation, depletion and amortization Others³ Proforma Net Income attributable 1Q26 1 Excluding a variation of US$ 40 million in taxes impacted by non-recurring items. 2 Including mark-to-market valuation variations of (i) US$ 362 million in other derivatives, (ii) US$ -402 million in currency and interest rate swaps, and (iii) US$ -274 million in shareholder debentures. 3 Including variations of (i) US$ 32 million in Brumadinho and decharacterization of dams, (ii) US$ 16 million in Impairment and gains (losses) on disposal of non-current assets, net (excluding a variation of US$ -117 million in related to non-recurring assets), (iii) US$ -90 million in Streaming, (iv) US$ -45 million in Net income attributable to non-controlling interests, (v) US$ -41 million in EBITDA from associates and JVs, and (vi) US$ -23 million in Equity results on associates and JVs and other results. Financial Results -4- Capital Expenditures Total CAPEX US$ million 1Q26 1Q25 Δ y/y 4Q25 Δ q/q Iron Ore Solutions 838 907 -8% 1,291 -35% Vale Base Metals 226 256 -12% 713 -68% Copper 89 57 56% 232 -62% Nickel 137 199 -31% 481 -72% Energy and others 25 11 127% 26 -4% Total 1,089 1,174 -7% 2,030 -46% Growth Projects US$ million 1Q26 1Q25 Δ y/y 4Q25 Δ q/q Iron Ore Solutions 158 282 -44% 212 -25% Vale Base Metals 24 30 -20% 75 -68% Copper 6 3 100% 6 0% Nickel 18 27 -33% 69 -74% Energy and others — — n.a. — n.a. Total 182 312 -42% 287 -37% Investments in growth projects totaled US$ 182 million, US$ 130 million, (-42%) lower y/y, mainly due to lower disbursements in the Iron Ore Solutions segment with the ramp-up of the Capanema project and the advanced physical stage of the Serra Sul +20 project, which is expected to start-up in the second half of 2026. Sustaining Investments US$ million 1Q26 1Q25 Δ y/y 4Q25 Δ q/q Iron Ore Solutions 680 625 9% 1,079 -37% Vale Base Metals 202 226 -11% 638 -68% Copper 83 54 54% 226 -63% Nickel 119 172 -31% 412 -71% Energy and others 25 11 127% 26 -4% Total 907 862 5% 1,743 -48% Sustaining investments totaled US$ 907 million, US$ 45 million (5%) higher y/y, driven by investments in the Bacaba copper project and higher planned investments at our iron ore pelletizing and railway operations, partially offset by lower expenditures in nickel with the ramp-up of the Voisey's Bay Mine Expansion and iron ore filtration initiatives. Financial Results -5- Free cash flow US$ million 1Q26 1Q25 Δ y/y 4Q25 Δ q/q Proforma EBITDA¹ 3,895 3,212 21% 4,834 -19% Working capital² (863) (252) 242% 179 n.a. Capex (1,089) (1,174) -7% (2,030) -46% Net financial expenses³ (74) (80) -8% (138) -46% Income taxes and REFIS (321) (596) -46% (360) -11% Associates & JV's, net of dividends received⁴ (205) (173) 18% (111) 85% Brumadinho incurred expenses & dams⁵ (137) (146) -6% (181) -24% Streaming² (257) (167) 161% (295) 90% Others (136) (120) 13% (210) -35% Free Cash Flow⁶ 813 504 61% 1,688 -52% Brumadinho (107) (84) 27% (280) -62% Samarco (129) (162) -20% (176) -27% Cash management and others (2,974) (1,308) 127% 300 n.a. Increase/(Decrease) in cash & equivalents (2,397) (1,050) 128% 1,532 n.a. 1 Excluding expenses related to Brumadinho and non-recurring items. Previous periods were restated. ² Includes US$ -34 million related to streaming transactions in 1Q26, US$ -51 million in 1Q25, and US$ -52 million, reflecting the difference between contractual terms and cash receipts, subject to volume and settlement dynamics. ³ Includes interest in loans and borrowings, leasing and net cash received on settlement of derivatives. ⁴ Net of US$ 28 million in dividends received in 1Q26, US$ 19 million in 1Q25, and US$ 175 million in 4Q25. ⁵ Includes payments related to dam decharacterization, incurred expenses related to Brumadinho, and others. 6 There were no non-recurring events in the periods presented above. Free Cash Flow generation reached US$ 813 million, US$ 309 million higher y/y, mainly driven by stronger Proforma EBITDA performance and lower taxes paid. Also, Vale continued to benefit from the settlement of derivatives under the currency swaps program. These effects were partially offset by a more negative working capital variation, resulting from lower cash collection from iron ore sales. The negative working capital effect in the quarter was mainly driven by (i) the seasonal disbursements related to profit sharing, (ii) an increase in inventories, and (iii) an increase in accounts receivables, the latter mainly attributed to copper volumes sold at the end of the quarter, with collection expected in the following quarters. Vale’s cash position was mainly impacted by the payment of dividends and interest on capital, resulting in a US$ 2.4 billion decrease in cash and cash equivalents during the quarter. Free Cash Flow 1Q26 - US$ million 3,895 (863) (1,089) (395) (205) (137) (257) (136) 81 3 (236) (2,974) (2,397) Proforma EBITDA Working capital variation Capex Net financial expenses & income taxes¹ Associates & JV's² Brumadinho incurred expenses & dams³ Streaming Others⁴ Free Cash Flow Brumadinho & Samarco⁵ Cash management and others⁶ Decrease in cash & equivalents ¹ Includes income taxes and REFIS (US$ -321 million), interests on loans and borrowings (US$ -214 million), leasing (US$ -34 million), net cash received on settlement of derivatives (US$ 116 million), and other financial revenues (US$ 58 million). ² Related to Associates and Joint Ventures EBITDA that was included in the Proforma EBITDA, net of dividends received. ³ Includes incurred expenses on Brumadinho (US$ -74 million) and payments on dam decharacterization (US$ -63 million). ⁴ Includes disbursements related to railway concession contracts (US$ -96 million), and others. ⁵ Payments related to Brumadinho and Samarco. Excludes incurred expenses. ⁶ Includes US$ -1.117 billion in debt repayment, US$ 962 million in new loans, US$ -2.745 billion in dividends and interest on capital, and US$ -74 million in share buyback program. Financial Results -6- Debt US$ million 1Q26 1Q25 Δ y/y 4Q25 Δ q/q Gross debt¹ 18,196 15,415 18% 18,134 0% Lease (IFRS 16) 641 781 -18% 668 -4% Gross debt and leases 18,837 16,196 16% 18,802 0% Cash, cash equivalents and short-term investments (5,279) (3,998) 32% (7,566) -30% Net debt 13,558 12,198 11% 11,236 21% Currency swaps² (422) 75 n.a. (181) 133% Brumadinho provisions 1,959 2,132 -8% 1,911 3% Samarco provisions 2,697 3,837 -30% 2,613 3% Expanded net debt 17,792 18,242 -2% 15,579 14% Average debt maturity (years) 8.4 9.5 -12% 8.4 0% Cost of debt after hedge (% pa) 5.5 5.5 0% 5.3 4% Total debt and leases / adjusted LTM EBITDA (x) 1.2 1.1 9% 1.2 0% Net debt / adjusted LTM EBITDA (x) 0.8 0.8 0% 0.7 14% Adjusted LTM EBITDA / LTM gross interest (x) 15.8 16.5 -4% 15.7 1% 1 Does not include leases (IFRS 16). 2 Includes interest rate swaps. Expanded net debt increased by US$ 2.2 billion q/q, totaling US$ 17.8 billion, with an increase in net debt to US$ 13.6 billion (US$ 2.3 billion higher q/q), as a result of dividends and interest on capital paid in the quarter. We recorded a positive mark-to-market impact on our swap positions related to provisions, driven by a 5.1% appreciation of the BRL vs. USD in 1Q26, offsetting the negative FX effects on Brumadinho and Samarco provisions. Gross debt and leases reached US$ 18.8 billion as of March 31st, 2026, mostly in line q/q. The average debt maturity was 8.4 years at the end of 1Q26, in line with the 8.4 years at the end of 4Q25. The average annual cost of debt after currency and interest rate swaps was 5.5%, slightly above the 5.3% at the end of 4Q25. Financial Results -7- Segments’ Performance Adjusted EBITDA by business area: US$ million 1Q26 1Q25 Δ y/y 4Q25 Δ q/q Iron Ore Solutions 2,906 2,887 1% 3,967 -27% Fines 2,441 2,333 5% 3,415 -29% Pellets 479 536 -11% 527 -9% Other ferrous products and logistics services (14) 18 n.a. 25 n.a. Vale Base Metals¹ 1,197 554 116% 1,393 -14% Copper 949 546 74% 1,059 -10% Nickel 277 41 576% 358 -23% Other (29) (33) -12% (24) 21% Unallocated Items² (208) (229) -9% (526) -60% Proforma EBITDA 3,895 3,212 21% 4,834 -19% Brumadinho & decharacterization of dams³ (65) (97) -33% (246) -74% Non-recurring expenses — — n.a. — n.a. Adjusted EBITDA 3,830 3,115 23% 4,588 -17% 1 Starting in 2Q25, the segment previously labeled 'Others' has been renamed to 'Unallocated Items'. There was no change in the allocation methodology or effects. For more information, please refer to Vale’s Financial Statements available on our website. Includes US$ 18 million in unallocated expenses from Vale Base Metals Ltd ("VBM") in 1Q26. Considering the unallocated expenses, VBM’s EBITDA was US$ 1.2 billion in 1Q26. 2 Find more information about these expenses in Annex 4: Brumadinho & Decharacterization. Segment information 1Q26 US$ million Net operating revenues Cost¹ SG&A and others¹ R&D¹ Pre operating & stoppage¹ Associates and JVs EBITDA Streaming Adjusted EBITDA Iron Ore Solutions 6,875 (3,997) (72) (66) (31) 197 — 2,906 Fines 5,692 (3,245) (46) (57) (22) 119 — 2,441 Pellets 1,030 (587) (1) (1) (2) 40 — 479 Other ferrous products and logistics services 153 (165) (25) (8) (7) 38 — (14) Vale Base Metals 2,383 (1,376) (74) (27) — 34 257 1,197 Copper² 1,414 (426) (31) (8) — — — 949 Nickel³ 1,184 (910) (8) (19) — 30 — 277 Others⁴ (215) (40) (35) — — 4 257 (29) Brumadinho & decharacterization of dams⁵ — — (65) — — — — (65) Non-recurring expenses — — — — — — — — Unallocated Items⁶ — — (189) (20) (1) 2 — (208) Total 9,258 (5,373) (400) (113) (32) 233 257 3,830 ¹ Excluding depreciation, depletion, and amortization. ² Including by-products from our copper operations. ³ Including copper and by-products from our nickel operations. ⁴ Starting in 3Q25, streaming transactions at market prices, previously reported under SG&A and others, will be disclosed separately as Streaming. Prior periods were restated. ⁵ Find more information of expenses in Annex 4: Brumadinho & Decharacterization. ⁶ Starting in 2Q25, the segment previously labeled 'Others' has been renamed to 'Unallocated Items'. There was no change in the allocation methodology or effects. For more information, please refer to Vale’s Financial Statements available on our website. Includes US$ 18 million in unallocated expenses from Vale Base Metals Ltd ("VBM") in 1Q26. Considering the unallocated expenses, VBM’s EBITDA was US$ 1.2 billion in 1Q26. Business Segments’ Performance -8- th Iron Ore Solutions Highlights 1Q26 1Q25 Δ y/y 4Q25 Δ q/q Average Prices (US$/t) Iron ore - 61% Fe price 103.6 100.6 3% 103.0 1% Iron ore fines realized price, CFR/FOB 95.8 90.8 6% 95.4 0% Iron ore pellets realized price, CFR/FOB 133.8 140.8 -5% 131.4 2% Volume sold (‘000 metric tons) Fines 59,436 56,762 5% 73,566 -19% Pellets 7,699 7,493 3% 9,056 -15% ROM 1,578 1,886 -16% 2,251 -30% Total - Iron ore 68,713 66,141 4% 84,874 -19% Financials indicators (US$ million) Net Revenues 6,875 6,375 8% 8,370 -18% Costs¹ (3,997) (3,506) 14% (4,469) -11% SG&A and Other expenses¹ (72) (25) 188% (28) 157% R&D expenses (66) (54) 22% (127) -48% Pre-operating and stoppage expenses¹ (31) (69) -55% (39) -21% EBITDA Associates & JV's 197 166 19% 260 -24% Adjusted EBITDA 2,906 2,887 1% 3,967 -27% Depreciation and amortization (558) (482) 16% (554) 1% Adjusted EBIT 2,348 2,405 -2% 3,413 -31% 1 Net of depreciation and amortization. Adjusted EBITDA per segment US$ million 1Q26 1Q25 Δ y/y 4Q25 Δ q/q Fines 2,441 2,333 5% 3,415 -29% Pellets 479 536 -11% 527 -9% Other ferrous products and logistics services (14) 18 n.a. 25 n.a. Adjusted EBITDA 2,906 2,887 1% 3,967 -27% Iron Ore Solutions EBITDA was US$ 2.9 billion, slightly higher y/y, mainly reflecting the higher realized prices and increased sales of iron ore fines, partially offset by higher operating costs and expenses and the negative impact of BRL appreciation. Iron Ore Fines EBITDA increased by 5% y/y, reaching US$ 2.4 billion, mostly explained by higher realized prices (US$ 300 million) and higher sales volumes (US$ 108 million). These effects were partly offset by the negative impact of the BRL appreciation (US$ -102 million) and higher C1 cash cost (US$ -57 million), excluding third-party purchase. Iron Ore Pellets EBITDA decreased by 11% y/y, totaling US$ 479 million, primarily driven by the negative impact of the BRL appreciation (US$ -37 million) and lower realized prices (US$ -35 million). These effects were partly offset by increased sales volumes (US$ 10 million). EBITDA variation – US$ million (1Q26 vs. 1Q25) 2,887 277 1 04 (225) (1 51 ) 1 4 2,906 1Q25 Price Volume Costs & Expenses¹ FX effect Others² 1Q26 1 Including iron ore freight costs. 2 Includes Associates and JVs EBITDA and others. -9- Iron Ore Fines Product mix 000 metric tons 1Q26 1Q25 Δ y/y 4Q25 Δ q/q Volume sold Fines¹ 59,436 56,762 5% 73,566 -19% IOCJ 3,833 4,596 -17% 5,042 -24% BRBF 30,175 35,814 -16% 36,337 -17% Mid-Grade Carajás 7,662 3,188 140% 10,512 -27% Pellet feed - China (PFC)² 9,069 3,928 131% 8,155 11% Lump 2,111 1,679 26% 2,085 1% High-silica products 681 1,957 -65% 4,213 -84% Other fines (60-62% Fe) 5,905 5,600 5% 7,222 -18% 1 Including third-party purchases. 2 Products concentrated in Chinese facilities. Revenues The average realized iron ore fines price was US$ 95.8/t, US$ 0.4/t higher q/q, mainly driven by higher Quality and Premiums (US$ 1.6/t higher q/q), reflecting the product portfolio strategy, adaptable product mix and higher market premiums for low-alumina products. This effect was partially offset by the negative effect of pricing mechanisms adjustments, mainly related to provisional pricing adjustments in the previous period (US$ 1.0/t lower q/q). Price realization iron ore fines – US$/t (1Q26) 1 03.6 4.1 (0.7) (0.4) (0.2) 0.5 1 06.9 (2.6) (8.5) 95.8 Average reference 61%Fe price 1Q26 (dmt) Quality and premiums¹ Provisional prices in prior quarter² Lagged prices Current prices Provisional prices in current quarter³ CFR reference (dmt) Adjustments for FOB sales⁴ Moisture Vale realized price (wmt)⁵ Impact of pricing system adjustments 1 Includes quality (US$ 2.9/t) and premiums/discounts and commercial conditions (US$ 1.1/t). 2 Adjustment as a result of provisional prices booked in 4Q25 at US$ 103.7/t. 3 Difference between the weighted average of the prices provisionally set at the end of 1Q26 at US$ 105.5/t based on forward curves and US$ 105.9/t from the 1Q26 average reference price. 4 Includes freight pricing mechanisms of CFR sales freight recognition. 5 Vale’s price is net of taxes. Previous periods were restated. Iron ore all-in premium US$/t 1Q26 1Q25 Δ y/y 4Q25 Δ q/q All-in premium - Total¹ 6.2 4.8 29% 3.6 72% Iron ore fines quality and premiums 4.1 1.7 141% 2.5 64% Pellets business' weighted average contribution² 2.1 3.1 -32% 1.1 91% 1 Starting in 1Q26, all-in premium will be disclosed in relation to the 61%Fe price index. Prior periods were restated. 2 Weighted average contribution. The all-in premium, adjusted for the 61%Fe price index, increased by US$ 2.6/t q/q, totaling US$ 6.2/t, mainly driven by higher Iron ore fines quality and premiums (US$ 1.6/t higher q/q), and higher contribution from the Pellets business, reflecting higher quarterly pellet premiums (US$ 1.0/t higher q/q). Business Segments’ Performance -10- Costs and expenses Iron ore fines and pellets all-in costs (cash cost break-even landed in China) US$/t 1Q26 1Q25 Δ y/y 4Q25 Δ q/q C1 cash cost, ex-third-party purchase costs 23.6 21.0 12% 21.3 11% Third-party purchases cost adjustments 4.6 3.7 24% 4.0 15% Freight cost¹ 18.1 18.6 -3% 18.0 1% Distribution cost 4.9 4.0 23% 3.5 40% Expenses & royalties² 7.6 6.1 25% 6.2 23% EBITDA from associates and joint ventures (2.0) (1.7) 18% (2.1) -5% Moisture adjustment 4.9 4.5 9% 4.3 14% Iron ore fines quality adjustment³ (4.1) (1.7) 141% (2.5) 64% Iron ore fines all-in costs (US$/dmt) 57.6 54.4 6% 52.7 9% Pellet business contribution (2.1) (3.1) -32% (1.1) 91% Iron ore fines and pellets all-in costs (US$/dmt) 55.4 51.3 8% 51.6 7% Sustaining investments (fines and pellets) 10.1 9.5 6% 13.4 -25% Iron ore fines and pellets all-in costs⁴ (US$/dmt) 65.5 60.8 8% 65.0 1% 1 Ex-bunker oil hedge. 2 Including stoppage costs and expenses. 3 Starting in 1Q26, all-in premium will be disclosed in relation to the 61%Fe price index. Prior periods were restated. ⁴ Including sustaining investment. Iron ore fines C1 production costs US$ million 1Q26 1Q25 Δ y/y 4Q25 Δ q/q C1 production costs, ex-third-party purchase costs 25.3 23.1 10% 21.4 18% C1 cash cost, ex-third-party purchase costs 23.6 21.0 12% 21.3 11% The C1 cash cost, excluding third-party purchases, reached US$ 23.6/t in 1Q26, 12% higher y/y. This increase mainly reflects (i) the negative impact of the BRL appreciation, (ii) the negative impact from inventory turnover effects, resulting from the consumption of inventories from the previous quarter at higher costs, and (iii) costs related to the deconsolidation of Aliança Energia. These effects were partially offset by higher dilution of fixed costs as a result of increased production volumes. C1 cash cost, excluding third-party purchase costs - US$/t, 1Q26 vs. 1Q25 21 .0 1 .5 0.8 0.5 (0.4) 0.2 23.6 1Q25 FX effect Inventory turnover Aliança Energia deconsolidation Mix and fixed cost dilution Others¹ 1Q26 1 Including maintenance, materials, fuel, personnel and others. Vale's average maritime freight cost was US$ 18.1/t in 1Q26, remaining flat q/q. Vale’s performance was US$ 6.7/t below the Brazil–China C3 route, highlighting the effectiveness of its long-term chartering strategy, which reduces both costs and volatility. CFR sales totaled 52.8 Mt in 1Q26, accounting for 89% of total iron ore fines sales. Assuming market consensus estimates for 2026 of an average BRL/USD exchange rate of 5.25 and Brent oil prices (and related products) at US$90/bbl, annual guidance for 2026 is trending toward the upper end of the previously announced ranges for C1 cash cost excluding third-party purchases (US$20–21.5/t) and all-in cash cost11 (US$52–56/t). For reference, a 0.10 movement in the BRL implies an approximate impact of US$0.25/t on the C1 cash cost excluding third-party purchases and US$0.40/t on the all-in cost. In addition, a 10% change in domestic diesel prices in Brazil impacts the C1 cash cost by approximately US$0.15/t, while a US$10/bbl change in Brent oil prices implies an approximate US$1/t variation in Vale’s maritime freight costs. Business Segments’ Performance -11- 1 All-in cash cost as referenced to the 61% Fe price index. Pellets US$ million 1Q26 1Q25 Δ y/y 4Q25 Δ q/q Net revenues 1,030 1,055 -2% 1,190 -13% Cash costs¹ (587) (559) 5% (703) -17% Pre-operational & stoppage expenses (3) (2) 50% (3) 0% Expenses² (1) 2 n.a. 1 n.a. Leased pelletizing plants EBITDA 40 40 0% 42 -5% EBITDA 479 536 -11% 527 -9% Iron ore pellets realized price (CFR/FOB, S$/t) 133.8 140.8 -5% 131.4 2% Cash costs¹ per ton (US$/t) 76.2 74.6 2% 77.6 -2% EBITDA per ton (US$/t) 62.2 71.5 -13% 58.2 7% 1 Including iron ore, leasing, freight, overhead, energy and others. 2 Including selling, R&D and others. Pellets sales totaled 7.7 Mt, 3% higher y/y and 15% lower q/q, in line with production volumes. The average realized iron ore pellets price was US$ 133.8/t, US$ 2.4/t higher q/q, primarily driven by higher contractual pellet premiums (US$ 3.8/t higher q/q). Pellets’ cash costs per ton were 2% higher y/y, totaling US$ 76.2/t, mainly reflecting the negative impact of the BRL appreciation. FOB sales accounted for 67% of total pellets sales in the quarter. Business Segments’ Performance -12- Vale Base Metals Highlights US$ million 1Q26 1Q25 Δ y/y 4Q25 Δ q/q Net Revenues 2,383 1,744 37% 2,691 -11% Costs¹ (1,376) (1,284) 7% (1,506) -9% SG&A and other expenses¹ ² (74) (65) 14% (51) 45% R&D expenses (27) (32) -16% (61) -56% Pre-operating and stoppage expenses¹ — (2) n.a. (2) n.a. EBITDA from associates and JV's 34 26 31% 27 26% Streaming² 257 167 54% 295 -13% Adjusted EBITDA 1,197 554 116% 1,393 -14% Depreciation and amortization (292) (207) 41% (301) -3% Adjusted EBIT 905 346 162% 1,092 -17% 1 Net of depreciation and amortization. 2 Starting in 3Q25, streaming transactions at market prices, previously reported under SG&A and others are disclosed separately as Streaming. Prior periods were restated. Adjusted EBITDA US$ million 1Q26 1Q25 Δ y/y 4Q25 Δ q/q Copper 949 546 74% 1,059 -10% Nickel 277 41 576% 358 -23% Others (29) (33) -12% (24) 21% Total 1,197 554 116% 1,393 -14% Vale Base Metals EBITDA increased by 116% y/y in 1Q26, totaling US$ 1.2 billion, supported by strong operational performance combined with favorable commodity market conditions across the portfolio. Copper EBITDA increased by 74% y/y, totaling US$ 949 million in the quarter, driven by a favorable market price environment for copper (US$ 301 million) and gold (US$ 197 million). In addition, Sossego achieved productivity gains, reflecting the production maximization in preparation for the SAG mill's 110-day planned maintenance in 2H26. These positive effects were partially offset by a negative effect from provisional price adjustments due to a decrease in copper forward prices applied to open invoices at the end of the quarter (US$ -107 million). Nickel EBITDA increased by 576% y/y, totaling US$ 277 million in the quarter, supported by cost improvements, reflecting operational performance in Sudbury and Voisey’s Bay & Long Harbour (US$ 110 million), along with higher by-product revenues (US$ 253 million) and higher nickel prices (US$ 45 million). These gains were partially offset by a negative effect from provisional price adjustments due to a decrease in copper and PGMs forward prices applied to open invoices at the end of the quarter (US$ -162 million). EBITDA variation – US$ million (1Q26 vs. 1Q25) 554 540 92 73 (62) 1 ,1 97 1Q25 Price¹ Costs & Expenses² Volume³ Others 1Q26 ¹ Includes variations of (i) US$ 463 million in realized prices for by-products, (ii) US$ -269 million in provisional price adjustments and (iii) US$ 346 million in realized prices for copper and nickel. ² Includes variations of (i) US$ 72 million in Voisey's Bay, (ii) US$ -15 million due to mineral tax (TFRM) increase. 3 Includes a variation of US$ -8 million in by-products volumes. -13- Copper US$ million (unless otherwise stated) 1Q26 1Q25 Δ y/y 4Q25 Δ q/q LME copper price (US$/t) 12,844 9,340 38% 11,092 16% Average realized copper price (US$/t) 13,143 8,891 48% 11,003 19% Volume sold – copper (kt) 72 61 18% 81 -11% Net Revenues 1,414 900 57% 1,565 -10% Costs¹ (426) (339) 26% (468) -9% Selling and other expenses¹ (31) (4) n.a. (8) 288% R&D expenses2 (8) (10) -20% (29) -72% Pre-operating and stoppage expenses¹ — (1) n.a. (1) n.a. Adjusted EBITDA 949 546 74% 1,059 -10% Depreciation and amortization (44) (34) 29% (53) -17% Adjusted EBIT 905 512 77% 1,006 -10% 1 Net of depreciation and amortization. 2 Includes R&D expenses not related to current operations of US$ 19 million in 1Q26. Adjusted EBITDA US$ million 1Q26 1Q25 Δ y/y 4Q25 Δ q/q Salobo 697 404 73% 853 -18% Sossego 309 80 286% 130 138% Other¹ (58) 62 n.a. 76 n.a. Total 949 546 74% 1,059 -10% 1 Includes R&D expenses and the unrealized provisional price adjustments. Revenues Net revenues totaled US$ 1.4 billion in 1Q26, 57% higher y/y, driven by higher realized copper prices (US$ 301 million) and sales volumes (US$ 40 million) along with higher by-product revenues, which were impacted by higher gold prices (US$ 197 million) and the increase in gold volumes sold in copper concentrates (US$ 7 million). These effects were partially offset by a negative effect from provisional price adjustments (US$ -107 million). The average realized copper price was US$ 13,143/t, 19% higher q/q, reflecting higher LME prices and the favorable impact of final price settlements within the current pricing environment. Average realized copper price 1Q26 – US$/t 1 2,844 (61 8) 1 2,227 1 ,11 9 1 3,346 (202) 1 3,1 43 Average LME copper price Current period price adjustments ¹ Copper gross realized price Prior period price adjustments ² Copper realized price before discounts TC/RCs, penalties, premiums discounts ³ Average copper realized price Note: Vale’s copper products are sold on a provisional pricing basis, with final prices determined in a future period. The average copper realized price excludes the mark-to-market of open invoices based on the copper price forward curve (unrealized provisional price adjustments) and includes the prior and current period price adjustments (realized provisional price adjustments). 1 Current-period price adjustments: Final invoices that were provisionally priced and settled within the quarter. 2 Prior-period price adjustment: Final invoices of sales provisionally priced in prior quarters. 3 TC/RCs, penalties, premiums, and discounts for intermediate products. Business Segments’ Performance -14- Costs & Expenses All-in costs (EBITDA break-even) US$/t 1Q26 1Q25 Δ y/y 4Q25 Δ q/q COGS 5,925 5,574 6% 5,749 3% By-product revenues (7,057) (4,760) 48% (7,022) 0% COGS after by-product revenues (1,132) 814 n.a. (1,273) -11% Other expenses¹ 288 113 155% 183 57% Total costs (844) 926 n.a. (1,090) -23% TC/RCs, penalties, premiums and discounts 202 286 -29% 209 -3% EBITDA break-even² ³ (642) 1,212 n.a. (881) -27% 1 Includes sales expenses, R&D associated with Salobo and Sossego, pre-operating and stoppage expenses and other expenses. 2 Considering only the cash effect of streaming transactions, copper operations EBITDA break-even would increase to US$ 2,952/t in 1Q26. 3 The realized price to be compared to the EBITDA break-even should be the copper realized price before discounts (US$ 13,346/t for 1Q26), given that TC/RCs, penalties, and other discounts are already part of the EBITDA break-even build-up. All-in costs reached US$ -642/t in 1Q26, down US$ 1,854/t y/y, driven by higher by-products volumes and prices, as well as fixed-cost dilution supported by increased sales volumes. Unit COGS was US$ 5,925/t, up 6% y/y, reflecting the negative effect of BRL appreciation and higher mineral tax payments from the TFRM rate adjustment, introduced in March 2025. These effects were partially offset by higher dilution of fixed costs driven by higher production levels. Unit COGS, net of by-products, reached US$ -1,132/t, down US$ -1,946/t y/y, driven by higher gold revenues, due to higher gold prices and higher gold volumes in concentrates. Unit COGS, net of by-products, by operation US$/t 1Q26 1Q25 Δ y/y 4Q25 Δ q/q Salobo (2,163) — n.a. (2,741) -21% Sossego 736 3,473 -79% 3,690 -80% Unit expenses were US$ 288/t, up by 155% y/y, explained by higher SG&A expenses. Business Segments’ Performance -15- Nickel US$ million (unless otherwise stated) 1Q26 1Q25 Δ y/y 4Q25 Δ q/q LME nickel price 17,356 15,571 11% 14,892 17% Average realized nickel price 17,015 16,106 6% 15,015 13% Volume sold - nickel (kt) 45 39 15% 50 -10% Volume sold - copper (kt) 19 21 -10% 26 -27% Net Revenues 1,184 969 22% 1,328 -11% Costs¹ (910) (907) 0% (954) -5% Selling and other expenses¹ (8) (21) -57% (10) -10% R&D expenses² (19) (22) -14% (31) -39% Pre-operating and stoppage expenses¹ — (1) -100% (1) -100% EBITDA from associates and JV's 30 23 30% 26 15% Adjusted EBITDA 277 41 576% 358 -23% Depreciation and amortization (235) (165) 42% (231) 2% Adjusted EBIT 42 (124) n.a. 127 -67% 1 Net of depreciation and amortization. ² Includes R&D expenses not related to current operations of US$ 15 million in 1Q26. Adjusted EBITDA US$ million 1Q26 1Q25 Δ y/y 4Q25 Δ q/q Sudbury¹ 227 4 n.a. 196 16% Voisey’s Bay & Long Harbour 66 (50) n.a. 1 n.a. Standalone Refineries² 24 24 0% 8 200% Onça Puma 51 19 168% 22 132% Others³ (91) 44 n.a. 131 n.a. Total 277 41 576% 358 -23% 1 Includes the Thompson operations. 2 Comprises the sales results for Clydach and Matsusaka refineries. 3 Includes intercompany eliminations, provisional price adjustments and inventories adjustments. Includes proportionate EBITDA from PTVI. Revenues Net revenues totaled US$ 1.2 billion in 1Q26, increasing by 22% y/y, driven by higher by-product prices (US$ 253 million) and higher nickel realized price (US$ 45 million). These effects were partially offset by a negative effect from provisional price adjustments (US$ -162 million). The average realized nickel price was US$ 17,015/t, up 13% q/q, mainly driven by a 17% increase in the LME nickel average price. The average realized nickel price was 2% lower than the LME average, mainly driven by higher discounts on Class II products, as well as the impact of timing-related pricing adjustments. Average realized nickel price 1Q26 – US$/t 1 7,356 (6) 1 7,350 (223) (11 3) 1 7,01 5 Average LME nickel price Nickel average aggregate premium Average realized price before timing and other adjustments Quotational period Fixed price sales Average nickel realized price Business Segments’ Performance -16- Costs & Expenses All-in costs (EBITDA break-even) US$/t 1Q26 1Q25 Δ y/y 4Q25 Δ q/q COGS ex-external feed 22,325 27,957 -20% 21,204 5% COGS¹ 20,284 23,277 -13% 19,225 6% By-product revenues¹ (11,707) (7,383) 59% (10,356) 13% COGS after by-product revenues 8,577 15,894 -46% 8,869 -3% Other expenses² 270 962 -72% 762 -65% EBITDA from associates & JV's (669) (590) 13% (524) 28% Total Costs 8,178 16,265 -50% 9,107 -10% Nickel average aggregate (premium) discount 6 (535) n.a. (106) n.a. EBITDA break-even³ 8,184 15,730 -48% 9,001 -9% 1 Excluding marketing activities. 2 Includes R&D associated with current nickel operations, sales expenses and pre-operating & stoppage. 3 Considering only the cash effect of streaming transactions, nickel operations EBITDA break-even would increase to US$ 8,907/t in 1Q26. All-in cost totaled US$ 8,184/t in the quarter, decreasing by 48% y/y and 9% q/q, driven by higher by-product revenues in polymetallic assets and lower unit COGS. Unit COGS, excluding external feed purchases, was US$ 22,325/t, declining by 20% y/y, underpinned by cost efficiencies at Voisey's Bay and record Q1 production at Long Harbour, contributing to fixed cost dilution. Unit COGS totaled US$ 20,284/t, down by 13% y/y and up 6% q/q, underpinned by lower costs and higher relative production of own-sourced feed. Unit by-product revenues were US$ 11,707/t, 59% higher y/y, in line with higher by-product sales and favorable price environment for precious metals. Unit COGS, net of by-products, by operation US$/t 1Q26 1Q25 Δ y/y 4Q25 Δ q/q Sudbury¹ ² 1,378 14,791 -91% (119) n.a. Voisey’s Bay & Long Harbour² 12,280 20,386 -40% 14,640 -16% Standalone refineries² ³ 16,100 13,676 18% 14,897 8% Onça Puma 9,825 9,683 1% 9,243 6% ¹ Sudbury costs include Thompson costs. ² A large portion of Sudbury, Clydach, Matsusaka and Long Harbour finished nickel production is derived from intercompany transfers, as well as from the purchase of ore or nickel intermediates from third parties. These transactions are valued at fair market value. ³ Comprises the unit COGS for Clydach and Matsusaka refineries. Unit expenses were US$ 270/t, decreased by 72% y/y, explained by lower SG&A expenses. Business Segments’ Performance -17- Webcast information Investor Relations Vale will host a webcast on vale.RI@vale.com Wednesday 29th april, 2026 10:00 a.m. (New York) Thiago Lofiego 11:00 a.m. (Brasília) thiago.lofiego@vale.com 2:00 p.m. (London) Luciana Oliveti luciana.oliveti@vale.com Internet access to the webcast and presentation materials will be available on Vale website at www.vale.com/investors Pedro Terra pedro.terra@vale.com A webcast replay will be accessible shortly after the completion of the call. Patricia Tinoco patricia.tinoco@vale.com Further information on Vale can be found at: vale.com Except where otherwise indicated, the operational and financial information in this release is based on the consolidated figures in accordance with IFRS. Our quarterly financial statements are reviewed by the company’s independent auditors. The main subsidiaries that are consolidated are the following: Companhia Portuária da Baía de Sepetiba, Vale Manganês S.A., Minerações Brasileiras Reunidas S.A., Vale Base Metals Ltd, Salobo Metais S.A, Tecnored Desenvolvimento Tecnológico S.A., Vale Holdings B.V, Vale Canada Limited, Vale International S.A., Vale Malaysia Minerals Sdn. Bhd. and Vale Oman Pelletizing Company LLC. This press release may include statements about Vale’s current expectations about future events or results (forward-looking statements). Many of those forward-looking statements can be identified by the use of forward-looking words such as ”anticipate,” ”believe,” ”could,” ”expect,” ”should,” ”plan,” ”intend,” ”estimate” “will” and ”potential,” among others. All forward-looking statements involve various risks and uncertainties. Vale cannot guarantee that these statements will prove correct. These risks and uncertainties include, among others, factors related to: (a) the countries where Vale operates, especially Brazil and Canada; (b) the global economy; (c) the capital markets; (d) the mining and metals prices and their dependence on global industrial production, which is cyclical by nature; and (e) global competition in the markets in which Vale operates. Vale cautions you that actual results may differ materially from the plans, objectives, expectations, estimates and intentions expressed in this presentation. Vale undertakes no obligation to publicly update or revise any forward-looking statement, whether as a result of new information or future events or for any other reason. To obtain further information on factors that may lead to results different from those forecast by Vale, please consult the reports that Vale files with the U.S. Securities and Exchange Commission (SEC), the Brazilian Comissão de Valores Mobiliários (CVM) and, in particular, the factors discussed under “Forward-Looking Statements” and “Risk Factors” in Vale’s annual report on Form 20-F. The information contained in this press release includes financial measures that are not prepared in accordance with IFRS. These non-IFRS measures differ from the most directly comparable measures determined under IFRS, but we have not presented a reconciliation to the most directly comparable IFRS measures, because the non-IFRS measures are forward-looking and a reconciliation cannot be prepared without unreasonable effort. -18- Annex 1: Detailed Financial Information Simplified financial statements Income Statement US$ million 1Q26 1Q25 Δ y/y 4Q25 Δ q/q Net operating revenue 9,258 8,119 14% 11,060 -16% Cost of goods sold and services rendered (6,173) (5,451) 13% (6,779) -9% Gross profit 3,085 2,668 16% 4,281 -28% Gross margin (%) 33% 33% 0 p.p. 39% -6 p.p. Selling and administrative expenses (152) (145) 5% (207) -27% Research and development (131) (123) 7% (260) -50% Pre-operating and operational stoppage (49) (90) -46% (57) -14% Other operational expenses, net (258) (258) 0% (610) -58% Impairment and gains (losses) on disposal of non-current assets, net (120) (253) -53% (3,844) -97% Operating income 2,375 1,799 32% (697) n.a. Financial income 128 116 10% 125 2% Financial expenses (418) (382) 9% (465) -10% Other financial items, net 324 451 -28% (699) n.a. Equity results and other results in associates and joint ventures 36 59 -39% (369) n.a. Income before income taxes 2,445 2,043 20% (2,105) n.a. Current tax (242) (186) 30% 253 n.a. Deferred tax (263) (461) -43% (2,391) -89% Net income 1,940 1,396 39% (4,243) n.a. Net income attributable to noncontrolling interests 47 2 n.a. (399) n.a. Net income attributable to Vale's shareholders 1,893 1,394 36% (3,844) n.a. Basic earnings per share (attributable to the Company's shareholders - US$): Basic and diluted earnings per share (attributable to the Company's shareholders - US$) 0.44 0.33 33% (0.90) n.a. Equity income (loss) by business segment US$ million 1Q26 % 1Q25 % Δ y/y 4Q25 % Δ q/q Iron Ore Solutions 31 55% 33 122% -6% 92 144% -66% Vale Base Metals 25 45% (6) -22% n.a. (27) -42% n.a. Unallocated items¹ — 0% — 0% n.a. (1) -2% n.a. Total 56 100% 27 100% 107% 64 100% -13% 1 Starting in 2Q25, the segment previously labeled 'Others' has been renamed to 'Unallocated Items'. For more information, please refer to Vale’s Financial Statements available on our website. Annexes -19- Balance sheet US$ million 03/31/2026 03/31/2025 Δ q/q 12/31/2025 Δ y/y Assets Current assets 16,751 14,687 14% 18,291 -8% Cash and cash equivalents 5,085 3,955 29% 7,372 -31% Short term investments 194 43 n.a. 194 0% Accounts receivable 2,401 2,144 12% 2,297 5% Other financial assets 926 277 234% 457 103% Inventories 6,135 4,919 25% 5,937 3% Recoverable taxes 1,312 1,093 20% 1,505 -13% Other 672 362 86% 529 27% Non-current assets held for sale 26 1,894 -99% — n.a. Non-current assets 10,660 12,003 -11% 10,627 0% Judicial deposits 597 580 3% 651 -8% Other financial assets 701 262 168% 482 45% Recoverable taxes 1,947 1,381 41% 1,776 10% Deferred income taxes 6,019 8,309 -28% 6,318 -5% Other 1,396 1,471 -5% 1,400 0% Fixed assets 60,180 56,740 6% 57,607 4% Total assets 87,591 83,430 5% 86,525 1% Liabilities Current liabilities 13,510 13,234 2% 15,870 -15% Suppliers and contractors 5,490 4,403 25% 5,565 -1% Loans, borrowings and leases 598 608 -2% 518 15% Leases 160 176 -9% 160 0% Railway concession 616 517 19% 570 8% Other financial liabilities 640 848 -25% 655 -2% Taxes payable 646 651 -1% 687 -6% Settlement program ("REFIS") 453 386 17% 423 7% Provisions for litigation 153 156 -2% 144 6% Employee benefits 684 664 3% 1,133 -40% Liabilities related to associates and joint ventures 1,181 1,929 -39% 1,082 9% Liabilities related to Brumadinho 868 876 -1% 758 15% De-characterization of dams and asset retirement obligations 1,003 937 7% 868 16% Dividends payable 21 — n.a. 2,651 -99% Other 857 385 123% 656 31% Liabilities associated with non-current assets held for sale 140 698 -80% — n.a. Non-current liabilities 36,529 33,834 8% 36,305 1% Loans, borrowings and leases 17,598 14,807 19% 17,616 0% Leases 481 605 -20% 508 -5% Railway concession 1,876 2,005 -6% 1,824 3% Other financial liabilities 3,399 2,572 32% 3,047 12% Settlement program (REFIS) 726 1,005 -28% 784 -7% Deferred income taxes 82 175 -53% 107 -23% Provisions for litigation 944 948 0% 899 5% Employee benefits 1,200 1,155 4% 1,214 -1% Liabilities related to associates and joint ventures 1,516 1,908 -21% 1,531 -1% Liabilities related to Brumadinho 1,091 1,256 -13% 1,153 -5% De-characterization of dams and asset retirement obligations 5,225 5,164 1% 5,294 -1% Streaming transactions 1,962 1,928 2% 1,968 0% Others 429 306 40% 360 19% Total liabilities 50,039 47,068 6% 52,175 -4% Shareholders' equity 37,552 36,362 3% 34,350 9% Total liabilities and shareholders' equity 87,591 83,430 5% 86,525 1% Annexes -20- Cash flow US$ million 1Q26 1Q25 Δ y/y 4Q25 Δ q/q Cash flow from operations 2,468 2,534 -3% 4,362 -43% Payment of interest on loans, financing and other financial liabilities (214) (240) -11% (306) -30% Receipts from the settlement of derivatives, net 116 134 -13% 203 -43% Payments related to Brumadinho (107) (84) 27% (280) -62% Payments related to de-characterization of dams (63) (79) -20% (106) -41% Interest on participative shareholders debentures paid — — n.a. (814) n.a. Payments of income taxes (including refinancing programs) (321) (596) -46% (360) -11% Net cash generated by operating activities 1,879 1,669 13% 2,699 -30% Cash flow from investing activities Short-term investment 58 26 123% 143 -59% Acquisition of property, plant and equipment and intangible assets (1,185) (1,255) -6% (2,189) -46% Payments related to Samarco dam failure (129) (162) -20% (176) -27% Dividends received from joint ventures and associates 28 19 47% 175 -84% Other investment activities, net (40) 1 n.a. (92) -57% Net cash used in investing activities (1,268) (1,371) -8% (2,139) -41% Cash flow from financing activities Loans and financing: Loans and borrowings from third parties 962 1,611 -40% 420 129% Payments of loans and borrowings from third parties (1,117) (940) 19% (23) n.a. Payments of leasing (34) (30) 13% (69) -51% Payments to shareholders: Dividends and interest on capital paid to Vale's shareholders (2,745) (1,979) 39% (97) n.a. Share buyback program (74) — n.a. — n.a. Issuance of subordinated notes — — n.a. 741 n.a. Net cash used in financing activities (3,008) (1,338) 125% 972 n.a. Net increase (decrease) in cash and cash equivalents (2,397) (1,040) 130% 1,532 n.a. Cash and cash equivalents in the beginning of the period 7,372 4,953 49% 5,902 25% Effect of exchange rate changes on cash and cash equivalents 110 145 -24% (62) n.a. Cash from subsidiaries classified as non-current assets held for sale and others — (103) n.a. — n.a. Cash and cash equivalents at the end of period 5,085 3,955 29% 7,372 -31% Non-cash transactions: Additions to property, plant and equipment - capitalized loans and borrowing costs 5 4 25% 5 0% Cash flow from operating activities Income before income taxes 2,445 2,043 20% (2,105) n.a. Adjusted for: Changes in estimates related to the provision of Brumadinho (6) 39 n.a. 243 n.a. Changes in estimates related to the provision of decharacterization of dams (3) (9) -67% (67) -96% Equity results and other results in associates and joint ventures (36) (59) -39% 369 n.a. Impairment and other results related to non-current assets, net 120 253 -53% 3,844 -97% Depreciation, depletion and amortization 845 704 20% 860 -2% Financial results, net (34) (185) -82% 1,039 n.a. Change in assets and liabilities Accounts receivable (119) 316 n.a. 170 n.a. Inventories (214) (239) -10% (349) -39% Suppliers and contractors (262) (21) n.a. 48 n.a. Other assets and liabilities, net (268) (308) -13% 310 n.a. Cash flow from operations 2,468 2,534 -3% 4,362 -43% Annexes -21- Reconciliation of IFRS and “non-GAAP” information (a) Adjusted EBIT US$ million 1Q26 1Q25 Δ y/y 4Q25 Δ q/q Net operating revenues 9,258 8,119 14% 11,060 -16% COGS (6,173) (5,451) 13% (6,779) -9% Sales and administrative expenses (152) (145) 5% (207) -27% Research and development expenses (131) (123) 7% (260) -50% Pre-operating and stoppage expenses (49) (90) -46% (57) -14% Brumadinho event and dam decharacterization of dams (65) (97) -33% (246) -74% Other operational expenses, net¹ (193) (161) 20% (364) -47% EBITDA from associates and JV's 233 192 21% 286 -19% Streaming² 257 167 54% 295 -13% Adjusted EBIT 2,985 2,411 24% 3,728 -20% ¹ Starting in 3Q25, streaming transactions at market prices, previously reported under "Other operational expenses, net", will be disclosed separately as Streaming. Prior periods were restated. (b) Adjusted EBITDA EBITDA defines profit or loss before interest, tax, depreciation, depletion and amortization. The definition of Adjusted EBITDA for the Company is the operating income or loss plus EBITDA associates and joint ventures, and excluding the amounts charged as (i) depreciation, depletion and amortization and (ii) impairment and gains (losses) on disposal of non-current assets. However, our adjusted EBITDA is not the measure defined as EBITDA under IFRS and may possibly not be comparable with indicators with the same name reported by other companies. Adjusted EBITDA should not be considered as a substitute for operational profit or as a better measure of liquidity than operational cash flow, which are calculated in accordance with IFRS. Vale provides its adjusted EBITDA to give additional information about its capacity to pay debt, carry out investments and cover working capital needs. The following tables shows the reconciliation between adjusted EBITDA and operational cash flow and adjusted EBITDA and net income, in accordance with its statement of changes in financial position. The definition of Adjusted EBIT is Adjusted EBITDA plus depreciation, depletion and amortization. Reconciliation between adjusted EBITDA and operational cash flow US$ million 1Q26 1Q25 Δ y/y 4Q25 Δ q/q Adjusted EBITDA 3,830 3,115 23% 4,588 -17% Working capital: Accounts receivable (119) 316 n.a. 170 n.a. Inventories (214) (239) -10% (349) -39% Suppliers and contractors (262) (21) n.a. 48 n.a. Changes in estimates related to the provision of Brumadinho (6) 39 n.a. 243 n.a. Changes in estimates related to the provision of decharacterization of dams (3) (9) -67% (67) -96% Others (758) (667) 14% (271) 180% Cash flow 2,468 2,534 -3% 4,362 -43% Payments of income taxes (including refinancing programs) (321) (596) -46% (360) -11% Payment of interest on loans, financing and other financial liabilities (214) (240) -11% (306) -30% Payments related to Brumadinho event (107) (84) 27% (280) -62% Payments related to de-characterization of dams (63) (79) -20% (106) -41% Interest on participative shareholders' debentures paid — — n.a. (814) n.a. Receipts from the settlement of derivatives, net 116 134 -13% 203 -43% Net cash generated by operating activities 1,879 1,669 13% 2,699 -30% Annexes -22- Reconciliation between adjusted EBITDA and net income US$ million 1Q26 1Q25 Δ y/y 4Q25 Δ q/q Adjusted EBITDA 3,830 3,115 23% 4,588 -17% Depreciation, depletion and amortization (845) (704) 20% (860) -2% EBITDA from associates and joint ventures (233) (192) 21% (286) -19% Impairment and gains (losses) on disposal of non-current assets, net¹ (120) (253) -53% (3,844) -97% Streaming¹ (257) (167) 54% (295) -13% Operating income 2,375 1,799 32% (697) n.a. Financial results 34 185 -82% (1,039) n.a. Equity results and other results in associates and joint ventures 36 59 -39% (369) n.a. Income taxes (505) (647) -22% (2,138) -76% Net income 1,940 1,396 39% (4,243) n.a. Net income attributable to noncontrolling interests 47 2 n.a. (399) n.a. Net income attributable to Vale's shareholders 1,893 1,394 36% (3,844) n.a. ¹ Starting in 3Q25, streaming transactions at market prices, previously reported under "Impairment and gains (losses) on disposal of non-current assets, net", are disclosed separately as Streaming. Prior periods were restated. (c) Net debt US$ million 1Q26 1Q25 Δ y/y 4Q25 Δ q/q Gross debt 18,196 15,415 18% 18,134 0% Leases 641 781 -18% 668 -4% Cash and cash equivalents (5,279) (3,998) 32% (7,566) -30% Net debt 13,558 12,198 11% 11,236 21% (d) Gross debt / LTM Adjusted EBITDA US$ million 1Q26 1Q25 Δ y/y 4Q25 Δ q/q Total debt and leases / LTM Adjusted EBITDA (x) 1.2 1.1 9% 1.2 0% Total debt and leases / LTM operational cash flow (x) 0.8 0.8 0% 0.8 0% (e) LTM Adjusted EBITDA / LTM interest payments US$ million 1Q26 1Q25 Δ y/y 4Q25 Δ q/q Adjusted LTM EBITDA / LTM gross interest (x) 15.8 16.5 -4% 15.7 1% LTM adjusted EBITDA / LTM interest payments (x) 16.6 15.7 6% 15.5 7% (f) US dollar exchange rates R$/US$ 1Q26 1Q25 Δ y/y 4Q25 Δ q/q Average 5.2591 5.8522 -10% 5.3955 -3% End of period 5.2194 5.7422 -9% 5.5024 -5% Annexes -23- Revenues and volumes Net operating revenue by business area US$ million 1Q26 % 1Q25 % Δ y/y 4Q25 % Δ q/q Iron Ore Solutions 6,875 74% 6,375 79% 8% 8,370 76% -18% Fines 5,692 61% 5,154 63% 10% 7,016 63% -19% ROM 20 0% 29 0% -31% 25 0% -20% Pellets 1,030 11% 1,055 13% -2% 1,190 11% -13% Other ferrous products and logistics services 133 1% 137 2% -3% 139 1% -4% Vale Base Metals 2,383 26% 1,744 21% 37% 2,691 24% -11% Copper 1,214 13% 709 9% 71% 1,179 11% 3% Nickel 763 8% 623 8% 22% 745 7% 2% PGMs 136 1% 66 1% 106% 110 1% 24% Gold as by-product¹ 282 3% 140 2% 101% 318 3% -11% Silver as by-product 46 0% 18 0% 156% 36 0% 28% Cobalt¹ 30 0% 18 0% 67% 30 0% 0% Others² (88) -1% 170 2% n.a. 273 2% n.a. Total 9,258 100% 8,119 100% 14% 11,061 100% -16% ¹ Excludes adjustment of US$ 257 million in 1Q26, US$ 295 million in 4Q25 and US$ 167 million in 1Q25 to reflect the performance of the streaming transactions at market price. ² Includes marketing activities. Net operating revenue by destination 1Q26 % 1Q25 % Δ y/y 4Q25 % Δ q/q North America 472 5% 417 5% 13% 436 4% 8% USA 304 3% 297 4% 2% 264 2% 15% Canada 168 2% 120 1% 40% 172 2% -2% South America 869 9% 863 11% 1% 806 7% 8% Brazil 783 8% 814 10% -4% 764 7% 2% Others 86 1% 49 1% 76% 42 0% 105% Asia 5,958 64% 5,113 63% 17% 7,302 66% -18% China 4,369 47% 3,886 48% 12% 5,495 50% -20% Japan 619 7% 517 6% 20% 640 6% -3% South Korea 268 3% 237 3% 13% 312 3% -14% Others 702 8% 473 6% 48% 855 8% -18% Europe 1,608 17% 1,274 16% 26% 1,956 18% -18% Germany 471 5% 463 6% 2% 630 6% -25% Italy 103 1% 99 1% 4% 58 1% 78% Others 1,034 11% 712 9% 45% 1,268 11% -18% Middle East 192 2% 208 3% -8% 283 3% -32% Rest of the World 159 2% 244 3% -35% 278 3% -43% Total 9,258 100% 8,119 100% 14% 11,061 100% -16% Annexes -24- Operating Expenses US$ million 1Q26 1Q25 Δ y/y 4Q25 Δ q/q SG&A 152 145 5% 207 -27% Administrative 128 123 4% 173 -26% Personnel 56 52 8% 56 0% Services 35 23 52% 54 -35% Depreciation 10 24 -58% 25 -60% Others 27 24 13% 38 -29% Selling 24 22 9% 34 -29% R&D 131 123 7% 260 -50% Pre-operating and stoppage expenses 49 90 -46% 57 -14% Expenses related to Brumadinho event and decharacterization of dams 65 97 -33% 246 -74% Other operating expenses 193 161 20% 364 -47% Total operating expenses 590 616 -4% 1,134 -48% Depreciation 45 43 5% 56 -20% Operating expenses, ex-depreciation 545 573 -5% 1,078 -49% Other operating expenses – breakdown by segment US$ million 1Q26 1Q25 Δ y/y 4Q25 Δ q/q Iron Ore Solutions 42 (8) n.a. (27) n.a. Fines 31 (11) n.a. (25) n.a. Pellets 2 (2) n.a. (1) n.a. Other ferrous products and logistics services 9 5 80% (1) n.a. Vale Base Metals 34 32 6% 20 70% Copper 32 4 n.a. 9 256% Nickel (2) 14 n.a. 8 n.a. Others 4 14 -71% 3 33% Unallocated items¹ 117 137 -15% 371 -68% TOTAL - Other operating expenses 193 161 20% 364 -47% 1 Starting in 2Q25, the segment previously labeled 'Others' has been renamed to 'Unallocated Items'. There was no change in the allocation methodology or effects. For more information, please refer to Vale’s Financial Statements available on our website. Annexes -25- Financial results US$ million 1Q26 1Q25 Δ y/y 4Q25 Δ q/q Financial expenses, of which: (418) (382) 9% (465) -10% Gross interest (264) (224) 18% (258) 2% Capitalization of interest 5 4 25% 5 0% Others (139) (144) -3% (190) -27% Financial expenses (REFIS) (20) (18) 11% (22) -9% Financial income 128 116 10% 125 2% Participative shareholders' debentures (236) 38 n.a. (466) -49% Derivatives¹ 725 765 -5% 50 n.a. Currency and interest rate swaps 362 764 -53% 58 n.a. Others (commodities, etc) 363 1 n.a. (8) n.a. Foreign exchange 95 (37) n.a. 16 n.a. Monetary variation (260) (315) -17% (299) -13% Foreign exchange and monetary variation (165) (352) -53% (283) -42% Financial result, net 34 185 -82% (1,039) n.a. ¹ The cash effect of the derivatives was a gain of US$ 116 million in 1Q26. Sustaining Investments by type US$ million Iron Ore Solutions Vale Base Metals Energy and others Total Enhancement of operations 435 150 1 587 Replacement projects 6 14 — 20 Filtration and dry stacking projects 15 — — 15 Dam management 30 6 — 36 Other investments in dams and waste dumps 57 15 — 73 Health and safety 54 9 11 74 Social investments and environmental protection 34 1 — 35 Administrative & others 49 5 13 67 Total 680 202 25 907 Annexes -26- Annex 2: Segment information Segment results 1Q26 US$ million Net operating revenues Cost¹ SG&A and others¹ R&D¹ Pre operating & stoppage¹ Associates and JVs EBITDA Streaming Adjusted EBITDA Iron Ore Solutions 6,875 (3,997) (72) (66) (31) 197 — 2,906 Fines 5,692 (3,245) (46) (57) (22) 119 — 2,441 Pellets 1,030 (587) (1) (1) (2) 40 — 479 Other ferrous products and logistics services 153 (165) (25) (8) (7) 38 — (14) Vale Base Metals 2,383 (1,376) (74) (27) — 34 257 1,197 Copper² 1,414 (426) (31) (8) — — — 949 Salobo 1,018 (308) (12) (1) — — — 697 Sossego 435 (118) (5) (3) — — — 309 Other (38) — (14) (4) — — — (57) Nickel³ 1,184 (910) (8) (19) — 30 — 277 Sudbury 675 (444) (3) (1) — — — 227 Voisey’s Bay & Long Harbour 311 (248) 9 (6) — — — 66 Standalone Refineries 222 (198) — — — — — 24 Onça Puma 157 (103) (3) — — — — 51 Other (181) 83 (11) (12) — 30 — (91) Others⁴ (215) (40) (35) — — 4 257 (29) Brumadinho and decharacterization of dams — — (65) — — — — (65) Non-recurring expenses — — — — — — — — Unallocated items⁵ — — (189) (20) (1) 2 — (208) Total 9,258 (5,373) (400) (113) (32) 233 257 3,830 ¹ Excluding depreciation, depletion and amortization. ² Including by-products from our copper operations. ³ Including copper and by-products from our nickel operations. ⁴ Starting in 3Q25, streaming transactions at market prices, previously reported under SG&A and others, are disclosed separately as Streaming. Prior periods were restated. ⁵ Starting in 2Q25, the segment previously labeled 'Others' has been renamed to 'Unallocated Items'. There was no change in the allocation methodology or effects. For more information, please refer to Vale’s Financial Statements available on our website. Includes US$ 18 million in unallocated expenses from Vale Base Metals Ltd ("VBM") in 1Q26. Considering the unallocated expenses, VBM’s EBITDA was US$ 1,2 billion in 1Q26. Annexes -27- Segment results 1Q25 US$ million Net operating revenues Cost¹ SG&A and others¹ R&D¹ Pre operating & stoppage¹ Associates and JVs EBITDA Streaming Adjusted EBITDA Iron Ore Solutions 6,375 (3,506) (25) (54) (69) 166 — 2,887 Fines 5,154 (2,810) (4) (45) (58) 96 — 2,333 Pellets 1,055 (559) 3 (1) (2) 40 — 536 Other ferrous products and logistics services 166 (137) (24) (8) (9) 30 — 18 Vale Base Metals 1,744 (1,284) (65) (32) (2) 26 167 554 Copper² 900 (339) (4) (10) (1) — — 546 Salobo 665 (257) (3) — (1) — — 404 Sossego 165 (82) — (3) — — — 80 Other 70 — (1) (7) — — — 62 Nickel³ 969 (907) (21) (22) (1) 23 — 41 Sudbury 507 (490) (3) (10) — — — 4 Voisey’s Bay & Long Harbour 213 (257) — (5) — — — (50) Standalone Refineries 217 (193) — — — — — 24 Onça Puma 75 (53) (2) — (1) — — 19 Other (43) 86 (16) (7) — 23 — 44 Others⁴ (125) (38) (40) — — 3 167 (33) Brumadinho and decharacterization of dams — — (97) — — — — (97) Non-recurring expenses — — — — — — — — Unallocated items⁵ — — (192) (37) — — — (229) Total 8,119 (4,790) (379) (123) (71) 192 167 3,115 ¹ Excluding depreciation, depletion and amortization. ² Including by-products from our copper operations. ³ Including copper and by-products from our nickel operations. ⁴ Starting in 3Q25, streaming transactions at market prices, previously reported under SG&A and others, will be disclosed separately as Streaming. Prior periods were restated. ⁵ Starting in 2Q25, the segment previously labeled 'Others' has been renamed to 'Unallocated Items'. There was no change in the allocation methodology or effects. For more information, please refer to Vale’s Financial Statements available on our website. Includes US$ 26 million in unallocated expenses from Vale Base Metals Ltd ("VBM") in 1Q25. Considering the unallocated expenses, VBM’s EBITDA was US$ 528 million in 1Q25. Annexes -28- Segment information 4Q25 US$ million Net operating revenues Cost¹ SG&A and others¹ R&D¹ Pre operating & stoppage¹ Associates and JVs EBITDA Streaming Adjusted EBITDA Iron Ore Solutions 8,370 (4,469) (28) (127) (39) 260 — 3,967 Fines 7,016 (3,618) (5) (104) (29) 155 — 3,415 Pellets 1,190 (703) 1 (1) (2) 42 — 527 Other ferrous products and logistics services 164 (148) (24) (22) (8) 63 — 25 Vale Base Metals 2,691 (1,506) (51) (61) (2) 27 295 1,393 Copper² 1,565 (468) (8) (29) (1) — — 1,059 Salobo 1,212 (347) (9) (2) (1) — — 853 Sossego 253 (121) 2 (4) — — — 130 Other 100 — (1) (23) — — — 76 Nickel³ 1,328 (954) (10) (31) (1) 26 — 358 Sudbury 631 (415) (2) (18) — — — 196 Voisey’s Bay & Long Harbour 206 (199) 1 (7) — — — 1 Standalone Refineries 217 (209) — — — — — 8 Onça Puma 104 (75) (7) — — — — 22 Other 170 (56) (2) (6) (1) 26 — 131 Others⁴ (202) (84) (33) (1) — 1 295 (24) Brumadinho and decharacterization of dams — — (246) — — — — (246) Non-recurring expenses — — — — — — — — Unallocated items⁵ — — (469) (57) — — — (526) Total 11,061 (5,975) (794) (245) (41) 287 295 4,588 ¹ Excluding depreciation, depletion and amortization. ² Including by-products from our copper operations. ³ Including copper and by-products from our nickel operations. ⁴ Starting in 3Q25, streaming transactions at market prices, previously reported under SG&A and others, will be disclosed separately as Streaming. Prior periods were restated. ⁵ Starting in 2Q25, the segment previously labeled 'Others' has been renamed to 'Unallocated Items'. There was no change in the allocation methodology or effects. For more information, please refer to Vale’s Financial Statements available on our website. Includes US$ 22 million in unallocated expenses from Vale Base Metals Ltd ("VBM") in 4Q25. Considering the unallocated expenses, VBM’s EBITDA was US$ 1.4 billion in 4Q25. Annexes -29- Annex 3: Additional information by business segment Iron Ore Solutions: Financial results detailed Volumes, prices, premium and revenues breakdown 1Q26 1Q25 Δ y/y 4Q25 Δ q/q Volume sold ('000 metric tons) Fines¹ 59,436 56,762 5% 73,566 -19% IOCJ 3,833 4,596 -17% 5,042 -24% BRBF 30,175 35,814 -16% 36,337 -17% Mid-Grade Carajás 7,662 3,188 140% 10,512 -27% Pellet feed - China (PFC1)² 9,069 3,928 131% 8,155 11% Lump 2,111 1,679 26% 2,085 1% High-silica products 681 1,957 -65% 4,213 -84% Other fines (60-62% Fe) 5,905 5,600 5% 7,222 -18% Pellets 7,699 7,493 3% 9,056 -15% ROM 1,578 1,886 -16% 2,251 -30% Total - Iron ore sales 68,713 66,141 4% 84,874 -19% 1Q26 1Q25 Δ y/y 4Q25 Δ q/q Average prices (US$/t) Iron ore - 61% Fe price index 103.6 100.6 3% 103.0 1% Iron ore - 62% Fe low alumina index 108.3 103.3 5% 107.7 1% Iron ore - 65% Fe index 121.2 117.1 4% 118.9 2% Provisional price at the end of the quarter 106.1 98.0 8% 103.7 2% Iron ore fines Vale's CFR reference (dmt) 106.9 102.0 5% 105.1 2% Iron ore fines realized price, CFR/FOB (wmt) 95.8 90.8 6% 95.4 0% Iron ore pellets realized price, CFR/FOB (wmt) 133.8 140.8 -5% 131.4 2% Iron ore fines and pellets quality premium (US$/t) Iron ore fines quality and premiums 4.1 1.7 141% 2.5 64% Pellets business' weighted average contribution 2.1 3.1 -32% 1.1 91% All-in premium - Total 6.2 4.8 29% 3.6 72% Net operating revenue by product (US$ million) Fines 5,692 5,154 10% 7,016 -19% ROM 20 29 -31% 25 -20% Pellets 1,030 1,055 -2% 1,190 -13% Other ferrous products and logistics services 133 137 -3% 139 -4% Total 6,875 6,375 8% 8,370 -18% 1 Including third-party purchases. 2 Products concentrated in Chinese facilities. Annexes -30- Volume sold by destination – Fines, pellets and ROM ‘000 metric tons 1Q26 1Q25 Δ y/y 4Q25 Δ q/q Americas 8,734 8,887 -2% 9,230 -5% Brazil 7,715 8,160 -5% 8,571 -10% Others 1,019 727 40% 659 55% Asia 53,897 50,438 7% 68,457 -21% China 40,855 39,635 3% 53,775 -24% Japan 5,930 4,834 23% 6,274 -5% Others 7,112 5,969 19% 8,408 -15% Europe 3,724 3,962 -6% 3,370 11% Germany 1,089 1,159 -6% 1,108 -2% France 97 312 -69% 213 -54% Others 2,538 2,491 2% 2,049 24% Middle East 1,231 1,302 -5% 1,932 -36% Rest of the World 1,127 1,552 -27% 1,885 -40% Total 68,713 66,141 4% 84,874 -19% Iron ore fines pricing Pricing system breakdown (%) 1Q26 1Q25 Δ y/y 4Q25 Δ q/q Lagged 13 14 -7% 13 0% Current 65 61 7% 61 7% Provisional 22 25 -12% 26 -15% Total 100 100 0% 100 0% Price realization US$/t 1Q26 1Q25 Δ y/y 4Q25 Δ q/q Average reference 61%Fe price (dmt) 103.6 100.6 3% 103.0 1% Quality and premiuns¹ 4.1 1.7 141% 2.5 64% Impact of pricing system adjustments (0.8) (0.3) 124% (0.5) 60% Provisional prices in prior quarter² (0.7) 0.7 n.a. 0.3 n.a. Lagged prices (0.4) (0.4) 0% (1.0) -60% Current prices (0.2) (0.1) 100% — n.a. Provisional prices in current quarter³ 0.5 (0.7) n.a. 0.2 150% CFR reference (dmt) 106.9 102.0 5% 105.1 2% Adjustments for FOB sales⁴ (2.6) (3.1) -16% (1.5) 73% Moisture (8.5) (8.2) 4% (8.2) 4% Vale realized price (wmt)⁵ 95.8 90.8 6% 95.4 0% 1 Includes quality (US$ 2.9/t) and premiums/discounts and commercial conditions (US$ 1.1/t). 2 Adjustment as a result of provisional prices booked in 4Q25 at US$ 103.7/t. 3 Difference between the weighted average of the prices provisionally set at the end of 1Q26 at US$ 105.5/t based on forward curves and US$ 105.9/t from the 1Q26 average reference price. 4 Includes freight pricing mechanisms of CFR sales freight recognition. 5 Vale’s price is net of taxes. Previous periods were restated. Annexes -31- Iron ore fines costs & expenses COGS - 1Q26 vs. 1Q25 US$ million 1Q25 Volume Exchange rate Others Total variation 1Q26 C1 cash costs 1,401 72 88 112 272 1,673 Freight 946 36 — (28) 8 954 Distribution costs 224 10 — 57 67 291 Royalties & others¹ 239 11 — 77 88 327 Total costs before depreciation and amortization 2,810 129 88 218 435 3,245 Depreciation 315 17 32 16 65 380 Total 3,125 146 120 234 500 3,625 ¹ Includes stoppage costs (USD 63MM in 1Q26). Cash cost and freight 1Q26 1Q25 Δ y/y 4Q25 Δ q/q C1 cash cost (US$ million) C1 cash cost, including third-party purchase costs (A) 1,673 1,401 19% 1,861 -10% Third-party purchase cost adjustment¹ (B) 432 340 27% 468 -8% C1 cash cost, ex-third-party purchase costs (C = A – B) 1,241 1,061 17% 1,393 -11% Sales volumes (Mt) Volume sold² (D) 59.4 56.8 5% 73.6 -19% Volume sold from third-party purchases (E) 6.8 6.2 10% 8.1 -16% Volume sold from own operations (F = D – E) 52.7 50.5 4% 65.5 -20% C1 cash cost², FOB (US$/t) C1 cash cost, ex-third-party purchase costs (C/F) 23.6 21.0 12% 21.3 11% Average third-party purchase C1 cash cost (B/E) 63.6 54.8 16% 58.1 9% Iron ore cash cost (A/D) 28.1 24.7 14% 25.3 11% Freight Maritime freight costs (G) 954 946 1% 1,181 -19% CFR sales (%) (H) 89% 90% -1 p.p. 89% 0 p.p. Volume CFR (Mt) (I = D x H) 52.8 50.9 4% 65.6 -20% Freight unit cost (US$/t) (G/I) 18.1 18.6 -3% 18.0 1% 1 Includes logistics costs related to third-party purchases. 2 Excludes ROM, royalties and distribution costs. Expenses US$ million 1Q26 1Q25 Δ y/y 4Q25 Δ q/q SG&A 12 14 -14% 27 -56% R&D 57 45 27% 104 -45% Pre-operating and stoppage expenses 22 58 -62% 29 -24% Other expenses 34 (10) n.a. (22) n.a. Total expenses 125 107 17% 138 -9% Annexes -32- Iron Ore Solutions: Project Details Growth projects Capex 1Q26 Financial Progress¹ Physical Progress Comments Serra Sul +20 Capacity: 20 Mtpy Start-up: 2H26 Capex: US$ 2,844 million 90 68% 86% Load testing of the long-distance conveyor belt was initiated in March 2026. At the plant, assembly of the Secondary Crushing and Classification buildings is progressing as planned. Sustaining projects Capex 1Q26 Financial Progress¹ Physical Progress Comments Compact Crushing S11D Capacity: 50 Mtpy Start-up: 2H26 Capex: US$ 755 milhões 28 76% 91% Civil works for the primary and secondary crushing facilities have been completed, while electromechanical assembly works and no-load testing are currently underway. 1 CAPEX disbursement until end of 1Q26 vs. CAPEX expected. Projects under evaluation Apolo Capacity: 14 Mtpy Stage: FEL2 Southeastern System (Brazil) Growth project Vale’s ownership: 100% Open pit mine Briquette plants Capacity: Under evaluation Stage: 1 plant under construction, 1 plant at FEL2; 2 plants at different stages of FEL Brazil and other regions Growth project Investment decision: 2026-2030 Vale’s ownership: N/A Cold agglomeration plant Itabira mines Capacity: 25 Mtpy Stage: projects at different phases of FEL1 and FEL2 Southeastern System (Brazil) Replacement project Vale’s ownership: 100% Open pit mine Diverse pits and tailing and waste stockpile projects aimed at maintaining Itabira´s long-term production volumes. Mega Hubs Capacity: Under evaluation Stage: Pre-feasibility Study Middle East Growth project Vale’s ownership: N/A Industrial complexes for iron ore concentration and agglomeration and production of direct reduction metallics Vale continues to advance in negotiations with worldclass players and jointly study the development of Mega Hubs S11C Capacity: Under evaluation Stage: FEL2 Northern System (Brazil) Replacement project Vale’s ownership: 100% Open pit mine Serra Norte N1/N2¹ Capacity: 10 Mtpy Stage: FEL2 Northern System (Brazil) Replacement project Vale’s ownership: 100% Open pit mine Serra Leste expansion Capacity: 10 Mtpy (+4 Mtpy) Stage: Engineering Northern System (Brazil) Growth Project Vale’s ownership: 100% Open pit mine expansion. The project will be implemented in stages until it reaches full capacity Part of the expansion capacity is already under construction. 1 Project scope is under review given permitting constraints. . Annexes -33- Vale Base Metals: Copper Revenues & price realization 1Q26 1Q25 Δ y/y 4Q25 Δ q/q Volume sold Copper ('000 metric tons) 72 61 18% 81 -11% Gold as by-product (‘000 oz) 98 95 3% 128 -23% Silver as by-product (‘000 oz) 244 278 -12% 389 -37% Average prices Average LME copper price (US$/t) 12,844 9,340 38% 11,092 16% Average copper realized price (US$/t) 13,143 8,891 48% 11,003 19% Gold (US$/oz)¹ 4,975 2,944 69% 4,293 16% Silver (US$/oz) 88 32 175% 55 60% Net revenue (US$ million) Copper 945 541 75% 895 6% Gold as by-product¹ 486 281 73% 550 -12% Silver as by-product 21 9 133% 20 5% Total 1,452 830 75% 1,465 -1% Provisional price adjustments² (38) 70 n.a. 100 n.a. Net revenue after provisional price adjustments 1,414 900 57% 1,565 -10% 1 Revenues presented were adjusted to reflect the market prices of products delivered related to the streaming transactions. 2 Provisional price adjustments are disclosed separately since 1Q24 onwards. On March 31st, 2026, Vale had provisionally priced copper sales from Sossego and Salobo totaling 67,863 tons valued at weighted average LME forward price of US$ 12,242/t, subject to final pricing over the following months. Breakdown of copper realized prices US$/t 1Q26 1Q25 Δ y/y 4Q25 Δ q/q Average LME copper price 12,844 9,340 38% 11,092 16% Current period price adjustments¹ (618) (85) n.a. (480) 29% Copper gross realized price 12,227 9,256 32% 10,612 15% Prior period price adjustments² 1,119 (79) n.a. 600 87% Copper realized price before discounts 13,346 9,177 45% 11,211 19% TC/RCs, penalties, premiums and discounts³ (202) (286) -29% (209) -3% Average copper realized price 13,143 8,891 48% 11,003 19% Note: Vale's copper products are sold on a provisional pricing basis, with final prices determined in a future period. The average copper realized price excludes the mark-to-market of open invoices based on the copper price forward curve (unrealized provisional price adjustments) and includes the prior and current period price adjustments (realized provisional price adjustments). 1 Currentperiod price adjustments: Final invoices that were provisionally priced and settled within the quarter. 2 Prior-period price adjustment: Final invoices of sales provisionally priced in prior quarters. 3 TC/ RCs, penalties, premiums, and discounts for intermediate products. Annexes -34- Vale Base Metals: Nickel Revenues & price realization 1Q26 1Q25 Δ y/y 4Q25 Δ q/q Volume sold ('000 metric tons) Nickel 45 39 15% 50 -10% Copper 19 21 -10% 26 -27% Gold as by-product ('000 oz) 9 9 0% 13 -31% Silver as by-product ('000 oz) 245 294 -17% 252 -3% PGMs ('000 oz) 44 56 -21% 53 -17% Cobalt (metric ton) 665 681 -2% 781 -15% Average realized prices (US$/t) Nickel 17,015 16,106 6% 15,015 13% Copper 13,895 7,983 74% 11,111 25% Gold (US$/oz) 5,090 3,034 68% 4,267 19% Silver (US$/oz) 103 31 232% 64 61% Cobalt 56,556 26,434 114% 49,587 14% Net revenue by product (US$ million) Nickel 763 623 22% 745 2% Copper 269 168 60% 284 -5% Gold as by-product¹ 46 27 70% 54 -15% Silver as by-product 25 9 178% 16 56% PGMs 136 57 139% 110 24% Cobalt¹ 38 18 111% 39 -3% Others 12 9 33% 11 9% Total 1,289 911 41% 1,259 2% Provisional price adjustments² (104) 58 n.a. 69 n.a. Net revenue after provisional price adjustments 1,184 969 22% 1,328 -11% 1 Revenues presented above were adjusted to reflect the market prices of products delivered related to the streaming transactions. 2 Provisional price adjustments are disclosed separately since 1Q24. Breakdown of nickel volumes sold, realized price and premium 1Q26 1Q25 Δ y/y 4Q25 Δ q/q Volumes (kt) Class I nickel 31.0 29.6 5% 30.0 3% Class II nickel 13.0 8.9 46% 18.0 -28% Intermediates 0.6 0.4 50% 2.0 -70% Total 45.0 38.9 16% 50.0 -10% Nickel realized price (US$/t) LME average nickel price 17,356 15,571 11% 14,892 17% Average nickel realized price 17,015 16,106 6% 15,015 13% Contribution to the nickel realized price by category: Nickel average aggregate premium/(discount) (6) 535 n.a. 106 n.a. Other timing and pricing adjustments contributions¹ (336) 1 n.a. 18 n.a. 1 Comprises (i) the realized quotational period effects (based on sales distribution in the prior three months, as well as the differences between the LME price at the moment of sale and the LME average price), with a negative impact of US$ 223/t and (ii) fixed-price sales, with a negative impact of US$ 113/t. Product type by operation % of sales North Atlantic¹ Matsusaka Onça Puma Class I nickel 93.4 — — Class II nickel 5.8 99.4 96.1 Intermediates 0.8 0.6 3.9 1 Comprises Sudbury, Clydach and Long Harbour refineries. Annexes -35- Vale Base Metals: Projects Details Sustaining projects Capex 1Q26 Financial progress¹ Physical progress Comments Bacaba Capacity: 50 ktpy Start-up: 1H28 Capex: US$ 290 million 31 11% 27% Pre-stripping activities have commenced, along with the execution of bridge civil works. 1 CAPEX disbursement until end of 1Q26 vs. Capex expected. Projects under evaluation Copper Alemão Capacity: ~80 ktpy Stage: FEL3 Carajás, Brazil Growth project Investment decision: 2026 Vale Base Metals ownership: 100% Underground mine 140 kozpy Au as by-product South Hub extension (118 / Cristalino) Capacity: 60-80 ktpy Stage: FEL2-FEL3 Carajás, Brazil Replacement project Vale Base Metals ownership: 100% Development of mines to feed Sossego mill Victor Capacity: ~25 ktpy Stage: FEL3 Ontario, Canada Replacement project Investment decision: 2027 Vale’s ownership: N/A Underground mine 5 ktpy Ni as co-product; JV partnership under discussion Hu’u Capacity: 300-350 ktpy Stage: FEL2 Dompu, Indonesia Growth project 200 kozpy Au as by-product Vale's ownership: 80% Underground block cave Paulo Afonso (North Hub) Capacity: 70-100 ktpy Stage: FEL2 Carajás, Brazil Growth project Vale Base Metals ownership: 100% Mines and Processing plant Salobo Expansion Capacity: ~30 ktpy Stage: FEL3 Carajás, Brazil Growth project Investment decision: 2026 Vale Base Metals ownership: 100% Processing plant Nickel CCM Pit Capacity: 12-15 ktpy Stage: FEL3 Ontario, Canada Replacement project Investment decision: 2026-2027 Vale Base Metals ownership: 100% Open pit mine 7-9 ktpy Cu as by-product Annexes -36- Annex 4: Brumadinho, Samarco & Dam Decharacterization Brumadinho & Dam decharacterization US$ million Provisions balance 31Dec25 EBITDA impact² Payments FX and other adjustments³ Provisions balance 31Mar26 Decharacterization 2,097 (3) (63) 153 2,184 Agreements & donations¹ 1,911 (6) (107) 161 1,959 Total Provisions 4,008 (9) (170) 314 4,143 Incurred Expenses — 74 (74) — — Total 4,008 65 (244) 314 4,143 1 Includes Integral Reparation Agreement, individual, labor and emergency indemnifications, tailing removal and containment works. 2 Includes the revision of estimates for provisions and incurred expenses, including discount rate effect. 3 Includes foreign exchange, present value and other adjustments. Impact of Brumadinho and Decharacterization from 2019 to 1Q26 US$ million EBITDA impact Payments FX and other adjustments² Provisions balance 31Mar26 Decharacterization 4,797 (2,570) (43) 2,184 Agreements & donations¹ 9,526 (8,222) 655 1,959 Total Provisions 14,323 (10,792) 612 4,143 Incurred expenses 3,719 (3,719) — — Others 180 (178) (2) — Total 18,222 (14,689) 610 4,143 ¹ Includes Integral Reparation Agreement, individual, labor and emergency indemnifications, tailing removal and containment works. ² Includes foreign exchange, present value and other adjustments. Cash outflow of Brumadinho commitments (included in the expanded net debt) 1 2 US$ billion Disbursed from 2019 to 1Q26 2026 (excl. 1Q26) 2027 2028 Yearly average 2029-2031 Integral Reparation Agreement & other reparation provisions (8.2) 0.9 0.7 0.3 0.1 1 Estimate cash outflow given BRL-USD exchange rate of 5.2194, as of March 31st, 2026. 2 Amounts stated without discount to present value, net of judicial deposits and inflation adjustments. Cash outflow of Samarco commitments (included in the expanded net debt)1 2 3 Already disbursed 2026 (excl. 1Q26) 2027 2028 2029 2030 2031 Yearly average 2032-2043 Mariana reparation – 100% 74.7 11.2 6.2 5.8 9.0 9.4 6.8 5.2 Vale’s contribution (R$ billion) 5.6 3.1 2.1 3.5 3.2 — — Vale’s contribution (US$ billion)³ 1.1 0.6 0.4 0.7 0.6 — — 1 Amounts stated in real terms. 2 Estimate cash outflow given BRL-USD exchange rate of 5.2194, as of March 31st, 2026. 3 Including UK Claim provision. Cash outflow of decharacterization and incurred expenses (not included in the expanded net debt) 1 2 US$ billion Disbursed from 2019 to 1Q26 2026 (excl. 1Q26) 2027 2028 Yearly average 2029-2035 Decharacterization (2.6) 0.4 0.5 0.4 0.2³ Incurred expenses (3.7) 0.3 0.3 0.3 0.2⁴ Total (6.3) 0.7 0.8 0.7 — 1 Estimate cash outflow given BRL-USD exchange rate of 5.2194. 2 Amounts stated without discount to present value, net of judicial deposits and inflation adjustments. 3 Estimate annual average cash flow for Decharacterization provisions in the 2029-2035 period is US$ 227 million per year. 4 Disbursements related to incurred expenses ending in 2030. Annexes -37-
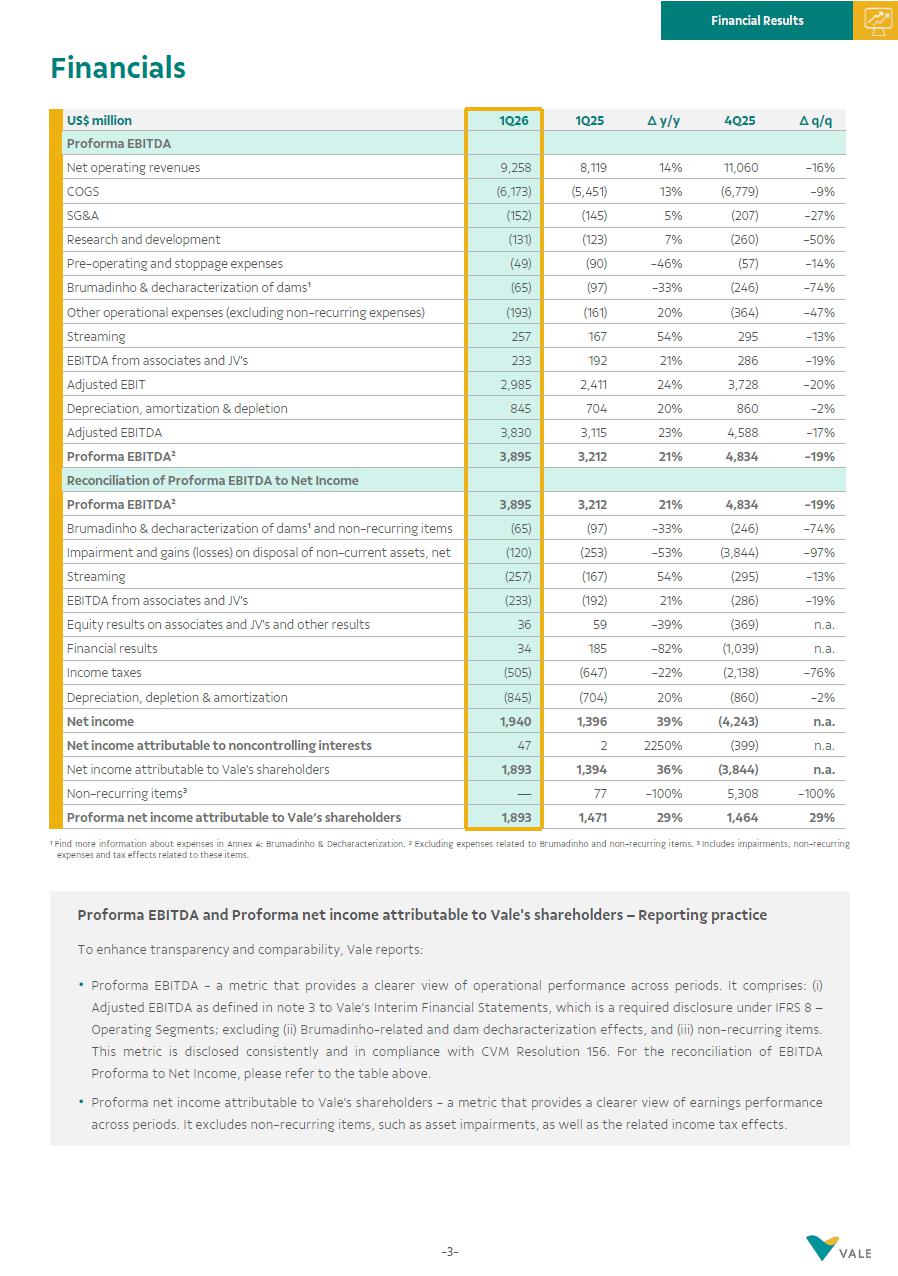
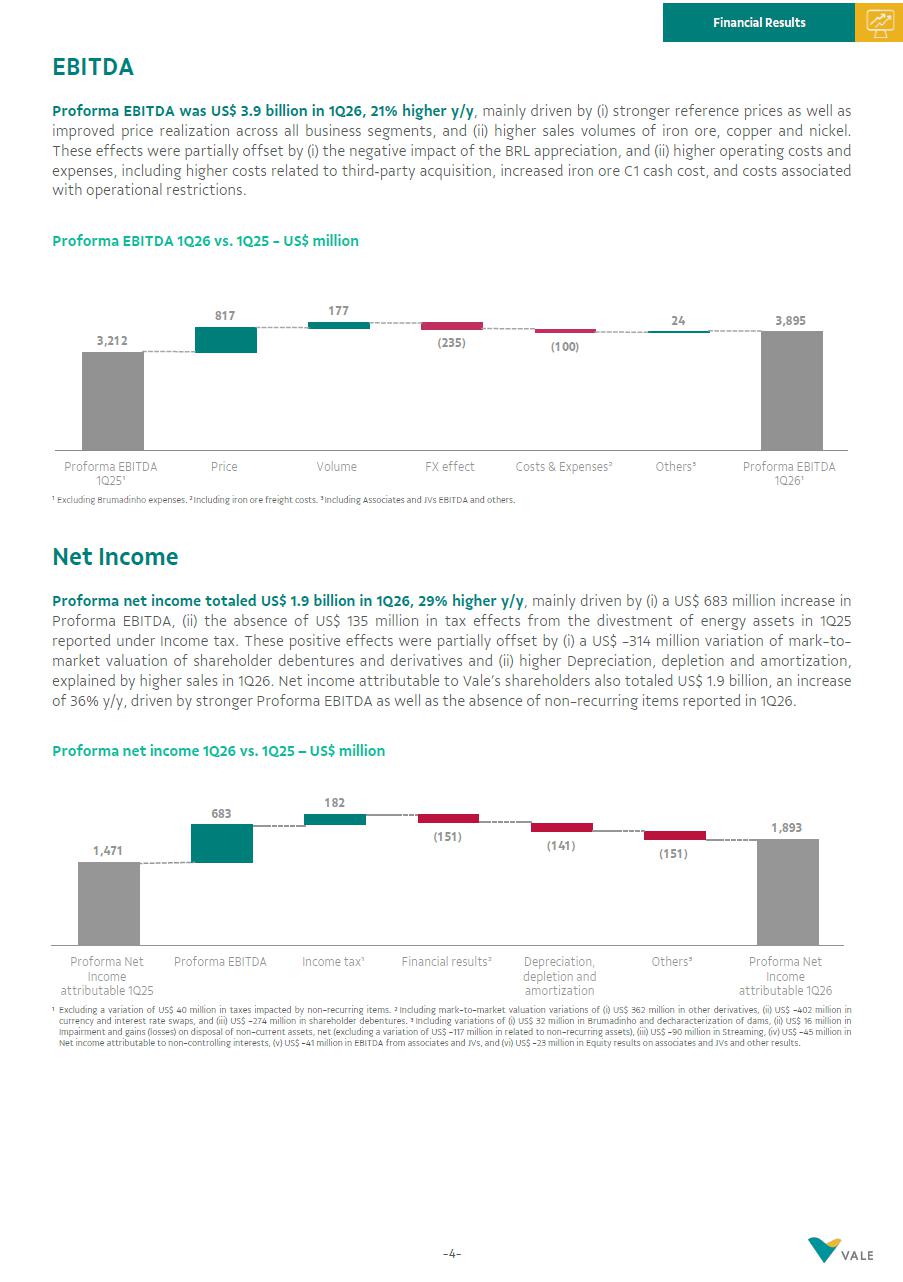
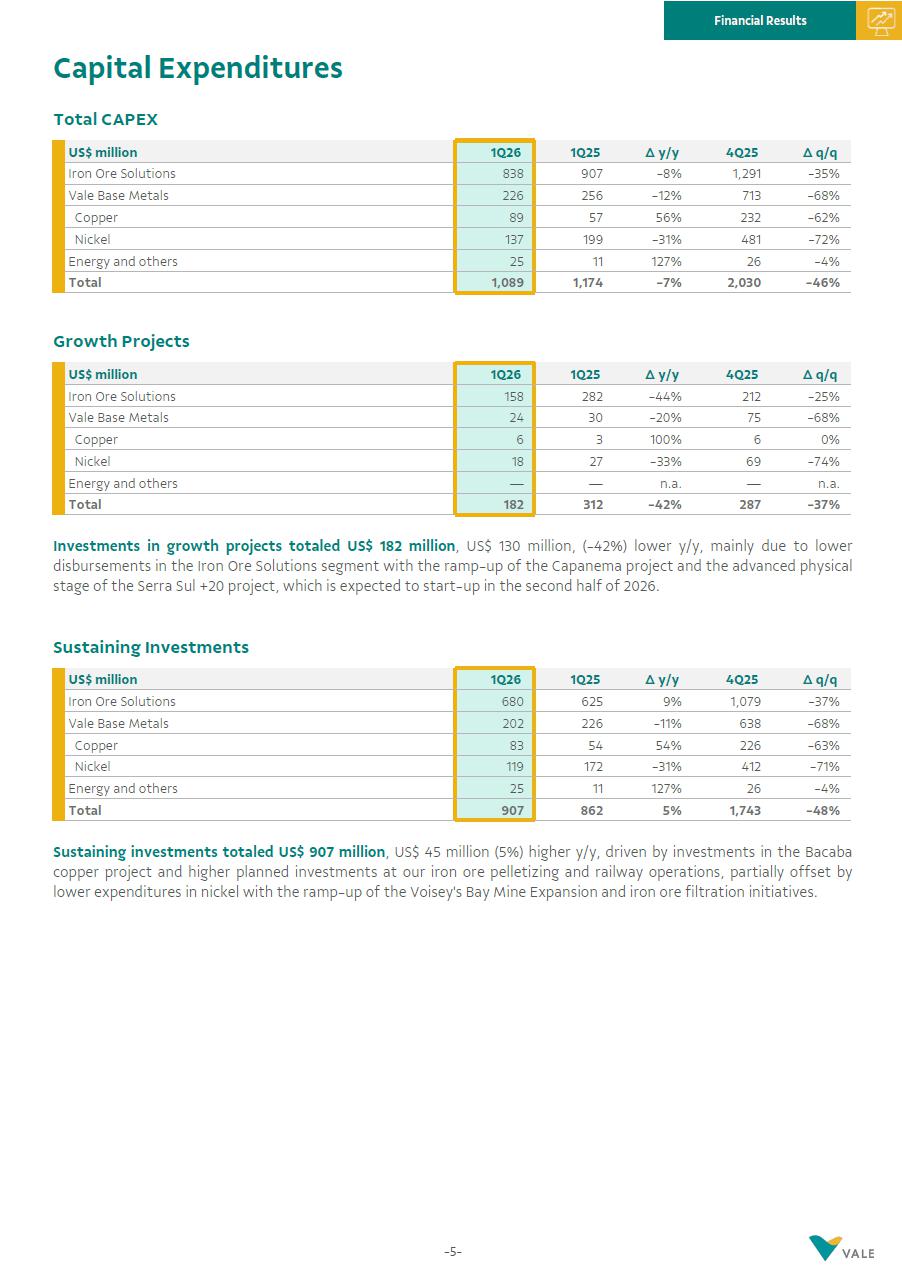
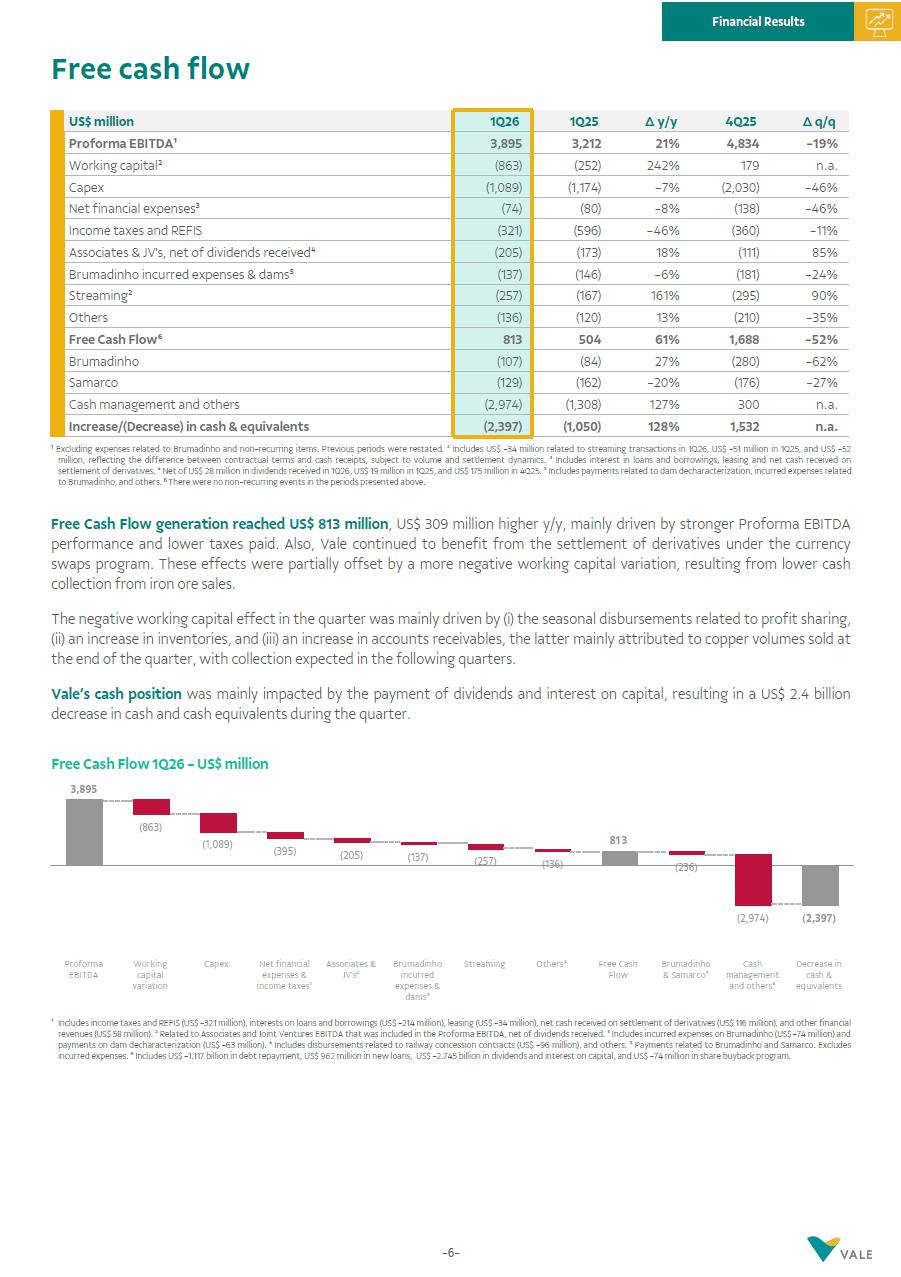
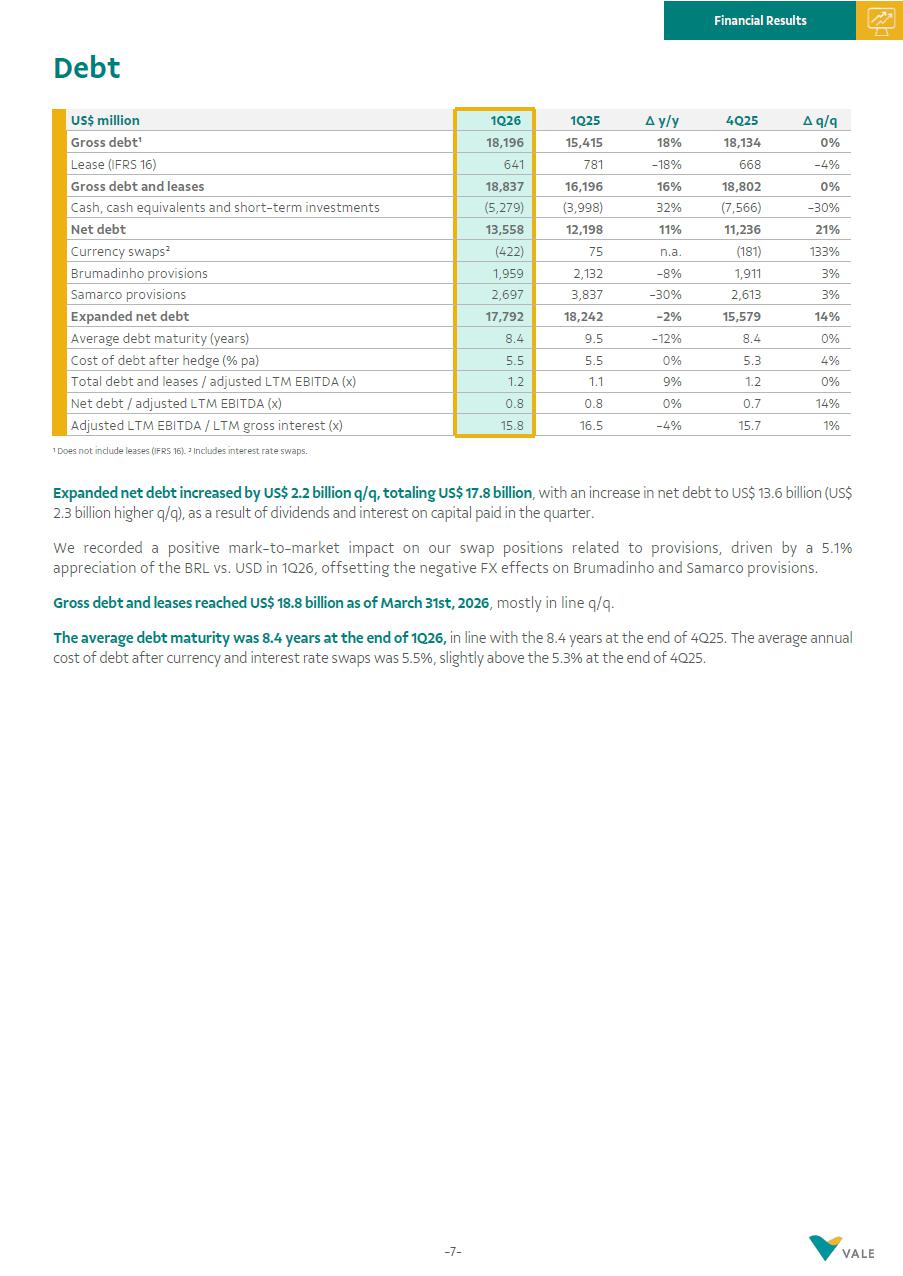
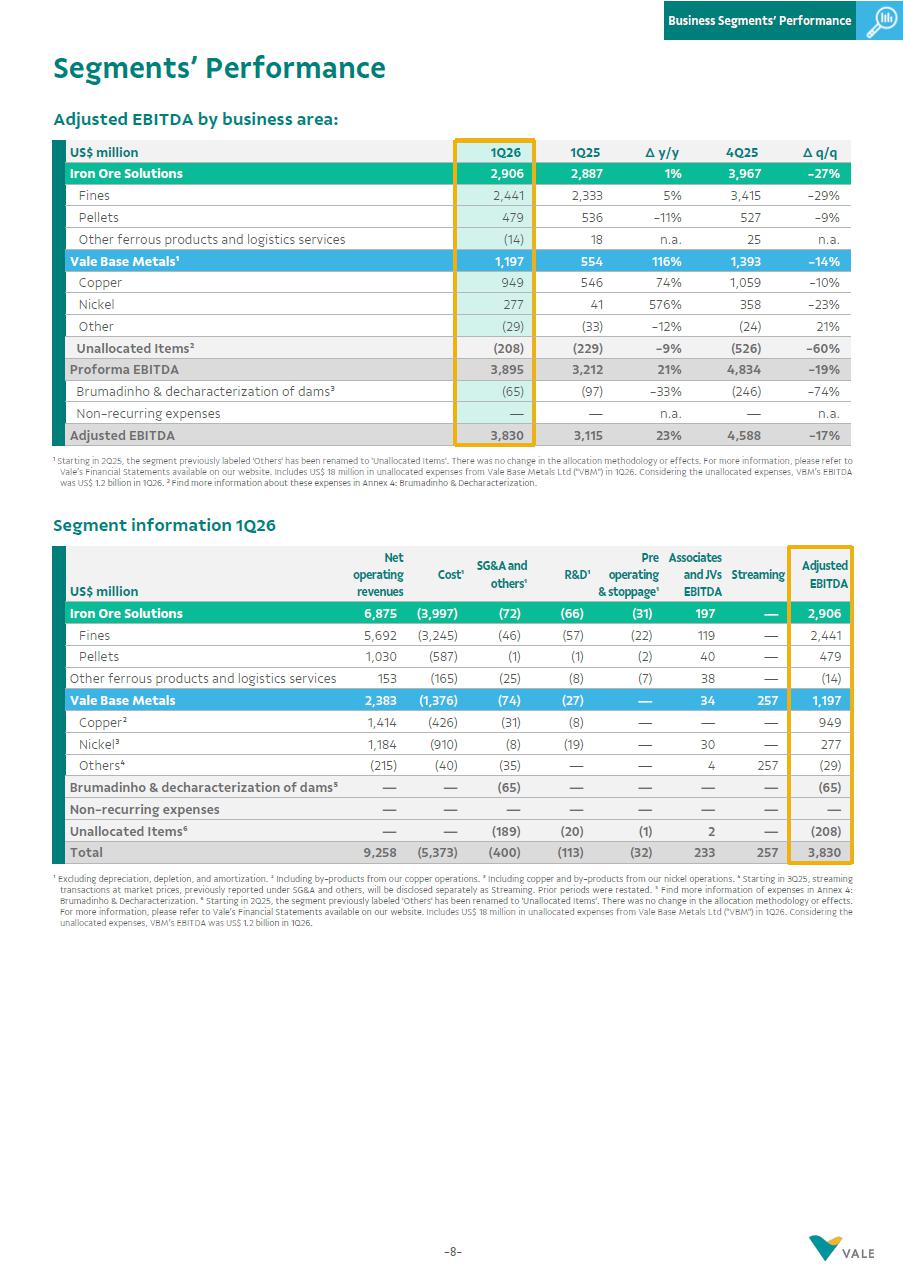
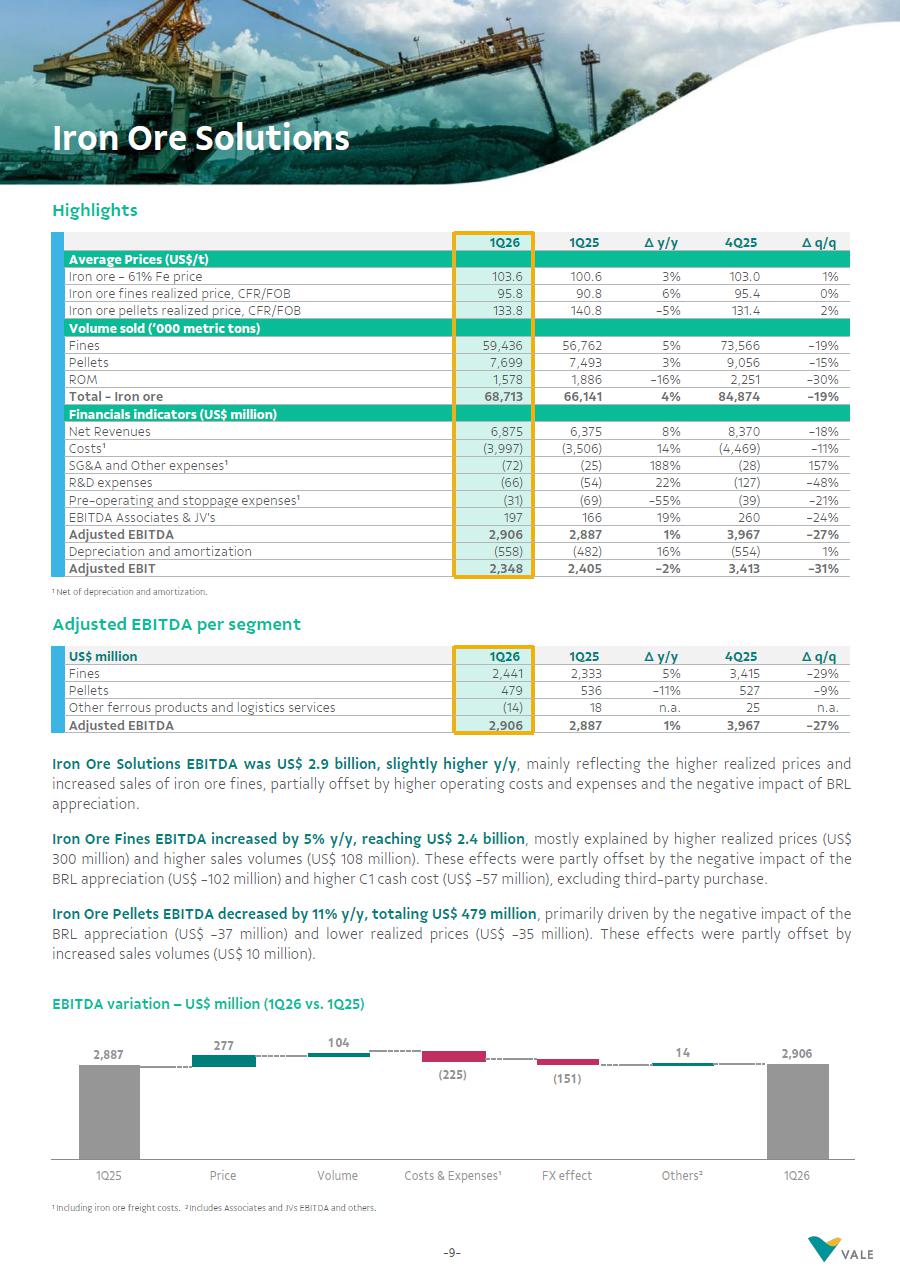
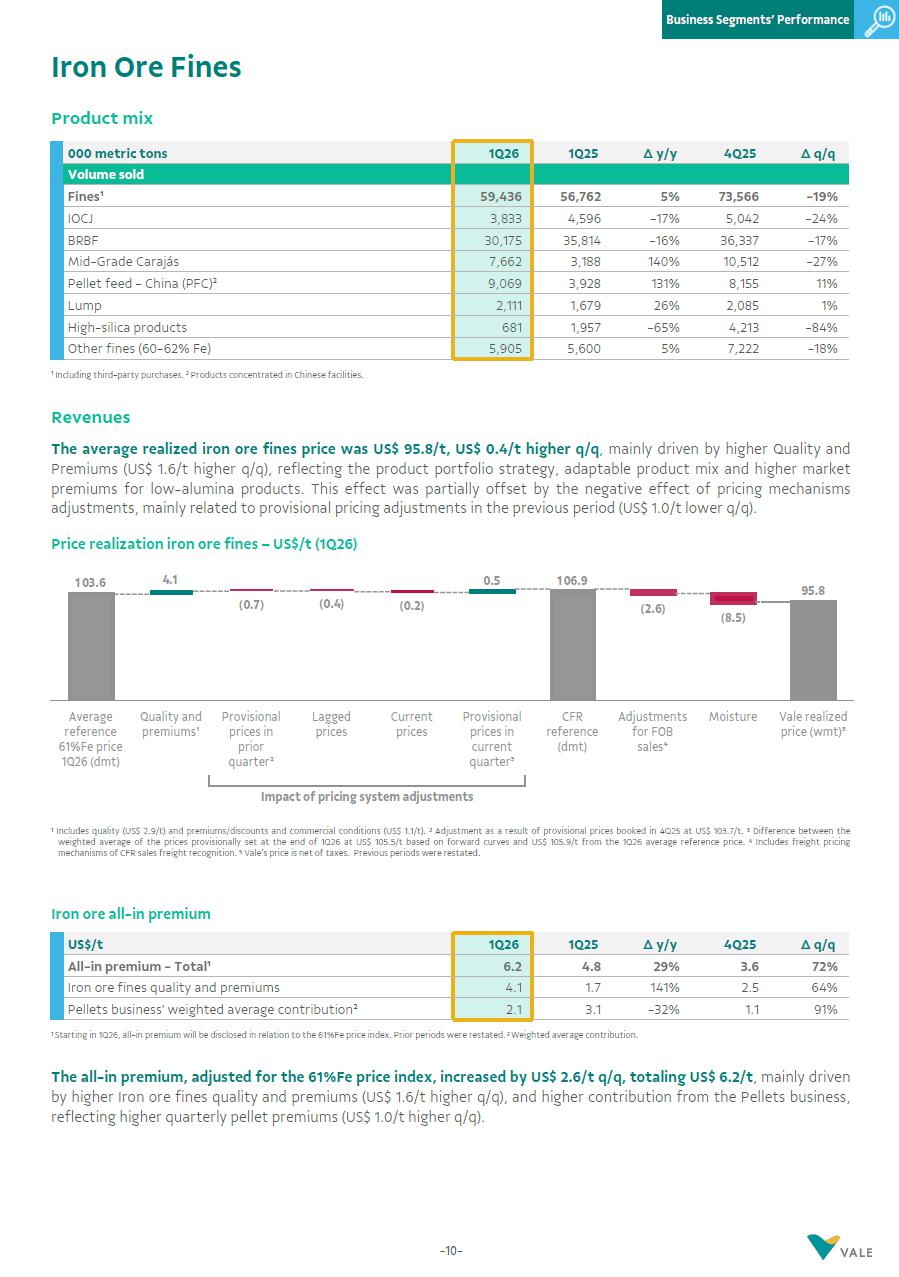
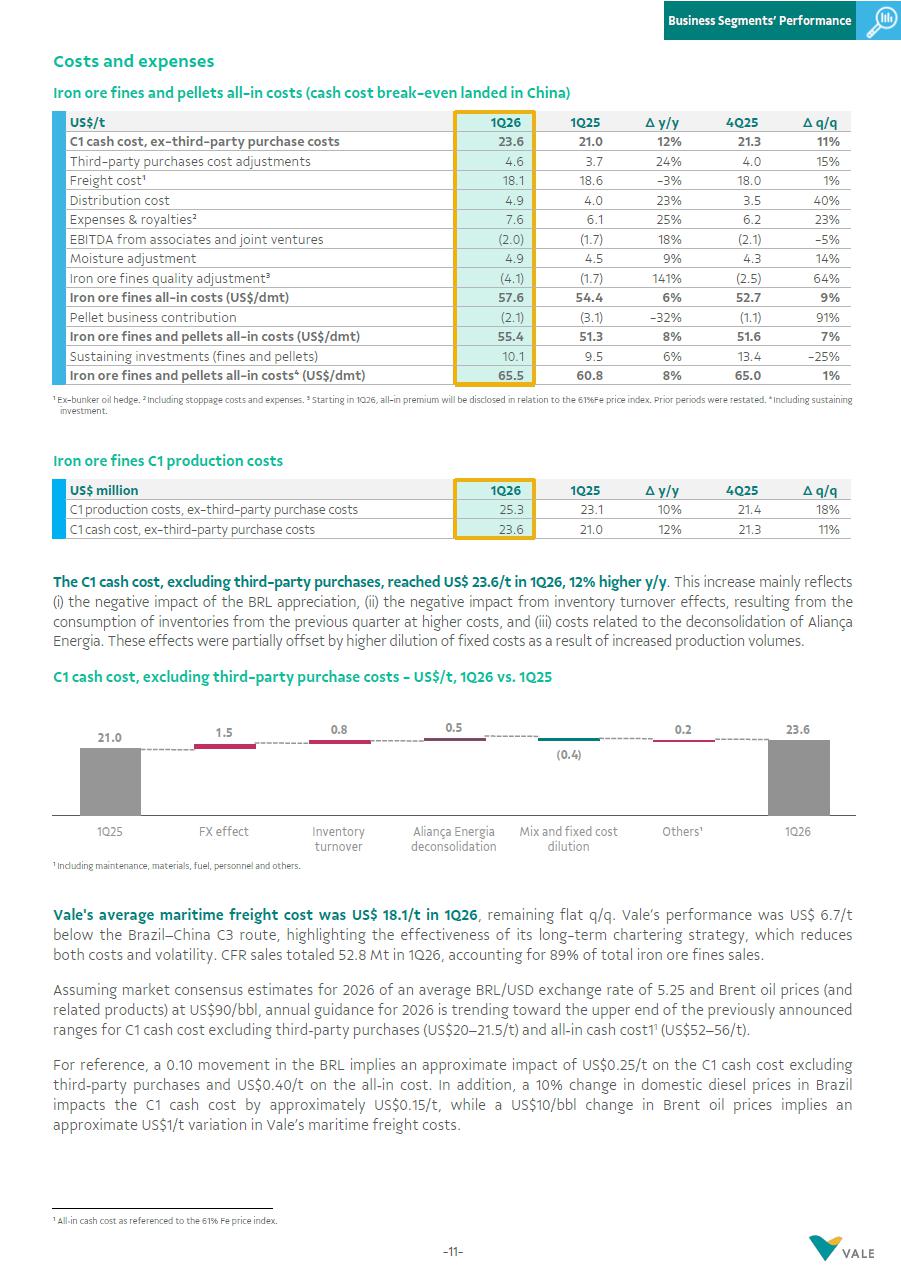
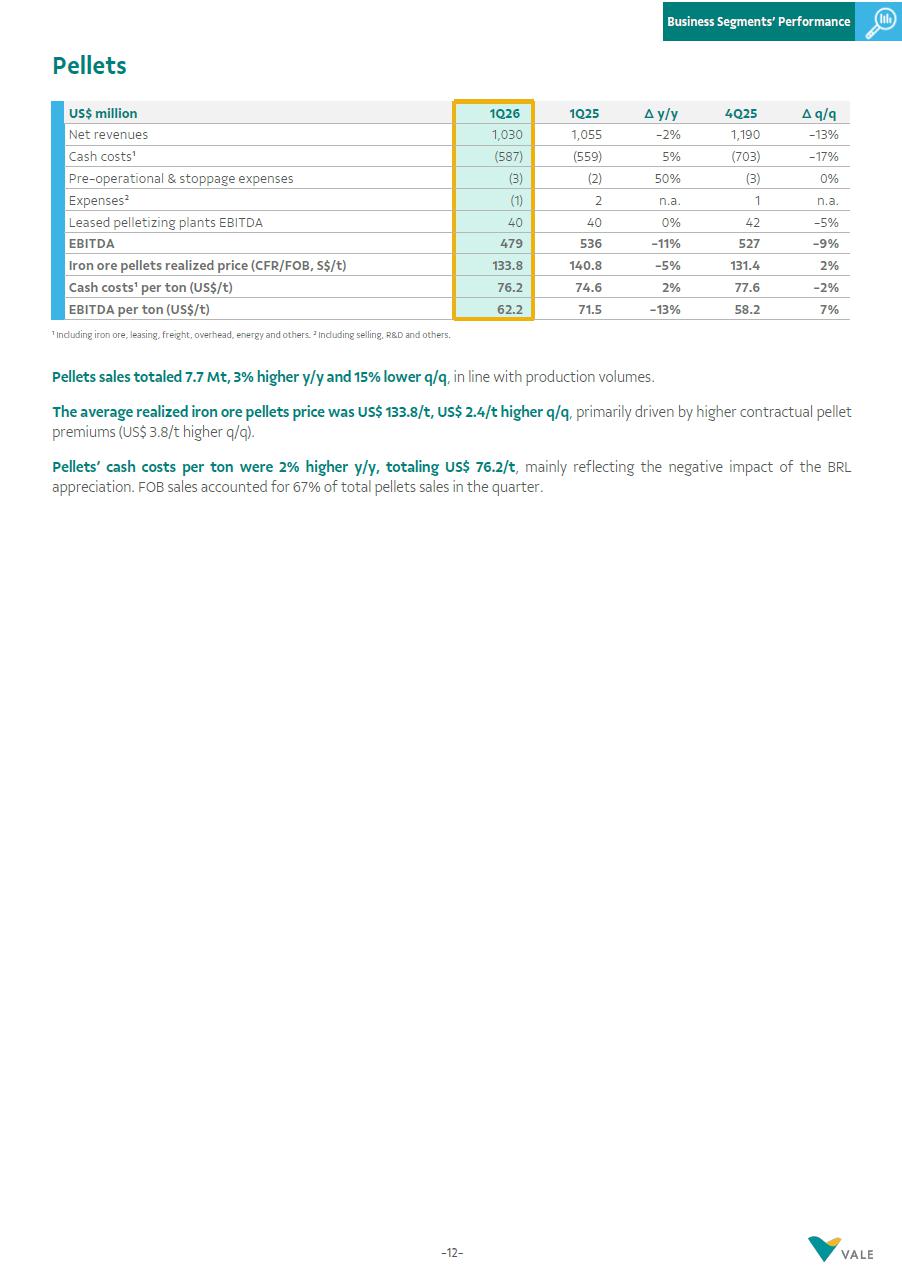
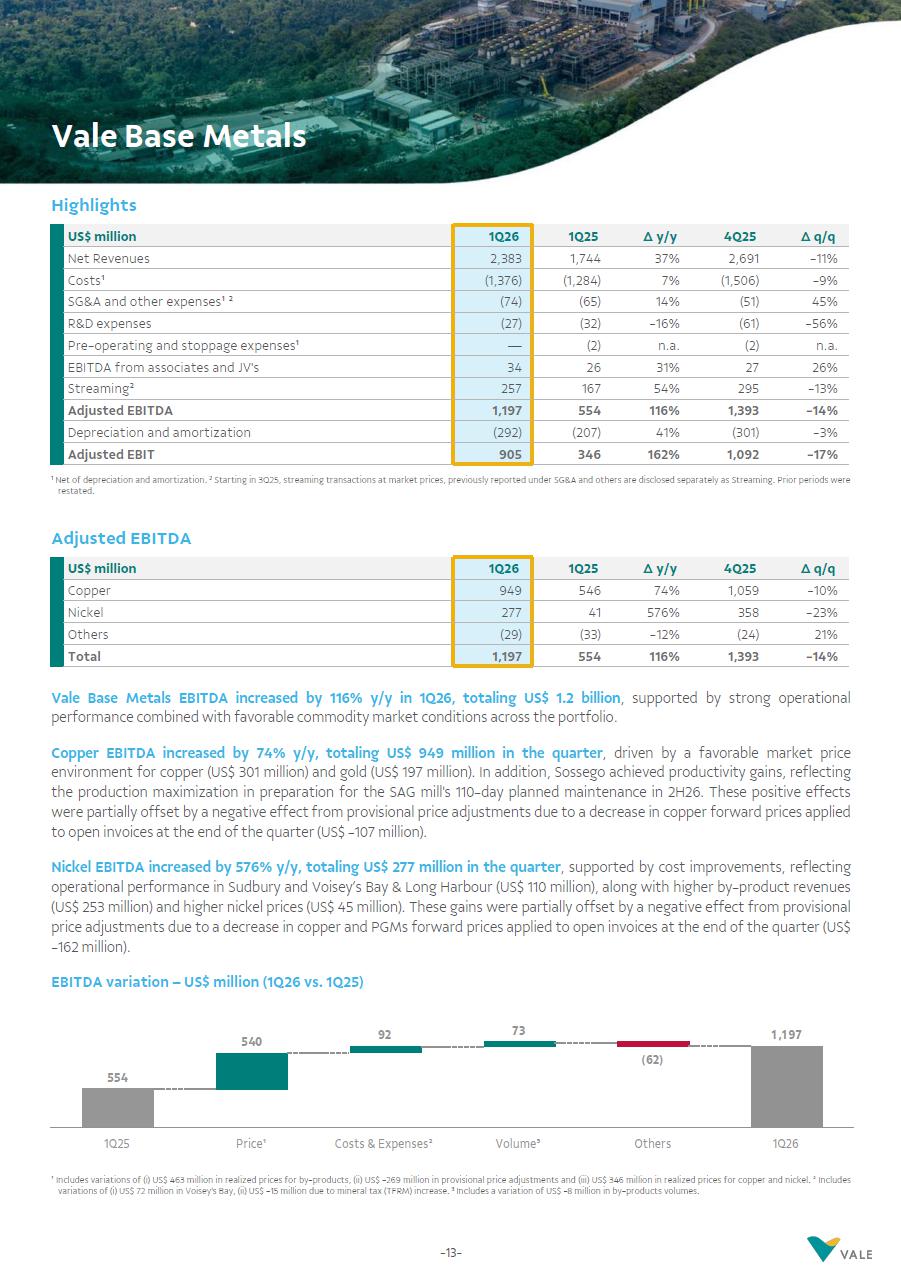
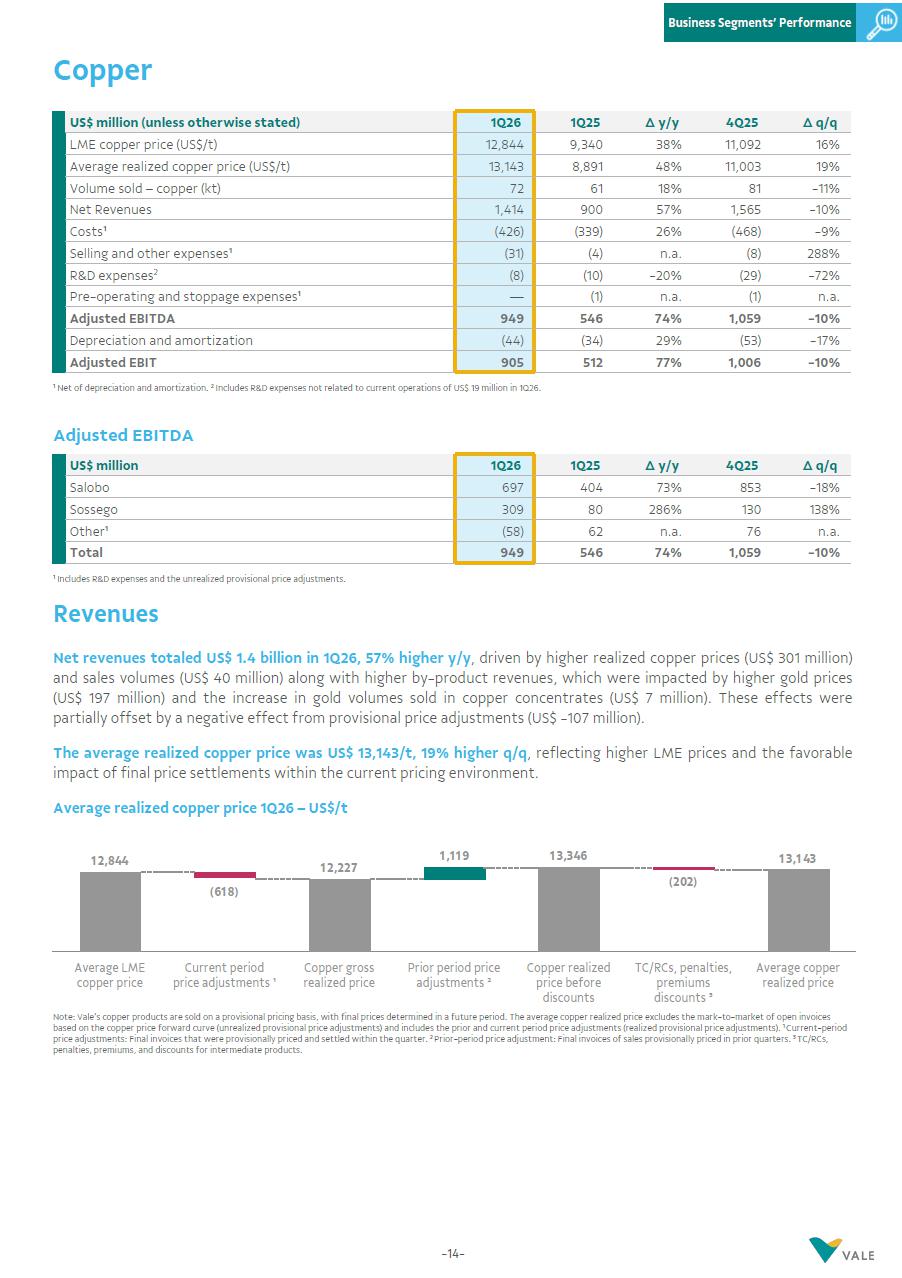
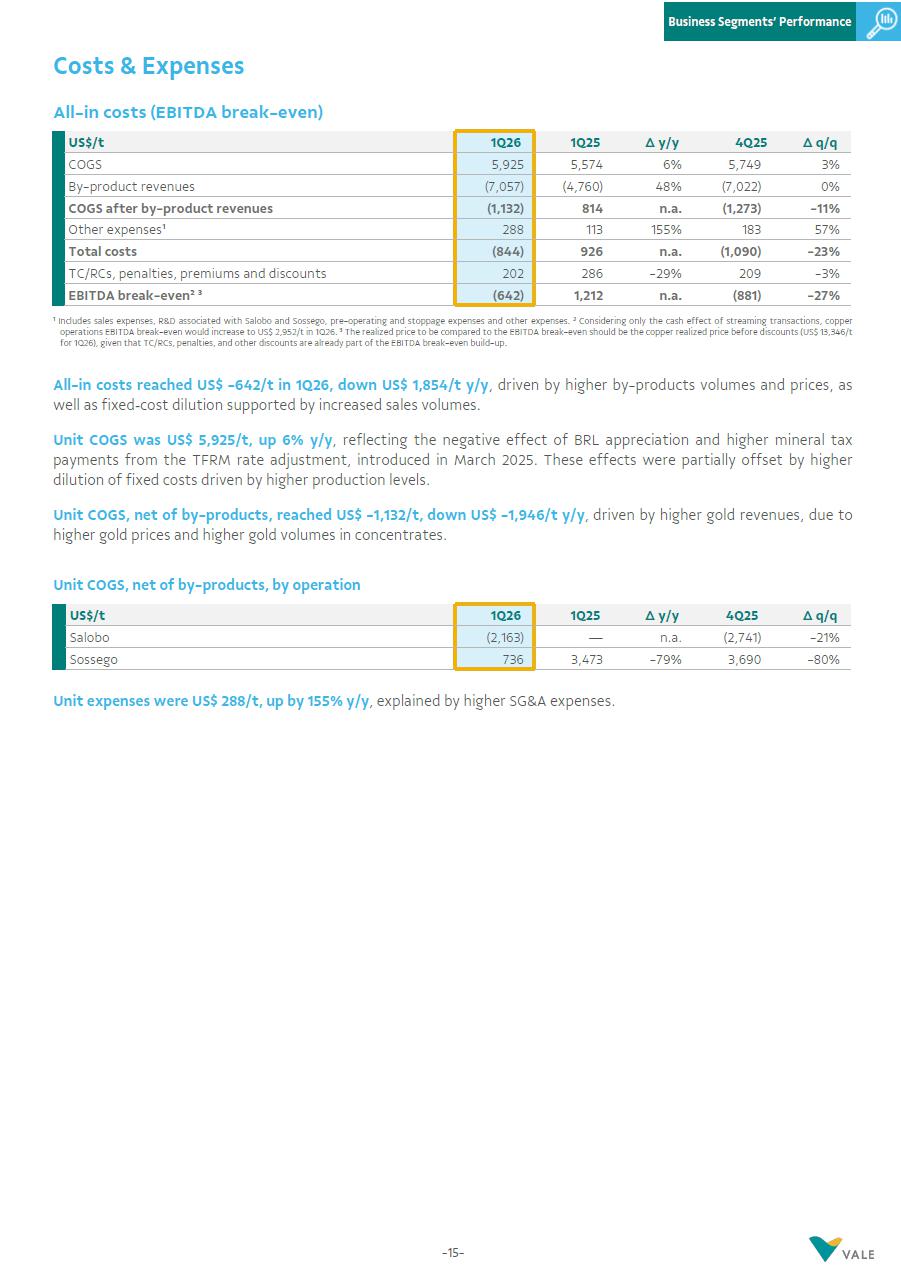
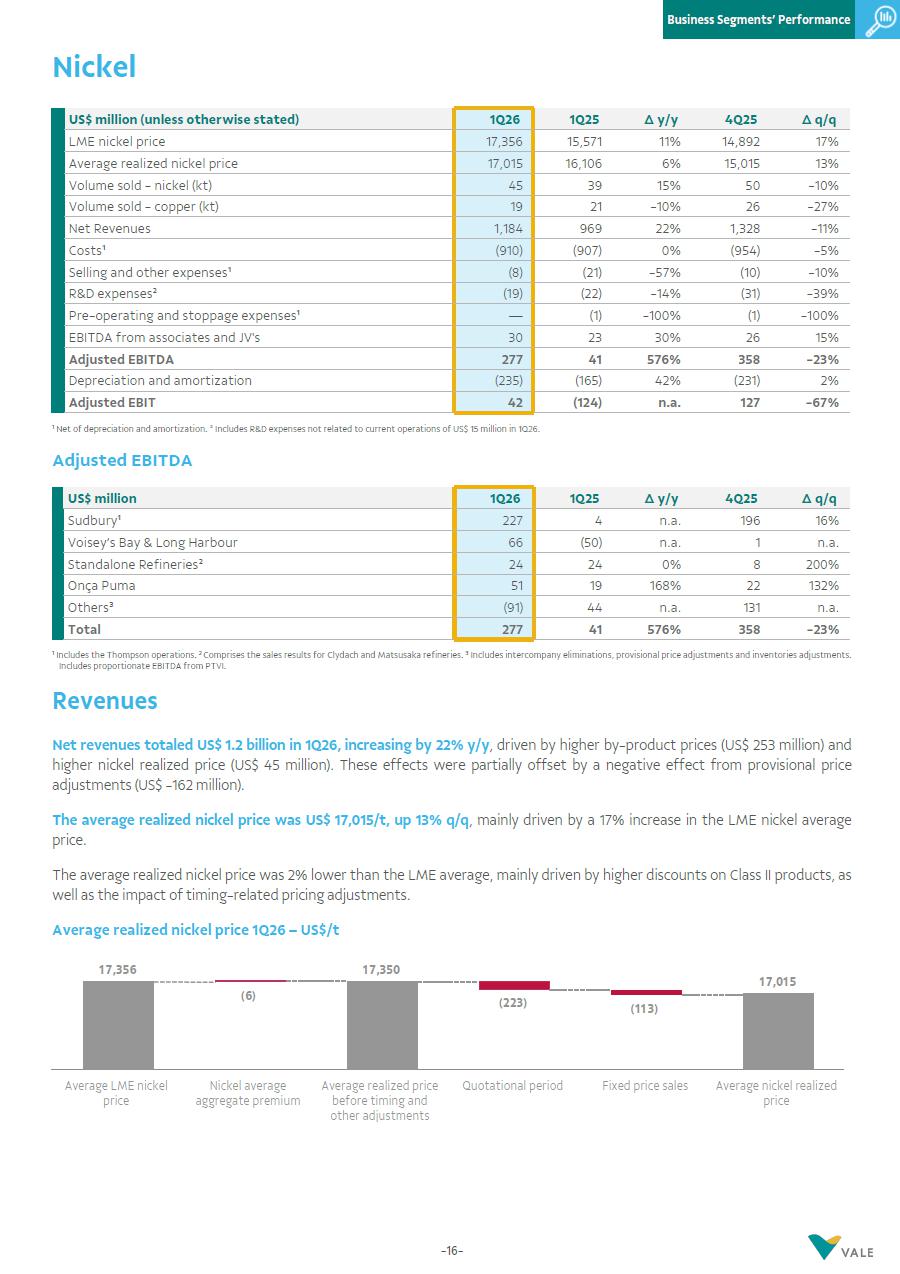
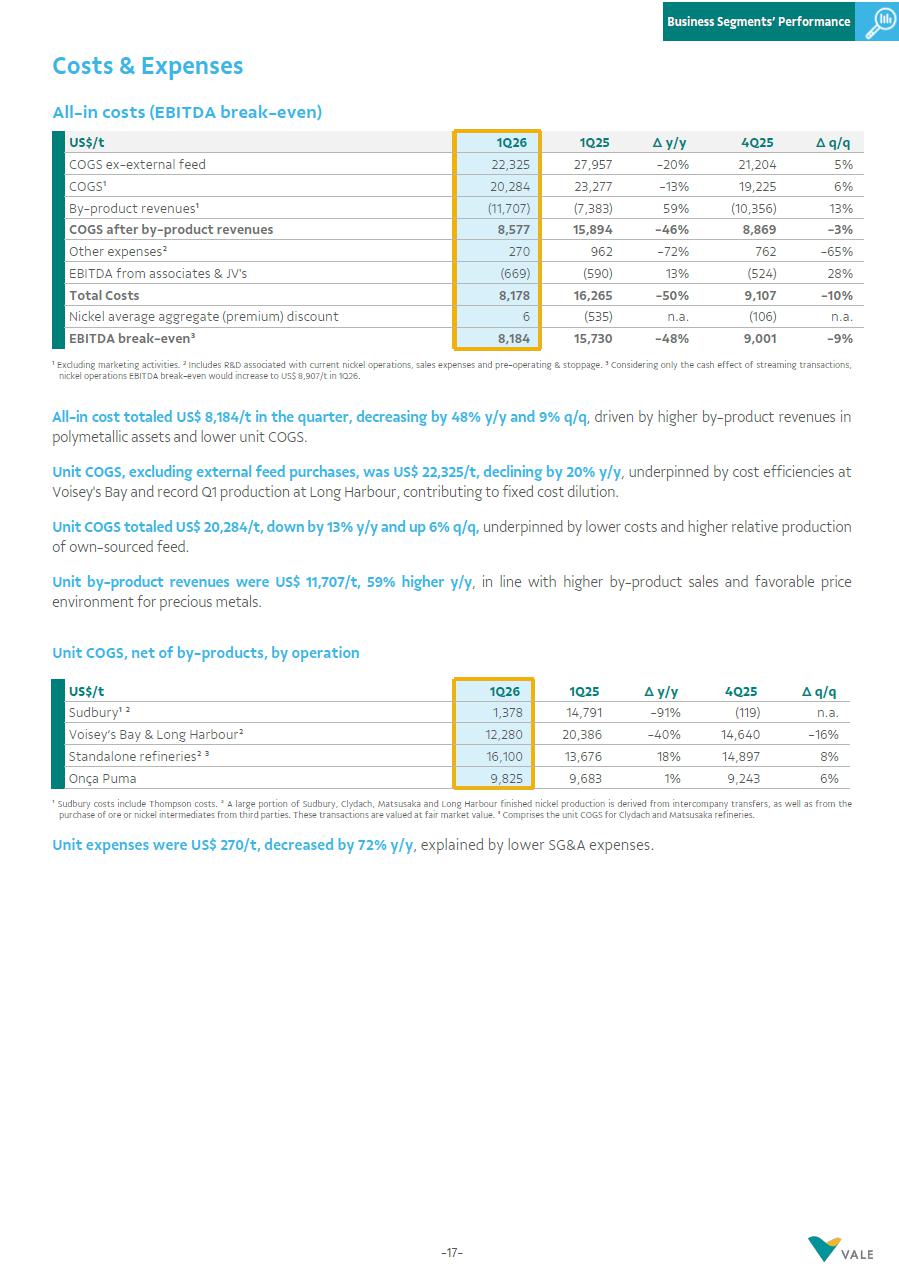
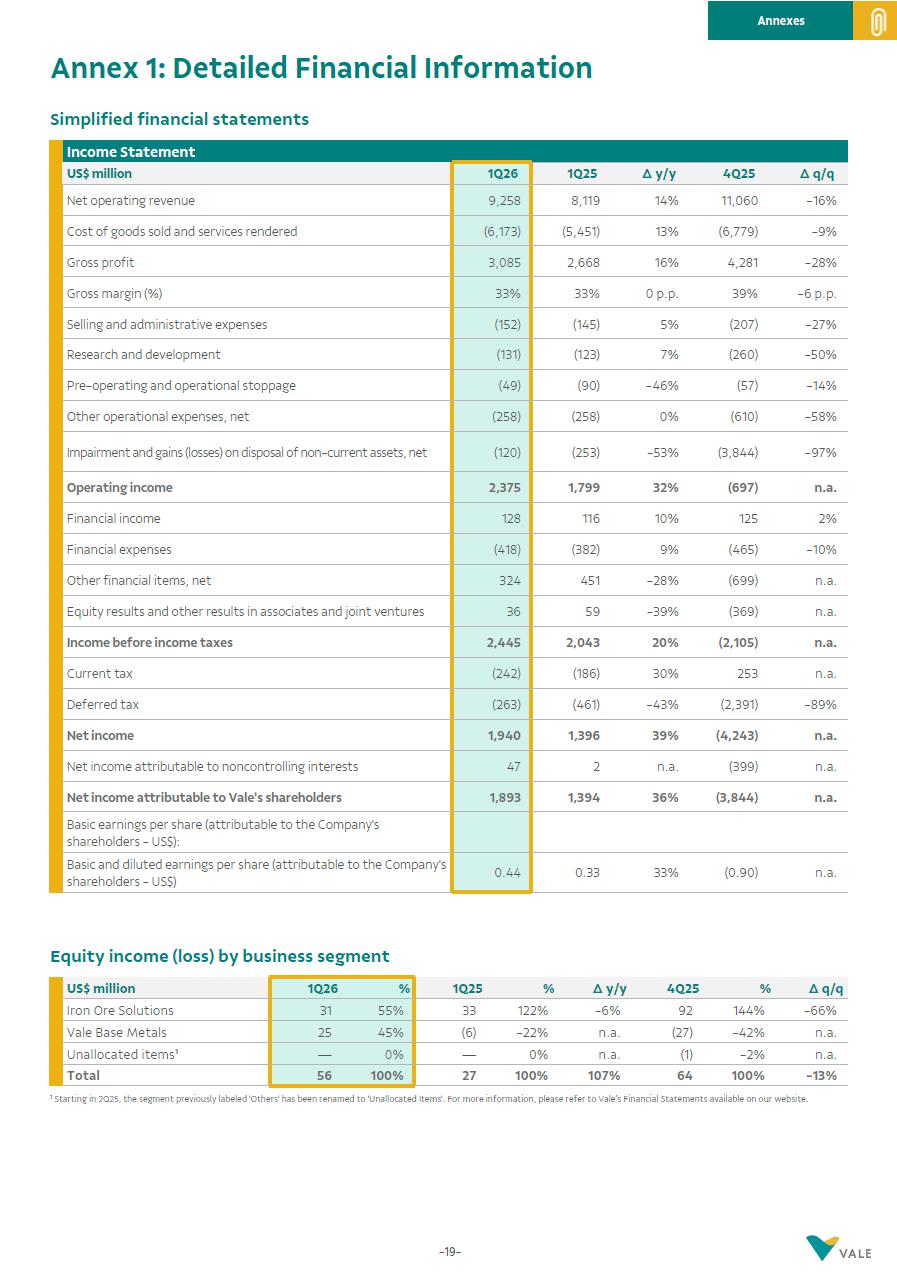
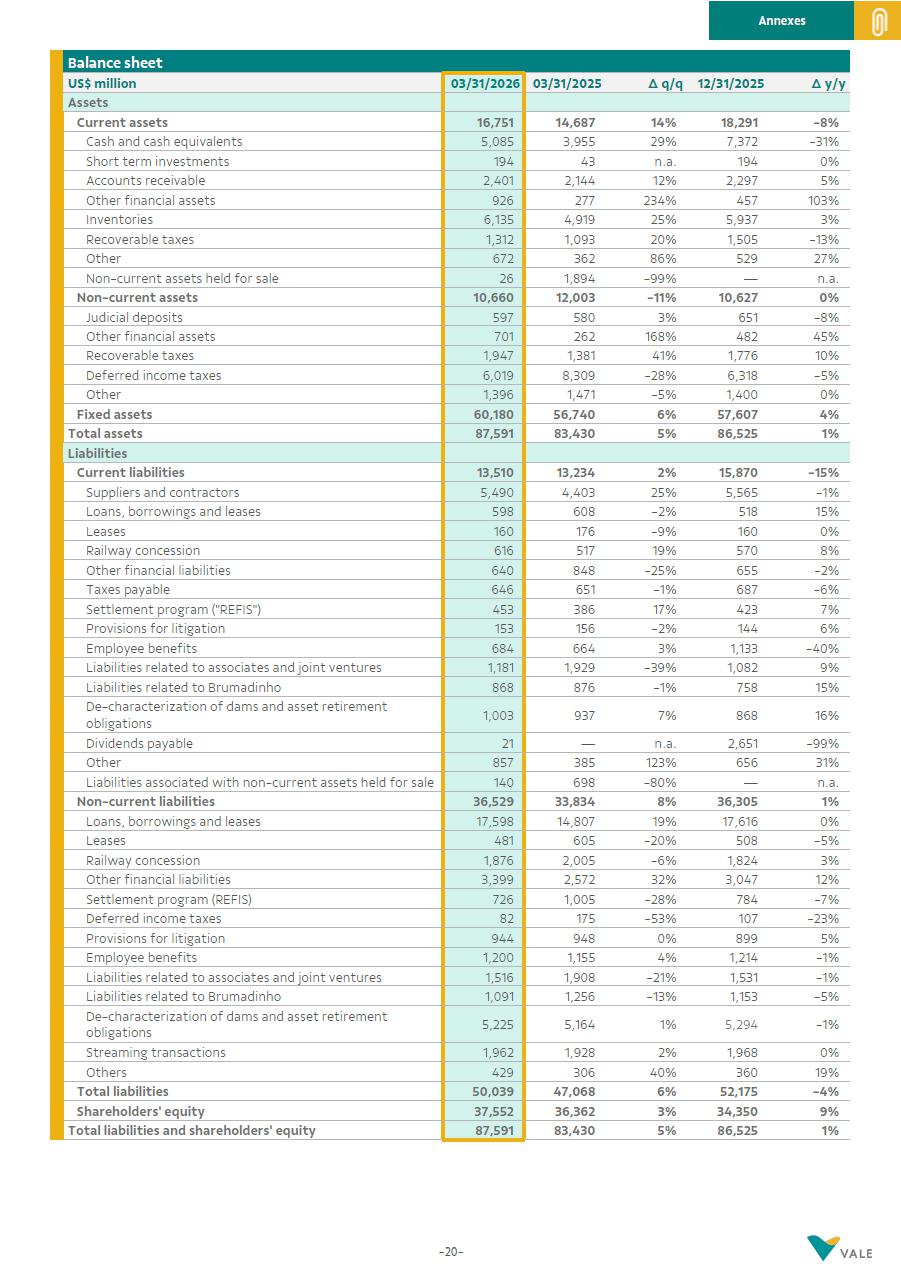
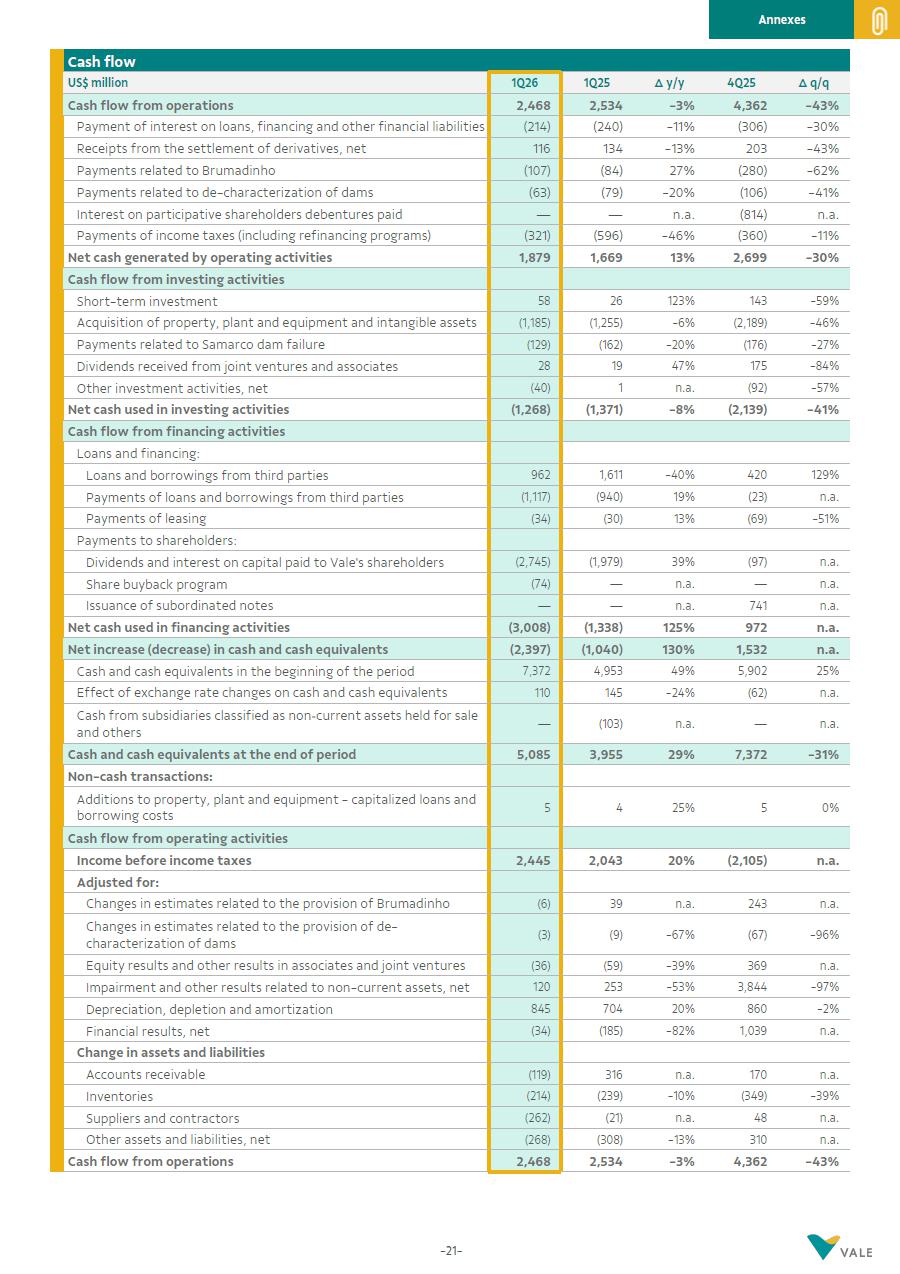
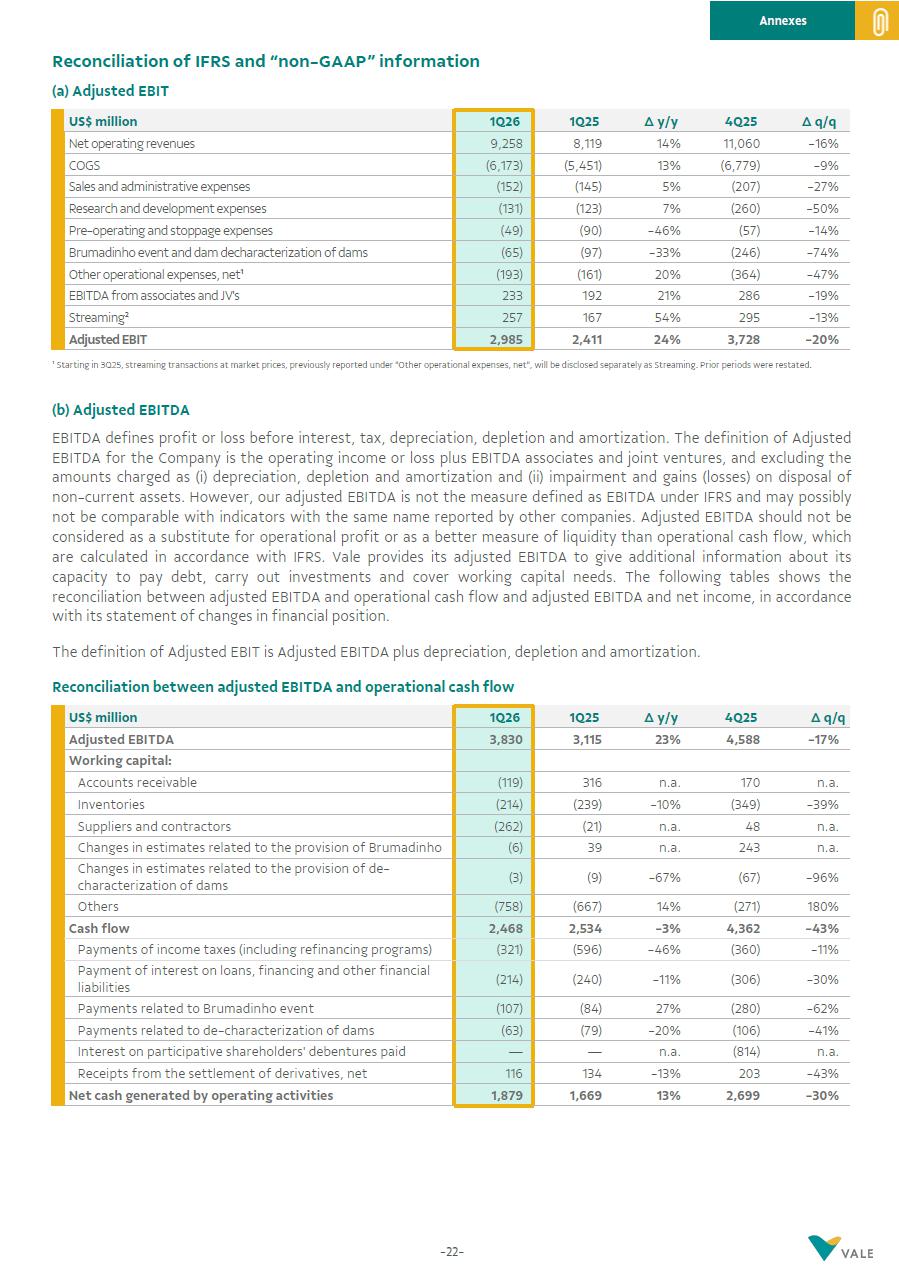
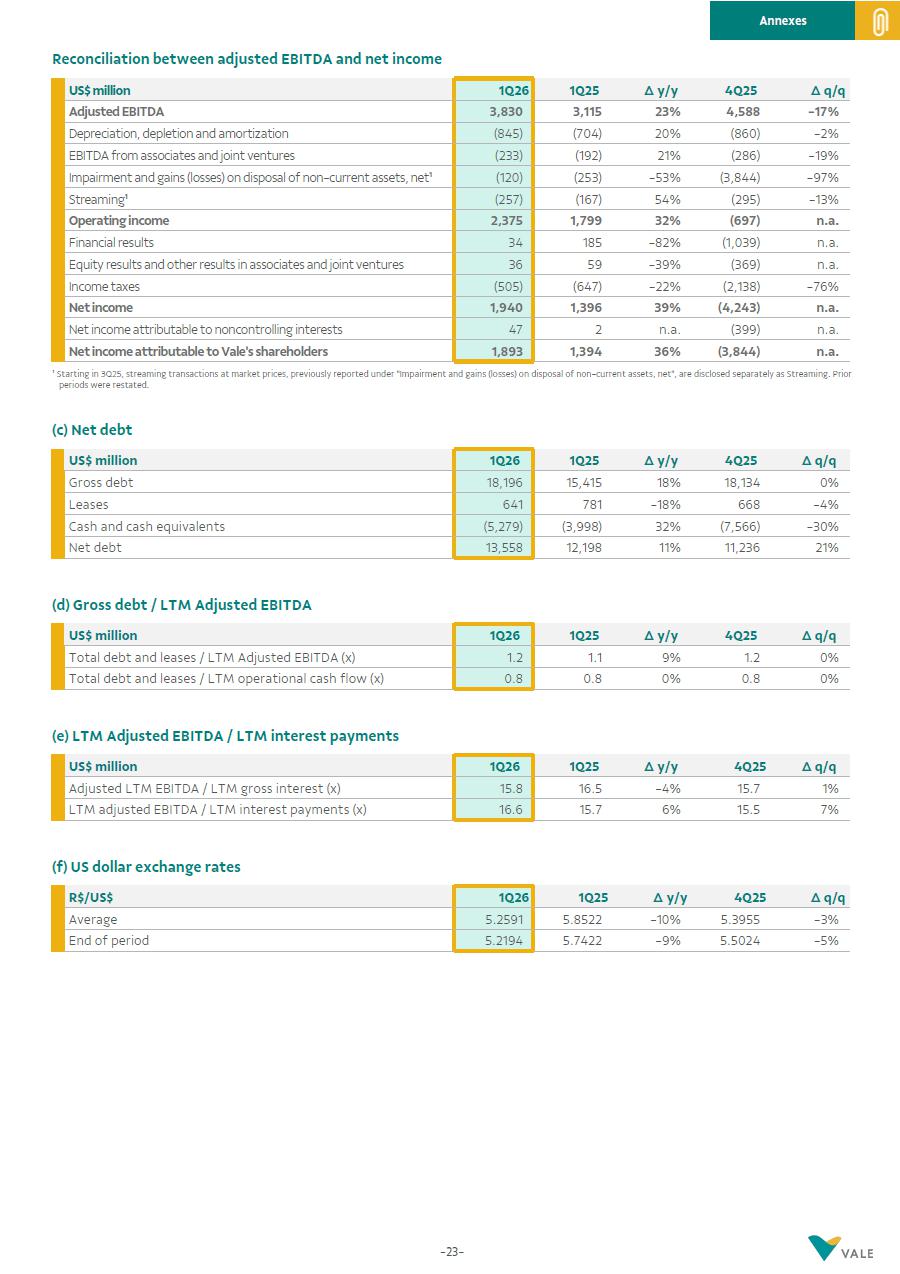
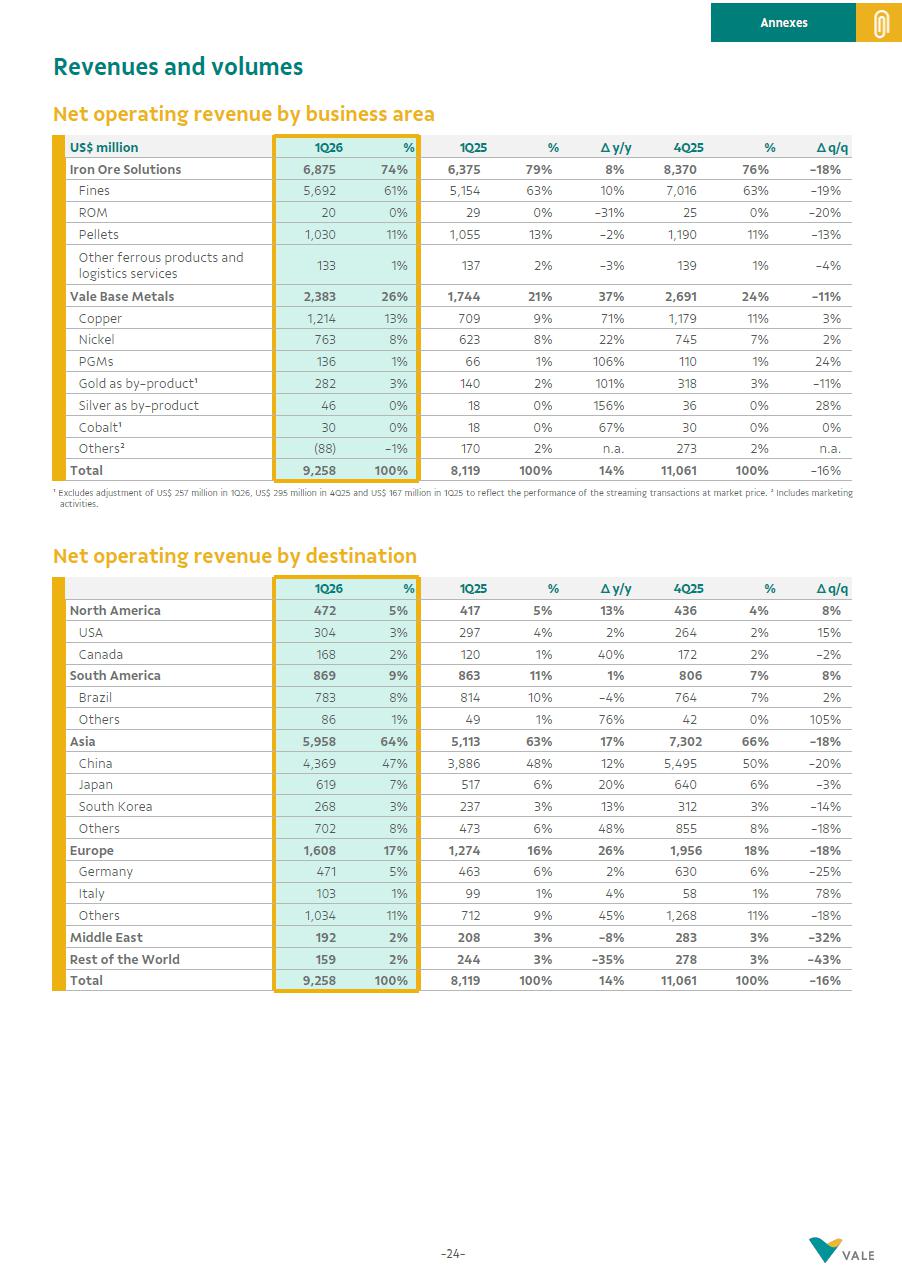
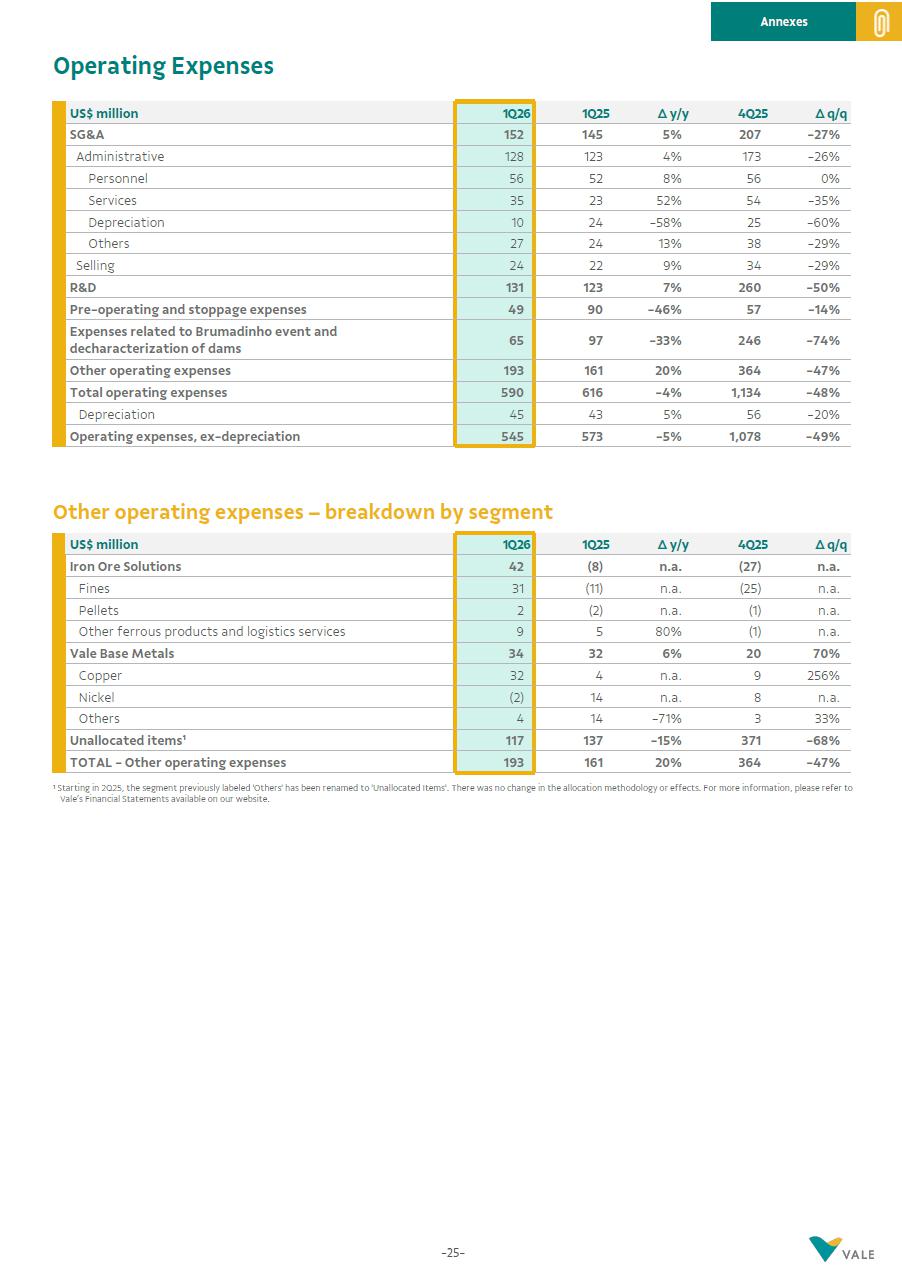
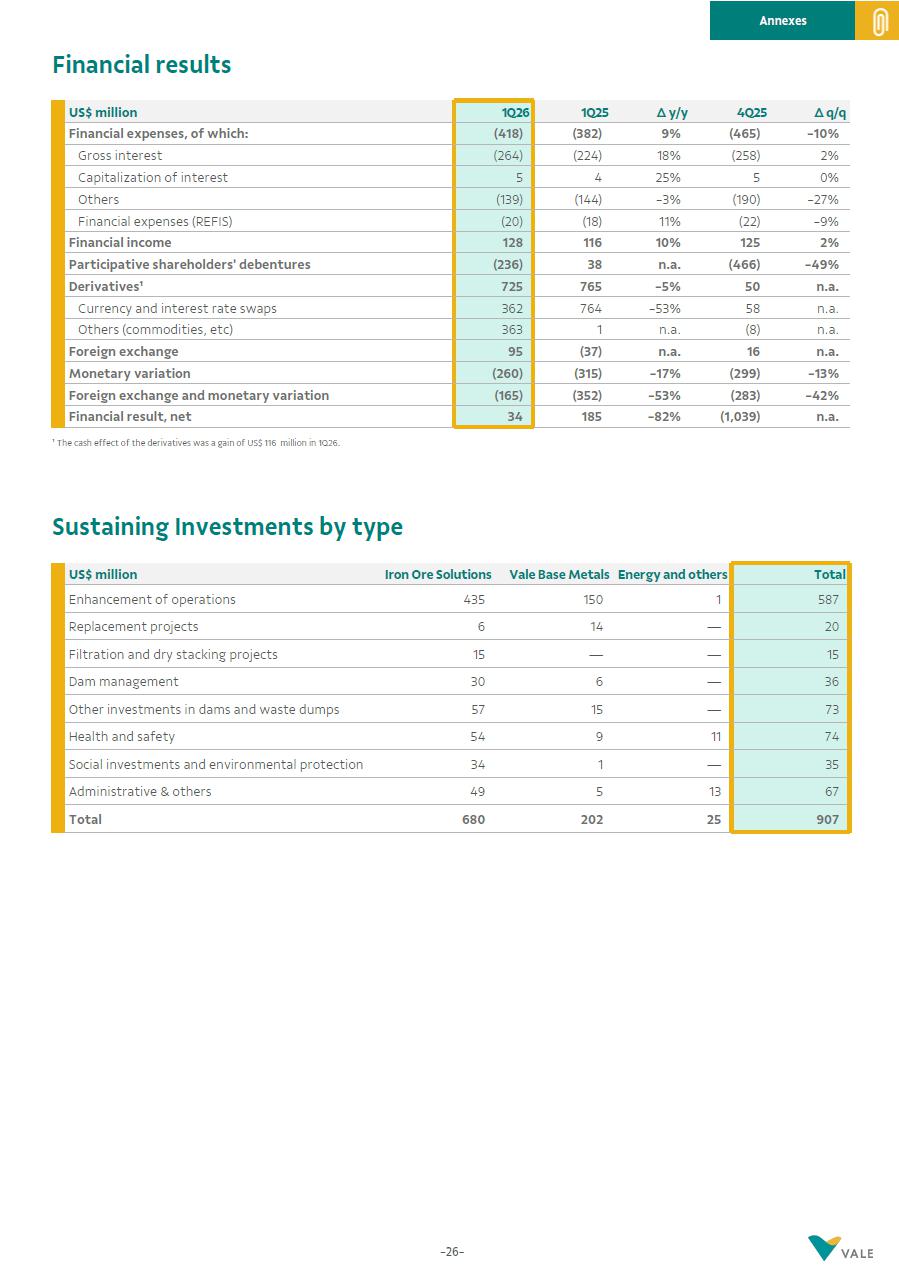
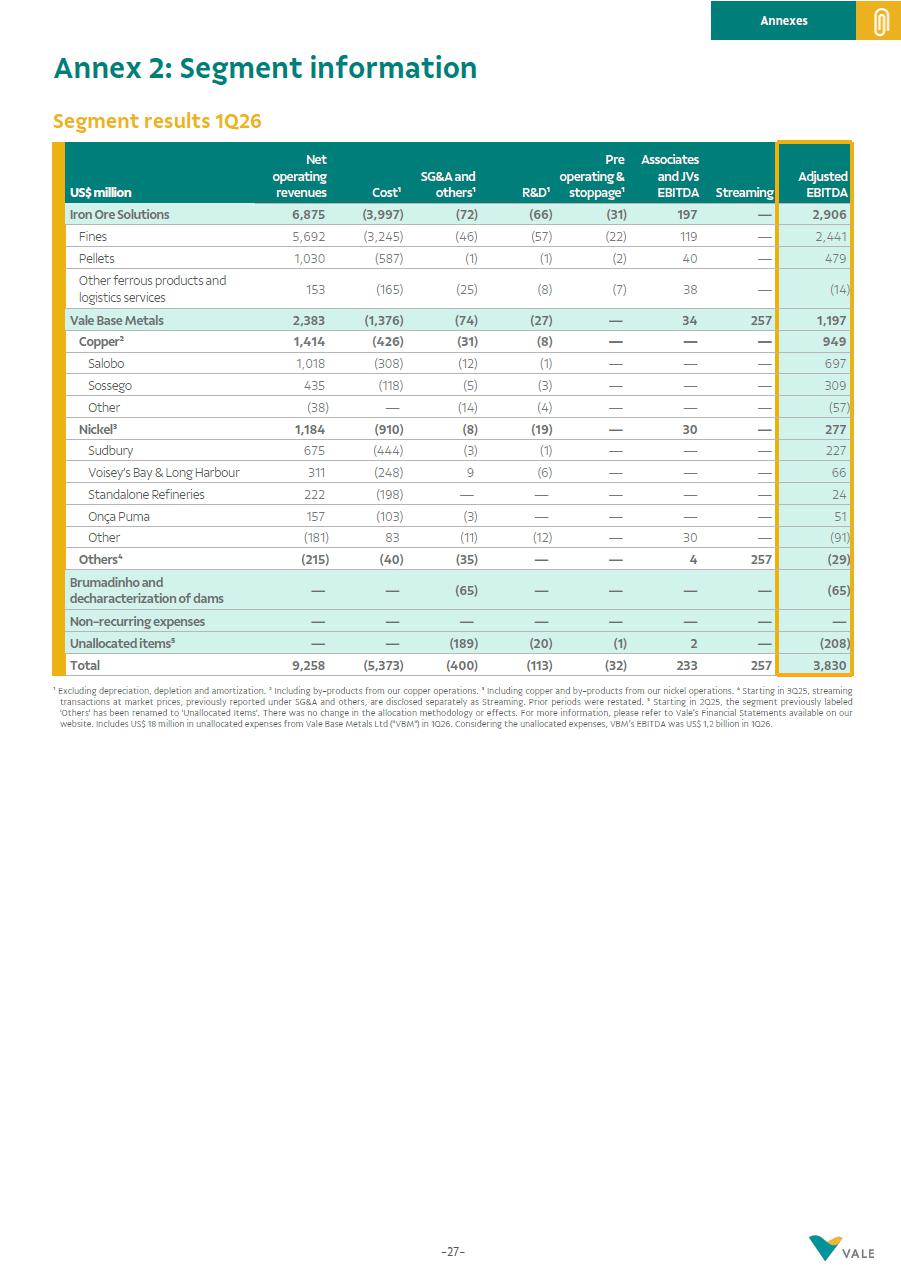
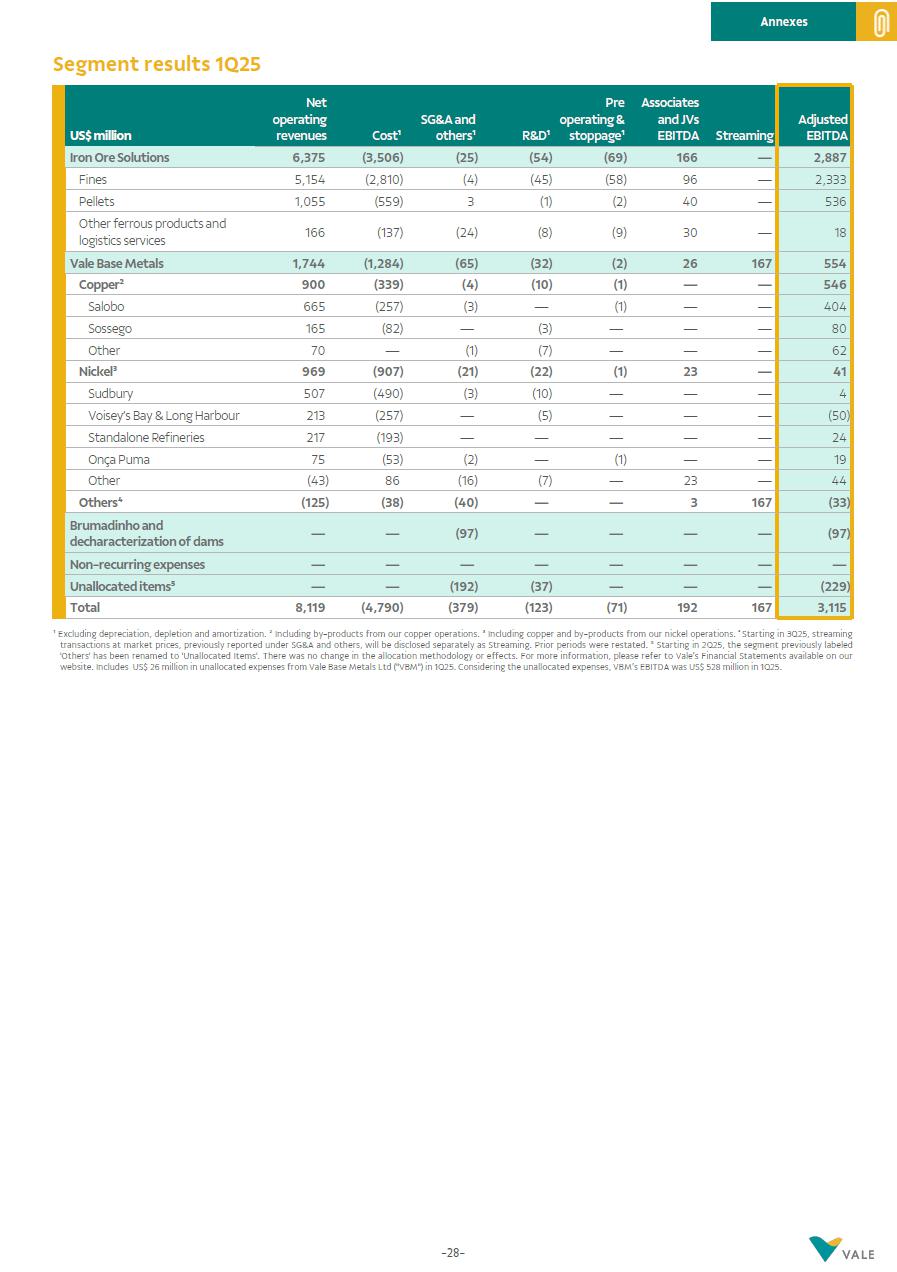

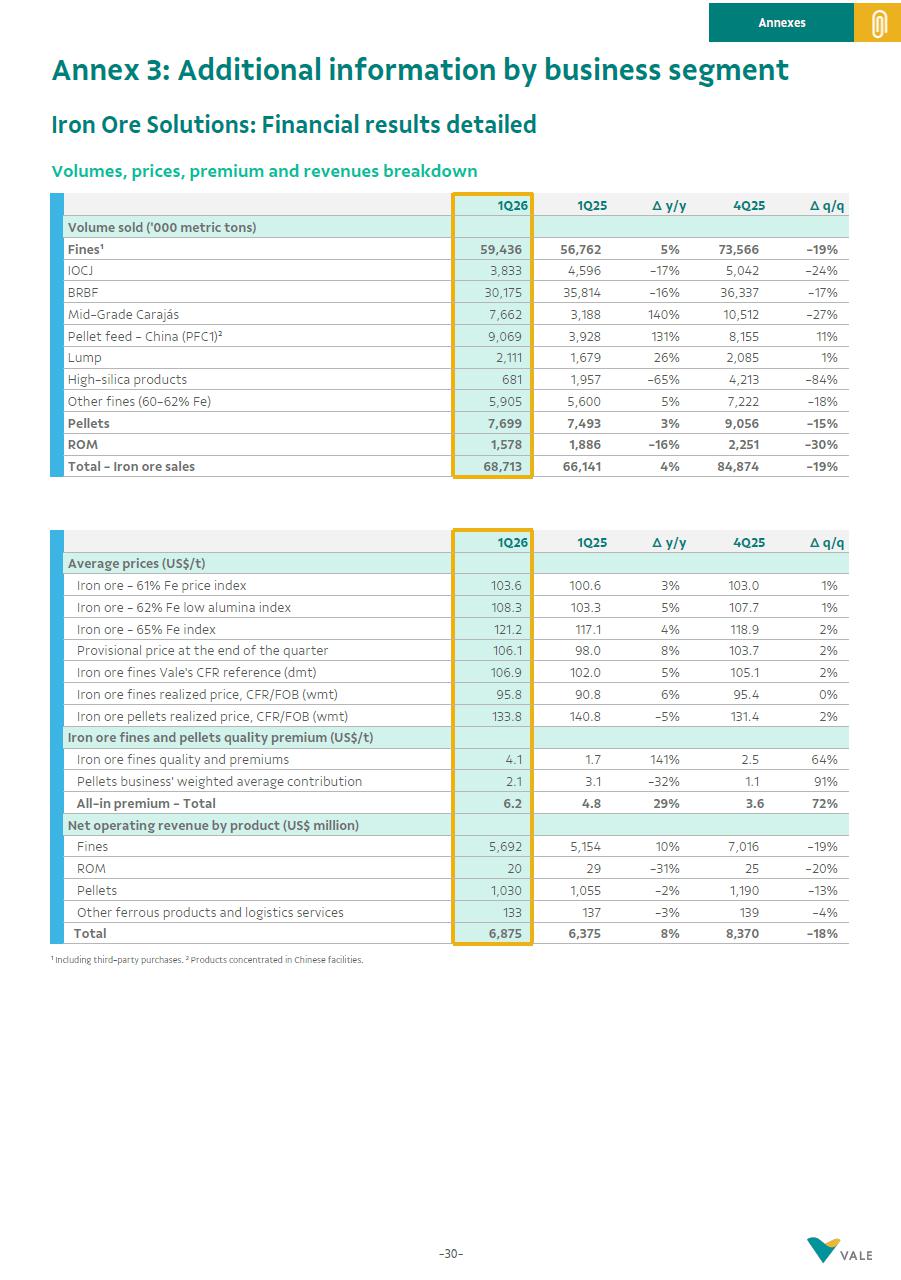
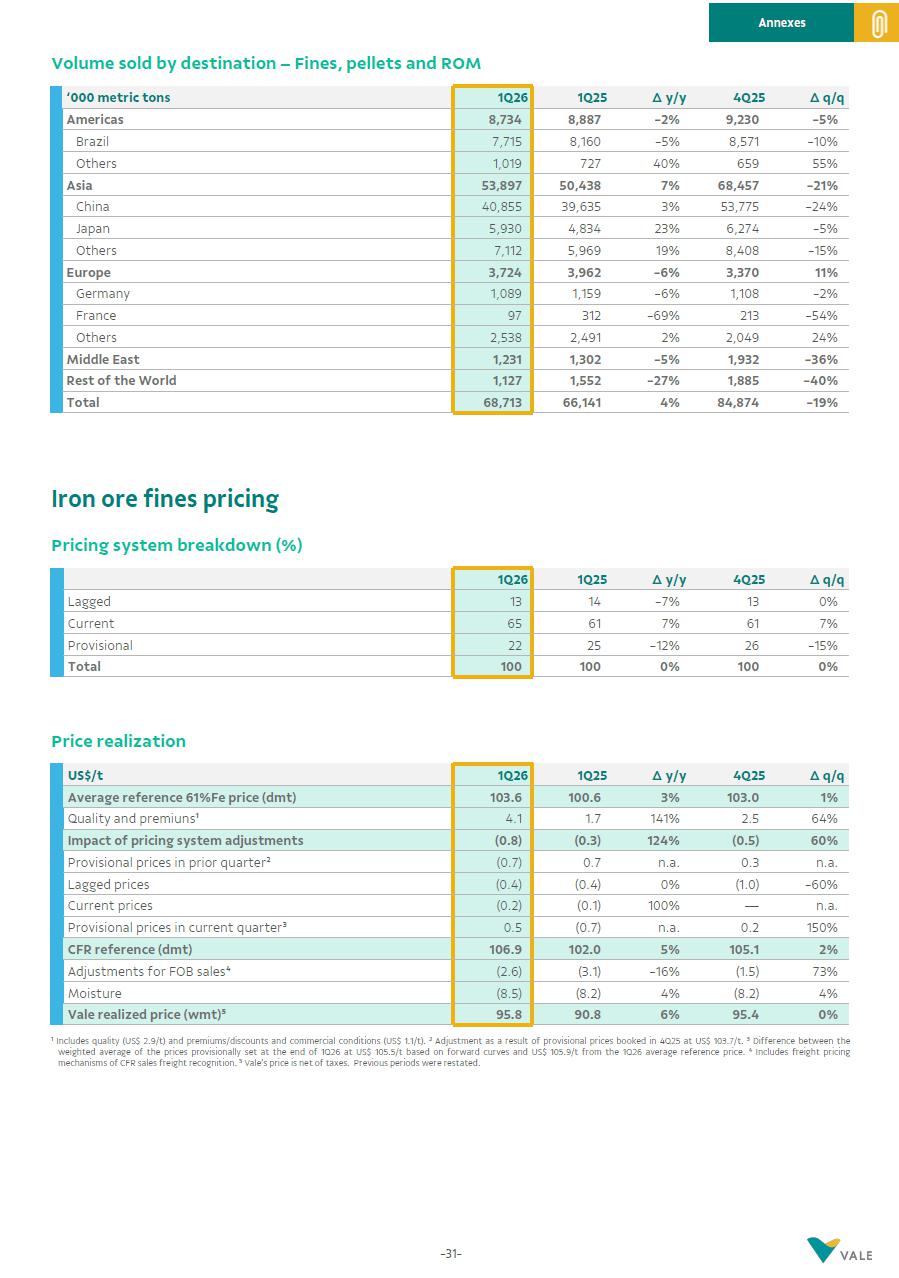
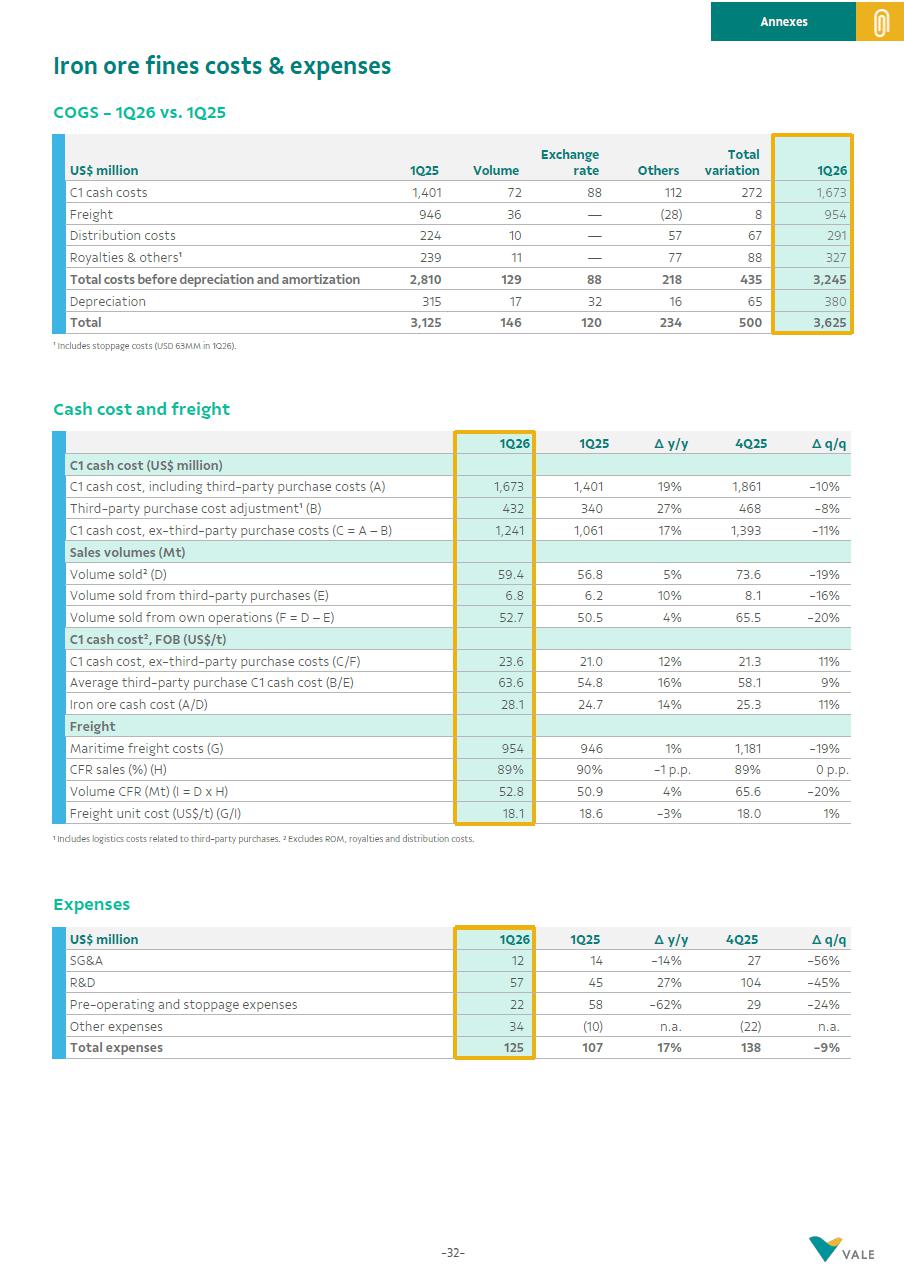
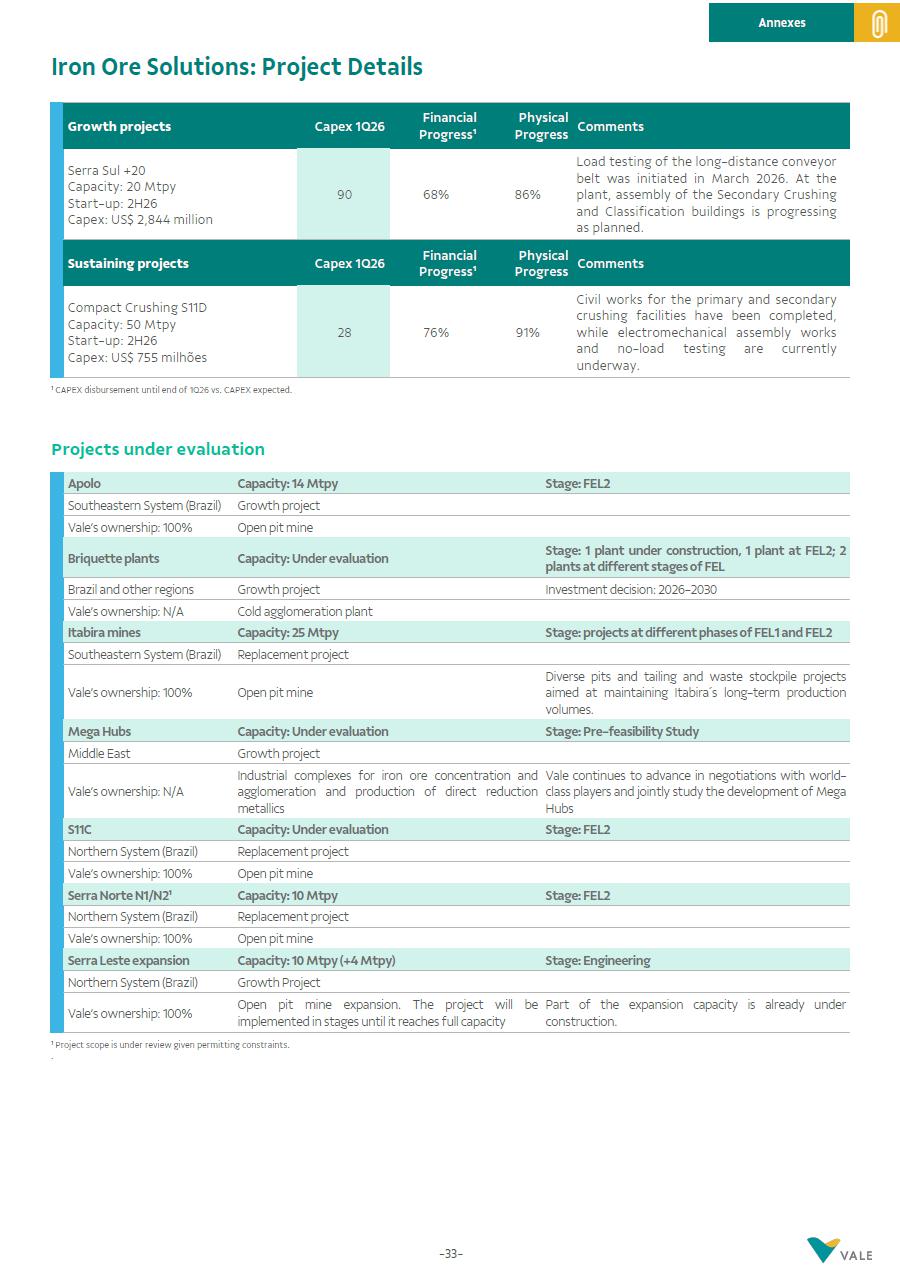
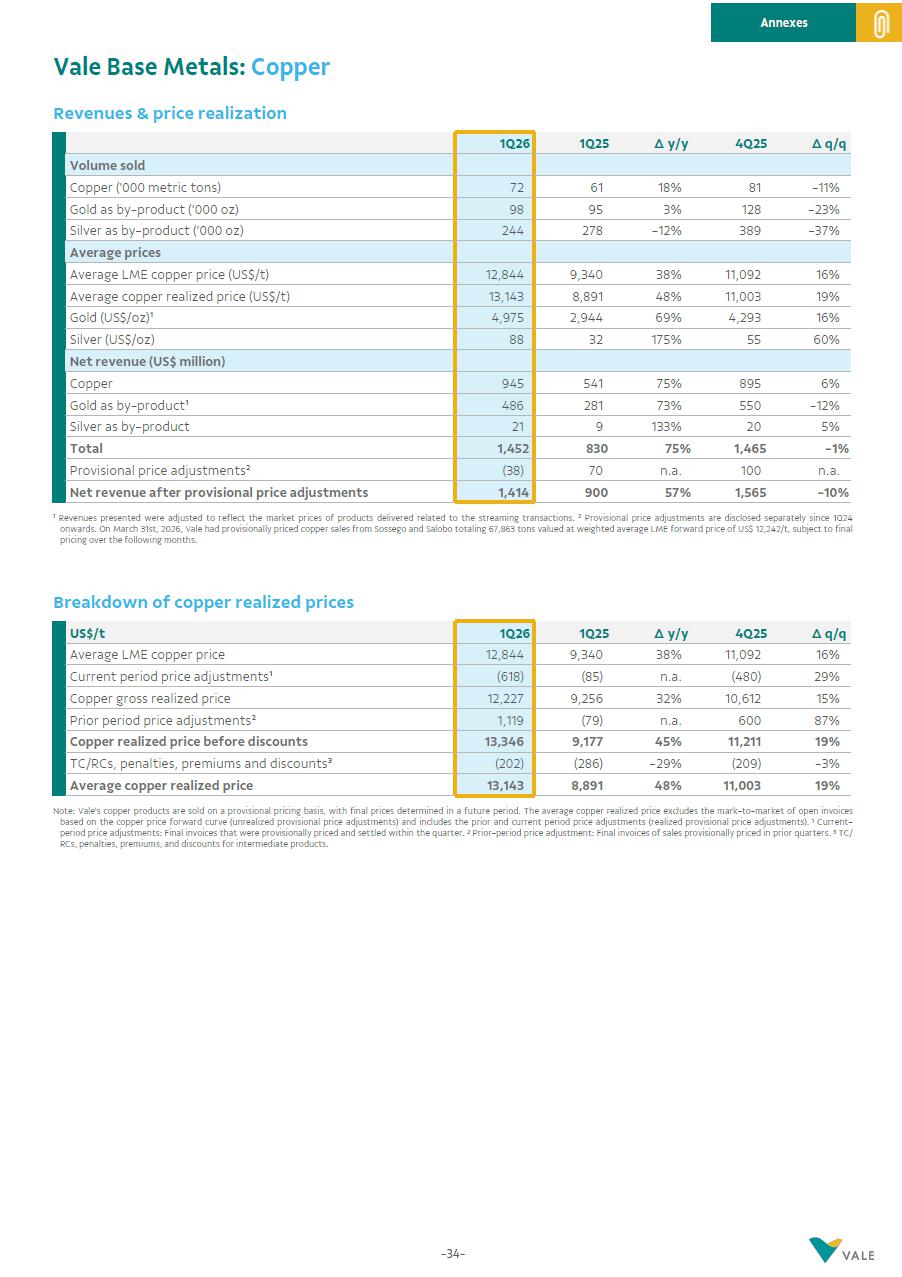
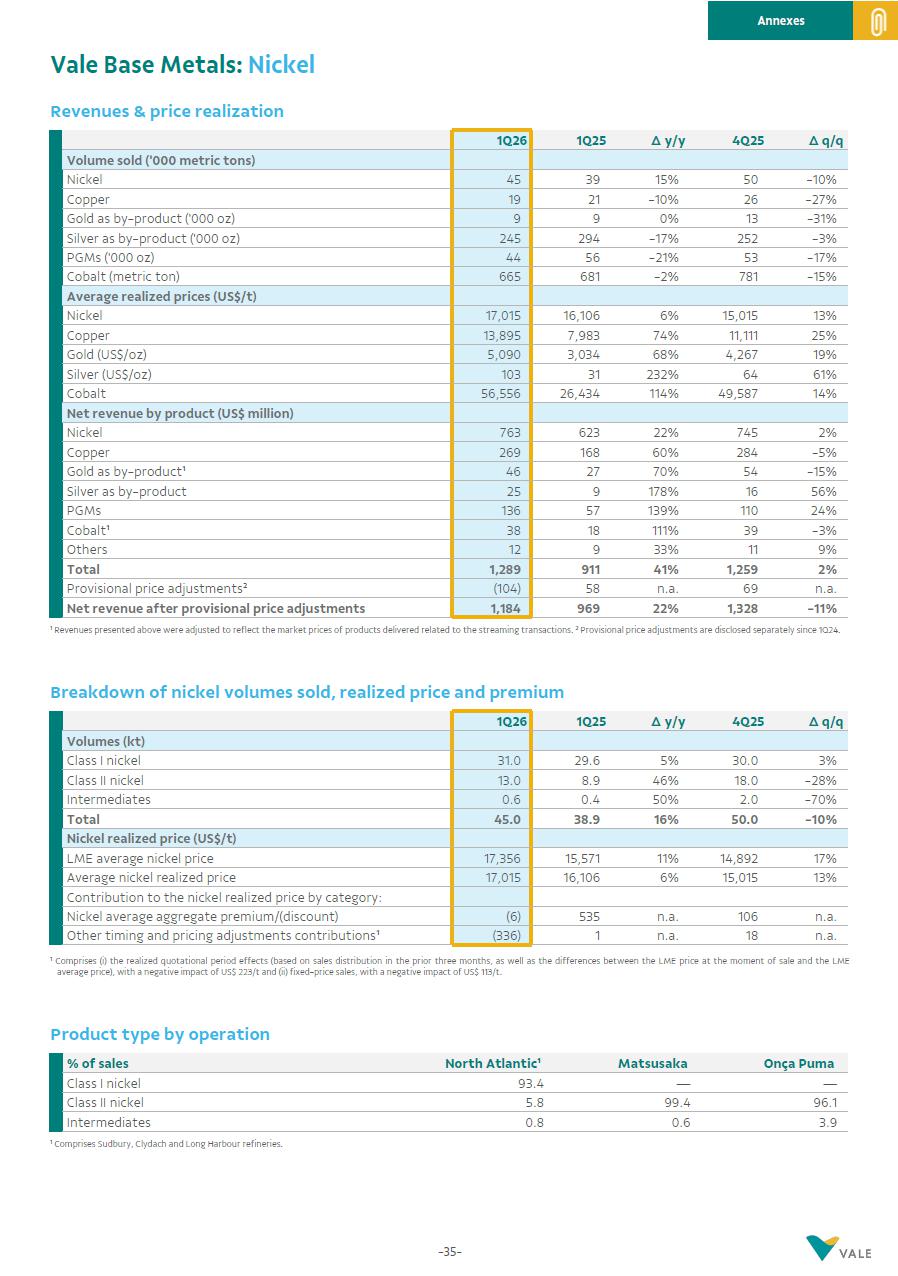
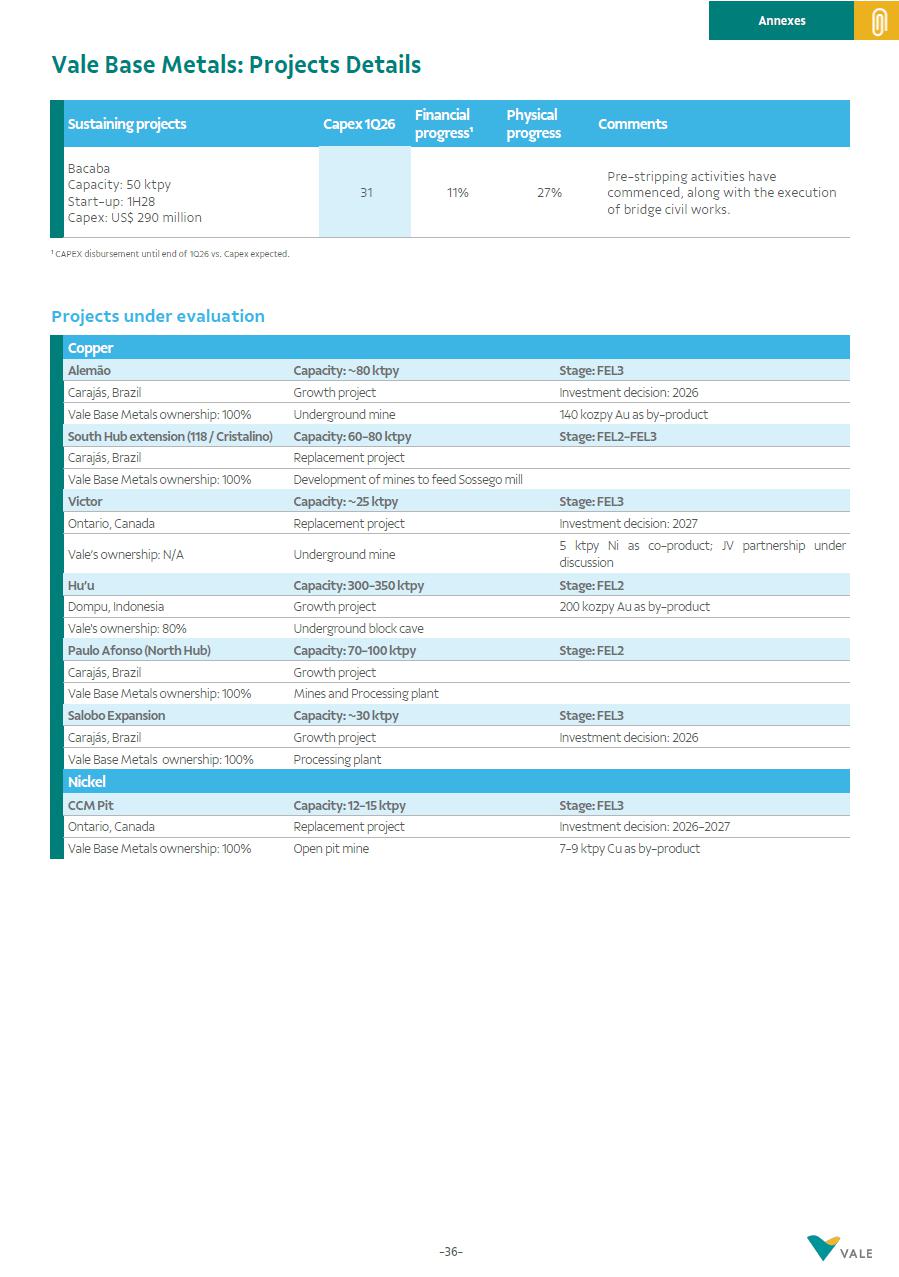
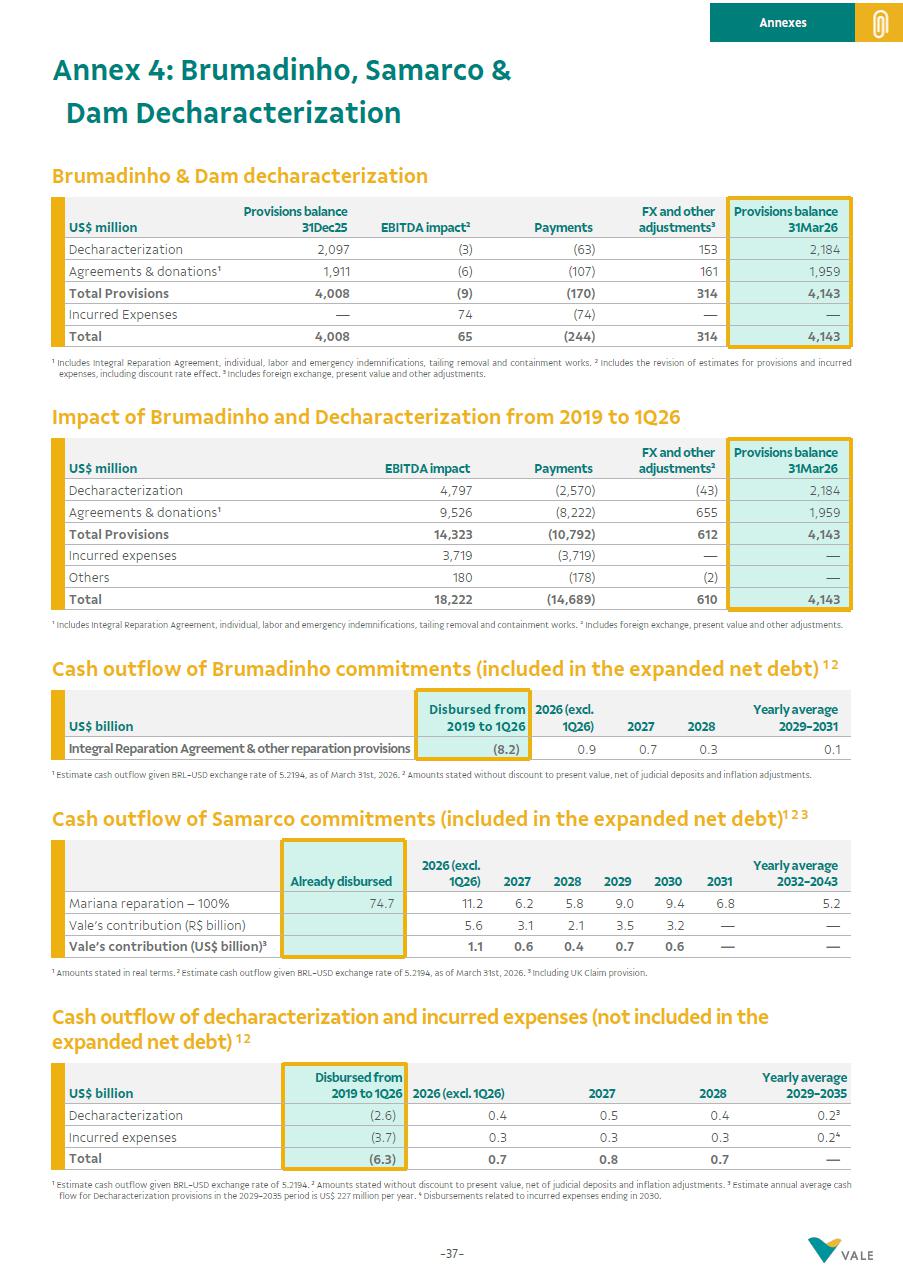
Signatures
Pursuant to the requirements of the Securities Exchange Act of 1934, the registrant has duly caused this report to be signed on its behalf by the undersigned, thereunto duly authorized.
| Vale S.A. (Registrant) | ||
| By: | /s/ Thiago Lofiego | |
| Date: April 28, 2026 | Director of Investor Relations | |