Please wait
 |
| Technical Report Summary
Hod Maden Project, Türkiye
SSR Mining Inc.
6900 E. Layton Avenue, Suite 1300, Denver, CO 80237
Prepared by:
SLR International Corporation
1658 Cole Blvd, Suite 100, Lakewood, Colorado, 80401
SLR Project No.: 123.000320.00001
Report Date:
January 7, 2026
Revision: 0
|
|
|
| |
| |
| |
Making
Sustainability Happen |
| SSR Mining Inc. | Hod Maden Project | | January 7, 2026 |
| Technical Report Summary | | SLR Project No.: 123.000320.00001 |
Cautionary Note Regarding Forward-Looking
Statements:
Certain statements contained in this report are "forward-looking statements" within the meaning of Section 27A of the
Securities Act of 1933, as amended (the “Securities Act”), and Section 21E of the Securities Exchange Act of 1934,
as amended (the “Exchange Act”), and are intended to be covered by the safe harbor provided for under these sections.
Forward looking statements can be identified with words such as “may,” “will,” “could,”
“should,” “expect,” “plan,” “anticipate,” “believe,”
“intend,” “estimate,” “projects,” “predict,” “potential,”
“continue” and similar expressions, as well as statements written in the future tense. Forward-looking statements are
based on information known at such time and/or with a good faith belief with respect to future events. Such statements are subject
to risks and uncertainties that could cause actual performance or results to differ materially from those expressed in the
forward-looking statements. Many of these risks and uncertainties cannot be controlled or predicted. Given these risks and
uncertainties, readers are cautioned not to place undue reliance on forward-looking statements. Forward-looking statements include,
among things: metal price price assumptions, cash flow forecasts, projected capital and operating costs, metal recoveries, mine life
and production rates, and other assumptions used in this report.
Such forward-looking information and statements are based on a number
of material factors and assumptions, including, but not limited to: the inherent speculative nature of exploration results; the ability
to explore; communications with local stakeholders; maintaining community and governmental relations; status of negotiations of joint
ventures; weather conditions at our operations; commodity prices; the ultimate determination of and realization of Mineral Reserves; existence
or realization of Mineral Resources; the development approach; availability and receipt of required approvals, titles, licenses and permits;
sufficient working capital to develop and operate the mines and implement development plans; access to adequate services and supplies;
foreign currency exchange rates; interest rates; access to capital markets and associated cost of funds; availability of a qualified work
force; ability to negotiate, finalize, and execute relevant agreements; lack of social opposition to our mines or facilities; lack of
legal challenges with respect to our properties; the timing and amount of future production; the ability to meet production, cost, and
capital expenditure targets; timing and ability to produce studies and analyses; capital and operating expenditures; economic conditions;
availability of sufficient financing; the ultimate ability to mine, process, and sell mineral products on economically favorable terms;
and any and all other timing, exploration, development, operational, financial, budgetary, economic, legal, social, geopolitical, regulatory
and political factors that may influence future events or conditions. While we consider these factors and assumptions to be reasonable
based on information currently available to us, they may prove to be incorrect.
The above list is not exhaustive list of the factors that may affect
any of the forward-looking statements and information included in this report, and such statements and information will not be updated
to reflect events or circumstances arising after the date of such statements or to reflect the occurrence of anticipated or unanticipated
events.
This technical report summary also contains financial measures which
are not recognized under U.S. generally accepted accounting principles.
| | i |  |
| SSR Mining Inc. | Hod Maden Project | | January 7, 2026 |
| Technical Report Summary | | SLR Project No.: 123.000320.00001 |
Table of Contents
| Cautionary Note Regarding Forward-Looking Statements: |
i |
| Table of Contents |
ii |
| 1.0 Executive Summary |
1-1 |
| 1.1 Summary |
1-1 |
| 1.2 Economic Analysis |
1-12 |
| 1.3 Technical Summary |
1-16 |
| 2.0 Introduction |
2-1 |
| 2.1 Site Visits |
2-1 |
| 2.2 Sources of Information |
2-2 |
| 2.3 Abbreviations, Acronyms and Units of Measure |
2-4 |
| 3.0 Property Description |
3-1 |
| 3.1 Location |
3-1 |
| 3.2 Land Tenure |
3-3 |
| 3.3 Encumbrances |
3-3 |
| 3.4 Royalties |
3-5 |
| 3.5 Required Permits and Status |
3-7 |
| 3.6 Other Significant Factors and Risks |
3-8 |
| 4.0 Accessibility, Climate, Local Resources, Infrastructure and Physiography |
4-1 |
| 4.1 Accessibility |
4-1 |
| 4.2 Climate |
4-4 |
| 4.3 Local Resources |
4-10 |
| 4.4 Infrastructure |
4-10 |
| 4.5 Physiography |
4-11 |
| 5.0 History |
5-1 |
| 5.1 Prior Ownership |
5-1 |
| 5.2 Exploration and Development History |
5-2 |
| 5.3 Past Production |
5-2 |
| 5.4 Previous Mineral Reserve and Mineral Resource Estimates |
5-2 |
| 6.0 Geological Setting, Mineralization, and Deposit |
6-1 |
| 6.1 Regional Geology |
6-1 |
| 6.2 Local Geology |
6-2 |
| 6.3 Property Geology and Mineralization |
6-5 |
| 6.4 Hod Maden Mineral System |
6-13 |
| | ii | |
| SSR Mining Inc. | Hod Maden Project | | January 7, 2026 |
| Technical Report Summary | | SLR Project No.: 123.000320.00001 |
| 6.5 Regional Prospects and Targets |
6-14 |
| 7.0 Exploration |
7-1 |
| 7.1 Exploration Overview |
7-1 |
| 7.2 Drilling |
7-4 |
| 7.3 Hydrogeological Data |
7-7 |
| 7.4 Geotechnical Data |
7-13 |
| 8.0 Sample Preparation, Analysis, and Security |
8-1 |
| 8.1 Sample Preparation |
8-1 |
| 8.2 Sample Analysis |
8-1 |
| 8.3 Sample Security |
8-3 |
| 8.4 Data Quality |
8-3 |
| 8.5 QP Opinion |
8-27 |
| 9.0 Data Verification |
9-1 |
| 9.1 Site Visit |
9-1 |
| 9.2 QP Opinion |
9-5 |
| 10.0 Mineral Processing and Metallurgical Testing |
10-1 |
| 10.1 Overview |
10-1 |
| 10.2 Scoping, PEA, and PFS Test Work |
10-1 |
| 10.3 Feasibility Study Metallurgical Test Work |
10-5 |
| 10.4 Feasibility Study Update Metallurgical Test Work |
10-15 |
| 10.5 Source: Ausenco 2024QP Opinion |
10-25 |
| 11.0 Mineral Resource Estimates |
11-1 |
| 11.1 Summary |
11-1 |
| 11.2 Resource Database |
11-2 |
| 11.3 Database Validation and Verification |
11-5 |
| 11.4 Geological Domains |
11-5 |
| 11.5 Hod Maden Estimation Domaining |
11-15 |
| 11.6 Compositing |
11-22 |
| 11.7 Treatment of High-Grade Assays |
11-25 |
| 11.8 Spatial Analysis |
11-26 |
| 11.9 Block Model |
11-31 |
| 11.10 Search Neighborhood Parameters |
11-31 |
| 11.11 Density Estimation |
11-33 |
| 11.12 Validation |
11-33 |
| | iii | |
| SSR Mining Inc. | Hod Maden Project | | January 7, 2026 |
| Technical Report Summary | | SLR Project No.: 123.000320.00001 |
| 11.13 Classification |
11-40 |
| 11.14 Consideration of Potential for Economic Extraction |
11-42 |
| 11.15 Mineral Resource Reporting |
11-43 |
| 11.16 Comparison with Previous Estimates |
11-44 |
| 11.17 QP Opinion |
11-45 |
| 12.0 Mineral Reserve Estimates |
12-1 |
| 12.1 Summary |
12-1 |
| 12.2 Orebody Description |
12-2 |
| 12.3 Mining Block Model |
12-4 |
| 12.4 Cut-off Value |
12-5 |
| 12.5 Dilution and Recovery Estimates |
12-7 |
| 12.6 Mineral Reserve Reporting |
12-8 |
| 13.0 Mining Methods |
13-1 |
| 13.1 Introduction |
13-1 |
| 13.2 Geotechnical Considerations |
13-2 |
| 13.3 Mining Method Selection |
13-15 |
| 13.4 Stope Design |
13-20 |
| 13.5 Development Design |
13-23 |
| 13.6 Stope Cycle and Sequence |
13-29 |
| 13.7 Ventilation |
13-34 |
| 13.8 Development and Production Schedule |
13-39 |
| 13.9 Material Handling |
13-51 |
| 13.10 Underground Mining Equipment |
13-58 |
| 13.11 Personnel |
13-62 |
| 13.12 Underground Mine Infrastructure |
13-63 |
| 14.0 Processing and Recovery Methods |
14-1 |
| 14.1 Introduction |
14-1 |
| 14.2 Process Design Criteria |
14-5 |
| 14.3 Process Description |
14-7 |
| 14.4 Consumables |
14-12 |
| 14.5 Electricity Supply and Consumption |
14-12 |
| 14.6 Process Plant Personnel |
14-13 |
| 14.7 Equipment Selection |
14-13 |
| 15.0 Infrastructure |
15-1 |
| | iv | |
| SSR Mining Inc. | Hod Maden Project | | January 7, 2026 |
| Technical Report Summary | | SLR Project No.: 123.000320.00001 |
| 15.1 Introduction |
15-1 |
| 15.2 Access Roads |
15-6 |
| 15.3 Power |
15-8 |
| 15.4 Hydrogeological Considerations |
15-9 |
| 15.5 Hydrology and Water Management |
15-21 |
| 15.6 Tailings Storage Facility |
15-37 |
| 15.7 Waste Rock Facilities |
15-45 |
| 16.0 Market Studies |
16-1 |
| 16.1 Markets |
16-1 |
| 16.2 Metal Price Assumptions |
16-1 |
| 16.3 Treatment and Refining Charges |
16-2 |
| 16.4 Expressions of Interest |
16-3 |
| 16.5 Contracts |
16-3 |
| 17.0 Environmental Studies, Permitting, and Plans, Negotiations, or Agreements with Local Individuals or Groups |
17-1 |
| 17.1 Environmental and Social Impacts and Risks |
17-1 |
| 17.2 Waste Management |
17-10 |
| 17.3 Project Permitting |
17-11 |
| 17.4 Mine Closure Planning |
17-12 |
| 18.0 Capital and Operating Costs |
18-1 |
| 18.1 Capital Costs |
18-1 |
| 18.2 Operating Costs |
18-4 |
| 19.0 Economic Analysis |
19-1 |
| 19.1 Economic Criteria |
19-1 |
| 19.2 Cash Flow Analysis |
19-2 |
| 19.3 Sensitivity Analysis |
19-5 |
| 20.0 Adjacent Properties |
20-1 |
| 21.0 Other Relevant Data and Information |
21-1 |
| 21.1 Project Execution |
21-1 |
| 22.0 Interpretation and Conclusions |
22-1 |
| 22.1 Geology and Mineral Resources |
22-1 |
| 22.2 Mining and Mineral Reserves |
22-2 |
| 22.3 Mineral Processing |
22-3 |
| 22.4 Infrastructure |
22-5 |
| 22.5 Marketing Studies |
22-6 |
| | v | |
| SSR Mining Inc. | Hod Maden Project | | January 7, 2026 |
| Technical Report Summary | | SLR Project No.: 123.000320.00001 |
| 22.6 Environment & Social |
22-6 |
| 22.7 Capital and Operating Costs |
22-7 |
| 22.8 Project Execution |
22-7 |
| 23.0 Recommendations |
23-1 |
| 23.1 Geology and Mineral Resources |
23-1 |
| 23.2 Mining and Mineral Reserves |
23-1 |
| 23.3 Mineral Processing |
23-2 |
| 23.4 Infrastructure |
23-2 |
| 23.5 Water Resources |
23-3 |
| 23.6 Marketing Studies |
23-3 |
| 23.7 Environment and Social |
23-3 |
| 23.8 Capital and Operating Costs |
23-4 |
| 23.9 Project Execution |
23-4 |
| 24.0 References |
24-1 |
| 25.0 Reliance on Information Provided by the Registrant |
25-1 |
| 26.0 Date and Signature Page |
26-1 |
| 27.0 Appendix 1 |
27-1 |
Tables
| Table 1-1: After-Tax Cash Flow Summary |
1-14 |
| Table 1-2: AISC Composition |
1-15 |
| Table 1-3: Summary of Hod Maden Mineral Resources, exclusive of Mineral Reserves, as of August 31, 2025 (SSR’s
Attributable Share) |
1-20 |
| Table 1-4: Mineral Reserve Estimate as of August 31, 2025 (SSR’s Attributable Ownership Basis) |
1-21 |
| Table 1-5: Grade and Recovery Values Over Life of Mine |
1-22 |
| Table 1-6: Capital Cost Summary |
1-26 |
| Table 1-7: Average Operating Costs Unit Rates |
1-26 |
| Table 1-8: Hod Maden Schedule Milestones |
1-28 |
| Table 2-1: Consulting Companies Which Acted as Qualified Persons in Preparing this Report |
2-2 |
| Table 3-1: Hod Maden Project, Licenses Details |
3-3 |
| Table 3-2: Royalty Rates for Gold and Copper |
3-6 |
| Table 3-3: Operating License Fee and Forestry Land Fees for 2020 |
3-7 |
| Table 4-1: On-Site Meteorological Station Information |
4-4 |
| | vi | |
| SSR Mining Inc. | Hod Maden Project | | January 7, 2026 |
| Technical Report Summary | | SLR Project No.: 123.000320.00001 |
| Table 4-2: On-Site Station Monthly Average Precipitation (mm) |
4-5 |
| Table 4-3: On-Site Station Temperature Summary (2017–2024) |
4-7 |
| Table 4-4: Monthly
Reference Evapotranspiration (ET0) Data (mm) |
4-8 |
| Table 4-5: Climate Change Projection for 2031 to 2060 Period |
4-9 |
| Table 5-1: Previous Hod Maden Reserves as of December 31, 2024 |
5-4 |
| Table 5-2: Previous Hod Maden Resources as of December 31, 2024 |
5-4 |
| Table 7-1: Overview of Exploration by Artmin at Hod Maden |
7-1 |
| Table 7-2: Overview of Diamond Drilling with Assay Results by Artmin Madençilik at Hod Maden Deposit |
7-5 |
| Table 7-3: Pumping and Slug Test Information and Analysis Results (2017–2025) |
7-12 |
| Table 8-1: Summary of Sample Preparation and Analysis Methods |
8-2 |
| Table 8-2: Summary of QA and SOP Review |
8-4 |
| Table 8-3: Summary of Hod Maden QC Review |
8-8 |
| Table 8-4: Dog-leg Severity of Downhole Surveys |
8-10 |
| Table 8-5: Summary of Hod Maden Quality Acceptance Testing |
8-16 |
| Table 8-6: Recovery Statistics for Hod Maden, 2014–2024 |
8-19 |
| Table 8-7: Summary of Hod Maden First-Split (“Field Duplicate”) QAT from 2014–2024 |
8-22 |
| Table 8-8: Summary of Hod Maden Third Split (“Pulp Duplicate”) QAT from 2014–2024 |
8-24 |
| Table 8-9: QAT Summary for Hod Maden CRMs (2014–2024) |
8-26 |
| Table 9-1: Summary of Check Analyses for HTD-077 |
9-3 |
| Table 9-2: Results of Check Measurements for Bulk Density Requested by the RSC QP |
9-5 |
| Table 10-1: Average Grade and Recoveries of the LCT Conducted at HMT |
10-4 |
| Table 10-2: Average Grade and Recoveries of the LCT Conducted at WAI |
10-5 |
| Table 10-3: Samples Selected for the Ore Variability Flotation Tests |
10-7 |
| Table 10-4: Comminution Test Samples |
10-8 |
| Table 10-5: Comminution Test Results of the Variability Samples |
10-13 |
| Table 10-6: Rougher/Scavenger tests (2024) |
10-16 |
| Table 10-7: OCT and LCT Test Results |
10-18 |
| Table 10-8: Detailed Analysis of OCT and LCT Concentrates |
10-22 |
| Table 11-1: Summary of Hod Maden Mineral Resources, exclusive of Mineral Reserves, as of August 31, 2025 (SSR’s
Attributable Share) |
11-1 |
| Table 11-2: Summary of Drill Hole Data Informing the MRE |
11-2 |
| Table 11-3: Summary of Available Data for all Elements Included in the MRE |
11-3 |
| Table 11-4: Summary of Remaining Core |
11-3 |
| Table 11-5: Grouped Lithology Column Used to Support the Lithology Model |
11-6 |
| | vii | |
| SSR Mining Inc. | Hod Maden Project | | January 7, 2026 |
| Technical Report Summary | | SLR Project No.: 123.000320.00001 |
| Table 11-6: Summary of the Sub-Domaining Strategy for Hod Maden |
11-18 |
| Table 11-7: Declustered Composite Statistics for Au and Cu Inside the Estimation Domains |
11-22 |
| Table 11-8: Declustered Composite Statistics for Fe, SS and C Inside the Estimation Domains |
11-25 |
| Table 11-9: Variogram Parameters for All Domains (Au, Cu) |
11-30 |
| Table 11-10: Block Model Description |
11-31 |
| Table 11-11: Kriging Neighborhood Settings for All Domains (Au, Cu) |
11-32 |
| Table 11-12: Hod Maden Density Statistics for Lithology Domains |
11-33 |
| Table 11-13: Summary of Hod Maden Mineral Resource Cut-off Value |
11-42 |
| Table 11-14: Summary of Hod Maden Mineral Resources, exclusive of Mineral Reserves as of August 31, 2025 (SSR’s
Attributable Share) |
11-43 |
| Table 11-: Summary of Hod Maden Mineral Resources, exclusive of Mineral Reserves as of August 31, 2025 (100%) |
11-43 |
| Table 12-1: Mineral Reserve Estimate as of August 31, 2025 (SSR’s Attributable Ownership Basis) |
12-1 |
| Table 12-2: NSR Input Parameters |
12-5 |
| Table 12-3 Cut-off Values Used for 2025 Mineral Reserve Estimation |
12-6 |
| Table 12-4: Hod Maden - Mining Recovery and Dilution Factors by Mining Method |
12-8 |
| Table 12-5: Comparison Mining Recovery and Dilution Factors for Long Hole Stoping |
12-8 |
| Table 12-6: Mineral Reserve Estimate as of August 31, 2025 (100% Ownership Basis) |
12-9 |
| Table 12-7: Mineral Reserve Estimate as of August 31, 2025 (SSR’s Attributable Ownership Basis) |
12-9 |
| Table 12-8 Previous Mineral Reserve Estimate (December 31, 2024) Compared to Current Mineral Reserve Estimate –August
31, 2025 (10% Basis) |
12-11 |
| Table 13-1: Intact Rock Properties and Laboratory Test Results (UCS with Elastic Constants) |
13-5 |
| Table 13-2: Estimated Development Ground Support Requirements – LHS |
13-9 |
| Table 13-3: Rock Mass Classification Based on the Q’ |
13-12 |
| Table 13-4: Stope Stability Assessment Results |
13-14 |
| Table 13-5: Stope Sizing |
13-15 |
| Table 13-6 Hod Maden Stope Optimizer Settings |
13-20 |
| Table 13-7: Hod Maden LHS Lateral Development Quantities |
13-27 |
| Table 13-8: Hod Maden Mine Lateral Development Quantities – Heading Type |
13-28 |
| Table 13-9: Hod Maden Vertical Development Types and Profiles |
13-28 |
| Table 13-10: Hod Maden Ventilation Design Criteria |
13-35 |
| Table 13-11: Total Airflow Requirements – Primary |
13-36 |
| | viii | |
| SSR Mining Inc. | Hod Maden Project | | January 7, 2026 |
| Technical Report Summary | | SLR Project No.: 123.000320.00001 |
| Table 13-12: DAF Lateral Development Peak Scheduled Advance Rates |
13-39 |
| Table 13-13: LHS Lateral Development Peak Scheduled Advance Rates |
13-39 |
| Table 13-14: Life of Mine Lateral Development Schedule – DAF and LHS |
13-40 |
| Table 13-15: Cable Drilling Summary |
13-41 |
| Table 13-16: LHS Vertical Development Peak Scheduled Advance Rates |
13-41 |
| Table 13-17: LHS Vertical Development Resource Assignments |
13-41 |
| Table 13-18: Life of Mine Vertical Development Summary |
13-42 |
| Table 13-19: Life of Mine Production Drilling Summary |
13-42 |
| Table 13-20: Life of Mine Production by Level Summary |
13-43 |
| Table 13-21: Production Schedule Assumptions |
13-44 |
| Table 13-22: Production Resource Assignments |
13-45 |
| Table 13-23: Hod Maden Life of Mine Production Schedule |
13-46 |
| Table 13-24: Hod Maden Process Schedule |
13-49 |
| Table 13-25: Paste Line and Service Hole Summary |
13-53 |
| Table 13-26: Summary of LOM Paste Backfill Requirements |
13-54 |
| Table 13-27: UCS Results for Various Binder Contents and Cure Times - PF with CUF Tailings |
13-55 |
| Table 13-28: PF Design Strengths for Vertical Exposures – 30 m Wide Stopes |
13-55 |
| Table 13-29: Life of Mine Equipment Fleet (Year 2, 2029) |
13-58 |
| Table 13-30: Proposed Mobile Equipment Fleet Availability and Utilization |
13-59 |
| Table 13-31: Mining Personnel Summary |
13-63 |
| Table 13-32: Typical Underground Electrical Consumption, kW |
13-67 |
| Table 14-1: Planned Mill Feed Data from Mine Plan – LOM Average |
14-5 |
| Table 14-2: Design Criteria |
14-6 |
| Table 14-3: Reagents Used |
14-11 |
| Table 14-4: Major Consumables with Expected Consumption Rates |
14-12 |
| Table 14-5: Electrical Loads and Electrical Energy Consumption |
14-13 |
| Table 14-6: Major Equipment List |
14-14 |
| Table 14-7: Regrind Mill Selection |
14-15 |
| Table 15-1: Hydraulic Parameters used for Hydrogeological Units |
15-7 |
| Table 15-2: Summary of Planned Sensitivity Analysis |
15-20 |
| Table 15-3: Summary Information of Stream Gauges (AGI) |
15-22 |
| Table 15-4: Descriptive
Statistics of Daily Streamflow Records (m3/s) (2018-2021) |
15-23 |
| Table 15-5: Summary of TSF Phases |
15-38 |
| Table 16-1: Metal Price Assumptions |
16-2 |
| | ix | |
| SSR Mining Inc. | Hod Maden Project | | January 7, 2026 |
| Technical Report Summary | | SLR Project No.: 123.000320.00001 |
| Table 16-2: Historical Gold and Copper Prices for the Preceding Five Years |
16-2 |
| Table 17-1: Land Acquisition Status |
17-9 |
| Table 17-2: Approval and Permit Status |
17-11 |
| Table 18-1: LOM Capital Cost Summary |
18-1 |
| Table 18-2: Sunk Costs as of November 30, 2025 |
18-1 |
| Table 18-3: LOM Capital Cost Estimate December 2025 – Level 1 Summary |
18-2 |
| Table 18-4: Key Capital Cost Metrics |
18-3 |
| Table 18-5: Capital Cost Estimate Percentage by Currency |
18-4 |
| Table 18-6: Average Operating Costs Unit Rates |
18-5 |
| Table 18-7: Mine Operating Cost Summary |
18-5 |
| Table 18-8: Process Operating Cost Summary |
18-6 |
| Table 18-9: G&A Operating Cost Summary |
18-6 |
| Table 18-10: Proposed Workforce |
18-6 |
| Table 19-1: After-Tax Cash Flow Summary |
19-3 |
| Table 19-2: AISC Composition |
19-4 |
| Table 19-3: After-Tax Sensitivity Analysis |
19-6 |
| Table 21-1: Hod Maden Schedule Current Overview |
21-1 |
| Table 21-2: Hod Maden Schedule Milestones |
21-3 |
| Table 21-3: Permitting Schedule Current Status |
21-4 |
| Table 21-4: Direct Labor Hours for Construction by Area |
21-7 |
| Table 21-5: Contracting Strategy |
21-12 |
| Table 21-6: Summary of Project Progress as at November 30, 2025 |
21-14 |
Figures
| Figure 1-1: After-Tax Annual Cash Flow Metrics |
1-14 |
| Figure 3-1: Location Map |
3-2 |
| Figure 3-2: Project Area Map |
3-4 |
| Figure 4-1: Main (Yukarimaden) Access Road |
4-3 |
| Figure 4-2: Monthly Average On-Site Precipitation (2017–2024) |
4-6 |
| Figure 4-3: Project Area Map |
4-13 |
| Figure 6-1: Tectonomagmatic Map of the Western Tethyan Orogenic Belt |
6-2 |
| Figure 6-2: Geological Map of the Artvin District |
6-3 |
| Figure 6-3: Simplified Stratigraphy of the Artvin District |
6-4 |
| Figure 6-4: Geological Map of the Hod Maden Region |
6-6 |
| | x | |
| SSR Mining Inc. | Hod Maden Project | | January 7, 2026 |
| Technical Report Summary | | SLR Project No.: 123.000320.00001 |
| Figure 6-5: Plan View of the Hod Maden Deposit Illustrating the Scale of the Mineralized System |
6-7 |
| Figure 6-6: Alteration Distribution throughout the Hod Maden Deposit |
6-9 |
| Figure 6-7: Mapped Element Zonations for the Main Zone and South Zone |
6-10 |
| Figure 6-8: Vein Textures in the Main Zone (left) and South Zone (right) |
6-12 |
| Figure 7-1: Hod Maden Bouguer Gravity Map |
7-3 |
| Figure 7-2: Number of Assayed Drill Holes by Year |
7-6 |
| Figure 7-3: Monitoring Well Locations |
7-9 |
| Figure 7-4: Packer Tests Measured Hydraulic Conductivity Values with Depth |
7-11 |
| Figure 7-5: Stream Flow Locations and Measured Flow Rates |
7-14 |
| Figure 8-1: DLS Histograms for Each Survey Method |
8-10 |
| Figure 8-2: Diamond Core Recovery at Hod Maden since December 2014 |
8-10 |
| Figure 8-3: Relative Difference Plot for First-Split Duplicates (2014–2022) |
8-11 |
| Figure 8-4: Relative Difference Plot for First-Split Duplicates (2023–2024) |
8-11 |
| Figure 8-5: Relative Difference Plot for Third-Split Duplicates (2014–2020) |
8-12 |
| Figure 8-6: Relative Difference Plot for Third-Split Duplicates (2023–2024) |
8-12 |
| Figure 8-7: CRMs inserted by SSR since 2015, analyzed for Au at ALS |
8-13 |
| Figure 8-8: CRMs inserted by SSR since 2015, analyzed for Cu at ALS |
8-13 |
| Figure 8-9: Shewhart Control Plot for G914-10 Au by AA25 (2015–2020) |
8-14 |
| Figure 8-10: Heat Map for Au, all CRMs analyzed at ALS (2015–2021) |
8-14 |
| Figure 8-11: Hod Maden Blank Analyses for Au by Analysis Date (ALS), 2014–2024 |
8-15 |
| Figure 8-12: Recovery Statistics for All Holes since 2014 |
8-19 |
| Figure 8-13: Comparison of Grades from Six Twin Holes at Hod Maden |
8-20 |
| Figure 8-14: Scatter and QQ Plot for Au in First-Split Duplicates (2014–2024). |
8-21 |
| Figure 8-15: Scatter and QQ Plot for Cu in First-Split Duplicates (2014–2024). |
8-21 |
| Figure 8-16: Scatter and QQ Plot for Au in Third-Split Duplicates (2014–2024). |
8-23 |
| Figure 8-17: Scatter and QQ Plot for Cu in Third-Split Duplicates (2014–2024). |
8-23 |
| Figure 8-18: Scatter and QQ Plot for S in Third-Split Duplicates (2014–2024) |
8-25 |
| Figure 8-19: Percentile Comparison of Umpire Analyses for Hod Maden, Au |
8-26 |
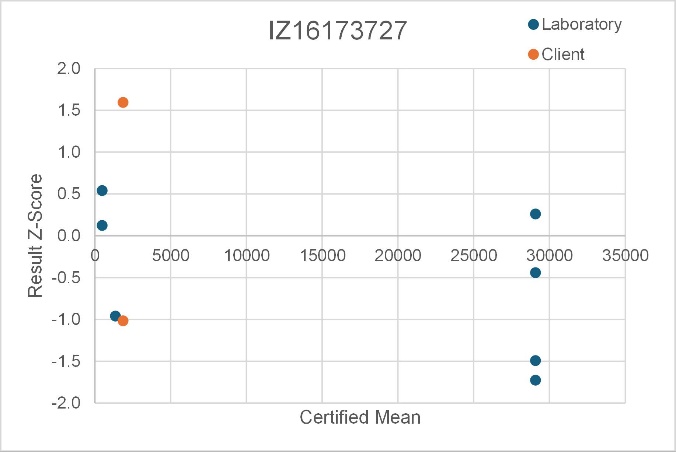
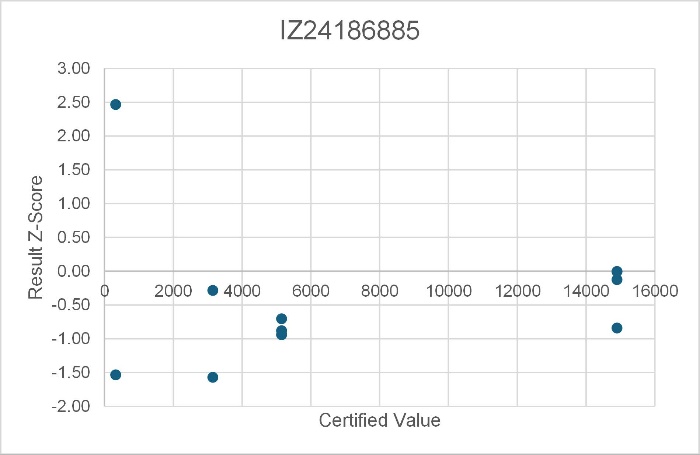
| Figure 9-1: Results for CRMs in batches IZ16173727 (Original) and IZ24186885 (Check) |
9-3 |
| Figure 9-2: Scatter and QQ plots for the Check Samples |
9-4 |
| Figure 10-1: Locked Cycle Flotation Test Flowsheet |
10-3 |
| Figure 10-2: Cross Section of Mining Shapes vs Intervals Tested (Looking West) |
10-9 |
| Figure 10-3: Distribution of Pyrite, Chalcopyrite and Ca-Sulfate in the Variability Samples |
10-11 |
| | xi | |
| SSR Mining Inc. | Hod Maden Project | | January 7, 2026 |
| Technical Report Summary | | SLR Project No.: 123.000320.00001 |
| Figure 10-4: LCT Flowsheet |
10-17 |
| Figure 10-5: Relationship between Copper Concentrate Grade and Gold Recovery |
10-19 |
| Figure 10-6: Relationship between Copper Concentrate Grade and Gold Concentrate Grade |
10-20 |
| Figure 10-7: Relationship between Copper Concentrate Grade and Copper Recovery |
10-20 |
| Figure 10-8: Mass Pull Based on Copper Head Grade |
10-23 |
| Figure 10-9: Cu Recovery as a Function of S/Cu Ratio |
10-24 |
| Figure 10-10: Au Recovery as a Function of Au/Ss Ratio |
10-24 |
| Figure 10-11: NSR Analysis and Gold Recovery Based on Concentrate Copper Grade |
10-25 |
| Figure 11-1: Random Forest Regression of Sulfide S (SS) |
11-4 |
| Figure 11-2: Random Forest Regression of Carbon |
11-4 |
| Figure 11-3: Perspective View of the Primary Lithology Model |
11-7 |
| Figure 11-4: Cross-section of the Solid Geology Model |
11-8 |
| Figure 11-5: Ratio of Co and Al Correlates with Massive Pyrite and Jasperoid |
11-10 |
| Figure 11-6: Logged Mineralization Style (left). Geochemical Proxy (right) |
11-11 |
| Figure 11-7: Perspective View of the Mineralization Model for Hod Maden |
11-11 |
| Figure 11-8: Perspective View of the Mineralization Model Illustrating the Relationship of the MPY and HSS Domains |
11-12 |
| Figure 11-9: Cross-section of the Mineralization Model |
11-13 |
| Figure 11-10: Plan View of the Mineralization Model, illustrating Controlling Trends |
11-14 |
| Figure 11-11: Perspective View of the Oxidation Model |
11-15 |
| Figure 11-12: Declustered Composite Statistics for Au in the Mineralized Domains |
11-16 |
| Figure 11-13: Drill Hole Correlation Supporting the Modeling of a High-Grade Sub-Domain |
11-17 |
| Figure 11-14: Histogram for Zn |
11-19 |
| Figure 11-15: Multimodality for C in MPY and HSS Domains |
11-20 |
| Figure 11-16: Multimodality for C, all data |
11-21 |
| Figure 11-17: Log-histograms for Au in Key Estimation Domains |
11-23 |
| Figure 11-18: Log-histograms for Cu in the Key Estimation Domains |
11-24 |
| Figure 11-19: HTD-085 - Highest Grade (grams per tonne) Au Composite Occurring in the Anhydrite:HSS Sub-Domain |
11-26 |
| Figure 11-20: Experimental and Modeled Variograms for Au in the HSS:HG Domain |
11-27 |
| Figure 11-21: Experimental and Modeled Variograms for Au in the MPY:HG Domain |
11-28 |
| Figure 11-22: Variogram Models for the High-Grade MPY and HSS Domains |
11-29 |
| Figure 11-23: Swath Plots and Log-Histogram for Au, Comparing Input Data and Block Grades in the HSS:HG Domain |
11-34 |
| | xii | |
| SSR Mining Inc. | Hod Maden Project | | January 7, 2026 |
| Technical Report Summary | | SLR Project No.: 123.000320.00001 |
| Figure 11-24: Swath Plots and Log-Histogram for Au, Comparing Input Data and Block Grades in the MPY:HG Domain |
11-35 |
| Figure 11-25: Swath Plots and Log-Histogram for Au, Comparing Input Data and Block Grades in the HSS:LG Domain |
11-36 |
| Figure 11-26: Swath Plots and Log-Histogram for Cu Comparing Input Data and Block Grades in the HSS Domain |
11-37 |
| Figure 11-27: Swath Plots and Log-Histogram for Cu, Comparing Input Data and Block Grades in the MPY Domain |
11-38 |
| Figure 11-28: Visual Validation of the Au Estimate at 4542215 N, Looking South |
11-39 |
| Figure 11-29: Visual Validation of the Au Estimate, Long Section Parallel to HTG-002 |
11-40 |
| Figure 11-30: Cross-Section showing Exclusive Mineral Resource vs Mineral Reserve MSO Shapes |
11-44 |
| Figure 12-1: Hod Maden Underground Mine Design and Mineralization Outlines - Longitudinal View Looking East |
12-3 |
| Figure 13-1: Hod Maden Underground Mine Design - Longitudinal View Looking East |
13-2 |
| Figure 13-2: Simplified Geological Sections, Showing the Main Lithologies and Alteration Types |
13-3 |
| Figure 13-3: Perspective View Showing all Drill Holes used for the Geotechnical Assessment |
13-4 |
| Figure 13-4: Example of Volcanic-Sedimentary Rock |
13-5 |
| Figure 13-5: Example of Volcanic-Sedimentary Rock Affected by Argillic Alteration |
13-5 |
| Figure 13-6: Example of Overburden Materials - Gravel with Clay |
13-6 |
| Figure 13-7: Example of Overburden Materials - Sandstones with Cobbles |
13-6 |
| Figure 13-8: Empirical Chart for Ground Support Selection |
13-7 |
| Figure 13-9: Drill Holes Used for Shaft Stability Assessment - View Looking Northeast |
13-10 |
| Figure 13-10: Typical Hanging Wall Ground Conditions in the VGYP (HDT-005) |
13-12 |
| Figure 13-11: Typical Ore Zone Ground Conditions in the BXCA (HDT-005) |
13-13 |
| Figure 13-12: Typical Footwall Ground Conditions in the BXDA (HDT-005) |
13-13 |
| Figure 13-13: Relationship of Damage to Angular Distortion and Horizontal Strain |
13-14 |
| Figure 13-14: Schematic of Modified Drift and Fill Layout - Perspective View |
13-16 |
| Figure 13-15: Typical Transverse LHS Layout |
13-18 |
| Figure 13-16: Typical Longitudinal LHS Layout |
13-19 |
| Figure 13-17: Hod Maden SO and Final Stoping Inventories - Longitudinal Sections Looking East |
13-21 |
| Figure 13-18: Hod Maden Typical Transverse LH Stope Drill and Blast Design |
13-22 |
| Figure 13-19: Typical Hod Maden Slot Raise Drill Patterns |
13-23 |
| Figure 13-20: 3D View Depicting Access to the Five DAF Levels |
13-24 |
| | xiii | |
| SSR Mining Inc. | Hod Maden Project | | January 7, 2026 |
| Technical Report Summary | | SLR Project No.: 123.000320.00001 |
| Figure 13-21: Hod Maden Underground Mine Design - Looking East |
13-25 |
| Figure 13-22: Hod Maden Typical Decline and Level Drive Profiles |
13-26 |
| Figure 13-23: Hod Maden Production Zones |
13-30 |
| Figure 13-24: DAF Development Sequence (Plan View) |
13-31 |
| Figure 13-25: Transverse LHS Level Layout |
13-32 |
| Figure 13-26: Hod Maden Transverse Long Hole Stoping Preferred Sequence |
13-33 |
| Figure 13-27: Hod Maden Transverse Stoping Alternative Sequence |
13-34 |
| Figure 13-28: Primary Ventilation System Overall Strategy |
13-37 |
| Figure 13-29: Typical Level Ventilation – Return Air Raise Off-Access Drive - LHS |
13-38 |
| Figure 13-30: Hod Maden LOM Production Profile |
13-44 |
| Figure 13-31: Hod Maden LOM Illustrative Development Schedule - Looking East |
13-47 |
| Figure 13-32: Hod Maden Typical Truck Loading Area Layout |
13-52 |
| Figure 13-33: Tele-remote Loading Arrangement to Ore Drive Stub or Stockpile |
13-53 |
| Figure 13-34: Mine Main Inter-Level Reticulation Layout |
13-56 |
| Figure 13-35: Standard End of Line Fill Pour Set-up |
13-57 |
| Figure 13-36: Life of Mine Mobile Equipment Fleet - LHS |
13-60 |
| Figure 13-37: Underground Personnel Mining Roster |
13-63 |
| Figure 13-38: Dewatering System |
13-64 |
| Figure 13-39: 725 Level Explosives Magazine |
13-65 |
| Figure 13-40: Yearly Underground Electrical Power Requirements |
13-67 |
| Figure 13-41: Underground Electrical Infrastructure - Section View Looking Northeast |
13-68 |
| Figure 13-42: Secondary Egress and Fixed Refuge Chamber Locations – 3D Schematic Looking Northeast |
13-70 |
| Figure 14-1: Process Flow Sheet |
14-2 |
| Figure 14-2: Process Area – Overview |
14-3 |
| Figure 14-3: Process Area – Details |
14-4 |
| Figure 15-1: Site Layout |
15-3 |
| Figure 15-2:
South Valley General Layout |
15-4 |
| Figure 15-3:
North Valley General Layout |
15-5 |
| Figure 15-4:
Groundwater Contours and Water Levels in the South Valley |
15-11 |
| Figure 15-5:
Groundwater Contours and Water Levels in the Northern Valley |
15-12 |
| Figure 15-6:
Conceptual Hydrogeological Cross-Section |
15-2 |
| Figure 15-7:
Conceptual Understanding of Shallow Groundwater System |
15-3 |
| Figure 15-8:
Model Extent and Mesh Discretization, Plan View |
15-4 |
| Figure 15-9:
Example of New Calibration Targets Incorporated into Latest Model Update |
15-5 |
| | xiv | |
| SSR Mining Inc. | Hod Maden Project | | January 7, 2026 |
| Technical Report Summary | | SLR Project No.: 123.000320.00001 |
| Figure 15-10: Simulated Hydrogeological Units Shown in the Uppermost Model Layer |
15-6 |
| Figure 15-11: Simulated Hydrogeological Units in Mine Area and the Numerical Model Mesh |
15-7 |
| Figure 15-12: Simulated Underground Mine Development, Agrega Pit and Saliçor Tunnel |
15-9 |
| Figure 15-13: Planned River Liner Extent (“Şurakev Diversion”) |
15-10 |
| Figure 15-14: Passive Inflow Predictions to the Underground Mine |
15-11 |
| Figure 15-15: Passive Inflow Sensitivity for Underground Mine |
15-12 |
| Figure 15-16: Location of Simulated Dewatering Wells |
15-13 |
| Figure 15-17: Residual Passive Inflow to the Underground Mine |
15-14 |
| Figure 15-18: Additional Dewatering Wells Locations Assessed |
15-15 |
| Figure 15-19: Predictive RPI and Dewatering Rates for Additional Dewatering Infrastructure Scenarios |
15-16 |
| Figure 15-20: Predictive Total Pumping Rate From All Wells (can be used for Water Supply) |
15-16 |
| Figure 15-21: Predictive RPI and Total Pumping Rate from Dewatering Wells - Risk Management Scenario |
15-17 |
| Figure 15-22: Predictive Total Pumping Rate From All Wells - Risk Management Scenario |
15-18 |
| Figure 15-23: Predictive RPI and Total Pumping Rate from Dewatering Wells - Risk Management Scenario |
15-19 |
| Figure 15-24: Predictive Total Pumping Rate From All Wells - Risk Management Scenario |
15-19 |
| Figure 15-25: Water Supply and Dewatering Well Locations |
15-21 |
| Figure 15-26: Location of Stream Gauges (AGI) |
15-23 |
| Figure 15-27: Monthly Average Streamflow Measurements (2018-2021) |
15-24 |
| Figure 15-28: Construction Water Supply Sources Under Current Licensed Well Capacity (Conservative GW - 100 m³/h
TWTP) |
15-28 |
| Figure 15-29: Process Plant Makeup Sources Annual Average Rates (Conservative GW) |
15-30 |
| Figure 15-30: Supply
from Water Wells (All GW Scenarios, 50th Percentile) |
15-30 |
| Figure 15-31: Construction Phase Treated Water Discharge (All GW Scenarios, 50th Percentile) |
15-32 |
| Figure 15-32: Annual Average and Cumulative Effluent Discharge to Şurakev Creek (50th Percentile) |
15-33 |
| Figure 15-33: TSF Ultimate Design |
15-39 |
| Figure 15-34: Typical TSF Impoundment Liner Detail |
15-42 |
| Figure 15-35: WDF Conceptual Design – Plan View |
15-46 |
| Figure 15-36: WDF Longitudinal Section |
15-47 |
| Figure 15-37: Surface Water Management for North Valley |
15-49 |
| | xv | |
| SSR Mining Inc. | Hod Maden Project | | January 7, 2026 |
| Technical Report Summary | | SLR Project No.: 123.000320.00001 |
| Figure 17-1: Streams Map Showing the Project Site |
17-2 |
| Figure 19-1: After-Tax Annual Cash Flow Metrics |
19-4 |
| Figure 19-2: After-Tax NPV Sensitivity Analysis |
19-7 |
| Figure 19-3: After-Tax IRR Sensitivity Analysis |
19-7 |
| Figure 19-4: After-Tax Discount Rate Sensitivity Analysis |
19-8 |
| Figure 21-1: Project Expenditures |
21-6 |
| Figure 21-2: Main Process Plant and Mine Site Area Manpower Curve |
21-8 |
| Figure 21-3: Monthly Planned Progress as a Percentage of Project Total |
21-8 |
| Figure 21-4: Monthly Planned Project Labor Hours by Discipline |
21-9 |
| Figure 21-5: Project Management Framework |
21-11 |
| | xvi | |
| SSR Mining Inc. | Hod Maden Project | | January 7, 2026 |
| Technical Report Summary | | SLR Project No.: 123.000320.00001 |
SLR International Corporation (SLR) was retained by SSR Mining Inc.
(SSR) to prepare an independent Technical Report Summary (TRS) on the Hod Maden Project (the Project), located in Türkiye.
The purpose of this TRS is to disclose the results of an updated feasibility
study (the FS update) for the Project and to support the disclosure of the Mineral Resource and Mineral Reserve estimates for the Project,
effective as of August 31, 2025. This TRS conforms to the United States Securities and Exchange Commission’s (SEC) Modernized Property
Disclosure Requirements for Mining Registrants as described in Subpart 229.1300 of Regulation S-K, Disclosure by Registrants Engaged in
Mining Operations (S-K 1300) and Item 601 (b)(96) Technical Report Summary. SLR, RSC Consulting Ltd. (RSC), WSP USA Inc. (WSP), Ausenco
Services Pty Ltd (Ausenco), and SRK Consulting Inc. (SRK) are the qualified persons (QPs), as defined by S-K 1300, for this TRS. RSC visited
the Project from July 1 to July 5, 2024; SLR visited the property on August 12 and 13, 2024, and September 5 and 6, 2025; SRK visited
the Project on August 13, 2024, and September 5 and 6, 2025; and WSP visited the Project on August 12 and 13, 2024, and September 5 and
6, 2025.
The Hod Maden Project is 100% owned by Turkish company Artmin Madençilik
(Artmin), which is jointly owned by SSR, Royal Gold Inc. (Royal Gold), and Lidya Madençilik (Lidya). SSR currently holds a 10%
interest in the Project; per the joint venture agreement (May 8, 2023), SSR will earn-in to 40% ownership of the Project and serve as
the Project operator.
The Project is envisioned as an underground mining operation using drift
and fill (DAF) and long hole stoping (LHS) mining methods. The processing facility (the Process Plant) will have a throughput capacity
of 800,000 dry metric tonnes per annum (tpa) of run-of-mine (ROM) ore. The Process Plant incorporates crushing, grinding, and flotation
to produce a single gold-copper concentrate that will be transported off-site for further processing.
This TRS supersedes the “Hod Maden Project, Feasibility Study
– Technical Report NI 43-101”, dated December 15, 2021 (the 2021 FS), compiled by GR Engineering Services Limited (GR Engineering)
for Sandstorm Gold Inc. (now Royal Gold).
The QPs offer the following conclusions by area:
| 1.1.1.1 | Geology and Mineral Resources |
| · | There are currently three geologically distinct models explaining the geology of Hod Maden, two of which have specific geologic attributes
whereas the third combines aspects of the first two models: |
| o | Structurally controlled intermediate sulfidation epithermal vein stockwork deposit with local semi and massive sulfide lenses |
| o | Hybrid gold-rich volcanogenic massive sulfide (VMS)-epithermal deposit formed in shallow water with high-temperature clay alteration |
| o | Cretaceous aged syn-VMS overprinted by younger high-level epithermal vein stockwork |
| | 1-1 | |
| SSR Mining Inc. | Hod Maden Project | | January 7, 2026 |
| Technical Report Summary | | SLR Project No.: 123.000320.00001 |
| · | The Hod Maden Project has been explored using modern exploration techniques starting in 2014, and a total of 90,410 m of drilling
has been completed in a total of 403 drill holes. |
| · | The RSC QP has estimated and prepared the Mineral Resources, including classification of Mineral Resources, in accordance with S-K
1300. |
| · | Mineral Resource estimates were prepared using a domain-controlled, ordinary kriging (OK) technique with verified drill hole location,
density, and sample data derived from exploration activities conducted by various companies from 2014 to 2024. |
| · | In the opinion of the QP, based on the assessment of legacy data, verification of data and materials on site, the sample preparation,
security, and analytical procedures meet industry standards for data quality and integrity; however, protocols and processes are poorly
documented, and this should be remedied. |
| · | The data informing the Mineral Resources are collected using core drilling. Overall, the RSC QP is of the opinion that the samples
are representative of the source materials. |
| · | In the RSC QP’s opinion, the sample preparation, security, and analytical procedures are adequate and meet industry standards,
and the QA/QC program, as designed and implemented at Hod Maden is adequate. The assay results within the drill hole database are within
acceptable levels of accuracy and precision, and the resulting database is sufficient for the purpose of Mineral Resource estimation and
classification in relevant categories. |
| · | The RSC QP was provided unlimited access by SSR for data verification purposes during the site visit. The RSC QP’s database
verification of the Hod Maden Project indicates that data collection procedures mostly comply with industry standards and are adequate
to support classification of at least Indicated Mineral Resources. In 2024, SSR initiated a re-logging study, which is in progress as
of date of publication of this TRS. |
| · | The RSC QP has domained massive pyrite with logged intervals, and this was confirmed in core by the RSC QP when on site. There is
a strong correlation of high silica + high sulfide zones and massive sulfide with the Co/Al ratio, and the RSC QP considers proxy model
for the high silica + high sulfide zones mineralization robust. Sensitivity to the modeling cut-off was found to be minimal with respect
to the global Mineral Resource estimate. More work is required to link the chemical proxy to core observations to better understand what
exactly the proxy represents and if the proxy model can be improved in future resource updates. |
| · | The Mineral Resource was classified based on confidence in geological understanding, drill spacing, and kriging quality metrics. Sensitivities
to domaining and gold grade capping parameters remain relatively high for a Measured classification and the RSC QP considers this a moderate
risk. |
| · | The Mineral Resource estimates for Hod Maden have an effective date of August 31, 2025. |
| · | Appropriate cut-off grades, stope optimizing and pit optimization parameters have been used to establish those portions of the block
models that meet the requirement for reasonable prospects for economic extraction for this style of gold-copper deposit and mineralization.
In assessing the potential of economic extraction, the RSC QP reviewed mining, metallurgical, economic, environmental, social and geotechnical
factors. |
| | 1-2 | |
| SSR Mining Inc. | Hod Maden Project | | January 7, 2026 |
| Technical Report Summary | | SLR Project No.: 123.000320.00001 |
| · | The Hod Maden Mineral Resources estimate, exclusive of Mineral Reserves, is reported below on a 100% basis; SSR‘s attributable
share is 10%: |
| o | 1,722 thousand tonnes (kt) Measured and Indicated Mineral Resources at an average grade of 11.9 g/t (Au) and 1.7% Cu, containing 658
thousand ounces (koz) gold and 65 million pounds (Mlb) copper. |
| o | 2,574 kt Inferred Mineral Resources at an average grade of 3.4 g/t (Au) and 0.5% Cu, containing 281 koz gold and 26 Mlb copper. |
| 1.1.1.2 | Mining and Mineral Reserves |
| · | The deposit is proposed to be mined using underground techniques, specifically long hole stoping (LHS) below 780 meters above sea
level (masl) elevation and modified drift and fill (DAF) methods above the 780 masl elevation. Access to the mine will be via a decline.
Mining zones are divided based on rock quality and depth, with electric-hydraulic equipment used for development. LHS level spacing is
25 m and the DAF level spacing is 5 m. |
| · | Two geotechnical drilling programs were conducted. Rock strength varies, especially in argillic alteration zones, and significant
testing was performed to characterize rock properties and overburden materials. Stress measurements were assumed due to the lack of direct
measurements. The underground mine elevations range approximately 380 m from approximately 805 masl (at the surface) down to 400
masl. The lateral extent of the underground workings is approximately 330 m (W-E) by 240 m (N-S). |
| · | It is noted that geotechnical stability within the crown pillar and hanging wall is a key concern, particularly because persistent
faulting in the hanging-wall sequence increases the potential for dilution or premature stope closure if not properly managed. To mitigate
this risk, the DAF mining areas will be developed with an elevated ground-support standard and will be paste filled promptly after extraction.
Subsequent underhand cut-and-fill stopes will also be paste filled as they advance. This mining sequence ensures that the crown pillar
is never left unsupported or exposed in a manner that could lead to instability or failure. |
| · | The ground support will be bolts and fibrecrete, with the potential for mesh and spiling bars as well. Successful ground support depends
on sourcing qualified project management and staff. |
| · | Poor ground conditions in the DAF could impact production. |
| o | Mining excavation techniques, such as a road header or other form of rock cutting technology, with low impact on excavation stability
will be employed as appropriate. Road headers typically have advance rates of 1 to 2 meters per day. |
| o | Where pockets of harder ground are encountered, drill and blast will be used with short rounds and the use of spiling bars. |
| · | Over 10 years, the total ore mined at the Project (100% basis) will be approximately 7.7 million tonnes (Mt), containing approximately
1,896 koz gold and 101 kt copper. There is a two-year ramp up period associated with the underground mine. The life of mine waste
production is projected to be 1.5 Mt. |
| · | The Project's production ramp-up is closely tied to contractor performance, specifically their ability to maintain the scheduled advance
rate of 21 m per week. The Definitive Feasibility Study (DFS) completed in 2020 (the 2020 FS, GR Engineering 2020) used a decline advance
rate of 130 m/month. This has been reduced to 90 m/month because of the shorter available time resulting from the legally proscribed shift
schedule and to mitigate the risk of using contractors. Delays in the contractor’s equipment or workforce availability could negatively
impact the Project's production timeline. |
| | 1-3 | |
| SSR Mining Inc. | Hod Maden Project | | January 7, 2026 |
| Technical Report Summary | | SLR Project No.: 123.000320.00001 |
| · | The potential for surface subsidence from mining activities and blast vibrations could affect sensitive buildings such as a local
mosque. Site-specific testing for blast vibration is necessary to mitigate these risks. It is assumed that the graveyard and mosque will
be re-located. |
| · | Studies have been carried out to include groundwater movement, hydraulic conductivity, and dewatering plans for the mine. Several
dewatering scenarios were simulated by SRK, including lining options for the Surakev Creek, and active dewatering options. |
| · | Inflows from groundwater are expected up to 30 L/s for the lined option, and 50 L/s in conservative scenarios. Load from underground mining
operations is calculated as 5 L/s. |
| · | Pump stations will be specified for the lined option without active dewatering of the host strata. In the early stages of mining,
face pumps will keep up, and the pump stations will be set up with two duty pumps to pump 35 L/s, a spare for an additional 17 L/s, plus
civil construction for an additional pump for expansion to cope with any additional flow. |
| · | Stability assessments were completed to determine mining dimensions, with recommendations on ground support; composed of shotcrete,
bolting, and the use of cable bolts. |
| · | The Project’s Mineral Reserves are reported in accordance with S-K 1300 as of August 31, 2025, using breakeven NSR cut-off values
of US$160/t for DAF and US$108/t for LHS, with an incremental cut-off value of US$82/t applied for material that could be accessed on
the way to the breakeven cut-off inventory. |
| · | Total Proven and Probable Mineral Reserves at Hod Maden, on a 100% ownership basis (SSR‘s attributable share is 10%), are estimated
to be 7,714 kt at 7.6 g/t Au and 1.3% Cu, containing 1,896 koz gold and 223.1 Mlb copper. |
| 1.1.1.3 | Mineral Processing |
Metallurgical Test Work
| · | Test work programs have been carried out at various levels of project definition, including prefeasibility, feasibility, and for this
FS update. Test work has adequately characterized the mineralization, and has included engineering tests such as comminution, Levin tests,
Metso Jar tests, flotation, thickening, filtration, transportable moisture limit (TML), and Self-Heating capacity tests to derive design
parameters for the process plant |
| · | In the FS update, the flowsheet was updated to reflect a single-product flotation circuit comprising rougher flotation and cleaning
to a lower-grade (>13% Cu) concentrate but containing more pyrite at increased gold recoveries to the concentrate. This work, supported
by marketing assessments, has justified the selection of a simpler, single-product flotation circuit producing a low-grade copper concentrate
with significant precious metal (gold) credits. Copper concentrate grade and gold recovery to the concentrate, as well as payability of
gold and copper is managed by the mine plan, production profile, and pH control in the plant, with further opportunities to blend out
of spec concentrates if required from time to time. |
| | 1-4 | |
| SSR Mining Inc. | Hod Maden Project | | January 7, 2026 |
| Technical Report Summary | | SLR Project No.: 123.000320.00001 |
| · | The rock breakage parameter (A × b) of the ore types ranged between 33.4 to 98.1 and Bond Ball Milling Work indices (BWi) ranged
between 10.4 kWh/t and 20.6 kWh/t, indicating that the samples were in hard to medium hardness range according to the JKTech database.
The softest samples were from the massive pyrite (MPY) lithology, and the hardest from Dacite Breccia lithology. The eightieth percentile
of A × b and BWi were 45 kWh/t and 16 kWh/t, respectively. |
| · | The optimum flotation flowsheet and conditions were developed during the Preliminary Feasibility Study (PFS) phase are carried through
to the current Project. The design is based on sulfide mineral flotation (mill-float-mill-float [MF2] mode of operation; mill to a P80
of 106 µm – rougher float – mill to a P80 of 38 µm – scavenger float). The rougher concentrate
is then reground to a P80 of 30 µm. pH is controlled to produce a +13% Cu copper concentrate and maximize gold recovery
to the copper concentrate whilst keeping copper grades above payability thresholds. |
| · | The mine plan indicates that a +13% Cu concentrate can be produced without significant pyrite rejection (and associated gold loss)
on a monthly basis, however, short term grade excursions will need to be managed. The process plant is designed for the maximum expected
mass pull of approximately 10% to concentrate. |
| · | Gold and copper recovery relationships appear to be independent of lithology, and more related to the flotation conditions and the
extent of sulfur flotation or rejection from the flotation circuit. Feed grade and mass pull to the concentrates were the main parameters
affecting the grade and recovery. |
| · | Detailed chemical analyses show that concentrations of penalty elements in concentrate are low and are unlikely to negatively affect
marketing. |
| · | Thickening and filtration tests showed that copper concentrate can be dewatered to approximately 1.5% w/w lower than the Transportable
Moisture Limit (TML). The TML of the concentrate was measured as 11%, and the filter cake product was 9.5% w/w moisture. The self-heating
tests showed that concentrate was not classified as Material Hazardous in Bulk (MHB) or Dangerous Goods (DG) Class 4.2 for the purposes
of bulk transport; |
| · | Results of simulated open cleaner flotation (OPC) and locked cycle flotation (LCT) tests were used to establish grade versus recovery
curves for copper and gold. These equations were used to calculate concentrate production over the life of mine. The average gold and
copper recoveries are calculated as 87% and 97%, respectively. |
| · | The entirety of the rougher scavenger tailings will be used for the production of paste. After thickening, the paste plant will filter
a portion of the tails to meet the target paste concentration of 68.5% w/w solids after addition of a dry binder. |
| · | Gypsum scaling over time is expected at Hod Maden, however it is not expected to be significant enough to warrant dosing of antiscalant
outside of the alkaline water system. |
Processing and Recovery Methods
| · | The processing plant will have the capability of treating 800,000 dry tonnes per year of ROM ore. The plant design incorporates crushing,
grinding, and flotation to maximize the recovery of copper and gold from the ore. |
| · | Various utility and plant infrastructure such as water supply, reagents supply and distribution, air services, electrical energy supply
and distribution, roads, communications and site buildings will support the Project. |
| | 1-5 | |
| SSR Mining Inc. | Hod Maden Project | | January 7, 2026 |
| Technical Report Summary | | SLR Project No.: 123.000320.00001 |
| · | The roads from Artvin to the intersection on State Road D.950 to the site access road are generally in good condition; major upgrades
will be implemented for the Yukarιmaden access road to ensure safe and efficient
long-term operations. The road upgrades will incorporate tunnels and bridges to navigate challenging terrain, thereby improving both traffic
safety and accessibility for the public. Overall, these improvements are crucial not only for operational efficiency but also for mitigating
risks associated with construction and ongoing mining activities. |
| · | The Project will establish a new 154 kV/11 kV substation to connect to the existing high voltage network. The Project will build the
power distribution system and have a standby diesel generator. |
| · | The surface water management strategy for the Project emphasizes minimizing contact water volumes through effective diversion and
treatment systems while ensuring proper management of both contact and non-contact water. The contact water management system will focus
on directing all contact water to a designated pond for treatment, with non-contact water diversion systems constructed around the Project
area. Updates to the site-wide water balance model and the development of an integrated surface water management plan have been used and
need to be maintained to ensure the effectiveness of this strategy and compliance with regulatory requirements. |
| · | The design of the Tailings Storage Facility (TSF) for the Hod Maden mine adheres to Canadian Dam Association (CDA) Dam Safety Guidelines.
The phased downstream construction approach allows for the effective containment of the tailings, accommodating an ultimate design capacity
of 5 Mm³ across all phases. |
| · | The stability analyses indicate acceptable factors of safety for both static and dynamic conditions, ensuring the TSF's structural
integrity throughout its operational lifespan. Ongoing monitoring and recommended mitigation measures, such as the installation of catch
benches and artificial support, have been used and need to be maintained to manage localized hazards within the TSF basin. |
| · | The design and management of the North Valley Waste Dump Facility (WDF) have been planned to address the challenges posed by the potentially
acid-generating (PAG) waste rock from the underground mining operation. The WDF design incorporates industry standards throughout its
operational life and closure phase. Ongoing geotechnical assessments and a focus on a “design for closure” approach have been
used and need to be maintained to mitigate risks and ensure the long-term integrity of the facility |
| · | The implementation of overdrain and underdrain systems will facilitate efficient water management for the North Valley infrastructure
while mitigating potential risks associated with water quality and hydraulic pressures on the liner system. Continuous monitoring and
adaptive management practices have been used and need to be maintained to ensure the effectiveness of these systems and to protect the
surrounding environment throughout the project's lifecycle. |
| · | Infrastructure design updates within the North Valley include an improved access road and utility corridor from the Saliçor
Tunnel to the crest of the TSF to facilitate surface water controls, safe operations and access to the tailings pipeline and general construction
and operational access. Additional consideration during early construction has considered the design and location of topsoil storage areas. |
| | 1-6 | |
| SSR Mining Inc. | Hod Maden Project | | January 7, 2026 |
| Technical Report Summary | | SLR Project No.: 123.000320.00001 |
| · | The average concentrate grades produced at the Project are expected to be very high grade at 113 g/t gold and 22% copper credit
with very little deleterious elements; however, variability in the ore will lead to periodic production of low copper concentrate grades
(>14% Cu, >70 g/t Au), which should be easily sold as the gold concentration is still very high. An Expression of Interest from
a commodity trader for the lower concentrate grade has been procured. |
| · | Negotiations with potential customers are still in early stages; therefore, assumptions around concentrate freight and commercial
costs are still at an early stage. |
| 1.1.1.6 | Environment & Social |
| · | Artmin undertook environmental and social baseline studies in the Project area between 2013 and 2021. The baseline studies conducted
from 2018 to 2021 considered the International Finance Corporation Performance Standards (IFC PS) for key aspects of the Project, including
biodiversity. |
| · | The Project holds environmental approval-in-principle. The Project’s Environmental Impact Assessment (EIA) was approved by regulatory
authorities on November 17, 2021. |
| · | Key environmental and social (E&S) aspects of the Project include biodiversity, surface and groundwater quality, and land acquisition. |
| · | Land acquisition and expropriation are at an advanced stage, with most of the land already acquired or expropriated. |
| · | Artmin has compiled a set of draft Environmental and Social Management Plans (ESMPs) that aim to comply with host country requirements,
including EIA commitments and conditions of approval, European Union directives, and the International Finance Corporation (IFC) Performance
Standards (PS). These plans cover biodiversity and water management. Engagement with local communities and stakeholders began during exploration
and continues. Much of the engagement focuses on land acquisition and resettlement. |
| · | The Project has a Conceptual Mine Decommissioning and Closure Plan that includes a closure cost estimate. The Government of Türkiye
will require a financial guarantee. |
| 1.1.1.7 | Capital and Operating Costs |
| · | The SLR QP is of the opinion that the capital cost estimate for the Hod Maden Project has been well prepared and appears to be realistic
for the scope of the Project. The estimate is considered an AACEi class 3 estimate. |
| · | The total initial development costs for the Project are estimated to be US$1,060 million, of which, US$149.2 million has been already
spent. |
| · | The Project team has developed a Basis of Estimate (BoE) document. It is well-prepared and consistent with industry standards. |
| · | The contingency as a percentage of direct plus indirect costs is appropriate, especially when considering allowances for potential
quantity growth. |
| · | There is a high level of design completion for the stage of the Project. |
| | 1-7 | |
| SSR Mining Inc. | Hod Maden Project | | January 7, 2026 |
| Technical Report Summary | | SLR Project No.: 123.000320.00001 |
| · | The capital cost estimate is based on a very high level of budgetary quotations or actual awards. |
| · | Approximately 64% of the initial capital costs has been quoted in Turkish Lira with approximately 29% quoted in USD. |
| · | Bulk earthwork scopes of work often exceed budget due to the uncertain nature of ground conditions. The Project is commencing the
Main Access Road bulk earthworks prior to other bulk earthworks. |
| · | The Project team has prepared a Project Execution Plan that clearly outlines the scope of the major contractual packages and purchase
orders, the management team roles and responsibilities, and the execution strategy. |
| · | The Project will be executed using an Integrated Project Management Team (IPMT) that will include the Owner’s Team, the engineering
and procurement (EP) contractors, various construction contractors by scope, and engineering consultants for specific specialist scopes. |
| · | The selected overall execution model for the construction phase of this Project is optimal for the size and scope of the Project. |
| · | The Project is currently on schedule with three overall indicators of project progress indicating the Project is on time. These indicators
are overall cashflow, overall commitments, and construction progress. This timely execution not only reflects well on the overall execution
team but also on the execution strategy of direct execution with an integrated project team. |
The QPs offer the following recommendations by area:
| 1.1.2.1 | Geology and Mineral Resources |
| 1 | Carry out an infill drilling to improve the confidence of ore that will be mined during the first four years of the life of mine (LOM),
Resource extension, Resource sterilization and assay programs as recommended below. The proposed budget for the 2025 infill drill program,
which includes 16,300 m of drilling as well as other related activities, is US$5.09 million. The recommended and planned infill drill
program for 2025 includes the following activities: |
| a) | Carry out twin-drilling for hole HTG-002 to confirm grade tenors and reduce dependence of the estimate on this hole. |
| b) | Implement standard operating procedures for all data collection procedures including the drilling, logging, density measurements and
sample preparation steps. |
| c) | Revise the geological logging process to encapsulate the broad understanding of mineralization to yield logging that is fit for the
purpose of geological and estimation domaining. |
| d) | Backflag estimation domains on drilling and assess if high-grade sub-populations can be linked to core observations that can be incorporated
into the new logging framework. |
| | 1-8 | |
| SSR Mining Inc. | Hod Maden Project | | January 7, 2026 |
| Technical Report Summary | | SLR Project No.: 123.000320.00001 |
| e) | Collect additional Sulfide S data from available pulps to improve the imputation model and better understand the low-S high-Fe population. |
| f) | Re-sample the remaining quarters as a matter of priority to yield at minimum half-core support for all samples. The RSC QP has made
recommendations for holes that should be prioritized in the re-sampling work. |
| g) | Discuss the likely 1% to 2% high-bias in Au results at ALS Loughrea with the laboratory management. |
| h) | Conduct additional check sampling for Cu to test the hypothesis that the apparent bias observed in the 2024 Cu check analyses was
associated with a single batch. |
| i) | Conduct check measurements for bulk density (e.g., by the core tray method) to benchmark measurements from the water-immersion method. |
| j) | Conduct check measurements for bulk density on the top and bottom 10% of the dataset. |
| 2 | The RSC QP agrees with the objectives and overall scope of these planned activities. |
| 1.1.2.2 | Mining and Mineral Reserves |
| 1 | Re-run and optimize the underground mining development and production schedule, as per the normal course of business. |
| 2 | Complete geotechnical drill holes along the centerlines of the fresh air (FAR), escapeway, and return air (RAR) ventilation shafts
to ensure a detailed design for construction. These holes have been drilled, and additional analyses are progressing. This work is crucial
for underground mining contract tender documents. |
| 3 | Reinforce all initial FAR and RAR ventilation shafts with a remote-controlled shotcrete machine. |
| 4 | Conduct tests to determine if the Hod Maden sulfide ores are compatible with ammonium nitrate,
especially for reactive ores that may require specific explosive products. This information is also necessary for the underground mining
contract tender documents. A Turkish Explosive Consultant, Madser, has been retained to assist with these type of risks. |
| 5 | Re-calibrate numerical modeling using results from pilot dewatering in the center of the Hod Maden deposit (DAF zone), which is expected
to be finished in Q4 2025. This will help refine the underground mine dewatering needs. |
| 6 | Carry out additional underground paste backfill testing using representative deposit samples. This will include material characterization,
rheology, and strength tests, with future testing incorporating process water samples, if available. An update from Minefill, a paste
fill plant test work consultant, is almost complete as of the date of this TRS. |
| 1.1.2.3 | Mineral Processing |
| 1 | Consider re-testing, investigation, and inclusion of gravity recoverable gold circuit. A non-trivial quantity of free gold is present
after secondary grinding which may be captured and either mixed with copper concentrate or sold as gold concentrate as needed. |
| | 1-9 | |
| SSR Mining Inc. | Hod Maden Project | | January 7, 2026 |
| Technical Report Summary | | SLR Project No.: 123.000320.00001 |
| 1 | Undertake comprehensive hydrological and geotechnical assessments for critical project infrastructure components to support detailed
design and ensure long-term stability. This scope should include: |
| o | The main Yukarιmaden access road and its associated tunnel alignments,
as well as the Saliçor Valley (i.e., North Valley) access tunnel |
| o | The process plant site, with emphasis on zones featuring structural walls and exposed bedrock |
| o | Additional focus areas to include the alignment and condition of internal site roads and external access roads including the updated
utility and tailings pipeline corridor in the North Valley from the Saliçor tunnel exit to the crest of the TSF |
| o | Continue with additional geotechnical boreholes and foundation characterization in the North Valley WDF, utility corridor and main
access roads, including geochemical characterization |
| o | Continue to perform waste characterization for both geotechnical and geochemical properties planned for disposal in the North Valley
WDF |
| o | Additional boreholes to confirm the groundwater elevations with the TSF basin, at the junction of the North Valley Access Road and
the TSF, and within the WDF footprint |
| o | The designated topsoil storage facility |
| o | The spoil deposition area for road construction materials |
| o | The footprint of the high-voltage (HV) substation installation |
| o | All water non-contact water diversions, contact water collection/storage structures, and sediment management structures. |
| o | The main construction camp. |
| 1 | Periodically update and validate the numerical groundwater model as mining advances (e.g., following decline construction, Saliçor
Tunnel development, and other major infrastructure changes) |
| 2 | Update and finalize necessary simulations addressing paste fill permitting and contaminant transport predictions to ensure regulatory
alignment and support informed decision-making |
| 3 | Expand the on-site meteorological network with precipitation, temperature, snowpack, and evaporation stations across both valleys
at multiple elevations to improve data coverage and hydrological model calibration. |
| 4 | Update the design rainfall analysis at least every three years using on-site data or sooner following any significant or extreme rainfall
event. |
| 1 | Reinstate the damaged stream gauges (AGI) and maintain continuous streamflow monitoring in line with EIA commitments for runoff validation
and model updates. |
| 2 | Expand the climate change assessment to include stochastic variability and projected changes in short-term rainfall and storm intensities
for future design evaluations. |
| | 1-10 | |
| SSR Mining Inc. | Hod Maden Project | | January 7, 2026 |
| Technical Report Summary | | SLR Project No.: 123.000320.00001 |
| 3 | Update the site-wide water balance model to reflect ongoing South Valley design revisions (including waste dump locations, PAG management
etc.), outcomes of the stormwater management design (such as updated diversion channels, sediment ponds, and process water facilities),
the latest mine plan, production schedules, waste and tailings placement details, and updated groundwater inflows and dewatering configurations. |
| 4 | Incorporate updated geochemical and water quality data into the source terms and revise the load balance accordingly to maintain consistency
with the overall water balance framework. |
| 1 | Continue to negotiate with potential customers and obtain more Expressions of Interest (EOI) to support assumptions around concentrate
freight and commercial costs. |
| 1.1.2.7 | Environment and Social |
| 1 | Continue to budget appropriately to update environmental approvals and permits to reflect potential changes to the Project definition
arising from optimization studies, and ensure that the Project execution schedule allows for these activities. |
| 2 | Revise the environmental approval and permitting tracking tool to clearly state the relevant law or regulation, the type of approval
needed, the decision maker (regulator), summarize the application requirements, and specify the expected time frame for obtaining the
approval or permit. Update this tool to reflect changes in the Project definition. For approvals and permits already obtained, include
the date of issuance and the expiry date. |
| 3 | Develop and implement a compliance tracking tool to ensure compliance with legal requirements and identify any non-compliance requiring
corrective action. |
| 4 | As appropriate, update environmental and social baseline studies in response to possible changes in the Project definition. |
| 5 | As appropriate, update the 2023 ESIA and the draft ESMPs according to the revised Project definition to support Project financing. |
| 6 | Continue engagement with local communities and stakeholders as Project development plans evolve. |
| 7 | Track the success of land acquisition and resettlement in line with IFC PS5, and address any grievances raised by the communities. |
| 8 | Update the Closure Plan and closure costing regularly as required by law and also to address the evolving Project definition. |
| 1.1.2.8 | Capital and Operating Costs |
| 1 | Select the main contractors for North Valley bulk earthworks and start as soon as possible (and in the year 2025) small scopes of
work with different equipment mixes in order to evaluate productivities and unit costs in the difficult terrain. These scopes of work
and the evaluation of productivities should be completed prior to the commencement of the main work inside the North Valley. |
| 2 | Closely monitor quantities for each contractor and area during the bulk earthworks. |
| | 1-11 | |
| SSR Mining Inc. | Hod Maden Project | | January 7, 2026 |
| Technical Report Summary | | SLR Project No.: 123.000320.00001 |
| 3 | Monitor changes in unit rates due to potential impacts of escalation/inflation. |
| 4 | Synchronize operating costs and sustaining capital estimates between project team members and finance group, especially with capitalized
underground development costs |
| 1 | Closely monitor the execution of the main access road camp (capacity of 350 beds) as well as the construction progress of the main
accommodation camp to ensure that accommodation constraints do not impact the construction schedule. The peak workforce requirement is
expected to be in the summer of 2026, requiring accommodations for 1,150. |
| 2 | Finalize all major equipment contracts and expedite approvals for development of certified vendor drawings. |
| 3 | Continue to update and monitor the Project schedule and cost estimate, including any delays in schedule that may require additional
workforce to maintain the overall Project schedule. |
The economic analysis contained in this TRS is based on an analysis
date as of November 30, 2025, economic assumptions, and capital and operating costs provided by SSR finance and technical teams and reviewed
by SLR. All costs are expressed in Q4 2025 US dollars and unit costs are based on metric tonnes.
An after-tax Cash Flow Projection in US dollars has been generated from
the Life of Mine production schedule and capital and operating cost estimates, and is summarized in Table 1-1. All metrics presented in
this section, including the cash flow analysis, is presented at the 100% Project level, however, SSR’s attributable share is 10%.
A summary of the key criteria is provided below.
| · | 7.73 million tonnes averaging 7.63 g/t gold,1.31% copper mined from underground only |
| · | 2,182 tonnes per day mining from underground (nominal 800 ktpa). |
| · | Mill recovery, as indicated by test work, averaging 87.1% gold and 96.8% copper. |
| · | Smelter payable terms: 97.5% gold, 96.5% copper for 44,540 dry tonnes gold sulfide concentrate per year averaging 116 g/t gold, 22%
copper during full production years |
| · | Annual average production from first production year 2028 onwards: 159 thousand ounces of payable gold and 21 million pounds of payable copper per year (189
thousand ounces gold equivalent per year) during full production years |
| · | Life of mine average metal price: US$3,167 per ounce gold, US$4.52 per pound copper. |
| · | Net Smelter Return (NSR) includes total concentrate freight cost of $100.01/wmt (wet metric tonnes), $12/dmt (dry metric tonnes) treatment
charge, and $0.012 per pound copper refining costs. |
| · | Revenue is recognized at the time of production. |
| | 1-12 | |
| SSR Mining Inc. | Hod Maden Project | | January 7, 2026 |
| Technical Report Summary | | SLR Project No.: 123.000320.00001 |
| · | Pre-production period: 30 months (December 2025 to May 2028). |
| · | Mine life: approximately 12 years, including two years of pre-production |
| · | Life of Mine production plan as summarized in Table 13-23. |
| · | All costs are as of Q4 2025 US dollar basis. |
| · | Growth/Development capital of $910 million – excluding sunk costs |
| · | Mine life capital, including sustaining capital, totals $985 million. |
| · | Final reclamation/closure cost: $14 million |
| · | Average operating cost over the mine life is $111.90 per tonne milled. |
| o | Underground mining costs of $50.35 per tonne milled |
| o | Processing costs of $29.82 per tonne milled |
| o | Exploration/Development costs of $5.66 per tonne milled |
| o | Site General and Administrative costs of $26.07 per tonne milled |
| 1.2.1.3 | Taxation and Royalties |
| · | Royalty costs total $880 million over LOM comprised of: |
| o | Turkish Government: Realized 12.8% NSR based on a sliding scale based upon gold prices and allowing for deductions of processing as
well as a 40% reduction in royalty rates based on assumption that gold sulfide concentrate produced at the Project is considered the product
of ore processing ($775 million) |
| o | Royal Gold (Sandstorm): 2.0% NSR royalty ($104 million) |
| · | Income taxes (per SSR tax group) |
| o | 24.5% corporate income tax rate |
| o | Unit of Production depreciation |
| o | Total income tax payable is $784 million over LOM. |
SLR has reviewed the SSR’s Hod Maden LOM cash flow model, considering
gold and copper as final saleable products and has prepared its own unlevered after-tax LOM cash flow model based on the information contained
in this TRS to confirm the physical and economic parameters of the Project.
The economic analysis prepared by SLR considers a base discount date
as of December 1, 2025, using mid-year convention discounting.
The base discount rate assumed in this TRS is 5% as per standard industry
practice.
To support the disclosure of Mineral Reserves, the economic analysis
demonstrates that Hod Maden’s Mineral Reserves are economically viable at the net realized prices of $3,167/oz gold and $4.52/lb
copper for the period 2027 to 2037, with long term prices of $3,094/oz gold and $4.46/lb copper.
| | 1-13 | |
| SSR Mining Inc. | Hod Maden Project | | January 7, 2026 |
| Technical Report Summary | | SLR Project No.: 123.000320.00001 |
The summary cash flow analysis is presented in Table 1-1 and Figure
1-1. The full annual cash flow model is in Appendix 1. The Project shows strong free cash flow in the early part of the mine life when
mining higher grades, tapering off towards end of mine life.
On a pre-tax basis, the undiscounted cash flow totals $3,237 million
over the mine life. The pre-tax net present value (NPV) at a 5% discount rate is $2,236 million. On an after-tax basis, the undiscounted
cash flow totals $2,453 million over the mine life. The after-tax NPV at 5% is $1,657 million. The after-tax Internal Rate of Return (IRR)
is 39.0%. Simple payback from the start of commercial production in 2029 is less than one year.
The World Gold Council Adjusted Operating Cost (AOC) is US$535 per ounce
of gold and the All in Sustaining Cost (AISC) is US$590 per ounce of gold. The AISC breakdown is presented in Table 1-2. The average annual
production during full operation is 200,000 gold equivalent ounces per year.
Figure 1-1: After-Tax Annual Cash
Flow Metrics

FIGURE 1-1
2025
2026
2027
2028
2029
2030
2031
2032
2033
2034
2035
2036
2037
2038
$ Million US
$600
$500
$400
$300
$200
$100
$0
($100)
($200)
($300)
($400)
($500)
Capex
Free Cash Flow
Payable AuEq
Payable AuEq (oz)
500,000
300,000
100,000
(100,000)
(300,000)
(500,000)
Table 1-1: After-Tax Cash Flow
Summary
| Description |
Value |
|
| Realized Market Prices |
|
|
| Au (US$/oz) |
$3,167 |
|
| Cu (US$/lb) |
$4.52 |
|
| Payable Metal |
|
|
| Au (koz) |
1,609 |
|
| Cu (Mlb) |
209 |
|
| Total Gross Revenue |
6,038 |
|
| Underground Mining |
(390) |
|
| Process Plant |
(230) |
|
| Exploration/Development |
(44) |
|
| G&A |
(201) |
|
| Concentrate Freight |
(49) |
|
| | 1-14 | |
| SSR Mining Inc. | Hod Maden Project | | January 7, 2026 |
| Technical Report Summary | | SLR Project No.: 123.000320.00001 |
| Description |
Value |
|
| TC/RC |
(8) |
|
| Royalties |
(880) |
|
| Total Operating Costs |
(1,802) |
|
| Operating Margin (EBITDA) |
4,236 |
|
| Total Tax Payable |
(784) |
|
| Working Capital* |
0 |
|
| Operating Cash Flow |
3,452 |
|
| Development Capital Costs |
(910) |
|
| Sustaining Capital |
(75) |
|
| Final Closure/Reclamation Costs |
(14) |
|
| Total Capital |
(999) |
|
| |
|
|
| Pre-tax Free Cash Flow |
3,237 |
|
| Pre-tax NPV @ 5% |
2,236 |
|
| Pre-tax NPV @ 8% |
1,804 |
|
| Pre-tax IRR |
47.9% |
|
| |
|
|
| After-tax Free Cash Flow |
2,453 |
|
| After-tax NPV @ 5% |
1,657 |
|
| After-tax NPV @ 8% |
1,314 |
|
| After-tax IRR |
39.0% |
|
Table 1-2: AISC Composition
| Description |
LOM Total
US$ million |
Unit Costs
($/oz Au) |
| Underground Mining |
390 |
242 |
| Process Plant |
230 |
143 |
| Exploration/Development |
44 |
28 |
| G&A |
201 |
125 |
| Subtotal Site Costs |
866 |
538 |
| Concentrate Freight |
49 |
30 |
| TC/RC |
8 |
5 |
| Royalties |
880 |
547 |
| Subtotal Offsite Costs |
937 |
582 |
| Total Direct Cash Costs |
1,802 |
1,120 |
| By-Product Credit |
(942) |
(585) |
| Adjusted Operating Costs |
860 |
535 |
| Sustaining Capital |
75 |
46 |
| | 1-15 | |
| SSR Mining Inc. | Hod Maden Project | | January 7, 2026 |
| Technical Report Summary | | SLR Project No.: 123.000320.00001 |
| Description |
LOM Total
US$ million |
Unit Costs
($/oz Au) |
| Closure/Reclamation Capital |
14 |
9 |
| Total Sustaining Costs |
89 |
55 |
| Total All-in Sustaining Costs |
949 |
590 |
| Gold Payable Metal (Moz) |
1.61 |
| Cu Payable Metal (Mlb) |
209 |
| Cu as Au Equivalent (Moz) |
0.30 |
| AuEq Payable Metal (Moz) |
1.91 |
| Notes: AuEq is gold equivalent. |
| 1.2.3 | Sensitivity Analysis |
Project risks can be identified in both economic and non-economic terms.
Potential economic risks were examined by running cash flow sensitivities to changes in the following variables:
After-tax NPV and IRR sensitivities over the Base Case have been calculated
for -20% to +20% variations for head grade and recovery, and for -30% to +30% for gold and copper price. For operating costs and capital
costs, the sensitivities over the Base Case have been calculated at -15% to +15% variations.
The analysis shows that the Project is most sensitive to changes in
head grade, recovery, and metal prices, but less sensitive to operating and capital costs.
| 1.3.1 | Property Description |
The Hod Maden Project is in northeastern Türkiye, within the Eastern
Pontides tectonic belt, approximately 20 km south of Artvin and 130 km northeast of Erzurum, near the Georgian border. The deposit lies
along the east-west striking Maden Valley (also known as the South Valley, which extends to a perpendicular minor valley known as the
Powerline Valley), near the villages of Yukarιmaden and Aşağımaden. The Project benefits from nearby infrastructure,
with two high tension power lines crossing the area and access to concentrate handling facilities at Hopa and Rize on the Black Sea coast.
The Project is accessible by road from both Artvin and Erzurum, with some partially paved roads leading to Yukarιmaden Village. Yukarιmaden
Village, within the property, has basic utilities and serves as a base for exploration activities.
| | 1-16 | |
| SSR Mining Inc. | Hod Maden Project | | January 7, 2026 |
| Technical Report Summary | | SLR Project No.: 123.000320.00001 |
The Hod Maden Property consists of Turkish operating licenses 87288
and 88657, comprising a total land area of 3,543.24 hectares. The licenses are 100% owned by Artmin, a 60:10:30 jointly owned company
between Lidya Madençilik (Lidya), SSR, and Royal Gold Inc.1
SSR will acquire up to an additional 30% from Lidya through earn-in structured milestone payments during the Project’s construction.
The tenements are covered by numerous small freeholdings (private lands),
which Artmin is in the process of acquiring via private sale or expropriation process. Currently 87% of the required land has been purchased
by Artmin. The expropriation process was approved and commenced by The General Directorate of Mining and Petroleum Affairs (the Mining
Directorate, MAPEG) on March 18, 2020. The population to be affected is very small and a high proportion of the effected land has been
purchased. Expropriation of the remaining tenements is well advanced (93%). A budget for land purchases, resumption, and restitution has
been allowed for in the capital cost estimate.
Mining at Hod Maden may pre-date the rise of the Ottoman Empire (14th
Century). The Hot Mines, which are mostly in the southern part of the current concessions of the Hod Maden property, were exploited from
1888 to 1904. The Hot Mines operations were closed sometime between 1904 and 1911. In 1913, the mine was acquired by the Russian Hot Company,
who ceased mining activities in 1923.
The mine site was acquired by the General Directorate of Mineral Research
and Exploration (MTA) in 1942. The tenements were acquired by Anglo-Tur (a subsidiary of Anglo-American Corporation Inc.) in circa 1991.
In 2006, Teck Cominco, now Teck Resources Limited (Teck), acquired concessions by auction.
AMG Mineral Madençilik AS (AMG) successfully bid on Hot North,
Ulutas, and Halilağa East properties via an auction held January 31, 2012. AMG’s parent company, Aegean Metals Group Inc.
(AGN or Aegean), acquired a 100% interest in Teck’s three concessions at Hod Maden. Teck retained a 2% Net Smelter Return (NSR)
on the concessions, which was acquired by Sandstorm in 2016.
AMG entered into an option agreement with private Turkish company Lidya
in June of 2014. Under the terms of the agreement, Lidya has earned a 70% interest in Hod Maden property through exploration expenditures
and cash payments.
Mariana Resources Limited (MARL) acquired AGN in January 2015. Artmin
was formed in January 2016, as a jointly owned company, upon the signing of the Shareholder Agreement between MARL and Lidya.
In July 2017, Sandstorm acquired MARL and its 30% interest in the Hod
Maden Project.
SSR entered into a joint venture agreement on May 8, 2023, whereby SSR
will earn-in to own up to 40% of the Project and serve as project operator, while Lidya will own 30% and Royal Gold will own 30%. SSR
currently owns 10% of the project.
1
Royal Gold Inc. recently acquired Sandstorm Gold Limited, who held the 30% interest in Artmin.
| | 1-17 | |
| SSR Mining Inc. | Hod Maden Project | | January 7, 2026 |
| Technical Report Summary | | SLR Project No.: 123.000320.00001 |
| 1.3.4 | Geological Setting, Mineralization, and Deposit |
The Artvin mineral district is part of the Eastern Pontides magmatic
belt. The magmatic-hydrothermal mineral deposits and occurrences of the Artvin district are clustered into three main groups: the Hod
Gold Corridor, the Kaçkar batholith, and the volcanogenic massive sulfide (VMS) bimodal-felsic Cu-Zn belt.
The Hod Maden deposit, located near Yukarımaden village in Türkiye,
lies within the Hod Gold Corridor and comprises three zones: the Main Zone, the South Zone, and approximately 1-km to the south, the Russian
Zone. The Main Zone extends ~150 along strike at surface, has a true thickness of up to 70 m and a down-dip extension of ~400 m, and contains
most of the high-grade gold and copper mineralization. Two phases of mineralization are dominant in the main zone: i) multiphase quartz-sulfide
(pyrite+chalcopyrite) ± hematite+jasper breccia bodies; and ii) semi-massive to massive sulfides (pyrite+chalcopyrite) and gold
mineralization.
The adjacent South Zone, measuring approximately 500 m along strike
and 300 m in depth, is mineralogically and structurally distinct. The South Zone is characterized by quartz-sulfide stockwork veins that
host Au and Cu mineralization. Mineralization at Hod Maden is zoned with an inner Au-Cu-Mo association and an outer Zn-Pb-As signature.
The Hod Maden deposit is located within an NNE-trending structural corridor
bound by the Hod Main Fault Zone (HMFZ) and the Hod East Fault Zone (HEFZ). Alteration in the area includes chlorite and jasperoid-quartz-pyrophyllite
associations.
The mineralogical model for Hod Maden is debated and theories include
a structurally controlled epithermal system, a hybrid VMS-epithermal system, or a syn-volcanic VMS overprinted by epithermal veins.
The hydrogeological assessment for the Hod Maden Mining Project involved
extensive data collection and studies conducted by various consultants from 2013 to 2022. These included hydrocensus studies, baseline
water assessments, and continuous monitoring of surface and groundwater, primarily by SRK from 2017 to 2021. Field activities comprised
stream flow measurements, water quality sampling, drilling, and hydraulic testing. The studies identified key hydrogeological units such
as alluvium, fractured andesite, and fault zones, along with their hydraulic properties like conductivity and storage. A conceptual hydrogeological
model was developed, highlighting groundwater recharge, flow patterns, and interactions with the river system. Using this data, SRK created
a three dimensional (3D) numerical groundwater flow model to predict mine inflow, dewatering needs, and post-mining groundwater recovery.
The model forecasts significant dewatering requirements initially, with residual passive inflow decreasing over time due to the depletion
of permeable units and active dewatering systems. The project’s water management strategy is integral to reducing environmental
impacts during and after mining.
| 1.3.5.2 | Geophysics, Geology and Drilling |
In 2015, Enerson Engineering conducted a gravity survey at the Main
Zone of the Hod Maden Project to map buried mineralized rocks by measuring gravity anomalies. Using Scintrex CG-5 Autograv at 267 stations
along eight profiles, spaced 20 meters apart, the survey identified high-density rocks, though these anomalies did not directly correlate
with semi-massive sulfides in certain regions. Polimetal Madençilik began reconnaissance exploration in 2014, focusing on geological
mapping and geochemical sampling. Their geological surveys revealed andesitic rocks, dacitic flows, and rhyolitic domes, helping guide
exploration and mine planning. The geochemical sampling program gathered 960 soil and 738 rock samples, which were analyzed to pinpoint
drilling targets.
| | 1-18 | |
| SSR Mining Inc. | Hod Maden Project | | January 7, 2026 |
| Technical Report Summary | | SLR Project No.: 123.000320.00001 |
From 2014 to 2024, diamond drilling was the primary method for exploring
and defining mineralization at Hod Maden. Between 2014 and 2020, 319 diamond drill holes covering over 83,000 meters were drilled by Geoteknik,
focusing on exploration and resource estimation. Drilling included both exploration and infill diamond holes and was conducted using advanced
drilling rigs, with most drill holes inclined and surveyed at regular intervals. Between 2023 and 2024, an additional 16 drill holes,
totaling over 4,400 meters, were completed to improve the understanding of gold-bearing structures, with ongoing re-logging and analysis
efforts to further refine resource estimates.
| 1.3.6 | Mineral Resource Estimates |
Mineral Resources have been classified in accordance with the definitions
for Mineral Resources in S-K 1300 and were estimated by the RSC QP. SLR has reviewed, audited, and accepted the Mineral Resource estimate
prepared by the RSC QP. The Mineral Resource estimates are based on block model values developed from assays on the mineralized properties.
The Mineral Resource estimates were completed using conventional block
modeling approach in Seequent’s Leapfrog Geo (Leapfrog Geo) and Deswik Stope optimization (Deswik) software.
Estimates were validated using standard industry techniques including
statistical comparisons with composite samples and parallel nearest neighbor (NN) estimates, swath plots, and visual reviews in cross-section
and plan. A visual review comparing blocks to drill holes was completed after the block modeling work was performed to ensure general
lithologic and analytical conformance, and it was peer reviewed prior to finalization. Mineral Resources (SSR ownership 10% only) have
been summarized based on deposit, resource classification and processing methodology.
The Mineral Resources estimate is presented in Table 1-3. The RSC QP
is of the opinion that with consideration of the recommendations summarized in Sections 1 and 23 of this TRS, any issues relating to all
relevant technical and economic factors likely to influence the prospect of economic extraction can be resolved with further work.
| | 1-19 | |
| SSR Mining Inc. | Hod Maden Project | | January 7, 2026 |
| Technical Report Summary | | SLR Project No.: 123.000320.00001 |
Table 1-3: Summary of Hod Maden
Mineral Resources, exclusive of Mineral Reserves, as of August 31, 2025 (SSR’s Attributable Share)
| Classification |
SSR Ownership Basis
(%) |
Tonnes
(kt) |
Grade |
Metal |
NSR Cut-off Values
(US$/t) |
Metallurgical Recovery |
Au
(g/t) |
Cu
(%) |
Au
(koz) |
Cu
(Mlb) |
Au
(%) |
Cu
(%) |
| Measured |
10% |
62 |
23.4 |
2.3 |
47 |
3.2 |
99 |
82-90 |
95-98 |
| Indicated |
110 |
5.4 |
1.4 |
19 |
3.4 |
| Measured + Indicated |
172 |
11.9 |
1.7 |
66 |
6.5 |
| Inferred |
257 |
3.4 |
0.5 |
28 |
2.6 |
|
Notes:
1.
Mineral Resources are based on $2,000/oz gold price and $4.0/lb of Cu and are exclusive of Mineral Reserves.
2.
Mineral Resources are reported within optimized stope shapes.
3.
Mineral Resources shown are SSR ownership only. SSR currently owns 10%.
4.
Mineral Resource cut-offs are based on a NSR value of $99/tonne.
5.
Metallurgical recoveries vary between 82%-90% for Au and 95%-98% for Cu based on grade and sulfur.
6.
Minimum mining width of 2 m with no external dilution has been considered while optimizing stope shapes.
7.
The point of reference for Mineral Resources is the point of feed into the processing facility.
8.
Totals may vary due to rounding. |
| | 1-20 | |
| SSR Mining Inc. | Hod Maden Project | | January 7, 2026 |
| Technical Report Summary | | SLR Project No.: 123.000320.00001 |
| 1.3.7 | Mineral Reserve Estimates |
Mineral Reserves have been estimated by SSR personnel and audited and
accepted by the SLR QP. The Mineral Reserves have been classified in accordance with SEC S-K 1300 definitions. A summary of the Mineral
Reserve estimate on SSR’s attributable ownership basis is shown in Table 1-4.
Table 1-4: Mineral Reserve Estimate
as of August 31, 2025 (SSR’s Attributable Ownership Basis)
| Reserve Classification |
SSR Ownership
(%) |
Tonnes
(kt) |
Grade |
Metal |
NSR Cut-off
Values |
Metallurgical Recovery |
Au
(g/t) |
Cu
(%) |
Au
(koz) |
Cu
(Mlb) |
(US$/t) |
Au |
Cu |
| Proven |
10% |
137 |
22.2 |
1.7 |
98 |
5 |
Varies by mining method |
82%–90% |
95%–98% |
| Probable |
634 |
4.5 |
1.2 |
92 |
17 |
| Total Proven + Probable |
771 |
7.6 |
1.3 |
190 |
22 |
|
Notes:
1.
Mineral Reserve estimates are classified in accordance with S-K 1300.
2.
Only Measured and Indicated Mineral Resources were used to define Mineral Reserves. All Inferred Mineral Resource was considered
as waste.
3.
The Mineral Reserve is estimated using metal prices of US$1,700/oz gold and US$3.50/lb copper.
4.
Mineral Reserves are reported on SSR’s 10% ownership basis with the point of reference of mined ore delivered to the plant
as mill feed.
5.
The estimation was carried out using breakeven NSR cut-off values:
· Drift
and Fill: US$160/t
·
Long Hole Stoping: US$108/t
·
Incremental Stoping: US$82/t
·
Marginal COG: US$57/t
6.
The average mining recovery and dilution factors applied were 94% and 10%, respectively.
7.
Process recovery averaged approximately 87% for gold and 97% for copper.
8.
Totals may not add due to rounding. |
Mineral Reserves are defined within an underground mine plan generated
considering diluted Measured and Indicated Mineral Resources.
Mineral Resources were converted to Mineral Reserves recognizing the
level of confidence in the Mineral Resource estimate and reflecting modifying factors, and after consideration of all The Proven Mineral
Reserve was derived from the Measured Mineral Resource. The Probable Mineral Reserve was derived from Measured and Indicated Mineral Resources.
The Measured Mineral Resource within the DAF development shapes above 780 masl was downgraded to Probable Mineral Reserve due to the greater
uncertainty regarding the modified DAF mining method. All stope and development shapes have planned internal dilution. The marginal development
NSR cut-off value is US$57/t. The stope optimisation algorithm will always allow for the inclusion of material below the cut-off value
to be included if it necessary to include high grade material, as long as the overall grade of the additional material is above cut-off,
which is a normal part of the process.
The SLR QP is not aware of any risk factors associated with, or changes
to, any aspects of the modifying factors such as mining, metallurgical, infrastructure, permitting, or other relevant factors that could
materially affect the Mineral Reserve estimate.
| | 1-21 | |
| SSR Mining Inc. | Hod Maden Project | | January 7, 2026 |
| Technical Report Summary | | SLR Project No.: 123.000320.00001 |
The Hod Maden deposit will be mined entirely using underground mining
techniques to minimize surface disturbance. The deposit consists of a Main Zone and a South Zone; however, as very little economic mineralization
is currently modeled in the South Zone, South Zone is not included in the current LOM plan.
In addition, the underground mine will be divided into two distinct
mining zones with a modified DAF underground mining technique applied to the Poor Ground Zone (PGZ) above the 780 masl level (the 780
level) and LHS applied to the more competent ground conditions below the 780 level. The bulk of the mineralization is located below the
780 level, however, gold and copper grades are highest above the 780 level, reducing with deposit depth.
The underground mine will be accessed through a single portal west of
the deposit with secondary egress and fresh air intake in close proximity. The primary exhaust and vertical shaft development are located
in the southwest of the deposit.
The Main Zone extends 450 m vertically from surface over a strike distance
of approximately 300 m. For the LHS level, spacing will be 25 m, and for the upper DAF levels will be extracted primarily in 5 m high
increments.
LHS will use electric-hydraulic jumbos for excavation and ground support
with diesel-powered load haul dump (LHD) units and articulated dump trucks for material handling. Ground support will use fibrecrete extensively.
Stopes will be drilled using electric-hydraulic top hammer long hole drills.
DAF mining will utilize excavators and rotary cutters for excavation
and front-end loaders (FEL), LHDs, and trucks for material handling. Fiber-reinforced sprayed concrete will be used extensively for the
primary support of development drives.
Ore will be trucked to the surface ROM pad located approximately 500
m from the portal in the South Valley. Waste rock will be trucked to a temporary waste rock dump near the portal from where it will be
rehandled to a permanent waste dump facility (WDF) through an access tunnel to the Saliçor Valley.
From portal construction, the mine has an expected life of approximately
12 years (December 2025 – 2037), of which there will be 11 years of processing the 7.7 Mt Mineral Reserve.
| 1.3.9 | Processing and Recovery Methods |
The processing plant will incorporate crushing, grinding, and flotation
to produce a gold concentrate at average grades over the LOM of approximately 22% Cu and 114 g/t Au. The design capacity is 800,000 dry
metric tonnes per year.
Results of historical and 2024 locked cycle results tests were used
to establish grade versus recovery curves for copper, gold, and mass pull. These equations were used to calculate concentrate production
over the life of mine. Table 1-5 shows the average grade and recovery figures of the gold concentrate produced over the life of mine according
to the mine plan. The average gold and copper recoveries are calculated as 87% and 97%, respectively.
Table 1-5: Grade and Recovery Values
Over Life of Mine
| Products |
Grade |
Recovery (%) |
|
| |
Cu (%) |
Au (g/t) |
Cu |
Au |
|
| Concentrate |
22 |
114 |
96.8 |
85.7 |
|
| | 1-22 | |
| SSR Mining Inc. | Hod Maden Project | | January 7, 2026 |
| Technical Report Summary | | SLR Project No.: 123.000320.00001 |
The processing plant will have the capability of treating 800,000 dry
tonnes per year. The flowsheet is summarized as:
| · | Primary ore crushing of ROM to produce a crusher product size of 80% passing 56 mm |
| · | Primary milling in closed circuit with hydrocyclones to produce an 80% passing 106 µm grind size |
| · | Flotation of the primary ground ore to generate a rougher concentrate. The rougher concentrate is directed to the Regrind Circuit.
The rougher flotation tailings are directed to the Secondary Grinding Circuit |
| · | Secondary grinding of the rougher flotation tail occurs in a variable speed stirred mill in closed circuit with hydrocyclones to produce
an 80% passing 38 µm grind size. Secondary grinding of the rougher tail improves the liberation and recovery of gold |
| · | The secondary ground material enters the scavenger circuit. Recovered scavenger concentrate is cleaned in the scavenger cleaner flotation.
The cleaned scavenger concentrate is directed to the cleaner flotation circuit. The scavenger tailings, low in sulfidic material is directed
to the low sulfide tailings thickener |
| · | A concentrate regrind mill in closed circuit with hydrocyclones to produce an 80% passing 30 µm grind size |
| · | A cleaner flotation circuit, comprising a cleaner conditioning tank with two stages of cleaning and a cleaner scavenger stage. The
rougher and cleaner scavenger concentrates are directed to the cleaner flotation circuit. The cleaner scavenger concentrate is recirculated
to the cleaner conditioning tank |
| · | Concentrate thickening, filtration and loadout |
| · | Sulfide tailings thickening and disposal to the tailings storage facility |
| · | Low sulfide tailings thickening, filtration and paste backfill |
The entirety of the scavenger tailings will be used for the production
of paste. After thickening, the paste plant will filter a portion of the tails to meet the target paste concentration of 68.5% solids
(by weight) after addition of a dry binder.
Various utility and plant infrastructure such as water supply, reagents
supply and distribution, air services, electrical energy supply and distribution, roads, communications and site buildings will support
the Project.
The Project's infrastructure development includes the following:
| · | Improvements to access roads |
| · | Processing facilities and associated infrastructure |
| · | Accommodation camp and associated facilities |
| · | Surface mining infrastructure |
| · | Water management system including water diversion, channels, and ponds |
| · | Tailings storage facility (TSF) |
| | 1-23 | |
| SSR Mining Inc. | Hod Maden Project | | January 7, 2026 |
| Technical Report Summary | | SLR Project No.: 123.000320.00001 |
Access roads from Artvin are in good condition, but significant upgrades
to the Yukarιmaden road will enhance safety and efficiency for long-term
operations.
A new 154 kV/11 kV substation will connect the Project to the existing
high-voltage network, ensuring a reliable power supply through an extensive distribution system. This system includes multiple feeders
and dedicated transformers, while a standby diesel generator will provide backup power to maintain operational continuity during outages.
The Project emphasizes effective surface water management, focusing
on minimizing contact water volumes through diversion and treatment systems. A contact water management system will direct all contact
water to a designated treatment pond, while a non-contact water diversion system will safeguard operational areas. Continuous updates
to the site-wide water balance model and an integrated management plan will ensure regulatory compliance and environmental integrity.
Tailings management at the Hod Maden mine will adhere to CDA Dam Safety
Guidelines, with a phased downstream construction approach for the TSF. The facility's design incorporates a composite liner system and
zoned filter design to contain hazardous Class I tailings, accommodating a total capacity of up to 4.82 Mm³ assuming construction
of the TSF to the 1,353 final elevation and considering 1m of freeboard and the anticipated depositional slope of the tailings. Comprehensive
geotechnical investigations and geological hazard assessments have been conducted to ensure understanding of the storage basin and embankment
foundation conditions, while ongoing monitoring and mitigation will manage localized risks during operations.
The North Valley Waste Dump Facility (WDF) is designed to handle PAG
waste rock from underground mining. The selected Saliçor Valley site presents advantages that mitigate associated risks, while
ongoing geotechnical assessments and a focus on a "design for closure" approach will ensure environmental protection and stability
throughout the facility's lifecycle.
The Hod Maden Project is expected to produce gold sulfide concentrate
containing copper credits, which will be highly desirable due to its cleanliness and lack of deleterious elements.
The Hod Maden Project is expected to produce an average of approximately
44,450 dry metric tonnes (dmt) per annum of gold sulfide concentrate. The concentrate can be sold either through traders or directly to
smelters. Due to its clean quality, it is expected to be competitive in the market. Best-value markets for Hod Maden's concentrates include
Europe, China, the Philippines (PASAR), and Korea, although Japan is considered less likely due to high financing costs associated with
gold.
Discussions have been conducted with potential customers, including
SSR’s joint venture partner, Lydia, who has expressed interest in the product. The marketing of this product falls outside the current
project scope and will be addressed in a future phase.
| 1.3.12 | Environmental Studies, Permitting and Plans, Negotiations, or Agreements with Local Individuals or Groups |
Artmin undertook environmental and social (E&S) baseline studies
between 2013 and 2015, 2017 to 2020 and 2018 to 2021 in the Project area. These informed the Environmental Impact Assessment (EIA) for
the Project, which was approved by the Ministry of Environment, Urbanisation and Climate Change on November 17, 2021. Consistent with
Good International Industry Practice (GIIP), the baseline studies conducted from 2018 to 2021 considered the International Finance Corporation
Performance Standards (IFC PS) for key aspects of the Project including, e.g., biodiversity.
| | 1-24 | |
| SSR Mining Inc. | Hod Maden Project | | January 7, 2026 |
| Technical Report Summary | | SLR Project No.: 123.000320.00001 |
The Project region is rich in biodiversity and endemic species. Vulnerable,
near threatened, endangered and critically endangered species on the International Union for Conservation of Nature’s (IUCN) Red
List of Threatened Species, as well as on the National Red Data List (Turkish Red Data Book, T-RDB) may occur in the Project area and
triggered the identification of critical habitat2.
Biodiversity is a key E&S aspect of the Project.
Water quality is another key E&S aspect of the Project. Potential
impacts to surface water and groundwater quality have been identified due to the potential for development of acid rock drainage and metal
leaching (ARD/ML) during mining development, as well as dewatering and discharge activities, disposal of flotation tailings and waste
rock, creek diversions and mining under Maden Creek.
The villages of Aşağımaden and Yukarımaden
are affected by land acquisition for the Project, with a total of 887 private land parcels, totalling 372,825 m2, required
for the construction of Project infrastructure in both the North and South valleys. Artmin commenced land acquisition in the South Valley
in 2019. The government’s Special Provincial Administration (SPA) are currently assisting the Project with ongoing land acquisition
efforts. The project is also arranging additional payments to landowners who have previously been compensated, to ensure parity with payments
made to other landowners.
Artmin compiled an Environmental and Social Impact Assessment (ESIA)
in 2023 to support eventual Project financing. The ESIA package includes a set of draft Environmental and Social Management Plans (ESMPs)
which aim to comply with host country requirements including EIA commitments and conditions of approval, European Union directives and
the International Finance Corporation (IFC) Performance Standards (PS). Key ESMPs related to the three key environmental and social aspects
mentioned above include the draft Biodiversity Management Plan, Water and Wastewater Management Plan, Waste Rock Management Plan, Community
Development Plan.
Artmin has a list of environmental approvals and permits and track these
applications. This list will need to be updated to address the revised Project definition. At this time, it is unclear to what extent
existing approvals and permits will need to be revised and/or updated as this depends on how the Project definition evolves during optimization
studies.
Engagement with local communities and stakeholders commenced during
the exploration and early scoping phases and Artmin established a community relations office in the Yukarımaden village. Artmin
maintains a Stakeholder Engagement Register showing engagement activities from June 2017 to August
2024 and plans to continue engagement activities.
A Conceptual Mine Decommissioning and Closure Plan, which included a
closure cost estimate, was compiled for the Project in 2022. The Government of Türkiye will require a financial guarantee.
| 1.3.13 | Capital and Operating Cost Estimates |
The Project site topography, with inclines of over 30% in two of the
main valleys, will present challenges for the construction and operations. The Project team has prepared a capital cost estimate as part
of the FS Update. The initial capital expenditures are estimated at US$1,060 million. The Project budget includes an estimated $149 million
of sunk costs as of November 30, 2025, with a remaining budget of $910 million to complete the initial Project.
2 As defined in IFC PS6, Biodiversity Conservation and
Sustainable Management of Living Natural Resources (IFC 2012).
| | 1-25 | |
| SSR Mining Inc. | Hod Maden Project | | January 7, 2026 |
| Technical Report Summary | | SLR Project No.: 123.000320.00001 |
The Project capital cost estimate should be classified as a high level
3 estimate using the AACE International (Association for the Advancement of Cost Engineering International) classification system, due
to the high level of design definition in the most critical areas: camp construction, bulk earthworks in the North Valley, and the main
access roads.
The capital cost estimate for the Process Plant is only US$84 million,
approximately 18% of the Project’s Direct Costs, which is unusual for mining projects; however, the SLR QP notes that the bulk earthworks
scope for the Hod Maden Project is significant, and the percentage of the total capital cost related to the Process Plant is appropriate.
The SLR QP has reviewed the Basis of Estimate document (BoE) developed
for the Project. The BoE indicates the initial capital cost estimate has been prepared to a Class 3 using the AACE classification system,
with a level of accuracy of -10% to +15%; the SLR QP agrees with this assessment.
The capital costs are summarized in Table 1-6.
Table 1-6: Capital Cost Summary
| Description |
Value
(US$ million) |
|
| Total Development (May 2023) |
1,060 |
|
| Sunk Costs – (May 2023 – November 2025) |
(149) |
|
| Net Development Costs |
910 |
|
| Sustaining |
75 |
|
| LOM Capital Costs |
985 |
|
| Final Closure/Reclamation |
14 |
|
| Total |
999 |
|
| Note: Numbers may not add to totals due to rounding. |
|
The projected LOM unit operating cost estimate, since the start of commercial
production, is summarized in Table 1-7. The estimated Hod Maden workforce is estimated to average 497 persons once full operations are
achieved. During construction, there will be a peak of 1,150 workers in the summer of 2026.
Table 1-7: Average Operating Costs
Unit Rates
| Activity |
Unit |
Avg LOM |
|
| UG Mining (contract) |
$/t ore processed |
50.35 |
|
| Processing |
$/t ore processed |
29.82 |
|
| Exploration/Development |
$/t ore processed |
5.66 |
|
| General and Administrative |
$/t ore processed |
26.07 |
|
| Total Operating Costs |
$/t ore processed |
111.90 |
|
| | 1-26 | |
| SSR Mining Inc. | Hod Maden Project | | January 7, 2026 |
| Technical Report Summary | | SLR Project No.: 123.000320.00001 |
The Hod Maden Project team has prepared an update to the FS, which includes
a schedule update. The Project started the construction of the onsite infrastructure in fiscal year 2025 (FY2025) while delaying the commencement
of the process facility construction until the year 2026.
The key aspects of the updated schedule are the following:
| · | Construction of onsite permanent accommodation facilities and offices to facilitate the full mobilization and construction of the
Project. |
| · | Clearing and bulk earthworks to the main Process Plant area. |
| · | Construction of the sedimentation ponds for the Saliçor Tunnel area |
| · | Expansion of the main access road where possible. |
| · | Commencement of the Upper and Lower WDF area bulk earthworks and drainage works. |
| · | Preparation of the main substation platform, including bulk earthworks, MSE (Mechanically Stabilized Earth) wall and backfill. |
| · | Construction of the permanent ATKAS creek diversion channel. |
| · | Commencement of the T2 Tunnel along the main access road and the Saliçor Tunnel. |
| · | Commencement of South Valley community-related scope, i.e., relocation and demolition of purchased buildings. |
Table 1-8 summarizes the current milestones for the Hod Maden Project.
Note that the “A” means an actual date that has been achieved.
| | 1-27 | |
| SSR Mining Inc. | Hod Maden Project | | January 7, 2026 |
| Technical Report Summary | | SLR Project No.: 123.000320.00001 |
Table 1-8: Hod Maden Schedule Milestones
| Description |
Start |
Finish |
Months from FID |
Duration
(Months) |
|
| LNTP – Limited Notice to Proceed |
|
15-Nov-24 |
- |
|
|
| Indicative
FID - Financial Investment Decision |
|
10-Dec-25 |
|
|
|
| Project Practical Completion |
|
31-May-28 |
30.1 |
|
|
| |
| MINING |
|
|
|
|
|
| Underground Mine Access Construction |
7-Mar-26 |
19-Jun-26 |
6.4 |
2.6 |
|
| Surface Mine Infrastructure Area |
6-Aug-25 A |
8-May-27 |
17.1 |
14.7 |
|
| Temporary Facilities Construction |
22-Apr-26 |
15-Aug-26 |
8.3 |
3.0 |
|
| PROCESS PLANT |
|
|
|
|
|
| Construction of Paste Plant and Commissioning |
11-Nov-26 |
27-Apr-28 |
29.0 |
12.2 |
|
| Construction of Process Plant |
8-Oct-26 |
13-Nov-27 |
23.4 |
11.0 |
|
| Wet and Process Commissioning of Process Plant |
11-Aug-27 |
31-May-28 |
30.1 |
6.8 |
|
| SERVICES AND UTILITIES |
|
|
|
|
|
| NORTH VALLEY |
|
|
|
|
|
| TSF1 Construction (Phase 1) |
28-Mar-26 |
31-May-28 |
30.1 |
18.4 |
|
| Utility Corridor Construction |
10-Jul-26 |
22-Jun-27 |
18.6 |
9.5 |
|
| PAG Waste Dump Facility Construction |
8-Aug-26 |
17-Jun-27 |
18.5 |
8.5 |
|
| North Valley Construction Access Road |
2-Jun-25 A |
24-Feb-27 |
14.7 |
17.3 |
|
| SOUTH VALLEY |
|
|
|
|
|
| Construction of Saliçor Tunnel |
1-Aug-25 |
16-Nov-27 |
23.5 |
19.4 |
|
| Construction of Power Substation |
6-Feb-26 |
29-Apr-27 |
16.8 |
10.4 |
|
| Lower Waste Dump (PAG) Construction |
1-Dec-25 |
3-Apr-26 |
3.8 |
2.7 |
|
| Process Plant Bulk Earthworks |
10-Feb-26 |
10-Nov-26 |
11.2 |
7.2 |
|
| Upper Waste Dump Road |
6-Dec-25 |
3-Mar-27 |
14.9 |
10.3 |
|
| Construction of Power Reticulation |
26-Nov-24 A |
22-Jan-28 |
25.8 |
26.4 |
|
| Surakev and Aktas Creek Diversion Construction |
23-Jul-25 A |
22-May-26 |
5.4 |
7.0 |
|
| REGIONAL INFRASTRUCTURE |
|
|
|
|
|
| Main Access Road Construction |
1-Sept-25 A |
11-Sep-27 |
21.3 |
17.1 |
|
| West Public Road |
23-Feb-26 |
14-Nov-26 |
11.3 |
7.1 |
|
| Phase 1 - Construction of Temporary Accommodation (350 employee) |
28-Jan-26 |
15-Apr-26 |
4.2 |
2.6 |
|
| Phase 2 - Construction of Permanent Accommodation (1200 employee) |
4-Mar-26 |
5-Aug-26 |
7.9 |
5.2 |
|
| | 1-28 | |
| SSR Mining Inc. | Hod Maden Project | | January 7, 2026 |
| Technical Report Summary | | SLR Project No.: 123.000320.00001 |
The critical path for the Project currently proceeds through the following:
| · | Completion of the Main Access Road construction camp |
| · | Completion of underground infrastructure |
| · | South Valley civil works |
| · | Non-tailings dam civil works to the North Valley |
| · | Construction of the main accommodation camp |
The Project has been advancing under a limited notice to proceed (LNTP)
since November 2024. During this time the Project has maintained the overall schedule and has achieved timely execution of the Project
scope. Three of the “meta” indicators of project progress, as listed below, are all tracking closely to the previous baselines:
| · | Overall Project cashflow |
| · | Overall construction progress (as calculated by earned value manhours) |
This overall timely project performance indicates good progress in the
early parts of the project development.
| | 1-29 | |
| SSR Mining Inc. | Hod Maden Project | | January 7, 2026 |
| Technical Report Summary | | SLR Project No.: 123.000320.00001 |
SLR International Corporation (SLR) was retained by SSR Mining Inc.
(SSR) to prepare an independent Technical Report Summary (TRS) on the Hod Maden Project (the Project), located in Türkiye.
The purpose of this TRS is to disclose the results of an updated feasibility
study completed in January 2025 (the FS update) for the Project, and to support the disclosure of the Mineral Resource and Mineral Reserve
estimates for the Project, effective as of August 31, 2025. This TRS conforms to the United States Securities and Exchange Commission’s
(SEC) Modernized Property Disclosure Requirements for Mining Registrants as described in Subpart 229.1300 of Regulation S-K, Disclosure
by Registrants Engaged in Mining Operations (S-K 1300) and Item 601 (b)(96) Technical Report Summary. SLR, RSC Consulting Ltd. (RSC),
WSP USA Inc. (WSP), Ausenco Services Pty Ltd (Ausenco), and SRK Consulting Inc. (SRK) are the qualified persons (QPs), as defined by S-K
1300, for this TRS.
The Hod Maden Project is 100% owned by Turkish company Artmin Madencilik
(Artmin), which is jointly owned by SSR, Royal Gold Limited (Royal Gold), and Lidya Madencilik (Lidya). SSR currently holds a 10% interest
in the Project; per the joint venture agreement (May 8, 2023), SSR will earn-in to 40% ownership of the Project and serve as the Project
operator.
The Project is envisioned as an underground mining operation using drift
and fill (DAF) and long hole stoping (LHS) mining methods. The processing facility (the Process Plant) will have a throughput capacity
of 800,000 dry metric tonnes per annum (tpa) of run-of-mine (ROM) ore. The Process Plant incorporates crushing, grinding, and flotation
to produce a single gold-copper concentrate that will be transported off-site for further processing.
The RSC QP, as defined by S-K 1300, for Geology and Mineral Resource
estimation visited the site from July 1 to 5, 2024. The RSC QP reviewed the Project geology, standard operating procedures, collar locations,
downhole surveys, logs, core, pulps, and laboratory certificates.
SLR team members visited the Project site and office on August 12 and
13, 2024. The focus of the site visit was to review the location of Project infrastructure taking into account the topography, location
of existing infrastructure, mine development, and other physical parameters on site. A visit to the Artmin office in Istanbul took place
on August 14, 2024, with the main objective of reviewing the Project execution strategy and status. This visit also included a review
of the main roads between site and the Rize port and a general view of the region, including visits to Artvin and Yusufeli, to understand
what facilities and services were available regionally to support the Hod Maden Project operation. The SLR team was escorted by Artmin
and SSR staff.
The SLR QPs visited the Project most recently on September 5 and 6,
2025. Primary objectives were to observe conditions in the North and South Valleys and along the Main Access road.
The SRK QP and the Owner’s team visited the site on August 13,
2024, and September 5 and 6, 2025. The objectives of the site visit and meetings were to observe surface water and hydrological conditions,
plan for groundwater investigations and visit historic mine audits. Review on selected exploration cores and the surficial geology provided
insight on hydrogeological and hydrological setting.
| | 2-1 | |
| SSR Mining Inc. | Hod Maden Project | | January 7, 2026 |
| Technical Report Summary | | SLR Project No.: 123.000320.00001 |
WSP team members, including the WSP QP, visited the Project most recently
on September 5 and 6, 2025. The objectives of the site visit were to observe the conditions of the North Valley and the TSF site.
Table 2-1 lists the consulting companies whose personnel are QPs in
this Report and the sections for which they are responsible. The QPs from SLR, RSC, WSP, SRK, and Ausenco, and their respective employers,
are independent of and unaffiliated with the registrant (SSR) or any other entities that have an ownership, royalty, or other interest
in the Project.
Table 2-1: Consulting Companies
Which Acted as Qualified Persons in Preparing this Report
| Qualified Person Firms |
Report Sections |
| SLR International Corporation |
1.1, 1.1.1.2, 1.1.1.4 to 1.1.1.8, 1.1.2.2, 1.1.2.4, 1.1.2.6 to 1.1.2.9, 1.2, 1.3.1 to 1.3.3, 1.3.7 to 1.3.8, 1.3.10 to 1.3.14, 2, 3, 4, 5, 7.4, 12, 13, 15.1 to 15.3, 16 to 21, 25, 22.2, 22.4 to 22.8, 23.2, 23.4, 23.6 to 23.9, 25, and 27 |
| RSC Consulting Ltd. |
1.1.1.1, 1.1.2.1, 1.3.4 to 1.3.6, 6, 7 excluding 7.3 and 7.4, 8, 9, 11, 22.1, 23.1 |
| WSP USA Inc. |
15.6 and 15.7 (Tailings Storage Facility [TSF] and Waste Dump Facility [WDF]) |
| SRK Consulting Inc. |
1.1.2.5, 7.3 (Hydrogeological Data), 15.4 (Hydrogeological Considerations), and 15.5 (Hydrology and Water Management), and 23.5 |
| Ausenco Services Pty Ltd |
1.1.1.3, 1.1.2.3, 1.3.9, 10, 14, 22.3, 23.3 |
| All |
24 |
| 2.2 | Sources of Information |
During the preparation of this TRS, discussions were held with personnel
from SSR, Artmin, WSP USA Inc. (WSP), Ausenco Services Pty Ltd (Ausenco), INR Consulting & Engineering Inc. (INR Consulting), Tiera
Group International, and SRK Consulting Inc. (SRK):
| • | Rafael Arribasplata, Project Manager, Artmin |
| • | Geoff Smith, HSE Manager, Artmin |
| • | John Lean, Mine Manager, Artmin |
| • | Urko Ipina, Financial Planning & Analysis Manager, Artmin |
| • | Roddy Ormonde, Mining Contractor, Rombus Mining |
| • | Volkan Sevilmiş, Environmental Superintendent, Artmin |
| • | Metin Güden, HR Manager, Artmin |
| • | Özgür Kalafat, Project Superintendent, Artmin |
| • | Özgür Koçak, Mineral and Land Rights Manager, Artmin |
| • | John Ebbett, EVP Growth & Innovation, SSR |
| • | Jonathan Holden, VP Innovation and Tech Services, SSR |
| • | Rex Brommecker, SVP Exploration and Geology, SSR |
| • | Erica Smith, VP Legal, Securities and Corporate Governance, SSR |
| | 2-2 | |
| SSR Mining Inc. | Hod Maden Project | | January 7, 2026 |
| Technical Report Summary | | SLR Project No.: 123.000320.00001 |
| • | Bill Patterson, Studies Contractor, Patterson Studies Consulting, Owner’s Representative |
| • | Karthik Rathnam, Resource Geology Director, SSR |
| • | Osman Uludağ, Resource Development Director, SSR |
| • | Allen Morris, Senior Director, Innovation and Mineral Processing, SSR |
| • | Chase Stevens, Senior Process Engineer, SSR |
| • | Daniel Kern, Finance Director, SSR |
| • | Nitin Laddha, Finance Manager, SSR |
| • | Emma Dodds, Senior Mine Engineer, SSR |
| • | Jim Daly, Senior Geotechnical Engineer, WSP |
| • | Richard Kiel, Senior Civil Engineer, WSP |
| • | Volkan Boğazliyanlioğlu, Senior Geological Engineer, WSP |
| • | Yusuf Celen, Senior Geological Engineer, WSP |
| • | Goktug Evin, Hydrogeology Principal, SRK |
| • | David Hoekstra, Geoenvironmental Principal, SRK |
| • | Gary Hurban, Principal Water Resource Engineer, SRK |
| • | Mehmetcan Özkadıoğlu, Hydrologist, SRK |
| • | Tommaso Roberto Raponi, Principal Metallurgist, Ausenco |
| • | Erdi Seyhan, Civil Engineer, INR Consulting |
| • | Logan Westgard, Staff Engineer, Tierra Group International |
This Technical Report Summary supersedes the “Hod Maden Project,
Feasibility Study – Technical Report NI 43-101”, dated December 15, 2021 (the 2021 FS), compiled by GR Engineering Services
Limited (GR Engineering) for Sandstorm Gold Limited (Sandstorm), recently purchased by Royal Gold Inc.
GR Engineering previously completed a pre-feasibility study for the
Project in 2018 (the PFS) and a definitive feasibility study (DFS) for the Project in 2020 (the 2020 DFS).
The documentation reviewed, and other sources of information, are listed
at the end of this TRS in Section 24.0 References.
| | 2-3 | |
| SSR Mining Inc. | Hod Maden Project | | January 7, 2026 |
| Technical Report Summary | | SLR Project No.: 123.000320.00001 |
| 2.3 | Abbreviations, Acronyms and Units of Measure |
| 2.3.1 | List of Units of Measure |
Units of measurement used in this TRS conform to the metric system.
All currency in this TRS is US dollars (US$) unless otherwise noted.
| m |
micron |
kPa |
kilopascal |
| mg |
microgram |
kVA |
kilovolt-amperes |
| a |
annum |
kW |
kilowatt |
| A |
ampere |
kWh |
kilowatt-hour |
| bbl |
barrels |
L |
litre |
| Btu |
British thermal units |
lb |
pound |
| °C |
degree Celsius |
L/s |
litres per second |
| C$ |
Canadian dollars |
m |
meter |
| cal |
calorie |
M |
mega (million); molar |
| cfm |
cubic feet per minute |
m2 |
square meter |
| cm |
centimeter |
m3 |
cubic meter |
| cm2 |
square centimeter |
masl |
meters above sea level |
| d |
day |
m3/h |
cubic meters per hour |
| |
|
mbps |
megabits per second |
| dia |
diameter |
mi |
mile |
| dmt |
dry metric tonne |
min |
minute |
| dwt |
dead-weight ton |
mm |
micrometer |
| °F |
degree Fahrenheit |
mm |
millimeter |
| ft |
foot |
mph |
miles per hour |
| ft2 |
square foot |
MVA |
megavolt-amperes |
| ft3 |
cubic foot |
MW |
megawatt |
| ft/s |
foot per second |
MWh |
megawatt-hour |
| g |
gram |
oz |
Troy ounce (31.1035g) |
| G |
giga (billion) |
oz/st, opt |
ounce per short ton |
| gal |
Gallon (U.S. Custom) |
ppb |
part per billion |
| g/L |
gram per litre |
ppm |
part per million |
| gpm |
gallons per minute |
psia |
pound per square inch absolute |
| g/t |
gram per tonne |
psig |
pound per square inch gauge |
| gr/ft3 |
grain per cubic foot |
RL |
relative elevation |
| gr/m3 |
grain per cubic meter |
s |
second |
| ha |
hectare |
st |
short ton |
| hp |
horsepower |
stpa |
short ton per year |
| hr |
hour |
stpd |
short ton per day |
| Hz |
hertz |
t |
metric tonne |
| in. |
inch |
tpa |
metric tonne per year |
| in2 |
square inch |
tpd |
metric tonne per day |
| J |
joule |
US$ |
United States dollar |
| k |
kilo (thousand) |
V |
volt |
| kcal |
kilocalorie |
W |
watt |
| kg |
kilogram |
wmt |
wet metric tonne |
| km |
kilometer |
wt% |
weight percent |
| km2 |
square kilometer |
yd3 |
cubic yard |
| km/h |
kilometer per hour |
yr |
year |
| |
|
|
|
| | 2-4 | |
| SSR Mining Inc. | Hod Maden Project | | January 7, 2026 |
| Technical Report Summary | | SLR Project No.: 123.000320.00001 |
| 2.3.2 | List of Abbreviations and Acronyms |
Abbreviation /
Acronym |
Definition |
| AB |
andesite breccia, alternatives: And Bx and BXAN) |
| Ai |
abrasion Index |
| ARD / ML |
acid rock drainage / metal leaching |
| AWOS |
automated weather station |
| BeV |
break-even cut-off value |
| BWi |
Bond Ball Mill Work Index |
| CAB |
chlorite andesite breccia, alternatives: Chl and Bx and BXCA). |
| CAF |
cemented aggregate fill |
| CDA |
Canadian Dam Association |
| CN Sol Au |
cyanide soluble gold |
| CN Sol Cu |
cyanide soluble copper |
| CP |
crown pillar |
| CPI |
cost-performance indicator |
| CU |
consolidated undrained triaxial |
| CUF |
cyclone underflow |
| DAF |
drift and fill |
| DAR |
Design Application Report |
| DB |
dacite breccia, alternatives: Dac Bx and BXDA |
| DF |
disk filtration |
| DSI |
Turkish General Directorate of State Hydraulics Works |
| E&S |
environmental and safety |
| EAC |
Estimate-at-Completion |
| ECMWR |
European Centre for Medium-Range Weather Forecasts |
| EIA |
Environmental Impact Statement |
| EOR |
Engineer-of-Record |
| EP |
Equator Principles |
| EPC |
Engineering, Procurement and Construction |
| EPCM |
Engineering, Procurement and Construction Management |
| ESIA |
Environmental and Social Impact Assessment |
| ESMP |
environmental and social management plan |
| FAR |
fresh air raise |
| FEL |
front-end loaders |
| | 2-5 | |
| SSR Mining Inc. | Hod Maden Project | | January 7, 2026 |
| Technical Report Summary | | SLR Project No.: 123.000320.00001 |
Abbreviation /
Acronym |
Definition |
| FFP |
fast-acting filter press |
| FoS |
factor of safety |
| FS |
Feasibility Study |
| GCL |
geosynthetic clay liner |
| GRG |
Gravity Recoverable Gold |
| GSI |
Geological Strength Index |
| GW |
groundwater |
| HDPE |
high-density polyethylene |
| HEFZ |
Hod East Fault Zone |
| HEPP |
hydroelectric power plant |
| HMFZ |
Hod Main Fault Zone |
| HSS |
High Silica High Sulfide |
| HV |
high voltage |
| HVBF |
horizontal vacuum belt filtration |
| IFC |
International Finance Corporation |
| IPCC |
Intergovernmental Panel on Climate Change |
| IUCN |
International Union for Conservation of Nature |
| ITRB |
Internal Technical Review Board |
| ITS |
indirect tensile strength |
| LARAP |
Land Acquisition and Resettlement Action Plan |
| LCT |
locked cycle flotation tests |
| LHD |
load haul dump |
| LHS |
long hole stoping |
| LOM |
life of mine |
| LSEV |
Low-Sulfide Epithermal Vein |
| LV |
low voltage |
| MAP |
mean annual precipitation |
| MAPEG |
The General Directorate of Mining and Petroleum Affairs |
| MCS |
Master Composite Sample |
| MDE |
Maximum Design Earthquake |
| MDV |
marginal development cut-off value |
| MHB |
Material Hazardous in Bulk |
| MF2 |
Mill-Float-Mill-Float |
| | 2-6 | |
| SSR Mining Inc. | Hod Maden Project | | January 7, 2026 |
| Technical Report Summary | | SLR Project No.: 123.000320.00001 |
Abbreviation /
Acronym |
Definition |
| MPE |
Massive Pyrite Enrichment Zone, alternative MPY \ Enr Zon |
| MSA |
mine services area |
| MSE |
mechanically stabilized earth |
| MPY |
Massive Pyrite Domain, alternative MPYR |
| NAG |
non-acid generating |
| NSR |
Net Smelter Return |
| OBE |
Operating Basis Earthquake |
| OCT |
open-cycle cleaner test |
| OMS |
Operations, Maintenance, and Surveillance |
| OPC |
open cleaner flotation |
| PAG |
potentially acid generating |
| PAP |
project-affected people |
| PAR |
population at risk |
| PBF |
paste backfill |
| PEA |
preliminary economic assessment |
| PF |
pressure filtration |
| PFD |
paste fill design |
| PFS |
pre-feasibility Study |
| PGA |
peak ground acceleration |
| PGZ |
poor ground conditions |
| PLL |
Potential Loss of Life |
| PMF |
Probable Maximum Flood |
| PO |
pyrite ore |
| PS |
Performance Standards |
| PSD |
particle size distribution |
| QAT |
quality acceptance testing |
| RAR |
return air raise |
| T-RDB |
Turkish Red Data Book |
| RF |
Random Forest regression model |
| RO |
regular ore |
| ROM |
run-of-mine |
| RPI |
residual passive inflow |
| RQD |
rock quality designation |
| | 2-7 | |
| SSR Mining Inc. | Hod Maden Project | | January 7, 2026 |
| Technical Report Summary | | SLR Project No.: 123.000320.00001 |
Abbreviation /
Acronym |
Definition |
| RTFE |
Responsible Tailings Facility Engineer |
| RWi |
Bond Rod Mill Work Index |
| SEE |
Safety Evaluation Earthquake |
| SEM |
Sequential Excavation Method |
| SEP |
Stakeholder Engagement Plan |
| SIV |
stoping incremental cut-off value |
| SMC |
SAG Mill Comminution |
| SO |
Stope Optimizer |
| SPA |
Special Provincial Administration |
| SS |
sulfide sulfur |
| SSP |
Shared Socioeconomic Pathways |
| ST |
total sulfur |
| SV |
schedule variance |
| TARP |
Triggered Action Response Plan |
| TC/RC |
treatment and refining charges |
| TDS |
total dissolved solids |
| TL |
Turkish lira |
| TML |
Transportable Moisture Limit |
| TRS |
Technical Report Summary |
| TSF |
tailings storage facility |
| TXT |
triaxial test |
| TWTP |
temporary water treatment plant |
| UCS |
uniaxial compressive strength |
| UHG |
ultra high grade |
| UHV |
Ultra-High Voltage |
| VGYP |
gypsum volcano-sedimentary, alternative Gyp VolSed |
| VMS |
volcanogenic massive sulfide |
| VSED |
volcano-sedimentary, alternative VolSed |
| VWP |
vibrating wire piezometers |
| WDF |
waste rock dump facility |
| WHO |
World Health Organization |
| WTP |
water treatment plant |
| XRD |
x-ray diffraction |
| | 2-8 | |
| SSR Mining Inc. | Hod Maden Project | | January 7, 2026 |
| Technical Report Summary | | SLR Project No.: 123.000320.00001 |
| Short Name |
Company |
| AMC |
AMC Consultants Pty Ltd |
| Artmin |
Artmin Madencilik |
| Ausenco |
Ausenco Services Pty Ltd |
| Golder Türkiye (now WSP Türkiye) |
Golder Associates (Türkiye) Ltd. ŞTI |
| Golder UK (now WSP UK) |
Golder Associates (UK) Ltd |
| Golder USA (now WSP USA) |
Golder Associates Inc. |
| GR Engineering |
GR Engineering Services Limited |
| HMT |
Hacettepe Mineral Technologies Inc. |
| INR Consulting |
INR Consulting & Engineering Inc. |
| Lidya |
Lidya Madencilik |
| Royal Gold |
Royal Gold Inc. |
| RSC |
RSC Consulting Ltd. |
| SLR |
SLR International Corporation |
| SRK |
SRK Consulting (U.S.) Inc. |
| SSR |
SSR Mining Inc. |
| TEİAŞ |
Turkish Electricity Transmission Company |
| Wardell |
Wardell Armstrong International |
| WSP Türkiye |
WSP Danışmanlık ve Mühendislik Ltd. Şti |
| WSP UK |
WSP UK Ltd. |
| WSP USA |
WSP USA Inc. |
| | 2-9 | |
| SSR Mining Inc. | Hod Maden Project | | January 7, 2026 |
| Technical Report Summary | | SLR Project No.: 123.000320.00001 |
The Hod Maden Project site is situated within the Eastern Pontides tectonic
belt, which coincides with the 500 km long, and 50 km to 75 km wide mountain chain extending along the southeastern Black Sea coastline.
Hod Maden is located approximately 20 km south of Artvin and 130 km northeast of Erzurum in northeastern Türkiye near the border
with Georgia (Figure 3-1). The Project uses ED50 co-ordinate reference system (CRS) and projection UTM Zone 37N (WGS84). The Project center
coordinates are 740,600 mE, 4,542,200 mN, with latitude and longitude coordinates of 41.032° N and 41.867° E, respectively.
The north-south striking Hod Maden deposit is transected by the (locally)
east-west trending Maden Valley (also known as the South Valley), which is the valley formed by Maden Creek, with the valley populated
by scattered neighborhoods of residential dwellings. The village of Yukarιmaden
sits near the deposit, while the village of Aşağımaden sits approximately two kilometers downstream.
The site is well positioned to access infrastructure. Yukarιmaden
village lies within the property and has limited power, running water, and sewage treatment facilities. Two high tension power lines (154
kV and 380 kV) stretch across hilltops above the Project area. There is a smaller line of 30 kV, which supplies local loads and the smaller
villages.
Two concentrate handling facilities and ports, Hopa and Rize, are situated
on the Black Sea coast near the Project. The closest is Hopa, approximately 120 km by road from Yukarιmaden.
Hopa was built to handle copper concentrate from the nearby Murgul mine. Rize, which handles concentrate from the Cayeli mine is approximately
200 km from the Project. The Project location is illustrated in Figure 3-1.
| | 3-1 | |
| SSR Mining Inc. | Hod Maden Project | | January 7, 2026 |
| Technical Report Summary | | SLR Project No.: 123.000320.00001 |
Figure 3-1: Location Map
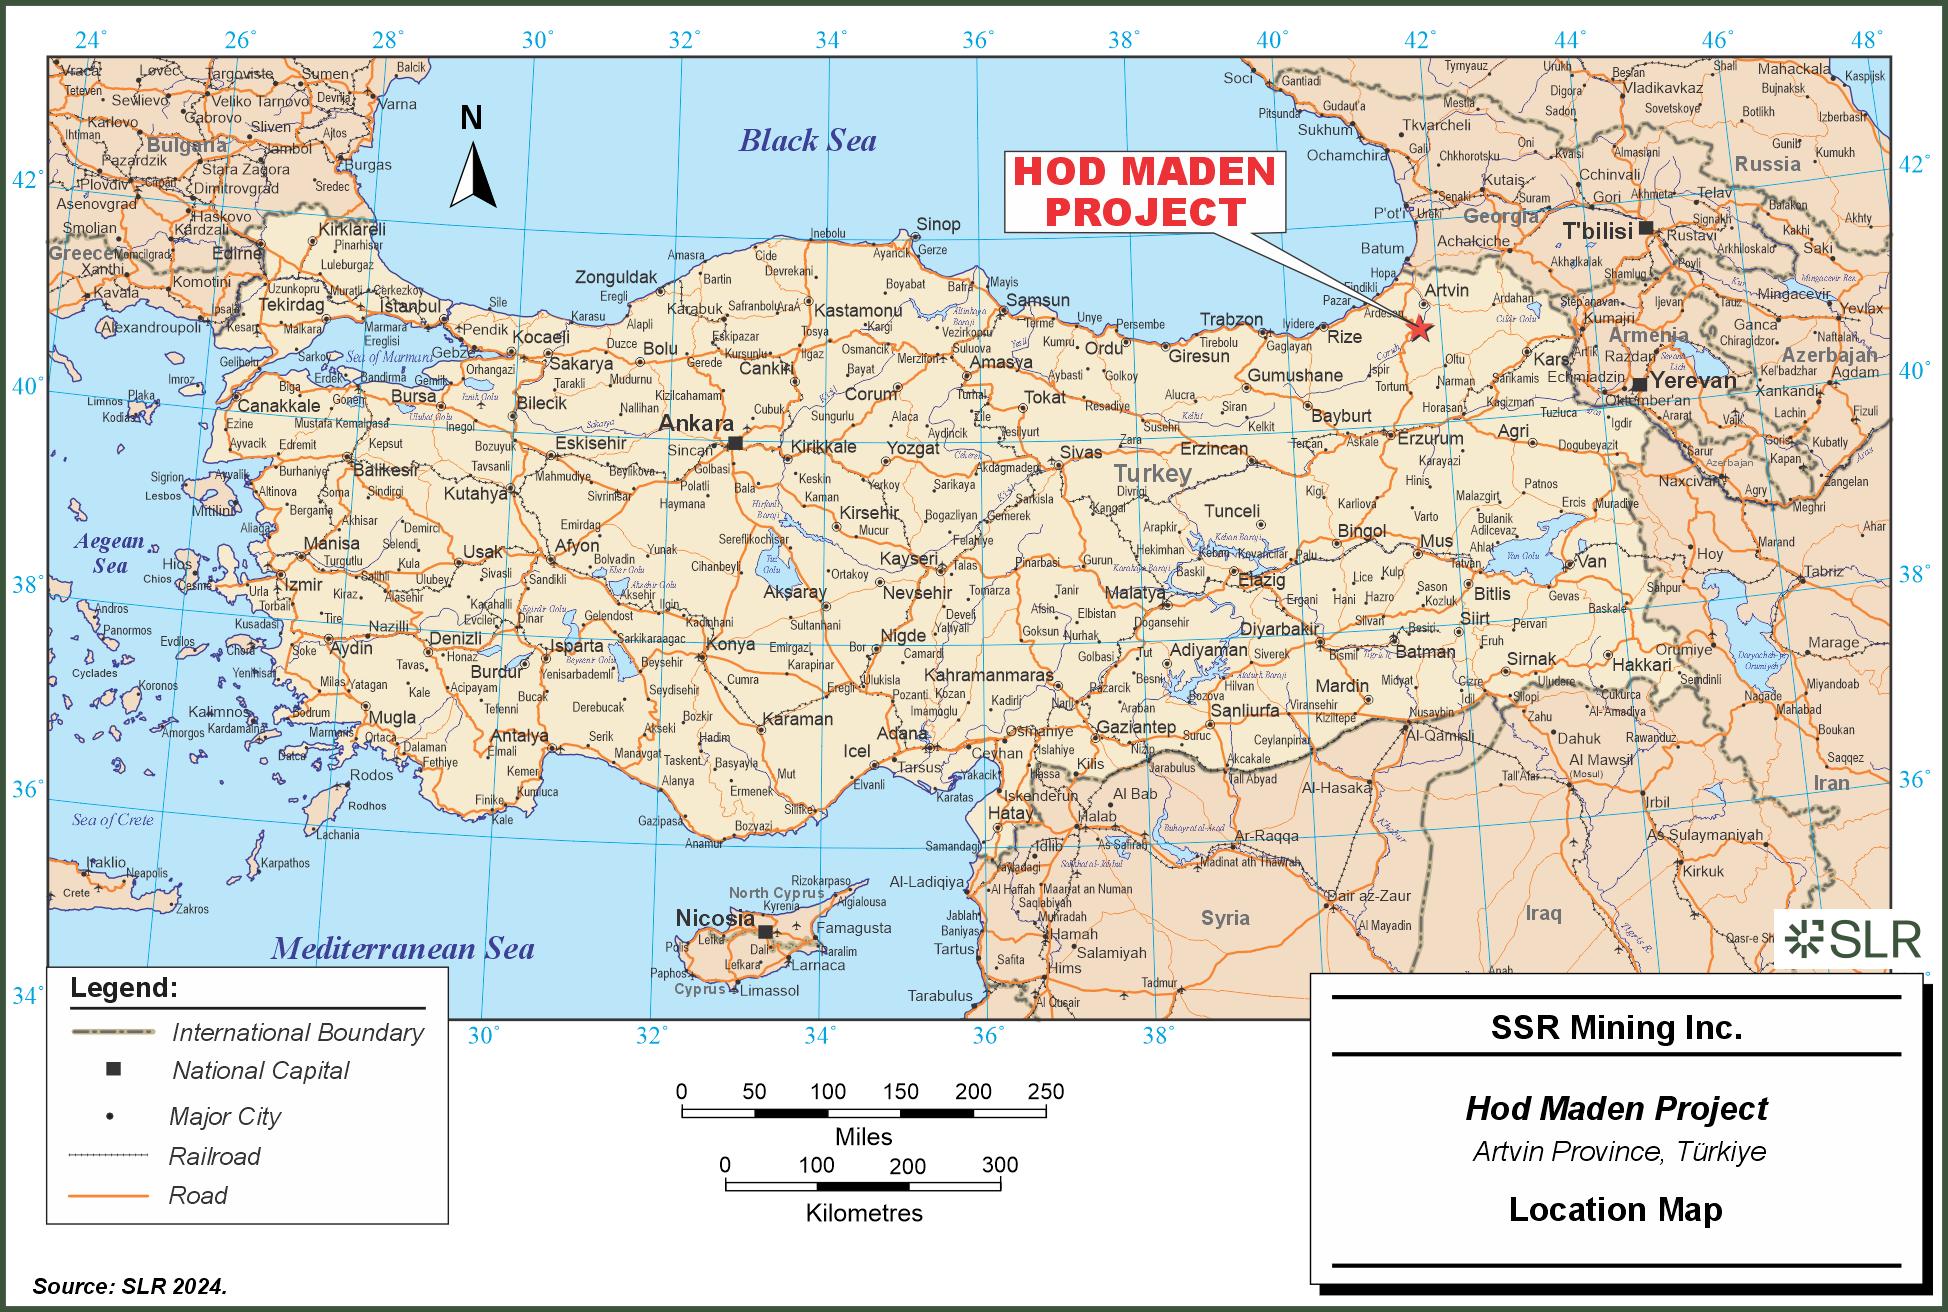
FIGURE 3-1
HOD MADEN PROJECT
Legend:
International Boundary
National Capital
Major City
Railroad
Road
Miles
0
50
100
150
200
250
Kilometres
0
100
200
300
SLR
SSR Mining Inc.
Hod Maden Project
Artvin Province, Türkiye
Location Map
Source: SLR 2024.
| | 3-2 | |
| SSR Mining Inc. | Hod Maden Project | | January 7, 2026 |
| Technical Report Summary | | SLR Project No.: 123.000320.00001 |
The Hod Maden Property consists of Turkish operating licenses 87288
and 88657, comprising a total land area of 3,543.24 hectares. The licenses, shown in Table 3-1, are 100% owned by Artmin, a 60:10:30 jointly-owned
company between Lidya Madencilik (Lidya), SSR, and Royal Gold Inc (who recently purchased Sandstorm Gold Limited). SSR will acquire an
additional 30% from Lidya upon commencement of production.
Table 3-1: Hod Maden Project, Licenses
Details
| No. |
City |
Town |
License No. |
ER No. |
Sheet No. |
Area
(ha) |
License Date |
Due Date |
| 1 |
ARTVİN |
MERKEZ |
87288 |
3389160 |
G47 b2, b1
F47 c3, c4 |
3,511.71 |
4-Feb-13 |
6-Feb-42 |
| 2 |
ARTVİN |
MERKEZ |
88657 |
3395598 |
F47 c4 |
31.53 |
16-Feb-21 |
17-Feb-31 |
Note: ER No. is the registration number of the mining area at the Turkish
General Directorate of Mining and Petroleum Affairs (MAPEG).
The tenements (Figure 3-2) are covered by numerous small freeholdings
(private lands), which Artmin is in the process of acquiring via private sale or expropriation process. Currently 87% of the required
land has been purchased by Artmin. The expropriation process was approved and commenced by The General Directorate of Mining and Petroleum
Affairs (the Mining Directorate, MAPEG) on March 18, 2020. The population to be affected is very small and a high proportion of the affected
land has been purchased. Expropriation of the remaining tenements is well advanced (93%). A budget for land purchases, resumption, and
restitution has been budgeted in the capital cost estimate.
There are no liens, mortgages covenants, or restrictions to the property
additional to the Royal Gold Royalty (described in Section 3.4) ,and the required permits described in Section 3.5.
An electrical transmission easement crosses the Project area. SLR understands
that the owners of the easement have no issue with the development, and the owners of the powerline(s) are currently in negotiation with
Artmin with respect to power supply.
| | 3-3 | |
| SSR Mining Inc. | Hod Maden Project | | January 7, 2026 |
| Technical Report Summary | | SLR Project No.: 123.000320.00001 |
Figure 3-2: Project Area Map
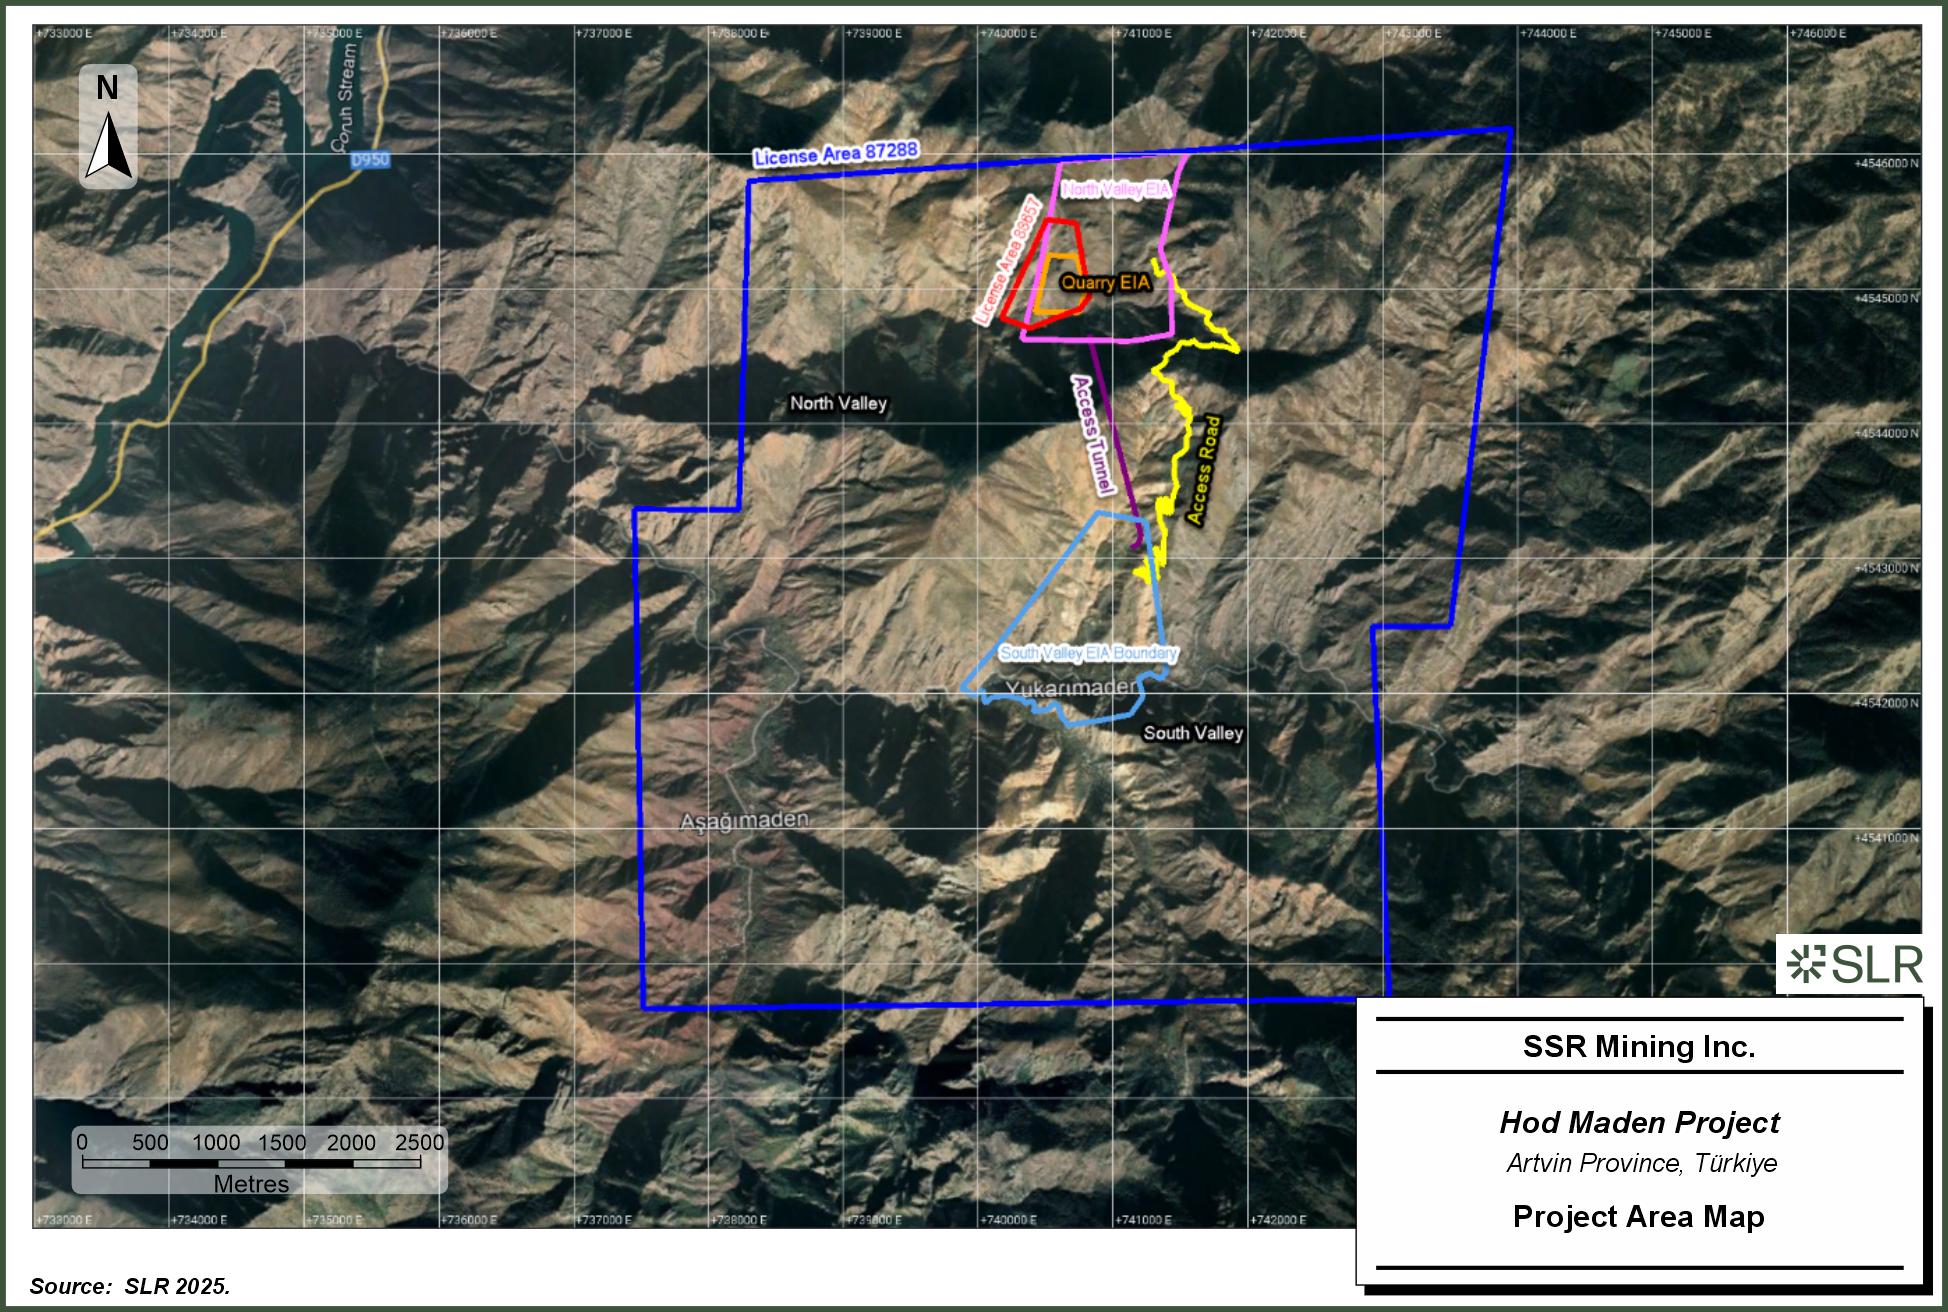
FIGURE 3-2
License Area 87288
License Area 88857
North Valley EIA
Quarry EIA
Access Tunnel
Access Road
South Valley EIA Boundary
Metres
0
500
1000
1500
2000
2500
SLR
SSR Mining Inc.
Hod Maden Project
Artvin Province, Türkiye
Project Area Map
Source: SLR 2025.
| | 3-4 | |
| SSR Mining Inc. | Hod Maden Project | | January 7, 2026 |
| Technical Report Summary | | SLR Project No.: 123.000320.00001 |
Royalties are payable to the state in Türkiye on the principle
of the value of the commodity at the underground mine portal. The royalty base is therefore arrived at by subtracting all non-mining related
on-site and off-site operating costs (including forestry fees, corporate expenses, freight and TC/RCs) and all non-mining related depreciation
and amortization from the gross revenue from payable minerals. Applicable royalty percentages are applied to the royalty base.
Prior to April 2020, the overall royalty rate for a polymetallic mine
in Türkiye was the rate derived from the value of the mineral forming the greatest proportion of gross revenue from payable metals
in a given period; however, in April 2020 the regime changed to one where applicable royalty rates were applied separately by commodity,
and the rates for each commodity in a given period depend on the price of that commodity. The royalty base for each metal is calculated
pro-rata to the gross revenue from payable metal proportions. This means that, if gold is 80% of gross revenue, it will also attract 80%
of common deductible costs in its royalty base.
Royalty rates for gold and copper are shown in Table 3-2.
| | 3-5 | |
| SSR Mining Inc. | Hod Maden Project | | January 7, 2026 |
| Technical Report Summary | | SLR Project No.: 123.000320.00001 |
Table 3-2: Royalty
Rates for Gold and Copper
Metal Price
($/oz Gold) |
Prescribed Royalty |
Royalty After 40% In-Country Processing Incentive |
Metal Price
($/t Copper) |
Prescribed Royalty |
Royalty After 50% In-Country Processing Incentive |
| From |
To |
Rate (%) |
Rate (%) |
From |
To |
Rate (%) |
Rate (%) |
| 0 |
800 |
1.25 |
0.75 |
0 |
5000 |
1.25 |
0.63 |
| 801 |
900 |
2.50 |
1.50 |
5001 |
5300 |
2.50 |
1.25 |
| 901 |
1000 |
3.75 |
2.25 |
5301 |
5600 |
3.75 |
1.88 |
| 1001 |
1100 |
5.00 |
3.00 |
5601 |
5900 |
5.00 |
2.50 |
| 1101 |
1200 |
6.25 |
3.75 |
5901 |
6200 |
6.25 |
3.13 |
| 1201 |
1300 |
7.50 |
4.50 |
6201 |
6500 |
7.50 |
3.75 |
| 1301 |
1400 |
8.75 |
5.25 |
6501 |
6800 |
8.75 |
4.38 |
| 1401 |
1500 |
10.00 |
6.00 |
6801 |
7100 |
10.00 |
5.00 |
| 1501 |
1600 |
11.25 |
6.75 |
7101 |
7400 |
11.25 |
5.63 |
| 1601 |
1700 |
12.50 |
7.50 |
7401 |
7700 |
12.50 |
6.25 |
| 1701 |
1800 |
13.75 |
8.25 |
7701 |
8000 |
13.75 |
6.88 |
| 1801 |
1900 |
15.00 |
9.00 |
8001 |
8300 |
15.00 |
7.50 |
| 1901 |
2000 |
16.25 |
9.75 |
8301 |
8600 |
16.25 |
8.13 |
| 2001 |
2100 |
17.50 |
10.50 |
8601 |
8900 |
17.50 |
8.75 |
| 2101 |
2400 |
18.75 |
11.25 |
8901 |
9800 |
18.75 |
9.38 |
| 2401 |
2700 |
20.00 |
12.00 |
9801 |
10700 |
20.00 |
10.00 |
| 2701 |
3000 |
21.25 |
12.75 |
10701 |
11600 |
21.25 |
10.63 |
| 3001 |
3300 |
22.50 |
13.50 |
11601 |
12500 |
22.50 |
11.25 |
| 3301 |
3600 |
23.75 |
14.25 |
12501 |
13400 |
23.75 |
11.88 |
| 3601 |
3900 |
25.00 |
15.00 |
13401 |
14300 |
25.00 |
12.50 |
| 3901 |
4200 |
26.25 |
15.75 |
14301 |
15200 |
26.25 |
13.13 |
| 4201 |
4500 |
27.50 |
16.50 |
15201 |
16100 |
27.50 |
13.75 |
| 4501 |
4800 |
28.75 |
17.25 |
16101 |
17000 |
28.75 |
14.38 |
| 4801 |
5100 |
30.00 |
18.00 |
17001 |
17900 |
30.00 |
15.00 |
| >5101 |
|
31.25 |
18.75 |
>17901 |
25 |
31.25 |
15.63 |
|
Source: Reproduced from Turkish Mining Law, as amended April
2025
Notes:
1.
The mean value of the London Stock Exchange is taken as basis of the period during which the state royalty is accrued.
2.
The mean value of the Central Bank of the Republic of Türkiye is taken as basis of the period during which the state royalty
is accrued.
3.
The price notified by the Turkish Ministry of Energy and Natural Resources shall be taken as the basis for mineral that are publicly
traded.
4.
The fractional numbers coming after the decimal point are rounded to the nearest decimal. |
| | 3-6 | |
| SSR Mining Inc. | Hod Maden Project | | January 7, 2026 |
| Technical Report Summary | | SLR Project No.: 123.000320.00001 |
Royal Gold holds a 2.0% Net Smelter Return (NSR) royalty covering 100%
of production from Hod Maden. The Project itself is operated by SSR Mining, which acquired an initial 10% interest in 2023 with an option
to earn up to 40%, while the balance of ownership remains primarily with Lidya and Royal Gold through its integrated interests.
| 3.5 | Required Permits and Status |
In Türkiye, mining activities are regulated by the Mining Law No.
3213 of 15 June 1985, as amended by Laws 5177 (2004), 5995 (2010), 6592 (2015), 7020 (2017), 7061 (2017), 7103 (2018), and 7164 (2019),
together with the Mining Regulation dated 21 September 2017 and the Mining Waste Directive of 15 July 2015.
Under the Mining Law, both an Exploration License and an Operating License
are required to conduct mining activities. The Hod Maden Operating License was issued on 4 February 2013 by the General Directorate of
Mining and Petroleum Affairs (MAPEG).
The Mining Regulation introduced an “environment-friendly guarantee”
(Çevreyle Uyum Teminatı), an annual financial assurance equal to 30 % of the license value, payable when the operating license
is granted. This guarantee is partially refundable upon certified mine closure, serving to offset reclamation costs.
Under the 2019 amendments (Law 7164), license holders must pay an annual
license fee and an environment-friendly guarantee, representing respectively 70 % and 30 % of the total license value, as defined by MAPEG
schedules.
Current license fees (sunk costs) are listed in Table 3-3. These licenses
enable Artmin to undertake the following activities within the leases on Forestry lands. Activities on private lands require the consent
of the owners.
Table 3-3: Operating License Fee
and Forestry Land Fees for 2020
| Payments (2020) |
Operating License (87288) |
| License Value (ACCORDING TO MINING LAW) |
179,135.00 TL |
| Forestry Land Permit Fee (52 drill sites) |
62,995.64 TL |
| Forestry Land Permit Fee (30 drill sites) |
64,106.52 TL |
| Forestry Land Permit Fee (30 drill sites) |
81,286.93 TL |
| Forestry Land Permit Fee (Road) |
12,187.19 TL |
| Forestry Land Permit Fee (28 drill sites) |
77,075.47 TL |
| Forestry Land Permit Fee (61 drill sites) |
261,384.40 TL |
| Forestry Land Permit Fee (30 drill sites) |
33,514.41 TL |
| Note: Fees are in Turkish lira. 1 US$ = 51.82 TL |
Mining projects undergo environmental review by the Ministry of Environment,
Urbanisation and Climate Change. Artmin submitted an Environmental Impact Assessment (EIA), which the Ministry approved on November 17,
2021. Environmental permits will also be required to support Project development, as discussed in Section 17.0.
| | 3-7 | |
| SSR Mining Inc. | Hod Maden Project | | January 7, 2026 |
| Technical Report Summary | | SLR Project No.: 123.000320.00001 |
| 3.6 | Other Significant Factors and Risks |
Environmental liabilities on the property are associated with the early
phases of project development and addressed in the context of the closure plan and closure cost estimate. SSR Mining Inc. has the necessary
environmental approval and permits to begin the proposed work on the property, and the company continues to obtain the necessary construction
and operating permits, as further described in Section 17.0. During the site visit SLR noted potentially acidic water emanating from the
pilot test hole drilled at the site of the planned portal to access the underground mine. Iron oxide precipitation was also noted; however,
this is expected due to the geology of the site, and it is not considered to be material. SLR is not aware of any other significant factors
and risks that may affect access, title, or the right or ability to perform the proposed work program on the property.
| | 3-8 | |
| SSR Mining Inc. | Hod Maden Project | | January 7, 2026 |
| Technical Report Summary | | SLR Project No.: 123.000320.00001 |
| 4.0 | Accessibility,
Climate, Local Resources, Infrastructure and Physiography |
The Project site is accessible from the city of Artvin (20 km radially,
one hour by road) or from the city of Erzurum (130 km radially, 2.5 hours by road via Yusufeli). The highways from Artvin or Erzurum are
asphalt to the main road junction along the reservoir on the Çoruh River. The road leading away from the reservoir to the working
area and nearby Yukarιmaden village is partly asphalt.
Yukarιmaden
village lies within the property and has limited power, running water, and sewage treatment facilities. The school was closed many years
ago and the old school building is currently used by Artmin as a base for exploration activities.
A map of the region has been provided in Figure 4-1 that shows the Project’s
relative location and the 8.82-km long main access road (in red) to the Hod Maden mine project in Artvin Province, Türkiye.
The alignment includes road cuts, fills, and tunnels, and traverses
complex mountainous terrain. As previously noted, the total road length is 8.82 km; the alignment crosses steep mountainous terrain with
grades up to 8% to 10%. The road will provide mine access for heavy equipment and ore haulage.
The geology along the road alignment is characterized by a sequence
of andesitic to dacitic volcanic rocks, including tuffs, pyroclastics, and volcanic breccias. Weathering conditions vary considerably,
ranging from shallow colluvial deposits to highly fractured bedrock. Several fault zones and altered tuff horizons have been mapped along
the corridor, and many of the discontinuities within these zones contain clay infill, which reduces their shear strength and overall stability.
Groundwater seepage is common in the fractured pyroclastics, and artesian inflows have been encountered locally, indicating that dedicated
drainage measures will be necessary.
Rock mass conditions vary as well. Most of the country rock has Rock
Mass Rating (RMR) values between about 30 and 40, indicating poor quality in several sections, while other areas fall in the 50–60
range, representing fair to good conditions. Geological Strength Index (GSI) values were used to derive appropriate geotechnical strength
parameters for design. Where weak or highly fractured zones occur, slope trimming, localized retaining structures, or rock bolting and
shotcrete will be required to ensure long-term stability.
Cut slope geometries reflect the range in rock quality: in competent
volcanic units, slope angles of roughly 60° to 70° are achievable, whereas weaker tuffs and breccias require more conservative
angles in the 40° to 50° range. Fill slopes are to be constructed using engineered, compacted material with appropriate drainage
provisions. Retaining structures, anticipated to include gabion walls, reinforced-earth systems, or shotcrete-stabilized faces, are included
where necessary. Surface and subsurface drainage elements, such as roadside ditches, culverts, and subdrains, form a key component of
the design to manage seepage and mitigate instability. In terrain where stability is particularly critical, more robust measures such
as reinforced cuts, anchored retaining walls, steel supports, and shotcrete linings are planned. The alignment includes two short tunnels:
one of tunnel length of approximately 105 m and a second, shorter tunnel. Tunnel sections will likely require systematic support including
bolts, shotcrete, and drainage due to poor to very poor rock mass quality.
| | 4-1 | |
| SSR Mining Inc. | Hod Maden Project | | January 7, 2026 |
| Technical Report Summary | | SLR Project No.: 123.000320.00001 |
Two long tunnels will be built as part of the 8.82 km long main access
road. Based on the alignment and geotechnical plan, the relative locations of the two tunnels are:
Tunnel T1: Start at km 0+840, Exit at km 2+370 – total length
approximately 1,530 m.
Tunnel T2: Start at km 4+242, Exit at km 6+585 – total length
approximately 2,343 m.
Tunnel cross-section dimensions and detailed support recommendations
(bolts, shotcrete, ribs) are indicated in the detailed engineering drawings and reports. The access road is technically feasible with
conventional slope design and engineered support in critical zones. Conservative excavation, systematic bolting, shotcrete, and drainage
will be required, particularly in fault zones, weathered tuffs, and tunnel sections.
| | 4-2 | |
| SSR Mining Inc. | Hod Maden Project | | January 7, 2026 |
| Technical Report Summary | | SLR Project No.: 123.000320.00001 |
Figure 4-1: Main (Yukarimaden) Access
Road
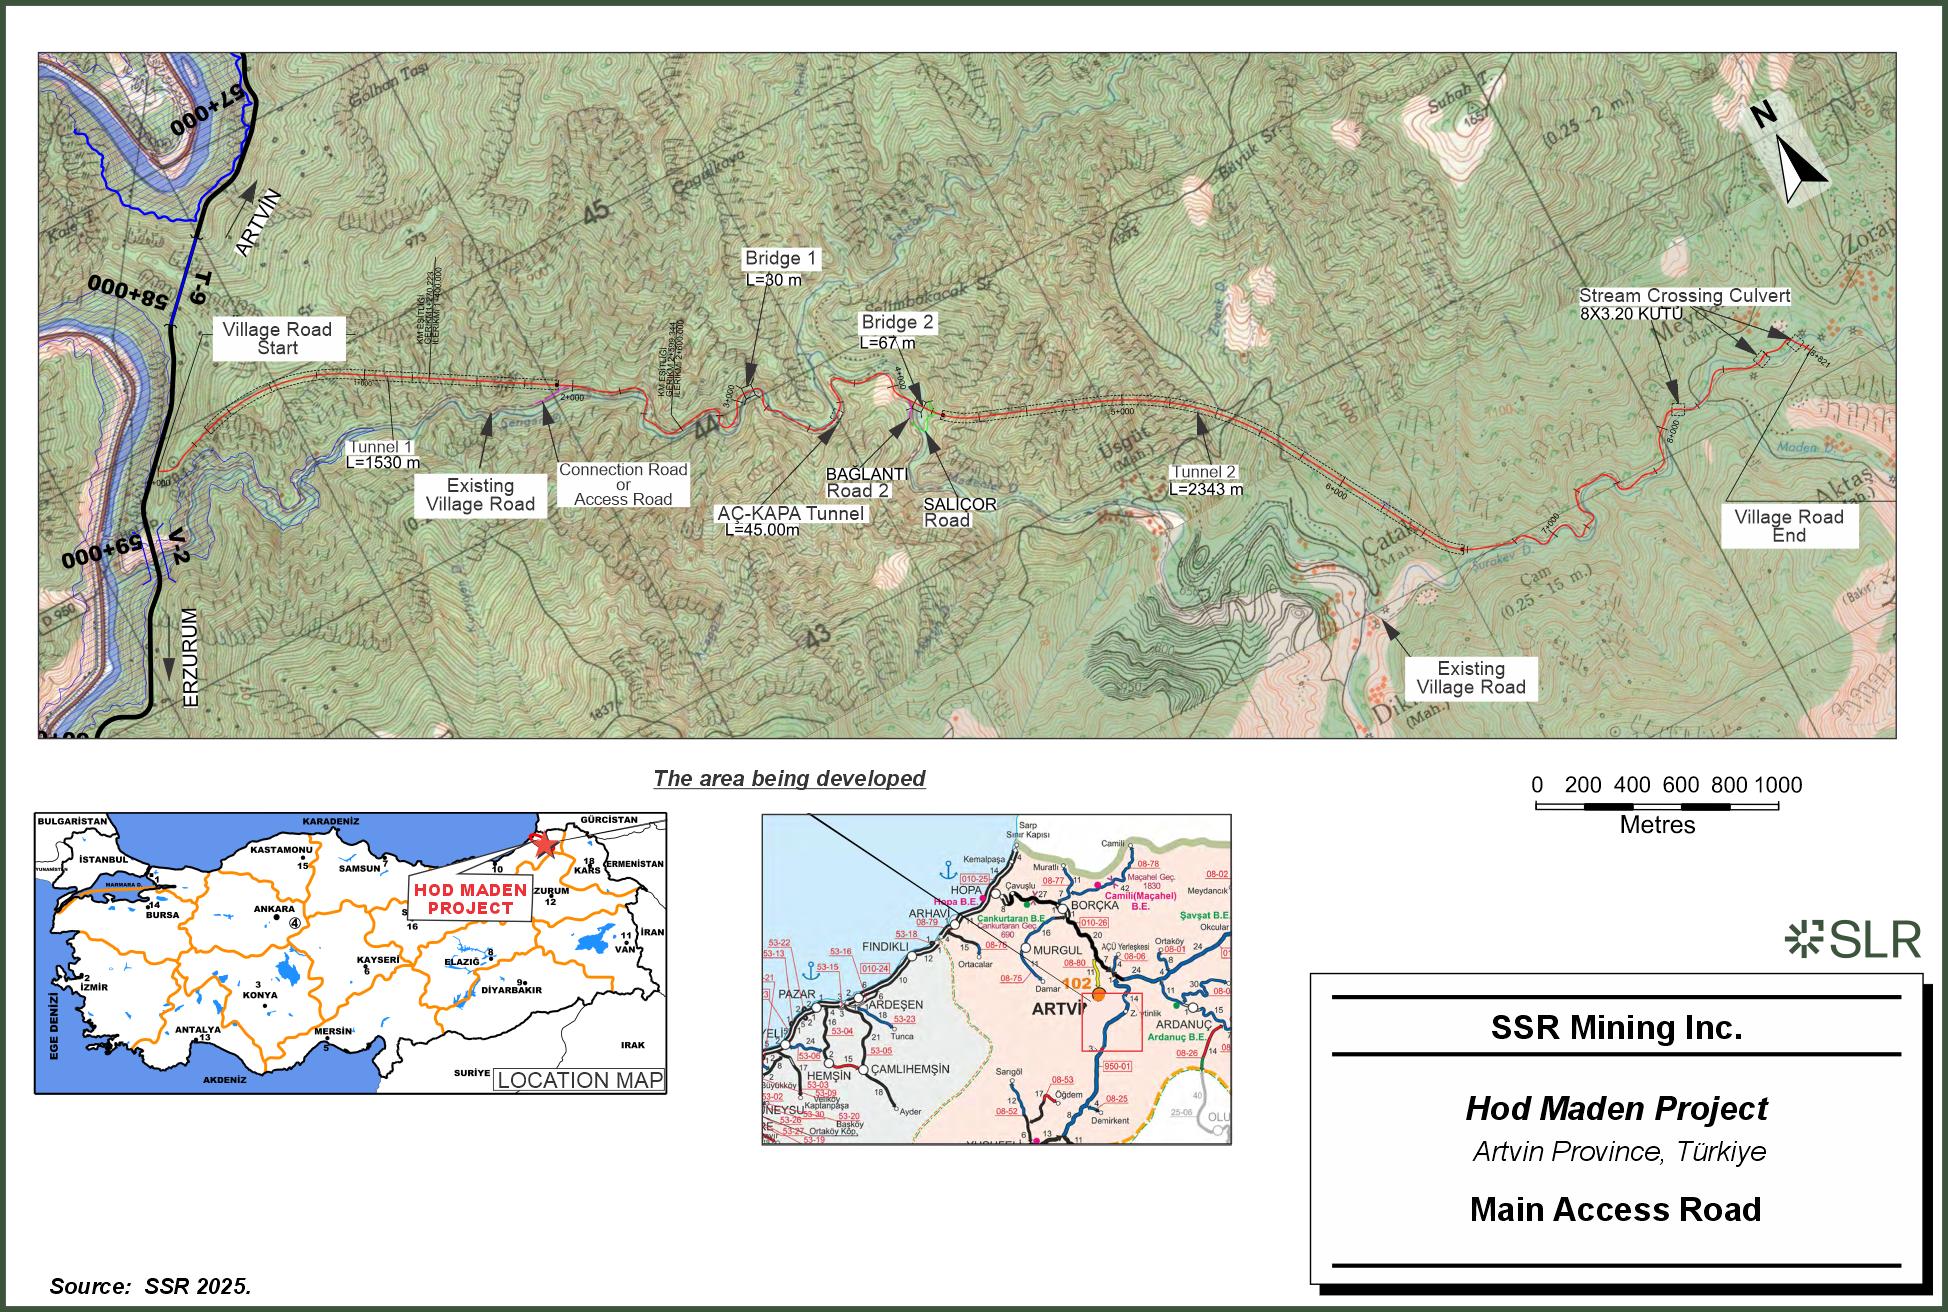
FIGURE 4-1
ARTVIN
ERZURUM
Village Road Start
Tunnel 1
L = 1530 m
Existing Village Road
Connection Road or Access Road
Bridge 1
L = 30 m
AC-KAPA Tunnel
L = 45.00m
BAGLANTI Road 2
SALICOR Road
Bridge 2
L = 67 m
Tunnel 2
L = 2343 m
Existing Village Road
Stream Crossing Culvert
8X3.20 KUTU
Village Road End
Metres
0
200
400
600
800
1000
The area being developed
HOD MADEN PROJECT
LOCATION MAP
ARTVIN
SLR
SSR Mining Inc.
Hod Maden Project
Artvin Province, Türkiye
Main Access Road
Source: SSR 2025.
| | 4-3 | |
| SSR Mining Inc. | Hod Maden Project | | January 7, 2026 |
| Technical Report Summary | | SLR Project No.: 123.000320.00001 |
The Project is situated in the northwestern portion of the Çoruh
Basin in northeastern Türkiye, within a region that marks a climatic transition between the humid Mediterranean influence of the
Black Sea coast and the drier continental climate of the interior.
The topography of the basin exerts a dominant control on local climatic
conditions. Elevations range from approximately 300 meters above sea level (masl) along the valley floors to about 2,830 masl along surrounding
ridges, with the Hod Maden Project area itself located at roughly 900 masl. This relief of more than 2,500 m strongly influences temperature
gradients and the form of precipitation: rainfall predominates at lower elevations, while snowfall dominates at higher altitudes.
An automated weather observation system (AWOS) operated by the General
Directorate of Meteorology (MGM)—the Yukarımaden Köyü Station (ID 18970)—is located on the ridge separating
the Saliçor and Şurakev drainages at an elevation of 1,503 masl. The station remains operational, and data available for
this assessment cover the period from June 21, 2017, through March 31, 2025. These data were compiled and analyzed by SRK Consulting as
part of the 2025 Water Balance Study (SRK 2025a).
Due to the limited duration of the on-site station, long-term climatic
conditions were supplemented using global gridded datasets. Precipitation was extended using the U.S. National Aeronautics and Space Administration’s
(NASA) Integrated Multi-Satellite Retrievals for Global Precipitation Measurement (GPM IMERG v07) dataset (Huffman et al. 2023), and temperature
was supplemented using the ERA5-Land reanalysis dataset developed by the European Centre for Medium-Range Weather Forecasts (ECMWF). Both
datasets were bias-corrected against site observations to provide a representative long-term climatic record for the Project area.
General descriptive information of the Yukarιmaden Village AWOS
is provided in Table 4-1.
Table 4-1: On-Site Meteorological
Station Information
| Station No |
Station Name |
Province |
District |
Latitude |
Longitude |
Elevation
(masl) |
Date of Start |
| 18970 |
Yukarımaden
Village (Hod) |
Artvin |
Yusufeli |
41.0121 |
41.8692 |
1503 |
June 21, 2017 |
Due to the Project area’s location in the transition zone between
the coastal and continental climate, combined with its steep mountainous topography, the precipitation values at the site are relatively
lower than the national average. The mean annual precipitation (MAP) for Türkiye, based on the 1991–2020 climate normals, is
573.4 mm (MGM 2025), while the Project site records comparatively lower totals.
The Yukarımaden AWOS has been operational since June 2017 and
continues to record data. At the time of preparation of this report, the latest received data from MGM extends to March 31, 2025. Completed
years from 2018 to 2024 indicate a mean annual precipitation of approximately 414 mm, with annual totals ranging between 228 mm and 570
mm. The most recent years, 2023 and 2024, have shown the highest precipitation on record, exceeding 490 mm and 570 mm, respectively.
| | 4-4 | |
| SSR Mining Inc. | Hod Maden Project | | January 7, 2026 |
| Technical Report Summary | | SLR Project No.: 123.000320.00001 |
Table 4-2 summarizes the monthly and annual precipitation totals
measured at the Yukarımaden AWOS.
Table 4-2: On-Site Station
Monthly Average Precipitation (mm)
| Year |
Jan |
Feb |
Mar |
Apr |
May |
Jun |
Jul |
Aug |
Sep |
Oct |
Nov |
Dec |
Annual |
| 2017 |
- |
- |
- |
- |
- |
- |
12.9 |
18.2 |
25.3 |
45.3 |
13.7 |
5.3 |
-- |
| 2018 |
23.5 |
11.6 |
30.1 |
3.9 |
108.9 |
31.4 |
24.2 |
32.6 |
54.9 |
41.3 |
15.2 |
40 |
417.6 |
| 2019 |
12.2 |
15.5 |
19.7 |
44.1 |
30.9 |
41.5 |
15.5 |
4.5 |
20.7 |
1.8 |
3.6 |
18.2 |
228.2 |
| 2020 |
8.4 |
16.3 |
32.9 |
32.7 |
101.9 |
32 |
87.2 |
21 |
6.6 |
16.5 |
20.8 |
10.2 |
386.5 |
| 2021 |
25.6 |
13.1 |
68.6 |
32.1 |
14.4 |
17.9 |
36.7 |
55.9 |
65.8 |
60.9 |
12.2 |
19.2 |
422.4 |
| 2022 |
30.8 |
8.7 |
44.3 |
28.7 |
71.4 |
74.2 |
7.5 |
3.1 |
23.5 |
51.8 |
8.9 |
22.4 |
375.3 |
| 2023 |
10.1 |
35.6 |
53.9 |
87.5 |
50.4 |
88.5 |
45.4 |
12.9 |
5.4 |
18.7 |
70.2 |
18.2 |
496.8 |
| 2024 |
33.9 |
20.9 |
47.9 |
4 |
101.5 |
34.4 |
66.1 |
36.9 |
88.3 |
55.1 |
26.5 |
54.6 |
570.1 |
| 2025 |
27.8 |
17.7 |
20.1 |
- |
- |
- |
- |
- |
- |
- |
- |
- |
-- |
| Max |
33.9 |
35.6 |
68.6 |
87.5 |
108.9 |
88.5 |
87.2 |
55.9 |
88.3 |
60.9 |
70.2 |
54.6 |
570.1 |
| Min |
8.4 |
8.7 |
19.7 |
3.9 |
14.4 |
17.9 |
7.5 |
3.1 |
5.4 |
1.8 |
3.6 |
5.3 |
228.2 |
| Average |
20.6 |
17.4 |
42.5 |
33.3 |
68.5 |
45.7 |
40.4 |
23.8 |
37.9 |
35.2 |
22.5 |
26.1 |
413.8 |
Source : 18970 – Yukarımaden Village AWOS (MGM)
Figure 4-2 presents the average monthly precipitation distribution
for the completed annual period of 2017 to 2024, measured at the Project site. The data shows a seasonal trend, with precipitation levels
generally peaking in spring and early summer before gradually decreasing through late summer and autumn. May records the highest precipitation
average (68.5 mm), followed by June (45.7 mm) and March (42.5 mm), indicating that spring as the wettest season. In contrast, the lowest
precipitation occurs in February (17.4 mm) and January (20.6 mm), reflecting relatively dry winter conditions at the Project elevation.
| | 4-5 | |
| SSR Mining Inc. | Hod Maden Project | | January 7, 2026 |
| Technical Report Summary | | SLR Project No.: 123.000320.00001 |
Figure 4-2: Monthly Average
On-Site Precipitation (2017–2024)
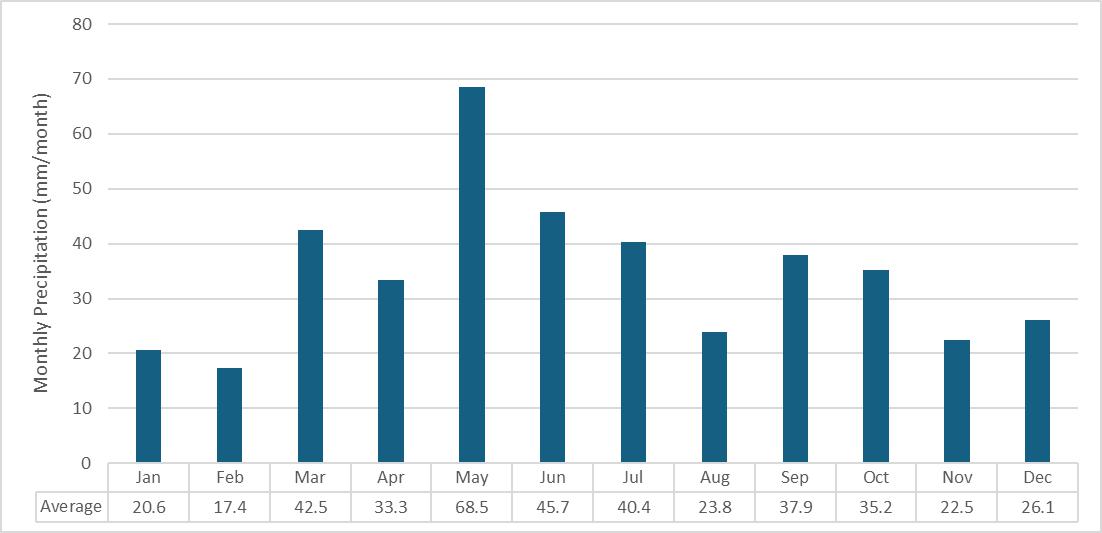
FIGURE 4-2
Monthly Precipitation (mm/month)
80
70
60
50
40
30
20
10
0
Average
Jan
20.6
Feb
17.4
Mar
42.5
Apr
33.3
May
68.5
Jun
45.7
Jul
40.4
Aug
23.8
Sep
37.9
Oct
35.2
Nov
22.5
Dec
26.1
Within SRK’s ongoing 2025 work, several gridded precipitation
datasets and the Artvin Meteorological Station, the closest long-term observation site, were evaluated to identify the most representative
source for the Project area and update the mean annual precipitation (MAP). Among the tested datasets, the GPM IMERG v07 product showed
the best agreement with on-site measurements and was therefore selected for the long-term precipitation assessment. The dataset was bias-corrected
using the Quantile Delta Mapping (QDM) method. The mean annual precipitation measured at the on-site station for 2018–2024 is approximately
414 mm/year, while the bias-corrected GPM dataset indicates a comparable long-term estimate of about 380 mm/year, based on the 1998–2024
(27-year) record (SRK 2025a).
During the observation period at the Project site, the average temperature
was recorded at 9.5°C. The coldest month was January, with an average temperature of -0.5°C, while the warmest month was August,
with an average temperature of 19.9°C. The highest temperature measured at the site was 36.7°C in July 2020, and the lowest was
-22.5°C in December 2017.
Table 4-3 presents the monthly average values for mean, maximum,
and minimum temperatures, along with the recorded monthly extreme low and high temperatures, measured at the on-site station for the 2017–2024
period.
To provide a long-term temperature representation, several global reanalysis
datasets were evaluated, and the ERA5-Land dataset was selected due to its strong correlation with on-site observations (R² >
0.90). The bias-corrected ERA5-Land dataset has been used to extend the temperature record and estimate long-term evaporation losses for
the water-balance analyses as part of SRK’s ongoing 2025 work (SRK 2025a).
| | 4-6 | |
| SSR Mining Inc. | Hod Maden Project | | January 7, 2026 |
| Technical Report Summary | | SLR Project No.: 123.000320.00001 |
Table 4-3: On-Site Station
Temperature Summary (2017–2024)
| Month |
Monthly Average Values |
Daily Extremes |
Monthly Mean
Temperature (°C) |
Average of
Maximum
Temperature (°C) |
Average of
Minimum
Temperature (°C) |
Maximum
Temperature
(°C) |
Minimum
Temperature
(°C) |
| Jan |
-0.5 |
3.2 |
-3.3 |
12.4 |
-13.0 |
| Feb |
0.0 |
4.6 |
-3.2 |
14.2 |
-14.6 |
| Mar |
3.1 |
8.5 |
-0.5 |
20.0 |
-9.4 |
| Apr |
8.8 |
15.4 |
4.3 |
27.8 |
-8.5 |
| May |
12.2 |
19.2 |
7.7 |
31.4 |
-2.0 |
| Jun |
17.2 |
24.9 |
12.6 |
33.5 |
5.3 |
| Jul |
18.5 |
26.3 |
13.9 |
36.7 |
7.1 |
| Aug |
19.9 |
28.1 |
15.0 |
36.6 |
9.3 |
| Sep |
16.5 |
23.5 |
12.2 |
35.5 |
2.4 |
| Oct |
11.1 |
16.7 |
7.5 |
27.0 |
-9.0 |
| Nov |
5.8 |
9.9 |
2.6 |
19.6 |
-8.4 |
| Dec |
1.8 |
5.3 |
-0.9 |
13.6 |
-22.5 |
| Annual |
9.5 |
15.5 |
5.6 |
36.7 |
-22.5 |
Source: 18970 – Yukarımaden Village AWOS (MGM)
Measured evaporation data from the Yukarımaden AWOS (Station
ID 18970) are limited; therefore, reference evapotranspiration (ET₀) was calculated
using the FAO Penman–Monteith method (Allen et al. 1998). The analysis was based on on-site meteorological data, supplemented and
extended with ERA5-Land reanalysis records to represent long-term climatic conditions. Table 4-4 summarizes the monthly ET₀
values for the Project area.
| | 4-7 | |
| SSR Mining Inc. | Hod Maden Project | | January 7, 2026 |
| Technical Report Summary | | SLR Project No.: 123.000320.00001 |
Table 4-4: Monthly Reference
Evapotranspiration (ET0) Data (mm)
| Parameter |
Reference
Evapotranspiration - ET0 (mm) |
| Jan |
11.2 |
| Feb |
25.2 |
| Mar |
58.6 |
| Apr |
97.3 |
| May |
145.5 |
| Jun |
167.0 |
| Jul |
172.2 |
| Aug |
143.9 |
| Sep |
93.0 |
| Oct |
49.2 |
| Nov |
18.7 |
| Dec |
8.3 |
| Annual |
990.2 |
| Source: SRK 2025a |
The mean annual ET₀
for the Project area is estimated at approximately 990 mm/year, based on site-adjusted climatic data (SRK 2025a). To estimate open-water
evaporation (E₀), ET₀
can be adjusted using a coefficient (Kc = 1.05), yielding an average Eo of about 1,040 mm/year, consistent with FAO-56 guidance.
For reference, long-term data from the Artvin Meteorological Station
(MGM, 1943–2018) indicate a Class-A pan evaporation of 1,326 mm/year (Mitto 2021), which corresponds to an Eo of approximately
995 mm/year when applying a pan coefficient (Kpan = 0.75), showing close agreement with modelled estimates.
Climate change refers to long-term shifts in weather patterns, primarily
driven by human activities such as fossil fuel combustion since the 1800s (UN 2021). The climate change assessment for the Hod Maden Project
was completed by Golder (2023a) using global climate models from the Intergovernmental Panel on Climate Change (IPCC) Sixth Assessment
Report (AR6) under the Climate Model Intercomparison Project Phase 6 (CMIP6) framework.
The assessment considered two greenhouse gas emissions scenarios, known
as Shared Socioeconomic Pathways (SSP), which replace the Representative Concentration Pathways (RCP) used in the previous CMIP5 models.
These include SSP2–4.5, representing a medium-mitigation scenario, and SSP5–8.5, representing a high-emission (worst-case)
condition.
The projected changes for precipitation, temperature, relative humidity,
solar radiation, and potential evapotranspiration under these scenarios for the period of 2031 to 2060 are summarized in Table 4-5.
These projections represent long-term climatic trends and do not reflect short-term rainfall intensities or extreme event behaviour, which
were not included in the previous studies.
| | 4-8 | |
| SSR Mining Inc. | Hod Maden Project | | January 7, 2026 |
| Technical Report Summary | | SLR Project No.: 123.000320.00001 |
Future climate projections for the Hod Maden Project area, based on
the SSP2-4.5 (intermediate) and SSP5-8.5 (high-emissions) scenarios, indicate modest increases in precipitation and significant warming,
accompanied by reductions in relative humidity and increased evapotranspiration potential.
Temperature: Mean annual temperatures are projected to rise by approximately
+1.9°C (SSP2-4.5) to +2.4°C (SSP5-8.5), with high-end (90th percentile) warming reaching +3.0°C to +3.8°C.
Precipitation: Average annual precipitation is expected to increase
slightly, by about 2% under both scenarios, though year-to-year variability increases (10th percentile declines up to -4%, 90th percentile
increases up to +7%).
Relative Humidity: Projected to decrease by 2–2.5% on average,
suggesting a modest drying trend despite slight increases in rainfall.
Solar Radiation: Expected to increase marginally (≈+1.5%),
contributing to enhanced surface energy inputs.
Potential Evapotranspiration: The combined effects of warming and higher
radiation result in a notable rise in potential evapotranspiration, ranging from +7.6% (SSP2-4.5) to +9.6% (SSP5-8.5), with upper-bound
changes exceeding +16%.
Overall, the 2031–2060 projections suggest a warmer and slightly
wetter but more evaporative climate regime at Hod Maden, with potential implications for runoff, water balance, and seasonal snow storage
within the Çoruh Basin.
Table 4-5: Climate Change Projection
for 2031 to 2060 Period
| Parameter |
Unit |
Statistics |
Projected Change
SSP 2-4.5
2031 to 2060 |
Projected Change
SSP 5-8.5
2031 to 2060 |
| Precipitation |
% |
Average |
2.0% |
1.9% |
| 10th Percentile |
-3.1% |
-3.9% |
| 50th Percentile |
1.7% |
1.9% |
| 90th Percentile |
7.2% |
7.2% |
| Temperature |
°C |
Average |
1.9 |
2.4 |
| 10th Percentile |
1.3 |
1.6 |
| 50th Percentile |
1.8 |
2.2 |
| 90th Percentile |
3.0 |
3.8 |
| Relative Humidity |
% |
Average |
-2.0% |
-2.5% |
| 10th Percentile |
-4.1% |
-5.1% |
| 50th Percentile |
-1.6% |
-2.4% |
| 90th Percentile |
-0.3% |
-0.7% |
| Solar Radiation |
% |
Average |
1.4% |
1.6% |
| 10th Percentile |
-0.3% |
-0.3% |
| 50th Percentile |
1.2% |
1.2% |
| 90th Percentile |
3.3% |
3.6% |
Potential Evapotranspiration
(Hargreaves Method) |
% |
Average |
7.6% |
9.6% |
| 10th Percentile |
4.9% |
6.2% |
| 50th Percentile |
6.6% |
8.4% |
| 90th Percentile |
12.6% |
16.1% |
|
Source: Golder 2023a
Notes: SSP Shared Socioeconomic Pathways |
| | 4-9 | |
| SSR Mining Inc. | Hod Maden Project | | January 7, 2026 |
| Technical Report Summary | | SLR Project No.: 123.000320.00001 |
The Hod Maden Project site lies in Artvin Province, which in 2022 had
a population of 169,403 over an area of 7,393 km², yielding a relatively low average density (~23 inhabitants/km²). The region
is relatively rural in character and has experienced demographic pressures, including out-migration over recent decades, contributing
to an older age profile (some sources suggest an average age in the upper 30s, though local demographic data should be confirmed).
Most of the local labor force is engaged in agriculture, mining, forestry,
and service sectors, with limited presence of large-scale construction firms locally. Consequently, major infrastructure and construction
contracts in the region (e.g., dams, roads) are often awarded to national or regional contractors based in western Türkiye, who may
still draw on local labor for skilled, semi-skilled, or unskilled roles, though many skilled workers may be transient.
In terms of supply chains, construction materials and heavy machinery
are generally sourced from the more industrialized regions of western Türkiye due to limited regional manufacturing capacity. Local
quarries (within 50 km) may supply aggregates (excluding cement), and the OYAK Çimento group maintains a plant in the Rize / Çayeli
area, which could serve local cement demand.
Regionally, the industrial production base remains modest and focused
primarily on housing and agricultural supply, reinforcing dependency on supplies from elsewhere.
Two high tension power lines (154 kV and 380 kV) stretch across hilltops
above the Project area. High voltage (HV) power is not currently available at site and a 30 kV limited medium voltage (MV) power services
the local community. There is no capacity at the HV substation near Artvin to supply the mine, hence, a new substation will need to be
built at the mine that draws off one of the power lines that traverse the site. The local power transmission company TEİAŞ
(The Turkish Electricity Transmission Company) has been approached by Artmin, and it has been determined that power can be taken off the
154 kV line but not the 380 kV. This arrangement is discussed in further detail in Section 15.3 of this report. Discussions with TEİAŞ
have also confirmed that interaction between the power transmission lines and the proposed mining activities are manageable without having
to relocate the lines.
| | 4-10 | |
| SSR Mining Inc. | Hod Maden Project | | January 7, 2026 |
| Technical Report Summary | | SLR Project No.: 123.000320.00001 |
Cellular and copper wire telecommunications are available at the mine
site. The existing Wide Area Network (WAN) in Artvin Province that currently services the site has a fibre optic backbone capable of speeds
of 30 Mbps (megabits per second). A new cellular tower will be required near the mine to achieve the connectivity required to operate
the mine and accommodate the increased volume of communications. These requirements are discussed in further detail in Section 15.0.
Water supply for the Project will be provided by a combination of reclaim
from the tailings impoundment, water collected from underground passive inflows, and flows from surface dewatering wells. No water will
be abstracted from the surface water flows around the Project.
Water balance modeling of the mine water management system and the distribution
of water supply for the Project requirements are discussed in Section 15.5.
There is a major highway (D950) between Hopa on the coast and Erzurum
in the interior. This road has been surveyed and, although in good quality, has height restrictions due to multiple tunnels. The highways
from Artvin or Erzurum are asphalt to the main road junction along the reservoir on the Çoruh River. The road leading away from
the reservoir to the Project site will be upgraded as part of the Project infrastructure and is discussed in Section 15.2.
The nearest major airport is at Erzurum, which has both an international
and significant domestic airport (the alternative is Trabzon).
The nearest concentrate handling facilities and ports are Hopa (approximately
100 km by road from the Project site), Rize (approximately 190 km from the Project site) and Trabzon (approximately 270 km from the Project
site) situated on the Black Sea coast.
The Project area is characterized by moderate to steep hills of exposed
rock, variable soil cover and vegetation.
The majority of the proposed Project infrastructure, as detailed in
Section 15.0, will be located at the base of the Maden Valley (the valley created by the Maden Creek; this valley is also known as the
South Valley), extending into a perpendicular minor valley (technically a draw), known as Powerline Valley. The waste rock dump facility
(WDF) and tailings storage facility (TSF) will be located to the north in Saliçor Valley (the North Valley), which was formed by
the Saliçor Creek (which flows into the Maden Creek some kilometers downstream). The Maden Creek ultimately flows into the reservoir
of the Çoruh River formed by the Deriner Dam.
Powerline Valley and South Valley are quite deforested in the Project
area, particularly on south facing slopes, and are characterized by bare rocky ground, grasses, small shrubs and sub-alpine flowers.
The Saliçor Valley (North Valley) has much less arable land than
the South Valley, and it has a lower population density than the South Valley. Saliçor Valley will be accessed from the main Project
infrastructure in Maden (South) Valley via a proposed road and access (Saliçor) tunnel. The Saliçor Valley access tunnel
northern portal will be located in the north facing slope of the Saliçor Valley, which has less sunshine and is forested with conifers
almost down to the valley floor (where other Mediterranean trees and shrubs start to become more common).
| | 4-11 | |
| SSR Mining Inc. | Hod Maden Project | | January 7, 2026 |
| Technical Report Summary | | SLR Project No.: 123.000320.00001 |
Snow occurs in the region, particularly at higher altitudes, and snow
melt has been observed swelling the local creeks in mid-spring. However, snow is not expected to be problematic, with one or two snow
showers expected per year and rarely much accumulation.
Exploration and mining activities can be conducted all year round.
Figure 4-3 shows the topography of the Project area and key Project
boundaries and infrastructure.
| | 4-12 | |
| SSR Mining Inc. | Hod Maden Project | | January 7, 2026 |
| Technical Report Summary | | SLR Project No.: 123.000320.00001 |
Figure 4-3: Project Area Map
FIGURE 4-3
License Area 87288
License Area 88857
North Valley EIA
Quarry EIA
Access Tunnel
Access Road
South Valley EIA Boundary
Metres
0
500
1000
1500
2000
2500
SLR
SSR Mining Inc.
Hod Maden Project
Artvin Province, Türkiye
Project Area Map
Source: SLR 2025.
| | 4-13 | |
| SSR Mining Inc. | Hod Maden Project | | January 7, 2026 |
| Technical Report Summary | | SLR Project No.: 123.000320.00001 |
Mining at Hod Maden may pre-date the rise of the Ottoman Empire (14th
Century). In 1886, the Hod property was in the territory of Russia during occupation and the operation of the Hot Mines was given to Mr.
Simonides by the Russian government. Hot Mines, which are mostly in the southern part of the current concessions, were exploited by this
group from 1888 to 1904.
The mining operation was closed sometime between 1904 and 1911. In 1913,
the mine was acquired by the Russian Hot Company (Hot). Exploration, including drilling was carried out by this company, however, the
results are not available. The company's activities ended in 1923 when the Russians were expelled, and the region was taken over by Türkiye.
The mine site was acquired by the General Directorate of Mineral Research and Exploration (MTA) in 1942. During 1942 and 1943, limited
geophysical field surveys, re-opening of the underground workings and sampling were carried by MTA in the southern historical mining area
(mostly Russian Zone). The presence of slag overburden in holes HTD-04 and HTD-05 may be due to previous mining activities conducted by
the Hot. The tailings from processing facilities are in the south and Russian zones of the deposit area.
The tenements were acquired by Anglo-Tur (a subsidiary of Anglo-American
Corporation Inc.) in circa 1991. In 2006, Teck Cominco (Teck) acquired concessions by auction, and focused their exploration efforts mostly
on the Russian Zone area; they staked two adjacent exploration concessions far enough north that it included what became the new ‘Main
Zone’ - Hod Maden discovery. In July 2011, the Turkish government announced plans to auction a number of mining licenses, commencing
January 9, 2012, and finishing May 24, 2015. AMG Mineral Madencilik AS (AMG) successfully bid on Hot North, Ulutas, and Halilağa
East properties via an auction held January 31, 2012. AMG’s parent company, Aegean Metals Group Inc. (AGN or Aegean), acquired a
100% interest in Teck’s three concessions at Hod Maden. Teck retained a 2% Net Smelter Return (NSR) on the concessions.
AMG entered into an option agreement with private Turkish company Lidya
in June of 2014. Under the terms of the agreement, Lidya has earned a 70% interest in Hod Maden property through exploration expenditures
and cash payments. Mariana Resources Limited (MARL) acquired AGN in January 2015. Artmin Madencilik, as a jointly owned company, was formed
in January 2016, upon the signing of the Shareholder Agreement between MARL and Lidya. Lidya and MARL held 70% and 30% interest, respectively,
in Artmin Madencilik.
In January 2016, Sandstorm acquired the 2% NSR from Teck. In July 2017,
Sandstorm acquired MARL and its 30% interest in the Hod Maden Project. In June 2018, Sandstorm filed a Technical Report on the Pre-Feasibility
Study (PFS), prepared in accordance with NI 43-101, outlining a 13-year underground mining operation. During the execution of the PFS,
Artmin Madencilik decided to change the name of the Project from “Hot Maden” to “Hod Maden”, to reflect the true
historical name of the area, rather than that used by the previous owners. As such, and particularly with reference to older documents,
the nouns “Hod” and “Hot” should be considered interchangeable.
SSR entered into a joint venture on May 8, 2023, whereby SSR will earn-in
to own up to 40% of the Project and serve as Project operator, while Lidya will own 30% and Sandstorm will own 30%. SSR currently owns
10% of the Project. Royal Gold acquired Sandstorm Gold Limited on October 9, 2025.
| | 5-1 | |
| SSR Mining Inc. | Hod Maden Project | | January 7, 2026 |
| Technical Report Summary | | SLR Project No.: 123.000320.00001 |
| 5.2 | Exploration and Development History |
Exploration of the Hod Maden deposit has been carried out by Artmin
and its predecessors since 2014. Work completed has included the following:
| · | Geological and reconnaissance mapping |
| · | Rock chip, grab, soil, channel, and stream sediment geochemical sampling |
| · | Ground geophysical surveys |
| · | Diamond core (DD) drilling programs |
| · | Mining technical studies |
| · | Geotechnical and hydrogeological studies |
| · | Environmental baseline studies |
| · | Studies in support of project permitting |
| · | Metallurgical test work and studies |
| · | Condemnation evaluations |
The principal exploration technique has been diamond core drilling (DDH),
conducted in multiple campaigns. Drilling continues to define and expand Mineral Resources.
There has been no reported production in the recent past.
| 5.4 | Previous Mineral Reserve and Mineral Resource Estimates |
The Hod Maden Mineral Reserve and Mineral Resource estimates for as
of December 31, 2024, are presented in Table 5-1 and Table 5-2, respectively as reported in SSR’s 2024 Form 10-K filing (SSR 2024).
These estimates have been prepared by SSR based on data available as of July 2019 and were approved by internal SSR Qualified Persons,
as defined under Regulation S-K 1300. The estimates have not been prepared, reviewed, or verified by an independent, third-party qualified
person and have not been prepared or presented in accordance with Regulation S-K 1300.
SSR considers these estimates to be historical in nature and should
not be relied upon. These estimates have been superseded by the Mineral Resource and Mineral Reserve estimates presented in Sections 11.0
and 12.0, respectively, of this TRS.
Measured and Indicated Resources were converted to Proven and Probable
Mineral Reserves through application of relevant modifying factors, and the appropriate mining recovery and dilution parameters were applied.
Mineral Reserves (Table 5-1) are reported based on mined ore to be delivered to the plant as mill feed. Ounces of gold or pounds of copper
in the Hod Maden Reserves presented below are calculated without regard to any losses during metallurgical treatment. Market price fluctuations
of gold and copper, as well as increased cost of production/sales or reduced metallurgical recovery rates, could result in the Hod Maden
Reserves containing relatively lower grades of mineralization uneconomic to exploit and result in a decrease in actual recovery as compared
to the Hod Maden Reserves reported herein.
The Mineral Resources (Table 5-2) are presented exclusive of Mineral
Reserves. Due to the uncertainty that may be attached to Inferred Mineral Resources, it cannot be assumed that all or any part of an Inferred
Mineral Resource will be upgraded to an Indicated or Measured Mineral Resource as a result of continued exploration.
| | 5-2 | |
| SSR Mining Inc. | Hod Maden Project | | January 7, 2026 |
| Technical Report Summary | | SLR Project No.: 123.000320.00001 |
The historical Mineral Reserves and Mineral Resources were based on
$1,300/oz gold price and $3.00/lb copper and an 85% metallurgical recovery for gold and are reported based on incremental cut-off of NSR
of $63/t and $40/t for development, respectively. Metals shown in the tables are contained metals in ore mined and processed. Tonnage
is metric tonnes, ounces represent troy ounces, and g/t represents grams per metric tonne. The point of reference for the Hod Maden Reserves
is the proposed onsite processing facility. The Mineral Reserve and Mineral Resource estimates reflect SSR ownership of 10%.
| | 5-3 | |
| SSR Mining Inc. | Hod Maden Project | | January 7, 2026 |
| Technical Report Summary | | SLR Project No.: 123.000320.00001 |
Table 5-1: Previous Hod Maden Reserves
as of December 31, 2024
| Category |
Proven |
Probable |
Proven
+ Probable |
Metallurgical
Recovery
(%) |
| Variable |
Tonnes
(kt) |
Grade
(g/t) |
Gold
(koz) |
Tonnes
(kt) |
Grade
(g/t) |
Gold
(koz) |
Tonnes
(kt) |
Grade
(g/t) |
Gold
(koz) |
| Gold |
190 |
16.7 |
102 |
680 |
6.5 |
143 |
870 |
8.77 |
245 |
85 |
| |
Tonnes
(kt) |
Grade
(%) |
Copper
(Mlb) |
Tonnes
(kt) |
Grade
(%) |
Copper
(Mlb) |
Tonnes
(kt) |
Grade
(%) |
Copper
(Mlb) |
Metallurgical
Recovery
(%) |
| Copper |
190 |
1.7 |
7.1 |
680 |
1.4 |
21.6 |
870 |
1.5 |
28.7 |
93 |
Notes:
1.
Mineral Reserves are estimated at a NSR cut-off value of $63/t and using average long-term metal prices of US$1,300/oz gold
and US$3.00/lb copper
2.
Numbers may not add due to rounding.
3.
The point of reference is the proposed onsite processing facility.
4.
The Mineral Reserve statement reflects SSR’s 10% ownership of the Hod Maden Project. |
Table 5-2: Previous Hod Maden Resources
as of December 31, 2024
| Category |
Measured |
Indicated |
Measured
+ Indicated |
Inferred |
| Variable |
Tonnes
(kt) |
Grade
(g/t) |
Gold
(koz) |
Tonnes
(kt) |
Grade
(g/t) |
Gold
(koz) |
Tonnes
(kt) |
Grade
(g/t) |
Gold
(koz) |
Tonnes
(kt) |
Grade
(g/t) |
Gold
(koz) |
| Gold |
- |
- |
- |
- |
- |
- |
- |
- |
- |
134 |
5.4 |
23 |
| |
Tonnes
(kt) |
Grade
(%) |
Copper
(Mlb) |
Tonnes
(kt) |
Grade
(%) |
Copper
(Mlb) |
Tonnes
(kt) |
Grade
(%) |
Copper
(Mlb) |
Tonnes
(kt) |
Grade
(%) |
Copper
(Mlb) |
| Copper |
- |
- |
- |
- |
- |
- |
- |
- |
- |
134 |
0.7 |
2.1 |
Notes:
1.
Mineral Resources are estimated at a NSR cut-off value of $40/t and using average long-term metal prices of US$1,300/oz gold
and US$3.00/lb copper
2.
Mineral Resources are exclusive of Mineral Reserves.
3.
Numbers may not add due to rounding.
4.
The Mineral Resource statement reflects SSR’s 10% ownership of the Hod Maden Project. |
| | 5-4 | |
| SSR Mining Inc. | Hod Maden Project | | January 7, 2026 |
| Technical Report Summary | | SLR Project No.: 123.000320.00001 |
| 6.0 | Geological Setting, Mineralization, and Deposit |
Türkiye is located within the western Tethyan-Eurasian Belt, and
has a complex geodynamic history and evolution, which resulted in the formation of multiple distinct tectonic terranes, shaped by the
closure of the Neotethyan Ocean during the late Mesozoic and Cenozoic (Kuşcu et al. 2019, Yilmaz et al. 1997). The terranes are
separated by Neotethyan sutures (Yilmaz et al. 1997), with the Pontides representing the northernmost tectonic terrane, extending from
west to the east across the country (Figure 6-1). The Pontides are separated into the Western, Central, and Eastern Pontides, the latter
compromising the mountain ranges of northeast Anatolia, north of the Izmir-Ankara-Erzican suture zone (Eyüboğlu et al. 2006).
The Eastern Pontides are part of an active continental margin extending 600 km along the eastern coast of the Black Sea.
| | 6-1 | |
| SSR Mining Inc. | Hod Maden Project | | January 7, 2026 |
| Technical Report Summary | | SLR Project No.: 123.000320.00001 |
Figure 6-1: Tectonomagmatic Map
of the Western Tethyan Orogenic Belt
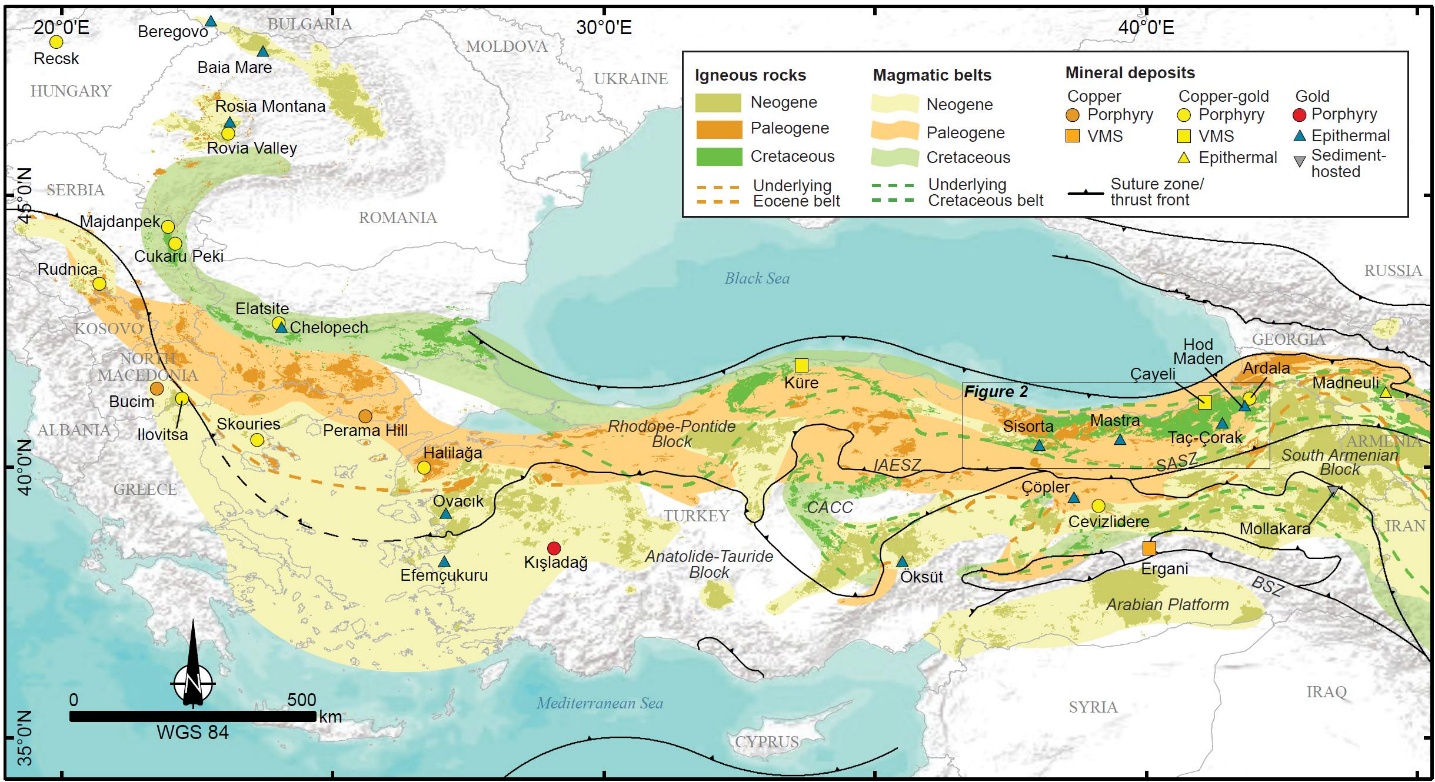
FIGURE 6-1
0
500
km
WGS 84
Figure 2
Sisorta
Mastra
Taç-çorak
Çayeli
Hod Maden
Ardala
Igneous rocks
Neogene
Paleogene
Cretaceous
Underlying
Eocene belt
Magmatic belts
Neogene
Paleogene
Cretaceous
Underlying
Cretaceous belt
Mineral deposits
Cooper
Porphyry
VMS
Cooper-gold
Porphyry
VMS
Epithermal
Gold
Porphyry
Epithermal
Sediment-hosted
Suture zone/thrust front
Source: Rabayrol et al. 2023
Note: showing the distribution of major Cu and Au deposits. BSZ = Bitlis
Suture Zone; CACC = Central Anatolian Crystalline Complex; IAESZ = Izmir-Ankara-Erzincan Suture Zone; SASZ = Sevan-Akera Suture Zone.
The Hod Maden deposit is located in the area surrounding the Yukarımaden
village, 50 km south-southeast of Artvin (Figure 6-2). The Artvin mineral district is part of the Eastern Pontides magmatic belt. The
basement geology of the Artvin district consists of Devonian–Carboniferous plutons, amphibolites, schists, and gneisses intruded
by Permo–Carboniferous plutons that formed during the closure of the Palaeotethys oceanic basin (Ustaömer and Robertson 2010,
Topuz et al. 2010).
The magmatic-hydrothermal mineral deposits and occurrences of the Artvin
district are clustered into three main groups: the Hod Gold Corridor, the Kaçkar batholith, and the VMS bimodal-felsic Cu-Zn belt.
The Hod Gold Corridor is a 110-km-long, northeast-trending, S-shaped alignment of the Şavşat, Salinbaş-Hod, and Yusufeli
porphyry-epithermal camps (Figure 6-2). The Hod Gold Corridor mimics the surface exposures of the inverted Jurassic volcanosedimentary
basin rocks and is bound to the north by the unconformity with the post-collisional Eocene volcanosedimentary sequence, to the west by
the composite Late Cretaceous to Eocene Kaçkar batholith, and to the east by the thrusted Mesozoic fore-arc volcanosedimentary
sequence. Intermediate to felsic volcanic and volcaniclastic rocks and interbedded clastic sedimentary rocks of the Late Cretaceous Eastern
Pontides sequence (i.e., the Çatak, Kızılkaya, and Sümbüllü formations) are the main hosts of economic
epithermal mineralization along the Hod Gold Corridor (Rabayrol et al. 2023). Figure 6-3 illustrates the stratigraphic sequence of the
Artvin District.
| | 6-2 | |
| SSR Mining Inc. | Hod Maden Project | | January 7, 2026 |
| Technical Report Summary | | SLR Project No.: 123.000320.00001 |
Figure 6-2: Geological Map of the
Artvin District
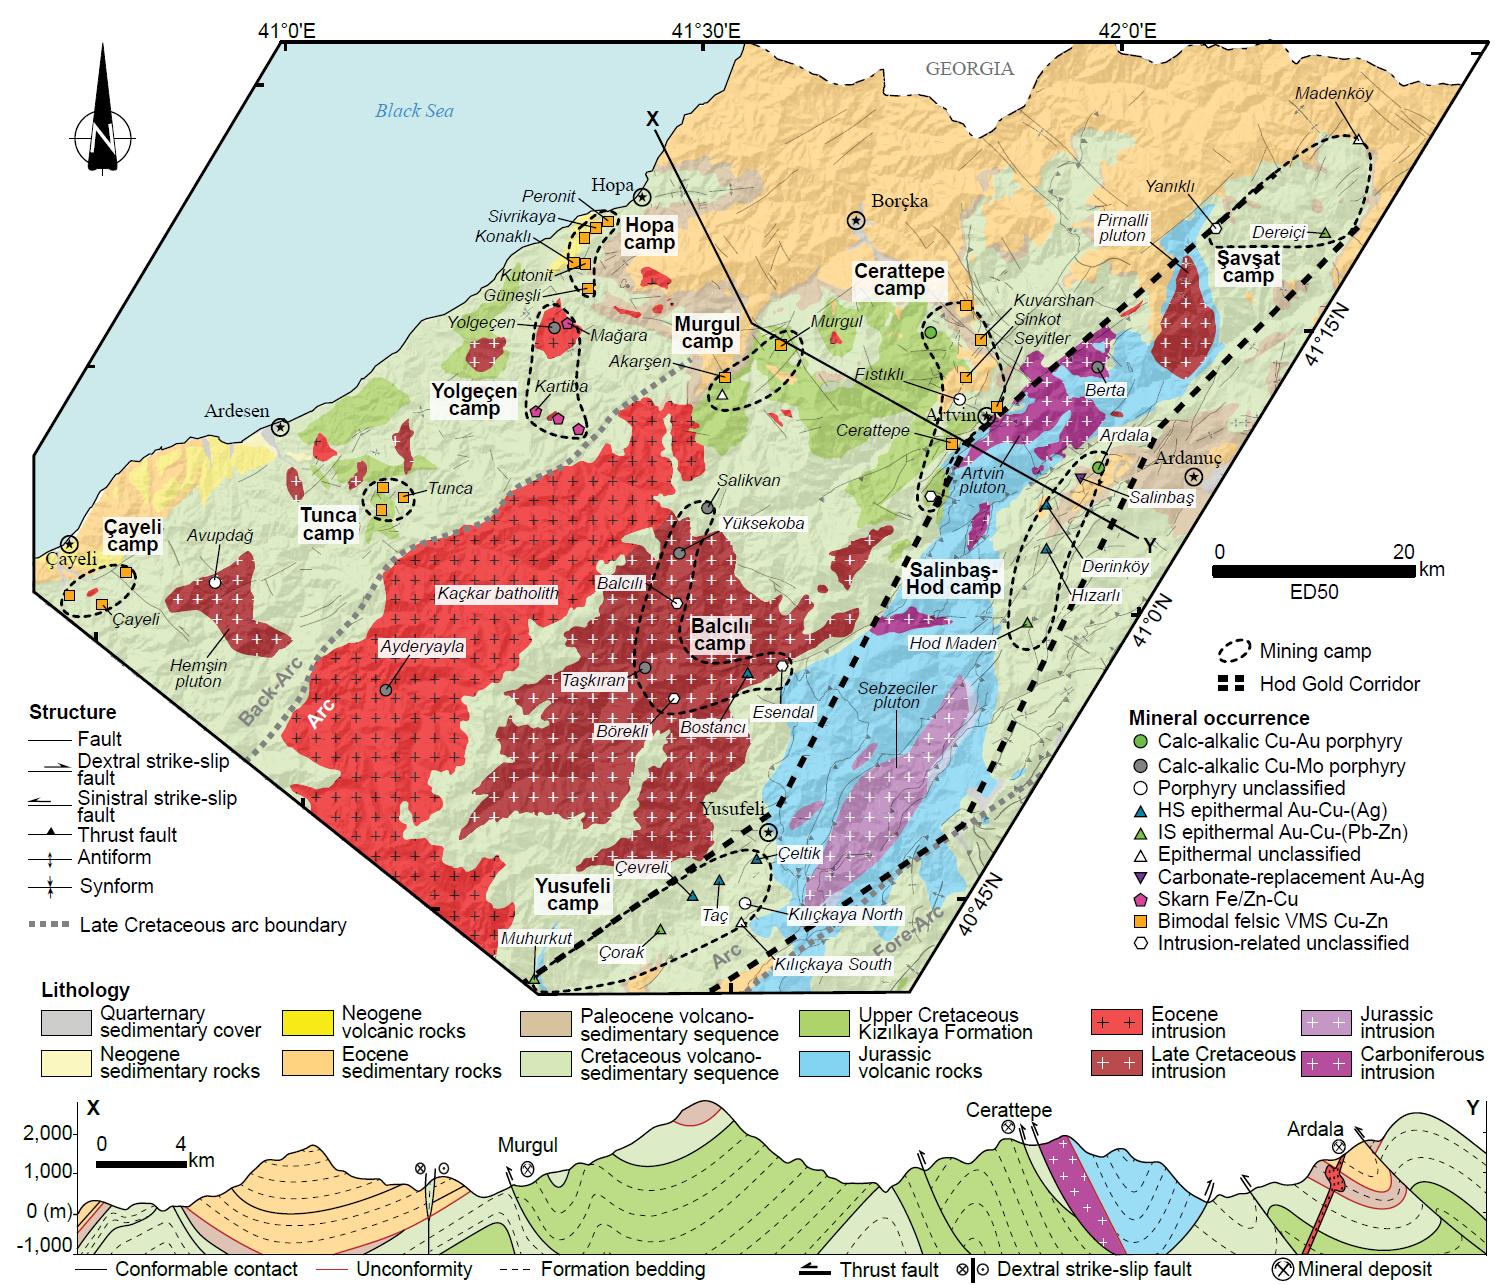
FIGURE 6-2
Structure
Fault
Dextral strike-slip fault
Sinistral strike-slip fault
Thrust fault
Antiform
Synform
Late Cretaceous arc boundary
0
20
km
ED50
Mining camp
Hod Gold Corridor
Mineral occurrence
Calc-alkalic Cu-Au porphyry
Calc-alkalic Cu-Mo porphyry
Porphyry unclassified
HS epithermal Au-Cu-(Ag)
IS epithermal Au-Cu-(Pb-Zn)
Epithermal unclassified
Carbonate-replacement Au-Ag
Skarn Fe/Zn-Cu
Bimodal felsic VMS Cu-Zn
Intrusion-related unclassified
Lithology
Quaternary sedimentary cover
Neogene sedimentary rocks
Neogene volcanic rocks
Eocene sedimentary rocks
Paleocene volcano-sedimentary sequence
Cretaceous volcano-sedimentary sequence
Upper Cretaceous Kizilkaya Formation
Jurassic volcanic rocks
Eocene intrusion
Late Cretaceous intrusion
Jurassic intrusion
Carboniferous intrusion
2,000
1,000
0 (m)
-1,000
X
0
4
km
Conformable contact
Unconformity
Murgul
Formation bedding
Cerattepe
Thrust fault
Dextral strike-slip fault
Ardala
Mineral deposit
Source: Rabayrol et al. 2023
Note: showing the distribution of magmatic-hydrothermal mineral occurrences,
the camps, and the Hod Gold Corridor (bold dashed line). The Hod Maden deposit is highlighted in the south of the Salinbaş-Hod
camp. The northwest-southeast cross section through the Artvin district shows the post-Eocene compressional deformation of the stratigraphy
and location of major volcanogenic massive sulfide (VMS) and porphyry mineralization. HS = high-sulfidation; IS = intermediate-sulfidation.
| | 6-3 | |
| SSR Mining Inc. | Hod Maden Project | | January 7, 2026 |
| Technical Report Summary | | SLR Project No.: 123.000320.00001 |
Figure 6-3: Simplified Stratigraphy
of the Artvin District
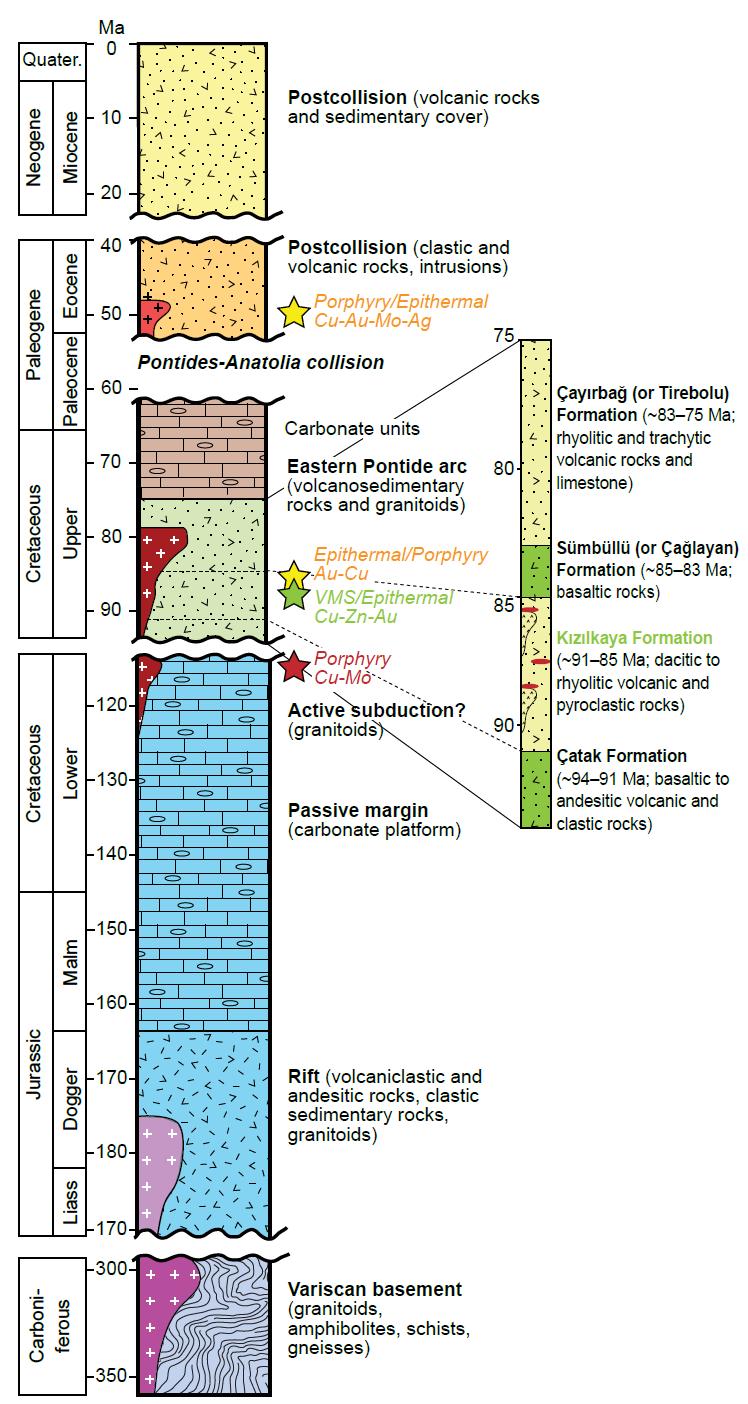
FIGURE 6-3
Ma
0
10
20
40
50
60
70
80
90
120
130
140
150
160
170
180
170
300
350
75
80
85
90
Quarter.
Neogene
Miocene
Paleogene
Paleocene
Eocene
Cretaceous
Upper
Cretaceous
Lower
Jurassic
Liass
Dogger
Malm
Carboni-ferous
Postcollision (volcanic rocks and sedimentary cover)
Postcollision (clastic and volcanic rocks, intrusions)
Porphyry/Epithermal
Cu-Au-Mo-Ag
Pontides-Anatolia collision
Carbonate units
Eastern Pontide arc (volcanosedimentary rocks and granitoids)
Epithermal/Porphyry
Au-Cu
VMS/Epithermal
Cu-Zn-Au
Porphyry
Cu-Mo
Active subduction?
(granitoids)
Passive margin
(carbonate platform)
Çayirba? (or Tirebolu) Formation (~83-75 Ma; rhyolitic and trachytic volcanic rocks and limestone)
Sümbüllü (or Ça?layan) Formation (~85-83 Ma; basaltic rocks)
Kizilkaya Formation (~91-85 Ma; dacitic to rhyolitic volcanic and pyroclastic rocks)
Çatak Formation (~94-91 Ma; basaltic to andesitic volcanic and clastic rocks)
Rift (volcaniclastic and andesitic rocks, clastic sedimentary rocks, granitoids)
Variscan basement (granitoids, amphibolites, schists, gneisses)
Source: Rabayrol et al. 2023
| | 6-4 | |
| SSR Mining Inc. | Hod Maden Project | | January 7, 2026 |
| Technical Report Summary | | SLR Project No.: 123.000320.00001 |
| 6.3 | Property Geology and Mineralization |
The Hod Maden deposit has three zones: the Main Zone, the South Zone,
and the Russian Zone. The Main Zone measures approximately 150 m along strike at the surface, widening to approximately 300 m at depth,
with a true thickness of up to 70 m and a down-dip extension of approximately 400 m. The adjacent South Zone, which is structurally and
mineralogically distinct, measures approximately 500 m along strike and 300 m in depth. Mineralization in the South Zone is discontinuous,
and the mineralized zone is typically 10 m and locally up to 30 m thick. The South Zone is characterized by quartz-sulfide stockwork veins
and hosts both copper and zinc-lead mineralization, indicating possible zonation within the gold-copper system. The Russian Zone is located
1 km south of the Main Zone, and mineralization occurs over approximately 100 m of the strike length. The Russian Zone has remnants of
early 20th-century Russian mining activity focused on high-grade copper polymetallic veins.
The Hod Maden deposit occurs in a steeply east-dipping Upper Cretaceous
host sequence of andesite, dacite, and intermediate volcaniclastic rocks (Figure 6-4). The host sequence has a structural style that is
typical of fault-bend folding and thrust repetition that is controlled by major north-northeast striking faults (Tripp 2023). Major faults
occur parallel to the lithological contacts. The host sequence has been described by Bilir et al. (2023) and is summarized below.
The Çatak Formation (94–91 Ma, Rabayrol et al. 2023) units
are comprised of (i) stratified basalt, andesite and volcanosedimentary rocks unconformably overlying the Aşağımaden
Formation (Lower Cretaceous) and (ii) amygdaloidal andesite porphyry and monomictic andesite clast breccia (which hosts mineralization
in the western margin of Hod Maden). These units define the onset of Late Cretaceous arc volcanism.
| 6.3.2.2 | Kızılkaya Formation |
The contact between the Kızılkaya Formation and Çatak
Formation is observed either as a magmatic or tectonic superimposition. The Kızılkaya Formation (91–85 Ma) (Rabayrol
et al. 2023, Bilir et al. 2023) is characterized by felsic to intermediate subvolcanic intrusions, lava flows, and volcaniclastics including
volcanosedimentary sequences and pyroclastics. The volcanic rocks of the Kızılkaya Formation comprise (i) spherulitic/amygdaloidal
dacite lava flows, as well as monomictic dacite breccia and mass flow deposits; (ii) columnar dacite; (iii) well-stratified dacite to
volcanosedimentary units with local limestone beds; and (iv) flow-banded (locally spherulitic) rhyodacitic lava flows and pyroclastics.
Local limestone beds developed in the upper part of the sequence as volcanic activity decreased (Bilir et al. 2023).
| | 6-5 | |
| SSR Mining Inc. | Hod Maden Project | | January 7, 2026 |
| Technical Report Summary | | SLR Project No.: 123.000320.00001 |
Figure 6-4: Geological Map of the
Hod Maden Region
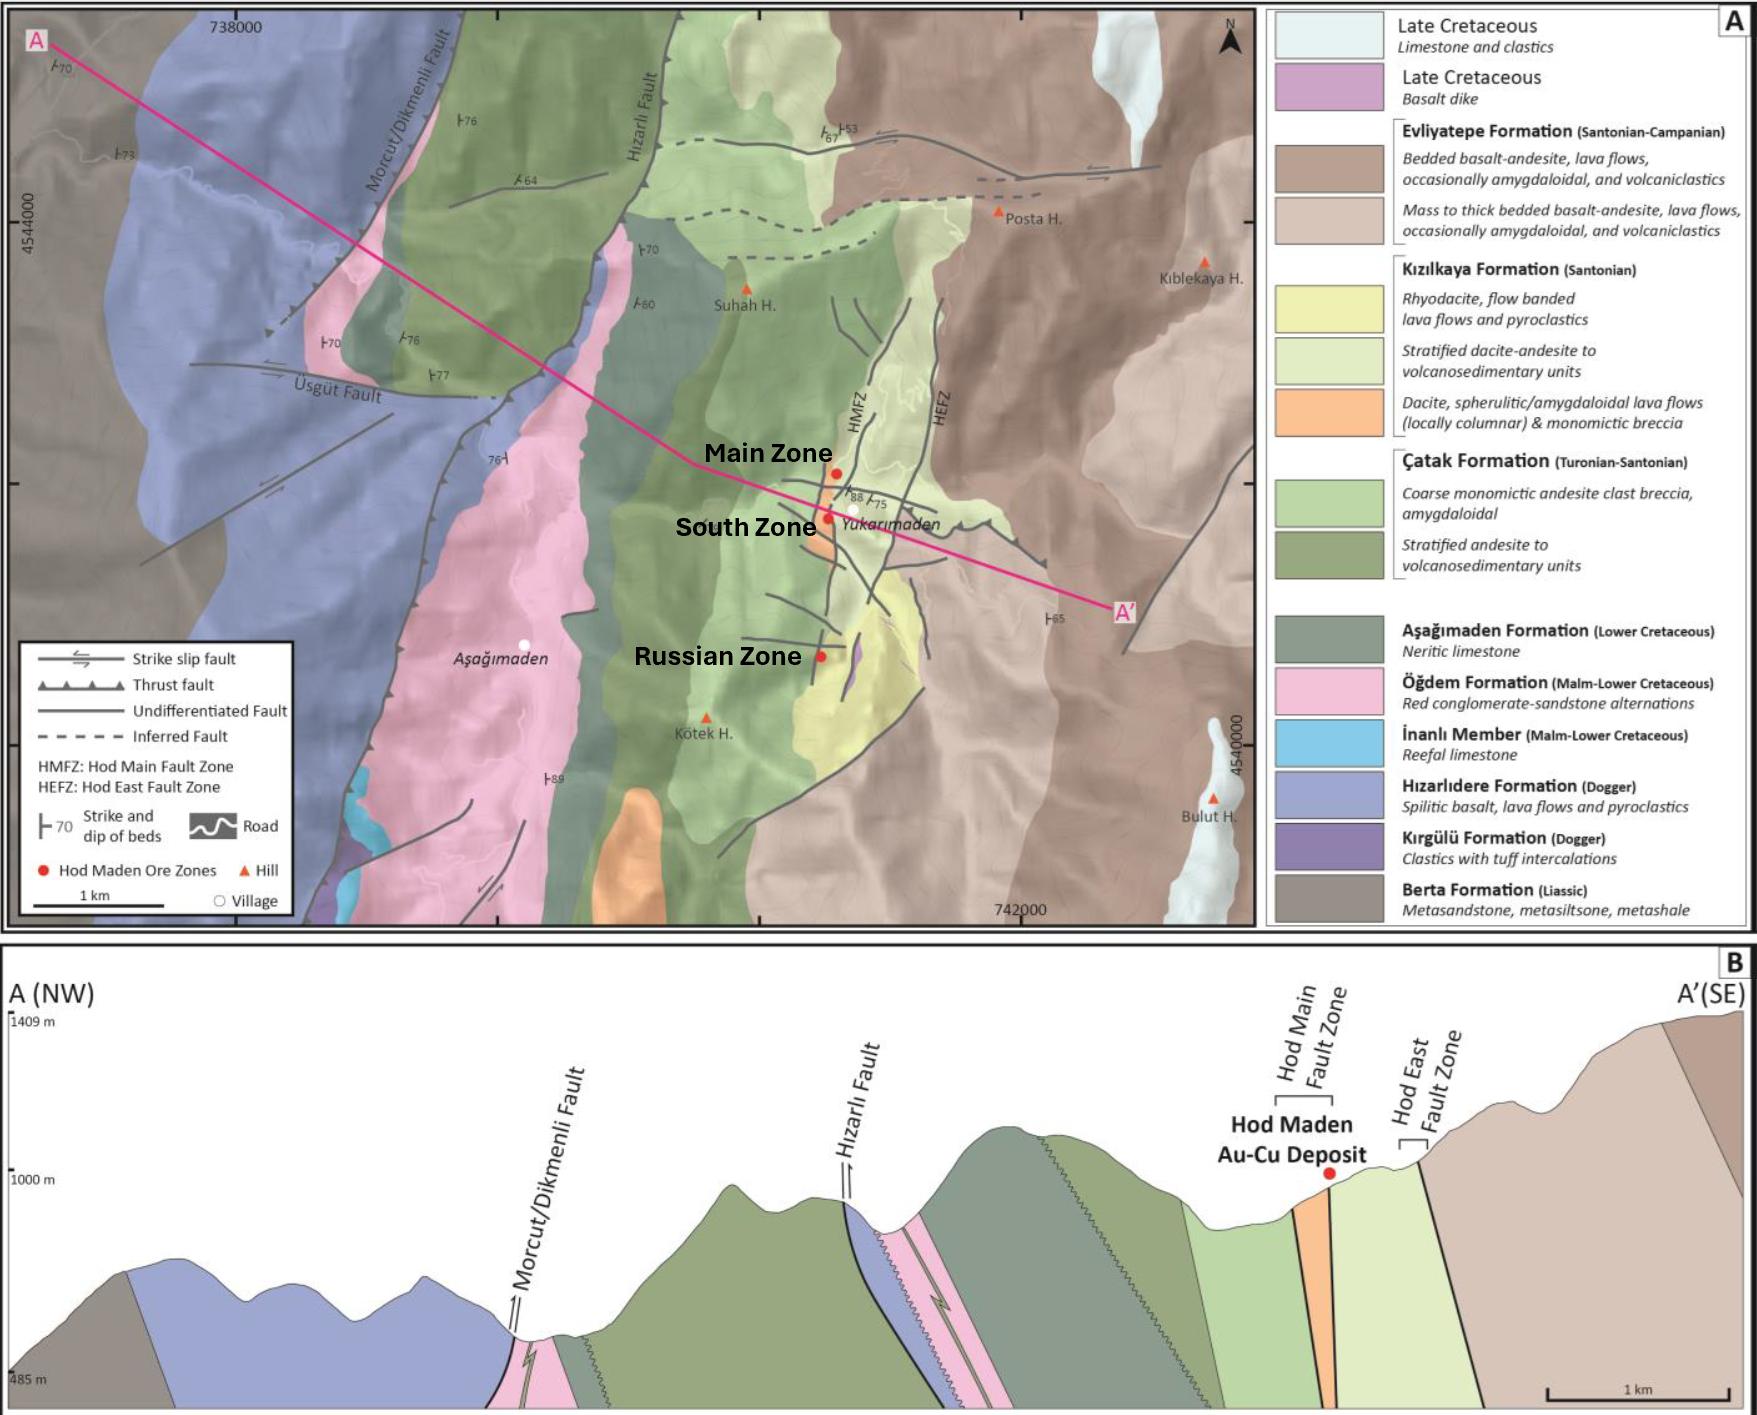
FIGURE 6-4
Main Zone
South Zone
Russian Zone
Strike slip fault
Thrust fault
Undifferentiated Fault
Inferred fault
HMFZ: Hod Main Fault Zone
HEFZ: Hod East Fault Zone
70
Strike and dip of beds
Road
Hod Maden Ore Zones
Hill
1 km
Village
Late Cretaceous
Limestone and clastics
Late Cretaceous
Basalt dike
Evliyatepe Formation (Santonian-Campanian)
Bedded basalt-andesite, lava flows, occasionally amygdaloidal, and volcaniclastics
Mass to thick bedded basalt-andesite, lava flows, occasionally amygdaloidal, and volcaniclastics
K?z?lkaya Formation (Santonian)
Rhyodacite, flow banded lava flows and pyroclastics
Stratified dacite-andesite to volcanosedimentary units
Dacite, spherulitic/amydaloidal lava flows (locally columnar) & monomictic breccia
?atak Formation (Turonian-Santonian)
Coarse monomictic andesite clast breccia, amygdloidal
Stratified andesite to volcanosedimentary units
A?a??maden Formation (Lower Cretaceous)
Neritic limestone
Ö?dem Formation (Malm-Lower Cretaceous)
Red conglomerate-sandstone alternations
?nanl? Member (Malm-Lower Cretaceous)
Reefal limestone
H?zarl?dere Formation (Dogger)
Spilitic basalt, lava flows and pyroclastics
K?rgülü Formation (Dogger)
Clastics with tuff intercalations
Berta Formation (Liassic)
Metasandstone, metasiltstone, metashale
A (NW)
B
A'(SE)
1409m
1000m
485m
Morcut/Dikmenli Fault
H?zarl? Fault
Hod Main Fault Zone
Hod Maden Au-Cu Deposit
Hod East Fault Zone
1 km
Source: modified from Bilir et al. 2023
Note: Plan (A) and schematic A-A’ cross section (B) showing the
stratigraphic and structural association of the main rock units in the Hod Maden Au-Cu deposit
| | 6-6 | |
| SSR Mining Inc. | Hod Maden Project | | January 7, 2026 |
| Technical Report Summary | | SLR Project No.: 123.000320.00001 |
Figure 6-5: Plan View of the Hod
Maden Deposit Illustrating the Scale of the Mineralized System
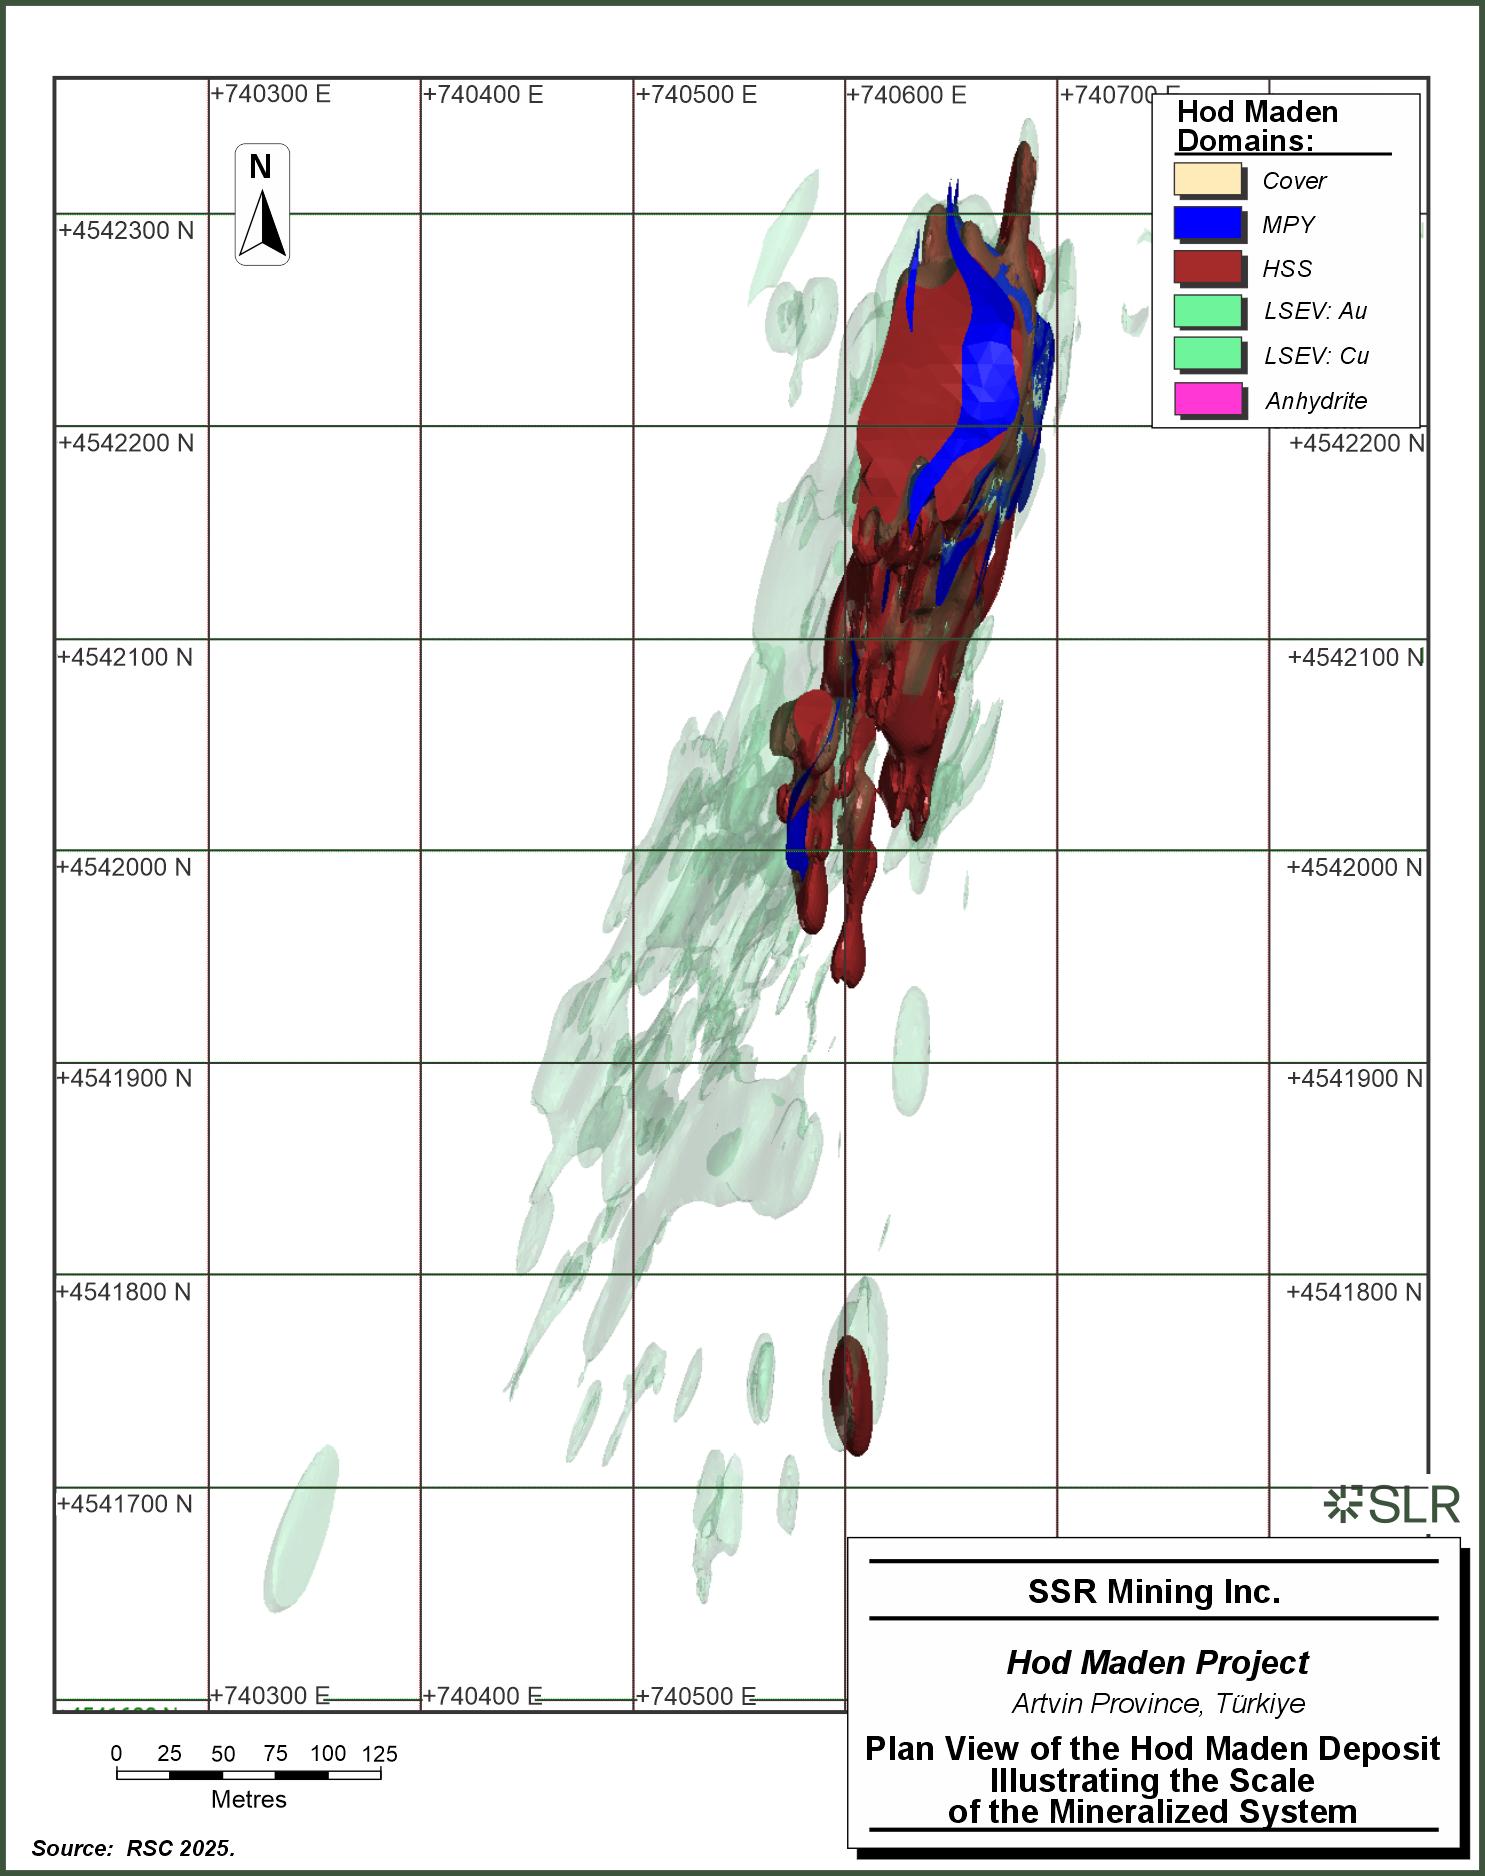
FIGURE 6-5
+740300 E
+740400 E
+740500 E
+740600 E
+740700 E
N
Hod Maden Domains:
Cover
MPY
HSS
LSEV: Au
LSEV: Cu
Anhydrite
+4542300 N
+4542200 N
+4542200 N
+4542100 N
+4542100 N
+4542000 N
+4542000 N
+4541900 N
+4541900 N
+4541800 N
+4541800 N
+4541700 N
+740300 E
+740400 E
+740500 E
SLR
SSR Mining Inc.
Hod Maden Project
Artvin Province, Türkiye
Plan View of the Hod Maden Deposit Illustrating the Scale of the Mineralized System
0
25
50
75
100
125
Metres
Source: RSC 2025.
Note: MPY = Massive Pyrite Domain; HSS = High Silica High Sulfide; LSEV
= Low-Sulfide Epithermal Veins
| | 6-7 | |
| SSR Mining Inc. | Hod Maden Project | | January 7, 2026 |
| Technical Report Summary | | SLR Project No.: 123.000320.00001 |
Hod Maden is characterized by a north-northeast trending, steeply dipping
to sub-vertical structural corridor which is bound to the west by a north-northeast trending, east-dipping fault zone and to the east
by a north-northeast trending, subvertical fault. The names used for the fault zones vary between authors who wrote technical reports
on the Hod Maden deposit (e.g. “West Fault”, “Western Margin Fault Zone” (Rojay 2023, Bozkurt 2017). In this report,
the western fault boundary is referred to the Hod Main Fault Zone (HMFZ) and the eastern fault is referred to as Hod East Fault Zone (HEFZ)
(Figure 6-4) to maintain consistency between this report and the Hod Maden Project Feasibility Study (Artmin 2021) and the Hod Maden structural
review by Tripp (2023).
| 6.3.3.1 | Hod Main Fault Zone |
The HMFZ is a complex north-northeast trending fault zone which is closely
associated with mineralization in Hod Maden. The HMFZ includes an en-echelon series of prominent north to north-northeast striking, steep
west dipping to vertical faults. The HMFZ developed along the boundary between two stratigraphic units of the Çatak Formation ―
the western margin of the stratified dacitic volcaniclastic sequence and the massive, porphyritic, vesicular and brecciated andesites
to the west. Competency contrasts between the bedded dacitic volcaniclastics and the more massive andesitic units appear to have focused
fault-related deformation into the adjacent “softer” bedded volcaniclastic domain. (Callan 2013, Rojay 2023). The orientations
of the HMFZ show a reverse shear sense of movement, and kinematic analyses of fault slip data indicate at least two phases of movement,
possibly an early thrust with a later stage of relaxation (Tripp 2023). The HMFZ is best exposed in the central part of the Hod Maden
prospect where roads cut through the cliff face; however, it is almost certain that the HMFZ persists into southwards along the lithological
boundary (Callan 2013)
| 6.3.3.2 | Hod East Fault Zone |
The HEFZ is a north-northeast striking, very steeply east-dipping to
vertical fault that separates the north-dipping, massive andesitic domain in the southeast from the steeply east-dipping volcaniclastic
package belonging to the Evliyatepe Formation (Figure 6-4) occupying the bulk of the central and western parts of the area. The fault
feature is clearly observed in the sharp northwest-trending ridge occupying the central part of the Hod Maden Project area (Callan 2013).
Rojay (2023) interpreted the HEFZ as a sinistral strike slip fault with reverse components, with the eastern block thrusted onto the central
block that forms the Hod Maden Project area. The HEFZ forms the eastern boundary of the mineral enriched Hod corridor.
Normal faults are also present in the project area with a similar trend
as the reverse faults. Kinematic analyses by Tripp (2023) indicates at least two phases of movement, possibly an early compressional regime
followed by relaxation which formed the normal faults.
| 6.3.3.3 | Weathering & Alteration |
At the Hod Maden deposit, mineralization is structurally controlled
and directly associated with argillic/phyllic hydrothermal alteration. The proximal alteration association is jasperoid-quartz-muscovite-black
chlorite ± kaolinite-illite (Figure 6-6). The distal alteration consists of green chlorite-phengite ± smectite-calcite-epidote.
SWIR data of surface samples from the Main and South Zones indicate the presence of acidic alteration (dickite and pyrophyllite) associated
with mineralization as well as muscovite. These alteration patterns indicate temperatures of around 260°C (pyrophyllite) and between
300°C to 350°C (muscovite) (Tosdal 2023, Tripp 2023). Anhydrite in intergrown with pyrite-chalcopyrite and overprints mineralization.
Anhydrite forms matrix to extensive micro-brecciation textures and is often associated with the jasperoid silica.
| | 6-8 | |
| SSR Mining Inc. | Hod Maden Project | | January 7, 2026 |
| Technical Report Summary | | SLR Project No.: 123.000320.00001 |
Isotopic studies by
Bilir (2023) determined the δ34S values overlap with the S isotopic composition
of Late Cretaceous seawater sulfate. At vertical depths of greater than 450 m below surface, late-stage anhydrite brecciation of the multiphase
Au-Cu breccias is common and results in the dilution of pre-existing Au-Cu grades (Artmin 2021). Alteration varies between the Main Zone
and the South Zone. Pyrite-chalcopyrite is the dominant sulfide phase in the Main Zone. Alteration in the Main Zone is dominated by chlorite,
with the flanking wall rocks typically displaying argillic and phyllic alteration assemblages. Pyrite is the dominant sulfide phase within
the South Zone, with relatively minor chalcopyrite. In contrast to the Main Zone, sericite is the dominant alteration mineral. Hematite
and jasper are present but in significantly lower abundances compared to the Main Zone.
Figure 6-6: Alteration Distribution
throughout the Hod Maden Deposit
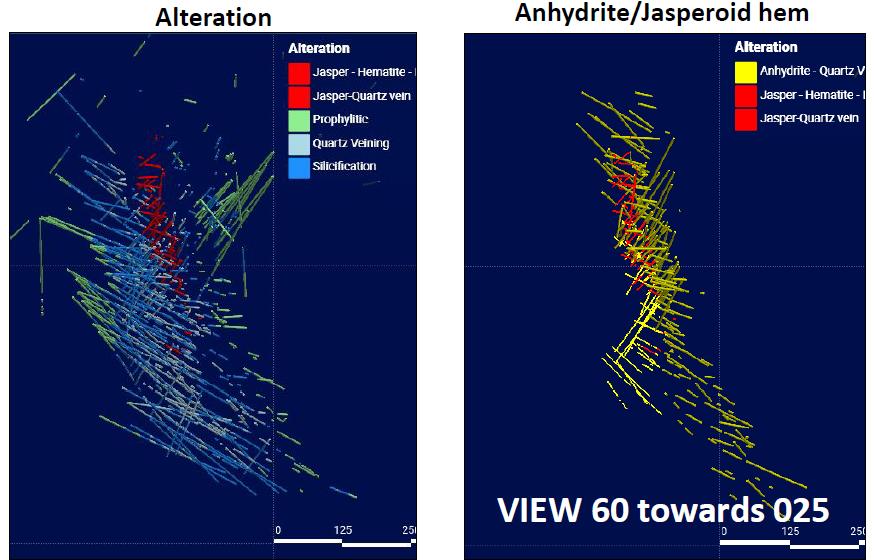
FIGURE 6-6
Alteration
Anhydrite/Jasperoid hem
Alteration
Jasper - Hematite -
Jasper-Quartz vein
Prophylitic
Quartz Veining
Silicification
Alteration
Anhydrite - Quartz V
Jasper - Hematite -
Jasper-Quartz vein
0
125
25
VIEW 60 towards 025
0
125
25
Source: Tripp 2023
Note: Showing the early jasper-quartz-pyrophyllite alteration phase
and the overprinting anhydrite phase
Mineralization in Hod Maden is structurally controlled, which at surface
can be seen as a gossanous outcrop with intense hydrothermal alteration. The outcrop is 300 m-wide and extends for more than seven kilometers.
Locally, mineralization has intense pyrite-chalcopyrite mineralization with a significant supergene clay alteration component. The inner
element zonation consists of Au-Cu-Mo, while the outer element zonation consists of Zn-Pb-As (+Ag) and are structurally controlled (Figure
6-7) (Tripp 2023). The highest Au-Cu grades are typically greater than 15 g/t Au (but can vary locally up to 100 g/t Au or more) and greater
than 2% Cu. All mineralization at Hod Maden is sulfide-hosted; no oxide mineralization is present with only limited supergene enrichment
near the surface and minor replacement of chalcopyrite by chalcocite. This is expected in mountainous terranes where erosion rates are
high (Artmin 2021).
| | 6-9 | |
| SSR Mining Inc. | Hod Maden Project | | January 7, 2026 |
| Technical Report Summary | | SLR Project No.: 123.000320.00001 |
Figure 6-7: Mapped Element Zonations
for the Main Zone and South Zone
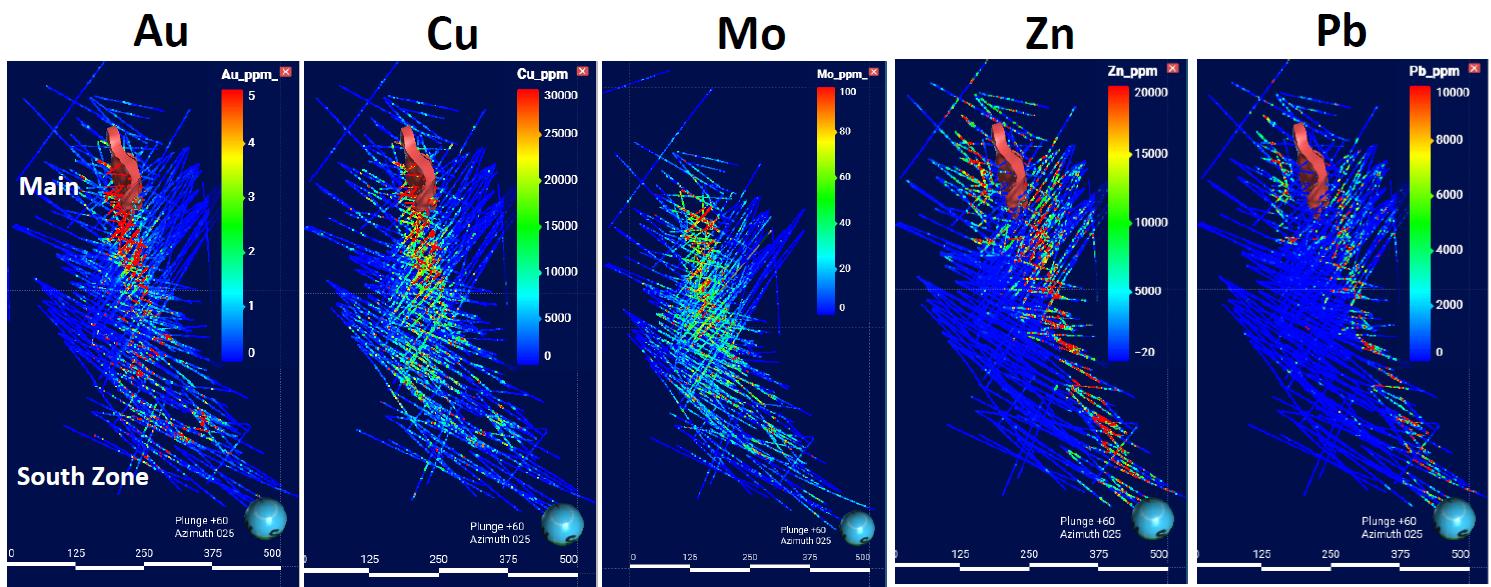
FIGURE 6-7
Au
Cu
Mo
Zn
Pb
Au_ppm_
5
4
3
2
1
0
Main
South Zone
Plunge +60
Azimuth 025
0
125
250
375
500
Cu_ppm_
30000
25000
20000
15000
10000
5000
0
Plunge +60
Azimuth 025
0
125
250
375
500
Mo_ppm_
100
80
60
40
20
0
Plunge +60
Azimuth 025
0
125
250
375
500
Zn_ppm
20000
15000
10000
5000
-20
Plunge +60
Azimuth 025
0
125
250
375
500
Pb_ppn
10000
8000
6000
4000
2000
0
Plunge +60
Azimuth 025
0
125
250
375
500
Source: Tripp 2023
| | 6-10 | |
| SSR Mining Inc. | Hod Maden Project | | January 7, 2026 |
| Technical Report Summary | | SLR Project No.: 123.000320.00001 |
The Main Zone, especially its eastern margin, is characterized by the
highest Au and Cu grades of the deposit. The zone of mineralization is typically >15 m thick. Two phases of mineralization have been
identified:
| 1 | Multiphase quartz-sulfide (pyrite+chalcopyrite) ± hematite+jasper breccia bodies |
| 2 | Semi-massive to massive sulfides (pyrite+chalcopyrite) and gold mineralization |
The early-stage quartz-sulfide stockwork and brecciated jasperoid-hematite-bearing
mineralization event is associated with pervasive chlorite alteration (Kuşcu 2023). Coarse native gold is visible with the naked
eye in jasperoid hematite-altered rocks with sulfide-quartz vein stockwork (Tosdal 2023) (Figure 6-8).
Mineralization in the South Zone is hosted predominantly in dacitic
porphyritic rocks, and comprises network quartz veins, veinlets, and breccia. The South Zone is characterized by comb-textured quartz-sulfide
stockwork veinlets (Figure 6-8) in structures that predominantly dip 80° to the north-northwest.
Two styles of base metal mineralization are present: (i) mineralization
dominated by stratabound, structurally hosted Zn+Pb sulfides in the hanging wall, and (ii) sulfide-bearing colloform veins in the footwall.
Lead-zinc mineralization is also present in the Main Zone but is more prominent and continuous in the South Zone (Figure 6-8). It is unclear
whether the base-metal mineralization represents a separate mineralization event or is part of a distal metal zonation in the Au-Cu system.
Sphalerite-pyrite forms several stratabound horizons in the hanging wall subparallel to the massive sulfide and bedding in the steeply
dipping stratigraphy. Sphalerite occurs either as discrete crystals in coarse clastic horizons or with wispy pyrite that is concentrated
at the contact between sandstone interbeds (Tosdal 2023).
| | 6-11 | |
| SSR Mining Inc. | Hod Maden Project | | January 7, 2026 |
| Technical Report Summary | | SLR Project No.: 123.000320.00001 |
Figure 6-8: Vein Textures in the
Main Zone (left) and South Zone (right)
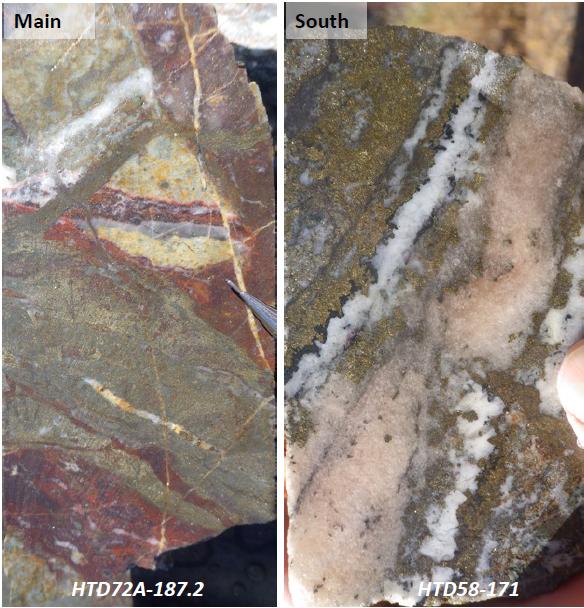
FIGURE 6-8
Main
HTD72A-187.2
South
HTD58-171
Source: Tosdal 2023
Note: The Main Zone is dominated by massive sulfide-quartz-jasper mineralization
whereas this texture is less common in the South Zone, where banded comb texture chalcopyrite-sphalerite-quartz-sulfate veins are common.
The Russian Zone is 1,500 m south of the Main Zone. Historical data
suggest small-scale historical mining was focused on narrow, high Cu grade polymetallic (Cu-Au-Pb-Zn-Ag) veins. Stratigraphically, the
Russian Zone lies 300 m above the Main Zone, indicating that deep drilling would be required to reach possible Main Zone-grade mineralization
(Artmin 2021). The Russian Zone is not included in the Hod Maden Mineral Resource Estimate.
| | 6-12 | |
| SSR Mining Inc. | Hod Maden Project | | January 7, 2026 |
| Technical Report Summary | | SLR Project No.: 123.000320.00001 |
| 6.4 | Hod Maden Mineral System |
The type of deposit at Hod Maden is subject to debate (Kuşcu
2023, Tosdal 2023). The stratabound sulfide orebody that includes pyrite-sphalerite-chalcopyrite mineralization is overprinted by colloform-textured
quartz-carbonate veins, which host relatively late sphalerite-chalcopyrite and Au. Three deposit models have been proposed:
| 1 | A structurally controlled intermediate sulfidation epithermal vein stockwork deposit with local semi and massive sulfide lenses. |
| 2 | A hybrid Au-rich volcanogenic massive sulfide (VMS)-epithermal deposit formed in shallow water with high temperature clay alteration. |
| 3 | A Cretaceous syn-volcanic massive sulfide overprinted by younger high-level epithermal vein stockwork. |
Tripp (2023) suggests that the timing, characteristics, and alteration
favour a post-volcanic and structurally controlled epithermal deposit. Tripp (2023) argues that syn-volcanic mineralization would be associated
with the preservation of primary features, such as paleosurface, syn-volcanic faults, and a stratigraphic growth sequence. VMS deposits
have asymmetric alteration patterns and a silica-carbonate cap layer, both of which are absent. The alteration patterns are structurally
controlled and symmetric about the massive sulfide lens.
Tosdal (2023) and Kuşcu (2023) argue the third model best accounts
for the metal distribution, rock characteristics, vein textures, sulfide distribution, metal zonation, and sulfur isotopic data. Early-phase
sulfides (pyrite-chalcopyrite-sphalerite) that form massive lens-like ore bodies are cataclastically deformed and fractured, replaced,
and truncated by a new phase of sulfides including pyrite-chalcopyrite-Au accompanied by flooding of grayish quartz. The deformation and
faulting post-date the sulfide mineralization and pervasive chlorite alteration and are typical of VMS deposits. The mechanism of deformation
is likely to be the north-trending main fault zone; however, the temporal and spatial association between regional tectonics and mineralization
is poorly constrained. Comb- to colloform-banded quartz-calcite-rhodochrosite veins observed in the South and Russian zones are typical
of low to intermediate sulfidation epithermal deposits. The veins crosscut the first and second phases of sulfide mineralization and represent
a third mineralizing phase. The Cu-Au-Zn mineralization event is also conformable with the north-trending faults, which favours the theory
of a temporal association between the two events.
Rabayrol et al. (2023) collected samples from plutonic and volcanic
rocks from the Artvin district for U-Pb and 40Ar/39Ar analysis with the aim of constraining the ages of epithermal and porphyry mineralization.
Combined with previous data; results indicated that porphyry and epithermal mineralization along the Hod Gold Corridor peaked in the Early
(approximately 113 Ma) and Late Cretaceous (86–82 Ma) and Eocene, whereas VMS bimodal-felsic mineralization only formed in
the Late Cretaceous (approximately 91–85 Ma). Molybdenite dates from the Salinbas-Hod camp indicate the epithermal mineralization
is Late Cretaceous in age, which suggests that Hod Maden is an epithermal-dominant Au-Cu deposit overprinting remnants of a stratabound
VMS-style Zn-rich sulfide lens.
The spatial variation of Late Cretaceous mineralization types is accompanied
by a possible eastward temporal evolution from VMS (approximately 91–85 Ma) to epithermal-porphyry systems (86.5–82 Ma) at
the onset of the Northern Neotethyan oceanic slab rollback (Rabayrol et al. 2023). Rabayrol et al. (2023) concluded that the Hod Gold
Corridor was a long-lived, deep crustal-scale structural feature along which the successive magmatic and mineralization events were emplaced.
| | 6-13 | |
| SSR Mining Inc. | Hod Maden Project | | January 7, 2026 |
| Technical Report Summary | | SLR Project No.: 123.000320.00001 |
| 6.5 | Regional Prospects and Targets |
The Salinbaş-Hod camp is a group of mineral deposits on the eastern
flank of the Hod Gold Corridor (Section 6.2) and includes the Hod Maden (intermediate-sulfidation epithermal Au-Cu(Pb-Zn)), Hızarlı
(high-sulfidation epithermal Au-Cu-(Cu)), Derinköy (high-sulfidation epithermal Au-Cu-(Ag)), Salinbaş (carbonate-replacement
Au-Ag), and Ardala (calc-alkalic Cu-Au) prospects (Rabayrol et al. 2023). Ariana Resources Plc, an AIM-listed mineral and exploration
development company, currently owns the Salinbaş project, which covers the Ardala, Salinbaş, Derinköy and Hızarlı
prospects
The Hızarlı and Derinköy prospects consist of widespread
silica-muscovite-illite-pyrite and kaolinite-dickite-pyrophyllite alteration zones and a quartz-pyrite-Fe oxyhydroxide vein stockwork
(Rabayrol et al. 2023). Short-wave infrared (SWIR) data analyzed by Rabayrol et al. (2023) indicate the presence of acidic alteration
minerals such as dickite and pyrophyllite throughout the Salinbaş-Hod camp.
| | 6-14 | |
| SSR Mining Inc. | Hod Maden Project | | January 7, 2026 |
| Technical Report Summary | | SLR Project No.: 123.000320.00001 |
Exploration of the Hod Maden deposit has been conducted by Artmin and
its predecessors since 2014. A summary of work completed to date is provided in Table 7-1.
Table 7-1: Overview of Exploration
by Artmin at Hod Maden
| Year |
Deposit |
Exploration Type |
Details |
| 2014 |
Hod Maden |
Surface Studies |
Detailed surface mapping and sampling at 1:25,000 scale by Polimetal
Madençilik (Lidya Madençilik), over an area of four square kilometers covering the south and central mineralized hydrothermally
altered zone.
A soil geochemistry survey with a focus on the central portion of the
Hod Maden Project for Au and Cu and for Pb and Zn was completed in 2014. A total of 960 soil samples located on a 100 m by 100 m spaced
grid were collected.
A total of 738 rock samples were collected from outcrops, road cuts
and trenches from the Hod Maden property. |
| 2015 |
Hod Maden |
Geophysics |
A gravity survey was undertaken by Enerson Engineering and Geophysical
Explorations Company to define the buried mineralization border. Gravity observations were conducted using Scintrex CG-5 Autograv at 267
stations along 8 profiles, spaced 20 m apart.
Maps were plotted in accordance with ED1950 UTM Datum Zone 37, except
where stated otherwise.
No other geophysical methods have been utilized. |
| 2014–2020 |
Hod Maden |
Exploration Drilling |
A total of 238 drillholes for 75,547 m, either PQ or HQ, were drilled
within the Hod Maden property for exploration purposes. Fifteen of these holes were twin holes drilled due to a problem with core recovery.
The collar spacing for exploration through the central areas is an approximate
25 m x 25 m grid, and most holes dip 60°, to the west or east. |
| 2017–2020 |
Hod Maden |
Geotechnical and Hydrological |
Geotechnical drilling completed in 2017 and 2019, comprised of 56 drill
holes for 4,226 m. Out of these, 10 drill holes were sampled and assayed.
25 drill holes for 3,459 m were drilled for hydrological purposes; four
of these drill holes were sampled and assayed |
| 2021–2022 |
Hod Maden |
Geotechnical Drilling |
13 drill holes for 1,063 m were drilled as part of the geotechnical program. None of these holes were sampled or assayed. |
| 2023–2024 |
Hod Maden |
Drilling |
Fourteen infill drill holes for 4,525 m were drilled in the Hod Maden
deposit and submitted for analysis of Au and Cu. Core diameters were PQ and HQ.
57 geotechnical holes for 1,590 m were drilled, of which one drill hole
was sampled or assayed. |
| | 7-1 | |
| SSR Mining Inc. | Hod Maden Project | | January 7, 2026 |
| Technical Report Summary | | SLR Project No.: 123.000320.00001 |
In 2015, Enerson Engineering and Geophysical Explorations Company carried
out a gravity survey on the Main Zone within the l Project area. The purpose of the study was to delineate the border of buried mineralized
rocks thought to have higher density than surrounding barren country rock. Gravity observations were conducted using Scintrex CG-5 Autograv
at 267 stations along eight profiles, spaced 20 m apart. Maps were plotted in accordance with ED1950 UTM Datum Zone 37, except as stated
otherwise. No other geophysical methods were used. The elevation-corrected Bouguer anomalies are presented in Figure 7-1. Within the black
lines, mineralized rocks with high density were interpreted. The anomalies do not correlate with the semi-massive to massive sulfides
intersected at approximately 4,542,200 mN, and 740,600 mE.
| | 7-2 | |
| SSR Mining Inc. | Hod Maden Project | | January 7, 2026 |
| Technical Report Summary | | SLR Project No.: 123.000320.00001 |
Figure 7-1: Hod Maden Bouguer Gravity
Map
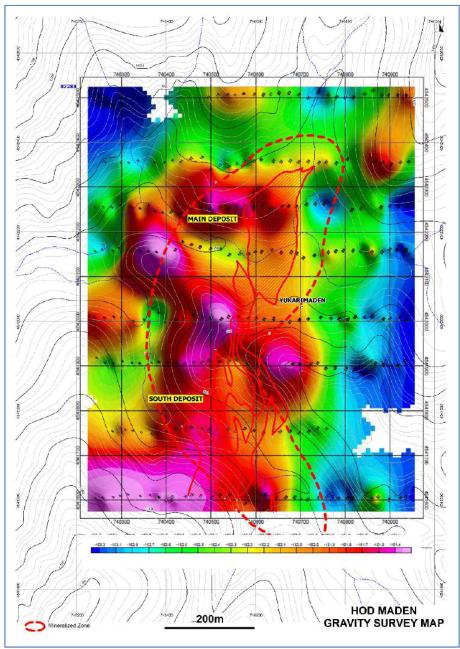
FIGURE 7-1
MAIN DEPOSIT
YUKARIMADEN
SOUTH DEPOSIT
[CAN'T READ NUMBERS ALONG HORIZONTAL COLOR LINE]
Mineralized Zone
200m
HOD MADEN GRAVITY SURVEY MAP
Source: Enerson Engineering and Geophysical Explorations Company 2015.
Note: Red areas indicate higher density rocks at unknown depth.
| | 7-3 | |
| SSR Mining Inc. | Hod Maden Project | | January 7, 2026 |
| Technical Report Summary | | SLR Project No.: 123.000320.00001 |
Polimetal Madençilik (Lidya Madençilik) commenced reconnaissance
exploration in 2014, focused on completion of geological mapping and collection of systematic soil and rock chip (channel) sampling over
the central portion of the Hod Maden property.
Geological mapping confirmed that the main rock types at Hod Maden are
andesites and intercalated andesitic volcanosedimentary rocks. Dacitic flows and breccias are also locally exposed to the south of the
Main Zone discovery, and a flow banded felsic (rhyolitic) dome complex is also exposed in the south-eastern portion of the tenement block.
The geological mapping work is used in support of exploration vectoring, exploration activities, infrastructure locations, mine planning
and environmental monitoring.
| 7.1.3 | Geochemical Sampling |
Polimetal Madençilik initiated a geochemical sampling program
in 2014, during which the following samples were collected:
| · | A total of 960 soil samples, located on a 100 m by 100 m spaced grid. Soil samples were collected from shallow pits, 10 cm to 20 cm
below the surface. Results for the soil geochemical sampling were used to identify drilling targets. |
| · | A total of 738 rock samples from outcrops, road cuts, and trenches from the property. |
All rock and soil samples were dispatched to SGS’s Ankara laboratory
for analysis. All soil and rock samples were analyzed for Au using a 30-g or 50-g Fire Assay with AAS (atomic absorption spectrometry)
finish, in addition to a 32-element ICP-AES (inductively coupled plasma atomic emission spectrometry) analysis of aqua regia digests.
Samples in which ICP analyses returned greater than the maximum detection limit for the elements Ag (10 ppm), Cu (10,000 ppm), Fe (15
%), Pb (10,000 ppm), and Zn (10,000 ppm) were reanalyzed using the AAS analytical technique. Standards and blanks were inserted into the
analytical sequence at the rate of one standard for every 20 samples, two blanks in every batch, and one duplicate every 40 samples. Reference
laboratory check assaying was performed to determine whether assay values were consistent between laboratories.
Diamond drilling is the principal method of exploration and delineation
of mineralization on the property and can generally be conducted year-round. As of the effective date of this TRS, SSR and its predecessor
companies have completed a total of 90,410 m of drilling in 403 holes over the Property, of which 266 holes have assay values and have
been used in the Mineral Resource Estimate (MRE).
A multiphase diamond drilling program was carried out at Hod Maden between
2014 and 2020 by independent drilling company Geoteknik. The initial drilling used a new track-mounted wireline Hanjin D&B rig and
a custom Turkish-manufactured rig. The Turkish rig was replaced by another Hanjin D&B rig in June 2015.
All holes were either HQ or PQ in sized diamond drilling. From 2014
to 2020, A total of 319 diamond core drill holes for 83,232 m were drilled during the period. A total of 251 drill holes were sampled
and assayed 78,251.95 m. Drill holes include exploration and infill diamond holes (HTD), geotechnical diamond holes (HTG) and hydrological
drill holes (HWD) (Table 7-2 and Figure 7-2). The average length of the holes was 311 m, with a maximum length of 708 m and minimum of
30 m. The maximum vertical depth reached was approximately 570 m below surface. Drilling was spaced on an approximate 25 m x 25 m grid,
and most holes were inclined approximately 60° to the west or east.
| | 7-4 | |
| SSR Mining Inc. | Hod Maden Project | | January 7, 2026 |
| Technical Report Summary | | SLR Project No.: 123.000320.00001 |
Drill holes up to hole number HTD-007 were not downhole surveyed. Drill
holes HTD-008 to HTD-192A were downhole surveyed using a Devico survey tool by Geoteknik. Surveys were taken while drilling and/or at
the completion of drilling from bottom up or top down. The survey interval was 40 m, starting at 10 m below the collar.
Drill holes were initially located using handheld GPS or differential
GPS. The final collar positions were located by a licensed surveyor. The drill core was collected and transported to the logging facilities
where it was geologically logged, photographed and cut for sampling.
The Hod Maden deposit continues to be tested by diamond drilling. From
2023 to 2024, a total of 16 diamond drill holes were drilled and assayed for a total of 4,435 m drilled at the time of writing this report
(Table 7-2 and Figure 7-2). Since 2023, drilling has focused on testing the main Au-bearing structures to improve geological and grade
continuity to aid Mineral Resource definition.
Table 7-2: Overview of Diamond Drilling
with Assay Results by Artmin Madençilik at Hod Maden Deposit
| Year |
Number of Holes |
Samples |
Meters |
| 2014 |
6 |
1,174 |
1,350 |
| 2015 |
27 |
6,843 |
8,771 |
| 2016 |
66 |
13,714 |
19,469 |
| 2017 |
72 |
17,272 |
26,045 |
| 2018 |
36 |
7,961 |
11,084 |
| 2019 |
78 |
7,280 |
12,565 |
| 2020 |
34 |
1,894 |
3,948 |
| 2022 |
13 |
- |
1,063 |
| 2023 |
47 |
2,326 |
4,475 |
| 2024 |
24 |
658 |
1,639 |
| Total |
403 |
59,122 |
90,410 |
| | 7-5 | |
| SSR Mining Inc. | Hod Maden Project | | January 7, 2026 |
| Technical Report Summary | | SLR Project No.: 123.000320.00001 |
Figure 7-2: Number of Assayed Drill
Holes by Year
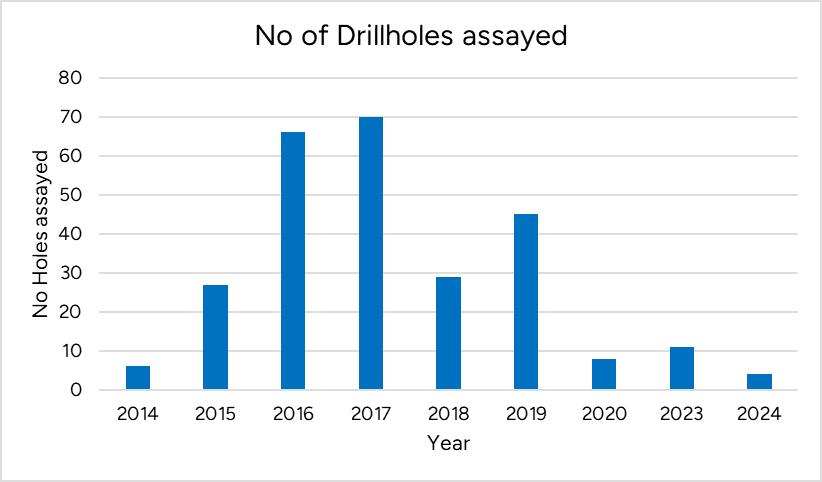
FIGURE 7-2
No of Drillholes assayed
No Holes assayed
80
70
60
50
40
30
20
10
0
2014
2015
2016
2017
2018
2019
2020
2023
2024
Year
Detailed logging of all drill holes was undertaken on site at Yukarımaden.
Drill core is subjected to detailed logging using standard geological codes and logging formats. Information captured includes lithology,
structure, alteration, mineralization, and geotechnical data on veining, joint frequency, and joint sets. In 2024, SSR initiated a re-logging
study, which is in progress as of date of publication of this report.
Diamond drilling at the Hod Maden Project was primarily PQ- or HQ-sized
core, and rarely NQ diameter. PQ core has a nominal diameter of 85 mm, HQ core has a nominal diameter of 63.5 mm, and NQ has a nominal
size of 47.6 mm.
The entire length of the drill holes is sampled. Sample lengths within
mineralized zone are one meters, terminated at lithological or alteration contacts. Samples lengths outside the mineralized zones are
two meters. Drill core samples are obtained by sawing the core in half along the long axis.
Core recovery was generally greater than 90% for the samples below the
transported cover sediments. The QP has established that there is no relationship between core recovery and grade or core recovery and
mineralization.
Prior to processing, drill core was photographed and measured for core
loss, then logged geologically and marked for sampling.
| | 7-6 | |
| SSR Mining Inc. | Hod Maden Project | | January 7, 2026 |
| Technical Report Summary | | SLR Project No.: 123.000320.00001 |
| 7.3.1 | Previous Hydrogeological Studies |
Surface water and groundwater related baseline data collection and assessments
have been carried out by multiple consultants:
| · | Golder Associates (Türkiye) Ltd. (Golder) in 2013 and 2015 |
| · | Hydrocensus Study, Limited Baseline Study: Serhat Demirel et al. 2015. |
| · | 201201058, 20050853, 201200321, 20120159 Licences, Hot Project - Artvin, Türkiye, Environmental Status Evaluation Report, 23
November 2015 |
·
MWH, Hod Maden Mining Project in 2017 - Water Management Assessment
(Van Rensburg, J. (Stantec) (2019). Hod Maden Mining Project - Water Management Desktop Assessment, 27th February 2017 (internal).)
| · | Mitto Consulting (Mitto) 2020 (Geotechnical drilling around TSF - study results have not been incorporated in the current hydrogeological
study) |
| · | Golder Associates (Türkiye) Ltd. (Golder) in 2021 - Hydrocensus Study Update |
| 7.3.2 | Summary of Baseline Field Characterization and Data Collection |
The Project studies are examined under two main headings: (1) Baseline
Studies and (2) 2024-2025 hydrogeological studies to examine the relationship between surface water and groundwater. Baseline studies,
which include detailed groundwater and surface water characterization, were completed by SRK during December 2017 through June 2020. The
baseline studies comprised the following:
| · | Construction/supervision of stream flow measurement stations (AGIs) |
| · | Continuous monitoring of surface water flow at four stream flow measurement stations |
| · | Conducting hydrocensus surveys that identified 128 water points, including seeps, springs |
| · | Groundwater monitoring wells, creeks, developed springs, and village water supply channels |
| · | Seasonal water quality sampling conducted at 21 locations |
| · | Drilling of 15 large diameter (10”) monitoring wells |
| · | Installation of six vibrating wire piezometers (VWP) |
| · | Conducting 38 packer tests |
| · | Conducting 14 pumping tests and one slug test |
| · | Monitoring water levels during the period between April 2018 and November 2021 at 38 points |
| 7.3.3 | Summary of Recent (2024–2025) Field Characterization Study |
In addition to the above characterization program, a recent field characterization
study was conducted by SRK in late 2024 and 2025. The objectives of this field campaign were to investigate the relationship between groundwater
and the Şurakev Creek, which flows over the planned underground operation. The following tasks have been completed:
| | 7-7 | |
| SSR Mining Inc. | Hod Maden Project | | January 7, 2026 |
| Technical Report Summary | | SLR Project No.: 123.000320.00001 |
| · | Drilling of 15 large diameter (12.5”) and one HQ diameter monitoring wells |
| · | Conducting 15 single pumping tests, two mutual pumping test, one slug test, and a multiple (5 wells) pumping test |
| · | Two manual stream measurements were made in November 2024 and February 2025 |
The locations of monitoring wells drilled at the site have been selected
to provide specific representation of the hydrostratigraphic units. Project facilities and long-term monitoring requirements were also
considered while doing well sitting. Within the scope of the baseline study, SRK supervised the drilling of 11 large diameter (10 inch)
wells and six narrow diameter (HQ) wells in 2018. In addition to the baseline phase drilling, four additional large diameter wells and
piezometer conversion of eight HQ holes were completed by SRK. The total drilling depth for the hydrogeological investigation from 2017
to 2020 was 3,353 m.
In 2024, SRK initiated a focused drilling and testing study on surface
water and groundwater interactions to inform the liner decision for the main creek channel (Şurakev Creek). As part of this study,
13 shallow wells were drilled at the side of the creek to evaluate streambed conductance. The total meterage drilled for the 2024 campaign
was 636 m. Complete baseline field characterization details to date are presented in the Hod Mine Project Baseline (SRK 2020), while the
factual report for the 2024–2025 drilling work is presented in the Factual Report Summary (Hydrogeology) (SRK 2025d).
Monitoring wells and hydraulic testing locations are provided on Figure 7-3.
| | 7-8 | |
| SSR Mining Inc. | Hod Maden Project | | January 7, 2026 |
| Technical Report Summary | | SLR Project No.: 123.000320.00001 |
Figure 7-3: Monitoring Well
Locations
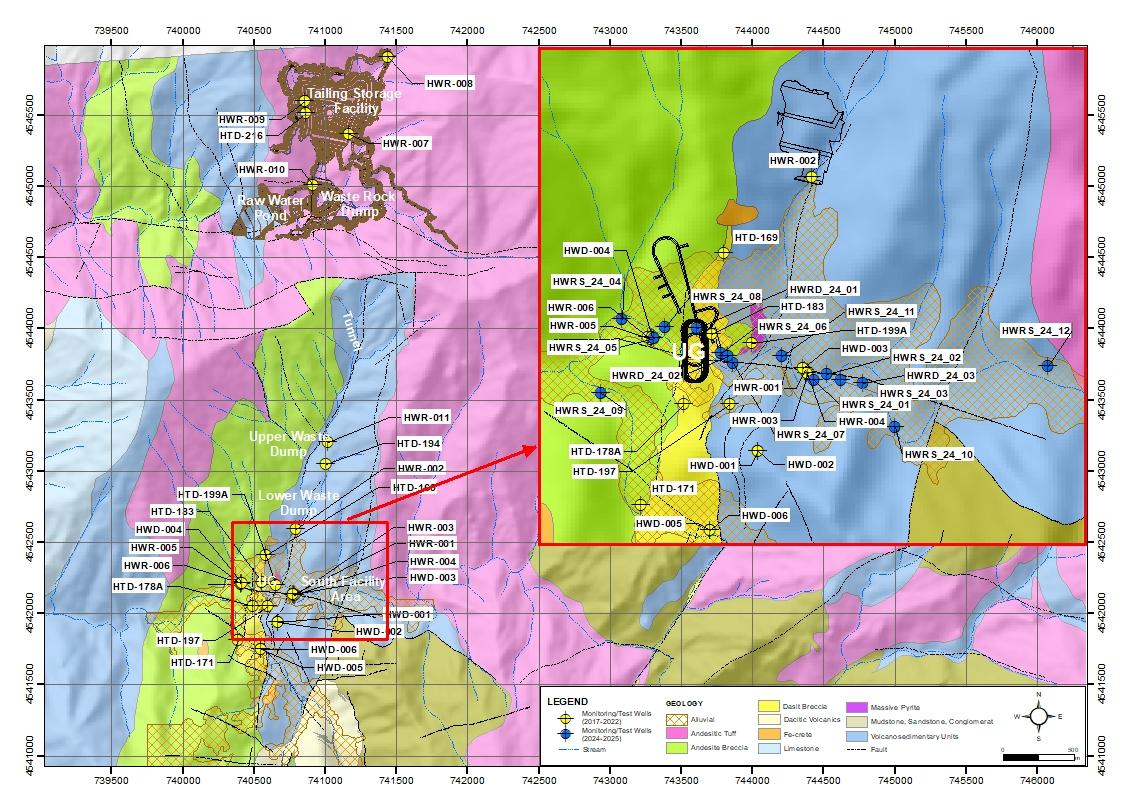
FIGURE 7-3
HWR-008
Tailing Storage Facility
HWR-009
HT D-2'6
HWR-007
HWR-010
Raw Water Pond
Waste Rock Dump
HWR-011
HT D-194
HWR-002
HT D-165
HT D-199A
HT D-183
HWD-004
HWR-005
HWR-006
HT D-178A
HT D-197
HT D-171
HWR-003
HWR-001
HWR-004
HWD-003
HWD-001
HWD-002
HWD-006
HWD-005
HWR-002
HWD-004
HWR S_24_04
HWR-006
HWR-005
HWR S_24_05
HWRD_24_02
HWR S_24_09
HTD-178A
HTD-197
HTD-169
HWR S-24_08
HWRD_24_01
HT D-183
HWR S_24_11
HWR S_24_06
HT D-199A
HWD-003
HWR S_24-02
HWRD_24_03
HWR S_24_03
HWR S_24_01
HWR-004
HWR S_24_10
HWR S_24_12
HWR-001
HWR-003
HWR S_24_07
HWD-001
HWD-002
HT D-171
HWD-005
HWD-006
LEGEND
Monitoring/Test Wells
(2017-2022)
Monitoring/Test Wells
(2024-2025)
Stream
Geology
Alluvial
Andesitic Tuff
Andesite Breccia
Dacite Breccia
Dacitic Breccia
Fe-crete
Limestone
Massive pyrite
Mudstone, Sandstone, Conglomerat
Volcanosedimentary Units
Fault
N
W
E
S
0
500
M
Source: Artmin 2025
| | 7-9 | |
| SSR Mining Inc. | Hod Maden Project | | January 7, 2026 |
| Technical Report Summary | | SLR Project No.: 123.000320.00001 |
Aquifer tests were carried out to determine the hydraulic parameters
of the hydrostratigraphic units (hydraulic conductivity [K], transmissibility [T], storage coefficient [S]) and the aquifer boundary conditions.
Hydraulic conductivity (K) is the amount of water that would move through a unit area of saturated formation in unit time under unit hydraulic
gradient and is a property of both the fluid and the medium. Transmissibility (T) is the amount of water that passes through a unit cross-section
per unit time under a unit hydraulic gradient over the entire thickness of the aquifer. The storage coefficient (S) is the amount of water
that must be taken or added from the unit aquifer cross-sectional area to make 1 m difference perpendicular to this cross-sectional area
at groundwater level. While hydraulic conductivity describes how much water can move in the aquifer, the storage coefficient defines how
much water can be found and withdrawn from the aquifer.
Packer tests were used to measure the hydraulic conductivity of discrete
intervals of the borehole and to investigate fractures and alteration zones encountered during the drilling. This data was assessed in
conjunction with structural information from the interpretation of core logs obtained from the geotechnical drilling. The most important
feature of the packer testing was the ability to measure the variation in hydraulic conductivity with depth. To examine the hydraulic
conductivity variation with depth, exploration drillings were employed for packer testing. Test intervals were determined considering
lithological units, faults and based on drilling observations (water losses, water strikes, gap crossing, fault zone, etc.). In four exploration
holes (HWD-001, HWD-003, HWD-004, and HWD-005), 38 packer tests were performed. Graphs showing the packer test results (hydraulic conductivity)
and the proposed mine depth are presented in Figure 7-4.
Step and constant rate pumping tests were completed in all the large
diameter (10 inch) wells. Test durations varied (from 24 h to 10 day) based on the observed boundary conditions
Table 7-3 provides a summary of the pumping tests.
| | 7-10 | |
| SSR Mining Inc. | Hod Maden Project | | January 7, 2026 |
| Technical Report Summary | | SLR Project No.: 123.000320.00001 |
Figure 7-4: Packer Tests Measured
Hydraulic Conductivity Values with Depth
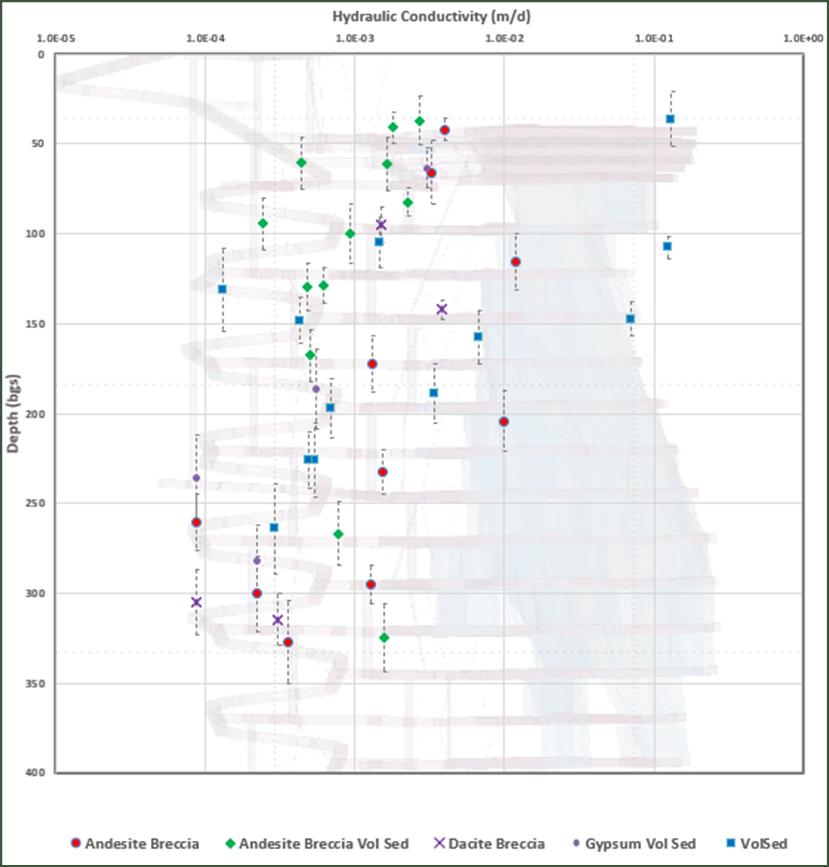
FIGURE 7-4
Hydraulic Conductivity (m/d)
1.0E-0 5
1.0E-0 4
1.0E-0 3
1.0E-0 2
1.0E-0 1
1.0E+00
Depth (bgs)
0
50
100
150
200
250
300
350
400
Andesite Breccia
Andesite Breccia Vol Sed
Dacite Breccia
Gypsum Vol Sed
VolSed
Source: SRK 2022.
Notes: Depth shown as meters below ground surface (m bgs)
| | 7-11 | |
| SSR Mining Inc. | Hod Maden Project | | January 7, 2026 |
| Technical Report Summary | | SLR Project No.: 123.000320.00001 |
Table 7-3: Pumping and Slug
Test Information and Analysis Results (2017–2025)
| Well ID |
Well Diameter
(mm) |
Well Depth
(m) |
Static Water
Level
(m bgs) |
Pumping Test Rate
(L/s) |
Geomean
K (m/s) |
Total Drawdown
(m) |
Pumping Duration
(hour) |
| HWR-001 |
254 |
31 |
1 |
9 |
3.0E-05 |
11 |
72 |
| HWR-002 |
254 |
98 |
0.9 |
0.1 |
1.0E-08 |
61.3 |
72 |
| HWR-003 |
254 |
99 |
0.88 |
1 |
1.0E-07 |
79.1 |
72 |
| HWR-004 |
254 |
5 |
1.75 |
0.8 |
2.0E-04 |
0.7 |
24 |
| HWR-005 |
254 |
7 |
0.5 |
0.4 |
6.0E-05 |
2.7 |
72 |
| HWR-006 |
254 |
99 |
0* |
11 |
4.0E-06 |
15.8 |
72 |
| HWR-007 |
254 |
204 |
72.54 |
Slug Test |
1.0E-06 |
Slug Test |
Slug Test |
| HWR-008 |
254 |
144 |
3.74 |
0.31 |
1.0E-07 |
12.1 |
72 |
| HWR-009 |
254 |
134 |
35.5 |
0.21 |
1.0E-07 |
67.7 |
11 |
| HWR-010 |
254 |
146 |
43.34 |
0.58 |
3.0E-05 |
74.4 |
72 |
| HWR-011 |
254 |
200 |
39.95 |
0.39 |
4.0E-06 |
74.6 |
18 |
| HWR-012 |
254 |
154 |
8.85 |
6 |
2.7E-06 |
44 |
45 |
| HWR-013 |
254 |
112 |
4.88 |
7.5 |
5.3E-06 |
16 |
72 |
| HWR-014 |
254 |
150 |
1.23 |
0.35 |
5.1E-09 |
44 |
8 |
| HWR-015 |
254 |
29 |
9.44 |
0.12 |
1.5E-06 |
6 |
8 |
| HWRS_24_01 |
305 |
21.3 |
1.86 |
2.64 |
1.3E-05 |
9.83 |
72 |
| HWRS_24_02 |
305 |
22 |
1.81 |
1.42 |
3.2E-04 |
9.94 |
73 |
| HWRS_24_03 |
305 |
20 |
2.46 |
2.00 |
2.3E-05 |
6.28 |
72 |
| HWRS_24_04 |
305 |
21.8 |
2.37 |
0.91 |
4.5E-06 |
9.12 |
72 |
| HWRS_24_05 |
305 |
20.5 |
0.84 |
0.45 |
1.7E-06 |
6.28 |
72 |
| HWRS_24_06 |
305 |
27.8 |
5.47 |
0.66 |
2.1E-06 |
12.97 |
63.6 |
| HWRS_24_07 |
305 |
21.6 |
1.41 |
1.40 |
8.0E-06 |
9.53 |
72 |
| HWRS_24_08 |
305 |
29 |
8.36 |
0.90 |
9.6E-06 |
17.42 |
49 |
| HWRS_24_09 |
305 |
22 |
1.62 |
1.02 |
7.6E-06 |
8.04 |
72 |
| HWRS_24_10 |
305 |
20 |
4.49 |
2.26 |
2.1E-05 |
6.33 |
60.8 |
| HWRS_24_11 |
305 |
20 |
0.56 |
0.80 |
9.7E-05 |
11.85 |
72 |
| HWRS_24_12 |
305 |
20 |
7.38 |
5.41 |
1.2E-04 |
7.88 |
96 |
| HWRS_24_13 |
96 (HQ) |
30 |
2.42 |
No test |
|
|
|
| HWRD_24_01 |
305 |
96 |
10.64 |
0.14 |
3.8E-08 |
27.05 |
72 |
| HWRD_24_02 |
305 |
98.6 |
4.42 |
No test** |
|
|
|
| HWRD_24_03 |
305 |
101 |
5.19 |
No test** |
|
|
|
|
N.A : Not Applicable (This well drilled HQ diameter for observation)
m bgs meters below ground surface
* Artesian conditions. Follow up needed to verify hydraulic head.
** Aquifer testing was not performed as per Artmin’s project revision
of Snake Road and PAG |
| | 7-12 | |
| SSR Mining Inc. | Hod Maden Project | | January 7, 2026 |
| Technical Report Summary | | SLR Project No.: 123.000320.00001 |
| 7.3.6 | Streamflow Measurements |
Instantaneous streamflow measurements were conducted along the creek
in the proposed mine area at 100 m intervals, from upstream to downstream. The objective of these instantaneous measurements was to characterize
the creek’s flow regime and to identify reaches exhibiting increases or decreases in surface flows to identify groundwater discharge/recharge
areas. Variations in measured flows were analyzed to infer the hydrogeological controls on streamflow, including potential contributions
from groundwater inflow, surface runoff, or losses to the subsurface. These data provide a basis for understanding stream–aquifer
interactions and for supporting conceptual hydrogeological and numerical groundwater models.
As part of the study, streamflow measurements were conducted in the
creek in November 2024 and February 2025. Previously collected measurements are compared with the current data on the map shown in Figure 7-5.
Based on the measurements, it is inferred that a probable portion of the creek flow diverts toward the alluvial deposits in the vicinity
of the mine site and recharges the groundwater system. However, since these data represent instantaneous measurements, they provide a
general indication of flow distribution but are not fully reliable for quantitative calculations (SRK 2025).
A summary of the geotechnical investigations is provided in Section
13.2.2.
| | 7-13 | |
| SSR Mining Inc. | Hod Maden Project | | January 7, 2026 |
| Technical Report Summary | | SLR Project No.: 123.000320.00001 |
Figure 7-5: Stream Flow Locations
and Measured Flow Rates
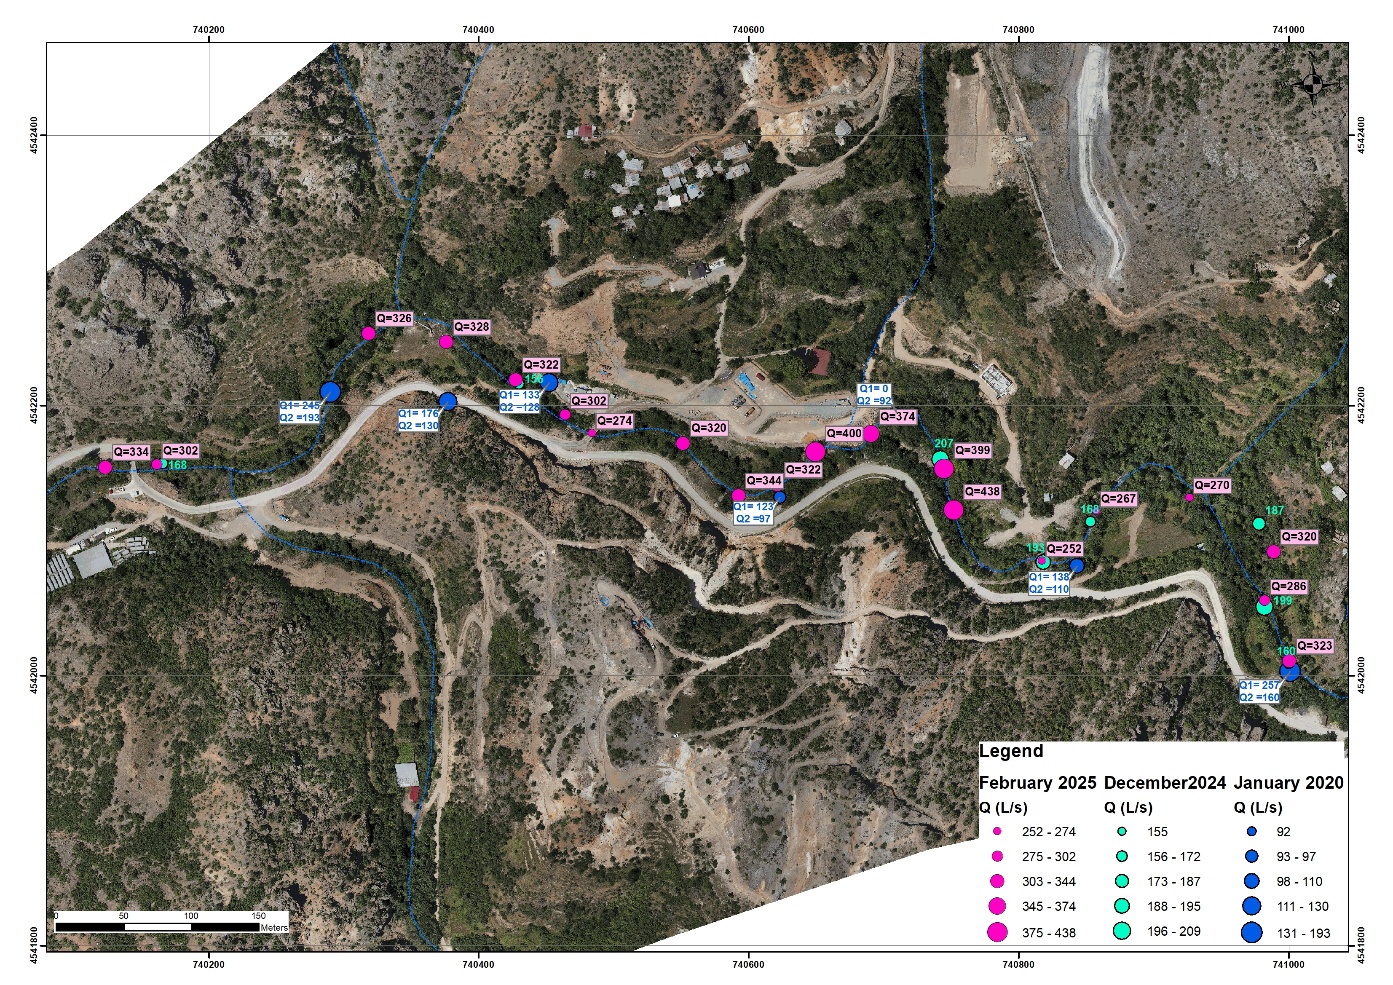
FIGURE 7-5
Q=334
Q=302
168
Q1=245
Q2=193
Q=326
Q=328
Q=322
156
Q1=176
Q2=130
Q1-133
Q2=128
Q=302
Q=274
Q=320
Q=344
Q1=123
Q2=97
Q=322
Q=400
Q1=0
Q2=92
Q=374
207
Q=399
Q=438
193
Q=252
Q1=138
Q2=110
168
Q=267
Q=270
187
Q=320
Q=286
199
160
Q=323
Q1=257
Q2=160
Legend
February 2025
December 2024
January 2020
Q (L/s)_
252 - 274
275 - 302
303 - 344
345 - 374
375 - 438
Q (L/s)
155
156 - 172
173 - 187
188 - 195
196 - 209
Q (L/s)
92
93 - 97
98 - 110
111 - 130
131 - 193
Source: SRK 2025d
| | 7-14 | |
| SSR Mining Inc. | Hod Maden Project | | January 7, 2026 |
| Technical Report Summary | | SLR Project No.: 123.000320.00001 |
| 8.0 | Sample Preparation, Analysis, and Security |
The sample preparation methodology from 2014–2024 is summarized
in Table 8-1.
From 2014 to 2015 diamond core samples were prepared at SGS, all remaining
diamond drill core samples were prepared at ALS İzmir, an ISO/IEC 17025:2017 certified facility in Izmir, Türkiye (Table 8-1).
ALS İzmir is independent of SSR.
Limited detail is available to the RSC QP on sample preparation methods
for the period from 2014–2015. The QP is broadly familiar with SGS preparation methods and, given the small proportion of samples
processed here, considers this a low risk with respect to the data quality objective (DQO) of classifying at least Indicated Mineral
Resources.
The sample analysis methodology from 2014–2024 is summarized in
Table 8-1.
From 2015–2020, analysis was conducted at ALS Izmir. Since 2020,
sample pulps were forwarded from ALS Izmir to ALS Loughrea, Ireland, for analysis. ALS Loughrea is an ISO/IEC 17025:2017 certified laboratory.
All laboratories used to analyze samples are independent of Polimetal
Madençilik and SSR.
| | 8-1 | |
| SSR Mining Inc. | Hod Maden Project | | January 7, 2026 |
| Technical Report Summary | | SLR Project No.: 123.000320.00001 |
Table 8-1: Summary of Sample Preparation
and Analysis Methods
| Date |
Laboratory |
Sample Preparation & Assay Methodology |
| 2014–2015 |
SGS Ankara |
FAA303: 30-g or 50-g Fire Assay with AAS finish, in addition to a 32-element
ICP-AES analysis of aqua regia digests (0.01 g/t Au–3 g/t Au). Over-limit samples were analyzed by FAG303.
ICP40B: An additional 36 elements were analyzed by four-acid digest,
followed by inductively coupled plasma-optical emission spectroscopy (ICP-OES). Over-limit samples (Ag > 10 ppm, Cu >10,000 ppm,
Fe >15%, Pb >10,000 ppm, and Zn >10,000 ppm) were re-analyzed with AAS finish. |
| 2015–2020 |
ALS İzmir, Türkiye |
CRU-31 (fine crushing 70% < 2 mm)
PUL-32 (pulverized 1,000 g to 85% < 75 µm).
Au-AA25: 30-g FA followed by AAS; (0.01–100 g/t Au). Over-limit
samples were analyzed using Au-GRA21.
ME-ICP61: 33 elements were analyzed by four-acid digest with ICP-AES
finish.
ME-ICP61a: 33 elements were analyzed by four-acid digest (ore grade)
with ICP-AES finish. |
| 2022–Present |
Sample Preparation at ALS İzmir
Analysis at ALS Loughrea, Ireland |
ALS İzmir (sample preparation)
CRU-31 (fine crushing 70% < 2 mm)
PUL-32 (pulverized 1,000 g to 85% < 75 µm).
ALS Loughrea, Ireland (analytical procedures)
Au-AA24: 50-g FA followed by AAS (0.005–10 g/t Au). Over-limit
samples were analyzed using Au-GRA21.
Au-AA23: 30-g FA followed by AAS (0.005–10 g/t Au). Over-limit
samples were analyzed using Au-GRA21.
ME-MS61: 48 elements were analyzed by four-acid digest, with inductively
coupled plasma-mass spectrometry (ICP-MS) finish
Cu-OG62, Zn-OG62, Pb-OG62: Ore grade Cu (>1%), Pb and Zn were analyzed
by four-acid digest, followed by with ICP-MS finish.
S-IR07: Sulfide sulfur by Na2CO3 leach.
S-IR08: Total sulfur (IR Spectroscopy).
C-IR07: Total carbon (IR Spectroscopy). |
| 2023–2024 |
ALS İzmir |
S-IR07: A total of 3,245 overlimit samples were re-assayed for sulfide sulfur. |
| | 8-2 | |
| SSR Mining Inc. | Hod Maden Project | | January 7, 2026 |
| Technical Report Summary | | SLR Project No.: 123.000320.00001 |
Sample security measures were taken throughout the sampling and shipping
processes. Half core was placed in a numbered sample bag and the other half stored in the core box for reference. Collected samples were
stored in an area of the exploration camp at Yukarιmaden; core storage was separate from the rest of the camp facilities. After the
samples were placed in plastic bags and secured by cable ties, they were placed in sequence, inside a shelter constructed for that purpose.
When sufficient samples were generated, they were placed in larger sacks that were labelled with the enclosed sample sequence and the
sacks securely closed. Samples were dispatched through private carriers/transportation companies to the sample preparation laboratory
of SGS Ankara and/or ALS İzmir. The retained split core was stored on site at Yukarιmaden.
The logging and sampling generation areas were secured, and entry was
restricted.
| 8.4.1 | Data Quality Objective |
Every data collection process implicitly comes with expectations for
the accuracy and precision of the data being collected. For Hod Maden, the data quality objective (DQO) is to classify at least Indicated
Mineral Resources. In other words, data should be of a quality that is ‘fit for the purpose of classifying at least Indicated Mineral
Resources.
Quality assurance (QA) is about error prevention and establishing processes
that are repeatable and self-checking. This can be achieved using technically sound, simple, and prescriptive standard operating procedures
(SOPs) and management systems.
No QA documents for collar location, downhole surveys, density, diamond
drilling first-split (core-split), or third-split (pulp repeats) were available for review by the QP (Table 8-2). The QP recommends SSR
establish new SOPs that are adjusted to the Hod Maden deposit. In the absence of any documented QA, the QP’s assessment of SSR’s
QA relies on the observations made during the site visit (Section 9.1). The QP observed the various data collection steps undertaken by
the Project’s staff, focusing on processes that affect the quality of the diamond drill hole dataset that supports the Mineral Resource
estimate. A summary of the QP’s review of SSR’s quality assurance system is given in Table 8-2.
| | 8-3 | |
| SSR Mining Inc. | Hod Maden Project | | January 7, 2026 |
| Technical Report Summary | | SLR Project No.: 123.000320.00001 |
Table 8-2: Summary of QA and SOP
Review
| Category |
Availability of SOP |
QA Measures in SOP |
DQO Stated in SOP |
Summary of Process/QP Comments |
QA Risk Factor |
| Collar location Data (X,Y, Z) and Downhole survey |
No |
No |
n/a |
Collars were initially surveyed using handheld GPS or differential GPS.
The final collar positions were located by a licensed surveyor. The QP witnessed the collar surveying process and considers the current
processes, under normal operating conditions, performed by a licensed surveyor, a low risk with respect to the DQO. The QP witnessed the
downhole surveying process during the site visit and confirms this process is performed in line with standard industry equipment and procedures.
Previously collected data, not audited by the Qualified Person, are
unverifiable but considered a low risk to the estimation quality and the resource classification. |
Low |
| Diamond: Primary Sampling |
No |
No |
n/a |
The primary sample is collected at the drill bit. The QP witnessed the
drilling process during the visit and confirms that the current procedures are performed in line with standard industry practice.
Previously collected data, not audited by the QP, are unverifiable but
based on a review of the core considered a low risk to the estimation quality and the resource classification. |
Low-Moderate |
| Diamond: First Split |
No |
No |
n/a |
The QP observed standard industry mark-up and core cutting practice.
Quarter core-split duplicates were collected from 2014 to 2024, which the QP considers acceptable practice for an exploration/resource
development project. However, the QP noted that a large amount of legacy primary samples remain at quarter core support, which is not
good practice; the QP recommends re-submitting these samples to yield half-core support and submitting at least half-core samples henceforth.
Previously collected data, not audited by the QP, are unverifiable but
based on a review of the core considered a low risk to the estimation quality and resource classification. |
Moderate |
| | 8-4 | |
| SSR Mining Inc. | Hod Maden Project | | January 7, 2026 |
| Technical Report Summary | | SLR Project No.: 123.000320.00001 |
| Category |
Availability
of SOP |
QA
Measures in SOP |
DQO
Stated in SOP |
Summary
of Process/QP Comments |
QA
Risk Factor |
| Second Split |
Yes (at the laboratory but not provided) |
Yes |
Yes |
The second splitting process takes place at the laboratory after the coarse crush. The QP did not witness the second splitting step but considers this, under normal operating conditions in an ISO-accredited facility, a low risk with respect to the DQO. |
Low |
| Third Split |
Yes (available at the laboratory but not provided) |
Yes |
Yes |
The third splitting process (pulp scoop/spoon) takes place at the laboratory. The QP did not witness the third splitting step but considers this, under normal operating conditions in an ISO-accredited facility, a low risk with respect to the DQO. |
Low |
| Analytical |
Yes (available at the laboratory but not provided) |
Yes |
Yes |
Samples are analyzed at ISO-accredited laboratories that are required to follow industry standard practices of analysis. The QP did not witness the quality assurance system for the analytical process but is familiar with the protocols used by ALS across the globe and considers this, under normal operating conditions, a low risk with respect to the DQO. |
Low |
| Density |
No |
No |
n/a |
For bulk density determination, 10 cm to 15 cm core samples are taken
approximately every 10 meters and oven-dried (105°C) for 24 hours. Dry samples are weighed then, waxed and weighed again in both air
and submerged in water. Dry bulk density values are calculated using the Archimedes’ Principle. The QP witnessed the current bulk
density measurement process during the visit and generally observed common industry practice. However, there exists a minor risk that
selection bias has caused a minor overestimation of bias in the weathered zones.
Previously collected data, not audited by the QP, are unverifiable and
based on a review of the density values contains some errors; however, are considered a low risk to the estimation quality and the resource
classification. |
Low-Moderate |
| Logging |
No |
No |
No |
An SOP for the logging process is not available, and this should be
remedied. SSR has recently adopted a new logging approach that results in much more detail in the logging process but likely overcomplicates
the logging process. The QP recommends revising the logging strategy based on the broad understanding of the deposit, putting emphasis
on those aspects relevant for domaining for mineral resource estimation. The QP recommends creating a detailed core library that encapsulates
the logging framework.
The QP reviewed previous logging data, which showed a number of inconsistencies
that affect the integrity of the geological domains, which in turn impact the estimation domains. This carries a moderate risk with respect
to the estimation quality and the resource classification. |
Moderate |
| | 8-5 | |
| SSR Mining Inc. | Hod Maden Project | | January 7, 2026 |
| Technical Report Summary | | SLR Project No.: 123.000320.00001 |
| Category |
Availability
of SOP |
QA
Measures in SOP |
DQO
Stated in SOP |
Summary
of Process/QP Comments |
QA
Risk Factor |
| |
|
|
|
The QP recommends revising the logging strategy based on the broad understanding of the deposit, putting emphasis on those aspects relevant for domaining for mineral resource estimation. The QP recommends creating a detailed core library that encapsulates the logging framework.
The QP reviewed previous logging data, which showed a number of inconsistencies
that affect the integrity of the geological domains, which in turn impact the estimation domains. This carries a moderate risk with respect
to the estimation quality and the resource classification. |
|
| | 8-6 | |
| SSR Mining Inc. | Hod Maden Project | | January 7, 2026 |
| Technical Report Summary | | SLR Project No.: 123.000320.00001 |
The purpose of quality control (QC) is to detect and correct errors
while a measuring or sample-collection system is in operation. The outcome of a good QC program is that it can be demonstrated that errors
were fixed during operation and that the system delivering the data was always in control. Together with good QA, it ensures that the
DQO is met.
Good QC is achieved by inserting and constantly evaluating checks and
balances. These checks and balances can be incorporated at every stage of the sample process (location, primary sample collection, preparation,
and analytical phases) and, if in place, should be monitored during data collection, allowing the operator to identify and fix errors
if and when they occur.
A summary of the QP’s review of quality control processes is provided
in Table 8-3 and associated figures are presented in Figure 8-1 to Figure 8-11.
| | 8-7 | |
| SSR Mining Inc. | Hod Maden Project | | January 7, 2026 |
| Technical Report Summary | | SLR Project No.: 123.000320.00001 |
Table 8-3: Summary of Hod Maden
QC Review
| Category |
QC Method |
QP Comments and Conclusion |
Risk Factor |
| Collar Survey |
Consistency monitored by repeat measurements. |
No results of QC checks on the collar surveying were available to the QP and the QP cannot evaluate whether the collar surveying process was always well controlled. |
Low |
| Downhole Survey |
Consistency is reviewed at the rig through assessment of magnetic intensity, gravity and deviation compared to the preceding survey. Severity of deviation can be determined by reviewing dog-leg severity (DLS). |
A record of the QC process on the downhole survey at the rig was not available to the QP for review. In the absence of such a record, the QP reviewed hole deviations between subsequent surveys in the database by determining dog-leg severity (DLS, hole deviation in degrees per 30 m) for all surveys in the database (Figure 8-1, Table 8-4). The review of DLS values demonstrates that hole deviations greater than 5°/30 m (or 0.17°/m) represent approximately 1.8% of surveys in the database (average 0.9°/30 m). These values suggest that the downhole survey process was mostly in control. The QP recommends that DLS checks are carried out during the drilling and that any values over 5°/30 m are flagged and resurveyed. |
Low |
| Diamond: Primary Sampling |
Consistency can be monitored by reviewing core recovery. |
While there are intervals with significant core loss, no trends were observed in the core recovery plots (Figure 8-2), suggesting that recovery of the primary sample was mostly in control. From December 2018 to February 2019, in January 2020, and in May 2022, recovery averaged less than 80%, suggesting that the recovery process was not well controlled during this time. The lower recovery in these periods may be due to the geotechnical properties of the zone being targeted or may reflect poor drilling practice. Overall core recovery was mostly well controlled and the QP considers the risk associated with the consistency of the primary sampling process low to moderate. |
Low-Moderate |
| Core Split |
Consistency of the splitting process can be monitored by reviewing the relative difference of first-split (field duplicate; core-split) duplicates. |
First-split duplicates (quarter core) were historically submitted at
a nominal rate of 1 in 40 samples from December 2014 to August 2017 (Artmin 2021). In September 2017, the field duplicate insertion rate
was increased to 1 in 20. Field duplicates from December 2014 to today are quarter-core duplicates.
The splitting process was relatively consistent from 2014–2020
(Figure 8-3). From 2023–2024, only limited duplicate data are available for review; no clear trends are visible in the relative
difference plots, suggesting that the first splitting process was mostly in control (Figure 8-3 and Figure 8-4). |
Low |
| Crushing & Second Split |
Consistency of the splitting process can be monitored by reviewing relative difference of second-split (coarse-split) duplicates. |
No duplicates were available for the second splitting step and the QP cannot comment if the splitting process was always well controlled. |
Low |
| | 8-8 | |
| SSR Mining Inc. | Hod Maden Project | | January 7, 2026 |
| Technical Report Summary | | SLR Project No.: 123.000320.00001 |
| Category |
QC
Method |
QP
Comments and Conclusion |
Risk
Factor |
| Pulverization & Third Split |
Consistency of the splitting process can be monitored by reviewing relative difference of third-split (pulp-split) duplicates. |
The third splitting process delivered consistent results from 2014–2024 and appears to have been in control; the QP did not observe any trends or step changes (Figure 8-5 and Figure 8-6). |
Low |
| Analytical Process |
Consistency can be monitored by certified reference materials (CRMs)
and blanks. Unwanted, special-cause variation (as opposed to “common-cause variation”) can be assessed for each
CRM using statistical process control plots (SCPs).
|
Several different CRMs have been selected for use at varying Au and
Cu grades over the life of the Hod Maden Project (Table 8-9, Figure 8-7, Figure 8-8). Relatively few different CRMs were submitted during
the 2023–2024 campaign.
The QP reviewed results of SSR’s disguised (i.e., blind) CRMs
through Shewhart control plots (e.g., Figure 8-9) and special cause variation heat maps (Figure 8-10). The review demonstrates some isolated
periods of special cause variation for individual CRMs, but the heatmaps do not reveal any consistent periods of special cause variation
across multiple CRMs. Overall, the analytical process at the laboratory (ALS İzmir) appears to have been mostly in control, and the
laboratory provided consistent data.
Blank samples were inserted into all sample batches to monitor sample
contamination from crushing and pulverizing. The blank samples comprise four low Au materials by Rocklabs and a Coarse Blank containing
coarse quartz material. The QP’s review of analytical results of blanks inserted in the sample stream indicates no trends or patterns
in the blank results, and Au contamination appears to have been well controlled over the period of analysis (Figure 8-11). |
Low |
| Density |
Consistency can be monitored by reviewing duplicate and standard measurements. |
No standard weights or duplicate measurements were taken by SSR for the density procedure. The QP recommends that duplicate measurements are taken, in particular for samples that fall outside three standard deviations of the global density population. The QP cannot comment on whether the bulk density measurement process was always in control. |
Low–Moderate |
| Logging |
Consistency of the logging can be monitored by check-logging and peer review. |
Quality control on the logging is not presently implemented systematically and the QP cannot comment if the logging process was always well controlled. Site observations indicate that anhydrite, jasperoid and quartz veining are logged inconsistently, suggesting that the process is not always well controlled. The QP recommends implementing systematic quality control on the logging process through cross-logging and peer review to improve consistency of the logging. |
Moderate |
| | 8-9 | |
| SSR Mining Inc. | Hod Maden Project | | January 7, 2026 |
| Technical Report Summary | | SLR Project No.: 123.000320.00001 |
Table 8-4: Dog-leg Severity of Downhole
Surveys
| Survey |
Number of Surveys |
Number of DLS >5° / 30 m |
Percentage of DLS >5° / 30 m |
| Total |
2,387 |
44 |
1.8% |
| Notes: DLS dog-leg severity |
Figure 8-1: DLS Histograms for Each
Survey Method
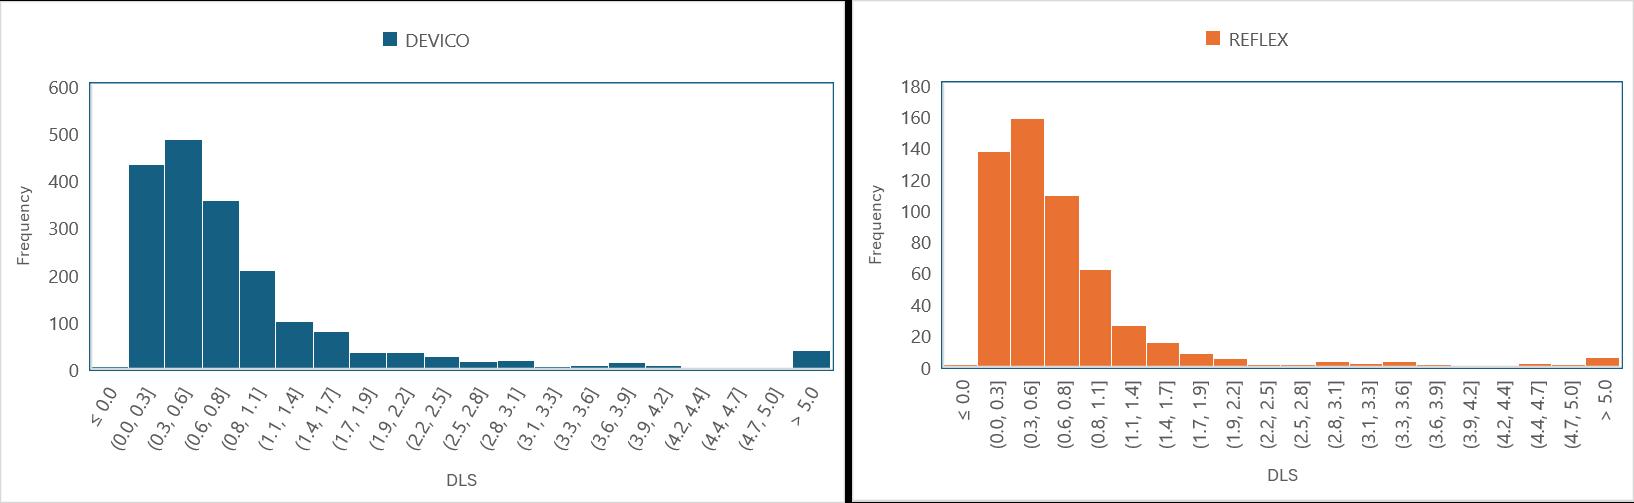
FIGURE 8-1
DEVICO
Frequency
600
500
400
300
200
100
0
? 0.0
(0.0, 0.3]
(0.3, 0.6]
(0.6, 0.8]
(0.8, 1.1]
(1.1, 1.4]
(1.4, 1.7]
(1.7, 1.9]
(1.9, 2.2]
(2.2, 2.5]
(2.5, 2.8]
(2.8, 3.1]
(3.1, 3.3]
(3.3, 3.6]
(3.6, 3.9]
(3.9, 4.2]
(4.2, 4.4]
(4.4, 4.7]
(4.7, 5.0]
> 5.0
DLS
REFLEX
Frequency
180
160
140
120
100
80
60
40
20
0
?0.0
(0.0, 0.3)
(0.3, 0.6)
(0.6, 0.8)
(0.8, 1.1)
(1.1, 1.4)
(1.4, 1.7)
(1.7, 1.9)
(1.9, 2.2)
(2.2, 2.5)
(2.5, 2.8)
(2.8, 3.1)
(3.1, 3.3)
(3.3, 3.6)
(3.6, 3.9)
(3.9, 4.2)
(4.2, 4.4)
(4.4, 4.7)
(4.7, 5.0)
> 5.0
DLS
Figure 8-2: Diamond Core Recovery
at Hod Maden since December 2014
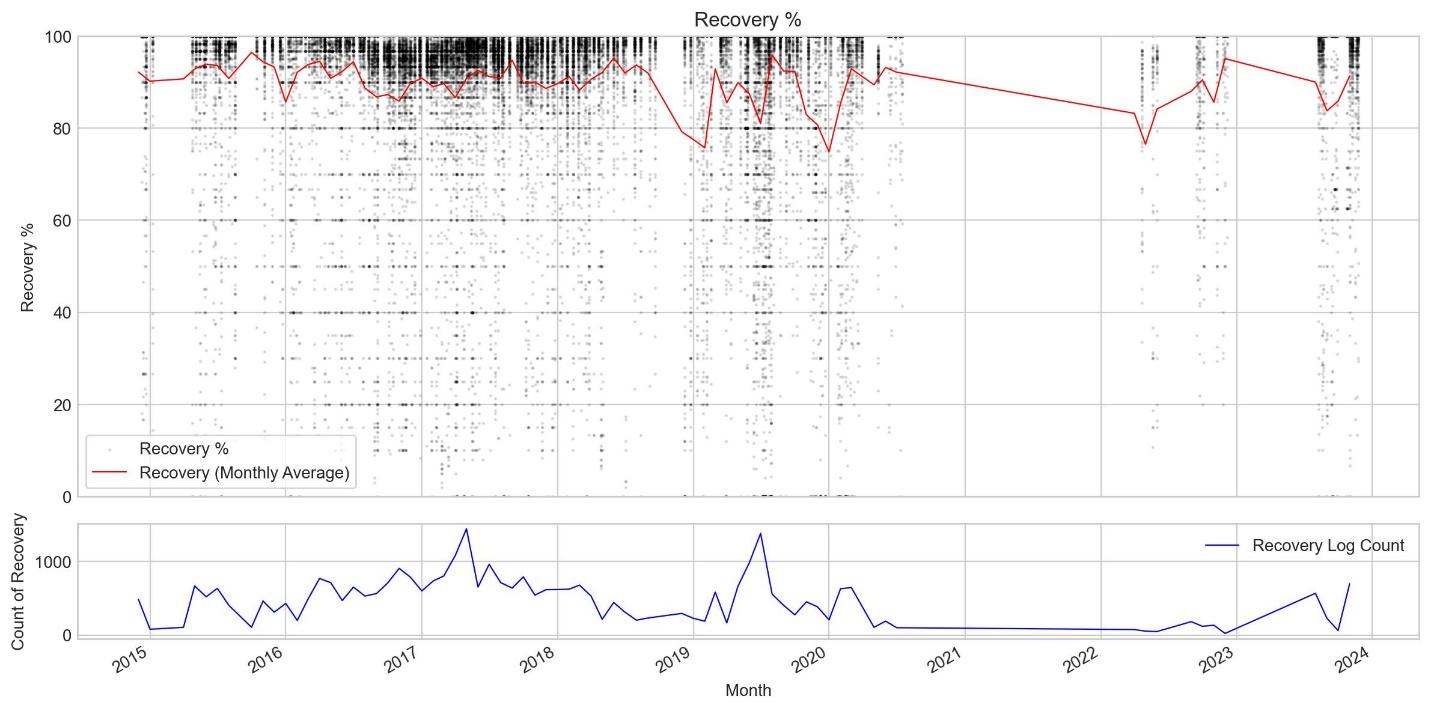
FIGURE 8-2
Recovery %
Recovery %
100
80
60
40
20
0
Count of Recovery
1000
0
Recovery %
Recovery (Monthly Average)
2015
2016
2017
2018
2019
2020
2021
2022
2023
2024
Recovery Log Count
Month
| | 8-10 | |
| SSR Mining Inc. | Hod Maden Project | | January 7, 2026 |
| Technical Report Summary | | SLR Project No.: 123.000320.00001 |
Figure 8-3: Relative Difference
Plot for First-Split Duplicates (2014–2022)
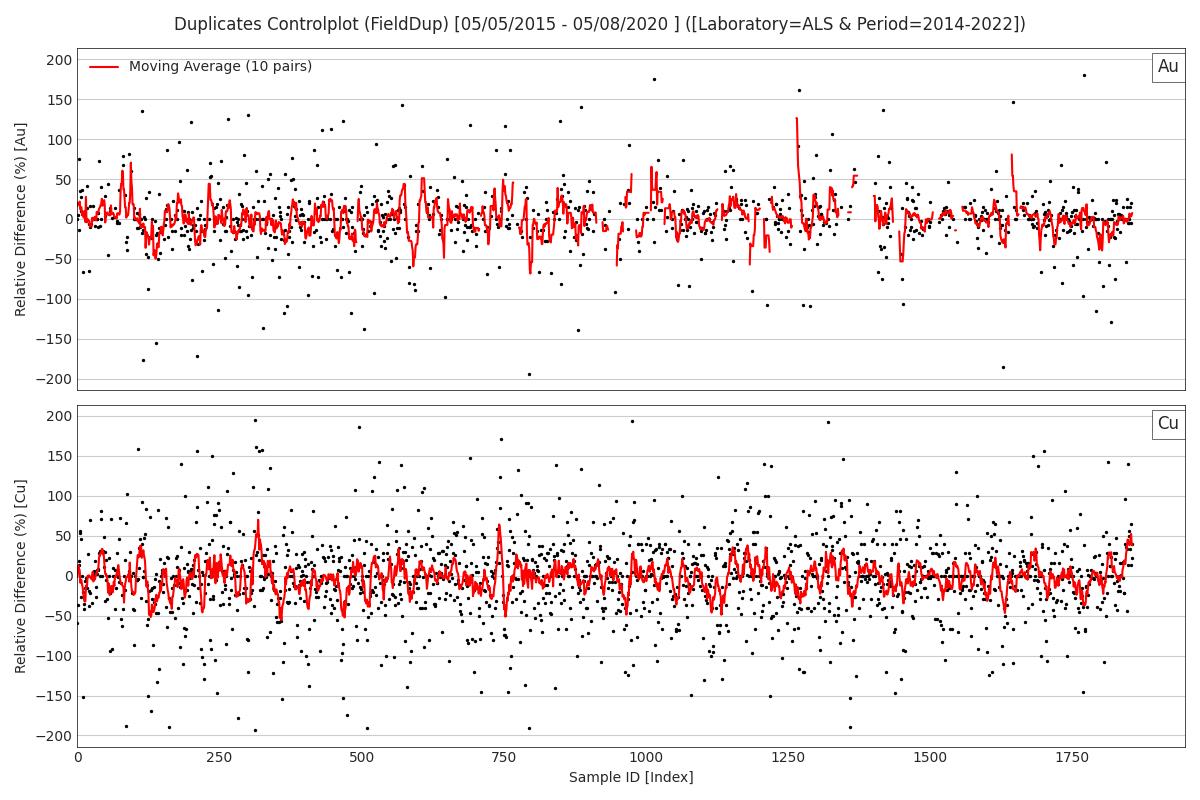
FIGURE 8-3
Duplicates Controlplot (FieldDup) [05/05/2015 - 05/08/2020] ([Laboratory=ALS & Period=2014-2022])
Relative Difference (%) [Au]
200
150
100
50
0
-50
-100
-150
-200
Moving Average (10 pairs)
Au
Relative Difference (%) [Cu]
200
150
100
50
0
-50
-100
-150
-200
0
250
500
750
1000
1250
1500
1750
Cu
Sample ID [Index]
Figure 8-4: Relative Difference
Plot for First-Split Duplicates (2023–2024)
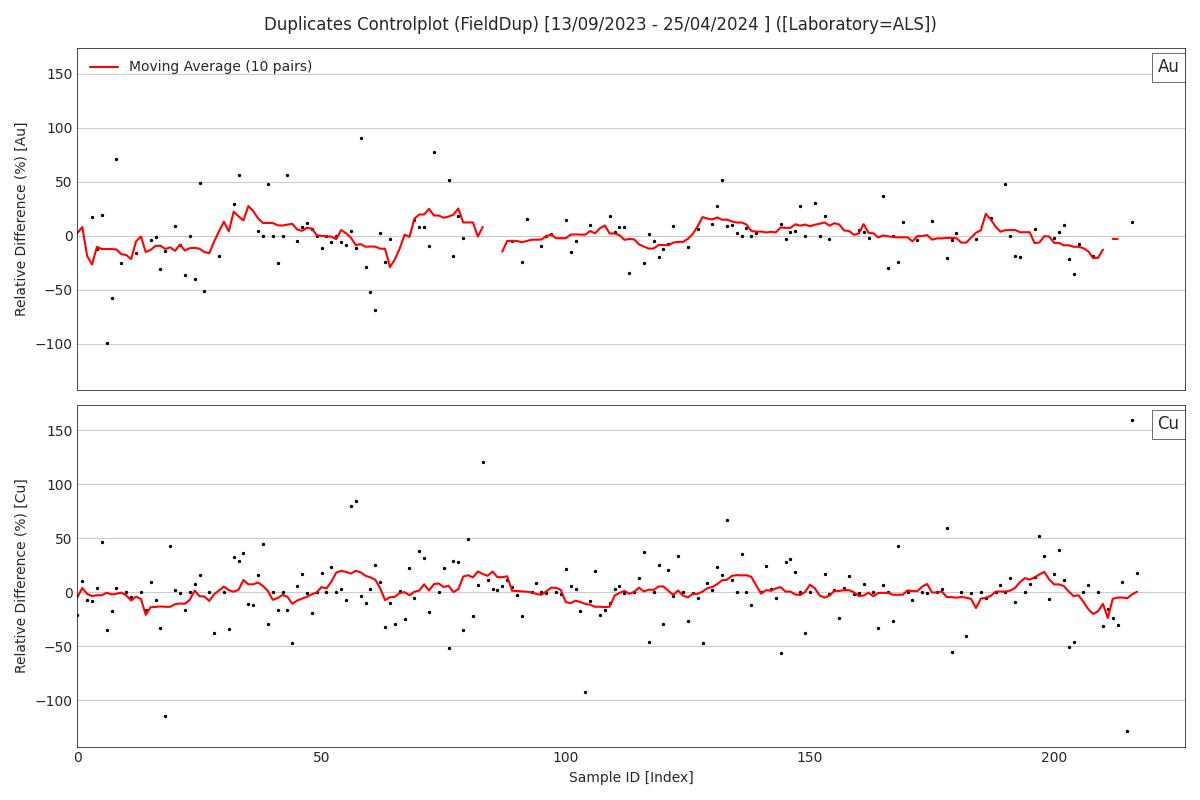
FIGURE 8-4
Duplicates Controlplot (FieldDup) [13/09/2023 - 25/04/2024] ([Laboratory=ALS])
Relative Difference (%) [Au]
150
100
50
0
-50
-100
Moving Average (10 pairs)
Au
Relative Difference (%) [Cu]
150
100
50
0
-50
-100
0
50
100
150
200
Sample ID [Index]
Cu
| | 8-11 | |
| SSR Mining Inc. | Hod Maden Project | | January 7, 2026 |
| Technical Report Summary | | SLR Project No.: 123.000320.00001 |
Figure 8-5: Relative Difference
Plot for Third-Split Duplicates (2014–2020)
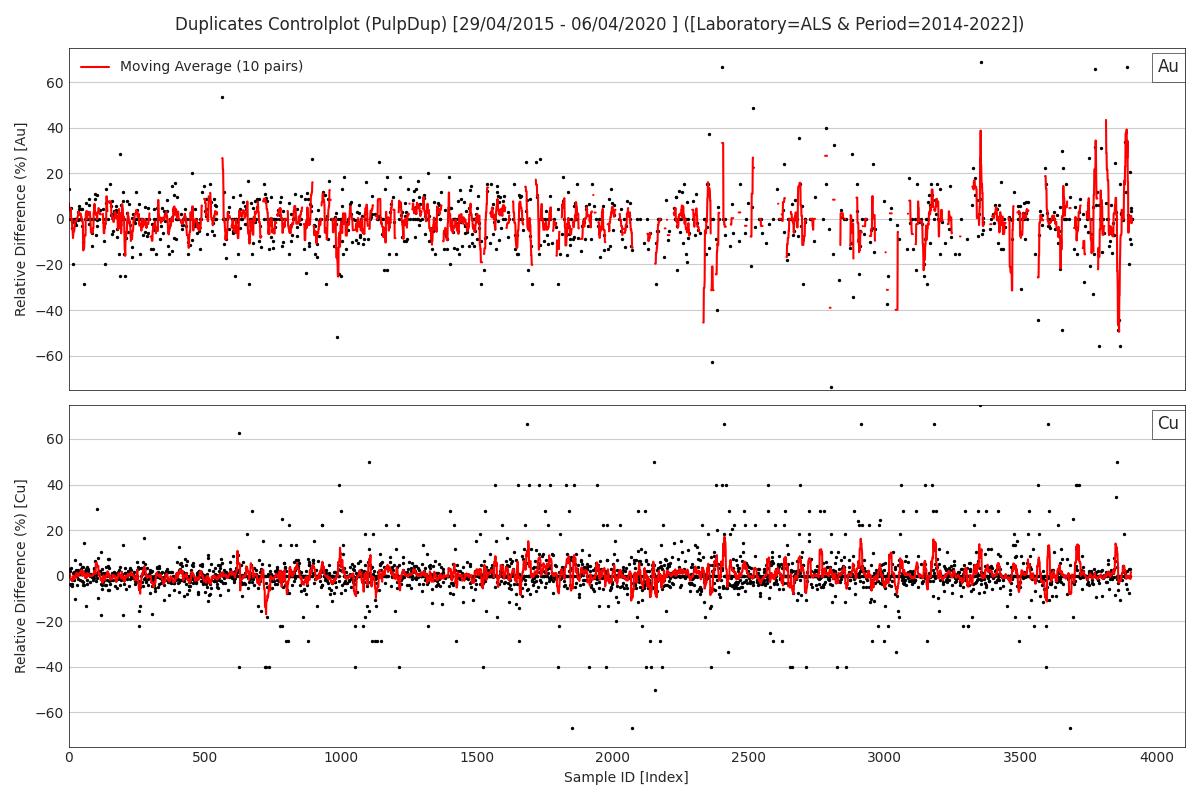
FIGURE 8-5
Duplicates Controlplot (PulpDup) [29/04/2015 - 06/04/2020] ([Laboratory=ALS & Period=2014-2022])
Relative Difference (%) [Au]
60
40
20
0
-20
-40
-60
Moving Average (10 pairs)
Au
Relative Difference (%) [Cu]
60
40
20
0
-20
-40
-60
0
500
1000
1500
2000
2500
3000
3500
4000
Sample ID (Index)
Cu
Figure 8-6: Relative Difference
Plot for Third-Split Duplicates (2023–2024)
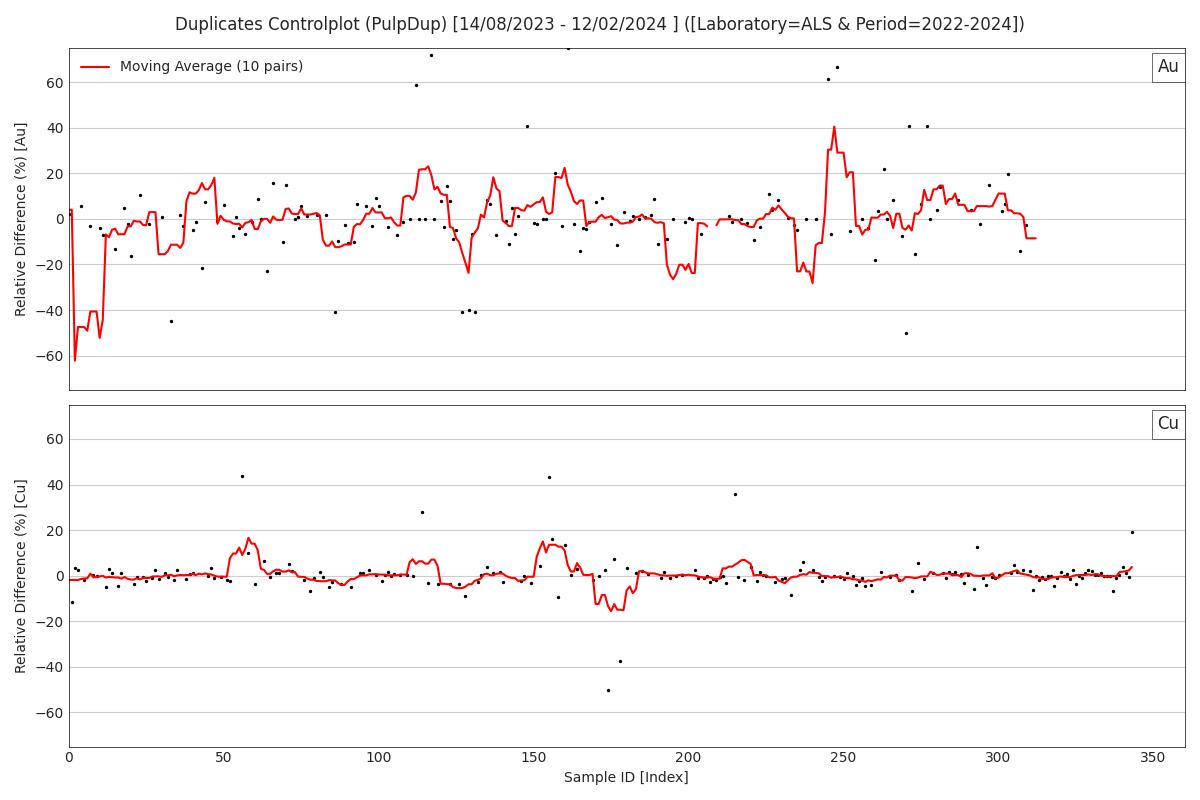
FIGURE 8-6
Duplicates Controlplot (PulpDup) [14/08/2023 - 12/02/2024] ([Laboratory=ALS & Period=2022-2024])
Relative Difference (%) [Au]
60
40
20
0
-20
-40
-60
Moving Average (10 pairs)
Au
Relative Difference (%) [Cu]
60
40
20
0
-20
-40
-60
0
50
100
150
200
250
300
350
Sample ID (Index)
Cu
| | 8-12 | |
| SSR Mining Inc. | Hod Maden Project | | January 7, 2026 |
| Technical Report Summary | | SLR Project No.: 123.000320.00001 |
Figure 8-7: CRMs inserted by SSR
since 2015, analyzed for Au at ALS
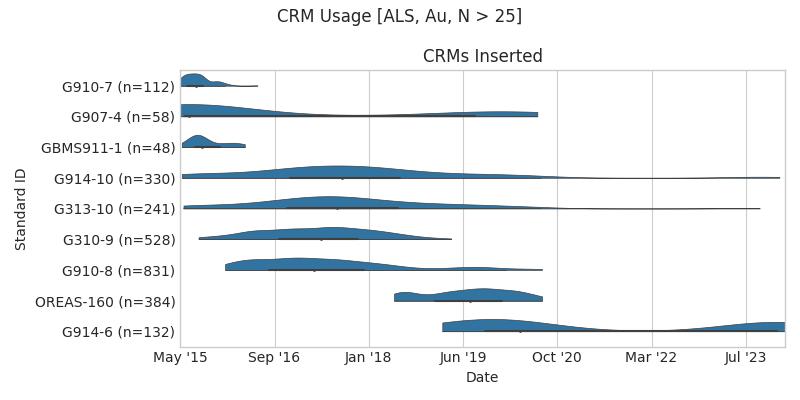
FIGURE 8-7
CRM Usage [ALS, Au, N > 25]
CRMs Inserted
Standard ID
G910-7 (n=112)
G907-4(n=58)
GBMS911-1 (n=48)
G914-10 (n=330)
G313-10 (n=241)
G310-9 (n=528)
G910-8 (n=831)
OREAS-160 (n=384)
G914-6 (n=132)
May'15
Sep'16
Jan'18
Jun'19
Oct'20
Mar'22
Jul'23
Date
Figure 8-8: CRMs inserted by SSR
since 2015, analyzed for Cu at ALS
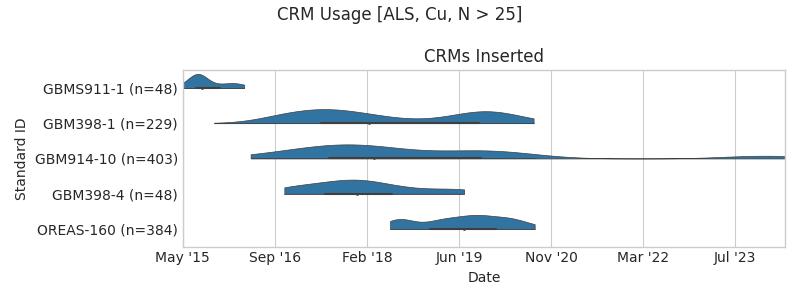
FIGURE 8-8
CRM Usage [ALS, Cu, N > 25]
CRMs Inserted
Standard ID
GBMS911-1 (n=48)
GBM398-1 (n=229)
GBM914-10 (n=403)
GBM398-4 (n=48)
OREAS-160 (n=384)
May'15
Sep'16
Feb'18
Jun'19
Nov'20
Mar'22
Jul'23
Date
| | 8-13 | |
| SSR Mining Inc. | Hod Maden Project | | January 7, 2026 |
| Technical Report Summary | | SLR Project No.: 123.000320.00001 |
Figure 8-9: Shewhart Control Plot
for G914-10 Au by AA25 (2015–2020)
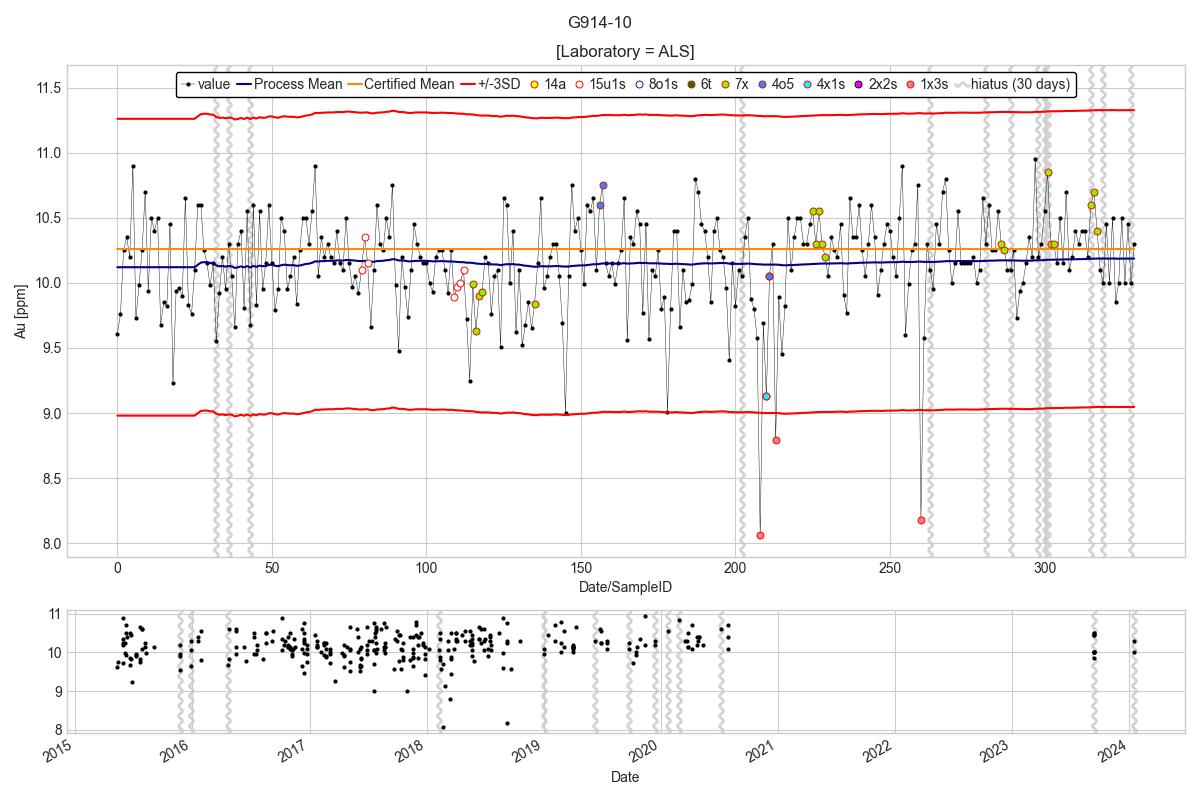
FIGURE 8-9
G914-10
[Laboratory = ALS]
Value
Process Mean
Certified mean
+/-3SD
14a
15u1s
8o1s
6t
7x
4o5
4x1s
2x2s
1x3s
hiatus (30 days)
Au [ppm]
11.5
11.0
10.5
10.0
9.5
9.0
8.5
8.0
0
50
100
150
200
250
300
Data/SampleID
11
10
9
8
2015
2016
2017
2018
2019
2020
2021
2022
2023
2024
Figure 8-10: Heat Map for Au, all
CRMs analyzed at ALS (2015–2021)
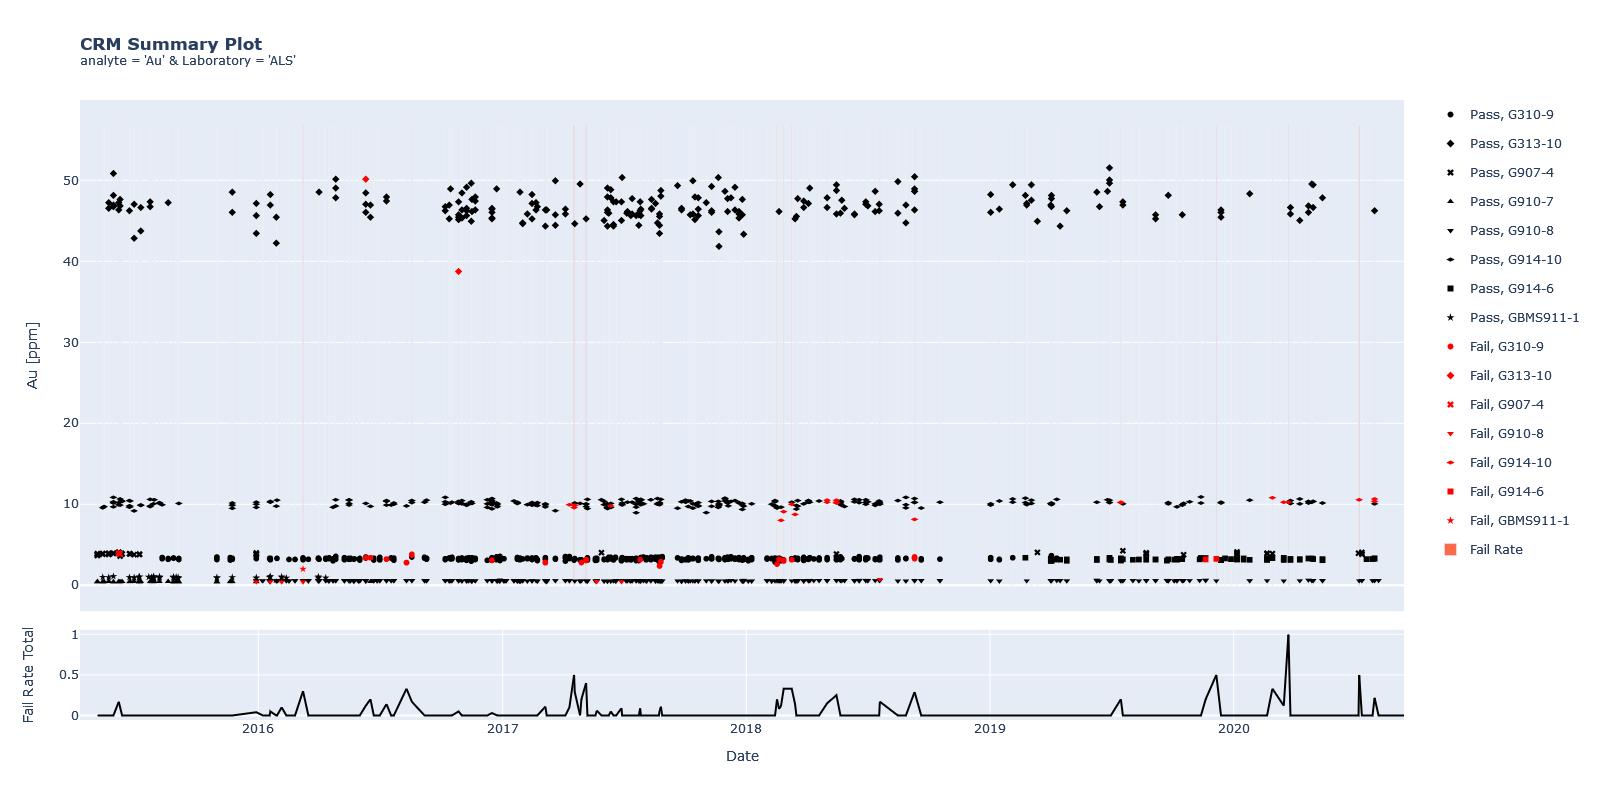
FIGURE 8-10
CRM Summary Plot
analyte = 'Au' & Laboratory = 'ALS'
Au [ppm]
50
40
30
20
10
0
Pass, G310-9
Pass, G313-10
Pass, G907-4
Pass, G910-7
Pass, G910-8
Pass, G914-10
Pass, G914-6
Pass, GBMS911-1
Fail, G310-9
Fail, G313-10
Fail, G907-4
Fail, G910-8
Fail, G914-10
Fail, G914-6
Fail, GBMS911-1
Fail Rate
Fail Rate Total
1
0.5
0
2016
2017
2018
2019
2020
Date
| | 8-14 | |
| SSR Mining Inc. | Hod Maden Project | | January 7, 2026 |
| Technical Report Summary | | SLR Project No.: 123.000320.00001 |
Figure 8-11: Hod Maden Blank Analyses
for Au by Analysis Date (ALS), 2014–2024
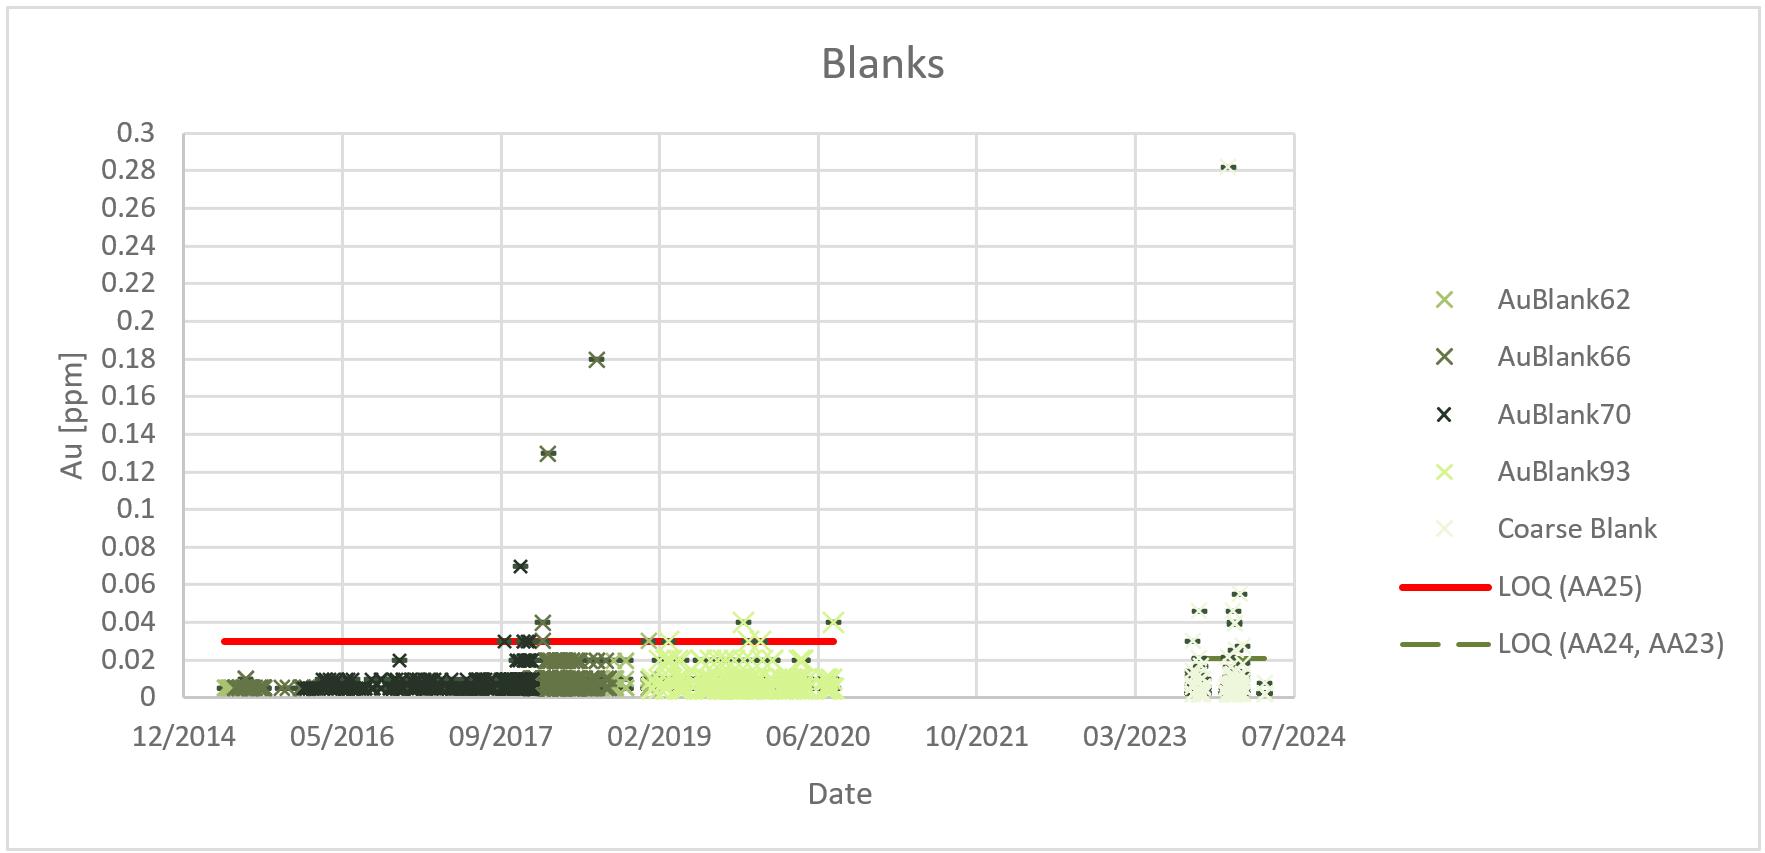
FIGURE 8-11
Blanks
Au [ppm]
0.3
0.28
0.26
0.24
0.22
0.2
0.18
0.16
0.14
0.12
0.1
0.08
0.06
0.04
0.02
0
12/2014
05/2016
09/2017
02/2019
06/2020
10/2021
03/2023
07/2024
Date
AuBlank62
AuBlank66
AuBlank70
AuBlank93
Coarse Blank
LOQ (AA25)
LOQ (AA24, AA23)
| 8.4.4 | Quality Acceptance Testing |
Quality acceptance testing (QAT) is where a final judgement of the data
is made by assessing the accuracy and precision of the data, for those periods where the process was demonstrated to be in control. Accuracy
and precision are evaluated, and a final risk assessment is made based on the DQO. The QP notes that where quality data was not available,
it has considered its review of processes, systems, and tools used, and/or its experience with certified laboratories, to make a final
judgement on data quality and risk.
A summary of the QP’s Hod Maden QAT review is provided in Table
8-5. Where relevant, summary text and figures are provided in the following sections.
| | 8-15 | |
| SSR Mining Inc. | Hod Maden Project | | January 7, 2026 |
| Technical Report Summary | | SLR Project No.: 123.000320.00001 |
Table 8-5: Summary of Hod Maden
Quality Acceptance Testing.
| Category |
Quality Acceptance Testing |
2014–2024 Summary |
Risk Factor |
| Collar Location |
Re-surveys |
No quantitative data are available to establish accuracy and precision of the collar surveys. The assessment of the collar locations therefore relies on the QPs assessment of protocols and QC systems. The QP considers the repeatability of collar locations a low risk for the resource estimate; however, the QP recommends having a contracted surveyor reporting on all the holes that can be found (see section 9.1.1). |
Low |
| Downhole Survey |
Re-surveys, DLS analysis |
The QP is not aware of any validation campaigns or re-surveys for downhole surveys. There is also no record remaining of QC data for any surveys. Based on the analysis of the DLS of the various surveying techniques (see previous section), it appears that most of the data (>98%) have values under 5°/30m, which is reasonable. The QP recommends that SSR investigate drill holes with multiple DLS failures and consider whether removing the offending values improves the trace of the hole, or whether some drill holes may need to be resurveyed. SSR should also review if DLS failures can be linked to drill rig, equipment, driller, or ground conditions. |
Low |
| Diamond: Primary Sampling |
Twin drilling with superior sampling methods, review of recovery vs grade. |
Six twin holes were drilled at Hod Maden, primarily due to low recovery
from the initial holes. Visual validation of the twin holes demonstrates good correlation between the twinned holes. On average, twin
holes had slightly better recoveries and returned slightly higher grades than the original holes (Figure 8-13).
Another quality measure for the primary sample is core recovery. Since
2014, recovery was >80% for 93% of intervals and >90% for 84% of intervals (Table 8-6). The QP did not establish a relationship
between recovery and grade (Figure 8-12). Overall, the QP considers the primary sample of a quality that meets the DQO of classifying
high-confidence Mineral Resources. |
Low–moderate |
| Diamond: First Split |
Review of scatter and QQ-plots, determination of statistically significant bias through the Wilcoxon signed-rank test. |
QQ and scatter plots for first-split duplicates analyzed for Au and
Cu are presented in Figure 8-14 and Figure 8-15. The non-parametric Wilcoxon signed-rank test indicates that, at 95% confidence, there
is no statistically significant bias between original and first-split duplicate for Au, Ag, Cu, Fe, Zn and S (Table 8-7).
Precision values for Au range from 22% to 33% as determined by the Root
Mean Square (RMS) Coefficient of Variation (CV) approach (Abzalov 2008). This is in line with what is expected for this style of mineralization.
First-split precision for Cu ranges from 18% to 48%, which is higher than Au and higher than expected for Cu in this style of mineralization.
Overall, the data resulting from the diamond first split are accurate
and meet the DQO associated with classification of high-confidence mineral resources. The QP considers the risk associated with the first-split
process to be low and considers the data fit for purpose. |
Low-Moderate |
| | 8-16 | |
| SSR Mining Inc. | Hod Maden Project | | January 7, 2026 |
| Technical Report Summary | | SLR Project No.: 123.000320.00001 |
Category
|
Quality
Acceptance Testing |
2014–2024
Summary |
Risk
Factor |
| Diamond: Second Split |
Review of scatter and QQ-plots, determination of statistically significant bias through the Wilcoxon signed-rank test. |
No second-split (coarse crush-split) duplicates were collected and the QP cannot comment on the precision or accuracy of the second splitting process. |
Low-moderate |
| Diamond: Third Split |
Review of scatter and QQ-plots, determination of statistically significant bias through the Wilcoxon signed-rank test. |
QQ and scatter plots for third-split duplicates analyzed for Au and
Cu are presented in Figure 8-16 and Figure 8-17. The non-parametric Wilcoxon signed-rank test indicates that, at 95% confidence, there
is no statistically significant bias between original and third-split duplicate for Au, Ag, Cu and Zn between the original and duplicate
(Table 8-8). A statistically significant bias between original and duplicate was identified for Fe (method: ME-ICP61) and S (method: ME-ICP61a).
Scatter and QQ-plots demonstrate no clear bias, and the RSC QP considers these biases immaterial (Figure 8-18).
The RMS CV precision for Au ranges from 7% to 11% and precision for
Cu ranges from 2% to 7%. The QP considers the third-split data accurate and precise and acceptable with respect to the DQO of classifying
high-confidence mineral resources. |
Low |
| Analytical Process |
F-testing and t-testing for precision and accuracy, review of umpire results |
The quality of the fire assaying and analytical process can be determined
from the performance of the CRMs and from the results of umpire testing.
The QP assessed the analytical performance by calculating bias and precision
of the CRM results from 2014–2024 (Table 8-9). All CRMs pass the precision tests demonstrating variance that is similar to or lower
than the certificate value. Most analytical methods pass the accuracy tests. CRM results for Au at SGS failed the accuracy test and demonstrate
a low bias of 3% based on results from 1 CRM. The QP recommends inserting a more diverse assortment of CRMs to better understand performance
of the analyses across the grade range for various elements.
An extensive umpire campaign was carried out for Hod Maden comparing
the primary laboratory against three umpire facilities (SGS, ACME, ARGETEST). The same samples were submitted to each laboratory and the
QP compared results for samples >1 g/t Au to avoid issues associated with detection limits. All four laboratories are very close. However,
looking at the percentiles of each distribution (Figure 8-19), the QP notes that the primary facility (ALS) is generally higher than the
umpire facilities with a mean relative difference (ALS vs mean of all facilities) of about 1.9%. Reviewing the individual CRM results
supports this conclusion with 5 of 7 CRMs with a certified mean >1 g/t Au returning a process mean higher than the certified mean.
Not all of these apparent biases are statistically significant, but they support the results from the umpire analysis that the primary
laboratory may have a high-bias of 1% to 2%. This bias warrants discussion with the ALS management.
The QP considers the bias of 1% to 2% in results for Au not material
with respect to the global MRE and considers the associated risk low to moderate. |
Low–Moderate |
| | 8-17 | |
| SSR Mining Inc. | Hod Maden Project | | January 7, 2026 |
| Technical Report Summary | | SLR Project No.: 123.000320.00001 |
| Category |
Quality
Acceptance Testing |
2014–2024
Summary |
Risk
Factor |
| Density |
Comparison against different methods |
Check measurements are unavailable for the bulk density data and the QP cannot comment on the accuracy of the density results. The QP recommends collecting density measurements with an alternative method such as the core-tray method to benchmark the results from the water-immersion method which is prone to selection bias. Selection bias is anticipated to be a minor issue at Hod Maden with most core being reasonably competent. The RSC QP considers the bulk density data a low- to moderate risk. |
Low–moderate |
| Logging |
Comparison between peers, cross-logging |
Assessment of the logging quality comes down to peer-review. A record of a peer review process is not (fully) available and the QP can only comment on the logging quality based on observations made during the site visit. These observations suggest that key features such as occurrence of jasperoid, anhydrite and quartz veining are not always logged consistently, and limited detail is available in the logs to reinterpret intervals based on primary observations. The new logging framework attempts to remedy this and emphasizes primary observations but perhaps overcomplicates the logging process. The QP is of the opinion that the legacy logging is marginally suitable to support domaining for estimation and recommends review of the logging process to incorporate SSR’s broad understanding of the mineralization history and overprinting relationships. |
Moderate |
| | 8-18 | |
| SSR Mining Inc. | Hod Maden Project | | January 7, 2026 |
| Technical Report Summary | | SLR Project No.: 123.000320.00001 |
Table 8-6: Recovery Statistics for
Hod Maden, 2014–2024
| Recovery Range |
Meters (%) |
| Above 95% Recovery |
63% |
| Above 90% Recovery |
84% |
| Above 80% Recovery |
93% |
Figure 8-12: Recovery Statistics
for All Holes since 2014
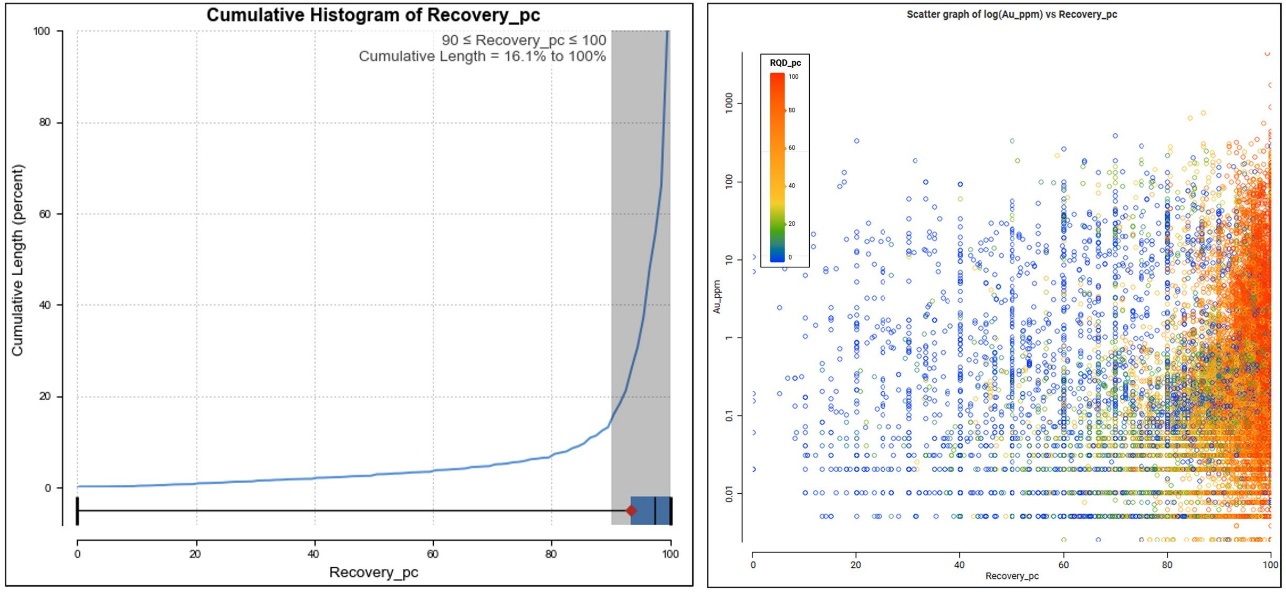
FIGURE 8-12
Cumulative Histogram of Recovery_pc
Cumulative Length (percent)
100
80
60
40
20
0
0
20
40
60
80
100
Recovery_pc
90 ? Recovery_pc ? 100
Cumulative Length = 16.1% to 100%
Scatter graph of log(Au_ppm) vs Recovery_pc
Au_ppm
1000
100
10
1
0.1
0.01
RQD_pc
100
80
60
40
20
0
0
20
40
60
80
100
Recovery_pc
| | 8-19 | |
| SSR Mining Inc. | Hod Maden Project | | January 7, 2026 |
| Technical Report Summary | | SLR Project No.: 123.000320.00001 |
Figure 8-13: Comparison of Grades
from Six Twin Holes at Hod Maden
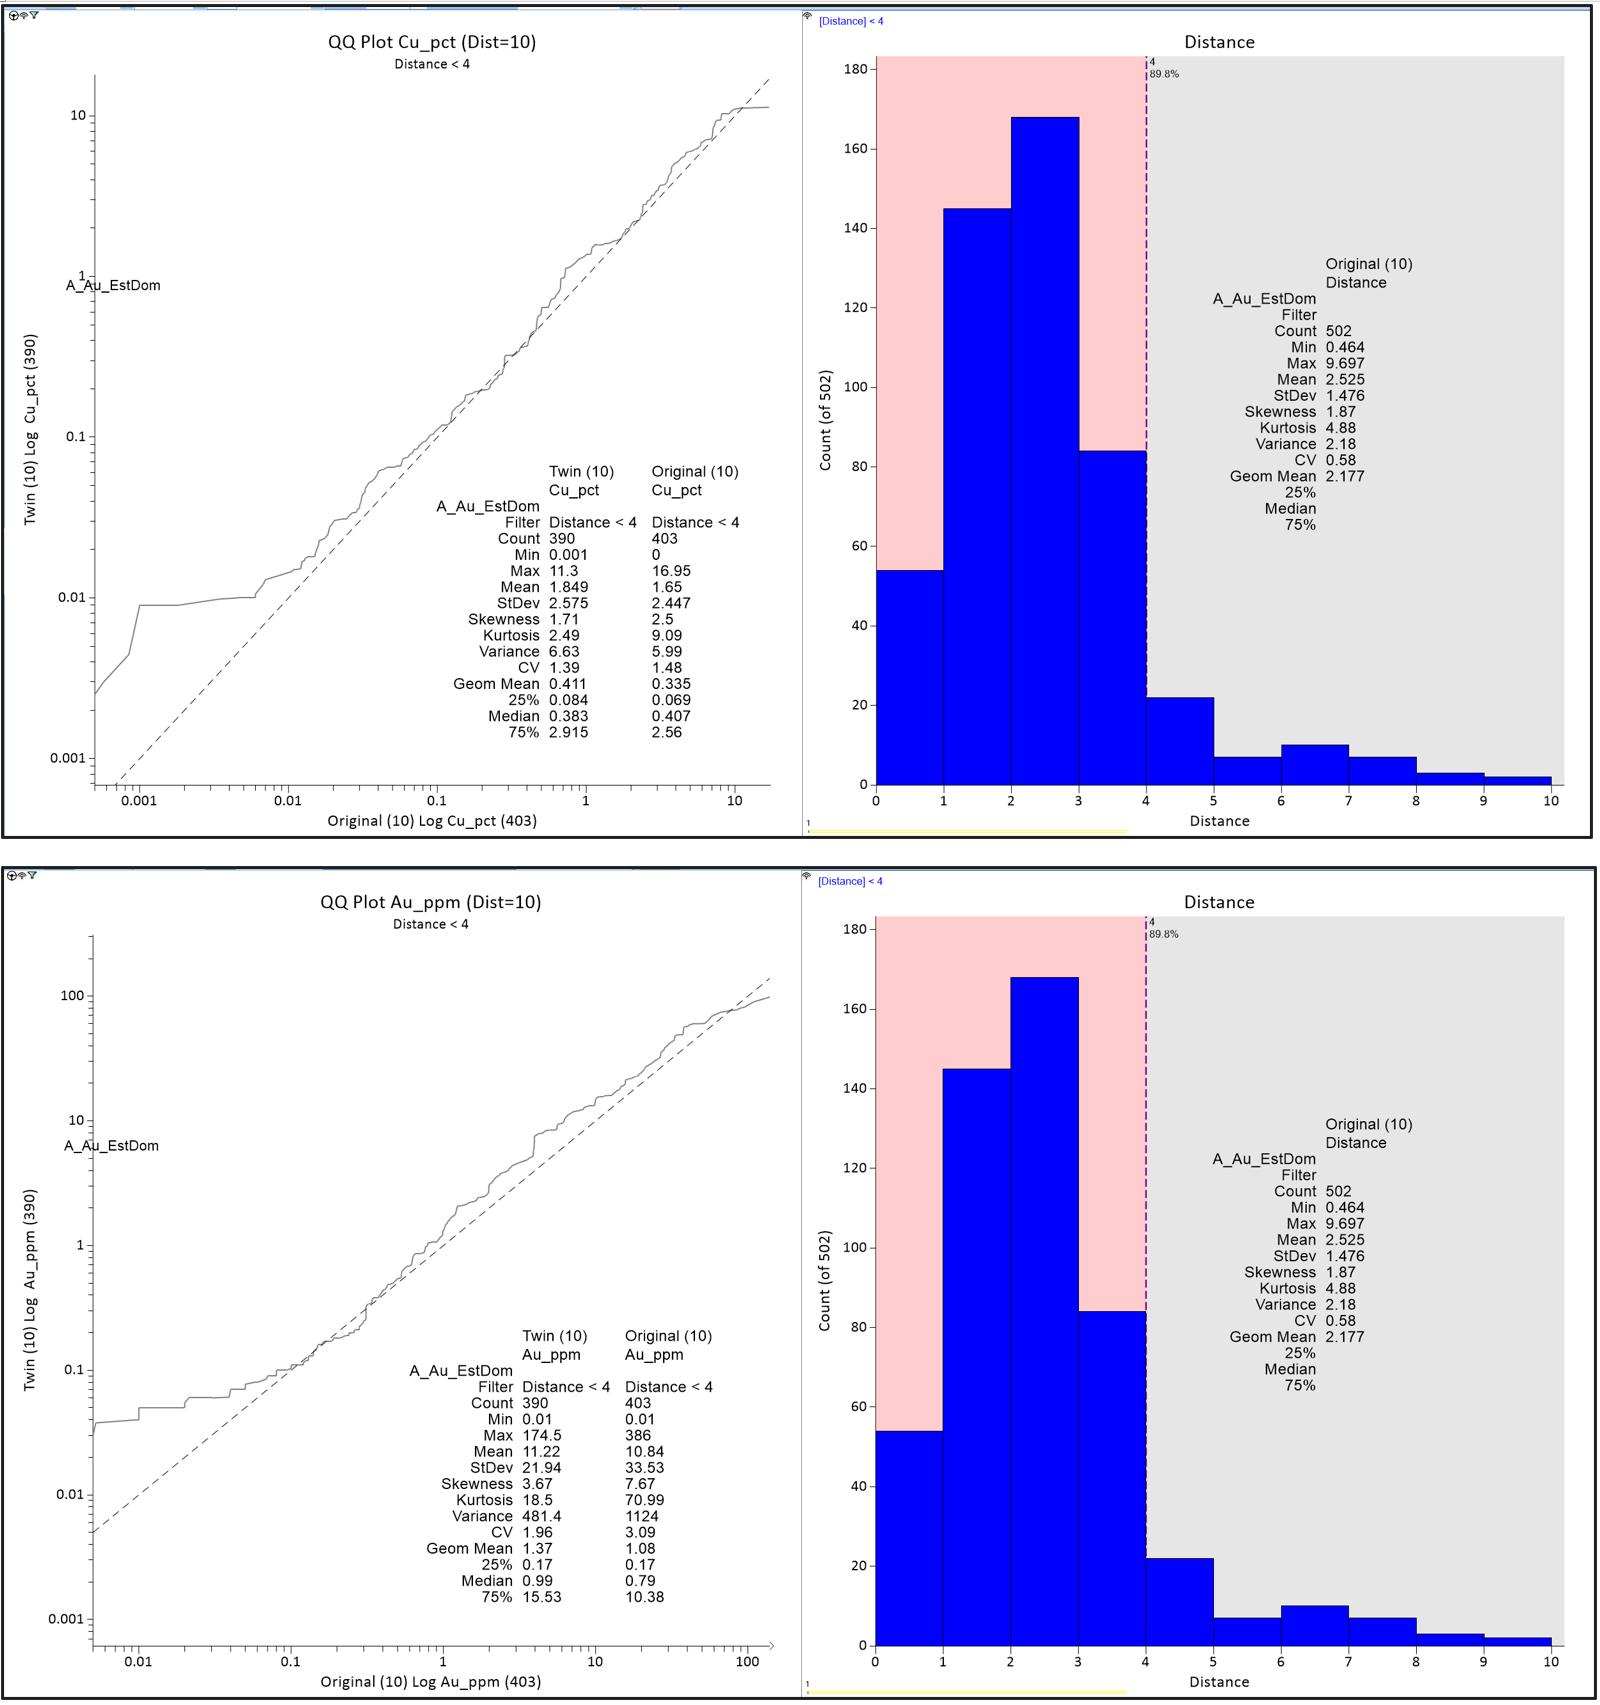
FIGURE 8-13
QQ Plot Cu_pct (Dist=10)
Distance < 4
Twin (10) Log Cu_pct (390)
A_Au_Est_Dom
10
1
0.1
0.01
0.001
0.001
0.01
0.1
1
10
Original (10) Log Cu_pct (403)
Twin (10)
Original (10)
Cu_pct
Cu_pct
A_Au_EstDom
Filter
Distance <4
Distance <4
Count
390
403
Min
0.001
0
Max
11.3
16.95
Mean
1.849
1.65
StDev
2.575
2.447
Skewness
1.71
2.5
Kurtosis
2.49
9.09
Variance
6.63
5.99
CV
1.39
1.48
Geom Mean
0.411
0.335
25%
0.084
0.069
Median
0.383
0.407
75%
2.915
2.56
[Distance] < 4
Distance
Count (of 502)
180
160
140
120
100
80
60
40
20
0
0
1
2
3
4
5
6
7
8
9
10
Distance
4
89.8%
Original (10)
Distance
A_Au_EstDom
Filter
Count 502
Min 0.464
Max 9.697
Mean 2.525
StDev 1.476
Skewness 1.87
Kurtosis 4.88
Variance 2.18
CV 0.58
Geom Mean 2.177
25%
Median
75%
QQ Plot Au_ppm (Dist=10)
Distance < 4
Twin (10) Log Au_ppm (390)
A_Au_EstDom
100
10
1
0.1
0.01
0.001
0.01
0.1
1
10
100
Original (10) Log Au_ppm (403)
Twin (10)
Original (10)
Au_ppm
Au_ppm
A_Au_EstDom
Filter
Distance < 4
Distance < 4
Count
390
403
Min
0.01
0.01
Max
174.5
386
Mean
11.22
10.84
StDev
21.94
33.53
Skewness
3.67
7.67
Kurtosis
18.5
70.99
Variance
481.4
1124
CV
1.96
3.09
Geom Mean
1.37
1.08
25%
0.17
0.17
Median
0.99
0.79
75%
15.53
10.38
[Distance] <4
Distance
Count (of 502)
180
160
140
120
100
80
60
40
20
0
0
1
2
3
4
5
6
7
8
9
10
Distance
4
89.8%
Original (10)
Distance
A_Au_EstDom
Filter
Count 502
Min 0.464
Max 9.697
Mean 2.525
StDev 1.476
Skewness 1.87
Kurtosis 4.88
Variance 2.18
CV 0.58
Geom Mean 2.177
25%
Median
75%
| | 8-20 | |
| SSR Mining Inc. | Hod Maden Project | | January 7, 2026 |
| Technical Report Summary | | SLR Project No.: 123.000320.00001 |
Figure 8-14: Scatter and QQ Plot
for Au in First-Split Duplicates (2014–2024).
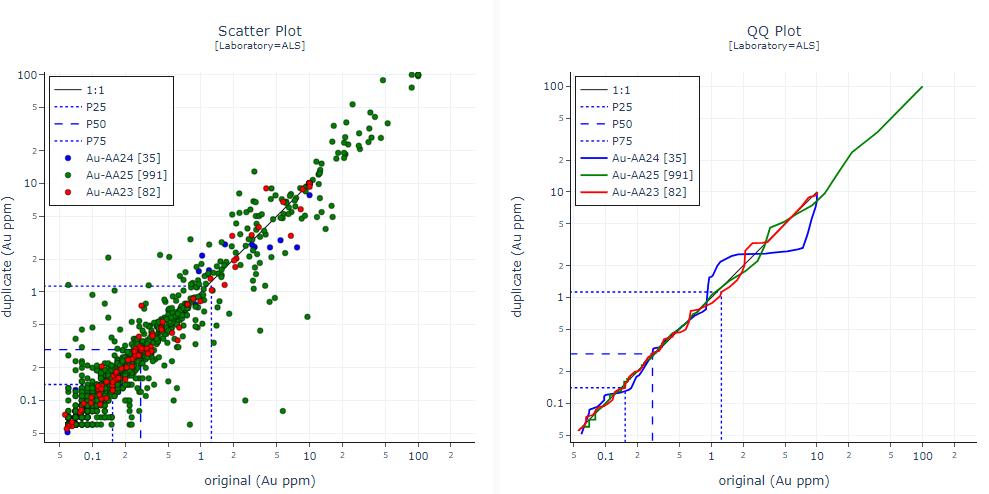
FIGURE 8-14
Scatter Plot
[Laboratory=ALS]
duplicate (Au ppm)
100
5
2
10
5
2
1
5
2
0.1
5
1:1
P25
P50
P75
Au-AA24 [35]
Au-AA25 [991]
Au-AA23 [82]
5
0.1
2
5
1
2
5
10
2
5
100
2
original (Au ppm)
QQ Plot
[Laboratory=ALS]
duplicate (Au ppm)
100
5
2
10
5
2
1
5
2
0.1
5
1:1
P25
P50
P75
Au-AA24 [35]
Au-AA25 [991]
Au-AA23 [82]
5
0.1
2
5
1
2
5
10
2
5
100
2
original (Au ppm)
Figure 8-15: Scatter and QQ Plot
for Cu in First-Split Duplicates (2014–2024).
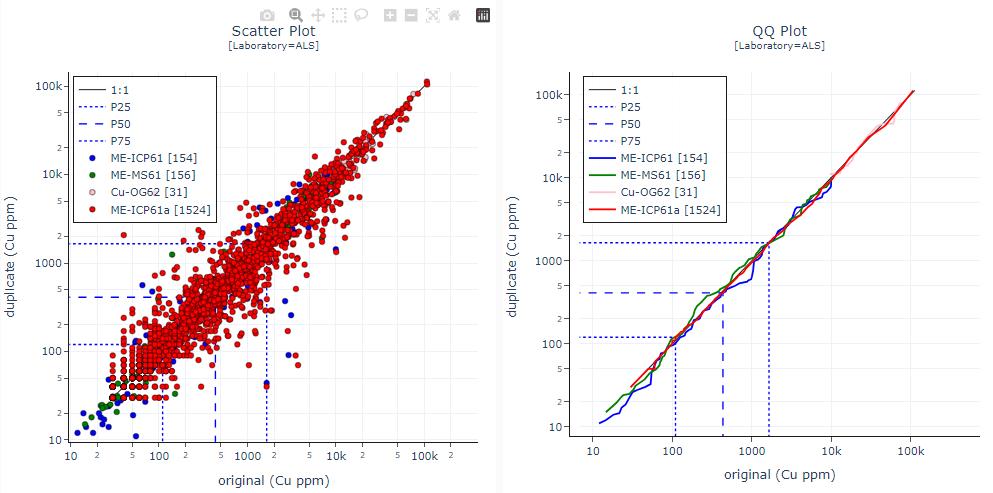
FIGURE 8-15
Scatter Plot
[Laboratory=ALS]
duplicate (Cu ppm)
100k
5
2
10k
5
2
1000
5
2
100
5
2
10
1:1
P25
P50
P75
ME-ICP61 [154]
ME-MS61 [156]
Cu-OG62 [31]
ME-ICP61a [1524]
10
2
5
100
2
5
1000
2
5
10k
2
5
100k
2
original (Cu ppm)
QQ Plot
[Laboratory=ALS]
duplicate (Cu ppm)
100k
5
2
10k
5
2
1000
5
2
100
5
2
10
1:1
P25
P50
P75
ME-ICP61 [154]
ME-MS61 [156]
Cu-OG62 [31]
ME-ICP61a [1524]
10
100
1000
10k
100k
original (Cu ppm)
| | 8-21 | |
| SSR Mining Inc. | Hod Maden Project | | January 7, 2026 |
| Technical Report Summary | | SLR Project No.: 123.000320.00001 |
Table 8-7: Summary of Hod Maden
First-Split (“Field Duplicate”) QAT from 2014–2024
| Analyte |
Method |
Split |
N Pairs |
Wilcoxon
p-value |
Wilcoxon Accuracy
Verdict (p95) |
RMSCV1 (%) |
| Au |
Au-AA23 |
FieldDup |
123 |
0.526 |
PASS |
22.6 |
| Au |
Au-AA24 |
FieldDup |
43 |
0.415 |
PASS |
25.6 |
| Au |
Au-AA25 |
FieldDup |
676 |
0.118 |
PASS |
32.6 |
| C |
C-IR07 |
FieldDup |
123 |
0.656 |
PASS |
26.5 |
| Cu |
Cu-AA46 |
FieldDup |
16 |
0.274 |
PASS |
19.2 |
| Cu |
Cu-OG62 |
FieldDup |
31 |
0.706 |
PASS |
18.3 |
| Cu |
ME-ICP61 |
FieldDup |
170 |
0.208 |
PASS |
47.9 |
| Cu |
ME-ICP61a |
FieldDup |
1852 |
0.11 |
PASS |
46 |
| Cu |
ME-MS61 |
FieldDup |
166 |
0.323 |
PASS |
28.4 |
| Fe |
ME-ICP61 |
FieldDup |
170 |
0.179 |
PASS |
12.0 |
| Fe |
ME-ICP61a |
FieldDup |
1852 |
0.063 |
PASS |
8.5 |
| Fe |
ME-MS61 |
FieldDup |
166 |
0.991 |
PASS |
7.0 |
| S |
ME-ICP61 |
FieldDup |
170 |
0.544 |
PASS |
12.8 |
| S |
ME-ICP61a |
FieldDup |
1852 |
0.233 |
PASS |
13.6 |
| S |
ME-MS61 |
FieldDup |
166 |
0.326 |
PASS |
9.5 |
| S |
S-IR08 |
FieldDup |
157 |
0.988 |
PASS |
9.8 |
| Zn |
ME-ICP61 |
FieldDup |
170 |
0.123 |
PASS |
30.2 |
| Zn |
ME-ICP61a |
FieldDup |
1852 |
0.445 |
PASS |
27.2 |
| Zn |
ME-MS61 |
FieldDup |
166 |
0.659 |
PASS |
19.4 |
|
Note:
1.
Root Mean Square Coefficient of Variation (RMSCV)
2.
LOQ – Limit of Quantification |
| | 8-22 | |
| SSR Mining Inc. | Hod Maden Project | | January 7, 2026 |
| Technical Report Summary | | SLR Project No.: 123.000320.00001 |
Figure 8-16: Scatter and QQ Plot
for Au in Third-Split Duplicates (2014–2024).
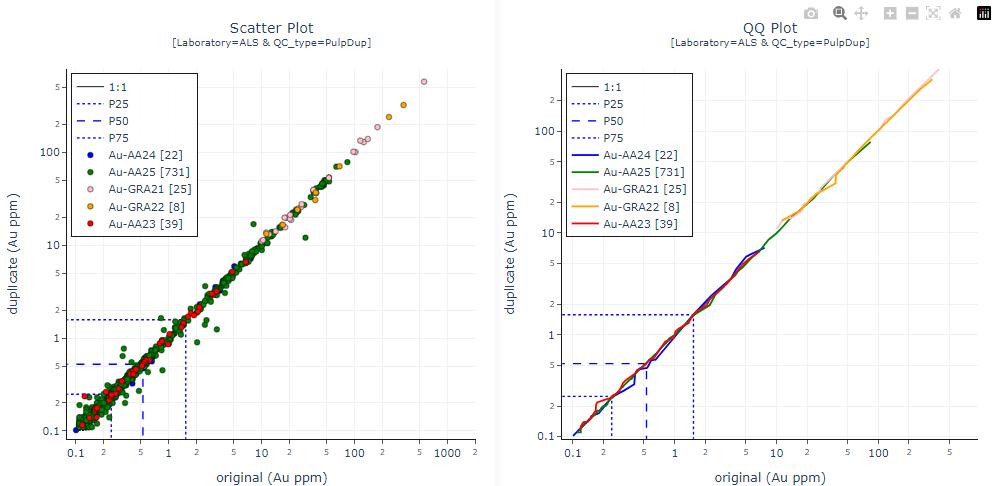
FIGURE 8-16
Scatter Plot
[Laboratory=ALS & QC_type=PulpDup]
duplicate (Au ppm)
5
2
100
5
2
10
5
2
1
5
2
0.1
1:1
P25
P50
P75
Au-AA24 [22]
Au-AA25 [731]
Au-GRA21 [25]
Au-GRA22 [8]
Au-AA23 [39]
0.1
2
5
1
2
5
10
2
5
100
2
5
1000
2
original (Au ppm)
QQ Plot
[Laboratory=ALS & QC_type=PulpDup]
duplicate (Au ppm)
2
100
5
2
10
5
2
1
5
2
0.1
1:1
P25
P50
P75
Au-AA24 [22]
Au-AA25 [731]
Au-GRA21 [25]
Au-GRA22 [8]
Au-AA23 [39]
0.1
2
5
1
2
5
10
2
5
100
2
5
original (Au ppm)
Figure 8-17: Scatter and QQ Plot
for Cu in Third-Split Duplicates (2014–2024).
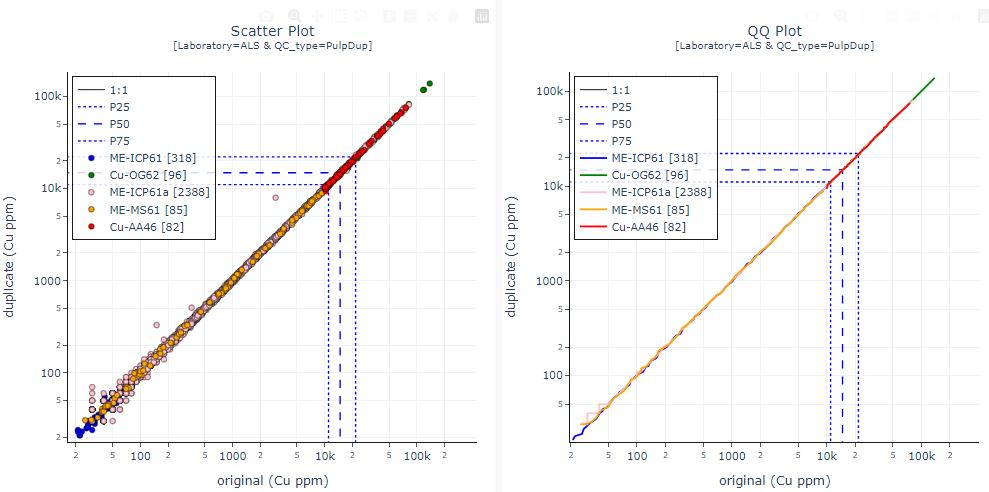
FIGURE 8-17
Scatter Plot
[Laboratory=ALS & QC_type=PulpDup]
duplicate (Cu ppm)
100k
5
2
10k
5
2
1000
5
2
100
5
2
1:1
P25
P50
P75
ME-ICP61 [318]
Cu-OG62 [96]
ME-ICP61a [2388]
ME-MS61 [85]
Cu-AA46 [82]
2
5
100
2
5
1000
2
5
10k
2
5
100k
2
original (Cu ppm)
QQ Plot
[Laboratory=ALS & QC_type=PulpDup]
Duplicate (Cu ppm)
100k
5
2
10k
5
2
1000
5
2
100
5
1:1
P25
P50
P75
ME-ICP61 [318]
Cu-OG62 [96]
ME-ICP61a [2388]
ME-MS61 [85]
Cu-AA46 [82]
2
5
100
2
5
1000
2
5
10k
2
5
100k
2
Original (Cu ppm)
| | 8-23 | |
| SSR Mining Inc. | Hod Maden Project | | January 7, 2026 |
| Technical Report Summary | | SLR Project No.: 123.000320.00001 |
Table 8-8: Summary of Hod Maden
Third Split (“Pulp Duplicate”) QAT from 2014–2024
| Analyte |
Method |
No. Pairs |
LOQ |
Upper LOQ |
Wilcoxon p-value |
Wilcoxon Accuracy
Verdict (p95) |
RMSCV (%) |
| Au |
Au-AA23 |
39 |
0.1 |
n/a |
0.811 |
PASS |
10.68 |
| Au |
Au-AA24 |
22 |
0.1 |
n/a |
0.75 |
PASS |
7.87 |
| Au |
Au-AA25 |
731 |
0.1 |
n/a |
0.2 |
PASS |
11.15 |
| Au |
Au-GRA21 |
25 |
0.1 |
n/a |
0.091 |
PASS |
6.9 |
| Cu |
Cu-AA46 |
82 |
20 |
n/a |
0.374 |
PASS |
2.01 |
| Cu |
Cu-OG62 |
96 |
20 |
n/a |
0.148 |
PASS |
1.62 |
| Cu |
ME-ICP61 |
318 |
20 |
n/a |
0.968 |
PASS |
3.79 |
| Cu |
ME-ICP61a |
2,385 |
20 |
n/a |
0.245 |
PASS |
6.99 |
| Cu |
ME-MS61 |
85 |
20 |
n/a |
0.883 |
PASS |
4.02 |
| Fe |
ME-ICP61 |
413 |
n/a |
n/a |
0.001 |
FAIL, Not Material |
2.25 |
| Fe |
ME-ICP61a |
2,852 |
n/a |
n/a |
0.902 |
PASS |
3.13 |
| Fe |
ME-MS61 |
128 |
n/a |
n/a |
0.839 |
PASS |
2.25 |
| S |
ME-ICP61 |
281 |
n/a |
n/a |
0.337 |
PASS |
6.85 |
| S |
ME-ICP61a |
2,021 |
0.2 |
10 |
0.006 |
FAIL, Not Material |
2.93 |
| S |
ME-MS61 |
72 |
n/a |
n/a |
0.966 |
PASS |
10.19 |
| S |
S-IR08 |
234 |
n/a |
n/a |
0.714 |
PASS |
8.32 |
| Zn |
ME-ICP61 |
390 |
n/a |
n/a |
0.253 |
PASS |
3.85 |
| Zn |
ME-ICP61a |
2,840 |
n/a |
n/a |
0.548 |
PASS |
11.93 |
| Zn |
ME-MS61 |
118 |
n/a |
n/a |
0.968 |
PASS |
13.8 |
| Zn |
Zn-AA46 |
84 |
n/a |
n/a |
0.893 |
PASS |
1.87 |
|
Notes:
LOQ – Limit of Quantification
RMSCV – Root Mean Square Coefficient of Variation |
| | 8-24 | |
| SSR Mining Inc. | Hod Maden Project | | January 7, 2026 |
| Technical Report Summary | | SLR Project No.: 123.000320.00001 |
Figure 8-18: Scatter and QQ Plot
for S in Third-Split Duplicates (2014–2024)
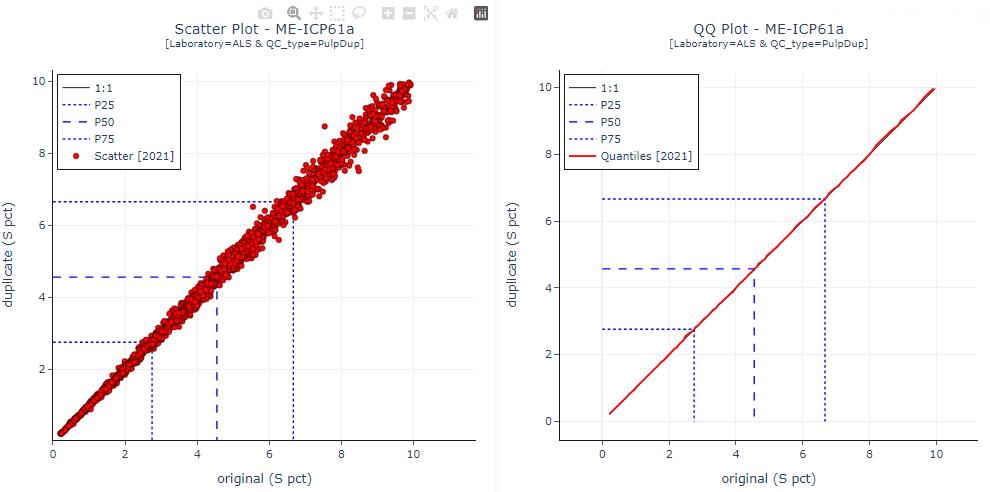
FIGURE 8-18
Scatter Plot - ME-ICP61a
[Laboratory=ALS & QC_type=PulpDup]
duplicate (S pct)
10
8
6
4
2
1:1
P25
P50
P75
Scatter [2021]
0
2
4
6
8
10
original (S pct)
QQ Plot - ME-ICP61a
[Laboratory=ALS & QC_type=PulpDup]
duplicate (S pct)
10
8
6
4
2
0
1:1
P25
P50
P75
Quantiles [2021]
0
2
4
6
8
10
original (S pct)
| | 8-25 | |
| SSR Mining Inc. | Hod Maden Project | | January 7, 2026 |
| Technical Report Summary | | SLR Project No.: 123.000320.00001 |
Table 8-9: QAT Summary for Hod Maden
CRMs (2014–2024)
| Analyte |
Lab |
Method |
Duration
(days) |
N CRM
Results |
Median
Bias (%) |
N Fail/Pass
(F-test) |
Precision
(F-test) |
N Fail/Pass
(t-test) |
Accuracy
(t-test) |
| Au |
ALS |
Au-AA23 |
49 |
44 |
0.864 |
0 / 1 |
PASS |
0 / 1 |
PASS |
| ALS |
Au-AA25 |
1,920 |
2206 |
0.239 |
1 / 7 |
PASS |
4 / 4 |
PASS |
| SGS |
FAA303 |
31 |
32 |
-3.117 |
0 / 1 |
PASS |
1 / 0 |
FAIL |
| Cu |
ALS |
ME-ICP61 |
251 |
39 |
-1.42 |
0 / 1 |
PASS |
0 / 1 |
PASS |
| ALS |
ME-ICP61a |
1,543 |
644 |
-0.917 |
0 / 3 |
PASS |
1 / 2 |
PASS |
| ALS |
ME-MS61 |
206 |
35 |
0.891 |
0 / 1 |
PASS |
0 / 1 |
PASS |
| S |
ALS |
ME-ICP61 |
251 |
39 |
-7.564 |
0 / 1 |
PASS |
1 / 0 |
FAIL |
| Zn |
ALS |
ME-ICP61 |
251 |
39 |
1.008 |
0 / 1 |
PASS |
0 / 1 |
PASS |
| ALS |
ME-ICP61a |
1,543 |
644 |
1.618 |
0 / 3 |
PASS |
1 / 2 |
PASS |
| ALS |
ME-MS61 |
206 |
35 |
0.891 |
0 / 1 |
PASS |
0 / 1 |
PASS |
Figure 8-19: Percentile Comparison
of Umpire Analyses for Hod Maden, Au
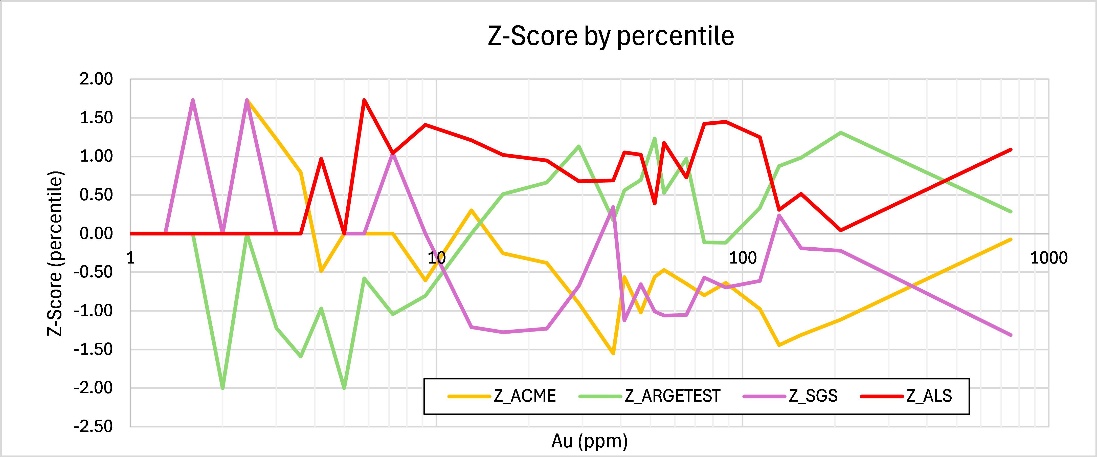
FIGURE 8-19
Z-Score by percentile
Z-Score (percentile)
2.00
1.50
1.00
0.50
0.00
-0.50
-1.00
-1.50
-2.00
-2.50
1
10
100
1000
Z_ACME
Z_ARGETEST
Z_SGS
Z_ALS
Au (ppm)
| | 8-26 | |
| SSR Mining Inc. | Hod Maden Project | | January 7, 2026 |
| Technical Report Summary | | SLR Project No.: 123.000320.00001 |
In the opinion of the QP, based on the assessment of legacy data, verification
of data and materials on site, the sample preparation, security, and analytical procedures meet industry standards for data quality and
integrity; however, protocols and processes are poorly documented, and this should be remedied.
The quality control data indicates that data collection, preparation
and analytical procedures were mostly well controlled.
The QP’s quality acceptance tests demonstrate that the sampling
and analytical processes delivered results that were mostly accurate and precise. Twin drilling confirmed the grade tenors in the original
holes supporting the quality of the sampling method. Umpire analyses suggest that Au analyses at ALS are biased high by approximately
1% to 2%, and this finding has some support from results of disguised certified reference materials (CRMs), submitted by SSR. This bias
warrants discussion with the laboratory management and should be remedied. The QP considers this bias a low-to-moderate risk with respect
to the global Mineral Resource estimate.
The QP considers that the assay results are within acceptable levels
of accuracy and precision and the resulting database is sufficient to support the estimation of Mineral Resources and classification in
the relevant confidence categories.
| | 8-27 | |
| SSR Mining Inc. | Hod Maden Project | | January 7, 2026 |
| Technical Report Summary | | SLR Project No.: 123.000320.00001 |
Data verification is the process of checking and verifying hard-copy
logs and digital records for accuracy, ensuring the data on which Mineral Resource estimates are based can be linked from digital databases
or records to log sheets and drilling or sampling intervals. Data verification may also include check sampling carried out by the QP,
especially if SOPs are not available or difficult to audit and QC data, used to demonstrate processes were in control, is limited.
The RSC QP for Geology and Mineral Resource estimation was on site at
Hod Maden from July 1 to 5, 2024. The RSC QP reviewed the Project geology, SOPs, collar locations, downhole surveys, logs, core,
pulps, and laboratory certificates.
| 9.1.1 | Collar Locations & Downhole Surveys |
Collars were picked up by differential GPS (DGPS) during the RSC QP’s
site visit. The RSC QP noted that both old and new diamond drill holes showed very good repeatability with the DGPS values recorded in
the database; however, there seems to be some minor confusion as to what diamond drill holes were surveyed by which contractor and what
methods have been used over the years. The RSC QP suggests clarifying this and recommends having a contracted surveyor report on all the
holes that can be found.
The geological architecture can be reconstituted from the original logging,
knowing that the logged “chlorite andesite breccia” is geologically and geochemically the same as the logged “dacite
breccia”.
There are three dominant mineralizing and depleting events at a scale
that is relevant for mineral resource estimation:
| 1 | a primary seafloor mineralizing event that includes the massive sulfides, the quartz stringers and jasperoid alteration; overprinted
by |
| 2 | an intermediate sulfidation epithermal event that emplaced quartz veins; and |
| 3 | a late anhydrite depletion event. |
The very high Au grades are associated with the primary seafloor event
that deposited the massive sulfides, the quartz stringers and jasperoid alteration. The RSC QP suggests logging jasperoid consistently
using a percent or semi-quantitative field. The massive sulfide can be modeled based on the existing logging, which was confirmed as robust.
However, the RSC QP is concerned that old logging was insufficiently consistent to support definition of a jasperoid domain based on the
logging. A good example of jasperoid alteration can be seen in Hole 248-A where there is no jasperoid between the massive sulfide for
the first few meters, but a high-grade sample related to jasperoid was taken between 285.50 m and 286.50 m. In the RSC QP’s opinion,
high grade domains are clearly related to the amount of jasperoid, and it is important that the semi-quantitative logging is accurate
or to identify a consistent geochemical proxy. The RSC QP tested various possible geochemical proxies as part of the domaining work and
found that the ratio of Al and Co provides a good proxy for the jasperoid alteration. There are zones/domains in the logged samples where
all three domains (massive sulfides, the quartz stringers and jasperoid alteration) are overprinting the host rock, which essentially
creates various options and combinations of domains, each with different grade signatures, and also for different elements (Au, Cu, Zn,
etc.)
| | 9-1 | |
| SSR Mining Inc. | Hod Maden Project | | January 7, 2026 |
| Technical Report Summary | | SLR Project No.: 123.000320.00001 |
Hole 248-A has three meters of breccia before the massive sulfides (278
m to 281 m). The RSC QP notes that this domain was logged as volcaniclastic sediments. In the hole right above it (HTD-82) this zone was
logged as tectonic breccia, but only for one meter, whilst it is clear that it is several meters thick. This example shows that even though
all logging was conducted by a by a single person, if holes are logged without the context of a 3D geological model, there is no feedback
loop and there will be mistakes.
The RSC QP found that Hole HTD-082 is a quarter core but its associated
logging was not in the database. The staff at Hod Maden pointed out that the hole was logged on paper and has been digitized in an Excel
spreadsheet, but has not yet been added to the database.
Hole 245 shows the same contact as in 248-A and 82 but the breccia is
not present. In this hole, the anhydrite is not logged properly. The RSC QP tested various geochemical proxies to support the definition
of the anhydrite domain and notes that a combination of Ca, Fe and S shows good correlation with logged anhydrite.
The site visit showed that legacy geological logging is not of sufficient
quality to support detailed and high-quality sub-domaining for resource estimation. Both anhydrite (depleting) and jasperoid (enriching)
are not consistently logged. The geochemical proxies are performing well but can be further enhanced by a diligent process of XRF analysis
(e.g., Si, Zr for jasperoid) of the sample pulps.
While spot checks completed by the RSC QP uncovered some database errors,
overall, the RSC QP is of the opinion that the Hod Maden Project data were collected through proper processes, although legacy geological
logging was not of sufficient quality. SSR is currently in the process of relogging some of the holes. Data quality was controlled to
be fit for the purpose of exploration targeting, Mineral Resource estimation, and Mineral Resource classification in high-confidence categories.
The RSC QP selected 113 legacy pulp samples from hole HTD-077 for re-submission
and check analysis at ALS Izmir. The RSC QP notes that check results for Au demonstrate no bias at 95% confidence whereas results for
Cu demonstrate a statistically significant bias (original > check) at 95% confidence (Table 9-1 and Figure 9-2). Results for Au demonstrate
significant heterogeneity in the pulps with a RMSCV precision of 62%, which is high for blind repeats on pulverized sample material.
At face value, the check analyses would suggest that the original assays
overstate Cu concentration by 7% to 8%. However, client and laboratory CRM results for the original submission showed an average z-score
of -0.35 (i.e., CRMs were 0.35 standard deviations below the certified value on average). Laboratory CRM results for the check submission
showed an average z-score of -0.40 (Figure 9-1). The RSC QP notes that ME-ICP61a is outside the scope of ALS Izmir’s accreditation,
and this puts caveats on the Cu results obtained from this laboratory (analyses up until 2020).
The check results confirm accuracy of the primary assays for Au but
put some question marks around the repeatability of the Cu analyses. The Cu results suggest that variability between batches at ALS Izmir
may be on the order of 7% to 8%, which is considerable. The limited number of mostly laboratory-inserted CRM results for both submissions
do not suggest a clear bias. The RSC QP recommends submitting a large batch of check assays with samples from various holes analyzed over
the period 2015 to 2020 to test the hypothesis that the apparent bias observed in the 2024 Cu check analyses was anomalous, associated
with a single batch. The RSC QP recommends submitting a large number of CRMs (1:3) certified for Cu by four-acid digestion alongside these
check samples to rule out any questions around the quality of the check assay.
| | 9-2 | |
| SSR Mining Inc. | Hod Maden Project | | January 7, 2026 |
| Technical Report Summary | | SLR Project No.: 123.000320.00001 |
Table 9-1: Summary of Check Analyses
for HTD-077
| Analyte |
Split |
N Pairs |
LOQ |
Upper LOQ |
Units |
Wilcoxon p-val |
Wilcoxon
Verdict (p95) |
RMSCV (%) |
| Au |
Check |
113 |
n/a |
n/a |
ppm |
0.36 |
Accept H0 |
68.1 |
| Cu |
Check |
107 |
50 |
n/a |
ppm |
<0.01 |
Reject H0 |
9.1 |
Figure 9-1: Results for CRMs in
batches IZ16173727 (Original) and IZ24186885 (Check)
FIGURE 9-1
IZ16173727
Laboratory
Client
Result Z-Score
2.0
1.5
1.0
0.5
0.0
-0.5
-1.0
-1.5
-2.0
0
5000
10000
15000
20000
25000
30000
35000
Certified Mean
IZ24186885
Result Z-Score
3.00
2.50
2.00
1.50
1.00
0.50
0.00
-0.50
-1.00
-1.50
-2.00
0
2000
4000
6000
8000
10000
12000
14000
16000
Certified Value
| | 9-3 | |
| SSR Mining Inc. | Hod Maden Project | | January 7, 2026 |
| Technical Report Summary | | SLR Project No.: 123.000320.00001 |
Figure 9-2: Scatter and QQ plots
for the Check Samples
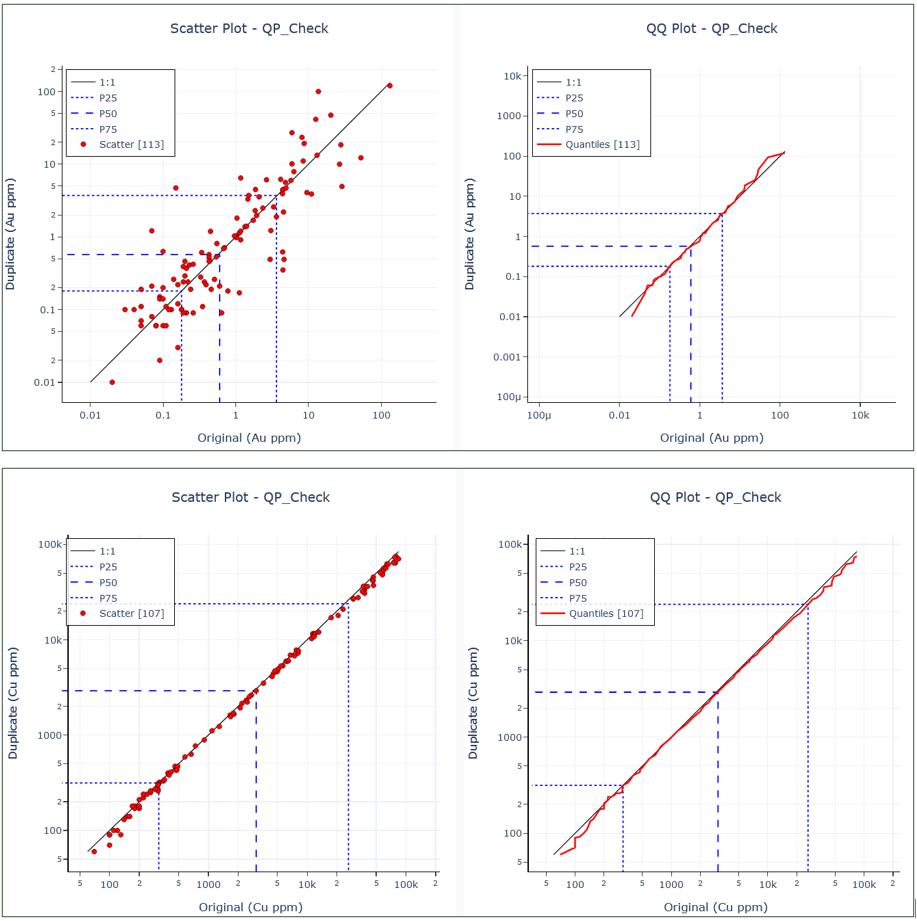
FIGURE 9-2
Scatter Plot - QP_Check
Duplicate (Au ppm)
2
100
5
2
10
5
2
1
5
2
0.1
5
2
0.01
1:1
P25
P50
P75
Scatter [113]
0.01
0.1
1
10
100
Original (Au ppm)
QQ Plot - QP_Check
Duplicate (Au ppm)
10k
1000
100
10
1
0.1
0.01
0.001
100µ
P25
P50
P75
Quantiles [113]
100µ
0.01
1
100
10k
Original (Au ppm)
Scatter Plot - QP_Check
Duplicate (Cu ppm)
100k
5
2
10k
5
2
1000
5
2
100
5
1:1
P25
P50
P75
Scatter [107]
5
100
2
5
1000
2
5
10k
2
5
100k
2
Original (Cu ppm)
QQ Plot - QP_Check
Duplicate (Cu ppm)
100k
5
2
10k
5
2
1000
5
2
100
5
1:1
P25
P50
P75
Quantiles[107]
5
100
2
5
1000
2
5
10k
2
5
100k
2
Original (Cu ppm)
The RSC QP remeasured and calculated the density of a selection samples
to validate the density measurements in the database. This showed that some values in the database are not correct (Table 9-2). The RSC
QP recommends carrying out additional random check measurements on the top 10% and bottom 10% of density values in the database to verify
the accuracy of the density measurements in the database.
| | 9-4 | |
| SSR Mining Inc. | Hod Maden Project | | January 7, 2026 |
| Technical Report Summary | | SLR Project No.: 123.000320.00001 |
Table 9-2: Results of Check Measurements
for Bulk Density Requested by the RSC QP
| Sample ID |
BD Original |
BD Check |
| 73070 |
4.01 |
3.67 |
| 96672 |
3.95 |
3.69 |
| 122350 |
4.13 |
3.87 |
| 511528 |
3.71 |
3.65 |
| 511533 |
3.92 |
3.85 |
The verification of the data carried out both as a desktop validation
of source data (scans, logs) against the database, as well as verification and check sampling carried out by the RSC QP during the site
visit, suggest that the database on which the Mineral Resource estimate is based is of good integrity. Errors, inconsistencies and biases
were identified, and these have been considered by the RSC QP in classifying the Mineral Resource.
The results from check analysis indicate a lack of repeatability of
the Cu analyses, and this warrants further investigation. The RSC QP recommends undertaking additional check measurements for bulk density
on the top and bottom 10% of the dataset.
The RSC QP’s database verification of the Hod Maden Project indicates
that data collection procedures mostly comply with industry standards and are adequate to support classification of at least Indicated
Mineral Resources.
| | 9-5 | |
| SSR Mining Inc. | Hod Maden Project | | January 7, 2026 |
| Technical Report Summary | | SLR Project No.: 123.000320.00001 |
| 10.0 | Mineral Processing and Metallurgical Testing |
The Hod Maden Au-Cu sulfide ore is a volcanic-sedimentary ore type with
moderate sulfide mineral content. The major sulfide minerals are pyrite and chalcopyrite. Gold is mostly associated with pyrite and to
a lesser degree with chalcopyrite and siliceous minerals. Test work completed to support the 2021 FS was focused on producing a copper
concentrate containing ≥20% Cu at the highest possible copper and gold recoveries, and, when possible, a separate precious metal pyrite
concentrate with associated gold content scavenged from the copper circuit tailings. The most recent 2024 test work developed the opportunity
to simplify the flowsheet and mine/plant operating strategy to produce a single concentrate at a lower copper grade (>13% Cu) leveraging
high gold grades in the concentrate while keeping copper and gold recovery near the 2021 FS levels.
Test work programs at various levels of study have been completed since
2015:
| · | Scoping and preliminary economic assessment (PEA) level characterization and metallurgical test work programs – between 2015
and 2016 |
| · | PFS phase test work between 2017 and 2018 |
| · | FS test work between 2019 and 2020 |
| · | FS update test work between 2023 and 2024 |
Reports related to the metallurgical test work are listed in Section
24.0 of this report.
| 10.2 | Scoping, PEA, and PFS Test Work |
PEA phase test work was based on an ore sample prepared from early drilling
work. Two alternative flotation flowsheets were tested: (1) sequential copper and pyrite flotation and (2) bulk sulfide mineral flotation
followed by selective copper flotation. The bulk sulfide mineral flotation flowsheet was selected based on increased total gold and copper
recoveries to the final copper concentrate.
PFS test work included flowsheet development and PFS level ore variability
tests. This test work was conducted by Hacettepe Mineral Technologies Inc. (HMT) using the composite samples selected by SGS Geostat (SGS
2017) group representing lithology/alteration and grade variations in the ore deposit. Eight samples were selected for comminution tests
and twelve samples for mineralogical characterization and flotation test work. After optimization of the flotation conditions and flowsheet
by HMT, an MCS (Master Composite Sample) sample was sent to Wardell Armstrong International (WAI) for confirmation tests. All laboratories
used are independent of SSR.
The main objectives of the PFS metallurgical test work were:
| · | Optimization of the flotation flowsheet and flotation conditions to reduce gold losses from bulk flotation tailings |
| · | Production of a pyrite concentrate with saleable gold and sulfur grade |
| · | Performing PFS level ore variability tests |
| · | Preliminary assessment of gold recovery from pyrite concentrate by hydrometallurgical methods |
| | 10-1 | |
| SSR Mining Inc. | Hod Maden Project | | January 7, 2026 |
| Technical Report Summary | | SLR Project No.: 123.000320.00001 |
The mineralogical characterization studies were performed by Petrolab,
located in the United Kingdom, using QEMSCAN (quantitative evaluation of minerals by scanning electron microscopy) and involved modal
mineralogical analysis, liberation analysis, and gold-copper deportment. The major sulfide minerals were pyrite and chalcopyrite in all
samples. The ore samples from the massive pyrite lithology contained the highest pyrite content.
The grain size distribution showed that the primary grind size P80
of 106 µm was suitable for bulk sulfide mineral flotation and the regrind size P80 of 30 µm suitable to obtain
adequate degree of liberation for selective copper flotation.
The gold was in the form of native gold/electrum and had a strong association
with sulfide phases (i.e. chalcopyrite, pyrite, pyrrhotite, and arsenopyrite) in all samples. It was generally fine-grained (<10 µm).
The optimum primary grind size was determined as P80 of 106
µm in the PEA phase. Further tests were conducted to investigate effects of a finer primary grind size and two stage grinding (i.e.,
MF2 [Mill-Float-Mill-Float]) mode of operation for reducing gold loss to bulk flotation tailings. In the MF2 mode of operation, the primary
grind size was set to a P80 of 106 µm and the bulk rougher flotation tail was reground to finer sizes prior to the scavenger
flotation stage. The scavenger flotation performance was tested at P80 sizes of 53 µm, 38 µm, and 20 µm secondary
grind sizes. The P80 of 38 µm was found as the optimum particle size.
Based on the test results, bulk sulfide mineral flotation section of
the flowsheet was modified from Mill-Float (MF) mode to MF2 mode of operation by including a secondary grinding stage producing a P80
of 38 µm material for bulk scavenger flotation. The MF2 mode of operation reduced gold loss significantly, particularly for flotation
feed containing high gold grade.
Locked cycle flotation tests (LCT) were conducted using the MCS ore
sample by both HMT and WAI. The LCT at WAI was conducted as a confirmatory test. Figure 10-1 shows the flowsheet applied in both laboratories.
| | 10-2 | |
| SSR Mining Inc. | Hod Maden Project | | January 7, 2026 |
| Technical Report Summary | | SLR Project No.: 123.000320.00001 |
Figure 10-1: Locked Cycle Flotation
Test Flowsheet
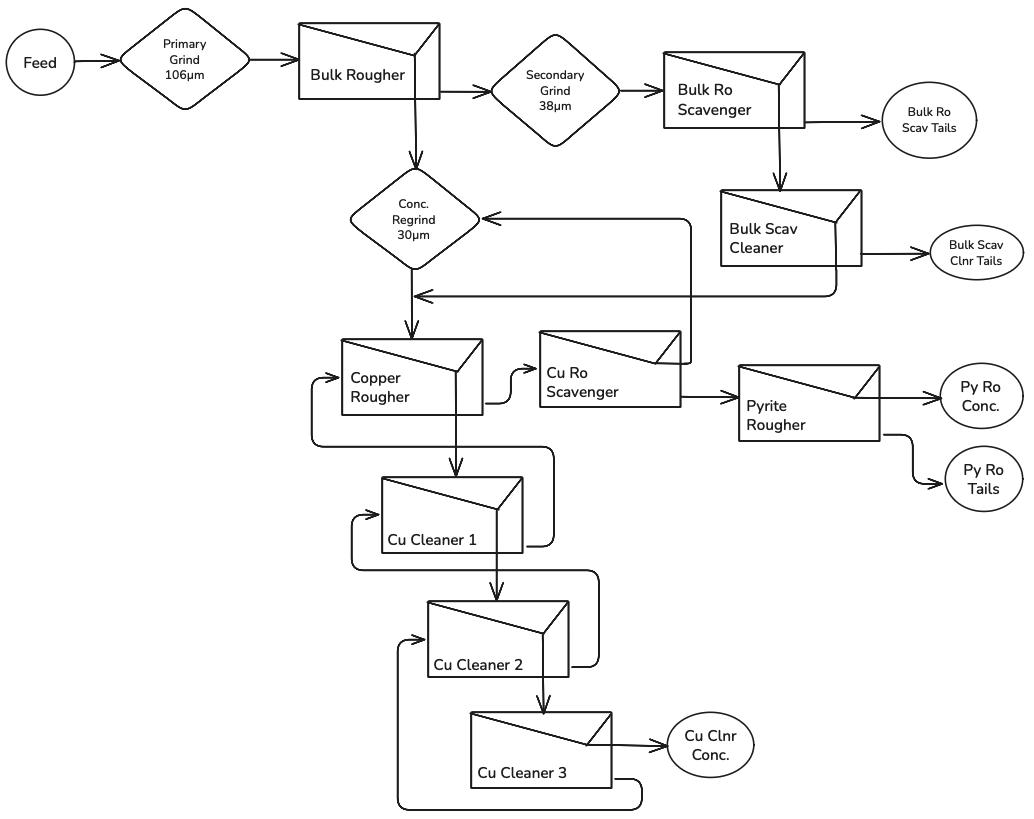
FIGURE 10-1
Feed
Primary Grind 106µm
Bulk Rougher
Secondary Grind 38µm
Bulk Ro Scavenger
Bulk Ro Scav Tails
Conc. Regrind 30 µm
Bulk Scab Cleaner
Bulk Scav Clnr Tails
Copper Rougher
Cu Ro Scavenger
Pyrite Rougher
Py Ro Conc.
Py Ro Tails
Cu Cleaner 1
Cu Cleaner 2
Cu Cleaner 3
Cu Clnr Conc.
Source: SSR 2025.
| | 10-3 | |
| SSR Mining Inc. | Hod Maden Project | | January 7, 2026 |
| Technical Report Summary | | SLR Project No.: 123.000320.00001 |
The primary grind size was a P80 of 106 µm, and bulk
rougher flotation was conducted with three stages of collector addition. Bulk rougher flotation tailing was ground to a P80
of 38 µm. Bulk scavenger flotation was conducted with two stages of collector addition. Sodium isopropyl xanthate (SIPX) and a modified
dithiophosphate (Aero Promoter 7249) were used as the collector and promoter in the bulk rougher and scavenger flotation. The bulk scavenger
concentrate was subjected to a cleaner flotation, whose concentrate was combined with the bulk rougher concentrate in the copper rougher
flotation stage. The bulk rougher concentrate was re-ground to a P80 of 30 µm in the presence of lime at pH 11.5 for
pyrite depression. The copper rougher flotation and scavenger flotation were applied at the same pH using Aero 3418A as the selective
copper collector. The copper final concentrate was produced after three stages of cleaner flotation. Pyrite flotation was applied to the
copper scavenger tailing after decreasing the pH to approximately 8 to 9 by addition of sulfuric acid (H2SO4 as
a 10% solution).
LCT test results from HMT and WAI are given in Table 10-1 and Table
10-2, respectively. Table 10-1 shows that a copper concentrate was produced assaying 83.15 g/t Au and 20.18% Cu at recoveries of 78.11%
for Au and 93.32% for Cu. The pyrite concentrate contains 7.04 g/t Au and 52.07% S with 13% Au recovery. The total gold recovery in the
circuit was approximately 91%. Similar results were obtained from the test conducted by WAI.
Table 10-1: Average Grade and Recoveries
of the LCT Conducted at HMT
| Product |
Wt % |
Assay |
Distribution (%) |
| g/t Au |
% Cu |
% Fe |
% S |
% Zn |
Au |
Cu |
Fe |
S |
Zn |
| Cu Cl3 Conc |
9.26 |
83.15 |
20.18 |
29.15 |
41.57 |
5.93 |
78.11 |
93.32 |
19.16 |
19.78 |
94.65 |
| Bulk Scv Cln Tail |
5.62 |
1.26 |
0.11 |
4.70 |
5.45 |
0.04 |
0.72 |
0.31 |
1.88 |
1.57 |
0.39 |
| Py Conc |
17.81 |
7.04 |
0.31 |
37.94 |
52.07 |
0.03 |
12.71 |
2.78 |
47.98 |
47.67 |
0.98 |
| Py Tail |
13.29 |
3.63 |
0.33 |
18.65 |
23.01 |
0.06 |
4.90 |
2.20 |
17.60 |
15.72 |
1.31 |
| Bulk Tail |
54.02 |
0.65 |
0.05 |
3.49 |
5.49 |
0.03 |
3.56 |
1.39 |
13.38 |
15.25 |
2.67 |
| Total |
100.00 |
9.86 |
2.00 |
14.08 |
19.46 |
0.58 |
100.00 |
100.00 |
100.00 |
100.00 |
100.00 |
|
Notes:
Cu Cl3 Conc = Copper 3rd Cleaner Concentrate
Scv Cln = Scavenger Cleaner
Py = Pyrite |
| | 10-4 | |
| SSR Mining Inc. | Hod Maden Project | | January 7, 2026 |
| Technical Report Summary | | SLR Project No.: 123.000320.00001 |
Table 10-2: Average Grade and Recoveries
of the LCT Conducted at WAI
| Product |
Wt % |
Assay |
Distribution (%) |
| g/t Au |
% Cu |
% Fe |
% S |
Au |
Cu |
Fe |
S |
| Cu Cleaner Conc |
10.7 |
66.5 |
19.9 |
30.8 |
39.0 |
78.3 |
96.2 |
21.3 |
23.4 |
| Py Ro Conc |
18.1 |
6.93 |
0.16 |
38.8 |
47.3 |
13.7 |
1.3 |
45.2 |
47.8 |
| Tailings |
71.2 |
1.01 |
0.077 |
7.32 |
7.22 |
7.9 |
2.5 |
33.6 |
28.8 |
| Feed |
100.0 |
9.11 |
2.22 |
15.5 |
17.9 |
100.0 |
100.0 |
100.0 |
100.0 |
| Note: Py = pyrite, Cln = Cleaner; Ro = Rougher |
Complete chemical analysis was performed on the copper and pyrite concentrates
produced from LCTs. There were no penalty elements at levels which could adversely affect marketing of the concentrates.
SAG (semi-autogenous) Mill Comminution (SMC), Bond Ball Mill Work Index
(BWi), Bond Rod Mill Work Index (RWi) and abrasion Index (Ai) tests were conducted on all the variability samples. All samples tested
showed medium to moderately soft resistance to impact breakage, while having medium resistance to abrasion breakage relative to the JKMRC
data base. The RWi ranged from 9.42 kWh/t to 13.65 kWh/t, classifying all the samples as being of medium hardness. The BWi varied
from 9.56 kWh/t to 14.6 kWh/t, classifying the samples from medium hardness to hard. The measured abrasion index values ranged from 0.043
to 0.47.
A comprehensive gravity concentration test work program was conducted
in the PEA phase to investigate the possibility of producing a GRG (Gravity Recoverable Gold) concentrate ahead of the flotation stage.
Gravity concentration tests were performed using a shaking table and a Falcon separator. In the shaking table tests, the highest gold
grade (29 g/t) was obtained at a particle size finer than 160 µm. There were no coarse gold particles which could be concentrated
by shaking table. The GRG test was conducted as E-GRG (size-by-size basis) to demonstrate the gold recovery as a function of particle
size. The GRG potential of the MCS (average grade, 10 g/t Au) and UHG (ultra high grade, 33 g/t Au) ore types were found as 13.51% and
18.99%, respectively. GRG values of both ores were considered low for an effective gold recovery by gravity separation.
| 10.3 | Feasibility Study Metallurgical Test Work |
After the work completed for the PFS in 2018, a comprehensive ore variability
test work program was performed using 99 ore samples to determine the ore variability across the orebody, the variations in flotation
response, and to derive grade-recovery curves for each lithology in the ore deposit. Following the variability test work, two composites
were created using sulfide sulfur (SS) grade. A cut off of 15% SS was used as an approximation for MPY and Massive Pyrite Enrichment Zone
(MPE) lithologies. Anything greater than 15% SS was labeled as “Pyrite Ore (PO)”, and everything below was labeled as “Regular
Ore (RO)”. The RO/PO test work was undertaken to increase total gold recovery by production of a pyrite concentrate with saleable
gold grade.
The metallurgical tests were performed for equipment sizing and selection
using master composite ore samples representing the two main material types. All the ore characterization and metallurgical tests were
conducted at ALS Metallurgy Services in Perth, Australia (ALS), which is certified as meeting the requirements of ISO 9001:2015 Quality
Management System. ALS is independent of SSR.
| | 10-5 | |
| SSR Mining Inc. | Hod Maden Project | | January 7, 2026 |
| Technical Report Summary | | SLR Project No.: 123.000320.00001 |
| 10.3.2 | Metallurgical Sample and Composite Sample Establishment |
The sample selection study was performed by Acar Metallurgical Consulting
in December 2018, using the Hod Maden resource model available at that time. The orebody consisted of two zones: the Main Zone represents
the majority of the orebody and the South Zone represents an extension of the orebody.
| · | Main Zone: Overall, 73 samples were selected. In terms of gold grade ranges, 20 samples were greater than 10 g/t Au, eight samples
were in the 5 g/t to 10 g/t Au range, 20 samples were in the 2.5 g/t to 5 g/t range, nine samples were in the 1.5 g/t to 2.5 g/t range,
and 16 samples were less than 1.5 g/t Au. |
| · | South Zone: Overall, 26 samples were proposed. In terms of gold grade ranges, six samples were greater than 10 g/t Au, three samples
were in the 5 g/t to 10 g/t Au range, nine samples were in the 2.5 g/t to 5 g/t range, six samples were in the 1.5 g/t to 2.5 g/t range,
and two samples were less than 1.5 g/t Au. |
Gold grade and lithological distribution of the variability samples
are given in Table 10-3.
Ten samples from Main Zone and four samples from South Zone were selected
for the comminution tests (Table 10-4). The samples were selected according to the distribution of Lithology-Alteration in both ore zones.
Half-HQ cores were used to produce coarse material for SMC tests.
| | 10-6 | |
| SSR Mining Inc. | Hod Maden Project | | January 7, 2026 |
| Technical Report Summary | | SLR Project No.: 123.000320.00001 |
Table 10-3: Samples Selected for
the Ore Variability Flotation Tests
| PHASE
1 MAIN AND SOUTH ZONE VARIABILITY SAMPLES |
| Lithology |
Alteration |
High
Grade |
2
x Average Grade |
Average
Grade |
Cut-off
Grade |
Sub
Cut-off Grade |
Total
(Number) |
Total
(%) |
| Au>10
g/t |
Au
5-10 g/t |
Au
2.5-5 g/t |
Au
1.5-2.5 g/t |
Au
<1.5 g/t |
| Andesite
Breccia (AB) |
Network
Quartz Vein |
|
3 |
1 |
|
|
4 |
8 |
4.00 |
8.10 |
| Quartz
Vein - Gray Silica |
1+1 |
|
|
|
|
2 |
2.00 |
| Quartz
Veining |
|
|
|
1 |
|
1 |
1.00 |
| Jasper
- Hematite -Network Quartz Vein |
|
|
1 |
|
|
1 |
1.00 |
| Chlorite
Andesite Breccia (CAB) |
Jasper
- Hematite - Network Quartz Vein |
8 |
2 |
5 |
2 |
1 |
18 |
37 |
18.20 |
37.40 |
| Anhydrite
- Quartz Vein |
2 |
|
3 |
1 |
4 |
10 |
10.10 |
| Network
Quartz Vein |
2 |
2 |
2 |
|
3 |
9 |
9.10 |
| Dacite
Breccia (DB) |
Quartz
Vein - Gray Silica |
1 |
3 |
1+3 |
1 |
1 |
10 |
36 |
10.10 |
36.40 |
| Quartz
Veining |
2 |
1 |
3 |
2+2 |
2 |
12 |
12.10 |
| Silicification |
1 |
|
1 |
|
1 |
3 |
3.00 |
| Anhydrite
Quartz Vein |
1 |
|
1 |
|
|
2 |
2.00 |
| Jasper
- Hematite -Network Quartz Vein |
1 |
|
1 |
|
1 |
3 |
3.00 |
| Network
Quartz Vein |
|
|
1 |
1+2 |
2 |
6 |
6.10 |
| Gypsum
Volcano Sedimentary |
Argillic |
|
|
2 |
|
1+2 |
5 |
5 |
5.10 |
5.10 |
| Volcanosedimentary |
Quartz
Veining |
|
|
1 |
1 |
|
2 |
2 |
2.00 |
2.00 |
| Massive
Pyrite (MPY) |
Massive
Pyrite |
4 |
|
2 |
1 |
|
7 |
7 |
7.10 |
7.10 |
| Massive
Pyrite Enrichment Zone (MPE) |
Massive
Pyrite Enrichment Zone |
2 |
|
1 |
1 |
|
4 |
4 |
4.00 |
4.00 |
| TOTAL |
|
26 |
11 |
29 |
15 |
18 |
99 |
99 |
100.00 |
100.00 |
| Note:
Red numbers indicate South Zone variability samples |
| | 10-7 | |
| SSR Mining Inc. | Hod Maden Project | | January 7, 2026 |
| Technical Report Summary | | SLR Project No.: 123.000320.00001 |
Table 10-4: Comminution Test Samples
| Lithology |
Alteration |
No of Samples |
| Main Zone |
Chlorite Andesite Breccia |
Jasper - Hematite - Net. Qtz Vein |
3 |
| |
Anhydrite - Quartz Vein |
2 |
| |
Network Quartz vein |
1 |
| Andesite Breccia |
Network Quartz vein |
1 |
| Dacite Breccia |
Quartz Veining |
1 |
| Gypsum Volc. Sed. |
Argillic |
1 |
| Massive Pyrite |
Massive Pyrite |
1 |
| Total - Main Zone |
10 |
| South Zone |
Dacite Breccia |
Quartz vein - Gray Silica |
1 |
| |
Quartz Veining |
1 |
| |
Anhydrite - Quartz Vein |
1 |
| |
Silicification |
1 |
| Total - South Zone |
4 |
| Grand Total |
14 |
| | 10-8 | |
| SSR Mining Inc. | Hod Maden Project | | January 7, 2026 |
| Technical Report Summary | | SLR Project No.: 123.000320.00001 |
Figure 10-2: Cross Section of Mining
Shapes vs Intervals Tested (Looking West)
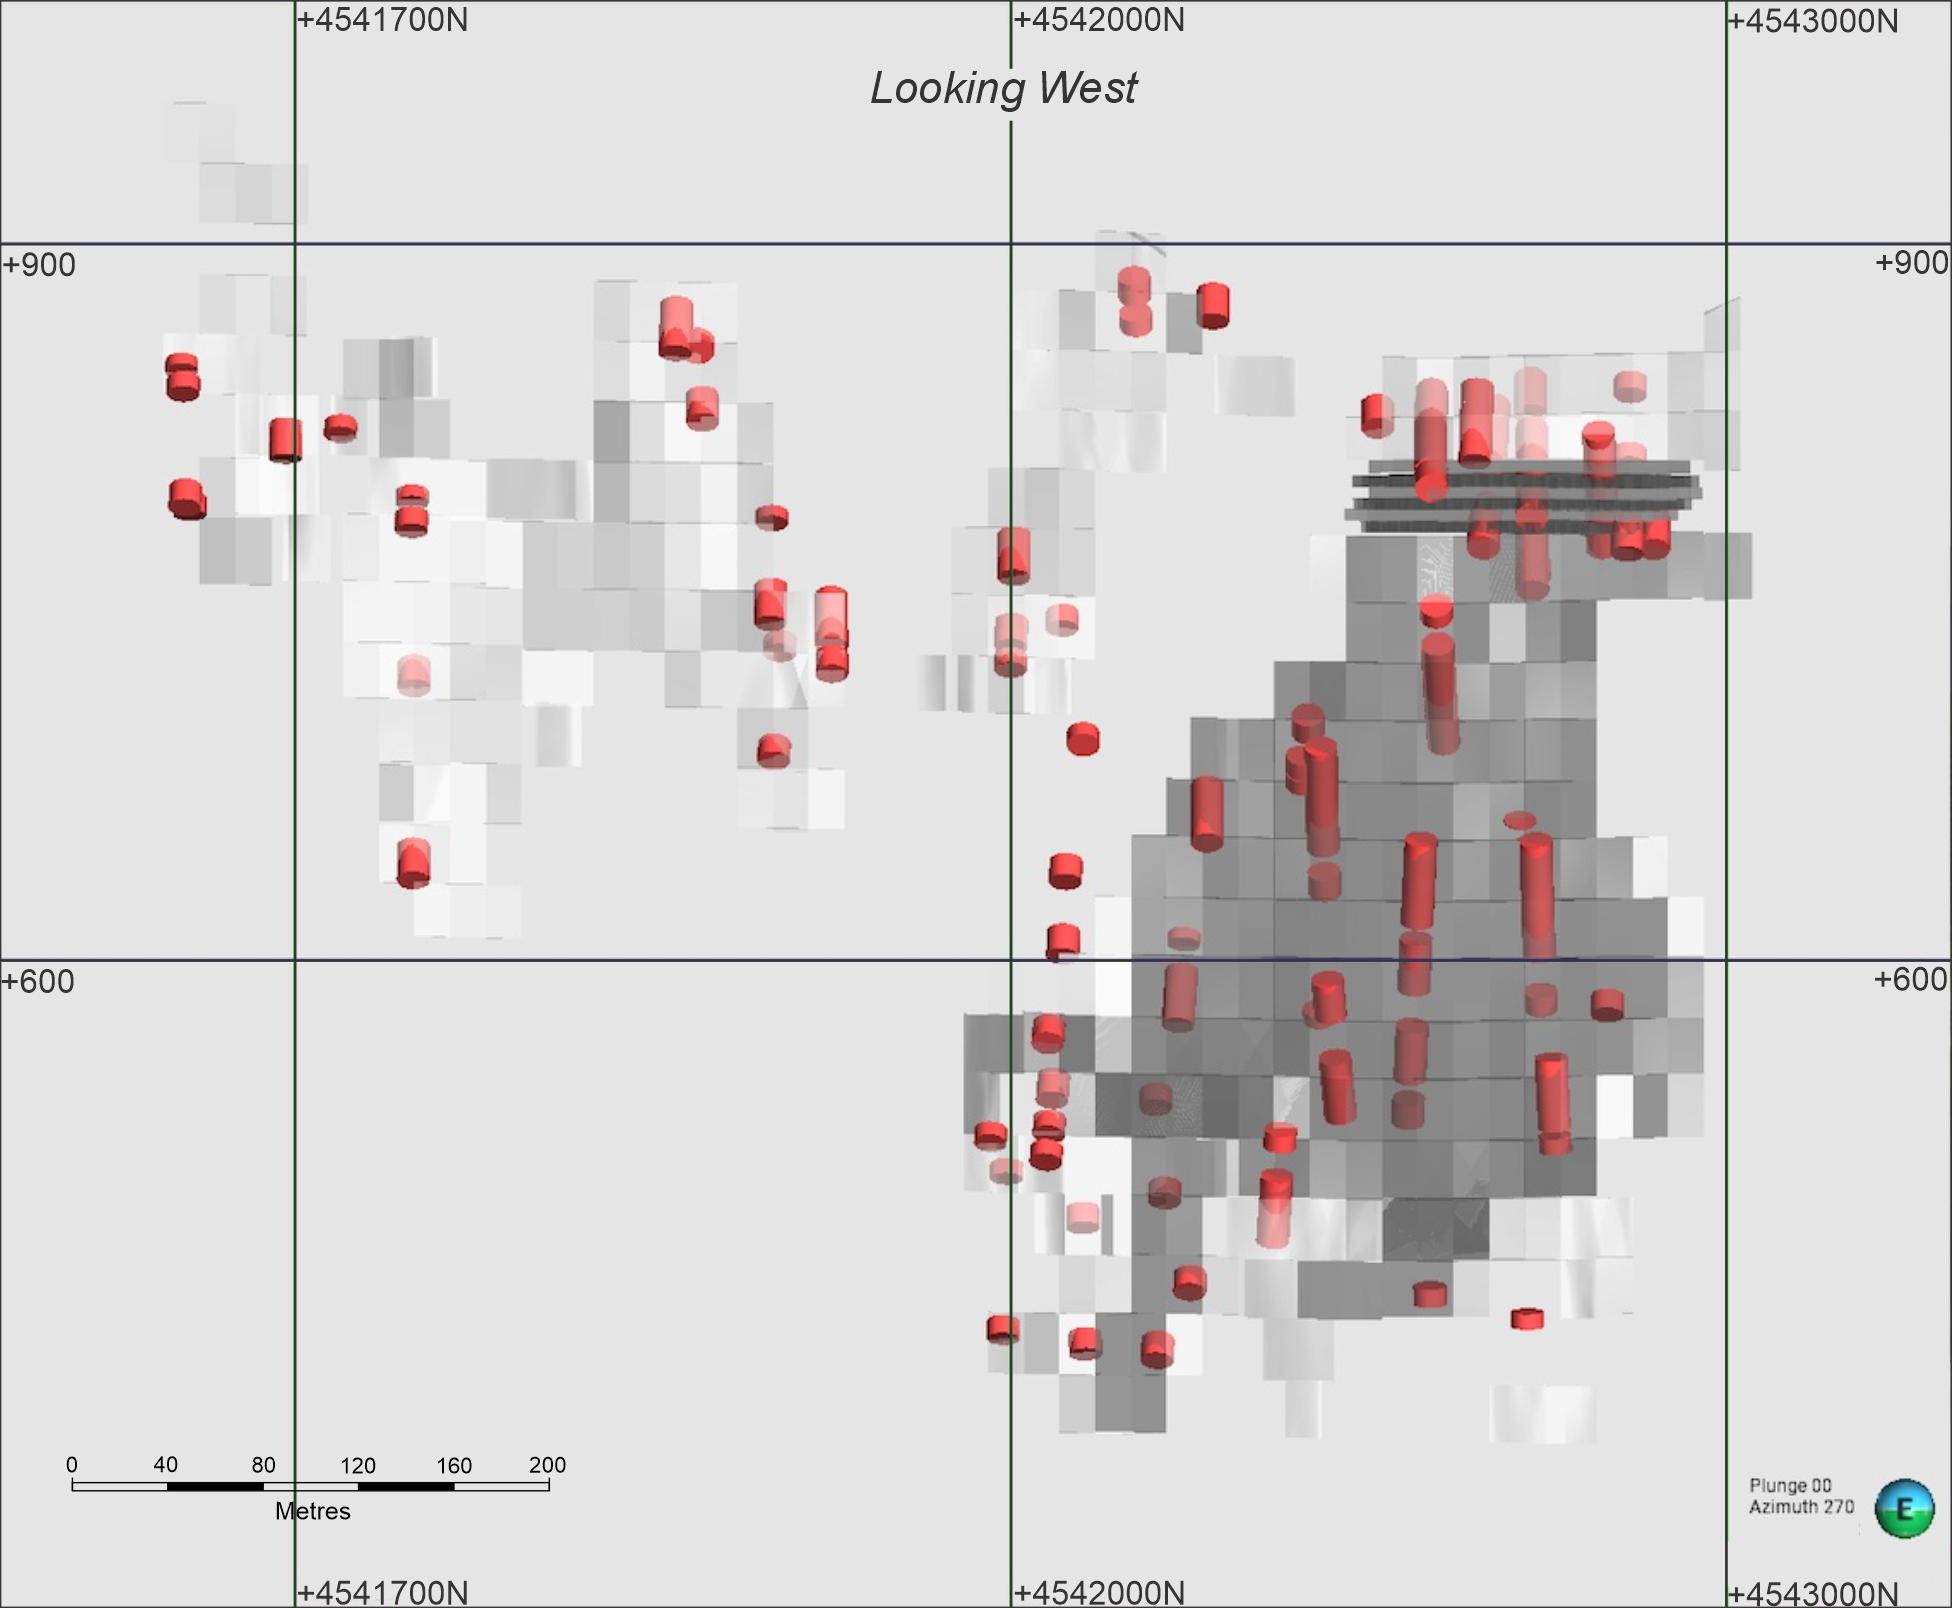
FIGURE 10-2
+4541700N
+4542000N
+4543000N
+900
+600
Looking West
+900
+600
0
40
80
120
160
200
Metres
+4541700N
+4542000N
+4543000N
Plunge 00
Azimuth 270
E
Source: SSR 2025
Complete chemical analysis including cyanide soluble gold (CN Sol Au)
and cyanide soluble copper (CN Sol Cu) of the 99 variability samples were performed by ALS Metallurgy. Duplicate gold assays were performed
by fire assay for all the samples to check sample homogeneity and the presence of any ‘nugget effect’. Gold assays varied
from 0.2 g/t to 70 g/t but generally accumulated in the 2.5 g/t to 20 g/t Au range. The duplicate assays were similar for most of the
samples.
The CN Sol Au assay is generally used as a proxy to estimate the form
of gold (free/exposed or refractory/encapsulated) in the ore samples. In Hod Maden variability samples, more than 70% of the gold in the
samples was in the form of CN Sol Au, except the samples from the massive pyrite (MPY) and massive pyrite enrichment zone (MPE) lithologies
and some samples from the dacite breccia (DB) lithology. CN Sol Cu assays were also performed to estimate presence of secondary copper
minerals in the samples. In general, less than 10% of the copper in the samples was in the form of CN Sol Cu, except the samples from
massive pyrite and massive pyrite enrichment zone lithology and a few others from the contact zone with MPY/MPE.
| | 10-9 | |
| SSR Mining Inc. | Hod Maden Project | | January 7, 2026 |
| Technical Report Summary | | SLR Project No.: 123.000320.00001 |
Copper grade of the samples varied from 0.06% Cu to 6.9% Cu but generally
ranged between 0.5% Cu to 2% Cu. Sulfide sulfur (SS) assays varied from 1.34% SS to 44.6% SS, but generally ranged between 5% SS to 20%
SS. Massive pyrite samples contained the highest sulfide sulfur, as expected. There were some samples from andesite breccia (AB) and chlorite
andesite breccia (CAB) lithologies containing >15% SS, which were from the contact zone with MPY/MPE. Total sulfur (ST) assay was also
performed on each sample to estimate presence of anhydrite (CaSO4), which is the major sulfate mineral in the ore. Sulfate
sulfur content varied from none to as high as 14% in some samples. Anhydrite was generally observed with CAB lithology samples.
Chemical analyses of the variability samples shows that the selected
samples cover a wide range of gold, copper and sulfide sulfur assays from different lithologies, which is critical for derivation of grade
vs. recovery curves.
| 10.3.4 | Mineralogical Characterization |
A total of 71 samples containing >2.5 g/t Au (higher than cut-off
grade) were submitted for quantitative mineralogical analysis by QEMSCAN and x-ray diffraction (XRD) methods. The samples were ground
to a P80 of 106 µm, which was the optimum primary grind size for sulfide mineral flotation. Bulk mineral analysis, mineral
liberation analysis, copper deportment, and gold search were performed on each sample. Analysis of pyrite texture was also performed by
optical images for eight samples selected in the beginning of the mineralogical characterization work. The results of the FS mineralogical
analysis were generally in agreement with the findings from the PFS phase.
The major minerals in Hod Maden ore were quartz, mica, pyrite, chalcopyrite,
Ca-sulfate minerals and minor amounts of secondary copper minerals (chalcocite/covellite). Figure 10-3 shows distribution of chalcopyrite,
pyrite and Ca-sulfate minerals in the samples. MPY ore contains the highest amount of pyrite, i.e. >40%, followed by MPE, AB, and CAB/DB.
Distribution of chalcopyrite was quite variable in the samples. There
were samples containing greater than 10% chalcopyrite from every lithology, although most samples containing greater than 10% chalcopyrite
were from MPY.
For the secondary copper minerals, chalcocite was more abundant than
covellite and typically occurred as rims and veins on/in chalcopyrite and pyrite and less commonly on/in sphalerite.
Combined Ca-sulfates are defined as anhydrite (CaSO4), gypsum
(CaSO4.2H2O) and bassanite (CaSO4.1/2H2O). The Ca-sulfates speciation was derived from XRD
results. The main Ca-sulfate mineral in the samples was either anhydrite or gypsum. There were few samples which contained the two minerals.
Bassanite was rarely observed.
Gold was predominantly as native gold (i.e. gold-silver alloys with
silver content less than 10% for most of the samples). Several gold-telluride grains (i.e. calaverite (AuTe2) and petzite (Ag3AuTe2))
were also detected.
Grain size of the chalcopyrite was slightly coarser than 80 µm
in CAB, AB, DB, and GVS (gypsum volcanic sediment) lithology samples, but around 40 µm in MPY and MPE. Grain size of the pyrite
follows a similar trend although slightly finer than chalcopyrite in most of the samples.
Grain size of the gold was generally finer than 20 µm. Presence
of liberated gold particles was observed in some samples, but the gold grains were generally in the locked form and associated with mostly
pyrite, then chalcopyrite and silicate minerals.
| | 10-10 | |
| SSR Mining Inc. | Hod Maden Project | | January 7, 2026 |
| Technical Report Summary | | SLR Project No.: 123.000320.00001 |
Figure 10-3: Distribution of Pyrite,
Chalcopyrite and Ca-Sulfate in the Variability Samples
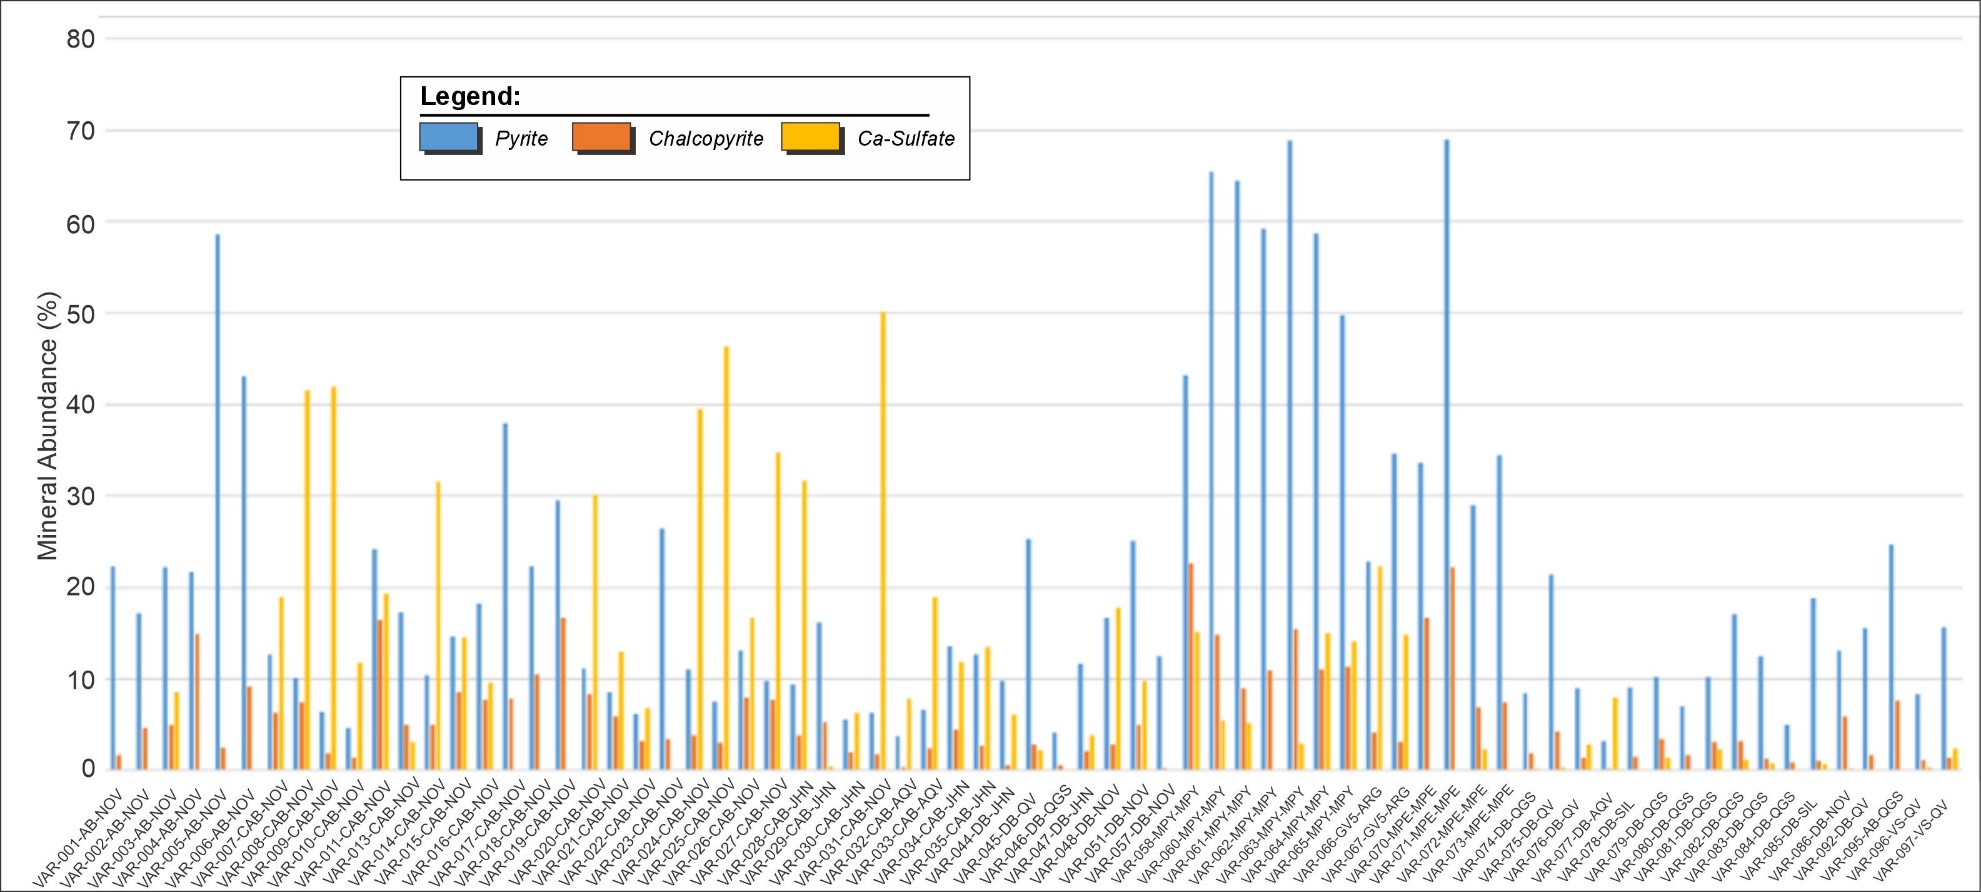
FIGURE 10-3
Mineral Abundance (%)
80
70
60
50
40
30
20
10
0
Legend:
Pyrite
Chalcopyrite
Ca-Sulfate
VAR-001-AB-NOV
VAR-002-AB-NOV
VAR-003-AB-NOV
VAR-004-AB-NOV
VAR-005-AB-NOV
VAR-006-AB-NOV
VAR-007-CAB-NOV
VAR-008-CAB-NOV
VAR-009-CAB-NOV
VAR-010-CAB-NOV
VAR-011-CAB-NOV
VAR-012-CAB-NOV
VAR-013-CAB-NOV
VAR-014-CAB-NOV
VAR-015-CAB-NOV
VAR-016-CAB-NOV
VAR-017-CAB-NOV
VAR-018-CAB-NOV
VAR-019-CAB-NOV
VAR-020-CAB-NOV
VAR-021-CAB-NOV
VAR-022-CAB-NOV
VAR-023-CAB-NOV
VAR-024-CAB-NOV
VAR-025-CAB-NOV
VAR-026-CAB-NOV
VAR-027-CAB-NOV
VAR-028-CAB-JHN
VAR-029-CAB-JHN
VAR-030-CAB-JHN
VAR-031-CAB-NOV
VAR-032-CAB-AQV
VAR-033-CAB-AQV
VAR-034-CAB-JHN
VAR-035-CAB-JHN
VAR-044-DB-JHN
VAR-045-DB-QV
VAR-046-DB-QGS
VAR-047-DB-JHN
VAR-048-DB-NOV
VAR-051-DB-NOV
VAR-057-DB-NOV
VAR-058-MPY-MPY
VAR-060-MPY-MPY
VAR-061-MPY-MPY
VAR-062-MPY-MPY
VAR-063-MPY-MPY
VAR-064-MPY-MPY
VAR-065-MPY-MPY
VAR-066-GV5-ARG
VAR-067-GV5-ARG
VAR-070-MPE-MPE
VAR-071-MPE-MPE
VAR-072-MPE-MPE
VAR-073-MPE-MPE
VAR-074-DB-QGS
VAR-075-DB-QV
VAR-076-DB-QV
VAR-077-DB-AQV
VAR-078-DB-SIL
VAR-079-DB-QGS
VAR-080-DB-QGS
VAR-081-DB-QGS
VAR-082-DB-QGS
VAR-083-DB-QGS
VAR-084-DB-QGS
VAR-085-DB-SIL
VAR-086-DB-NOV
VAR-092-DB-QV
VAR-095-AB-QGS
VAR-096-VS-QV
VAR-097-VS-QV
Source: Ausenco 2024.
| | 10-11 | |
| SSR Mining Inc. | Hod Maden Project | | January 7, 2026 |
| Technical Report Summary | | SLR Project No.: 123.000320.00001 |
The proposed process plant will consist of a primary crushing and grinding
circuit producing a product P80 of 106 µm particle size, a secondary grinding circuit treating the rougher flotation
tailing to reduce the particle size to a P80 of 38 µm, and a regrind circuit treating the rougher concentrate reducing
the particle size P80 to 30 µm. SMC, Bond ball mill work index (BWI) and abrasion index tests (Ai) were conducted on
the selected drill core samples. Levin tests and Metso Jar Mill Grindability tests were conducted on the rougher flotation tailing and
rougher flotation concentrate produced from the large-scale flotation tests.
Fourteen samples were selected representing different lithologies and
alterations in the orebody. The number of samples from each lithology was determined based on their relative abundance in the deposit.
SMC, BWi, Ai, and specific gravity (SG) of the samples were measured as shown in Table 10-5.
The A x b values of the fourteen samples varied from 33.4 to 98.1. Most
of the samples were in the hard to medium hardness range according to the JKTech database, and the softest sample was from MPY lithology.
The samples from DB lithology were the hardest material with an average A x b of 41±5.7.
According to the results of Bond Abrasion Index testing, eight variability
samples were classified as abrasive, four as moderately abrasive, and two as non-abrasive.
Bond Ball Mill Work Indices (BWi) ranged frm 10.4 kWh/t to 20.6 kWh/t.
Twelve of the samples would be classified as being of medium hardness and two (COM-013 and COM-014) as hard. The samples from DB lithology
had the highest BWi values with an average of 17.3±3.1 kWh/t. The lowest BWi was obtained with the MPY sample. Eighty percent of
the material had BWi values lower than 16 kWh/t.
Levin tests were performed using rougher flotation tailing and rougher
flotation concentrate. The results show that energy requirement for grinding the rougher tail to a P80 of 38 µm was 24
kWh/t, and for grinding the rougher concentrate to a P80 of 30 µm was 40 kWh/t.
The required specific energies from the Levin tests were considerably
higher than expected. This was attributed to the Levin test procedure and low efficiency of ball milling for fine grinding. Therefore,
Metso Jar Mill Grindability Tests were performed on the same samples to determine the required specific energy for regrinding using an
alternative testing method. The required specific energy was between 7.47 kWh/t to 8.67 kWh/t to grind the rougher tailing from about
F80 of 100 µm to a P80 of 38 µm. The energy required for the rougher concentrate was 13.49 kWh/t
to a P80 of 30 µm. To reduce energy consumption, Vertimill or equivalent technologies are recommended for regrinding
the rougher concentrate and the rougher tailings.
| | 10-12 | |
| SSR Mining Inc. | Hod Maden Project | | January 7, 2026 |
| Technical Report Summary | | SLR Project No.: 123.000320.00001 |
Table 10-5: Comminution Test Results
of the Variability Samples
| ID |
DWi |
DWi |
Mia |
Mih |
Mic |
A |
b |
A×b |
SG |
ta |
SCSE |
BWi
(kWh/t) |
Ai |
| kWh/m3 |
% |
kWh/t |
kWh/t |
kWh/t |
kWh/t |
106
µm |
125
µm |
| COM-01-CAB-JHN |
7.41 |
60 |
18.7 |
14.1 |
7.3 |
71.6 |
0.57 |
40.8 |
3.04 |
0.35 |
10.54 |
15.8 |
15.3 |
0.3482 |
| COM-02-CAB-JHN |
7.02 |
55 |
17.8 |
13.3 |
6.9 |
64.8 |
0.67 |
43.4 |
3.06 |
0.37 |
10.26 |
14.5 |
|
0.2695 |
| COM-03-CAB-JHN |
6.81 |
52 |
18.8 |
13.9 |
7.2 |
66.8 |
0.62 |
41.4 |
2.84 |
0.38 |
10.01 |
15.1 |
|
0.2149 |
| COM-04-CAB-AQV |
4.94 |
28 |
14.0 |
9.8 |
5.1 |
64.6 |
0.92 |
59.4 |
2.93 |
0.53 |
8.65 |
10.9 |
|
0.1110 |
| COM-05-CAB-AQV |
4.70 |
25 |
13.6 |
9.4 |
4.8 |
62.4 |
0.99 |
61.8 |
2.91 |
0.55 |
8.47 |
12.6 |
11.7 |
0.1144 |
| COM-06-CAB-NQV |
4.53 |
23 |
12.2 |
8.3 |
4.3 |
66.9 |
1.04 |
69.6 |
3.15 |
0.57 |
8.32 |
10.7 |
|
0.1700 |
| COM-07-AB-NQV |
3.79 |
16 |
11.6 |
7.7 |
4.0 |
62.7 |
1.21 |
75.9 |
2.87 |
0.68 |
7.73 |
14.2 |
|
0.1869 |
| COM-08-CAB-QV |
5.87 |
40 |
15.9 |
11.5 |
5.9 |
61.3 |
0.83 |
50.9 |
2.97 |
0.44 |
9.35 |
13.3 |
13.7 |
0.1435 |
| COM-09-GVS-ARG |
6.91 |
54 |
16.8 |
12.5 |
6.5 |
62.2 |
0.75 |
46.7 |
3.2 |
0.38 |
10.08 |
15.9 |
|
0.0354 |
| COM-10-MPY-MPY |
3.75 |
16 |
9.0 |
5.9 |
3.1 |
72.1 |
1.36 |
98.1 |
3.67 |
0.69 |
7.04 |
10.4 |
|
0.1036 |
| COM-11-DB-QGS |
6.03 |
42 |
17.1 |
12.4 |
6.4 |
66.4 |
0.70 |
46.5 |
2.82 |
0.43 |
9.44 |
16.4 |
17.4 |
0.1717 |
| COM-12-DB-QV |
6.12 |
43 |
17.2 |
12.5 |
6.5 |
63.8 |
0.73 |
46.6 |
2.84 |
0.42 |
9.48 |
12.7 |
13.5 |
0.0837 |
| COM-013-DB-AQV |
7.58 |
62 |
20.6 |
15.6 |
8.1 |
70.8 |
0.53 |
37.5 |
2.82 |
0.34 |
10.45 |
20.6 |
20.4 |
0.1506 |
| COM-014-DB-SIL |
8.50 |
73 |
224 |
17.4 |
9.0 |
72.5 |
0.46 |
33.4 |
2.84 |
0.30 |
11.13 |
19.8 |
|
0.1048 |
Notes:
SCSE – SAG circuit specific
energy
ta is an ore hardness parameter. |
| | 10-13 | |
| SSR Mining Inc. | Hod Maden Project | | January 7, 2026 |
| Technical Report Summary | | SLR Project No.: 123.000320.00001 |
Rougher-scavenger kinetic flotation tests, open cleaner flotation tests
and locked cycle flotation tests (LCTs) were performed in the test program. These tests were in support of the flowsheet to produce separate
copper and pyrite concentrates, and are not relevant to the current single concentrate flowsheet.
| 10.3.7 | Dewatering, Transportable Moisture Limit, and Self-Heating Tests |
Thickening and filtration test work was conducted on the copper concentrate
and low sulfide tailings generated from the large-scale flotation tests using the master composite for the regular ore (MCS-RO composite).
The test work was undertaken by Outotec’s laboratory in Perth, Australia.
Optimum flocculant type and dose, overflow clarity, underflow density,
and underflow yield stress were determined. Dynamic thickening tests were performed in a 99 mm diameter Supaflo High-Rate Thickener test
rig.
BASF Magnafloc 5250 produced very good flocculation with the fastest
settling rate for all the samples.
The final tailings sample reached densities of 53.7% to 57.4% solids
(w/w) with yield stresses of 46 Pa to 59 Pa, over a flux rate range of 0.25 to 1.00 t/(m2h).
At a flux rate of 0.25 t/(m2h), the copper concentrate sample
reached a density of 77.2% solids (w/w) with a yield stress of 94 Pa.
The objectives of the filtration test work were to determine cake thickness,
maximum filtration capacity, moisture content of the cake and cake handling for the copper concentrate, the pyrite concentrate and the
final tailings. Performance of horizontal vacuum belt filtration (HVBF), disk filtration (DF), pressure filtration (PF), and fast-acting
filter press (FFP) were assessed in the tests.
Copper Concentrate:
| · | Solids content of the copper concentrate was adjusted to 74% w/w according to the thickening test work. |
| · | Residual filter cake moisture level: HVBF 15.4%; PF 12.4%; FFP 9.5%. |
Final Tailing:
| · | Solids content of the final tailings was adjusted to 55% w/w according to the thickening test work results. |
| · | Residual filter cake moisture: HVBF 23.2%; FFP 19.2%; DF 23.2%. |
| · | FFP generated the best results for all three samples. |
| 10.3.7.3 | Transportable Moisture Limit and Self-Heating Tests |
Transportable moisture limit (TML) and self-heating tests were conducted
by Microanalysis Australia on the copper concentrate produced from large scale tests using MCS-RO. Flow table, angle of repose, moisture
content, and bulk density measurements were performed as part of the TML testing.
| | 10-14 | |
| SSR Mining Inc. | Hod Maden Project | | January 7, 2026 |
| Technical Report Summary | | SLR Project No.: 123.000320.00001 |
| · | TML of the copper concentrate was measured in duplicate as 11.1% and 10.8%. |
| · | The self-heating tests were conducted in a series of 53 µm wire mesh cubes, enclosed in two 0.6 mm wire mesh cages and heated
in a fan-forced oven to the designated temperature for 24 hours. |
| · | The tests showed that the copper concentrate was not classified as Material Hazardous in Bulk (MHB) or Dangerous Goods (DG) Class
4.2 for the purposes of bulk transport. |
| 10.4 | Feasibility Study Update Metallurgical Test Work |
The FS Update test work aimed to refine the approach of the FS as follows:
| · | Provide the ability to lower the target copper concentrate grade from 20% Cu to 13% Cu, supported by marketing assessments, in order
to increase gold recovery (by recovering more pyrite) into the copper concentrate stream. |
| · | Consequently, remove the need for a separate pyrite flotation circuit, as well as pyrite thickening, filtration and concentrate loadout
from the design. |
| · | Alleviate the need to campaign (and therefore store) massive pyrite ores for pyrite recovery and instead plan to manage sulfur ratios
in the process plant feed at the mine, which was supported by feedback from the mining team that selective mining of massive pyrite ores
was likely to be difficult and infeasible due to limitations in stope design. |
| · | Increase the concentrate treatment and production capacity of the copper circuit to handle the increased mass. |
| · | Improve metallurgical performance and reduce the potential for scaling by reducing the addition of lime and sequential addition of
acid for pyrite depression and then pyrite re-activation in the pyrite circuit. |
The test work program was based on re-using existing samples that were
stored from the previous testing campaign, and generating a series of composites regular ore (RO) and pyrite ore (PO) blends that represented
a split of sulfide sulfur grade either greater than or less than 15%. This inflection point acts as an approximation of MPY and MPE lithologies
across the deposit, though it should be noted that other lithologies also appear in this PO composite.
The first tests used identical conditions to the FS and demonstrated
that there had been no deterioration in flotation performance since the previous test work.
| 10.4.1 | Open Circuit Rougher Tests |
Eight open-circuit rougher/scavenger tests were performed under the
conditions shown in Table 10-6. The pH for the rougher-scavenger flotation stages was natural (approximately 7) and reagent usage was
kept the same as in the FS test work.
| | 10-15 | |
| SSR Mining Inc. | Hod Maden Project | | January 7, 2026 |
| Technical Report Summary | | SLR Project No.: 123.000320.00001 |
Table 10-6: Rougher/Scavenger tests
(2024)
| Composite Ratio |
Process route (based on previous FS) |
| RO 100% |
Regular ore flowsheet (106 µm feed, secondary grind to 38 µm before scavenger) |
| PYO 100% |
Regular ore flowsheet (106 µm feed, secondary grind to 38 µm before scavenger) |
| PYO 90% : RO 10% |
Regular ore flowsheet (106 µm feed, secondary grind to 38 µm before scavenger) |
| PYO 80% : RO 20% |
Regular ore flowsheet (106 µm feed, secondary grind to 38 µm before scavenger) |
| PYO 50% : RO 50% |
Regular ore flowsheet (106 µm feed, secondary grind to 38 µm before scavenger) |
| PYO 10% : RO 90% |
Regular ore flowsheet (106 µm feed, secondary grind to 38 µm before scavenger) |
| PYO 20% : RO 80% |
Regular ore flowsheet (106 µm feed, secondary grind to 38 µm before scavenger) |
| PYO 100% |
Pyrite ore flowsheet (75 µm feed) |
|
Notes:
RO – regular ore
PYO – pyrite ore |
| 10.4.2 | Open Circuit Cleaner Tests |
A total of seven open-cycle cleaner tests (OCTs) were performed. These
tests focused mostly on the 10% pyrite ore blend; however, there were two tests for regular ore only and one for the 20% pyrite ore blend.
In addition, four tests were conducted on the 10% pyrite ore blend under the following pH conditions:
| · | Previous process route pH at the cleaners (i.e., approximately pH 12) |
| · | Lower pH to assess pyrite recovery to the cleaner concentrate (i.e., approximately pH 10) |
| · | Natural pH to assess pyrite recovery to the cleaner concentrate (i.e., approximately pH 7), for two different composites. |
These results indicated that with fewer cleaning stages, the copper
concentrate obtained had a lower grade of copper, but a high gold recovery. Furthermore, the pyrite concentrate does not achieve minimum
saleable gold grade (i.e., 9 g/t) unless the pyrite content in the feed blend is at least 20%. This supports the approach of eliminating
pyrite flotation from the process route.
Three locked-cycle tests (LCTs) were performed (Figure 10-4): one was
on RO, one was RO with 10% pyrite ore blend, and the third was RO with 20% pyrite ore blend.
The results for the LCTs were in line with the OCT results. Results
from the LCTs were used to confirm mass pulls and design parameters.
| | 10-16 | |
| SSR Mining Inc. | Hod Maden Project | | January 7, 2026 |
| Technical Report Summary | | SLR Project No.: 123.000320.00001 |
Figure 10-4: LCT Flowsheet
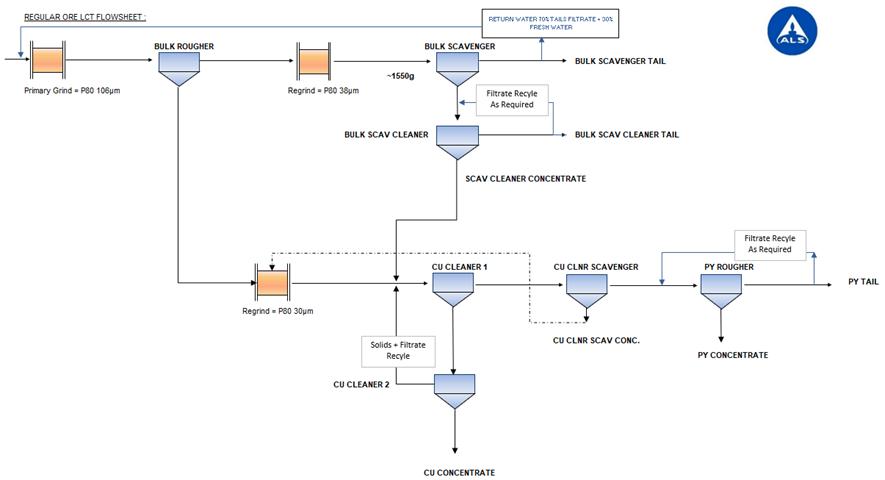
FIGURE 10-4
REGULAR ORE LCT FLOWSHEET:
RETURN WATER 70% TAILS FILTRATE - 30% FRESH WATER
ALS
Primary Grid = P80 106 µm
BULK ROUGHER
Regrind = P80 38µm
~ 1550g
BULK SCAVENGER
BULK SCAVENGER TAIL
Filtrate Recycle As Required
BULK SCAV CLEANER
BULK SCAV CLEANER TAIL
SCAV CLEANER CONCENTRATE
Regrind = P80 30µm
CU CLEANER 1
Solids ? Filtrate Recycle
CU CLEANER 2
CU CONCENTRATE
CU CLNR SCAVENGER
CU CLNR SCAV CONC.
PY ROUGHER
PU CONCENTRATE
PY TAIL
Filtrate Recycle As Required
Source: Ausenco 2024.
| 10.4.4 | Test Work Results and Interpretation |
Table 10-7 summarizes the results from the OCT and LCT tests.
| | 10-17 | |
| SSR Mining Inc. | Hod Maden Project | | January 7, 2026 |
| Technical Report Summary | | SLR Project No.: 123.000320.00001 |
Table 10-7: OCT and LCT Test Results
| Sample
Information |
Conditions |
Head
Grade |
CuRo
Conc+Cu Scv Con + Scv Cl Conc |
CuRo
Con + Cu Scv con + Scv Cl Con + Py Con |
| Composite |
Sample |
RO |
PO |
Clnr |
Au |
Cu |
S2- |
S/Cu |
Au/S |
Wt |
Au |
Au
Distribution |
Cu |
Cu
Distribution |
Wt |
Au |
Au
Distribution |
Cu |
Cu
Distribution |
| ID |
% |
% |
pH |
g/t |
% |
% |
|
|
(%) |
(g/t) |
(%) |
(%) |
(% |
(%) |
(g/t) |
(%) |
(%) |
(%) |
| OPC |
RO
7941 |
100 |
0 |
11.8 |
6.08 |
1.54 |
12.82 |
8.33 |
0.47 |
8.3 |
66.1 |
89.8 |
18.2 |
97.6 |
13.2 |
43.4 |
94 |
11.5 |
98.4 |
| OPC |
RO
7942 |
90 |
10 |
11.8 |
7.06 |
1.8 |
14.09 |
7.82 |
0.5 |
10.7 |
56.5 |
85.2 |
16.5 |
97.7 |
17.4 |
38 |
93.4 |
10.2 |
98.8 |
| OPC |
RO
7943 |
80 |
20 |
11.8 |
9.36 |
2.18 |
15.88 |
7.28 |
0.59 |
15.3 |
53.3 |
87.1 |
14 |
98.2 |
22.3 |
39.8 |
94.9 |
9.7 |
98.9 |
| OPC |
RO2
8020 |
100 |
0 |
12 |
7.47 |
1.05 |
13.74 |
13.05 |
0.54 |
8.7 |
78.1 |
91 |
11.8 |
97.7 |
13.9 |
51.2 |
95.2 |
7.5 |
98.5 |
| OPC |
RO
8313 |
90 |
10 |
10.1 |
6.88 |
1.83 |
14.18 |
7.75 |
0.49 |
13.1 |
43.1 |
82.1 |
13.5 |
97 |
14.6 |
39.8 |
84.4 |
12.3 |
98.1 |
| OPC |
RO
8314 |
90 |
10 |
7.5 |
7.69 |
1.86 |
14.36 |
7.71 |
0.54 |
13.3 |
45.4 |
78.2 |
13.7 |
97.2 |
14.3 |
42.9 |
79.8 |
12.8 |
98 |
| OPC |
RO2
8315 |
90 |
10 |
11.7 |
7.04 |
1.48 |
15.17 |
10.27 |
0.46 |
11.6 |
52.8 |
86.6 |
12.5 |
97.9 |
18 |
36.7 |
94.1 |
8.1 |
98.6 |
| LCT
|
PW8116
|
100 |
0 |
|
6.55 |
1.52 |
6.04 |
3.97 |
1.08 |
6.7 |
87.2 |
88.7 |
22.3 |
97.8 |
|
|
|
|
|
| LCT
|
PW8117 |
90 |
10 |
|
8.29 |
1.83 |
7.66 |
4.19 |
1.08 |
8.7 |
81.9 |
86.2 |
20.5 |
97.6 |
|
|
|
|
|
| LCT
|
PW8118 |
80 |
20 |
|
8.8 |
2.18 |
9.58 |
4.39 |
0.92 |
10.9 |
65.6 |
81.3 |
19.5 |
97.5 |
|
|
|
|
|
Notes:
RO - regular ore
PO - pyrite ore
Cu Scv Con - Copper Scavenger Concentrate
Scv Cl Conc - Scavenger Cleaner Concentrate
CuRo Conc - Copper Regular Ore Concentrate
Py Con - Pyrite Ore Concentrate |
| | 10-18 | |
| SSR Mining Inc. | Hod Maden Project | | January 7, 2026 |
| Technical Report Summary | | SLR Project No.: 123.000320.00001 |
The relationships between copper concentrate grade and gold recovery,
gold concentrate grade, and copper recovery are presented in Figure 10-5, Figure 10-6, and Figure 10-7, respectively.
Figure 10-5: Relationship between
Copper Concentrate Grade and Gold Recovery
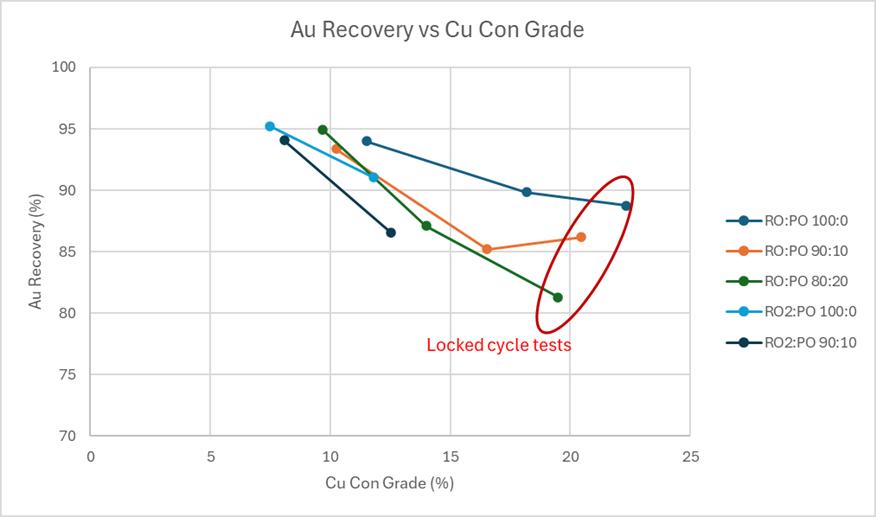
FIGURE 10-5
Au Recovery vs Cu Con Grade
Au Recovery (%)
100
95
90
85
80
75
70
0
5
10
15
20
25
Cu Con Grade (%)
RO:PO 100:0
RO:PO 90:10
RO:PO 80:20
RO2:PO 100:0
RO2:PO 90:10
Locked cycle tests
Source: Ausenco 2024.
| | 10-19 | |
| SSR Mining Inc. | Hod Maden Project | | January 7, 2026 |
| Technical Report Summary | | SLR Project No.: 123.000320.00001 |
Figure 10-6: Relationship between
Copper Concentrate Grade and Gold Concentrate Grade
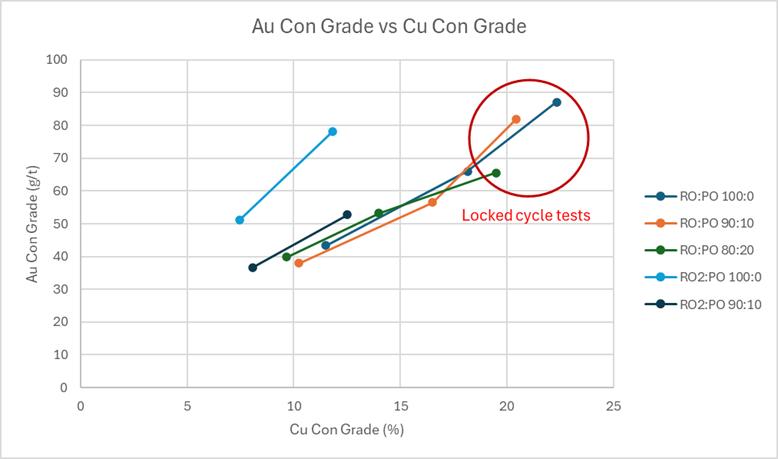
FIGURE 10-6
Au Con Grade vs Cu Con Grade
Au Con Grade (g/t)
100
90
80
70
60
50
40
30
20
10
0
0
5
10
15
20
25
Cu Con Grade (%)
Locked cycle tests
RO:PO 100:0
RO:PO 90:10
RO:PO 80:20
RO2:PO 100:0
RO2:PO 90:10
Source: Ausenco 2024.
Figure 10-7: Relationship between
Copper Concentrate Grade and Copper Recovery
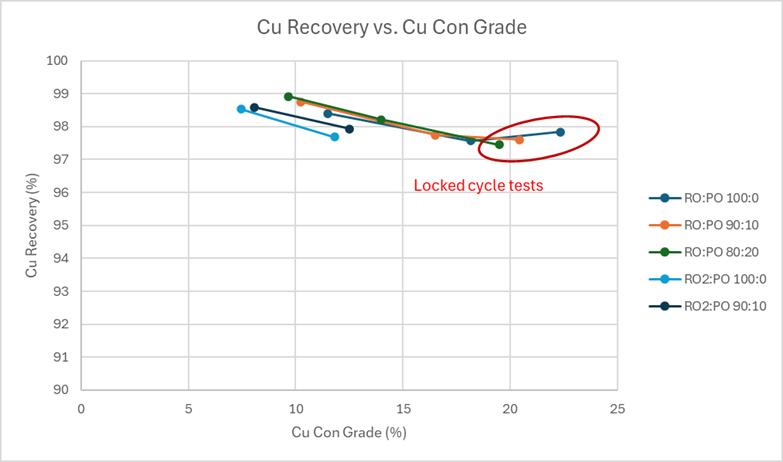
FIGURE 10-7
Cu Recovery vs. Cu Con Grade
Cu Recovery (%)
100
99
98
97
96
95
94
93
92
91
90
0
5
10
15
20
25
Cu Con Grade (%)
Locked cycle tests
RO:PO 100:0
RO:PO 90:10
RO:PO 80:20
RO2:PO 100:0
RO2:PO 90:10
Source: Ausenco 2024.
| | 10-20 | |
| SSR Mining Inc. | Hod Maden Project | | January 7, 2026 |
| Technical Report Summary | | SLR Project No.: 123.000320.00001 |
These graphs indicate that for these 10 tests, as copper concentrate
grade is reduced (by including pyrite concentrate in the copper concentrate, which is analogous to reducing pH) to the life of mine (LOM)
average (blend equivalent to the RO:PO 90:10 sample), gold recovery increases from approximately 85% to approximately 90%, gold grade
in concentrate reduces from approximately 80 g/t to 50 g/t, and copper recovery increases by approximately 1% or less.
The LCTs also performed marginally better than the OCTs.
This test work series provides confidence in the approach to improve
the Project recoveries by targeting reduced concentrate grades. This was supported by a net smelter return (NSR) assessment, with final
optimization by mine planning.
| 10.4.5 | Concentrate Analysis |
During the FS update, OCT and LCT concentrates were analyzed for deleterious
elements. The OCT results included rougher concentrate, scavenger concentrate, and scavenger cleaner concentrates. The LCT results only
show cleaner 1 concentrate from Stage 7 of the locked cycle testing. The OCT results represent the lowest grade, maximum recovery results,
while the LCT results reflect a higher, more upgraded concentrate. Low to no concentrations of deleterious elements such as arsenic, bismuth,
and fluorine are found at this stage.
| | 10-21 | |
| SSR Mining Inc. | Hod Maden Project | | January 7, 2026 |
| Technical Report Summary | | SLR Project No.: 123.000320.00001 |
Table 10-8: Detailed Analysis of
OCT and LCT Concentrates
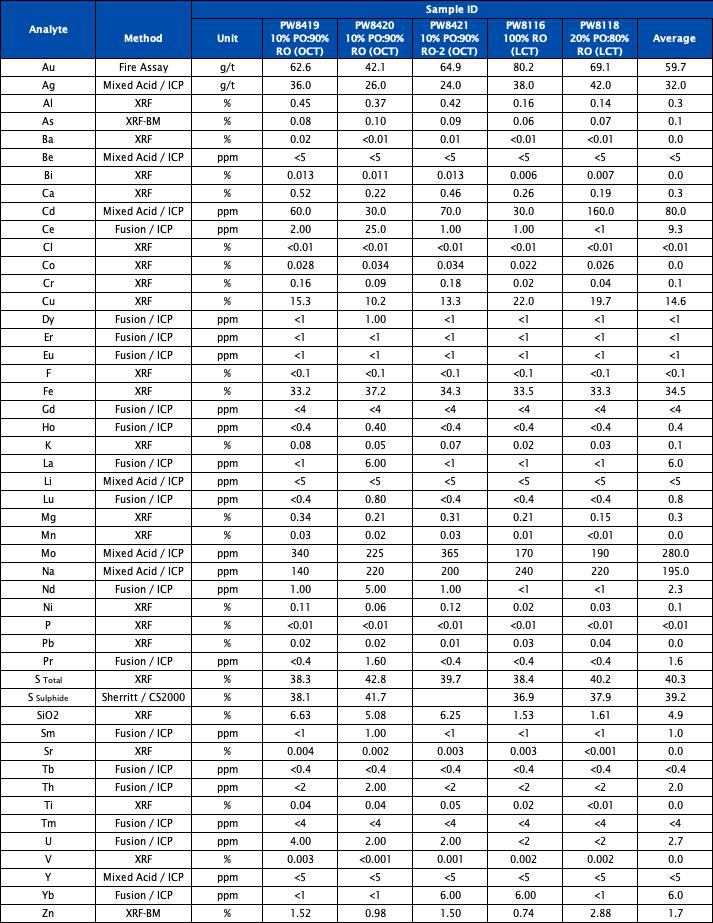
XXXX
| | 10-22 | |
| SSR Mining Inc. | Hod Maden Project | | January 7, 2026 |
| Technical Report Summary | | SLR Project No.: 123.000320.00001 |
The LCT and OCT results allowed development of recovery and concentrate
grade models which were then incorporated into a Net Smelter Return (NSR) model for mine plan optimization.
These results indicated that with fewer cleaning stages, the copper
concentrate obtained had a lower grade of copper, but a high gold recovery.
The results for the LCTs were in line with the OCT results. Results
from the LCTs were used to confirm mass pulls and design parameters. Figure 10-8 demonstrates a consistent linear trend between the copper
in the feed and the percent mass pull observed.
Figure 10-8: Mass Pull Based on
Copper Head Grade
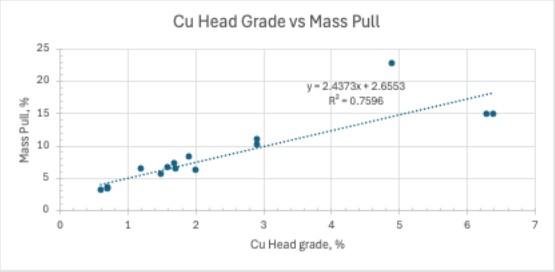
FIGURE 10-8
Cu Head Grade vs Mass Pull
Mass Pull, %
25
20
15
10
5
0
0
1
2
3
4
5
6
7
Cu Head grade, %
y = 2.4373x + 2.6553
R2 = 0.7596
Source: Ausenco 2024
Figure 10-9 presents the copper recovery as a function of SS/Cu ratio.
Ultimately, copper recovery is consistently high, above 95% Cu.
| | 10-23 | |
| SSR Mining Inc. | Hod Maden Project | | January 7, 2026 |
| Technical Report Summary | | SLR Project No.: 123.000320.00001 |
Figure 10-9: Cu Recovery as a Function
of S/Cu Ratio
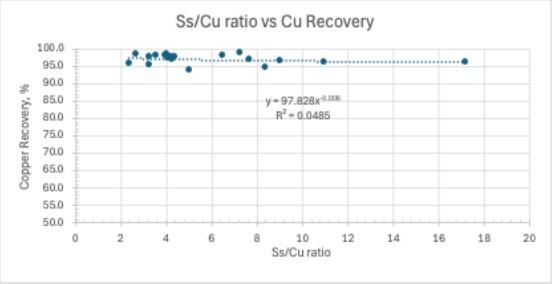
FIGURE 10-9
Ss/Cu ratio vs Cu Recovery
Copper Recovery, %
100.0
95.0
90.0
85.0
80.0
75.0
70.0
65.0
60.0
55.0
50.0
0
2
4
6
8
10
12
14
16
18
20
Ss/Cu ratio
Y = 97.828x#
R2 = 0.0485
Source: Ausenco 2024.
Figure 10-10 presents the gold recovery as a function of Au/SS ratio.
As Au/SS ratio decreases, more gold is lost to the cleaner circuit tailings as pyrite is rejected in order to hit the target concentrate
grade.
Figure 10-10: Au Recovery as a Function
of Au/Ss Ratio
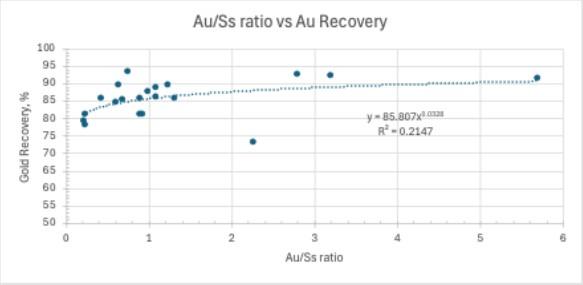
FIGURE 10-10
Au/Ss ratio vs Au Recovery
Gold Recovery, %
100
95
90
85
80
75
70
65
60
55
50
0
1
2
3
4
5
6
Au/Ss ratio
Y = 85.807x#
R2 = 0.2147
Source: Ausenco 2024.
Utilizing the individual mass pull and recovery models, it is possible
to calculate estimated concentrate grades. Utilizing concentrate grades, metal recoveries, current shipping, treatment, and refining charges,
an NSR model can be developed, which is shown below in Figure 10-11.
The current flowsheet maximizes NSR on ore processed by optimizing recovery
while maintaining a salable concentrate grade since the value of contained gold outweighs concentrate treatment charges.
| | 10-24 | |
| SSR Mining Inc. | Hod Maden Project | | January 7, 2026 |
| Technical Report Summary | | SLR Project No.: 123.000320.00001 |
Figure 10-11: NSR Analysis and Gold
Recovery Based on Concentrate Copper Grade
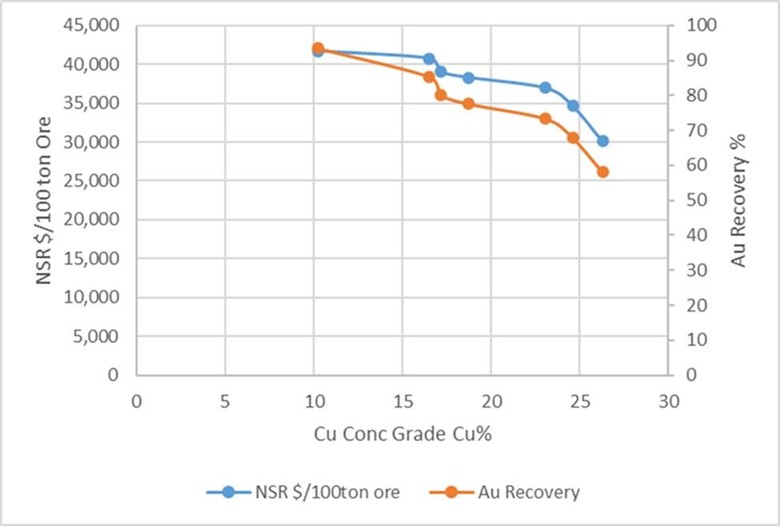
FIGURE 10-11
NSR $/100 ton Ore
45,000
40,000
35,000
30,000
25,000
20,000
15,000
10,000
5,000
0
0
5
10
15
20
25
30
Cu Conc Grade Cu%
NSR $/100ton ore
Au Recovery
100
90
80
70
60
50
40
30
20
10
0
Au Recovery %
Source: SSR 2025
| 10.5 | Source: Ausenco 2024QP Opinion |
In the opinion of the QP, the data, including metallurgical test work
on the various ore types within the deposit, are adequate for the purposes used in this TRS and the analytical procedures used in the
analyses are of conventional industry practice. The detailed chemical analyses show that concentrations of penalty elements in concentrate
are low and are unlikely to negatively affect marketing.
| | 10-25 | |
| SSR Mining Inc. | Hod Maden Project | | January 7, 2026 |
| Technical Report Summary | | SLR Project No.: 123.000320.00001 |
| 11.0 | Mineral Resource Estimates |
Mineral Resources have been classified in accordance with the U.S. Securities
and Exchange Commission (US SEC) Regulation S-K subpart 1300 rules for Property Disclosures for Mining Registrants (S-K 1300) and were
estimated by RSC.
The RSC QP has prepared the Mineral Resource Estimate (MRE) based on
drilling carried out on the properties that are subject of this report.
The Mineral Resource estimate was completed and validated using a combination
of various software tools, including Seequent’s Leapfrog Geo (Leapfrog Geo), Deswik Stope optimizer (Deswik), and Supervisor software.
Estimates were validated using standard industry techniques including statistical comparisons with composite samples, swath plots, and
visual reviews in cross-section and plan. A visual review comparing blocks to drill holes was completed after the block modeling work
was performed to ensure general lithologic and analytical conformance. The block model was peer reviewed prior to finalization.
Mineral Resources are not Mineral Reserves and do not have demonstrated
economic viability, nor is there certainty that all or any part of the Mineral Resource estimated here will be converted to Mineral Reserves
through further study. Sources of uncertainty that may affect the reporting of Mineral Resources include sampling or drilling methods,
data processing and handling, geologic modeling, and estimation.
Mineral Resources are reported exclusive of Mineral Reserves and have
been summarized by Mineral Resource classification in Table 11-1, which also summarizes the cut-off values, metallurgical recoveries,
and SSR ownership percentage associated with the Mineral Resources. Mineral Resources have an effective date of August 31, 2025.
Table 11-1: Summary of Hod Maden
Mineral Resources, exclusive of Mineral Reserves, as of August 31, 2025 (SSR’s Attributable Share)
| Classification |
SSR Ownership Basis
% |
Tonnes
(kt) |
Grade |
Metal |
NSR Cut-off Values
(US$/t) |
Metallurgical Recovery |
| Au (g/t) |
Cu (%) |
Au
(koz) |
Cu
(Mlb) |
Au |
Cu |
| Measured |
10% |
62 |
23.4 |
2.3 |
47 |
3.2 |
99 |
82%–90% |
95%–98% |
| Indicated |
110 |
5.4 |
1.4 |
19 |
3.4 |
| Measured + Indicated |
172 |
11.9 |
1.7 |
66 |
6.5 |
| Inferred |
257 |
3.4 |
0.5 |
28 |
2.6 |
|
Notes:
1.
Mineral Resources are based on $2,000/oz gold price and $4.00/lb of Cu and are exclusive of Mineral Reserves.
2.
Mineral Resources are reported within optimized stope shapes.
3.
Mineral Resources shown are SSR ownership only. SSR currently owns 10% of the Project.
4.
Mineral Resource cut-offs are based on a NSR value of $99/tonne.
5.
Metallurgical recoveries vary between 82%–90% for Au and 95%–98% for Cu based on grade and sulfur.
6.
Minimum mining width of 2 m with no external dilution has been considered while optimizing stope shapes.
7.
The point of reference for Mineral Resources is the point of feed into the processing facility.
8.
Totals may vary due to rounding. |
| | 11-1 | |
| SSR Mining Inc. | Hod Maden Project | | January 7, 2026 |
| Technical Report Summary | | SLR Project No.: 123.000320.00001 |
In the opinion of the RSC QP, the resource evaluation reported herein
is an appropriate representation of the Au and Cu Mineral Resources found at the Hod Maden Project at the current level of sampling.
The RSC QP is of the opinion that with consideration of the recommendations
summarized in Sections 1 and 23 of this TRS, any issues relating to all relevant technical and economic factors likely to influence the
prospect of economic extraction can be resolved with further work.
The Hod Maden drill hole database was provided to RSC on May 2, 2024,
and contains 266 drill holes and a total of 59,122 samples representing 80,714 drill meters (Table 11-2). Analyses for the resource elements
(Au, Cu) are available for all samples (Table 11-3).
First-split duplicates were collected by SSR as quarter-core duplicates.
For estimation, the two quarter-core results were combined in the database to yield the standard half-core support. The RSC QP notes that
historically, some samples were submitted for assay as quarter core and a considerable number of assay results (37%) remain at quarter
core support (Table 11-4). The RSC QP recommends re-sampling the remaining quarters as a matter of priority to yield at minimum half-core
support for all samples. The RSC QP has made recommendations to SSR for holes that should be prioritized in the re-sampling work.
For the elements controlling metallurgical parameters (sulfur [S], sulfide
sulfur [SS], carbon [C]), few analytical results are available. Therefore, the RSC QP imputed the missing data prior to estimation. Imputation
was also used to address limit of detection issues in the S analyses, owing to use of legacy methods with low upper detection limits.
The RSC QP employed a Random Forest (RF) regression model based on a
combination of major and minor elements (Al, Na, Ca, Fe, P, K, Mg, Mn, Ti, Cu, Zn). For imputation of S over-limits, the RF model demonstrated
a very good correlation with the primary analyses, signified by an R-value of 0.99 (Figure 11-1). Importantly, Performance of the model
is consistent across different mineralization domains (Figure 11-2).
For carbon and sulfide sulfur, lab analyses are available for respectively
6% and 3% of the samples. Despite this, a very good regression result was obtained for SS (R = 0.99) and a good regression result was
obtained for C (R = 0.93) (Figure 11-1). Regression results are consistent across mineralized domains for both elements. Given the importance
of a robust estimate for SS for the metallurgical constraints, the RSC QP recommends collecting additional SS data from available pulps
to improve robustness of the SS imputation model.
Table 11-2: Summary of Drill Hole
Data Informing the MRE
| Drill Type |
No. of Holes |
Total Samples |
Total Meters |
|
| DD |
266 |
59,122 |
80,714 |
|
| Total |
266 |
59,122 |
80,714 |
|
| | 11-2 | |
| SSR Mining Inc. | Hod Maden Project | | January 7, 2026 |
| Technical Report Summary | | SLR Project No.: 123.000320.00001 |
Table 11-3: Summary of Available
Data for all Elements Included in the MRE
| Assay |
No. of Results |
No. of Results Imputed |
|
| Au Final ppm |
59,122 |
0 |
|
| Cu Final % |
59,121 |
0 |
|
| C Final % |
3,444 |
54,813 |
|
| Cu Final ppm |
59,121 |
0 |
|
| Fe Final % |
59,121 |
0 |
|
| S Final % |
59,121 |
5,668 |
|
| SS Final % |
1,836 |
56,383 |
|
| Zn Final ppm |
59,121 |
0 |
|
Table 11-4: Summary of Remaining
Core
| Core Left |
N Intervals |
% Intervals |
Sample Support |
|
| Quarter |
2,142 |
4% |
Half |
|
| Half |
31,503 |
54% |
Half |
|
| Three-Quarter |
21,556 |
37% |
Quarter |
|
| Full |
2,111 |
4% |
Not Sampled |
|
| No Core Left |
514 |
1% |
Unknown |
|
| Unknown |
984 |
2% |
Unknown |
|
| | 11-3 | |
| SSR Mining Inc. | Hod Maden Project | | January 7, 2026 |
| Technical Report Summary | | SLR Project No.: 123.000320.00001 |
Figure 11-1: Random Forest Regression
of Sulfide S (SS)
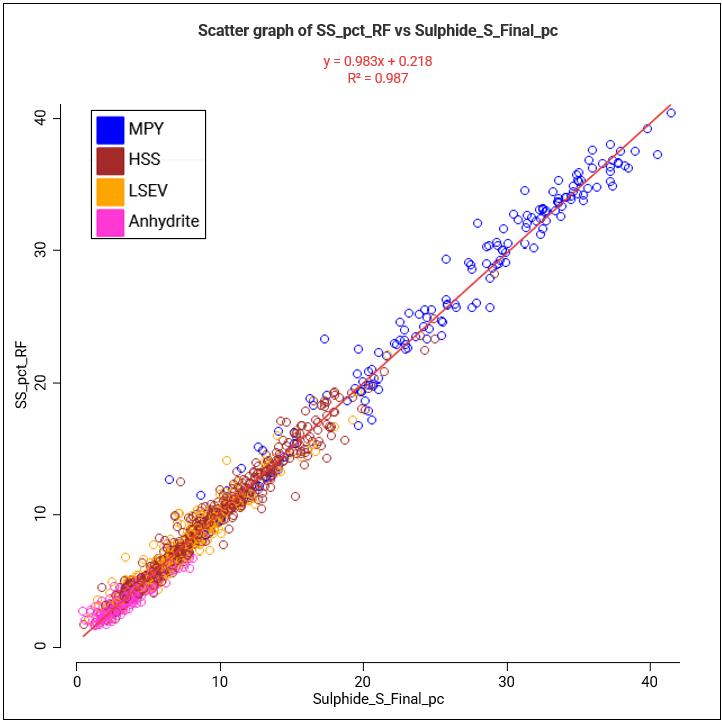
FIGURE 11-1
Scatter graph of SS_pct_RF vs Sulphide_S_Final_pc
Y = 0.983x + 0.218
R2 = 0.987
SS_pct_RF
MPY
HSS
LSEV
Anhydrite
40
30
20
10
0
0
10
20
30
40
Sulphide_S_Final_pc
Figure 11-2: Random Forest Regression
of Carbon
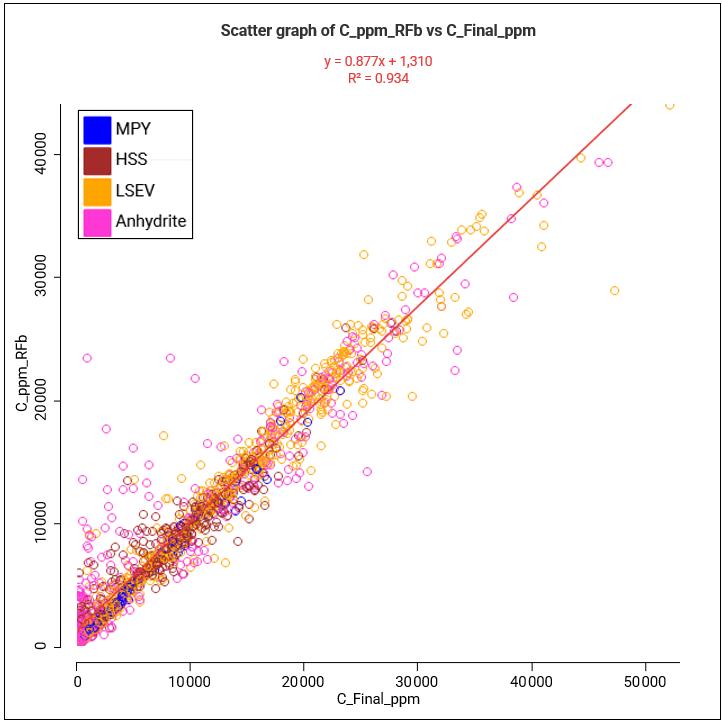
FIGURE 11-2
Scatter graph of C_ppm_RFb_ vs C_Final_ppm
y = 0.877x + 1,310
R2 = 0.934
MPY
HSS
LSEV
Anhydrite
C_ppm_RFb
40000
30000
20000
10000
0
0
10000
20000
30000
40000
50000
C_Final_ppm
| | 11-4 | |
| SSR Mining Inc. | Hod Maden Project | | January 7, 2026 |
| Technical Report Summary | | SLR Project No.: 123.000320.00001 |
| 11.3 | Database Validation and Verification |
All data were validated (Section 8.4) and verified (Section 9.0) where
possible, and other than some minor data adjustments and corrections, no data were excluded from the estimation process; the RSC QP considers
the database suitable for estimation and classification of at least Indicated Mineral Resources.
All numerical data were transferred to the Leapfrog Geo modeling software,
where collar, survey, lithology, assay, and density tables were further validated, and inconsistencies checked. Below-detection values
were replaced by two-thirds of the detection limit in the model, while original entries were retained in the database.
The data checks completed are summarized below.
| · | Consistency checks of alphanumeric fields, numeric fields, assay data, density, and interval tables (i.e. assays, lithology and surveys). |
| · | Checks for erroneous drill hole collar outliers — easting, northing, elevation. |
| · | Discrepancies in maximum hole depths between collar and assay, survey, and geology records. |
| · | Survey table drill hole dips and azimuths checked to be within the expected range (in degrees), and that no excessive deviation exists
between successive downhole readings. |
| · | Survey table was checked for any positive or near-zero drill hole inclinations. |
| · | Assay table checked for overlaps of assay sample intervals. |
| · | Assay table checked for negative assays (other than below detection limit values), missing assays or assays outside of expected ranges. |
| · | Visual inspection of the drill holes in 3D to identify spatial inconsistencies of drill hole traces (i.e., unlikely hole deviations). |
| 11.4.1 | Primary Lithologies |
A lithology model was created for the Hod Maden deposit, after grouping
the logged lithology data to just the primary lithologies and ignoring all logged intervals not representing primary lithology (Table
11-5). The four key lithologies (Andesite Breccia, Dacite Breccia, Epiclastics, and Rhyodacite) were captured using an implicit model
with steep contacts dipping approximately 80° towards the east (Figure 11-3 and Figure 11-4).
The unit previously modeled as ‘Chlorite Andesite Breccia’
has since been recognized as being lithologically equivalent to the Dacite Breccia, with a chloritic alteration overprint, and was modeled
as part of the Dacite Breccia unit. Intervals logged as Andesite Breccia, on the contact between the Dacite Breccia and Epiclastics, were
re-assigned by RSC to either the Epiclastics unit or the Dacite Breccia, based on a review of the cross-sections and using multi-element
data (Al/Ca, Sr/Ca ratios). The distinction between epiclastics and gypsum epiclastics was not included in the modeling; rather, the gypsum
was modeled as part of the anhydrite model. The transported cover sequence was modeled separately.
| | 11-5 | |
| SSR Mining Inc. | Hod Maden Project | | January 7, 2026 |
| Technical Report Summary | | SLR Project No.: 123.000320.00001 |
Table 11-5: Grouped Lithology Column
Used to Support the Lithology Model
| Grouped Code |
Primary Code |
|
| Non-Primary |
Overburden |
|
| |
Slag-Surface |
|
| |
Massive Pyrite |
|
| |
No Core |
|
| |
Ferricrete |
|
| |
Mafic Dyke |
|
| |
Void |
|
| |
Tectonic Breccia |
|
| |
Felsic Dyke |
|
| |
Massive Pyrite |
|
| |
Slag-Underground |
|
| Abx |
Andesite Breccia |
|
| DBx |
Dacite Breccia |
|
| |
Chlorite Andesite Breccia |
|
| |
Dacite |
|
| Epiclastic |
Volcano Sedimentary |
|
| |
Gypsum Volcanosedimentary |
|
| Rhyodacite |
Rhyodacite |
|
| Andesite |
Andesite |
|
| Source: RSC 2024 |
|
| | 11-6 | |
| SSR Mining Inc. | Hod Maden Project | | January 7, 2026 |
| Technical Report Summary | | SLR Project No.: 123.000320.00001 |
Figure 11-3: Perspective View of
the Primary Lithology Model
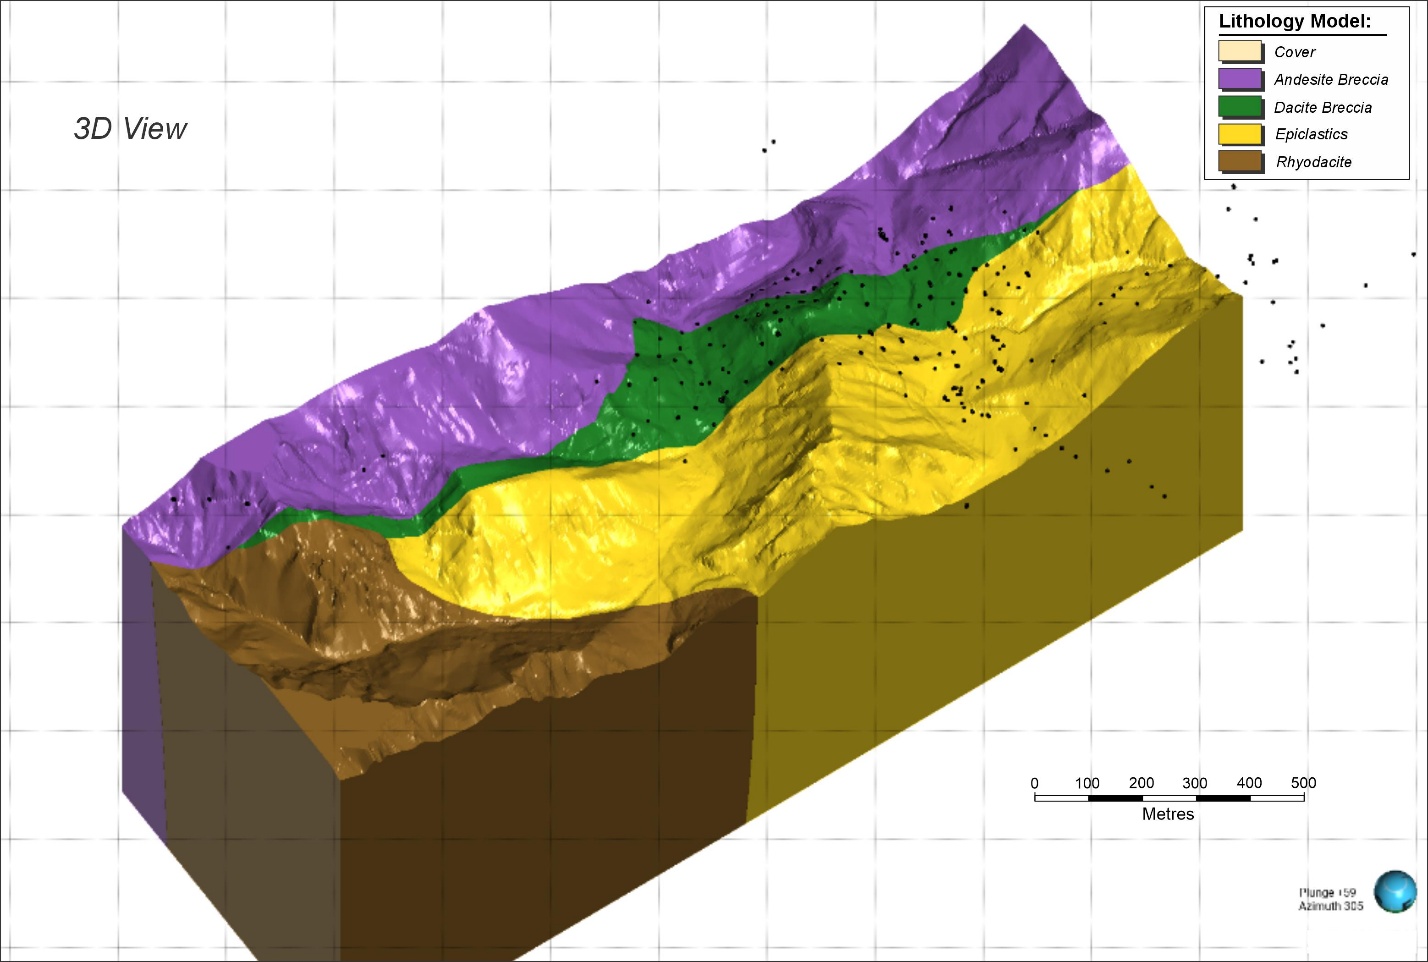
FIGURE 11-3
3D View
Lithology Model:
Cover
Andesite Breccia
Dacite Breccia
Epiclastics
Rhyodacite
0
100
200
300
400
500
Metres
Plunge 159
Azimuth 305
Source: RSC 2025
| | 11-7 | |
| SSR Mining Inc. | Hod Maden Project | | January 7, 2026 |
| Technical Report Summary | | SLR Project No.: 123.000320.00001 |
Figure 11-4: Cross-section of the
Solid Geology Model
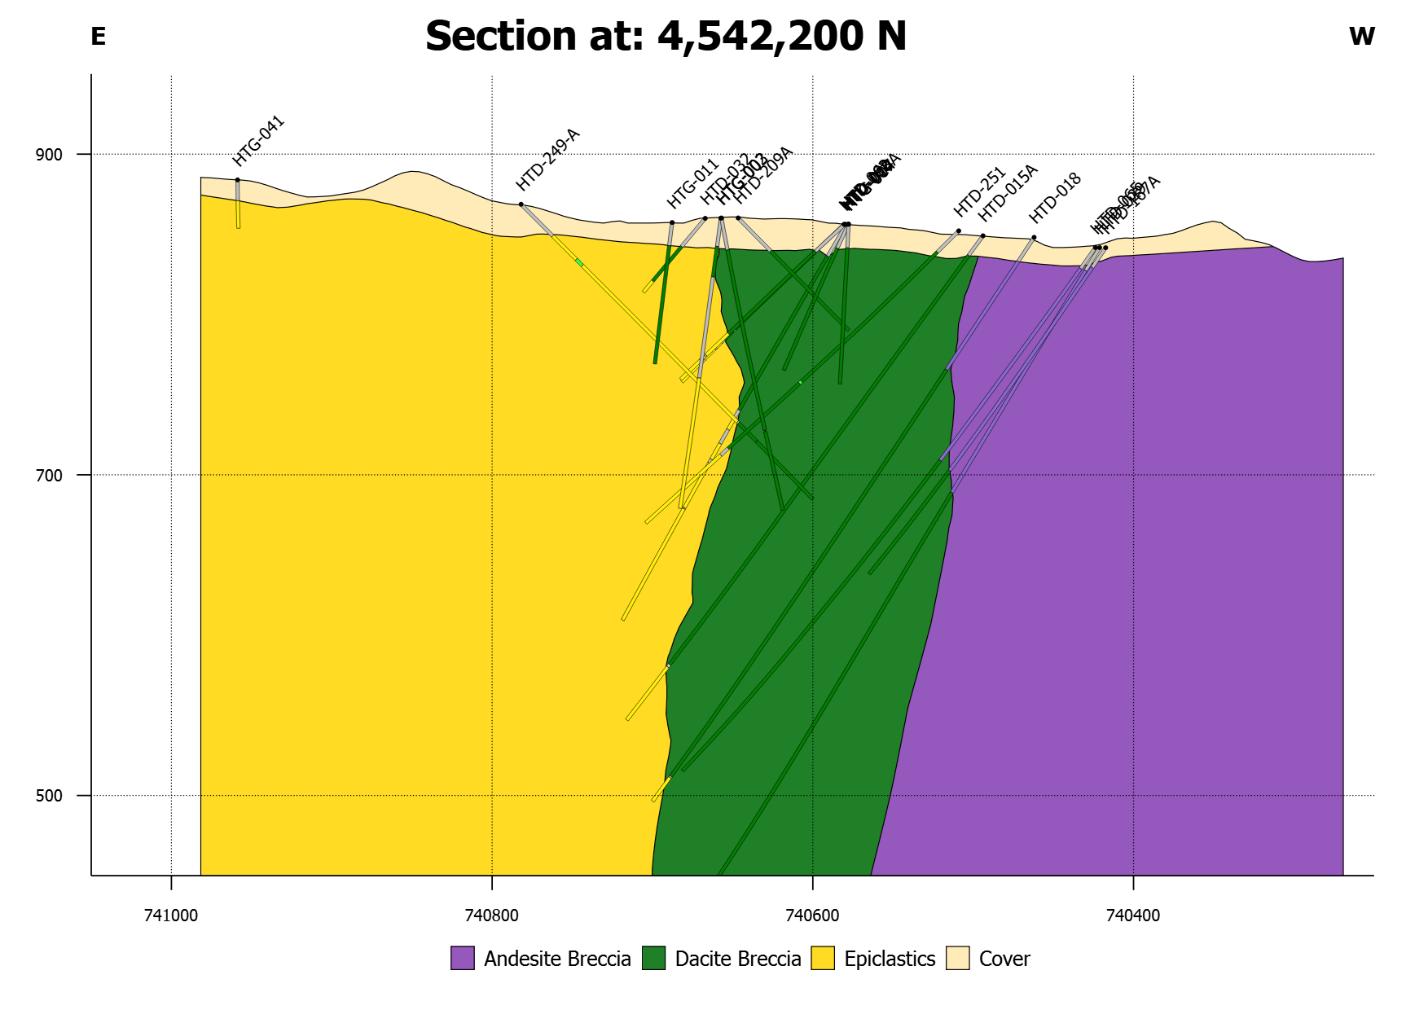
FIGURE 11-4
Section at: 4,542,200 N
E
W
900
700
500
HTD-041
HTD-249-A
HTG-011
HTD-032
HTG-003
HTD-209A
?
HTD-251
HTD-015A
HTD-018
?
741000
740800
740600
740400
Andesite Breccia
Dacite Breccia
Epliclastics
Cover
Source: RSC 2025
| 11.4.2 | Mineralization Domains |
Three main mineralizing and depleting events are distinguished at Hod
Maden, and are represented in the mineralization domain strategy:
| 1 | early massive pyrite ± jasperoid-hematite |
| 3 | a late anhydrite depletion event |
The RSC QP confirmed the robustness of the massive pyrite logging during
the site visit and the massive pyrite domain (MPY) was modeled directly from the legacy logging, with minor adjustments based on measured
sulfide sulfur (SS) concentration.
The occurrence of jasperoid-hematite has been captured in the legacy
mineralization log but was identified by the RSC QP as being logged inconsistently. Recent re-logging efforts underpin this conclusion;
however, at the time of this resource estimation, the number of re-logged holes is insufficient to support domaining based on the new
logging. The RSC QP identified Co/Al as demonstrating a good correlation with logged jasperoid and massive pyrite (Figure 11-5). The Co/Al
ratio is interpreted as representing the combination of increased sulfides (Co substituting for Fe in sulfide) and dilution of the host
rock (decrease in Al) through increased vein density (addition of Si). The Co/Al ratio does not correlate exclusively with jasperoid,
and tracks a broader signal of increased sulfides and veining but demonstrates good spatial correlation with the logged jasperoid. Therefore,
the Co/Al ratio was used to constrain a high-sulfide, high-silica domain (HSS) using a numerical indicator model, selecting a ratio cut-off
(Co/Al > 12) that appropriately represents the intervals of logged jasperoid that were confirmed by the RSC QP during the site visit.
The HSS domain represents the zone of less intense sulfide and jasperoid mineralization surrounding the massive pyrite zone.
| | 11-8 | |
| SSR Mining Inc. | Hod Maden Project | | January 7, 2026 |
| Technical Report Summary | | SLR Project No.: 123.000320.00001 |
Epithermal quartz veining is the dominant style of mineralization in
the South Zone and postdates and overprints the massive pyrite and jasperoid-hematite mineralization in the Main Zone. Quartz veining
has been logged in the core but was identified during the site visit as having been logged inconsistently. The RSC QP’s inspection,
supported by visualization in Leapfrog 3-D software, demonstrated a poor correlation of the logged quartz veining with Au and Cu grades
in the South Zone. Therefore, numerical indicator models were created for both Au and Cu to represent the low-sulfide epithermal quartz
veining (LSEV) outside the main mineralized zone (MPY + HSS domains). The LSEV domain was modeled using only intervals that were not domained
as MPY or HSS, to reflect the time difference between the low-sulfide epithermal veins and the high-sulfide-high-silica mineralization.
Low-grade cut-offs (0.15 g/t Au, 0.2% Cu) were used for modeling the low-sulfide epithermal mineralization, intended to represent the
broad mineralized zone of Au and Cu mineralization. For the South Zone mineralization, two dominant mineralizing trends are recognized
in the spatial distributions of the grades and were used to guide the numerical models. Overall, these trends represent a main mineralizing
trend striking approximately north, and a secondary north-northeast-striking trend that controls the mineralization in the footwall (Figure
11-7, Figure 11-8, and Figure 11-10).
Barren anhydrite overprints all mineralization styles at Hod Maden and
is interpreted as the final overprint of the mineralizing sequence. During the site visit, the RSC QP concluded that anhydrite was logged
inconsistently and a geochemical model might be better suited to model the anhydrite overprint. Therefore, RSC modeled the anhydrite using
a geochemical proxy based on Ca, Sr, Fe and S (Figure 11-6). The modeling cut-off was set by reviewing scatter plots of these elements
coded by anhydrite logging and selecting a threshold that best represents the cloud of logged anhydrite. For modeling the anhydrite, a
threshold of 250 on the (Ca + Sr)/Fe ratio was selected and a threshold of 0.6 on the S/Ca ratio was selected (Figure 11-6). The anhydrite
was modeled as the ‘final’ overprint and ‘subtracts’ from the prior mineralizing phases, i.e.: if the chemical
proxy suggests the presence of anhydrite above the selected modeling cut-off, the interval was modeled as anhydrite. The only exception
to this workflow is the MPY domain, which is considered robustly defined from logging and hence the anhydrite was not allowed to ‘subtract’
from it.
Perspective views of the model are illustrated in Figure 11-7 and Figure
11-8. The cross-section in Figure 11-9 illustrates the LSEV domain wrapping the HSS and MPY domains, and the Anhydrite domain overprinting
the HSS and LSEV domains, but not the MPY domain. A horizontal slice view of the mineralization model illustrating the bifurcating trend
in the south is presented in Figure 11-10.
| | 11-9 | |
| SSR Mining Inc. | Hod Maden Project | | January 7, 2026 |
| Technical Report Summary | | SLR Project No.: 123.000320.00001 |
Figure 11-5: Ratio of Co and Al
Correlates with Massive Pyrite and Jasperoid
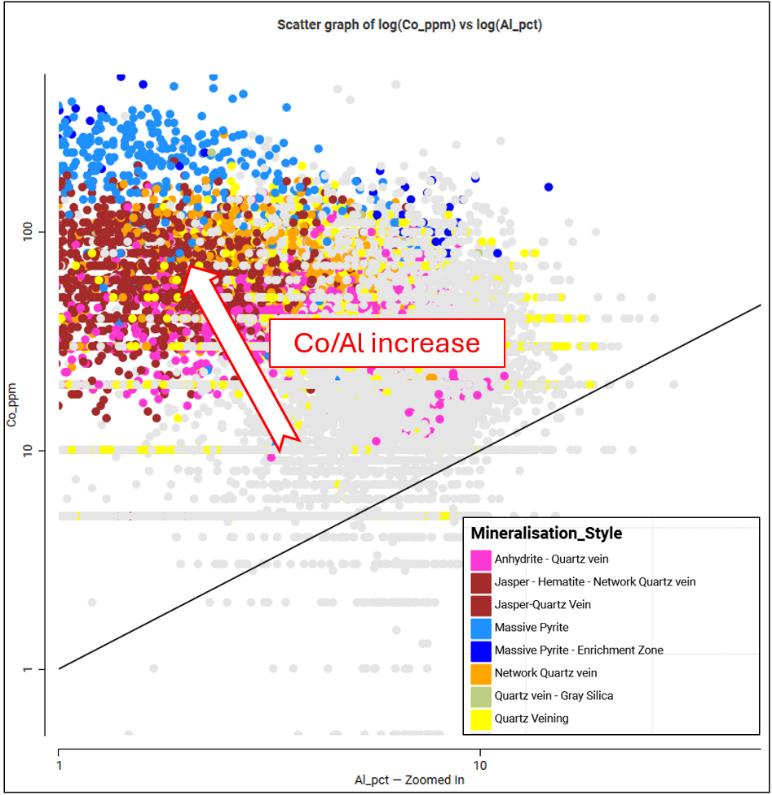
FIGURE 11-5
Scatter graph of log(Co_ppm) vs log(AI_pct)
Co/AI increase
Co_ppm
100
10
1
1
10
AI_pct - Zoomed In
Mineralisation_Style
Anhydrite - Quartz vein
Jasper - Hematite - Network Quartz vein
Jasper-Quartz vein
Massive Pyrite
Massive Pyrite - Enrichment Zone
Network Quartz vein
Quartz vein - Gray Silica
Quartz Veining
Source: RSC 2025
| | 11-10 | |
| SSR Mining Inc. | Hod Maden Project | | January 7, 2026 |
| Technical Report Summary | | SLR Project No.: 123.000320.00001 |
Figure 11-6: Logged Mineralization
Style (left). Geochemical Proxy (right)
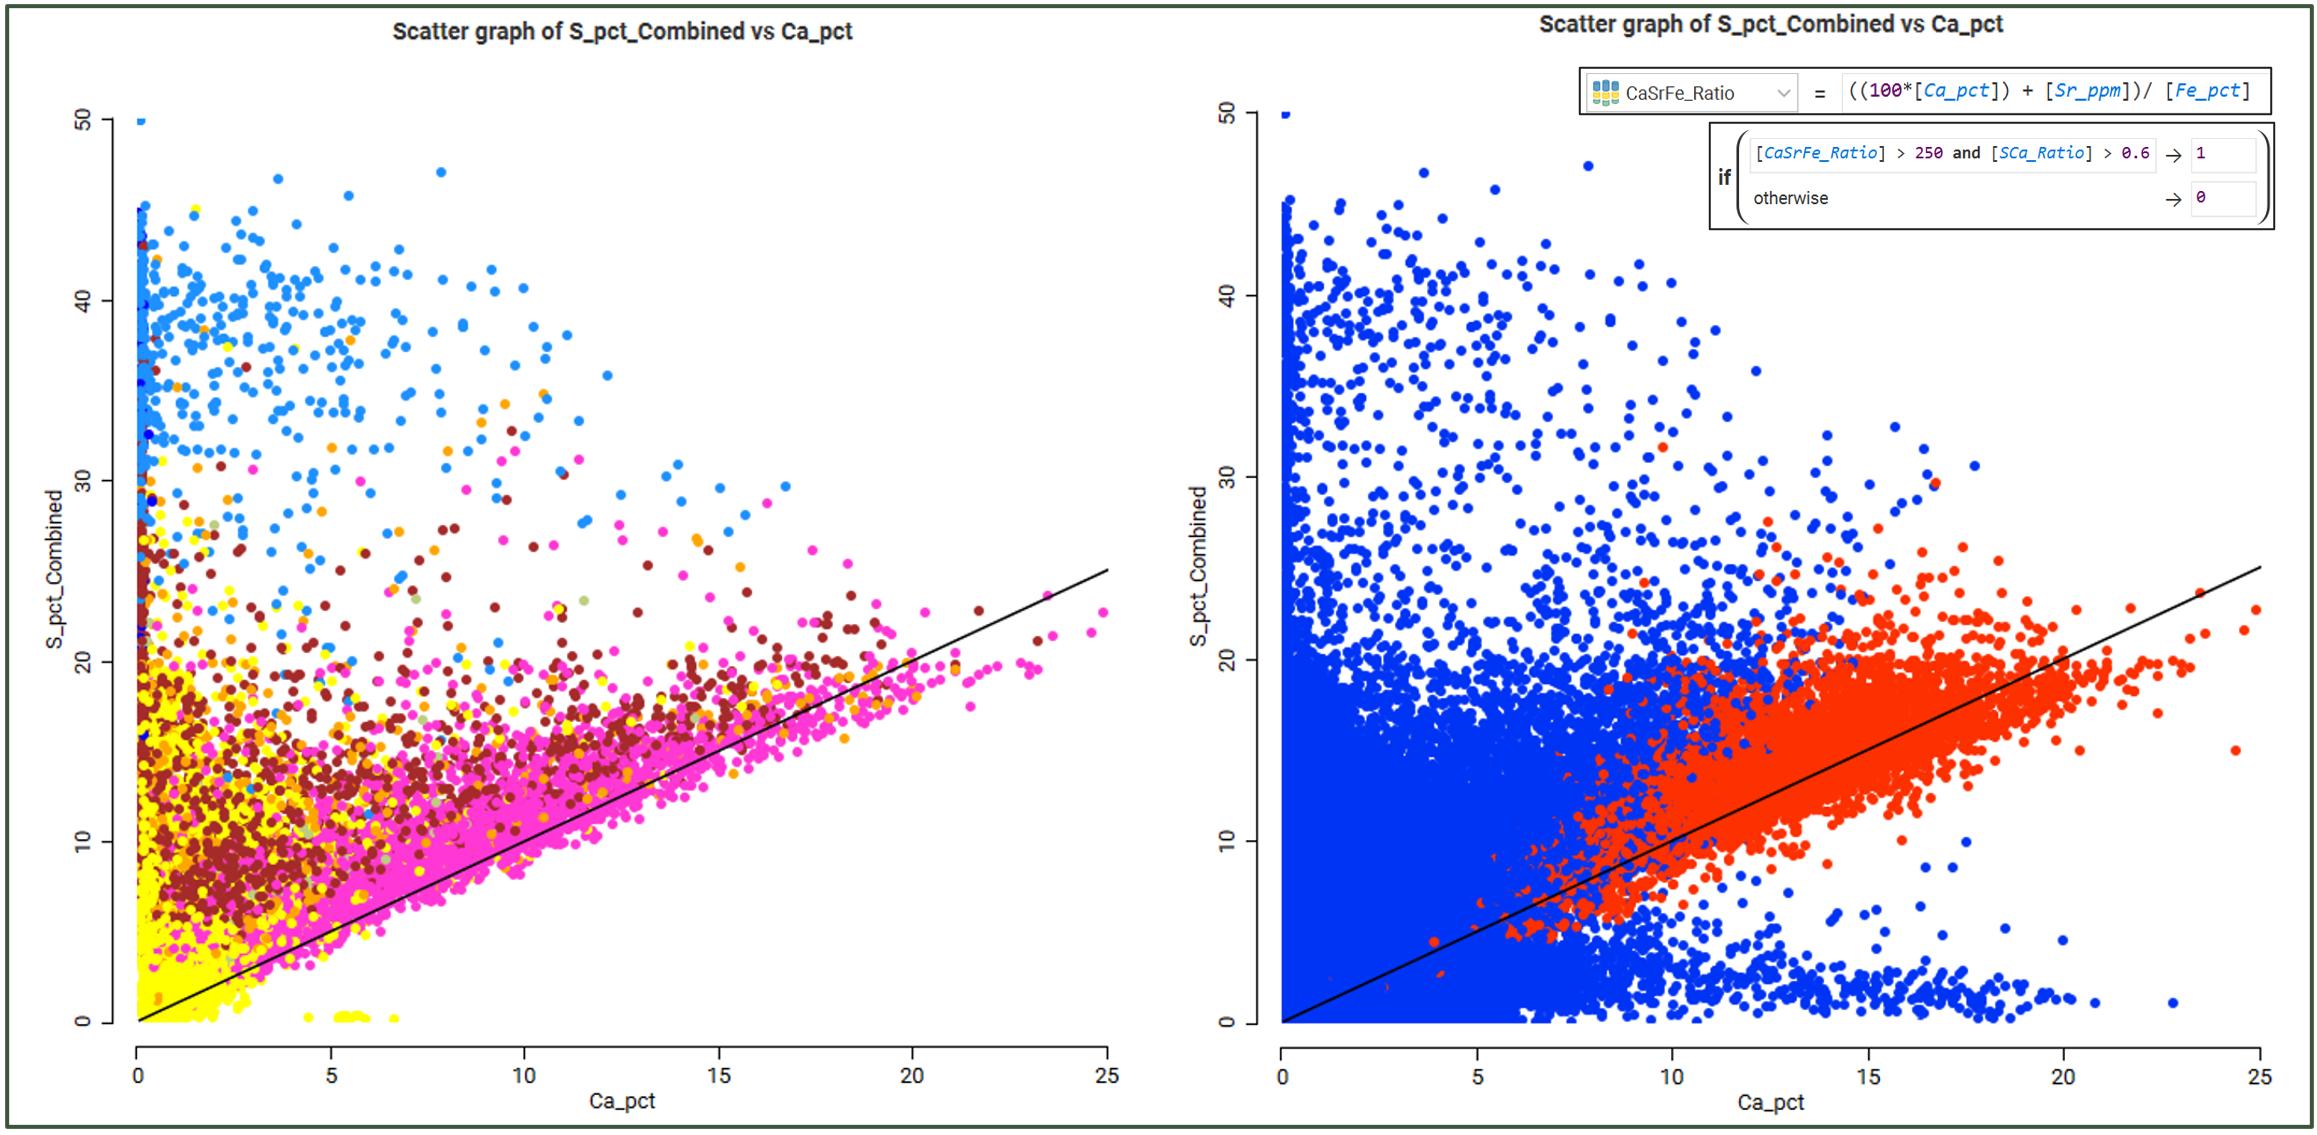
FIGURE 11-6
Scatter graph of S_pct_Combined vs Ca_pct
S_pct_Combined
50
40
30
20
10
0
0
5
10
15
20
25
Ca_pct
Scatter graph of S_pct_Combined vs Ca_pct
CaSrFe_Ratio
=
((100*[Ca_pct]) + [Sr_ppm])/ [Fe_pct]
If(
[CaSrFe_Ratio] < 250 and [SCa_Ratio] < 0.6 1
otherwise 0
)
S_pct_Combined
50
40
30
20
10
0
0
5
10
15
20
25
Ca_pct
Note: The ratio of Ca and S provides a good proxy for anhydrite. Not
all points were logged for mineralization style.
Source: RSC 2025
Figure 11-7: Perspective View of
the Mineralization Model for Hod Maden
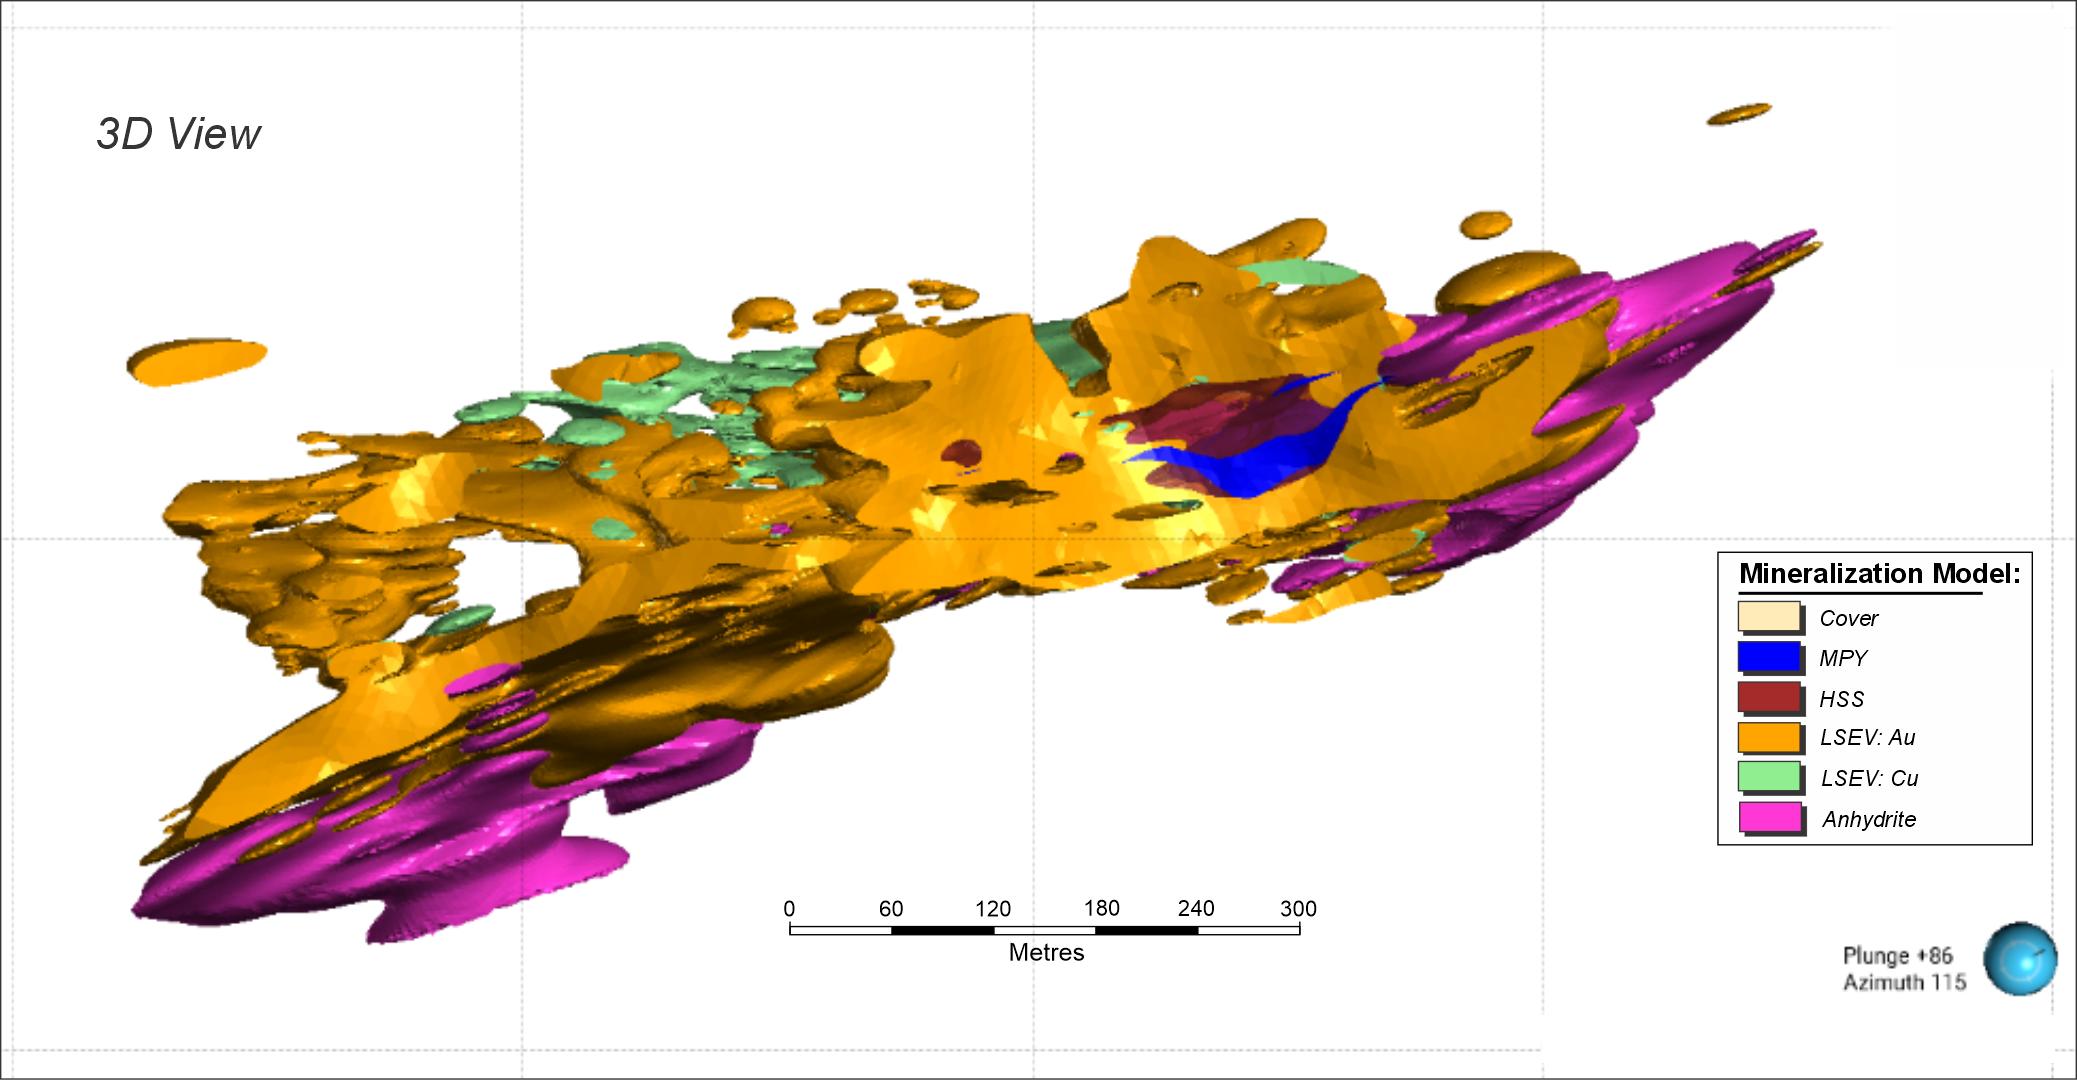
FIGURE 11-7
3D View
Mineralization Model
Cover
MPY
HSS
LSEV: Au
LSEV: Cu
Anhydrite
0
60
120
180
240
300
Metres
Plunge +86
Azimuth 115
Source: RSC 2025
| | 11-11 | |
| SSR Mining Inc. | Hod Maden Project | | January 7, 2026 |
| Technical Report Summary | | SLR Project No.: 123.000320.00001 |
Figure 11-8: Perspective View of
the Mineralization Model Illustrating the Relationship of the MPY and HSS Domains
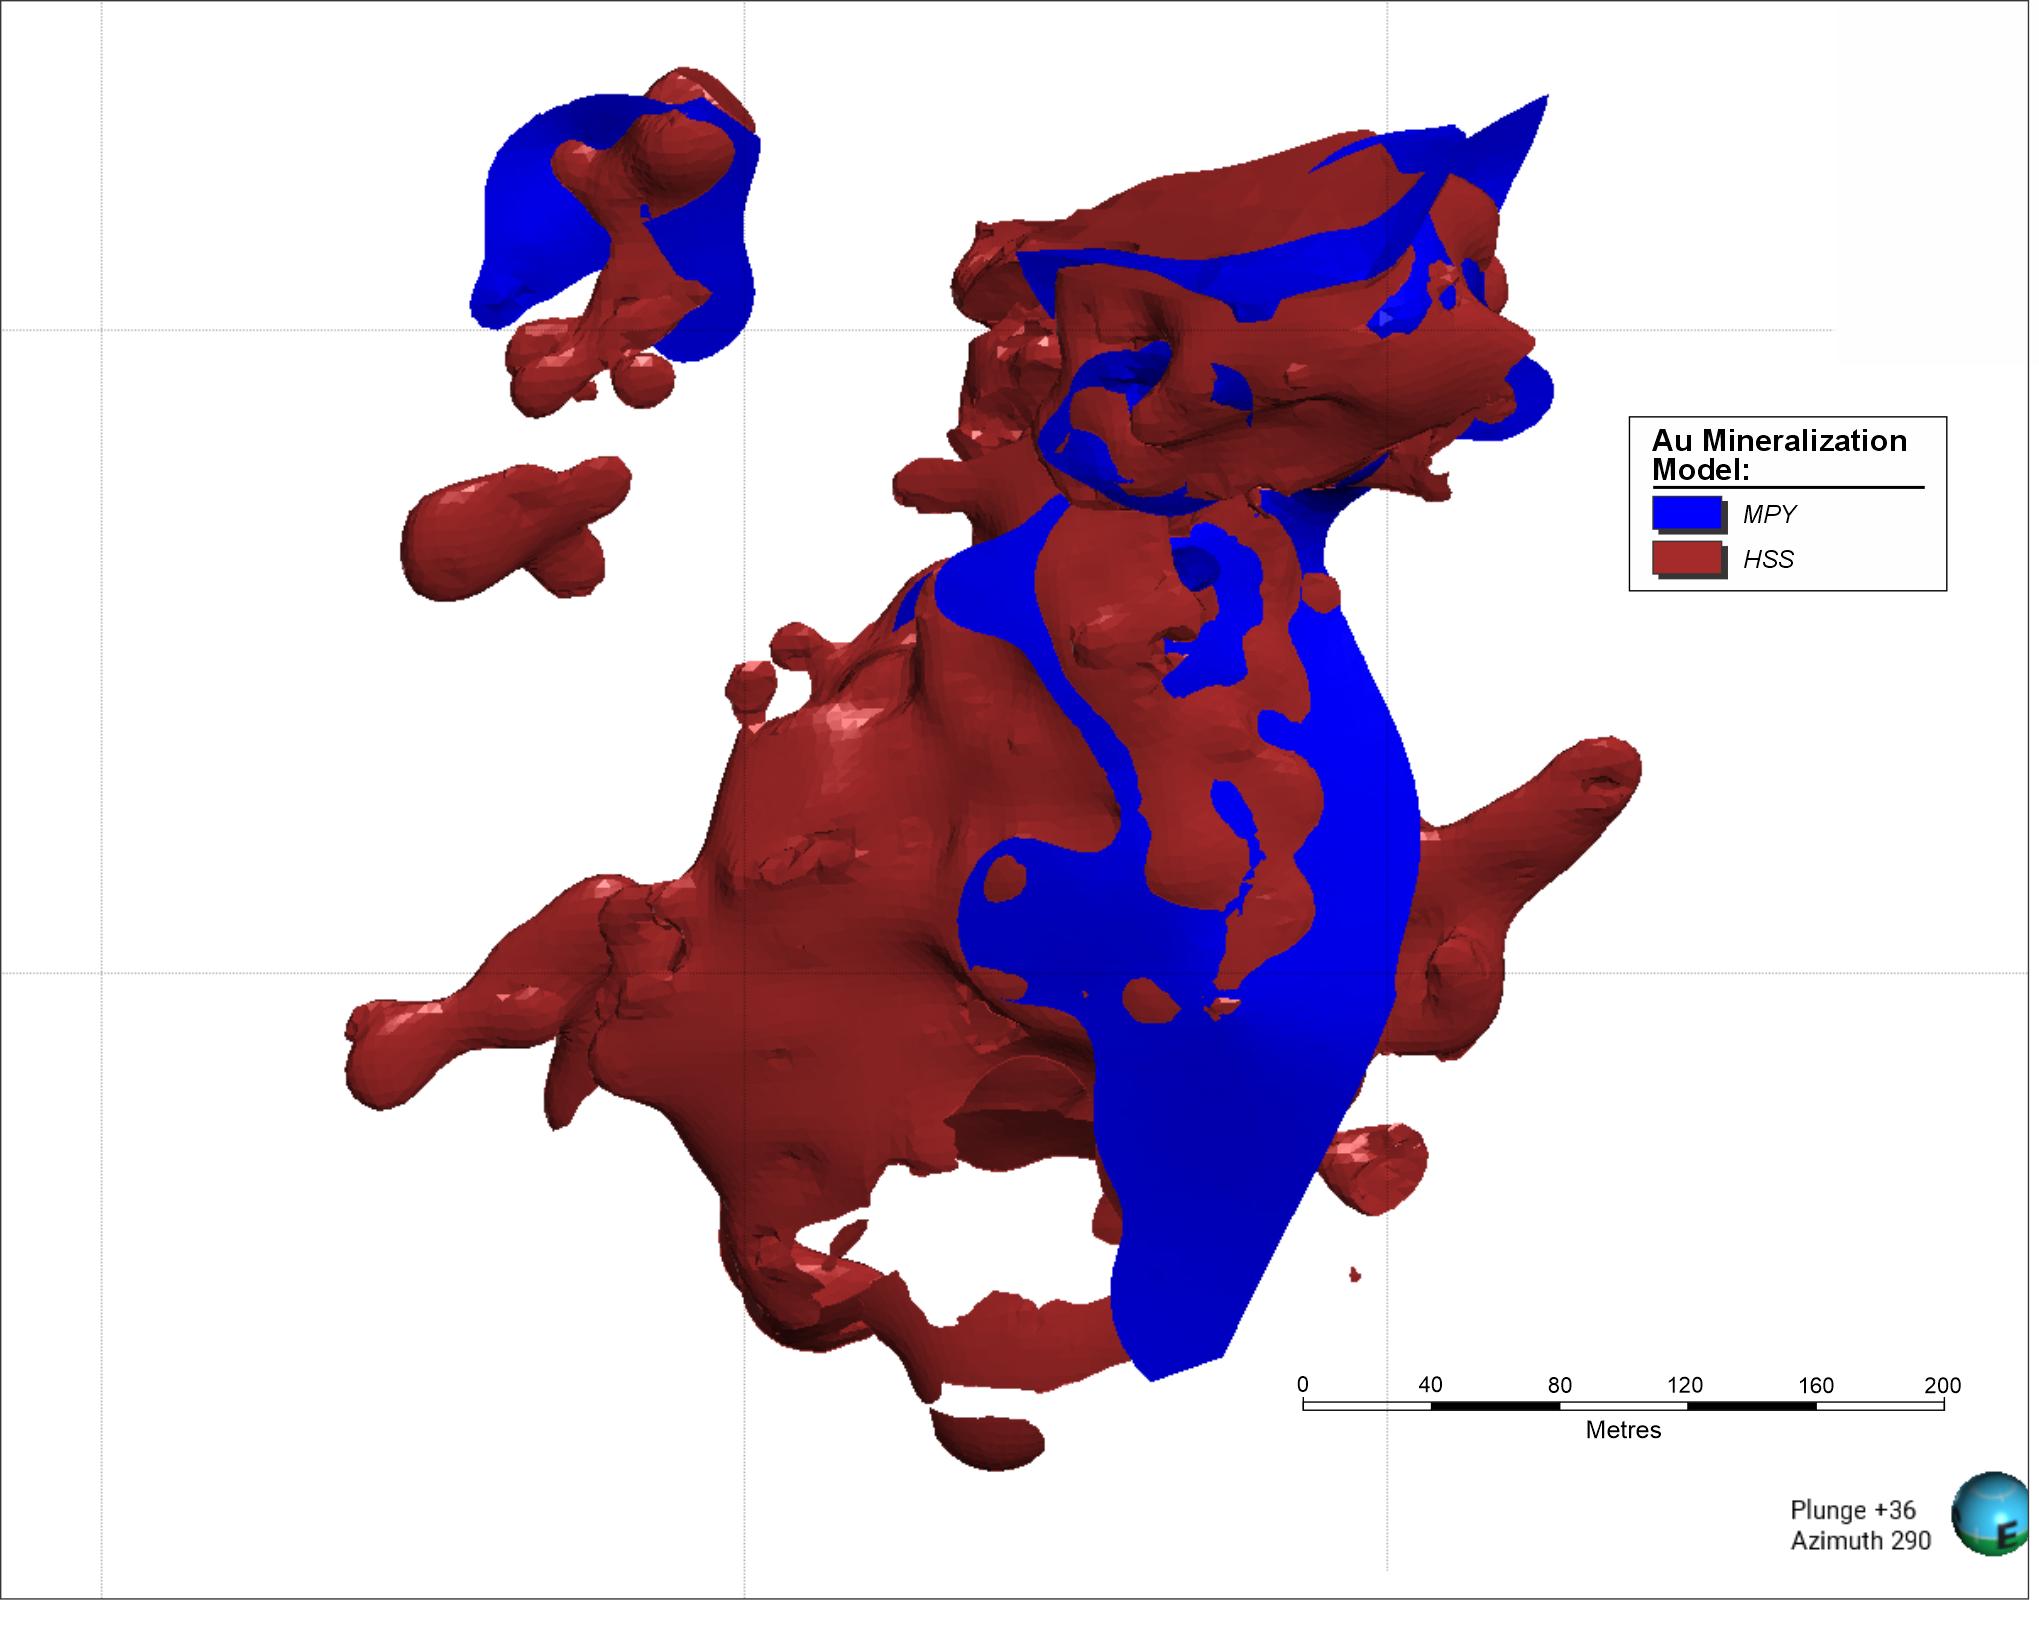
FIGURE 11-8
Au Mineralization Model:
MPY
HSS
0
40
80
120
160
200
Metres
Plunge +36
Azimuth 290
E
Source: RSC 2025
| | 11-12 | |
| SSR Mining Inc. | Hod Maden Project | | January 7, 2026 |
| Technical Report Summary | | SLR Project No.: 123.000320.00001 |
Figure 11-9: Cross-section of the
Mineralization Model
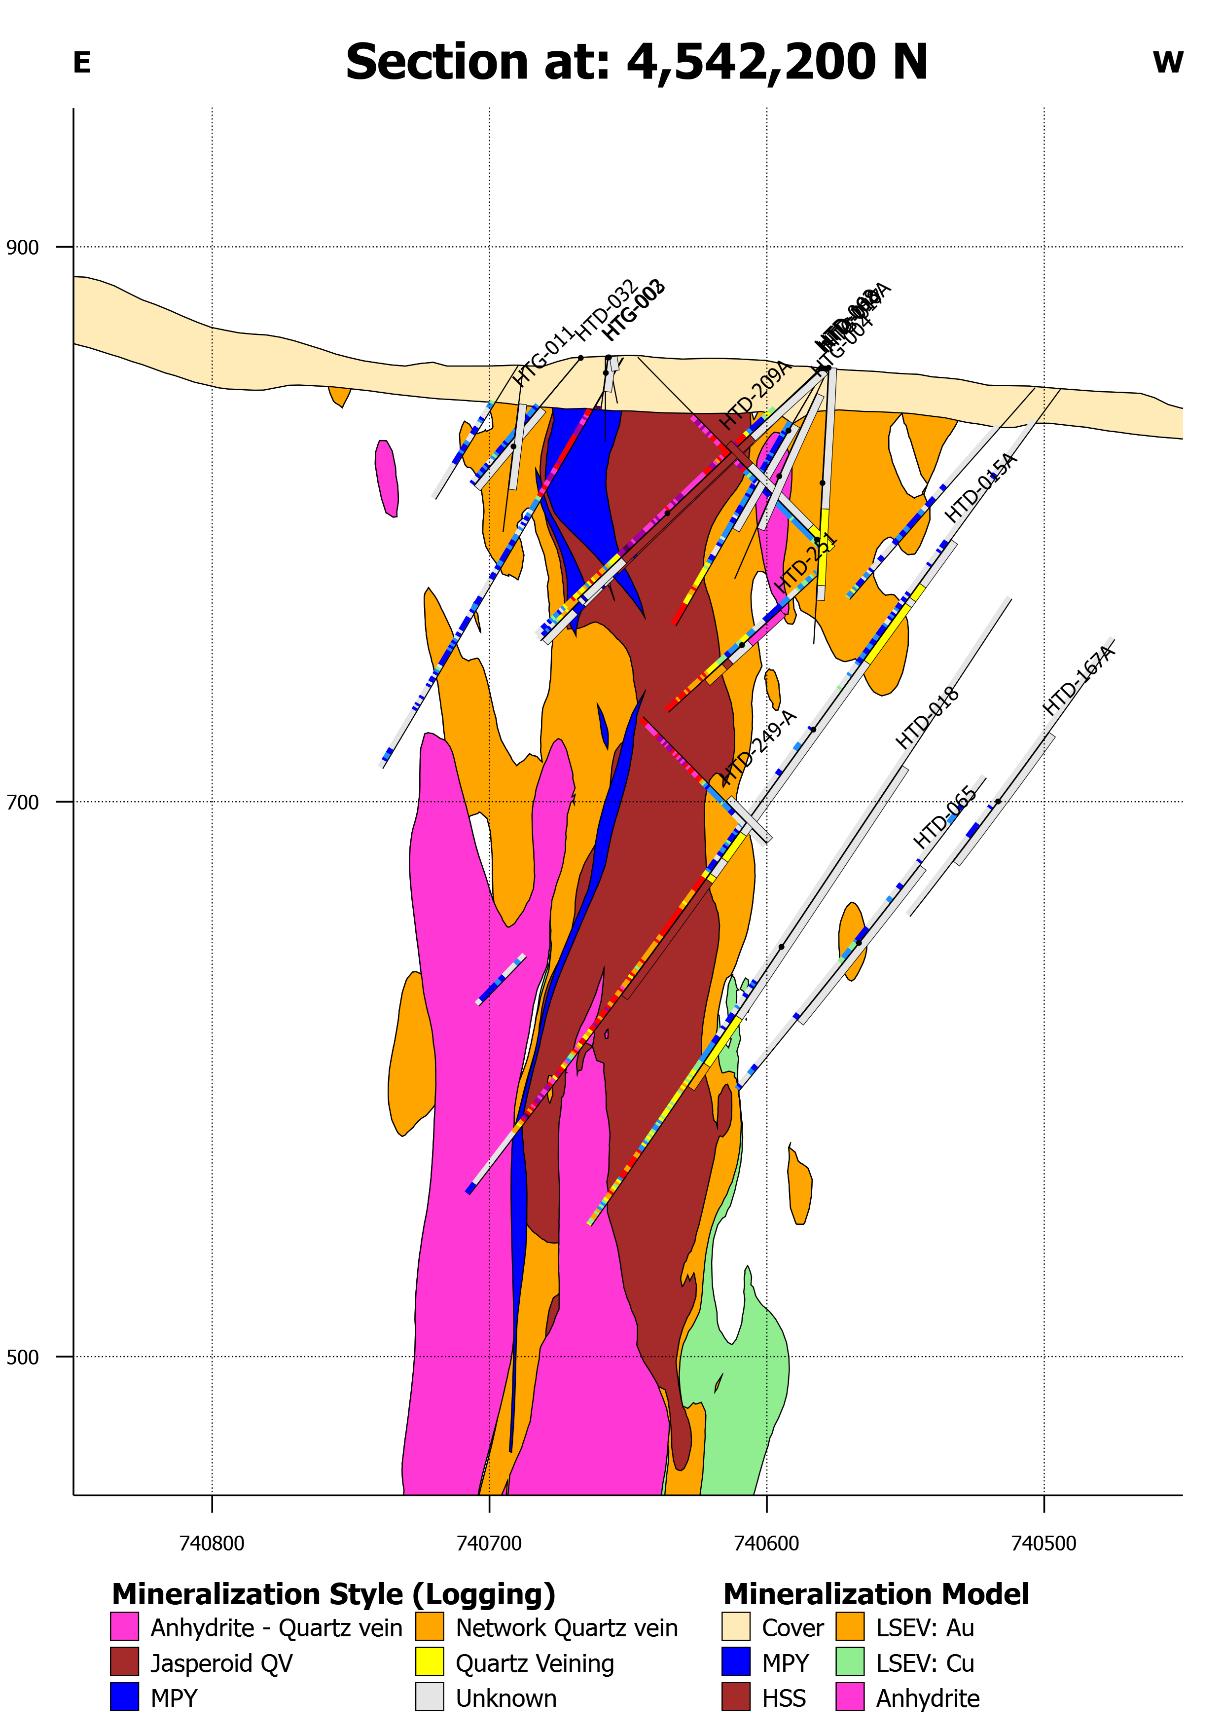
FIGURE 11-9
Section at: 4,542,200 N
E
W
900
700
500
740800
740700
740600
740500
Mineralization Style (Logging)
Anhydrite - Quartz vein
Jasperiod QV
MPY
Network Quartz Vein
Quartz Veining
Unknown
Mineralization Model
Cover
MPY
HSS
LSEV: Au
LSEV: Cu
Anhydrite
HTG-011
HTD-032
HTG-002
HTG-003
HTD-209A
?
HTG-004
HTD-251
HTD-015A
HTD-249-A
HTD-018
HTD-065
HTD-167A
Source: RSC 2024
| | 11-13 | |
| SSR Mining Inc. | Hod Maden Project | | January 7, 2026 |
| Technical Report Summary | | SLR Project No.: 123.000320.00001 |
Figure 11-10: Plan View of the Mineralization
Model, illustrating Controlling Trends
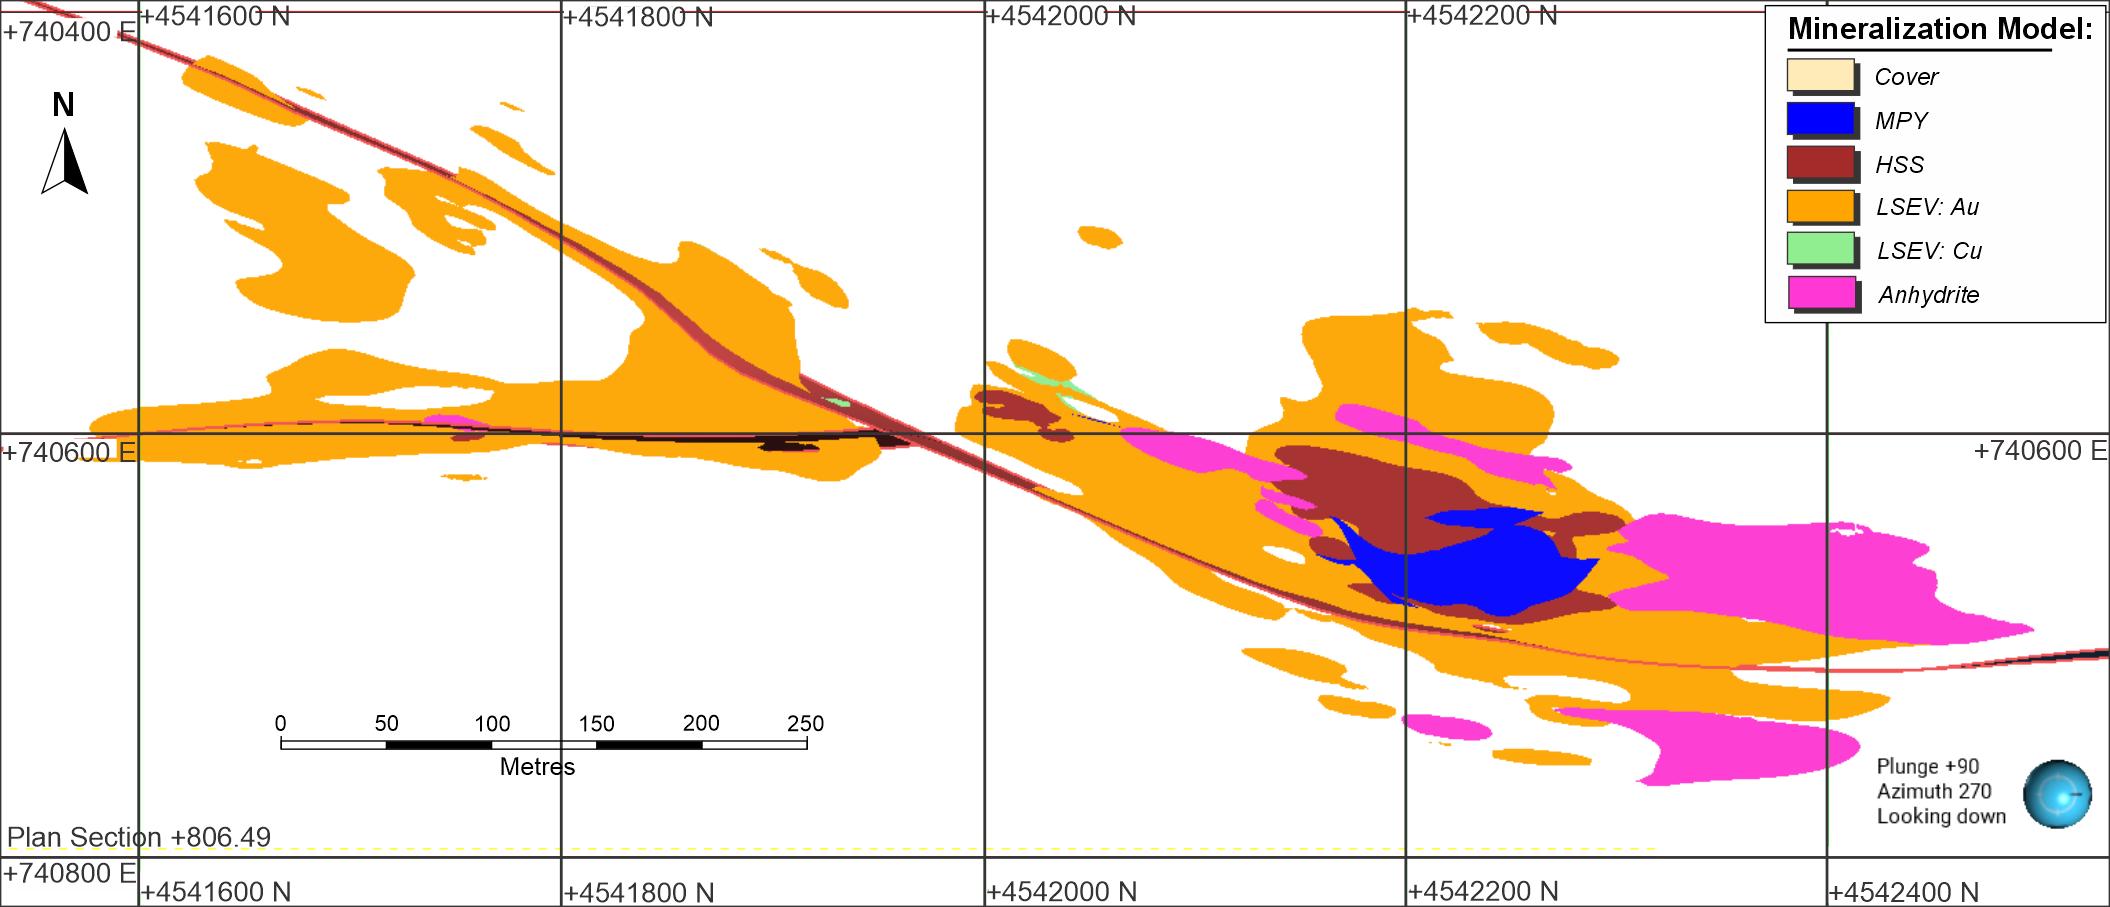
FIGURE 11-10
+740400 E
N
+740600 E
Plan Section +806.49
+740800 E
+4541600 N
+4541800 N
+4542000 N
+4542200 N
0
50
100
150
200
250
Metres
+4541600 N
+4541800 N
+4542000 N
+4542400 N
Mineralization Model:
Cover
MPY
HSS
LSEV: Au
LSEV: Cu
Anhydrite
+740600 E
Plunge +90
Azimuth 270
Looking down
Source: RSC 2024
| | 11-14 | |
| SSR Mining Inc. | Hod Maden Project | | January 7, 2026 |
| Technical Report Summary | | SLR Project No.: 123.000320.00001 |
An oxidation model was created from the logging data consisting of a
fresh, transitional, and oxidized domain (Figure 11-11).
Figure 11-11: Perspective View of
the Oxidation Model
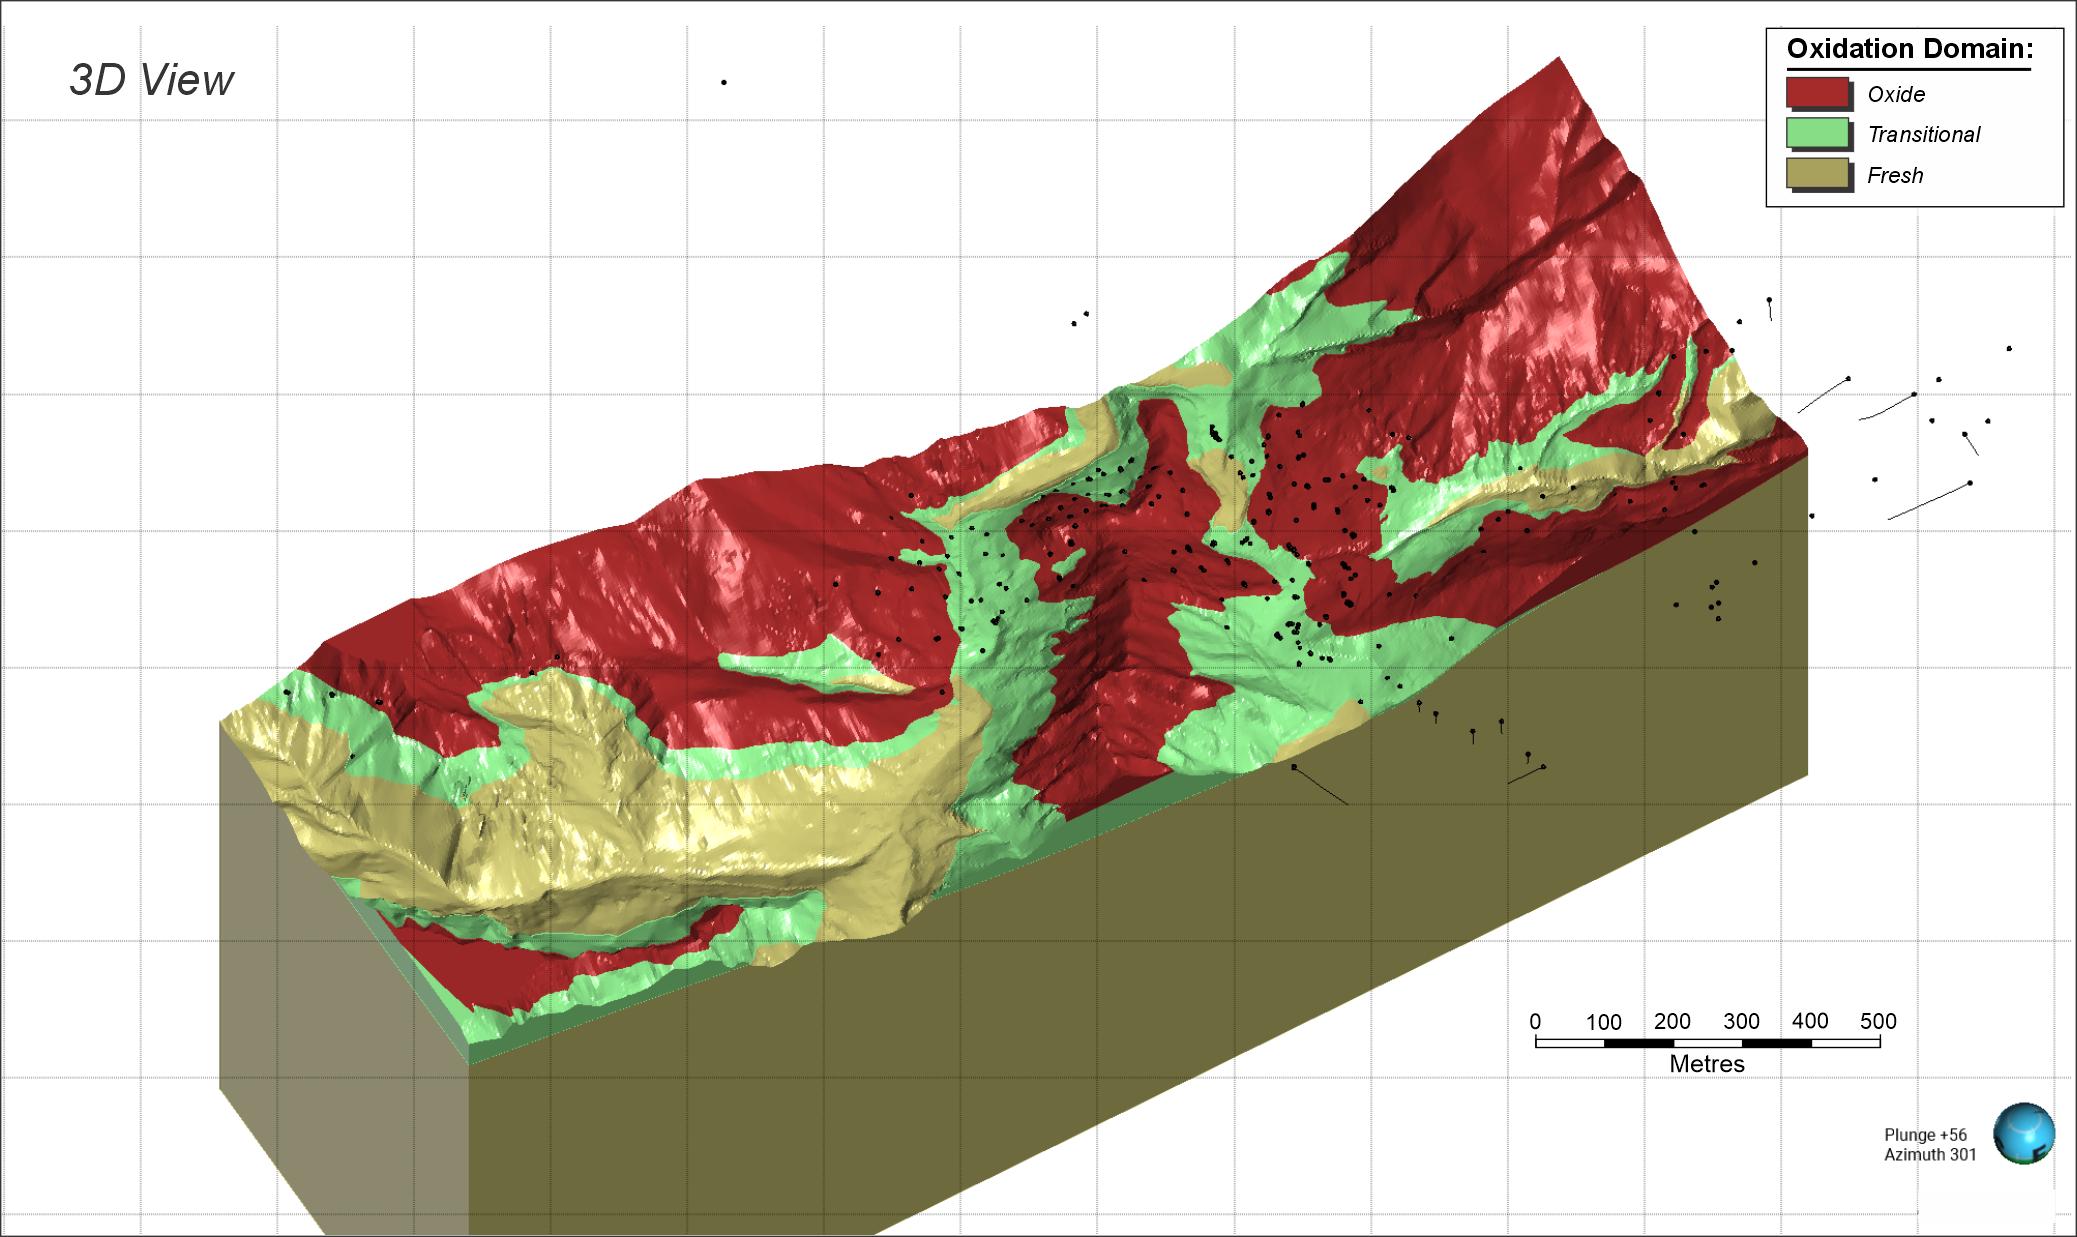
FIGURE 11-11
3D View
Oxidation Domain:
Oxide
Transitional
Fresh
0
100
200
300
400
500
Metres
Plunge +56
Azimuth 301
Source: RSC 2024
| 11.5 | Hod Maden Estimation Domaining |
The Hod Maden estimation domains were built and nested within the geological
domains that separate the various main mineralizing and depleting events
Review of the composite statistics within the primary mineralization
domains illustrates that the mineralization domains are not appropriate for linear estimation of Au, with domain populations demonstrating
strong skewness and high coefficients of variation (CVs) (Figure 11-12). Therefore, the primary mineralization domains were sub-domained
to yield estimation domains suitable for estimation and mitigate the need for strict grade caps. Any sub-domaining was always reconciled
with and supported by, where possible, geological evidence.
The RSC QP notes that a portion of the Anhydrite domain overlaps with
the HSS domain, representing anhydrite flooding in the core of the mineralized system. This portion of the anhydrite domain has characteristics
of both the anhydrite and HSS domains and is characterized by higher grades than the rest of the Anhydrite domain but lower grades than
the HSS domain proper. The intersection volume was therefore adopted as a separate estimation domain.
| | 11-15 | |
| SSR Mining Inc. | Hod Maden Project | | January 7, 2026 |
| Technical Report Summary | | SLR Project No.: 123.000320.00001 |
For the MPY, HSS, and LSEV domains, no clear geological proxies are
available to support sub-domaining of the mineralization domains. Inspection of composite statistics demonstrates no evident grade jumps
in the domain populations (Figure 11-12) but provides some support for a break in the grade populations of the MPY and HSS domains around
8 g/t Au. Inspection of downhole plots provides further support for a contrast in the grade data around this threshold (Figure 11-13).
Therefore, RSC used a numerical model to sub-domain the MPY and HSS domains, separating spatially contiguous zones of grade >8 g/t
Au in a high-grade sub-domain.
For the LSEV domain, a high-grade sub-domain was modeled to separate
spatially contiguous zones above 1 g/t Au and prevent the high-grade population from smearing into the low-grade part of the domain.
A summary of the sub-domaining strategy for Au and other elements is
presented in Table 11-6.
Figure 11-12: Declustered Composite
Statistics for Au in the Mineralized Domains
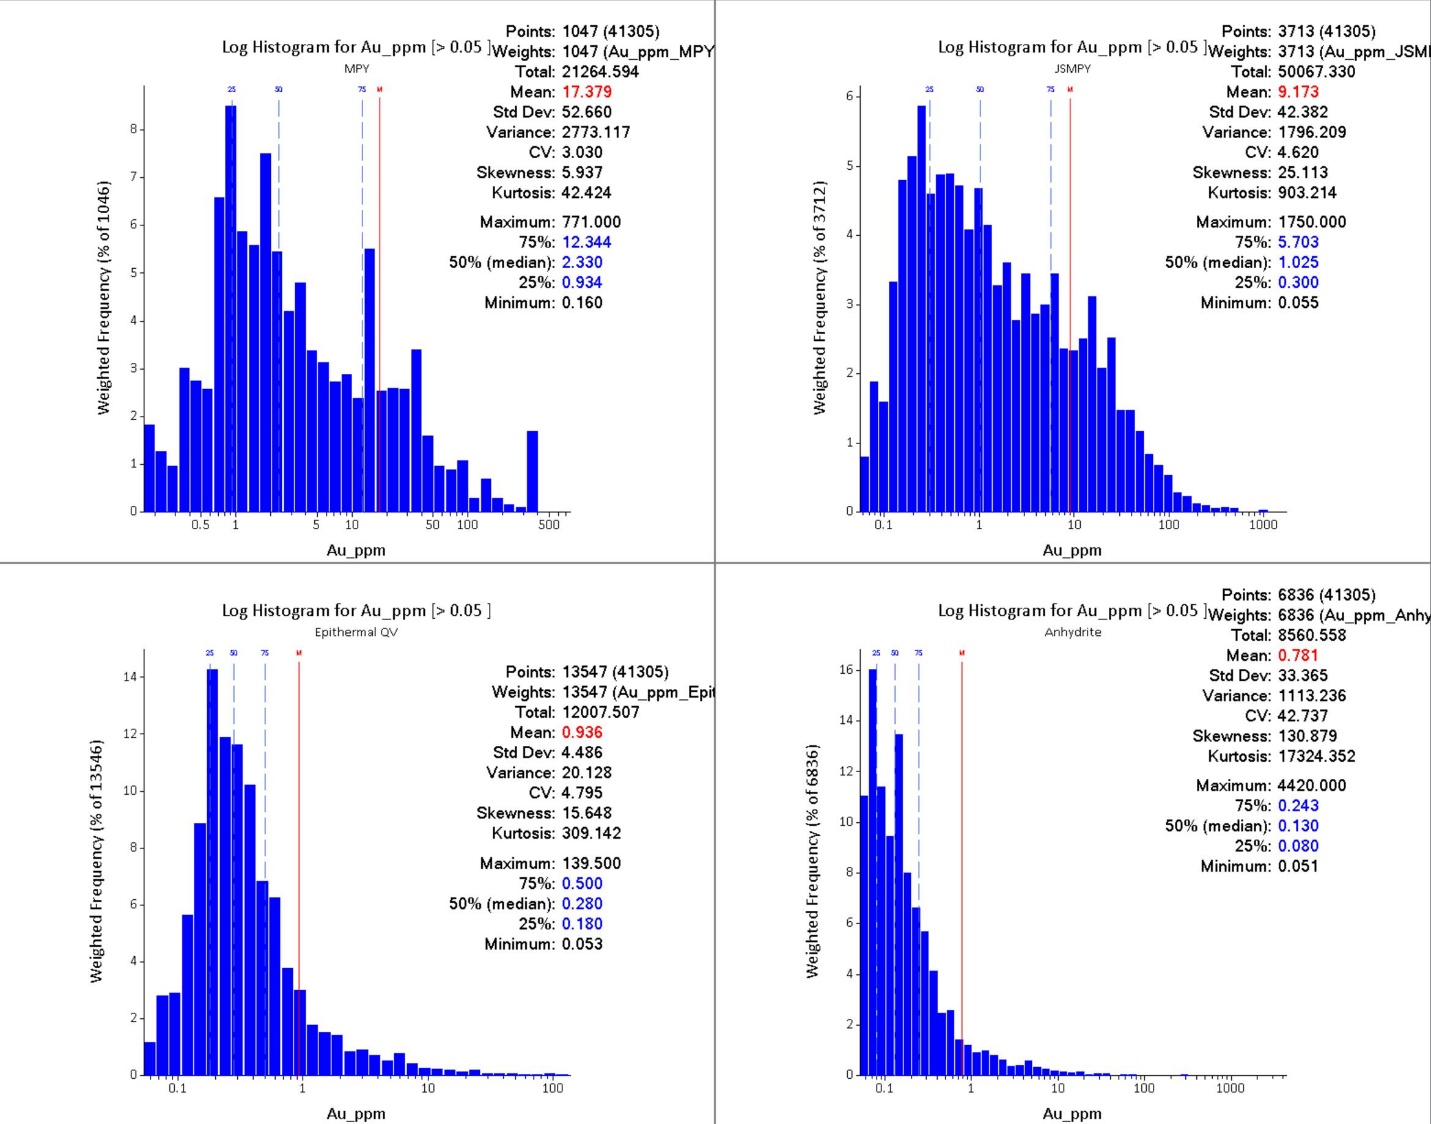
FIGURE 11-12
Log Histogram for Au_ppm [<0.05]
MPY
Points: 1047 (41305)
Weights: 1047 (Au_ppm_MPY
Total: 21264.594
Mean: 17.379
Std Dev: 52.660
Variance: 2773.117
CV: 3.030
Skewness: 5.937
Kurtosis: 42.424
Maximum: 771.000
75%: 12.344
50% (median): 2.330
25%: 0.934
Minimum: 0.160
Weighted Frequency (% of 1046)
8
7
6
5
4
3
2
1
0
0.5
1
5
10
50
100
500
Au_ppm
Log Histogram for Au_ppm [<0.05]
JSMPY
Points: 3713 (41305)
Weights: 3713 (Au_ppm_JSMPY
Total: 50067.330
Mean: 9.173
Std Dev: 42.382
Variance: 1796.209
CV: 4.620
Skewness: 25.113
Kurtosis: 903.214
Maximum: 1750.000
75%: 5.703
50% (median): 1.025
25%: 0.300
Minimum: 0.055
Weighted Frequency (% of 3712)
6
5
4
3
2
1
0
0.1
1
10
100
1000
Au_ppm
Log Histogram for Au_ppm [<0.05]
Epithermal QV
Points: 13547 (41305)
Weights: 13547 (Au_ppm_Epit
Total: 12007.507
Mean: 0.936
Std Dev: 4.486
Variance: 20.128
CV: 4.795
Skewness: 15.648
Kurtosis: 309.142
Maximum: 139.500
75%: 0.500
50% (median): 0.280
25%: 0.180
Minimum: 0.053
Weighted Frequency (% of 13546)
14
12
10
8
6
4
2
0
0.1
1
10
100
Au_ppm
Log Histogram for Au_ppm [<0.05]
Anhydrite
Points: 6836 (41305)
Weights: 6836 (Au_ppm_Epit
Total: 8560.558
Mean: 0.781
Std Dev: 33.365
Variance: 1113.236
CV: 42.737
Skewness: 130.879
Kurtosis: 17324.352
Maximum: 4420.000
75%: 0.243
50% (median): 0.130
25%: 0.080
Minimum: 0.051
Weighted Frequency (% of 6836)
16
14
12
10
8
6
4
2
0
0.1
1
10
100
1000
Au_ppm
Source: RSC 2024
| | 11-16 | |
| SSR Mining Inc. | Hod Maden Project | | January 7, 2026 |
| Technical Report Summary | | SLR Project No.: 123.000320.00001 |
Figure 11-13: Drill Hole Correlation
Supporting the Modeling of a High-Grade Sub-Domain
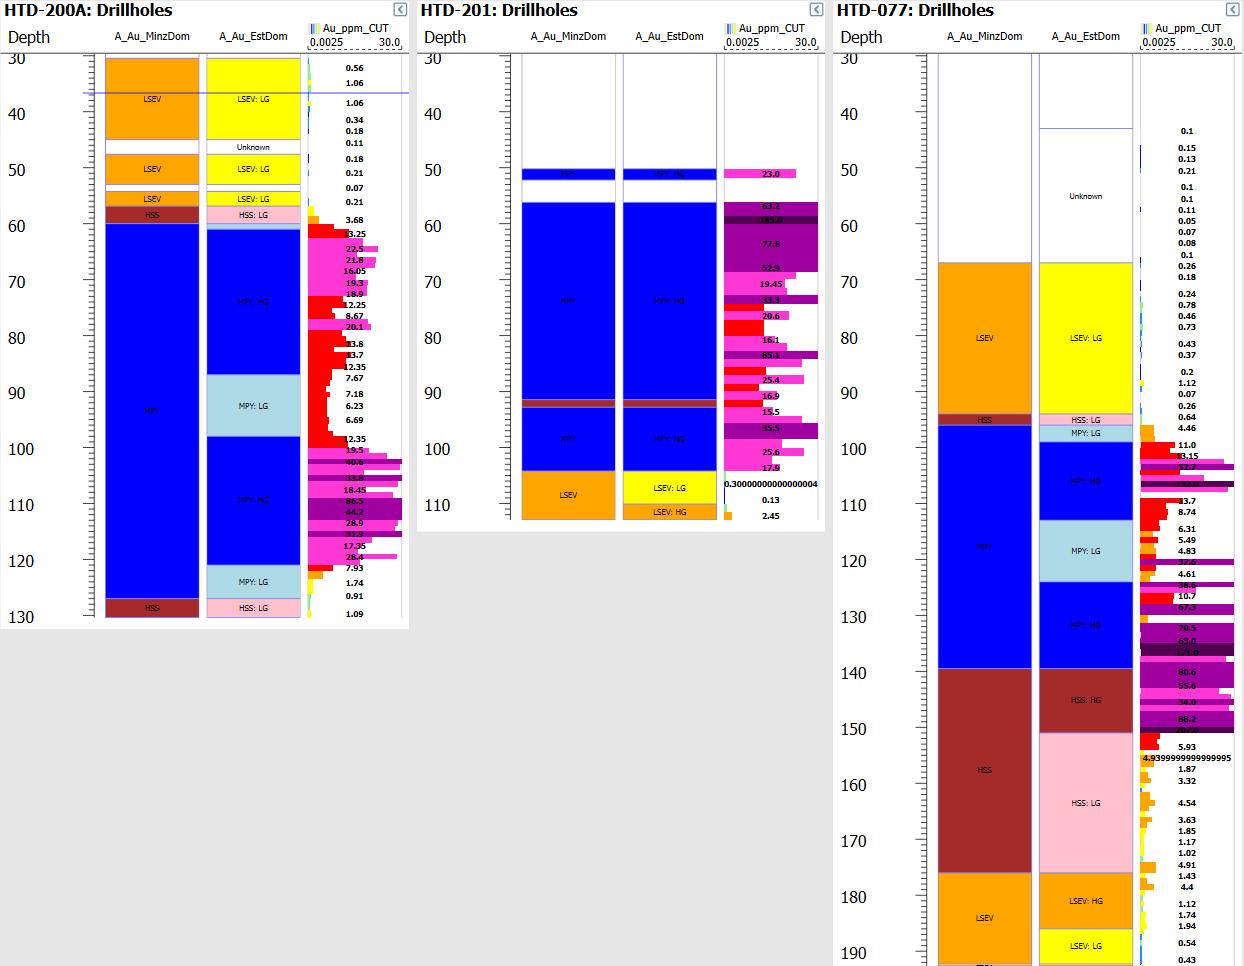
FIGURE 11-13
HTD-200A: Drillholes
Depth
30
40
50
60
70
80
90
100
110
120
130
A_Au_MinzDom
LSEV
LSEV
LSEV
HSS
?
HSS
A_Au_EstDom
LSEV:LG
Unknown
LSEV:LG
LSEV:LG
HSS:LG
?
MPY:LG
?
MPY:LG
HSS:LG
Au_ppm_CUT
0.0025 30.0
0.56
1.06
1.06
0.34
0.18
0.11
0.18
0.21
0.07
0.21
3.68
13.25
22.5
21.8
16.05
19.3
18.9
12.25
8.67
20.1
13.8
13.7
12.35
7.67
7.18
6.23
6.69
12.35
19.5
40.5
33.8
18.45
86.5
44.2
28.9
31.9
17.35
28.4
7.93
1.74
0.91
1.09
HTD-201: Drillholes
Depth
30
40
50
60
70
80
90
100
110
A_Au_MinzDom
?
?
?
LSEV
A_Au_EstDom
?
?
?
LSEV: LG
LSEV: HG
Au_ppm_CUT
0.0025 30.0
23.0
63.2
185.0
77.6
52.9
19.45
33.3
20.6
16.1
85.1
25.4
16.9
15.5
35.5
25.6
17.9
0.30000000000000004
0.13
2.45
HTD-077: Drillholes
Depth
30
40
50
60
70
80
90
100
110
120
130
140
150
160
170
180
190
A_Au_MinzDom
LSEV
HSS
?
HSS
LSEV
A_Au_EstDom
Unknown
LSEV: LG
HSS: LG
MPY: LG
?
MPY: LG
?
HSS: HG
HSS: LG
LSEV: HG
LSEV: LG
Au_ppm_CUT
0.0025 30.0
0.1
0.15
0.13
0.21
0.1
0.1
0.11
0.05
0.07
0.08
0.1
0.26
0.18
0.24
0.78
0.46
0.73
0.43
0.37
0.2
1.12
0.07
0.26
0.64
4.46
11.0
13.15
52.7
132.0
13.7
8.74
6.31
5.49
4.83
32.6
4.61
38.6
10.7
67.3
70.5
63.0
171.0
80.6
55.6
34.0
202.0
5.93
4.9399999999999995
1.87
3.32
4.54
3.63
1.85
1.17
1.02
4.91
1.43
4.4
1.12
1.74
1.94
0.54
0.43
Source: RSC 2024
| | 11-17 | |
| SSR Mining Inc. | Hod Maden Project | | January 7, 2026 |
| Technical Report Summary | | SLR Project No.: 123.000320.00001 |
Table 11-6: Summary of the Sub-Domaining
Strategy for Hod Maden
| Mineralization Domain |
Au |
Cu |
Zn |
SS |
Fe |
Density |
| MPY |
HG >8 g/t Au |
NS* |
NS |
NS |
NS |
NS |
| HSS |
HG >8 g/t Au |
NS |
NS |
NS |
NS |
NS |
| LSEV: Au |
HG >1 g/t Au |
Background |
NS |
Combined |
Combined |
Combined |
| LSEV: Cu |
Background |
NS |
NS |
| Anhydrite |
Post HSS / Other |
Post HSS / Other |
NS |
Post HSS / Other |
Post HSS / Other |
Post HSS / Other |
| Zn |
Background |
Background |
HG >1% Zn |
Background |
Background |
NS |
| Lithology Domains (Abx/DBx/Epiclastic) |
Not Estimated |
Not Estimated |
Not Estimated |
Not Estimated |
Not Estimated |
NS |
| * Not Sub-domained, mineralization domain used for estimation. |
Review of composite statistics, within the primary mineralization domains,
illustrates that the mineralization domains are appropriate estimation domains for Cu, with domain populations demonstrating moderate
CVs and skewness, and no multi-modality. The intersection of the Anhydrite and HSS domain was used to estimate grades in the portion of
Anhydrite overprinting the high-sulfide-high-silica mineralization.
The Zn mineralization mostly occurs adjacent to the main mineralization
domains (MPY, HSS) and cannot be linked to any of the logged attributes. Therefore, RSC created a numerical indicator model to represent
the Zn mineralization. The global north striking anisotropy was implemented for the Zn mineralization domain. Inspection of the histogram
for Zn demonstrates a clear break around 1,500 ppm that was used to define the Zn mineralized domain (Figure 11-14).
Inspection of the grade data in Leapfrog 3-D suggests the presence of
a high-grade Zn core, and this core was modeled by selecting continuous high-grade intervals above 1% Zn.
| | 11-18 | |
| SSR Mining Inc. | Hod Maden Project | | January 7, 2026 |
| Technical Report Summary | | SLR Project No.: 123.000320.00001 |
Figure 11-14: Histogram for Zn
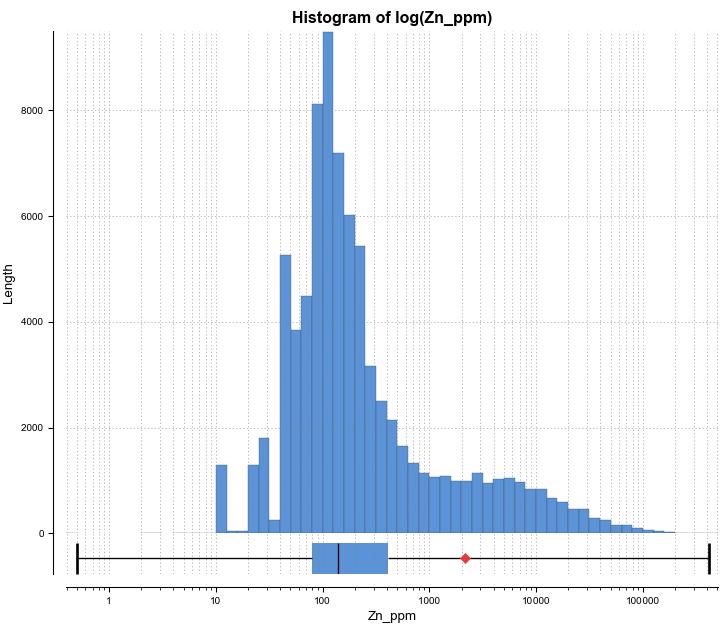
FIGURE 11-14
Histogram of log(Zn_ppm)
Length
8000
6000
4000
2000
0
1
10
100
1000
10000
100000
Zn_ppm
Source: RSC 2024
| 11.5.4 | Sulfide Sulfur, Iron and Bulk Density |
Review of composite statistics, within the primary mineralization domains,
illustrates that the mineralization domains are appropriate estimation domains for Sulfide S, Fe, and density, with domain populations
demonstrating moderate CVs and skewness.
The intersection of the Anhydrite and HSS domain was used to estimate
grades in the portion of Anhydrite overprinting the high-sulfide-high-silica mineralization.
For estimation of Sulfide S, Fe, and density, the LSEV domains modeled
for Au and Cu were combined for estimation to yield a combined LSEV domain.
The primary lithology domains were used to estimate bulk density in
the unmineralized host rock.
For carbon, the mineralization domains demonstrate strong multimodality
(Figure 11-15 and Figure 11-16) and therefore, RSC used a numerical interpolant to constrain the estimation domains for C, separating
the areas with very low concentrations of C (<0.25%), medium concentrations of C (0.5% to 3%), and relatively high concentrations of
C (>2.7%).
| | 11-19 | |
| SSR Mining Inc. | Hod Maden Project | | January 7, 2026 |
| Technical Report Summary | | SLR Project No.: 123.000320.00001 |
Figure 11-15: Multimodality for
C in MPY and HSS Domains
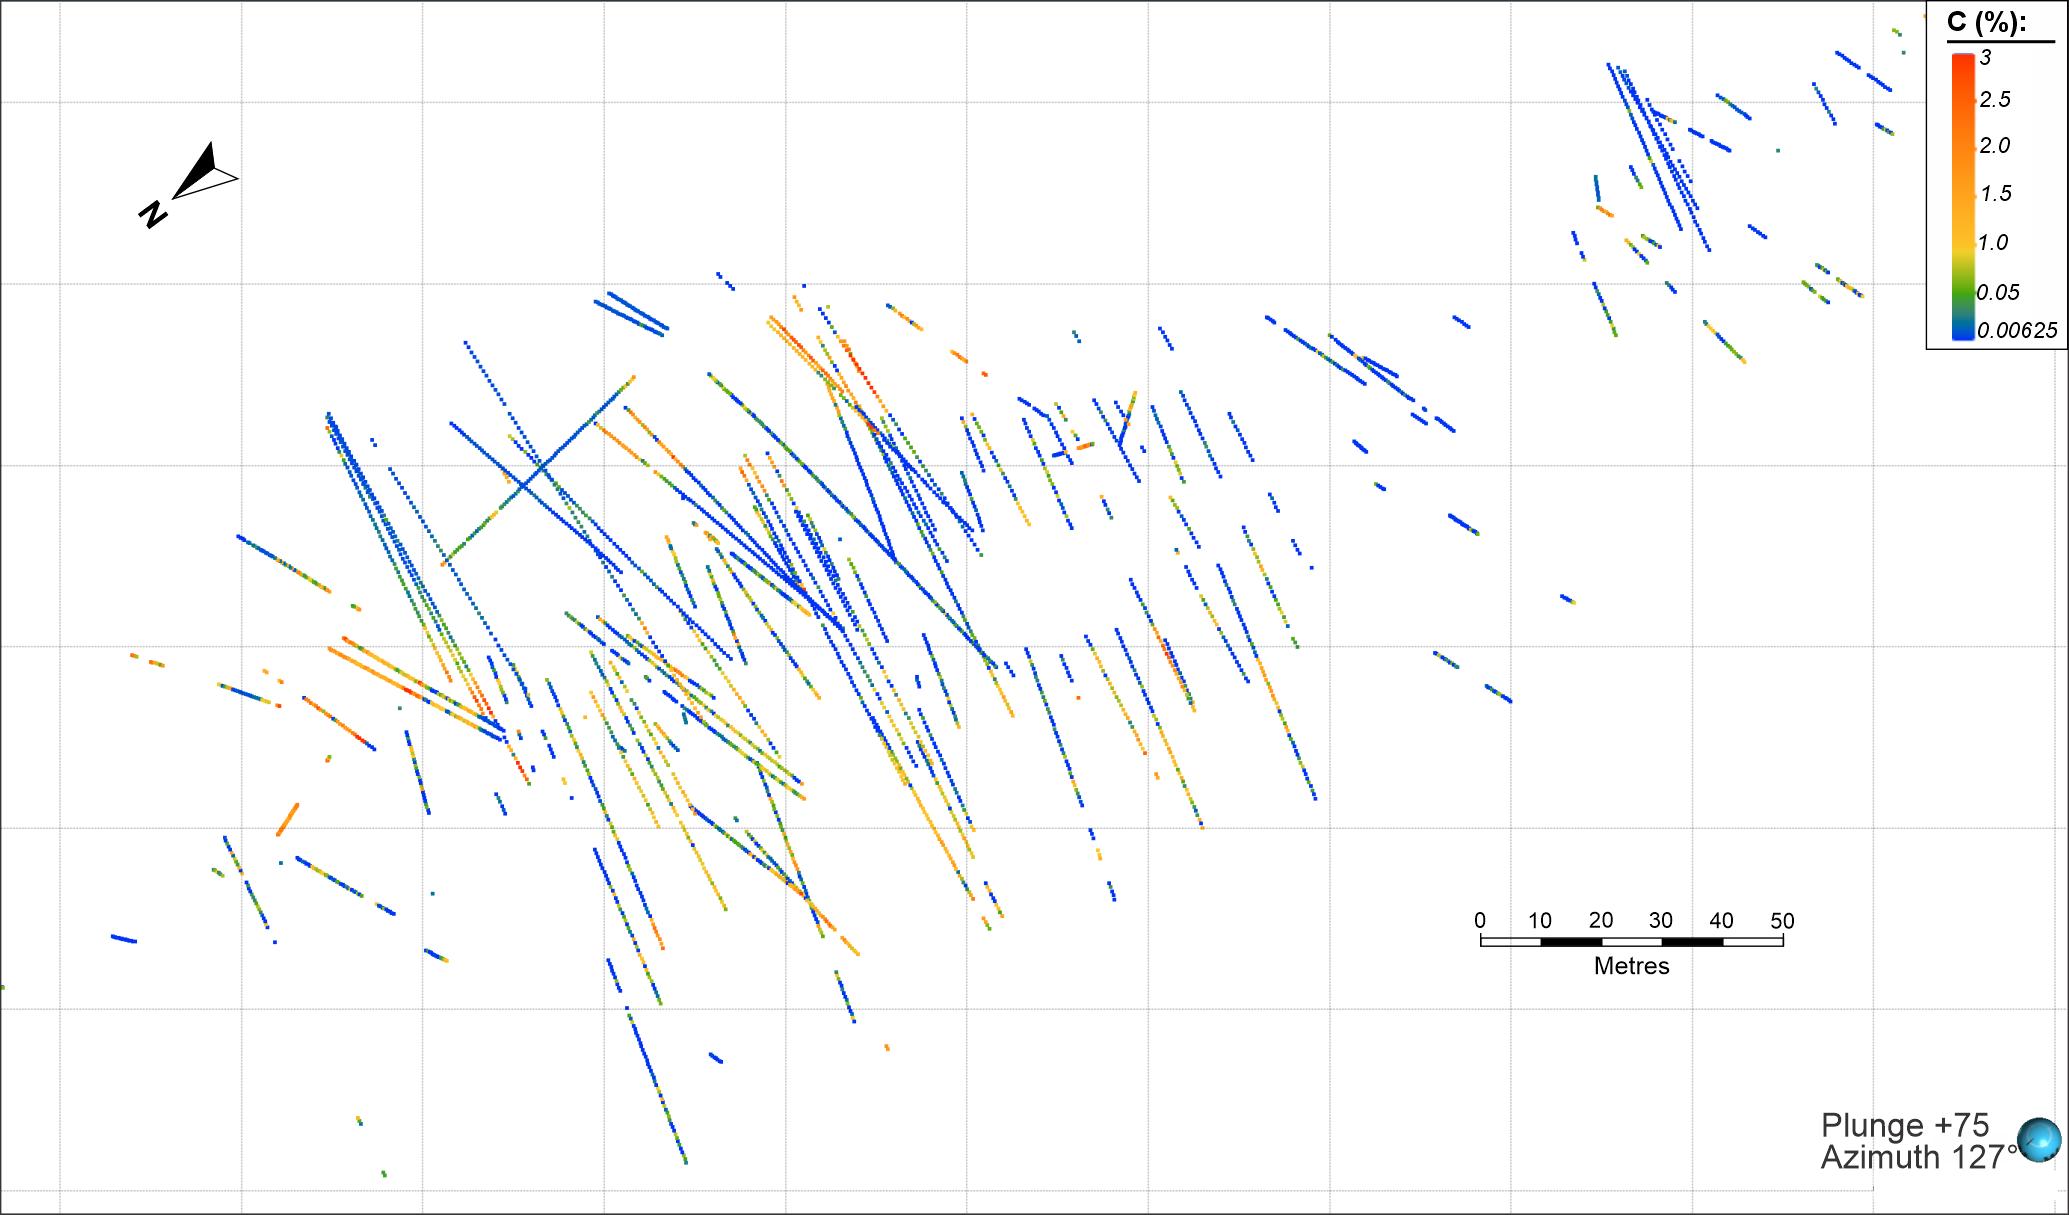
FIGURE 11-15
0
10
20
30
40
50
Metres
C (%):
3
2.5
2.0
1.5
1.0
0.05
0.00625
Plunge +75
Azimuth 127?
Source: RSC 2024
| | 11-20 | |
| SSR Mining Inc. | Hod Maden Project | | January 7, 2026 |
| Technical Report Summary | | SLR Project No.: 123.000320.00001 |
Figure 11-16: Multimodality for
C, all data
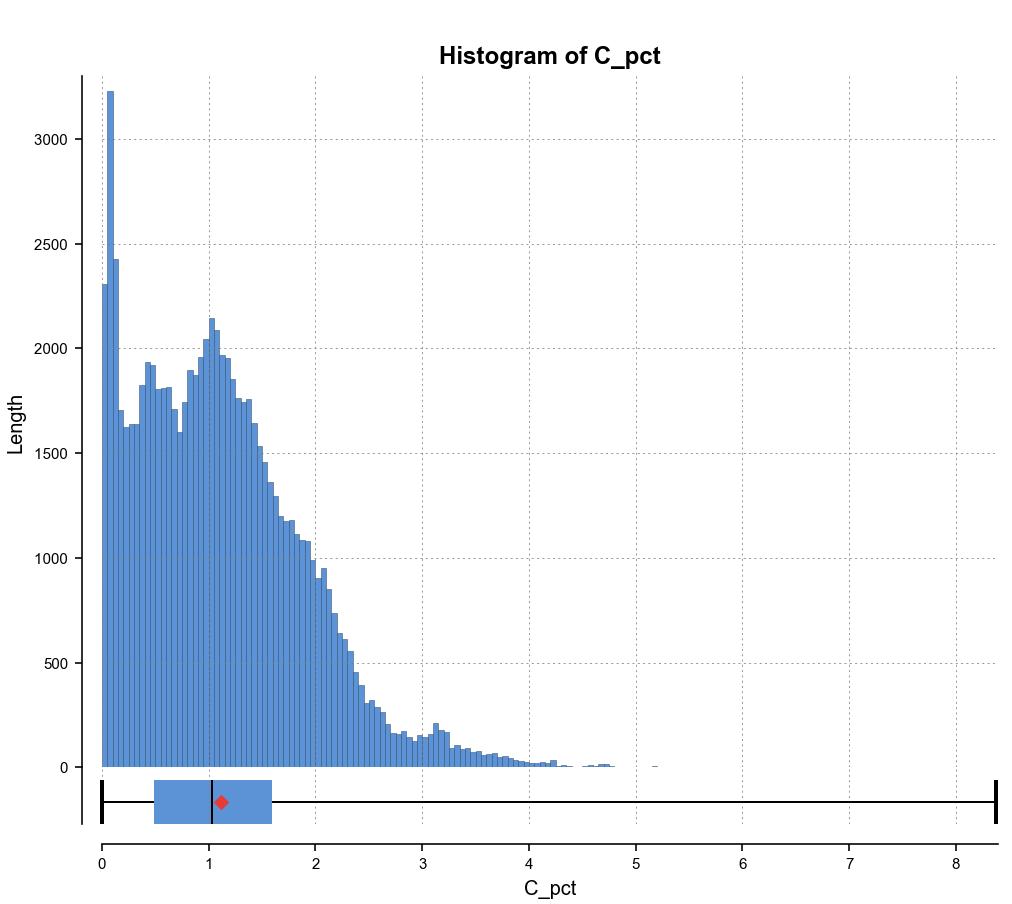
FIGURE 11-16
Histogram of C_pct
Length
3000
2500
2000
1500
1000
500
0
0
1
2
3
4
5
6
7
8
C_pct
Source: RSC 2024
| 11.5.6 | Domain Extrapolation |
No constraints were set to the extrapolation distance during the domaining
stage. However, by design, the implicit algorithms function best in areas of high data-density and therefore domain extrapolations are
‘naturally’ limited in areas of limited data. Distance to drilling was factored into the classification of the MRE.
| 11.5.7 | Alternative Interpretation and Risk in Domaining |
The RSC QP considers the interpretation of the mineralization history,
starting with the emplacement of massive pyrite and jasperoid, followed by an intermediate-sulfidation epithermal event and overprinted
by the emplacement of anhydrite, reasonably well understood.
At present, the geological logging is insufficiently detailed and presents
too many internal inconsistencies to support definition of robust mineralization and estimation domains for all mineralization styles,
except the massive pyrite. This leads the RSC QP, in places, to favor a geochemical proxy to support the mineralization and estimation
domaining workflow. The proxy model has limitations and requires further work to better understand the relationship between chemistry
and mineralogy, but is, in the RSC QP’s opinion, the only internally consistent dataset available and therefore the most robust
basis for modeling the mineralization.
Sensitivity of the global MRE to the selected modeling cut-off grades
for the HSS domain was tested as part of the sensitivity analysis; the RSC QP found that the global MRE demonstrated limited sensitivity
to the domaining thresholds. By contrast, a sensitivity analysis comparing domains based on geological logging against the chemical proxy
model demonstrated greater sensitivity of approximately 10% on contained metal in the global MRE (logging-based model < chemical proxy
model). This sensitivity highlights the need to complete the re-logging work at a scale that incorporates the broad understanding of the
mineralized system and yields a robust basis to support estimation domain definition.
| | 11-21 | |
| SSR Mining Inc. | Hod Maden Project | | January 7, 2026 |
| Technical Report Summary | | SLR Project No.: 123.000320.00001 |
The RSC QP considers the decision to sub-domain inevitable and low risk
given the strongly skewed grade populations in the geological mineralization domains. Presently, grade-based sub-domains cannot be linked
back to core observations, and it is important in revising the logging framework to put emphasis on whether the high-grade population
can be linked to core observations.
Samples were composited to 2 m inside the estimation domains, except
for the LSEV domain, for which samples were composited to 1 m to preserve resolution in the estimate. While 1 m is the dominant sample
length, considerable string effects identified in the estimate were the main reason to composite to 2 m to combat this effect. The impact
on grade and tonnage was assessed to be relatively minor on the global MRE.
Summary statistics for Au and Cu in the declustered composites are presented
in Table 11-7. Logarithmic-transform histograms are presented in Figure 11-17 and Figure 11-18. After sub-domaining, the key estimation
domains are characterized by moderately high CVs. The Anhydrite domain and some low-grade sub-domains (MPY, LSEV) still demonstrate relatively
high CVs, owing to isolated, high-grade intervals that are not sufficiently contiguous to be captured by the sub-domaining approach, as
indicated by the comparison of median, 95th percentile and maximum grades in these domains. These extreme grades were addressed in the
grade capping strategy.
Composite statistics for the minor elements are presented in Table 11-8.
Table 11-7: Declustered Composite
Statistics for Au and Cu Inside the Estimation Domains
Mineralization
Domain |
Sub-domain |
Comp
Size (m) |
Element |
Count |
Mean |
CV |
Min |
Median |
p95 |
Max |
| Anhydrite |
HSS |
2 |
Au |
731 |
3.41 |
19.05 |
0.06 |
0.4 |
7.11 |
2220.6 |
| Anhydrite |
Other |
2 |
Au |
2862 |
0.31 |
8.35 |
0.05 |
0.12 |
0.6 |
144.07 |
| LSEV |
HG |
2 |
Au |
1093 |
3.99 |
2.46 |
0.06 |
1.13 |
15.5 |
101.5 |
| LSEV |
LG |
2 |
Au |
12455 |
0.61 |
5.05 |
0.05 |
0.26 |
1.38 |
139.5 |
| HSS |
HG |
2 |
Au |
535 |
36.4 |
1.65 |
2.56 |
21.73 |
93.52 |
1080 |
| HSS |
LG |
2 |
Au |
1384 |
2.86 |
2.18 |
0.06 |
0.89 |
9.92 |
80.7 |
| MPY |
HG |
2 |
Au |
239 |
35.37 |
1.37 |
3.47 |
19.73 |
107.23 |
538 |
| MPY |
LG |
2 |
Au |
306 |
9.7 |
4.89 |
0.2 |
1.87 |
11.39 |
346 |
| LSEV |
- |
2 |
Cu |
2469 |
0.56 |
1.06 |
0 |
0.37 |
1.69 |
5.66 |
| HSS |
- |
2 |
Cu |
1907 |
1.45 |
1.06 |
0 |
0.99 |
4.93 |
11.92 |
| MPY |
- |
2 |
Cu |
536 |
3.11 |
0.88 |
0.02 |
2.3 |
8.29 |
20.53 |
| Anhydrite |
HSS |
2 |
Cu |
736 |
0.81 |
0.87 |
0 |
0.65 |
2.07 |
5.4 |
| Anhydrite |
Other |
2 |
Cu |
4265 |
0.14 |
2.31 |
0 |
0.02 |
0.7 |
5.26 |
| | 11-22 | |
| SSR Mining Inc. | Hod Maden Project | | January 7, 2026 |
| Technical Report Summary | | SLR Project No.: 123.000320.00001 |
Figure 11-17: Log-histograms for
Au in Key Estimation Domains
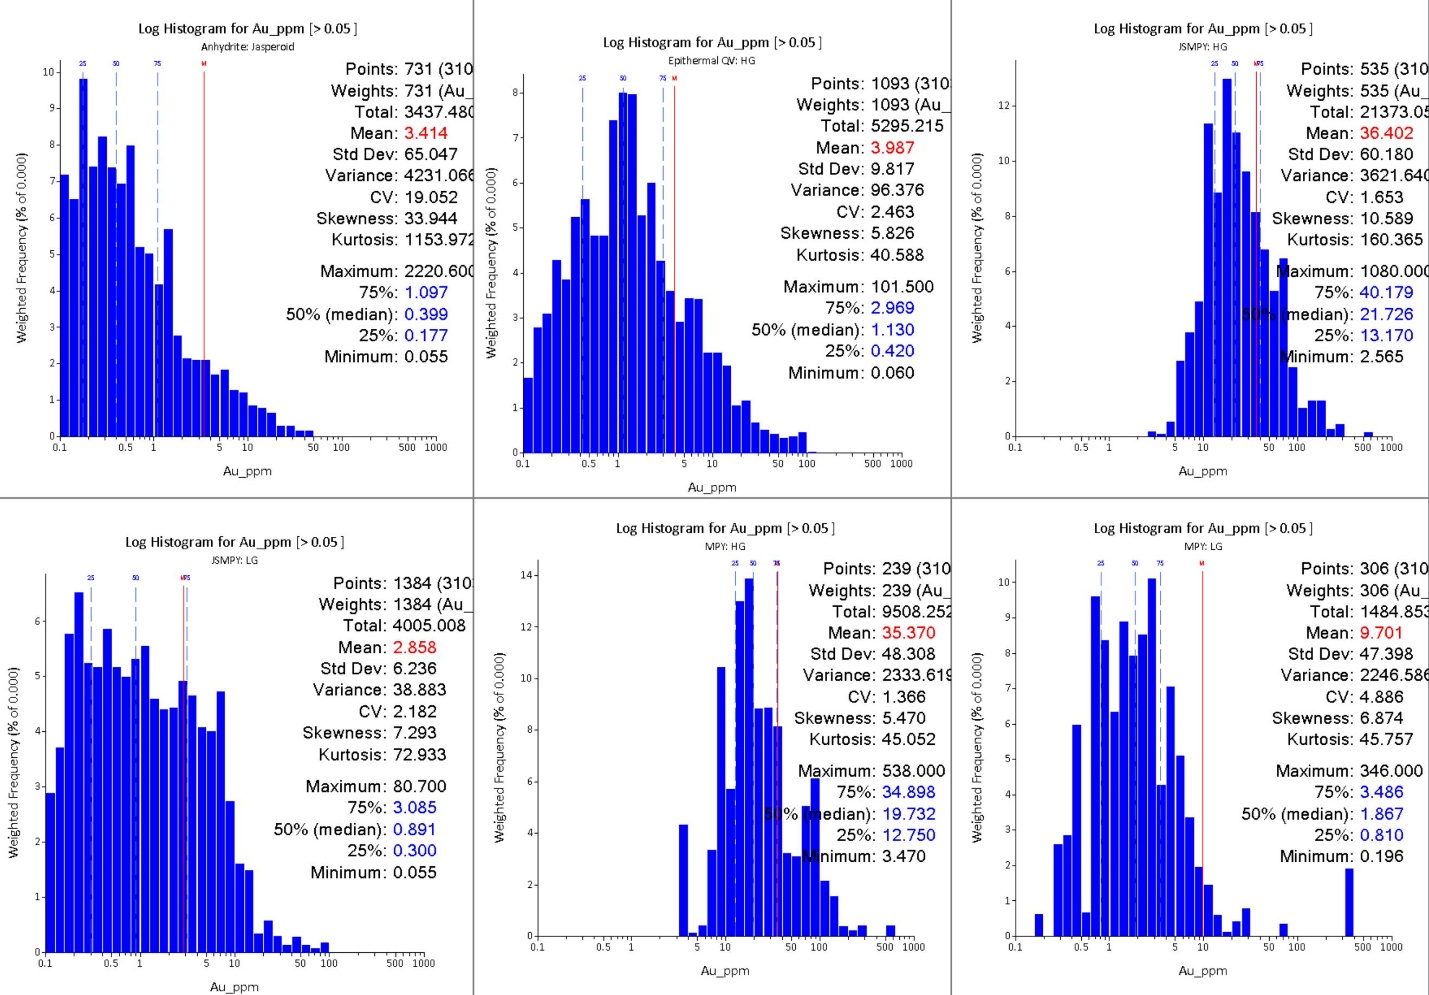
FIGURE 11-17
Log Histogram for Au_ppm [<0.05]
Anhydrite: Jasperoid
Weighted Frequency (% of 0.000)
0
1
2
3
4
5
6
7
8
9
10
0.1
0.5
1
5
10
50
100
500
1000
25
50
75
M
Points: 731 (310
Weights: 731 (Au_
Total: 3437.480
Mean: 3.414
Std Dev: 65.047
Variance: 4231.066
CV: 19.052
Skewness: 33.944
Kurtosis: 1153.972
Maximum: 2220.600
75%: 1.097
50% (median): 0.399
25%: 0.177
Minimum: 0.055
Au_ppm
Log Histogram for Au_ppm [<0.05]
Epithermal QV: HG
Weighted Frequency (% of 0.000)
0
1
2
3
4
5
6
7
8
0.1
0.5
1
5
10
50
100
500
1000
25
50
75
M
Points: 1093 (310
Weights: 1093 (Au_
Total: 5295.215
Mean: 3.987
Std Dev: 9.817
Variance: 96.376
CV: 2.463
Skewness: 5.826
Kurtosis: 40.588
Maximum: 101.500
75%: 2.969
50% (median): 1.130
25%: 0.420
Minimum: 0.060
Au_ppm
Log Histogram for Au_ppm [<0.05]
JSMPY: HG
Weighted Frequency (% of 0.000)
0
2
4
6
8
10
12
0.1
0.5
1
5
10
50
100
500
1000
25
50
M
75
Points: 535 (310
Weights: 535 (Au_
Total: 21373.05
Mean: 36.402
Std Dev: 60.180
Variance: 3621.640
CV: 1.653
Skewness: 10.589
Kurtosis: 160.365
Maximum: 1080.000
75%: 40.179
50% (median): 21.726
25%: 13.170
Minimum: 2.565
Au_ppm
Log Histogram for Au_ppm [<0.05]
JSMPY: LG
Weighted Frequency (% of 0.000)
0
1
2
3
4
5
6
0.1
0.5
1
5
10
50
100
500
1000
25
50
M
75
Points: 1384 (310
Weights: 1384 (Au_
Total: 4005.008
Mean: 2.858
Std Dev: 6.236
Variance: 38.883
CV: 2.182
Skewness: 7.293
Kurtosis: 72.933
Maximum: 80.700
75%: 3.085
50% (median): 0.891
25%: 0.300
Minimum: 0.055
Au_ppm
Log Histogram for Au_ppm [<0.05]
MPY: HG
Weighted Frequency (% of 0.000)
0
2
4
6
8
10
12
14
0.1
0.5
1
5
10
50
100
500
1000
25
50
75
M
Points: 239 (310
Weights: 239 (Au_
Total: 9508.252
Mean: 35.370
Std Dev: 48.308
Variance: 2333.619
CV: 1.366
Skewness: 5.470
Kurtosis: 45.052
Maximum: 538.000
75%: 34.898
50% (median): 19.732
25%: 12.750
Minimum: 3.470
Au_ppm
Log Histogram for Au_ppm [<0.05]
MPY: LG
Weighted Frequency (% of 0.000)
0
1
2
3
4
5
6
7
8
9
10
0.1
0.5
1
5
10
50
100
500
1000
25
50
75
M
Points: 306 (310
Weights: 306 (Au_
Total: 1484.853
Mean: 9.701
Std Dev: 47.398
Variance: 2246.586
CV: 4.886
Skewness: 6.874
Kurtosis: 45.757
Maximum: 346.000
75%: 3.486
50% (median): 1.867
25%: 0.810
Minimum: 0.196
Au_ppm
Source: RSC 2024
| | 11-23 | |
| SSR Mining Inc. | Hod Maden Project | | January 7, 2026 |
| Technical Report Summary | | SLR Project No.: 123.000320.00001 |
Figure 11-18: Log-histograms for
Cu in the Key Estimation Domains
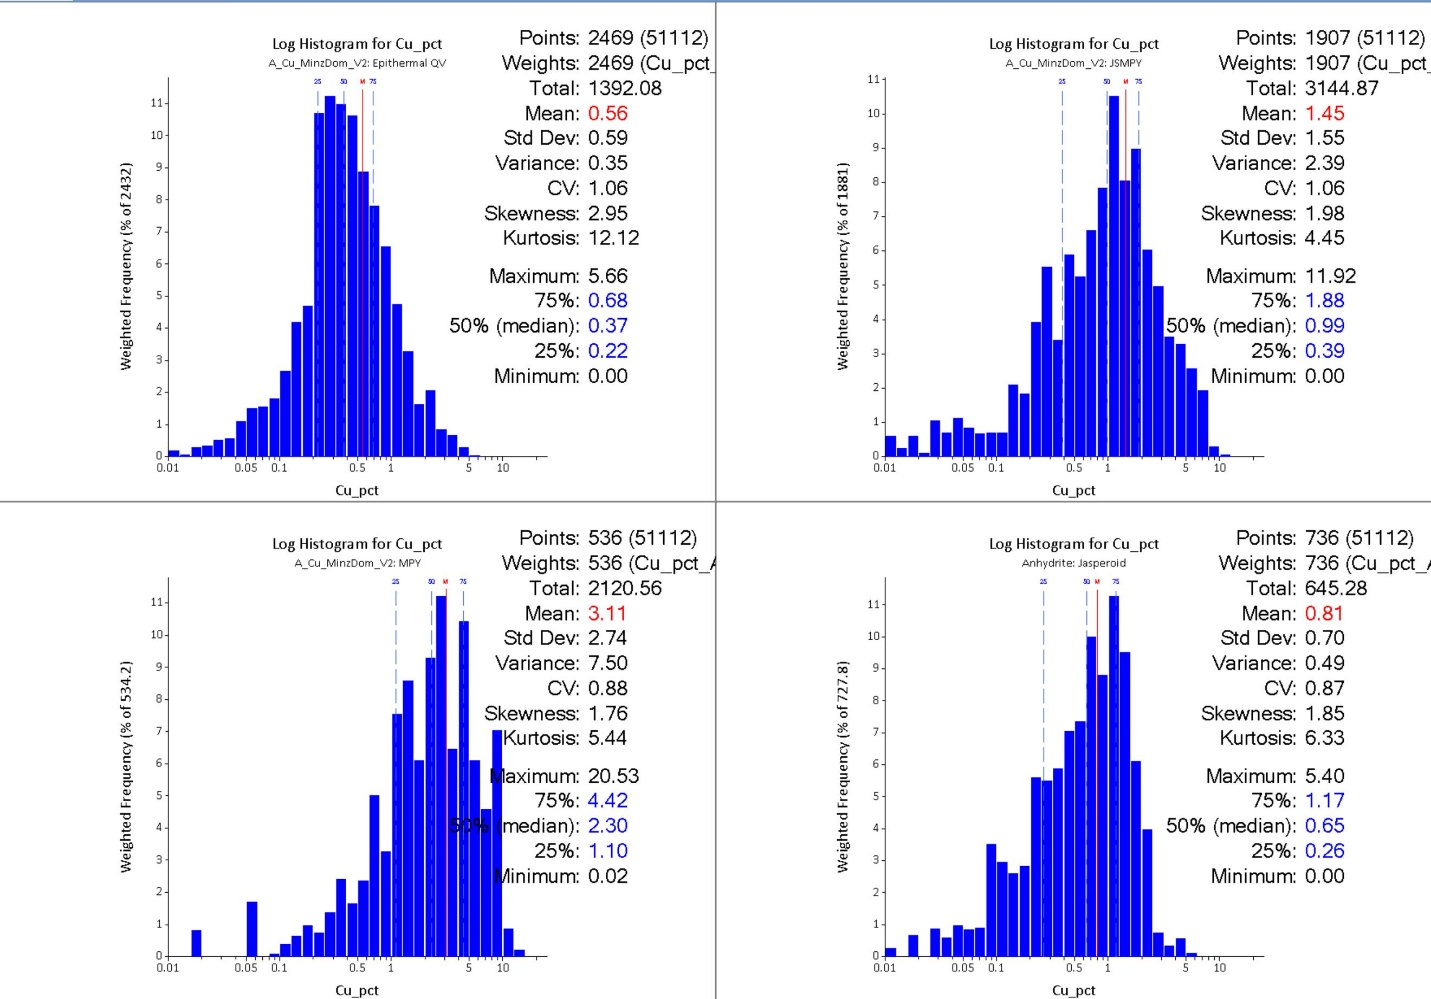
Figure 11-18
Log Histogram for Cu_pct
A_Cu_MinzDom_V2: Epithermal QV
Weighted Frequency (% of 2432)
0
1
2
3
4
5
6
7
8
9
10
11
0.01
0.05
0.1
0.5
1
5
10
25
50
M
75
Points: 2469 (51112)
Weights: 2469 (Cu_pct_
Total: 1392.08
Mean: 0.56
Std Dev: 0.59
Variance: 0.35
CV: 1.06
Skewness: 2.95
Kurtosis: 12.12
Maximum: 5.66
75%: 0.68
50% (median): 0.37
25%: 0.22
Minimum: 0.00
Cu_pct
Log Histogram for Cu_pct
A_Cu_MinzDom_V2: JSMPY
Weighted Frequency (% of 1881)
0
1
2
3
4
5
6
7
8
9
10
11
0.01
0.05
0.1
0.5
1
5
10
25
50
M
75
Points: 1907 (51112)
Weights: 1907 (Cu_pct_
Total: 3144.87
Mean: 1.45
Std Dev: 1.55
Variance: 2.39
CV: 1.06
Skewness: 1.98
Kurtosis: 4.45
Maximum: 11.92
75%: 1.88
50% (median): 0.99
25%: 0.39
Minimum: 0.00
Cu_pct
Log Histogram for Cu_pct
A_Cu_MinzDom_V2: MPY
Weighted Frequency (% of 534.2)
0
1
2
3
4
5
6
7
8
9
10
11
0.01
0.05
0.1
0.5
1
5
10
25
50
M
75
Points: 536 (51112)
Weights:536 (Cu_pct_A
Total: 2120.56
Mean: 3.11
Std Dev: 2.74
Variance: 7.50
CV: 0.88
Skewness: 1.76
Kurtosis: 5.44
Maximum: 20.53
75%: 4.42
50% (median): 2.30
25%: 1.10
Minimum: 0.02
Cu_pct
Log Histogram for Cu_pct
Anhydrite: Jasperoid
Weighted Frequency (% of 727.8)
0
1
2
3
4
5
6
7
8
9
10
11
0.01
0.05
0.1
0.5
1
5
10
25
50
M
75
Points: 736 (51112)
Weights: 736 (Cu_pct_A
Total: 645.28
Mean: 0.81
Std Dev: 0.70
Variance: 0.49
CV: 0.87
Skewness: 1.85
Kurtosis: 6.33
Maximum: 5.40
75%: 1.17
50% (median): 0.65
25%: 0.26
Minimum: 0.00
Cu_pct
Source: RSC 2024
| | 11-24 | |
| SSR Mining Inc. | Hod Maden Project | | January 7, 2026 |
| Technical Report Summary | | SLR Project No.: 123.000320.00001 |
Table 11-8: Declustered Composite
Statistics for Fe, SS and C Inside the Estimation Domains
Mineralization
Domain |
Sub-domain |
Comp Size
(m) |
Element |
Count |
Mean |
CV |
Min |
Median |
Max |
| High C |
- |
2 |
C |
590 |
3.26 |
0.18 |
0.47 |
3.18 |
4.36 |
| Low C |
- |
2 |
C |
3,593 |
0.14 |
1.13 |
0 |
0.1 |
0.36 |
| Med C |
- |
2 |
C |
34,962 |
1.16 |
0.58 |
0 |
1.08 |
2.36 |
| Anhydrite |
HSS |
2 |
Fe |
736 |
6.39 |
0.38 |
1.36 |
6.08 |
10.39 |
| Anhydrite |
Other |
2 |
Fe |
4,265 |
4.62 |
0.51 |
0.38 |
4.29 |
8.74 |
| HSS |
- |
2 |
Fe |
1,907 |
10.66 |
0.36 |
2.24 |
10.2 |
17.38 |
| MPY |
- |
2 |
Fe |
536 |
23.78 |
0.24 |
8.7 |
23.09 |
33.92 |
| Zn |
- |
2 |
Fe |
2,392 |
5.64 |
0.36 |
0.9 |
5.49 |
8.95 |
| LSEV |
- |
2 |
Fe |
7,942 |
7.9 |
0.35 |
1.2 |
7.55 |
13.06 |
| Anhydrite |
HSS |
2 |
SS |
736 |
3.54 |
0.73 |
0.05 |
3.01 |
8.25 |
| Anhydrite |
Other |
2 |
SS |
4,265 |
2.38 |
0.89 |
0.05 |
1.98 |
6.07 |
| HSS |
- |
2 |
SS |
1,905 |
8.63 |
0.51 |
0.46 |
7.84 |
16.9 |
| MPY |
- |
2 |
SS |
536 |
23.96 |
0.28 |
7.56 |
23.6 |
36 |
| Zn |
- |
2 |
SS |
2,357 |
4.08 |
0.62 |
0.05 |
3.99 |
8.4 |
| LSEV |
- |
2 |
SS |
7,783 |
6.15 |
0.53 |
0.05 |
5.66 |
12.19 |
| 11.7 | Treatment of High-Grade Assays |
After sub-domaining, only moderate grade caps were required to limit
the impact of high-grade assays. Caps were applied with a distance yield, thus allowing samples to inform the closest block and capping
grades beyond a certain distance (typically 8 m to 10 m or one block for the key estimation domains). Capping levels were set by reviewing
Mean/CV plots and striking a balance between minimizing impact of extreme grades and honoring the data distribution.
For the MPY domain, it was found that a hard cap was needed to limit
the impact of hole HTG-002, which, depending on estimation settings, may contribute up to approximately 160 koz AuEq within the MPY domain.
Hole HTG-002 was drilled down-plunge through the deposit and returned a best intercept of 90 m at 80.2 g/t Au from 19 m. Given the sensitivity
of the estimate to this particular hole, various capping strategies were tested and a cap at 100 g/t Au from 8 m was considered to sufficiently
mitigate risk associated with including this hole in the estimate. The RSC QP recommends twin- and scissor-drilling HTG-002 to reduce
the associated risk.
For the Jasperoid domain, a global cap was applied at 600 g/t Au, on
top of the distance-yielded grade cap, to limit the impact of one individual composite of 2,221 g/t Au in HTD-085, resulting from a one-meter
4,420 g/t Au intercept in the Anhydrite: HSS, which exceeds the domain median by three orders of magnitude (Figure 11-19).
| | 11-25 | |
| SSR Mining Inc. | Hod Maden Project | | January 7, 2026 |
| Technical Report Summary | | SLR Project No.: 123.000320.00001 |
Figure 11-19: HTD-085 - Highest
Grade (grams per tonne) Au Composite Occurring in the Anhydrite:HSS Sub-Domain
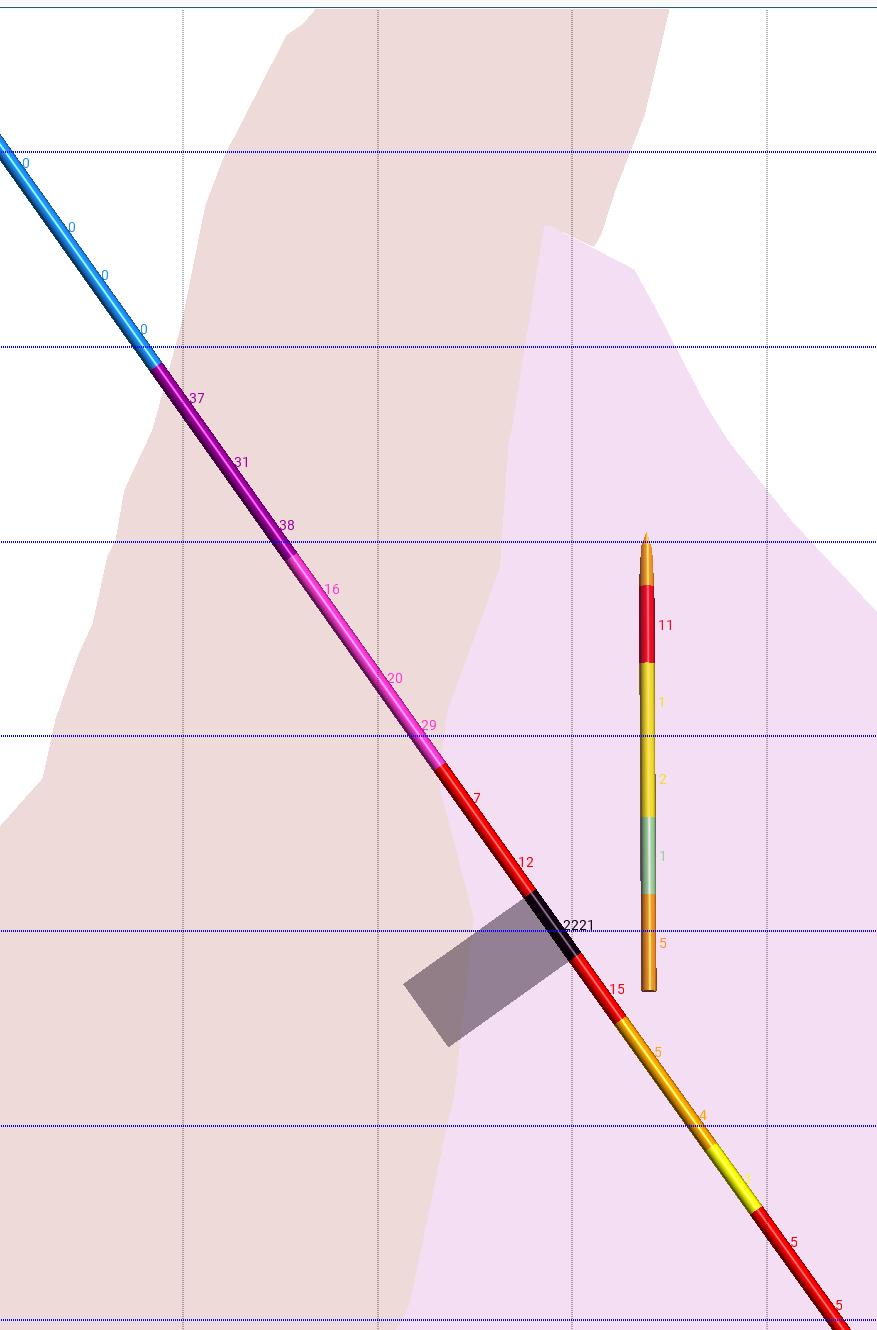
Figure 11-19
0
0
0
0
37
31
38
16
20
29
7
12
2221
15
5
4
3
5
5
11
1
2
1
5
Source: RSC 2024
Variograms were modeled on normal-score transformed data. The HSS domain
demonstrates reasonable structure and downhole variograms indicates a relative nugget of approximately 30% (Figure 11-20). For the high-grade
MPY domain, the experimental variogram shows poor structure especially in the semi-major and minor directions and the variogram fit is
relatively low confidence along these axes (Figure 11-21). For the semi-major axis, the range of the major was adopted, consistent with
the massive style of mineralization. For the minor axis, experimental variograms suggest a long range of 15 m but the structure of the
short range is poorly defined. The high-grade domains are characterized by shorter ranges (1:3) and higher nugget effect ratios (approximately
2:1) compared to the low-grade domains.
A 3-D view of the variograms for the high-grade domains is given in
Figure 11-22. A summary of the variogram parameters for Au and Cu is given in Table 11-9.
| | 11-26 | |
| SSR Mining Inc. | Hod Maden Project | | January 7, 2026 |
| Technical Report Summary | | SLR Project No.: 123.000320.00001 |
Figure 11-20: Experimental and Modeled
Variograms for Au in the HSS:HG Domain
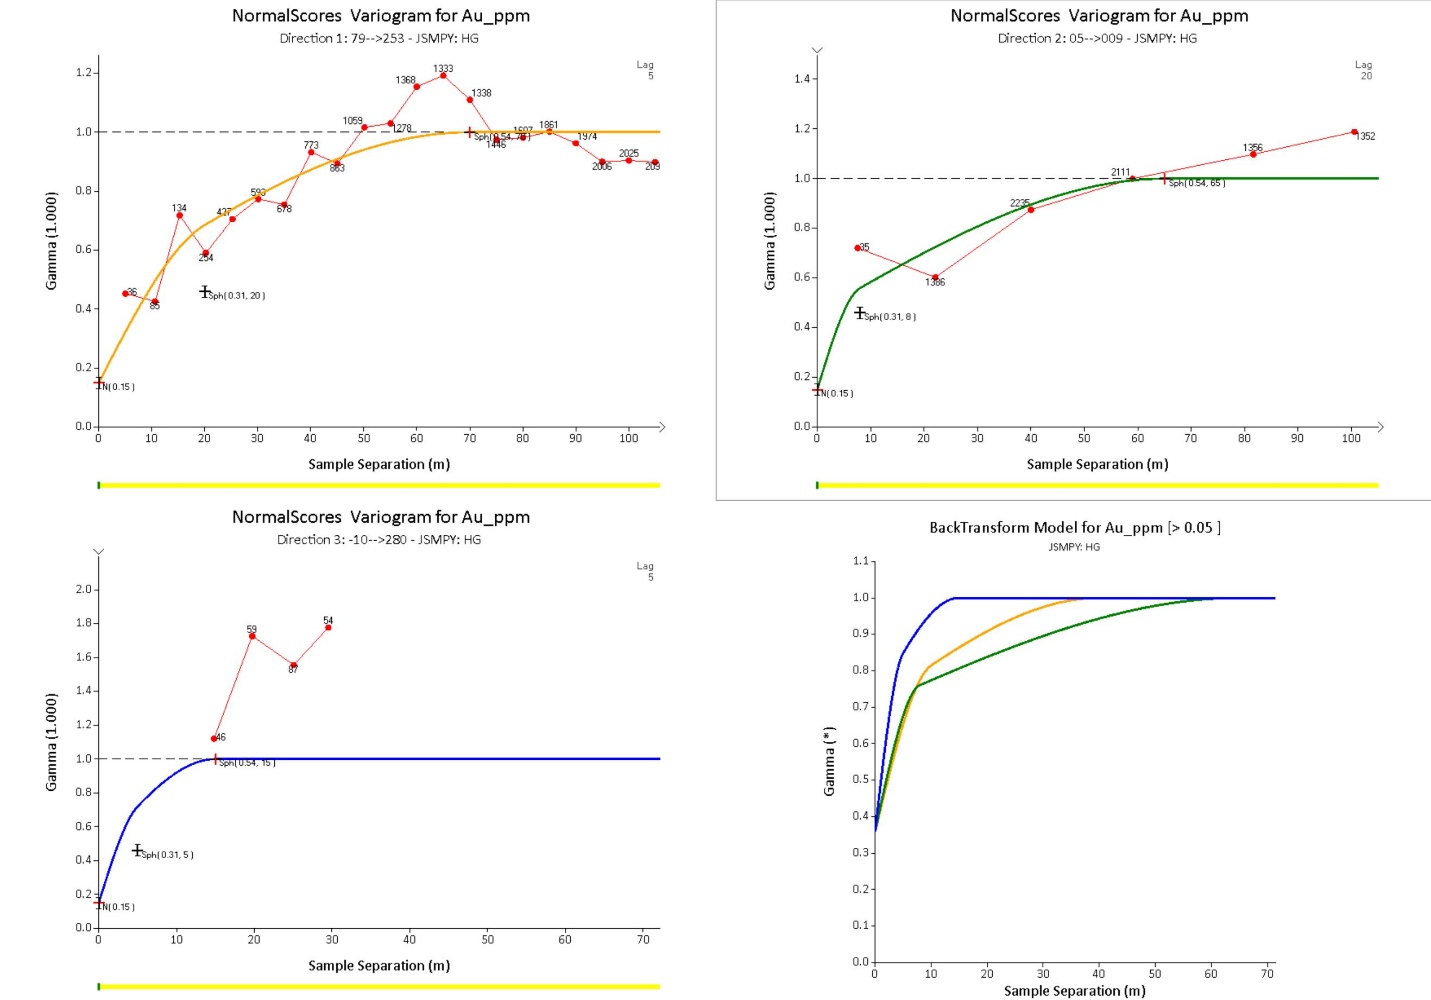
Figure 11-20
NormalScores Variogram for Au_ppm
Direction 1: 79--<253 - JSMPY: HG
Gamma (1.000)
0.0
0.2
0.4
0.6
0.8
1.0
1.2
0
10
20
30
40
50
60
70
80
90
100
N(0.15)
Sph(0.31, 20)
Sph(0.54, 75)
36
85
134
254
427
593
678
773
863
1059
1278
1368
1333
1338
1446
1607
1861
1974
2006
2025
209
Lag
5
Sample Separation (m)
NormalScores Variogram for Au_ppm
Direction 2: 05--<009 - JSMPY: HG
Gamma (1.000)
0.0
0.2
0.4
0.6
0.8
1.0
1.2
1.4
0
10
20
30
40
50
60
70
80
90
100
N(0.15)
Sph(0.31, 8)
Sph(0.54, 65)
35
1386
2235
2111
1356
1352
Lag
20
Sample Separation (m)
NormalScores Variogram for Au_ppm
Direction 3: -10--<280 - JSMPY: HG
Gamma (1.000)
0.0
0.2
0.4
0.6
0.8
1.0
1.2
1.4
1.6
1.8
2.0
0
10
20
30
40
50
60
70
N(0.15)
Sph(0.31, 5)
Sph(0.54, 15)
46
59
87
54
Lag
5
Sample Separation (m)
BackTransform Model for Au_ppm [<0.05]
JSMPY: HG
Gamma (*)
0.0
0.1
0.2
0.3
0.4
0.5
0.6
0.7
0.8
0.9
1.0
1.1
0
10
20
30
40
50
60
70
Sample Separation (m)
Source: RSC 2024
| | 11-27 | |
| SSR Mining Inc. | Hod Maden Project | | January 7, 2026 |
| Technical Report Summary | | SLR Project No.: 123.000320.00001 |
Figure 11-21: Experimental and Modeled
Variograms for Au in the MPY:HG Domain
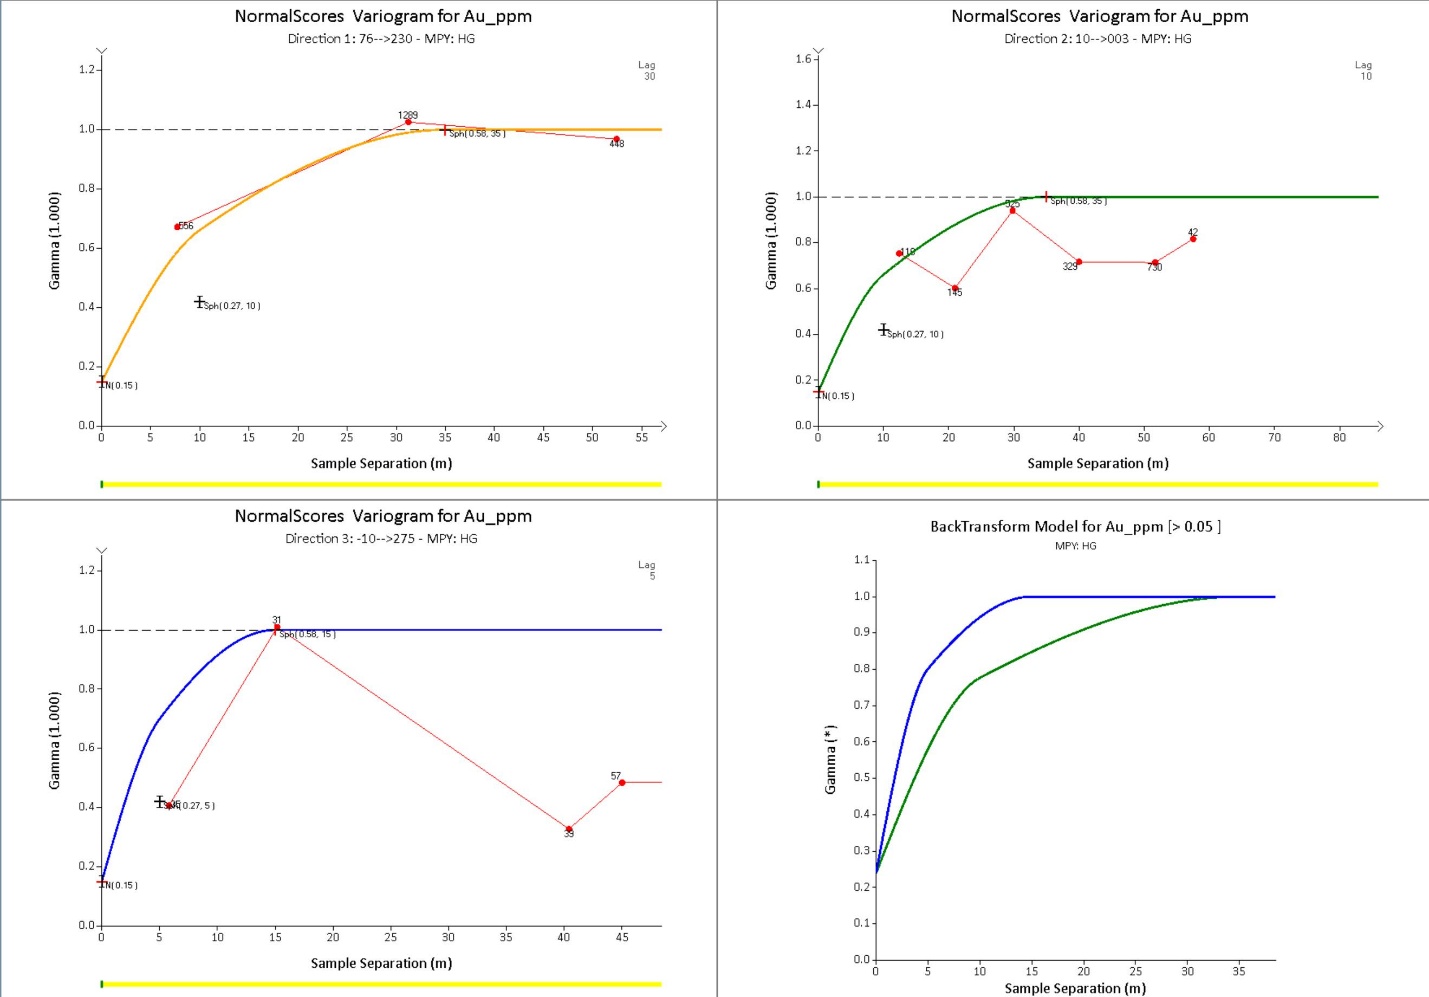
Figure 11-21
NormalScores Variogram for Au_ppm
Direction 1: 76--<230 - MPY: HG
Gamma (1.000)
0.0
0.2
0.4
0.6
0.8
1.0
1.2
0
5
10
15
20
25
30
35
40
45
50
55
N(0.15)
Sph(0.27, 10)
Sph(0.58, 35)
556
1289
448
Lag
30
Sample Separation (m)
NormalScores Variogram for Au_ppm
Direction 2: 10--<003 - MPY: HG
Gamma (1.000)
0.0
0.2
0.4
0.6
0.8
1.0
1.2
1.4
1.6
0
10
20
30
40
50
60
70
80
N(0.15)
Sph(0.27, 10)
Sph(0.58, 35)
119
145
525
329
730
42
Lag
10
Sample Separation (m)
NormalScores Variogram for Au_ppm
Direction 3: -10--<275 - MPY: HG
Gamma (1.000)
0.0
0.2
0.4
0.6
0.8
1.0
1.2
0
5
10
15
20
25
30
35
40
45
N(0.15)
Sph(0.27, 5)
Sph(0.58, 15)
35
31
39
57
Lag
5
Sample Separation (m)
BackTransform Model for Au_ppm [>0.05]
MPY: HG
Gamma (*)
0.0
0.1
0.2
0.3
0.4
0.5
0.6
0.7
0.8
0.9
1.0
1.1
0
5
10
15
20
25
30
35
Sample Separation (m)
Source: RSC 2024
| | 11-28 | |
| SSR Mining Inc. | Hod Maden Project | | January 7, 2026 |
| Technical Report Summary | | SLR Project No.: 123.000320.00001 |
Figure 11-22: Variogram Models for
the High-Grade MPY and HSS Domains
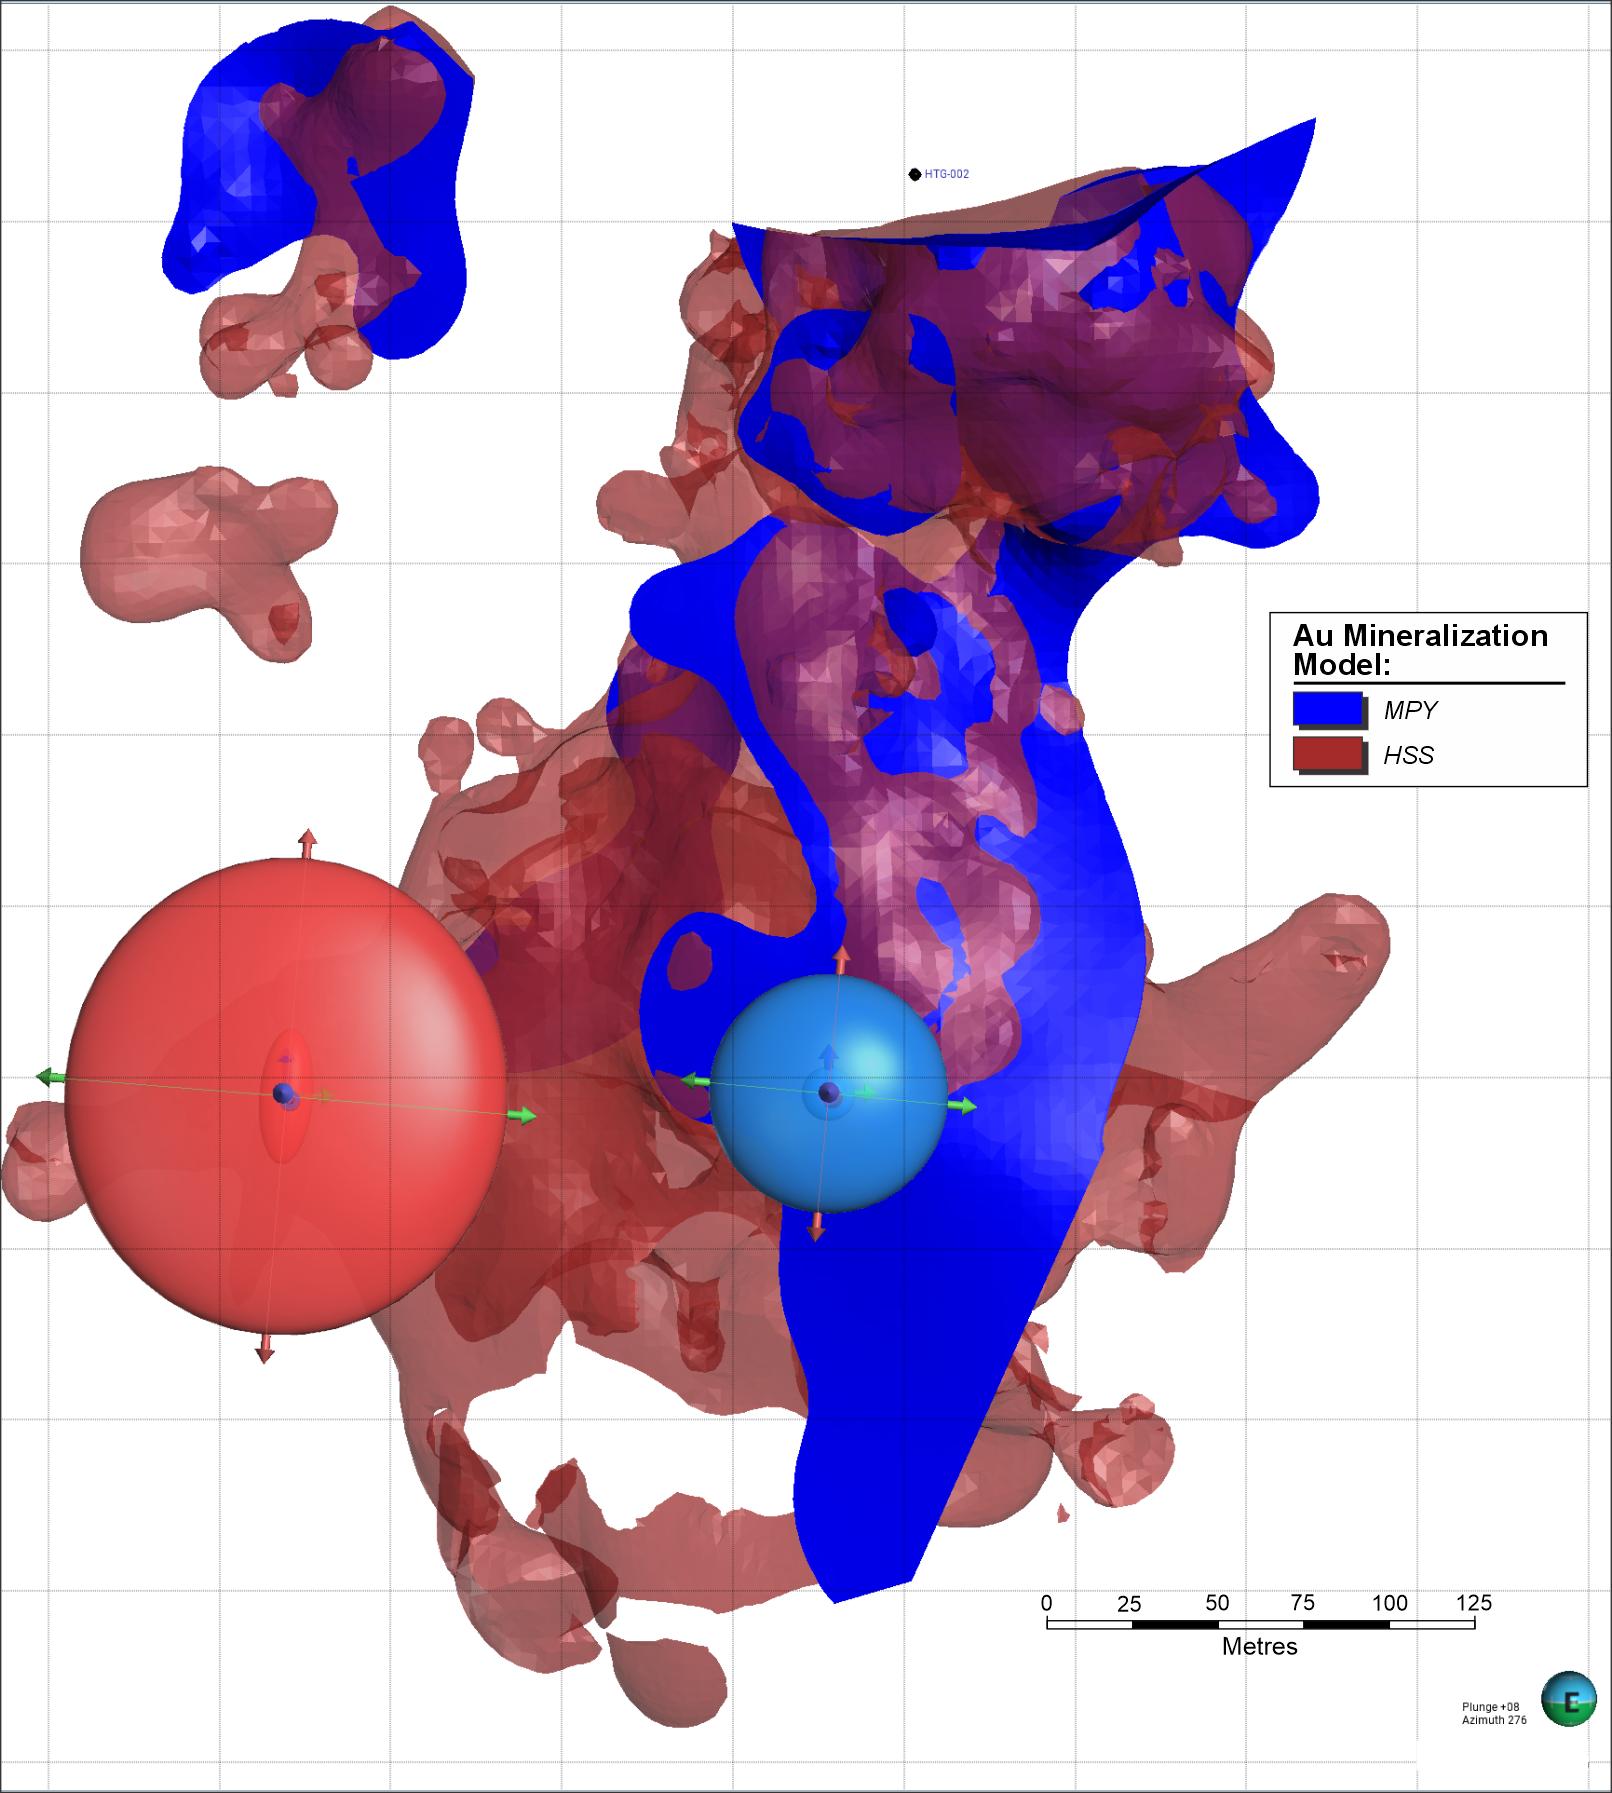
Figure 11-22
HTG-002
Au Mineralization Model:
MPY
HSS
0
25
50
70
100
125
Metres
Plunge +08
Azimuth 276
E
Source: RSC 2024
| | 11-29 | |
| SSR Mining Inc. | Hod Maden Project | | January 7, 2026 |
| Technical Report Summary | | SLR Project No.: 123.000320.00001 |
Table 11-9: Variogram Parameters
for All Domains (Au, Cu)
| |
General |
Structure 1 |
Structure 2 |
Orientation |
| Element |
Domain |
Sub-
domain |
Model
Space |
Variance |
Nugget |
Nugget Norm. |
Sill |
Sill Norm. |
Dir1 |
Dir2 |
Dir3 |
Sill |
Sill Norm. |
Dir1 |
Dir2 |
Dir3 |
Dip |
Azi |
Pitch |
| Au |
Anhydrite |
HSS |
Data |
1072 |
561 |
0.52 |
442 |
0.41 |
14 |
12 |
5 |
68.2 |
0.06 |
171 |
90 |
6 |
85 |
106 |
28 |
| Au |
Anhydrite |
Other |
Data |
0.25 |
0.09 |
0.37 |
0.11 |
0.44 |
11 |
20 |
5 |
0.05 |
0.19 |
118 |
179 |
26 |
85 |
106 |
63 |
| Au |
LSEV |
HG |
Data |
195 |
107 |
0.55 |
64.6 |
0.33 |
10 |
10 |
5 |
23.5 |
0.12 |
50 |
50 |
10 |
85 |
111 |
107 |
| Au |
LSEV |
LG |
Data |
3.31 |
1.76 |
0.53 |
1.36 |
0.41 |
25 |
35 |
2 |
0.19 |
0.06 |
319 |
219 |
8 |
85 |
97 |
144 |
| Au |
HSS |
HG |
Data |
4287 |
1238 |
0.29 |
1850 |
0.43 |
20 |
8 |
5 |
1196 |
0.28 |
70 |
65 |
15 |
80 |
99 |
94 |
| Au |
HSS |
LG |
Data |
29.3 |
4.48 |
0.15 |
12.2 |
0.42 |
15 |
15 |
15 |
12.6 |
0.43 |
200 |
120 |
25 |
80 |
99 |
91 |
| Au |
MPY |
HG |
Data |
3840 |
970 |
0.25 |
1427 |
0.37 |
8 |
8 |
5 |
1437 |
0.37 |
35 |
35 |
15 |
81 |
96 |
95 |
| Au |
MPY |
LG |
Data |
411 |
159 |
0.39 |
203 |
0.49 |
18 |
35 |
8 |
48.7 |
0.12 |
45 |
65 |
35 |
81 |
96 |
108 |
| Cu |
Anhydrite |
HSS |
Data |
0.69 |
0.21 |
0.30 |
0.18 |
0.26 |
20 |
12 |
2 |
0.30 |
0.44 |
90 |
70 |
13 |
85 |
97 |
59 |
| Cu |
Anhydrite |
Other |
Data |
0.07 |
0.03 |
0.38 |
0.02 |
0.34 |
50 |
15 |
5 |
0.02 |
0.28 |
150 |
75 |
15 |
85 |
106 |
166 |
| Cu |
HSS |
- |
Data |
2.75 |
0.71 |
0.26 |
0.97 |
0.35 |
20 |
8 |
5 |
1.07 |
0.39 |
150 |
73 |
20 |
82 |
98 |
94 |
| Cu |
MPY |
- |
Data |
8.29 |
1.79 |
0.22 |
2.33 |
0.28 |
15 |
15 |
8 |
4.15 |
0.50 |
45 |
33 |
18 |
77 |
83 |
99 |
| Cu |
LSEV |
- |
Data |
0.50 |
0.21 |
0.42 |
0.24 |
0.48 |
15 |
10 |
2 |
0.05 |
0.10 |
140 |
125 |
15 |
85 |
97 |
53 |
| | 11-30 | |
| SSR Mining Inc. | Hod Maden Project | | January 7, 2026 |
| Technical Report Summary | | SLR Project No.: 123.000320.00001 |
Grades were estimated into parent blocks of 5 m by 10 m by 10 m (x-y-z),
and sub-blocked to 1.25 m by 2.5 m by 2.5 m to honor domain boundaries (Table 11-10). A 10 m block size in the y-direction corresponds
with roughly half the drill spacing in the center of the deposit. Sensitivity to the block size was tested as part of the sensitivity
analysis and found to be minimal. Discretization was set to 5 x 5 x 6 discretization points, consistent with six 2 m composites per 10
m block (z-dimension) based on an average 60° dip of the holes.
Table 11-10: Block Model Description
| Parameter |
X |
Y |
Z |
| Parent block size (m) |
5 |
10 |
10 |
| Sub-block size (m) |
1.25 |
2.5 |
2.5 |
| Sub-block divisions |
4 |
4 |
4 |
| Minimum parent centroid |
740,102.5 |
4,541,405 |
145 |
| Maximum parent centroid |
740,942.5 |
4,542,615 |
1,055 |
| Minimum corner |
740,100 |
4,541,400 |
140 |
| Maximum corner |
740,945 |
4,542,620 |
1,060 |
| Size (m) |
845 |
1220 |
930 |
| Azimuth (°) |
0 |
|
|
| Dip (°) |
0 |
| Pitch (°) |
0 |
| 11.10 | Search Neighborhood Parameters |
All grades were interpolated using ordinary kriging (OK). The RSC QP
used a dynamic search ellipsoid for all domains to capture the variable orientations of the grade.
Search parameters (Table 11-11) were optimized to minimize conditional
bias and ensure that sufficient drill holes inform the blocks. This resulted in the use of search ellipsoids, approximately 100% to 300%
of the variogram range, to ensure that all blocks were estimated. The MPY and HSS domains were estimated with a double search pass to
ensure that the grade trend along the z-axis was honored in the model, especially for Au. The first pass was typically 100% to 150% the
range of the variogram, and the second pass 200% or 300% of the variogram range, whichever was needed to fill the blocks.
To limit the impact of individual drill holes (specifically HTG-002),
the maximum number of samples per drill hole was set to two composites on the first pass (i.e. four 1 m samples) and four composites on
the second pass. In the model validation process, this approach was found to provide better results than using alternative search strategies,
such as octant searches, which were found to have undesired side effects near the margins of the domains where all samples are located
on one side of the ellipsoid. The impact of hole HTG-002 was tested in the sensitivity analysis and found to be significant for the MPY
domain. This impact was considered in the search and grade-capping strategy and various search strategies were benchmarked to limit the
risk associated with this single hole. The RSC QP notes that hole HTG-002 was not included in the previous (2019) MRE update.
| | 11-31 | |
| SSR Mining Inc. | Hod Maden Project | | January 7, 2026 |
| Technical Report Summary | | SLR Project No.: 123.000320.00001 |
Table 11-11: Kriging Neighborhood
Settings for All Domains (Au, Cu)
| Element |
Domain |
PASS |
Dir1
(m) |
Dir2
(m) |
Dir3
(m) |
Variable
Orientation |
Min.
Comps |
Max.
Comps |
Capping
Method |
Distance
(%) |
Cap
(ppm)
|
Max.
Comps
per Hole |
| Au |
Anhydrite:
Other |
1 |
120 |
120 |
40 |
YES |
2 |
24 |
Distance
Yield |
20 |
3.3 |
2 |
| Au |
Anhydrite:
HSS |
1 |
150 |
150 |
70 |
YES |
3 |
24 |
Distance
Yield |
7 |
20 |
2 |
| Au |
LSEV:
HG |
1 |
150 |
150 |
40 |
YES |
2 |
24 |
Distance
Yield |
7 |
63 |
8 |
| Au |
LSEV:
LG |
1 |
200 |
200 |
60 |
YES |
2 |
24 |
Distance
Yield |
10 |
7.5 |
8 |
| Au |
HSS:
HG |
1 |
65 |
65 |
25 |
YES |
12 |
24 |
Distance
Yield |
15 |
350 |
2 |
| Au |
HSS:
HG |
2 |
100 |
100 |
45 |
YES |
3 |
24 |
Distance
Yield |
10 |
350 |
4 |
| Au |
HSS:
LG |
1 |
65 |
65 |
25 |
YES |
12 |
24 |
Distance
Yield |
15 |
24 |
2 |
| Au |
HSS:
LG |
2 |
150 |
150 |
50 |
YES |
3 |
24 |
Distance
Yield |
7 |
24 |
4 |
| Au |
MPY:
HG |
1 |
40 |
40 |
20 |
YES |
12 |
24 |
Distance
Yield |
20 |
100 |
2 |
| Au |
MPY:
HG |
2 |
90 |
75 |
40 |
YES |
3 |
24 |
Distance
Yield |
10 |
100 |
4 |
| Au |
MPY:
LG |
1 |
65 |
65 |
20 |
YES |
12 |
24 |
Distance
Yield |
15 |
15 |
2 |
| Au |
MPY:
LG |
2 |
150 |
150 |
40 |
YES |
3 |
24 |
Distance
Yield |
7 |
27 |
4 |
| Cu |
Anhydrite:
HSS |
1 |
150 |
90 |
45 |
YES |
2 |
24 |
Distance
Yield |
10 |
7 |
2 |
| Cu |
Anhydrite:
Other |
1 |
180 |
150 |
45 |
YES |
2 |
24 |
Distance
Yield |
10 |
7 |
2 |
| Cu |
HSS |
1 |
50 |
50 |
25 |
YES |
12 |
24 |
Distance
Yield |
15 |
3.5 |
2 |
| Cu |
HSS |
2 |
100 |
100 |
35 |
YES |
3 |
24 |
Distance
Yield |
7 |
3.5 |
4 |
| Cu |
MPY |
1 |
50 |
50 |
25 |
YES |
12 |
24 |
Distance
Yield |
15 |
4.5 |
2 |
| Cu |
MPY |
2 |
100 |
100 |
35 |
YES |
3 |
24 |
Distance
Yield |
8 |
4.5 |
4 |
| Cu |
LSEV |
1 |
220 |
220 |
45 |
YES |
2 |
24 |
Distance
Yield |
10 |
2 |
8 |
| | 11-32 | |
| SSR Mining Inc. | Hod Maden Project | | January 7, 2026 |
| Technical Report Summary | | SLR Project No.: 123.000320.00001 |
A large number of density measurements is available for the Hod Maden
Project; bulk density was estimated by ordinary kriging in the mineralization domains and lithology domains. Domain statistics for bulk
density are presented in Table 11-12. Insufficient density measurements are available for the transitional and oxidized zones, and these
could not be separated for estimation.
Table 11-12: Hod Maden Density Statistics
for Lithology Domains
| Domain |
Count |
Mean
(g/cm3) |
CV |
Min |
Median |
p95 |
Max |
| Andesite Breccia |
854 |
2.81 |
0.05 |
2.59 |
2.79 |
3.02 |
4.49 |
| Anhydrite: HSS |
224 |
2.94 |
0.05 |
2.52 |
2.93 |
3.2 |
3.74 |
| Anhydrite: Other |
941 |
2.93 |
0.05 |
2.4 |
2.94 |
3.11 |
4.04 |
| Dacite Breccia |
2304 |
2.87 |
0.04 |
2.35 |
2.86 |
3.09 |
4.04 |
| Epiclastics |
964 |
2.83 |
0.05 |
2.4 |
2.82 |
3.07 |
3.69 |
| LSEV |
1581 |
2.89 |
0.06 |
1.87 |
2.85 |
3.22 |
4.38 |
| HSS |
506 |
2.97 |
0.06 |
2.59 |
2.93 |
3.31 |
4 |
| MPY |
53 |
3.58 |
0.12 |
2.61 |
3.59 |
4.25 |
4.28 |
| Rhyodacite |
131 |
2.67 |
0.02 |
2.6 |
2.66 |
2.76 |
2.93 |
| Zn |
439 |
2.84 |
0.06 |
2.38 |
2.83 |
3.09 |
4.39 |
The estimate was validated through conventional procedures including
swath plots (Figure 11-23 to Figure 11-27), global mean comparisons and visual validations (Figure 11-28 and Figure 11-29). Individual
blocks high-grade blocks were investigated to ensure these were well informed and accurately represent the local grade distribution.
Swath plots demonstrate that grade trends are accurately reproduced
with an appropriate level of smoothing.
Negative kriging weights were found in a handful of blocks but did not
result in negative grades.
| | 11-33 | |
| SSR Mining Inc. | Hod Maden Project | | January 7, 2026 |
| Technical Report Summary | | SLR Project No.: 123.000320.00001 |
Figure 11-23: Swath Plots and Log-Histogram
for Au, Comparing Input Data and Block Grades in the HSS:HG Domain
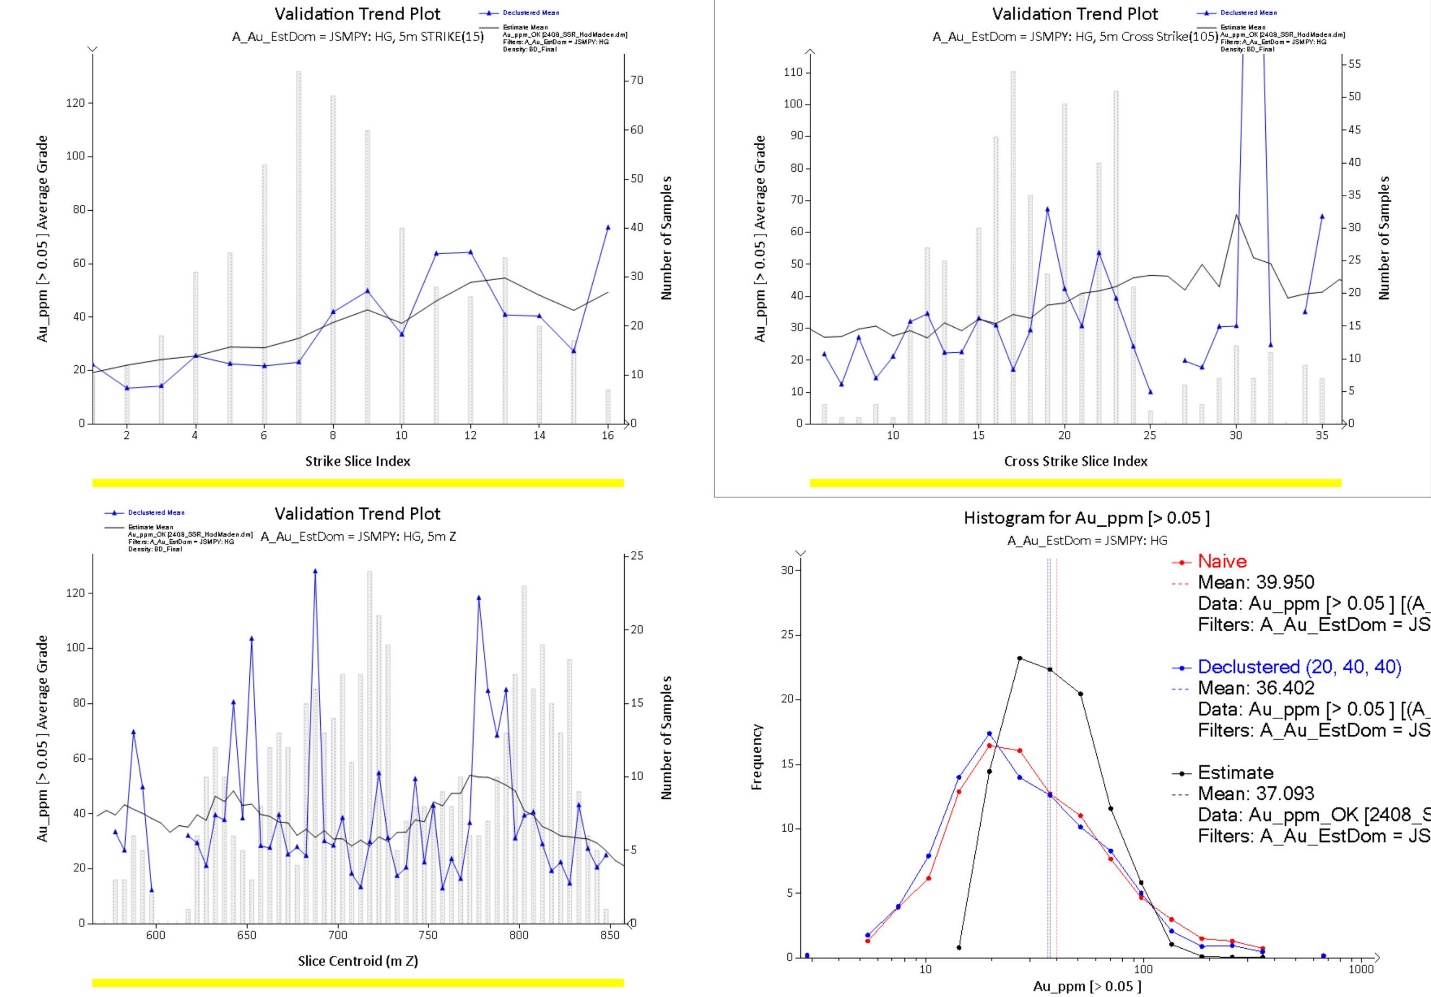
Figure 11-23
Validation Trend Plot
A_Au_EstDom = JSMPY: HG, 5m STRIKE(15)
Declustered Mean
Estimated Mean
Au_ppm_OK [2408_SSR_
: A_Au_ - JSMPY: HG
-8D_Final
Au_ppm [>0.05] Average Grade
0
20
40
60
80
100
120
2
4
6
8
10
12
14
16
Strike Slice Index
0
10
20
30
40
50
60
70
Number of Samples
Validation Trend Plot
A_Au_EstDom = JSMPY: HG, 5m Cross Strike(105)
Declustered Mean
Estimated Mean
Au_ppm_OK [2409_SSR_
A_Au_ - JSMPY: HG
Density: BD_Final
Au_ppm [>0.05] Average Grade
0
10
20
30
40
50
60
70
80
90
100
110
10
15
20
25
30
35
Cross Strike Slice Index
0
5
10
15
20
25
30
35
40
45
50
55
Number of Samples
Validation Trend Plot
A_Au_EstDom = JSMPY: HG, 5m Z
Declustered Mean
Estimated Mean
Au_ppm_OK [2408_SSR_
Filters: A_Au_ - JSMPY: HG
Density: BD_Final
Au_ppm [>0.05] Average Grade
0
20
40
60
80
100
120
600
650
700
750
800
850
Slice Centroid (m Z)
0
5
10
15
20
25
Number of Samples
Histogram for Au_ppm [>.0.05]
A_Au_EstDom = JSMPY: HG
Naive
Mean: 39.950
Data: Au_ppm [>0.05] [(A_
Filters: A_Au_EstDom = JS
Declustered (20, 40, 40)
Mean: 36.402
Data: Au_ppm [>0.05] [(A_
Filters: A_Au_EstDom = JS
Estimate
Mean: 37.093
Data: Au_ppm_OK [2408_S
Filters: A_Au_EstDom = JS
Frequency
0
5
10
15
20
25
30
10
100
1000
Au_ppm [>0.05]
Source: RSC 2024
| | 11-34 | |
| SSR Mining Inc. | Hod Maden Project | | January 7, 2026 |
| Technical Report Summary | | SLR Project No.: 123.000320.00001 |
Figure 11-24: Swath Plots and Log-Histogram
for Au, Comparing Input Data and Block Grades in the MPY:HG Domain
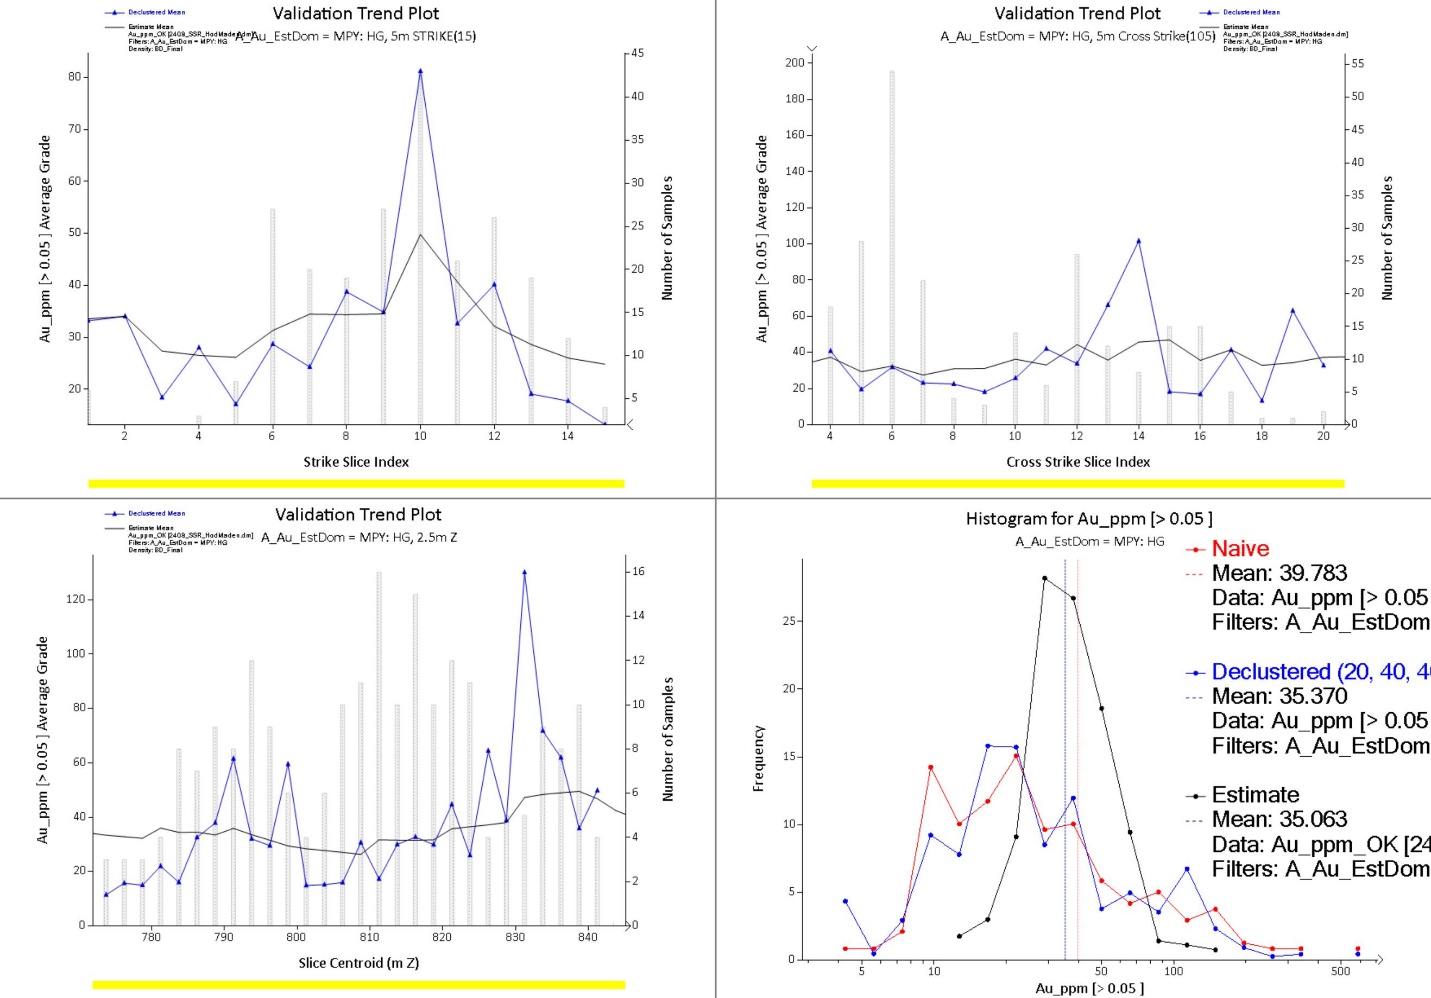
Figure 11-24
Validation Trend Plot
A_Au_EstDom = MPY: HG, 5m STRIKE(15)
Declustered Mean
Estimated Mean
Au_ppm_OK [2409_SSR_
Filers: A)_Au_EstDom - MPY: HG
Desnsity: BD_Final
Au_ppm [>0.05] Average Grade
20
30
40
50
60
70
80
2
4
6
8
10
12
14
Strike Slice Index
5
10
15
20
25
30
35
40
45
Number of Samples
Validation Trend Plot
A_Au_EstDom = MPY: HG, 5m Cross Strike(105)
Declustered Mean
Estimated Mean
Au_ppm_OK [2409_SSR_
Filers: A_Au_EstDom - MPY: HG
Density: BD_Final
Au_ppm [>0.05] Average Grade
0
20
40
60
80
100
120
140
160
180
200
4
6
8
10
12
14
16
18
20
Cross Strike Slice Index
0
5
10
15
20
25
30
35
40
45
50
55
Number of Samples
Validation Trend Plot
A_Au_EstDom = MPY: HG, 2.5m Z
Declustered Mean
Estimated Mean
Au_ppm_OK [2409_SSR_
Filers: A_Au_EstDom - MPY: HG
Density: BD_Final
Au_ppm [>0.05] Average Grade
0
20
40
60
80
100
120
780
790
800
810
820
830
840
Slice Centroid (m Z)
0
2
4
6
8
10
12
14
16
Number of Samples
Histogram for Au_ppm [>0.05]
A_Au_EstDom = MPY: HG
Naive
Mean: 39.783
Data: Au_ppm [>0.05
Filters: A_Au_EstDom
Declustered (20, 40, 4
Mean: 35.370
Data: Au_ppm [>0.05
Filters: A_Au_EstDom
Estimate
Mean: 35.063
Data: Au_ppm_OK [24
Filters: A_Au_EstDom
Frequency
0
5
10
15
20
25
5
10
50
100
500
Au_ppm [>0.05]
Source: RSC 2024
| | 11-35 | |
| SSR Mining Inc. | Hod Maden Project | | January 7, 2026 |
| Technical Report Summary | | SLR Project No.: 123.000320.00001 |
Figure 11-25: Swath Plots and Log-Histogram
for Au, Comparing Input Data and Block Grades in the HSS:LG Domain
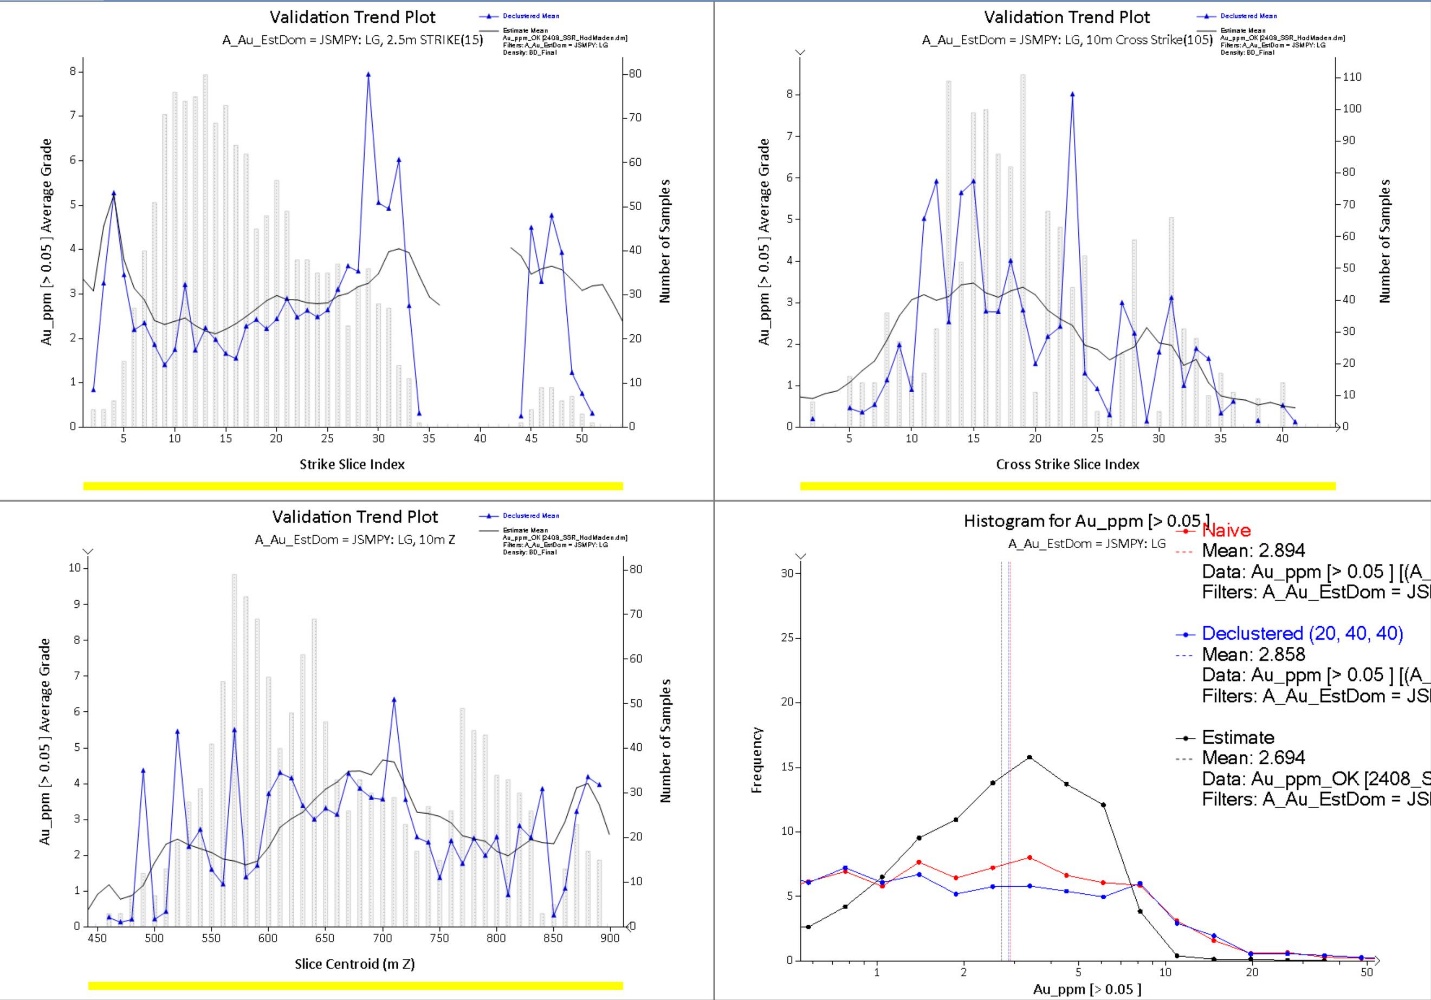
Figure 11-25
Validation Trend Plot
A_Au_EstDom = JSMPY: LG, 2.5m STRIKE(15)
Declustered Mean
Estimated Mean
Au_ppm_OK [2409_SSR_
Filters: A_Au_ - JSMPY: LG
Density: BD_Final
Au_ppm [>0.05] Average Grade
0
1
2
3
4
5
6
7
8
5
10
15
20
25
30
35
40
45
50
Strike Slice Index
0
10
20
30
40
50
60
70
80
Number of Samples
Validation Trend Plot
A_Au_EstDom = JSMPY: LG, 10m Cross Strike(105)
Declustered Mean
Estimated Mean
Au_ppm_OK [2409_SSR_
Filters: A_Au_ - JSPMY: LG
Density: BD_Final
Au_ppm [>0.05] Average Grade
0
1
2
3
4
5
6
7
8
5
10
15
20
25
30
35
40
Cross Strike Slice Index
0
10
20
30
40
50
60
70
80
90
100
110
Number of Samples
Validation Trend Plot
A_Au_EstDom = JSMPY: LG, 10m Z
Declustered Mean
Estimated Mean
Au_ppm_OK [2409_SSR_
Filters: A_Au_ - JSMPY: LG
Density: BD_Final
Au_ppm [>0.05] Average Grade
0
1
2
3
4
5
6
7
8
9
10
450
500
550
600
650
700
750
800
850
900
Slice Centroid (m Z)
0
10
20
30
40
50
60
70
80
Number of Samples
Histogram for Au_ppm [>0.05]
A_Au_EstDom = JSMPY: LG
Naive
Mean: 2.894
Data: Au_ppm [> 0.05] [(A_
Filters: A_Au_EstDom = JS
Declustered (20, 40, 40)
Mean: 2.858
Data: Au_ppm [> 0.05] [(A_
Filters: A_Au_EstDom = JS
Estimate
Mean: 2.694
Data: Au_ppm_OK [2408_S
Filters: A_Au_EstDom = JS
Frequency
0
5
10
15
20
25
30
1
2
5
10
20
50
Au_ppm [>0.05]
Source: RSC 2024
| | 11-36 | |
| SSR Mining Inc. | Hod Maden Project | | January 7, 2026 |
| Technical Report Summary | | SLR Project No.: 123.000320.00001 |
Figure 11-26: Swath Plots and Log-Histogram
for Cu Comparing Input Data and Block Grades in the HSS Domain
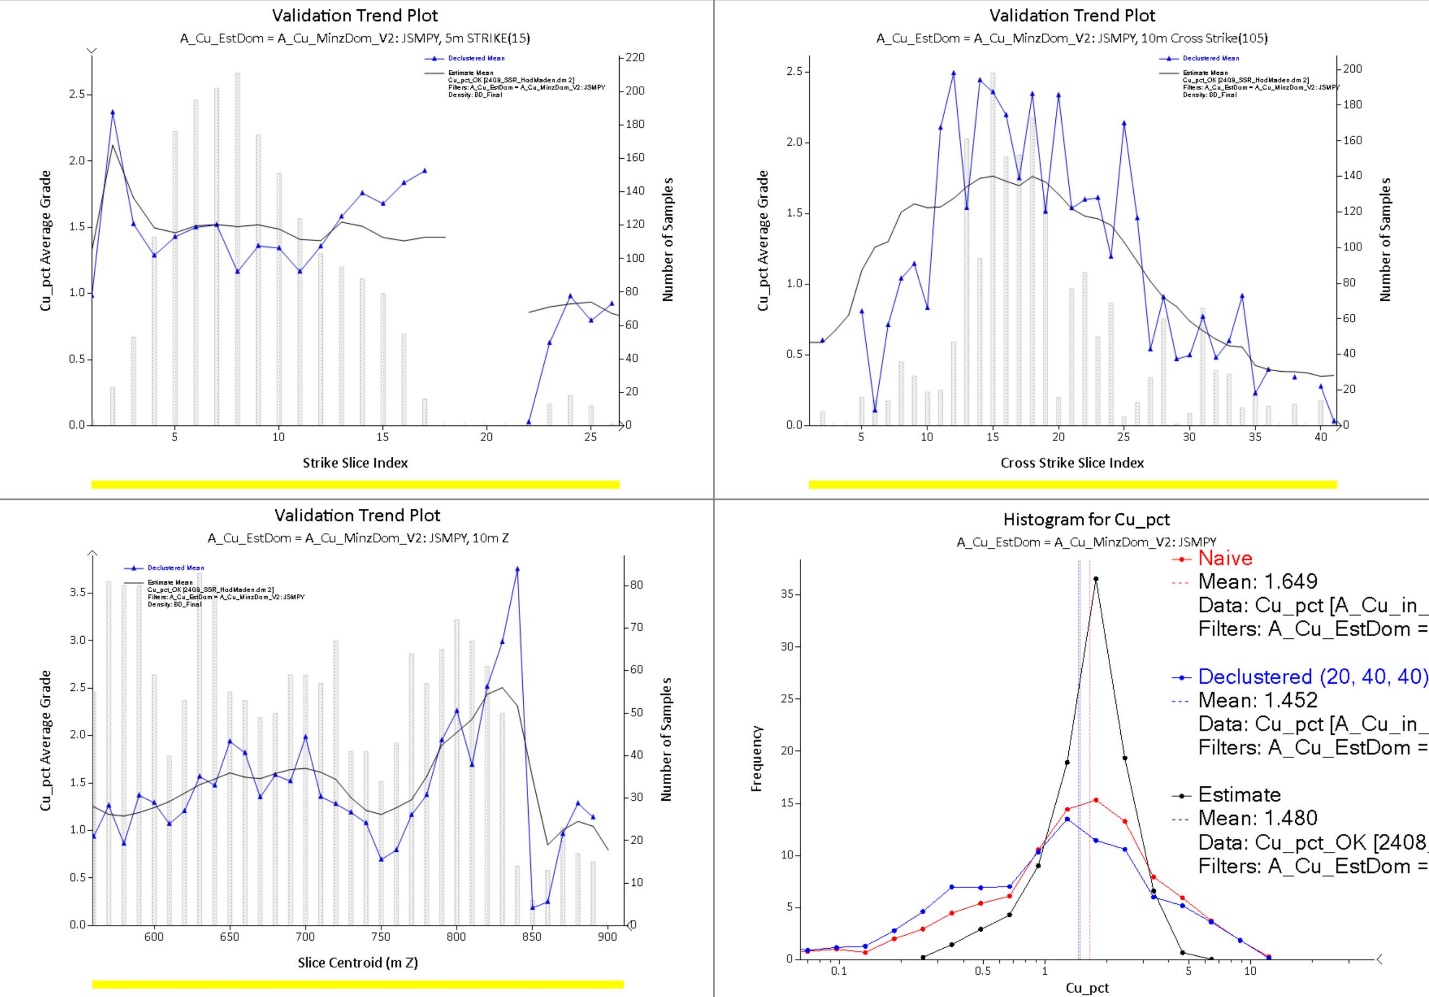
Figure 11-26
Validation Trend Plot
A_Cu_EstDom = A_Cu_MinzDom_V2: JSMPY, 5m STRIKE(15)
Declustered Mean
Estimated Mean
Cu_pct_OK [240
Cu_pc
Filters: A_Cu_B
Density: BD_Final
Cu_pct Average Grade
0.0
0.5
1.0
1.5
2.0
2.5
5
10
15
20
25
Strike Slice Index
0
20
40
60
80
100
120
140
160
180
200
220
Number of Samples
Validation Trend Plot
A_Cu_EstDom = A_Cu_MinzDom_V2: JSMPY, 10m Cross Strike(105)
Declustered Mean
Estimated Mean
Cu_pct_OK [240
Filters: A_Ca_
Density: BD_Final
Cu_pct Average Grade
0.0
0.5
1.0
1.5
2.0
2.5
5
10
15
20
25
30
35
40
Cross Strike Slice Index
0
20
40
60
80
100
120
140
160
180
200
Number of Samples
Validation Trend Plot
A_Cu_EstDom = A_Cu_MinzDom_V2: JSMPY, 10m Z
Declustered Mean
Estimated Mean
Cu_pct_OK [240
Filters: A_Cu_
Density: BD_Final
Cu_pct Average Grade
0.0
0.5
1.0
1.5
2.0
2.5
3.0
3.5
600
650
700
750
800
850
900
Slice Centroid (m Z)
0
10
20
30
40
50
60
70
80
Number of Samples
Histogram for Cu_pct
A_Cu_EstDom = A_Cu_MinzDom_V2: JSMPY
Naive
Mean: 1.649
Data: Cu_pct [A_Cu_in_
Filters: A_Cu_EstDom =
Declustered (20, 40, 40)
Mean: 1.452
Data: Cu_pct [A_Cu_in_
Filters: A_Cu_EstDom =
Estimate
Mean: 1.480
Data: Cu_pct_OK [2408
Filters: A_Cu_EstDom =
Frequency
0
5
10
15
20
25
30
35
0.1
0.5
1
5
10
Cu_pct
Source: RSC 2024
| | 11-37 | |
| SSR Mining Inc. | Hod Maden Project | | January 7, 2026 |
| Technical Report Summary | | SLR Project No.: 123.000320.00001 |
Figure 11-27: Swath Plots and Log-Histogram
for Cu, Comparing Input Data and Block Grades in the MPY Domain
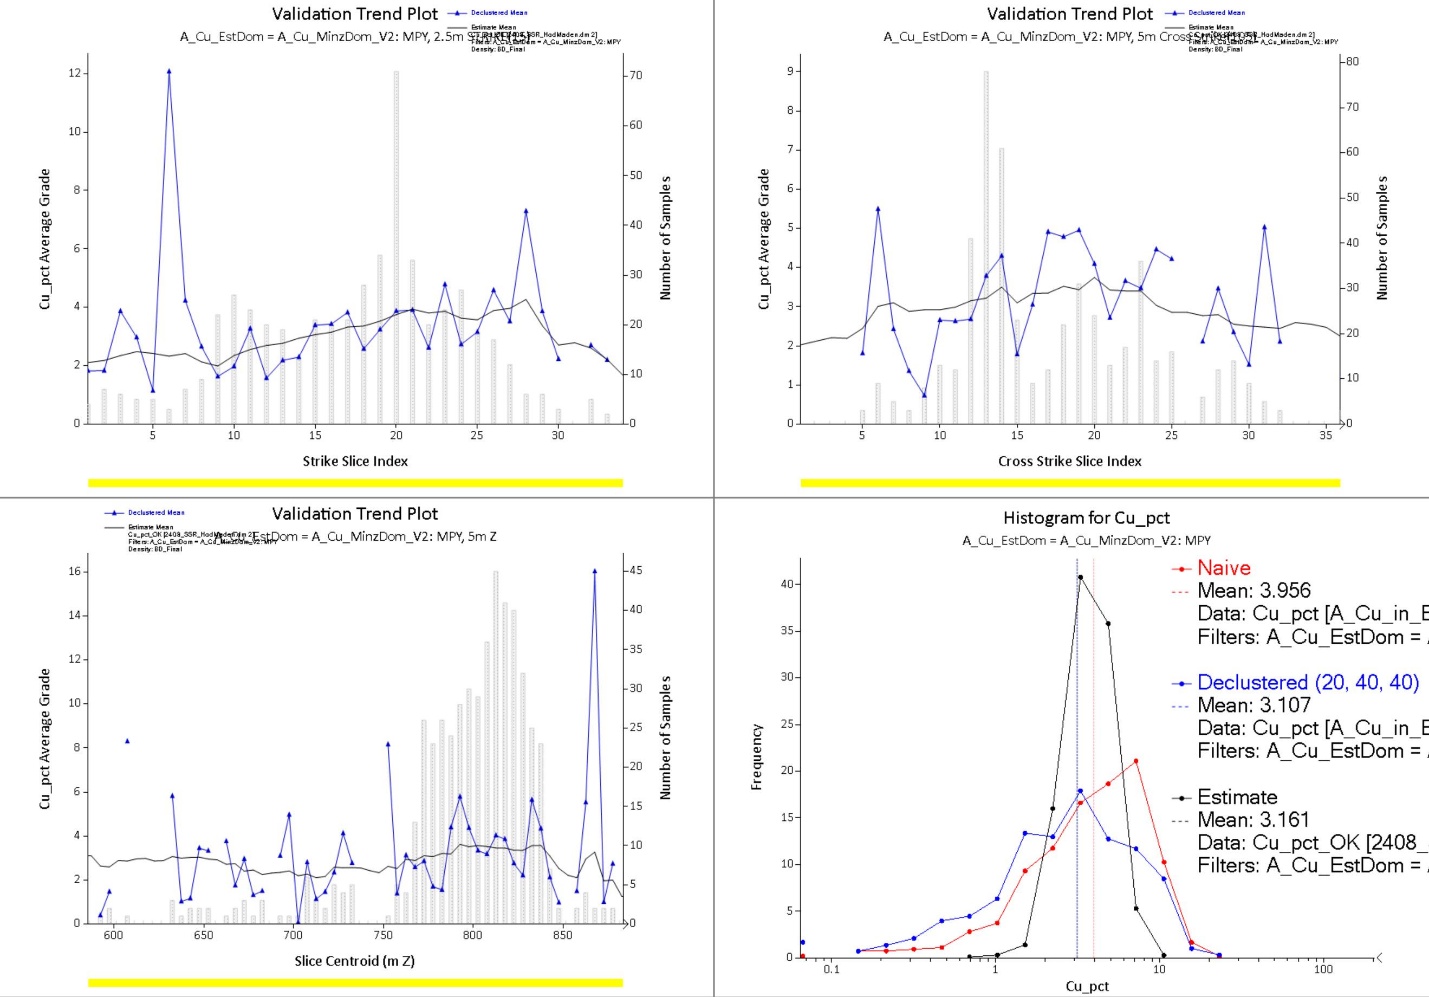
Figure 11-27
Validation Trend Plot
A_Cu_EstDom = A_Cu_MinzDom_V2: MPY, 2.5m STRIKE(15)
Declustered Mean
Estimated Mean
Filters: A_Cu_
Density: BD_Final
Cu_pct Average Grade
0
2
4
6
8
10
12
5
10
15
20
25
30
Strike Slice Index
0
10
20
30
40
50
60
70
Number of Samples
Validation Trend Plot
A_Cu_EstDom = A_Cu_MinzDom_V2: MPY, 5m Cross Strike(105)
Declustered Mean
Estimated Mean
Filters: A_Cu_
Density: BD_Final
Cu_pct Average Grade
0
1
2
3
4
5
6
7
8
9
5
10
15
20
25
30
35
Cross Strike Slice Index
0
10
20
30
40
50
60
70
80
Number of Samples
Validation Trend Plot
A_Cu_EstDom = A_Cu_MinzDom_V2: MPY, 5m Z
Declustered Mean
Estimated Mean
Cu_pct_OK [240
Filters: A_Cu_
Density: BD_Final
Cu_pct Average Grade
0
2
4
6
8
10
12
14
16
600
650
700
750
800
850
Slice Centroid (m Z)
0
5
10
15
20
25
30
35
40
45
Number of Samples
Histogram for Cu_pct
A_Cu_EstDom = A_Cu_MinzDom_V2: MPY
Naive
Mean: 3.956
Data: Cu_pct [A_Cu_in_
Filters: A_Cu_EstDom =
Declustered (20, 40, 40)
Mean: 3.107
Data: Cu_pct [A_Cu_in_
Filters: A_Cu_EstDom =
Estimate
Mean: 3.161
Data: Cu_pct_OK [2408_
Filters: A_Cu_EstDom =
Frequency
0
5
10
15
20
25
30
35
40
0.1
1
10
100
Cu_pct
Source: RSC 2024
| | 11-38 | |
| SSR Mining Inc. | Hod Maden Project | | January 7, 2026 |
| Technical Report Summary | | SLR Project No.: 123.000320.00001 |
Figure 11-28: Visual Validation
of the Au Estimate at 4542215 N, Looking South
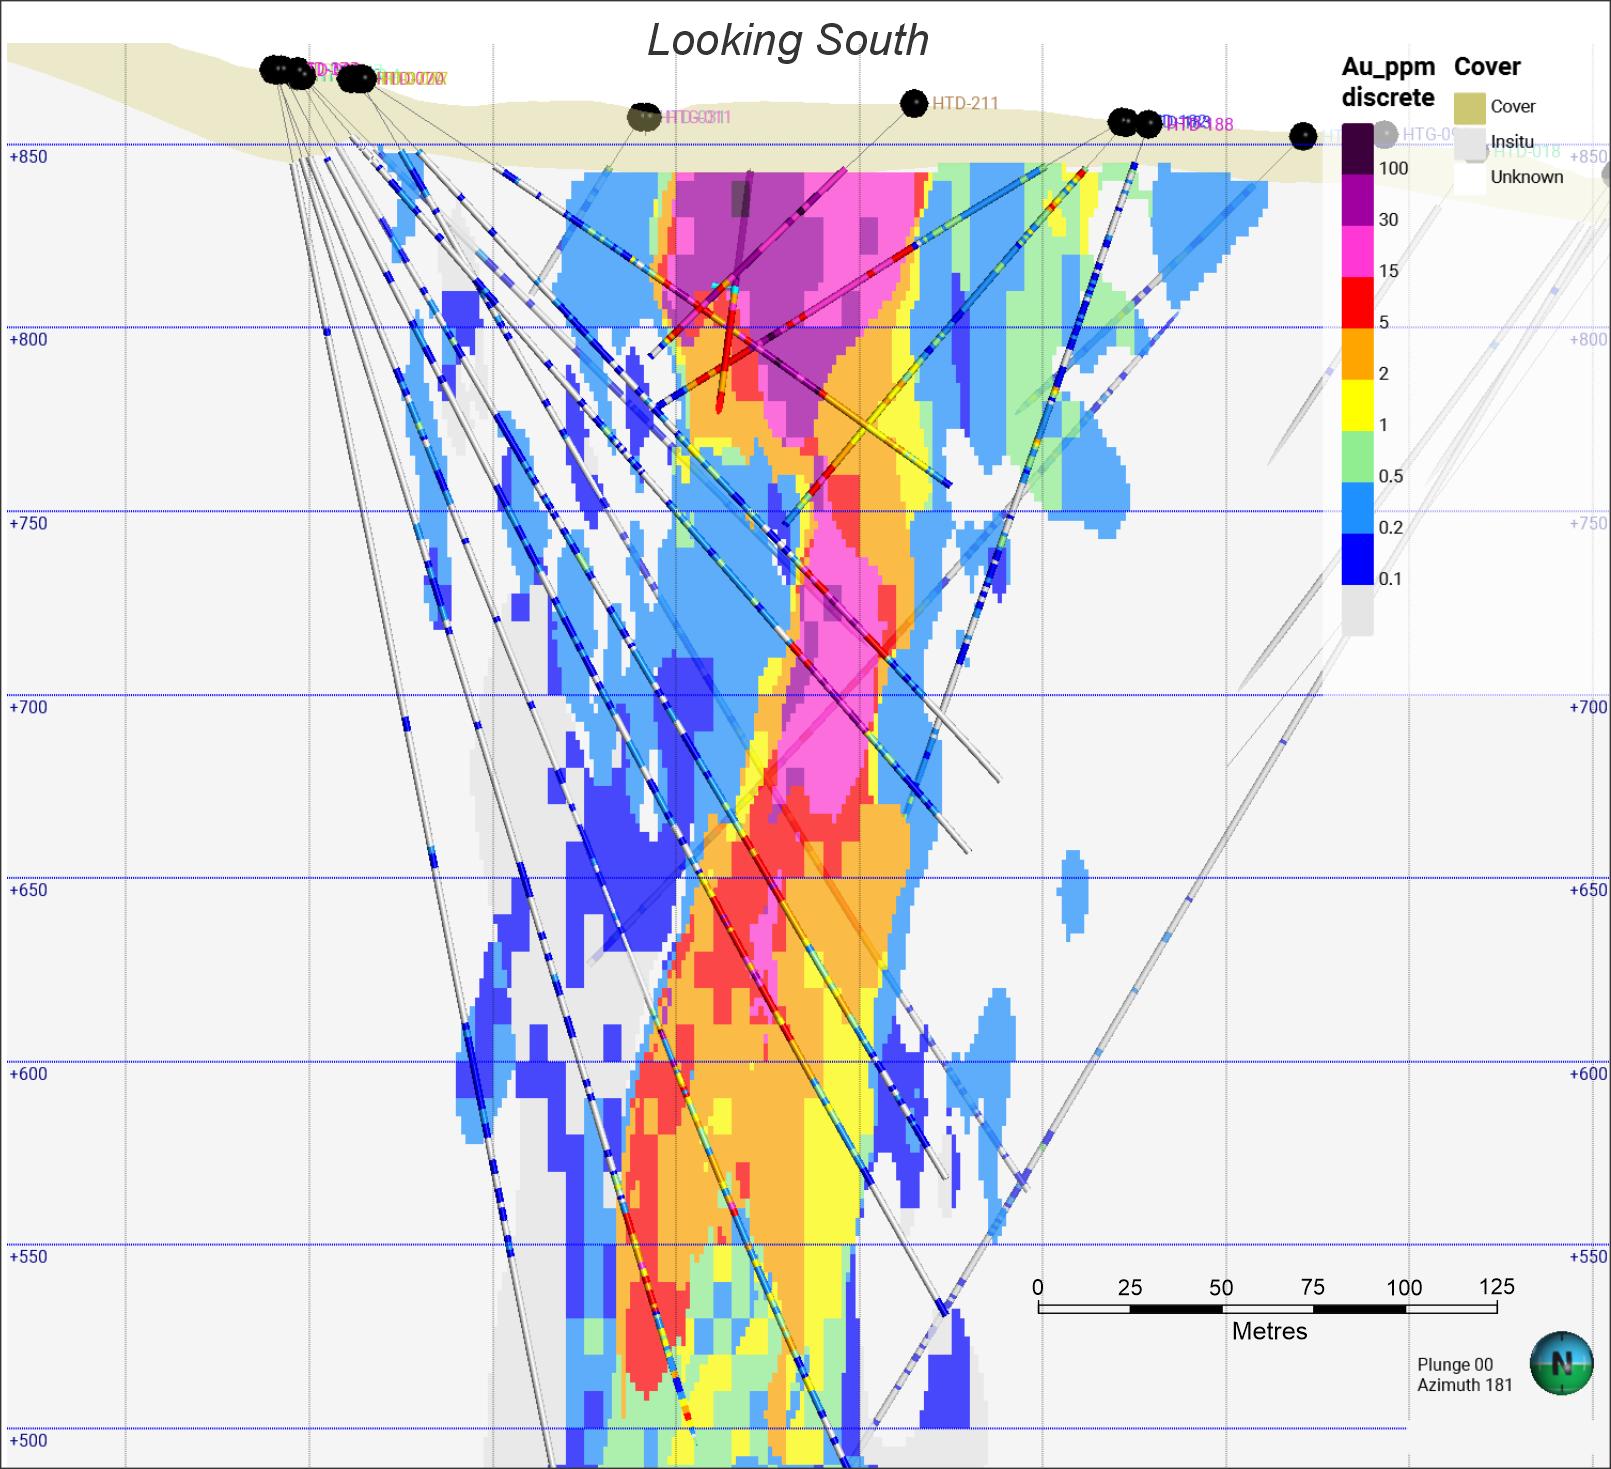
Figure 11-28
Looking South
Au_ppm discrete
100
30
15
5
2
1
0.5
0.2
0.1
Cover
Cover
Insitu
Unknown
0
25
50
75
100
125
Metres
Plunge 00
Azimuth 181
N
Source: RSC 2024
| | 11-39 | |
| SSR Mining Inc. | Hod Maden Project | | January 7, 2026 |
| Technical Report Summary | | SLR Project No.: 123.000320.00001 |
Figure 11-29: Visual Validation
of the Au Estimate, Long Section Parallel to HTG-002
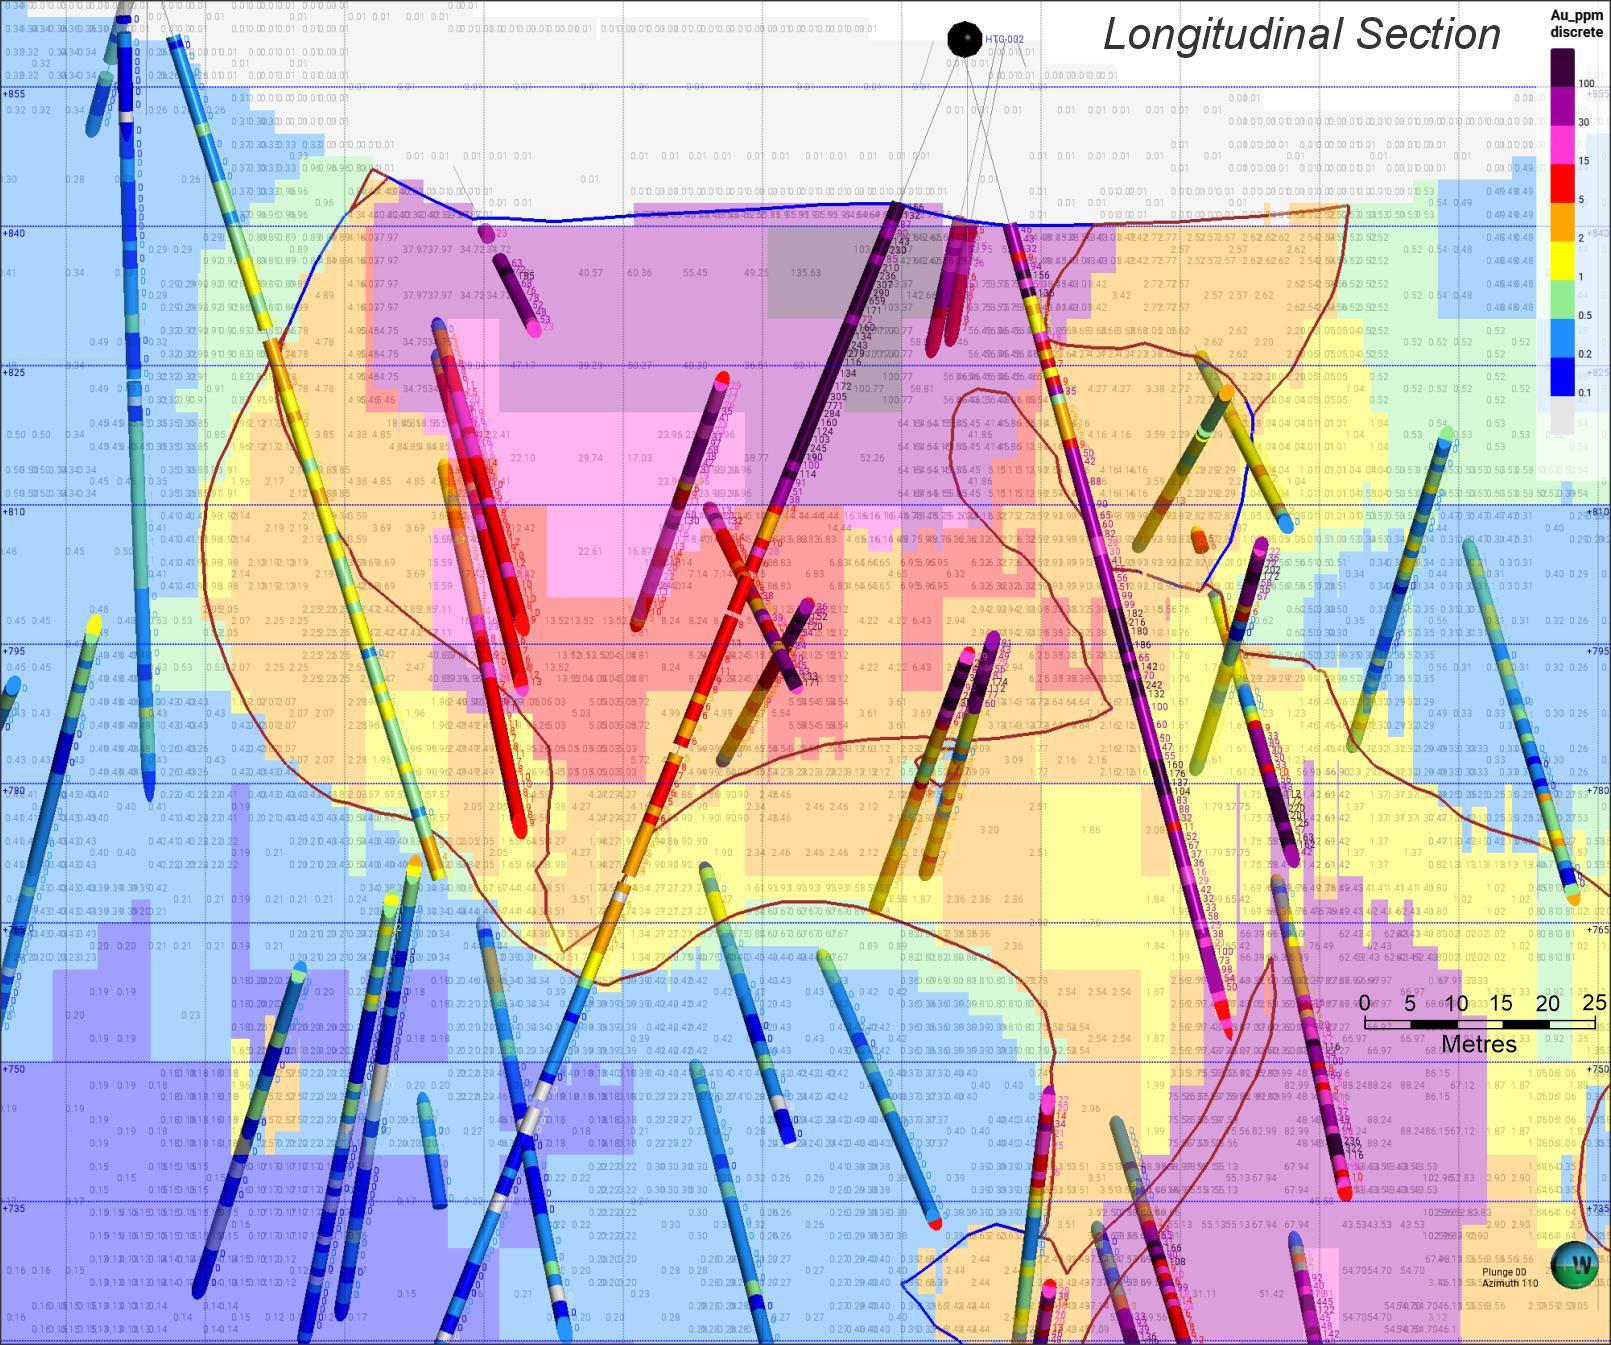
Figure 11-29
Longitudinal Section
Au_ppm
discrete
100
30
15
5
2
1
.5
.2
.1
0
5
10
15
20
25
Metres
Plunge 00
Azimuth 110
W
Source: RSC 2024
Mineral Resources were classified by the RSC QP in accordance with S-K
1300.
A Mineral Resource is defined as a concentration or occurrence of material
of economic interest in or on the Earth’s crust in such form, grade or quality, and quantity that there are reasonable prospects
for economic extraction. A mineral resource is a reasonable estimate
of mineralization, considering relevant factors such as cut-off grade, likely mining dimensions, location, or continuity, that with the
assumed and justifiable technical and economic conditions, is likely to, in whole or in part, become economically extractable.
It is not merely an inventory of all mineralization drilled or sampled.
The Mineral Resources estimated in this TRS have been classified according
to these definitions based on geology, grade continuity, and drill hole spacing.
A Measured Mineral Resource is that part of a mineral resource for which
quantity and grade or quality are estimated on the basis of conclusive geological evidence and sampling.
| | 11-40 | |
| SSR Mining Inc. | Hod Maden Project | | January 7, 2026 |
| Technical Report Summary | | SLR Project No.: 123.000320.00001 |
The level of geological certainty associated with a measured mineral resource is sufficient to allow a qualified person to apply modifying
factors, as defined in this section, in sufficient detail to support detailed mine planning and final evaluation of the economic viability
of the deposit. Because a measured mineral resource has a higher
level of confidence than the level of confidence of either an indicated mineral resource or an inferred mineral resource, a measured mineral
resource may be converted to a proven mineral reserve or to a probable mineral reserve.
An Indicated Mineral Resource is that part of a mineral resource for
which quantity and grade or quality are estimated on the basis of adequate geological evidence and sampling.
The level of geological certainty associated with an indicated mineral resource is sufficient to allow a qualified person to apply modifying
factors in sufficient detail to support mine planning and evaluation of the economic viability of the deposit.
Because an indicated mineral resource has a lower level of confidence than the level of confidence of a measured mineral resource, an
indicated mineral resource may only be converted to a probable mineral reserve.
An Inferred Mineral Resource is that part of a mineral resource for
which quantity and grade or quality are estimated on the basis of limited geological evidence and sampling.
The level of geological uncertainty associated with an inferred mineral resource is too high to apply relevant technical and economic
factors likely to influence the prospects of economic extraction in a manner useful for evaluation of economic viability.
Because an Inferred Mineral Resource has the lowest level of geological confidence of all mineral resources, which prevents the application
of the modifying factors in a manner useful for evaluation of economic viability, an inferred mineral resource may not be considered when
assessing the economic viability of a mining project and may not be converted to a mineral reserve.
The MRE was classified by reviewing robustness of the geological interpretation
and domaining, inspection of kriging quality metrics and considering drill spacing. The confidence categories were assigned using a combination
of the interpretation of geological continuity — which in some places is very well developed, but in other cases is uncertain —
as well as kriging metrics that provide a quantitative indication of the quality of the estimate and availability of informing data. The
slope of regression (SoR) and kriging efficiency (KE) were used as broad rules of thumb to divide areas of high and low confidence. These
metrics inherently carry information on the amount of local conditional bias, and the drill spacing, as compared to the block size. To
avoid the ‘spotted dog’ effect in classification, the final classification process included the generation of manual strings
to capture areas of high and low confidence. These strings were based on an assessment of a combination of grade continuity and geological
continuity.
Geological evidence is derived from adequately detailed and reliable
exploration, sampling and testing gathered through appropriate techniques from locations such as outcrops, trenches, pits, workings and
drill holes, and is sufficient to assume geological and grade (or quality) continuity between points of observation where data and samples
are gathered.
For the Inferred portion of the Mineral Resource, quantity and grade
are estimated on the basis of limited geological evidence and sampling. Geological evidence is sufficient to imply but not verify geological
and grade (or quality) continuity.
It is reasonably expected by the RSC QP that most of the Indicated Mineral
Resources could be upgraded to Measured Mineral Resources with continued work and studies.
It is reasonably expected by the RSC QP that most of the Inferred Mineral
Resources could be upgraded to Indicated Mineral Resources with continued work and studies.
| | 11-41 | |
| SSR Mining Inc. | Hod Maden Project | | January 7, 2026 |
| Technical Report Summary | | SLR Project No.: 123.000320.00001 |
The Mineral Resource reported here is a realistic inventory of mineralization
which, under assumed and justifiable technical, economic and developmental conditions, may become economically extractable. Portions of
the deposit that do not have reasonable potential for economic extraction (RPEE) are not included in the Mineral Resource.
| 11.14 | Consideration of Potential for Economic Extraction |
The RSC QP has considered the reasonable potential of economic extraction
(RPEE) of the Hod Maden Mineral Resource. In assessing the RPEE, the QP has evaluated preliminary mining, metallurgical, economic, environmental,
social and governance, and geotechnical parameters.
For this Mineral Resource estimation, the RSC QP considered that the
Hod Maden deposit would be mined entirely using underground mining methods, such as longhole stoping and drift and fill (DAF) mining.
Considerations of mining methods are detailed in section 13.0 of this report.
Mine stopes were optimized by SSR based on the block model and used
to back-flag the MRE for RPEE. Blocks above cut-off value but without RPEE were not included in the MRE.
The MRE cut-off value (COV) was determined by taking into consideration
mining and processing costs (Table 11-13).
Table 11-13: Summary of Hod Maden Mineral
Resource Cut-off Value
| Description |
Cost (US$/t) |
|
| Total Operating Cost |
39.2 |
|
| Development cost |
15.3 |
|
| Contract Services |
2.5 |
|
| Dev Load and Haul Cost |
2.9 |
|
| Stoping cost - Sub total |
59.9 |
|
| Processing Cost |
37.4 |
|
| Processing site sustaining cost |
2.8 |
|
| Mineral Resource COV |
99.0 |
|
The environmental, social and governance factors impacting the Hod Maden
Project were assessed (Section 17.0). The RSC QP has not independently validated the findings presented therein and relies on the domain
experts of the subject matter.
| | 11-42 | |
| SSR Mining Inc. | Hod Maden Project | | January 7, 2026 |
| Technical Report Summary | | SLR Project No.: 123.000320.00001 |
| 11.15 | Mineral Resource Reporting |
The Mineral Resource Estimate for SSR’s attributable share of
the Hod Maden Project is tabulated in Table 11-14. Table 11-15 presents the corresponding Mineral Resources for the Hod Maden Project
on a full (100%) basis, without applying the Company’s ownership percentage.”
Figure 11-30 shows a generalized cross-section of the Deswik MSO shapes
for exclusive Mineral Resources versus Mineral Reserves.
Table 11-14: Summary of Hod Maden
Mineral Resources, exclusive of Mineral Reserves as of August 31, 2025 (SSR’s Attributable Share)
| Classification |
SSR Ownership Basis
(%) |
Tonnes
(kt) |
Grade |
Metal |
NSR Cut-off Values
(US$/t) |
Metallurgical Recovery |
| Au (g/t) |
Cu (%) |
Au
(koz) |
Cu
(Mlb) |
Au |
Cu |
| Measured |
10% |
62 |
23.4 |
2.3 |
47 |
3.2 |
99 |
82%–90% |
95%–98% |
| Indicated |
110 |
5.4 |
1.4 |
19 |
3.4 |
| Measured + Indicated |
172 |
11.9 |
1.7 |
66 |
6.5 |
| Inferred |
257 |
3.4 |
0.5 |
28 |
2.6 |
|
Notes:
1.
Mineral Resources are based on $2,000/oz gold price and $4.0/lb of Cu and are exclusive of Mineral Reserves
2.
Mineral Resources are reported within optimized stope shapes.
3.
Mineral Resources shown are SSR ownership only. SSR currently owns 10%.
4.
Mineral Resource cut-offs are based on a NSR value $99/tonne.
5.
Metallurgical recoveries vary between 82%–90% for Au and 95%–98% for Cu based on grade and sulfur.
6.
Minimum mining width of 2m with no external dilution has been considered while optimizing stope shapes.
7.
The point of reference for Mineral Resources is the point of feed into the processing facility.
8.
Totals may vary due to rounding. |
Table 11-15: Summary of Hod Maden
Mineral Resources, exclusive of Mineral Reserves as of August 31, 2025 (100%)
| Classification |
SSR Ownership Basis
(%) |
Tonnes
(kt) |
Grade |
Metal |
NSR Cut-off Values
(US$/t) |
Metallurgical Recovery |
| Au (g/t) |
Cu (%) |
Au
(koz) |
Cu
(Mlb) |
Au (%) |
Cu (%) |
| Measured |
100% |
621 |
23.4 |
2.3 |
468 |
31.6 |
99 |
82%–90% |
95%–98% |
| Indicated |
1,100 |
5.4 |
1.4 |
191 |
33.8 |
| Measured + Indicated |
1,722 |
11.9 |
1.7 |
658 |
65.3 |
| Inferred |
2,574 |
3.4 |
0.5 |
281 |
26.3 |
| | 11-43 | |
| SSR Mining Inc. | Hod Maden Project | | January 7, 2026 |
| Technical Report Summary | | SLR Project No.: 123.000320.00001 |
Figure 11-30: Cross-Section showing
Exclusive Mineral Resource vs Mineral Reserve MSO Shapes
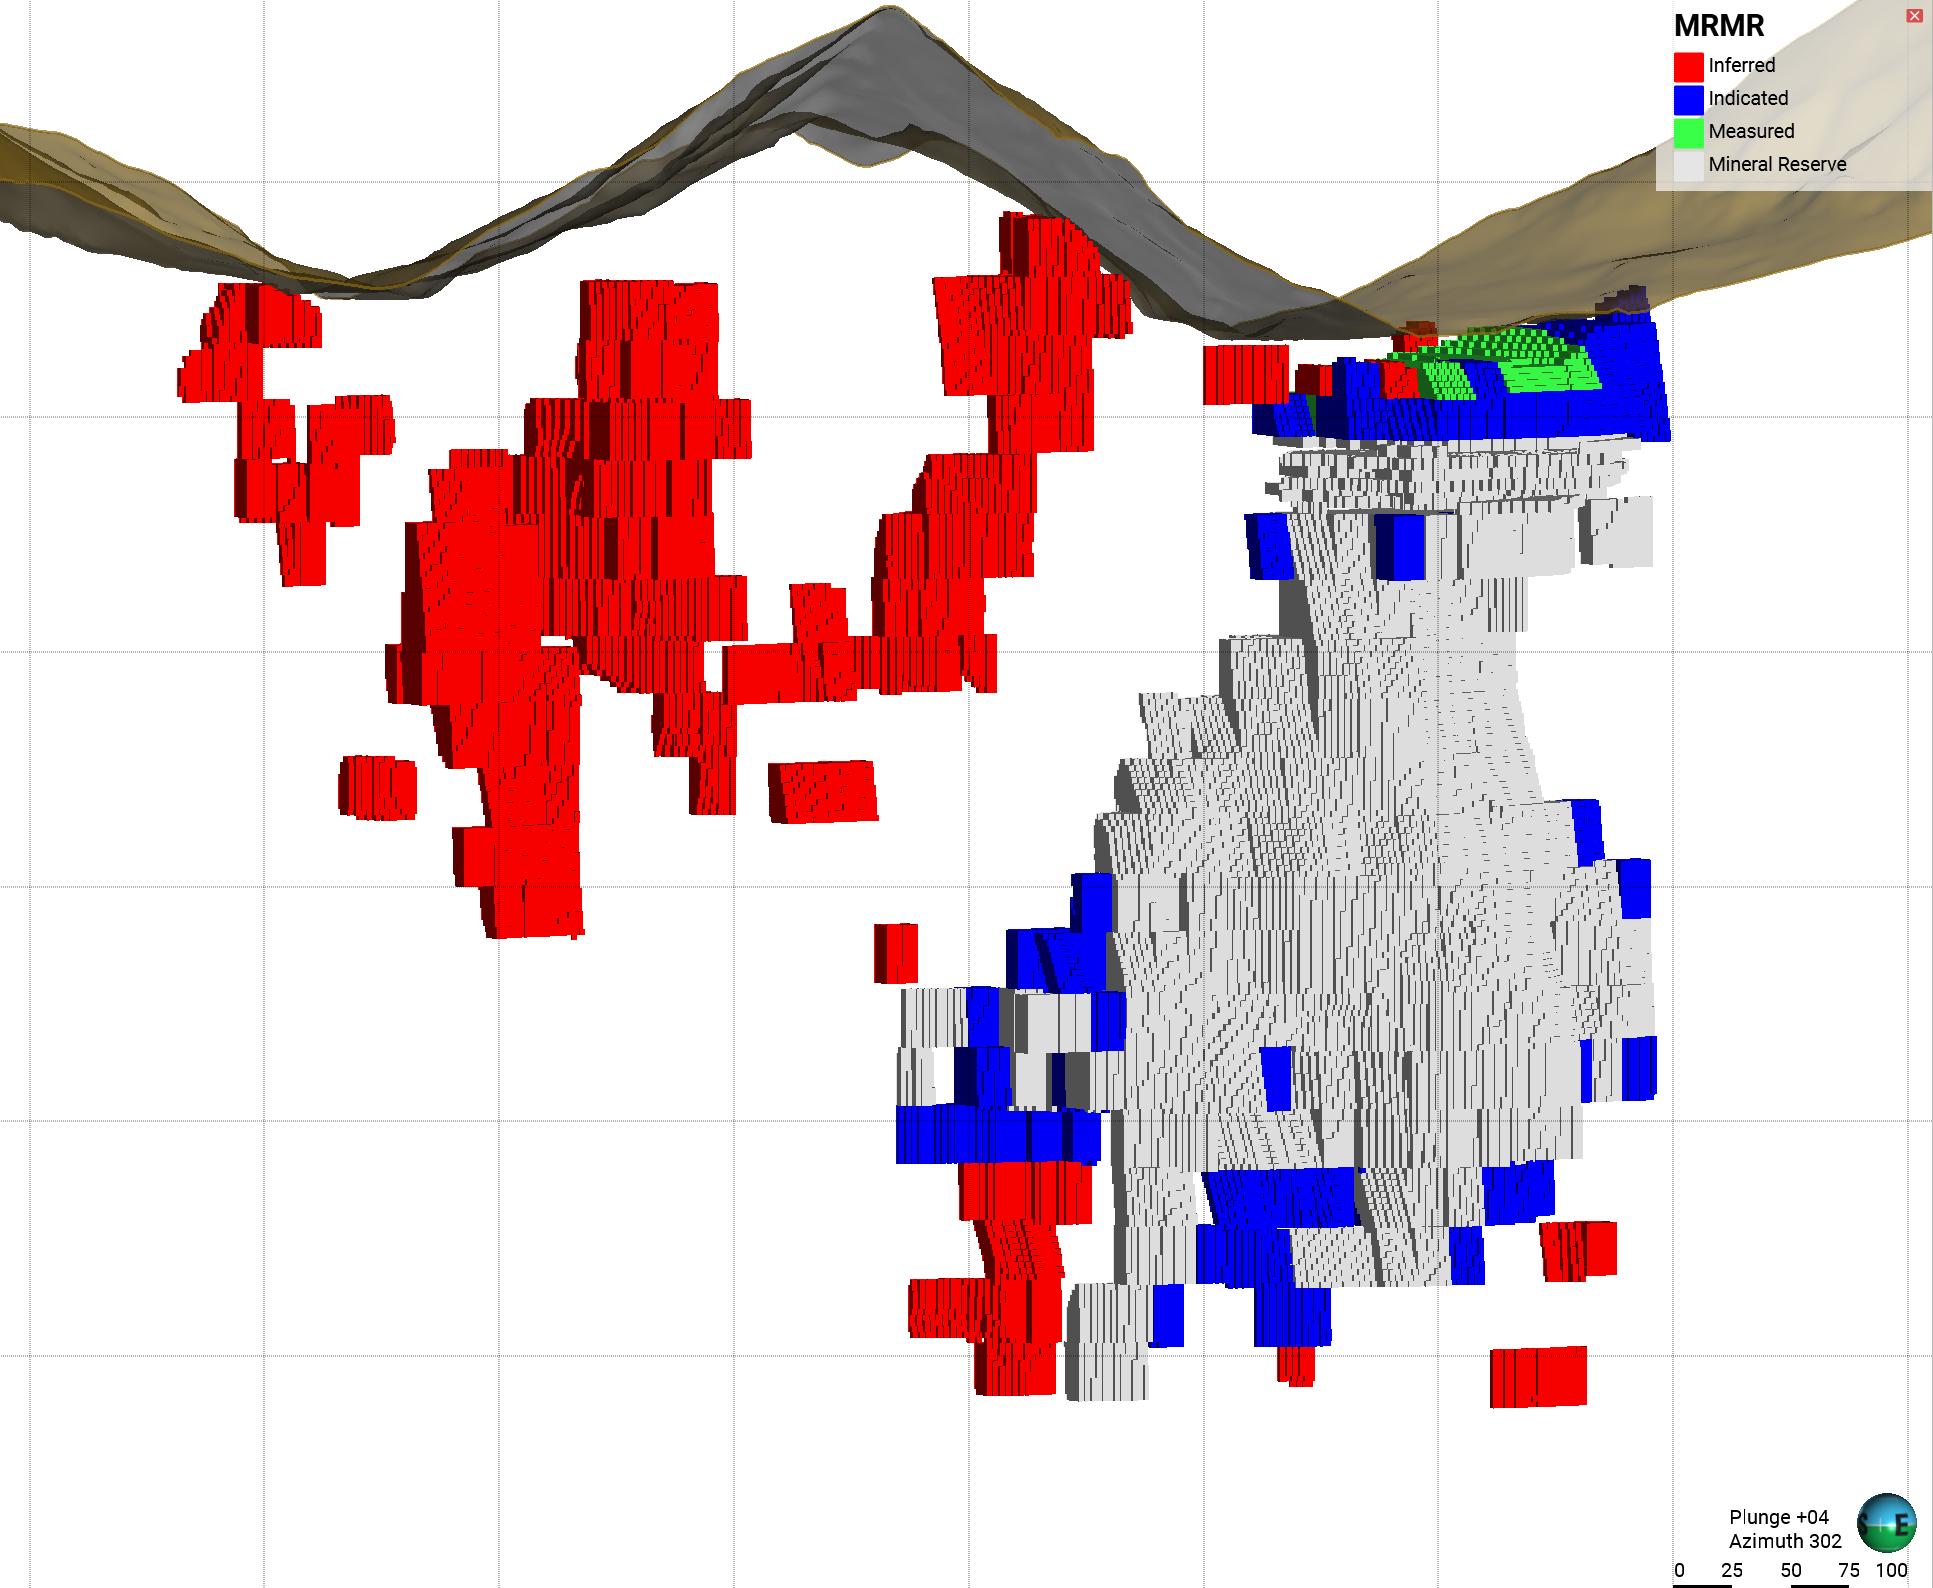
Figure 11-30
MRMR
Inferred
Indicated
Measured
Mineral Reserve
Plunge +04
Azimuth 302
E
0
25
50
75
100
| 11.16 | Comparison with Previous Estimates |
The RSC QP compared the 2025 Mineral Resource exclusive of Mineral Reserves
against the previous Mineral Resource estimate as reported in SSR’s 2024 Form 10-K filing. The changes listed are based on SSR’s
attributable share (10%)
| · | Increase in total contained gold ounces of 66 koz and an increase of 6.5 Mlb of copper in the Measured and Indicated categories. |
| · | Increase of 5 koz of gold and 0.5 Mlb of copper in the Inferred category. |
| · | No material was previously classified in Indicated or Measured. |
These changes can be attributed to the following factors:
| · | Re-interpretation of the mineralized envelopes based on additional drill holes, better geological understanding. |
| | 11-44 | |
| SSR Mining Inc. | Hod Maden Project | | January 7, 2026 |
| Technical Report Summary | | SLR Project No.: 123.000320.00001 |
| · | Changes to optimization parameters with regards to cost and metal price assumptions, processing recoveries and cut-off value used;
and |
·
Re-assignment of DAF stopes above 810 masl from Mineral Reserves to Mineral Resource.
In the opinion of the RSC QP,
the resource estimation reported herein is an appropriate representation of the gold and copper Mineral Resources found at the Hod Maden
Project at the current level of drilling and sampling. The QP is of the opinion that with consideration of the recommendations summarized
in Section 1.0 and 23.0 of this TRS, any issues relating to all relevant technical and economic factors likely to influence the prospect
of economic extraction can be resolved with further work.
| | 11-45 | |
| SSR Mining Inc. | Hod Maden Project | | January 7, 2026 |
| Technical Report Summary | | SLR Project No.: 123.000320.00001 |
| 12.0 | Mineral Reserve Estimates |
Mineral Reserves have been estimated by SSR personnel and audited and
accepted by the SLR QP. The Mineral Reserves have been classified in accordance with SEC S-K 1300 definitions.
Table 12-1 summarizes the Mineral Reserve estimate on an SSR attributable
basis with an effective date of August 31, 2025.
Table 12-1: Mineral Reserve Estimate
as of August 31, 2025 (SSR’s Attributable Ownership Basis)
| Reserve Classification |
SSR Ownership |
Tonnes |
Grade |
Metal |
NSR Cut-off Values |
Metallurgical Recovery |
| (%) |
(kt) |
Au
(g/t) |
Cu
(%) |
Au
(koz) |
Cu
(Mlb) |
(US$/t) |
Au |
Cu |
| Proven |
10% |
137 |
22.2 |
1.7 |
98 |
5 |
Varies by mining method |
82%–90% |
95%–98% |
| Probable |
634 |
4.5 |
1.2 |
92 |
17 |
| Total Proven + Probable |
771 |
7.6 |
1.3 |
190 |
22 |
|
Notes:
1.
Mineral Reserve estimates are classified in accordance with S-K 1300.
2.
Only Measured and Indicated Mineral Resources were used to define Mineral Reserves. All Inferred Mineral Resource was considered
as waste.
3.
The Mineral Reserve is estimated using metal prices of US$1,700/oz gold and US$3.50/lb copper.
4.
Mineral Reserves are reported on SSR’s 10% ownership basis with the point of reference of mined ore delivered to the plant
as mill feed.
5.
The estimation was carried out using breakeven NSR cut-off values:
·
Drift and Fill: US$160/t
·
Long Hole Stoping: US$108/t
·
Incremental Stoping: US$82/t
·
Marginal COG: US$57/t
6.
The average mining recovery and dilution factors applied were 94% and 10% respectively.
7.
Process recovery averaged approximately 87% for gold and 97% for copper.
8.
Totals may not add due to rounding. |
The Proven Mineral Reserve was derived from the Measured Mineral Resource.
The Probable Mineral Reserve was derived from Measured and Indicated Mineral Resources. The Measured Mineral Resource within the DAF development
shapes above 780 masl was downgraded to Probable Mineral Reserve due to the greater uncertainty regarding the modified DAF mining method.
All stope and development shapes have planned internal dilution. The marginal development NSR cut-off value is US$57/t. The stope optimisation
algorithm will always allow for the inclusion of material below the cut-off value to be included if it necessary to include high grade
material, as long as the overall grade of the additional material is above cut-off, which is a normal part of the process.
| | 12-1 | |
| SSR Mining Inc. | Hod Maden Project | | January 7, 2026 |
| Technical Report Summary | | SLR Project No.: 123.000320.00001 |
The SLR QP is not aware of any risk factors associated with, or changes
to, any aspects of the modifying factors such as mining, metallurgical, infrastructure, permitting, or other relevant factors that could
materially affect the Mineral Reserve estimate.
The Hod Maden orebody is made up of north-south striking mineralization
comprising two zones: Main Zone, which contains the bulk of the orebody, and South Zone, which currently contains limited economic mineralization.
Figure 12-1 is a longitudinal view of the underground mine showing the
development and stope design, which is an update to the 2021 FS with overlays of the mineralization outlines. Two mining methods will
be utilized for extraction of the Mineral Reserve: long hole stoping (LHS) and a modified drift and fill (DAF).
The Hod Maden deposit also consists of zinc-bearing mineralization located
to the east of the orebody. No consideration has been given to this mineralization in the updated FS or Mineral Reserve estimate.
The Main Zone deposit is sub-vertical, has current dimensions of approximately
300 m in length (north-south), 50 m to 70 m true thickness, and a down-dip extension of more than 400 m. The South Zone is also sub-vertical
and closer to 200 m in length and 300 m in depth with significantly reduced thickness and sporadic economic mineralization. The South
Zone was re-classified as Inferred Resources in 2024, therefore the stopes and the development to exploit South Zone has been removed
from the Mineral Reserves.
| | 12-2 | |
| SSR Mining Inc. | Hod Maden Project | | January 7, 2026 |
| Technical Report Summary | | SLR Project No.: 123.000320.00001 |
Figure 12-1: Hod Maden Underground
Mine Design and Mineralization Outlines - Longitudinal View Looking East
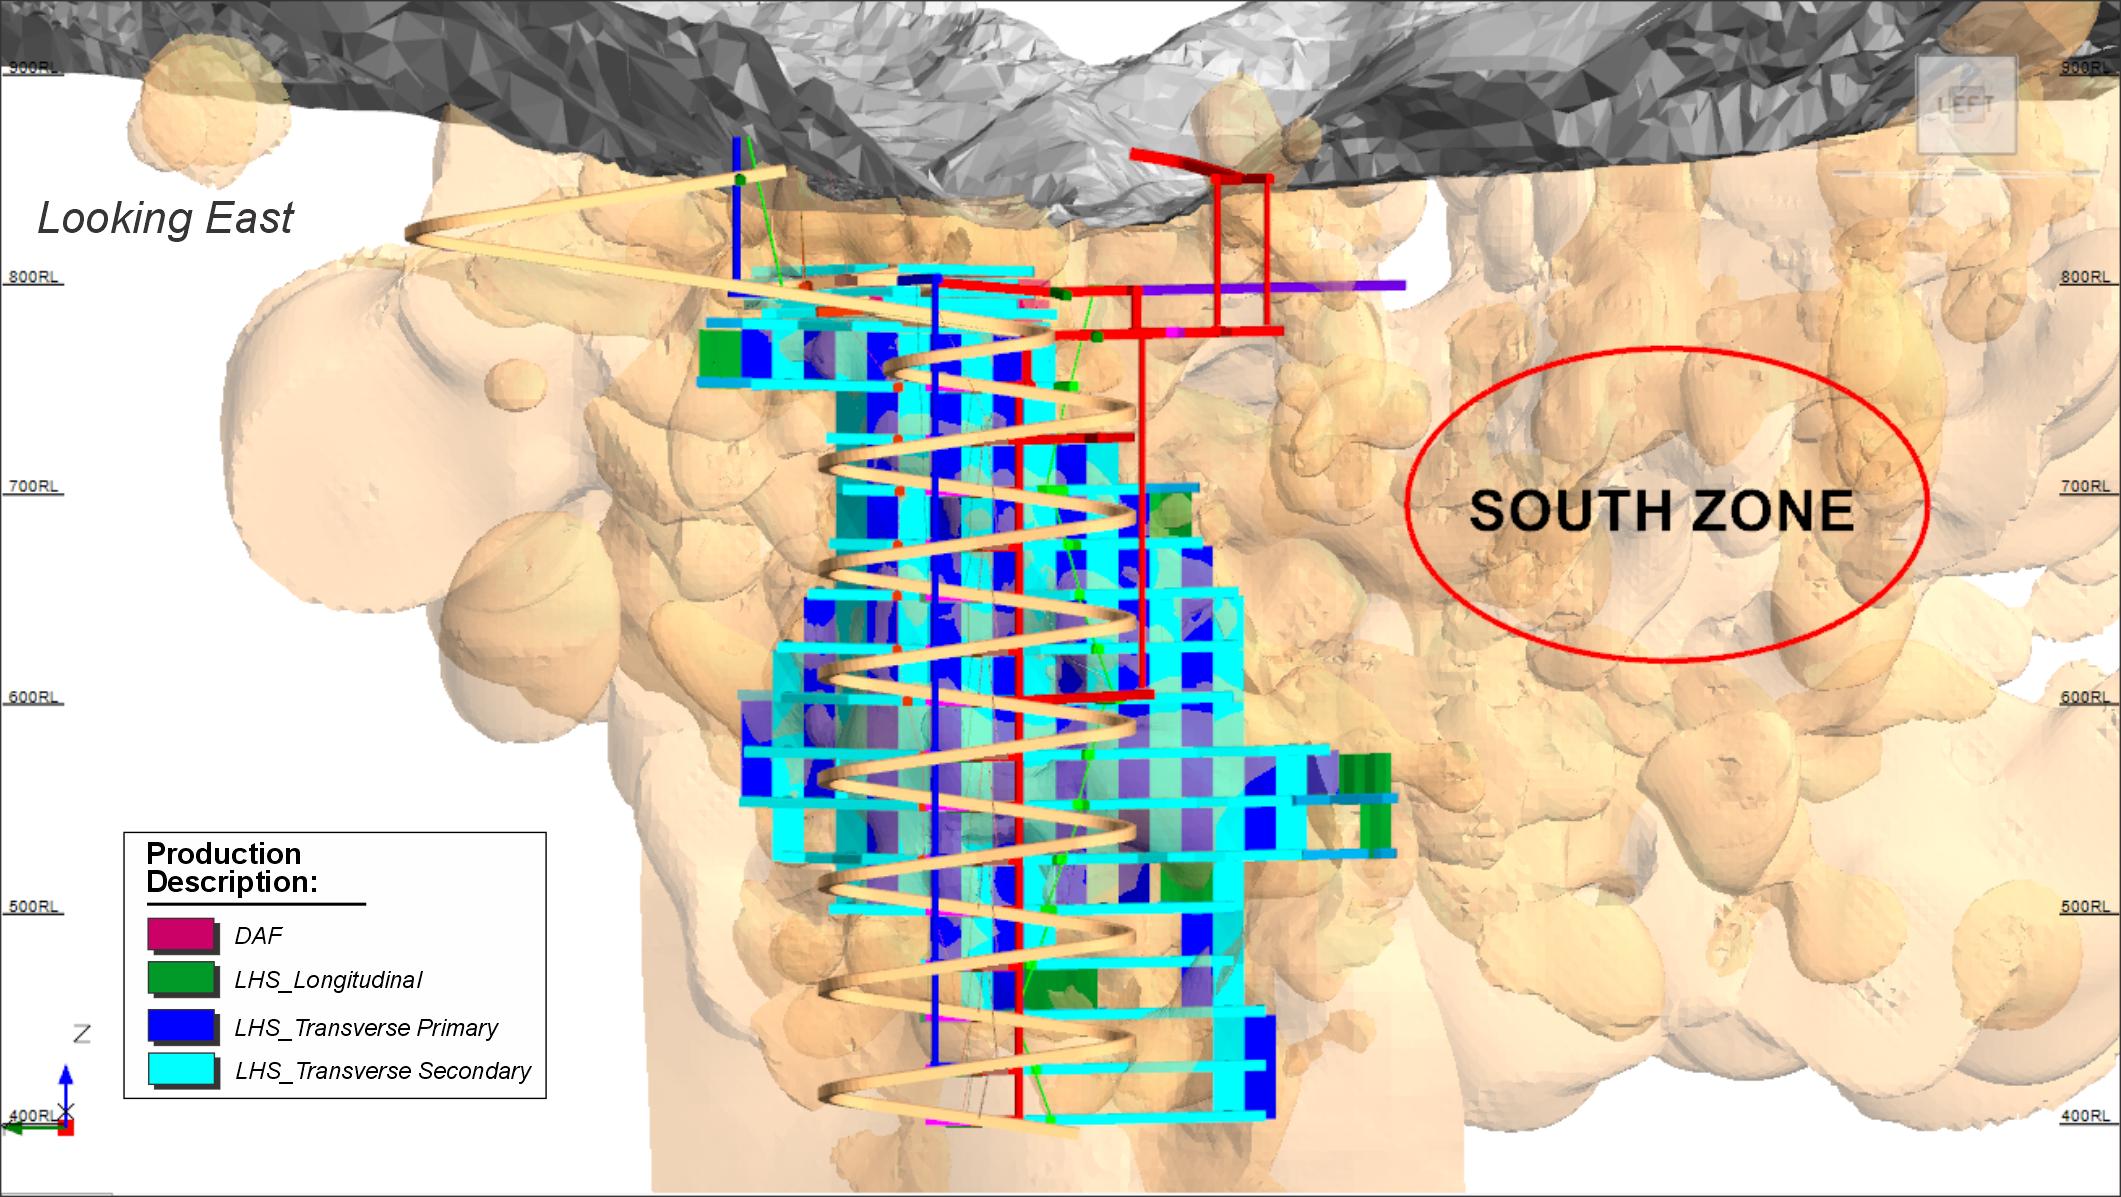
Figure 12-1
Looking East
SOUTH ZONE
Production Description:
DAF
LHS_Longitudinal
LHS_Transverse Primary
LHS_Transverse Secondary
Source: Artmin 2025
| | 12-3 | |
| SSR Mining Inc. | Hod Maden Project | | January 7, 2026 |
| Technical Report Summary | | SLR Project No.: 123.000320.00001 |
The mining block model was built up from the resource block model 3008_hodmaden_reso_nsr.dm
dated August 30, 2024. Three steps were taken in the preparation of the mining block model:
Step 1 - Removal of Inferred and unclassified blocks (unclassified
is the resource category below Inferred)
All mine planning and reserve estimation was performed based on Measured
and Indicated Resources only. The first step in the preparation of the mining block model was to ensure the Inferred and unclassified
blocks played no part in the determination of Mineral Reserves. A macro was written and executed on the resource block model, which applied
the following values to grades of Inferred and unclassified blocks:
These grade values were consistent with the surrounding waste rock material.
Step 2 - Process recoveries and concentrate grades were calculated
using equations developed by Ausenco
The second step in preparation of the mining block model was the calculation
of process recoveries. Ausenco derived mathematical equations to estimate metal recovery based on chemical drivers of the ore.
An NSR macro was developed and executed to populate the mining block
model with all recoveries to the concentrate. The fields created and populated were:
| · | au_rec - recovery of gold to the concentrate |
| · | cu_rec - recovery of copper to the concentrate |
The average process recoveries calculated over the LOM were:
Step 3 - NSR values were calculated based on the concentrate
tonnes and grades from Step 2 and economic factors and concentrate terms and conditions provided by Artmin
The NSR macro was developed to calculate the concentrate quantities
and the NSR value for each block. The concentrate quantity and block value were calculated from the Ausenco derived equations.
The fields created and populated are listed:
| · | conc_dmt – dry metric tonnes of concentrate produced |
| · | val_res – value of the metal recovered |
The NSR value for each block was calculated using the parameters listed
in Table 12-2. These values were provided by Artmin Madencilik.
| | 12-4 | |
| SSR Mining Inc. | Hod Maden Project | | January 7, 2026 |
| Technical Report Summary | | SLR Project No.: 123.000320.00001 |
Table 12-2: NSR Input Parameters
| Parameters |
Units |
Value |
| Economic |
| Au Price |
US$/oz |
1,700 |
| Cu Price |
US$/lb |
3.50 |
| Royalty |
% |
4.6 |
| Au Recovery |
% |
85.807 |
| Cu Recovery |
% |
97.828 |
| Concentrate |
| Treatment Cost |
US$/dt |
72.00 |
| Transport Cost |
US$/dt |
150.00 |
| Au Refining Cost |
US$/oz |
6.00 |
| Cu Refining Cost |
US$/lb |
0.072 |
The mining block model preparation was performed using Datamine mine
planning software. Datamine macros were written to perform Steps 1 to 3.
A macro was developed for the NSR calculations used in the Datamine
macros to populate the mining block model. For this purpose, numerous block volumes, densities, and grades from the mining block model
were evaluated in the macro to ensure the same NSR value was calculated correctly This was completed for a range of grades found in the
block model.
The cut-off value strategy was based on the following owner’s
objectives:
| · | Targeting minimum annual production rate of approximately 800,000 dry metric tonnes per annum |
| · | Mine life of at least 10 years |
| · | Maximizing Mineral Reserves |
Costs used to calculate cut-off values for this Technical Report, which
is an update to the 2021 FS, were sourced from the current mining cost model, version 28, based on a full contractor model.
Three cut-off values have been applied for the Mineral Reserve estimate.
| · | Breakeven Cut-off Value (BeV), dependent on mining method - All operating and sustaining capital costs. |
| · | Stoping Incremental Cut-off Value (SIV) - Operating costs, sustaining mine equipment and process costs (development and general and
administrative (G&A) costs excluded). |
| · | Marginal Development Cut-off Value (MDV) - Process Operating and G&A costs. |
A core inventory of material was estimated based on a BeV of US$108/t.
This was calculated from the total operating and sustaining capital costs for the operation.
| | 12-5 | |
| SSR Mining Inc. | Hod Maden Project | | January 7, 2026 |
| Technical Report Summary | | SLR Project No.: 123.000320.00001 |
The SIV was then applied for material that could be accessed on the
way to the breakeven cut-off inventory. This incremental inventory assumed mine development was already in place and could therefore exclude
the cost of development. G&A costs were also excluded as inclusion of this material enabled an increase in production rate rather
than an increase in mine life. The SIV applied was US$82/t.
The MDV was applied to development material that had to be hauled to
surface, to decide whether to send it to the waste dump in the Saliçor Valley or to the process plant. This figure included process
operating and sustaining costs plus G&A. Dilution is already accounted for as this cut-off is applied to evaluated material in the
mine plan. The MDV value was US$57/t.
The calculation of the cut-off values based on updated costs and used
to estimate Mineral Reserves is shown in Table 12-3.
Table 12-3 Cut-off Values Used for
2025 Mineral Reserve Estimation
| Cost |
Marginal Development Cut-off Value
(US$/t) |
Stoping Incremental Value (SIV)
(US$/t) |
LHS Stoping Break Even Value
(US$/t) |
DAF Break Even Value
(US$/t) |
| Total Mine Operating |
- |
- |
51.66 |
103.38 |
| Mine Operating less Development |
- |
42.00 |
- |
|
| Sustaining Capital |
2.75 |
2.75 |
2.75 |
2.75 |
| Processing |
37.40 |
37.40 |
37.40 |
37.40 |
| G&A |
16.47 |
- |
16.47 |
16.47 |
| Cut-off Value |
57.00 |
82.00 |
108.00 |
160.00 |
Cashflow assessment of all stopes was completed to further validate
the Mineral Reserve estimate. All stopes were cashflow positive - SIV stopes were only required to pass the incremental test. All mining
levels in the mine plan were cashflow positive.
| 12.4.2 | Modified Drift and Fill |
The proposed modified DAF method applies civil tunnelling techniques
to establish a crown pillar before mining of the underhand (undercut) levels below. This enables extraction of the high-grade mineralization
located in the Poor Ground Zone above 780 masl (the 780 level). The modified DAF design requires a regular geometric footprint located
in the shadow of the crown pillar for each of the levels, which are accessed from the decline that has its portal located to the west
of the mineralization.
The design limits of the DAF have been established such that most of
the material within the mineralized interpretation is enveloped. Mineralization in the poor ground zone is predominantly above the modified
DAF total cost of US$160/t. Due to the mining method, material that graded below US$160/t was mined as required.
| | 12-6 | |
| SSR Mining Inc. | Hod Maden Project | | January 7, 2026 |
| Technical Report Summary | | SLR Project No.: 123.000320.00001 |
| 12.5 | Dilution and Recovery Estimates |
Mining recovery and dilution factors have been based on experience with
other similar projects, however, every operation is unique and site-specific mining recovery and dilution factors must ultimately be determined
through ongoing reconciliation after mining has commenced.
Mining external dilution for the LHS zone will predominantly consist
of paste fill but will also have some waste rock from the hanging wall and footwall of stopes. External dilution has been applied as follows:
| · | Hanging Wall Dilution - applied to all stopes – 1.0 m (waste rock and paste fill) |
| · | Footwall Dilution - applied to footwall stopes only - 0.5 m (waste rock) |
| · | Crown dilution - sill pillar stopes only - 0.5 m (paste fill) |
| · | Sidewall dilution - secondary and longitudinal stopes - 0.5 m for each wall (waste rock and paste fill) |
| · | Floor dilution - all stopes except first level in each zone (which has hard rock floor) - 0.3 m (waste rock) |
DAF dilution has been assigned as a flat 2.5% with the short advance
rates expected to keep this figure low. Dilution will mainly be from fibre reinforced sprayed concrete and cemented paste backfill. Ore
development overbreak in the LHS mining area has been assigned as zero as any dilution would be ore from the stope shape. Waste development
overbreak has been assumed to be 5%.
All external dilution not evaluated in the mining block model has been
assigned zero grade.
The Mineral Reserve estimate also contains internal dilution within
the stope designs, which are blocks below a US$82/t NSR value, however, they are included to ensure practical and continuous mining shapes.
Mining recoveries have been applied based on typical values for the
mining methods selected. Mining recovery in LHS primary stopes is assumed to be 98%. There is little exposure to paste fill, and wall
fall off will be ore from neighboring future secondary stopes. Mining recovery in LHS secondary stopes is assumed to be significantly
lower at 92%, due to some loss to primary stopes and greater exposure to paste fill fall off. An additional 4% of ore loss has been applied
to primary and secondary sill stopes due to an expectation that the extensive mining above and below up to that point will result in additional
damage in the final stoping zones. A mining recovery of 95% has been applied to LHS longitudinal stopes, which is a typical factor for
this type of mining method. Mining losses of 4% have been applied to the DAF mining zone. Higher losses are expected in the poorer ground
conditions above the 810 level.
A summary of the Hod Maden mining recoveries and dilution factors is
provided in Table 12-4 and comparison to similar projects in Table 12-5. For the Mineral Reserve total, the mining recovery and dilution
factors are 94% and 10%, respectively. The SLR QP has reviewed the methodology for determining mining recovery and dilution and benchmarked
the results against comparable operations, and considers these modifying factors to be reasonable.
| | 12-7 | |
| SSR Mining Inc. | Hod Maden Project | | January 7, 2026 |
| Technical Report Summary | | SLR Project No.: 123.000320.00001 |
Table 12-4: Hod Maden - Mining Recovery
and Dilution Factors by Mining Method
| Production Method |
Mining Recovery
(%) |
Dilution
(%) |
| DAF |
96% |
2.5% |
| LHS - Primary Stope |
98% |
7.0% |
| LHS - Secondary Stope |
92% |
13.0% |
| LHS - Primary Sill Stope |
94% |
9.0% |
| LHS - Secondary Sill Stope |
88% |
15.0% |
| LHS - Longitudinal Stope |
95% |
16% |
| Total |
94% |
10% |
Table 12-5: Comparison Mining Recovery
and Dilution Factors for Long Hole Stoping
| Mine Name |
Commodity |
Mine Recovery Range
(%) |
Mine Dilution Range
(%) |
| Macassa (Canada) |
Gold |
90-95 |
5-10 |
| Fosterville (Australia) |
Gold |
92-96 |
5-10 |
| Young-Davidson (Canada) |
Gold |
88-93 |
8-15 |
| Garson (Canada) |
Base Metal |
85-90 |
10-20 |
| Neves-Corvo (Portugal) |
Base Metal |
80-90 |
15-25 |
| Perseverance (Canada) |
Base Metal |
85-90 |
10-20 |
| 12.6 | Mineral Reserve Reporting |
The Mineral Reserve estimated at the cut-off values shown in Table 12-3
and with mining factors applied as shown in Table 12-4. Table 12-6 presents the Mineral Reserve estimate for the Project, and Table 12-7
provides the Mineral Reserves for SSR’s 10% ownership share.
| | 12-8 | |
| SSR Mining Inc. | Hod Maden Project | | January 7, 2026 |
| Technical Report Summary | | SLR Project No.: 123.000320.00001 |
Table 12-6: Mineral Reserve Estimate
as of August 31, 2025 (100% Ownership Basis)
| Reserve Classification |
Ownership Basis
(%) |
Tonnes
(kt) |
Grade |
Metal |
NSR Cut-off Values
(US$/tonne) |
Metallurgical Recovery |
Au
(g/t) |
Cu
(%) |
Au
(koz) |
Cu
(Mlb) |
Au
(%) |
Cu
(%) |
| Proven |
100% |
1,372 |
22.2 |
1.7 |
979 |
52.8 |
DAF: $160/t |
82–90 |
95–98 |
| Probable |
|
6,342 |
4.5 |
1.2 |
917 |
170.3 |
LHS: $108/t |
| Total Proven + Probable |
|
7,714 |
7.6 |
1.3 |
1,896 |
223.1 |
SIV: $82/t |
|
Notes:
1.
Mineral Reserve estimates are classified in accordance with S-K 1300.
2.
Only Measured and Indicated Mineral Resources were used to define Mineral Reserves. All Inferred Mineral Resource was considered
as waste.
3.
Mineral Reserves are based on $1,700/oz gold price and $3.50/lb of Cu.
4.
Mineral Reserves shown are reported on a 100% ownership basis. SSR currently owns 10% of the Mineral Reserves.
5.
The estimation was carried out using a breakeven cut-off values
·
Drift and Fill: US$160/t
·
Long Hole Stoping: US$108/t and
·
Incremental Stoping: US$82/t.
6.
The average mining recovery and dilution factors applied were 94% and 10% respectively.
7.
Process recovery averaged approximately 87% for gold and 97% for copper.
8.
Totals may not add due to rounding. |
Table 12-7: Mineral Reserve Estimate
as of August 31, 2025 (SSR’s Attributable Ownership Basis)
| Reserve Classification |
SSR Ownership
(%) |
Tonnes
(kt) |
Grade |
Metal |
NSR Cut-off Values
(US $/tonne) |
Metallurgical Recovery |
Au
(g/t) |
Cu
(%) |
Au
(koz) |
Cu
(Mlb) |
Au
(%) |
Cu
(%) |
| Proven |
10% |
137 |
22.2 |
1.7 |
98 |
5 |
DAF: $160/t |
82–90 |
95–98 |
| Probable |
10% |
634 |
4.5 |
1.2 |
92 |
17 |
LHS: $108/t |
| Total Proven + Probable |
10% |
771 |
7.6 |
1.3 |
190 |
22 |
SIV: $82/t |
|
Notes:
1.
Mineral Reserve estimates are classified in accordance with S-K 1300.
2.
Only Measured and Indicated Mineral Resources were used to define Mineral Reserves. All Inferred Mineral Resource was considered
as waste.
3.
The Mineral Reserve is estimated using metal prices of US$1,700/oz gold and US$3.50/lb copper.
4.
Mineral Reserves are reported on the 10% basis of mined ore to be delivered to the plant as mill feed.
5.
The estimation was carried out using a breakeven cut-off values:
·
Drift and Fill: US$160/t
·
Long Hole Stoping: US$108/t and
·
Incremental Stoping: US$82/t.
6.
The average mining recovery and dilution factors applied were 94% and 10% respectively.
7.
Process recovery averaged approximately 87% for gold and 97% for copper.
8.
Totals may not add due to rounding. |
| | 12-9 | |
| SSR Mining Inc. | Hod Maden Project | | January 7, 2026 |
| Technical Report Summary | | SLR Project No.: 123.000320.00001 |
The SLR QP is not aware of any risk factors associated with, or changes
to, any aspects of the modifying factors such as mining, metallurgical, infrastructure, permitting, or other relevant factors that could
materially affect the Mineral Reserve estimate.
The Hod Maden deposit is characterized by higher gold and copper grades
closer to ground surface, and a trend of vertically reducing grades. This is reflected in the higher grades of the Proven category (in
the upper LHS zone) and lower grades of the Probable Mineral Reserve classification (predominantly the lower section of the LHS zone).
Table 12-8 provides a comparison of the current Mineral Reserve estimate
with the previous, 2023 Mineral Reserve. There has been a 22% reduction in gold ounces and a 24% reduction in copper metal. The primary
reason for the reduction in Mineral Reserves is due to excluding Mineral Resources above 810 masl from Reserves pending additional geotechnical
studies. In addition, there has been changes to estimation, an increase in the estimated cost of production, and changes to recovery parameters.
| | 12-10 | |
| SSR Mining Inc. | Hod Maden Project | | January 7, 2026 |
| Technical Report Summary | | SLR Project No.: 123.000320.00001 |
Table 12-8 Previous Mineral Reserve
Estimate (December 31, 2024) Compared to Current Mineral Reserve Estimate –August 31, 2025 (10% Basis)
| 2025
Reserve Classification |
SSR
Ownership
(%) |
Tonnes
(kt) |
Grade |
Contained
Metal |
NSR
Cut-off Values
(US$/tonne) |
Metallurgical
Recovery |
Au
(g/t) |
Cu
(%) |
Au
(ko)z |
Cu
(Mlb) |
Au
(%) |
Cu
(%) |
| 2025
Hod Maden Mineral Reserve |
| Proven |
10% |
137 |
22 |
1.7
|
98 |
5 |
57
- 160 |
87% |
97% |
| Probable |
634 |
5 |
1.2
|
92 |
17 |
| Total
Proven + Probable |
771 |
8 |
1.3
|
190 |
22 |
| 2024
Hod Maden Mineral Reserve |
| Proven |
10% |
190 |
17 |
1.7 |
102 |
7 |
40
- 63 |
85% |
93% |
| Probable |
680 |
9 |
1.4 |
143 |
22 |
| Total
Proven + Probable |
870 |
11 |
1.5 |
245 |
29 |
| %
Difference - 2025 Mineral Reserve Compared to 2024 Mineral Reserve |
| Proven |
10% |
-28% |
29% |
0% |
-4% |
-29% |
43%
- 154% |
1% |
4% |
| Probable |
-7% |
-44% |
-14% |
-36% |
-23% |
| Total
Proven + Probable |
-11% |
-27% |
-13% |
-22% |
-24% |
| | 12-11 | |
| SSR Mining Inc. | Hod Maden Project | | January 7, 2026 |
| Technical Report Summary | | SLR Project No.: 123.000320.00001 |
The Hod Maden deposit will be mined using underground mining techniques.
The deposit is divided into a northern Main Zone, the contiguous South Zone and the Russian Zone.
The Main Zone extends 450 m vertically from surface over a strike distance
of approximately 300 m. The South Zone is narrower than the Main Zone. The mineralization here is of lower grade and has been re-classified
from the 2021 FS as Inferred Mineral Resource; development and stoping previously included in the 2021 FS has been removed from the current
LOM design. The current LOM plan considers the Main Zone only.
The underground mine will be divided vertically into two distinct mining
zones with a drift and fill (DAF) underground mining technique applied to the Poor Ground Zone (PGZ) above the 780 level and long hole
stoping (LHS) applied to the more competent ground conditions below the 780 level. For the LHS level, spacing will be 25 m; the upper
DAF levels will be extracted primarily in 5 m high increments.
LHS will use electric-hydraulic jumbos for excavation and ground support
with diesel powered load haul dump (LHD) units and articulated dump trucks for material handling. Ground support will use sprayed fibre-reinforced
concrete (fibrecrete) extensively. Stopes will be drilled using electric-hydraulic top hammer long hole drills.
DAF mining will utilize excavators, rotary cutters, and/or jumbo drilling
machines for excavation and front-end loaders (FEL), LHDs, and trucks for material handling. Fibrecrete will be used extensively for primary
support of development drives.
The underground mine will be accessed through a single portal west of
the deposit (in the South Valley), with secondary egress and fresh air intake in proximity. The primary exhaust and vertical shaft development
are in the southwest of the deposit.
Ore will be trucked to the surface run-of-mine (ROM) pad located approximately
500 m from the underground portal in the South Valley. Waste rock will be trucked to a temporary WDF near the portal from where it will
be rehandled either to the North Valley WDF via the Saliçor Tunnel, or to a WDF in the South Valley until the Saliçor Tunnel
and North Valley WDF are constructed.
Including the portal construction, the mine has an expected life of
approximately 12 years. It is expected that the 7.7 Mt Mineral Reserve will be mined and processed over 11 years.
Figure 13-1 is a longitudinal section of the underground mine showing
the development and stope design from the current LOM plan. The mine design has been updated from the 2021 FS by Artmin and SSR personnel.
The SLR QP has performed an audit and review of the mine design and considers it acceptable.
| | 13-1 | |
| SSR Mining Inc. | Hod Maden Project | | January 7, 2026 |
| Technical Report Summary | | SLR Project No.: 123.000320.00001 |
Figure 13-1: Hod Maden Underground
Mine Design - Longitudinal View Looking East
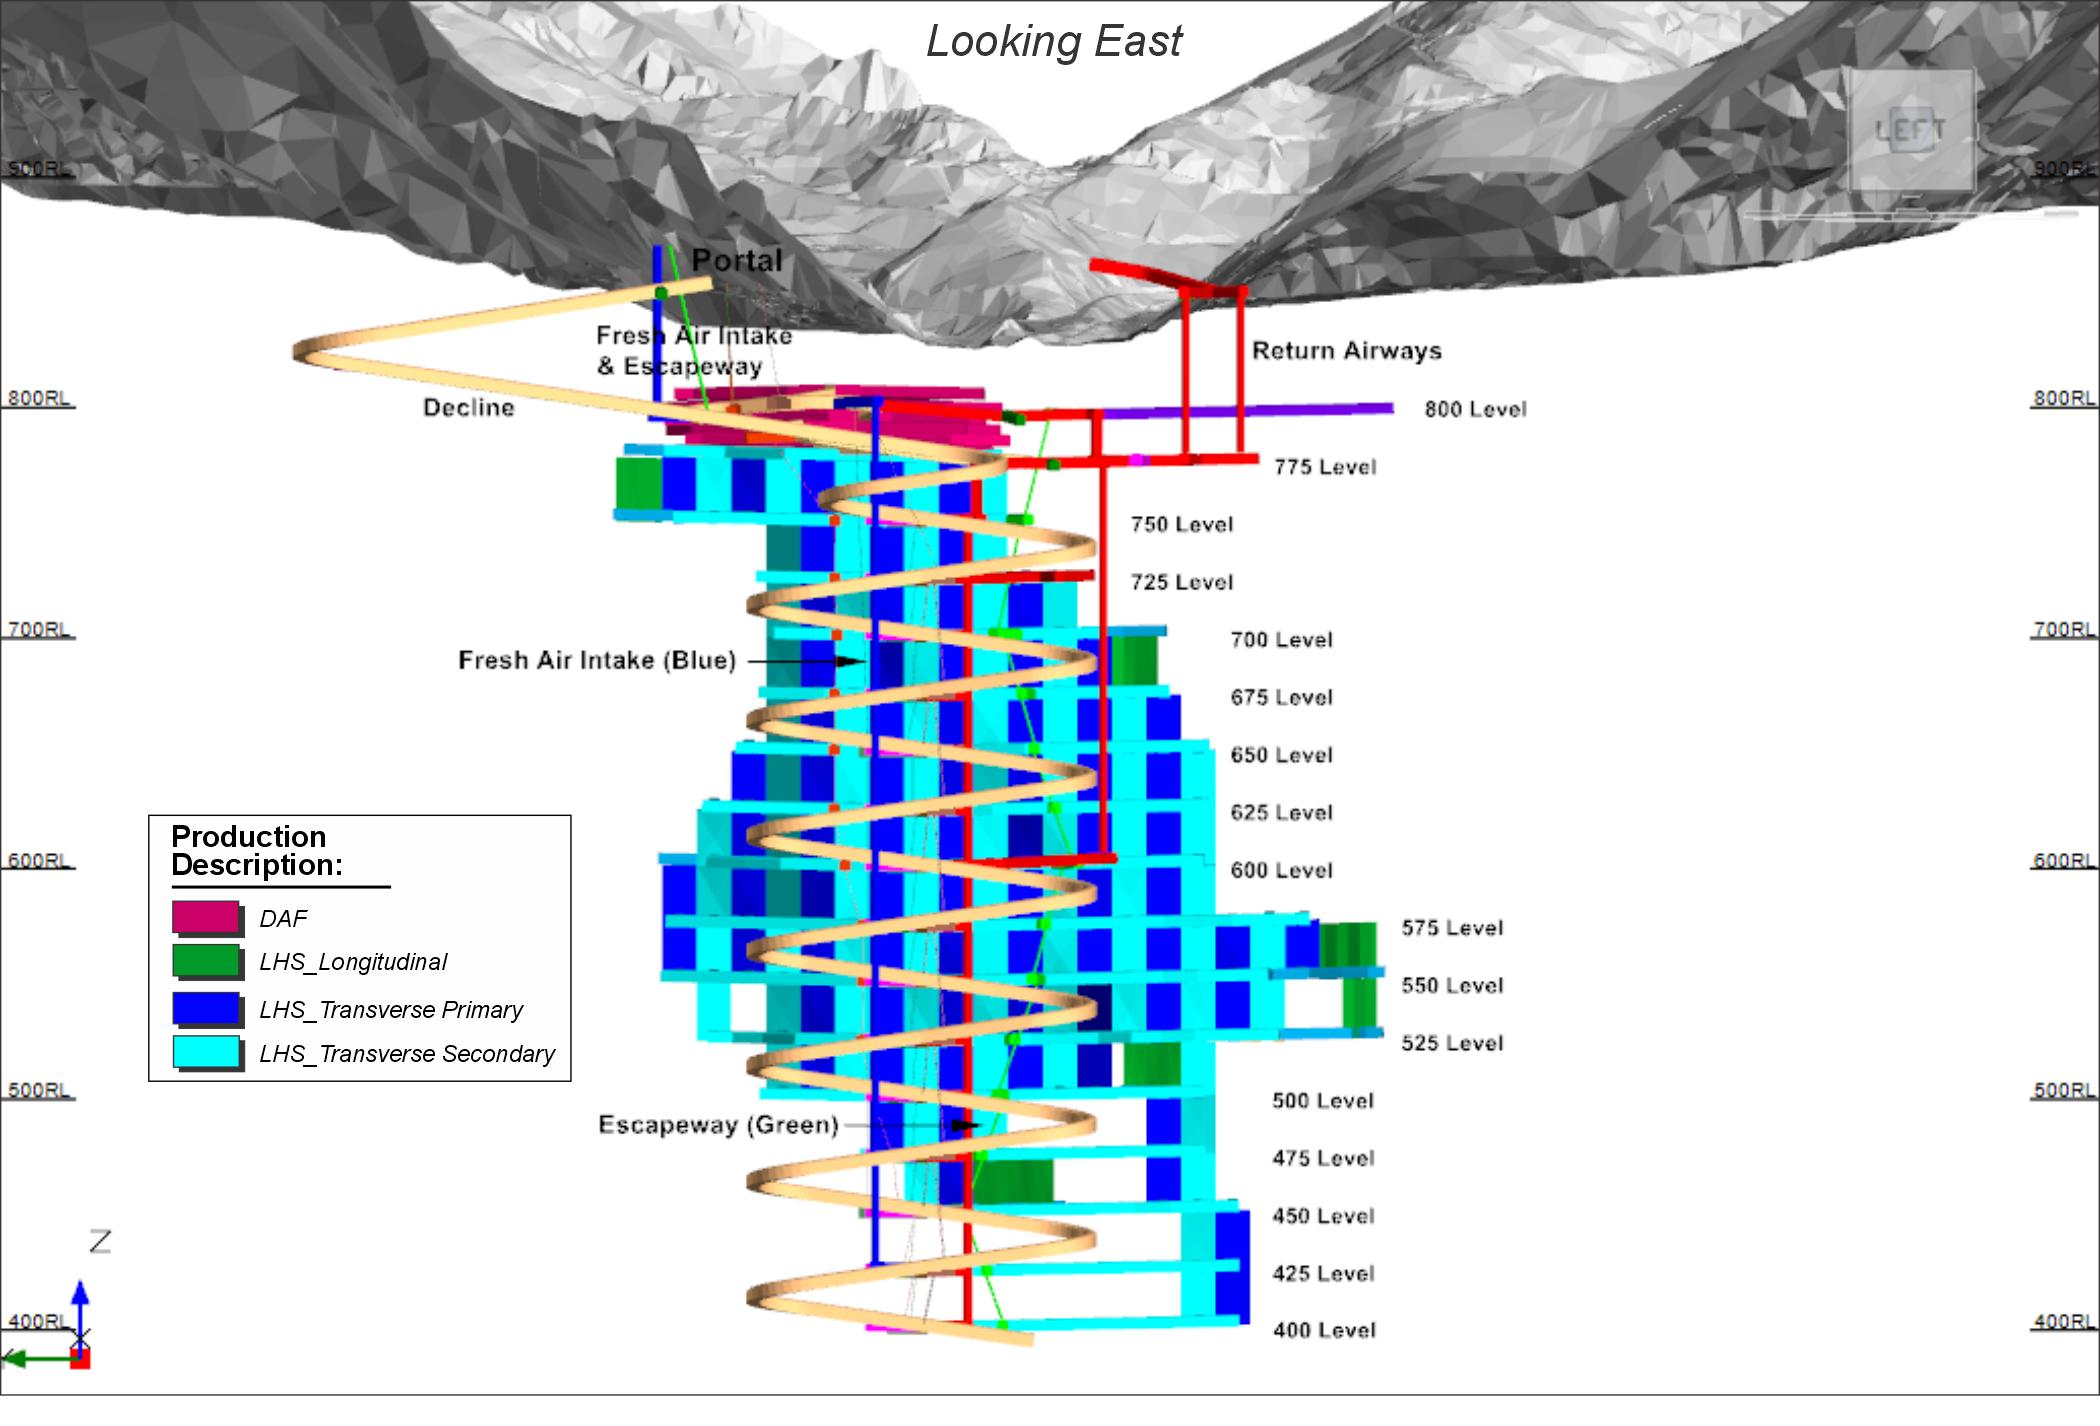
Figure 13-1
Looking East
Portal
Fresh Air Intake & Escapeway
Decline
Fresh Air Intake (Blue)
Escapeway (Green)
Return Airways
Production Description:
DAF
LHS_Longitudinal
LHS_Transverse Primary
LHS_Transverse Secondary
Source: Artmin 2025
| 13.2 | Geotechnical Considerations |
The Hod Maden deposit is developed within an NNE-SSW trending subvertical
structural corridor (Hod structural corridor) extending up to one kilometer and characterized by intense hydrothermal alteration. The
mineralization comprises a paragenetically complex assemblage of Au-Ag bearing polymetallic quartz-sulfide veins, with local associated
stratabound replacement type semi-massive to massive sulfide mineralization (Callan 2013).
Significant mineralization identified on the property occurs within
the Hod Maden Fault Zone, which at surface is a broadly NNE striking corridor of gossanous and locally argillic/phyllic hydrothermal alteration
that extends for more than 7 km with a width of up to 300 m.
The deposit is divided into a northern Main Zone and the contiguous
South Zone, with a third area of mineralization located 500 m further to the south at the Russian Mining area (Roth & Alizade 2017).
The geology of the area comprises Jurassic to Upper Cretaceous sedimentary,
dacitic-andesitic brecciated volcanics and volcano sedimentary lithologies. For the deposit seven main geological units have been identified:
| | 13-2 | |
| SSR Mining Inc. | Hod Maden Project | | January 7, 2026 |
| Technical Report Summary | | SLR Project No.: 123.000320.00001 |
| · | BXDA (Dac Bx) |
(Dacite Breccia) |
| · | BXAN (And Bx) |
(Andesite Breccia) |
| · | BXCA (Chl And Bx) |
(Dacite Breccia, formerly Chlorite Andesite Breccia) |
| · | VSED (VolSed) |
(Volcano-sedimentary) |
| · | VGYP (Gyp VolSed) |
(Gypsum Volcano-sedimentary) |
| · | MPYR/MPYE (Mpy \ Enr Zon) |
(Massive Pyrite/Massive Pyrite - Enriched) |
The mineralization is predominantly hosted within the dacite breccia
(Formerly classified as a chlorite andesite breccia) and the massive pyrite/enrichment zone. The hanging wall and footwall are represented
by the dacite breccia and gypsum volcano-sedimentary units, respectively.
The deposit area is also affected by different types of alteration,
comprising silicified, argillic, and network quartz vein and massive sulfide alteration (Figure 13-2).
Figure 13-2: Simplified Geological
Sections, Showing the Main Lithologies and Alteration Types
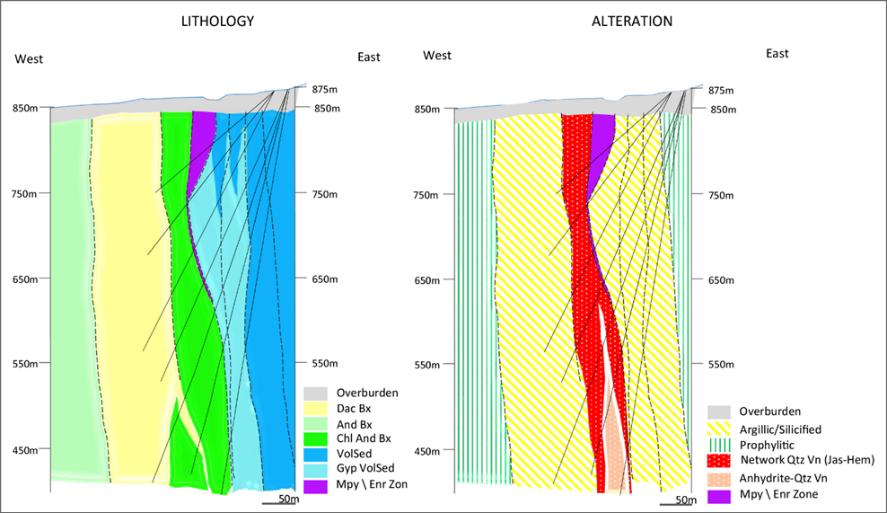
Figure 13-2
LITHOLOGY
Overburden
Dac Bx
And Bx
Chl and Bx
VolSed
Gyp VolSed
Mpy \ Enr Zon
ALTERATION
Overburden
Argillic/Silicified
Prophylitic
Network Qtz Vn (Jas-Hem)
Anhydrite-Qtz Vn
Mpy \ Enr Zon
Source: after Artmin 2018.
| 13.2.2 | Geotechnical Investigations |
Two main geotechnical drilling programs were conducted for the Hod Maden
deposit. The first, completed in 2017 comprises 11 deep drill holes (approximately 500 m from surface), mainly within the Main Zone. A
second drilling campaign was completed in September 2019 and includes 21 geotechnical holes, targeting the shallower part of the deposit
(approximately 200 m from surface), which is generally characterized by poor ground conditions.
| | 13-3 | |
| SSR Mining Inc. | Hod Maden Project | | January 7, 2026 |
| Technical Report Summary | | SLR Project No.: 123.000320.00001 |
Two additional drill holes were also completed
near the proposed portal area, with one of them along the expected decline access trace. Core photographs were available for all drill
holes.
Additionally, in 2019, 11 drill holes were selected within the existing
resource drilling program. Any missing geotechnical parameters for these holes were estimated through photo logging.
A perspective view showing all the drill holes used for the geotechnical
assessment is presented in Figure 13-3.
Figure 13-3: Perspective View Showing
all Drill Holes used for the Geotechnical Assessment
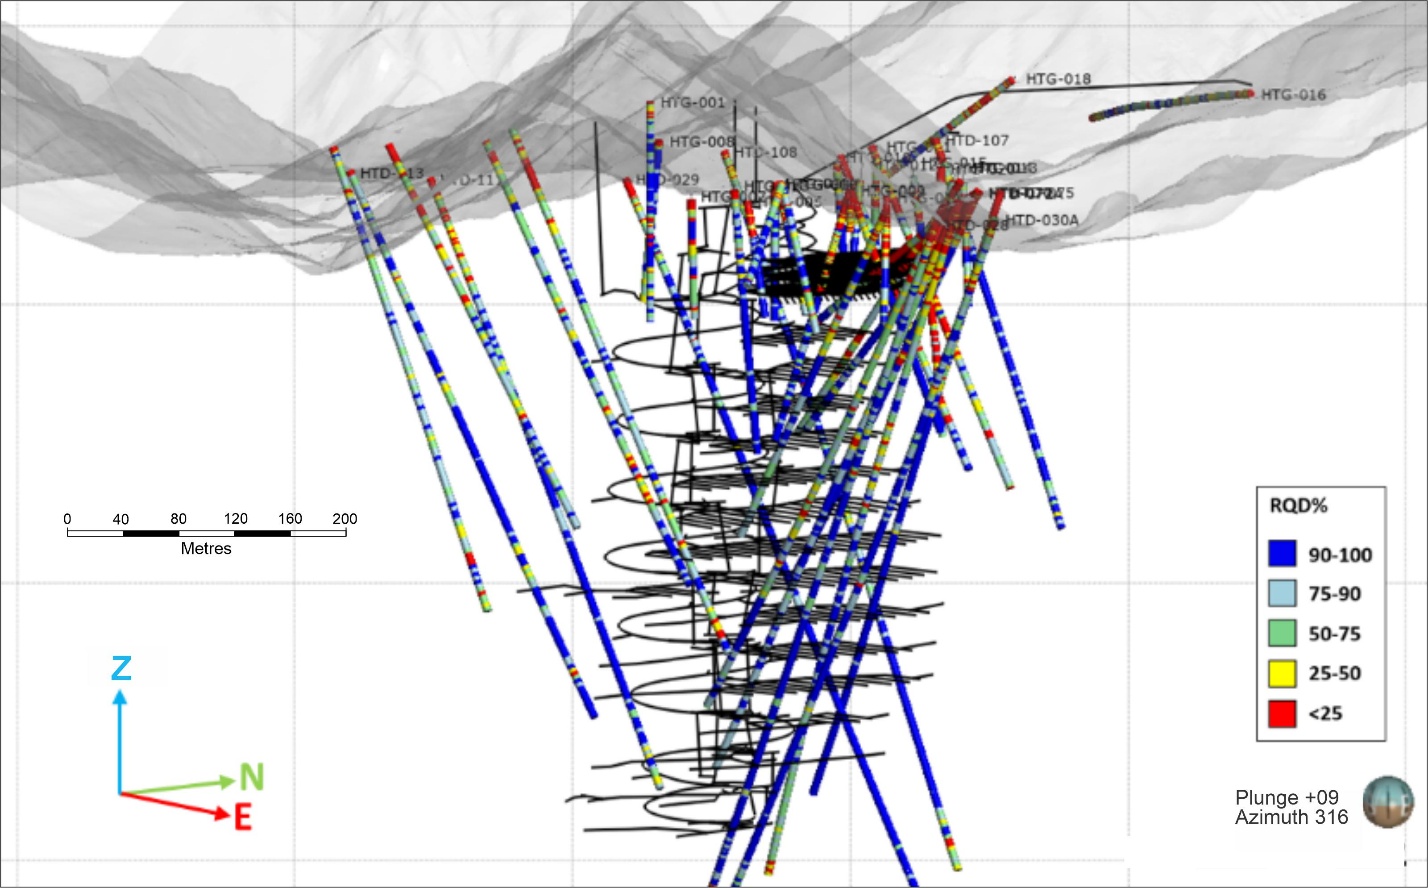
Figure 13-3
RQD%
90-100
75-90
50-75
25-50
<25
0
40
80
120
160
200
Metres
Source: Artmin 2025
Rock property testing was conducted for the major rock types at Hod
Maden. A total of 250 uniaxial compressive strength (UCS) tests, including measurement of elastic constants, were conducted for the Project.
An additional 89 indirect tensile strength (ITS) and 300 triaxial (TXT) tests were also performed.
A preliminary assessment was conducted grouping the results by major
rock type. However, it was found that argillic alteration causes a major reduction in rock strength. This type of alteration can be correlated
with the presence of NNE-SSW trending steep dipping large-scale structures. Examples of core photographs showing argillic and non-argillic
alteration for the same unit are presented in Figure 13-4 and Figure 13-5. A summary of the statistics for UCS is shown in Table 13-1.
| | 13-4 | |
| SSR Mining Inc. | Hod Maden Project | | January 7, 2026 |
| Technical Report Summary | | SLR Project No.: 123.000320.00001 |
Figure 13-4: Example of Volcanic-Sedimentary
Rock
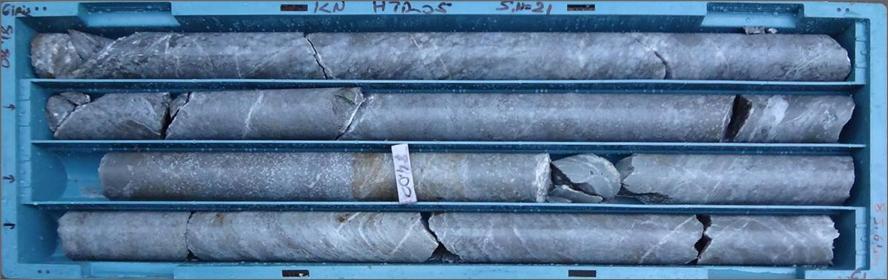
XXXX
Figure 13-5: Example of Volcanic-Sedimentary
Rock Affected by Argillic Alteration
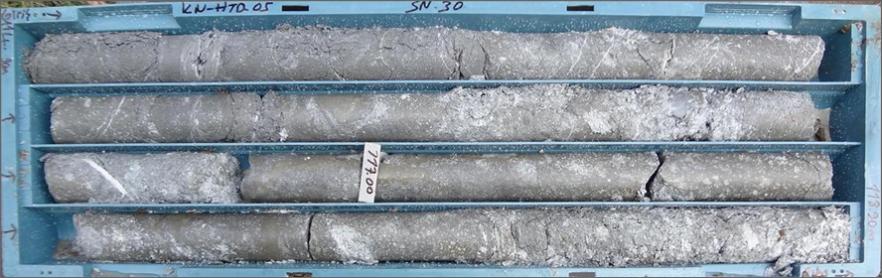
XXXX
Table 13-1: Intact Rock Properties
and Laboratory Test Results (UCS with Elastic Constants)
| Rock Type |
Alteration |
No. Tests |
UCS¹ |
| Median |
SD² |
| BXDA |
Non-Argillic
Argillic |
43
3 |
75
41 |
20.4
13.2 |
| BXAN |
Non-Argillic
Argillic |
38
3 |
72
30 |
20.0
3.5 |
| BXCA |
Non-Argillic |
44 |
67 |
19.0 |
| VSED |
Non-Argillic
Argillic |
25
9 |
63
17 |
17.6
11.6 |
| VGYP |
Non-Argillic
Argillic |
25
28 |
66
26 |
18.7
16.0 |
| MPYR |
Non-Argillic |
4 |
20 |
7.3 |
| Note 1. UCS accounts for samples that failed through intact rock only. Results from samples that failed in shear have been discarded. |
| | 13-5 | |
| SSR Mining Inc. | Hod Maden Project | | January 7, 2026 |
| Technical Report Summary | | SLR Project No.: 123.000320.00001 |
A range of laboratory tests were conducted to characterize the overburden.
The unit is comprised of alluvial material, with a thickness that, in the valley area, is approximately 20 m. A total of 31 samples were
collected and consolidated undrained triaxial (CU), particle size distribution (PSD) and Atterberg limit tests were conducted. The results
indicate that the overburden is predominantly composed of clayey sand, with the fine-grained fraction classified as low plasticity clay.
The results from the CU tests indicate a cohesion varying from 0 to 55 KPa and a friction angle between 25° and 39°. Examples
of overburden materials are shown in Figure 13-6 and Figure 13-7.
Figure 13-6: Example of Overburden
Materials - Gravel with Clay
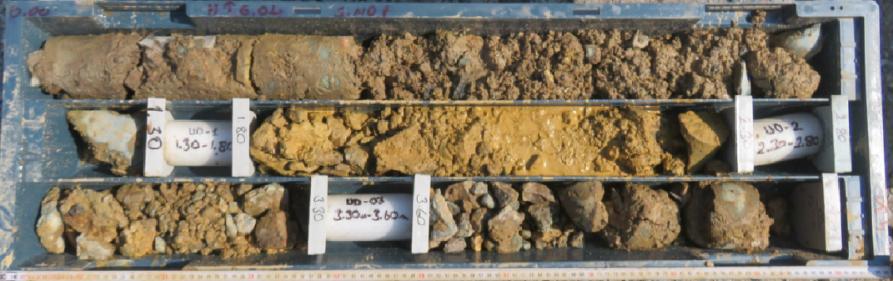
Figure 13-7: Example of Overburden
Materials - Sandstones with Cobbles
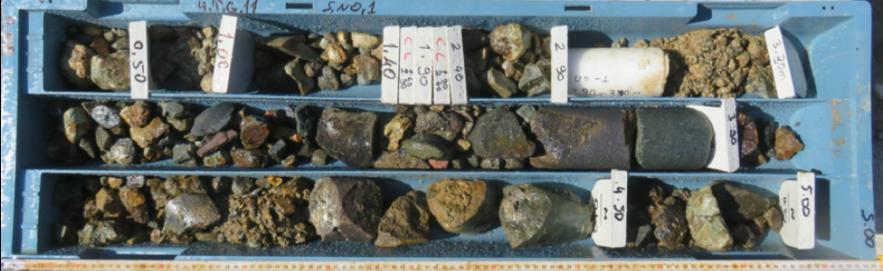
Stress measurements are not available for Hod Maden. Given the mountainous
terrain in which the deposit is located and the relative shallow depth of the mine (maximum 500 m), high stress conditions are not expected.
For the current analysis, the major principal stress was assumed to be horizontal and perpendicular to the orebody and 1.5 times the overburden
for the LHS mine and was assumed to be isotropic for the DAF mine.
| 13.2.3 | Overall Ground Conditions |
In general, “very poor” to “poor” ground conditions
(DAF stopes) were identified in the shallow part of the deposit (approximately 70 m from surface). The top layer is represented by alluvial
material and completely weathered rocks. Its thickness can vary from 15 m to 20 m within the valley zone to less than a meter towards
the toe of the surrounding steep slopes. Below this first layer and down to 70 m, the ground is highly variable.
| | 13-6 | |
| SSR Mining Inc. | Hod Maden Project | | January 7, 2026 |
| Technical Report Summary | | SLR Project No.: 123.000320.00001 |
The bulk of the material
is expected to be in the Poor Ground Zone (PGZ), characterized by weathered, low strength, intensely fractured rock (RQD<40%). The
rock mass itself is locally affected by the presence of thick argillic bands with very low strength, extremely low RQD, and soil/clay
like mechanical behaviour. These argillic zones seem to be particularly dominant in the massive pyrite and the hanging wall units.
These zones can be related by the presence of large-scale NNE-SSW trending,
steep-dipping structures. In the northern part of the deposit, this zone locally extends up to 190 m from surface. However, given the
limited lateral extent (approximately 25 m), it is likely that the deepening is related to possible E-W trending subvertical faults.
The rest of the deposit (LHS stopes) appear to comprise “good”
to “very good” ground conditions. However, large scale faults seem to locally affect the rock mass, with intense argillic
alteration and weakening of the rock. This characteristic is noted predominantly in the hanging wall within the volcano-sedimentary and
gypsum volcano sedimentary units. However, it is occasionally observed in the footwall within the dacite breccia.
| 13.2.4 | Ground Support - LHS Development |
Ground support requirements were estimated for each of the main excavation
types using the Q-system (Barton, Lien and Lunde 1974) and a recently published support selection chart (Potvin and Hadjigeorgiou 2016).
For each excavation type general ground support requirements were assessed for the expected range of ground conditions, as presented in
Figure 13-8.
Figure 13-8: Empirical Chart for
Ground Support Selection
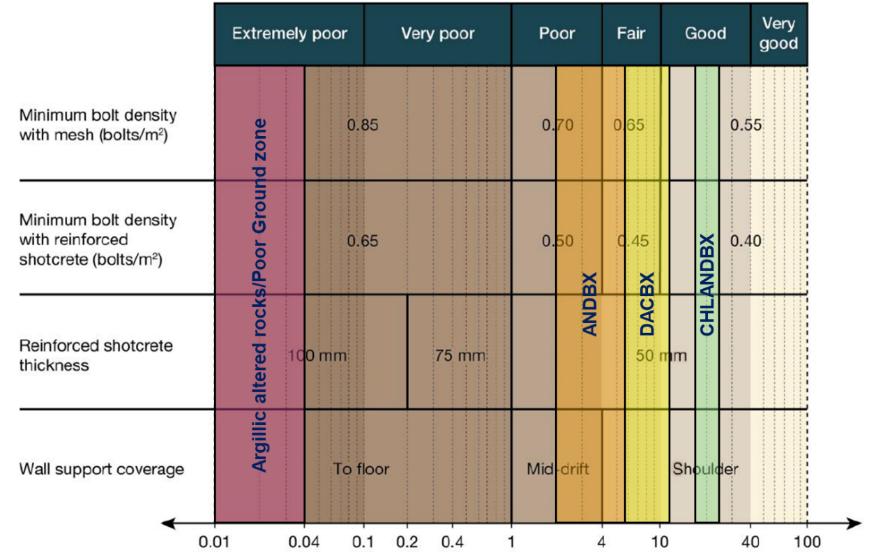
Figure 13-8
Minimum bolt density with mesh (bolts/m2)
Minimum bolt density with reinforced shotcrete (bolts/m2)
Reinforced shotcrete thickness
Wall support coverage
Extremely poor
Very poor
Poor
Fair
Good
Very good
Argillic altered rocks/Poor Ground zone
ANDBX
DACBX
CHLANDBX
0.85
0.70
0.65
0.55
0.65
0.50
0.45
0.40
100 mm
75 mm
50 mm
To floor
Mid-drift
Shoulder
0.01
0.04
0.1
0.2
0.4
1
4
10
40
100
Source: after Potvin and Hadjigeorgiou 2016.
Wedge analysis was undertaken to assess the potential for structurally
controlled failures in development drives and intersections using the program Unwedge software (v.5.0, Rocscience Inc.).
| | 13-7 | |
| SSR Mining Inc. | Hod Maden Project | | January 7, 2026 |
| Technical Report Summary | | SLR Project No.: 123.000320.00001 |
| 13.2.4.1 | Development Ground Support Recommendations |
Table 13-2 summarizes estimated development ground support requirements
for each development type. These are based on consideration of the wedge analysis and empirical assessments presented above. The approximate
proportion of development in argillic and non-argillic conditions for each development type has been based on the mine design layout.
| 13.2.4.2 | Intersection Ground Support Recommendations |
Large spans can be formed at the intersection of two development tunnels
creating the possibility for large wedges to form if unfavorably orientated structures are present. Intersection of the decline with level
accesses and the footwall drives with ore drives intersections represent the most critical cases.
The results of the wedge analysis for a typical intersection indicates
that potentially hazardous wedges could be adequately supported using 6 m long double strand cable bolts in combination with 2.4 m long
resin bolts installed vertically.
| 13.2.4.3 | LHS Ground Support Recommendations |
Stope walls at Hod Maden can be supported with cable bolts to achieve
larger spans, as indicated in Table 13-2. Hanging wall and footwall spans should be supported with 10 m cable bolts installed into the
walls two per ring with a 2.5 m ring spacing. Where stope crowns (in rock) are greater than 6 m wide, 8 m long cable bolts should be installed
in the backs at a spacing of 2 m x 2 m in development.
| 13.2.4.4 | Portal Support Recommendations |
Portal face preparation will include:
| · | Formation of 70° to 80° batter face 15 m high |
| · | Establishment of catch berm 5 m wide at the top of the batter |
| · | 75 mm thickness of fibrecrete applied to batter face at least 10 m either side of the portal development centerline |
| · | Two rows of 6 m cable bolts installed +10° from the horizontal above the portal development backs at 1.5 m by 1.5 m spacing
staggered to 5 m either side of portal |
Portal development (first 16 m from portal face) will include:
| · | Development rounds restricted 2 m length in the first 10 m |
| · | Smooth wall blasting for at least the first 10 m of development |
| · | 75 mm fibrecrete applied floor to floor |
| · | Fully encapsulated 2.4 m resin bolts installed on a 1.2 m by 1.2 m spacing to within 2 m of floor |
| · | Cable bolts 6 m long installed in a 2 m by 2 m spacing in the backs |
| · | Initial 15 m to 20 m will also require the installation of steel sets. |
| | 13-8 | |
| SSR Mining Inc. | Hod Maden Project | | January 7, 2026 |
| Technical Report Summary | | SLR Project No.: 123.000320.00001 |
Table 13-2: Estimated Development
Ground Support Requirements – LHS
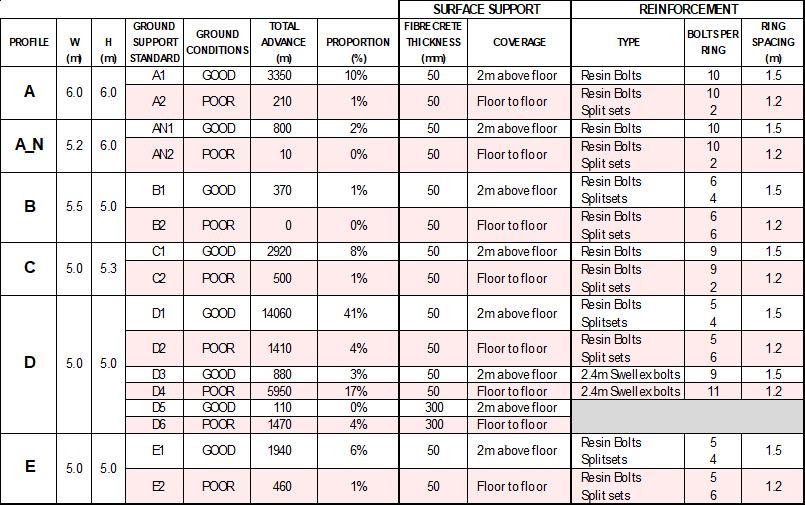
Table 13-2
PROFILE
A
A_N
B
C
D
E
W (m)
6.0
5.2
5.5
5.0
5.0
5.0
H (m)
6.0
6.0
5.0
5.3
5.0
5.0
GROUND SUPOPRT STANDARD
A1
A2
AN1
AN2
B1
B2
C1
C2
D1
D2
D3
D4
D5
D6
E1
E2
GROUND CONDITIONS
GOOD
POOR
GOOD
POOR
GOOD
POOR
GOOD
POOR
GOOD
POOR
GOOD
POOR
GOOD
POOR
GOOD
POOR
TOTAL ADVNACE (m)
3350
210
800
10
370
0
2920
500
14060
1410
880
5950
110
1470
1940
460
PROPORTION (%)
10%
1%
2%
0%
1%
0%
8%
1%
41%
4%
3%
17%
0%
4%
6%
1%
SURFACE SUPPORT
FIBRECRETE THICKNESS (mm)
50
50
50
50
50
50
50
50
50
50
50
50
300
300
50
50
COVERAGE
2m above floor
Floor to floor
2m above floor
Floor to floor
2m above floor
Floor to floor
2m above floor
Floor to floor
2m above floor
Floor to floor
2m above floor
Floor to floor
2m above floor
Floor to floor
2m above floor
Floor to floor
REINFORCEMENT
TYPE
Resin Bolts
Resin Bolts
Split sets
Resin Bolts
Resin Bolts
Split sets
Resin Bolts
Splitsets
Resin Bolts
Split sets
Resin Bolts
Resin Bolts
Split sets
Resin Bolts
Splitsets
Resin Bolts
Split sets
2.4m Swellex bolts
2.4m Swellex bolts
Resin Bolts
Splitsets
Resin Bolts
Split sets
BOLTS PER RING
10
10
2
10
10
2
6
4
6
6
9
9
2
5
4
5
6
9
11
5
4
5
6
RING SPACING (m)
1.5
1.2
1.5
1.2
1.5
1.2
1.5
1.2
1.5
1.2
1.5
1.2
1.5
1.2
PROFILE
A
A_N
B
C
D1/2
D3/4
D5/6
E
W (m)
6.0
5.2
5.5
5.0
5.0
5.0
H (m)
6.0
6.0
5.0
5.3
5.0
5.0
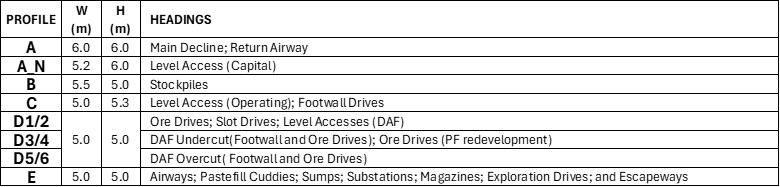
HEADINGS
Main Decline; Return Airway
Level Access (Capital)
Stockpiles
Level Access (Operating); Footwall Drives
Ore Drives; Slot Drives; Level Accesses (DAF)
DAF Undercut(Footwall and Ore Drives); Ore Drives (PF redevelopment)
DAF Overcut( Footwall and Ore Drives)
Airways; Pastefill Cuddies; Sumps; Substations; Magazines; Exploration Drives; and Escapeways
| 13.2.4.5 | Raise Bore Shaft Stability Assessment |
Ventilation shaft stability was assessed using the method proposed by
McCracken and Stacey (1989), with reference to the back-analysed information in Stephenson (2011), and updated analyses by Peck and Lee
(2008), Peck et al. (2011), and Penney, Stephenson and Pascoe (2018).
As there have been no geotechnical drill holes specifically drilled
in the alignment of the raises, the assessment has been based on the nearest resource drill holes to the raises. These are shown in Figure
13-9.
| | 13-9 | |
| SSR Mining Inc. | Hod Maden Project | | January 7, 2026 |
| Technical Report Summary | | SLR Project No.: 123.000320.00001 |
Figure 13-9: Drill Holes Used for
Shaft Stability Assessment - View Looking Northeast
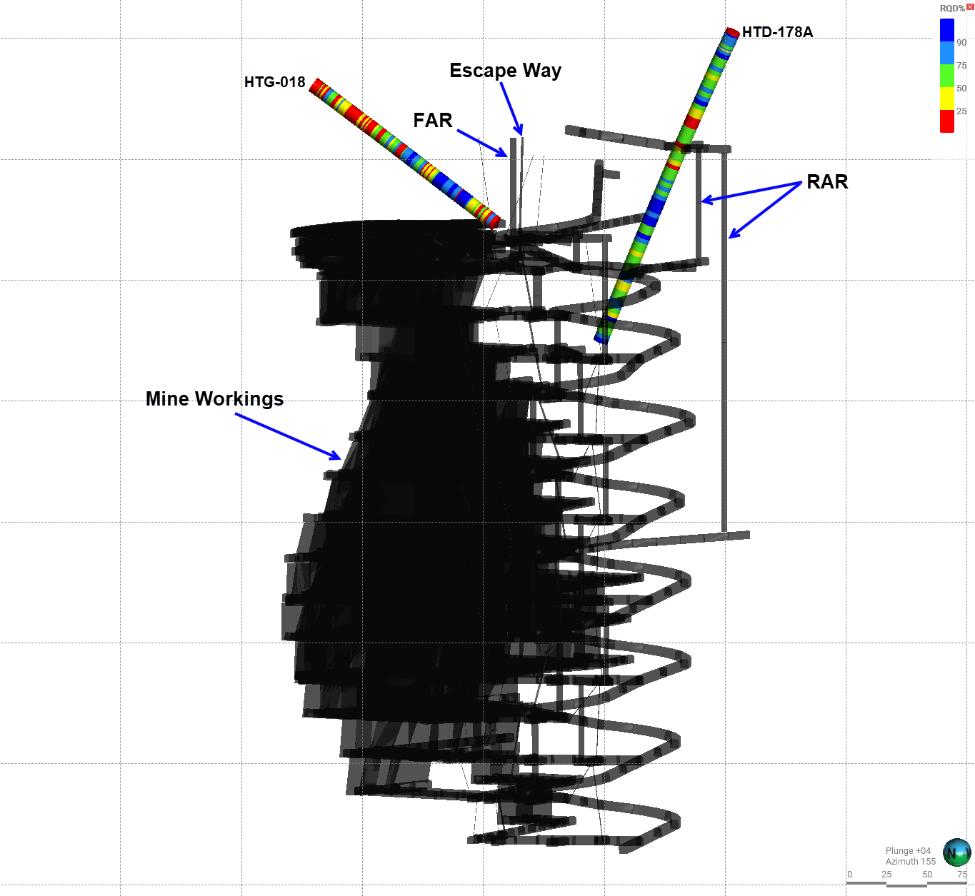
Figure 13-9
HTG-018
FAR
Escape Way
HTD-178A
RAR
Mine Workings
RQD%
90
75
50
25
Plunge +04
Azimuth 155
1
25
50
75
N
Source: Artmin 2025
The assessment for the return air raise (RAR) indicated that poor ground
conditions may be encountered between 52 m and 58 m. On the assumption that the hole is representative of conditions at the proposed raise
locations, the poor ground zone would have implications for both face and wall short term stability. Therefore, a Return Air Rise Portal
Adit will be mined in approximately 90 m with the ventilation shaft now starting in better ground conditions. Below this (based on
the assumed conditions), the rest of the ventilation shafts could be raise bored at a maximum stable diameter of 3.5 m. For long term
stability, the ventilation shafts would need to be lined with 100 mm high quality fibrecrete through their length.
For the fresh air raise (FAR) and escapeway, again assuming that the
hole is broadly indicative of the ground conditions at the proposed raise locations, the assessment indicates that the ventilation shafts
could be raise bored at a maximum stable diameter of 3.5 m without pre-sinking. As for the RAR, 100 mm high quality fibrecrete lining
should be adopted for long-term support.
| | 13-10 | |
| SSR Mining Inc. | Hod Maden Project | | January 7, 2026 |
| Technical Report Summary | | SLR Project No.: 123.000320.00001 |
The RAR and FAR assessments are general in nature as they are based
on information that is, in some places, some distance from the ventilation shafts. Geotechnical holes have been drilled during mid-2024
for both RAR and FAR with now known ground conditions expected for vertical development.
| 13.2.5 | Ground Support - Mine Ventilation Shafts and Drifts |
Construction in the DAF mining zone will apply civil engineering techniques
such as the Sequential Excavation Method (SEM) to advance drifts. Soft ground tunnelling methods such as SEM utilize sprayed concrete
lining in conjunction with pre-support spiles (in soil or very poor-quality rock conditions).
The crown pillar (CP) level will be comprised of access headings, footwall
drifts, and ore drives.
The CP access heading will be approximately 5 m high by 5 m wide. Support
will be a 75 mm sealing layer of fibre reinforced sprayed concrete followed by a 300 mm fibre reinforced concrete primary lining.
The lining will be completed with a 225 mm mesh reinforced concrete. This will be increased to 375 mm on the cross-heading side of the
access heading.
The CP ore drives will be the same size as the access and footwall drifts,
approximately 5 m high by 5 m wide. Surface support will be a 75 mm sealing layer of fibre reinforced sprayed concrete followed by
a 200 mm primary lining. Where the ore drives are in soil zones a final mesh reinforced concrete 145 mm layer will be applied.
The undercut levels will have a footwall drive and undercut ore drives.
The undercut footwall drives will be a similar profile to the CP access
headings, approximately 5 m high by 5 m wide. Support will be a 75 mm sealing layer of fibre reinforced sprayed concrete followed
by a 300 mm to 525 mm reinforced concrete primary lining depending on ground conditions.
The undercut ore drives will average 5 m high by 5 m wide. Surface support
will be a 75 mm sealing layer.
| 13.2.5.2 | Stope Design Parameters - LHS |
The modified rock quality index Q’, after Mathews et al. (1981)
and Potvin (1988), has application in stope stability assessments. Q’ uses four of the same parameters as Q and is calculated as
follows:
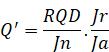
For the underground stope analysis, distribution of rock mass parameters
was investigated for the ore zone and the immediate 2 m, 5 m and 10 m of the footwall and the immediate 2 m, 5 m, 10 m and 20 m of the
hanging wall. The results indicated a homogeneous rock mass both in the footwall and the hanging wall. A summary of the assessments is
presented in Table 13-3.
| | 13-11 | |
| SSR Mining Inc. | Hod Maden Project | | January 7, 2026 |
| Technical Report Summary | | SLR Project No.: 123.000320.00001 |
Table 13-3: Rock Mass Classification
Based on the Q’
| Domain |
Meters Logged |
RQD Quartile |
Q’ Quartile |
| 25 |
50 |
75 |
25 |
50 |
75 |
| Hanging wall |
121.0 |
81 |
81 |
97 |
6.8 |
18.4 |
24.2 |
| Ore Zone |
1,468.7 |
90 |
90 |
100 |
18.2 |
29.7 |
48.5 |
| Footwall |
119.9 |
79 |
92 |
98 |
8.6 |
11.8 |
21.3 |
Typical hanging wall, ore zone, and footwall ground conditions can be
evidenced by the photographs of core presented in Figure 13-10, Figure 13-11, and Figure 13-12.
Figure 13-10: Typical Hanging Wall
Ground Conditions in the VGYP (HDT-005)
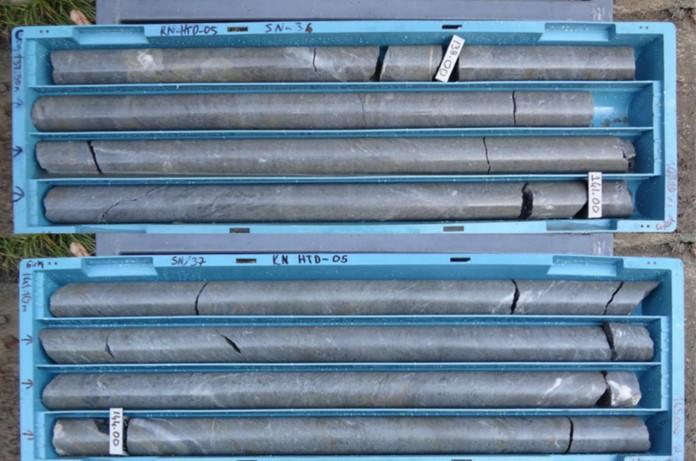
| | 13-12 | |
| SSR Mining Inc. | Hod Maden Project | | January 7, 2026 |
| Technical Report Summary | | SLR Project No.: 123.000320.00001 |
Figure 13-11: Typical Ore Zone Ground
Conditions in the BXCA (HDT-005)
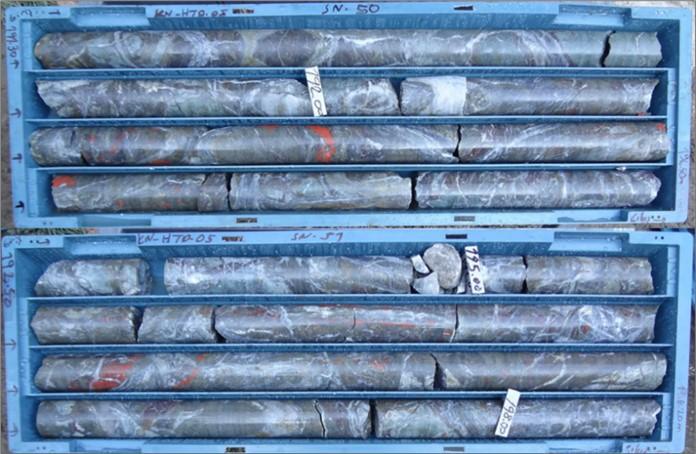
Figure 13-12: Typical Footwall Ground
Conditions in the BXDA (HDT-005)
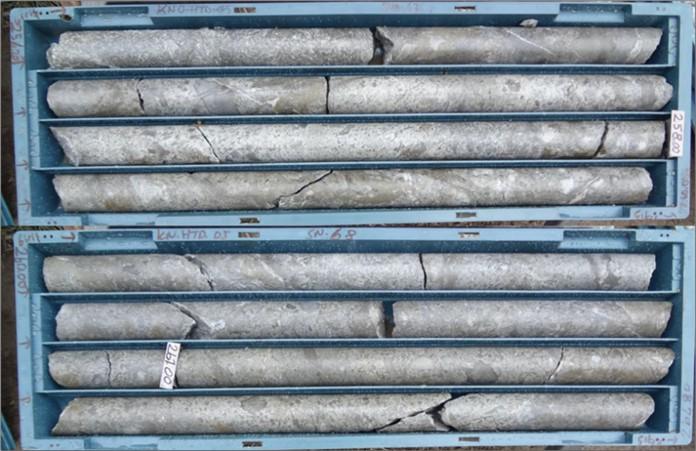
A stope stability assessment was undertaken using the stability graph
method to derive stope design parameters. This was originally developed in Canada (Mathews et al. 1981 and Potvin 1988) to derive
preliminary stope design parameters from rock mass classification data.
| | 13-13 | |
| SSR Mining Inc. | Hod Maden Project | | January 7, 2026 |
| Technical Report Summary | | SLR Project No.: 123.000320.00001 |
The method is described in detail in Hutchinson and Diederichs
(1996) and revised in Villaescusa (2014).
The method uses Q’ as a basic rock mass quality input, with additional
factors to account for the influence of stress (“Factor A”), dominant structure (“Factor B”), and the inclination
of the stope wall being assessed (“Factor C”), on expected stability. The product of Q’, and the A, B, and C factors
is referred to as the “Modified Stability Number”, N’.
N’ is plotted against “Hydraulic Radius” (HR) on the
“Modified Stability Graph”, which allows assessment of stability based on the region of the chart in which the result plots.
The stable dimensions presented in Table 13-4 refer to maximum practical
mining dimensions. Two cases are presented for the backs, which will in most cases be to be supported with cable bolts to increase the
stable dimensions. The case of supported backs indicates that a maximum mining width of 50 m (hanging wall to footwall) can be achieved
(for example in transverse stoping). However, recognizing that the stability graph method is very approximate, and that no local stoping
experience is currently available, designs were based on the unsupported cases.
Table 13-4: Stope Stability Assessment
Results
| Stope Wall |
Stable Hydraulic Radius HR (m) |
Practical Stable Dimensions (m x m) |
| Hanging wall (unsupported) |
5.6 |
15 x 25 |
| Footwall (unsupported) |
5.2 |
15 x 25 |
| Backs (unsupported) |
5.2 |
30 x 15 |
| Backs (supported) |
10.1 |
50 x 15 |
| Side walls (unsupported) |
6.9 |
30 x 25 |
Figure 13-13: Relationship of Damage
to Angular Distortion and Horizontal Strain
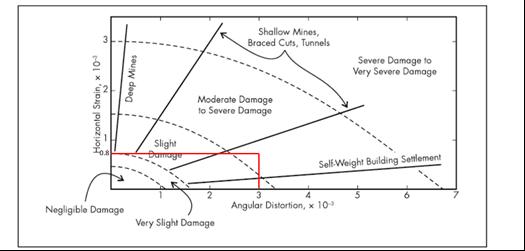
Source: after Harrison 2011.
Figure 13-13
Horizontal Strain, x 10-3
3
2
1
0.8
Angular Distortion, x 10-3
1
2
3
4
5
6
7
Shallow Mines, Braced Cuts, Tunnels
Severe Damage to Very Severe Damage
Deep Mines
Moderate Damage to Severe Damage
Self-Weight Building Settlement
Slight Damage
Negligible Damage
Very Slight Damage
For the LHS zone the worst-case scenario was modeled where continuous
hanging wall faults were assumed.
| | 13-14 | |
| SSR Mining Inc. | Hod Maden Project | | January 7, 2026 |
| Technical Report Summary | | SLR Project No.: 123.000320.00001 |
The model indicated that there could be some potential damage and unravelling within the hanging wall
along the fault, which could result in increased dilution. However, based on review of drill core, it is very unlikely that the structures
are as continuous as represented in the model. As a result, it is expected that areas of damage will be localized.
The numerical analysis showed that no significant damage will occur
during the extraction of the sill pillars. This is due to the relatively benign stress environment in which the deposit will be mined
and the overall rock mass strength. Based on the analysis, there are no significant geotechnical risks constraining the sequence, which
could therefore be further optimized.
| 13.3 | Mining Method Selection |
The deposit, in general, lends itself to underground mining. Although
it is located close to surface, the surrounding topography is mountainous and generally not well suited to the placement of large waste
rock dumps and stockpiles. Open pit mining was also considered unsuitable due the commitment to minimize surface disturbance.
The two main underground mining methods selected for Hod Maden are DAF
and LHS.
The DAF mining method is suitable for the poor ground conditions encountered
in the upper section of the deposit. The underhand mining method allows high recovery while limiting exposure to the poor ground conditions.
LHS was selected for the more competent ground conditions at the lower
levels of the mine due to the flexibility of the mining method and the suitable geometry of the deposit - steeply dipping with moderate
width. Stope sizes are shown below in Table 13-5.
Table 13-5: Stope Sizing
| Mining Method |
Length (m) |
Width (m) |
Height (m) |
| Primary LHS |
10–30 |
15 |
25 |
| Secondary LHS |
10–30 |
15 |
25 |
| DAF |
1–2 |
5 |
5 |
| 13.3.1 | Modified Drift and Fill Mining |
A modified form of DAF mining is proposed in the Poor Ground Zone (i.e.,
poor ground conditions) from the base of the overburden to the 780 masl elevation. Civil excavation techniques will be utilized to establish
a crown pillar (CP) to support the alluvium and surface features. The CP will be constructed at shallow depth using soft ground tunneling
methods, with sprayed concrete linings. Subsequent undercut DAF levels will have ore drives developed on alternate (offset) orientations
in the shadow of the CP. All drives will be filled with paste backfill to ensure the ability to mine adjacent drives and undercut levels.
The proposed modified DAF mining method layout is illustrated in perspective
view in Figure 13-14.
| | 13-15 | |
| SSR Mining Inc. | Hod Maden Project | | January 7, 2026 |
| Technical Report Summary | | SLR Project No.: 123.000320.00001 |
Figure 13-14: Schematic of Modified
Drift and Fill Layout - Perspective View
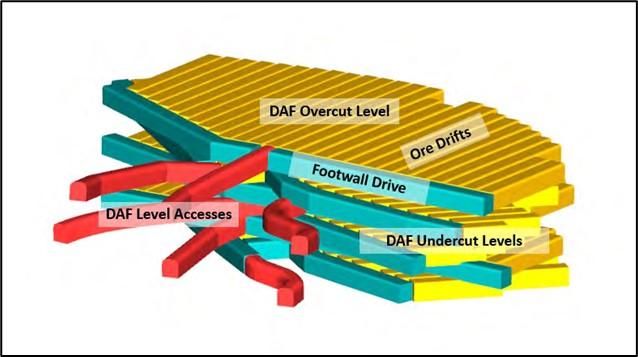
Figure 13-14
DAF Overcut Level
Ore Drifts
Footwall Drive
DAF Level Accesses
DAF Undercut Levels
Source: Artmin 2025
The LHS mining method will be utilized in the orebody below the 780
masl elevation, where the bulk of the mineralization occurs, and will consist of transverse and longitudinal LHS. Transverse LHS will
apply in the wider zones (>10 m) and longitudinal in the narrower extremities of the orebody.
Transverse LHS is a mechanized mining method where the strike of the
stope is perpendicular to the strike of the orebody. Ore drill drives are developed from the footwall to the hanging wall from a footwall
drive, which is subparallel to the orebody.
The transverse LHS will be extracted in a primary/secondary sequence
with paste backfill ensuring high recovery of the reserve. The width of the orebody is up to 60 m, which enables two stoping panels of
approximately 30 m width to be mined sequentially from hanging wall to footwall.
The LHS mining method requires that a proportion of the blasted stope
ore be extracted using tele-remote loader operation.
A typical transverse LHS method is illustrated in Figure 13-15 and a
typical longitudinal LHS method, in Figure 13-16. Further discussion on the stope sequence can be found in Section 13.6.2.
| 13.3.3 | Comparisons to Similar Underground Mines |
These mines listed below share comparable underground mining methods,
which are optimized for high-grade ore extraction, like Hod Maden.
| · | Fosterville Gold Mine (Australia) – A high-grade underground gold mine using long-hole open stoping with cemented rock
fill, similar to Hod Maden’s proposed method. |
| | 13-16 | |
| SSR Mining Inc. | Hod Maden Project | | January 7, 2026 |
| Technical Report Summary | | SLR Project No.: 123.000320.00001 |
| · | Brucejack Mine (Canada) – An underground high-grade gold mine utilizing long-hole stoping with backfill, making it similar
in terms of mining technique and orebody characteristics. |
| · | Dugald River, Queensland (Australia) - Dugald River uses long-hole open stoping, which is the same method planned for Hod Maden.
Both mines focus on extracting high-grade ore (zinc-lead-silver for Dugald River, gold-copper for Hod Maden). Both operations involve
mining relatively narrow, high-grade ore bodies, making efficient underground mining crucial. |
| | 13-17 | |
| SSR Mining Inc. | Hod Maden Project | | January 7, 2026 |
| Technical Report Summary | | SLR Project No.: 123.000320.00001 |
Figure 13-15: Typical Transverse
LHS Layout
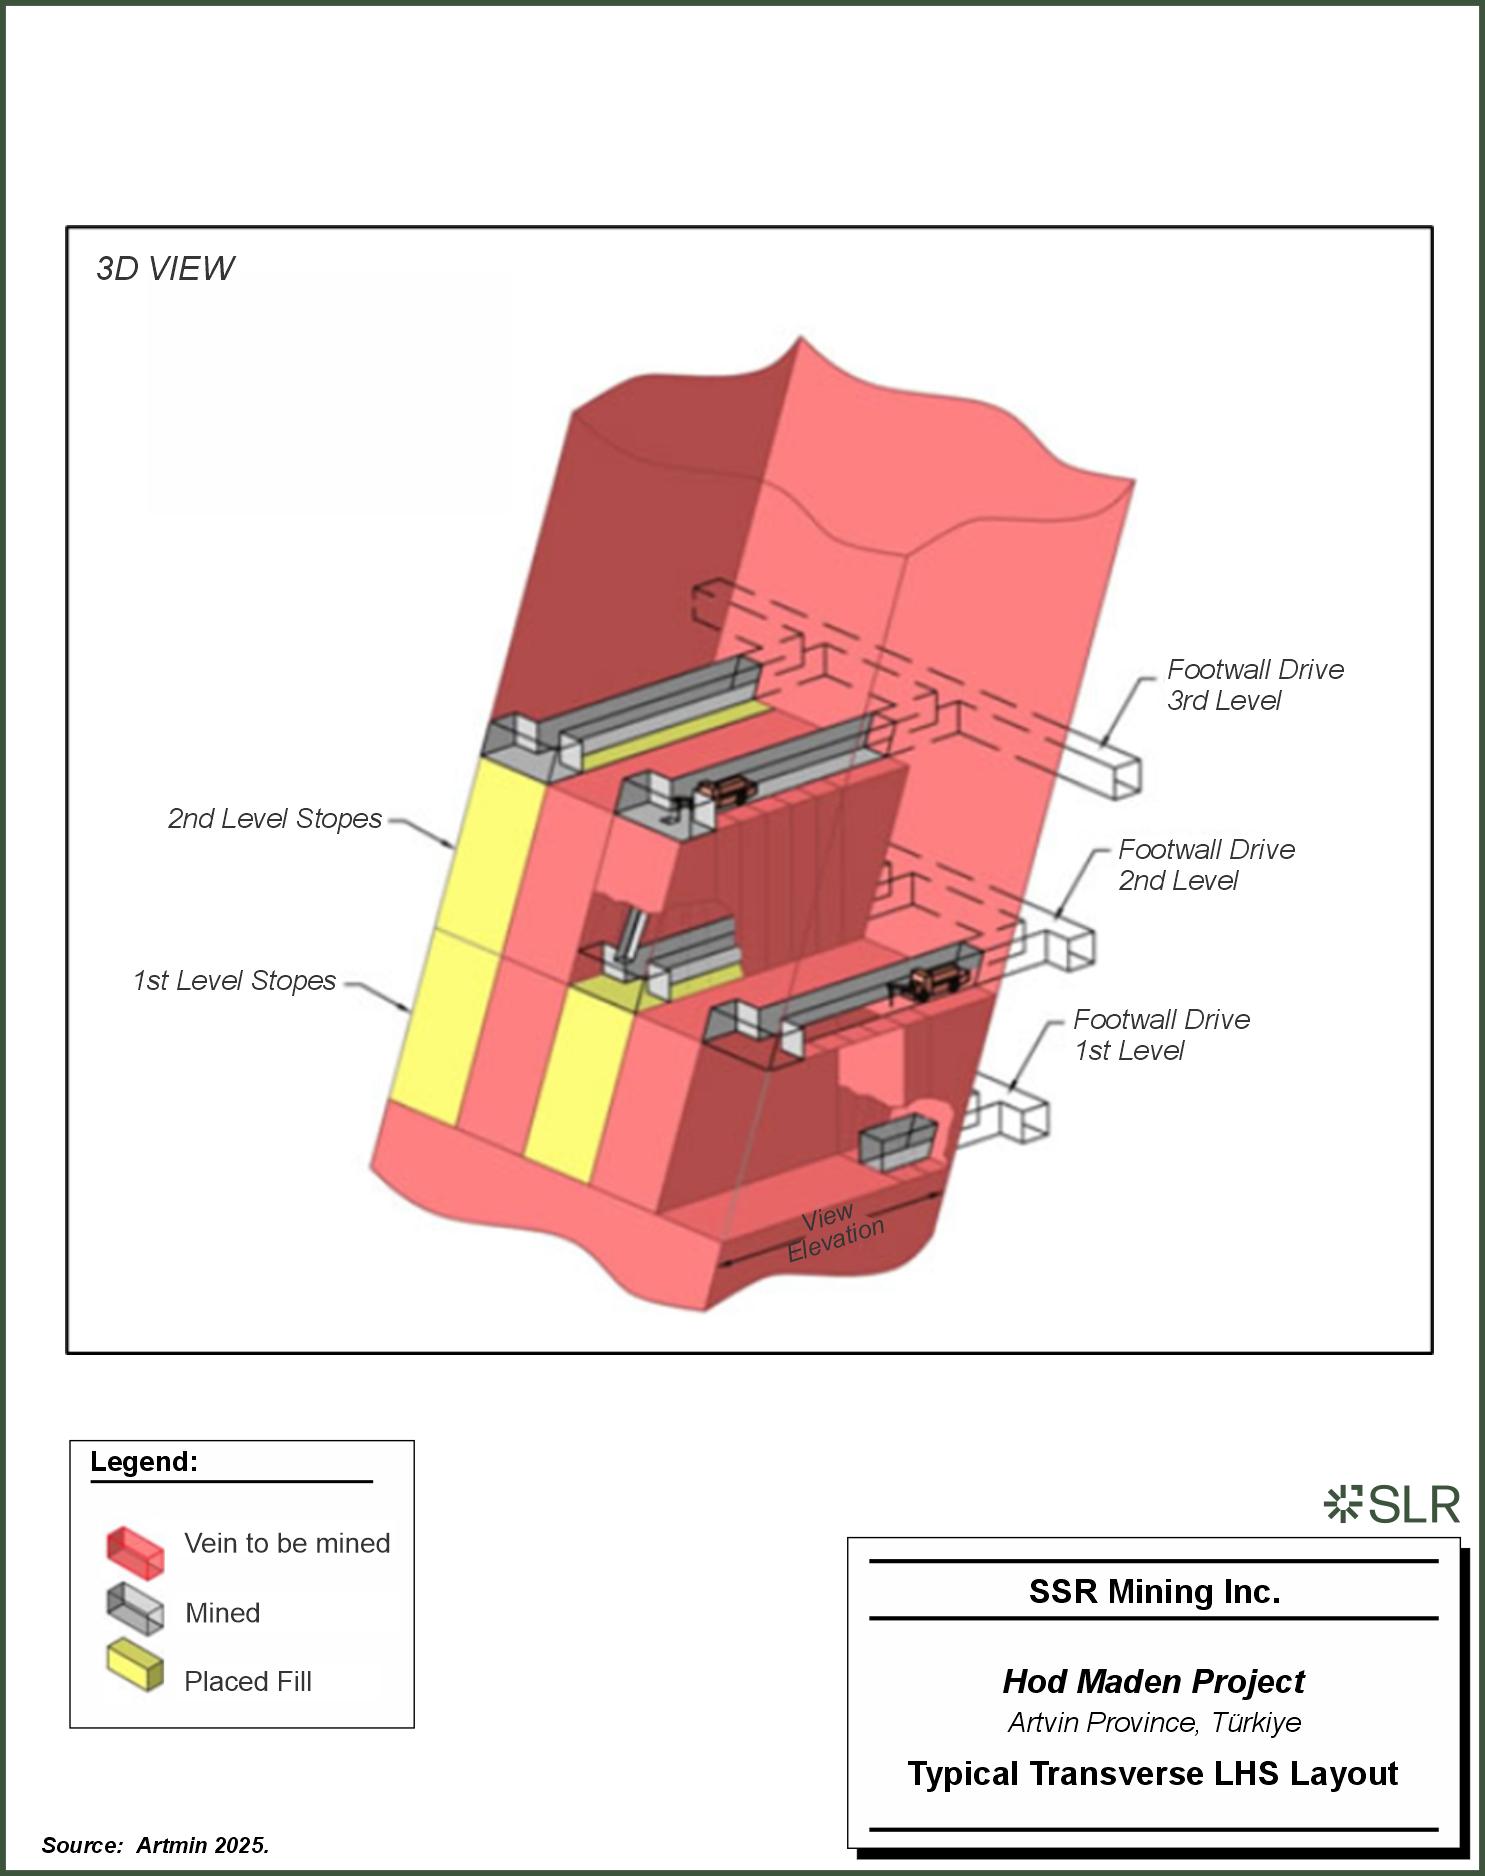
Figure 13-15
3D VIEW
2nd Level Stopes
1st Level Stopes
Footwall Drive 3rd Level
Footwall Drive 2nd Level
Footwall Drive 1st Level
View Elevation
Legend:
Vein to be mined
Mined
Placed Fill
SSR Mining Inc.
Hod Maden Project
Artvin Province, Türkiye
Typical Transverse LHS Layout
Source: Artmin 2025.
| | 13-18 | |
| SSR Mining Inc. | Hod Maden Project | | January 7, 2026 |
| Technical Report Summary | | SLR Project No.: 123.000320.00001 |
Figure 13-16: Typical Longitudinal
LHS Layout
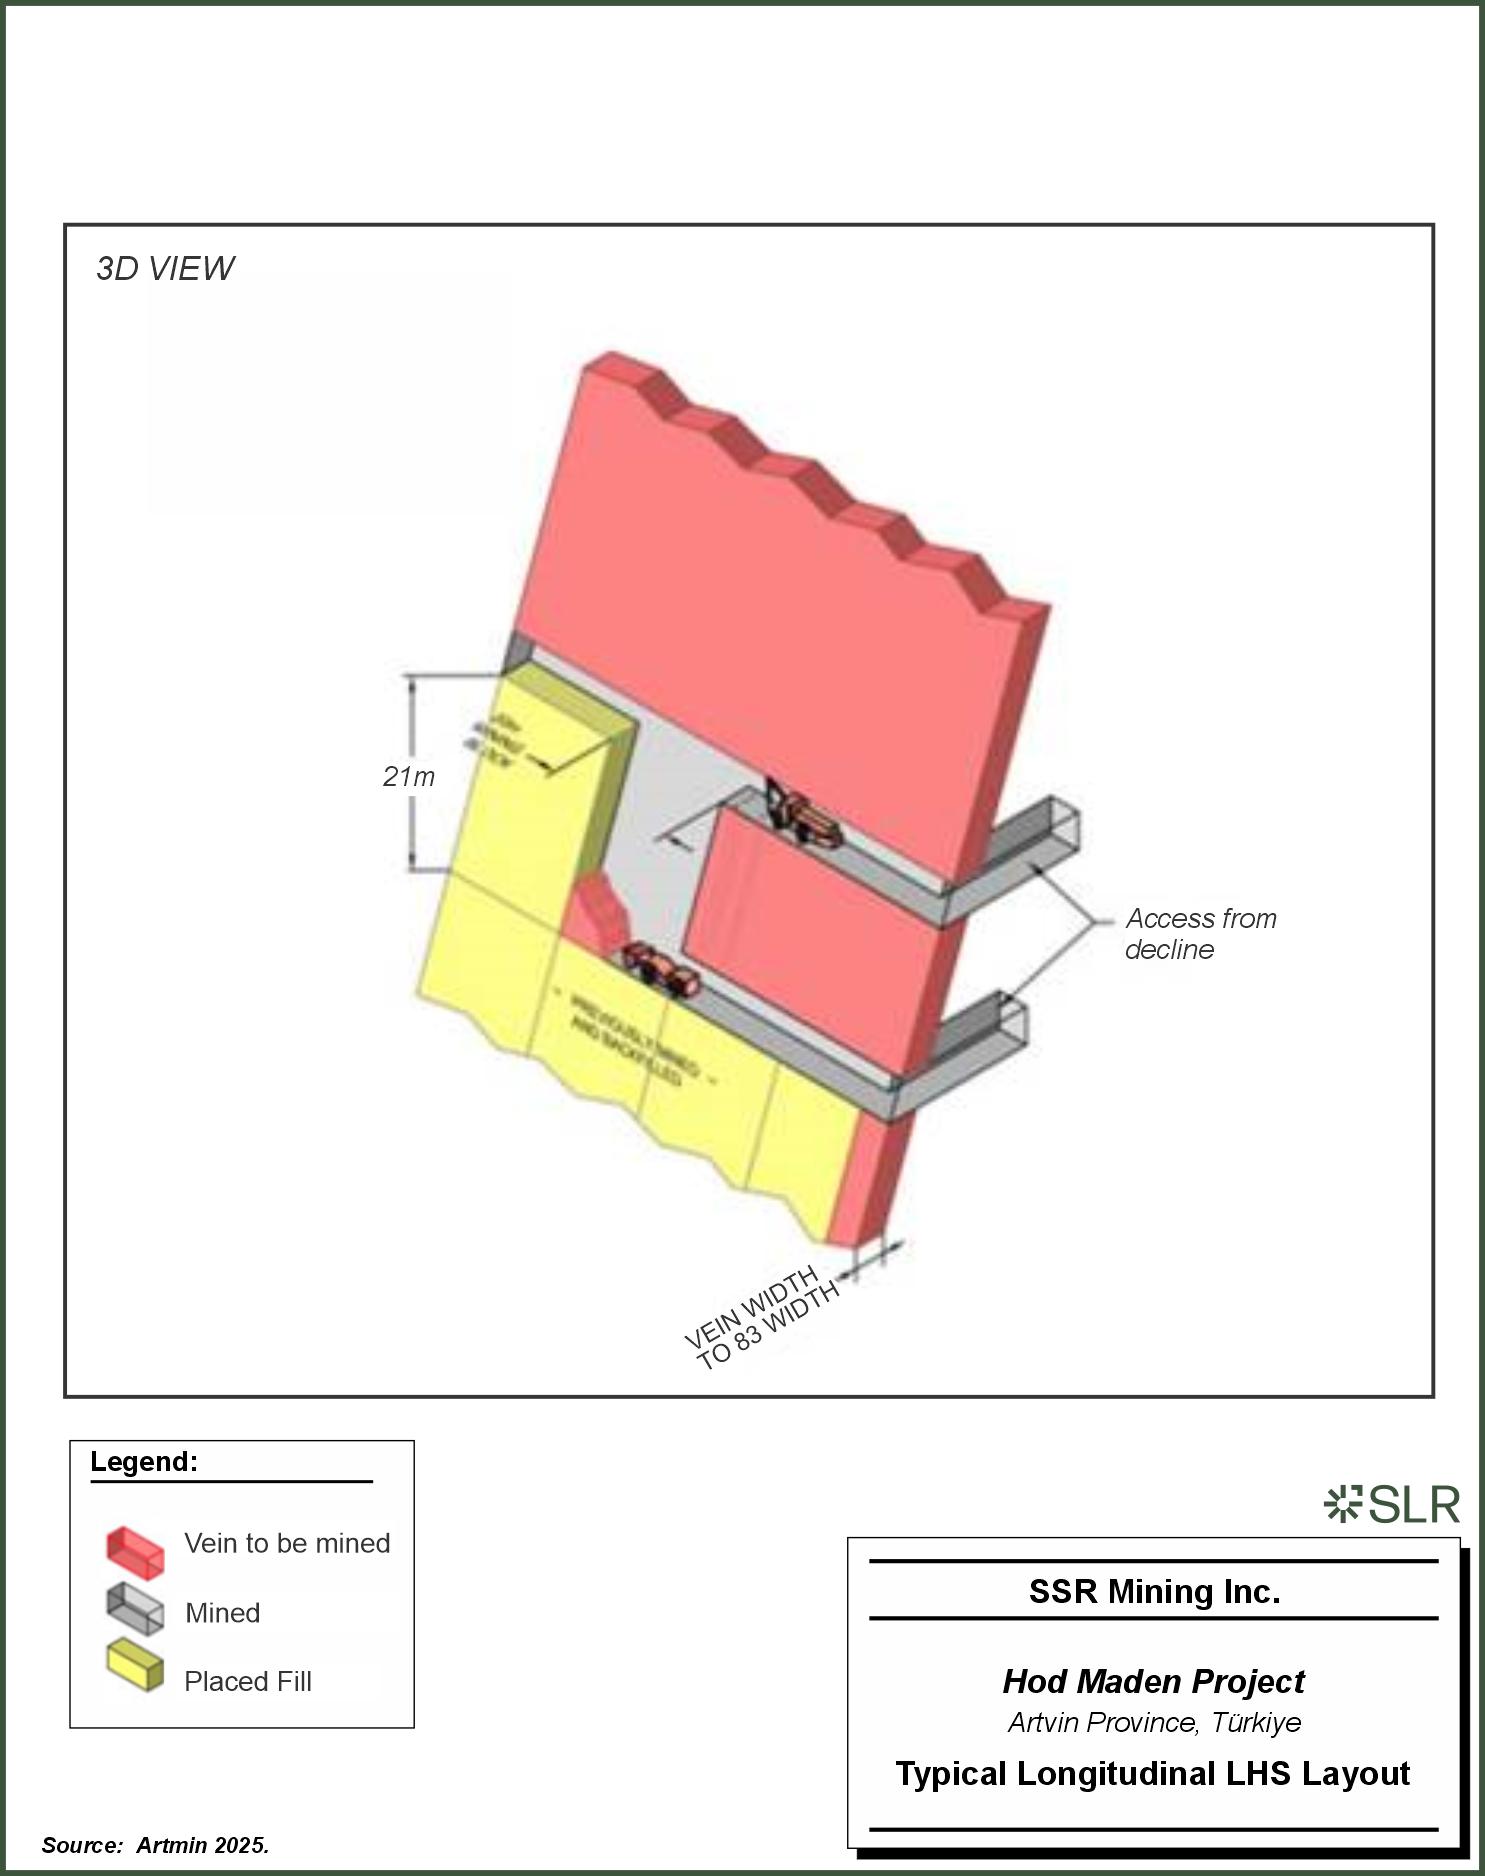
Figure 13-16
3D VIEW
21m
Access from decline
VEIN WIDTH TO 83 WIDTH
Legend:
Vein to be mined
Mined
Placed Fill
SSR Mining Inc.
Hod Maden Project
Artvin Province, Turkiye
Typical Longitudinal LHS Layout
Source: Artmin 2025.
| | 13-19 | |
| SSR Mining Inc. | Hod Maden Project | | January 7, 2026 |
| Technical Report Summary | | SLR Project No.: 123.000320.00001 |
| 13.4.1 | Modified Drift and Fill |
DAF development mining will have ground support applied at a much higher
density, which will also provide a crown pillar to ensure stability for the remaining five underhand drift and fill levels. This enables
extraction of the high-grade mineralization located in the DAF zone above the 780 level. The design requires a regular geometric footprint
for each of the levels, which are accessed by level access off the decline and footwall drives. The overall regular geometric shape of
all levels has been established such that most of the mineralization is enveloped. The core inventory was determined by using the BeV
of US$160/t for drift and fill, with some material below the cut-off value as required for the mining method.
| 13.4.2 | LHS Stope Optimization |
LHS stope designs for the study have been generated using the Stope
Optimizer (SO) module of Deswik mine planning software. Transverse stopes are typically 25 m high by 15 m wide (along strike of deposit)
and up to 30 m long (across width of deposit). The SO settings are summarized in Table 13-6. The post processing settings shown at the
bottom of Table 13-6 were used to determine final stope dimensions for the transverse LHS inventories. Longitudinal LHS inventories did
not undergo post processing.
Table 13-6 Hod Maden Stope Optimizer
Settings
| Parameters |
Value |
Units |
| Optimization field |
NSR |
US$ |
| Cut-off value |
$82/t to $108/t |
US$/t |
| Strike azimuth |
0 |
degrees |
| Stope length (width) |
15 |
m |
| Minimum mining width |
2 |
m |
| Minimum waste pillar length |
10 |
m |
| Minimum hanging wall angle |
90 |
degrees |
| Minimum footwall angle |
45 |
degrees |
| Maximum strike variation |
-90 to +90 |
degrees |
| Maximum strike change |
10 |
degrees |
| Post processing stope split - min length (width) |
10 |
m |
| Post processing stope split - max length (width) |
30 |
m |
Stope Optimizer runs were completed against the mining block model.
The core inventory was determined by using the BeV of US$108/t for long hole stoping, which incorporated all operating and all capital
costs except for initial capital. A second SO run was made using the SIV of US$82/t, which excluded development costs and some capital
costs and was used to determine incremental stoping inventories, which were included where development was already in place. Some manual
manipulation of the incremental stopes was completed to incorporate into the primary inventory.
| | 13-20 | |
| SSR Mining Inc. | Hod Maden Project | | January 7, 2026 |
| Technical Report Summary | | SLR Project No.: 123.000320.00001 |
Outlier stopes were removed where they were located well outside the
main orebody and others were removed through cashflow assessment to arrive at the final ore reserve inventory. The evolution of the LHS
stoping inventory is shown in Figure 13-17. Most incremental stoping material was located on the footwall of the transverse LHS mining
area.
Figure 13-17: Hod Maden SO and Final
Stoping Inventories - Longitudinal Sections Looking East
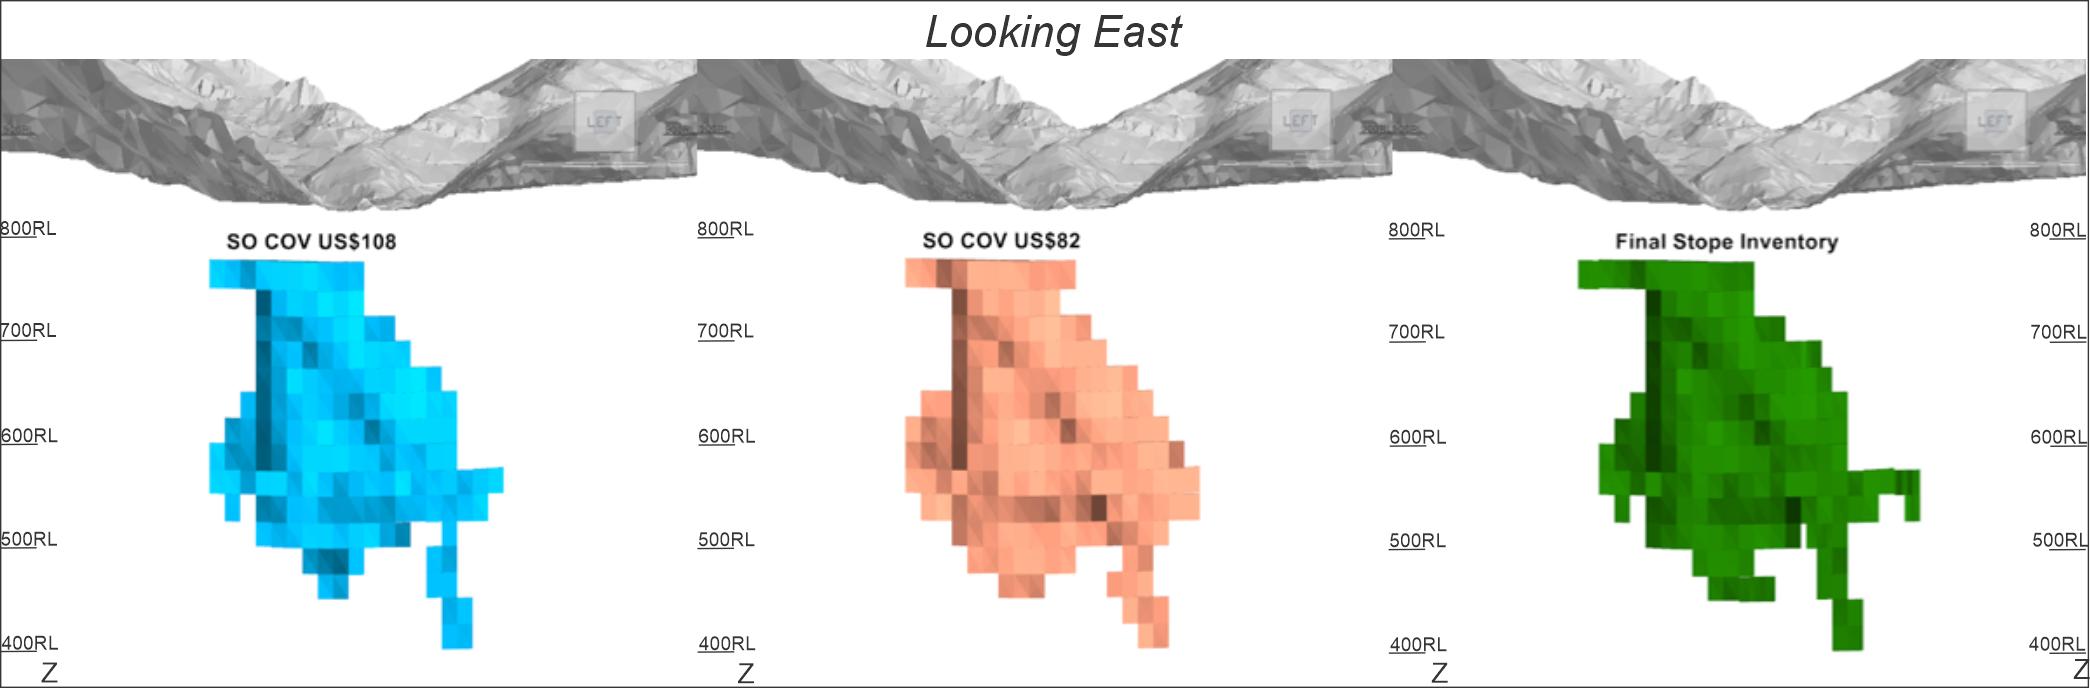
Figure 13-17
Looking East
SO COV US$108
SO COV US$82
Final Slope Inventory
Source: Artmin 2025
Notes: COV cut-off value
| 13.4.3 | Stope Drill and Blast Design |
Stope drilling patterns have been designed with a burden of 2.2 m and
a toe spacing of 2.5 m using 89 mm diameter drill holes. These are typical drilling parameters for the stope dimensions. Slot rises will
be constructed with either an ITH (in the hole) production drill fitted with a V30 reaming head to provide a 30 in., or 760 mm, diameter
opening to assist in establishing the slot or a Rhino Drill rig by Sandvik. This will ensure rapid establishment of the slot and reduced
risk of poor execution compared to long hole rises drilled with top hammer production drills. On average these figures result in 9.0 tonnes
per drill meter and a predicted powder factor of 0.5 kg per tonne. This has been calculated with no consideration for lower density emulsion,
which is likely to be applied to holes near the hanging-wall and drill drive thereby reducing the average powder factor.
The typical drill pattern and blast sequence for the transverse stopes
is shown in Figure 13-18. Slot drives are developed for the first level of each zone only. These are stopes with a hard rock floor and
the slot drives ensures a free face to reduce the risk of leaving lumps in the floor either side of the lower extraction drive. The slot
raise opening drill patterns for the V30 slot raise (base case) and an alternative long hole raise using smaller reamers, which would
be drilled with the top hammer production drill are shown in Figure 13-19.
The number of rings included in each firing will depend on stope conditions
and whether there is a mix of regular and pyrite ore in the stope, which will require separate ring firing of those ore types.
All stope firings will be completed using either nonelectric detonators
and/or electronic detonators. This will enable options to optimize stope blasting from a cost and vibration viewpoint. Stope blasts will
be fired through the WiFi/Fibreoptic network that originates on the surface.
| | 13-21 | |
| SSR Mining Inc. | Hod Maden Project | | January 7, 2026 |
| Technical Report Summary | | SLR Project No.: 123.000320.00001 |
Figure 13-18: Hod Maden Typical
Transverse LH Stope Drill and Blast Design
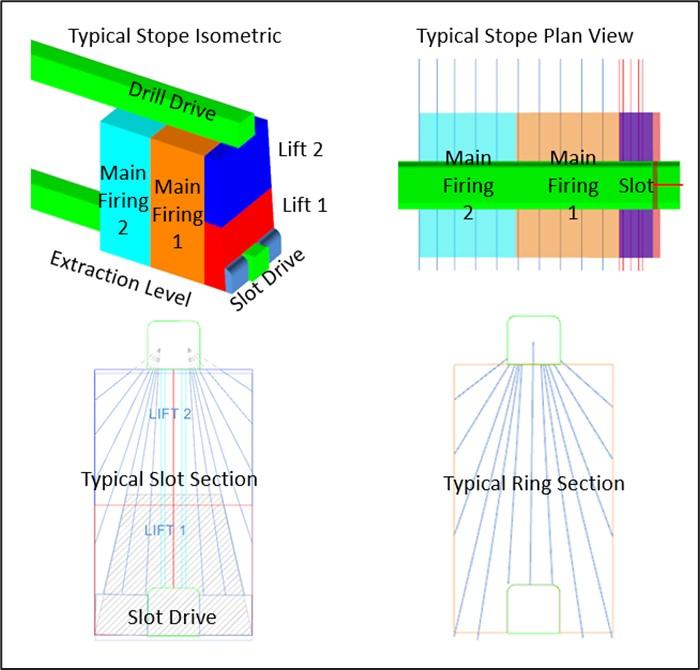
Figure 13-18
Typical Stope Isometric
Drill Drive
Lift 2
Lift 1
Main Firing 2
Main Firing 1
Extraction Level
Slot Drive
Typical Stope Plan View
Main Firing 2
Main Firing 1
Slot
Typical Slot Section
Slot Drive
Lift 2
Lift 1
Typical Ring Section
Source: Artmin 2025
| | 13-22 | |
| SSR Mining Inc. | Hod Maden Project | | January 7, 2026 |
| Technical Report Summary | | SLR Project No.: 123.000320.00001 |
Figure 13-19: Typical Hod Maden
Slot Raise Drill Patterns
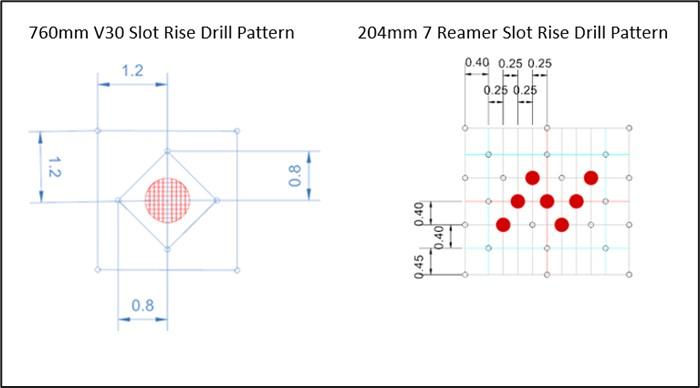
Figure 13-19
760mm V30 Slot Rise Drill Pattern
1.2
1.2
0.8
0.8
204mm 7 Reamer Slot Rise Drill Pattern
0.40
0.25
0.25
0.25
0.25
0.40
0.40
0.45
Source: Artmin 2025
| 13.5.1 | DAF Development Design |
The DAF mining zone is accessed by crosscuts from the main decline,
which are advanced with the completion of each of the five levels. DAF will be used in the upper levels of the mine above the 780 masl
level. There will be a crown pillar of approximately 25 m thickness. A 3D view of the DAF mining zone is shown in Figure 13-20.
There are six key drift types in the design:
| · | Underhand (undercut) Access Headings |
| · | Underhand Footwall Drives |
| | 13-23 | |
| SSR Mining Inc. | Hod Maden Project | | January 7, 2026 |
| Technical Report Summary | | SLR Project No.: 123.000320.00001 |
Figure 13-20: 3D View Depicting
Access to the Five DAF Levels
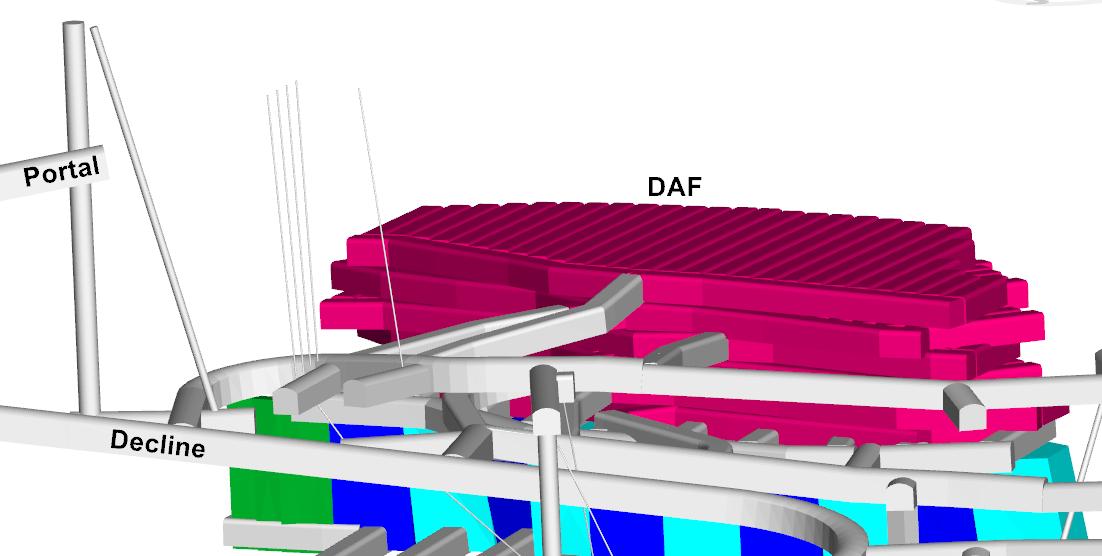
Figure 13-20
Portal
DAF
Decline
Source: Artmin 2025
It is envisioned that some of the drifts in the DAF mining area will
be excavated with excavators, which can be fitted with rotary cutting heads.
The CP access and undercut access headings provide access to the footwall
drifts. The access headings are a similar profile shape to the footwall and ore drives. Ore drives will have alternating orientations,
which will be different between levels.
| 13.5.2 | LHS Development Design |
The design for the LHS mine consists of 26 km of lateral development,
and 1.6 km of vertical development for the entire mine. The mine is accessed from a portal west of the deposit with all development infrastructure
located to the west of and in the footwall of the deposit. LHS will be used at the lower levels of the mine below the 780 masl level.
A longitudinal section of the mine design, looking east, is shown in Figure 13-21.
| 13.5.2.1 | Lateral Development |
The underground mine will have mobile equipment and personnel access
through a single decline portal located to the west of the deposit at an elevation of 850 masl. The decline will be driven north for 160 m
and then turn to the right (east) 180° and run parallel to the footwall of the orebody. The decline will then progress in a ‘racecourse’
configuration to access LHS zone levels spaced at 25 m intervals. Level names correspond approximately to the corresponding equivalent
elevation.
The decline at its closest point is approximately 70 m from the footwall
of the deposit. Level access is driven from the decline to a footwall drive, which is located approximately 25 m from the footwall of
the deposit. A sump, loading area, and RAR access will be located between the decline and the footwall drive on each level. FAR access
will be located between the decline and the footwall drive every other level (every 50 vertical meters).
| | 13-24 | |
| SSR Mining Inc. | Hod Maden Project | | January 7, 2026 |
| Technical Report Summary | | SLR Project No.: 123.000320.00001 |
Figure 13-21: Hod Maden Underground
Mine Design - Looking East
Figure 13-21
Looking East
Portal
Fresh Air Intake & Escapeway
Decline
Fresh Air Intake (Blue)
Escapeway (Green)
Return Airways
800 Level
775 Level
750 Level
725 Level 700 Level
700 Level
675 Level
650 Level
625 Level
600 Level
575 Level
550 Level
525 Level
500 Level
475 Level
450 Level
425 Level
400 Level
800RL
700RL
600RL
500RL
400RL
Production Description:
DAF
LHS_Longitudinal
LHS_Transverse Primary
LHS_Transverse Secondary
Source: Artmin 2025.
Access to the fresh air and secondary egress rises will be from the
north of the decline. Substations will be located directly off the decline near level accesses. The underground magazine will be located
on the 725 level near the return air system.
Development profiles have been designed for all areas of the mine based
on equipment access requirements. Typical decline and level profiles with largest equipment is shown in Figure 13-22.
| | 13-25 | |
| SSR Mining Inc. | Hod Maden Project | | January 7, 2026 |
| Technical Report Summary | | SLR Project No.: 123.000320.00001 |
Figure 13-22: Hod Maden Typical
Decline and Level Drive Profiles
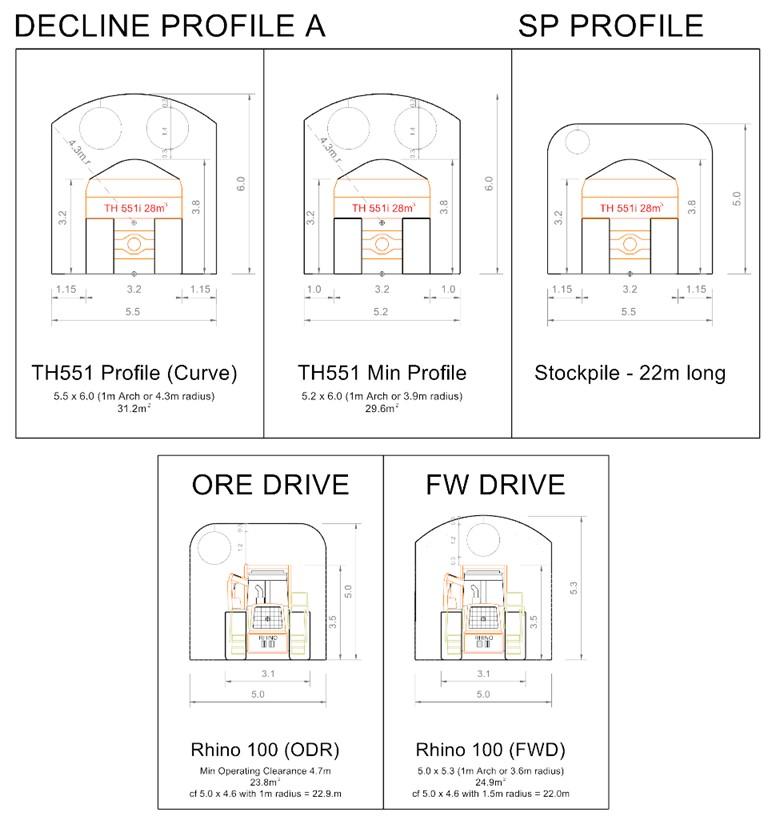
Figure 13-22
DECLINE PROFILE A
SP PROFILE
TH551 Profile (Curve)
5.5 x 6.0 (1m Arch or 4.3 radius)
31.2m2
TH551 Min Profile
5.2 x 6.0 (1m Arch or 3.9m radius)
29.6m2
Stockpile - 22m long
ORE DRIVE
Rhino 100 (ODR)
Min Operating Clearance 4.7m
23.8m2
cf 5.0 x 4.6 with 1m radius = 22.9.m
FW DRIVE
Rhino 100 (FWD)
5.0 x 5.3 (1m Arch or 3.6m radius)
24.9m2
cf 5.0 x 4.6 with 1.5m radius = 22.0m
Source: Artmin 2025.
| | 13-26 | |
| SSR Mining Inc. | Hod Maden Project | | January 7, 2026 |
| Technical Report Summary | | SLR Project No.: 123.000320.00001 |
Lateral development types and quantities are listed in Table 13-7. Capital
development is defined as an area which is expected to be in use for the duration of the LOM. All other development is classified as operating.
Table 13-7: Hod Maden LHS Lateral
Development Quantities
| Capital Development |
Operating Development |
| Development Type |
Advance Quantity (m) |
Development Type |
Advance Quantity (m) |
| Decline/Decline Stockpile |
3,579 |
Footwall Drive |
2,947 |
| Escapeway |
275 |
Level Stockpile |
330 |
| Drill Drive |
132 |
Ore Drive - LHS/Slot |
11,945 |
| Fresh Air Drive |
336 |
Paste Re-development |
3,194 |
| Level Access |
805 |
|
|
| Stope Access |
807 |
|
|
| Magazine |
110 |
|
|
| Paste Fill Drive |
191 |
|
|
| Pump Station/Sump |
297 |
|
|
| Return Air Drive |
1,014 |
|
|
| Substation |
107 |
|
|
| Total Capital |
7,654 |
Total Operating |
18,415 |
| 13.5.3 | Development Summary |
| 13.5.3.1 | Lateral Development |
Lateral development totals for each drift type (heading dimension),
for both DAF and LHS, are shown in Table 13-8.
Lateral development face blast holes will be drilled by electric-hydraulic
two boomed Jumbos. The Hod Maden development drilling patterns are expected to have between 62 and 68 charged 45 mm holes. These will
be charged with bulk emulsion and standard non-electric detonators. Development faces will be fired through the leaky feeder system.
| | 13-27 | |
| SSR Mining Inc. | Hod Maden Project | | January 7, 2026 |
| Technical Report Summary | | SLR Project No.: 123.000320.00001 |
Table 13-8: Hod Maden Mine Lateral
Development Quantities – Heading Type
| Lateral Development |
Length
(m) |
|
| Profile A 5.5mW x 6.0mH Arch - GSA01 |
31 |
|
| Profile A 5.5mW x 6.0mH Arch - GSA1 |
3,349 |
|
| Profile A 5.5mW x 6.0mH Arch - GSA2 |
212 |
|
| Profile A_N 5.2mW x 6.0mH Arch - GSAN1 |
800 |
|
| Profile A_N 5.2mW x 6.0mH Arch - GSAN2 |
5 |
|
| Profile B 5.5mW x 5.5H Square - GSB1 |
374 |
|
| Profile B 5.5mW x 5.5mH Square - GSB2 |
0 |
|
| Profile C 5.0mW x 5.3mH Arch - GSC1 |
2,922 |
|
| Profile C 5.0mW x 5.3mH Arch - GSC2 |
503 |
|
| Profile D 5.0mW x 5.0mH Square - GSD1 |
14,063 |
|
| Profile D 5.0mW x 5.0mH Square - GSD2 |
1,408 |
|
| Profile D 5.0mW x 5.0mH Square - GSD3 |
877 |
|
| Profile D 5.0mW x 5.0mH Square - GSD4 |
5,946 |
|
| Profile D 5.0mW x 5.0mH Square - GSD5 |
114 |
|
| Profile D 5.0mW x 5.0mH Square - GSD6 |
1,468 |
|
| Profile E 5.0mW x 5.0mH Arch - GSE1 |
1,944 |
|
| Profile E 5.0mW x 5.0mH Arch - GSE2 |
459 |
|
|
Note.
GS: Ground Support |
|
| 13.5.3.2 | Vertical Development |
Primary vertical development for the mine is made up of secondary egress,
fresh air intake, and exhaust air. All vertical excavations will be raise bored except for the internal return air rises, which will be
long hole rises. The vertical development summary is listed in Table 13-9.
Table 13-9: Hod Maden Vertical Development
Types and Profiles
| Development Type |
Profile
(m) |
Length
(m) |
|
| Escapeway Raise - Surface |
1.5 m Diameter |
80 |
|
| Escapeway Raise - Internal |
1.2 m Diameter |
388 |
|
| FAR - Surface |
4.0 m Diameter |
77 |
|
| FAR - Internal |
3.5 m Diameter |
375 |
|
| RAR - Surface |
3.5 m Diameter |
302 |
|
| RAR - Internal |
4.0 m Square |
397 |
|
| Total |
- |
1,618 |
|
| | 13-28 | |
| SSR Mining Inc. | Hod Maden Project | | January 7, 2026 |
| Technical Report Summary | | SLR Project No.: 123.000320.00001 |
Raise bored vertical excavations for ventilation to the surface have
been limited to a minimum 3.5 m diameter based on assessment of the nearest resource definition drill holes. These holes are some distance
away from the planned location of ventilation shafts and geotechnical holes along the path of each shaft will be required to determine
suitable design dimensions. For long term stability these ventilations shafts may be lined with up to 100 mm of fibercrete in sections
where it is deemed necessary. Fibercrete will be sprayed using remote, robotic spraying machines.
| 13.6 | Stope Cycle and Sequence |
The mine has been divided into five zones to enable higher production
rates from multiple stoping fronts. The production zones are shown in Figure 13-23. The DAF zone will be mined top down and will operate
independently. Each LHS zone will be mined bottom up with the final level in each zone - sill stopes - being mined under the paste-backfilled
stopes of the zone above. The five zones have been divided as:
| · | DAF Zone – 805 masl to 780 masl |
| · | LHS Zone 1 – 780 masl to 700 masl |
| · | LHS Zone 2 – 700 masl to 625 masl |
| · | LHS Zone 3 – 625 masl to 525 masl |
| · | LHS Zone 4 – 525 masl to 400 masl |
| | 13-29 | |
| SSR Mining Inc. | Hod Maden Project | | January 7, 2026 |
| Technical Report Summary | | SLR Project No.: 123.000320.00001 |
Figure 13-23: Hod Maden Production
Zones
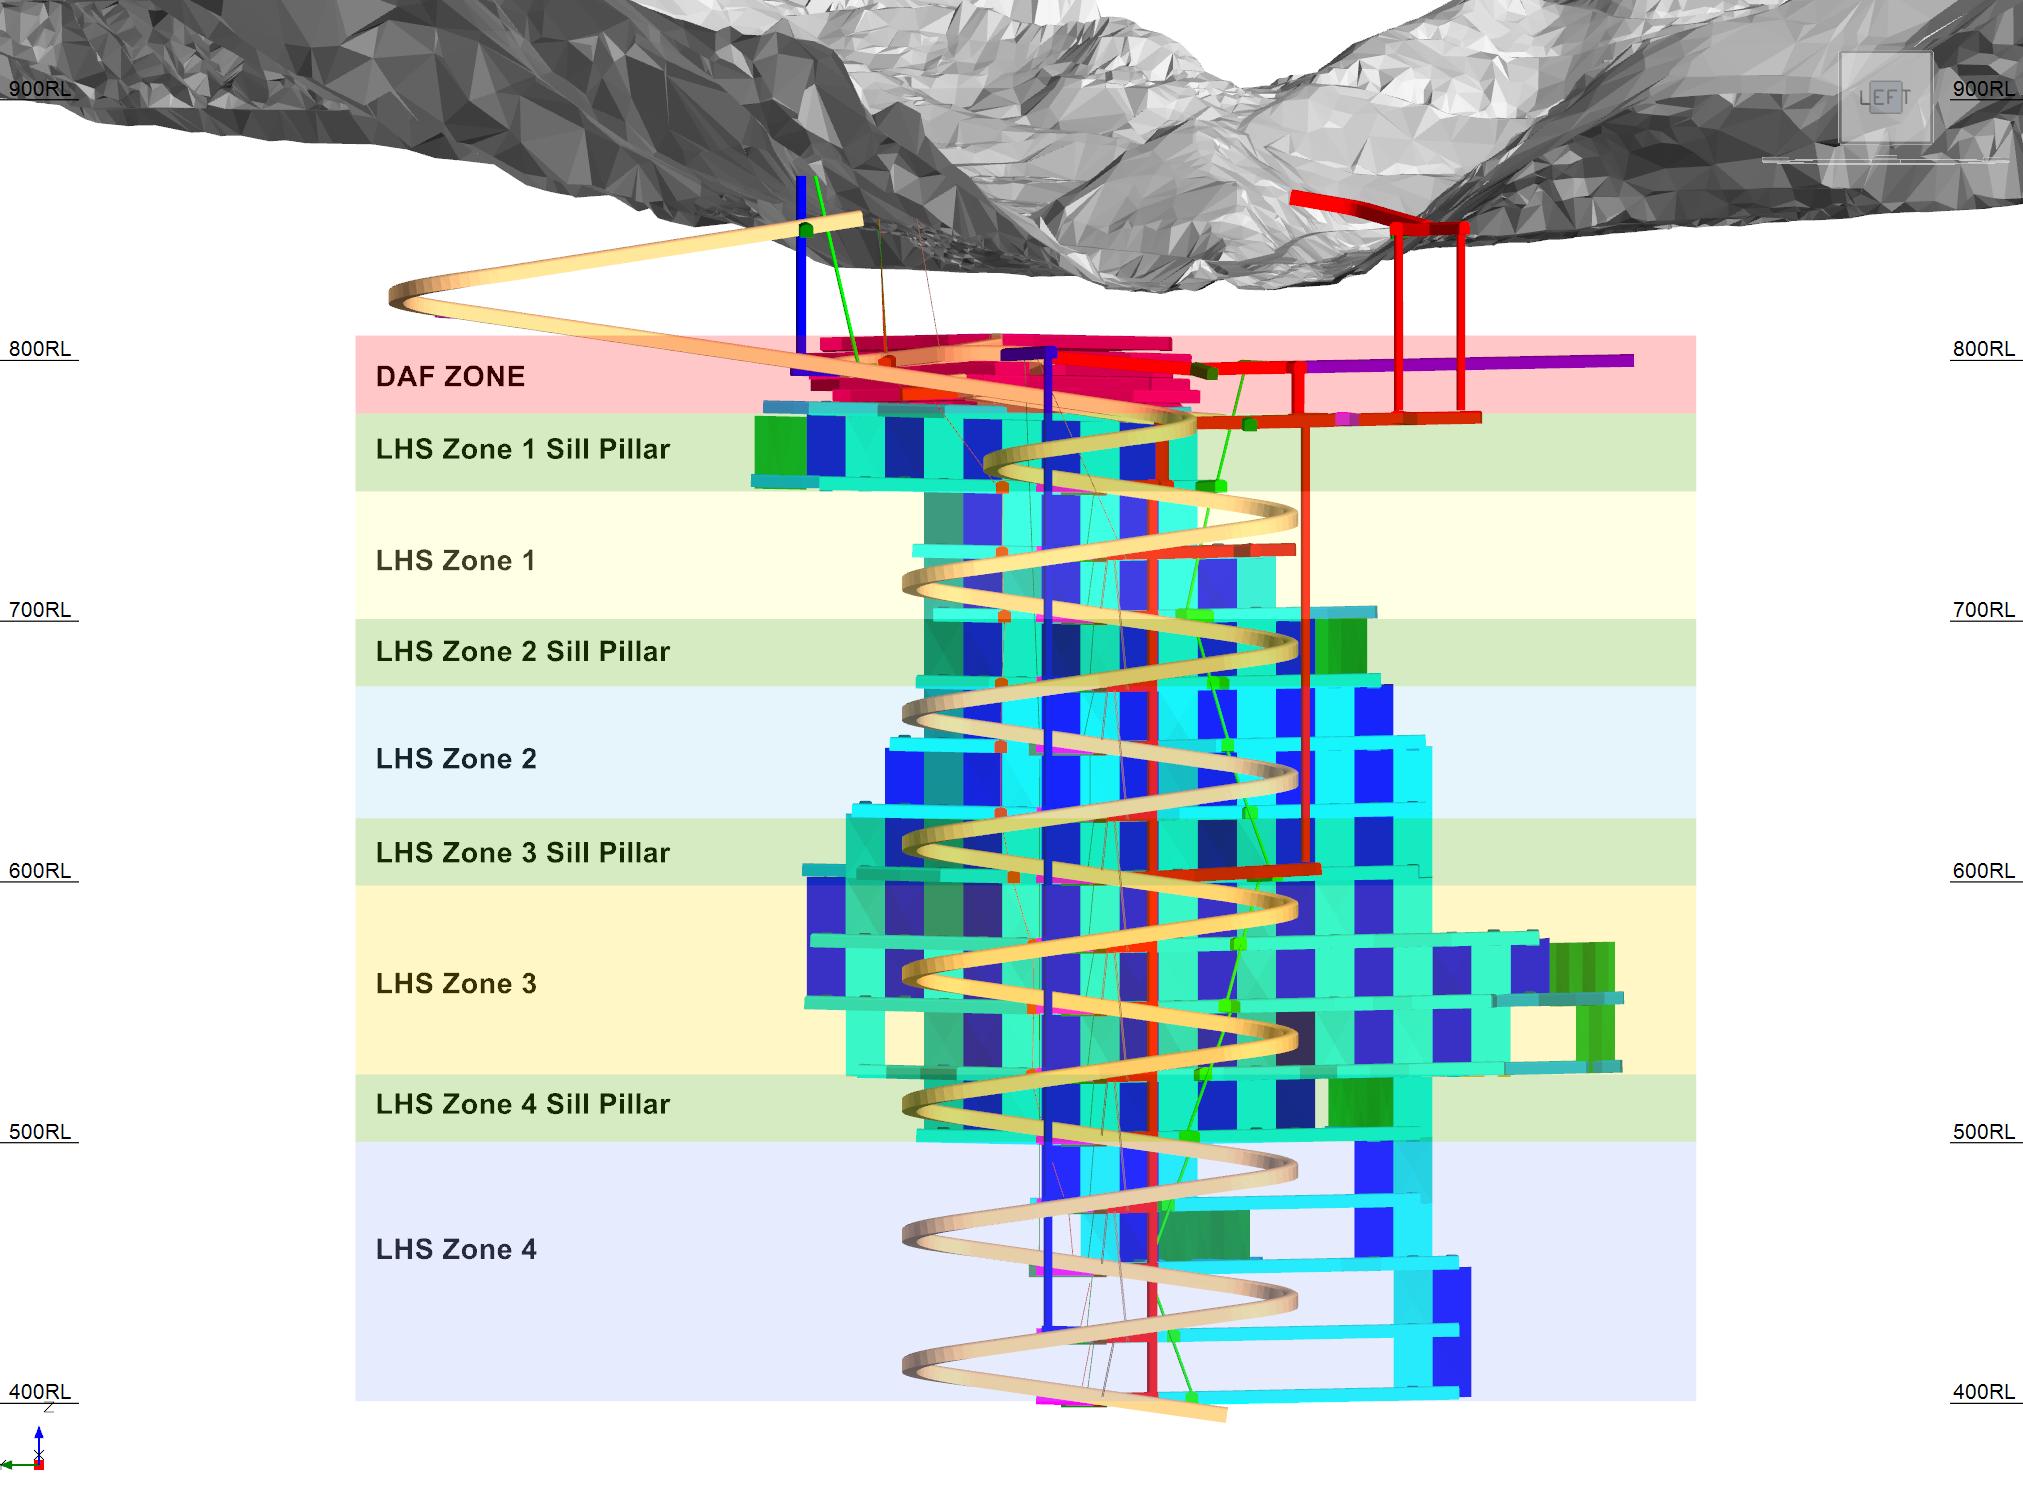
Figure 13-23
DAF ZONE
LHS Zone 1 Sill Pillar
LHS Zone 1
LHS Zone 2 Sill Pillar
LHS Zone 2
LHS Zone 3 Sill Pillar
LHS Zone 3
LHS Zone 4 Sill Pillar
LHS Zone 4
800RL
700RL
600RL
500RL
400RL
Source: Artmin 2025.
| 13.6.1 | Drift and Fill Mining |
Different rates of mining will apply to the overcut and the undercut
DAF development. The overcut, or top level, of the DAF will have first exposure to the poor ground conditions in the backs and walls and
will progress one drift at a time at a rate of advance limited to 2 m per day six days per week.
This results in the overcut level taking approximately 16 months to complete mining. The mining sequence will be a primary/secondary/tertiary
sequence.
The drifts will be advanced at small increments of 1 m to 2 m at a time
depending on conditions and then immediately fibercreted. The drifts will be advanced fully from footwall to hanging wall and then barricaded
at the footwall and paste filled. The drifts have a downward gradient from the footwall to the hanging wall to promote tight filling with
paste. Inevitable gaps between the fibercreted backs of the drift and the paste fill in the drift will be loaded with fibercrete.
The undercut levels will be mined in a primary/secondary/tertiary sequence,
which will allow more than one heading to be advanced at a time. The orientation of undercut drifts will be offset 40º to the drifts
in the level above to avoid drifting parallel to cold joints, i.e., interfaces between successive paste fills that do not bond well due
to pour timing. Advance rates in each heading have been capped at a high rate of 16 m per week due to the more competent high-strength
paste in the backs. Mining of the four undercut levels is completed in four years.
| | 13-30 | |
| SSR Mining Inc. | Hod Maden Project | | January 7, 2026 |
| Technical Report Summary | | SLR Project No.: 123.000320.00001 |
The typical cycle for DAF mining is as follows:
| · | Drift advance – 40 days (Overcut), 25 days (Undercut) |
| · | Fill preparation – 7 days |
| · | Paste filling – 1.5 days |
·
Paste cure time – 14 days
The DAF level accesses will be
separate so undercutting of levels will occur only where the level above is filled with paste backfill, i.e., the footwall drive
and ore drifts. The DAF zone design is shown in Figure 13-14, with Figure 13-24 showing the sequencing of the overcut and undercut development.
Figure 13-24: DAF Development Sequence
(Plan View)
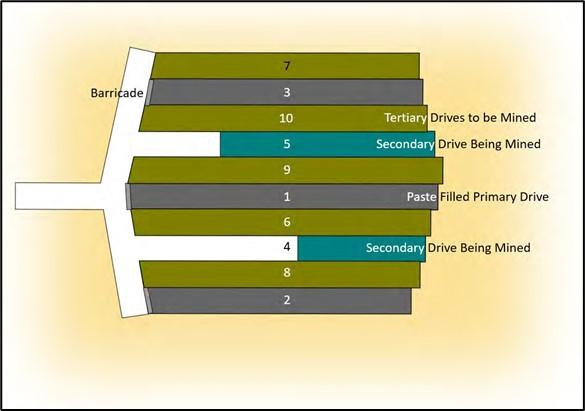
Figure 13-24
Barricade
7
3
10
Tertiary Drives to be Mined
5
Secondary Drive Being Mined
9
1
Paste Filled Primary Drive
6
4
Secondary Drive Being Mined
8
2
Source: Artmin 2025.
The sequence of excavation for the DAF mining will be:
Mining of the CP level, which is accessed from the main decline –
approximately 16 months
Mining of the underhand levels - average of approximately 12 months
for each of the five underhand levels
This results in a total duration for mining of the DAF Zone of approximately
six years.
In summary, both the CP level and the underhand levels will be constructed
in a primary/secondary/tertiary type of sequence to ensure continuity of excavation while the paste is curing and enable more than one
heading to be mined concurrently. The orientation of underhand ore drift headings will be offset 40º to the headings in the level
above to avoid drifting parallel to cold joints.
| | 13-31 | |
| SSR Mining Inc. | Hod Maden Project | | January 7, 2026 |
| Technical Report Summary | | SLR Project No.: 123.000320.00001 |
Advance rates have been capped at 12 m per week for each CP heading and at 16 m per week
in each underhand heading.
The typical stope cycle for LHS following completion of the ore drive
is:
| · | Drill preparation and cable installation – 9 days |
| · | Production drilling – 22 days |
| · | Stope blast and mucking – 25 days |
| · | Fill preparation – 7 days |
| · | Fill topping with waste rock – 0.5 days |
| · | Paste cure time – 28 days |
For the average 25,000 tonne transverse stope, this cycle typically
takes 3.5 months.
For the LHS zone level, access drives will connect the decline to a
footwall drive. From the footwall drive a series of parallel cross cutting ore drives will provide drilling and mucking access to the
15 m wide primary and secondary stopes. The layout is shown in Figure 13-25.
Figure 13-25: Transverse LHS Level
Layout
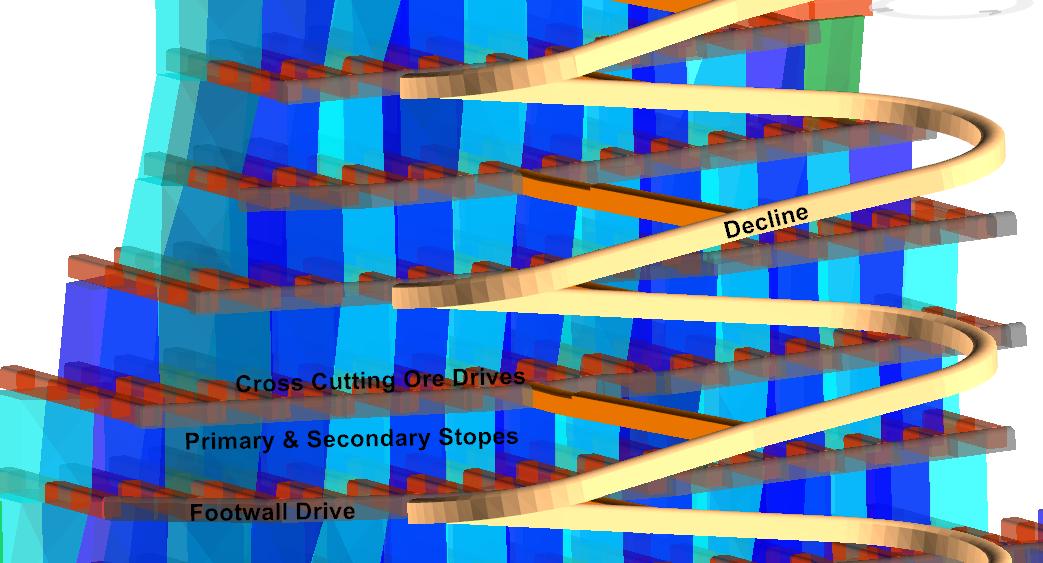
Figure 13-25
Decline
Cross Cutting Ore Drives
Primary & Secondary Stopes
Footwall Drive
The transverse LHS may be mined in a primary/secondary sequence with
the primary stopes advancing one level above prior to mining any adjacent secondary stopes. This will ensure that tight filling of adjacent
walls is achieved. This sequence is illustrated in Figure 13-26.
| | 13-32 | |
| SSR Mining Inc. | Hod Maden Project | | January 7, 2026 |
| Technical Report Summary | | SLR Project No.: 123.000320.00001 |
An alternative sequence, which allows secondary stopes to be mined immediately
after the appropriate curing time of the adjacent primary will be possible if tight paste filling is achieved beneath the wall undercuts
of the primary stope. This sequence is illustrated in Figure 13-27.
It is expected that the transverse LHS sequence will be a combination
of both the sequences outlined above.
For all sequences shown, there will be two or more stopes from the hanging
wall (out of page) to footwall (into page). All stopes in the hanging wall to footwall sequence would be mined before commencing any secondaries
next in the sequence shown. Primary stopes would be mined alternatively until all hanging wall to footwall stopes were mined and the same
would apply to secondaries.
Figure 13-26: Hod Maden Transverse
Long Hole Stoping Preferred Sequence
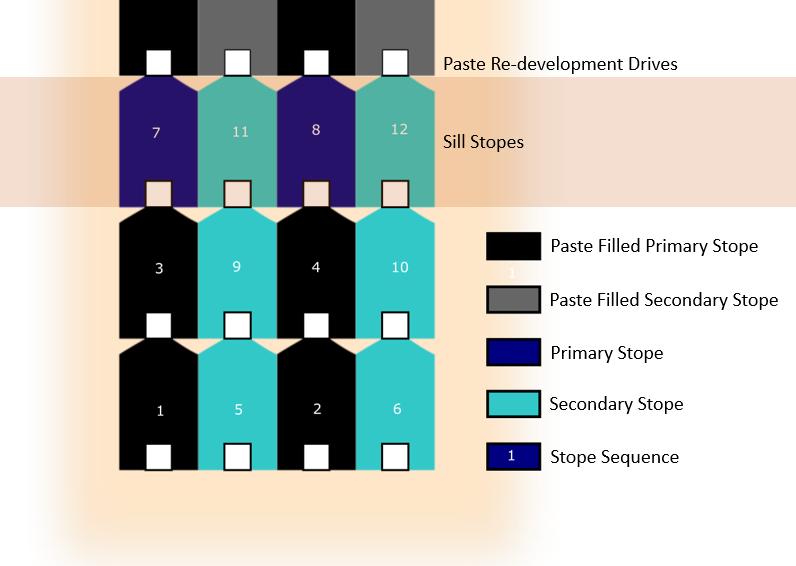
Figure 13-26
Paste Re-development Drives
7
11
8
12
Sill Stopes
3
9
4
10
1
5
2
6
Paste Filled Primary Stope
Paste Filled Secondary Stope
Primary Stope
Secondary Stope
1
Stope Sequence
| | 13-33 | |
| SSR Mining Inc. | Hod Maden Project | | January 7, 2026 |
| Technical Report Summary | | SLR Project No.: 123.000320.00001 |
Figure 13-27: Hod Maden Transverse
Stoping Alternative Sequence
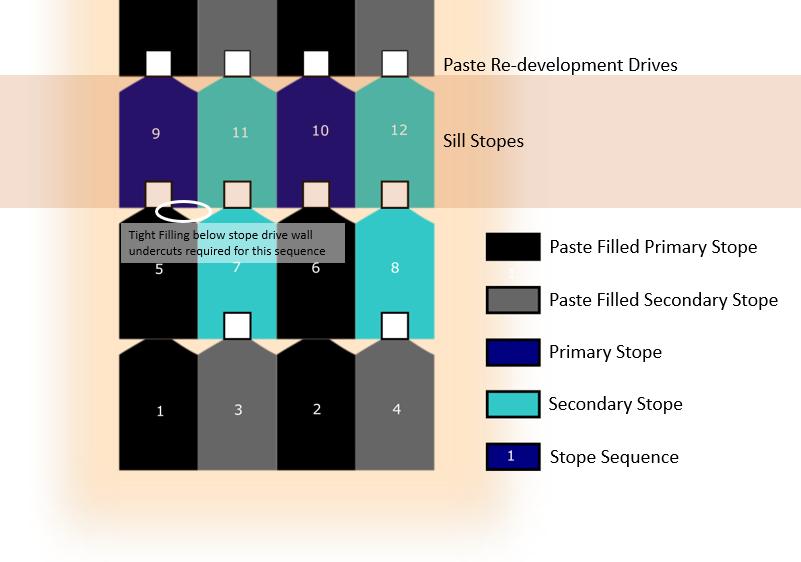
Figure 13-27
Paste Re-development Drives
9
11
10
12
Sill Stopes
Tight Filling below stope drive wall undercuts required for this sequence
5
7
6
8
1
3
2
4
Paste Filled Primary Stope
Paste Filled Secondary Stope
Primary Stope
Secondary Stope
1
Stope Sequence
A new Ventsim model representing the updated LOM mine plan for Hod Maden
was built by HoltzVent in May 2024. The previous Ventsim model was completed by AMC Consultants Pty Ltd. (AMC) for the 2020 DFS.
The criteria and basis for design of the ventilation system for the
Project has been defined based upon the following:
| · | Turkish legislation “Regulation on Health and Safety at Mining Facilities” - published in the Official Gazette No. 28770
dated 19 September 2013. (The Regulations); |
The mine will be ventilated by a “pull” or exhausting type
ventilation system with primary ventilation fans located at the primary exhaust of the mine. The following further general criteria are
also established:
| · | Air residence time will be kept as short as possible to minimize personnel exposure to dust, heat, diesel particulates and other contaminants. |
| · | Each level will be developed such that an exhaust route is established prior to commencement of production on that level. |
| · | Recirculation is prohibited. |
| | 13-34 | |
| SSR Mining Inc. | Hod Maden Project | | January 7, 2026 |
| Technical Report Summary | | SLR Project No.: 123.000320.00001 |
| · | Series ventilation will be kept to an absolute minimum and only if a suitable quantity of fresh air is introduced at the start of
the series. |
| · | Regulators will be used to control and redistribute the quantity of flow in each split of air. |
The Regulations do not define requirements on air quantity in an underground
mine. Industry best practice has been adopted, which specifies that the minimum ventilation quantity (volume of air) in each place where
a diesel engine operates shall be such that a ventilation flow of not less than:
| · | 0.06 m³/s/kW of maximum capacity of the engine; or |
·
Approximately 15 m³/s to 16 m3/s.
| · | Whichever is the greater is directed along the airway in which the engine is operating. |
Table 13-10 shows the primary fan requirements with the RARs increased
to 3.5 m diameter:
| · | Provide total flow of 430 m3/s at Collar Total Pressure of 2,850 Pa. |
| · | Two fans must be installed in parallel to provide redundancy in the event of an unplanned fan stoppage/failure. |
| · | Each fan to provide 215 m3/s at Collar Total Pressure of 2.85 kPa |
A maximum primary ventilation flow of 450 m3/s will be required
on surface at the fan installation, which will allow for system leakage and the impact of auto compression on the air at depth. It is
recommended that a fan capable of producing 430 m3/s be considered as the higher flow profile is only predicted for a two-year
period. It would be possible to produce more than the airflow requirement now as the fan will still be operating lower on the curve, as
the full system resistance would not be realized.
Table 13-10: Hod Maden Ventilation
Design Criteria
| Item |
Design |
Source/Rationale |
| Dilution rate for Diesel Equipment |
0.06 m3/s per kW |
Update to FS Report by Artmin |
| Dedicated RAD/FAD velocity |
12–14 m/s |
Safety, economics, and system pressure loss considerations. |
| Decline velocity |
6–7 m/s |
Typical industry maximum value to manage dust generation. |
| Vertical RAR targeted air speeds |
15–25 m/s |
Minimize surface raises and reduce electrical input power requirements. This may be exceeded for short term system design. |
| Airway friction factor (blasted) |
0.011–0.0117 kg/m3 |
Decline, return air drives (RAD), fresh air drives (FAD), footwall drives. |
| Raise friction factor (raise bored) |
0.004–0.005 kg/m3 |
Primary RAR, FAR, Un-equipped Escape Raises etc. |
| Surface ambient (Wb) |
20.0⁰C |
Supplied Ventsim Model (AMC DFS) |
| Surface ambient (Db) |
30.0⁰C |
Supplied Ventsim Model (AMC DFS) |
| Underground design reject (Wb) |
28.0⁰C |
To ensure production zones remains below 32ᵒC |
| | 13-35 | |
| SSR Mining Inc. | Hod Maden Project | | January 7, 2026 |
| Technical Report Summary | | SLR Project No.: 123.000320.00001 |
| Item |
Design |
Source/Rationale |
| VRT gradient |
2.5ºC per 100m |
Supplied Ventsim Model |
| Surface rock temperature |
20ºC |
Supplied Ventsim Model |
| Air Density |
1.05 kg/m3 |
Updated FS Report |
| Power Cost |
A$0.10 |
Updated FS report cost converted from US$ to A$ |
| Oxygen Levels |
19.5% to 23% |
Normal 20.95% |
| Flammable Gas |
<0.5% |
|
| Diesel Particulate Matter (DPM) |
<0.1 mg/m3 |
By convention for the work zones |
| Silica Dust |
0.05 mg/m3 |
|
| General Respirable Dust |
<3 mg/m3 |
(If no silica is present) |
| General Inhalable Dust |
<10 mg/m3 |
|
| 13.7.2 | Mine Ventilation Strategy |
Table 13-11 shows the airflow requirements for anticipated peak equipment
loading by year representing steady state production from the decline.
Table 13-11: Total Airflow Requirements
– Primary
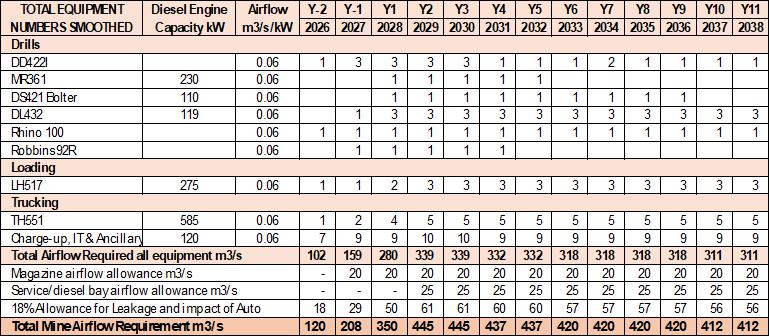
Table 13-11
TOTAL EQUIPMENT NUMBERS SMOOTHED
Diesel Engine Capacity kW
Airflow m3/s/kW
Y-2
2026
Y-1
2027
Y1
2028
Y2
2029
Y3
2030
Y4
2031
Y5
2032
Y6
2033
Y7
2034
Y8
2035
Y9
2036
Y10
2037
Y11
2038
Drills
DD422I
MR361
DS421 Bolter
DL432
Rhino 100
Robbins92R
230
110
119
0.06
0.06
0.06
0.06
0.06
0.06
1
1
3
1
1
1
3
1
1
3
1
1
3
1
1
3
1
1
3
1
1
3
1
1
1
1
1
3
1
1
1
1
1
3
1
1
1
3
1
2
1
3
1
1
1
3
1
1
1
3
1
1
3
1
1
3
1
Loading
LH517
275
0.06
1
1
2
3
3
3
3
3
3
3
3
3
3
Trucking
TH551
Charge-up, IT & Ancillary
585
120
0.06
0.06
1
7
2
9
4
9
5
10
5
10
5
9
5
9
5
9
5
9
5
9
5
9
5
9
5
9
Total Airflow Required all equipment m3/s
102
159
280
339
339
332
332
318
318
318
318
311
311
Magazine airflow allowance m3/s
Service/diesel bay airflow allowance m3/s
18% Allowance for Leakage and impact of Auto
-
-
18
20
-
29
20
-
50
20
25
61
20
25
61
20
25
60
20
20
25
60
20
25
57
20
25
57
20
25
57
20
25
57
20
25
56
20
25
56
Total Mine Airflow Requirement m3/s
120
208
350
445
445
437
437
420
420
420
420
412
412
Fresh air for the mine will be sourced from the portal, primary FAR,
and escapeway. Exhaust will be via two RARs with primary fan installations planned to be located on the surface.
Each level will have its own ventilation circuit. Fresh air will enter
each level from the decline, which is, in turn, fed by the internal FAR system and exhausted to the surface via internal RARs, connected
through to the primary RARs.
A series of FARs and RARs will be developed as the mine deepens. The
internal FARs are developed adjacent to the decline connecting at regular intervals. The internal RARs connect to each level. Contaminated
air from each active level will enter the RAR system via a regulator installed in the access to the RAR on each level. The RAR system
will connect to the surface. Figure 13-28 shows the overall ventilation strategy.
| | 13-36 | |
| SSR Mining Inc. | Hod Maden Project | | January 7, 2026 |
| Technical Report Summary | | SLR Project No.: 123.000320.00001 |
An activity-based approach has been undertaken to determine the air
volume requirements for the LHS mine. Airflows have been allocated based upon maintaining ventilation for all concurrent mine activities.
This means providing the required ventilation for diesel equipment based upon the design criteria presented in Table 13-10, however, it
also accounts for activities where diesel equipment is not being used (for example production drilling), but still requires airflow to
remove dust and maintain a safe thermal environment for the worker. Table 13-11 shows the annual airflow allocation by activity.
Based on ventilation requirements for mobile and tethered equipment,
five trucks, three loaders, eight drills, and ten ancillary units, the ventilation system will require approximately 430 m3/s.
Figure 13-28: Primary Ventilation
System Overall Strategy
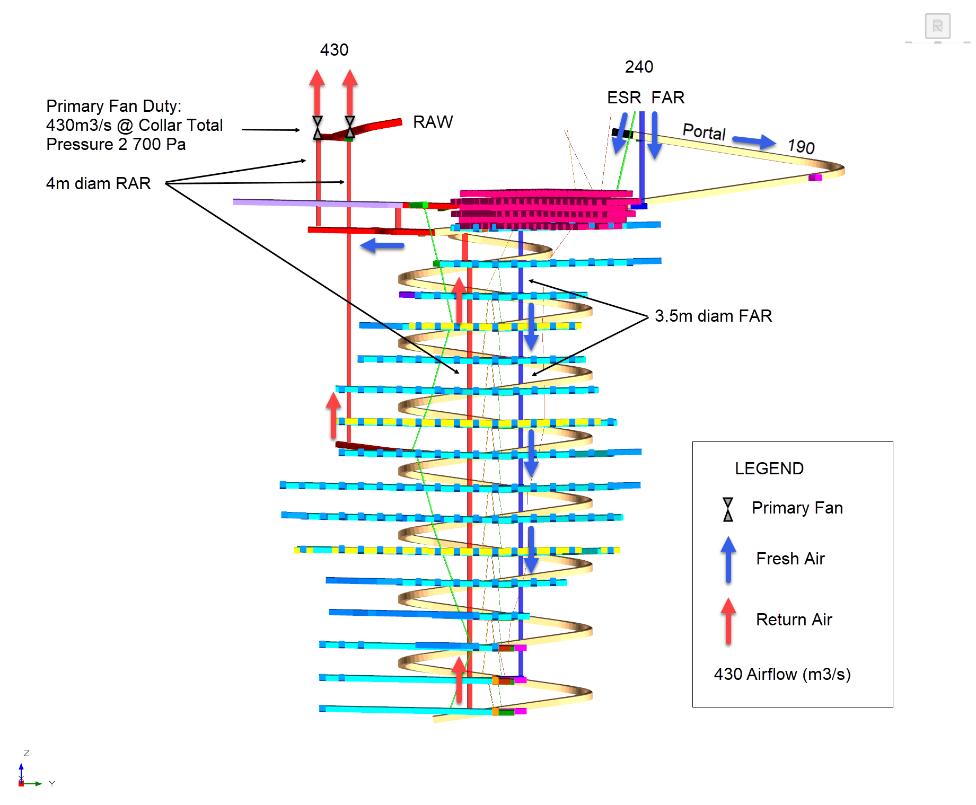
Figure 13-28
Primary Fan Duty:
430m3/s @ Collar Total
Pressure 2 700 Pa
4m diam RAR
430
RAW
240
ESR FAR
Portal
190
3.5m diam FAR
LEGEND
Primary Fan
Fresh Air
Return Air
430 Airflow (m3/s)
Source: Artmin 2025.
The level ventilation strategy has been adjusted to allow the secondary
fans to be installed on the decline, which will allow the air to be re-used for low contaminant activities and only return air on the
level for high pollutant activities. Applying this strategy will reduce the primary ventilation flow requirements due to:
| | 13-37 | |
| SSR Mining Inc. | Hod Maden Project | | January 7, 2026 |
| Technical Report Summary | | SLR Project No.: 123.000320.00001 |
| · | Secondary fans will not be installed on the level access which would have required all levels where fans are operating to return the
flow directly to return. |
| · | Only high pollutant activities on levels will have the air used only once. |
| · | Low pollutant activities will have the air reintroduced on the decline to be used further down in the circuit. |
The FAR system will be utilized to manage air quality and air speed
on the decline only and no fans will be installed drawing air directly from the FAR system as this arrangement increases the primary ventilation
system requirements and is hard to balance.
For secondary ventilation of production levels, the general approach
is to install two auxiliary fans in the decline above the level access. Ducting is extended from the auxiliary fans along to the strike
drive at which point, the ducts diverge to either extent of the ore drives. Where more than one workplace is active on the same side of
the level access, ‘T’ piece dampers will be installed or the use of series ventilation employed provided that a suitable quantity
of fresh air is introduced at the start of the series. Figure 13-29 shows the typical level arrangements.
Figure 13-29: Typical Level Ventilation
– Return Air Raise Off-Access Drive - LHS
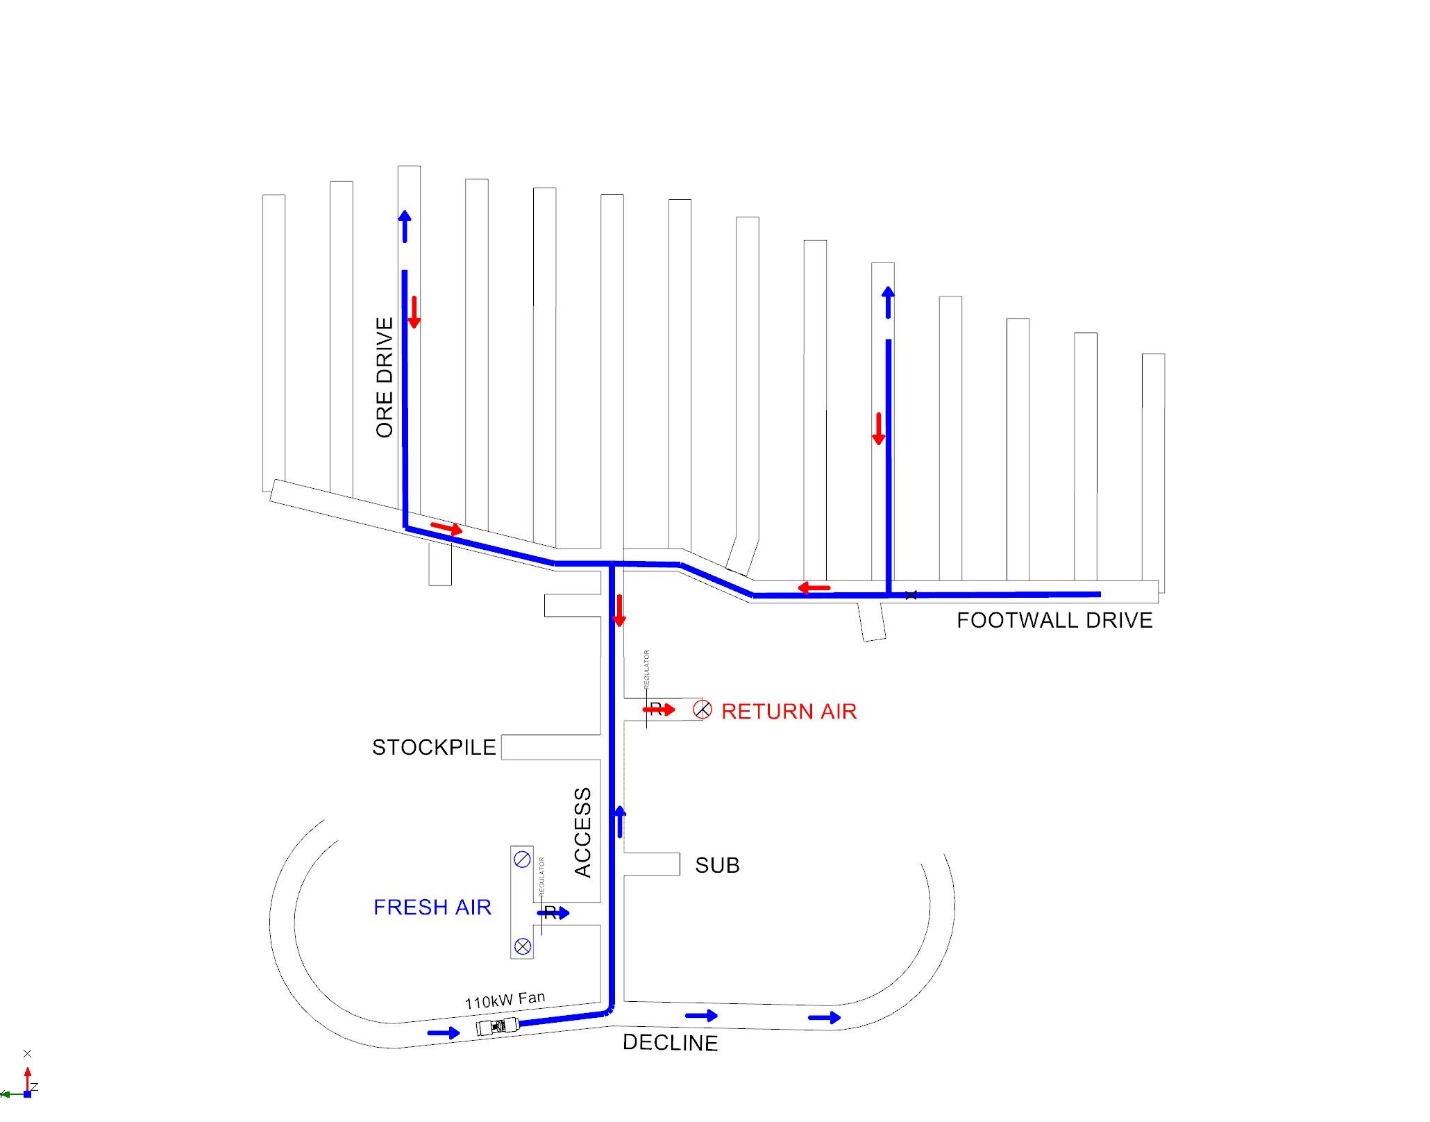
Figure 13-29
ORE DRIVE
FOOTWALL DRIVE
RETURN AIR
STOCKPILE
ACCESS
SUB
FRESH AIR
110kW Fan
DECLINE
Source: Artmin 2025.
| | 13-38 | |
| SSR Mining Inc. | Hod Maden Project | | January 7, 2026 |
| Technical Report Summary | | SLR Project No.: 123.000320.00001 |
| 13.8 | Development and Production Schedule |
The Project's production ramp-up is closely tied to contractor performance,
specifically their ability to maintain the scheduled advance rate of 21 m per week. The Definitive Feasibility Study (DFS) completed in
2020 (the 2020 FS, GR Engineering 2020) used a decline advance rate of 130 m/month. This has been reduced to 90 m/month because of the
shorter available time resulting from the legally proscribed shift schedule and to mitigate the risk of using contractors. Delays in the
contractor’s equipment or workforce availability could negatively impact the Project's production timeline. The DAF development
schedule has been timed to start at the same time as the commissioning of the process facility. Pre-production ore development from the
LHS mining zone will commence in Q2 Year -1, which is six months before the process plant commissioning. This will provide approximately
25 kt of ore for commissioning purposes. During this time, the priority will be on decline development and fresh air intake, secondary
egress and return air infrastructure, which once in place, will allow the ramp up of production. Establishing primary ventilation and
secondary egress will allow stope production activities to commence.
| 13.8.1 | Life of Mine Lateral Development Schedule |
The scheduled maximum advance rates for the DAF lateral development
are shown in Table 13-12. These were based on rates achieved at various tunnelling projects completed utilizing similar construction techniques.
With the application of resource leveling actual rates of advance are often lower than these peak rates. Resource leveling was applied
to the excavation and filling activities.
Table 13-12: DAF Lateral Development
Peak Scheduled Advance Rates
| Production Activity |
Scheduled Rate/Activity Duration |
| DAF Overcut (crown pillar) |
12 m per week |
| DAF Undercut (All below crown pillar) |
16 m per week |
The LHS lateral development advance rates used in the schedule are shown
in Table 13-13. The decline advance rate was provided by one of the local mining contractors as an average achievable rate based on the
profile and support requirements. The portal advance rate applies to the first 16 m of the decline where shorter rounds will be taken,
and intensive ground support will be required.
Table 13-13: LHS Lateral Development
Peak Scheduled Advance Rates
| Lateral Development |
Scheduled
Advance (m/mo.) |
|
| Portal |
8 |
|
| Decline |
90 |
|
| Decline Stockpile |
90 |
|
| First 20m of all other Development off Decline |
90 |
|
| Paste Re-development Drive |
70 |
|
| All Other Development |
60 |
|
| | 13-39 | |
| SSR Mining Inc. | Hod Maden Project | | January 7, 2026 |
| Technical Report Summary | | SLR Project No.: 123.000320.00001 |
All other lateral development has been set at a maximum of 20 m per
week. With the application of resource leveling in the schedule the actual rate per heading per week is below 20 m unless the heading
is prioritized.
The DAF and LHS lateral development summary are shown in Table 13-14.
Table 13-14: Life of Mine Lateral
Development Schedule – DAF and LHS
| Lateral Development Meters |
Units |
Value |
|
| DAF Overcut |
m |
1,582 |
|
| DAF Undercut |
m |
6,823 |
|
| Decline |
m |
3,504 |
|
| Decline Stockpile |
m |
44 |
|
| Escapeway Drive |
m |
275 |
|
| Exploration Drive |
m |
132 |
|
| Footwall Drive |
m |
2,947 |
|
| Fresh Air Drive |
m |
336 |
|
| Level Access |
m |
805 |
|
| Level Stockpile |
m |
330 |
|
| Magazine |
m |
110 |
|
| Ore Drive (excl. DAF) |
m |
11,295 |
|
| Paste Re-development Drive |
m |
3,193 |
|
| Paste Fill Drive |
m |
191 |
|
| Portal |
m |
31 |
|
| Pump Station |
m |
99 |
|
| Return Air Drive |
m |
1,014 |
|
| Slot |
m |
650 |
|
| Stope Access (PROFILE C) |
m |
478 |
|
| Stope Access (PROFILE D) |
m |
329 |
|
| Substation |
m |
107 |
|
| Sump |
m |
198 |
|
| Total Lateral Development |
m |
34,473 |
|
| Number of Development Headings |
Number |
2,328 |
|
| | 13-40 | |
| SSR Mining Inc. | Hod Maden Project | | January 7, 2026 |
| Technical Report Summary | | SLR Project No.: 123.000320.00001 |
As part of the ground support needed during development, the cable bolt
summary is presented in Table 13-15.
Table 13-15: Cable Drilling Summary
| Cable Drilling |
Units |
Value |
|
| Intersection Cable Bolt |
m |
66,120 |
|
| Stope Cable Bolt |
m |
107,839 |
|
| Total Cable Bolt Meters |
m |
173,959 |
|
| 13.8.2 | Life of Mine Vertical Development |
Mine vertical development will be largely completed by contract raise
boring. Short internal RARs between levels will be excavated as long hole raises with a production drill rig. The excavation rates have
been scheduled at between 2.5 m and 4.0 m per day as shown in Table 13-16.
Table 13-16: LHS Vertical Development
Peak Scheduled Advance Rates
| Vertical Development |
Scheduled Advance
(m/d) |
|
| Return Air Raise - Raise bore |
2.5 |
|
| Fresh Air Raise - Raise bore |
2.5 |
|
| Escapeway - Raise bore |
4.0 |
|
| Return Air Raise – Long Hole Raise |
4.0 |
|
Equipment resources are assigned to the main activities in the development
schedule to smooth equipment requirements and physicals and ensure installed capacity is not exceeded. The assignment of resources, particularly
the jumbo fleet to lateral development, balances advance rates over several development headings. This results in the peak individual
heading rates shown in Table 13-16 only being achieved where the heading is very high priority or there are limited alternative areas
to go. This results in some float in the development schedule, which provides greater confidence that the schedule can be executed. The
development resource assignments made are shown in Table 13-17.
Table 13-17: LHS Vertical Development
Resource Assignments
| Resource |
Scheduled
Capacity |
| Jumbo |
180 m per month |
| Raise bore Rig - Large |
2.5 m per day |
| Raise bore Rig - Small |
4 m per day |
A LOM vertical development summary is provided in Table 13-18.
Key development milestones include:
| · | Decline Commencement - Q1 Year -2 |
| · | FAR Construction – Q3 Year -2 |
| | 13-41 | |
| SSR Mining Inc. | Hod Maden Project | | January 7, 2026 |
| Technical Report Summary | | SLR Project No.: 123.000320.00001 |
| · | RAR 1 Construction – Q1 Year -1 |
| · | RAR 2 Construction – Q4 Year 1 |
| · | Underground Magazine Construction – Q3 Year -1 |
| · | Pump Station Number 1 Construction – Q2 Year 1 |
Table 13-18: Life of Mine Vertical
Development Summary
| Vertical Development Meters |
Units |
Value |
|
| Escapeway Raise Surface |
m |
79 |
|
| Escapeway Raise Internal |
m |
388 |
|
| Fresh Air Raise (FAR) Surface |
m |
77 |
|
| FAR Internal |
m |
375 |
|
| Return Air Raise (RAR) Surface |
m |
302 |
|
| RAR Internal |
m |
397 |
|
| Ore Pass |
m |
0 |
|
| Total Vertical Development |
m |
1,618 |
|
| 13.8.3 | Life of Mine Production Schedule |
The steady state ore production rate from the Hod Maden underground
mine is estimated to be in the range of 640,000 tonnes to 806,000 tonnes per annum. The mine plan in both the DAF and LHS mining zones
is limited by the extraction sequence, number of concurrent mining areas, activity rates, and activity preparation durations. The mine
plan averages 800,000 tonnes per annum for the eight years from Year 2 to Year 9 inclusive with one-year ramp up and one-year ramp down
periods (Figure 13-30). LOM production drilling is summarized in Table 13-19.
DAF levels are spaced every five meters and production LHS levels are
spaced every 25 m. LOM production by level is summarized in Table 13-20.
Table 13-19: Life of Mine Production
Drilling Summary
| Production Drilling |
Units |
Values |
| Production Drill Cap |
m |
0 |
| Production Drill Slot Raise |
m |
6,400 |
| Production Drill Stope |
m |
872,790 |
| Total Production Drill Meters |
m |
879,190 |
| Number of Stopes |
|
255 |
| | 13-42 | |
| SSR Mining Inc. | Hod Maden Project | | January 7, 2026 |
| Technical Report Summary | | SLR Project No.: 123.000320.00001 |
Table 13-20: Life of Mine Production
by Level Summary
| Level -Mining Method |
Ore Tonnes
(000 t) |
Starting Year |
Ending Year |
| Prod Ore - Level 805 - DAF |
124 |
Yr 1 |
Yr 2 |
| Prod Ore - Level 800 - DAF |
117 |
Yr 2 |
Yr 3 |
| Prod Ore - Level 795 - DAF |
112 |
Yr 3 |
Yr 4 |
| Prod Ore - Level 790 - DAF |
106 |
Yr 4 |
Yr 5 |
| Prod Ore - Level 785 - DAF |
94 |
Yr 5 |
Yr 6 |
| Prod Ore - Level 780 - DAF |
86 |
Yr 6 |
Yr 7 |
| Prod Ore - Level 750 - LHS |
470 |
Yr -1 |
Yr 8 |
| Prod Ore - Level 725 - LHS |
288 |
Yr -1 |
Yr 2 |
| Prod Ore - Level 700 - LHS |
406 |
Yr -1 |
Yr 2 |
| Prod Ore - Level 675 - LHS |
502 |
Yr 1 |
Yr 7 |
| Prod Ore - Level 650 - LHS |
602 |
Yr 1 |
Yr 6 |
| Prod Ore - Level 625 - LHS |
763 |
Yr 2 |
Yr 6 |
| Prod Ore - Level 600 - LHS |
757 |
Yr 1 |
Yr 10 |
| Prod Ore - Level 575 - LHS |
917 |
Yr 2 |
Yr 10 |
| Prod Ore - Level 550 - LHS |
892 |
Yr 2 |
Yr 9 |
| Prod Ore - Level 525 - LHS |
768 |
Yr 3 |
Yr 7 |
| Prod Ore - Level 500 - LHS |
439 |
Yr 4 |
Yr 10 |
| Prod Ore - Level 475 - LHS |
162 |
Yr 4 |
Yr 9 |
| Prod Ore - Level 450 - LHS |
63 |
Yr 3 |
Yr 8 |
| Prod Ore - Level 425 - LHS |
30 |
Yr 4 |
Yr 6 |
| Prod Ore - Level 400 - LHS |
25 |
Yr 5 |
Yr 5 |
| Total Ore Tonnes |
7,724 |
Yr-1 |
Yr 10 |
| | 13-43 | |
| SSR Mining Inc. | Hod Maden Project | | January 7, 2026 |
| Technical Report Summary | | SLR Project No.: 123.000320.00001 |
Figure 13-30: Hod Maden LOM Production
Profile
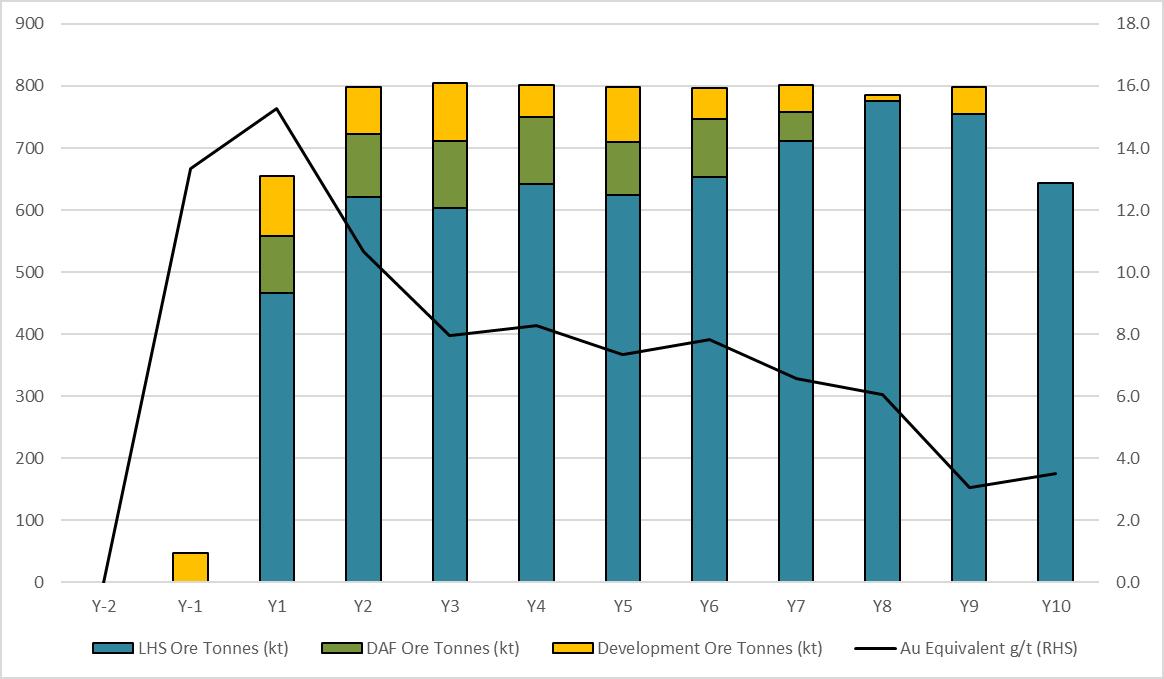
Figure 13-30
900
800
700
600
500
400
300
200
100
0
Y-2
Y-1
Y1
Y2
Y3
Y4
Y5
Y6
Y7
Y8
Y9
Y10
18.0
16.0
14.0
12.0
10.0
8.0
6.0
4.0
2.0
0.0
LHS Ore Tonnes (kt)
DAF Ore Tonnes (kt)
Development Ore Tonnes (kt)
Au Equivalent g/t (RHS)
Production schedule assumptions made in building the mine plan were
largely based on rates built up from cycle time analysis and typical mid-range industry rates.
A summary of some of the key activity rates and durations is provided
in Table 13-21.
Equipment resources are assigned to the main activities in the production
schedule to smooth equipment requirements and physicals and ensure installed capacity is not exceeded. The assignment of resources balances
production activities over several stopes. This results in the scheduled rates shown in Table 13-21 only being achieved where the stope
is very high priority or there are limited alternative areas to go. This results in some float in the production schedule, which provides
greater confidence that the schedule can be executed. The production resource assignments made are shown in Table 13-22.
Table 13-21: Production Schedule
Assumptions
| Production Activity |
Scheduled Rate/Activity Duration |
| DAF Overcut (crown pillar) |
12 m per week |
| DAF Undercut (All below crown pillar) |
16 m per week |
| Production Drill Rate |
180 m per day |
| Stope Mining Rate |
1,000 t per day |
| Paste Fill Rate |
1,200 m³ per day |
| Long Hole Stope Paste Cure Time |
28 Days |
| Stope Fill Preparation |
7 days |
| Stope Cable Install and Drill Preparation |
9 days |
| | 13-44 | |
| SSR Mining Inc. | Hod Maden Project | | January 7, 2026 |
| Technical Report Summary | | SLR Project No.: 123.000320.00001 |
Table 13-22: Production Resource
Assignments
| Resource |
Scheduled Capacity |
| Mine |
| Production Drill |
180 m per day |
| LHD |
1,200 t per day |
| Paste Plant |
1,200 m³ per day |
| Slot Drill |
10 m per day |
Key production milestones include:
| · | DAF Commencement - First DAF Ore – Q1 Year 1 |
| · | Zone 1 LHS Ore Production Commences – Q1 Year 1 |
| · | Zone 2 LHS Ore Production Commences – Q1 Year 2 |
| · | Zone 3 LHS Ore Production Commences – Q4 Year 2 |
| · | Zone 4 LHS Ore Production Commences – Q1 Year 4 |
The Hod Maden LOM production schedule in annual increments is detailed
in Table 13-23.
| | 13-45 | |
| SSR Mining Inc. | Hod Maden Project | | January 7, 2026 |
| Technical Report Summary | | SLR Project No.: 123.000320.00001 |
Table 13-23: Hod Maden Life of Mine
Production Schedule
| Name |
Totals |
Yr -2 |
Yr -1 |
Yr 1 |
Yr 2 |
Yr 3 |
Yr 4 |
Yr 5 |
Yr 6 |
Yr 7 |
Yr 8 |
Yr 9 |
Yr 10 |
| Ore - Total Tonnes (kt) |
7,726 |
0 |
47 |
655 |
798 |
804 |
801 |
798 |
797 |
801 |
786 |
798 |
643 |
| Ore - Total Au g/t |
7.6 |
0.0 |
13.3 |
15.3 |
10.7 |
8.0 |
8.3 |
7.4 |
7.8 |
6.6 |
6.0 |
3.1 |
3.5 |
| Ore - Total Cu % |
1.3 |
0.0 |
1.3 |
1.6 |
1.5 |
1.4 |
1.4 |
1.2 |
1.3 |
1.2 |
1.3 |
1.0 |
1.1 |
| Ore - Total Au koz |
1,896 |
0 |
20 |
321 |
274 |
206 |
213 |
189 |
200 |
169 |
153 |
78 |
73 |
| Ore - Total Cu Mlb |
223 |
0 |
1 |
23 |
27 |
24 |
25 |
22 |
23 |
21 |
23 |
18 |
16 |
| Ore - Total SS kt |
596 |
0 |
5 |
77 |
72 |
62 |
68 |
59 |
57 |
57 |
68 |
39 |
31 |
| |
|
|
|
|
|
|
|
|
|
|
|
|
|
| Waste - Total (kt) |
1,470 |
113 |
252 |
262 |
247 |
195 |
82 |
60 |
83 |
82 |
86 |
7 |
0 |
| Waste - Capital Lateral (kt) |
633 |
101 |
160 |
127 |
119 |
112 |
8 |
1 |
0 |
4 |
0 |
0 |
0 |
| Waste - Capital Vertical (kt) |
38 |
3 |
10 |
9 |
9 |
6 |
0 |
0 |
0 |
0 |
0 |
0 |
0 |
| Waste - Operating Lateral (kt) |
799 |
8 |
83 |
126 |
119 |
76 |
74 |
60 |
83 |
78 |
86 |
7 |
0 |
| |
|
|
|
|
|
|
|
|
|
|
|
|
|
| Total Lateral Development, m |
34,437 |
1,266 |
3,703 |
5,615 |
5,316 |
5,004 |
3,180 |
3,129 |
2,980 |
2,303 |
1,246 |
694 |
0 |
| Total Number of Headings |
2,325 |
73 |
258 |
376 |
381 |
365 |
233 |
235 |
172 |
144 |
37 |
51 |
0 |
| Total Vertical Development, m |
1,618 |
156 |
405 |
353 |
408 |
248 |
0 |
48 |
0 |
0 |
0 |
0 |
0 |
| Total Production Drilling, m |
879,190 |
0 |
13,863 |
56,551 |
92,039 |
74,389 |
94,203 |
82,703 |
103,911 |
99,427 |
93,259 |
106,841 |
62,003 |
| Total Production Stopes |
255 |
0 |
0 |
18 |
23 |
24 |
27 |
28 |
25 |
26 |
32 |
30 |
22 |
| Pastefill, 000 m3 |
2,400 |
0 |
0 |
177 |
240 |
232 |
262 |
244 |
249 |
271 |
252 |
261 |
213 |
| Rockfill, 000 m3 |
45 |
0 |
0 |
3 |
4 |
4 |
5 |
4 |
5 |
5 |
5 |
5 |
5 |
| | 13-46 | |
| SSR Mining Inc. | Hod Maden Project | | January 7, 2026 |
| Technical Report Summary | | SLR Project No.: 123.000320.00001 |
| 13.8.4 | Overall Mine Development and Production Schedule |
The LOM development and production schedule is summarized visually in
Figure 13-31. Establishing capital infrastructure is the priority in the early years to support the commencement of mining in each of
the five production zones. Most of the lateral and vertical capital infrastructure for the mine is in place by the end of Year 3, which
aligns with 94% of peak production being reached.
Figure 13-31: Hod Maden LOM Illustrative
Development Schedule - Looking East
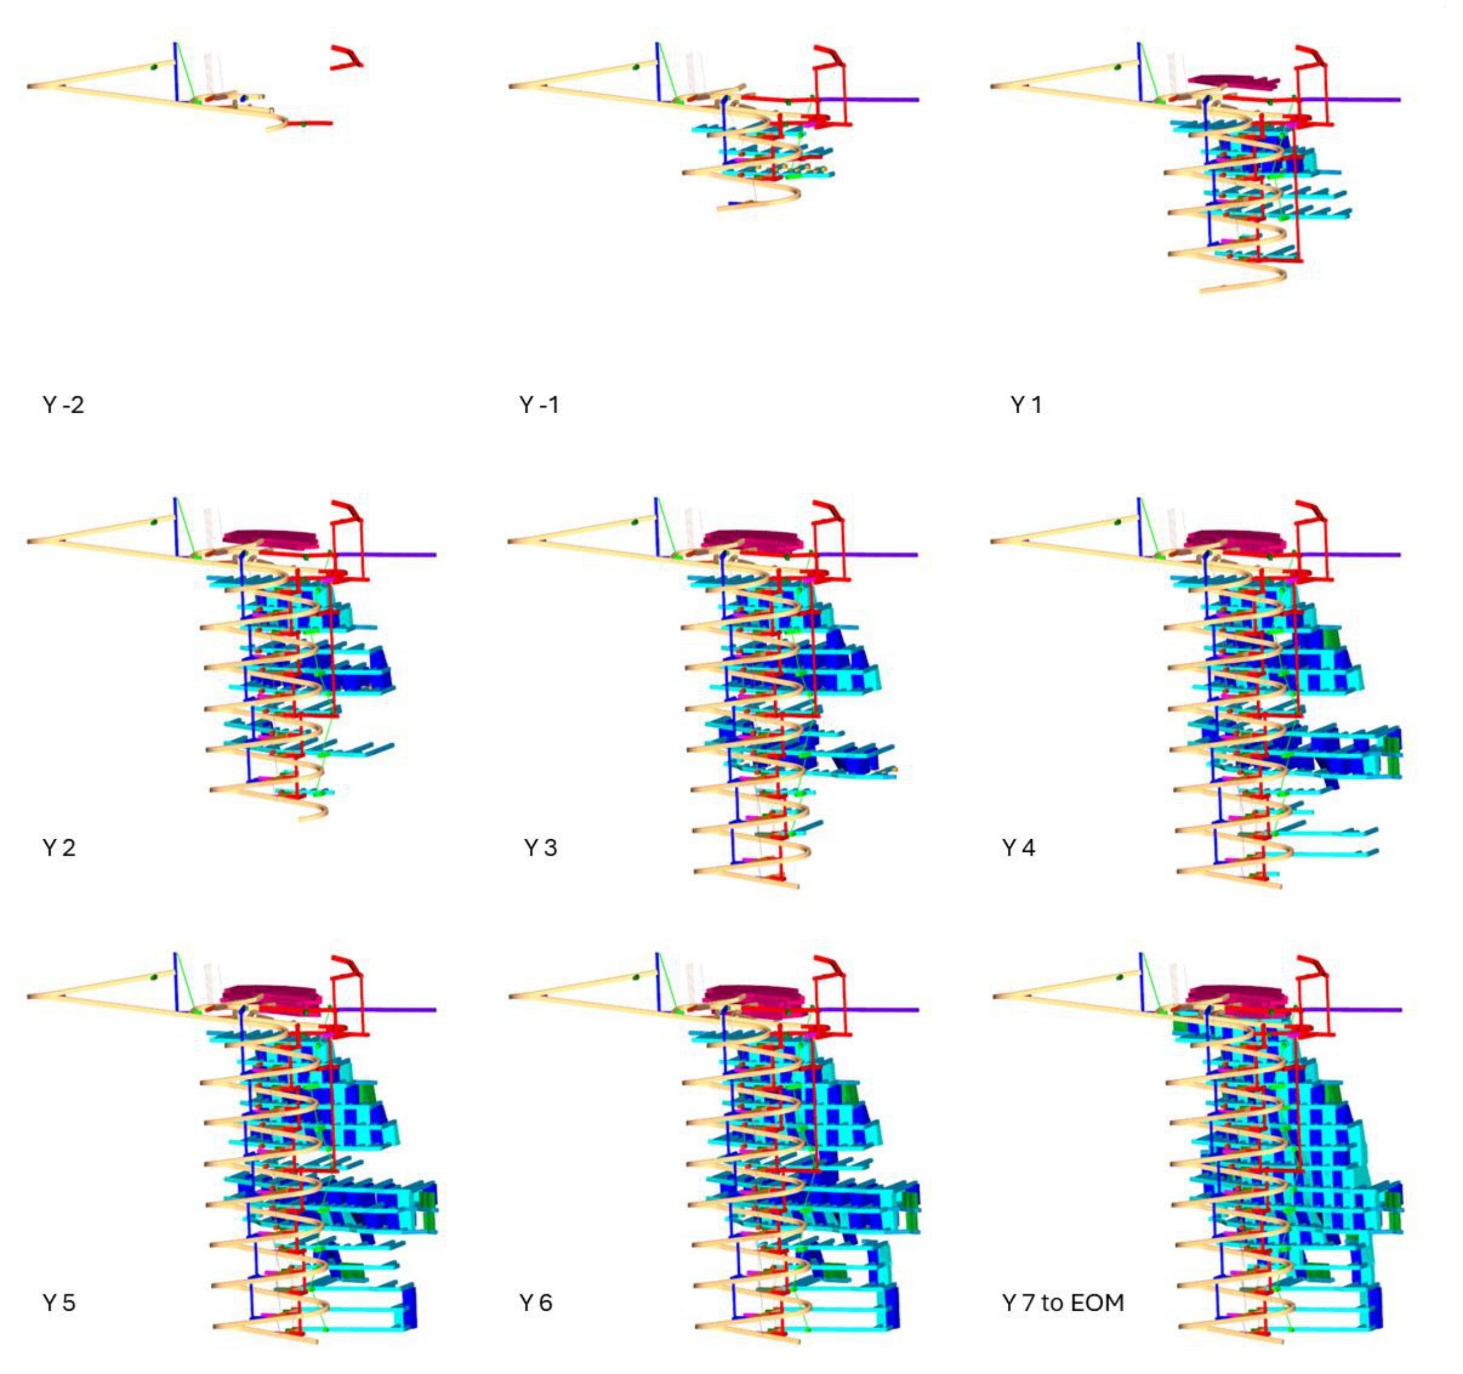
Figure 13-31
Y-2
Y-1
Y-1
Y2
Y3
Y4
Y5
Y6
Y7 to EOM
| | 13-47 | |
| SSR Mining Inc. | Hod Maden Project | | January 7, 2026 |
| Technical Report Summary | | SLR Project No.: 123.000320.00001 |
Processing of underground ore commences in Year 1 as the underground
mine continues to ramp up. The plant reaches 80% of design rate in year 1 and design rate of 800,000 tonnes per annum in Year 2.
The annual process schedule is detailed below in Table 13-24.
| | 13-48 | |
| SSR Mining Inc. | Hod Maden Project | | January 7, 2026 |
| Technical Report Summary | | SLR Project No.: 123.000320.00001 |
Table 13-24: Hod Maden Process Schedule
| Processing Physicals |
Units |
Totals |
2027 |
2028 |
2029 |
2030 |
2031 |
2032 |
2033 |
2034 |
2035 |
2036 |
2037 |
2038 |
| |
|
|
|
|
|
|
|
|
|
|
|
|
|
|
| Ore Processed |
kt |
7,726 |
46.9 |
512.0 |
800.0 |
800.0 |
800.0 |
800.0 |
800.0 |
800.0 |
800.0 |
800.0 |
767.4 |
- |
| Gold grade - Processed Ore |
g/t |
7.63 |
13.35 |
15.26 |
10.67 |
7.95 |
8.28 |
7.35 |
7.82 |
6.58 |
6.04 |
3.05 |
5.63 |
13.60 |
| Silver grade - Processed Ore |
g/t |
3.10 |
3.70 |
3.70 |
4.05 |
3.73 |
3.74 |
2.99 |
2.70 |
2.62 |
2.72 |
2.80 |
2.04 |
2.04 |
| Copper grade - Processed Ore |
% |
1.31% |
1.31% |
1.58% |
1.53% |
1.37% |
1.39% |
1.24% |
1.32% |
1.21% |
1.30% |
1.05% |
1.20% |
1.12% |
| |
|
|
|
|
|
|
|
|
|
|
|
|
|
|
| Contained Metal |
|
|
|
|
|
|
|
|
|
|
|
|
|
|
| Contained Au |
koz |
1,896 |
20.1 |
251.1 |
274.5 |
204.5 |
213.0 |
189.1 |
201.2 |
169.1 |
155.4 |
78.5 |
139.0 |
- |
| Contained Ag |
koz |
769 |
5.6 |
61.0 |
104.2 |
95.8 |
96.2 |
76.8 |
69.5 |
67.4 |
70.0 |
72.1 |
50.4 |
- |
| Contained Cu |
klb |
223,162 |
1,352 |
17,849 |
26,913 |
24,191 |
24,589 |
21,909 |
23,336 |
21,257 |
22,972 |
18,443 |
20,352 |
- |
| |
|
|
|
|
|
|
|
|
|
|
|
|
|
|
| Metal Recovery |
|
|
|
|
|
|
|
|
|
|
|
|
|
|
| Recovery Au |
% |
87.1% |
87.1% |
87.1% |
87.1% |
87.1% |
87.1% |
87.1% |
87.1% |
87.1% |
87.1% |
87.1% |
87.1% |
87.1% |
| Recovery Ag |
% |
87.1% |
87.1% |
87.1% |
87.1% |
87.1% |
87.1% |
87.1% |
87.1% |
87.1% |
87.1% |
87.1% |
87.1% |
87.1% |
| Recovery Cu |
% |
96.8% |
96.8% |
96.8% |
96.8% |
96.8% |
96.8% |
96.8% |
96.8% |
96.8% |
96.8% |
96.8% |
96.8% |
96.8% |
| |
|
|
|
|
|
|
|
|
|
|
|
|
|
|
| Recovered Metal |
|
|
|
|
|
|
|
|
|
|
|
|
|
|
| Recovered Au |
koz |
1,650 |
17.53 |
218.62 |
238.94 |
178.03 |
185.40 |
164.65 |
175.17 |
147.22 |
135.29 |
68.38 |
121.04 |
- |
| Recovered Ag |
koz |
669 |
4.86 |
53.07 |
90.68 |
83.44 |
83.78 |
66.87 |
60.53 |
58.64 |
60.93 |
62.73 |
43.88 |
- |
| Recovered Cu |
klb |
216,100 |
1,309 |
17,284 |
26,061 |
23,425 |
23,811 |
21,216 |
22,598 |
20,585 |
22,245 |
17,859 |
19,708 |
- |
| |
|
|
|
|
|
|
|
|
|
|
|
|
|
|
| Au Concentrate |
|
|
|
|
|
|
|
|
|
|
|
|
|
|
| Cu grade in Concentrate |
% |
|
24.2% |
21.6% |
21.7% |
21.5% |
24.1% |
22.5% |
22.3% |
22.4% |
22.0% |
21.5% |
22.7% |
23.7% |
| Concentrate Moisture |
% |
|
10.0% |
10.0% |
10.0% |
10.0% |
10.0% |
10.0% |
10.0% |
10.0% |
10.0% |
10.0% |
10.0% |
10.0% |
| | 13-49 | |
| SSR Mining Inc. | Hod Maden Project | | January 7, 2026 |
| Technical Report Summary | | SLR Project No.: 123.000320.00001 |
| Processing Physicals |
Units |
Totals |
2027 |
2028 |
2029 |
2030 |
2031 |
2032 |
2033 |
2034 |
2035 |
2036 |
2037 |
2038 |
| |
|
|
|
|
|
|
|
|
|
|
|
|
|
|
| Payable % |
|
|
|
|
|
|
|
|
|
|
|
|
|
|
| Payability Au |
% |
|
97.5% |
97.5% |
97.5% |
97.5% |
97.5% |
97.5% |
97.5% |
97.5% |
97.5% |
97.5% |
97.5% |
97.5% |
| Payability Ag |
% |
|
90.0% |
90.0% |
90.0% |
90.0% |
90.0% |
90.0% |
90.0% |
90.0% |
90.0% |
90.0% |
90.0% |
90.0% |
| Payability Cu |
% |
|
96.5% |
96.5% |
96.5% |
96.5% |
96.5% |
96.5% |
96.5% |
96.5% |
96.5% |
96.5% |
96.5% |
96.5% |
| |
|
|
|
|
|
|
|
|
|
|
|
|
|
|
| Payable Metal |
|
|
|
|
|
|
|
|
|
|
|
|
|
|
| Payable Au |
koz |
1,609 |
17.09 |
213.16 |
232.97 |
173.58 |
180.77 |
160.53 |
170.79 |
143.54 |
131.90 |
66.67 |
118.01 |
- |
| Payable Ag |
koz |
602 |
4.38 |
47.76 |
81.61 |
75.09 |
75.40 |
60.19 |
54.48 |
52.78 |
54.83 |
56.46 |
39.49 |
- |
| Payable Cu |
klb |
208,536 |
1,263.60 |
16,679.33 |
25,148.83 |
22,605.15 |
22,977.41 |
20,472.98 |
21,806.74 |
19,864.09 |
21,466.00 |
17,234.12 |
19,017.92 |
- |
| |
|
|
|
|
|
|
|
|
|
|
|
|
|
|
| | 13-50 | |
| SSR Mining Inc. | Hod Maden Project | | January 7, 2026 |
| Technical Report Summary | | SLR Project No.: 123.000320.00001 |
All ore will be transported to the surface ROM dumps.
Waste rock will be transported to temporary WDFs located near the portal
and ventilation shaft collars. From these locations, waste rock will be transported to the permanent WDF in the Saliçor Valley
by haulage contractors via the Saliçor Tunnel. There will be PAG and non-PAG material generated from the underground workings.
These materials will be identified and handled accordingly as to their respective classification.
| 13.9.1 | Material Handling – DAF and LHS |
Ore and waste will be transported from the mine using LHDs and 50 t
articulated dump trucks. The use of re-muck bays will also be employed for the haulage of ore and waste.
Development ore and waste will be mucked from the development face to
stockpiles and/or directly to trucks. A typical truck loading area layout is shown in Figure 13-32.
For decline development, the distance between stockpiles (or temporary
stockpiles/level accesses) will be 180 m or less. Dedicated stockpiles will be on every level access for loading, with the stubs of secondary
stope ore drives and primary stopes stubs against paste fill also used to stockpile broken ore and waste.
Stope loading will utilize tele-remote technology to load from the stopes
to stockpiles (Figure 13-33). In addition to purpose-built stockpiles, the secondary ore drive stubs will be utilized for primary stope
ore and the primary drive stubs against paste fill will be used for stockpiling of secondary stope ore. Secondary ore drives will be fully
excavated following the mining and filling of the adjacent primary stopes.
| | 13-51 | |
| SSR Mining Inc. | Hod Maden Project | | January 7, 2026 |
| Technical Report Summary | | SLR Project No.: 123.000320.00001 |
Figure 13-32: Hod Maden Typical
Truck Loading Area Layout
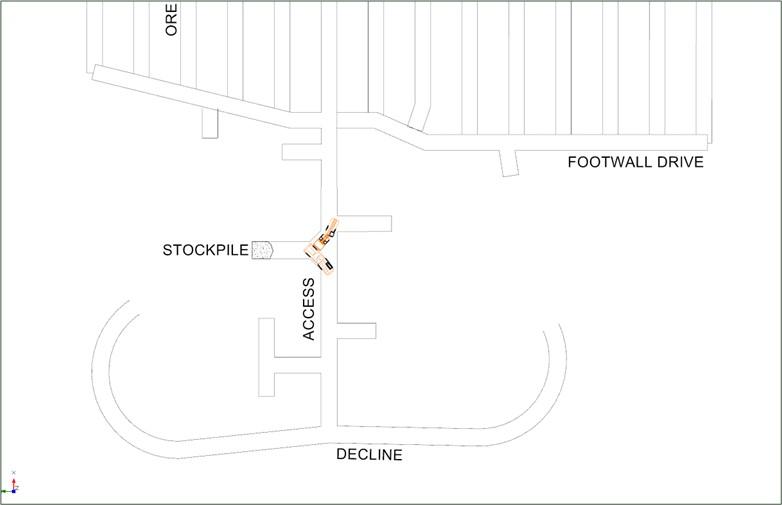
Figure 13-32
ORE
FOOTWALL DRIVE
STOCKPILE
ACCESS
DECLINE
Source: Artmin 2025
| | 13-52 | |
| SSR Mining Inc. | Hod Maden Project | | January 7, 2026 |
| Technical Report Summary | | SLR Project No.: 123.000320.00001 |
Figure 13-33: Tele-remote Loading
Arrangement to Ore Drive Stub or Stockpile
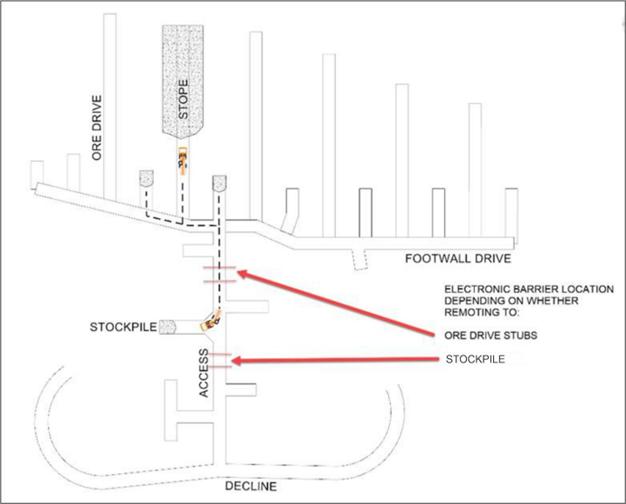
Figure 13-33
ORE DRIVE
STOPE
FOOTWALL DRIVE
STOCKPILE
ELECTRONIC BARRIER LOCATION DEPENDING ON WHETHER REMOTING TO:
ORE DRIVE STUBS
STOCKPILE
ACCESS
DECLINE
Source: Artmin 2025
Paste backfill (paste) is proposed to be employed as the preferred backfilling
method in the Hod Maden LHS mining zone, as discussed below. Paste will also be used in the DAF mining zone, but with much lower requirements
due to the total volume of the DAF mining.
LOM paste requirements are summarized in Table 13-25 and Table 13-26.
Table 13-25: Paste Line and Service
Hole Summary
| Paste Line and Service Hole Meters |
Units |
Value |
|
| Paste Line Surface |
m |
155 |
|
| Paste Line Internal |
m |
428 |
|
| Service Hole |
m |
1,891 |
|
| Total Service Hole |
m |
2,475 |
|
| | 13-53 | |
| SSR Mining Inc. | Hod Maden Project | | January 7, 2026 |
| Technical Report Summary | | SLR Project No.: 123.000320.00001 |
Table 13-26: Summary of LOM Paste
Backfill Requirements
| Backfilling |
Units |
Value |
|
| Paste: DAF |
000 m3 |
206 |
|
| Paste: LHS Primary stope |
000 m3 |
1,098 |
|
| Paste: LHS Secondary stope |
000 m3 |
1,111 |
|
| Paste: LHS Longitudinal stope |
000 m3 |
15 |
|
| Paste: Total |
000 m3 |
2,429 |
|
| Rockfill |
000 m3 |
45 |
|
| |
|
|
|
| Number of Barricades – Drift and Fill |
No. |
173 |
|
| Number of Barricades – Long hole Stope |
No. |
255 |
|
| Number of Barricades - Total |
No. |
428 |
|
A well-engineered cemented fill enables high recovery of the Mineral
Resource with reasonable rates of dilution. Cemented Aggregate Fill (CAF) could be utilized as an alternative engineered backfill in the
LHS mining zone; however, this change would require a change to the equipment fleet and primary ventilation design and would result in
a reduction in production rate.
| 13.9.3.1 | Paste Back Fill Test Work |
A binder assessment was conducted as part of the paste test work program
during the generation of the DFS in November 2020. Two paste fill test programmes were undertaken during the DFS. The first test programme
utilized the full tails stream and the second a (deslimed) cyclone underflow (CUF) tails sample. The second test programme was completed
for two reasons:
| 1. | Inability to adequately filter the full tails stream within a practical footprint. |
| 2. | Suspension of the first test program following government enforced restrictions on access
due to the COVID-19 pandemic. |
Both test programs included tailings characterization and unconfined
compressive strength (UCS) testing.
This determined that a local Blast Furnace Slag Cement achieved a 30%
greater UCS than the nearest alternative binder. With consideration of cost, the Blast Furnace Slag Cement was found to have the greatest
effectiveness and was used for ongoing strength test work.
A preliminary assessment of strength generation for varied binder contents
and cure times was measured by UCS tests. The UCS tests were undertaken on paste back fill mixes with w/w binder contents from 3% to 15%
that generated yield stresses of approximately 250 Pa. The averaged results of the tests for cyclone underflow (CUF) tails are presented
in Table 13-27.
The UCS results for the CUF tailings mixed with blast furnace slag cement
shows reasonable strengths being achieved at 28 days with strength development continuing through to 56 days.
| | 13-54 | |
| SSR Mining Inc. | Hod Maden Project | | January 7, 2026 |
| Technical Report Summary | | SLR Project No.: 123.000320.00001 |
Table 13-27: UCS Results for Various
Binder Contents and Cure Times - PF with CUF Tailings
| Cement Content |
UCS Avg. (MPa)
7 Days |
UCS Avg. (MPa)
14 Days |
UCS Avg. (MPa)
28 Days |
UCS Avg. (MPa)
56 Days |
| 3% |
0.17 |
0.24 |
0.33 |
0.35 |
| 7% |
0.28 |
0.47 |
0.54 |
0.80 |
| 11% |
0.66 |
1.01 |
1.30 |
1.96 |
| 15% |
1.43 |
2.13 |
2.72 |
3.42 |
| 13.9.3.2 | Paste Back Fill Design Criteria |
The paste fill design (PFD) of the Hod Maden tailings ranges from approximately
30% w/w of the CUF tailings being finer than 20 microns, up to approximately 58% w/w of the full plant tailings being finer than 20 microns.
The design solids content of Hod Maden paste ranges from approximately
71.5% w/w solids for the CUF tailings down to approximately 65% w/w solids for the full plant tailings. This has been determined based
on the 250 Pa yield stress from the paste back fill rheological test program.
Factors of safety of 1.5 for vertical exposures and 2.0 for undercut
exposures have been selected to be applied to the PF design strengths. Strength requirements for vertical fill exposures are based on
Terzgahi’s 3D arching theory, which has been modified to account for multiple exposures.
For stopes that are 15 m along strike by up to 30 m wide (hanging wall
to footwall) by 25 m high, the paste design strengths and design slag cement addition are presented in Table 13-28 for each application.
The design slag cement additions are based on the generated in the 28-day design strengths achieved in the UCS test program.
Table 13-28: PF Design Strengths
for Vertical Exposures – 30 m Wide Stopes
| Paste Type |
Application |
Design Strength (kPa) |
Slag Cement Addition1 |
| High Strength Paste |
Sill Stopes |
1,850 |
13% w/w |
| Regular Paste |
Primary Stopes |
500 |
6% w/w |
| Low Strength Paste |
Secondary Stopes |
300 |
3% w/w |
|
Notes:
1. kg of binder per kg of paste (dry basis) |
| 13.9.3.3 | Paste Back Fill Production |
The planned paste plant at Hod Maden receives the total tailings stream
directly from the process plant. Thickened tailings report to the tailings storage tank where a portion is pumped to a plate and frame
filter press to dewater to 19% w/w moisture. The filter cake and remainder of the thickened tailings are combined in a single shaft paste
mixer along with a dry cement binder before being pumped underground into the mine for backfilling at approximately 68.5% solids.
The paste plant runs at similar throughput and utilization to the concentrator.
It is sized to receive and process all low sulfide tails.
| | 13-55 | |
| SSR Mining Inc. | Hod Maden Project | | January 7, 2026 |
| Technical Report Summary | | SLR Project No.: 123.000320.00001 |
| 13.9.3.4 | Paste Reticulation |
The proposed paste reticulation system for Hod Maden consists of two
surface boreholes (one operating and one standby), which deliver paste initially to the 825 level and then by pairs of sub-vertical boreholes
to each of the production levels down to 450 level as required. The boreholes are cased and PF is delivered to each of the distribution
levels by means of steel pipes. High-density polyethylene (HDPE) lines will be installed for the last 100 m to the stope to be filled.
Duplication of the boreholes and trunk line enables preparation of the next stope to be filled while the current stope is filling. Boreholes
and lines can be switched on each level as required. The main interlevel reticulation layout is shown in Figure 13-34.
Figure 13-34: Mine Main Inter-Level
Reticulation Layout
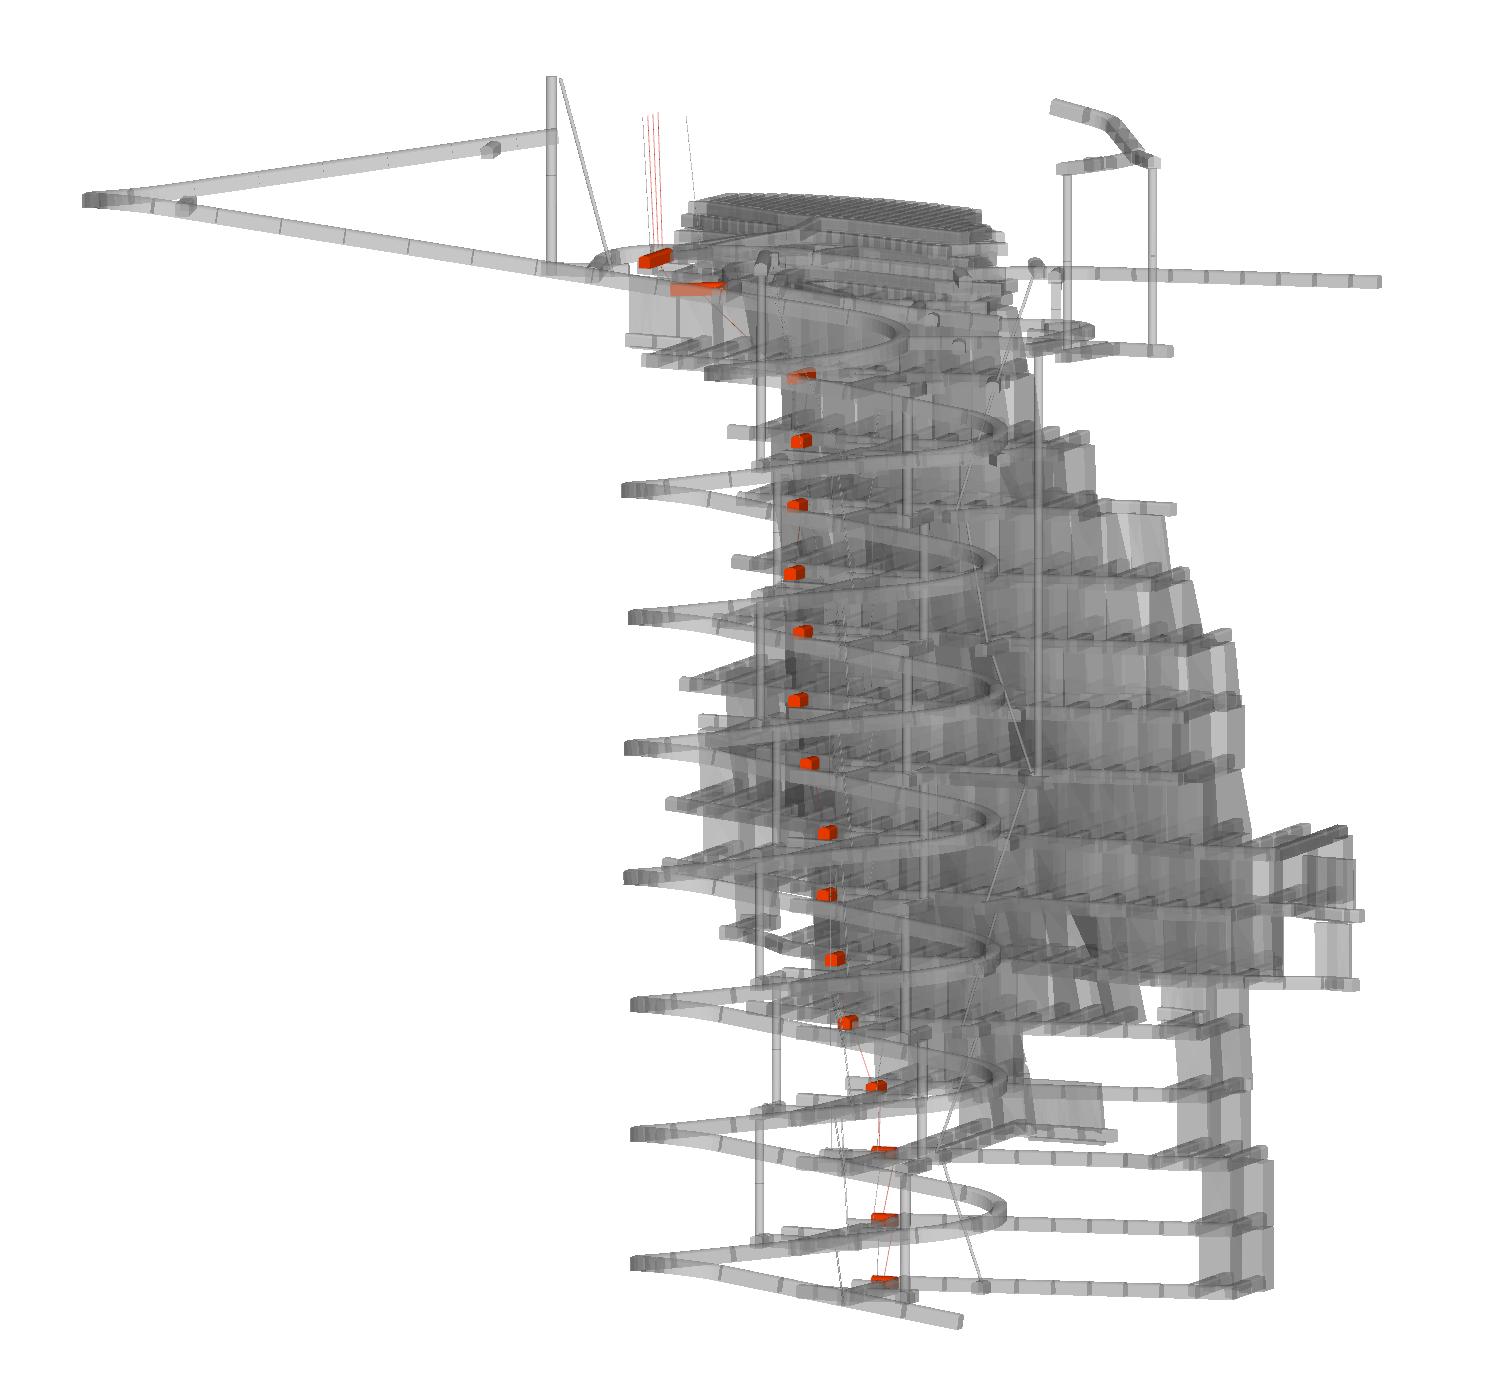
Source: Artmin 2025
| | 13-56 | |
| SSR Mining Inc. | Hod Maden Project | | January 7, 2026 |
| Technical Report Summary | | SLR Project No.: 123.000320.00001 |
| 13.9.3.5 | Paste Fill Placement |
After completion of ore production from stopes, backfill preparation
will commence. This will consist of connecting the stope to the main paste reticulation system via steel pipes on the sub levels with
the final low-pressure open discharge sections consisting of HDPE lines.
Typical paste pouring regime includes placing and curing of a fill plug
that covers the brow by 2 m and then continual filling of the rest of the stope. paste has a low rill angle (2° to 5°), and is
suitable for tight filling.
Figure 13-35 shows an end-of-level pipeline set-up recommended for filling
the stope. The end of the drive is filled up with mine waste as a bund wall. The pipeline protrudes a few meters beyond the mine waste
bund. The following is recommended to be strictly followed:
| · | Filling should be closely monitored as the fill top approaches the drive level above. |
| · | Filling should be stopped as the void is almost full, leaving at least half a meter below the floor of the drive. |
| · | After curing for 28 days, the unfilled portion should be topped up with mine waste and levelled throughout the length of the drive,
so that it can be used as working platform or for tramming or access. |
Figure 13-35: Standard End of Line
Fill Pour Set-up
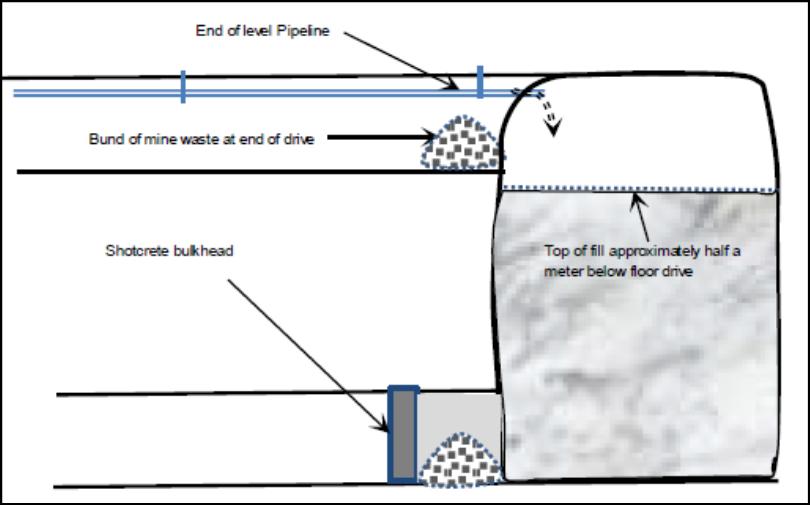
Figure 13-35
End of level Pipeline
Bund of mine waste at end of drive
Shotcrete bulkhead
Top of fill approximately half a meter below floor drive
Source: Artmin 2025.
| 13.9.3.6 | Paste Fill Barricades |
Barricades are engineered retaining structures that are constructed
at the base of open stopes to retain paste until it gains sufficient strength to become self-supporting. Arched shotcrete barricades sprayed
onto a curved formwork are recommended. The formwork can be made of any combination of steel or timber and often with mesh and hessian
to provide a surface on which to spray the shotcrete.
| | 13-57 | |
| SSR Mining Inc. | Hod Maden Project | | January 7, 2026 |
| Technical Report Summary | | SLR Project No.: 123.000320.00001 |
| 13.10 | Underground Mining Equipment |
| 13.10.1 | DAF Underground Equipment |
The modified DAF mining method proposed utilizes similar excavation
techniques to a civil engineering tunnelling operation. The equipment workload is expected to be consistent and therefore the equipment
fleet size is expected also to be consistent over the life of the Project. The equipment requirements for each equipment type for the
life of the Project are summarized in Table 13-29.
Table 13-29: Life of Mine Equipment
Fleet (Year 2, 2029)
| Function |
Description |
Model Number |
Number |
| Drill |
Jumbo |
DD422I |
3 |
| Drill |
Roadheader |
MR361 |
1 |
| Drill |
Cablebolter |
DS422i |
1 |
| Drill |
Production Drill Rig |
DL4321 |
3 |
| Drill |
Slot Raise Rig |
Rhino 100 |
1 |
| Drill |
Raiseborer |
Robbins92R |
1 |
| Load |
Loader (LHD) |
LH517I |
3 |
| Load |
Loader (FEL ROM) |
L220H |
1 |
| Haul |
Articulated DT |
TH551 |
5 |
| Support |
Charger |
Charmec MC605 |
2 |
| Support |
Sprayer |
Spraymec MF 050 DV |
2 |
| Support |
Agitator |
Utimec MF 700 |
2 |
| Support |
Personnel Carrier |
Multimec MF 100 Pers |
1 |
| Support |
Scissor Lift |
UT1LIFTSF330 |
2 |
| Support |
Grader |
CAT 150 |
1 |
| Support |
Integrated Tool Handler |
L45H |
1 |
| Support |
Telescopic Handler |
MH 10160 |
1 |
| Support |
Multipurpose |
Multimec MF 100 Serv |
1 |
Excavators and Rotary Cutters (Headers)
Most excavations in the DAF mining area are expected to be highly weathered
or highly fractured/faulted zones and where rock is more competent it is not expected to be high strength. Excavation is therefore planned
to be predominantly mechanical. Equipment will vary in size, however, it will essentially be comprised of excavators with 360° rotation
capability and some fitted with rotary cutters.
| | 13-58 | |
| SSR Mining Inc. | Hod Maden Project | | January 7, 2026 |
| Technical Report Summary | | SLR Project No.: 123.000320.00001 |
Loaders
Loaders will vary in size and will include FELs, LHDs, and skid steers.
These will be utilized for material movement from the decline to the drift and from the drift to the decline. A larger FEL is utilized
on surface for life of the Project.
Jumbos
Jumbos are expected to be underutilized but will be available for use
where more competent ground that stretches the capability of the mechanical excavation equipment is encountered.
Ancillary
Ancillary equipment consists of concrete sprayer, concrete pumps, and
general-purpose service units.
| 13.10.3 | LHS Underground Equipment |
For the first three years of mine development (Year -2 to Year 1) and
LOM mine production, all mobile equipment will be provided by the mining contractor.
Equipment requirements have been determined from the mine physicals
and typical industry mechanical availability and utilization, which have been adjusted to take into consideration the available working
time for underground personnel. Equipment life (operating and percussion hours), rebuild intervals, mechanical availability, and utilization
for each equipment type are shown in Table 13-30. The equipment life was provided by the equipment vendors.
Table 13-30: Proposed Mobile Equipment
Fleet Availability and Utilization
| Equipment Type |
Life (Hrs) |
Rebuild (Hrs) |
Availability |
Utilization* |
LOM Average Utilization |
| Jumbo |
17,000 |
8,500 |
87% |
19% |
12% |
| Cable Bolter |
17,000 |
8,500 |
84% |
32% |
13% |
| Production Drill |
17,000 |
8,500 |
84% |
24% |
14% |
| LHD |
40,000 |
20,000 |
81% |
48% |
45% |
| ROM Loader |
40,000 |
20,000 |
83% |
60% |
60% |
| Truck |
40,000 |
20,000 |
83% |
54% |
53% |
| Ancillary |
16,000 |
8,000 |
85% |
54% |
16% |
Note *. Jumbo and Production Drill showing percussion utilization. Utilization
is proportion of total hours.
The mobile equipment fleet peaks at 25 units as peak production levels
are reached. The LOM LHS equipment requirements are illustrated in Figure 13-
| | 13-59 | |
| SSR Mining Inc. | Hod Maden Project | | January 7, 2026 |
| Technical Report Summary | | SLR Project No.: 123.000320.00001 |
Figure 13-36: Life of Mine Mobile
Equipment Fleet - LHS
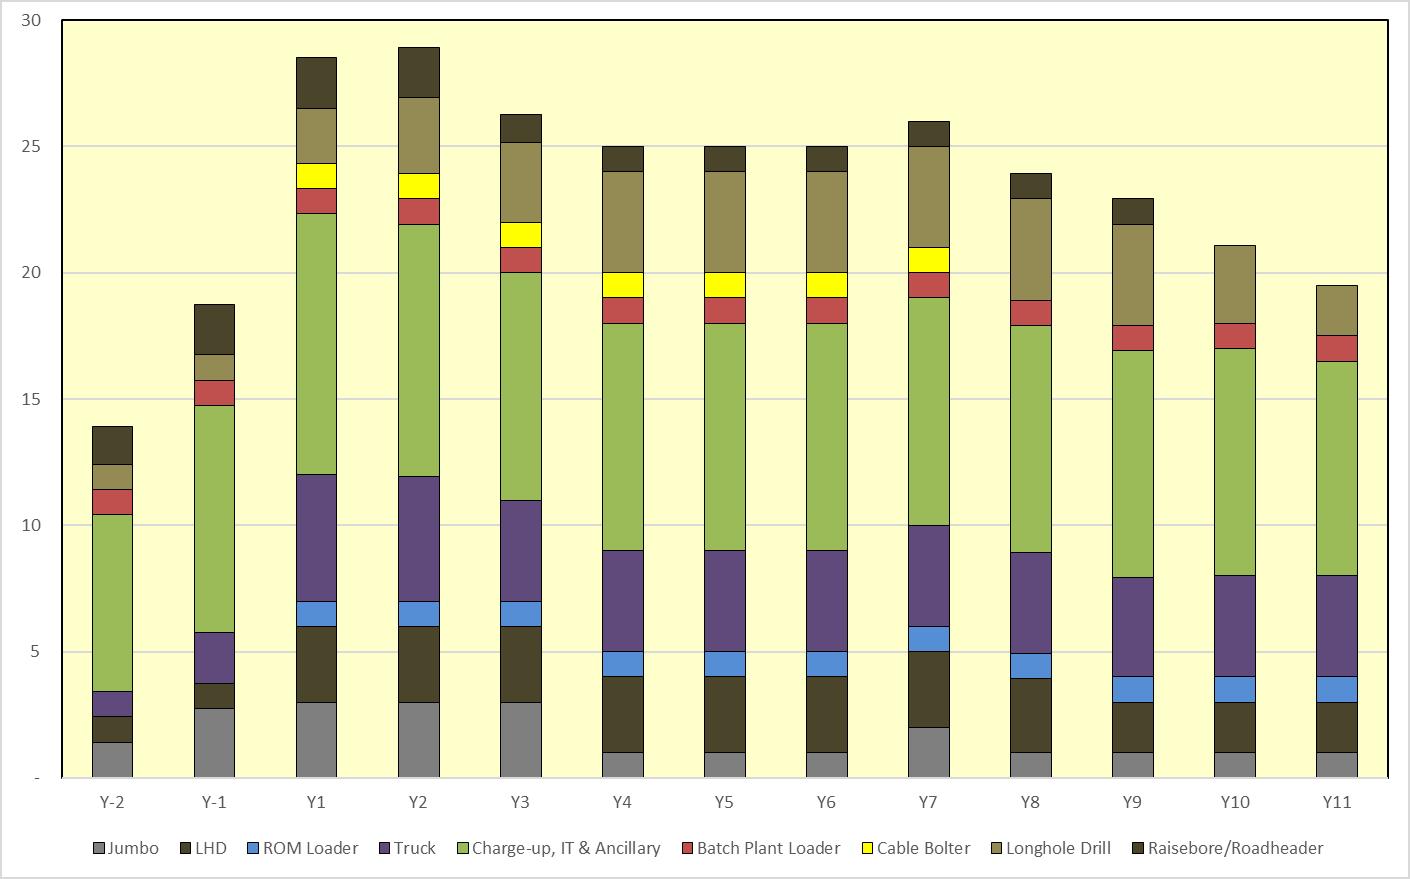
Figure 13-36
30
25
20
15
10
5
-
Y-2
Y-1
Y1
Y2
Y3
Y4
Y5
Y6
Y7
Y8
Y9
Y10
Y11
Jumbo
LHD
ROM Loader
Truck
Charge-up, IT & Ancillary
Batch Plant Loader
Cable Bolter
Longhole Drill
Raisebore/Roadheader
| 13.10.3.1 | Major Mobile Equipment |
Jumbos
Twin boom electro-hydraulic jumbos will be utilized for lateral development
and bolting for excavation of 450 m per month on average. It is estimated that three twin boom jumbos will be required with an average
of just over 150 m per month advance per jumbo.
Cable Bolter
Cable bolting will be required in all development intersections and
extensively through production ore drives for hanging wall and backs support during stoping. A dedicated machine to perform this function
will ensure this is completed efficiently.
LHDs
LHDs will be utilized for mucking of all development and stope material.
A 21-tonne unit is proposed, which is matched to the development profiles and the proposed 51-tonne truck, with three pass loading of
trucks when accounting for bucket fill factors. The forecast loader productivity, of 150 tonnes loaded per operating hour, includes the
rehandle assumptions - stope ore will be loaded into a stockpile and then direct from stockpile to truck resulting in high productivity.
Five LHDs are expected to be required to provide sufficient capacity for the life of mine development and stoping ore and waste movement.
| | 13-60 | |
| SSR Mining Inc. | Hod Maden Project | | January 7, 2026 |
| Technical Report Summary | | SLR Project No.: 123.000320.00001 |
Trucks
A 51t truck is proposed, which is compatible with the proposed 21t LHD.
Five 51t trucks are estimated to be required for the Project.
Production Drills
The primary production drill will be a top hammer long hole drill, which
will utilize drill tubes to maintain accuracy of the 89 mm diameter production holes. Two primary production drills will be required for
the Project.
A secondary production drill is proposed, which has the capability of
drilling slot rises and longer service holes. This rig would also be utilized for return air long hole rises and would provide additional
stope production drilling capacity at times of high demand. One unit is proposed for these tasks over the mine life.
ROM Loader
The nominated ROM loader has a five cubic meter bucket, which meets
the requirements of the ROM to crusher workload. Each bucket is expected to deliver 10 tonnes to the crusher and the unit will operate
at a productivity of 15 buckets per operating hour.
Paste Plant Loader
A loader is also required in the paste plant to feed stockpiled filtered
tailings to the paste mixer during periods of peak demand. This unit is proposed to be the same as the ROM Loader and would also provide
backup to the ROM Loader.
| 13.10.3.2 | Supporting Mobile Equipment |
Shotcrete Sprayer
An electrohydraulic shotcrete spraying machine will be required for
the Project to apply fibrecrete which is recommended as the surface support for all lateral development. One unit is expected to be required
for the Project however, given the criticality of this unit it is recommended to have a backup unit.
Transmixer
A machine will also be required for transport of fibrecrete to the shotcrete
spraying machine from the batch plant on surface. One unit is expected to be required for the Project, however, given the criticality
of this unit, a backup unit is recommended. Backup will be provided by a transmixer cassette for use with the multi-purpose vehicle.
Charge up Machine
The explosives loading machine is required for loading of emulsion into
development faces and production holes. The work demand for the unit is expected to be three development rounds per day and one production
firing every one to two days. The emulsion pump will be leased monthly from a local supplier.
Grader
A suitably sized underground grader is required to maintain underground
roadways for all traffic. One grader will be required for the Project.
| | 13-61 | |
| SSR Mining Inc. | Hod Maden Project | | January 7, 2026 |
| Technical Report Summary | | SLR Project No.: 123.000320.00001 |
Telehandler
A telehandler machine will be required for unloading and loading of
mine services, consumables, and explosives. It will also be a resource for the paste crew. Two units are expected to be required.
Scissor Lift
For the installation of mine services (pipe and electrical cable) and
installation of secondary ventilation fans a scissor lift is the preferred machine from which to safely carry out these tasks. One unit
is expected to be required.
Multi-Purpose Vehicle
A multi-purpose vehicle will be used for personnel transport, fuel and
lube servicing, water spray for roadways and backup and/or peak demand support for the transmixer. The unit will be capable of interchanging
various cassettes to suit the mines requirements. It is expected that two units will be required.
Batch Plant Loader
The batch plant loader will be required to load aggregate and sand into
the plant feed hopper. This unit is expected to have a low workload enabling it to also be utilized as a backup for underground services
work where required. The size of the unit is suitable for manoeuvring through the underground mine and is typically used as an Integrated
Toolcarrier (IT) for underground services work.
The underground mine will be a 24-hour, seven-day week operation.
The underground mining roster is driven by Turkish legislation, which
stipulates a 37.5 hour working week, 8-hour shifts with 0.5-hour meal breaks. Underground operational personnel will work a four-panel
roster of day, afternoon, and night shifts. One day per week will consist of only two shifts. This shift will be used to perform additional
scheduled maintenance on mobile equipment and an opportunity for overtime underground work to be offered. Figure 13-37 shows the roster
over the full three-week cycle.
Nominal shift times will be:
| · | Day Shift (D) 0800 to 1600 h |
| · | Afternoon Shift (A) 1600 to 2400 h |
| · | Night Shift (N) 2400 to 0800 h |
| | 13-62 | |
| SSR Mining Inc. | Hod Maden Project | | January 7, 2026 |
| Technical Report Summary | | SLR Project No.: 123.000320.00001 |
Figure 13-37: Underground Personnel
Mining Roster
| Mining Crew |
S |
M |
T |
W |
T |
F |
S |
S |
M |
T |
W |
T |
F |
S |
S |
M |
T |
W |
T |
F |
S |
| Panel A |
D |
D |
D |
D |
|
|
N |
N |
N |
N |
N |
|
|
A |
A |
A |
A |
A |
|
|
D |
| Panel B |
|
N |
N |
N |
N |
N |
|
|
A |
A |
A |
A |
A |
|
|
D |
D |
D |
D |
D |
|
| Panel C |
|
|
A |
A |
A |
A |
A |
|
|
D |
D |
D |
D |
D |
|
|
N |
N |
N |
N |
N |
| Panel D |
A |
A |
|
|
D |
D |
D |
D |
D |
|
|
N |
N |
N |
N |
N |
|
|
A |
A |
A |
| Number of Shifts/Day |
2 |
3 |
3 |
3 |
3 |
3 |
3 |
2 |
3 |
3 |
3 |
3 |
3 |
3 |
2 |
3 |
3 |
3 |
3 |
3 |
3 |
| Working Hours/Day |
15 |
23 |
23 |
23 |
23 |
23 |
23 |
15 |
23 |
23 |
23 |
23 |
23 |
23 |
15 |
23 |
23 |
23 |
23 |
23 |
23 |
| UG Working Hours/Day |
12 |
18 |
18 |
18 |
18 |
18 |
18 |
12 |
18 |
18 |
18 |
18 |
18 |
18 |
12 |
18 |
18 |
18 |
18 |
18 |
18 |
Figure 13-37
Mining Crew
Panel A
Panel B
Panel C
Panel D
Number of Shifts/Day
Working Hours/Day
UG Working Hours/Day
S
M
T
W
T
F
S
S
M
T
W
T
G
S
S
M
T
W
T
F
S
D
D
D
D
N
N
N
N
N
A
A
A
A
A
D
N
N
N
N
N
A
A
A
A
A
D
D
D
D
D
A
A
A
A
A
D
D
D
D
D
N
N
N
N
N
A
A
D
D
D
D
D
N
N
N
N
N
A
A
A
2
3
3
3
3
3
3
2
3
3
3
3
3
3
2
3
3
3
3
3
3
15
23
23
23
23
23
23
15
23
23
23
23
23
23
15
23
23
23
23
23
23
12
18
18
18
18
18
18
12
18
18
18
18
18
18
12
18
18
18
18
18
18
Permanent surface operational personnel will work 9-hour shifts. Mining
management and technical personnel will work a nominal 45-hour week of day shift only.
| 13.11.2 | Mining Personnel Summary |
The mining headcount is driven by the activity level for the Project.
There is a ramp up period for two years with the establishment of the crown pillar followed by steady state activity as the undercut levels
are extracted over the remaining ten years. Total personnel requirements peak at 283. A yearly summary of the estimated mining personnel
is shown in Table 13-31. The company is currently evaluating what supervisory and technical positions will be staffed by the contractor
and what positions will be staffed by Hod Maden employees.
Table 13-31: Mining Personnel Summary
| |
yr-3 |
yr-2 |
yr-1 |
yr1 |
yr2 |
yr3 |
yr4 |
yr5 |
yr6 |
yr7 |
yr8 |
yr 9 |
yr 10 |
| Expat- Mining & Maintenance |
3 |
7 |
7 |
7 |
6 |
1 |
0 |
0 |
0 |
0 |
0 |
0 |
0 |
| Mine Management Supervision |
7 |
36 |
40 |
40 |
39 |
35 |
34 |
34 |
34 |
34 |
34 |
34 |
34 |
| Mining Technical Services |
8 |
37 |
37 |
37 |
37 |
37 |
37 |
37 |
37 |
37 |
37 |
37 |
37 |
| Mine Operations |
0 |
80 |
160 |
168 |
168 |
168 |
160 |
160 |
160 |
140 |
140 |
140 |
140 |
| Mine Maintenance |
0 |
51 |
51 |
51 |
51 |
49 |
49 |
49 |
49 |
49 |
49 |
49 |
49 |
| Total |
15 |
204 |
288 |
296 |
295 |
289 |
280 |
280 |
280 |
260 |
260 |
260 |
260 |
| 13.12 | Underground Mine Infrastructure |
Dewatering is required to remove all groundwater inflow as well as service
water used for mine development and production. Service water inflow is estimated to average 6 L/s with the remaining inflow of 30 L/s
from groundwater. Approximately 1 L/s of this is expected to be removed as moisture in waste and ore, the remaining 35 L/s will be pumped
from the mine to the water treatment plant.
Each level of the mine will have a water collection sump. Water from
the sumps will either drain to a level below and ultimately to a pump station, or be equipped with an internal settler, the clear water
then being pumped
The sumps with settling dams will be divided into two sections with
the first part of the sump collecting coarser slimes and the water decanting over a concrete retaining wall. Water from the sumps will
either pass through drain holes to sumps deeper in the mine or be pumped using 18 kW submersible pumps to one of two main settling
sumps.
| | 13-63 | |
| SSR Mining Inc. | Hod Maden Project | | January 7, 2026 |
| Technical Report Summary | | SLR Project No.: 123.000320.00001 |
The main settling sumps will be located on the 675 and 475 levels. From the main settling sumps, water will drain to the two main
pump stations, the first on the 650 level and the second on the 450 level. Figure 13-38 shows the layout of the dewatering system.
Figure 13-38: Dewatering System
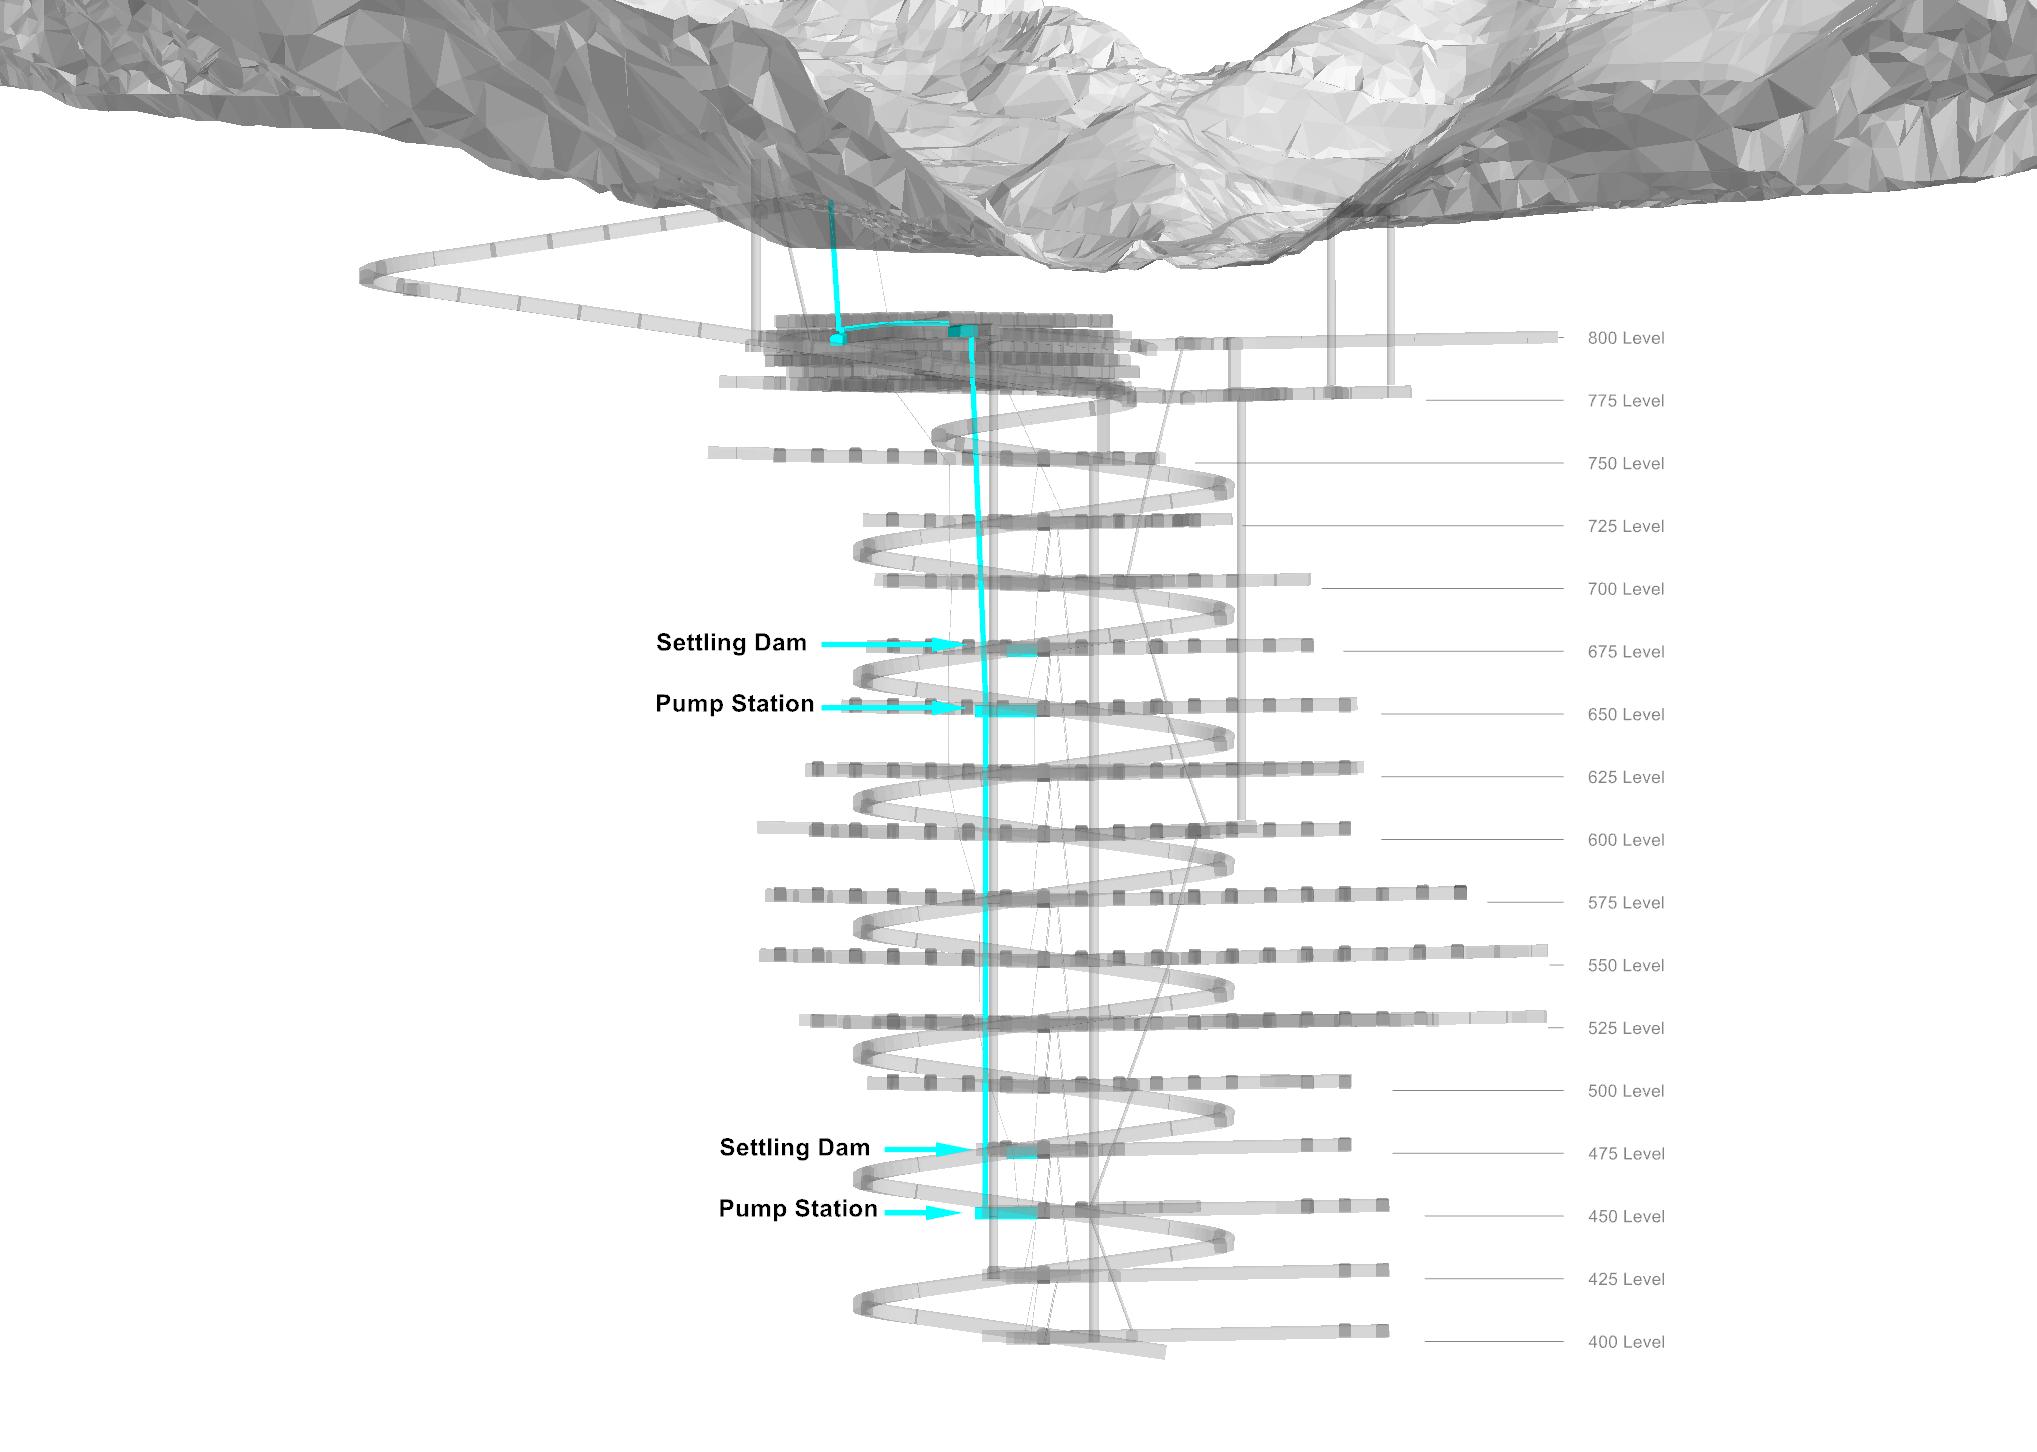
Figure 13-38
Settling Dam
Pump Station
Settling Dam
Pump Station
Source: Artmin 2025
Primary pumping from the mine will be done in two stages. Water will
first be pumped from the 450 level to the 650 level. At the 650 level, lower-level water will join water collected above the 700 level
and the combined flow will be pumped to the surface water treatment plant. Pumps will be 110 kW plinth-mounted helical rotor pumps, which
will each be capable of pumping 18 L/s.
There will be two duty pumps and one spare pump at each pump station
to maintain redundancy. Potentially higher service water inflows from raise boring and diamond drilling in the early years of the mine
life will be offset by lower expected groundwater inflows. This aligns with the recommendations made by the hydrogeological consultants
(SRK) as referenced in Section 15.4.
During the development phase dewatering will be undertaken utilizing
a “travelling” progressive helical rotor pump. Water from development will be pumped from the face to settling sumps and then
to the helical rotor pump where it would be pumped to surface and water treatment. Once excavation has reached the first pump station
at the 650 level, the permanent pump station will be installed. The travelling pump system of staging water will be repeated for the lower
section of the mine until the second permanent pump station is established.
| | 13-64 | |
| SSR Mining Inc. | Hod Maden Project | | January 7, 2026 |
| Technical Report Summary | | SLR Project No.: 123.000320.00001 |
| 13.12.2 | Underground Explosives Magazine |
The Hod Maden operation is estimated to consume on average 550 t of
explosives annually from Years 1 to 8 with a peak consumption of 740 t. The explosives magazine will be designed to contain a maximum
of 30 t of explosives with detonators kept in a separate magazine. There will be two bays for explosives and one for detonators. The detonator
magazine will contain shelving such that packages of detonators can be kept neat and inventory can be easily kept. One of the two explosive
bays will also contain some shelving units for packaged emulsion. The remainder of the explosives will be bulk emulsion in intermediate
bulk container (IBC) tanks and will be handled by forklift or telehandler.
The magazine area will be equipped with a deluge fire suppression system,
which can either be activated manually or automatically. There will be flow-through ventilation in the magazine area with ventilation
controlled by a regulator at the magazine area exit. Smaller fans will ventilate the individual magazine bays as required. The entrance
will have locked gates such that only authorized personnel will have access to the explosive magazine. Figure 13-39 shows the magazine
location in the mine and a plan view of the general layout.
Figure 13-39: 725 Level Explosives
Magazine
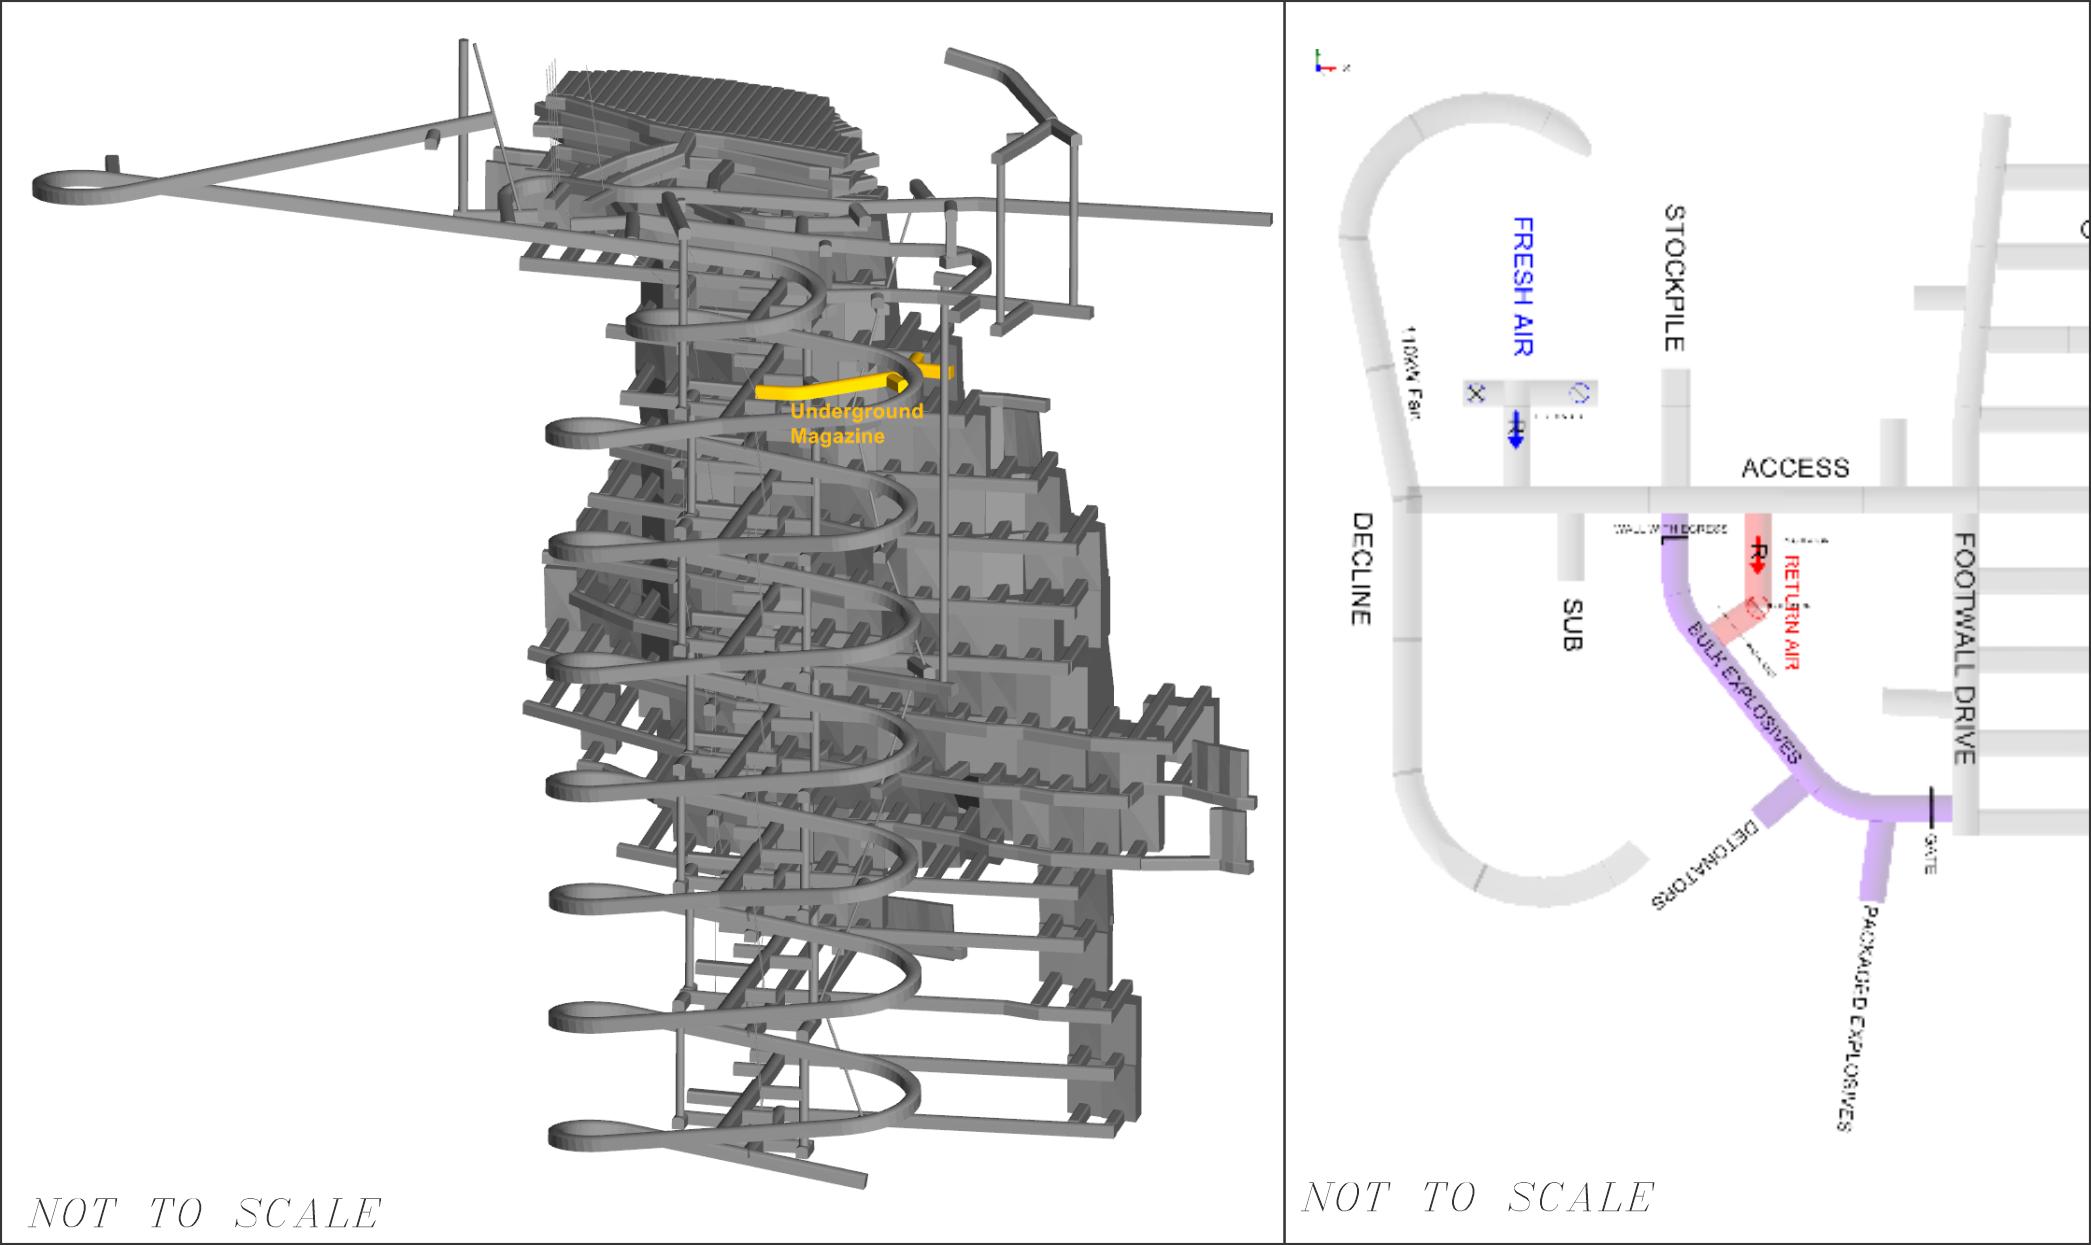
Figure 13-39
Underground Magazine
NOT TO SCALE
FOOTWALL DRIVE
ACCESS
RETURN AIR
GATE
PACKAGED EXPLOSIVES
DETONATORS
BULK EXPLOSIVES
STOCKPILE
FRESH AIR
SUB
DECLINE
NOT TO SCALE
Source: Artmin 2025
Explosives will be delivered by the supplier directly to the mine portal.
Mining personnel will receive the explosives and immediately transport them to the underground magazine. Packaged explosives, detonators,
and blasting accessories will be transported in cardboard cases while bulk emulsion will be transported in 1,000 L IBC tanks. Detonators
and explosives will never be transported together.
| | 13-65 | |
| SSR Mining Inc. | Hod Maden Project | | January 7, 2026 |
| Technical Report Summary | | SLR Project No.: 123.000320.00001 |
| 13.12.3 | Mine Communications and Data |
Radio communications will be established underground by means of a fiber
backbone with WiFi and 4G local hotspots for digital communications with handheld radios. The system headend will be installed at a suitable
location near the portal. In addition to the fiber, Leaky Feeder cables will run the length of the decline and to a surface antenna. In
the mine, VHF amplifiers will be spaced between Leaky Feeder VHF coax cable segments at no more than 500 m intervals. Leaky Feeder cables
will also branch out to all active mining levels with “end-of-line” termination antennas, as required. Leaky Feeder is a simple
and robust system that can be used for communication as the mine is being developed and installed progressively by the development crews.
Once production begins, the mine will use technology such as remote
loading in the stopes, backfill placement and monitoring, ventilation fans and dewatering pump monitoring. At this stage, the fibre optics
system will be used for the high data volume required to leverage the latest technology.
The Leaky Feeder system will be used for:
| · | Mine Control communications - relay of information (voice) |
| · | Primary voice communications - between underground personnel |
The Digital Fiber Optic and WiFi System will be used for:
| · | Personnel and equipment tracking |
| · | Paste system monitoring – each paste barricade will have a camera with a live feed back to the control room |
| · | Ventilation fan and pump control and monitoring |
| 13.12.4.1 | Power Requirements |
Yearly power consumption is provided in Figure 13-40
An estimate of the typical underground power requirements is shown
in Table 13-32. Ventilation accounts for approximately 67% of the electricity demand. Overall, typical demand will be approximately 4.7
MW for the underground operations.
| | 13-66 | |
| SSR Mining Inc. | Hod Maden Project | | January 7, 2026 |
| Technical Report Summary | | SLR Project No.: 123.000320.00001 |
Figure 13-40: Yearly Underground
Electrical Power Requirements
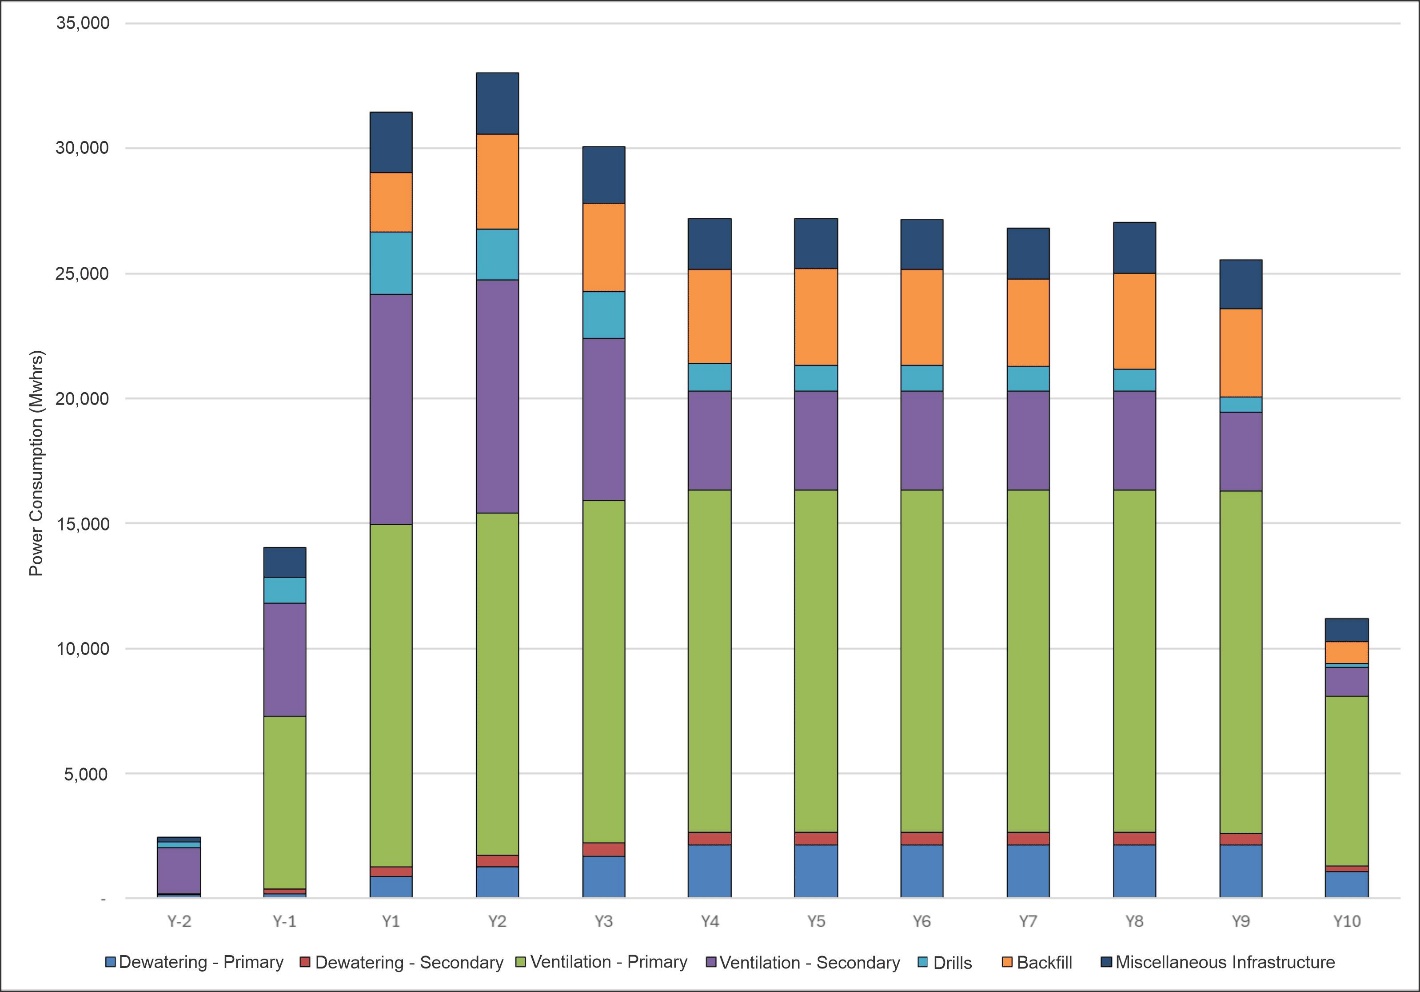
Figure 13-40
Power Consumption (Mwhrs)
35,000
30,000
25,000
20,000
15,000
10,000
5,000
-
Y-2
Y-1
Y1
Y2
Y3
Y4
Y5
Y6
Y7
Y8
Y9
Y10
Dewatering - Primary
Dewatering - Secondary
Ventilation - Primary
Ventilation - Secondary
Drills
Backfill
Miscellaneous Infrastructure
Table 13-32: Typical Underground
Electrical Consumption, kW
| Area |
Typical Power
Consumptions (kW) |
% of Total |
| Dewatering - Primary |
285 |
6% |
| Dewatering - Secondary |
88 |
2% |
| Ventilation - Primary |
1,631 |
36% |
| Ventilation - Secondary |
1,414 |
31% |
| Miscellaneous Infrastructure |
342 |
7% |
| Drills |
829 |
18% |
| Backfill |
0 |
0% |
| Total |
4,589 |
100% |
| 13.12.5 | Underground Electrical Infrastructure |
Underground mines in Türkiye typically use 380 V equipment but
the intent is to change to a 1,000 V system for mining equipment and the underground electrical supply for Hod Maden. There are significant
limitations on cable runs when running at 380 V compared to 1,000 V, which is used widely in other parts of the world. The limited cable
runs and the requirement to operate on multiple levels concurrently would result in at least one substation on every level of the mine.
| | 13-67 | |
| SSR Mining Inc. | Hod Maden Project | | January 7, 2026 |
| Technical Report Summary | | SLR Project No.: 123.000320.00001 |
Figure 13-41 shows the general underground electrical layout.
Figure 13-41: Underground Electrical
Infrastructure - Section View Looking Northeast
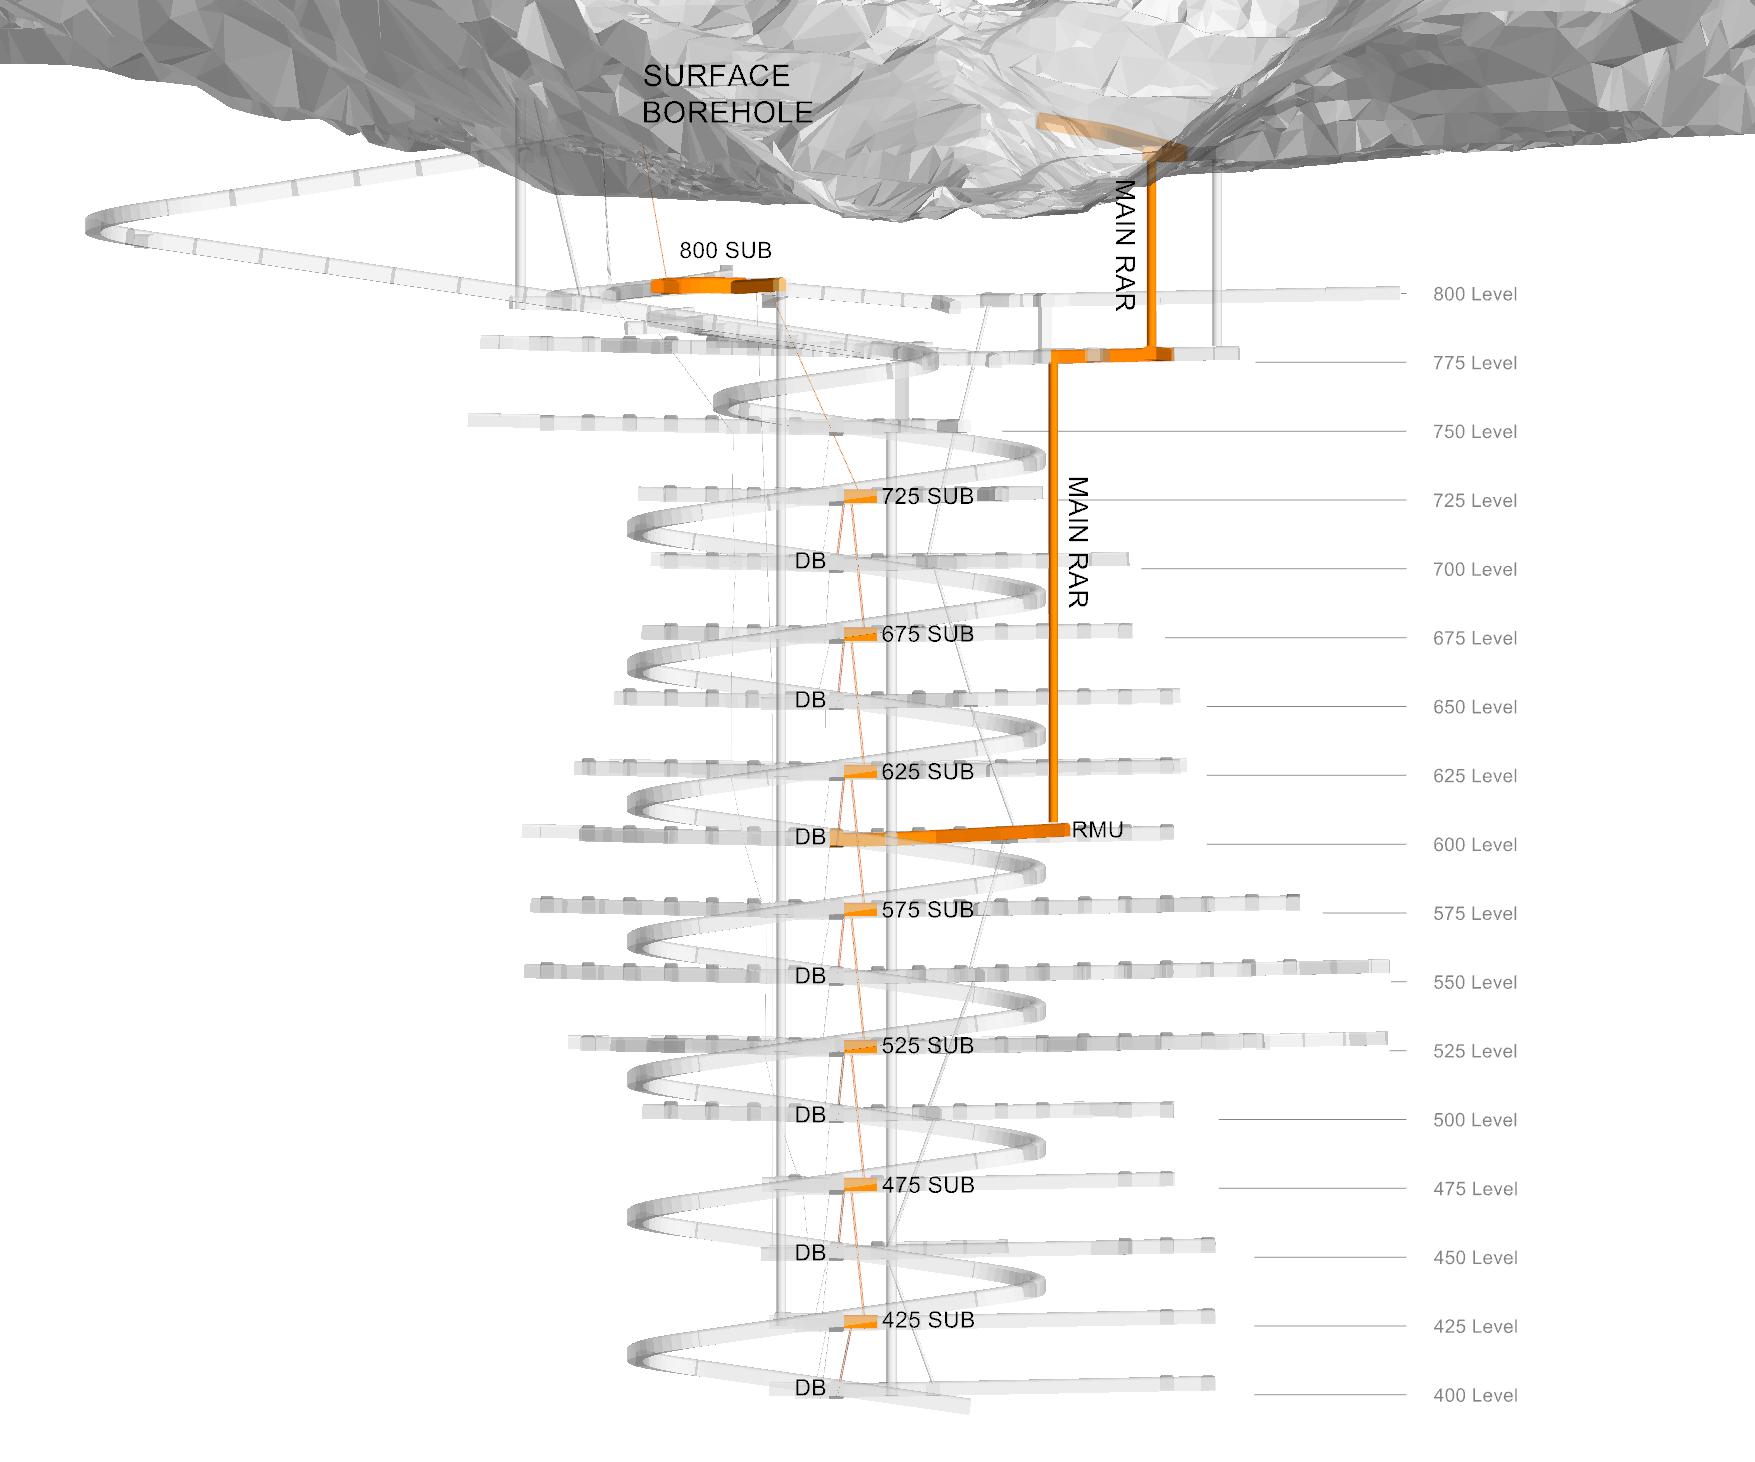
Figure 13-41
SURFACE BOREHOLE
800 SUB
MAIN RAR
725 SUB
DB
675 SUB
DB
625 SUB
DB
MAIN RAR
RMU
575 SUB
DB
525 SUB
DB
475 SUB
DB
425 SUB
DB
Source: Artmin 2025.
High voltage power will first be established near the portal where feed
to decline fans, pumps, and drills will be provided from a surface substation. As the decline progresses, a travelling substation will
be established as voltage drop becomes too high until the first fixed substation is established near the bottom of the FAR to surface.
This will feed fans, which will be established at the base of this raise to boost airflow prior to establishment of primary ventilation.
The travelling substation will be established at 800 mRL, with level
substations established on 725 mRL and each 50 m spaced level thereafter.
A ring feed high voltage line will be run down the escapeway ultimately
linking to the 425 level substation and ensuring backup supply to the system.
A ring feed line will be installed in the second RAR to ensure secondary
high voltage supply.
| | 13-68 | |
| SSR Mining Inc. | Hod Maden Project | | January 7, 2026 |
| Technical Report Summary | | SLR Project No.: 123.000320.00001 |
| 13.12.6 | Mine Emergency Provisions |
The mine design has incorporated secondary egress from the bottom of
the mine to surface and suitable positions for refuge chambers. Secondary egress is provided for when the primary access to the mine is
compromised such as in the event of a rock fall or vehicle accident. Refuge chambers are provided for when the atmosphere in the underground
mine becomes toxic. The primary cause of this would be an underground fire. Emergency situations are communicated to all underground personnel
through communications systems and the release of stench gas.
Secondary Egress
For the production stoping blocks, a ladderway will be installed in
each of the escapeway raises with access off the decline. The raises are sized appropriately to ensure easy passageway.
Refuge Chambers
Fixed and mobile self-sufficient rescue chambers will be located at
suitable positions within the mine. They are independent of a compressed air supply with appropriate provisions for safe refuge until
any fire is extinguished/burnt out or safe egress is established. These will be located relative to the active working areas to be within
the average walking pace duration of a personal self-rescuer device. Four 20-person refuge chambers will be provided in fixed locations
throughout the mine. This is to cater for the largest number of personnel ever expected in the mine. Smaller mobile refuge chambers will
be utilized on the levels and for decline advance where personnel have loading operations between them and the path to a fixed refuge
chamber.
Stench Gas System
An automatic stench gas warning system will be installed at both the
portal and primary FAR. When fired, this system will release stench gas into the main fresh air system allowing the stench gas to permeate
rapidly throughout the mine workings.
Stench gas may be released in the event of several mine emergencies,
including fire, serious accident, or injury. It is expected that the procedure will be to call in the emergency to a central mine control
room from where the release will be triggered.
Once stench is released, underground mine personnel would report immediately
to the nearest mine refuge chamber or surface, whichever is closer.
The location of the secondary egress and the stench gas release points
are shown in Figure 13-42. The fixed 20-person refuge chambers will be located in the Fresh Air Return (FAR) access.
| | 13-69 | |
| SSR Mining Inc. | Hod Maden Project | | January 7, 2026 |
| Technical Report Summary | | SLR Project No.: 123.000320.00001 |
Figure 13-42: Secondary Egress and
Fixed Refuge Chamber Locations – 3D Schematic Looking Northeast
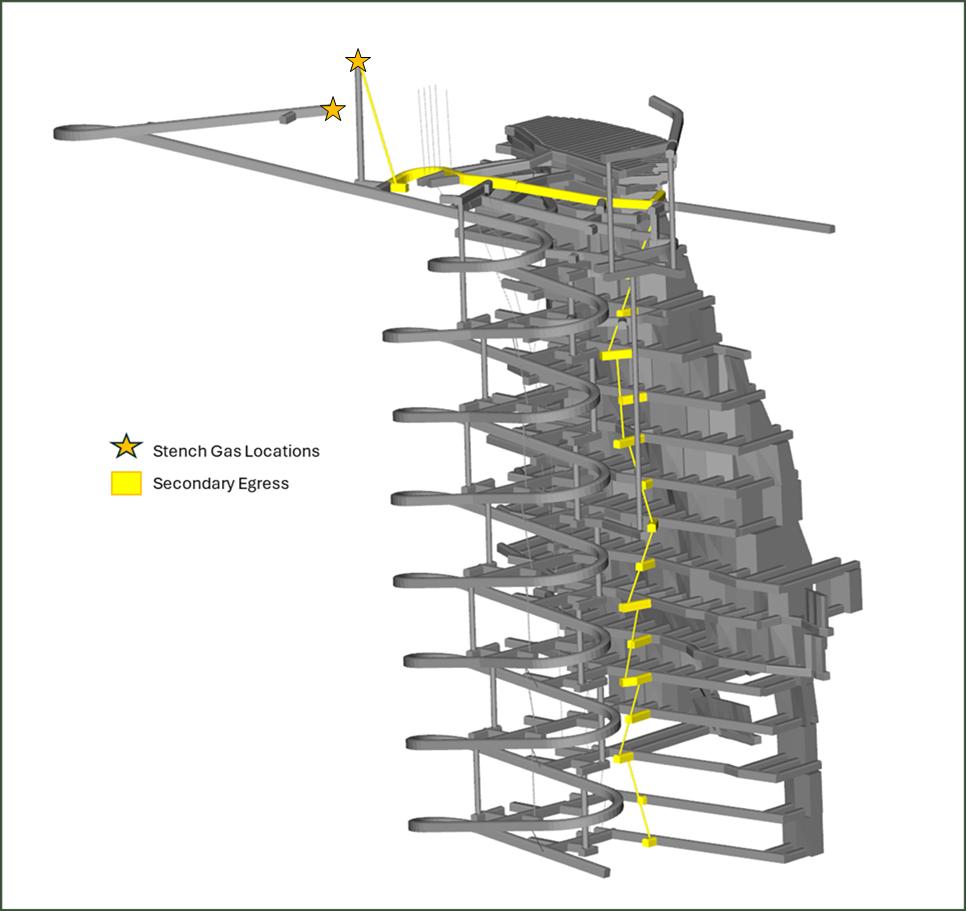
Figure 13-42
Stench Gas Locations
Secondary Egress
Source: Artmin 2025.
| 13.12.7 | Mine Service Water and Compressed Air |
Peak compressed air requirement is estimated at 470 L/s (1,000 cfm)
including leakage. To supply this, a compressed air reticulation system will be installed. The reticulation will consist of HDPE line
running down the main ramp. Service drops will be supplied at 90 m intervals, typically one drop at each level and one drop halfway between
levels. Levels will be supplied with HDPE line with service drops located at 60 m intervals.
To supply this line, two rotary screw compressors will be located on
surface near the portal. Each compressor will supply 280 L/s (600 cfm) at 8.5 bar (125 psi). The system will include automatic controls
to cycle the compressors as well as a 7,570 L (2,000 gal) air receiver tank and air dryer.
| | 13-70 | |
| SSR Mining Inc. | Hod Maden Project | | January 7, 2026 |
| Technical Report Summary | | SLR Project No.: 123.000320.00001 |
Typical water demand in the mine is estimated at 6 L/s. Service water
will be supplied via HDPE line running from the mill water source to the portal and down the main ramp. Service drops will be supplied
at 90 m intervals, typically one drop at each level and one drop halfway between levels. Pressure reducing station will be placed at each
level to maintain pressure at 4.8 bar (70 psi) on the levels and a max pressure of 7.5 bar (110 psi) in the ramp. Levels will be supplied
with HDPE line with service drops located at 60 m intervals.
| | 13-71 | |
| SSR Mining Inc. | Hod Maden Project | | January 7, 2026 |
| Technical Report Summary | | SLR Project No.: 123.000320.00001 |
| 14.0 | Processing and Recovery Methods |
The processing plant will have the capability of treating 800,000 dry
tonnes per year of ROM ore. The plant design incorporates crushing, grinding, and flotation to recover copper and gold from the ore.
The flowsheet is shown in Figure 14-1. A summary of the flowsheet follows:
| · | Primary ore crushing of ROM to produce a crusher product size of 80% passing 56 mm. |
| · | Primary milling in closed circuit with hydrocyclones to produce an 80% passing 106 µm grind size. |
| · | Rougher flotation of the primary ground material to generate a rougher concentrate. The rougher concentrate is directed to the Regrind
Circuit. The rougher flotation tailings are directed to the Secondary Grinding Circuit. |
| · | Secondary grinding of the rougher flotation tail in a variable speed stirred mill in closed circuit with hydrocyclones to produce
an 80% passing 38 µm grind size. Secondary grinding of the rougher tail improves the liberation and recovery of gold. |
| · | Scavenger and scavenger cleaner flotation of the secondary ground material to the scavenger concentrate. The cleaned scavenger concentrate
is directed to the cleaner flotation circuit. The scavenger tailings, which are low in sulfidic material, are directed to the low sulfide
tailings thickener. |
| · | A concentrate regrind mill in closed circuit with hydrocyclones to produce an 80% passing 30 µm grind size. |
| · | A cleaner flotation circuit, comprising a cleaner conditioning tank with two stages of cleaning and a cleaner scavenger stage. The
rougher and scavenger concentrates are directed to the cleaner flotation circuit. The cleaner scavenger concentrate is recirculated to
the cleaner conditioning tank. |
| · | Concentrate thickening, filtration and loadout. |
| · | Sulfide tailings thickening and disposal to the tailings storage facility. |
| · | Low sulfide tailings thickening, filtration and paste backfill. |
Various utility and plant infrastructure such as water supply, reagents
supply and distribution, air services, electrical energy supply and distribution, roads, communications and site buildings will support
the Project. Figure 14-2 and Figure 14-3 provide an overview of the process area and details of the process area components, respectively.
| | 14-1 | |
| SSR Mining Inc. | Hod Maden Project | | January 7, 2026 |
| Technical Report Summary | | SLR Project No.: 123.000320.00001 |
Figure 14-1: Process Flow Sheet
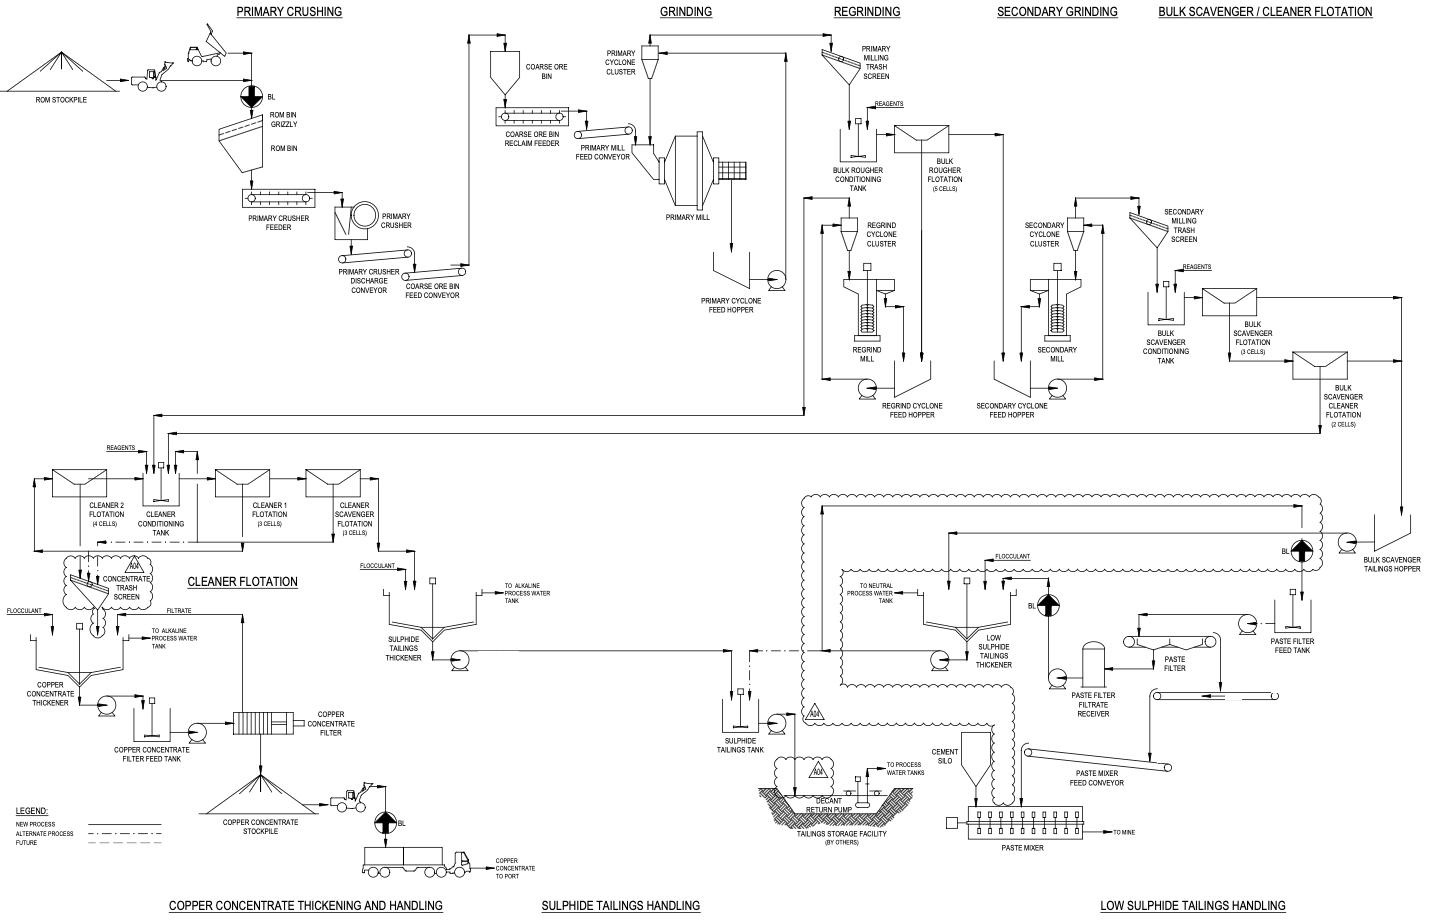
Figure 14-1
PRIMARY CRUSHING
ROM STOCKPILE
BL
ROM BIN GRIZZLY
ROM BIN
PRIMARY CRUSHER FEEDER
PRIMARY CRUSHER
PRIMARY CRUSHER DISCHARGE CONVEYOR
COARSE ORE BIN FEED CONVEYOR
COARSE ORE BIN
COARSE ORE BIN RECLAIM FEEDER
PRIMARY MILL FEED CONVEYOR
GRINDING
PRIMARY CYCLONE CLUSTER
PRIMARY MILL
PRIMARY CYCLONE FEED HOPPER
REGRINDING
PRIMARY MILLING TRASH SCREEN
REAGENTS
BULK ROUGHER CONDITIONING TANK
BULK ROUGHER FLOTATION (5 CELLS)
REGRIND CYCLONE CLUSTER
REGRIND MILL
REGRIND CYCLONE FEED HOPPER
SECONDARY GRINDING
SECONDARY CYCLONE CLUSTER
SECONDARY MILL
SECONDARY CYCLONE FEED HOPPER
BULK SCAVENGER / CLEANER FLOTATION
SECONDARY MILLING TRASH SCREEN
REAGENTS
BULK SCAVENGER CONDITIONING TANK
BULK SCAVENGER FLOTATION (3 CELLS)
BULK SCAVENGER CLEANER FLOTATION (2 CELLS)
BULK SCAVENGER TAILINGS HOPPER
PASTE FILTER FEED TANK
FLOCCULANT
TO NEUTRAL PROCESS WATER TANK
LOW SULPHIDE TAILINGS THICKENER
PASTE FILTER FILTRATE RECEIVER
PASTE FILTER
PASTE MIXER FEED CONVEYOR
TO MINE
PASTE MIER
CEMENT SILO
TO PROCESS WATER TANKS
DECANT RETURN PUMP
TAILINGS STORAGE FACILITY
(BY OTHERS)
SULPHIDE TAILINGS TANK
TO ALKALINE PROCESS WATER TANK
SULPHIDE TAILINGS THICKENER
FLOCCULANT
CLEANER SCAVNEGER FLOTATION (3 CELLS)
CLEANER 1 FLOTATION (3 CELLS)
REAGENTS
CLEANER CONDITIONING TANK
CLEANER 2 FLOTATION (4 CELLS)
CONCENTRATE TRASH SCREEN
CLEANER FLOTATION
FLOCCULANT
FILTRATE
TO ALKALINE PROCESS WATER TANK
COPPER CONCENTRATE THICKENER
COPPER CONCENTRATE FILTER FEED TANK
COPPER CONCENTRATE FILTER
COPPER CONCENTRATE STOCKPILE
COPPER CONCNETRATE TO PORT
LEGEND:
NEW PROCESS
ALTERNATE PROCESS
FUTURE
COPPER CONCENTRATE THICKENING AND HANDLING
SULPHIDE TAILINGS HANDLING
LOW SULPHIDE TAILINGS HANDLING
Source: Ausenco 2025
Source: Ausenco 2025
| | 14-2 | |
| SSR Mining Inc. | Hod Maden Project | | January 7, 2026 |
| Technical Report Summary | | SLR Project No.: 123.000320.00001 |
Figure 14-2: Process Area –
Overview
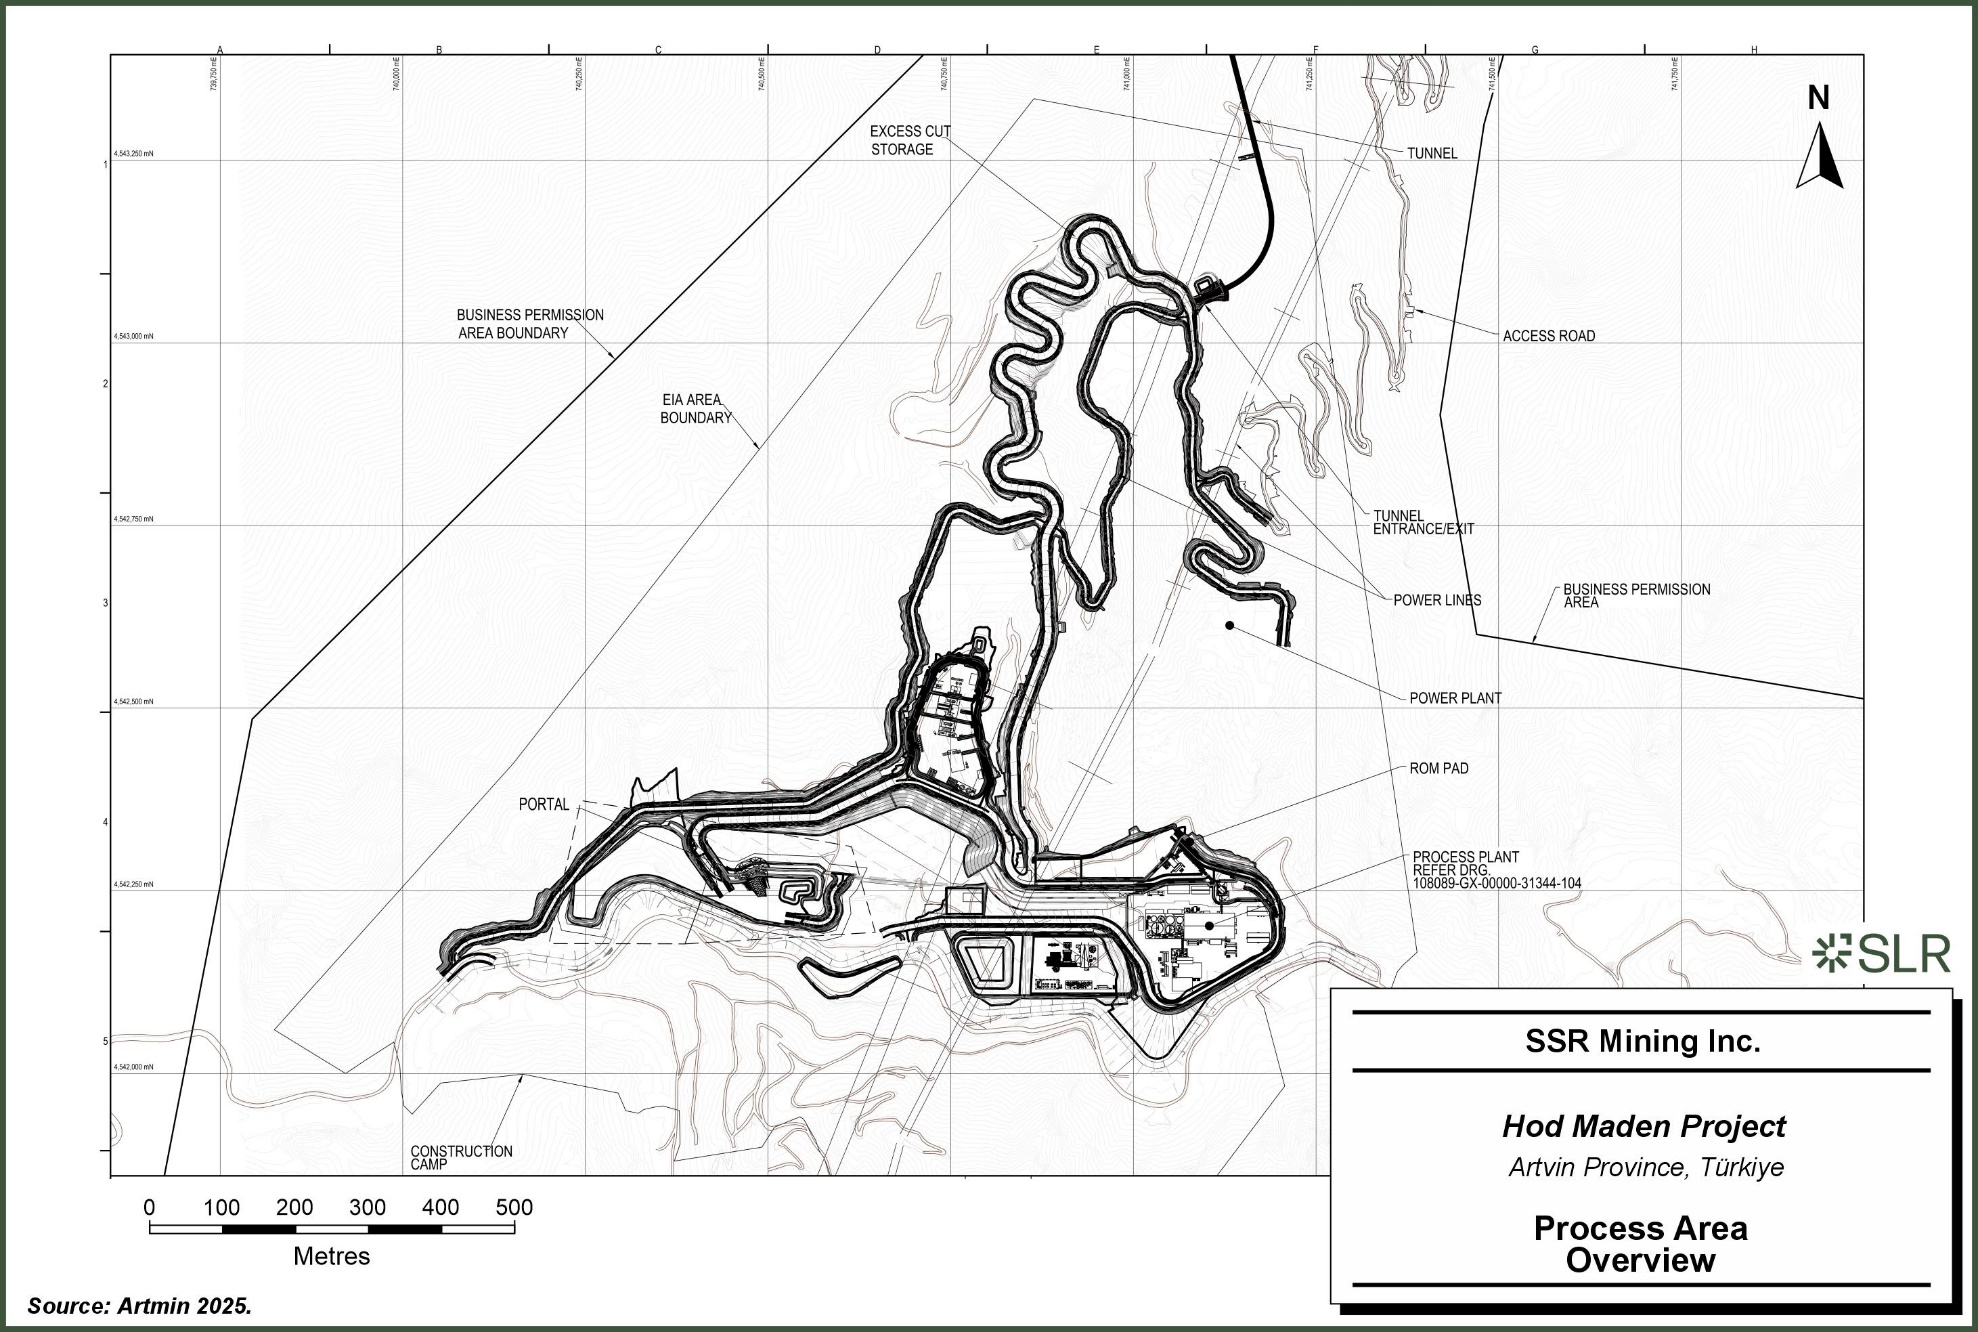
Figure 14-2
EXCESS CUT STORAGE
BUSINESS PERMISSION AREA BOUNDARY
EIA AREA BOUNDARY
PORTAL
TUNNEL
ACCESS ROAD
BUSINESS PERMISSION AREA
TUNNEL ENTRANCE/EXIT
POWER LINES
POWER PLANT
ROM PAD
PROCESS PLANT REFER DRG. 108089-GX-00000-31344-104
CONSTRUCTION CAMP
SSR Mining Inc.
Hod Maden Project
Artvin Province, Türkiye
Process Area Overview
0
100
200
300
400
500
Metres
Source: Artmin 2025.
| | 14-3 | |
| SSR Mining Inc. | Hod Maden Project | | January 7, 2026 |
| Technical Report Summary | | SLR Project No.: 123.000320.00001 |
Figure 14-3: Process Area –
Details
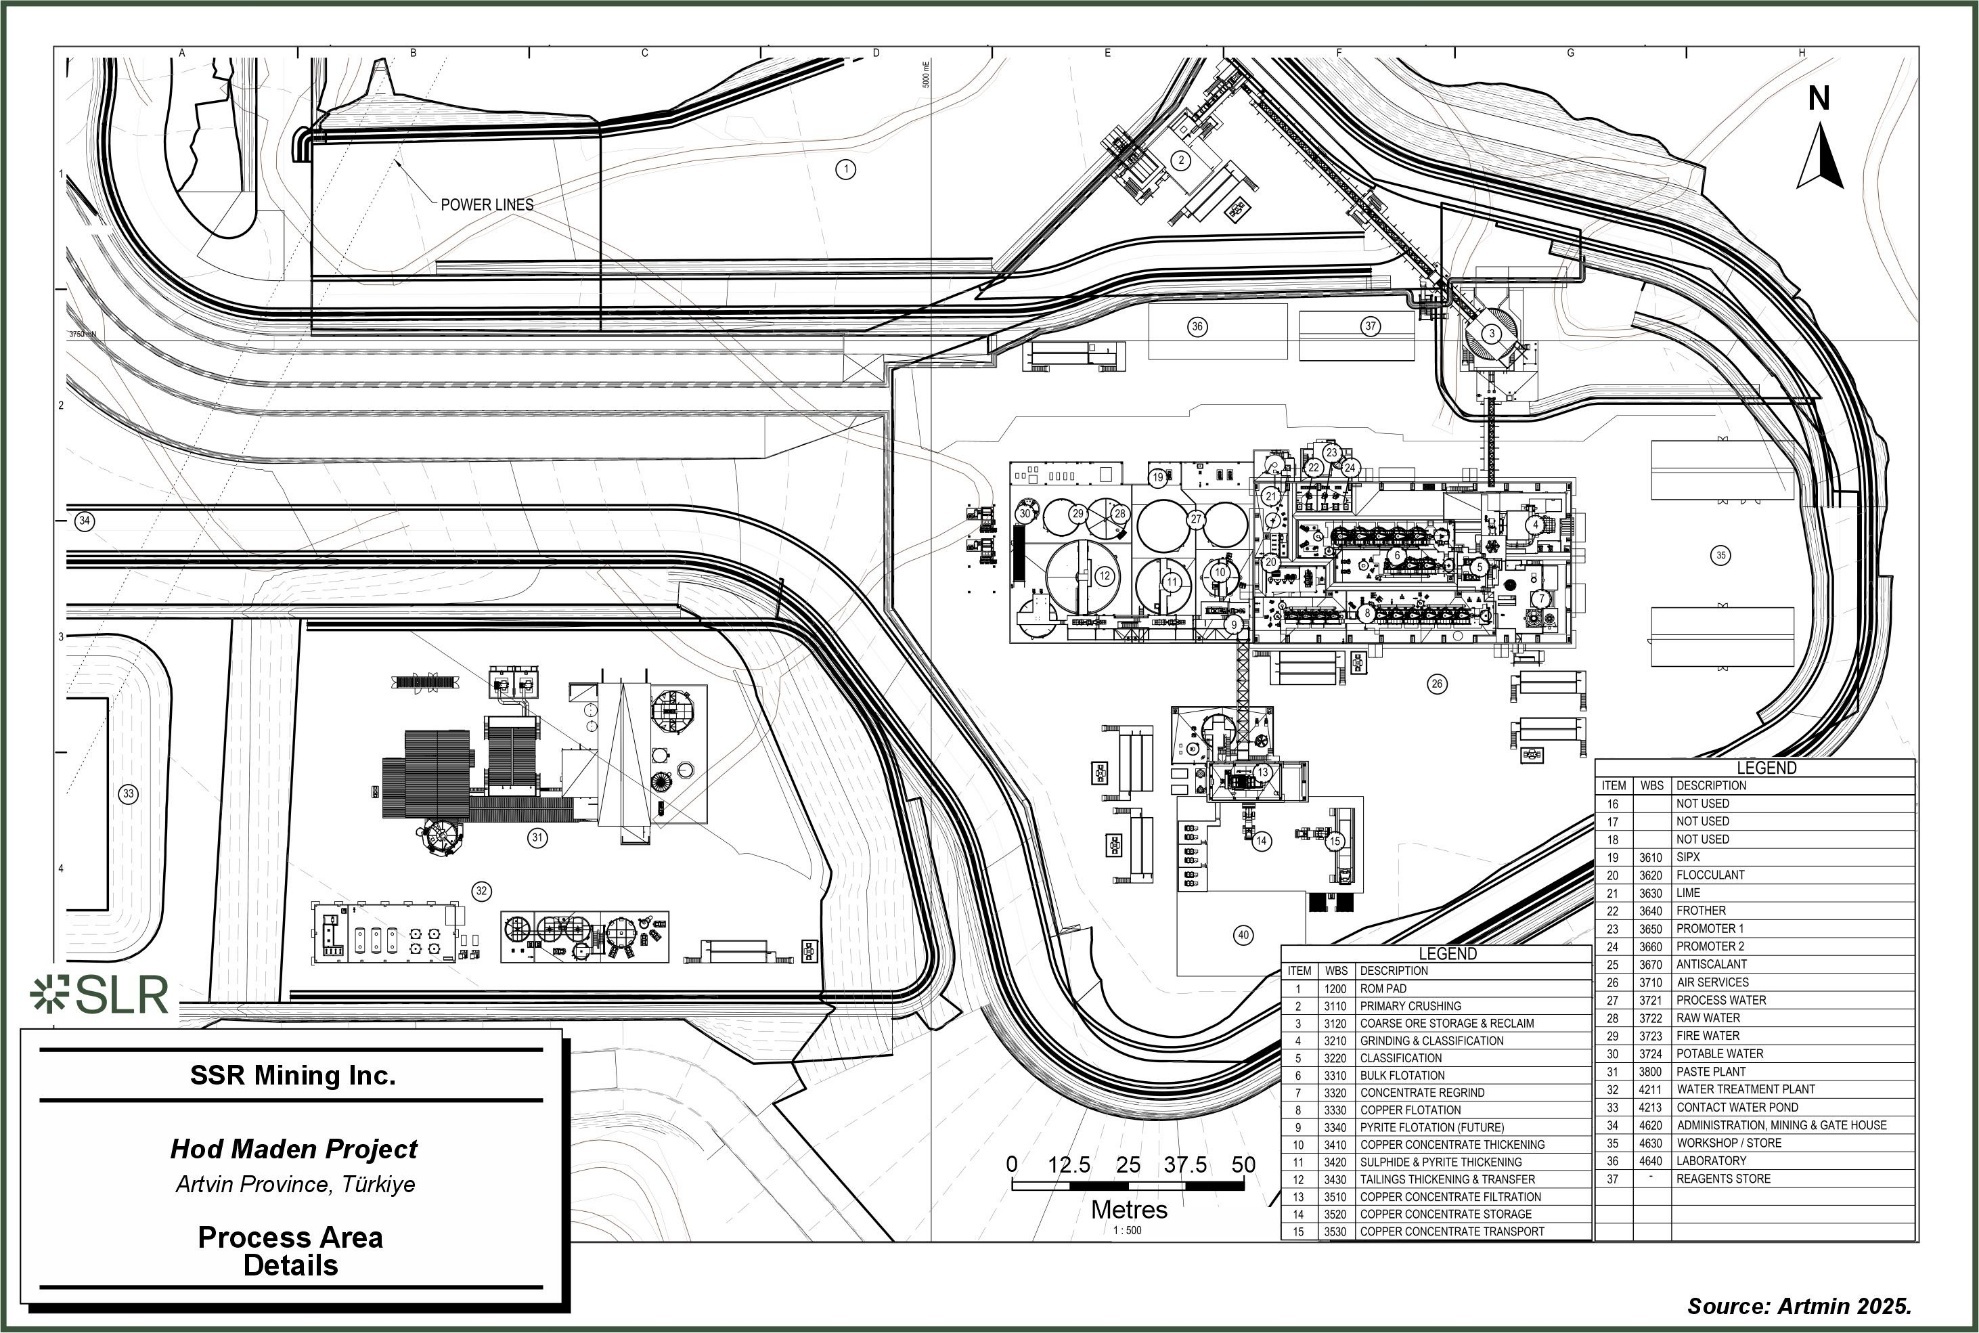
Figure 14-3
POWER LINES
LEGEND
ITEM
1
2
3
4
5
6
7
8
9
10
11
12
13
14
15
WBS
1200
3110
3120
3210
3220
3310
3320
3330
3340
3410
3420
3430
3510
3520
3530
DESCRIPTION
ROM PAD
PRIMARY CRUSHING
COARSE ORE STORAGE & RECLAIM
GRINDING & CLASSIFICATION
CLASSIFICATION
BULK FLOTATION
CONCENTRATE REGRIND
COPPER FLOTATION
PYRITE FLOTATION (FUTURE)
COPPER CONCENTRATE THICKENING
SULPHIDE & PYRITE THICKENING
TAILINGS THICKENING & TRANSFER
COPPER CONCENTRATE FILTRATION
COPPER CONCENTRATE STORAGE
COPPER CONCENTRATE TRANSPORT
LEGEND
ITEM
16
17
18
19
20
21
22
23
24
25
26
27
28
29
30
31
32
33
34
35
36
37
WBS
3610
3620
3630
3640
3650
3660
3670
3710
3721
3722
3723
3724
3800
4211
4213
4620
4630
4640
-
DESCRIPTION
NOT USED
NOT USED
NOT USED
SIPX
FLOCCULANT
LIME
FROTHER
PROMOTER 1
PROMOTER 2
ANTISCALANT
AIR SERVICES
PROCESS WATER
RAW WATER
FIRE WATER
POTABLE WATER
PASTE PLANT
WATER TREATMENT PLANT
CONTACT WATER POND
ADMINISTRATION, MINING & GATE HOUSE
WORKSHOP / STORE
LABORATORY
REAGENTS STORE
SSR Mining Inc.
Hod Maden Project
Artvin Province, Türkiye
Process Area Details
Source: Artmin 2025.
0
12.5
25
37.5
50
Metres
1:500
| | 14-4 | |
| SSR Mining Inc. | Hod Maden Project | | January 7, 2026 |
| Technical Report Summary | | SLR Project No.: 123.000320.00001 |
| 14.2 | Process Design Criteria |
The key design criteria used for the plant design include:
| · | Mill throughput rate of 2,190 tpd or 800 ktpa |
| · | Crushing plant availability of 76% or approximately 6,650 operating hours per year |
| · | Grinding, flotation, and thickening equipment availabilities of 92.1% or 8,070 operating hours per year |
| · | Filtration availability of 80% or 7,020 operating hours per year. |
The plant sizing is based on geometallurgical testwork which spanned
the ore body and was built to provide a robust plant design. The current mine plan utilizes an optimized schedule to maximize value and
includes higher quality ore than that which the geometallurgical testwork was based on. Table 14-1 shows LOM feed and concentrate values.
Concentrate production is estimated using models found from Section 10.4.6. While these values differ from the plant design criteria,
the plant design criteria remains conservative and is well positioned to handle any variability received from the mine.
Table 14-1: Planned Mill Feed Data
from Mine Plan – LOM Average
| Design Parameter |
Assay |
Average |
| Mill Feed grades, average |
Cu % |
1.31 |
| Au g/t |
7.63 |
| SS % |
7.65 |
| Concentrate Grades |
Cu % |
22 |
| Au % |
116 |
| Metal Recoveries |
Cu % |
96.8 |
| Au % |
87.1 |
Table 14-2 provides key design criteria values for the Hod Maden Process
Plant.
| | 14-5 | |
| SSR Mining Inc. | Hod Maden Project | | January 7, 2026 |
| Technical Report Summary | | SLR Project No.: 123.000320.00001 |
Table 14-2: Design Criteria
| Design Parameter |
Unit |
Value |
| Mill throughput |
t/d |
2,190 |
| Mill Feed grades, average |
Cu % |
1.35 |
| Au g/t |
8.37 |
| S % |
7.33 |
| Crushing availability |
% |
76 |
| Grinding / Flotation / Thickening availability |
% |
92.1 |
| Filtration availability |
% |
80 |
| Ore Characteristics |
|
|
| Bond crushing work index (CWi) |
kWh/t |
15.3 |
| Bond rod mill work index (RWi) |
kWh/t |
15.6 |
| Bond ball mill work index (BWi) |
kWh/t |
17.6 |
| Axb |
- |
45.6 |
| Bond abrasion index (Ai) |
g |
0.167 |
| ROM moisture |
% w/w |
3.0 |
| ROM solids specific gravity |
- |
2.91 |
| Primary grind product size (P80) |
µm |
106 |
| Bulk rougher concentrate regrind product size (P80) |
µm |
30 |
| Secondary grind product size (P80) |
µm |
38 |
| Concentrate filter cake moisture |
% w/w |
9.1 |
| Flotation |
|
|
| Bulk rougher flotation |
|
|
| Residence time |
min |
30 |
| Stage recovery, copper |
% of stage feed |
97.8 |
| Stage recovery, gold |
% of stage feed |
90.5 |
| Mass recovery |
% of plant feed |
26.2 – 35.0 |
| Bulk scavenger flotation |
|
|
| Residence time |
min |
15 |
| Stage recovery, copper |
% of stage feed |
30.5 |
| Stage recovery, gold |
% of stage feed |
70.1 |
| Mass recovery |
% of plant feed |
1.8 |
| Bulk scavenger cleaner flotation |
|
|
| Residence time |
min |
12 |
| | 14-6 | |
| SSR Mining Inc. | Hod Maden Project | | January 7, 2026 |
| Technical Report Summary | | SLR Project No.: 123.000320.00001 |
| Design Parameter |
Unit |
Value |
| Stage recovery, copper |
% of stage feed |
72.2 |
| Stage recovery, gold |
% of stage feed |
84.2 |
| Mass recovery |
% of plant feed |
0.5 |
| Cleaner 1 flotation |
|
|
| Residence time |
min |
17.5 |
| Stage recovery, copper |
% of stage feed |
98.3 |
| Stage recovery, gold |
% of stage feed |
86.5 |
| Mass recovery |
% of plant feed |
13 |
| Cleaner scavenger flotation |
|
|
| Residence time |
min |
20 |
| Stage recovery, copper |
% of stage feed |
54.1 |
| Stage recovery, gold |
% of stage feed |
36.0 |
| Mass recovery |
% of plant feed |
3.0 |
| Cleaner 2 flotation |
|
|
| Residence time |
min |
21 |
| Stage recovery, copper |
% of stage feed |
84.6 |
| Stage recovery, gold |
% of stage feed |
82 – 88 |
| Mass recovery |
% of plant feed |
10 |
| Concentrate grade, copper at average grade |
% |
13.0 |
| Concentrate grade, gold at average grade |
g/t |
71 |
Run-of-mine (ROM) from the underground mine is either hauled by dump
truck to feed the crushing circuit or added to the ROM stockpile (7,615 tonnes). Ore is fed directly by dump truck or reclaimed from the
stockpile by loader onto a static grizzly with 550 mm apertures, fitted to the ROM bin to protect downstream equipment from blockages.
Oversize material can be broken up by using a mobile rock breaker from the mine. The ROM ore is reclaimed by an apron feeder, which feeds
the single-toggle jaw crusher, and its product is discharged to the primary crushing discharge conveyor. The crusher closed-side setting
is 70 mm to 80 mm to generate a final crushed product with an 80% passing size (P80) of 56 mm.
All transfer points and the crusher are enclosed to collect the dust
via dust extraction fans and a collecting system with baghouses.
| | 14-7 | |
| SSR Mining Inc. | Hod Maden Project | | January 7, 2026 |
| Technical Report Summary | | SLR Project No.: 123.000320.00001 |
| 14.3.2 | Ore Storage and Reclaim |
The Coarse Ore Bin provides a surge capacity of 14 hours at the design
milling rate. Crushed ore is withdrawn from the bin by an apron feeder. The reclaim feeder discharges onto the SAG mill feed conveyor
and is conveyed to the SAG mill.
| 14.3.3 | Primary Grinding and Classification |
The primary grinding circuit comprises a SAG mill in closed circuit
with the primary cyclone cluster. The single-stage semi-autogenous (SAG) mill at 6.0 m diameter by 4.5 m long and with an installed power
of 2.4 MW grinds the crushed ore to a P80 of 106 µm.
The SAG mill discharge reports to the SAG mill trommel screen, the trommel
screen undersize material reports to the cyclone feed hopper and the oversize (scats) material directed to a scats bunker. Dilution water
is added to the cyclone feed hopper to control density to the primary cyclones. Cyclone underflow slurry gravitates back to the SAG mill
while the overflow slurry passes over a trash screen. The trash screen undersize (Plant feed – i.e., Rougher Flotation Feed) is
sampled by a metallurgical sampler, then reports to the rougher flotation conditioning tank.
Rougher flotation of the ore is performed on the primary cyclone overflow
stream. The slurry is fed to a conditioning tank where flotation reagents (sodium isopropyl xanthate (SIPX), Aero Promoter 7249) are added.
The conditioning tank overflows continuously into the rougher flotation bank; frother is added to the rougher feed box. The flotation
products from the rougher flotation are a rougher concentrate and the rougher tailings.
| 14.3.5 | Rougher Concentrate Regrind |
The rougher concentrate reports to the regrind circuit where it is reground
to a P80 of 30 µm. This circuit consists of a vertical mill in closed circuit with a regrind cyclone cluster. Regrind
cyclone overflow reports to the cleaner conditioning tank.
Lime is added to the regrind cyclone feed hopper to condition the slurry
prior to flotation in the cleaner circuit.
The rougher tailings slurry from the rougher flotation stage reports
to the secondary milling circuit where it is ground to a P80 of 38 µm. This circuit consists of a vertical mill in closed
circuit with a secondary cyclone cluster. Secondary cyclone overflow reports to a secondary trash screen, the screen undersize reports
to the scavenger conditioning tank.
| 14.3.7 | Scavenger Flotation |
Reground rougher tailings report to the scavenger flotation conditioning
tank where flotation reagents (SIPX and Aero Promoter 7249) are added. The conditioning tank overflows continuously into the scavenger
flotation bank. Frother is added to the scavenger flotation feed box. The flotation products from the scavenger flotation are a scavenger
concentrate and the scavenger tailings.
The scavenger concentrate reports to the scavenger cleaner flotation
bank. Tailings from the scavenger tailings and scavenger cleaner tailings report to the low sulfide tailings dewatering system. The 2020
DFS considered sending the scavenger cleaner tailings to the sulfide tailings thickener, however, testwork demonstrates that this stream
contains low levels of sulfide minerals as most of the sulfide material is recovered in the scavenger cleaner concentrate. Concentrate
from the scavenger cleaner flotation bank reports to the cleaner conditioning tank.
| | 14-8 | |
| SSR Mining Inc. | Hod Maden Project | | January 7, 2026 |
| Technical Report Summary | | SLR Project No.: 123.000320.00001 |
The cleaner circuit consists of a conditioning tank, two cleaning flotation
stages, and a cleaner scavenger flotation stage.
The regrind circuit product and the scavenger cleaner concentrate report
to the cleaner conditioning tank where flotation reagents (Lime and Aero 3418 A) are added. Frother is added to the cleaner 1 feed box.
Lime is used to adjust pH of the slurry in the cleaner 1 and cleaner 2 flotation stages. The pH range used in the cleaning stages will
vary between 7 and 12. Actual pH targets will be adjusted to ensure copper concentrate grade targets are achieved and to maximize copper
and gold recoveries.
The cleaner 1 flotation concentrate reports to the cleaner 2 flotation
bank for further cleaning or alternatively diverted to the final concentrate hopper if copper grades are achieved from this flotation
stage. This alternate destination aims to maximize overall copper and gold recoveries.
The cleaner 1 flotation tailings gravity feed to the cleaner scavenger
flotation bank. The cleaner scavenger concentrate is recirculated to the cleaner conditioning tank or alternatively diverted to the final
concentrate hopper if copper grades are achieved from this flotation stage. This alternate destination aims to maximize overall copper
and gold recoveries.
The cleaner scavenger tailings report to the sulfide tailings thickener
and represent sulfide tailings.
The cleaner 2 concentrate is the final copper concentrate reporting
to the concentrate dewatering area. The cleaner 2 tailings are recirculated to the cleaner conditioning tank.
| 14.3.9 | Concentrate Handling |
Final concentrate is pumped from the flotation area to the concentrate
thickener. The concentrate thickener is a high-rate type thickener with an auto-dilution feedwell. The thickener is equipped with froth
control devices like froth sprays. The thickener dewaters the incoming slurry to 60% to 65% solids by weight in the underflow slurry before
being pumped to a trash removal screen. The screen undersize feeds the concentrate filter feed tank. The thickener overflow water reports
to the alkaline process water tank for reuse in the cleaner flotation circuit.
The concentrate filter feed tank has 24 hours residence time. A single
horizontal plate and frame filter press is used to dewater the concentrate. Dedicated filter feed pumps, feed the concentrate filter via
a continuous ring main to fill the filter chambers on a batch basis. Filtrate is recirculated back to the concentrate thickener. Filtered
concentrate will contain approximately 10% moisture.
A concentrate storage shed is designed to provide an economical and
environmentally sound storage for the concentrate. Approximately 17 days of storage capacity are available in the shed which gives ample
time and space for concentrate blending if required. A dust collector is installed to extract fugitive dust from within the concentrate
storage shed.
Concentrate will be reclaimed from the concentrate storage shed by FEL,
loaded into trucks and transported to the port.
| | 14-9 | |
| SSR Mining Inc. | Hod Maden Project | | January 7, 2026 |
| Technical Report Summary | | SLR Project No.: 123.000320.00001 |
| 14.3.10 | Low Sulfide Tailings Dewatering |
The low sulfide tailings are pumped to the low sulfide tailings thickener.
The low sulfide tailings thickener is a high-rate type thickener with an auto-dilution feedwell. Low sulfide tailings are thickened to
55% w/w solids.
The full flow of thickened low sulfide tailings report to the paste
plant when paste is required by the mine. Thickened tailings report to the tailings storage tank where a portion is pumped to a horizontal
plate and frame filter press to dewater to 19% w/w moisture. The filter cake and remainder of the thickened tailings are combined in a
single shaft paste mixer along with a dry cement binder before being pumped underground into the mine for backfilling at approximately
68.5% solids.
Low sulfide tailings thickener overflow reports to the Neutral process
water tank for use in the primary and secondary grinding circuits as well as rougher and scavenger flotation.
Sulfide Tailings Dewatering
The cleaner scavenger tailings are pumped to the sulfide tailings thickener.
The sulfide tailings thickener is a high-rate type thickener with an auto-dilution in the feedwell. Thickener overflow reports to the
alkaline process water tank. The thickener underflow is dewatered to 65% solids by weight and is pumped to the sulfide tailings tank,
from which it is further pumped to the Tailings Storage Facility (TSF).
The sulfide tailings thickener overflow reports to the Alkaline process
water tank for use in the regrind and cleaner flotation circuit.
| 14.3.11 | On-Stream Analyser |
The performance of the flotation circuit will be monitored by a Courier
6G OSA. The unit will measure copper and gold and other elements of interest. Sulfur cannot be measured using the Courier 6G OSA, but
will be analyzed by the on-site laboratory from shift composite samples as well as a cross belt PGNAA analyzer on the feed to the SAG
mill.
A particle size analyser will provide analysis to assist in monitoring
and control of the grinding circuits. The streams that will be analyzed are listed:
| · | Primary cyclone overflow or rougher flotation feed |
| · | Secondary cyclone overflow or scavenger flotation feed |
| · | Regrind cyclone overflow or cleaner flotation feed |
Water management around the site will be controlled by a series of ponds
and pumping systems. All excess contact water and mine water will be treated through the Water Treatment Plant (WTP) prior to release.
The WTP will be designed for a peak treatment rate of 200 m3/hr, equivalent to a 10 year storm event falling on contact areas.
The proposed WTP will consist of the following treatment stages:
| · | Water pre-treatment to reduce the total suspended solids (TSS) concentration loading |
| · | Total dissolved solids (TDS) removal to acceptable levels |
| · | Waste handling of the concentrated TDS to the TSF. |
| | 14-10 | |
| SSR Mining Inc. | Hod Maden Project | | January 7, 2026 |
| Technical Report Summary | | SLR Project No.: 123.000320.00001 |
To allow flotation of the metal bearing minerals a suite of reagents
and chemicals are metered at strategic locations in the flowsheet. Table 14-3 provides the reagents used at the Process Plant.
The 2021 FS considered two hydrated lime mixing systems, one located
at the process plant and another at the WTP. The FS update has considered using a single mixing system located at the Process Plant. Lime
will be fed to the cleaner circuit via a ring main and pumped to a storage tank at the WTP to feed the water treatment tanks.
Table 14-3: Reagents Used
| Reagent |
Use |
| Lime (Hydrated lime) |
pH control in cleaner circuit and WTP |
| Collector - Sodium Isopropyl Xanthate (SIPX) |
Used in copper and precious metal flotation |
| Collector - Promoter 1 - Aero 7249 |
Strong copper collector and precious collector used in Rougher flotation circuit |
| Collector - Promotor 2 - Aerophine 3418A |
Collector for copper-gold ores, selective against pyrite, used in the cleaner circuit |
| Frother - F549 |
Frothing agent used in flotation |
| Flocculant (Magnafloc 5250) |
Settling aid, used in the concentrate, sulfide tailings and low sulfide tailings thickeners |
| Antiscalant |
Scale build-up control in the alkaline process water system |
| Sulfuric acid (future) |
pH control in the pyrite flotation circuit (future) |
Raw water will be supplied by dewatering wells and used as make-up to
the process water systems, reagent mixing, filter cloth wash, fire water, truck wash and the mine operations support area. The Process
Plant raw water consumption has been estimated at 72 m3/h on average. Water for human consumption will be supplied as bottled
water.
There will be two process water systems: a neutral and an alkaline (elevated
pH) system. Neutral process water is used in the following plant areas:
| · | Primary and secondary grinding and classification |
| · | Rougher and scavenger flotation |
| · | Flocculant dilution and spray water to the low sulfide tailings thickener |
| · | General hose down requirements |
Alkaline (elevated pH) process water is used in the following plant
areas:
| · | Concentrate regrind and classification |
| · | Cleaner flotation circuit |
| · | Flocculant dilution and spray water to the concentrate and sulfide tailings thickener |
| | 14-11 | |
| SSR Mining Inc. | Hod Maden Project | | January 7, 2026 |
| Technical Report Summary | | SLR Project No.: 123.000320.00001 |
Operating the rougher and scavengers at natural pH allows flotation
of copper and pyrite minerals; maximizing copper and gold recoveries. The pH in the cleaners is adjusted between 7 to 12 to achieve the
target concentrate grade at the maximum copper and gold recoveries. This control strategy maximizes the net smelter return of the Project.
Air services include:
| · | Plant and instrument air |
| · | High pressure air supplied to the concentrate filters |
| · | Low pressure air supplied to the flotation area |
Key consumables and their expected consumption rates are shown in Table
14-3.
Table 14-4: Major Consumables with
Expected Consumption Rates
| Item |
Consumption |
| Rate |
Basis |
| Consumables |
|
|
| Crusher Liners |
1.3 sets per year |
Vendor Update |
| Primary Mill Liners |
1.1 sets per year |
Calculated |
| Secondary Mill Liners |
1.0 sets per year |
Vendor Update |
| Regrind Mill Liners |
1.0 sets per year |
Vendor Update |
| Primary Mill Media |
0.67 kg/t feed |
Calculated |
| Secondary Mill Media |
0.196 kg/t feed |
Calculated |
| Regrind Mill Media |
0.085 kg/t feed |
Calculated |
| Reagents |
|
|
| Flocculant |
5 to 48 g/t feed (thickener) |
Metallurgical testing |
| Collector (SIPX) |
155 g/t feed |
Metallurgical testing |
| Promotor (3418A) |
30.5 g/t feed |
Metallurgical testing |
| Promotor (7249) |
17.5 g/t feed |
Metallurgical testing |
| Frother |
67.5 g/t feed |
Metallurgical testing |
| Hydrated Lime |
2.29 kg/t feed (float) |
Metallurgical testing |
| 14.5 | Electricity Supply and Consumption |
Electrical loads grouped by area including installed power, power absorbed
and annual electrical energy consumption are shown in Table 14-5.
| | 14-12 | |
| SSR Mining Inc. | Hod Maden Project | | January 7, 2026 |
| Technical Report Summary | | SLR Project No.: 123.000320.00001 |
Table 14-5: Electrical Loads and
Electrical Energy Consumption
| Area Description |
Total Connected Load (kW) |
Total Absorbed Power (kW) |
Power Consumed (MWh/y) |
| Crushing |
192 |
109 |
889 |
| Process Plant |
6,062 |
4,521 |
33,333 |
| Tailings |
871 |
608 |
4,889 |
| Water Supply and Distribution |
598 |
418 |
2,378 |
| Services and Utilities |
826 |
578 |
4,612 |
| Reagents |
47 |
32 |
267 |
| Water Treatment |
218 |
15 |
444 |
| Plant Services |
2,548 |
1,291 |
1,306 |
| Total |
11,362 |
7,707 |
48,118 |
| 14.6 | Process Plant Personnel |
Estimated personnel requirements include 114 in Processing and 73 in
General and Administration.
Equipment selection was undertaken through budgetary enquiries to multiple
vendors for all major packages. Equipment specifications and datasheets were prepared for each equipment package to allow quotation preparation
by vendors. The quotations were technically and commercially evaluated to select suitable equipment for the Project.
Major mechanical equipment for the Project is listed in Table 14-6.
| | 14-13 | |
| SSR Mining Inc. | Hod Maden Project | | January 7, 2026 |
| Technical Report Summary | | SLR Project No.: 123.000320.00001 |
Table 14-6: Major Equipment List
| Item |
2021 FS |
2024 FS Update |
2025 TRS |
| Primary crusher |
Jaw crusher, 1,060 mm x 700 mm, 110 kW |
Jaw crusher, 1,060 mm x 700 mm, 110 kW |
Jaw crusher, 1,060 mm x 700 mm, 110 kW |
| SAG mill |
5.8 m diameter x 5.0 m effective grinding length, 2,400 kW |
5.8m diameter x 5.0 m effective grinding length, 2,400 kW |
6.0 m diameter x 4.5 m effective grinding length, 2,400 kW |
| Rougher flotation cells |
Three 30 m³ tank cells |
Five 30 m³ tank cells |
Five 30 m³ tank cells |
| Regrind mill |
VTM 800 |
VTM 500 |
VTM 650 |
|
Scavenger flotation cells
Scavenger cleaner flotation cells |
Six 20 m³ tank cells
Three 0.8 m³ flotation cells |
Three 30 m³ tank cells
Two 1.5 m³ flotation cells |
Three 30 m³ tank cells
Two 1.5 m³ flotation cells |
| Secondary grinding mill |
VTM 400 |
VTM 650 |
VTM 650 |
| Cleaner flotation cells |
Three 20 m³ Copper Rougher tank cells
Two 20 m³ Copper Scavenger tank cells
Four 10 m³ Copper Cleaner 1 tank cells
Four 5 m³ Copper Cleaner 2 tank cells
Two 5 m³ Copper Cleaner 3 tank cells |
Three 20 m³ Cleaner 1 tank cells
Three 20 m³ Cleaner Scavenger tank cells
Four 10 m³ Cleaner 2 tank cells |
Three 20 m³ Cleaner 1 tank cells
Three 20 m³ Cleaner Scavenger tank cells
Four 10 m³ Cleaner 2 tank cells |
| Concentrate thickener |
8 m diameter |
8 m diameter |
8 m diameter |
| Low Sulfide Tailings thickener |
15 m diameter |
18 m diameter |
18 m diameter |
| Sulfide tailings thickener |
12 m diameter |
11 m diameter |
11 m diameter |
| Concentrate filter |
1.5 m x 1.5 m plates, 17 plates, vertical plate filter press |
1.5 m x 1.5 m plates, 46 plates, vertical plate filter press |
2.0 m x 2.2 m plates, 20 plates, vertical plate filter press |
The primary crusher selection was selected using Bruno software from
Metso. Direct feed to the crusher was selected based on a 600 mm Run of Mine (ROM) top size and feed opening requirements of the C106
Jaw Crusher.
The dust collection system will be confirmed during the basic design
phase based on dust control requirements at the plant site. A dust suppression system to control dust at the ROM ore bin and transfer
chutes has been incorporated at the crushing plant.
| | 14-14 | |
| SSR Mining Inc. | Hod Maden Project | | January 7, 2026 |
| Technical Report Summary | | SLR Project No.: 123.000320.00001 |
The ore characteristics used in the FS update are based on the comminution
data from the 2021 FS (ALS 2020). The design ore characteristics are based on the weighted average of the 90/10 blend (Regular Ore/Pyrite
ore) ore characteristics. These design values were used for mill selection utilizing Ausgrind, Ausenco’s in-house program used for
power-based comminution calculations (Lane et al. 2013).
The Primary Mill will be a trunnion supported mill with a variable voltage,
variable frequency (VVVF) drive.
This FS update has selected a high-aspect SAG mill with a grate discharge
and a radial pulp lifter to ensure the mill has enough volumetric discharge capacity and to avoid slurry pooling. This selection eliminated
the need for a pebble recycle as the mill discharge grate and trommel have the same aperture (15 mm), hence no pebbles are generated (scats
bunker available). The cyclone circulating load to the SAG mill is designed for 250% to 300% to ensure the grind size is achieved.
The flotation cells will be agitated and forced air aspirated. Vendors
provided their technically preferred solution for each flotation stage that best accommodates the operating requirements for the range
of operating conditions.
| 14.7.5 | Secondary Grinding and Regrind |
Typical correction factors were applied to the jar mill test results,
as recommended by the vendor, which resulted in specific energies for mill sizing.
The Secondary Mill and Concentrate Regrind Mill will be VVVF stirred
mills. Vendors provided their technically preferred solution based on information included within respective datasheets. VTM-650 was chosen
for both secondary and regrind duties to reduce spare requirements and maximize installed power for any future need.
Table 14-7 shows mill selection for secondary grinding of the rougher
tailings and regrinding of the rougher concentrate.
Table 14-7: Regrind Mill Selection
| Description |
Units |
Specifications |
| Secondary mill |
|
VTM-650 |
| Throughput |
tph |
99 |
| F80 |
µm |
106 |
| P80 |
µm |
38 |
| Specific Energy |
kWh/t |
5.2 |
| Regrind mill |
|
VTM-650 |
| Throughput |
tph |
26 - 35 |
| F80 |
µm |
106 |
| P80 |
µm |
30 |
| Specific Energy |
kWh/t |
9.3 |
| | 14-15 | |
| SSR Mining Inc. | Hod Maden Project | | January 7, 2026 |
| Technical Report Summary | | SLR Project No.: 123.000320.00001 |
| 14.7.6 | Thickeners / Filters |
The vendor which performed the filtration test work provided a technically
preferred solution. A plate and frame filter was selected for concentrate and tailings filtration duty. Test work had been performed by
one of the vendors.
| | 14-16 | |
| SSR Mining Inc. | Hod Maden Project | | January 7, 2026 |
| Technical Report Summary | | SLR Project No.: 123.000320.00001 |
The Project facilities are to be constructed on a greenfield site. Some
limited infrastructure has already been established to support initial activities:
| · | Small accommodation building and stores |
| · | Core cutting and storage/logging areas |
The majority of the proposed Project infrastructure will be located
in the South Valley and extend into Powerline Valley, which is accessible from State Road D.950 via an existing all-weather sealed road.
The tailings storage facility (TSF), WDF, and an aggregate borrow pit to be developed as part of the Phase 3 TSF expansion, will be located
in Saliçor Valley (North Valley), which lies to the north of the Maden Valley (South Valley) and is currently accessed by an unsealed
road from South Valley.
The proposed infrastructure that will be above or adjacent to the orebody
in South Valley are listed:
| · | Maden Creek and Şurakev Creek flood control alignment drains |
| · | Yukarιmaden to site access bridge |
| · | Access road and Saliçor Tunnel linking South Valley to North Valley |
| · | Amenities and administration buildings |
| · | Processing, maintenance, and emergency services building |
| · | Mining technical services building |
| · | Integrated prayer room, site change house (dry), and restaurant |
| · | Security facilities and infrastructure |
| · | ROM pad, ROM storage and ROM bin |
| · | Processing plant and process offices |
| · | Paste plant and temporary dry tailings storage |
| · | Accommodation village (camp) and associated catering facilities |
| · | Plant maintenance workshops |
| · | Plant and mining warehouse |
| · | Reagents storage building |
| · | Mining concrete batch plant |
| | 15-1 | |
| SSR Mining Inc. | Hod Maden Project | | January 7, 2026 |
| Technical Report Summary | | SLR Project No.: 123.000320.00001 |
| · | Heavy vehicle/light vehicle wash-down bays |
| · | Mining heavy vehicle workshop |
| · | Shaft cranage and hoisting facilities |
| · | Ventilation shaft cranage |
| · | Water management diversion channels |
| · | Sewage treatment facilities |
Due to space constraints in the South Valley, a portion of the infrastructure
will be situated in the North Valley. The infrastructure in North Valley will include:
| · | Essential water services |
| · | TSF and associated overdrain and underdrain systems |
| · | Access road and utility corridor from the Saliçor tunnel to the crest of the TSF to facilitate surface water controls, safe
operations and access to the tailings pipeline and general construction and operational access. |
| · | Waste rock dump facilities (WDF) and associated overdrain and underdrain systems |
An overall site layout is provided in Figure 15-1. The South Valley
layout is shown in Figure 15-2, and the North Valley layout is shown in Figure 15-3.
| | 15-2 | |
| SSR Mining Inc. | Hod Maden Project | | January 7, 2026 |
| Technical Report Summary | | SLR Project No.: 123.000320.00001 |
Figure 15-1: Site Layout
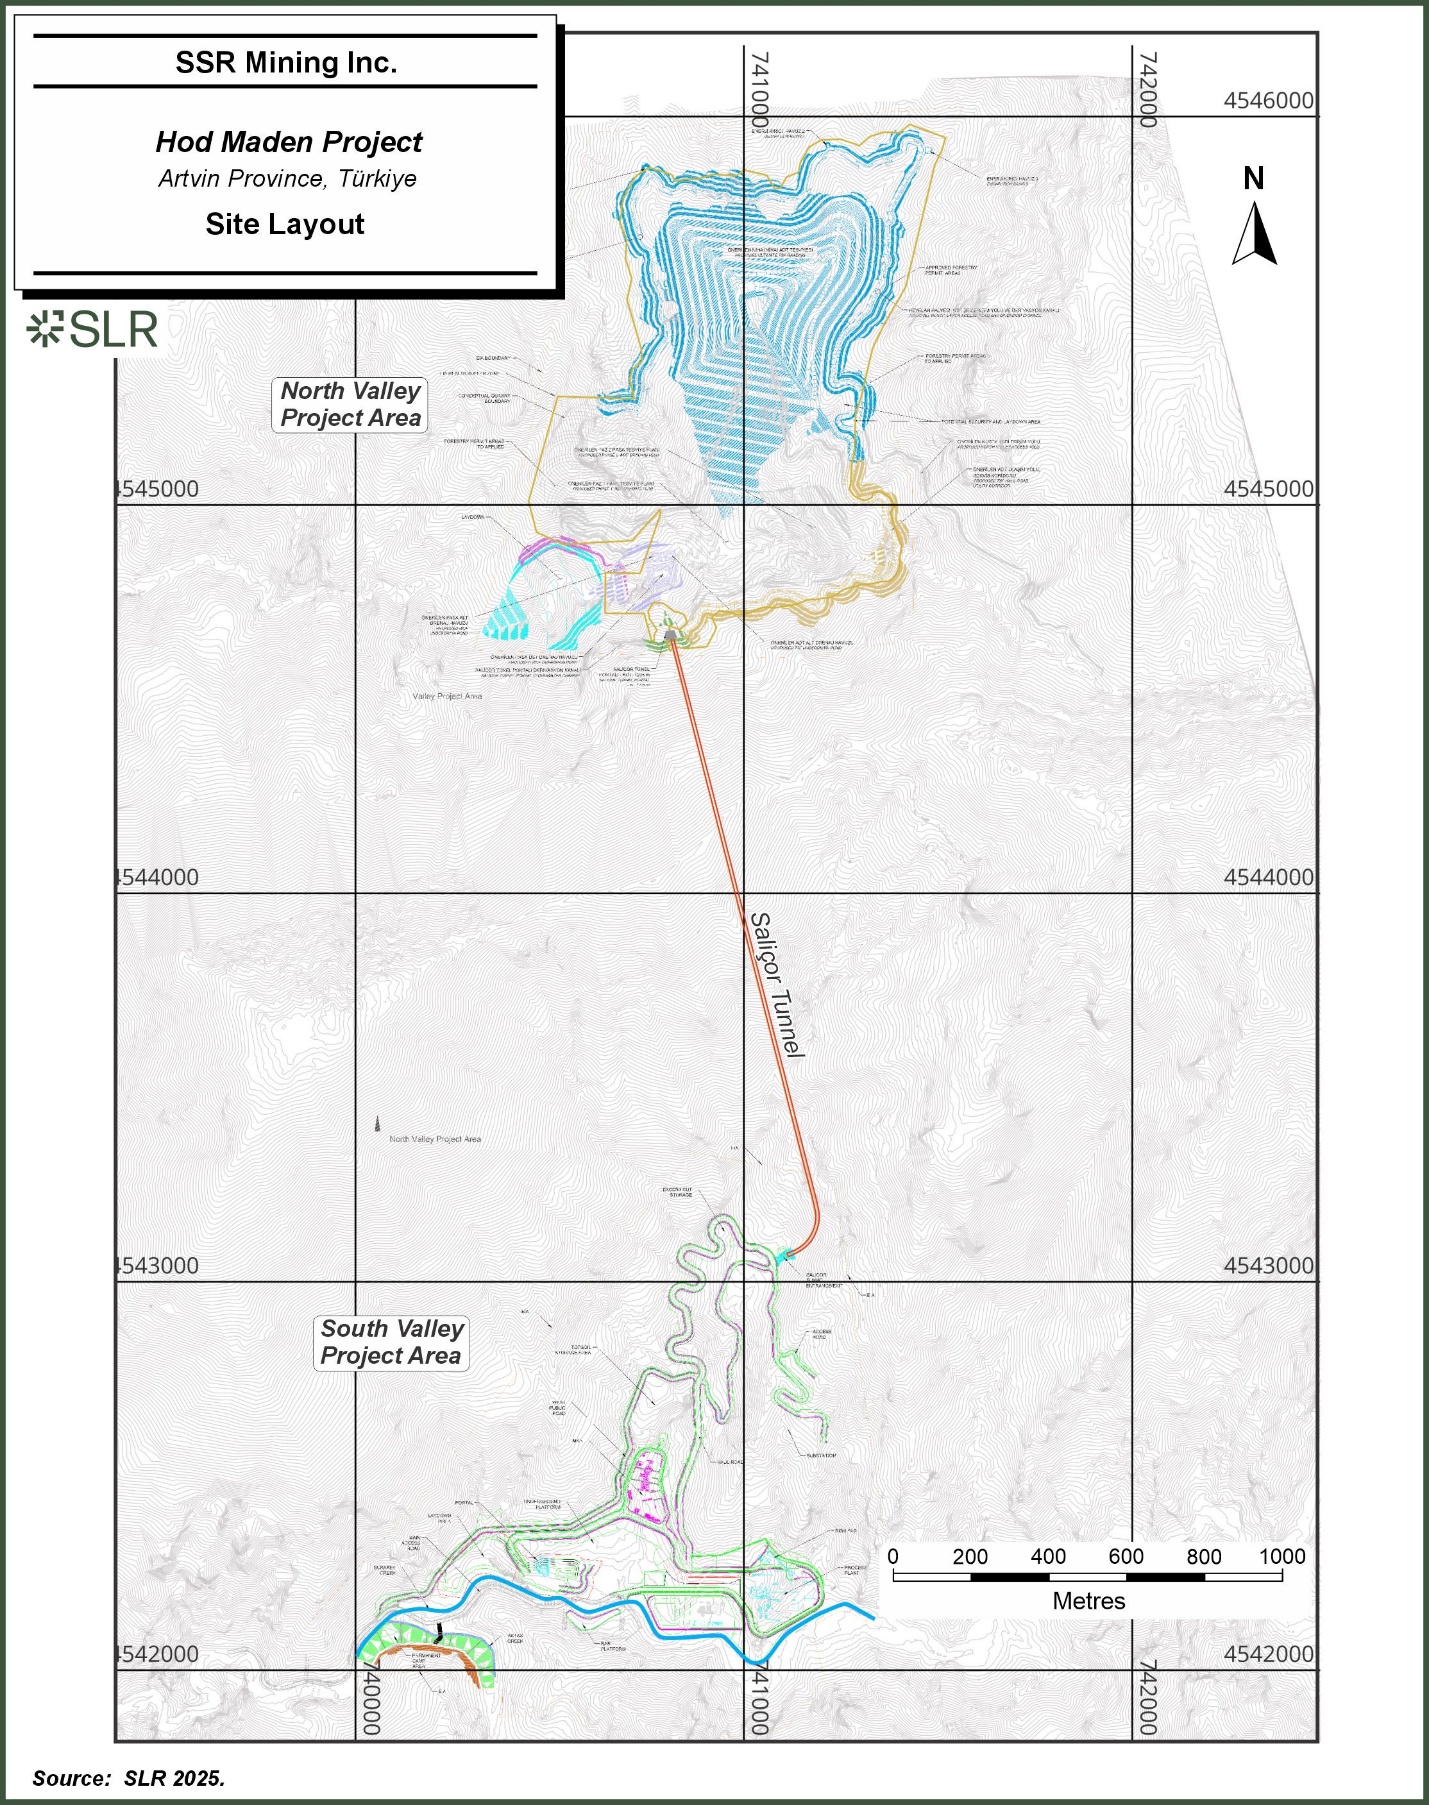
Figure 15-1
SSR Mining Inc.
Hod Maden Project
Artvin Province, Türkiye
Site Layout
North Valley Project Area
Saliçor Tunnel
South Valley Project Area
0
200
400
600
800
1000
Metres
Source: SLR 2025.
| | 15-3 | |
| SSR Mining Inc. | Hod Maden Project | | January 7, 2026 |
| Technical Report Summary | | SLR Project No.: 123.000320.00001 |
Figure 15-2: South Valley General
Layout
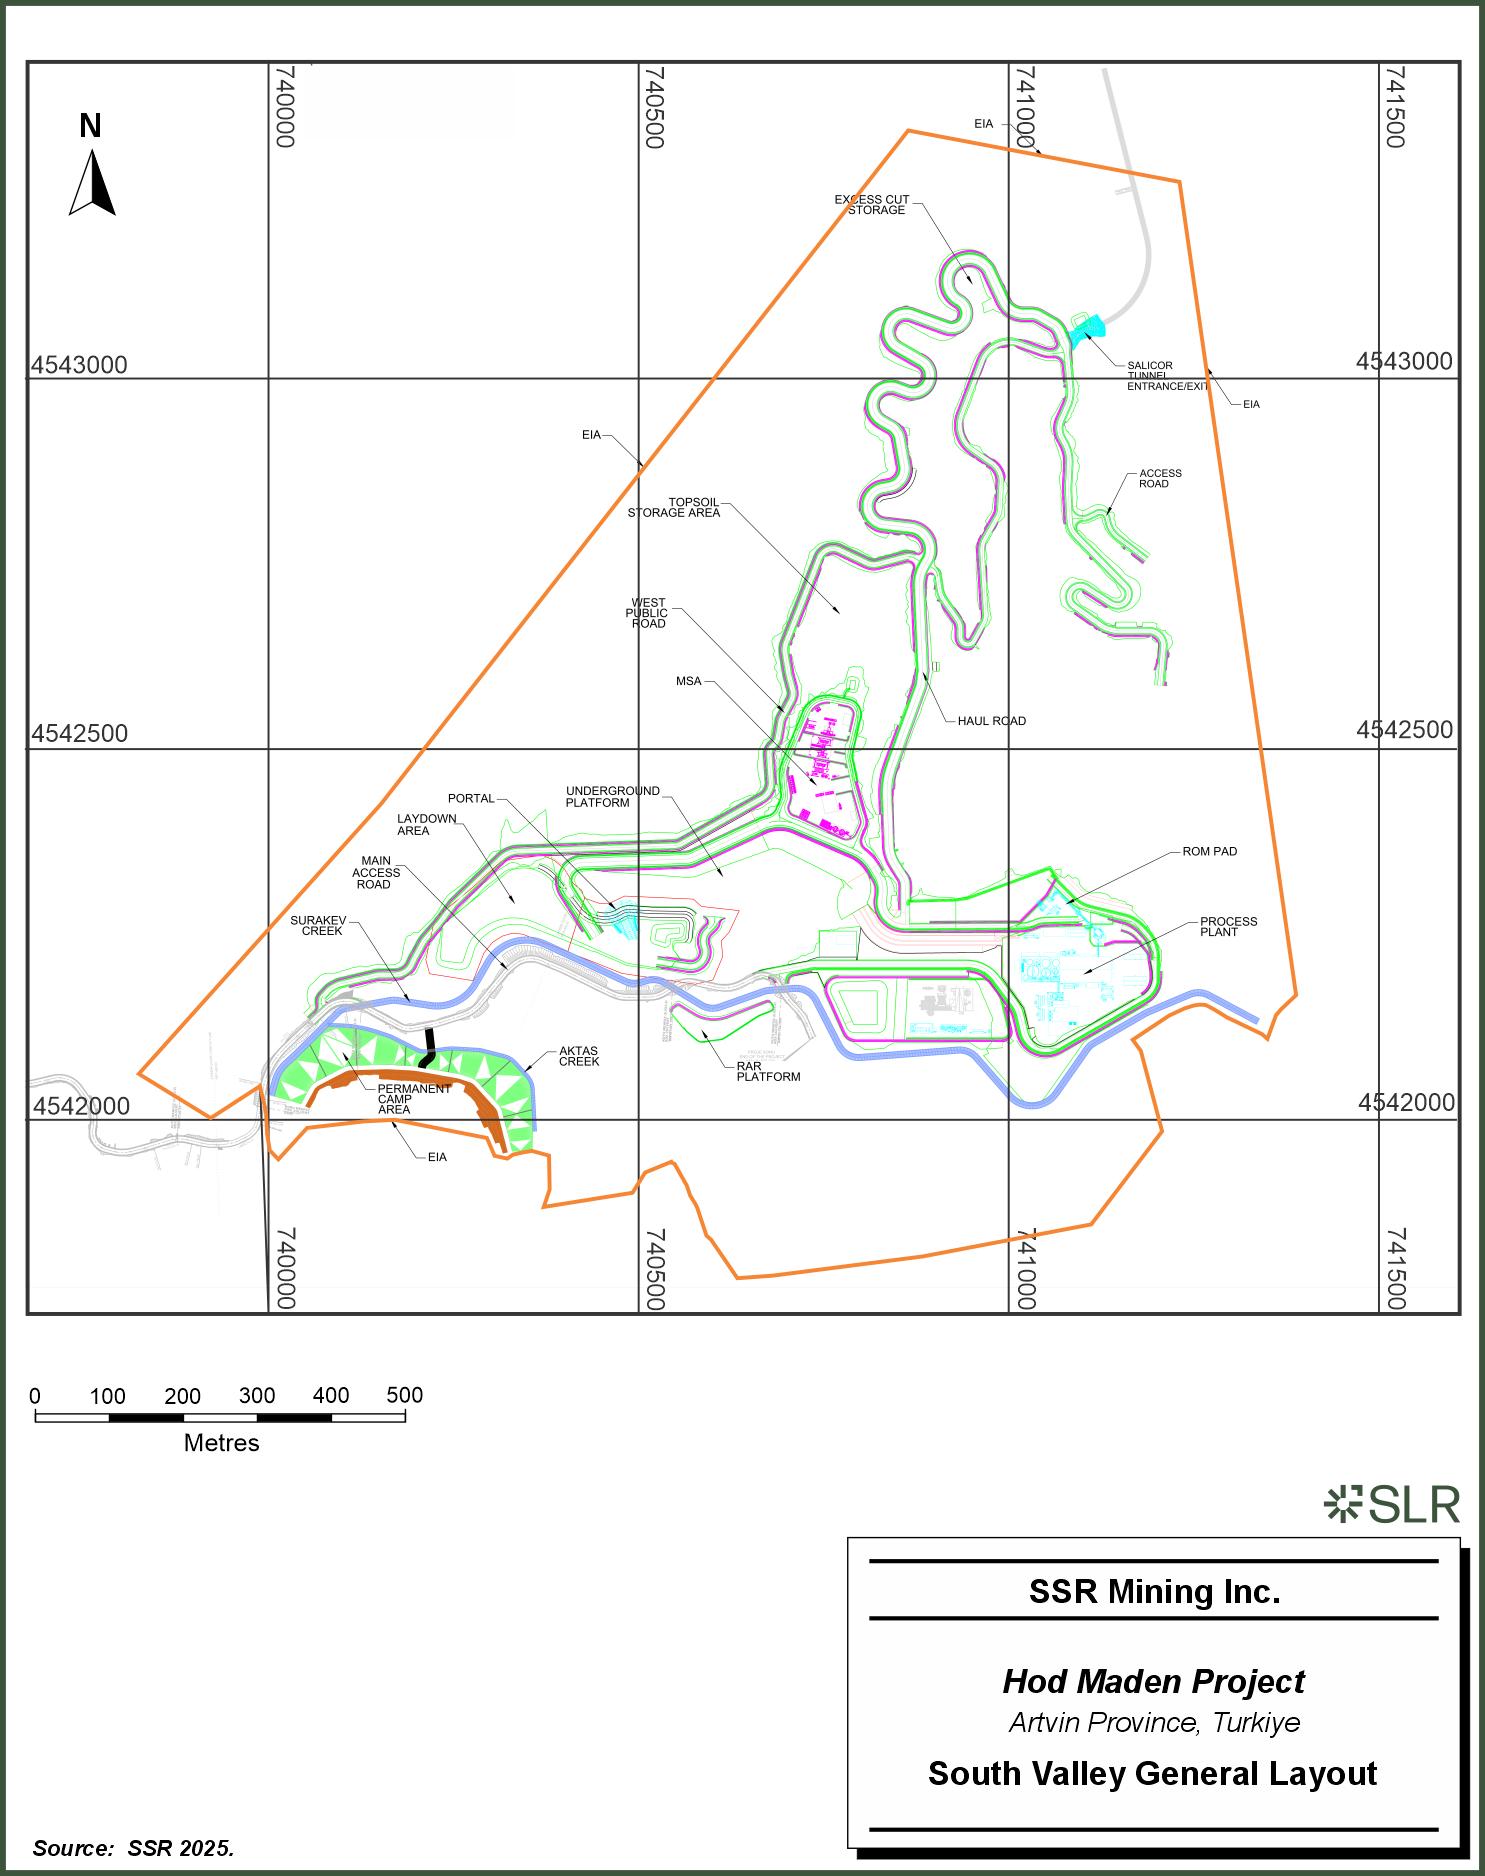
Figure 15-2
SSR Mining Inc.
Hod Maden Project
Artvin Province, Turkiye
South Valley General Layout
0
100
200
300
400
500
Metres
Source: SSR 2025.
| | 15-4 | |
| SSR Mining Inc. | Hod Maden Project | | January 7, 2026 |
| Technical Report Summary | | SLR Project No.: 123.000320.00001 |
Figure 15-3: North Valley General
Layout
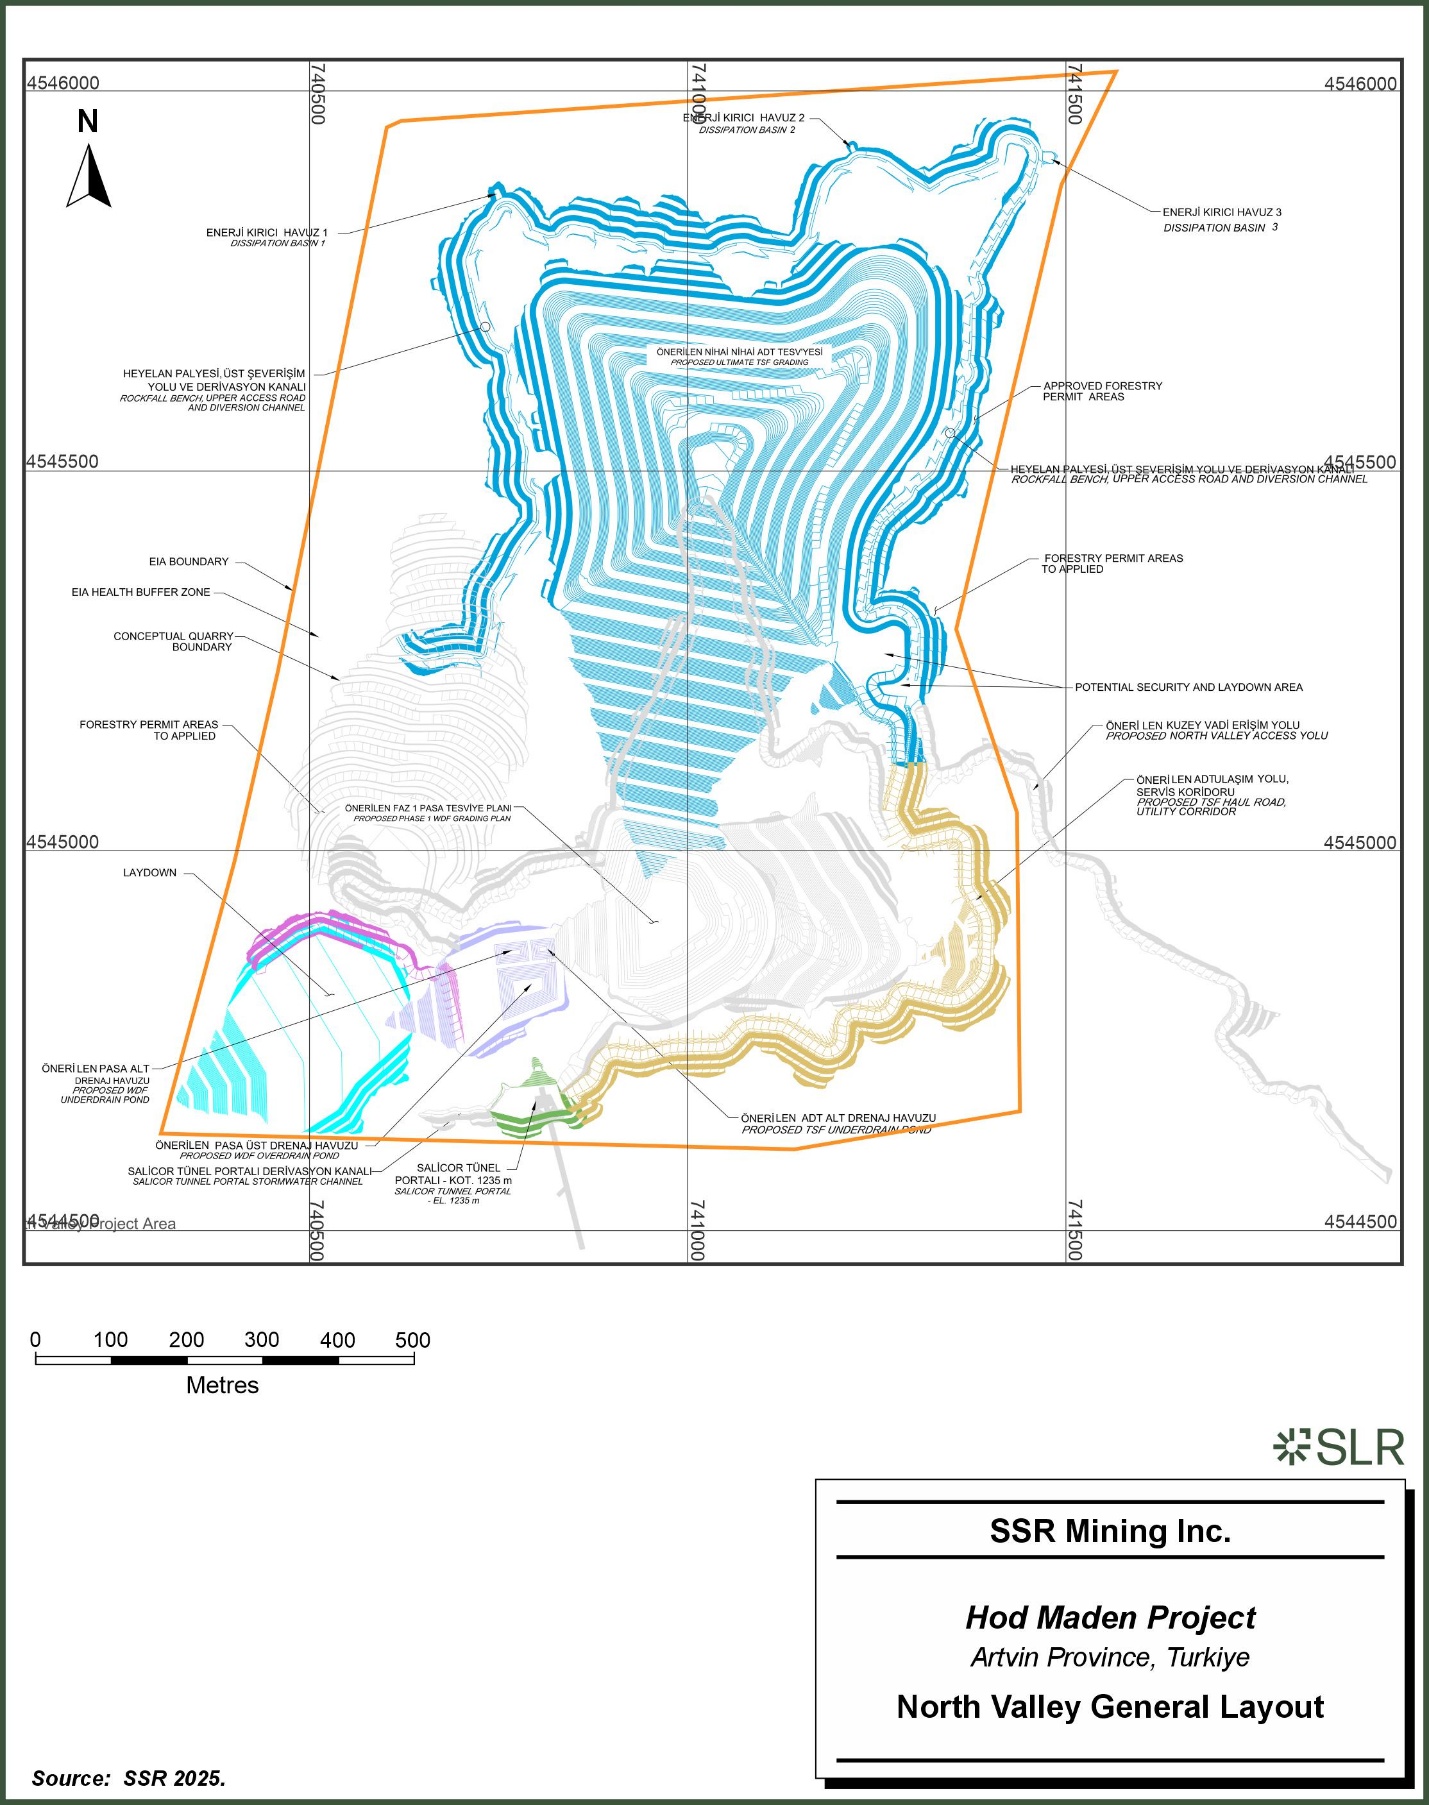
Figure 15-3
SSR Mining Inc.
Hod Maden Project
Artvin Province, Turkiye
North Valley General Layout
Source: SSR 2025.
0
100
200
300
400
500
Metres
| | 15-5 | |
| SSR Mining Inc. | Hod Maden Project | | January 7, 2026 |
| Technical Report Summary | | SLR Project No.: 123.000320.00001 |
The access to site is from Artvin through regional paved roads (Erzurum
Artvin Yolu; State Road D.950). Artvin city center is approximately 70 km from Yukarιmaden Village. A detailed assessment of the
condition of the road from Artvin to the Yukarιmaden Village via the access road from the Şengan Valley intersection with
State Road D.950 was completed, and it was noted during the QP site visits that the road is in good condition.
The road from Artvin (and indeed the coast at Hopa) to the abovementioned
intersection is single carriageway, winding, and has some isolated steep grades. However, the road is well paved, generally in good condition
and passable by commercial trucks. This segment of the access road requires no modification for construction and long-term operations.
The existing road, which will become the Main Access Road, deteriorates
after the turn-off into the Şengan Valley (the last segment of the Madenler Creek Network) and as the road progresses through the
North and South valleys, it continues to narrow and is unsealed in places. This road will require remediation to enable construction works
to commence and major upgrade works to make it suitable for long term mining operations traffic.
| 15.2.1 | Yukarιmaden (Main) Access Road |
The Yukarιmaden access road will provide access from the main Artvin-Erzurum
state road. This road commences at the Şengan Valley intersection with the Artvin-Erzurum state road and will generally follow
the existing provincial road; however, it will require major upgrades and the inclusion of tunnels to safely navigate through the difficult
terrain.
Artmin has engaged with State and local authorities to develop an accord
for the upgrade and realignment of the Yukarιmaden access road. A protocol between Artvin Special Provincial Administration (on behalf
of Artvin Governorship) and Artmin has been agreed to improve the existing road by constructing access tunnels and bridges. The Artvin
Special Provincial Administration will be responsible for all permitting and land access requirements. There will be two major tunnels
built as part of the access road; T1 will be 1.530-km long and T2 will be 2.343-km long.
Significant improvements will be made in terms of driving comfort, traffic
safety, and traffic density on the proposed route. The 8.82-km long route will also be modified to provide bends and inclinations suitable
for standard trucks and public vehicles. Improvement of the Yukarιmaden access road is a key project risk mitigating action, which
will reduce both construction and operating risks, whilst improving accessibility to the region for the general public. Figure 4-1 provides
an overview of the Main Access Road to the Hod Maden site.
This road will remain the main access road for both the mine and public.
The existing road in South Valley is the starting point of the Project
site access road and will be the primary means of accessing the site. This access road is also used by locals residing in Meydan District,
which is the nearest residential area to the Project site. Within the scope of the Maden and Şurakev creeks diversion works, service
roads for the non-accessible sections of the channel will be provided for maintenance purposes during operation. In addition to new service
roads, the existing and proposed routes of the main access road will also be used for this purpose. Additionally, the present road located
at the left bank of the old-school region channel will be upgraded as a service road (i.e., improving the quality of road pavement and
enlarging the traffic lane width) at locations where they form part of the public access road.
| | 15-6 | |
| SSR Mining Inc. | Hod Maden Project | | January 7, 2026 |
| Technical Report Summary | | SLR Project No.: 123.000320.00001 |
The existing Saliçor access road falls within the fence line
boundary of the proposed project infrastructure. A new public road section will bypass this portion of the existing road to ensure public
traffic and construction or operations traffic do not mix with each other.
| 15.2.3 | Maden Valley and Powerline Valley Roads |
A 1,585 m long road will be constructed from Maden Valley (South Valley)
to the Saliçor Tunnel portal, via the Powerline Valley. This access road to the Saliçor Tunnel portal will also be used
to access both topsoil and excess cut storage areas. Access to the substation area located in the South Valley will be provided by a 250
m long dirt road that runs off the public access road to North Valley.
| 15.1.4 | Saliçor Valley Roads |
Two separate access roads are proposed from the north end of the Saliçor
Tunnel to access the WDF and TSF. Access to the WDF perimeter berm will be provided by approximately 200 m long road. Access from the
north end of the Saliçor Tunnel to the TSF perimeter berm will be provided by a 1,190 m long haulage road.
| 15.2.5 | Saliçor Tunnel (Primary Connection Between the North and South Valleys) |
The Saliçor Tunnel is a 1,662 m access tunnel designed to connect
the South Valley to the North Valley. The alignment rises from 1,071 m at the South Valley entrance to 1,235 m at the North Valley exit.
Geological conditions include dacitic breccias, dacitic andesitic pyroclastics, and andesitic lava. Hydrogeological conditions include
artesian inflows, requiring 'wet' ground considerations in the support design.
Rock Mass Rating (RMR) values range from 34 (very poor dacitic breccia)
to 53 (moderately strong andesite). Q-system results ranged from 0.06 (very poor) to 1.12 (poor–fair). The Geological Strength Index
(GSI) classification was used for deriving rock strength parameters. Overall ground quality expected will predominantly be poor to very
poor; with short, stable stand-up times.
In summary, the following support will be applied based on the Class
of ground conditions encountered.
| · | Class III (Fair ground, RMR 43–53, Q ~1): 3–4 m bolts, 1.5–2.0 m spacing, mesh, 50–100 mm shotcrete crown,
30 mm sidewalls. |
| · | Class IV (Poor ground, RMR 38–43, Q 0.4–1.0): 4–5 m bolts at 1.0–1.5 m spacing, mesh, 100–150 mm shotcrete
crown, 100 mm sidewalls, intermittent sleepers. |
| · | Class V (Very poor ground, RMR <40, Q ≤0.1): 5 m bolts, 1.0–1.5 m spacing, mesh, 150–200 mm shotcrete crown, 150
mm sidewalls, 50 mm face, steel ribs, heavy sleepers at 0.75 m spacing. |
The Saliçor Tunnel will traverse highly variable ground conditions,
with significant poor to very poor zones. A conservative New Austrian Tunneling Method (NATM) approach is recommended: short advances
(0.5 m to 1.5 m), rapid support installation, and flexible design adaptation. Drainage and hydrogeological control will be critical to
stability and safety. There should be continuous monitoring.
| | 15-7 | |
| SSR Mining Inc. | Hod Maden Project | | January 7, 2026 |
| Technical Report Summary | | SLR Project No.: 123.000320.00001 |
Two high tension power lines, 154 kV and 380 kV, stretch across hilltops
above the Project area. High voltage (HV) power is currently unavailable at the site, and limited power services exist in the local community.
There is no capacity at the HV substation near Artvin to supply the mine. The Project will be required to build a new substation at the
site that draws off Ultra-High Voltage (UHV) power lines that traverse the site.
Power will be drawn from the 154 kV UHV mains line running across the
mine area. A step-down substation will be built near the line and power distributed to main busses at the respective infrastructure areas.
| 15.3.1 | High Voltage Substation |
Power supply to the site will be obtained from the existing 154
kV overhead line that runs through the lease area. Grid connection permission has been granted by the Turkish Electricity Transmission
Authority (TEİAŞ) for construction of a new Artmin 154 kV/11 kV Substation (S/S).
A 154 kV/11 kV substation is proposed to be constructed with a 20 MVA,
11 kV, 50 Hz step down transformer at the east of the existing 154 kV line, approximately 400 m north of the processing plant with an
approximate footprint of 60 m by 100 m layout.
The new HV switchyard will be commissioned in conjunction with TEİAŞ.
Artmin will operate and maintain the switchyard thereafter.
The primary network distribution voltage will be 11 kV. Power will be
distributed at 11 kV from the new HV switchyard by three feeders to the North Valley, process plant, and underground mine. Each area will
have a dedicated HV/LV (low voltage) transformer and switchboard.
Substations throughout the process plant and the above ground mining
services will comprise 11 kV/400 V step-down transformers. Switchrooms will be steel framed, metal clad, modular, transportable construction
complete with access landings and stairways. Switchrooms will house the 380 V MCCs (motor control centers), variable speed drives, Uninterruptible
Power Supplies (UPS), battery chargers, communication racks, distribution boards, process control system cabinets, fire alarm/detection
systems, and 11 kV switchgear as required.
Power will be reticulated at 11 kV via direct buried underground armored
cables via direct buried, armored cable for the processing plant, paste plant, water treatment plant, underground mine, accommodation
village (camp area), and ancillary loads. The ancillary loads include the workshop/ warehouse, dry/canteen, and administration buildings.
Direct buried cable routes will generally follow the project access roads except at the underground mine.
Power will be reticulated at 11 kV within the underground mine via armored
suspended cable (catenary) in ventilation, escape, and access shafts or installed in dedicated drilled boreholes where required. Power
distribution for the underground mine will be provided in a ring configuration to provide redundancy and the required flexibility for
operations.
The Project will be connected to the 154 kV mains network. Reliability
is expected to be extremely high, with unplanned outages typically occurring with a frequency in the order of once every ten years. To
allow for these infrequent outages, a standby diesel generator rated at 3,500 kVA, 11,000 V, will be located adjacent to the mining services
switchroom. The diesel generator will be supplied to operate essential services (thickeners, agitators, essential mine ventilation fans)
and emergency lighting in the event of a power outage.
| | 15-8 | |
| SSR Mining Inc. | Hod Maden Project | | January 7, 2026 |
| Technical Report Summary | | SLR Project No.: 123.000320.00001 |
| 15.4 | Hydrogeological Considerations |
Hydrogeological work was completed by SRK Consulting (U.S.) Inc. (SRK).
This section provides the hydrogeological understanding of the site
formed based on the various data collection programs summarized in Section 7.3.
The regional hydrogeology is mostly governed by the properties of the
underlying geology. The groundwater movement is limited within the alluvial and colluvial deposits that extend on the lower slopes and
along riverbeds. Weathered top sections of volcanics, intrusive, and sedimentary rocks also host groundwater within their secondary developed
fractured parts. Groundwater movement in the relatively fresh unfractured deeper zones is expected to be negligible.
| 15.4.2 | Project Area Hydrogeological Units and Faults |
The main hydrogeological units at site include:
| · | Alluvium/Overburden (present near the underground mine area with thickness varied from 10 m to 80 m) |
| · | Fractured Andesite (andesite breccia) to the depth up to 100 m |
| · | Fault zone associated to East-West fault |
·
Fresh bedrock (andesite breccia, andesite breccia volcanic sediments, dacite breccia, gypsum volcanic sediments)
Additionally, the geological model indicates the presence of faults
in the mine area perpendicular to the Şurakev Creek. Packer testing and analyses of water level distribution on these faults has
not provided any hydraulic property difference than bedrock hydraulic properties, therefore these faults were not incorporated in the
hydrogeological model.
| 15.4.3 | Hydraulic Parameters |
Hydraulic conductivities (K) for the alluvial and bedrock groundwater
systems in the vicinity of the mine were obtained from the 2017 to 2025 hydrogeological field campaign (as discussed in Section 7.3.5).
The results of the study indicate:
| · | The most permeable units are overburden and fractured andesite. |
| · | There is a large variability of hydraulic conductivity values (two to three orders of magnitude) within the model domain. |
| · | There is a general trend of decreasing hydraulic conductivity of bedrock with depth. |
| · | The low permeability values at depths below 200 m were observed where proposed underground mine is planned. |
| 15.4.4 | Measured Water Levels and Direction of Groundwater Flow |
A total of 43 wells/piezometers (including 16 wells drilled in 2025)
and six VWP data were used to generate the water table surface for the underground mine area (Şurakev Valley). Due to the absence
of recent measurements in some wells, a combination of water level measurements from 2021 and recent data (2025) has been used for water
table generation.
| | 15-9 | |
| SSR Mining Inc. | Hod Maden Project | | January 7, 2026 |
| Technical Report Summary | | SLR Project No.: 123.000320.00001 |
The water table appears to be deep around higher elevations and generally showed a flatter surface close to the main
drainage channel because of high conductivity of the alluvium/overburden. As expected, a downward vertical gradient was recorded at peak
elevations and a strong upward gradient was observed in the deep VWPs installed in the center of the valley.
Generated water table surface and groundwater flow directions are presented
on Figure 15-4 and Figure 15-5 for the South Valley and Northern Valley.
For the Northern Valley (Saliçor Creek Area), data from nine
groundwater wells and one spring (HSP-32) were incorporated to generate the local water table. Compared to the Şurakev Valley,
the area exhibited relatively steep contours due to lower hydraulic conductivities. Since no new boreholes have been drilled in this area,
the water table has not been updated since 2022. SRK has recommended additional data collection, potentially integrating with the upcoming
geotechnical characterization program, to improve the understanding of groundwater conditions, particularly in the quarry area
Although there were occasional interruptions due to access difficulties,
a continuous (mostly monthly) groundwater level monitoring program was in place between May 2018 and November 2021. During this period,
the maximum seasonal variations in water levels were approximately 5 m in both areas, observed at HTD-183 in Şurakev Valley
and HTG-28 in Saliçor. However, groundwater level monitoring was paused between 2021 and 2024 until the initiation of SRK’s
data collection program. Following this period, groundwater level monitoring was resumed at a weekly frequency.
Measured water levels show elevations from 820 meters to 1,046 meters
above mean sea level (masl), following the topography between 0-m and 64-m depth.
Water levels versus depth and vertical hydraulic gradients were measured
in HWD coded (HWD-001, 003, 004, 005, 006, and 007A) VWPs, generally indicating downward gradients in the mountain area and upward gradient
in the river valley, as shown in the conceptual hydrogeological cross-section in 13-3 Groundwater flows from the mountains (which originated
by recharge from precipitation) discharge into the Şurakev River and River and its tributaries.
| | 15-10 | |
| SSR Mining Inc. | Hod Maden Project | | January 7, 2026 |
| Technical Report Summary | | SLR Project No.: 123.000320.00001 |
Figure 15-4: Groundwater Contours
and Water Levels in the South Valley
Figure 15-4
Srk danismanlik
LEGEND
EIA Border
Project Units
Well Location
(Water Level m asl )
Flow Direction
Water Level
0
250
500
m
Source: SRK 2025
Source: SRK 2025
| | 15-11 | |
| SSR Mining Inc. | Hod Maden Project | | January 7, 2026 |
| Technical Report Summary | | SLR Project No.: 123.000320.00001 |
Figure 15-5: Groundwater Contours
and Water Levels in the Northern Valley
Figure 15-5
Tailing Storage Facility
1398
1312
1297
1253
1245
1277
1237
1226
1180
Waste Rock Dump
LEGEND
EIA Border
Project Units
Well Location (Water Level m asl )
Flow Direction
Water Level
0
200
400
m
Source: SRK 2022
Source: SRK 2022
| | 15-12 | |
| SSR Mining Inc. | Hod Maden Project | | January 7, 2026 |
| Technical Report Summary | | SLR Project No.: 123.000320.00001 |
A conceptual hydrogeological model refers to a simplified representation
of the groundwater system, describing all critical components that govern groundwater flow and storage at the site. For the Hod Maden
project, the key conceptual components are shown on Figure 15-6 and are described as follows:
| · | Surakev River: interaction between surface and groundwater at site plays a major role in the groundwater system, with the river being
a large source of the water. The presence of permeable hydrogeological conduits available to transmit groundwater was confirmed by river
flow measurements indicating loss of flow in the proximity of the mine. River losses of up to 120 L/s in the dry season (30–50%
of flow) have been measured. |
| · | Surface Alluvial Units: permeable alluvium units, paleo channels and local confining layers connect surface water to underlying groundwater
system. Hydraulic conductivity values ranging from 0.1 m/d up to 20 m/d in conductivity, with geomean of 1.0 m/d. |
| · | Permeable fractured zone: weathered and fractured bedrock between the alluvium and underlying fresh bedrock units. The fracture zone
is related to low RQD rock. Hydraulic conductivities are slightly lower than overlying alluvium, ranging between 0.1 m/d and 2 m/d. Testing
indicates that the fractured system directly above the planned mine workings is thinner, and of lower hydraulic conductivity than those
found east and west of the planned developments. |
| · | Fault zone: associated with the east-west fault, generally parallel to the river, that cuts through the planned developments. Its
hydraulic characteristics are uncertain, but it is estimated that it can act as a flow conduit in the system. |
| · | Low-permeability fresh bedrock: underlying the fractured zone. Hydraulic conductivities two or three orders of magnitude lower than
overlying fractured zone. |
| · | Recharge from precipitation: direct recharge is assumed to be between 10% and 24% of average precipitation (364 mm/year) depending
on units and topographical characteristics. |
During the mining, the water table will be lowered as a result of dewatering,
and hydraulic gradient will be reversed. Potential sources of mine inflow include:
| · | Inflow from the Surakev river: the river is expected to be the main source of groundwater inflow in its current condition. However,
diversion and lining of the creekbed in critical areas has been numerically demonstrated to reduce this inflow substantially. |
| · | Groundwater flow capture: Groundwater discharge into the river that would be captured by mine dewatering is a major component of inflows.
Additionally, the reverting of groundwater flow directions due to mining will cause impacts to the Surakev baseflow. Measurements of baseflow
have shown wide variations, with project overall values ranging from 2.6 L/s to 105.9 L/s. |
| · | Depletion of groundwater storage: this is a smaller component of inflows, since more drawdown will be developed within bedrock aquifer
with relatively low groundwater storage parameters. |
| | 15-1 | |
| SSR Mining Inc. | Hod Maden Project | | January 7, 2026 |
| Technical Report Summary | | SLR Project No.: 123.000320.00001 |
Figure 15-6: Conceptual Hydrogeological
Cross-Section
Figure 15-6
Direct recharge from precipitation
Surakev River (0.2-3 m3/s)
Hydrostatigraphic Units:
Alluvium Units - K = 0.1-20 m/d
Paleo Channels - K > 10 m/d
Fractured bedrock (RQD<25)
E-W Fault Zone - K ~ 0.1 m/d
Remaining bedrock units - K = 1E-2 to 5 E-4 m/d
Water Table
Equi-Potential Lines
Groundwater Flow Direction
River-Groundwater Interaction
K (m/d)
1.0E0
5.0E-1
1.0E-1
5.0E-2
13.0E-2
5.0E-3
1.0E-3
Plunge +06
Azimuth 270
Looking West
E
0
50
100
150
Direct recharge from precipitation
Surakev River (Baseflow impacted by mining)
Mining Condition
Mine Stopes and Developments
Water Table
Groundwater Flow Direction
River-Groundwater Interaction (liner dependent)
Plunge -06
Azimuth 270
Looking West
E
0
50
100
150
Note: The top cross-section shows
pre-mining conditions, and the bottom cross-section shows the end of mining conditions.
Furthermore, Figure 15-7 shows the current understanding of shallow
units around the mine area. Recent hydraulic testing points to relatively high hydraulic conductivities (> 0.05 m/d) throughout the
alluvial units near the surface, as well as up to 100 m deep in the fractured bedrock to the east, and west of the planned mine developments.
In contrast, the Dacite Breccia unit and its fractured portion directly
on top of the planned development have shown low hydraulic conductivity results from testing. This points to this unit having a more heterogeneous
behavior, particularly in its upper fractured portion, than previously considered.
| | 15-2 | |
| SSR Mining Inc. | Hod Maden Project | | January 7, 2026 |
| Technical Report Summary | | SLR Project No.: 123.000320.00001 |
Figure 15-7: Conceptual Understanding
of Shallow Groundwater System
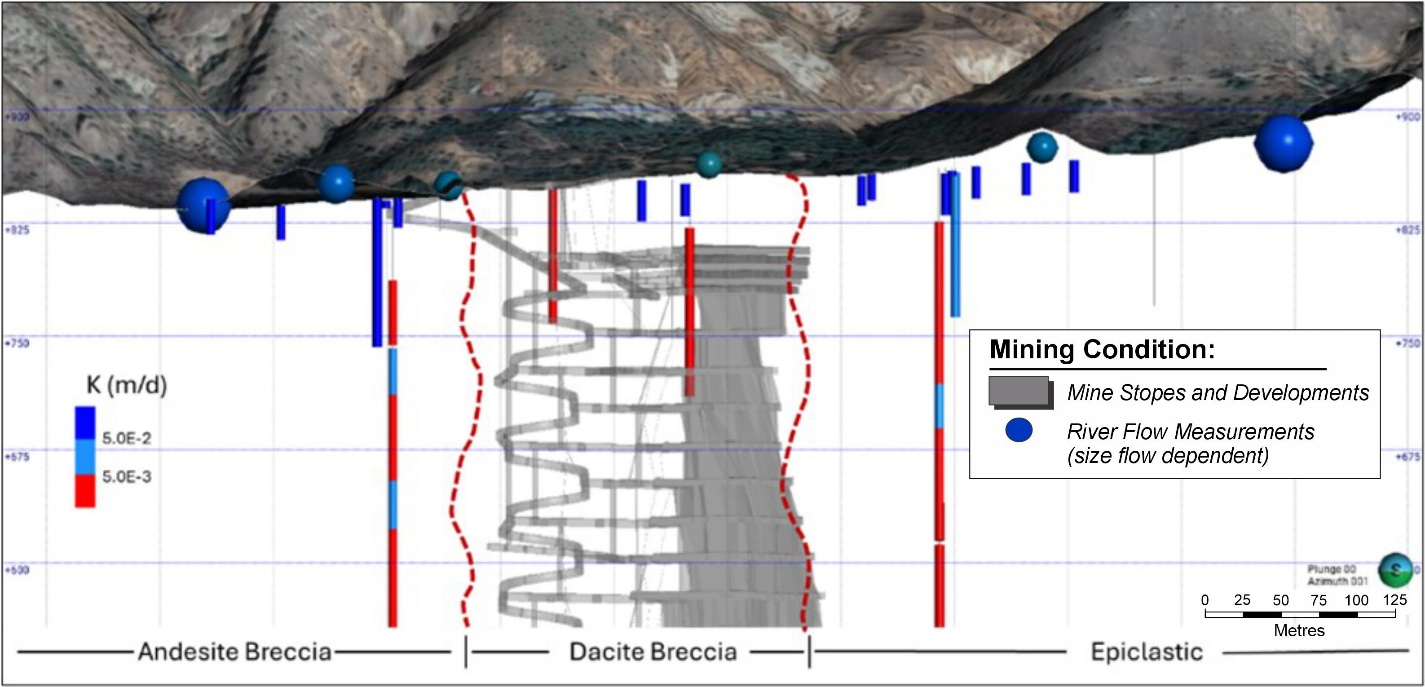
Figure 15-7
Andesite Breccia
Dacite Breccia
Epiclastic
Mining Condition:
Mine Stopes and Developments
River Flow Measurements (size flow dependent)
K (m/d)
5.0E-2
5.0E-3
Plunge 00
Azimuth 001
S
0
25
50
75
100
125
| 15.4.6 | Descriptions of Numerical Groundwater Model |
In Q1 and Q2 of 2025, SRK generated the latest update to the 3D numerical
groundwater flow model of the site, using the MINEDW finite-element code (Itasca 2022), based on available climatic, geological, and hydrogeological
data. This update incorporates all the new hydrogeological knowledge acquired from the 2024-2025 field campaign, with changes primarily
focused on the area of the Surakev valley in proximity to the proposed developments. Figure 15-8 shows the plan view of the model
extent.
Proposed underground mine developments were incorporated into the model
based on the plan provided (dated October 1, 2024). SRK has frequently reviewed the mine design updates and confirmed that the changes
have been minor or incorporated to account for the effects on the groundwater model. This model update is planned to be transferred to
the FEFLOW code to evaluate pathways and contaminant transport for the post-mining phase
| | 15-3 | |
| SSR Mining Inc. | Hod Maden Project | | January 7, 2026 |
| Technical Report Summary | | SLR Project No.: 123.000320.00001 |
Figure 15-8: Model Extent and
Mesh Discretization, Plan View
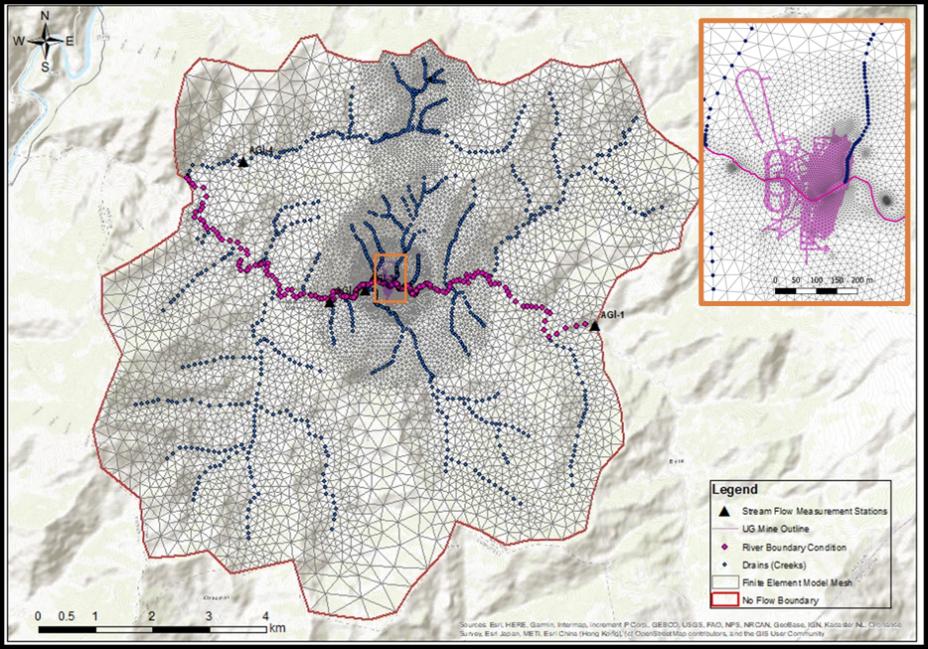
Figure 15-8
Legend
Stream Flow Measurement Stations
UG Mine Outline
River Boundary Condition
Drains (Creeks)
Finite Element Model Mesh
No Flow Boundary
0
0.5
1
2
3
4
km
Source: SRK 2025
Note: The simulated mine developments are shown by a pink line in the
window map.
| 15.4.7 | 2025 Numerical Model Updates |
For the 2025 numerical model update, the new hydrogeological understanding
was incorporated, while also expanding on the calibration targets, hydrogeological units, and sensitivity scenarios.
Relating to the model calibration, the new model update expands on the
targets previously established, incorporating new hydraulic testing as well as focusing on the hydraulic connection between the surface
water and groundwater. Additional calibration targets include (Figure 15-9):
| · | Water level measurements and transmissivities calculated for each of the 17 wells drilled during the 2024-2025 field campaign |
| · | Three cross-stream pumping tests, defining riverbed conductance along different segments of the South Valley. |
| · | 15-day multi-well pumping test, considering the water level responses and transmissivity of six pumping wells, thirteen observation
wells, and three VWP strings of transducers. |
| · | Dry season river flow measurements for the Şurakev River. |
| · | Correlation between the river and groundwater level in the South Valley to simulate gaining and losing stream portions. |
| | 15-4 | |
| SSR Mining Inc. | Hod Maden Project | | January 7, 2026 |
| Technical Report Summary | | SLR Project No.: 123.000320.00001 |
Figure 15-9: Example of New
Calibration Targets Incorporated into Latest Model Update
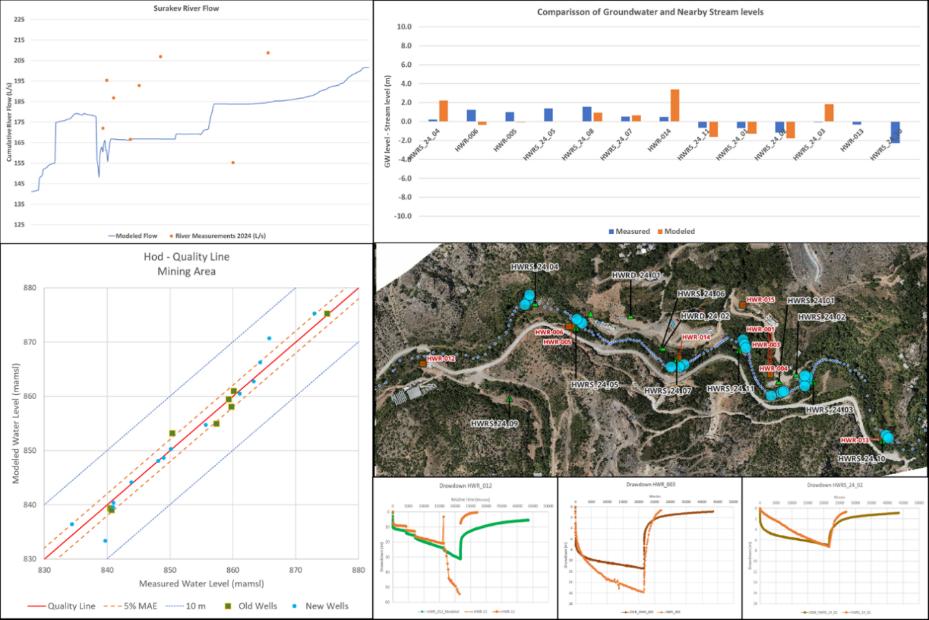
Figure 15-9
Surakev River Flow
Cumulative River Flow (L/s )
225
215
205
195
185
175
165
155
145
135
125
Modeled Flow
River Measurements 2024 (L/s)
Comparisson of Groundwater and Nearby Stream levels
GW level - Stream level (m)
10.0
8.0
6.0
4.0
2.0
0.0
-2.0
-4.0
-6.0
-8.0
-10.0
HWRS_24_04
HWR_006
HWR_005
HWRS_24_05
HWRS_24_08
HWRS_24_07
HWR-014
HWRS_24_11
HWRS_24_01
HWRS_24_07
HWRS_24_01
HWR-013
HWRS_24_10
Measured
Modeled
Hod - Quality Line
Mining Area
Modeled Water Level (mamsl)
880
870
860
850
840
830
Measured Water Level (mamsl)
830
840
850
860
870
880
Quality Line
5% MAE
10 m
Old Wells
New Wells
Based on the new hydrogeological conceptual understanding, the model
update also incorporates changes in the simulated hydrogeological units near the mine area. These include:
| · | Subdivision and refinement of the alluvium units (previously homogenous overburden) into four subzones with varying hydraulic conductivities
and distributions. |
| · | Subdivision and refinement of the fractured bedrock units (previously homogenous) into five subzones with varying hydraulic conductivities,
thicknesses, and distributions |
| · | Subdivision of the Surakev River segments with different riverbed conductance (previously homogenous). |
The latest mining plan (01/10/2024) has been incorporated (parsed monthly,
differentiating developments and stopes), while different liner scenarios (length, location, and efficacy) have also been incorporated
and evaluated, as requested by Artmin.
| 15.4.8 | Groundwater Numerical Model Characteristics |
Model characteristics are shown in plan view on Figure 15-10. The
groundwater model domain encompasses 90.0 km2 in the vicinity of the proposed underground mine operation. The model mesh contains
450,266 elements and 235,965 nodes with up to 18 slices (33 layers including the pinchouts). The Leapfrog geological model developed by
Artmin was incorporated explicitly into the groundwater flow model, and sub-units were defined based on the latest hydrogeological understanding.
| | 15-5 | |
| SSR Mining Inc. | Hod Maden Project | | January 7, 2026 |
| Technical Report Summary | | SLR Project No.: 123.000320.00001 |
Figure 15-10: Simulated Hydrogeological
Units Shown in the Uppermost Model Layer
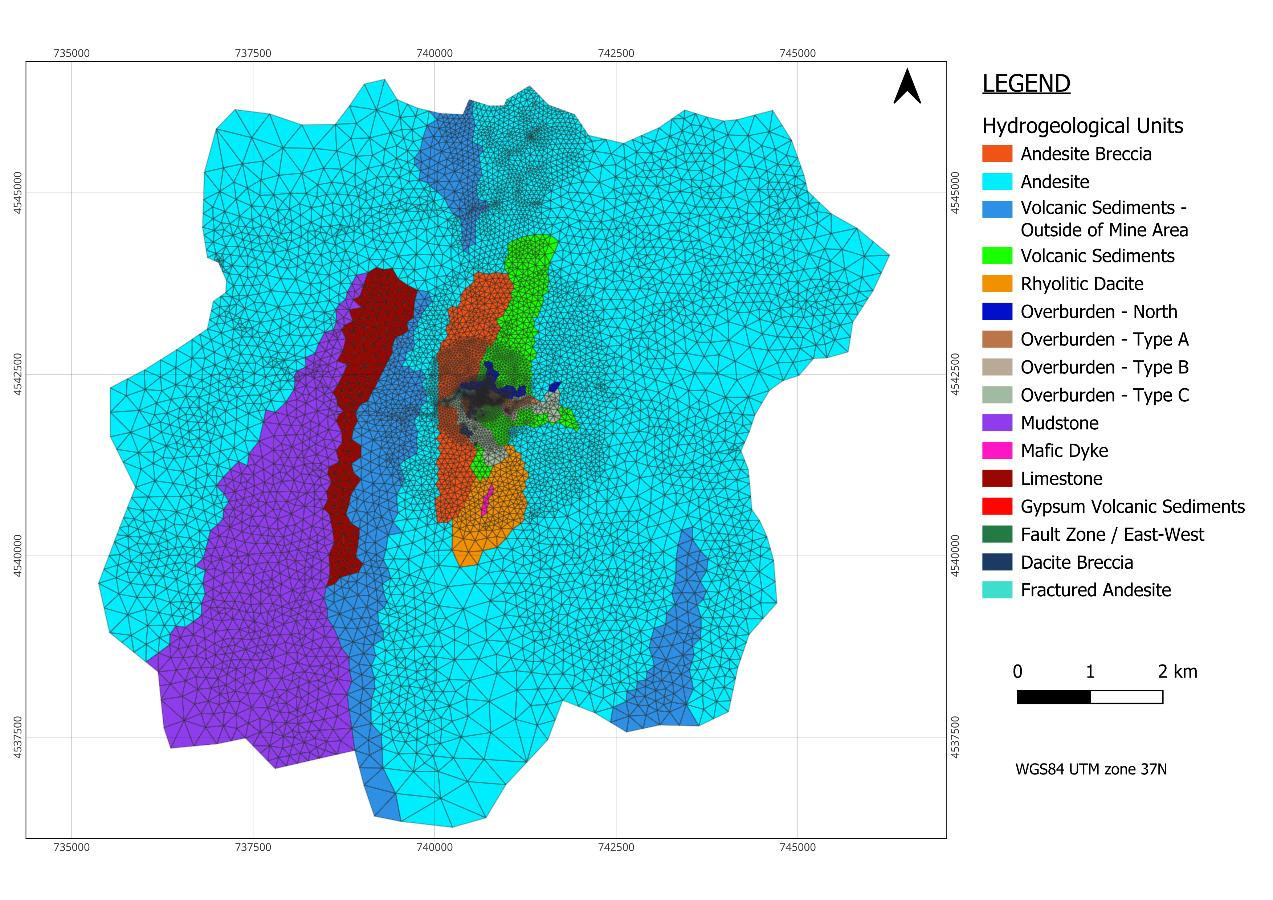
Figure 15-10
735000
737500
740000
742500
745000
4545000
4542500
4540000
4537500
LEGEND
Hydrogeological Units
Andesite Breccia
Andesite
Volcanic Sediments - Outside of Mine Area
Volcanic Sediments
Rhyolitic Dacite
Overburden - Type A
Overburden - Type B
Overburden - Type C
Mudstone
Mafic Dyke
Limestone
Gypsum Volcanic Sediments
Fault Zone / East-West
Dacite Breccia
Fractured Andesite
0
1
2
km
WGS84 UTM zone 37N
Source: SRK 2025
Figure 15-11 shows an example of the simulated hydrogeological
units in the mine area in 3D, while Table 15-1 shows the hydraulic parameters used for all units incorporated into the model.
| | 15-6 | |
| SSR Mining Inc. | Hod Maden Project | | January 7, 2026 |
| Technical Report Summary | | SLR Project No.: 123.000320.00001 |
Figure 15-11: Simulated Hydrogeological
Units in Mine Area and the Numerical Model Mesh
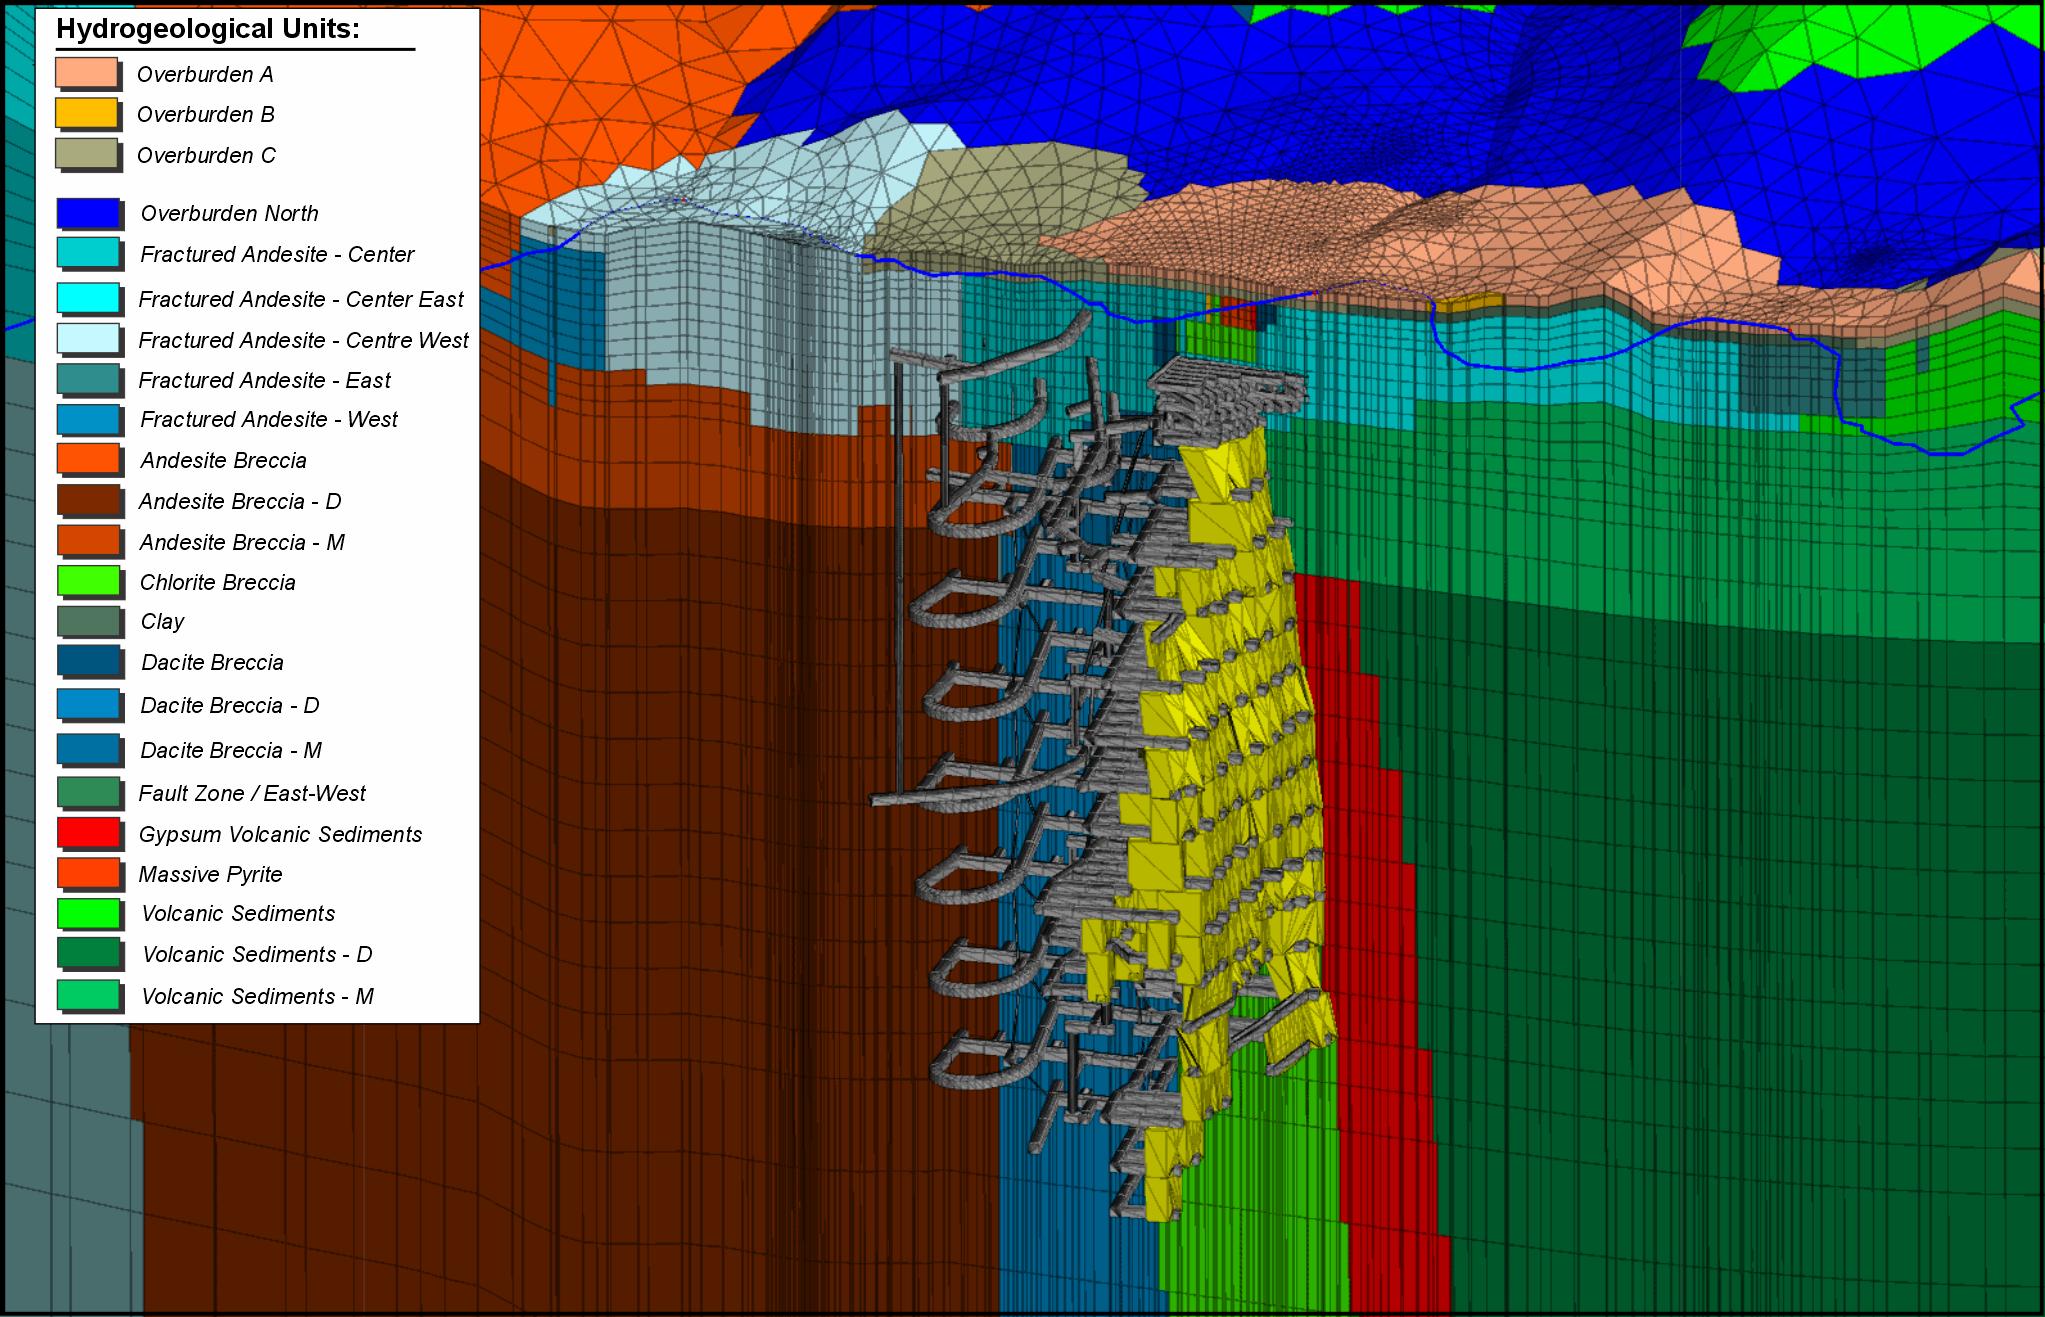
Figure 15-11
Hydrogeological Units:
Overburden A
Overburden B
Overburden C
Overburden North
Fractured Andesite - Center
Fractured Andesite - Center East
Fractured Andesite - Centre West
Fractured Andesite - East
Fractured Andesite - West
Andesite Breccia
Andesite Breccia - D
Andesite Breccia - M
Chlorite Breccia
Clay
Dacite Breccia
Dacite Breccia - D
Dacite Breccia - M
Fault Zone / East-West
Gypsum Volcanic Sediments
Massive Pyrite
Volcanic Sediments
Volcanic Sediments - D
Volcanic Sediments - M
Source: SRK 2025
Table 15-1: Hydraulic Parameters
used for Hydrogeological Units
Hydrogeological
Unit |
Horizontal Hydraulic
Conductivity (m/s) |
Vertical Hydraulic
Conductivity (m/s) |
Specific
Yield |
Specific
Storage (1/m) |
| Overburden A |
1.2E-04 |
1.2E-05 |
0.10 |
1.00E-06 |
| Overburden B |
9.8E-06 |
9.8E-07 |
0.07 |
1.00E-06 |
| Overburden C |
2.3E-06 |
2.3E-07 |
0.15 |
1.00E-06 |
| Overburden North |
5.8E-06 |
5.8E-06 |
0.15 |
1.00E-06 |
| Fractured Andesite – East |
2.3E-05 |
2.3E-05 |
0.05 |
1.00E-06 |
| Fractured Andesite – Center East |
8.7E-06 |
8.7E-06 |
0.02 |
1.00E-06 |
| Fractured Andesite - Center |
1.0E-07 |
1.0E-07 |
0.01 |
1.00E-06 |
| Fractured Andesite – Center West |
2.3E-06 |
2.3E-06 |
0.02 |
1.00E-06 |
| Fractured Andesite – West |
6.9E-06 |
6.9E-06 |
0.02 |
1.00E-06 |
| Fault Zone/East-West |
1.2E-06 |
1.2E-06 |
0.05 |
1.00E-06 |
| Mafic Dike |
5.8E-08 |
5.8E-09 |
0.01 |
1.00E-06 |
| Massive Pyrite |
5.8E-08 |
5.8E-08 |
0.01 |
1.00E-06 |
| Limestone |
5.8E-08 |
5.8E-09 |
0.01 |
1.00E-06 |
| | 15-7 | |
| SSR Mining Inc. | Hod Maden Project | | January 7, 2026 |
| Technical Report Summary | | SLR Project No.: 123.000320.00001 |
Hydrogeological
Unit |
Horizontal Hydraulic
Conductivity (m/s) |
Vertical Hydraulic
Conductivity (m/s) |
Specific
Yield |
Specific
Storage (1/m) |
| Mudstone |
5.8E-08 |
5.8E-09 |
0.01 |
1.00E-06 |
| Chlorite Brescia |
1.2E-08 |
1.2E-08 |
0.01 |
1.00E-06 |
| Gypsum Volcanic Sediments |
1.2E-08 |
1.2E-08 |
0.01 |
1.00E-06 |
| Andesite Breccia |
5.2E-07 |
5.2E-07 |
0.01 |
1.00E-06 |
| Andesite Breccia - M |
2.9E-07 |
2.9E-07 |
0.01 |
1.00E-06 |
| Andesite Breccia - D |
2.9E-08 |
2.9E-08 |
0.01 |
1.00E-06 |
| Andesite |
5.2E-07 |
5.2E-07 |
0.01 |
1.00E-06 |
| Andesite - M |
2.9E-07 |
2.9E-07 |
0.01 |
1.00E-06 |
| Andesite - D |
2.9E-08 |
2.9E-08 |
0.01 |
1.00E-06 |
| Volcanic Sediments |
1.0E-07 |
1.0E-07 |
0.01 |
1.00E-06 |
| Volcanic Sediments - M |
5.8E-08 |
5.8E-08 |
0.01 |
1.00E-06 |
| Volcanic Sediments - D |
5.8E-09 |
5.8E-09 |
0.01 |
1.00E-06 |
Volcanic Sediments
(outside mine area) |
1.0E-07 |
1.0E-08 |
0.01 |
1.00E-06 |
Volcanic Sediments
(outside mine area) - M |
5.8E-08 |
5.8E-09 |
0.01 |
1.00E-06 |
Volcanic Sediments
(outside mine area) - D |
5.8E-09 |
5.8E-10 |
0.01 |
1.00E-06 |
| Dacite Breccia |
1.0E-07 |
1.0E-07 |
0.01 |
1.00E-06 |
| Dacite Breccia - M |
5.8E-08 |
5.8E-08 |
0.01 |
1.00E-06 |
| Dacite Breccia - D |
5.8E-09 |
5.8E-09 |
0.01 |
1.00E-06 |
| Rhyolitic Dacite |
5.8E-08 |
5.8E-09 |
0.01 |
1.00E-06 |
| Rhyolitic Dacite - D |
5.8E-09 |
5.8E-10 |
0.01 |
1.00E-06 |
| Backfilled Stopes* |
2.3E-05 |
2.3E-05 |
0.30 |
1.00E-06 |
| Development Voids* |
1.2E-02 |
1.2E-02 |
0.50 |
1.00E-06 |
|
Notes:
M indicates Medium Zone with depth between 100 and 200 m; D - Deep zone
with depth below 200 m from surface.
Backfilled Stopes and “Development Voids” are modeled units
only incorporated in groundwater model for post-mining simulations. |
Recharge from precipitation was applied to the water table based on
water balance calculations, and with the consideration of topography and surficial lithology. Recharge rates applied to model nodes were:
| · | 53 mm/y - Bedrock below elevation of 2,500 masl |
| · | 86 mm/y - Bedrock above elevation of 2,500 masl |
| · | 38 mm/y - Narrow valley channels where runoff contributes (returning) to the alluvium |
These rates represent 15%, 24%, and 10% of mean annual precipitation
(MAP) with an average rate of 364 mm/y (measured from 2018 through 2021). Recharge values were verified during the model calibration to
measured pre-mining water levels.
| | 15-8 | |
| SSR Mining Inc. | Hod Maden Project | | January 7, 2026 |
| Technical Report Summary | | SLR Project No.: 123.000320.00001 |
Proposed future underground mine developments (tunnels, drifts, declines,
stopes, vents and ramps), Agrega Pit (The necessity of this is currently under review by Artmin), and Saliçor Tunnel were simulated
using drain nodes (conductance 1,000 m2/day), which extract groundwater from the model depending on the water level elevation
above the development and the assigned conductance. The elements of the simulated planned underground mine are shown on Figure 15-12.
The stopes were assumed to be non-restrictive to groundwater inflow during their excavation due to their size (similar to model elements).
Figure 15-12: Simulated Underground
Mine Development, Agrega Pit and Saliçor Tunnel
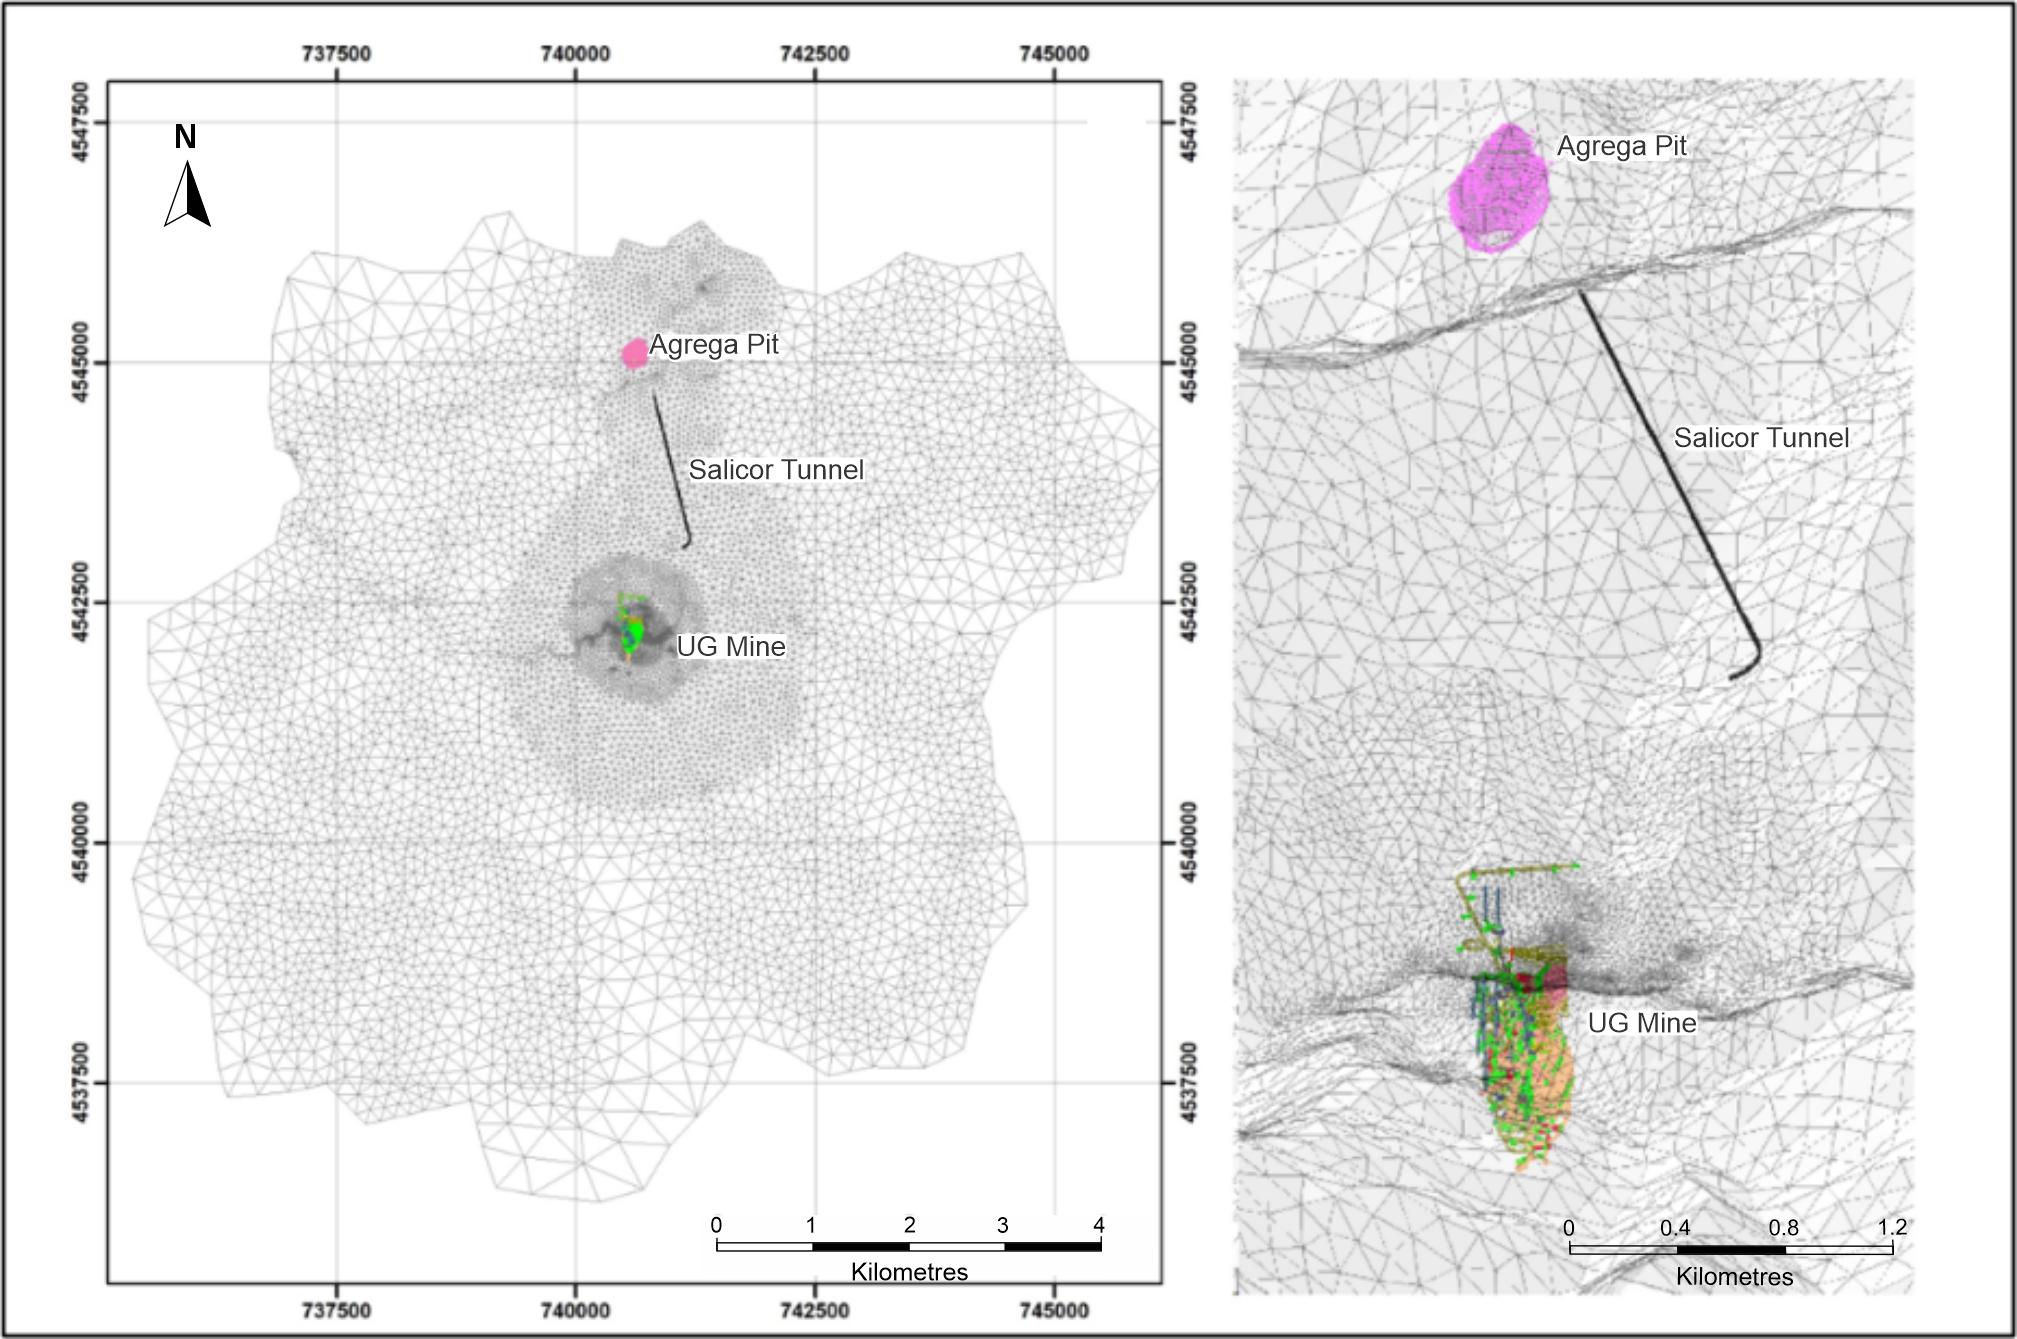
Figure 15-12
Agrega Pit
Salicor Tunnel
UG Mine
0
1
2
3
4
Kilometres
Agrega Pit
Salicor tunnel
UG Mine
0
.04
.08
1.2
Kilometres
Source: SRK 2022 (Note: Underground mine plan has been updated in 2025
model, Figure only for spatial reference)
Additionally, it was assumed that the Şurakev Creek would be
lined for a total length of 2.2 km prior to mining. The extent of the proposed liner in relation to the mine working is shown on Figure 15-13.
The liner was simulated as a reduction in riverbed conductance by two orders of magnitude.
| | 15-9 | |
| SSR Mining Inc. | Hod Maden Project | | January 7, 2026 |
| Technical Report Summary | | SLR Project No.: 123.000320.00001 |
Figure 15-13: Planned River
Liner Extent (“Şurakev Diversion”)
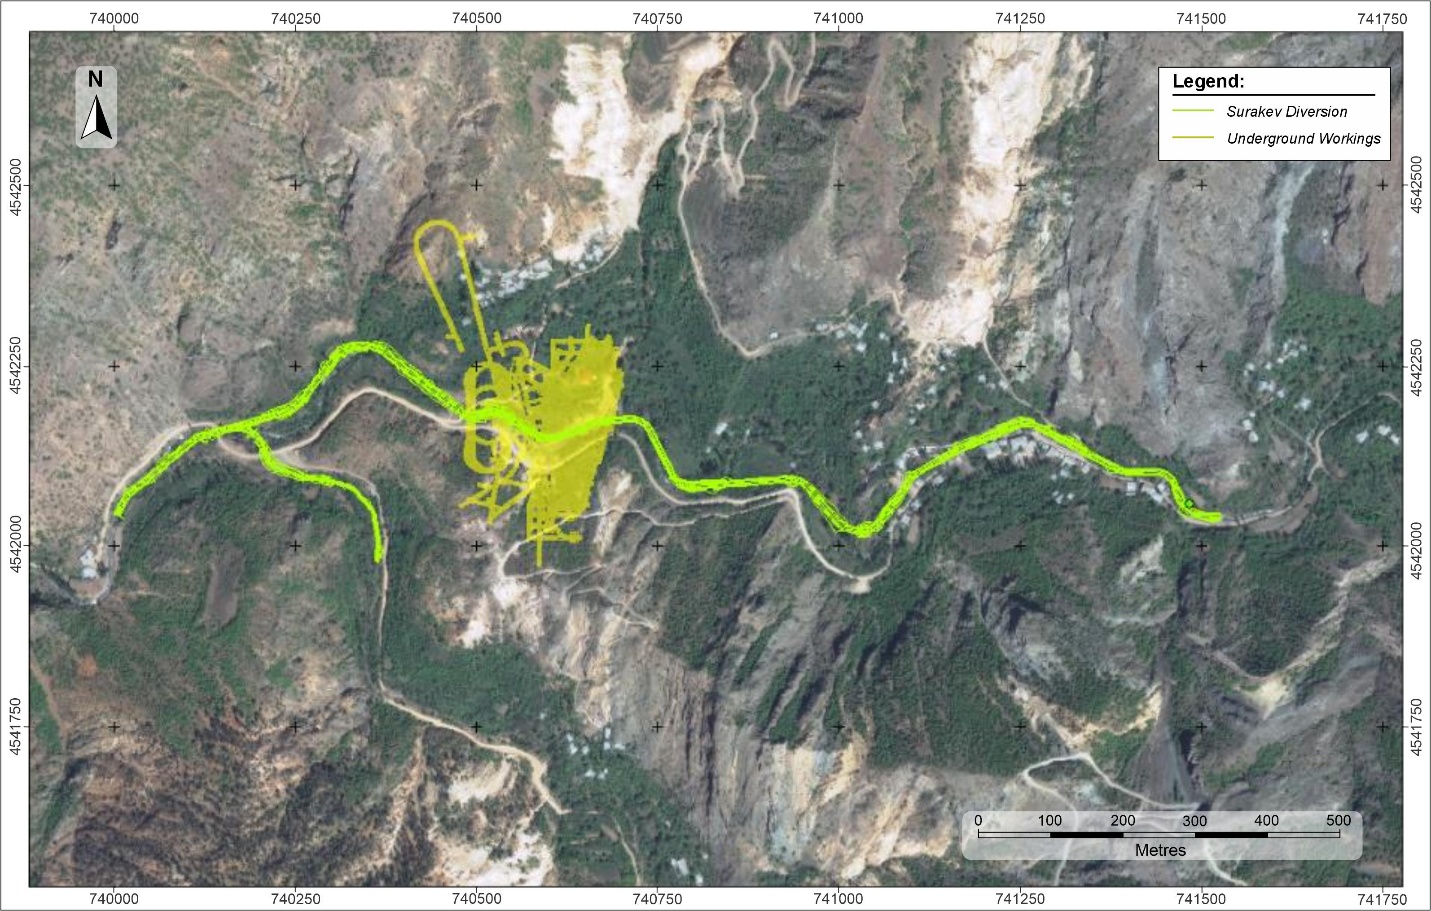
Figure 15-13
740000
740250
740500
740750
741000
741250
741500
741750
4541750
4542000
4542250
4542500
Legend:
Surakev Diversion
Underground Workings
0
100
200
300
400
500
Metres
Source: Artmin 2022
| 15.4.9 | Groundwater Model Predictions |
The 2025 update of the 3D numerical groundwater flow model was reasonably
calibrated to available measured water level and baseflow data, and used to make predictive simulations of:
| · | Passive inflow to the planned underground mine (as initial estimate and a reference for evaluation of efficiency proposed dewatering
system) |
| · | Dewatering rates and residual passive inflow to the mine |
| · | Additional predictive simulations are ongoing and planned for Q4 of 2025, to address and update: |
| · | Propagation of drawdown as the result of planned dewatering under mining conditions |
| · | Changes to groundwater discharge to river and creeks under mining conditions |
| · | Recovery and long- term changes to the groundwater system and surface water features during post-mining. |
| · | Changes to springs under the post-mining conditions |
| · | Contaminant transport simulations for post-mining conditions |
Predictions of passive inflow to the underground mine (no pumping from
dewatering wells) were completed under the lined riverbed scenario and are shown on Figure 15-14. The maximum passive inflow to the
mine is 25.8 L/s for the Passive Inflow Expected Conservative Case, reached around 5 years after the start of mining. Overall, the residual
inflow is approximately 25 L/s for the period of mining, after a sharp increase over the first two years of development relating
to the storage depletion of overburden and fractured andesite units.
| | 15-10 | |
| SSR Mining Inc. | Hod Maden Project | | January 7, 2026 |
| Technical Report Summary | | SLR Project No.: 123.000320.00001 |
The model predicts:
| · | Rapid increase in the flow during first 18 months of installation of mine developments. This occurs as the mine workings intersect
the permeable overburden and fractured andesite units |
| · | Stable/slight increase of mine inflow during the following 3 years of mining, up to the 4th year |
| · | Continued inflows of approximately 25 L/s with a small reduction thereafter up until the end of operation |
Figure 15-14: Passive Inflow
Predictions to the Underground Mine
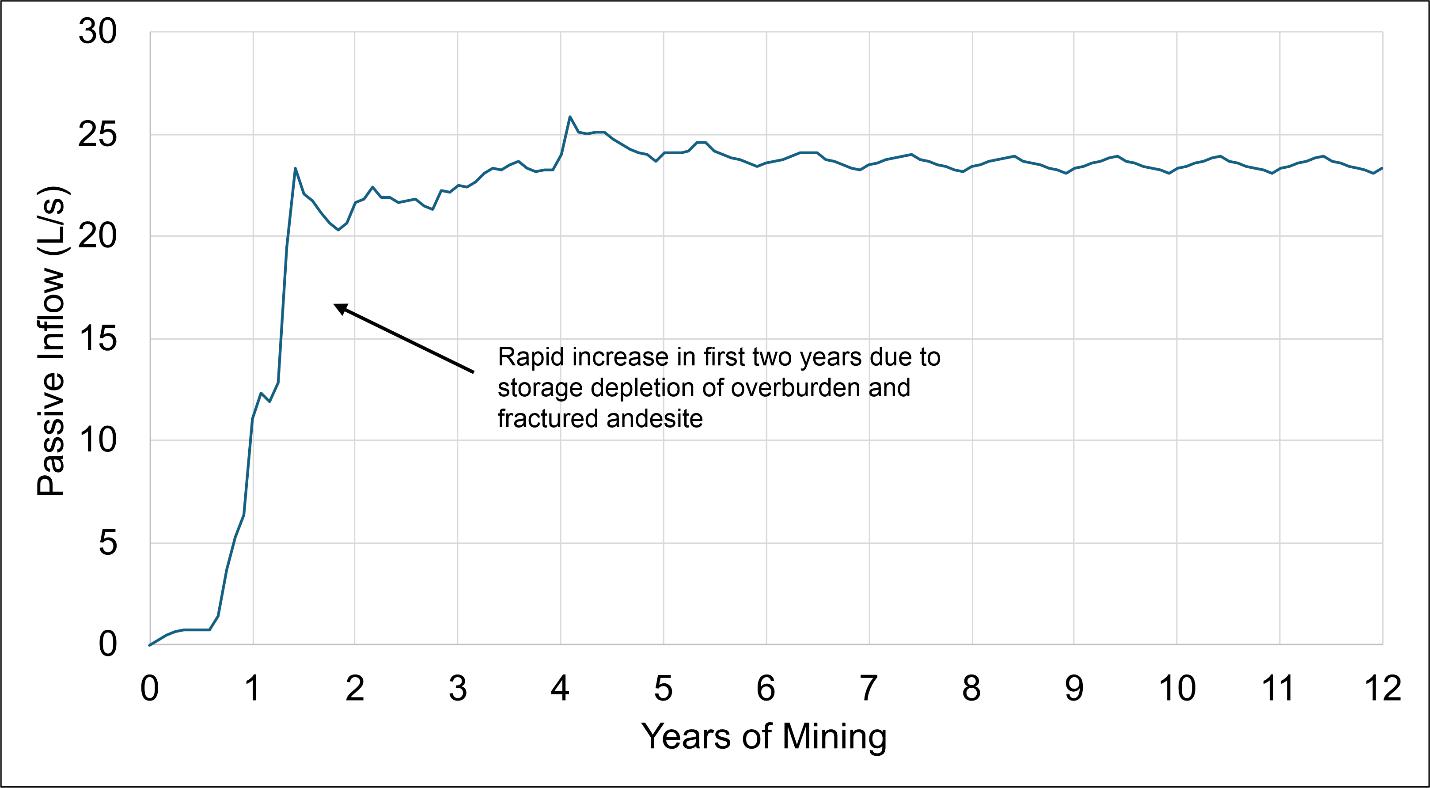
Figure 15-14
Passive Inflow (L/s)
30
25
20
15
10
5
0
Years of Mining
0
1
2
3
4
5
6
7
8
9
10
11
12
Rapid increase in first two years due to storage depletion of overburden and fractured andesite
Source: SRK 2025
In addition to the Expected Conservative Case, two further scenarios
were assessed, as shown in Figure 15-15:
The first was called “Risk Assessment Case”, and it simulates
the maximum measured hydraulic conductivity values for all units, as well as a maximum conceptual storage parameter for each. This scenario
reaches a maximum passive inflow of approximately 45 L/s within the first year of mining and shows a prolonged passive inflow of approximately
35 L/s for the remainder.
The second was called “Optimistic Case”, and it simulates
an overall lower hydraulic conductivity for andesite units, as well as a reduced recharge from precipitation. This scenario assumes that
all realistic, albeit optimistic conditions materialize. This scenario reaches a maximum passive inflow of approximately 19 L/s within
the first two years of mining and shows a prolonged passive inflow of approximately 15 L/s for the remainder.
| | 15-11 | |
| SSR Mining Inc. | Hod Maden Project | | January 7, 2026 |
| Technical Report Summary | | SLR Project No.: 123.000320.00001 |
Both scenarios are considered less likely to occur than the Expected
Conservative case and thus should only be taken as a reference for planning.
Figure 15-15: Passive Inflow Sensitivity
for Underground Mine
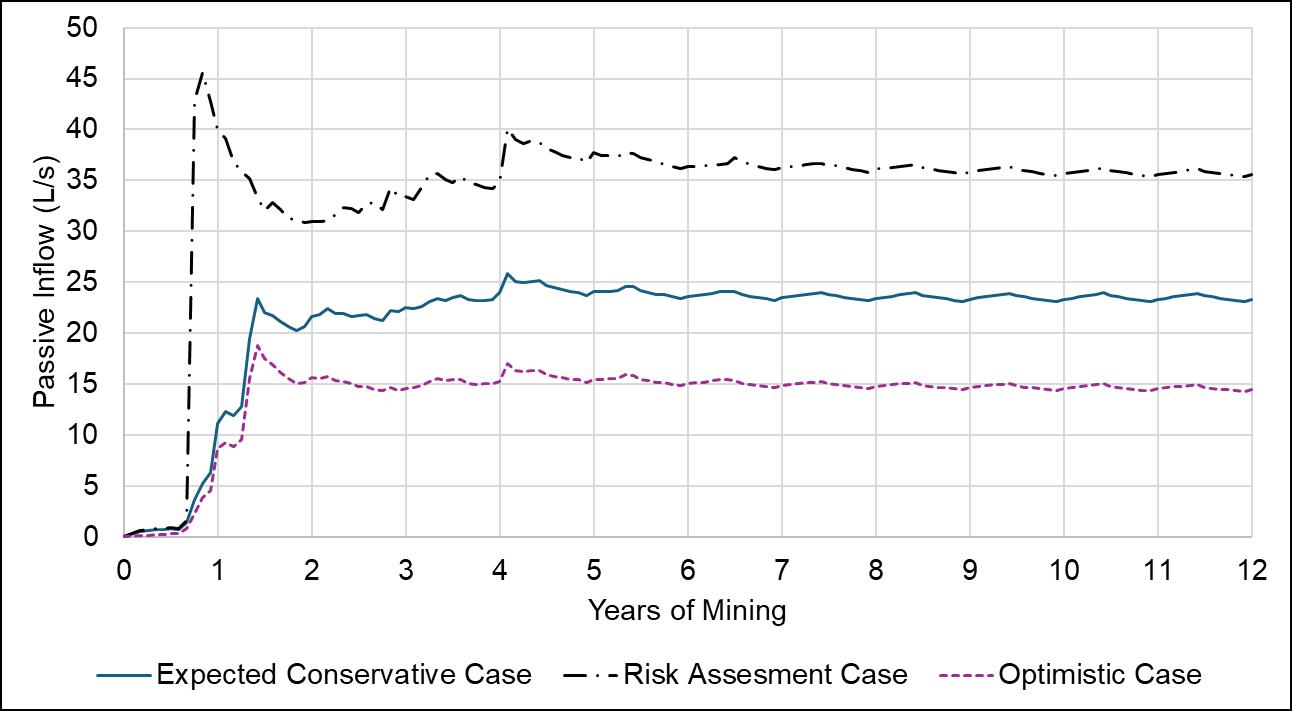
Figure 15-15
Passive Inflow (L/s)
50
45
40
35
30
25
20
15
10
5
0
Years of Mining
0
1
2
3
4
5
6
7
8
9
10
11
12
Expected Conservative Case
Risk Assessment Case
Optimistic Case
Additionally, an active pumping scenario was assessed for the Expected
Conservative Case model, using the available dewatering wells at the site. Predictions were made for residual passive inflow to the mine
under active dewatering by using pumping wells installed within fractured bedrock/fault (existing HWR-01, HWR-03, HWR-12, and HWR-13 wells),
as shown on Figure 15-16.
| | 15-12 | |
| SSR Mining Inc. | Hod Maden Project | | January 7, 2026 |
| Technical Report Summary | | SLR Project No.: 123.000320.00001 |
Figure 15-16: Location of Simulated
Dewatering Wells
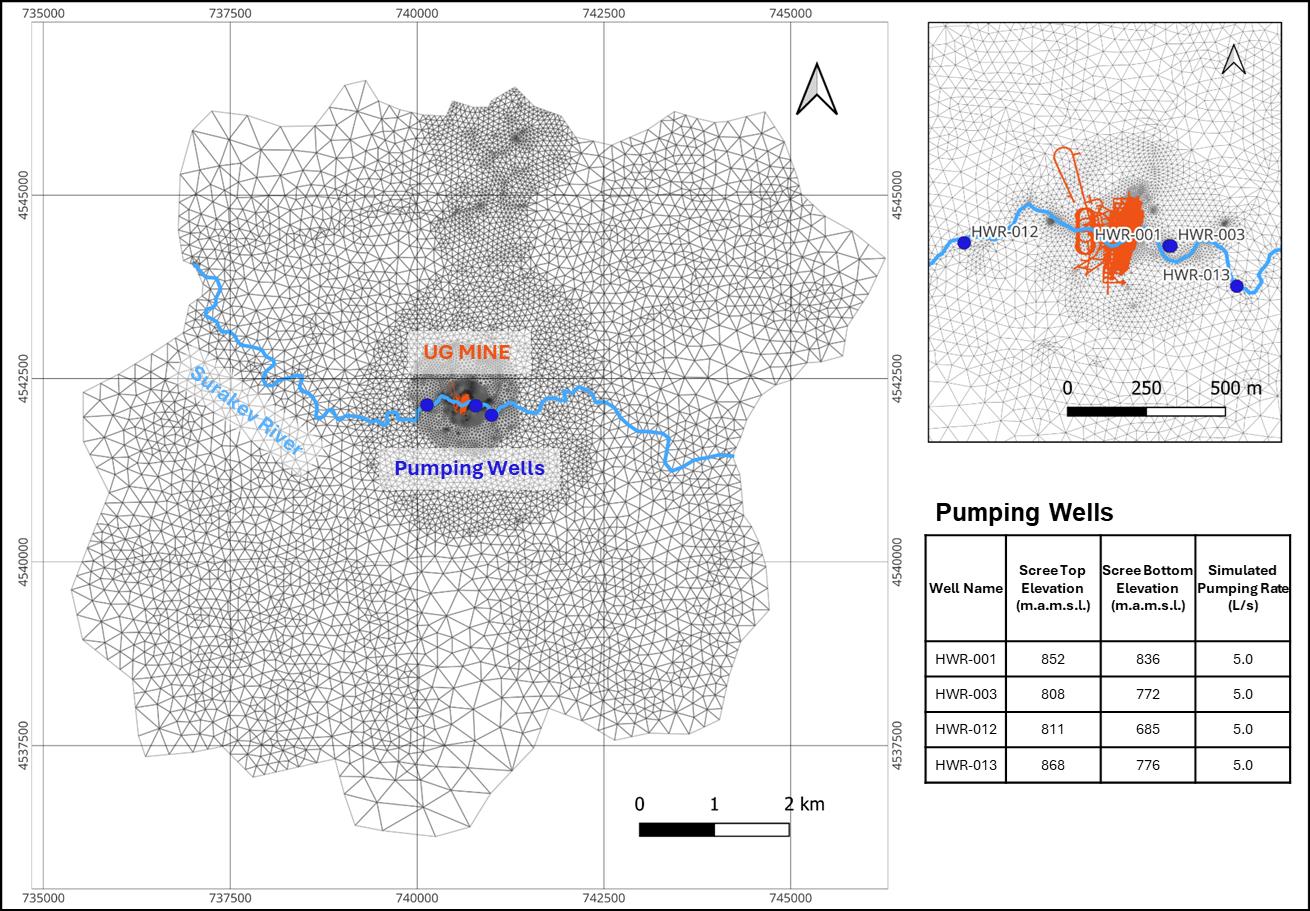
Figure 15-16
UG MINE
Surakev River
Pumping Wells
HWR-012
HWR-001
HWR-003
HWR-013
0
250
500
m
Pumping Wells
Well Name
HWR-001
HWR-003
HWR-012
HWR-013
ScreeTop Elevation (m.a.m.s.l)
852
808
811
868
ScreeBottom Elevation (m.a.m.s.l.)
836
772
685
776
Simulated Pumping Rate (L/s)
5.0
5.0
5.0
5.0
0
1
2
km
Source: SRK 2022
Predicted dewatering rates and a comparison between passive (no active
dewatering) and residual passive (with active dewatering by the wells) inflows for the Expected Conservative Case are shown on Figure 15-17.
The model predicts that:
| · | Active dewatering can significantly reduce residual passive inflow to the underground mine throughout the life of the development. |
| · | HWR-03 will not reach a pumping rate above 0.5 L/s for all the simulated period, while HWR-01 is expected to drop to 0 L/s after 18
months of mining. For this reason, these wells were not considered in further predictive dewatering simulations. |
| · | Starting at their maximum value of 15 L/s, dewatering rates decrease in time due to dewatering of Fracture and Fault zones, approaching
pump freeboard elevations and reaching an equilibrated pumping rate of 9 L/s by the fourth year of mining. |
| · | Major sources of mine inflow at the end of mining are related to depletion of groundwater storage, and capture of groundwater discharge
into surface bodies. |
| | 15-13 | |
| SSR Mining Inc. | Hod Maden Project | | January 7, 2026 |
| Technical Report Summary | | SLR Project No.: 123.000320.00001 |
Figure 15-17: Residual Passive
Inflow to the Underground Mine
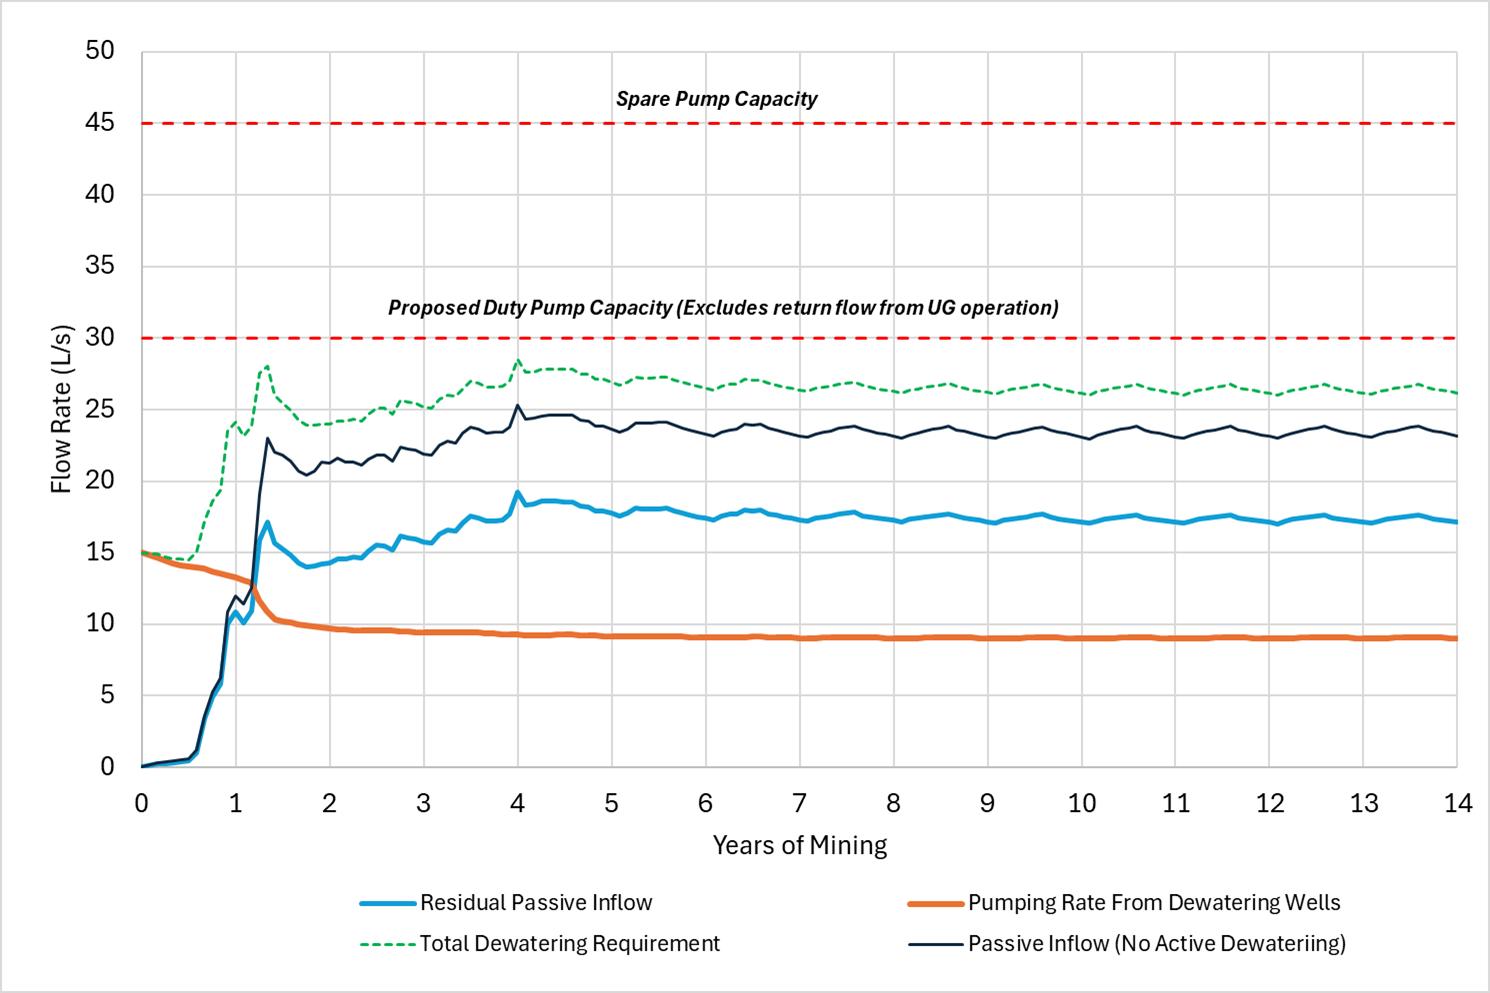
Figure 15-17
Spare Pump Capacity
Proposed Duty Pump Capacity (Excludes return flow from UG operation)
Flow Rate (L/s)
50
45
40
35
30
25
20
15
10
5
0
Years of Mining
0
1
2
3
4
5
6
7
8
9
10
11
12
13
14
Residual Passive Inflow
Total Dewatering Requirement
Pumping Rate From Dewatering Wells
Passive Inflow (No Active Dewatering)
| 15.4.10 | Predictive Active Dewatering |
The updated numerical groundwater flow model was employed to assess
a range of predictive dewatering infrastructure scenarios and to evaluate their potential effectiveness in diminishing residual passive
inflow (RPI) to the underground mine. Importantly, these assessments also considered the impact of additional dewatering on the water
supply for the onsite water treatment plant, ensuring that critical production needs could continue to be met without interruption.
For these assessments, it was assumed that existing wells HWR-12 and
HWR-13 will continue to be used for dewatering operations. Additionally, scenarios were developed wherein four new pumping wells were
constructed at the site. The locations of these four proposed wells were selected to optimize dewatering outcomes, with two wells located
directly east of the proposed development (E1 and E2) and two wells to the west (W1 and W2). Figure 15-18 presents the spatial arrangement
of the proposed wells in relation to the planned mine infrastructure, with current wells shown in red, and proposed wells in blue.
| | 15-14 | |
| SSR Mining Inc. | Hod Maden Project | | January 7, 2026 |
| Technical Report Summary | | SLR Project No.: 123.000320.00001 |
Figure 15-18: Additional Dewatering
Wells Locations Assessed
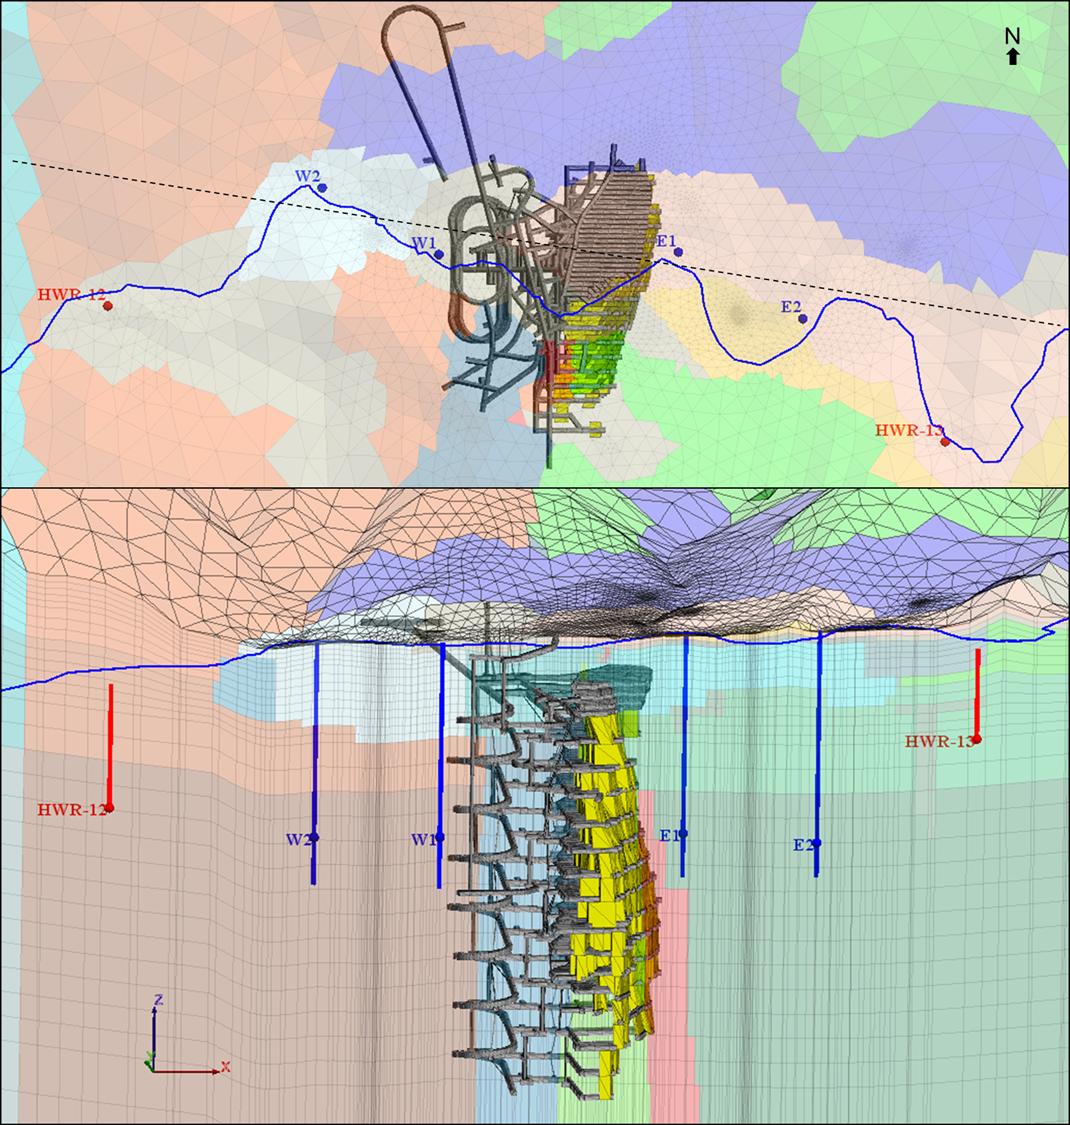
Figure 15-18
HWR-12
W2
W1
E1
E2
HWR-13
HWR-12
W2
W1
E1
E2
HWR-13
Source: SRK 2025
Each additional well was modeled to a depth of 250 m, with an initial
pumping rate of 8 L/s and the ability to lower the water level to a depth of 170 m. The model maintains an initial pumping rate until
the water level reaches this elevation and starts keeping this elevation constant, reducing the pumping rate. MINEDW simulates the dewatering
wells with this pumping rate behavior by using the Limited Pumping Efficiency (LPE) option.
Three primary scenarios were evaluated: (A) placement of the two wells
closest to the mine, E1 and W1; (B) placement of the two wells furthest from the mine, E2 and W2; and (C) deployment of all four additional
dewatering wells (E1, E2, W1, W2). The results of these simulations are shown in Figure 15-19 and Figure 15-20.
| | 15-15 | |
| SSR Mining Inc. | Hod Maden Project | | January 7, 2026 |
| Technical Report Summary | | SLR Project No.: 123.000320.00001 |
Figure 15-19: Predictive RPI and
Dewatering Rates for Additional Dewatering Infrastructure Scenarios
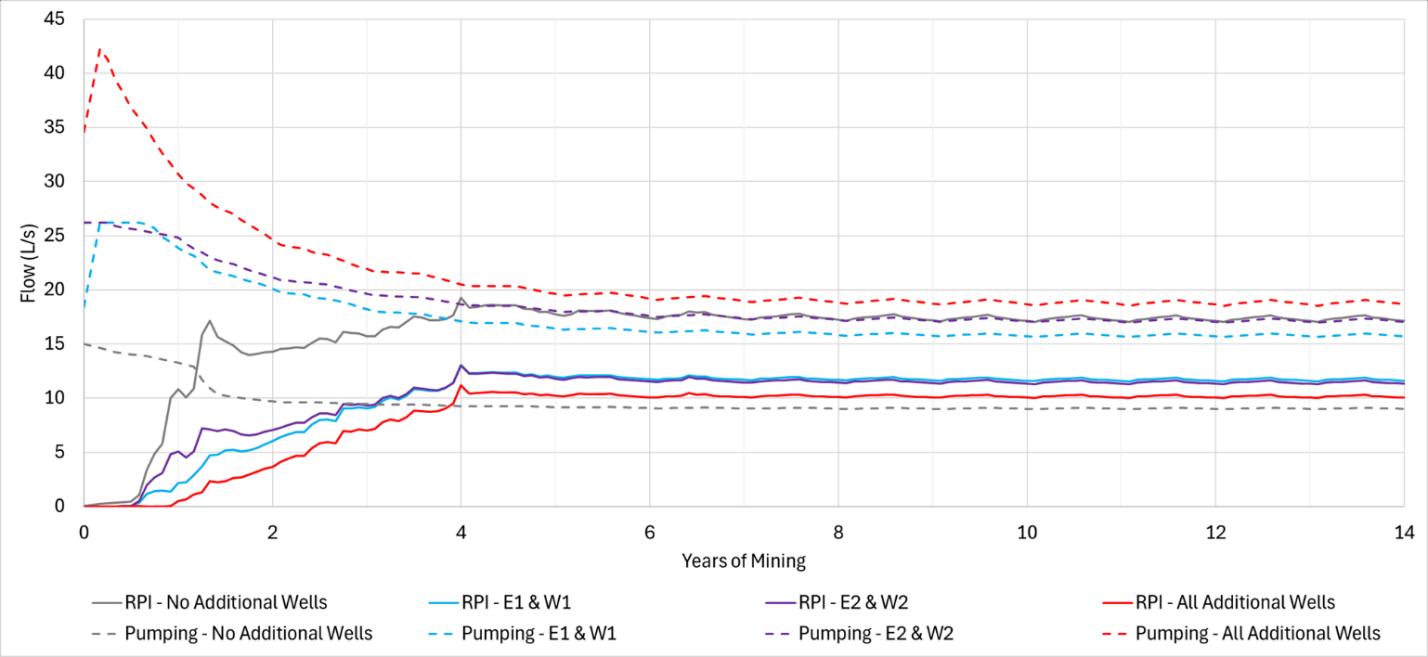
Figure 15-19
Flow (L/s)
45
40
35
30
25
20
15
10
5
0
Years of Mining
0
2
4
6
8
10
12
14
RPI - No Additional Wells
Pumping - No Additional Wells
RPI - E1 & W1
Pumping - E1 & W1
RPI - E2 & W2
Pumping - E2 & W2
RPI - All Additional Wells
Pumping - All Additional Wells
Source: SRK 2025 (Note: all scenarios assume pumping from HWR-12 and
HWR-13 at 5 L/s)
Figure 15-20: Predictive Total Pumping
Rate From All Wells (can be used for Water Supply)
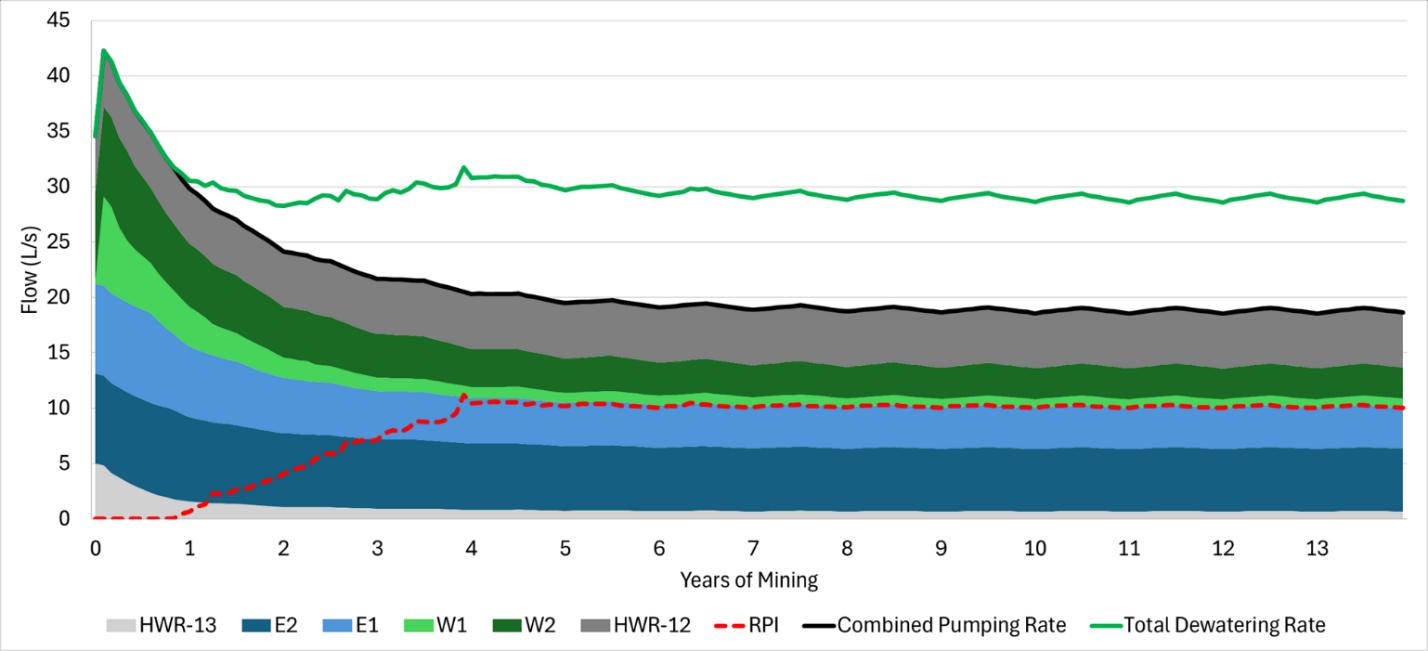
Figure 15-20
Flow (L/s)
45
40
35
30
25
20
15
10
5
0
Years of Mining
0
1
2
3
4
5
6
7
8
9
10
11
12
13
HWR-13
E2
E1
W1
W2
HWR-12
RPI
Combined Pumping Rate
Total Dewatering Rate
Source: SRK 2025
Simulation results indicate the following:
Additional dewatering wells, when strategically located with respect
to underground development, have the capacity to significantly reduce long-term residual passive inflow to the mine.
| | 15-16 | |
| SSR Mining Inc. | Hod Maden Project | | January 7, 2026 |
| Technical Report Summary | | SLR Project No.: 123.000320.00001 |
The proposed wells to the east (upstream in reference to Surakev Creek)
are more likely to maintain high pumping rates over time. In contrast, wells situated to the west (downstream) display earlier onset of
reduced pumping rates as they approach dry-out conditions.
Predictive modeling suggests that dewatering wells can reduce RPI by
15 L/s in the first two years and is expected to reduce RPI by up to 8 L/s over the long term.
Furthermore, deployment of these wells is projected to increase the
water supply to the onsite treatment plant by up to 40 L/s during the first years of mining (peak pumping volumes at early stages), dropping
in the long term to sustained increases of up to 6 L/s through protracted mining periods.
An additional scenario was then simulated, to assess the effectiveness
of these wells in mitigating the high inflows reported by the Risk Assessment Case. Reduction of the peaks inflows reported during the
first year of mining were of particular concern. The same predictive dewatering well configuration was used for the Risk Assessment Case,
and the results are shown in Figure 15-21 and Figure 15-22.
Figure 15-21: Predictive RPI and
Total Pumping Rate from Dewatering Wells - Risk Management Scenario
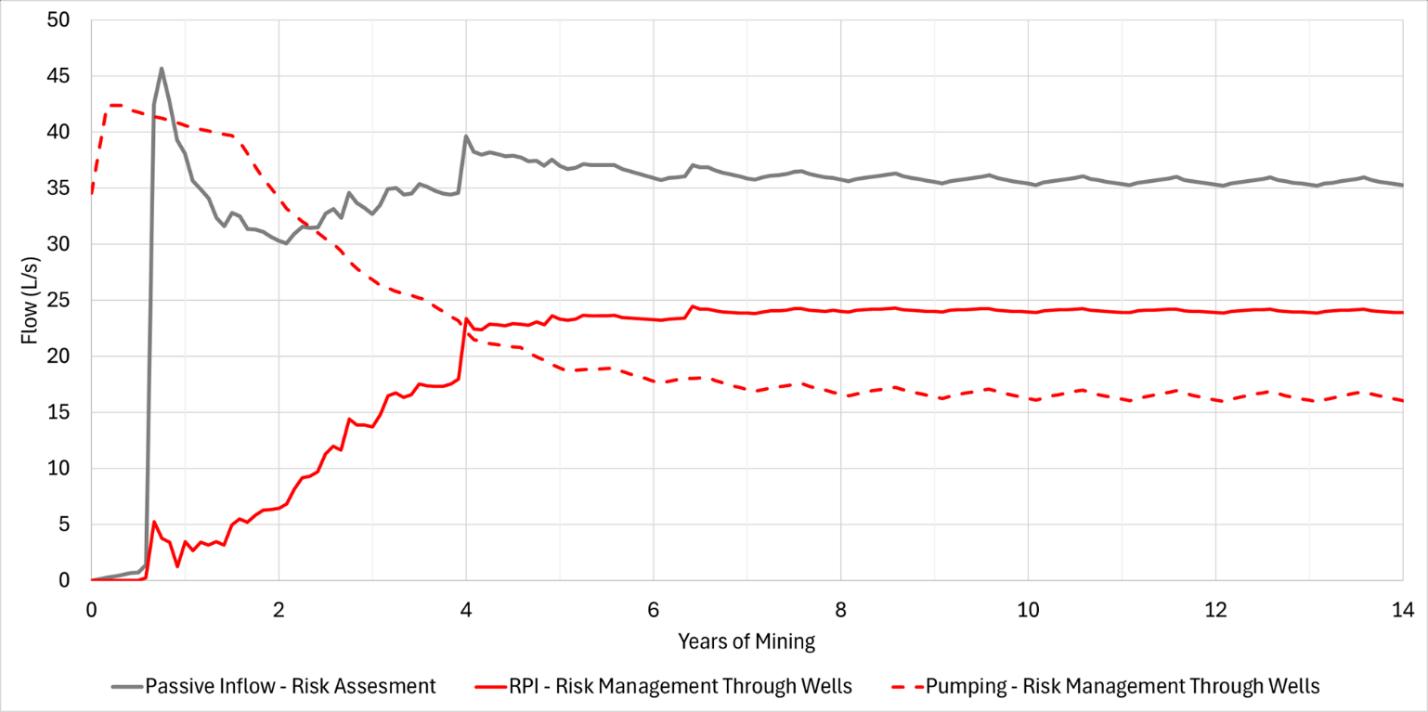
Figure 15-21
Flow (L/s)
50
45
40
35
30
25
20
15
10
5
0
Years of Mining
0
2
4
6
8
10
12
14
Passive Inflow - Risk Assessment
RPI - Risk Management Through Wells
Pumping - Risk Management Through Wells
| | 15-17 | |
| SSR Mining Inc. | Hod Maden Project | | January 7, 2026 |
| Technical Report Summary | | SLR Project No.: 123.000320.00001 |
Figure 15-22: Predictive Total Pumping
Rate From All Wells - Risk Management Scenario
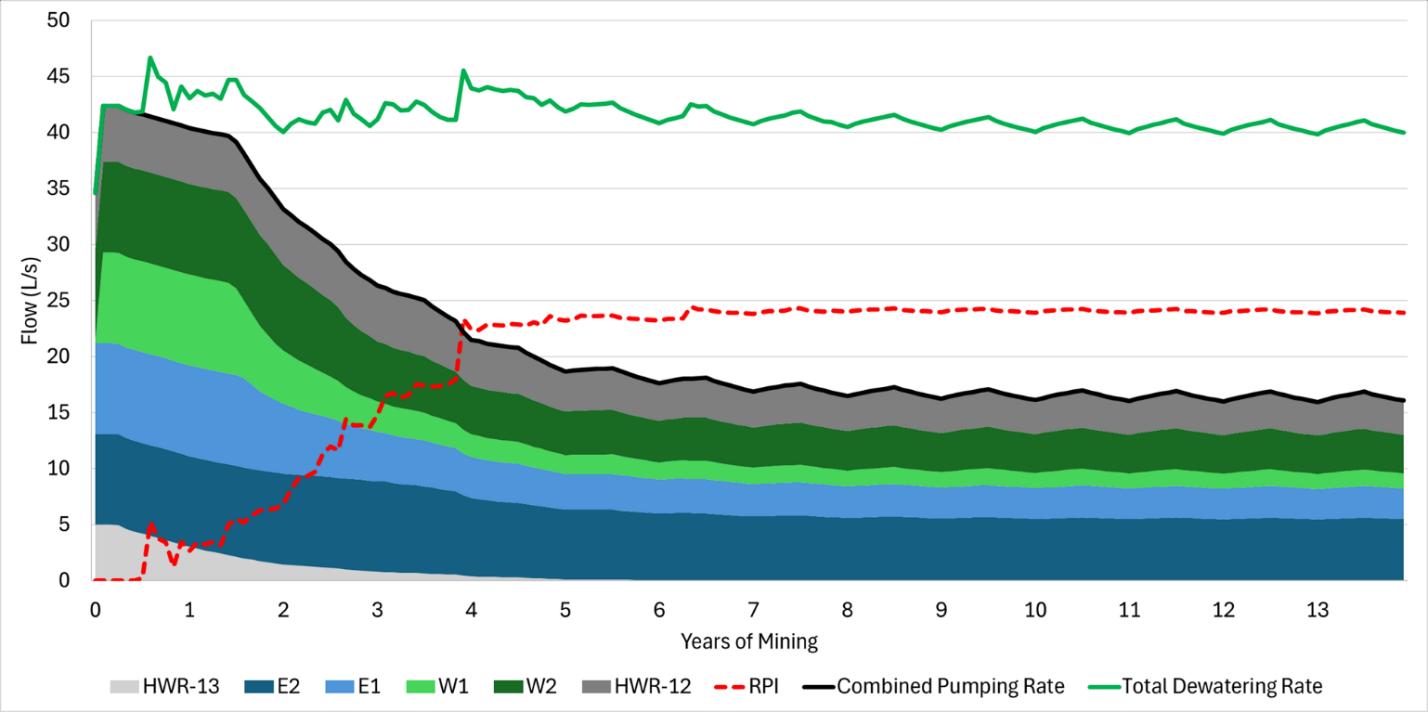
Figure 15-22
Flow (L/s)
50
45
40
35
30
25
20
15
10
5
0
Years of Mining
0
1
2
3
4
5
6
7
8
9
10
11
12
13
HWR-13
E2
E1
W1
W2
HWR-12
RPI
Combined Pumping Rate
Total Dewatering Rate
The results of this risk management simulation show that the inclusion
of well-placed dewatering wells can effectively mitigate the peak underground inflows reported by the Risk Assessment Case, preventing
contact water rates to surpass the temporary water treatment plant capacity.
An additional scenario was then simulated, to assess the effectiveness
of these wells in mitigating the high inflows reported by the Risk Assessment Case. Reduction of the peaks inflows reported during the
first year of mining were of particular concern. The same predictive dewatering well configuration was used for the Risk Assessment Case,
and the results are shown in Figure 15-21 and Figure 15-22.
| | 15-18 | |
| SSR Mining Inc. | Hod Maden Project | | January 7, 2026 |
| Technical Report Summary | | SLR Project No.: 123.000320.00001 |
Figure 15-23: Predictive RPI and
Total Pumping Rate from Dewatering Wells - Risk Management Scenario
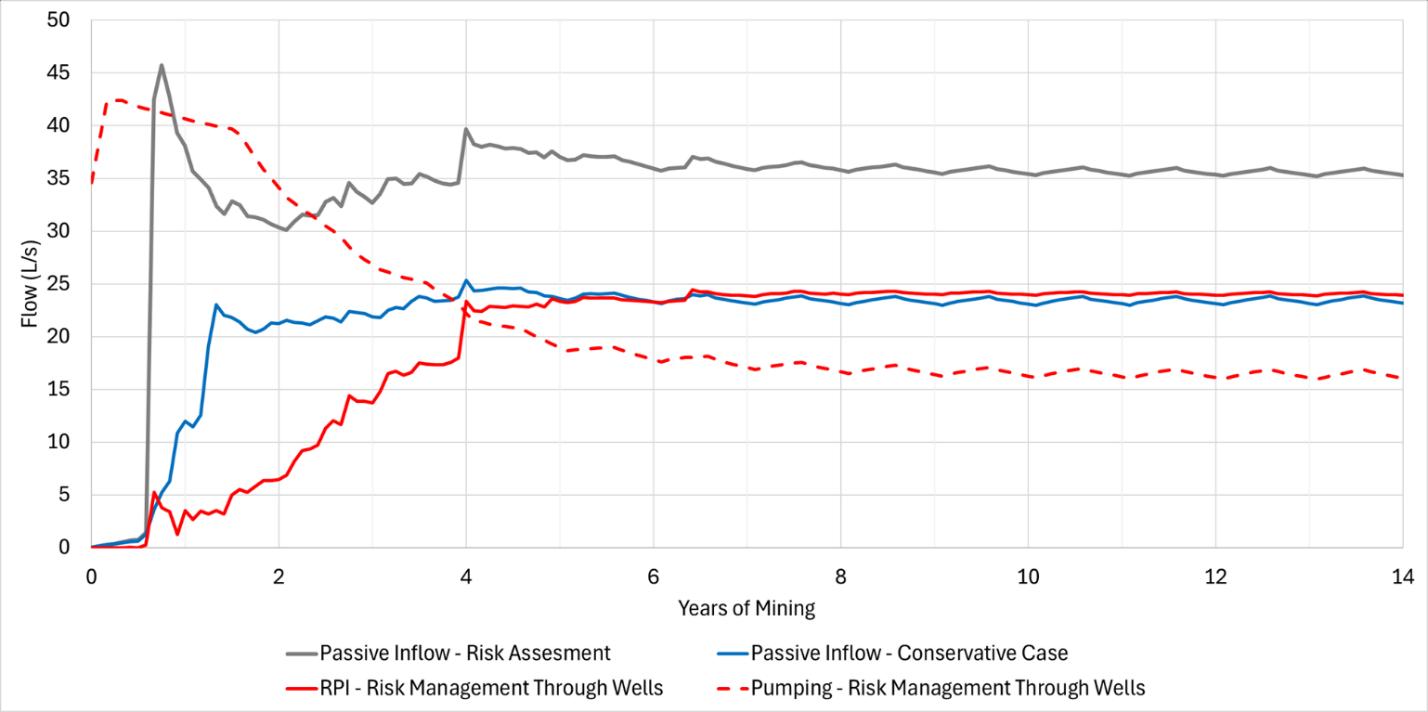
Figure 15-23
Flow (L/s)
50
45
40
35
30
25
20
15
10
5
0
Years of Mining
0
2
4
6
8
10
12
14
Passive Inflow - Risk Assessment
RPI - Risk Management Through Wells
Passive Inflow - Conservative Case
Pumping - Risk Management Through Wells
Figure 15-24: Predictive Total Pumping
Rate From All Wells - Risk Management Scenario
Figure 15-24
Flow (L/s)
50
45
40
35
30
25
20
15
10
5
0
Years of Mining
0
1
2
3
4
5
6
7
8
9
10
11
12
13
HWR-13
E2
E1
W1
W2
HWR-12
RPI
Combined Pumping Rate
Total Dewatering Rate
The results of this risk management simulation show that the inclusion
of well-placed dewatering wells can effectively mitigate the peak underground inflows reported by the Risk Assessment Case, preventing
contact water rates to surpass the temporary water treatment plant capacity.
| | 15-19 | |
| SSR Mining Inc. | Hod Maden Project | | January 7, 2026 |
| Technical Report Summary | | SLR Project No.: 123.000320.00001 |
| 15.4.11 | Ongoing Model Uncertainty and Sensitivity Analysis |
Sensitivities of the 2025 Updated Groundwater model are currently ongoing
and scheduled to be finalized during Q4 of 2025. Uncertainty and sensitivity analyses will follow the template of previously carried out
analyses for the 2022 version of the numerical model.
The planned numerical groundwater model sensitivity scenarios are described
in Table 15-2. For each sensitivity scenario various hydrogeological predictions will be assessed, including:
| · | Maximum predicted residual passive inflow to the underground mine |
| · | Dewatering rate after 3, 5, 10 and 14 years of mining |
| · | Equivalent average pumping rate for complete mining period |
| · | Maximum impact to baseflow during mining |
| · | Number of springs within 5 m drawdown extent |
| · | Maximum extent of 5 m cone of drawdown |
Table 15-2: Summary of Planned Sensitivity
Analysis
Planned Sensitivity
Scenario |
Description |
| A |
Hydraulic conductivity of the overburden increased by a factor of 5 |
| B |
Overburden assumed as isotropic (vertical hydraulic conductivity increased by a factor of 10) |
| C |
Riverbed conductance at around the diversion channel inlet and outlet increased by a factor of 10 |
| D |
Hydraulic conductivity of the fractured andesite zones increased by a factor of 5 |
| E |
Hydraulic conductivity of the fractured andesite zones decreased by a factor of 5 |
| F |
Recharge and hydraulic conductivity of all units decreased by a factor of 2 |
| G |
Recharge and hydraulic conductivity of all units increased by a factor of 2 |
| H |
Storage parameters increased (specific yield increased by a factor of 2; specific storage increased by a factor of 5) |
| I |
Storage parameters decreased (specific yield decreased by a factor of 2; specific storage decreased by a factor of 5) |
| JJ |
Unlined River During Mining and Post-Mining Condition (catastrophic*) |
The amount of water required for mining activities is defined in section
13.12.7 of this report. Water will be supplied from the groundwater wells installed close to mine workings (Figure 15-25). These
wells will also help to reduce mine inflow. As the mine progresses to later stages, it is estimated that the production rate of the wells
will be impacted due to extension and deepening of the drawdown cone. To overcome the risk of having water shortage from the dewatering/water
supply wells, two additional water wells are proposed outside of the mine impact area. The locations of these wells were selected where
Surakev and Maden creeks won’t be lined. Water from both surface water and groundwater can be abstracted via these two wells in
case of water shortage. The location of the proposed well locations are shown in Figure 15-25.
| | 15-20 | |
| SSR Mining Inc. | Hod Maden Project | | January 7, 2026 |
| Technical Report Summary | | SLR Project No.: 123.000320.00001 |
Figure 15-25: Water Supply
and Dewatering Well Locations
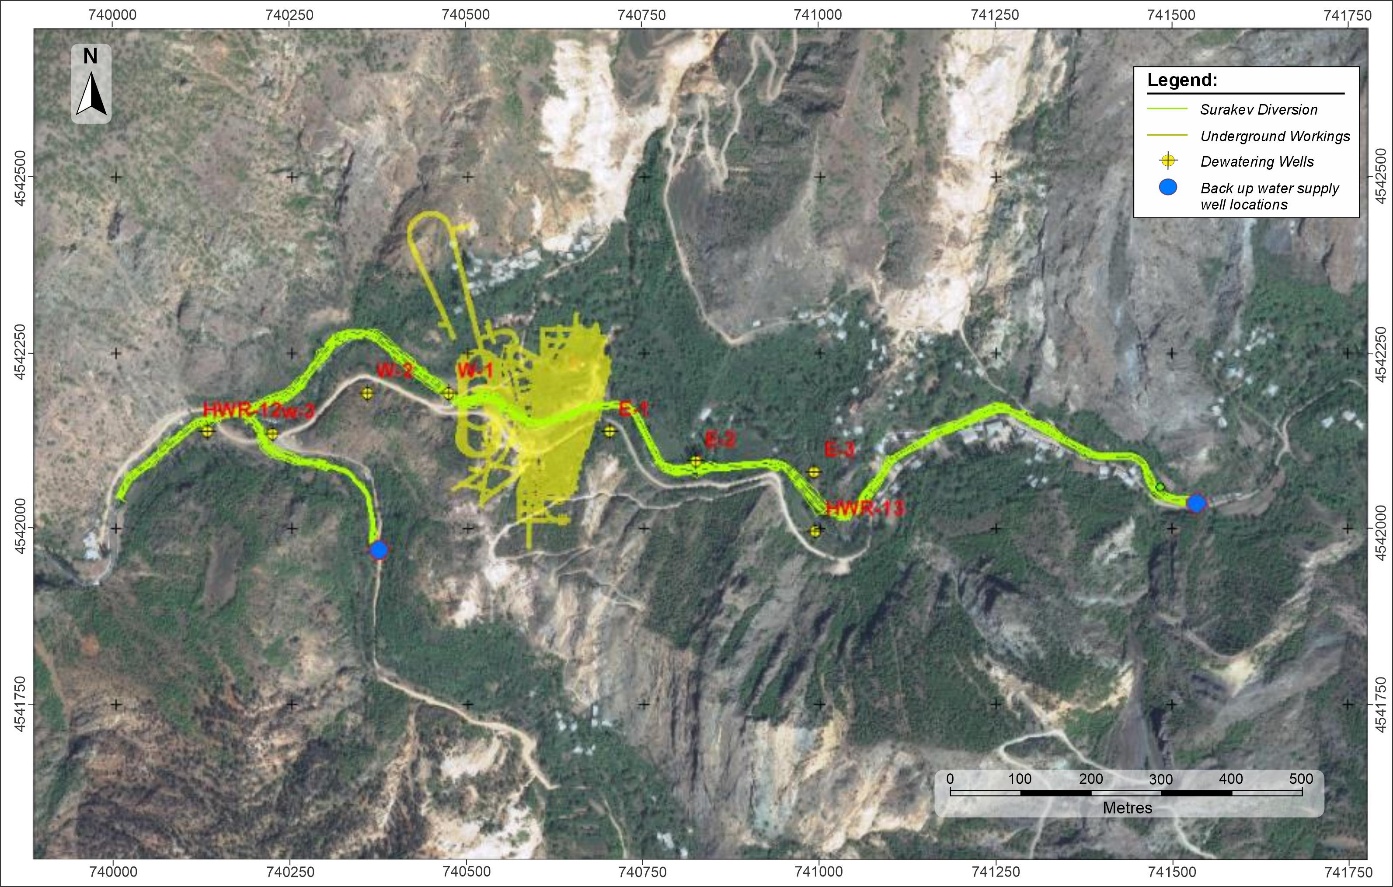
Figure 15-25
740000
740250
740500
740750
741000
741250
741500
741750
4541750
4542000
4542250
4542500
0
100
200
300
400
500
Metres
Legend:
Surakev Diversion
Underground Workings
Dewatering Wells
Back up water supply well locations
Source: SRK 2020 (Note: Dewatering wells used for 2022 Numerical Sensitivities
are show for spatial reference only)
| 15.5 | Hydrology and Water Management |
| 15.5.1.1 | Regional Hydrology |
The Project site is located within the Çoruh Basin, a key hydrological
system in northeastern Türkiye characterized by steep, rugged terrain, and highly variable flow patterns. The basin experiences a
transitional climate between coastal to continental conditions, leading to significant seasonal variations in river discharge. Peak flows
typically occur in the spring due to snowmelt, while lower flows are observed in the summer and early autumn when precipitation is minimal.
The Çoruh River, along with its tributaries, forms the primary
drainage network in the region and is highly responsive to seasonal precipitation and snowmelt from higher altitudes. Near the project
site, the Maden Creek and Büyük Creek merge to form the Şurakev Creek, which later joins the Çoruh River after
receiving flow from the Saliçor Creek. The Çoruh River continues its northwest-north flow and eventually discharges into
the Black Sea within Georgian territory.
The variability in flow rates throughout the year makes the basin vulnerable
to flooding during wet periods and water scarcity during dry periods, presenting challenges for water management and infrastructure planning.
| | 15-21 | |
| SSR Mining Inc. | Hod Maden Project | | January 7, 2026 |
| Technical Report Summary | | SLR Project No.: 123.000320.00001 |
| 15.5.1.2 | Project Site Hydrology |
The hydrology of the Project area is strongly influenced by the steep
terrain and significant elevation changes, ranging from 2,830 masl at the highest point to 300 masl at the lowest point, where the basin
meets the Çoruh River. This elevation difference of approximately 2,500 m directly impacts the distribution and type of precipitation,
with lower elevations primarily receiving rainfall, while snowfall is prevalent at higher altitudes.
High flow rates are typically observed in the vicinity of project area
between April and May dominated by snow melting from the higher altitudes. In addition to significant snow melting, groundwater discharge
(baseflow) was observed in surface water measurements on a regular basis.
The regional drainage with respect to the Project consists of south
flowing Büyük Creek and north flowing Maden Creek which confluence east of the Project to form Şurakev Creek - the main
stream through the Project.
The hydrology of the Project area will be influenced by the infrastructure
associated with mining operations, which are located within two primary drainage systems. To the south, the Şurakev Drainage contains
the underground workings, surface dewatering wells, processing areas, truck shop, administration buildings, contact water pond, water
treatment plant, and NAG waste rock dump (WDF) primarily for overburden material, along with associated surface water diversions, based
on the 2022 mine layout.
To the north, the Saliçor Drainage includes the tailings storage
facility (TSF), PAG waste rock dump facility (WDF), drainage collection ponds (over liner and under liner), and surface water diversions,
as well as access roads.
These two drainage systems are separated by a high ridge, which is penetrated
by a tunnel used for the conveyance of waste rock, tailings slurry, and reclaimed water from the TSF and contact water ponds.
| 15.5.1.3 | Flow Measurements |
Continuous surface water flow measurements were carried out at four
stream gauges (called AGI), namely AGI-1, AGI-2, AGI-3, and AGI-4, around the Project Site. The information regarding the stream gauges
is given in Table 15-3 and located in Figure 15-26.
Table 15-3: Summary Information
of Stream Gauges (AGI)
| ID |
X |
Y |
Stream |
Catchment Area (km2) |
Description |
| AGI-1 |
744220 |
4541443 |
Büyük C. |
41.45 |
Upstream of project area |
| AGI-2 |
739558 |
4541864 |
Şurakev C. |
80.17 |
Downstream of project area |
| AGI-3 |
740167 |
4542071 |
Maden C. |
9.25 |
Tributary to main creek |
| AGI-4 |
738027 |
4544338 |
Saliçor C. |
9.98 |
Downstream of TSF |
| | 15-22 | |
| SSR Mining Inc. | Hod Maden Project | | January 7, 2026 |
| Technical Report Summary | | SLR Project No.: 123.000320.00001 |
Figure 15-26: Location of Stream
Gauges (AGI)
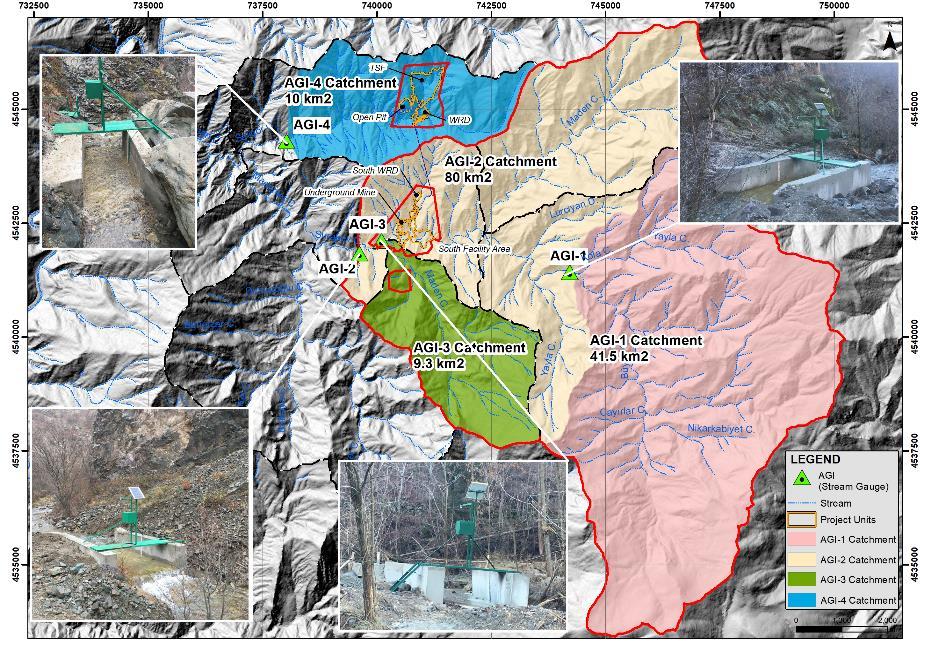
Figure 15-26
732500
735000
737500
740000
742500
745000
747500
750000
4535000
4537500
4540000
4542500
4545000
AGI-4 Catchment
10 km2
AGI-2 Catchment
80 km2
AGI-3 Catchment
9.3 km2
AGI-1 Catchment
41.5 km2
AGI-4
AGI-3
AGI-2
AGI-1
LEGEND
AGI (Stream Gauge)
Stream
Project Units
AGI-1 Catchment
AGI-2 Catchment
AGI-3 Catchment
AGI-4 Catchment
Source: SRK 2022
Flow monitoring data obtained from the State Hydraulic Works (DSİ)
were evaluated within previous studies (SRK, 2022). Descriptive statistics for the 2018–2021 daily flow records are presented in
Table 15-4.
Table 15-4: Descriptive Statistics
of Daily Streamflow Records (m3/s) (2018-2021)
| Descriptive Statistic |
AGI1 |
AGI2 |
AGI3 |
AGI4 |
| Mean |
0.51 |
0.68 |
0.05 |
0.02 |
| Median |
0.23 |
0.33 |
0.03 |
0.01 |
| Standard Deviation |
0.62 |
0.77 |
0.05 |
0.03 |
| Range |
3.47 |
3.93 |
0.30 |
0.18 |
| Minimum |
0.09 |
0.13 |
0.02 |
0.002 |
| Maximum |
3.56 |
4.06 |
0.32 |
0.18 |
| Count (days) |
1,431 |
1,431 |
1,431 |
1,431 |
Source: SRK 2022
Analysis of flow and precipitation records indicates that streamflow
in the Saliçor and Şurakev Creek is primarily influenced by spring precipitation and snowmelt originating from higher elevations
around the Project site. Snowmelt typically begins in early March, peaks in April and May, and gradually declines through July. From August
to February, flows are sustained mainly by baseflow from groundwater discharge. Based on available data, all AGI locations show perennial
flow, and neither the Saliçor nor the Şurakev Creek becomes dry.
| | 15-23 | |
| SSR Mining Inc. | Hod Maden Project | | January 7, 2026 |
| Technical Report Summary | | SLR Project No.: 123.000320.00001 |
Figure 15-27 presents the monthly average flow rates and the corresponding
hydrograph derived from the 2018–2021 monitoring data.
Figure 15-27: Monthly Average
Streamflow Measurements (2018-2021)
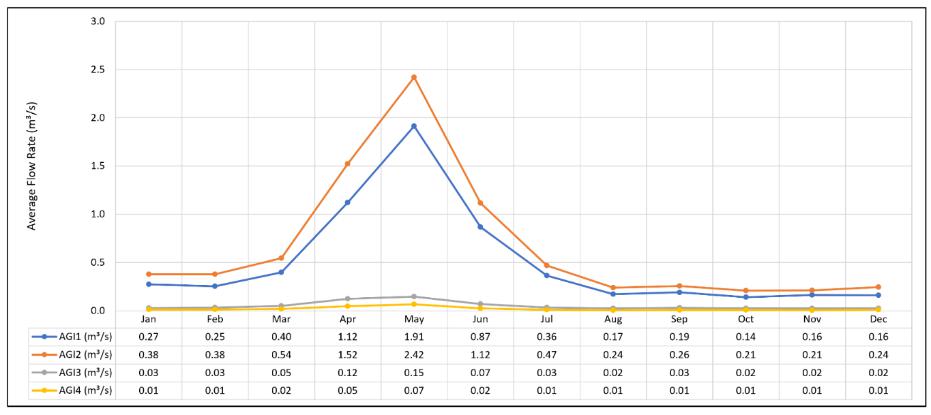
Figure 15-27
Average Flow Rate (m3/s)
3.0
2.5
2.0
1.5
1.0
0.5
0.0
AGI1 (m3/s)
AGI2 (m3/s)
AGI3 (m3/s)
AGI4 (m3/s)
Jan
0.27
0.38
0.03
0.01
Feb
0.25
0.38
0.03
0.01
Mar
0.40
0.54
0.05
0.02
Apr
1.12
1.52
0.12
0.05
May
1.91
2.42
0.15
0.07
Jun
0.87
1.12
0.07
0.02
Jul
0.36
0.47
0.03
0.01
Aug
0.17
0.24
0.02
0.01
Sep
0.19
0.26
0.03
0.01
Oct
0.14
0.21
0.02
0.01
Nov
0.16
0.21
0.02
0.01
Dec
0.16
0.24
0.02
0.01
Source: SRK 2022
Following this period, streamflow monitoring was interrupted due to
a flooding event that damaged the AGI stations. The gauges are under reconstruction and are planned to be reinstated as part of the Project’s
Environmental Monitoring Program, in accordance with the commitments outlined in the Environmental Impact Assessment (EIA).
The mining operation will require water to process ore and generate
concentrate product, paste backfill, and tailings slurry. While the Processing Plant primarily requires process water with few quality
restrictions, a portion of the demand must be met with relatively clean raw water.
A key component of the Project’s water management strategy is
the reuse of process and contact water to minimize discharge. Contact water, defined as water that has interacted with mining or process
areas, will be recycled where practical and discharged only following treatment or when water-quality monitoring confirms compliance with
applicable standards. Non-contact water, originating from undisturbed catchments, will be diverted around active areas through surface
water channels, reducing contact-water generation and limiting sediment-laden runoff to downstream watercourses.
The site-wide water balance was initially developed by SRK in 2020 to
evaluate feasibility-level water availability and infrastructure sizing. It was subsequently refined in 2022 as part of the Water Resources
Impact Assessment (SRK 2022). The current 2025 update builds upon the 2022 version to reflect revised mine scheduling, construction sequencing,
and updated site layouts (SRK 2025a).
The updated framework represents the current configuration of the Project’s
water-management system and is structured to simulate both the Construction Phase and the Operational Phase to evaluate the adequacy of
the proposed water-management strategies. The following revisions summarize the main updates in the 2025 model:
| | 15-24 | |
| SSR Mining Inc. | Hod Maden Project | | January 7, 2026 |
| Technical Report Summary | | SLR Project No.: 123.000320.00001 |
·
The Aggregate Pit at North Valley has been removed.
·
A Temporary Water Treatment Plant (TWTP) has been added to represent construction-phase contact-water management.
| · | Climatic inputs and stochastic weather-generation (WGEN) parameters have been updated using on-site data collected since 2022. |
·
Discrete design-storm module has been introduced to evaluate system response under extreme rainfall events.
·
Groundwater inflows for the underground mine and Saliçor Tunnel have been refined based on the 2025 hydrogeological update
(SRK 2025a).
| · | Water-supply prioritization has been revised to draw primarily from groundwater dewatering sources. |
| · | Mine schedule and water-demand inputs have been updated using current production planning data and the Environmental and Social Impact
Assessment (Golder 2023a). |
The 2025 model incorporates interim assumptions consistent with current
mine planning while awaiting completion of detailed design updates. Pending confirmation of geotechnical suitability and final location,
the NAG-WDF was not included in the current configuration. As an interim measure, all waste material is routed to the PAG-WDF at North
Valley until final waste management designs are confirmed.
Key elements that remain subject to confirmation or update include:
| · | Final TSF design, staging, and phase-specific operating rules. |
·
Updated waste management plan (especially WDF may be required to store PAG material in South Valley), including deposition locations
and capacities.
| · | Final design parameters and material properties for WDFs, including staging and phase sequencing. |
·
Water management strategy at North Valley, including design parameters for underdrain and overdrain ponds.
| · | Updated mine layouts for the North and South Valleys. |
| · | Final design and sizing of the contact water pond. |
·
Final design and siting of the permanent WTP and discharge infrastructure.
·
Paste backfill schedule and tonnages, including water-demand integration.
·
Process-water demand estimates to be refined based on final plant design.
These pending design inputs are not expected to change the overall water-management
approach but may influence localized storage capacities, water-routing efficiencies, and seasonal water-balance variability. Future model
updates will integrate the final TSF and WDF designs and refined operational data to improve estimates of contact-water volumes and support
load-balance and water-quality predictions.
| | 15-25 | |
| SSR Mining Inc. | Hod Maden Project | | January 7, 2026 |
| Technical Report Summary | | SLR Project No.: 123.000320.00001 |
Construction-Phase Water Management
During construction, the primary focus is on managing contact water
generated from tunneling, underground development, and surface works before the permanent infrastructure is fully commissioned. A Temporary
Water Treatment Plant (TWTP) is used to treat contact water collected from the Saliçor Tunnel, underground workings, and active
construction areas.
The Water Treatment Pond provides short-term storage to buffer inflow
variability and minimize uncontrolled discharge during storm events. Treated water is discharged to the Şurakev drainage or reused
for dust suppression and batching as water quality permits.
Runoff from undisturbed areas will be diverted around construction zones
through temporary channels and perimeter drains to minimize contact-water generation. Groundwater inflows from the tunnel and underground
development will be captured and routed to the Water Treatment Pond, and than to TWTP system. Water supply for potable and non-potable
use will be drawn from surface wells, with additional capacity available through temporary abstraction points if required.
Operational-Phase Water Management
Once the Process Plant and permanent facilities are operational, water
management will shift toward maximizing internal reuse and minimizing discharge. Reclaim water from the TSF will serve as the primary
process make-up source, supplemented by underground mine dewatering and surface dewatering wells. Contact water from active mining and
waste storage areas will be routed to the Water Treatment Pond for reuse or treatment before discharge.
Non-contact water from undisturbed catchments will be diverted through
engineered surface-water channels to reduce the volume of contact water requiring management. Excess contact water, when not reused in
the process circuit, will be directed to the permanent WTP for treatment prior to controlled release. The water-management system is designed
to provide sufficient storage to retain contact water during wet periods and balance reclaim and discharge during dry seasons.
In the 2025 mine configuration, the Project area occupies two main drainages
separated by a topographic ridge, connected by the Saliçor Tunnel for the transfer of tailings slurry, waste rock, reclaim water,
and contact water between the valleys.
Saliçor Drainage (North Valley): Contains the Tailings
Storage Facility (TSF), PAG-WDF, underdrain and overdrain collection ponds, access roads, and surface-water diversions. The Aggregate
Pit is no longer included in the current design, and all waste material is simulated to be temporarily routed to the PAG-WDF at North
Valley under the interim mine plan.
Şurakev Drainage (South Valley): Hosts the underground
mine workings, surface dewatering wells, Process Plant, truck shop, administration facilities, Water Treatment Pond, Temporary Water Treatment
Plant (TWTP), and the permanent Water Treatment Plant (WTP).
The South Valley layout remains under development and will be refined
as final engineering designs for the process and water-management systems are completed.
The NAG-WDF is currently excluded from the 2025 model pending confirmation
of its geotechnical suitability and final location. NAG waste rock placement and associated surface-water diversions are also located
within this drainage.
In addition to the water balance study, A load balance module was added
to the site-wide water balance model by SRK on May 2024, including the following Source Terms.
| | 15-26 | |
| SSR Mining Inc. | Hod Maden Project | | January 7, 2026 |
| Technical Report Summary | | SLR Project No.: 123.000320.00001 |
| · | NAG WDF (Previously Designed at South Valley) |
| · | Water Treatment Plant (WTP) |
SRK identified that additional Source Terms need to be incorporated
into the water balance, including:
| · | Temporary Waste Rock Dumps prior to completion of Saliçor Tunnel |
| · | Rockfill and Filters used in TSF Construction |
| · | Cut and fill for road construction and other construction fills (such as plant site) |
| · | Long term seepage from TSF |
SLR notes that the completion of the site-wide water balance model with
all the relevant sources and the development of an integrated site-wide surface water management plan are required.
Construction Phase Water Treatment Capacity
During the construction phase, water management focuses on capturing
and treating contact water from tunneling, underground development, excavation, and early infrastructure works. The performance of the
TWTP was evaluated under three groundwater inflow scenarios to assess its ability to manage variable inflows.
Within the model, 80, 100, and 120 m3/h treatment capacity
scenarios were evaluated, versus three groundwater inflow scenarios. Model simulations indicate that a treatment capacity of 100 m³/h
is sufficient under the Conservative Groundwater (GW) scenario, while 120 m³/h provides additional operational flexibility under
wetter or higher-inflow conditions. Under the Risk-Assessment GW scenario, localized exceedances of this capacity may occur, requiring
short-term storage or additional active dewatering to prevent overtopping.
Construction Phase Water Supply Evaluation
Construction-phase water demand, estimated at approximately 83 m³/h
(23 L/s), follows the assumptions presented in the ESIA (Golder 2023a) and provides a reasonable basis for preliminary planning. This
value represents a preliminary estimate; the final design details, activity schedules, and water-use requirements will be confirmed as
construction planning advances and the Project’s detailed engineering progresses.
The current evaluation was undertaken to assess the adequacy of the
licensed supply wells (HWR-01, HWR-02, and HWR-12) and to determine the extent of freshwater supplementation that may be required as mitigation.
The analysis incorporated treated contact water from the TWTP (100 m³/h nominal capacity) together with freshwater abstraction from
the licensed wells.
| | 15-27 | |
| SSR Mining Inc. | Hod Maden Project | | January 7, 2026 |
| Technical Report Summary | | SLR Project No.: 123.000320.00001 |
The current wellfield has an estimated capacity of approximately 35
m³/h, based on ongoing groundwater modelling under conservative conditions. The first allocation from this capacity is reserved for
potable water supply (2.8 m³/h) and dust control (2.5–5.0 m³/h), while the remaining potential can be directed toward
meeting the construction-phase demand of 83 m³/h. However, this combined capacity is insufficient to meet total demand, and the current
licensed well configuration therefore indicates a water deficit during early construction activities.
Model simulations show that while treated contact water from the TWTP
gradually becomes available and offsets part of the demand, temporary shortfalls occur in the early construction period before full dewatering
and treatment operations stabilize (Figure 15-28). These deficits emphasize the need for contingency planning to ensure uninterrupted
water supply during critical construction milestones.
Figure 15-28: Construction Water
Supply Sources Under Current Licensed Well Capacity (Conservative GW - 100 m³/h TWTP)
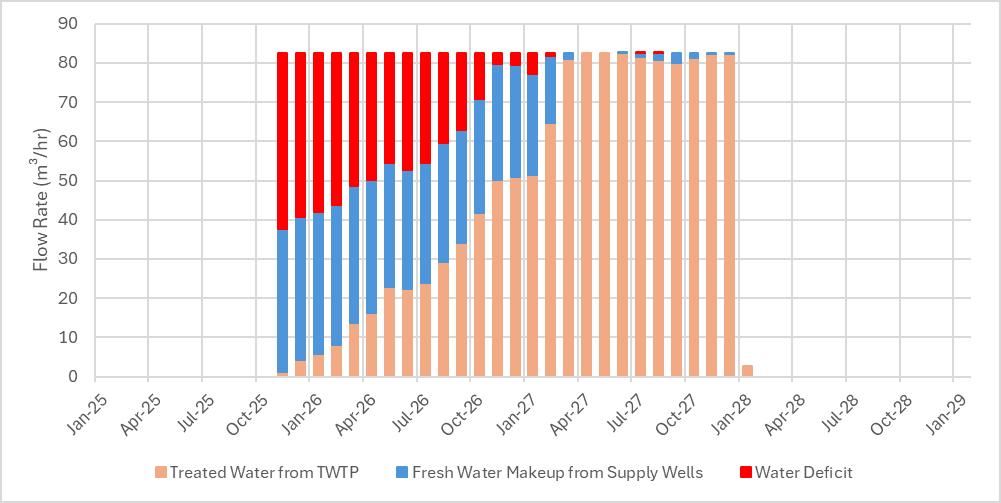
Figure 15-28
Flow Rate (m3/hr)
90
80
70
60
50
40
30
20
10
0
Jan-25
Apr-25
Jul-25
Oct-25
Jan-26
Apr-26
Jul-26
Oct-26
Jan-27
Apr-27
Jul-27
Oct-27
Jan-28
Apr-28
Jul-28
Oct-28
Jan-29
Treated Water from TWTP
Fresh Water Makeup from Supply Wells
Water Deficit
To address this, mitigation measures were evaluated, including the development
of additional groundwater abstraction wells and, if necessary, temporary surface-water withdrawal, subject to permitting.
As described in Section 15.4, groundwater model simulations were undertaken
to assess the feasibility and sustainable yield of additional wells. The results indicate that, while the existing system relies mainly
on contact-water inflows from the underground mine, the initial construction demand can be met using a combination of existing and potential
new wells. This configuration provides readily available freshwater capacity as a backup source, ensuring supply reliability in the event
of limited contact-water generation or delayed treatment-plant commissioning.
Process Makeup Water
The process plant requires a continuous water supply to support ore
processing, paste backfill, and tailings transport. In the 2025 site-wide water balance, plant demand is defined as the difference between
uncontrolled inflows and operational losses.
The priority for makeup water sources in the model is as follows:
| | 15-28 | |
| SSR Mining Inc. | Hod Maden Project | | January 7, 2026 |
| Technical Report Summary | | SLR Project No.: 123.000320.00001 |
| · | TSF reclaim and WDF contact water |
| · | Underground mine dewatering |
| · | RAW Water Makeup (for gland seal and utility use): |
| · | Underground mine dewatering |
| · | Upstream water supply wells, meeting plant utility needs separately from process water |
Modeled process demand rises during plant commissioning, averaging ~40
m³/h in the first year of operation and stabilizing at ~75 m³/h during steady-state production, consistent with the process
plant design basis (~78 m³/h; Ausenco 2024).
As shown in Figure 15-29, process water demand is consistently
met under the Conservative Groundwater (GW) scenario (50th percentile), with supply dominated by reclaimed water from the TSF and WDF
(35–43 m³/h) and underground mine dewatering (30–39 m³/h). The rate of freshwater use is directly related to variations
in underground mine inflows, which control the extent of surface well supplementation over time.
Figure 15-30 compares raw water supply from surface wells across
all groundwater scenarios. Withdrawals remain low, typically < 0.1 m³/h during early operations, with small intermittent increases
in later years when dewatering rates decline. Potable water requirements of approximately 2.8 m³/h are fully met by the upgradient
wellfield.
The permanent WTP, simulated with a nominal treatment capacity of 250
m³/h, provides sufficient capacity to treat contact water and support internal reuse and controlled discharge.
| | 15-29 | |
| SSR Mining Inc. | Hod Maden Project | | January 7, 2026 |
| Technical Report Summary | | SLR Project No.: 123.000320.00001 |
Figure 15-29: Process Plant
Makeup Sources Annual Average Rates (Conservative GW)
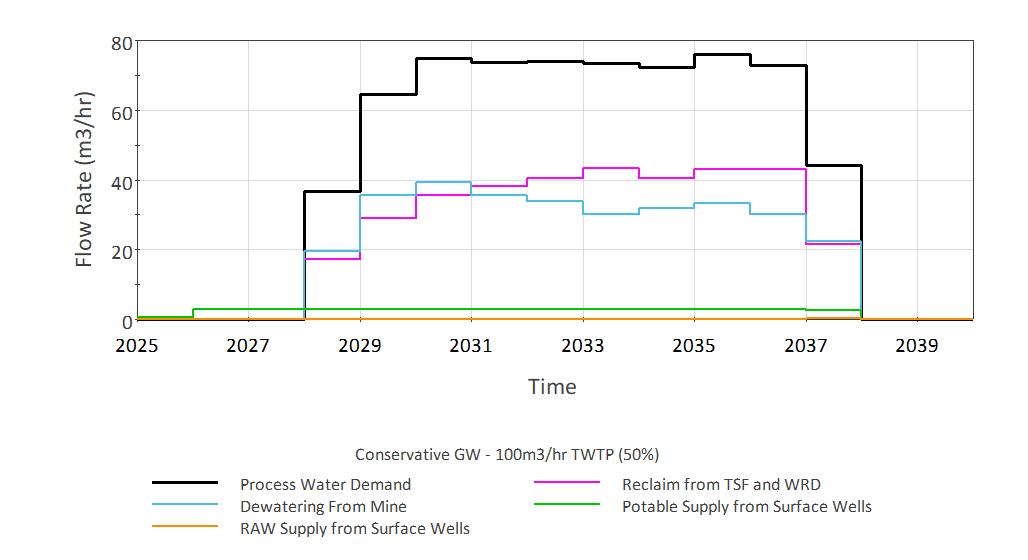
Figure 15-29
Flow Rate (m3/hr)
80
60
40
20
0
Time
2025
2027
2029
2031
2033
2035
2037
2039
Conservative GW - 100m3/hr TWTP (50%)
Process Water Demand
Dewatering From Mine
RAW Supply from Surface Wells
Reclaim from TSF and WRD
Potable Supply from Surface Wells
Source: SRK 2025a.
Figure 15-30: Supply from Water
Wells (All GW Scenarios, 50th Percentile)
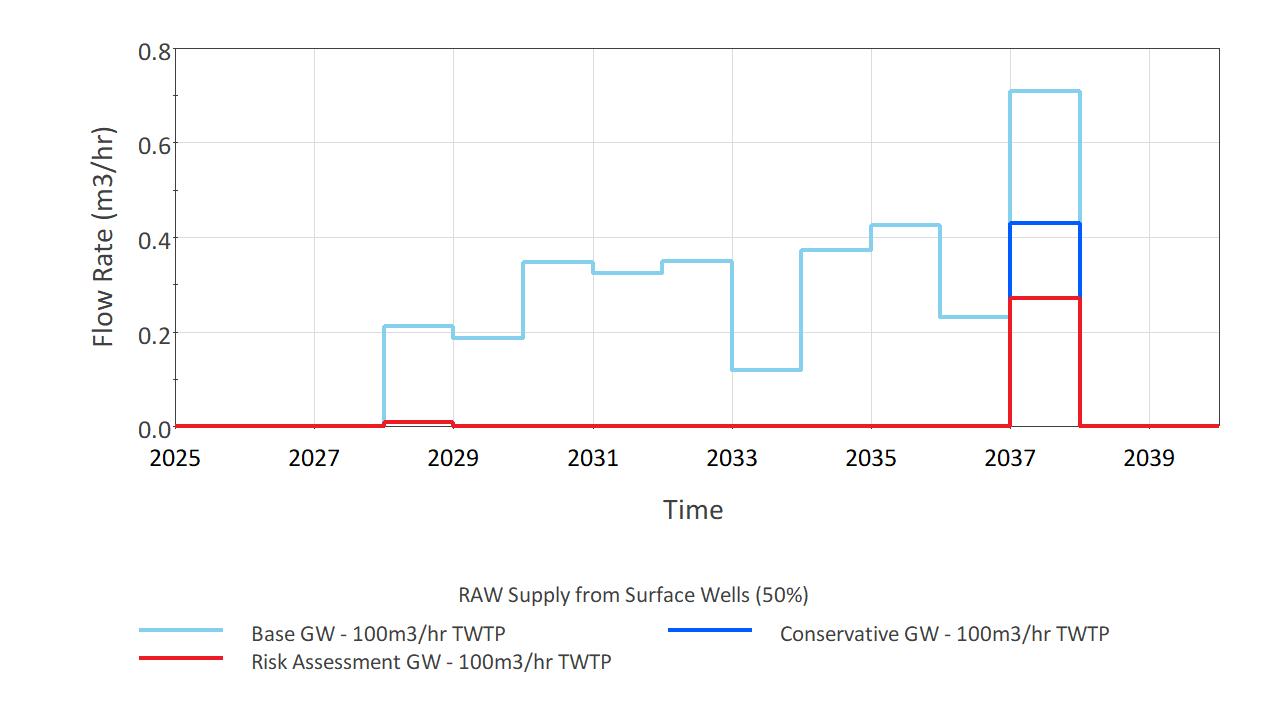
Figure 15-30
Flow Rate (m3/hr)
0.8
0.6
0.4
0.2
0.0
Time
2025
2027
2029
2031
2033
2035
2037
2039
RAW Supply from Surface Wells (50%)
Base GW- 100m3/hr TWTP
Risk Assessment GW - 100m3/hr TWTP
Conservative GW - 100m3/hr TWTP
Source: SRK 2025a.
Potable Water Demand
The upgradient surface dewatering wells are configured to supply the
potable water demand at the process plant.
| | 15-30 | |
| SSR Mining Inc. | Hod Maden Project | | January 7, 2026 |
| Technical Report Summary | | SLR Project No.: 123.000320.00001 |
Potable water requirements, estimated at approximately 2.8 m³/h,
are fully met by the upgradient surface wells throughout operations. While the model results under all groundwater inflow scenarios confirm
that the available wellfield capacity remains sufficient to meet potable supply needs without supplementary groundwater wells outside
of the Şurakev channel are proposed to establish water security.
Underground Mine Dewatering
Groundwater inflows to the underground mine were updated using the 2025
hydrogeological model. The results indicate that inflows will gradually increase as development advances and additional mining levels
are accessed and stabilize eventually.
Under the Base Case scenario, inflows are projected approximately 60
m³/h over the life of mine. Under the Conservative Case, inflows approximately 80 m³/h, while the Risk Assessment Case predicts
peak inflows of up to 165 m³/h during advanced operations.
These inflows represent contact water reporting to underground mine
and it will be directed to the Water Treatment Pond after any losses in the underground mine, prior to treatment at the WTP. Treated water
is reused within the process circuit or discharged under controlled conditions, depending on water-balance requirements.
Tunnel Dewatering
Hydraulic characterization and water level information along the tunnel
are limited due to access and permit difficulties. Groundwater inflows to the Saliçor Tunnel were updated using the 2025 groundwater
model with limited calibration target. Under the Conservative GW scenario, inflows are predicted to peak at approximately 9 m³/h
during initial tunneling and gradually decline as excavation progresses and drainage pathways stabilize. During steady-state conditions,
inflows are expected to range between 3 and 6 m³/h, reflecting seasonal and hydraulic variability.
Water generated from the tunnel is routed to the Water Treatment Pond
in the Şurakev Valley, from where it is pumped to the TWTP during construction and to the WTP during operations. Treated water
is reused in the process-water system, contributing to the site’s overall water-reuse strategy and reducing the need for freshwater
supply.
Surface Dewatering Wells
Surface supply wells are included in the model to provide freshwater
for potable use, raw water makeup, and dust suppression. Under the Conservative GW scenario, the total freshwater availability from the
wellfield is estimated at approximately 35 m³/h (~10 L/s), which is sufficient to meet expected non-contact water demands during
both construction and operations.
During the construction phase, well abstractions primarily support potable
water supply (2.8 m³/h), dust control (2.5–5.0 m³/h), and the portion of construction water demand not met by treated
contact water. As the operational phase commences, these wells continue to provide potable and utility water, as well as limited raw-water
makeup when underground inflows decline.
All water drawn from the supply wells is applied exclusively to meet
freshwater requirements and is assumed to a 20% reduction to account for brine generation under the assumption of reverse-osmosis treatment.
| | 15-31 | |
| SSR Mining Inc. | Hod Maden Project | | January 7, 2026 |
| Technical Report Summary | | SLR Project No.: 123.000320.00001 |
Treated Water Discharge Strategy
During the construction phase, once water treatment output exceeds construction
demands, excess treated water is discharged to the sediment pond and subsequently to the Şurakev. This discharge occurs only after
construction water requirements are fully met and will be subject to future discharge permitting under the Su Kirliliği Kontrolü
Yönetmeliği (Water Pollution Control Regulation). The presented results represent conditions with 100 m³/h TWTP treatment
capacity.
Figure 15-31 illustrates the treated discharge rate under different
groundwater scenarios, highlighting the strong dependence of treated discharge on groundwater inflows and showing how only the Risk Assessment
case generates long-term, high-volume discharges during construction.
Figure 15-31: Construction Phase
Treated Water Discharge (All GW Scenarios, 50th Percentile)
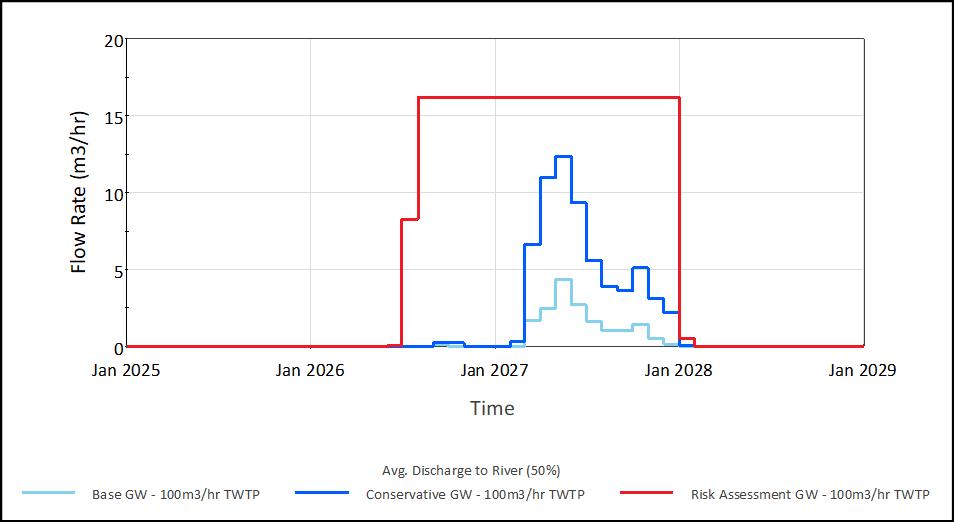
Figure 15-31
Flow Rate (m3/hr)
20
15
10
5
0
Time
Jan 2025
Jan 2026
Jan 2027
Jan 2028
Jan 2029
Avg. Discharge to River (50%)
Base GW - 100m3/hr TWTP
Conservative GW - 100m3/hr TWTP
Risk Assessment GW - 100m3/hr TWTP
Source: SRK 2025a.
During operations, contact water collected in the Water Treatment Pond
is routed to the permanent Water Treatment Plant (WTP), modeled with a nominal treatment capacity of 250 m³/h. Treated effluent
is conveyed through the Sediment Pond prior to controlled discharge to the Şurakev Creek.
Figure 15-32 presents the annual average treated discharge under median
climatic conditions for all groundwater inflow scenarios. Discharge rates are primarily governed by groundwater inflows, ranging from
approximately 40 m³/h early in operations and declining to 20 m³/h under the Base GW scenario. The Conservative GW scenario
maintains average rates of 60–45 m³/h, while the Risk Assessment GW case represents the upper bound, with sustained discharges
exceeding 90 m³/h for much of the mine life.
| | 15-32 | |
| SSR Mining Inc. | Hod Maden Project | | January 7, 2026 |
| Technical Report Summary | | SLR Project No.: 123.000320.00001 |
Figure 15-32: Annual Average and
Cumulative Effluent Discharge to Şurakev Creek (50th Percentile)
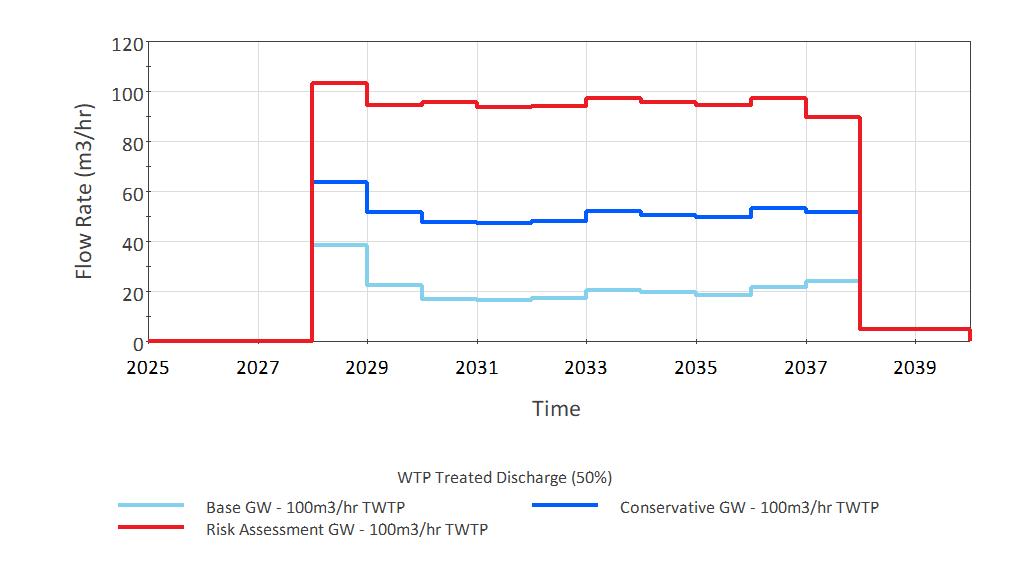
Figure 15-32
Flow Rate (m3/hr)
120
100
80
60
40
20
0
Time
2025
2027
2029
2031
2033
2035
2037
2039
WTP Treated Discharge (50%)
Base GW - 100m3/hr TWTP
Risk Assessment GW - 100m3/hr TWTP
Conservative GW - 100m3/hr TWTP
Source: SRK 2025a.
| 15.5.3 | Surface Water Management |
The surface water management strategy at the site aims to minimize the
volume of contact water by diverting potential run-on to the mine and plant facilities around them and into natural streams. Contact water
is collected and conveyed for industrial use or treated before being released to ensure compliance with environmental standards.
A key aspect of an effective stormwater control strategy is to isolate
mine facilities (tailings, waste rock dumps, etc.) and contact water sources (such as workshop areas and pollution control dams) to minimize
contamination of the fresh water and minimize the contact water discharge from mine site to the environment. The other main objectives
of stormwater management is to mitigate flood risk to protect mine facilities and other civil structures, and to minimize risk of degrading
any water resources under extreme rainfall events.
Each facility designer is responsible for the water management systems
associated with their structures (e.g., WSP for the North Valley, Ausenco for the process plant), although there is no comprehensive site-wide
surface water management plan in place.
The Hod Project mine facilities are located across two distinct sub-catchments:
the Saliçor (North Valley) and the Şurakev (South Valley). In the south, the Şurakev drainage contains critical infrastructure,
including underground operations, truck shops, processing areas, a contact water pond, topsoil storage area, and the PAG WDF. The area
also includes the Main Access Road and the Saliçor Tunnel Connection Road, linking the South Valley to the North Valley facilities.
The South Valley layout remains under development, and the NAG-WDF,
originally proposed in this area, is under refinement due to ongoing geotechnical assessments and uncertainty regarding its final location
and design suitability. Future design updates will confirm its configuration or define an alternative waste storage arrangement.
| | 15-33 | |
| SSR Mining Inc. | Hod Maden Project | | January 7, 2026 |
| Technical Report Summary | | SLR Project No.: 123.000320.00001 |
Due to the site’s location within two primary catchments, surface
water management is studied separately for the Saliçor (North Valley) and Şurakev (South Valley). Flow discharges were determined
based on hydrological studies, which examined various flood return intervals (Q2, Q5, Q10, Q25, Q50, Q100, and Q500) (INR 2024).
In this context, a site-wide flood hydrology report was prepared by
INR (2024) and presented to Directorate General for State Hydraulic Works (DSI). Within the report, the required diversion structures
and peak design flow rates were detailed. In the studies carried out, the Artvin Meteorological Station’s long term historical records
and Intensity-Duration-Frequency (IDF) tables were used. The peak flow rate calculations were made by using the suggested methodologies
by DSI such as Mockus, DSI Synthetic, Rational Method, and frequency analysis and design flow rates were calculated for different recurrence
intervals (Q2, Q5, Q10, Q25, Q50, Q100, and Q500). Channel sizing by INR were carried out for the 100-year flood event with freeboard
or 500-year peak flow rate without freeboard.
In early 2025, SRK completed hydrologic and hydraulic review of the
INR-designed Şurakev Creek Diversion Structure and provided technical comments and recommendations for potential design improvements.
Subsequently, SRK developed a conceptual stilling basin design for the downstream end of the Şurakev diversion to address energy
dissipation requirements. The construction of the Şurakev and Aktaş diversion has commenced based on the DSİ-approved
INR design (INR 2021).
| 15.5.3.1 | Contact Water Management System |
The management of contact water is based on grading all pads and earthworks
to direct runoff into engineered ditches and channels, conveying flow toward the Contact Water Pond located downslope of the paste plant
pad. All major Project pads and internal roads are planned to be lined with asphalt or concrete, with perimeter channels, gradients of
0.5% to 1%, and silt traps to control sediment transport. Contact water drains will be lined with fiber-reinforced concrete, to provide
structural durability and erosion resistance.
Mine dewatering flows will be directed to the Water Treatment Pond,
and when water becomes turbid, it will be routed directly to the WTP to prevent sediment accumulation. Water falling on process bunds
and concrete-lined areas will be classified as process water and managed within the plant’s spillage system, while precipitation
on the TSF will be managed through the decant and reclaim system.
In the North Valley, contact seepage water collected from the WDF overdrain
systems will be conveyed to the lined Overdrain Pond for temporary storage; contact water from the TSF will be collected locally in a
lined sump and pumped to the process plant. When the Process Plant is operational, this water will be reclaimed to meet process water
demands. If these facilities are not active, the collected water will be pumped to the Water Treatment Pond for treatment and subsequent
discharge or reuse.
The contact water management system design will be finalized once the
South Valley layout is confirmed, ensuring drainage pathways, storage facilities, and treatment systems are fully integrated across both
valleys.
| | 15-34 | |
| SSR Mining Inc. | Hod Maden Project | | January 7, 2026 |
| Technical Report Summary | | SLR Project No.: 123.000320.00001 |
| 15.5.3.2 | Non-Contact Water Management System |
Non-contact water management at the Project is designed to minimize
the inflow of surface runoff to active mining and processing areas. Diversion channels and perimeter drains will collect and redirect
clean runoff around disturbed zones. Runoff from administrative and accommodation areas will be classified as non-contact water and discharged
to natural drainages through sediment-control structures.
The TSF and WDF underdrain systems intercept baseflow beneath these
facilities. Water collected from these systems is provisionally classified as non-contact water, subject to routine water-quality verification
to confirm suitability for reuse or controlled discharge. Underdrain flows are conveyed to the TSF/WDF Underdrain Pond, where they may
be reused in the process circuit or discharged following treatment, depending on monitoring results.
Non-contact water management concepts for the North and South Valleys
were originally developed by INR (2021) under the Surface Water Structures Implementation Project (INR-020-001-REP-010). These designs,
prepared for an earlier mine layout, established the initial framework for surface-water diversion planning. The designs are now being
updated under ongoing engineering programs: WSP is leading surface-water design for the North Valley, while Ausenco is responsible for
the South Valley, including the Saliçor Tunnel access road and mine services area (MSA) area, where conceptual drainage studies
are in progress.
The Şurakev and Aktaş creeks surface water engineering
designs (INR 2021; INR 2024) have undergone third-party review (SRK 2025b). Construction of main creeks diversion channels is now underway
using the DSİ-approved INR design (INR, 2021), which remains the governing design basis. The Şurakev diversion is a major
component of the Project’s non-contact water management system, designed to safely convey flows through the valley while reducing
flood risk during construction and operation. The diversion also reduces hydraulic connection between surface water and groundwater, thereby
limiting inflows to the underground mine. Energy dissipation structures were studied by SRK (SRK 2025c) as part of the Stilling Basin
Design for the Downstream End of the Şurakev Channel (Calculation Package No. 01, Task 210, Project USPR001858). The design incorporates
measures to manage flow velocities, minimize erosion, and protect downstream channels.
The INR (2021) channel network, including perimeter, transmission, and
roadside channels with sediment-trap facilities, remains a reference framework for planning. However, it will be refined and validated
once the updated drainage designs by WSP and Ausenco are finalized to reflect the current site configuration and final drainage strategy.
At present, conceptual-level works are being undertaken for the South Valley, focusing on the Saliçor Tunnel access road and the
MSA area, where future updates to the non-contact drainage network are expected.
| 15.5.4 | Path Forward and Ongoing Hydrology & Water Management Work |
The ongoing work focuses on refining the comprehensive water management
approach for the Project, encompassing the site-wide water balance, stormwater management, and surface water systems for both contact
and non-contact water. These refinements address recent updates to the mine plan, facility layouts, and current understanding of site
hydrology, ensuring that diversion, drainage, and treatment systems are aligned with the updated site configuration and effectively integrated
between construction- and operation-phase water systems.
SRK recommends that the recent baseline data collected at the site be
incorporated into the model. This would include:
| | 15-35 | |
| SSR Mining Inc. | Hod Maden Project | | January 7, 2026 |
| Technical Report Summary | | SLR Project No.: 123.000320.00001 |
| · | Expand the on-site meteorological network to include dedicated precipitation, snowpack, and evaporation monitoring stations across
both valleys and at multiple elevations to improve spatial coverage and support hydrological model calibration. |
| · | Reconstruct and maintain continuous streamflow monitoring at key catchments in line with EIA requirements to ensure reliable long-term
flow records for runoff validation and model updates. |
·
The current climate change analysis includes only long-term trend adjustments from the IPCC Sixth Assessment Report (AR6). It should
be expanded to incorporate stochastic variability and projected changes in short-term storm intensities, using updated methods to better
represent climate uncertainty in both stochastic and deterministic simulations.
| · | Ongoing water quality sampling, geochemistry testing, and geochemical model have refined and updated the water chemistry projections
for the Project. Update source terms should be developed and incorporated into the water and load balance. |
While the site-wide water balance model was updated in 2025 to reflect
major mine plan and infrastructure revisions, several design and planning updates remain ongoing. Further refinements are required to
ensure the model accurately represents the final facility layouts, sequencing, and operational strategies. The following items summarize
the key areas where model alignment will be required:
| · | Ongoing design work in the South Valley, including updates to waste dump locations, PAG management, and related stormwater infrastructure,
should be reflected in the water balance model once the revised mine layout and designs are finalized. |
| · | Incorporating outcomes of the ongoing stormwater management design, such as revised diversion channels, sediment control ponds, and
process pond capacities into the site-wide water balance model. |
| · | Integrating any updates to the mine plan and schedule, including changes to production rates, tailings deposition, and waste placement,
to ensure consistency with current operational planning. |
| · | Integrating updated groundwater inflows, dewatering configurations, and underground stope storage representation as new hydrogeological
information becomes available. |
| · | Representing process water ponds, seepage collection ponds, sediment control ponds, and storm surge ponds as dynamic storage elements.
These were previously simplified as nodes due to limited design information and will be updated once final sizing and locations are available. |
| · | Updating the load balance and water quality predictions using the most representative water balance framework once all relevant source
terms are defined. |
A Triggered Action Response Plan (TARP) will be developed once the South
Valley mine layout and stormwater management design are finalized. The TARP will define update actions, performance indicators, and review
triggers to ensure the model remains representative of evolving design and operational conditions.
| | 15-36 | |
| SSR Mining Inc. | Hod Maden Project | | January 7, 2026 |
| Technical Report Summary | | SLR Project No.: 123.000320.00001 |
| 15.6 | Tailings Storage Facility |
The TSF of the Hod Maden mine is located to the north of the main ore
deposit within the Saliçor Valley. The TSF design was initially prepared by INR Mühendislik Müşavirlik A. Ş
(INR) to a prefeasibility study (PFS)-level that was included in the PFS prepared by AMC in 2018 (AMC 2018).
Golder Associates Inc. (now WSP) advanced the design to feasibility
level as part of the Hod Maden 2021 FS. The feasibility-level design was used in preparation of the Design Application Report (DAR) which
was prepared by Golder Associates (Türkiye) Ltd. ŞTI (WSP Golder January 2023) now WSP Türkiye. The DAR was initially
reviewed by the approved Su Yapıları Denetim Firması (SYDF, or water structures inspection company) firm, HIDROGRUP
on behalf of the Ministry and then submitted to the Ministry for review and approval. The Ministry provided the approval for the TSF DAR
via an official letter dated March 14, 2023. WSP is currently engaged and updating the TSF design to a detailed design level suitable
for use in construction as part of ongoing constructability and value engineering reviews with the Artmin project team.
The facility was classified, based on dam break assessment and Canadian
Dam Association (CDA) Dam Safety Guidelines (CDA 2013) guidance, as “High”. The tailings were classified as Class I (hazardous
waste) based on chemistry and physical characteristics of the tailings. It should be noted that dam breach analyses and related inundation
studies are based on hypothetical scenarios. A dam breach analysis and inundation study does not constitute, nor imply a Dam Safety Review
and specifically does not imply any likelihood of failure. Rather, it assumes that a breach is initiated irrespective of likelihood and
assumes hypothetical credible failure modes (e.g. earthquake, overtopping) based on assumed site conditions and historic dam failures
at other locations. The dam break assessment considered two scenarios: a sunny day scenario which assumes that the breach is induced by
an earthquake, and a rainy-day scenario which assumes that the failure type is overtopping and considers the Probable Maximum Flood (PMF).
The volume released through a potential breach would travel south, into the Salebe Creek and propagate into the Saliçor Creek,
Sengan Creek and the Coruh River, based on the inundation maps generated from the dam break assessment.
The dam classification was assessed following the guidelines provided
in CDA and based on:
| · | Population at Risk (PAR) |
| · | Potential Loss of Life (PLL) |
| · | Environmental and Cultural Values |
| · | Infrastructure and Economics |
The selection of dam classification is driven by the chances for loss
of life and loss or deterioration of important fish or wildlife habitat. Environmental losses are anticipated as a result of discharge
of tailings into downstream river network. No residential buildings or other occupied places were identified within the impact zone in
the dam break assessment. Therefore, no permanent PAR is situated within the inundated area. Considering these factors, the dam was classified
as “High”. The TSF was designed to be constructed in three phases with a composite liner system, zoned upstream filter system,
and rockfill dam using the downstream construction method. Phase 1 of the TSF will provide 1.98 Mm3 of capacity with development
of the TSF crest elevation to 1,333 m. The two additional phases (Phase 2 and Phase 3) will result TSF phase capacities of 1.21 Mm3
(crest elevation 1343) and 1.64 Mm3 (crest elevation 1353), respectively, with the maximum capacities based on allowance for
1m of freeboard and the estimated tailings depositional slope.
| | 15-37 | |
| SSR Mining Inc. | Hod Maden Project | | January 7, 2026 |
| Technical Report Summary | | SLR Project No.: 123.000320.00001 |
The struck level (deposition slope is eliminated) TSF capacity (Phase 3)
is approximately 5 Mm3. Based on the current mine plan (Artmin 2025), a total of 4.4 million tonnes (Mt) of tailings with 58%
solids by weight are planned for disposal to the TSF over the 12-year mine life. Tailings are expected to have an average end of filling
tailings dry density of 1.90 t/m3 requiring storage capacity of approximately 2.32 Mm3 plus freeboard. On this basis
of construction and development of the TSF may only need to progress through Phase 2, because a portion may be used as paste backfill
in the underground mine. Table 15-5 summarizes the individual phase capacities of the TSF.
Table 15-5: Summary of TSF Phases
| Phase |
Embankment Crest Elevation
(MASL) |
Maximum Tailings Elevation
(MASL) |
Phase Volume
Mm3 |
Phase Tonnage
Mt |
| Phase 1 |
1333 |
1332 |
1.98 |
3.67 |
| Phase 2 |
1343 |
1342 |
1.21 |
2.33 |
| Phase 3 |
1353 |
1352 |
1.64 |
3.18 |
| Total |
1353 |
1352 |
4.82 |
9.18 |
The tailings slurry will be pumped from the process plant to the TSF
for sub-aerial disposal via spigot points around the perimeter of the TSF. Tailings disposal will be managed to maintain the supernatant
pond away from the embankment towards the northern section of the TSF.
Figure 15-33 provides an overview of the Ultimate (Phase 3) TSF configuration.
| | 15-38 | |
| SSR Mining Inc. | Hod Maden Project | | January 7, 2026 |
| Technical Report Summary | | SLR Project No.: 123.000320.00001 |
Figure 15-33: TSF Ultimate Design
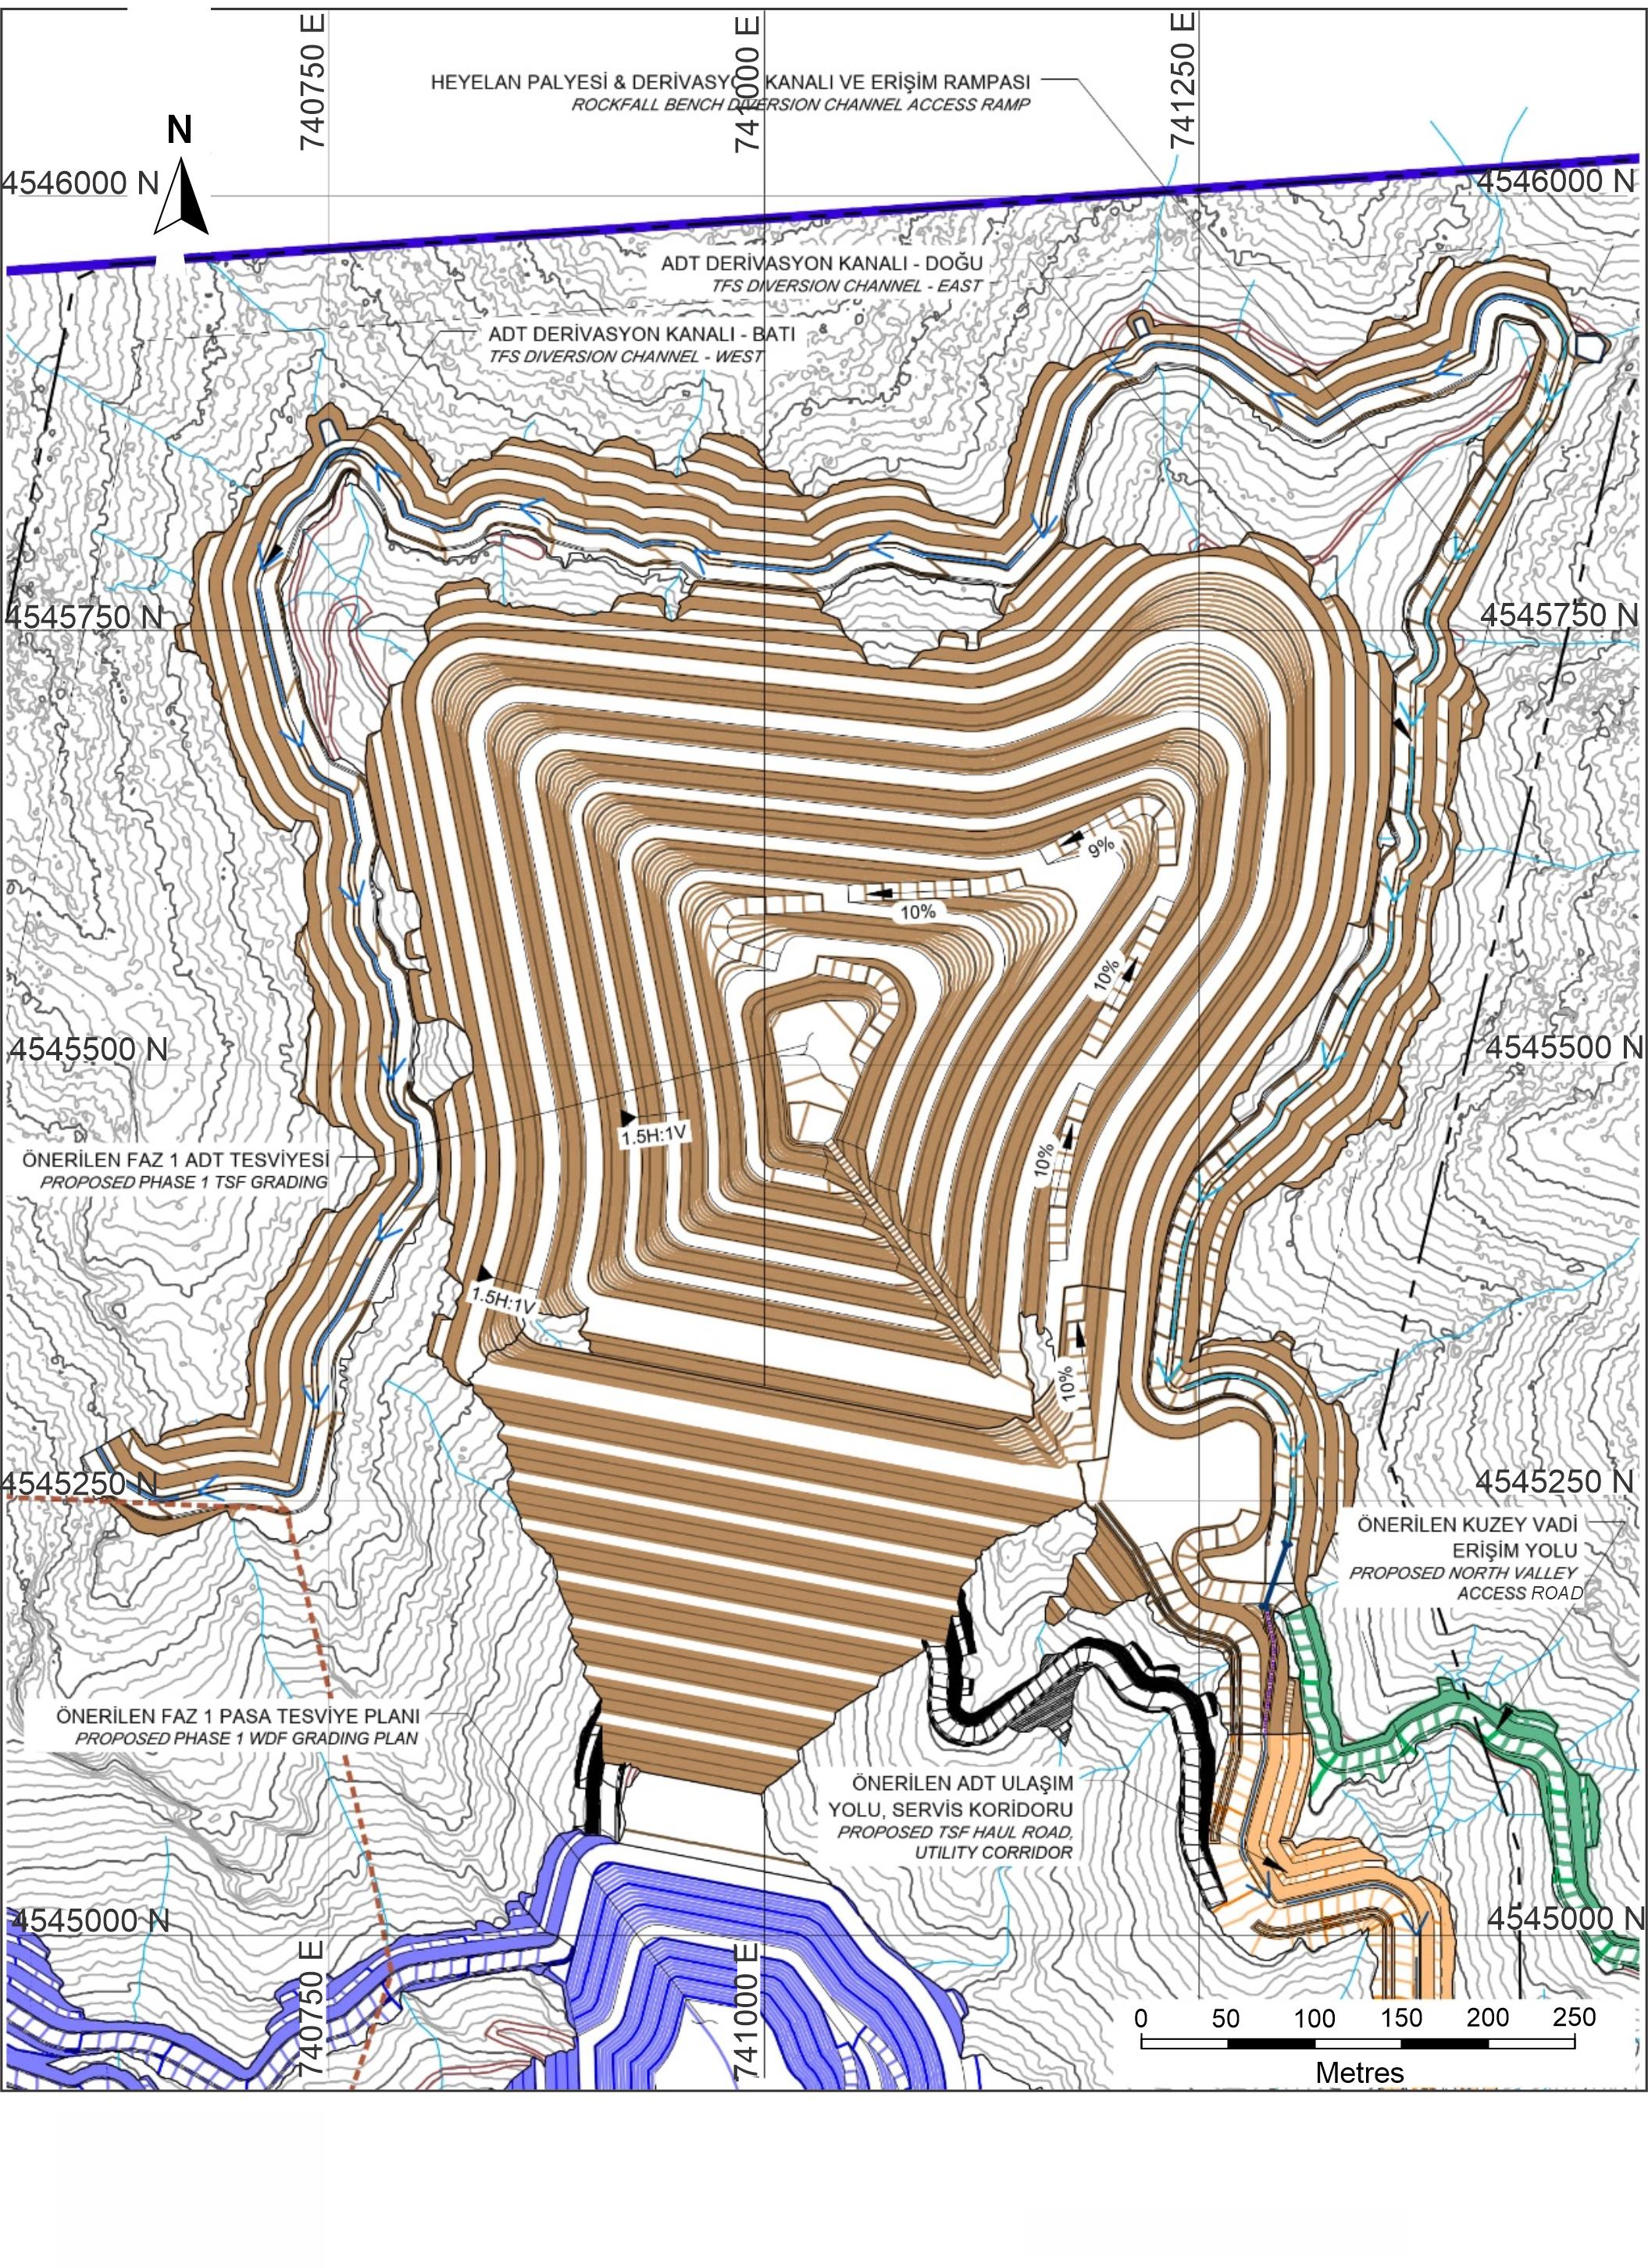
Figure 15-33
ADT DER?VASYON KANALI - DO?U
TFS DIVERSION CHANNEL - EAST
ADT DER?VASYON KANALI - BATI
TFS DIVERSION CHANNEL - WEST
ÖNER?LEN FAZ 1 ADT TESV?YESI
PROPOSED PHASE 1 TSF GRADING
ÖNER?LEN FAZ 1 PASA TESV?YE PLANI
PROPOSED PHASE 1 WDF GRADING PLAN
ÖNER?LEN KUZEY VAD? ER???M YOLU
PROPOSED NORTH VALLEY ACCESS ROAD
ÖNER?LEN ADT ULA?IM YOLU, SERV?S KOR?DORU
PROPOSED TSF HAUL ROAD, UTILITY CORRIDOR
0
50
100
150
200
250
Metres
Source: WSP 2025
| | 15-39 | |
| SSR Mining Inc. | Hod Maden Project | | January 7, 2026 |
| Technical Report Summary | | SLR Project No.: 123.000320.00001 |
| 15.6.2 | Site Geotechnical Investigation and Geological Hazard Assessment |
Eight geotechnical boreholes were drilled in the Project TSF area as
part of a geotechnical investigation to evaluate the bedrock conditions at that site. In addition, as part of the hydrocensus studies
conducted in 2017, four monitoring wells (HWR-7, HWR-8, HWR-9, and HWR-10) were installed within the TSF footprint. Most of these boreholes
and monitoring wells were drilled within the TSF impoundment area. No geotechnical boreholes were drilled within the upper cut areas above
the final crest level, with only monitoring well HWR-8 at a higher elevation in this initial Phase 1 investigation due to access and Forestry
permit limitations. Field geological mapping was used to supplement the initial assessment of the upper cut slopes to support the feasibility
level design.
The TSF footprint is in a steep valley where the dominant geological
unit is strong andesite. Therefore, the design includes relatively steep cut slopes for the impoundment and cut areas above the impoundment
level. The impoundment cut slopes are designed at 1.5H:1V slope with benching at every 10 m vertical interval, which yields a 2.25H:1V
overall slope to satisfy the Turkish Mine Waste Regulation (CBS 2015) requirements for lined impoundments.
Above the lined impoundment areas, Turkish regulations do not dictate
a specific requirement. Accordingly, the best management practices and stability of upper cut slopes were considered while designing these
slopes. The upper cut slopes are sloped at 0.5H:1V with benching at every 15 m vertical interval. Stability of these cut slopes were evaluated
during the design stages based on the available data provided by Artmin and previous studies performed by others.
The following potential geohazards are identified at the TSF site:
| · | Rockslides/rockfalls that may be triggered by rock slope excavations |
| · | Erosion due to storm runoff, snow melt or discharge from natural springs |
At the recommendation of a third-party peer review, additional geotechnical
investigations were conducted to further investigate select areas of upper cut slopes and additional review, including a supplement geotechnical
program, were conducted in 2021 and 2022 (Phase 2 supplemental field investigation program).
The Phase 2 supplemental field investigation program, completed by WSP
in 2022, addressed the third-party peer review concerns, and included nine additional boreholes on the east, west and north slopes of
the TSF, above the impoundment level, up to a maximum depth of 85.5 m. This program included additional surface mapping of geologic conditions
at the borehole locations and accessible areas, and acoustic (in fluid) or optic (in dry or clean holes) televiewer surveying of each
borehole. The results were further analyzed by kinematic assessment with additional stability analysis conducted.
The evaluation and geotechnical studies conducted to-date have concluded
that risks are likely to be limited to bench-scale failures which would be contained on catch benches or mitigated during construction.
During operations of the TSF, WSP recommends that the Owner visually
monitor excavated rock cuts for stability on a quarterly basis and adjust their schedule based on the results of this study and based
on the data available during construction. These visual observations should be made by a qualified engineer or geologist with specific
experience in identification of geohazards associated with large rock excavation and embankment fills.
| | 15-40 | |
| SSR Mining Inc. | Hod Maden Project | | January 7, 2026 |
| Technical Report Summary | | SLR Project No.: 123.000320.00001 |
The following operational controls and monitoring actions are also recommended
during the construction and operations of the TSF:
| · | WSP designed catch benches with at least 6.5 m width for the 15 m high slopes at steep cut slopes at the perimeter of the TSF to retain
rockfalls from both natural and excavated slopes. Rockfall catchment berms and ditches can be cost effective measures for protection of
roads and the perimeter of the TSF lining. |
| · | Routine mapping of exposed bench faces during construction should be implemented to confirm design assumptions and provide early warning
of local areas that may require remediation (scaling, bolting etc.). |
| · | Small-scale failures (i.e., one- to two-bench wedge) are most effectively remediated during excavations by bench scaling, trim blasting
and local modifications to the bench slope and catch bench width. |
| · | The addition of rockfall drapes made up from steel wire nets and mesh attached to the rock faces could be an additional measure against
rockfall and a contingency allowance for this was included in the construction cost estimate. |
| · | Estimates of TSF operating costs should include amounts necessary for installations of prism monitoring systems for the rock excavation
with measurements made monthly. |
| 15.6.3 | TSF Design Components |
The TSF is designed to consist of a zoned-earth, downstream raised rockfill
embankment with a composite-lined impoundment to contain 4.32 Mm3 consisting of a blend of high sulfide (33%) and low sulfide
(67%) tailings. The TSF design includes the following primary components:
| · | A compacted rockfill embankment with a zoned upstream granular filter protection system. |
| · | Composite liner system consisting of two-millimeter (mm), double-sided textured, high-density polyethylene (HDPE) geomembrane over
a geosynthetic clay liner (GCL) with a low-permeability clay liner added within the base of the TSF within the sump region where slopes
are shallower than 3H:1V. The liner system on the upper slopes includes allowance for foundation preparation shotcrete applied to excavations
in bedrock where the surfaces are anticipated to be rough due to effects of blasting. The shotcrete application will allow for slope surface
preparation suitable for the installation of the GCL and HDPE liner system. WSP has experience with similar slope liner systems on steep
canyon municipal landfills TSF side slopes. Shotcrete is typically only required when the bedrock surface is not suitable for liner installation
directly on exposed rock without further improvement. The typical slope liner system detail included in the design is provided in Figure
15-34 for liner and anchor trench details in bedrock. |
| | 15-41 | |
| SSR Mining Inc. | Hod Maden Project | | January 7, 2026 |
| Technical Report Summary | | SLR Project No.: 123.000320.00001 |
Figure 15-34: Typical TSF Impoundment
Liner Detail
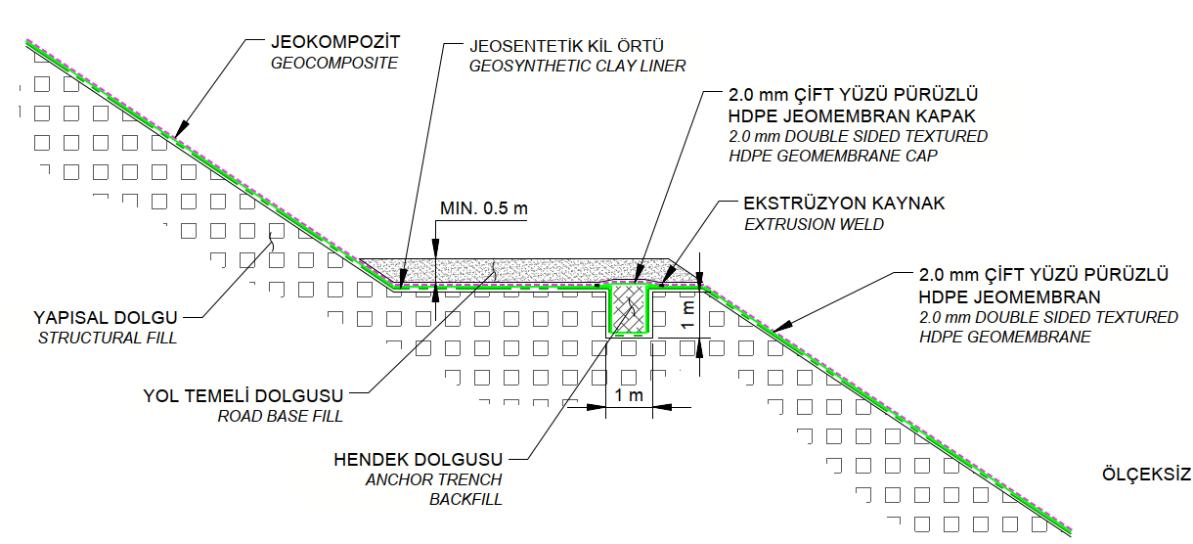
Figure 15-34
JEOKOMPOZ?T
GEOCOMPOSITE
JEOSENTET?K K?L ÖRTÜ
GEOSYHNTHETIC CLAY LINER
MIN. 0.5 m
2.0 mm Ç?FT YÜZÜ PÜRÜZLÜ HDPE JEOMEMBRAN KAPAK
2.0 mm DOUBLE SIDED TEXTURED HDPE GEOMEMBRANE CAP
EKSTRÜZYON KAYNAK
EXTRUSION WELD
2.0 mm Ç?FT YÜZÜ PÜRÜZLÜ HDPE JEOMEMBRAN
2.0 mm DOUBLE SIDED TEXTURED HDPE GEOMEMBRANE
ÖLÇEKS?Z
YAPISAL DOLGU
STRUCTURAL FILL
YOL TEMEL? DOLGUSU
ROAD BASE FILL
HENDEK DOLGUSU
ANCHOR TRENCH BACKFILL
1 m
1 m
Source: WSP 2025.
| · | Impoundment gravity flow underdrain system for monitoring of naturally occurring seeps and springs. The underdrain system will be
constructed in the existing valleys and will be located below the liner system. The underdrains consist of trapezoidal shaped trenches
that include granular drainage materials surrounded by a nonwoven geotextile to provide separation from the adjacent subgrade foundation
and overlying backfill materials. Underdrain flow will be conveyed by a solid HDPE transfer pipe from the toe of the TSF, below the adjacent
WDF, to a lined Underdrain Pond. |
| · | Impoundment overdrain collection and conveyance system to manage tailings seepage water generated as result of natural consolidation
and drainage of excess process water. The overdrain system includes a geocomposite drainage layer above the HDPE geomembrane on the sides
slopes, collection pipes, and a gravel-lined sump with pumping and piping systems (to be designed by Ausenco) located in a riser system
located in the southeast corner of the TSF. During operations, overdrain fluids will be pumped back to Plant Site or into the TSF reclaim
pool; during the closure and post-closure period an allowance for water treatment is required. |
| · | Drainage components, including 1 m thick gravel drainage layer over the base of TSF sump overlain by coarse filter fill and fine filter
fill, respectively. |
| · | Permanent surface water management consisting of sediment basins, dissipation basins, energy dissipators, culverts, and channels. |
| · | Temporary construction surface water management consisting of concrete box culverts and HDPE pipe culverts as well as HDPE solid wall
temporary surface water transfer pipe under the embankment. |
| · | Perimeter roads, benches within the impoundment area, and access ramp to the TSF sump area for access of tailings distribution/reclaim
water pipes. |
| · | Tailings distribution system. |
The proposed TSF is designed based on specific engineering design criteria
which was set by Golder and agreed by Artmin at the onset of the feasibility study and that is being further optimized as part of the
ongoing detailed design being completed by WSP.
| | 15-42 | |
| SSR Mining Inc. | Hod Maden Project | | January 7, 2026 |
| Technical Report Summary | | SLR Project No.: 123.000320.00001 |
The design criteria were developed based on the recommendations or guidance provided by
the Canadian Dam Association (CDA), the Turkish General Directorate of State Hydraulics Works (DSI), the Turkish Ministry of Environment
and Urbanization, and others, and included acceptable design methodologies, critical engineering input values, and certain capacity and
geometrical requirements. The following engineering analyses were performed based on the design criteria set forth to support the TSF
design:
| · | Geological hazard assessment of the TSF |
| · | Borrow source evaluation in the vicinity of the TSF site providing approximate quantities of low-permeability soil and liner bedding
soil to be used during construction |
| · | Limit equilibrium slope stability analysis |
| · | Site response analysis providing displacements for the embankment crest and base |
| · | Filter compatibility evaluation for the TSF embankment upstream filter layers |
| · | Hydrological calculations, channel/culvert sizing, and sediment controls |
| · | Probabilistic TSF operational water balance, providing anticipated reclaimed water and make-up water requirements |
| · | TSF underdrain system capacity calculations |
| · | Liner system uplift, ballast, and anchor trench evaluation |
| · | Overdrain system design calculations |
| · | Large-strain consolidation analysis of tailings providing tailings density, pore pressures, effective stresses, rate of rise, and
tailings seepage water rates |
Tailings deposition model providing anticipated reclaimed water volumes,
recommended spigot locations, spigot spacing, and total available tailings capacity in terms of volume.
| 15.6.4 | Stability Assessment |
The stability of the TSF embankment was assessed for both static and
pseudo-static (earthquake shaking) conditions under Operating Basis Earthquake (OBE) and Safety Evaluation Earthquake (SEE) conditions
using the seismic design parameters obtained through the Probabilistic Seismic Hazard Assessment. The SEE is also commonly referred to
as the Maximum Design Earthquake (MDE). The peak ground acceleration (PGA) values for the OBE and SEE conditions were 0.239g and 0.556g,
respectively. The stability analysis of the TSF embankment downstream slopes indicated a minimum factor of safety (FoS) greater than 1.5
for the static case and a FoS greater than 1.0 for the pseudo-static case.
The short-term stability of TSF impoundment slopes was also evaluated
for static conditions. These slopes will remain open until tailings are deposited in the impoundment. After the tailings deposition, the
slopes will be fully buttressed by tailings. The calculated factor of safety for the impoundment slopes under short-term conditions was
greater than 1.1.
Additionally, stability analyses of upper cut slopes, above the TSF
impoundment level, were performed using the greatest slope heights at the North, East, and West slopes of the TSF impoundment area. Assessments
completed include both overall and bench-scale circular and non-circular failures through the rock mass for static and pseudo-static loading
conditions. The stability analyses of the upper cut slopes indicated acceptable static (FoS ≥1.3) and pseudostatic (FoS>1.1) factor
of safety, except for the lowest bench of the cut slopes on the west slope of the TSF near the embankment for which the FoS for MDE was
less than 1.0.
| | 15-43 | |
| SSR Mining Inc. | Hod Maden Project | | January 7, 2026 |
| Technical Report Summary | | SLR Project No.: 123.000320.00001 |
Based on the shear surface geometry and location estimated in the analyses, these bench slopes are likely going to require
some support to prevent bench-scale rockslides in the case of the MDE occurrence during the closure period. These bench slopes should
be evaluated during construction and improvements through use of additional rock-bolts or other measures should be assessed and taken
as needed such that the FoS will be acceptable during the closure period.
| 15.6.5 | Tailings Delivery, Deposition and Water Management |
The tailings delivery and deposition system will consist of a tailings
pipeline with main header and valves, as required, with a series of spigots. This delivery and deposition system will be constructed for
each of the planned tailings discharge elevations (1,293 m, 1,313 m, 1,333 m, 1,343 m and 1,353 m), as the TSF is raised in phases. The
system will be operated by systematically cycling the discharge of tailings among multiple spigots, to maintain the beach and a reclaim
pool location away from the upstream dam face. Tailings delivery and deposition design is by Ausenco, based on the initial deposition
plan prepared by Golder. The reclaim pumping and piping system is envisioned to consist of floating pumps with power and pipeline systems
located on the adjacent access roads or temporary working platforms.
Surface water channels have been designed such that runoff from the
design storm event of a once in 500 year flood will be conveyed around the TSF.
The TSF has capacity to contain the probable maximum flood event.
An operational probabilistic water balance model was developed using
GoldSim modeling software v. 12.1 to estimate the amount of reclaimable water from the TSF. The average reclaimed water from the TSF pool
is approximately 650 m3/day.
| 15.6.6 | Instrumentation and Monitoring |
An instrumentation and monitoring plan was prepared. The plan includes
a total of 12 survey prisms, 33 vibrating wire piezometers, two accelerometers, and two inclinometers. The plan offers a brief rationale
for the proposed instrumentation and monitoring system, details on instrumentation equipment types and their proposed locations, monitoring
roles and responsibilities, guidelines for definitions of data trends and triggering levels and frequency for data collection and reporting.
| 15.6.7 | Operational Considerations |
WSP has been engaged to prepare an Operations, Maintenance, and Surveillance
(OMS) Plan for the Hod Maden TSF, which will be prepared prior to start of operations. The OMS Plan will be prepared in accordance with
guidelines provided by the Mining Association of Canada and international best practice. The OMS Plan will include recommendations that
Artmin retain WSP to provide Engineer-of-Record (EOR) services in accordance with industry best practices and that Artmin nominate a Responsible
Tailings Facility Engineer (RTFE). These services are expected to include periodic inspections by the EOR during construction, as well
as an annual dam safety inspection and reporting. Artmin has established an independent third-party tailings engineer (Tierra Group) who
conducted a site visit in October 2024 and is expected to involve the services of an Independent Technical Review Board (ITRB) for the
Hod Maden TSF project.
In addition, review by a DSI-approved independent construction inspection
firm (Su Yapıları Denetim Firması [SYDF]) will be required to provide the necessary documentation to the Turkish
Environment and Urbanization Ministry.
| | 15-44 | |
| SSR Mining Inc. | Hod Maden Project | | January 7, 2026 |
| Technical Report Summary | | SLR Project No.: 123.000320.00001 |
Conceptual closure grading plans were developed considering development
through Phase 2 of the TSF. As part of the conceptual closure plan, the reclaim pond in the northeast area of the TSF will be pumped to
a water treatment plant upon completion of deposition and completion of the majority of tailings consolidation. A cover system compatible
with Turkish Mine Waste Regulations will be constructed over the tailings surface to limit infiltration flux contributing to seepage and
contact water runoff from the TSF.
| 15.7 | Waste Rock Facilities |
Geochemical characterization has indicated waste rock from the underground
mining operation will have high sulfide content and is considered potentially acid-generating (PAG). Where possible, waste rock will be
used to backfill underground mine stopes but the remaining balance of waste rock will be transported and deposited in a special-purpose
surface waste rock dump facility (WDF).
While there are other waste material storage areas identified on the
Project site, required to store surplus excavations during the construction, these areas will be operational for a short period and rehabilitated
at the end of construction, so no deliberation is necessary except for the concerns like drainage monitoring and stability. On the other
hand, the WDF will store PAG materials, and requires appropriate design consideration for operation and closure.
After the site selection studies, the Saliçor Valley (North Valley)
option has been proposed as the final WDF location for this Study. Although there are some drawbacks to the North Valley option, such
as distance from the mine, and larger watershed area, it is considered superior to the previous option in terms of geotechnical and social
standpoints. This location also has upside potential for possible future expansion. The amount of excess waste rock from the mine operation
has been estimated to be 733,000 m³ (approximately 1.5 Mt). The design of the WDF (North Valley WDF) has a capacity of 750,000 m³,
allowing for potential growth in resource and subsequent waste quantities.
| 15.7.1 | North Valley WDF Design |
The WDF was designed by INR Consulting & Engineering Inc. (INR)
in 2020 in accordance with industry standards and Mine Waste Regulation (CBS 2015) in effect at the time. Based on INR’s design,
the WDF geometric configuration was set as two 20 m high waste rock lifts placed with 1.75H:1.0V inter bench slopes and a 10 m wide bench
between the lifts (at elevation 1210 masl). This configuration provided approximately 750,000 m3 of waste material storage capacity.
Based on further review and value engineering by Artmin and WSP, the
WDF design has been revised to be consistent with the EIA guidelines which require a “design for closure” approach and for
enhanced stability. WSP has completed an updated design to conceptual level, which will subsequently be advanced to detailed design. The
updated conceptual design achieves the 750,000 m3 target capacity using a revised WDF geometry comprised of overall slopes of 3.0H:1.0V
and a top of waste elevation 10 m higher than the original INR design. This proposed configuration is subject to further geotechnical
engineering analysis on the waste material and an updated stability analysis. A plan view of the conceptual WDF design is presented in
Figure 15-35, and a longitudinal section is presented in Figure 15-36.
| | 15-45 | |
| SSR Mining Inc. | Hod Maden Project | | January 7, 2026 |
| Technical Report Summary | | SLR Project No.: 123.000320.00001 |
Figure 15-35: WDF Conceptual Design
– Plan View
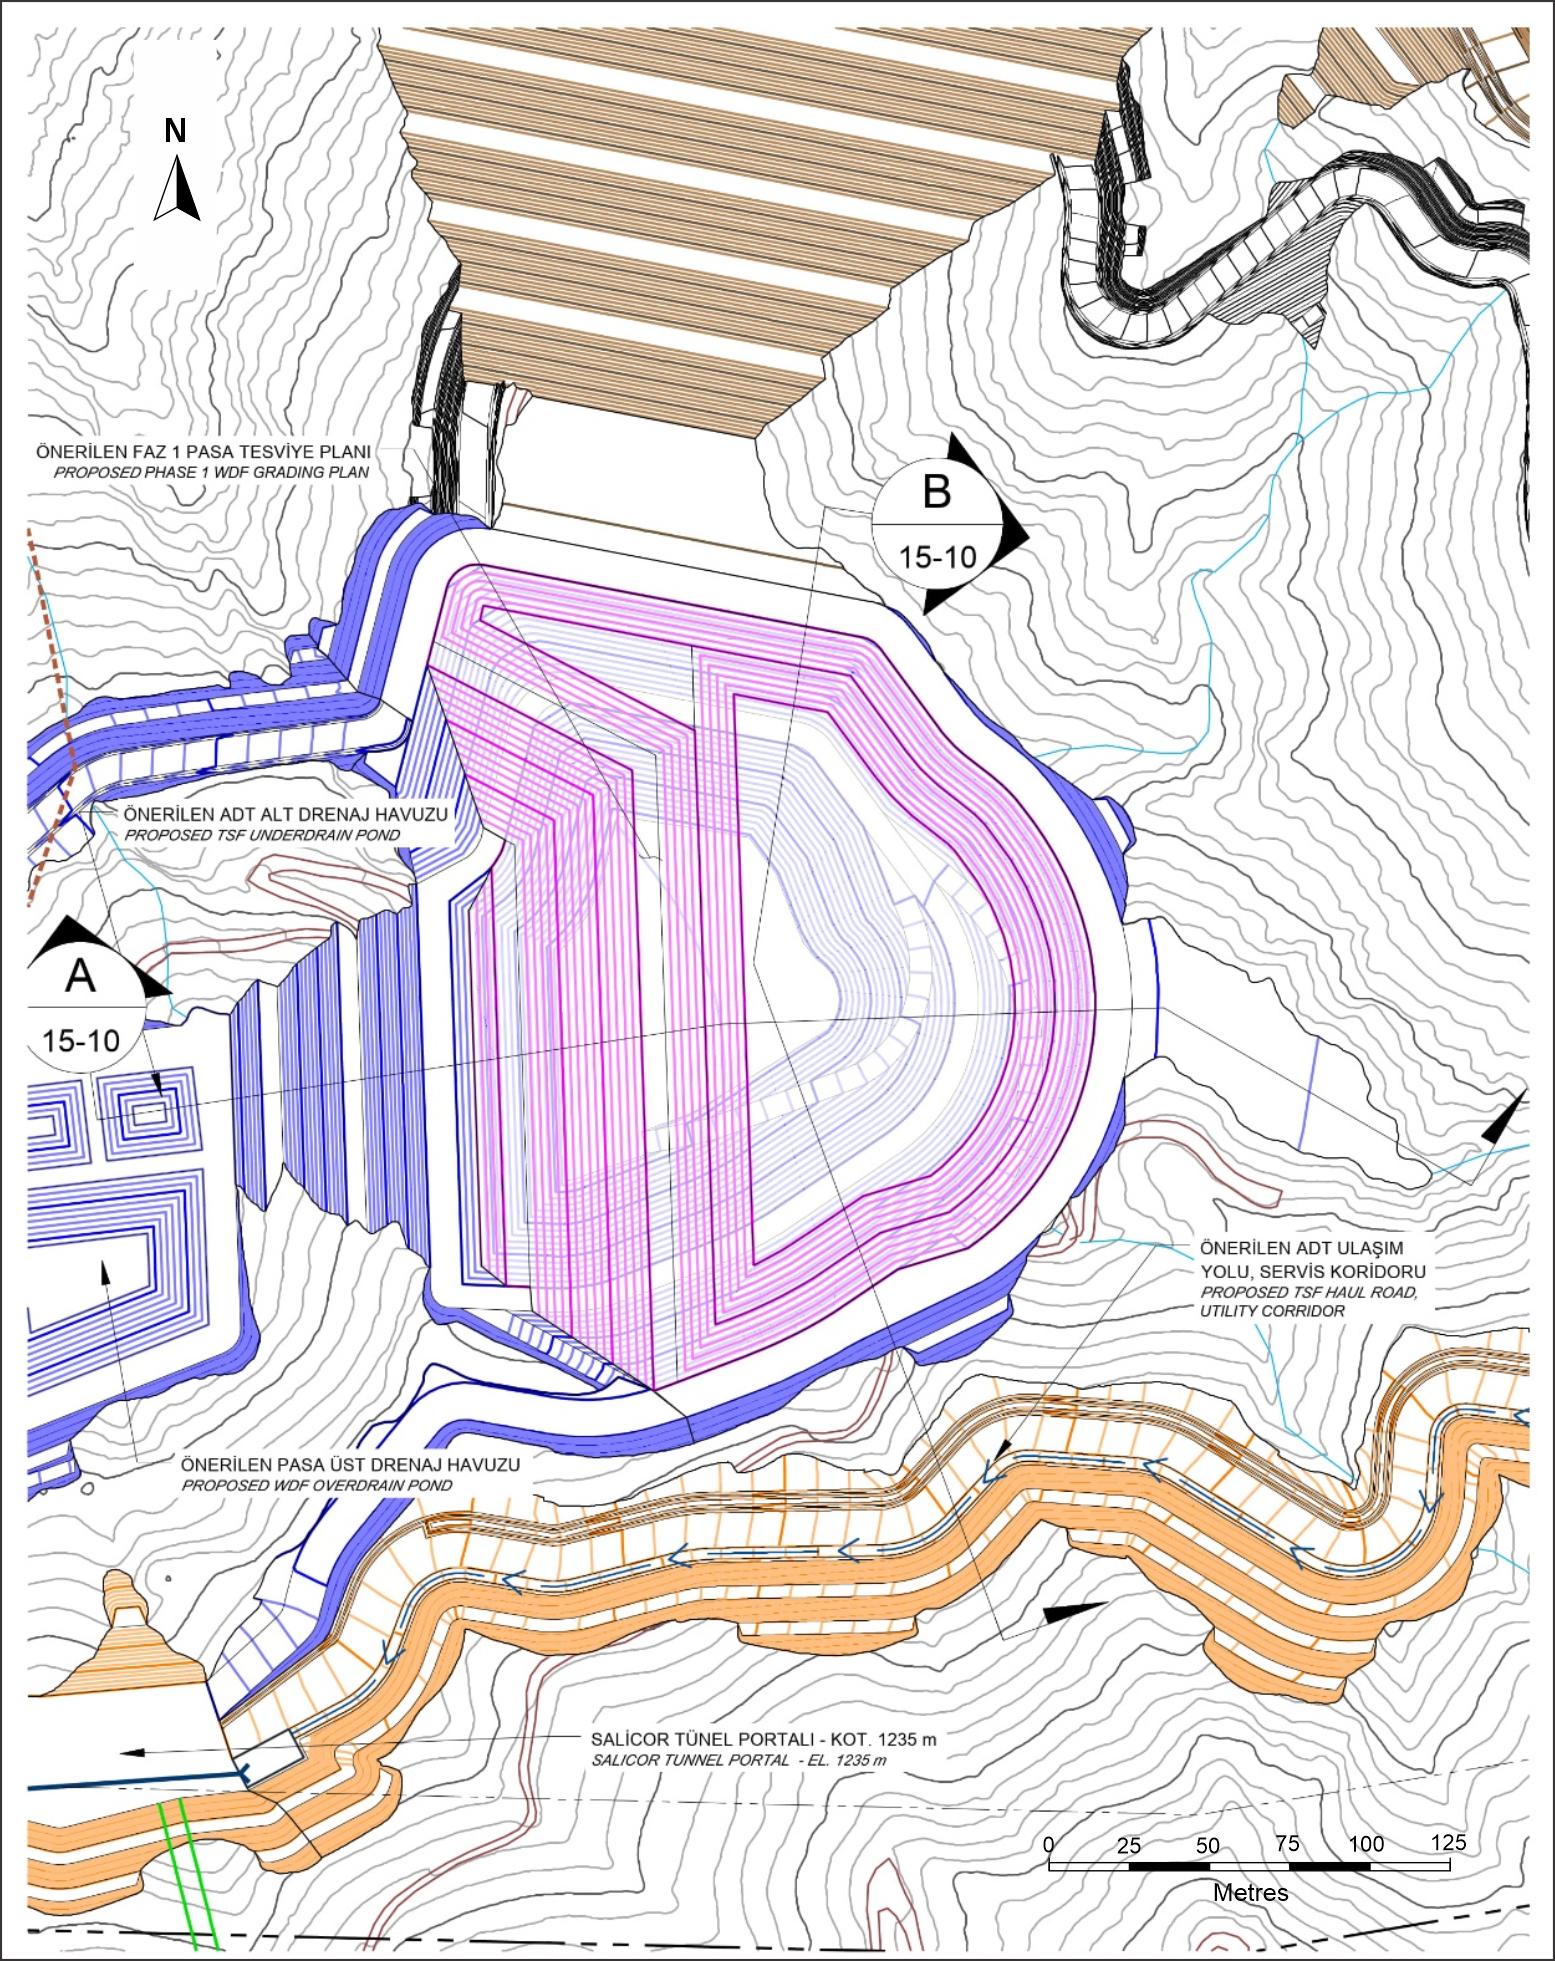
Figure 15-35
ÖNER?LEN FAZ 1 PASA TESV?YE PLANI
PROPOSED PHASE 1 WDF GRADING PLAN
ÖNER?LEN ADT ALT DRENAJ HAVUZU
PROPOSED TSF UNDERDRAIN POND
B
15-10
A
15-10
ÖNER?LEN PASA ÜST DRENAG HAVUZU
PROPOSED WDF OVERDRAIN POND
ÖNER?LEN ADT ULA?IM YOLU, SERV?S KOR?DORU
PROPOSED TSF HAUL ROAD, UTILITY CORRIDOR
SAL?COR TÜNEL PORTALI - KOT. 1235 m
SALICOR TUNNEL PORTAL - EL. 1235 m
0
25
50
75
100
125
Metres
Source: WSP 2025
| | 15-46 | |
| SSR Mining Inc. | Hod Maden Project | | January 7, 2026 |
| Technical Report Summary | | SLR Project No.: 123.000320.00001 |
Figure 15-36: WDF Longitudinal Section
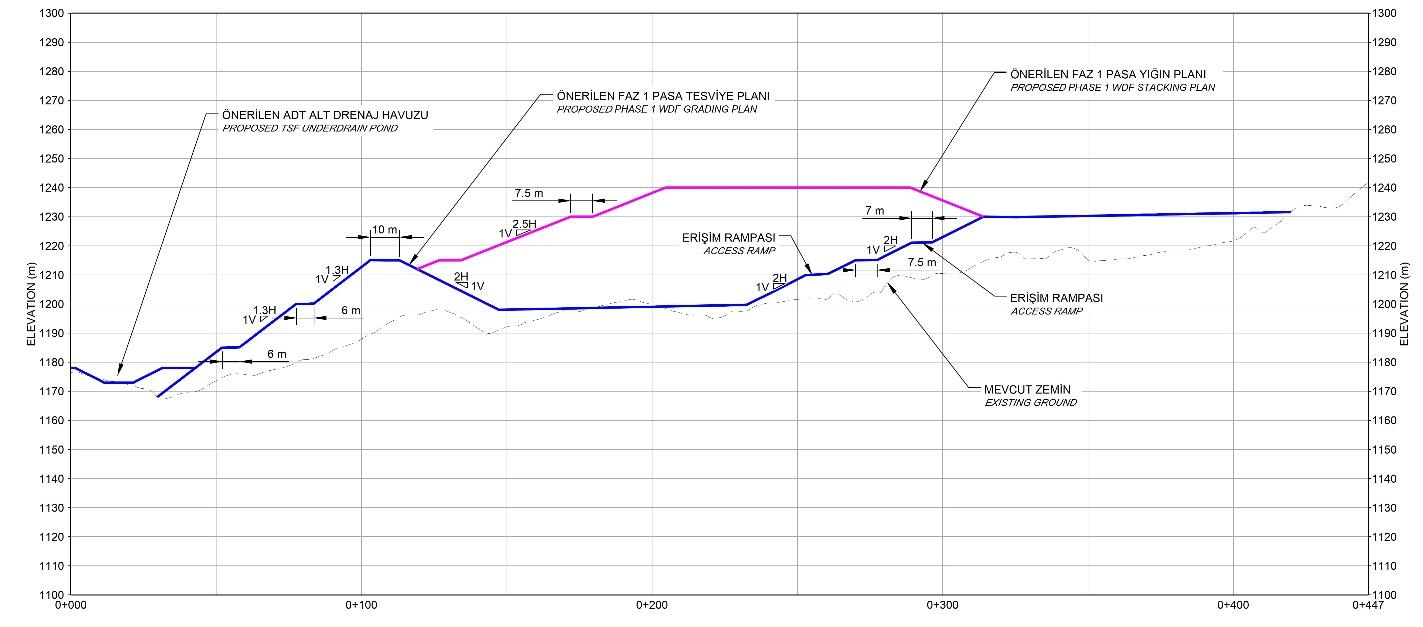
Figure 15-36
ELEVATION (m)
1300
1290
1280
1270
1260
1250
1240
1230
1220
1210
1200
1190
1180
1170
1160
1150
1140
1130
1120
1110
1100
0+000
0+100
0+200
0+300
0+400
0+447
ÖNER?LEN ADT ALT DRENAJ HAVUZU
PROPOSED TSF UNDERDRAIN POND
ÖNER?LEN FAZ 1 PASA TESV?YE PLANI
PROPOSED PHASE 1 WDF GRADING PLAN
ÖNER?LEN FAZ 1 PASA YI?IN PLANI
PROPOSED PHASE 1 WDF STACKING PLAN
ER???M RAMPASI
ACCESS RAMP
MEVCUT ZEM?N
EXISTING GROUND
Source: WSP 2025
The revised WDF design will comprise similar components and design philosophy
when comped to the original (INR) design, with some changes to the liner system. The new base liner design consists of an HDPE geomembrane
liner in place of the GCL (considered in the prior INR design), placed on a prepared sub-grade foundation.
An overdrain system, designed to collect potential seepage from the
based of the waste stack, reducing the potential pore pressure build up at the base of the waste stack while conveying seepage to a lined
overdrain pond at downstream side of the WDF.
The WDF design will include an underdrain system located below the liner
system, designed to collect water from natural springs and seeps within the valley bottom and convey the flows via an underdrain conveyance
pipeline to the lined underdrain pond located at downstream side of the WDF.
| 15.7.2 | North Valley WDF Stability Assessment |
Engineering and stability analyses will be completed during the detailed
design period. Further assessment and determination of the material properties for the waste material will be developed to support the
analysis and to finalize the ultimate WDF configuration, if needed. In addition, a test plan is being in scheduled to determine interface
direct shear properties of lining components under the design loading. The existing geotechnical data will be reviewed and may be supported
with supplementary investigations within the WDF area and in the designated pond areas.
The WDF will be designed to withstand the Operating Basis Earthquake
(OBE) events for the operational period and the Safety Evaluation Earthquake (SEE) criteria for the ultimate configuration. Stability
modeling and analysis will be undertaken for both static and pseudo-static conditions with the calculated factors of safety higher than
the minimum required values in accordance with CDA guidelines (CDA 2013).
| | 15-47 | |
| SSR Mining Inc. | Hod Maden Project | | January 7, 2026 |
| Technical Report Summary | | SLR Project No.: 123.000320.00001 |
The WDF configuration will be established considering the closure stage
of the facility, to allow rehabilitation activities during operations, or after operations, with only minimal re-grading activities required.
Closure will be initiated by covering the waste with a liner or clay group minerals as development of the waste stack progresses and the
final elevation is achieved. Following cover construction, overdrain flows will be monitored until draindown of the WDF is achieved, at
which time the overdrain collection pipe will be sealed and the overdrain (and underdrain) pond liner removed. The area downstream of
the WDF including the ponds will be filled by dump rock, obtained from a non-acid generating (NAG) waste rock storage area. The final
closure plan will be developed to satisfy the requirements of the related government authorities.
| 15.7.4 | North Valley Water Management |
Non-contact water management structures (fresh water diversion channels)
have been updated with recent general layout changes. Diversion channels at south and east perimeter of the WDF have been relocated to
align with the planned TSF Utility Corridor. In addition, the diversion channel at the north and east side of the TSF was re-routed at
the upper elevations of the proposed quarry area such that inflow of non-contact water will not be managed via diversion channels at the
WDF perimeters, as indicated in previous design packages. The northern component of the diversion channels is subject to further change
based on the pending quarry design. The overall freshwater management plan for North Valley is presented in Figure 15-37.
The overdrain system collects contact water from above the TSF and WDF
liners and directs that water to overdrain sump or the overdrain pond areas and reduce the hydraulic head on the liner system. Contact
water collected by the overdrain piping network will report to the overdrain pond located downstream of the WDF. Depending on the quality
of the overdrain flow and project requirements, overdrain water will be discharged or pumped to the TSF decant pond or Plant Site. Surface
water run-off occurring between the utility corridor and the WDF footprint will be treated as contact water and managed via WDF overdrain
systems of the WDF; the transfer pipe for this sub-catchment will be separated from the WDF overdrain collection systems in support of
closure considerations.
Underdrains will collect and route groundwater flows beneath the TSF
and the WDF to a downstream underdrain sump where water quality will be monitored. The underdrain system can also be used to monitor the
performance of the liner system for leakage. Underdrain water is considered non-contact water which can be discharged to the Saliçor
Creek. However, should the underdrain water quality deteriorate, it could also be pumped to the TSF to be recovered as part of the decant
water. For this purpose, a pump system is being designed for pumping underdrain water to the overdrain pond.
| | 15-48 | |
| SSR Mining Inc. | Hod Maden Project | | January 7, 2026 |
| Technical Report Summary | | SLR Project No.: 123.000320.00001 |
Figure 15-37: Surface Water Management
for North Valley
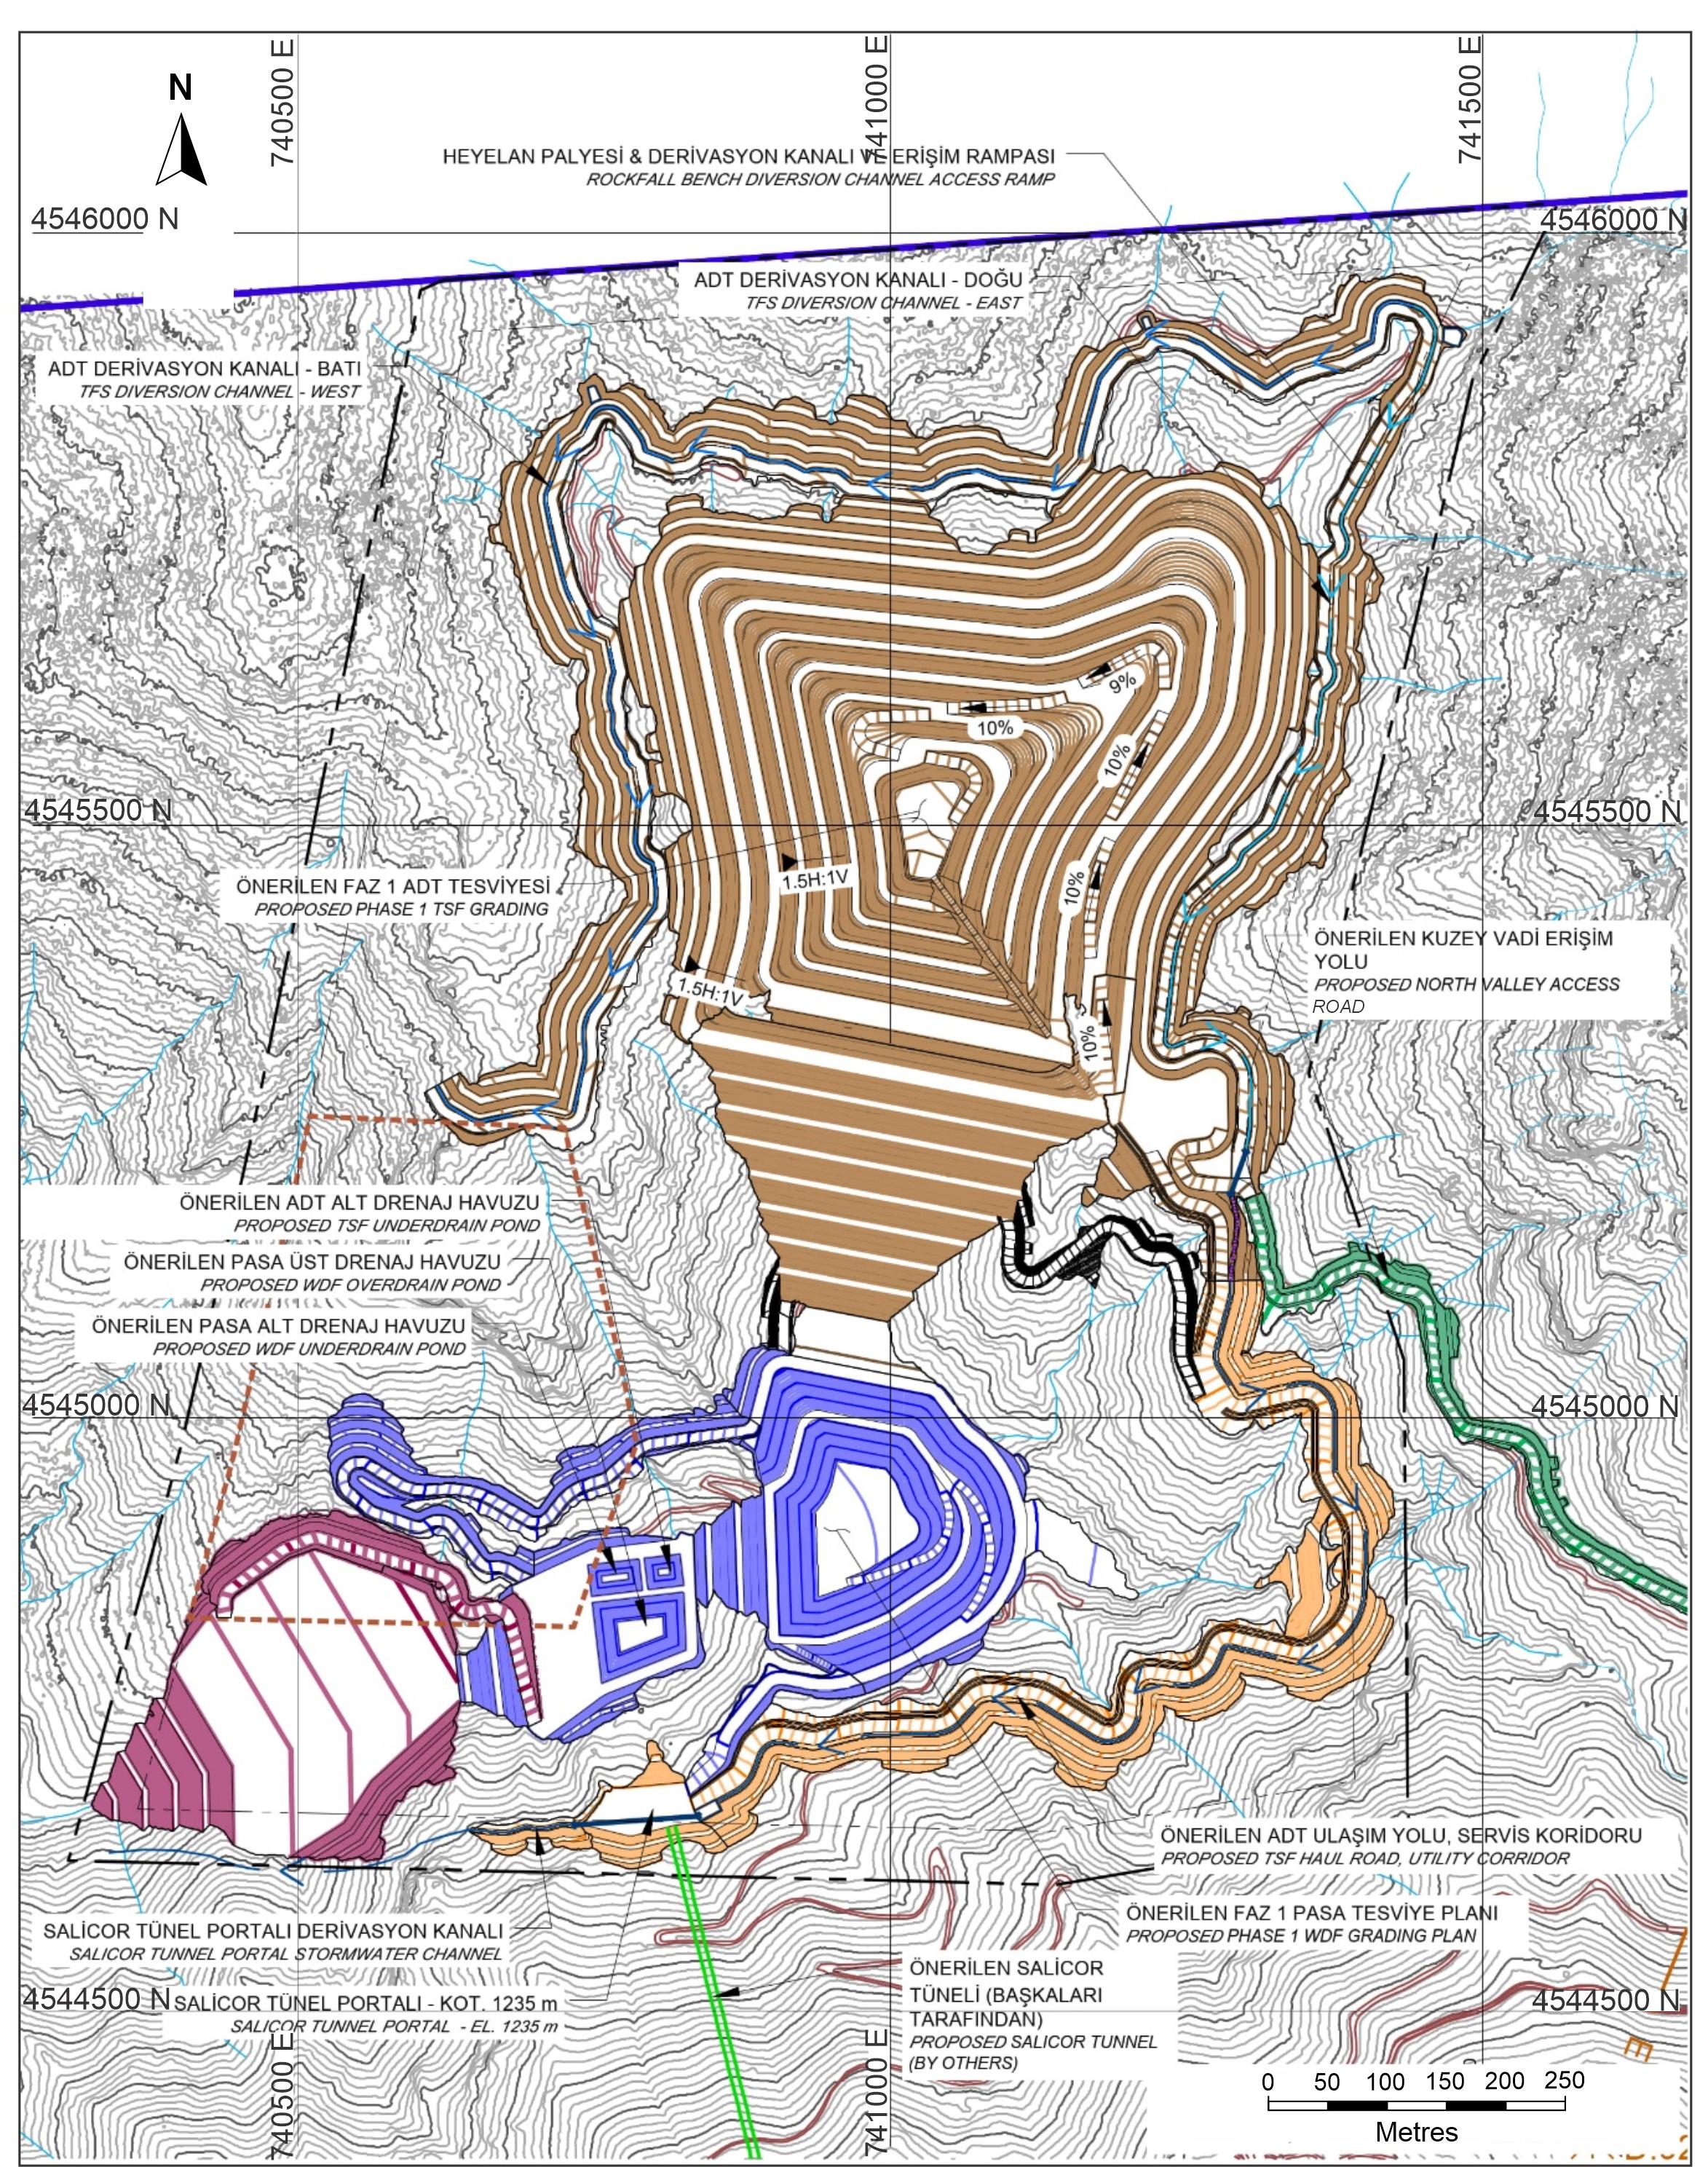
Figure 15-37
HEYELAN PALYES? & DER?VASYON KANALI VE ER???M RAMPASI
ROCKFALL BENCH DIVERSION CHANNEL ACCESS RAMP
ADT DER?VASYON KANALI - DO?U
TFS DIVERSION CHANNEL - EAST
ADT DER?VASYON KANALI - BATI
TFS DIVERSION CHANNEL - WEST
ÖNER?LEN FAZ 1 ADT TESV?YES?
PROPOSED PHASE 1 TSF GRADING
ÖNER?LEN ADT ALT DRENAJ HAVUZU
PROPOSED TSF UNDERDRAIN POND
ÖNER?LEN PASA ÜST DRENAG HAVUZU
PROPOSED WDF OVERDRAIN POND
ÖNER?LEN PASA ALT DRENAG HAVUZU
PROPOSED WDF UNDERDRAIN POND
ÖNER?LEN KUZEY VAD? ER???M YOLU
PROPOSED NORTH VALLEY ACCESS ROAD
SAL?COR TÜNEL PORTALI DER?VASYON KANALI
SALICOR TUNNEL PORTAL STORMWATER CHANNEL
SAL?COR TÜNEL PORTALI - KOT. 1235 m
SALICOR TUNNEL PORTAL - EL. 1235 m
ÖNER?LEN SAL?COR TÜNEL? (BA?KALARI TARAFINDAN)
PROPOSED SALICOR TUNNEL (BY OTHERS)
ÖNER?LEN ADT ULA?IM YOLU, SERV?S KOR?DORU
PROPOSED TSF HAUL ROAD, UTILITY CORRIDOR
ÖNER?LEN FAZ 1 PASA TESV?YE PLANI
PROPOSED PHASE 1 WDF GRADING PLAN
Source: WSP 2025
| | 15-49 | |
| SSR Mining Inc. | Hod Maden Project | | January 7, 2026 |
| Technical Report Summary | | SLR Project No.: 123.000320.00001 |
The Hod Maden Project is expected to produce gold sulfide concentrate
containing copper credits, which will be highly desirable due to its cleanliness and lack of deleterious elements.
The metallurgical test work developed equations that were applied to
mine plan outputs. These equations indicate the following grades for the final concentrate:
| · | Gold Grade: 113.6 grams per ton (g/t) |
For the basis of the economic analysis, a conservative assumption of
a concentrate grade of 14% Cu and 70 g/t Au to 120 g/t Au was chosen as variability in the ore delivered to the mill will at times produce
a lower grade concentrate. While silver was measured in metallurgical testing, its grade in the final concentrate (28.7 g/t) did not meet
payable levels (>30g/t). Therefore, the current Mineral Reserves and production schedule described in Sections 12.0 and 13.0, respectively,
do not include silver.
| 16.1.1 | Market and Production Context |
Domestic consumption of refined copper in Türkiye is estimated
at 528,000 t in 2025, with growth expanding to 599,000 t by 2029. The country remains largely reliant on imports due to the limited capacity
of the Samsun smelter (now estimated at 73,000 t annual capacity) and declining domestic copper production.
The Hod Maden Project is expected to produce an average of approximately
44,450 dry metric tonnes (dmt) per annum of gold sulfide concentrate, commencing with first concentrate in Q2 2028 and full production
2029.
| 16.1.2 | Sales and Market Competition |
The concentrate can be sold either through traders or directly to smelters.
Due to its clean quality, it is expected to be competitive in the market. Best-value markets for Hod Maden's concentrate include China,
Malaysia, Korea, and Taiwan. Japan is considered less likely due to high financing costs associated with gold.
In the short term, ocean freight rates from Türkiye to European
destinations should remain elevated and steady in the $70/wmt to $75/wmt range. In the medium term, and with the assumption that military
issues in the Black Sea, Mediterranean and the Suez Canal continue for an extended period, Türkiye/Far East freight rates for China
/ Korea can be expected to also remain elevated and steady.
| 16.2 | Metal Price Assumptions |
Metal prices for the economic analysis were estimated after analysis
of recent consensus industry metal price forecasts and compared to those used in other published studies. The metal prices selected have
taken into account the current Project life. The prices used for the economic analysis are shown in Table 16-1, and represent the average
analyst consensus prices of October 2025.
| | 16-1 | |
| SSR Mining Inc. | Hod Maden Project | | January 7, 2026 |
| Technical Report Summary | | SLR Project No.: 123.000320.00001 |
Table 16-1: Metal Price Assumptions
| Commodity |
Unit |
2025 |
2026 |
2027 |
2028 |
2029 |
2030 |
Long Term |
| Copper |
$/lb |
4.38 |
4.56 |
4.63 |
4.68 |
4.67 |
4.44 |
4.48 |
| Gold |
$/oz |
3,322 |
3,793 |
3,704 |
3,396 |
3,252 |
3,130 |
3,094 |
| Source: Analysts Street Consensus – Average Consensus Metal Price Forecast. October 2025 |
From 2020 through 2024, both gold and copper experienced notable price
volatility reflecting shifting global economic conditions. Gold prices rose steadily from about $1,770 per troy ounce in 2020 to approximately
$2,388 in 2024, driven by inflationary pressures, geopolitical uncertainty, and strong investment demand. Copper, a key industrial metal,
surged from $2.80 per pound in 2020 to a peak of $4.23/lb in 2021 as post-pandemic stimulus boosted infrastructure and manufacturing activity,
then stabilized around $4.00/lb to $4.15/lb through 2024. Overall, the data illustrate a five-year period of elevated commodity pricing
linked to strong demand, supply-chain constraints, and broader macroeconomic volatility.
Table 16-2: Historical Gold and
Copper Prices for the Preceding Five Years
| Metal |
Units |
2020 |
2021 |
2022 |
2023 |
2024 |
| Gold Price |
$/oz |
1,770 |
1,800 |
1,801 |
1,943 |
2,388 |
| Copper Price |
$/lb |
2.80 |
4.23 |
4.00 |
3.85 |
4.15 |
| 16.3 | Treatment and Refining Charges |
Sulfide concentrates bearing gold and copper will be subject to treatment
and refining charges (TC/RCs). Historical data shows that selling in the spot market typically offers better terms compared to annual
benchmarks.
The 2025 benchmark TC/RC was not as standardized as in prior years,
with China settling at $21.25/2.125¢ and Japan at $25/2.5¢. These are historically the lowest benchmark terms agreed.
Latest forecast benchmark from October 2025 show negative TC/RCs. SSR
is using based on their internal analysis a TC/RC Forecast of + $12/1.2¢.
These terms are considerably lower than the previous long-term TC/RC
forecast of $72/7.2¢. Based on forecast market balance, TC/RCs in 2029/2030 are likely to be circa $60/6¢, or slightly higher.
Considerations:
Ocean Freight Costs: Assumptions on ocean freight rates are as follow:
| · | $120 to $130/wmt via Suez Canal. Voyage time circa 37 days. |
| · | $190 to $200/wmt via Cape Town (avoiding Suez). Voyage time circa 65 days. |
| · | $130 to 140/wmt for far East destinations via Cape of Good Hope |
| · | $70 to $75/wmt for European destinations, assuming 10,000 wmt load |
The Black Sea is not currently being considered due to the Russia-Ukraine
conflict, as many shipowners are avoiding the area.
| | 16-2 | |
| SSR Mining Inc. | Hod Maden Project | | January 7, 2026 |
| Technical Report Summary | | SLR Project No.: 123.000320.00001 |
For the economic analysis in this report, SSR assumes a European destination,
although the East Asian customers offer the best commercial terms, which may offset or partly offset the higher Asian freight costs.
Should regional conflicts cease in the short term, a reduction of ocean
freight costs can be expected across the board.
Placeholder estimates of $17/wmt and $8/wmt land concentrate freight
costs with truck and port loading charges are included in the economic analysis presented in Section 0.
| 16.4 | Expressions of Interest |
Discussions have been conducted with potential customers, including
SSR’s joint venture partner, Lydia, who has expressed interest in the product. The marketing of this product falls outside the current
Project scope and will be addressed in a future phase.
SLR has reviewed an expression of interest (EOI) provided by a major
commodity trader during the period of assembling this report. While SLR notes that multiple firm EOIs would typically be expected at this
advanced stage of the Project, the current state of the copper market suggests that the absence of formal EOIs is not considered a significant
risk at this time.
The contracting strategy is discussed in Section 21.1.4.
| | 16-3 | |
| SSR Mining Inc. | Hod Maden Project | | January 7, 2026 |
| Technical Report Summary | | SLR Project No.: 123.000320.00001 |
| 17.0 | Environmental Studies, Permitting, and Plans, Negotiations, or Agreements with Local Individuals or Groups |
This chapter has been based on the 2021 FS (GR Engineering Services
2021), with updates where new information is available.
| 17.1 | Environmental and Social Impacts and Risks |
Artmin has developed two environmental assessment (EA) documents to
support Project development. In 2020, consultancy Mitto Danışmanlık A.Ş. (Mitto) compiled a Turkish language
Environmental Impact Assessment (EIA) principally to support the Project’s environmental review by local communities and the regulatory
authorities of Türkiye (Section 17.3). SLR has reviewed an English translation of an outline of the 2020 EIA.
In 2023, consultancy Golder Associates prepared a draft English language
Environmental and Social Impact Assessment (ESIA) incorporating updated baseline data and directed at satisfying the Equator Principles
(EP) and the World Bank / International Finance Corporation Environmental and Social Performance Standards (IFC PS), in support of eventual
Project financing (Golder 2023a). This section presents a high-level review of the ESIA carried out by SLR’s QPs.
| 17.1.1 | Environmental and Social Baseline |
Artmin undertook environmental and social baseline studies between 2013
and 2021 in the Project area. These informed the Project EIA and ESIA. Key conclusions of the baseline studies are detailed below:
Physical Components:
| · | Seismicity: Located approximately 200 km north of the North Anatolian Fault Zone, the Project’s TSF is classified as
having a “High” facility hazard according to the CDA Dam Safety Guidelines (CDA 2013) and as such, has been designed to withstand
a maximum 1 in 4,975-year event. |
| · | Hydrology: The streams in the mining license area generally flow towards the west and northwest. The north branch of Maden
Creek runs over the orebody and is fed by a large basin to the east, with the perennial Büyükdere considered the most important
tributary. Figure 17-1 shows the streams in the Project area. |
Several streams lie within the proposed infrastructure areas:
| o | Salebe Creek lies within the proposed TSF. |
| o | The eastern arm and the head of the Saliçor Creek lie within the proposed waste rock dump. |
| o | An unnamed intermittent creek of the south branch of Maden Creek lies within the proposed clay area. |
Two creeks named Maden Creek converge (the south branch is also known
as the Aktaş Creek) to form the Şurakev Creek just downstream of the proposed mine. All site drainage flows to the Çoruh
River via the Şengan Creek. Peak stream flows occur between April and July associated with snowmelt and spring rains.
| | 17-1 | |
| SSR Mining Inc. | Hod Maden Project | | January 7, 2026 |
| Technical Report Summary | | SLR Project No.: 123.000320.00001 |
Surface water quality in the Project area and local region was determined
to be generally good but does not meet potable water quality requirements. Three sampling locations within the Maden and Şurakev
catchments were found to have pH, Cd, Cu, and Zn levels that exceed IFC Environmental, Health, and Safety Guidelines for Mining (IFC 2007).
Two dams, the Deriner Dam and the Artvin Dam, lie west and southwest
of the mining license area, respectively. The closest, Deriner Dam, and associated hydroelectric power plant (HEPP) is the highest in
Türkiye. The Project lies within the upper catchment of the Deriner Dam on the Çoruh River, and the HEPP is approximately
9 km away from the Project.
Figure 17-1: Streams Map Showing
the Project Site
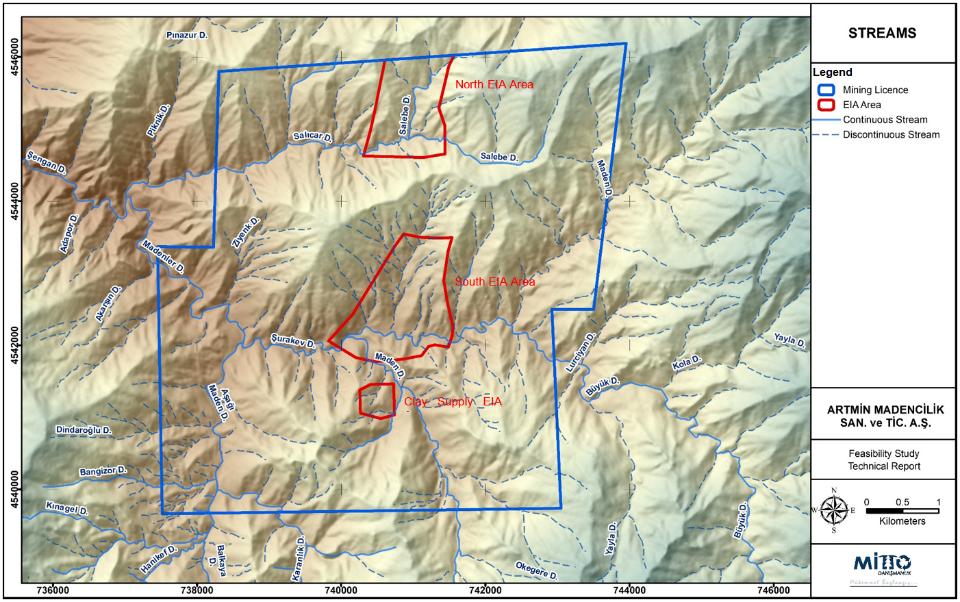
FIGURE 17-1
4546000
454000
4542000
4540000
736000
738000
740000
742000
744000
746000
STREAMS
Legend
Mining Licence
EIA Area
Continuous Stream
Discontinuous Stream
ARTM?N MADENC?L?K SAN. ve T?C. A. ?.
Feasibility Study Technical Report
0
0.5
1
Kilometers
Source: GR Engineering Services 2021
Hydrogeology: Groundwater originating from recharge by rainfall
and snowmelt flows from the mountains and discharges into the Şurakev River. Measured water levels show elevations from 820 to
1,046 masl, following the topography. Water levels show a downward gradient in the mountain area and upward gradient in the river valley.
The groundwater system includes zones of permeable hydrogeological conduits, a fault zone running east-west generally parallel to the
river and other faults perpendicular to the river.
Groundwater quality in the local area and was determined to be generally
good but not meeting potable water quality requirements. Groundwater wells in the proximity of the underground mine showed high concentrations
of As, Cu, Cd, Pb, Ni, Al, Fe, Mn, Se, F, and Na, as well as exhibiting a low pH.
Water Stakeholders: A hydro census was undertaken by Golder in
2021 to identify water users, and important water resources in the local area. Many of the springs identified were monitored as part of
the baseline studies.
| | 17-2 | |
| SSR Mining Inc. | Hod Maden Project | | January 7, 2026 |
| Technical Report Summary | | SLR Project No.: 123.000320.00001 |
Soil and Subsoil: preliminary baseline studies on soil quality
found exceedances against Turkish standards for As, Co, and Cr in some samples. No chemical contaminants were detected.
Geochemistry and Acid Rock Drainage Potential: Artmin carried
out geochemical testing of representative rock lithologies. Static test (conventional acid-base accounting, or ABA) results determined
that most lithologies exhibit acid generating potential and are classified as potentially acid-generating (PAG). However, overburden lithology
and some samples of the volcanosedimentary lithology were classified as non-acid generating (NAG). All lithologies have metal leaching
potential in terms of zinc, copper, cadmium, lead, and cobalt under neutral pH conditions. Two samples of massive pyrite lithology indicated
high metal leaching potential. Management of potential impacts to water quality arising from acid rock drainage / metals leaching (ARD/ML)
is a key E&S aspect for the Project.
Climate and Meteorology: The regional climate varies considerably
due to the terrain and variable elevations, resulting in microclimates, but the most prevalent classifications according to the Köppen-Geiger
climate classification system are Dfb (warm-summer humid continental climate) and Cfb (Temperate oceanic climate). Artmin installed a
meteorological station at the Project site in 2017 to collect site-specific data, which have been supplemented with regional data to generate
an estimate of mean annual precipitation of 330 mm (Section 4.2). Snow occurs in the region, particularly at higher altitudes, and snow
melt swells the local creeks in spring. Average monthly temperatures vary between –0.6°C in January and 19.8°C in August
(Section 4.2.2).
Air Quality: The Project area is rural with no significant commercial
or industrial air pollution sources. Residential heating in Yukarιmaden and
Aşağımaden are reported to be
the principal sources of air pollution in the vicinity of the Project site.
Noise: Noise measurements carried out at the closest sensitive
receptors around the Project area found that noise levels vary between 30.3 and 57.0 dBA during the day, and 27.3 and 57.0 dBA at
night, and generally complied with national standards. Road traffic was identified as the primary source of noise in the area, with nearby
receptors experiencing noise levels in excess of IFC/WHO (World Health Organization) standards, particularly at night.
Biological Components
Protected areas: The Ministry of Environment and Urbanization
and the XII Regional Directorate of Forestry and Water Affairs have confirmed in writing that there are no legal protected areas within
the Project license areas. Protected areas in the region are outside the Project’s area of influence (AOI) and will not be directly
or indirectly affected by the Project.
Biodiversity: The region is rich in biodiversity and endemic
species. Vulnerable, near threatened, endangered and critically endangered species on the International Union for Conservation of Nature’s
(IUCN) Red List of Threatened Species, as well as on the National Red Data List (Turkish Red Data Book, T-RDB) may occur in the Project
area. Some of these triggered the identification of critical habitat3
as part of the Critical Habitat Assessment in the 2023 ESIA. These include seven plant species, two species of butterfly, two fish and
one amphibian. Not all these species have been confirmed to be present within the Project area. Biodiversity is a key E&S aspect
of the Project.
___________________________
3
As defined in IFC PS6, Biodiversity Conservation and Sustainable Management of Living Natural Resources (IFC 2012).
| | 17-3 | |
| SSR Mining Inc. | Hod Maden Project | | January 7, 2026 |
| Technical Report Summary | | SLR Project No.: 123.000320.00001 |
Social Components
Nearest communities: The Project lies 20 km south of the city
of Artvin and 35 km north of the Yusufeli townsite. The closest settlements are the villages of Aşağımaden (2.3 km
southwest), Dikmenli (3.8 km north), Hızarlı (2 km north, although separated by a high mountain ridge), and Yukarιmaden
(420 m east). Aşağımaden and Yukarιmaden lie within the primary impact zone of the Project where Artmin identified
land to be purchased or expropriated. Land acquisition is a key E&S aspect of the Project.
Socio-economic aspects: The main economic activities in Artvin
province are agriculture, animal husbandry and agriculture-based industry. There are mining activities in the region, especially in the
districts of Artvin and Murgul.
At the village level, most of the residents of Yukarımaden and
Aşağımaden within the Project area are retired from full-time work and rely mainly on pensions. These villages experience
a doubling in population during summer as people who reside in other provinces return to the village to grow food for household consumption.
The percentage population of men in Yukarımaden increases from 51% to 60% during this period.
Most households grow their own fruit and vegetables in small gardens
while some engage in animal husbandry. Honey production and poultry farming are notable activities in both villages. Since 2004, about
70 residents from surrounding villages have been employed by Artmin as part of the exploration and feasibility work for the Project.
Both communities are better educated compared to Türkiye's and
Artvin's respective provincial averages, with most having completed high school. There are no illiterate people in Yukarιmaden, and
only 3% of the Aşağımaden population is illiterate.
The ethnic structure is homogeneous and the villagers are Muslim and
Turkish. Female headed households, persons with chronic diseases, people over 70 years old who live alone, and disabled people make the
majority of the vulnerable group.
Public education and health care services are available in Artvin, but
not within the local villages. Land use within the mining license area includes forestland, agricultural and residential use.
Heritage Resources: The Cultural and Natural Assets Regional
Board Directorate of Trabzon has stated that there are no registered heritage sites or places of cultural significance or assets known
to occur within the Project area. Desktop and field surveys covering the Project area were carried out between 2019 and 2022 to identify
archaeological features on the surface. No archaeological excavations were undertaken. Non-registered findings identified in the Project
impact area include a watchtower, graves, mosque, a monumental plane tree in the garden of the mosque, and mine quarries. The ESIA notes
that the Museum Directorate and/or the Provincial Directorate of the Environment, Urbanization and Climate Change must be informed about
the presence these structures and recommends that the plane tree is put under protection through registration.
| 17.1.2 | Community Engagement |
The draft Community Development Plan provides a list of stakeholders
(Artmin 2024k) including local communities, land users, landowners, indirectly affected communities, non-government organizations (NGOs),
universities, the media, local and regional government bodies and national government departments.
| | 17-4 | |
| SSR Mining Inc. | Hod Maden Project | | January 7, 2026 |
| Technical Report Summary | | SLR Project No.: 123.000320.00001 |
Stakeholder engagement commenced during the exploration and early scoping
phases when Artmin established a community relations office in Yukarımaden village. Artmin community relations specialists are
responsible for stakeholder engagement activities, providing information on the Project to local stakeholders, and dealing with any complaints
or grievances under grievance management protocols.
The Project’s environmental review process included one documented
public participation meeting in April 2019 at the former Yukarımaden village school. This meeting included government representatives
and about 350 local villagers. The Artmin management team attended the meeting to respond to questions asked by the public.
Engagement activities included five focus group meetings for women to
understand current conditions of the women members of the communities in terms of their role, education level, participation to decision
making process, land use patterns (Artmin 2024b).
Additional engagement was undertaken as part of the ESIA scoping, and
baseline studies in 2021 and 2022, including two community level surveys, 112 household surveys, three focus group discussions, and 20
key informant interviews.
SSR has assembled the Stakeholder Engagement Register showing engagement
activities from June 2017 to Aug 2024, which included 586 entries related to meetings, visits and telephone conversations. Artmin continues
with regular engagement and responding to community requests and complaints. Subject matter varies and includes purchase of properties,
scholarship requests, road maintenance etc. (Artmin 2024ac). Artmin has established a grievance mechanism, through which stakeholders
can communicate concerns anonymously with the Project.
Through its Stakeholder Engagement Plan (SEP), Artmin will continue
engagement activities and plans to support the local communities through employment, local contract opportunities, local purchasing, and
community development programs.
| 17.1.2.1 | Community Development Projects |
Artmin invests in community development projects including (GR Engineering
2021):
| · | Scholarship opportunities were provided to more than 30 successful university students from the local communities. |
| · | The road between Aşağımaden and Yukarımaden villages was upgraded in cooperation with Artvin governorship.
A protocol was signed by Artmin Madençilik and the Artvin Governor (Mustafa Yemlihalioğlu) to upgrade the rest of the main
access road. |
| · | A new cemetery and social facility projects were agreed upon by Artmin Madençilik and the village delegation of Yukarımaden.
The construction and furnishing of the Social Facility, which contains a hall and administrative facilities, as wells as accommodation
for seasonal visitors (generally the families of the ancestral land holders) was completed and the facility was handed over to the Village
Committee. |
| · | The villagers of Aşağımaden have requested repairs or upgrading of the irrigation pipeline. This initiative will
be funded by Artmin to improve agricultural productivity. |
| | 17-5 | |
| SSR Mining Inc. | Hod Maden Project | | January 7, 2026 |
| Technical Report Summary | | SLR Project No.: 123.000320.00001 |
| 17.1.3 | Impact Assessment and Management |
| 17.1.3.1 | Overview of Impacts |
The 2020 Project EIA identifies and assesses the environmental and social
impacts associated with Project development. Artmin submitted the EIA to regulatory authorities in 2020 and received environmental approval-in-principle
in 2021 (Section 17.3).
The 2023 ESIA assessed environmental and social impacts considering
the application of mitigation measures as part of project design, good industry practice, the application of project-specific management
plans, and environmental and social monitoring programmes. Most impacts were not considered to be significant when taking these mitigation
measures into account. The key conclusions of the ESIA were (Golder (Türkiye), 2023a):
Physical Components:
An air, noise, and greenhouse gas monitoring programme should be put
in place to meet the necessary regulatory requirements and guidelines. With the implementation of the mitigation measures defined in the
ESIA, no major impacts are expected on air quality, noise levels in the nearest communities.
Dewatering is not expected to produce adverse impacts on the drinking
water supplies in communities, and no major cumulative impacts on the baseflow of Şurakev Creek are expected from dewatering.
No major water quality impacts are expected according to water quality
mixing model results from discharges. Surface and groundwater monitoring programs will be implemented to monitor water quality.
In the long term after the mine ceases operations, the underground workings
will be flooded and underground contact water will migrate into surrounding groundwater areas and ultimately report to surface. The underground
backfill material will be non-PAG to minimize contact water impacts on local groundwater resources. Water quality modeling determined
that underground mine water would not have a detrimental effect on the surface water quality in the Surakev River. Mitigation measures
include sealing exposed areas above the water table and the portal and underground workings, and this is expected to be sufficient to
minimize water quality impacts. However, if adverse impacts are detected, Artmin commits to revising the mitigation measures and undertaking
remedial action to address the source and migration of leachate.
Biodiversity Components:
Biodiversity impacts on critical habitat and plant and animal species
are expected and will need to be managed through a Biodiversity Management Plan. Additional baseline studies are required to confirm the
presence of certain species, and if confirmed to be present, an action plan is required to ensure net gain of these species.
Social Components:
The most significant social impacts are those from land acquisition
and resettlement. A Land Acquisition and Resettlement Plan has already been implemented, and many people have already moved away through
this program.
A stakeholder engagement plan and grievance mechanism will be applied
to the Project. Continuous stakeholder engagement should be undertaken to manage the Projects social risks.
| | 17-6 | |
| SSR Mining Inc. | Hod Maden Project | | January 7, 2026 |
| Technical Report Summary | | SLR Project No.: 123.000320.00001 |
The site access road is paved but narrow and passes through two community
areas. The Project is developing two tunnels to bypass the most difficult portions of the road, but these will not be complete until late
in the construction phase. Active management of inbound and outbound traffic will be necessary during the period before the tunnels are
in use, to ensure that equipment and personnel can be transported to and from the site without delay, while managing risks to community
health and safety.
Three key E&S aspects of Project development—biodiversity,
water quality, and land acquisition—are discussed in Section 17.1.3.3.
| 17.1.3.2 | Environmental and Social Management Plans (ESMPs) |
Artmin has compiled a set of draft ESMPs (Artmin 2024a-aa). The ESMPs
aim to comply with host country requirements, EIA commitments and conditions of approval, European Union directives, and the IFC PS. The
ESMPs include:
Environmental resources: resource efficiency and pollution prevention,
noise and vibration, soil management, spill prevention, water and wastewater management, biodiversity management, waste management, hydrocarbon
management, emergency management and environmental monitoring.
Social: Community development, health and safety and security
(includes grievance mechanism), influx management, traffic management, cultural heritage, visual aesthetics and social monitoring.
Worker conditions: Code of Conduct, health and safety, employment
plan, labour and working conditions, contractor management, supply chain.
Biodiversity
The draft Biodiversity Management Plan includes the key mitigation measures
aimed at addressing the potential impacts on vulnerable species and habitats. The plan commits the Project to conduct additional field
surveys to confirm the presence of flora and fauna species that would trigger the Critical Habitat designation within the Project area.
If found, these will be mapped and offset measure(s) will be developed consistent with GIIP (IFC PS6).
Water Management
Although the site is relatively dry, water management at Hod Maden is
complex due to the environmental geochemistry of ore, waste rock, and tailings, and the complex site layout with Project infrastructure
in two valleys. The Project’s water management plan is premised on separation and separate management of contact water4
and non-contact water5. Key elements of the
water management plan are summarized below and described in detail in Section 15.5.
_____________________
4
Contact water refers to water that has come into direct contact with materials and substances that are part of the mining and milling
processes, including water used in the process plant and water that interacts with mined rock including ore and waste rock stockpiles,
tailings deposits, leach facilities, and open pit walls.
5
Non-contact water refers to water that has not come into direct contact with any of the materials or substances
in the mining and milling processes. Generally, non-contact water either naturally occurring or sourced externally, for example surface
run-on water flowing overland from undisturbed areas upstream of the mine site, and groundwater that is not influenced by mining activities.
| | 17-7 | |
| SSR Mining Inc. | Hod Maden Project | | January 7, 2026 |
| Technical Report Summary | | SLR Project No.: 123.000320.00001 |
·
Non-contact water will be diverted around mine infrastructure and routed into natural drainages downstream of the facilities. Water
quality will be monitored and erosion and sediment control (ESC) measures will be implemented as appropriate.
·
Contact water will be collected, monitored, and treated as necessary in an industrial water treatment plant (WTP) employing lime
neutralization and reverse osmosis to meet regulatory limits for discharge to the receiving environment. Domestic wastewater will be treated
and the effluent will be discharged into the Şurakev Creek.
| · | Mine dewatering volumes have been determined using a numerical groundwater model for the tunnel and underground mine void. Surface
dewatering wells will be drilled. Excess water from dewatering activities will be discharged directly to the Şurakev River, or
treated prior to discharge. |
·
The bed of the Maden Creek, which overlies the orebody, will be sealed to limit the infiltration of water into the underground
mine.
·
In the North Valley, the TSF and WDF will be lined to protect the quality of underlying groundwater and surface water in downstream
watercourses.
| · | Artmin has committed not to abstract water from surface watercourses. The Project will source process water primarily using reclaim
water from the TSF and underground dewatering. Under the low flow groundwater predictions, the surface dewatering well will occasionally
need to provide makeup to the process. |
·
Potable water will be supplied from the dewatering system or from the fresh water borefield in South Valley to feed a dedicated
reverse osmosis potable water treatment plant.
·
The Project has developed a site-wide water balance model using the GoldSim software package to inform water management planning
and the hydraulic design of water management infrastructure.
·
Surface and groundwater monitoring will be conducted regularly during the construction, operation and closure phases. In addition,
underdrain pools, seepage and discharge water quality will be monitored.
Land Acquisition and Resettlement Action Plan
The villages of Aşağımaden and Yukarımaden
are affected by land acquisition for the Project, with a total of 887 private land parcels, totalling 372,825 m2, required
for the construction of Project infrastructure in both the North and South valleys.
Artmin commenced land acquisition in the South Valley in 2019. The government’s
Special Provincial Administration (SPA) are currently assisting the Project with ongoing land acquisition efforts. The project is also
arranging additional payments to landowners who have previously been compensated, to ensure parity with payments made to other landowners.
The status of the Land Acquisition process at the time of writing is shown in Table 17-1.
| | 17-8 | |
| SSR Mining Inc. | Hod Maden Project | | January 7, 2026 |
| Technical Report Summary | | SLR Project No.: 123.000320.00001 |
Table 17-1: Land Acquisition Status
| Land
Parcel Type |
Total
Parcels (All Project) |
Completed
(2025) |
In
Progress |
| Purchased
(Voluntary Basis) |
Expropriation |
To
be Purchased (Voluntary Basis) |
Expropriation |
| Private
Land Parcels (total no.) |
887 |
522 |
349 |
26 |
- |
| Structures/Buildings
(no.) |
115 |
59 |
56 |
- |
- |
| Businesses
(no.) |
3 |
3 |
- |
- |
- |
| Treasury
Title Deeds (no.) |
37 |
37 |
- |
- |
- |
| Village
Legal Entity Parcels (no.) |
18 |
- |
- |
18 |
- |
| Forest
Land (m2) |
2,447,330 |
2,18,574 |
262,756 |
A Land Acquisition and Resettlement Action Plan (LARAP) was by Project
in 2023, and is in the process of being updated over Q4 2025. The 2023 Land Acquisition and Resettlement Action Plan is a comprehensive
plan identifying the Project-affected people (PAP), their possessions and livelihoods, affected structures, graves to be relocated, economically
affected people, vulnerable people, income sources and main expenditures. The plan further provides the methods for land acquisition and
compensation, livelihood restoration plans, a grievance mechanism, engagement with affected people and communities as well as monitoring,
evaluation and auditing plans. The plan includes a comparison of national legal requirements to IFC Performance Standard 5 and actions
taken by the Project to bridge the gap (Golder 2023b).
Land valuations were completed by a valuation firm authorized by the
Capital Markets Board in accordance with International Valuation Standards in 2017 and 2019. They were carried out transparently with
the people of the region in conformance with a Land Acquisition and Resettlement Action Plan. The company also implemented an incentive
program to encourage landowners to sell their land as a part of a Resettlement Plan (GR Engineering 2021).
According to the 2023 LARAP, of the 68 affected homes, 20 were in useable
condition, and only five were used on a permanent basis. Since receiving compensation from the Project, five homes have been reconstructed
in Yukarimaden village, and the Tanzagara hamlet as of 2023. Common areas and treasury lands within the land acquisition area include
the mosque and cemetery belonging to the village of Yukarimaden. Engagement with the village board determined that the mosque and cemetery
would be relocated with the Project’s support. Specific permits are being sought to enable the relocation of martyr graves in the
cemetery, which will be undertaken as part of a military ceremony.
The scope of resettlement planning includes restoration of livelihoods
lost or reduced because of the Project development, through the following livelihood programs (Golder 2023b):
| · | Support small scale animal husbandry and agricultural activity to grow food and sell surplus food |
| · | Support a co-operative to mediate the sale of locally produced goods and services |
| · | Support irrigation projects to increase agricultural production |
| · | Develop a Local Employment and Training Procedure through consultation with local employee candidates to build a job placement and
capacity building strategy. This process will be ongoing during life of mine and Artmin will include skill building programs and on the
job training programs for workers, including contractors. |
| | 17-9 | |
| SSR Mining Inc. | Hod Maden Project | | January 7, 2026 |
| Technical Report Summary | | SLR Project No.: 123.000320.00001 |
In addition to livelihood restoration programs, local employment and
procurement is expected to play an important role in mitigating negative social impacts and to improve the livelihoods of affected villages.
Artmin plans to employ 50% of the required unskilled, semi-skilled and skilled workforce required locally, with priority given to Aşağımaden
and Yukarimaden.
The draft Community Development Plan includes a commitment to actively
include women in the private land acquisition process and ensure that compensation benefits address their needs to the extent possible,
and to provide additional assistance to vulnerable households affected by resettlement.
Monitoring will include record keeping of support provided through livelihood
programs, local employment and support to vulnerable people, and key performance indicators include local employment achieved, percentage
of community grievances closed out and collaboration with interested co-operatives to increase farming and work opportunities at least
once a year.
| 17.2.1 | Mine Waste and Tailings Disposal |
To the extent practical, waste rock will be used to backfill underground
mine stopes but the remaining waste rock will be transported and deposited in a special-purpose surface waste dump facility (WDF) in the
North Valley. Because most of the waste rock excavated from the underground mine workings will be classified as potentially acid generating
(PAG), the WDF will be designed and constructed to protect groundwater and surface water from impacts due to ARD/ML. The design of this
facility is detailed in Section 15.7.
The process plant will produce two tailings products, a low sulfur (NAG)
stream and a high sulfur (PAG) stream (Section 14.3). The low sulfur tailings will be thickened and then either mixed with cement and
backfilled to the underground mine workings (when areas to backfill are available) or will be pumped to disposal in the TSF in the North
Vally. The high sulfur tailings will be thickened and pumped to the TSF.
Under Turkish law, the high sulfur tailings are classified as Class
I (hazardous waste) based on their sulfide mineral content. Owing to the classification of the high sulfur tailings as PAG, the TSF has
been designed and will be operated to protect groundwater and surface water from the potential impacts of ARD/ML. Facility design is described
in Section 15.6.
The Project EIA was approved with a range of backfill options. However,
at the time the law did not allow for tailings backfill below the water table. Recent changes to legislation allow this, and the regulator
will develop guidelines for tailings backfill as the next step. Artmin awaits these guidelines to finalize the tailings backfill plan.
A permit will also be required for this activity.
| 17.2.2 | Domestic and Solid Waste |
The mine will have a dedicated sewage treatment plant to service facilities
in South Valley including the process plant, change house, administration and service facilities. Treated wastewater will be discharged
to the environment in accordance with the requirements of the EIA and solid waste will be collected by a licensed contractor for appropriate
disposal off site.
At Powerline Valley (South Portal Area) a smaller sewage treatment facility
will be installed.
Wastewater generated from the accommodation village will be collected
in centralized pits and pumped to a dedicated treatment plant located close to the village boundary. Treated effluent will be transferred
to a waste drying pond area. Sludge will be collected and removed from site as required on a regular basis.
| | 17-10 | |
| SSR Mining Inc. | Hod Maden Project | | January 7, 2026 |
| Technical Report Summary | | SLR Project No.: 123.000320.00001 |
The solid waste management system will include a landfill facility and
one incinerator. Hazardous waste unsuitable for landfill or incineration will be stored on site and later shipped off site for treatment
or disposal at the Artvin municipal putrescible dump.
Artmin submitted the Project EIA to regulatory authorities in November
2020 and, following receipt of comments and additional requirements from authorities, submitted an updated document in July 2021. The
updated EIA received approval by the Ministry of Environment, Urbanization and Climate Change on November 17, 2021.
Artmin has provided a list of permits required with the current application
status, which is summarised in Table 17-2
Recent changes in the Project layout, particularly the siting of soil
stockpiles, has meant that some additional forestry permits are required. The Project is also seeking the opinion of the General Directorate
on whether an amendment to the EIA is required based on these changes.
Timing for the receipt of the tailings backfill permit is uncertain
due to evolving regulatory developments (Section 17.2). In the absence of the permit, the plan would be to start the mine using cemented
aggregate fill and/or cemented waste rock fill (GR Engineering Services 2021).
The environmental approvals and permits for port operations and improvements
needed to export copper and pyrite concentrates out of Hopa Port, Rize Port, or Trabzon Port will need to be obtained by the relevant
port authority. The mine is not responsible for these approvals and permits. These permitting activities present a low risk to the Project
schedule because the ports are existing facilities.
Table 17-2: Approval and Permit
Status
| Permitting |
Number of Permits Required |
Status |
| Operations Licences and Permits |
4 |
Completed |
| Workplace Opening and Working Permit |
1 |
Completed |
| Forestry Permits |
15 |
4 Completed, 8 On Track, 3 Not Started |
| Land Acquisition and Land use Permits |
15 |
9 Completed, 4 On Track, 2 Not Started |
| Environmental Impact Assessment (EIA) |
1 |
Completed- consultation on potential amendments ongoing |
| Power Supply Contract |
1 |
Completed |
| Office |
1 |
Completed |
| Explosives Usage and Storage Permits |
2 |
Not Started |
| Main Access Road |
8 |
1 Completed, 2 On Track, 5 Not Started |
| Tailings Storage Facility |
6 |
2 On Track, 4 Not Started |
| PAG Waste Dump |
6 |
Not Started |
| | 17-11 | |
| SSR Mining Inc. | Hod Maden Project | | January 7, 2026 |
| Technical Report Summary | | SLR Project No.: 123.000320.00001 |
| Permitting |
Number of Permits Required |
Status |
| Underground Mine |
2 |
Not Started |
| Mobile Crushers |
1 |
Not Started |
| Waste Water Management |
5 |
1 Completed, 4 Not Started |
| Groundwater Use |
1 |
Completed |
| Hazardous Materials Management |
2 |
Not Started |
| Surface water Management |
4 |
3 Completed, 1 Not Started |
| Radio Permit |
1 |
Completed |
| Waste Management |
5 |
4 Completed, 1 Not Started |
| Relocation of Historical Sites |
2 |
2 On Track |
| 17.4 | Mine Closure Planning |
A Reclamation Plan was prepared as part of the EIA, and a conceptual
closure plan has been prepared specifically for the TSF.
The Reclamation Plan does not state final land use objectives; these
will be determined in consultation with regulatory authorities and local stakeholders. The plan notes that not all areas will be fully
returned to their natural state. This includes the WDFs, aggregate (andesite) quarry, and TSF. Some infrastructure will be used post-closure
such as part of the internal roads that will be used for maintenance and monitoring activities, the Saliçor Valley access tunnel,
as well as the tunnels along the access roads, the diversion and interception channels, and the substation and its associated facilities.
Mine closure will include:
| · | The partially-backfilled underground mine will be allowed to flood and the decline portal and ventilation and secondary shafts will
be sealed. Groundwater levels will slowly rebound in the mine area over four to five years following closure. |
·
The quarry will be developed with overall slopes to ensure long-term stability. At this stage no treatment is anticipated for runoff
water and it will discharge into the environment. Pit lake development will be allowed. Pit water quality will be monitored during operations
and should it not meet project discharge standards, then the lower portions of the pit would be backfilled or regraded to eliminate a
pit lake.
| · | General structures and concrete footings will be removed e.g. accommodation units, industrial buildings, offices etc. It is possible
that the local community may wish to take over useful buildings and this will be negotiated as part of the closure plan. Concrete and
masonry from demolished structures will be placed within the waste dump prior to encapsulation and rehabilitation to the final landform. |
| · | Any contaminated soil will be removed and disposed in accordance with local regulations. |
| · | Bio-restoration and revegetation planning will be conducted by an expert botany team. |
| · | The TSF surface and side slopes will be re-profiled and regraded and engineered systems will be installed to limit infiltration and
manage runoff. Seepage will be collected from the overdrain layer and routed to the WTP. It is anticipated that once the cover system
is constructed, there will be a significant decrease in seepage reporting out of the toe of the TSF. The TSF will be revegetated prioritizing
native plant species. The reclaim pond will be emptied and removed as well as the tailings distribution system. |
| | 17-12 | |
| SSR Mining Inc. | Hod Maden Project | | January 7, 2026 |
| Technical Report Summary | | SLR Project No.: 123.000320.00001 |
| · | The North Valley WDF will be regraded and covered with a liner system. Drainage systems will remain in place and be monitored for
a period of time after mine closure. Once the drainage becomes negligible, the surface drainage system will be connected to a channel
on the downstream face. |
| · | A contact water treatment plant (WTP) will treat contact water during closure. Treated effluent will be discharged to the receiving
environment in accordance with the discharge standards. During the closure period, contact water collected in PAG WDF and TSF ponds will
be routed to the WTP. The contact WTP will be operational until all facilities are removed and/or closed and contact water treatment is
no longer required. |
| · | Ponds which are no longer needed will be closed. Any remaining sludge or sediment will first be tested to determine appropriate disposal
methods, then stabilized by mixing with cement or removed and disposed per local regulatory requirements. |
| · | Monitoring programs will be implemented for water quality, biodiversity, social and other aspects. |
Decommissioning and closure will be completed in consultation with the
Provincial Directorate of Agriculture and Forestry for forest areas.
A Social Impact Assessment (SIA) will be prepared five years prior to
final mine closure and mitigation measures identified as needed.
Artmin will maintain a separate closure and rehabilitation fund within
their accounting system that can only be used for closure purposes, as per IFC requirements. The Government of Türkiye will require
a financial guarantee. The mine closure cost was estimated at US$14.3 million.
| | 17-13 | |
| SSR Mining Inc. | Hod Maden Project | | January 7, 2026 |
| Technical Report Summary | | SLR Project No.: 123.000320.00001 |
| 18.0 | Capital and Operating Costs |
The total Project LOM capital costs total $1,060 million (in Q4 2025
US dollars), which considers all costs incurred before December 01, 2025, as sunk. The capital cost estimate was prepared by SSR and the
Hod Maden project team in combination with Ausenco. The capital costs are summarized in Table 18-1.
Table 18-1: LOM Capital Cost Summary
| Description |
Value
(US$ million) |
| Total Development (May 2023) |
1,060 |
| Sunk Costs – (May 2023 - November 2025) |
(149) |
| Net Development Costs |
910 |
| Sustaining |
75 |
| LOM Capital Costs |
985 |
| Final Closure/Reclamation |
14 |
| Total |
999 |
Note: Numbers may not add to totals due to rounding
Table 18-2 details the sunk costs for the Project as of November 30,
2025.
Table 18-2: Sunk Costs as of November
30, 2025
| WBS |
Description |
Sunk Costs
(US$ million) |
| 1000 |
Waste Dumps and Quarries |
- |
| 2000 |
Underground Mining |
0.5 |
| 3000 |
Process Plant |
0.6 |
| 4000 |
Services and Utilities |
19.7 |
| 5000 |
Regional Infrastructure |
31.7 |
| 6000 |
Site Support Services |
8.8 |
| 7000 |
Project Delivery Management |
62.8 |
| 8000 |
Other Capitalised Costs |
25.2 |
| 9000 |
Provisions |
- |
| Total |
|
149.1 |
| | 18-1 | |
| SSR Mining Inc. | Hod Maden Project | | January 7, 2026 |
| Technical Report Summary | | SLR Project No.: 123.000320.00001 |
| 18.1.1 | Development Capital |
| 18.1.1.1 | Statement of Classification |
The SLR QP has reviewed the Basis of Estimate document (BoE) developed
for the Project. The BoE indicates the initial capital cost estimate has been prepared to a Class 3 using the AACEi classification system,
with a level of accuracy of -10% to +15%; the SLR QP agrees with this assessment.
| 18.1.1.2 | LOM Capital Cost Estimate |
The LOM capital cost estimate, updated as of December 2025, is presented
in Table 18-3. Indirect Costs have been estimated as 42% of Direct Costs. This level of indirects is slightly lower than a typical final
range for a project of this size, which would be between 55% to 65%.
Table 18-3: LOM Capital Cost Estimate
December 2025 – Level 1 Summary
| Cost Items |
US$ millions |
| Direct Costs |
|
| UG Mine Development |
75 |
| UG Mining & Mine Management |
2 |
| Process Plant |
84 |
| Site Infrastructure |
209 |
| Regional Infrastructure |
95 |
| Total Direct Cost |
465 |
| Other Costs |
|
| Site Support Services |
55 |
| Project Delivery Mgmt (EPCM/Owner's Costs) |
97 |
| Other Costs |
37 |
| Subtotal Indirects |
189 |
| Subtotal Directs and Indirects |
654 |
| Contingency |
106 |
| Escalation |
150 |
| Subtotal Escalation and Contingency |
256 |
| Initial Capital Cost |
910 |
| Sustaining |
75 |
| Subtotal |
985 |
| Reclamation and Closure |
14 |
| Total Project Costs |
999 |
| | 18-2 | |
| SSR Mining Inc. | Hod Maden Project | | January 7, 2026 |
| Technical Report Summary | | SLR Project No.: 123.000320.00001 |
The capital cost estimate for the Process Plant is only US$84.0 million,
approximately 18% of the Project’s Direct Costs, which is unusual for mining projects; however, the SLR QP notes that the bulk earthworks
scope for the Hod Maden Project is significant.
While contingency is approximately 16% of Direct and Indirect costs,
the Project has added a further 23% to allow for escalation in this estimate. The effective contingency (calculated by removing sunk costs
from the Direct + Indirect estimate and reallocating growth allowances from Direct Costs to Contingency) is 21% (Table 18-4). The SLR
QP considers this to be an appropriate contingency for a Class 3 estimate; however, it recommends that the Project team carefully monitor
and control the bulk earthworks scope.
Table 18-4 presents key metrics related to the capital cost estimate.
Table 18-4: Key Capital Cost Metrics
| Description |
Metric |
| Process facility as a percentage of Directs Costs |
18% |
| Indirect Costs as a percentage of Direct Costs |
41% |
| Contingency as percentage of Direct + Indirect Costs |
16% |
| Escalation |
23% |
| Sunk Cost (as of September 2025) |
$149.2 million |
| Effective Contingency (Percentage of Direct + Indirect Costs less Sunk Costs) |
21% |
During 2025, monthly expenditures have averaged $8.5 million before
increasing substantially following the release of the main construction contract packages at the end of 2025. The main construction packages
include the following:
| · | Underground lateral development. |
| · | North Valley and tailings dam bulk earthworks. |
| · | Process plant construction packages. |
| · | Common infrastructure packages. |
| · | Tunnels T1 and T2 along the Main Access Road. |
| 18.1.1.3 | Foreign Currency Exchange |
Table 18-5 lists the percentage of the budget for each of the Project’s
major currencies that were included in the estimate. It should be noted that some budgets for work that is to be executed in Turkish lira
has been included in the capital cost estimate in US dollars.
| | 18-3 | |
| SSR Mining Inc. | Hod Maden Project | | January 7, 2026 |
| Technical Report Summary | | SLR Project No.: 123.000320.00001 |
Table 18-5: Capital Cost Estimate
Percentage by Currency
| Currency Name |
Code |
Percentage of Initial Capital Cost Budget |
| US Dollar |
USD |
14% |
| Australian Dollar |
AUD |
3% |
| Euro |
EUR |
4% |
| Turkish Lira |
TRY |
64% |
| Monies spent since LNTP |
|
15% |
| Total |
|
100% |
| LNTP: Limited Notice to Proceed |
The Turkish currency has experienced volatility in inflation and currency
rate fluctuations during the last several years. Approximately 43% of the capital cost estimate, or approximately US$420 million ($977
million x 0.43), has exposure to the Turkish Lira to US dollar foreign exchange rate for the initial capital costs. It should be noted
that much of the costs are in the USD classification for this budget for escalation and contingency. The most probable destination for
these expenditures will be in Turkish Lira; however, at this point in time the final currency of these budget items have not been specifically
identified. The SLR QP recommends that the Project continue to carefully monitor the ongoing exposure to foreign currency fluctuations
during construction.
The Basis of Estimate (BoE) document indicates that the inflation/escalation
is excluded from the estimate as are any potential impacts to the Project for pending international tariffs.
The capital cost estimate for the Project has a high level of quotations,
i.e., awarded contractors plus formal or recent budget quotations total 85% of the total value of the budget. Including the sunk costs,
the total value is 91%. The budget quotations included unit rates for labor and unit productivity rates.
A LOM total of $74.76 million in sustaining capital has been estimated
by the SSR Project Team with allowances in the latest budget update. The sustaining capital estimate accounts for the process plant (US$19
million), infrastructure (US$18 million), and mine (US$34.2 million).
Operating costs were estimated based on current site cost assumptions
for labor, consumables, contracts, and budget assumptions. The SLR QP considers that according to the AACE classifications, these estimates
would mainly be Class 3 with a level of accuracy of -10% to +15.
The projected average LOM unit operating cost estimates, from the start
of commercial production, are summarized in Table 18-6.
| | 18-4 | |
| SSR Mining Inc. | Hod Maden Project | | January 7, 2026 |
| Technical Report Summary | | SLR Project No.: 123.000320.00001 |
Table 18-6: Average Operating Costs
Unit Rates
| Activity |
Unit |
Avg LOM |
| UG Mining (contract) |
$/t ore processed |
50.35 |
| Processing |
$/t ore processed |
29.82 |
| Exploration/Development |
$/t ore processed |
5.66 |
| General and Administrative |
$/t ore processed |
26.07 |
| Total Operating Costs |
$/t ore processed |
111.90 |
Mine operating costs were estimated by the SSR project team with the
assumption that mining operations will be carried by a Turkish mining contractor. No capital cost is included for mining equipment or
facilities. All such costs are built into the unit rate for mining operations included in the operating cost estimate. Average mining
unit rates, summarized in Table 18-7, total $50.35/t milled.
Table 18-7: Mine Operating Cost
Summary
| Description |
LOM Total
(US$ millions) |
LOM Average
($/t milled) |
| Lateral Development |
43.5 |
$5.63 |
| Production |
45.8 |
$5.93 |
| Loading |
33.5 |
$4.33 |
| Hauling |
56.4 |
$7.30 |
| Backfill |
31.3 |
$4.05 |
| Subtotal Production |
210.4 |
$27.23 |
| Mine Services |
30.2 |
$3.91 |
| Labor |
148.4 |
$19.21 |
| Total Mining |
389.0 |
$50.35 |
Note: LOM Mine operating costs include $2.6 million ($0.33/t milled)
from pre-commercial production period
The following processing costs in Table 18-8 were estimated by Ausenco
2024-25 FS work to be $29.82/t ore, mainly by using lower labor rates based on the Çöpler workforce.
| | 18-5 | |
| SSR Mining Inc. | Hod Maden Project | | January 7, 2026 |
| Technical Report Summary | | SLR Project No.: 123.000320.00001 |
Table 18-8: Process Operating Cost
Summary
| Description |
LOM Total (US$ millions) |
LOM Average ($/t ore) |
| Labour |
70.71 |
9.15 |
| Power |
60.40 |
7.82 |
| Consumables |
54.11 |
7.00 |
| Maintenance |
28.50 |
3.69 |
| Contract Services |
12.85 |
1.66 |
| General |
3.92 |
0.51 |
| Total Processing |
230.49 |
29.82 |
| 18.2.3 | Exploration/Development Costs |
The SSR project team provided an allowance of $44 million for exploration/development
costs to upgrade and confirm Mineral Reserves from Years -4 through 11. These costs average up to $5.66/t ore over the LOM.
| 18.2.4 | General and Administration Costs |
The General and Administrative (G&A) costs estimates were developed
by the SSR project team as presented in Table 18-9 and average $26.07/t milled over LOM. The SLR QP is of the opinion that the G&A
estimate of $19.76 million per year is adequate since it is approximately 32% of direct operating costs (mining and processing), which
is reasonable for a semi-remote underground mine operation with camp facilities.
Table 18-9: G&A Operating Cost
Summary
| Description |
LOM G&A Costs (US$ millions) |
LOM Average ($/t ore) |
| Labor |
45.67 |
5.91 |
| Administration |
118.88 |
15.39 |
| Regional and corporate support |
32.76 |
4.24 |
| Miscellaneous |
4.12 |
0.53 |
| Total G&A |
201.44 |
26.07 |
| Note: Numbers may not add to totals due to rounding. |
The estimated Hod Maden workforce is estimated to average 497 persons
once full operations are achieved. The breakdown by department during full operations in 2030 is shown in Table 18-10. During construction,
there will be a peak of 1,150 workers in the summer of 2026.
Table 18-10: Proposed Workforce
| Area |
Total |
| Mine |
283 |
| Processing |
127 |
| G&A |
87 |
| Total |
497 |
| | 18-6 | |
| SSR Mining Inc. | Hod Maden Project | | January 7, 2026 |
| Technical Report Summary | | SLR Project No.: 123.000320.00001 |
The economic analysis contained in this TRS is based on an analysis
date as of November 30, 2025, economic assumptions, and capital and operating costs provided by SSR finance and technical teams and reviewed
by SLR. All costs are expressed in Q4 2025 US dollars and unit costs are based on metric tonnes.
An after-tax Cash Flow Projection in US dollars has been generated from
the Life of Mine production schedule and capital and operating cost estimates and is summarized in Table 19-1. All metrics presented in
this section, including the cash flow analysis, is presented at the 100% Project level, however, SSR’s attributable share is 10%.
A summary of the key criteria is provided below.
| · | 7.73 million tonnes averaging 7.63 g/t gold,1.31% copper mined from underground only |
| · | 2,182 tonnes per day mining from underground (nominal 800 ktpa). |
| · | Mill recovery, as indicated by test work, averaging 87.1% gold and 96.8% copper. |
| · | Smelter payable terms: 97.5% gold, 96.5% copper for 44,540 dry tonnes gold sulfide concentrate per year averaging 116 g/t gold, 22%
copper during full production years |
| · | Annual average production from first production year 2028 onwards: 159 thousand ounces of payable gold and 21 million pounds of payable copper per year (189
thousand ounces gold equivalent per year) during full production years |
| · | Life of mine average metal price: US$3,167 per ounce gold, US$4.52 per pound copper. |
| · | Net Smelter Return (NSR) includes total concentrate freight cost of $100.01/wmt, $12/dmt treatment charge, and $0.012 per pound copper
refining costs. |
| · | Revenue is recognized at the time of production. |
| · | Pre-production period: 30 months (December 2025 to May 2028). |
| · | Mine life: approximately 12 years, including two years of pre-production |
| · | Life of Mine production plan as summarized in Table 13-23. |
| · | All costs are as of Q4 2025 US dollar basis. |
| · | Growth/Development capital of $910 million – excluding sunk costs |
| · | Mine life capital, including sustaining capital, totals $985 million. |
| · | Final reclamation/closure cost: $14 million |
| · | Average operating cost over the mine life is $111.90 per tonne milled. |
| o | Underground mining costs of $50.35 per tonne milled |
| o | Processing costs of $29.82 per tonne milled |
| o | Exploration/Development costs of $5.66 per tonne milled |
| | 19-1 | |
| SSR Mining Inc. | Hod Maden Project | | January 7, 2026 |
| Technical Report Summary | | SLR Project No.: 123.000320.00001 |
| o | Site General and Administrative costs of $26.07 per tonne milled |
| 19.1.3 | Taxation and Royalties |
| · | Royalty costs total $880 million over LOM comprised of: |
| o | Turkish Government: Realized 12.8% NSR based on a sliding scale based upon gold prices and allowing for deductions of processing as
well as a 40% reduction in royalty rates based on assumption that gold sulfide concentrate produced at the Project is considered the product
of ore processing ($775 million) |
| o | Royal Gold (Sandstorm): 2.0% NSR royalty ($104 million) |
| · | Income taxes (per SSR tax group) |
| o | 24.5% corporate income tax rate |
| o | Unit of Production depreciation |
| o | Total income tax payable is $784 million over LOM. |
SLR has reviewed the SSR’s Hod Maden LOM cash flow model, considering
gold and copper as final saleable products and has prepared its own unlevered after-tax LOM cash flow model based on the information contained
in this TRS to confirm the physical and economic parameters of the Project.
The economic analysis prepared by SLR considers a base discount date
as of December 1, 2025, using mid-year convention discounting.
The base discount rate assumed in this TRS is 5% as per standard industry
practice.
To support the disclosure of Mineral Reserves, the economic analysis
demonstrates that Hod Maden’s Mineral Reserves are economically viable at the net realized prices of $3,167/oz gold and $4.52/lb
copper for the period 2027 to 2037, with long term prices of $3,094/oz gold and $4.46/lb copper.
The summary cash flow analysis is presented in Table 19-1 and Figure
19-1. The full annual cash flow model is in Appendix 1. The Project shows strong free cash flow in the early part of the mine life when
mining higher grades, tapering off towards end of mine life.
On a pre-tax basis, the undiscounted cash flow totals $3,237 million
over the mine life. The pre-tax net present value (NPV) at a 5% discount rate is $2,236 million. On an after-tax basis, the undiscounted
cash flow totals $2,453million over the mine life. The after-tax NPV at 5% is $1,657 million. The after-tax Internal Rate of Return (IRR)
is 39.0%. Simple payback from the start of commercial production in 2029 is less than one year.
The World Gold Council Adjusted Operating Cost (AOC) is US$535 per ounce
of gold and the All in Sustaining Cost (AISC) is US$590 per ounce of gold. The AISC breakdown is presented in Table 19-2. Average annual
production during full operation is 200 thousand gold equivalent ounces per year.
| | 19-2 | |
| SSR Mining Inc. | Hod Maden Project | | January 7, 2026 |
| Technical Report Summary | | SLR Project No.: 123.000320.00001 |
Table 19-1: After-Tax Cash Flow
Summary
| Description |
Value |
| Realized Market Prices |
|
| Au (US$/oz) |
$3,167 |
| Cu (US$/lb) |
$4.52 |
| Payable Metal |
|
| Au (koz) |
1,609 |
| Cu (Mlb) |
209 |
| Total Gross Revenue |
6,038 |
| Underground Mining |
(390) |
| Process Plant |
(230) |
| Exploration/Development |
(44) |
| G&A |
(201) |
| Concentrate Freight |
(49) |
| TC/RC |
(8) |
| Royalties |
(880) |
| Total Operating Costs |
(1,802) |
| Operating Margin (EBITDA) |
4,236 |
| Total Tax Payable |
(784) |
| Working Capital* |
0 |
| Operating Cash Flow |
3,452 |
| Development Capital Costs |
(910) |
| Sustaining Capital |
(75) |
| Final Closure/Reclamation Costs |
(14) |
| Total Capital |
(999) |
| |
|
| Pre-tax Free Cash Flow |
3,237 |
| Pre-tax NPV @ 5% |
2,236 |
| Pre-tax NPV @ 8% |
1,804 |
| Pre-tax IRR |
47.9% |
| |
|
| After-tax Free Cash Flow |
2,453 |
| After-tax NPV @ 5% |
1,657 |
| After-tax NPV @ 8% |
1,314 |
| After-tax IRR |
39.0% |
| | 19-3 | |
| SSR Mining Inc. | Hod Maden Project | | January 7, 2026 |
| Technical Report Summary | | SLR Project No.: 123.000320.00001 |
Figure 19-1: After-Tax Annual Cash
Flow Metrics
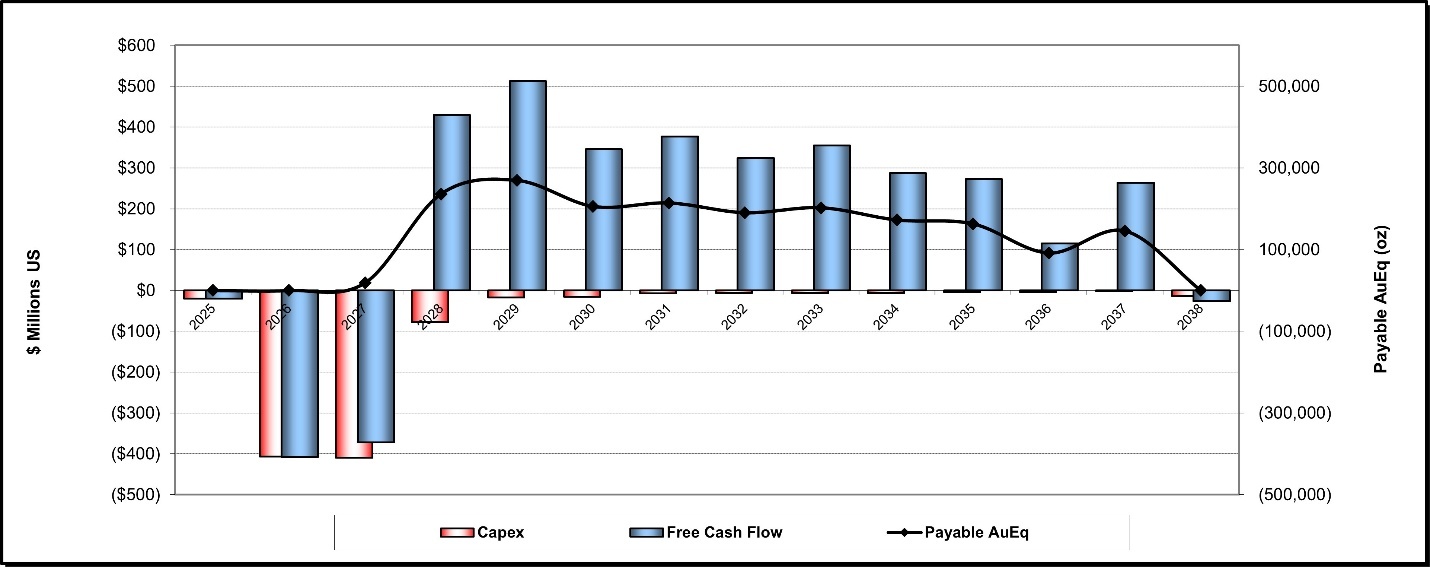
FIGURE 19-1
$ Million US
$600
$500
$400
$300
$200
$100
$0
($100)
($200)
($300)
($400)
($500)
2025
2026
2027
2028
2029
2030
2031
2032
2033
2034
2035
2036
2037
2038
Capex
Free Cash Flow
Payable AuEq
500,000
300,000
100,000
(100,000)
(200,000)
(300,000)
(500,000)
Payable AuEq (oz)
Table 19-2: AISC Composition
| Description |
LOM Total
US$ million |
Unit Costs
($/oz Au) |
| Underground Mining |
390 |
242 |
| Process Plant |
230 |
143 |
| Exploration/Development |
44 |
27 |
| G&A |
201 |
125 |
| Subtotal Site Costs |
866 |
538 |
| Concentrate Freight |
49 |
30 |
| TC/RC |
8 |
5 |
| Royalties |
880 |
547 |
| Subtotal Offsite Costs |
937 |
582 |
| Total Direct Cash Costs |
1,802 |
1,120 |
| Copper By-Product Credit |
(942) |
(585) |
| Adjusted Operating Costs |
860 |
535 |
| Sustaining Capital |
75 |
46 |
| Closure/Reclamation Capital |
14 |
9 |
| Total Sustaining Costs |
89 |
55 |
| Total All-in Sustaining Costs |
949 |
590 |
| Gold Payable Metal (Moz) |
1.61 |
| Cu Payable Metal (Mlb) |
209 |
| Cu as Au Equivalent (Moz) |
0.30 |
| AuEq Payable Metal (Moz) |
1.91 |
| | 19-4 | |
| SSR Mining Inc. | Hod Maden Project | | January 7, 2026 |
| Technical Report Summary | | SLR Project No.: 123.000320.00001 |
Project risks can be identified in both economic and non-economic terms.
Potential economic risks were examined by running cash flow sensitivities to changes in the following variables:
After-tax NPV and IRR sensitivities over the Base Case have been calculated
for -20% to +20% variations for head grade and recovery, and for -30% to +30% for gold and copper price. For operating costs and capital
costs, the sensitivities over the Base Case have been calculated at -15% to +15% variations.
The sensitivities are shown in Figure 19-2 and Figure 19-3, respectively,
and summarized in Table 19-3. The analysis shows that the Project is most sensitive to changes in head grade, recovery, and metal prices
but, less sensitive to operating and capital costs.
| | 19-5 | |
| SSR Mining Inc. | Hod Maden Project | | January 7, 2026 |
| Technical Report Summary | | SLR Project No.: 123.000320.00001 |
Table 19-3: After-Tax Sensitivity
Analysis
| Variance |
Head Grade
(g/t Au) |
NPV at 5%
(US$ millions) |
IRR (%) |
| 80% |
6.10 |
1,083 |
28.7 |
| 90% |
6.87 |
1,370 |
34.0 |
| 100% |
7.63 |
1,657 |
39.0 |
| 110% |
8.39 |
1,945 |
43.9 |
| 120% |
9.16 |
2,232 |
48.6 |
| Variance |
Recovery
(% Au) |
NPV at 5%
(US$ millions) |
IRR (%) |
| 90% |
78.3 |
1,370 |
34.0 |
| 95% |
82.7 |
1,514 |
36.5 |
| 100% |
87.1 |
1,657 |
39.0 |
| 105% |
91.4 |
1,801 |
41.5 |
| 110% |
95.8 |
1,945 |
43.9 |
| Variance |
Metal Prices
(US$/oz Au) |
NPV at 5%
(US$ millions) |
IRR (%) |
| 70% |
2,217 |
852 |
24.3 |
| 85% |
2,692 |
1,263 |
32.0 |
| 100% |
3,167 |
1,657 |
39.0 |
| 115% |
3,642 |
2,056 |
45.6 |
| 130% |
4,117 |
2,427 |
51.6 |
| Variance |
Operating Costs
(US$/t) |
NPV at 5%
(US$ millions) |
IRR (%) |
| 95% |
106.31 |
1,650 |
38.9 |
| 98% |
109.10 |
1,654 |
39.0 |
| 100% |
111.90 |
1,657 |
39.0 |
| 108% |
120.30 |
1,668 |
39.2 |
| 115% |
128.69 |
1,679 |
39.3 |
| Variance |
Capital Costs
(US$ millions) |
NPV at 5%
(US$ millions) |
IRR (%) |
| 95% |
864 |
1,692 |
41.2 |
| 98% |
887 |
1,675 |
40.1 |
| 100% |
910 |
1,657 |
39.0 |
| 108% |
978 |
1,605 |
36.1 |
| 115% |
1,046 |
1,552 |
33.5 |
| | 19-6 | |
| SSR Mining Inc. | Hod Maden Project | | January 7, 2026 |
| Technical Report Summary | | SLR Project No.: 123.000320.00001 |
Figure 19-2: After-Tax NPV Sensitivity
Analysis
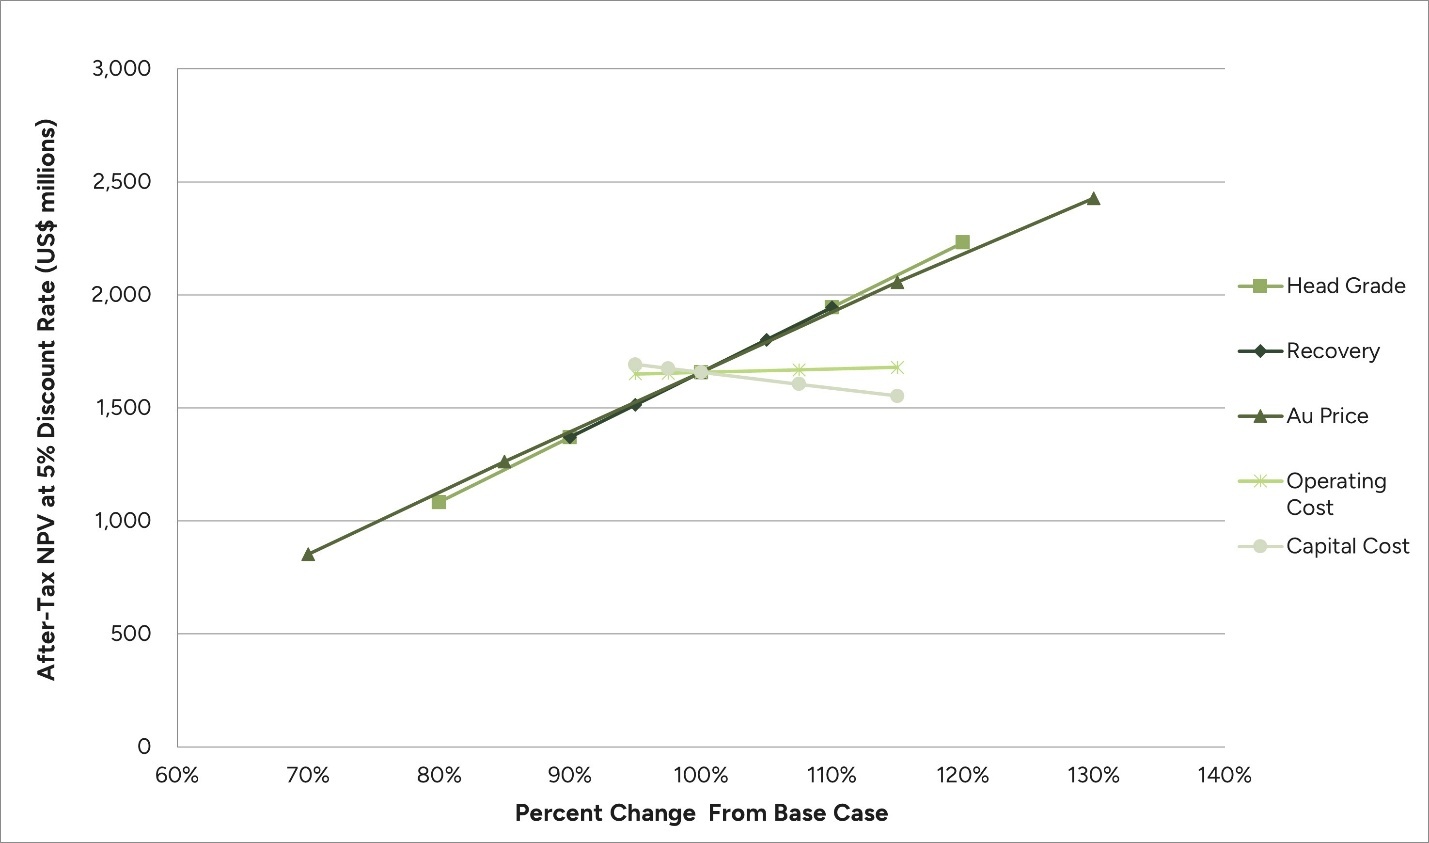
FIGURE 19-2
After-Tax NPV at 5% Discount Rate (US$ millions)
3,000
2,500
2,000
1,500
1,000
500
0
60%
70%
80%
90%
100%
110%
120%
130%
140%
Percentage Change From Base Case
Head Grade
Recovery
Au Price
Operating Cost
Capital Cost
Figure 19-3: After-Tax IRR Sensitivity
Analysis
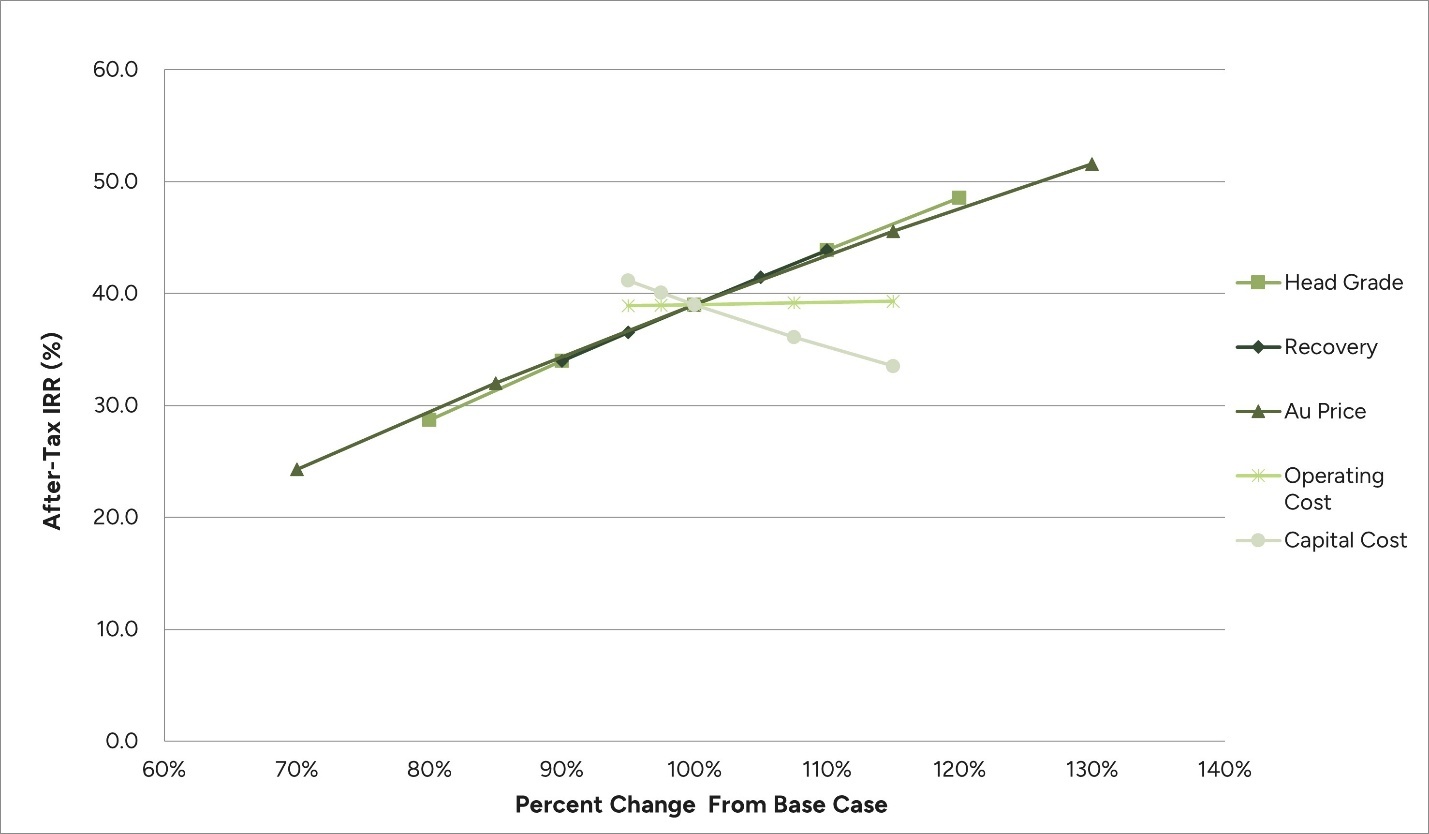
FIGURE 19-3
After-Tax IRR (%)
60.0
50.0
40.0
30.0
20.0
10.0
0.0
60%
70%
80%
90%
100%
110%
120%
130%
140%
Percent Change From Base Case
Head Grade
Recovery
Au Price
Operating Cost
Capital Cost
| | 19-7 | |
| SSR Mining Inc. | Hod Maden Project | | January 7, 2026 |
| Technical Report Summary | | SLR Project No.: 123.000320.00001 |
A sensitivity analysis of discount rates is presented in Figure 19-4
Figure 19-4: After-Tax Discount
Rate Sensitivity Analysis
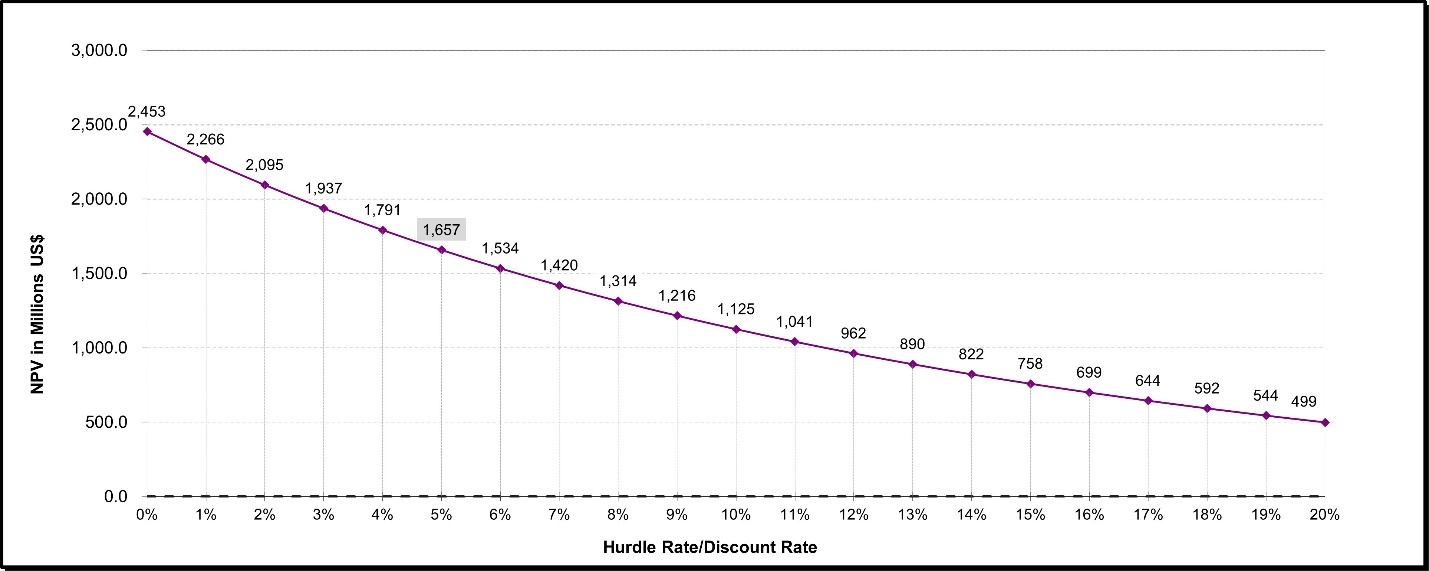
FIGURE 19-4
NPV in Millions US$
3,000.0
2,500.0
2,000.0
1,500.0
1,000.0
500.0
0.0
0%
1%
2%
3%
4%
5%
6%
7%
8%
9%
10%
11%
12%
13%
14%
15%
16%
17%
18%
19%
20%
Hurdle Rate/Discount Rate
2,453
2,266
2,095
1,937
1,791
1,657
1,534
1,420
1,314
1,216
1,125
1,041
962
890
822
758
699
644
592
544
499
| | 19-8 | |
| SSR Mining Inc. | Hod Maden Project | | January 7, 2026 |
| Technical Report Summary | | SLR Project No.: 123.000320.00001 |
There are no operational properties adjacent to the Hod Maden Project
site, nor properties in the immediate region. Some of the closest copper-gold prospects include Taç and Çorak, in the Yusufeli
district, approximately 20 km southwest of the Hod Maden Project site, owned by Mediterranean Resources Ltd. Akdeniz Resources Madençilik
A.S., a subsidiary of Mediterranean Resources Ltd, owns an interest in the Red Mountain property, which includes the Taç, Çorak,
Çeltik, and Cevreli projects.
Ariana Resources PLC is currently exploring the Salinbas/Ardala Projects,
approximately 15 km to the north of Hod Maden. Ariana is also exploring the Hizarliyayla Au-Ag system, approximately seven kilometers
to the north of the Project.
In the valley to the north of Saliçor, there is an exploration
license owned by Tüprag Metal Madençilik Sanayi Ve Tic. A.Ş. (201201347).
The closest mine under construction is located at Cerattepe, Artvin
Province, approximately 70 km northwest of Yukarımaden. The closest active operating mine is located at Murgul, Artvin Province,
approximately 114 km northwest of Yukarımaden.
| | 20-1 | |
| SSR Mining Inc. | Hod Maden Project | | January 7, 2026 |
| Technical Report Summary | | SLR Project No.: 123.000320.00001 |
| 21.0 | Other Relevant Data and Information |
The Hod Maden Project team has updated the Project schedule and Project
Execution Plan. The Project started the construction of the onsite infrastructure in fiscal year 2025 (FY2025), after a limited notice
to proceed (LNTP) was received in the fourth quarter (Q4) of 2024. The commencement of the process facilities construction was delayed
until the year 2026. Headcounts as of November 2025 for Artmin staff and total contractor are 131 and 501, respectively.
The key activities included in the updated schedule are the following:
| · | Construction of onsite permanent accommodation facilities and offices to facilitate the full mobilization and construction of the
Project |
| · | Clearing and bulk earthworks to the main Process Plant area |
| · | Construction of the sedimentation ponds for the Saliçor Tunnel area |
| · | Expansion of the main access road where possible |
| · | Commencement of the Upper and Lower waste dumps area bulk earthworks and drainage works |
| · | Preparation of the main substation platform, including bulk earthworks, MSE (Mechanically Stabilized Earth) wall and backfill |
| · | Construction of the permanent Aktaş Creek diversion channel |
| · | Commencement of the T2 Tunnel along the main access road and the Saliçor Tunnel |
| · | Commencement of South Valley community-related scope, i.e., relocation and demolition of purchased buildings |
The Project master schedule has been prepared using Primavera P6 (P6)
and would be classified as a level three master schedule. It is a resource-driven, workforce-hour loaded schedule, and it has approximately
5,347 activities. This level of scheduling detail is consistent with industry practice for a schedule comprised of commencement of the
main construction activities. The current master schedule was updated in October 2025. The duration of the construction period is expected
to be 36.5 months, and Artmin is expecting to produce the first concentrate in Q2 2028. An overview of the progress is shown in Table
21-1.
Table 21-1: Hod Maden Schedule Current
Overview
| Project Area Description |
Start Date |
End Date |
Months
(Duration) |
Earned Value as at December 1, 2025
(%) |
| Total Project |
15-Nov-24 |
May-28 |
42.1 |
14.6% |
| Engineering |
16-Nov-24 |
Dec-26 |
24.8 |
68.0% |
| Tendering/Procurement |
16-Nov-24 |
May-27 |
29.9 |
26% |
| Construction |
2-May-25 |
May-28 |
36.5 |
7.0% |
| Commissioning |
Jul-27 |
May-28 |
10.2 |
0.0% |
| | 21-1 | |
| SSR Mining Inc. | Hod Maden Project | | January 7, 2026 |
| Technical Report Summary | | SLR Project No.: 123.000320.00001 |
The Project contains three months of schedule contingency, which is
consistent with scheduling best practices.
The parameters of the Project calendar used for the Project master schedule
are listed:
| · | For engineering - six days per week and eight hours per day |
| · | For construction - six days per week and ten hours per day |
| · | All work relating to the North Valley will run three shifts per day. |
| · | All work offsite will observe public holidays. |
| · | Onsite work will not observe public holidays; however, a schedule slowdown has been assumed during Ramadan. |
| · | For non-site-based personnel, the standard rotation for onsite work is 3 weeks on and 10 days off. |
As of November 2025, the Hod Maden Project remains broadly on track
against its approved execution plan. Engineering deliverables continue to progress in line with schedule, with all major process plant
and underground design packages nearing completion. Procurement and contracting activities have intensified ahead of full construction
mobilization, including permanent camp, substation, and regional infrastructure packages. Field activities at the South Valley, T1/T2
portals that are part of the Main Access Road, and access road areas continue to expand, while early underground and process facilities
preparation remains aligned with milestone targets.
The Project entering Q4 2025 is in a strong position, with engineering
maturity at 63.8% and critical procurement items awarded or in final negotiation. Upcoming milestones include underground-contractor mobilization,
permanent-camp construction start, and the first controlled blast at T2 Portal. Cost and schedule trends both indicate that the Hod Maden
Project remains on schedule and within budget, with positive earned-value indicators supporting the baseline completion date of May 31,
2028.
Table 21-2 summarizes the current schedule for the Hod Maden Project.
| | 21-2 | |
| SSR Mining Inc. | Hod Maden Project | | January 7, 2026 |
| Technical Report Summary | | SLR Project No.: 123.000320.00001 |
Table 21-2: Hod Maden Schedule Milestones
| Description |
Start |
Finish |
Months from FID |
Duration
(Months) |
|
| LNTP – Limited Notice to Proceed |
|
15-Nov-24 |
- |
|
|
| Indicative
FID - Financial Investment Decision |
|
10-Dec-25 |
|
|
|
| Project Practical Completion |
|
31-May-28 |
30.1 |
|
|
| |
| MINING |
|
|
|
|
|
| Underground Mine Access Construction |
7-Mar-26 |
19-Jun-26 |
6.4 |
2.6 |
|
| Surface Mine Infrastructure Area |
6-Aug-25 A |
8-May-27 |
17.1 |
14.7 |
|
| Temporary Facilities Construction |
22-Apr-26 |
15-Aug-26 |
8.3 |
3.0 |
|
| PROCESS PLANT |
|
|
|
|
|
| Construction of Paste Plant and Commissioning |
11-Nov-26 |
27-Apr-28 |
29.0 |
12.2 |
|
| Construction of Process Plant |
8-Oct-26 |
13-Nov-27 |
23.4 |
11.0 |
|
| Wet and Process Commissioning of Process Plant |
11-Aug-27 |
31-May-28 |
30.1 |
6.8 |
|
| SERVICES AND UTILITIES |
|
|
|
|
|
| NORTH VALLEY |
|
|
|
|
|
| TSF1 Construction (Phase 1) |
28-Mar-26 |
31-May-28 |
30.1 |
18.4 |
|
| Utility Corridor Construction |
10-Jul-26 |
22-Jun-27 |
18.6 |
9.5 |
|
| PAG Waste Dump Facility Construction |
8-Aug-26 |
17-Jun-27 |
18.5 |
8.5 |
|
| North Valley Construction Access Road |
2-Jun-25 A |
24-Feb-27 |
14.7 |
17.3 |
|
| SOUTH VALLEY |
|
|
|
|
|
| Construction of Saliçor Tunnel |
1-Aug-25 |
16-Nov-27 |
23.5 |
19.4 |
|
| Construction of Power Substation |
6-Feb-26 |
29-Apr-27 |
16.8 |
10.4 |
|
| Lower Waste Dump (PAG) Construction |
1-Dec-25 |
3-Apr-26 |
3.8 |
2.7 |
|
| Process Plant Bulk Earthworks |
10-Feb-26 |
10-Nov-26 |
11.2 |
7.2 |
|
| Upper Waste Dump Road |
6-Dec-25 |
3-Mar-27 |
14.9 |
10.3 |
|
| Construction of Power Reticulation |
26-Nov-24 A |
22-Jan-28 |
25.8 |
26.4 |
|
| Surakev and Aktas Creek Diversion Construction |
23-Jul-25 A |
22-May-26 |
5.4 |
7.0 |
|
| REGIONAL INFRASTRUCTURE |
|
|
|
|
|
| Main Access Road Construction |
1-Sept-25 A |
11-Sep-27 |
21.3 |
17.1 |
|
| West Public Road |
23-Feb-26 |
14-Nov-26 |
11.3 |
7.1 |
|
| Phase 1 - Construction of Temporary Accommodation (350 employee) |
28-Jan-26 |
15-Apr-26 |
4.2 |
2.6 |
|
| Phase 2 - Construction of Permanent Accommodation (1200 employee) |
4-Mar-26 |
5-Aug-26 |
7.9 |
5.2 |
|
| | 21-3 | |
| SSR Mining Inc. | Hod Maden Project | | January 7, 2026 |
| Technical Report Summary | | SLR Project No.: 123.000320.00001 |
Table 21-3 indicates the status for the permitting schedule.
Table 21-3: Permitting Schedule
Current Status
| Description |
Duration
(Days) |
Start |
Finish |
Months Float |
| Permitting |
2,348 |
08-Jan-19 A |
27-Apr-28 |
0.80 |
| General Permits and Approvals |
1,267 |
05-Apr-21 A |
22-Apr-26 |
6.03 |
| Mining Law |
504 |
31-Jan-22 A |
23-Jan-24 A |
0 |
| Environmental Regulations |
2,354 |
08-Jan-19 A |
27-Apr-28 |
0.80 |
| Hazardous Materials |
142 |
30-Jun-25 A |
16-Jan-26 |
19.83 |
| Governor Permits |
58 |
24-Jan-22 A |
13-Apr-22 A |
0 |
| Graves |
103 |
05-May-25 A |
1-Oct-25 |
0 |
| Land Acquisitions (Expropriation, Tree Cutting, Demolishing, Non-Agricultural Usage) |
156 |
13-May-25 A |
16-Dec-25 |
0.80 |
| Forestry Permits |
257 |
13-Aug-25 A |
25-Aug-26 |
6.20 |
| Note: “A” means an actual date. |
The critical path for the Project currently proceeds through the following
activities:
·
North Valley access road, temporary camp construction, mass earthworks, lining and TSF commissioning
| · | Mine development to enable underground infrastructure construction |
| · | Construction of surface and underground infrastructure and process plant scope |
| · | Saliçor Tunnel to have sustainable North Valley Access |
| · | Camp Construction to accommodate the required workforce |
The primary objective of the Project is to commission and operate the
underground material handling, process plant, and surface Infrastructure system.
The above critical path is derived based on the utilization of a constraint
for the commencement of the mining contractor and the commencement of work for the TSF. This Project is unusual in that the critical
path goes through the North Valley bulk earthworks, i.e., the TSF, rather than the process facilities. There is float of 155 days for
the construction of the main Process Plant facilities before they become critical. If the Process Plant is completed on time, the wet
commissioning of the facility will be dependent upon the completion of the TSF.
Near Critical Activities
Near critical activities are listed:
| · | Completion of the Main Access Road construction camp |
| · | Completion of underground infrastructure |
| | 21-4 | |
| SSR Mining Inc. | Hod Maden Project | | January 7, 2026 |
| Technical Report Summary | | SLR Project No.: 123.000320.00001 |
| · | South Valley civil works |
| · | Non-tailings dam civil works to the North Valley |
| · | Construction of the main accommodation camp |
The construction of the main construction camp is the most important
of these near critical activities. The duration of the construction of the 1,250-bed camp is currently scheduled to be six months. The
planned construction work for the first six months in the main Project site area only requires 600 beds, as indicated in the manpower
curves. The SLR QP considers the construction of at least the initial 600-bed requirement to be achievable in the 6-month time frame.
This accommodation requirement does not include the approximately 120 beds that are currently being utilized by the existing accommodation
on-site. The peak workforce requirement will be in the summer of 2026.
| 21.1.3 | Budget and Cost Control |
The November 2025 cost curve shows cumulative expenditures tracking
closely with the planned baseline. Earned-value analysis indicates approximately 14.6% physical progress achieved, compared with about
16% planned, yielding a slightly positive schedule variance (SV) of approximately +1% and a cost-performance index (CPI) of approximately
1.02. November 2025 actual expenditures totaled about $4.9 million, mainly reflecting advance payments for South Valley Earthworks and
Camp Construction packages that have not yet been fully committed. Cumulative commitments remain concentrated in the Main Access Road
(KSE, approximately $62 million), creek rehabilitation works (Parsan, approximately $13.5 million), and new substation and camp contracts
commencing in Q4 2025.
The November 2025 S-curve shows the cumulative actual cost line
converging toward the planned curve after the mid-year acceleration caused by mobilization advances. Forecast to completion remains
within ±2% of the control budget, confirming adequate cost containment. The trend line projects steady monthly expenditure
growth through mid-2026 as major engineering, procurement and construction (EPC) contracts transition into construction. The
Project’s Estimate-at-Completion (EAC) remains consistent with the revised capital envelope prepared for the upcoming
indicative financial investment decision (FID) review, indicating no material budget overruns to date.
The Project schedule shows limited activity through late 2024, with
significant ramp-up beginning in early 2025 and peaking during mid-2026 to mid-2027, driven primarily by underground mine development,
process plant construction, and regional infrastructure works. Major capital outlays occur between April 2025 and December 2026, indicating
a period of intense construction and commissioning across key site areas, including utilities and support facilities. Expenditures then
decline gradually through 2027 to 2028 as major infrastructure and plant works are completed and the project transitions toward steady-state
operations. Overall, the schedule reflects a front-loaded capital program aligned with a multi-year development horizon culminating in
production readiness by late 2027/early 2028. Figure 21-1 presents the summary of expenditures to date and through commissioning.
| | 21-5 | |
| SSR Mining Inc. | Hod Maden Project | | January 7, 2026 |
| Technical Report Summary | | SLR Project No.: 123.000320.00001 |
Figure 21-1: Project Expenditures
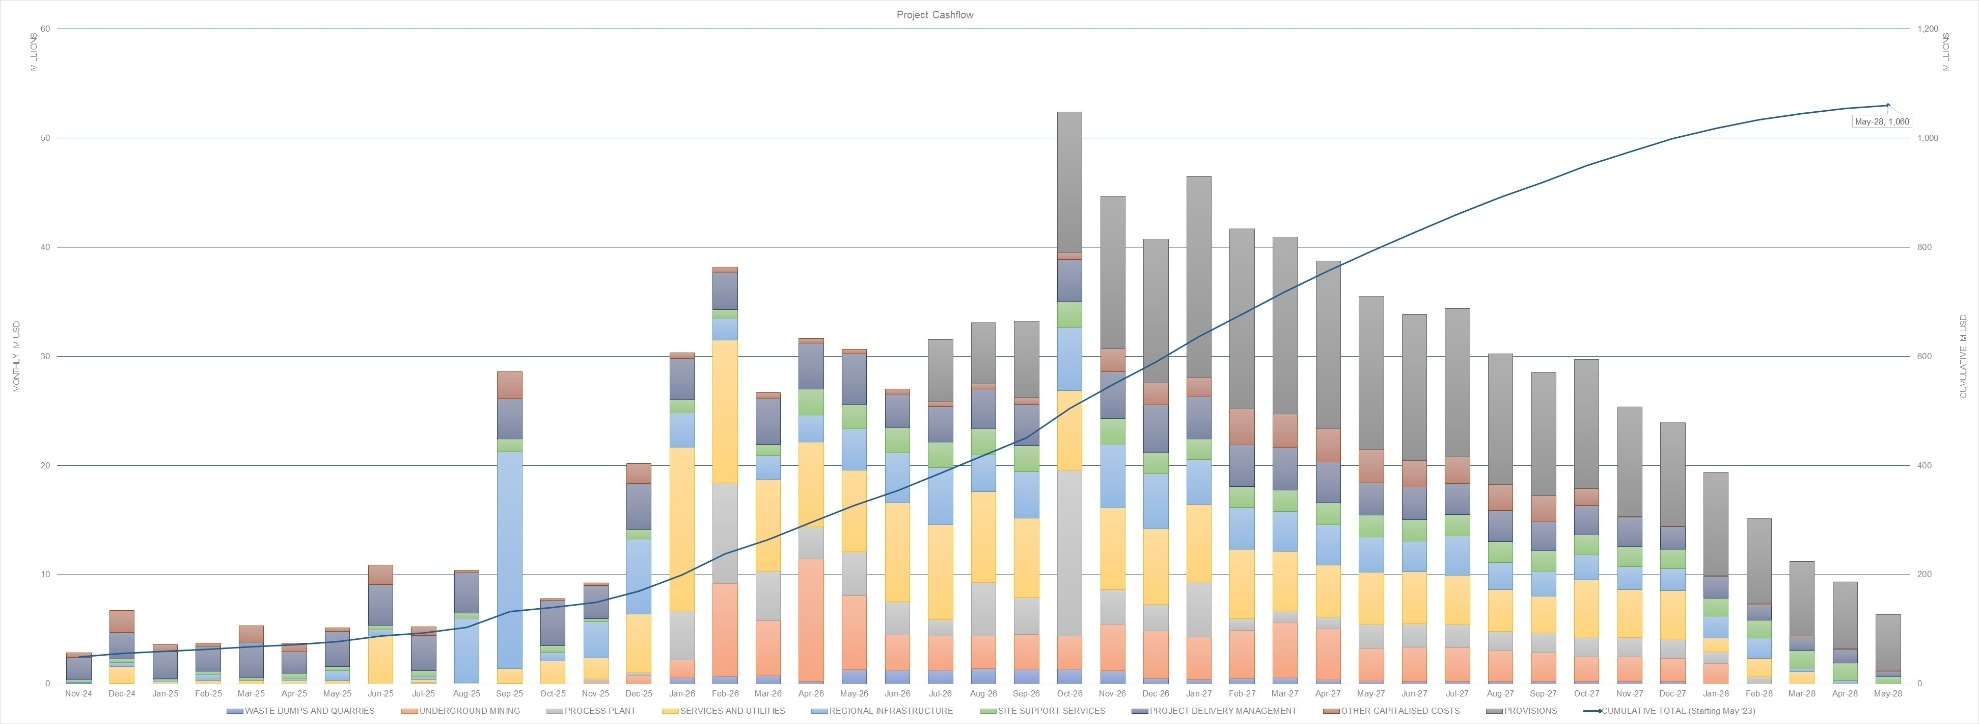
FIGURE 21-1
Project Cashflow
Monthly MLSD
60
50
40
30
20
10
0
Nov 24
Dec 24
Jan 25
Feb 25
Mar 25
Apr 25
May 25
Jun 25
Jul 25
Aug 25
Sep 25
Oct 25
Nov 25
Dec 25
Jan 26
Feb 26
Mar 26
Apr 26
May 26
Jun 26
Jul 26
Aug 26
Sep 26
Oct 26
Nov 26
Dec 26
Jan 27
Feb 27
Mar 27
Apr 27
May 27
Jun 27
Jul 27
Aug 27
Sep 27
Oct 27
Nov 27
Dec 27
Jan 28
Feb 28
Mar 28
Apr 28
May 28
WASTE DUMPS AND QUARRIES
UNDERGROUND MINI INC
PROCESS PLANT
SERVICES AND UTILITIES
REGIONAL INFRASTRUCTURE
SITE SUPPORT SERVICES
PROJECT DELIVERY MANAGEMENT
OTHER CAPITALISED COSTS
PROVISIONS
CUMULATIVE TOTAL (Starting May 23)
1,200
1,000
800
600
400
200
0
CUMULATIVE M USD
SNDIT W
| | 21-6 | |
| SSR Mining Inc. | Hod Maden Project | | January 7, 2026 |
| Technical Report Summary | | SLR Project No.: 123.000320.00001 |
| 21.1.3.1 | Workforce Requirements |
The Project workforce will be divided into two areas: (i) the Main Access
Road and (ii) the main Process Plant and Mine Site area. For the Main Access Road construction, there will be a small camp with 300 beds
located on the main highway area. For the Process Plant and Mine Site area, an accommodation camp with a capacity of 1,250 beds will be
constructed.
Table 21-4 indicates the total direct labor hours that the Project is
planning to spend throughout the execution of the Project’s construction.
Table 21-4: Direct Labor Hours for
Construction by Area
| Area |
Total, 000 hr |
| Open Pit Mining |
288 |
| Underground Mining |
1,061 |
| Process Plant |
515 |
| Services & Utilities |
1,766 |
| Regional Infrastructures |
1,361 |
| Total Direct Labor Hours |
4,992 |
Figure 21-2 illustrates the required workforce by area, as reported
in the resource-driven Project schedule, as well as the expected capacity at the 1,250-bed camp. The Project will consistently have spare
capacity to allow for expenditures of contingency and additional labor. The SLR QP is of the opinion that the camp has been appropriately
sized for the Project execution with ample allowance for workforce contingency in the event of schedule delays.
| | 21-7 | |
| SSR Mining Inc. | Hod Maden Project | | January 7, 2026 |
| Technical Report Summary | | SLR Project No.: 123.000320.00001 |
Figure 21-2: Main Process Plant
and Mine Site Area Manpower Curve
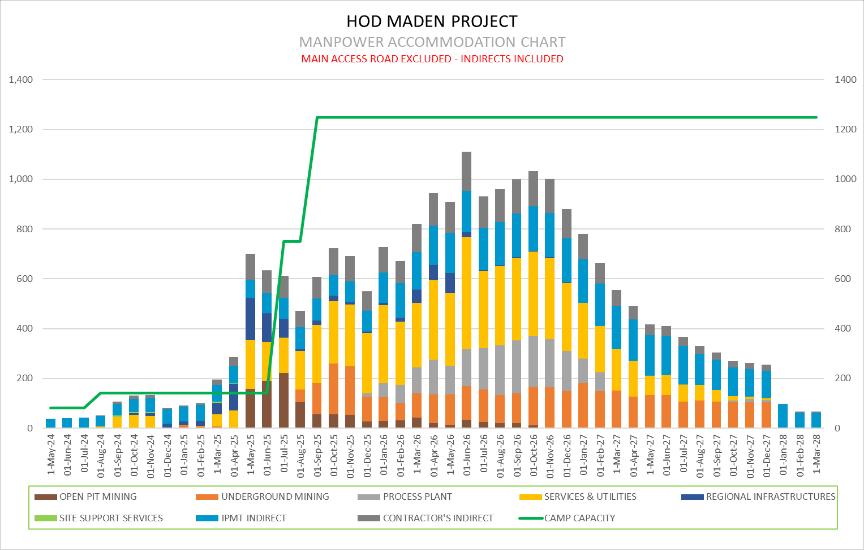
FIGURE 21-2
HOD MADEN PROJECT
MANPOWER ACCOMMODATION CHART
MAIN ACCESS ROAD EXCLUDED - INDIRECTS INCLUDED
1,400
1,200
1,000
800
600
400
200
0
1-May-24
01-Jun-24
01-Jul-24
01-Aug-24
01-Sep-24
01-Oct-24
01-Nov-24
01-Dec-24
01-Jan-25
01-Feb-25
1-Mar-25
01-Apr-25
1-May-25
01-Jun-25
01-Jul-25
01-Aug-25
01-Sep-25
01-Oct-25
01-Nov-25
01-Dec-25
01-Jan-26
01-Feb-26
1-Mar-26
01-Apr-26
1-May-26
01-Jun-26
01-Jul-26
01-Aug-26
01-Sep-26
01-Oct-26
01-Nov-26
01-Dec-26
01-Jan-27
01-Feb-27
1-Mar-27
01-Apr-27
1-May-27
01-Jun-27
01-Jul-27
01-Aug-27
01-Sep-27
01-Oct-27
01-Nov-27
01-Dec-27
01-Jan-28
01-Feb-28
1-Mar-28
OPEN PIT MINING
UNDERGROUND MINING
PROCESS PLANT
SERVICES & UTILITIES
REGIONAL INFRASTRUCTURE
SITE SUPPORT SERVICES
IMPT INDIRECT
CONTRACTOR'S INDIRECT
CAMP CAPACITY
Figure 21-3 illustrates the overall direct labor hours when calculated
as a percentage of total required labor hours. The Project is only planning to achieve construction progress of over 5% of the total in
one month, which is considered good practice as sustained progress of over 5% is difficult to achieve. In addition, there is sufficient
capacity in the final year of the Project construction (after January 2028) to account for any schedule contingency. During the first
six months of 2027, the Process Plant will be approaching completion and the remaining critical and near critical areas will be the underground
development and the TSF bulk earthworks and lining.
Figure 21-3: Monthly Planned Progress
as a Percentage of Project Total
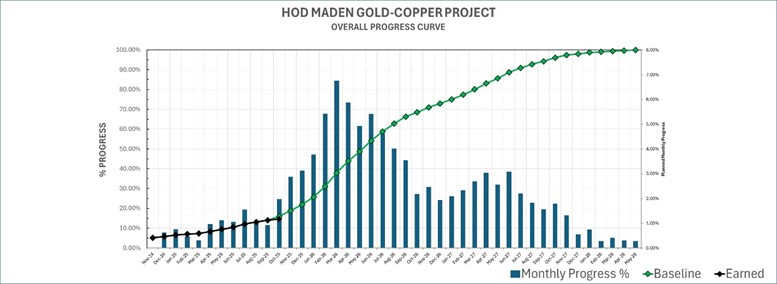
FIGURE 21-3
HOD MADEN GOLD COPPER PROJECT
OVERALL PROGRESS CURVE
% PROGRESS
100.00%
90.00%
80.00%
70.00%
60.00%
50.00%
40.00%
30.00%
20.00%
10.00%
0.00%
Nov 24
Dec 24
Jan 25
Feb 25
Mar 25
Apr 25
May 25
Jun 25
Jul 25
Aug 25
Sep 25
Oct 25
Nov 25
Dec 25
Jan 26
Feb 26
Mar 26
Apr 26
May 26
Jun 26
Jul 26
Aug 26
Sep 26
Oct 26
Nov 26
Dec 26
Jan 27
Feb 27
Mar 27
Apr 27
May 27
Jun 27
Jul 27
Aug 27
Sep 27
Oct 27
Nov 27
Dec 27
Jan 28
Feb 28
Mar 28
Apr 28
May 28
8.00%
7.00%
6.00%
5.00%
4.00%
3.00%
2.00%
1.00%
0.00%
Monthly Progress %
Baseline
Earned
| | 21-8 | |
| SSR Mining Inc. | Hod Maden Project | | January 7, 2026 |
| Technical Report Summary | | SLR Project No.: 123.000320.00001 |
Figure 21-4 illustrates the monthly planned Project workforce hours
expended by discipline.
Figure 21-4: Monthly Planned Project
Labor Hours by Discipline
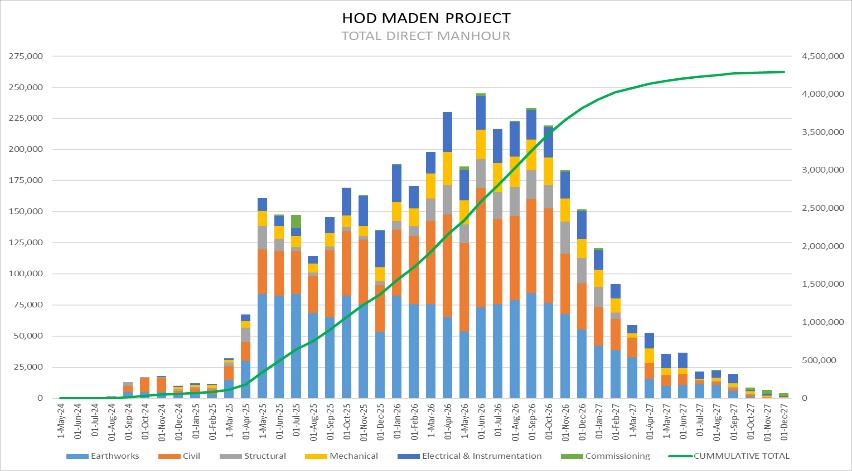
FIGURE 21-4
HOD MADEN PROJECT
TOTAL DIRECT MANHOUR
275,000
250,000
225,000
200,000
175,000
150,000
125,000
100,000
75,000
50,000
25,000
0
1-May-24
01-Jun-24
01-Jul-24
01-Aug-24
01-Sep-24
01-Oct-24
01-Nov-24
01-Dec-24
01-Jan-25
01-Feb-25
1-Mar-25
01-Apr-25
1-May-25
01-Jun-25
01-Jul-25
01-Aug-25
01-Sep-25
01-Oct-25
01-Nov-25
01-Dec-25
01-Jan-26
01-Feb-26
1-Mar-26
01-Apr-26
1-May-26
01-Jun-26
01-Jul-26
01-Aug-26
01-Sep-26
01-Oct-26
01-Nov-26
01-Dec-26
01-Jan-27
01-Feb-27
1-Mar-27
01-Apr-27
1-May-27
01-Jun-27
01-Jul-27
01-Aug-27
01-Sep-27
01-Oct-27
01-Nov-27
01-Dec-27
4,500,000
4,000,000
3,500,000
3,000,000
2,500,000
2,000,000
1,500,000
1,000,000
500,000
0
Earthworks
Civil
Structural
Mechanical
Electrical & Instrumentation
Commissiong
CUMMULATIVE TOTAL
The cumulative labor hours curve is not a typical S-curve and indicates
the front end loading effect of commencing the following areas in 2025:
| · | Bulk earthworks to the main valley coming from the highway |
| · | Relocation of local residents |
| · | Commencement of bulk earthworks to the main Process Plant |
This front end loading also provides a sharper drop off in the overall
Project progress towards the end of the Project, which provides potential for schedule recovery in the case of schedule delays.
| 21.1.4 | Project Execution Plan |
The Project has prepared a Project Execution Plan (PEP), which has been
shared with SLR. The PEP outlines the plan for the execution of the Project. The PEP contains detailed scope descriptions of all the major
contractual packages and purchase orders as well as detailed role descriptions of all the main positions in the project management organizational
structure, including scope and responsibility of each critical position.
The basic components of the plan are as follows:
| · | Execution of the Project with an Integrated Project Management Team (IPMT) involving the following key organizations: |
| | 21-9 | |
| SSR Mining Inc. | Hod Maden Project | | January 7, 2026 |
| Technical Report Summary | | SLR Project No.: 123.000320.00001 |
| o | Owners’ team, which includes mining, community relations, and project execution personnel |
| o | Engineering and procurement (EP) contractors |
| o | Construction contractors for various aspects of the scope |
| o | Engineering consultants for specific specialist scopes, e.g., TSF design, underground mining design, QA/QC. |
| · | Early execution of critical project scope by the Owners’ Team. The most critical components of these packages are the camp installations
and the Main Access Road tunnels. |
| · | Execution of the main process plant by Turkish contractors with construction management by the design engineer for the scope. |
| · | Execution of the main site infrastructure by construction contractors, contracted directly to the Owner. |
| · | Execution of the underground mining early development by specialist construction contractors with this work also contracted directly
to the Owner. |
The SLR QP considers this an appropriate model for the execution of
a project of this size and configuration, i.e., bulk earthworks, site development, and underground mine development account for a high
percentage of the initial capital costs with the Process Plant accounting for a relatively smaller portion of the capital costs. In the
SLR QP’s opinion, bulk earthwork contracts more can be effectively executed by the owner than by an EPCM contractor.
The overall responsibilities of the project management are best illustrated
in Figure 21-5.
| | 21-10 | |
| SSR Mining Inc. | Hod Maden Project | | January 7, 2026 |
| Technical Report Summary | | SLR Project No.: 123.000320.00001 |
Figure 21-5: Project Management
Framework
| |
U/G Mining Development and Saliçor Tunnel |
Camps & Temporary Buildings |
Roads, Tunnels & Infrastructure |
Process Plant |
TFS & Waste Dumps |
| Overall Project Management and Governance |
Artmin |
| Land Use Permitting EIA Approvals |
| Engineering and Design |
Rombus |
GAP Unşaat |
Various Designers |
Ausenco |
WSP |
| Procurement Management |
Artmin |
Artmin |
Artmin |
| Contract Management |
|
| Construction Contract Sign |
GAP Unşaat |
GAP Unşaat |
| Construction Supervision |
| Construction Quality Assurance |
Ausenco |
WSP |
| Construction |
U/G Mining Contractor |
GAP Unşaat With Various Subcontractors |
Various Contractors |
Note: GAP Insaat is a local project management contractor who has won
the scope for the management of the local contractors. To date, the major components of the detailed construction scope are yet to be
executed.
Table 21-5 indicates the plan for the execution of the contracts and
upon what basis the contracts will be executed.
| | 21-11 | |
| SSR Mining Inc. | Hod Maden Project | | January 7, 2026 |
| Technical Report Summary | | SLR Project No.: 123.000320.00001 |
Table 21-5: Contracting Strategy
| # |
Ref. |
Description |
Contract Type |
| |
Major Contracts |
|
| 1 |
HMC-300 |
Temporary Camp (200 pax) |
EPC – Lump Sum |
| 2 |
GAP-SubCon-2 |
Camp Design and Buildings Construction (750pax) |
EPC – Lump Sum |
| 3 |
GAP-SubCon-3 |
Camp Infrastructure: Potable Water, Sewage, Power, HVAC |
EPC – Lump Sum |
| 4 |
GAP-SubCon-4 |
Camp Fit-out and Furniture (750pax) |
Lump Sum |
| 5 |
HMC-0027 |
MSE Walls Engineering and Supply |
EP – Lump Sum |
| 6 |
HMC-0050 |
Electrical Substation(*) |
Turn-Key |
| 7 |
HMC-0050 |
Pylon Relocation |
Lump Sum |
| 8 |
HMC-0218 |
Earthworks Equipment – Early Miscellaneous Works |
Monthly Rent |
| 9 |
HMC-0025 |
GAP - Main Contractor Contract |
Cost + Incentive Fee |
| 10 |
TBD |
Mosque Relocation |
TBD |
| |
SV Bulk Earthworks: 2025 Scope |
|
| 11 |
GAP-SubCon-1 |
Main Access Road (Tunnel 2, Bridge 2) |
Schedule of Rates |
| |
|
Saliçor Tunnel |
Schedule of Rates |
| 12 |
HMC-304 |
UWD Access Road (Partial) |
Schedule of Rates |
| |
|
Camp Earthworks |
Schedule of Rates |
| |
|
Switchyard Earthworks |
Schedule of Rates |
| |
|
Saliçor Tunnel Access Road |
Schedule of Rates |
| |
|
Switchyard Bypass |
Schedule of Rates |
| |
|
UWD |
Schedule of Rates |
| |
|
LWD & MSA Preparation |
Schedule of Rates |
| |
|
Aktaş and Şurakev Creeks Diversion Channels |
Schedule of Rates |
| |
|
North Valley Access Road |
Schedule of Rates |
| |
Equipment Procurement |
|
| 13 |
P0001 |
Primary Crusher |
Supply Agreement |
| 14 |
P0002 |
Screens |
Supply Agreement |
| 15 |
P0010 |
Primary Mills |
Supply Agreement |
| 16 |
P0014 |
Flotation Cells |
Supply Agreement |
| 17 |
P0016 |
Thickeners |
Supply Agreement |
| 18 |
P0100 |
Vertical Mills |
Supply Agreement |
| 19 |
P0003 |
Apron Feeders |
Supply Agreement |
| 20 |
P0015 |
Concentrate Filters |
Supply Agreement |
| | 21-12 | |
| SSR Mining Inc. | Hod Maden Project | | January 7, 2026 |
| Technical Report Summary | | SLR Project No.: 123.000320.00001 |
| # |
Ref. |
Description |
Contract Type |
| 21 |
P0017 |
Agitators |
Supply Agreement |
| 22 |
P0018 |
Cyclones |
Supply Agreement |
| 23 |
P0050 |
Cranes & Hoist |
Supply Agreement |
| 24 |
P0060 |
On-Stream Analyzers |
Supply Agreement |
| 25 |
HMC-0128 |
Transformers Supply* |
Supply Agreement |
| 26 |
TBD |
Underground Primary Extraction Fans |
Supply Agreement |
| 27 |
HMC-0248 |
Fire and Rescue Vehicle |
Supply Agreement |
| 28 |
HMC-0247 |
Cold Room Supply and Installation |
Supply Agreement |
| 29 |
HMC-0206 |
Guardrail for Main Access Road |
Supply Agreement |
| 30 |
HMC-0236 |
Crane Rental |
Supply Agreement |
| |
Engineering & Consultancy |
|
| 31 |
HMC-0045 |
EP(**) - Ausenco |
Calculated Rates |
| 32 |
HMC-0178 |
SRK US |
Schedule of Rates |
| 33 |
HMC-0028 |
WSP |
Schedule of Rates |
| 34 |
HMC-0027 |
Maccaferri (MSE Wall Design and Partial Start) |
Schedule of Rates |
| 35 |
HMC-0256 |
BGC Engineering Inc. |
Schedule of Rates |
| 36 |
HMC-0031 |
Turner Townsend |
Schedule of Rates |
| 37 |
HMC-0037 |
IME Consulting |
Schedule of Rates |
| 38 |
Various |
Others |
Various |
| |
Administration / Finance / Legal |
|
| 39 |
Various |
Catering, Accommodation, Shuttle |
Various |
| 40 |
Various |
Finance / Tax Advisors |
Various |
| 41 |
Various |
Legal Advisors / Lawyer |
Various |
|
Notes:
* Committed in 2024 under Pre-FID (financial investment decision)
** Phased release for Engineering and Procurement for 2025
UWD Upper Waste Dump
LWD Lower Waste Dump
MSA mine services area
MSE mechanically stabilized earth
EPC Engineering, Procurement and Construction Contracts |
The SLR QP agrees with the overall contracting strategy; these forms
of contracts are consistent with typical practice in the industry. The SLR QP notes that EPC (engineering, procurement, and construction)
contracts can reduce the owner’s ability to direct the direct, e.g., initiate an acceleration in the event of a schedule overrun.
EPC contracts are best applied when a scope of work is not on the critical path but is large enough that the owner really wants to control
cost overruns.
| | 21-13 | |
| SSR Mining Inc. | Hod Maden Project | | January 7, 2026 |
| Technical Report Summary | | SLR Project No.: 123.000320.00001 |
| 21.1.4.1 | Current Project Status Summary. |
Table 21-6 indicates the overall summary metrics of the Project progress.
Table 21-6: Summary of Project Progress
as at November 30, 2025
| Description |
Cumulative |
| Planned |
Actual |
Variance |
| Current Budget (US$ million) |
1,060 |
|
|
| Current Expenditure (US$ million) |
149 |
146 |
3 |
| Expenditure Cashflow as Percentage |
13.8% |
13.7% |
0.1% |
| Overall Commitment (US$ million) |
265 |
259 |
6 |
| Commitment as Percentage |
25.1% |
24.8% |
0.3% |
| Progress Calculations (% Complete) |
|
|
|
| Engineering |
79% |
68.0% |
11% |
| Tendering and Procurement |
27% |
26.0% |
1% |
| Construction |
7.3% |
7.0% |
0.3% |
| Commissioning |
0.0% |
0.0% |
0% |
| Overall Project Progress |
16.0% |
14.6% |
1.4% |
| |
|
|
|
| |
Start |
Finish |
|
| Project Schedule |
Nov-24 |
May-28 |
|
| Overall Duration (Days) |
1,277 |
|
|
| Total Days Expended |
365 |
28.5% |
|
| Total Days To Go |
912 |
71.5% |
|
As at the end of November 2025, the Project is at 13.7% of the overall
cashflow and 25% of the commitment compared to the updated capital expense forecast as of November 2025. The Project has been operating
under a limited notice to proceed funding arrangement for the last 15 months. The overall amount of expended manhours is approximately
1,258,000. This also indicates that the Project is holding close to the originally budgeted manhour productivities. The key comparison
is the overall manhours as compared to the overall construction progress.
A total of 37 out of 45 major purchase orders for the process facility
have received firm quotations and have been signed off on contractual awards, ready for contract release. It is anticipated that once
the contracts and purchase orders are signed off there will be a significant increase in the overall commitments for the Project.
There have been several significant contract awards released with mobilization
pending the full release of funds. The status of significant contracts is listed:
| · | Bulk Earthworks to South Valley and North Valley. |
| · | A Letter of Intent has been awarded for the main substation contract, pending full release of funds. |
| | 21-14 | |
| SSR Mining Inc. | Hod Maden Project | | January 7, 2026 |
| Technical Report Summary | | SLR Project No.: 123.000320.00001 |
| · | The main process plant installation contract was awarded with initial mobilisation commencing. |
| · | Main Construction Camp, this contract was awarded. |
| · | Detailed Earthworks to the North Valley is in bid evaluation and is ready for release. |
| · | EP contract was awarded and amendments were made for additional items of scope. |
With respect to the overall engineering, the Project is approximately
four months behind schedule; however, it is still advanced for this stage of the Project, i.e., being at 74% of the overall progress.
The overall progress for the tendering and procurement is inline with
the previous forecast progress, and it is anticipated that if all the major contracts are released, then this progress will exceed the
planned contracting and procurement progress as these contracts represents some US$300 million of the outstanding capital costs.
The overall level of commitments is currently US$259 million, which
is very close to the original forecast commitment curves, previously prepared by SLR, of US$265 million. The discrepancy indicates the
process of preparing contracts for award, and then not releasing the award due to limitation of funds to proceed with the execution. This
is a wise strategy.
Commitments are a critical leading indicator or project progress and
having overall commitments being very close to the previously forecast baseline is a great indicator of timely project execution. At a
high level, when examining overall progress, if three or more “meta” indicators of project progress all indicate the same
level of project status, then this gives a good indication of the overall effectiveness of the project execution, the project execution
strategy, and the project team. In the case of the Hod Maden project, the overall cashflow, commitment curves and construction progress
are all indicating that the project execution is on schedule or very close to it.
During discussions on the Project capital costs, it was indicated that
the Project is reviewing the overall project capital requirements in light of the large number of proposals that have been received that
are ready for release. In these proposals, many of the contractors and suppliers are indicating serious concerns about the volatility
of the Turkish Lira exchange rate and the inflationary effect this has on prices. Projects all around the world have been struggling in
how to handle significant escalation/inflation pressures in the overall project budgeting and the principal solution to this is to include
this escalation/inflation inside regular budget updates and include allowances as a nominated owner’s contingency or as a management
reserve specifically for inflation/escalation costs.
The only area of concern for the Project is the delay in the execution
of the construction contract for the main construction camp. In November, this scope was awarded; however, the monthly report indicates
limited mobilisation due to the waiting for full approval of funds. In SLR’s opinion, the good overall project performance to date
indicates that the project execution strategy is effective.
| | 21-15 | |
| SSR Mining Inc. | Hod Maden Project | | January 7, 2026 |
| Technical Report Summary | | SLR Project No.: 123.000320.00001 |
| 22.0 | Interpretation and Conclusions |
The QPs offer the following conclusions by area:
| 22.1 | Geology and Mineral Resources |
| · | There are currently three geologically distinct models explaining the geology of Hod Maden, two of which have specific geologic attributes
whereas the third combines aspects of the first two models: |
| o | Structurally controlled intermediate sulfidation epithermal vein stockwork deposit with local semi and massive sulfide lenses |
| o | Hybrid gold-rich volcanogenic massive sulfide (VMS)-epithermal deposit formed in shallow water with high-temperature clay alteration |
| o | Cretaceous aged syn-VMS overprinted by younger high-level epithermal vein stockwork |
| · | The Hod Maden Project has been explored using modern exploration techniques starting in 2014, and a total of 90,410 m of drilling
has been completed in a total of 403 drill holes. |
| · | The RSC QP has estimated and prepared the Mineral Resources, including classification of Mineral Resources, in accordance with S-K
1300. |
| · | Mineral Resource estimates were prepared using a domain-controlled, ordinary kriging (OK) technique with verified drill hole location,
density, and sample data derived from exploration activities conducted by various companies from 2014 to 2024. |
| · | In the opinion of the QP, based on the assessment of legacy data, verification of data and materials on site, the sample preparation,
security, and analytical procedures meet industry standards for data quality and integrity; however, protocols and processes are poorly
documented, and this should be remedied. |
| · | The data informing the Mineral Resources are collected using core drilling. Overall, the RSC QP is of the opinion that the samples
are representative of the source materials. |
| · | In the RSC QP’s opinion, the sample preparation, security, and analytical procedures are adequate and meet industry standards,
and the QA/QC program, as designed and implemented at Hod Maden is adequate. The assay results within the drill hole database are within
acceptable levels of accuracy and precision, and the resulting database is sufficient for the purpose of Mineral Resource estimation and
classification in relevant categories. |
| · | The RSC QP was provided unlimited access by SSR for data verification purposes during the site visit. The RSC QP’s database
verification of the Hod Maden Project indicates that data collection procedures mostly comply with industry standards and are adequate
to support classification of at least Indicated Mineral Resources. In 2024, SSR initiated a re-logging study, which is in progress as
of date of publication of this TRS. |
| · | The RSC QP has domained massive pyrite with logged intervals, and this was confirmed in core by the RSC QP when on site. There is
a strong correlation of high silica + high sulfide zones and massive sulfide with the Co/Al ratio, and the RSC QP considers proxy model
for the high silica + high sulfide zones mineralization robust. Sensitivity to the modeling cut-off was found to be minimal with respect
to the global Mineral Resource estimate. More work is required to link the chemical proxy to core observations to better understand what
exactly the proxy represents and if the proxy model can be improved in future resource updates. |
| | 22-1 | |
| SSR Mining Inc. | Hod Maden Project | | January 7, 2026 |
| Technical Report Summary | | SLR Project No.: 123.000320.00001 |
| · | The Mineral Resource was classified based on confidence in geological understanding, drill spacing, and kriging quality metrics. Sensitivities
to domaining and gold grade capping parameters remain relatively high for a Measured classification and the RSC QP considers this a moderate
risk. |
| · | The Mineral Resource estimates for Hod Maden have an effective date of August 31, 2025. |
| · | Appropriate cut-off grades, stope optimizing and pit optimization parameters have been used to establish those portions of the block
models that meet the requirement for reasonable prospects for economic extraction for this style of gold-copper deposit and mineralization.
In assessing the potential of economic extraction, the RSC QP reviewed mining, metallurgical, economic, environmental, social and geotechnical
factors. |
| · | The Hod Maden Mineral Resources estimate, exclusive of Mineral Reserves, is reported below on a 100% basis; SSR‘s attributable
share is 10%: |
| o | 1,722 thousand tonnes (kt) Measured and Indicated Mineral Resources at an average grade of 11.9 g/t (Au) and 1.7% Cu, containing 658
thousand ounces (koz) gold and 65 million pounds (Mlb) copper. |
| o | 2,574 kt Inferred Mineral Resources at an average grade of 3.4 g/t (Au) and 0.5% Cu, containing 281 koz gold and 26 Mlb copper. |
| 22.2 | Mining and Mineral Reserves |
| · | The deposit is proposed to be mined using underground techniques, specifically long hole stoping (LHS) below 780 meters above sea
level (masl) elevation and modified drift and fill (DAF) methods above the 780 masl elevation. Access to the mine will be via a decline.
Mining zones are divided based on rock quality and depth, with electric-hydraulic equipment used for development. LHS level spacing is
25 m and the DAF level spacing is 5 m. |
| · | Two geotechnical drilling programs were conducted. Rock strength varies, especially in argillic alteration zones, and significant
testing was performed to characterize rock properties and overburden materials. Stress measurements were assumed due to the lack of direct
measurements. The underground mine elevations range approximately 380 m from approximately 805 masl (at the surface) down to 400
masl. The lateral extent of the underground workings is approximately 330 m (W-E) by 240 m (N-S). |
| · | It is noted that the geotechnical stability of the crown pillar and hanging wall, particularly due to continuous faulting in the hanging
wall of the deposit, which could lead to early halting of stopes and require paste filling before significant fall-of ground. The DAF
mining will have an increased ground support standard. It will be paste filled, and then subsequent underhand cut and fill will be paste
filled. The mining sequence will not expose the crown to failure. |
| · | The ground support will be bolts and fibrecrete, with the potential for mesh and spiling bars as well. Successful ground support depends
on sourcing qualified project management and staff. |
| · | Poor ground conditions in the DAF could impact production. |
| | 22-2 | |
| SSR Mining Inc. | Hod Maden Project | | January 7, 2026 |
| Technical Report Summary | | SLR Project No.: 123.000320.00001 |
| o | Mining excavation techniques, such as a road header or other form of rock cutting technology, with low impact on excavation stability
will be employed as appropriate. Road headers typically have advance rates of 1 to 2 meters per day. |
| o | Where pockets of harder ground are encountered, drill and blast will be used with short rounds and the use of spiling bars. |
| · | Over 10 years, the total ore mined at the Project (100% basis) will be approximately 7.7 million tonnes (Mt), containing approximately
1,896 koz gold and 101 kt copper. There is a two-year ramp up period associated with the underground mine. The life of mine waste
production is projected to be 1.5 Mt. |
| · | The Project's production ramp-up is closely tied to contractor performance, specifically their ability to maintain the scheduled advance
rate of 21 m per week. The Definitive Feasibility Study (DFS) completed in 2020 (the 2020 FS, GR Engineering 2020) used a decline advance
rate of 130 m/month. This has been reduced to 90 m/month because of the shorter available time resulting from the legally proscribed shift
pattern and to mitigate the risk of using contractors. Delays in the contractor’s equipment or workforce availability could negatively
impact the Project's production timeline. |
| · | The potential for surface subsidence from mining activities and blast vibrations could affect sensitive buildings such as a local
mosque. Site-specific testing for blast vibration is necessary to mitigate these risks. It is assumed that the graveyard and mosque will
be re-located. |
| · | Studies have been carried out to include groundwater movement, hydraulic conductivity, and dewatering plans for the mine. Several
dewatering scenarios were simulated by SRK, including lining options for the Surakev Creek, and active dewatering options. |
| · | Inflows from groundwater are expected up to 30 L/s for the lined option, and 50 L/s in conservative scenarios. Load from underground
mining operations is calculated as 5 L/s. |
| · | Pump stations will be specified for the lined option without active dewatering of the host strata. In the early stages of mining,
face pumps will keep up, and the pump stations will be set up with two duty pumps to pump 35 L/s, a spare for an additional 17 L/s, plus
civil construction for an additional pump for expansion to cope with any additional flow. |
| · | Stability assessments were completed to determine mining dimensions, with recommendations on ground support; composed of shotcrete,
bolting, and the use of cable bolts. |
| · | The Project’s Mineral Reserves are reported in accordance with S-K 1300 as of August 31, 2025, using breakeven NSR cut-off values
of US$160/t for DAF and US$108/t for LHS, with an incremental cut-off value of US$82/t applied for material that could be accessed on
the way to the breakeven cut-off inventory. |
| · | Total Proven and Probable Mineral Reserves at Hod Maden, on a 100% ownership basis (SSR‘s attributable share is 10%), are estimated
to be 7,714 kt at 7.6 g/t Au and 1.3% Cu, containing 1,896 koz gold and 223.1 Mlb copper. |
| 22.3.1 | Metallurgical Test Work |
| · | Test work programs have been carried out at various levels of project definition, including prefeasibility, feasibility, and for this
FS update. Test work has adequately characterized the mineralization, and has included engineering tests such as comminution, Levin tests,
Metso Jar tests, flotation, thickening, filtration, transportable moisture limit (TML), and Self-Heating capacity tests to derive design
parameters for the process plant |
| | 22-3 | |
| SSR Mining Inc. | Hod Maden Project | | January 7, 2026 |
| Technical Report Summary | | SLR Project No.: 123.000320.00001 |
| · | In the FS update, the flowsheet was updated to reflect a single-product flotation circuit comprising rougher flotation and cleaning
to a lower-grade (>13% Cu) concentrate but containing more pyrite at increased gold recoveries to the concentrate. This work, supported
by marketing assessments, has justified the selection of a simpler, single-product flotation circuit producing a low-grade copper concentrate
with significant precious metal (gold) credits. Copper concentrate grade and gold recovery to the concentrate, as well as payability of
gold and copper is managed by the mine plan, production profile, and pH control in the plant, with further opportunities to blend out
of spec concentrates if required from time to time. |
| · | The rock breakage parameter (A × b) of the ore types ranged between 33.4 to 98.1 and Bond Ball Milling Work indices (BWi) ranged
between 10.4 kWh/t and 20.6 kWh/t, indicating that the samples were in hard to medium hardness range according to the JKTech database.
The softest samples were from the massive pyrite (MPY) lithology, and the hardest from Dacite Breccia lithology. The eightieth percentile
of A × b and BWi were 45 kWh/t and 16 kWh/t, respectively. |
| · | The optimum flotation flowsheet and conditions were developed during the Preliminary Feasibility Study (PFS) phase are carried through
to the current Project. The design is based on sulfide mineral flotation (mill-float-mill-float [MF2] mode of operation; mill to a P80
of 106 µm – rougher float – mill to a P80 of 38 µm – scavenger float). The rougher concentrate
is then reground to a P80 of 30 µm. pH is controlled to produce a +13% Cu copper concentrate and maximize gold recovery
to the copper concentrate whilst keeping copper grades above payability thresholds. |
| · | The mine plan indicates that a +13% Cu concentrate can be produced without significant pyrite rejection (and associated gold loss)
on a monthly basis, however, short term grade excursions will need to be managed. The process plant is designed for the maximum expected
mass pull of approximately 10% to concentrate. |
| · | Gold and copper recovery relationships appear to be independent of lithology, and more related to the flotation conditions and the
extent of sulfur flotation or rejection from the flotation circuit. Feed grade and mass pull to the concentrates were the main parameters
affecting the grade and recovery. |
| · | Detailed chemical analyses show that concentrations of penalty elements in concentrate are low and are unlikely to negatively affect
marketing. |
| · | Thickening and filtration tests showed that copper concentrate can be dewatered to approximately 1.5% w/w lower than the Transportable
Moisture Limit (TML). The TML of the concentrate was measured as 11%, and the filter cake product was 9.5% w/w moisture. The self-heating
tests showed that concentrate was not classified as Material Hazardous in Bulk (MHB) or Dangerous Goods (DG) Class 4.2 for the purposes
of bulk transport; |
| · | Results of simulated open cleaner flotation (OPC) and locked cycle flotation (LCT) tests were used to establish grade versus recovery
curves for copper and gold. These equations were used to calculate concentrate production over the life of mine. The average gold and
copper recoveries are calculated as 87% and 97%, respectively. |
| | 22-4 | |
| SSR Mining Inc. | Hod Maden Project | | January 7, 2026 |
| Technical Report Summary | | SLR Project No.: 123.000320.00001 |
| · | The entirety of the rougher scavenger tailings will be used for the production of paste. After thickening, the paste plant will filter
a portion of the tails to meet the target paste concentration of 68.5% w/w solids after addition of a dry binder. |
| · | Gypsum scaling over time is expected at Hod Maden, however it is not expected to be significant enough to warrant dosing of antiscalant
outside of the alkaline water system. |
| 22.3.2 | Processing and Recovery Methods |
| · | The processing plant will have the capability of treating 800,000 dry tonnes per year of ROM ore. The plant design incorporates crushing,
grinding, and flotation to maximize the recovery of copper and gold from the ore. |
| · | Various utility and plant infrastructure such as water supply, reagents supply and distribution, air services, electrical energy supply
and distribution, roads, communications and site buildings will support the Project. |
| · | The roads from Artvin to the intersection on State Road D.950 to the site access road are generally in good condition; major upgrades
will be implemented for the Yukarιmaden access road to ensure safe and efficient long-term operations. The road upgrades will incorporate
tunnels and bridges to navigate challenging terrain, thereby improving both traffic safety and accessibility for the public. Overall,
these improvements are crucial not only for operational efficiency but also for mitigating risks associated with construction and ongoing
mining activities. |
| · | The Project will establish a new 154 kV/11 kV substation to connect to the existing high voltage network. The Project will build the
power distribution system and have a standby diesel generator. |
| · | The surface water management strategy for the Project emphasizes minimizing contact water volumes through effective diversion and
treatment systems while ensuring proper management of both contact and non-contact water. The contact water management system will focus
on directing all contact water to a designated pond for treatment, with non-contact water diversion systems constructed around the Project
area. Updates to the site-wide water balance model and the development of an integrated surface water management plan has been used and
needs to be maintained to ensure the effectiveness of this strategy and compliance with regulatory requirements. |
| · | The design of the Tailings Storage Facility (TSF) for the Hod Maden mine adheres to Canadian Dam Association (CDA) Dam Safety Guidelines.
The phased downstream construction approach allows for the effective containment of the tailings, accommodating an ultimate design capacity
of 5 Mm³ across all phases. |
| · | The stability analyses indicate acceptable factors of safety for both static and dynamic conditions, ensuring the TSF's structural
integrity throughout its operational lifespan. Ongoing monitoring and recommended mitigation measures, such as the installation of catch
benches and artificial support, have been used and need to be maintained to manage localized hazards within the TSF basin. |
| · | The design and management of the North Valley Waste Dump Facility (WDF) have been planned to address the challenges posed by the potentially
acid-generating (PAG) waste rock from the underground mining operation. The WDF design incorporates industry standards throughout its
operational life and closure phase. Ongoing geotechnical assessments and a focus on a “design for closure” approach have been
used and need to be maintained to mitigate risks and ensure the long-term integrity of the facility |
| | 22-5 | |
| SSR Mining Inc. | Hod Maden Project | | January 7, 2026 |
| Technical Report Summary | | SLR Project No.: 123.000320.00001 |
| · | The implementation of overdrain and underdrain systems will facilitate efficient water management for the North Valley infrastructure
while mitigating potential risks associated with water quality and hydraulic pressures on the liner system. Continuous monitoring and
adaptive management practices have been used and need to be maintained to ensure the effectiveness of these systems and to protect the
surrounding environment throughout the project's lifecycle. |
| · | Infrastructure design updates within the North Valley include an improved access road and utility corridor from the Saliçor
Tunnel to the crest of the TSF to facilitate surface water controls, safe operations and access to the tailings pipeline and general construction
and operational access. Additional consideration during early construction has considered the design and location of topsoil storage areas. |
| · | The concentrate produced at the Project is very high grade at 116 g/t gold and 22% copper credit with very little deleterious elements,
which should be easily sold. |
| · | Negotiations with potential customers are still in early stages, therefore assumptions around concentrate freight and commercial costs
are still at an early stage. |
| · | Artmin undertook environmental and social baseline studies in the Project area between 2013 and 2021. The baseline studies conducted
from 2018 to 2021 considered the International Finance Corporation Performance Standards (IFC PS) for key aspects of the Project, including
biodiversity. |
| · | The Project holds environmental approval-in-principle. The Project’s Environmental Impact Assessment (EIA) was approved by regulatory
authorities on November 17, 2021. |
| · | Key environmental and social (E&S) aspects of the Project include biodiversity, surface and groundwater quality, and land acquisition. |
| · | Land acquisition and expropriation are at an advanced stage, with most of the land already acquired or expropriated. |
| · | Artmin has compiled a set of draft Environmental and Social Management Plans (ESMPs) that aim to comply with host country requirements,
including EIA commitments and conditions of approval, European Union directives, and the International Finance Corporation (IFC) Performance
Standards (PS). These plans cover biodiversity and water management. Engagement with local communities and stakeholders began during exploration
and continues. Much of the engagement focuses on land acquisition and resettlement. |
| · | The Project has a Conceptual Mine Decommissioning and Closure Plan that includes a closure cost estimate. The Government of Türkiye
will require a financial guarantee. |
| | 22-6 | |
| SSR Mining Inc. | Hod Maden Project | | January 7, 2026 |
| Technical Report Summary | | SLR Project No.: 123.000320.00001 |
| 22.7 | Capital and Operating Costs |
| · | The SLR QP is of the opinion that the capital cost estimate for the Hod Maden Project has been well prepared and appears to be realistic
for the scope of the Project. The estimate is considered an AACE class 3 estimate. |
| · | The total initial development costs for the Project are estimated to be US$1,060 million, of which, US$149.2 million has been already
spent. |
| · | The Project team has developed a Basis of Estimate (BoE) document. It is well-prepared and consistent with industry standards. |
| · | The contingency as a percentage of direct plus indirect costs is appropriate, especially when considering allowances for potential
quantity growth. |
| · | There is a high level of design completion for the stage of the Project. |
| · | The capital cost estimate is based on a very high level of budgetary quotations or actual awards. |
| · | Approximately 64% of the initial capital costs has been quoted in Turkish Lira with approximately 29% quoted in USD. |
| · | Bulk earthwork scopes of work often exceed budget due to the uncertain nature of ground conditions. The Project is commencing the
Main Access Road bulk earthworks prior to other bulk earthworks. |
| · | The Project team has prepared a Project Execution Plan that clearly outlines the scope of the major contractual packages and purchase
orders, the management team roles and responsibilities, and the execution strategy. |
| · | The Project will be executed using an Integrated Project Management Team (IPMT) that will include the Owner’s Team, the engineering
and procurement (EP) contractors, various construction contractors by scope, and engineering consultants for specific specialist scopes. |
·
The selected overall execution model for the construction phase of this Project is optimal for the size and scope of the Project.
| · | The Project is currently on schedule with three overall indicators of project progress indicating the project is on time. These indicators
are overall cashflow, overall commitments, and construction progress. This timely execution not only reflects well on the overall execution
team but also on the execution strategy of direct execution with an integrated project team. |
| | 22-7 | |
| SSR Mining Inc. | Hod Maden Project | | January 7, 2026 |
| Technical Report Summary | | SLR Project No.: 123.000320.00001 |
The QPs offer the following recommendations by area:
| 23.1 | Geology and Mineral Resources |
| 1 | Carry out an infill drilling to improve the confidence of ore that will be mined during the first four years of the life of mine (LOM),
Resource extension, Resource sterilization and assay programs as recommended below. The proposed budget for the 2025 infill drill program,
which includes 16,300 m of drilling as well as other related activities, is US$5.09 million. The recommended and planned infill drill
program for 2025 includes the following activities: |
| a) | Carry out twin-drilling for hole HTG-002 to confirm grade tenors and reduce dependence of the estimate on this hole. |
| b) | Implement standard operating procedures for all data collection procedures including the drilling, logging, density measurements and
sample preparation steps. |
| c) | Revise the geological logging process to encapsulate the broad understanding of mineralization to yield logging that is fit for the
purpose of geological and estimation domaining. |
| d) | Backflag estimation domains on drilling and assess if high-grade sub-populations can be linked to core observations that can be incorporated
into the new logging framework. |
| e) | Collect additional Sulfide S data from available pulps to improve the imputation model and better understand the low-S high-Fe population. |
| f) | Re-sample the remaining quarters as a matter of priority to yield at minimum half-core support for all samples. The RSC QP has made
recommendations for holes that should be prioritized in the re-sampling work. |
| g) | Discuss the likely 1% to 2% high-bias in Au results at ALS Loughrea with the laboratory management. |
| h) | Conduct additional check sampling for Cu to test the hypothesis that the apparent bias observed in the 2024 Cu check analyses was
associated with a single batch. |
| i) | Conduct check measurements for bulk density (e.g., by the core tray method) to benchmark measurements from the water-immersion method. |
| j) | Conduct check measurements for bulk density on the top and bottom 10% of the dataset. |
| 2 | The RSC QP agrees with the objectives and overall scope of these planned activities. |
| 23.2 | Mining and Mineral Reserves |
| 1 | Re-run and optimize the underground mining development and production schedule, as per the normal course of business. |
| 2 | Complete geotechnical drill holes along the centerlines of the fresh air (FAR), escapeway, and return air (RAR) ventilation shafts
to ensure a detailed design for construction. These holes have been drilled, and additional analyses are progressing. This work is crucial
for underground mining contract tender documents. |
| | 23-1 | |
| SSR Mining Inc. | Hod Maden Project | | January 7, 2026 |
| Technical Report Summary | | SLR Project No.: 123.000320.00001 |
| 3 | Reinforce all initial FAR and RAR ventilation shafts with a remote-controlled shotcrete machine. |
| 4 | Conduct tests to determine if the Hod Maden sulfide ores are compatible with ammonium nitrate,
especially for reactive ores that may require specific explosive products. This information is also necessary for the underground mining
contract tender documents. A Turkish Explosive Consultant, Madser, has been retained to assist with these type of risks. |
| 5 | Re-calibrate numerical modeling using results from pilot dewatering in the center of the Hod Maden deposit (DAF zone), which is expected
to be finished in Q4 2025. This will help refine the underground mine dewatering needs. |
| 6 | Carry out additional underground paste backfill testing using representative deposit samples. This will include material characterization,
rheology, and strength tests, with future testing incorporating process water samples, if available. An update from Minefill, a paste
fill plant test work consultant, is almost complete as of the date of this TRS. |
| 1 | Consider re-testing, investigation, and inclusion of gravity recoverable gold circuit. A non-trivial quantity of free gold is present
after secondary grinding which may be captured and either mixed with copper concentrate or sold as gold concentrate as needed. |
| 1 | Undertake comprehensive hydrological and geotechnical assessments for critical project infrastructure components to support detailed
design and ensure long-term stability. This scope should include: |
| o | The main Yukarιmaden access road and its associated tunnel alignments,
as well as the Saliçor Valley (i.e., North Valley) access tunnel |
| o | The process plant site, with emphasis on zones featuring structural walls and exposed bedrock |
| o | Additional focus areas to include the alignment and condition of internal site roads and external access roads including the updated
utility and tailings pipeline corridor in the North Valley from the Saliçor tunnel exit to the crest of the TSF |
| o | Continue with additional geotechnical boreholes and foundation characterization in the North Valley WDF, utility corridor and main
access roads, including geochemical characterization |
| o | Continue to perform waste characterization for both geotechnical and geochemical properties planned for disposal in the North Valley
WDF |
| o | Additional boreholes to confirm the groundwater elevations with the TSF basin, at the junction of the North Valley Access Road and
the TSF, and within the WDF footprint |
| o | The designated topsoil storage facility |
| o | The spoil deposition area for road construction materials |
| o | The footprint of the high-voltage (HV) substation installation |
| | 23-2 | |
| SSR Mining Inc. | Hod Maden Project | | January 7, 2026 |
| Technical Report Summary | | SLR Project No.: 123.000320.00001 |
| o | All water non-contact water diversions, contact water collection/storage structures, and sediment management structures. |
| o | The main construction camp. |
| 1 | Periodically update and validate the numerical groundwater model as mining advances (e.g., following decline construction, Saliçor
Tunnel development, and other major infrastructure changes) |
| 2 | Update and finalize necessary simulations addressing paste fill permitting and contaminant transport predictions to ensure regulatory
alignment and support informed decision-making |
| 3 | Expand the on-site meteorological network with precipitation, temperature, snowpack, and evaporation stations across both valleys
at multiple elevations to improve data coverage and hydrological model calibration. |
| 4 | Update the design rainfall analysis at least every three years using on-site data or sooner following any significant or extreme rainfall
event. |
| 5 | Reinstate the damaged stream gauges (AGI) and maintain continuous streamflow monitoring in line with EIA commitments for runoff validation
and model updates. |
| 6 | Expand the climate change assessment to include stochastic variability and projected changes in short-term rainfall and storm intensities
for future design evaluations. |
| 7 | Update the site-wide water balance model to reflect ongoing South Valley design revisions (including waste dump locations, PAG management
etc.), outcomes of the stormwater management design (such as updated diversion channels, sediment ponds, and process water facilities),
the latest mine plan, production schedules, waste and tailings placement details, and updated groundwater inflows and dewatering configurations. |
| 8 | Incorporate updated geochemical and water quality data into the source terms and revise the load balance accordingly to maintain consistency
with the overall water balance framework. |
| 1 | Continue to negotiate with potential customers and obtain more Expression of Interest (EOI) to support assumptions around concentrate
freight and commercial costs. |
| 23.7 | Environment and Social |
| 2 | Continue to budget appropriately to update environmental approvals and permits to reflect potential changes to the Project definition
arising from optimization studies, and ensure that the Project execution schedule allows for these activities. |
| 3 | Revise the environmental approval and permitting tracking tool to clearly state the relevant law or regulation, the type of approval
needed, the decision maker (regulator), summarize the application requirements, and specify the expected time frame for obtaining the
approval or permit. Update this tool to reflect changes in the Project definition. For approvals and permits already obtained, include
the date of issuance and the expiry date. |
| | 23-3 | |
| SSR Mining Inc. | Hod Maden Project | | January 7, 2026 |
| Technical Report Summary | | SLR Project No.: 123.000320.00001 |
| 4 | Develop and implement a compliance tracking tool to ensure compliance with legal requirements and identify any non-compliance requiring
corrective action. |
| 5 | As appropriate, update environmental and social baseline studies in response to possible changes in the Project definition. |
| 6 | As appropriate, update the 2023 ESIA and the draft ESMPs according to the revised Project definition to support Project financing. |
| 7 | Continue engagement with local communities and stakeholders as Project development plans evolve. |
| 8 | Track the success of land acquisition and resettlement in line with IFC PS5, and address any grievances raised by the communities. |
| 9 | Update the Closure Plan and closure costing regularly as required by law and also to address the evolving Project definition. |
| 23.8 | Capital and Operating Costs |
| 10 | Select the main contractors for North Valley bulk earthworks and start as soon as possible (and in the year 2025) small scopes of
work with different equipment mixes in order to evaluate productivities and unit costs in the difficult terrain. These scopes of work
and the evaluation of productivities should be completed prior to the commencement of the main work inside the North Valley. |
| 11 | Closely monitor quantities for each contractor and area during the bulk earthworks. |
| 12 | Monitor changes in unit rates due to potential impacts of escalation/inflation. |
| 13 | Synchronize operating costs and sustaining capital estimates between project team members and finance group, especially with capitalized
underground development costs |
| 14 | Closely monitor the execution of the main access road camp (capacity of 350 beds) as well as the construction progress of the main
accommodation camp to ensure that accommodation constraints do not impact the construction schedule. The peak workforce requirement is
expected to be in the summer of 2026, requiring accommodations for 1,150. |
| 15 | Finalize all major equipment contracts and expedite approvals for development of certified vendor drawings. |
| 16 | Continue to update and monitor the Project schedule and cost estimate, including any delays in schedule that may require additional
workforce to maintain the overall Project schedule. |
| | 23-4 | |
| SSR Mining Inc. | Hod Maden Project | | January 7, 2026 |
| Technical Report Summary | | SLR Project No.: 123.000320.00001 |
Abzalov, M. 2008. "Quality control
of assay data: a review of procedures for measuring and monitoring precision and accuracy." Exploration and Mining Geology 17(3-4):
131–144.
Adamia, Ş., et al. 1981.
"Tectonics of the Causaus and Adjoining Regions - implications for the Evolution of the Tethys Ocean." Journal of Structural
Geology 3: 437–447.
AFAD. 2014. Ulusal Deprem Araştırma
Programı, Türkiye Sismik Tehlike Haritasının Güncellenmesi. UDAP-Ç-13-06, Sonuç Raporu, Aralık
2014.
AFAD. 2018. Turkish Ministry of Interior
Disaster and Emergency Management Presidency. https://en.afad.gov.tr/ (Accessed 3rd July 2020).
Akrapro Mühendιslιk
Mιmarlik Müşavιrlιk
A. Ş. 2020. Hod Mine Project Access Road Corridor Investigation Report, April 2020, Rev
0 (internal).
Alitalesh, M., Mollaali, M. and Yazdani,
M. 2015. Correlation between uniaxial strength and point load index of rocks. Proc. 15th Asian Regional Conference on Soil Mechanics and
Geotechnical Engineering, Japanese Geotechnical Society, Fukuoka, Japan, November.
Allen, R.G., Pereira, L.S., Raes, D.,
Smith, M. 1998. Crop evapotranspiration – Guidelines for computing crop water requirements. FAO irrigation and drainage paper 56.
Rome, Italy.
ALS Metallurgy (ALS). 2020. Metallurgical
Test Work conducted upon Variability Ore Samples from the Hod Maden Gold and Copper Project for Artmin Madençilik San. Tic. A.Ş.,
Report No: 19822, September 2020.
ALS. 2024. Metallurgical Testwork conducted
upon Composite Samples from the Hod Maden Copper/Gold Project. July 2024.
AMC (AMC Consultants Pty Ltd.). 2018.
Hod Maden Project Prefeasibility Study NI 43-101 Technical Report. Dated May 30, 2018.
AMC. 2019. Hod Maden Geometallurgical
Study, October 2019.
AMC. 2020a. Hod Maden Stage 2 Geometallurgical
Study, August 2020.
AMC. 2020b. Process Plan. Document no:
HM_AMCDAF_FINAL_ProcessPlan_2020 07_v0.xlsx.
Artmin Madençilik (Artmin). 2018.
Hot Maden Project Geological Report. Exploration Department. Unpublished report, October 2018.
Artmin. 2021. Hod Maden Project Feasibility
Study.
Artmin. 2024a. Draft Air Quality Monitoring
Plan.
Artmin. 2024aa. Draft Waste Rock Management
Plan
Artmin. 2024ab. Permit Tracking (Microsoft
Excel File).
Artmin. 2024ac. Stakeholder Engagement
Register (Microsoft Excel File).
Artmin. 2024b. Draft Biodiversity Management
Plan.
Artmin. 2024c. Draft Water and Wastewater
Management Plan
Artmin. 2024d. Draft Waste Management
Plan
Artmin. 2024e. Draft Environmental and
Social Monitoring Plan
| | 24-1 | |
| SSR Mining Inc. | Hod Maden Project | | January 7, 2026 |
| Technical Report Summary | | SLR Project No.: 123.000320.00001 |
Artmin. 2024f. Draft Project Health and
Safety Management Plan
Artmin. 2024g. Draft Emergency Preparedness
and Response Plan
Artmin. 2024h. Draft Traffic Management
Plan
Artmin. 2024i. Draft Chemical Management
Plan
Artmin. 2024j. Draft Code of Conduct
Artmin. 2024k. Draft Community Development
Plan.
Artmin. 2024l. Draft Community and Health
Management Plan
Artmin. 2024m. Draft Contractor Management
Plan
Artmin. 2024n. Draft Cultural Heritage
Management Plan
Artmin. 2024o. Draft Employment Plan
Artmin. 2024p. Draft Erosion Sediment
Management Plan
Artmin. 2024q. Draft Hydrocarbon Management
Plan
Artmin. 2024r. Draft Influx Management
Plan
Artmin. 2024s. Draft Labor and Working
Conditions Plan
Artmin. 2024t. Draft Noise and Vibration
Management Plan
Artmin. 2024u. Draft Resource Efficiency
and Pollution Prevention Plan
Artmin. 2024v. Draft Security Management
Plan
Artmin. 2024w. Draft Topsoil Management
Plan
Artmin. 2024x. Draft Spill Prevention
Plan
Artmin. 2024y. Draft Supply Chain Management
Plan
Artmin. 2024z. Draft Visual Aesthetics
Management Plan
Ausenco. 2024. Artmin Hod Maden FS Update
– Process Plant. June 2024
Aydin, F. et al. 2020. "Temporal,
geochemical and geodynamic evolution of the Late Cretaceous subduction zone volcanism in the eastern Sakarya zone, NE Türkiye: Implications
for mantle-crust interaction in an arc setting." Journal of Asian Earth Sciences 192.
Barton, N., Lien, R. and Lunde, J. 1974.
Engineering classification of rock masses for the design of tunnel support. Rock Mechanics, Vol. 6 pp 189-239.
Bektaş, O. et al. 1999. "Migration
of the Upper Cretaceous subduction-related volcanism towards the back-arc basin of the eastern Pontide magnatic arc (NE Türkiye)."
Geological Journal 34: 95–106.
Bilir, M. E. et al. 2023. "Geology
and stratigraphy of Hod (Artvin) region, Eastern Pontides, NE Türkiye." Mugla Journal of Science and Technology.
Bozkurt, E. 2017. Draft report on structures
of the Hot Maden property., Middle East Technical University.
Bozkurt, E. 2017. Report on structures
of Hod Maden property. March 2017. Unpublish report; 127 pages.
| | 24-2 | |
| SSR Mining Inc. | Hod Maden Project | | January 7, 2026 |
| Technical Report Summary | | SLR Project No.: 123.000320.00001 |
Callan, N. J. 2013. Report on Geological
Mapping and Prospect Evaluation, Hot Maden Property (Lic. #’s 201201058, 201201059, 20050853, 201200321), Artvin District, NE Türkiye.
Internal Aegean Metals Group technical report, 2013.
CDA (Canadian Dam Association). 2013.
Dam Safety Guidelines 2007 (2013 edition).
Carroll, D. 2014. Mining through backfill
using spiling bars. Ausrock 2014, 3rd Australasian ground control in mining, Sydney, November.
Cavazza, W. et al. 2019. "Continental
accretion and incremental deformation in the thermochronologic evolution of the Lesser Caucasus." Geoscience Frontiers.
Çiftçi, E. 2019. Chapter
9: Volcanogenic Massive Sulfide (VMS) Deposits of Türkiye. In: Mineral Resources of Türkiye., Springer.
Corbett, G. 2012. Structural Controls
to, and Exploration for, Epithermal Au-Ag Deposits.
Çoşkun, E. (Hareket Heavy
Lifting and Project Transportation Co.) 2018. Road Survey Route Report, PR-2018-08-047-R-RS01 R0, 14th September, 2018 Rev 0 (internal).
Danciu, L., Sesetyan, K., Demircioğlu,
M., Erdik, M. and Giardini, D. 2016. OpenQuake input files of the Seismogenic Source Model of the 2014 Earthquake Model of the Middle
East (EMME-Project), doi:10.12686/a3.
Dawson, L., Yumlu, M., English, M. 2008.
Drift and Fill - The high value, high recovery mining system. Proceedings of Narrow Vein Mining Conference. AusIMM. Ballarat, Vic, 14-15th
October 2008.
Deere, D. U., Hendron, A. J., Patton,
F. D. and Cording, E. J. 1967. Design of surface and near surface construction in rock, in Failure and Breakage of Rock, C Fairhurst (Ed.),
Society of Mining Engineers of AIME. New York, pp. 237-302.
DLH. 2008. Seismic Regulations for Seaport
Structures, Railways, Airports and Infrastructure. Available online: http//www.kugm.gov.tr/BLSM_WIYS/DLH/tr/DOKUMAN _SOL_MENU/ Kiyi Yapilari
_Deprem_ Tkn/20100602_111229_10288_ 1_10314.html (last accessed 7th April 2011).
Dokuz, A. et al. 2019. "Postcollisional
transition from subduction-to intraplate-type magmatism in the eastern Sakarya zone, Türkiye: indicators of northern Neotethyan slab
breakoff." Geological Society of America Bulletin.
Dowding, C. H., Rozen, A. 1978. Damage
to rock tunnels from earthquake shaking. American Society of Civil Engineering, Journal of Geotechnical Engineering Division, Vol. 104,
pp.175-191.
Ekmekçi, Z. (Hacettepe Mineral
Technologies). 2019. Hod Maden Variability Test Program - Derivation of mathematical equations to estimate concentrate grade and recovery
from feed grade (unpublished), 27th November 2019.
Eyüboğlu, Y. and Bektaş,
O. 2007. "Mid-Cretaceous olistostromal ophiolitic mélange developed in the back-arc basin of the Eastern Pontide Magmatic
Arc, Northeast Türkiye." International Geology Review 49: 1103–1126.
Eyüboğlu, Y. et al. 2006.
Three-directional extensional deformation and formation of the Liassic rift basins in the Eastern Pontides (NE Türkiye). Geologica
Carpathica 57(5): 337–346.
Federal Highway Administration. 2006.
Hydraulic Engineering Circular No.14, Third Edition Hydraulic Design of Energy Dissipators for Culverts and Channels. FHWA-NHI-06-086.
| | 24-3 | |
| SSR Mining Inc. | Hod Maden Project | | January 7, 2026 |
| Technical Report Summary | | SLR Project No.: 123.000320.00001 |
Gaudreau, D. 2006. Current support practices
at Perseverance mine. Proc. 3rd Intl. Sem. on Deep and High Stress Mining, 2nd - 4th October 2006, Quebec City, Canada.
GeoDestek Ltd. Şti. 2021a. Seismic
Hazard Assessment Report for Hod Maden Project. Document no: 116-REP-C-011-0.
Global Mining Guidelines Group (GMG).
2018. GMG recommended Practices for Battery Electric Vehicles in Underground Mining - 2nd Edition.
Golder. 2013. Hydrocensus Study, Limited
Baseline Study: Serhat Demirel, et al. Prepared by Prepared by Golder Associates (Türkiye) Ltd.
Golder. 2015. Hydrocensus Study, Limited
Baseline Study: Serhat Demirel, et al. Prepared by Prepared by Golder Associates (Türkiye) Ltd.
Golder. 2015. 201201058, 20050853, 201200321,
20120159 Licences, Hot Project - Artvin, Türkiye, Environmental Status Evaluation Report. Prepared by Golder Associates (Türkiye)
Ltd. 23rd November 2015.
Golder. 2016. Basic Data Collection Studies.
Prepared by Golder Associates (Türkiye) Ltd. September 2016.
Golder. 2020a. Geological Hazard Assessment.
Document No: 116-REP-C-005-0. Prepared by Golder Associates (Türkiye) Ltd.
Golder. 2020b. Preliminary Reclamation
and Closure Plan. Document no: 116-REP-C-013-2_Preliminary_Reclamation_and_Closure_Plan. Prepared by Golder Associates Inc.
Golder. 2021. Hod Maden Mine - Upper
Zone Ore Body Undercut & Fill Mining Option in conjunction with Artificial Crown Pillar - Detailed Feasibility Study. Prepared by
Golder Associates (UK) Ltd.
Golder. 2021a. Hod Maden TSF Feasibility
Design Report. Document no: 116-REP-C-017-0. Prepared by Golder Associates Inc.
Golder. 2021b. Hod Maden TSF Phase 1
Instrumentation and Monitoring Plan. Document No: 116-REP-C-019-0_TSF_Instr_Mon_Plan. Prepared by Golder Associates Inc.
Golder. 2021c. Hod Maden TSF Dam Breach
Analysis. Document No: 116-REP-C-021-A_Dam_Break_Analysis_Rpt. Prepared by Golder Associates Inc.
Golder. 2022. Hod Maden ESIA –
Conceptual Mine Decommissioning and Closure Plan. Prepared by Golder Associates (Türkiye) Ltd.
Golder. 2023a. Hod Maden Project –
Environmental and Social Impact Assessment. Prepared by Golder Associates (Türkiye) Ltd.
Golder. 2023b. Hod Maden Project - Land
Acquisition and Resettlement Action Plan. Prepared by Golder Associates (Türkiye) Ltd.
GR Engineering (GR Engineering Services
Limited). 2018. Hod Maden Project Pre-Feasibility Study - Technical Report NI 43-101.
GR Engineering. 2020. Hod Maden Project,
Definitive Feasibility Study. Prepared for Artmin Madencilik San Tic AŞ. November 17, 2020 (the 2020 DFS).
GR Engineering. 2021. Hod Maden Project,
Feasibility Study – Technical Report NI 43-101. Prepared for Sandstorm Gold Limited. December 15, 2021 (the 2021 FS).
| | 24-4 | |
| SSR Mining Inc. | Hod Maden Project | | January 7, 2026 |
| Technical Report Summary | | SLR Project No.: 123.000320.00001 |
Hacettepe Mineral Technologies Ltd. (HMT).
2016. Metallurgical Assessment of Hot Maden Au-Cu Ore, November 2016.
Hacettepe Mineral Technologies Ltd. (HMT).
2017. Mass Balance & Equipment Selection Studies for Hot Maden Au-Cu Ore Process Plant, Flotation Circuit of Hot Maden Au-Cu Ore,
July 2017.
Hacettepe Mineral Technologies Ltd. (HMT).
2020. Flotation of Hod Maden Au-Cu Ore Using Mine Site Water, March 2020.
Hacettepe Mineral Technologies Ltd. (HMT).
2020. Hod Maden Project-Feasibility Study Metallurgical Testing, September 2020.
Hamon, W.R. 1961. Estimating Potential
Evapotranspiration. Journal of the Hydraulics Division, Volk. 87, Issue 3. May 1961.
Hashash, Y. M. A. et al. 2017. DEEPSOIL
7.0, User Manual.
Huffman, G., D. Bolvin, D. Braithwaite,
K. Hsu, R. Joyce, and P. Xie. 2023. Integrated Multi-satellite Retrievals for GPM (IMERG), Version 07. NASA Precipitation Processing
Center. Accessed March 2025. ftp://arthurhou.pps.eosdis.nasa.gov/gpmdata/
Hynes-Griffin, M. E. and Franklin, A.
G. 1984. Rationalizing the Seismic Coefficient Method. Miscellaneous Paper GL-84-13, U.S. Army Corps of Engineers, Vicksburg, Mississippi.
IFC. 2012. Performance Standard (PS)
6, Biodiversity Conservation and Sustainable Management of Living Natural Resources. World Bank / International Finance Corporation. Washington,
DC. 2012. Available at International Finance Corporation (IFC).
INR. 2021. Hod Maden Tesisleri Yuzey
Suyu Yapilari Uygulama Projesi Raporu “INR-020-001-REP-001”. INR Consulting & Engineering Inc., December 19, 2021
INR. 2024. Hod Mine Site Wide Flood Calculations
“INR-023-005-TEM-019-Rev 0”. INR Consulting & Engineering Inc., July 06, 2024
INR Mühendislik Müşavirlik
A.Ş. 2017a. Technical Memorandum - Study on Hot Mine TSF Sitting. Document number: INR-017-013-TEM-001-Rev B.
INR Mühendislik Müşavirlik
A.Ş. 2017b. Technical Memorandum - Geologic Hazards and Risk Assessment of Hot Mine TSF. Document number: INR-017-013-TEM-003-Rev
A.
INR Mühendislik Müşavirlik
A.Ş. 2017c. Technical Memorandum - Site Specific Seismic Hazard Risk Analysis. Document number: INR-017-013-TEM-002-Rev A.).
INR Mühendislik Müşavirlik
A.Ş. 2018. Hot Gold Mine Tailings Storage Facility PFS Level Design Report. Document No: INR-017-013-REP-001.
INR Mühendislik Müşavirlik
A.Ş. 2019. Hod Mine Project TSF Phase-1 Field Investigation Report. Document number: INR-017-013-REP-010.
Itasca 2022. MINEDW. Groundwater Flow
Code for Mining Applications in 3D. https://www.itascainternational.com/software/minedw
Kandemir, Ö., et al. 2019. "From
arc evolution to arc-continent collision: Late Cretaceous-middle Eocene geology of the Eastern Pontides, northeastern Türkiye."
Geological Society of America Bulletin 131: 1889–1906.
Kirlioğlu Kιmya
Sanayι ve Tιcaret
A. Ş. (no date). Artvin Province, Yukarimaden Village Mobile Explosive Storage Project
(8 Tonnes Capacity).
| | 24-5 | |
| SSR Mining Inc. | Hod Maden Project | | January 7, 2026 |
| Technical Report Summary | | SLR Project No.: 123.000320.00001 |
Kuşcu, İ. 2023. Exploration
Activity Report: Hod Maden, SSR Mining.
Kuşcu, İ. et al. 2019. Chapter
8: Porphyry-Cu Deposits of Türkiye. In: Mineral Resources of Türkiye., Springer.
Lane, G. et al. 2013. Power-based comminution
calculations using Ausgrind, 10th Internation Mineral Processing Conference, Procemin 2013. Santiago de Chile.
Lenhardt, W. A. 2009. The impact of earthquakes
on mining operations. BHM Berg Hüttenmännische Monatshefte154, 249-254, 2009.
Maden, N., et al. 2009. "Determination
of Tectonic and Crustal Structure of the Eastern Pontide Orogenic Belt (NE Türkiye) using Gravity and Magnetic Data." Pure and
Applied Geophysics 166: 1987–2006.
Mathews, K. E., Hoek, E., Wyllie, D.
C. and Stewart, S. B. V. 1981. Prediction of Stable Excavations for Mining at Depth below 1000 Metres in Hard Rock. CANMET Report DSS
Serial No. OSQ80-00081, DSS File No. 17 SQ.23440-0-9020, Ottawa: Dept. Energy Mines and Resources. 39.
McCracken, A. and Stacey, T. R. 1989.
Geotechnical Risk Assessment for Large-Diameter Raise-Bored Shafts. Proceedings of Shaft Engineering, IMM.
Metso-Outotec. 2020. Metso-Outotec Test
Center Report-ALS, OPP-A19822, September 2020.
MGM (Turkish State Meteorological Service).
2025. State of the climate in Türkiye in 2024. General Directorate of Meteorology. Retrieved from https://www.emcc.mgm.gov.tr/files/State_of_the_Climate_in_Türkiye_in_2024.pdf
Mitto Danışmanlık
A.Ş. 2018. Final Hydrocensus Field Report. October, 2018 (Turkish)
Mitto Danışmanlık
A.Ş. 2021. Artmin Madencilik San. ve Tic. A.Ş., 87288 Ruhsat Numaralı Sahada Kompleks (Cu-Au-Ag-Pirit) Yeraltı
Maden İşletmesi Kapasite Artışı, Cevher Zenginleştirme ve Kırma Eleme Tesisi, Kil Ocağı,
Andezit Ocağı, Atık Depolama Tesisi, Hazır Beton Tesisi Nihai ÇED Raporu (Final EIA Report). Artvin,
Türkiye.
MWH, Hod Maden Mining Project, 2017 -
Water Management Assessment
Okay, A. I. and Topuz, G. 2017. "Variscan
orogeny in the Black Sea region." International Journal of Earth Sciences 106: 569–592.
Owen, G. N. and Scholl, R. E. 1981. Earthquake
engineering of large underground structures. Report No. FHWA/RD80/195. Federal Highway Administration and Natural Science Foundation.
Oyman, T. 2019. Chapter 4: Epithermal
Deposits of Türkiye. In: Mineral Resources of Türkiye., Springer.
Peck, W. 2000. Determining the stress
reduction factor in highly stressed jointed rock. Australian Geomechanics, Vol. 35, No. 2.
Peck, W. A., and Lee, M. F. 2008. Stability
of Raise Bored Shafts in Australian Mines. 13th Australian Tunnelling Conference, Melbourne.
Peck, W., Coombes, B. and Lee, M. 2011.
Fine-Tuning Raisebore Stability Assessments and Risk. 11th AusIMM Underground Operators Conference, Canberra.
Penney, A. R., Stephenson, R. M. and
Pascoe, M. J. 2018. Raise bore stability and risk assessment empirical database update. Conf. proc. Ausrock 2018.
| | 24-6 | |
| SSR Mining Inc. | Hod Maden Project | | January 7, 2026 |
| Technical Report Summary | | SLR Project No.: 123.000320.00001 |
Potvin, Y. 1988. Empirical Open Stope
Design in Canada. Ph.D. Thesis, Dept. of Mining and Mineral Processing, University of British Columbia. 343 p.
Power, M. S., Rosidi, D., Kaneshiro 1998.
Seismic vulnerability of tunnels and underground structures revisited. Proc. North American Tunnelling ’98, Newport Beach, CA, Balkema
Rotterdam, pp. 243-250.
Rabayrol, F. et al. 2023. "District-scale
VMS to porphyry-epithermal transitions in subduction to postcollisional tectonic environments: the Artvin Au-Cu district and the Hod Gold
Corridor, Eastern Pontides Belt, Türkiye." Society of Economic Geologists 118: 801–822.
Rojay, B. 2023. Geological Investigation
of Hod Maden area (Artvin, Northern Türkiye), Middle
Roth, E. and Alizade, F. 2017. High grade
gold-copper mineralisation at the Hod Maden Project, NE Türkiye (abstr.), proceedings from the 2017 NewGen Gold Conference, Perth,
Australia, 14th - 25th November 2017; 12 p.
Seyhan, E. (INR Engineering & Consultancy
Inc.) 2020. Hod Mine - South Valley Drainage Plan, INR-020-002-TEM-006-Rev 0, INR, 14th August 2020 (internal).
SGS Canada Inc. 2017. Sample Selection,
Hot Maden, Artvin Province, Eastern Türkiye, April 28, 2017.
Sillitoe, R. H. 2010. "Porphyry
copper systems." Economic Geology 105(1): 3–41.
SRK. 2020. Environmental Baseline Data
Collection Study: Project 1541005. Prepared by SRK Danismanlik ve Muhendislik A.S. 2020 October 2020.
SRK. 2022. Water Resource Impact Assessment.
Prepared for Artmin Madencilik San by SRK Consulting (U.S.), Inc.
SRK. 2025a. Hod Maden Project: Water
Balance Model Update, Design Basis and Preliminary Results (Draft). Technical Memorandum prepared for Artmin Madencilik A.Ş. by
SRK Consulting (U.S.), Inc. Project No. USPR001858, dated August 27, 2025.
SRK. 2025b. Hod Maden Şurakev
Stream and Aktaş Stream Surface Water Engineering Designs, Third Party Review. Memorandum prepared for SSR Mining by SRK Consulting
(U.S.), Inc. Project No. USPR001858, dated April 17, 2025.
SRK. 2025c. Stilling Basin Design for
Downstream End of Şurakev Channel, HOD Maden Project. Calculation Package No. 01, Task 210, Project No. USPR001858, prepared for
Artmin Madencilik A.Ş. by SRK Consulting (U.S.), Inc. dated September 3, 2025.
SRK. 2025d. Factual Report Summary (Hydrogeology).
Prepared by SRK Danismanlik ve Muhendislik A.S.
Stephenson, R. 2011. Geotechnical analysis
of large diameter raise bored shafts at Gwalia Mine. Unpublished Master’s thesis, Curtin University.
Taylor, C. D., et al. 1995. Chapter 16:
Volcanic-associated massive sulfide deposits.
Topuz, G., et al. 2010. "Carboniferous
high-potassium I-type granitoid magmatism in the Eastern Pontides: the Gümüşhane pluton (NE Türkiye)." Lithos
116: 92–110.
Tosdal, R. M. 2023. Review of the geology
and hydrothermal ore deposit model for the Hod Maden Cu-Au deposit, Eastern Pontides, Türkiye. Folly Beach, SC 29439 U.S.A.
Tripp, G. I. 2023. Hod Maden Structural
Review.
| | 24-7 | |
| SSR Mining Inc. | Hod Maden Project | | January 7, 2026 |
| Technical Report Summary | | SLR Project No.: 123.000320.00001 |
Turkish Ministry of Environment, Urbanization
and Climate Change (CSB). 2015. Mine Waste Regulation. Official Gazette, Issue No: 29417, Date: 15/07/2015. Available online: https://www.resmigazete.gov.tr/eskiler/2015/07/20150715-3.htm.
Accessed 30 September 2020.
Turkish State Meteorological Service
(MGM), 2025. The State of the Türkiye’s Climate in 2024. Ministry of Environment, Urbanization and Climate Change, Climate
and Agricultural Meteorology Department, Research Department, Ankara, Türkiye. Retrieved from https://www.emcc.mgm.gov.tr/files/State_of_the_Climate_in_Turkey_in_2024.pdf
United Nations 2021. What is climate
change? United Nations Climate Action. Retrieved from https://www.un.org/en/climatechange/what-is-climate-change
Ustaömer, T., and Robertson, A.
H. F. 2010. "Late Palaeozoic–Early Cenozoic tectonic development of the Eastern Pontides (Artvin area), Türkiye: stages
of closure of Tethys along the southern margin of Eurasia." Geological Society of London Special Publication 340: 281–327.
Van Rensburg, J. (Stantec). 2019. Hod
Maden Mining Project - Water Management Desktop Assessment, 27th February 2017 (internal)
Wardell Armstrong International. 2018.
Metallurgical Test Work on Samples from the Hot Maden Copper-Gold Project, Türkiye. January 2018.
Westgard, J. O., et al. 1981. "A
multi-rule Shewhart chart for quality control in clinical chemistry." Clinical Chemistry 27: 493–501.
WSP. 2023. Geotechnical Field Investigation
and Laboratory Testing at Hod Maden TSF Cut Slopes Above the Impoundment Level and Wave Assessment. Document number: 19126670-116-TM-016-A-Geotetech_Field_Investigation_and_Testing_20MAR23.
WSP. 2025. North Valley Drawing Set (Issued
for Tender).
Yilmaz, Y. et al. 1997. Chapter 11: Geology
and Tectonic Evolution of the Pontides. In: Regional and petroleum geology of the Black Sea and surrounding region., AAPG Memoir.
Yunatcı, A. A. 2010. GIS Based
Seismic Hazard Mapping of Türkiye. PhD Dissertation, Graduate School of Natural and Applied Sciences, Middle East Technical University,
Ankara, Türkiye. 399 p.
| | 24-8 | |
| SSR Mining Inc. | Hod Maden Project | | January 7, 2026 |
| Technical Report Summary | | SLR Project No.: 123.000320.00001 |
| 25.0 | Reliance on Information Provided by the Registrant |
This TRS has been prepared by SLR for SSR Mining Inc. The information,
conclusions, opinions, and estimates contained herein are based on:
| · | Information available to SLR at the time of preparation of this TRS. |
| · | Assumptions, conditions, and qualifications as set forth in this TRS. |
| · | Data, reports, and other information supplied by SSR and other third party sources. |
For the purpose of this TRS, SLR has relied on ownership information
provided by SSR’s internal land and legal department. SLR has not researched property title or mineral rights for the Hod Maden
Project as we consider it reasonable to rely on SSR and their legal counsel who is responsible for maintaining this information.
SLR has relied on SSR’s Tax Director for guidance on applicable
taxes, royalties, and other government levies or interests, applicable to revenue or income from the Hod Maden Project in the Executive
Summary and Section 19.
The Qualified Persons have taken all appropriate steps, in their professional
opinion, to ensure that the above information from SSR is sound.
Except as provided by applicable laws, any use of this TRS by any third
party is at that party’s sole risk.
| | 25-1 | |
| SSR Mining Inc. | Hod Maden Project | | January 7, 2026 |
| Technical Report Summary | | SLR Project No.: 123.000320.00001 |
| 26.0 | Date and Signature Page |
This report titled “Technical Report Summary, Hod Maden Project,
Türkiye” dated January 7, 2026, was prepared and signed by:
| |
(Signed) SLR International Corporation |
| |
|
| Dated at Lakewood, ON |
|
| January 7, 2026 |
SLR International Corporation |
| |
|
| |
(Signed) RSC Consulting Ltd. |
| |
|
| Dated at Dunedin, New Zealand |
|
| January 7, 2026 |
RSC Consulting Ltd. |
| |
|
| |
(Signed) WSP USA Inc. |
| |
|
| Dated at Lakewood, CO |
|
| January 7, 2026 |
WSP USA Inc. |
| |
|
| |
(Signed) SRK Consulting Inc. |
| |
|
| Dated at Denver, CO |
|
| January 7, 2026 |
SRK Consulting Inc. |
| |
|
| |
|
| |
(Signed) Ausenco Services Pty Ltd. |
| |
|
| Dated at South Brisbane, Australia |
|
| January 7, 2026 |
Ausenco Services Pty Ltd. |
| | 26-1 | |
| SSR Mining Inc. | Hod Maden Project | | January 7, 2026 |
| Technical Report Summary | | SLR Project No.: 123.000320.00001 |
| | 27-1 | |
| SSR Mining Inc. | Hod Maden Project | | January 7, 2026 |
| Technical Report Summary | | SLR Project No.: 123.000320.00001 |
Table 27-1: Cash Flow Summary
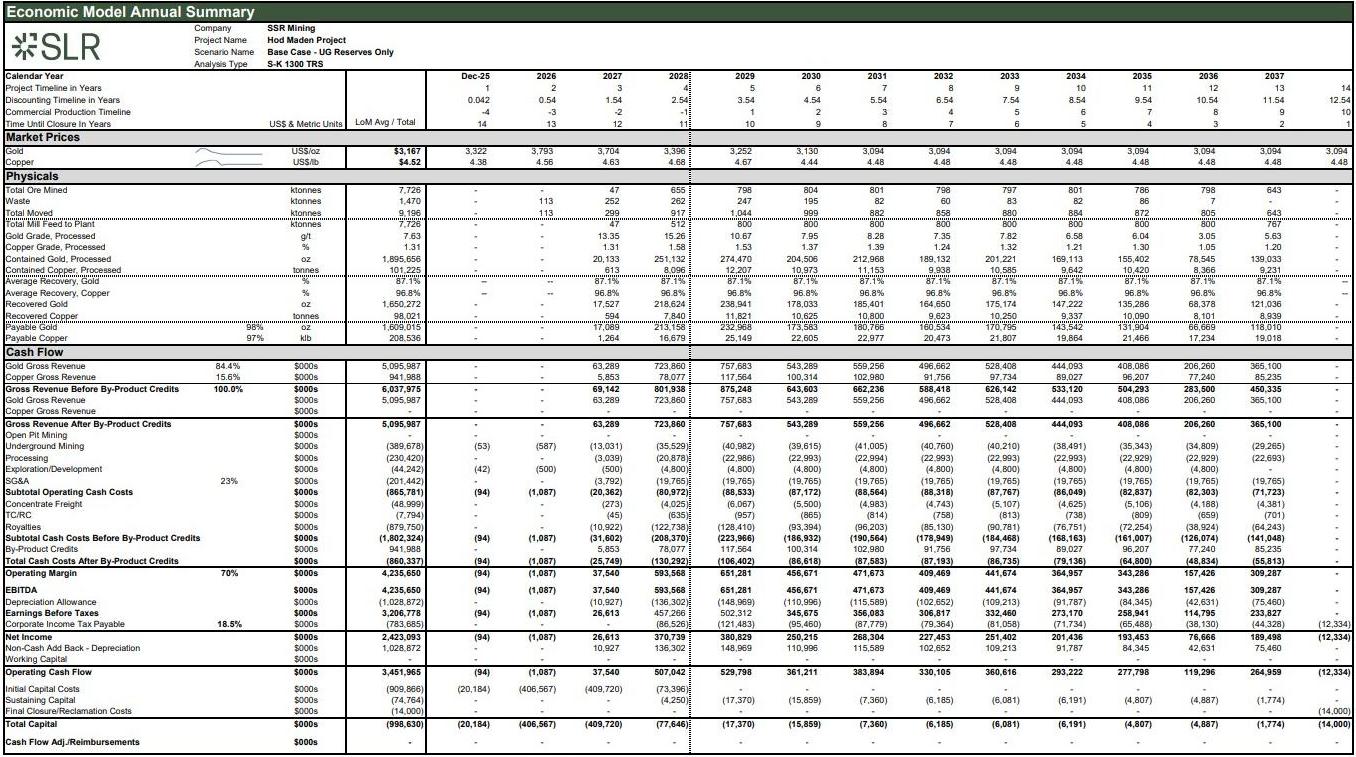
TABLE 27-1
Economic Model Annual Summary
SLR
Company SSR Mining
Project Name Hod Maden Project
Scenario Name Base Case - UG Reserves Only
Analysis Type S-K 1300 TRS
Calendar Year
Dec-25
2026
2027
2028
2029
2030
2031
2032
2033
2034
2035
2036
2037
Project Timeline in Years
1
2
3
4
5
6
7
8
9
10
11
12
13
14
Discounting Timeline in Years
0.042
0.54
1.54
2.54
3.54
4.54
5.54
6.54
7.54
8.54
9.54
10.54
11.54
12.54
Commercial Production Timeline
-4
-3
-2
-1
1
2
3
4
5
6
7
8
9
10
Time Until Closure In Years
US$ & Metric Units
LoM Avg / Total
14
13
12
11
10
9
8
7
6
5
4
3
2
1
Market Prices
Gold
US$/oz
$3,167
3,322
3,793
3,704
3,396
3,252
3,130
3,094
3,094
3,094
3,094
3,094
3,094
3,094
3,094
Copper
US$/lb
$4.52
4.38
4.56
4.63
4.68
4.67
4.44
4.48
4.48
4.48
4.48
4.48
4.48
4.48
4.48
Physicals
Total Ore Mined
ktonnes
7,726
-
-
47
655
798
804
801
798
797
801
786
798
643
-
Waste
ktonnes
1,470
-
113
252
262
247
195
82
60
83
82
86
7
-
-
Total Moved
ktonnes
9,196
-
113
299
917
1,044
999
882
858
880
884
872
805
643
-
Total Mill Feed to Plant
ktonnes
7,726
-
-
47
512
800
800
800
800
800
800
800
800
767
-
Gold Grade, Processed
g/t
7.63
-
-
13.35
15.26
10.67
7.95
8.28
7.35
7.82
6.58
6.04
3.05
5.63
-
Copper Grade, Processed
%
1.31
-
-
1.31
1.58
1.53
1.37
1.39
1.24
1.32
1.21
1.30
1.05
1.20
-
Contained Gold, Processed
oz
1,895,656
-
-
20,133
251,132
274,470
204,506
212,968
189,132
201,221
169,113
155,402
78,545
139,033
-
Contained Copper, Processed
tonnes
101,225
-
-
613
8,096
12,207
10,973
11,153
9,938
10,585
9,642
10,420
8,366
9,231
-
Average Recovery, Gold
%
87.1%
--
--
87.1%
87.1%
87.1%
87.1%
87.1%
87.1%
87.1%
87.1%
87.1%
87.1%
87.1%
--
Average Recovery, Copper
%
96.8%
--
--
96.8%
96.8%
96.8%
96.8%
96.8%
96.8%
96.8%
96.8%
96.8%
96.8%
96.8%
--
Recovered Gold
oz
1,650,272
-
-
17,527
218,624
238,941
178,033
185,401
164,650
175,174
147,222
135,286
68,378
121,036
-
Recovered Copper
tonnes
98,021
-
-
594
7,840
11,821
10,625
10,800
9,623
10,250
9,337
10,090
8,101
8,939
-
Payable Gold
98%
oz
1,609,015
-
-
17,089
213,158
232,968
173,583
180,766
160,534
170,795
143,542
131,904
66,669
118,010
-
Payable Copper
97%
klb
208,536
-
-
1,264
16,679
25,149
22,605
22,977
20,473
21,807
19,864
21,466
17,234
19,018
-
Cash Flow
Gold Gross Revenue
84.4%
$000s
5,095,987
-
-
63,289
723,860
757,683
543,289
559,256
496,662
528,408
444,093
408,086
206,260
365,100
-
Copper Gross Revenue
15.6%
$000s
941,988
-
-
5,853
78,077
117,564
100,314
102,980
91,756
97,734
89,027
96,207
77,240
85,235
-
Gross Revenue Before By-Product Credits
100.0%
$000s
6,037,975
-
-
69,142
801,938
875,248
643,603
662,236
588,418
626,142
533,120
504,293
283,500
450,335
-
Gold Gross Revenue
$000s
5,095,987
-
-
63,289
723,860
757,683
543,289
559,256
496,662
528,408
444,093
408,086
206,260
365,100
-
Copper Gross Revenue
$000s
-
-
-
-
-
-
-
-
-
-
-
-
-
-
-
Gross Revenue After By-Product Credits
$000s
5,095,987
-
-
63,289
723,860
757,683
543,289
559,256
496,662
528,408
444,093
408,086
206,260
365,100
-
Open Pit Mining
$000s
-
-
-
-
-
-
-
-
-
-
-
-
-
-
-
Underground Mining
$000s
(389,678)
(53)
(587)
(13,031)
(35,529)
(40,982)
(39,615)
(41,005)
(40,760)
(40,210)
(38,491)
(35,343)
(34,809)
(29,265)
-
Processing
$000s
(230,420)
-
-
(3,039)
(20,878)
(22,986)
(22,993)
(22,994)
(22,993)
(22,993)
(22,993)
(22,929)
(22,929)
(22,693)
-
Exploration/Development
$000s
(44,242)
(42)
(500)
(500)
(4,800)
(4,800)
(4,800)
(4,800)
(4,800)
(4,800)
(4,800)
(4,800)
(4,800)
-
-
SG&A
23%
$000s
(201,442)
-
-
(3,792)
(19,765)
(19,765)
(19,765)
(19,765)
(19,765)
(19,765)
(19,765)
(19,765)
(19,765)
(19,765)
-
Subtotal Operating Cash Costs
$000s
(865,781)
(94)
(1,087)
(20,362)
(80,972)
(88,533)
(87,172)
(88,564)
(88,318)
(87,767)
(86,049)
(82,837)
(82,303)
(71,723)
-
Concentrate Freight
$000s
(48,999)
-
-
(273)
(4,025)
(6,067)
(5,500)
(4,983)
(4,743)
(5,107)
(4,625)
(5,106)
(4,188)
(4,381)
-
TC/RC
$000s
(7,794)
-
-
(45)
(635)
(957)
(865)
(814)
(758)
(813)
(738)
(809)
(659)
(701)
-
Royalties
$000s
(879,750)
-
-
(10,922)
(122,738)
(128,410)
(93,394)
(96,203)
(85,130)
(90,781)
(76,751)
(72,254)
(38,924)
(64,243)
-
Subtotal Cash Costs Before By-Product Credits
$000s
(1,802,324)
(94)
(1,087)
(31,602)
(208,370)
(223,966)
(186,932)
(190,564)
(178,949)
(184,468)
(168,163)
(161,007)
(126,074)
(141,048)
-
By-Product Credits
$000s
941,988
-
-
5,853
78,077
117,564
100,314
102,980
91,756
97,734
89,027
96,207
77,240
85,235
-
Total Cash Costs After By-Product Credits
$000s
(860,337)
(94)
(1,087)
(25,749)
(130,292)
(106,402)
(86,618)
(87,583)
(87,193)
(86,735)
(79,136)
(64,800)
(48,834)
(55,813)
-
Operating Margin
70%
$000s
4,235,650
(94)
(1,087)
37,540
593,568
651,281
456,671
471,673
409,469
441,674
364,957
343,286
157,426
309,287
-
EBITDA
$000s
4,235,650
(94)
(1,087)
37,540
593,568
651,281
456,671
471,673
409,469
441,674
364,957
343,286
157,426
309,287
-
Depreciation Allowance
$000s
(1,028,872)
-
-
(10,927)
(136,302)
(148,969)
(110,996)
(115,589)
(102,652)
(109,213)
(91,787)
(84,345)
(42,631)
(75,460)
-
Earnings Before Taxes
$000s
3,206,778
(94)
(1,087)
26,613
457,266
502,312
345,675
356,083
306,817
332,460
273,170
258,941
114,795
233,827
-
Corporate Income Tax Payable
18.5%
$000s
(783,685)
-
-
-
(86,526)
(121,483)
(95,460)
(87,779)
(79,364)
(81,058)
(71,734)
(65,488)
(38,130)
(44,328)
(12,334)
Net Income
$000s
2,423,093
(94)
(1,087)
26,613
370,739
380,829
250,215
268,304
227,453
251,402
201,436
193,453
76,666
189,498
(12,334)
Non-Cash Add Back - Depreciation
$000s
1,028,872
-
-
10,927
136,302
148,969
110,996
115,589
102,652
109,213
91,787
84,345
42,631
75,460
-
Working Capital
$000s
-
-
-
-
-
-
-
-
-
-
-
-
-
-
-
Operating Cash Flow
$000s
3,451,965
(94)
(1,087)
37,540
507,042
529,798
361,211
383,894
330,105
360,616
293,222
277,798
119,296
264,959
(12,334)
Initial Capital Costs
$000s
(909,866)
(20,184)
(406,567)
(409,720)
(73,396)
-
-
-
-
-
-
-
-
-
-
Sustaining Capital
$000s
(74,764)
-
-
-
(4,250)
(17,370)
(15,859)
(7,360)
(6,185)
(6,081)
(6,191)
(4,807)
(4,887)
(1,774)
-
Final Closure/Reclamation Costs
$000s
(14,000)
-
-
-
-
-
-
-
-
-
-
-
-
-
(14,000)
Total Capital
$000s
(998,630)
(20,184)
(406,567)
(409,720)
(77,646)
(17,370)
(15,859)
(7,360)
(6,185)
(6,081)
(6,191)
(4,807)
(4,887)
(1,774)
(14,000)
Cash Flow Adj./Reimbursements
$000s
-
-
-
-
-
-
-
-
-
-
-
-
-
-
-
| | 27-2 | |
| SSR Mining Inc. | Hod Maden Project | | January 7, 2026 |
| Technical Report Summary | | SLR Project No.: 123.000320.00001 |
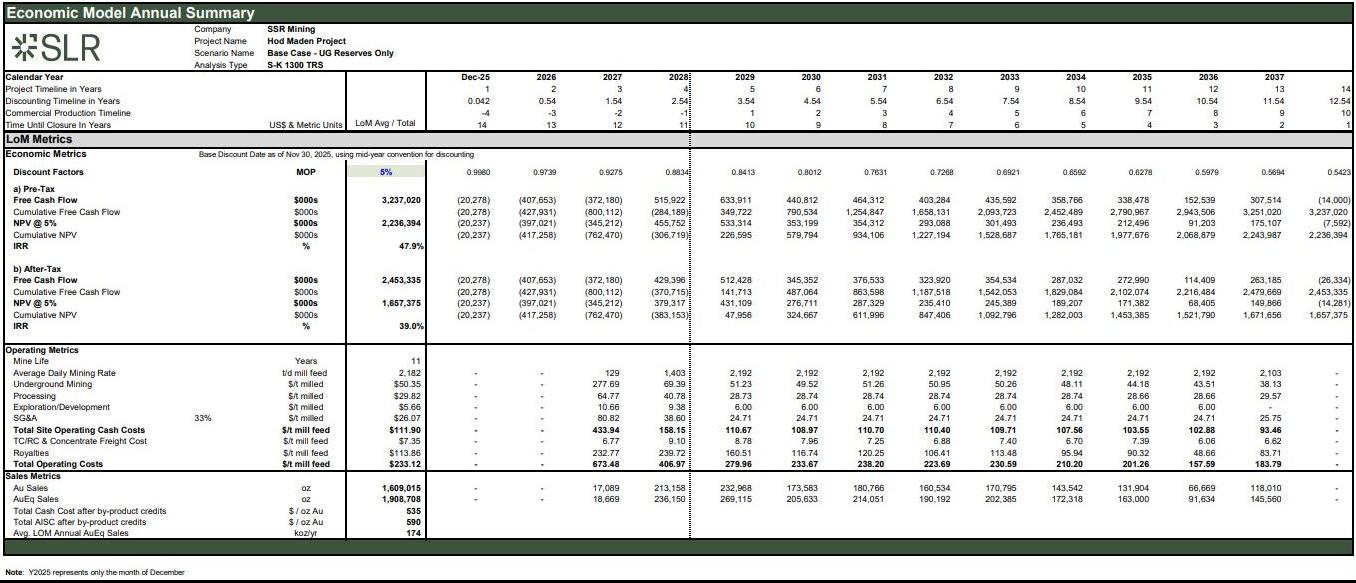
LoM Metrics
Economic Metrics
Base Discount Date as of Nov 30, 2025, using mid-year convention for discounting
Discount Factors
MOP
5%
0.9980
0.9739
0.9275
0.8834
0.8413
0.8012
0.7631
0.7268
0.6921
0.6592
0.6278
0.5979
0.5694
0.5423
a) Pre-Tax
Free Cash Flow
$000s
3,237,020
(20,278)
(407,653)
(372,180)
515,922
633,911
440,812
464,312
403,284
435,592
358,766
338,478
152,539
307,514
(14,000)
Cumulative Free Cash Flow
$000s
(20,278)
(427,931)
(800,112)
(284,189)
349,722
790,534
1,254,847
1,658,131
2,093,723
2,452,489
2,790,967
2,943,506
3,251,020
3,237,020
NPV @ 5%
$000s
2,236,394
(20,237)
(397,021)
(345,212)
455,752
533,314
353,199
354,312
293,088
301,493
236,493
212,496
91,203
175,107
(7,592)
Cumulative NPV
$000s
(20,237)
(417,258)
(762,470)
(306,719)
226,595
579,794
934,106
1,227,194
1,528,687
1,765,181
1,977,676
2,068,879
2,243,987
2,236,934
IRR
%
47.9%
b) After-Tax
Free Cash Flow
$000s
2,453,335
(20,278)
(407,653)
(372,180)
429,396
512,428
345,352
376,533
323,920
354,534
287,032
272,990
114,409
263,185
(26,334)
Cumulative Free Cash Flow
$000s
(20,278)
(427,931)
(800,112)
(370,715)
141,713
487,064
863,598
1,187,518
1,542,053
1,829,084
2,102,074
2,216,484
2,479,669
2,453,335
NPV @ 5%
$000s
1,657,375
(20,237)
(397,021)
(345,212)
379,317
431,109
276,711
287,329
235,410
245,389
189,207
171,382
68,405
149,866
(14,281)
Cumulative NPV
$000s
(20,237)
(417,258)
(762,470)
(383,153)
47,956
324,667
611,996
847,406
1,092,796
1,282,003
1,453,385
1,521,790
1,671,656
1,657,375
IRR
%
39.0%
Operating Metrics
Mine Life
Years
11
Average Daily Mining Rate
t/d mill feed
2,182
-
-
129
1,403
2,192
2,192
2,192
2,192
2,192
2,192
2,192
2,192
2,103
-
Underground Mining
$/t milled
$50.35
-
-
277.69
69.39
51.23
49.52
51.26
50.95
50.26
48.11
44.18
43.51
38.13
-
Processing
$/t milled
$29.82
-
-
64.77
40.78
28.73
28.74
28.74
28.74
28.74
28.74
28.66
28.66
29.57
-
Exploration/Development
$/t milled
$5.66
-
-
10.66
9.38
6.00
6.00
6.00
6.00
6.00
6.00
6.00
6.00
-
-
SG&A
33%
$/t milled
$26.07
-
-
80.82
38.60
24.71
24.71
24.71
24.71
24.71
24.71
24.71
24.71
25.75
-
Total Site Operating Cash Costs
$/t mill feed
$111.90
-
-
433.94
158.15
110.67
108.97
110.70
110.40
109.71
107.56
103.55
102.88
93.46
-
TC/RC Concentrate Freight Cost
$/t mill feed
$7.35
-
-
6.77
9.10
8.78
7.96
7.25
6.88
7.40
6.70
7.39
6.06
6.62
-
Royalties
$/t mill feed
$113.86
-
-
232.77
239.72
160.51
116.74
120.25
106.41
113.48
95.94
90.32
48.66
83.71
-
Total Operating Costs
$/t mill feed
$233.12
-
-
673.48
406.97
279.96
233.67
238.20
223.69
230.59
210.20
201.26
157.59
183.79
-
Sales Metrics
Au Sales
oz
1,609,015
-
-
17,089
213,158
232,968
173,583
180,766
160,534
170,795
143,542
131,904
66,669
118,010
-
AuEq Sales
oz
1,908,708
-
-
18,669
236,150
269,115
205,633
214,051
190,192
202,385
172,318
163,000
91,634
145,560
-
Total Cash Cost after by-product credits
$ / oz Au
535
Total AISC after by-product credits
$ / oz Au
590
Avg. LOM Annual AuEq Sales
koz/yr
200
Note: Y2025 represents only the month of December
| | 27-3 | |
| SSR Mining Inc. | Hod Maden Project | | January 7, 2026 |
| Technical Report Summary | | SLR Project No.: 123.000320.00001 |