| These materials are not to be printed, downloaded or distributed. These materials are only available to QIBs and non-US persons. FERRELLGAS INVESTOR PRESENTATION October 15, 2025 |

| These materials are not to be printed, downloaded or distributed. These materials are only available to QIBs and non-US persons. DISCLAIMER This presentation was prepared by or on behalf of Ferrellgas Partners, L.P., Ferrellgas, L.P., Ferrellgas Partners Finance Corp., Ferrellgas Finance Corp., Ferrellgas, Inc., or one or more direct or indirect subsidiaries or affiliates (collectively, “Ferrellgas,” “we,” “us,” “our,” the “Partnership,” or the “Company”) for informational purposes only. Forward-Looking Statements Forward-looking statements are not guarantees of performance. You should not put undue reliance on any forward-looking statements. All forward-looking statements are subject to risks, uncertainties and assumptions that could cause our actual results to differ materially from those expressed in or implied by these forward-looking statements. Many of the factors that will affect our future results are beyond our ability to control or predict. Some of the risk factors that may affect our business, financial condition or results of operations include: the effect of weather conditions on the demand for propane; the prices of wholesale propane, motor fuel and crude oil; disruptions to the supply of propane; competition from other industry participants and other energy sources; energy efficiency and technology advances; significant delays in the collection of accounts or notes receivable; customer, counterparty, supplier or vendor defaults; changes in demand for, and production of, hydrocarbon products; increased trucking and rail regulations; inherent operating and litigation risks in gathering, transporting, handling and storing propane; our inability to complete acquisitions or to successfully integrate acquired operations; costs of complying with, or liabilities imposed under, environmental, health and safety laws; the impact of pending and future legal proceedings; the interruption, disruption, failure or malfunction of our information technology systems including due to cyber-attack; the impact of changes in tax law that could adversely affect the tax treatment of Ferrellgas Partners for federal income tax purposes; economic and political instability, particularly in areas of the world tied to the energy industry, including the ongoing conflict between Russia and Ukraine and in the Middle East; disruptions in the capital and credit markets, related to the evolving global tariff environment or otherwise; and access to available capital to meet our operating and debt-service requirements; and the anticipated completion of a refinancing. When considering any forward-looking statement, you should also keep in mind the risk factors set forth in “Item1A. Risk Factors” of our Annual Report on Form 10-K for fiscal 2025 and in any more recent filings with the SEC. Any of these risks could impair our business, financial condition or results of operations. Any such impairment may affect our ability to make distributions to our unitholders or pay interest on the principal of any of our debt securities. In addition, the trading price of our securities could decline as a result of any such impairment. Except for our ongoing obligations to disclose material information as required by federal securities laws, we undertake no obligation to update any forward-looking statements or risk factors after the date of this presentation. Non-GAAP Financial Measures Certain financial information presented herein, including information regarding “EBITDA”, “Adjusted EBITDA” and “Unlevered Free Cash Flow” is not made in accordance with U.S. Generally Accepted Accounting Principals (“GAAP”). The use of such “Non-GAAP Financial Measures” varies, including among others in our industry. Non-GAAP Financial Measures should not be considered as alternatives to performance measures derived in accordance with GAAP. Non-GAAP Financial Measures have important limitations as analytical tools and should not be considered in isolation or as substitutes for results reported under GAAP. The appendix page of this presentation includes a reconciliation of certain Non-GAAP Financial Measures to the most directly comparable financial measures calculated in accordance with GAAP. Market and Industry Data The market and industry data included herein is based on a variety of sources, including independent industry publications, government publications and other published independent sources, information obtained from customers, distributors, suppliers, trade and business organizations, and other publicly available information, as well as our good faith estimates, which have been derived from management’s knowledge and experience in the areas in which our business operates. Estimates of market size and relative positions in a market are difficult to develop and inherently uncertain. Although we believe that these sources are generally reliable, we have not independently verified data from these sources or obtained third-party verification of market share data. Accordingly, investors and others should not place undue weight on the industry and market share data presented in this presentation. Trademarks and trade names We own or have rights to various trademarks, service marks and trade names that we use in connection with the operation of our business. This presentation may also contain trademarks, service marks and trade names of third-parties, which are the property of their respective owners. Our use or display of third-parties’ trademarks, service marks, trade names or products in this presentation is not intended to, and does not imply, a relationship with us or an endorsement or sponsorship by or of us. Solely for convenience, the trademarks, service marks and trade names referred to in this presentation may appear without the ®, or ℠ symbols, but such references are not intended to indicate, in any way, that we will not assert, to the fullest extent under applicable law, our rights or the right of the applicable licensor to these trademarks, service marks and trade names. Legal Disclaimer This presentation (together with oral statements made in connection herewith, this “presentation”) is provided for information purposes only and has been prepared to assist interested parties in making their own evaluation of the Company and for no other purpose. In addition, this presentation does not purport to be all-inclusive or to contain all of the information that may be required to make a full analysis of the Company or the proposed transaction. Nothing herein should be construed as legal, financial, tax or other advice. You should consult your own advisers concerning any legal, financial, tax or other considerations concerning the opportunity described herein. The general explanations included in this presentation cannot address, and are not intended to address, your specific investment objectives, financial situations or financial needs. To the fullest extent permitted by law, in no circumstances will the Company or any of their respective subsidiaries, stockholders, affiliates, representatives, partners, directors, officers, employees, advisers or agents be responsible or liable for any direct, indirect or consequential loss or loss of profit arising from the use of this presentation, its contents, its omissions, reliance on the information contained within it, or on opinions communicated in relation thereto or otherwise arising in connection therewith. No representations or warranties, express or implied, are given in or in respect of, this presentation. 2 |
| These materials are not to be printed, downloaded or distributed. These materials are only available to QIBs and non-US persons. COMPANY OVERVIEW 3 |

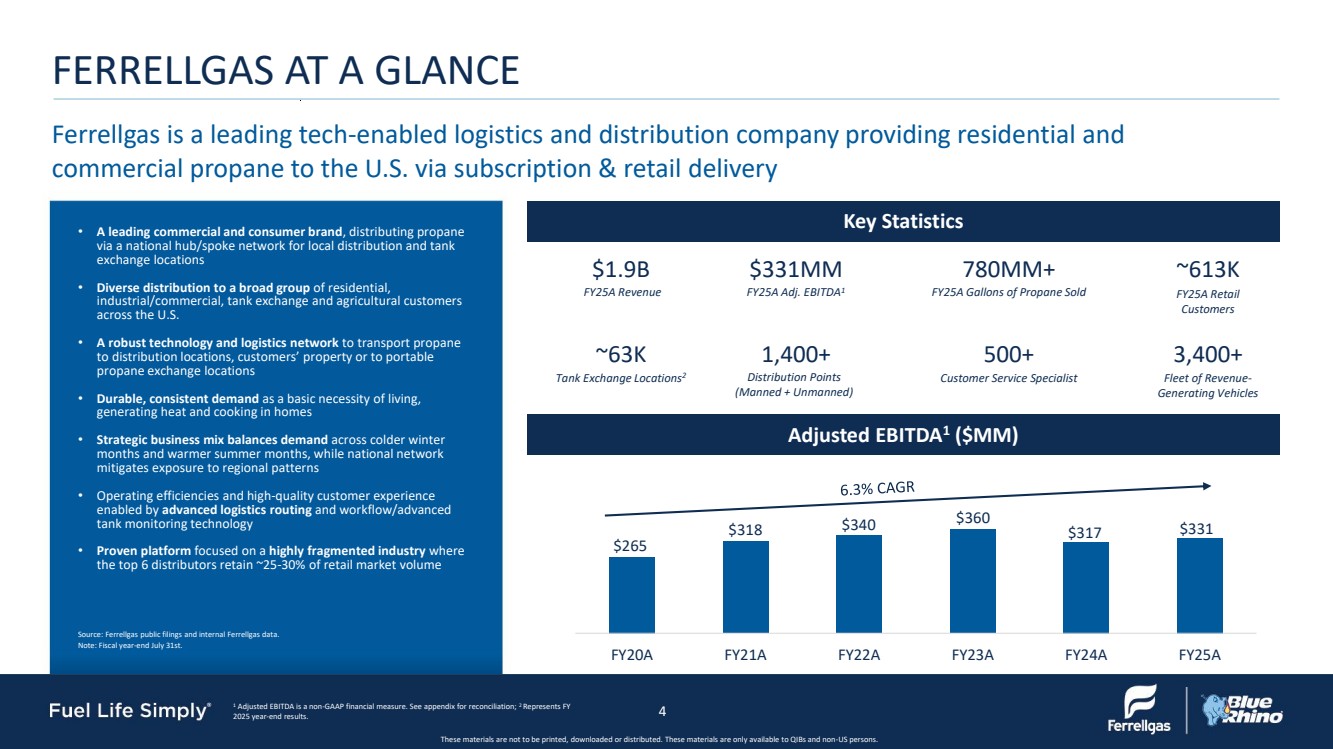
| These materials are not to be printed, downloaded or distributed. These materials are only available to QIBs and non-US persons. Ferrellgas is a leading tech-enabled logistics and distribution company providing residential and commercial propane to the U.S. via subscription & retail delivery Key Statistics Adjusted EBITDA1 ($MM) FERRELLGAS AT A GLANCE • A leading commercial and consumer brand, distributing propane via a national hub/spoke network for local distribution and tank exchange locations • Diverse distribution to a broad group of residential, industrial/commercial, tank exchange and agricultural customers across the U.S. • A robust technology and logistics network to transport propane to distribution locations, customers’ property or to portable propane exchange locations • Durable, consistent demand as a basic necessity of living, generating heat and cooking in homes • Strategic business mix balances demand across colder winter months and warmer summer months, while national network mitigates exposure to regional patterns • Operating efficiencies and high-quality customer experience enabled by advanced logistics routing and workflow/advanced tank monitoring technology • Proven platform focused on a highly fragmented industry where the top 6 distributors retain ~25-30% of retail market volume $1.9B $331MM 780MM+ ~613K ~63K 1,400+ 500+ 3,400+ FY25A Revenue FY25A Adj. EBITDA1 FY25A Gallons of Propane Sold FY25A Retail Customers Tank Exchange Locations2 Distribution Points (Manned + Unmanned) Customer Service Specialist Fleet of Revenue-Generating Vehicles FY20A FY21A FY22A FY23A FY24A FY25A $265 $318 $340 $360 $317 $331 4 1 Adjusted EBITDA is a non-GAAP financial measure. See appendix for reconciliation; 2 Represents FY 2025 year-end results. Source: Ferrellgas public filings and internal Ferrellgas data. Note: Fiscal year-end July 31st. |
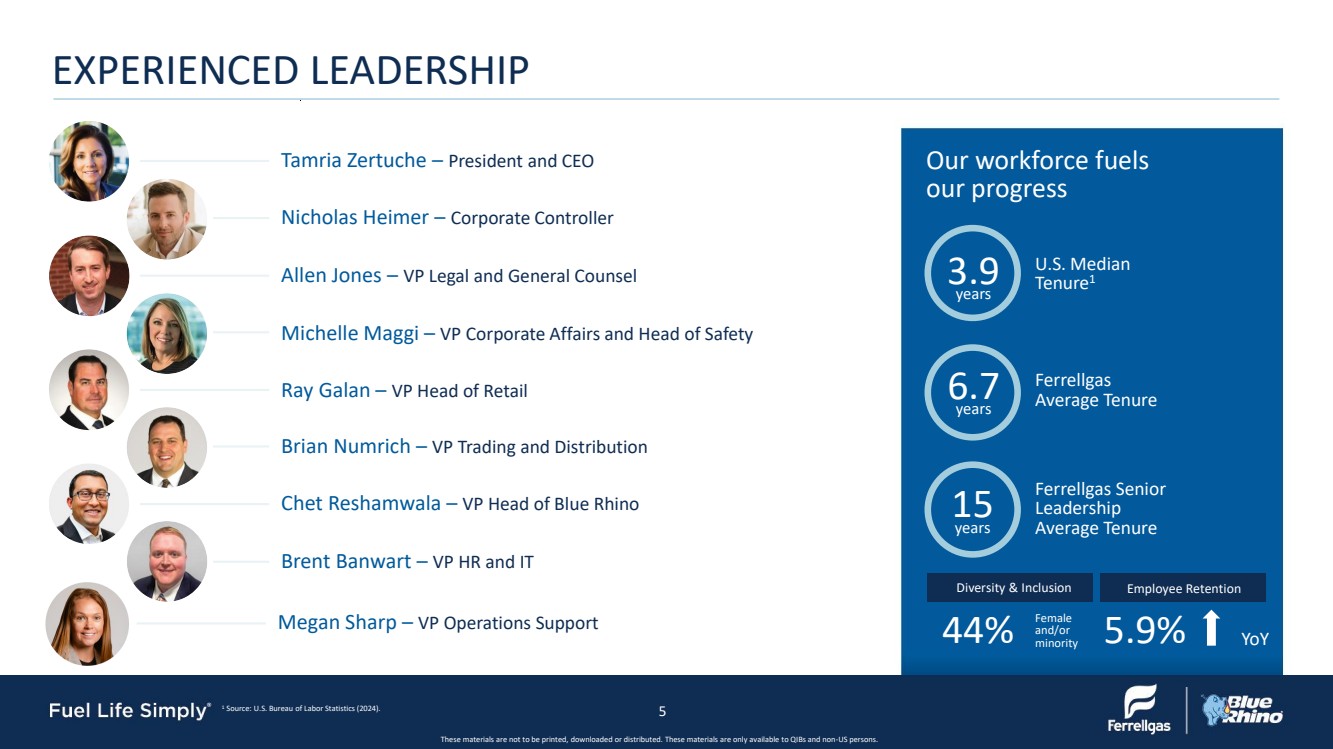
| These materials are not to be printed, downloaded or distributed. These materials are only available to QIBs and non-US persons. EXPERIENCED LEADERSHIP Our workforce fuels our progress U.S. Median Tenure1 Ferrellgas Average Tenure Ferrellgas Senior Leadership Average Tenure Diversity & Inclusion Employee Retention 3.9 years 6.7 years 15 years 44% Female and/or minority 5.9% YoY Michelle Maggi – VP Corporate Affairs and Head of Safety Tamria Zertuche – President and CEO Nicholas Heimer – Corporate Controller Allen Jones – VP Legal and General Counsel Ray Galan – VP Head of Retail Brian Numrich – VP Trading and Distribution Chet Reshamwala – VP Head of Blue Rhino Brent Banwart – VP HR and IT Megan Sharp – VP Operations Support 5 1 Source: U.S. Bureau of Labor Statistics (2024). |
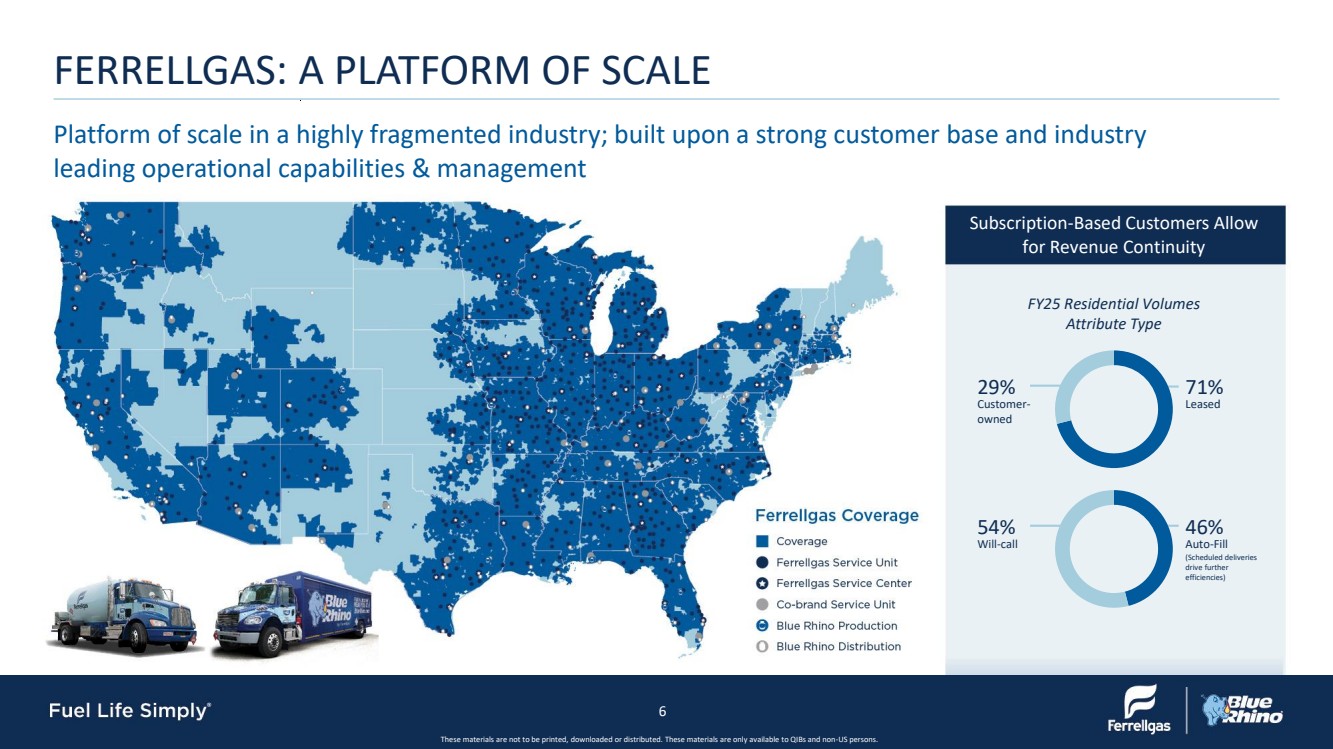
| These materials are not to be printed, downloaded or distributed. These materials are only available to QIBs and non-US persons. Platform of scale in a highly fragmented industry; built upon a strong customer base and industry leading operational capabilities & management FERRELLGAS: A PLATFORM OF SCALE 29% Customer-owned 71% Leased 54% Will-call 46% Auto-Fill (Scheduled deliveries drive further efficiencies) Subscription-Based Customers Allow for Revenue Continuity FY25 Residential Volumes Attribute Type 6 |
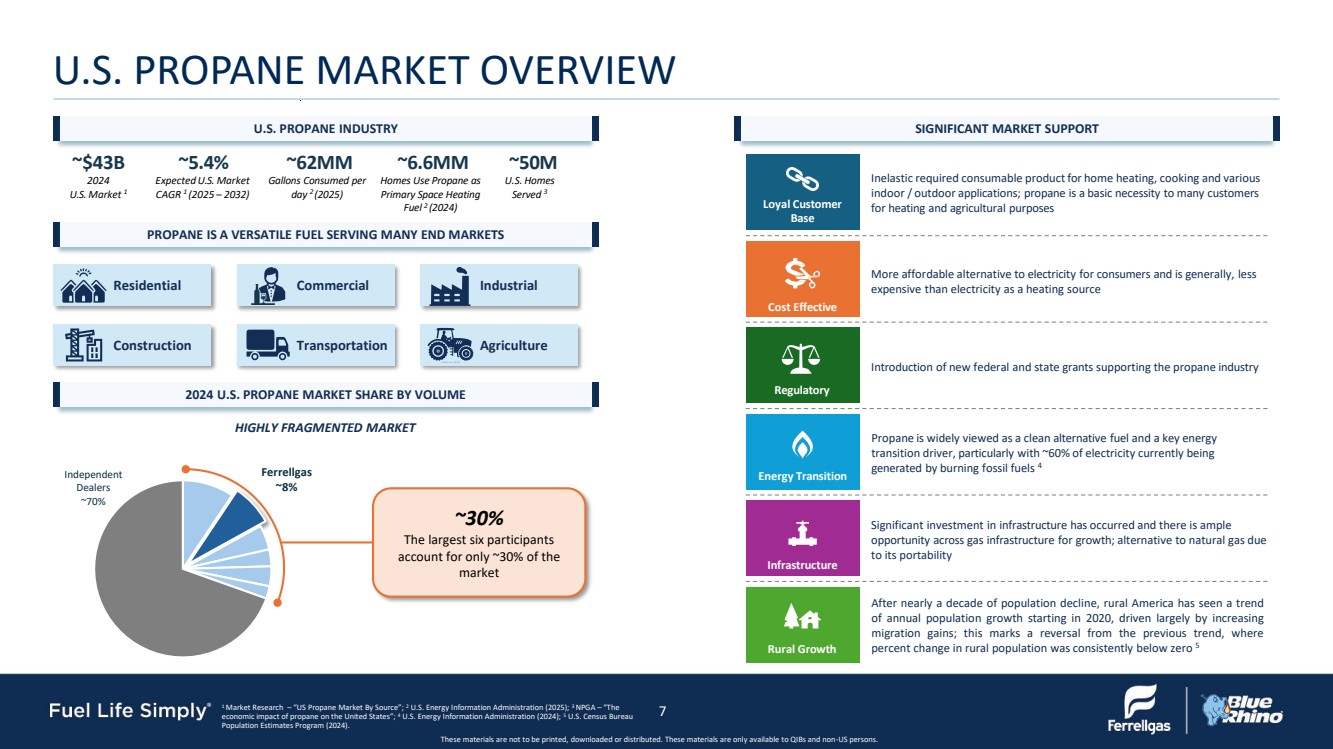
| These materials are not to be printed, downloaded or distributed. These materials are only available to QIBs and non-US persons. Ferrellgas ~8% Independent Dealers ~70% Inelastic required consumable product for home heating, cooking and various indoor / outdoor applications; propane is a basic necessity to many customers for heating and agricultural purposes More affordable alternative to electricity for consumers and is generally, less expensive than electricity as a heating source Regulatory Introduction of new federal and state grants supporting the propane industry Propane is widely viewed as a clean alternative fuel and a key energy transition driver, particularly with ~60% of electricity currently being generated by burning fossil fuels 4 Significant investment in infrastructure has occurred and there is ample opportunity across gas infrastructure for growth; alternative to natural gas due to its portability Rural Growth After nearly a decade of population decline, rural America has seen a trend of annual population growth starting in 2020, driven largely by increasing migration gains; this marks a reversal from the previous trend, where percent change in rural population was consistently below zero 5 Loyal Customer Base Cost Effective Energy Transition Infrastructure U.S. PROPANE MARKET OVERVIEW 1 Market Research – “US Propane Market By Source”; 2 U.S. Energy Information Administration (2025); 3 NPGA – “The economic impact of propane on the United States”; 4 U.S. Energy Information Administration (2024); 5 U.S. Census Bureau Population Estimates Program (2024). ~$43B 2024 U.S. Market 1 ~5.4% ExpectedU.S. Market CAGR 1 (2025 – 2032) ~62MM Gallons Consumed per day 2 (2025) ~6.6MM Homes Use Propane as Primary Space Heating Fuel 2 (2024) ~50M U.S. Homes Served 3 Residential Commercial Industrial Construction Transportation Agriculture U.S. PROPANE INDUSTRY SIGNIFICANT MARKET SUPPORT PROPANE IS A VERSATILE FUEL SERVING MANY END MARKETS 7 • Leading distributor of propane and related equipment in United States • Second largest retail marketer of propane based on FY 2025 retail sales volume • Large, fragmented, addressable market with growing market share • Strong, sticky relationship with both suppliers and diverse blue-chip customers • Significant buying power and long-term relationships with suppliers • Growing customer base with large blue-chip anchors Ferrellgas is a Leading Player in the U.S. Propane Market ~30% The largest six participants account for only ~30% of the market 2024 U.S. PROPANE MARKET SHARE BY VOLUME HIGHLY FRAGMENTED MARKET |
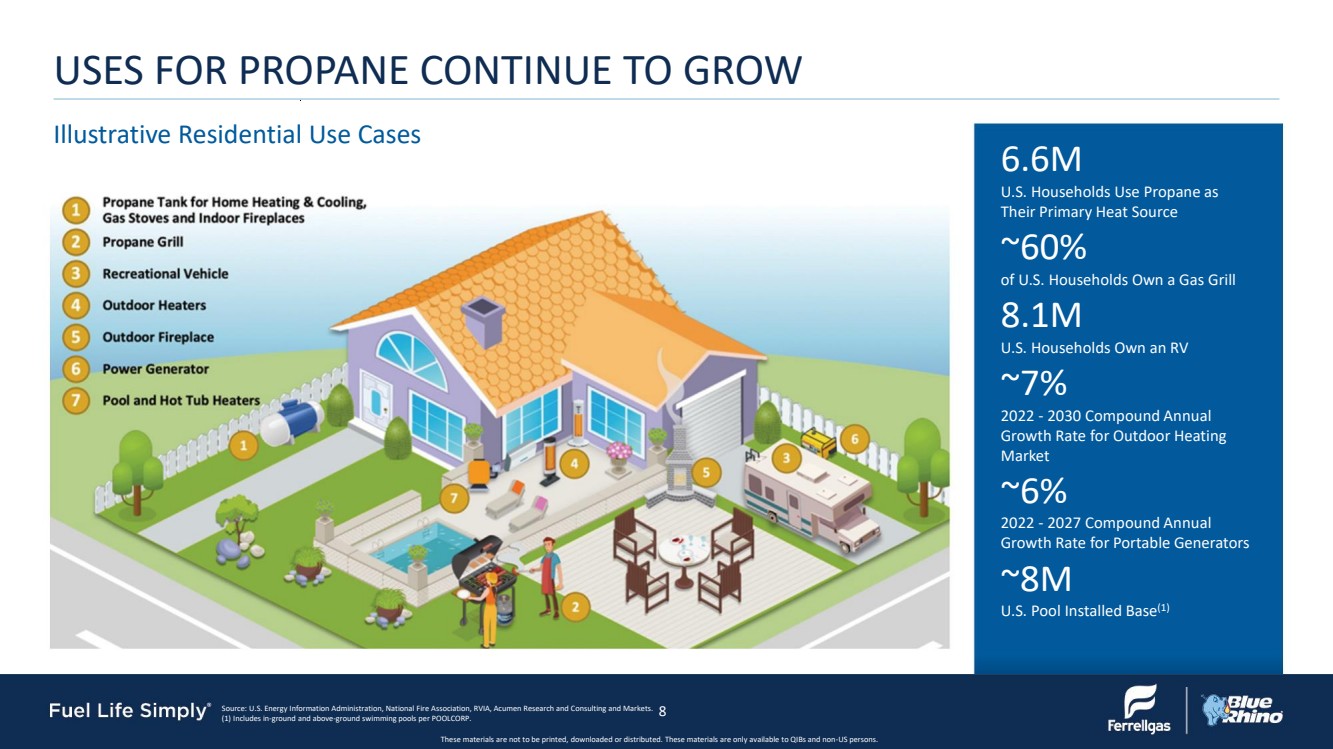
| These materials are not to be printed, downloaded or distributed. These materials are only available to QIBs and non-US persons. Illustrative Residential Use Cases USES FOR PROPANE CONTINUE TO GROW 6.6M U.S. Households Use Propane as Their Primary Heat Source ~60% of U.S. Households Own a Gas Grill 8.1M U.S. Households Own an RV ~7% 2022 - 2030 Compound Annual Growth Rate for Outdoor Heating Market ~6% 2022 - 2027 Compound Annual Growth Rate for Portable Generators ~8M U.S. Pool Installed Base(1) Source: U.S. Energy Information Administration, National Fire Association, RVIA, Acumen Research and Consulting and Markets. (1) Includes in-ground and above-ground swimming pools per POOLCORP. 8 |
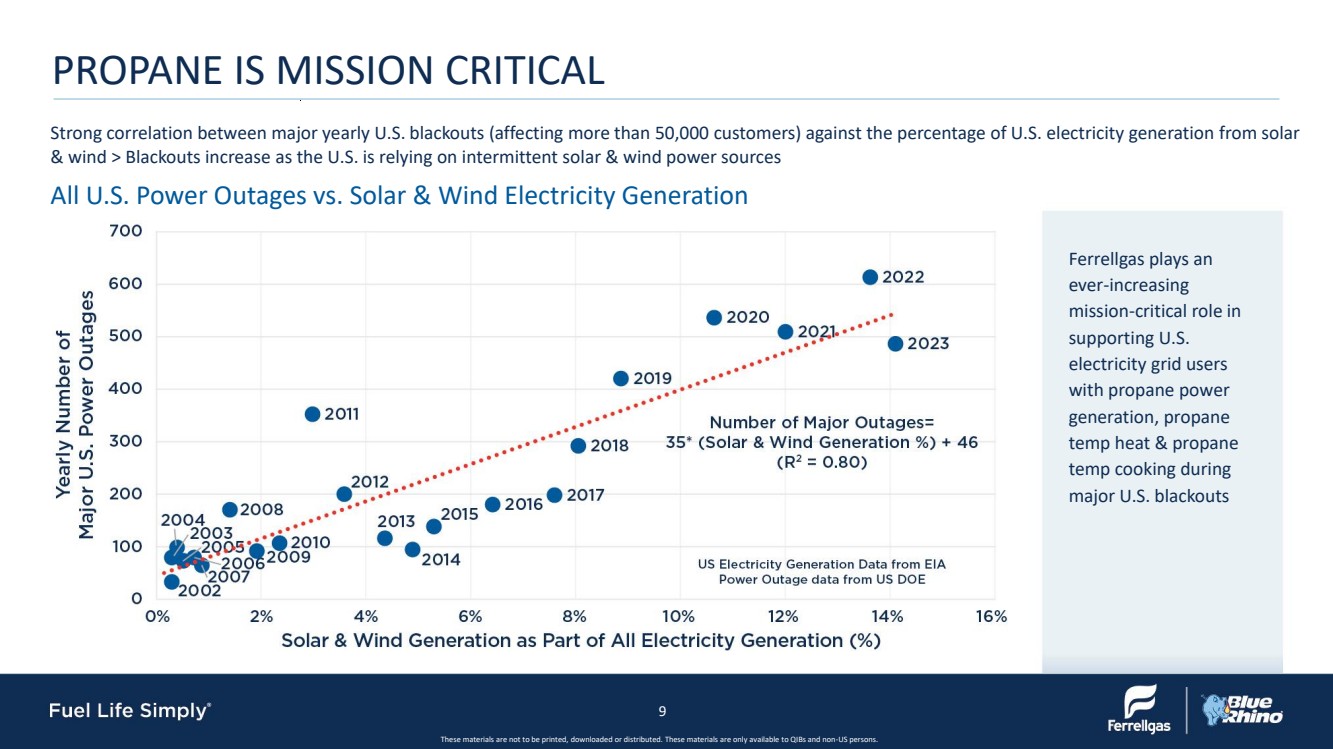
| These materials are not to be printed, downloaded or distributed. These materials are only available to QIBs and non-US persons. PROPANE IS MISSION CRITICAL Strong correlation between major yearly U.S. blackouts (affecting more than 50,000 customers) against the percentage of U.S. electricity generation from solar & wind > Blackouts increase as the U.S. is relying on intermittent solar & wind power sources All U.S. Power Outages vs. Solar & Wind Electricity Generation Ferrellgas plays an ever-increasing mission-critical role in supporting U.S. electricity grid users with propane power generation, propane temp heat & propane temp cooking during major U.S. blackouts 9 |
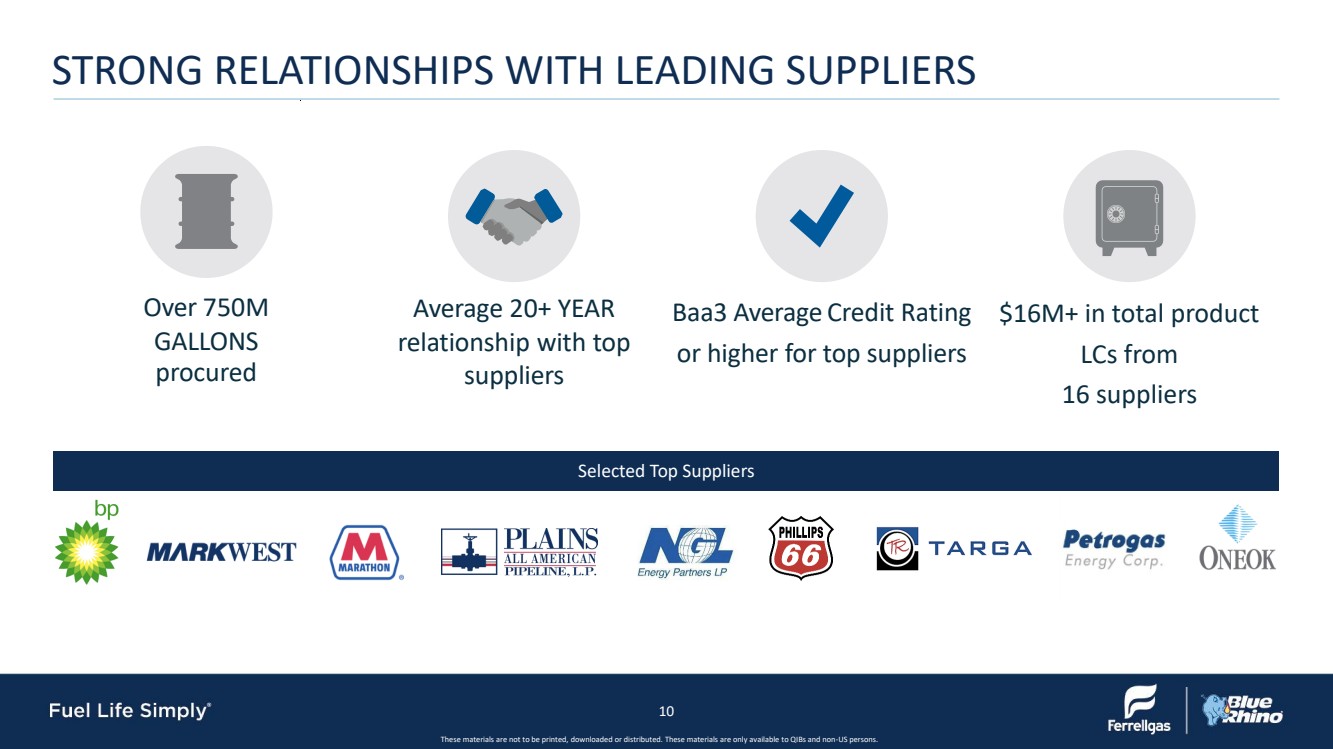
| These materials are not to be printed, downloaded or distributed. These materials are only available to QIBs and non-US persons. Over 750M GALLONS procured Average 20+ YEAR relationship with top suppliers Baa3 Average Credit Rating or higher for top suppliers $16M+ in total product LCs from 16 suppliers STRONG RELATIONSHIPS WITH LEADING SUPPLIERS Selected Top Suppliers 10 |
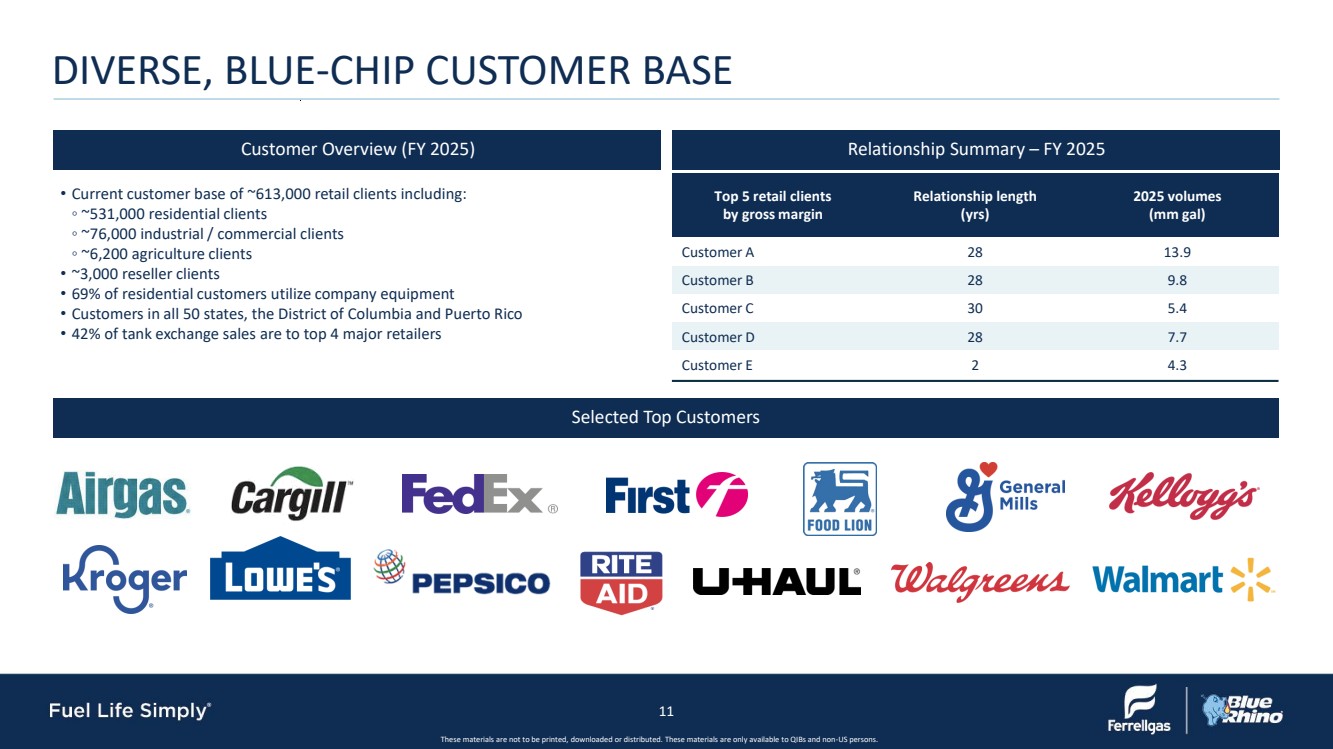
| These materials are not to be printed, downloaded or distributed. These materials are only available to QIBs and non-US persons. DIVERSE, BLUE-CHIP CUSTOMER BASE • Current customer base of ~613,000 retail clients including: ◦ ~531,000 residential clients ◦ ~76,000 industrial / commercial clients ◦ ~6,200 agriculture clients • ~3,000 reseller clients • 69% of residential customers utilize company equipment • Customers in all 50 states, the District of Columbia and Puerto Rico • 42% of tank exchange sales are to top 4 major retailers Customer Overview (FY 2025) Relationship Summary – FY 2025 Selected Top Customers Top 5 retail clients by gross margin Relationship length (yrs) 2025 volumes (mm gal) Customer A 28 13.9 Customer B 28 9.8 Customer C 30 5.4 Customer D 28 7.7 Customer E 2 4.3 11 |
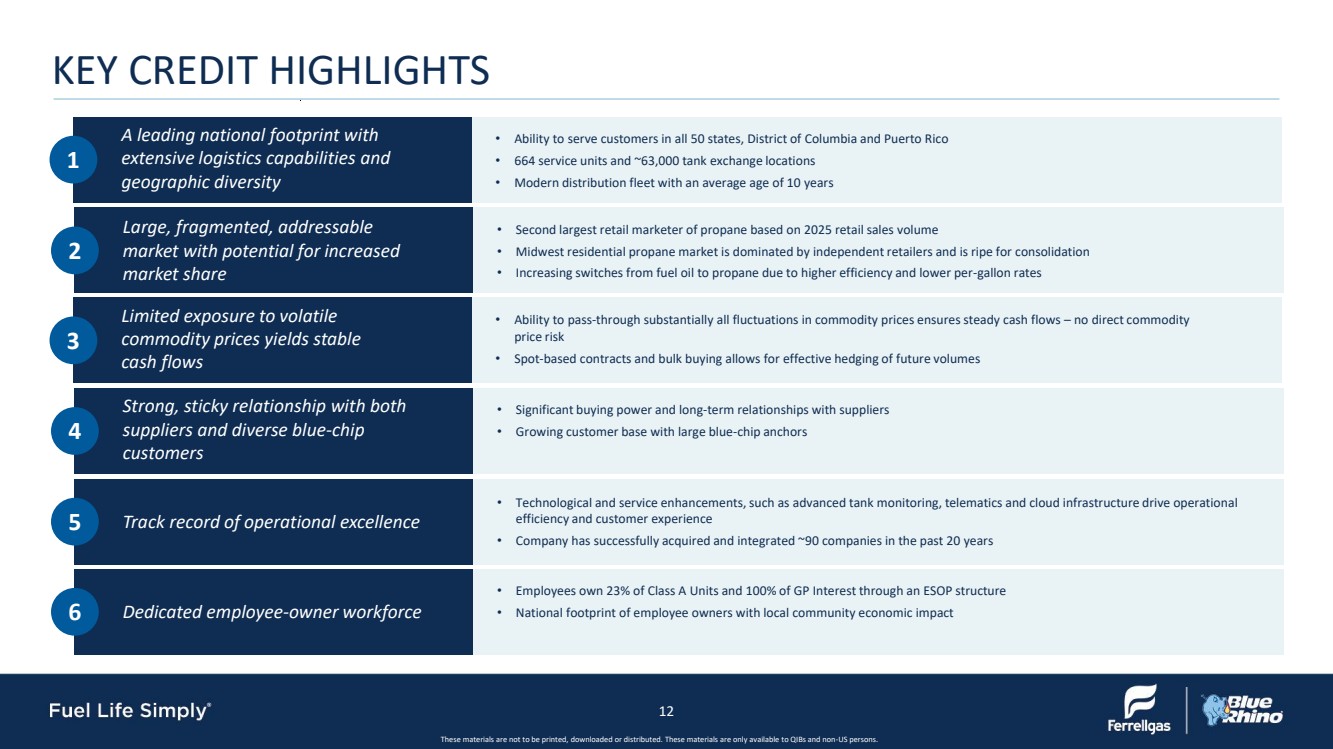
| These materials are not to be printed, downloaded or distributed. These materials are only available to QIBs and non-US persons. 1 A leading national footprint with extensive logistics capabilities and geographic diversity • Ability to serve customers in all 50 states, District of Columbia and Puerto Rico • 664 service units and ~63,000 tank exchange locations • Modern distribution fleet with an average age of 10 years 2 Large, fragmented, addressable market with potential for increased market share • Second largest retail marketer of propane based on 2025 retail sales volume • Midwest residential propane market is dominated by independent retailers and is ripe for consolidation • Increasing switches from fuel oil to propane due to higher efficiency and lower per-gallon rates 3 Limited exposure to volatile commodity prices yields stable cash flows • Ability to pass-through substantially all fluctuations in commodity prices ensures steady cash flows – no direct commodity price risk • Spot-based contracts and bulk buying allows for effective hedging of future volumes 4 Strong, sticky relationship with both suppliers and diverse blue-chip customers • Significant buying power and long-term relationships with suppliers • Growing customer base with large blue-chip anchors 5 Track record of operational excellence • Technological and service enhancements, such as advanced tank monitoring, telematics and cloud infrastructure drive operational efficiency and customer experience • Company has successfully acquired and integrated ~90 companies in the past 20 years 6 Dedicated employee-owner workforce • Employees own 23% of Class A Units and 100% of GP Interest through an ESOP structure • National footprint of employee owners with local community economic impact KEY CREDIT HIGHLIGHTS 12 |
| These materials are not to be printed, downloaded or distributed. These materials are only available to QIBs and non-US persons. OPERATIONAL HIGHLIGHTS & INITIATIVES 13 |
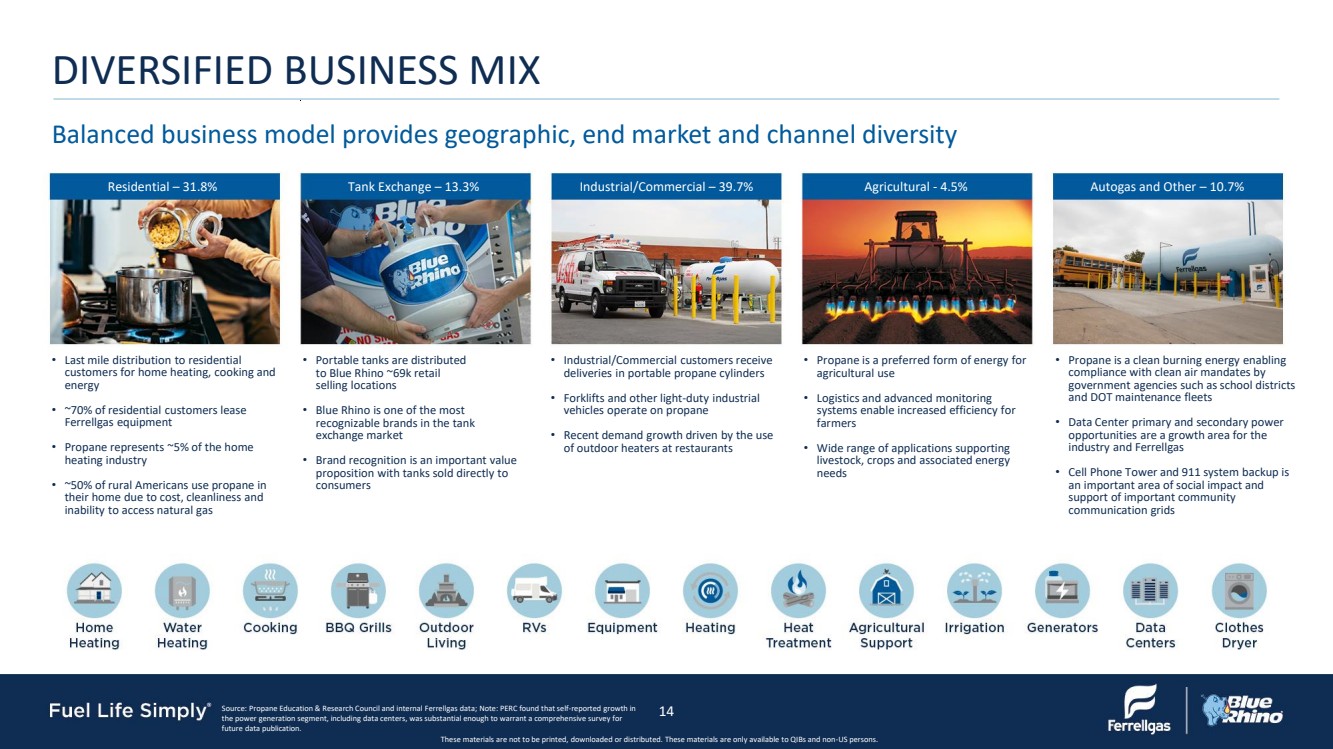
| These materials are not to be printed, downloaded or distributed. These materials are only available to QIBs and non-US persons. DIVERSIFIED BUSINESS MIX Balanced business model provides geographic, end market and channel diversity • Last mile distribution to residential customers for home heating, cooking and energy • ~70% of residential customers lease Ferrellgas equipment • Propane represents ~5% of the home heating industry • ~50% of rural Americans use propane in their home due to cost, cleanliness and inability to access natural gas • Portable tanks are distributed to Blue Rhino ~69k retail selling locations • Blue Rhino is one of the most recognizable brands in the tank exchange market • Brand recognition is an important value proposition with tanks sold directly to consumers • Industrial/Commercial customers receive deliveries in portable propane cylinders • Forklifts and other light-duty industrial vehicles operate on propane • Recent demand growth driven by the use of outdoor heaters at restaurants • Propane is a preferred form of energy for agricultural use • Logistics and advanced monitoring systems enable increased efficiency for farmers • Wide range of applications supporting livestock, crops and associated energy needs • Propane is a clean burning energy enabling compliance with clean air mandates by government agencies such as school districts and DOT maintenance fleets • Data Center primary and secondary power opportunities are a growth area for the industry and Ferrellgas • Cell Phone Tower and 911 system backup is an important area of social impact and support of important community communication grids Source: Propane Education & Research Council and internal Ferrellgas data; Note: PERC found that self-reported growth in the power generation segment, including data centers, was substantial enough to warrant a comprehensive survey for future data publication. Residential – 31.8% Tank Exchange – 13.3% Industrial/Commercial – 39.7% Agricultural - 4.5% Autogas and Other – 10.7% 14 |
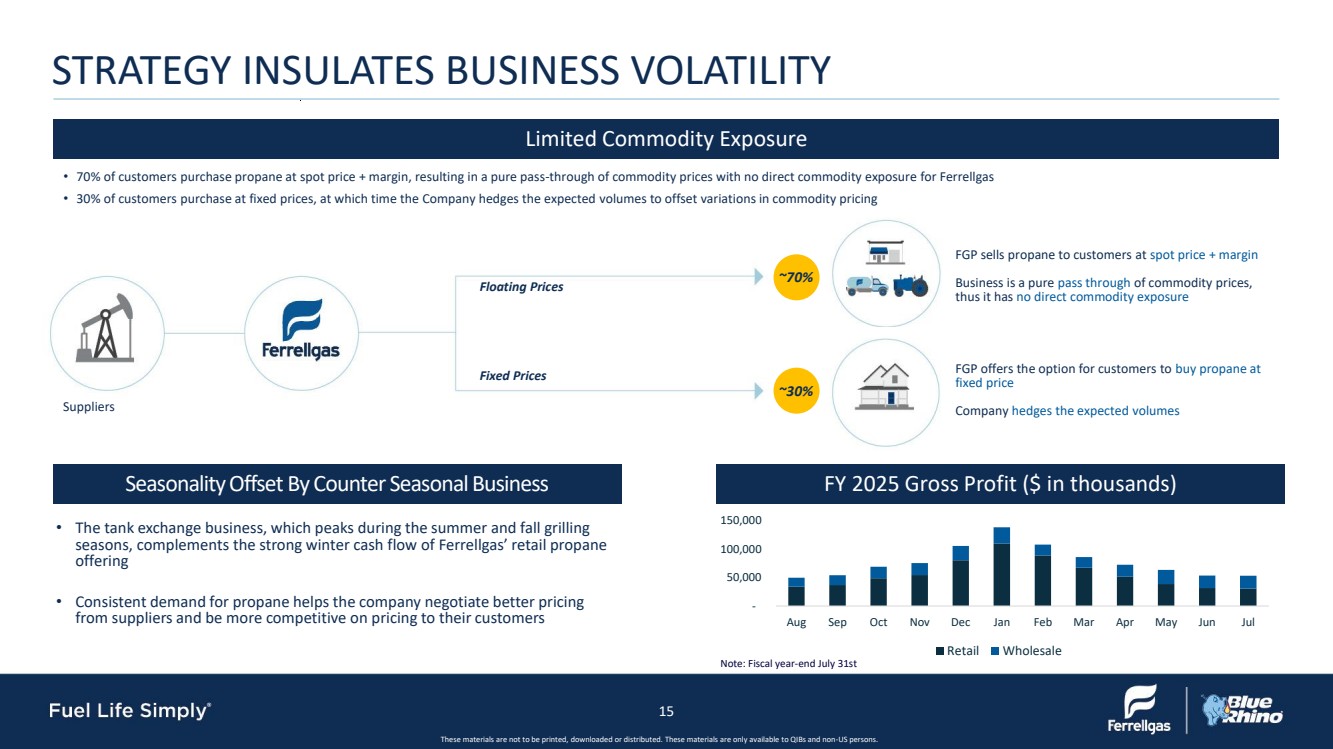
| These materials are not to be printed, downloaded or distributed. These materials are only available to QIBs and non-US persons. STRATEGY INSULATES BUSINESS VOLATILITY • 70% of customers purchase propane at spot price + margin, resulting in a pure pass-through of commodity prices with no direct commodity exposure for Ferrellgas • 30% of customers purchase at fixed prices, at which time the Company hedges the expected volumes to offset variations in commodity pricing Limited Commodity Exposure Seasonality Offset By Counter Seasonal Business FY 2025 Gross Profit ($ in thousands) Fixed Prices Floating Prices ~30% ~70% FGP offers the option for customers to buy propane at fixed price Company hedges the expected volumes FGP sells propane to customers at spot price + margin Business is a pure pass through of commodity prices, thus it has no direct commodity exposure • The tank exchange business, which peaks during the summer and fall grilling seasons, complements the strong winter cash flow of Ferrellgas’ retail propane offering • Consistent demand for propane helps the company negotiate better pricing from suppliers and be more competitive on pricing to their customers Note: Fiscal year-end July 31st Suppliers - 50,000 100,000 150,000 Aug Sep Oct Nov Dec Jan Feb Mar Apr May Jun Jul Retail Wholesale 15 |
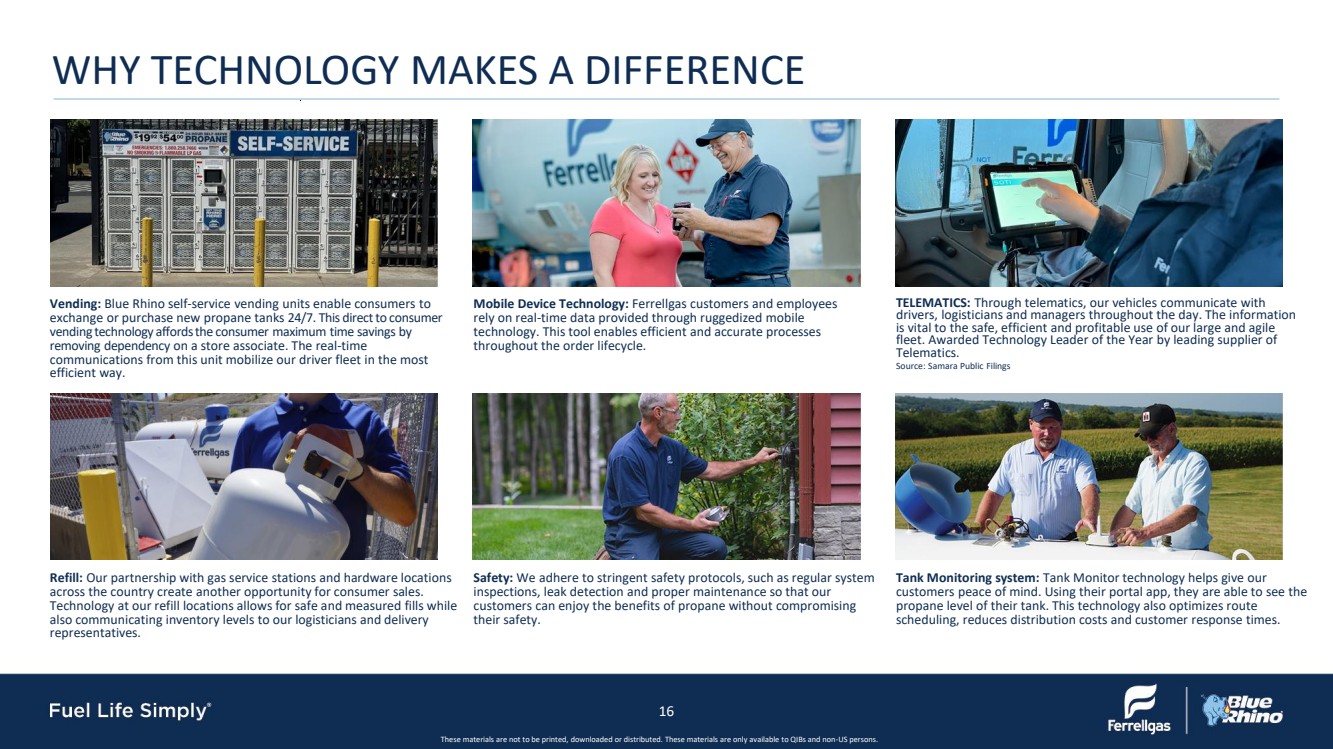
| These materials are not to be printed, downloaded or distributed. These materials are only available to QIBs and non-US persons. Vending: Blue Rhino self-service vending units enable consumers to exchange or purchase new propane tanks 24/7. This direct to consumer vending technology affords the consumer maximum time savings by removing dependency on a store associate. The real-time communications from this unit mobilize our driver fleet in the most efficient way. Mobile Device Technology: Ferrellgas customers and employees rely on real-time data provided through ruggedized mobile technology. This tool enables efficient and accurate processes throughout the order lifecycle. TELEMATICS: Through telematics, our vehicles communicate with drivers, logisticians and managers throughout the day. The information is vital to the safe, efficient and profitable use of our large and agile fleet. Awarded Technology Leader of the Year by leading supplier of Telematics. Source: Samara Public Filings Refill: Our partnership with gas service stations and hardware locations across the country create another opportunity for consumer sales. Technology at our refill locations allows for safe and measured fills while also communicating inventory levels to our logisticians and delivery representatives. Safety: We adhere to stringent safety protocols, such as regular system inspections, leak detection and proper maintenance so that our customers can enjoy the benefits of propane without compromising their safety. Tank Monitoring system: Tank Monitor technology helps give our customers peace of mind. Using their portal app, they are able to see the propane level of their tank. This technology also optimizes route scheduling, reduces distribution costs and customer response times. WHY TECHNOLOGY MAKES A DIFFERENCE 16 |
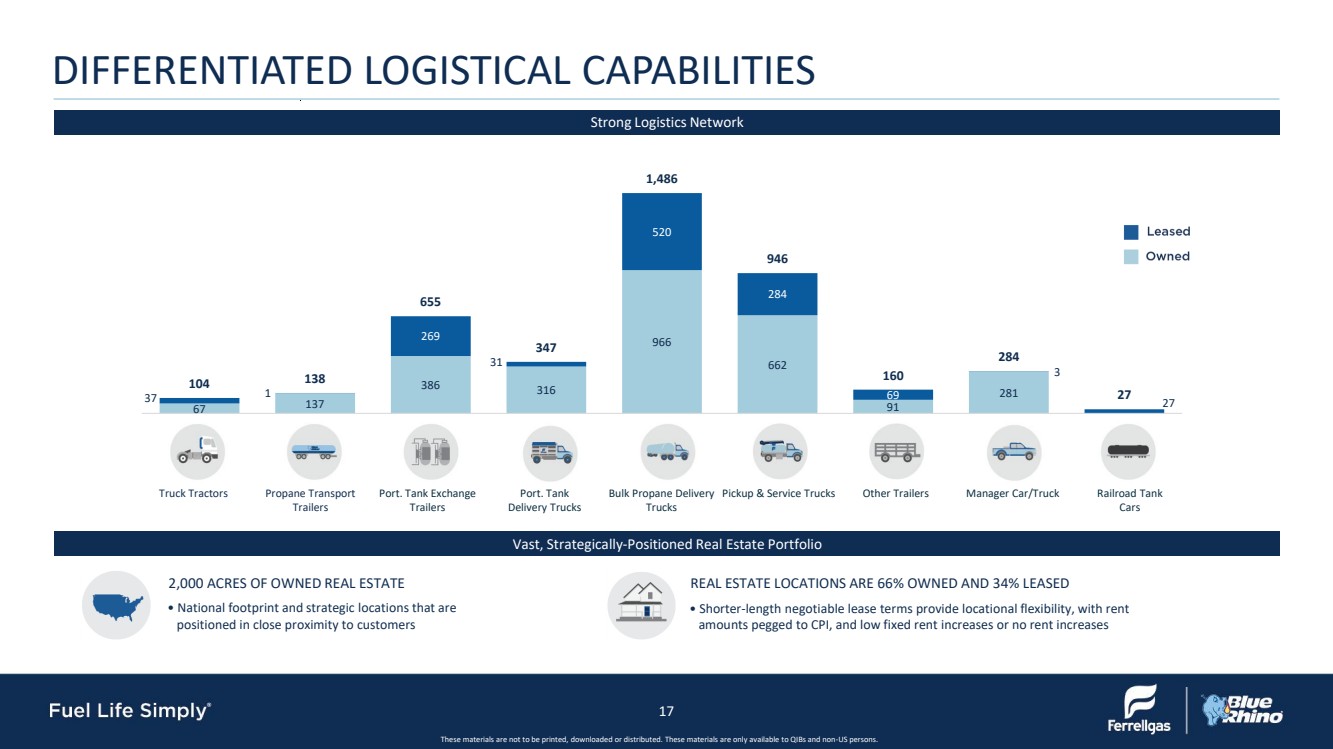
| These materials are not to be printed, downloaded or distributed. These materials are only available to QIBs and non-US persons. Strong Logistics Network Vast, Strategically-Positioned Real Estate Portfolio 2,000 ACRES OF OWNED REAL ESTATE • National footprint and strategic locations that are positioned in close proximity to customers REAL ESTATE LOCATIONS ARE 66% OWNED AND 34% LEASED • Shorter-length negotiable lease terms provide locational flexibility, with rent amounts pegged to CPI, and low fixed rent increases or no rent increases Truck Tractors Propane Transport Trailers Port. Tank Exchange Trailers Port. Tank Delivery Trucks Bulk Propane Delivery Trucks Pickup & Service Trucks Other Trailers Manager Car/Truck Railroad Tank Cars 17 DIFFERENTIATED LOGISTICAL CAPABILITIES 67 137 386 316 966 662 91 281 37 1 269 31 520 284 69 3 27 104 138 655 347 1,486 946 160 284 27 |
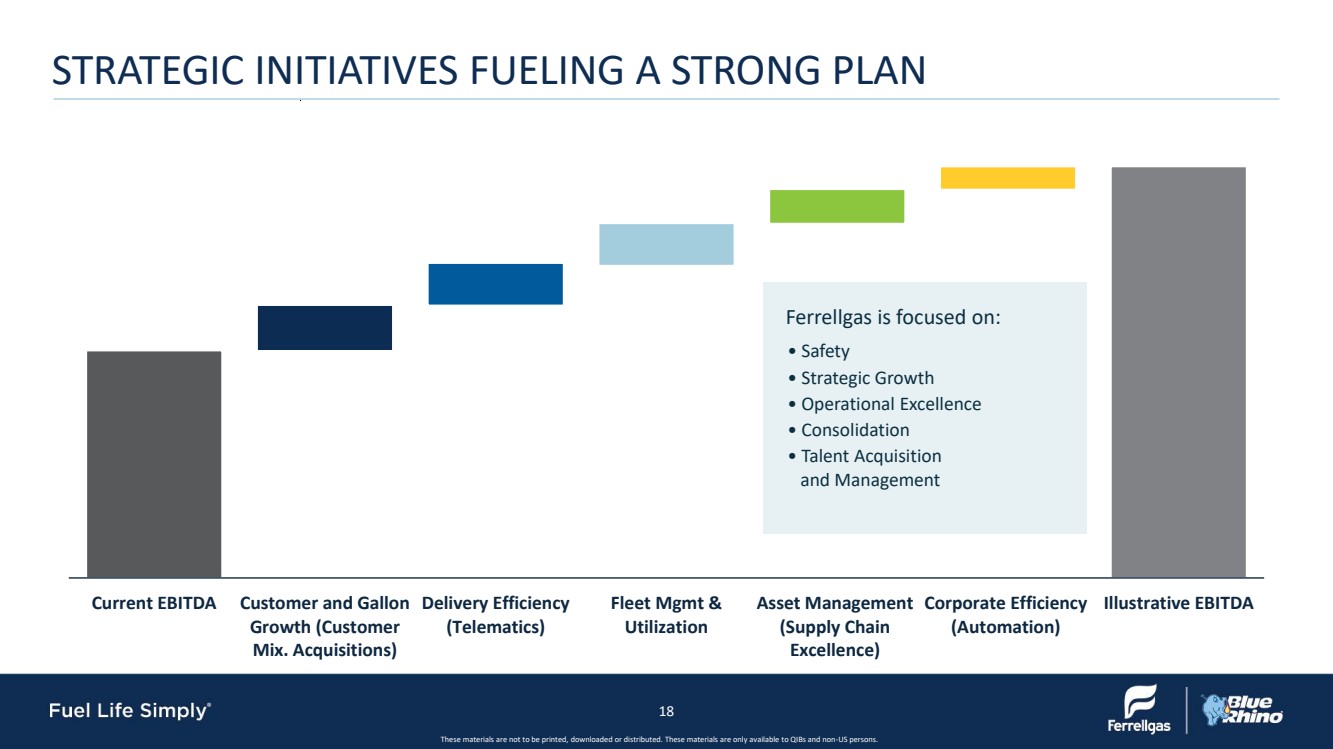
| These materials are not to be printed, downloaded or distributed. These materials are only available to QIBs and non-US persons. STRATEGIC INITIATIVES FUELING A STRONG PLAN 18 Current EBITDA Customer and Gallon Growth (Customer Mix. Acquisitions) Delivery Efficiency (Telematics) Fleet Mgmt & Utilization Asset Management (Supply Chain Excellence) Corporate Efficiency (Automation) Illustrative EBITDA Ferrellgas is focused on: • Safety • Strategic Growth • Operational Excellence • Consolidation • Talent Acquisition and Management |
| These materials are not to be printed, downloaded or distributed. These materials are only available to QIBs and non-US persons. FINANCIAL UPDATE 19 |

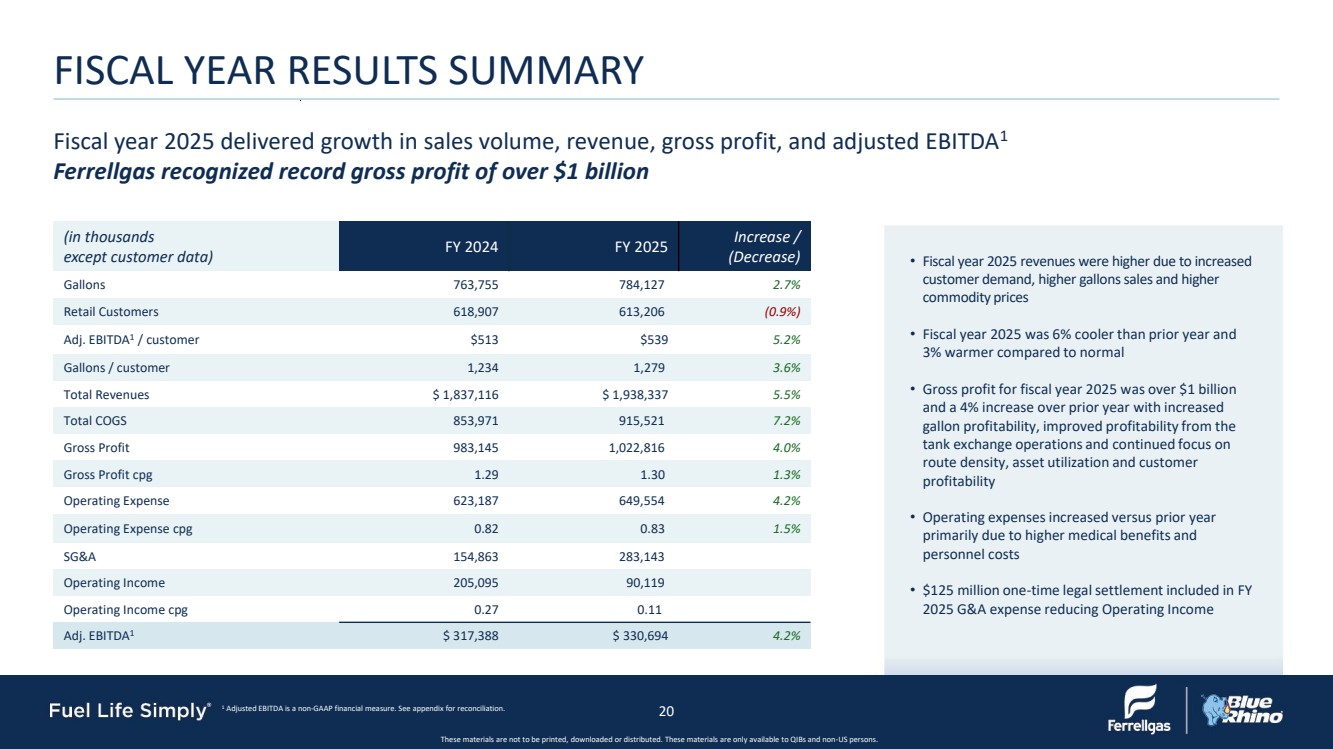
| These materials are not to be printed, downloaded or distributed. These materials are only available to QIBs and non-US persons. 1 Adjusted EBITDA is a non-GAAP financial measure. See appendix for reconciliation. (in thousands except customer data) FY 2024 FY 2025 Increase / (Decrease) Gallons 763,755 784,127 2.7% Retail Customers 618,907 613,206 (0.9%) Adj. EBITDA1 / customer $513 $539 5.2% Gallons / customer 1,234 1,279 3.6% Total Revenues $ 1,837,116 $ 1,938,337 5.5% Total COGS 853,971 915,521 7.2% Gross Profit 983,145 1,022,816 4.0% Gross Profit cpg 1.29 1.30 1.3% Operating Expense 623,187 649,554 4.2% Operating Expense cpg 0.82 0.83 1.5% SG&A 154,863 283,143 Operating Income 205,095 90,119 Operating Income cpg 0.27 0.11 Adj. EBITDA1 $ 317,388 $ 330,694 4.2% Fiscal year 2025 delivered growth in sales volume, revenue, gross profit, and adjusted EBITDA1 Ferrellgas recognized record gross profit of over $1 billion FISCAL YEAR RESULTS SUMMARY • Fiscal year 2025 revenues were higher due to increased customer demand, higher gallons sales and higher commodity prices • Fiscal year 2025 was 6% cooler than prior year and 3% warmer compared to normal • Gross profit for fiscal year 2025 was over $1 billion and a 4% increase over prior year with increased gallon profitability, improved profitability from the tank exchange operations and continued focus on route density, asset utilization and customer profitability • Operating expenses increased versus prior year primarily due to higher medical benefits and personnel costs • $125 million one-time legal settlement included in FY 2025 G&A expense reducing Operating Income 20 |
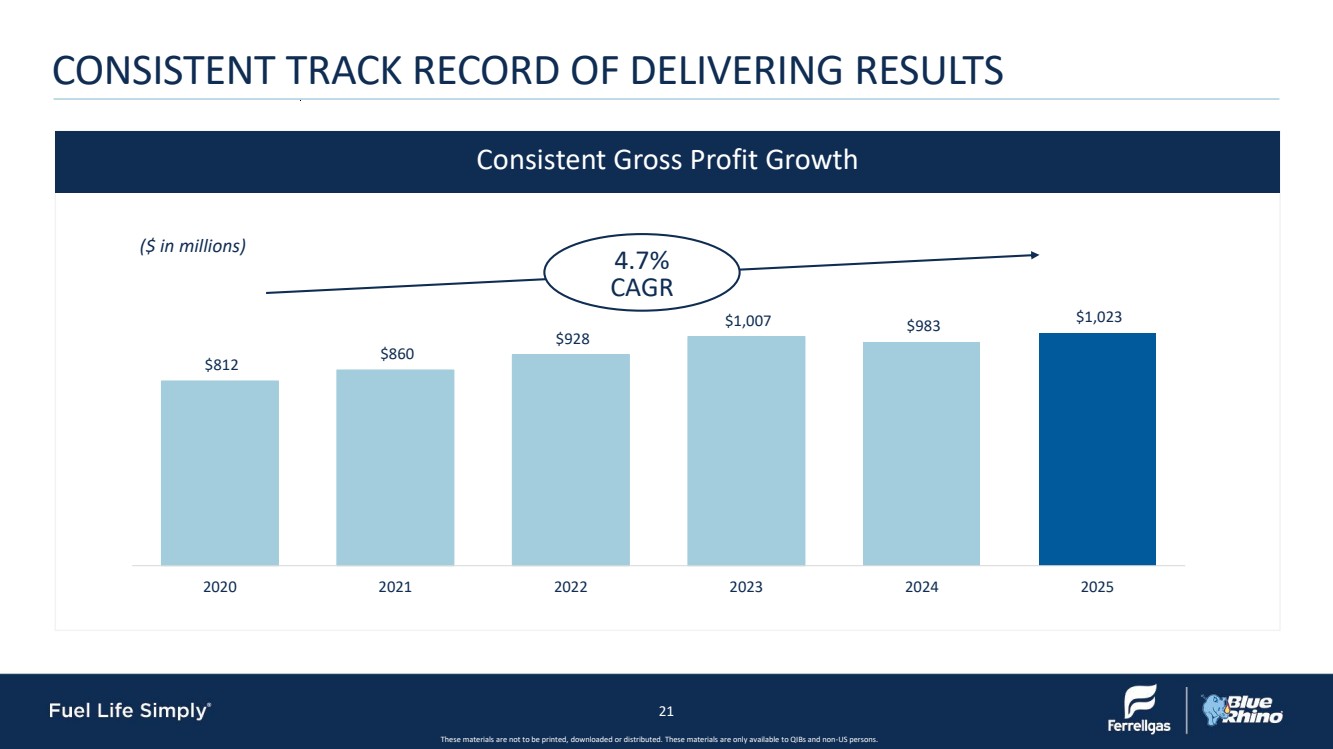
| These materials are not to be printed, downloaded or distributed. These materials are only available to QIBs and non-US persons. CONSISTENT TRACK RECORD OF DELIVERING RESULTS $812 $860 $928 $1,007 $983 $1,023 2020 2021 2022 2023 2024 2025 ($ in millions) Consistent Gross Profit Growth 4.7% CAGR 21 |
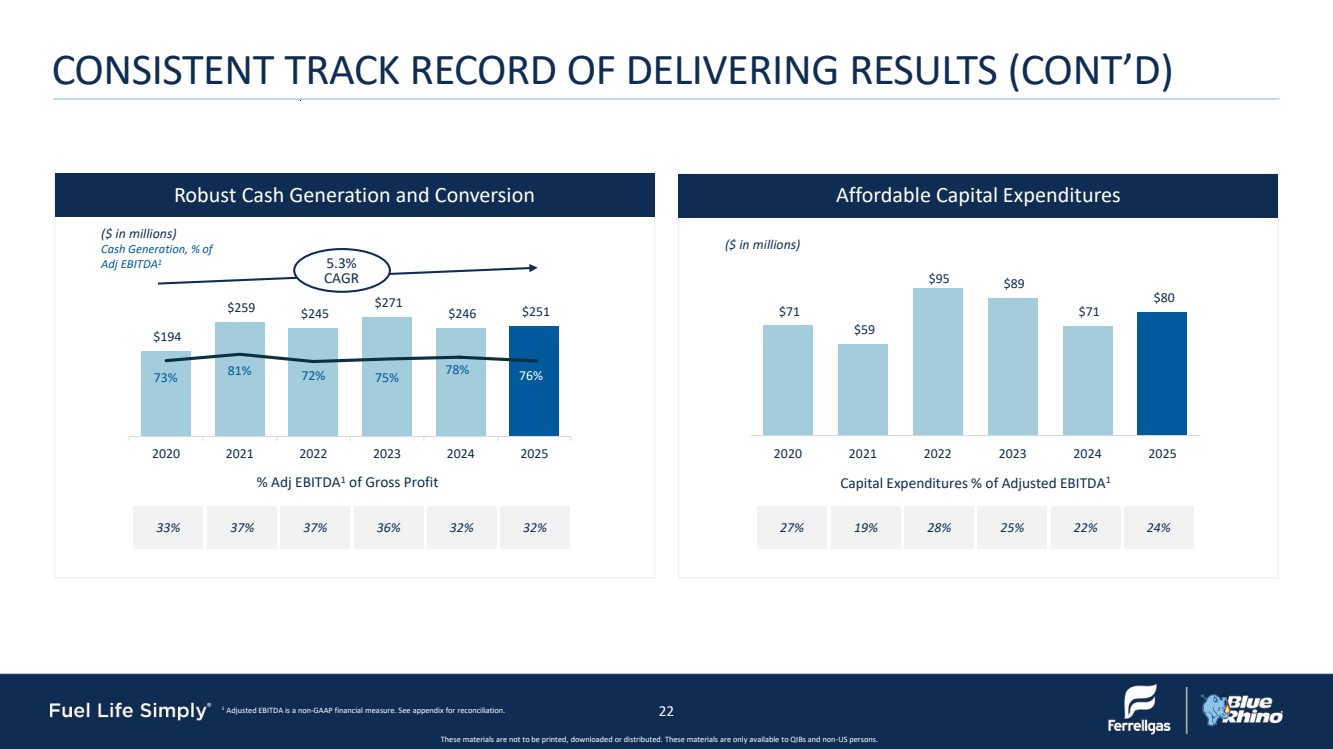
| These materials are not to be printed, downloaded or distributed. These materials are only available to QIBs and non-US persons. 1 Adjusted EBITDA is a non-GAAP financial measure. See appendix for reconciliation. $194 $259 $245 $271 $246 $251 73% 81% 72% 75% 78% -25% 25% 75% 125% 175% $- $50 $100 $150 $200 $250 $300 $350 2020 2021 2022 2023 2024 2025 ($ in millions) Cash Generation, % of Adj EBITDA1 Robust Cash Generation and Conversion 5.3% CAGR 33% 37% 37% 36% 32% 32% % Adj EBITDA1 of Gross Profit $71 $59 $95 $89 $71 $80 2020 2021 2022 2023 2024 2025 ($ in millions) Affordable Capital Expenditures 27% 19% 28% 25% 22% 24% Capital Expenditures % of Adjusted EBITDA1 76% 22 CONSISTENT TRACK RECORD OF DELIVERING RESULTS (CONT’D) |
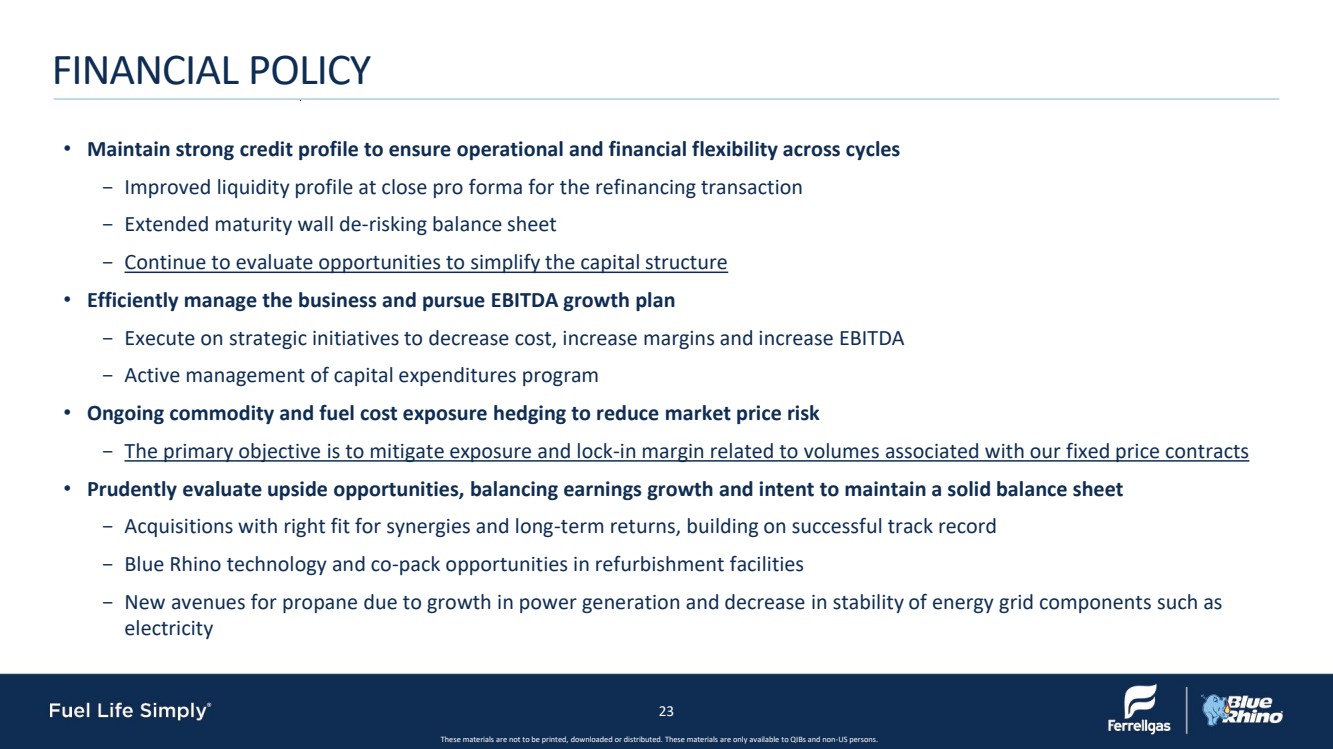
| These materials are not to be printed, downloaded or distributed. These materials are only available to QIBs and non-US persons. FINANCIAL POLICY 23 • Maintain strong credit profile to ensure operational and financial flexibility across cycles - Improved liquidity profile at close pro forma for the refinancing transaction - Extended maturity wall de-risking balance sheet - Continue to evaluate opportunities to simplify the capital structure • Efficiently manage the business and pursue EBITDA growth plan - Execute on strategic initiatives to decrease cost, increase margins and increase EBITDA - Active management of capital expenditures program • Ongoing commodity and fuel cost exposure hedging to reduce market price risk - The primary objective is to mitigate exposure and lock-in margin related to volumes associated with our fixed price contracts • Prudently evaluate upside opportunities, balancing earnings growth and intent to maintain a solid balance sheet - Acquisitions with right fit for synergies and long-term returns, building on successful track record - Blue Rhino technology and co-pack opportunities in refurbishment facilities - New avenues for propane due to growth in power generation and decrease in stability of energy grid components such as electricity |
| These materials are not to be printed, downloaded or distributed. These materials are only available to QIBs and non-US persons. QUESTIONS? 24 |

| These materials are not to be printed, downloaded or distributed. These materials are only available to QIBs and non-US persons. APPENDIX 25 |
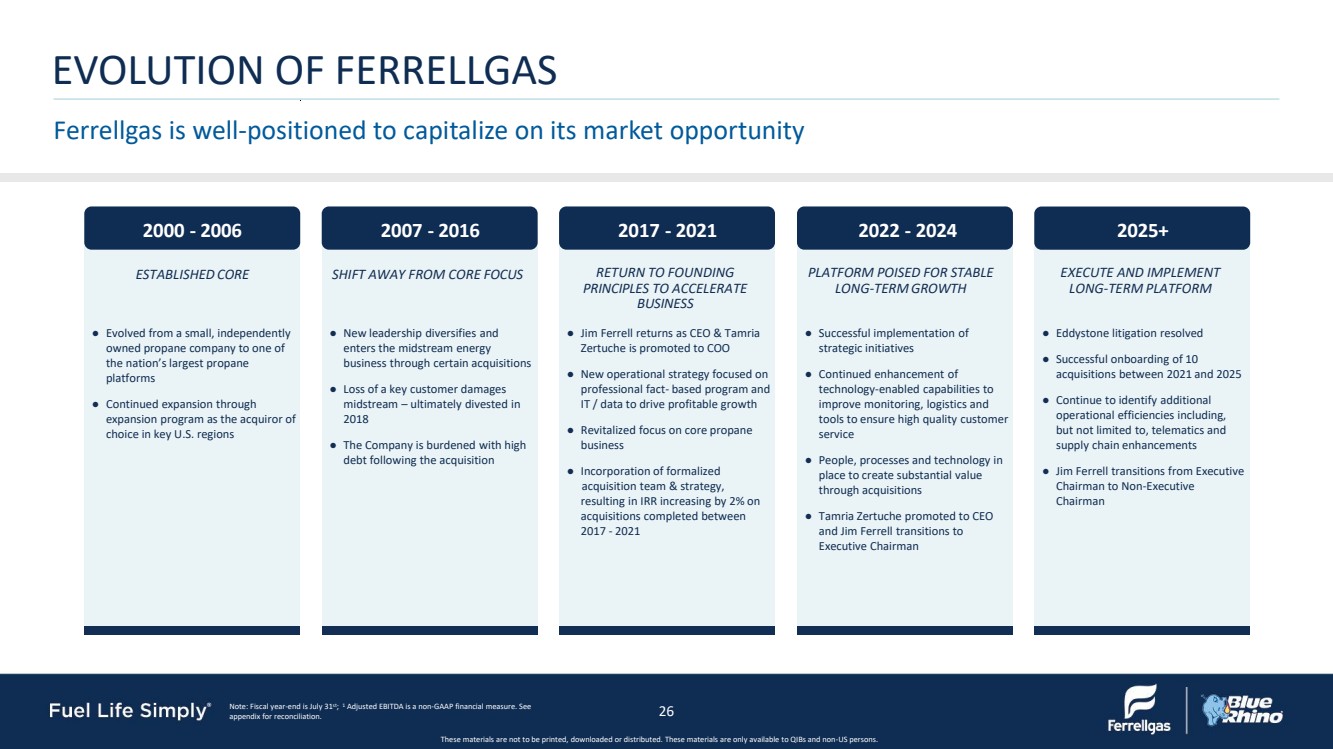
| These materials are not to be printed, downloaded or distributed. These materials are only available to QIBs and non-US persons. EVOLUTION OF FERRELLGAS Note: Fiscal year-end is July 31st; 1 Adjusted EBITDA is a non-GAAP financial measure. See appendix for reconciliation. 26 Note: Fiscal year-end is July 31st Ferrellgas is well-positioned to capitalize on its market opportunity RETURN TO FOUNDING PRINCIPLES TO ACCELERATE BUSINESS ESTABLISHEDCORE SHIFT AWAY FROM CORE FOCUS ● Evolved from a small, independently owned propane company to one of the nation’s largest propane platforms ● Continued expansion through expansion program as the acquiror of choice in key U.S. regions ● Successful implementation of strategic initiatives ● Continued enhancement of technology-enabled capabilities to improve monitoring, logistics and tools to ensure high quality customer service ● People, processes and technology in place to create substantial value through acquisitions ● Tamria Zertuche promoted to CEO and Jim Ferrell transitions to Executive Chairman ● Jim Ferrell returns as CEO & Tamria Zertuche is promoted to COO ● New operational strategy focused on professional fact- based program and IT / data to drive profitable growth ● Revitalized focus on core propane business ● Incorporation of formalized acquisition team & strategy, resulting in IRR increasing by 2% on acquisitions completed between 2017 - 2021 ● New leadership diversifies and enters the midstream energy business through certain acquisitions ● Loss of a key customer damages midstream – ultimately divested in 2018 ● The Company is burdened with high debt following the acquisition PLATFORM POISED FOR STABLE LONG-TERM GROWTH 2000 - 2006 2007 - 2016 2017 - 2021 2022 - 2024 ● Eddystone litigation resolved ● Successful onboarding of 10 acquisitions between 2021 and 2025 ● Continue to identify additional operational efficiencies including, but not limited to, telematics and supply chain enhancements ● Jim Ferrell transitions from Executive Chairman to Non-Executive Chairman EXECUTE AND IMPLEMENT LONG-TERM PLATFORM 2025+ |
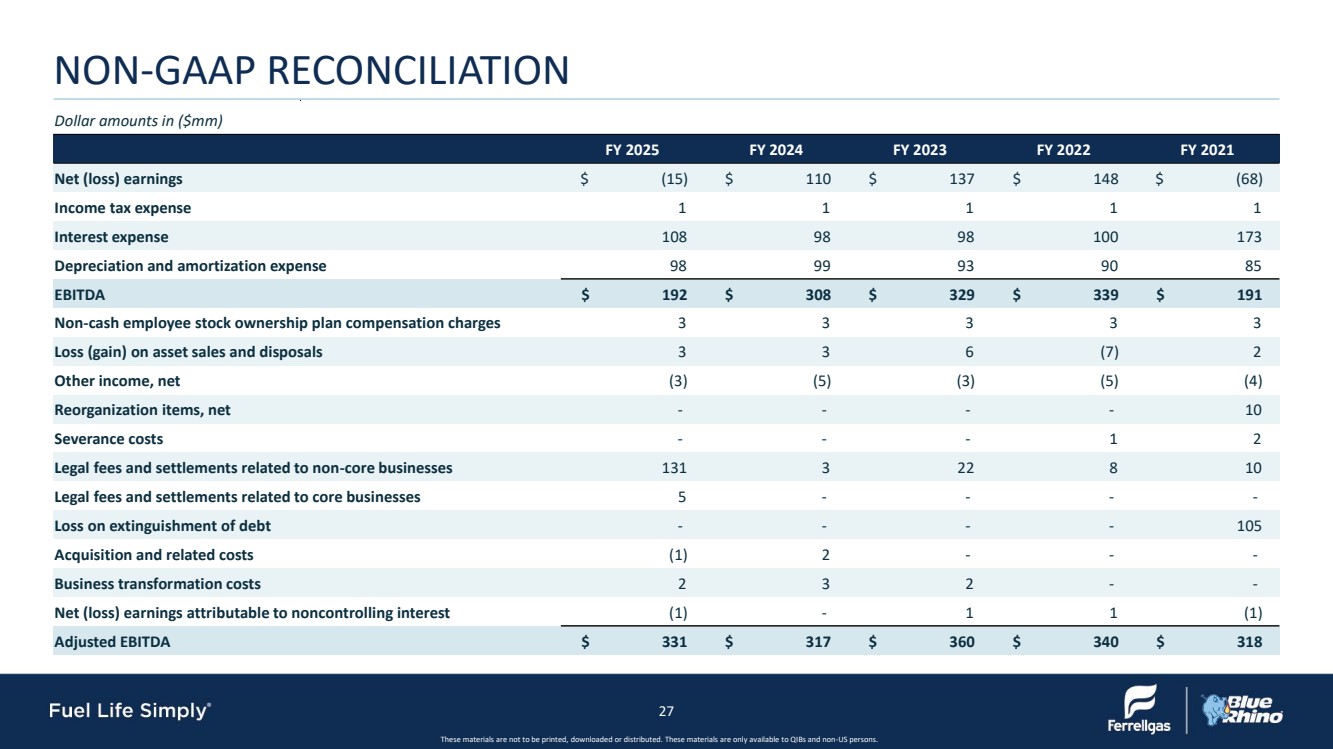
| These materials are not to be printed, downloaded or distributed. These materials are only available to QIBs and non-US persons. NON-GAAP RECONCILIATION 27 Dollar amounts in ($mm) FY 2025 FY 2024 FY 2023 FY 2022 FY 2021 Net (loss) earnings $ (15) $ 110 $ 137 $ 148 $ (68) Income tax expense 1 1 1 1 1 Interest expense 108 98 98 100 173 Depreciation and amortization expense 98 99 93 90 85 EBITDA $ 192 $ 308 $ 329 $ 339 $ 191 Non-cash employee stock ownership plan compensation charges 3 3 3 3 3 Loss (gain) on asset sales and disposals 3 3 6 (7) 2 Other income, net (3) (5) (3) (5) (4) Reorganization items, net - - - - 10 Severance costs - - - 1 2 Legal fees and settlements related to non-core businesses 131 3 22 8 10 Legal fees and settlements related to core businesses 5 - - - - Loss on extinguishment of debt - - - - 105 Acquisition and related costs (1) 2 - - - Business transformation costs 2 3 2 - - Net (loss) earnings attributable to noncontrolling interest (1) - 1 1 (1) Adjusted EBITDA $ 331 $ 317 $ 360 $ 340 $ 318 |