Please wait
11238
11503
10399
10000
12543
17.1
13161
10142
10000
10252
14016
10394
10000
1.7
15093
10385
0.2
11998
14497
10581
12645
11015
13277
10945
11269
91.2
10000
10527
11434
0.3
11326
11059
6.7
1.7
10613
10981
10152
11431
12245
0.3
10452
14.9
12161
10415
12271
1.8
13382
14.9
29.1
28.2
29.1
6.7
91.2
10519
17.1
11470
10586
1.8
0.2
11506
11662
11523
11058
28.2
0000924727
false
N-1A
0000924727
imstiii1:BloombergUSAggregateBondIndexMember
2015-09-30
2015-09-30
0000924727
imstiii1:C000243216Member
2015-09-30
2015-09-30
0000924727
imstiii1:C000249814Member
2015-09-30
2015-09-30
0000924727
imstiii1:ConsumerPriceIndexSeasonallyAdjusted100BpsMember
2015-09-30
2015-09-30
0000924727
imstiii1:BloombergUSAggregateBondIndexMember
2015-10-01
2017-09-30
0000924727
imstiii1:C000243216Member
2015-10-01
2017-09-30
0000924727
imstiii1:C000249814Member
2015-10-01
2017-09-30
0000924727
imstiii1:ConsumerPriceIndexSeasonallyAdjusted100BpsMember
2015-10-01
2017-09-30
0000924727
imstiii1:BloombergUSAggregateBondIndexMember
2015-10-01
2018-09-30
0000924727
imstiii1:C000243216Member
2015-10-01
2018-09-30
0000924727
imstiii1:C000249814Member
2015-10-01
2018-09-30
0000924727
imstiii1:ConsumerPriceIndexSeasonallyAdjusted100BpsMember
2015-10-01
2018-09-30
0000924727
imstiii1:BloombergUSAggregateBondIndexMember
2015-10-01
2019-09-30
0000924727
imstiii1:C000243216Member
2015-10-01
2019-09-30
0000924727
imstiii1:C000249814Member
2015-10-01
2019-09-30
0000924727
imstiii1:ConsumerPriceIndexSeasonallyAdjusted100BpsMember
2015-10-01
2019-09-30
0000924727
imstiii1:BloombergUSAggregateBondIndexMember
2015-10-01
2021-09-30
0000924727
imstiii1:C000243216Member
2015-10-01
2021-09-30
0000924727
imstiii1:C000249814Member
2015-10-01
2021-09-30
0000924727
imstiii1:ConsumerPriceIndexSeasonallyAdjusted100BpsMember
2015-10-01
2021-09-30
0000924727
imstiii1:BloombergUSAggregateBondIndexMember
2015-10-01
2022-09-30
0000924727
imstiii1:C000243216Member
2015-10-01
2022-09-30
0000924727
imstiii1:C000249814Member
2015-10-01
2022-09-30
0000924727
imstiii1:ConsumerPriceIndexSeasonallyAdjusted100BpsMember
2015-10-01
2022-09-30
0000924727
imstiii1:BloombergUSAggregateBondIndexMember
2015-10-01
2023-09-30
0000924727
imstiii1:C000243216Member
2015-10-01
2023-09-30
0000924727
imstiii1:C000249814Member
2015-10-01
2023-09-30
0000924727
imstiii1:ConsumerPriceIndexSeasonallyAdjusted100BpsMember
2015-10-01
2023-09-30
0000924727
imstiii1:BloombergUSAggregateBondIndexMember
2015-10-01
2024-09-30
0000924727
imstiii1:C000243216Member
2015-10-01
2024-09-30
0000924727
imstiii1:C000249814Member
2015-10-01
2024-09-30
0000924727
imstiii1:ConsumerPriceIndexSeasonallyAdjusted100BpsMember
2015-10-01
2024-09-30
0000924727
2024-10-01
2025-09-30
0000924727
imstiii1:BloombergUSAggregateBondIndexMember
2015-10-01
2020-09-30
0000924727
imstiii1:C000243216Member
2015-10-01
2020-09-30
0000924727
imstiii1:C000249814Member
2015-10-01
2020-09-30
0000924727
imstiii1:ConsumerPriceIndexSeasonallyAdjusted100BpsMember
2015-10-01
2020-09-30
0000924727
imstiii1:BloombergUSAggregateBondIndexMember
2020-10-01
2025-09-30
0000924727
imstiii1:C000243216Member
2020-10-01 2025-09-30
0000924727
imstiii1:C000249814Member
2020-10-01 2025-09-30
0000924727
imstiii1:ConsumerPriceIndexSeasonallyAdjusted100BpsMember
2020-10-01
2025-09-30
0000924727
imstiii1:BloombergUSAggregateBondIndexMember
2015-10-01
2016-09-30
0000924727
imstiii1:C000243216Member
2015-10-01
2016-09-30
0000924727
imstiii1:C000249814Member
2015-10-01
2016-09-30
0000924727
imstiii1:ConsumerPriceIndexSeasonallyAdjusted100BpsMember
2015-10-01
2016-09-30
0000924727
imstiii1:BloombergUSAggregateBondIndexMember
2024-10-01
2025-09-30
0000924727
imstiii1:C000243216Member
2024-10-01
2025-09-30
0000924727
imstiii1:C000249814Member
2024-10-01 2025-09-30
0000924727
imstiii1:ConsumerPriceIndexSeasonallyAdjusted100BpsMember
2024-10-01
2025-09-30
0000924727
imstiii1:BloombergUSAggregateBondIndexMember
2015-10-01
2025-09-30
0000924727
imstiii1:C000243216Member
2015-10-01
2025-09-30
0000924727
imstiii1:C000249814Member
2015-10-01
2025-09-30
0000924727
imstiii1:ConsumerPriceIndexSeasonallyAdjusted100BpsMember
2015-10-01
2025-09-30
0000924727
imstiii1:C000243216Member
2025-09-30
0000924727
imstiii1:C000243216Member
us-gaap:AssetBackedSecuritiesMember
2025-09-30
0000924727
imstiii1:C000243216Member
imstiii1:BondsAndDebenturesMember
2025-09-30
0000924727
imstiii1:C000243216Member
us-gaap:CommercialMortgageBackedSecuritiesMember
2025-09-30
0000924727
imstiii1:C000243216Member
us-gaap:CommonStockMember
2025-09-30
0000924727
imstiii1:C000243216Member
imstiii1:CorporateBankDebtMember
2025-09-30
0000924727
imstiii1:C000243216Member
us-gaap:CorporateBondSecuritiesMember
2025-09-30
0000924727
imstiii1:C000243216Member
imstiii1:FannieMaePool1000312037Member
2025-09-30
0000924727
imstiii1:C000243216Member
imstiii1:FederalHomeLoanMortgageCorpSeriesK096ClassA225197252029Member
2025-09-30
0000924727
imstiii1:C000243216Member
imstiii1:FordCreditFloorplanMasterOwnerTrustSeries20184ClassA406011152030Member
2025-09-30
0000924727
imstiii1:C000243216Member
imstiii1:FortressCreditOpportunitiesLtdSeries20179AClassA1TR612910152033Member
2025-09-30
0000924727
imstiii1:C000243216Member
imstiii1:OtherAssetsInExcessOfLiabilitiesMember
2025-09-30
0000924727
imstiii1:C000243216Member
imstiii1:PHIGroupIncMember
2025-09-30
0000924727
imstiii1:C000243216Member
us-gaap:ResidentialMortgageBackedSecuritiesMember
2025-09-30
0000924727
imstiii1:C000243216Member
us-gaap:ShortTermInvestmentsMember
2025-09-30
0000924727
imstiii1:C000243216Member
imstiii1:USTreasuryNote36258312030Member
2025-09-30
0000924727
imstiii1:C000243216Member
imstiii1:USTreasuryNote36259302030Member
2025-09-30
0000924727
imstiii1:C000243216Member
imstiii1:USTreasuryNote38756302030Member
2025-09-30
0000924727
imstiii1:C000243216Member
imstiii1:USTreasuryNote46259302030Member
2025-09-30
0000924727
imstiii1:C000243216Member
imstiii1:USTreasuryNotesAndBondsMember
2025-09-30
0000924727
imstiii1:C000243216Member
imstiii1:VerizonMasterTrustSeries20242ClassA483012222031Member
2025-09-30
0000924727
imstiii1:C000249814Member
2025-09-30
0000924727
imstiii1:C000249814Member
us-gaap:AssetBackedSecuritiesMember
2025-09-30
0000924727
imstiii1:C000249814Member
imstiii1:BondsAndDebenturesMember
2025-09-30
0000924727
imstiii1:C000249814Member
us-gaap:CommercialMortgageBackedSecuritiesMember
2025-09-30
0000924727
imstiii1:C000249814Member
us-gaap:CommonStockMember
2025-09-30
0000924727
imstiii1:C000249814Member
imstiii1:CorporateBankDebtMember
2025-09-30
0000924727
imstiii1:C000249814Member
us-gaap:CorporateBondSecuritiesMember
2025-09-30
0000924727
imstiii1:C000249814Member
imstiii1:FannieMaePool1000312037Member
2025-09-30
0000924727
imstiii1:C000249814Member
imstiii1:FederalHomeLoanMortgageCorpSeriesK096ClassA225197252029Member
2025-09-30
0000924727
imstiii1:C000249814Member
imstiii1:FordCreditFloorplanMasterOwnerTrustSeries20184ClassA406011152030Member
2025-09-30
0000924727
imstiii1:C000249814Member
imstiii1:FortressCreditOpportunitiesLtdSeries20179AClassA1TR612910152033Member
2025-09-30
0000924727
imstiii1:C000249814Member
imstiii1:OtherAssetsInExcessOfLiabilitiesMember
2025-09-30
0000924727
imstiii1:C000249814Member
imstiii1:PHIGroupIncMember
2025-09-30
0000924727
imstiii1:C000249814Member
us-gaap:ResidentialMortgageBackedSecuritiesMember
2025-09-30
0000924727
imstiii1:C000249814Member
us-gaap:ShortTermInvestmentsMember
2025-09-30
0000924727
imstiii1:C000249814Member
imstiii1:USTreasuryNote36258312030Member
2025-09-30
0000924727
imstiii1:C000249814Member
imstiii1:USTreasuryNote36259302030Member
2025-09-30
0000924727
imstiii1:C000249814Member
imstiii1:USTreasuryNote38756302030Member
2025-09-30
0000924727
imstiii1:C000249814Member
imstiii1:USTreasuryNote46259302030Member
2025-09-30
0000924727
imstiii1:C000249814Member
imstiii1:USTreasuryNotesAndBondsMember
2025-09-30
0000924727
imstiii1:C000249814Member
imstiii1:VerizonMasterTrustSeries20242ClassA483012222031Member
2025-09-30
iso4217:USDiso4217:USDxbrli:sharesxbrli:purexbrli:sharesutr:Dimstiii1:Holding
UNITED STATES
SECURITIES AND EXCHANGE COMMISSION
Washington, D.C. 20549
FORM N-CSR
CERTIFIED SHAREHOLDER REPORT OF REGISTERED MANAGEMENT INVESTMENT COMPANIES
Investment Company Act file number
Investment Managers Series Trust III
(Exact name of registrant as specified in charter)
235 West Galena Street
Milwaukee, Wisconsin 53212
(Address of Principal Executive Offices, including Zip Code)
Diane J. Drake
Mutual Fund Administration, LLC
2220 E. Route 66, Suite 226
Glendora, California 91740
(Name and Address of Agent for Service)
COPIES TO:
Laurie Anne Dee
Morgan, Lewis & Bockius LLP
600 Anton Boulevard, Suite 1800
Costa Mesa, California 92626
Registrant's telephone number, including area code:
Date of reporting period:
Item 1. Report to Stockholders.
(a) The registrant’s annual report transmitted to shareholders pursuant to Rule 30e-1 under the Investment Company Act of 1940, as amended (the “Investment Act”), is as follows:
FPA New Income Fund
Institutional Class/FPNIX
ANNUAL SHAREHOLDER REPORT | September 30, 2025
This annual shareholder report contains important information about the FPA New Income Fund (“Fund”) for the period of October 1, 2024 to September 30, 2025. You can find additional information about the Fund at https://fpa.com/funds/overview/new-income. You can also request this information by contacting us at (800) 638-3060.
Fund Expenses
(Based on a hypothetical $10,000 investment)
| Fund (Class) |
Costs of a $10,000 investment |
Costs paid as a percentage
of a $10,000 investment |
FPA New Income Fund
(Institutional Class/FPNIX) |
$46 |
0.45% |
Management’s Discussion of Fund Performance
How did the Fund perform over the reporting period?
For the twelve-month period ending September 30, 2025, the FPA New Income Fund’s Institutional Class (“Fund”) net return was 5.00%, which includes reinvestment of all distributions.
What affected the Fund’s performance?
During the 12 months ending September 30, 2025, Treasury yields decreased for maturities up to two years, driven by cuts to the Fed Funds rate and expectations of further cuts. Treasury yields for maturities greater than two years increased over the 12 months ending September 30, 2025. Spreads on investment grade and high yield rated debt decreased. Due to low spreads, we largely focused on buying longer-duration, High Quality bonds (rated single-A or higher) we believe will enhance both the Fund’s long-term returns and short-term upside-versus-downside return profile. Over the past 12 months, the Fund’s duration has increased from 3.2 years to 3.3 years. We seek to opportunistically invest in Credit when we believe prices adequately compensate for the risk of permanent impairment of capital and near-term mark-to-market risk. The Fund’s exposure to investments rated BBB or lower decreased as decreasing spreads in that part of the market generally made these investments unattractive.
Fund performance can be attributed to the following:[1]
The largest contributors to performance during the 12 months ending September 30, 2025:
• Agency-guaranteed residential mortgage pools
• Corporates
• Asset-backed securities (ABS) backed by equipment
The only detractor from performance was ABS backed by credit card receivables (part of ABS Other sector). While there were individual investments that detracted from performance during the fiscal year, there were no other meaningful detractors from performance at the sector level.
[1] This information is not a recommendation for a specific security or sector and these securities/sectors may not be in the Fund at the time you receive this report. The information provided does not reflect all positions purchased, sold or recommended by FPA during the quarter. The portfolio holdings as of the most recent quarter-end may be obtained at https://fpa.com. Past performance is no guarantee, nor is it indicative, of future results.
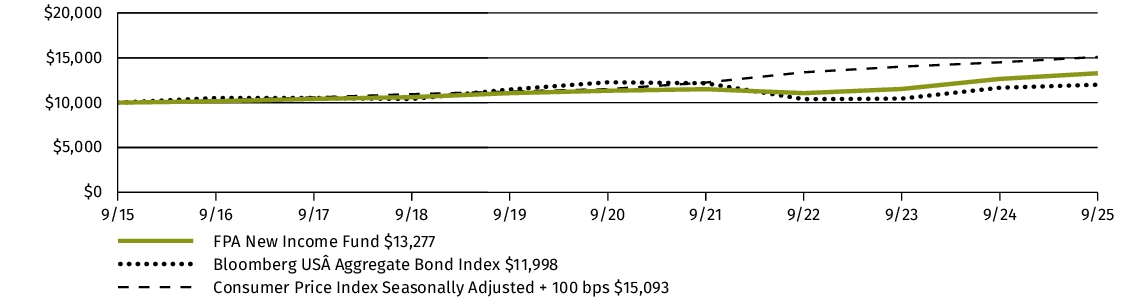
Fund Performance
The following graph and chart compare the initial and subsequent account values at the end of each of the most recently completed 10 fiscal years of the Fund, or for the life of the Fund, if shorter. It assumes a $10,000 initial investment at the beginning of the first fiscal year in an appropriate, broad-based securities market index for the same period.
GROWTH OF $10,000
| AVERAGE ANNUAL TOTAL RETURN |
1 Year |
5 Years |
10 Years |
| FPA New Income Fund (Institutional Class/FPNIX) |
5.00% |
3.23% |
2.88% |
| Bloomberg US Aggregate Bond Index |
2.88% |
-0.45% |
1.84% |
| Consumer Price Index Seasonally Adjusted + 100 bps |
4.11% |
5.58% |
4.20% |
Keep in mind that the Fund’s past performance is not a good predictor of how the Fund will perform in the future.
The graph and table do not reflect the deduction of taxes that a shareholder would pay on Fund distributions or redemption of Fund shares.
Visit https://fpa.com/funds/performance/new-income for the most recent performance information.
Key Fund Statistics
The following table outlines key fund statistics that you should pay attention to.
| Fund net assets |
$10,288,577,158 |
| Total number of portfolio holdings |
358 |
| Total advisory fees paid (net) |
$33,443,026 |
| Portfolio turnover rate as of the end of the reporting period |
41% |
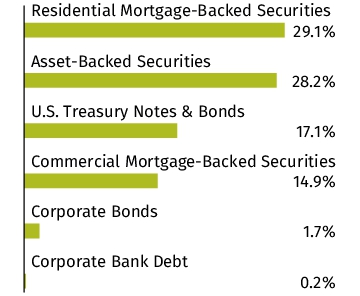
Graphical Representation of Holdings
The tables below show the investment makeup of the Fund, representing percentage of the total net assets of the Fund. The Top Ten Holdings and Sector Allocation exclude short-term holdings, if any. The Top Ten Holdings table may not reflect the total exposure to an issuer. Interest rates presented in the Top Ten Holdings are as of the reporting period end. The Sector Allocation chart represents Bonds & Debentures of the Fund.
| U.S. Treasury Note, 3.875%, 6/30/2030 |
11.5% |
| U.S. Treasury Note, 3.625%, 8/31/2030 |
3.1% |
| U.S. Treasury Note, 3.625%, 9/30/2030 |
1.4% |
| PHI Group, Inc. |
1.2% |
| Fortress Credit Opportunities Ltd., Series 2017-9A, Class A1TR, 6.129%, 10/15/2033 |
1.2% |
| Fannie Mae Pool, 1.000%, 3/1/2037 |
1.1% |
| U.S. Treasury Note, 4.625%, 9/30/2030 |
1.1% |
| Verizon Master Trust, Series 2024-2, Class A, 4.830%, 12/22/2031 |
0.8% |
| Federal Home Loan Mortgage Corp., Series K096, Class A2, 2.519%, 7/25/2029 |
0.8% |
| Ford Credit Floorplan Master Owner Trust, Series 2018-4, Class A, 4.060%, 11/15/2030 |
0.8% |
Material Fund Changes
The Fund did not have any material changes that occurred since the beginning of the reporting period.
Changes in and Disagreements with Accountants
There were no changes in or disagreements with the Fund's accountants during the reporting period.
Availability of Additional Information
You can find additional information about the Fund such as the prospectus, financial information, fund holdings and proxy voting information at https://fpa.com/funds/overview/new-income. You can also request this information by contacting us at (800) 638-3060.
Householding
In order to reduce expenses, we will deliver a single copy of prospectuses, proxies, financial reports and other communication to shareholders with the same residential address, provided they have the same last name, or we reasonably believe them to be members of the same family. Unless we are notified otherwise, we will continue to send recipients only one copy of these materials for as long as they remain a shareholder of the Fund. If you would like to receive individual mailings, please call (800) 638-3060 and we will begin sending you separate copies of these materials within 30 days after receiving your request.
FPA New Income Fund - Institutional Class
FPA New Income Fund
Investor Class/FPNRX
ANNUAL SHAREHOLDER REPORT | September 30, 2025
This annual shareholder report contains important information about the FPA New Income Fund (“Fund”) for the period of October 1, 2024 to September 30, 2025. You can find additional information about the Fund at https://fpa.com/funds/overview/new-income. You can also request this information by contacting us at (800) 638-3060.
Fund Expenses
(Based on a hypothetical $10,000 investment)
| Fund (Class) |
Costs of a $10,000 investment |
Costs paid as a percentage
of a $10,000 investment |
FPA New Income Fund
(Investor Class/FPNRX) |
$56 |
0.55% |
Management’s Discussion of Fund Performance
How did the Fund perform over the reporting period?
For the twelve-month period ending September 30, 2025, the FPA New Income Fund’s Investor Class (“Fund”) net return was 4.93%, which includes reinvestment of all distributions.
What affected the Fund’s performance?
During the 12 months ending September 30, 2025, Treasury yields decreased for maturities up to two years, driven by cuts to the Fed Funds rate and expectations of further cuts. Treasury yields for maturities greater than two years increased over the 12 months ending September 30, 2025. Spreads on investment grade and high yield rated debt decreased. Due to low spreads, we largely focused on buying longer-duration, High Quality bonds (rated single-A or higher) we believe will enhance both the Fund’s long-term returns and short-term upside-versus-downside return profile. Over the past 12 months, the Fund’s duration has increased from 3.2 years to 3.3 years. We seek to opportunistically invest in Credit when we believe prices adequately compensate for the risk of permanent impairment of capital and near-term mark-to-market risk. The Fund’s exposure to investments rated BBB or lower decreased as decreasing spreads in that part of the market generally made these investments unattractive.
Fund performance can be attributed to the following:[1]
The largest contributors to performance during the 12 months ending September 30, 2025:
• Agency-guaranteed residential mortgage pools
• Corporates
• Asset-backed securities (ABS) backed by equipment
The only detractor from performance was ABS backed by credit card receivables (part of ABS Other sector). While there were individual investments that detracted from performance during the fiscal year, there were no other meaningful detractors from performance at the sector level.
[1] This information is not a recommendation for a specific security or sector and these securities/sectors may not be in the Fund at the time you receive this report. The information provided does not reflect all positions purchased, sold or recommended by FPA during the quarter. The portfolio holdings as of the most recent quarter-end may be obtained at https://fpa.com. Past performance is no guarantee, nor is it indicative, of future results.
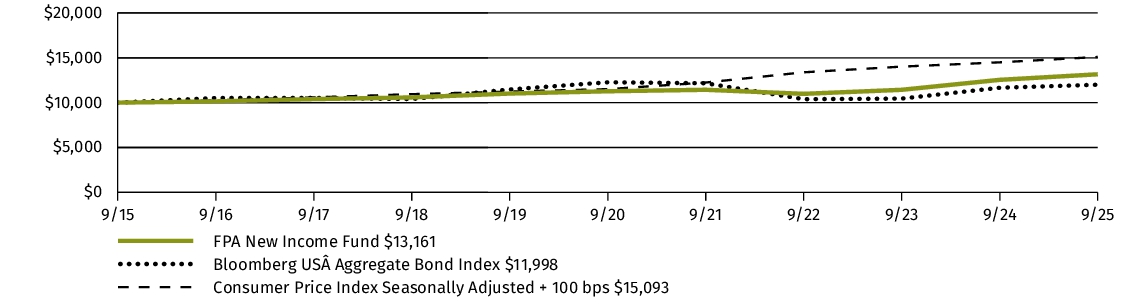
Fund Performance
The following graph and chart compare the initial and subsequent account values at the end of each of the most recently completed 10 fiscal years of the Fund, or for the life of the Fund, if shorter. It assumes a $10,000 initial investment at the beginning of the first fiscal year in an appropriate, broad-based securities market index for the same period.
GROWTH OF $10,000
| AVERAGE ANNUAL TOTAL RETURN |
1 Year |
5 Years |
10 Years |
| FPA New Income Fund (Investor Class/FPNRX)1 |
4.93% |
3.15% |
2.79% |
| Bloomberg US Aggregate Bond Index |
2.88% |
-0.45% |
1.84% |
| Consumer Price Index Seasonally Adjusted + 100 bps |
4.11% |
5.58% |
4.20% |
|
1
|
Investor Class commenced operations on April 30, 2024. The performance figures for Investor Class shares include the performance for the Institutional Class shares for the periods prior to the inception date of Investor Class shares, adjusted for the difference in Institutional Class shares and Investor Class shares expenses. Investor Class shares impose higher expenses than Institutional Class shares. Since Investor Class shares have higher expenses and are therefore more expensive than Institutional Class shares, the returns for Investor Class shares will be lower than the returns shown for Institutional Class shares.
|
Keep in mind that the Fund’s past performance is not a good predictor of how the Fund will perform in the future.
The graph and table do not reflect the deduction of taxes that a shareholder would pay on Fund distributions or redemption of Fund shares.
Visit https://fpa.com/funds/performance/new-income for the most recent performance information.
Key Fund Statistics
The following table outlines key fund statistics that you should pay attention to.
| Fund net assets |
$10,288,577,158 |
| Total number of portfolio holdings |
358 |
| Total advisory fees paid (net) |
$33,443,026 |
| Portfolio turnover rate as of the end of the reporting period |
41% |
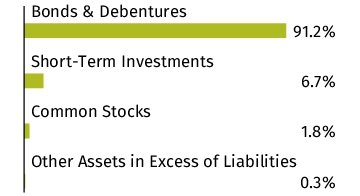
Graphical Representation of Holdings
The tables below show the investment makeup of the Fund, representing percentage of the total net assets of the Fund. The Top Ten Holdings and Sector Allocation exclude short-term holdings, if any. The Top Ten Holdings table may not reflect the total exposure to an issuer. Interest rates presented in the Top Ten Holdings are as of the reporting period end. The Sector Allocation chart represents Bonds & Debentures of the Fund.
| U.S. Treasury Note, 3.875%, 6/30/2030 |
11.5% |
| U.S. Treasury Note, 3.625%, 8/31/2030 |
3.1% |
| U.S. Treasury Note, 3.625%, 9/30/2030 |
1.4% |
| PHI Group, Inc. |
1.2% |
| Fortress Credit Opportunities Ltd., Series 2017-9A, Class A1TR, 6.129%, 10/15/2033 |
1.2% |
| Fannie Mae Pool, 1.000%, 3/1/2037 |
1.1% |
| U.S. Treasury Note, 4.625%, 9/30/2030 |
1.1% |
| Verizon Master Trust, Series 2024-2, Class A, 4.830%, 12/22/2031 |
0.8% |
| Federal Home Loan Mortgage Corp., Series K096, Class A2, 2.519%, 7/25/2029 |
0.8% |
| Ford Credit Floorplan Master Owner Trust, Series 2018-4, Class A, 4.060%, 11/15/2030 |
0.8% |
Material Fund Changes
The Fund did not have any material changes that occurred since the beginning of the reporting period.
Changes in and Disagreements with Accountants
There were no changes in or disagreements with the Fund's accountants during the reporting period.
Availability of Additional Information
You can find additional information about the Fund such as the prospectus, financial information, fund holdings and proxy voting information at https://fpa.com/funds/overview/new-income. You can also request this information by contacting us at (800) 638-3060.
Householding
In order to reduce expenses, we will deliver a single copy of prospectuses, proxies, financial reports and other communication to shareholders with the same residential address, provided they have the same last name, or we reasonably believe them to be members of the same family. Unless we are notified otherwise, we will continue to send recipients only one copy of these materials for as long as they remain a shareholder of the Fund. If you would like to receive individual mailings, please call (800) 638-3060 and we will begin sending you separate copies of these materials within 30 days after receiving your request.
FPA New Income Fund - Investor Class
(b)
Not applicable.
Item
2. Code of Ethics.
The
registrant has adopted a code of ethics that applies to the registrant's principal executive officer and principal financial officer.
The registrant has not made any amendments to its code of ethics during the period covered by this report. The registrant has
not granted any waivers from any provisions of the code of ethics during the period covered by this report.
The
registrant undertakes to provide to any person without charge, upon request, a copy of its code of ethics by mail when they call
the registrant at 1-800-982-4372.
Item
3. Audit Committee Financial Expert.
The
Board of Trustees of the Registrant has determined that John Zader and Sandra Brown, who are members of the Registrant’s
Audit Committee and Board of Trustees, are “audit committee financial experts” and are “independent” as
those terms are defined in this Item.
Item
4. Principal Accountant Fees and Services.
The
registrant has engaged its principal accountant to perform audit services, audit-related services, tax services and other services
during the past two fiscal years. "Audit services" refer to performing an audit of the registrant's annual financial
statements or services that are normally provided by the accountant in connection with statutory and regulatory filings or engagements
for those fiscal years. "Audit-related services" refer to the assurance and related services by the principal accountant
that are reasonably related to the performance of the audit. "Tax services" refer to professional services rendered
by the principal accountant for tax compliance, tax advice, and tax planning. There were no "other services" provided
by the principal accountant. The following table details the aggregate fees billed or expected to be billed for each of the last
two fiscal years for audit fees, audit-related fees, tax fees and other fees by the principal accountant.
| |
FPA
New Income Fund |
FYE
9/30/2025 |
FYE
9/30/2024 |
| (a) |
Audit
Fees |
$14,500 |
$13,500 |
| (b) |
Audit-Related
Fees |
N/A |
N/A |
| (c) |
Tax
Fees |
$2,500 |
$2,500 |
| (d) |
All
Other Fees |
N/A |
N/A |
(e)(1)
The audit committee has adopted pre-approval policies and procedures that require the audit committee to pre-approve all audit
and non-audit services of the registrant, including services provided to any entity affiliated with the registrant.
(e)(2)
The percentage of fees billed by Tait, Weller, & Weller LLP applicable to non-audit services pursuant to waiver of pre-approval
requirement were as follows:
| FPA
New Income Fund |
FYE
9/30/2025 |
FYE
9/30/2024
|
| Audit-Related
Fees |
0% |
0% |
| Tax
Fees |
0% |
0% |
| All
Other Fees |
0% |
0% |
| (f) | All
of the principal accountant's hours spent on auditing the registrant's financial statements
were attributed to work performed by full-time permanent employees of the principal accountant. |
The
following table indicates the non-audit fees billed or expected to be billed by the registrant's accountant for services to the
registrant and to the registrant's investment advisor (and any other controlling entity, etc.—not sub-advisor) for the last
two years. The audit committee of the Board of Trustees has considered whether the provision of non-audit services that were rendered
to the registrant's investment advisor is compatible with maintaining the principal accountant's independence and has concluded
that the provision of such non-audit services by the accountant has not compromised the accountant's independence.
| |
FPA
New Income Fund |
FYE
9/30/2025 |
FYE
9/30/2024
|
| (g) |
Registrant
Non-Audit Related Fees |
N/A |
N/A |
| (h) |
Registrant’s
Investment Advisor |
N/A |
N/A |
Item
5. Audit Committee of Listed Registrants.
| (a) | Not
applicable to registrants who are not listed issuers (as defined in Rule 10A-3 under
the Securities Exchange Act of 1934). |
Item
6. Investments.
| (a) | Schedule
of Investments is included as part of the report to shareholders filed under Item 7 of
this Form. |
Item
7. Financial Statements and Financial Highlights for Open-End Management Investment Companies.

FPA
New Income Fund
(Investor
Class: FPNRX)
(Institutional
Class: FPNIX)
ANNUAL
FINANCIALS AND OTHER INFORMATION
SEPTEMBER
30, 2025
FPA
New Income Fund
A
series of Investment Managers Series Trust III
Table
of Contents
Please
note the Financials and Other Information only contains Items 7-11 required in Form N-CSR. All other required items will be filed
with the SEC.
| Item 7. |
Financial Statements and Financial Highlights |
|
| |
Schedule of Investments |
1 |
| |
Statement of Assets and Liabilities |
15 |
| |
Statement of Operations |
16 |
| |
Statements of Changes in Net Assets |
17 |
| |
Financial Highlights |
18 |
| |
Notes to Financial Statements |
20 |
| |
Report of Independent Registered Public Accounting
Firm |
31 |
This
report and the financial statements contained herein are provided for the general information of the shareholders of the FPA New
Income Fund (the “Fund”). This report is not authorized for distribution to prospective investors in the Fund unless
preceded or accompanied by an effective shareholder report and prospectus.
https://fpa.com
FPA
New Income Fund
SCHEDULE
OF INVESTMENTS
As
of September 30, 2025
Principal
Amount | | |
| |
Value | |
| | | | |
BONDS & DEBENTURES — 91.2% | |
| | |
| | | | |
ASSET-BACKED SECURITIES — 28.2% | |
| | |
| | | | |
AUTO — 6.4% | |
| | |
| | | | |
Ally Auto Receivables Trust | |
| | |
| $ | 8,996,000 | | |
Series 2023-1, Class A4, 5.270%, 11/15/2028 | |
$ | 9,163,599 | |
| | | | |
BMW Vehicle Owner Trust | |
| | |
| | 6,776,000 | | |
Series 2023-A, Class A4, 5.250%, 11/26/2029 | |
| 6,891,115 | |
| | | | |
CarMax Auto Owner Trust | |
| | |
| | 21,176,000 | | |
Series 2023-2, Class A4, 5.010%, 11/15/2028 | |
| 21,429,144 | |
| | 10,892,000 | | |
Series 2023-1, Class A4, 4.650%, 1/16/2029 | |
| 10,966,444 | |
| | 20,637,000 | | |
Series 2023-3, Class A4, 5.260%, 2/15/2029 | |
| 21,019,787 | |
| | | | |
Ford Credit Auto Owner Trust | |
| | |
| | 14,487,000 | | |
Series 2023-A, Class A4, 4.560%, 12/15/2028 | |
| 14,594,378 | |
| | 7,137,000 | | |
Series 2023-B, Class A4, 5.060%, 2/15/2029 | |
| 7,235,828 | |
| | | | |
GM Financial Consumer Automobile Receivables Trust | |
| | |
| | 15,767,000 | | |
Series 2023-1, Class A4, 4.590%, 7/17/2028 | |
| 15,839,848 | |
| | 13,758,000 | | |
Series 2023-3, Class A4, 5.340%, 12/18/2028 | |
| 13,985,930 | |
| | | | |
GM Financial Revolving Receivables Trust | |
| | |
| | 38,305,000 | | |
Series 2021-1, Class A, 1.170%, 6/12/2034(a) | |
| 37,294,951 | |
| | 49,942,000 | | |
Series 2023-1, Class A, 5.120%, 4/11/2035(a) | |
| 51,405,980 | |
| | 12,704,000 | | |
Series 2023-2, Class A, 5.770%, 8/11/2036(a) | |
| 13,317,442 | |
| | 64,237,000 | | |
Series 2024-1, Class A, 4.980%, 12/11/2036(a) | |
| 65,918,044 | |
| | | | |
Hyundai Auto Receivables Trust | |
| | |
| | 10,743,000 | | |
Series 2023-B, Class A4, 5.310%, 8/15/2029 | |
| 10,925,888 | |
| | | | |
Mercedes-Benz Auto Receivables Trust | |
| | |
| | 10,006,000 | | |
Series 2023-1, Class A4, 4.310%, 4/16/2029 | |
| 10,046,709 | |
| | 8,831,000 | | |
Series 2024-1, Class A4, 4.790%, 7/15/2031 | |
| 8,966,606 | |
| | | | |
Nissan Auto Receivables Owner Trust | |
| | |
| | 13,366,000 | | |
Series 2022-B, Class A4, 4.450%, 11/15/2029 | |
| 13,419,197 | |
| | 15,538,000 | | |
Series 2023-A, Class A4, 4.850%, 6/17/2030 | |
| 15,701,673 | |
| | | | |
Porsche Financial Auto Securitization Trust | |
| | |
| | 17,279,000 | | |
Series 2023-1A, Class A4, 4.720%, 6/23/2031(a) | |
| 17,429,763 | |
| | | | |
SFS Auto Receivables Securitization Trust | |
| | |
| | 8,951,000 | | |
Series 2023-1A, Class A4, 5.470%, 12/20/2029(a) | |
| 9,125,319 | |
| | | | |
Toyota Auto Loan Extended Note Trust | |
| | |
| | 54,519,000 | | |
Series 2022-1A, Class A, 3.820%, 4/25/2035(a) | |
| 54,395,951 | |
| | 43,813,000 | | |
Series 2023-1A, Class A, 4.930%, 6/25/2036(a) | |
| 44,828,108 | |
| | 56,286,000 | | |
Series 2024-1A, Class A, 5.160%, 11/25/2036(a) | |
| 58,278,980 | |
| | | | |
Toyota Auto Receivables Owner Trust | |
| | |
| | 16,189,000 | | |
Series 2023-A, Class A4, 4.420%, 8/15/2028 | |
| 16,280,559 | |
| | 19,879,000 | | |
Series 2023-B, Class A4, 4.660%, 9/15/2028 | |
| 20,035,493 | |
| | 25,523,000 | | |
Series 2023-C, Class A4, 5.010%, 2/15/2029 | |
| 25,881,583 | |
| | | | |
Volkswagen Auto Loan Enhanced Trust | |
| | |
| | 11,637,000 | | |
Series 2023-1, Class A4, 5.010%, 1/22/2030 | |
| 11,792,882 | |
| | | | |
World Omni Auto Receivables Trust | |
| | |
| | 14,612,000 | | |
Series 2023-A, Class A4, 4.660%, 5/15/2029 | |
| 14,723,029 | |
FPA
New Income Fund
SCHEDULE
OF INVESTMENTS - Continued
As
of September 30, 2025
Principal
Amount | | |
| |
Value | |
| | | | |
BONDS & DEBENTURES (Continued) | |
| | |
| | | | |
ASSET-BACKED SECURITIES (Continued) | |
| | |
| | | | |
AUTO (Continued) | |
| | |
| $ | 21,627,000 | | |
Series 2023-B, Class A4, 4.680%, 5/15/2029 | |
$ | 21,752,021 | |
| | 10,417,000 | | |
Series 2023-C, Class A4, 5.030%, 11/15/2029 | |
| 10,558,853 | |
| | | | |
| |
| 653,205,104 | |
| | | | |
| |
| | |
| | | | |
COLLATERALIZED LOAN OBLIGATION — 3.1% | |
| | |
| | | | |
Cerberus Loan Funding LLC | |
| | |
| | 10,299,000 | | |
Series 2023-1A, Class A, 6.718% (3-Month Term SOFR+240 basis points), 3/22/2035(a),(b) | |
| 10,308,145 | |
| | 51,840,000 | | |
Series 2023-2A, Class A1, 6.867% (3-Month Term SOFR+255 basis points), 7/15/2035(a),(b) | |
| 52,389,867 | |
| | 52,569,000 | | |
Series 2023-4A, Class A, 6.743% (3-Month Term SOFR+242.5 basis points), 10/15/2035(a),(b) | |
| 53,036,549 | |
| | | | |
Fortress Credit Opportunities Ltd. | |
| | |
| | 118,776,000 | | |
Series 2017-9A, Class A1TR, 6.129% (3-Month Term SOFR+181.161 basis points), 10/15/2033(a),(b) | |
| 119,190,528 | |
| | | | |
Golub Capital Partners Ltd. | |
| | |
| | 43,478,000 | | |
Series 2023-67A, Class A1, 6.726% (3-Month Term SOFR+250 basis points), 5/9/2036(a),(b) | |
| 43,959,041 | |
| | 41,996,000 | | |
Series 2019-46A, Class A1R, 6.135% (3-Month Term SOFR+181 basis points), 4/20/2037(a),(b) | |
| 42,093,095 | |
| | | | |
| |
| 320,977,225 | |
| | | | |
| |
| | |
| | | | |
EQUIPMENT — 10.9% | |
| | |
| | | | |
Avis Budget Rental Car Funding AESOP LLC | |
| | |
| | 4,211,000 | | |
Series 2021-2A, Class A, 1.660%, 2/20/2028(a) | |
| 4,089,847 | |
| | 13,136,000 | | |
Series 2023-1A, Class A, 5.250%, 4/20/2029(a) | |
| 13,437,449 | |
| | 38,251,000 | | |
Series 2023-4A, Class A, 5.490%, 6/20/2029(a) | |
| 39,286,986 | |
| | 48,017,000 | | |
Series 2023-6A, Class A, 5.810%, 12/20/2029(a) | |
| 50,013,240 | |
| | 34,038,000 | | |
Series 2023-8A, Class A, 6.020%, 2/20/2030(a) | |
| 35,725,111 | |
| | 14,768,000 | | |
Series 2024-1A, Class A, 5.360%, 6/20/2030(a) | |
| 15,242,954 | |
| | 57,519,000 | | |
Series 2024-3A, Class A, 5.230%, 12/20/2030(a) | |
| 59,192,032 | |
| | | | |
CNH Equipment Trust | |
| | |
| | 7,414,000 | | |
Series 2022-B, Class A4, 3.910%, 3/15/2028 | |
| 7,402,983 | |
| | 6,738,000 | | |
Series 2023-A, Class A4, 4.770%, 10/15/2030 | |
| 6,831,885 | |
| | 17,009,000 | | |
Series 2023-B, Class A4, 5.460%, 3/17/2031 | |
| 17,608,501 | |
| | | | |
Coinstar Funding LLC | |
| | |
| | 11,767,855 | | |
Series 2017-1A, Class A2, 5.216%, 4/25/2047(a) | |
| 10,961,327 | |
| | | | |
Enterprise Fleet Financing LLC | |
| | |
| | 37,963,000 | | |
Series 2023-2, Class A3, 5.500%, 4/22/2030(a) | |
| 38,644,747 | |
| | 34,823,000 | | |
Series 2023-3, Class A3, 6.410%, 6/20/2030(a) | |
| 36,150,784 | |
| | 11,576,000 | | |
Series 2024-4, Class A4, 4.700%, 6/20/2031(a) | |
| 11,738,939 | |
| | | | |
Ford Credit Floorplan Master Owner Trust | |
| | |
| | 83,977,000 | | |
Series 2018-4, Class A, 4.060%, 11/15/2030 | |
| 83,921,525 | |
FPA
New Income Fund
SCHEDULE
OF INVESTMENTS - Continued
As
of September 30, 2025
Principal
Amount | | |
| |
Value | |
| | | | |
BONDS & DEBENTURES (Continued) | |
| | |
| | | | |
ASSET-BACKED SECURITIES (Continued) | |
| | |
| | | | |
EQUIPMENT (Continued) | |
| | |
| $ | 46,054,000 | | |
Series 2024-2, Class A, 5.240%, 4/15/2031(a) | |
$ | 47,749,524 | |
| | 27,030,000 | | |
Series 2024-4, Class A, 4.400%, 9/15/2031(a) | |
| 27,271,678 | |
| | | | |
GMF Floorplan Owner Revolving Trust | |
| | |
| | 18,848,000 | | |
Series 2023-2, Class A, 5.340%, 6/15/2030(a) | |
| 19,475,490 | |
| | 46,933,000 | | |
Series 2024-2A, Class A, 5.060%, 3/15/2031(a) | |
| 48,393,151 | |
| | | | |
GreatAmerica Leasing Receivables Funding LLC | |
| | |
| | 16,501,000 | | |
Series 2023-1, Class A4, 5.060%, 3/15/2030(a) | |
| 16,752,300 | |
| | | | |
Hertz Vehicle Financing LLC | |
| | |
| | 44,631,000 | | |
Series 2021-2A, Class A, 1.680%, 12/27/2027(a) | |
| 43,484,452 | |
| | 38,642,000 | | |
Series 2022-2A, Class A, 2.330%, 6/26/2028(a) | |
| 37,505,025 | |
| | 72,333,000 | | |
Series 2022-5A, Class A, 3.890%, 9/25/2028(a) | |
| 71,821,758 | |
| | | | |
John Deere Owner Trust | |
| | |
| | 15,675,000 | | |
Series 2023-A, Class A4, 5.010%, 12/17/2029 | |
| 15,823,521 | |
| | 11,706,000 | | |
Series 2023-B, Class A4, 5.110%, 5/15/2030 | |
| 11,882,777 | |
| | 15,742,000 | | |
Series 2023-C, Class A4, 5.390%, 8/15/2030 | |
| 16,079,457 | |
| | | | |
Kubota Credit Owner Trust | |
| | |
| | 12,897,000 | | |
Series 2023-2A, Class A4, 5.230%, 6/15/2028(a) | |
| 13,145,645 | |
| | 9,456,000 | | |
Series 2023-1A, Class A4, 5.070%, 2/15/2029(a) | |
| 9,565,258 | |
| | | | |
M&T Equipment Notes | |
| | |
| | 9,785,000 | | |
Series 2023-1A, Class A4, 5.750%, 7/15/2030(a) | |
| 9,951,055 | |
| | 17,531,000 | | |
Series 2024-1A, Class A4, 4.940%, 8/18/2031(a) | |
| 17,867,097 | |
| | | | |
MMAF Equipment Finance LLC | |
| | |
| | 24,567,000 | | |
Series 2023-A, Class A4, 5.500%, 12/13/2038(a) | |
| 25,225,772 | |
| | 7,081,000 | | |
Series 2020-A, Class A5, 1.560%, 10/9/2042(a) | |
| 6,774,765 | |
| | 29,990,727 | | |
Series 2024-A, Class A4, 5.100%, 7/13/2049(a) | |
| 30,924,146 | |
| | 8,060,000 | | |
Series 2025-A, Class A4, 5.020%, 6/13/2050(a) | |
| 8,334,854 | |
| | | | |
Prop 2017-1A | |
| | |
| | 8,456,940 | | |
5.300%, 3/15/2042(c),(d) | |
| 7,864,954 | |
| | | | |
Verizon Master Trust | |
| | |
| | 76,585,000 | | |
Series 2023-6, Class A, 5.350%, 9/22/2031(a) | |
| 79,448,789 | |
| | 85,708,000 | | |
Series 2024-2, Class A, 4.830%, 12/22/2031(a) | |
| 87,675,204 | |
| | 31,930,000 | | |
Series 2024-7, Class A, 4.350%, 8/20/2032(a) | |
| 32,204,304 | |
| | | | |
Volvo Financial Equipment LLC Series 2025-2 | |
| | |
| | 4,788,000 | | |
Series 2025-2A, Class A4, 4.060%, 6/15/2033(a) | |
| 4,786,796 | |
| | | | |
| |
| 1,120,256,082 | |
| | | | |
| |
| | |
| | | | |
OTHER — 7.8% | |
| | |
| | | | |
ABPCI Direct Lending Fund LLC | |
| | |
| | 21,942,094 | | |
Series 2022-2A, Class A1, 6.414% (3-Month Term SOFR+210 basis points), 3/1/2032(a),(b) | |
| 21,920,920 | |
| | | | |
ABPCI Direct Lending Fund Ltd. | |
| | |
| | 23,371,809 | | |
Series 2020-1A, Class A, 3.199%, 12/29/2030(a) | |
| 22,966,845 | |
FPA
New Income Fund
SCHEDULE
OF INVESTMENTS - Continued
As
of September 30, 2025
Principal
Amount | | |
| |
Value | |
| | | | |
BONDS & DEBENTURES (Continued) | |
| | |
| | | | |
ASSET-BACKED SECURITIES (Continued) | |
| | |
| | | | |
OTHER (Continued) | |
| | |
| | | | |
American Tower Trust 1 | |
| | |
| $ | 77,012,000 | | |
5.490%, 3/15/2028(a) | |
$ | 78,282,929 | |
| | | | |
Brazos Securitization LLC | |
| | |
| | 7,444,560 | | |
5.014%, 9/1/2031(a) | |
| 7,560,201 | |
| | | | |
Centerpoint Energy Restoration Bond Co. II LLC | |
| | |
| | 61,032,000 | | |
4.255%, 12/15/2034 | |
| 60,610,849 | |
| | | | |
Cleco Securitization LLC | |
| | |
| | 16,043,162 | | |
4.016%, 3/1/2031 | |
| 15,906,795 | |
| | | | |
Cologix Data Centers US Issuer LLC | |
| | |
| | 58,068,000 | | |
Series 2021-1A, Class A2, 3.300%, 12/26/2051(a) | |
| 56,674,049 | |
| | | | |
Consumers 2023 Securitization Funding LLC | |
| | |
| | 22,847,000 | | |
5.210%, 9/1/2031 | |
| 23,475,292 | |
| | | | |
DTE Electric Securitization Funding II LLC | |
| | |
| | 24,356,102 | | |
5.970%, 3/1/2033 | |
| 25,634,798 | |
| | | | |
Duke Energy Carolinas Nc Storm Funding II LLC | |
| | |
| | 27,367,000 | | |
4.226%, 7/1/2037 | |
| 27,256,684 | |
| | | | |
Elm Trust | |
| | |
| | 896,870 | | |
Series 2020-3A, Class A2, 2.954%, 8/20/2029(a) | |
| 895,581 | |
| | 1,596,291 | | |
Series 2020-4A, Class A2, 2.286%, 10/20/2029(a) | |
| 1,593,407 | |
| | | | |
Golub Capital Partners Funding Ltd. | |
| | |
| | 9,271,113 | | |
Series 2020-1A, Class A2, 3.208%, 1/22/2029(a) | |
| 9,252,914 | |
| | 30,739,956 | | |
Series 2021-1A, Class A2, 2.773%, 4/20/2029(a) | |
| 30,614,813 | |
| | 51,771,693 | | |
Series 2021-2A, Class A, 2.944%, 10/19/2029(a) | |
| 50,818,472 | |
| | | | |
Kansas Gas Service Securitization I LLC | |
| | |
| | 40,864,198 | | |
5.486%, 8/1/2032 | |
| 42,515,671 | |
| | | | |
Monroe Capital Funding Ltd. | |
| | |
| | 18,822,390 | | |
Series 2021-1A, Class A2, 2.815%, 4/22/2031(a) | |
| 18,674,729 | |
| | | | |
Oklahoma Development Finance Authority | |
| | |
| | 23,653,102 | | |
4.135%, 12/1/2033 | |
| 23,421,870 | |
| | 8,426,999 | | |
4.285%, 2/1/2034 | |
| 8,376,841 | |
| | 19,954,608 | | |
3.877%, 5/1/2037 | |
| 19,284,649 | |
| | | | |
PG&E Recovery Funding LLC | |
| | |
| | 31,252,414 | | |
5.045%, 7/15/2032 | |
| 31,994,658 | |
| | 12,226,552 | | |
4.838%, 6/1/2033 | |
| 12,447,657 | |
| | | | |
PG&E Wildfire Recovery Funding LLC | |
| | |
| | 39,088,202 | | |
4.022%, 6/1/2031 | |
| 38,892,760 | |
| | | | |
SBA Tower Trust | |
| | |
| | 14,427,000 | | |
1.631%, 11/15/2026(a) | |
| 13,967,108 | |
| | 17,196,000 | | |
2.328%, 1/15/2028(a) | |
| 16,341,115 | |
| | 12,423,000 | | |
6.599%, 1/15/2028(a) | |
| 12,722,003 | |
| | | | |
SpringCastle America Funding LLC | |
| | |
| | 7,706,529 | | |
Series 2020-AA, Class A, 1.970%, 9/25/2037(a) | |
| 7,291,839 | |
FPA
New Income Fund
SCHEDULE
OF INVESTMENTS - Continued
As
of September 30, 2025
Principal
Amount | | |
| |
Value | |
| | | | |
BONDS & DEBENTURES (Continued) | |
| | |
| | | | |
ASSET-BACKED SECURITIES (Continued) | |
| | |
| | | | |
OTHER (Continued) | |
| | |
| | | | |
Texas Electric Market Stabilization Funding N LLC | |
| | |
| $ | 29,070,560 | | |
4.265%, 8/1/2036(a) | |
$ | 28,924,472 | |
| | | | |
Texas Natural Gas Securitization Finance Corp. | |
| | |
| | 7,556,544 | | |
5.102%, 4/1/2035 | |
| 7,785,485 | |
| | | | |
VCP RRL Ltd. | |
| | |
| | 19,629,727 | | |
Series 2021-1A, Class A, 2.152%, 10/20/2031(a) | |
| 19,130,033 | |
| | | | |
Virginia Power Fuel Securitization LLC | |
| | |
| | 58,246,000 | | |
4.877%, 5/1/2031 | |
| 59,598,938 | |
| | | | |
WEPCo Environmental Trust Finance LLC | |
| | |
| | 8,310,063 | | |
Series 2021-1, Class A, 1.578%, 12/15/2035 | |
| 7,454,683 | |
| | | | |
| |
| 802,289,060 | |
| | | | |
TOTAL ASSET-BACKED SECURITIES | |
| | |
| | | | |
(Cost $2,848,579,107) | |
| 2,896,727,471 | |
| | | | |
COMMERCIAL MORTGAGE-BACKED SECURITIES — 14.9% | |
| | |
| | | | |
AGENCY — 12.3% | |
| | |
| | | | |
Federal Home Loan Mortgage Corp. | |
| | |
| | 41,061,276 | | |
Series K062, Class A2, 3.413%, 12/25/2026 | |
| 40,771,145 | |
| | 16,539,000 | | |
Series K063, Class A2, 3.430%, 1/25/2027(b) | |
| 16,422,981 | |
| | 9,702,802 | | |
Series K065, Class A2, 3.243%, 4/25/2027 | |
| 9,598,103 | |
| | 7,223,000 | | |
Series K066, Class A2, 3.117%, 6/25/2027 | |
| 7,127,130 | |
| | 8,509,735 | | |
Series K068, Class A2, 3.244%, 8/25/2027 | |
| 8,399,516 | |
| | 12,338,034 | | |
Series K072, Class A2, 3.444%, 12/25/2027 | |
| 12,205,970 | |
| | 29,086,020 | | |
Series K073, Class A2, 3.350%, 1/25/2028 | |
| 28,649,474 | |
| | 16,051,256 | | |
Series K076, Class A2, 3.900%, 4/25/2028 | |
| 16,025,110 | |
| | 4,086,000 | | |
Series K077, Class A2, 3.850%, 5/25/2028(b) | |
| 4,078,115 | |
| | 30,559,000 | | |
Series K079, Class A2, 3.926%, 6/25/2028 | |
| 30,514,051 | |
| | 25,020,308 | | |
Series K080, Class A2, 3.926%, 7/25/2028(b) | |
| 24,977,856 | |
| | 62,664,000 | | |
Series K081, Class A2, 3.900%, 8/25/2028(b) | |
| 62,607,822 | |
| | 46,777,000 | | |
Series K082, Class A2, 3.920%, 9/25/2028(b) | |
| 46,760,623 | |
| | 24,028,000 | | |
Series K083, Class A2, 4.050%, 9/25/2028(b) | |
| 24,143,938 | |
| | 68,841,723 | | |
Series K084, Class A2, 3.780%, 10/25/2028(b) | |
| 68,484,923 | |
| | 27,924,000 | | |
Series K085, Class A2, 4.060%, 10/25/2028(b) | |
| 28,058,345 | |
| | 27,195,714 | | |
Series K089, Class A2, 3.563%, 1/25/2029 | |
| 26,831,683 | |
| | 4,691,000 | | |
Series K088, Class A2, 3.690%, 1/25/2029 | |
| 4,642,935 | |
| | 43,626,000 | | |
Series K090, Class A2, 3.422%, 2/25/2029 | |
| 42,959,264 | |
| | 25,293,822 | | |
Series K091, Class A2, 3.505%, 3/25/2029 | |
| 24,907,026 | |
| | 2,376,000 | | |
Series K092, Class A2, 3.298%, 4/25/2029 | |
| 2,325,806 | |
| | 4,294,004 | | |
Series K093, Class A2, 2.982%, 5/25/2029 | |
| 4,163,331 | |
| | 84,442,000 | | |
Series K095, Class A2, 2.785%, 6/25/2029 | |
| 81,129,281 | |
| | 71,380,000 | | |
Series K094, Class A2, 2.903%, 6/25/2029 | |
| 68,853,648 | |
| | 40,814,000 | | |
Series K097, Class A2, 2.508%, 7/25/2029 | |
| 38,650,270 | |
| | 91,996,000 | | |
Series K096, Class A2, 2.519%, 7/25/2029 | |
| 87,461,968 | |
FPA
New Income Fund
SCHEDULE
OF INVESTMENTS - Continued
As
of September 30, 2025
Principal
Amount | | |
| |
Value | |
| | | | |
COMMERCIAL MORTGAGE-BACKED SECURITIES (Continued) | |
| | |
| | | | |
AGENCY (Continued) | |
| | |
| $ | 19,173,000 | | |
Series K099, Class A2, 2.595%, 9/25/2029 | |
$ | 18,227,253 | |
| | 49,942,000 | | |
Series K101, Class A2, 2.524%, 10/25/2029 | |
| 47,168,846 | |
| | 33,400,000 | | |
Series K102, Class A2, 2.537%, 10/25/2029 | |
| 31,577,085 | |
| | 47,045,000 | | |
Series K103, Class A2, 2.651%, 11/25/2029 | |
| 44,591,415 | |
| | 4,756,000 | | |
Series K107, Class A2, 1.639%, 1/25/2030 | |
| 4,327,476 | |
| | 3,071,000 | | |
Series K105, Class A2, 1.872%, 1/25/2030 | |
| 2,808,064 | |
| | 11,740,000 | | |
Series K106, Class A2, 2.069%, 1/25/2030 | |
| 10,852,060 | |
| | 16,200,000 | | |
Series K104, Class A2, 2.253%, 1/25/2030 | |
| 15,137,403 | |
| | 9,186,000 | | |
Series K108, Class A2, 1.517%, 3/25/2030 | |
| 8,307,414 | |
| | 61,806,000 | | |
Series K751, Class A2, 4.412%, 3/25/2030 | |
| 62,697,138 | |
| | 17,591,000 | | |
Series K109, Class A2, 1.558%, 4/25/2030 | |
| 15,847,297 | |
| | 22,485,000 | | |
Series K151, Class A3, 3.511%, 4/25/2030 | |
| 21,845,219 | |
| | 1,742,000 | | |
Series K111, Class A2, 1.350%, 5/25/2030 | |
| 1,552,607 | |
| | 9,465,000 | | |
Series K114, Class A2, 1.366%, 6/25/2030 | |
| 8,371,884 | |
| | 3,768,000 | | |
Series K116, Class A2, 1.378%, 7/25/2030 | |
| 3,331,594 | |
| | 18,741,000 | | |
Series K752, Class A2, 4.284%, 7/25/2030 | |
| 18,820,074 | |
| | 61,809,000 | | |
Series K117, Class A2, 1.406%, 8/25/2030 | |
| 54,580,079 | |
| | 15,691,000 | | |
Series K120, Class A2, 1.500%, 10/25/2030 | |
| 13,871,680 | |
| | 75,127,967 | | |
Series K754, Class A2, 4.940%, 11/25/2030(b) | |
| 77,682,859 | |
| | | | |
| |
| 1,272,347,761 | |
| | | | |
| |
| | |
| | | | |
AGENCY STRIPPED — 0.3% | |
| | |
| | | | |
Government National Mortgage Association | |
| | |
| | 9,206,316 | | |
Series 2014-77, Class IO, 0.518%, 12/16/2047(b) | |
| 71,643 | |
| | 12,166,009 | | |
Series 2012-150, Class IO, 0.441%, 11/16/2052(b) | |
| 174,740 | |
| | 11,537,327 | | |
Series 2012-114, Class IO, 0.609%, 1/16/2053(b) | |
| 158,339 | |
| | 32,911,833 | | |
Series 2012-125, Class IO, 0.174%, 2/16/2053(b) | |
| 222,003 | |
| | 33,178,332 | | |
Series 2012-79, Class IO, 0.350%, 3/16/2053(b) | |
| 382,616 | |
| | 16,209,046 | | |
Series 2013-45, Class IO, 0.047%, 12/16/2053(b) | |
| 3,209 | |
| | 6,444,852 | | |
Series 2013-125, Class IO, 0.248%, 10/16/2054(b) | |
| 95,941 | |
| | 23,556,494 | | |
Series 2014-157, Class IO, 0.185%, 5/16/2055(b) | |
| 140,017 | |
| | 26,404,164 | | |
Series 2014-153, Class IO, 0.320%, 4/16/2056(b) | |
| 264,865 | |
| | 48,370,919 | | |
Series 2014-175, Class IO, 0.462%, 4/16/2056(b) | |
| 648,712 | |
| | 4,792,608 | | |
Series 2014-138, Class IO, 0.508%, 4/16/2056(b) | |
| 78,808 | |
| | 54,915,992 | | |
Series 2014-187, Class IO, 0.615%, 5/16/2056(b) | |
| 1,173,231 | |
| | 4,439,035 | | |
Series 2015-41, Class IO, 0.159%, 9/16/2056(b) | |
| 22,910 | |
| | 1,346,655 | | |
Series 2015-108, Class IO, 0.340%, 10/16/2056(b) | |
| 7,295 | |
| | 10,954,688 | | |
Series 2014-110, Class IO, 0.099%, 1/16/2057(b) | |
| 48,425 | |
| | 26,448,448 | | |
Series 2015-19, Class IO, 0.293%, 1/16/2057(b) | |
| 343,589 | |
| | 9,800,337 | | |
Series 2015-7, Class IO, 0.488%, 1/16/2057(b) | |
| 190,067 | |
| | 42,815,792 | | |
Series 2015-169, Class IO, 0.248%, 7/16/2057(b) | |
| 424,955 | |
| | 7,294,169 | | |
Series 2015-150, Class IO, 0.366%, 9/16/2057(b) | |
| 110,999 | |
| | 28,937,045 | | |
Series 2016-125, Class IO, 0.814%, 12/16/2057(b) | |
| 978,738 | |
FPA
New Income Fund
SCHEDULE
OF INVESTMENTS - Continued
As
of September 30, 2025
Principal
Amount | | |
| |
Value | |
| | | | |
COMMERCIAL MORTGAGE-BACKED SECURITIES (Continued) | |
| | |
| | | | |
AGENCY STRIPPED (Continued) | |
| | |
| $ | 24,255,861 | | |
Series 2016-65, Class IO, 0.459%, 1/16/2058(b) | |
$ | 515,309 | |
| | 79,774,770 | | |
Series 2016-106, Class IO, 0.969%, 9/16/2058(b) | |
| 3,333,333 | |
| | 38,578,920 | | |
Series 2020-43, Class IO, 1.262%, 11/16/2061(b) | |
| 2,755,415 | |
| | 50,646,017 | | |
Series 2020-71, Class IO, 1.094%, 1/16/2062(b) | |
| 3,219,350 | |
| | 96,462,786 | | |
Series 2020-75, Class IO, 0.870%, 2/16/2062(b) | |
| 5,290,000 | |
| | 121,402,166 | | |
Series 2020-42, Class IO, 0.939%, 3/16/2062(b) | |
| 7,387,686 | |
| | | | |
| |
| 28,042,195 | |
| | | | |
| |
| | |
| | | | |
NON-AGENCY — 2.3% | |
| | |
| | | | |
BBCMS Trust | |
| | |
| | 5,394,741 | | |
Series 2015-SRCH, Class A1, 3.312%, 8/10/2035(a) | |
| 5,301,162 | |
| | 9,736,000 | | |
Series 2025-5C36, Class A3, 5.517%, 8/15/2058 | |
| 10,147,721 | |
| | | | |
Benchmark Mortgage Trust | |
| | |
| | 17,340,000 | | |
Series 2024-V11, Class A3, 5.909%, 11/15/2057(b) | |
| 18,219,216 | |
| | | | |
BMO Mortgage Trust | |
| | |
| | 17,350,000 | | |
Series 2024-5C7, Class A3, 5.566%, 11/15/2057(b) | |
| 17,985,779 | |
| | 8,363,000 | | |
Series 2024-5C8, Class A3, 5.625%, 12/15/2057(b) | |
| 8,703,050 | |
| | | | |
BX Commercial Mortgage Trust | |
| | |
| | 27,999,133 | | |
Series 2021-VOLT, Class E, 6.265% (1-Month Term SOFR+211.448 basis points), 9/15/2036(a),(b) | |
| 27,947,334 | |
| | | | |
Progress Residential Trust | |
| | |
| | 13,308,933 | | |
Series 2024-SFR5, Class A, 3.000%, 8/9/2029(a) | |
| 12,614,138 | |
| | 13,629,642 | | |
Series 2021-SFR11, Class A, 2.283%, 1/17/2039(a) | |
| 12,876,923 | |
| | 47,883,127 | | |
Series 2021-SFR10, Class A, 2.393%, 12/17/2040(a) | |
| 45,237,459 | |
| | 16,051,066 | | |
Series 2024-SFR3, Class A, 3.000%, 6/17/2041(a) | |
| 15,250,466 | |
| | 27,192,216 | | |
Series 2024-SFR4, Class A, 3.100%, 7/17/2041(a) | |
| 25,897,930 | |
| | 21,930,985 | | |
Series 2025-SFR2, Class A, 3.305%, 4/17/2042(a) | |
| 20,851,465 | |
| | 16,479,000 | | |
Series 2025-SFR3, Class A, 3.390%, 7/17/2042(a) | |
| 15,651,789 | |
| | | | |
| |
| 236,684,432 | |
| | | | |
TOTAL COMMERCIAL MORTGAGE-BACKED SECURITIES | |
| | |
| | | | |
(Cost $1,524,324,449) | |
| 1,537,074,388 | |
| | | | |
CORPORATE BANK DEBT — 0.2% | |
| | |
| | | | |
Capstone Acquisition Holdings, Inc. Term Loan | |
| | |
| | 19,168,952 | | |
8.763% (1-Month Term SOFR+460 basis points), 11/12/2029(b),(c),(d),(e) | |
| 19,273,269 | |
| | | | |
JC Penney Corp., Inc. | |
| | |
| | 26,526,226 | | |
5.568% (3-Month USD Libor+425 basis points), 6/23/2027*,(b),(c),(d),(e),(f) | |
| 2,653 | |
| | | | |
Lealand Finance Company B.V. Senior Exit LC | |
| | |
| | 9,783,645 | | |
5.250%, 6/30/2027(c),(d),(e),(g),(h) | |
| (978,365 | ) |
| | | | |
McDermott Technology Americas, Inc. | |
| | |
| | 354,541 | | |
8.278% (1-Month Term SOFR+400 basis points), 12/31/2027(b),(c),(d),(e),(i) | |
| 280,088 | |
| | | | |
TOTAL CORPORATE BANK DEBT | |
| | |
| | | | |
(Cost $19,246,022) | |
| 18,577,645 | |
FPA
New Income Fund
SCHEDULE
OF INVESTMENTS - Continued
As
of September 30, 2025
Principal
Amount | | |
| |
Value | |
| | | | |
CORPORATE BONDS — 1.7% | |
| | |
| | | | |
COMMUNICATIONS — 0.0% | |
| | |
| | | | |
Frontier Communications Holdings LLC | |
| | |
| $ | 5,925,000 | | |
5.875%, 10/15/2027(a) | |
$ | 5,917,594 | |
| | | | |
FINANCIALS — 1.6% | |
| | |
| | | | |
Apollo Debt Solutions BDC Senior Notes | |
| | |
| | 26,023,000 | | |
8.620%, 9/28/2028(c),(d) | |
| 26,023,000 | |
| | | | |
Blue Owl Credit Income Corp. | |
| | |
| | 22,579,000 | | |
7.950%, 6/13/2028 | |
| 24,160,361 | |
| | | | |
Hlend Senior Notes | |
| | |
| | 42,500,000 | | |
8.170%, 3/15/2028(c),(d) | |
| 42,500,000 | |
| | | | |
HPS Corporate Lending Fund | |
| | |
| | 24,864,000 | | |
6.750%, 1/30/2029 | |
| 25,913,472 | |
| | | | |
Oaktree Strategic Credit Fund | |
| | |
| | 27,351,000 | | |
8.400%, 11/14/2028 | |
| 29,700,040 | |
| | | | |
OCREDIT BDC Senior Notes | |
| | |
| | 12,891,000 | | |
7.770%, 3/7/2029(c),(d) | |
| 12,891,000 | |
| | | | |
| |
| 161,187,873 | |
| | | | |
HEALTH CARE — 0.1% | |
| | |
| | | | |
Heartland Dental LLC/Heartland Dental Finance Corp. | |
| | |
| | 8,756,000 | | |
10.500% (1-Month Term SOFR+500 basis points), 4/30/2028(a),(d) | |
| 9,226,635 | |
| | | | |
TOTAL CORPORATE BONDS | |
| | |
| | | | |
(Cost $170,227,525) | |
| 176,332,102 | |
| | | | |
RESIDENTIAL MORTGAGE-BACKED SECURITIES — 29.1% | |
| | |
| | | | |
AGENCY COLLATERALIZED MORTGAGE OBLIGATION — 0.7% | |
| | |
| | | | |
Federal National Mortgage Association | |
| | |
| | 162,466 | | |
Series 2010-43, Class MK, 5.500%, 5/25/2040 | |
| 165,014 | |
| | 5,708,072 | | |
Series 3810, Class PE, 4.000%, 2/15/2041 | |
| 5,542,078 | |
| | 775,669 | | |
Series 2012-144, Class PD, 3.500%, 4/25/2042 | |
| 766,852 | |
| | 434,519 | | |
Series 2013-93, Class PJ, 3.000%, 7/25/2042 | |
| 421,082 | |
| | 56,039,951 | | |
Series 2024-70, Class EC, 3.000%, 11/25/2047 | |
| 52,218,693 | |
| | | | |
GS Mortgage-Backed Securities Trust | |
| | |
| | 15,884,735 | | |
Series 2024-95, Class AB, 2.500%, 6/20/2045(a),(b) | |
| 14,531,592 | |
| | | | |
| |
| 73,645,311 | |
| | | | |
| |
| | |
| | | | |
AGENCY POOL ADJUSTABLE RATE — 1.5% | |
| | |
| | | | |
Fannie Mae Pool | |
| | |
| | 2,726,351 | | |
1.728% (30-Day SOFR Average+211 basis points), 7/1/2051(b) | |
| 2,475,271 | |
| | 23,088,566 | | |
1.970% (30-Day SOFR Average+207.4 basis points), 8/1/2051(b) | |
| 21,125,880 | |
| | 1,849,650 | | |
1.604% (30-Day SOFR Average+209.4 basis points), 9/1/2051(b) | |
| 1,668,746 | |
| | 21,281,666 | | |
1.888% (30-Day SOFR Average+233.4 basis points), 4/1/2052(b) | |
| 19,307,236 | |
| | | | |
Freddie Mac Non Gold Pool | |
| | |
| | 8,739,399 | | |
1.662% (30-Day SOFR Average+213 basis points), 9/1/2051(b) | |
| 7,895,132 | |
| | 10,623,064 | | |
2.556% (30-Day SOFR Average+213 basis points), 3/1/2052(b) | |
| 9,831,621 | |
| | 7,493,785 | | |
2.545% (30-Day SOFR Average+214 basis points), 5/1/2052(b) | |
| 6,946,199 | |
FPA
New Income Fund
SCHEDULE
OF INVESTMENTS - Continued
As
of September 30, 2025
Principal
Amount | | |
| |
Value | |
| | | | |
RESIDENTIAL MORTGAGE-BACKED SECURITIES (Continued) | |
| | |
| | | | |
AGENCY POOL ADJUSTABLE RATE (Continued) | |
| | |
| $ | 74,031,638 | | |
2.158% (30-Day SOFR Average+217.8 basis points), 7/1/2052(b) | |
$ | 67,507,577 | |
| | 9,049,402 | | |
3.334% (30-Day SOFR Average+222.4 basis points), 11/1/2052(b) | |
| 8,659,580 | |
| | 10,916,651 | | |
2.164% (30-Day SOFR Average+217.9 basis points), 5/1/2053(b) | |
| 9,956,551 | |
| | | | |
| |
| 155,373,793 | |
| | | | |
| |
| | |
| | | | |
AGENCY POOL FIXED RATE — 20.5% | |
| | |
| | | | |
Fannie Mae Pool | |
| | |
| | 65,832,876 | | |
1.500%, 12/1/2035 | |
| 59,195,269 | |
| | 13,155,706 | | |
1.500%, 12/1/2035 | |
| 11,800,503 | |
| | 1,918,162 | | |
1.500%, 3/1/2036 | |
| 1,721,766 | |
| | 15,012,292 | | |
1.000%, 4/1/2036 | |
| 13,060,210 | |
| | 4,913,996 | | |
1.500%, 4/1/2036 | |
| 4,410,864 | |
| | 15,957,741 | | |
1.500%, 4/1/2036 | |
| 14,323,867 | |
| | 11,595,845 | | |
1.500%, 5/1/2036 | |
| 10,408,574 | |
| | 25,349,730 | | |
1.500%, 6/1/2036 | |
| 22,754,232 | |
| | 5,560,014 | | |
1.500%, 6/1/2036 | |
| 4,990,738 | |
| | 9,853,759 | | |
1.500%, 7/1/2036 | |
| 8,844,856 | |
| | 89,192,729 | | |
1.500%, 8/1/2036 | |
| 80,199,863 | |
| | 6,434,393 | | |
1.500%, 8/1/2036 | |
| 5,769,559 | |
| | 23,313,868 | | |
1.000%, 9/1/2036 | |
| 20,218,642 | |
| | 11,124,941 | | |
1.500%, 9/1/2036 | |
| 9,975,455 | |
| | 26,625,599 | | |
1.500%, 10/1/2036 | |
| 23,874,506 | |
| | 14,355,977 | | |
1.000%, 11/1/2036 | |
| 12,396,145 | |
| | 93,119,099 | | |
1.000%, 12/1/2036 | |
| 80,408,091 | |
| | 131,244,147 | | |
1.000%, 3/1/2037 | |
| 113,328,967 | |
| | 59,151,090 | | |
1.500%, 3/1/2037 | |
| 53,094,752 | |
| | 44,493,259 | | |
1.500%, 8/1/2037 | |
| 39,868,180 | |
| | 11,294,775 | | |
2.000%, 6/1/2040 | |
| 9,908,559 | |
| | 4,212,051 | | |
2.000%, 9/1/2040 | |
| 3,689,120 | |
| | 4,571,743 | | |
2.000%, 10/1/2040 | |
| 4,002,201 | |
| | 13,294,691 | | |
2.000%, 10/1/2040 | |
| 11,642,154 | |
| | 3,317,424 | | |
1.500%, 11/1/2040 | |
| 2,809,472 | |
| | 21,793,159 | | |
2.000%, 11/1/2040 | |
| 19,067,162 | |
| | 13,687,111 | | |
1.500%, 12/1/2040 | |
| 11,582,373 | |
| | 16,365,672 | | |
2.000%, 12/1/2040 | |
| 14,308,974 | |
| | 4,683,970 | | |
1.500%, 1/1/2041 | |
| 3,960,725 | |
| | 13,012,255 | | |
1.500%, 2/1/2041 | |
| 10,994,546 | |
| | 15,166,819 | | |
1.500%, 5/1/2041 | |
| 12,773,251 | |
| | 14,489,855 | | |
2.500%, 5/1/2041 | |
| 12,997,855 | |
| | 8,779,962 | | |
2.000%, 7/1/2041 | |
| 7,641,109 | |
| | 59,562,857 | | |
2.000%, 9/1/2041 | |
| 52,099,250 | |
| | 58,008,725 | | |
1.500%, 10/1/2041 | |
| 48,651,540 | |
| | 85,988,241 | | |
1.500%, 11/1/2041 | |
| 72,069,470 | |
FPA
New Income Fund
SCHEDULE
OF INVESTMENTS - Continued
As
of September 30, 2025
Principal
Amount | | |
| |
Value | |
| | | | |
RESIDENTIAL MORTGAGE-BACKED SECURITIES (Continued) | |
| | |
| | | | |
AGENCY POOL FIXED RATE (Continued) | |
| | |
| $ | 6,275,078 | | |
1.500%, 12/1/2041 | |
$ | 5,255,428 | |
| | 5,803,688 | | |
1.500%, 3/1/2042 | |
| 4,867,329 | |
| | 18,488,064 | | |
1.500%, 3/1/2042 | |
| 15,621,142 | |
| | 28,808,470 | | |
1.500%, 3/1/2042 | |
| 24,199,221 | |
| | 42,825,645 | | |
1.500%, 3/1/2042 | |
| 35,976,865 | |
| | 51,950,048 | | |
1.500%, 3/1/2042 | |
| 43,564,406 | |
| | 20,605,793 | | |
2.000%, 8/1/2042 | |
| 17,893,653 | |
| | 57,647,194 | | |
2.000%, 8/1/2042 | |
| 49,882,578 | |
| | 29,012,253 | | |
3.500%, 4/1/2044 | |
| 27,372,645 | |
| | 38,614,353 | | |
4.000%, 6/1/2045 | |
| 37,725,620 | |
| | 67,097,350 | | |
4.000%, 3/1/2046 | |
| 65,574,200 | |
| | 8,249,818 | | |
4.000%, 7/1/2046 | |
| 8,055,586 | |
| | 9,525,465 | | |
4.000%, 10/1/2046 | |
| 9,300,414 | |
| | 5,233,554 | | |
4.000%, 10/1/2046 | |
| 5,113,210 | |
| | 7,917,341 | | |
4.000%, 3/1/2048 | |
| 7,724,312 | |
| | 34,138,705 | | |
4.500%, 1/1/2050 | |
| 34,191,756 | |
| | 30,233,454 | | |
4.500%, 1/1/2050 | |
| 30,283,373 | |
| | | | |
Freddie Mac Pool | |
| | |
| | 269,639 | | |
2.500%, 8/1/2028 | |
| 264,749 | |
| | 87,831,420 | | |
1.500%, 11/1/2035 | |
| 79,167,940 | |
| | 6,470,252 | | |
1.500%, 11/1/2035 | |
| 5,803,735 | |
| | 22,986,616 | | |
1.500%, 1/1/2036 | |
| 20,646,576 | |
| | 2,956,170 | | |
1.500%, 4/1/2036 | |
| 2,653,495 | |
| | 4,884,879 | | |
1.500%, 5/1/2036 | |
| 4,384,728 | |
| | 14,638,595 | | |
1.500%, 6/1/2036 | |
| 13,107,763 | |
| | 5,795,972 | | |
1.000%, 7/1/2036 | |
| 5,020,778 | |
| | 26,444,996 | | |
1.500%, 8/1/2036 | |
| 23,712,564 | |
| | 8,737,568 | | |
1.000%, 10/1/2036 | |
| 7,592,895 | |
| | 19,602,320 | | |
1.500%, 10/1/2036 | |
| 17,576,908 | |
| | 59,207,728 | | |
1.500%, 10/1/2036 | |
| 53,145,591 | |
| | 5,796,833 | | |
1.500%, 11/1/2036 | |
| 5,212,366 | |
| | 18,009,774 | | |
2.000%, 6/1/2040 | |
| 15,800,661 | |
| | 3,947,841 | | |
2.000%, 8/1/2040 | |
| 3,459,297 | |
| | 2,813,021 | | |
4.000%, 10/1/2040 | |
| 2,750,371 | |
| | 10,375,973 | | |
1.500%, 11/1/2040 | |
| 8,794,631 | |
| | 2,546,442 | | |
4.000%, 11/1/2040 | |
| 2,490,611 | |
| | 5,878,355 | | |
2.000%, 12/1/2040 | |
| 5,139,155 | |
| | 4,055,335 | | |
4.000%, 12/1/2040 | |
| 3,962,487 | |
| | 3,885,313 | | |
1.500%, 2/1/2041 | |
| 3,287,899 | |
| | 32,775,375 | | |
1.500%, 3/1/2041 | |
| 27,657,104 | |
| | 86,649,151 | | |
1.500%, 3/1/2041 | |
| 73,210,847 | |
| | 24,556,878 | | |
1.500%, 4/1/2041 | |
| 20,706,065 | |
| | 76,011,475 | | |
1.500%, 5/1/2041 | |
| 64,053,350 | |
FPA
New Income Fund
SCHEDULE
OF INVESTMENTS - Continued
As
of September 30, 2025
Principal
Amount | | |
| |
Value | |
| | | | |
RESIDENTIAL MORTGAGE-BACKED SECURITIES (Continued) | |
| | |
| | | | |
AGENCY POOL FIXED RATE (Continued) | |
| | |
| $ | 70,664,049 | | |
1.500%, 6/1/2041 | |
$ | 59,496,840 | |
| | 10,692,058 | | |
1.500%, 7/1/2041 | |
| 8,993,580 | |
| | 6,805,508 | | |
2.000%, 8/1/2041 | |
| 5,916,132 | |
| | 11,274,571 | | |
1.500%, 10/1/2041 | |
| 9,455,989 | |
| | 4,132,720 | | |
1.500%, 11/1/2041 | |
| 3,482,124 | |
| | 16,534,923 | | |
1.500%, 11/1/2041 | |
| 13,858,683 | |
| | 63,602,337 | | |
1.500%, 12/1/2041 | |
| 53,275,804 | |
| | 30,493,669 | | |
1.500%, 12/1/2041 | |
| 25,731,610 | |
| | 5,113,995 | | |
1.500%, 1/1/2042 | |
| 4,298,856 | |
| | 35,909,359 | | |
1.500%, 1/1/2042 | |
| 30,141,706 | |
| | 36,899,467 | | |
2.000%, 5/1/2042 | |
| 32,041,379 | |
| | 25,092,859 | | |
2.000%, 8/1/2042 | |
| 21,777,126 | |
| | 18,577,515 | | |
2.000%, 8/1/2042 | |
| 16,162,047 | |
| | 42,811,843 | | |
4.500%, 12/1/2045 | |
| 42,882,696 | |
| | | | |
| |
| 2,108,561,676 | |
| | | | |
| |
| | |
| | | | |
NON-AGENCY COLLATERALIZED MORTGAGE OBLIGATION — 6.4% | |
| | |
| | | | |
Citigroup Mortgage Loan Trust | |
| | |
| | 1,634,246 | | |
Series 2014-A, Class A, 4.000%, 1/25/2035(a),(b) | |
| 1,603,161 | |
| | | | |
GS Mortgage-Backed Securities Trust | |
| | |
| | 8,456,150 | | |
Series 2021-PJ4, Class A8, 2.500%, 9/25/2051(a),(b) | |
| 7,591,488 | |
| | 33,142,284 | | |
Series 2021-PJ5, Class A8, 2.500%, 10/25/2051(a),(b) | |
| 29,726,793 | |
| | 35,999,670 | | |
Series 2021-PJ6, Class A8, 2.500%, 11/25/2051(a),(b) | |
| 32,226,527 | |
| | 28,784,395 | | |
Series 2021-PJ7, Class A8, 2.500%, 1/25/2052(a),(b) | |
| 25,713,396 | |
| | 9,785,088 | | |
Series 2021-PJ10, Class A8, 2.500%, 3/25/2052(a),(b) | |
| 8,726,031 | |
| | 6,149,418 | | |
Series 2022-PJ1, Class A8, 2.500%, 5/28/2052(a),(b) | |
| 5,462,317 | |
| | 13,460,659 | | |
Series 2022-PJ2, Class A24, 3.000%, 6/25/2052(a),(b) | |
| 12,267,043 | |
| | 10,290,122 | | |
Series 2022-PJ3, Class A22, 2.500%, 8/25/2052(a),(b) | |
| 9,158,996 | |
| | 5,318,919 | | |
Series 2022-PJ3, Class A24, 3.000%, 8/25/2052(a),(b) | |
| 4,842,142 | |
| | 33,830,234 | | |
Series 2022-PJ4, Class A22, 2.500%, 9/25/2052(a),(b) | |
| 30,050,102 | |
| | 6,319,429 | | |
Series 2022-PJ4, Class A24, 3.000%, 9/25/2052(a),(b) | |
| 5,743,434 | |
| | 77,034,793 | | |
Series 2022-PJ5, Class A22, 2.500%, 10/25/2052(a),(b) | |
| 68,223,168 | |
| | 49,683,283 | | |
Series 2022-PJ6, Class A15, 2.500%, 1/25/2053(a),(b) | |
| 44,025,390 | |
| | | | |
J.P. Morgan Mortgage Trust | |
| | |
| | 4,966,883 | | |
Series 2021-6, Class A4, 2.500%, 10/25/2051(a),(b) | |
| 4,464,831 | |
| | 10,653,789 | | |
Series 2021-7, Class A4, 2.500%, 11/25/2051(a),(b) | |
| 9,566,662 | |
| | 15,654,256 | | |
Series 2021-10, Class A4A, 2.000%, 12/25/2051(a),(b) | |
| 13,687,787 | |
| | 42,085,210 | | |
Series 2021-10, Class A4, 2.500%, 12/25/2051(a),(b) | |
| 37,624,278 | |
| | 11,400,493 | | |
Series 2021-8, Class A4, 2.500%, 12/25/2051(a),(b) | |
| 10,231,705 | |
| | 52,565,230 | | |
Series 2021-11, Class A4, 2.500%, 1/25/2052(a),(b) | |
| 47,110,368 | |
| | 58,014,547 | | |
Series 2021-13, Class A4, 2.500%, 4/25/2052(a),(b) | |
| 52,104,814 | |
| | 3,297,015 | | |
Series 2021-15, Class A4, 2.500%, 6/25/2052(a),(b) | |
| 2,941,864 | |
| | 3,070,457 | | |
Series 2022-3, Class A4A, 2.500%, 8/25/2052(a),(b) | |
| 2,730,389 | |
FPA
New Income Fund
SCHEDULE
OF INVESTMENTS - Continued
As
of September 30, 2025
Principal
Amount | | |
| |
Value | |
| | | | |
RESIDENTIAL MORTGAGE-BACKED SECURITIES (Continued) | |
| | |
| | | | |
NON-AGENCY COLLATERALIZED MORTGAGE OBLIGATION (Continued) | |
| | |
| $ | 5,537,663 | | |
Series 2022-4, Class A4, 3.000%, 10/25/2052(a),(b) | |
$ | 5,039,214 | |
| | 28,069,987 | | |
Series 2024-3, Class A4, 3.000%, 5/25/2054(a),(b) | |
| 25,511,352 | |
| | 26,760,962 | | |
Series 2025-1, Class A4, 3.692%, 1/25/2063(a),(b) | |
| 25,134,321 | |
| | | | |
OBX 2021-J3 Trust | |
| | |
| | 1,414,635 | | |
Series 2021-J3, Class A4, 2.500%, 10/25/2051(a),(b) | |
| 1,266,345 | |
| | | | |
OBX 2022-J1 Trust | |
| | |
| | 39,355,928 | | |
Series 2022-J1, Class A3, 3.000%, 2/25/2052(a),(b) | |
| 35,710,699 | |
| | | | |
Pretium Mortgage Credit Partners LLC | |
| | |
| | 7,341,807 | | |
Series 2024-RPL1, Class A1, 3.900%, 10/25/2063(a),(b) | |
| 7,045,235 | |
| | | | |
Sequoia Mortgage Trust | |
| | |
| | 4,541,211 | | |
Series 2021-5, Class A4, 2.500%, 7/25/2051(a),(b) | |
| 4,066,264 | |
| | 4,254,369 | | |
Series 2022-1, Class A4, 2.500%, 2/25/2052(a),(b) | |
| 3,783,950 | |
| | 48,705,814 | | |
Series 2025-S1, Class A4, 2.500%, 9/25/2054(a),(b) | |
| 43,224,443 | |
| | | | |
Towd Point Mortgage Trust | |
| | |
| | 6,481,986 | | |
Series 2020-4, Class A1, 1.750%, 10/25/2060(a) | |
| 5,933,459 | |
| | 18,046,772 | | |
Series 2023-1, Class A1, 3.750%, 1/25/2063(a) | |
| 17,481,957 | |
| | | | |
Wells Fargo Mortgage Backed Securities | |
| | |
| | 5,892,104 | | |
Series 2021-2, Class A3, 2.500%, 6/25/2051(a),(b) | |
| 5,264,701 | |
| | 2,499,354 | | |
Series 2022-1, Class A3, 2.500%, 8/25/2051(a),(b) | |
| 2,223,032 | |
| | 12,989,768 | | |
Series 2022-2, Class A4, 2.500%, 12/25/2051(a),(b) | |
| 11,523,679 | |
| | | | |
| |
| 659,031,337 | |
| | | | |
TOTAL RESIDENTIAL MORTGAGE-BACKED SECURITIES | |
| | |
| | | | |
(Cost $2,917,101,571) | |
| 2,996,612,117 | |
| | | | |
U.S. TREASURY NOTES & BONDS — 17.1% | |
| | |
| | | | |
U.S. Treasury Note | |
| | |
| | 1,178,095,000 | | |
3.875%, 6/30/2030 | |
| 1,185,374,685 | |
| | 317,008,000 | | |
3.625%, 8/31/2030 | |
| 315,472,413 | |
| | 149,720,000 | | |
3.625%, 9/30/2030 | |
| 148,959,707 | |
| | 106,471,000 | | |
4.625%, 9/30/2030 | |
| 110,663,924 | |
| | | | |
TOTAL U.S. TREASURY NOTES & BONDS | |
| | |
| | | | |
(Cost $1,743,086,457) | |
| 1,760,470,729 | |
| | | | |
TOTAL BONDS & DEBENTURES | |
| | |
| | | | |
(Cost $9,222,565,131) | |
| 9,385,794,452 | |
| | | | |
| |
| | |
Number
of Shares
| | |
| |
| | |
| | | | |
COMMON STOCKS — 1.8% | |
| | |
| | | | |
METALS & MINING — 0.5% | |
| | |
| | 39,831,957 | | |
AIPCF VIII A-BL Aggregator Cayman LP (c),(d),(j) | |
| 49,921,392 | |
| | | | |
REAL ESTATE SERVICES — 0.1% | |
| | |
| | 520,208 | | |
Copper Property CTL Pass Through Trust(d) | |
| 6,455,781 | |
FPA
New Income Fund
SCHEDULE
OF INVESTMENTS - Continued
As
of September 30, 2025
Number
of Shares | | |
| |
Value | |
| | | | |
COMMON STOCKS (Continued) | |
| | |
| | | | |
TRANSPORTATION & LOGISTICS — 1.2% | |
| | |
| | 3,806,420 | | |
PHI Group, Inc.(c),(d),(j) | |
$ | 121,805,440 | |
| | | | |
TOTAL COMMON STOCKS | |
| | |
| | | | |
(Cost $125,200,428) | |
| 178,182,613 | |
| | | | |
SHORT-TERM INVESTMENTS — 6.7% | |
| | |
| | | | |
MONEY MARKET INVESTMENTS — 0.2% | |
| | |
| | 18,085,493 | | |
Morgan Stanley Institutional Liquidity Treasury Portfolio - Institutional Class, 3.92%(k) | |
| 18,085,493 | |
| | | | |
| |
| | |
Principal
Amount | | |
| |
| | |
| | | | |
TREASURY BILLS — 6.5% | |
| | |
| | | | |
U.S. Treasury Bill | |
| | |
| $ | 297,713,000 | | |
4.02%, 10/2/2025(l) | |
| 297,680,231 | |
| | 375,458,000 | | |
4.08%, 10/9/2025(l) | |
| 375,122,591 | |
| | | | |
| |
| 672,802,822 | |
| | | | |
TOTAL SHORT-TERM INVESTMENTS | |
| | |
| | | | |
(Cost $690,888,315) | |
| 690,888,315 | |
| | | | |
| |
| | |
| | | | |
TOTAL INVESTMENTS — 99.7% | |
| | |
| | | | |
(Cost $10,038,653,874) | |
| 10,254,865,380 | |
| | | | |
| |
| | |
| | | | |
Other Assets in Excess of Liabilities — 0.3% | |
| 33,711,778 | |
| | | | |
TOTAL NET ASSETS — 100.0% | |
$ | 10,288,577,158 | |
BDC
– Business Development Company
IO
– Interest Only
LLC
– Limited Liability Company
LP
– Limited Partnership
US
– United States
| * | Non-income
producing security. |
| (a) | Security
exempt from registration under Rule 144A of the Securities Act of 1933. These securities are restricted and may be resold in transactions
exempt from registration normally to qualified institutional buyers. The total value of these securities is $2,893,779,496, which
represents 28.13% of Total Net Assets. |
| (b) | Variable
or floating rate security. |
| (c) | The
value of these securities was determined using significant unobservable inputs. These are reported as Level 3 securities in the
Fair Value Hierarchy. |
| (d) | Restricted
securities. These restricted securities, most of which are considered liquid by the Adviser, are not registered and may not be
sold to the public. There are legal and/or contractual restrictions on resale. The Fund does not have the right to demand that
such securities be registered. The values of these securities are determined by valuations provided by pricing services, brokers,
dealers, market makers, or in good faith under policies adopted by authority of the Fund's Board of Trustees. The total value
of these securities is $295,265,847, which represents 2.87% of Total Net Assets. |
FPA
New Income Fund
SCHEDULE
OF INVESTMENTS - Continued
As
of September 30, 2025
| (e) | Bank
loans generally pay interest at rates which are periodically determined by reference to a base lending rate plus a premium. All
loans carry a variable rate of interest. These base lending rates are generally (i) the Prime Rate offered by one or more major
United States banks, (ii) the lending rate offered by one or more European banks such as the London Interbank Offered Rate (“LIBOR”),
(iii) the Certificate of Deposit rate, or (iv) Secured Overnight Financing Rate (“SOFR”). Bank Loans, while exempt
from registration, under the Securities Act of 1933, contain certain restrictions on resale and cannot be sold publicly. Floating
rate bank loans often require prepayments from excess cash flow or permit the borrower to repay at its election. The degree to
which borrowers repay, whether as a contractual requirement or at their election, cannot be predicted with accuracy. |
| (f) | Security
is in default. |
| (g) | As
of September 30, 2025, the Fund had entered into commitments to fund various delayed draw debt-related investments. Such commitments
are subject to the satisfaction of certain conditions set forth in the documents governing those investments and there can be
no assurance that such conditions will be satisfied. See Note 8 of the Notes to Financial Statements for further information on
these commitments and contingencies. |
| (h) | All
or a portion of the loan is unfunded. |
| (i) | Payment-in-kind
interest is generally paid by issuing additional par/shares of the security rather than paying cash. |
| (k) | The
rate is the annualized seven-day yield at period end. |
| (l) | Treasury
bill discount rate. |
See
accompanying Notes to Financial Statements.
FPA
New Income Fund
STATEMENT
OF ASSETS AND LIABILITIES
As
of September 30, 2025
| Assets: | |
| |
| Investments, at value (cost $9,939,205,843) | |
$ | 10,083,138,548 | |
| Investments in affiliates, at value (cost $99,448,031) | |
| 171,726,832 | |
| Cash | |
| 2,287,351 | |
| Receivables: | |
| | |
| Investment securities sold | |
| 957,830 | |
| Fund shares sold | |
| 9,514,126 | |
| Dividends and interest | |
| 39,745,235 | |
| Prepaid expenses | |
| 145,221 | |
| Total assets | |
| 10,307,515,143 | |
| | |
| | |
| Liabilities: | |
| | |
| Payables: | |
| | |
| Fund shares redeemed | |
| 14,217,441 | |
| Advisory fees | |
| 3,006,062 | |
| Shareholder servicing fees (Note 7) | |
| 1,037,077 | |
| Fund services fees | |
| 270,002 | |
| Shareholder reporting fees | |
| 79,438 | |
| Trustees' deferred compensation (Note 3) | |
| 36,400 | |
| Auditing fees | |
| 18,000 | |
| Trustees' fees and expenses | |
| 12,409 | |
| Chief Compliance Officer fees | |
| 7,567 | |
| Legal fees | |
| 3,315 | |
| Accrued other expenses | |
| 250,274 | |
| Total liabilities | |
| 18,937,985 | |
| Commitments and contingencies (Note 8) | |
| | |
| Net Assets | |
$ | 10,288,577,158 | |
| | |
| | |
| Components of Net Assets: | |
| | |
| Capital Stock — par value $0.01 per share; authorized
1,500,000,000 shares; outstanding 1,020,139,947 shares | |
$ | 10,746,278,566 | |
| Total distributable earnings (accumulated deficit) | |
| (457,701,408 | ) |
| Net Assets | |
$ | 10,288,577,158 | |
| | |
| | |
| Maximum Offering Price per Share: | |
| | |
| Investor Class Shares: | |
| | |
| Net assets applicable to shares outstanding | |
$ | 29,219,510 | |
| Shares of beneficial interest issued and outstanding | |
| 2,890,553 | |
| Redemption price per share | |
$ | 10.11 | |
| | |
| | |
| Institutional Class Shares: | |
| | |
| Net assets applicable to shares outstanding | |
$ | 10,259,357,648 | |
| Shares of beneficial interest issued and outstanding | |
| 1,017,249,395 | |
| Redemption price per share | |
$ | 10.09 | |
See
accompanying Notes to Financial Statements.
FPA
New Income Fund
STATEMENT
OF OPERATIONS
For
the Year Ended September 30, 2025
| Investment income: | |
| |
| Interest | |
$ | 427,252,949 | |
| Dividends from affiliated issuers | |
| 3,806,420 | |
| Dividends | |
| 1,042,932 | |
| Total investment income | |
| 432,102,301 | |
| | |
| | |
| Expenses: | |
| | |
| Advisory fees | |
| 45,361,090 | |
| Shareholder servicing fees - Investor Class (Note 7) | |
| 42,346 | |
| Shareholder servicing fees - Institutional Class (Note 7) | |
| 5,512,155 | |
| Fund services fees | |
| 1,260,338 | |
| Shareholder reporting fees | |
| 271,663 | |
| Registration fees | |
| 271,070 | |
| Trustees' fees and expenses | |
| 150,114 | |
| Miscellaneous | |
| 75,228 | |
| Insurance fees | |
| 73,678 | |
| Legal fees | |
| 66,885 | |
| Chief Compliance Officer fees | |
| 19,355 | |
| Auditing fees | |
| 19,000 | |
| Interest expense | |
| 6,940 | |
| Total expenses | |
| 53,129,862 | |
| Advisory fees waived and shareholder servicing fees reimbursed (Note 3 and 7) | |
| (11,918,064 | ) |
| Net expenses | |
| 41,211,798 | |
| Net investment income (loss) | |
| 390,890,503 | |
| | |
| | |
| Realized and Unrealized Gain (Loss): | |
| | |
| Net realized gain (loss) on: | |
| | |
| Investments | |
| 3,449,589 | |
| Total realized gain (loss) | |
| 3,449,589 | |
| Net change in unrealized appreciation (depreciation) on: | |
| | |
| Investments | |
| 13,231,480 | |
| Investments in affiliated issuers | |
| 45,637,040 | |
| Net change in unrealized appreciation (depreciation) | |
| 58,868,520 | |
| Net realized and unrealized gain (loss) | |
| 62,318,109 | |
| | |
| | |
| Net Increase (Decrease) in Net Assets from Operations | |
$ | 453,208,612 | |
See
accompanying Notes to Financial Statements.
FPA
New Income Fund
STATEMENTS
OF CHANGES IN NET ASSETS
| | |
For the Year Ended September 30, 2025 | | |
For the Year Ended September 30, 2024 | |
| Increase (Decrease) in Net Assets from: | |
| | | |
| | |
| Operations: | |
| | | |
| | |
| Net investment income (loss) | |
$ | 390,890,503 | | |
$ | 375,281,039 | |
| Total realized gain (loss) on investments and
Investments in affiliated issuers - realized | |
| 3,449,589 | | |
| (48,558,580 | ) |
| Net change in unrealized
appreciation (depreciation) on investments and Investments in affiliated issuers - unrealized | |
| 58,868,520 | | |
| 442,858,789 | |
| Net increase (decrease) in net assets resulting from operations | |
| 453,208,612 | | |
| 769,581,248 | |
| | |
| | | |
| | |
| Distributions to Shareholders: | |
| | | |
| | |
| Distributions: | |
| | | |
| | |
| Investor Class | |
| (653,513 | ) | |
| (70,719 | )1 |
| Institutional Class | |
| (369,436,565 | ) | |
| (348,540,473 | )2 |
| Total distributions to shareholders | |
| (370,090,078 | ) | |
| (348,611,192 | ) |
| | |
| | | |
| | |
| Capital Transactions: | |
| | | |
| | |
| Net proceeds from shares sold: | |
| | | |
| | |
| Investor Class | |
| 26,790,740 | | |
| 11,079,132 | 1 |
| Institutional Class | |
| 3,275,851,451 | | |
| 2,465,183,765 | 2 |
| Reinvestment of distributions: | |
| | | |
| | |
| Investor Class | |
| 525,220 | | |
| 45,135 | 1 |
| Institutional Class | |
| 324,630,316 | | |
| 302,676,804 | 2 |
| Cost of shares redeemed: | |
| | | |
| | |
| Investor Class | |
| (8,512,295 | ) | |
| (1,169,168 | )1 |
| Institutional Class | |
| (2,170,166,498 | ) | |
| (2,261,511,387 | )2 |
| Net increase (decrease) in net assets from capital transactions | |
| 1,449,118,934 | | |
| 516,304,28 | 1 |
| | |
| | | |
| | |
| Total increase (decrease) in net assets | |
| 1,532,237,468 | | |
| 937,274,337 | |
| | |
| | | |
| | |
| Net Assets: | |
| | | |
| | |
| Beginning of period | |
| 8,756,339,690 | | |
| 7,819,065,353 | |
| End of period | |
$ | 10,288,577,158 | | |
$ | 8,756,339,690 | |
| | |
| | | |
| | |
| Capital Share Transactions: | |
| | | |
| | |
| Shares sold: | |
| | | |
| | |
| Investor Class | |
| 2,689,720 | | |
| 1,117,131 | 1 |
| Institutional Class | |
| 329,511,487 | | |
| 253,058,848 | 2 |
| Shares reinvested: | |
| | | |
| | |
| Investor Class | |
| 52,771 | | |
| 4,518 | 1 |
| Institutional Class | |
| 32,795,272 | | |
| 31,103,997 | 2 |
| Shares redeemed: | |
| | | |
| | |
| Investor Class | |
| (856,888 | ) | |
| (116,699 | )1 |
| Institutional Class | |
| (219,207,441 | ) | |
| (232,217,355 | )2 |
| Net increase (decrease) in capital share transactions | |
| 144,984,921 | | |
| 52,950,440 | |
| 1 | The
Investor Class commenced operations on April 30, 2024. The data shown reflects operations
for the period April 30, 2024 to September 30, 2024. |
| 2 | All
existing class of shares were designated as Institutional Class Shares, effective April
30, 2024. The ticker symbol for Institutional Class Shares remains "FPNIX". |
See
accompanying Notes to Financial Statements.
FPA
New Income Fund
FINANCIAL
HIGHLIGHTS
Investor
Class
Per
share operating performance.
For a capital share outstanding throughout each period.
| | |
For the Year Ended September 30, | | |
For
the Period Ended September 30, | |
| | |
2025 | | |
20241 | |
| Net asset value, beginning of period | |
$ | 10.02 | | |
$ | 9.63 | |
| Income from Investment Operations: | |
| | | |
| | |
| Net investment income (loss)2 | |
| 0.42 | | |
| 0.18 | |
| Net realized and unrealized gain | |
| 0.06 | | |
| 0.37 | |
| Total from investment operations | |
| 0.48 | | |
| 0.55 | |
| | |
| | | |
| | |
| Less Distributions: | |
| | | |
| | |
| From net investment income | |
| (0.39 | ) | |
| (0.16 | ) |
| Total distributions | |
| (0.39 | ) | |
| (0.16 | ) |
| Net asset value, end of period | |
$ | 10.11 | | |
$ | 10.02 | |
| | |
| | | |
| | |
| Total return3 | |
| 4.93 | % | |
| 5.80 | %4 |
| | |
| | | |
| | |
| Ratios and Supplemental Data: | |
| | | |
| | |
| Net assets, end of period (in thousands) | |
$ | 29,220 | | |
$ | 10,072 | |
| | |
| | | |
| | |
| Ratio of expenses to average net assets: | |
| | | |
| | |
| Before fees waived and expenses absorbed | |
| 0.77 | %5 | |
| 0.78 | %6 |
| After fees waived and expenses absorbed | |
| 0.55 | %5,7 | |
| 0.55 | %8 |
| Ratio of net investment income (loss) to average net assets: | |
| | | |
| | |
| Before fees waived and expenses absorbed | |
| 3.99 | % | |
| 4.15 | %6 |
| After fees waived and expenses absorbed | |
| 4.21 | % | |
| 4.38 | %6 |
| | |
| | | |
| | |
| Portfolio turnover rate | |
| 41 | % | |
| 63 | %4 |
| 1 | The
Investor Class commenced operations on April 30, 2024. The data shown reflects operations
for the period April 30, 2024 to September 30, 2024. |
| 2 | Based
on average shares outstanding for the period. |
| 3 | Total
returns would have been higher/lower had expenses not been recovered/waived and absorbed
by the Advisor. Returns shown do not reflect the deduction of taxes that a shareholder
would pay on Fund distributions or the redemption of Fund shares. |
| 5 | If
interest expense had been excluded, the expense ratios would have been lowered by 0.00%
for the year ended September 30, 2025. |
| 7 | The
Adviser has contractually agreed to reimburse the Fund for Total Annual Fund Operating
Expenses (excluding interest, taxes, brokerage fees and commissions payable by the Fund
in connection with the purchase or sale of portfolio securities, and extraordinary expenses,
including litigation expenses not incurred in the Fund's ordinary course of business)
in excess of 0.554% of the average daily net assets of the Investor Class shares of the
Fund from through January 31, 2026. This agreement may only be terminated earlier by
the Fund's Board of Trustees (the "Board") or upon termination of the Advisory
Agreement. |
| 8 | The
Adviser has contractually agreed to reimburse the Fund for Total Annual Fund Operating
Expenses (excluding interest, taxes, brokerage fees and commissions payable by the Fund
in connection with the purchase or sale of portfolio securities, and extraordinary expenses,
including litigation expenses not incurred in the Fund's ordinary course of business)
in excess of 0.55% of the average daily net assets of the Investor Class shares of the
Fund from inception through July 27, 2024, and in excess of 0.554% of the average daily
net assets of the Investor Class shares of the Fund from July 28, 2024 through April
30, 2025. This agreement may only be terminated earlier by the Fund's Board of Trustees
(the "Board") or upon termination of the Advisory Agreement. |
See
accompanying Notes to Financial Statements.
FPA
New Income Fund
FINANCIAL
HIGHLIGHTS
Institutional
Class*
Per
share operating performance.
For
a capital share outstanding throughout each period.
| | |
| | |
| | |
| | |
| | |
| |
| | |
For the Year Ended September 30, | |
| | |
| 2025 | | |
| 2024 | | |
| 2023 | | |
| 20221 | | |
| 20211 | |
| Net asset value, beginning of period | |
$ | 10.01 | | |
$ | 9.51 | | |
$ | 9.48 | | |
$ | 10.02 | | |
$ | 10.00 | |
| Income from Investment Operations: | |
| | | |
| | | |
| | | |
| | | |
| | |
| Net investment income (loss)2 | |
| 0.43 | | |
| 0.44 | | |
| 0.36 | | |
| 0.15 | | |
| 0.13 | |
| Net realized and unrealized gain (loss) | |
| 0.05 | | |
| 0.47 | | |
| 0.03 | | |
| (0.53 | ) | |
| 0.03 | |
| Total from investment operations | |
| 0.48 | | |
| 0.91 | | |
| 0.39 | | |
| (0.38 | ) | |
| 0.16 | |
| | |
| | | |
| | | |
| | | |
| | | |
| | |
| Less Distributions: | |
| | | |
| | | |
| | | |
| | | |
| | |
| From net investment income | |
| (0.40 | ) | |
| (0.41 | ) | |
| (0.36 | ) | |
| (0.16 | ) | |
| (0.14 | ) |
| Total distributions | |
| (0.40 | ) | |
| (0.41 | ) | |
| (0.36 | ) | |
| (0.16 | ) | |
| (0.14 | ) |
| Net asset value, end of period | |
$ | 10.09 | | |
$ | 10.01 | | |
$ | 9.51 | | |
$ | 9.48 | | |
$ | 10.02 | |
| | |
| | | |
| | | |
| | | |
| | | |
| | |
| Total return3 | |
| 5.00 | % | |
| 9.74 | % | |
| 4.21 | % | |
| (3.87 | )% | |
| 1.56 | % |
| | |
| | | |
| | | |
| | | |
| | | |
| | |
| Ratios and Supplemental Data: | |
| | | |
| | | |
| | | |
| | | |
| | |
| Net assets, end of period (in thousands) | |
$ | 10,259,358 | | |
$ | 8,746,268 | | |
$ | 7,819,065 | | |
$ | 9,465,665 | | |
$ | 11,944,191 | |
| | |
| | | |
| | | |
| | | |
| | | |
| | |
| Ratio of expenses to average net assets: | |
| | | |
| | | |
| | | |
| | | |
| | |
| Before fees waived and expenses absorbed | |
| 0.59 | %4 | |
| 0.58 | % | |
| 0.59 | % | |
| 0.59 | % | |
| 0.58 | % |
| After fees waived and expenses absorbed | |
| 0.45 | %4,5 | |
| 0.45 | %6 | |
| 0.45 | % | |
| 0.46 | % | |
| 0.48 | % |
| Ratio of net investment income (loss) to average net assets: | |
| | | |
| | | |
| | | |
| | | |
| | |
| Before fees waived and expenses absorbed | |
| 4.17 | % | |
| 4.35 | % | |
| 3.59 | % | |
| 1.43 | % | |
| 1.18 | % |
| After fees waived and expenses absorbed | |
| 4.31 | % | |
| 4.48 | % | |
| 3.73 | % | |
| 1.56 | % | |
| 1.28 | % |
| | |
| | | |
| | | |
| | | |
| | | |
| | |
| Portfolio turnover rate | |
| 41 | % | |
| 63 | % | |
| 50 | % | |
| 103 | % | |
| 81 | % |
| * | All
existing class of shares were designated as Institutional Class Shares, effective April
30, 2024. The ticker symbol for Institutional Class Shares remains "FPNIX". |
| 1 | Audits
performed for the fiscal years indicated by the Fund's previous auditor, Ernst &
Young LLP. |
| 2 | Based
on average shares outstanding for the period. |
| 3 | Total
returns would have been higher/lower had expenses not been recovered/waived and absorbed
by the Advisor. Returns shown do not reflect the deduction of taxes that a shareholder
would pay on Fund distributions or the redemption of Fund shares. |
| 4 | If
interest expense had been excluded, the expense ratios would have been lowered by 0.00%
for the year ended September 30, 2025. |
| 5 | The
Adviser has contractually agreed to reimburse the Fund for Total Annual Fund Operating
Expenses (excluding interest, taxes, brokerage fees and
commissions payable by the Fund in connection with the purchase or sale of portfolio securities, and extraordinary expenses, including
litigation expenses not incurred in the Fund's ordinary course of business) in excess of 0.454% of the average daily net assets
of the Institutional Class shares of the Fund from through January 31, 2026. This agreement may only be terminated earlier by
the Fund's Board of Trustees (the "Board") or upon termination of the Advisory Agreement. |
| 6 | The
Adviser has contractually agreed to reimburse the Fund for Total Annual Fund Operating
Expenses (excluding interest, taxes, brokerage fees and commissions payable by the Fund
in connection with the purchase or sale of portfolio securities, and extraordinary expenses,
including litigation expenses not incurred in the Fund's ordinary course of business)
in excess of 0.45% of the average daily net assets of the Institutional Class shares
of the Fund through July 27, 2024, and in excess of 0.454% of the average daily net assets
of the Institutional Class shares of the Fund from July 28, 2024 through April 30, 2025.
This agreement may only be terminated earlier by the Fund's Board of Trustees (the "Board")
or upon termination of the Advisory Agreement. |
See
accompanying Notes to Financial Statements.
FPA
New Income Fund
NOTES
TO FINANCIAL STATEMENTS
September 30, 2025
Note
1 – Organization
FPA
New Income Fund (the “Fund”) is a diversified series of Investment Managers Series Trust III, (formerly, FPA Funds
Trust), (the “Trust”), which is registered as an open-end management company under the Investment Company Act of 1940,
as amended (the “1940 Act”). The Fund’s primary investment objective is to seek current income and long-term
total return taking into consideration capital preservation. First Pacific Advisors, LP (the “Adviser”) has served
as the Fund’s investment adviser since July 11, 1984.
The
Fund is an investment company and accordingly follows the investment company accounting and reporting guidance of the Financial
Accounting Standards Board (FASB) Accounting Standard Codification Topic 946 “Financial Services— Investment Companies”.
The
Fund is deemed to be an individual reporting segment and is not part of a consolidated reporting entity. The objective and strategy
of the Fund is used by the Adviser to make investment decisions, and the results of the operations, as shown on the Statements
of Operations and the financial highlights for the Fund is the information utilized for the day-to-day management of the Fund.
The Fund is party to the expense agreements as disclosed in the Notes to the Financial Statements and there are no resources allocated
to a Fund based on performance measurements. The management of the Fund’s Adviser is deemed to be the Chief Operating Decision
Maker with respect to the Fund's investment decisions.
Note
2 – Accounting Policies
The
following is a summary of the significant accounting policies consistently followed by the Fund in the preparation of its financial
statements. The preparation of financial statements in conformity with accounting principles generally accepted in the United
States of America (“GAAP”) requires management to make estimates and assumptions that affect the reported amounts
and disclosures in the financial statements. Actual results could differ from these estimates.
(a)
Valuation of Investments
The
Fund values equity securities at the last reported sale price on the principal exchange or in the principal over the counter (“OTC”)
market in which such securities are traded, as of the close of regular trading on the NYSE on the day the securities are being
valued or, if the last-quoted sales price is not readily available, the securities will be valued at the last bid or the mean
between the last available bid and ask price. Securities traded on the NASDAQ are valued at the NASDAQ Official Closing Price
(“NOCP”). Investments in open-end investment companies are valued at the daily closing net asset value of the respective
investment company. Debt securities are valued by utilizing a price supplied by independent pricing service providers. The independent
pricing service providers may use various valuation methodologies including matrix pricing and other analytical pricing models
as well as market transactions and dealer quotations. These models generally consider such factors as yields or prices of bonds
of comparable quality, type of issue, coupon, maturity, ratings and general market conditions. If a price is not readily available
for a portfolio security, the security will be valued at fair value (the amount which the Fund might reasonably expect to receive
for the security upon its current sale). The Board of Trustees has designated the Adviser as the Fund’s valuation designee
(the “Valuation Designee”) to make all fair value determinations with respect to the Fund’s portfolio investments,
subject to the Board’s oversight. As the Valuation Designee, the Adviser has adopted and implemented policies and procedures
to be followed when the Fund must utilize fair value pricing.
(b)
Investment Transactions, Investment Income and Expenses
Investment
transactions are accounted for on the trade date. Realized gains and losses on investments are determined on the identified cost
basis. Dividend income is recorded net of applicable withholding taxes on the ex-dividend date and interest income is recorded
on an accrual basis. Withholding taxes on foreign dividends, if applicable, are paid (a portion of which may be reclaimable) or
provided for in accordance with the applicable country’s tax rules and rates and are disclosed in the Statement of Operations.
Withholding tax reclaims are filed in certain countries to recover a portion of the amounts previously withheld. The Fund records
a reclaim receivable based on a number of factors, including a jurisdiction’s legal obligation to pay reclaims as well as
payment history and market convention. Discounts on debt securities are accreted or amortized to interest income over the lives
of the respective securities using the effective interest method. Premiums for callable debt securities are amortized to the earliest
call date, if the call price was less than the purchase price. If the call price was not at par and the security was not called,
the security is amortized to the next call price and date. Income and expenses of the Fund are allocated on a pro rata basis to
each class of shares relative net assets, except for distribution and service fees which are unique to each class of shares relative
net assets. Expenses incurred by the Trust with respect to more than one fund are allocated in proportion to the net assets of
each fund except where allocation of direct expenses to each fund or an alternative allocation method can be more appropriately
made.
FPA
New Income Fund
NOTES
TO FINANCIAL STATEMENTS - Continued
September 30, 2025
(c)
Mortgage-Backed Securities
The
Fund may invest in mortgage-backed securities ("MBS"), representing direct or indirect interests in pools of underlying
residential or commercial mortgage loans that are secured by real property. These securities provide investors with payments consisting
of both principal and interest as the mortgages in the underlying mortgage pools are paid.
The
timely payment of principal and interest (but not the market value) on MBS issued or guaranteed by Ginnie Mae (formally
known as the Government National Mortgage Association or GNMA) is backed by Ginnie Mae and the full faith and credit of the
US government. Obligations issued by Fannie Mae (formally known as the Federal National Mortgage Association or FNMA) and
Freddie Mac (formally known as the Federal Home Loan Mortgage Corporation or FHLMC) are historically supported only by the
credit of the issuer, but currently are guaranteed by the US government in connection with such agencies being placed
temporarily into conservatorship by the US government. Some MBS are sponsored or issued by private entities. Payments of
principal and interest (but not the market value) of such private MBS may be supported by pools of residential or commercial
mortgage loans or other MBS that are guaranteed, directly or indirectly, by the US government or one of its agencies or
instrumentalities, or they may be issued without any government guarantee of the underlying mortgage assets but may contain
some form of non-government credit enhancement.
Collateralized
mortgage obligations ("CMO") are a type of MBS. A CMO is a debt security that may be collateralized by whole mortgage
loans or mortgage pass-through securities. The mortgage loans or mortgage pass-through securities are divided into classes or
tranches with each class having its own characteristics. Investors typically receive payments out of the interest and principal
on the underlying mortgages. The portions of these payments that investors receive, as well as the priority of their rights to
receive payments, are determined by the specific terms of the CMO class.
The
yield characteristics of MBS differ from those of traditional debt securities. Among the major differences are that interest and
principal payments are made more frequently, usually monthly, and that principal may be prepaid at any time because the underlying
mortgage loans or other obligations generally may be prepaid at any time. Prepayments on a pool of mortgage loans are influenced
by a variety of economic, geographic, social and other factors. Generally, prepayments on fixed-rate mortgage loans will increase
during a period of falling interest rates and decrease during a period of rising interest rates. Certain classes of CMOs and other
MBS are structured in a manner that makes them extremely sensitive to changes in prepayment rates.
(d)
Federal Income Taxes
The
Fund intends to comply with the requirements of Subchapter M of the Internal Revenue Code applicable to regulated investment companies
and to distribute substantially all of their net investment income and any net realized gains to their shareholders. Therefore,
no provision is made for federal income or excise taxes. Due to the timing of dividend distributions and the differences in accounting
for income and realized gains and losses for financial statement and federal income tax purposes, the fiscal year in which amounts
are distributed may differ from the year in which the income and realized gains and losses are recorded by the Fund.
FPA
New Income Fund
NOTES
TO FINANCIAL STATEMENTS - Continued
September 30, 2025
Accounting
for Uncertainty in Income Taxes (the “Income Tax Statement”) requires an evaluation of tax positions taken (or
expected to be taken) in the course of preparing a Fund’s tax returns to determine whether these positions meet a “more-likely-than-not”
standard that, based on the technical merits, have a more than fifty percent likelihood of being sustained by a taxing authority
upon examination. A tax position that meets the “more-likely-than-not” recognition threshold is measured to determine
the amount of benefit to recognize in the financial statements. The Fund recognizes interest and penalties, if any, related to
unrecognized tax benefits as income tax expense in the Statement of Operations.
The
Income Tax Statement requires management of the Fund to analyze tax positions taken in the prior three open tax years, if any,
and tax positions expected to be taken in the Fund's current tax year, as defined by the IRS statute of limitations for all major
jurisdictions, including federal tax authorities and certain state tax authorities. As of September 30, 2025 and during the prior
three open tax years, the Fund did not have a liability for any unrecognized tax benefits. The Fund has no examinations in progress
and is not aware of any tax positions for which it is reasonably possible that the total amounts of unrecognized tax benefits
will significantly change in the next twelve months.
(e)
Distributions to Shareholders
The
Fund will make distributions of net investment income monthly and net capital gains, if any, at least annually. Distributions
to shareholders are recorded on the ex-dividend date. The amount and timing of distributions are determined in accordance with
federal income tax regulations, which may differ from GAAP.
The
character of distributions made during the year from net investment income or net realized gains may differ from the characterization
for federal income tax purposes due to differences in the recognition of income, expense and gain (loss) items for financial statement
and tax purposes.
(f)
Illiquid Securities
Pursuant
to Rule 22e-4 under the 1940 Act, the Fund has adopted a Liquidity Risk Management Program (“LRMP”) that requires,
among other things, that the Fund limits its illiquid investments that are assets to no more than 15% of net assets. An illiquid
investment is any security which may not reasonably be expected to be sold or disposed of in current market conditions in seven
calendar days or less without the sale or disposition significantly changing the market value of the investment. If the Adviser,
at any time determines that the value of illiquid securities held by the Fund exceeds 15% of its net asset value, the Adviser
will take such steps as it considers appropriate to reduce them as soon as reasonably practicable in accordance with the Fund’s
written LRMP.
(g)
Use of Estimates
The
presentation of financial statements in conformity with GAAP requires management to make estimates and assumptions that affect
the reported amounts of assets and liabilities at the date of the financial statements and the reported amounts of income and
expenses during the reporting period. Actual results could differ from those estimates.
(h)
Stripped Mortgage-Backed Interest Only (“I/O”) and Principal Only (“P/O”) Securities
Stripped
mortgage-backed securities are usually structured with two classes that receive different proportions of the interest and principal
distributions on a pool of mortgage assets. In certain cases, one class will receive all of the interest payments on the underlying
mortgages (the I/O class), while the other class will receive all of the principal payments (the P/O class). The Fund currently
has investments in I/O securities. The yield to maturity on I/Os is sensitive to the rate of principal repayments (including prepayments)
on the related underlying mortgage assets, and principal payments may have a material effect on yield-to-maturity. If the underlying
mortgage assets experience greater than anticipated prepayments of principal, a Fund may not fully recoup its initial investment
in I/Os.
FPA
New Income Fund
NOTES
TO FINANCIAL STATEMENTS - Continued
September 30, 2025
(i)
Credit Risk
Debt
securities are subject to credit risk, meaning that the issuer of the debt security may default or fail to make timely payments
of principal or interest. The values of any of the Fund's investments may also decline in response to events affecting the issuer
or its credit rating. The lower rated debt securities in which the Fund may invest are considered speculative and are generally
subject to greater volatility and risk of loss than investment grade securities, particularly in deteriorating economic conditions.
The Fund invests a significant portion of its assets in securities of issuers that hold mortgage-and asset-backed securities and
direct investments in securities backed by commercial and residential mortgage loans and other financial assets. The value and
related income of these securities is sensitive to changes in economic conditions, including delinquencies and/or defaults. Continuing
shifts in the market's perception of credit quality on securities backed by commercial and residential mortgage loans and other
financial assets may result in increased volatility of market price and periods of illiquidity that can negatively impact the
valuation of certain securities held by the Fund.
Note
3 – Investment Advisory and Other Agreements
The
Trust, on behalf of the Fund, entered into an Investment Advisory Agreement (the “Agreement”) with the Adviser. Under
the terms of the Agreement, the Fund pays a monthly investment advisory fee to the Adviser at the annual rate of 0.50% of the
Fund’s average daily net assets. In addition, the Adviser has voluntarily agreed to waive the advisory fee it receives from
the Fund by 0.046% through January 31, 2026 of the Fund’s average daily net assets. The Adviser will not seek recoupment
of the advisory fees voluntarily waived.
The
Adviser has contractually agreed to reimburse the Fund for Total Annual Fund Operating Expenses (excluding interest, taxes, brokerage
fees and commissions payable by the Fund in connection with the purchase or sale of portfolio securities, and extraordinary expenses,
including litigation expenses not incurred in the Fund's ordinary course of business) in excess of 0.454% of the average daily
net assets of the Institutional Class shares of the Fund through January 31, 2026, and in excess of 0.554% of the average daily
net assets of the Investor Class shares of the Fund through January 31, 2026. This agreement may only be terminated earlier by
the Fund’s Board of Trustees (the “Board”) or upon termination of the Agreement. For the year ended September
30, 2025, the Adviser waived a portion of its advisory fees totaling $6,380,556.
UMBFS
serves as the Fund’s fund accountant, transfer agent and co-administrator; and Mutual Fund Administration, LLC (“MFAC”)
serves as the Fund’s other co-administrator. UMB Bank, n.a., an affiliate of UMBFS, serves as the Fund’s custodian.
The Fund’s allocated fees incurred for fund accounting, fund administration, transfer agency and custody services for the
year ended September 30, 2025, are reported as “Fund services fees” on the Statement of Operations.
Distribution
Services, LLC, serves as the Fund’s distributor (the “Distributor”). Prior to December 6, 2024, UMB Distribution
Services, LLC ("UMB Distribution Services"), a wholly owned subsidiary of UMBFS, served as the Fund's distributor. The
Distributor does not receive compensation from the Fund for its distribution services; The Adviser pays the Distributor a fee
for its distribution-related services.
Dziura
Compliance Consulting, LLC provides Chief Compliance Officer (“CCO”) services to the Trust. The Fund’s allocated
fees incurred for CCO services for the year ended September 30, 2025 are reported on the Statement of Operations.
FPA
New Income Fund
NOTES
TO FINANCIAL STATEMENTS - Continued
September 30, 2025
Certain
trustees and officers of the Trust are employees of UMBFS, MFAC or the Adviser. The Fund does not compensate trustees and officers
affiliated with the Fund’s co-administrators or the Adviser. For the year ended September 30, 2025, the Fund’s allocated
fees incurred to Trustees of the Trust who are not “interested persons” of the Trust, as that term is defined in the
1940 Act (collectively, the “Independent Trustees”) are reported on the Statement of Operations.
The
Fund's Board of Trustees has adopted a Deferred Compensation Plan (the “Plan”) for the Independent Trustees that enables
Trustees to elect to receive payment in cash or the option to defer some or all of their fees. If a trustee elects to defer payment,
the Plan provides for the creation of a deferred payment account. A Trustee’s deferred fees are deemed to be invested in
designated mutual funds available under the Plan. The Fund's liability for these amounts is adjusted for market value changes
in the invested fund and remains a liability to the Fund until distributed in accordance with the Plan. The Trustees Deferred
compensation liability under the Plan constitutes a general unsecured obligation of the Fund and is disclosed in the Statement
of Assets and Liabilities. Contributions made under the plan and the change in unrealized appreciation/depreciation and income
are included in the Trustees' fees and expenses in the Statement of Operations.
Note
4 – Federal Income Taxes
At
September 30, 2025, gross unrealized appreciation/(depreciation) of investments, based on cost for federal income tax purposes
were as follows:
| Cost of investments | |
$ | 10,039,085,924 | |
| | |
| | |
| Gross unrealized appreciation | |
$ | 286,989,865 | |
| Gross unrealized depreciation | |
| (71,210,409 | ) |
| | |
| | |
| Net unrealized appreciation/(depreciation) | |
$ | 215,779,456 | |
The
difference between cost amounts for financial statement and federal income tax purposes is due primarily to timing differences
in recognizing certain gains and losses in security transactions.
GAAP
requires that certain components of net assets be reclassified between financial and tax reporting. These reclassifications
have no effect on net asset value per share. For the year ended September 30, 2025, permanent differences in book and tax
accounting have been reclassified to paid in capital and total distributable earnings as follows:
| Increase
(Decrease) |
| Paid
in Capital |
Distributable
Earnings |
| - |
- |
FPA New Income Fund
NOTES
TO FINANCIAL STATEMENTS - Continued
September 30, 2025
As of September 30, 2025, the components of accumulated earnings on a tax basis were as follows:
| Undistributed
ordinary income | |
| 37,616,066 | |
| Undistributed
long-term capital gains | |
| - | |
| Tax accumulated earnings | |
| 37,616,066 | |
| | |
| | |
| Accumulated capital
and other losses | |
| (717,829,020 | ) |
| Grantor Trust Basis
Adjustments | |
| 6,732,090 | |
| Unrealized
appreciation on investments | |
| 215,779,456 | |
| Total
accumulated earnings (deficit) | |
$ | (457,701,408 | ) |
| The tax character of the distributions paid during the fiscal years ended September 30, 2025 and September 30, 2024 were as follows: |
| | |
| | |
| |
| Distributions paid from: | |
9/30/2025 | | |
9/30/2024 | |
| Ordinary Income | |
$ | 370,090,078 | | |
$ | 348,611,192 | |
| Net long term capital gains | |
| - | | |
| - | |
| Return of capital | |
| - | | |
| - | |
| Total distributions paid | |
$ | 370,090,078 | | |
$ | 348,611,192 | |
As of September 30, 2025, the Fund had non-expiring capital loss carryforwards as follows:
| Short-term | | |
$ | (305,394,187 | ) |
| Long-term | | |
| (412,414,529 | ) |
| | | |
$ | (717,808,716 | ) |
During
the tax year ended September 30, 2025, the Fund utilized $0 of short-term and $0 of long-term non-expiring capital loss carryforwards,
respectively.
Note
5 – Investment Transactions
For
the year ended September 30, 2025, purchases and sales of investments, excluding short-term investments, were $4,708,113,056 and
$3,532,535,435, respectively.
Note
6 – Indemnifications
In
the normal course of business, the Fund enters into contracts that contain a variety of representations which provide general
indemnifications. The Fund’s maximum exposure under these arrangements is unknown, as this would involve future claims that
may be made against the Fund that have not yet occurred. However, the Fund expects the risk of loss to be remote.
Note
7 – Shareholder Servicing Plan
Pursuant
to the Shareholder Service Plan adopted by the Board, on behalf of the Fund, the Fund may pay a fee at an annual rate of up to
0.10% and 0.25% of its average daily net assets attributable to the Institutional Class and Investor Class shares of the Fund,
respectively. The Fund does not pay these service fees on shares purchased directly. In addition, the Adviser may, at its own
expense, pay financial representatives and/or shareholder servicing agents for these services. Such fees are reported on the Statement
of Operations. For the year ended September 30, 2025, Adviser reimbursed shareholder service fee of $5,512,155 and $25,353 for
Institutional Class shares and Investor Class shares, respectively.
FPA New Income Fund
NOTES
TO FINANCIAL STATEMENTS - Continued
September 30, 2025
Note
8 – Commitments and Contingencies
The
Fund may enter into unfunded loan commitments. Unfunded loan commitments may be partially or wholly unfunded. During the contractual
period, the Fund is obliged to provide funding to the borrower upon demand. Unfunded loan commitments are fair valued in accordance
with the valuation policy described in Note 2(a) and unrealized appreciation or depreciation, if any, is recorded on the Statement
of Assets and Liabilities. As of September 30, 2025, the total unfunded amount was 0.10% of the Fund’s net assets.
As
of September 30, 2025, the Fund had the following unfunded loan commitments outstanding:
| Loan | |
Principal | | |
Cost | | |
Value | | |
Unrealized Appreciation/ (Depreciation) | | |
Unfunded Commitment | |
| Lealand Finance Super Senior Exit LC | |
$ | 9,783,645 | | |
$ | (11,922 | ) | |
$ | (978,365 | ) | |
$ | (966,443 | ) | |
$ | 9,783,645 | |
Note
9 – Fair Value Measurements and Disclosure
Fair
Value Measurements and Disclosures defines fair value, establishes a framework for measuring fair value in accordance with
GAAP, and expands disclosure about fair value measurements. It also provides guidance on determining when there has been a significant
decrease in the volume and level of activity for an asset or a liability, when a transaction is not orderly, and how that information
must be incorporated into a fair value measurement.
Under
Fair Value Measurements and Disclosures, various inputs are used in determining the value of the Fund’s investments.
These inputs are summarized into three broad Levels as described below:
| ● | Level
1 – Unadjusted quoted prices in active markets for identical assets or liabilities that the Fund has the ability to access. |
| ● | Level
2 – Observable inputs other than quoted prices included in level 1 that are observable for the asset or liability, either
directly or indirectly. These inputs may include quoted prices for the identical instrument on an inactive market, prices for
similar instruments, interest rates, prepayment speeds, credit risk, yield curves, default rates and similar data. |
| ● | Level
3 – Unobservable inputs for the asset or liability, to the extent relevant observable inputs are not available, representing
the Fund’s own assumptions about the assumptions a market participant would use in valuing the asset or liability, and would
be based on the best information available. |
The
availability of observable inputs can vary from security to security and is affected by a wide variety of factors, including,
for example, the type of security, whether the security is new and not yet established in the marketplace, the liquidity of markets,
and other characteristics particular to the security. To the extent that valuation is based on models or inputs that are less
observable or unobservable in the market, the determination of fair value requires more judgment. Accordingly, the degree of judgment
exercised in determining fair value is greatest for instruments categorized in Level 3.
The
inputs used to measure fair value may fall into different Levels of the fair value hierarchy. In such cases, for disclosure purposes,
the Level in the fair value hierarchy within which the fair value measurement falls in its entirety, is determined based on the
lowest Level input that is significant to the fair value measurement in its entirety.
FPA New Income Fund
NOTES
TO FINANCIAL STATEMENTS - Continued
September 30, 2025
The
inputs or methodology used for valuing securities are not an indication of the risk associated with investing in those securities.
The following is a summary of the inputs used, as of September 30, 2025, in valuing the Fund’s assets carried at fair value:
| Investments | |
Level
1 | | |
Level
2 | | |
Level
3 | | |
Total | |
| Asset-Backed
Securities | |
| | | |
| | | |
| | | |
| | |
| Auto | |
$ | - | | |
$ | 653,205,104 | | |
$ | - | | |
$ | 653,205,104 | |
| Collateralized
Loan Obligation | |
| - | | |
| 320,977,225 | | |
| - | | |
| 320,977,225 | |
| Equipment | |
| - | | |
| 1,112,391,128 | | |
| 7,864,954 | | |
| 1,120,256,082 | |
| Other | |
| - | | |
| 802,289,060 | | |
| - | | |
| 802,289,060 | |
| Commercial
Mortgage-Backed Securities | |
| | | |
| | | |
| | | |
| | |
| Agency | |
| - | | |
| 1,272,347,761 | | |
| - | | |
| 1,272,347,761 | |
| Agency
Stripped | |
| - | | |
| 28,042,195 | | |
| - | | |
| 28,042,195 | |
| Non-Agency | |
| - | | |
| 236,684,432 | | |
| - | | |
| 236,684,432 | |
| Corporate
Bank Debt | |
| - | | |
| - | | |
| 18,577,645 | | |
| 18,577,645 | |
| Corporate
Bonds | |
| | | |
| | | |
| | | |
| | |
| Communications | |
| - | | |
| 5,917,594 | | |
| - | | |
| 5,917,594 | |
| Financials | |
| - | | |
| 79,773,873 | | |
| 81,414,000 | | |
| 161,187,873 | |
| Health
Care | |
| - | | |
| 9,226,635 | | |
| | | |
| 9,226,635 | |
| Residential
Mortgage-Backed Securities | |
| | | |
| | | |
| | | |
| | |
| Agency
Collateralized Mortgage Obligation | |
| - | | |
| 73,645,311 | | |
| - | | |
| 73,645,311 | |
| Agency
Pool Adjustable Rate | |
| - | | |
| 155,373,793 | | |
| - | | |
| 155,373,793 | |
| Agency
Pool Fixed Rate | |
| - | | |
| 2,108,561,676 | | |
| - | | |
| 2,108,561,676 | |
| Non-Agency
Collateralized Mortgage Obligation | |
| - | | |
| 659,031,337 | | |
| - | | |
| 659,031,337 | |
| U.S.
Treasury Notes & Bonds | |
| - | | |
| 1,760,470,729 | | |
| - | | |
| 1,760,470,729 | |
| Common
Stocks | |
| | | |
| | | |
| | | |
| | |
| Metals
& Mining | |
| - | | |
| - | | |
| 49,921,392 | | |
| 49,921,392 | |
| Real
Estate Services | |
| 6,455,781 | | |
| - | | |
| - | | |
| 6,455,781 | |
| Transportation
& Logistics | |
| - | | |
| - | | |
| 121,805,440 | | |
| 121,805,440 | |
| Short-Term
Investments | |
| 18,085,493 | | |
| 672,802,822 | | |
| - | | |
| 690,888,315 | |
| | |
$ | 24,541,274 | | |
$ | 9,950,740,675 | | |
$ | 279,583,431 | | |
$ | 10,254,865,380 | |
The
following is a reconciliation of assets in which significant unobservable inputs (Level 3) were used in determining value:
| | |
Asset-Backed
Securities | | |
Common
Stocks | | |
Corporate
Bank Debt | | |
Corporate
Bonds | | |
Residential
Mortgage-Backed Securities | |
| Balance
as of September 30, 2024 | |
$ | 9,745,908 | | |
$ | 126,049,792 | | |
$ | 14,265,059 | | |
$ | 81,414,000 | | |
$ | 4,166,581 | |
| Transfers
into Level 3 during the period | |
| - | | |
| - | | |
| - | | |
| - | | |
| - | |
| Transfers
out of Level 3 during the period | |
| - | | |
| - | | |
| - | | |
| - | | |
| (7,591,488 | ) |
| Total
realized gain/(loss) | |
| 1,368 | | |
| - | | |
| (654,228 | ) | |
| - | | |
| 79,501 | |
| Total
unrealized appreciation/(depreciation) | |
| 798,919 | | |
| 45,637,040 | | |
| 5,279,022 | | |
| - | | |
| 16,875 | |
| Return of capital | |
| - | | |
| 40,000 | | |
| - | | |
| - | | |
| - | |
| Amortization
of Discount (Amortization of Premium) | |
| - | | |
| - | | |
| 42,867 | | |
| - | | |
| 18,225 | |
| Net
purchases | |
| - | | |
| - | | |
| 10,608 | | |
| - | | |
| 4,076,766 | |
| Net
sales | |
| (2,681,241 | ) | |
| - | | |
| (365,683 | ) | |
| - | | |
| (766,460 | ) |
| Balance as of September
30, 2025 | |
$ | 7,864,954 | | |
$ | 171,726,832 | | |
$ | 18,577,645 | | |
$ | 81,414,000 | | |
$ | - | |
FPA New Income Fund
NOTES
TO FINANCIAL STATEMENTS - Continued
September 30, 2025
The
following table presents additional quantitative information about valuation methodologies and inputs used for investments that
are measured at fair value and categorized within Level 3 as of September 30, 2025:
| Asset Class |
|
Fair Value
September 30, 2025 |
|
|
Valuation
Methodologies |
|
Unobservable Input |
|
Input
Range/Value |
|
|
Valuation
Weighted Average
of
Input |
|
|
Impact to Valuation
From an Increase in
Input(1) |
| Asset-Backed Securities - Equipment |
|
$ |
7,864,954 |
|
|
Third-Party Broker Quote(2) |
|
Quotes/Prices |
|
$ |
93.00 |
|
|
$ |
93.00 |
|
|
Increase |
| Common Stocks |
|
$ |
121,805,440 |
|
|
Pricing Model(3) |
|
Quotes/Prices |
|
$ |
32.00 |
|
|
$ |
32.00 |
|
|
Increase |
| |
|
$ |
49,921,392 |
|
|
Pricing Model(4) |
|
Transaction Terms |
|
$ |
1.25 |
|
|
$ |
1.25 |
|
|
Increase |
| Corporate Bank Debt |
|
$ |
19,553,357 |
|
|
Third-Party Broker Quote(2) |
|
Quotes/Prices |
|
|
$79.00 - $100.54 |
|
|
$ |
100.24 |
|
|
Increase |
| |
|
$ |
2,653 |
|
|
Pricing Model(5) |
|
Residual Value |
|
$ |
0.01 |
|
|
$ |
0.01 |
|
|
Increase |
| |
|
$ |
(978,365 |
) |
|
Pricing Model(6) |
|
Quotes/Prices |
|
$ |
90.00 |
|
|
$ |
90.00 |
|
|
Increase |
| Corporate Bonds |
|
$ |
81,414,000 |
|
|
Pricing Model(7) |
|
Cost |
|
$ |
100.00 |
|
|
$ |
100.00 |
|
|
Decrease |
| (1) | This
column represents the directional change in the fair value of the Level 3 investments that would result from an increase to the
corresponding unobservable input. A decrease to the unobservable input would have the opposite effect. |
| (2) | The
Third Party Broker Quote technique involves obtaining an independent third-party broker quote for the security. |
| (3) | The
Pricing Model technique for Level 3 securities involves the last reported trade in the security. |
| (4) | The
Pricing Model technique for Level 3 securities involves the terms of a completed third-party acquisition of the company. If the
financial condition of the underlying assets were to deteriorate, or if the market comparables were to fall, the value of the
investment could be lower. |
| (5) | The
Pricing Model technique for Level 3 securities involves evaluation of the residual value of a term loan that is pending any final
liquidation distributions from the bankruptcy trustee. |
| (6) | The
Pricing Model technique for Level 3 securities involves recently quoted funding prices of the security. |
| (7) | The
fair value of the investment is based on the initial purchase price or more recent capital activity. If the financial condition
of the underlying assets were to deteriorate, or if the market comparables were to fall, the value of the investment could be
lower. |
Note
10 – Investments in Affiliated Issuers
An
affiliated issuer is an entity in which the Fund has ownership of a least 5% of the voting securities. Issuers that are affiliates
of the Fund at period-end are noted in the Fund’s Schedule of Investments. Additional security purchases and the reduction
of certain securities shares outstanding of existing portfolio holdings that were not considered affiliated in prior years may
result in the Fund owning in excess of 5% of the outstanding shares at period-end. The table below reflects transactions during
the period with entities that are affiliates as of September 30, 2025 and may include acquisitions of new investments, prior year
holdings that became affiliated during the period and prior period affiliated holdings that are no longer affiliated as of period-end:
| Security
Description | |
Shares
Held as of September 30, 2024 | | |
Beginning
Value as of September 30, 2024 | | |
Purchases
at Cost | | |
Proceeds
from Sales | | |
Net
Realized Gain (Loss) on Sales Affiliated Investment | | |
Return
of Capital | | |
Change
in Unrealized Appreciation (Depreciation) | | |
Transfer
In (Out) | | |
Ending
Value as of September 30, 2025 | | |
Shares
as of September 30, 2025 | | |
Dividend
Income From Affiliated Investments | |
| AIPCF
VIII A-BL Aggregator Cayman LP Restricted | |
| 39,831,957 | | |
$ | 49,921,392 | | |
$ | - | | |
$ | - | | |
$ | - | | |
$ | 40,000 | | |
$ | (40,000 | ) | |
$ | - | | |
$ | 49,921,392 | | |
| 39,831,957 | | |
$ | - | |
| PHI
Group, Inc. | |
| 3,806,420 | | |
| 76,128,400 | | |
| - | | |
| - | | |
| - | | |
| - | | |
| 45,677,040 | | |
| - | | |
$ | 121,805,440 | | |
| 3,806,420 | | |
| 3,806,420 | |
| Total | |
| | | |
$ | 126,049,792 | | |
$ | - | | |
$ | - | | |
$ | - | | |
$ | 40,000 | | |
$ | 45,637,040 | | |
$ | - | | |
$ | 171,726,832 | | |
| | | |
$ | 3,806,420 | |
Note
11 – Restricted Securities
Restricted
securities include securities that have not been registered under the Securities Act of 1933, as amended, and securities that
are subject to restrictions on resale. The Fund may invest in restricted securities that are consistent with the Fund’s
investment objective and investment strategies. Investments in restricted securities are valued at net asset value as a practical
expedient for fair value, or fair value as determined in good faith in accordance with procedures adopted by the Board. It is
possible that the estimated value may differ significantly from the amount that might ultimately be realized in the near term,
and the difference could be material.
FPA New Income Fund
NOTES
TO FINANCIAL STATEMENTS - Continued
September 30, 2025
As
of September 30, 2025, the Fund invested in the following restricted securities:
| Issuer | |
Initial
Acquisition Date | |
Cost | | |
Fair
Value | | |
Fair
Value as a % of Net Assets | |
| AIPCF
VIII A-BL Aggregator Cayman LP | |
4/18/2024 | |
$ | 68,316,627 | | |
$ | 49,921,392 | | |
| 0.49 | % |
| Apollo
Debt Solution BDC Senior Notes, 8.620%, 9/28/2028 | |
8/10/2023 | |
| 26,023,000 | | |
| 26,023,000 | | |
| 0.25 | % |
| Capstone
Acquisition Holdings, Inc. Term Loan, 8.763% (1-Month Term SOFR+460 basis points),11/12/2029 | |
11/12/2020 | |
| 19,060,998 | | |
| 19,273,269 | | |
| 0.19 | % |
| Copper
Property CTL Pass Through Trust | |
10/6/2017 | |
| 25,752,396 | | |
| 6,455,781 | | |
| 0.06 | % |
| Heartland
Dental LLC/Heartland Dental Finance Corp., 10.500% (1-Month Term SOFR+500 basis points), 4/30/2028 | |
5/25/2023 | |
| 8,623,088 | | |
| 9,226,635 | | |
| 0.09 | % |
| Hlend
Senior Notes, 8.170%, 3/15/2028 | |
2/16/2023 | |
| 42,500,000 | | |
| 42,500,000 | | |
| 0.41 | % |
| JC
Penney Corp., Inc., 5.568% (3-Month USD Libor+425 basis points), 6/23/2027 | |
2/3/2021 | |
| - | | |
| 2,653 | | |
| 0.00 | % |
| Lealand
Finance Company B.V. Senior Exit LC, 5.250%, 6/30/2027 | |
2/28/2020 | |
| (11,922 | ) | |
| (978,365 | ) | |
| -0.01 | % |
| McDermott
Technology Americas, Inc., 8.278%, (1-Month Term SOFR+400 basis points), 12/31/2027 | |
3/25/2024 | |
| 196,946 | | |
| 280,088 | | |
| 0.00 | % |
| OCREDIT
BDC Senior Notes, 7.770%, 3/07/2029 | |
2/22/2024 | |
| 12,891,000 | | |
| 12,891,000 | | |
| 0.13 | % |
| PHI
Group, Inc. | |
8/19/2019 | |
| 31,131,405 | | |
| 121,805,440 | | |
| 1.18 | % |
| Prop
2017-1A, 5.300%, 03/15/2042 | |
2/9/2017 | |
| 8,452,626 | | |
| 7,864,954 | | |
| 0.08 | % |
| | |
| |
$ | 242,936,164 | | |
$ | 295,265,847 | | |
| 2.87 | % |
Note
12 – Market Disruption and Geopolitical Risks
Certain
local, regional, or global events such as war, acts of terrorism, the spread of infectious illness and/or other public health
issues, financial institution instability or other events may have a significant impact on a security or instrument. These types
of events and others like them are collectively referred to as “Market Disruptions and Geopolitical Risks” and they
may have adverse impacts on the worldwide economy, as well as the economies of individual countries, the financial health of individual
companies and the market in general in significant and unforeseen ways. Some of the impacts noted in recent times include but
are not limited to embargos, political actions, supply chain disruptions, tariffs, bank failures, restrictions to investment and/or
monetary movement including the forced selling of securities or the inability to participate impacted markets. The duration of
these events could adversely affect the Fund’s performance, the performance of the securities in which the Funds invests
and may lead to losses on your investment. The ultimate impact of “Market Disruptions and Geopolitical Risks” on the
financial performance of the Fund’s investments is not reasonably estimable at this time. Management is actively monitoring
these events.
Note
13 – New Accounting Pronouncements
In
November 2023, the FASB issued ASU 2023-07, “Segment Reporting (Topic 280): Improvements to Reportable Segment Disclosures
(“ASU 2023-07”),” which enhances disclosure requirements about significant segment expenses that are regularly
provided to the chief operating decision maker (the “CODM”). ASU 2023-07, among other things, (i) requires a single
segment public entity to provide all of the disclosures as required by Topic 280, (ii) requires a public entity to disclose the
title and position of the CODM and an explanation of how the CODM uses the reported measure(s) of segment profit or loss in assessing
segment performance and deciding how to allocate resources and (iii) provides the ability for a public entity to elect more than
one performance measure. ASU 2023-07 is effective for fiscal years beginning after December 15, 2023, and interim periods within
fiscal years beginning after December 15, 2024. Management has evaluated the impact of applying ASU 2023-07, and the Fund has
adopted the ASU during the reporting period. The adoption of the ASU does not have a material impact on the financial statements.
Required disclosure is included in Note 1.
In
December 2023, the FASB issued Accounting Standards Updated 2023-09 (“ASU 2023-09”), Income Taxes (Topic 740) Improvements
to Income Tax Disclosures, which amends quantitative and qualitative income tax disclosure requirements in order to increase disclosure
consistency, bifurcate income tax information by jurisdiction and remove information that is no longer beneficial. ASU 2023-09
is effective for annual periods beginning after December 15, 2024, and early adoption is permitted. Fund Management is evaluating
the impacts of these changes on the Funds financial statements.
FPA
New Income Fund
NOTES
TO FINANCIAL STATEMENTS - Continued
September 30, 2025
Note
14 – Events Subsequent to the Fiscal Period End
The
Fund has adopted financial reporting rules regarding subsequent events which require an entity to recognize in the financial statements
the effects of all subsequent events that provide additional evidence about conditions that existed at the date of the balance
sheet. Management has evaluated the Fund’s related events and transactions that occurred through the date of issuance of
the Fund’s financial statements.
There
were no events or transactions that occurred during this period that materially impacted the amounts or disclosures in the Fund’s
financial statements.
REPORT
OF INDEPENDENT REGISTERED PUBLIC ACCOUNTING FIRM
To
the Board of Trustees of
Investment
Managers Series Trust III
and
the Shareholders of the FPA New Income Fund
Opinion
on the Financial Statements
We
have audited the accompanying statement of assets and liabilities of the FPA New Income Fund (the “Fund”), a series
of Investment Managers Series Trust III, including the schedule of investments, as of September 30, 2025, the related statement
of operations for the year then ended, the statements of changes in net assets for each of the two years in the period then ended,
and financial highlights for each of the three years in the period then ended, and the related notes (collectively referred to
as the “financial statements”). In our opinion, the financial statements present fairly, in all material respects,
the financial position of the Fund as of September 30, 2025, the results of its operations for the year then ended, the changes
in its net assets for each of the two years in the period then ended, and the financial highlights for each of the three years
in the period then ended, in conformity with accounting principles generally accepted in the United States of America.
The
financial highlights for each of the two years in the period ended September 30, 2022, were audited by other auditors, whose report
dated November 28, 2022 expressed an unqualified opinion on those financial highlights.
Basis
for Opinion
These
financial statements are the responsibility of the Fund’s management. Our responsibility is to express an opinion on the
Fund’s financial statements based on our audits. We are a public accounting firm registered with the Public Company Accounting
Oversight Board (United States) (“PCAOB”) and are required to be independent with respect to the Fund in accordance
with the U.S. federal securities laws and the applicable rules and regulations of the Securities and Exchange Commission and the
PCAOB. We have served as the auditor of the Fund since 2023.
We
conducted our audits in accordance with the standards of the PCAOB. Those standards require that we plan and perform the audit
to obtain reasonable assurance about whether the financial statements are free of material misstatement, whether due to error
or fraud. The Fund is not required to have, nor were we engaged to perform, an audit of its internal control over financial reporting.
As part of our audits, we are required to obtain an understanding of internal control over financial reporting, but not for the
purpose of expressing an opinion on the effectiveness of the Fund’s internal control over financial reporting. Accordingly,
we express no such opinion.
Our
audits included performing procedures to assess the risks of material misstatement of the financial statements, whether due to
error or fraud, and performing procedures that respond to those risks. Such procedures included examining, on a test basis, evidence
regarding the amounts and disclosures in the financial statements. Our audits also included evaluating the accounting principles
used and significant estimates made by management, as well as evaluating the overall presentation of the financial statements.
Our procedures included confirmation of securities owned as of September 30, 2025 by correspondence with the custodian, agent
banks, and brokers or by other appropriate auditing procedures where replies were not received. We believe that our audits provide
a reasonable basis for our opinion.
| |  |
| | |
| | TAIT,
WELLER & BAKER LLP |
Philadelphia,
Pennsylvania
November
26, 2025
Item 8. Changes in and Disagreements
with Accountants for Open-End Management Investment Companies.
Not Applicable.
Item 9.
Proxy Disclosures for Open-End Management Investment Companies.
Not Applicable.
Item 10. Remuneration Paid
to Directors, Officers, and Others of Open-End Management Investment Companies.
This information is included in Item 7, as part of
the financial statements.
Item 11.
Statement Regarding Basis for Approval of Investment Advisory Contract.
Board
Consideration of Investment Advisory Agreement
At
an in-person meeting held on April 22, 2025, the Board of Trustees (the “Board”) of Investment Managers Series
Trust III (the “Trust”), including the trustees who are not “interested persons” of the Trust (the
“Independent Trustees”) as defined in the Investment Company Act of 1940, as amended (the “1940 Act”),
reviewed and unanimously approved the renewal of the investment advisory agreement (the “Advisory Agreement”)
between the Trust and First Pacific Advisors, LP (the “Advisor”) with respect to the FPA New Income Fund series
of the Trust (the “Fund”) for an additional one-year period from when it otherwise would expire. In approving
the renewal of the Advisory Agreement, the Board, including the Independent Trustees, determined that such renewal was in the
best interests of the Fund and its shareholders.
Background
In
advance of the meeting, the Board received information about the Fund and the Advisory Agreement from the Advisor and from Mutual
Fund Administration, LLC and UMB Fund Services, Inc., the Trust’s co-administrators, certain portions of which are discussed
below. The materials, among other things, included information about the Advisor’s organization and financial condition;
information regarding the background, experience, and compensation structure of relevant personnel providing services to the Fund;
information about the Advisor’s compliance policies and procedures, disaster recovery and contingency planning, and policies
with respect to portfolio execution and trading; information regarding the profitability of the Advisor’s overall relationship
with the Fund; reports comparing the performance of the Fund with returns of the Bloomberg U.S. Aggregate Bond Index (the “Bloomberg
Index”), the Consumer Price Index (“CPI”) + 100 basis points, and a group of comparable funds (the
“Peer Group”) selected by Broadridge Financial Solutions, Inc. from Morningstar, Inc.’s Short-Term Bond
category (the “Fund Universe”) for the one-, three-, five-, and ten-year periods ended December 31, 2024; and
reports comparing the investment advisory fee and total expenses of the Fund with those of the Peer Group and Fund Universe. The
Board also received a memorandum from legal counsel to the Trust and the Independent Trustees discussing the legal standards under
the 1940 Act and other applicable law for their consideration of the proposed renewal of the Advisory Agreement. In addition,
the Board considered information reviewed by the Board during the year at other Board and Board committee meetings.
In
renewing the Advisory Agreement, the Independent Trustees met separately in an executive session prior to the meeting with the
Board to consider the Advisory Agreement, including the items discussed below, and were represented by their legal counsel with
respect to the matters considered. The Board, including all of the Independent Trustees, then met and also considered a variety
of factors for renewal of the Advisory Agreement, including those discussed below. In their deliberations, the Board and the Independent
Trustees did not identify any particular factor that was controlling, and each Trustee may have attributed different weights to
the various factors.
Nature,
Extent, and Quality of Services
With
respect to the performance results of the Fund, the meeting materials indicated that the Fund’s annualized total return
for the three-year period was above the Peer Group and Fund Universe median returns and the Bloomberg Index return, but below
the CPI + 100 basis points by 2.35%. For the five-year period, the Fund’s annualized total return was above the Fund Universe
median return and the Bloomberg Index return, and was the same as the Peer Group median return, but was below the CPI + 100 basis
points by 2.85%. The Fund’s annualized total return for the ten-year period was above the Fund Universe median return and
the Bloomberg Index return, but below the Peer Group median return by 0.10% and the CPI + 100 basis points by 1.71%. For the one-year
period, the Fund’s total return was above the Bloomberg Index return and the CPI + 100 basis points, but below the Fund
Universe and Peer Group median returns by 0.54% and 1.07%, respectively. The Trustees noted the Advisor’s assertion that
the Fund’s underperformance in comparison to the CPI + 100 basis points over the three-and five-year periods was due to
the Advisor’s unwillingness to take on uncompensated risk coupled with unexpectedly high inflation over the past few years.
The Trustees also considered the Advisor’s belief that the Fund’s underperformance relative to the Peer Group over
the ten-year period was primarily due to the Fund’s conservative positioning during the extended low interest rate environment.
The Trustees also observed that Morningstar upgraded the Fund’s rating to Silver in July 2024.
The
Board also considered the overall quality of services provided by the Advisor to the Fund. In doing so, the Board considered the
Advisor’s specific responsibilities in day-to-day management and oversight of the Fund, as well as the qualifications, experience,
and responsibilities of the personnel involved in the activities of the Fund. The Board also considered the overall quality of
the organization and operations of the Advisor, as well as its compliance structure. The Board and the Independent Trustees concluded
that based on the various factors they had reviewed, the nature, overall quality, and extent of the management and oversight services
provided by the Advisor to the Fund were satisfactory.
Advisory
Fee and Expense Ratio
With
respect to the advisory fee paid by the Fund, the meeting materials indicated that the Fund’s annual investment advisory
fee (gross of fee waivers) was above the Peer Group and Fund Universe medians by 0.18% and 0.20%, respectively. The Trustees observed
that the Advisor has been waiving fees since 2016. The Trustees noted that the Fund’s advisory fee was higher than the fees
that the Advisor charges to manage separate accounts for institutional investors with similar objectives and policies as the Fund.
The Trustees observed, however, that management of mutual fund assets requires compliance with certain requirements under the
1940 Act that do not apply to the institutional separate accounts that the Advisor manages, and noted the differences between
the services provided by the Advisor to the Fund and those provided to the institutional separate accounts. The Trustees also
noted that the Fund’s advisory fee was among the lowest of the advisory fees paid by other series of the Trust managed by
the Advisor.
The
annual total expenses paid by the Fund (net of fee waivers) for the Fund’s most recent fiscal year were the same as the
Peer Group median, but slightly above the Fund Universe median by 0.01%. The Trustees considered that the Fund’s total net
expenses were not in the highest quartile of funds in the Peer Group or the Fund Universe.
The
Board and the Independent Trustees concluded that based on the factors they had reviewed, the compensation payable to the Advisor
under the Advisory Agreement was fair and reasonable in light of the nature and quality of the services the Advisor provides to
the Fund.
Advisor
Profitability and Costs
The
Board and the Independent Trustees considered information provided by the Advisor regarding the Advisor’s costs in providing
services to the Fund, the profitability of the Advisor, and the benefits to the Advisor from its relationship with the Fund. The
Independent Trustees reviewed and considered the Advisor’s representations regarding its assumptions and methods of allocating
certain costs, such as personnel costs, which constitute the Advisor’s largest operating cost, and overhead costs with respect
to the provision of investment advisory services. The Independent Trustees discussed with the Advisor the general process through
which individuals’ compensation is determined and then reviewed by the management committee of the Advisor, as well as the
Advisor’s methods for determining that its compensation levels are set at appropriate levels to attract and retain the personnel
necessary to provide high quality professional investment advice. The Independent Trustees recognized that the Advisor is entitled
under the law to earn a reasonable level of profits for the services that it provides to the Fund. The Board observed that the
Advisor had waived a significant portion of its advisory fee with respect to the Fund. Recognizing the difficulty in evaluating
an investment advisor’s profitability with respect to the funds it manages in the context of an advisor with multiple lines
of business, and noting that other profitability methodologies might also be reasonable, the Board and the Independent Trustees
concluded that the profits of the Advisor from its relationship with the Fund were reasonable.
Economies
of Scale
The
Board and the Independent Trustees considered, and discussed with the Advisor, whether there have been economies of scale with
respect to the management of the Fund, whether the Fund has appropriately benefited from any economies of scale, and whether the
advisory fee rate is reasonable in relation to the Fund’s asset levels and any economies of scale that may exist. The Independent
Trustees also considered the Advisor’s representation that its internal costs of providing investment management services
to the Fund have increased in recent years as a result of a number of factors, including the ongoing and growing complexity of
the Fund’s investments, as well as the Advisor’s investment in building a highly-seasoned trading, compliance, valuation,
client service and operations staff to support the Advisor’s investment teams. The Trustees also noted the Advisor’s
representation that it would continue making such investments in its personnel, systems, and facilities in an effort to maintain
and increase the level and quality of services that it provides to the Fund. The Trustees also considered the Advisor’s
willingness to close funds to new investors when it believes that a fund has limited capacity to grow or when it otherwise would
be detrimental to fund shareholders.
The
Independent Trustees recognized that the advisory fee schedule for the Fund does not have any breakpoints. They considered that
many registered funds have breakpoints in the advisory fee structure as a means by which to share in the benefits of potential
economies of scale as a fund’s assets grow. They also considered that not all funds have breakpoints in their fee structures
and that breakpoints are not the exclusive means of sharing potential economies of scale. The Independent Trustees considered
the Advisor’s statement that it believes that breakpoints are currently not warranted for the Fund given the ongoing investments
the Advisor is making in its business for the benefit of the Fund, the increases in compensation paid to attract and retain high
quality investment professionals, uncertainties regarding the direction of the economy, and uncertainties regarding future growth
or contraction in the Fund’s assets, all of which could negatively impact the Advisor’s profitability. The Board and
the Independent Trustees concluded that the Fund is benefitting from the ongoing investments made by the Advisor in its team of
personnel serving the Fund and in the Advisor’s service infrastructure, and that in light of these investments, the addition
of breakpoints to the Fund’s advisory fee structure was not warranted at current asset levels.
Benefits
to the Advisor
The
Board and the Independent Trustees considered other “fall out” benefits to the Advisor as a result of its relationship
with the Fund, other than the advisory fee, including research services provided to it by broker-dealers providing execution services
to the Fund, the beneficial effects from the review by the Trust’s Chief Compliance Officer of the Advisor’s compliance
program, the intangible benefits of its association with the Fund generally, and any favorable publicity arising in connection
with the Fund’s performance.
Conclusion
Based
on these and other factors, the Board and the Independent Trustees concluded that renewal of the Advisory Agreement was in the
best interests of the Fund and its shareholders and, accordingly, approved the renewal of the Advisory Agreement.
Item
12. Disclosure of Proxy Voting Policies and Procedures for Closed-End Management Investment Companies.
Not
applicable to open-end investment companies.
Item
13. Portfolio Managers of Closed-End Management Investment Companies.
Not
applicable to open-end investment companies.
Item
14. Purchases of Equity Securities by Closed-End Management Investment Company and Affiliated Purchasers.
Not
applicable to open-end investment companies.
Item
15. Submission of Matters to a Vote of Security Holders.
The
registrant has not made any material changes to the procedures by which shareholders may recommend nominees to the registrant’s
Board of Trustees.
Item
16. Controls and Procedures.
| (a) | The
Registrant’s Principal Executive Officer and Principal Financial Officer have reviewed
the Registrant's disclosure controls and procedures (as defined in Rule 30a-3(c) under
the Investment Company Act of 1940 (the “Act”)) as of a date within 90 days
of the filing of this report, as required by Rule 30a-3(b) under the Act and Rules 13a-15(b)
or 15d-15(b) under the Securities Exchange Act of 1934. Based on their review, such
officers have concluded that the disclosure controls and procedures are effective in
ensuring that information required to be disclosed in this report is appropriately recorded,
processed, summarized and reported and made known to them by others within the Registrant
and by the Registrant’s service provider. |
| (b) | There
were no changes in the Registrant's internal control over financial reporting (as defined
in Rule 30a-3(d) under the Act) that occurred during the period covered by this report
that has materially affected, or is reasonably likely to materially affect, the Registrant's
internal control over financial reporting. |
Item
17. Disclosure of Securities Lending Activities for Closed-End Management Investment Companies.
Not
applicable to open-end investment companies.
Item
18. Recovery of Erroneously Awarded Compensation.
(a)
Not Applicable.
(b)
Not Applicable.
Item
19. Exhibits.
(a)
(2) Any policy required by the listing standards adopted pursuant to Rule 10D-1 under the Exchange Act (17 CFR 240.10D-1) by
the registered national securities exchange or registered national securities association upon which the registrant’s securities
are listed. Instruction to paragraph (a)(2). Not Applicable.
(a)
(3) A separate certification for each principal executive and principal financial officer of the registrant as required by Rule 30a-2(a) under the Act (17 CFR 270.30a-2(a)). Filed herewith.
(a)
(4) Not Applicable
(a)
(5) Not Applicable
SIGNATURES
Pursuant
to the requirements of the Securities Exchange Act of 1934 and the Investment Company Act of 1940, the registrant has duly caused
this report to be signed on its behalf by the undersigned, thereunto duly authorized.
| (Registrant) |
Investment
Managers Series Trust III |
|
| |
|
|
| By
(Signature and Title) |
/s/
Maureen Quill |
|
| |
Maureen Quill, President and Principal Executive Officer |
| |
|
|
| Date |
12/5/2025 |
|
Pursuant
to the requirements of the Securities Exchange Act of 1934 and the Investment Company Act of 1940, this report has been signed
below by the following persons on behalf of the registrant and in the capacities and on the dates indicated.
| By
(Signature and Title) |
/s/
Maureen Quill |
|
| |
Maureen Quill, President and Principal Executive Officer |
| |
|
|
| Date |
12/5/2025 |
|
| |
|
|
| By
(Signature and Title) |
/s/
Rita Dam |
|
| |
Rita Dam, Treasurer and Principal Financial Officer |
| |
|
|
| Date |
12/5/2025 |
|