Please wait
0.2
8.4
2.7
0.5
19.1
19.1
0.0
87.1
29.5
8.4
9.6
2.5
12.3
0.5
8.7
21.0
11.2
19.1
18.5
87.1
4.5
4.5
0.2
26.7
11.2
4.6
21.0
9.6
21.0
9.6
87.1
4.3
1.0
8.4
11.2
4.5
0.5
2.7
0.2
91.3
4.3
18.5
14.7
4.3
2.7
18.5
0000924727
false
N-1A
N-CSRS
0000924727
imstiii:C000243218Member
2025-05-31
2025-11-30
0000924727
imstiii:C000244000Member
2025-05-31
2025-11-30
0000924727
imstiii:C000244001Member
2025-05-31
2025-11-30
0000924727
imstiii:C000244002Member
2025-05-31
2025-11-30
0000924727
2025-05-31
2025-11-30
0000924727
imstiii:C000243218Member
2025-11-30
0000924727
imstiii:C000243218Member
imstiii:AmericanExpressCoMember
2025-11-30
0000924727
imstiii:C000243218Member
imstiii:AmeripriseFinancialIncMember
2025-11-30
0000924727
imstiii:C000243218Member
imstiii:BerkshireHathawayIncClassAMember
2025-11-30
0000924727
imstiii:C000243218Member
us-gaap:CommonStockMember
2025-11-30
0000924727
imstiii:C000243218Member
oef:CommunicationsSectorMember
2025-11-30
0000924727
imstiii:C000243218Member
oef:ConsumerDiscretionarySectorMember
2025-11-30
0000924727
imstiii:C000243218Member
oef:ConsumerStaplesSectorMember
2025-11-30
0000924727
imstiii:C000243218Member
imstiii:EatonCorpPLCMember
2025-11-30
0000924727
imstiii:C000243218Member
us-gaap:FinancialServicesSectorMember
2025-11-30
0000924727
imstiii:C000243218Member
imstiii:GeneralDynamicsCorpMember
2025-11-30
0000924727
imstiii:C000243218Member
us-gaap:HealthcareSectorMember
2025-11-30
0000924727
imstiii:C000243218Member
imstiii:HersheyCoMember
2025-11-30
0000924727
imstiii:C000243218Member
oef:IndustrialSectorMember
2025-11-30
0000924727
imstiii:C000243218Member
imstiii:JPMorganChaseAndCoMember
2025-11-30
0000924727
imstiii:C000243218Member
imstiii:OracleCorpMember
2025-11-30
0000924727
imstiii:C000243218Member
imstiii:OtherAssetsInExcessOfLiabilitiesMember
2025-11-30
0000924727
imstiii:C000243218Member
imstiii:PfizerIncMember
2025-11-30
0000924727
imstiii:C000243218Member
us-gaap:ShortTermInvestmentsMember
2025-11-30
0000924727
imstiii:C000243218Member
us-gaap:TechnologySectorMember
2025-11-30
0000924727
imstiii:C000243218Member
imstiii:TraneTechnologiesPLCMember
2025-11-30
0000924727
imstiii:C000244000Member
2025-11-30
0000924727
imstiii:C000244000Member
us-gaap:CommonStockMember
2025-11-30
0000924727
imstiii:C000244000Member
oef:CommunicationsSectorMember
2025-11-30
0000924727
imstiii:C000244000Member
oef:ConsumerDiscretionarySectorMember
2025-11-30
0000924727
imstiii:C000244000Member
oef:ConsumerStaplesSectorMember
2025-11-30
0000924727
imstiii:C000244000Member
imstiii:CSGSystemsInternationalIncMember
2025-11-30
0000924727
imstiii:C000244000Member
us-gaap:ExchangeTradedFundsMember
2025-11-30
0000924727
imstiii:C000244000Member
us-gaap:FinancialServicesSectorMember
2025-11-30
0000924727
imstiii:C000244000Member
oef:IndustrialSectorMember
2025-11-30
0000924727
imstiii:C000244000Member
imstiii:InterDigitalIncMember
2025-11-30
0000924727
imstiii:C000244000Member
oef:MaterialsSectorMember
2025-11-30
0000924727
imstiii:C000244000Member
imstiii:NewJerseyResourcesCorpMember
2025-11-30
0000924727
imstiii:C000244000Member
imstiii:OshkoshCorpMember
2025-11-30
0000924727
imstiii:C000244000Member
imstiii:OtherAssetsInExcessOfLiabilitiesMember
2025-11-30
0000924727
imstiii:C000244000Member
imstiii:PVHCorpMember
2025-11-30
0000924727
imstiii:C000244000Member
imstiii:REVGroupIncMember
2025-11-30
0000924727
imstiii:C000244000Member
imstiii:RLICorpMember
2025-11-30
0000924727
imstiii:C000244000Member
us-gaap:ShortTermInvestmentsMember
2025-11-30
0000924727
imstiii:C000244000Member
imstiii:TDSYNNEXCorpMember
2025-11-30
0000924727
imstiii:C000244000Member
us-gaap:TechnologySectorMember
2025-11-30
0000924727
imstiii:C000244000Member
imstiii:UGICorpMember
2025-11-30
0000924727
imstiii:C000244000Member
oef:UtilitiesSectorMember
2025-11-30
0000924727
imstiii:C000244000Member
imstiii:Vanguard03MonthTreasuryBillETF0238Member
2025-11-30
0000924727
imstiii:C000244001Member
2025-11-30
0000924727
imstiii:C000244001Member
us-gaap:CommonStockMember
2025-11-30
0000924727
imstiii:C000244001Member
oef:CommunicationsSectorMember
2025-11-30
0000924727
imstiii:C000244001Member
oef:ConsumerDiscretionarySectorMember
2025-11-30
0000924727
imstiii:C000244001Member
oef:ConsumerStaplesSectorMember
2025-11-30
0000924727
imstiii:C000244001Member
imstiii:CSGSystemsInternationalIncMember
2025-11-30
0000924727
imstiii:C000244001Member
us-gaap:ExchangeTradedFundsMember
2025-11-30
0000924727
imstiii:C000244001Member
us-gaap:FinancialServicesSectorMember
2025-11-30
0000924727
imstiii:C000244001Member
oef:IndustrialSectorMember
2025-11-30
0000924727
imstiii:C000244001Member
imstiii:InterDigitalIncMember
2025-11-30
0000924727
imstiii:C000244001Member
oef:MaterialsSectorMember
2025-11-30
0000924727
imstiii:C000244001Member
imstiii:NewJerseyResourcesCorpMember
2025-11-30
0000924727
imstiii:C000244001Member
imstiii:OshkoshCorpMember
2025-11-30
0000924727
imstiii:C000244001Member
imstiii:OtherAssetsInExcessOfLiabilitiesMember
2025-11-30
0000924727
imstiii:C000244001Member
imstiii:PVHCorpMember
2025-11-30
0000924727
imstiii:C000244001Member
imstiii:REVGroupIncMember
2025-11-30
0000924727
imstiii:C000244001Member
imstiii:RLICorpMember
2025-11-30
0000924727
imstiii:C000244001Member
us-gaap:ShortTermInvestmentsMember
2025-11-30
0000924727
imstiii:C000244001Member
imstiii:TDSYNNEXCorpMember
2025-11-30
0000924727
imstiii:C000244001Member
us-gaap:TechnologySectorMember
2025-11-30
0000924727
imstiii:C000244001Member
imstiii:UGICorpMember
2025-11-30
0000924727
imstiii:C000244001Member
oef:UtilitiesSectorMember
2025-11-30
0000924727
imstiii:C000244001Member
imstiii:Vanguard03MonthTreasuryBillETF0238Member
2025-11-30
0000924727
imstiii:C000244002Member
2025-11-30
0000924727
imstiii:C000244002Member
us-gaap:CommonStockMember
2025-11-30
0000924727
imstiii:C000244002Member
oef:CommunicationsSectorMember
2025-11-30
0000924727
imstiii:C000244002Member
oef:ConsumerDiscretionarySectorMember
2025-11-30
0000924727
imstiii:C000244002Member
oef:ConsumerStaplesSectorMember
2025-11-30
0000924727
imstiii:C000244002Member
imstiii:CSGSystemsInternationalIncMember
2025-11-30
0000924727
imstiii:C000244002Member
us-gaap:ExchangeTradedFundsMember
2025-11-30
0000924727
imstiii:C000244002Member
us-gaap:FinancialServicesSectorMember
2025-11-30
0000924727
imstiii:C000244002Member
oef:IndustrialSectorMember
2025-11-30
0000924727
imstiii:C000244002Member
imstiii:InterDigitalIncMember
2025-11-30
0000924727
imstiii:C000244002Member
oef:MaterialsSectorMember
2025-11-30
0000924727
imstiii:C000244002Member
imstiii:NewJerseyResourcesCorpMember
2025-11-30
0000924727
imstiii:C000244002Member
imstiii:OshkoshCorpMember
2025-11-30
0000924727
imstiii:C000244002Member
imstiii:OtherAssetsInExcessOfLiabilitiesMember
2025-11-30
0000924727
imstiii:C000244002Member
imstiii:PVHCorpMember
2025-11-30
0000924727
imstiii:C000244002Member
imstiii:REVGroupIncMember
2025-11-30
0000924727
imstiii:C000244002Member
imstiii:RLICorpMember
2025-11-30
0000924727
imstiii:C000244002Member
us-gaap:ShortTermInvestmentsMember
2025-11-30
0000924727
imstiii:C000244002Member
imstiii:TDSYNNEXCorpMember
2025-11-30
0000924727
imstiii:C000244002Member
us-gaap:TechnologySectorMember
2025-11-30
0000924727
imstiii:C000244002Member
imstiii:UGICorpMember
2025-11-30
0000924727
imstiii:C000244002Member
oef:UtilitiesSectorMember
2025-11-30
0000924727
imstiii:C000244002Member
imstiii:Vanguard03MonthTreasuryBillETF0238Member
2025-11-30
iso4217:USDiso4217:USDxbrli:sharesxbrli:purexbrli:sharesutr:Dimstiii:Holding
UNITED STATES
SECURITIES AND EXCHANGE COMMISSION
Washington, D.C. 20549
FORM N-CSR
CERTIFIED SHAREHOLDER REPORT OF REGISTERED MANAGEMENT INVESTMENT COMPANIES
Investment Company Act file number
Investment Managers Series Trust III
(Exact name of registrant as specified in charter)
235 West Galena Street
Milwaukee, Wisconsin 53212
(Address of Principal Executive Offices, including Zip Code)
Diane J. Drake
Mutual Fund Administration, LLC
2220 E. Route 66, Suite 226
Glendora, California 91740
(Name and Address of Agent for Service)
COPIES TO:
Laurie Anne Dee
Morgan, Lewis & Bockius LLP
600 Anton Boulevard, Suite 1800
Costa Mesa, California 92626
Registrant's telephone number, including area code:
Date of reporting period:
Item 1. Report to Stockholders.
(a) The registrant’s semi-annual report transmitted to shareholders pursuant to Rule 30e-1 under the Investment Company Act of 1940, as amended (the “Investment Act”), is as follows:
FPA Queens Road Small Cap Value Fund
Advisor Class/QRSAX
SEMI-ANNUAL SHAREHOLDER REPORT | November 30, 2025
This semi-annual shareholder report contains important information about the FPA Queens Road Small Cap Value Fund (“Fund”) for the period of June 1, 2025 to November 30, 2025. You can find additional information about the Fund at https://fpa.com/funds/overview/fpa-queens-road-small-cap-value-fund. You can also request this information by contacting us at (800) 638-3060.
Fund Expenses
(Based on a hypothetical $10,000 investment)
| Fund (Class) |
Costs of a $10,000 investment |
Costs paid as a percentage
of a $10,000 investment |
FPA Queens Road Small Cap Value Fund
(Advisor Class/QRSAX) |
$46 |
0.86%1 |
Key Fund Statistics
The following table outlines key fund statistics that you should pay attention to.
| Fund net assets |
$1,076,396,133 |
| Total number of portfolio holdings |
48 |
| Portfolio turnover rate as of the end of the reporting period |
13% |
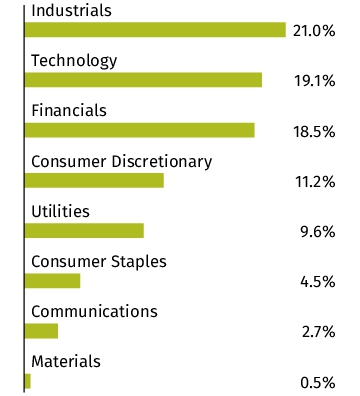
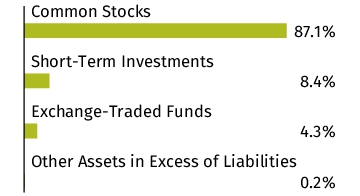
Graphical Representation of Holdings
The tables below show the investment makeup of the Fund, representing percentage of the total net assets of the Fund. The Top Ten Holdings and Sector Allocation exclude short-term holdings, if any. The Top Ten Holdings table may not reflect the total exposure to an issuer. The Sector Allocation chart represents Common Stocks of the Fund.
| UGI Corp. |
4.5% |
| Vanguard 0-3 Month Treasury Bill ETF, 0.238% |
4.3% |
| RLI Corp. |
4.2% |
| TD SYNNEX Corp. |
4.0% |
| InterDigital, Inc. |
3.8% |
| PVH Corp. |
2.9% |
| Oshkosh Corp. |
2.8% |
| CSG Systems International, Inc. |
2.8% |
| REV Group, Inc. |
2.7% |
| New Jersey Resources Corp. |
2.6% |
Changes in and Disagreements with Accountants
There were no changes in or disagreements with the Fund's accountants during the reporting period.
Availability of Additional Information
You can find additional information about the Fund such as the prospectus, financial information, fund holdings and proxy voting information at https://fpa.com/funds/overview/fpa-queens-road-small-cap-value-fund. You can also request this information by contacting us at (800) 638-3060.
Householding
In order to reduce expenses, we will deliver a single copy of prospectuses, proxies, financial reports and other communication to shareholders with the same residential address, provided they have the same last name, or we reasonably believe them to be members of the same family. Unless we are notified otherwise, we will continue to send recipients only one copy of these materials for as long as they remain a shareholder of the Fund. If you would like to receive individual mailings, please call (800) 638-3060 and we will begin sending you separate copies of these materials within 30 days after receiving your request.
FPA Queens Road Small Cap Value Fund - Advisor Class
FPA Queens Road Small Cap Value Fund
Institutional Class/QRSIX
SEMI-ANNUAL SHAREHOLDER REPORT | November 30, 2025
This semi-annual shareholder report contains important information about the FPA Queens Road Small Cap Value Fund (“Fund”) for the period of June 1, 2025 to November 30, 2025. You can find additional information about the Fund at https://fpa.com/funds/overview/fpa-queens-road-small-cap-value-fund. You can also request this information by contacting us at (800) 638-3060.
Fund Expenses
(Based on a hypothetical $10,000 investment)
| Fund (Class) |
Costs of a $10,000 investment |
Costs paid as a percentage
of a $10,000 investment |
FPA Queens Road Small Cap Value Fund
(Institutional Class/QRSIX) |
$40 |
0.76%1 |
Key Fund Statistics
The following table outlines key fund statistics that you should pay attention to.
| Fund net assets |
$1,076,396,133 |
| Total number of portfolio holdings |
48 |
| Portfolio turnover rate as of the end of the reporting period |
13% |
Graphical Representation of Holdings
The tables below show the investment makeup of the Fund, representing percentage of the total net assets of the Fund. The Top Ten Holdings and Sector Allocation exclude short-term holdings, if any. The Top Ten Holdings table may not reflect the total exposure to an issuer. The Sector Allocation chart represents Common Stocks of the Fund.
| UGI Corp. |
4.5% |
| Vanguard 0-3 Month Treasury Bill ETF, 0.238% |
4.3% |
| RLI Corp. |
4.2% |
| TD SYNNEX Corp. |
4.0% |
| InterDigital, Inc. |
3.8% |
| PVH Corp. |
2.9% |
| Oshkosh Corp. |
2.8% |
| CSG Systems International, Inc. |
2.8% |
| REV Group, Inc. |
2.7% |
| New Jersey Resources Corp. |
2.6% |
Changes in and Disagreements with Accountants
There were no changes in or disagreements with the Fund's accountants during the reporting period.
Availability of Additional Information
You can find additional information about the Fund such as the prospectus, financial information, fund holdings and proxy voting information at https://fpa.com/funds/overview/fpa-queens-road-small-cap-value-fund. You can also request this information by contacting us at (800) 638-3060.
Householding
In order to reduce expenses, we will deliver a single copy of prospectuses, proxies, financial reports and other communication to shareholders with the same residential address, provided they have the same last name, or we reasonably believe them to be members of the same family. Unless we are notified otherwise, we will continue to send recipients only one copy of these materials for as long as they remain a shareholder of the Fund. If you would like to receive individual mailings, please call (800) 638-3060 and we will begin sending you separate copies of these materials within 30 days after receiving your request.
FPA Queens Road Small Cap Value Fund - Institutional Class
FPA Queens Road Small Cap Value Fund
Investor Class/QRSVX
SEMI-ANNUAL SHAREHOLDER REPORT | November 30, 2025
This semi-annual shareholder report contains important information about the FPA Queens Road Small Cap Value Fund (“Fund”) for the period of June 1, 2025 to November 30, 2025. You can find additional information about the Fund at https://fpa.com/funds/overview/fpa-queens-road-small-cap-value-fund. You can also request this information by contacting us at (800) 638-3060.
Fund Expenses
(Based on a hypothetical $10,000 investment)
| Fund (Class) |
Costs of a $10,000 investment |
Costs paid as a percentage
of a $10,000 investment |
FPA Queens Road Small Cap Value Fund
(Investor Class/QRSVX) |
$47 |
0.89%1 |
Key Fund Statistics
The following table outlines key fund statistics that you should pay attention to.
| Fund net assets |
$1,076,396,133 |
| Total number of portfolio holdings |
48 |
| Portfolio turnover rate as of the end of the reporting period |
13% |
Graphical Representation of Holdings
The tables below show the investment makeup of the Fund, representing percentage of the total net assets of the Fund. The Top Ten Holdings and Sector Allocation exclude short-term holdings, if any. The Top Ten Holdings table may not reflect the total exposure to an issuer. The Sector Allocation chart represents Common Stocks of the Fund.
| UGI Corp. |
4.5% |
| Vanguard 0-3 Month Treasury Bill ETF, 0.238% |
4.3% |
| RLI Corp. |
4.2% |
| TD SYNNEX Corp. |
4.0% |
| InterDigital, Inc. |
3.8% |
| PVH Corp. |
2.9% |
| Oshkosh Corp. |
2.8% |
| CSG Systems International, Inc. |
2.8% |
| REV Group, Inc. |
2.7% |
| New Jersey Resources Corp. |
2.6% |
Changes in and Disagreements with Accountants
There were no changes in or disagreements with the Fund's accountants during the reporting period.
Availability of Additional Information
You can find additional information about the Fund such as the prospectus, financial information, fund holdings and proxy voting information at https://fpa.com/funds/overview/fpa-queens-road-small-cap-value-fund. You can also request this information by contacting us at (800) 638-3060.
Householding
In order to reduce expenses, we will deliver a single copy of prospectuses, proxies, financial reports and other communication to shareholders with the same residential address, provided they have the same last name, or we reasonably believe them to be members of the same family. Unless we are notified otherwise, we will continue to send recipients only one copy of these materials for as long as they remain a shareholder of the Fund. If you would like to receive individual mailings, please call (800) 638-3060 and we will begin sending you separate copies of these materials within 30 days after receiving your request.
FPA Queens Road Small Cap Value Fund - Investor Class
FPA Queens Road Value Fund
QRVLX
SEMI-ANNUAL SHAREHOLDER REPORT | November 30, 2025
This semi-annual shareholder report contains important information about the FPA Queens Road Value Fund (“Fund”) for the period of June 1, 2025 to November 30, 2025. You can find additional information about the Fund at https://fpa.com/funds/overview/fpa-queens-value-fund. You can also request this information by contacting us at (800) 638-3060.
This report describes changes to the Fund that occurred during the reporting period.
Fund Expenses
(Based on a hypothetical $10,000 investment)
| Fund (Class) |
Costs of a $10,000 investment |
Costs paid as a percentage
of a $10,000 investment |
FPA Queens Road Value Fund
(QRVLX) |
$35 |
0.67%1 |
Key Fund Statistics
The following table outlines key fund statistics that you should pay attention to.
| Fund net assets |
$51,981,955 |
| Total number of portfolio holdings |
29 |
| Portfolio turnover rate as of the end of the reporting period |
0% |
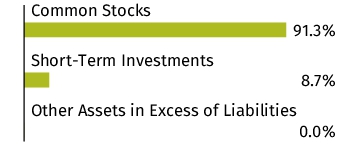
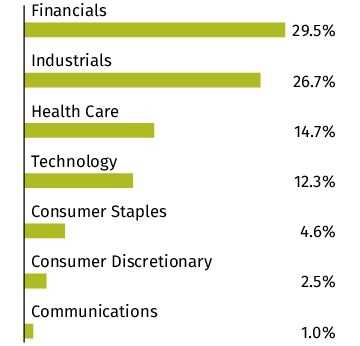
Graphical Representation of Holdings
The tables below show the investment makeup of the Fund, representing percentage of the total net assets of the Fund. The Top Ten Holdings and Sector Allocation exclude short-term holdings, if any. The Top Ten Holdings table may not reflect the total exposure to an issuer. The Sector Allocation chart represents Common Stocks of the Fund.
| American Express Co. |
7.7% |
| Trane Technologies PLC |
7.5% |
| Oracle Corp. |
7.2% |
| Eaton Corp. PLC |
6.6% |
| JPMorgan Chase & Co. |
5.4% |
| Ameriprise Financial, Inc. |
5.3% |
| General Dynamics Corp. |
5.3% |
| Berkshire Hathaway, Inc. - Class A |
4.4% |
| Pfizer, Inc. |
3.8% |
| Hershey Co. |
3.6% |
Material Fund Changes
Effective October 1, 2025, the Fund's expense limitation is increased to 0.73% from 0.65%.
On October 14, 2025, based on the recommendation of the Fund’s adviser, First Pacific Advisors, L.P. (the “Adviser”) and the Fund’s sub-adviser, Bragg Financial Advisors, Inc. (the “Sub-Adviser”), the Board of Trustees of the Trust has approved the reorganization of the Fund (the “Fund”) into an exchange-traded fund (the “Reorganization”). The Reorganization of the Fund is subject to approval by its shareholders and will occur pursuant to an Agreement and Plan of Reorganization whereby the Fund will transfer all of its assets and liabilities to the FPA Queens Road Value ETF (the “ETF”), a newly created series of the Trust. If approved, each shareholder of the Fund will receive shares of the ETF and/or cash equal to the value of the shares of the Fund owned by the shareholder.
The Trust will call a shareholder meeting at which shareholders of the Fund will be asked to consider and vote on the Reorganization. If the required shareholder approval for the Reorganization of the Fund is obtained, the Reorganization is expected to take effect in the fourth quarter of 2026.
This is a summary of certain changes to the Fund since June 1, 2025. For more complete information, you may review the Fund's prospectus, which is dated September 30, 2025, at https://fpa.com/funds/overview/fpa-queens-value-fund.
Changes in and Disagreements with Accountants
There were no changes in or disagreements with the Fund's accountants during the reporting period.
Availability of Additional Information
You can find additional information about the Fund such as the prospectus, financial information, fund holdings and proxy voting information at https://fpa.com/funds/overview/fpa-queens-value-fund. You can also request this information by contacting us at (800) 638-3060.
Householding
In order to reduce expenses, we will deliver a single copy of prospectuses, proxies, financial reports and other communication to shareholders with the same residential address, provided they have the same last name, or we reasonably believe them to be members of the same family. Unless we are notified otherwise, we will continue to send recipients only one copy of these materials for as long as they remain a shareholder of the Fund. If you would like to receive individual mailings, please call (800) 638-3060 and we will begin sending you separate copies of these materials within 30 days after receiving your request.
FPA Queens Road Value Fund
(b) Not applicable.
Item
2. Code of Ethics.
Not applicable.
Item
3. Audit Committee Financial Expert.
Not applicable.
Item
4. Principal Accountant Fees and Services.
Not applicable.
Item
5. Audit Committee of Listed Registrants.
Not applicable.
Item
6. Investments.
|
| (a) |
Schedule of Investments is included as part of the report to shareholders filed under Item 7 of this Form. |
Item
7. Financial Statements and Financial Highlights for Open-End Management Investment Companies.

FPA Queens Road Small Cap Value Fund
(Investor Class: QRSVX)
(Institutional Class: QRSIX)
(Advisor Class: QRSAX)
SEMI-ANNUAL FINANCIALS AND OTHER INFORMATION
NOVEMBER 30, 2025
FPA Queens Road Small Cap Value Fund
A series of Investment Managers Series Trust
III
Table of Contents
Please note the Financials and Other Information only contains Items
7-11 required in Form N-CSR. All other required items will be filed with the SEC.
| Item 7. Financial Statements and Financial Highlights |
|
| Schedule of Investments |
1 |
| Statement of Assets and Liabilities |
4 |
| Statement of Operations |
5 |
| Statements of Changes in Net Assets |
6 |
| Financial Highlights |
|
| Investor Class |
7 |
| Institutional Class |
8 |
| Advisor Class |
9 |
| Notes to Financial Statements |
10 |
This report and the financial statements contained
herein are provided for the general information of the shareholders of the FPA Queens Road Small Cap Value Fund (the “Fund”).
This report is not authorized for distribution to prospective investors in the Fund unless preceded or accompanied by an effective shareholder
report and prospectus.
https://fpa.com
FPA Queens Road Small Cap Value Fund
SCHEDULE OF INVESTMENTS
As of November 30, 2025 (Unaudited)
|
Number
of Shares |
|
|
|
|
Value |
|
| |
|
|
|
COMMON STOCKS — 87.1% |
|
|
|
|
| |
|
|
|
AEROSPACE & DEFENSE — 0.9% |
|
|
|
|
| |
109,929 |
|
|
Ducommun, Inc.* |
|
$ |
10,079,390 |
|
| |
|
|
|
APPAREL & TEXTILE PRODUCTS — 4.9% |
|
|
|
|
| |
23,807 |
|
|
Deckers Outdoor Corp.* |
|
|
2,095,730 |
|
| |
878,700 |
|
|
Levi Strauss & Co. - Class A |
|
|
19,357,761 |
|
| |
371,552 |
|
|
PVH Corp. |
|
|
31,492,748 |
|
| |
|
|
|
|
|
|
52,946,239 |
|
| |
|
|
|
BANKING — 5.3% |
|
|
|
|
| |
323,282 |
|
|
Axos Financial, Inc.* |
|
|
26,567,315 |
|
| |
97,223 |
|
|
Five Star Bancorp |
|
|
3,353,221 |
|
| |
384,754 |
|
|
ServisFirst Bancshares, Inc. |
|
|
27,367,552 |
|
| |
|
|
|
|
|
|
57,288,088 |
|
| |
|
|
|
COMMERCIAL SUPPORT SERVICES — 2.8% |
|
|
|
|
| |
376,114 |
|
|
CSG Systems International, Inc. |
|
|
29,626,500 |
|
| |
|
|
|
CONSUMER SERVICES — 1.6% |
|
|
|
|
| |
955,661 |
|
|
Upbound Group, Inc. |
|
|
17,125,445 |
|
| |
|
|
|
CONTAINERS & PACKAGING — 0.5% |
|
|
|
|
| |
363,852 |
|
|
Graphic Packaging Holding Co. |
|
|
5,887,125 |
|
| |
|
|
|
ELECTRICAL EQUIPMENT — 2.2% |
|
|
|
|
| |
93,761 |
|
|
Littelfuse, Inc. |
|
|
24,004,691 |
|
| |
|
|
|
ENGINEERING & CONSTRUCTION — 1.2% |
|
|
|
|
| |
139,479 |
|
|
Everus Construction Group, Inc.* |
|
|
12,826,489 |
|
| |
|
|
|
FOOD — 1.1% |
|
|
|
|
| |
331,396 |
|
|
Darling Ingredients, Inc.* |
|
|
12,132,408 |
|
| |
|
|
|
GAS & WATER UTILITIES — 9.6% |
|
|
|
|
| |
1,234,938 |
|
|
MDU Resources Group, Inc. |
|
|
26,328,878 |
|
| |
590,009 |
|
|
New Jersey Resources Corp. |
|
|
28,367,633 |
|
| |
1,228,590 |
|
|
UGI Corp. |
|
|
48,590,734 |
|
| |
|
|
|
|
|
|
103,287,245 |
|
| |
|
|
|
INDUSTRIAL INTERMEDIATE PRODUCTS — 0.3% |
|
|
|
|
| |
102,635 |
|
|
L B Foster Co. - Class A* |
|
|
2,769,092 |
|
| |
|
|
|
INDUSTRIAL SUPPORT SERVICES — 2.6% |
|
|
|
|
| |
258,539 |
|
|
MSC Industrial Direct Co., Inc. - Class A |
|
|
22,999,629 |
|
| |
30,204 |
|
|
VSE Corp. |
|
|
5,442,459 |
|
| |
|
|
|
|
|
|
28,442,088 |
|
| |
|
|
|
INSURANCE — 8.4% |
|
|
|
|
| |
639,304 |
|
|
CNO Financial Group, Inc. |
|
|
26,166,713 |
|
| |
415,832 |
|
|
Horace Mann Educators Corp. |
|
|
19,036,789 |
|
| |
726,288 |
|
|
RLI Corp. |
|
|
44,782,918 |
|
| |
|
|
|
|
|
|
89,986,420 |
|
FPA Queens Road Small Cap Value Fund
SCHEDULE OF INVESTMENTS - Continued
As of November 30, 2025 (Unaudited)
|
Number
of Shares |
|
|
|
|
Value |
|
| |
|
|
|
COMMON STOCKS (Continued) |
|
|
|
|
| |
|
|
|
INTERNET MEDIA & SERVICES — 1.1% |
|
|
|
|
| |
341,303 |
|
|
IAC, Inc.* |
|
$ |
11,969,496 |
|
| |
|
|
|
MACHINERY — 8.3% |
|
|
|
|
| |
224,475 |
|
|
AGCO Corp. |
|
|
23,785,371 |
|
| |
15,520 |
|
|
CSW Industrials, Inc. |
|
|
4,219,423 |
|
| |
81,171 |
|
|
Graco, Inc. |
|
|
6,691,737 |
|
| |
173,045 |
|
|
JBT Marel Corp. |
|
|
24,318,014 |
|
| |
235,640 |
|
|
Oshkosh Corp. |
|
|
30,204,335 |
|
| |
|
|
|
|
|
|
89,218,880 |
|
| |
|
|
|
PUBLISHING & BROADCASTING — 1.6% |
|
|
|
|
| |
581,707 |
|
|
Scholastic Corp. |
|
|
17,183,625 |
|
| |
|
|
|
RETAIL - CONSUMER STAPLES — 3.4% |
|
|
|
|
| |
325,061 |
|
|
Ingles Markets, Inc. - Class A |
|
|
25,003,692 |
|
| |
139,656 |
|
|
Sprouts Farmers Market, Inc.* |
|
|
11,704,569 |
|
| |
|
|
|
|
|
|
36,708,261 |
|
| |
|
|
|
RETAIL - DISCRETIONARY — 1.7% |
|
|
|
|
| |
343,013 |
|
|
Advance Auto Parts, Inc. |
|
|
17,795,514 |
|
| |
|
|
|
SEMICONDUCTORS — 5.3% |
|
|
|
|
| |
136,153 |
|
|
Qorvo, Inc.* |
|
|
11,694,181 |
|
| |
332,713 |
|
|
Synaptics, Inc.* |
|
|
22,794,168 |
|
| |
1,665,006 |
|
|
Vishay Intertechnology, Inc. |
|
|
22,760,632 |
|
| |
|
|
|
|
|
|
57,248,981 |
|
| |
|
|
|
SOFTWARE — 0.4% |
|
|
|
|
| |
125,731 |
|
|
Concentrix Corp. |
|
|
4,552,719 |
|
| |
|
|
|
SPECIALTY FINANCE — 4.8% |
|
|
|
|
| |
891,532 |
|
|
MGIC Investment Corp. |
|
|
25,274,932 |
|
| |
200,594 |
|
|
Nelnet, Inc., Class A |
|
|
25,924,769 |
|
| |
|
|
|
|
|
|
51,199,701 |
|
| |
|
|
|
TECHNOLOGY HARDWARE — 12.2% |
|
|
|
|
| |
249,675 |
|
|
Arrow Electronics, Inc.* |
|
|
26,967,397 |
|
| |
43,673 |
|
|
Fabrinet* |
|
|
20,063,813 |
|
| |
115,774 |
|
|
InterDigital, Inc. |
|
|
41,418,149 |
|
| |
284,230 |
|
|
TD SYNNEX Corp. |
|
|
43,339,390 |
|
| |
|
|
|
|
|
|
131,788,749 |
|
| |
|
|
|
TECHNOLOGY SERVICES — 1.2% |
|
|
|
|
| |
154,904 |
|
|
Science Applications International Corp. |
|
|
13,354,274 |
|
| |
|
|
|
TRANSPORTATION EQUIPMENT — 2.7% |
|
|
|
|
| |
539,334 |
|
|
REV Group, Inc. |
|
|
28,730,322 |
|
| |
|
|
|
WHOLESALE - DISCRETIONARY — 3.0% |
|
|
|
|
| |
134,726 |
|
|
ePlus, Inc. |
|
|
12,071,450 |
|
FPA Queens Road Small Cap Value Fund
SCHEDULE OF INVESTMENTS - Continued
As of November 30, 2025 (Unaudited)
|
Number
of Shares |
|
|
|
|
Value |
|
| |
|
|
|
COMMON STOCKS (Continued) |
|
|
|
|
| |
|
|
|
WHOLESALE - DISCRETIONARY (Continued) |
|
|
|
|
| |
677,440 |
|
|
G-III Apparel Group Ltd.* |
|
$ |
19,747,376 |
|
| |
|
|
|
|
|
|
31,818,826 |
|
| |
|
|
|
TOTAL COMMON STOCKS |
|
|
|
|
| |
|
|
|
(Cost $683,783,952) |
|
|
937,970,568 |
|
| |
|
|
|
EXCHANGE-TRADED FUNDS — 4.3% |
|
|
|
|
| |
605,802 |
|
|
Vanguard 0-3 Month Treasury Bill ETF |
|
|
45,813,776 |
|
| |
|
|
|
TOTAL EXCHANGE-TRADED FUNDS |
|
|
|
|
| |
|
|
|
(Cost $45,682,494) |
|
|
45,813,776 |
|
| |
|
|
|
SHORT-TERM INVESTMENTS — 8.4% |
|
|
|
|
| |
|
|
|
MONEY MARKET INVESTMENTS — 8.4% |
|
|
|
|
| |
90,941,933 |
|
|
Morgan Stanley Institutional Liquidity Treasury Portfolio
- Institutional Class, 3.77%(a) |
|
|
90,941,933 |
|
| |
|
|
|
TOTAL SHORT-TERM INVESTMENTS |
|
|
|
|
| |
|
|
|
(Cost $90,941,933) |
|
|
90,941,933 |
|
| |
|
|
|
TOTAL INVESTMENTS — 99.8% |
|
|
|
|
| |
|
|
|
(Cost $820,408,379) |
|
|
1,074,726,277 |
|
| |
|
|
|
Other Assets in Excess of Liabilities — 0.2% |
|
|
1,669,856 |
|
| |
|
|
|
TOTAL NET ASSETS — 100.0% |
|
$ |
1,076,396,133 |
|
ETF – Exchange-Traded Fund
|
| * |
Non-income producing security. |
|
| (a) |
The rate is the annualized seven-day yield at period end. |
See accompanying Notes to Financial Statements.
FPA Queens Road Small Cap Value Fund
STATEMENT OF ASSETS AND LIABILITIES
As of November 30, 2025 (Unaudited)
| Assets: |
|
|
|
|
| Investments, at value (cost $820,408,379) |
|
$ |
1,074,726,277 |
|
| Receivables: |
|
|
|
|
| Fund shares sold |
|
|
644,866 |
|
| Dividends and interest |
|
|
2,260,508 |
|
| Prepaid expenses |
|
|
29,845 |
|
| Total assets |
|
|
1,077,661,496 |
|
| |
|
|
|
|
| Liabilities: |
|
|
|
|
| Payables: |
|
|
|
|
| Fund shares redeemed |
|
|
550,219 |
|
| Advisory fees |
|
|
566,277 |
|
| Shareholder servicing fees (Note 7) |
|
|
49,651 |
|
| Fund services fees |
|
|
33,816 |
|
| Shareholder reporting fees |
|
|
16,429 |
|
| Legal fees |
|
|
12,144 |
|
| Trustees' deferred compensation (Note 3) |
|
|
8,760 |
|
| Auditing fees |
|
|
8,608 |
|
| Chief Compliance Officer fees |
|
|
2,994 |
|
| Trustees' fees and expenses |
|
|
1,754 |
|
| Accrued other expenses |
|
|
14,711 |
|
| Total liabilities |
|
|
1,265,363 |
|
| |
|
|
|
|
| Net Assets |
|
$ |
1,076,396,133 |
|
| |
|
|
|
|
| Components of Net Assets: |
|
|
|
|
| Capital Stock (no par value with an unlimited number of shares authorized) |
|
$ |
742,071,344 |
|
| Total distributable earnings (accumulated deficit) |
|
|
334,324,789 |
|
| Net Assets |
|
$ |
1,076,396,133 |
|
| |
|
|
|
|
| Maximum Offering Price per Share: |
|
|
|
|
| Investor Class Shares: |
|
|
|
|
| Net assets applicable to shares outstanding |
|
$ |
128,379,195 |
|
| Shares of beneficial interest issued and outstanding |
|
|
2,874,874 |
|
| Redemption price per share |
|
$ |
44.66 |
|
| |
|
|
|
|
| Institutional Class Shares: |
|
|
|
|
| Net assets applicable to shares outstanding |
|
$ |
903,824,786 |
|
| Shares of beneficial interest issued and outstanding |
|
|
20,243,489 |
|
| Redemption price per share |
|
$ |
44.65 |
|
| |
|
|
|
|
| Advisor Class Shares: |
|
|
|
|
| Net assets applicable to shares outstanding |
|
$ |
44,192,152 |
|
| Shares of beneficial interest issued and outstanding |
|
|
992,786 |
|
| Redemption price per share |
|
$ |
44.51 |
|
See accompanying Notes to Financial Statements.
FPA Queens Road Small Cap Value Fund
STATEMENT OF OPERATIONS
For the Six Months Ended November 30, 2025 (Unaudited)
| Investment income: |
|
|
|
| Dividends |
|
$ |
8,830,134 |
|
| Interest |
|
|
1,261,105 |
|
| Total investment income |
|
|
10,091,239 |
|
| |
|
|
|
|
| Expenses: |
|
|
|
|
| Advisory fees |
|
|
3,337,475 |
|
| Shareholder servicing fees - Investor Class (Note 7) |
|
|
105,078 |
|
| Shareholder servicing fees - Institutional Class (Note 7) |
|
|
229,485 |
|
| Shareholder servicing fees - Advisor Class (Note 7) |
|
|
29,238 |
|
| Fund services fees |
|
|
118,715 |
|
| Registration fees |
|
|
38,067 |
|
| Trustees' fees and expenses |
|
|
24,144 |
|
| Miscellaneous |
|
|
23,693 |
|
| Shareholder reporting fees |
|
|
19,821 |
|
| Redemption liquidity service |
|
|
12,795 |
|
| Legal fees |
|
|
12,453 |
|
| Insurance fees |
|
|
10,021 |
|
| Auditing fees |
|
|
9,089 |
|
| Chief Compliance Officer fees |
|
|
5,364 |
|
| Total expenses |
|
|
3,975,438 |
|
| Net investment income (loss) |
|
|
6,115,801 |
|
| |
|
|
|
|
| Realized and Unrealized Gain (Loss): |
|
|
|
|
| Net realized gain (loss) on: |
|
|
|
|
| Investments |
|
|
44,973,901 |
|
| In-kind redemptions |
|
|
8,425,352 |
|
| Total realized gain (loss) |
|
|
53,399,253 |
|
| Net change in unrealized appreciation (depreciation) on: |
|
|
|
|
| Investments |
|
|
53,968,321 |
|
| Net change in unrealized appreciation (depreciation) |
|
|
53,968,321 |
|
| Net realized and unrealized gain (loss) |
|
|
107,367,574 |
|
| |
|
|
|
|
| Net Increase (Decrease) in Net Assets from Operations |
|
$ |
113,483,375 |
|
See accompanying Notes to Financial Statements.
FPA Queens Road Small Cap Value Fund
STATEMENTS OF CHANGES
IN NET ASSETS
| |
|
For the
Six Months Ended
November
30, 2025
(Unaudited) |
|
|
For the
Year Ended
May 31, 2025 |
|
| Increase (Decrease) in Net Assets from: |
|
|
|
|
|
|
|
|
| Operations: |
|
|
|
|
|
|
|
|
| Net investment income (loss) |
|
$ |
6,115,801 |
|
|
$ |
8,038,370 |
|
| Total realized gain (loss) on investments |
|
|
53,399,253 |
|
|
|
32,898,512 |
|
| Net change in unrealized appreciation (depreciation) on investments |
|
|
53,968,321 |
|
|
|
25,946,662 |
|
| Net increase (decrease) in net assets resulting from
operations |
|
|
113,483,375 |
|
|
|
66,883,544 |
|
| |
|
|
|
|
|
|
|
|
| Distributions to Shareholders: |
|
|
|
|
|
|
|
|
| Distributions: |
|
|
|
|
|
|
|
|
| Investor Class |
|
|
- |
|
|
|
(4,334,028 |
) |
| Institutional Class |
|
|
- |
|
|
|
(32,840,884 |
) |
| Advisor Class |
|
|
- |
|
|
|
(1,546,449 |
) |
| Total distributions to shareholders |
|
|
- |
|
|
|
(38,721,361 |
) |
| |
|
|
|
|
|
|
|
|
| Capital Transactions: |
|
|
|
|
|
|
|
|
| Net proceeds from shares sold: |
|
|
|
|
|
|
|
|
| Investor Class |
|
|
41,282,663 |
|
|
|
31,256,196 |
|
| Institutional Class |
|
|
83,662,670 |
|
|
|
215,903,807 |
|
| Advisor Class |
|
|
9,387,677 |
|
|
|
12,763,673 |
|
| Reinvestment of distributions: |
|
|
|
|
|
|
|
|
| Investor Class |
|
|
- |
|
|
|
4,326,093 |
|
| Institutional Class |
|
|
- |
|
|
|
30,073,326 |
|
| Advisor Class |
|
|
- |
|
|
|
1,510,109 |
|
| Cost of shares redeemed: |
|
|
|
|
|
|
|
|
| Investor Class |
|
|
(20,208,564 |
) |
|
|
(25,937,442 |
) |
| Institutional Class |
|
|
(58,282,058 |
) |
|
|
(89,648,643 |
) |
| Advisor Class |
|
|
(2,409,491 |
) |
|
|
(23,869,104 |
) |
| Net increase (decrease) in net assets from capital
transactions |
|
|
53,432,897 |
|
|
|
156,378,015 |
|
| |
|
|
|
|
|
|
|
|
| Total increase (decrease) in net assets |
|
|
166,916,272 |
|
|
|
184,540,198 |
|
| |
|
|
|
|
|
|
|
|
| Net Assets: |
|
|
|
|
|
|
|
|
| Beginning of period |
|
|
909,479,861 |
|
|
|
724,939,663 |
|
| End of period |
|
$ |
1,076,396,133 |
|
|
$ |
909,479,861 |
|
| Capital Share Transactions: |
|
|
|
|
|
|
|
|
| Shares sold: |
|
|
|
|
|
|
|
|
| Investor Class |
|
|
945,557 |
|
|
|
795,691 |
|
| Institutional Class |
|
|
1,935,219 |
|
|
|
5,549,972 |
|
| Advisor Class |
|
|
217,093 |
|
|
|
323,488 |
|
| Shares reinvested: |
|
|
|
|
|
|
|
|
| Investor Class |
|
|
- |
|
|
|
111,411 |
|
| Institutional Class |
|
|
- |
|
|
|
775,485 |
|
| Advisor Class |
|
|
- |
|
|
|
39,001 |
|
| Shares redeemed: |
|
|
|
|
|
|
|
|
| Investor Class |
|
|
(465,901 |
) |
|
|
(668,386 |
) |
| Institutional Class |
|
|
(1,342,745 |
) |
|
|
(2,330,783 |
) |
| Advisor Class |
|
|
(56,229 |
) |
|
|
(611,069 |
) |
| Net increase (decrease) in capital share transactions |
|
|
1,232,994 |
|
|
|
3,984,810 |
|
See accompanying Notes to Financial Statements.
FPA Queens Road Small Cap Value Fund
FINANCIAL HIGHLIGHTS
Investor Class
Per share operating performance.
For a capital share outstanding throughout each period.
| |
|
For the
Six Months
Ended
November 30,
2025 |
|
|
For the
Year Ended
May 31, |
|
| |
|
(Unaudited) |
|
|
2025 |
|
|
2024 |
|
|
20231 |
|
|
20221 |
|
|
20211 |
|
| Net asset value, beginning of period |
|
$ |
39.79 |
|
|
$ |
38.40 |
|
|
$ |
32.12 |
|
|
$ |
34.03 |
|
|
$ |
35.52 |
|
|
$ |
23.22 |
|
| Income from Investment Operations: |
|
|
|
|
|
|
|
|
|
|
|
|
|
|
|
|
|
|
|
|
|
|
|
|
| Net investment
income (loss)2 |
|
|
0.24 |
|
|
|
0.35 |
|
|
|
0.27 |
|
|
|
0.31 |
|
|
|
0.07 |
|
|
|
0.06 |
|
| Net realized and unrealized gain (loss) |
|
|
4.63 |
|
|
|
2.93 |
|
|
|
6.96 |
|
|
|
(1.54 |
) |
|
|
(0.95 |
) |
|
|
12.34 |
|
| Total from investment operations |
|
|
4.87 |
|
|
|
3.28 |
|
|
|
7.23 |
|
|
|
(1.23 |
) |
|
|
(0.88 |
) |
|
|
12.40 |
|
| |
|
|
|
|
|
|
|
|
|
|
|
|
|
|
|
|
|
|
|
|
|
|
|
|
| Less Distributions: |
|
|
|
|
|
|
|
|
|
|
|
|
|
|
|
|
|
|
|
|
|
|
|
|
| From net investment income |
|
|
- |
|
|
|
(0.31 |
) |
|
|
(0.44 |
) |
|
|
- |
|
|
|
- |
|
|
|
(0.09 |
) |
| From net realized gain |
|
|
- |
|
|
|
(1.58 |
) |
|
|
(0.51 |
) |
|
|
(0.68 |
) |
|
|
(0.61 |
) |
|
|
(0.01 |
) |
| Total distributions |
|
|
- |
|
|
|
(1.89 |
) |
|
|
(0.95 |
) |
|
|
(0.68 |
) |
|
|
(0.61 |
) |
|
|
(0.10 |
) |
| Net asset value, end of period |
|
$ |
44.66 |
|
|
$ |
39.79 |
|
|
$ |
38.40 |
|
|
$ |
32.12 |
|
|
$ |
34.03 |
|
|
$ |
35.52 |
|
| |
|
|
|
|
|
|
|
|
|
|
|
|
|
|
|
|
|
|
|
|
|
|
|
|
| Total return3 |
|
|
12.24 |
%4 |
|
|
8.67 |
% |
|
|
22.62 |
% |
|
|
(3.63 |
)% |
|
|
(2.52 |
)% |
|
|
53.51 |
% |
| |
|
|
|
|
|
|
|
|
|
|
|
|
|
|
|
|
|
|
|
|
|
|
|
|
| Ratios and Supplemental Data: |
|
|
|
|
|
|
|
|
|
|
|
|
|
|
|
|
|
|
|
|
|
|
|
|
| Net assets, end of period (in thousands) |
|
$ |
128,379 |
|
|
$ |
95,295 |
|
|
$ |
82,801 |
|
|
$ |
72,820 |
|
|
$ |
82,461 |
|
|
$ |
193,922 |
|
| |
|
|
|
|
|
|
|
|
|
|
|
|
|
|
|
|
|
|
|
|
|
|
|
|
| Ratio of expenses to average net assets: |
|
|
|
|
|
|
|
|
|
|
|
|
|
|
|
|
|
|
|
|
|
|
|
|
| Before fees waived and expenses absorbed |
|
|
0.89 |
%5 |
|
|
0.92 |
% |
|
|
0.98 |
% |
|
|
1.00 |
% |
|
|
1.00 |
% |
|
|
1.11 |
% |
| After fees waived and expenses absorbed |
|
|
0.89 |
%5 |
|
|
0.92 |
% |
|
|
0.98 |
% |
|
|
1.00 |
% |
|
|
1.00 |
% |
|
|
1.09 |
%6 |
| Ratio of net investment income (loss) to average net assets: |
|
|
|
|
|
|
|
|
|
|
|
|
|
|
|
|
|
|
|
|
|
|
|
|
| Before fees waived and expenses absorbed |
|
|
1.09 |
%5 |
|
|
0.89 |
% |
|
|
0.77 |
% |
|
|
0.95 |
% |
|
|
0.21 |
% |
|
|
0.22 |
% |
| After fees waived and expenses absorbed |
|
|
1.09 |
%5 |
|
|
0.89 |
% |
|
|
0.77 |
% |
|
|
0.95 |
% |
|
|
0.21 |
% |
|
|
0.20 |
% |
| |
|
|
|
|
|
|
|
|
|
|
|
|
|
|
|
|
|
|
|
|
|
|
|
|
| Portfolio turnover rate |
|
|
13 |
%4 |
|
|
15 |
% |
|
|
19 |
% |
|
|
13 |
% |
|
|
10 |
% |
|
|
15 |
% |
|
| 1 |
Audits performed for the fiscal years indicated by the Fund's previous auditor, Ernst & Young LLP. |
|
| 2 |
Based on average shares outstanding for the period. |
|
| 3 |
Return is based on net asset value per share, adjusted for reinvestment of distributions, and does not reflect
deduction of the sales charge. |
|
| 6 |
Effective November 1, 2020, the Advisor has contractually agreed to limit the annual fund operating expenses
to 1.04%. Prior to November 1, 2020, the Fund had a unitary fee structure that limited annual operating expenses to 1.18%. |
See accompanying Notes to Financial Statements.
FPA Queens Road Small Cap Value Fund
FINANCIAL HIGHLIGHTS
Institutional Class
Per share operating performance.
For a capital share outstanding throughout each period.
| |
|
For the
Six Months
Ended
November
30,
2025 |
|
|
For the
Year Ended
May 31, |
|
|
For the
Period Ended
May 31, |
|
| |
|
(Unaudited) |
|
|
2025 |
|
|
2024 |
|
|
20231 |
|
|
20221 |
|
|
20211,2 |
|
| Net asset value, beginning of period |
|
$ |
39.75 |
|
|
$ |
38.37 |
|
|
$ |
32.10 |
|
|
$ |
33.99 |
|
|
$ |
35.52 |
|
|
$ |
28.16 |
|
| Income from Investment Operations: |
|
|
|
|
|
|
|
|
|
|
|
|
|
|
|
|
|
|
|
|
|
|
|
|
| Net investment
income (loss)3 |
|
|
0.26 |
|
|
|
0.41 |
|
|
|
0.34 |
|
|
|
0.37 |
|
|
|
0.13 |
|
|
|
0.02 |
|
| Net realized and unrealized gain (loss) |
|
|
4.64 |
|
|
|
2.93 |
|
|
|
6.95 |
|
|
|
(1.54 |
) |
|
|
(0.94 |
) |
|
|
7.44 |
|
| Total from investment operations |
|
|
4.90 |
|
|
|
3.34 |
|
|
|
7.29 |
|
|
|
(1.17 |
) |
|
|
(0.81 |
) |
|
|
7.46 |
|
| |
|
|
|
|
|
|
|
|
|
|
|
|
|
|
|
|
|
|
|
|
|
|
|
|
| Less Distributions: |
|
|
|
|
|
|
|
|
|
|
|
|
|
|
|
|
|
|
|
|
|
|
|
|
| From net investment income |
|
|
- |
|
|
|
(0.38 |
) |
|
|
(0.51 |
) |
|
|
(0.04 |
) |
|
|
(0.11 |
) |
|
|
(0.09 |
) |
| From net realized gain |
|
|
- |
|
|
|
(1.58 |
) |
|
|
(0.51 |
) |
|
|
(0.68 |
) |
|
|
(0.61 |
) |
|
|
(0.01 |
) |
| Total distributions |
|
|
- |
|
|
|
(1.96 |
) |
|
|
(1.02 |
) |
|
|
(0.72 |
) |
|
|
(0.72 |
) |
|
|
(0.10 |
) |
| |
|
|
|
|
|
|
|
|
|
|
|
|
|
|
|
|
|
|
|
|
|
|
|
|
| Redemption fee proceeds |
|
|
- |
|
|
|
- |
|
|
|
- |
|
|
|
- |
|
|
|
- |
|
|
|
- |
|
| Net asset value, end of period |
|
$ |
44.65 |
|
|
$ |
39.75 |
|
|
$ |
38.37 |
|
|
$ |
32.10 |
|
|
$ |
33.99 |
|
|
$ |
35.52 |
|
| |
|
|
|
|
|
|
|
|
|
|
|
|
|
|
|
|
|
|
|
|
|
|
|
|
| Total return4 |
|
|
12.33 |
%5 |
|
|
8.82 |
% |
|
|
22.82 |
% |
|
|
(3.44 |
)% |
|
|
(2.34 |
)% |
|
|
26.59 |
%5 |
| |
|
|
|
|
|
|
|
|
|
|
|
|
|
|
|
|
|
|
|
|
|
|
|
|
| Ratios and Supplemental Data: |
|
|
|
|
|
|
|
|
|
|
|
|
|
|
|
|
|
|
|
|
|
|
|
|
| Net assets, end of period (in thousands) |
|
$ |
903,825 |
|
|
$ |
781,187 |
|
|
$ |
600,743 |
|
|
$ |
367,607 |
|
|
$ |
376,221 |
|
|
$ |
301,941 |
|
| |
|
|
|
|
|
|
|
|
|
|
|
|
|
|
|
|
|
|
|
|
|
|
|
|
| Ratio of expenses to average net assets: |
|
|
|
|
|
|
|
|
|
|
|
|
|
|
|
|
|
|
|
|
|
|
|
|
| Before fees waived and expenses absorbed |
|
|
0.76 |
%6 |
|
|
0.78 |
% |
|
|
0.79 |
% |
|
|
0.81 |
% |
|
|
0.83 |
% |
|
|
0.91 |
%6 |
| After fees waived and expenses absorbed |
|
|
0.76 |
%6 |
|
|
0.78 |
% |
|
|
0.79 |
% |
|
|
0.81 |
% |
|
|
0.83 |
% |
|
|
0.89 |
%6 |
| Ratio of net investment income (loss) to average net assets: |
|
|
|
|
|
|
|
|
|
|
|
|
|
|
|
|
|
|
|
|
|
|
|
|
| Before fees waived and expenses absorbed |
|
|
1.22 |
%6 |
|
|
1.03 |
% |
|
|
0.97 |
% |
|
|
1.14 |
% |
|
|
0.38 |
% |
|
|
0.08 |
%6 |
| After fees waived and expenses absorbed |
|
|
1.22 |
%6 |
|
|
1.03 |
% |
|
|
0.97 |
% |
|
|
1.14 |
% |
|
|
0.38 |
% |
|
|
0.10 |
%6 |
| |
|
|
|
|
|
|
|
|
|
|
|
|
|
|
|
|
|
|
|
|
|
|
|
|
| Portfolio turnover rate |
|
|
13 |
%5 |
|
|
15 |
% |
|
|
19 |
% |
|
|
13 |
% |
|
|
10 |
% |
|
|
15 |
%5 |
|
| 1 |
Audits performed for the fiscal years indicated by the Fund's previous auditor, Ernst & Young LLP. |
|
| 2 |
The Institutional Class commenced operations on December 1, 2020. The data shown reflects operations for the
period December 1, 2020 to May 31, 2021. |
|
| 3 |
Based on average shares outstanding for the period. |
|
| 4 |
Return is based on net asset value per share, adjusted for reinvestment of distributions, and does not reflect
deduction of the sales charge. |
See accompanying Notes to Financial Statements.
FPA Queens Road Small Cap Value Fund
FINANCIAL HIGHLIGHTS
Advisor Class
Per share operating performance.
For a capital share outstanding throughout each period.
| |
|
For the
Six Months
Ended
November
30,
2025 |
|
|
For the
Year Ended
May 31, |
|
|
For the
Period Ended
May 31, |
|
| |
|
(Unaudited) |
|
|
2025 |
|
|
2024 |
|
|
20231 |
|
|
20221 |
|
|
20211,2 |
|
| Net asset value, beginning of period |
|
$ |
39.67 |
|
|
$ |
38.31 |
|
|
$ |
32.05 |
|
|
$ |
33.94 |
|
|
$ |
35.52 |
|
|
$ |
28.16 |
|
| Income from Investment Operations: |
|
|
|
|
|
|
|
|
|
|
|
|
|
|
|
|
|
|
|
|
|
|
|
|
| Net investment income (loss) 3 |
|
|
0.24 |
|
|
|
0.37 |
|
|
|
0.30 |
|
|
|
0.34 |
|
|
|
0.10 |
|
|
|
0.02 |
|
| Net realized and unrealized gain (loss) |
|
|
4.60 |
|
|
|
2.90 |
|
|
|
6.94 |
|
|
|
(1.54 |
) |
|
|
(0.95 |
) |
|
|
7.44 |
|
| Total from investment operations |
|
|
4.84 |
|
|
|
3.27 |
|
|
|
7.24 |
|
|
|
(1.20 |
) |
|
|
(0.85 |
) |
|
|
7.46 |
|
| |
|
|
|
|
|
|
|
|
|
|
|
|
|
|
|
|
|
|
|
|
|
|
|
|
| Less Distributions: |
|
|
|
|
|
|
|
|
|
|
|
|
|
|
|
|
|
|
|
|
|
|
|
|
| From net investment income |
|
|
- |
|
|
|
(0.33 |
) |
|
|
(0.47 |
) |
|
|
(0.01 |
) |
|
|
(0.12 |
) |
|
|
(0.09 |
) |
| From net realized gain |
|
|
- |
|
|
|
(1.58 |
) |
|
|
(0.51 |
) |
|
|
(0.68 |
) |
|
|
(0.61 |
) |
|
|
(0.01 |
) |
| Total distributions |
|
|
- |
|
|
|
(1.91 |
) |
|
|
(0.98 |
) |
|
|
(0.69 |
) |
|
|
(0.73 |
) |
|
|
(0.10 |
) |
| Net asset value, end of period |
|
$ |
44.51 |
|
|
$ |
39.67 |
|
|
$ |
38.31 |
|
|
$ |
32.05 |
|
|
$ |
33.94 |
|
|
$ |
35.52 |
|
| |
|
|
|
|
|
|
|
|
|
|
|
|
|
|
|
|
|
|
|
|
|
|
|
|
| Total return4 |
|
|
12.20 |
%5 |
|
|
8.66 |
% |
|
|
22.69 |
% |
|
|
(3.56 |
)% |
|
|
(2.46 |
)% |
|
|
26.58 |
%5 |
| |
|
|
|
|
|
|
|
|
|
|
|
|
|
|
|
|
|
|
|
|
|
|
|
|
| Ratios and Supplemental Data: |
|
|
|
|
|
|
|
|
|
|
|
|
|
|
|
|
|
|
|
|
|
|
|
|
| Net assets, end of period (in thousands) |
|
$ |
44,192 |
|
|
$ |
32,998 |
|
|
$ |
41,396 |
|
|
$ |
43,514 |
|
|
$ |
39,219 |
|
|
$ |
724 |
|
| |
|
|
|
|
|
|
|
|
|
|
|
|
|
|
|
|
|
|
|
|
|
|
|
|
| Ratio of expenses to average net assets: |
|
|
|
|
|
|
|
|
|
|
|
|
|
|
|
|
|
|
|
|
|
|
|
|
| Before fees waived and expenses absorbed |
|
|
0.86 |
%6 |
|
|
0.86 |
% |
|
|
0.90 |
% |
|
|
0.93 |
% |
|
|
0.93 |
% |
|
|
0.90 |
%6 |
| After fees waived and expenses absorbed |
|
|
0.86 |
%6 |
|
|
0.86 |
% |
|
|
0.90 |
% |
|
|
0.93 |
% |
|
|
0.93 |
% |
|
|
0.90 |
%6 |
| Ratio of net investment income to average net assets: |
|
|
|
|
|
|
|
|
|
|
|
|
|
|
|
|
|
|
|
|
|
|
|
|
| Before fees waived and expenses absorbed |
|
|
1.12 |
%6 |
|
|
0.95 |
% |
|
|
0.85 |
% |
|
|
1.04 |
% |
|
|
0.28 |
% |
|
|
0.10 |
%6 |
| After fees waived and expenses absorbed |
|
|
1.12 |
%6 |
|
|
0.95 |
% |
|
|
0.85 |
% |
|
|
1.04 |
% |
|
|
0.28 |
% |
|
|
0.10 |
%6 |
| |
|
|
|
|
|
|
|
|
|
|
|
|
|
|
|
|
|
|
|
|
|
|
|
|
| Portfolio turnover rate |
|
|
13 |
%5 |
|
|
15 |
% |
|
|
19 |
% |
|
|
13 |
% |
|
|
10 |
% |
|
|
15 |
%5 |
|
| 1 |
Audits performed for the fiscal years indicated by the Fund's previous auditor, Ernst & Young LLP. |
|
| 2 |
The Advisor Class commenced operations on December 1, 2020. The data shown reflects operations for the period
December 1, 2020 to May 31, 2021. |
|
| 3 |
Based on average shares outstanding for the period. |
|
| 4 |
Return is based on net asset value per share, adjusted for reinvestment of distributions, and does not reflect
deduction of the sales charge. |
See accompanying Notes to Financial Statements.
FPA Queens Road Small Cap Value Fund
NOTES TO FINANCIAL STATEMENTS
November 30, 2025 (Unaudited)
Note 1 – Organization
FPA Queens Road Small Cap Value Fund (the “Fund”)
is a diversified series of Investment Managers Series Trust III (the “Trust”), which is registered as an open-end management
investment company under the Investment Company Act of 1940, as amended (the “1940 Act”). The Fund’s primary investment
objective is to seek long-term capital growth. First Pacific Advisors, LP (the “Adviser”) has served as the Fund’s investment
adviser since November 1, 2020.
On July 28, 2023, the Fund acquired the assets
and assumed the liabilities of FPA Queens Road Small Cap Value Fund, a series of Bragg Capital Trust, (the “Predecessor Fund”)
in a tax-free reorganization pursuant to the Agreement and Plan of Reorganization (the “Plan of Reorganization”). The Plan
of Reorganization was approved by the Trust’s Board and by the Predecessor Fund’s Board on May 8, 2023. The tax-free reorganization
was accomplished on July 28, 2023. As a result of the reorganization, the Fund assumed the performance and accounting history of the Predecessor
Fund. Financial information included for the dates prior to the reorganization is that of the Predecessor Fund.
The reorganization was accomplished by the following
tax-free exchange in which each shareholder of the Fund received the same aggregate share net asset value as noted below:
| Shares Issued |
|
|
Net Assets |
|
| Investor Class |
|
|
2,273,407 |
|
|
$ |
80,361,287 |
|
| Institutional Class |
|
|
11,451,635 |
|
|
|
404,622,337 |
|
| Advisor Class |
|
|
1,384,548 |
|
|
|
48,836,652 |
|
The net unrealized appreciation of investments
transferred was $138,240,430 as of the date of the acquisition.
The Fund is an investment company and accordingly
follows the investment company accounting and reporting guidance of the Financial Accounting Standards Board (FASB) Accounting Standard
Codification Topic 946 “Financial Services— Investment Companies”.
The Fund is deemed to be an individual reporting
segment and is not part of a consolidated reporting entity. The objective and strategy of the Fund is used by the Adviser to make investment
decisions, and the results of the operations, as shown on the Statements of Operations and the financial highlights for the Fund is the
information utilized for the day-to-day management of the Fund. The Fund is party to the expense agreements as disclosed in the Notes
to the Financial Statements and there are no resources allocated to a Fund based on performance measurements. The management of the Fund’s
Adviser is deemed to be the Chief Operating Decision Maker with respect to the Fund's investment decisions.
Note 2 – Accounting
Policies
The following is a summary of the significant
accounting policies consistently followed by the Fund in the preparation of its financial statements. The preparation of financial statements
in conformity with accounting principles generally accepted in the United States of America (“GAAP”) requires management to
make estimates and assumptions that affect the reported amounts and disclosures in the financial statements. Actual results could differ
from these estimates.
(a) Valuation of Investments
The Fund values equity securities at the last
reported sale price on the principal exchange or in the principal over the counter (“OTC”) market in which such securities
are traded, as of the close of regular trading on the NYSE on the day the securities are being valued or, if the last-quoted sales price
is not readily available, the securities will be valued at the last bid or the mean between the last available bid and ask price. Securities
traded on the NASDAQ are valued at the NASDAQ Official Closing Price (“NOCP”). Investments in open-end investment companies
are valued at the daily closing net asset value of the respective investment company. Debt securities are valued by utilizing a price
supplied by independent pricing service providers. The independent pricing service providers may use various valuation methodologies including
matrix pricing and other analytical pricing models as well as market transactions and dealer quotations. These models generally consider
such factors as yields or prices of bonds of comparable quality, type of issue, coupon, maturity, ratings and general market conditions.
If a price is not readily available for a portfolio security, the security will be valued at fair value (the amount which the Fund might
reasonably expect to receive for the security upon its current sale). The Board of Trustees has designated the Advisor as the Fund’s
valuation designee (the “Valuation Designee”) to make all fair value determinations with respect to the Fund’s portfolio
investments, subject to the Board’s oversight. As the Valuation Designee, the Advisor has adopted and implemented policies and procedures
to be followed when the Fund must utilize fair value pricing.
FPA Queens Road Small Cap Value Fund
NOTES TO FINANCIAL STATEMENTS - Continued
November 30, 2025 (Unaudited)
(b) Investment Transactions, Investment Income
and Expenses
Investment transactions are accounted for on the
trade date. Realized gains and losses on investments are determined on the identified cost basis. Dividend income is recorded net of applicable
withholding taxes on the ex-dividend date and interest income is recorded on an accrual basis. Withholding taxes on foreign dividends,
if applicable, are paid (a portion of which may be reclaimable) or provided for in accordance with the applicable country’s tax
rules and rates and are disclosed in the Statement of Operations. Withholding tax reclaims are filed in certain countries to recover a
portion of the amounts previously withheld. The Fund records a reclaim receivable based on a number of factors, including a jurisdiction’s
legal obligation to pay reclaims as well as payment history and market convention. Discounts on debt securities are accreted or amortized
to interest income over the lives of the respective securities using the effective interest method. Premiums for callable debt securities
are amortized to the earliest call date, if the call price was less than the purchase price. If the call price was not at par and the
security was not called, the security is amortized to the next call price and date. Income and expenses of the Fund are allocated on a
pro rata basis to each class of shares relative net assets, except for distribution and service fees which are unique to each class of
shares. Expenses incurred by the Trust with respect to more than one fund are allocated in proportion to the net assets of each fund except
where allocation of direct expenses to each fund or an alternative allocation method can be more appropriately made.
(c) Federal Income Taxes
The Fund intends to comply with the requirements
of Subchapter M of the Internal Revenue Code applicable to regulated investment companies and to distribute substantially all of their
net investment income and any net realized gains to their shareholders. Therefore, no provision is made for federal income or excise taxes.
Due to the timing of dividend distributions and the differences in accounting for income and realized gains and losses for financial statement
and federal income tax purposes, the fiscal year in which amounts are distributed may differ from the year in which the income and realized
gains and losses are recorded by the Fund.
Accounting for Uncertainty in Income Taxes
(the “Income Tax Statement”) requires an evaluation of tax positions taken (or expected to be taken) in the course of preparing
a Fund’s tax returns to determine whether these positions meet a “more-likely-than-not” standard that, based on the
technical merits, have a more than fifty percent likelihood of being sustained by a taxing authority upon examination. A tax position
that meets the “more-likely-than-not” recognition threshold is measured to determine the amount of benefit to recognize in
the financial statements. The Fund recognizes interest and penalties, if any, related to unrecognized tax benefits as income tax expense
in the Statement of Operations.
FPA Queens Road Small Cap Value Fund
NOTES TO FINANCIAL STATEMENTS - Continued
November 30, 2025 (Unaudited)
The Income Tax Statement requires management of
the Fund to analyze tax positions taken in the prior three open tax years, if any, and tax positions expected to be taken in the Fund’s
current tax year, as defined by the IRS statute of limitations for all major jurisdictions, including federal tax authorities and certain
state tax authorities. As of November 30, 2025, and during the prior three open tax years, the Fund did not have a liability for any unrecognized
tax benefits. The Fund has no examinations in progress and is not aware of any tax positions for which it is reasonably possible that
the total amounts of unrecognized tax benefits will significantly change in the next twelve months.
(d) Distributions to Shareholders
The Fund will make distributions of net investment
income annually and net capital gains, if any, at least annually. Distributions to shareholders are recorded on the ex-dividend date.
The amount and timing of distributions are determined in accordance with federal income tax regulations, which may differ from GAAP.
The character of distributions made during the
year from net investment income or net realized gains may differ from the characterization for federal income tax purposes due to differences
in the recognition of income, expense and gain (loss) items for financial statement and tax purposes.
(e) Illiquid Securities
Pursuant to Rule 22e-4 under the 1940 Act, the
Fund has adopted a Liquidity Risk Management Program (“LRMP”) that requires, among other things, that the Fund limits its
illiquid investments that are assets to no more than 15% of net assets. An illiquid investment is any security which may not reasonably
be expected to be sold or disposed of in current market conditions in seven calendar days or less without the sale or disposition significantly
changing the market value of the investment. If the Adviser, at any time determines that the value of illiquid securities held by the
Fund exceeds 15% of its net asset value, the Adviser will take such steps as it considers appropriate to reduce them as soon as reasonably
practicable in accordance with the Fund’s written LRMP.
(f) Use of Estimates
The presentation of financial statements in conformity
with GAAP requires management to make estimates and assumptions that affect the reported amounts of assets and liabilities at the date
of the financial statements and the reported amounts of income and expenses during the reporting period. Actual results could differ from
those estimates.
Note 3 – Investment Advisory and Other
Agreements
The Trust, on behalf of the Fund, entered into
an Investment Advisory Agreement (the “Agreement”) with the Adviser. Under the terms of the Agreement, the Fund pays a monthly
investment advisory fee to the Adviser at the annual rate of 0.75% of the Fund’s average daily net assets up to $50 million and
0.65% of the Fund’s average daily net assets in excess of $50 million. The Adviser engages Bragg Financial Advisors, Inc. (the “Sub-Adviser”)
to manage the Fund and pays the Sub-Adviser from its advisory fees.
UMB Fund Services, Inc. (“UMBFS”)
serves as the Fund’s fund accountant, transfer agent and co-administrator; and Mutual Fund Administration, LLC (“MFAC”)
serves as the Fund’s other co-administrator. UMB Bank, n.a., an affiliate of UMBFS, serves as the Fund’s custodian. The Fund’s
allocated fees incurred for fund accounting, fund administration, transfer agency and custody services for the six months ended November
30, 2025 are reported as Fund services fees on the Statement of Operations.
Distribution Services, LLC, serves as the Fund’s
distributor (the “Distributor”). The Distributor does not receive compensation from the Fund for its distribution services;
The Adviser pays the Distributor a fee for its distribution-related services.
FPA Queens Road Small Cap Value Fund
NOTES TO FINANCIAL STATEMENTS - Continued
November 30, 2025 (Unaudited)
Certain trustees and officers of the Trust are
employees of UMBFS, MFAC or Adviser. The Fund does not compensate trustees and officers affiliated with the Fund’s Adviser or co-administrators.
For the six months ended November 30, 2025, the Fund’s allocated fees incurred to Trustees of the Trust who are not “interested
persons” of the Trust, as that term is defined in the 1940 Act (collectively, the “Independent Trustees”) are reported
as Trustees’ fees and expenses on the Statement of Operations.
The Fund's Board of Trustees has adopted a Deferred
Compensation Plan (the “Plan”) for the Independent Trustees that enables Trustees to elect to receive payment in cash or the
option to defer some or all of their fees. If a trustee elects to defer payment, the Plan provides for the creation of a deferred payment
account. A Trustee’s deferred fees are deemed to be invested in designated mutual funds available under the Plan. The Fund's liability
for these amounts is adjusted for market value changes in the invested fund and remains a liability to the Fund until distributed in accordance
with the Plan. The Trustees Deferred compensation liability under the Plan constitutes a general unsecured obligation of the Fund and
is disclosed in the Statement of Assets and Liabilities. Contributions made under the plan and the change in unrealized appreciation/depreciation
and income are included in the Trustees' fees and expenses in the Statement of Operations.
Dziura Compliance Consulting, LLC provides Chief
Compliance Officer (“CCO”) services to the Trust. The Fund’s allocated fees incurred for CCO services for the six months
ended November 30, 2025 are reported as Chief Compliance Officer fees on the Statement of Operations.
Note 4 – Fund Liquidity Programs
The Fund may participate in “Liquidity Programs”
or “Programs” offered by independent third-party service providers, which are designed to provide an alternative liquidity
source when conducting normal business activities. Under the programs, cash is provided to the Fund to meet net shareowner redemptions,
manage and optimize portfolio composition, offset transaction costs, and/or more efficiently manage the portfolio. Following purchases
of Fund shares, the programs then generally redeem those shares when the Fund experiences net sales, at the end of a maximum holding period
ranging from 2 to 8 days or at other times at the discretion of the program or the Adviser. For use of certain services, the Fund pays
a fee calculated by applying a fee rate to the purchase amount determined through an automated daily auction. The current minimum fee
rate is 0.14% of the value of the Fund shares purchased, although the Fund may submit a bid at a higher fee rate if it determines that
doing so is in the best interest of Fund shareowners. In accordance with federal securities laws, certain providers are prohibited from
acquiring more than 3% of the outstanding voting securities of a Fund, while others are prohibited from acquiring more than 5%. The providers
will periodically redeem their entire share position in the Fund and request that such redemption be met in kind in accordance with the
Fund’s in-kind redemption policies. There is no assurance that these programs will have sufficient funds available to meet the Funds’
liquidity needs on a particular day. During the six months ended November 30, 2025, the fees associated with these programs are disclosed
in the Statement of Operations within redemption liquidity service fees.
Note 5 – Federal Income Taxes
At November 30, 2025, gross unrealized appreciation/(depreciation)
of investments, based on cost for federal income tax purposes were as follows:
| Cost of investments |
|
$ |
822,205,175 |
|
| |
|
|
|
|
| Gross unrealized appreciation |
|
$ |
284,842,242 |
|
| Gross unrealized depreciation |
|
|
(32,321,140 |
) |
| |
|
|
|
|
| Net unrealized appreciation/(depreciation) |
|
$ |
252,521,102 |
|
FPA Queens Road Small Cap Value Fund
NOTES TO FINANCIAL STATEMENTS - Continued
November 30, 2025 (Unaudited)
The difference between cost amounts for financial
statement and federal income tax purposes is due primarily to timing differences in recognizing certain gains and losses in security transactions.
Note 6 – Investment Transactions
For the six months ended November 30, 2025, purchases,
sales, and in-kind redemptions of investments, excluding short-term investments, were $169,144,126, $111,254,281, and $9,335,822, respectively.
Note 7 – Shareholder Servicing Plan
Pursuant to the Shareholder Service Plan adopted
by the Board, on behalf of the Fund, the Fund may pay a fee at an annual rate of up to 0.25%, 0.10%, and 0.15% of its average daily net
assets attributable to Investor Class, Institutional Class, and Advisor Class shares of the Fund, respectively. The Fund does not pay
these service fees on shares purchased directly. In addition, the Adviser may, at its own expense, pay financial representatives and/or
shareholder servicing agents for these services. For the six months ended November 30, 2025, the Fund’s shareholder servicing fees
incurred are disclosed on the Statement of Operations.
Note 8 – Indemnifications
In the normal course of business, the Fund enters
into contracts that contain a variety of representations which provide general indemnifications. The Fund’s maximum exposure under
these arrangements is unknown, as this would involve future claims that may be made against the Fund that have not yet occurred. However,
the Fund expects the risk of loss to be remote.
Note 9 – Fair Value Measurements and
Disclosure
Fair Value Measurements and Disclosures defines
fair value, establishes a framework for measuring fair value in accordance with GAAP, and expands disclosure about fair value measurements.
It also provides guidance on determining when there has been a significant decrease in the volume and level of activity for an asset or
a liability, when a transaction is not orderly, and how that information must be incorporated into a fair value measurement.
Under Fair Value Measurements and Disclosures,
various inputs are used in determining the value of the Fund’s investments. These inputs are summarized into three broad Levels
as described below:
|
| ● |
Level 1 – Unadjusted quoted prices in active markets
for identical assets or liabilities that the Fund has the ability to access. |
|
| ● |
Level 2 – Observable inputs other than quoted
prices included in level 1 that are observable for the asset or liability, either directly or indirectly. These inputs may include quoted
prices for the identical instrument on an inactive market, prices for similar instruments, interest rates, prepayment speeds, credit risk,
yield curves, default rates and similar data. |
|
| ● |
Level 3 – Unobservable inputs for the asset
or liability, to the extent relevant observable inputs are not available, representing the Fund’s own assumptions about the assumptions
a market participant would use in valuing the asset or liability, and would be based on the best information available. |
The availability of observable inputs can vary
from security to security and is affected by a wide variety of factors, including, for example, the type of security, whether the security
is new and not yet established in the marketplace, the liquidity of markets, and other characteristics particular to the security. To
the extent that valuation is based on models or inputs that are less observable or unobservable in the market, the determination of fair
value requires more judgment. Accordingly, the degree of judgment exercised in determining fair value is greatest for instruments categorized
in Level 3.
FPA Queens Road Small Cap Value Fund
NOTES TO FINANCIAL STATEMENTS - Continued
November 30, 2025 (Unaudited)
The inputs used to measure fair value may fall
into different Levels of the fair value hierarchy. In such cases, for disclosure purposes, the Level in the fair value hierarchy within
which the fair value measurement falls in its entirety, is determined based on the lowest Level input that is significant to the fair
value measurement in its entirety.
The inputs or methodology used for valuing securities
are not an indication of the risk associated with investing in those securities. The following is a summary of the inputs used, as of
November 30, 2025, in valuing the Fund’s assets carried at fair value:
| |
|
Level 1 |
|
|
Level 2** |
|
|
Level 3** |
|
|
Total |
|
| Common Stocks* |
|
$ |
937,970,568 |
|
|
$ |
- |
|
|
$ |
- |
|
|
$ |
937,970,568 |
|
| Exchange-Traded Funds |
|
|
45,813,776 |
|
|
|
- |
|
|
|
- |
|
|
|
45,813,776 |
|
| Short-Term Investments |
|
|
90,941,933 |
|
|
|
- |
|
|
|
- |
|
|
|
90,941,933 |
|
| Total |
|
$ |
1,074,726,277 |
|
|
$ |
- |
|
|
$ |
- |
|
|
$ |
1,074,726,277 |
|
|
| * |
All sub-categories within Common Stocks represent Level 1 investments. See Schedule of Investments for industry
categories. |
|
| ** |
The Fund did not hold any Level 2 or Level 3 securities at period end. |
Transfers of investments between different levels
of the fair value hierarchy are recorded at fair value as of the end of the reporting period. There were no transfers into or out of Level
3 during the six months ended November 30, 2025.
The Fund did not hold derivatives as of November
30, 2025.
Note 10 – Market Disruption and Geopolitical
Risks
Certain local, regional or global events such
as war, acts of terrorism, the spread of infectious illnesses and/or other public health issues, financial institution instability or
other events may have a significant impact on a security or instrument. These types of events and other like them are collectively referred
to as “Market Disruptions and Geopolitical Risks” and they may have adverse impacts on the worldwide economy, as well as the
economies of individual countries, the financial health of individual companies and the market in general in significant and unforeseen
ways. Some of the impacts noted in recent times include but are not limited to embargos, political actions, supply chain disruptions,
tariffs, bank failures, restrictions to investment and/or monetary movement including the forced selling of securities or the inability
to participate impacted markets. The duration of these events could adversely affect the Fund’s performance, the performance of
the securities in which the Fund invests and may lead to losses on your investment. The ultimate impact of “Market Disruptions and
Geopolitical Risks” on the financial performance of the Fund’s investments is not reasonably estimable at this time. Management
is actively monitoring these events.
Note 11 – New Accounting Pronouncements
In November 2023, the FASB issued ASU 2023-07,
“Segment Reporting (Topic 280): Improvements to Reportable Segment Disclosures (“ASU 2023-07”),” which enhances
disclosure requirements about significant segment expenses that are regularly provided to the chief operating decision maker (the “CODM”).
ASU 2023-07, among other things, (i) requires a single segment public entity to provide all of the disclosures as required by Topic 280,
(ii) requires a public entity to disclose the title and position of the CODM and an explanation of how the CODM uses the reported measure(s)
of segment profit or loss in assessing segment performance and deciding how to allocate resources and (iii) provides the ability for a
public entity to elect more than one performance measure. ASU 2023-07 is effective for fiscal years beginning after December 15, 2023,
and interim periods within fiscal years beginning after December 15, 2024. Management has evaluated the impact of applying ASU 2023-07,
and the fund has adopted the ASU during the reporting period. The adoption of the ASU does not have a material impact on the financial
statements. Required disclosure is included in Note 1.
FPA Queens Road Small Cap Value Fund
NOTES TO FINANCIAL STATEMENTS - Continued
November 30, 2025 (Unaudited)
In December 2023, the FASB issued Accounting Standards
Update 2023-09 (“ASU 2023-09”), Income Taxes (Topic 740) Improvements to Income Tax Disclosures, which amends quantitative
and qualitative income tax disclosure requirements in order to increase disclosure consistency, bifurcate income tax information by jurisdiction
and remove information that is no longer beneficial. ASU 2023-09 is effective for annual periods beginning after December 15, 2024, and
early adoption is permitted. Fund Management is evaluating the impacts of these changes on the Fund’s financial statements.
Note 12 – Events Subsequent to the Fiscal
Period End
The Fund has adopted financial reporting rules
regarding subsequent events which require an entity to recognize in the financial statements the effects of all subsequent events that
provide additional evidence about conditions that existed at the date of the balance sheet. Management has evaluated the Fund’s
related events and transactions that occurred through the date of issuance of the Fund’s financial statements.
There were no events or transactions that occurred
during this period that materially impacted the amounts or disclosures in the Fund’s financial statements.
FPA Queens Road Value Fund
SEMI-ANNUAL FINANCIALS AND OTHER INFORMATION
NOVEMBER 30, 2025
FPA Queens Road Value Fund
A series of Investment Managers Series Trust
III
Table of Contents
Please note the Financials and Other Information only contains Items
7-11 required in Form N-CSR. All other required items will be filed with the SEC.
| Item 7. Financial Statements and Financial Highlights |
|
| Schedule of Investments |
1 |
| Statement of Assets and Liabilities |
3 |
| Statement of Operations |
4 |
| Statements of Changes in Net Assets |
5 |
| Financial Highlights |
6 |
| Notes to Financial Statements |
7 |
This report and the financial statements contained
herein are provided for the general information of the shareholders of the FPA Queens Road Value Fund (the “Fund”). This report
is not authorized for distribution to prospective investors in the Fund unless preceded or accompanied by an effective shareholder report
and prospectus.
https://fpa.com
FPA Queens Road Value Fund
SCHEDULE OF INVESTMENTS
As of November 30, 2025 (Unaudited)
|
Number
of Shares |
|
|
|
|
Value |
|
| |
|
|
|
COMMON STOCKS — 91.3% |
|
|
|
|
| |
|
|
|
AEROSPACE & DEFENSE — 7.5% |
|
|
|
|
| |
8,000 |
|
|
General Dynamics Corp. |
|
$ |
2,733,040 |
|
| |
6,600 |
|
|
RTX Corp. |
|
|
1,154,406 |
|
| |
|
|
|
|
|
|
3,887,446 |
|
| |
|
|
|
ASSET MANAGEMENT — 6.8% |
|
|
|
|
| |
6,000 |
|
|
Ameriprise Financial, Inc. |
|
|
2,734,440 |
|
| |
7,900 |
|
|
T. Rowe Price Group, Inc. |
|
|
808,802 |
|
| |
|
|
|
|
|
|
3,543,242 |
|
| |
|
|
|
BANKING — 5.4% |
|
|
|
|
| |
9,000 |
|
|
JPMorgan Chase & Co. |
|
|
2,817,720 |
|
| |
|
|
|
BIOTECH & PHARMA — 6.6% |
|
|
|
|
| |
13,820 |
|
|
Merck & Co., Inc. |
|
|
1,448,751 |
|
| |
76,000 |
|
|
Pfizer, Inc. |
|
|
1,956,240 |
|
| |
|
|
|
|
|
|
3,404,991 |
|
| |
|
|
|
DIVERSIFIED INDUSTRIALS — 1.2% |
|
|
|
|
| |
3,600 |
|
|
3M Co. |
|
|
619,380 |
|
| |
|
|
|
ELECTRICAL EQUIPMENT — 15.2% |
|
|
|
|
| |
3,400 |
|
|
Allegion PLC |
|
|
564,502 |
|
| |
10,000 |
|
|
Eaton Corp. PLC |
|
|
3,458,900 |
|
| |
9,200 |
|
|
Trane Technologies PLC |
|
|
3,877,616 |
|
| |
|
|
|
|
|
|
7,901,018 |
|
| |
|
|
|
ENTERTAINMENT CONTENT — 1.0% |
|
|
|
|
| |
5,151 |
|
|
Walt Disney Co. |
|
|
538,125 |
|
| |
|
|
|
FOOD — 4.6% |
|
|
|
|
| |
10,000 |
|
|
Hershey Co. |
|
|
1,880,800 |
|
| |
9,000 |
|
|
Mondelez International, Inc. - Class A |
|
|
518,130 |
|
| |
|
|
|
|
|
|
2,398,930 |
|
| |
|
|
|
HEALTH CARE FACILITIES & SVCS — 5.2% |
|
|
|
|
| |
30,000 |
|
|
Centene Corp.* |
|
|
1,180,200 |
|
| |
4,500 |
|
|
Elevance Health, Inc. |
|
|
1,522,170 |
|
| |
|
|
|
|
|
|
2,702,370 |
|
| |
|
|
|
INSTITUTIONAL FINANCIAL SVCS — 3.1% |
|
|
|
|
| |
14,500 |
|
|
Bank of New York Mellon Corp. |
|
|
1,625,450 |
|
| |
|
|
|
INSURANCE — 6.5% |
|
|
|
|
| |
3 |
|
|
Berkshire Hathaway, Inc. - Class A* |
|
|
2,310,300 |
|
| |
10,000 |
|
|
Prudential Financial, Inc. |
|
|
1,082,500 |
|
| |
|
|
|
|
|
|
3,392,800 |
|
| |
|
|
|
LEISURE FACILITIES & SERVICES — 2.5% |
|
|
|
|
| |
4,225 |
|
|
McDonald's Corp. |
|
|
1,317,439 |
|
| |
|
|
|
MACHINERY — 1.4% |
|
|
|
|
| |
9,000 |
|
|
Ingersoll Rand, Inc. |
|
|
723,060 |
|
FPA Queens Road Value Fund
SCHEDULE OF INVESTMENTS - Continued
As of November 30, 2025 (Unaudited)
Number
of Shares |
|
|
|
|
Value |
|
| |
|
|
|
COMMON STOCKS (Continued) |
|
|
|
|
| |
|
|
|
MEDICAL EQUIPMENT & DEVICES — 2.9% |
|
|
|
|
| |
6,300 |
|
|
Danaher Corp. |
|
$ |
1,428,714 |
|
| |
900 |
|
|
Solventum Corp.* |
|
|
76,734 |
|
| |
|
|
|
|
|
|
1,505,448 |
|
| |
|
|
|
SEMICONDUCTORS — 2.0% |
|
|
|
|
| |
26,000 |
|
|
Intel Corp.* |
|
|
1,054,560 |
|
| |
|
|
|
SOFTWARE — 7.2% |
|
|
|
|
| |
18,395 |
|
|
Oracle Corp. |
|
|
3,714,870 |
|
| |
|
|
|
SPECIALTY FINANCE — 7.7% |
|
|
|
|
| |
11,000 |
|
|
American Express Co. |
|
|
4,017,970 |
|
| |
|
|
|
TECHNOLOGY HARDWARE — 3.1% |
|
|
|
|
| |
20,700 |
|
|
Cisco Systems, Inc. |
|
|
1,592,658 |
|
| |
|
|
|
TRANSPORTATION & LOGISTICS — 1.4% |
|
|
|
|
| |
3,000 |
|
|
Union Pacific Corp. |
|
|
695,490 |
|
| |
|
|
|
TOTAL COMMON STOCKS |
|
|
|
|
| |
|
|
|
(Cost $14,724,589) |
|
|
47,452,967 |
|
| |
|
|
|
SHORT-TERM INVESTMENTS — 8.7% |
|
|
|
|
| |
|
|
|
MONEY MARKET INVESTMENTS — 8.7% |
|
|
|
|
| |
4,516,830 |
|
|
Morgan Stanley Institutional Liquidity Treasury Portfolio
- Institutional Class, 3.77%(a) |
|
|
4,516,830 |
|
| |
|
|
|
TOTAL SHORT-TERM INVESTMENTS |
|
|
|
|
| |
|
|
|
(Cost $4,516,830) |
|
|
4,516,830 |
|
| |
|
|
|
|
|
|
|
|
| |
|
|
|
TOTAL INVESTMENTS — 100.0% |
|
|
|
|
| |
|
|
|
(Cost $19,241,419) |
|
|
51,969,797 |
|
| |
|
|
|
Other Assets in Excess of Liabilities — 0.0% |
|
|
12,158 |
|
| |
|
|
|
TOTAL NET ASSETS — 100.0% |
|
$ |
51,981,955 |
|
PLC – Public Limited Company
|
| * |
Non-income producing security. |
|
| (a) |
The rate is the annualized seven-day yield at period end. |
See accompanying Notes to Financial Statements.
FPA Queens Road Value Fund
STATEMENT OF ASSETS AND LIABILITIES
As of November 30, 2025 (Unaudited)
| Assets: |
|
|
|
| Investments, at value (cost $19,241,419) |
|
$ |
51,969,797 |
|
| Receivables: |
|
|
|
|
| Fund shares sold |
|
|
150 |
|
| Dividends and interest |
|
|
80,152 |
|
| Prepaid expenses |
|
|
15,156 |
|
| Total assets |
|
|
52,065,255 |
|
| |
|
|
|
|
| Liabilities: |
|
|
|
|
| Payables: |
|
|
|
|
| Fund shares redeemed |
|
|
625 |
|
| Advisory fees |
|
|
11,677 |
|
| Shareholder servicing fees (Note 6) |
|
|
856 |
|
| Fund services fees |
|
|
22,049 |
|
| Shareholder reporting fees |
|
|
12,867 |
|
| Legal fees |
|
|
12,526 |
|
| Auditing fees |
|
|
7,417 |
|
| Trustees' deferred compensation (Note 3) |
|
|
5,760 |
|
| Trustees' fees and expenses |
|
|
1,856 |
|
| Chief Compliance Officer fees |
|
|
1,774 |
|
| Accrued other expenses |
|
|
5,893 |
|
| Total liabilities |
|
|
83,300 |
|
| Commitments and contingencies (Note 3) |
|
|
|
|
| Net Assets |
|
$ |
51,981,955 |
|
| |
|
|
|
|
| Components of Net Assets: |
|
|
|
|
| Capital Stock (no par value with an unlimited number of shares authorized) |
|
$ |
18,394,168 |
|
| Total distributable earnings (accumulated deficit) |
|
|
33,587,787 |
|
| Net Assets |
|
$ |
51,981,955 |
|
| Number of shares issued and outstanding |
|
|
1,562,219 |
|
| Net asset value per share |
|
$ |
33.27 |
|
See accompanying Notes to Financial Statements.
FPA Queens Road Value Fund
STATEMENT OF OPERATIONS
For the Six Months Ended November 30, 2025 (Unaudited)
| Investment income: |
|
|
|
| Dividends |
|
$ |
408,213 |
|
| Interest |
|
|
84,331 |
|
| Total investment income |
|
|
492,544 |
|
| |
|
|
|
|
| Expenses: |
|
|
|
|
| Advisory fees |
|
|
249,232 |
|
| Shareholder servicing fees (Note 6) |
|
|
13,818 |
|
| Fund services fees |
|
|
33,290 |
|
| Trustees' fees and expenses |
|
|
16,431 |
|
| Legal fees |
|
|
8,753 |
|
| Auditing fees |
|
|
8,601 |
|
| Registration fees |
|
|
7,929 |
|
| Insurance fees |
|
|
7,023 |
|
| Miscellaneous |
|
|
3,860 |
|
| Chief Compliance Officer fees |
|
|
3,851 |
|
| Shareholder reporting fees |
|
|
2,406 |
|
| Total expenses |
|
|
355,194 |
|
| Advisory fees waived |
|
|
(177,524 |
) |
| Net expenses |
|
|
177,670 |
|
| Net investment income (loss) |
|
|
314,874 |
|
| |
|
|
|
|
| Realized and Unrealized Gain (Loss): |
|
|
|
|
| Net realized gain (loss) on: |
|
|
|
|
| Investments |
|
|
274,524 |
|
| Total realized gain (loss) |
|
|
274,524 |
|
| Net change in unrealized appreciation (depreciation) on: |
|
|
|
|
| Investments |
|
|
2,904,920 |
|
| Net change in unrealized appreciation (depreciation) |
|
|
2,904,920 |
|
| Net realized and unrealized gain (loss) |
|
|
3,179,444 |
|
| |
|
|
|
|
| Net Increase (Decrease) in Net Assets from Operations |
|
$ |
3,494,318 |
|
See accompanying Notes to Financial Statements.
FPA Queens Road Value Fund
STATEMENTS OF CHANGES IN NET ASSETS
| |
|
For the
Six Months Ended
November
30, 2025
(Unaudited) |
|
|
For the
Year Ended
May 31, 2025 |
|
| Increase (Decrease) in Net Assets from: |
|
|
|
|
|
|
|
|
| Operations: |
|
|
|
|
|
|
|
|
| Net investment income (loss) |
|
$ |
314,874 |
|
|
$ |
653,623 |
|
| Total realized gain (loss) on investments |
|
|
274,524 |
|
|
|
- |
|
| Net change in unrealized appreciation (depreciation) on investments |
|
|
2,904,920 |
|
|
|
1,550,465 |
|
| Net increase (decrease) in net assets resulting from
operations |
|
|
3,494,318 |
|
|
|
2,204,088 |
|
| |
|
|
|
|
|
|
|
|
| Distributions to Shareholders: |
|
|
|
|
|
|
|
|
| Distributions |
|
|
- |
|
|
|
(1,843,837 |
) |
| Total distributions to shareholders |
|
|
- |
|
|
|
(1,843,837 |
) |
| |
|
|
|
|
|
|
|
|
| Capital Transactions: |
|
|
|
|
|
|
|
|
| Net proceeds from shares sold |
|
|
2,174,618 |
|
|
|
13,662,215 |
|
| Reinvestment of distributions |
|
|
- |
|
|
|
1,837,884 |
|
| Cost of shares redeemed |
|
|
(3,982,064 |
) |
|
|
(13,032,860 |
) |
| Net increase (decrease) in net assets from capital
transactions |
|
|
(1,807,446 |
) |
|
|
2,467,239 |
|
| |
|
|
|
|
|
|
|
|
| Total increase (decrease) in net assets |
|
|
1,686,872 |
|
|
|
2,827,490 |
|
| |
|
|
|
|
|
|
|
|
| Net Assets: |
|
|
|
|
|
|
|
|
| Beginning of period |
|
|
50,295,083 |
|
|
|
47,467,593 |
|
| End of period |
|
$ |
51,981,955 |
|
|
$ |
50,295,083 |
|
| Capital Share Transactions: |
|
|
|
|
|
|
|
|
| Shares sold |
|
|
65,237 |
|
|
|
429,960 |
|
| Shares reinvested |
|
|
- |
|
|
|
59,421 |
|
| Shares redeemed |
|
|
(121,200 |
) |
|
|
(416,773 |
) |
| Net increase (decrease) in capital share transactions |
|
|
(55,963 |
) |
|
|
72,608 |
|
See accompanying Notes to Financial Statements.
FPA Queens Road Value Fund
FINANCIAL HIGHLIGHTS
Per share operating performance.
For a capital share outstanding throughout each period.
| |
|
For the
Six Months
Ended
November 30,
2025 |
|
|
For the
Year Ended
May 31, |
|
| |
|
(Unaudited) |
|
|
2025 |
|
|
2024 |
|
|
20231 |
|
|
20221 |
|
|
20211 |
|
| Net asset value, beginning of period |
|
$ |
31.08 |
|
|
$ |
30.71 |
|
|
$ |
23.86 |
|
|
$ |
24.37 |
|
|
$ |
29.21 |
|
|
$ |
22.45 |
|
| Income from Investment Operations: |
|
|
|
|
|
|
|
|
|
|
|
|
|
|
|
|
|
|
|
|
|
|
|
|
| Net investment income2 |
|
|
0.20 |
|
|
|
0.41 |
|
|
|
0.39 |
|
|
|
0.36 |
|
|
|
0.32 |
|
|
|
0.39 |
|
| Net realized and unrealized gain (loss) |
|
|
1.99 |
|
|
|
1.10 |
|
|
|
7.26 |
|
|
|
(0.20 |
) |
|
|
(0.63 |
) |
|
|
7.99 |
|
| Total from investment operations |
|
|
2.19 |
|
|
|
1.51 |
|
|
|
7.65 |
|
|
|
0.16 |
|
|
|
(0.31 |
) |
|
|
8.38 |
|
| |
|
|
|
|
|
|
|
|
|
|
|
|
|
|
|
|
|
|
|
|
|
|
|
|
| Less Distributions: |
|
|
|
|
|
|
|
|
|
|
|
|
|
|
|
|
|
|
|
|
|
|
|
|
| From net investment income |
|
|
- |
|
|
|
(0.40 |
) |
|
|
(0.35 |
) |
|
|
(0.36 |
) |
|
|
(0.37 |
) |
|
|
(0.48 |
) |
| From net realized gains |
|
|
- |
|
|
|
(0.74 |
) |
|
|
(0.45 |
) |
|
|
(0.31 |
) |
|
|
(4.16 |
) |
|
|
(1.14 |
) |
| Total distributions |
|
|
- |
|
|
|
(1.14 |
) |
|
|
(0.80 |
) |
|
|
(0.67 |
) |
|
|
(4.53 |
) |
|
|
(1.62 |
) |
| Net asset value, end of period |
|
$ |
33.27 |
|
|
$ |
31.08 |
|
|
$ |
30.71 |
|
|
$ |
23.86 |
|
|
$ |
24.37 |
|
|
$ |
29.21 |
|
| |
|
|
|
|
|
|
|
|
|
|
|
|
|
|
|
|
|
|
|
|
|
|
|
|
| Total return3 |
|
|
7.05 |
%4 |
|
|
4.91 |
% |
|
|
32.53 |
% |
|
|
0.65 |
% |
|
|
(2.19 |
)% |
|
|
38.62 |
% |
| |
|
|
|
|
|
|
|
|
|
|
|
|
|
|
|
|
|
|
|
|
|
|
|
|
| Ratios and Supplemental Data: |
|
|
|
|
|
|
|
|
|
|
|
|
|
|
|
|
|
|
|
|
|
|
|
|
| Net assets, end of period (in thousands) |
|
$ |
51,982 |
|
|
$ |
50,295 |
|
|
$ |
47,468 |
|
|
$ |
31,729 |
|
|
$ |
34,335 |
|
|
$ |
41,935 |
|
| |
|
|
|
|
|
|
|
|
|
|
|
|
|
|
|
|
|
|
|
|
|
|
|
|
| Ratio of expenses to average net assets: |
|
|
|
|
|
|
|
|
|
|
|
|
|
|
|
|
|
|
|
|
|
|
|
|
| Before fees waived and expenses absorbed |
|
|
1.35 |
%5 |
|
|
1.35 |
% |
|
|
1.61 |
% |
|
|
2.10 |
% |
|
|
1.95 |
% |
|
|
1.43 |
% |
| After fees waived and expenses absorbed |
|
|
0.67 |
%5,6 |
|
|
0.65 |
% |
|
|
0.65 |
% |
|
|
0.65 |
% |
|
|
0.65 |
% |
|
|
0.77 |
%7 |
| Ratio of net investment income (loss) to average net assets: |
|
|
|
|
|
|
|
|
|
|
|
|
|
|
|
|
|
|
|
|
|
|
|
|
| Before fees waived and expenses absorbed |
|
|
0.52 |
%5 |
|
|
0.60 |
% |
|
|
0.47 |
% |
|
|
0.04 |
% |
|
|
(0.18 |
)% |
|
|
0.89 |
% |
| After fees waived and expenses absorbed |
|
|
1.20 |
%5 |
|
|
1.30 |
% |
|
|
1.43 |
% |
|
|
1.49 |
% |
|
|
1.12 |
% |
|
|
1.55 |
% |
| |
|
|
|
|
|
|
|
|
|
|
|
|
|
|
|
|
|
|
|
|
|
|
|
|
| Portfolio turnover rate |
|
|
0 |
%4 |
|
|
0 |
% |
|
|
9 |
% |
|
|
0 |
% |
|
|
4 |
% |
|
|
0 |
% |
|
| 1 |
Audits performed for the fiscal years indicated by the Fund's previous auditor, Ernst & Young LLP. |
|
| 2 |
Based on average shares outstanding for the period. |
|
| 3 |
Total returns would have been higher/lower had expenses not been recovered/waived and absorbed by the Adviser.
Returns shown do not reflect the deduction of taxes that a shareholder would pay on Fund distributions or the redemption of Fund shares. |
|
| 6 |
Effective October 1, 2025, the Adviser has contractually agreed to limit the annual fund operating expenses
to 0.73%. Prior to October 1, 2025, the Adviser had contractually agreed to limit the annual fund operating expenses to 0.65%. |
|
| 7 |
Effective November 1, 2020, the Adviser has contractually agreed to limit the annual fund operating expenses
to 0.65%. Prior to November 1, 2020, the Fund had a unitary fee structure that limited annual operating expenses to 0.95%. |
See accompanying Notes to Financial Statements.
FPA Queens Road Value Fund
NOTES TO FINANCIAL STATEMENTS
November 30, 2025 (Unaudited)
Note 1 – Organization
FPA Queens Road Value Fund (the “Fund”)
is a diversified series of Investment Managers Series Trust III (the “Trust”), which is registered as an open-end management
investment company under the Investment Company Act of 1940, as amended (the “1940 Act”). The Fund’s primary investment
objective is to seek long-term capital growth. First Pacific Advisors, LP (the “Adviser”) has served as the Fund’s investment
adviser since November 1, 2020.
On July 28, 2023, the Fund acquired the assets
and assumed the liabilities of FPA Queens Road Value Fund, a series of Bragg Capital Trust, (the “Predecessor Fund”) in a
tax-free reorganization pursuant to the Agreement and Plan of Reorganization (the “Plan of Reorganization”). The Plan of Reorganization
was approved by the Trust’s Board and by the Predecessor Fund’s Board on May 8, 2023. The tax-free reorganization was accomplished
on July 28, 2023. As a result of the reorganization, the Fund assumed the performance and accounting history of the Predecessor Fund.
Financial information included for the dates prior to the reorganization is that of the Predecessor Fund.
The reorganization was accomplished by the following
tax-free exchange in which each shareholder of the Fund received the same aggregate share net asset value as noted below:
| Shares Issued |
|
|
Net Assets |
|
| |
1,309,954 |
|
|
$ |
34,362,082 |
|
The net unrealized appreciation of investments
transferred was $22,847,187 as of the date of the acquisition.
The Fund is an investment company and accordingly
follows the investment company accounting and reporting guidance of the Financial Accounting Standards Board (FASB) Accounting Standard
Codification Topic 946 “Financial Services— Investment Companies”.
The Fund is deemed to be an individual reporting
segment and is not part of a consolidated reporting entity. The objective and strategy of the Fund is used by the Adviser to make investment
decisions, and the results of the operations, as shown on the Statements of Operations and the financial highlights for the Fund is the
information utilized for the day-to-day management of the Fund. The Fund is party to the expense agreements as disclosed in the Notes
to the Financial Statements and there are no resources allocated to a Fund based on performance measurements. The management of the Fund’s
Adviser is deemed to be the Chief Operating Decision Maker with respect to the Fund’s investment decisions.
Note 2 – Accounting
Policies
The following is a summary of the significant
accounting policies consistently followed by the Fund in the preparation of its financial statements. The preparation of financial statements
in conformity with accounting principles generally accepted in the United States of America (“GAAP”) requires management to
make estimates and assumptions that affect the reported amounts and disclosures in the financial statements. Actual results could differ
from these estimates.
(a) Valuation of Investments
The Fund values equity securities at the last
reported sale price on the principal exchange or in the principal over the counter (“OTC”) market in which such securities
are traded, as of the close of regular trading on the NYSE on the day the securities are being valued or, if the last-quoted sales price
is not readily available, the securities will be valued at the last bid or the mean between the last available bid and ask price. Securities
traded on the NASDAQ are valued at the NASDAQ Official Closing Price (“NOCP”). Investments in open-end investment companies
are valued at the daily closing net asset value of the respective investment company. Debt securities are valued by utilizing a price
supplied by independent pricing service providers. The independent pricing service providers may use various valuation methodologies including
matrix pricing and other analytical pricing models as well as market transactions and dealer quotations. These models generally consider
such factors as yields or prices of bonds of comparable quality, type of issue, coupon, maturity, ratings and general market conditions.
If a price is not readily available for a portfolio security, the security will be valued at fair value (the amount which the Fund might
reasonably expect to receive for the security upon its current sale). The Board of Trustees has designated the Advisor as the Fund’s
valuation designee (the “Valuation Designee”) to make all fair value determinations with respect to the Fund’s portfolio
investments, subject to the Board’s oversight. As the Valuation Designee, the Advisor has adopted and implemented policies and procedures
to be followed when the Fund must utilize fair value pricing.
FPA Queens Road Value Fund
NOTES TO FINANCIAL STATEMENTS - Continued
November 30, 2025 (Unaudited)
(b) Investment Transactions, Investment Income
and Expenses
Investment transactions are accounted for on the
trade date. Realized gains and losses on investments are determined on the identified cost basis. Dividend income is recorded net of applicable
withholding taxes on the ex-dividend date and interest income is recorded on an accrual basis. Withholding taxes on foreign dividends,
if applicable, are paid (a portion of which may be reclaimable) or provided for in accordance with the applicable country’s tax
rules and rates and are disclosed in the Statement of Operations. Withholding tax reclaims are filed in certain countries to recover a
portion of the amounts previously withheld. The Fund records a reclaim receivable based on a number of factors, including a jurisdiction’s
legal obligation to pay reclaims as well as payment history and market convention. Discounts on debt securities are accreted or amortized
to interest income over the lives of the respective securities using the effective interest method. Premiums for callable debt securities
are amortized to the earliest call date, if the call price was less than the purchase price. If the call price was not at par and the
security was not called, the security is amortized to the next call price and date. Expenses incurred by the Trust with respect to more
than one fund are allocated in proportion to the net assets of each fund except where allocation of direct expenses to each fund or an
alternative allocation method can be more appropriately made.
(c) Federal Income Taxes
The Fund intends to comply with the requirements
of Subchapter M of the Internal Revenue Code applicable to regulated investment companies and to distribute substantially all of their
net investment income and any net realized gains to their shareholders. Therefore, no provision is made for federal income or excise taxes.
Due to the timing of dividend distributions and the differences in accounting for income and realized gains and losses for financial statement
and federal income tax purposes, the fiscal year in which amounts are distributed may differ from the year in which the income and realized
gains and losses are recorded by the Fund.
Accounting for Uncertainty in Income Taxes
(the “Income Tax Statement”) requires an evaluation of tax positions taken (or expected to be taken) in the course of preparing
a Fund’s tax returns to determine whether these positions meet a “more-likely-than-not” standard that, based on the
technical merits, have a more than fifty percent likelihood of being sustained by a taxing authority upon examination. A tax position
that meets the “more-likely-than-not” recognition threshold is measured to determine the amount of benefit to recognize in
the financial statements. The Fund recognizes interest and penalties, if any, related to unrecognized tax benefits as income tax expense
in the Statement of Operations.
The Income Tax Statement requires management of
the Fund to analyze tax positions taken in the prior three open tax years, if any, and tax positions expected to be taken in the Fund’s
current tax year, as defined by the IRS statute of limitations for all major jurisdictions, including federal tax authorities and certain
state tax authorities. As of November 30, 2025, and during the prior three open tax years, the Fund did not have a liability for any unrecognized
tax benefits. The Fund has no examinations in progress and is not aware of any tax positions for which it is reasonably possible that
the total amounts of unrecognized tax benefits will significantly change in the next twelve months.
FPA Queens Road Value Fund
NOTES TO FINANCIAL STATEMENTS - Continued
November 30, 2025 (Unaudited)
(d) Distributions to Shareholders
The Fund will make distributions of net investment
income and net capital gains, if any, at least annually. Distributions to shareholders are recorded on the ex-dividend date. The amount
and timing of distributions are determined in accordance with federal income tax regulations, which may differ from GAAP.
The character of distributions made during the
year from net investment income or net realized gains may differ from the characterization for federal income tax purposes due to differences
in the recognition of income, expense and gain (loss) items for financial statement and tax purposes.
(e) Illiquid Securities
Pursuant to Rule 22e-4 under the 1940 Act, the
Fund has adopted a Liquidity Risk Management Program (“LRMP”) that requires, among other things, that the Fund limits its
illiquid investments that are assets to no more than 15% of net assets. An illiquid investment is any security which may not reasonably
be expected to be sold or disposed of in current market conditions in seven calendar days or less without the sale or disposition significantly
changing the market value of the investment. If the Adviser, at any time determines that the value of illiquid securities held by the
Fund exceeds 15% of its net asset value, the Adviser will take such steps as it considers appropriate to reduce them as soon as reasonably
practicable in accordance with the Fund’s written LRMP.
(f) Use of Estimates
The presentation of financial statements in conformity
with GAAP requires management to make estimates and assumptions that affect the reported amounts of assets and liabilities at the date
of the financial statements and the reported amounts of income and expenses during the reporting period. Actual results could differ from
those estimates.
Note 3 – Investment Advisory and Other
Agreements
The Trust, on behalf of the Fund, entered into
an Investment Advisory Agreement (the “Agreement”) with the Adviser. Under the terms of the Agreement, the Fund pays a monthly
investment advisory fee to the Adviser at the annual rate of 0.95% of the Fund’s average daily net assets. The Adviser engages Bragg
Financial Advisors, Inc. (the “Sub-Adviser”) to manage the Fund and pays the Sub-Adviser from its advisory fees.
The Adviser has contractually agreed to waive
its fees and/or pay for operating expenses of the Fund to ensure that total annual fund operating expenses (excluding any interest, taxes,
brokerage fees and commissions payable by the Fund in connection with the purchase or sale of portfolio securities, fees and expenses
of other funds in which the Fund invests, and extraordinary expenses, including litigation expenses not incurred in the Fund’s ordinary
course of business) do not exceed 0.73% of the Fund’s average daily net assets. Prior to October 1, 2025, the Adviser had contractually
agreed to limit the annual fund operating expenses to 0.65%. This agreement is in effect until September 30, 2026, and it may be terminated
before that date only by the Trust’s Board of Trustees. For the six months ended November 30, 2025, the Adviser waived a portion
of its advisory fees totaling $177,524.
These expense reimbursements are subject to possible
recoupment by the Adviser from the Fund in future years (within the three years from the date when the amount is waived or reimbursed)
if such recoupment can be achieved within the lesser of the foregoing expense limits or the then-current expense limits. Similarly, the
Adviser is permitted to seek reimbursement from the Fund, subject to certain limitations, of fees waived or payments made by the Adviser
to the Predecessor Fund prior to the Predecessor Fund's reorganization on July 28, 2023 for a period ending three years after the date
of the waiver or payment. This agreement may be terminated only by the Fund’s Board of Trustees (the “Board”), upon
written notice to the adviser. The potential recoverable amount is noted as “Commitments and contingencies” as reported on
the Statement of Assets and Liabilities. As of November 30, 2025, the Adviser may seek recoupment for previously waived or reimbursed
expenses, subject to the limitations noted above, no later than the dates as outlined below:
FPA Queens Road Value Fund
NOTES TO FINANCIAL STATEMENTS - Continued
November 30, 2025 (Unaudited)
| May 31, 2026 |
|
$ |
474,577 |
|
| May 31, 2027 |
|
|
354,046 |
|
| May 31, 2028 |
|
|
352,543 |
|
| May 31, 2029 |
|
|
177,524 |
|
| Total |
|
$ |
1,358,690 |
|
UMB Fund Services, Inc. (“UMBFS”)
serves as the Fund’s fund accountant, transfer agent and co-administrator; and Mutual Fund Administration, LLC (“MFAC”)
serves as the Fund’s other co-administrator. UMB Bank, n.a., an affiliate of UMBFS, serves as the Fund’s custodian. The Fund’s
allocated fees incurred for fund accounting, fund administration, transfer agency and custody services for the six months ended November
30, 2025 are reported as Fund services fees on the Statement of Operations.
Distribution Services, LLC, serves as the Fund’s
distributor (the “Distributor”). The Distributor does not receive compensation from the Fund for its distribution services;
The Adviser pays the Distributor a fee for its distribution-related services.
Certain trustees and officers of the Trust are
employees of UMBFS, MFAC or Adviser. The Fund does not compensate trustees and officers affiliated with the Fund’s Adviser or co-administrators.
For the six months ended November 30, 2025, the Fund’s allocated fees incurred to Trustees of the Trust who are not “interested
persons” of the Trust, as that term is defined in the 1940 Act (collectively, the “Independent Trustees”) are reported
on the Statement of Operations.
The Fund’s Board of Trustees has adopted
a Deferred Compensation Plan (the “Plan”) for the Independent Trustees that enables Trustees to elect to receive payment in
cash or the option to defer some or all of their fees. If a trustee elects to defer payment, the Plan provides for the creation of a deferred
payment account. A Trustee’s deferred fees are deemed to be invested in designated mutual funds available under the Plan. The Fund’s
liability for these amounts is adjusted for market value changes in the invested fund and remains a liability to the Fund until distributed
in accordance with the Plan. The Trustees Deferred compensation liability under the Plan constitutes a general unsecured obligation of
the Fund and is disclosed in the Statement of Assets and Liabilities. Contributions made under the plan and the change in unrealized appreciation/depreciation
and income are included in the Trustees’ fees and expenses in the Statement of Operations.
Dziura Compliance Consulting, LLC provides Chief
Compliance Officer (“CCO”) services to the Trust. The Fund’s allocated fees incurred for CCO services for the six months
ended November 30, 2025 are reported on the Statement of Operations.
FPA Queens Road Value Fund
NOTES TO FINANCIAL STATEMENTS - Continued
November 30, 2025 (Unaudited)
Note 4 – Federal Income Taxes
At November 30, 2025, gross unrealized appreciation/(depreciation)
of investments, based on cost for federal income tax purposes were as follows:
| Cost of investments |
|
$ |
19,249,653 |
|
| |
|
|
|
|
| Gross unrealized appreciation |
|
$ |
33,990,236 |
|
| Gross unrealized depreciation |
|
|
(1,270,092 |
) |
| |
|
|
|
|
| Net unrealized appreciation/(depreciation) |
|
$ |
32,720,144 |
|
The difference between cost amounts for financial
statement and federal income tax purposes is due primarily to timing differences in recognizing certain gains and losses in security transactions.
Note 5 – Investment Transactions
For the six months ended November 30, 2025, purchases
and sales of investments, excluding short-term investments, were $0 and $1,661,283, respectively.
Note 6 – Shareholder Servicing Plan
Pursuant to the Shareholder Service Plan adopted
by the Board, on behalf of the Fund, the Fund may pay a fee at an annual rate of up to 0.25% of its average daily net assets attributable
to shares of the Fund. The Fund does not pay these service fees on shares purchased directly. In addition, the Adviser may, at its own
expense, pay financial representatives and/or shareholder servicing agents for these services. For the six months ended November 30, 2025,
the Fund’s shareholder servicing fees incurred are disclosed on the Statement of Operations.
Note 7 – Indemnifications
In the normal course of business, the Fund enters
into contracts that contain a variety of representations which provide general indemnifications. The Fund’s maximum exposure under
these arrangements is unknown, as this would involve future claims that may be made against the Fund that have not yet occurred. However,
the Fund expects the risk of loss to be remote.
Note 8 – Fair Value Measurements and
Disclosure
Fair Value Measurements and Disclosures defines
fair value, establishes a framework for measuring fair value in accordance with GAAP, and expands disclosure about fair value measurements.
It also provides guidance on determining when there has been a significant decrease in the volume and level of activity for an asset or
a liability, when a transaction is not orderly, and how that information must be incorporated into a fair value measurement.
Under Fair Value Measurements and Disclosures,
various inputs are used in determining the value of the Fund’s investments. These inputs are summarized into three broad Levels
as described below:
|
| ● |
Level 1 – Unadjusted quoted prices in active markets
for identical assets or liabilities that the Fund has the ability to access. |
|
| ● |
Level 2 – Observable inputs other than quoted
prices included in level 1 that are observable for the asset or liability, either directly or indirectly. These inputs may include quoted
prices for the identical instrument on an inactive market, prices for similar instruments, interest rates, prepayment speeds, credit risk,
yield curves, default rates and similar data. |
|
| ● |
Level 3 – Unobservable inputs for the asset
or liability, to the extent relevant observable inputs are not available, representing the Fund’s own assumptions about the assumptions
a market participant would use in valuing the asset or liability, and would be based on the best information available. |
FPA Queens Road Value Fund
NOTES TO FINANCIAL STATEMENTS - Continued
November 30, 2025 (Unaudited)
The availability of observable inputs can vary
from security to security and is affected by a wide variety of factors, including, for example, the type of security, whether the security
is new and not yet established in the marketplace, the liquidity of markets, and other characteristics particular to the security. To
the extent that valuation is based on models or inputs that are less observable or unobservable in the market, the determination of fair
value requires more judgment. Accordingly, the degree of judgment exercised in determining fair value is greatest for instruments categorized
in Level 3.
The inputs used to measure fair value may fall
into different Levels of the fair value hierarchy. In such cases, for disclosure purposes, the Level in the fair value hierarchy within
which the fair value measurement falls in its entirety, is determined based on the lowest Level input that is significant to the fair
value measurement in its entirety.
The inputs or methodology used for valuing securities
are not an indication of the risk associated with investing in those securities. The following is a summary of the inputs used, as of
November 30, 2025, in valuing the Fund’s assets carried at fair value:
| |
|
Level 1 |
|
|
Level 2** |
|
|
Level 3** |
|
|
Total |
|
| Common Stocks* |
|
$ |
47,452,967 |
|
|
$ |
- |
|
|
$ |
- |
|
|
$ |
47,452,967 |
|
| Short-Term Investments |
|
|
4,516,830 |
|
|
|
- |
|
|
|
- |
|
|
|
4,516,830 |
|
| Total |
|
$ |
51,969,797 |
|
|
$ |
- |
|
|
$ |
- |
|
|
$ |
51,969,797 |
|
|
| * |
All sub-categories within Common Stocks represent Level 1 investments. See Schedule of Investments for industry
categories. |
|
| ** |
The Fund did not hold any Level 2 or Level 3 securities at period end. |
Transfers of investments between different levels
of the fair value hierarchy are recorded at fair value as of the end of the reporting period. There were no significant transfers into
or out of Level 3 during the six months ended November 30, 2025.
The Fund did not hold derivatives as of November
30, 2025.
Note 9 – Market Disruption and Geopolitical
Risks
Certain local, regional or global events such
as war, acts of terrorism, the spread of infectious illnesses and/or other public health issues, financial institution instability or
other events may have a significant impact on a security or instrument. These types of events and other like them are collectively referred
to as “Market Disruptions and Geopolitical Risks” and they may have adverse impacts on the worldwide economy, as well as the
economies of individual countries, the financial health of individual companies and the market in general in significant and unforeseen
ways. Some of the impacts noted in recent times include but are not limited to embargos, political actions, supply chain disruptions,
tariffs, bank failures, restrictions to investment and/or monetary movement including the forced selling of securities or the inability
to participate impacted markets. The duration of these events could adversely affect the Fund’s performance, the performance of
the securities in which the Fund invests and may lead to losses on your investment. The ultimate impact of “Market Disruptions and
Geopolitical Risks” on the financial performance of the Fund’s investments is not reasonably estimable at this time. Management
is actively monitoring these events.
FPA Queens Road Value Fund
NOTES TO FINANCIAL STATEMENTS - Continued
November 30, 2025 (Unaudited)
Note 10 – New Accounting Pronouncements
In November 2023, the FASB issued ASU 2023-07,
“Segment Reporting (Topic 280): Improvements to Reportable Segment Disclosures (“ASU 2023-07”),” which enhances
disclosure requirements about significant segment expenses that are regularly provided to the chief operating decision maker (the “CODM”).
ASU 2023-07, among other things, (i) requires a single segment public entity to provide all of the disclosures as required by Topic 280,
(ii) requires a public entity to disclose the title and position of the CODM and an explanation of how the CODM uses the reported measure(s)
of segment profit or loss in assessing segment performance and deciding how to allocate resources and (iii) provides the ability for a
public entity to elect more than one performance measure. ASU 2023-07 is effective for fiscal years beginning after December 15, 2023,
and interim periods within fiscal years beginning after December 15, 2024. Management has evaluated the impact of applying ASU 2023-07,
and the fund has adopted the ASU during the reporting period. The adoption of the ASU does not have a material impact on the financial
statements. Required disclosure is included in Note 1.
In December 2023, the FASB issued Accounting Standards
Update 2023-09 (“ASU 2023-09”), Income Taxes (Topic 740) Improvements to Income Tax Disclosures, which amends quantitative
and qualitative income tax disclosure requirements in order to increase disclosure consistency, bifurcate income tax information by jurisdiction
and remove information that is no longer beneficial. ASU 2023-09 is effective for annual periods beginning after December 15, 2024, and
early adoption is permitted. Fund Management is evaluating the impacts of these changes on the Fund’s financial statements.
Note 11 – Reorganization Information
On October 14, 2025, based on the recommendation
of the Fund’s Adviser and Sub-Adviser, the Board of Trustees of the Trust has approved the reorganization of the Fund into an exchange-traded
fund (the “Reorganization”). The Reorganization of the Fund is subject to approval by its shareholders and will occur pursuant
to an Agreement and Plan of Reorganization whereby the Fund will transfer all of its assets and liabilities to the FPA Queens Road Value
ETF (the “ETF”), a newly created series of the Trust. If approved, each shareholder of the Fund will receive shares of the
ETF and/or cash equal to the value of the shares of the Fund owned by the shareholder.
There will be no change in the Fund’s investment
objective, principal investment strategies or portfolio management in connection with the Reorganization. Further, there will be no change
to the Adviser or the Sub-Adviser serving as the investment adviser and sub-adviser, respectively, to the ETF following the Reorganization.
The Reorganization is not generally expected to result in the recognition of gain or loss by the Fund or its shareholders for U.S. federal
income tax purposes (except with respect to cash received by shareholders in lieu of fractional shares, if any, or with respect to redemptions
of shares held through an account that is not permitted to hold the ETF shares as discussed below). The costs of the Reorganization will
be borne by the Adviser and Sub-Adviser.
The Trust will call a shareholder meeting at which
shareholders of the Fund will be asked to consider and vote on the Reorganization. If the required shareholder approval for the Reorganization
of the Fund is obtained, the Reorganization is expected to take effect in the fourth quarter of 2026.
FPA Queens Road Value Fund
NOTES TO FINANCIAL STATEMENTS - Continued
November 30, 2025 (Unaudited)
Note 12 – Events Subsequent to the Fiscal
Period End
The Fund has adopted financial reporting rules
regarding subsequent events which require an entity to recognize in the financial statements the effects of all subsequent events that
provide additional evidence about conditions that existed at the date of the balance sheet. Management has evaluated the Fund’s
related events and transactions that occurred through the date of issuance of the Fund’s financial statements.
There were no events or transactions that occurred
during this period that materially impacted the amounts or disclosures in the Fund’s financial statements.
Item 8. Changes in and
Disagreements with Accountants for Open-End Management Investment Companies.
Not Applicable.
Item
9. Proxy Disclosures for Open-End Management Investment Companies.
Not Applicable.
Item 10. Remuneration Paid
to Directors, Officers, and Others of Open-End Management Investment Companies.
This information is included in Item 7, as part of the financial statements.
Item
11. Statement Regarding Basis for Approval of Investment Advisory Contract.
Not Applicable.
Item
12. Disclosure of Proxy Voting Policies and Procedures for Closed-End Management Investment Companies.
Not applicable to open-end investment companies.
Item
13. Portfolio Managers of Closed-End Management Investment Companies.
Not applicable to open-end investment companies.
Item
14. Purchases of Equity Securities by Closed-End Management Investment Company and Affiliated Purchasers.
Not applicable to open-end investment companies.
Item
15. Submission of Matters to a Vote of Security Holders.
The registrant has not made any material changes
to the procedures by which shareholders may recommend nominees to the registrant’s Board of Trustees.
Item
16. Controls and Procedures.
|
| (a) |
The Registrant’s Principal Executive Officer and Principal Financial Officer have reviewed the Registrant's
disclosure controls and procedures (as defined in Rule 30a-3(c) under the Investment Company Act of 1940 (the “Act”)) as of
a date within 90 days of the filing of this report, as required by Rule 30a-3(b) under the Act and Rules 13a-15(b) or 15d-15(b) under
the Securities Exchange Act of 1934. Based on their review, such officers have concluded that the disclosure controls and procedures are
effective in ensuring that information required to be disclosed in this report is appropriately recorded, processed, summarized and reported
and made known to them by others within the Registrant and by the Registrant’s service provider. |
|
| (b) |
There were no changes in the Registrant's internal control over financial reporting (as defined in Rule 30a-3(d)
under the Act) that occurred during the period covered by this report that has materially affected, or is reasonably likely to materially
affect, the Registrant's internal control over financial reporting. |
Item 17. Disclosure of
Securities Lending Activities for Closed-End Management Investment Companies.
Not applicable to open-end investment companies.
Item 18. Recovery of Erroneously
Awarded Compensation.
(a) Not applicable.
(b) Not applicable.
Item 19. Exhibits.
|
| (a) |
(1) Any code of ethics or amendment thereto, that is subject of the disclosure required by Item 2,
to the extent that the registrant intends to satisfy Item 2 requirements through filing an exhibit. Not Applicable. |
|
| (a) |
(2) Any policy required by the listing standards adopted pursuant to Rule 10D-1 under the Exchange Act
(17 CFR 240.10D-1) by the registered national securities exchange or registered national securities association upon which the registrant’s
securities are listed. Instruction to paragraph (a)(2). – Not Applicable. |
SIGNATURES
Pursuant to the requirements
of the Securities Exchange Act of 1934 and the Investment Company Act of 1940, the registrant has duly caused this report to be signed
on its behalf by the undersigned, thereunto duly authorized.
| (Registrant) |
Investment Managers Series Trust III |
|
| |
|
|
| By (Signature and Title) |
/s/ Maureen Quill |
|
| |
Maureen Quill, President and Principal Executive Officer |
|
| |
|
|
| Date |
2/6/2026 |
|
Pursuant to the requirements
of the Securities Exchange Act of 1934 and the Investment Company Act of 1940, this report has been signed below by the following persons
on behalf of the registrant and in the capacities and on the dates indicated.
| By (Signature and Title) |
/s/ Maureen Quill |
|
| |
Maureen Quill, President and Principal Executive Officer |
|
| |
|
|
| Date |
2/6/2026 |
|
| |
|
|
| By (Signature and Title) |
/s/ Rita Dam |
|
| |
Rita Dam, Treasurer and Principal Financial Officer |
|
| |
|
|
| Date |
2/6/2026 |
|