Please wait
10000
10000
100000000
11670
10108
110161272
12301
10215
141783519
10283
116105297
146626618
10345
183312191
10337
216088400
10036
100000000
10092
10140
106413264
10157
123286964
10194
103824487
10000
10002
100000000
10243
122168972
140547579
159804513
100000000
101017851
108266183
115206076
119034584
122485253
125700736
10130
113246610
8805
10180
134243125
9348
109589041
10225
133918774
10293
157341017
10303
10262
10000
10000
192488182
10750
100000000
9988
30301
12170
11811
17354
120501587
15083
13522
17458
10000
11025
13519
12913
12113
12985
10208
107888
10000
132285
12568
134985
103782
17149
10120
11223
10000
145000614
11014
17827
13713
123366
12146
11196
25309
21081
109602
21399
10000
107412
12370
141701
148107
20304
25566
9539
16932
12079
19067
33786
194626320
18915
39827
15159
15743
17251
27025
116274
10672
100000
25428
107474
13042
13468
16520
11266
108665
19617
11233
13640
22363
15853
21729
26132
132623082
109291
10787
100000
21535
21133
11020
10424
128058
110590
15335
10000
117963
13372
12034
24769
10000
117572
14758
100000
115079605
13362
101167
10085
117173
9804
19439
10631
10878
10831
165382241
104389
10000
117912
4.9
1.5
6.1
0.2
6.3
1.0
0.2
0.5
33.9
0.0
19.5
12.8
27.9
0.0
12.4
1.0
1.5
27.9
6.1
60.4
0.2
12.4
12.8
86.9
4.9
12.4
12.8
12.8
6.5
86.9
3.7
12.8
0.1
6.1
1.8
0.0
6.3
2.9
5.6
3.7
1.0
7.5
4.9
33.9
1.8
0.0
23.6
0.0
19.5
0.0
0.2
86.9
1.8
60.4
0.2
0.1
1.5
0.0
0.1
0.2
3.7
2.9
23.6
12.8
27.9
0.2
23.6
6.3
0.0
19.5
7.5
5.6
0.2
0.2
0.2
8.1
2.9
7.5
33.9
0.5
6.5
6.5
0.0
0.0
0.5
5.6
8.1
0.2
0.2
60.4
0.0
8.1
0.0
0000924727
false
N-1A
0000924727
imstiii:C000025975Member
2015-12-31
2015-12-31
0000924727
imstiii:C000249813Member
2015-12-31
2015-12-31
0000924727
imstiii:ConsumerPriceIndexUSCPIMember
2015-12-31
2015-12-31
0000924727
imstiii:MSCIAllCountryWorldIndexMember
2015-12-31
2015-12-31
0000924727
imstiii:Sixty40SAndP500IndexBloombergBarclaysUSAggregateBondIndexMember
2015-12-31
2015-12-31
0000924727
imstiii:StandardAndPoorS500IndexMember
2015-12-31
2015-12-31
0000924727
imstiii:C000025975Member
2016-01-01
2017-12-31
0000924727
imstiii:C000249813Member
2016-01-01
2017-12-31
0000924727
imstiii:ConsumerPriceIndexUSCPIMember
2016-01-01
2017-12-31
0000924727
imstiii:MSCIAllCountryWorldIndexMember
2016-01-01
2017-12-31
0000924727
imstiii:Sixty40SAndP500IndexBloombergBarclaysUSAggregateBondIndexMember
2016-01-01
2017-12-31
0000924727
imstiii:StandardAndPoorS500IndexMember
2016-01-01
2017-12-31
0000924727
imstiii:C000025975Member
2016-01-01
2018-12-31
0000924727
imstiii:C000249813Member
2016-01-01
2018-12-31
0000924727
imstiii:ConsumerPriceIndexUSCPIMember
2016-01-01
2018-12-31
0000924727
imstiii:MSCIAllCountryWorldIndexMember
2016-01-01
2018-12-31
0000924727
imstiii:Sixty40SAndP500IndexBloombergBarclaysUSAggregateBondIndexMember
2016-01-01
2018-12-31
0000924727
imstiii:StandardAndPoorS500IndexMember
2016-01-01
2018-12-31
0000924727
imstiii:C000025975Member
2016-01-01
2019-12-31
0000924727
imstiii:C000249813Member
2016-01-01
2019-12-31
0000924727
imstiii:ConsumerPriceIndexUSCPIMember
2016-01-01
2019-12-31
0000924727
imstiii:MSCIAllCountryWorldIndexMember
2016-01-01
2019-12-31
0000924727
imstiii:Sixty40SAndP500IndexBloombergBarclaysUSAggregateBondIndexMember
2016-01-01
2019-12-31
0000924727
imstiii:StandardAndPoorS500IndexMember
2016-01-01
2019-12-31
0000924727
imstiii:C000025975Member
2016-01-01
2021-12-31
0000924727
imstiii:C000249813Member
2016-01-01
2021-12-31
0000924727
imstiii:ConsumerPriceIndexUSCPIMember
2016-01-01
2021-12-31
0000924727
imstiii:MSCIAllCountryWorldIndexMember
2016-01-01
2021-12-31
0000924727
imstiii:Sixty40SAndP500IndexBloombergBarclaysUSAggregateBondIndexMember
2016-01-01
2021-12-31
0000924727
imstiii:StandardAndPoorS500IndexMember
2016-01-01
2021-12-31
0000924727
imstiii:C000025975Member
2016-01-01
2022-12-31
0000924727
imstiii:C000249813Member
2016-01-01
2022-12-31
0000924727
imstiii:ConsumerPriceIndexUSCPIMember
2016-01-01
2022-12-31
0000924727
imstiii:MSCIAllCountryWorldIndexMember
2016-01-01
2022-12-31
0000924727
imstiii:Sixty40SAndP500IndexBloombergBarclaysUSAggregateBondIndexMember
2016-01-01
2022-12-31
0000924727
imstiii:StandardAndPoorS500IndexMember
2016-01-01
2022-12-31
0000924727
imstiii:C000025975Member
2016-01-01
2023-12-31
0000924727
imstiii:C000249813Member
2016-01-01
2023-12-31
0000924727
imstiii:ConsumerPriceIndexUSCPIMember
2016-01-01
2023-12-31
0000924727
imstiii:MSCIAllCountryWorldIndexMember
2016-01-01
2023-12-31
0000924727
imstiii:Sixty40SAndP500IndexBloombergBarclaysUSAggregateBondIndexMember
2016-01-01
2023-12-31
0000924727
imstiii:StandardAndPoorS500IndexMember
2016-01-01
2023-12-31
0000924727
imstiii:C000025975Member
2016-01-01
2024-12-31
0000924727
imstiii:C000249813Member
2016-01-01
2024-12-31
0000924727
imstiii:ConsumerPriceIndexUSCPIMember
2016-01-01
2024-12-31
0000924727
imstiii:MSCIAllCountryWorldIndexMember
2016-01-01
2024-12-31
0000924727
imstiii:Sixty40SAndP500IndexBloombergBarclaysUSAggregateBondIndexMember
2016-01-01
2024-12-31
0000924727
imstiii:StandardAndPoorS500IndexMember
2016-01-01
2024-12-31
0000924727
imstiii:BloombergUSUniversalBondIndexMember
2018-12-30
2025-12-31
0000924727
imstiii:C000207154Member
2018-12-30
2025-12-31
0000924727
imstiii:CPI200BasisPointsMember
2018-12-30
2025-12-31
0000924727
imstiii:BloombergUSUniversalBondIndexMember
2018-12-31
2018-12-31
0000924727
imstiii:C000207154Member
2018-12-31
2018-12-31
0000924727
imstiii:CPI200BasisPointsMember
2018-12-31
2018-12-31
0000924727
imstiii:BloombergUSUniversalBondIndexMember
2019-01-01
2020-12-31
0000924727
imstiii:C000207154Member
2019-01-01
2020-12-31
0000924727
imstiii:CPI200BasisPointsMember
2019-01-01
2020-12-31
0000924727
imstiii:BloombergUSUniversalBondIndexMember
2019-01-01
2021-12-31
0000924727
imstiii:C000207154Member
2019-01-01
2021-12-31
0000924727
imstiii:CPI200BasisPointsMember
2019-01-01
2021-12-31
0000924727
imstiii:BloombergUSUniversalBondIndexMember
2019-01-01
2022-12-31
0000924727
imstiii:C000207154Member
2019-01-01
2022-12-31
0000924727
imstiii:CPI200BasisPointsMember
2019-01-01
2022-12-31
0000924727
imstiii:BloombergUSUniversalBondIndexMember
2019-01-01
2024-12-31
0000924727
imstiii:C000207154Member
2019-01-01
2024-12-31
0000924727
imstiii:CPI200BasisPointsMember
2019-01-01
2024-12-31
0000924727
imstiii:BloombergUSUniversalBondIndexMember
2019-01-01
2025-12-31
0000924727
imstiii:C000207154Member
2019-01-01
2025-12-31
0000924727
imstiii:CPI200BasisPointsMember
2019-01-01
2025-12-31
0000924727
imstiii:C000221940Member
2020-09-04
2020-09-04
0000924727
imstiii:ConsumerPriceIndexUSCPIMember
2020-09-04
2020-09-04
0000924727
imstiii:MSCIAllCountryWorldIndexMember
2020-09-04
2020-09-04
0000924727
imstiii:Sixty40SAndP500IndexBloombergBarclaysUSAggregateBondIndexMember
2020-09-04
2020-09-04
0000924727
imstiii:StandardAndPoorS500IndexMember
2020-09-04
2020-09-04
0000924727
imstiii:C000221940Member
2020-09-04
2025-12-31
0000924727
imstiii:ConsumerPriceIndexUSCPIMember
2020-09-04
2025-12-31
0000924727
imstiii:MSCIAllCountryWorldIndexMember
2020-09-04
2025-12-31
0000924727
imstiii:Sixty40SAndP500IndexBloombergBarclaysUSAggregateBondIndexMember
2020-09-04
2025-12-31
0000924727
imstiii:StandardAndPoorS500IndexMember
2020-09-04
2025-12-31
0000924727
imstiii:C000221940Member
2020-09-05
2020-12-31
0000924727
imstiii:ConsumerPriceIndexUSCPIMember
2020-09-05
2020-12-31
0000924727
imstiii:MSCIAllCountryWorldIndexMember
2020-09-05
2020-12-31
0000924727
imstiii:Sixty40SAndP500IndexBloombergBarclaysUSAggregateBondIndexMember
2020-09-05
2020-12-31
0000924727
imstiii:StandardAndPoorS500IndexMember
2020-09-05
2020-12-31
0000924727
imstiii:C000221940Member
2020-09-05
2021-12-31
0000924727
imstiii:ConsumerPriceIndexUSCPIMember
2020-09-05
2021-12-31
0000924727
imstiii:MSCIAllCountryWorldIndexMember
2020-09-05
2021-12-31
0000924727
imstiii:Sixty40SAndP500IndexBloombergBarclaysUSAggregateBondIndexMember
2020-09-05
2021-12-31
0000924727
imstiii:StandardAndPoorS500IndexMember
2020-09-05
2021-12-31
0000924727
imstiii:C000221940Member
2020-09-05
2022-12-31
0000924727
imstiii:ConsumerPriceIndexUSCPIMember
2020-09-05
2022-12-31
0000924727
imstiii:MSCIAllCountryWorldIndexMember
2020-09-05
2022-12-31
0000924727
imstiii:Sixty40SAndP500IndexBloombergBarclaysUSAggregateBondIndexMember
2020-09-05
2022-12-31
0000924727
imstiii:StandardAndPoorS500IndexMember
2020-09-05
2022-12-31
0000924727
imstiii:C000221940Member
2020-09-05
2023-12-31
0000924727
imstiii:ConsumerPriceIndexUSCPIMember
2020-09-05
2023-12-31
0000924727
imstiii:MSCIAllCountryWorldIndexMember
2020-09-05
2023-12-31
0000924727
imstiii:Sixty40SAndP500IndexBloombergBarclaysUSAggregateBondIndexMember
2020-09-05
2023-12-31
0000924727
imstiii:StandardAndPoorS500IndexMember
2020-09-05
2023-12-31
0000924727
imstiii:C000221940Member
2020-09-05
2024-12-31
0000924727
imstiii:ConsumerPriceIndexUSCPIMember
2020-09-05
2024-12-31
0000924727
imstiii:MSCIAllCountryWorldIndexMember
2020-09-05
2024-12-31
0000924727
imstiii:Sixty40SAndP500IndexBloombergBarclaysUSAggregateBondIndexMember
2020-09-05
2024-12-31
0000924727
imstiii:StandardAndPoorS500IndexMember
2020-09-05
2024-12-31
0000924727
imstiii:C000221940Member
2020-09-05
2025-12-31
0000924727
imstiii:ConsumerPriceIndexUSCPIMember
2020-09-05
2025-12-31
0000924727
imstiii:MSCIAllCountryWorldIndexMember
2020-09-05
2025-12-31
0000924727
imstiii:Sixty40SAndP500IndexBloombergBarclaysUSAggregateBondIndexMember
2020-09-05
2025-12-31
0000924727
imstiii:StandardAndPoorS500IndexMember
2020-09-05
2025-12-31
0000924727
imstiii:BloombergUSUniversalBondIndexMember
2021-04-16
2021-04-16
0000924727
imstiii:C000227168Member
2021-04-16
2021-04-16
0000924727
imstiii:CPI200BasisPointsMember
2021-04-16
2021-04-16
0000924727
imstiii:BloombergUSUniversalBondIndexMember
2021-04-16
2025-12-31
0000924727
imstiii:C000227168Member
2021-04-16
2025-12-31
0000924727
imstiii:CPI200BasisPointsMember
2021-04-16
2025-12-31
0000924727
imstiii:BloombergUSUniversalBondIndexMember
2021-04-17
2021-12-31
0000924727
imstiii:C000227168Member
2021-04-17
2021-12-31
0000924727
imstiii:CPI200BasisPointsMember
2021-04-17
2021-12-31
0000924727
imstiii:BloombergUSUniversalBondIndexMember
2021-04-17
2022-12-31
0000924727
imstiii:C000227168Member
2021-04-17
2022-12-31
0000924727
imstiii:CPI200BasisPointsMember
2021-04-17
2022-12-31
0000924727
imstiii:BloombergUSUniversalBondIndexMember
2021-04-17
2023-12-31
0000924727
imstiii:C000227168Member
2021-04-17
2023-12-31
0000924727
imstiii:CPI200BasisPointsMember
2021-04-17
2023-12-31
0000924727
imstiii:BloombergUSUniversalBondIndexMember
2021-04-17
2024-12-31
0000924727
imstiii:C000227168Member
2021-04-17
2024-12-31
0000924727
imstiii:CPI200BasisPointsMember
2021-04-17
2024-12-31
0000924727
imstiii:BloombergUSUniversalBondIndexMember
2021-04-17
2025-12-31
0000924727
imstiii:C000227168Member
2021-04-17
2025-12-31
0000924727
imstiii:CPI200BasisPointsMember
2021-04-17
2025-12-31
0000924727
imstiii:BloombergUSUniversalBondIndexMember
2025-07-01
2025-07-01
0000924727
imstiii:C000262097Member
2025-07-01
2025-07-01
0000924727
imstiii:CPI200BasisPointsMember
2025-07-01
2025-07-01
0000924727
imstiii:BloombergUSUniversalBondIndexMember
2025-07-01
2025-12-31
0000924727
imstiii:C000262097Member
2025-07-01
2025-12-31
0000924727
imstiii:CPI200BasisPointsMember
2025-07-01
2025-12-31
0000924727
imstiii:BloombergUSUniversalBondIndexMember
2025-07-02
2025-07-31
0000924727
imstiii:C000262097Member
2025-07-02
2025-07-31
0000924727
imstiii:CPI200BasisPointsMember
2025-07-02
2025-07-31
0000924727
imstiii:BloombergUSUniversalBondIndexMember
2025-07-02
2025-08-31
0000924727
imstiii:C000262097Member
2025-07-02
2025-08-31
0000924727
imstiii:CPI200BasisPointsMember
2025-07-02
2025-08-31
0000924727
imstiii:BloombergUSUniversalBondIndexMember
2025-07-02
2025-09-30
0000924727
imstiii:C000262097Member
2025-07-02
2025-09-30
0000924727
imstiii:CPI200BasisPointsMember
2025-07-02
2025-09-30
0000924727
imstiii:BloombergUSUniversalBondIndexMember
2025-07-02
2025-10-31
0000924727
imstiii:C000262097Member
2025-07-02
2025-10-31
0000924727
imstiii:CPI200BasisPointsMember
2025-07-02
2025-10-31
0000924727
imstiii:BloombergUSUniversalBondIndexMember
2025-07-02
2025-11-30
0000924727
imstiii:C000262097Member
2025-07-02
2025-11-30
0000924727
imstiii:CPI200BasisPointsMember
2025-07-02
2025-11-30
0000924727
imstiii:BloombergUSUniversalBondIndexMember
2025-07-02
2025-12-31
0000924727
imstiii:C000262097Member
2025-07-02
2025-12-31
0000924727
imstiii:CPI200BasisPointsMember
2025-07-02
2025-12-31
0000924727
2025-01-01
2025-12-31
0000924727
imstiii:C000025975Member
2016-01-01
2020-12-31
0000924727
imstiii:C000249813Member
2016-01-01
2020-12-31
0000924727
imstiii:ConsumerPriceIndexUSCPIMember
2016-01-01
2020-12-31
0000924727
imstiii:MSCIAllCountryWorldIndexMember
2016-01-01
2020-12-31
0000924727
imstiii:Sixty40SAndP500IndexBloombergBarclaysUSAggregateBondIndexMember
2016-01-01
2020-12-31
0000924727
imstiii:StandardAndPoorS500IndexMember
2016-01-01
2020-12-31
0000924727
imstiii:BloombergUSUniversalBondIndexMember
2019-01-01
2023-12-31
0000924727
imstiii:C000207154Member
2019-01-01
2023-12-31
0000924727
imstiii:CPI200BasisPointsMember
2019-01-01
2023-12-31
0000924727
imstiii:BloombergUSUniversalBondIndexMember
2021-01-01
2025-12-31
0000924727
imstiii:C000025975Member
2021-01-01 2025-12-31
0000924727
imstiii:C000207154Member
2021-01-01 2025-12-31
0000924727
imstiii:C000221940Member
2021-01-01 2025-12-31
0000924727
imstiii:C000249813Member
2021-01-01 2025-12-31
0000924727
imstiii:ConsumerPriceIndexUSCPIMember
2021-01-01
2025-12-31
0000924727
imstiii:CPI200BasisPointsMember
2021-01-01
2025-12-31
0000924727
imstiii:MSCIAllCountryWorldIndexMember
2021-01-01
2025-12-31
0000924727
imstiii:Sixty40SAndP500IndexBloombergBarclaysUSAggregateBondIndexMember
2021-01-01
2025-12-31
0000924727
imstiii:StandardAndPoorS500IndexMember
2021-01-01
2025-12-31
0000924727
imstiii:C000025975Member
2016-01-01
2016-12-31
0000924727
imstiii:C000249813Member
2016-01-01
2016-12-31
0000924727
imstiii:ConsumerPriceIndexUSCPIMember
2016-01-01
2016-12-31
0000924727
imstiii:MSCIAllCountryWorldIndexMember
2016-01-01
2016-12-31
0000924727
imstiii:Sixty40SAndP500IndexBloombergBarclaysUSAggregateBondIndexMember
2016-01-01
2016-12-31
0000924727
imstiii:StandardAndPoorS500IndexMember
2016-01-01
2016-12-31
0000924727
imstiii:BloombergUSUniversalBondIndexMember
2019-01-01
2019-12-31
0000924727
imstiii:C000207154Member
2019-01-01
2019-12-31
0000924727
imstiii:CPI200BasisPointsMember
2019-01-01
2019-12-31
0000924727
imstiii:BloombergUSUniversalBondIndexMember
2025-01-01
2025-12-31
0000924727
imstiii:C000025975Member
2025-01-01 2025-12-31
0000924727
imstiii:C000207154Member
2025-01-01
2025-12-31
0000924727
imstiii:C000221940Member
2025-01-01 2025-12-31
0000924727
imstiii:C000227168Member
2025-01-01 2025-12-31
0000924727
imstiii:C000249813Member
2025-01-01 2025-12-31
0000924727
imstiii:C000262097Member
2025-01-01 2025-12-31
0000924727
imstiii:ConsumerPriceIndexUSCPIMember
2025-01-01
2025-12-31
0000924727
imstiii:CPI200BasisPointsMember
2025-01-01
2025-12-31
0000924727
imstiii:MSCIAllCountryWorldIndexMember
2025-01-01
2025-12-31
0000924727
imstiii:Sixty40SAndP500IndexBloombergBarclaysUSAggregateBondIndexMember
2025-01-01
2025-12-31
0000924727
imstiii:StandardAndPoorS500IndexMember
2025-01-01
2025-12-31
0000924727
imstiii:C000025975Member
2016-01-01
2025-12-31
0000924727
imstiii:C000249813Member
2016-01-01
2025-12-31
0000924727
imstiii:ConsumerPriceIndexUSCPIMember
2016-01-01
2025-12-31
0000924727
imstiii:MSCIAllCountryWorldIndexMember
2016-01-01
2025-12-31
0000924727
imstiii:Sixty40SAndP500IndexBloombergBarclaysUSAggregateBondIndexMember
2016-01-01
2025-12-31
0000924727
imstiii:StandardAndPoorS500IndexMember
2016-01-01
2025-12-31
0000924727
imstiii:C000025975Member
2025-12-31
0000924727
imstiii:C000025975Member
imstiii:AlphabetIncClassAMember
2025-12-31
0000924727
imstiii:C000025975Member
imstiii:AlphabetIncClassCMember
2025-12-31
0000924727
imstiii:C000025975Member
imstiii:AnalogDevicesIncMember
2025-12-31
0000924727
imstiii:C000025975Member
imstiii:BectonDickinsonAndCoMember
2025-12-31
0000924727
imstiii:C000025975Member
imstiii:BondsAndDebenturesMember
2025-12-31
0000924727
imstiii:C000025975Member
imstiii:CitigroupIncMember
2025-12-31
0000924727
imstiii:C000025975Member
imstiii:ClosedEndFundsMember
2025-12-31
0000924727
imstiii:C000025975Member
us-gaap:CommonStockMember
2025-12-31
0000924727
imstiii:C000025975Member
oef:CommunicationsSectorMember
2025-12-31
0000924727
imstiii:C000025975Member
oef:ConsumerDiscretionarySectorMember
2025-12-31
0000924727
imstiii:C000025975Member
oef:ConsumerStaplesSectorMember
2025-12-31
0000924727
imstiii:C000025975Member
us-gaap:EnergySectorMember
2025-12-31
0000924727
imstiii:C000025975Member
us-gaap:FinancialServicesSectorMember
2025-12-31
0000924727
imstiii:C000025975Member
us-gaap:HealthcareSectorMember
2025-12-31
0000924727
imstiii:C000025975Member
imstiii:HeinekenHoldingNVMember
2025-12-31
0000924727
imstiii:C000025975Member
oef:IndustrialSectorMember
2025-12-31
0000924727
imstiii:C000025975Member
imstiii:InternationalFlavorsAndFragrancesIncMember
2025-12-31
0000924727
imstiii:C000025975Member
imstiii:JDEPeetSNVMember
2025-12-31
0000924727
imstiii:C000025975Member
imstiii:LimitedPartnershipsMember
2025-12-31
0000924727
imstiii:C000025975Member
oef:MaterialsSectorMember
2025-12-31
0000924727
imstiii:C000025975Member
imstiii:MetaPlatformsIncClassAMember
2025-12-31
0000924727
imstiii:C000025975Member
imstiii:OtherAssetsInExcessOfLiabilitiesMember
2025-12-31
0000924727
imstiii:C000025975Member
us-gaap:RealEstateSectorMember
2025-12-31
0000924727
imstiii:C000025975Member
imstiii:SecuritiesSoldShortMember
2025-12-31
0000924727
imstiii:C000025975Member
us-gaap:ShortTermInvestmentsMember
2025-12-31
0000924727
imstiii:C000025975Member
us-gaap:TechnologySectorMember
2025-12-31
0000924727
imstiii:C000025975Member
imstiii:TEConnectivityLtdMember
2025-12-31
0000924727
imstiii:C000025975Member
oef:UtilitiesSectorMember
2025-12-31
0000924727
imstiii:C000025975Member
us-gaap:WarrantMember
2025-12-31
0000924727
imstiii:C000207154Member
2025-12-31
0000924727
imstiii:C000207154Member
us-gaap:AssetBackedSecuritiesMember
2025-12-31
0000924727
imstiii:C000207154Member
imstiii:BondsAndDebenturesMember
2025-12-31
0000924727
imstiii:C000207154Member
us-gaap:CommercialMortgageBackedSecuritiesMember
2025-12-31
0000924727
imstiii:C000207154Member
us-gaap:CommonStockMember
2025-12-31
0000924727
imstiii:C000207154Member
imstiii:CorporateBankDebtMember
2025-12-31
0000924727
imstiii:C000207154Member
us-gaap:CorporateBondSecuritiesMember
2025-12-31
0000924727
imstiii:C000207154Member
imstiii:FannieMaePool1000312037Member
2025-12-31
0000924727
imstiii:C000207154Member
imstiii:FannieMaePool15001112041Member
2025-12-31
0000924727
imstiii:C000207154Member
imstiii:FederalHomeLoanMortgageCorpSeriesK096ClassA225197252029Member
2025-12-31
0000924727
imstiii:C000207154Member
imstiii:FreddieMacPool1500312041Member
2025-12-31
0000924727
imstiii:C000207154Member
imstiii:FreddieMacPool1500512041Member
2025-12-31
0000924727
imstiii:C000207154Member
imstiii:OtherAssetsInExcessOfLiabilitiesMember
2025-12-31
0000924727
imstiii:C000207154Member
us-gaap:PreferredStockMember
2025-12-31
0000924727
imstiii:C000207154Member
us-gaap:ResidentialMortgageBackedSecuritiesMember
2025-12-31
0000924727
imstiii:C000207154Member
us-gaap:ShortTermInvestmentsMember
2025-12-31
0000924727
imstiii:C000207154Member
imstiii:USTreasuryNote350011302030Member
2025-12-31
0000924727
imstiii:C000207154Member
imstiii:USTreasuryNote362510312030Member
2025-12-31
0000924727
imstiii:C000207154Member
imstiii:USTreasuryNote36258312030Member
2025-12-31
0000924727
imstiii:C000207154Member
imstiii:USTreasuryNote36259302030Member
2025-12-31
0000924727
imstiii:C000207154Member
imstiii:USTreasuryNote38757312030Member
2025-12-31
0000924727
imstiii:C000207154Member
imstiii:USTreasuryNotesAndBondsMember
2025-12-31
0000924727
imstiii:C000207154Member
us-gaap:WarrantMember
2025-12-31
0000924727
imstiii:C000221940Member
2025-12-31
0000924727
imstiii:C000221940Member
imstiii:AlphabetIncClassAMember
2025-12-31
0000924727
imstiii:C000221940Member
imstiii:AlphabetIncClassCMember
2025-12-31
0000924727
imstiii:C000221940Member
imstiii:AnalogDevicesIncMember
2025-12-31
0000924727
imstiii:C000221940Member
imstiii:BectonDickinsonAndCoMember
2025-12-31
0000924727
imstiii:C000221940Member
imstiii:BondsAndDebenturesMember
2025-12-31
0000924727
imstiii:C000221940Member
imstiii:CitigroupIncMember
2025-12-31
0000924727
imstiii:C000221940Member
imstiii:ClosedEndFundsMember
2025-12-31
0000924727
imstiii:C000221940Member
us-gaap:CommonStockMember
2025-12-31
0000924727
imstiii:C000221940Member
oef:CommunicationsSectorMember
2025-12-31
0000924727
imstiii:C000221940Member
oef:ConsumerDiscretionarySectorMember
2025-12-31
0000924727
imstiii:C000221940Member
oef:ConsumerStaplesSectorMember
2025-12-31
0000924727
imstiii:C000221940Member
us-gaap:EnergySectorMember
2025-12-31
0000924727
imstiii:C000221940Member
us-gaap:FinancialServicesSectorMember
2025-12-31
0000924727
imstiii:C000221940Member
us-gaap:HealthcareSectorMember
2025-12-31
0000924727
imstiii:C000221940Member
imstiii:HeinekenHoldingNVMember
2025-12-31
0000924727
imstiii:C000221940Member
oef:IndustrialSectorMember
2025-12-31
0000924727
imstiii:C000221940Member
imstiii:InternationalFlavorsAndFragrancesIncMember
2025-12-31
0000924727
imstiii:C000221940Member
imstiii:JDEPeetSNVMember
2025-12-31
0000924727
imstiii:C000221940Member
imstiii:LimitedPartnershipsMember
2025-12-31
0000924727
imstiii:C000221940Member
oef:MaterialsSectorMember
2025-12-31
0000924727
imstiii:C000221940Member
imstiii:MetaPlatformsIncClassAMember
2025-12-31
0000924727
imstiii:C000221940Member
imstiii:OtherAssetsInExcessOfLiabilitiesMember
2025-12-31
0000924727
imstiii:C000221940Member
us-gaap:RealEstateSectorMember
2025-12-31
0000924727
imstiii:C000221940Member
imstiii:SecuritiesSoldShortMember
2025-12-31
0000924727
imstiii:C000221940Member
us-gaap:ShortTermInvestmentsMember
2025-12-31
0000924727
imstiii:C000221940Member
us-gaap:TechnologySectorMember
2025-12-31
0000924727
imstiii:C000221940Member
imstiii:TEConnectivityLtdMember
2025-12-31
0000924727
imstiii:C000221940Member
oef:UtilitiesSectorMember
2025-12-31
0000924727
imstiii:C000221940Member
us-gaap:WarrantMember
2025-12-31
0000924727
imstiii:C000227168Member
2025-12-31
0000924727
imstiii:C000227168Member
us-gaap:AssetBackedSecuritiesMember
2025-12-31
0000924727
imstiii:C000227168Member
imstiii:BondsAndDebenturesMember
2025-12-31
0000924727
imstiii:C000227168Member
us-gaap:CommercialMortgageBackedSecuritiesMember
2025-12-31
0000924727
imstiii:C000227168Member
us-gaap:CommonStockMember
2025-12-31
0000924727
imstiii:C000227168Member
imstiii:CorporateBankDebtMember
2025-12-31
0000924727
imstiii:C000227168Member
us-gaap:CorporateBondSecuritiesMember
2025-12-31
0000924727
imstiii:C000227168Member
imstiii:FannieMaePool1000312037Member
2025-12-31
0000924727
imstiii:C000227168Member
imstiii:FannieMaePool15001112041Member
2025-12-31
0000924727
imstiii:C000227168Member
imstiii:FederalHomeLoanMortgageCorpSeriesK096ClassA225197252029Member
2025-12-31
0000924727
imstiii:C000227168Member
imstiii:FreddieMacPool1500312041Member
2025-12-31
0000924727
imstiii:C000227168Member
imstiii:FreddieMacPool1500512041Member
2025-12-31
0000924727
imstiii:C000227168Member
imstiii:OtherAssetsInExcessOfLiabilitiesMember
2025-12-31
0000924727
imstiii:C000227168Member
us-gaap:PreferredStockMember
2025-12-31
0000924727
imstiii:C000227168Member
us-gaap:ResidentialMortgageBackedSecuritiesMember
2025-12-31
0000924727
imstiii:C000227168Member
us-gaap:ShortTermInvestmentsMember
2025-12-31
0000924727
imstiii:C000227168Member
imstiii:USTreasuryNote350011302030Member
2025-12-31
0000924727
imstiii:C000227168Member
imstiii:USTreasuryNote362510312030Member
2025-12-31
0000924727
imstiii:C000227168Member
imstiii:USTreasuryNote36258312030Member
2025-12-31
0000924727
imstiii:C000227168Member
imstiii:USTreasuryNote36259302030Member
2025-12-31
0000924727
imstiii:C000227168Member
imstiii:USTreasuryNote38757312030Member
2025-12-31
0000924727
imstiii:C000227168Member
imstiii:USTreasuryNotesAndBondsMember
2025-12-31
0000924727
imstiii:C000227168Member
us-gaap:WarrantMember
2025-12-31
0000924727
imstiii:C000249813Member
2025-12-31
0000924727
imstiii:C000249813Member
imstiii:AlphabetIncClassAMember
2025-12-31
0000924727
imstiii:C000249813Member
imstiii:AlphabetIncClassCMember
2025-12-31
0000924727
imstiii:C000249813Member
imstiii:AnalogDevicesIncMember
2025-12-31
0000924727
imstiii:C000249813Member
imstiii:BectonDickinsonAndCoMember
2025-12-31
0000924727
imstiii:C000249813Member
imstiii:BondsAndDebenturesMember
2025-12-31
0000924727
imstiii:C000249813Member
imstiii:CitigroupIncMember
2025-12-31
0000924727
imstiii:C000249813Member
imstiii:ClosedEndFundsMember
2025-12-31
0000924727
imstiii:C000249813Member
us-gaap:CommonStockMember
2025-12-31
0000924727
imstiii:C000249813Member
oef:CommunicationsSectorMember
2025-12-31
0000924727
imstiii:C000249813Member
oef:ConsumerDiscretionarySectorMember
2025-12-31
0000924727
imstiii:C000249813Member
oef:ConsumerStaplesSectorMember
2025-12-31
0000924727
imstiii:C000249813Member
us-gaap:EnergySectorMember
2025-12-31
0000924727
imstiii:C000249813Member
us-gaap:FinancialServicesSectorMember
2025-12-31
0000924727
imstiii:C000249813Member
us-gaap:HealthcareSectorMember
2025-12-31
0000924727
imstiii:C000249813Member
imstiii:HeinekenHoldingNVMember
2025-12-31
0000924727
imstiii:C000249813Member
oef:IndustrialSectorMember
2025-12-31
0000924727
imstiii:C000249813Member
imstiii:InternationalFlavorsAndFragrancesIncMember
2025-12-31
0000924727
imstiii:C000249813Member
imstiii:JDEPeetSNVMember
2025-12-31
0000924727
imstiii:C000249813Member
imstiii:LimitedPartnershipsMember
2025-12-31
0000924727
imstiii:C000249813Member
oef:MaterialsSectorMember
2025-12-31
0000924727
imstiii:C000249813Member
imstiii:MetaPlatformsIncClassAMember
2025-12-31
0000924727
imstiii:C000249813Member
imstiii:OtherAssetsInExcessOfLiabilitiesMember
2025-12-31
0000924727
imstiii:C000249813Member
us-gaap:RealEstateSectorMember
2025-12-31
0000924727
imstiii:C000249813Member
imstiii:SecuritiesSoldShortMember
2025-12-31
0000924727
imstiii:C000249813Member
us-gaap:ShortTermInvestmentsMember
2025-12-31
0000924727
imstiii:C000249813Member
us-gaap:TechnologySectorMember
2025-12-31
0000924727
imstiii:C000249813Member
imstiii:TEConnectivityLtdMember
2025-12-31
0000924727
imstiii:C000249813Member
oef:UtilitiesSectorMember
2025-12-31
0000924727
imstiii:C000249813Member
us-gaap:WarrantMember
2025-12-31
0000924727
imstiii:C000262097Member
2025-12-31
0000924727
imstiii:C000262097Member
us-gaap:AssetBackedSecuritiesMember
2025-12-31
0000924727
imstiii:C000262097Member
imstiii:BondsAndDebenturesMember
2025-12-31
0000924727
imstiii:C000262097Member
us-gaap:CommercialMortgageBackedSecuritiesMember
2025-12-31
0000924727
imstiii:C000262097Member
us-gaap:CommonStockMember
2025-12-31
0000924727
imstiii:C000262097Member
imstiii:CorporateBankDebtMember
2025-12-31
0000924727
imstiii:C000262097Member
us-gaap:CorporateBondSecuritiesMember
2025-12-31
0000924727
imstiii:C000262097Member
imstiii:FannieMaePool1000312037Member
2025-12-31
0000924727
imstiii:C000262097Member
imstiii:FannieMaePool15001112041Member
2025-12-31
0000924727
imstiii:C000262097Member
imstiii:FederalHomeLoanMortgageCorpSeriesK096ClassA225197252029Member
2025-12-31
0000924727
imstiii:C000262097Member
imstiii:FreddieMacPool1500312041Member
2025-12-31
0000924727
imstiii:C000262097Member
imstiii:FreddieMacPool1500512041Member
2025-12-31
0000924727
imstiii:C000262097Member
imstiii:OtherAssetsInExcessOfLiabilitiesMember
2025-12-31
0000924727
imstiii:C000262097Member
us-gaap:PreferredStockMember
2025-12-31
0000924727
imstiii:C000262097Member
us-gaap:ResidentialMortgageBackedSecuritiesMember
2025-12-31
0000924727
imstiii:C000262097Member
us-gaap:ShortTermInvestmentsMember
2025-12-31
0000924727
imstiii:C000262097Member
imstiii:USTreasuryNote350011302030Member
2025-12-31
0000924727
imstiii:C000262097Member
imstiii:USTreasuryNote362510312030Member
2025-12-31
0000924727
imstiii:C000262097Member
imstiii:USTreasuryNote36258312030Member
2025-12-31
0000924727
imstiii:C000262097Member
imstiii:USTreasuryNote36259302030Member
2025-12-31
0000924727
imstiii:C000262097Member
imstiii:USTreasuryNote38757312030Member
2025-12-31
0000924727
imstiii:C000262097Member
imstiii:USTreasuryNotesAndBondsMember
2025-12-31
0000924727
imstiii:C000262097Member
us-gaap:WarrantMember
2025-12-31
iso4217:USDiso4217:USDxbrli:sharesxbrli:purexbrli:sharesutr:Dimstiii:Holding
UNITED STATES
SECURITIES AND EXCHANGE COMMISSION
Washington, D.C. 20549
FORM N-CSR
CERTIFIED SHAREHOLDER REPORT OF REGISTERED MANAGEMENT INVESTMENT COMPANIES
Investment Company Act file number
Investment Managers Series Trust III
(Exact name of registrant as specified in charter)
235 West Galena Street
Milwaukee, Wisconsin 53212
(Address of Principal Executive Offices, including Zip Code)
Diane J. Drake
Mutual Fund Administration, LLC
2220 E. Route 66, Suite 226
Glendora, California 91740
(Name and Address of Agent for Service)
COPIES TO:
Laurie Anne Dee
Morgan, Lewis & Bockius LLP
600 Anton Boulevard, Suite 1800
Costa Mesa, California 92626
Registrant's telephone number, including area code:
Date of reporting period:
The Registrant is filing this amendment to its Form N-CSR (the “Amendment”) for the period ended December 31, 2025, originally
filed with the Securities and Exchange Commission on March 9, 2026 (Accession Number 0001398344-26-004865) (the “Original
Filing”). The amendment’s sole purpose is to correct the benchmark return figure for the CPI + 200 Basis Point, 5-year average total
return in FPA Flexible Fixed Income Fund - Institutional Class performance table, included in Item 1. Report to Stockholders. Except
for this and the updates to signature page dates and the certifications required by Rules 30a-2(a) and 30a-2(b), the Amendment
makes no other changes to the Original Filing.
Item 1. Report to Stockholders.
(a) The registrant’s annual report transmitted to shareholders pursuant to Rule 30e-1 under the Investment Company Act of 1940, as amended (the “Investment Act”), is as follows:
FPA Crescent Fund
Institutional Class/FPACX
ANNUAL SHAREHOLDER REPORT | December 31, 2025
This annual shareholder report contains important information about the FPA Crescent Fund (“Fund”) for the period of January 1, 2025 to December 31, 2025. You can find additional information about the Fund at https://fpa.com/funds/overview/crescent. You can also request this information by contacting us at (800) 638-3060.
Fund Expenses
(Based on a hypothetical $10,000 investment)
| Fund (Class) |
Costs of a $10,000 investment |
Costs paid as a percentage
of a $10,000 investment |
FPA Crescent Fund
(Institutional Class/FPACX) |
$114 |
1.05% |
Management’s Discussion of Fund Performance
SUMMARY OF RESULTS
The FPA Crescent Fund – Institutional Class (“Fund” or “Crescent”) gained 3.09% in the trailing three months and 17.65% in the trailing twelve months ending December 31, 2025, on a net basis, which includes reinvestment of all distributions. The MSCI ACWI Index and the S&P 500 Index returns for the three-month period were 3.29% and 2.66%; and 22.34% and 17.88% for the trailing twelve-month period, respectively. The Fund is managed according to FPA’s Contrarian Value Strategy, which seeks to invest in companies that currently appear out of favor or undervalued but have a favorable outlook for growth, in the portfolio manager’s estimation, over 5-10 years. The portfolio managers conduct deep research into the underlying financial condition and prospects of individual companies, and select those whose securities are offered at a “substantial discount” to the portfolio managers’ estimation of the company’s worth or intrinsic value.
TOP PERFORMANCE CONTRIBUTORS*
TE Connectivity (TE) is a longtime holding that benefitted in 2025 from continued demand growth in several of the markets in which it sells into, including: AI infrastructure and data center connectivity; energy and grid update cycling; and industrial automation. TE also acquired Richards Manufacturing earlier in the year, which helped strengthen the company’s competitive position in industrial and utility markets, and raised the dividend throughout 2025.
Safran was buoyed by robust aerospace and aftermarket parts demand, reporting record profits in early 2025 for the prior year. As global air traffic continued to recover and air carriers ramped up maintenance projects, the company enjoyed higher aftermarket growth and converted operational efficiency into higher earnings, leading management to raise full-year guidance for 2025.
TOP PERFORMANCE DETRACTORS*
CarMax, the largest retailer of used cars in the US, has been a disappointment. We entered 2025 with hopes that an improved omnichannel offering in an improving used vehicle market would drive increased sales volumes, market share, and profit growth. Instead, we’ve watched management make a series of missteps. The company withdrew its 2030 unit sales targets at the beginning of the year, citing tariff-related uncertainty expected to have little impact five years from now—not particularly confidence-boosting, especially when their competitors retained their stated medium-term goals. Management mistakenly expected their strong fiscal first quarter to continue. They overbought inventory at elevated prices, which they were then forced to work through in the second quarter, causing them to lose market share. Investors have punished the company for its mistakes, and shares have declined by 53% in 2025. Despite our disappointment in management’s execution, the company’s share price appears inexpensive to us. Two independent directors of Carmax bought shares in early October, which could signal that they share a similar outlook to ours. The company also increased its share repurchase program, though we wish they would have held off on repurchases until the market was aware of the current disappointing news. We still believe that CarMax has built a differentiated used vehicle retail business and could see substantial share price improvement if the company rights itself, but operational execution needs to significantly improve.
International Flavors & Fragrances has been plagued with poor management for years. As a leading producer of food, beverage, scent, home and personal care, and health products and ingredients, its products are ubiquitous across many household staples. They produce one-third of probiotics, the enzyme used in half of cold-water laundry detergents, another enzyme used in 20% of the beer brewed globally, and one-third of yogurts use an IFF culture, to name a few. Prior management's reckless capital allocation and ineptitude at managing its diverse global enterprise, transforming a high-margin, unlevered company into one with a lower margin and a higher level of leverage. We have a constructive view of the new CEO, who has renewed the company's focus on being a best-in-class operationally with a smaller product suite. They have sold, and will continue to sell, non-core assets, which will decrease their leverage and, hopefully, allow for higher margins. The company has burned the market, and many investors have taken a wait-and-see attitude reasonably.
* The information provided reflects some of the top performance contributors and detractors over the trailing twelve months (“TTM”). It does not reflect all positions purchased, sold or recommended during the TTM. It should not be assumed that recommendations made in the future will be profitable or will equal the performance of the securities or sectors listed. As of 12/31/2025, the position sizes for the securities mentioned as a percentage of net assets were: TE Connectivity (2.2%), Safran (1.6%), CarMax (0.6%), and IFF (1.8%). The company data and statistics referenced in the Contributors and Detractors sections, including competitor data, are sourced from company press releases, investor presentations, financial disclosures, SEC filings, or company websites, unless otherwise noted. Past performance is no guarantee, nor is it indicative, of future results.
Indices are unmanaged and do not reflect any commissions, transaction costs, or fees and expenses which would be incurred by an investor purchasing the underlying securities and which would reduce the performance in an actual account. You cannot invest directly in an index. The MSCI ACWI NR USD Index is an unmanaged free float-adjusted market capitalization weighted index that is designed to measure the equity market performance of developed and emerging markets. The S&P 500 Index includes a representative sample of 500 hundred companies in leading industries of the U.S. economy. The Index focuses on the large-cap segment of the market, with over 80% coverage of U.S. equities, but is also considered a proxy for the total market. The Fund does not include outperformance of any index in its investment objectives.
Fund Performance
The following graph and chart compare the initial and subsequent account values at the end of each of the most recently completed 10 fiscal years of the Fund, or for the life of the Fund, if shorter. It assumes a $10,000 initial investment at the beginning of the first fiscal year in an appropriate, broad-based securities market index for the same period.
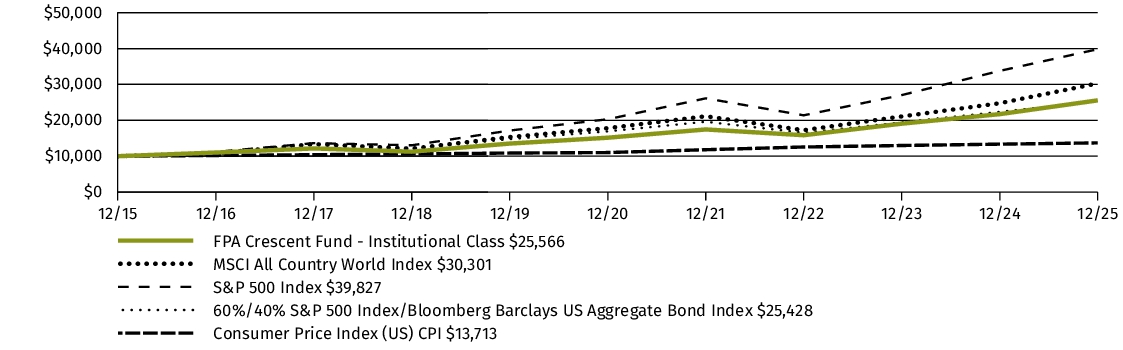
GROWTH OF $10,000
| AVERAGE ANNUAL TOTAL RETURN |
1 Year |
5 Years |
10 Years |
| FPA Crescent Fund (Institutional Class/FPACX) |
17.65% |
11.02% |
9.84% |
| MSCI All Country World Index |
22.34% |
11.19% |
11.72% |
| S&P 500 Index |
17.88% |
14.42% |
14.82% |
| 60%/40% S&P 500 Index/Bloomberg Barclays US Aggregate Bond Index |
13.70% |
8.47% |
9.78% |
| Consumer Price Index (US) CPI |
2.63% |
4.47% |
3.21% |
Keep in mind that the Fund’s past performance is not a good predictor of how the Fund will perform in the future.
The graph and table do not reflect the deduction of taxes that a shareholder would pay on Fund distributions or redemption of Fund shares.
Visit https://fpa.com/funds/performance/crescent for the most recent performance information.
Key Fund Statistics
The following table outlines key fund statistics that you should pay attention to.
| Fund net assets |
$11,881,915,485 |
| Total number of portfolio holdings |
140 |
| Total advisory fees paid (net) |
$99,044,133 |
| Portfolio turnover rate as of the end of the reporting period |
23% |
Graphical Representation of Holdings
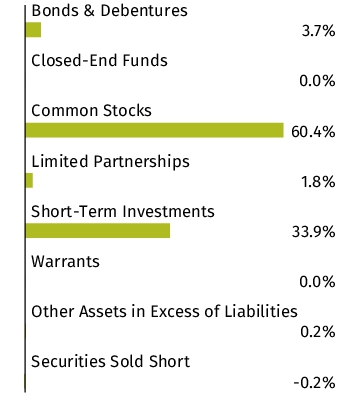
The tables below show the investment makeup of the Fund, representing percentage of the total net assets of the Fund. The Top Ten Holdings and Sector Allocation exclude short-term holdings, if any. The Top Ten Holdings table may not reflect the total exposure to an issuer. The Sector Allocation chart represents Common Stocks of the Fund.
| Alphabet, Inc. - Class A |
3.7% |
| Analog Devices, Inc. |
2.9% |
| Meta Platforms, Inc. - Class A |
2.6% |
| TE Connectivity Ltd. |
2.2% |
| Citigroup, Inc. |
2.2% |
| Alphabet, Inc. - Class C |
2.0% |
| Becton, Dickinson and Co. |
1.9% |
| Heineken Holding N.V. |
1.9% |
| JDE Peet's N.V. |
1.8% |
| International Flavors & Fragrances, Inc. |
1.8% |
Material Fund Changes
There were no material fund changes to the Fund during the reporting period.
Changes in and Disagreements with Accountants
There were no changes in or disagreements with the Fund's accountants during the reporting period.
Availability of Additional Information
You can find additional information about the Fund such as the prospectus, financial information, fund holdings and proxy voting information at https://fpa.com/funds/overview/crescent. You can also request this information by contacting us at (800) 638-3060.
Householding
In order to reduce expenses, we will deliver a single copy of prospectuses, proxies, financial reports and other communication to shareholders with the same residential address, provided they have the same last name, or we reasonably believe them to be members of the same family. Unless we are notified otherwise, we will continue to send recipients only one copy of these materials for as long as they remain a shareholder of the Fund. If you would like to receive individual mailings, please call (800) 638-3060 and we will begin sending you separate copies of these materials within 30 days after receiving your request.
FPA Crescent Fund - Institutional Class
FPA Crescent Fund
Investor Class/FPFRX
ANNUAL SHAREHOLDER REPORT | December 31, 2025
This annual shareholder report contains important information about the FPA Crescent Fund (“Fund”) for the period of January 1, 2025 to December 31, 2025. You can find additional information about the Fund at https://fpa.com/funds/overview/crescent. You can also request this information by contacting us at (800) 638-3060.
Fund Expenses
(Based on a hypothetical $10,000 investment)
| Fund (Class) |
Costs of a $10,000 investment |
Costs paid as a percentage
of a $10,000 investment |
FPA Crescent Fund
(Investor Class/FPFRX) |
$125 |
1.15% |
Management’s Discussion of Fund Performance
SUMMARY OF RESULTS
The FPA Crescent Fund – Investor Class (“Fund” or “Crescent”) gained 3.04% in the trailing three months and 17.52% in the trailing twelve months ending December 31, 2025, on a net basis, which includes reinvestment of all distributions. The MSCI ACWI Index and the S&P 500 Index returns for the three-month period were 3.29% and 2.66%; and 22.34% and 17.88% for the trailing twelve-month period, respectively. The Fund is managed according to FPA’s Contrarian Value Strategy, which seeks to invest in companies that currently appear out of favor or undervalued but have a favorable outlook for growth, in the portfolio manager’s estimation, over 5-10 years. The portfolio managers conduct deep research into the underlying financial condition and prospects of individual companies, and select those whose securities are offered at a “substantial discount” to the portfolio managers’ estimation of the company’s worth or intrinsic value.
TOP PERFORMANCE CONTRIBUTORS*
TE Connectivity (TE) is a longtime holding that benefitted in 2025 from continued demand growth in several of the markets in which it sells into, including: AI infrastructure and data center connectivity; energy and grid update cycling; and industrial automation. TE also acquired Richards Manufacturing earlier in the year, which helped strengthen the company’s competitive position in industrial and utility markets, and raised the dividend throughout 2025.
Safran was buoyed by robust aerospace and aftermarket parts demand, reporting record profits in early 2025 for the prior year. As global air traffic continued to recover and air carriers ramped up maintenance projects, the company enjoyed higher aftermarket growth and converted operational efficiency into higher earnings, leading management to raise full-year guidance for 2025.
TOP PERFORMANCE DETRACTORS*
CarMax, the largest retailer of used cars in the US, has been a disappointment. We entered 2025 with hopes that an improved omnichannel offering in an improving used vehicle market would drive increased sales volumes, market share, and profit growth. Instead, we’ve watched management make a series of missteps. The company withdrew its 2030 unit sales targets at the beginning of the year, citing tariff-related uncertainty expected to have little impact five years from now—not particularly confidence-boosting, especially when their competitors retained their stated medium-term goals. Management mistakenly expected their strong fiscal first quarter to continue. They overbought inventory at elevated prices, which they were then forced to work through in the second quarter, causing them to lose market share. Investors have punished the company for its mistakes, and shares have declined by 53% in 2025. Despite our disappointment in management’s execution, the company’s share price appears inexpensive to us. Two independent directors of Carmax bought shares in early October, which could signal that they share a similar outlook to ours. The company also increased its share repurchase program, though we wish they would have held off on repurchases until the market was aware of the current disappointing news. We still believe that CarMax has built a differentiated used vehicle retail business and could see substantial share price improvement if the company rights itself, but operational execution needs to significantly improve.
International Flavors & Fragrances has been plagued with poor management for years. As a leading producer of food, beverage, scent, home and personal care, and health products and ingredients, its products are ubiquitous across many household staples. They produce one-third of probiotics, the enzyme used in half of cold-water laundry detergents, another enzyme used in 20% of the beer brewed globally, and one-third of yogurts use an IFF culture, to name a few. Prior management's reckless capital allocation and ineptitude at managing its diverse global enterprise, transforming a high-margin, unlevered company into one with a lower margin and a higher level of leverage. We have a constructive view of the new CEO, who has renewed the company's focus on being a best-in-class operationally with a smaller product suite. They have sold, and will continue to sell, non-core assets, which will decrease their leverage and, hopefully, allow for higher margins. The company has burned the market, and many investors have taken a wait-and-see attitude reasonably.
* The information provided reflects some of the top performance contributors and detractors over the trailing twelve months (“TTM”). It does not reflect all positions purchased, sold or recommended during the TTM. It should not be assumed that recommendations made in the future will be profitable or will equal the performance of the securities or sectors listed. As of 12/31/2025, the position sizes for the securities mentioned as a percentage of net assets were: TE Connectivity (2.2%), Safran (1.6%), CarMax (0.6%), and IFF (1.8%). The company data and statistics referenced in the Contributors and Detractors sections, including competitor data, are sourced from company press releases, investor presentations, financial disclosures, SEC filings, or company websites, unless otherwise noted. Past performance is no guarantee, nor is it indicative, of future results.
Indices are unmanaged and do not reflect any commissions, transaction costs, or fees and expenses which would be incurred by an investor purchasing the underlying securities and which would reduce the performance in an actual account. You cannot invest directly in an index. The MSCI ACWI NR USD Index is an unmanaged free float-adjusted market capitalization weighted index that is designed to measure the equity market performance of developed and emerging markets. The S&P 500 Index includes a representative sample of 500 hundred companies in leading industries of the U.S. economy. The Index focuses on the large-cap segment of the market, with over 80% coverage of U.S. equities, but is also considered a proxy for the total market. The Fund does not include outperformance of any index in its investment objectives.
Fund Performance
The following graph and chart compare the initial and subsequent account values at the end of each of the most recently completed 10 fiscal years of the Fund, or for the life of the Fund, if shorter. It assumes a $10,000 initial investment at the beginning of the first fiscal year in an appropriate, broad-based securities market index for the same period.
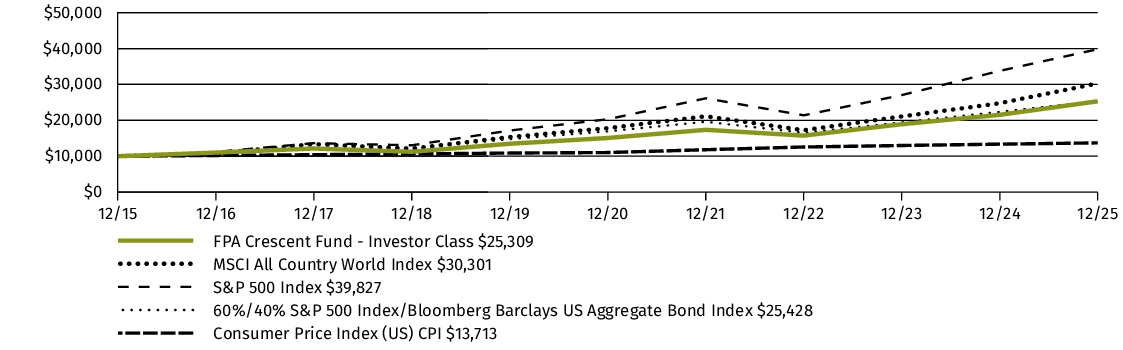
GROWTH OF $10,000
| AVERAGE ANNUAL TOTAL RETURN |
1 Year |
5 Years |
10 Years |
| FPA Crescent Fund (Investor Class/FPFRX)1 |
17.52% |
10.91% |
9.73% |
| MSCI All Country World Index |
22.34% |
11.19% |
11.72% |
| S&P 500 Index |
17.88% |
14.42% |
14.82% |
| 60%/40% S&P 500 Index/Bloomberg Barclays US Aggregate Bond Index |
13.70% |
8.47% |
9.78% |
| Consumer Price Index (US) CPI |
2.63% |
4.47% |
3.21% |
|
1
|
Investor Class commenced operations on April 30, 2024. The performance figures for Investor Class shares include the performance for the Institutional Class shares for the periods prior to the inception date of Investor Class shares, adjusted for the difference in Institutional Class shares and Investor Class shares expenses. Investor Class shares impose higher expenses than Institutional Class shares. Since Investor Class shares have higher expenses and are therefore more expensive than Institutional Class shares, the returns for Investor Class shares will be lower than the returns shown for Institutional Class shares.
|
Keep in mind that the Fund’s past performance is not a good predictor of how the Fund will perform in the future.
The graph and table do not reflect the deduction of taxes that a shareholder would pay on Fund distributions or redemption of Fund shares.
Visit https://fpa.com/funds/performance/crescent for the most recent performance information.
Key Fund Statistics
The following table outlines key fund statistics that you should pay attention to.
| Fund net assets |
$11,881,915,485 |
| Total number of portfolio holdings |
140 |
| Total advisory fees paid (net) |
$99,044,133 |
| Portfolio turnover rate as of the end of the reporting period |
23% |
Graphical Representation of Holdings
The tables below show the investment makeup of the Fund, representing percentage of the total net assets of the Fund. The Top Ten Holdings and Sector Allocation exclude short-term holdings, if any. The Top Ten Holdings table may not reflect the total exposure to an issuer. The Sector Allocation chart represents Common Stocks of the Fund.
| Alphabet, Inc. - Class A |
3.7% |
| Analog Devices, Inc. |
2.9% |
| Meta Platforms, Inc. - Class A |
2.6% |
| TE Connectivity Ltd. |
2.2% |
| Citigroup, Inc. |
2.2% |
| Alphabet, Inc. - Class C |
2.0% |
| Becton, Dickinson and Co. |
1.9% |
| Heineken Holding N.V. |
1.9% |
| JDE Peet's N.V. |
1.8% |
| International Flavors & Fragrances, Inc. |
1.8% |
Material Fund Changes
There were no material fund changes to the Fund during the reporting period.
Changes in and Disagreements with Accountants
There were no changes in or disagreements with the Fund's accountants during the reporting period.
Availability of Additional Information
You can find additional information about the Fund such as the prospectus, financial information, fund holdings and proxy voting information at https://fpa.com/funds/overview/crescent. You can also request this information by contacting us at (800) 638-3060.
Householding
In order to reduce expenses, we will deliver a single copy of prospectuses, proxies, financial reports and other communication to shareholders with the same residential address, provided they have the same last name, or we reasonably believe them to be members of the same family. Unless we are notified otherwise, we will continue to send recipients only one copy of these materials for as long as they remain a shareholder of the Fund. If you would like to receive individual mailings, please call (800) 638-3060 and we will begin sending you separate copies of these materials within 30 days after receiving your request.
FPA Crescent Fund - Investor Class
FPA Crescent Fund
Supra Institutional Class/FPCSX
ANNUAL SHAREHOLDER REPORT | December 31, 2025
This annual shareholder report contains important information about the FPA Crescent Fund (“Fund”) for the period of January 1, 2025 to December 31, 2025. You can find additional information about the Fund at https://fpa.com/funds/overview/crescent. You can also request this information by contacting us at (800) 638-3060.
Fund Expenses
(Based on a hypothetical $10,000 investment)
| Fund (Class) |
Costs of a $10,000 investment |
Costs paid as a percentage
of a $10,000 investment |
FPA Crescent Fund
(Supra Institutional Class/FPCSX) |
$108 |
0.99% |
Management’s Discussion of Fund Performance
SUMMARY OF RESULTS
The FPA Crescent Fund – Supra Institutional Class (“Fund” or “Crescent”) gained 3.09% in the trailing three months and 17.68% in the trailing twelve months ending December 31, 2025, on a net basis, which includes reinvestment of all distributions. The MSCI ACWI Index and the S&P 500 Index returns for the three-month period were 3.29% and 2.66%; and 22.34% and 17.88% for the trailing twelve-month period, respectively. The Fund is managed according to FPA’s Contrarian Value Strategy, which seeks to invest in companies that currently appear out of favor or undervalued but have a favorable outlook for growth, in the portfolio manager’s estimation, over 5-10 years. The portfolio managers conduct deep research into the underlying financial condition and prospects of individual companies, and select those whose securities are offered at a “substantial discount” to the portfolio managers’ estimation of the company’s worth or intrinsic value.
TOP PERFORMANCE CONTRIBUTORS*
TE Connectivity (TE) is a longtime holding that benefitted in 2025 from continued demand growth in several of the markets in which it sells into, including: AI infrastructure and data center connectivity; energy and grid update cycling; and industrial automation. TE also acquired Richards Manufacturing earlier in the year, which helped strengthen the company’s competitive position in industrial and utility markets, and raised the dividend throughout 2025.
Safran was buoyed by robust aerospace and aftermarket parts demand, reporting record profits in early 2025 for the prior year. As global air traffic continued to recover and air carriers ramped up maintenance projects, the company enjoyed higher aftermarket growth and converted operational efficiency into higher earnings, leading management to raise full-year guidance for 2025.
TOP PERFORMANCE DETRACTORS*
CarMax, the largest retailer of used cars in the US, has been a disappointment. We entered 2025 with hopes that an improved omnichannel offering in an improving used vehicle market would drive increased sales volumes, market share, and profit growth. Instead, we’ve watched management make a series of missteps. The company withdrew its 2030 unit sales targets at the beginning of the year, citing tariff-related uncertainty expected to have little impact five years from now—not particularly confidence-boosting, especially when their competitors retained their stated medium-term goals. Management mistakenly expected their strong fiscal first quarter to continue. They overbought inventory at elevated prices, which they were then forced to work through in the second quarter, causing them to lose market share. Investors have punished the company for its mistakes, and shares have declined by 53% in 2025. Despite our disappointment in management’s execution, the company’s share price appears inexpensive to us. Two independent directors of Carmax bought shares in early October, which could signal that they share a similar outlook to ours. The company also increased its share repurchase program, though we wish they would have held off on repurchases until the market was aware of the current disappointing news. We still believe that CarMax has built a differentiated used vehicle retail business and could see substantial share price improvement if the company rights itself, but operational execution needs to significantly improve.
International Flavors & Fragrances has been plagued with poor management for years. As a leading producer of food, beverage, scent, home and personal care, and health products and ingredients, its products are ubiquitous across many household staples. They produce one-third of probiotics, the enzyme used in half of cold-water laundry detergents, another enzyme used in 20% of the beer brewed globally, and one-third of yogurts use an IFF culture, to name a few. Prior management's reckless capital allocation and ineptitude at managing its diverse global enterprise, transforming a high-margin, unlevered company into one with a lower margin and a higher level of leverage. We have a constructive view of the new CEO, who has renewed the company's focus on being a best-in-class operationally with a smaller product suite. They have sold, and will continue to sell, non-core assets, which will decrease their leverage and, hopefully, allow for higher margins. The company has burned the market, and many investors have taken a wait-and-see attitude reasonably.
* The information provided reflects some of the top performance contributors and detractors over the trailing twelve months (“TTM”). It does not reflect all positions purchased, sold or recommended during the TTM. It should not be assumed that recommendations made in the future will be profitable or will equal the performance of the securities or sectors listed. As of 12/31/2025, the position sizes for the securities mentioned as a percentage of net assets were: TE Connectivity (2.2%), Safran (1.6%), CarMax (0.6%), and IFF (1.8%). The company data and statistics referenced in the Contributors and Detractors sections, including competitor data, are sourced from company press releases, investor presentations, financial disclosures, SEC filings, or company websites, unless otherwise noted. Past performance is no guarantee, nor is it indicative, of future results.
Indices are unmanaged and do not reflect any commissions, transaction costs, or fees and expenses which would be incurred by an investor purchasing the underlying securities and which would reduce the performance in an actual account. You cannot invest directly in an index. The MSCI ACWI NR USD Index is an unmanaged free float-adjusted market capitalization weighted index that is designed to measure the equity market performance of developed and emerging markets. The S&P 500 Index includes a representative sample of 500 hundred companies in leading industries of the U.S. economy. The Index focuses on the large-cap segment of the market, with over 80% coverage of U.S. equities, but is also considered a proxy for the total market. The Fund does not include outperformance of any index in its investment objectives.
Fund Performance
The following graph and chart compare the initial and subsequent account values at the end of each of the most recently completed 10 fiscal years of the Fund, or for the life of the Fund, if shorter. It assumes a $100,000,000 initial investment at the beginning of the first fiscal year in an appropriate, broad-based securities market index for the same period.
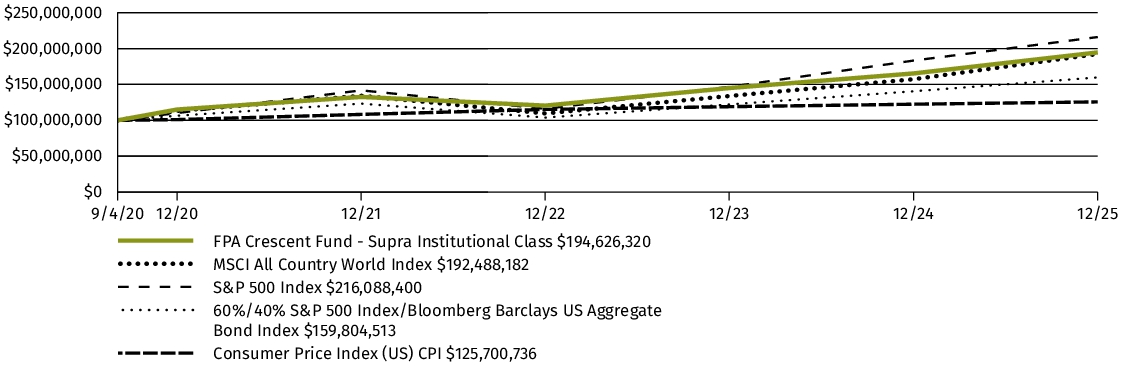
GROWTH OF $100,000,000
| AVERAGE ANNUAL TOTAL RETURN |
1 Year |
5 Years |
Since
Inception1 |
| FPA Crescent Fund (Supra Institutional Class/FPCSX) |
17.68% |
11.08% |
13.33% |
| MSCI All Country World Index |
22.34% |
11.19% |
13.09% |
| S&P 500 Index |
17.88% |
14.42% |
15.57% |
| 60%/40% S&P 500 Index/Bloomberg Barclays US Aggregate Bond Index |
13.70% |
8.47% |
9.21% |
| Consumer Price Index (US) CPI |
2.63% |
4.47% |
4.38% |
|
1
|
Supra Institutional Class commenced operations on September 4, 2020.
|
Keep in mind that the Fund’s past performance is not a good predictor of how the Fund will perform in the future.
The graph and table do not reflect the deduction of taxes that a shareholder would pay on Fund distributions or redemption of Fund shares.
Visit https://fpa.com/funds/performance/crescent for the most recent performance information.
Key Fund Statistics
The following table outlines key fund statistics that you should pay attention to.
| Fund net assets |
$11,881,915,485 |
| Total number of portfolio holdings |
140 |
| Total advisory fees paid (net) |
$99,044,133 |
| Portfolio turnover rate as of the end of the reporting period |
23% |
Graphical Representation of Holdings
The tables below show the investment makeup of the Fund, representing percentage of the total net assets of the Fund. The Top Ten Holdings and Sector Allocation exclude short-term holdings, if any. The Top Ten Holdings table may not reflect the total exposure to an issuer. The Sector Allocation chart represents Common Stocks of the Fund.
| Alphabet, Inc. - Class A |
3.7% |
| Analog Devices, Inc. |
2.9% |
| Meta Platforms, Inc. - Class A |
2.6% |
| TE Connectivity Ltd. |
2.2% |
| Citigroup, Inc. |
2.2% |
| Alphabet, Inc. - Class C |
2.0% |
| Becton, Dickinson and Co. |
1.9% |
| Heineken Holding N.V. |
1.9% |
| JDE Peet's N.V. |
1.8% |
| International Flavors & Fragrances, Inc. |
1.8% |
Material Fund Changes
There were no material fund changes to the Fund during the reporting period.
Changes in and Disagreements with Accountants
There were no changes in or disagreements with the Fund's accountants during the reporting period.
Availability of Additional Information
You can find additional information about the Fund such as the prospectus, financial information, fund holdings and proxy voting information at https://fpa.com/funds/overview/crescent. You can also request this information by contacting us at (800) 638-3060.
Householding
In order to reduce expenses, we will deliver a single copy of prospectuses, proxies, financial reports and other communication to shareholders with the same residential address, provided they have the same last name, or we reasonably believe them to be members of the same family. Unless we are notified otherwise, we will continue to send recipients only one copy of these materials for as long as they remain a shareholder of the Fund. If you would like to receive individual mailings, please call (800) 638-3060 and we will begin sending you separate copies of these materials within 30 days after receiving your request.
FPA Crescent Fund - Supra Institutional Class
FPA Flexible Fixed Income Fund
Institutional Class/FPFIX
ANNUAL SHAREHOLDER REPORT | December 31, 2025
This annual shareholder report contains important information about the FPA Flexible Fixed Income Fund (“Fund”) for the period to January 1, 2025 to December 31, 2025. You can find additional information about the Fund at https://fpa.com/funds/overview/flexible-fixed-income. You can also request this information by contacting us at (800) 638-3060.
Fund Expenses
(Based on a hypothetical $10,000 investment)
| Fund (Class) |
Costs of a $10,000 investment |
Costs paid as a percentage
of a $10,000 investment |
FPA Flexible Fixed Income Fund
(Institutional Class/FPFIX) |
$57 |
0.55% |
Management’s Discussion of Fund Performance
How did the Fund perform over the reporting period?
For the twelve-month period ending December 31, 2025, the FPA Flexible Fixed Income Fund’s Institutional Class (“Fund”) net return was 7.23%, which includes reinvestment of all distributions.
What affected the Fund’s performance?
During the 12 months ending December 31, 2025, Treasury yields decreased between 7-77 basis points for maturities less than 30 years. Spreads on investment grade and high yield rated debt decreased. Due to low spreads, we largely focused on buying longer-duration, High Quality bonds (rated single-A or higher) which we believe will enhance both the Fund’s long-term returns and short-term upside-versus-downside return profile. Over the past 12 months, the Fund’s duration has ranged from 3.3 years to 3.5 years. We seek to opportunistically invest in Credit when we believe prices adequately compensate for the risk of permanent impairment of capital and near-term mark-to-market risk. The Fund’s exposure to investments rated BBB or lower decreased as decreasing spreads in that part of the market generally made these investments unattractive.
Fund performance can be attributed to the following:[1]
The largest contributors to performance during the 12 months ending December 31, 2025:
• Agency-guaranteed residential mortgage pools driven by price increase due to lower benchmark yields and spreads; interest income; and amortization of principal
• U.S. Treasuries due to interest income and price increase due to lower benchmark yields
• Agency-guaranteed commercial mortgage-backed securities driven by price increase due to lower benchmark yields and spreads; and interest income
Although certain individual bonds detracted from performance during the year, there were no meaningful detractors at the sector level.
[1] This information is not a recommendation for a specific security or sector and these securities/sectors may not be in the Fund at the time you receive this report. The information provided does not reflect all positions purchased, sold or recommended by FPA during the quarter. The portfolio holdings as of the most recent quarter-end may be obtained at https://fpa.com. Past performance is no guarantee, nor is it indicative, of future results.
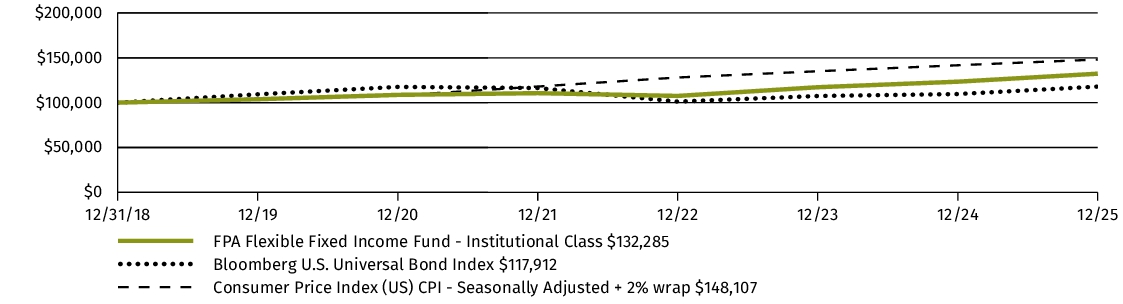
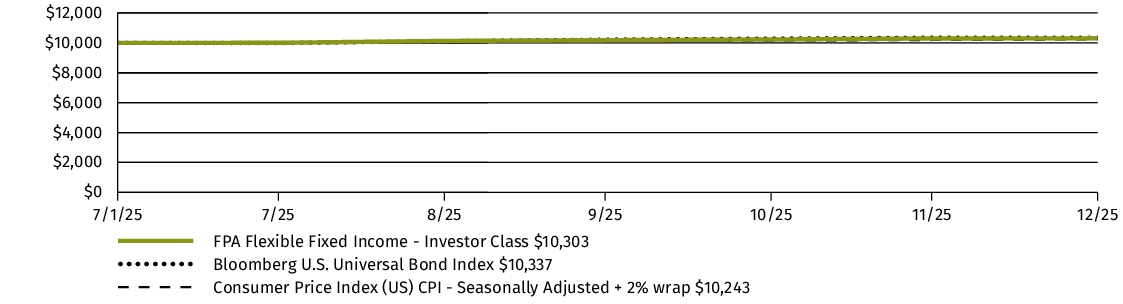
Fund Performance
The following graph and chart compare the initial and subsequent account values at the end of each of the most recently completed 10 fiscal years of the Fund, or for the life of the Fund, if shorter. It assumes a $100,000 initial investment at the beginning of the first fiscal year in an appropriate, broad-based securities market index for the same period.
GROWTH OF $100,000
| AVERAGE ANNUAL TOTAL RETURN |
1 Year |
5 Years |
Since
Inception |
| FPA Flexible Fixed Income Fund (Institutional Class/FPFIX) |
7.23% |
4.01% |
4.08% |
| Bloomberg U.S. Universal Bond Index |
7.58% |
0.06% |
2.38% |
| CPI + 200 Basis Points |
4.70% |
6.58% |
5.80% |
Keep in mind that the Fund’s past performance is not a good predictor of how the Fund will perform in the future.
The graph and table do not reflect the deduction of taxes that a shareholder would pay on Fund distributions or redemption of Fund shares.
Visit https://fpa.com/funds/performance/flexible-fixed-income for the most recent performance information.
Key Fund Statistics
The following table outlines key fund statistics that you should pay attention to.
| Fund net assets |
$1,939,413,246 |
| Total number of portfolio holdings |
412 |
| Total advisory fees paid (net) |
$6,764,534 |
| Portfolio turnover rate as of the end of the reporting period |
48% |
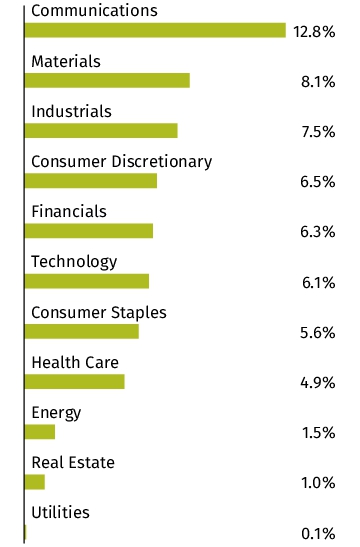
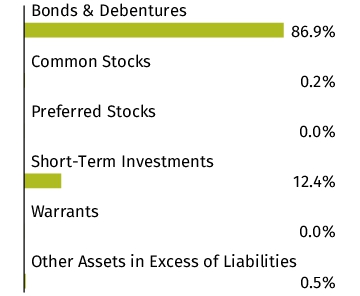
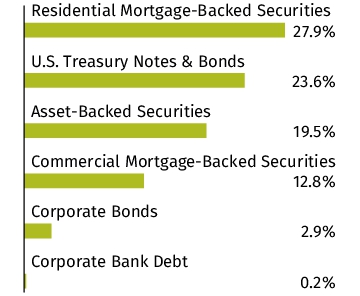
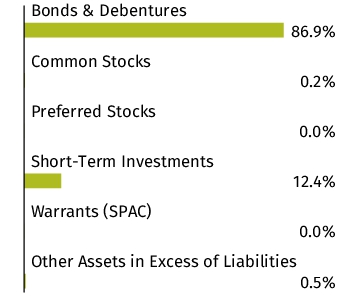
Graphical Representation of Holdings
The tables below show the investment makeup of the Fund, representing percentage of the total net assets of the Fund. The Top Ten Holdings and Sector Allocation exclude short-term holdings, if any. The Top Ten Holdings table may not reflect the total exposure to an issuer. Interest rates presented in the Top Ten Holdings are as of the reporting period end. The Sector Allocation chart represents Bonds & Debentures of the Fund.
| U.S. Treasury Note, 3.625%, 10/31/2030 |
9.0% |
| U.S. Treasury Note, 3.625%, 8/31/2030 |
5.3% |
| U.S. Treasury Note, 3.875%, 7/31/2030 |
4.2% |
| U.S. Treasury Note, 3.500%, 11/30/2030 |
2.4% |
| U.S. Treasury Note, 3.625%, 9/30/2030 |
2.1% |
| Fannie Mae Pool, 1.000%, 3/1/2037 |
0.8% |
| Freddie Mac Pool, 1.500%, 3/1/2041 |
0.8% |
| Freddie Mac Pool, 1.500%, 5/1/2041 |
0.7% |
| Federal Home Loan Mortgage Corp., Series K096, Class A2, 2.519%, 7/25/2029 |
0.7% |
| Fannie Mae Pool, 1.500%, 11/1/2041 |
0.7% |
Material Fund Changes
There were no material fund changes to the Fund during the reporting period.
Changes in and Disagreements with Accountants
There were no changes in or disagreements with the Fund's accountants during the reporting period.
Availability of Additional Information
You can find additional information about the Fund such as the prospectus, financial information, fund holdings and proxy voting information at https://fpa.com/funds/overview/flexible-fixed-income. You can also request this information by contacting us at (800) 638-3060.
Householding
In order to reduce expenses, we will deliver a single copy of prospectuses, proxies, financial reports and other communication to shareholders with the same residential address, provided they have the same last name, or we reasonably believe them to be members of the same family. Unless we are notified otherwise, we will continue to send recipients only one copy of these materials for as long as they remain a shareholder of the Fund. If you would like to receive individual mailings, please call (800) 638-3060 and we will begin sending you separate copies of these materials within 30 days after receiving your request.
FPA Flexible Fixed Income Fund - Institutional Class
FPA Flexible Fixed Income Fund
Advisor Class/FFIAX
ANNUAL SHAREHOLDER REPORT | December 31, 2025
This annual shareholder report contains important information about the FPA Flexible Fixed Income Fund (“Fund”) for the period to January 1, 2025 to December 31, 2025. You can find additional information about the Fund at https://fpa.com/funds/overview/flexible-fixed-income. You can also request this information by contacting us at (800) 638-3060.
Fund Expenses
(Based on a hypothetical $10,000 investment)
| Fund (Class) |
Costs of a $10,000 investment |
Costs paid as a percentage
of a $10,000 investment |
FPA Flexible Fixed Income Fund
(Advisor Class/FFIAX) |
$62 |
0.60% |
Management’s Discussion of Fund Performance
How did the Fund perform over the reporting period?
For the twelve-month period ending December 31, 2025, the FPA Flexible Fixed Income Fund’s Advisor Class (“Fund”) net return was 7.22%, which includes reinvestment of all distributions.
What affected the Fund’s performance?
During the 12 months ending December 31, 2025, Treasury yields decreased between 7-77 basis points for maturities less than 30 years. Spreads on investment grade and high yield rated debt decreased. Due to low spreads, we largely focused on buying longer-duration, High Quality bonds (rated single-A or higher) which we believe will enhance both the Fund’s long-term returns and short-term upside-versus-downside return profile. Over the past 12 months, the Fund’s duration has ranged from 3.3 years to 3.5 years. We seek to opportunistically invest in Credit when we believe prices adequately compensate for the risk of permanent impairment of capital and near-term mark-to-market risk. The Fund’s exposure to investments rated BBB or lower decreased as decreasing spreads in that part of the market generally made these investments unattractive.
Fund performance can be attributed to the following:[1]
The largest contributors to performance during the 12 months ending December 31, 2025:
• Agency-guaranteed residential mortgage pools driven by price increase due to lower benchmark yields and spreads; interest income; and amortization of principal
• U.S. Treasuries due to interest income and price increase due to lower benchmark yields
• Agency-guaranteed commercial mortgage-backed securities driven by price increase due to lower benchmark yields and spreads; and interest income
Although certain individual bonds detracted from performance during the year, there were no meaningful detractors at the sector level.
[1] This information is not a recommendation for a specific security or sector and these securities/sectors may not be in the Fund at the time you receive this report. The information provided does not reflect all positions purchased, sold or recommended by FPA during the quarter. The portfolio holdings as of the most recent quarter-end may be obtained at https://fpa.com. Past performance is no guarantee, nor is it indicative, of future results.
Fund Performance
The following graph and chart compare the initial and subsequent account values at the end of each of the most recently completed 10 fiscal years of the Fund, or for the life of the Fund, if shorter. It assumes a $10,000 initial investment at the beginning of the first fiscal year in an appropriate, broad-based securities market index for the same period.
GROWTH OF $10,000
| AVERAGE ANNUAL TOTAL RETURN |
1 Year |
Since
Inception1 |
| FPA Flexible Fixed Income Fund (Advisor Class/FFIAX) |
7.22% |
4.02% |
| Bloomberg U.S. Universal Bond Index |
7.58% |
0.55% |
| CPI + 200 Basis Points |
4.70% |
6.62% |
|
1
|
Advisor Class commenced operations on April 16, 2021.
|
Keep in mind that the Fund’s past performance is not a good predictor of how the Fund will perform in the future.
The graph and table do not reflect the deduction of taxes that a shareholder would pay on Fund distributions or redemption of Fund shares.
Visit https://fpa.com/funds/performance/flexible-fixed-income for the most recent performance information.
Key Fund Statistics
The following table outlines key fund statistics that you should pay attention to.
| Fund net assets |
$1,939,413,246 |
| Total number of portfolio holdings |
412 |
| Total advisory fees paid (net) |
$6,764,534 |
| Portfolio turnover rate as of the end of the reporting period |
48% |
Graphical Representation of Holdings
The tables below show the investment makeup of the Fund, representing percentage of the total net assets of the Fund. The Top Ten Holdings and Sector Allocation exclude short-term holdings, if any. The Top Ten Holdings table may not reflect the total exposure to an issuer. Interest rates presented in the Top Ten Holdings are as of the reporting period end. The Sector Allocation chart represents Bonds & Debentures of the Fund.
| U.S. Treasury Note, 3.625%, 10/31/2030 |
9.0% |
| U.S. Treasury Note, 3.625%, 8/31/2030 |
5.3% |
| U.S. Treasury Note, 3.875%, 7/31/2030 |
4.2% |
| U.S. Treasury Note, 3.500%, 11/30/2030 |
2.4% |
| U.S. Treasury Note, 3.625%, 9/30/2030 |
2.1% |
| Fannie Mae Pool, 1.000%, 3/1/2037 |
0.8% |
| Freddie Mac Pool, 1.500%, 3/1/2041 |
0.8% |
| Freddie Mac Pool, 1.500%, 5/1/2041 |
0.7% |
| Federal Home Loan Mortgage Corp., Series K096, Class A2, 2.519%, 7/25/2029 |
0.7% |
| Fannie Mae Pool, 1.500%, 11/1/2041 |
0.7% |
Material Fund Changes
There were no material fund changes to the Fund during the reporting period.
Changes in and Disagreements with Accountants
There were no changes in or disagreements with the Fund's accountants during the reporting period.
Availability of Additional Information
You can find additional information about the Fund such as the prospectus, financial information, fund holdings and proxy voting information at https://fpa.com/funds/overview/flexible-fixed-income. You can also request this information by contacting us at (800) 638-3060.
Householding
In order to reduce expenses, we will deliver a single copy of prospectuses, proxies, financial reports and other communication to shareholders with the same residential address, provided they have the same last name, or we reasonably believe them to be members of the same family. Unless we are notified otherwise, we will continue to send recipients only one copy of these materials for as long as they remain a shareholder of the Fund. If you would like to receive individual mailings, please call (800) 638-3060 and we will begin sending you separate copies of these materials within 30 days after receiving your request.
FPA Flexible Fixed Income Fund - Advisor Class
FPA Flexible Fixed Income Fund
Investor Class/FFIRX
ANNUAL SHAREHOLDER REPORT | December 31, 2025
This annual shareholder report contains important information about the FPA Flexible Fixed Income Fund (“Fund”) for the period July 1, 2025 to December 31, 2025. You can find additional information about the Fund at https://fpa.com/funds/overview/flexible-fixed-income. You can also request this information by contacting us at (800) 638-3060.
Fund Expenses
(Based on a hypothetical $10,000 investment)
| Fund (Class) |
Costs of a $10,000 investment |
Costs paid as a percentage
of a $10,000 investment |
FPA Flexible Fixed Income Fund
(Investor Class/FFIRX)1 |
$33 |
0.65%2 |
|
1
|
The Investor Class commenced operations on July 1, 2025. If the Investor Class had been operational for the entire annual period of January 1, 2025 to December 31, 2025, expenses would have been higher.
|
|
2
|
Annualized.
|
Management’s Discussion of Fund Performance
How did the Fund perform over the reporting period?
For the period ending December 31, 2025, the FPA Flexible Fixed Income Fund’s Investor Class (“Fund”) net return was 3.03%, which includes reinvestment of all distributions.
What affected the Fund’s performance?
During the 12 months ending December 31, 2025, Treasury yields decreased between 7-77 basis points for maturities less than 30 years. Spreads on investment grade and high yield rated debt decreased. Due to low spreads, we largely focused on buying longer-duration, High Quality bonds (rated single-A or higher) which we believe will enhance both the Fund’s long-term returns and short-term upside-versus-downside return profile. Over the past 12 months, the Fund’s duration has ranged from 3.3 years to 3.5 years. We seek to opportunistically invest in Credit when we believe prices adequately compensate for the risk of permanent impairment of capital and near-term mark-to-market risk. The Fund’s exposure to investments rated BBB or lower decreased as decreasing spreads in that part of the market generally made these investments unattractive.
Fund performance can be attributed to the following:[1]
The largest contributors to performance during the 12 months ending December 31, 2025:
• Agency-guaranteed residential mortgage pools driven by price increase due to lower benchmark yields and spreads; interest income; and amortization of principal
• U.S. Treasuries due to interest income and price increase due to lower benchmark yields
• Agency-guaranteed commercial mortgage-backed securities driven by price increase due to lower benchmark yields and spreads; and interest income
Although certain individual bonds detracted from performance during the year, there were no meaningful detractors at the sector level.
[1] This information is not a recommendation for a specific security or sector and these securities/sectors may not be in the Fund at the time you receive this report. The information provided does not reflect all positions purchased, sold or recommended by FPA during the quarter. The portfolio holdings as of the most recent quarter-endv may be obtained at https://fpa.com. Past performance is no guarantee, nor is it indicative, of future results.
Fund Performance
The following graph and chart compare the initial and subsequent account values at the end of each of the most recently completed 10 fiscal years of the Fund, or for the life of the Fund, if shorter. It assumes a $10,000 initial investment at the beginning of the first fiscal year in an appropriate, broad-based securities market index for the same period.
GROWTH OF $10,000
| ANNUAL TOTAL RETURN |
Since
Inception |
| FPA Flexible Fixed Income Fund (Investor Class/FFIRX)1 |
3.03% |
| Bloomberg U.S. Universal Bond Index |
3.37% |
| CPI + 200 Basis Points |
2.43% |
|
1
|
The Investor Class commenced operations on July 1, 2025. If the Investor Class had been operational for the entire annual period of January 1, 2025 to December 31, 2025, expenses would have been higher.
|
Keep in mind that the Fund’s past performance is not a good predictor of how the Fund will perform in the future.
The graph and table do not reflect the deduction of taxes that a shareholder would pay on Fund distributions or redemption of Fund shares.
Visit https://fpa.com/funds/performance/flexible-fixed-income for the most recent performance information.
Key Fund Statistics
The following table outlines key fund statistics that you should pay attention to.
| Fund net assets |
$1,939,413,246 |
| Total number of portfolio holdings |
412 |
| Total advisory fees paid (net) |
$6,764,534 |
| Portfolio turnover rate as of the end of the reporting period |
48% |
Graphical Representation of Holdings
The tables below show the investment makeup of the Fund, representing percentage of the total net assets of the Fund. The Top Ten Holdings and Sector Allocation exclude short-term holdings, if any. The Top Ten Holdings table may not reflect the total exposure to an issuer. Interest rates presented in the Top Ten Holdings are as of the reporting period end. The Sector Allocation chart represents Bonds & Debentures of the Fund.
| U.S. Treasury Note, 3.625%, 10/31/2030 |
9.0% |
| U.S. Treasury Note, 3.625%, 8/31/2030 |
5.3% |
| U.S. Treasury Note, 3.875%, 7/31/2030 |
4.2% |
| U.S. Treasury Note, 3.500%, 11/30/2030 |
2.4% |
| U.S. Treasury Note, 3.625%, 9/30/2030 |
2.1% |
| Fannie Mae Pool, 1.000%, 3/1/2037 |
0.8% |
| Freddie Mac Pool, 1.500%, 3/1/2041 |
0.8% |
| Freddie Mac Pool, 1.500%, 5/1/2041 |
0.7% |
| Federal Home Loan Mortgage Corp., Series K096, Class A2, 2.519%, 7/25/2029 |
0.7% |
| Fannie Mae Pool, 1.500%, 11/1/2041 |
0.7% |
Material Fund Changes
There were no material fund changes to the Fund during the reporting period.
Changes in and Disagreements with Accountants
There were no changes in or disagreements with the Fund's accountants during the reporting period.
Availability of Additional Information
You can find additional information about the Fund such as the prospectus, financial information, fund holdings and proxy voting information at https://fpa.com/funds/overview/flexible-fixed-income. You can also request this information by contacting us at (800) 638-3060.
Householding
In order to reduce expenses, we will deliver a single copy of prospectuses, proxies, financial reports and other communication to shareholders with the same residential address, provided they have the same last name, or we reasonably believe them to be members of the same family. Unless we are notified otherwise, we will continue to send recipients only one copy of these materials for as long as they remain a shareholder of the Fund. If you would like to receive individual mailings, please call (800) 638-3060 and we will begin sending you separate copies of these materials within 30 days after receiving your request.
FPA Flexible Fixed Income Fund - Investor Class
(b) Not applicable.
Item 2.
Code of Ethics.
The registrant has adopted a code of ethics that applies
to the registrant's principal executive officer and principal financial officer. The registrant has not made any amendments to its code
of ethics during the period covered by this report. The registrant has not granted any waivers from any provisions of the code of ethics
during the period covered by this report.
The registrant undertakes to provide to any person
without charge, upon request, a copy of its code of ethics by mail when they call the registrant at 1-800-982-4372.
Item 3.
Audit Committee Financial Expert.
The Board of Trustees of the Registrant has determined
that John Zader and Sandra Brown, who are members of the Registrant’s Audit Committee and Board of Trustees, are “audit committee
financial experts” and are “independent” as those terms are defined in this Item.
Item
4. Principal Accountant Fees and Services.
The registrant has engaged its principal accountant
to perform audit services, audit-related services, tax services and other services during the past two fiscal years. "Audit services"
refer to performing an audit of the registrant's annual financial statements or services that are normally provided by the accountant
in connection with statutory and regulatory filings or engagements for those fiscal years. "Audit-related services" refer to the
assurance and related services by the principal accountant that are reasonably related to the performance of the audit. "Tax services"
refer to professional services rendered by the principal accountant for tax compliance, tax advice, and tax planning. There were no "other
services" provided by the principal accountant. The following table details the aggregate fees billed or expected to be billed for
each of the last two fiscal years for audit fees, audit-related fees, tax fees and other fees by the principal accountant.
| |
FPA Flexible Fixed Income Fund
FPA Crescent Fund
|
FYE 12/31/2025 |
FYE 12/31/2024 |
| (a) |
Audit Fees |
$28,000 |
$27,000 |
| (b) |
Audit-Related Fees |
N/A |
N/A |
| (c) |
Tax Fees |
$5,000 |
$5,000 |
| (d) |
All Other Fees |
N/A |
N/A |
(e)(1) The audit committee has adopted pre-approval
policies and procedures that require the audit committee to pre-approve all audit and non-audit services of the registrant, including
services provided to any entity affiliated with the registrant.
(e)(2) The percentage of fees billed by Tait, Weller,
& Weller LLP applicable to non-audit services pursuant to waiver of pre-approval requirement were as follows:
|
FPA Flexible Fixed Income Fund
FPA Crescent Fund |
FYE 12/31/2025 |
FYE 12/31/2024 |
| Audit-Related Fees |
0% |
0% |
| Tax Fees |
0% |
0% |
| All Other Fees |
0% |
0% |
|
| (f) |
All of the principal accountant's hours spent on auditing the registrant's financial statements were attributed
to work performed by full-time permanent employees of the principal accountant. |
The following table indicates the non-audit
fees billed or expected to be billed by the registrant's accountant for services to the registrant and to the registrant's investment
advisor (and any other controlling entity, etc.—not sub-advisor) for the last two years. The audit committee of the Board of Trustees
has considered whether the provision of non-audit services that were rendered to the registrant's investment advisor is compatible with
maintaining the principal accountant's independence and has concluded that the provision of such non-audit services by the accountant
has not compromised the accountant's independence.
| |
FPA Flexible Fixed Income Fund
FPA Crescent Fund |
FYE 12/31/2025 |
FYE 12/31/2024 |
| (g) |
Registrant Non-Audit Related Fees |
N/A |
N/A |
| (h) |
Registrant’s Investment Advisor |
N/A |
N/A |
Item
5. Audit Committee of Listed Registrants.
|
| (a) |
Not applicable to registrants who are not listed issuers (as defined in Rule 10A-3 under the Securities Exchange
Act of 1934). |
Item
6. Investments.
|
| (a) |
Schedule of Investments is included as part of the report to shareholders filed under Item 7 of this Form. |
Item 7.
Financial Statements and Financial Highlights for Open-End Management Investment Companies.

FPA Crescent Fund
(Institutional Class: FPACX)
(Investor Class: FPFRX)
(Supra Institutional Class: FPCSX)
ANNUAL FINANCIALS AND OTHER INFORMATION
DECEMBER 31, 2025
FPA Crescent Fund
A series of Investment Managers Series Trust III
Table of Contents
Please note the Financials and Other Information only
contains Items 7-11 required in Form N-CSR. All other required items will be filed with the SEC.
| Item 7. Financial Statements and Financial Highlights |
|
| Schedule of Investments |
1 |
| Statement of Assets and Liabilities |
10 |
| Statement of Operations |
11 |
| Statements of Changes in Net Assets |
12 |
| Financial Highlights |
13 |
| Notes to Financial Statements |
16 |
| Report of Independent Registered Public Accounting Firm |
33 |
This report and the financial statements contained
herein are provided for the general information of the shareholders of the FPA Crescent Fund (the “Fund”). This report is
not authorized for distribution to prospective investors in the Fund unless preceded or accompanied by an effective shareholder report
and prospectus.
https://fpa.com
FPA Crescent Fund
SCHEDULE OF INVESTMENTS
As of December 31, 2025
Principal
Amount |
|
|
|
|
Value |
|
| |
|
|
|
BONDS & DEBENTURES — 3.7% |
|
|
|
|
| |
|
|
|
CONVERTIBLE BONDS — 2.1% |
|
|
|
|
| |
|
|
|
Delivery Hero AG |
|
|
|
|
| $ |
86,200,000 |
|
|
1.000%, 1/23/2027 |
|
$ |
98,340,331 |
|
| |
1,600,000 |
|
|
1.500%, 1/15/2028 |
|
|
1,756,258 |
|
| |
126,000,000 |
|
|
3.250%, 2/21/2030 |
|
|
143,908,615 |
|
| |
|
|
|
Wayfair, Inc. |
|
|
|
|
| |
4,278,000 |
|
|
1.000%, 8/15/2026 |
|
|
4,258,749 |
|
| |
|
|
|
TOTAL CONVERTIBLE BONDS |
|
|
|
|
| |
|
|
|
(Cost $227,903,055) |
|
|
248,263,953 |
|
| |
|
|
|
CORPORATE BANK DEBT — 0.4% |
|
|
|
|
| |
|
|
|
Cornerstone OnDemand, Inc. |
|
|
|
|
| |
2,487,023 |
|
|
7.683% (1-Month Term SOFR+375 basis points), 10/16/2028(a),(b),(c) |
|
|
2,275,626 |
|
| |
|
|
|
Lealand Finance Company B.V. Senior Exit LC |
|
|
|
|
| |
21,844,968 |
|
|
3.500%, 6/30/2027(a),(b),(c),(d),(e),(f),(g) |
|
|
(5,461,242 |
) |
| |
|
|
|
Lealand Reficar LC Term Loan |
|
|
|
|
| |
602,758 |
|
|
11.433% (3-Month Term SOFR+750 basis points), 6/30/2027(a),(b),(c),(d),(e),(f),(h) |
|
|
530,427 |
|
| |
|
|
|
McDermott LC |
|
|
|
|
| |
26,500,921 |
|
|
8.552% (3-Month Term SOFR+426.16 basis points), 6/30/2027(a),(b),(c),(d),(e),(f) |
|
|
19,875,691 |
|
| |
|
|
|
McDermott Technology Americas, Inc. |
|
|
|
|
| |
1,074,221 |
|
|
6.831% (1-Month Term SOFR+300 basis points), 6/30/2027(a),(b),(c),(d),(f) |
|
|
880,861 |
|
| |
40,595,493 |
|
|
7.831% (1-Month Term SOFR+400 basis points), 12/31/2027(a),(b),(c),(d),(f),(h) |
|
|
31,258,530 |
|
| |
|
|
|
Vision Solutions, Inc. |
|
|
|
|
| |
2,486,598 |
|
|
8.102% (3-Month Term SOFR+400 basis points), 4/24/2028(a),(b),(c) |
|
|
2,296,995 |
|
| |
|
|
|
TOTAL CORPORATE BANK DEBT |
|
|
|
|
| |
|
|
|
(Cost $74,153,380) |
|
|
51,656,888 |
|
| |
|
|
|
CORPORATE BONDS — 1.2% |
|
|
|
|
| |
|
|
|
COMMUNICATIONS — 0.9% |
|
|
|
|
| |
|
|
|
EchoStar Corp. |
|
|
|
|
| |
33,209,948 |
|
|
3.875%, 11/30/2030 |
|
|
110,921,226 |
|
| |
|
|
|
FINANCIALS — 0.3% |
|
|
|
|
| |
|
|
|
Charles Schwab Corp. |
|
|
|
|
| |
18,976,000 |
|
|
4.000% (USD 5 Year Tsy+316.8 basis points)(c),(i) |
|
|
18,811,858 |
|
| |
2,588,000 |
|
|
5.000% (3-Month USD Libor+257.5 basis points)(c),(i) |
|
|
2,532,254 |
|
| |
|
|
|
Vornado Realty LP |
|
|
|
|
| |
8,623,000 |
|
|
2.150%, 6/1/2026 |
|
|
8,515,989 |
|
| |
|
|
|
|
|
|
29,860,101 |
|
| |
|
|
|
TOTAL CORPORATE BONDS |
|
|
|
|
| |
|
|
|
(Cost $57,092,266) |
|
|
140,781,327 |
|
| |
|
|
|
TOTAL BONDS & DEBENTURES |
|
|
|
|
| |
|
|
|
(Cost $359,148,701) |
|
|
440,702,168 |
|
FPA Crescent Fund
SCHEDULE OF INVESTMENTS - Continued
As of December 31, 2025
Number
of Shares |
|
|
|
|
Value |
|
| |
|
|
|
CLOSED-END FUNDS — 0.0% |
|
|
|
|
| |
4,756,180 |
|
|
Altegrity, Inc.(b),(f) |
|
$ |
5,469,607 |
|
| |
|
|
|
TOTAL CLOSED-END FUNDS |
|
|
|
|
| |
|
|
|
(Cost $0) |
|
|
5,469,607 |
|
| |
|
|
|
COMMON STOCKS — 60.4% |
|
|
|
|
| |
|
|
|
AEROSPACE & DEFENSE — 1.6% |
|
|
|
|
| |
544,912 |
|
|
Safran S.A. |
|
|
189,806,381 |
|
| |
|
|
|
APPAREL & TEXTILE PRODUCTS — 0.8% |
|
|
|
|
| |
446,942 |
|
|
Cie Financiere Richemont S.A. - Class A |
|
|
96,383,513 |
|
| |
|
|
|
ASSET MANAGEMENT — 1.0% |
|
|
|
|
| |
344,126 |
|
|
LPL Financial Holdings, Inc. |
|
|
122,911,483 |
|
| |
457,176 |
|
|
Pershing Square Tontine Holdings Ltd.(b),(f) |
|
|
— |
|
| |
|
|
|
|
|
|
122,911,483 |
|
| |
|
|
|
BANKING — 2.7% |
|
|
|
|
| |
2,192,317 |
|
|
Citigroup, Inc. |
|
|
255,821,471 |
|
| |
703,204 |
|
|
Wells Fargo & Co. |
|
|
65,538,613 |
|
| |
|
|
|
|
|
|
321,360,084 |
|
| |
|
|
|
BEVERAGES — 4.4% |
|
|
|
|
| |
3,088,974 |
|
|
Heineken Holding N.V. |
|
|
226,200,821 |
|
| |
5,885,188 |
|
|
JDE Peet's N.V. |
|
|
220,098,700 |
|
| |
926,151 |
|
|
Pernod Ricard S.A. |
|
|
79,304,713 |
|
| |
|
|
|
|
|
|
525,604,234 |
|
| |
|
|
|
BIOTECH & PHARMA — 0.6% |
|
|
|
|
| |
465,134 |
|
|
Merck KGaA |
|
|
66,386,905 |
|
| |
|
|
|
|
|
|
|
|
| |
|
|
|
CABLE & SATELLITE — 2.3% |
|
|
|
|
| |
325,576 |
|
|
Charter Communications, Inc. - Class A* |
|
|
67,963,990 |
|
| |
3,996,138 |
|
|
Comcast Corp. - Class A |
|
|
119,444,565 |
|
| |
1,890,532 |
|
|
Liberty Broadband Corp. - Class C* |
|
|
91,879,855 |
|
| |
|
|
|
|
|
|
279,288,410 |
|
| |
|
|
|
CHEMICALS — 4.6% |
|
|
|
|
| |
16,929,662 |
|
|
Azelis Group N.V.(d) |
|
|
184,966,854 |
|
| |
640,089 |
|
|
IMCD N.V. |
|
|
58,097,348 |
|
| |
3,163,067 |
|
|
International Flavors & Fragrances, Inc. |
|
|
213,159,085 |
|
| |
12,787,300 |
|
|
Nippon Paint Holdings Co., Ltd. |
|
|
85,620,378 |
|
| |
|
|
|
|
|
|
541,843,665 |
|
| |
|
|
|
COMMERCIAL SUPPORT SERVICES — 1.2% |
|
|
|
|
| |
1,637,209 |
|
|
Eurofins Scientific S.E. |
|
|
119,729,254 |
|
| |
562,744 |
|
|
Sodexo S.A. |
|
|
28,833,405 |
|
| |
|
|
|
|
|
|
148,562,659 |
|
| |
|
|
|
CONSTRUCTION MATERIALS — 1.8% |
|
|
|
|
| |
2,429,341 |
|
|
Amrize Ltd.* |
|
|
131,378,761 |
|
FPA Crescent Fund
SCHEDULE OF INVESTMENTS - Continued
As of December 31, 2025
Number
of Shares |
|
|
|
|
Value |
|
| |
|
|
|
COMMON STOCKS (Continued) |
|
|
|
|
| |
|
|
|
CONSTRUCTION MATERIALS (Continued) |
|
|
|
|
| |
826,751 |
|
|
Holcim AG* |
|
$ |
80,484,487 |
|
| |
|
|
|
|
|
|
211,863,248 |
|
| |
|
|
|
E-COMMERCE DISCRETIONARY — 1.7% |
|
|
|
|
| |
875,695 |
|
|
Amazon.com, Inc.* |
|
|
202,127,920 |
|
| |
|
|
|
ELECTRIC UTILITIES — 0.1% |
|
|
|
|
| |
720,710 |
|
|
PG&E Corp. |
|
|
11,581,810 |
|
| |
|
|
|
ELECTRICAL EQUIPMENT — 2.6% |
|
|
|
|
| |
438,300 |
|
|
Hirose Electric Co., Ltd. |
|
|
48,504,257 |
|
| |
1,148,440 |
|
|
TE Connectivity Ltd. |
|
|
261,281,585 |
|
| |
|
|
|
|
|
|
309,785,842 |
|
| |
|
|
|
ENGINEERING & CONSTRUCTION — 1.3% |
|
|
|
|
| |
2,851,885 |
|
|
McDermott International, Ltd.*,(b),(d),(f) |
|
|
42,778,275 |
|
| |
675,846 |
|
|
Samsung C&T Corp. |
|
|
112,253,445 |
|
| |
|
|
|
|
|
|
155,031,720 |
|
| |
|
|
|
ENTERTAINMENT CONTENT — 0.1% |
|
|
|
|
| |
33,130 |
|
|
Epic Games, Inc.(b),(f) |
|
|
12,981,991 |
|
| |
|
|
|
FOOD — 1.1% |
|
|
|
|
| |
1,049,585 |
|
|
Magnum Ice Cream Co. N.V.* |
|
|
16,635,922 |
|
| |
365,104 |
|
|
Magnum Ice Cream Co. N.V.* |
|
|
5,794,716 |
|
| |
3,692,119 |
|
|
Magnum Ice Cream Co. N.V.* |
|
|
59,080,846 |
|
| |
651,117 |
|
|
Orion Corp. |
|
|
47,710,799 |
|
| |
|
|
|
|
|
|
129,222,283 |
|
| |
|
|
|
HEALTH CARE FACILITIES & SVCS — 0.9% |
|
|
|
|
| |
580,243 |
|
|
ICON PLC* |
|
|
105,731,879 |
|
| |
|
|
|
HOME CONSTRUCTION — 0.9% |
|
|
|
|
| |
2,196,279 |
|
|
Fortune Brands Innovations, Inc. |
|
|
109,857,876 |
|
| |
|
|
|
HOUSEHOLD PRODUCTS — 0.1% |
|
|
|
|
| |
1,007,600 |
|
|
Rohto Pharmaceutical Co., Ltd. |
|
|
16,890,772 |
|
| |
83,300 |
|
|
Shiseido Co. Ltd. |
|
|
1,212,258 |
|
| |
|
|
|
|
|
|
18,103,030 |
|
| |
|
|
|
INSTITUTIONAL FINANCIAL SVCS — 1.2% |
|
|
|
|
| |
2,277,248 |
|
|
Jefferies Financial Group, Inc. |
|
|
141,121,059 |
|
| |
|
|
|
INSURANCE — 1.4% |
|
|
|
|
| |
477,746 |
|
|
Aon PLC - Class A |
|
|
168,587,008 |
|
| |
|
|
|
INTERNET MEDIA & SERVICES — 10.2% |
|
|
|
|
| |
1,390,001 |
|
|
Alphabet, Inc. - Class A |
|
|
435,070,313 |
|
| |
769,465 |
|
|
Alphabet, Inc. - Class C |
|
|
241,458,117 |
|
| |
457,981 |
|
|
Meta Platforms, Inc. - Class A |
|
|
302,308,678 |
|
| |
2,882,508 |
|
|
Prosus N.V.* |
|
|
178,485,817 |
|
FPA Crescent Fund
SCHEDULE OF INVESTMENTS - Continued
As of December 31, 2025
Number
of Shares |
|
|
|
|
Value |
|
| |
|
|
|
COMMON STOCKS (Continued) |
|
|
|
|
| |
|
|
|
INTERNET MEDIA & SERVICES (Continued) |
|
|
|
|
| |
602,717 |
|
|
Uber Technologies, Inc.* |
|
$ |
49,248,006 |
|
| |
|
|
|
|
|
|
1,206,570,931 |
|
| |
|
|
|
LEISURE FACILITIES & SERVICES — 1.4% |
|
|
|
|
| |
244,440 |
|
|
Marriott International, Inc. - Class A |
|
|
75,835,066 |
|
| |
672,835 |
|
|
Vail Resorts, Inc. |
|
|
89,352,488 |
|
| |
|
|
|
|
|
|
165,187,554 |
|
| |
|
|
|
MACHINERY — 0.3% |
|
|
|
|
| |
919,020 |
|
|
Hoshizaki Corp. |
|
|
30,611,664 |
|
| |
|
|
|
MEDICAL EQUIPMENT & DEVICES — 3.4% |
|
|
|
|
| |
2,490,982 |
|
|
Avantor, Inc.* |
|
|
28,546,654 |
|
| |
1,180,043 |
|
|
Becton, Dickinson and Co. |
|
|
229,010,945 |
|
| |
243,903 |
|
|
Bio-Rad Laboratories, Inc.* |
|
|
73,900,170 |
|
| |
134,470 |
|
|
Thermo Fisher Scientific, Inc. |
|
|
77,918,641 |
|
| |
|
|
|
|
|
|
409,376,410 |
|
| |
|
|
|
METALS & MINING — 1.7% |
|
|
|
|
| |
26,947,501 |
|
|
Glencore PLC* |
|
|
147,305,014 |
|
| |
5,233,690 |
|
|
Grupo Mexico S.A.B. de C.V. |
|
|
49,417,427 |
|
| |
|
|
|
|
|
|
196,722,441 |
|
| |
|
|
|
OIL & GAS PRODUCERS — 0.8% |
|
|
|
|
| |
111,713 |
|
|
Gulfport Energy Corp.* |
|
|
23,235,187 |
|
| |
2,488,164 |
|
|
Kinder Morgan, Inc. |
|
|
68,399,628 |
|
| |
|
|
|
|
|
|
91,634,815 |
|
| |
|
|
|
OIL & GAS SERVICES & EQUIP — 0.7% |
|
|
|
|
| |
5,037,287 |
|
|
NOV, Inc. |
|
|
78,732,796 |
|
| |
|
|
|
REAL ESTATE OWNERS & DEVELOPERS — 0.1% |
|
|
|
|
| |
2,098,628 |
|
|
Swire Pacific Ltd. - Class A |
|
|
16,917,783 |
|
| |
|
|
|
REIT — 0.9% |
|
|
|
|
| |
5,119,454 |
|
|
Douglas Emmett, Inc. |
|
|
56,262,800 |
|
| |
1,448,615 |
|
|
Vornado Realty Trust |
|
|
48,209,907 |
|
| |
|
|
|
|
|
|
104,472,707 |
|
| |
|
|
|
RETAIL - DISCRETIONARY — 1.7% |
|
|
|
|
| |
1,836,295 |
|
|
CarMax, Inc.* |
|
|
70,954,439 |
|
| |
576,928 |
|
|
Ferguson Enterprises, Inc. |
|
|
128,441,480 |
|
| |
|
|
|
|
|
|
199,395,919 |
|
| |
|
|
|
SEMICONDUCTORS — 3.9% |
|
|
|
|
| |
1,260,676 |
|
|
Analog Devices, Inc. |
|
|
341,895,331 |
|
| |
51,455 |
|
|
Broadcom, Inc. |
|
|
17,808,575 |
|
| |
482,460 |
|
|
NXP Semiconductors N.V. |
|
|
104,722,768 |
|
| |
|
|
|
|
|
|
464,426,674 |
|
FPA Crescent Fund
SCHEDULE OF INVESTMENTS - Continued
As of December 31, 2025
Number
of Shares |
|
|
|
|
Value |
|
| |
|
|
|
COMMON STOCKS (Continued) |
|
|
|
|
| |
|
|
|
TECHNOLOGY HARDWARE — 1.5% |
|
|
|
|
| |
382,985 |
|
|
Dell Technologies, Inc. - Class C |
|
$ |
48,210,152 |
|
| |
1,660,761 |
|
|
NCR Atleos Corp.* |
|
|
63,291,601 |
|
| |
3,636,184 |
|
|
NCR Voyix Corp.* |
|
|
37,089,077 |
|
| |
455,180 |
|
|
Nintendo Co., Ltd. |
|
|
30,731,281 |
|
| |
|
|
|
|
|
|
179,322,111 |
|
| |
|
|
|
TECHNOLOGY SERVICES — 0.7% |
|
|
|
|
| |
1,442,197 |
|
|
LG Corp. |
|
|
80,802,712 |
|
| |
|
|
|
|
|
|
|
|
| |
|
|
|
TELECOMMUNICATIONS — 0.2% |
|
|
|
|
| |
170,053 |
|
|
EchoStar Corp. - Class A* |
|
|
18,484,761 |
|
| |
|
|
|
|
|
|
|
|
| |
|
|
|
TRANSPORTATION EQUIPMENT — 0.5% |
|
|
|
|
| |
281,311 |
|
|
Westinghouse Air Brake Technologies Corp. |
|
|
60,045,833 |
|
| |
|
|
|
TOTAL COMMON STOCKS |
|
|
|
|
| |
|
|
|
(Cost $4,193,259,746) |
|
|
7,170,848,111 |
|
| |
|
|
|
LIMITED PARTNERSHIPS — 1.8% |
|
|
|
|
| |
150,000 |
|
|
Footpath Ventures SPV IV LP(b),(f) |
|
|
23,758,344 |
|
| |
2,073,734 |
|
|
FPS Holdco LLC(b),(d),(f) |
|
|
154,474,796 |
|
| |
107,799 |
|
|
FPS Shelby Holdco I LLC(b),(d),(f) |
|
|
10,276,468 |
|
| |
22,500,000 |
|
|
Jett Texas LLC(b),(j) |
|
|
23,960,250 |
|
| |
1,146,250 |
|
|
Sound Holding FP(b),(d),(f) |
|
|
— |
|
| |
120,000 |
|
|
U.S. Farming Realty Trust II LP(b),(d),(f) |
|
|
479,299 |
|
| |
|
|
|
TOTAL LIMITED PARTNERSHIPS |
|
|
|
|
| |
|
|
|
(Cost $98,805,380) |
|
|
212,949,157 |
|
| |
|
|
|
WARRANTS — 0.0% |
|
|
|
|
| |
414,327 |
|
|
Electriq Power Holdings, Inc., Expiration Date: July 31, 2028*,(f) |
|
|
— |
|
| |
316,054 |
|
|
MariaDB PLC, Expiration Date: December 16, 2027*,(f) |
|
|
— |
|
| |
77,074 |
|
|
Ross Acquisition Corp. II, Expiration Date: February 12, 2026*,(f) |
|
|
— |
|
| |
|
|
|
TOTAL WARRANTS |
|
|
|
|
| |
|
|
|
(Cost $230,012) |
|
|
— |
|
| |
|
|
|
SHORT-TERM INVESTMENTS — 33.9% |
|
|
|
|
| |
|
|
|
MONEY MARKET INVESTMENTS — 0.2% |
|
|
|
|
| |
28,535,016 |
|
|
Morgan Stanley Institutional Liquidity Treasury Portfolio - Institutional Class, 3.64%(k) |
|
|
28,535,016 |
|
Principal
Amount |
|
|
|
|
|
|
| |
|
|
|
COMMERCIAL PAPER — 18.7% |
|
|
|
|
| $ |
70,350,000 |
|
|
Chevron Corp., 3.67%, 6/2/2026 |
|
|
69,259,888 |
|
| |
150,000,000 |
|
|
Cisco Systems, Inc., 3.86%, 3/20/2026 |
|
|
148,745,500 |
|
| |
|
|
|
Exxon Mobil Corp. |
|
|
|
|
| |
85,000,000 |
|
|
3.63%, 1/5/2026 |
|
|
84,965,717 |
|
| |
160,000,000 |
|
|
3.62%, 1/6/2026 |
|
|
159,919,555 |
|
| |
108,000,000 |
|
|
3.80%, 1/21/2026 |
|
|
107,772,000 |
|
FPA Crescent Fund
SCHEDULE OF INVESTMENTS - Continued
As of December 31, 2025
Principal
Amount |
|
|
|
|
Value |
|
| |
|
|
|
COMMERCIAL PAPER (Continued) |
|
|
|
|
| $ |
123,000,000 |
|
|
3.72%, 1/23/2026 |
|
$ |
122,720,380 |
|
| |
79,000,000 |
|
|
3.68%, 2/2/2026 |
|
|
78,740,516 |
|
| |
100,000,000 |
|
|
3.84%, 2/4/2026 |
|
|
99,637,333 |
|
| |
131,000,000 |
|
|
3.75%, 2/5/2026 |
|
|
130,522,396 |
|
| |
115,000,000 |
|
|
3.84%, 2/6/2026 |
|
|
114,558,400 |
|
| |
91,000,000 |
|
|
3.62%, 2/13/2026 |
|
|
90,605,929 |
|
| |
|
|
|
Johnson & Johnson Co. |
|
|
|
|
| |
35,000,000 |
|
|
3.87%, 1/5/2026 |
|
|
34,984,950 |
|
| |
139,000,000 |
|
|
3.81%, 1/15/2026 |
|
|
138,794,048 |
|
| |
51,000,000 |
|
|
3.85%, 1/16/2026 |
|
|
50,918,187 |
|
| |
132,000,000 |
|
|
3.80%, 2/3/2026 |
|
|
131,540,200 |
|
| |
80,000,000 |
|
|
Nestle Capital, 4.23%, 1/7/2026 |
|
|
79,951,733 |
|
| |
77,000,000 |
|
|
Nestle Finance International Ltd., 3.62%, 1/9/2026 |
|
|
76,927,620 |
|
| |
|
|
|
Pepsico, Inc. |
|
|
|
|
| |
124,000,000 |
|
|
3.84%, 1/22/2026 |
|
|
123,722,240 |
|
| |
100,000,000 |
|
|
3.71%, 2/11/2026 |
|
|
99,577,472 |
|
| |
95,000,000 |
|
|
3.63%, 3/9/2026 |
|
|
94,358,196 |
|
| |
10,000,000 |
|
|
TotalEnergies Capital S.A., 4.00%, 2/9/2026 |
|
|
9,956,667 |
|
| |
|
|
|
Walmart Stores, Inc. |
|
|
|
|
| |
72,000,000 |
|
|
3.64%, 1/21/2026 |
|
|
71,854,400 |
|
| |
100,000,000 |
|
|
3.64%, 1/22/2026 |
|
|
99,787,667 |
|
| |
|
|
|
|
|
|
2,219,820,994 |
|
| |
|
|
|
TREASURY BILLS — 15.0% |
|
|
|
|
| |
|
|
|
U.S. Treasury Bill |
|
|
|
|
| |
61,000,000 |
|
|
3.87%, 1/6/2026(l) |
|
|
60,967,700 |
|
| |
32,000,000 |
|
|
3.66%, 1/8/2026(l) |
|
|
31,976,639 |
|
| |
51,000,000 |
|
|
3.84%, 1/13/2026(l) |
|
|
50,935,772 |
|
| |
86,000,000 |
|
|
3.88%, 1/20/2026(l) |
|
|
85,826,728 |
|
| |
74,000,000 |
|
|
3.82%, 1/27/2026(l) |
|
|
73,799,153 |
|
| |
89,000,000 |
|
|
3.52%, 1/29/2026(l) |
|
|
88,739,717 |
|
| |
131,000,000 |
|
|
3.76%, 2/5/2026(l) |
|
|
130,529,639 |
|
| |
93,000,000 |
|
|
3.82%, 2/10/2026(l) |
|
|
92,612,583 |
|
| |
100,000,000 |
|
|
3.80%, 2/12/2026(l) |
|
|
99,564,250 |
|
| |
139,000,000 |
|
|
3.82%, 2/17/2026(l) |
|
|
138,319,298 |
|
| |
129,000,000 |
|
|
3.83%, 2/19/2026(l) |
|
|
128,339,824 |
|
| |
99,000,000 |
|
|
3.79%, 2/24/2026(l) |
|
|
98,448,322 |
|
| |
112,000,000 |
|
|
3.77%, 2/26/2026(l) |
|
|
111,355,378 |
|
| |
140,000,000 |
|
|
3.72%, 3/3/2026(l) |
|
|
139,175,134 |
|
| |
100,000,000 |
|
|
3.75%, 3/5/2026(l) |
|
|
99,392,070 |
|
| |
101,000,000 |
|
|
3.68%, 3/10/2026(l) |
|
|
100,350,954 |
|
| |
101,000,000 |
|
|
3.59%, 3/12/2026(l) |
|
|
100,318,533 |
|
| |
78,000,000 |
|
|
3.60%, 3/17/2026(l) |
|
|
77,443,485 |
|
FPA Crescent Fund
SCHEDULE OF INVESTMENTS - Continued
As of December 31, 2025
Principal
Amount |
|
|
|
|
Value |
|
| |
|
|
|
TREASURY BILLS (Continued) |
|
|
|
|
| $ |
76,000,000 |
|
|
3.57%, 3/19/2026(l) |
|
$ |
75,436,848 |
|
| |
|
|
|
|
|
|
1,783,532,027 |
|
| |
|
|
|
TOTAL SHORT-TERM INVESTMENTS |
|
|
|
|
| |
|
|
|
(Cost $4,031,742,817) |
|
|
4,031,888,037 |
|
| |
|
|
|
|
|
|
|
|
| |
|
|
|
TOTAL INVESTMENTS — 99.8% |
|
|
|
|
| |
|
|
|
(Cost $8,683,186,656) |
|
|
11,861,857,080 |
|
| |
|
|
|
Other Assets in Excess of Liabilities — 0.2% |
|
|
20,058,405 |
|
| |
|
|
|
TOTAL NET ASSETS — 100.0% |
|
$ |
11,881,915,485 |
|
Number
of Shares |
|
|
|
|
|
|
| |
|
|
|
SECURITIES SOLD SHORT — (0.2)% |
|
|
|
|
| |
|
|
|
EXCHANGE-TRADED FUNDS — (0.2)% |
|
|
|
|
| |
(12,968 |
) |
|
Vanguard Growth ETF |
|
|
(6,326,568 |
) |
| |
(28,642 |
) |
|
Vanguard S&P 500 Growth ETF |
|
|
(12,733,947 |
) |
| |
|
|
|
TOTAL EXCHANGE-TRADED FUNDS |
|
|
|
|
| |
|
|
|
(Proceeds $19,264,975) |
|
|
(19,060,515 |
) |
| |
|
|
|
|
|
|
|
|
| |
|
|
|
TOTAL SECURITIES SOLD SHORT |
|
|
|
|
| |
|
|
|
(Proceeds $19,264,975) |
|
$ |
(19,060,515 |
) |
ETF – Exchange-Traded Fund
LLC – Limited Liability Company
LP – Limited Partnership
PLC – Public Limited Company
REIT – Real Estate Investment Trust
|
| * |
Non-income producing security. |
|
| (a) |
Bank loans generally pay interest at
rates which are periodically determined by reference to a base lending rate plus a premium. All loans carry a variable rate of interest.
These base lending rates are generally (i) the Prime Rate offered by one or more major United States banks, (ii) the lending rate offered
by one or more European banks such as the London Interbank Offered Rate (“LIBOR”), (iii) the Certificate of Deposit rate,
or (iv) Secured Overnight Financing Rate (“SOFR”). Bank Loans, while exempt from registration, under the Securities Act of
1933, contain certain restrictions on resale and cannot be sold publicly. Floating rate bank loans often require prepayments from excess
cash flow or permit the borrower to repay at its election. The degree to which borrowers repay, whether as a contractual requirement or
at their election, cannot be predicted with accuracy. |
|
| (b) |
Restricted securities. These restricted
securities, most of which are considered liquid by the Adviser, are not registered and may not be sold to the public. There are legal
and/or contractual restrictions on resale. The Fund does not have the right to demand that such securities be registered. The values of
these securities are determined by valuations provided by pricing services, brokers, dealers, market makers, or in good faith under policies
adopted by authority of the Fund's Board of Trustees. The total value of these securities is $325,835,918, which represents 2.74% of Total
Net Assets. |
|
| (c) |
Variable or floating rate security. |
FPA Crescent Fund
SCHEDULE OF INVESTMENTS - Continued
As of December 31, 2025
|
| (e) |
As of December 31, 2025, the Fund had entered into commitments to fund various
delayed draw debt-related investments. Such commitments are subject to the satisfaction of certain conditions set forth in the documents
governing those investments and there can be no assurance that such conditions will be satisfied. See Note 10 of the Notes to Financial
Statements for further information on these commitments and contingencies. |
|
| (f) |
The value of these securities was determined using significant unobservable inputs.
These are reported as Level 3 securities in the Fair Value Hierarchy. |
|
| (g) |
All or a portion of the loan is unfunded. |
|
| (h) |
Payment-in-kind interest is generally paid by issuing additional par/shares of
the security rather than paying cash. |
|
| (i) |
Perpetual security. Maturity date is not applicable. |
|
| (j) |
Investment valued using net asset value per share (or its equivalent) as a practical
expedient. |
|
| (k) |
The rate is the annualized seven-day yield at period end. |
|
| (l) |
Treasury bill discount rate. |
See accompanying Notes to Financial Statements.
FPA Crescent Fund
SCHEDULE OF INVESTMENTS - Continued
As of December 31, 2025
Total Return Swaps
| Receive |
|
Pay |
|
Payment
Frequency |
|
Counterparty |
|
Expiration
Date |
|
Notional Amount |
|
|
Value |
|
|
Upfront Premiums
Paid(Received) |
|
|
Unrealized
Appreciation
(Depreciation) |
|
| Green Thumb Industries, Inc. |
|
OBFR + 1.500% |
|
Annual |
|
Nomura Securities International, Inc. |
|
8/17/2026 |
|
$ |
17,447,488 |
|
|
$ |
(781,827 |
) |
|
|
— |
|
|
$ |
(781,827 |
) |
| |
|
|
|
|
|
|
|
|
|
|
|
|
|
$ |
(781,827 |
) |
|
|
— |
|
|
$ |
(781,827 |
) |
FPA Crescent Fund
STATEMENT OF ASSETS AND LIABILITIES
As of December 31, 2025
| Assets: |
|
|
|
| Investments, at value (cost $8,306,525,337) |
|
$ |
11,421,797,121 |
|
| Investments in affiliates, at value (cost $376,661,319) |
|
|
440,059,959 |
|
| Cash |
|
|
30,825 |
|
| Deposits held at broker |
|
|
29,892,705 |
|
| Receivables: |
|
|
|
|
| Investment securities sold |
|
|
10,432,534 |
|
| Fund shares sold |
|
|
12,002,276 |
|
| Dividends and interest |
|
|
9,839,357 |
|
| Reclaims receivable |
|
|
9,421,834 |
|
| Prepaid expenses |
|
|
48,065 |
|
| Total assets |
|
|
11,933,524,676 |
|
| |
|
|
|
|
| Liabilities: |
|
|
|
|
| Securities sold short, at value (proceeds $19,264,975) |
|
|
19,060,515 |
|
| Payables: |
|
|
|
|
| Investment securities purchased |
|
|
11,712,103 |
|
| Fund shares redeemed |
|
|
4,128,815 |
|
| Unrealized depreciation on open swap contracts |
|
|
781,827 |
|
| Advisory fees |
|
|
8,984,888 |
|
| Shareholder servicing fees (Note 8) |
|
|
1,021,016 |
|
| Fund services fees |
|
|
340,003 |
|
| Administrative service fees (Note 3) |
|
|
489,754 |
|
| Redemption liquidity service |
|
|
4,878,971 |
|
| Shareholder reporting fees |
|
|
70,675 |
|
| Trustees' deferred compensation (Note 3) |
|
|
49,136 |
|
| Auditing fees |
|
|
17,000 |
|
| Trustees' fees and expenses |
|
|
12,698 |
|
| Legal fees |
|
|
4,254 |
|
| Chief Compliance Officer fees |
|
|
2,804 |
|
| Accrued other expenses |
|
|
54,732 |
|
| Total liabilities |
|
|
51,609,191 |
|
| Commitments and contingencies (Note 10) |
|
|
|
|
| Net Assets |
|
$ |
11,881,915,485 |
|
| |
|
|
|
|
| Components of Net Assets: |
|
|
|
|
| Capital Stock (no par value with an unlimited number of shares authorized) |
|
$ |
8,823,525,708 |
|
| Total distributable earnings (accumulated deficit) |
|
|
3,058,389,777 |
|
| Net Assets |
|
$ |
11,881,915,485 |
|
| |
|
|
|
|
| Maximum Offering Price per Share: |
|
|
|
|
| Investor Class Shares: |
|
|
|
|
| Net assets applicable to shares outstanding |
|
$ |
27,936,916 |
|
| Shares of beneficial interest issued and outstanding |
|
|
648,317 |
|
| Redemption price per share |
|
$ |
43.09 |
|
| |
|
|
|
|
| Institutional Class Shares: |
|
|
|
|
| Net assets applicable to shares outstanding |
|
$ |
7,558,759,683 |
|
| Shares of beneficial interest issued and outstanding |
|
|
175,396,522 |
|
| Redemption price per share |
|
$ |
43.10 |
|
| |
|
|
|
|
| Supra Institutional Class Shares: |
|
|
|
|
| Net assets applicable to shares outstanding |
|
$ |
4,295,218,886 |
|
| Shares of beneficial interest issued and outstanding |
|
|
99,531,529 |
|
| Redemption price per share |
|
$ |
43.15 |
|
See accompanying Notes to Financial Statements.
FPA Crescent Fund
STATEMENT OF OPERATIONS
For the Year Ended December 31, 2025
| Investment income: |
|
|
|
| Interest (net of foreign withholding taxes of $146,094) |
|
$ |
194,545,081 |
|
| Dividends (net of foreign withholding taxes of $5,086,693) |
|
|
104,166,400 |
|
| Dividends from affiliated issuers |
|
|
33,264,754 |
|
| Interest from affiliated issuers |
|
|
7,040,066 |
|
| Total investment income |
|
|
339,016,301 |
|
| |
|
|
|
|
| Expenses: |
|
|
|
|
| Advisory fees |
|
|
103,595,446 |
|
| Shareholder servicing fees - Investor Class (Note 8) |
|
|
44,660 |
|
| Shareholder servicing fees - Institutional Class (Note 8) |
|
|
4,471,639 |
|
| Shareholder servicing fees - Supra Institutional Class (Note 8) |
|
|
3,119,222 |
|
| Fund services fees |
|
|
1,622,361 |
|
| Administrative service fees - Investor Class (Note 3) |
|
|
12,546 |
|
| Administrative service fees - Institutional Class (Note 3) |
|
|
5,023,429 |
|
| Administrative service fees - Supra Institutional Class (Note 3) |
|
|
394,504 |
|
| Redemption liquidity service |
|
|
337,954 |
|
| Registration fees |
|
|
227,327 |
|
| Shareholder reporting fees |
|
|
225,955 |
|
| Trustees' fees and expenses |
|
|
192,411 |
|
| Dividends on securities sold short |
|
|
172,598 |
|
| Legal fees |
|
|
95,033 |
|
| Insurance fees |
|
|
64,745 |
|
| Miscellaneous |
|
|
34,527 |
|
| Chief Compliance Officer fees |
|
|
21,342 |
|
| Auditing fees |
|
|
19,659 |
|
| Interest expense |
|
|
17,727 |
|
| Total expenses |
|
|
119,693,085 |
|
| Advisory fees waived and shareholder servicing fees reimbursed (Note
3 and 8) |
|
|
(4,551,313 |
) |
| Net expenses |
|
|
115,141,772 |
|
| Net investment income (loss) |
|
|
223,874,529 |
|
| |
|
|
|
|
| Realized and Unrealized Gain (Loss): |
|
|
|
|
| Net realized gain (loss) on: |
|
|
|
|
| Investments |
|
|
663,620,699 |
|
| Investments in affiliated issuers |
|
|
80,949,534 |
|
| In-kind redemptions |
|
|
500,904,170 |
|
| Securities sold short |
|
|
(1,522,926 |
) |
| Swap contracts |
|
|
(15,218,378 |
) |
| Foreign currency transactions |
|
|
85,735 |
|
| Total realized gain (loss) |
|
|
1,228,818,834 |
|
| Net change in unrealized appreciation (depreciation) on: |
|
|
|
|
| Investments |
|
|
340,986,140 |
|
| Investments in affiliated issuers |
|
|
14,551,156 |
|
| Securities sold short |
|
|
18,309 |
|
| Swap contracts |
|
|
13,760,053 |
|
| Foreign currency translations |
|
|
1,083,848 |
|
| Net change in unrealized appreciation (depreciation) |
|
|
370,399,506 |
|
| Net realized and unrealized gain (loss) |
|
|
1,599,218,340 |
|
| |
|
|
|
|
| Net Increase (Decrease) in Net Assets from Operations |
|
$ |
1,823,092,869 |
|
See accompanying Notes to Financial Statements.
FPA Crescent Fund
STATEMENTS OF CHANGES IN NET ASSETS
| |
|
For the |
|
|
For the |
|
| |
|
Year Ended |
|
|
Year Ended |
|
| |
|
December 31, 2025 |
|
|
December 31, 2024 |
|
| Increase (Decrease) in Net Assets from: |
|
|
|
|
|
|
|
|
| Operations: |
|
|
|
|
|
|
|
|
| Net investment income (loss) |
|
$ |
223,874,529 |
|
|
$ |
237,658,006 |
|
| Total realized gain (loss) on investments, Investments in affiliated
issuers - realized, securities sold short, Swap contracts - realized and foreign currency transactions |
|
|
1,228,818,834 |
|
|
|
696,085,008 |
|
| Net change in unrealized appreciation (depreciation)
on investments, Investments in affiliated issuers - unrealized, securities sold short, Swap contracts - unrealized and foreign currency
translations |
|
|
370,399,506 |
|
|
|
408,330,369 |
|
| Net increase (decrease) in net
assets resulting from operations |
|
|
1,823,092,869 |
|
|
|
1,342,073,383 |
|
| |
|
|
|
|
|
|
|
|
| Distributions to Shareholders: |
|
|
|
|
|
|
|
|
| Distributions: |
|
|
|
|
|
|
|
|
| Investor Class |
|
|
(2,382,760 |
) |
|
|
(362,286 |
)1 |
| Institutional Class |
|
|
(681,547,405 |
) |
|
|
(613,259,813 |
) |
| Supra Institutional Class |
|
|
(387,112,291 |
) |
|
|
(317,440,683 |
) |
| Total distributions to shareholders |
|
|
(1,071,042,456 |
) |
|
|
(931,062,782 |
) |
| |
|
|
|
|
|
|
|
|
| Capital Transactions: |
|
|
|
|
|
|
|
|
| Net proceeds from shares sold: |
|
|
|
|
|
|
|
|
| Investor Class |
|
|
25,936,607 |
|
|
|
7,231,016 |
1 |
| Institutional Class |
|
|
837,884,203 |
|
|
|
720,419,100 |
|
| Supra Institutional Class |
|
|
1,210,206,676 |
|
|
|
1,099,107,496 |
|
| Reinvestment of distributions: |
|
|
|
|
|
|
|
|
| Investor Class |
|
|
2,382,760 |
|
|
|
362,286 |
1 |
| Institutional Class |
|
|
562,908,557 |
|
|
|
510,800,548 |
|
| Supra Institutional Class |
|
|
322,178,238 |
|
|
|
285,821,922 |
|
| Cost of shares redeemed: |
|
|
|
|
|
|
|
|
| Investor Class |
|
|
(7,266,796 |
) |
|
|
(1,080,782 |
)1 |
| Institutional Class |
|
|
(1,221,070,001 |
) |
|
|
(1,633,167,326 |
) |
| Supra Institutional Class |
|
|
(1,097,102,878 |
) |
|
|
(609,534,340 |
) |
| Net increase (decrease) in net assets from capital
transactions |
|
|
636,057,366 |
|
|
|
379,959,920 |
|
| |
|
|
|
|
|
|
|
|
| Total increase (decrease) in net assets |
|
|
1,388,107,779 |
|
|
|
790,970,521 |
|
| |
|
|
|
|
|
|
|
|
| Net Assets: |
|
|
|
|
|
|
|
|
| Beginning of period |
|
|
10,493,807,706 |
|
|
|
9,702,837,185 |
|
| End of period |
|
$ |
11,881,915,485 |
|
|
$ |
10,493,807,706 |
|
| |
|
|
|
|
|
|
|
|
| Capital Share Transactions: |
|
|
|
|
|
|
|
|
| Shares sold: |
|
|
|
|
|
|
|
|
| Investor Class |
|
|
609,414 |
|
|
|
169,840 |
1 |
| Institutional Class |
|
|
19,543,040 |
|
|
|
17,713,291 |
|
| Supra Institutional Class |
|
|
27,885,011 |
|
|
|
27,222,535 |
|
| Shares reinvested: |
|
|
|
|
|
|
|
|
| Investor Class |
|
|
55,512 |
|
|
|
9,075 |
1 |
| Institutional Class |
|
|
13,113,465 |
|
|
|
12,722,319 |
|
| Supra Institutional Class |
|
|
7,496,674 |
|
|
|
7,112,264 |
|
| Shares redeemed: |
|
|
|
|
|
|
|
|
| Investor Class |
|
|
(169,833 |
) |
|
|
(25,691 |
)1 |
| Institutional Class |
|
|
(28,806,343 |
) |
|
|
(40,319,922 |
) |
| Supra Institutional Class |
|
|
(25,067,133 |
) |
|
|
(14,805,338 |
) |
| Net increase (decrease) in capital share transactions |
|
|
14,659,807 |
|
|
|
9,798,373 |
|
|
| 1 |
The Investor Class commenced operations on April 30, 2024. The data shown reflects operations for the period
April 30, 2024 to December 31, 2024. |
See accompanying Notes to Financial Statements.
FPA Crescent Fund
FINANCIAL HIGHLIGHTS
Investor Class
Per share operating performance.
For a capital share outstanding throughout each period.
| |
|
For the |
|
|
For the |
|
| |
|
Year Ended |
|
|
Period Ended |
|
| |
|
December 31, |
|
|
December 31, |
|
| |
|
2025 |
|
|
20241 |
|
| Net asset value, beginning of period |
|
$ |
40.19 |
|
|
$ |
40.13 |
|
| Income from Investment Operations: |
|
|
|
|
|
|
|
|
| Net investment income (loss)2 |
|
|
0.82 |
|
|
|
0.71 |
|
| Net realized and unrealized gain |
|
|
6.17 |
|
|
|
3.11 |
|
| Total from investment operations |
|
|
6.99 |
|
|
|
3.82 |
|
| |
|
|
|
|
|
|
|
|
| Less Distributions: |
|
|
|
|
|
|
|
|
| From net investment income |
|
|
(1.11 |
) |
|
|
(1.27 |
) |
| From net realized gain |
|
|
(2.98 |
) |
|
|
(2.49 |
) |
| Total distributions |
|
|
(4.09 |
) |
|
|
(3.76 |
) |
| Net asset value, end of period |
|
$ |
43.09 |
|
|
$ |
40.19 |
|
| |
|
|
|
|
|
|
|
|
| Total return3 |
|
|
17.52 |
% |
|
|
9.71 |
%4 |
| |
|
|
|
|
|
|
|
|
| Ratios and Supplemental Data: |
|
|
|
|
|
|
|
|
| Net assets, end of period (in thousands) |
|
$ |
27,937 |
|
|
$ |
6,159 |
|
| |
|
|
|
|
|
|
|
|
| Ratio of expenses to average net assets: |
|
|
|
|
|
|
|
|
| Before fees waived and expenses absorbed |
|
|
1.28 |
%5 |
|
|
1.28 |
%5,6 |
| After fees waived and expenses absorbed |
|
|
1.15 |
%5 |
|
|
1.16 |
%5,6 |
| Ratio of net investment income (loss) to average net assets: |
|
|
|
|
|
|
|
|
| Before fees waived and expenses absorbed |
|
|
1.76 |
% |
|
|
2.38 |
%6 |
| After fees waived and expenses absorbed |
|
|
1.89 |
% |
|
|
2.50 |
%6 |
| |
|
|
|
|
|
|
|
|
| Portfolio turnover rate |
|
|
23 |
% |
|
|
10 |
%6 |
|
| 1 |
The Investor Class commenced operations on April 30, 2024. The data shown reflects
operations for the period April 30, 2024 to December 31, 2024. |
|
| 2 |
Based on average shares outstanding for the period. |
|
| 3 |
Return is based on net asset value per share, adjusted for reinvestment of distributions, and does not reflect
deduction of the sales charge. |
|
| 5 |
Includes short sale dividend, tax, and interest expenses that rounds to less than 0.01% of average net assets. |
See accompanying Notes to Financial Statements.
FPA Crescent Fund
FINANCIAL HIGHLIGHTS
Institutional Class
Per share operating performance.
For a capital share outstanding throughout each period.
| |
|
For the
Year Ended
December 31, |
|
| |
|
2025 |
|
|
2024 |
|
|
2023 |
|
|
20221 |
|
|
20211 |
|
| Net asset value, beginning of period |
|
$ |
40.20 |
|
|
$ |
38.63 |
|
|
$ |
33.34 |
|
|
$ |
37.01 |
|
|
$ |
35.97 |
|
| Income from Investment Operations: |
|
|
|
|
|
|
|
|
|
|
|
|
|
|
|
|
|
|
|
|
| Net investment income (loss)2 |
|
|
0.85 |
|
|
|
0.94 |
|
|
|
0.70 |
|
|
|
0.17 |
|
|
|
- |
3 |
| Net realized and unrealized gain (loss) |
|
|
6.19 |
|
|
|
4.37 |
|
|
|
6.03 |
|
|
|
(3.58 |
) |
|
|
5.34 |
|
| Total from investment operations |
|
|
7.04 |
|
|
|
5.31 |
|
|
|
6.73 |
|
|
|
(3.41 |
) |
|
|
5.34 |
|
| |
|
|
|
|
|
|
|
|
|
|
|
|
|
|
|
|
|
|
|
|
| Less Distributions: |
|
|
|
|
|
|
|
|
|
|
|
|
|
|
|
| From net investment income |
|
|
(1.16 |
) |
|
|
(1.25 |
) |
|
|
(0.05 |
) |
|
|
(0.02 |
) |
|
|
(0.29 |
) |
| From net realized gain |
|
|
(2.98 |
) |
|
|
(2.49 |
) |
|
|
(1.39 |
) |
|
|
(0.24 |
) |
|
|
(4.01 |
) |
| Total distributions |
|
|
(4.14 |
) |
|
|
(3.74 |
) |
|
|
(1.44 |
) |
|
|
(0.26 |
) |
|
|
(4.30 |
) |
| |
|
|
|
|
|
|
|
|
|
|
|
|
|
|
|
|
|
|
|
|
| Redemption fee proceeds |
|
|
- |
|
|
|
- |
3 |
|
|
- |
3 |
|
|
- |
3 |
|
|
- |
3 |
| Net asset value, end of period |
|
$ |
43.10 |
|
|
$ |
40.20 |
|
|
$ |
38.63 |
|
|
$ |
33.34 |
|
|
$ |
37.01 |
|
| |
|
|
|
|
|
|
|
|
|
|
|
|
|
|
|
|
|
|
|
|
| Total return4 |
|
|
17.65 |
% |
|
|
13.96 |
% |
|
|
20.27 |
% |
|
|
(9.20 |
)% |
|
|
15.17 |
% |
| |
|
|
|
|
|
|
|
|
|
|
|
|
|
|
|
|
|
|
|
|
| Ratios and Supplemental Data: |
|
|
|
|
|
|
|
|
|
|
|
|
|
|
|
|
|
|
|
|
| Net assets, end of period (in thousands) |
|
$ |
7,558,760 |
|
|
$ |
6,896,876 |
|
|
$ |
7,009,178 |
|
|
$ |
6,301,530 |
|
|
$ |
8,394,402 |
|
| |
|
|
|
|
|
|
|
|
|
|
|
|
|
|
|
|
|
|
|
|
| Ratio of expenses to average net assets: |
|
|
|
|
|
|
|
|
|
|
|
|
|
|
|
|
|
|
|
|
| Before fees waived and expenses absorbed |
|
|
1.09 |
%5 |
|
|
1.07 |
%5 |
|
|
1.08 |
% |
|
|
1.09 |
%6 |
|
|
1.17 |
%7 |
| After fees waived and expenses absorbed |
|
|
1.05 |
%5 |
|
|
1.06 |
%5 |
|
|
1.05 |
% |
|
|
1.06 |
%6 |
|
|
1.14 |
%7 |
| Ratio of net investment income (loss) to average net assets: |
|
|
|
|
|
|
|
|
|
|
|
|
|
|
|
|
|
|
|
|
| Before fees waived and expenses absorbed |
|
|
1.95 |
% |
|
|
2.26 |
% |
|
|
1.89 |
% |
|
|
0.46 |
% |
|
|
(0.03 |
)% |
| After fees waived and expenses absorbed |
|
|
1.99 |
% |
|
|
2.27 |
% |
|
|
1.92 |
% |
|
|
0.50 |
% |
|
|
0.01 |
% |
| Portfolio turnover rate |
|
|
23 |
% |
|
|
10 |
% |
|
|
14 |
% |
|
|
20 |
% |
|
|
20 |
% |
|
| 1 |
Audits performed for the fiscal years indicated by the Fund's previous auditor, Ernst & Young LLP. |
|
| 2 |
Based on average shares outstanding for the period. |
|
| 3 |
Amount represents less than $0.01 per share. |
|
| 4 |
Return is based on net asset value per share, adjusted for reinvestment of distributions, and does not reflect
deduction of the sales charge. |
|
| 5 |
Includes short sale dividend, tax, and interest expenses that rounds to less than 0.01% of average net assets. |
|
| 6 |
For the year ended December 31, 2022, the expense ratio includes short sale dividend expense that rounds to
less than 0.01% of average net assets. |
|
| 7 |
For the year ended December 31, 2021, the expense ratio includes short sale dividend expense equal to 0.09%
of average net assets. |
See accompanying Notes to Financial Statements.
FPA Crescent Fund
FINANCIAL HIGHLIGHTS
Supra Institutional Class
Per share operating performance.
For a capital share outstanding throughout each period.
| |
|
For the
Year Ended
December 31, |
|
| |
|
2025 |
|
|
2024 |
|
|
2023 |
|
|
20221 |
|
|
20211 |
|
| Net asset value, beginning of period |
|
$ |
40.25 |
|
|
$ |
38.65 |
|
|
$ |
33.35 |
|
|
$ |
37.01 |
|
|
$ |
35.98 |
|
| Income from Investment Operations: |
|
|
|
|
|
|
|
|
|
|
|
|
|
|
|
|
|
|
|
|
| Net investment income (loss)2 |
|
|
0.88 |
|
|
|
0.96 |
|
|
|
0.72 |
|
|
|
0.22 |
|
|
|
0.02 |
|
| Net realized and unrealized gain (loss) |
|
|
6.18 |
|
|
|
4.39 |
|
|
|
6.03 |
|
|
|
(3.61 |
) |
|
|
5.33 |
|
| Total from investment operations |
|
|
7.06 |
|
|
|
5.35 |
|
|
|
6.75 |
|
|
|
(3.39 |
) |
|
|
5.35 |
|
| |
|
|
|
|
|
|
|
|
|
|
|
|
|
|
|
|
|
|
|
|
| Less Distributions: |
|
|
|
|
|
|
|
|
|
|
|
|
|
|
|
|
|
|
|
|
| From net investment income |
|
|
(1.18 |
) |
|
|
(1.26 |
) |
|
|
(0.06 |
) |
|
|
(0.03 |
) |
|
|
(0.31 |
) |
| From net realized gain |
|
|
(2.98 |
) |
|
|
(2.49 |
) |
|
|
(1.39 |
) |
|
|
(0.24 |
) |
|
|
(4.01 |
) |
| Total distributions |
|
|
(4.16 |
) |
|
|
(3.75 |
) |
|
|
(1.45 |
) |
|
|
(0.27 |
) |
|
|
(4.32 |
) |
| |
|
|
|
|
|
|
|
|
|
|
|
|
|
|
|
|
|
|
|
|
| Redemption fee proceeds |
|
|
- |
|
|
|
- |
3 |
|
|
- |
3 |
|
|
- |
3 |
|
|
- |
3 |
| Net asset value, end of period |
|
$ |
43.15 |
|
|
$ |
40.25 |
|
|
$ |
38.65 |
|
|
$ |
33.35 |
|
|
$ |
37.01 |
|
| |
|
|
|
|
|
|
|
|
|
|
|
|
|
|
|
|
|
|
|
|
| Total return4 |
|
|
17.68 |
% |
|
|
14.06 |
% |
|
|
20.33 |
% |
|
|
(9.14 |
)% |
|
|
15.24 |
% |
| |
|
|
|
|
|
|
|
|
|
|
|
|
|
|
|
|
|
|
|
|
| Ratios and Supplemental Data: |
|
|
|
|
|
|
|
|
|
|
|
|
|
|
|
|
|
|
|
|
| Net assets, end of period (in thousands) |
|
$ |
4,295,219 |
|
|
$ |
3,590,773 |
|
|
$ |
2,693,659 |
|
|
$ |
2,258,987 |
|
|
$ |
1,890,554 |
|
| |
|
|
|
|
|
|
|
|
|
|
|
|
|
|
|
|
|
|
|
|
| Ratio of expenses to average net assets: |
|
|
|
|
|
|
|
|
|
|
|
|
|
|
|
|
|
|
|
|
| Before fees waived and expenses absorbed |
|
|
1.05 |
%5 |
|
|
1.03 |
%5 |
|
|
1.02 |
% |
|
|
1.03 |
%6 |
|
|
1.12 |
%7 |
| After fees waived and expenses absorbed |
|
|
0.99 |
%5 |
|
|
1.00 |
%5 |
|
|
0.99 |
% |
|
|
1.00 |
%6 |
|
|
1.09 |
%7 |
| Ratio of net investment income (loss) to average net assets: |
|
|
|
|
|
|
|
|
|
|
|
|
|
|
|
|
|
|
|
|
| Before fees waived and expenses absorbed |
|
|
1.99 |
% |
|
|
2.33 |
% |
|
|
1.95 |
% |
|
|
0.61 |
% |
|
|
0.02 |
% |
| After fees waived and expenses absorbed |
|
|
2.05 |
% |
|
|
2.36 |
% |
|
|
1.98 |
% |
|
|
0.64 |
% |
|
|
0.06 |
% |
| Portfolio turnover rate |
|
|
23 |
% |
|
|
10 |
% |
|
|
14 |
% |
|
|
20 |
% |
|
|
20 |
% |
|
| 1 |
Audits performed for the fiscal years indicated by the Fund's previous auditor,
Ernst & Young LLP. |
|
| 2 |
Based on average shares outstanding for the period. |
|
| 3 |
Amount represents less than $0.01 per share. |
|
| 4 |
Return is based on net asset value per share, adjusted for reinvestment of distributions, and does not reflect
deduction of the sales charge. |
|
| 5 |
Includes short sale dividend, tax, and interest expenses that rounds to less than 0.01% of average net assets. |
|
| 6 |
For the year ended December 31, 2022, the expense ratio includes short sale dividend expense that rounds to
less than 0.01% of average net assets. |
|
| 7 |
For the year ended December 31, 2021, the expense ratio includes short sale dividend expense equal to 0.10%
of average net assets. |
See accompanying Notes to Financial Statements.
FPA Crescent Fund
NOTES TO FINANCIAL STATEMENTS
December 31, 2025
Note 1 – Organization
FPA Crescent Fund (the “Fund”), is a diversified
series of Investment Managers Series Trust III (the “Trust”) which is registered as an open-end management investment company
under the Investment Company Act of 1940, as amended (the “1940 Act”). The Fund’s investment objective is to seek to
generate equity-like returns over the long-term, take less risk than the market and avoid permanent impairment of capital. First Pacific
Advisors, LP (the "Adviser"), has served as the Fund's investment adviser since March 1, 1996.
The Fund is an investment company and accordingly
follows the investment company accounting and reporting guidance of the Financial Accounting Standards Board (FASB) Accounting Standard
Codification Topic 946 “Financial Services— Investment Companies”.
The Fund is deemed to be an individual reporting segment
and is not part of a consolidated reporting entity. The objective and strategy of the Fund is used by the Adviser to make investment decisions,
and the results of the operations, as shown on the Statements of Operations and the financial highlights for the Fund is the information
utilized for the day-to-day management of the Fund. The Fund is party to the expense agreements as disclosed in the Notes to the Financial
Statements and there are no resources allocated to a Fund based on performance measurements. The management of the Fund’s Adviser
is deemed to be the Chief Operating Decision Maker with respect to the Fund’s investment decisions.
Note 2 – Accounting Policies
The following is a summary of the significant accounting
policies consistently followed by the Fund in the preparation of its financial statements. The preparation of financial statements in
conformity with accounting principles generally accepted in the United States of America (“GAAP”) requires management to make
estimates and assumptions that affect the reported amounts and disclosures in the financial statements. Actual results could differ from
these estimates.
(a) Valuation of Investments
The Fund values equity securities at the last reported
sale price on the principal exchange or in the principal over the counter (“OTC”) market in which such securities are traded,
as of the close of regular trading on the NYSE on the day the securities are being valued or, if the last-quoted sales price is not readily
available, the securities will be valued at the last bid or the mean between the last available bid and ask price. Securities traded on
the NASDAQ are valued at the NASDAQ Official Closing Price (“NOCP”). Investments in open-end investment companies are valued
at the daily closing net asset value of the respective investment company. Debt securities are valued by utilizing a price supplied by
independent pricing service providers. The independent pricing service providers may use various valuation methodologies including matrix
pricing and other analytical pricing models as well as market transactions and dealer quotations. These models generally consider such
factors as yields or prices of bonds of comparable quality, type of issue, coupon, maturity, ratings and general market conditions. If
a price is not readily available for a portfolio security, the security will be valued at fair value (the amount which the Fund might
reasonably expect to receive for the security upon its current sale). The Board of Directors has designated the Adviser as the Fund’s
valuation designee (the “Valuation Designee”) to make all fair value determinations with respect to the Fund’s portfolio
investments, subject to the Board’s oversight. As the Valuation Designee, the Adviser has adopted and implemented policies and procedures
to be followed when the Fund must utilize fair value pricing.
(b) Investment Transactions, Investment Income
and Expenses
Investment transactions are accounted for on the trade
date. Realized gains and losses on investments are determined on the identified cost basis. Dividend income is recorded net of applicable
withholding taxes on the ex-dividend date and interest income is recorded on an accrual basis. Withholding taxes on foreign dividends,
if applicable, are paid (a portion of which may be reclaimable) or provided for in accordance with the applicable country’s tax
rules and rates and are disclosed in the Statement of Operations. Withholding tax reclaims are filed in certain countries to recover a
portion of the amounts previously withheld. The Fund records a reclaim receivable based on a number of factors, including a jurisdiction’s
legal obligation to pay reclaims as well as payment history and market convention. Discounts on debt securities are accreted or amortized
to interest income over the lives of the respective securities using the effective interest method. Premiums for callable debt securities
are amortized to the earliest call date, if the call price was less than the purchase price. If the call price was not at par and the
security was not called, the security is amortized to the next call price and date. Income and expenses of the Fund are allocated on a
pro rata basis to each class of shares relative net assets, except for distribution and service fees which are unique to each class of
shares relative net assets. Expenses incurred by the Trust with respect to more than one fund are allocated in proportion to the net assets
of each fund except where allocation of direct expenses to each fund or an alternative allocation method can be more appropriately made.
FPA Crescent Fund
NOTES TO FINANCIAL STATEMENTS - Continued
December 31, 2025
(c) Mortgage-Backed Securities
The Fund may invest in mortgage-backed securities
("MBS"), representing direct or indirect interests in pools of underlying residential or commercial mortgage loans that are secured
by real property. These securities provide investors with payments consisting of both principal and interest as the mortgages in the underlying
mortgage pools are paid.
The timely payment of principal and interest (but
not the market value) on MBS issued or guaranteed by Ginnie Mae (formally known as the Government National Mortgage Association or GNMA)
is backed by Ginnie Mae and the full faith and credit of the US government. Obligations issued by Fannie Mae (formally known as the Federal
National Mortgage Association or FNMA) and Freddie Mac (formally known as the Federal Home Loan Mortgage Corporation or FHLMC) are historically
supported only by the credit of the issuer, but currently are guaranteed by the US government in connection with such agencies being placed
temporarily into conservatorship by the US government. Some MBS are sponsored or issued by private entities. Payments of principal and
interest (but not the market value) of such private MBS may be supported by pools of residential or commercial mortgage loans or other
MBS that are guaranteed, directly or indirectly, by the US government or one of its agencies or instrumentalities, or they may be issued
without any government guarantee of the underlying mortgage assets but may contain some form of non-government credit enhancement.
Collateralized mortgage obligations ("CMO")
are a type of MBS. A CMO is a debt security that may be collateralized by whole mortgage loans or mortgage pass-through securities. The
mortgage loans or mortgage pass-through securities are divided into classes or tranches with each class having its own characteristics.
Investors typically receive payments out of the interest and principal on the underlying mortgages. The portions of these payments that
investors receive, as well as the priority of their rights to receive payments, are determined by the specific terms of the CMO class.
The yield characteristics of MBS differ from those
of traditional debt securities. Among the major differences are that interest and principal payments are made more frequently, usually
monthly, and that principal may be prepaid at any time because the underlying mortgage loans or other obligations generally may be prepaid
at any time. Prepayments on a pool of mortgage loans are influenced by a variety of economic, geographic, social and other factors. Generally,
prepayments on fixed-rate mortgage loans will increase during a period of falling interest rates and decrease during a period of rising
interest rates. Certain classes of CMOs and other MBS are structured in a manner that makes them extremely sensitive to changes in prepayment
rates.
(d) Asset-Backed Securities
Asset-backed securities include pools of mortgages,
loans, receivables or other assets. Payment of principal and interest may be largely dependent upon the cash flows generated by the assets
backing the securities, and, in certain cases, supported by letters of credit, surety bonds, or other credit enhancements. The value of
asset-backed securities may also be affected by the creditworthiness of the servicing agent for the pool, the originator of the loans
or receivables, or the financial institution(s) providing the credit support. In addition, asset-backed securities are not backed by any
governmental agency.
FPA Crescent Fund
NOTES TO FINANCIAL STATEMENTS - Continued
December 31, 2025
Collateralized Debt Obligations (“CDOs”)
include Collateralized Bond Obligations (“CBOs”), Collateralized Loan Obligations (“CLOs”) and other similarly
structured securities. CBOs and CLOs are types of asset backed securities. A CBO is a trust which is backed by a diversified pool of high
risk, below investment grade fixed income securities. A CLO is a trust typically collateralized by a pool of loans, which may include,
among others, domestic and foreign senior secured loans, senior unsecured loans, and subordinate corporate loans, including loans that
may be rated below investment grade or equivalent unrated loans. The risks of an investment in a CDO depend largely on the type of the
collateral securities and the class of the CDO in which a Fund invests. CDOs carry additional risks including, but not limited to, (i)
the possibility that distributions from collateral securities will not be adequate to make interest or other payments, (ii) the collateral
may decline in value or default, (iii) a Fund may invest in CDOs that are subordinate to other classes, and (iv) the complex structure
of the security may not be fully understood at the time of investment and may produce disputes with the issuer or unexpected investment
results.
(e) Stripped Mortgage-Backed Interest Only (“I/O”)
and Principal Only (“P/O”) Securities
Stripped mortgage-backed securities are usually structured
with two classes that receive different proportions of the interest and principal distributions on a pool of mortgage assets. In certain
cases, one class will receive all of the interest payments on the underlying mortgages (the I/O class), while the other class will receive
all of the principal payments (the P/O class). The Fund currently has investments in I/O securities. The yield to maturity on I/Os is
sensitive to the rate of principal repayments (including prepayments) on the related underlying mortgage assets, and principal payments
may have a material effect on yield-to-maturity. If the underlying mortgage assets experience greater than anticipated prepayments of
principal, a Fund may not fully recoup its initial investment in I/Os.
(f) Credit Risk
Debt securities are subject to credit risk, meaning
that the issuer of the debt security may default or fail to make timely payments of principal or interest. The values of any of the Fund's
investments may also decline in response to events affecting the issuer or its credit rating. The lower rated debt securities in which
the Fund may invest are considered speculative and are generally subject to greater volatility and risk of loss than investment grade
securities, particularly in deteriorating economic conditions. The Fund invests a significant portion of its assets in securities of issuers
that hold mortgage-and asset-backed securities and direct investments in securities backed by commercial and residential mortgage loans
and other financial assets. The value and related income of these securities is sensitive to changes in economic conditions, including
delinquencies and/or defaults. Continuing shifts in the market's perception of credit quality on securities backed by commercial and residential
mortgage loans and other financial assets may result in increased volatility of market price and periods of illiquidity that can negatively
impact the valuation of certain securities held by the Fund.
FPA Crescent Fund
NOTES TO FINANCIAL STATEMENTS - Continued
December 31, 2025
(g) Special Purpose Acquisition Companies
The Fund may invest in stock, warrants, and other
securities of special purpose acquisition companies (“SPACs”) or similar special purpose entities that pool funds to seek
potential acquisition opportunities. Because SPACs and similar entities are in essence blank check companies without operating history
or ongoing business other than seeking acquisitions, the value of their securities is particularly dependent on the ability of the entity’s
management to identify and complete a profitable acquisition. An investment in a SPAC is subject to a variety of risks, including that
(i) a portion of the monies raised by the SPAC for the purpose of effecting an acquisition or merger may be expended prior to the transaction
for payment of taxes and other purposes; (ii) prior to any acquisition or merger, a SPAC’s assets are typically invested in government
securities, money market funds and similar investments whose returns or yields may be significantly lower than those of the Fund’s
other investments; (iii) the Fund generally will not receive significant income from its investments in SPACs (both prior to and after
any acquisition or merger) and, therefore, the Fund's investments in SPACs will not significantly contribute to the Fund's distributions
to shareholders; (iv) an attractive acquisition or merger target may not be identified at all, in which case the SPAC will be required
to return any remaining monies to shareholders; (v) if an acquisition or merger target is identified, the Fund may elect not to participate
in the proposed transaction or the Fund may be required to divest its interests in the SPAC due to regulatory or other considerations,
in which case the warrants or other rights with respect to the SPAC held by the Fund may expire worthless or may be repurchased or retired
by the SPAC at an unfavorable price; (vi) any proposed merger or acquisition may be unable to obtain the requisite approval, if any, of
SPAC shareholders; (vii) under any circumstances in which the Fund receives a refund of all or a portion of its original investment (which
typically represents a pro rata share of the proceeds of the SPAC's assets, less any applicable taxes), the returns on that investment
may be negligible, and the Fund may be subject to opportunity costs to the extent that alternative investments would have produced higher
returns; (viii) to the extent an acquisition or merger is announced or completed, shareholders who redeem their shares prior to that time
may not reap any resulting benefits; (ix) the Fund may be delayed in receiving any redemption or liquidation proceeds from a SPAC to which
it is entitled; (x) an acquisition or merger once effected may prove unsuccessful and an investment in the SPAC may lose value; (xi) an
investment in a SPAC may be diluted by additional later offerings of interests in the SPAC or by other investors exercising existing rights
to purchase shares of the SPAC; (xii) only a thinly traded market for shares of or interests in a SPAC may develop, or there may be no
market at all, leaving the Fund unable to sell its interest in a SPAC or to sell its interest only at a price below what the Fund believes
is the SPAC interest's intrinsic value; and (xiii) the values of investments in SPACs may be highly volatile and may depreciate significantly
over time. There were no Private Investment in Public Equity (“PIPE”) share purchase commitments for the SPACs the Fund invested
in as of December 31, 2025.
(h) Currency Translation
Assets and liabilities denominated in foreign currencies
are translated into U.S. dollars at the mean of the quoted bid and ask prices of such currencies against the U.S. dollar. Purchases and
sales of portfolio securities are translated into U.S. dollars at the rates of exchange prevailing when such securities were acquired
or sold. Income and expenses are translated into U.S. dollars at rates of exchange prevailing when accrued.
Net realized gain or loss on foreign currency transactions
represents foreign exchange gains and losses from sales and maturities of foreign fixed income investments, holding of foreign currencies,
currency gains or losses realized between the trade and settlement dates on foreign investment transactions, and the difference between
the amounts of dividends, interest and foreign withholding taxes recorded on the Fund’s books and the U.S. dollar equivalent amounts
actually received or paid. Net unrealized currency gains and losses from valuing foreign currency denominated assets and liabilities at
year-end exchange rates are reflected as a component of net unrealized appreciation or depreciation of foreign currency denominated assets
and liabilities.
(i) Illiquid Securities
Pursuant to Rule 22e-4 under the 1940 Act, the Fund
has adopted a Liquidity Risk Management Program (“LRMP”) that requires, among other things, that the Fund limits its illiquid
investments that are assets to no more than 15% of net assets. An illiquid investment is any security which may not reasonably be expected
to be sold or disposed of in current market conditions in seven calendar days or less without the sale or disposition significantly changing
the market value of the investment. If the Adviser, at any time determines that the value of illiquid securities held by the Fund exceeds
15% of its net asset value, the Adviser will take such steps as it considers appropriate to reduce them as soon as reasonably practicable
in accordance with the Fund’s written LRMP.
FPA Crescent Fund
NOTES TO FINANCIAL STATEMENTS - Continued
December 31, 2025
(j) Use of Estimates
The presentation of financial statements in conformity
with GAAP requires management to make estimates and assumptions that affect the reported amounts of assets and liabilities at the date
of the financial statements and the reported amounts of income and expenses during the reporting period. Actual results could differ from
those estimates.
(k) Federal Income Taxes
The Fund intends to comply with the requirements of
Subchapter M of the Internal Revenue Code applicable to regulated investment companies and to distribute substantially all of their net
investment income and any net realized gains to their shareholders. Therefore, no provision is made for federal income or excise taxes.
Due to the timing of dividend distributions and the differences in accounting for income and realized gains and losses for financial statement
and federal income tax purposes, the fiscal year in which amounts are distributed may differ from the year in which the income and realized
gains and losses are recorded by the Fund.
Accounting for Uncertainty in Income Taxes
(the “Income Tax Statement”) requires an evaluation of tax positions taken (or expected to be taken) in the course of preparing
a Fund’s tax returns to determine whether these positions meet a “more-likely-than-not” standard that, based on the
technical merits, have a more than fifty percent likelihood of being sustained by a taxing authority upon examination. A tax position
that meets the “more-likely-than-not” recognition threshold is measured to determine the amount of benefit to recognize in
the financial statements. The Fund recognizes interest and penalties, if any, related to unrecognized tax benefits as income tax expense
in the Statement of Operations.
The Income Tax Statement requires management of the
Fund to analyze tax positions taken in the prior three open tax years, if any, and tax positions expected to be taken in the Fund’s
current tax year, as defined by the IRS statute of limitations for all major jurisdictions, including federal tax authorities and certain
state tax authorities. As of December 31, 2025, and during the prior three open tax years, the Fund did not have a liability for any unrecognized
tax benefits. The Fund has no examinations in progress and is not aware of any tax positions for which it is reasonably possible that
the total amounts of unrecognized tax benefits will significantly change in the next twelve months.
(l) Distributions to Shareholders
The Fund will make distributions of net investment
income and net capital gains, if any, at least annually. Distributions to shareholders are recorded on the ex-dividend date. The amount
and timing of distributions are determined in accordance with federal income tax regulations, which may differ from GAAP.
The character of distributions made during the year
from net investment income or net realized gains may differ from the characterization for federal income tax purposes due to differences
in the recognition of income, expense and gain (loss) items for financial statement and tax purposes.
Note 3 – Investment Advisory and Other Agreements
The Trust, on behalf of the Fund, entered into an
Investment Advisory Agreement (the “Agreement”) with the Adviser. Under the terms of the Agreement, the Fund pays a monthly
investment advisory fee to the Adviser at the annual rate of 0.93% plus class-specific administrative service fee of 0.07%, 0.07% and
0.01% of the Fund’s average daily net assets for the Institutional Class, Investor Class and Supra Institutional Class, respectively.
The Adviser has contractually agreed to reimburse
operating expenses in excess of 0.05%, 0.15% and 0.05% of the average daily net assets of the Institutional Class, Investor Class and
Supra Institutional Class, respectively, excluding management fees, administrative service fees, short sale dividend expenses and interest
expenses on cash deposits relating to short sales, brokerage fees and commissions, redemption liquidity service expense, interest, taxes,
fees and expenses of other funds in which the Fund invests, and extraordinary expenses, including litigation expenses not incurred in
the Fund’s ordinary course of business, through April 30, 2026. The Adviser has also contractually agreed to reimburse the Fund
for redemption liquidity service expenses in excess of 0.0044% of the daily average net assets of the Fund through April 30, 2026. These
agreements may only be terminated earlier by the Fund’s Board of Trustees (the “Board”) or upon termination of the Advisory
Agreement. For the year ended December 31, 2025, the Adviser waived a portion of its advisory fees totaling $2,503,361.
FPA Crescent Fund
NOTES TO FINANCIAL STATEMENTS - Continued
December 31, 2025
UMB Fund Services, Inc. (“UMBFS”) serves
as the Fund’s fund accountant, transfer agent and co-administrator; and Mutual Fund Administration, LLC (“MFAC”) serves
as the Fund’s other co-administrator. UMB Bank, n.a., an affiliate of UMBFS, serves as the Fund’s custodian. The Fund’s
allocated fees incurred for fund accounting, fund administration, transfer agency and custody services for the year ended December 31,
2025 are reported as Fund services fees on the Statement of Operations.
Distribution Services, LLC, serves as the Fund’s
distributor (the “Distributor”). The Distributor does not receive compensation from the Fund for its distribution services;
The Adviser pays the Distributor a fee for its distribution-related services.
Certain trustees and officers of the Trust are employees
of UMBFS, MFAC or Adviser. The Fund does not compensate trustees and officers affiliated with the Fund’s Adviser or co-administrators.
For the year ended December 31, 2025, the Fund’s allocated fees incurred to Trustees of the Trust who are not “interested
persons” of the Trust, as that term is defined in the 1940 Act (collectively, the “Independent Trustees”) are reported
on the Statement of Operations.
The Fund's Board of Trustees has adopted a Deferred
Compensation Plan (the “Plan”) for the Independent Trustees that enables Trustees to elect to receive payment in cash or the
option to defer some or all of their fees. If a trustee elects to defer payment, the Plan provides for the creation of a deferred payment
account. A Trustee’s deferred fees are deemed to be invested in designated mutual funds available under the Plan. The Fund's liability
for these amounts is adjusted for market value changes in the invested fund and remains a liability to the Fund until distributed in accordance
with the Plan. The Trustees Deferred compensation liability under the Plan constitutes a general unsecured obligation of the Fund and
is disclosed in the Statement of Assets and Liabilities. Contributions made under the plan and the change in unrealized appreciation/depreciation
and income are included in the Trustees' fees and expenses in the Statement of Operations.
Dziura Compliance Consulting, LLC provides Chief Compliance
Officer (“CCO”) services to the Trust. The Fund’s allocated fees incurred for CCO services for the year ended December
31, 2025, are reported on the Statement of Operations.
Note 4 –Redemption Liquidity Service Fees
The Fund may participate in “Liquidity Programs”
or “Programs” offered by independent third-party service providers, which are designed to provide an alternative liquidity
source when conducting normal business activities. Under the programs, cash is provided to the Fund to meet net shareowner redemptions,
manage and optimize portfolio composition, offset transaction costs, and/or more efficiently manage the portfolio. Following purchases
of Fund shares, the programs then generally redeem those shares when the Fund experiences net sales, at the end of a maximum holding period
ranging from 2 to 8 days or at other times at the discretion of the program or the Adviser. During the period that a third party holds
the Fund’s shares through a Program, the third party will have the same rights and privileges with respect to those shares as any
other shareholder. A third party that invests in the Fund through a Program does so on an investment-blind basis without regard to the
Fund’s objective, policies, or anticipated performance. The third party purchases shares of the Fund at net asset value and is not
subject to the Fund’s investment minimums or the limitations noted under “Excessive Trading and Market Timing” section
contained in the Prospectus.
FPA Crescent Fund
NOTES TO FINANCIAL STATEMENTS - Continued
December 31, 2025
For use of certain services, the Fund pays a fee calculated
by applying a fee rate to the purchase amount determined through an automated daily auction. The current minimum fee rate is 0.14% of
the value of the Fund shares purchased, although the Fund may submit a bid at a higher fee rate if it determines that doing so is in the
best interest of Fund shareowners. In accordance with federal securities laws, certain providers are prohibited from acquiring more than
3% of the outstanding voting securities of a Fund, while others are prohibited from acquiring more than 5%. The providers will periodically
redeem their entire share position in the Fund and request that such redemption be met in kind in accordance with the Fund’s in-kind
redemption policies. There is no assurance that these programs will have sufficient funds available to meet the Funds’ liquidity
needs on a particular day. During the year ended December 31, 2025, the fees associated with these programs are disclosed in the Statement
of Operations within redemption liquidity service fees.
Note 5 – Securities Sold Short
The Fund maintains cash deposits and segregates marketable
securities in amounts equal to the current fair value of the securities sold short or the fair value of the securities at the time they
were sold short, whichever is greater. The Fund considers cash deposits held in connection with securities sold short to be restricted
cash. The restriction will lapse when the related short positions are terminated. Possible losses from short sales may be unlimited, whereas
losses from purchases cannot exceed the total amount invested. The dividends on securities sold short are reflected as short sale dividend
expense.
Note 6 – Federal Income Taxes
At December 31, 2025, gross unrealized appreciation/(depreciation)
of investments, based on cost for federal income tax purposes were as follows:
| Cost of investments |
|
$ |
8,842,039,500 |
|
| Gross unrealized appreciation |
|
$ |
3,397,959,280 |
|
| Gross unrealized depreciation |
|
|
(397,202,215 |
) |
| Net unrealized appreciation/(depreciation) |
|
$ |
3,000,757,065 |
|
The difference between cost amounts for financial
statement and federal income tax purposes is due primarily to timing differences in recognizing certain gains and losses in security transactions.
GAAP requires that certain components of net assets
be reclassified between financial and tax reporting. These reclassifications have no effect on net assets or net asset value per share.
For the year ended December 31, 2025, permanent differences in book and tax have been reclassified to paid-in capital and total distributable
earnings/(deficit) as follows:
| Increase (Decrease) |
|
| Paid-in Capital |
|
|
Total accumulated earnings/(deficit) |
|
| $ |
607,730,051 |
|
|
$ |
(607,730,051 |
) |
FPA Crescent Fund
NOTES TO FINANCIAL STATEMENTS - Continued
December 31, 2025
As of December 31, 2025, the components of accumulated
earnings/(deficit) on a tax basis were as follows:
| Undistributed ordinary income |
|
$ |
56,626,324 |
|
| Undistributed long-term capital gains |
|
|
- |
|
| Tax accumulated earnings |
|
|
56,626,324 |
|
| |
|
|
|
|
| Accumulated capital and other losses |
|
|
1,270,532 |
|
| Net Unrealized appreciation/(depreciation) on investments |
|
|
3,000,757,065 |
|
| Deferred compensation |
|
|
(49,136 |
) |
| Foreign currency translations |
|
|
566,819 |
|
| Swap value change |
|
|
(781,827 |
) |
| Total accumulated earnings/(deficit) |
|
$ |
3,058,389,777 |
|
The tax character of distributions paid during the
fiscal years ended December 31, 2025 and December 31, 2024, were as follows:
| |
|
2025 |
|
|
2024 |
|
| Distributions paid from: |
|
|
|
|
|
|
|
|
| Ordinary income |
|
$ |
360,610,439 |
|
|
$ |
333,402,961 |
|
| Net long-term capital gains |
|
|
710,432,017 |
|
|
|
597,659,821 |
|
| Total distributions paid |
|
$ |
1,071,042,456 |
|
|
$ |
931,062,782 |
|
As of December 31, 2025, the Fund did not have any
non-expiring capital loss carryforwards.
During the tax year ended December 31, 2025, the Fund
utilized $0 of short-term and $0 of long-term non-expiring capital loss carryforwards, respectively.
Note 7 – Investment Transactions
For the year ended December 31, 2025, purchases, sales,
and in-kind redemptions of investments, excluding short-term investments, were $1,669,193,929, $1,965,646,744, and $500,904,170, respectively.
Note 8 – Shareholder Servicing Plan
Pursuant to the Shareholder Service Plan adopted by
the Board, on behalf of the Fund, the Fund may pay a fee at an annual rate of up to 0.10%, 0.25%, and 0.10% of its average daily net assets
attributable to the Institutional Class, Investor Class and Supra Institutional Class shares of the Fund, respectively. The Fund does
not pay these service fees on shares purchased directly. In addition, the Adviser may, at its own expense, pay financial representatives
and/or shareholder servicing agents for these services. Such fees are reported on the Statement of Operations. For the year ended December
31, 2025, the Adviser reimbursed shareholder service fees of $883,477, $17,775, and $1,146,700 for Institutional Class shares, Investor
Class shares, and Supra Institutional Class shares, respectively.
Note 9 – Indemnifications
In the normal course of business, the Fund enters
into contracts that contain a variety of representations which provide general indemnifications. The Fund’s maximum exposure under
these arrangements is unknown, as this would involve future claims that may be made against the Fund that have not yet occurred. However,
the Fund expects the risk of loss to be remote.
FPA Crescent Fund
NOTES TO FINANCIAL STATEMENTS - Continued
December 31, 2025
Note 10 – Commitments and Contingencies
The Fund may enter into unfunded loan commitments.
Unfunded loan commitments may be partially or wholly unfunded. During the contractual period, the Fund is obliged to provide funding to
the borrower upon demand.
Unfunded loan commitments are fair valued in accordance
with the valuation policy described in Note 2(a) and unrealized appreciation or depreciation, if any, is recorded on the Statement of
Assets and Liabilities.
As of December 31, 2025, the Fund had the following
unfunded loan commitments outstanding:
| Loan |
|
Principal |
|
|
Cost |
|
|
Value |
|
|
Unrealized
Appreciation/
(Depreciation) |
|
|
Unfunded Commitment |
|
| Lealand Finance Company B.V. Senior Exit LC |
|
$ |
21,844,968 |
|
|
$ |
(9,488,847 |
) |
|
$ |
(5,461,242 |
) |
|
$ |
4,027,605 |
|
|
$ |
5,461,242 |
|
Note 11 – Fair Value Measurements and Disclosure
Fair Value Measurements and Disclosures defines
fair value, establishes a framework for measuring fair value in accordance with GAAP, and expands disclosure about fair value measurements.
It also provides guidance on determining when there has been a significant decrease in the volume and level of activity for an asset or
a liability, when a transaction is not orderly, and how that information must be incorporated into a fair value measurement.
Under Fair Value Measurements and Disclosures,
various inputs are used in determining the value of the Fund’s investments. These inputs are summarized into three broad Levels
as described below:
|
| ● |
Level 1 – Unadjusted quoted prices in active markets
for identical assets or liabilities that the Fund has the ability to access. |
|
| ● |
Level 2 – Observable inputs other than quoted
prices included in level 1 that are observable for the asset or liability, either directly or indirectly. These inputs may include quoted
prices for the identical instrument on an inactive market, prices for similar instruments, interest rates, prepayment speeds, credit risk,
yield curves, default rates and similar data. |
|
| ● |
Level 3 – Unobservable inputs for the asset
or liability, to the extent relevant observable inputs are not available, representing the Fund’s own assumptions about the assumptions
a market participant would use in valuing the asset or liability, and would be based on the best information available. |
The availability of observable inputs can vary from
security to security and is affected by a wide variety of factors, including, for example, the type of security, whether the security
is new and not yet established in the marketplace, the liquidity of markets, and other characteristics particular to the security. To
the extent that valuation is based on models or inputs that are less observable or unobservable in the market, the determination of fair
value requires more judgment. Accordingly, the degree of judgment exercised in determining fair value is greatest for instruments categorized
in Level 3.
The inputs used to measure fair value may fall into
different Levels of the fair value hierarchy. In such cases, for disclosure purposes, the Level in the fair value hierarchy within which
the fair value measurement falls in its entirety, is determined based on the lowest Level input that is significant to the fair value
measurement in its entirety.
FPA Crescent Fund
NOTES TO FINANCIAL STATEMENTS - Continued
December 31, 2025
The inputs or methodology used for valuing securities
are not an indication of the risk associated with investing in those securities. The following is a summary of the inputs used, as of
December 31, 2025, in valuing the Fund’s assets carried at fair value:
| Investments |
|
Level 1 |
|
|
Level 2 |
|
|
Level 3 |
|
|
NAV as
Practical
Expedient* |
|
|
Total |
|
| Convertible Bonds |
|
$ |
- |
|
|
$ |
248,263,953 |
|
|
$ |
- |
|
|
$ |
- |
|
|
$ |
248,263,953 |
|
| Corporate Bank Debt |
|
|
- |
|
|
|
4,572,621 |
|
|
|
47,084,267 |
|
|
|
- |
|
|
|
51,656,888 |
|
| Corporate Bonds |
|
|
|
|
|
|
|
|
|
|
|
|
|
|
|
|
|
|
- |
|
| Communications |
|
|
- |
|
|
|
110,921,226 |
|
|
|
- |
|
|
|
- |
|
|
|
110,921,226 |
|
| Financials |
|
|
- |
|
|
|
29,860,101 |
|
|
|
- |
|
|
|
- |
|
|
|
29,860,101 |
|
| Closed-End Funds |
|
|
- |
|
|
|
- |
|
|
|
5,469,607 |
|
|
|
- |
|
|
|
5,469,607 |
|
| Common Stocks |
|
|
|
|
|
|
|
|
|
|
|
|
|
|
|
|
|
|
|
|
| Aerospace & Defense |
|
|
- |
|
|
|
189,806,381 |
|
|
|
- |
|
|
|
- |
|
|
|
189,806,381 |
|
| Apparel & Textile Products |
|
|
- |
|
|
|
96,383,513 |
|
|
|
- |
|
|
|
- |
|
|
|
96,383,513 |
|
| Asset Management |
|
|
122,911,483 |
|
|
|
- |
|
|
|
- |
|
|
|
- |
|
|
|
122,911,483 |
|
| Banking |
|
|
321,360,084 |
|
|
|
- |
|
|
|
- |
|
|
|
- |
|
|
|
321,360,084 |
|
| Beverages |
|
|
- |
|
|
|
525,604,234 |
|
|
|
- |
|
|
|
- |
|
|
|
525,604,234 |
|
| Biotech & Pharma |
|
|
- |
|
|
|
66,386,905 |
|
|
|
- |
|
|
|
- |
|
|
|
66,386,905 |
|
| Cable & Satellite |
|
|
279,288,410 |
|
|
|
- |
|
|
|
- |
|
|
|
- |
|
|
|
279,288,410 |
|
| Chemicals |
|
|
213,159,085 |
|
|
|
328,684,580 |
|
|
|
- |
|
|
|
- |
|
|
|
541,843,665 |
|
| Commercial Support Services |
|
|
- |
|
|
|
148,562,659 |
|
|
|
- |
|
|
|
- |
|
|
|
148,562,659 |
|
| Construction Materials |
|
|
131,378,761 |
|
|
|
80,484,487 |
|
|
|
- |
|
|
|
- |
|
|
|
211,863,248 |
|
| E-Commerce Discretionary |
|
|
202,127,920 |
|
|
|
- |
|
|
|
- |
|
|
|
- |
|
|
|
202,127,920 |
|
| Electric Utilities |
|
|
11,581,810 |
|
|
|
- |
|
|
|
- |
|
|
|
- |
|
|
|
11,581,810 |
|
| Electrical Equipment |
|
|
261,281,585 |
|
|
|
48,504,257 |
|
|
|
- |
|
|
|
- |
|
|
|
309,785,842 |
|
| Engineering & Construction |
|
|
- |
|
|
|
112,253,445 |
|
|
|
42,778,275 |
|
|
|
- |
|
|
|
155,031,720 |
|
| Entertainment Content |
|
|
- |
|
|
|
- |
|
|
|
12,981,991 |
|
|
|
- |
|
|
|
12,981,991 |
|
| Food |
|
|
81,511,484 |
|
|
|
47,710,799 |
|
|
|
- |
|
|
|
- |
|
|
|
129,222,283 |
|
| Health Care Facilities & Svcs |
|
|
105,731,879 |
|
|
|
- |
|
|
|
- |
|
|
|
- |
|
|
|
105,731,879 |
|
| Home Construction |
|
|
109,857,876 |
|
|
|
- |
|
|
|
- |
|
|
|
- |
|
|
|
109,857,876 |
|
| Household Products |
|
|
- |
|
|
|
18,103,030 |
|
|
|
- |
|
|
|
- |
|
|
|
18,103,030 |
|
| Institutional Financial Svcs |
|
|
141,121,059 |
|
|
|
- |
|
|
|
- |
|
|
|
- |
|
|
|
141,121,059 |
|
| Insurance |
|
|
168,587,008 |
|
|
|
- |
|
|
|
- |
|
|
|
- |
|
|
|
168,587,008 |
|
| Internet Media & Services |
|
|
1,028,085,114 |
|
|
|
178,485,817 |
|
|
|
- |
|
|
|
- |
|
|
|
1,206,570,931 |
|
| Leisure Facilities & Services |
|
|
165,187,554 |
|
|
|
- |
|
|
|
- |
|
|
|
- |
|
|
|
165,187,554 |
|
| Machinery |
|
|
- |
|
|
|
30,611,664 |
|
|
|
- |
|
|
|
- |
|
|
|
30,611,664 |
|
| Medical Equipment & Devices |
|
|
409,376,410 |
|
|
|
- |
|
|
|
- |
|
|
|
- |
|
|
|
409,376,410 |
|
| Metals & Mining |
|
|
49,417,427 |
|
|
|
147,305,014 |
|
|
|
- |
|
|
|
- |
|
|
|
196,722,441 |
|
| Oil & Gas Producers |
|
|
91,634,815 |
|
|
|
- |
|
|
|
- |
|
|
|
- |
|
|
|
91,634,815 |
|
| Oil & Gas Services & Equip |
|
|
78,732,796 |
|
|
|
- |
|
|
|
- |
|
|
|
- |
|
|
|
78,732,796 |
|
| Real Estate Owners & Developers |
|
|
- |
|
|
|
16,917,783 |
|
|
|
- |
|
|
|
- |
|
|
|
16,917,783 |
|
| Reit |
|
|
104,472,707 |
|
|
|
- |
|
|
|
- |
|
|
|
- |
|
|
|
104,472,707 |
|
| Retail - Discretionary |
|
|
199,395,919 |
|
|
|
- |
|
|
|
- |
|
|
|
- |
|
|
|
199,395,919 |
|
| Semiconductors |
|
|
464,426,674 |
|
|
|
- |
|
|
|
- |
|
|
|
- |
|
|
|
464,426,674 |
|
FPA Crescent Fund
NOTES TO FINANCIAL STATEMENTS - Continued
December 31, 2025
| Investments |
|
Level 1 |
|
|
Level 2 |
|
|
Level 3 |
|
|
NAV as
Practical
Expedient* |
|
|
Total |
|
| Technology Hardware |
|
|
148,590,830 |
|
|
|
30,731,281 |
|
|
|
- |
|
|
|
- |
|
|
|
179,322,111 |
|
| Technology Services |
|
|
- |
|
|
|
80,802,712 |
|
|
|
- |
|
|
|
- |
|
|
|
80,802,712 |
|
| Telecommunications |
|
|
18,484,761 |
|
|
|
- |
|
|
|
- |
|
|
|
- |
|
|
|
18,484,761 |
|
| Transportation Equipment |
|
|
60,045,833 |
|
|
|
- |
|
|
|
- |
|
|
|
- |
|
|
|
60,045,833 |
|
| Limited Partnerships |
|
|
- |
|
|
|
- |
|
|
|
188,988,907 |
|
|
|
23,960,250 |
|
|
|
212,949,157 |
|
| Warrants |
|
|
- |
|
|
|
- |
|
|
|
- |
|
|
|
- |
|
|
|
- |
|
| Short-Term Investments |
|
|
28,535,016 |
|
|
|
4,003,353,021 |
|
|
|
- |
|
|
|
- |
|
|
|
4,031,888,037 |
|
| |
|
$ |
4,996,284,300 |
|
|
$ |
6,544,309,483 |
|
|
$ |
297,303,047 |
|
|
$ |
23,960,250 |
|
|
$ |
11,861,857,080 |
|
| Securities Sold Short Exchange-Traded Funds |
|
$ |
(19,060,515 |
) |
|
$ |
- |
|
|
$ |
- |
|
|
$ |
- |
|
|
$ |
(19,060,515 |
) |
| Total Return Swaps |
|
$ |
- |
|
|
$ |
(781,827 |
) |
|
$ |
- |
|
|
$ |
- |
|
|
$ |
(781,827 |
) |
* Investments valued using net asset value per share
(or its equivalent) as a practical expedient are excluded from the fair value hierarchy. The fair value amounts presented in this table
are intended to permit reconciliation of the fair value hierarchy to the amounts presented in the Schedule of Investments.
The following is a reconciliation of assets in which
significant unobservable inputs (Level 3) were used in determining value:
| Investments |
|
Beginning
balance at
December 31,
2024 |
|
|
Transfers
into/(out) of
Level 3
during
the period |
|
|
Total
realized
gain/(loss) |
|
|
Total change
in net
unrealized
appreciation/
(depreciation) |
|
|
Accretion of Discount
(Amortization of
Premium) and Return
of Capital |
|
|
Net
purchases |
|
|
Net sales |
|
|
Ending Value at
December 31,
2025 |
|
| Corporate Bank Debt |
|
$ |
19,555,734 |
|
|
$ |
880,861 |
|
|
$ |
2,115,024 |
|
|
$ |
28,232,814 |
|
|
$ |
- |
|
|
$ |
1,287,443 |
|
|
$ |
(4,987,609 |
) |
|
$ |
47,084,267 |
|
| Closed-End Funds |
|
|
5,850,101 |
|
|
|
- |
|
|
|
- |
|
|
|
(380,494 |
) |
|
|
- |
|
|
|
- |
|
|
|
- |
|
|
|
5,469,607 |
|
| Common Stocks |
|
|
26,636,846 |
|
|
|
- |
|
|
|
- |
|
|
|
29,123,420 |
|
|
|
- |
|
|
|
- |
|
|
|
- |
|
|
|
55,760,266 |
|
| Limited Partnerships |
|
|
282,400,075 |
|
|
|
23,758,344 |
|
|
|
78,834,510 |
|
|
|
(33,769,001 |
) |
|
|
(83,400,511 |
) |
|
|
- |
|
|
|
(78,834,510 |
) |
|
|
188,988,907 |
|
| Preferred Stocks |
|
|
1,395,231 |
|
|
|
- |
|
|
|
15,484,979 |
|
|
|
(123,689 |
) |
|
|
- |
|
|
|
- |
|
|
|
(16,756,521 |
) |
|
|
- |
|
| Warrants |
|
|
- |
|
|
|
- |
|
|
|
(6,275 |
) |
|
|
6,275 |
|
|
|
- |
|
|
|
- |
|
|
|
- |
|
|
|
- |
|
| |
|
$ |
335,837,987 |
|
|
$ |
24,639,205 |
|
|
$ |
96,428,238 |
|
|
$ |
23,089,325 |
|
|
$ |
(83,400,511 |
) |
|
$ |
1,287,443 |
|
|
$ |
(100,578,640 |
) |
|
$ |
297,303,047 |
|
The change in unrealized gains or losses attributable
to Level 3 investments held at December 31, 2025 was $34,583,963.
Transfers of investments between different levels
of the fair value hierarchy are recorded at fair value as of the end of the reporting period. There were transfers of $24,639,205 out
of Level 2 and NAV as Practical Expedient into Level 3. Transfers into Level 3 were due to change in valuation technique from NAV as Practical
Expedient to adjusted NAV as Practical Expedient.
FPA Crescent Fund
NOTES TO FINANCIAL STATEMENTS - Continued
December 31, 2025
The following table presents additional quantitative
information about valuation methodologies and inputs used for investments that are measured at fair value and categorized within Level
3 as of December 31, 2025.
| Asset Class |
|
Fair Value
December 31,
2025 |
|
|
Valuation
Methodologies |
|
Unobservable
Input |
|
Input Range/
Value |
|
Valuation
Weighted
Average of
Input |
|
|
Impact
to
Valuation
From an
Increase in
Input (1) |
| Corporate Bank Debt |
|
$ |
46,203,406 |
|
|
Pricing Model(2) |
|
Quotes/Prices |
|
$25 - $88 |
|
$ |
82.41 |
|
|
Increase |
| |
|
|
880,861 |
|
|
Third-Party Broker Quote (3) |
|
Quotes/Prices |
|
$82.00 |
|
$ |
82.00 |
|
|
Increase |
| Closed End Funds |
|
|
5,469,607 |
|
|
Pricing Model(4) |
|
Last Reported Trade |
|
$1.15 |
|
$ |
1.15 |
|
|
Increase |
| Common Stocks - Long |
|
|
- |
|
|
Pricing Model(5) |
|
Estimated Recovery Proceeds |
|
$0.00 |
|
$ |
0.00 |
|
|
Increase |
| |
|
|
12,981,991 |
|
|
Most Recent Capitalization (Funding)(6) |
|
Revenue Multiple |
|
$391.85 |
|
$ |
391.85 |
|
|
Increase |
| |
|
|
42,778,275 |
|
|
Pricing Model(2) |
|
Quotes/Prices |
|
$15.00 |
|
$ |
15.00 |
|
|
Increase |
| Limited Partnerships |
|
|
164,751,264 |
|
|
Market Approach(7) |
|
Shipping Broker Valuations |
|
10% - 25% |
|
|
24 |
% |
|
Increase |
| |
|
|
23,758,344 |
|
|
Adjusted NAV as Practical Expedient
(8) |
|
Quotes/Prices |
|
35% |
|
|
35 |
% |
|
Increase |
| |
|
|
479,299 |
|
|
Discounted NAV(9) |
|
Market Discount |
|
10% |
|
|
10 |
% |
|
Decrease |
| Warrants |
|
|
- |
|
|
Asset Approach(10) |
|
Estimated Recovery Proceeds |
|
$0.00 |
|
$ |
0.00 |
|
|
Increase |
|
| (1) |
This column represents the directional change in the fair value of the Level 3 investments that would results
from an increase to the corresponding unobservable input. A decrease to the unobservable input would have the opposite effect. |
|
| (2) |
The Pricing Model technique for Level 3 securities involves recently quoted prices of the security. |
|
| (3) |
The Third Party Broker Quote technique involves obtaining an independent third-party broker quote for the
security. |
|
| (4) |
The Pricing Model technique for Level 3 securities involves the last reported trade in the security. |
|
| (5) |
The Pricing Model technique for Level 3 securities involves the issuance of non-tradable rights with no set
exercise date. |
|
| (6) |
The fair value of the investment is based on capital funding terms and discounted based on market trends.
If the financial condition of the underlying assets were to deteriorate, or if the market comparables were to fall, the value of the investment
could be lower. |
|
| (7) |
The Discounted Cash Flow valuation technique involves estimating the value of an asset based on discounting
a future stream of estimated cash flows using a discount rate determined by the Advisor. |
|
| (8) |
The NAV provided by the general partner has been adjusted for the market price change of the underlying security
subsequent to the September 30, 2025 NAV. |
|
| (9) |
The NAV provided by the general partner has been discounted for the possible impact from various exit strategies
under consideration by the general partner. |
|
| (10) |
The Asset Approach technique for Level 3 securities involves the projected value of warrants that are pending
cancellation. |
FPA Crescent Fund
NOTES TO FINANCIAL STATEMENTS - Continued
December 31, 2025
The following is the fair value measurement of investments
that are valued at NAV per share (or its equivalent) as a practical expedient:
| Limited Partnerships |
|
Investment
Strategy |
|
Value |
|
|
Unfunded
Commitments |
|
|
Redemption
Frequency |
|
Redemption
Notice
Period |
|
Lock Up
Period |
| Jett Texas LLC |
|
Long-term Equity |
|
$ |
23,960,250 |
|
|
$ |
- |
|
|
Closed End Fund |
|
N/A |
|
N/A |
| |
|
|
|
$ |
23,960,250 |
|
|
$ |
- |
|
|
|
|
|
|
|
Note 12 – Derivatives and Hedging Disclosures
Derivatives and Hedging requires enhanced disclosures
about the Fund’s derivative and hedging activities, including how such activities are accounted for and their effects on the Fund’s
financial position, performance and cash flows.
The effects of these derivative instruments on the
Fund’s financial position and financial performance as reflected in the Statement of Assets and Liabilities and Statement of Operations
are presented in the tables below. The fair values of derivative instruments as of December 31, 2025 by risk category are as follows:
| |
|
Asset Derivatives |
|
Liability Derivatives |
| Derivatives not designated as hedging instruments |
|
Statements of Assets
and Liabilities |
|
Value |
|
|
Statements of Assets
and Liabilities |
|
Value |
|
| Equity contracts |
|
Unrealized appreciation on open swap contracts |
|
$ |
- |
|
|
Unrealized depreciation on open swap contracts |
|
$ |
781,827 |
|
The effects of derivative instruments on the Statement
of Operations for the year ended December 31, 2025, are as follows:
| |
|
Derivatives not designated as hedging instruments |
|
| |
|
Equity Contracts |
|
|
Total |
|
| Realized Gain (Loss) on Derivatives |
|
|
|
|
|
|
|
|
| Swap contracts |
|
$ |
(15,218,378 |
) |
|
$ |
(15,218,378 |
) |
| |
|
Equity Contracts |
|
|
Total |
|
| Net Change in Unrealized Appreciation/Depreciation on Derivatives |
|
|
|
|
|
|
|
|
| Swap contracts |
|
$ |
13,760,053 |
|
|
$ |
13,760,053 |
|
The notional amount is included on the Schedule of
Investments. The quarterly average volumes of derivative instruments as of December 31, 2025 are as follows:
| Derivatives not designated as hedging instruments |
|
|
|
|
|
|
|
| Equity contracts |
|
Swap contracts |
|
Notional amount |
|
$ |
28,163,851 |
|
FPA Crescent Fund
NOTES TO FINANCIAL STATEMENTS - Continued
December 31, 2025
Note 13 - Disclosures about Offsetting Assets and
Liabilities
Disclosures about Offsetting Assets and Liabilities
requires an entity to disclose information about offsetting and related arrangements to enable users of its financial statements to understand
the effect of those arrangements on its financial position. The guidance requires retrospective application for all comparative periods
presented.
A Fund mitigates credit risk with respect to OTC derivative
counterparties through credit support annexes included with International Swaps and Derivatives Association Master Agreements or other
Master Netting Agreements which are the standard contracts governing most derivative transactions between the Fund and each of its counterparties.
These agreements allow the Fund and each counterparty to offset certain derivative financial instruments’ payables and/or receivables
against each other and/or with collateral, which is generally held by the Fund’s custodian. The amount of collateral moved to/from
applicable counterparties is based upon minimum transfer amounts specified in the agreement. To the extent amounts due to the Fund from
its counterparties are not fully collateralized contractually or otherwise, the Fund bears the risk of loss from counterparty non-performance.
The Fund’s Statement of Assets and Liabilities
presents financial instruments on a gross basis, therefore there are no net amounts and no offset amounts within the Statement of Assets
and Liabilities to present below. Gross amounts of the financial instruments, amounts related to financial instruments/cash collateral
not offset in the Statement of Assets and Liabilities and net amounts are presented below:
| |
|
|
|
|
|
|
Amounts Not Offset in
Statements of Assets
and
Liabilities |
|
|
|
|
| Description |
|
Counterparty |
|
Gross Amounts
Recognized in the
Statements of
Assets and
Liabilities |
|
|
Financial
Instruments |
|
|
Cash
Collateral |
|
|
Net Amount |
|
| Unrealized depreciation on open swap contracts |
|
Nomura |
|
$ |
(781,827 |
) |
|
$ |
- |
|
|
$ |
- |
|
|
$ |
(781,827 |
) |
Note 14 – Investments in Affiliated Issuers
An affiliated issuer is an entity in which the Fund
has ownership of a least 5% of the voting securities. Issuers that are affiliates of the Fund at period-end are noted in the Fund’s
Schedule of Investments. Additional security purchases and the reduction of certain securities shares outstanding of existing portfolio
holdings that were not considered affiliated in prior years may result in the Fund owning in excess of 5% of the outstanding shares at
period-end. The table below reflects transactions during the period with entities that are affiliates as of December 31, 2025 and may
include acquisitions of new investments, prior year holdings that became affiliated during the period and prior period affiliated holdings
that are no longer affiliated as of period-end:
FPA Crescent Fund
NOTES TO FINANCIAL STATEMENTS - Continued
December 31, 2025
| Security Description |
|
Shares Held as of
December 31,
2024 |
|
|
Beginning Value
December 31, 2024 |
|
|
Purchases at
Cost |
|
|
Proceeds from
Sales |
|
|
Net Realized
Gain (Loss) on
Sales
Affiliated
Investment |
|
| Azelis Group N.V. |
|
|
- |
|
|
$ |
- |
|
|
$ |
190,182,642 |
|
|
$ |
- |
|
|
$ |
- |
|
| FPS Holdco LLC |
|
|
2,073,734 |
|
|
|
251,127,867 |
|
|
|
- |
|
|
|
(33,076,210 |
) |
|
|
33,076,210 |
|
| FPS Shelby Holdco I LLC |
|
|
107,799 |
|
|
|
8,876,467 |
|
|
|
- |
|
|
|
- |
|
|
|
- |
|
| Lealand Finance Company B.V. Senior Exit LC, 3.500%, 6/30/2027 |
|
|
26,423,878 |
|
|
|
(11,890,745 |
) |
|
|
- |
|
|
|
- |
|
|
|
2,115,045 |
|
| Lealand Reficar LC Term Loan, 11.433% (3-Month Term SOFR+750 basis points), 6/30/2027 |
|
|
529,985 |
|
|
|
344,490 |
|
|
|
72,773 |
|
|
|
- |
|
|
|
- |
|
| McDermott International, Ltd. |
|
|
356,485,315 |
|
|
|
17,824,266 |
|
|
|
- |
|
|
|
- |
|
|
|
- |
|
| McDermott LC, 8.552% (3-Month Term SOFR+426.16 basis points), 6/30/2027 |
|
|
31,488,546 |
|
|
|
17,318,701 |
|
|
|
- |
|
|
|
(4,987,609 |
) |
|
|
(21 |
) |
| McDermott Technology Americas, Inc., 6.831% (1-Month Term SOFR+300 basis points), 6/30/2027 |
|
|
1,074,221 |
|
|
|
531,739 |
|
|
|
- |
|
|
|
- |
|
|
|
- |
|
| McDermott Technology Americas, Inc., 7.831% (1-Month Term SOFR+400 basis points), 12/31/2027 |
|
|
39,380,822 |
|
|
|
13,783,288 |
|
|
|
1,214,670 |
|
|
|
- |
|
|
|
- |
|
| Sound Holding FP |
|
|
1,146,250 |
|
|
|
21,949,607 |
|
|
|
- |
|
|
|
(45,758,300 |
) |
|
|
45,758,300 |
|
| U.S. Farming Realty Trust II LP |
|
|
120,000 |
|
|
|
446,134 |
|
|
|
- |
|
|
|
- |
|
|
|
- |
|
| Total |
|
|
|
|
|
$ |
320,311,814 |
|
|
$ |
191,470,085 |
|
|
$ |
(83,822,119 |
) |
|
$ |
80,949,534 |
|
| Security Description - Continued |
|
Accretion of
Discount
(Amortization
of
Premium) and
Return of Capital |
|
|
Change in
Unrealized
Appreciation
(Depreciation) |
|
|
Transfer In
(Out) |
|
|
Ending Value
December 31,
2025 |
|
|
Shares as of
December
31, 2025 |
|
|
Income from
Affiliated
Investments |
|
| Azelis Group N.V. |
|
$ |
- |
|
|
$ |
(5,215,788 |
) |
|
$ |
- |
|
|
$ |
184,966,854 |
|
|
|
16,929,662 |
|
|
$ |
491,462 |
|
| FPS Holdco LLC |
|
|
(83,400,511 |
) |
|
|
(13,252,560 |
) |
|
|
- |
|
|
|
154,474,796 |
|
|
|
2,073,734 |
|
|
|
32,773,292 |
|
| FPS Shelby Holdco I LLC |
|
|
- |
|
|
|
1,400,001 |
|
|
|
- |
|
|
|
10,276,468 |
|
|
|
107,799 |
|
|
|
- |
|
| Lealand Finance Company B.V. Senior Exit LC, 3.500%, 6/30/2027 |
|
|
- |
|
|
|
4,314,458 |
|
|
|
- |
|
|
|
(5,461,242 |
) |
|
|
21,844,968 |
|
|
|
958,300 |
|
| Lealand Reficar LC Term Loan, 11.433% (3-Month Term SOFR+750 basis points), 6/30/2027 |
|
|
- |
|
|
|
113,164 |
|
|
|
- |
|
|
|
530,427 |
|
|
|
602,758 |
|
|
|
55,823 |
|
| McDermott International, Ltd. |
|
|
- |
|
|
|
24,954,009 |
|
|
|
- |
|
|
|
42,778,275 |
|
|
|
2,851,885 |
|
|
|
- |
|
| McDermott LC, 8.552% (3-Month Term SOFR+426.16 basis points), 6/30/2027 |
|
|
- |
|
|
|
7,544,620 |
|
|
|
- |
|
|
|
19,875,691 |
|
|
|
26,500,921 |
|
|
|
2,550,881 |
|
| McDermott Technology Americas, Inc., 6.831% (1-Month Term SOFR+300 basis points), 6/30/2027 |
|
|
- |
|
|
|
349,122 |
|
|
|
- |
|
|
|
880,861 |
|
|
|
1,074,221 |
|
|
|
80,190 |
|
| McDermott Technology Americas, Inc., 7.831% (1-Month Term SOFR+400 basis points), 12/31/2027 |
|
|
- |
|
|
|
16,260,572 |
|
|
|
- |
|
|
|
31,258,530 |
|
|
|
40,595,493 |
|
|
|
3,394,872 |
|
| Sound Holding FP |
|
|
- |
|
|
|
(21,949,607 |
) |
|
|
- |
|
|
|
- |
|
|
|
1,146,250 |
|
|
|
- |
|
| US Farming Realty Trust II LP |
|
|
- |
|
|
|
33,165 |
|
|
|
- |
|
|
|
479,299 |
|
|
|
120,000 |
|
|
|
- |
|
| Total |
|
$ |
(83,400,511 |
) |
|
$ |
14,551,156 |
|
|
$ |
- |
|
|
$ |
440,059,959 |
|
|
|
|
|
|
$ |
40,304,820 |
|
FPA Crescent Fund
NOTES TO FINANCIAL STATEMENTS - Continued
December 31, 2025
Note 15 – Restricted Securities
Restricted securities include securities that have
not been registered under the Securities Act of 1933, as amended, and securities that are subject to restrictions on resale. The Fund
may invest in restricted securities that are consistent with the Fund’s investment objective and investment strategies. Investments
in restricted securities are valued at net asset value as a practical expedient for fair value, or fair value as determined in good faith
in accordance with procedures adopted by the Board. It is possible that the estimated value may differ significantly from the amount that
might ultimately be realized in the near term, and the difference could be material.
As of December 31, 2025, the Fund invested in the
following restricted securities:
| Restricted Security |
|
Initial
Acquisition
Date |
|
Cost |
|
|
Fair Value |
|
|
Fair Value
as a %
of Net
Assets |
|
| Altegrity, Inc. |
|
9/1/2021 |
|
$ |
- |
|
|
$ |
5,469,607 |
|
|
|
0.05 |
% |
| Cornerstone OnDemand, Inc., 7.683% (1-Month Term SOFR+375 basis points), 10/16/2028 |
|
12/7/2022 |
|
|
2,462,128 |
|
|
|
2,275,626 |
|
|
|
0.02 |
% |
| Epic Games, Inc. |
|
6/25/2020 |
|
|
19,049,750 |
|
|
|
12,981,991 |
|
|
|
0.11 |
% |
| Footpath Ventures SPV IV LP |
|
9/24/2021 |
|
|
15,962,550 |
|
|
|
23,758,344 |
|
|
|
0.20 |
% |
| FPS Holdco LLC |
|
10/17/2018 |
|
|
49,268,895 |
|
|
|
154,474,796 |
|
|
|
1.30 |
% |
| FPS Shelby Holdco I LLC |
|
2/4/2020 |
|
|
11,073,935 |
|
|
|
10,276,468 |
|
|
|
0.09 |
% |
| Jett Texas LLC |
|
12/2/2024 |
|
|
22,500,000 |
|
|
|
23,960,250 |
|
|
|
0.20 |
% |
| Lealand Finance Company B.V. Senior Exit LC, 3.500% 6/30/2027 |
|
11/12/2019 |
|
|
(9,488,847 |
) |
|
|
(5,461,242 |
) |
|
|
-0.05 |
% |
| Lealand Reficar LC Term Loan, 11.433% (3-Month Term SOFR+750 basis points), 6/30/2027 |
|
4/5/2024 |
|
|
602,758 |
|
|
|
530,427 |
|
|
|
0.00 |
% |
| McDermott International, Ltd. |
|
7/1/2020 |
|
|
56,700,448 |
|
|
|
42,778,275 |
|
|
|
0.36 |
% |
| McDermott LC, 8.552% (3-Month Term SOFR+426.16 basis points), 6/30/2027 |
|
12/31/2020 |
|
|
26,500,949 |
|
|
|
19,875,691 |
|
|
|
0.17 |
% |
| McDermott Technology Americas, Inc., 6.831% (1-Month Term SOFR+300 basis points), 6/30/2027 |
|
7/1/2020 |
|
|
1,074,192 |
|
|
|
880,861 |
|
|
|
0.01 |
% |
| McDermott Technology Americas, Inc., 7.831% (1-Month Term SOFR+400 basis points), 12/31/2027 |
|
7/1/2020 |
|
|
50,746,348 |
|
|
|
31,258,530 |
|
|
|
0.26 |
% |
| Pershing Square Tontine Holdings Ltd. |
|
7/26/2022 |
|
|
- |
|
|
|
- |
|
|
|
0.00 |
% |
| Sound Holding FP |
|
10/7/2013 |
|
|
- |
|
|
|
- |
|
|
|
0.00 |
% |
| U.S. Farming Realty Trust II LP |
|
12/24/2012 |
|
|
- |
|
|
|
479,299 |
|
|
|
0.00 |
% |
| Vision Solutions, Inc., 8.102% (3-Month Term SOFR+400 basis points), 4/24/2028 |
|
12/7/2022 |
|
|
2,255,852 |
|
|
|
2,296,995 |
|
|
|
0.02 |
% |
| |
|
|
|
$ |
248,708,958 |
|
|
$ |
325,835,918 |
|
|
|
2.74 |
% |
Note 16 – Market Disruption and Geopolitical
Risks
Certain local, regional or global events such as war,
acts of terrorism, the spread of infectious illness and/or other public health issues, financial institution instability or other events
may have a significant impact on a security or instrument. These types of events and other like them are collectively referred to as “Market
Disruptions and Geopolitical Risks” and they may have adverse impacts on the worldwide economy, as well as the economies of individual
countries, the financial health of individual companies and the market in general in significant and unforeseen ways. Some of the impacts
noted in recent times include but are not limited to embargos, political actions, supply chain disruptions, tariffs, bank failures, restrictions
to investment and/or monetary movement including the forced selling of securities or the inability to participate impacted markets. The
duration of these events could adversely affect the Funds’ performance, the performance of the securities in which the Funds invest
and may lead to losses on your investment. The ultimate impact of “Market Disruptions and Geopolitical Risks” on the financial
performance of the Funds’ investments is not reasonably estimable at this time. Management is actively monitoring these events.
FPA Crescent Fund
NOTES TO FINANCIAL STATEMENTS - Continued
December 31, 2025
Note 17 – New Accounting Pronouncements
In the reporting period, the Fund adopted FASB Accounting
Standards Update 2023-09, Income Taxes (Topic 740) — Improvements to Income Tax Disclosures (ASU 2023-09), which enhances income
tax disclosures, including disclosure income taxes paid disaggregated by jurisdiction. Adoption of the new standard did not materially
impact financial statement disclosures and did not affect the Fund’s financial position or the results of its operations.
Note 18 – Events Subsequent to the Fiscal
Period End
The Fund has adopted financial reporting rules regarding
subsequent events which require an entity to recognize in the financial statements the effects of all subsequent events that provide additional
evidence about conditions that existed at the date of the balance sheet. Management has evaluated the Fund’s related events and
transactions that occurred through the date of issuance of the Fund’s financial statements.
On July 15, 2025, the Board of Trustees approved an
Agreement and Plan of Reorganization (the “Plan”) for the reorganization of the Centerstone Investors Fund, a series of Northern
Lights Fund Trust III (the “Acquired Fund”), into the FPA Crescent Fund (the “Acquiring Fund”). The Plan provides
for the transfer of all of the assets of the Acquired Fund to the Acquiring Fund in exchange for shares of the Acquiring Fund and the
assumption of all of the liabilities of the Acquired Fund by the Acquiring Fund, and the distribution of the Acquiring Fund’s shares
received by such Acquired Fund to its shareholders in complete liquidation of the Acquired Fund (the “Reorganization”). The
Reorganization of the Acquired Fund generally is not expected to result in the recognition of gain or loss by the Acquired Fund or its
shareholders for federal income tax purposes. The reorganization was effective as of the close of business on January 9, 2026.
There were no other events or transactions that occurred
during this period that materially impacted the amounts or disclosures in the Fund’s financial statements.
REPORT OF INDEPENDENT REGISTERED PUBLIC ACCOUNTING
FIRM
To the Board of Trustees
and the Shareholders of the FPA Crescent Fund
Opinion on the Financial Statements
We have audited the accompanying statement of assets
and liabilities of the FPA Crescent Fund (the “Fund”), a series of Investment Managers Series Trust III, including the schedule
of investments, as of December 31, 2025, the related statement of operations for the year then ended, the statement of changes in net
assets for each of the two years in the period then ended, and financial highlights for each of the three years in the period then ended,
and the related notes (collectively referred to as the “financial statements”). In our opinion, the financial statements present
fairly, in all material respects, the financial position of the Fund as of December 31, 2025, the results of its operations for the year
then ended, the changes in its net assets for each of the two years in the period then ended, and the financial highlights for each of
the three years in the period then ended, in conformity with accounting principles generally accepted in the United States of America.
The financial highlights for each of the two years
in the period ended December 31, 2022, were audited by other auditors, whose report dated March 1, 2023 expressed unqualified opinions
on those financial highlights.
Basis for Opinion
These financial statements are the responsibility
of the Fund’s management. Our responsibility is to express an opinion on the Fund’s financial statements based on our audits.
We are a public accounting firm registered with the Public Company Accounting Oversight Board (United States) (“PCAOB”) and
are required to be independent with respect to the Fund in accordance with the U.S. federal securities laws and the applicable rules and
regulations of the Securities and Exchange Commission and the PCAOB. We have served as the auditor of the Fund since 2023.
We conducted our audits in accordance with the standards
of the PCAOB. Those standards require that we plan and perform the audit to obtain reasonable assurance about whether the financial statements
are free of material misstatement, whether due to error or fraud. The Fund is not required to have, nor were we engaged to perform, an
audit of its internal control over financial reporting. As part of our audits, we are required to obtain an understanding of internal
control over financial reporting, but not for the purpose of expressing an opinion on the effectiveness of the Fund’s internal control
over financial reporting. Accordingly, we express no such opinion.
Our audits included performing procedures to assess
the risks of material misstatement of the financial statements, whether due to error or fraud, and performing procedures that respond
to those risks. Such procedures included examining, on a test basis, evidence regarding the amounts and disclosures in the financial statements.
Our audits also included evaluating the accounting principles used and significant estimates made by management, as well as evaluating
the overall presentation of the financial statements. Our procedures included confirmation of securities owned as of December 31, 2025
by correspondence with the custodian, agent banks, brokers, and others or by other appropriate auditing procedures where replies were
not received. We believe that our audits provide a reasonable basis for our opinion.
| |
 |
| |
TAIT, WELLER &
BAKER LLP |
Philadelphia, Pennsylvania
February 27, 2026
FPA Flexible Fixed Income Fund
(Investor Class: FFIRX)
(Institutional Class: FPFIX)
(Advisor Class: FFIAX)
ANNUAL FINANCIALS AND OTHER INFORMATION
DECEMBER 31, 2025
FPA Flexible Fixed Income Fund
A series of Investment Managers Series Trust III
Table of Contents
Please note the Financials and Other Information only
contains Items 7-11 required in Form N-CSR. All other required items will be filed with the SEC.
| Item 7. Financial Statements and Financial Highlights |
|
| Schedule of Investments |
1 |
| Statement of Assets and Liabilities |
17 |
| Statement of Operations |
18 |
| Statements of Changes in Net Assets |
19 |
| Financial Highlights |
20 |
| Notes to Financial Statements |
23 |
| Report of Independent Registered Public Accounting Firm |
37 |
This report and the financial statements contained
herein are provided for the general information of the shareholders of the FPA Flexible Fixed Income Fund (the “Fund”). This
report is not authorized for distribution to prospective investors in the Fund unless preceded or accompanied by an effective shareholder
report and prospectus.
https://fpa.com
FPA Flexible Fixed Income Fund
SCHEDULE OF INVESTMENTS
As of December 31, 2025
Principal
Amount |
|
|
|
|
Value |
|
| |
|
|
|
BONDS & DEBENTURES — 86.9% |
|
|
|
|
| |
|
|
|
ASSET-BACKED SECURITIES — 19.5% |
|
|
|
|
| |
|
|
|
AUTO — 3.4% |
|
|
|
|
| $ |
931,000 |
|
|
Ally Auto Receivables Trust
Series 2023-1, Class A4, 5.270%, 11/15/2028 |
|
$ |
948,149 |
|
| |
701,000 |
|
|
BMW Vehicle Owner Trust
Series 2023-A, Class A4, 5.250%, 11/26/2029 |
|
|
711,567 |
|
| |
|
|
|
CarMax Auto Owner Trust |
|
|
|
|
| |
2,027,000 |
|
|
Series 2023-2, Class A4, 5.010%, 11/15/2028 |
|
|
2,052,044 |
|
| |
904,000 |
|
|
Series 2023-1, Class A4, 4.650%, 1/16/2029 |
|
|
908,936 |
|
| |
2,146,000 |
|
|
Series 2023-3, Class A4, 5.260%, 2/15/2029 |
|
|
2,187,142 |
|
| |
|
|
|
Ford Credit Auto Owner Trust |
|
|
|
|
| |
1,343,000 |
|
|
Series 2023-A, Class A4, 4.560%, 12/15/2028 |
|
|
1,352,554 |
|
| |
734,000 |
|
|
Series 2023-B, Class A4, 5.060%, 2/15/2029 |
|
|
743,755 |
|
| |
1,424,000 |
|
|
GM Financial Consumer Automobile Receivables Trust
Series 2023-3, Class A4, 5.340%,
12/18/2028 |
|
|
1,447,749 |
|
| |
|
|
|
GM Financial Revolving Receivables Trust |
|
|
|
|
| |
3,383,000 |
|
|
Series 2021-1, Class
A, 1.170%, 6/12/2034(a) |
|
|
3,317,265 |
|
| |
5,133,000 |
|
|
Series 2023-1, Class
A, 5.120%, 4/11/2035(a) |
|
|
5,261,401 |
|
| |
1,403,000 |
|
|
Series 2023-2, Class
A, 5.770%, 8/11/2036(a) |
|
|
1,472,489 |
|
| |
8,349,000 |
|
|
Series 2024-1, Class
A, 4.980%, 12/11/2036(a) |
|
|
8,578,555 |
|
| |
1,112,000 |
|
|
Hyundai Auto Receivables Trust
Series 2023-B, Class A4, 5.310%, 8/15/2029 |
|
|
1,129,731 |
|
| |
|
|
|
Mercedes-Benz Auto Receivables Trust |
|
|
|
|
| |
816,000 |
|
|
Series 2023-1, Class A4, 4.310%, 4/16/2029 |
|
|
819,176 |
|
| |
1,038,000 |
|
|
Series 2024-1, Class A4, 4.790%, 7/15/2031 |
|
|
1,057,868 |
|
| |
1,485,000 |
|
|
Nissan Auto Receivables Owner Trust
Series 2023-A, Class A4, 4.850%, 6/17/2030 |
|
|
1,499,550 |
|
| |
1,721,000 |
|
|
Porsche Financial
Auto Securitization Trust
Series 2023-1A, Class A4, 4.720%, 6/23/2031(a) |
|
|
1,732,239 |
|
| |
919,000 |
|
|
SFS Auto Receivables
Securitization Trust
Series 2023-1A, Class A4, 5.470%, 12/20/2029(a) |
|
|
934,522 |
|
| |
|
|
|
Toyota Auto Loan Extended Note Trust |
|
|
|
|
| |
5,017,000 |
|
|
Series 2022-1A,
Class A, 3.820%, 4/25/2035(a) |
|
|
5,015,391 |
|
| |
4,553,000 |
|
|
Series 2023-1A,
Class A, 4.930%, 6/25/2036(a) |
|
|
4,656,171 |
|
| |
8,239,000 |
|
|
Series 2024-1A,
Class A, 5.160%, 11/25/2036(a) |
|
|
8,545,003 |
|
| |
|
|
|
Toyota Auto Receivables Owner Trust |
|
|
|
|
| |
1,343,000 |
|
|
Series 2023-A, Class A4, 4.420%, 8/15/2028 |
|
|
1,350,873 |
|
| |
1,973,000 |
|
|
Series 2023-B, Class A4, 4.660%, 9/15/2028 |
|
|
1,991,364 |
|
| |
2,714,000 |
|
|
Series 2023-C, Class A4, 5.010%, 2/15/2029 |
|
|
2,757,830 |
|
| |
1,181,000 |
|
|
Volkswagen Auto Loan Enhanced Trust
Series 2023-1, Class A4, 5.010%, 1/22/2030 |
|
|
1,195,116 |
|
| |
|
|
|
World Omni Auto Receivables Trust |
|
|
|
|
| |
1,251,000 |
|
|
Series 2023-A, Class A4, 4.660%, 5/15/2029 |
|
|
1,258,786 |
|
| |
2,055,000 |
|
|
Series 2023-B, Class A4, 4.680%, 5/15/2029 |
|
|
2,073,017 |
|
FPA Flexible Fixed Income Fund
SCHEDULE OF INVESTMENTS - Continued
As of December 31, 2025
Principal
Amount |
|
|
|
|
Value |
|
| |
|
|
|
BONDS & DEBENTURES (Continued) |
|
|
|
|
| |
|
|
|
ASSET-BACKED SECURITIES (Continued) |
|
|
|
|
| |
|
|
|
AUTO (Continued) |
|
|
|
|
| $ |
1,107,000 |
|
|
Series 2023-C, Class A4, 5.030%, 11/15/2029 |
|
$ |
1,122,726 |
|
| |
|
|
|
|
|
|
66,120,969 |
|
| |
|
|
|
COLLATERALIZED LOAN OBLIGATION — 2.1% |
|
|
|
|
| |
1,460,000 |
|
|
Barings Middle Market
Ltd.
Series 2021-IA, Class D, 12.796% (3-Month Term SOFR+891.161 basis points), 7/20/2033(a),(b) |
|
|
1,461,481 |
|
| |
|
|
|
Cerberus Loan Funding LLC |
|
|
|
|
| |
901,000 |
|
|
Series 2023-1A,
Class A, 6.305% (3-Month Term SOFR+240 basis points), 3/22/2035(a),(b) |
|
|
903,125 |
|
| |
5,057,000 |
|
|
Series 2023-2A,
Class A1, 6.454% (3-Month Term SOFR+255 basis points), 7/15/2035(a),(b) |
|
|
5,091,625 |
|
| |
5,734,000 |
|
|
Series 2023-4A,
Class A, 6.330% (3-Month Term SOFR+242.5 basis points), 10/15/2035(a),(b) |
|
|
5,790,704 |
|
| |
|
|
|
Fortress Credit Opportunities Ltd. |
|
|
|
|
| |
5,645,000 |
|
|
Series 2017-9A,
Class A1TR, 5.716% (3-Month Term SOFR+181.161 basis points), 10/15/2033(a),(b) |
|
|
5,662,217 |
|
| |
8,814,000 |
|
|
Series 2017-9A,
Class ER, 12.226% (3-Month Term SOFR+832.161 basis points), 10/15/2033(a),(b) |
|
|
8,854,606 |
|
| |
|
|
|
Golub Capital Partners Ltd. |
|
|
|
|
| |
4,361,000 |
|
|
Series 2023-67A,
Class A1, 6.365% (3-Month Term SOFR+250 basis points), 5/9/2036(a),(b) |
|
|
4,395,452 |
|
| |
5,388,000 |
|
|
Series 2019-46A,
Class A1R, 5.694% (3-Month Term SOFR+181 basis points), 4/20/2037(a),(b) |
|
|
5,399,153 |
|
| |
2,646,000 |
|
|
Parliament
Ltd.
Series 2021-2A, Class D, 7.851% (3-Month Term SOFR+396.161 basis points), 8/20/2032(a),(b) |
|
|
2,640,586 |
|
| |
|
|
|
|
|
|
40,198,949 |
|
| |
|
|
|
EQUIPMENT — 7.8% |
|
|
|
|
| |
|
|
|
Avis Budget Rental Car Funding AESOP LLC |
|
|
|
|
| |
1,059,000 |
|
|
Series 2023-1A,
Class A, 5.250%, 4/20/2029(a) |
|
|
1,082,376 |
|
| |
3,527,000 |
|
|
Series 2023-4A,
Class A, 5.490%, 6/20/2029(a) |
|
|
3,615,841 |
|
| |
4,981,000 |
|
|
Series 2023-6A,
Class A, 5.810%, 12/20/2029(a) |
|
|
5,184,431 |
|
| |
3,599,000 |
|
|
Series 2023-8A,
Class A, 6.020%, 2/20/2030(a) |
|
|
3,771,644 |
|
| |
1,728,000 |
|
|
Series 2024-1A,
Class A, 5.360%, 6/20/2030(a) |
|
|
1,783,082 |
|
| |
7,423,000 |
|
|
Series 2024-3A,
Class A, 5.230%, 12/20/2030(a) |
|
|
7,652,369 |
|
| |
|
|
|
CNH Equipment Trust |
|
|
|
|
| |
581,000 |
|
|
Series 2022-B, Class A4, 3.910%, 3/15/2028 |
|
|
580,774 |
|
| |
644,000 |
|
|
Series 2023-A, Class A4, 4.770%, 10/15/2030 |
|
|
651,892 |
|
| |
1,805,000 |
|
|
Series 2023-B, Class A4, 5.460%, 3/17/2031 |
|
|
1,853,713 |
|
| |
2,436,645 |
|
|
Coinstar Funding
LLC
Series 2017-1A, Class A2, 5.216%, 4/25/2047(a) |
|
|
2,772,846 |
|
FPA Flexible Fixed Income Fund
SCHEDULE OF INVESTMENTS - Continued
As of December 31, 2025
Principal
Amount |
|
|
|
|
Value |
|
| |
|
|
|
BONDS & DEBENTURES (Continued) |
|
|
|
|
| |
|
|
|
ASSET-BACKED SECURITIES (Continued) |
|
|
|
|
| |
|
|
|
EQUIPMENT (Continued) |
|
|
|
|
| |
|
|
|
Enterprise Fleet Financing LLC |
|
|
|
|
| $ |
1,104,472 |
|
|
Series
2022-2, Class A3, 4.790%, 5/21/2029(a) |
|
$ |
1,104,947 |
|
| |
760,000 |
|
|
Series 2022-3, Class
A3, 4.290%, 7/20/2029(a) |
|
|
760,822 |
|
| |
2,522,000 |
|
|
Series 2023-1, Class
A3, 5.420%, 10/22/2029(a) |
|
|
2,545,495 |
|
| |
1,601,000 |
|
|
Series 2022-4, Class
A3, 5.650%, 10/22/2029(a) |
|
|
1,616,532 |
|
| |
3,800,000 |
|
|
Series 2023-2, Class
A3, 5.500%, 4/22/2030(a) |
|
|
3,864,485 |
|
| |
3,748,000 |
|
|
Series 2023-3, Class
A3, 6.410%, 6/20/2030(a) |
|
|
3,882,708 |
|
| |
1,693,000 |
|
|
Series 2024-4, Class
A4, 4.700%, 6/20/2031(a) |
|
|
1,719,644 |
|
| |
3,339,000 |
|
|
Series 2025-4, Class
A4, 4.280%, 6/20/2032(a) |
|
|
3,348,971 |
|
| |
|
|
|
Ford Credit Floorplan Master Owner Trust |
|
|
|
|
| |
10,771,000 |
|
|
Series 2018-4, Class A, 4.060%, 11/15/2030 |
|
|
10,817,952 |
|
| |
6,057,000 |
|
|
Series 2024-2, Class
A, 5.240%, 4/15/2031(a) |
|
|
6,280,663 |
|
| |
3,949,000 |
|
|
Series 2024-4, Class
A, 4.400%, 9/15/2031(a) |
|
|
3,992,223 |
|
| |
|
|
|
GMF Floorplan Owner Revolving Trust |
|
|
|
|
| |
2,130,000 |
|
|
Series 2023-2, Class
A, 5.340%, 6/15/2030(a) |
|
|
2,196,410 |
|
| |
6,852,000 |
|
|
Series 2024-2A,
Class A, 5.060%, 3/15/2031(a) |
|
|
7,067,210 |
|
| |
|
|
|
GreatAmerica Leasing Receivables Funding LLC |
|
|
|
|
| |
1,675,000 |
|
|
Series 2023-1, Class
A4, 5.060%, 3/15/2030(a) |
|
|
1,699,574 |
|
| |
1,385,000 |
|
|
Series 2025-2, Class
A4, 4.290%, 9/15/2032(a) |
|
|
1,393,588 |
|
| |
|
|
|
Hertz Vehicle Financing LLC |
|
|
|
|
| |
3,499,000 |
|
|
Series 2021-2A,
Class A, 1.680%, 12/27/2027(a) |
|
|
3,433,211 |
|
| |
3,489,000 |
|
|
Series 2022-2A,
Class A, 2.330%, 6/26/2028(a) |
|
|
3,408,270 |
|
| |
6,142,000 |
|
|
Series 2022-5A,
Class A, 3.890%, 9/25/2028(a) |
|
|
6,106,998 |
|
| |
|
|
|
John Deere Owner Trust |
|
|
|
|
| |
1,372,000 |
|
|
Series 2023-A, Class A4, 5.010%, 12/17/2029 |
|
|
1,383,933 |
|
| |
1,203,000 |
|
|
Series 2023-B, Class A4, 5.110%, 5/15/2030 |
|
|
1,219,275 |
|
| |
1,664,000 |
|
|
Series 2023-C, Class A4, 5.390%, 8/15/2030 |
|
|
1,696,299 |
|
| |
|
|
|
Kubota Credit Owner Trust |
|
|
|
|
| |
1,359,000 |
|
|
Series 2023-2A,
Class A4, 5.230%, 6/15/2028(a) |
|
|
1,384,227 |
|
| |
876,000 |
|
|
Series 2023-1A,
Class A4, 5.070%, 2/15/2029(a) |
|
|
883,948 |
|
| |
|
|
|
M&T Equipment Notes |
|
|
|
|
| |
1,028,000 |
|
|
Series 2023-1A,
Class A4, 5.750%, 7/15/2030(a) |
|
|
1,043,146 |
|
| |
2,469,000 |
|
|
Series 2024-1A,
Class A4, 4.940%, 8/18/2031(a) |
|
|
2,518,609 |
|
| |
|
|
|
MMAF Equipment Finance LLC |
|
|
|
|
| |
2,626,000 |
|
|
Series 2023-A, Class
A4, 5.500%, 12/13/2038(a) |
|
|
2,683,092 |
|
| |
736,000 |
|
|
Series 2020-A, Class
A5, 1.560%, 10/9/2042(a) |
|
|
713,549 |
|
| |
5,085,000 |
|
|
Series 2024-A, Class
A4, 5.100%, 7/13/2049(a) |
|
|
5,262,922 |
|
| |
4,370,000 |
|
|
Series 2025-A, Class
A4, 5.020%, 6/13/2050(a) |
|
|
4,511,231 |
|
| |
3,350,000 |
|
|
Series 2025-B, Class
A4, 4.290%, 9/13/2050(a) |
|
|
3,343,201 |
|
| |
|
|
|
Verizon Master Trust |
|
|
|
|
| |
6,196,000 |
|
|
Series 2023-3, Class
A, 4.730%, 4/21/2031(a) |
|
|
6,308,162 |
|
| |
8,097,000 |
|
|
Series 2023-6, Class
A, 5.350%, 9/22/2031(a) |
|
|
8,393,838 |
|
| |
10,281,000 |
|
|
Series 2024-2, Class
A, 4.830%, 12/22/2031(a) |
|
|
10,529,684 |
|
FPA Flexible Fixed Income Fund
SCHEDULE OF INVESTMENTS - Continued
As of December 31, 2025
Principal
Amount |
|
|
|
|
Value |
|
| |
|
|
|
BONDS & DEBENTURES (Continued) |
|
|
|
|
| |
|
|
|
ASSET-BACKED SECURITIES (Continued) |
|
|
|
|
| |
|
|
|
EQUIPMENT (Continued) |
|
|
|
|
| $ |
4,579,000 |
|
|
Series
2024-7, Class A, 4.350%, 8/20/2032(a) |
|
$ |
4,602,742 |
|
| |
812,000 |
|
|
Volvo
Financial Equipment LLC
Series 2025-2A, Class A4, 4.060%, 6/15/2033(a) |
|
|
813,789 |
|
| |
|
|
|
|
|
|
151,480,318 |
|
| |
|
|
|
OTHER — 6.2% |
|
|
|
|
| |
|
|
|
ABPCI Direct Lending Fund LLC |
|
|
|
|
| |
1,354,437 |
|
|
Series 2022-2A,
Class A1, 5.958% (3-Month Term SOFR+210 basis points), 3/1/2032(a),(b) |
|
|
1,352,935 |
|
| |
5,659,440 |
|
|
Series 2022-2A,
Class C, 8.236%, 3/1/2032(a) |
|
|
5,631,199 |
|
| |
|
|
|
ABPCI Direct Lending Fund Ltd. |
|
|
|
|
| |
722,970 |
|
|
Series 2020-1A,
Class A, 3.199%, 12/29/2030(a) |
|
|
715,638 |
|
| |
1,842,899 |
|
|
Series 2020-1A,
Class B, 4.935%, 12/29/2030(a) |
|
|
1,822,750 |
|
| |
8,058,000 |
|
|
American Tower Trust
1
5.490%, 3/15/2028(a) |
|
|
8,181,316 |
|
| |
617,221 |
|
|
Brazos Securitization
LLC
5.014%, 9/1/2031(a) |
|
|
624,898 |
|
| |
10,409,000 |
|
|
Centerpoint Energy Restoration Bond Co. II LLC
4.255%, 12/15/2035 |
|
|
10,383,186 |
|
| |
7,283,154 |
|
|
Cleco Securitization II LLC
4.680%, 12/1/2036 |
|
|
7,388,592 |
|
| |
1,282,794 |
|
|
Cleco Securitization LLC
4.016%, 3/1/2031 |
|
|
1,270,107 |
|
| |
2,542,000 |
|
|
Consumers 2023 Securitization Funding LLC
5.210%, 9/1/2031 |
|
|
2,611,204 |
|
| |
512,000 |
|
|
Diamond Infrastructure
Funding LLC
Series 2021-1A, Class C, 3.475%, 4/15/2049(a) |
|
|
496,909 |
|
| |
1,718,000 |
|
|
Diamond Issuer LLC
Series 2021-1A, Class C, 3.787%, 11/20/2051(a) |
|
|
1,648,732 |
|
| |
2,621,112 |
|
|
DTE Electric Securitization Funding II LLC
5.970%, 3/1/2033 |
|
|
2,746,532 |
|
| |
5,175,000 |
|
|
Duke Energy Carolinas Nc Storm Funding II LLC
4.226%, 7/1/2037 |
|
|
5,171,481 |
|
| |
|
|
|
Elm Trust |
|
|
|
|
| |
54,654 |
|
|
Series 2020-3A,
Class A2, 2.954%, 8/20/2029(a) |
|
|
54,584 |
|
| |
9,541 |
|
|
Series 2020-3A,
Class B, 4.481%, 8/20/2029(a) |
|
|
9,529 |
|
| |
15,623 |
|
|
Series 2020-4A,
Class A2, 2.286%, 10/20/2029(a) |
|
|
15,598 |
|
| |
60,311 |
|
|
Series 2020-4A,
Class B, 3.866%, 10/20/2029(a) |
|
|
60,212 |
|
| |
|
|
|
Golub Capital Partners Funding Ltd. |
|
|
|
|
| |
686,985 |
|
|
Series 2020-1A,
Class A2, 3.208%, 1/22/2029(a) |
|
|
684,907 |
|
| |
472,655 |
|
|
Series 2020-1A,
Class B, 4.496%, 1/22/2029(a) |
|
|
470,059 |
|
| |
2,317,416 |
|
|
Series 2021-1A,
Class A2, 2.773%, 4/20/2029(a) |
|
|
2,308,114 |
|
| |
1,292,729 |
|
|
Series 2021-1A,
Class B, 3.816%, 4/20/2029(a) |
|
|
1,276,961 |
|
FPA Flexible Fixed Income Fund
SCHEDULE OF INVESTMENTS - Continued
As of December 31, 2025
Principal
Amount |
|
|
|
|
Value |
|
| |
|
|
|
BONDS & DEBENTURES (Continued) |
|
|
|
|
| |
|
|
|
ASSET-BACKED SECURITIES (Continued) |
|
|
|
|
| |
|
|
|
OTHER (Continued) |
|
|
|
|
| $ |
3,761,801 |
|
|
Series
2021-2A, Class A, 2.944%, 10/19/2029(a) |
|
$ |
3,675,178 |
|
| |
4,377,243 |
|
|
Series 2021-2A,
Class B, 3.994%, 10/19/2029(a) |
|
|
4,267,895 |
|
| |
|
|
|
Hotwire Funding LLC |
|
|
|
|
| |
1,250,000 |
|
|
Series 2021-1, Class
C, 4.459%, 11/20/2051(a) |
|
|
1,231,119 |
|
| |
1,385,000 |
|
|
Series 2023-1A,
Class A2, 5.687%, 5/20/2053(a) |
|
|
1,399,073 |
|
| |
4,896,122 |
|
|
Kansas Gas Service Securitization I LLC
5.486%, 8/1/2032 |
|
|
5,052,985 |
|
| |
|
|
|
Monroe Capital Funding Ltd. |
|
|
|
|
| |
1,123,821 |
|
|
Series 2021-1A,
Class A2, 2.815%, 4/22/2031(a) |
|
|
1,112,645 |
|
| |
385,746 |
|
|
Series 2021-1A,
Class B, 3.908%, 4/22/2031(a) |
|
|
382,821 |
|
| |
2,837,836 |
|
|
Monroe Capital Income
Plus Funding LLC
Series 2022-1A, Class A, 4.050%, 4/30/2032(a) |
|
|
2,797,397 |
|
| |
|
|
|
Oklahoma Development Finance Authority |
|
|
|
|
| |
1,694,071 |
|
|
4.135%, 12/1/2033 |
|
|
1,684,142 |
|
| |
647,669 |
|
|
4.285%, 2/1/2034 |
|
|
645,525 |
|
| |
1,463,168 |
|
|
3.877%, 5/1/2037 |
|
|
1,431,134 |
|
| |
|
|
|
PG&E Recovery Funding LLC |
|
|
|
|
| |
3,334,901 |
|
|
5.045%, 7/15/2032 |
|
|
3,377,054 |
|
| |
4,534,710 |
|
|
4.838%, 6/1/2033 |
|
|
4,613,310 |
|
| |
2,788,262 |
|
|
PG&E Wildfire Recovery Funding LLC
4.022%, 6/1/2031 |
|
|
2,784,330 |
|
| |
|
|
|
SBA Tower Trust |
|
|
|
|
| |
1,380,000 |
|
|
1.631%, 11/15/2026(a) |
|
|
1,347,651 |
|
| |
1,767,000 |
|
|
2.328%, 1/15/2028(a) |
|
|
1,692,531 |
|
| |
1,049,000 |
|
|
6.599%, 1/15/2028(a) |
|
|
1,071,036 |
|
| |
6,800,000 |
|
|
SCE Recovery Funding LLC
4.453%, 3/15/2036 |
|
|
6,815,640 |
|
| |
539,893 |
|
|
SpringCastle America
Funding LLC
Series 2020-AA, Class A, 1.970%, 9/25/2037(a) |
|
|
507,023 |
|
| |
4,951,277 |
|
|
Texas Electric Market
Stabilization Funding N LLC
4.265%, 8/1/2036(a) |
|
|
4,931,778 |
|
| |
664,822 |
|
|
Texas Natural Gas Securitization Finance Corp.
5.102%, 4/1/2035 |
|
|
682,471 |
|
| |
|
|
|
VCP RRL Ltd. |
|
|
|
|
| |
762,716 |
|
|
Series 2021-1A,
Class A, 2.152%, 10/20/2031(a) |
|
|
752,625 |
|
| |
1,241,270 |
|
|
Series 2021-1A,
Class B, 2.848%, 10/20/2031(a) |
|
|
1,185,416 |
|
| |
1,926,955 |
|
|
Series 2021-1A,
Class C, 5.425%, 10/20/2031(a) |
|
|
1,769,209 |
|
| |
8,504,000 |
|
|
Virginia Power Fuel Securitization LLC
4.877%, 5/1/2031 |
|
|
8,702,781 |
|
FPA Flexible Fixed Income Fund
SCHEDULE OF INVESTMENTS - Continued
As of December 31, 2025
Principal
Amount |
|
|
|
|
Value |
|
| |
|
|
|
BONDS & DEBENTURES (Continued) |
|
|
|
|
| |
|
|
|
ASSET-BACKED SECURITIES (Continued) |
|
|
|
|
| |
|
|
|
OTHER (Continued) |
|
|
|
|
| $ |
757,070 |
|
|
WEPCo Environmental Trust Finance LLC
Series 2021-1,
Class A, 1.578%, 12/15/2035 |
|
$ |
682,563 |
|
| |
|
|
|
|
|
|
119,520,775 |
|
| |
|
|
|
TOTAL ASSET-BACKED SECURITIES |
|
|
|
|
| |
|
|
|
(Cost $371,234,095) |
|
|
377,321,011 |
|
| |
|
|
|
COMMERCIAL MORTGAGE-BACKED SECURITIES — 12.8% |
|
|
|
|
| |
|
|
|
AGENCY — 8.2% |
|
|
|
|
| |
|
|
|
Federal Home Loan Mortgage Corp. |
|
|
|
|
| |
784,000 |
|
|
Series K068, Class A2, 3.244%, 8/25/2027 |
|
|
775,182 |
|
| |
1,135,000 |
|
|
Series K072, Class A2, 3.444%, 12/25/2027 |
|
|
1,127,586 |
|
| |
3,064,000 |
|
|
Series K073, Class A2, 3.350%, 1/25/2028 |
|
|
3,031,855 |
|
| |
1,691,000 |
|
|
Series K076, Class A2, 3.900%, 4/25/2028 |
|
|
1,701,249 |
|
| |
377,000 |
|
|
Series K077, Class
A2, 3.850%, 5/25/2028(b) |
|
|
375,541 |
|
| |
3,220,000 |
|
|
Series K079, Class A2, 3.926%, 6/25/2028 |
|
|
3,224,871 |
|
| |
2,683,000 |
|
|
Series K080, Class
A2, 3.926%, 7/25/2028(b) |
|
|
2,699,352 |
|
| |
7,407,000 |
|
|
Series K081, Class
A2, 3.900%, 8/25/2028(b) |
|
|
7,452,172 |
|
| |
5,016,000 |
|
|
Series K082, Class
A2, 3.920%, 9/25/2028(b) |
|
|
5,020,278 |
|
| |
2,785,000 |
|
|
Series K083, Class
A2, 4.050%, 9/25/2028(b) |
|
|
2,797,786 |
|
| |
7,311,000 |
|
|
Series K084, Class
A2, 3.780%, 10/25/2028(b) |
|
|
7,294,485 |
|
| |
2,867,000 |
|
|
Series K085, Class
A2, 4.060%, 10/25/2028(b) |
|
|
2,881,071 |
|
| |
3,232,000 |
|
|
Series K089, Class A2, 3.563%, 1/25/2029 |
|
|
3,202,619 |
|
| |
509,000 |
|
|
Series K088, Class A2, 3.690%, 1/25/2029 |
|
|
506,243 |
|
| |
5,136,000 |
|
|
Series K090, Class A2, 3.422%, 2/25/2029 |
|
|
5,065,031 |
|
| |
2,866,000 |
|
|
Series K091, Class A2, 3.505%, 3/25/2029 |
|
|
2,826,377 |
|
| |
669,000 |
|
|
Series K092, Class A2, 3.298%, 4/25/2029 |
|
|
656,939 |
|
| |
552,128 |
|
|
Series K093, Class A2, 2.982%, 5/25/2029 |
|
|
539,006 |
|
| |
10,160,420 |
|
|
Series K095, Class A2, 2.785%, 6/25/2029 |
|
|
9,791,927 |
|
| |
10,437,000 |
|
|
Series K094, Class A2, 2.903%, 6/25/2029 |
|
|
10,084,728 |
|
| |
5,934,750 |
|
|
Series K097, Class A2, 2.508%, 7/25/2029 |
|
|
5,660,763 |
|
| |
13,412,000 |
|
|
Series K096, Class A2, 2.519%, 7/25/2029 |
|
|
12,814,396 |
|
| |
2,622,000 |
|
|
Series K099, Class A2, 2.595%, 9/25/2029 |
|
|
2,504,069 |
|
| |
6,883,000 |
|
|
Series K101, Class A2, 2.524%, 10/25/2029 |
|
|
6,550,524 |
|
| |
4,314,000 |
|
|
Series K102, Class A2, 2.537%, 10/25/2029 |
|
|
4,125,233 |
|
| |
6,001,000 |
|
|
Series K103, Class A2, 2.651%, 11/25/2029 |
|
|
5,724,750 |
|
| |
894,000 |
|
|
Series K107, Class A2, 1.639%, 1/25/2030 |
|
|
819,211 |
|
| |
449,000 |
|
|
Series K105, Class A2, 1.872%, 1/25/2030 |
|
|
415,902 |
|
| |
1,718,000 |
|
|
Series K106, Class A2, 2.069%, 1/25/2030 |
|
|
1,608,459 |
|
| |
2,381,000 |
|
|
Series K104, Class A2, 2.253%, 1/25/2030 |
|
|
2,229,238 |
|
| |
1,265,000 |
|
|
Series K108, Class A2, 1.517%, 3/25/2030 |
|
|
1,146,512 |
|
| |
8,157,000 |
|
|
Series K751, Class A2, 4.412%, 3/25/2030 |
|
|
8,272,717 |
|
| |
1,920,000 |
|
|
Series K109, Class A2, 1.558%, 4/25/2030 |
|
|
1,740,065 |
|
| |
2,981,000 |
|
|
Series K151, Class A3, 3.511%, 4/25/2030 |
|
|
2,924,528 |
|
FPA Flexible Fixed Income Fund
SCHEDULE OF INVESTMENTS - Continued
As of December 31, 2025
Principal
Amount |
|
|
|
|
Value |
|
| |
|
|
|
| |
|
|
|
COMMERCIAL MORTGAGE-BACKED SECURITIES (Continued) |
|
|
|
|
| |
|
|
|
AGENCY (Continued) |
|
|
|
|
| $ |
258,000 |
|
|
Series K111, Class A2, 1.350%, 5/25/2030 |
|
$ |
231,242 |
|
| |
1,407,000 |
|
|
Series K114, Class A2, 1.366%, 6/25/2030 |
|
|
1,257,286 |
|
| |
564,000 |
|
|
Series K116, Class A2, 1.378%, 7/25/2030 |
|
|
503,206 |
|
| |
2,774,000 |
|
|
Series K752, Class A2, 4.284%, 7/25/2030 |
|
|
2,801,283 |
|
| |
9,296,000 |
|
|
Series K117, Class A2, 1.406%, 8/25/2030 |
|
|
8,330,791 |
|
| |
2,108,000 |
|
|
Series K120, Class A2, 1.500%, 10/25/2030 |
|
|
1,888,917 |
|
| |
11,142,000 |
|
|
Series K754, Class
A2, 4.940%, 11/25/2030(b) |
|
|
11,538,280 |
|
| |
|
|
|
Freddie Mac Multifamily Structured Pass-Through Certificates |
|
|
|
|
| |
2,550,000 |
|
|
Series K100, Class A2, 2.673%, 9/25/2029 |
|
|
2,439,984 |
|
| |
695,000 |
|
|
Series K110, Class A2, 1.477%, 4/25/2030 |
|
|
629,883 |
|
| |
1,000,000 |
|
|
Series K113, Class A2, 1.341%, 6/25/2030 |
|
|
895,541 |
|
| |
1,978,000 |
|
|
Series K115, Class A2, 1.383%, 6/25/2030 |
|
|
1,770,019 |
|
| |
|
|
|
|
|
|
159,877,097 |
|
| |
|
|
|
AGENCY STRIPPED — 0.1% |
|
|
|
|
| |
|
|
|
Government National Mortgage Association |
|
|
|
|
| |
1,240,876 |
|
|
Series 2015-19,
Class IO, 0.292%, 1/16/2057(b) |
|
|
15,368 |
|
| |
715,000 |
|
|
Series 2015-7, Class
IO, 0.488%, 1/16/2057(b) |
|
|
13,281 |
|
| |
1,925,439 |
|
|
Series 2020-43,
Class IO, 1.262%, 11/16/2061(b) |
|
|
157,182 |
|
| |
2,580,931 |
|
|
Series 2020-71,
Class IO, 1.094%, 1/16/2062(b) |
|
|
168,351 |
|
| |
4,966,545 |
|
|
Series 2020-75,
Class IO, 0.870%, 2/16/2062(b) |
|
|
284,305 |
|
| |
3,286,492 |
|
|
Series
2020-42, Class IO, 0.939%, 3/16/2062(b) |
|
|
214,684 |
|
| |
|
|
|
|
|
|
853,171 |
|
| |
|
|
|
NON-AGENCY — 4.5% |
|
|
|
|
| |
6,960,000 |
|
|
Arbor Multifamily
Mortgage Securities Trust
Series 2020-MF1, Class A5, 2.756%, 5/15/2053(a) |
|
|
6,532,421 |
|
| |
1,390,376 |
|
|
Arbor Realty Commercial
Real Estate Notes Ltd.
Series 2022-FL1, Class A, 5.434% (30-Day SOFR Average+145 basis points), 1/15/2037(a),(b) |
|
|
1,390,376 |
|
| |
5,385,000 |
|
|
BANK5
Series 2025-5YR18, Class A3, 5.145%, 12/15/2058 |
|
|
5,532,424 |
|
| |
1,000,000 |
|
|
BBCMS Mortgage Trust
Series 2025-5C34, Class A3, 5.659%, 5/15/2058 |
|
|
1,046,405 |
|
| |
|
|
|
BBCMS Trust |
|
|
|
|
| |
348,283 |
|
|
Series 2015-SRCH,
Class A1, 3.312%, 8/10/2035(a) |
|
|
343,556 |
|
| |
2,296,000 |
|
|
Series 2025-5C36, Class A3, 5.517%, 8/15/2058 |
|
|
2,394,186 |
|
| |
2,591,000 |
|
|
Benchmark Mortgage
Trust
Series 2024-V11, Class A3, 5.909%, 11/15/2057(b) |
|
|
2,720,421 |
|
| |
|
|
|
BMO Mortgage Trust |
|
|
|
|
| |
2,581,000 |
|
|
Series 2024-5C7,
Class A3, 5.566%, 11/15/2057(b) |
|
|
2,679,293 |
|
| |
1,258,000 |
|
|
Series 2024-5C8,
Class A3, 5.625%, 12/15/2057(b) |
|
|
1,309,312 |
|
| |
2,696,000 |
|
|
Series 2025-5C13,
Class A3, 5.227%, 12/15/2058(b) |
|
|
2,774,224 |
|
FPA Flexible Fixed Income Fund
SCHEDULE OF INVESTMENTS - Continued
As of December 31, 2025
Principal
Amount |
|
|
|
|
Value |
|
| |
|
|
|
COMMERCIAL MORTGAGE-BACKED SECURITIES (Continued) |
|
|
|
|
| |
|
|
|
NON-AGENCY (Continued) |
|
|
|
|
| $ |
5,125,000 |
|
|
BX Trust
Series 2019-OC11, Class A, 3.202%, 12/9/2041(a) |
|
$ |
4,831,799 |
|
| |
1,732,708 |
|
|
BXMT Ltd.
Series 2021-FL4, Class A, 4.900% (1-Month Term SOFR+116.448 basis points), 5/15/2038(a),(b) |
|
|
1,723,718 |
|
| |
7,209,000 |
|
|
CHI Commercial Mortgage
Trust
Series 2025-SFT, Class A, 5.482%, 4/15/2042(a),(b) |
|
|
7,368,208 |
|
| |
236,910 |
|
|
Greystone CRE Notes
Ltd.
Series 2021-FL3, Class A, 4.885% (1-Month Term SOFR+113.448 basis points), 7/15/2039(a),(b) |
|
|
236,762 |
|
| |
1,100,000 |
|
|
Hudson Yards Mortgage
Trust
Series 2025-SPRL, Class A, 5.467%, 1/13/2040(a),(b) |
|
|
1,136,860 |
|
| |
4,991,000 |
|
|
Manhattan West Mortgage
Trust
Series 2020-1MW, Class A, 2.130%, 9/10/2039(a) |
|
|
4,804,295 |
|
| |
675,771 |
|
|
MF1 Ltd.
Series
2021-FL7, Class A, 4.929% (1-Month Term SOFR+119.448 basis points), 10/16/2036(a),(b) |
|
|
675,364 |
|
| |
|
|
|
Progress Residential Trust |
|
|
|
|
| |
1,837,691 |
|
|
Series 2024-SFR5,
Class A, 3.000%, 8/9/2029(a) |
|
|
1,751,106 |
|
| |
1,410,235 |
|
|
Series 2021-SFR11,
Class A, 2.283%, 1/17/2039(a) |
|
|
1,341,080 |
|
| |
3,754,417 |
|
|
Series 2021-SFR10,
Class A, 2.393%, 12/17/2040(a) |
|
|
3,620,498 |
|
| |
2,110,172 |
|
|
Series 2024-SFR3,
Class A, 3.000%, 6/17/2041(a) |
|
|
2,015,857 |
|
| |
9,769,610 |
|
|
Series 2024-SFR4,
Class A, 3.100%, 7/17/2041(a) |
|
|
9,352,733 |
|
| |
7,317,970 |
|
|
Series 2025-SFR2,
Class A, 3.305%, 4/17/2042(a) |
|
|
6,981,085 |
|
| |
2,751,000 |
|
|
Series 2025-SFR3,
Class A, 3.390%, 7/17/2042(a) |
|
|
2,620,602 |
|
| |
4,311,000 |
|
|
ROCK Trust
Series 2024-CNTR, Class A, 5.388%, 11/13/2041(a) |
|
|
4,419,812 |
|
| |
5,585,000 |
|
|
SLG Office Trust
Series 2021-OVA, Class A, 2.585%, 7/15/2041(a) |
|
|
4,979,152 |
|
| |
1,395,358 |
|
|
TRTX Issuer Ltd.
Series 2022-FL5, Class A, 5.386% (1-Month Term SOFR+165 basis points), 2/15/2039(a),(b) |
|
|
1,394,783 |
|
| |
1,900,000 |
|
|
WHARF
Commercial Mortgage Trust
Series 2025-DC, Class A, 5.349%, 7/15/2040(a),(b) |
|
|
1,953,474 |
|
| |
|
|
|
|
|
|
87,929,806 |
|
| |
|
|
|
TOTAL COMMERCIAL MORTGAGE-BACKED SECURITIES |
|
|
|
|
| |
|
|
|
(Cost $241,514,781) |
|
|
248,660,074 |
|
| |
|
|
|
CORPORATE BANK DEBT — 0.2% |
|
|
|
|
| |
1,828,327 |
|
|
Capstone Acquisition
Holdings, Inc. Term Loan
8.316% (1-Month Term SOFR+460 basis points), 11/12/2029(b),(c),(d),(e) |
|
|
1,841,994 |
|
| |
464,034 |
|
|
JC Penney Corp.,
Inc.
5.568% (3-Month USD Libor+425 basis points), 6/23/2027*,(b),(c),(d),(e),(f) |
|
|
46 |
|
FPA Flexible Fixed Income Fund
SCHEDULE OF INVESTMENTS - Continued
As of December 31, 2025
Principal
Amount |
|
|
|
|
Value |
|
| |
|
|
|
CORPORATE BANK DEBT (Continued) |
|
|
|
|
| $ |
341,263 |
|
|
Lealand
Finance Company B.V. Senior Exit LC
3.500%, 6/30/2027(b),(c),(d),(e),(g),(h) |
|
$ |
(40,952 |
) |
| |
13,635 |
|
|
McDermott Technology
Americas, Inc.
7.830% (1-Month Term SOFR+400 basis points), 12/31/2027(b),(c),(d),(e),(i) |
|
|
10,499 |
|
| |
2,776,050 |
|
|
WH
Borrower LLC
8.734% (3-Month Term SOFR+450 basis points), 2/20/2032(b),(c),(e) |
|
|
2,785,294 |
|
| |
|
|
|
TOTAL CORPORATE BANK DEBT |
|
|
|
|
| |
|
|
|
(Cost $4,588,428) |
|
|
4,596,881 |
|
| |
|
|
|
CORPORATE BONDS — 2.9% |
|
|
|
|
| |
|
|
|
COMMUNICATIONS — 0.7% |
|
|
|
|
| |
2,633,000 |
|
|
CCO Holdings LLC
/ CCO Holdings Capital Corp.
6.375%, 9/1/2029(a) |
|
|
2,659,514 |
|
| |
2,000,000 |
|
|
DISH Network Corp.
11.750%, 11/15/2027(a) |
|
|
2,081,480 |
|
| |
1,014,000 |
|
|
EchoStar Corp.
3.875%, 11/30/2030 |
|
|
3,386,760 |
|
| |
|
|
|
Frontier Communications Holdings LLC |
|
|
|
|
| |
3,066,000 |
|
|
5.875%, 10/15/2027(a) |
|
|
3,065,418 |
|
| |
1,636,000 |
|
|
6.000%, 1/15/2030(a) |
|
|
1,661,456 |
|
| |
|
|
|
|
|
|
12,854,628 |
|
| |
|
|
|
CONSUMER DISCRETIONARY — 0.4% |
|
|
|
|
| |
1,612,341 |
|
|
Air Canada Pass-Through
Trust
Series 2017-1, Class AA, 3.300%, 7/15/2031(a) |
|
|
1,521,400 |
|
| |
5,947,000 |
|
|
VT
Topco, Inc.
8.500%, 8/15/2030(a) |
|
|
6,196,952 |
|
| |
|
|
|
|
|
|
7,718,352 |
|
| |
|
|
|
FINANCIALS — 1.8% |
|
|
|
|
| |
3,644,000 |
|
|
Apollo Debt Solutions
BDC Senior Notes
8.620%, 9/28/2028(d),(e) |
|
|
3,644,000 |
|
| |
5,727,000 |
|
|
Blue Owl Credit Income Corp.
7.950%, 6/13/2028 |
|
|
6,052,478 |
|
| |
400,000 |
|
|
Five Point Operating
Co. LP
8.000%, 10/1/2030(a) |
|
|
416,000 |
|
| |
5,000,000 |
|
|
Hlend Senior Notes
8.170%, 3/15/2028(d),(e) |
|
|
5,000,000 |
|
| |
2,981,000 |
|
|
HPS Corporate Lending Fund
6.750%, 1/30/2029 |
|
|
3,108,852 |
|
| |
10,563,000 |
|
|
Midcap Financial
Issuer Trust
6.500%, 5/1/2028(a) |
|
|
10,534,903 |
|
| |
4,032,000 |
|
|
Oaktree Strategic Credit Fund
8.400%, 11/14/2028 |
|
|
4,343,137 |
|
FPA Flexible Fixed Income Fund
SCHEDULE OF INVESTMENTS - Continued
As of December 31, 2025
Principal
Amount |
|
|
|
|
Value |
|
| |
|
|
|
CORPORATE BONDS (Continued) |
|
|
|
|
| |
|
|
|
FINANCIALS (Continued) |
|
|
|
|
| $ |
1,557,000 |
|
|
OCREDIT
BDC Senior Notes
7.770%, 3/7/2029(d),(e) |
|
$ |
1,557,000 |
|
| |
|
|
|
|
|
|
34,656,370 |
|
| |
|
|
|
HEALTH CARE — 0.0% |
|
|
|
|
| |
938,000 |
|
|
Heartland
Dental LLC/Heartland Dental Finance Corp.
10.500% (1-Month Term SOFR+500 basis points), 4/30/2028(a),(e) |
|
|
980,313 |
|
| |
|
|
|
TOTAL CORPORATE BONDS |
|
|
|
|
| |
|
|
|
(Cost $52,039,336) |
|
|
56,209,663 |
|
| |
|
|
|
RESIDENTIAL MORTGAGE-BACKED SECURITIES — 27.9% |
|
|
|
|
| |
|
|
|
AGENCY COLLATERALIZED MORTGAGE OBLIGATION — 0.6% |
|
|
|
|
| |
|
|
|
Federal National Mortgage Association |
|
|
|
|
| |
862,963 |
|
|
Series 3810, Class PE, 4.000%, 2/15/2041 |
|
|
848,763 |
|
| |
39,095 |
|
|
Series 2012-144, Class PD, 3.500%, 4/25/2042 |
|
|
38,760 |
|
| |
9,277,861 |
|
|
Series 2024-70, Class EC, 3.000%, 11/25/2047 |
|
|
8,684,128 |
|
| |
72,484 |
|
|
Freddie Mac REMICS
Series 4162, Class P, 3.000%, 2/15/2033 |
|
|
71,322 |
|
| |
2,589,299 |
|
|
GS Mortgage-Backed Securities Trust
Series 2024-95, Class AB, 2.500%,
6/20/2045 |
|
|
2,404,722 |
|
| |
|
|
|
|
|
|
12,047,695 |
|
| |
|
|
|
AGENCY POOL ADJUSTABLE RATE — 1.0% |
|
|
|
|
| |
|
|
|
Fannie Mae Pool |
|
|
|
|
| |
320,538 |
|
|
1.729% (30-Day SOFR
Average+211 basis points), 7/1/2051(b) |
|
|
292,780 |
|
| |
2,617,811 |
|
|
1.969% (30-Day SOFR
Average+207.716 basis points), 8/1/2051(b) |
|
|
2,409,113 |
|
| |
216,038 |
|
|
1.606% (30-Day SOFR
Average+209.4 basis points), 9/1/2051(b) |
|
|
196,032 |
|
| |
1,402,706 |
|
|
1.957% (30-Day SOFR
Average+212 basis points), 1/1/2052(b) |
|
|
1,282,745 |
|
| |
2,486,066 |
|
|
1.886% (30-Day SOFR
Average+233.495 basis points), 4/1/2052(b) |
|
|
2,267,520 |
|
| |
|
|
|
Freddie Mac Non Gold Pool |
|
|
|
|
| |
944,483 |
|
|
1.662% (30-Day SOFR
Average+213 basis points), 9/1/2051(b) |
|
|
857,777 |
|
| |
1,228,300 |
|
|
2.556% (30-Day SOFR
Average+213 basis points), 3/1/2052(b) |
|
|
1,142,341 |
|
| |
849,500 |
|
|
2.544% (30-Day SOFR
Average+214 basis points), 5/1/2052(b) |
|
|
791,196 |
|
| |
8,610,601 |
|
|
2.160% (30-Day SOFR
Average+217.815 basis points), 7/1/2052(b) |
|
|
7,892,923 |
|
| |
1,065,680 |
|
|
3.311% (30-Day SOFR
Average+222.209 basis points), 11/1/2052(b) |
|
|
1,023,318 |
|
| |
1,242,932 |
|
|
2.166%
(30-Day SOFR Average+217.906 basis points), 5/1/2053(b) |
|
|
1,139,553 |
|
| |
|
|
|
|
|
|
19,295,298 |
|
| |
|
|
|
AGENCY POOL FIXED RATE — 19.4% |
|
|
|
|
| |
|
|
|
Fannie Mae Pool |
|
|
|
|
| |
6,838,181 |
|
|
1.500%, 12/1/2035 |
|
|
6,216,307 |
|
| |
1,812,778 |
|
|
1.500%, 12/1/2035 |
|
|
1,639,424 |
|
| |
867,059 |
|
|
1.500%, 3/1/2036 |
|
|
786,040 |
|
| |
2,314,492 |
|
|
1.000%, 4/1/2036 |
|
|
2,021,963 |
|
| |
553,669 |
|
|
1.500%, 4/1/2036 |
|
|
501,933 |
|
FPA Flexible Fixed Income Fund
SCHEDULE OF INVESTMENTS - Continued
As of December 31, 2025
Principal
Amount |
|
|
|
|
Value |
|
| |
|
|
|
RESIDENTIAL MORTGAGE-BACKED SECURITIES (Continued) |
|
|
|
|
| |
|
|
|
AGENCY POOL FIXED RATE (Continued) |
|
|
|
|
| $ |
2,270,647 |
|
|
1.500%, 4/1/2036 |
|
$ |
2,058,474 |
|
| |
1,647,869 |
|
|
1.500%, 5/1/2036 |
|
|
1,493,890 |
|
| |
3,630,456 |
|
|
1.500%, 6/1/2036 |
|
|
3,291,221 |
|
| |
791,686 |
|
|
1.500%, 6/1/2036 |
|
|
717,463 |
|
| |
1,402,102 |
|
|
1.500%, 7/1/2036 |
|
|
1,270,650 |
|
| |
9,972,540 |
|
|
1.500%, 8/1/2036 |
|
|
9,040,692 |
|
| |
723,432 |
|
|
1.500%, 8/1/2036 |
|
|
655,607 |
|
| |
3,758,756 |
|
|
1.000%, 9/1/2036 |
|
|
3,272,877 |
|
| |
1,245,168 |
|
|
1.500%, 9/1/2036 |
|
|
1,128,429 |
|
| |
3,003,676 |
|
|
1.500%, 10/1/2036 |
|
|
2,722,069 |
|
| |
2,313,643 |
|
|
1.000%, 11/1/2036 |
|
|
2,005,477 |
|
| |
13,300,016 |
|
|
1.000%, 12/1/2036 |
|
|
11,528,700 |
|
| |
687,641 |
|
|
1.000%, 12/1/2036 |
|
|
596,058 |
|
| |
17,848,064 |
|
|
1.000%, 3/1/2037 |
|
|
15,471,032 |
|
| |
8,485,578 |
|
|
1.500%, 3/1/2037 |
|
|
7,692,674 |
|
| |
6,386,567 |
|
|
1.500%, 8/1/2037 |
|
|
5,783,810 |
|
| |
1,653,286 |
|
|
2.000%, 6/1/2040 |
|
|
1,462,493 |
|
| |
616,196 |
|
|
2.000%, 9/1/2040 |
|
|
544,200 |
|
| |
671,471 |
|
|
2.000%, 10/1/2040 |
|
|
592,726 |
|
| |
425,334 |
|
|
1.500%, 11/1/2040 |
|
|
362,469 |
|
| |
3,663,052 |
|
|
2.000%, 11/1/2040 |
|
|
3,231,609 |
|
| |
2,023,324 |
|
|
1.500%, 12/1/2040 |
|
|
1,722,914 |
|
| |
2,539,495 |
|
|
2.000%, 12/1/2040 |
|
|
2,238,895 |
|
| |
762,025 |
|
|
1.500%, 1/1/2041 |
|
|
648,389 |
|
| |
2,754,257 |
|
|
1.500%, 2/1/2041 |
|
|
2,341,688 |
|
| |
7,234,673 |
|
|
1.500%, 3/1/2041 |
|
|
6,146,751 |
|
| |
270,463 |
|
|
1.500%, 4/1/2041 |
|
|
229,456 |
|
| |
6,321,943 |
|
|
1.500%, 5/1/2041 |
|
|
5,359,903 |
|
| |
1,544,052 |
|
|
2.500%, 5/1/2041 |
|
|
1,391,282 |
|
| |
7,054,287 |
|
|
1.500%, 7/1/2041 |
|
|
5,969,512 |
|
| |
933,491 |
|
|
2.000%, 7/1/2041 |
|
|
819,215 |
|
| |
8,794,141 |
|
|
2.000%, 9/1/2041 |
|
|
7,756,491 |
|
| |
7,116,792 |
|
|
1.500%, 10/1/2041 |
|
|
6,003,634 |
|
| |
15,099,504 |
|
|
1.500%, 11/1/2041 |
|
|
12,729,042 |
|
| |
3,036,831 |
|
|
1.500%, 11/1/2041 |
|
|
2,560,005 |
|
| |
2,572,611 |
|
|
1.500%, 12/1/2041 |
|
|
2,167,098 |
|
| |
12,799,530 |
|
|
1.500%, 1/1/2042 |
|
|
10,772,327 |
|
| |
1,493,729 |
|
|
1.500%, 1/1/2042 |
|
|
1,261,626 |
|
| |
2,736,113 |
|
|
1.500%, 2/1/2042 |
|
|
2,322,401 |
|
| |
858,840 |
|
|
1.500%, 3/1/2042 |
|
|
725,062 |
|
| |
2,728,203 |
|
|
1.500%, 3/1/2042 |
|
|
2,317,627 |
|
| |
4,856,474 |
|
|
1.500%, 3/1/2042 |
|
|
4,106,662 |
|
| |
7,221,990 |
|
|
1.500%, 3/1/2042 |
|
|
6,102,557 |
|
FPA Flexible Fixed Income Fund
SCHEDULE OF INVESTMENTS - Continued
As of December 31, 2025
Principal
Amount |
|
|
|
|
Value |
|
| |
|
|
|
RESIDENTIAL MORTGAGE-BACKED SECURITIES (Continued) |
|
|
|
|
| |
|
|
|
AGENCY POOL FIXED RATE (Continued) |
|
|
|
|
| $ |
4,765,305 |
|
|
1.500%, 3/1/2042 |
|
$ |
4,013,823 |
|
| |
8,894,327 |
|
|
1.500%, 3/1/2042 |
|
|
7,502,140 |
|
| |
2,194,504 |
|
|
2.000%, 8/1/2042 |
|
|
1,922,805 |
|
| |
7,433,615 |
|
|
2.000%, 8/1/2042 |
|
|
6,490,141 |
|
| |
3,083,738 |
|
|
3.500%, 4/1/2044 |
|
|
2,926,155 |
|
| |
4,862,169 |
|
|
4.000%, 6/1/2045 |
|
|
4,761,850 |
|
| |
10,998,661 |
|
|
4.000%, 3/1/2046 |
|
|
10,777,038 |
|
| |
1,039,715 |
|
|
4.000%, 7/1/2046 |
|
|
1,017,865 |
|
| |
700,928 |
|
|
4.000%, 7/1/2046 |
|
|
678,353 |
|
| |
1,186,625 |
|
|
4.000%, 10/1/2046 |
|
|
1,161,583 |
|
| |
659,433 |
|
|
4.000%, 10/1/2046 |
|
|
645,945 |
|
| |
996,952 |
|
|
4.000%, 3/1/2048 |
|
|
975,135 |
|
| |
5,228,295 |
|
|
4.500%, 1/1/2050 |
|
|
5,233,645 |
|
| |
4,612,177 |
|
|
4.500%, 1/1/2050 |
|
|
4,617,752 |
|
| |
|
|
|
Freddie Mac Pool |
|
|
|
|
| |
9,128,464 |
|
|
1.500%, 11/1/2035 |
|
|
8,298,309 |
|
| |
872,142 |
|
|
1.500%, 11/1/2035 |
|
|
788,740 |
|
| |
3,300,749 |
|
|
1.500%, 1/1/2036 |
|
|
2,990,342 |
|
| |
420,603 |
|
|
1.500%, 4/1/2036 |
|
|
381,301 |
|
| |
1,190,374 |
|
|
1.000%, 5/1/2036 |
|
|
1,038,849 |
|
| |
694,719 |
|
|
1.500%, 5/1/2036 |
|
|
629,803 |
|
| |
1,665,484 |
|
|
1.500%, 6/1/2036 |
|
|
1,505,695 |
|
| |
824,991 |
|
|
1.000%, 7/1/2036 |
|
|
717,496 |
|
| |
2,944,362 |
|
|
1.500%, 8/1/2036 |
|
|
2,668,317 |
|
| |
1,198,297 |
|
|
1.000%, 10/1/2036 |
|
|
1,045,619 |
|
| |
2,202,628 |
|
|
1.500%, 10/1/2036 |
|
|
1,996,123 |
|
| |
8,491,518 |
|
|
1.500%, 10/1/2036 |
|
|
7,698,058 |
|
| |
650,773 |
|
|
1.500%, 11/1/2036 |
|
|
589,964 |
|
| |
2,639,094 |
|
|
2.000%, 6/1/2040 |
|
|
2,334,705 |
|
| |
582,524 |
|
|
2.000%, 8/1/2040 |
|
|
514,700 |
|
| |
350,696 |
|
|
4.000%, 10/1/2040 |
|
|
343,781 |
|
| |
10,353,597 |
|
|
1.500%, 11/1/2040 |
|
|
8,823,577 |
|
| |
319,149 |
|
|
4.000%, 11/1/2040 |
|
|
312,960 |
|
| |
750,359 |
|
|
2.000%, 12/1/2040 |
|
|
661,483 |
|
| |
500,008 |
|
|
1.500%, 2/1/2041 |
|
|
425,776 |
|
| |
6,503,788 |
|
|
1.500%, 2/1/2041 |
|
|
5,524,570 |
|
| |
4,323,222 |
|
|
1.500%, 3/1/2041 |
|
|
3,672,719 |
|
| |
17,050,136 |
|
|
1.500%, 3/1/2041 |
|
|
14,483,821 |
|
| |
3,793,843 |
|
|
1.500%, 4/1/2041 |
|
|
3,217,844 |
|
| |
15,571,246 |
|
|
1.500%, 5/1/2041 |
|
|
13,198,993 |
|
| |
12,244,784 |
|
|
1.500%, 6/1/2041 |
|
|
10,370,442 |
|
| |
7,354,231 |
|
|
1.500%, 7/1/2041 |
|
|
6,222,381 |
|
| |
7,427,527 |
|
|
1.500%, 8/1/2041 |
|
|
6,279,027 |
|
FPA Flexible Fixed Income Fund
SCHEDULE OF INVESTMENTS - Continued
As of December 31, 2025
Principal
Amount |
|
|
|
|
Value |
|
| |
|
|
|
RESIDENTIAL MORTGAGE-BACKED SECURITIES (Continued) |
|
|
|
|
| |
|
|
|
AGENCY POOL FIXED RATE (Continued) |
|
|
|
|
| $ |
1,004,634 |
|
|
2.000%, 8/1/2041 |
|
$ |
880,660 |
|
| |
4,711,810 |
|
|
1.500%, 9/1/2041 |
|
|
3,980,519 |
|
| |
3,234,649 |
|
|
1.500%, 10/1/2041 |
|
|
2,728,732 |
|
| |
528,715 |
|
|
1.500%, 11/1/2041 |
|
|
448,111 |
|
| |
2,620,567 |
|
|
1.500%, 11/1/2041 |
|
|
2,209,203 |
|
| |
8,176,124 |
|
|
1.500%, 12/1/2041 |
|
|
6,888,400 |
|
| |
4,500,435 |
|
|
1.500%, 12/1/2041 |
|
|
3,820,127 |
|
| |
654,505 |
|
|
1.500%, 1/1/2042 |
|
|
553,411 |
|
| |
6,060,114 |
|
|
1.500%, 1/1/2042 |
|
|
5,116,491 |
|
| |
4,796,903 |
|
|
1.500%, 4/1/2042 |
|
|
4,078,314 |
|
| |
3,961,608 |
|
|
2.000%, 5/1/2042 |
|
|
3,468,843 |
|
| |
2,675,850 |
|
|
2.000%, 8/1/2042 |
|
|
2,341,713 |
|
| |
2,740,709 |
|
|
2.000%, 8/1/2042 |
|
|
2,404,315 |
|
| |
6,572,579 |
|
|
4.500%, 12/1/2045 |
|
|
6,580,567 |
|
| |
|
|
|
|
|
|
376,739,855 |
|
| |
|
|
|
AGENCY STRIPPED — 0.0% |
|
|
|
|
| |
19,009 |
|
|
Fannie Mae Interest Strip
Series 284, Class 1, 0.000%, 7/25/2027 |
|
|
18,463 |
|
| |
|
|
|
NON-AGENCY COLLATERALIZED MORTGAGE OBLIGATION — 6.9% |
|
|
|
|
| |
|
|
|
GS Mortgage-Backed Securities Trust |
|
|
|
|
| |
1,620,901 |
|
|
Series 2021-PJ4,
Class A8, 2.500%, 9/25/2051(a),(b) |
|
|
1,462,353 |
|
| |
6,285,369 |
|
|
Series 2021-PJ5,
Class A8, 2.500%, 10/25/2051(a),(b) |
|
|
5,664,545 |
|
| |
5,947,319 |
|
|
Series 2021-PJ6,
Class A8, 2.500%, 11/25/2051(a),(b) |
|
|
5,347,756 |
|
| |
4,050,585 |
|
|
Series 2021-PJ7,
Class A8, 2.500%, 1/25/2052(a),(b) |
|
|
3,634,530 |
|
| |
1,672,237 |
|
|
Series 2021-PJ10,
Class A8, 2.500%, 3/25/2052(a),(b) |
|
|
1,497,762 |
|
| |
896,018 |
|
|
Series 2022-PJ1,
Class A8, 2.500%, 5/28/2052(a),(b) |
|
|
799,814 |
|
| |
6,011,887 |
|
|
Series 2022-PJ2,
Class A24, 3.000%, 6/25/2052(a),(b) |
|
|
5,501,543 |
|
| |
1,667,282 |
|
|
Series 2022-PJ3,
Class A22, 2.500%, 8/25/2052(a),(b) |
|
|
1,490,967 |
|
| |
833,291 |
|
|
Series 2022-PJ3,
Class A24, 3.000%, 8/25/2052(a),(b) |
|
|
761,875 |
|
| |
5,476,615 |
|
|
Series 2022-PJ4,
Class A22, 2.500%, 9/25/2052(a),(b) |
|
|
4,887,265 |
|
| |
1,108,490 |
|
|
Series 2022-PJ4,
Class A24, 3.000%, 9/25/2052(a),(b) |
|
|
1,011,759 |
|
| |
12,887,891 |
|
|
Series 2022-PJ5,
Class A22, 2.500%, 10/25/2052(a),(b) |
|
|
11,460,321 |
|
| |
8,076,104 |
|
|
Series 2022-PJ6,
Class A15, 2.500%, 1/25/2053(a),(b) |
|
|
7,187,852 |
|
| |
|
|
|
J.P. Morgan Mortgage Trust |
|
|
|
|
| |
658,813 |
|
|
Series 2021-6, Class
A4, 2.500%, 10/25/2051(a),(b) |
|
|
594,946 |
|
| |
3,190,255 |
|
|
Series 2021-7, Class
A4, 2.500%, 11/25/2051(a),(b) |
|
|
2,878,371 |
|
| |
2,232,502 |
|
|
Series 2021-10,
Class A4A, 2.000%, 12/25/2051(a),(b) |
|
|
1,961,674 |
|
| |
6,003,096 |
|
|
Series 2021-10,
Class A4, 2.500%, 12/25/2051(a),(b) |
|
|
5,391,419 |
|
| |
1,957,069 |
|
|
Series 2021-8, Class
A4, 2.500%, 12/25/2051(a),(b) |
|
|
1,764,978 |
|
| |
6,866,887 |
|
|
Series 2021-11,
Class A4, 2.500%, 1/25/2052(a),(b) |
|
|
6,183,394 |
|
| |
9,446,797 |
|
|
Series 2021-13,
Class A4, 2.500%, 4/25/2052(a),(b) |
|
|
8,525,205 |
|
FPA Flexible Fixed Income Fund
SCHEDULE OF INVESTMENTS - Continued
As of December 31, 2025
Principal
Amount |
|
|
|
|
Value |
|
| |
|
|
|
RESIDENTIAL MORTGAGE-BACKED SECURITIES (Continued) |
|
|
|
|
| |
|
|
|
NON-AGENCY COLLATERALIZED MORTGAGE OBLIGATION (Continued) |
|
|
|
|
| $ |
1,373,158 |
|
|
Series
2021-15, Class A4, 2.500%, 6/25/2052(a),(b) |
|
$ |
1,230,687 |
|
| |
11,939,385 |
|
|
Series 2022-1, Class
A4, 2.500%, 7/25/2052(a),(b) |
|
|
10,680,863 |
|
| |
530,583 |
|
|
Series 2022-3, Class
A4A, 2.500%, 8/25/2052(a),(b) |
|
|
474,087 |
|
| |
896,450 |
|
|
Series 2022-4, Class
A4, 3.000%, 10/25/2052(a),(b) |
|
|
819,506 |
|
| |
110,281 |
|
|
Series 2022-8, Class
A4A, 4.000%, 1/25/2053(a),(b) |
|
|
105,788 |
|
| |
405,663 |
|
|
Series 2024-7, Class
A4, 3.000%, 4/25/2053(a),(b) |
|
|
367,517 |
|
| |
3,996,584 |
|
|
Series 2024-3, Class
A4, 3.000%, 5/25/2054(a),(b) |
|
|
3,650,167 |
|
| |
4,324,151 |
|
|
Series 2025-1, Class
A4, 3.688%, 1/25/2063(a),(b) |
|
|
4,064,562 |
|
| |
|
|
|
OBX Trust |
|
|
|
|
| |
395,767 |
|
|
Series 2021-J3,
Class A4, 2.500%, 10/25/2051(a),(b) |
|
|
355,985 |
|
| |
6,536,069 |
|
|
Series 2022-J1,
Class A3, 3.000%, 2/25/2052(a),(b) |
|
|
5,954,153 |
|
| |
915,387 |
|
|
Pretium Mortgage
Credit Partners LLC
Series 2024-RPL1, Class A1, 3.900%, 10/25/2063(a),(b) |
|
|
882,783 |
|
| |
2,561,000 |
|
|
Progress Residential
Trust
Series 2025-SFR6, Class A, 4.000%, 12/17/2042(a),(b) |
|
|
2,494,374 |
|
| |
|
|
|
Sequoia Mortgage Trust |
|
|
|
|
| |
2,447,990 |
|
|
Series 2021-4, Class
A4, 2.500%, 6/25/2051(a),(b) |
|
|
2,203,999 |
|
| |
988,374 |
|
|
Series 2021-5, Class
A4, 2.500%, 7/25/2051(a),(b) |
|
|
889,278 |
|
| |
2,184,156 |
|
|
Series 2021-6, Class
A4, 2.500%, 10/25/2051(a),(b) |
|
|
1,956,488 |
|
| |
3,462,007 |
|
|
Series 2021-9, Class
A4, 2.500%, 1/25/2052(a),(b) |
|
|
3,095,373 |
|
| |
710,451 |
|
|
Series 2022-1, Class
A4, 2.500%, 2/25/2052(a),(b) |
|
|
634,576 |
|
| |
8,246,539 |
|
|
Series 2025-S1,
Class A4, 2.500%, 9/25/2054(a),(b) |
|
|
7,353,109 |
|
| |
|
|
|
Towd Point Mortgage Trust |
|
|
|
|
| |
104,782 |
|
|
Series 2018-2, Class
A1, 3.250%, 3/25/2058(a),(b) |
|
|
103,930 |
|
| |
3,302,920 |
|
|
Series 2019-4, Class
A1, 2.900%, 10/25/2059(a),(b) |
|
|
3,204,605 |
|
| |
545,605 |
|
|
Series 2020-4, Class
A1, 1.750%, 10/25/2060(a) |
|
|
502,831 |
|
| |
1,447,668 |
|
|
Series 2023-1, Class
A1, 3.750%, 1/25/2063(a) |
|
|
1,409,585 |
|
| |
|
|
|
Wells Fargo Mortgage Backed Securities |
|
|
|
|
| |
989,973 |
|
|
Series 2021-2, Class
A3, 2.500%, 6/25/2051(a),(b) |
|
|
888,464 |
|
| |
413,721 |
|
|
Series 2022-1, Class
A3, 2.500%, 8/25/2051(a),(b) |
|
|
369,587 |
|
| |
2,158,787 |
|
|
Series
2022-2, Class A4, 2.500%, 12/25/2051(a),(b) |
|
|
1,923,005 |
|
| |
|
|
|
|
|
|
133,623,631 |
|
| |
|
|
|
TOTAL RESIDENTIAL MORTGAGE-BACKED SECURITIES |
|
|
|
|
| |
|
|
|
(Cost $526,208,577) |
|
|
541,724,942 |
|
| |
|
|
|
U.S. TREASURY NOTES & BONDS — 23.6% |
|
|
|
|
| |
|
|
|
U.S. Treasury Note |
|
|
|
|
| |
80,491,000 |
|
|
3.875%, 7/31/2030 |
|
|
81,094,682 |
|
| |
102,514,000 |
|
|
3.625%, 8/31/2030 |
|
|
102,237,725 |
|
| |
42,097,000 |
|
|
3.625%, 9/30/2030 |
|
|
41,939,136 |
|
| |
10,896,000 |
|
|
4.625%, 9/30/2030 |
|
|
11,324,554 |
|
| |
174,687,000 |
|
|
3.625%, 10/31/2030 |
|
|
173,977,334 |
|
FPA Flexible Fixed Income Fund
SCHEDULE OF INVESTMENTS - Continued
As of December 31, 2025
Principal
Amount |
|
|
|
|
Value |
|
| |
|
|
|
U.S. TREASURY NOTES & BONDS (Continued) |
|
|
|
|
| $ |
47,761,000 |
|
|
3.500%, 11/30/2030 |
|
$ |
47,290,607 |
|
| |
|
|
|
TOTAL U.S. TREASURY NOTES & BONDS |
|
|
|
|
| |
|
|
|
(Cost $456,528,269) |
|
|
457,864,038 |
|
| |
|
|
|
TOTAL BONDS & DEBENTURES |
|
|
|
|
| |
|
|
|
(Cost $1,652,113,486) |
|
|
1,686,376,609 |
|
Number
of Shares |
|
|
|
|
|
|
| |
|
|
|
COMMON STOCKS — 0.2% |
|
|
|
|
| |
|
|
|
REAL ESTATE SERVICES — 0.1% |
|
|
|
|
| |
58,520 |
|
|
Copper
Property CTL Pass Through Trust(e) |
|
|
658,350 |
|
| |
|
|
|
TELECOMMUNICATIONS — 0.0% |
|
|
|
|
| |
11,258 |
|
|
Uniti Group, Inc.* |
|
|
78,918 |
|
| |
|
|
|
TRANSPORTATION & LOGISTICS — 0.1% |
|
|
|
|
| |
75,292 |
|
|
PHI
Group, Inc.(d),(e) |
|
|
2,409,344 |
|
| |
|
|
|
TOTAL COMMON STOCKS |
|
|
|
|
| |
|
|
|
(Cost $1,733,607) |
|
|
3,146,612 |
|
| |
|
|
|
PREFERRED STOCKS — 0.0% |
|
|
|
|
| |
|
|
|
INDUSTRIALS — 0.0% |
|
|
|
|
| |
72 |
|
|
Uniti
Group, Inc. - Series A, 11.000%(d),(e) |
|
|
71,820 |
|
| |
|
|
|
TOTAL PREFERRED STOCKS |
|
|
|
|
| |
|
|
|
(Cost $148,804) |
|
|
71,820 |
|
| |
|
|
|
WARRANTS — 0.0% |
|
|
|
|
| |
2,179 |
|
|
Uniti
Group, Inc. , Expiration Date: August 11, 2035*,(d),(e) |
|
|
15,079 |
|
| |
|
|
|
TOTAL WARRANTS |
|
|
|
|
| |
|
|
|
(Cost $0) |
|
|
15,079 |
|
| |
|
|
|
SHORT-TERM INVESTMENTS — 12.4% |
|
|
|
|
| |
|
|
|
MONEY MARKET INVESTMENTS — 0.8% |
|
|
|
|
| |
15,012,708 |
|
|
Morgan
Stanley Institutional Liquidity Treasury Portfolio - Institutional Class, 3.64%(j) |
|
|
15,012,708 |
|
Principal
Amount |
|
|
|
|
|
|
| |
|
|
|
TREASURY BILLS — 11.6% |
|
|
|
|
| |
|
|
|
U.S. Treasury Bill |
|
|
|
|
| $ |
51,444,000 |
|
|
3.66%, 1/8/2026(k) |
|
|
51,407,922 |
|
| |
69,734,000 |
|
|
3.62%, 1/15/2026(k) |
|
|
69,637,214 |
|
| |
57,691,000 |
|
|
3.60%, 1/22/2026(k) |
|
|
57,571,888 |
|
FPA Flexible Fixed Income Fund
SCHEDULE OF INVESTMENTS - Continued
As of December 31, 2025
Principal
Amount |
|
|
|
|
Value |
|
| |
|
|
|
TREASURY BILLS (Continued) |
|
|
|
|
| $ |
46,331,000 |
|
|
3.52%,
1/29/2026(k) |
|
$ |
46,206,710 |
|
| |
|
|
|
|
|
|
224,823,734 |
|
| |
|
|
|
TOTAL SHORT-TERM INVESTMENTS |
|
|
|
|
| |
|
|
|
(Cost $239,836,442) |
|
|
239,836,442 |
|
| |
|
|
|
TOTAL INVESTMENTS — 99.5% |
|
|
|
|
| |
|
|
|
(Cost $1,893,832,339) |
|
|
1,929,446,562 |
|
| |
|
|
|
Other Assets in Excess of Liabilities — 0.5% |
|
|
9,966,684 |
|
| |
|
|
|
TOTAL NET ASSETS — 100.0% |
|
$ |
1,939,413,246 |
|
BDC – Business Development Company
IO – Interest Only
LLC – Limited Liability Company
LP – Limited Partnership
|
| * |
Non-income producing security. |
|
| (a) |
Security exempt from registration under Rule 144A of the Securities Act of 1933. These securities are restricted
and may be resold in transactions exempt from registration normally to qualified institutional buyers. The total value of these securities
is $498,680,811, which represents 25.71% of Total Net Assets. |
|
| (b) |
Variable or floating rate security. |
|
| (c) |
Bank loans generally pay interest at rates which are periodically determined by reference to a base lending
rate plus a premium. All loans carry a variable rate of interest. These base lending rates are generally (i) the Prime Rate offered by
one or more major United States banks, (ii) the lending rate offered by one or more European banks such as the London Interbank Offered
Rate (“LIBOR”), (iii) the Certificate of Deposit rate, or (iv) Secured Overnight Financing Rate (“SOFR”).
Bank Loans, while exempt from registration, under the Securities Act of 1933, contain certain restrictions on resale and cannot be sold
publicly. Floating rate bank loans often require prepayments from excess cash flow or permit the borrower to repay at its election. The
degree to which borrowers repay, whether as a contractual requirement or at their election, cannot be predicted with accuracy. |
|
| (d) |
The value of these securities was determined using significant unobservable inputs. These are reported
as Level 3 securities in the Fair Value Hierarchy. |
|
| (e) |
Restricted securities. These restricted securities, most of which are considered liquid by the Adviser, are
not registered and may not be sold to the public. There are legal and/or contractual restrictions on resale. The Fund does not have the
right to demand that such securities be registered. The values of these securities are determined by valuations provided by pricing services,
brokers, dealers, market makers, or in good faith under policies adopted by authority of the Fund's Board of Trustees. The total value
of these securities is $18,932,787, which represents 0.98% of Total Net Assets. |
|
| (f) |
Security is in default. |
|
| (g) |
As of December 31, 2025, the Fund had entered into commitments to fund various delayed draw debt-related investments.
Such commitments are subject to the satisfaction of certain conditions set forth in the documents governing those investments and there
can be no assurance that such conditions will be satisfied. See Note 8 of the Notes to Financial Statements for further information on
these commitments and contingencies. |
|
| (h) |
All or a portion of the loan is unfunded. |
|
| (i) |
Payment-in-kind interest is generally paid by issuing additional par/shares of the security rather than paying
cash. |
|
| (j) |
The rate is the annualized seven-day yield at period end. |
|
| (k) |
Treasury bill discount rate. |
See accompanying Notes to Financial Statements.
FPA Flexible Fixed Income Fund
STATEMENT OF ASSETS AND LIABILITIES
As of December 31, 2025
| Assets: |
|
|
|
| Investments, at value (cost $1,893,832,339) |
|
$ |
1,929,446,562 |
|
| Cash |
|
|
22,924,105 |
|
| Receivables: |
|
|
|
|
| Investment securities sold |
|
|
131,737 |
|
| Fund shares sold |
|
|
1,678,277 |
|
| Dividends and interest |
|
|
9,245,849 |
|
| Prepaid expenses |
|
|
43,470 |
|
| Total assets |
|
|
1,963,470,000 |
|
| |
|
|
|
|
| Liabilities: |
|
|
|
|
| Payables: |
|
|
|
|
| Investment securities purchased |
|
|
22,926,363 |
|
| Fund shares redeemed |
|
|
202,964 |
|
| Advisory fees |
|
|
630,304 |
|
| Shareholder servicing fees (Note 6) |
|
|
78,053 |
|
| Fund services fees |
|
|
150,160 |
|
| Shareholder reporting fees |
|
|
15,581 |
|
| Auditing fees |
|
|
15,577 |
|
| Trustees' deferred compensation (Note 3) |
|
|
10,913 |
|
| Legal fees |
|
|
10,388 |
|
| Trustees' fees and expenses |
|
|
8,292 |
|
| Chief Compliance Officer fees |
|
|
693 |
|
| Accrued other expenses |
|
|
7,466 |
|
| Total liabilities |
|
|
24,056,754 |
|
| Commitments and contingencies (Notes 3 and 8) |
|
|
|
|
| Net Assets |
|
$ |
1,939,413,246 |
|
| |
|
|
|
|
| Components of Net Assets: |
|
|
|
|
| Capital Stock (no par value with an unlimited number of shares authorized) |
|
$ |
1,903,832,077 |
|
| Total distributable earnings (accumulated deficit) |
|
|
35,581,169 |
|
| Net Assets |
|
$ |
1,939,413,246 |
|
| |
|
|
|
|
| Maximum Offering Price per Share: |
|
|
|
|
| Investor Class
Shares:1 |
|
|
|
|
| Net assets applicable to shares outstanding |
|
$ |
3,360,775 |
|
| Shares of beneficial interest issued and outstanding |
|
|
324,312 |
|
| Redemption price per share |
|
$ |
10.36 |
|
| |
|
|
|
|
| Institutional Class Shares: |
|
|
|
|
| Net assets applicable to shares outstanding |
|
$ |
1,862,957,213 |
|
| Shares of beneficial interest issued and outstanding |
|
|
179,617,096 |
|
| Redemption price per share |
|
$ |
10.37 |
|
| |
|
|
|
|
| Advisor Class Shares: |
|
|
|
|
| Net assets applicable to shares outstanding |
|
$ |
73,095,258 |
|
| Shares of beneficial interest issued and outstanding |
|
|
7,052,488 |
|
| Redemption price per share |
|
$ |
10.36 |
|
|
| 1 |
The Investor Class commenced operations
on July 1, 2025. The data shown reflects operations for the period July 1, 2025 to December 31, 2025. |
See accompanying Notes to Financial Statements.
FPA Flexible Fixed Income Fund
STATEMENT OF OPERATIONS
For the Year Ended December 31, 2025
| Investment income: |
|
|
|
| Interest |
|
$ |
77,479,567 |
|
| Dividends |
|
|
175,573 |
|
| Total investment income |
|
|
77,655,140 |
|
| |
|
|
|
|
| Expenses: |
|
|
|
|
| Advisory fees |
|
|
8,095,755 |
|
| Shareholder servicing fees - Investor Class (Note 6) |
|
|
1,562 |
|
| Shareholder servicing fees - Institutional Class (Note 6) |
|
|
1,121,502 |
|
| Shareholder servicing fees - Advisor Class (Note 6) |
|
|
64,589 |
|
| Fund services fees |
|
|
620,718 |
|
| Registration fees |
|
|
184,750 |
|
| Shareholder reporting fees |
|
|
111,424 |
|
| Trustees' fees and expenses |
|
|
58,767 |
|
| Legal fees |
|
|
32,569 |
|
| Insurance fees |
|
|
18,120 |
|
| Auditing fees |
|
|
16,077 |
|
| Miscellaneous |
|
|
8,825 |
|
| Chief Compliance Officer fees |
|
|
3,327 |
|
| Total expenses |
|
|
10,337,985 |
|
| Advisory fees waived and shareholder servicing fees reimbursed (Note
3 and 6) |
|
|
(1,331,221 |
) |
| Net expenses |
|
|
9,006,764 |
|
| Net investment income (loss) |
|
|
68,648,376 |
|
| |
|
|
|
|
| Realized and Unrealized Gain (Loss): |
|
|
|
|
| Net realized gain (loss) on: |
|
|
|
|
| Investments |
|
|
6,710,124 |
|
| Total realized gain (loss) |
|
|
6,710,124 |
|
| Net change in unrealized appreciation (depreciation) on: |
|
|
|
|
| Investments |
|
|
36,262,391 |
|
| Net change in unrealized appreciation (depreciation) |
|
|
36,262,391 |
|
| Net realized and unrealized gain (loss) |
|
|
42,972,515 |
|
| |
|
|
|
|
| Net Increase (Decrease) in Net Assets from Operations |
|
$ |
111,620,891 |
|
See accompanying Notes to Financial Statements.
FPA Flexible Fixed Income Fund
STATEMENTS OF CHANGES IN NET ASSETS
| |
|
For the
Year Ended
December 31,
2025 |
|
|
For the
Year Ended
December 31,
2024 |
|
| Increase (Decrease) in Net Assets from: |
|
|
|
|
|
|
|
|
| Operations: |
|
|
|
|
|
|
|
|
| Net investment income (loss) |
|
$ |
68,648,376 |
|
|
$ |
57,167,257 |
|
| Total realized gain (loss) on investments |
|
|
6,710,124 |
|
|
|
305,556 |
|
| Net change in unrealized appreciation (depreciation) on investments |
|
|
36,262,391 |
|
|
|
566,008 |
|
| Net increase (decrease) in net assets resulting from
operations |
|
|
111,620,891 |
|
|
|
58,038,821 |
|
| |
|
|
|
|
|
|
|
|
| Distributions to Shareholders: |
|
|
|
|
|
|
|
|
| Distributions: |
|
|
|
|
|
|
|
|
| Investor Class |
|
|
(31,424 |
) |
|
|
- |
|
| Institutional Class |
|
|
(64,794,783 |
) |
|
|
(53,343,853 |
) |
| Advisor Class |
|
|
(2,983,571 |
) |
|
|
(2,840,087 |
) |
| Total distributions to shareholders |
|
|
(67,809,778 |
) |
|
|
(56,183,940 |
) |
| |
|
|
|
|
|
|
|
|
| Capital Transactions: |
|
|
|
|
|
|
|
|
| Net proceeds from shares sold: |
|
|
|
|
|
|
|
|
| Investor Class |
|
|
4,645,967 |
1 |
|
|
- |
|
| Institutional Class |
|
|
856,771,446 |
|
|
|
516,543,240 |
|
| Advisor Class |
|
|
45,297,587 |
|
|
|
34,149,517 |
|
| Reinvestment of distributions: |
|
|
|
|
|
|
|
|
| Investor Class |
|
|
31,424 |
1 |
|
|
- |
|
| Institutional Class |
|
|
52,921,359 |
|
|
|
43,651,502 |
|
| Advisor Class |
|
|
1,103,278 |
|
|
|
1,004,808 |
|
| Cost of shares redeemed: |
|
|
|
|
|
|
|
|
| Investor Class |
|
|
(1,311,641 |
)1 |
|
|
- |
|
| Institutional Class |
|
|
(338,618,010 |
) |
|
|
(220,696,475 |
) |
| Advisor Class |
|
|
(40,378,436 |
) |
|
|
(19,113,261 |
) |
| Net increase (decrease) in net assets from capital
transactions |
|
|
580,462,974 |
|
|
|
355,539,331 |
|
| |
|
|
|
|
|
|
|
|
| Total increase (decrease) in net assets |
|
|
624,274,087 |
|
|
|
357,394,212 |
|
| |
|
|
|
|
|
|
|
|
| Net Assets: |
|
|
|
|
|
|
|
|
| Beginning of period |
|
|
1,315,139,159 |
|
|
|
957,744,947 |
|
| End of period |
|
$ |
1,939,413,246 |
|
|
$ |
1,315,139,159 |
|
| Capital Share Transactions: |
|
|
|
|
|
|
|
|
| Shares sold: |
|
|
|
|
|
|
|
|
| Investor Class |
|
|
447,667 |
1 |
|
|
- |
|
| Institutional Class |
|
|
83,463,665 |
|
|
|
51,032,150 |
|
| Advisor Class |
|
|
4,421,175 |
|
|
|
3,371,824 |
|
| Shares reinvested: |
|
|
|
|
|
|
|
|
| Investor Class |
|
|
3,030 |
1 |
|
|
- |
|
| Institutional Class |
|
|
5,146,898 |
|
|
|
4,327,415 |
|
| Advisor Class |
|
|
107,549 |
|
|
|
99,631 |
|
| Shares redeemed: |
|
|
|
|
|
|
|
|
| Investor Class |
|
|
(126,385 |
)1 |
|
|
- |
|
| Institutional Class |
|
|
(33,054,153 |
) |
|
|
(21,836,219 |
) |
| Advisor Class |
|
|
(3,934,851 |
) |
|
|
(1,885,848 |
) |
| Net increase (decrease) in capital share transactions |
|
|
56,474,595 |
|
|
|
35,108,953 |
|
|
| 1 |
The Investor Class commenced operations
on July 1, 2025. The data shown reflects operations for the period July 1, 2025 to December 31, 2025. |
See accompanying Notes to Financial Statements.
FPA Flexible Fixed Income Fund
FINANCIAL HIGHLIGHTS
Investor Class
Per share operating performance.
For a capital share outstanding throughout each period.
| |
|
For the
Period Ended
December 31,
20251 |
|
| Net asset value, beginning of period |
|
$ |
10.27 |
|
| Income from Investment Operations: |
|
|
|
|
| Net investment
income (loss)2 |
|
|
0.21 |
|
| Net realized and unrealized gain |
|
|
0.10 |
|
| Total from investment operations |
|
|
0.31 |
|
| |
|
|
|
|
| Less Distributions: |
|
|
|
|
| From net investment income |
|
|
(0.22 |
) |
| Total distributions |
|
|
(0.22 |
) |
| Net asset value, end of period |
|
$ |
10.36 |
|
| |
|
|
|
|
| Total return3 |
|
|
3.03 |
%4 |
| |
|
|
|
|
| Ratios and Supplemental Data: |
|
|
|
|
| Net assets, end of period (in thousands) |
|
$ |
3,361 |
|
| |
|
|
|
|
| Ratio of expenses to average net assets: |
|
|
|
|
| Before fees waived and expenses absorbed |
|
|
0.81 |
%5 |
| After fees waived and expenses absorbed |
|
|
0.65 |
%5 |
| Ratio of net investment income (loss) to average net assets: |
|
|
|
|
| Before fees waived and expenses absorbed |
|
|
3.80 |
%5 |
| After fees waived and expenses absorbed |
|
|
3.96 |
%5 |
| |
|
|
|
|
| Portfolio turnover rate |
|
|
48 |
%5 |
|
| 1 |
The Investor Class commenced operations
on July 1, 2025. The data shown reflects operations for the period July 1, 2025 to December 31, 2025. |
|
| 2 |
Based on average shares outstanding
for the period. |
|
| 3 |
Return is based on net asset value
per share, adjusted for reinvestment of distributions, and does not reflect deduction of the sales charge. |
See accompanying Notes to Financial Statements.
FPA Flexible Fixed Income Fund
FINANCIAL HIGHLIGHTS
Institutional Class
Per share operating performance.
For a capital share outstanding throughout each period.
| |
|
For the
Year Ended
December 31, |
|
| |
|
2025 |
|
|
2024 |
|
|
2023 |
|
|
20221 |
|
|
20211 |
|
| Net asset value, beginning of period |
|
$ |
10.08 |
|
|
$ |
10.04 |
|
|
$ |
9.68 |
|
|
$ |
10.24 |
|
|
$ |
10.29 |
|
| Income from Investment Operations: |
|
|
|
|
|
|
|
|
|
|
|
|
|
|
|
|
|
|
|
|
| Net investment
income (loss)2 |
|
|
0.44 |
|
|
|
0.50 |
|
|
|
0.50 |
|
|
|
0.29 |
|
|
|
0.20 |
|
| Net realized and unrealized gain (loss) |
|
|
0.28 |
|
|
|
0.02 |
|
|
|
0.34 |
|
|
|
(0.57 |
) |
|
|
(0.02 |
) |
| Total from investment operations |
|
|
0.72 |
|
|
|
0.52 |
|
|
|
0.84 |
|
|
|
(0.28 |
) |
|
|
0.18 |
|
| |
|
|
|
|
|
|
|
|
|
|
|
|
|
|
|
|
|
|
|
|
| Less Distributions: |
|
|
|
|
|
|
|
|
|
|
|
|
|
|
|
|
|
|
|
|
| From net investment income |
|
|
(0.43 |
) |
|
|
(0.48 |
) |
|
|
(0.48 |
) |
|
|
(0.28 |
) |
|
|
(0.20 |
) |
| From net realized gain |
|
|
- |
|
|
|
- |
|
|
|
- |
|
|
|
- |
|
|
|
(0.03 |
) |
| Total distributions |
|
|
(0.43 |
) |
|
|
(0.48 |
) |
|
|
(0.48 |
) |
|
|
(0.28 |
) |
|
|
(0.23 |
) |
| Net asset value, end of period |
|
$ |
10.37 |
|
|
$ |
10.08 |
|
|
$ |
10.04 |
|
|
$ |
9.68 |
|
|
$ |
10.24 |
|
| |
|
|
|
|
|
|
|
|
|
|
|
|
|
|
|
|
|
|
|
|
| Total return3 |
|
|
7.23 |
% |
|
|
5.29 |
% |
|
|
9.02 |
% |
|
|
(2.82 |
)% |
|
|
1.77 |
% |
| |
|
|
|
|
|
|
|
|
|
|
|
|
|
|
|
|
|
|
|
|
| Ratios and Supplemental Data: |
|
|
|
|
|
|
|
|
|
|
|
|
|
|
|
|
|
|
|
|
| Net assets, end of period (in thousands) |
|
$ |
1,862,957 |
|
|
$ |
1,250,081 |
|
|
$ |
908,830 |
|
|
$ |
684,315 |
|
|
$ |
666,786 |
|
| |
|
|
|
|
|
|
|
|
|
|
|
|
|
|
|
|
|
|
|
|
| Ratio of expenses to average net assets: |
|
|
|
|
|
|
|
|
|
|
|
|
|
|
|
|
|
|
|
|
| Before fees waived and expenses absorbed |
|
|
0.63 |
% |
|
|
0.62 |
% |
|
|
0.63 |
% |
|
|
0.67 |
% |
|
|
0.71 |
% |
| After fees waived and expenses absorbed |
|
|
0.55 |
% |
|
|
0.55 |
%4 |
|
|
0.54 |
%5 |
|
|
0.51 |
% |
|
|
0.49 |
% |
| Ratio of net investment income (loss) to average net assets: |
|
|
|
|
|
|
|
|
|
|
|
|
|
|
|
|
|
|
|
|
| Before fees waived and expenses absorbed |
|
|
4.16 |
% |
|
|
4.83 |
% |
|
|
4.97 |
% |
|
|
2.75 |
% |
|
|
1.69 |
% |
| After fees waived and expenses absorbed |
|
|
4.24 |
% |
|
|
4.90 |
% |
|
|
5.06 |
% |
|
|
2.91 |
% |
|
|
1.91 |
% |
| |
|
|
|
|
|
|
|
|
|
|
|
|
|
|
|
|
|
|
|
|
| Portfolio turnover rate |
|
|
48 |
% |
|
|
58 |
% |
|
|
55 |
% |
|
|
31 |
% |
|
|
35 |
% |
|
| 1 |
Audits performed for the fiscal
years indicated by the Fund's previous auditor, Ernst & Young LLP. |
|
| 2 |
Based on average shares outstanding
for the period. |
|
| 3 |
Return is based on net asset value
per share, adjusted for reinvestment of distributions, and does not reflect deduction of the sales charge. |
|
| 4 |
Effective May 1, 2024, the Adviser
contractually agreed to waive its fees and/or pay for operating expenses of the Fund to ensure that total annual fund operating expenses
(excluding any taxes, leverage interest, brokerage commissions, dividend and interest expenses on short sales, acquired fund fees and
expenses (as determined in accordance with Form N-1A), expenses incurred in connection with any merger or reorganization, and extraordinary
expenses such as litigation expenses) do not exceed 0.554% of the average daily net assets. Prior to May 1, 2024, the limit of the annual
operating expenses was 0.55%. |
|
| 5 |
Effective May 1, 2023, the Adviser
contractually agreed to waive its fees and/or pay for operating expenses of the Fund to ensure that total annual fund operating expenses
(excluding any taxes, leverage interest, brokerage commissions, dividend and interest expenses on short sales, acquired fund fees and
expenses (as determined in accordance with Form N-1A), expenses incurred in connection with any merger or reorganization, and extraordinary
expenses such as litigation expenses) do not exceed 0.55% of the average daily net assets. Prior to May 1, 2023, the limit of the annual
operating expenses was 0.52%. |
See accompanying Notes to Financial Statements.
FPA Flexible Fixed Income Fund
FINANCIAL HIGHLIGHTS
Advisor Class
Per share operating performance.
For a capital share outstanding throughout each period.
| |
|
For the
Year Ended
December 31, |
|
|
For the
Period Ended
December 31, |
|
| |
|
2025 |
|
|
2024 |
|
|
2023 |
|
|
20221 |
|
|
20211,2 |
|
| Net asset value, beginning of period |
|
$ |
10.07 |
|
|
$ |
10.04 |
|
|
$ |
9.68 |
|
|
$ |
10.24 |
|
|
$ |
10.32 |
|
| Income from Investment Operations: |
|
|
|
|
|
|
|
|
|
|
|
|
|
|
|
|
|
|
|
|
| Net investment
income (loss) 3 |
|
|
0.43 |
|
|
|
0.49 |
|
|
|
0.49 |
|
|
|
0.34 |
|
|
|
0.13 |
|
| Net realized and unrealized gain (loss) |
|
|
0.28 |
|
|
|
0.02 |
|
|
|
0.34 |
|
|
|
(0.63 |
) |
|
|
(0.05 |
) |
| Total from investment operations |
|
|
0.71 |
|
|
|
0.51 |
|
|
|
0.83 |
|
|
|
(0.29 |
) |
|
|
0.08 |
|
| |
|
|
|
|
|
|
|
|
|
|
|
|
|
|
|
|
|
|
|
|
| Less Distributions: |
|
|
|
|
|
|
|
|
|
|
|
|
|
|
|
|
|
|
|
|
| From net investment income |
|
|
(0.42 |
) |
|
|
(0.48 |
) |
|
|
(0.47 |
) |
|
|
(0.27 |
) |
|
|
(0.13 |
) |
| From net realized gain |
|
|
- |
|
|
|
- |
|
|
|
- |
|
|
|
- |
|
|
|
(0.03 |
) |
| Total distributions |
|
|
(0.42 |
) |
|
|
(0.48 |
) |
|
|
(0.47 |
) |
|
|
(0.27 |
) |
|
|
(0.16 |
) |
| Net asset value, end of period |
|
$ |
10.36 |
|
|
$ |
10.07 |
|
|
$ |
10.04 |
|
|
$ |
9.68 |
|
|
$ |
10.24 |
|
| |
|
|
|
|
|
|
|
|
|
|
|
|
|
|
|
|
|
|
|
|
| Total return4 |
|
|
7.22 |
% |
|
|
5.16 |
% |
|
|
8.86 |
% |
|
|
(2.79 |
)% |
|
|
0.85 |
% |
| Ratios and Supplemental Data: |
|
|
|
|
|
|
|
|
|
|
|
|
|
|
|
|
|
|
|
|
| Net assets, end of period (in thousands) |
|
$ |
73,095 |
|
|
$ |
65,058 |
|
|
$ |
48,915 |
|
|
$ |
1,083 |
|
|
$ |
32 |
|
| |
|
|
|
|
|
|
|
|
|
|
|
|
|
|
|
|
|
|
|
|
| Ratio of expenses to average net assets: |
|
|
|
|
|
|
|
|
|
|
|
|
|
|
|
|
|
|
|
|
| Before fees waived and expenses absorbed |
|
|
0.65 |
% |
|
|
0.65 |
% |
|
|
0.68 |
% |
|
|
0.70 |
% |
|
|
3.06 |
%5 |
| After fees waived and expenses absorbed |
|
|
0.60 |
% |
|
|
0.60 |
%6 |
|
|
0.59 |
%7 |
|
|
0.56 |
% |
|
|
0.59 |
%5 |
| Ratio of net investment income to average net assets: |
|
|
|
|
|
|
|
|
|
|
|
|
|
|
|
|
|
|
|
|
| Before fees waived and expenses absorbed |
|
|
4.16 |
% |
|
|
4.80 |
% |
|
|
4.93 |
% |
|
|
3.32 |
% |
|
|
(0.69 |
)%5 |
| After fees waived and expenses absorbed |
|
|
4.21 |
% |
|
|
4.85 |
% |
|
|
5.02 |
% |
|
|
3.45 |
% |
|
|
1.79 |
%5 |
| |
|
|
|
|
|
|
|
|
|
|
|
|
|
|
|
|
|
|
|
|
| Portfolio turnover rate |
|
|
48 |
% |
|
|
58 |
% |
|
|
55 |
% |
|
|
31 |
% |
|
|
35 |
%5 |
|
| 1 |
Audits performed for the fiscal
years indicated by the Fund's previous auditor, Ernst & Young LLP. |
|
| 2 |
The Advisor Class commenced operations
on April 16, 2021. The data shown reflects operations for the period April 16, 2021 to December 31, 2021. |
|
| 3 |
Based on average shares outstanding
for the period. |
|
| 4 |
Return is based on net asset value
per share, adjusted for reinvestment of distributions, and does not reflect deduction of the sales charge. |
|
| 6 |
Effective May 1, 2024, the Adviser
contractually agreed to waive its fees and/or pay for operating expenses of the Fund to ensure that total annual fund operating expenses
(excluding any taxes, leverage interest, brokerage commissions, dividend and interest expenses on short sales, acquired fund fees and
expenses (as determined in accordance with Form N-1A), expenses incurred in connection with any merger or reorganization, and extraordinary
expenses such as litigation expenses) do not exceed 0.604% of the average daily net assets. Prior to May 1, 2024, the limit of the annual
operating expenses was 0.60%. |
|
| 7 |
Effective May 1, 2023, the Adviser
contractually agreed to waive its fees and/or pay for operating expenses of the Fund to ensure that total annual fund operating expenses
(excluding any taxes, leverage interest, brokerage commissions, dividend and interest expenses on short sales, acquired fund fees and
expenses (as determined in accordance with Form N-1A), expenses incurred in connection with any merger or reorganization, and extraordinary
expenses such as litigation expenses) do not exceed 0.60% of the average daily net assets. Prior to May 1, 2023, the limit of the annual
operating expenses was 0.57%. |
See accompanying Notes to Financial Statements.
FPA Flexible Fixed Income Fund
NOTES TO FINANCIAL STATEMENTS
December 31, 2025
Note 1 – Organization
FPA Flexible Fixed Income Fund (the “Fund”),
is a diversified series of Investment Managers Series Trust III (the “Trust”) which is registered as an open-end management
investment company under the Investment Company Act of 1940, as amended (the “1940 Act”). The Fund’s primary investment
objective is to seek long-term total return, which includes income and capital appreciation, while considering capital preservation. First
Pacific Advisors, LP (the "Adviser") has served as the Fund's investment adviser since December 31, 2018.
The Fund is an investment company and accordingly
follows the investment company accounting and reporting guidance of the Financial Accounting Standards Board (FASB) Accounting Standard
Codification Topic 946 “Financial Services— Investment Companies”.
The Fund is deemed to be an individual reporting segment
and is not part of a consolidated reporting entity. The objective and strategy of the Fund is used by the Adviser to make investment decisions,
and the results of the operations, as shown on the Statements of Operations and the financial highlights for the Fund is the information
utilized for the day-to-day management of the Fund. The Fund is party to the expense agreements as disclosed in the Notes to the Financial
Statements and there are no resources allocated to a Fund based on performance measurements. The management of the Fund’s Adviser
is deemed to be the Chief Operating Decision Maker with respect to the Fund’s investment decisions.
Note 2 – Accounting Policies
The following is a summary of the significant accounting
policies consistently followed by the Fund in the preparation of its financial statements. The preparation of financial statements in
conformity with accounting principles generally accepted in the United States of America (“GAAP”) requires management to make
estimates and assumptions that affect the reported amounts and disclosures in the financial statements. Actual results could differ from
these estimates.
(a) Valuation of Investments
The Fund values equity securities at the last reported
sale price on the principal exchange or in the principal over the counter (“OTC”) market in which such securities are traded,
as of the close of regular trading on the NYSE on the day the securities are being valued or, if the last-quoted sales price is not readily
available, the securities will be valued at the last bid or the mean between the last available bid and ask price. Securities traded on
the NASDAQ are valued at the NASDAQ Official Closing Price (“NOCP”). Investments in open-end investment companies are valued
at the daily closing net asset value of the respective investment company. Debt securities are valued by utilizing a price supplied by
independent pricing service providers. The independent pricing service providers may use various valuation methodologies including matrix
pricing and other analytical pricing models as well as market transactions and dealer quotations. These models generally consider such
factors as yields or prices of bonds of comparable quality, type of issue, coupon, maturity, ratings and general market conditions. If
a price is not readily available for a portfolio security, the security will be valued at fair value (the amount which the Fund might
reasonably expect to receive for the security upon its current sale). The Board of Trustees has designated the Adviser as the Fund’s
valuation designee (the “Valuation Designee”) to make all fair value determinations with respect to the Fund’s portfolio
investments, subject to the Board’s oversight. As the Valuation Designee, the Adviser has adopted and implemented policies and procedures
to be followed when the Fund must utilize fair value pricing.
(b) Investment Transactions, Investment Income
and Expenses
Investment transactions are accounted for on the trade
date. Realized gains and losses on investments are determined on the identified cost basis. Dividend income is recorded net of applicable
withholding taxes on the ex-dividend date and interest income is recorded on an accrual basis. Withholding taxes on foreign dividends,
if applicable, are paid (a portion of which may be reclaimable) or provided for in accordance with the applicable country’s tax
rules and rates and are disclosed in the Statement of Operations. Withholding tax reclaims are filed in certain countries to recover a
portion of the amounts previously withheld. The Fund records a reclaim receivable based on a number of factors, including a jurisdiction’s
legal obligation to pay reclaims as well as payment history and market convention. Discounts on debt securities are accreted or amortized
to interest income over the lives of the respective securities using the effective interest method. Premiums for callable debt securities
are amortized to the earliest call date if the call price was less than the purchase price. If the call price was not at par and the security
was not called, the security is amortized to the next call price and date. Income and expenses of the Fund are allocated on a pro rata
basis to each class of shares relative net assets, except for distribution and service fees which are unique to each class of shares relative
net assets. Expenses incurred by the Trust with respect to more than one fund are allocated in proportion to the net assets of each fund
except where allocation of direct expenses to each fund or an alternative allocation method can be more appropriately made.
FPA Flexible Fixed Income Fund
NOTES TO FINANCIAL STATEMENTS (Continued)
December 31, 2025
(c) Mortgage-Backed Securities
The Fund may invest in mortgage-backed securities
("MBS"), representing direct or indirect interests in pools of underlying residential or commercial mortgage loans that are secured
by real property. These securities provide investors with payments consisting of both principal and interest as the mortgages in the underlying
mortgage pools are paid.
The timely payment of principal and interest (but
not the market value) on MBS issued or guaranteed by Ginnie Mae (formally known as the Government National Mortgage Association or GNMA)
is backed by Ginnie Mae and the full faith and credit of the US government. Obligations issued by Fannie Mae (formally known as the Federal
National Mortgage Association or FNMA) and Freddie Mac (formally known as the Federal Home Loan Mortgage Corporation or FHLMC) are historically
supported only by the credit of the issuer, but currently are guaranteed by the US government in connection with such agencies being placed
temporarily into conservatorship by the US government.
Some MBS are sponsored or issued by private entities.
Payments of principal and interest (but not the market value) of such private MBS may be supported by pools of residential or commercial
mortgage loans or other MBS that are guaranteed, directly or indirectly, by the US government or one of its agencies or instrumentalities,
or they may be issued without any government guarantee of the underlying mortgage assets but may contain some form of non-government credit
enhancement.
Collateralized mortgage obligations ("CMO")
are a type of MBS. A CMO is a debt security that may be collateralized by whole mortgage loans or mortgage pass-through securities. The
mortgage loans or mortgage pass-through securities are divided into classes or tranches with each class having its own characteristics.
Investors typically receive payments out of the interest and principal on the underlying mortgages. The portions of these payments that
investors receive, as well as the priority of their rights to receive payments, are determined by the specific terms of the CMO class.
The yield characteristics of MBS differ from those
of traditional debt securities. Among the major differences are that interest and principal payments are made more frequently, usually
monthly, and that principal may be prepaid at any time because the underlying mortgage loans or other obligations generally may be prepaid
at any time. Prepayments on a pool of mortgage loans are influenced by a variety of economic, geographic, social and other factors. Generally,
prepayments on fixed-rate mortgage loans will increase during a period of falling interest rates and decrease during a period of rising
interest rates. Certain classes of CMOs and other MBS are structured in a manner that makes them extremely sensitive to changes in prepayment
rates.
(d) Asset-Backed Securities
Asset-backed securities include pools of mortgages,
loans, receivables or other assets. Payment of principal and interest may be largely dependent upon the cash flows generated by the assets
backing the securities, and, in certain cases, supported by letters of credit, surety bonds, or other credit enhancements. The value of
asset-backed securities may also be affected by the creditworthiness of the servicing agent for the pool, the originator of the loans
or receivables, or the financial institution(s) providing the credit support. In addition, asset-backed securities are not backed by any
governmental agency.
FPA Flexible Fixed Income Fund
NOTES TO FINANCIAL STATEMENTS (Continued)
December 31, 2025
Collateralized Debt Obligations (“CDOs”)
include Collateralized Bond Obligations (“CBOs”), Collateralized Loan Obligations (“CLOs”) and other similarly
structured securities. CBOs and CLOs are types of asset backed securities. A CBO is a trust which is backed by a diversified pool of high
risk, below investment grade fixed income securities. A CLO is a trust typically collateralized by a pool of loans, which may include,
among others, domestic and foreign senior secured loans, senior unsecured loans, and subordinate corporate loans, including loans that
may be rated below investment grade or equivalent unrated loans. The risks of an investment in a CDO depend largely on the type of the
collateral securities and the class of the CDO in which a Fund invests. CDOs carry additional risks including, but not limited to, (i)
the possibility that distributions from collateral securities will not be adequate to make interest or other payments, (ii) the collateral
may decline in value or default, (iii) a Fund may invest in CDOs that are subordinate to other classes, and (iv) the complex structure
of the security may not be fully understood at the time of investment and may produce disputes with the issuer or unexpected investment
results.
(e) Stripped Mortgage-Backed Interest Only (“I/O”)
and Principal Only (“P/O”) Securities
Stripped mortgage-backed securities are usually structured
with two classes that receive different proportions of the interest and principal distributions on a pool of mortgage assets. In certain
cases, one class will receive all of the interest payments on the underlying mortgages (the I/O class), while the other class will receive
all of the principal payments (the P/O class). The Fund currently has investments in I/O securities. The yield to maturity on I/Os is
sensitive to the rate of principal repayments (including prepayments) on the related underlying mortgage assets, and principal payments
may have a material effect on yield-to-maturity. If the underlying mortgage assets experience greater than anticipated prepayments of
principal, a Fund may not fully recoup its initial investment in I/Os.
(f) Credit Risk
Debt securities are subject to credit risk, meaning
that the issuer of the debt security may default or fail to make timely payments of principal or interest. The values of any of the Fund's
investments may also decline in response to events affecting the issuer or its credit rating. The lower rated debt securities in which
the Fund may invest are considered speculative and are generally subject to greater volatility and risk of loss than investment grade
securities, particularly in deteriorating economic conditions. The Fund invests a significant portion of its assets in securities of issuers
that hold mortgage-and asset-backed securities and direct investments in securities backed by commercial and residential mortgage loans
and other financial assets. The value and related income of these securities is sensitive to changes in economic conditions, including
delinquencies and/or defaults. Continuing shifts in the market's perception of credit quality on securities backed by commercial and residential
mortgage loans and other financial assets may result in increased volatility of market price and periods of illiquidity that can negatively
impact the valuation of certain securities held by the Fund.
(g) Currency Translation
Assets and liabilities denominated in foreign currencies
are translated into U.S. dollars at the mean of the quoted bid and ask prices of such currencies against the U.S. dollar. Purchases and
sales of portfolio securities are translated into U.S. dollars at the rates of exchange prevailing when such securities were acquired
or sold. Income and expenses are translated into U.S. dollars at rates of exchange prevailing when accrued.
Net realized gain or loss on foreign currency transactions
represents foreign exchange gains and losses from sales and maturities of foreign fixed income investments, holding of foreign currencies,
currency gains or losses realized between the trade and settlement dates on foreign investment transactions, and the difference between
the amounts of dividends, interest and foreign withholding taxes recorded on the Fund’s books and the U.S. dollar equivalent amounts
actually received or paid. Net unrealized currency gains and losses from valuing foreign currency denominated assets and liabilities at
year-end exchange rates are reflected as a component of net unrealized appreciation or depreciation of foreign currency denominated assets
and liabilities.
FPA Flexible Fixed Income Fund
NOTES TO FINANCIAL STATEMENTS (Continued)
December 31, 2025
(h) Illiquid Securities
Pursuant to Rule 22e-4 under the 1940 Act, the Fund
has adopted a Liquidity Risk Management Program (“LRMP”) that requires, among other things, that the Fund limits its illiquid
investments that are assets to no more than 15% of net assets. An illiquid investment is any security which may not reasonably be expected
to be sold or disposed of in current market conditions in seven calendar days or less without the sale or disposition significantly changing
the market value of the investment. If the Adviser, at any time determines that the value of illiquid securities held by the Fund exceeds
15% of its net asset value, the Adviser will take such steps as it considers appropriate to reduce them as soon as reasonably practicable
in accordance with the Fund’s written LRMP.
(i) Use of Estimates
The presentation of financial statements in conformity
with GAAP requires management to make estimates and assumptions that affect the reported amounts of assets and liabilities at the date
of the financial statements and the reported amounts of income and expenses during the reporting period. Actual results could differ from
those estimates.
(j) Federal Income Taxes
The Fund intends to comply with the requirements of
Subchapter M of the Internal Revenue Code applicable to regulated investment companies and to distribute substantially all of their net
investment income and any net realized gains to their shareholders. Therefore, no provision is made for federal income or excise taxes.
Due to the timing of dividend distributions and the differences in accounting for income and realized gains and losses for financial statement
and federal income tax purposes, the fiscal year in which amounts are distributed may differ from the year in which the income and realized
gains and losses are recorded by the Fund.
Accounting for Uncertainty in Income Taxes
(the “Income Tax Statement”) requires an evaluation of tax positions taken (or expected to be taken) in the course of preparing
a Fund’s tax returns to determine whether these positions meet a “more-likely-than-not” standard that, based on the
technical merits, have a more than fifty percent likelihood of being sustained by a taxing authority upon examination. A tax position
that meets the “more-likely-than-not” recognition threshold is measured to determine the amount of benefit to recognize in
the financial statements. The Fund recognizes interest and penalties, if any, related to unrecognized tax benefits as income tax expense
in the Statement of Operations.
The Income Tax Statement requires management of the
Fund to analyze tax positions taken in the prior three open tax years, if any, and tax positions expected to be taken in the Fund’s
current tax year, as defined by the IRS statute of limitations for all major jurisdictions, including federal tax authorities and certain
state tax authorities. As of December 31, 2025, and during the prior three open tax years, the Fund did not have a liability for any unrecognized
tax benefits. The Fund has no examinations in progress and is not aware of any tax positions for which it is reasonably possible that
the total amounts of unrecognized tax benefits will significantly change in the next twelve months.
(k) Distributions to Shareholders
The Fund will make distributions of net investment
income monthly and net capital gains, if any, at least annually. Distributions to shareholders are recorded on the ex-dividend date. The
amount and timing of distributions are determined in accordance with federal income tax regulations, which may differ from GAAP.
FPA Flexible Fixed Income Fund
NOTES TO FINANCIAL STATEMENTS (Continued)
December 31, 2025
The character of distributions made during the year
from net investment income or net realized gains may differ from the characterization for federal income tax purposes due to differences
in the recognition of income, expense and gain (loss) items for financial statement and tax purposes.
Note 3 – Investment Advisory and Other Agreements
The Trust, on behalf of the Fund, entered into an
Investment Advisory Agreement (the “Agreement”) with the Adviser. Under the terms of the Agreement, the Fund pays a monthly
investment advisory fee to the Adviser at the annual rate of 0.50% of the Fund’s average daily net assets. In addition, the Adviser
has contractually agreed to waive its fees and/or pay for operating expenses of the Fund to ensure that total annual fund operating expenses
(excluding interest, taxes, brokerage fees and commissions payable by the Fund in connection with the purchase or sale of portfolio securities,
redemption liquidity service expenses, and extraordinary expenses, including litigation expenses not incurred in the Fund’s ordinary
course of business) do not exceed 0.604%, 0.554%, and 0.654% of the Fund’s average daily net assets for the one-year period ending
June 30, 2026, for the Advisor Class, Institutional Class, and Investor Class, respectively.
For the year ended December 31, 2025, the Adviser
waived a portion of its advisory fees totaling $ 180,494 for the Fund. Any expenses reimbursed to the Fund by the Adviser during any of
the previous 36 months may be recouped by the Adviser, provided the Fund’s Total Annual Fund Operating Expenses do not exceed 0.64%
of the average net assets of the Fund attributable to the Institutional Class, 0.74% of the average net assets of the Fund attributable
to the Advisor Class, and 0.79% of the average net assets of the Fund attributable to the Investor Class for any subsequent calendar year,
regardless of whether there is a then-effective higher expense limit. This agreement may only be terminated earlier by the Fund’s
Board of Trustees or upon termination of the Advisory Agreement. The potential recoverable amount is noted as "Commitments and contingencies"
as reported on the Statement of Assets and Liabilities. The Adviser may recapture all or a portion of this amount no later than dates
stated below:
| December 31, 2026 |
|
$ |
774,947 |
|
| December 31, 2027 |
|
|
802,310 |
|
| December 31, 2028 |
|
|
1,331,221 |
|
| Total |
|
$ |
2,908,478 |
|
UMB Fund Services, Inc. ("UMBFS") serves as
the Fund’s fund accountant, transfer agent and co-administrator; and Mutual Fund Administration, LLC (“MFAC”) serves
as the Fund’s other co-administrator. UMB Bank, n.a., an affiliate of UMBFS, serves as the Fund’s custodian. The Fund’s
allocated fees incurred for fund accounting, fund administration, transfer agency and custody services for the year ended December 31,
2025, are reported as fund services fees on the Statement of Operations.
Distribution Services, LLC serves as the Fund’s
distributor (the “Distributor”). The Distributor does not receive compensation from the Fund for its distribution services;
the Adviser pays the Distributor a fee for its distribution-related services.
Certain trustees and officers of the Trust are employees
of UMBFS, MFAC or the Adviser. The Fund does not compensate trustees and officers affiliated with the Fund’s Adviser or co-administrators.
For the year ended December 31, 2025, the Fund’s allocated fees incurred to Trustees of the Trust who are not “interested
persons” of the Trust, as that term is defined in the 1940 Act (collectively, the “Independent Trustees”) are reported
on the Statement of Operations.
FPA Flexible Fixed Income Fund
NOTES TO FINANCIAL STATEMENTS (Continued)
December 31, 2025
The Fund's Board of Trustees has adopted a Deferred
Compensation Plan (the “Plan”) for the Independent Trustees that enables Trustees to elect to receive payment in cash or the
option to defer some or all of their fees. If a trustee elects to defer payment, the Plan provides for the creation of a deferred payment
account. A Trustee’s deferred fees are deemed to be invested in designated mutual funds available under the Plan. The Fund's liability
for these amounts is adjusted for market value changes in the invested fund and remains a liability to the Fund until distributed in accordance
with the Plan. The Trustees Deferred compensation liability under the Plan constitutes a general unsecured obligation of the Fund and
is disclosed in the Statement of Assets and Liabilities. Contributions made under the plan and the change in unrealized appreciation/depreciation
and income are included in the Trustees' fees and expenses in the Statement of Operations.
Dziura Compliance Consulting, LLC provides Chief Compliance
Officer (“CCO”) services to the Trust. The Fund’s allocated fees incurred for CCO services for the year ended December
31, 2025 are reported on the Statement of Operations.
Note 4 – Federal Income Taxes
At December 31, 2025, gross unrealized appreciation/(depreciation)
of investments, based on cost for federal income tax purposes were as follows:
| Cost of investments |
|
$ |
1,893,042,392 |
|
| |
|
|
|
|
| Gross unrealized appreciation |
|
$ |
38,454,891 |
|
| Gross unrealized depreciation |
|
|
(2,050,721 |
) |
| |
|
|
|
|
| Net unrealized appreciation/(depreciation) |
|
$ |
36,404,170 |
|
The difference between cost amounts for financial
statement and federal income tax purposes is due primarily to timing differences in recognizing certain gains and losses in security transactions.
GAAP requires that certain components of net assets
be reclassified between financial and tax reporting. These reclassifications have no effect on net assets or net asset value per share.
For the year ended December 31, 2025, permanent differences in book and tax have been reclassified to paid-in capital and total distributable
earnings/(deficit) as follows:
| Increase (Decrease) |
| |
Paid-in
Capital |
|
|
|
Total
distributable earnings/(deficit) |
|
| $ |
- |
|
|
$ |
- |
|
As of December 31, 2025, the components of accumulated
earnings/(deficit) on a tax basis were as follows:
| Undistributed ordinary income |
|
$ |
650,420 |
|
| Undistributed long-term capital gains |
|
|
- |
|
| Tax accumulated earnings |
|
|
650,420 |
|
| |
|
|
|
|
| Accumulated capital and other losses |
|
|
(1,462,508 |
) |
| Unrealized appreciation/(depreciation) on investments |
|
|
36,404,170 |
|
| Deferred compensation |
|
|
(10,913 |
) |
| Total accumulated earnings/(deficit) |
|
$ |
35,581,169 |
|
FPA Flexible Fixed Income Fund
NOTES TO FINANCIAL STATEMENTS (Continued)
December 31, 2025
The tax character of distributions paid during the
fiscal years ended December 31, 2025 and December 31, 2024, were as follows:
| |
|
2025 |
|
|
2024 |
|
| Distributions paid from: |
|
|
|
|
|
|
|
|
| Ordinary income |
|
$ |
67,809,778 |
|
|
$ |
56,183,940 |
|
| Net long-term capital gains |
|
|
- |
|
|
|
- |
|
| Total distributions paid |
|
$ |
67,809,778 |
|
|
$ |
56,183,940 |
|
As of December 31, 2025, the Fund had non-expiring
capital loss carryforwards as follows:
| |
|
2025 |
|
| Short-term |
|
$ |
- |
|
| Long-term |
|
|
1,455,360 |
|
| Total capital loss carryforwards |
|
$ |
1,455,360 |
|
During the tax year ended December 31, 2025, the Fund
utilized $3,396,799 of short-term and $4,754,583 of long-term non-expiring capital loss carryforwards, respectively.
Note 5 – Investment Transactions
For the year ended December 31, 2025, purchases and
sales of investments, excluding short-term investments, were $ 1,119,723,132 and $ 713,699,104, respectively.
Note 6 – Shareholder Servicing Plan
Pursuant to the Shareholder Service Plan adopted by
the Board, on behalf of the Fund, the Fund may pay a fee at an annual rate of up to 0.10%, 0.15%, and 0.25% of its average daily net assets
attributable to Institutional Class, Advisor Class, and Investor Class shares, respectively. The Fund does not pay these service fees
on shares purchased directly. In addition, the Adviser may, at its own expense, pay financial representatives and/or shareholder servicing
agents for these services. For the year ended December 31, 2025, the Adviser reimbursed shareholder servicing fees of $1,121,503, $28,297,
and $927 for the Institutional Class, Advisor Class, and Investor Class shares, respectively.
Note 7 – Indemnifications
In the normal course of business, the Fund enters
into contracts that contain a variety of representations which provide general indemnifications. The Fund’s maximum exposure under
these arrangements is unknown, as this would involve future claims that may be made against the Fund that have not yet occurred. However,
the Fund expects the risk of loss to be remote.
Note 8 – Commitments and Contingencies
The Fund may enter into unfunded loan commitments.
Unfunded loan commitments may be partially or wholly unfunded. During the contractual period, the Fund is obliged to provide funding to
the borrower upon demand. Unfunded loan commitments are fair valued in accordance with the valuation policy described in Note 2(a) and
unrealized appreciation or depreciation, if any, is recorded on the Statement of Assets and Liabilities. As of December 31, 2025, the
total unfunded amount was 0.02% of the Fund’s net assets.
FPA Flexible Fixed Income Fund
NOTES TO FINANCIAL STATEMENTS (Continued)
December 31, 2025
As of December 31, 2025, the Fund had the following
unfunded loan commitments outstanding:
| Loan |
|
Principal |
|
|
Cost |
|
|
Value |
|
|
Unrealized
Appreciation/
(Depreciation) |
|
|
Unfunded
Commitment |
|
| Lealand Finance Super Senior Exit LC |
|
$ |
341,263 |
|
|
$ |
(356 |
) |
|
$ |
(40,952 |
) |
|
$ |
(40,596 |
) |
|
$ |
341,263 |
|
Note 9 – Fair Value Measurements and Disclosure
Fair Value Measurements and Disclosures defines
fair value, establishes a framework for measuring fair value in accordance with GAAP, and expands disclosure about fair value measurements.
It also provides guidance on determining when there has been a significant decrease in the volume and level of activity for an asset or
a liability, when a transaction is not orderly, and how that information must be incorporated into a fair value measurement.
Under Fair Value Measurements and Disclosures,
various inputs are used in determining the value of the Fund’s investments. These inputs are summarized into three broad Levels
as described below:
|
| ● |
Level 1 – Unadjusted quoted prices in active markets
for identical assets or liabilities that the Fund has the ability to access. |
|
| ● |
Level 2 – Observable inputs other than quoted
prices included in level 1 that are observable for the asset or liability, either directly or indirectly. These inputs may include quoted
prices for the identical instrument on an inactive market, prices for similar instruments, interest rates, prepayment speeds, credit risk,
yield curves, default rates and similar data. |
|
| ● |
Level 3 – Unobservable inputs for the asset
or liability, to the extent relevant observable inputs are not available, representing the Fund’s own assumptions about the assumptions
a market participant would use in valuing the asset or liability, and would be based on the best information available. |
The availability of observable inputs can vary from
security to security and is affected by a wide variety of factors, including, for example, the type of security, whether the security
is new and not yet established in the marketplace, the liquidity of markets, and other characteristics particular to the security. To
the extent that valuation is based on models or inputs that are less observable or unobservable in the market, the determination of fair
value requires more judgment. Accordingly, the degree of judgment exercised in determining fair value is greatest for instruments categorized
in Level 3.
The inputs used to measure fair value may fall into
different Levels of the fair value hierarchy. In such cases, for disclosure purposes, the Level in the fair value hierarchy within which
the fair value measurement falls in its entirety, is determined based on the lowest Level input that is significant to the fair value
measurement in its entirety.
The inputs or methodology used for valuing securities
are not an indication of the risk associated with investing in those securities. The following is a summary of the inputs used, as of
December 31, 2025, in valuing the Fund’s assets carried at fair value:
FPA Flexible Fixed Income Fund
NOTES TO FINANCIAL STATEMENTS (Continued)
December 31, 2025
| Investments |
|
Level 1 |
|
|
Level 2 |
|
|
Level 3 |
|
|
Total |
|
| Asset-Backed Securities |
|
|
|
|
|
|
|
|
|
|
|
|
|
|
|
|
| Auto |
|
$ |
- |
|
|
$ |
66,120,969 |
|
|
$ |
- |
|
|
$ |
66,120,969 |
|
| Collateralized Loan Obligation |
|
|
- |
|
|
|
40,198,949 |
|
|
|
- |
|
|
|
40,198,949 |
|
| Equipment |
|
|
- |
|
|
|
151,480,318 |
|
|
|
- |
|
|
|
151,480,318 |
|
| Other |
|
|
- |
|
|
|
119,520,775 |
|
|
|
- |
|
|
|
119,520,775 |
|
| Commercial Mortgage-Backed Securities |
|
|
|
|
|
|
|
|
|
|
|
|
|
|
|
|
| Agency |
|
|
- |
|
|
|
159,877,097 |
|
|
|
- |
|
|
|
159,877,097 |
|
| Agency Stripped |
|
|
- |
|
|
|
853,171 |
|
|
|
- |
|
|
|
853,171 |
|
| Non-Agency |
|
|
- |
|
|
|
87,929,806 |
|
|
|
- |
|
|
|
87,929,806 |
|
| Corporate Bank Debt |
|
|
- |
|
|
|
2,785,294 |
|
|
|
1,811,587 |
|
|
|
4,596,881 |
|
| Corporate Bonds |
|
|
|
|
|
|
|
|
|
|
|
|
|
|
|
|
| Communications |
|
|
- |
|
|
|
12,854,628 |
|
|
|
- |
|
|
|
12, 854,628 |
|
| Consumer Discretionary |
|
|
- |
|
|
|
7,718,352 |
|
|
|
- |
|
|
|
7,718,352 |
|
| Financials |
|
|
- |
|
|
|
24,455,370 |
|
|
|
10,201,000 |
|
|
|
34,656,370 |
|
| Health Care |
|
|
- |
|
|
|
980,313 |
|
|
|
- |
|
|
|
980,313 |
|
| Residential Mortgage-Backed Securities |
|
|
|
|
|
|
|
|
|
|
|
|
|
|
|
|
| Agency Collateralized Mortgage Obligation |
|
|
- |
|
|
|
12,047,695 |
|
|
|
- |
|
|
|
12,047,695 |
|
| Agency Pool Adjustable Rate |
|
|
- |
|
|
|
19,295,298 |
|
|
|
- |
|
|
|
19, 295,298 |
|
| Agency Pool Fixed Rate |
|
|
- |
|
|
|
376,739,855 |
|
|
|
- |
|
|
|
376,739,855 |
|
| Agency Stripped |
|
|
- |
|
|
|
18,463 |
|
|
|
- |
|
|
|
18,463 |
|
| Non-Agency Collateralized Mortgage Obligation |
|
|
- |
|
|
|
133,623,631 |
|
|
|
- |
|
|
|
133,623,631 |
|
| U.S. Treasury Notes & Bonds |
|
|
- |
|
|
|
457,864,038 |
|
|
|
- |
|
|
|
457,864,038 |
|
| Common Stocks |
|
|
|
|
|
|
|
|
|
|
|
|
|
|
|
|
| Real Estate Services |
|
|
658,350 |
|
|
|
- |
|
|
|
- |
|
|
|
658,350 |
|
| Telecommunications |
|
|
78,918 |
|
|
|
- |
|
|
|
- |
|
|
|
78,918 |
|
| Transportation & Logistics |
|
|
- |
|
|
|
- |
|
|
|
2,409,344 |
|
|
|
2,409,344 |
|
| Preferred Stocks |
|
|
|
|
|
|
|
|
|
|
|
|
|
|
|
|
| Industrials |
|
|
- |
|
|
|
- |
|
|
|
71,820 |
|
|
|
71,820 |
|
| Warrants |
|
|
- |
|
|
|
- |
|
|
|
15,079 |
|
|
|
15,079 |
|
| Short-Term Investments |
|
|
15,012,708 |
|
|
|
224,823,734 |
|
|
|
- |
|
|
|
239,836,442 |
|
| |
|
$ |
15,749,976 |
|
|
$ |
1,899,187,756 |
|
|
$ |
14,508,830 |
|
|
$ |
1,929,446,562 |
|
The following is a reconciliation of assets in which
significant unobservable inputs (Level 3) were used in determining value:
| Investments |
|
Beginning
value at
December 31,
2024 |
|
|
Transfers
In/(out) of
Level 3
during the
period |
|
|
Total
Realized
gain/loss |
|
|
Total Change
in unrealized
appreciation/
depreciation |
|
|
Amortization of
Discount
(Amortization
of
Premium) |
|
|
Net
Purchases |
|
|
Net Sales |
|
|
Ending Value at
December 31,
2025 |
|
| Common Stocks |
|
$ |
1,725,371 |
|
|
$ |
- |
|
|
$ |
- |
|
|
$ |
1,056,754 |
|
|
$ |
(46,005 |
) |
|
$ |
- |
|
|
$ |
(326,776 |
) |
|
$ |
2,409,344 |
|
| Corporate Bank Debt |
|
|
1,638,579 |
|
|
|
- |
|
|
|
(57,100 |
) |
|
|
248,743 |
|
|
|
1,788 |
|
|
|
408 |
|
|
|
(20,831 |
) |
|
|
1,811,587 |
|
| Corporate Bonds |
|
|
10,201,000 |
|
|
|
- |
|
|
|
- |
|
|
|
- |
|
|
|
- |
|
|
|
- |
|
|
|
- |
|
|
|
10,201,000 |
|
| Preferred Stocks |
|
|
- |
|
|
|
- |
|
|
|
- |
|
|
|
(76,984 |
) |
|
|
- |
|
|
|
148,804 |
|
|
|
- |
|
|
|
71,820 |
|
| Warrants |
|
|
- |
|
|
|
- |
|
|
|
- |
|
|
|
15,079 |
|
|
|
- |
|
|
|
- |
|
|
|
- |
|
|
|
15,079 |
|
| |
|
$ |
13,564,950 |
|
|
$ |
- |
|
|
$ |
(57,100 |
) |
|
$ |
1,243,592 |
|
|
$ |
(44,217 |
) |
|
$ |
149,212 |
|
|
$ |
(347,607 |
) |
|
$ |
14,508,830 |
|
FPA Flexible Fixed Income Fund
NOTES TO FINANCIAL STATEMENTS (Continued)
December 31, 2025
The change in unrealized gains or losses attributable
to Level 3 investments held at December 31, 2025 was $1,026,114.
Transfers of investments between different levels
of the fair value hierarchy are recorded at fair value as of the end of the reporting period. Transfers into Level 3 were due to change
in valuation technique from vendor priced to fair valued.
The following table presents additional quantitative
information about valuation methodologies and inputs used for investments that are measured at fair value and categorized within Level
3 as of December 31, 2025.
| Financial Assets |
|
Fair Value at
December
31, 2025 |
|
|
Valuation
Technique(s) |
|
Unobservable
Inputs |
|
Price/Range |
|
Weighted
Average
Price |
|
|
Impact
to Valuation From an
Increase in Input(1) |
| Corporate Bank Debt |
|
$ |
1,841,994 |
|
|
Third-Party Broker Quote(2) |
|
Quotes/Prices |
|
$100.75 |
|
$ |
100.75 |
|
|
Increase |
| |
|
|
(30,453 |
) |
|
Pricing Model(3) |
|
Quotes/Prices |
|
$77.00 - $88.00 |
|
$ |
85.76 |
|
|
Increase |
| |
|
|
47 |
|
|
Asset Approach(4) |
|
Estimated Recovery Proceeds |
|
$0.01 |
|
$ |
0.01 |
|
|
Increase |
| Common Stocks |
|
|
2,409,344 |
|
|
Pricing Model(5) |
|
Last Reported Trade |
|
$32.00 |
|
$ |
32.00 |
|
|
Increase |
| Corporate Bonds & Notes |
|
|
10,201,000 |
|
|
Pricing Model(6) |
|
Cost |
|
$100.00 |
|
$ |
100.00 |
|
|
Increase |
| Preferred Stocks |
|
|
71,820 |
|
|
Pricing Model(6) |
|
Cost |
|
$1000.00 |
|
$ |
1000.00 |
|
|
Increase |
| Warrants |
|
|
15,079 |
|
|
Pricing Model(7) |
|
Quoted Price of Underlying Common Stock |
|
$6.92 |
|
$ |
6.92 |
|
|
Increase |
|
| (1) |
This column represents the directional change in the fair value of the Level 3 investments that would result
from an increase to the corresponding unobservable input. A decrease to the unobservable input would have the opposite effect. |
|
| (2) |
The Third Party Broker Quote technique involves obtaining an independent third-party broker quote for the
security. |
|
| (3) |
The Pricing Model technique for Level 3 securities involves recently quoted funding prices of the security. |
|
| (4) |
The Asset Approach technique for Level 3 securities involves the potential of likelihood of future bankruptcy
distributions. |
|
| (5) |
The Pricing Model technique for Level 3 securities involves the last reported trade in the security. |
|
| (6) |
The fair value of the investment is based on the initial purchase price or more recent capital activity. If
the financial condition of the underlying assets were to deteriorate, or if the market comparables were to fall, the value of the investment
could be lower. |
|
| (7) |
The fair value of the investment is based on yield-to-maturity values that are comparable to other similar
fixed-income instruments at similar price levels, which are not congruent with vendor quoted prices for the security. |
FPA Flexible Fixed Income Fund
NOTES TO FINANCIAL STATEMENTS (Continued)
December 31, 2025
Note 10 – Restricted Securities
Restricted securities include securities that have
not been registered under the Securities Act of 1933, as amended, and securities that are subject to restrictions on resale. The Fund
may invest in restricted securities that are consistent with the Fund’s investment objective and investment strategies. Investments
in restricted securities are valued at net asset value as a practical expedient for fair value, or fair value as determined in good faith
in accordance with procedures adopted by the Board. It is possible that the estimated value may differ significantly from the amount that
might ultimately be realized in the near term, and the difference could be material.
As of December 31, 2025, the Fund invested in the
following restricted securities:
| Restricted Security |
|
Initial
Acquisition
Date |
|
Cost |
|
|
Fair Value |
|
|
Fair Value as a
% of Net
Assets |
|
| Apollo Debt Solutions BDC Senior Notes, 8.620%, 9/28/2028 |
|
8/10/2023 |
|
$ |
3,644,000 |
|
|
$ |
3,644,000 |
|
|
|
0.19 |
% |
| Capstone Acquisition Holdings, Inc. Term Loan, 8.316% (1-Month Term SOFR+460 basis points), 11/12/2029 |
|
11/12/2020 |
|
|
1,818,540 |
|
|
|
1,841,994 |
|
|
|
0.10 |
% |
| Copper Property CTL Pass Through Trust |
|
1/17/2019 |
|
|
939,850 |
|
|
|
658,350 |
|
|
|
0.04 |
% |
| Heartland Dental LLC/Heartland Dental Finance Corp., 10.500% (1-Month Term SOFR+500 basis points), 4/30/2028 |
|
5/25/2023 |
|
|
923,387 |
|
|
|
980,313 |
|
|
|
0.05 |
% |
| Hlend Senior Notes, 8.170%, 3/15/2028 |
|
2/16/2023 |
|
|
5,000,000 |
|
|
|
5,000,000 |
|
|
|
0.26 |
% |
| JC Penney Corp., Inc., 5.568% (3-Month USD Libor+425 basis points), 6/23/2027 |
|
2/3/2021 |
|
|
- |
|
|
|
46 |
|
|
|
0.00 |
% |
| Lealand Finance Company B.V. Senior Exit LC, 3.500%, 6/30/2027 |
|
2/28/2020 |
|
|
(357 |
) |
|
|
(40,952 |
) |
|
|
0.00 |
% |
| McDermott Technology Americas, Inc., 7.830% (1-Month Term SOFR+400 basis points), 12/31/2027 |
|
3/25/2024 |
|
|
8,075 |
|
|
|
10,499 |
|
|
|
0.00 |
% |
| OCREDIT BDC Senior Notes, 7.770%, 3/07/2029 |
|
2/22/2024 |
|
|
1,557,000 |
|
|
|
1,557,000 |
|
|
|
0.08 |
% |
| PHI Group, Inc. |
|
8/19/2019 |
|
|
615,785 |
|
|
|
2,409,344 |
|
|
|
0.12 |
% |
| Uniti Group, Inc. |
|
11/16/2020 |
|
|
- |
|
|
|
15,079 |
|
|
|
0.00 |
% |
| Uniti Group, Inc. - Series A |
|
11/16/2020 |
|
|
148,804 |
|
|
|
71,820 |
|
|
|
0.00 |
% |
| WH Borrower LLC, Term Loan B, 8.734% (3-Month Term SOFR+450 basis points), 2/20/2032 |
|
2/9/2022 |
|
|
2,762,170 |
|
|
|
2,785,294 |
|
|
|
0.14 |
% |
| |
|
|
|
$ |
17,417,254 |
|
|
$ |
18,932,787 |
|
|
|
0.98 |
% |
Note 11 – Market Disruption and Geopolitical
Risks
Certain local, regional or global events such as war,
acts of terrorism, the spread of infectious illness and/or other public health issues, financial institution instability or other events
may have a significant impact on a security or instrument. These types of events and other like them are collectively referred to as “Market
Disruptions and Geopolitical Risks” and they may have adverse impacts on the worldwide economy, as well as the economies of individual
countries, the financial health of individual companies and the market in general in significant and unforeseen ways. Some of the impacts
noted in recent times include but are not limited to embargos, political actions, supply chain disruptions, tariffs, bank failures, restrictions
to investment and/or monetary movement including the forced selling of securities or the inability to participate impacted markets. The
duration of these events could adversely affect the Funds’ performance, the performance of the securities in which the Funds invest
and may lead to losses on your investment. The ultimate impact of “Market Disruptions and Geopolitical Risks” on the financial
performance of the Funds’ investments is not reasonably estimable at this time. Management is actively monitoring these events.
FPA Flexible Fixed Income Fund
NOTES TO FINANCIAL STATEMENTS (Continued)
December 31, 2025
Note 12 – New Accounting Pronouncements
In the reporting period, the Funds adopted FASB Accounting
Standards Update 2023-09, Income Taxes (Topic 740) — Improvements to Income Tax Disclosures (ASU 2023-09), which enhances income
tax disclosures, including disclosure income taxes paid disaggregated by jurisdiction. Adoption of the new standard did not materially
impact financial statement disclosures and did not affect the Fund’s financial position or the results of its operations.
Note 13 – Events Subsequent to the Fiscal
Period End
The Fund has adopted financial reporting rules regarding
subsequent events which require an entity to recognize in the financial statements the effects of all subsequent events that provide additional
evidence about conditions that existed at the date of the balance sheet. Management has evaluated the Fund’s related events and
transactions that occurred through the date of issuance of the Fund’s financial statements.
There were no events or transactions that occurred
during this period that materially impacted the amounts or disclosures in the Fund’s financial statements.
REPORT OF INDEPENDENT REGISTERED PUBLIC ACCOUNTING
FIRM
To the Board of Trustees
and the Shareholders of the FPA Flexible Fixed Income Fund
Opinion on the Financial Statements
We have audited the accompanying statement of assets
and liabilities of the FPA Flexible Fixed Income Fund (the “Fund”), a series of Investment Managers Series Trust III, including
the schedule of investments, as of December 31, 2025, the related statement of operations for the year then ended, the statement of changes
in net assets for each of the two years in the period then ended, and financial highlights for each of the three years in the period then
ended, and the related notes (collectively referred to as the “financial statements”). In our opinion, the financial statements
present fairly, in all material respects, the financial position of the Fund as of December 31, 2025, the results of its operations for
the year then ended, the changes in its net assets for each of the two years in the period then ended, and the financial highlights for
each of the three years in the period then ended, in conformity with accounting principles generally accepted in the United States of
America.
The financial highlights for each of the two years
in the period ended December 31, 2022, were audited by other auditors, whose report dated March 1, 2023 expressed unqualified opinions
on those financial highlights.
Basis for Opinion
These financial statements are the responsibility
of the Fund’s management. Our responsibility is to express an opinion on the Fund’s financial statements based on our audits.
We are a public accounting firm registered with the Public Company Accounting Oversight Board (United States) (“PCAOB”) and
are required to be independent with respect to the Fund in accordance with the U.S. federal securities laws and the applicable rules and
regulations of the Securities and Exchange Commission and the PCAOB. We have served as the auditor of the Fund since 2023.
We conducted our audits in accordance with the standards
of the PCAOB. Those standards require that we plan and perform the audit to obtain reasonable assurance about whether the financial statements
are free of material misstatement, whether due to error or fraud. The Fund is not required to have, nor were we engaged to perform, an
audit of its internal control over financial reporting. As part of our audits, we are required to obtain an understanding of internal
control over financial reporting, but not for the purpose of expressing an opinion on the effectiveness of the Fund’s internal control
over financial reporting. Accordingly, we express no such opinion.
Our audits included performing procedures to assess
the risks of material misstatement of the financial statements, whether due to error or fraud, and performing procedures that respond
to those risks. Such procedures included examining, on a test basis, evidence regarding the amounts and disclosures in the financial statements.
Our audits also included evaluating the accounting principles used and significant estimates made by management, as well as evaluating
the overall presentation of the financial statements. Our procedures included confirmation of securities owned as of December 31, 2025
by correspondence with the custodian, agent banks, brokers, and others or by other appropriate auditing procedures where replies were
not received. We believe that our audits provide a reasonable basis for our opinion.
| |
|
| |
TAIT, WELLER & BAKER LLP |
Philadelphia, Pennsylvania
February 27, 2026
Item 8. Changes in and Disagreements
with Accountants for Open-End Management Investment Companies.
Not Applicable.
Item 9.
Proxy Disclosures for Open-End Management Investment Companies.
Not Applicable.
Item 10. Remuneration Paid
to Directors, Officers, and Others of Open-End Management Investment Companies.
This information is included in Item 7, as part of
the financial statements.
Item 11.
Statement Regarding Basis for Approval of Investment Advisory Contract.
Not Applicable.
Item
12. Disclosure of Proxy Voting Policies and Procedures for Closed-End Management Investment Companies.
Not applicable to open-end investment companies.
Item 13.
Portfolio Managers of Closed-End Management Investment Companies.
Not applicable to open-end investment companies.
Item
14. Purchases of Equity Securities by Closed-End Management Investment Company and Affiliated Purchasers.
Not applicable to open-end investment companies.
Item 15.
Submission of Matters to a Vote of Security Holders.
The registrant has not made any material changes to
the procedures by which shareholders may recommend nominees to the registrant’s Board of Trustees.
Item 16.
Controls and Procedures.
|
| (a) |
The Registrant’s Principal Executive Officer and Principal Financial Officer have reviewed the Registrant's
disclosure controls and procedures (as defined in Rule 30a-3(c) under the Investment Company Act of 1940 (the “Act”)) as of
a date within 90 days of the filing of this report, as required by Rule 30a-3(b) under the Act and Rules 13a-15(b) or 15d-15(b) under
the Securities Exchange Act of 1934. Based on their review, such officers have concluded that the disclosure controls and procedures are
effective in ensuring that information required to be disclosed in this report is appropriately recorded, processed, summarized and reported
and made known to them by others within the Registrant and by the Registrant’s service provider. |
|
| (b) |
There were no changes in the Registrant's internal control over financial reporting (as defined in Rule 30a-3(d)
under the Act) that occurred during the period covered by this report that has materially affected, or is reasonably likely to materially
affect, the Registrant's internal control over financial reporting. |
Item 17. Disclosure of Securities
Lending Activities for Closed-End Management Investment Companies.
Not applicable to open-end investment companies.
Item 18. Recovery of Erroneously
Awarded Compensation.
(a) Not Applicable.
(b) Not Applicable.
Item 19. Exhibits.
(a) (2) Any policy required by the listing standards adopted pursuant
to Rule 10D-1 under the Exchange Act (17 CFR 240.10D-1) by the registered national securities exchange or registered national securities
association upon which the registrant’s securities are listed. Instruction to paragraph (a)(2). Not Applicable.
(a)
(3) A separate certification for each principal executive and principal financial officer of the registrant as required by Rule 30a-2(a)
under the Act (17 CFR 270.30a-2(a)). Filed herewith.
(a) (4) Not Applicable
(a) (5) Not Applicable
SIGNATURES
Pursuant to the requirements of
the Securities Exchange Act of 1934 and the Investment Company Act of 1940, the registrant has duly caused this report to be signed on
its behalf by the undersigned, thereunto duly authorized.
| (Registrant) |
Investment Managers Series Trust III |
|
| |
|
|
| By (Signature and Title) |
/s/ Maureen Quill |
|
| |
Maureen Quill, President and Principal Executive Officer |
|
| |
|
|
| Date |
5/21/26 |
|
Pursuant to the requirements of
the Securities Exchange Act of 1934 and the Investment Company Act of 1940, this report has been signed below by the following persons
on behalf of the registrant and in the capacities and on the dates indicated.
| By (Signature and Title) |
/s/ Maureen Quill |
|
| |
Maureen Quill, President and Principal Executive Officer |
|
| |
|
|
| Date |
5/21/26 |
|
| |
|
|
| By (Signature and Title) |
/s/ Rita Dam |
|
| |
Rita Dam, Treasurer and Principal Financial Officer |
|
| |
|
|
| Date |
5/21/26 |
|