
Third Quarter 2025 Earnings Presentation November 4, 2025
Forward-Looking Statements Certain statements set forth in this presentation constitute forward-looking statements (within the meaning of Section 27A of the Securities Act of 1933 and Section 21E of the Securities Exchange Act of 1934) regarding Flotek Industries, Inc.’s business, financial condition, results of operations and prospects. Words such as will, continue, expects, anticipates, intends, plans, believes, seeks, estimates and similar expressions or variations of such words are intended to identify forward-looking statements, but are not the exclusive means of identifying forward-looking statements in this presentation. Although forward-looking statements in this presentation reflect the good faith judgment of management, such statements can only be based on facts and factors currently known to management. Consequently, forward-looking statements are inherently subject to risks and uncertainties, and actual results and outcomes may differ materially from the results and outcomes discussed in the forward-looking statements. Further information about the risks and uncertainties that may impact the Company are set forth in the Company’s most recent filing with the Securities and Exchange Commission on Form 10-K and Form 10-Q (including, without limitation, in the "Risk Factors" section thereof), and in the Company’s other SEC filings and publicly available documents. Readers are urged not to place undue reliance on these forward-looking statements, which speak only as of the date of this presentation. The Company undertakes no obligation to revise or update any forward-looking statements in order to reflect any event or circumstance that may arise after the date of this presentation. This presentation includes certain non-GAAP measures. Please refer to the reconciliations provided in the earnings press release and the appendix in this presentation for the most comparable GAAP measure. // 2
// 3 12 Consecutive Quarters of Improved Adj. EBITDA* Growing High-Margin Data Analytics Backlog Long-term Contracts Insulate Market Risk Outstanding HS&E Record Flotek Industries CHEMISTRY AS THE COMMON VALUE CREATION PLATFORM Proven Top-tier Leadership Team * Adjusted EBITDA is a non-GAAP measure. See the Appendix in this presentation for a reconciliation to the most comparable GAAP measure Pioneering Data & Chemistry Technology
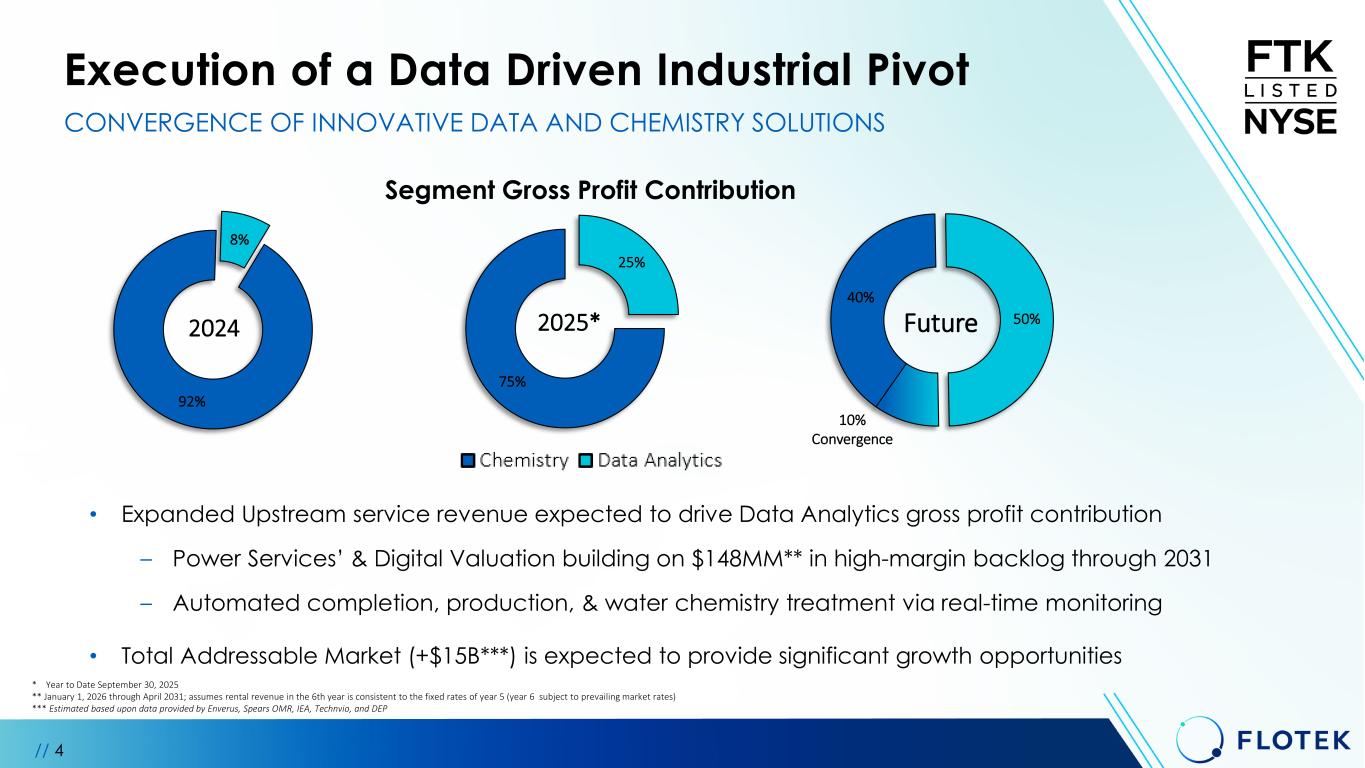
CONVERGENCE OF INNOVATIVE DATA AND CHEMISTRY SOLUTIONS Execution of a Data Driven Industrial Pivot // 4 92% 8% 2024 75% 25% 2025* 40% 50% 10% Convergence Future * Year to Date September 30, 2025 ** January 1, 2026 through April 2031; assumes rental revenue in the 6th year is consistent to the fixed rates of year 5 (year 6 subject to prevailing market rates) *** Estimated based upon data provided by Enverus, Spears OMR, IEA, Technvio, and DEP • Expanded Upstream service revenue expected to drive Data Analytics gross profit contribution – Power Services’ & Digital Valuation building on $148MM** in high-margin backlog through 2031 – Automated completion, production, & water chemistry treatment via real-time monitoring • Total Addressable Market (+$15B***) is expected to provide significant growth opportunities Segment Gross Profit Contribution
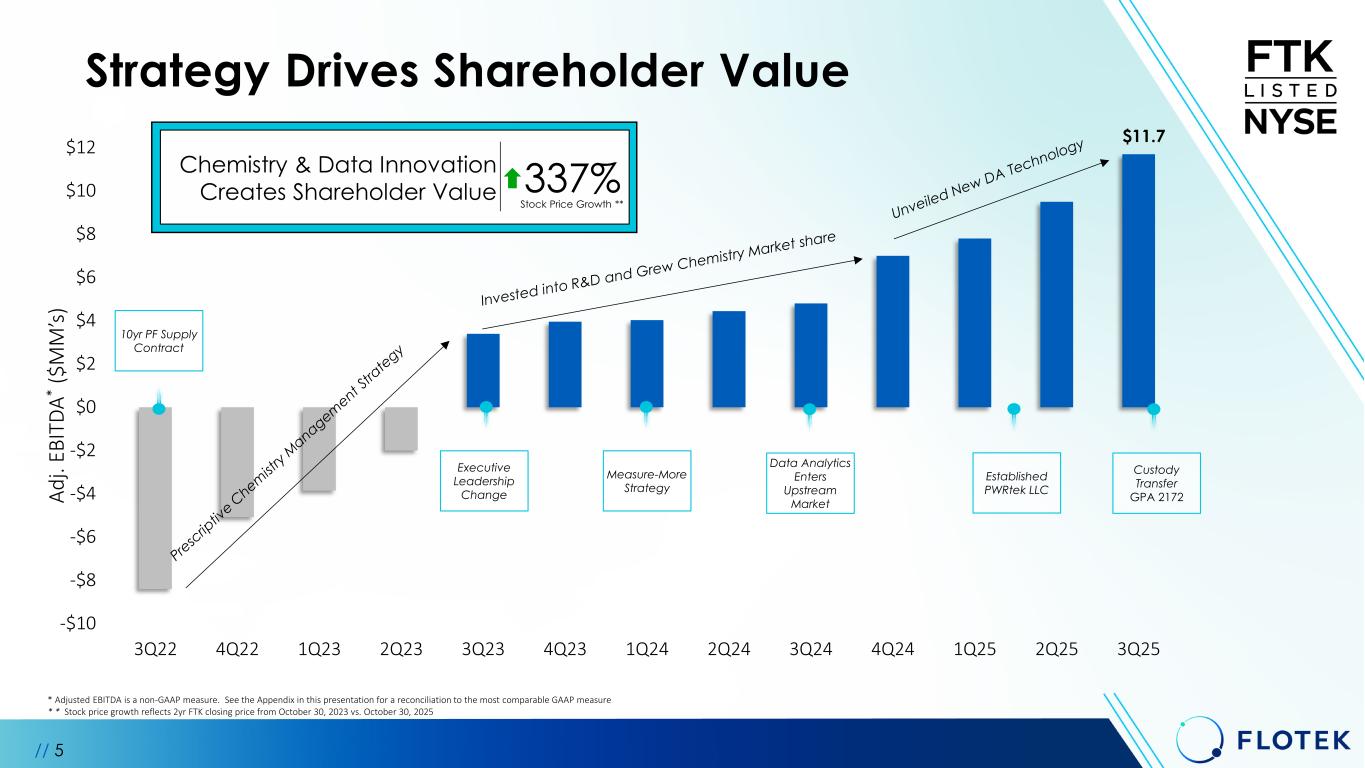
// 5 Strategy Drives Shareholder Value -$10 -$8 -$6 -$4 -$2 $0 $2 $4 $6 $8 $10 $12 3Q22 4Q22 1Q23 2Q23 3Q23 4Q23 1Q24 2Q24 3Q24 4Q24 1Q25 2Q25 3Q25 Ad j. EB IT DA * ( $M M ’s) * Adjusted EBITDA is a non-GAAP measure. See the Appendix in this presentation for a reconciliation to the most comparable GAAP measure * * Stock price growth reflects 2yr FTK closing price from October 30, 2023 vs. October 30, 2025 10yr PF Supply Contract Executive Leadership Change Established PWRtek LLC 337% Stock Price Growth ** Chemistry & Data Innovation Creates Shareholder Value Measure-More Strategy Data Analytics Enters Upstream Market $11.7 Custody Transfer GPA 2172
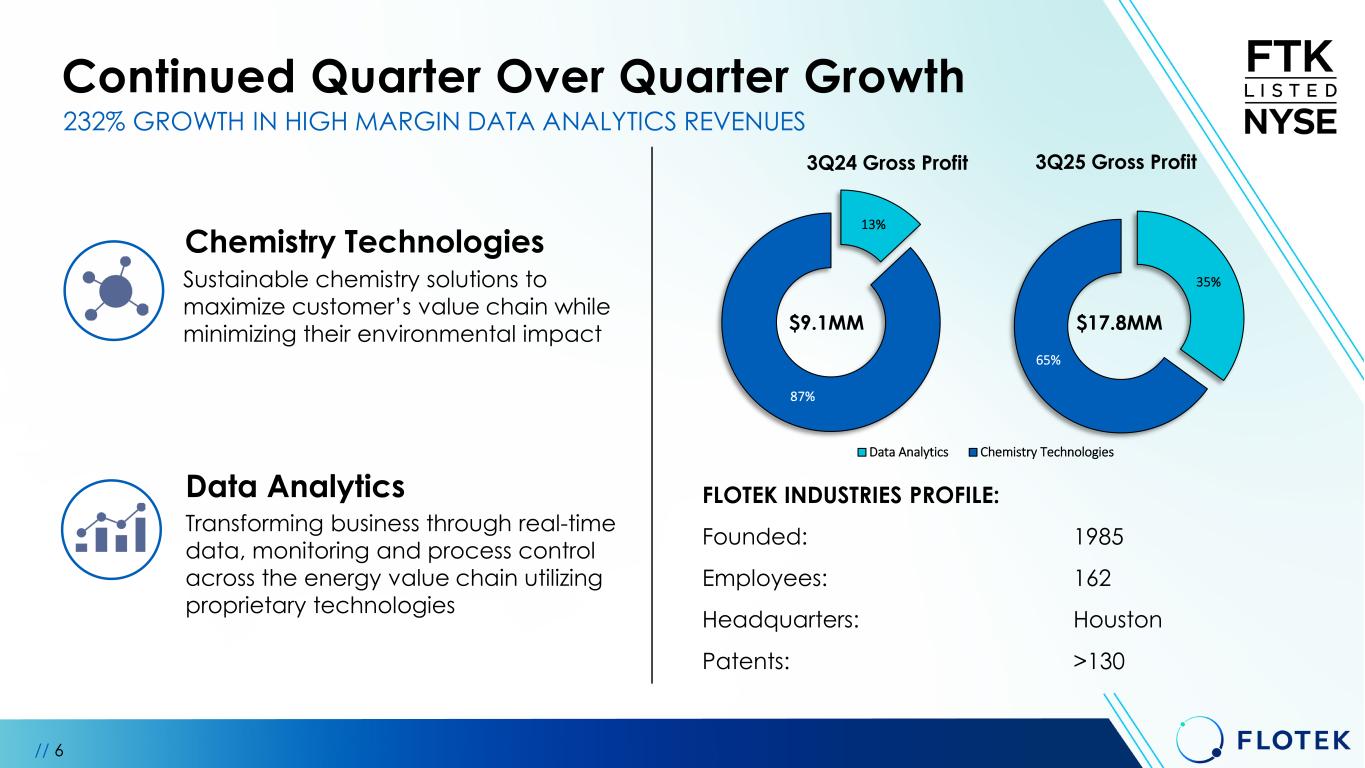
13% 87% 3Q24 Gross Profit Data Analytics Chemistry Technologies Continued Quarter Over Quarter Growth // 6 Sustainable chemistry solutions to maximize customer’s value chain while minimizing their environmental impact Transforming business through real-time data, monitoring and process control across the energy value chain utilizing proprietary technologies Chemistry Technologies Data Analytics 232% GROWTH IN HIGH MARGIN DATA ANALYTICS REVENUES FLOTEK INDUSTRIES PROFILE: Founded: 1985 Employees: 162 Headquarters: Houston Patents: >130 35% 65% 3Q25 Gross Profit $9.1MM $17.8MM
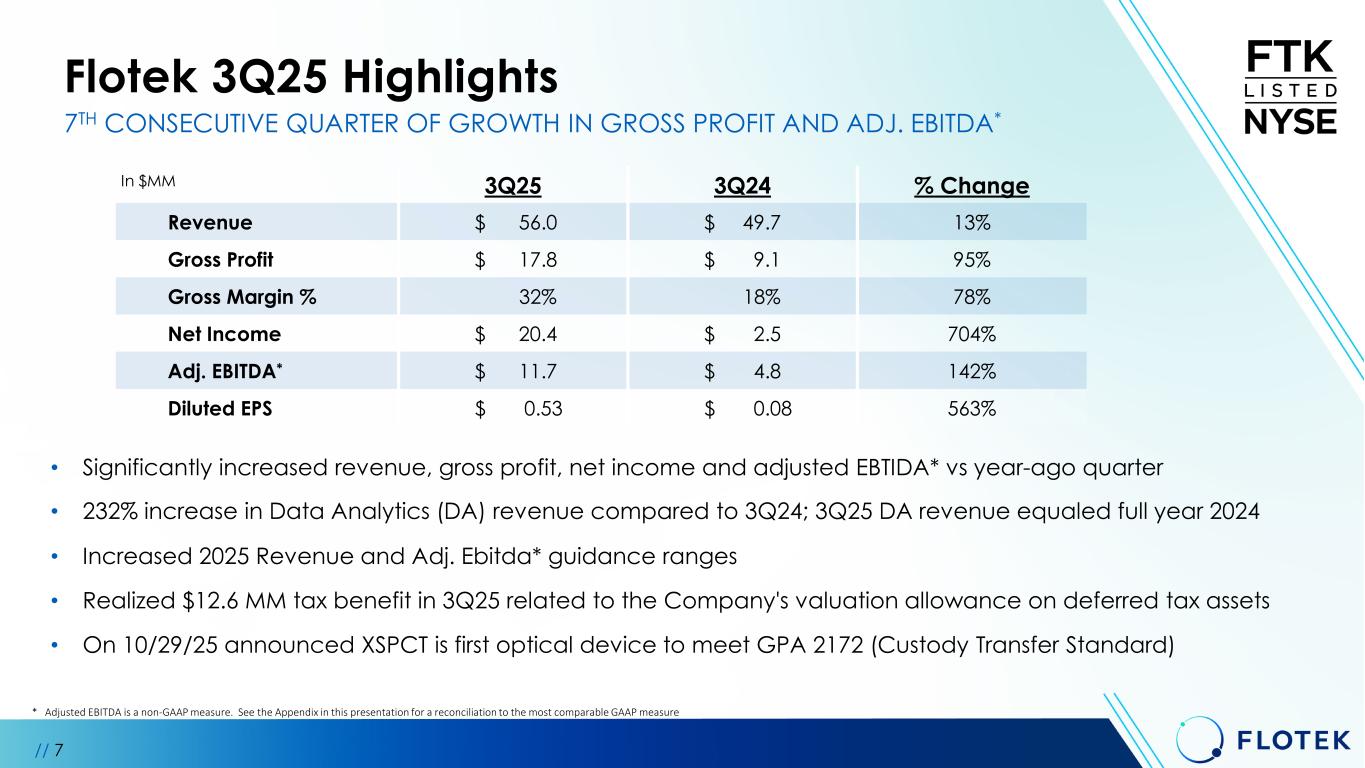
• Significantly increased revenue, gross profit, net income and adjusted EBTIDA* vs year-ago quarter • 232% increase in Data Analytics (DA) revenue compared to 3Q24; 3Q25 DA revenue equaled full year 2024 • Increased 2025 Revenue and Adj. Ebitda* guidance ranges • Realized $12.6 MM tax benefit in 3Q25 related to the Company's valuation allowance on deferred tax assets • On 10/29/25 announced XSPCT is first optical device to meet GPA 2172 (Custody Transfer Standard) Flotek 3Q25 Highlights // 7 7TH CONSECUTIVE QUARTER OF GROWTH IN GROSS PROFIT AND ADJ. EBITDA* * Adjusted EBITDA is a non-GAAP measure. See the Appendix in this presentation for a reconciliation to the most comparable GAAP measure In $MM 3Q25 3Q24 % Change Revenue $ 56.0 $ 49.7 13% Gross Profit $ 17.8 $ 9.1 95% Gross Margin % 32% 18% 78% Net Income $ 20.4 $ 2.5 704% Adj. EBITDA* $ 11.7 $ 4.8 142% Diluted EPS $ 0.53 $ 0.08 563%
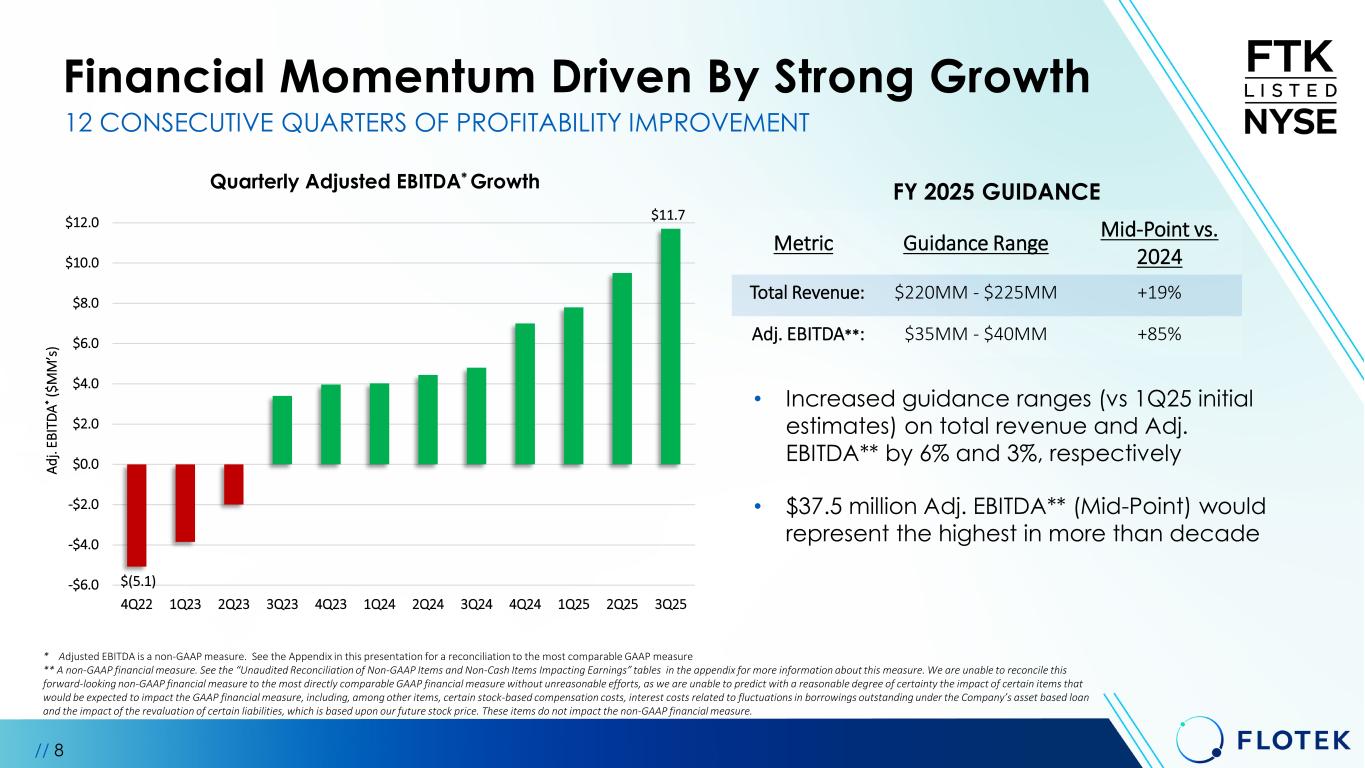
Financial Momentum Driven By Strong Growth // 8 Quarterly Adjusted EBITDA* Growth * Adjusted EBITDA is a non-GAAP measure. See the Appendix in this presentation for a reconciliation to the most comparable GAAP measure ** A non-GAAP financial measure. See the “Unaudited Reconciliation of Non-GAAP Items and Non-Cash Items Impacting Earnings” tables in the appendix for more information about this measure. We are unable to reconcile this forward-looking non-GAAP financial measure to the most directly comparable GAAP financial measure without unreasonable efforts, as we are unable to predict with a reasonable degree of certainty the impact of certain items that would be expected to impact the GAAP financial measure, including, among other items, certain stock-based compensation costs, interest costs related to fluctuations in borrowings outstanding under the Company’s asset based loan and the impact of the revaluation of certain liabilities, which is based upon our future stock price. These items do not impact the non-GAAP financial measure. $(5.1) $11.7 -$6.0 -$4.0 -$2.0 $0.0 $2.0 $4.0 $6.0 $8.0 $10.0 $12.0 4Q22 1Q23 2Q23 3Q23 4Q23 1Q24 2Q24 3Q24 4Q24 1Q25 2Q25 3Q25 Ad j. EB IT DA * ( $M M ’s ) 12 CONSECUTIVE QUARTERS OF PROFITABILITY IMPROVEMENT FY 2025 GUIDANCE Metric Guidance Range Mid-Point vs. 2024 Total Revenue: $220MM - $225MM +19% Adj. EBITDA**: $35MM - $40MM +85% • Increased guidance ranges (vs 1Q25 initial estimates) on total revenue and Adj. EBITDA** by 6% and 3%, respectively • $37.5 million Adj. EBITDA** (Mid-Point) would represent the highest in more than decade
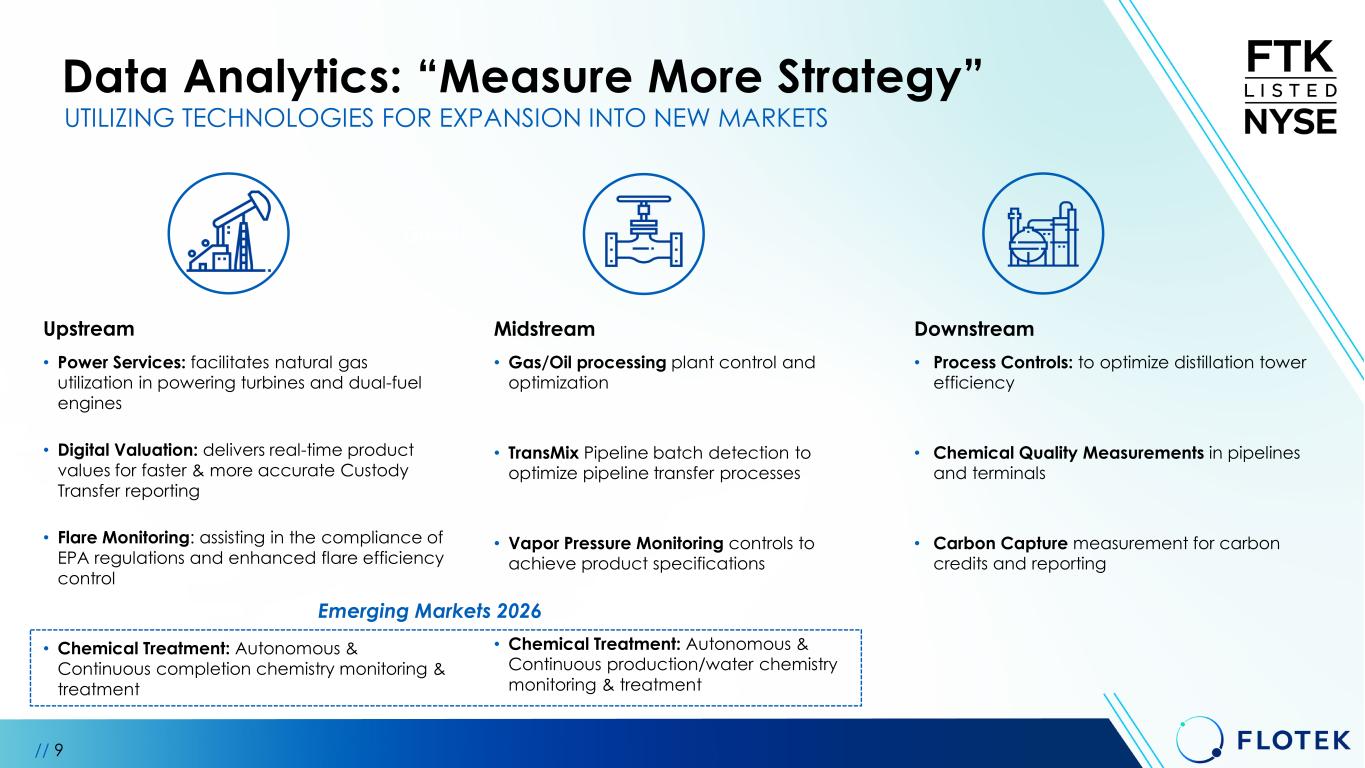
Data Analytics: “Measure More Strategy” Upstream • Power Services: facilitates natural gas utilization in powering turbines and dual-fuel engines • Digital Valuation: delivers real-time product values for faster & more accurate Custody Transfer reporting • Flare Monitoring: assisting in the compliance of EPA regulations and enhanced flare efficiency control • Chemical Treatment: Autonomous & Continuous completion chemistry monitoring & treatment Midstream • Gas/Oil processing plant control and optimization • TransMix Pipeline batch detection to optimize pipeline transfer processes • Vapor Pressure Monitoring controls to achieve product specifications • Chemical Treatment: Autonomous & Continuous production/water chemistry monitoring & treatment Downstream • Process Controls: to optimize distillation tower efficiency • Chemical Quality Measurements in pipelines and terminals • Carbon Capture measurement for carbon credits and reporting UTILIZING TECHNOLOGIES FOR EXPANSION INTO NEW MARKETS // 9 Growth Emerging Markets 2026
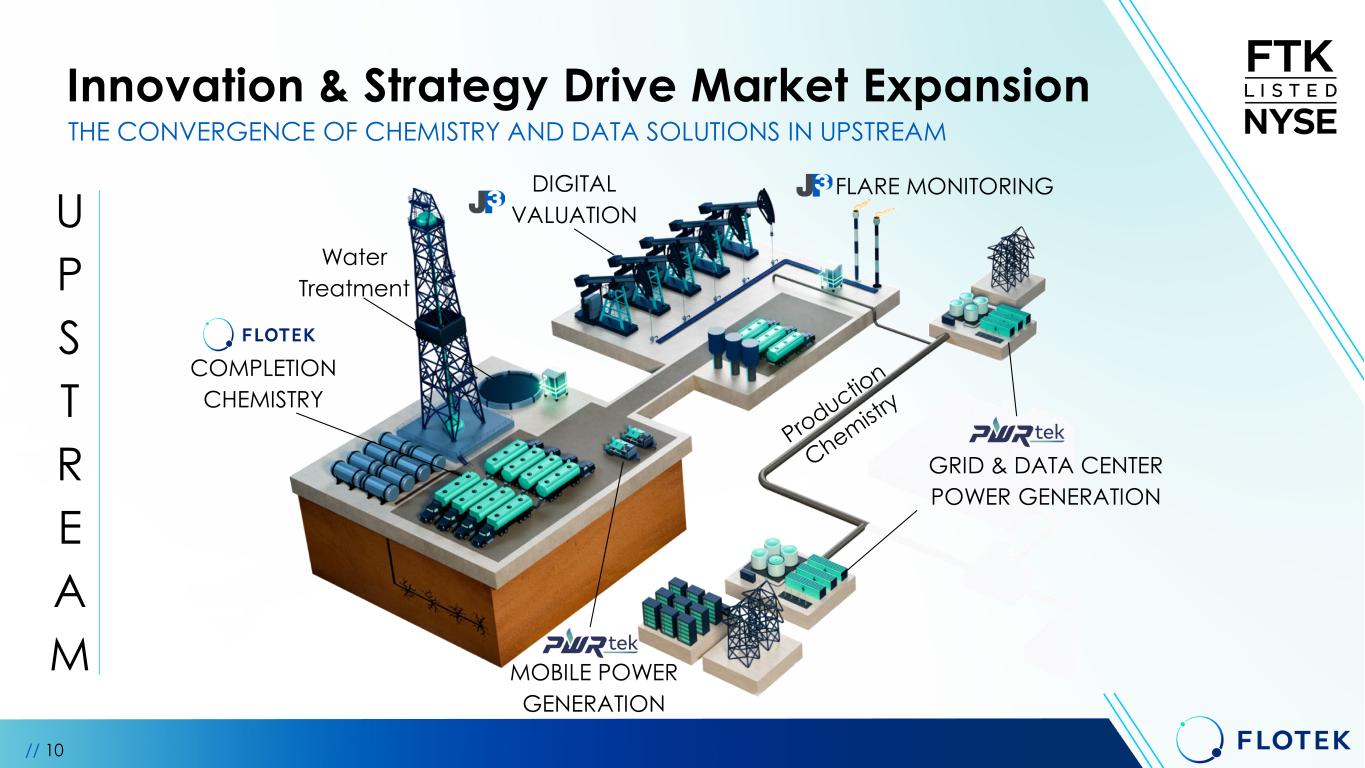
THE CONVERGENCE OF CHEMISTRY AND DATA SOLUTIONS IN UPSTREAM COMPLETION CHEMISTRY // 10 Innovation & Strategy Drive Market Expansion DIGITAL VALUATION MOBILE POWER GENERATION FLARE MONITORING GRID & DATA CENTER POWER GENERATION U P S T R E A M Water Treatment
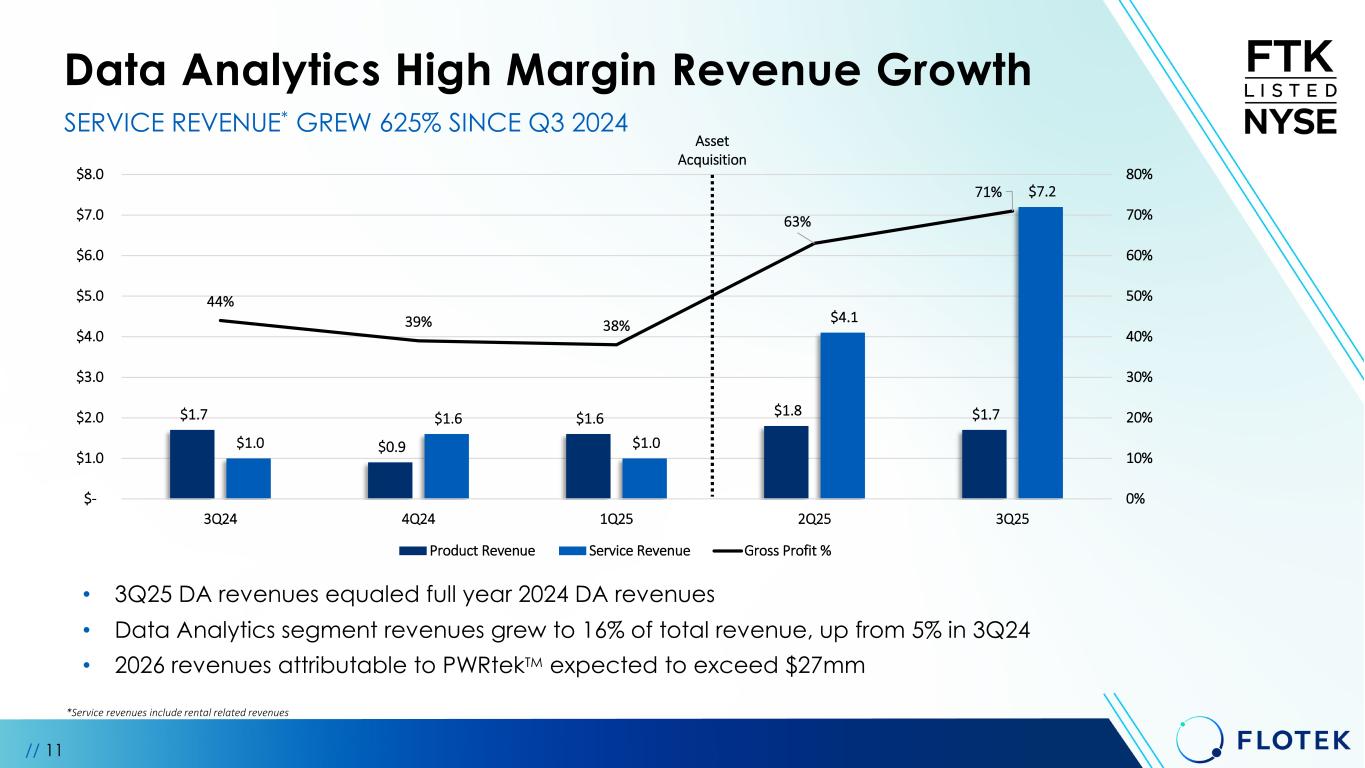
SERVICE REVENUE* GREW 625% SINCE Q3 2024 Data Analytics High Margin Revenue Growth • 3Q25 DA revenues equaled full year 2024 DA revenues • Data Analytics segment revenues grew to 16% of total revenue, up from 5% in 3Q24 • 2026 revenues attributable to PWRtekTM expected to exceed $27mm Asset Acquisition // 11 $1.7 $0.9 $1.6 $1.8 $1.7 $1.0 $1.6 $1.0 $4.1 $7.2 44% 39% 38% 63% 71% 0% 10% 20% 30% 40% 50% 60% 70% 80% $- $1.0 $2.0 $3.0 $4.0 $5.0 $6.0 $7.0 $8.0 3Q24 4Q24 1Q25 2Q25 3Q25 Product Revenue Service Revenue Gross Profit % *Service revenues include rental related revenues
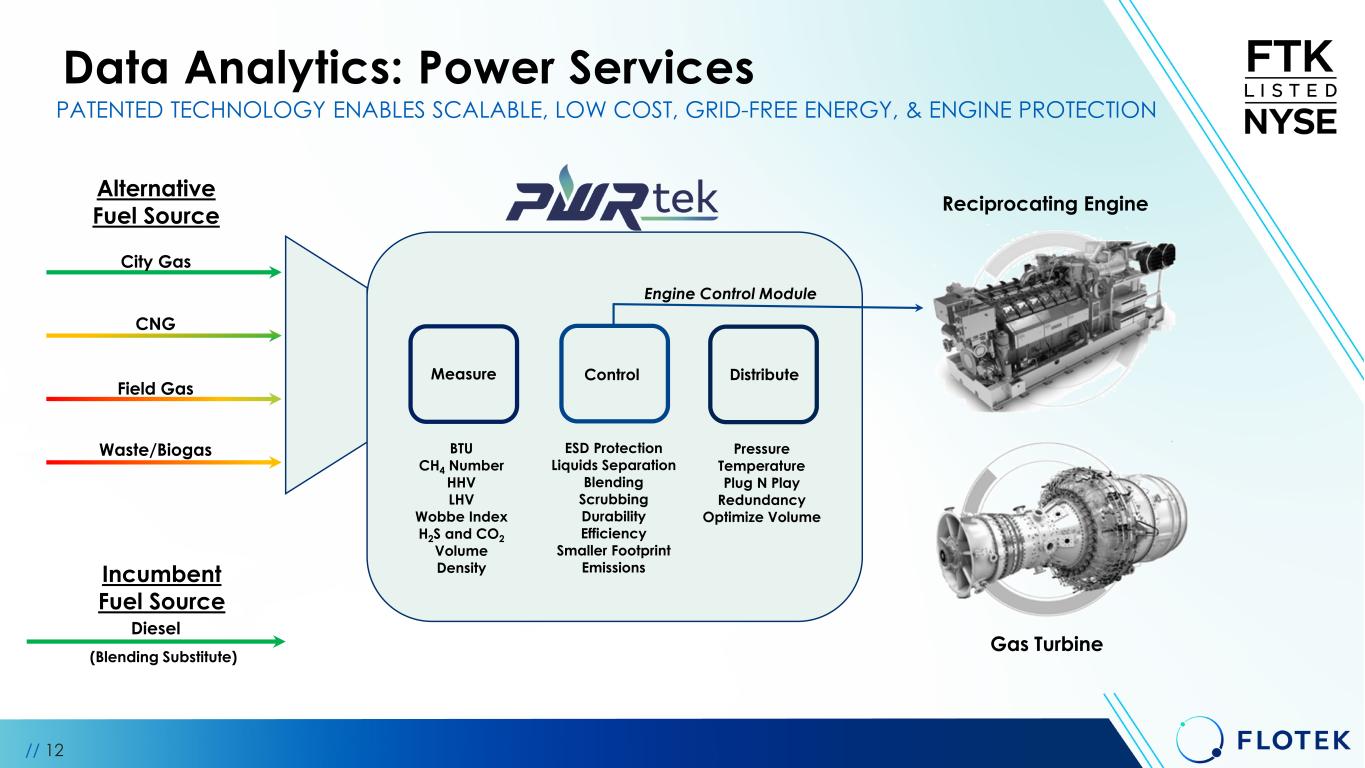
Data Analytics: Power Services // 12 PATENTED TECHNOLOGY ENABLES SCALABLE, LOW COST, GRID-FREE ENERGY, & ENGINE PROTECTION City Gas CNG Field Gas Waste/Biogas Measure Control Distribute Reciprocating Engine Gas Turbine Engine Control Module BTU CH4 Number HHV LHV Wobbe Index H2S and CO2 Volume Density ESD Protection Liquids Separation Blending Scrubbing Durability Efficiency Smaller Footprint Emissions Pressure Temperature Plug N Play Redundancy Optimize Volume Diesel (Blending Substitute) Alternative Fuel Source Incumbent Fuel Source
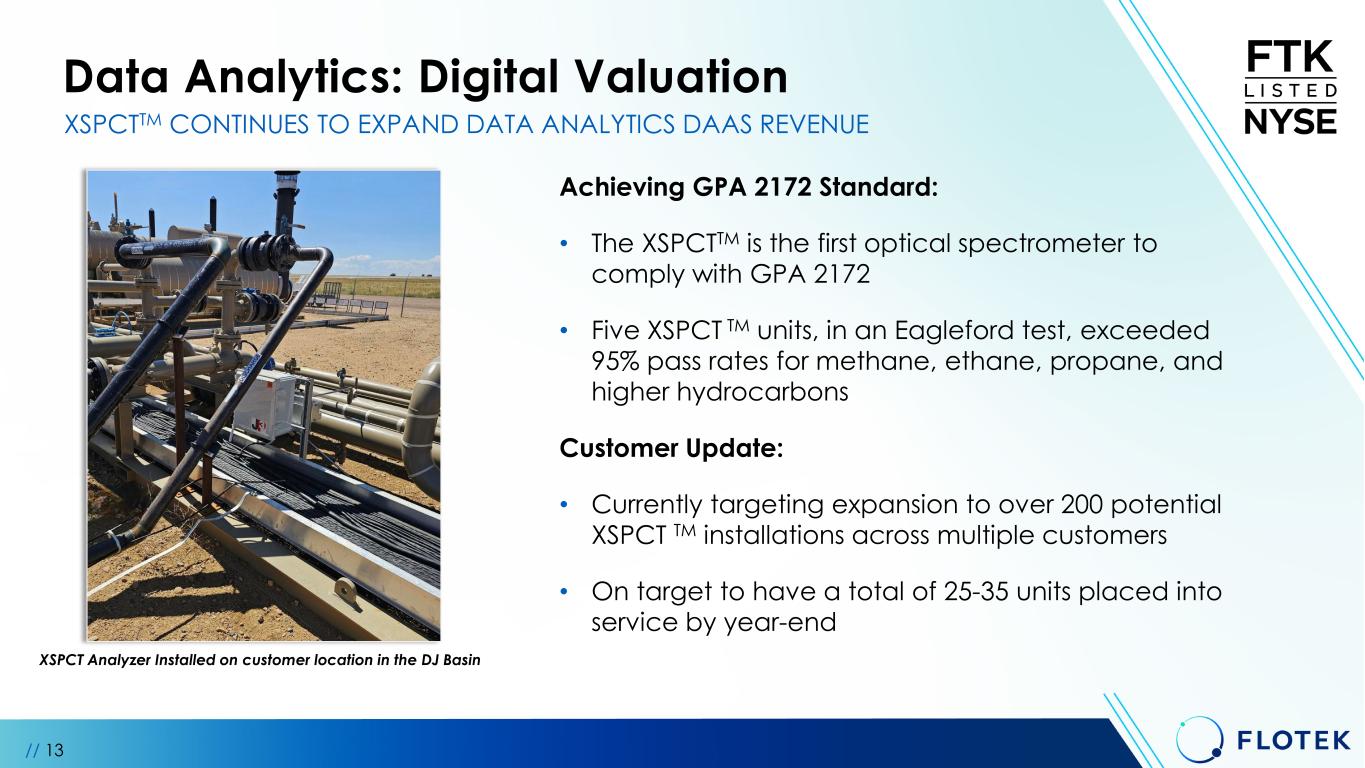
Data Analytics: Digital Valuation // 13 Achieving GPA 2172 Standard: • The XSPCTTM is the first optical spectrometer to comply with GPA 2172 • Five XSPCT TM units, in an Eagleford test, exceeded 95% pass rates for methane, ethane, propane, and higher hydrocarbons Customer Update: • Currently targeting expansion to over 200 potential XSPCT TM installations across multiple customers • On target to have a total of 25-35 units placed into service by year-end XSPCTTM CONTINUES TO EXPAND DATA ANALYTICS DAAS REVENUE XSPCT Analyzer Installed on customer location in the DJ Basin
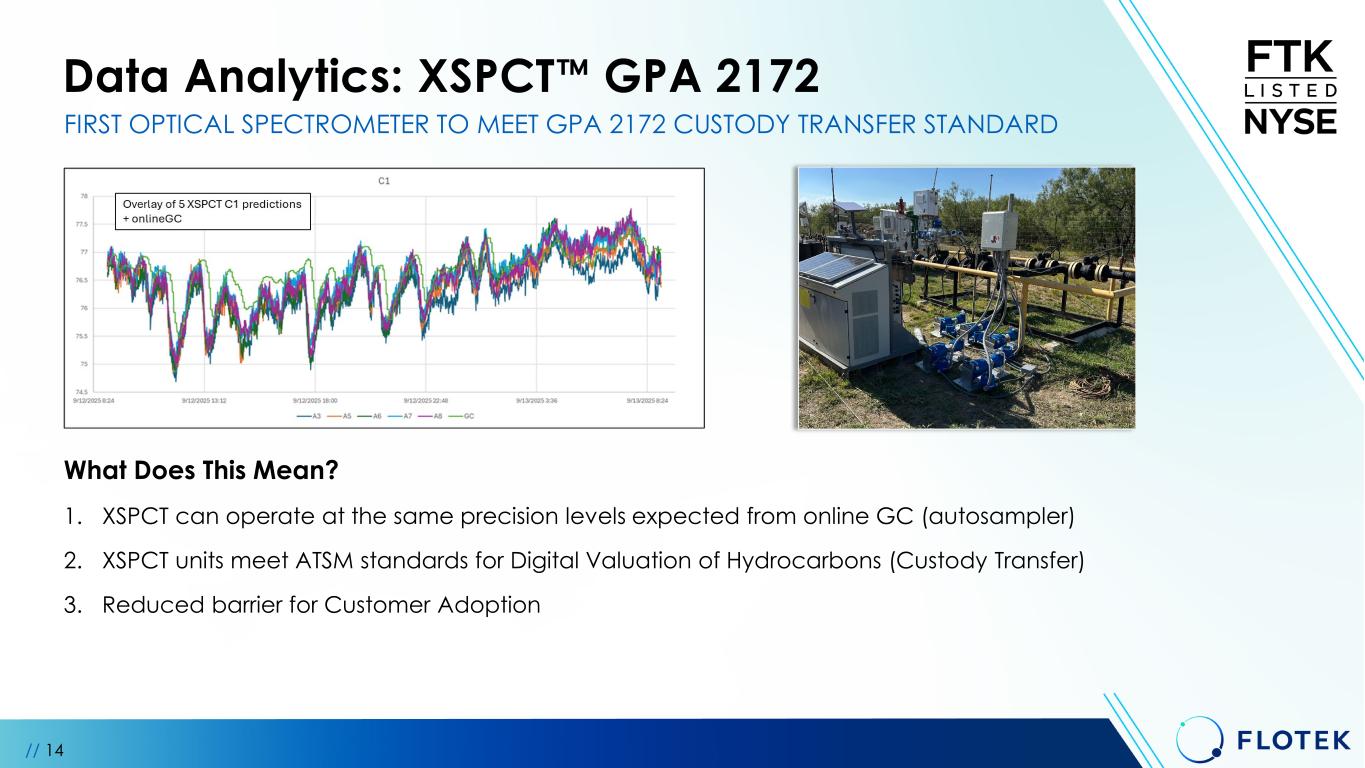
Data Analytics: XSPCT GPA 2172 // 14 FIRST OPTICAL SPECTROMETER TO MEET GPA 2172 CUSTODY TRANSFER STANDARD What Does This Mean? 1. XSPCT can operate at the same precision levels expected from online GC (autosampler) 2. XSPCT units meet ATSM standards for Digital Valuation of Hydrocarbons (Custody Transfer) 3. Reduced barrier for Customer Adoption
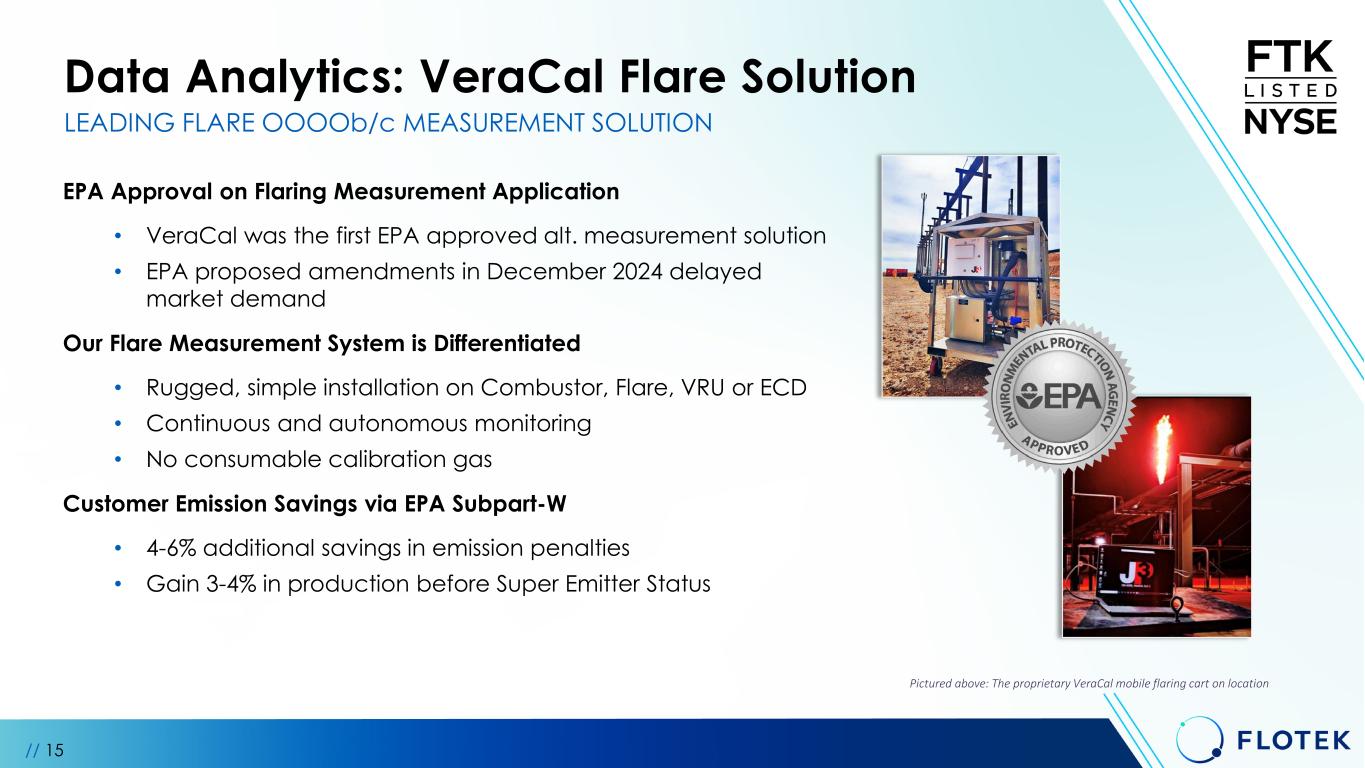
Data Analytics: VeraCal Flare Solution // 15 LEADING FLARE OOOOb/c MEASUREMENT SOLUTION Pictured above: The proprietary VeraCal mobile flaring cart on location EPA Approval on Flaring Measurement Application • VeraCal was the first EPA approved alt. measurement solution • EPA proposed amendments in December 2024 delayed market demand Our Flare Measurement System is Differentiated • Rugged, simple installation on Combustor, Flare, VRU or ECD • Continuous and autonomous monitoring • No consumable calibration gas Customer Emission Savings via EPA Subpart-W • 4-6% additional savings in emission penalties • Gain 3-4% in production before Super Emitter Status
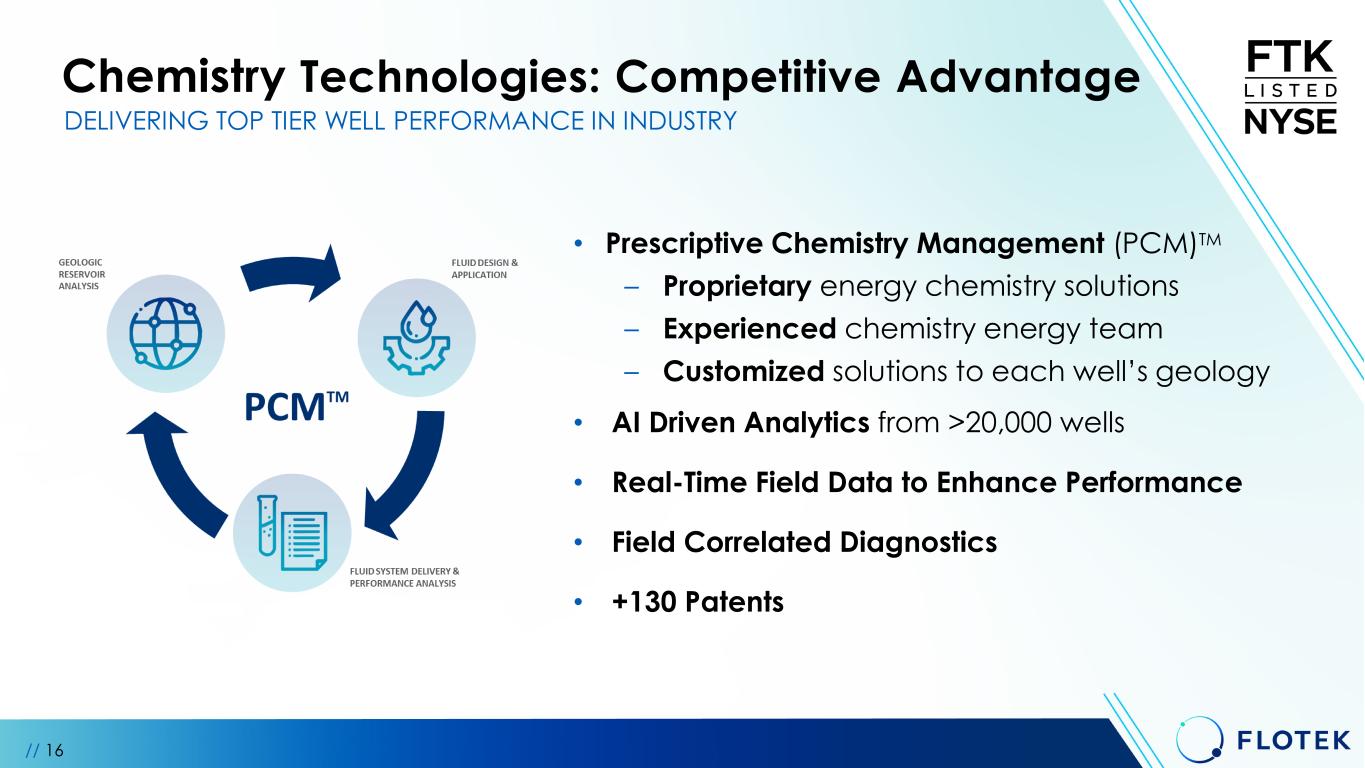
// 16 • Prescriptive Chemistry Management (PCM)TM – Proprietary energy chemistry solutions – Experienced chemistry energy team – Customized solutions to each well’s geology • AI Driven Analytics from >20,000 wells • Real-Time Field Data to Enhance Performance • Field Correlated Diagnostics • +130 Patents DELIVERING TOP TIER WELL PERFORMANCE IN INDUSTRY Chemistry Technologies: Competitive Advantage
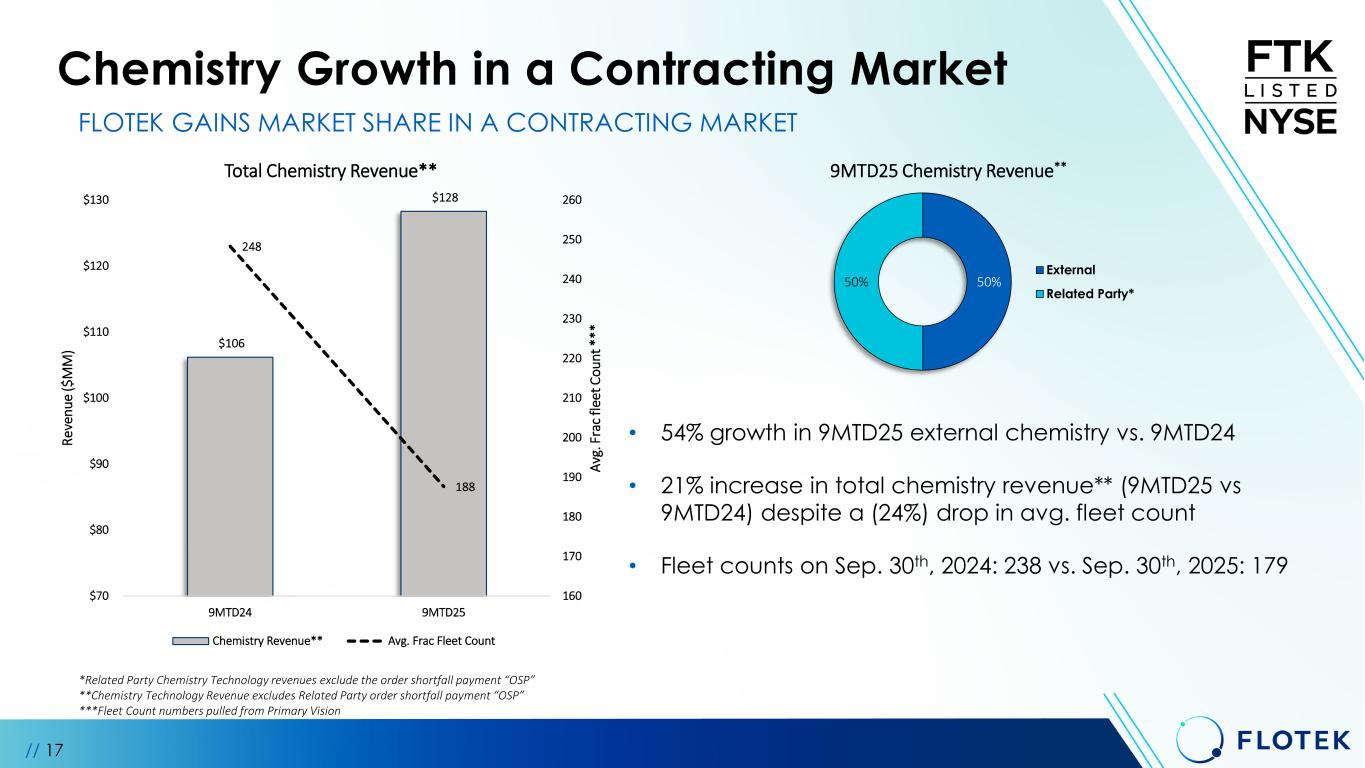
Chemistry Growth in a Contracting Market // 17 • 54% growth in 9MTD25 external chemistry vs. 9MTD24 • 21% increase in total chemistry revenue** (9MTD25 vs 9MTD24) despite a (24%) drop in avg. fleet count • Fleet counts on Sep. 30th, 2024: 238 vs. Sep. 30th, 2025: 179 FLOTEK GAINS MARKET SHARE IN A CONTRACTING MARKET *Related Party Chemistry Technology revenues exclude the order shortfall payment “OSP” **Chemistry Technology Revenue excludes Related Party order shortfall payment “OSP” ***Fleet Count numbers pulled from Primary Vision 50%50% 9MTD25 Chemistry Revenue** External Related Party* $106 $128 248 188 160 170 180 190 200 210 220 230 240 250 260 $70 $80 $90 $100 $110 $120 $130 9MTD24 9MTD25 Av g. F ra c f le et C ou nt * ** Re ve nu e ($ M M ) Total Chemistry Revenue** Chemistry Revenue** Avg. Frac Fleet Count
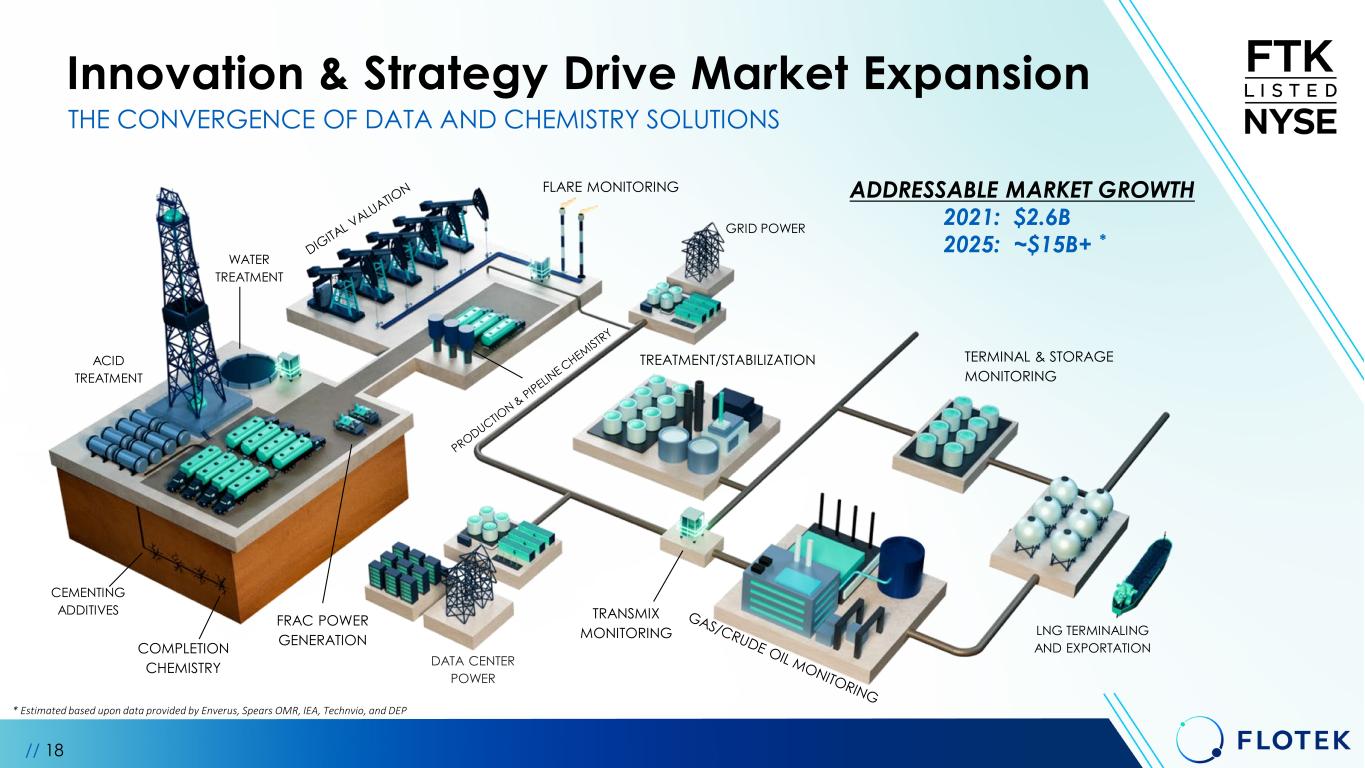
THE CONVERGENCE OF DATA AND CHEMISTRY SOLUTIONS COMPLETION CHEMISTRY FRAC POWER GENERATION TRANSMIX MONITORING TREATMENT/STABILIZATION FLARE MONITORING DATA CENTER POWER GRID POWER TERMINAL & STORAGE MONITORING LNG TERMINALING AND EXPORTATION WATER TREATMENT ACID TREATMENT CEMENTING ADDITIVES // 18 Innovation & Strategy Drive Market Expansion * Estimated based upon data provided by Enverus, Spears OMR, IEA, Technvio, and DEP ADDRESSABLE MARKET GROWTH 2021: $2.6B 2025: ~$15B+ *
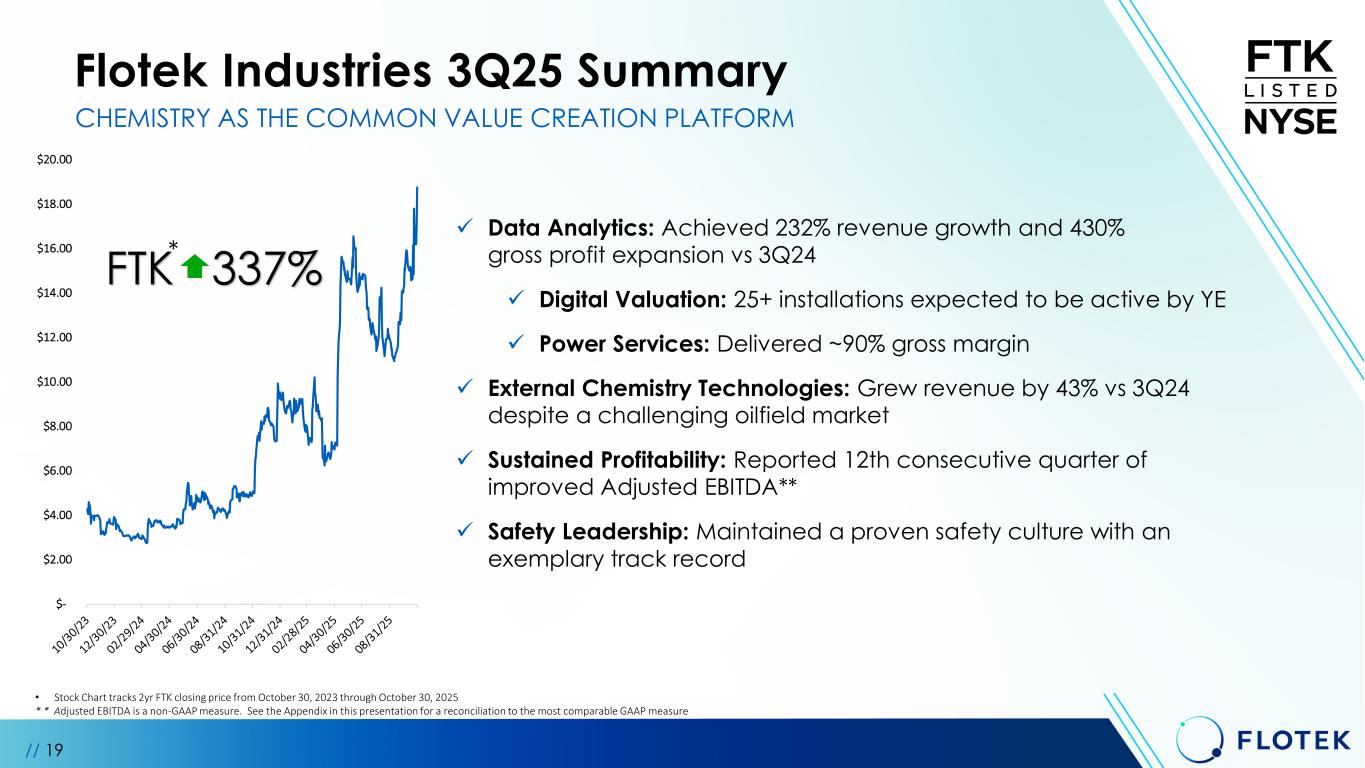
$- $2.00 $4.00 $6.00 $8.00 $10.00 $12.00 $14.00 $16.00 $18.00 $20.00 // 19 Flotek Industries 3Q25 Summary CHEMISTRY AS THE COMMON VALUE CREATION PLATFORM FTK 337%* • Stock Chart tracks 2yr FTK closing price from October 30, 2023 through October 30, 2025 * * Adjusted EBITDA is a non-GAAP measure. See the Appendix in this presentation for a reconciliation to the most comparable GAAP measure Data Analytics: Achieved 232% revenue growth and 430% gross profit expansion vs 3Q24 Digital Valuation: 25+ installations expected to be active by YE Power Services: Delivered ~90% gross margin External Chemistry Technologies: Grew revenue by 43% vs 3Q24 despite a challenging oilfield market Sustained Profitability: Reported 12th consecutive quarter of improved Adjusted EBITDA** Safety Leadership: Maintained a proven safety culture with an exemplary track record

// 20 Permian Basin BBQ Cookoff November 11-12th 2025 Scharbauer Sports Complex Midland, TX INVEST Houston 2nd Edition November 20th 2025 JW Marriott Houston, TX DEP NY Executive Series December 3, 2025 Nasdaq New York City, NY 14th Annual ROTH Deer Valley Event December 10-13th 2025 Park City, UT Northland Growth Conference December 16th 2025 Virtual Investor Contact: Mike Critelli Director of Finance & Investor Relations ir@flotekind.com Upcoming 2025 Events JOIN US

Appendix
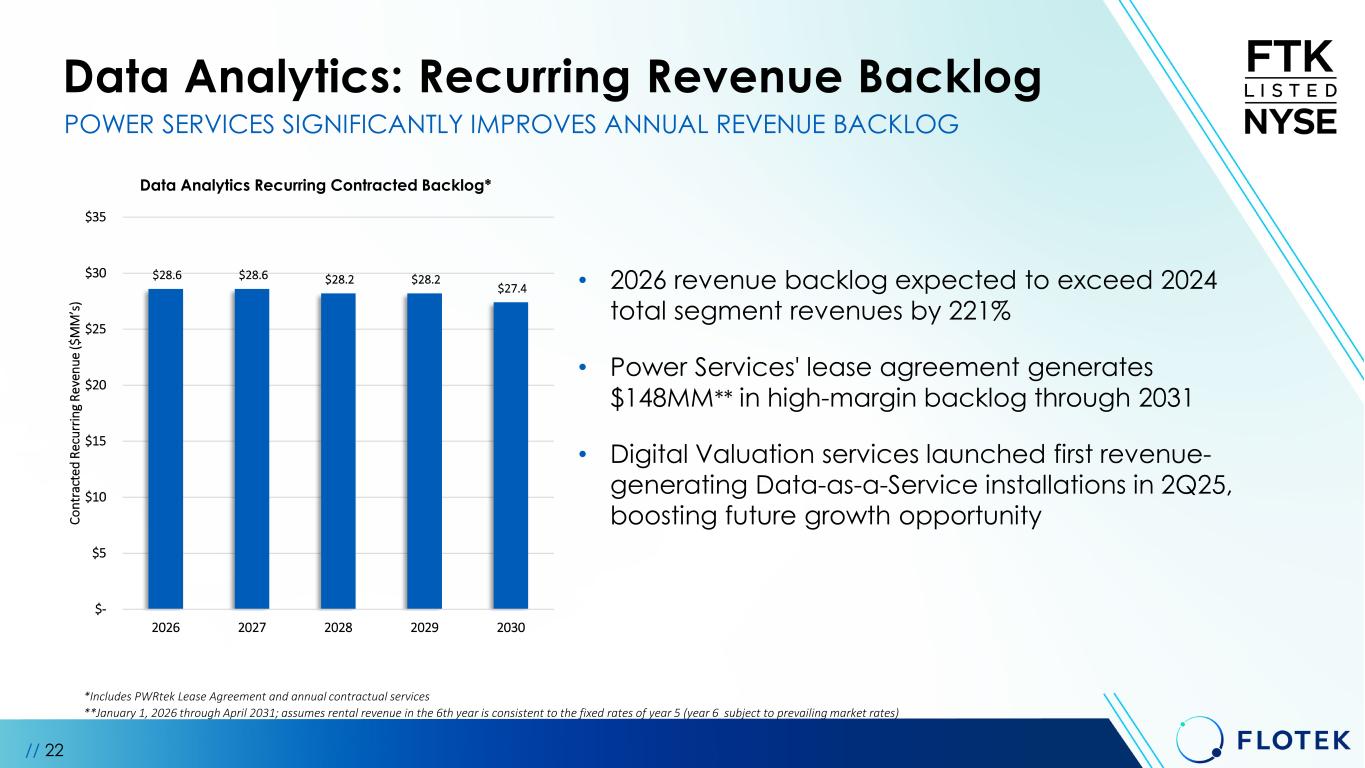
Data Analytics: Recurring Revenue Backlog // 22 • 2026 revenue backlog expected to exceed 2024 total segment revenues by 221% • Power Services' lease agreement generates $148MM** in high-margin backlog through 2031 • Digital Valuation services launched first revenue- generating Data-as-a-Service installations in 2Q25, boosting future growth opportunity POWER SERVICES SIGNIFICANTLY IMPROVES ANNUAL REVENUE BACKLOG $28.6 $28.6 $28.2 $28.2 $27.4 $- $5 $10 $15 $20 $25 $30 $35 2026 2027 2028 2029 2030 Co nt ra ct ed R ec ur rin g Re ve nu e ($ M M ’s ) Data Analytics Recurring Contracted Backlog* *Includes PWRtek Lease Agreement and annual contractual services **January 1, 2026 through April 2031; assumes rental revenue in the 6th year is consistent to the fixed rates of year 5 (year 6 subject to prevailing market rates)
Data Analytics: XSPCT GPA 2172 // 23 FIRST OPTICAL SPECTROMETER TO MEET GPA 2172 CUSTODY TRANSFER STANDARD GPA 2172 (API 14.5) is the O&G industry standard for calculating gross heating value (GHV), relative density, and compressibility factor from compositional analysis GPA 2172-19 (API 14.5): • Defines how to calculate GHV and related properties from measured composition • Used directly in custody transfer billing • Recognizes that sample analysis may come from GPA 2261 GC or other technically acceptable methods, including optical spectroscopy that meet reproducibility requirements GPA 2261-20 (Gas Chromatography Analysis): • Sets criteria for reproducibility and performance acceptance between labs/instruments • FTK NIR methods (per GPA 2119 / ASTM D6122) are benchmarked against these limits GPA 2119-24 (Optical Spectroscopy Analysis): • Defines how optical spectroscopy can be used to determine hydrocarbon composition • This is the direct validation pathway for FTK analyzers ASTM D6122: • Provides validation procedures for multivariate NIR/IR analyzers • Ensures models meet performance standards before being accepted for use
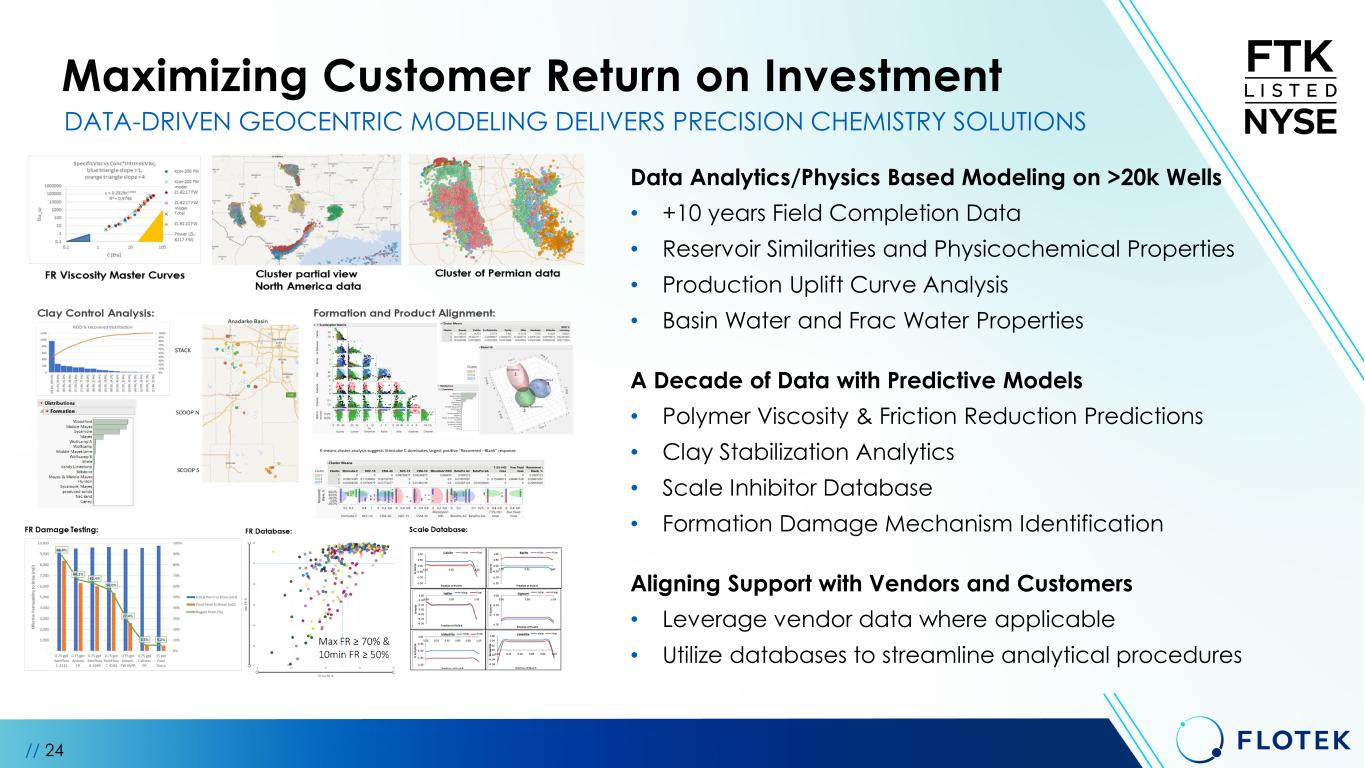
Maximizing Customer Return on Investment Data Analytics/Physics Based Modeling on >20k Wells • +10 years Field Completion Data • Reservoir Similarities and Physicochemical Properties • Production Uplift Curve Analysis • Basin Water and Frac Water Properties A Decade of Data with Predictive Models • Polymer Viscosity & Friction Reduction Predictions • Clay Stabilization Analytics • Scale Inhibitor Database • Formation Damage Mechanism Identification Aligning Support with Vendors and Customers • Leverage vendor data where applicable • Utilize databases to streamline analytical procedures DATA-DRIVEN GEOCENTRIC MODELING DELIVERS PRECISION CHEMISTRY SOLUTIONS // 24
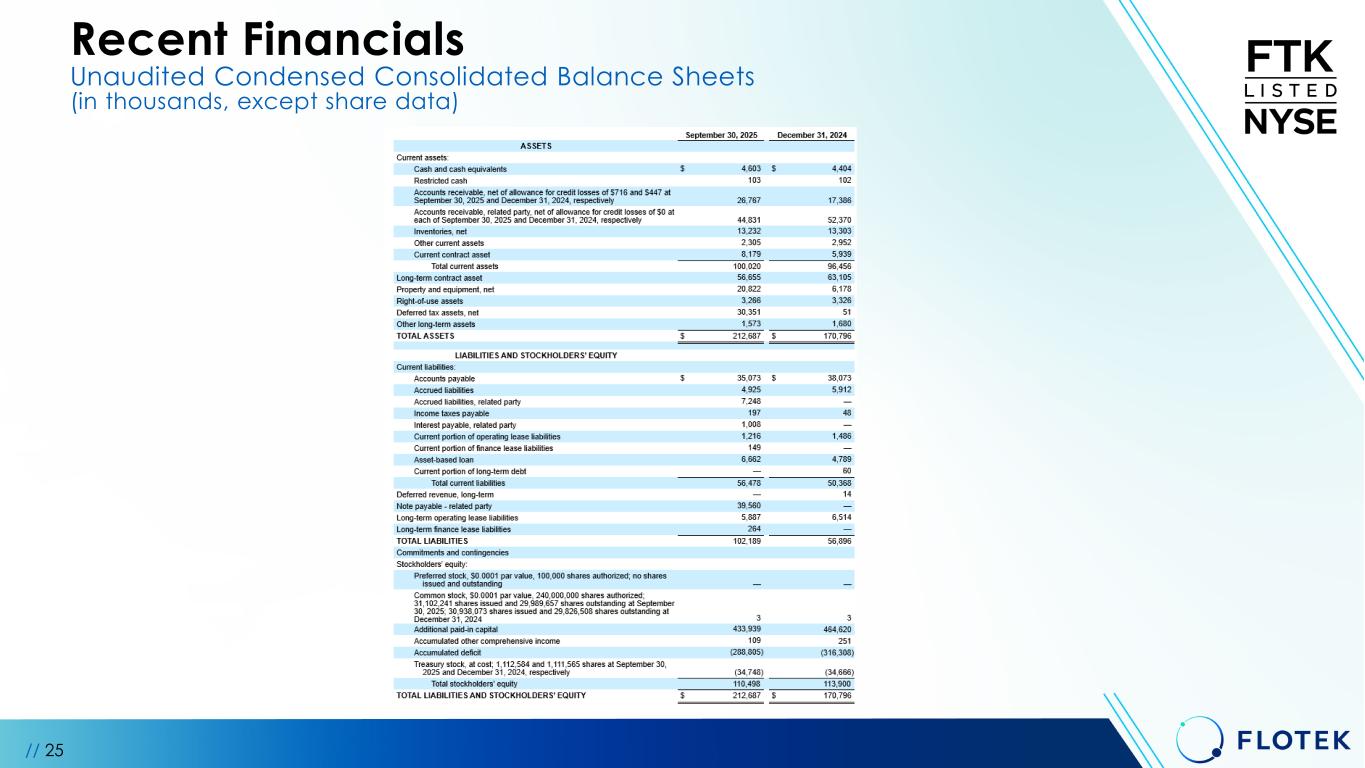
// 25 Recent Financials Unaudited Condensed Consolidated Balance Sheets (in thousands, except share data)
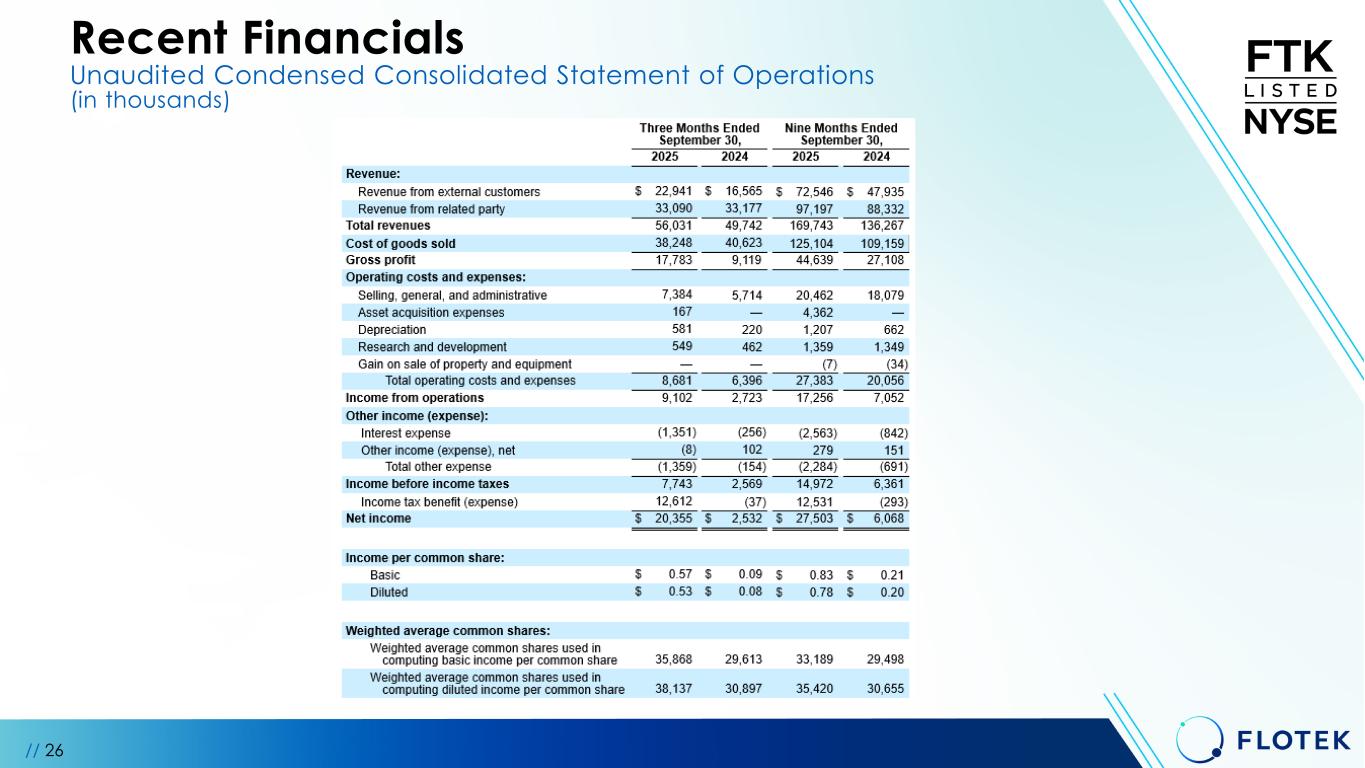
Recent Financials Unaudited Condensed Consolidated Statement of Operations (in thousands) // 26
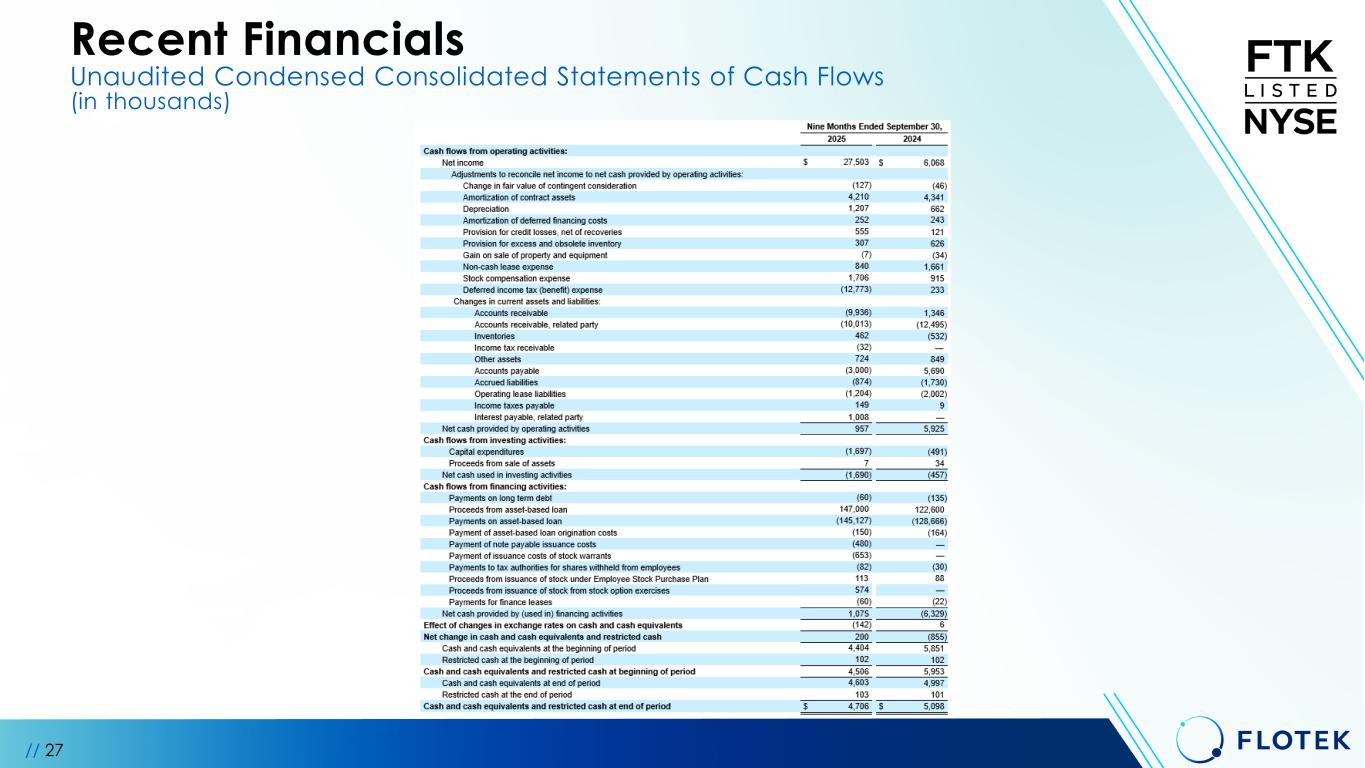
// 27 Recent Financials Unaudited Condensed Consolidated Statements of Cash Flows (in thousands)
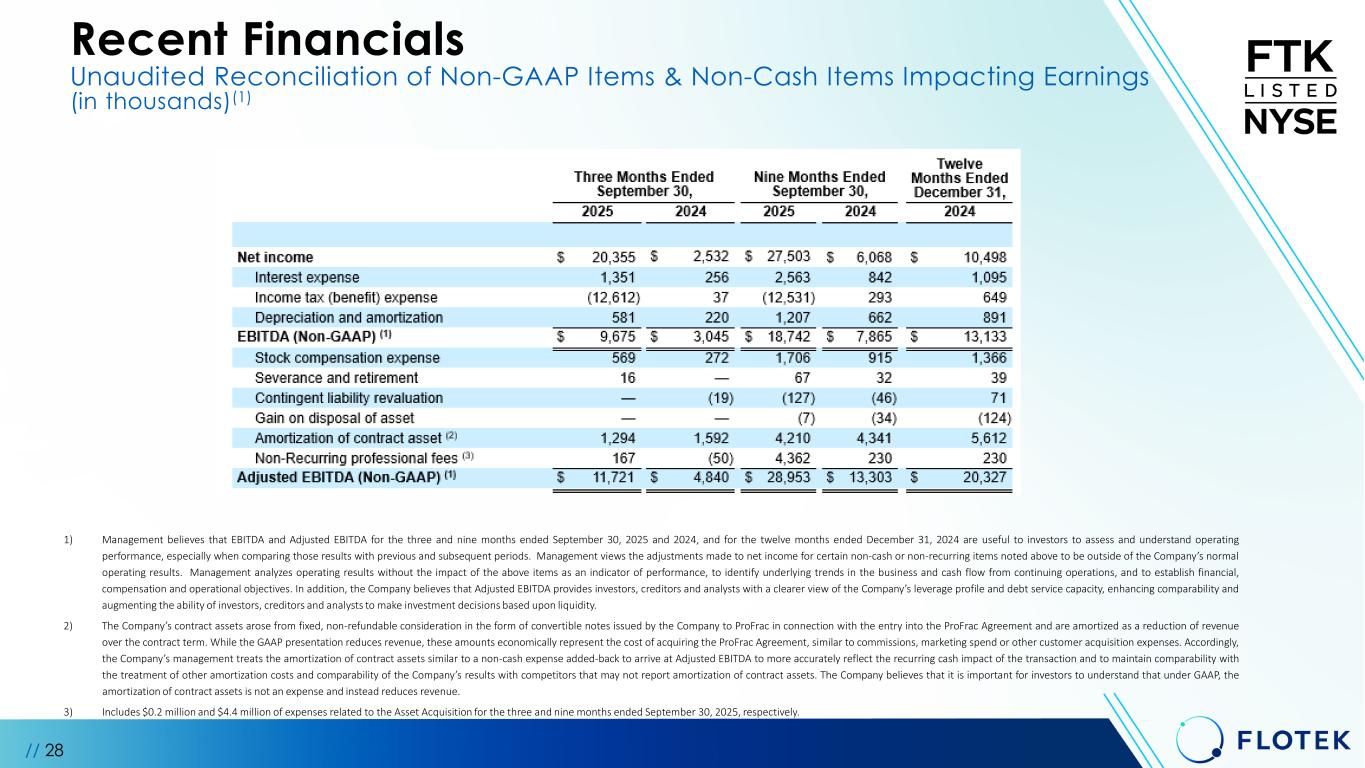
// 28 1) Management believes that EBITDA and Adjusted EBITDA for the three and nine months ended September 30, 2025 and 2024, and for the twelve months ended December 31, 2024 are useful to investors to assess and understand operating performance, especially when comparing those results with previous and subsequent periods. Management views the adjustments made to net income for certain non-cash or non-recurring items noted above to be outside of the Company’s normal operating results. Management analyzes operating results without the impact of the above items as an indicator of performance, to identify underlying trends in the business and cash flow from continuing operations, and to establish financial, compensation and operational objectives. In addition, the Company believes that Adjusted EBITDA provides investors, creditors and analysts with a clearer view of the Company’s leverage profile and debt service capacity, enhancing comparability and augmenting the ability of investors, creditors and analysts to make investment decisions based upon liquidity. 2) The Company’s contract assets arose from fixed, non-refundable consideration in the form of convertible notes issued by the Company to ProFrac in connection with the entry into the ProFrac Agreement and are amortized as a reduction of revenue over the contract term. While the GAAP presentation reduces revenue, these amounts economically represent the cost of acquiring the ProFrac Agreement, similar to commissions, marketing spend or other customer acquisition expenses. Accordingly, the Company’s management treats the amortization of contract assets similar to a non-cash expense added-back to arrive at Adjusted EBITDA to more accurately reflect the recurring cash impact of the transaction and to maintain comparability with the treatment of other amortization costs and comparability of the Company’s results with competitors that may not report amortization of contract assets. The Company believes that it is important for investors to understand that under GAAP, the amortization of contract assets is not an expense and instead reduces revenue. 3) Includes $0.2 million and $4.4 million of expenses related to the Asset Acquisition for the three and nine months ended September 30, 2025, respectively. Recent Financials Unaudited Reconciliation of Non-GAAP Items & Non-Cash Items Impacting Earnings (in thousands)(1)
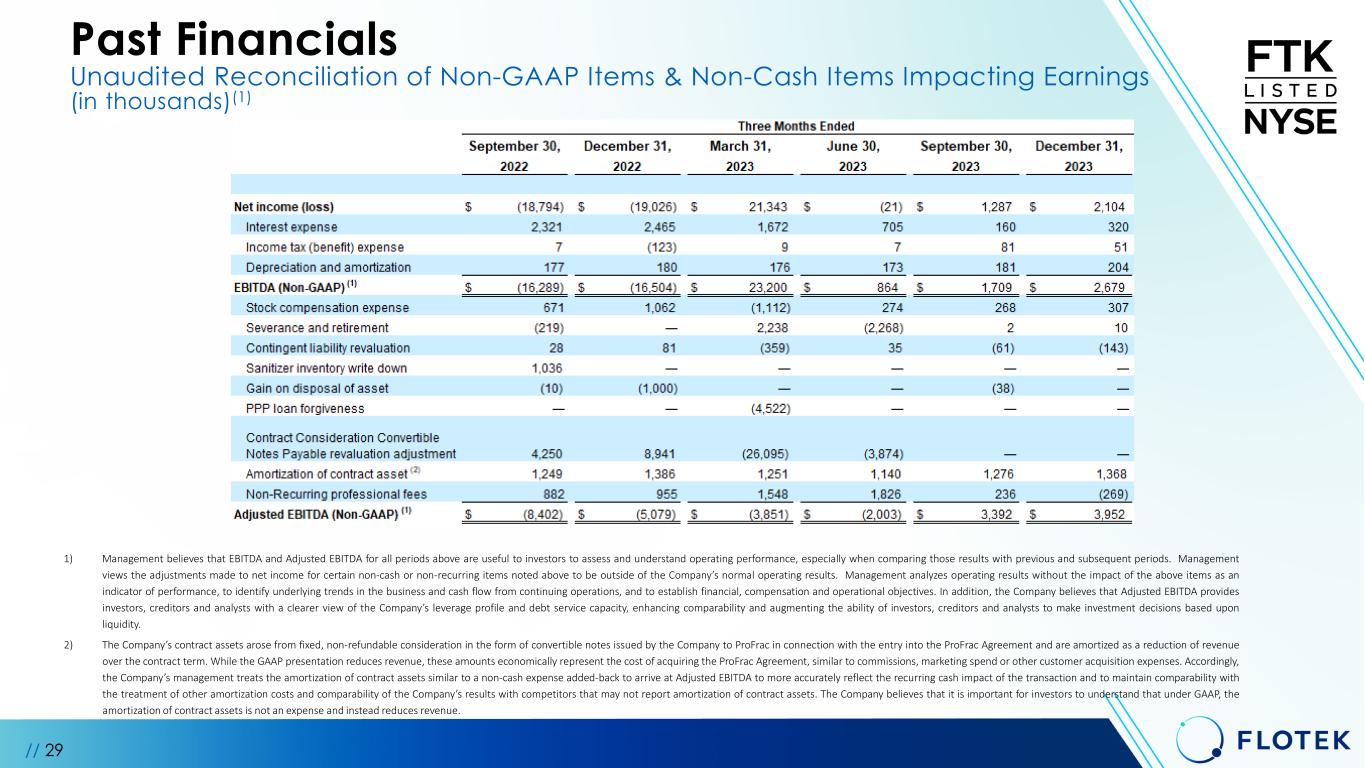
// 29 1) Management believes that EBITDA and Adjusted EBITDA for all periods above are useful to investors to assess and understand operating performance, especially when comparing those results with previous and subsequent periods. Management views the adjustments made to net income for certain non-cash or non-recurring items noted above to be outside of the Company’s normal operating results. Management analyzes operating results without the impact of the above items as an indicator of performance, to identify underlying trends in the business and cash flow from continuing operations, and to establish financial, compensation and operational objectives. In addition, the Company believes that Adjusted EBITDA provides investors, creditors and analysts with a clearer view of the Company’s leverage profile and debt service capacity, enhancing comparability and augmenting the ability of investors, creditors and analysts to make investment decisions based upon liquidity. 2) The Company’s contract assets arose from fixed, non-refundable consideration in the form of convertible notes issued by the Company to ProFrac in connection with the entry into the ProFrac Agreement and are amortized as a reduction of revenue over the contract term. While the GAAP presentation reduces revenue, these amounts economically represent the cost of acquiring the ProFrac Agreement, similar to commissions, marketing spend or other customer acquisition expenses. Accordingly, the Company’s management treats the amortization of contract assets similar to a non-cash expense added-back to arrive at Adjusted EBITDA to more accurately reflect the recurring cash impact of the transaction and to maintain comparability with the treatment of other amortization costs and comparability of the Company’s results with competitors that may not report amortization of contract assets. The Company believes that it is important for investors to understand that under GAAP, the amortization of contract assets is not an expense and instead reduces revenue. Past Financials Unaudited Reconciliation of Non-GAAP Items & Non-Cash Items Impacting Earnings (in thousands)(1)
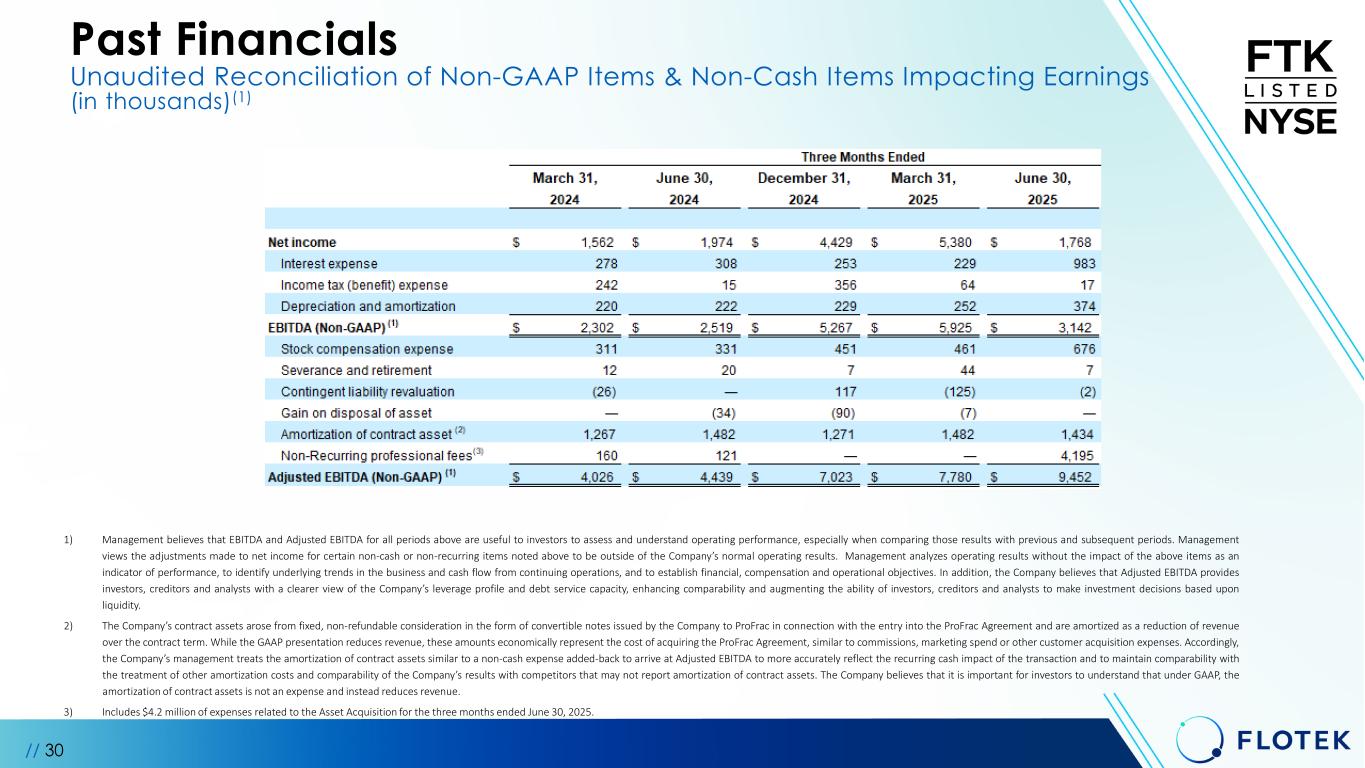
// 30 1) Management believes that EBITDA and Adjusted EBITDA for all periods above are useful to investors to assess and understand operating performance, especially when comparing those results with previous and subsequent periods. Management views the adjustments made to net income for certain non-cash or non-recurring items noted above to be outside of the Company’s normal operating results. Management analyzes operating results without the impact of the above items as an indicator of performance, to identify underlying trends in the business and cash flow from continuing operations, and to establish financial, compensation and operational objectives. In addition, the Company believes that Adjusted EBITDA provides investors, creditors and analysts with a clearer view of the Company’s leverage profile and debt service capacity, enhancing comparability and augmenting the ability of investors, creditors and analysts to make investment decisions based upon liquidity. 2) The Company’s contract assets arose from fixed, non-refundable consideration in the form of convertible notes issued by the Company to ProFrac in connection with the entry into the ProFrac Agreement and are amortized as a reduction of revenue over the contract term. While the GAAP presentation reduces revenue, these amounts economically represent the cost of acquiring the ProFrac Agreement, similar to commissions, marketing spend or other customer acquisition expenses. Accordingly, the Company’s management treats the amortization of contract assets similar to a non-cash expense added-back to arrive at Adjusted EBITDA to more accurately reflect the recurring cash impact of the transaction and to maintain comparability with the treatment of other amortization costs and comparability of the Company’s results with competitors that may not report amortization of contract assets. The Company believes that it is important for investors to understand that under GAAP, the amortization of contract assets is not an expense and instead reduces revenue. 3) Includes $4.2 million of expenses related to the Asset Acquisition for the three months ended June 30, 2025. Past Financials Unaudited Reconciliation of Non-GAAP Items & Non-Cash Items Impacting Earnings (in thousands)(1)