
Third Quarter Webcast Presentation October 30, 2025 NYSE: WCC

Forward-Looking Statements and Non-GAAP Measures 2 All statements made herein that are not historical facts should be considered as "forward-looking statements" within the meaning of the Private Securities Litigation Reform Act of 1995. Such statements involve known and unknown risks, uncertainties and other factors that may cause actual results to differ materially. These statements include, but are not limited to, statements regarding business strategy, growth strategy, competitive strengths, productivity and profitability enhancement, competition, new product and service introductions, and liquidity and capital resources. Such statements can generally be identified by the use of words such as "anticipate," "plan," "believe," "estimate," "intend," "expect," "project," and similar words, phrases or expressions or future or conditional verbs such as "could," "may," "should," "will," and "would," although not all forward-looking statements contain such words. These forward-looking statements are based on current expectations and beliefs of Wesco's management, as well as assumptions made by, and information currently available to, Wesco's management, current market trends and market conditions and involve risks and uncertainties, many of which are outside of Wesco's and Wesco's management's control, and which may cause actual results to differ materially from those contained in forward-looking statements. Accordingly, you should not place undue reliance on such statements. Important factors that could cause actual results or events to differ materially from those presented or implied in the forward-looking statements include, among others, the failure to achieve the anticipated benefits of, and other risks associated with, acquisitions, joint ventures, divestitures and other corporate transactions; the inability to successfully integrate acquired businesses; the impact of increased interest rates or borrowing costs; fluctuations in currency exchange rates; evolving impacts from tariffs or other trade tensions between the U.S. and other countries (including implementation of new tariffs and retaliatory measures); failure to adequately protect Wesco's intellectual property or successfully defend against infringement claims; the inability to successfully deploy new technologies, digital products and information systems or to otherwise adapt to emerging technologies in the marketplace, such as those incorporating artificial intelligence; failure to execute on our efforts and programs related to environmental, social and governance (ESG) matters; unanticipated expenditures or other adverse developments related to compliance with new or stricter government policies, laws or regulations, including those relating to data privacy, sustainability and environmental protection; the inability to successfully develop, manage or implement new technology initiatives or business strategies, including with respect to the expansion of e-commerce capabilities and other digital solutions and digitalization initiatives; disruption of information technology systems or operations; natural disasters (including as a result of climate change), health epidemics, pandemics and other outbreaks; supply chain disruptions; geopolitical issues, including the impact of the evolving conflicts in the Middle East and Russia/Ukraine; the impact of sanctions imposed on, or other actions taken by the U.S. or other countries against, Russia or China; the failure to manage the increased risks and impacts of cyber incidents or data breaches; and exacerbation of key materials shortages, inflationary cost pressures, material cost increases, demand volatility, and logistics and capacity constraints, any of which may have a material adverse effect on the Company's business, results of operations and financial condition. All such factors are difficult to predict and are beyond the Company's control. Additional factors that could cause results to differ materially from those described above can be found in Wesco's most recent Annual Report on Form 10-K and other periodic reports filed with the U.S. Securities and Exchange Commission. Non-GAAP Measures In addition to the results provided in accordance with U.S. Generally Accepted Accounting Principles (“U.S. GAAP”) above, this presentation includes certain non-GAAP financial measures. These financial measures include organic sales growth, gross profit, gross margin, earnings before interest, taxes, depreciation and amortization (EBITDA), adjusted EBITDA, adjusted EBITDA margin, financial leverage, free cash flow, adjusted selling, general and administrative expenses, adjusted income from operations, adjusted operating margin, adjusted other non-operating expense (income), adjusted provision for income taxes, adjusted income before income taxes, adjusted net income, adjusted net income attributable to WESCO International, Inc., adjusted net income attributable to common stockholders, and adjusted earnings per diluted share. The Company believes that these non-GAAP measures are useful to investors as they provide a better understanding of our financial condition and results of operations on a comparable basis. Additionally, certain non-GAAP measures either focus on or exclude items impacting comparability of results such as digital transformation costs, restructuring costs, merger-related and integration costs, cloud computing arrangement amortization, pension settlement cost and excise taxes on excess pension plan assets related to the settlement of the Anixter Inc. Pension Plan, loss on abandonment of assets, the gain recognized on the divestiture of the WIS business, the loss on termination of business arrangement, and the related income tax effects, allowing investors to more easily compare the Company's financial performance from period to period. Management does not use these non-GAAP financial measures for any purpose other than the reasons stated above.
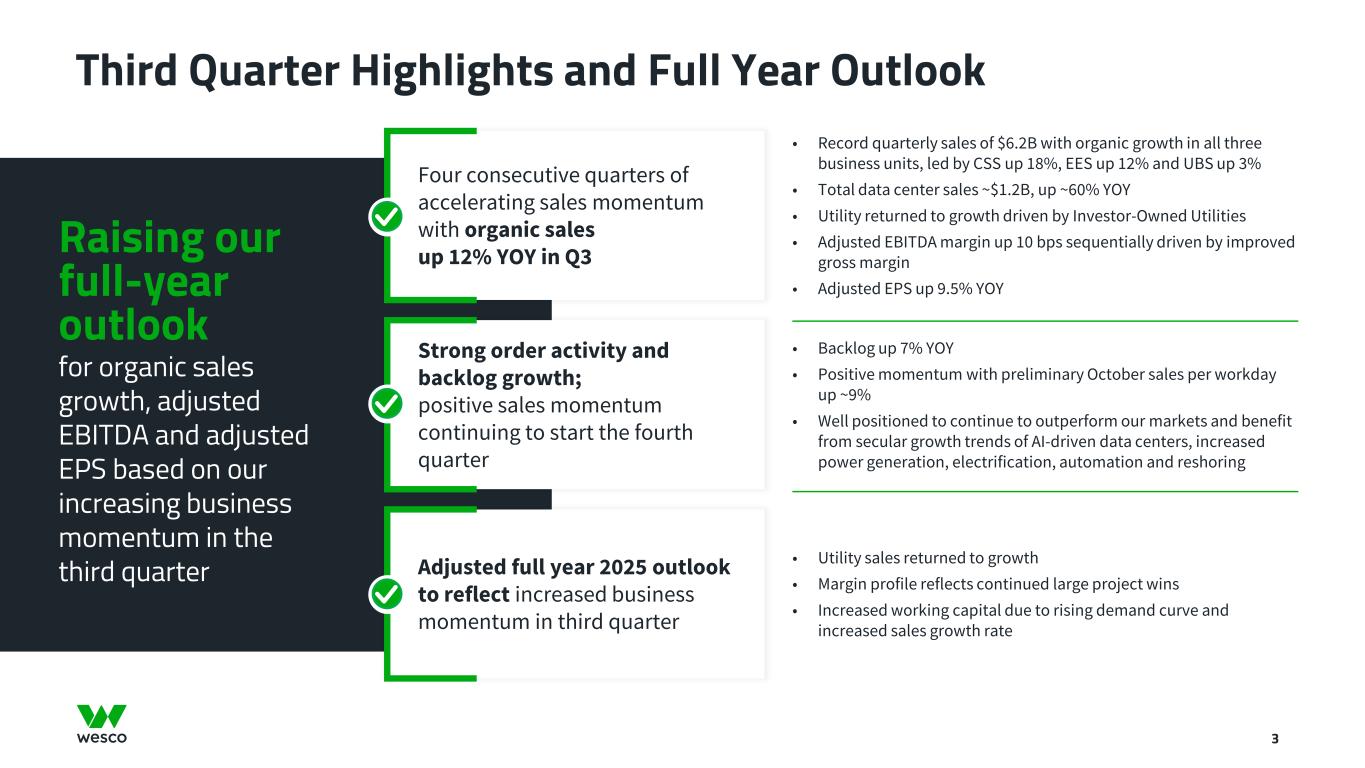
Third Quarter Highlights and Full Year Outlook 3 Raising our full-year outlook for organic sales growth, adjusted EBITDA and adjusted EPS based on our increasing business momentum in the third quarter • Record quarterly sales of $6.2B with organic growth in all three business units, led by CSS up 18%, EES up 12% and UBS up 3% • Total data center sales ~$1.2B, up ~60% YOY • Utility returned to growth driven by Investor-Owned Utilities • Adjusted EBITDA margin up 10 bps sequentially driven by improved gross margin • Adjusted EPS up 9.5% YOY Four consecutive quarters of accelerating sales momentum with organic sales up 12% YOY in Q3 • Backlog up 7% YOY • Positive momentum with preliminary October sales per workday up ~9% • Well positioned to continue to outperform our markets and benefit from secular growth trends of AI-driven data centers, increased power generation, electrification, automation and reshoring Strong order activity and backlog growth; positive sales momentum continuing to start the fourth quarter • Utility sales returned to growth • Margin profile reflects continued large project wins • Increased working capital due to rising demand curve and increased sales growth rate Adjusted full year 2025 outlook to reflect increased business momentum in third quarter
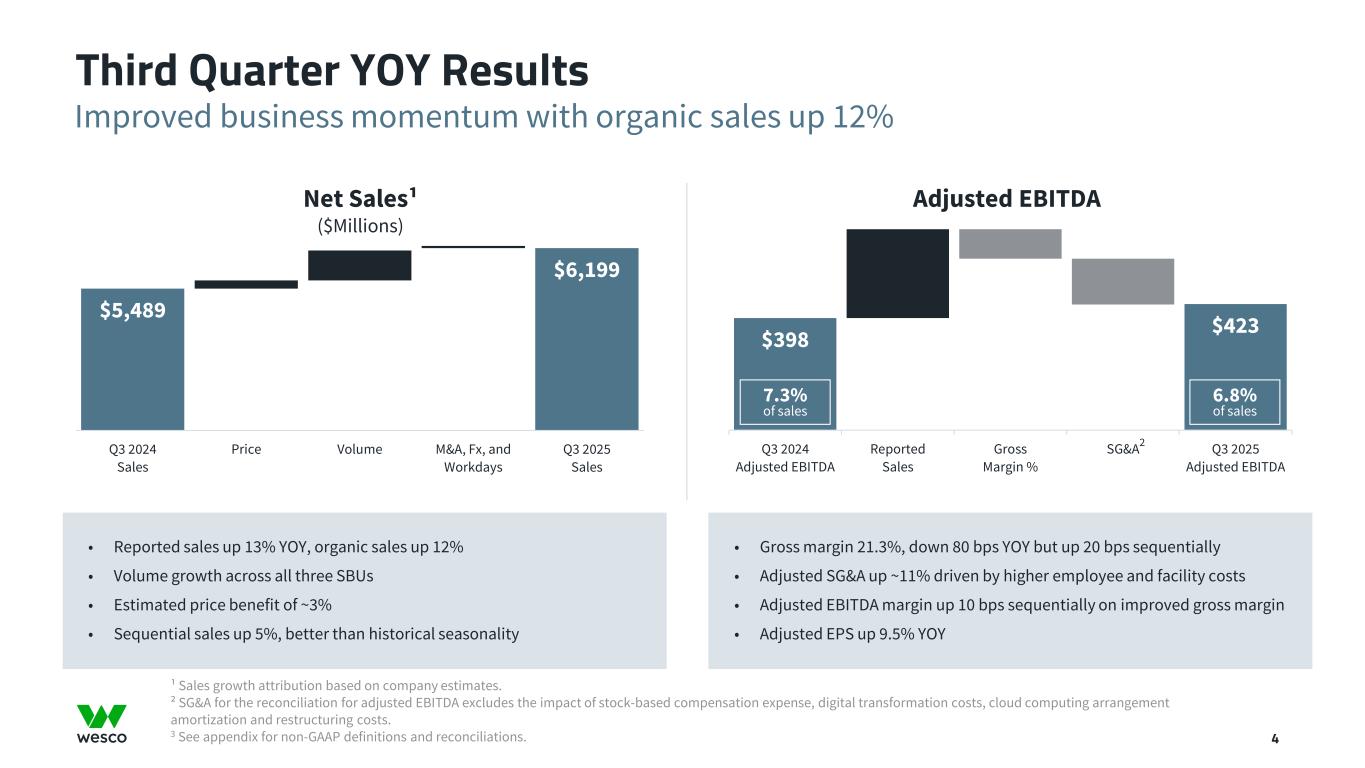
$5,489 $6,199 Q3 2024 Sales Price Volume M&A, Fx, and Workdays Q3 2025 Sales ¹ Sales growth attribution based on company estimates. ² SG&A for the reconciliation for adjusted EBITDA excludes the impact of stock-based compensation expense, digital transformation costs, cloud computing arrangement amortization and restructuring costs. 3 See appendix for non-GAAP definitions and reconciliations. Improved business momentum with organic sales up 12% Third Quarter YOY Results 4 • Reported sales up 13% YOY, organic sales up 12% • Volume growth across all three SBUs • Estimated price benefit of ~3% • Sequential sales up 5%, better than historical seasonality • Gross margin 21.3%, down 80 bps YOY but up 20 bps sequentially • Adjusted SG&A up ~11% driven by higher employee and facility costs • Adjusted EBITDA margin up 10 bps sequentially on improved gross margin • Adjusted EPS up 9.5% YOY $398 $423 Q3 2024 Adjusted EBITDA Reported Sales Gross Margin % SG&A Q3 2025 Adjusted EBITDA 7.3% of sales Net Sales¹ ($Millions) Adjusted EBITDA 6.8% of sales 2
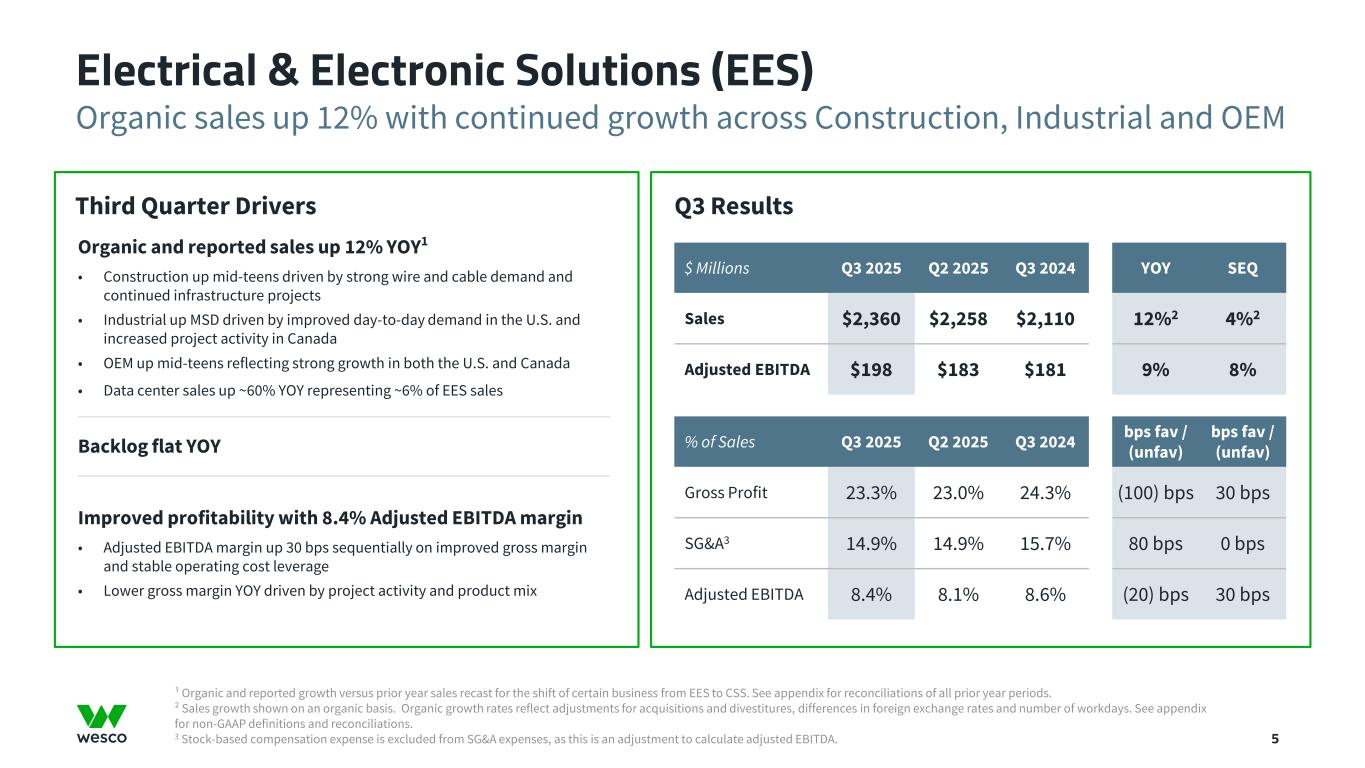
¹ Organic and reported growth versus prior year sales recast for the shift of certain business from EES to CSS. See appendix for reconciliations of all prior year periods. ² Sales growth shown on an organic basis. Organic growth rates reflect adjustments for acquisitions and divestitures, differences in foreign exchange rates and number of workdays. See appendix for non-GAAP definitions and reconciliations. 3 Stock-based compensation expense is excluded from SG&A expenses, as this is an adjustment to calculate adjusted EBITDA. Organic sales up 12% with continued growth across Construction, Industrial and OEM Electrical & Electronic Solutions (EES) 5 Q3 Results Third Quarter Drivers Organic and reported sales up 12% YOY1 • Construction up mid-teens driven by strong wire and cable demand and continued infrastructure projects • Industrial up MSD driven by improved day-to-day demand in the U.S. and increased project activity in Canada • OEM up mid-teens reflecting strong growth in both the U.S. and Canada • Data center sales up ~60% YOY representing ~6% of EES sales Backlog flat YOY Improved profitability with 8.4% Adjusted EBITDA margin • Adjusted EBITDA margin up 30 bps sequentially on improved gross margin and stable operating cost leverage • Lower gross margin YOY driven by project activity and product mix $ Millions Q3 2025 Q2 2025 Q3 2024 YOY SEQ Sales $2,360 $2,258 $2,110 12%2 4%2 Adjusted EBITDA $198 $183 $181 9% 8% % of Sales Q3 2025 Q2 2025 Q3 2024 bps fav / (unfav) bps fav / (unfav) Gross Profit 23.3% 23.0% 24.3% (100) bps 30 bps SG&A3 14.9% 14.9% 15.7% 80 bps 0 bps Adjusted EBITDA 8.4% 8.1% 8.6% (20) bps 30 bps
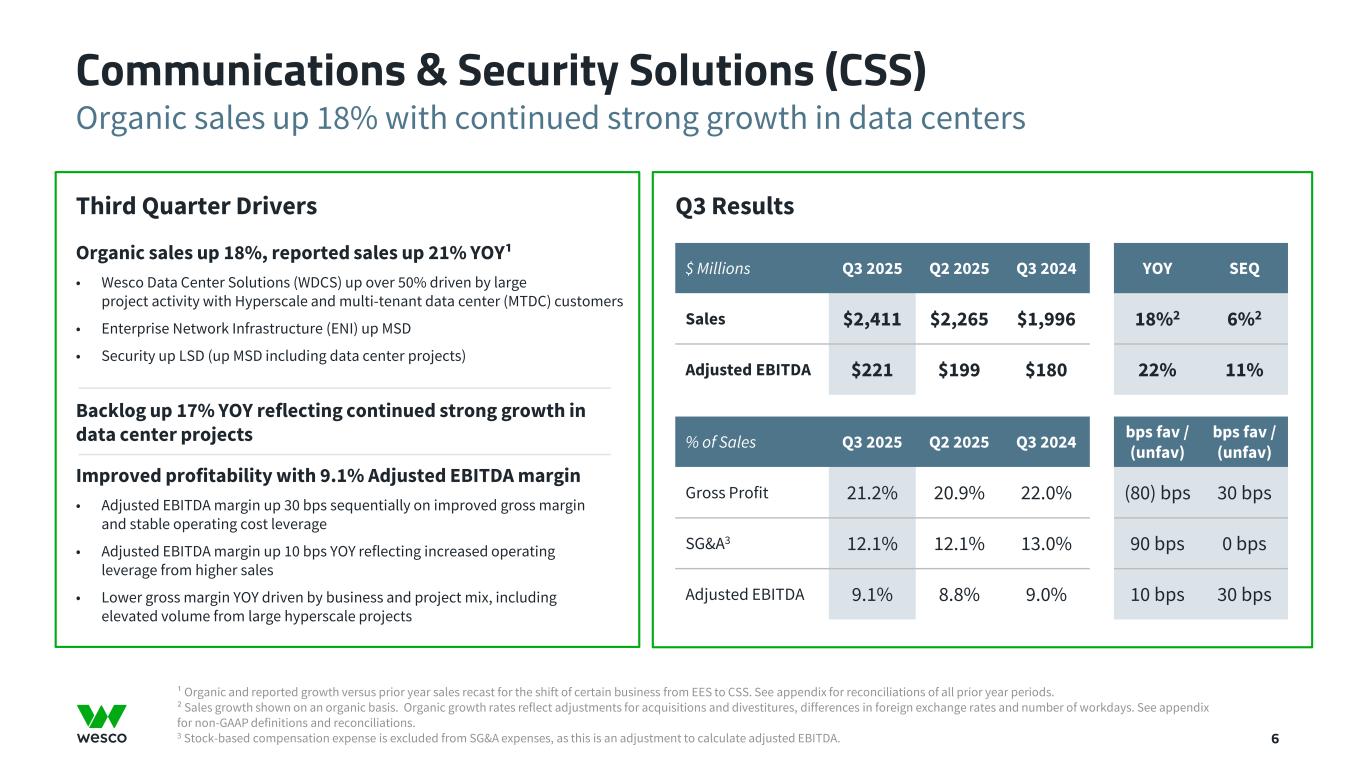
Organic sales up 18% with continued strong growth in data centers Communications & Security Solutions (CSS) 6 $ Millions Q3 2025 Q2 2025 Q3 2024 YOY SEQ Sales $2,411 $2,265 $1,996 18%2 6%2 Adjusted EBITDA $221 $199 $180 22% 11% % of Sales Q3 2025 Q2 2025 Q3 2024 bps fav / (unfav) bps fav / (unfav) Gross Profit 21.2% 20.9% 22.0% (80) bps 30 bps SG&A3 12.1% 12.1% 13.0% 90 bps 0 bps Adjusted EBITDA 9.1% 8.8% 9.0% 10 bps 30 bps Q3 Results Third Quarter Drivers Organic sales up 18%, reported sales up 21% YOY¹ • Wesco Data Center Solutions (WDCS) up over 50% driven by large project activity with Hyperscale and multi-tenant data center (MTDC) customers • Enterprise Network Infrastructure (ENI) up MSD • Security up LSD (up MSD including data center projects) Backlog up 17% YOY reflecting continued strong growth in data center projects Improved profitability with 9.1% Adjusted EBITDA margin • Adjusted EBITDA margin up 30 bps sequentially on improved gross margin and stable operating cost leverage • Adjusted EBITDA margin up 10 bps YOY reflecting increased operating leverage from higher sales • Lower gross margin YOY driven by business and project mix, including elevated volume from large hyperscale projects ¹ Organic and reported growth versus prior year sales recast for the shift of certain business from EES to CSS. See appendix for reconciliations of all prior year periods. ² Sales growth shown on an organic basis. Organic growth rates reflect adjustments for acquisitions and divestitures, differences in foreign exchange rates and number of workdays. See appendix for non-GAAP definitions and reconciliations. 3 Stock-based compensation expense is excluded from SG&A expenses, as this is an adjustment to calculate adjusted EBITDA.
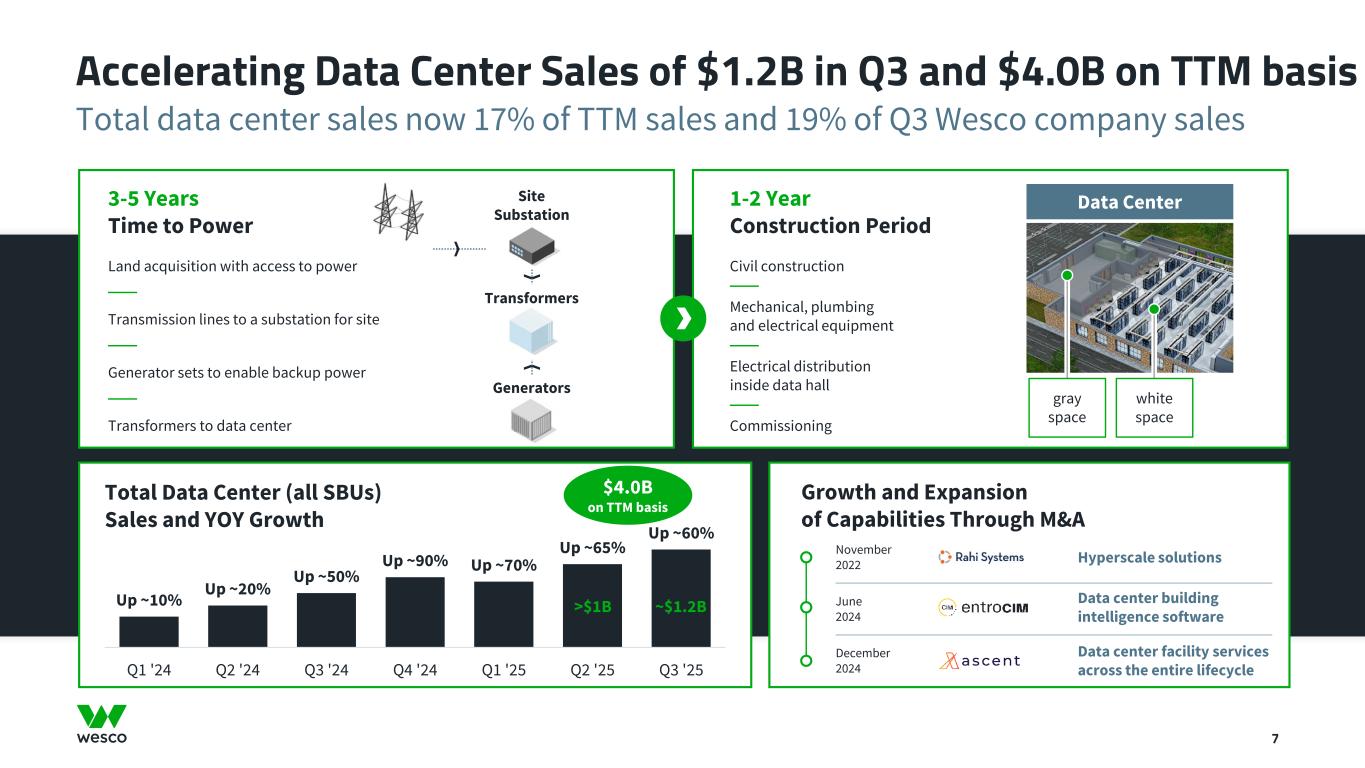
Total data center sales now 17% of TTM sales and 19% of Q3 Wesco company sales Accelerating Data Center Sales of $1.2B in Q3 and $4.0B on TTM basis 7 Up ~10% Up ~20% Up ~50% Up ~90% Up ~70% Up ~65% Up ~60% Q1 '24 Q2 '24 Q3 '24 Q4 '24 Q1 '25 Q2 '25 Q3 '25 Growth and Expansion of Capabilities Through M&A Data Center Land acquisition with access to power Transmission lines to a substation for site Generator sets to enable backup power Transformers to data center Civil construction Mechanical, plumbing and electrical equipment Electrical distribution inside data hall Commissioning November 2022 Hyperscale solutions Data center building intelligence software June 2024 Data center facility services across the entire lifecycle December 2024 3-5 Years Time to Power 1-2 Year Construction Period Total Data Center (all SBUs) Sales and YOY Growth white space gray space Transformers Site Substation Generators >$1B ~$1.2B $4.0B on TTM basis

Providing holistic services and solutions for every phase of the data center lifecycle Data Center Product, Services and Solutions Offering 8 White SpaceGray Space End-to-end electrical, automation and MRO capabilities Extensive next-generation infrastructure and services for always-on connectivity Physical Security, IoT, Pro A/V Access control, sensors and monitoring, video surveillance Electrical Infrastructure Building wire, cable trays, medium-voltage cable, switch gear, UPS systems MRO, Safety and Other Communication devices, janitorial, lighting, tools and equipment Mechanical and Cooling Automated switches and sensors, chillers, Computer Room Air Conditioning (CRAC), thermal IT Infrastructure Compute, network, storage, wireless technologies Communications Infrastructure Copper and fiber cabling systems, racks and enclosures, high-speed interconnects 80% 20% Wesco data center sales mix Data Center White Space Gray Space Global Ecosystem Expansive Portfolio Holistic Solutions Services and Solutions for Every Phase of the Data Center Lifecycle Installation Enhancement Rack and Roll Services Managed Services Project Deployment Services Advisory Services Grid Services OperationsPre-construction 8
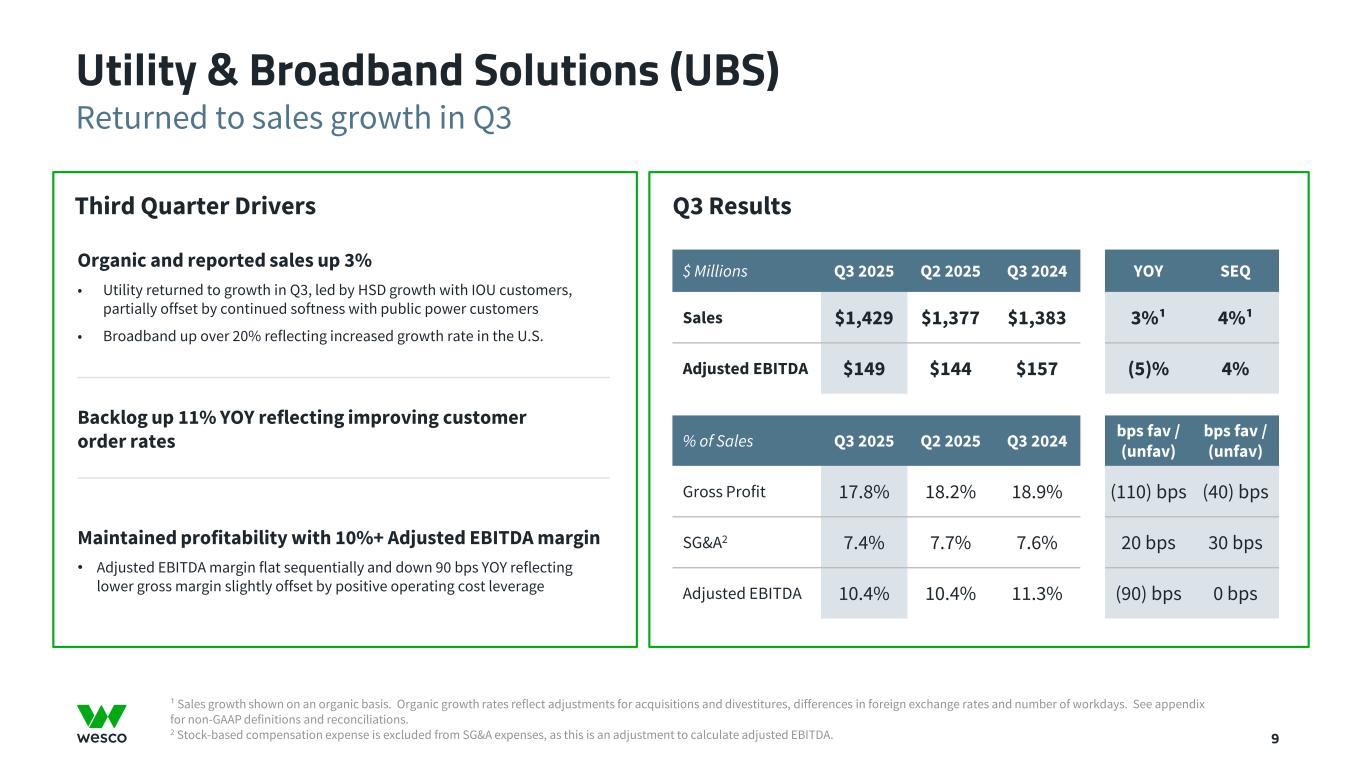
Returned to sales growth in Q3 Utility & Broadband Solutions (UBS) 9 $ Millions Q3 2025 Q2 2025 Q3 2024 YOY SEQ Sales $1,429 $1,377 $1,383 3%¹ 4%¹ Adjusted EBITDA $149 $144 $157 (5)% 4% % of Sales Q3 2025 Q2 2025 Q3 2024 bps fav / (unfav) bps fav / (unfav) Gross Profit 17.8% 18.2% 18.9% (110) bps (40) bps SG&A2 7.4% 7.7% 7.6% 20 bps 30 bps Adjusted EBITDA 10.4% 10.4% 11.3% (90) bps 0 bps Q3 Results Third Quarter Drivers Organic and reported sales up 3% • Utility returned to growth in Q3, led by HSD growth with IOU customers, partially offset by continued softness with public power customers • Broadband up over 20% reflecting increased growth rate in the U.S. Backlog up 11% YOY reflecting improving customer order rates Maintained profitability with 10%+ Adjusted EBITDA margin • Adjusted EBITDA margin flat sequentially and down 90 bps YOY reflecting lower gross margin slightly offset by positive operating cost leverage ¹ Sales growth shown on an organic basis. Organic growth rates reflect adjustments for acquisitions and divestitures, differences in foreign exchange rates and number of workdays. See appendix for non-GAAP definitions and reconciliations. 2 Stock-based compensation expense is excluded from SG&A expenses, as this is an adjustment to calculate adjusted EBITDA.
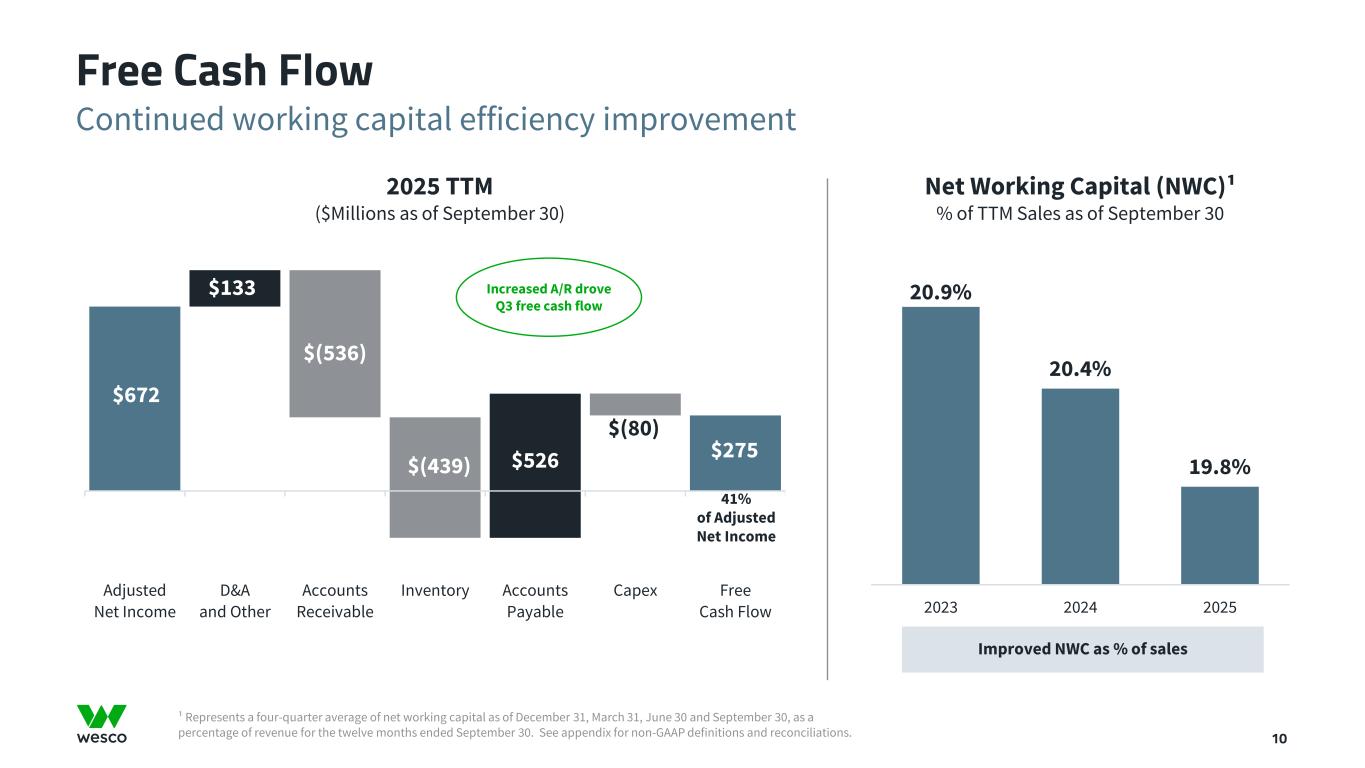
$672 $(536) $526 $275 $133 $(439) $526 $(80) Adjusted Net Income D&A and Other Accounts Receivable Inventory Accounts Payable Capex Free Cash Flow ¹ Represents a four-quarter average of net working capital as of December 31, March 31, June 30 and September 30, as a percentage of revenue for the twelve months ended September 30. See appendix for non-GAAP definitions and reconciliations. Continued working capital efficiency improvement Free Cash Flow 10 41% of Adjusted Net Income 2025 TTM ($Millions as of September 30) Net Working Capital (NWC)¹ % of TTM Sales as of September 30 20.9% 20.4% 19.8% 2023 2024 2025 Improved NWC as % of sales Increased A/R drove Q3 free cash flow
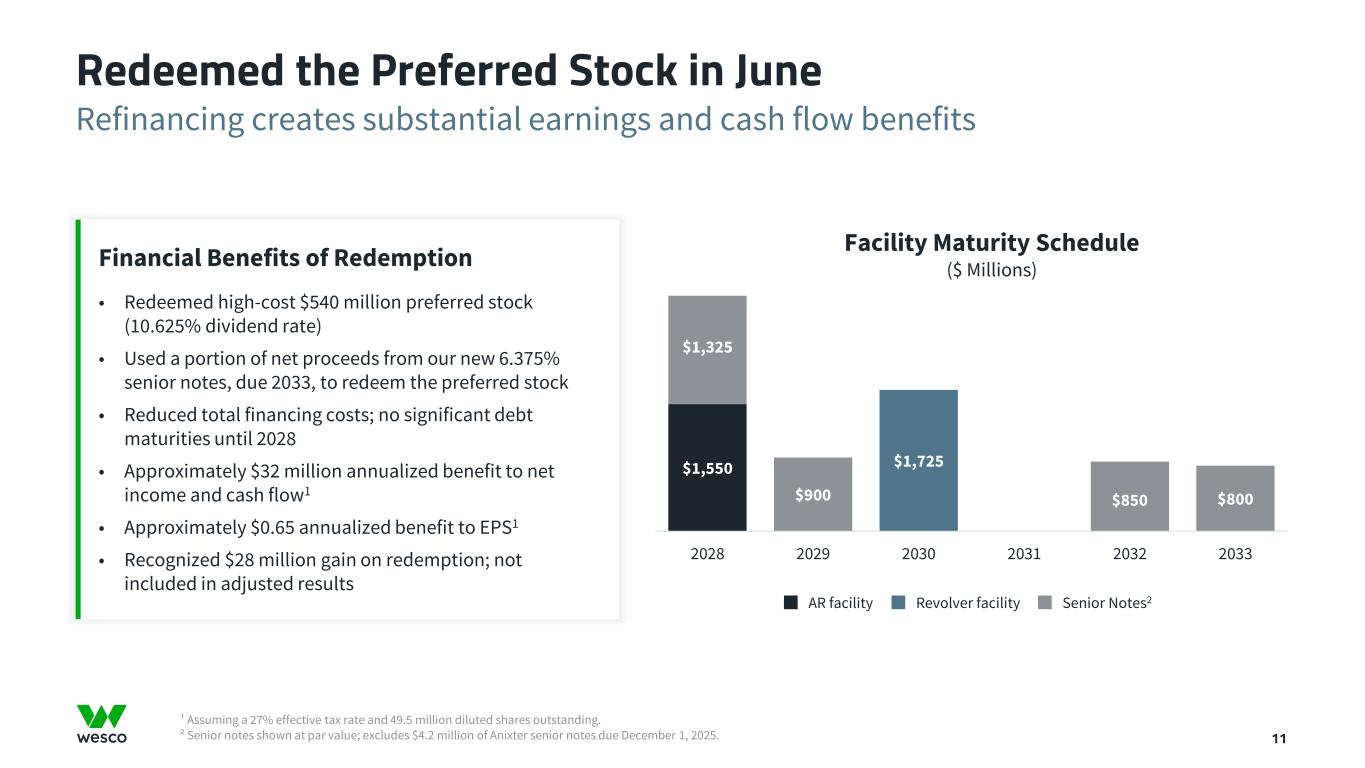
$1,550 $1,725 $1,325 $850$900 $800 2028 2029 2030 2031 2032 2033 ¹ Assuming a 27% effective tax rate and 49.5 million diluted shares outstanding. ² Senior notes shown at par value; excludes $4.2 million of Anixter senior notes due December 1, 2025. Refinancing creates substantial earnings and cash flow benefits Redeemed the Preferred Stock in June Financial Benefits of Redemption • Redeemed high-cost $540 million preferred stock (10.625% dividend rate) • Used a portion of net proceeds from our new 6.375% senior notes, due 2033, to redeem the preferred stock • Reduced total financing costs; no significant debt maturities until 2028 • Approximately $32 million annualized benefit to net income and cash flow1 • Approximately $0.65 annualized benefit to EPS1 • Recognized $28 million gain on redemption; not included in adjusted results AR facility Senior Notes2Revolver facility Facility Maturity Schedule ($ Millions) Refinancing of the preferred stock creates substantial net income, EPS and cash flow benefits 11
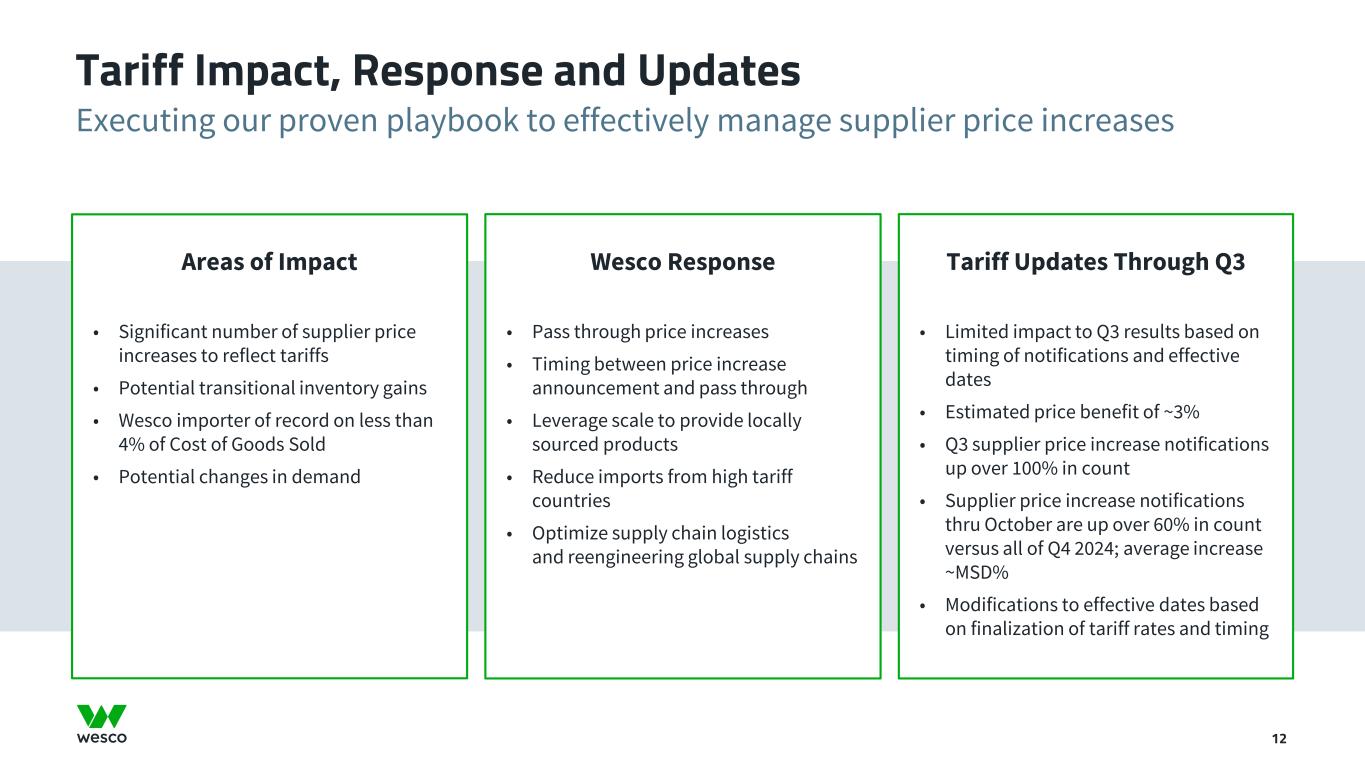
Executing our proven playbook to effectively manage supplier price increases Tariff Impact, Response and Updates 12 Areas of Impact • Significant number of supplier price increases to reflect tariffs • Potential transitional inventory gains • Wesco importer of record on less than 4% of Cost of Goods Sold • Potential changes in demand Wesco Response • Pass through price increases • Timing between price increase announcement and pass through • Leverage scale to provide locally sourced products • Reduce imports from high tariff countries • Optimize supply chain logistics and reengineering global supply chains Tariff Updates Through Q3 • Limited impact to Q3 results based on timing of notifications and effective dates • Estimated price benefit of ~3% • Q3 supplier price increase notifications up over 100% in count • Supplier price increase notifications thru October are up over 60% in count versus all of Q4 2024; average increase ~MSD% • Modifications to effective dates based on finalization of tariff rates and timing
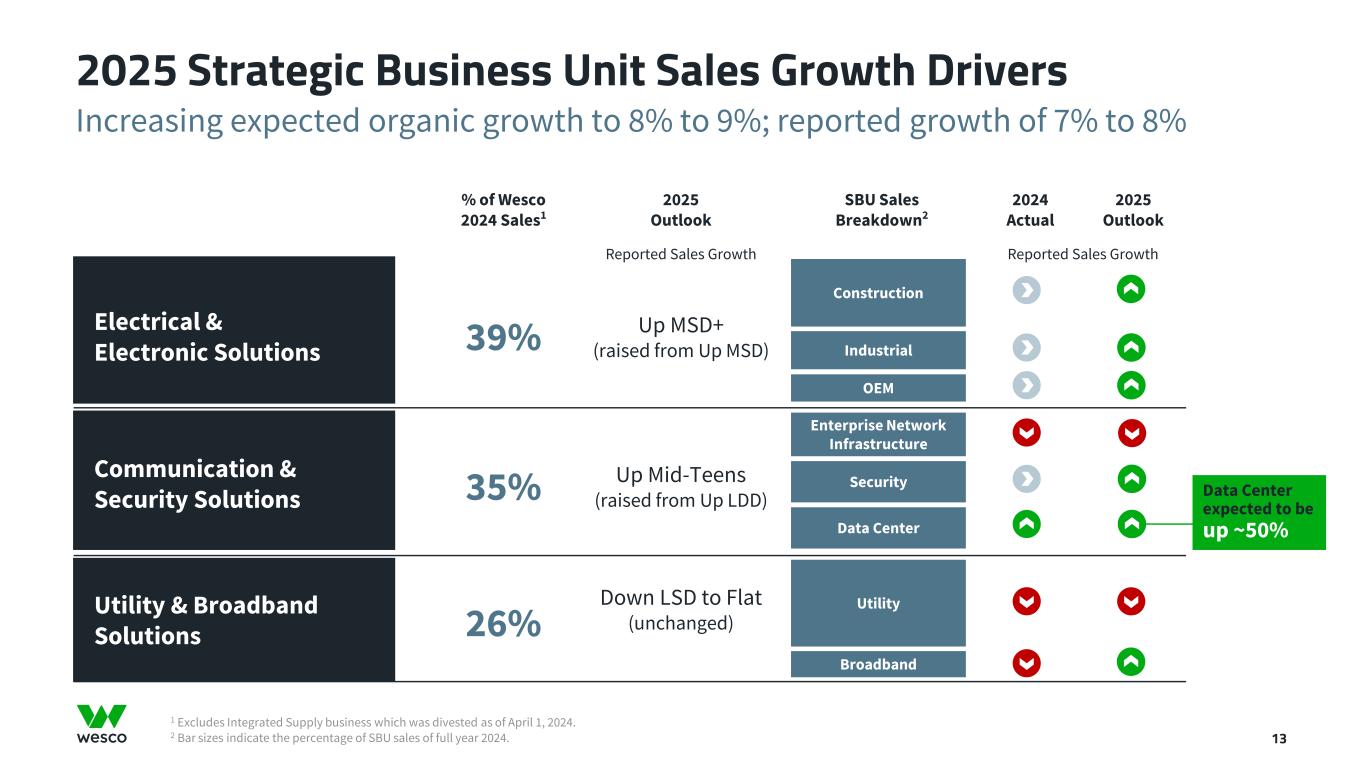
1 Excludes Integrated Supply business which was divested as of April 1, 2024. 2 Bar sizes indicate the percentage of SBU sales of full year 2024. Increasing expected organic growth to 8% to 9%; reported growth of 7% to 8% 2025 Strategic Business Unit Sales Growth Drivers 13 % of Wesco 2024 Sales1 2025 Outlook SBU Sales Breakdown2 2024 Actual 2025 Outlook Reported Sales Growth Reported Sales Growth Electrical & Electronic Solutions 39% Up MSD+ (raised from Up MSD) Construction Industrial OEM Communication & Security Solutions 35% Up Mid-Teens (raised from Up LDD) Enterprise Network Infrastructure Security Data Center Utility & Broadband Solutions 26% Down LSD to Flat (unchanged) Utility Broadband Data Center expected to be up ~50% Construction Industrial OEM Utility Broadband Enterprise Network Infrastructure Security Data Center

¹ Cloud computing amortization recognized as SG&A expense in accordance with GAAP. See appendix for non-GAAP definitions and reconciliations. 14 Increasing organic sales growth, adjusted EBITDA and adjusted EPS Revised Full-Year 2025 Outlook 2025 Underlying Assumptions • The impact of future pricing, including tariffs, is not incorporated in the outlook consistent with past practice • Increased capital spending continues for data centers • Utility sales recovery in the second half of the year 2025 Outlook July October Sales Organic sales growth 5% - 7% 8% - 9% Estimated Fx impact ~0% ~0% M&A and Workday impact (1)% (1)% Reported sales growth 4% - 6% 7% - 8% Reported sales $22.7 – $23.1 billion $23.3 – $23.6 billion Adjusted EBITDA Adjusted EBITDA margin 6.6% - 6.8% ~6.6% Adjusted EPS Adjusted diluted EPS $12.50 – $14.00 $13.10 – $13.60 Cash Free cash flow $600 – $800 million $400 – $500 million FY 2025 July October Depreciation and Amortization ~$185–195 ~$195 Cloud Computing Amortization Expense Adjustment ~$351 ~$351 Interest Expense ~$360–370 ~$375 Other Expense, net ~$0 ~$(5) Capital Expenditures ~$120 ~$100 Share Count 49–49.5 ~49.5 Effective Tax Rate ~26% ~25% 2025 Modeling Assumptions (millions, except effective tax rate)
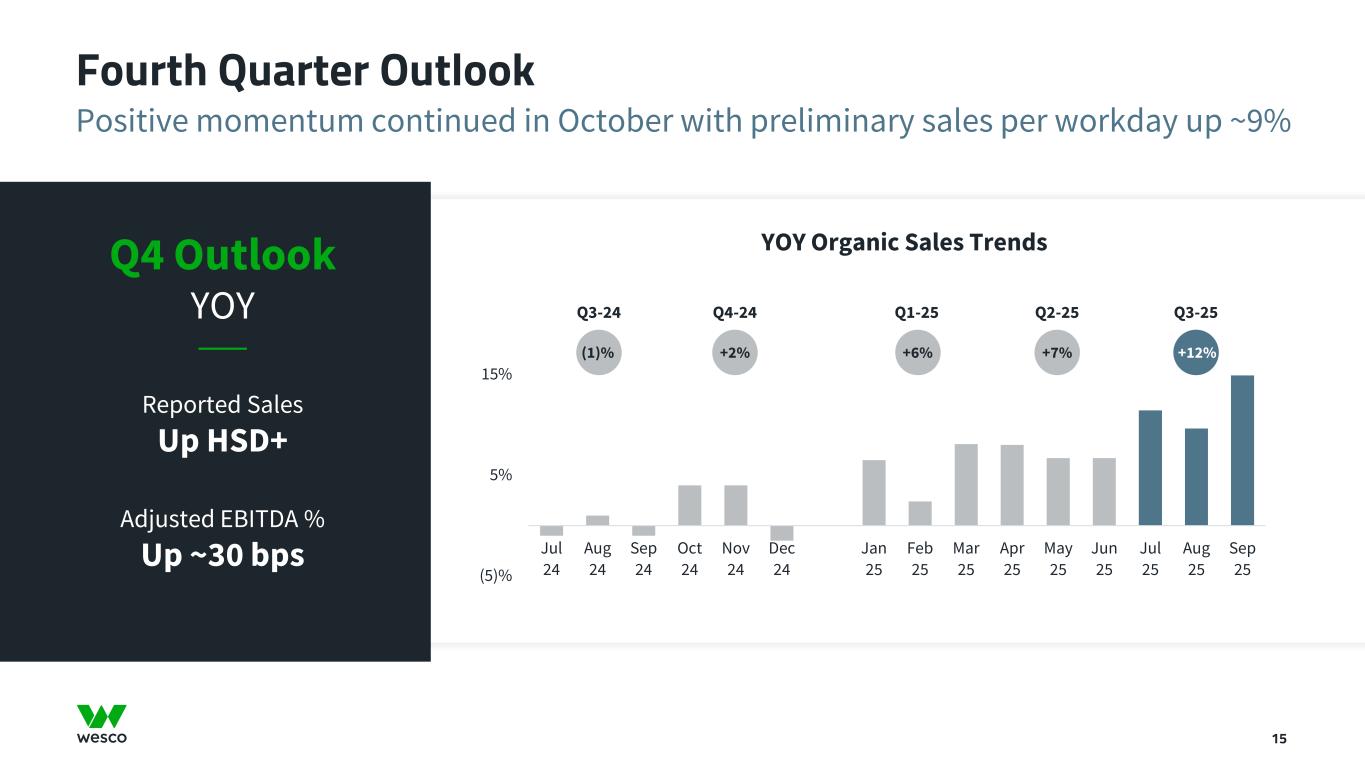
Positive momentum continued in October with preliminary sales per workday up ~9% Fourth Quarter Outlook 15 Q4 Outlook YOY Reported Sales Up HSD+ Adjusted EBITDA % Up ~30 bps (5)% 5% 15% Jul 24 Aug 24 Sep 24 Oct 24 Nov 24 Dec 24 Jan 25 Feb 25 Mar 25 Apr 25 May 25 Jun 25 Jul 25 Aug 25 Sep 25 YOY Organic Sales Trends Q3-24 Q4-24 Q1-25 Q2-25 Q3-25 (1)% +2% +6% +7% +12%
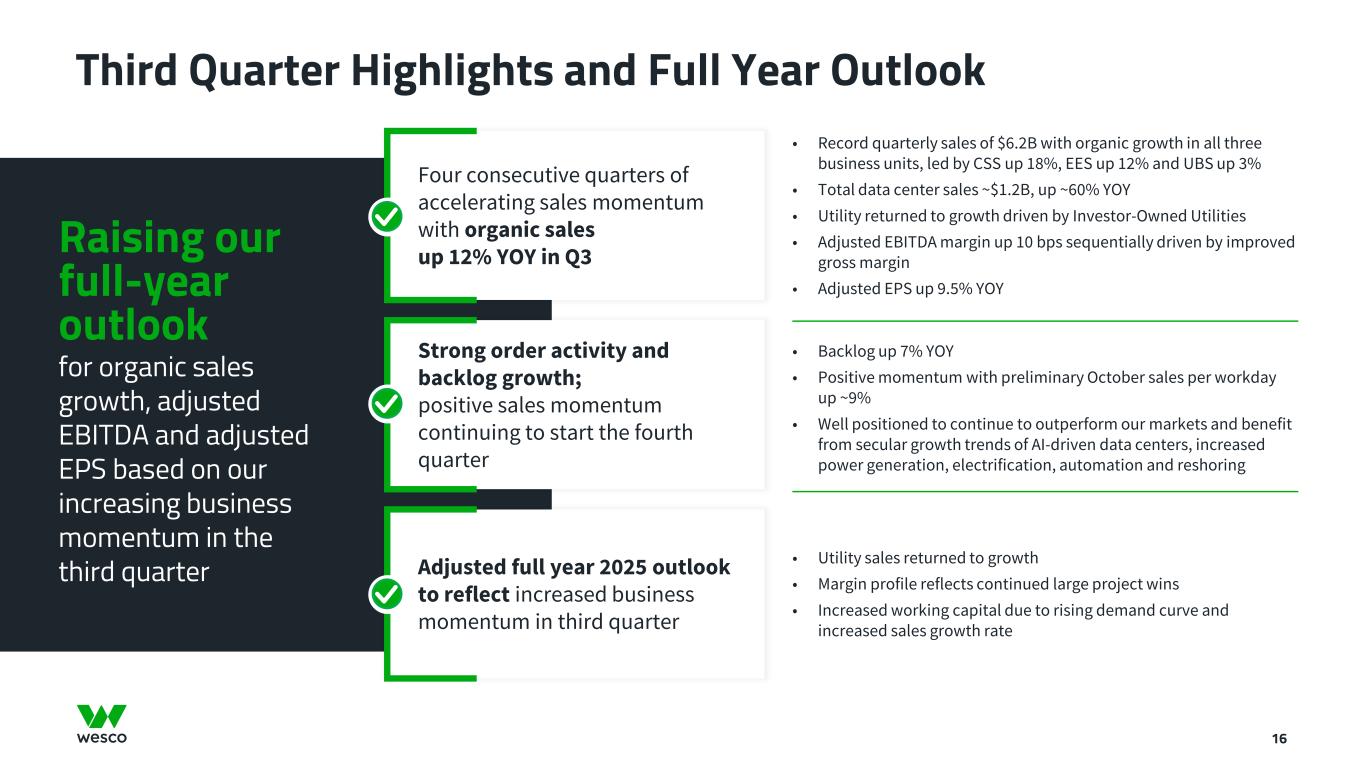
Third Quarter Highlights and Full Year Outlook 16 Raising our full-year outlook for organic sales growth, adjusted EBITDA and adjusted EPS based on our increasing business momentum in the third quarter • Record quarterly sales of $6.2B with organic growth in all three business units, led by CSS up 18%, EES up 12% and UBS up 3% • Total data center sales ~$1.2B, up ~60% YOY • Utility returned to growth driven by Investor-Owned Utilities • Adjusted EBITDA margin up 10 bps sequentially driven by improved gross margin • Adjusted EPS up 9.5% YOY Four consecutive quarters of accelerating sales momentum with organic sales up 12% YOY in Q3 • Backlog up 7% YOY • Positive momentum with preliminary October sales per workday up ~9% • Well positioned to continue to outperform our markets and benefit from secular growth trends of AI-driven data centers, increased power generation, electrification, automation and reshoring Strong order activity and backlog growth; positive sales momentum continuing to start the fourth quarter • Utility sales returned to growth • Margin profile reflects continued large project wins • Increased working capital due to rising demand curve and increased sales growth rate Adjusted full year 2025 outlook to reflect increased business momentum in third quarter

17 Appendix
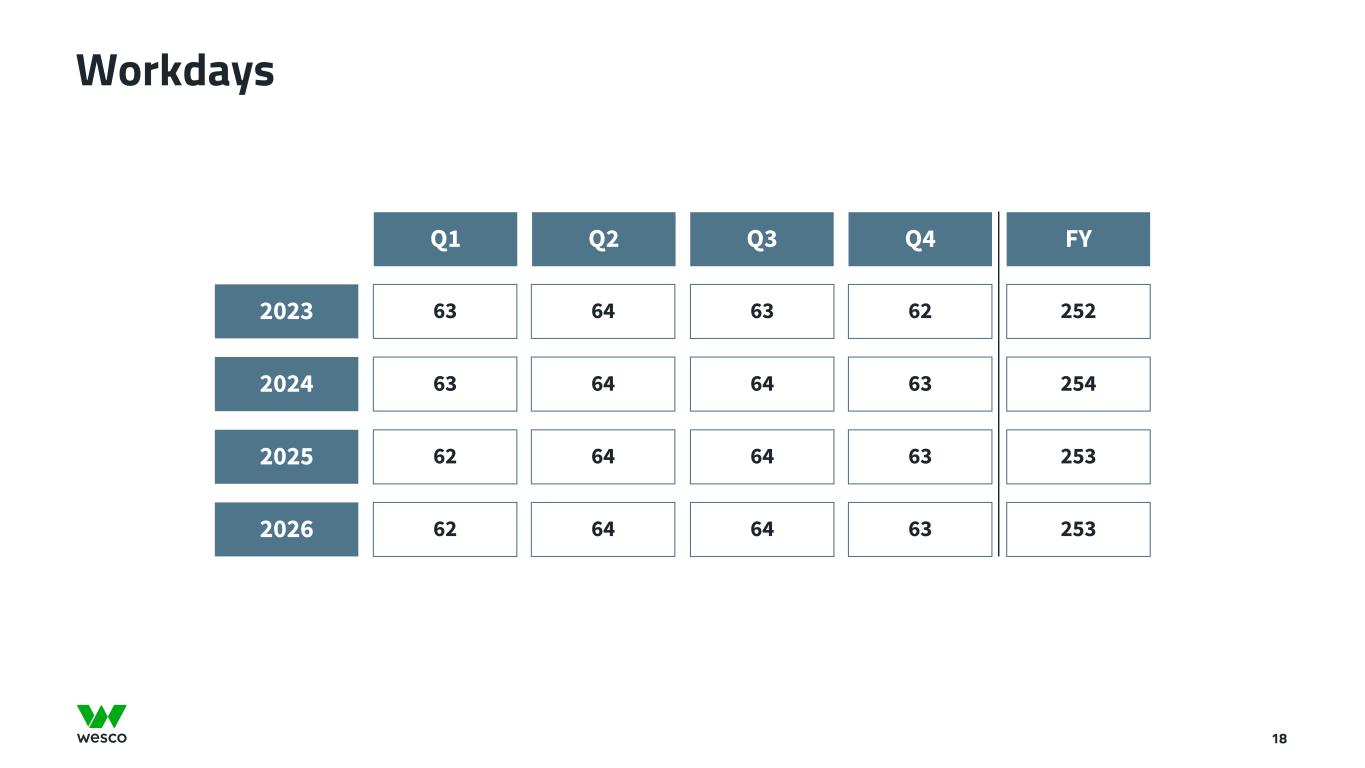
Workdays Q1 Q2 Q3 Q4 FY 2024 63 64 64 63 254 2025 62 64 64 63 253 2026 62 64 64 63 253 2023 63 64 63 62 252 18
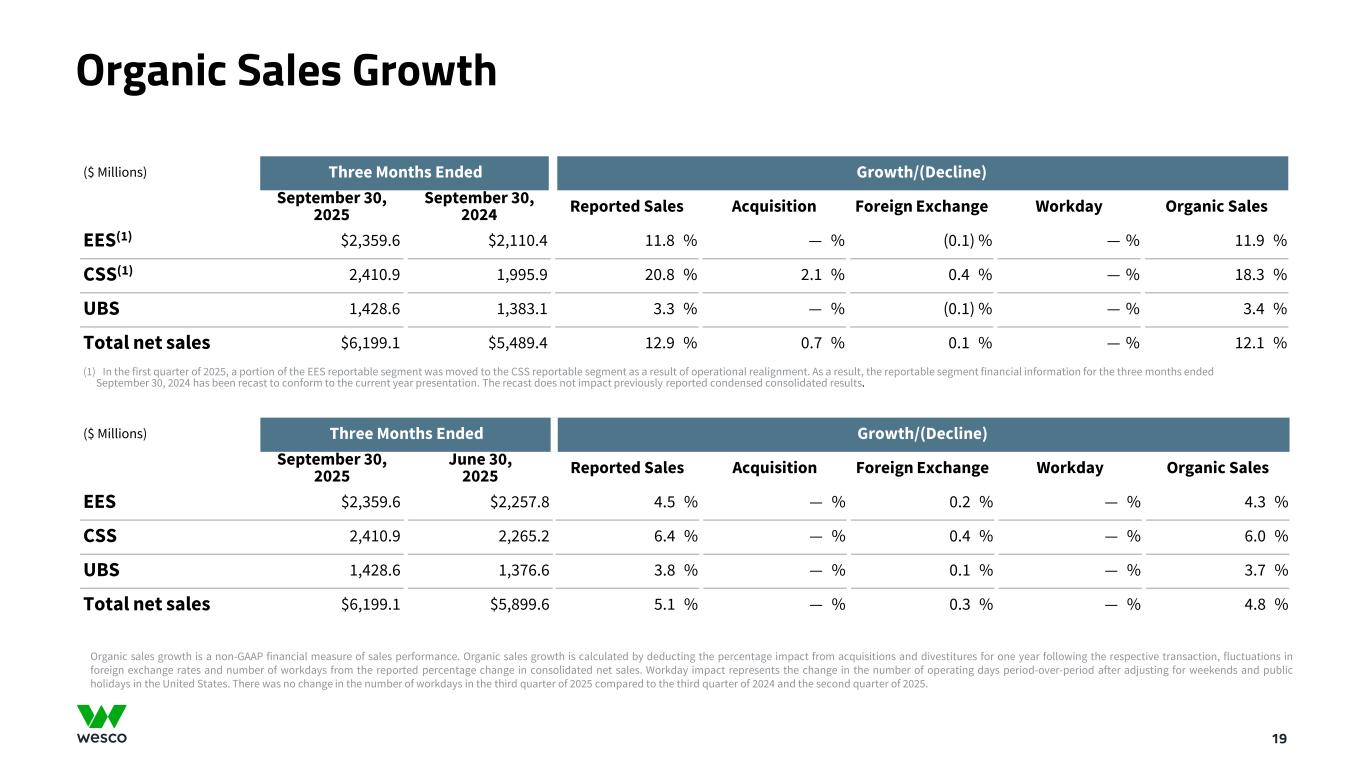
Organic Sales Growth 19 ($ Millions) Three Months Ended Growth/(Decline) September 30, 2025 September 30, 2024 Reported Sales Acquisition Foreign Exchange Workday Organic Sales EES(1) $2,359.6 $2,110.4 11.8 % — % (0.1) % — % 11.9 % CSS(1) 2,410.9 1,995.9 20.8 % 2.1 % 0.4 % — % 18.3 % UBS 1,428.6 1,383.1 3.3 % — % (0.1) % — % 3.4 % Total net sales $6,199.1 $5,489.4 12.9 % 0.7 % 0.1 % — % 12.1 % (1) In the first quarter of 2025, a portion of the EES reportable segment was moved to the CSS reportable segment as a result of operational realignment. As a result, the reportable segment financial information for the three months ended September 30, 2024 has been recast to conform to the current year presentation. The recast does not impact previously reported condensed consolidated results. ($ Millions) Three Months Ended Growth/(Decline) September 30, 2025 June 30, 2025 Reported Sales Acquisition Foreign Exchange Workday Organic Sales EES $2,359.6 $2,257.8 4.5 % — % 0.2 % — % 4.3 % CSS 2,410.9 2,265.2 6.4 % — % 0.4 % — % 6.0 % UBS 1,428.6 1,376.6 3.8 % — % 0.1 % — % 3.7 % Total net sales $6,199.1 $5,899.6 5.1 % — % 0.3 % — % 4.8 % Organic sales growth is a non-GAAP financial measure of sales performance. Organic sales growth is calculated by deducting the percentage impact from acquisitions and divestitures for one year following the respective transaction, fluctuations in foreign exchange rates and number of workdays from the reported percentage change in consolidated net sales. Workday impact represents the change in the number of operating days period-over-period after adjusting for weekends and public holidays in the United States. There was no change in the number of workdays in the third quarter of 2025 compared to the third quarter of 2024 and the second quarter of 2025.
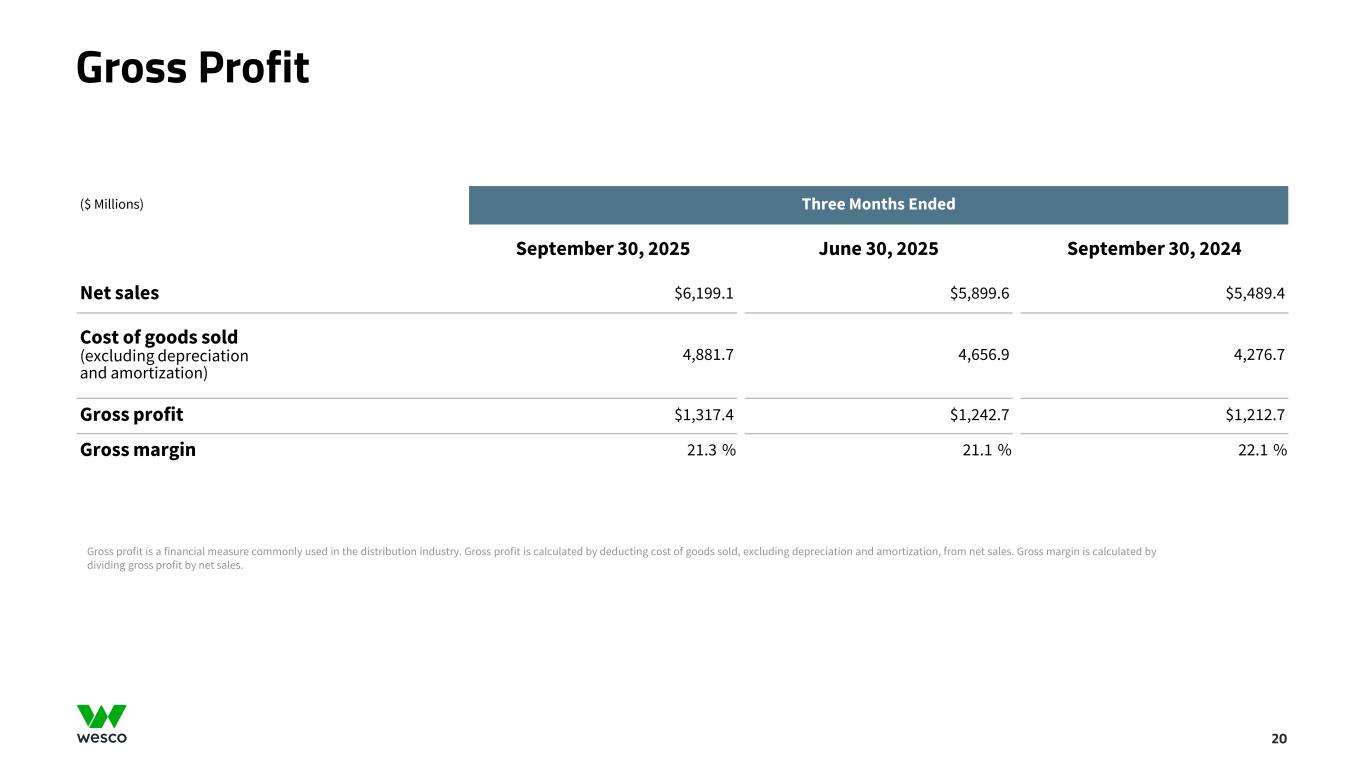
Gross Profit 20 ($ Millions) Three Months Ended September 30, 2025 June 30, 2025 September 30, 2024 Net sales $6,199.1 $5,899.6 $5,489.4 Cost of goods sold (excluding depreciation and amortization) 4,881.7 4,656.9 4,276.7 Gross profit $1,317.4 $1,242.7 $1,212.7 Gross margin 21.3 % 21.1 % 22.1 % Gross profit is a financial measure commonly used in the distribution industry. Gross profit is calculated by deducting cost of goods sold, excluding depreciation and amortization, from net sales. Gross margin is calculated by dividing gross profit by net sales.
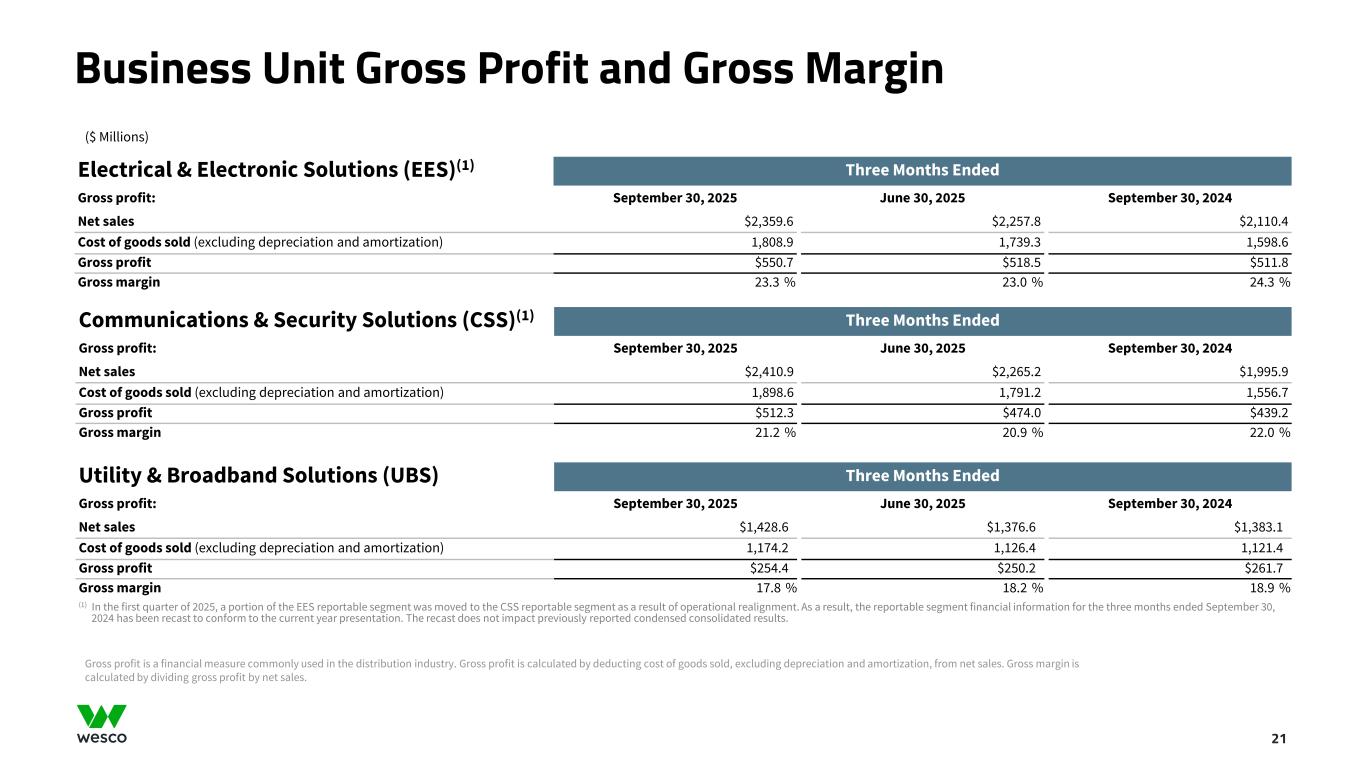
Business Unit Gross Profit and Gross Margin 21 ($ Millions) Electrical & Electronic Solutions (EES)(1) Three Months Ended Gross profit: September 30, 2025 June 30, 2025 September 30, 2024 Net sales $2,359.6 $2,257.8 $2,110.4 Cost of goods sold (excluding depreciation and amortization) 1,808.9 1,739.3 1,598.6 Gross profit $550.7 $518.5 $511.8 Gross margin 23.3 % 23.0 % 24.3 % Gross profit is a financial measure commonly used in the distribution industry. Gross profit is calculated by deducting cost of goods sold, excluding depreciation and amortization, from net sales. Gross margin is calculated by dividing gross profit by net sales. Communications & Security Solutions (CSS)(1) Three Months Ended Gross profit: September 30, 2025 June 30, 2025 September 30, 2024 Net sales $2,410.9 $2,265.2 $1,995.9 Cost of goods sold (excluding depreciation and amortization) 1,898.6 1,791.2 1,556.7 Gross profit $512.3 $474.0 $439.2 Gross margin 21.2 % 20.9 % 22.0 % Utility & Broadband Solutions (UBS) Three Months Ended Gross profit: September 30, 2025 June 30, 2025 September 30, 2024 Net sales $1,428.6 $1,376.6 $1,383.1 Cost of goods sold (excluding depreciation and amortization) 1,174.2 1,126.4 1,121.4 Gross profit $254.4 $250.2 $261.7 Gross margin 17.8 % 18.2 % 18.9 % (1) In the first quarter of 2025, a portion of the EES reportable segment was moved to the CSS reportable segment as a result of operational realignment. As a result, the reportable segment financial information for the three months ended September 30, 2024 has been recast to conform to the current year presentation. The recast does not impact previously reported condensed consolidated results.
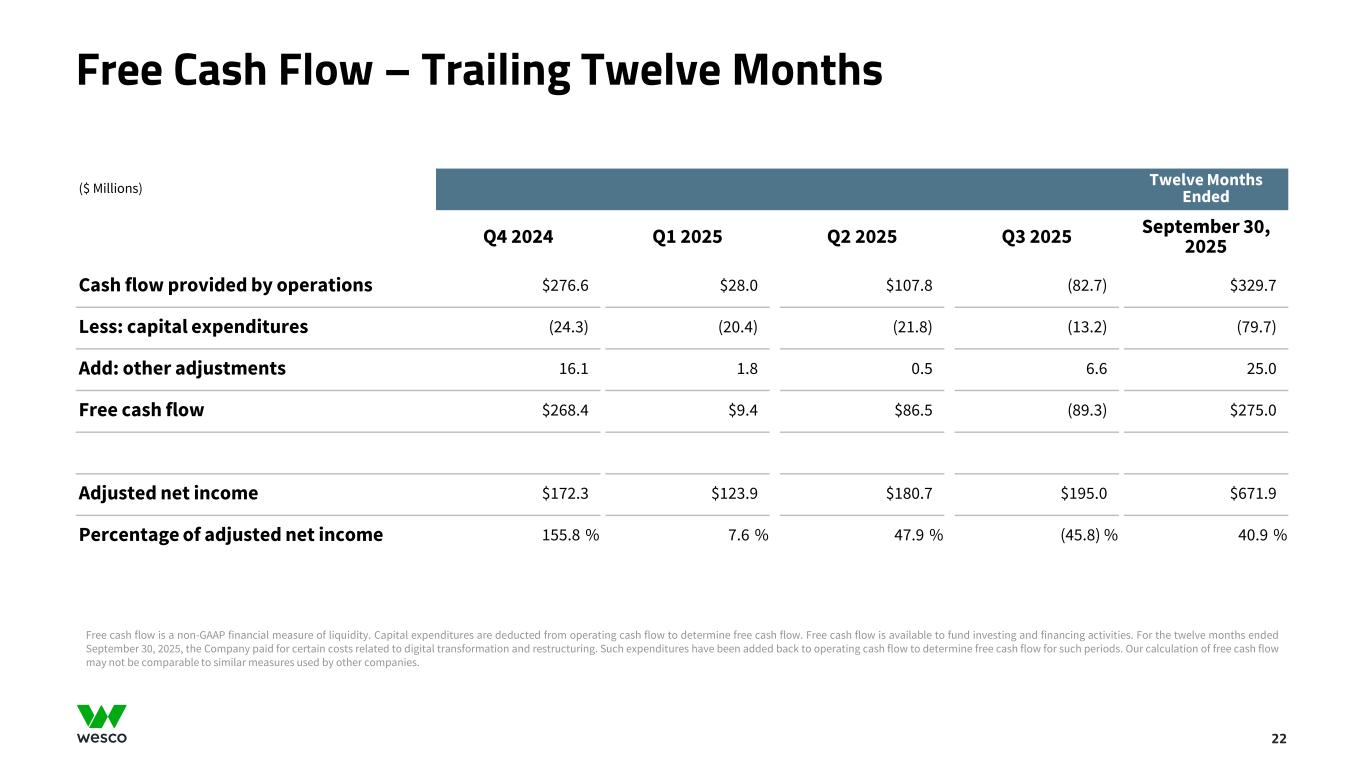
Free Cash Flow – Trailing Twelve Months 22 ($ Millions) Twelve Months Ended Q4 2024 Q1 2025 Q2 2025 Q3 2025 September 30, 2025 Cash flow provided by operations $276.6 $28.0 $107.8 (82.7) $329.7 Less: capital expenditures (24.3) (20.4) (21.8) (13.2) (79.7) Add: other adjustments 16.1 1.8 0.5 6.6 25.0 Free cash flow $268.4 $9.4 $86.5 (89.3) $275.0 Adjusted net income $172.3 $123.9 $180.7 $195.0 $671.9 Percentage of adjusted net income 155.8 % 7.6 % 47.9 % (45.8) % 40.9 % Free cash flow is a non-GAAP financial measure of liquidity. Capital expenditures are deducted from operating cash flow to determine free cash flow. Free cash flow is available to fund investing and financing activities. For the twelve months ended September 30, 2025, the Company paid for certain costs related to digital transformation and restructuring. Such expenditures have been added back to operating cash flow to determine free cash flow for such periods. Our calculation of free cash flow may not be comparable to similar measures used by other companies.
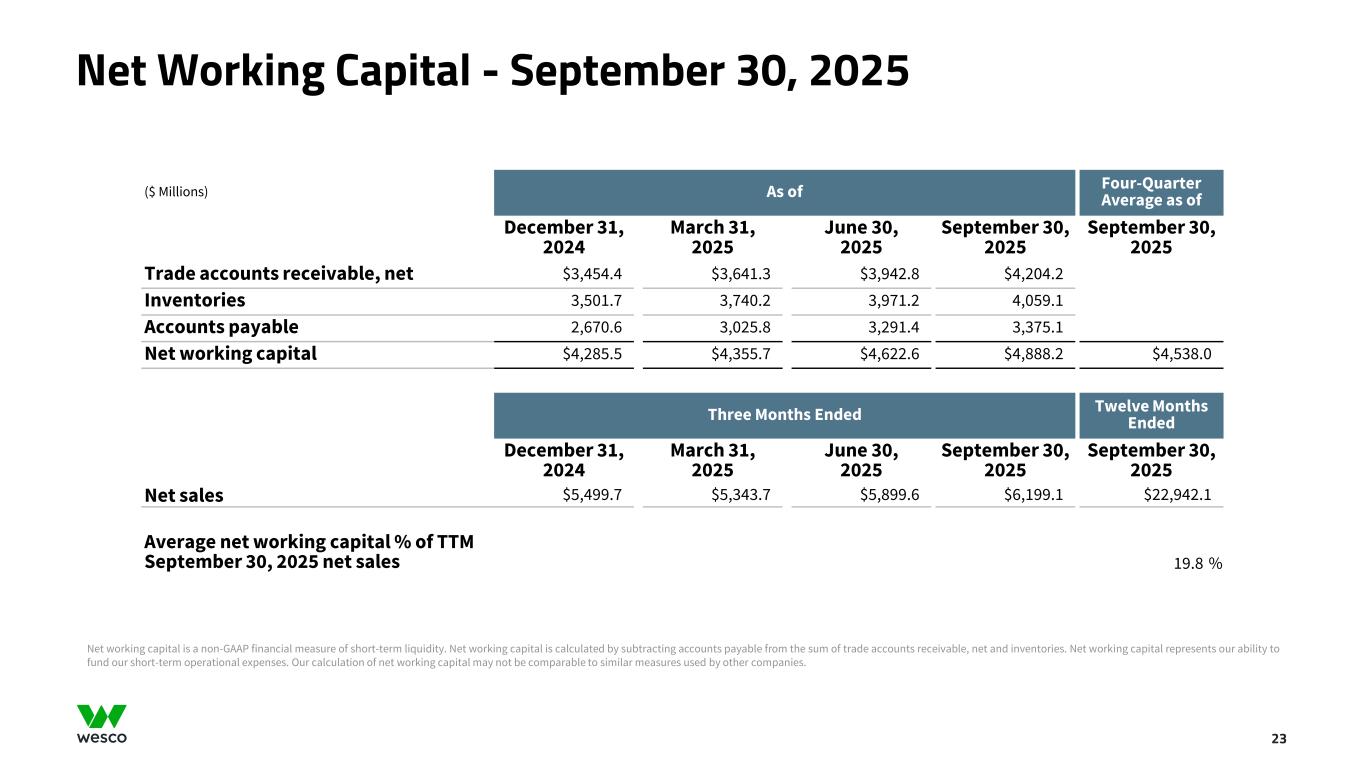
23 Net Working Capital - September 30, 2025 ($ Millions) As of Four-Quarter Average as of December 31, 2024 March 31, 2025 June 30, 2025 September 30, 2025 September 30, 2025 Trade accounts receivable, net $3,454.4 $3,641.3 $3,942.8 $4,204.2 Inventories 3,501.7 3,740.2 3,971.2 4,059.1 Accounts payable 2,670.6 3,025.8 3,291.4 3,375.1 Net working capital $4,285.5 $4,355.7 $4,622.6 $4,888.2 $4,538.0 Three Months Ended Twelve Months Ended December 31, 2024 March 31, 2025 June 30, 2025 September 30, 2025 September 30, 2025 Net sales $5,499.7 $5,343.7 $5,899.6 $6,199.1 $22,942.1 Average net working capital % of TTM September 30, 2025 net sales 19.8 % Net working capital is a non-GAAP financial measure of short-term liquidity. Net working capital is calculated by subtracting accounts payable from the sum of trade accounts receivable, net and inventories. Net working capital represents our ability to fund our short-term operational expenses. Our calculation of net working capital may not be comparable to similar measures used by other companies.

24 Net Working Capital - September 30, 2024 ($ Millions) As of Four-quarter Average as of December 31, 2023 March 31, 2024 June 30, 2024 September 30, 2024 September 30, 2024 Trade accounts receivable, net $3,639.5 $3,526.7 $3,654.6 $3,629.1 Inventories 3,572.1 3,525.4 3,505.8 3,630.1 Accounts payable 2,431.5 2,974.3 2,688.9 2,839.1 Net working capital $4,780.1 $4,077.8 $4,471.5 $4,420.1 $4,437.4 Three Months Ended Twelve Months Ended December 31, 2023 March 31, 2024 June 30, 2024 September 30, 2024 September 30, 2024 Net sales $5,473.4 $5,350.0 $5,479.7 $5,489.4 $21,792.5 Average net working capital % of TTM September 30, 2024 net sales 20.4 % Net working capital is a non-GAAP financial measure of short-term liquidity. Net working capital is calculated by subtracting accounts payable from the sum of trade accounts receivable, net and inventories. Net working capital represents our ability to fund our short-term operational expenses. Our calculation of net working capital may not be comparable to similar measures used by other companies.
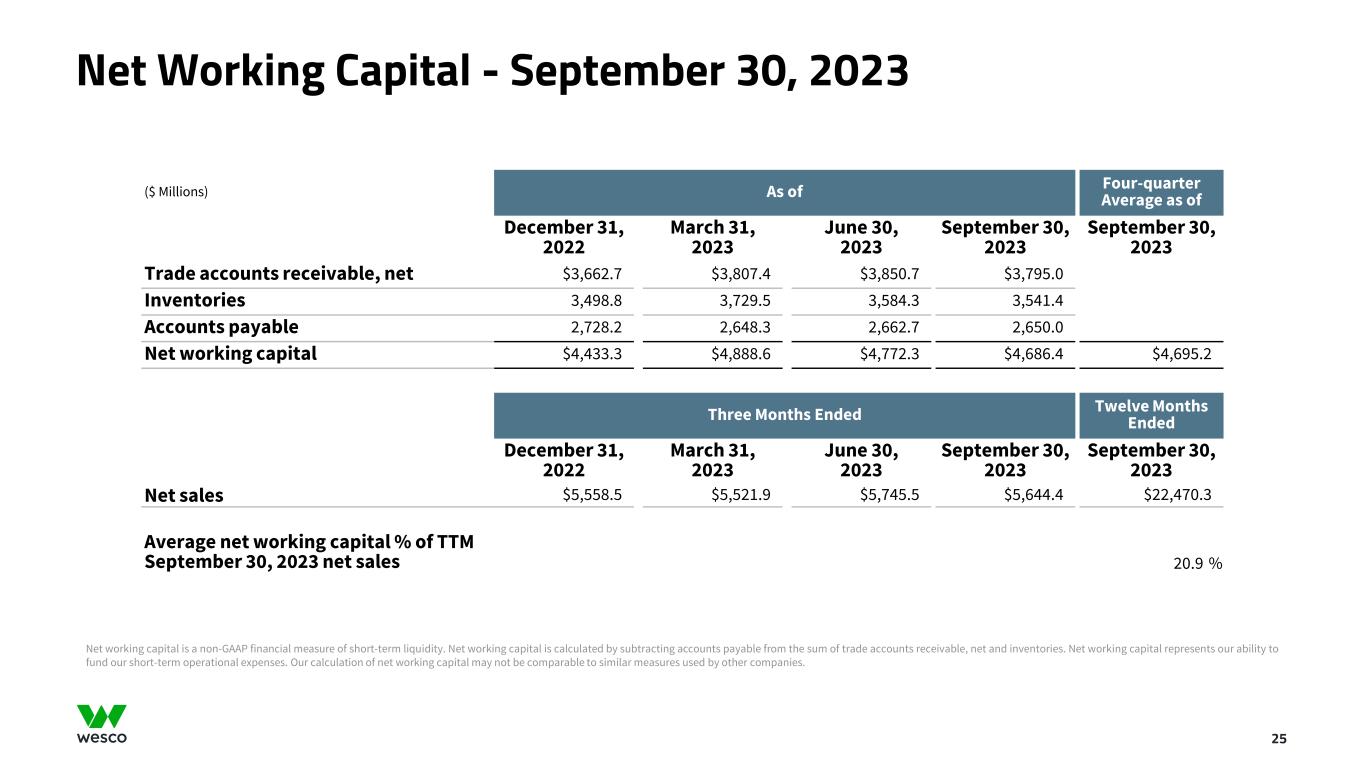
25 Net Working Capital - September 30, 2023 ($ Millions) As of Four-quarter Average as of December 31, 2022 March 31, 2023 June 30, 2023 September 30, 2023 September 30, 2023 Trade accounts receivable, net $3,662.7 $3,807.4 $3,850.7 $3,795.0 Inventories 3,498.8 3,729.5 3,584.3 3,541.4 Accounts payable 2,728.2 2,648.3 2,662.7 2,650.0 Net working capital $4,433.3 $4,888.6 $4,772.3 $4,686.4 $4,695.2 Three Months Ended Twelve Months Ended December 31, 2022 March 31, 2023 June 30, 2023 September 30, 2023 September 30, 2023 Net sales $5,558.5 $5,521.9 $5,745.5 $5,644.4 $22,470.3 Average net working capital % of TTM September 30, 2023 net sales 20.9 % Net working capital is a non-GAAP financial measure of short-term liquidity. Net working capital is calculated by subtracting accounts payable from the sum of trade accounts receivable, net and inventories. Net working capital represents our ability to fund our short-term operational expenses. Our calculation of net working capital may not be comparable to similar measures used by other companies.
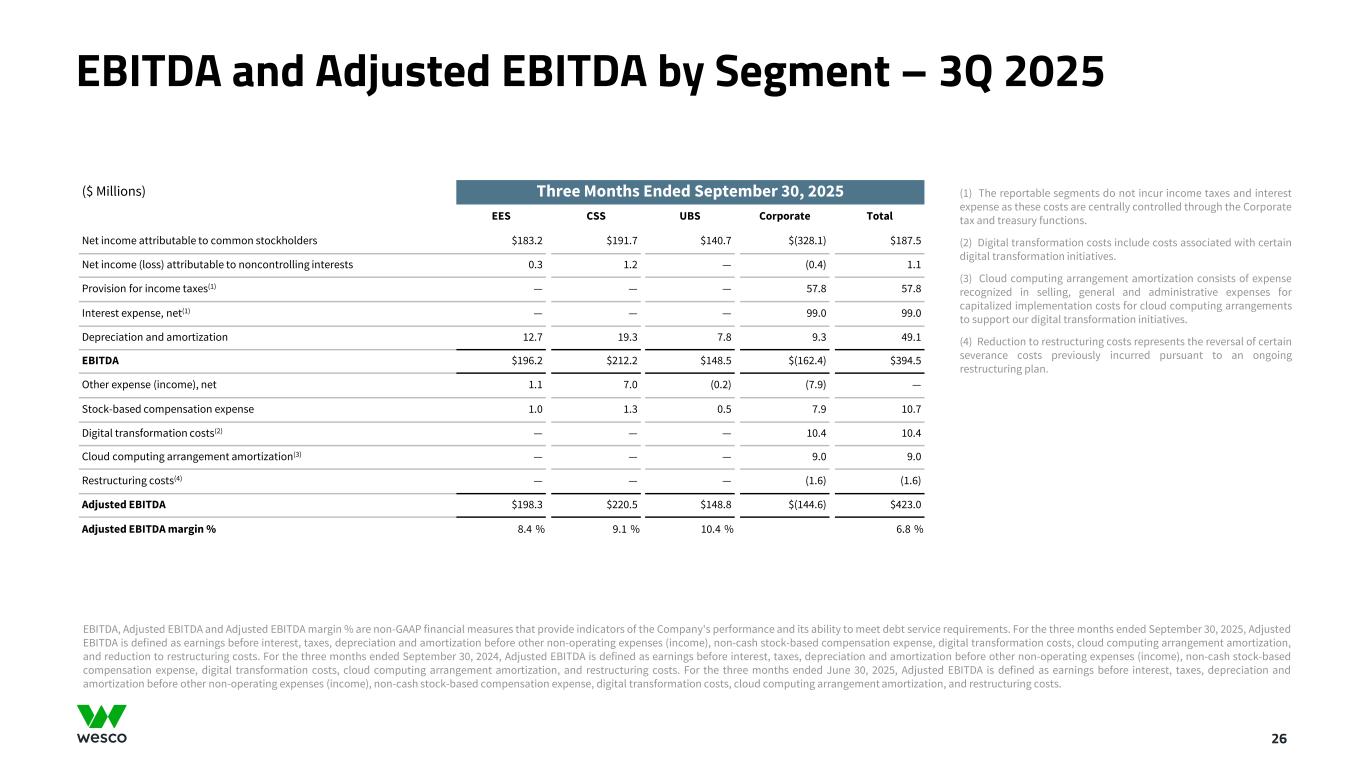
EBITDA and Adjusted EBITDA by Segment – 3Q 2025 26 (1) The reportable segments do not incur income taxes and interest expense as these costs are centrally controlled through the Corporate tax and treasury functions. (2) Digital transformation costs include costs associated with certain digital transformation initiatives. (3) Cloud computing arrangement amortization consists of expense recognized in selling, general and administrative expenses for capitalized implementation costs for cloud computing arrangements to support our digital transformation initiatives. (4) Reduction to restructuring costs represents the reversal of certain severance costs previously incurred pursuant to an ongoing restructuring plan. EBITDA, Adjusted EBITDA and Adjusted EBITDA margin % are non-GAAP financial measures that provide indicators of the Company's performance and its ability to meet debt service requirements. For the three months ended September 30, 2025, Adjusted EBITDA is defined as earnings before interest, taxes, depreciation and amortization before other non-operating expenses (income), non-cash stock-based compensation expense, digital transformation costs, cloud computing arrangement amortization, and reduction to restructuring costs. For the three months ended September 30, 2024, Adjusted EBITDA is defined as earnings before interest, taxes, depreciation and amortization before other non-operating expenses (income), non-cash stock-based compensation expense, digital transformation costs, cloud computing arrangement amortization, and restructuring costs. For the three months ended June 30, 2025, Adjusted EBITDA is defined as earnings before interest, taxes, depreciation and amortization before other non-operating expenses (income), non-cash stock-based compensation expense, digital transformation costs, cloud computing arrangement amortization, and restructuring costs. ($ Millions) Three Months Ended September 30, 2025 EES CSS UBS Corporate Total Net income attributable to common stockholders $183.2 $191.7 $140.7 $(328.1) $187.5 Net income (loss) attributable to noncontrolling interests 0.3 1.2 — (0.4) 1.1 Provision for income taxes(1) — — — 57.8 57.8 Interest expense, net(1) — — — 99.0 99.0 Depreciation and amortization 12.7 19.3 7.8 9.3 49.1 EBITDA $196.2 $212.2 $148.5 $(162.4) $394.5 Other expense (income), net 1.1 7.0 (0.2) (7.9) — Stock-based compensation expense 1.0 1.3 0.5 7.9 10.7 Digital transformation costs(2) — — — 10.4 10.4 Cloud computing arrangement amortization(3) — — — 9.0 9.0 Restructuring costs(4) — — — (1.6) (1.6) Adjusted EBITDA $198.3 $220.5 $148.8 $(144.6) $423.0 Adjusted EBITDA margin % 8.4 % 9.1 % 10.4 % 6.8 %
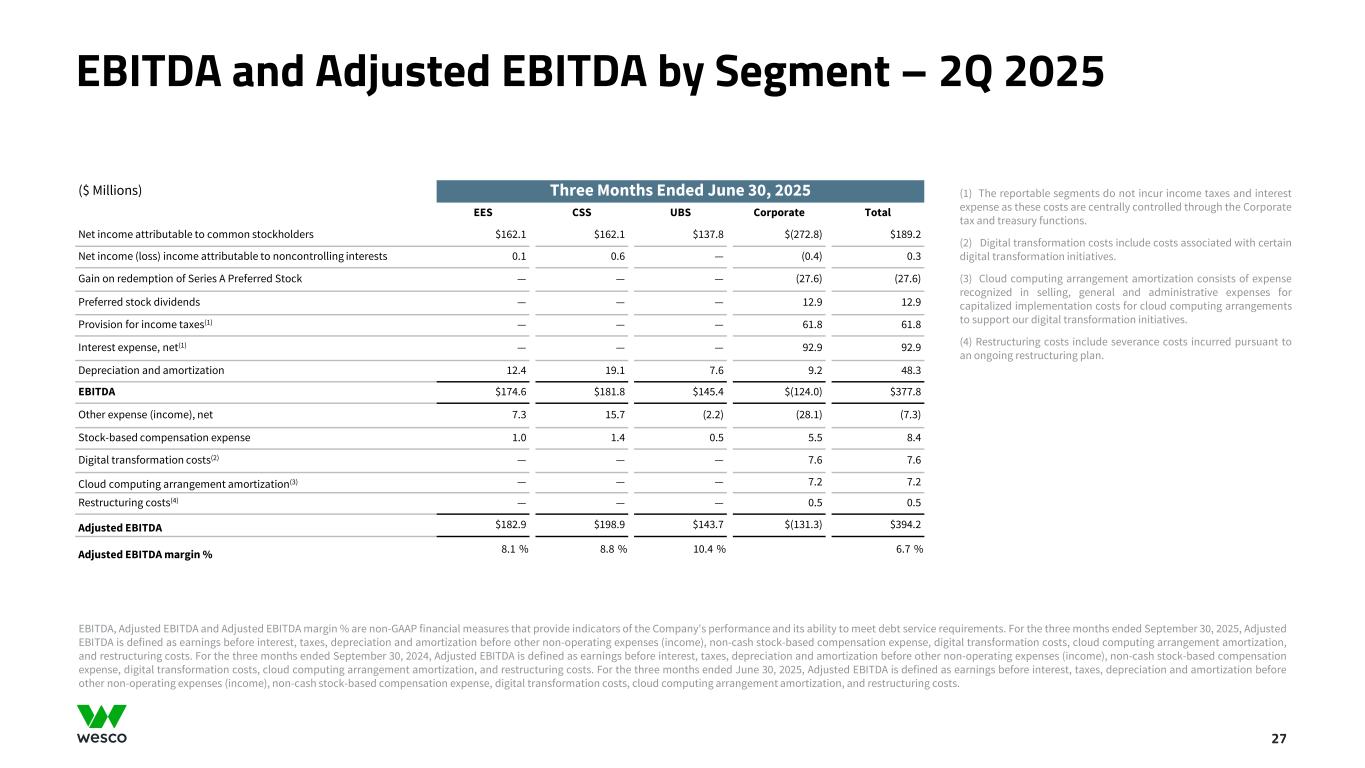
EBITDA and Adjusted EBITDA by Segment – 2Q 2025 27 ($ Millions) Three Months Ended June 30, 2025 EES CSS UBS Corporate Total Net income attributable to common stockholders $162.1 $162.1 $137.8 $(272.8) $189.2 Net income (loss) income attributable to noncontrolling interests 0.1 0.6 — (0.4) 0.3 Gain on redemption of Series A Preferred Stock — — — (27.6) (27.6) Preferred stock dividends — — — 12.9 12.9 Provision for income taxes(1) — — — 61.8 61.8 Interest expense, net(1) — — — 92.9 92.9 Depreciation and amortization 12.4 19.1 7.6 9.2 48.3 EBITDA $174.6 $181.8 $145.4 $(124.0) $377.8 Other expense (income), net 7.3 15.7 (2.2) (28.1) (7.3) Stock-based compensation expense 1.0 1.4 0.5 5.5 8.4 Digital transformation costs(2) — — — 7.6 7.6 Cloud computing arrangement amortization(3) — — — 7.2 7.2 Restructuring costs(4) — — — 0.5 0.5 Adjusted EBITDA $182.9 $198.9 $143.7 $(131.3) $394.2 Adjusted EBITDA margin % 8.1 % 8.8 % 10.4 % 6.7 % (1) The reportable segments do not incur income taxes and interest expense as these costs are centrally controlled through the Corporate tax and treasury functions. (2) Digital transformation costs include costs associated with certain digital transformation initiatives. (3) Cloud computing arrangement amortization consists of expense recognized in selling, general and administrative expenses for capitalized implementation costs for cloud computing arrangements to support our digital transformation initiatives. (4) Restructuring costs include severance costs incurred pursuant to an ongoing restructuring plan. EBITDA, Adjusted EBITDA and Adjusted EBITDA margin % are non-GAAP financial measures that provide indicators of the Company's performance and its ability to meet debt service requirements. For the three months ended September 30, 2025, Adjusted EBITDA is defined as earnings before interest, taxes, depreciation and amortization before other non-operating expenses (income), non-cash stock-based compensation expense, digital transformation costs, cloud computing arrangement amortization, and restructuring costs. For the three months ended September 30, 2024, Adjusted EBITDA is defined as earnings before interest, taxes, depreciation and amortization before other non-operating expenses (income), non-cash stock-based compensation expense, digital transformation costs, cloud computing arrangement amortization, and restructuring costs. For the three months ended June 30, 2025, Adjusted EBITDA is defined as earnings before interest, taxes, depreciation and amortization before other non-operating expenses (income), non-cash stock-based compensation expense, digital transformation costs, cloud computing arrangement amortization, and restructuring costs.
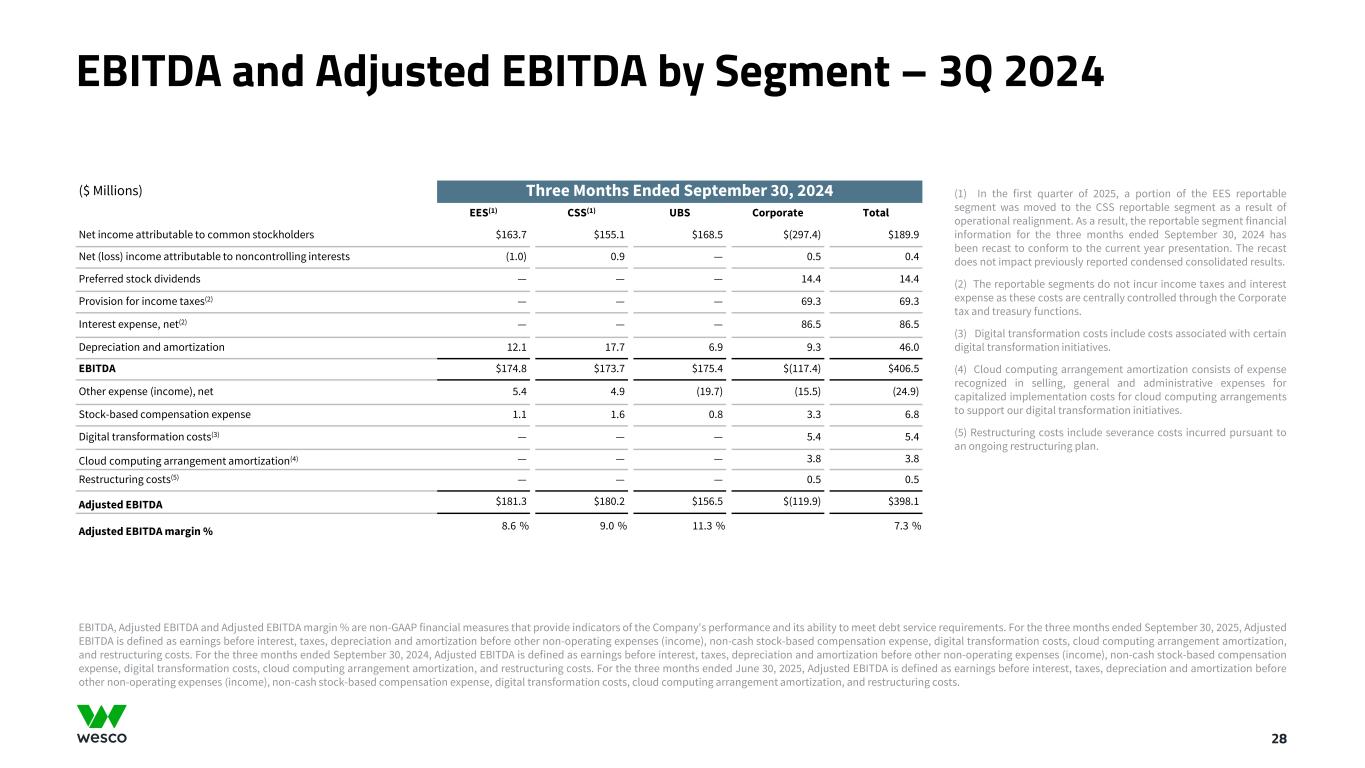
EBITDA and Adjusted EBITDA by Segment – 3Q 2024 28 ($ Millions) Three Months Ended September 30, 2024 EES(1) CSS(1) UBS Corporate Total Net income attributable to common stockholders $163.7 $155.1 $168.5 $(297.4) $189.9 Net (loss) income attributable to noncontrolling interests (1.0) 0.9 — 0.5 0.4 Preferred stock dividends — — — 14.4 14.4 Provision for income taxes(2) — — — 69.3 69.3 Interest expense, net(2) — — — 86.5 86.5 Depreciation and amortization 12.1 17.7 6.9 9.3 46.0 EBITDA $174.8 $173.7 $175.4 $(117.4) $406.5 Other expense (income), net 5.4 4.9 (19.7) (15.5) (24.9) Stock-based compensation expense 1.1 1.6 0.8 3.3 6.8 Digital transformation costs(3) — — — 5.4 5.4 Cloud computing arrangement amortization(4) — — — 3.8 3.8 Restructuring costs(5) — — — 0.5 0.5 Adjusted EBITDA $181.3 $180.2 $156.5 $(119.9) $398.1 Adjusted EBITDA margin % 8.6 % 9.0 % 11.3 % 7.3 % (1) In the first quarter of 2025, a portion of the EES reportable segment was moved to the CSS reportable segment as a result of operational realignment. As a result, the reportable segment financial information for the three months ended September 30, 2024 has been recast to conform to the current year presentation. The recast does not impact previously reported condensed consolidated results. (2) The reportable segments do not incur income taxes and interest expense as these costs are centrally controlled through the Corporate tax and treasury functions. (3) Digital transformation costs include costs associated with certain digital transformation initiatives. (4) Cloud computing arrangement amortization consists of expense recognized in selling, general and administrative expenses for capitalized implementation costs for cloud computing arrangements to support our digital transformation initiatives. (5) Restructuring costs include severance costs incurred pursuant to an ongoing restructuring plan. EBITDA, Adjusted EBITDA and Adjusted EBITDA margin % are non-GAAP financial measures that provide indicators of the Company's performance and its ability to meet debt service requirements. For the three months ended September 30, 2025, Adjusted EBITDA is defined as earnings before interest, taxes, depreciation and amortization before other non-operating expenses (income), non-cash stock-based compensation expense, digital transformation costs, cloud computing arrangement amortization, and restructuring costs. For the three months ended September 30, 2024, Adjusted EBITDA is defined as earnings before interest, taxes, depreciation and amortization before other non-operating expenses (income), non-cash stock-based compensation expense, digital transformation costs, cloud computing arrangement amortization, and restructuring costs. For the three months ended June 30, 2025, Adjusted EBITDA is defined as earnings before interest, taxes, depreciation and amortization before other non-operating expenses (income), non-cash stock-based compensation expense, digital transformation costs, cloud computing arrangement amortization, and restructuring costs.
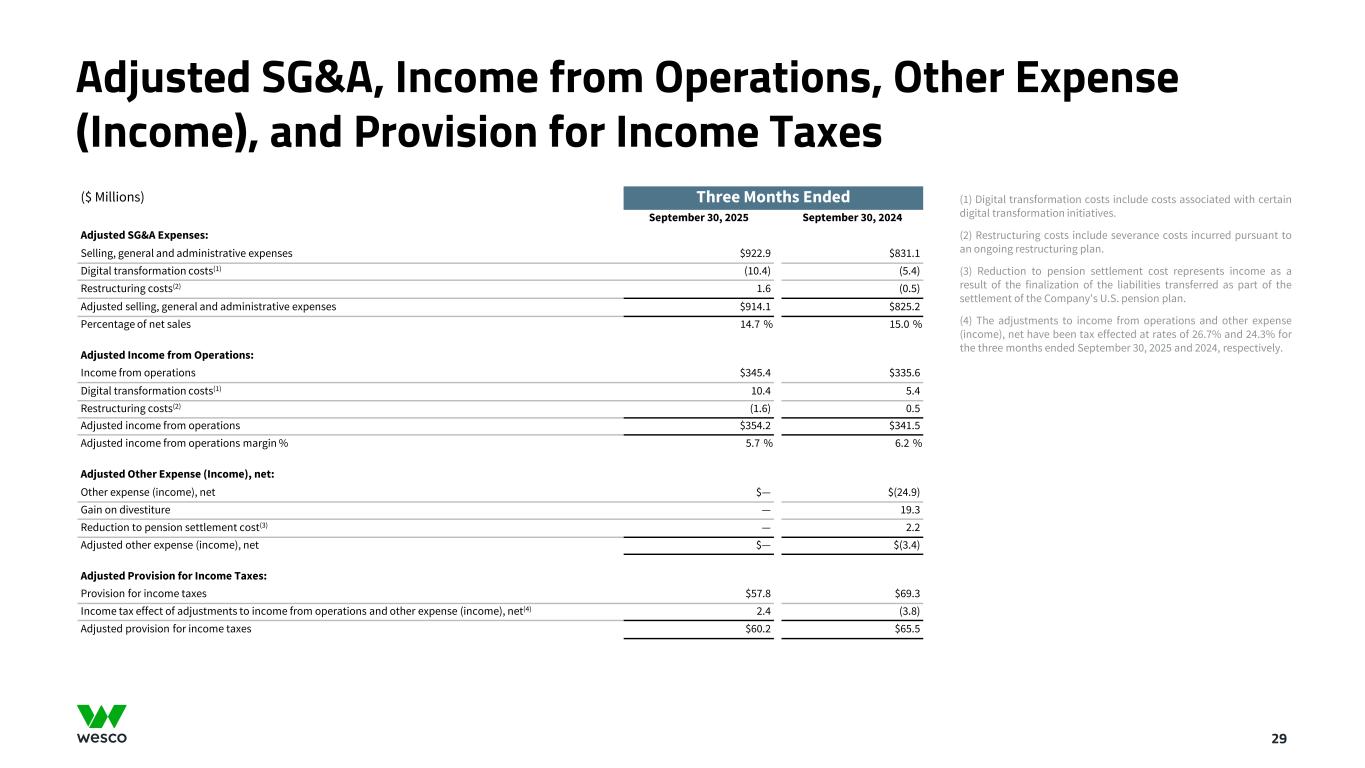
Adjusted SG&A, Income from Operations, Other Expense (Income), and Provision for Income Taxes 29 ($ Millions) Three Months Ended September 30, 2025 September 30, 2024 Adjusted SG&A Expenses: Selling, general and administrative expenses $922.9 $831.1 Digital transformation costs(1) (10.4) (5.4) Restructuring costs(2) 1.6 (0.5) Adjusted selling, general and administrative expenses $914.1 $825.2 Percentage of net sales 14.7 % 15.0 % Adjusted Income from Operations: Income from operations $345.4 $335.6 Digital transformation costs(1) 10.4 5.4 Restructuring costs(2) (1.6) 0.5 Adjusted income from operations $354.2 $341.5 Adjusted income from operations margin % 5.7 % 6.2 % Adjusted Other Expense (Income), net: Other expense (income), net $— $(24.9) Gain on divestiture — 19.3 Reduction to pension settlement cost(3) — 2.2 Adjusted other expense (income), net $— $(3.4) Adjusted Provision for Income Taxes: Provision for income taxes $57.8 $69.3 Income tax effect of adjustments to income from operations and other expense (income), net(4) 2.4 (3.8) Adjusted provision for income taxes $60.2 $65.5 (1) Digital transformation costs include costs associated with certain digital transformation initiatives. (2) Restructuring costs include severance costs incurred pursuant to an ongoing restructuring plan. (3) Reduction to pension settlement cost represents income as a result of the finalization of the liabilities transferred as part of the settlement of the Company's U.S. pension plan. (4) The adjustments to income from operations and other expense (income), net have been tax effected at rates of 26.7% and 24.3% for the three months ended September 30, 2025 and 2024, respectively.
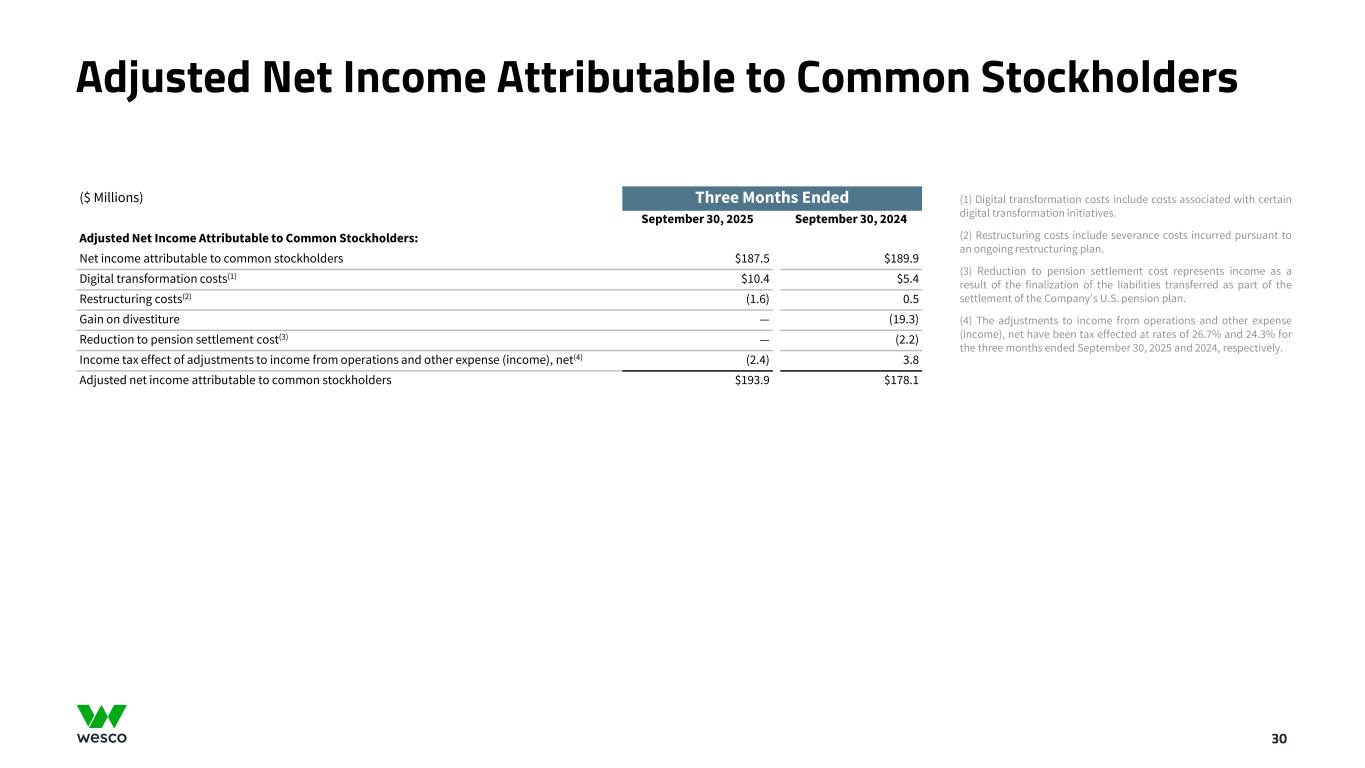
Adjusted Net Income Attributable to Common Stockholders 30 ($ Millions) Three Months Ended September 30, 2025 September 30, 2024 Adjusted Net Income Attributable to Common Stockholders: Net income attributable to common stockholders $187.5 $189.9 Digital transformation costs(1) $10.4 $5.4 Restructuring costs(2) (1.6) 0.5 Gain on divestiture — (19.3) Reduction to pension settlement cost(3) — (2.2) Income tax effect of adjustments to income from operations and other expense (income), net(4) (2.4) 3.8 Adjusted net income attributable to common stockholders $193.9 $178.1 (1) Digital transformation costs include costs associated with certain digital transformation initiatives. (2) Restructuring costs include severance costs incurred pursuant to an ongoing restructuring plan. (3) Reduction to pension settlement cost represents income as a result of the finalization of the liabilities transferred as part of the settlement of the Company's U.S. pension plan. (4) The adjustments to income from operations and other expense (income), net have been tax effected at rates of 26.7% and 24.3% for the three months ended September 30, 2025 and 2024, respectively.
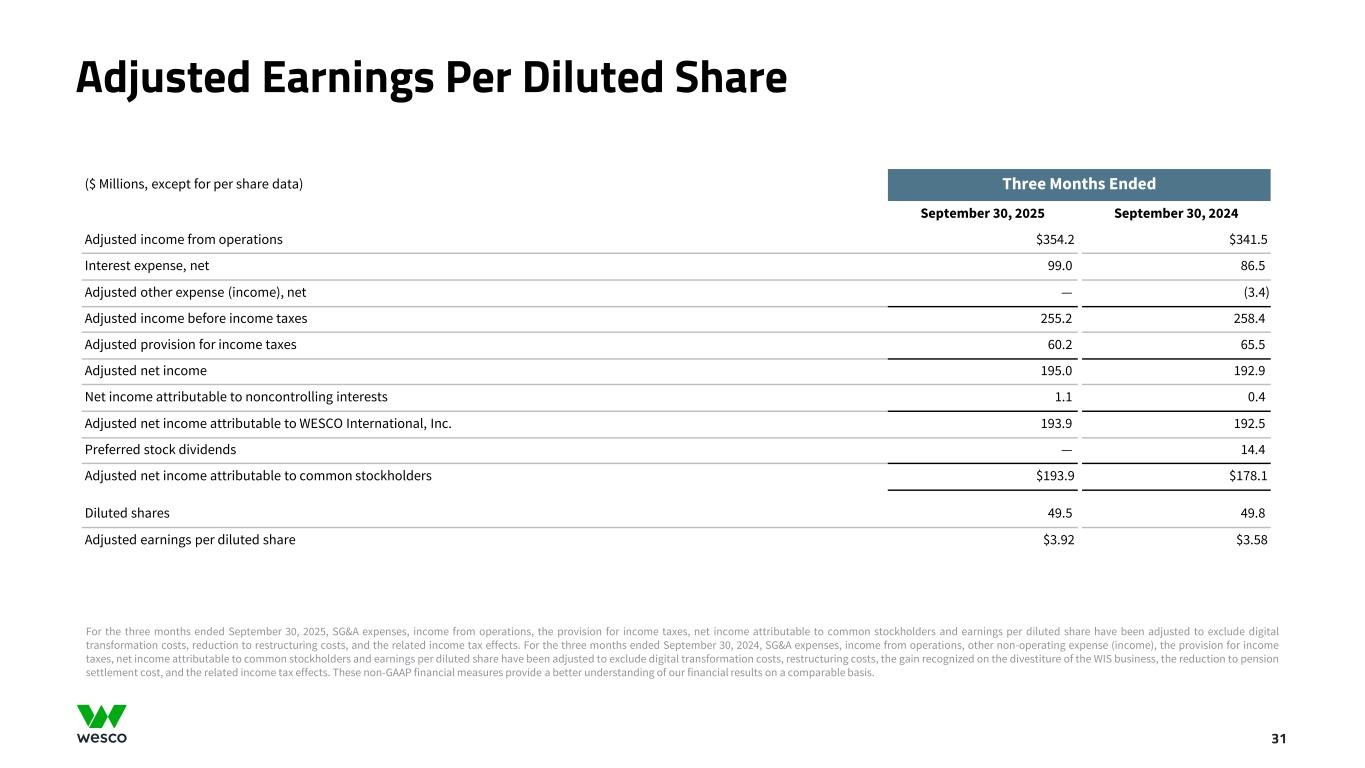
Adjusted Earnings Per Diluted Share 31 ($ Millions, except for per share data) Three Months Ended September 30, 2025 September 30, 2024 Adjusted income from operations $354.2 $341.5 Interest expense, net 99.0 86.5 Adjusted other expense (income), net — (3.4) Adjusted income before income taxes 255.2 258.4 Adjusted provision for income taxes 60.2 65.5 Adjusted net income 195.0 192.9 Net income attributable to noncontrolling interests 1.1 0.4 Adjusted net income attributable to WESCO International, Inc. 193.9 192.5 Preferred stock dividends — 14.4 Adjusted net income attributable to common stockholders $193.9 $178.1 Diluted shares 49.5 49.8 Adjusted earnings per diluted share $3.92 $3.58 For the three months ended September 30, 2025, SG&A expenses, income from operations, the provision for income taxes, net income attributable to common stockholders and earnings per diluted share have been adjusted to exclude digital transformation costs, reduction to restructuring costs, and the related income tax effects. For the three months ended September 30, 2024, SG&A expenses, income from operations, other non-operating expense (income), the provision for income taxes, net income attributable to common stockholders and earnings per diluted share have been adjusted to exclude digital transformation costs, restructuring costs, the gain recognized on the divestiture of the WIS business, the reduction to pension settlement cost, and the related income tax effects. These non-GAAP financial measures provide a better understanding of our financial results on a comparable basis.
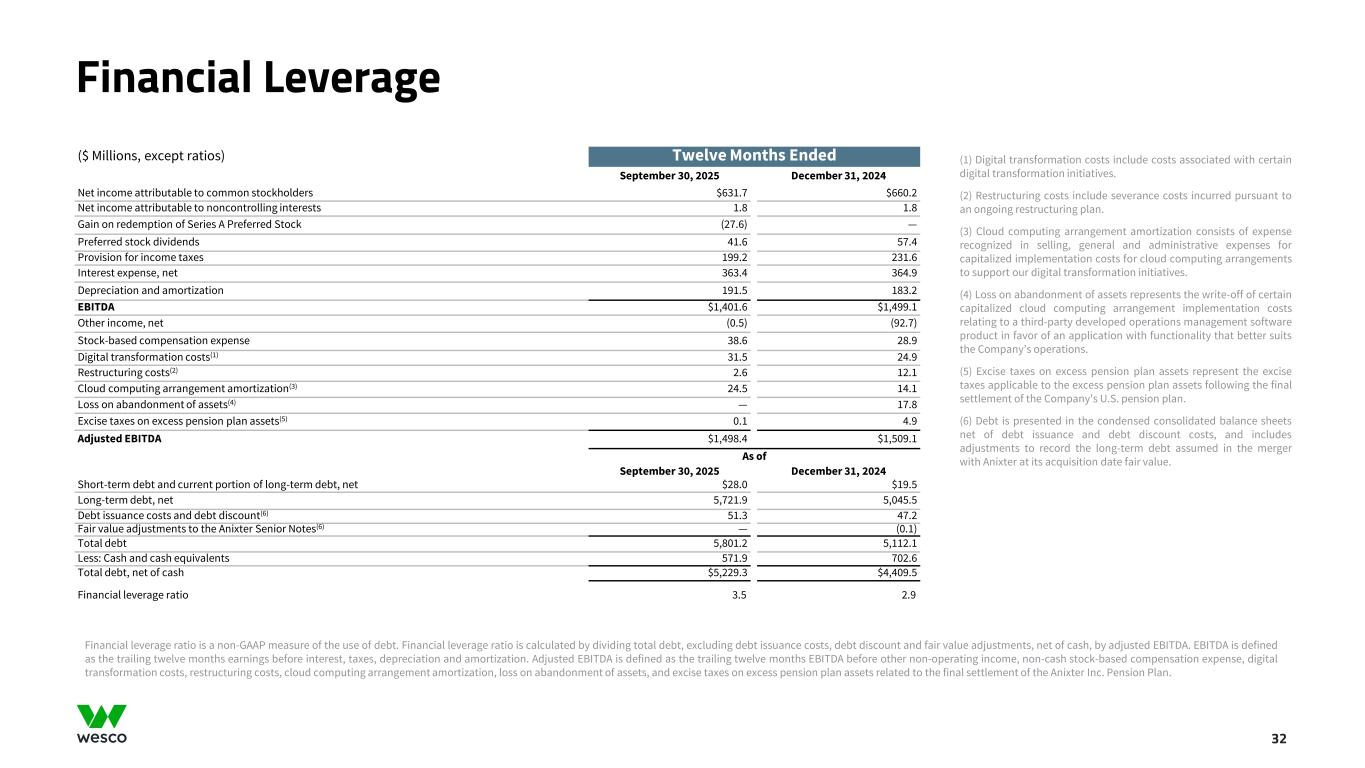
Financial Leverage 32 ($ Millions, except ratios) Twelve Months Ended September 30, 2025 December 31, 2024 Net income attributable to common stockholders $631.7 $660.2 Net income attributable to noncontrolling interests 1.8 1.8 Gain on redemption of Series A Preferred Stock (27.6) — Preferred stock dividends 41.6 57.4 Provision for income taxes 199.2 231.6 Interest expense, net 363.4 364.9 Depreciation and amortization 191.5 183.2 EBITDA $1,401.6 $1,499.1 Other income, net (0.5) (92.7) Stock-based compensation expense 38.6 28.9 Digital transformation costs(1) 31.5 24.9 Restructuring costs(2) 2.6 12.1 Cloud computing arrangement amortization(3) 24.5 14.1 Loss on abandonment of assets(4) — 17.8 Excise taxes on excess pension plan assets(5) 0.1 4.9 Adjusted EBITDA $1,498.4 $1,509.1 As of September 30, 2025 December 31, 2024 Short-term debt and current portion of long-term debt, net $28.0 $19.5 Long-term debt, net 5,721.9 5,045.5 Debt issuance costs and debt discount(6) 51.3 47.2 Fair value adjustments to the Anixter Senior Notes(6) — (0.1) Total debt 5,801.2 5,112.1 Less: Cash and cash equivalents 571.9 702.6 Total debt, net of cash $5,229.3 $4,409.5 Financial leverage ratio 3.5 2.9 (1) Digital transformation costs include costs associated with certain digital transformation initiatives. (2) Restructuring costs include severance costs incurred pursuant to an ongoing restructuring plan. (3) Cloud computing arrangement amortization consists of expense recognized in selling, general and administrative expenses for capitalized implementation costs for cloud computing arrangements to support our digital transformation initiatives. (4) Loss on abandonment of assets represents the write-off of certain capitalized cloud computing arrangement implementation costs relating to a third-party developed operations management software product in favor of an application with functionality that better suits the Company’s operations. (5) Excise taxes on excess pension plan assets represent the excise taxes applicable to the excess pension plan assets following the final settlement of the Company's U.S. pension plan. (6) Debt is presented in the condensed consolidated balance sheets net of debt issuance and debt discount costs, and includes adjustments to record the long-term debt assumed in the merger with Anixter at its acquisition date fair value. Financial leverage ratio is a non-GAAP measure of the use of debt. Financial leverage ratio is calculated by dividing total debt, excluding debt issuance costs, debt discount and fair value adjustments, net of cash, by adjusted EBITDA. EBITDA is defined as the trailing twelve months earnings before interest, taxes, depreciation and amortization. Adjusted EBITDA is defined as the trailing twelve months EBITDA before other non-operating income, non-cash stock-based compensation expense, digital transformation costs, restructuring costs, cloud computing arrangement amortization, loss on abandonment of assets, and excise taxes on excess pension plan assets related to the final settlement of the Anixter Inc. Pension Plan.
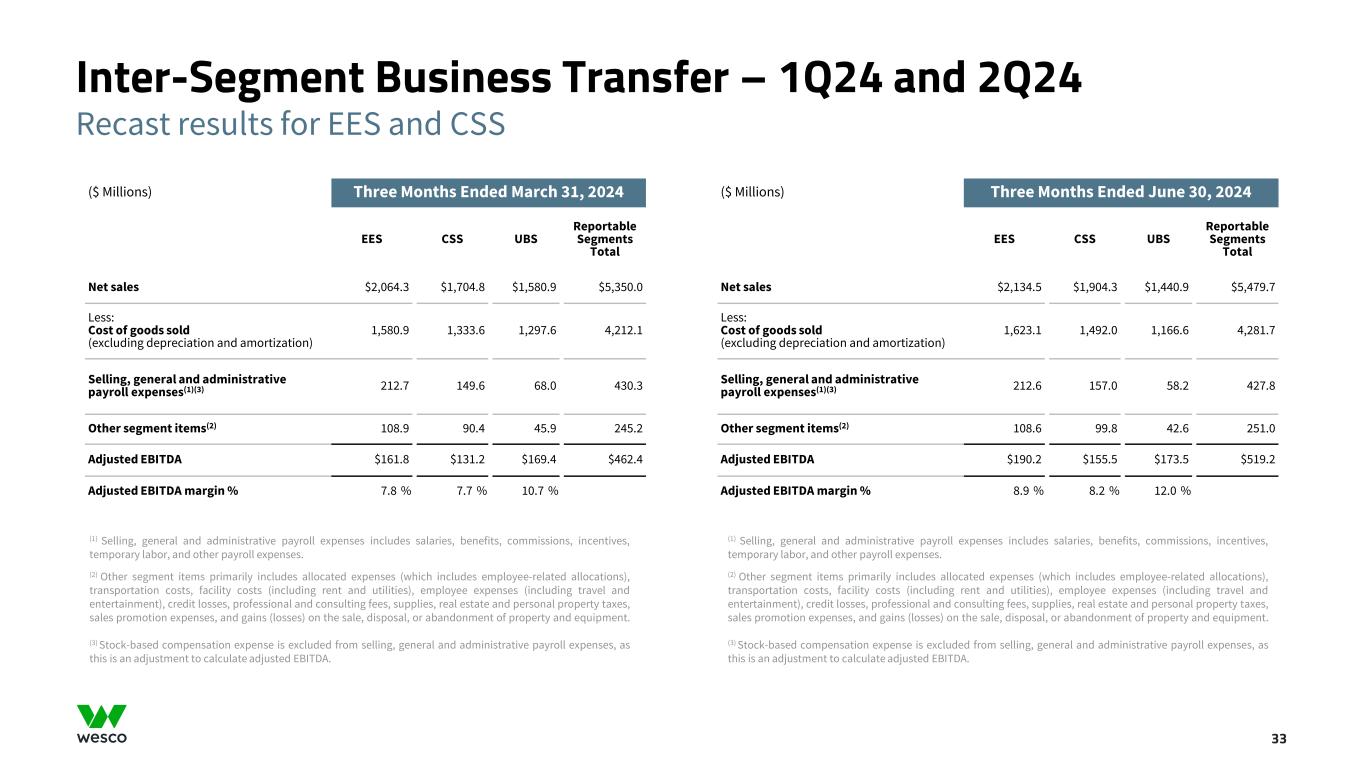
Inter-Segment Business Transfer – 1Q24 and 2Q24 33 (1) Selling, general and administrative payroll expenses includes salaries, benefits, commissions, incentives, temporary labor, and other payroll expenses. (2) Other segment items primarily includes allocated expenses (which includes employee-related allocations), transportation costs, facility costs (including rent and utilities), employee expenses (including travel and entertainment), credit losses, professional and consulting fees, supplies, real estate and personal property taxes, sales promotion expenses, and gains (losses) on the sale, disposal, or abandonment of property and equipment. (3) Stock-based compensation expense is excluded from selling, general and administrative payroll expenses, as this is an adjustment to calculate adjusted EBITDA. (1) Selling, general and administrative payroll expenses includes salaries, benefits, commissions, incentives, temporary labor, and other payroll expenses. (2) Other segment items primarily includes allocated expenses (which includes employee-related allocations), transportation costs, facility costs (including rent and utilities), employee expenses (including travel and entertainment), credit losses, professional and consulting fees, supplies, real estate and personal property taxes, sales promotion expenses, and gains (losses) on the sale, disposal, or abandonment of property and equipment. (3) Stock-based compensation expense is excluded from selling, general and administrative payroll expenses, as this is an adjustment to calculate adjusted EBITDA. ($ Millions) Three Months Ended June 30, 2024 EES CSS UBS Reportable Segments Total Net sales $2,134.5 $1,904.3 $1,440.9 $5,479.7 Less: Cost of goods sold (excluding depreciation and amortization) 1,623.1 1,492.0 1,166.6 4,281.7 Selling, general and administrative payroll expenses(1)(3) 212.6 157.0 58.2 427.8 Other segment items(2) 108.6 99.8 42.6 251.0 Adjusted EBITDA $190.2 $155.5 $173.5 $519.2 Adjusted EBITDA margin % 8.9 % 8.2 % 12.0 % ($ Millions) Three Months Ended March 31, 2024 EES CSS UBS Reportable Segments Total Net sales $2,064.3 $1,704.8 $1,580.9 $5,350.0 Less: Cost of goods sold (excluding depreciation and amortization) 1,580.9 1,333.6 1,297.6 4,212.1 Selling, general and administrative payroll expenses(1)(3) 212.7 149.6 68.0 430.3 Other segment items(2) 108.9 90.4 45.9 245.2 Adjusted EBITDA $161.8 $131.2 $169.4 $462.4 Adjusted EBITDA margin % 7.8 % 7.7 % 10.7 % Recast results for EES and CSS
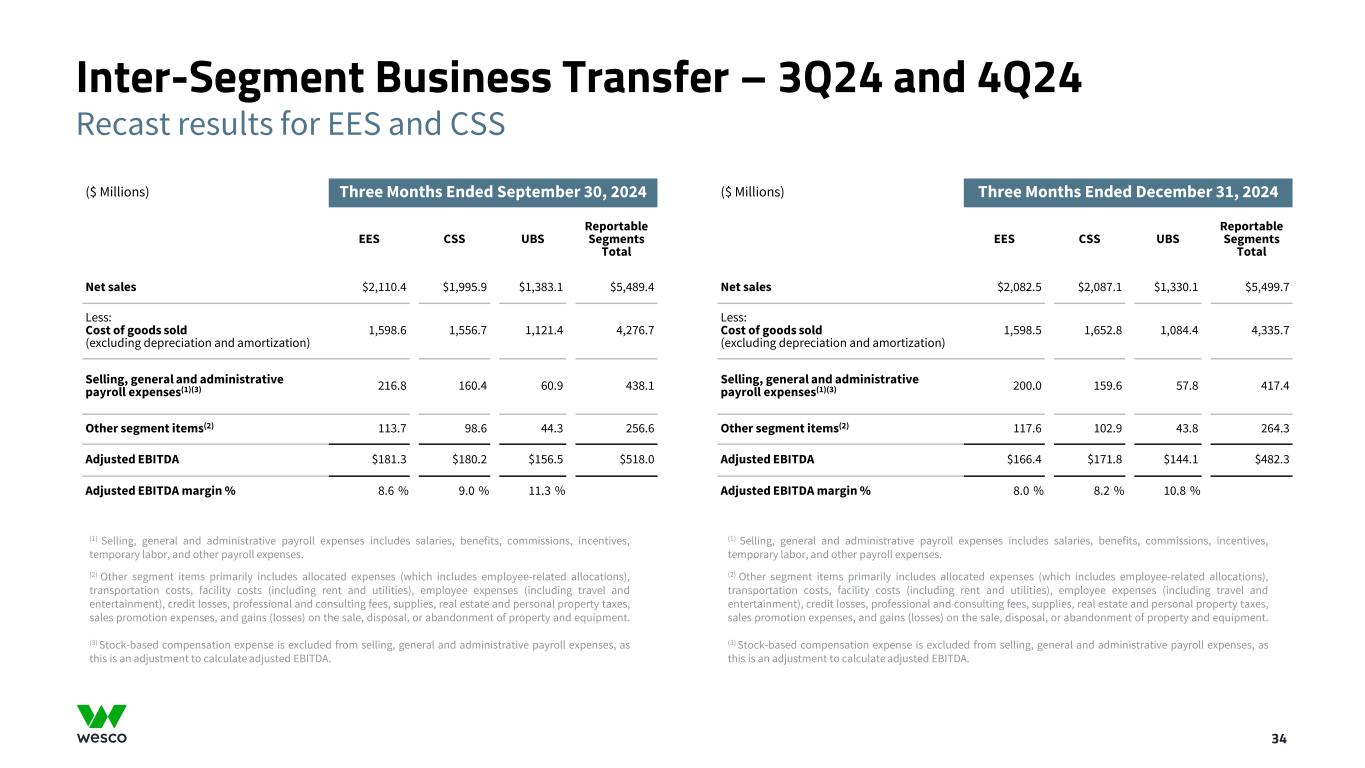
Inter-Segment Business Transfer – 3Q24 and 4Q24 34 ($ Millions) Three Months Ended September 30, 2024 EES CSS UBS Reportable Segments Total Net sales $2,110.4 $1,995.9 $1,383.1 $5,489.4 Less: Cost of goods sold (excluding depreciation and amortization) 1,598.6 1,556.7 1,121.4 4,276.7 Selling, general and administrative payroll expenses(1)(3) 216.8 160.4 60.9 438.1 Other segment items(2) 113.7 98.6 44.3 256.6 Adjusted EBITDA $181.3 $180.2 $156.5 $518.0 Adjusted EBITDA margin % 8.6 % 9.0 % 11.3 % ($ Millions) Three Months Ended December 31, 2024 EES CSS UBS Reportable Segments Total Net sales $2,082.5 $2,087.1 $1,330.1 $5,499.7 Less: Cost of goods sold (excluding depreciation and amortization) 1,598.5 1,652.8 1,084.4 4,335.7 Selling, general and administrative payroll expenses(1)(3) 200.0 159.6 57.8 417.4 Other segment items(2) 117.6 102.9 43.8 264.3 Adjusted EBITDA $166.4 $171.8 $144.1 $482.3 Adjusted EBITDA margin % 8.0 % 8.2 % 10.8 % Recast results for EES and CSS (1) Selling, general and administrative payroll expenses includes salaries, benefits, commissions, incentives, temporary labor, and other payroll expenses. (2) Other segment items primarily includes allocated expenses (which includes employee-related allocations), transportation costs, facility costs (including rent and utilities), employee expenses (including travel and entertainment), credit losses, professional and consulting fees, supplies, real estate and personal property taxes, sales promotion expenses, and gains (losses) on the sale, disposal, or abandonment of property and equipment. (3) Stock-based compensation expense is excluded from selling, general and administrative payroll expenses, as this is an adjustment to calculate adjusted EBITDA. (1) Selling, general and administrative payroll expenses includes salaries, benefits, commissions, incentives, temporary labor, and other payroll expenses. (2) Other segment items primarily includes allocated expenses (which includes employee-related allocations), transportation costs, facility costs (including rent and utilities), employee expenses (including travel and entertainment), credit losses, professional and consulting fees, supplies, real estate and personal property taxes, sales promotion expenses, and gains (losses) on the sale, disposal, or abandonment of property and equipment. (3) Stock-based compensation expense is excluded from selling, general and administrative payroll expenses, as this is an adjustment to calculate adjusted EBITDA.
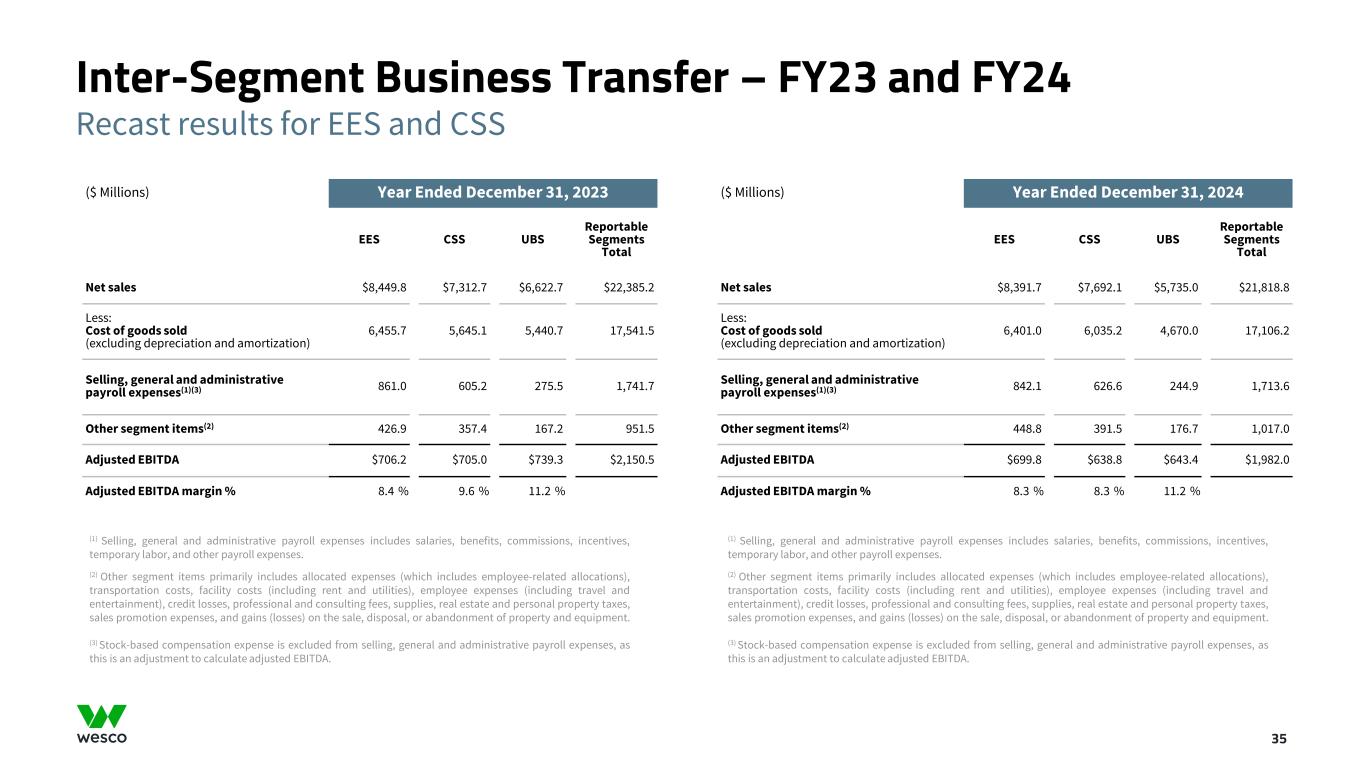
Inter-Segment Business Transfer – FY23 and FY24 35 ($ Millions) Year Ended December 31, 2023 EES CSS UBS Reportable Segments Total Net sales $8,449.8 $7,312.7 $6,622.7 $22,385.2 Less: Cost of goods sold (excluding depreciation and amortization) 6,455.7 5,645.1 5,440.7 17,541.5 Selling, general and administrative payroll expenses(1)(3) 861.0 605.2 275.5 1,741.7 Other segment items(2) 426.9 357.4 167.2 951.5 Adjusted EBITDA $706.2 $705.0 $739.3 $2,150.5 Adjusted EBITDA margin % 8.4 % 9.6 % 11.2 % ($ Millions) Year Ended December 31, 2024 EES CSS UBS Reportable Segments Total Net sales $8,391.7 $7,692.1 $5,735.0 $21,818.8 Less: Cost of goods sold (excluding depreciation and amortization) 6,401.0 6,035.2 4,670.0 17,106.2 Selling, general and administrative payroll expenses(1)(3) 842.1 626.6 244.9 1,713.6 Other segment items(2) 448.8 391.5 176.7 1,017.0 Adjusted EBITDA $699.8 $638.8 $643.4 $1,982.0 Adjusted EBITDA margin % 8.3 % 8.3 % 11.2 % Recast results for EES and CSS (1) Selling, general and administrative payroll expenses includes salaries, benefits, commissions, incentives, temporary labor, and other payroll expenses. (2) Other segment items primarily includes allocated expenses (which includes employee-related allocations), transportation costs, facility costs (including rent and utilities), employee expenses (including travel and entertainment), credit losses, professional and consulting fees, supplies, real estate and personal property taxes, sales promotion expenses, and gains (losses) on the sale, disposal, or abandonment of property and equipment. (3) Stock-based compensation expense is excluded from selling, general and administrative payroll expenses, as this is an adjustment to calculate adjusted EBITDA. (1) Selling, general and administrative payroll expenses includes salaries, benefits, commissions, incentives, temporary labor, and other payroll expenses. (2) Other segment items primarily includes allocated expenses (which includes employee-related allocations), transportation costs, facility costs (including rent and utilities), employee expenses (including travel and entertainment), credit losses, professional and consulting fees, supplies, real estate and personal property taxes, sales promotion expenses, and gains (losses) on the sale, disposal, or abandonment of property and equipment. (3) Stock-based compensation expense is excluded from selling, general and administrative payroll expenses, as this is an adjustment to calculate adjusted EBITDA.