Exhibit 15.2

| Annual Report and Financial Statements 2018 |
Exhibit 15.2
| Annual Report and Financial Statements 2018 |
RELX is a global provider of information-based
analytics and decision tools for professional and
business customers.
We help scientists make new discoveries, doctors and
nurses improve the lives of patients and lawyers win
cases. We prevent online fraud and money laundering,
and help insurance companies evaluate and predict risk.
Our events enable customers to learn about markets,
source products and complete transactions.
In short, we enable our customers to make better
decisions, get better results and be more productive.
Forward-looking statements
This Annual Report contains forward-looking statements within the meaning of Section 27A of the US Securities Act of 1933, as amended, and Section 21E of the US Securities Exchange Act of 1934, as amended. These statements are subject to risks and uncertainties that could cause actual results or outcomes of RELX PLC (together with its subsidiaries, “RELX”, “we” or “our”) to differ materially from those expressed in any forward-looking statement. The terms “outlook”, “estimate”, “project”, “plan”, “intend”, “expect”, “should”, “will”, “believe”, “trends” and similar expressions may indicate a forward-looking statement. Important factors that could cause actual results or outcomes to differ materially from estimates or forecasts contained in the forward-looking statements include, among others, current and future economic, political and market forces; changes in law and legal interpretations affecting RELX intellectual property rights and internet communications; regulatory and other changes regarding the collection, transfer or use of third-party content and data; demand for RELX products and services; competitive factors in the industries in which RELX operates; ability to realise the future anticipated benefits of acquisitions; significant failure or interruption of our systems; compromises of our data security systems or other unauthorised access to our databases; legislative, fiscal, tax and regulatory developments and political risks; exchange rate fluctuations; and other risks referenced from time to time in the filings of RELX PLC with the US Securities and Exchange Commission.
| RELX Annual report and financial statements 2018 | 1 | |
|
| ||
| 2 | RELX Annual report and financial statements 2018 | Overview | |
|
| ||
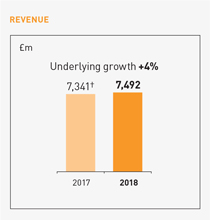
| ◾ | Underlying revenue growth of 4% |
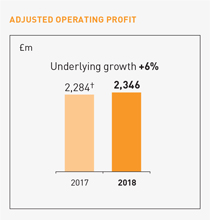
| ◾ | Underlying adjusted operating profit growth of 6% |
| ◾ | Reported operating profit £1,964m (£1,905m) |
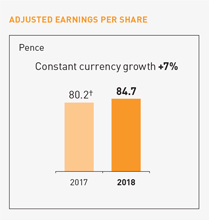
| ◾ | Adjusted EPS growth at constant currency up 7%; in sterling up 6% to 84.7p |
| ◾ | Reported EPS 71.9p (81.6p) |
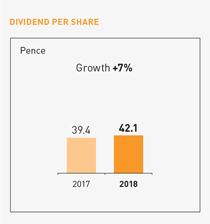
| ◾ | Full-year dividend up 7% to 42.1p |
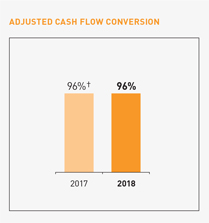
| ◾ | Strong financial position and cash flow; cash flow conversion at 96% |
RELX
|
|
| ||
|

|
|
RELX PLC and its subsidiaries, joint ventures and associates are together known as “RELX”
† 2017 restated for adoption of new accounting standards IFRS 9, IFRS 15 and IFRS 16. See note 1 on page 126 for further details.
RELX uses adjusted and underlying figures as additional performance measures. Adjusted figures primarily exclude the amortisation of acquired intangible assets and other items related to acquisitions and disposals, and the associated deferred tax movements. In 2018 and 2017, we also excluded exceptional tax credits, see note 9 on page 138. Reconciliations between the reported and adjusted figures are set out on page 176. Underlying growth rates are calculated at constant currencies, excluding the results of acquisitions until twelve months after purchase, and excluding the results of disposals and assets held for sale. Underlying revenue growth rates also exclude exhibition cycling. Constant currency growth rates are based on 2017 full-year average and hedge exchange rates.
| RELX Annual report and financial statements 2018 | 3 | |
|
| ||
| RELX Annual report and financial statements 2018 | Chief Executive Officer’s report | 5 | |
|
| ||
| 6 | RELX Annual report and financial statements 2018 | Overview | |
|
| ||
|
|
|

| RELX Annual report and financial statements 2018 | 7 | |
|
| ||
|
review | ||
| In this section | ||
| 8 | RELX business overview | |
| 14 | Scientific, Technical & Medical | |
| 20 | Risk & Business Analytics | |
| 28 | Legal | |
| 34 | Exhibitions | |
| 41 | Corporate Responsibility | |
| 8 | RELX Annual report and financial statements 2018 | Business review | |
|
| ||
RELX is a global provider of information-based analytics and decision tools for professional and business customers.
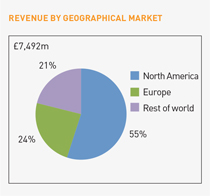
The Group serves customers in more than 180 countries and has offices in about 40 countries. It employs over 30,000 people, of whom almost half are in North America.
RELX financial summary
| REPORTED FIGURES | Change at | |||||||||||||||||||
| 2018 | 2017 | † | constant | Change | ||||||||||||||||
| For the year ended 31 December | £m | £m | Change | currencies | underlying | |||||||||||||||
| Revenue |
7,492 | 7,341 | +2% | +4% | +4% | |||||||||||||||
| Operating profit |
1,964 | 1,905 | +3% | |||||||||||||||||
| Profit before tax |
1,720 | 1,721 | 0% | |||||||||||||||||
| Net profit attributable to RELX PLC shareholders |
1,422 | 1,648 | -14% | |||||||||||||||||
| Net margin |
19.0% | 22.4% | ||||||||||||||||||
| Net borrowings |
6,177 | 5,042 | ||||||||||||||||||
| Reported earnings per share |
71.9p | 81.6p | -12% | |||||||||||||||||
| Ordinary dividend per RELX PLC share |
42.1p | 39.4p | +7% | |||||||||||||||||
| ADJUSTED FIGURES | Change at | |||||||||||||||||||
| 2018 | 2017 | † | constant | Change | ||||||||||||||||
| For the year ended 31 December | £m | £m | Change | currencies | underlying | |||||||||||||||
| Operating profit |
2,346 | 2,284 | +3% | +4% | +6% | |||||||||||||||
| Operating margin |
31.3% | 31.1% | ||||||||||||||||||
| Profit before tax |
2,145 | 2,101 | +2% | +3% | ||||||||||||||||
| Net profit attributable to RELX PLC shareholders |
1,674 | 1,620 | +3% | +5% | ||||||||||||||||
| Net margin |
22.3% | 22.1% | ||||||||||||||||||
| Cash flow |
2,243 | 2,197 | +2% | |||||||||||||||||
| Cash flow conversion |
96% | 96% | ||||||||||||||||||
| Return on invested capital |
13.2% | 12.9% | ||||||||||||||||||
| Adjusted earnings per share |
84.7p | 80.2p | +6% | +7% | ||||||||||||||||
† 2017 numbers have been restated to reflect the adoption of new accounting standards. See note 1 on page 126 for further details.
The shares of RELX PLC are traded on the London, Amsterdam and New York stock exchanges. RELX PLC and its subsidiaries, joint ventures and associates are together known as ‘RELX’.
| RELX Annual report and financial statements 2018 | RELX business overview | 9 | |
|
| ||

| 10 RELX Annual report and financial statements 2018 | Business review |
||||||
|
|
||||||
| Harnessing technology across RELX |
| Around 8,000 technologists, half of whom are software engineers, work at RELX. Annually, the company spends $1.4bn on technology. The combination of our rich data assets, technology infrastructure and knowledge of how to use next generation technologies, such as machine learning and natural language processing, allows us to create effective solutions for our customers. |
| Helping research chemists with Elsevier’s Reaxys
Reaxys enables the shortest path to chemistry research answers, supporting the early stages of drug development in the pharmaceutical industry, exploratory chemistry research in academia, and product development in industries such as chemicals and oil & gas.
The amount of chemical information published each year is increasing exponentially, making it more and more challenging for research chemists to quickly find targeted and actionable information to help support their research.
To help researchers stay on top of their field, Elsevier developed a new chemistry text mining engine, using state-of-the-art natural language processing that identified 4.9m key substances in 5.2m documents from more than 15,000 journal titles in 2018.
This significantly increased the content coverage and substance information searchable on Reaxys, addressing a key pain point in customer efforts to find the data they need for drug discovery. |
4.9m
key chemical substances identified using Elsevier’s natural language processing technology |
Providing comprehensive and relevant information as fast as possible is a critical challenge for our customers in a highly competitive environment. Elsevier’s sophisticated automatic processing methods have helped make Reaxys, where this information is contained, an indispensable tool for chemical research.
Dr Juergen Swienty-Busch
Director of Product Management, Chemistry Solutions, Elsevier |
|

| RELX Annual report and financial statements 2018 | RELX business overview 11 |
||||||
|
|
||||||
|
|
Making legal research faster and more intuitive with Lexis Answers
Every year, an immense volume of legal data is generated, adding to the existing collection of more than 16m case law legal decisions and 91m statutes, regulations, constitutions and legislative documents in the US alone. As the amount of electronic data increases, legal research, analysis and discovery has become increasingly challenging and time-consuming.
Traditional legal database searches require legal researchers to make their query using precise key words or phrases. This can often produce multiple responses which may not give the specific answer needed.
As part of the Lexis Advance online legal research tool, LexisNexis developed the Lexis Answers service which allows users to enter their query in the form of a natural language question. Using machine learning, cognitive computing and advanced natural language processing technologies, Lexis Answers anticipates a user’s research path, curating and delivering relevant answers based on their question type. The result is faster answers in fewer searches. |
44%
time saved per research query using Lexis Answers |
Lexis Answers is one of several features within Lexis Advance that brings the power of artificial intelligence and machine learning to our customers – ultimately improving their research efficiency, enhancing their legal workflow and transforming legal research.
Jeff Pfeifer Vice President of Product Management, LexisNexis
|
|
RELX data centre

| 12 RELX Annual report and financial statements 2018 | Business review |
||||||
|
|
||||||

| RELX Annual report and financial statements 2018 | 13 | |
|
| ||
|
segments | ||
| In this section | ||
| 14 | Scientific, Technical & Medical | |
| 20 | Risk & Business Analytics | |
| 28 | Legal | |
| 34 | Exhibitions | |
| RELX Annual report and financial statements 2018 | Scientific, Technical & Medical | 15 | |
|
| ||
| 16 | RELX Annual report and financial statements 2018 | Business review | |
|
| ||
|
|
|
| RELX Annual report and financial statements 2018 | Scientific, Technical & Medical | 17 | |
|
| ||

| 18 RELX Annual report and financial statements 2018 | Business review |
||||||
|
|
||||||
Via Oncology
| helping The Center for Cancer and Blood Disorders improve patient treatment |
| The Center for Cancer and Blood Disorders in Fort Worth, Texas, treats more than 6,000 new cancer patients annually. That equates to more than 300,000 patient visits every year. It has over 25 specialist oncologists and 150 healthcare professionals across nine locations throughout North Texas. |
|
Elsevier’s Via Oncology partnered with The Center over ten years ago after oncologists at the clinic identified a need to ensure that patients experience consistent, standardised treatment across their many locations and oncologists.
Via Oncology’s sophisticated online clinical pathway system, Via Pathways, is an advanced clinical decision support system that provides points of care recommendations for diagnostics and treatment. By using Via Pathways, oncologists can follow evidence-based care maps based upon the most current medical evidence and reduce unwarranted care variability. |
Oncologists also are presented with all locally available clinical trials prior to starting a treatment pathway for new patients, ensuring they are presented with all options for treatment.
Since implementing Via Pathways, The Center’s oncologists can review more data on their patients’ outcomes, demonstrating that the care they deliver is consistent across their network. For example, The Center’s capture rate, which measures how consistently doctors use Via Pathways and tracks all patient visits, has reached 89% across 34 disease pathways representing over 95% of cancer types.
The Center considers Via Oncology to be at the crux of its value-based care initiatives, enabling participation in studies of new care models. |
25% clinical trials participation rate for lung cancer patients as a result of using Via Pathways, more than five times higher than the national average |

| RELX Annual report and financial statements 2018 | Scientific, Technical & Medical | 19 | |
| About Via Oncology
Part of Elsevier, Via Oncology is a Pittsburgh, Pennsylvania-based business that provides decision support and best practices in cancer care management.
It helps cancer centres demonstrate the value of their care to patients, doctors and payers by developing and implementing clinical pathways in collaboration with its network of more than 1,500 US cancer care providers. Via Oncology’s evidence-based proprietary content, Via Pathways, is developed by leading oncologists and forms the basis of clinical algorithms covering 95% of cancer types treated in the US. This content is deployed to doctors and their staff at the point of care through the Via Portal, a patient-specific decision support tool that is integrated with electronic medical records and provides seamless measurements of adherence to treatment. |
Oncology doctor and nurse at The Center for Cancer and Blood Disorders | |||||
| Via Pathways is a great tool that we can use to standardize our therapies. We can show that physicians are being congruent with standards of care and are taking into account the effectiveness, toxicity and cost, and making appropriate treatment choices. That means we’re providing the highest standard of care to our patients.
Dr Ray Page, DO, PhD President of The Center for Cancer and Blood Disorders, Texas | ||||||
| RELX Annual report and financial statements 2018 | Risk & Business Analytics | 21 | |
|
| ||
| 22 | RELX Annual report and financial statements 2018 | Business review | |
|
| ||
|
|
|
| RELX Annual report and financial statements 2018 | Risk & Business Analytics | 23 | |
|
| ||

| 24
|
RELX Annual report and financial statements 2018 | Business review
|
Cirium
managing the cost
of disrupted flights
Gant Travel Management is an innovative travel
management company based in Bloomington,
Indiana, with more than 80 years of experience.
It is expert in optimising the performance of the
world’s largest travel and expense reporting
platform. Its people and technology help
manage the expense and experience of
corporate travel.
| Labour strikes, natural disasters and extreme weather all cause flight disruption, which has a significant impact on traveller experience and travel industry costs. In 2017, 3.6m flights were cancelled or delayed by over 30 minutes. Every year, airlines lose approximately $35bn because of these irregular operations. This cost jumps to more than $60bn when considering the impact to travellers and the broader ecosystem.
When disruption happens, most airlines publish waivers to allow travellers to change their flight plans ahead of the disruption with no change fee. Most waivers are handled manually on a reactive basis. There isn’t a standardised format and travellers often aren’t alerted effectively or quickly enough.
Cirium’s Travel Waiver Services automate the process of matching trips to waivers, making it easier and quicker for agents to find waiver details and understand if a traveller’s flight qualifies. |
These services allow agents to reallocate travellers proactively with new travel plans when needed, reducing the average handling time for incoming calls and ultimately saving the traveller time and worry about flight changes.
By integrating Cirium’s service, Gant reduced the amount of time needed to resolve a traveller’s disrupted flight by a third. It also contributed to a reduction in the number of calls agents had to make to airlines to solve problems by an average of 50%. Having the right information at the right time means that Gant could save costs and provide a superior level of service for travellers affected by disruption. |
30%
reduction in time spent resolving a traveller’s disrupted flight using Cirium’s services |

| RELX Annual report and financial statements 2018 | Risk & Business Analytics
|
25
| |
|
| ||
| Cirium holds data on more than 100,000 commercial aircraft including the Airbus A330 |
| About Cirium
Cirium brings together powerful data and analytics to keep the world in motion. Delivering insight, built from decades of experience in the sector, enabling travel companies, aircraft manufacturers, airports, airlines and financial institutions, among others, to make logical and informed decisions which shape the future of travel, growing revenues and enhancing customer experiences. |
Cirium worked in concert with us and the travel ecosystem suppliers to fix a broken process that we all thought was unfixable. The results were innovation that saved us over 10% labor costs during key periods of disruption. This gave us a significant advantage in staffing and directly benefited our traveller experience. Cirium made our new process possible.
Patrick Linnihan President & CEO of Gant Travel Management |

| 26
|
RELX Annual report and financial statements 2018 | Business review
|
ThreatMetrix
identifying and blocking
fraud in real time
Gumtree was founded in 2000 as a classified
adverts site for travellers arriving in London.
From these modest beginnings, Gumtree.com
is now the UK’s leading classifieds site, with
16.4m unique visitors and 12.6m replies
to adverts each month.
| Gumtree brings together an eclectic collection of like-minded buyers, sellers and other users ranging from flat-sharers looking to fill a vacant room to cars, clothes and vintage furniture sales. The platform does not process any payment transactions and therefore relies on the safety, trustworthiness and authenticity of users.
Historically fraudsters have seen a clear opportunity to exploit the platform. They sign up for accounts in order to make fake listings or dupe unsuspecting users into transferring money for an item that never materialises. Gumtree needed a solution that could maintain the integrity of the platform while keeping fraudsters out. It harnessed intelligence from the ThreatMetrix Digital Identity Network to better identify high-risk users before they opened a Gumtree account. |
The ThreatMetrix Digital Identity Network crowdsources intelligence from millions of daily consumer interactions including logins, payments, and new account applications across thousands of global businesses. Using this information, ThreatMetrix creates a unique digital identity for each user by analysing the myriad connections between devices, locations and anonymised personal information.
Behaviour that deviates from this trusted digital identity can be accurately identified in real time, alerting Gumtree to new users who may be using stolen identity data, obfuscating their location or attempting to sign up for multiple accounts from the same device. |
84%
increased fraud detection rate forecasted by using ThreatMetrix’s data and analysis |

| RELX Annual report and financial statements 2018 | Risk & Business Analytics
|
27
| |
|
| ||
| Gumtree was founded in London in 2000 |
| About ThreatMetrix
ThreatMetrix, a LexisNexis Risk Solutions Company, empowers the global economy to grow profitably and securely without compromise.
With deep insight into anonymised digital identities, ThreatMetrix ID delivers the intelligence behind 30bn annual authentication and trust decisions, to differentiate legitimate customers from fraudsters in real time. |
The ThreatMetrix team has been really proactive in helping us improve our rules for detecting fraud, so much so that we have seen a significant increase in the fraud detection rate since we worked together to improve the performance of the model.
Fergus Campbell Head of Communications, Gumtree
|
| RELX Annual report and financial statements 2018 | Legal | 29 | |
|
| ||
| 30 | RELX Annual report and financial statements 2018 | Business review | |
|
| ||

|
|
|
| RELX Annual report and financial statements 2018 | Legal | 31 | |
|
| ||

| 32
|
RELX Annual report and financial statements 2018 | Business review
|
Intelligize
helping law firms advise on complex financial disclosures
Mayer Brown is a global law firm that advises
the world’s leading companies and financial
institutions on their most complex deals and
disputes. With extensive reach across four
continents, it is the only integrated law firm in
the world with approximately 200 lawyers in
each of the world’s largest financial centres
– New York, London and Hong Kong.
| Mayer Brown advises issuers, investment banks and investors in making disclosures to the US Securities and Exchange Commission (SEC). These disclosures relate to transactions such as public offerings. The firm’s clients are under constant pressure to stay up to date with regulatory change. They depend on Mayer Brown partner Anna Pinedo and her colleagues to help them ensure the disclosures are accurate and that they are aware of disclosure trends, peer company disclosures and related matters. However, researching relevant precedents can take a lot of time – so finding a more efficient way of working is critical to Mayer Brown and its clients.
When Mayer Brown is engaged on a new securities offering, it regularly uses Intelligize to quickly find peer companies in the same industry for insights on similar disclosures. Intelligize instantly provides links to relevant SEC comments and responses from multiple peer companies. This puts clients in a position to anticipate potential problems and put forward disclosures that avoid expensive and time consuming comment letters from the regulator. |
About Intelligize
Intelligize pulls together and automatically links a broad set of SEC disclosure documents from filings to comment letters, agreements and other exhibits – enabling customers to navigate between related content with ease.
With advanced search tools and graphical analytical views, the solution rapidly delivers deep insights into filing and disclosure characteristics that would otherwise require extensive research effort. Intelligize makes it easy to identify market standard language and mitigate risk in disclosures by benchmarking output from multiple peer companies. |

| RELX Annual report and financial statements 2018 | Legal
|
33
| |
|
| ||
| Mayer Brown LLP’s offices in New York |
| Intelligize makes it easy to find the precedents you know are out there for specific transaction types and peer companies. It allows us to very efficiently analyze massive amounts of disclosure documents, efficiencies we can pass on to our clients.
Anna Pinedo Partner, Mayer Brown LLP
|
| RELX Annual report and financial statements 2018 | Exhibitions | 35 | |
|
| ||
| 36 | RELX Annual report and financial statements 2018 | Business review | |
|
| ||
|
|
|
| ||
| MIPIM: The world’s property market | Everything about information security | China (Shenzhen) International Gifts, Handicrafts, Watches & Houseware Fair: One of the largest business gifts & home fairs in China | ||
|
|
|
| ||
| World Travel Market: Premier global event for the travel industry |
Salão Internacional do Automóvel: Brazil’s automobile event |
Bar Convent Berlin: International bar & beverage trade show | ||
|
|
|
| ||
| National Hardware Show: US home improvement and DIY trade fair |
Interphex Japan: Japan’s pharmaceutical R&D and manufacturing show |
Expoprotection: The exhibition for risk prevention & management | ||
|
|
|
| ||
| One of the largest & longest standing electronics manufacturing trade shows |
The world’s entertainment content market | The destination for the global aircraft interiors industry | ||
|
|
|
| ||
| Leading international exhibition for personal care ingredients |
International security conference | Focused on the culture & community that is gaming | ||
|
|
|
| ||
| The golf business show | The trade show for the doors and windows industry |
New York Comic Con: The East Coast’s largest pop culture convention
| ||
|
|

|
| RELX Annual report and financial statements 2018 | Exhibitions | 37 | |
|
| ||

| 38
|
RELX Annual report and financial statements 2018 | Business review
|
Vision Expo
bringing clarity and vision
to small business growth
Coco and Breezy is a designer glasses and
sunglasses brand co-founded, owned and
designed by twins Corianna and Brianna
Dotson. The sisters launched their brand
in 2009 at the age of 19 and in a few short
years have built a successful and high-profile
business with innovative eyewear designs
that have been worn by celebrities including
Prince, Beyoncé, Lady Gaga and Rihanna.
| Based in New York, the twins channel their unique style to create frames using a variety of materials, patterns and colours. Over the past four years, Coco and Breezy have presented their brand and unveiled new frames and products to an audience of experts at Vision Expo. They attribute a component of their growth to showcasing their products via multiple platforms at the show including fashion shows, panel discussions, style events, interviews, and press previews. Vision Expo has enabled Coco and Breezy to make the shift from being a fashion brand, sold only in fashion stores, to embedding their company into the eyewear and eye care industry. | 400
stores across North America now stock Coco and Breezy eyewear thanks in part to business growth opportunities at Vision Expo |
About Vision Expo
Vision Expo is one of the leading shows for eye care professionals to discover and learn about the latest technologies, trends and products in the sector.
The exhibition has two locations – Vision Expo East based in New York and Vision Expo West in Las Vegas. Combined, the shows bring together over 700 exhibitors and 27,000 global industry professionals to network and share knowledge on the latest innovations in products, solutions and fashion in the industry. Through the collaboration of The Vision Council, the exhibition also invests in programmes to drive market growth and promote awareness of eye health. |

| RELX Annual report and financial statements 2018 | Exhibitions
|
39
| |
|
| ||
| Coco and Breezy at Vision Expo West |
| Before we started showing at Vision Expo our eyewear was sold in about 30 fashion stores. Now our eyewear is sold in about 400 optical practices in North America.
Corianna and Brianna Dotson Co-founders, Owners and Designers, Coco and Breezy
|

| 40
|
RELX Annual report and financial statements 2018 | Business review
|

| RELX Annual report and financial statements 2018 | 41
| |
|
| ||
Responsibility
| The Corporate Responsibility Report is an integral part of our Annual Report and Financial Statements. This section highlights progress on our 2018 czorporate responsibility objectives. The full 2018 Corporate Responsibility Report is available at www.relx.com/go/CRReport
Non-financial information statement RELX is required to comply with the reporting requirements of sections 414CA and 414CB of the Companies Act 2006, which relate to non-financial information. The list below outlines for our stakeholders where this information for RELX can be found:
Reporting Requirement: |
||||
| Environmental matters | 51 – 52 | |||
| Employees | 47 | |||
| Social matters | 43, 45, 49, 50 | |||
| Human rights, | 42, 46, 49, 50 | |||
| Anti-corruption and anti-bribery matters, | 42, 46, 49, 50 | |||
| Policies, due diligence processes and outcomes | 45 – 46 | |||
| Description and management of principal risks and impact of business activity, |
60 – 63 | |||
| Description of business model | 16, 23, 30, 35 | |||
| Non-financial metrics | 14 – 52 | |||
| 42 | RELX Annual report and financial statements 2018 | Business review | |
|
| ||
Corporate responsibility

| RELX Annual report and financial statements 2018 | Corporate responsibility | 43 | |
| REACT
Digital expertise to deploy educational resources quickly in emergencies
The private sector wants to support children’s education in emergencies with their skills and expertise, but do not know how to be most effective. REACT matches leading corporations with education needs on the ground in real time. We are using tech solutions to tackle the global education crisis.”
Sarah Brown GBC-Education Executive Chair |
The Global Business Coalition |
|
60 companies have joined REACT to ensure education for the most disadvantaged children around the world |
In 2018, LexisNexis Risk Solutions launched the Rapid Education Action (REACT) online platform for the Global Business Coalition for Education (GBC-Education) to allow companies to pledge and deploy their resources quickly in emergencies and disasters. The aim is to get millions of displaced and marginalised children whose learning has been disrupted by humanitarian crises back into education.
REACT was established to channel private sector engagement in support of Education Cannot Wait, a fund dedicated to education in emergencies launched at the 2016 World Humanitarian Summit in Istanbul, Turkey. |
To date more than 60 firms have signed up to the digital platform. One of them, software company Cerego, brokered a partnership with Thaki, a charity supporting education for refugee and migrant children in Lebanon. Thaki founder, Rudayna Abdo, says: “Providing online literacy training for dispersed migrant communities comes with many challenges. We were introduced to Cerego through REACT which is helping us pursue a successful, scalable, affordable, self-paced solution that can be replicated across geographies.” |
| 44 | RELX Annual report and financial statements 2018 | Business review | |
|
| ||
| RELX Annual report and financial statements 2018 | Corporate responsibility | 45 | |
|
| ||
| 46 | RELX Annual report and financial statements 2018 | Business review | |
|
| ||
| RELX Annual report and financial statements 2018 | Corporate responsibility | 47 | |
|
| ||

| 48
|
RELX Annual report and financial statements 2018 | Business review
|
| Advancing the RELX SDG Resource Centre
Access to critical knowledge to advance the United Nations Sustainable Development Goals | ||||
|
The RELX SDG Resource Centre was an essential tool for the women entrepreneurs who took part in the We Empower UN SDG Challenge for women from around the world supporting the SDGs through their businesses who are helping to create the world we want by 2030.
Amanda Ellis Former New Zealand Ambassador to the United Nations in Geneva, Senior Special Adviser for International Diplomacy and the SDGs at the Julie Ann Wrigley Global Institute of Sustainability |
||||
| The RELX SDG Resource Centre advances awareness, understanding and implementation of the 17 global goals |
| 75,000+
sources in the RELX SDG Resource Centre’s SDG News Tracker for up-to-the-minute news on the SDGs from around the world |
The free RELX SDG Resource Centre (sdgresources.relx.com) advances awareness, understanding and implementation of the 17 UN SDGs which aim to end poverty, protect the planet and ensure prosperity for all people by 2030.
The site provides leading edge articles, reports, tools, events, videos and legal practical guidance from across RELX. It also features content from partners, including the UNGC and the United Nations Development Programme.
In 2018, we released original research on the state of science underpinning SDG 3 (good health and well-being) and added content from Scientific African. This is a partnership between the Next Einstein Forum and Elsevier, bringing state-of-the-art technology and processes to create an open access megajournal to accelerate scientific capacity-building across Africa. |
Scientific African will provide African researchers with a new platform to boost the impact and discoverability of their research.
Also in the year, we held two RELX SDG Inspiration Days to showcase the SDG Resource Centre and the importance of knowledge to advance the SDGs bringing together more than 100 business colleagues, government representatives, NGO leaders, and young people.
RELX SDG Inspiration Day Silicon Valley focused on disruptive technology to advance the SDGs and SDG Inspiration Day Amsterdam concentrated on The Power of Partnerships to advance the SDGs: what partners, what responsibilities, what innovation, and how to scale and measure impact. Partners on the events included the UNGC, the Ban Ki-Moon Centre for Global Citizens and the Responsible Media Forum. |
| RELX Annual report and financial statements 2018 | Corporate responsibility | 49 | |
|
| ||
| 50 | RELX Annual report and financial statements 2018 | Business review | |
|
| ||
| RELX Annual report and financial statements 2018 | Corporate responsibility | 51 | |
|
| ||
| 52 | RELX Annual report and financial statements 2018 | Business review | |
|
| ||
7. Environment (continued)
| ENVIRONMENTAL TARGETS | ||||||
| Focus area | Targets 2020 | 2018 Performance |
||||
| Climate change | Reduce Scope 1 and 2 location-based carbon emissions by 40% against a 2010 baseline | -49% | ||||
| Energy | Reduce energy and fuel consumption by 30% against a 2010 baseline | -35% | ||||
| Purchase renewable electricity equivalent to 100% of RELX’s global electricity consumption | 81% | |||||
| Waste | Decrease total waste generated at reporting locations by 40% against a 2010 baseline | -52% | ||||
| 90% of waste from reporting locations to be diverted from landfill | 88% | |||||
| Production paper* | 100% of RELX production papers, graded in PREPS, to be rated as ‘known and responsible sources’ | 100% | ||||
| Environmental | Achieve ISO 14001 certification for 50% of the business by 2020 | 25% | ||||
| Management System | Reporting locations achieving five or more RELX Environmental Standards | 41% | ||||
| * | All paper we graded in 2018 – 90% of total production stock – was graded 3 or 5 stars (known and responsible sources). |
We have reported on all emission sources required under the Companies Act 2006 (Strategic Report and Directors’ Report) Regulations 2013. We have included emissions from all operating companies within the Group.
We have used the GHG Protocol Corporate Accounting and Reporting Standard (revised edition) and the data has been assured by an independent third party, EY. Details on methodology and the assurance statement can be viewed in the 2018 Corporate Responsibility Report at www.relx.com/go/CRReport.
| 2018 investor and other recognition | ||||||
|
|
|
|
| |||
| Constituent of the Ethibel | CDP | EPA Green Power Leader | FTSE4Good Index | |||
| Sustainability Index | – Climate programme score: A | – Top 100 | Included in | |||
| Included in | – Forest programme score: B | – FTSE4Good Global Index | ||||
| – Excellence Europe | – Water programme score: B- | – FTSE4Good UK Index | ||||
| – Excellence Global | – FTSE4Good Europe Index | |||||
|
|
|
|
| |||
| RE100 | Dow Jones Sustainability | ISO 14001 | STOXX Global ESG | |||
| – Member | Index Europe | – Certified | Leaders Indices | |||
| – Constituent | – Included | |||||
|
|
|
|
| |||
| ECPI Indices | Forbes | Oekom Corporate | Philippine Quality Award | |||
| – Included | – The World’s Most Innovative | Responsibility Rating | – Recipient | |||
| Companies 2018
|
– Prime status | |||||

|
The full 2018 Corporate Responsibility Report is available at www.relx.com/go/CRReport |
| RELX Annual report and financial statements 2018
|
53
| |
|
| ||
|
review |
| In this section | ||
| 54 |
||
| 60 |
||
| RELX Annual report and financial statements 2018 | Chief Financial Officer’s report | 55 | |
|
| ||
| 56 | RELX Annual report and financial statements 2018 | Financial review | |
|
| ||
| RELX Annual report and financial statements 2018 | Chief Financial Officer’s report | 57 | |
|
| ||
| 58 | RELX Annual report and financial statements 2018 | Financial review | |
|
| ||
| RELX Annual report and financial statements 2018 | Chief Financial Officer’s report | 59 | |
|
| ||
| 60 | RELX Annual report and financial statements 2018 | Financial review | |
|
| ||
| EXTERNAL RISKS | ||||
| Risk | Description and impact | Mitigation | ||
| Economy and market conditions | Demand for our products and services may be adversely impacted by factors beyond our control, such as the economic environment in the United States, Europe and other major economies, political uncertainties (including the potential consequences of the United Kingdom’s withdrawal from the European Union under Article 50 of the Treaty of Lisbon (“Brexit”)), acts of war and civil unrest as well as levels of government and private funding provided to academic and research institutions. | Our businesses are focused on professional markets which have generally been more resilient in periods of economic downturn. We deliver information solutions, many on a subscription and recurring revenue basis, which are important to our customers’ effectiveness and efficiency. We operate diversified businesses in terms of sectors, markets, customers, geographies and products and services. We have extended our position in long-term global growth markets through organic new launches supported by the selective acquisition of small content and data sets. We continue to dispose of businesses that no longer fit our strategy. | ||
| We continuously monitor economic and political developments to assess their impact on our strategy which is designed to mitigate these risks. In response to specific uncertainties, such as Brexit, our businesses engage in scenario planning and develop contingency plans where relevant. | ||||
|
|
||||
| Intellectual property rights | Our products and services include and utilise intellectual property. We rely on trademark, copyright, patent and other intellectual property laws to establish and protect our proprietary rights in this intellectual property. There is a risk that our proprietary rights could be challenged, limited, invalidated or circumvented, which may impact demand for and pricing of our products and services. Copyright laws are subject to national legislative initiatives, as well as cross border initiatives such as those from the European Commission and increased judicial scrutiny in several jurisdictions in which we operate. This creates additional challenges for us in protecting our proprietary rights in content delivered through the internet and electronic platforms. | We actively engage in developing and promoting the legal protection of intellectual property rights. Our subscription contracts with customers contain provisions regarding the use of proprietary content. We are vigilant as to the use of our intellectual property and, as appropriate, take legal action to challenge illegal content distribution sources. | ||
|
|
||||
| RELX Annual report and financial statements 2018 | Principal risks | 61 | |
|
| ||
| 62 | RELX Annual report and financial statements 2018 | Financial review | |
|
| ||
| OPERATIONAL RISKS | ||||
| Risk | Description and impact | Mitigation | ||
| Technology and business resilience | Our businesses are dependent on electronic platforms and networks, primarily the internet, for delivery of our products and services. These could be adversely affected if our electronic delivery platforms, networks or supporting infrastructure experience a significant failure, interruption or security breach. | We have established procedures for the protection of our businesses and technology assets. These include the development and testing of business continuity plans, including IT disaster recovery plans and back-up delivery systems, to reduce business disruption in the event of major technology or infrastructure failure, terrorism or adverse weather incidents. | ||
|
|
||||
| Cyber security | Our businesses maintain online databases and platforms delivering our products and services, which we rely on, and provide data to third parties, including customers and service providers. These databases and information are a target for compromise and face a risk of unauthorised access and use by unauthorised parties.
Our cyber security measures, and the measures used by our third-party service providers, may not detect or prevent all attempts to compromise our systems, which may jeopardise the security of the data we maintain or may disrupt our systems. Failures of our cyber security measures could result in unauthorised access to our systems, misappropriation of our or our users’ data, deletion or modification of stored information or other interruption to our business operations. As techniques used to obtain unauthorised access to or to sabotage systems change frequently and may not be known until launched against us or our third-party service providers, we may be unable to anticipate or implement adequate measures to protect against these attacks and our service providers and customers may likewise be unable to do so.
Compromises of our or our third-party service providers’ systems, or failure to comply with applicable legislation or regulatory or contractual requirements could adversely affect our financial performance, damage our reputation and expose us to risk of loss, fines and penalties, litigation and increased regulation. |
We have established security programmes with the aim of ensuring that data is protected, our business infrastructures continue to operate and that we comply with relevant legislative, regulatory and contractual requirements.
We have governance mechanisms in place to design and monitor common policies and standards across our businesses.
We invest in appropriate technological and physical controls which are applied across the enterprise in a risk-based security programme which operates at the infrastructure, application and user levels. These controls include, but are not limited to, infrastructure vulnerability management, application scanning and penetration testing, network segmentation, encryption and logging and monitoring. We provide regular training and communication initiatives to establish and maintain awareness of risks at all levels of our businesses. We have appropriate incident response plans to respond to threats and attacks. We maintain appropriate information security policies and contractual requirements for our businesses and run programmes monitoring the application of our data security policies by third-party service providers. We use independent internal and third-party auditors to test, evaluate, and help enhance our procedures and controls. | ||
|
|
||||
| Supply Chain dependencies | Our organisational and operational structures depend on outsourced and offshored functions, including use of cloud service providers. Poor performance, failure or breach of third parties to whom we have outsourced activities, could adversely affect our business performance, reputation and financial condition. | We select our vendors with care and establish contractual service levels that we closely monitor, including through key performance indicators and targeted supplier audits and security assessments. We have developed business continuity plans to reduce disruption in the event of a major failure by a vendor. | ||
|
|
||||
| Talent | The implementation and execution of our strategies and business plans depend on our ability to recruit, motivate and retain skilled employees and management. We compete globally and across business sectors for talented management and skilled individuals, particularly those with technology and data analytics capabilities. An inability to recruit, motivate or retain such people could adversely affect our business performance. Failure to recruit and develop talent regardless of gender, race or other characteristics could adversely affect our reputation and business performance. | We have well established management development and talent review programmes. We monitor capability needs and remuneration schemes are tailored to attract and motivate the best talent available at an appropriate level of cost. We actively seek feedback from employees, which feeds into plans to enhance employee engagement and motivation. Our Diversity and Inclusion Strategy creates a diverse workforce and environment that respects individuals and their contributions. |
| RELX Annual report and financial statements 2018 | Principal risks | 63 | |
|
| ||

| 64 | RELX Annual report and financial statements 2018 | Governance | |

| RELX Annual report and financial statements 2018 | 65 | |
| Governance |
| In this section | ||
| 66 |
||
| 68 |
||
| 70 |
Chairman’s introduction to corporate governance | |
| 72 |
||
| 83 |
||
| 85 |
||
| 106 |
||
| 108 |
||
| 66 | RELX Annual report and financial statements 2018 | Governance | |
|
| ||
| Executive Directors | Non-Executive Directors | |||||||

|

|

| ||||||
| Erik Engstrom (55) Chief Executive Officer
Appointed: Chief Executive Officer of RELX since November 2009. Joined as Chief Executive Officer of Elsevier in 2004. Other appointments: Non-Executive Director of Smith & Nephew plc. Past appointments: Prior to joining was a partner at General Atlantic Partners. Before that was President and Chief Operating Officer of Random House Inc and President and Chief Executive Officer of Bantam Doubleday Dell, North America. Began his career as a consultant with McKinsey. Served as a Non-Executive Director of Eniro AB and Svenska Cellulosa Aktiebolaget SCA. Education: Holds a BSc from Stockholm School of Economics, an MSc from the Royal Institute of Technology in Stockholm, and gained an MBA from Harvard Business School as a Fulbright Scholar. Nationality: Swedish |
Sir Anthony Habgood (72)
Chairman
Appointed: June 2009 Other appointments: Chairman of Preqin Holding Limited and Deputy Chairman of RG Carter Holdings Limited. Past appointments: Previously was Chairman of the Court of the Bank of England, Whitbread plc, Bunzl plc, Mölnlycke Health Care Limited and Norwich Research Partners LLP and served as Chief Executive of Bunzl plc, Chief Executive of Tootal Group plc and a Director of The Boston Consulting Group. Formerly Non-Executive Director of Geest plc, Marks and Spencer plc, National Westminster Bank plc, Powergen plc, SVG Capital plc, and Norfolk and Norwich University Hospitals Trust. Education: Holds an MA in Economics from Cambridge University, an MS in Industrial Administration from Carnegie Mellon University and an Honorary Doctorate of Civil Law from the University of East Anglia. He is a visiting Fellow at Oxford University. Nationality: British |
Wolfhart Hauser (69)
Non-Executive Director Senior Independent Director Chairman of the Remuneration Committee
Appointed: April 2013 Other appointments: Chairman of FirstGroup plc and a Non-Executive Director of Associated British Foods plc. Past appointments: Chief Executive Officer of Intertek Group plc from 2005 until 2015. Prior to that he was Chief Executive Officer of TÜV Sud AG between 1998 and 2002 and Chief Executive Officer of TÜV Product Service GmbH for ten years. Formerly a Non-Executive Director of Logica plc. Education: Holds a master’s degree in Medicine from Ludwig-Maximilian- University Munich and a Medical Doctorate from Technical University Munich. Nationality: German | ||||||

|

|

| ||||||
| Nick Luff (51) Chief Financial Officer
|
Robert MacLeod (54)
Non-Executive Director
|
Carol Mills (65)
Non-Executive Director
| ||||||
|
Appointed: September 2014 Other appointments: Non-Executive Director of Rolls-Royce Holdings plc. Past appointments: Prior to joining the Group was Group Finance Director of Centrica plc from 2007. Before that was Chief Financial Officer at The Peninsular & Oriental Steam Navigation Company (P&O) and its affiliated companies, having previously held a number of senior finance roles at P&O. Began his career as an accountant with KPMG. Formerly a Non-Executive Director of QinetiQ Group plc and Lloyds Banking Group plc. Education: Has a degree in Mathematics from Oxford University and is a qualified UK Chartered Accountant. Nationality: British |
Appointed: April 2016 Other appointments: Appointed as Chief Executive of Johnson Matthey plc in June 2014 after five years as Group Finance Director. Past appointments: Prior to joining Johnson Matthey, spent five years as Group Finance Director of WS Atkins plc, having joined as Group Financial Controller in 2003. From 1993 to 2002, held a variety of senior finance and M&A roles with Enterprise Oil plc in the UK and US. Formerly a Non-Executive Director of Aggreko plc. Nationality: British |
Appointed: April 2016 Other appointments: Independent Director of Zynga Inc and Entertainment Partners. Past appointments: A member of the Boards of Adobe Systems, Alaska Communications, Tekelec Corporation, Blue Coat Systems, Xactly Corporation, WhiteHat Security and Ingram Micro. From 2004 to 2006, was Executive Vice President and General Manager of the Infrastructure Products Group at Juniper Networks. From 1998 to 2002 was Chief Executive Officer of Acta Technology, and before Acta, spent 16 years at Hewlett-Packard in a number of executive roles. Nationality: American |
| RELX Annual report and financial statements 2018 | Board Directors | 67 | |
|
| ||
| 68 | RELX Annual report and financial statements 2018 | Governance | |
|
| ||
Senior Business Executives

| ||||||
| Kumsal Bayazit | Mark Kelsey | Chet Burchett | Mike Walsh | |||
| Chief Executive Officer | Chief Executive Officer | Chief Executive Officer | Chief Executive Officer | |||
| Scientific, Technical | Risk & Business Analytics | Exhibitions | Legal | |||
| & Medical and Chairwoman, | ||||||
| RELX Technology Forum | ||||||
|
|
|
|
| |||
| Joined in 2004. Appointed to current position in 2019. | Joined in 1989. Appointed CEO Business Information in 2010 and CEO Risk Solutions in 2012. | Joined in 2004. Appointed to current position in 2015. | Joined in 2003. Appointed to current position in 2011. | |||
|
|
||||||
| Previously President, Exhibitions Europe, Chief Strategy Officer, RELX, and Executive Vice President of Global Strategy and Business Development for LexisNexis. Prior to that worked with Bain & Company in New York, Los Angeles, Johannesburg and Sydney. Holds an MBA from Harvard Business School and is a Graduate of the University of California at Berkeley. | Has held a number of senior positions across the Group over the past 30 years. Previously Chief Operating Officer and then Chief Executive Officer of Reed Business Information. Studied at Liverpool University and received his MBA from Bradford University. | Previously President of the Americas for Reed Exhibitions. Prior to that was President and Chief Executive Officer, USA, for Burson-Marsteller, a leading global public relations agency. Holds a degree from Baylor University. | Previously CEO of LexisNexis US Legal Markets and Director of Strategic Business Development Home Depot. Prior to that was a practising attorney at Weil, Gotshal and Manges in Washington DC and served as a consultant with The Boston Consulting Group. Holds a Juris Doctor degree from Harvard Law School and is a graduate of Yale University. | |||
| RELX Annual report and financial statements 2018 | RELX Business Leaders | 69 | |
|
| ||
| RELX Annual report and financial statements 2018 | Chairman’s introduction to Corporate Governance | 71 | |
|
| ||
| RELX Annual report and financial statements 2018 | Corporate Governance Review | 73 | |
|
| ||
| 74 | RELX Annual report and financial statements 2018 | Governance | |
|
| ||
|
Key roles of the Directors
Chairman
◾ Provides leadership of the Board, ensuring that it functions effectively
◾ Ensures that all Directors are sufficiently apprised of matters to make informed judgements, through the provision of accurate, timely and clear information
◾ Promotes high standards of corporate governance and a Board culture of openness and debate
◾ Sets the agenda and chairs meetings of the Board
◾ Chairs the Nominations and Corporate Governance Committees
◾ Facilitates the effective contribution of all of the Directors
◾ Ensures effective dialogue with shareholders
◾ Ensures the performance of the Board, its Committees and individual Directors is assessed annually
◾ Ensures effective induction and development of Directors
Chief Executive Officer
◾ Day-to-day management of the Group, within the delegated authority limits set by the Board
◾ Develops the Group’s strategy for consideration and approval by the Board
◾ Ensures that the decisions of the Board are implemented
◾ Informs and advises the Chairman and Nominations Committee on executive succession planning
◾ Leads communication with shareholders
◾ Promotes and conducts the affairs of the Company with the highest standards of integrity, probity and corporate governance |
Chief Financial Officer
◾ Day-to-day management of the Group’s financial affairs
◾ Responsible for the Group’s financial planning, reporting and analysis
◾ Ensures that a robust system of internal control and risk management is in place
◾ Maintains high-quality reporting of financial and environmental performance internally and externally
◾ Supports the Chief Executive Officer in developing and implementing strategy
Senior Independent Director
◾ Leads the Board’s annual assessment of the performance of the Chairman
◾ Available to meet with shareholders on matters where usual channels are deemed inappropriate
◾ Deputises for the Chairman, as necessary
◾ Serves as a sounding board for the Chairman and acts as an intermediary between the other Directors, when necessary
Non-Executive Directors
◾ Bring an external perspective and constructively challenge and provide advice to the Executive Directors
◾ Effectively contribute to the development of strategy
◾ Scrutinise the performance of management in meeting agreed goals and monitor the delivery of the Group’s strategy
◾ Serve as members of Board Committees and chair the Audit and Remuneration Committees
|
Effectiveness
| RELX Annual report and financial statements 2018 | Corporate Governance Review | 75 | |
|
| ||
| 76 | RELX Annual report and financial statements 2018 | Governance | |
|
| ||
Key activities of the Board
The Board met regularly through the year and, in 2018, held seven scheduled meetings. There was also one additional meeting held in February 2018, to deal with matters solely related to the Simplification. The Board’s programme ensures that all relevant matters are considered during scheduled meetings. Additionally, throughout the year, the Non-Executive Directors meet without the Executive Directors present on a regular basis.
In 2018, the Board considered the following:
|
Business and financial performance ◾ Reports from the Chief Executive Officer and Chief Financial Officer on the Group’s actual and forecast operational and financial performance
◾ Annual and interim financial results
◾ Annual review of invested capital |
Strategy, business and functional reviews ◾ Strategy and business presentations, including two full-day strategy reviews
◾ Budgets and Annual Strategy
◾ Updates on major acquisitions, investments and disposals
◾ Capital structure and funding requirements
◾ Group tax strategy review
◾ Prospects of the Group and Viability Statement |
Risk, legal, governance and regulatory matters ◾ The Group’s principal risks and ongoing monitoring of risk management and internal control
◾ The Group’s operating and governance principles
◾ Board succession and executive talent management
◾ Appointments and re-appointments to the Board and appointments to Board Committees
◾ Litigation update
◾ Reports from the Committee Chairmen on the key activities of the Board’s Committees
◾ Matters Reserved for the Board and the Terms of Reference for each Board Committee
◾ Corporate structure simplification
◾ Modern Slavery Act Statement/Gender Pay Gap Report/General Data Protection Regulation readiness and compliance with data privacy legislation
◾ Cyber security
◾ Approve updated Group Ethics and Business Conduct Policy
◾ The requirements of the New Code and associated action for the Group |
Stakeholders ◾ Investor relations activities including feedback from investors
◾ Dividend declarations and policy
◾ Share buyback programme
◾ Approval of shareholder communications, such as the Annual Report, Notices of Meetings, and the Corporate Simplification Prospectus and Circular
◾ Review of Corporate Responsibility Programme
◾ Updates on media relations
◾ Assessing customer satisfaction
◾ Reviewing the Group’s Supply Chain
◾ Review of the results of 2018 group-wide employee engagement survey |
| RELX Annual report and financial statements 2018 | Corporate Governance Review | 77 | |
|
| ||
| 78 | RELX Annual report and financial statements 2018 | Governance | |
|
| ||
Attendance at meetings of the Board and Board Committees
The table below shows the attendance of Directors at meetings of the Board and the Board Committees during the year. Attendance is expressed as the number of meetings attended out of the number eligible to be attended.
| Director | |
Committee appointments |
|
Board | (1) | Audit | Remuneration | Nominations | |
Corporate Governance |
|
|||||||||||||||
| Anthony Habgood (Chairman) |

|
8/8 | – | 4/4 | 4/4 | 4/4 | Board Committee membership key
| |||||||||||||||||||
| Erik Engstrom |
– | 8/8 | – | – | – | – | ||||||||||||||||||||
| Nick Luff |
– | 8/8 | – | – | – | – | ||||||||||||||||||||
| Wolfhart Hauser |

|
8/8 | – | 4/4 | 4/4 | 4/4 | ||||||||||||||||||||
| Adrian Hennah (2) |

|
8/8 | 4/4 | – | 1/1 | 4/4 | ||||||||||||||||||||
| Marike van Lier Lels (3) |

|
8/8 | 4/4 | – | 1/1 | 4/4 | ||||||||||||||||||||
| Robert MacLeod |

|
8/8 | – | 4/4 | – | 4/4 | ||||||||||||||||||||
| Carol Mills (4) |

|
7/8 | 4/4 | – | – | 4/4 | ||||||||||||||||||||
| Linda Sanford |

|
8/8 | – | 4/4 | – | 4/4 | ||||||||||||||||||||
| Ben van der Veer (5) |

|
8/8 | 2/3 | – | 3/3 | 4/4 | ||||||||||||||||||||
| Suzanne Wood |

|
8/8 | 4/4 | – | – | 4/4 |
| (1) | In addition to the seven scheduled meetings , there was an additional meeting to discuss matters related to the Simplification. Serving Directors also attended two full-day strategy and business review meetings. |
| (2) | Mr Hennah was appointed as Chairman of the Audit Committee with effect from 19 April 2018, and a member of the Nominations Committee with effect from 1 September 2018. |
| (3) | Ms van Lier Lels was appointed as a member of the Nominations Committee with effect from 1 September 2018. |
| (4) | Ms Mills was unable to attend the unscheduled February meeting of the Board, held at short notice to discuss matters related to the Simplification. She was provided with the papers in advance of the meeting for her review and comment (which was provided to the Chairman), and subsequent to the meeting taking place was provided with a copy of the minutes. |
| (5) | Mr van der Veer stepped down as Chairman of the Audit Committee on 19 April 2018, and as a member of the Audit and Nominations Committees with effect from 1 September 2018. |
| RELX Annual report and financial statements 2018 | Corporate Governance Review | 79 | |
|
| ||
| 80 | RELX Annual report and financial statements 2018 | Governance | |
|
| ||
| RELX Annual report and financial statements 2018 | Corporate Governance Review | 81 | |
|
| ||
| 82 | RELX Annual report and financial statements 2018 | Governance | |
|
| ||
|
Viability statement
|
||
| The UK Corporate Governance Code requires Directors to assess the prospects of the Group over a period significantly longer than twelve months and to state whether they have a reasonable expectation that the Company will be able to continue in operation and meet its liabilities as they fall due over the period of their assessment.
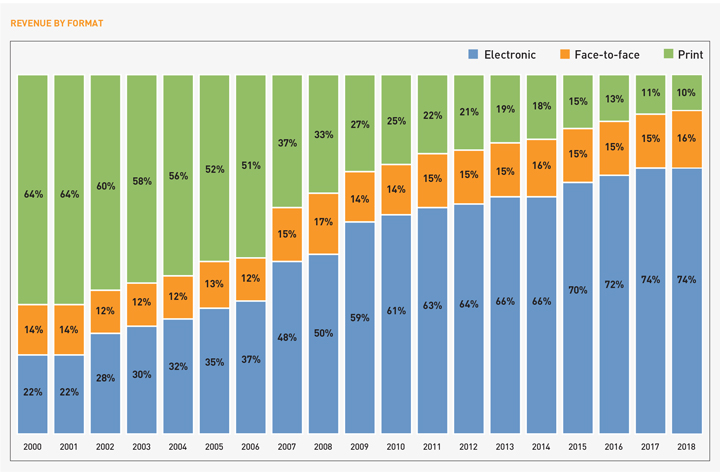
Assessing the Group’s Prospects The Group develops information-based analytics and decision tools for professional and business customers in the Scientific, Technical &Medical, Risk and Business Analytics, Legal and Exhibitions sectors. The Group has leading positions in long-term growth markets, deep customer understanding and has developed innovative solutions that often account for about 1% of our customers’ cost base but can have a significant and positive impact on the economics of the remaining 99%. Having effectively transitioned the business from print to digital, the Group is systematically migrating its information solutions toward higher value-add decision tools, adding broader data sets, embedding more sophisticated analytics and leveraging more powerful technology. We believe this evolution is improving our business profile and positions the Group for future business success.
The Group’s prospects are assessed through the annual strategy planning process. This process includes a review of assumptions made and assesses each business area’s longer-term plan. The resulting three-year strategy plan forms the basis for Group and divisional targets and in-year budgets. Objectives are set with consideration given to the economic and regulatory environment, and to customer trends, as well as incorporating risks and opportunities. The most recent three-year strategy business plan was agreed by the Directors in September 2018.
In assessing the Group’s prospects, our current position and principal risks are considered as follows:
Current position and business model ◾ Diversified business in terms of sectors, markets, customers, geographies and products and services so that we are not dependent on any one business, customer, region or product
◾ High percentage of subscription and recurring revenue streams
◾ Leading positions in long-term global growth markets
◾ Low working capital and capital investment requirements leading to high levels of cash generation
◾ Clear strategy focused on organic growth supplemented by selective acquisitions in higher growth areas
◾ Continued development of increasingly sophisticated information-based analytics and decision tools
◾ Expansion into higher growth adjacencies and geographies primarily through organic investment augmented with selective acquisitions
Further details on our strategy and 2018 progress are on pages 4 and 5.
Principal risks related to our business model ◾ Challenges to the intellectual property rights of content embedded in our products and services
◾ Disruption or loss of data sources that our businesses rely on due to regulation or other reasons
◾ Changes to the paid subscription model for our primary research business within Scientific, Technical & Medical
|
◾ Technological failure of our electronic platforms and networks
◾ Failure of our cyber security measures resulting in unauthorised access to our systems and breach of data privacy
Detailed descriptions of all principal risks and mitigations are on pages 60 to 63.
Assessing the Group’s Viability The three-year strategy plan for our businesses includes management’s assessment of the anticipated operational risks affecting the business and assumes that current economic conditions broadly persist, financing will be available on similar terms to those negotiated recently and interest rates will follow market expectations. Management then considers the viability of the business should unexpected events, linked to the principal risks, occur. To first make the assessment, the financial impact of each principal risk on revenue and cashflow is estimated. Owing to the diversified nature of the Group, no individual risk was estimated to have an impact close to the amount, broadly estimated at one third of total Group cashflow, necessary for a breach of the covenant in the Group’s $3.0bn committed bank facility.
The assessment then considers various stress-test scenarios under which multiple risks occur simultaneously accompanied by an inability to access the debt capital markets to refinance scheduled liabilities as they become due, together with an increase in interest rates much faster than currently expected. The resulting analysis, which assumes share buybacks are suspended but dividends continue uninterrupted, then considers the impact on available headroom and whether any scenario results in breaching the covenant in the committed bank facility.
The worst-case stress case modelled a combination of the following risks: (a) the inability to use certain third-party data resources; (b) an adverse impact on revenue from a shift away from the paid subscription model; and (c) having our systems disrupted by a cyber security event. The analysis concluded that even with the simultaneous occurrence of these three risks, no access to the debt capital markets and a sharply rising interest rate environment, the Group would still have sufficient funds to trade, settle its liabilities as they come due and remain compliant with the covenant in its committed bank facility, whilst still paying forecast dividends.
In addition to scenario modelling, the Directors bi-annually review the Group’s principal risks, assess the likelihood and impact of each risk together with the effectiveness of mitigating controls, and consider emerging risks. The Directors also receive regular updates from management on treasury, tax, acquisitions and divestments, and significant risk areas including information security, technology and legal and regulatory matters. Finally, separate from the annual strategy plan, the Directors periodically receive updates from business area management on their operations, prospects and risks. Whilst these reviews and discussions naturally focus more closely on the quantifiable risks facing the business within the three-year planning period, they also cover longer-term risks.
As a result of stress-testing the three-year strategy plan, supported by regular reviews of risk during the year, the Directors confirm that they have a reasonable expectation that the Group will be able to continue its operations and meet its liabilities as they fall due over the next three years and are not aware of any longer-term operational or strategic risks that would result in a different outcome from the three-year review. |
| RELX Annual report and financial statements 2018 | 83 | |
|
| ||
| 84 | RELX Annual report and financial statements 2018 | Governance | |
|
| ||
| RELX Annual report and financial statements 2018 | 85 | |
|
| ||
| 86 | RELX Annual report and financial statements 2018 | Governance | |
|
| ||
2018 Corporate Governance Code
Following the publication by the FRC of the new Corporate Governance Code in July 2018, the Committee has reviewed the updated provisions relating to remuneration matters. The Committee will report on how these have been implemented in next year’s Report. You will see that with respect to workforce engagement, we have decided to designate a non-executive director to take on responsibility for this and have introduced a fee for this activity.
2019 Implementation of Remuneration Policy
In line with increases for the wider employee population, and consistent with the 2019 salary increase guidelines for UK based employees, the Committee has approved 2019 salary increases for the Executive Directors of 2.5%. As the CEO pays pension contributions and a participation fee which increase each year, after taking into account these increasing fees, his 2019 salary after these increasing deductions will decrease again in 2019 compared to 2018.
Following a review in 2019, we will propose a directors’ remuneration policy for approval by shareholders at the AGM in April 2020.
The audited sections of the Report are clearly marked.
Wolfhart Hauser
Chairman, Remuneration Committee
| RELX Annual report and financial statements 2018 | Directors’ Remuneration Report | 87 | |
|
| ||
| 88 | RELX Annual report and financial statements 2018 | Governance | |
|
| ||
2018 Annual Incentive
Set out below is a summary of performance against each financial measure and Key Performance Objective and the resulting annual incentive payout for 2018:
| Erik Engstrom | Nick Luff | |||||||||||||||
| Performance measure |
Relative weighting % at target |
Achievement vs target | Payout % of target |
Payout % of target |
||||||||||||
| Revenue | 35% | Revenue was £7,492m versus a target(1) of £7,499m, resulting in achievement versus target of 99.9% and a payout(2) of 98.5% of 35%. | 34.5% | 34.5% | ||||||||||||
| Adjusted net profit after tax |
35% | Adjusted net profit after tax was £1,674m versus a target(1) of £1,665m, resulting in achievement versus target of 100.5% and a payout(2) of 105.0% of 35%. | 36.8% | 36.8% | ||||||||||||
| Cash conversion | 15% | Cash flow was £2,243m (96% conversion) versus a target(1) of £2,182m, resulting in achievement versus target of 102.8% and a payout(2) of 128.0% of 15%. | 19.2% | 19.2% | ||||||||||||
| Key Performance Objectives (KPOs)(3) | 15% | A detailed description of the KPOs and achievement against those KPOs for each Executive Director is set out below. | 13.75% | 14.5% | ||||||||||||
| Total | 100% | 104.2% | 104.9% | |||||||||||||
| Total AIP payout as % of salary | ||||||||||||||||
| Cash | 100% | 104.2% | 104.9% | |||||||||||||
| Deferred Shares | 50% | 52.1% | 52.5% | |||||||||||||
| Total | 150% | 156.3% | 157.4% | |||||||||||||
The Cash AIP (£1,269,277 for the CEO and £752,818 for the CFO) will be paid in Q1 2019 and the Deferred Shares (with a current value of £634,639 in the case of the CEO and £376,409 in the case of the CFO) will be released in Q1 2022. The release of Deferred Shares is not subject to any further performance conditions, but is subject to malus and claw-back.
| (1) | On an equivalent basis (at actual exchange rates and after the net impact of acquisitions and disposals completed during the year). |
| (2) | For achievement above target, each 0.1% of overachievement increased the payout ratio for that component by 1 percentage point up to a maximum payout ratio of 150% at 105% achievement vs target. For achievement below target, each 0.1% of underachievement reduced the payout ratio by 1.5 percentage points down to a threshold payout ratio of 10% at 94% achievement vs target. |
KPOs – Erik Engstrom
| KPO | Relative weighting % at target |
Achievement vs KPO | Payout % of target |
|||||||||
| Risk Mitigation |
3% | This KPO was almost fully achieved. | 2.5% | |||||||||
| ◾ Cyber security training provided to 100% of employees, social engineering testing (e.g. phishing simulations) covering RELX globally completed and requirement to continue re-training and re-testing of employees introduced. Met target. ◾ Three cyber security incident response simulations completed at senior levels within the business divisions; six security awareness training sessions delivered; four penetration tests of financial integrity processes performed; lessons learned incorporated into Incident Response Plan. Met target. |
||||||||||||
|
◾ Five out of six elements of the Compliance Testing and Monitoring Plan were completed and an In-Person Training Assessment was completed and recommendations for implementation were agreed. Target almost fully met. |
||||||||||||
| Customers | 3% | This KPO was almost fully achieved. |
2.5% | |||||||||
| ◾ Expanded use of customer satisfaction and loyalty metrics in business reviews and in some of the business areas’ annual incentive plans. Target almost fully met. |
||||||||||||
| ◾ RELX Accessibility awards introduced to recognise exceptional employee efforts to advance accessibility. Met target. |
||||||||||||
|
◾ Increased the number and reach of our business community working groups and projects which focus on the advancement of the rule of law. Met target. |
||||||||||||
| People | 3% | This KPO was fully achieved. |
3.0% | |||||||||
| ◾ Assessed and reported on employee engagement via employee opinion surveys, with the highest employee participation rates and employee satisfaction scores in the last 15 years. Exceeded target. |
||||||||||||
| ◾ Employee alignment with company strategy and values measured via employee opinion survey and workshops held throughout the business to further drive alignment. Met target. |
||||||||||||
|
◾ New diversity and inclusion (D&I) initiatives launched/existing initiatives expanded and indicators to track D&I progress established. Met target. |
||||||||||||
| RELX Annual report and financial statements 2018 | Directors’ Remuneration Report | 89 | |
|
| ||
| 90 | RELX Annual report and financial statements 2018 | Governance | |
|
| ||
Multi-year incentives (granted under the Remuneration Policy in effect prior to the approval by shareholders of the current Remuneration Policy at the Annual General Meetings in April 2017)
Multi-year incentives with a performance period ended 31 December 2018 were the 2016–2018 cycles of BIP, LTIP and ESOS granted to Executive Directors.
The Committee assessed the performance measures for these awards and made an overall assessment of underlying business performance and other relevant factors. The vesting outcome resulting from this review is summarised below.
| LTIP: 2016–18 cycle performance outcome
|
||||||||||||||||||||
| Performance measure |
Weighting | Performance range and vesting levels set at grant(1) |
Achievement against the performance range |
Resulting vesting percentage |
||||||||||||||||
| TSR over the three-year |
1/3rd | below median | 0% | Near the upper | 59.8% | |||||||||||||||
| performance period(2) |
median | 30% | quartile of sterling | |||||||||||||||||
| upper quartile | 100% | and euro comparator | ||||||||||||||||||
| groups and below | ||||||||||||||||||||
| median of US dollar | ||||||||||||||||||||
| comparator group | ||||||||||||||||||||
| Average growth in adjusted EPS over |
1/3rd | below 5% p.a. | 0% | 7.0% p.a. | 65.0% | |||||||||||||||
| the three-year performance period(3) |
5% p.a. | 33% | ||||||||||||||||||
| 6% p.a. | 52.5% | |||||||||||||||||||
| 7% p.a. | 65% | |||||||||||||||||||
| 8% p.a. | 75% | |||||||||||||||||||
| 9% p.a. | 85% | |||||||||||||||||||
| 10% p.a. | 92.5% | |||||||||||||||||||
| 11% p.a. and above | 100% | |||||||||||||||||||
| ROIC in the third year of the |
1/3rd | below 12.3% | 0% | 13.2%(4) | 81.0% | |||||||||||||||
| performance period(3) |
12.3% | 33% | ||||||||||||||||||
| 12.55% | 52.5% | |||||||||||||||||||
| 12.8% | 65% | |||||||||||||||||||
| 13.05% | 75% | |||||||||||||||||||
| 13.3% | 85% | |||||||||||||||||||
| 13.55% | 92.5% | |||||||||||||||||||
| 13.8% and above | 100% | |||||||||||||||||||
| Total vesting percentage: |
68.6% | |||||||||||||||||||
|
(1) Calculated on a straight-line basis for performance between the points. (2) In respect of the euro TSR comparator group, RELX NV shares were, subsequent to the merger of RELX NV into RELX PLC, replaced with Euronext Amsterdam listed RELX PLC shares priced in euros and, in respect of the US dollar TSR comparator group, RELX NV ADRs were, subsequent to the merger, replaced with RELX PLC ADRs. (3) Growth in adjusted EPS at constant currencies and ROIC are calculated as set out in the Chief Financial Officer’s report on pages 54 to 59 and note 10 to the consolidated financial statements on page 141, with adjustments made to remove the effect on ROIC of changes in exchange rates, pension deficits and accounting standards over the three-year performance period. (4) For 2018, ROIC on pages 57 to 58 of the Chief Financial Officer’s report of 13.2% is the same as ROIC under the plan methodology after adjustments for changes in exchange rates, pension deficits and accounting standards.
|
| |||||||||||||||||||
| BIP: 2016–18 cycle performance outcome
|
||||||||||||||||||||
| Performance measure |
Weighting | Performance range and vesting levels set at grant (1) |
Achievement against the performance range |
Resulting vesting percentage |
||||||||||||||||
| Average growth in adjusted EPS over |
50% | below 4% p.a. | 0% | 7.0% p.a. | 80.0% | |||||||||||||||
| the three-year performance period(2) |
4% p.a. | 50% | ||||||||||||||||||
| 6.5% p.a. | 75% | |||||||||||||||||||
| 9% p.a. or above | 100% | |||||||||||||||||||
| ROIC in the third year of the |
50% | below 12.3% | 0% | 13.2%(3) | 95.0% | |||||||||||||||
| performance period(2) |
12.3% | 50% | ||||||||||||||||||
| 12.8% | 75% | |||||||||||||||||||
| 13.3% or above | 100% | |||||||||||||||||||
| Total vesting percentage: |
87.5% | |||||||||||||||||||
| (1) | Calculated on a straight-line basis for performance between the points. |
| (2) | Growth in adjusted EPS at constant currencies and ROIC are calculated as set out in the Chief Financial Officer’s report on pages 54 to 59 and note 10 to the consolidated financial statements on page 141, with adjustments made to remove the effect on ROIC of changes in exchange rates, pension deficits and accounting standards over the three-year performance period. |
| (3) | For 2018, ROIC on pages 57 to 58 of the Chief Financial Officer’s report of 13.2% is the same as ROIC under the plan methodology after adjustments for changes in exchange rates, pension deficits and accounting standards. |
| RELX Annual report and financial statements 2018 | Directors’ Remuneration Report | 91 | |
|
| ||
| 92 | RELX Annual report and financial statements 2018 | Governance | |
|
| ||
Scheme interests awarded during the financial year (audited)
| LTIP – PERFORMANCE SHARE AWARDS | ||||||||||||
| Basis on which award is made |
Face value of award at grant(1) |
Value of awards if vest in line with expectations(2) |
Percentage of maximum that would be received if threshold performance achieved(3) |
|
End of performance period | |||||||
| Erik Engstrom | 450% of salary | £5,348,499 | £2,674,250 | If the measure with the lowest payout at threshold pays out at threshold, the overall payout is 2%. If each measure pays out at threshold, the overall payout is 25% | 31 December 2020 | |||||||
| Nick Luff | 375% of salary | £2,624,636 | £1,312,318 | |||||||||
| (1) | The face value of the LTIP awards granted in February 2018 was calculated using (i) the middle market quotation of a PLC ordinary share (£14.915); (ii) the closing price of an NV ordinary share (€16.87); and (iii) the GBP:EUR exchange rate on the trading day before the date of grant of 19 February 2018. These share prices were used to determine the number of awards granted. Subsequent to the corporate simplification which took effect on 8 September 2018, each award over an NV ordinary share has been exchanged for an award over the same number of PLC ordinary shares. |
| (2) | Vesting in line with expectations for LTIP is as per the performance scenario chart disclosed on page 87 of the 2016 Remuneration Report, i.e. 50%. |
| (3) | Threshold payout levels for each measure under LTIP have been included as it is possible to achieve threshold, and hence payout, in respect of just one of the measures (or, for TSR, in respect of one of the three TSR comparator groups). |
The LTIP awards granted in 2018 are based on ROIC, EPS and TSR weighted 40%:40%:20% respectively and assessed independently. The targets and vesting scales applicable to these awards are set out on page 94 of the 2017 Remuneration Report.
| RELX Annual report and financial statements 2018 | Directors’ Remuneration Report | 93 | |
|
| ||
| 94 | RELX Annual report and financial statements 2018 | Governance | |
|
| ||
Multi-year incentive interests (audited)
The tables below and on page 95 set out vested but unexercised and unvested options and unvested share awards held by the Executive Directors including details of awards granted, options exercised and awards vested during the year of reporting.
All outstanding unvested options and share awards are subject to performance conditions. For disclosure purposes, any PLC ADRs awarded under the multi-year incentive plans are included as ordinary shares. Between 31 December 2018 and the date of this Report, there have been no changes in the options or share awards held by the Executive Directors.
As a result of the corporate simplification to merge RELX NV into RELX PLC, which took effect on 8 September 2018, all outstanding options and awards which were granted over shares in RELX NV were exchanged for outstanding options and awards over shares in RELX PLC priced in euros and listed on Euronext Amsterdam on a one-for-one basis.
Erik Engstrom
| OPTIONS | Year of grant |
No. of options held on 1 Jan 2018 |
No. of options granted during 2018 |
Option price on date of grant |
No. of options exercised during 2018 |
Market price per share at exercise |
No. of options held on 31 Dec 2018 |
Unvested options vesting on |
Options exercisable until |
|||||||||||||||||||||||||||
| 2014 | 145,604 | £9.245 | 145,604 | 07 Apr 24 | ||||||||||||||||||||||||||||||||
| 158,166 | €10.286 | 158,166 | 07 Apr 24 | |||||||||||||||||||||||||||||||||
| 2015 | (1) | 119,771 | £11.520 | 114,584 | 02 Apr 25 | |||||||||||||||||||||||||||||||
| 126,358 | €15.003 | 120,886 | 02 Apr 25 | |||||||||||||||||||||||||||||||||
| 2016 | 112,690 | £12.550 | 112,690 | Mar 19 | 15 Mar 26 | |||||||||||||||||||||||||||||||
| 119,312 | €15.285 | 119,312 | Mar 19 | 15 Mar 26 | ||||||||||||||||||||||||||||||||
| 2017 | 96,996 | £14.945 | 96,996 | Feb 20 | 27 Feb 27 | |||||||||||||||||||||||||||||||
| 102,405 | €16.723 | 102,405 | Feb 20 | 27 Feb 27 | ||||||||||||||||||||||||||||||||
| Total |
981,302 | 970,643 | ||||||||||||||||||||||||||||||||||
| SHARES | Year of grant |
No. of unvested shares held on 1 Jan 2018 |
No. of shares awarded during 2018 |
Market price per share at award |
No. of shares vested during 2018 |
Market price per share at vesting |
No. of unvested shares held on 31 Dec 2018 |
End of performance period |
Date of vesting |
|||||||||||||||||||||||||||
| BIP |
2015 | (1) | 97,607 | €15.003 | 90,608 | €16.870 | ||||||||||||||||||||||||||||||
| 2016 | 94,965 | €15.285 | 94,965 | Dec 2018 | Feb 2019 | |||||||||||||||||||||||||||||||
| 2017 | 81,781 | €16.723 | 81,781 | Dec 2019 | Feb 2020 | |||||||||||||||||||||||||||||||
| LTIP |
2015 | (1) | 119,771 | £11.520 | 105,518 | £14.915 | ||||||||||||||||||||||||||||||
| 126,359 | €15.003 | 111,322 | €16.870 | |||||||||||||||||||||||||||||||||
| 2016 | 112,690 | £12.550 | 112,690 | Dec 2018 | Feb 2019 | |||||||||||||||||||||||||||||||
| 119,312 | €15.285 | 119,312 | Dec 2018 | Feb 2019 | ||||||||||||||||||||||||||||||||
| 2017 | 96,996 | £14.945 | 96,996 | Dec 2019 | Feb 2020 | |||||||||||||||||||||||||||||||
| 102,405 | €16.723 | 102,405 | Dec 2019 | Feb 2020 | ||||||||||||||||||||||||||||||||
| 2018 | 179,318 | £14.915 | 179,318 | Dec 2020 | Feb 2021 | |||||||||||||||||||||||||||||||
| 178,482 | €16.870 | 178,482 | Dec 2020 | Feb 2021 | ||||||||||||||||||||||||||||||||
| Total |
951,886 | 357,800 | 307,448 | 965,949 | ||||||||||||||||||||||||||||||||
| (1) | The performance outcomes for the 2015 ESOS options, BIP and LTIP were disclosed on pages 86 and 87 of the 2017 Remuneration Report. |
| RELX Annual report and financial statements 2018 | Directors’ Remuneration Report | 95 | |
|
| ||
| 96 | RELX Annual report and financial statements 2018 | Governance | |
|
| ||
Performance graphs
The graphs below show total shareholder returns for RELX calculated on the basis of the average share price in the 30 trading days before the respective year end and assuming dividends were reinvested. RELX’s performance is compared with the FTSE 100. The three-year chart covers the performance period of the 2016–18 cycle of the LTIP.
| 3 years | 5 years | 10 years | ||
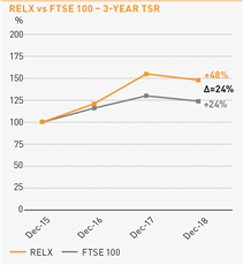
|
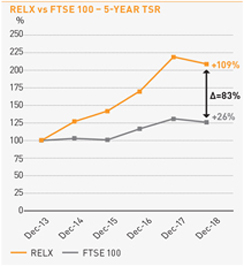
|
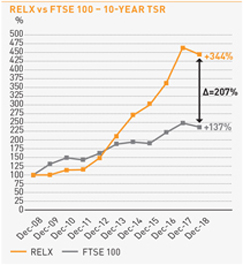
| ||
CEO historical pay table
The table below shows the historical CEO pay over an eleven-year period. The year 2008 has been included to show the pre-2009 position, as 2009 was a transition year with three CEO incumbents.
| £’000 | 2008 | 2009(1) | 2010 | 2011 | 2012 | 2013 | 2014 | 2015 | 2016 | 2017 | 2018 | |||||||||||||||||||||||||||||||||||||||||
| CEO | Sir Crispin Davis |
Sir Crispin Davis |
Ian Smith |
Erik Engstrom |
Erik Engstrom |
Erik Engstrom |
Erik Engstrom |
Erik Engstrom |
Erik Engstrom |
Erik Engstrom |
Erik Engstrom |
Erik Engstrom |
Erik Engstrom |
|||||||||||||||||||||||||||||||||||||||
| Annualised base salary | 1,181 | 1,181 | 900 | 1,000 | 1,000 | 1,025 | 1,051 | 1,077 | 1,104 | 1,131 | 1,160 | 1,189 | 1,218 | |||||||||||||||||||||||||||||||||||||||
| Annual incentive payout as a % of maximum | 61% | 30% | 37% | 71% | 67% | 66% | 73% | 70% | 71% | 70% | 68% | 69% | 78% | |||||||||||||||||||||||||||||||||||||||
| Multi-year incentive vesting as a % of maximum | 100% | 0% | 0% | 0% | 0% | 0% | 70% | (2) | 96% | (2) | 90% | (2) | 97% | (2) | 97% | (2) | 92% | (2) | 81% | (2) | ||||||||||||||||||||||||||||||||
| CEO total | 7,193 | 706 | 1,033 | 426 | 3,140 | 2,738 | 11,145 | (3) | 5,463 | 17,447 | (4) | 11,416 | (5) | 11,399 | (6) | 8,748 | (7) | 8,414 | (8) | |||||||||||||||||||||||||||||||||
| (1) | Sir Crispin Davis was CEO from 1 January to 31 March, Ian Smith was CEO from 1 April to 10 November and Erik Engstrom was CEO from 11 November to 31 December. |
| (2) | The 2018, 2017, 2016 and 2015 percentages reflect BIP, LTIP and ESOS. The 2014 percentage reflects the final tranche of the discontinued Reed Elsevier Growth Plan (REGP), BIP and ESOS. The 2013 percentage reflects BIP and ESOS only and the 2012 figure reflects BIP and the first tranche of the discontinued REGP. |
| (3) | The 2012 figure reflects the vesting of the first tranche of the discontinued REGP and includes the entire amount that was performance tested over the 2010–12 period, including the 50% of shares deferred until 2015 in accordance with the plan rules including £3m attributed to share price appreciation. |
| (4) | The 2014 figure includes the vesting of the second and final tranche of the discontinued REGP and includes £8.8m attributed to share price appreciation. |
| (5) | The 2015 figure includes £4.4m attributed to share price appreciation. |
| (6) | The 2016 figure includes £4.2m attributed to share price appreciation. |
| (7) | The 2017 figure includes £1.7m attributed to share price appreciation. The share award value has been restated for actual share prices and exchange rates applicable on the dates of vesting (see page 87 for further detail). |
| (8) | The 2018 figure includes £1.5m attributed to share price appreciation. |
| RELX Annual report and financial statements 2018 | Directors’ Remuneration Report | 97 | |
|
| ||
| 98 | RELX Annual report and financial statements 2018 | Governance | |
|
| ||
Shareholder voting at 2018 Annual General Meeting
At the Annual General Meeting of RELX PLC, on 19 April 2018, votes cast by proxy and at the meeting in respect of the Directors’ remuneration were as follows:
| Resolution | Votes For | % For | Votes Against | % Against | Total votes cast | Votes Withheld | ||||||||||||||||||||||||||||||||||||||
| Remuneration Report (advisory) |
562,551,352 | 83.62% | 110,216,944 | 16.38% | 672,768,296 | 169,795,175 | ||||||||||||||||||||||||||||||||||||||
Wolfhart Hauser
Chairman, Remuneration Committee
20 February 2019
| RELX Annual report and financial statements 2018 | Directors’ Remuneration Report | 99 | |
|
| ||
| 100 | RELX Annual report and financial statements 2018 | Governance | |
|
| ||
OTHER BENEFITS
Purpose and link to strategy
To provide competitive benefits at appropriate cost.
Operation
Other benefits, subject to periodic review, may include private medical and dental cover, life assurance, tax return preparation costs, car benefits, directors’ and officers’ liability insurance, relocation benefits and expatriate allowances and other benefits available to employees generally, including, where appropriate, the tax on such benefits.
Performance framework
N/A
Maximum value
The maximum for ongoing benefits for Executive Directors will not normally exceed 10% of salary (excluding relocation benefits and any tax related charge on benefits which is met by the Company). However, the Committee may provide reasonable benefits beyond this amount in exceptional situations, such as a change in the individual’s circumstances caused by the Company, or if there is a significant increase in the cost of providing the agreed benefit.1
AIP (ANNUAL INCENTIVE PLAN)
Purpose and link to strategy
The annual incentive provides focus on the delivery of annual financial targets and the achievement of annual objectives and milestones which are chosen to align with the company’s strategy and create a platform for sustainable future performance. The compulsory deferral of one-third of any annual incentive earned into RELX shares for three years promotes longer-term alignment of Executive Directors’ interests with shareholders’ interests, including an element of post-termination shareholding.
Why performance measures are chosen and how targets are set
Performance measures include a balanced set of financial targets and Key Performance Objectives (KPOs), which are appropriately weighted and which support current strategy and incentivise the Executive Directors to achieve the desired outcomes without undue risk of focusing on any one financial measure.
The targets are designed to be challenging. They are set with reference to the previous year’s performance and internal and external forecasts for the following year.
Operation
The Committee reviews and sets the financial targets and KPOs annually, taking into account internal forecasts and strategic plans. It approves four to six KPOs for each Executive Director, reflecting critical business priorities for which each is accountable. At least one KPO will relate to the achievement of sustainability targets.
Following year end, the Committee compares actual performance with the financial targets and assesses the achievement of individual KPOs. Two-thirds of any annual incentive earned is paid in cash to the Executive Director and the remaining one-third is deferred into RELX shares, which are not released to the Executive Director for three years.
Dividend equivalents accrued during the deferral period are payable in respect of the shares that vest.
On a change in control, the default position is that deferred shares vest. Alternatively, the Committee may determine that deferred shares will not vest and will instead be exchanged for equivalent awards in the acquiring company.
Performance framework
The measures include financial targets, which have a weighting of at least 70%, and individual KPOs, with each element assessed separately.
| ◾ | The minimum payout is zero. |
| ◾ | If threshold is reached for each of the financial measures, the overall payout for the financial measures is 10.5% of salary. If the financial measure with the lowest weighting pays out at threshold and the others do not pay out at all, the overall payout for financial measures is 1.5% of salary. There is no threshold level for KPOs. |
| ◾ | Payout for target performance is 150% of salary. |
Following an assessment of achievement and scoring of KPOs, the Committee agrees the overall level of earned incentive for each Executive Director.
Committee discretion applies.2,3,4
Maximum value
The maximum potential annual incentive is 200% of annual base salary. This includes the deferred share element but excludes dividend equivalents payable in respect of the deferred shares.
Recovery of sums paid
Claw-back applies.5
| RELX Annual report and financial statements 2018 | Directors’ Remuneration Report | 101 | |
|
| ||
| 102 | RELX Annual report and financial statements 2018 | Governance | |
|
| ||
| (6) | Explanation of differences between the company’s policy on Executive Directors’ remuneration and the policy for other employees: Incentives: A larger percentage of Executive Directors’ remuneration is performance related than that of other employees. All managers participate in an annual incentive plan, but participation levels, measures and targets vary according to their role, seniority and local business priorities. Approximately 100 senior executives currently participate in the LTIP and about 1,000 participate in the Executive Share Option Scheme (ESOS). Grant levels under the plans vary according to role and seniority. In considering the remuneration policy for Executive Directors, under which the Executive Directors only participate in the AIP and the LTIP, the Committee considered the incentive plan participation for the wider senior management population. Other benefits: The range and level of retirement and other benefits provided to employees vary according to role, seniority and local market practice. This is to ensure that we provide competitive packages which are appropriate to specific roles. In reducing the maximum company contribution for Executive Directors under the defined contribution pension plan, the Committee took into account the contribution rates for Executive Directors and for the wider employee population. |
| (7) | Changes to pay components: The changes which were made since the previous remuneration policy, together with the rationale for the changes, are described in the Committee Chairman’s introduction on pages 81 to 83 of the Annual Reports and Financial Statements 2016 and in notes 1 and 5 above. |
Remuneration outcomes in different performance scenarios
The Committee considers the level of remuneration that may be paid in the context of the performance delivered and value added for shareholders. The charts below are an illustration of how the CEO’s and CFO’s regular annual remuneration could vary under different performance scenarios. The salary, benefits and pension levels are the same in all three scenarios in each chart. Salary is based on 2017 salary. Benefits is based on the 2016 Single Total Figure table. Pension, annual incentive and LTIP are all based on the policy table’s award levels and percentages applied to the 2017 salary. Annual incentive amounts include the one-third portion which is subject to compulsory deferral into RELX shares for three years, although the deferral portion is separately identified within the annual incentive amount in the charts. The performance assumptions which have been used are as follows: Minimum means no AIP payout and no LTIP vesting. In line with expectations means AIP payout at 150% of salary (of which one-third is deferred into shares) and LTIP vesting at half of the award. Maximum means AIP payout at 200% of salary (of which one-third is deferred into shares) and LTIP vesting at 100% of the award.
No share price movement is assumed and any dividend equivalents payable in respect of the AIP deferred shares and the LTIP are not included.
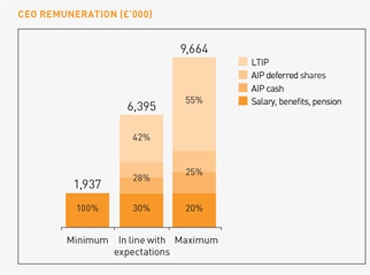
|
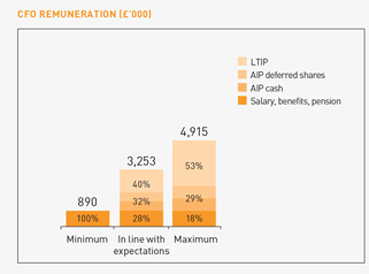
|
| RELX Annual report and financial statements 2018 | Directors’ Remuneration Report | 103 | |
|
| ||
| 104 | RELX Annual report and financial statements 2018 | Governance | |
|
| ||
Policy on payments for loss of office (continued)
| GENERAL 1 | INCENTIVES | |
|
Mutually agreed termination/termination by the Company other than for cause2 | ||
| The Executive Director would be entitled to salary, benefits and other contractual payments in the normal way up to the termination date and would be paid for any accrued but untaken holiday.
Salary: Payment of up to 12 months’ salary to reflect the notice period or payment in lieu of notice.
Other benefits: Where possible, benefits would be continued for up to the duration of any unworked period of notice (not exceeding the maximum stated in the policy table) or the Executive Director would receive a cash payment (not exceeding the cost to the company of providing those benefits).
Pension: Deferred or immediate pension in accordance with scheme rules, with a credit in respect of, or payment for up to, the full period of any unworked period of notice. There is provision under the defined benefit pension scheme for members leaving company service by reason of permanent incapacity to make an application to the scheme trustee for early payment of their pension.
Other: The company may pay compensation in respect of any statutory employment rights and may make other appropriate and customary payments.
The company would have due regard to principles of mitigation of loss. Reductions would be applied to reflect any portion of the notice period that is worked and/or spent on gardening leave.
On injury, disability, ill-health or death, the Committee reserves the right to vary the treatment outlined in this section. |
Annual incentive: Any unpaid annual incentive for the previous year and a pro-rata payment in respect of the part of the financial year up to the termination date would generally be payable (subject to the deferral provisions), with the amount being determined by reference to the original performance criteria. However, the Committee has discretion to decide otherwise depending on the reason for termination and other specific circumstances. The company would not pay any annual incentive in respect of any part of the financial year following the termination date (e.g. for any unworked period of notice). Any unvested AIP deferred shares would vest in full at the end of the deferral period. The annual incentive claw-back provisions would apply.
LTIP: The default position is that unvested LTIP awards would be pro-rated to reflect time employed and would vest subject to performance measured at the end of the relevant performance period and subject to the Executive Director continuing to meet his shareholding requirement on a pro-rated basis. The Committee has discretion to allow unvested LTIP awards to vest earlier and to adjust the application of time pro-rating and performance conditions, subject to the plan rules. | |
| Employee instigated resignation The Executive Director would not receive any payments for loss of office. The Executive Director would be entitled to salary, benefits and other contractual payments in the normal way up to the termination date and would be paid for any accrued but untaken holiday.
Pension: A deferred or immediate pension would be payable in accordance with the scheme rules. |
Annual incentive: The Executive Director would be entitled to receive an annual incentive for a completed previous year (subject to the deferral provisions), but not a pro-rated annual incentive in respect of a part year up to the termination date, unless the Committee decides otherwise in the specific circumstances. Any unvested AIP deferred shares would vest in full at the end of the deferral period. Annual incentive claw-back provisions would apply.
LTIP: All outstanding LTIP awards would lapse on the date of notice. | |
| Dismissal for cause The Executive Director would be entitled to salary, benefits and other contractual payments in the normal way up to the termination date and would be paid for any accrued but untaken holiday, but would not receive any payments for loss of office.
Pension: A deferred or immediate pension would be payable in accordance with the scheme rules. |
Annual incentive: The Executive Director would not receive any unpaid annual incentive. Any unvested AIP deferred shares lapse on the date of dismissal.
LTIP: All outstanding LTIP awards would lapse on the date of dismissal. |
| (1) | In addition to what is set out in this section, on termination for any reason, Erik Engstrom will be entitled to payment of amounts held in his ‘Retirement Account’. Before he joined the company’s UK defined benefit scheme, he was not a member of any company pension scheme and RELX made annual contributions of 19.5% of base salary to a deferred compensation plan. Contributions to this Retirement Account ceased when he became a member of the UK defined benefit arrangement. |
| (2) | In cases where the approved leaver treatment applies, the AIP and LTIP have a default position as well as giving the Committee discretion to adjust the default treatment within certain parameters. The Committee would only expect to exercise such discretion where the Committee believes the personal circumstances of the Executive Director so require. |
| RELX Annual report and financial statements 2018 | Directors’ Remuneration Report | 105 | |
|
| ||
| RELX Annual report and financial statements 2018 | Report of the Audit Committee | 107 | |
|
| ||
| RELX Annual report and financial statements 2018 | Directors’ Report | 109 | |
|
| ||
| 110 | RELX Annual report and financial statements 2018 | Governance | |
|
| ||
| RELX Annual report and financial statements 2018 | Directors’ Report | 111 | |
|
| ||
| 112
|
RELX Annual report and financial statements 2018 | Financial statements and other information
|
| Financial statements and other information | ||
| In this section | ||
| 113 |
Independent auditor’s report | |
| 121 |
Consolidated financial statements | |
| 126 |
Notes to the consolidated financial statements | |
| 168 |
||
| RELX Annual report and financial statements 2018 | 113 | |
|
| ||
| 114 | RELX Annual report and financial statements 2018 | Financial statements and other information | |
|
| ||
| OVERVIEW OF OUR AUDIT APPROACH
|
||
| Key audit matters | ◾ Uncertain tax positions | |
| ◾ Internally developed intangible assets | ||
| ◾ Aspects of revenue recognition | ||
| ◾ Carrying value of goodwill and acquired intangible assets | ||
| ◾ Finance systems | ||
| ◾ Accounting for the corporate simplification | ||
|
◾ Acquisition accounting for significant new business combinations | ||
| Audit scope | ◾ We performed an audit of the complete financial information of six components and audit procedures on specific balances for a further seven components. We also instructed two locations to perform specified procedures. | |
|
◾ The components where we performed full or specific audit procedures accounted for 81% of absolute profit before tax, 80% of revenue and 75% of total assets. | ||
| Materiality |
◾ Overall Group materiality of £90m which represents 5% of profit before tax. |
KEY AUDIT MATTERS
Key audit matters are those matters that, in our professional judgment, were of most significance in our audit of the financial statements of the current period and include the most significant assessed risks of material misstatement (whether or not due to fraud) that we identified. These matters included those which had the greatest effect on: the overall audit strategy, the allocation of resources in the audit; and directing the efforts of the engagement team. These matters were addressed in the context of our audit of the financial statements as a whole, and in our opinion thereon, and we do not provide a separate opinion on these matters.
| KEY OBSERVATIONS | ||||
| COMMUNICATED | ||||
| RISK | OUR RESPONSE TO THE RISK | TO THE AUDIT COMMITTEE | ||
|
Uncertain tax positions
Refer to the Audit Committee Report (page 106) and Note 9 of the Consolidated Financial Statements (page 138)
The group is subject to tax in numerous jurisdictions. Its complex organisation and operational structure gives rise to potential tax exposures that require management to exercise significant judgement in making determinations as to the amount of tax that is payable.
The group reports cross-border transactions undertaken between subsidiaries on an arm’s-length basis in tax returns in accordance with Organisation for Economic Co-operation and Development (OECD) guidelines. However, transfer pricing relies on the exercise of judgement and it is frequently possible for there to be a range of legitimate and reasonable views.
The group is subject to tax authority audits as a matter of routine and has a number of open tax enquiries.
As a result, it has recognised a number of provisions against uncertain tax positions, the valuation of which requires significant judgement.
We focused on this area due to the significance of the balance and the subjectivity in the quantification of the provision and the judgement around the trigger for recognition or release. There is a risk that the tax provisions may be incorrectly quantified, impacting the provision and the effective tax rate. |
Our procedures on the uncertain tax positions were performed centrally by the group team supported by overseas teams including specialists, and included the following:
◾ We assessed the processes and tested controls over the tax provisioning process.
◾ We met with tax management to understand the group cross-border transactions, status of all significant provisions, and any changes to management’s judgements in the year.
◾ We read correspondence with tax authorities and external advisors to inform our assessment of recorded estimates and evaluate the completeness of the provisions recorded.
◾ We evaluated management’s methodology to record or release provisions following tax audits, settlements and the expiry of timeframes.
◾ We tested the calculation of the year end provisions by inspecting underlying documentation and supporting schedules. |
We reported our conclusions to the Audit Committee that we challenged the robustness of the key management judgements. We confirmed that we were satisfied that management’s judgements in relation to the extent of provisions for uncertain tax positions are appropriate. We noted further that there continues to be a high degree of uncertainty about the eventual outcome of many of these provisions. |
| RELX Annual report and financial statements 2018 | Independent auditors’ report to the members of RELX PLC | 115 | |
|
| ||
| 116 | RELX Annual report and financial statements 2018 | Financial statements and other information | |
|
| ||
| KEY OBSERVATIONS | ||||
| COMMUNICATED | ||||
| RISK | OUR RESPONSE TO THE RISK | TO THE AUDIT COMMITTEE | ||
|
Carrying value of goodwill and acquired intangible assets
Refer to the Audit Committee Report (page 106) and Note 14 of the Consolidated Financial Statements (page 144)
We focused on this area because of the size of the goodwill balance of £6,899 million (2017: £5,965 million); the size of the acquired intangible assets net book amount of £2,317 million (2017: £2,058 million); and the fact that management’s assessment of the value in use of the group’s Cash Generating Units (‘CGU’) and any possible consequential impairment involves judgement about the future results of the relevant CGUs and the discount rates applied to cash flow forecasts. |
Procedures on the carrying value of goodwill and acquired intangible assets were performed centrally by the group team supported by overseas teams including specialists, and included the following:
◾ We assessed the processes and tested controls over the goodwill and acquired intangible asset process.
◾ We assessed the key information and assumptions used in determining the valuation including the weighted average cost of capital, cash flow forecasts and the implicit growth, utilising our specialist support as necessary. We also conducted a sensitivity analysis to understand by how much these projections would need to change by for there to be an impairment.
◾ We assessed management’s annual goodwill and indefinite lived acquired intangible asset impairment review as well as management’s consideration as to whether indicators of impairment existed for finite lived acquired intangible assets. Where indicators were present for acquired intangible assets, we focused on the key judgements in the impairment review calculations, for example, the expected cash flows and future benefits as compared to the costs where applicable. |
We reported our conclusions to the Audit Committee that the assumptions relating to the impairment models fell within acceptable ranges.
Based on the procedures performed, we agree with management’s conclusion that no material impairment of goodwill or intangible assets was required in the year. | ||
|
Finance systems
The group has many IT systems that are vital to the ongoing operations and to the integrity of the financial reporting process. Owing to the global nature of the group and its operations, the applications, associated infrastructure and IT processes that support significant business and financial processes are spread across a number of locations. These are delivered by a mix of in-house teams and third party support providers some of whom reside in different countries from the physical location of the IT infrastructure or the location of the RELX business users. Understanding the IT environment including interfaces between them was an area of audit focus to assess if transactions were being processed accurately. |
We utilised IT specialists to support our evaluation of the design and operation of IT controls to address the group’s control objectives and financial reporting risks, including the following:
◾ We made enquiries of management to understand the IT environment and walked through the financial processes end-to-end in order to understand where IT systems were integral to the group accounting processes, as applicable.
◾ We performed data analytic procedures in certain locations and business areas to understand the flow of transactions and perform specific test procedures.
◾ We tested the IT general controls environment for the key applications.
◾ Where appropriate, we received reports from the service auditors of the outsourced systems and evaluated the adequacy of the work performed and followed up on matters arising, performing further procedures as necessary.
◾ Where required, we tested compensating controls or performed alternative procedures to complement the controls based audit approach. |
Based on the procedures performed, we have not identified any misstatements in the financial statements due to any limitations of the IT environment. Our understanding and testing of IT systems and controls supported our audit approach. | ||
|
Accounting for the corporate simplification
Refer to Note 1 of the Consolidated Financial Statements (page 126)
On 8 September 2018, the structure of group was further simplified from a dual parent structure to a single parent structure by way of a merger of RELX PLC and RELX NV. Following the completion of the Simplification, RELX PLC is the sole parent company of the group. It owns 100% of the shares in RELX Group plc which, in turn, holds the operating businesses, subsidiaries and financing activities of the group.
We focused on this area as it was a significant and unusual transaction. |
Procedures on the accounting for the corporate simplification were performed centrally by the group team supported by our team in the Netherlands and specialists, as necessary.
We assessed the accounting for the transaction including whether the transaction was considered a merger or acquisition, the impact on earnings per share, share based payments and share capital.
We also evaluated the disclosure in the financial statements including accounting for the restructure in the parent company financial statements. |
Based on the procedures performed, we reported to the Audit Committee that management’s judgements in relation to the accounting for the corporate simplification of the group are appropriate, as are the related disclosures. |
| RELX Annual report and financial statements 2018 | Independent auditors’ report to the members of RELX PLC | 117 | |
|
| ||
| 118 | RELX Annual report and financial statements 2018 | Financial statements and other information | |
|
| ||
The charts below illustrate the coverage obtained from the work performed by our audit teams.
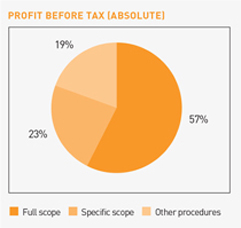
|
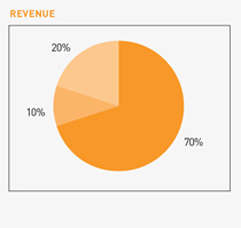
|
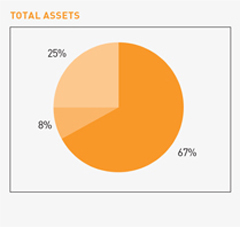
|
Changes from the prior year
Changes from the prior year include increasing scope of one component from other procedures scope to specific scope as part of risk focused approach. We have also added one component to specific scope and instructed two locations to perform specified procedures as a result of acquisitions. The corporate structure has also been simplified in the year to a single parent company structure, with RELX PLC as the surviving company.
Involvement with component teams
In establishing our overall approach to the group audit, we determined the type of work that needed to be undertaken at each of the components by us, as the primary audit engagement team, or by component auditors from other EY global network firms operating under our instruction. Of the six full scope components, audit procedures were performed on three of these directly by the primary audit team. For the seven specific scope components and two specified procedure locations, where the work was performed by component auditors, we determined the appropriate level of involvement to enable us to determine that sufficient audit evidence had been obtained as a basis for our opinion on the group as a whole.
The group audit team continued to follow a programme of planned visits that has been designed to ensure that the Senior Statutory Auditor, or another group audit partner, meet with the all full scope locations and specific scope locations on a rotational basis. During the current year’s audit cycle, visits were undertaken by the primary audit team to component teams in the United Kingdom, the Netherlands, the United States, France, Switzerland, and Japan. These visits involved meeting local management and discussing the audit approach and any issues arising with the component audit team. The group audit team also participated in key discussions, via conference calls with all full and specific scope locations. The primary team interacted regularly with the component teams where appropriate during various stages of the audit, reviewed key working papers and were responsible for the scope and direction of the audit process. This, together with the additional procedures performed at group level, gave us appropriate evidence for our opinion on the group financial statements.
OUR APPLICATION OF MATERIALITY
We apply the concept of materiality in planning and performing the audit, in evaluating the effect of identified misstatements on the audit and in forming our audit opinion.
Materiality
The magnitude of an omission or misstatement that, individually or in the aggregate, could reasonably be expected to influence the economic decisions of the users of the financial statements. Materiality provides a basis for determining the nature and extent of our audit procedures.
We determined materiality for the group to be £90 million (2017: £86.7 million), which is 5% (2017: 5%) of profit before tax. We believe that profit before tax provides us with the best assessment of the requirements of the users of the financial statements.
We determined materiality for the Parent Company to be £90 million (2017: £63.4 million), which is 0.5% (2017: 2%) of equity. Materiality has increased due to the changes in equity following the corporate simplification.
Performance materiality
The application of materiality at the individual account or balance level. It is set at an amount to reduce to an appropriately low level the probability that the aggregate of uncorrected and undetected misstatements exceeds materiality.
On the basis of our risk assessments, together with our assessment of the group’s overall control environment, our judgement was that performance materiality was 75% (2017: 75%) of our planning materiality, namely £67.5 million (2017: £65.0m). We have set performance materiality at this percentage due to our assessment of the control environment and the historic lack of significant audit findings.
Audit work at component locations for the purpose of obtaining audit coverage over significant financial statement accounts is undertaken based on a percentage of total performance materiality. The performance materiality set for each component is based on the relative scale and risk of the component to the group as a whole and our assessment of the risk of misstatement at that component. In the current year, the range of performance materiality allocated to components was £19.4 million to £48.4 million (2017: £19.5 million to £48.7 million).
| RELX Annual report and financial statements 2018 | Independent auditors’ report to the members of RELX PLC | 119 | |
|
| ||
| 120 | RELX Annual report and financial statements 2018 | Financial statements and other information | |
|
| ||
Auditor’s responsibilities for the audit of the financial statements
Our objectives are to obtain reasonable assurance about whether the financial statements as a whole are free from material misstatement, whether due to fraud or error, and to issue an auditor’s report that includes our opinion. Reasonable assurance is a high level of assurance, but is not a guarantee that an audit conducted in accordance with ISAs (UK) will always detect a material misstatement when it exists. Misstatements can arise from fraud or error and are considered material if, individually or in the aggregate, they could reasonably be expected to influence the economic decisions of users taken on the basis of these financial statements.
Explanation as to what extent the audit was considered capable of detecting irregularities, including fraud
The objectives of our audit, in respect to fraud, are; to identify and assess the risks of material misstatement of the financial statements due to fraud; to obtain sufficient appropriate audit evidence regarding the assessed risks of material misstatement due to fraud, through designing and implementing appropriate responses; and to respond appropriately to fraud or suspected fraud identified during the audit. However, the primary responsibility for the prevention and detection of fraud rests with both those charged with governance of the entity and management.
Our approach was as follows:
| ◾ | We obtained an understanding of the legal and regulatory frameworks that are applicable to the group and determined that the most significant are those that relate to the reporting framework (IFRS, FRS 101, the Companies Act 2006 and UK Corporate Governance Code) and the relevant tax compliance regulations in the jurisdictions in which the group operates. |
| ◾ | We understood how RELX PLC is complying with those frameworks by making enquiries of management, internal audit, those responsible for legal and compliance procedures and the company secretary. We corroborated our enquiries through our review of board minutes and papers provided to the Audit Committee. |
| ◾ | We assessed the susceptibility of the group’s financial statements to material misstatement, including how fraud might occur by meeting with management from various parts of the business to understand where it considered there was susceptibility to fraud. |
| We also considered performance targets and their propensity to influence on efforts made by management to manage earnings. We considered the programmes and controls that the group has established to address risks identified, or that otherwise prevent, deter and detect fraud; and how senior management monitors those programmes and controls. Where the risk was considered to be higher, we performed audit procedures to address each identified fraud risk. These procedures included testing manual journals and were designed to provide reasonable assurance that the financial statements were free from fraud or error. |
| ◾ | Based on this understanding we designed our audit procedures to identify non-compliance with such laws and regulations. Our procedures involved: journal entry testing, with a focus on manual consolidation journals and journals indicating large or unusual transactions based on our understanding of the business; enquiries of legal counsel, Group management, internal audit, country management at all full and specific scope management; and focused testing. In addition, we completed procedures to conclude on the compliance of the disclosures in the annual report and accounts with all applicable requirements. |
| ◾ | Any instances of non-compliance with laws and regulations were communicated by/to components and considered in our audit approach, if applicable. |
A further description of our responsibilities for the audit of the financial statements is located on the Financial Reporting Council’s website at https://www.frc.org.uk/auditorsresponsibilities. This description forms part of our auditor’s report.
Other matters we are required to address
| ◾ | We were appointed by the company on 21 April 2016 to audit the financial statements for the year ending 31 December and subsequent financial periods. |
The period of total uninterrupted engagement including previous renewals and reappointments is three years, covering the years ending 2016 to 2018.
| ◾ | The non-audit services prohibited by the FRC’s Ethical Standard were not provided to the group or the parent company and we remain independent of the group and the parent company in conducting the audit. |
| ◾ | The audit opinion is consistent with the additional report to the audit committee. |
USE OF OUR REPORT
This report is made solely to the company’s members, as a body, in accordance with Chapter 3 of Part 16 of the Companies Act 2006. Our audit work has been undertaken so that we might state to the company’s members those matters we are required to state to them in an auditor’s report and for no other purpose. To the fullest extent permitted by law, we do not accept or assume responsibility to anyone other than the company and the company’s members as a body, for our audit work, for this report, or for the opinions we have formed.
Hywel Ball (Senior statutory auditor)
for and on behalf of Ernst & Young LLP, Statutory Auditor
London
20 February 2019
Notes:
| (1) | The maintenance and integrity of the RELX PLC web site is the responsibility of the directors; the work carried out by the auditors does not involve consideration of these matters and, accordingly, the auditors accept no responsibility for any changes that may have occurred to the financial statements since they were initially presented on the web site. |
| (2) | Legislation in the United Kingdom governing the preparation and dissemination of financial statements may differ from legislation in other jurisdictions. |
| RELX Annual report and financial statements 2018 | 121 | |
|
| ||
| 122 | RELX Annual report and financial statements 2018 | Financial statements and other information | |
|
| ||
Consolidated statement of comprehensive income
| FOR THE YEAR ENDED 31 DECEMBER | Note | 2018 £m |
Restated £m |
Restated £m |
||||||||||||
| Net profit for the year |
1,428 | 1,656 | 1,158 | |||||||||||||
| Items that will not be reclassified to profit or loss: |
||||||||||||||||
| Actuarial (losses)/gains on defined benefit pension schemes |
6 | (91 | ) | 233 | (262 | ) | ||||||||||
| Tax on items that will not be reclassified to profit or loss |
9 | 15 | (59 | ) | 45 | |||||||||||
| Total items that will not be reclassified to profit or loss |
(76 | ) | 174 | (217 | ) | |||||||||||
| Items that may be reclassified subsequently to profit or loss: |
||||||||||||||||
| Exchange differences on translation of foreign operations |
207 | (507 | ) | 667 | ||||||||||||
| Fair value movements on cash flow hedges |
18 | (59 | ) | 137 | (165 | ) | ||||||||||
| Transfer to net profit from cash flow hedge reserve |
18 | 17 | 25 | 46 | ||||||||||||
| Tax on items that may be reclassified to profit or loss |
9 | 9 | (30 | ) | 19 | |||||||||||
| Total items that may be reclassified to profit or loss |
174 | (375 | ) | 567 | ||||||||||||
| Other comprehensive income/(loss) for the year |
98 | (201 | ) | 350 | ||||||||||||
| Total comprehensive income for the year |
1,526 | 1,455 | 1,508 | |||||||||||||
| Attributable to: |
||||||||||||||||
| RELX PLC shareholders |
1,520 | 1,447 | 1,500 | |||||||||||||
| Non-controlling interests |
6 | 8 | 8 | |||||||||||||
| Total comprehensive income for the year |
1,526 | 1,455 | 1,508 | |||||||||||||
| RELX Annual report and financial statements 2018 | 123 | |
|
| ||
| 124 | RELX Annual report and financial statements 2018 | Financial statements and other information | |
|
| ||
Consolidated statement of financial position
| AS AT 31 DECEMBER | Note | 2018 £m |
Restated £m |
Restated £m |
||||||||||||
| Non-current assets |
||||||||||||||||
| Goodwill |
14 | 6,899 | 5,965 | 6,392 | ||||||||||||
| Intangible assets |
15 | 3,534 | 3,194 | 3,604 | ||||||||||||
| Investments in joint ventures |
16 | 104 | 102 | 102 | ||||||||||||
| Other investments |
16 | 151 | 141 | 137 | ||||||||||||
| Property, plant and equipment |
17 | 198 | 194 | 223 | ||||||||||||
| Right of use assets |
23 | 263 | 287 | 326 | ||||||||||||
| Deferred tax assets |
9 | 455 | 431 | 469 | ||||||||||||
| Net pension assets |
6 | 6 | 22 | – | ||||||||||||
| Derivative financial instruments |
18 | 37 | 86 | 49 | ||||||||||||
| 11,647 | 10,422 | 11,302 | ||||||||||||||
| Current assets |
||||||||||||||||
| Inventories and pre-publication costs |
19 | 212 | 197 | 209 | ||||||||||||
| Trade and other receivables |
20 | 2,015 | 1,873 | 2,015 | ||||||||||||
| Derivative financial instruments |
18 | 10 | 29 | 20 | ||||||||||||
| Cash and cash equivalents |
11 | 114 | 111 | 162 | ||||||||||||
| 2,351 | 2,210 | 2,406 | ||||||||||||||
| Assets held for sale |
1 | – | 6 | |||||||||||||
| Total assets |
13,999 | 12,632 | 13,714 | |||||||||||||
| Current liabilities |
||||||||||||||||
| Trade and other payables |
21 | 3,432 | 3,298 | 3,479 | ||||||||||||
| Derivative financial instruments |
18 | 32 | 32 | 85 | ||||||||||||
| Borrowings |
22 | 1,392 | 762 | 1,169 | ||||||||||||
| Taxation |
450 | 560 | 612 | |||||||||||||
| Provisions |
24 | 15 | 12 | 17 | ||||||||||||
| 5,321 | 4,664 | 5,362 | ||||||||||||||
| Non-current liabilities |
||||||||||||||||
| Derivative financial instruments |
18 | 37 | 25 | 110 | ||||||||||||
| Borrowings |
22 | 4,973 | 4,491 | 4,087 | ||||||||||||
| Deferred tax liabilities |
9 | 830 | 738 | 1,137 | ||||||||||||
| Net pension obligations |
6 | 439 | 350 | 636 | ||||||||||||
| Provisions |
24 | 36 | 51 | 69 | ||||||||||||
| 6,315 | 5,655 | 6,039 | ||||||||||||||
| Liabilities associated with assets held for sale |
4 | – | 5 | |||||||||||||
| Total liabilities |
11,640 | 10,319 | 11,406 | |||||||||||||
| Net assets |
2,359 | 2,313 | 2,308 | |||||||||||||
| Capital and reserves |
||||||||||||||||
| Share capital |
25 | 290 | 224 | 226 | ||||||||||||
| Share premium |
25 | 1,415 | 3,104 | 3,003 | ||||||||||||
| Shares held in treasury |
25 | (734 | ) | (1,631 | ) | (1,471 | ) | |||||||||
| Translation reserve |
374 | 170 | 727 | |||||||||||||
| Other reserves |
26 | 984 | 425 | (215 | ) | |||||||||||
| Shareholders’ equity |
2,329 | 2,292 | 2,270 | |||||||||||||
| Non-controlling interests |
30 | 21 | 38 | |||||||||||||
| Total equity |
2,359 | 2,313 | 2,308 | |||||||||||||
The consolidated balance sheet as presented as at 31 December 2016 is equivalent to the balance sheet as at 1 January 2017 and as such fulfils the requirements of IAS 1 Presentation of Financial Statements relating to the retrospective application of IFRS 9, IFRS 15 and IFRS 16.
The consolidated financial statements were approved by the Board of Directors and authorised for issue on 20 February 2019. They were signed on its behalf by:
| A J Habgood | N L Luff | |
| Chairman | Chief Financial Officer |
| RELX Annual report and financial statements 2018 | 125 | |
|
| ||
| 126 | RELX Annual report and financial statements 2018 | Financial statements and other information | |
|
| ||
Notes to the consolidated financial statements
for the year ended 31 December 2018
1 Basis of preparation and accounting policies
Basis of preparation
The shares of RELX PLC are traded on the London, Amsterdam and New York stock exchanges. RELX PLC and its subsidiaries, joint ventures and associates are together known as ‘RELX’.
Up until the corporate simplification, consolidated accounts were prepared on the basis that all shareholders were regarded as having interests in a single economic entity, and as such the dual parent Group formed a single reporting entity for the presentation of consolidated financial statements. The corporate simplification as described on page 72 therefore has had no impact on the basis of preparation of the consolidated financial statements.
In preparing the consolidated financial statements, subsidiaries are accounted for under the acquisition method and investments in associates and joint ventures are accounted for under the equity method. All intra-group transactions and balances are eliminated.
On acquisition of a subsidiary, or interest in an associate or joint venture, fair values, reflecting conditions at the date of acquisition, are attributed to the net assets, including identifiable intangible assets acquired. Adjustments are made to bring accounting policies into line with those of the Group. The results of subsidiaries sold or acquired are included in the consolidated financial statements up to or from the date that control passes from or to the Group.
Non-controlling interests in the net assets of the Group are identified separately from shareholders’ equity. Non-controlling interests consist of the amount of those interests at the date of the original acquisition and the non-controlling share of changes in equity since the date of acquisition.
The Directors of RELX PLC, having made appropriate enquiries, consider that adequate resources exist for the Group to continue in operational existence for the foreseeable future and that, therefore, it is appropriate to adopt the going concern basis in preparing the consolidated financial statements for the year ended 31 December 2018.
Accounting policies
The Group’s consolidated financial statements are prepared in accordance with International Financial Reporting Standards (IFRS) as adopted by the European Union and as issued by the International Accounting Standards Board (IASB). The accounting policies under IFRS are included in the relevant notes to the consolidated financial statements. The accounting policies below are applied throughout the financial statements and are unchanged from those applied in preparing the consolidated financial statements for the year ended 31 December 2017 and 2016, with the exception of policies relating to the adoption of IFRS 9 – Financial Instruments, IFRS 15 – Revenue from Contracts with Customers and IFRS 16 – Leases.
Restatement
The consolidated financial statements have been restated for the retrospective adoption of IFRS 9, IFRS 15 and IFRS 16. Each note identifies where comparatives have been restated.
Foreign exchange translation
The consolidated financial statements are presented in sterling.
Transactions in foreign currencies are recorded at the rate of exchange prevailing on the date of the transaction. Non-monetary assets and liabilities that are measured at historical cost in foreign currencies are translated using the exchange rate at the date of the transaction. At each statement of financial position date, monetary assets and liabilities that are denominated in foreign currencies are retranslated at the rate prevailing on the statement of financial position date. Exchange differences arising are recorded in the income statement other than where hedge accounting applies, as set out on pages 150 to 155.
Assets and liabilities of foreign operations are translated at exchange rates prevailing on the statement of financial position date. Income and expense items and cash flows of foreign operations are translated at the average exchange rate for the period. Significant individual items of income and expense and cash flows in foreign operations are translated at the rate prevailing on the date of transaction. Exchange differences arising are classified as equity and transferred to the translation reserve. When foreign operations are disposed of, the related cumulative translation differences are recognised within the income statement in the period.
The Group uses derivative financial instruments, primarily forward contracts, to hedge its exposure to certain foreign exchange risks. Details of the Group’s accounting policies in respect of derivative financial instruments are set out on page 150.
Critical judgements and key sources of estimation uncertainty
The most significant accounting policies in determining the financial condition and results of the Group, and those requiring the most subjective or complex judgement, relate to and are included in the following notes:
| ◾ | valuation of goodwill and intangible assets – notes 14 and 15; |
| ◾ | capitalisation of development spend – note 15; |
| ◾ | taxation – note 9; and |
| ◾ | accounting for defined benefit pension schemes – note 6. |
| RELX Annual report and financial statements 2018 | Notes to the consolidated financial statements | 127 | |||||
|
|
|
|
||||
| 128 | RELX Annual report and financial statements 2018 | Financial statements and other information | |
|
| ||
Notes to the consolidated financial statements
for the year ended 31 December 2018
1 Basis of preparation and accounting policies (continued)
IFRS 16 – Leases (early adopted and therefore effective for the 2018 financial year)
IFRS 16 eliminates the distinction between operating and finance leases and requires lessees to recognise all leases with a lease term of greater than 12 months in the statement of financial position. RELX has adopted this standard a year earlier than the mandatory effective date of 1 January 2019. IFRS 16 has been adopted on a fully retrospective basis.
The change in accounting standard results in both an asset and liability being brought onto the statement of financial position for the majority of leases where RELX is a lessee. The asset is then depreciated, and interest expense recognised over the life of the lease. The standard also gives guidance on the recognition of subleases, which results in finance sublease receivables being recognised on the balance sheet. As at 31 December 2017, the restated statement of financial position includes additional right-of-use assets of £271m, finance lease receivables of £57m and additional lease liabilities of £381m (31 December 2016: right-of-use assets of £306m, finance lease receivables of £63m and lease liabilities of £430m).
The impact on the income statement for the 12 months to 31 December 2017 is an increase of £11m to both reported and adjusted operating profit (31 December 2016: £6m increase to reported operating profit) offset by a net increase to finance costs of £15m (31 December 2016: £16m). After taking into account additional gains from disposals of right-of-use assets, there is no impact on reported net profit.
Opening balance sheet adjustment
An opening balance sheet adjustment has been made at 1 January 2016 to reflect the impact of adoption on prior years. The adjustment reduces opening retained earnings by £36m. This mainly relates to the recognition of lease expense earlier on in the lease under IFRS 16 and the deferral of revenue into future periods under IFRS 15.
Additionally, the other interpretations and amendments to IFRS effective for 2018 have not had a significant impact on the Group’s accounting policies or reporting.
Standards, amendments and interpretations not yet effective
A number of amendments and interpretations have been issued which are not expected to have any significant impact on the accounting policies and reporting.
2 Revenue and segment analysis
| Accounting policy The Group’s reported segments are based on the internal reporting structure and financial information provided to the Board.
Adjusted operating profit is the key segmental profit measure used by the Group in assessing performance. Adjusted operating profit is reconciled to operating profit on page 131.
Revenue arises from the provision of products and services under contracts with customers. In all cases, revenue is recognised to depict the transfer of promised goods or services to customers in an amount that reflects the consideration to which the entity expects to be entitled in exchange for those goods or services, and is recognised when the customer obtains control of the good or service.
Revenue is stated at the transaction price, which includes allowance for anticipated discounts and returns and excludes customer sales taxes and other amounts to be collected on behalf of third parties.
Where the goods or services promised within a contract are distinct, they are identified as separate performance obligations and are accounted for separately.
Where separate performance obligations are identified, total revenue is allocated on the basis of relative stand-alone selling prices or management’s best estimate of relative value where stand-alone selling prices do not exist. Management estimates may include a cost-plus method or comparable product approach, but must be supported by objective evidence. A residual approach may be applied where it is not possible to derive a reliable management estimate for a specific component.
Revenue is recognised for the various categories as follows:
◾ Subscriptions – revenue comprises income derived from the periodic distribution or update of a product. Subscription revenue is generally invoiced in advance and recognised systematically over the period of the subscription. Recognition is either on a straight-line basis where the transaction involves the transfer of goods and services to the customer in a consistent manner over a specific period of time; or based on the value received by the customer where the goods and services are not delivered in a consistent manner.
◾ Transactional – revenue is recognised when control of the product is passed to the customer or the service has been performed. For exhibitions, revenue primarily comprises income from exhibitors and attendees at exhibitions. Exhibition revenue is recognised on occurrence of the exhibition.
◾ Advertising – revenue is recognised on publication or over the period of online display. |
| RELX Annual report and financial statements 2018 | Notes to the consolidated financial statements | 129 | |||
|
| ||||
| 130 | RELX Annual report and financial statements 2018 | Financial statements and other information | |
|
| ||
Notes to the consolidated financial statements
for the year ended 31 December 2018
2 Revenue and segment analysis (continued)
| 2017 |
Scientific, Technical & Medical |
Risk & Business Analytics |
Legal |
Exhibitions |
Total |
|||||||||||||||
| Revenue by geographical market |
||||||||||||||||||||
| North America |
1,045 | 1,658 | 1,145 | 230 | 4,078 | |||||||||||||||
| Europe |
617 | 308 | 340 | 429 | 1,694 | |||||||||||||||
| Rest of world |
811 | 107 | 201 | 450 | 1,569 | |||||||||||||||
| Total revenue |
2,473 | 2,073 | 1,686 | 1,109 | 7,341 | |||||||||||||||
| Revenue by format |
||||||||||||||||||||
| Electronic |
1,995 | 1,967 | 1,384 | 42 | 5,388 | |||||||||||||||
| Face-to-face |
10 | 38 | 7 | 1,067 | 1,122 | |||||||||||||||
| |
468 | 68 | 295 | – | 831 | |||||||||||||||
| Total revenue |
2,473 | 2,073 | 1,686 | 1,109 | 7,341 | |||||||||||||||
| Revenue by type |
||||||||||||||||||||
| Subscriptions |
1,776 | 732 | 1,291 | 1 | 3,800 | |||||||||||||||
| Transactional |
646 | 1,301 | 389 | 1,108 | 3,444 | |||||||||||||||
| Advertising |
51 | 40 | 6 | – | 97 | |||||||||||||||
| Total revenue |
2,473 | 2,073 | 1,686 | 1,109 | 7,341 | |||||||||||||||
| 2016 | Scientific, Technical & Medical |
Risk & Business Analytics |
Legal |
Exhibitions |
Total |
|||||||||||||||
| Revenue by geographical market |
||||||||||||||||||||
| North America |
960 | 1,499 | 1,106 | 210 | 3,775 | |||||||||||||||
| Europe |
605 | 322 | 330 | 454 | 1,711 | |||||||||||||||
| Rest of world |
753 | 84 | 183 | 383 | 1,403 | |||||||||||||||
| Total revenue |
2,318 | 1,905 | 1,619 | 1,047 | 6,889 | |||||||||||||||
| Revenue by format |
||||||||||||||||||||
| Electronic |
1,834 | 1,758 | 1,321 | 35 | 4,948 | |||||||||||||||
| Face-to-face |
10 | 37 | 7 | 1,012 | 1,066 | |||||||||||||||
| |
474 | 110 | 291 | – | 875 | |||||||||||||||
| Total revenue |
2,318 | 1,905 | 1,619 | 1,047 | 6,889 | |||||||||||||||
| Revenue by type |
||||||||||||||||||||
| Subscriptions |
1,628 | 684 | 1,299 | 1 | 3,612 | |||||||||||||||
| Transactional |
631 | 1,172 | 314 | 1,046 | 3,163 | |||||||||||||||
| Advertising |
59 | 49 | 6 | – | 114 | |||||||||||||||
| Total revenue |
2,318 | 1,905 | 1,619 | 1,047 | 6,889 | |||||||||||||||
Around half of RELX’s revenue comes from subscription arrangements, and revenue for these is generally recognised on a straight line basis over the time period covered by the agreement, in line with the provision of services. There are a number of multi-year contracts, mainly in Risk & Business Analytics, where revenue is recognised on the achievement of delivery milestones or other specified performance obligations. As at 31 December 2018, the aggregate amount of the transaction price of such contracts which relates to performance obligations which have not yet been delivered was approximately £210m. It is expected that revenue will be recognised in relation to this amount over the next ten years.
| RELX Annual report and financial statements 2018 | Notes to the consolidated financial statements | 131 | |
|
| ||
| 132 | RELX Annual report and financial statements 2018 | Financial statements and other information | |
|
| ||
Notes to the consolidated financial statements
for the year ended 31 December 2018
3 Operating profit (continued)
Operating profit is stated after charging/(crediting) the following:
| Note | 2018 £m |
Restated £m |
Restated £m |
|||||||||||||
| Staff costs |
||||||||||||||||
| Wages and salaries |
1,959 | 1,926 | 1,767 | |||||||||||||
| Social security costs |
215 | 213 | 198 | |||||||||||||
| Pensions |
6 | 135 | 95 | 111 | ||||||||||||
| Share based remuneration |
41 | 39 | 38 | |||||||||||||
| Total staff costs |
2,350 | 2,273 | 2,114 | |||||||||||||
| Depreciation and amortisation |
||||||||||||||||
| Amortisation of acquired intangible assets |
15 | 287 | 313 | 342 | ||||||||||||
| Share of joint ventures’ amortisation of acquired intangible assets |
1 | 1 | 4 | |||||||||||||
| Amortisation of internally developed intangible assets |
15 | 225 | 203 | 189 | ||||||||||||
| Depreciation of property, plant and equipment |
17 | 62 | 65 | 62 | ||||||||||||
| Depreciation of right-of-use assets |
77 | 75 | 74 | |||||||||||||
| Total depreciation and amortisation |
652 | 657 | 671 | |||||||||||||
| Other expenses and income |
||||||||||||||||
| Cost of sales including pre-publication costs and inventory expenses |
2,638 | 2,628 | 2,488 | |||||||||||||
| Operating lease rentals expense |
18 | 28 | 35 | |||||||||||||
| Operating lease rentals income |
(3 | ) | (3 | ) | (6 | ) | ||||||||||
The amortisation of acquired intangible assets is included within administration and other expenses.
The Group provides a number of share based remuneration schemes to Directors and employees. The principal share based remuneration schemes are the Executive Share Option Schemes (ESOS), the Long-Term Incentive Plan (LTIP), the Retention Share Plan (RSP) and the Bonus Investment Plan (BIP). Share options granted under ESOS are exercisable after three years and up to ten years from the date of grant at a price equivalent to the market value of the respective shares at the date of grant. Conditional shares granted under LTIP, RSP and BIP are exercisable after three years for nil consideration if conditions are met. Other awards principally relate to all employee share based saving schemes in the UK and the Netherlands. Further details are provided in the remuneration report on pages 85 to 105.
4 Auditor’s remuneration
| 2018 £m |
2017 £m |
2016 £m |
||||||||||
| Auditor’s remuneration |
||||||||||||
| Payable to the auditors of RELX PLC |
0.9 | 0.9 | 0.9 | |||||||||
| Payable to the auditors of the Group’s subsidiaries |
5.9 | 5.9 | 5.3 | |||||||||
| Audit services |
6.8 | 6.8 | 6.2 | |||||||||
| Audit-related assurance services |
0.9 | 0.8 | 0.6 | |||||||||
| Total audit and audit-related assurance services |
7.7 | 7.6 | 6.8 | |||||||||
| Tax services |
– | – | 0.4 | |||||||||
| Other services: Consulting |
– | – | 0.1 | |||||||||
| Other services: Due diligence and other transaction-related services |
2.7 | 0.3 | 0.4 | |||||||||
| Total non-audit related services |
2.7 | 0.3 | 0.9 | |||||||||
| Total auditor’s remuneration |
10.4 | 7.9 | 7.7 | |||||||||
Amounts payable to the auditors of the Group’s subsidiaries include amounts for the audit of internal controls over financial reporting in accordance with the US Sarbanes-Oxley Act. Included in audit related assurance services for 2018 are £0.1m in fees for services relating to RELX pension plans (2017: £0.1m). The amounts payable in 2017 and 2016 to the auditors of RELX PLC also reflect amounts payable to the auditors of RELX NV. The previously reported 2017 fees paid to EY for audit services have been revised to include additional amounts for expenses incurred and final fees for statutory audits which took place subsequent to the audit of the RELX consolidated accounts.
| RELX Annual report and financial statements 2018 | Notes to the consolidated financial statements | 133 | |
|
| ||
| 134 | RELX Annual report and financial statements 2018 | Financial statements and other information | |
|
| ||
Notes to the consolidated financial statements
for the year ended 31 December 2018
6 Pension schemes (continued)
In the UK, the level of funding is determined by statutory triennial actuarial valuations in accordance with pensions legislation. Where the scheme falls below 100% funded status, the Group and the scheme trustees must agree on how the deficit is to be remedied. The UK Pensions Regulator has significant powers and sets out in codes and guidance the parameters for scheme funding.
The US scheme has an annual statutory valuation which forms the basis for establishing the employer contribution each year (subject to ERISA and IRS minimums). Should the statutory funded status fall to below 100%, the US Pension Protection Act requires the deficit to be rectified with additional contributions over a seven-year period.
The Group and the scheme trustees have completed the 2018 triennial valuation under which the Group has committed to providing £176m of deficit funding contributions to the scheme over the period 2019 to 2022. Employer cash contributions to defined benefit pension schemes in respect of 2019 are expected to be approximately £62m including a £44m pension deficit funding contribution relating to the UK scheme recovery plan.
The pension expense in total, including amounts in relation to the UK and US defined benefit schemes, defined contribution schemes and GMP equalisation cost, recognised in the income statement consists of:
| 2018 £m |
2017 £m |
2016 £m |
||||||||||
| Defined benefit pension expense (including past service cost for GMP equalisation in 2018) |
47 | 4 | 36 | |||||||||
| Defined contribution pension expense |
95 | 91 | 75 | |||||||||
| Total |
142 | 95 | 111 | |||||||||
£135m (2017: £95m; 2016: £111m) of the total pension cost is recognised within operating profit. In 2018 a past service cost was recognised to account for the impact of GMP equalisation in the UK. In 2017 settlement and past service credits primarily relate to changes to the UK scheme.
The amounts recognised in the income statement in respect of defined benefit pension schemes during the year are presented by major scheme as follows:
| 2018 | 2017 | 2016 | ||||||||||||||||||||||||||||||||||||||||||
| UK £m |
US £m |
Total £m |
UK £m |
US £m |
Total £m |
UK £m |
US £m |
Total £m |
||||||||||||||||||||||||||||||||||||
| Service cost |
27 | 9 | 36 | 33 | 14 | 47 | 27 | 14 | 41 | |||||||||||||||||||||||||||||||||||
| Settlement and past service cost/(credits) |
11 | – | 11 | (42 | ) | (1 | ) | (43 | ) | – | (5 | ) | (5 | ) | ||||||||||||||||||||||||||||||
| Defined benefit pension expense |
38 | 9 | 47 | (9 | ) | 13 | 4 | 27 | 9 | 36 | ||||||||||||||||||||||||||||||||||
| Net interest on net defined benefit obligation |
6 | 3 | 9 | 10 | 5 | 15 | 9 | 5 | 14 | |||||||||||||||||||||||||||||||||||
| Net defined benefit pension expense |
44 | 12 | 56 | 1 | 18 | 19 | 36 | 14 | 50 | |||||||||||||||||||||||||||||||||||
Net interest on net defined benefit pension scheme liabilities is presented within net finance costs in the income statement.
The significant valuation assumptions, determined for each major scheme in conjunction with the respective independent actuaries, are presented below. The net defined benefit pension expense for each year is based on the assumptions and scheme valuations set at 31 December of the prior year.
| AS AT 31 DECEMBER | 2018 | 2017 | 2016 | |||||||||||||||||||||||||||||
| UK | US | UK | US | UK | US | |||||||||||||||||||||||||||
| Discount rate |
2.85% | 4.20% | 2.60% | 3.55% | 2.65% | 4.00% | ||||||||||||||||||||||||||
| Inflation |
3.15% | 2.50% | 3.15% | 2.50% | 3.25% | 2.50% | ||||||||||||||||||||||||||
Discount rates are set by reference to high-quality corporate bond yields.
Mortality assumptions make allowance for future improvements in longevity and have been determined by reference to applicable mortality statistics. The average life expectancy assumptions are set out below:
| AS AT 31 DECEMBER 2018 | Male average life expectancy |
Female average life expectancy |
||||||||||||||
| UK | US | UK | US | |||||||||||||
| Member currently aged 60 years |
85 | 86 | 88 | 88 | ||||||||||||
| Member currently aged 45 years |
87 | 87 | 90 | 89 | ||||||||||||
| RELX Annual report and financial statements 2018 | Notes to the consolidated financial statements | 135 | |
|
| ||
| 136 | RELX Annual report and financial statements 2018 | Financial statements and other information | |
|
| ||
Notes to the consolidated financial statements
for the year ended 31 December 2018
6 Pension schemes (continued)
Amounts recognised in the statement of comprehensive income are set out below:
| 2018 £m |
2017 £m |
2016 £m |
||||||||||
| Gains and losses arising during the year: |
||||||||||||
| Experience gains/(losses) on scheme liabilities |
6 | (38 | ) | 25 | ||||||||
| Experience (losses)/gains on scheme assets |
(273 | ) | 287 | 548 | ||||||||
| Actuarial gains/ (losses) on the present value of scheme liabilities due to changes in: |
||||||||||||
| – discount rates |
242 | (102 | ) | (873 | ) | |||||||
| – inflation |
– | 69 | (96 | ) | ||||||||
| – other actuarial assumptions |
(66 | ) | 17 | 134 | ||||||||
| (91 | ) | 233 | (262 | ) | ||||||||
| Net cumulative losses at start of year |
(613 | ) | (846 | ) | (584 | ) | ||||||
| Net cumulative losses at end of year |
(704 | ) | (613 | ) | (846 | ) | ||||||
The major categories and fair values of scheme assets at the end of the reporting period are as follows:
| FAIR VALUE OF SCHEME ASSETS | 2018 | 2017 | ||||||||||||||||||||||
| UK £m |
US £m |
Total £m |
UK £m |
US £m |
Total £m |
|||||||||||||||||||
| Equities |
1,128 | 115 | 1,243 | 1,252 | 143 | 1,395 | ||||||||||||||||||
| Government bonds |
1,224 | 224 | 1,448 | 1,395 | 221 | 1,616 | ||||||||||||||||||
| Corporate bonds |
– | 607 | 607 | – | 622 | 622 | ||||||||||||||||||
| Property funds and ground leases |
723 | – | 723 | 620 | – | 620 | ||||||||||||||||||
| Structured debt and direct lending |
290 | – | 290 | 253 | – | 253 | ||||||||||||||||||
| Cash and cash equivalents |
26 | 4 | 30 | 46 | 18 | 64 | ||||||||||||||||||
| Other |
22 | 16 | 38 | 23 | 8 | 31 | ||||||||||||||||||
| Total |
3,413 | 966 | 4,379 | 3,589 | 1,012 | 4,601 | ||||||||||||||||||
Assets and obligations associated with the schemes are sensitive to changes in the market values of assets and the market-related assumptions used to value scheme liabilities. In particular, adverse changes to asset values, discount rates or inflation could increase future pension costs and funding requirements.
Typically, the Group’s schemes are exposed to: investment risks, whereby actual rates of return on plan assets may be below those rates used to determine the defined benefit obligations, and interest rate risks, whereby scheme deficits may increase if bond yields in the UK and the US decline and are not offset by returns in government and corporate bond portfolios. The schemes are also exposed to other risks, such as unanticipated future increases in member longevity patterns and inflation, all potentially leading to an increase in scheme liabilities.
Investment policies of each scheme are intended to ensure continuous payment of defined benefit pensions in the short-term and long-term. Efforts are made to limit risks on marketable securities by adopting investment policies that diversify assets across geographies and among equities, government and corporate bonds, property funds and cash. Asset allocations are dependent on a variety of factors including the duration of scheme liabilities and the funded position of the plan.
All equities, government and corporate bonds have quoted prices in active markets.
Sensitivity analysis
The valuation of the Group’s pension scheme liabilities involves significant actuarial assumptions, being the life expectancy of the members, inflation and the rate at which the future pension payments are discounted. Differences arising from actual experience or future changes in assumptions may materially affect future pension charges. In particular, changes in assumptions for discount rates, inflation and life expectancies that are reasonably possible would have the following approximate effects on the defined benefit pension obligations:
| £m | ||||
| Increase/decrease of 0.25% in discount rate |
207 | |||
| Increase/decrease of 0.25% in the expected inflation rate |
94 | |||
| Increase/decrease of one year in assumed life expectancy |
177 | |||
The above analysis has been calculated on the same basis used to determine the defined benefit obligation recognised in the statement of financial position. There has been no change in the methods used to prepare the analysis compared with prior years. This sensitivity analysis may not be representative of the actual change in the defined benefit obligation as it is unlikely that changes in the above assumptions would occur in isolation as some of the assumptions may be correlated.
| RELX Annual report and financial statements 2018 | Notes to the consolidated financial statements | 137 | |
|
| ||
| 138 | RELX Annual report and financial statements 2018 | Financial statements and other information | |
|
| ||
Notes to the consolidated financial statements
for the year ended 31 December 2018
9 Taxation
| Accounting policy Tax expense comprises current and deferred tax. Current and deferred tax are charged or credited in the income statement except to the extent that the tax arises from a transaction or event which is recognised, in the same or a different period, outside the income statement (either in other comprehensive income, directly in equity, or through a business combination), in which case the tax appears in the same statement as the transaction that gave rise to it.
Current tax is the amount of corporate income taxes expected to be payable or recoverable based on the profit for the period as adjusted for items that are not taxable or not deductible, and is calculated using tax rates and laws that were enacted or substantively enacted at the date of the statement of financial position. Management periodically evaluates positions taken in tax returns with respect to situations in which applicable tax regulation is subject to interpretation. Provisions are established where appropriate on the basis of amounts expected to be paid to the tax authorities.
Current tax includes amounts provided in respect of uncertain tax positions when management expects that, upon examination of the uncertainty by a tax authority in possession of all relevant knowledge, it is more likely than not that an economic outflow will occur. Changes in facts and circumstances underlying these provisions are reassessed at the date of each statement of financial position, and the provisions are remeasured as required to reflect current information.
Deferred tax is recognised on temporary differences arising between the tax bases of assets and liabilities and their carrying amounts in the statement of financial position. Deferred tax is calculated using tax rates and laws that have been enacted or substantively enacted at the end of the reporting period, and which are expected to apply when the related deferred tax asset is realised or the deferred tax liability is settled.
Deferred tax liabilities are generally recognised for all taxable temporary differences but not recognised for taxable temporary differences arising on investments in subsidiaries, associates and joint ventures where the reversal of the temporary difference can be controlled and it is probable that the difference will not reverse in the foreseeable future. Deferred tax liabilities are not recognised on temporary differences that arise from goodwill which is not deductible for tax purposes.
Deferred tax assets are recognised to the extent it is probable that taxable profits will be available against which the deductible temporary differences can be utilised, and are reviewed at the end of each reporting period and reduced to the extent that it is no longer probable that sufficient taxable profits will be available to allow all or part of the asset to be recovered.
Deferred tax assets and liabilities are not recognised in respect of temporary differences that arise on initial recognition of assets and liabilities acquired other than in a business combination. Deferred tax is not discounted.
Critical judgement and key source of estimation uncertainty The Group is subject to tax in numerous jurisdictions, giving rise to complex tax issues that require management to exercise judgement in making tax determinations. As a multinational enterprise, our tax returns in the countries in which we operate are subject to tax authority audits as a matter of routine. While the Group is confident that tax returns are appropriately prepared and filed, amounts are provided in respect of uncertain tax positions that reflect the risk with respect to tax matters under active discussion with tax authorities, or which are otherwise considered to involve uncertainty.
Provisions against uncertain tax positions are measured using one of the following methods, depending on which of the methods management expects will better predict the amount it will pay over to the tax authority: |
||||
| ◾ |
The Single Best Estimate – where there is a single outcome that is more likely than not to occur. This will happen, for example, where the tax outcome is binary (such as whether an entity can deduct an item of expenditure) or the range of possible outcomes is narrow or concentrated on a single value. The most likely outcome may be that no tax is expected to be payable, in which case the provision is nil; or |
|||
| ◾ |
A Probability-Weighted Expected Value – where, on the balance of probabilities, something will be paid to the tax authority but the possible outcomes are widely dispersed with low individual probabilities (i.e. there is no single outcome more likely than not to occur). In this case, the provision is the sum of the probability-weighted amounts in the range. |
|||
| In assessing provisions against uncertain tax positions, management uses in-house tax experts, professional firms and previous experience to inform the evaluation of risk. However, it remains possible that uncertainties will ultimately be resolved at amounts greater or smaller than the liabilities recorded.
In particular, although we report cross-border transactions undertaken between Group subsidiaries on an arm’s-length basis in tax returns in accordance with OECD guidelines, transfer pricing relies on the exercise of judgement and it is frequently possible for there to be a range of legitimate and reasonable views. This means that it is impossible to be certain that the returns basis will be sustained on examination. Discussions with tax authorities relating to cross-border transactions and other matters are ongoing in each of our major trading jurisdictions. Although the timing and amount of final resolution of these uncertain tax positions cannot be reliably predicted, no significant impact on the profitability of the Group is expected in the near term.
Estimation of income taxes also includes assessments of the recoverability of deferred tax assets. Deferred tax assets are only recognised to the extent that they are considered recoverable based on existing tax laws and forecasts of future taxable profits against which the underlying tax deductions can be utilised. The recoverability of these assets is reassessed at the end of each reporting period, and changes in recognition of deferred tax assets will affect the tax liability in the period of that reassessment. |
||||
| RELX Annual report and financial statements 2018 | Notes to the consolidated financial statements | 139 | |
|
| ||
| 140 | RELX Annual report and financial statements 2018 | Financial statements and other information | |
|
| ||
Notes to the consolidated financial statements
for the year ended 31 December 2018
9 Taxation (continued)
In the UK, a reduction in the corporate tax rate from 19% to 17% from April 2020 was enacted in September 2016. In the US, the Tax Cuts and Jobs Act which included a reduction in the federal corporate tax rate from 35% to 21% from January 2018 was enacted in December 2017. In the Netherlands, a reduction in the corporate tax rate from 25% to 22.55% from 2020 and to 20.5% from 2021 was substantively enacted in December 2018. In total, the deferred tax effect of changes in tax rates for the year was a tax credit of £8m (2017: £346m, 2016: £1m).
The effective tax rate of 17% (2017: 3.8%, 2016: 20.6%) is lower than the weighted average applicable tax rate mainly because of an exceptional tax credit arising from the substantial resolution of certain prior year tax matters and the deferred tax effect of tax rate reductions in the Netherlands and the US. In 2017, the exceptional tax credit related to a one-off non-cash credit from a deferred tax adjustment arising from the US Tax Cuts and Jobs Act. On the basis of their size and non-recurring nature, the exceptional tax credits have been excluded from adjusted earnings.
The following tax has been recognised in other comprehensive income or directly in equity during the year:
| 2018 £m |
2017 £m |
2016 £m |
||||||||||
| Tax on items that will not be reclassified to profit or loss |
||||||||||||
| Tax on actuarial movements on defined benefit pension schemes |
15 | (59 | ) | 45 | ||||||||
| Tax on items that may be reclassified to profit or loss |
||||||||||||
| Tax on fair value movements on cash flow hedges |
9 | (30 | ) | 19 | ||||||||
| Net tax credit/(debit) recognised in other comprehensive income |
24 | (89 | ) | 64 | ||||||||
| Tax (debit)/credit on share based remuneration recognised directly in equity |
(3 | ) | 8 | 10 | ||||||||
The measurement of the US deferred tax assets and liabilities has also resulted in a charge of £1m in other comprehensive income.
| 2018 £m |
Restated £m |
|||||||
| Deferred tax assets |
455 | 431 | ||||||
| Deferred tax liabilities |
(830 | ) | (738 | ) | ||||
| Total |
(375 | ) | (307 | ) | ||||
Movements in deferred tax liabilities and assets (before taking into consideration the offsetting of balances within the same jurisdiction) are summarised as follows:
| Deferred tax liabilities | Deferred tax assets | |||||||||||||||||||||||||||||||
| Excess of tax allowances over amortisation £m |
Acquired £m |
Other temporary differences £m |
Excess of amortisation over tax allowances £m |
Tax losses carried forward £m |
Pension balances £m |
Other temporary differences £m |
Total £m |
|||||||||||||||||||||||||
| Deferred tax (liability)/asset at 1 January 2017 (restated) |
(393 | ) | (767 | ) | (338 | ) | 263 | 70 | 145 | 352 | (668 | ) | ||||||||||||||||||||
| Credit/(charge) to profit |
97 | 298 | 2 | (15 | ) | 22 | – | (30 | ) | 374 | ||||||||||||||||||||||
| Credit/(charge) to equity/other comprehensive income |
– | – | 7 | – | – | (76 | ) | (20 | ) | (89 | ) | |||||||||||||||||||||
| Acquisitions |
– | (2 | ) | – | – | – | – | – | (2 | ) | ||||||||||||||||||||||
| Exchange translation differences |
29 | 45 | 27 | 9 | (5 | ) | (3 | ) | (24 | ) | 78 | |||||||||||||||||||||
| Deferred tax (liability)/asset at 1 January 2018 (restated) |
(267 | ) | (426 | ) | (302 | ) | 257 | 87 | 66 | 278 | (307 | ) | ||||||||||||||||||||
| Credit/(charge) to profit |
75 | 13 | 13 | (51 | ) | (32 | ) | 3 | (16 | ) | 5 | |||||||||||||||||||||
| Credit/(charge) to equity/other comprehensive income |
– | – | – | – | – | 15 | (3 | ) | 12 | |||||||||||||||||||||||
| Acquisitions |
– | (88 | ) | – | – | 37 | – | – | (51 | ) | ||||||||||||||||||||||
| Exchange translation differences |
(12 | ) | (26 | ) | (17 | ) | 1 | 4 | 2 | 14 | (34 | ) | ||||||||||||||||||||
| Deferred tax (liability)/asset at 31 December 2018 |
(204 | ) | (527 | ) | (306 | ) | 207 | 96 | 86 | 273 | (375 | ) | ||||||||||||||||||||
Other deferred tax liabilities include temporary differences in respect of property, plant and equipment, capitalised development spend and financial instruments. Other deferred tax assets include temporary differences in respect of share based remuneration provisions and financial instruments.
As a result of exemptions on dividends from subsidiaries and capital gains on disposal there are no significant taxable temporary differences associated with investments in subsidiaries, branches, associates and interests in joint arrangements.
| RELX Annual report and financial statements 2018 | Notes to the consolidated financial statements | 141 | |
|
| ||
| 142 | RELX Annual report and financial statements 2018 | Financial statements and other information | |
|
| ||
Notes to the consolidated financial statements
for the year ended 31 December 2018
11 Statement of cash flows
| Accounting policy Cash and cash equivalents comprise cash balances, call deposits and other short-term highly liquid investments and are held in the statement of financial position at fair value. |
| RECONCILIATION OF PROFIT BEFORE TAX TO CASH GENERATED FROM OPERATIONS | 2018 £m |
Restated £m |
Restated £m |
|||||||||||||
| Profit before tax |
1,720 | 1,721 | 1,459 | |||||||||||||
| Disposals and other non-operating items |
33 | (15 | ) | 36 | ||||||||||||
| Net finance costs |
211 | 199 | 213 | |||||||||||||
| Operating profit |
1,964 | 1,905 | 1,708 | |||||||||||||
| Share of results of joint ventures |
(32 | ) | (37 | ) | (37 | ) | ||||||||||
| Amortisation of acquired intangible assets |
287 | 313 | 342 | |||||||||||||
| Amortisation of internally developed intangible assets |
225 | 203 | 189 | |||||||||||||
| Depreciation of property, plant and equipment |
62 | 65 | 62 | |||||||||||||
| Depreciation of right of use assets |
77 | 75 | 74 | |||||||||||||
| Share based remuneration |
41 | 39 | 38 | |||||||||||||
| Total non-cash items |
692 | 695 | 705 | |||||||||||||
| (Increase)/decrease in inventories and pre-publication costs |
(7 | ) | 2 | (24 | ) | |||||||||||
| (Increase)/decrease in receivables |
(89 | ) | 37 | (145 | ) | |||||||||||
| Increase/(decrease) in payables |
27 | (76 | ) | 104 | ||||||||||||
| Increase in working capital |
(69 | ) | (37 | ) | (65 | ) | ||||||||||
| Cash generated from operations |
2,555 | 2,526 | 2,311 | |||||||||||||
| CASH FLOW ON ACQUISITIONS | Note | 2018 £m |
2017 £m |
2016 £m |
||||||||||||
| Purchase of businesses |
12 | (919 | ) | (117 | ) | (336 | ) | |||||||||
| Investment in joint ventures |
– | (1 | ) | (1 | ) | |||||||||||
| Deferred payments relating to prior year acquisitions |
(16 | ) | (13 | ) | (24 | ) | ||||||||||
| Total |
(935 | ) | (131 | ) | (361 | ) | ||||||||||
| RECONCILIATION OF NET BORROWINGS | Cash and cash equivalents £m |
Borrowings £m |
Related instruments |
Finance lease receivable £m |
2018 £m |
Restated £m |
Restated £m |
|||||||||||||||||||||
| At start of year |
111 | (5,253 | ) | 43 | 57 | (5,042 | ) | (5,050 | ) | (4,095 | ) | |||||||||||||||||
| Increase/(decrease) in cash and cash equivalents |
1 | – | – | – | 1 | (45 | ) | 9 | ||||||||||||||||||||
| (Increase)/decrease in short-term bank loans, overdrafts and commercial paper |
– | (147 | ) | – | – | (147 | ) | 148 | (271 | ) | ||||||||||||||||||
| Issuance of term debt |
– | (958 | ) | – | – | (958 | ) | (873 | ) | (603 | ) | |||||||||||||||||
| Repayment of term debt |
– | 211 | – | – | 211 | 712 | 474 | |||||||||||||||||||||
| Repayment of leases |
– | 95 | – | (14 | ) | 81 | 78 | 74 | ||||||||||||||||||||
| Change in net borrowings resulting from cash flows |
1 | (799 | ) | – | (14 | ) | (812 | ) | 20 | (317 | ) | |||||||||||||||||
| Borrowings in acquired businesses |
– | (12 | ) | – | – | (12 | ) | – | – | |||||||||||||||||||
| Remeasurement and derecognition of leases |
– | (12 | ) | – | – | (12 | ) | (6 | ) | (14 | ) | |||||||||||||||||
| Inception of leases |
– | (31 | ) | – | 3 | (28 | ) | (36 | ) | (49 | ) | |||||||||||||||||
| Fair value and other adjustments to borrowings and related derivatives |
– | (7 | ) | (18 | ) | – | (25 | ) | (11 | ) | (24 | ) | ||||||||||||||||
| Exchange translation differences |
2 | (251 | ) | – | 3 | (246 | ) | 41 | (551 | ) | ||||||||||||||||||
| At end of year |
114 | (6,365 | ) | 25 | 49 | (6,177 | ) | (5,042 | ) | (5,050 | ) | |||||||||||||||||
Net borrowings comprise cash and cash equivalents, loan capital, lease liabilities and receivables, promissory notes, bank and other loans, derivative financial instruments that are used to hedge certain borrowings and adjustments in respect of cash collateral received/paid. The Group monitors net borrowings as part of capital and liquidity management.
| RELX Annual report and financial statements 2018 | Notes to the consolidated financial statements | 143 | |
|
| ||
| 144 | RELX Annual report and financial statements 2018 | Financial statements and other information | |
|
| ||
Notes to the consolidated financial statements
for the year ended 31 December 2018
13 Equity dividends (continued)
The Employee Benefit Trust has currently waived the right to receive dividends on RELX PLC shares. This waiver has been applied to dividends paid in 2018, 2017 and 2016.
14 Goodwill
| Accounting policy On the acquisition of a subsidiary or business, the purchase consideration is allocated between the net tangible and intangible assets on a fair value basis, with any excess purchase consideration representing goodwill. Goodwill arising on acquisitions also includes amounts corresponding to deferred tax liabilities recognised in respect of acquired intangible assets.
Goodwill is recognised as an asset and reviewed for impairment when there is an indicator that the asset may be impaired and at least annually. Any impairment is recognised immediately in the income statement and not subsequently reversed.
On disposal of a subsidiary or business, the attributable amount of goodwill is included in the determination of the profit or loss on disposal.
At each statement of financial position date, the carrying amounts of tangible and intangible assets and goodwill are reviewed to determine whether there is any indication that those assets have suffered an impairment loss. If any such indication exists, the recoverable amount, which is the higher of value in use and fair value less costs to sell, of the asset is estimated in order to determine the extent, if any, of the impairment loss. Where the asset does not generate cash flows that are independent from other assets, value in use estimates are made based on the cash flows of the cash generating unit to which the asset belongs. Intangible assets with an indefinite useful life are tested for impairment at least annually and whenever there is any indication that the asset may be impaired.
If the recoverable amount of an asset or cash generating unit is estimated to be less than its net carrying amount, the net carrying amount of the asset or cash generating unit is reduced to its recoverable amount. Impairment losses are recognised immediately in the income statement in administration and other expenses.
Critical judgement and key source of estimation uncertainty The carrying amounts of goodwill and indefinite lived intangible assets in each business are reviewed for impairment at least annually. The carrying amounts of all other intangible assets are reviewed where there are indications of possible impairment. An impairment review involves a comparison of the carrying value of the asset with estimated values in use based on the latest management cash flow projections, approved by the Board. Key areas of judgement in estimating the values in use of businesses are the growth in cash flows over a forecast period of up to five years, the long-term growth rate assumed thereafter and the discount rate applied to the forecast cash flows. A description of the key assumptions and sensitivities is provided below. |
| 2018 £m |
2017 £m |
|||||||
| At start of year |
5,965 | 6,392 | ||||||
| Acquisitions |
626 | 77 | ||||||
| Disposals/reclassified as held for sale |
(25 | ) | (72 | ) | ||||
| Transfers |
– | 11 | ||||||
| Exchange translation differences |
333 | (443 | ) | |||||
| At end of year |
6,899 | 5,965 | ||||||
Transfers relate to movements in goodwill as a result of the finalisation of the accounting for prior year acquisitions.
The carrying amount of goodwill is after cumulative amortisation of £1,222m (2017: £1,173m), which was charged prior to the adoption of IFRS, and £9m (2017: £9m) of subsequent impairment charges recorded in prior years.
| RELX Annual report and financial statements 2018 | Notes to the consolidated financial statements | 145 | |
|
| ||
| 146 | RELX Annual report and financial statements 2018 | Financial statements and other information | |
|
| ||
Notes to the consolidated financial statements
for the year ended 31 December 2018
15 Intangible assets
| Accounting policy Intangible assets acquired as part of a business combination are stated in the statement of financial position at their fair value as at the date of acquisition, less accumulated amortisation. Internally generated intangible assets are stated in the statement of financial position at the directly attributable cost of creation of the asset, less accumulated amortisation.
Intangible assets acquired as part of business combinations comprise: market-related assets (e.g. trademarks, imprints, brands); customer-related assets (e.g. subscription bases, customer lists, customer relationships); editorial content; software and systems (e.g. application infrastructure, product delivery platforms, in-process research and development); contract-based assets (e.g. publishing rights, exhibition rights, supply contracts); and other intangible assets. Internally generated intangible assets typically comprise software and systems development where an identifiable asset is created that is probable to generate future economic benefits.
Intangible assets, other than journal titles determined to have indefinite lives, are amortised on a straight-line basis over their estimated useful lives. The estimated useful lives of intangible assets with finite lives are as follows: market and customer-related assets – 3 to 40 years; content, software and other acquired intangible assets – 3 to 20 years; and internally developed intangible assets – 3 to 10 years. Journal titles determined to have indefinite lives are not amortised and are subject to impairment review at least annually, including a review of events and circumstances to ensure that they continue to support an indefinite useful life.
Critical judgements and key sources of estimation uncertainty On acquisition of a subsidiary or business, the purchase consideration is allocated between the net tangible and intangible assets other than goodwill on a fair value basis, with any excess purchase consideration representing goodwill. The valuation of acquired intangible assets represents the estimated economic value in use, using standard valuation methodologies, including as appropriate, discounted cash flow, relief from royalty and comparable market transactions. Acquired intangible assets are capitalised and amortised systematically over their estimated useful lives, subject to impairment review. The assumptions used are subject to management judgement.
Appropriate amortisation periods are selected based on assessments of the longevity of the brands and imprints, the strength and stability of customer relationships, the market positions of the acquired assets and the technological and competitive risks that they face. Certain intangible assets in relation to acquired science and medical publishing businesses have been determined to have indefinite lives. The longevity of these assets is evidenced by their long-established and well-regarded journal titles, and their characteristically stable market positions. The assumptions used are subject to management judgement.
Development spend encompasses investment in new products and other initiatives, ranging from the building of online delivery platforms, to launch costs of new services, to building new infrastructure and applications. Launch costs and other ongoing operating expenses of new products and services are expensed as incurred. The costs of building product applications, platforms and infrastructure are capitalised as intangible assets, where the investment they represent has demonstrable value and the technical and commercial feasibility is assured. Costs eligible for capitalisation must be incremental, clearly identified and directly attributable to a particular project. The resulting assets are amortised over their estimated useful lives. Impairment reviews are carried out at least annually where indicators of impairment are identified. Judgement is required in the assessment of the potential value of a development project, the identification of costs eligible for capitalisation and the selection of appropriate asset lives. |
| RELX Annual report and financial statements 2018 | Notes to the consolidated financial statements | 147 | |
|
| ||
| 148 | RELX Annual report and financial statements 2018 | Financial statements and other information | |
|
| ||
Notes to the consolidated financial statements
for the year ended 31 December 2018
16 Investments
| Accounting policy Investments, other than investments in joint arrangements and associates, are stated in the statement of financial position at fair value. Changes in the fair value of investments held as part of the venture capital portfolio are reported in disposals and other non-operating items in the income statement. All items recognised in the income statement relating to investments, other than investments in joint arrangements and associates, are reported as disposals and other non-operating items.
Venture capital investments and equity investments represent interests in unlisted securities. The fair value of unlisted securities is based on management’s estimate of fair value based on standard valuation techniques, including market comparisons and discounts of future cash flows, having regard to maximising the use of observable inputs and adjusting for risk. Advice from valuation experts is used as appropriate.
All joint arrangements are classified as joint ventures because the Group shares joint control and has rights to the net assets of the arrangements. Investments in joint ventures and associates are accounted for under the equity method and stated in the statement of financial position at cost as adjusted for post-acquisition changes in the Group’s share of net assets, less any impairment in value. |
| 2018 £m |
2017 £m |
|||||||
| Investments in joint ventures |
104 | 102 | ||||||
| Equity investments |
– | 2 | ||||||
| Venture capital investments |
151 | 139 | ||||||
| Total |
255 | 243 | ||||||
The value of venture capital investments and equity investments has been determined by reference to other observable market inputs or, when these are not available, by reference to inputs we believe would reflect the assumptions market participants would use. Gains and losses included in the consolidated income statement are provided in note 8.
An analysis of changes in the carrying value of investments in joint ventures is set out below:
| 2018 £m |
2017 £m |
|||||||
| At start of year |
102 | 102 | ||||||
| Share of results of joint ventures |
32 | 37 | ||||||
| Dividends received from joint ventures |
(30 | ) | (38 | ) | ||||
| Additions |
2 | 2 | ||||||
| Exchange translation differences |
(2 | ) | (1 | ) | ||||
| At end of year |
104 | 102 | ||||||
Summarised aggregate information in respect of the Group’s share of joint ventures is set out below:
| RELX’s share | ||||||||
| 2018 £m |
2017 £m |
|||||||
| Revenue |
101 | 101 | ||||||
| Net profit for the year |
32 | 37 | ||||||
| Total assets |
96 | 85 | ||||||
| Total liabilities |
(49 | ) | (42 | ) | ||||
| Net assets |
47 | 43 | ||||||
| Goodwill |
57 | 59 | ||||||
| Total |
104 | 102 | ||||||
The Group’s consolidated other comprehensive income includes no income or losses relating to joint ventures in either period.
| RELX Annual report and financial statements 2018 | Notes to the consolidated financial statements | 149 | |
|
| ||
| 150 | RELX Annual report and financial statements 2018 | Financial statements and other information | |
|
| ||
Notes to the consolidated financial statements
for the year ended 31 December 2018
18 Financial instruments
| Accounting policy Financial instruments comprise investments (other than investments in joint ventures or associates), trade receivables, cash and cash equivalents, payables and accruals, borrowings and derivative financial instruments.
Investments (other than investments in joint ventures and associates) are described in note 16. The fair value of such investments is based on standard valuation techniques, including market comparisons and discounts of future cash flows, having regard to maximising the use of observable inputs and adjusting for risk. (These investments are typically classified as either Level 2 or 3 in the IFRS 13 fair value hierarchy).
Trade receivables are carried in the statement of financial position at invoiced value less allowance for estimated irrecoverable amounts. Irrecoverable amounts are estimated based on the ageing of trade receivables, experience and circumstance. Borrowings and payables are recorded initially at fair value and subsequently carried at amortised cost (other than fixed rate borrowings in designated hedging relationships for which the carrying amount of the hedged portion of the borrowings is subsequently adjusted for the gain or loss attributable to the hedged risk).
Derivative financial instruments are used to hedge interest rate and foreign exchange risks. Where an effective hedge is in place against changes in the fair value of fixed rate borrowings, the hedged borrowings are adjusted for changes in fair value attributable to the risk being hedged with a corresponding income or expense included in the income statement within finance costs. The offsetting gains or losses from remeasuring the fair value of the related derivatives are also recognised in the income statement within finance costs. When the related derivative expires, is sold or terminated, or no longer qualifies for hedge accounting, the cumulative change in fair value of the hedged borrowing is amortised in the income statement over the period to maturity of the borrowing using the effective interest method.
Changes in the fair value of derivative financial instruments that are designated and effective as hedges of future cash flows are recognised (net of tax) in other comprehensive income and accumulated in the hedge reserve. With effect from 1 January 2018, the fair value amounts relating to foreign currency basis spreads are recorded in a separate component of equity in the cost of hedging reserve. If a hedged firm commitment or forecasted transaction results in the recognition of a non-financial asset or liability, then, at the time that the asset or liability is recognised, the associated gains or losses on the derivative that had previously been recognised in other comprehensive income are included in the initial measurement of the asset or liability. For hedges that do not result in the recognition of an asset or a liability, amounts deferred in the hedge reserve are recognised in the income statement in the same period in which the hedged item affects net profit or loss. Any ineffective portion of hedges is recognised immediately in the income statement.
Cash flow hedge accounting is discontinued when a hedging instrument expires or is sold, terminated or exercised, or no longer qualifies for hedge accounting. At that time, any cumulative gain or loss on the hedging instrument recognised in other comprehensive income is either retained in the hedge reserve until the firm commitment or forecasted transaction occurs, or, where a hedged transaction is no longer expected to occur, is immediately credited or expensed in the income statement.
Derivative financial instruments that are not designated as hedging instruments are recorded in the statement of financial position at fair value, with changes in fair value recognised in the income statement.
The fair values of derivative financial instruments represent the replacement costs calculated using observable market rates of interest and exchange. The fair value of long-term borrowings is calculated by discounting expected future cash flows at observable market rates. (These instruments are accordingly classified as Level 2 in the IFRS 13 fair value hierarchy.)
|
||
The main financial risks faced by the Group are liquidity risk, market risk – comprising interest rate risk and foreign exchange risk – and credit risk. Financial instruments are used to finance the Group’s businesses and to manage interest rate and foreign exchange risks. The Group’s businesses do not enter into speculative derivative transactions. Details of financial instruments subject to liquidity, market and credit risks are described below.
Liquidity risk
The Group maintains a range of borrowing facilities and debt programmes to fund its requirements at competitive rates.
The balance of long-term debt, short-term debt and committed bank facilities is managed to provide security of funding, taking into account the cash generation cycle of the business and the uncertain size and timing of acquisition spend. To accommodate the significant free cash flow generated by the Group and to capitalise on an inexpensive source of funding, a meaningful portion of the overall debt portfolio is typically kept short-term as long as there exists acceptable liquidity in the commercial paper markets and sufficient capacity under committed credit lines. The Group’s treasury policies ensure adequate liquidity by requiring that (a) no more than $1.5bn of term debt matures in any 12-month period, (b) the sum of term debt maturing over the ensuing 12 months plus short-term borrowings is less than the sum of available cash plus committed facilities and (c) minimum levels of borrowing with maturities over three and five years are maintained.
The treasury policies ensure debt efficiency by (a) targeting certain levels of short-term borrowings across a given year, (b) maintaining a weighted average maturity of the gross debt portfolio of approximately five years and (c) minimising surplus cash balances. From time to time, based on cash flow and market conditions, the Group may redeem term debt early or repurchase outstanding debt in the open market.
| RELX Annual report and financial statements 2018 | Notes to the consolidated financial statements | 151 | |
|
| ||
| 152 | RELX Annual report and financial statements 2018 | Financial statements and other information | |
|
| ||
Notes to the consolidated financial statements
for the year ended 31 December 2018
18 Financial instruments (continued)
At 31 December 2018, the Group had access to a $3,000m committed bank facility, consisting of a $1,750m tranche maturing in July 2023 and a $1,250m tranche maturing in July 2021, which was undrawn. This facility backs up short-term borrowings. All borrowings that mature within the next two years can be covered by the facility and by utilising available cash resources.
The committed bank facility is subject to a financial covenant typical to the Group’s size and financial strength. The Group had significant headroom within this covenant for the year ended 31 December 2018. There are no financial covenants in any outstanding public bonds.
Market risk
The Group’s primary market risks are interest rate fluctuations and exchange rate movements. Derivatives are used to manage the risks associated with interest rate and exchange rate movements and the Group does not enter into speculative derivatives. Where the impact of derivatives on the income statement and the statement of financial position could be significant, hedge accounting is applied (subject to satisfying the required criteria) as described in ‘Hedge accounting’ below. Derivatives used by the Group for hedging a particular risk are not specialised and are generally available from numerous sources. The impact of market risks on net post-employment benefit obligations and taxation is excluded from the following market risk sensitivity analysis.
Interest rate exposure management
The Group’s interest rate exposure management policy aims to minimise interest costs with an acceptable level of year on year volatility. To achieve this, the Group uses fixed rate term debt and interest rate swaps to give a target mix of fixed rate and floating rate borrowings. Interest rate derivatives are used only to hedge an underlying risk and no net market positions are held.
At 31 December 2018, 45% of gross bank and bond borrowings were at fixed rate. A 100 basis point reduction in interest rates would result in an estimated decrease in net finance costs of £32m (2017: £26m), based on the composition of financial instruments including cash, cash equivalents, bank loans and commercial paper borrowings at 31 December 2018. A 100 basis point rise in interest rates would result in an estimated increase in net finance costs of £32m (2017: £26m).
The impact on net equity of a theoretical change in interest rates as at 31 December 2018 is restricted to the change in carrying value of floating rate to fixed rate interest rate derivatives in a designated cash flow hedge relationship and undesignated interest rate derivatives. A 100 basis point reduction in interest rates would result in an estimated increase in net equity of £1m (2017: £2m) and a 100 basis point increase in interest rates would reduce net equity by an estimated £1m (2017: £2m). The impact of a change in interest rates on the carrying value of fixed rate borrowings in a designated fair value hedge relationship would be offset by the change in carrying value of the related interest rate derivative. Fixed rate borrowings not in a designated hedging relationship are carried at amortised cost.
Foreign currency exposure management
Translation exposures arise on the earnings and net assets of individual businesses whose operational currencies are other than sterling. Some of these exposures are offset by denominating borrowings in US dollars, euros and other currencies. Currency exposures on transactions denominated in a foreign currency are generally hedged using forward contracts. In addition, recurring transactions and future investment exposures may be hedged, in advance of becoming contractual. The precise policy differs according to the specific circumstances of the individual businesses. Highly predictable future cash flows may be covered for transactions expected to occur during the next 24 months (50 months for the Scientific, Technical & Medical subscription businesses) within limits defined according to the period before the transaction is expected to become contractual. Cover takes the form of foreign exchange forward contracts. Further information is provided in ‘Cash flow hedges’ below.
A theoretical weakening of all currencies by 10% against sterling at 31 December 2018 would decrease the carrying value of net assets, excluding net borrowings, by £782m (2017: £650m). This would be offset to a degree by a decrease in net borrowings of £625m (2017: £473m). A strengthening of all currencies by 10% against sterling at 31 December 2018 would increase the carrying value of net assets, excluding net borrowings, by £782m (2017: £650m) and increase net borrowings by £625m (2017: £473m).
A retranslation of the Group’s net profit for the year, assuming a 10% weakening of all foreign currencies against sterling but excluding transactional exposures, would reduce net profit by £127m (2017: £147m). A 10% strengthening of all foreign currencies against sterling on this basis would increase net profit for the year by £127m (2017: £147m).
| RELX Annual report and financial statements 2018 | Notes to the consolidated financial statements | 153 | |
|
| ||
| 154 | RELX Annual report and financial statements 2018 | Financial statements and other information | |
|
| ||
Notes to the consolidated financial statements
for the year ended 31 December 2018
18 Financial instruments (continued)
The gains and losses on the borrowings and related derivatives designated as fair value hedges, which are included in the income statement as part of finance costs, together with the total carrying values of the borrowings and related derivatives included in the statement of financial position, for the three years ended 31 December 2018, 2017 and 2016 were as follows:
| GAINS/(LOSSES) ON BORROWINGS AND RELATED DERIVATIVES AND CARRYING VALUES |
1 January £m |
Fair value movement gain/(loss) £m |
Exchange gain/(loss) £m |
31 December £m |
Carrying values £m |
|||||||||||||||
| USD debt |
12 | – | 1 | 13 | (701 | ) | ||||||||||||||
| Related interest rate swaps |
(12 | ) | (1 | ) | (1 | ) | (14 | ) | (14 | ) | ||||||||||
| – | (1 | ) | – | (1 | ) | (715 | ) | |||||||||||||
| EUR debt |
(17 | ) | (21 | ) | (1 | ) | (39 | ) | (1,952 | ) | ||||||||||
| Related interest rate swaps |
17 | 21 | 1 | 39 | 39 | |||||||||||||||
| – | – | – | – | (1,913 | ) | |||||||||||||||
| Total relating to USD and EUR debt |
(5 | ) | (21 | ) | – | (26 | ) | (2,653 | ) | |||||||||||
| Total related interest rate swaps |
5 | 20 | – | 25 | 25 | |||||||||||||||
| Net loss on borrowings and related derivatives/total carrying value |
– | (1 | ) | – | (1 | ) | (2,628 | ) | ||||||||||||
| GAINS/(LOSSES) ON BORROWINGS AND RELATED DERIVATIVES AND CARRYING VALUES |
1 January £m |
Fair value movement gain/(loss) £m |
De-designated £m |
Exchange gain/(loss) £m |
31 December £m |
Carrying values £m |
||||||||||||||||||
| USD debt |
16 | (1 | ) | (2 | ) | (1 | ) | 12 | (147 | ) | ||||||||||||||
| Related interest rate swaps |
(16 | ) | 1 | 2 | 1 | (12 | ) | (12 | ) | |||||||||||||||
| – | – | – | – | – | (159 | ) | ||||||||||||||||||
| EUR debt |
(33 | ) | 17 | – | (1 | ) | (17 | ) | (1,922 | ) | ||||||||||||||
| Related interest rate swaps |
32 | (16 | ) | – | 1 | 17 | 17 | |||||||||||||||||
| (1 | ) | 1 | – | – | – | (1,905 | ) | |||||||||||||||||
| Total relating to USD and EUR debt |
(17 | ) | 16 | (2 | ) | (2 | ) | (5 | ) | (2,069 | ) | |||||||||||||
| Total related interest rate swaps |
16 | (15 | ) | 2 | 2 | 5 | 5 | |||||||||||||||||
| Net (loss)/gain on borrowings and related derivatives/total carrying value |
(1 | ) | 1 | – | – | – | (2,064 | ) | ||||||||||||||||
| GAINS/(LOSSES) ON BORROWINGS AND RELATED DERIVATIVES AND CARRYING VALUES |
1 January £m |
Fair value movement gain/(loss) £m |
De-designated £m |
Exchange £m |
31 December £m |
Carrying values £m |
||||||||||||||||||
| USD debt |
2 | 13 | – | 1 | 16 | (387 | ) | |||||||||||||||||
| Related interest rate swaps |
(2 | ) | (13 | ) | – | (1 | ) | (16 | ) | (16 | ) | |||||||||||||
| – | – | – | – | – | (403 | ) | ||||||||||||||||||
| GBP debt |
(14 | ) | – | 14 | – | – | – | |||||||||||||||||
| Related interest rate swaps |
14 | – | (14 | ) | – | – | – | |||||||||||||||||
| – | – | – | – | – | – | |||||||||||||||||||
| EUR debt |
(9 | ) | (21 | ) | – | (3 | ) | (33 | ) | (1,011 | ) | |||||||||||||
| Related interest rate swaps |
8 | 21 | – | 3 | 32 | 32 | ||||||||||||||||||
| (1 | ) | – | – | – | (1 | ) | (979 | ) | ||||||||||||||||
| Total relating to USD, GBP and EUR debt |
(21 | ) | (8 | ) | 14 | (2 | ) | (17 | ) | (1,398 | ) | |||||||||||||
| Total related interest rate swaps |
20 | 8 | (14 | ) | 2 | 16 | 16 | |||||||||||||||||
| Net loss on borrowings and related derivatives/total carrying value |
(1 | ) | – | – | – | (1 | ) | (1,382 | ) | |||||||||||||||
All fair value hedges were highly effective throughout the three years ended 31 December 2018.
| RELX Annual report and financial statements 2018 | Notes to the consolidated financial statements |
155 | |
|
| ||
| 156 | RELX Annual report and financial statements 2018 | Financial statements and other information | |
|
| ||
Notes to the consolidated financial statements
for the year ended 31 December 2018
19 Inventories and pre-publication costs
| Accounting policy Inventories and pre-publication costs are stated at the lower of cost, including appropriate attributable overhead, and estimated net realisable value. Such costs typically comprise direct internal labour costs and externally commissioned editorial and other fees.
Pre-publication costs, representing costs incurred in the origination of content prior to publication, are expensed systematically reflecting the expected sales profile over the estimated economic lives of the related products, generally up to five years.
Annual reviews are carried out to assess the recoverability of carrying amounts.
|
| 2018 £m |
2017 £m |
|||||||
| Raw materials |
2 | 2 | ||||||
| Pre-publication costs |
171 | 157 | ||||||
| Finished goods |
39 | 38 | ||||||
| Total |
212 | 197 | ||||||
| 20 Trade and other receivables
|
||||||||
| 2018 £m |
Restated £m |
|||||||
| Trade receivables |
1,829 | 1,682 | ||||||
| Loss allowance |
(87 | ) | (79 | ) | ||||
| 1,742 | 1,603 | |||||||
| Prepayments and accrued income |
224 | 213 | ||||||
| Net finance lease receivable |
49 | 57 | ||||||
| Total |
2,015 | 1,873 | ||||||
| Trade receivables are predominantly non-interest bearing and their carrying amounts approximate to their fair value.
Trade receivables are stated net of a loss allowance for expected credit losses. The movements in the loss allowance during the year were as follows:
|
| |||||||
| 2018 £m |
2017 £m |
|||||||
| At start of year |
79 | 56 | ||||||
| Charge for the year |
14 | 39 | ||||||
| Trade receivables written off |
(8 | ) | (15 | ) | ||||
| Exchange translation differences |
2 | (1 | ) | |||||
| At end of year |
87 | 79 | ||||||
| 21 Trade and other payables | ||||||||
| Accounting policy Deferred income is recognised when either a customer has paid consideration, or RELX has an unconditional right to an amount of consideration, in advance of the goods and services being delivered.
|
| |||||||
| 2018 £m |
Restated £m |
|||||||
| Trade payables |
187 | 240 | ||||||
| Accruals |
711 | 663 | ||||||
| Social security and other taxes |
127 | 114 | ||||||
| Other payables |
407 | 371 | ||||||
| Deferred income |
2,000 | 1,910 | ||||||
| Total |
3,432 | 3,298 | ||||||
Trade and other payables are predominantly non-interest bearing and their carrying amounts approximate to their fair value.
| RELX Annual report and financial statements 2018 | Notes to the consolidated financial statements | 157 | |
|
| ||
| 158 | RELX Annual report and financial statements 2018 | Financial statements and other information | |
|
| ||
Notes to the consolidated financial statements
for the year ended 31 December 2018
22 Borrowings (continued)
Analysis by currency
| 2018 |
Restated 2017 |
|||||||||||||||||||||||||||||||||
|
Short-term £m |
Term debt £m |
Lease liabilities £m |
Total £m |
Short-term £m |
Term debt £m |
Lease liabilities £m |
Total £m |
|||||||||||||||||||||||||||
| US dollars |
19 | 2,493 | 177 | 2,689 | 103 | 2,044 | 187 | 2,334 | ||||||||||||||||||||||||||
| £ sterling |
317 | 300 | 66 | 683 | 262 | 299 | 69 | 630 | ||||||||||||||||||||||||||
| Euro |
318 | 2,526 | 85 | 2,929 | 76 | 2,055 | 97 | 2,228 | ||||||||||||||||||||||||||
| Other currencies |
32 | – | 32 | 64 | 23 | – | 38 | 61 | ||||||||||||||||||||||||||
| Total |
686 | 5,319 | 360 | 6,365 | 464 | 4,398 | 391 | 5,253 | ||||||||||||||||||||||||||
Included in the US dollar amounts for term debt above is £544m of debt denominated in euros (€600m) (2017: £742m of debt denominated in euros (€600m) and Swiss francs (CHF 275m)) that was swapped into US dollars on issuance and against which there are related derivative financial instruments, which, as at 31 December 2018, had a fair value of £19m (2017: £38m).
23 Lease arrangements
| Accounting policy All leases where RELX is the lessee (with the exception of short-term and low-value leases) are recognised in the statement of financial position. A lease liability is recognised based on the present value of the future lease payments, and a corresponding right-of-use asset is recognised. The right-of-use asset is depreciated over the shorter of the lease term or the useful life of the asset. Lease payments are apportioned between finance charges and a reduction of the lease liability.
Low-value items and short-term leases with a term of 12 months or less are not required to be recognised on the balance sheet and payments made in relation to these leases are recognised on a straight-line basis in the income statement.
The leases held by the Group can be split into two categories: property and non-property. The Group leases various properties, principally offices, which have varying terms and renewal rights that are typical to the territory in which they are located. Non-property includes all other leases, such as cars and printers.
|
||
Right-of-use assets
| Property £m |
Non- property £m |
2018 £m |
Property £m |
Non- property £m |
Restated £m |
|||||||||||||||||||
| At start of year |
264 | 23 | 287 | 298 | 27 | 325 | ||||||||||||||||||
| Additions |
26 | 5 | 31 | 41 | 5 | 46 | ||||||||||||||||||
| Acquisitions |
7 | 5 | 12 | – | – | – | ||||||||||||||||||
| Remeasurement |
13 | – | 13 | 8 | – | 8 | ||||||||||||||||||
| Disposals |
(2 | ) | (8 | ) | (10 | ) | (8 | ) | – | (8 | ) | |||||||||||||
| Depreciation |
(68 | ) | (9 | ) | (77 | ) | (67 | ) | (8 | ) | (75 | ) | ||||||||||||
| Exchange translation differences |
6 | 1 | 7 | (8 | ) | (1 | ) | (9 | ) | |||||||||||||||
| At end of year |
246 | 17 | 263 | 264 | 23 | 287 | ||||||||||||||||||
| RELX Annual report and financial statements 2018 | Notes to the consolidated financial statements | 159 | |
|
| ||
| 160 | RELX Annual report and financial statements 2018 | Financial statements and other information | |
|
| ||
Notes to the consolidated financial statements
for the year ended 31 December 2018
25 Share capital, share premium and shares held in treasury
| Accounting policy Shares of RELX PLC that are repurchased and not cancelled are classified as shares held in treasury. The consideration paid, including directly attributable costs, is recognised as a deduction from equity. Shares of RELX PLC that are purchased by the Employee Benefit Trust are also classified as shares held in treasury, with the cost recognised as a deduction from equity.
|
RELX PLC
| CALLED UP SHARE CAPITAL – ISSUED AND FULLY PAID | No. of shares | 2018 £m |
No. of shares | 2017 £m |
||||||||||||
| At start of year |
1,123,682,106 | 162 | 1,144,122,623 | 165 | ||||||||||||
| Issue of ordinary shares |
1,580,885 | – | 2,019,483 | – | ||||||||||||
| Issue of ordinary shares in exchange for RELX NV shares |
930,780,110 | 134 | – | – | ||||||||||||
| Cancellation of shares |
(45,000,000 | ) | (6 | ) | (22,460,000 | ) | (3 | ) | ||||||||
| At end of year |
2,011,043,101 | 290 | 1,123,682,106 | 162 | ||||||||||||
| RELX NV | ||||||||||||||||
| CALLED UP SHARE CAPITAL – ISSUED AND FULLY PAID | No. of shares | 2018 €m |
No. of shares | 2017 €m |
||||||||||||
| At start of year |
999,961,098 | 70 | 1,019,893,404 | 71 | ||||||||||||
| Issue of ordinary shares |
888,128 | – | 2,067,694 | – | ||||||||||||
| Cancellation of shares |
– | – | (22,000,000 | ) | (1 | ) | ||||||||||
| Cancellation of ordinary shares on completion of the corporate simplification |
(930,780,110 | ) | (65 | ) | – | – | ||||||||||
| Cancellation of treasury shares on completion of the corporate simplification |
(70,069,116 | ) | (5 | ) | – | – | ||||||||||
| At end of year |
– | – | 999,961,098 | 70 | ||||||||||||
| NUMBER OF ORDINARY SHARES | Year ended 31 December | |||||||||||||||
| Shares in issue (millions) |
Treasury shares (millions) |
2018 Shares in issue net of treasury shares (millions) |
2017 Shares in issue net of treasury shares (millions) |
|||||||||||||
| RELX PLC |
||||||||||||||||
| At start of year |
1,123.6 | (63.5 | ) | 1,060.1 | 1,080.5 | |||||||||||
| Issue of ordinary shares |
1.6 | – | 1.6 | 2.0 | ||||||||||||
| Issue of ordinary shares in exchange for RELX NV shares |
930.8 | (3.5 | ) | 927.3 | – | |||||||||||
| Repurchase of ordinary shares |
– | (26.9 | ) | (26.9 | ) | (23.1 | ) | |||||||||
| Net (purchase)/release of shares by the Employee Benefit Trust |
– | (0.2 | ) | (0.2 | ) | 0.7 | ||||||||||
| Cancellation of shares |
(45.0 | ) | 45.0 | – | – | |||||||||||
| At end of year |
2,011.0 | (49.1 | ) | 1,961.9 | 1,060.1 | |||||||||||
| RELX NV |
||||||||||||||||
| At start of year |
1,000.0 | (56.4 | ) | 943.6 | 962.2 | |||||||||||
| Issue of ordinary shares |
0.9 | – | 0.9 | 2.1 | ||||||||||||
| Repurchase of ordinary shares |
– | (17.5 | ) | (17.5 | ) | (21.4 | ) | |||||||||
| Net release of shares by the Employee Benefit Trust |
– | 0.3 | 0.3 | 0.7 | ||||||||||||
| Cancellation of ordinary shares on completion of the corporate simplification |
(930.8 | ) | 3.5 | (927.3 | ) | – | ||||||||||
| Cancellation of treasury shares on completion of the corporate simplification |
(70.1 | ) | 70.1 | – | – | |||||||||||
| At end of year |
– | – | – | 943.6 | ||||||||||||
| At end of year |
2,011.0 | (49.1 | ) | 1,961.9 | 2,003.7 | |||||||||||
| RELX Annual report and financial statements 2018 | Notes to the consolidated financial statements | 161 | |
|
| ||
| 162 | RELX Annual report and financial statements 2018 | Financial statements and other information | |
|
| ||
Notes to the consolidated financial statements
for the year ended 31 December 2018
27 Related party transactions
Transactions between RELX PLC and subsidiaries of the Group have been eliminated within the consolidated financial statements. Transactions with joint ventures were made on normal market terms of trading and comprise sales of goods and services of £3m (2017: £16m; 2016: £2m) and the rendering and receiving of goods and services of £0.1m (2017: £0.1m; 2016: nil). As at 31 December 2018, amounts owed by joint ventures were £2m (2017: £2m; 2016: nil) and amounts due to joint ventures were £0.9m (2017: £1m; 2016: nil). See note 6 for details of the Group’s participation in defined benefit pension schemes.
Key management personnel are also related parties as defined by IAS 24 – Related Party Disclosures and comprise the Executive and Non-Executive Directors of RELX PLC. Key management personnel remuneration is set out below. For reporting purposes, salary, benefits and annual incentive payments are considered short-term employee benefits.
| KEY MANAGEMENT PERSONNEL REMUNERATION | 2018 £m |
2017 £m |
2016 £m |
|||||||||
| Salaries, other short-term employee benefits and non-executive fees |
7 | 5 | 5 | |||||||||
| Post-employment benefits |
1 | 1 | 1 | |||||||||
| Share based remuneration* |
7 | 8 | 12 | |||||||||
| Total |
15 | 14 | 18 | |||||||||
| EXECUTIVE DIRECTORS | |
Salary £’000 |
|
|
Benefits £’000 |
|
|
Annual incentive £’000 |
|
|
Cost of share based remuneration £’000 |
* |
|
Cost of pension provision |
* |
|
Total £’000 |
| ||||||||||
| Total Executive Directors |
2018 | 1,935 | 99 | 3,033 | 7,003 | 741 | 12,811 | |||||||||||||||||||||
| 2017 | 1,889 | 101 | 1,964 | 8,205 | 983 | 13,142 | ||||||||||||||||||||||
| 2016 | 1,843 | 88 | 1,881 | 12,038 | 1,052 | 16,902 |
* The figures for share based awards are calculated in accordance with the methodology set out in the UK Regulations. The figure for performance-related share based awards includes share price appreciation since the date the award was granted. Please see page 87 for further details. The cost of pension provision is calculated in accordance with the methodology set out in the UK Regulations. The amount is reduced by the Directors’ contributions and participation fee for defined benefit schemes and reduced by the payments made to defined contribution schemes or in lieu of pension.
| NON-EXECUTIVE DIRECTORS | 2018 £’000 |
2017 £’000 |
2016 £’000 |
|||||||||
| Fees and benefits |
1,634 | 1,396 | 1,364 | |||||||||
The remuneration of non-executive directors comprises fees for services, and benefits primarily relating to tax filing support in respect of filings resulting from their directorships. No deemed benefits were provided during 2018 to former Directors (2017: £2,460; 2016: nil). No loans, advances or guarantees have been provided on behalf of any Director. The aggregate gains made by Executive Directors on the exercise of options during 2018 were nil (2017: £2,804,358; 2016: £3,082,715).
28 Exchange rates
The following exchange rates have been applied in preparing the consolidated financial statements:
| Income statement | Statement
of financial position |
|||||||||||||||||||||||
| 2018 | 2017 | 2016 | 2018 | 2017 | ||||||||||||||||||||
| Euro to sterling |
1.13 | 1.14 | 1.22 | 1.11 | 1.12 | |||||||||||||||||||
| US dollar to sterling |
1.34 | 1.29 | 1.36 | 1.27 | 1.35 | |||||||||||||||||||
29 Approval of financial statements
The consolidated financial statements were approved and authorised for issue by the Board of Directors on 20 February 2019.
| RELX Annual report and financial statements 2018 | Notes to the consolidated financial statements | 163 | |
|
| ||
| 164 | RELX Annual report and financial statements 2018 | Financial statements and other information | |
|
| ||
Notes to the consolidated financial statements
for the year ended 31 December 2018
30 Related undertakings (continued)
| RELX Annual report and financial statements 2018 | Notes to the consolidated financial statements | 165 | |
|
| ||
| 166 | RELX Annual report and financial statements 2018 | Financial statements and other information | |
|
| ||
Notes to the consolidated financial statements
for the year ended 31 December 2018
30 Related undertakings (continued)
| RELX Annual report and financial statements 2018 | Notes to the consolidated financial statements | 167 | |
|
| ||
| 168 | RELX Annual report and financial statements 2018 | Financial statements and other information | |
|
| ||
| Restated(3) | ||||||||||||||||||||||||
| Note | 2018 £m |
2017 £m |
2016 £m |
2015 £m |
2014 £m |
|||||||||||||||||||
| RELX consolidated financial information |
||||||||||||||||||||||||
| Revenue |
7,492 | 7,341 | 6,889 | 5,971 | 5,773 | |||||||||||||||||||
| Reported operating profit |
1,964 | 1,905 | 1,708 | 1,497 | 1,402 | |||||||||||||||||||
| Adjusted operating profit |
1 | 2,346 | 2,284 | 2,114 | 1,822 | 1,739 | ||||||||||||||||||
| Reported net profit attributable to RELX PLC shareholders |
1,422 | 1,648 | 1,150 | 1,008 | 955 | |||||||||||||||||||
| Adjusted net profit attributable to RELX PLC shareholders |
1 | 1,674 | 1,620 | 1,473 | 1,275 | 1,213 | ||||||||||||||||||
| RELX PLC financial information |
||||||||||||||||||||||||
| Reported earnings per ordinary share (pence) |
71.9p | 81.6p | 55.8p | 46.4p | 43.0p | |||||||||||||||||||
| Adjusted earnings per ordinary share (pence) |
84.7p | 80.2p | 71.4p | 60.5p | 56.3p | |||||||||||||||||||
| Dividend per ordinary share (pence) |
2 | 42.1p | 39.4p | 35.95p | 29.7p | 26.0p | ||||||||||||||||||
| (1) | Adjusted figures are presented as additional performance measures used by management. A reconciliation of the adjusted measures to the comparable GAAP measures can be found on page 176. Adjusted measures are stated before amortisation and impairment of acquired intangible assets and goodwill, the net financing cost on defined benefit pension schemes and acquisition-related costs, exceptional tax credits and in respect of attributable net profit, reflect a tax rate that excludes the effect of movements in deferred taxation assets and liabilities that are not expected to crystallise in the near term and includes the benefit of tax amortisation where available on acquired goodwill and intangible assets. Acquisition-related financing costs and profit and loss from disposal gains and losses and other non-operating items are also excluded from the adjusted figures. |
| (2) | Dividend per ordinary share is based on the interim dividend and proposed final dividend for the relevant year. |
| (3) | 2017 and 2016 numbers have been restated to reflect the adoption of new accounting standards. See note 1 on page 126 for further details. |
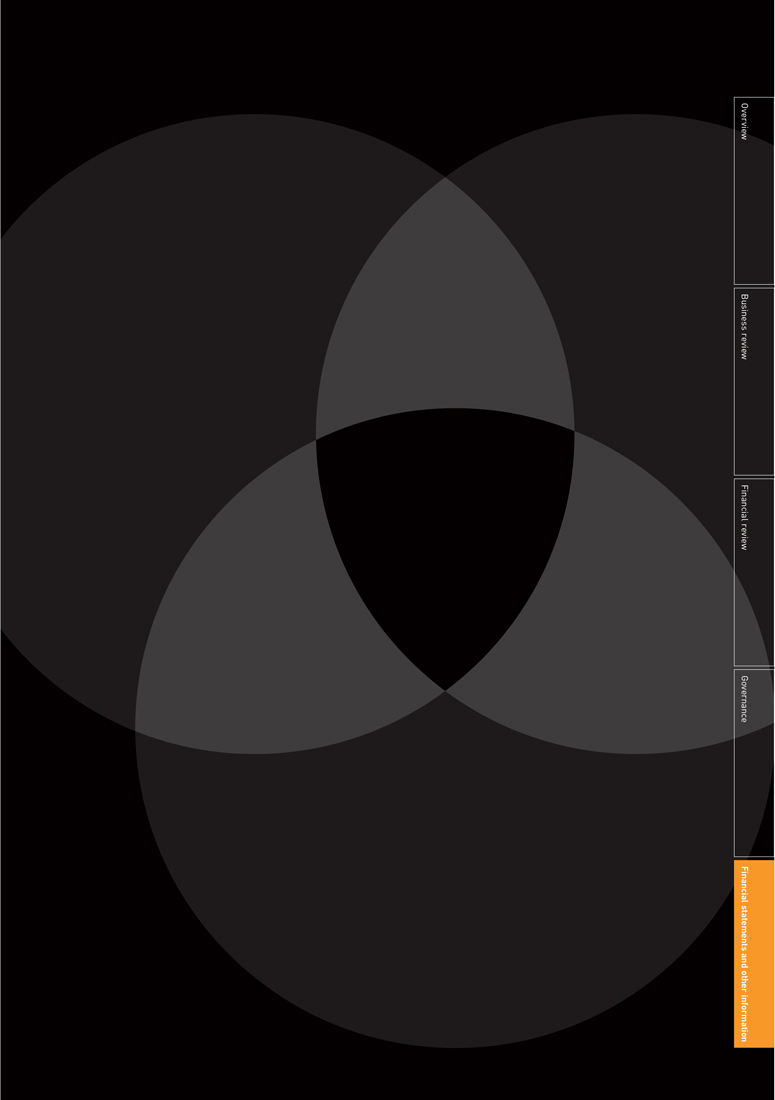
| RELX Annual report and financial statements 2018 | 169 | |
|
| ||
|
Annual Report and Financial Statements | ||
| In this section | ||
| 170 | RELX PLC statement of financial position | |
| 171 | RELX PLC statement of changes in equity | |
| 171 | RELX PLC accounting policies | |
| 172 | Notes to the RELX PLC financial statements | |
| 170 | RELX Annual report and financial statements 2018 | Financial statements and other information | |
|
| ||
RELX PLC statement of financial position
| AS AT 31 DECEMBER | Note |
2018 £m |
2017 £m |
|||||||||
| Non-current assets |
||||||||||||
| Investments in subsidiary undertakings |
1 | 18,314 | – | |||||||||
| Investments in joint ventures |
1 | – | 3,027 | |||||||||
| 18,314 | 3,027 | |||||||||||
| Current assets |
||||||||||||
| Cash and cash equivalents |
1 | – | ||||||||||
| Trade and other receivables |
1 | – | ||||||||||
| Receivables: amounts due from subsidiary undertakings |
1,536 | – | ||||||||||
| Receivables: amounts due from joint venture |
– | 205 | ||||||||||
| Total assets |
19,852 | 3,232 | ||||||||||
| Current liabilities |
||||||||||||
| Taxation |
4 | 2 | ||||||||||
| Other payables |
109 | 56 | ||||||||||
| 113 | 58 | |||||||||||
| Net assets |
19,739 | 3,174 | ||||||||||
| Capital and reserves |
||||||||||||
| Share capital |
290 | 162 | ||||||||||
| Share premium |
1,415 | 1,309 | ||||||||||
| Shares held in treasury |
(643 | ) | (753 | ) | ||||||||
| Capital redemption reserve |
31 | 25 | ||||||||||
| Other reserves |
164 | 160 | ||||||||||
| Merger reserve |
15,150 | – | ||||||||||
| Net profit |
2,063 | 817 | ||||||||||
| Reserves |
1,269 | 1,454 | ||||||||||
| Shareholders’ equity |
19,739 | 3,174 | ||||||||||
The RELX PLC Company financial statements were approved by the Board of Directors and authorised for issue on 20 February 2019. They were signed on its behalf by:
| A J Habgood |
N L Luff | |
| Chairman |
Chief Financial Officer |
| RELX Annual report and financial statements 2018 | 171 | |
|
| ||
| 172 | RELX Annual report and financial statements 2018 | Financial statements and other information | |
|
| ||
Notes to the RELX PLC financial statements
1 Investments
| Subsidiary undertaking £m |
Joint £m |
Total £m |
||||||||||
| At 1 January 2017 |
77 | 3,025 | 3,102 | |||||||||
| Impairment |
(77 | ) | – | (77 | ) | |||||||
| Equity instruments granted to employees of the Group |
– | 2 | 2 | |||||||||
| At 1 January 2018 |
– | 3,027 | 3,027 | |||||||||
| Acquisition of interest in RELX Group plc not already owned |
18,310 | (3,027 | ) | 15,283 | ||||||||
| Equity instruments granted to employees of the Group |
4 | – | 4 | |||||||||
| At 31 December 2018 |
18,314 | – | 18,314 | |||||||||
The acquisition of the remaining RELX Group plc interest relates to the transfer of RELX NV’s previously held interest in RELX Group plc as a result of the corporate simplification. Following the simplification, RELX Group plc is recognised as a 100% owned subsidiary of RELX PLC.
2 Related party transactions
All transactions with joint ventures, subsidiaries and the Group’s employees, which are related parties of RELX PLC, are reflected in these financial statements. Transactions with key management personnel including share based remuneration costs are set out in note 27 of the Group consolidated financial statements and details of the Directors’ remuneration are included in the Directors’ Remuneration Report on pages 85 to 105.
3 Contingent liabilities
There are contingent liabilities in respect of borrowings of subsidiaries guaranteed by RELX PLC as follows:
| 2018 £m |
2017 £m |
|||||||
| Contingent liabilities guaranteed by RELX PLC |
5,775 | 4,644 | ||||||
Financial instruments disclosures in respect of the borrowings covered by the above guarantees are given in note 18 of the Group’s consolidated financial statements.
| RELX Annual report and financial statements 2018 | 173 | |
|
| ||
| Other financial information | ||
| In this section | ||
| 174 | Summary financial information in euros | |
| 175 | Summary financial information in US dollars | |
| 176 | Reconciliation of adjusted to GAAP measures | |
| 174 | RELX Annual report and financial statements 2018 | Financial statements and other information | |
|
| ||
Summary financial information in euros
Basis of preparation
The Group’s consolidated financial information is presented in sterling. The summary financial information is a simple translation of the Group’s consolidated financial statements into euros at the stated rates of exchange.
| EXCHANGE RATES FOR TRANSLATION | Income statement | Statement of financial position |
||||||||||||||||||||||||||
| 2018 | 2017 | 2016 | 2018 | 2017 | 2016 | |||||||||||||||||||||||
| Euro to sterling |
1.13 | 1.14 | 1.22 | 1.11 | 1.12 | 1.17 | ||||||||||||||||||||||
Consolidated income statement
| FOR THE YEAR ENDED 31 DECEMBER |
2018 €m |
Restated €m |
Restated €m |
|||||||||
| Revenue |
8,466 | 8,369 | 8,405 | |||||||||
| Operating profit |
2,219 | 2,172 | 2,084 | |||||||||
| Profit before tax |
1,944 | 1,962 | 1,780 | |||||||||
| Net profit attributable to RELX PLC shareholders |
1,607 | 1,879 | 1,403 | |||||||||
| Adjusted operating profit |
2,651 | 2,604 | 2,579 | |||||||||
| Adjusted profit before tax |
2,424 | 2,395 | 2,338 | |||||||||
| Adjusted net profit attributable to RELX PLC shareholders |
1,892 | 1,847 | 1,797 | |||||||||
| Adjusted earnings per ordinary share |
€0.957 | €0.915 | €0.871 | |||||||||
| Basic earnings per ordinary share |
€0.813 | €0.930 | €0.680 | |||||||||
| Net dividend per ordinary RELX PLC share paid in the year |
€0.453 | €0.426 | €0.397 | |||||||||
| Net dividend per ordinary RELX PLC share paid and proposed in relation to the financial year |
€0.476 | €0.449 | €0.439 | |||||||||
| Consolidated statement of cash flows
|
||||||||||||
| FOR THE YEAR ENDED 31 DECEMBER | 2018 €m |
Restated €m |
Restated €m |
|||||||||
| Net cash from operating activities |
2,243 | 2,182 | 2,124 | |||||||||
| Net cash used in investing activities |
(1,436 | ) | (473 | ) | (805 | ) | ||||||
| Net cash used in financing activities |
(806 | ) | (1,760 | ) | (1,308 | ) | ||||||
| Increase/(decrease) in cash and cash equivalents |
1 | (51 | ) | 11 | ||||||||
| Movement in cash and cash equivalents |
||||||||||||
| At start of year |
124 | 190 | 166 | |||||||||
| Increase/(decrease) in cash and cash equivalents |
1 | (51 | ) | 11 | ||||||||
| Exchange translation differences |
2 | (15 | ) | 13 | ||||||||
| At end of year |
127 | 124 | 190 | |||||||||
| Adjusted cash flow |
2,535 | 2,505 | 2,463 | |||||||||
| Consolidated statement of financial position
|
||||||||||||
| AS AT 31 DECEMBER | 2018 €m |
Restated €m |
Restated €m |
|||||||||
| Non-current assets |
12,928 | 11,673 | 13,223 | |||||||||
| Current assets |
2,609 | 2,475 | 2,815 | |||||||||
| Assets held for sale |
1 | – | 7 | |||||||||
| Total assets |
15,538 | 14,148 | 16,045 | |||||||||
| Current liabilities |
5,906 | 5,224 | 6,274 | |||||||||
| Non-current liabilities |
7,010 | 6,333 | 7,065 | |||||||||
| Liabilities associated with assets held for sale |
4 | – | 6 | |||||||||
| Total liabilities |
12,920 | 11,557 | 13,345 | |||||||||
| Net assets |
2,618 | 2,591 | 2,700 | |||||||||
| RELX Annual report and financial statements 2018 | 175 | |
|
| ||
| 176 | RELX Annual report and financial statements 2018 |Financial statements and other information | |
|
| ||
Reconciliation of adjusted to GAAP measures
The Group uses adjusted figures, which are not defined by generally accepted accounting principles (“GAAP”) such as IFRS, as additional performance measures. These measures are used by management, alongside the comparable GAAP measures, in evaluating the business performance. The measures may not be comparable to similarly reported measures by other companies.
A reconciliation of non-GAAP measures to relevant GAAP measures is as follows:
| YEAR ENDED 31 DECEMBER | 2018 £m |
Restated £m |
||||||||||
| Operating profit |
1,964 | 1,905 | ||||||||||
| Adjustments: |
||||||||||||
| Amortisation of acquired intangible assets |
288 | 314 | ||||||||||
| Acquisition-related costs |
84 | 56 | ||||||||||
| Reclassification of tax in joint ventures |
11 | 10 | ||||||||||
| Reclassification of finance income in joint ventures |
(1 | ) | (1 | ) | ||||||||
| Adjusted operating profit |
2,346 | 2,284 | ||||||||||
| Profit before tax |
1,720 | 1,721 | ||||||||||
| Adjustments: |
||||||||||||
| Amortisation of acquired intangible assets |
288 | 314 | ||||||||||
| Acquisition-related costs |
84 | 56 | ||||||||||
| Reclassification of tax in joint ventures |
11 | 10 | ||||||||||
| Net interest on net defined benefit pension obligation |
9 | 15 | ||||||||||
| Disposals and other non-operating items |
33 | (15 | ) | |||||||||
| Adjusted profit before tax |
2,145 | 2,101 | ||||||||||
| Tax charge |
(292 | ) | (65 | ) | ||||||||
| Adjustments: |
||||||||||||
| Deferred tax movements on goodwill and acquired intangible assets |
34 | 42 | ||||||||||
| Tax on acquisition-related costs |
(13 | ) | (13 | ) | ||||||||
| Reclassification of tax in joint ventures |
(11 | ) | (10 | ) | ||||||||
| Tax on net interest on net defined benefit pension obligation |
(2 | ) | (4 | ) | ||||||||
| Tax on disposals and other non-operating items |
(14 | ) | 16 | |||||||||
| Other deferred tax credits from intangible assets* |
(55 | ) | (93 | ) | ||||||||
| Exceptional tax credit** |
(112 | ) | (346 | ) | ||||||||
| Adjusted tax charge |
(465 | ) | (473 | ) | ||||||||
| Net profit attributable to RELX PLC shareholders |
1,422 | 1,648 | ||||||||||
| Adjustments (post-tax): |
||||||||||||
| Amortisation of acquired intangible assets |
322 | 356 | ||||||||||
| Acquisition-related costs |
71 | 43 | ||||||||||
| Net interest on net defined benefit pension obligation |
7 | 11 | ||||||||||
| Disposals and other non-operating items |
19 | 1 | ||||||||||
| Other deferred tax credits from intangible assets* |
(55 | ) | (93 | ) | ||||||||
| Exceptional tax credit** |
(112 | ) | (346 | ) | ||||||||
| Adjusted net profit attributable to RELX PLC shareholders |
1,674 | 1,620 | ||||||||||
| Cash generated from operations |
2,555 | 2,526 | ||||||||||
| Adjustments: |
||||||||||||
| Dividends received from joint ventures |
30 | 38 | ||||||||||
| Purchases of property, plant and equipment |
(56 | ) | (51 | ) | ||||||||
| Proceeds on disposals of property, plant and equipment |
4 | 1 | ||||||||||
| Expenditure on internally developed intangible assets |
(306 | ) | (303 | ) | ||||||||
| Payments in relation to acquisition-related costs/other |
97 | 62 | ||||||||||
| Repayment of lease principal |
(82 | ) | (76 | ) | ||||||||
| Sublease payments received |
1 | – | ||||||||||
| Adjusted cash flow |
2,243 | 2,197 | ||||||||||
| * | Movements on deferred tax liabilities arising on acquired intangible assets that do not qualify for tax amortisation. |
| ** | In 2018 relates to the substantial resolution of certain prior year tax matters and deferred tax effect of tax rate reductions in the Netherlands and US. In 2017 relates to a one-off non-cash credit from a deferred tax adjustment arising from the US Tax Cuts and Jobs Act. |
| RELX Annual report and financial statements 2018 | 177 | |
|
| ||
|
information | ||
| In this section | ||
| 178 | Shareholder information | |
| 182 | Shareholder information and contacts | |
| IBC | 2019 financial calendar | |
| RELX Annual report and financial statements 2018 | Shareholder information | 179 | |
|
| ||
| 21 February |
Results announcement for the year ended 31 December 2018 | |
| 25 April |
Trading update issued in relation to the 2019 financial year | |
| 25 April |
Annual General Meeting – Amba Hotel , Strand, London WC2N 5HX | |
| 2 May |
Ex-dividend date – 2018 final dividend, ordinary shares and ADRs | |
| 3 May |
Record date – 2018 final dividend, ordinary shares and ADRs | |
| 20 May |
Dividend currency and DRIP election deadline | |
| 23 May |
Euro dividend equivalent announcement | |
| 4 June |
Payment date – 2018 final dividend, ordinary shares | |
| 7 June |
Payment date – 2018 final dividend, ADRs | |
| 25 July |
Interim results announcement for the six months to 30 June 2019 | |
| 1 August* |
Ex-dividend date – 2019 interim dividend, ordinary shares and ADRs | |
| 2 August * |
Record date – 2019 interim dividend, ordinary shares and ADRs |
| * | Please note that these dates are provisional and subject to change. The 2019 Interim Dividend payment dates in respect of ordinary shares and ADRs will be confirmed by the Company in its 2019 Interim Results announcement, currently scheduled for release on 25 July 2019. |
Dividend history
The following tables set out dividends paid (or proposed) in relation to the three financial years 2016–2018.
| ORDINARY SHARES | pence per PLC ordinary share | Payment date | ||||||
| Final dividend for 2018** |
29.70 | 4 June 2019 | ||||||
| Interim dividend for 2018 |
12.40 | 24 August 2018 | ||||||
| Final dividend for 2017 |
27.70 | 22 May 2018 | ||||||
| Interim dividend for 2017 |
11.70 | 25 August 2017 | ||||||
| Final dividend for 2016 |
25.70 | 22 May 2017 | ||||||
| Interim dividend for 2016 |
10.25 | 26 August 2016 | ||||||
| **Proposed | dividend, to be submitted for approval at the Annual General Meeting of RELX PLC in April 2019. |
| ADRS | $ per PLC ADR | Payment date | ||||||
| Final Dividend for 2018*** |
*** | 7 June 2019 | ||||||
| Interim Dividend for 2018 |
0.15914 | 29 August 2018 | ||||||
| Final dividend for 2017 |
0.37159 | 25 May 2018 | ||||||
| Interim dividend for 2017 |
0.15085 | 30 August 2017 | ||||||
| Final dividend for 2016 |
0.33387 | 25 May 2017 | ||||||
| Interim dividend for 2016 |
0.13452 | 31 August 2016 | ||||||
| ***Payment | will be determined using the appropriate £/US$ exchange rate on 4 June 2019. |
Credits

www.relx.com


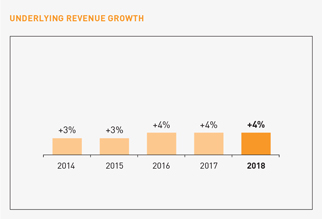
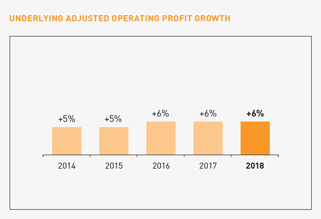
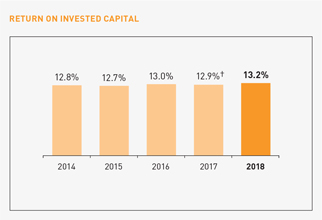
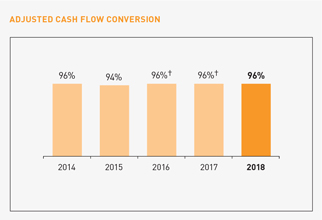
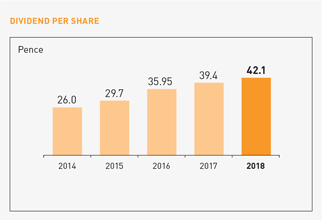
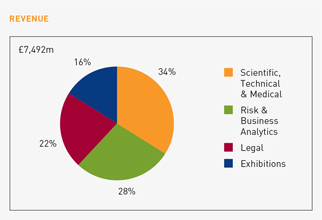
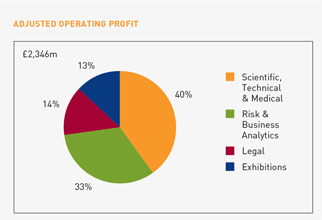


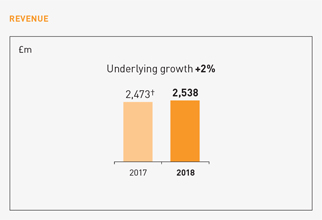
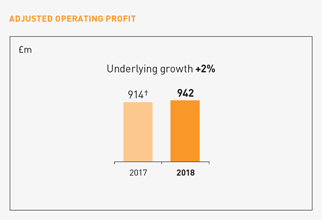


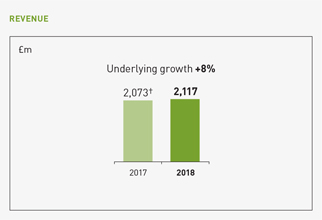
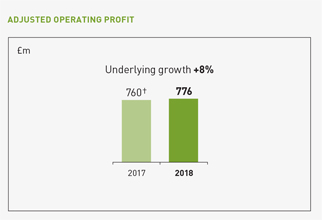


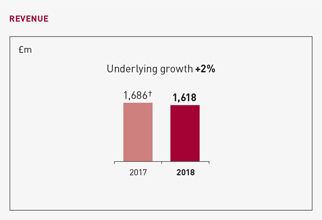
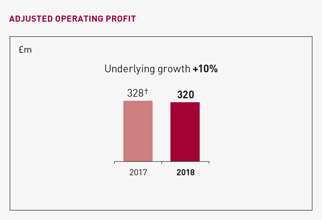


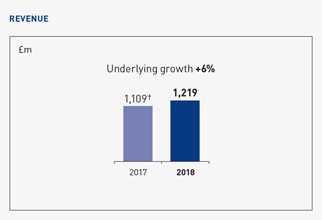
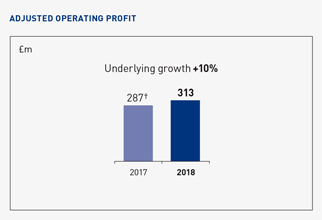


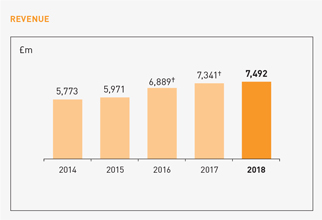
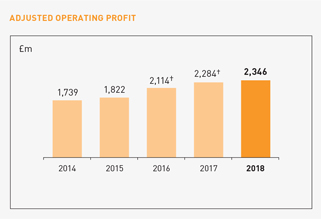
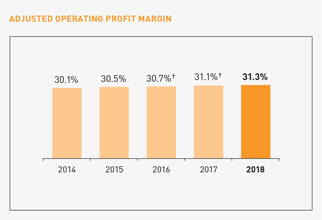
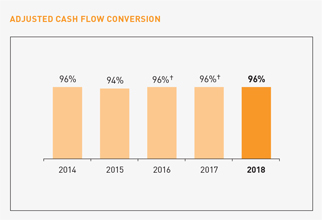

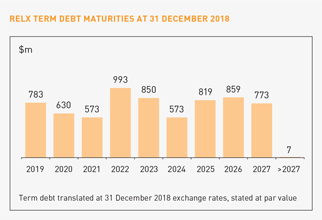
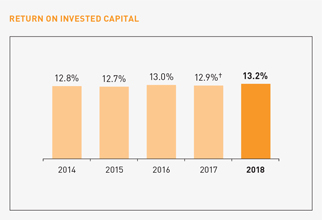


 Audit Committee
 Remuneration Committee
 Nominations Committee
 Corporate Governance Committee
 Committee Chairman

 www.frc.org.uk
  www.relx.com. The membership and activities of these Committees are described on pages 83, 85 and 106.
  www.relx.com. Board Committees are principally supported by the Chief Executive Officer, Chief Financial Officer, Chief Legal Officer and Company Secretary, and the Chief Human Resources Officer, although senior
managers within the Group are invited to attend meetings where appropriate. The Board’s annual programme and the agendas for the Committees are prepared by their respective Chairs with support from the Company Secretary.
www.relx.com. Board Committees are principally supported by the Chief Executive Officer, Chief Financial Officer, Chief Legal Officer and Company Secretary, and the Chief Human Resources Officer, although senior
managers within the Group are invited to attend meetings where appropriate. The Board’s annual programme and the agendas for the Committees are prepared by their respective Chairs with support from the Company Secretary.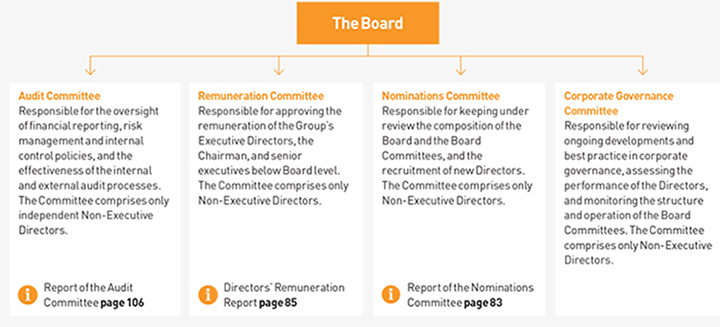
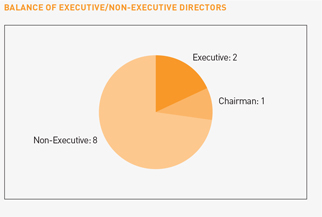
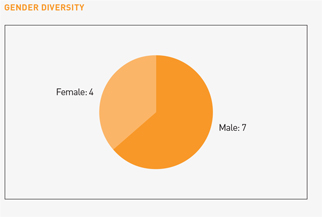
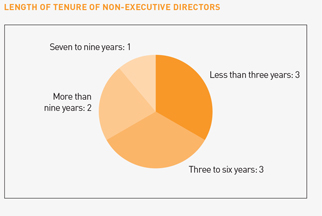
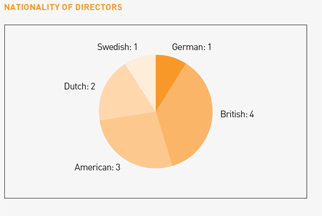
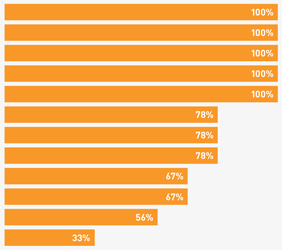
 Audit
Audit Remuneration
 Nominations
 Corporate Governance
 Committee Chairman


 www.relx.com.
  www.relx.com.
  www.relx.com) and include:
 www.relx.com
 www.relx.com
  www.relx.com/go/CRReport.

 www.relx.com