Exhibit 15.2

| Annual Report and Financial Statements 2019 |
Exhibit 15.2
| Annual Report and Financial Statements 2019 |
|
RELX is a global provider of information-based analytics and decision tools for professional and business customers.
We help scientists make new discoveries, doctors and nurses improve the lives of patients and lawyers win cases. We prevent online fraud and money laundering, and help insurance companies evaluate and predict risk. Our events enable customers to learn about markets, source products and complete transactions.
In short, we enable our customers to make better decisions, get better results and be more productive.
Forward-looking statements This Annual Report contains forward-looking statements within the meaning of Section 27A of the US Securities Act of 1933, as amended, and Section 21E of the US Securities Exchange Act of 1934, as amended. These statements are subject to risks and uncertainties that could cause actual results or outcomes of RELX PLC (together with its subsidiaries, “RELX”, “we” or “our”) to differ materially from those expressed in any forward-looking statement. The terms “outlook”, “estimate”, “project”, “plan”, “intend”, “expect”, “should”, “will”, “believe”, “trends” and similar expressions may indicate a forward-looking statement. Important factors that could cause actual results or outcomes to differ materially from estimates or forecasts contained in the forward-looking statements include, among others, current and future economic, political and market forces; changes in law and legal interpretations affecting RELX intellectual property rights and internet communications; regulatory and other changes regarding the collection, transfer or use of third-party content and data; demand for RELX products and services; competitive factors in the industries in which RELX operates; ability to realise the future anticipated benefits of acquisitions; significant failure or interruption of our systems; compromises of our data security systems or other unauthorised access to our databases; legislative, fiscal, tax and regulatory developments and political risks; exchange rate fluctuations; and other risks referenced from time to time in the filings of RELX PLC with the US Securities and Exchange Commission.
|
| RELX Annual report and financial statements 2019 | 1 | |
|
| ||
| 2 | RELX Annual report and financial statements 2019 | Overview | |
|
| ||
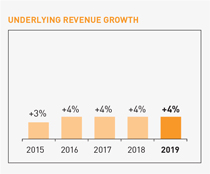
| ◾ | Underlying revenue growth of 4% |
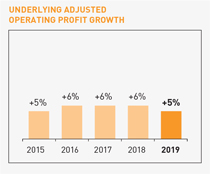
| ◾ | Underlying adjusted operating profit growth of 5% |
| ◾ | Reported operating profit £2,101m (£1,964m) |
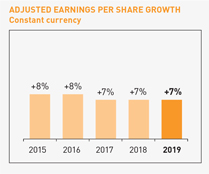
| ◾ | Adjusted EPS at constant currency up 7%; in sterling up 10% to 93.0p |
| ◾ | Reported EPS 77.4p (71.9p) |
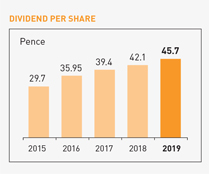
| ◾ | Full-year dividend up 9% to 45.7p |
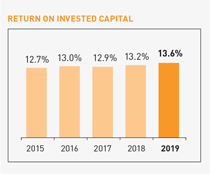
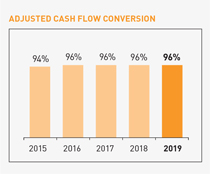
| ◾ | Strong financial position and cash flow; cash flow conversion at 96% |
RELX financial summary
| REPORTED FIGURES | Change at | |||||||||||||||||||
| 2019 | 2018 | constant | Change | |||||||||||||||||
| For the year ended 31 December | £m | £m | Change | currencies | underlying | |||||||||||||||
| Revenue |
7,874 | 7,492 | +5% | +2% | +4% | |||||||||||||||
| Operating profit |
2,101 | 1,964 | +7% | |||||||||||||||||
| Profit before tax |
1,847 | 1,720 | +7% | |||||||||||||||||
| Net profit attributable to RELX PLC shareholders |
1,505 | 1,422 | +6% | |||||||||||||||||
| Net margin |
19.1% | 19.0% | ||||||||||||||||||
| Net borrowings |
6,191 | 6,177 | ||||||||||||||||||
| Reported earnings per share |
77.4p | 71.9p | +8% | |||||||||||||||||
| Ordinary dividend per RELX PLC share |
45.7p | 42.1p | +9% | |||||||||||||||||
| ADJUSTED FIGURES | Change at | |||||||||||||||||||
| 2019 | 2018 | constant | Change | |||||||||||||||||
| For the year ended 31 December | £m | £m | Change | currencies | underlying | |||||||||||||||
| Operating profit |
2,491 | 2,346 | +6% | +3% | +5% | |||||||||||||||
| Operating margin |
31.6% | 31.3% | ||||||||||||||||||
| Profit before tax |
2,200 | 2,145 | +3% | 0% | ||||||||||||||||
| Net profit attributable to RELX PLC shareholders |
1,808 | 1,674 | +8% | +5% | ||||||||||||||||
| Net margin |
23.0% | 22.3% | ||||||||||||||||||
| Cash flow |
2,402 | 2,243 | +7% | |||||||||||||||||
| Cash flow conversion |
96% | 96% | ||||||||||||||||||
| Return on invested capital |
13.6% | 13.2% | ||||||||||||||||||
| Adjusted earnings per share |
93.0p | 84.7p | +10% | +7% | ||||||||||||||||
The shares of RELX PLC are traded on the London, Amsterdam and New York stock exchanges. RELX PLC and its subsidiaries, joint ventures and associates are together known as ‘RELX’.
RELX uses adjusted and underlying figures as additional performance measures. Adjusted figures primarily exclude the amortisation of acquired intangible assets and other items related to acquisitions and disposals, and the associated deferred tax movements. In 2018, we excluded exceptional tax credits, see note 9 on page 145. Reconciliations between the reported and adjusted figures are set out on page 184. Underlying growth rates are calculated at constant currencies, excluding the results of acquisitions until twelve months after purchase, and excluding the results of disposals and assets held for sale. Underlying revenue growth rates also exclude exhibition cycling. Constant currency growth rates are based on 2018 full-year average and hedge exchange rates.
| RELX Annual report and financial statements 2019 | 3 | |
|
| ||
| RELX Annual report and financial statements 2019 | 5 | |
|
| ||
| 6 | RELX Annual report and financial statements 2019 | Overview | |
|
| ||
Financial KPIs
|
|
| ||
|
|
|
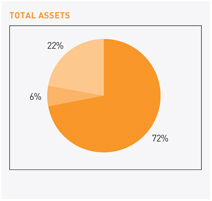
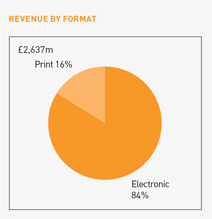
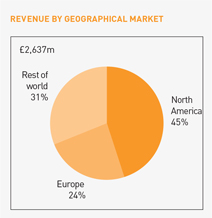
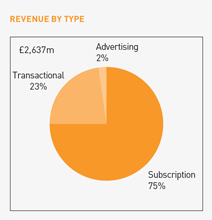
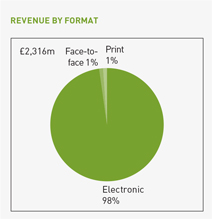
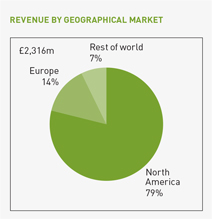
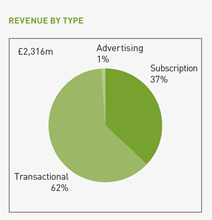
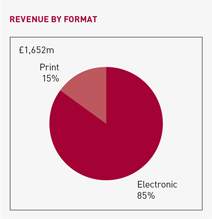
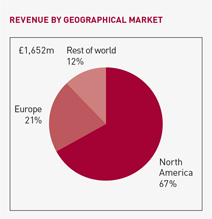
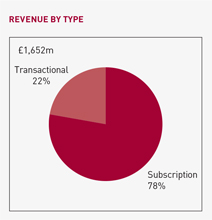
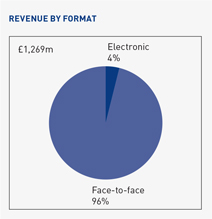
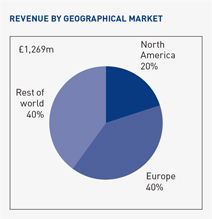
Revenue by category
| RELX Annual report and financial statements 2019 | RELX business overview | 7 | |
|
| ||
| 8 | RELX Annual report and financial statements 2019 | Overview | |
|
| ||

| Harnessing technology across RELX
Around 9,000 technologists, half of whom are software engineers, work at RELX. Annually, the company spends $1.4bn on technology. The combination of our rich data assets, technology infrastructure and knowledge of how to use next generation technologies, such as machine learning and natural language processing, allows us to create effective solutions for our customers. |
| 4
new drug candidates to treat chronic pancreatitis, identified on Elsevier’s AI-powered life sciences platform Entellect in 60 days through analysis of 10 million drug target interactions |
Helping discover new drugs to treat rare diseases
Chronic pancreatitis, which affects about one million people globally, is a painful disease with no current cure. Because of the high cost and low return for finding treatments for such relatively rare diseases, drug makers devote little time and effort to finding cures.
Elsevier, with its vast stores of drug data and artificial intelligence (AI) technologies, including Entellect, its newest AI-powered life sciences platform, felt this was the perfect opportunity to make a difference in the community. Elsevier teamed with non-profit organisations, industry and academic partners, as well as researchers across the globe to find drugs already in existence that could be repurposed to treat the rare disease.
The company hosted a datathon collaboration ‘Repurposing Drugs for Rare Diseases’ with non-profit organisations Cures Within Reach, Mission: Cure, and the Pistoia Alliance (which represents 14 of the top 20 global pharmaceutical companies), life sciences and technology companies including Ariel Precision Medicine, and academia including Cincinnati Children’s Hospital Medical Center and University of Northern Iowa.
The datathon leveraged Elsevier’s expertise, with Entellect as the underpinning AI platform. They combined data from Elsevier’s Life Sciences products (including Reaxys) and third party external data from Open Targets, including data scientists and researchers from the participating organisations.
After 60 days of intense work, the datathon revealed four drugs that could potentially be repurposed to treat chronic pancreatitis. These drugs were validated by independent experts and will now be taken for clinical testing. |
We are enthusiastic about the discoveries made in the Elsevier-Pistoia Alliance datathon. The problem-solving and teamwork focused on chronic pancreatitis were inspiring. We look forward to taking the promising candidates to the next step where we hope they will help us find effective treatments for this difficult, rare disease. The datathon exceeded our expectations, producing four repurposing candidates to address multiple chronic pancreatitis targets.
Megan Golden co-founder and co-director, Mission: Cure |
| RELX Annual report and financial statements 2019 | 9 | |
|
| ||

|
|
| 10m financial transactions processed every day using machine learning capabilities from LexisNexis Risk Solutions’ HPCC Systems
DataSeers is based in Atlanta, Georgia |
Managing complex financial data quickly and efficiently with HPCC Systems
DataSeers is a Georgia-based company that was created in 2017 and provides a reconciliation, analytics and fraud-prevention engine (FinanSeer) for the financial services space. The DataSeers platform is comprised of four modules, one of which is ReconSeer – a rule-based engine that oversees reconciliation of millions of prepaid cards and accounts at unprecedented speeds, helping make monetary decisions in a fast and efficient manner.
The global market for prepaid cards is expected to reach $3,600bn by 2022. Much of this growth is fuelled by the rising need for financial inclusion of unbanked consumers, increasing volumes of online transactions, and the demand for cost-effective payment solutions. The industry continues to be plagued with problems when it comes to back office data management.
Prepaid cards generate a tremendous amount of data that need to be linked and analysed quickly. Companies must replicate data within multiple systems which can create trust issues.
DataSeers needed a big data partner that could handle what it termed the 4V big data conundrum – volume, velocity, variety, and veracity. DataSeers decided to leverage the robust capabilities of LexisNexis Risk Solutions’ HPCC Systems to create a machine learning-based approach to managing financial data.
Typically it takes hours to reconcile records, but with ReconSeer, millions of records on various platforms can be reconciled within seconds, enabling clients to make smarter decisions faster than ever before. The system identifies fraud and compliance issues using machine learning capabilities from HPCC Systems, which is important since FinTech companies have very little to no time to react to these transactions. Ultimately, this helps increase trust in the use of prepaid cards and helps prevent fraud and money laundering. |
Our choice of HPCC Systems as a core technology has allowed us to reduce our integration time to customers and provide results back in a timeline that was not possible before. A great partnership with LexisNexis Risk Solutions around Know Your Customer and Know Your Business helps us even further, and we can now provide a completely unified experience from onboarding to account closure all on a single platform.
Adwait Joshi CEO and founder, DataSeers |

| 10
|
RELX Annual report and financial statements 2019 | Market segments
|
| RELX Annual report and financial statements 2019 | Scientific, Technical & Medical | 13 | |
|
| ||
| 14 | RELX Annual report and financial statements 2019 | Market segments | |
|
| ||
|
|
|
| RELX Annual report and financial statements 2019 | Scientific, Technical & Medical | 15 | |
|
| ||
| 16 | RELX Annual report and financial statements 2019 | Market segments | |
|
| ||

| Pure: Building a scholarly reporting system to capture university success
1000
number of faculty days saved annually by using CityU Scholars based on Pure to maintain a comprehensive and up-to-date overview of research production data across CityU. |
| RELX Annual report and financial statements 2019 | Scientific, Technical & Medical | 17 | |
|
| ||
| RELX Annual report and financial statements 2019 | Risk & Business Analytics | 19 | |
|
| ||
| 20 | RELX Annual report and financial statements 2019 | Market segments | |
|
| ||
|
|
|
| RELX Annual report and financial statements 2019 | Risk & Business Analytics | 21 | |
|
| ||
| 22 | RELX Annual report and financial statements 2019 | Market segments | |
|
| ||

| LexisNexis Risk Solutions: reducing customer friction and stopping fraud for Commercial Bank of Dubai
87% decrease in managing the number of Commercial Bank of Dubai’s policies leading to improved efficiency and a reduction in overall operating cost |
| RELX Annual report and financial statements 2019 | Risk & Business Analytics | 23 | |
|
| ||
| RELX Annual report and financial statements 2019 | Legal | 25 | |
|
| ||
| 26 | RELX Annual report and financial statements 2019 | Market segments | |
|
| ||
|
|
|
| RELX Annual report and financial statements 2019 | Legal | 27 | |
|
| ||
| 28 | RELX Annual report and financial statements 2019 | Market segments | |
|
| ||

| LexisNexis Practical Guidance: helping specialist and boutique law firms to grow
80% time saved for Curlington Legal, when conducting research for clients using LexisNexis products |
| RELX Annual report and financial statements 2019 | Legal | 29 | |
|
| ||
| RELX Annual report and financial statements 2019 | Exhibitions | 31 | |
|
| ||
| 32 | RELX Annual report and financial statements 2019 | Market segments | |
|
| ||
|
|
|
| ||
| The world’s property market | Asia’s sourcing and networking platform for the complete aluminium industry chain | International trade fair for the building industry | ||
|
|
|
| ||
| CHINA DAILY-USE ARTICLES TRADE FAIR China’s event for suppliers and buyers in the housewares industry |
A premier comic book and pop culture convention | Latin America’s event for hardware, electronics and construction | ||
|
|
|
| ||
| The leading international trade show for fitness, wellness & health | Asia Pacific’s luxury travel event | International exhibition for airport equipment, technology, design and services | ||
|
|
|
| ||
| The North American jewellery industry’s premier event | International perfumery and cosmetics exhibition | The No.1 machine tools and metalworking exhibition serving ASEAN | ||
|
|
|
| ||
| Leading international exhibition for personal care ingredients | International Security Conference & Exposition | An exhibition gathering equipment, solutions and services for electronics manufacturing | ||
|
|
|
| ||
| Japan’s one-stop shop for office related products and services | Premier global event for the travel industry | International trade fair for autoparts, equipment and services | ||
|
|
||||
| International art fair for photography | ||||
|
|

|
| RELX Annual report and financial statements 2019 | Exhibitions | 33 | |
|
| ||
| 34 | RELX Annual report and financial statements 2019 | Market segments | |
|
| ||

| We have a lot of people who ask us how to get started in this business and we say there’s one show you have to go to and that’s the National Hardware Show.
Bob Thorsen Founder The Little Burros |
| RELX Annual report and financial statements 2019 | Exhibitions | 35 | |
|
| ||
| The National Hardware Show: the event that powers businesses
| ||
|
1200 Little Burros secured its first order of 1,200 pieces from a major retailer at the National Hardware Show
About the National Hardware Show
The National Hardware Show, which takes place annually in Las Vegas, is a showcase for home improvement innovations and retail trends.
Each year it brings together over 25,000+ home improvement professionals and some 120 media outlets for three days of face-to-face sourcing, trading, networking and learning.
The Little Burros Burro Buddy in use |
The Little Burros is a family operated, garden tool brand, co-founded, owned and run by innovator Bob Thorsen and his family.
The family of five launched their brand at The National Hardware Show in 2014 and in five years have built an impressive following by providing innovative solutions to everyday garden problems.
Based in Virginia, US, Bob and his wife Sudie were working in the garden when Bob thought up an ingenious tool organiser for attaching to your wheelbarrow. The whole family came together to build a 3D prototype of the ‘Original Little Burro’ and decided to present it at the National Hardware Show. They ended up securing their first order of 1,200 pieces from a major retailer at the show.
The Thorsen family, who have won countless awards for their innovative product, attribute their initial success to The National Hardware Show, and return to the event each year with their expanded offering of garden products. | |

| RELX Annual report and financial statements 2019
|
37
|
|
|
Responsibility
| The Corporate Responsibility Report is
Non-financial information statement RELX is required to comply with the
Reporting Requirement: |
||||
| Environmental matters | 48-49 | |||
| Employees | 45-46 | |||
| Social matters | 38-42, 44-47 | |||
| Human rights | 38, 40-42, 44, 46-48 |
|||
| Anti-corruption and anti-bribery matters |
40, 42-43, 47-48 |
|||
| Policies, due diligence processes and outcomes | 42-43, 47-48 | |||
| Description and management of principal and emerging risks and impact of business activity |
58-61 | |||
| Description of business model |
5, 14-15, 21, 26, 31 |
|||
| Non-financial metrics | 12, 18, 24, 30, 38, 45-49 |
|||
| RELX Annual report and financial statements 2019 | Corporate responsibility overview | 39 | |
|
| ||

| Technology unites missing people with their families
“I’ve lost touch with someone and am not sure what to do.” This statement on the website of Missing People – the only British organisation focused on uniting missing children and adults with their families and others of importance in their lives – is apt. According to Missing People, 186,000 people are reported missing each year in the United Kingdom. |
| 300
applications to Missing People’s Lost Contact service
Missing People’s Lost Contact service uses LexisNexis Risk Solutions tools to reconnect missing people with their families and others |
According to Missing People,
186,000 people are reported missing each year
In 2019, with free access to LexisNexis Risk Solutions’ TraceIQ, Missing People re-launched its Lost Contact service. Lost Contact helps people reconnect with someone missing who is not at risk or missing in the eyes of the law.
TraceIQ allowed Missing People to find more people through faster and more efficient searches. During 2019, the relaunch led to over 300 applications for support. Of completed cases, 64% of missing family members were found and given the chance to reconnect. This was the result for three brothers, separated for over a decade: “We lost contact with my younger brother 12 years ago and had been unable to find him through other channels but Missing People found him and we had an amazing reunion with all the family so thank you for your amazing work.” |
TraceIQ has enabled Missing People to reinvigorate our vital Lost Contact service which can reunite the missing with the people who matter most to them.
Jo Youle CEO Missing People |
| 40 | RELX Annual report and financial statements 2019 | Corporate responsibility | |
|
| ||
| RELX Annual report and financial statements 2019 | Corporate responsibility overview | 41 | |
|
| ||
| 42 | RELX Annual report and financial statements 2019 | Corporate responsibility | |
|
| ||
| RELX Annual report and financial statements 2019 | Corporate responsibility overview | 43 | |
|
| ||
| 44 | RELX Annual report and financial statements 2019 | Corporate responsibility | |
|
| ||

| Inspiring Action on the SDGs in Delhi
On 2 May 2019, we held the fourth RELX SDG Inspiration Day in Delhi, India to catalyse action on the UN Sustainable Development Goals (SDGs). The focus, in partnership with the Ban Ki-Moon Centre for Global Citizens, (UN) Global Compact India, and the Responsible Media Forum, was SDG 11, Sustainable Cities and Communities, and the interconnection with the other 16 SDGs, including Good Health and Well-being (SDG 3) and the Rule of Law (SDG 16). |
| 4th
global RELX SDG Inspiration Day
RELX SDG Inspiration Day Delhi in May 2019 engaged stakeholders on SDG 11, Sustainable Cities and Communities
|
Business, government, investors, academia, youth and NGOs – all stakeholders needed to advance the SDGs – came together to discuss positive, collaborative action.
Kamal Singh, Executive Director of Global Compact India, cited the importance of India; if India achieves the goals , he said, the world is half way to realising the SDGs. Yet the task globally, according to Anna French, Deputy Director of the UK’s Department for International Development India, requires around $5tn USD each year. New approaches are needed to fund the goals, she said, and business must do its part.
There was an Expert Café allowing participants to engage with experts including Arunava Dasgupta, Head of Urban Design at Delhi’s School of Planning and Architecture; Amit Sharma, Head of Energy and Sustainability Services at Schneider Electric India and Aditi Haldar, South-Asia Director of GRI. Themes included: health and urban populations, the role of data and technology, green city energy systems and the implications for skills and jobs.
Barbara Müller, Senior Manager at BMW Foundation, highlighted the Foundation’s Responsible Leader Networks mobilising leaders to collaborate for a sustainable and just future, such as Yash Ranga, Stakeholder Engagement Partner at Jaipur Rugs Foundation. Ranga stated, “hope is a beggar that makes you walk on fire,” don’t hope for change, make it happen.
Ambassador Kim Won-Soo, former UN High Representative for Disarmament Affairs and Board Member of the Ban Ki-moon Centre for Global Citizens, made the case for smaller, smart municipalities. |
The RELX SDG Inspiration Day positively connected those working to achieve the SDGs in India.
Kamal Singh Executive Director (UN) Global Compact India |
| RELX Annual report and financial statements 2019 | Corporate responsibility overview | 45 | |
|
| ||
| 46 | RELX Annual report and financial statements 2019 | Corporate responsibility | |
|
| ||
| RELX Annual report and financial statements 2019 | Corporate responsibility overview | 47 | |
|
| ||
| 48 | RELX Annual report and financial statements 2019 | Corporate responsibility | |
|
| ||
| RELX Annual report and financial statements 2019 | Corporate responsibility overview | 49 | |
|
| ||
| RELX Annual report and financial statements 2019 | Chief Financial Officer’s report | 53 | |
|
| ||
| 54 | RELX Annual report and financial statements 2019 | Financial review | |
|
| ||
| RELX Annual report and financial statements 2019 | Chief Financial Officer’s report | 55 | |
|
| ||
| 56 | RELX Annual report and financial statements 2019 | Financial review | |
|
| ||
| RELX Annual report and financial statements 2019 | Chief Financial Officer’s report | 57 | |
|
| ||
| 58 | RELX Annual report and financial statements 2019 | Financial review | |
|
| ||
| EXTERNAL RISKS |
||||
| Risk | Description and impact | Mitigation | ||
| Economy and market conditions |
Demand for our products and services may be adversely impacted by factors beyond our control, such as the economic environment in the United States, Europe and other major economies, international trading relations, political uncertainties, epidemics, acts of war and civil unrest, and levels of government funding available to our customers. | Our businesses are focused on professional markets which have generally been more resilient in periods of economic downturn. We deliver information solutions, many on a subscription and recurring revenue basis, which are important to our customers’ effectiveness and efficiency. We operate diversified businesses in terms of sectors, markets, customers, geographies and products and services. We have extended our position in long-term global growth markets through organic new launches supported by the selective acquisition of small content and data sets. | ||
| We continue to dispose of businesses that no longer fit our strategy. We continuously monitor economic and political developments to assess their impact on our strategy which is designed to mitigate these risks. In response to specific uncertainties, our businesses engage in scenario planning and develop contingency plans where relevant. | ||||
| Intellectual property rights | Our products and services include and utilise intellectual property. We rely on trademark, copyright, patent and other intellectual property laws to establish and protect our proprietary rights in this intellectual property. There is a risk that our proprietary rights could be challenged, limited, invalidated or circumvented, which may impact demand for and pricing of our products and services. Copyright laws are subject to national legislative initiatives, as well as cross- border initiatives such as those from the European Commission and increased judicial scrutiny in several jurisdictions in which we operate. This creates additional challenges for us in protecting our proprietary rights in content delivered through the internet and electronic platforms. | We actively engage in developing and promoting the legal protection of intellectual property rights. Our subscription contracts with customers contain provisions regarding the use of proprietary content. We are vigilant as to the use of our intellectual property and, as appropriate, take legal action to challenge illegal content distribution sources. | ||
| RELX Annual report and financial statements 2019 | Principal and emerging risks | 59 | |
|
| ||
| 60 | RELX Annual report and financial statements 2019 | Financial review | |
|
| ||
| OPERATIONAL RISKS | ||||
| Risk | Description and impact | Mitigation | ||
| Technology and business resilience | Our businesses are dependent on electronic platforms and networks, primarily the internet, for delivery of our products and services. These could be adversely affected if our electronic delivery platforms, networks or supporting infrastructure experience a significant failure, interruption or security breach. | We have established procedures for the protection of our businesses and technology assets. These include the development and testing of business continuity plans, including IT disaster recovery plans and back-up delivery systems, to reduce business disruption in the event of major technology or infrastructure failure, terrorism or adverse weather incidents. | ||
| Cyber security | Our businesses maintain online databases and platforms delivering our products and services, which we rely on, and provide data to third parties, including customers and service providers. These databases and information are a target for compromise and face a risk of unauthorised access and use by unauthorised parties.
Our cyber security measures, and the measures used by our third-party service providers, may not detect or prevent all attempts to compromise our systems, which may jeopardise the security of the data we maintain or may disrupt our systems. Failures of our cyber security measures could result in unauthorised access to our systems, misappropriation of our or our users’ data, deletion or modification of stored information or other interruption to our business operations. As techniques used to obtain unauthorised access to or to sabotage systems change frequently and may not be known until launched against us or our third-party service providers, we may be unable to anticipate or implement adequate measures to protect against these attacks and our service providers and customers may likewise be unable to do so.
Compromises of our or our third-party service providers’ systems, or failure to comply with applicable legislation or regulatory or contractual requirements could adversely affect our financial performance, damage our reputation and expose us to risk of loss, fines and penalties, litigation and increased regulation. |
We have established security programmes with the aim of ensuring that data is protected, our business infrastructures continue to operate and that we comply with relevant legislative, regulatory and contractual requirements.
We have governance mechanisms in place to design and monitor common policies and standards across our businesses.
We invest in appropriate technological and physical controls which are applied across the enterprise in a risk-based security programme which operates at the infrastructure, application and user levels. These controls include, but are not limited to, infrastructure vulnerability management, application scanning and penetration testing, network segmentation, encryption and logging and monitoring. We provide regular training and communication initiatives to establish and maintain awareness of risks at all levels of our businesses. We have appropriate incident response plans to respond to threats and attacks. We maintain appropriate information security policies and contractual requirements for our businesses and run programmes monitoring the application of our data security policies by third-party service providers. We use independent internal and third-party auditors to test, evaluate, and help enhance our procedures and controls. | ||
| Supply chain dependencies | Our organisational and operational structures depend on outsourced and offshored functions, including use of cloud service providers. Poor performance, failure or breach of third parties to whom we have outsourced activities, could adversely affect our business performance, reputation and financial condition. | We select our vendors with care and establish contractual service levels that we closely monitor, including through key performance indicators and targeted supplier audits and security assessments. We have developed business continuity plans to reduce disruption in the event of a major failure by a vendor. | ||
| Talent | The implementation and execution of our strategies and business plans depend on our ability to recruit, motivate and retain skilled employees and management. We compete globally and across business sectors for talented management and skilled individuals, particularly those with technology and data analytics capabilities. An inability to recruit, motivate or retain such people could adversely affect our business performance. Failure to recruit and develop talent regardless of gender, race, national origin or other characteristics could adversely affect our reputation and business performance. | We have well established management development and talent review programmes. We monitor capability needs and remuneration schemes are tailored to attract and motivate the best talent available at an appropriate level of cost. We actively seek feedback from employees, which feeds into plans to enhance employee engagement and motivation. Our Inclusion and Diversity Policy fosters a diverse workforce and environment that respects all individuals and their contributions. |
| RELX Annual report and financial statements 2019 | Principal and emerging risks | 61 | |
|
| ||

| RELX Annual report and financial statements 2019
|
63
|
| Governance | ||||
| In this section | ||||
| 64 |
||||
| 66 |
||||
| 68 |
||||
| 70 |
||||
| 85 |
||||
| 88 |
||||
| 112 |
||||
| 115 |
||||
| 64 | RELX Annual report and financial statements 2019 | Governance | |
|
| ||
| Executive Directors | Non-Executive Directors | |||||||
|
|

|

| ||||||
| Erik Engstrom (56) Chief Executive Officer
Appointed: Chief Executive Officer of RELX since November 2009. Joined as Chief Executive Officer of Elsevier in 2004. Other appointments: Non-Executive Director of Smith & Nephew plc and Bonnier Group. Past appointments: Prior to joining was a partner at General Atlantic Partners. Before that was President and Chief Operating Officer of Random House Inc and President and Chief Executive Officer of Bantam Doubleday Dell, North America. Began his career as a consultant with McKinsey. Served as a Non-Executive Director of Eniro AB and Svenska Cellulosa Aktiebolaget SCA. Education: Holds a BSc from Stockholm School of Economics, an MSc from the Royal Institute of Technology in Stockholm, and gained an MBA from Harvard Business School as a Fulbright Scholar. Nationality: Swedish |
Sir Anthony Habgood (73)
Chair
Appointed: June 2009 Other appointments: Chair of Preqin Holding Limited and Deputy Chair of RG Carter Holdings Limited. Past appointments: Previously was Chair of the Court of the Bank of England, Whitbread plc, Bunzl plc, Mölnlycke Health Care Limited and Norwich Research Partners LLP and served as Chief Executive of Bunzl plc, Chief Executive of Tootal Group plc and a Director of The Boston Consulting Group. Formerly Non-Executive Director of Geest plc, Marks and Spencer plc, National Westminster Bank plc, Powergen plc, SVG Capital plc, and Norfolk and Norwich University Hospitals Trust. Education: Holds an MA in Economics from Cambridge University, an MS in Industrial Administration from Carnegie Mellon University and an Honorary Doctorate of Civil Law from the University of East Anglia. He is a visiting Fellow at Oxford University. Nationality: British |
Adrian Hennah
(62)
Non-Executive Director Chair of the Audit Committee
Appointed: April 2011 Other appointments: Chief Financial Officer of Reckitt Benckiser Group plc. Past appointments: Chief Financial Officer of Smith & Nephew plc from 2006 to 2012. Before that was Chief Financial Officer of Invensys plc, having previously held various senior finance and management positions with GlaxoSmithKline for 18 years. Formerly, a Non-Executive Director of Indivior PLC. Nationality: British | ||||||

|
|
| ||||||
|
Nick Luff (52) Chief Financial Officer
Appointed: September 2014 Other appointments: Non-Executive Director of Rolls-Royce Holdings plc. Past appointments: Prior to joining the Group was Group Finance Director of Centrica plc from 2007. Before that was Chief Financial Officer at The Peninsular & Oriental Steam Navigation Company (P&O) and its affiliated companies, having previously held a number of senior finance roles at P&O. Began his career as an accountant with KPMG. Formerly a Non-Executive Director of QinetiQ Group plc and Lloyds Banking Group plc. Education: Has a degree in Mathematics from Oxford University and is a qualified UK Chartered Accountant. Nationality: British
|
Wolfhart Hauser
(70)
Non-Executive Director Senior Independent Director Chair of the Remuneration Committee
Appointed: April 2013 Other appointments: Non-Executive Director of Associated British Foods plc. Past appointments: Chair of FirstGroup plc until July 2019. Chief Executive Officer of Intertek Group plc from 2005 until 2015. Prior to that he was Chief Executive Officer of TÜV Sud AG between 1998 and 2002 and Chief Executive Officer of TÜV Product Service GmbH for ten years. Formerly a Non-Executive Director of Logica plc. Education: Holds a master’s degree in Medicine from Ludwig-Maximilian-University Munich and a Medical Doctorate from Technical University Munich. Nationality: German
|
Charlotte Hogg
(49)
Non-Executive Director
Appointed: December 2019 Other appointments: Executive Vice President and Chief Executive Officer for the European Region of Visa Inc. Executive Director of Visa Europe Limited. Non-Executive Director of UK Finance and NowTeach. Past appointments: Chief Operating Officer at the Bank of England. Before that was Head of Retail Banking for Santander UK, Managing Director UK and Ireland for Experian plc, and held senior roles at Morgan Stanley in New York and London. Nationality: British and American |
| RELX Annual report and financial statements 2019 | Board Directors | 65 | |
|
| ||
| 66 | RELX Annual report and financial statements 2019 | Governance | |
|
| ||

| Mark Kelsey | Kumsal Bayazit | Mike Walsh | Hugh M Jones IV | |||
| Chief Executive Officer | Chief Executive Officer | Chief Executive Officer | Chief Executive Officer | |||
| Risk & Business Analytics | Scientific, Technical | Legal | Exhibitions | |||
| & Medical and Chair, | ||||||
| RELX Technology Forum | ||||||
|
|
|
|
| |||
| Joined in 1983. Appointed to current position in 2012. |
Joined in 2004. Appointed to current position in 2019. |
Joined in 2003. Appointed to current position in 2011. |
Joined in 2011. Appointed to current position in 2020. | |||
| Has held a number of senior positions across the Group over the past 30 years. Previously Chief Operating Officer and then Chief Executive Officer of Reed Business Information. Studied at Liverpool University and received his MBA from Bradford University. | Previously President, Exhibitions Europe, Chief Strategy Officer, RELX, and Executive Vice President of Global Strategy and Business Development for LexisNexis. Prior to that worked with Bain & Company in New York, Los Angeles, Johannesburg and Sydney. Holds an MBA from Harvard Business School and is a Graduate of the University of California at Berkeley. | Previously CEO of LexisNexis US Legal Markets and Director of Strategic Business Development Home Depot. Prior to that was a practising attorney at Weil, Gotshal and Manges in Washington DC and served as a consultant with The Boston Consulting Group. Holds a Juris Doctor degree from Harvard Law School and is a graduate of Yale University. | Previously Group Managing Director, Accuity, ICIS, Cirium, and EG within Risk & Business Analytics. Prior to that was Chief Executive Officer, Accuity. Holds an MBA from the Ross School of Business at the University of Michigan and is a graduate of Yale University. | |||
| RELX Annual report and financial statements 2019 | RELX Senior Executives | 67 | |
|
| ||
| RELX Annual report and financial statements 2019 | Chair’s introduction to corporate governance | 69 | |
|
| ||
| RELX Annual report and financial statements 2019 | Corporate Governance Review | 71 | |
|
| ||
| 72 | RELX Annual report and financial statements 2019 | Governance | |
|
| ||
| RELX Annual report and financial statements 2019 | Corporate Governance Review | 73 | |
|
| ||
| 74 | RELX Annual report and financial statements 2019 | Governance | |
|
| ||
| RELX Annual report and financial statements 2019 | Corporate Governance Review | 75 | |
|
| ||
| 76 | RELX Annual report and financial statements 2019 | Governance | |
|
| ||
Stakeholder engagement
The Board recognises that relationships with RELX’s key stakeholders, including its investors, employees, customers, suppliers and the communities in which we operate, are important in allowing the Company to achieve its business aims. Engagement takes place with our stakeholders at all levels across RELX, and the size, diversity of our business and global nature of the Group means that it can take many different forms. Much of it takes place at an operational level, and this is especially true in respect of our customers and suppliers, with whom we deal in the ordinary course of business on a day-to-day basis. In addition to the activities set out on pages 76 to 78, in 2019 to help the organisation and the Board understand the issues that our stakeholders believe we should be focused on, we asked an external third party to test our ranking of 14 issues that we consider to be material with our stakeholders. The results of this engagement, which are seen by the Board and indicate that RELX is focusing on the right issues, are set out on page 8 of our 2019 Corporate Responsibility Report.
| Stakeholder: Investors
| ||
| Why effective engagement is important:
|
This helps investors to understand our strategy, performance and governance arrangements, and to make informed and effective investment decisions concerning RELX. It also makes clear our prioritisation of the long-term in our decision-making and focus on delivery of consistent financial performance.
| |
| How the Board ensures effective engagement with investors, understands their views and considered these in its discussions and decision-making in 2019: | RELX’s material communications to investors, such as its trading results and updates, other regulatory announcements, Annual Report and Accounts and Notice of Annual General Meeting must be reviewed and approved by the Board under our corporate governance framework. The Board also receives regular reports on investor engagement activities and outcomes from each of the Chief Executive Officer, Chief Financial Officer, Head of Investor Relations and Director of Corporate Responsibility. In 2019, these updates provided the Board with information arising from or relating to: the completion of investor roadshows; ad hoc interaction with institutional shareholders on significant issues; and ongoing dialogue with investors through our dedicated Investor Relations, Corporate Responsibility and Treasury teams, concerning our recent and proposed activities. The Board also received a full update from the Chair of the Remuneration Committee on the results of a consultation exercise with major investors concerning the proposed 2020 Directors’ Remuneration Policy, and had direct interaction with shareholders at the 2019 Annual General Meeting, at which it received their thoughts and views on Company performance.
| |
| During the year, the views of our investors informed Board discussions and decision-making in respect of its: approval of the quantum of the Company’s share buy back programme, dividend declarations and dividend policy; recommendation to shareholders to increase the distributable reserves of the Company through a capital reduction; approval of the RELX three-year strategy plan, priority order for the use of cash generated by the Group, and annual budgets and targets; and approval of the Group’s risk appetite. It also assisted the Board in recommending the proposed 2020 Directors’ Remuneration Policy be put to shareholders for approval at the Company’s 2020 AGM, and in respect of its approval of the Group’s 2019 annual and interim results announcements and reports. | ||
| Stakeholder: Employees
| ||
| Why effective engagement is important: | Our people are essential to our success, future growth, and our aim to build leading positions in long-term global growth markets. We continue to invest substantial time and effort to employ, train, develop and retain employees who are passionate about our markets and have up-to-date knowledge and world class expertise in our key functional areas. Hearing their views on what we do well, and what we can do better, is an important driver for improvement and retaining our best talent.
| |
| How the Board ensures effective engagement with employees, understands their views and considered these in its discussions and decision-making in 2019: | In accordance with the Code, the Board appointed Marike van Lier Lels as Workforce Engagement Director, with effect from 1 January 2019. In this role, and supported by the Chief Human Resources Officer, she has overseen the RELX Workforce Engagement Programme for 2019. During the year, she met with European, US and Asia-Pacific workforce representatives, and reported to the Board on engagement processes, outcomes and findings. A wide range of topics were discussed, which included employee views and perspectives on areas including pay and benefits, career development, training, inclusion and diversity, working environment, flexible working, corporate responsibility and the effectiveness and frequency of employee surveys. The Directors’ Remuneration Policy, in so far as it applies to the Executive Directors and how it aligns with broader workforce policies, was also discussed. As a result of the findings, the Board provided direction on providing employees with greater transparency on career development, and its review of flexible working policies and their implementation in 2020. Marike will continue the programme of engagement in 2020, which will be broadened to include her meeting with HR Business Leaders, Heads of Talent and Heads of Recruitment. Additionally in 2019, the Board also reviewed net promoter score survey results for individual business areas, and met and received presentations from Group employees in London, Atlanta and Amsterdam. As a regular item on its agendas, the Board received internal Group-wide communications to employees, and received an update from the Chief Compliance Officer on reports submitted by RELX employees, in confidence, on potential breaches of RELX approved policies or procedures. | |
| The Board considered the information provided to it to assist in its discussions and decision-making in the following areas: its assessment and monitoring of RELX’s culture, and its alignment with our strategy, values and purpose; its discussion and approval of updated RELX Inclusion and Diversity Policies, applicable to each of the Board and the rest of the Group; its review and approval of RELX Workforce Policies in the areas of reward, recruitment and flexible working; and its approval of the proposed Workforce Engagement programme for 2020.
| ||
| RELX Annual report and financial statements 2019 | Corporate Governance Review | 77 | |
|
| ||
| 78 | RELX Annual report and financial statements 2019 | Governance | |
|
| ||
|
Stakeholder: Community
| ||
| Why effective engagement is important: | Contributing to our local and global communities is a responsibility and an opportunity. Our employees feel passionately about supporting scientific research throughout the scientific community and advancing the rule of law throughout the global community. Our commitments help us to be an employer of choice.
| |
| How the Board ensures effective engagement with the community, understands its views and considered these in its discussions and decision-making in 2019:
|
The Company’s engagement with the community is completed primarily through our annual RE Cares programme, by which our businesses pursue Corporate Responsibility activities that maximise RELX’s positive impact on society through its Unique Contributions, which include fostering communities. The Board receives an update on the RE Cares programme, and our engagement with the communities in which we operate, from the Director of Corporate Responsibility. This included detail on our UN Sustainable Development Goals (SDG) Resource Centre, participation in UN SDG Action Platforms, and engagement processes through which RELX individuals serve on the boards of UN Global Compact networks in the UK and the Netherlands. The Board was also provided with an overview of the materials provided on the corporate responsibility section of our website, and received updates on our involvement and participation in corporate responsibility forums, initiatives and workshops through our dedicated team and network of 240 RE Cares Champions across our businesses, who ensure the vibrancy of our engagement with the community. | |
Attendance at meetings of the Board and Board Committees
The table below shows the attendance of Directors at meetings of the Board and its Committees during the year. Attendance is expressed as the number of meetings attended out of the number eligible to be attended.
| Director | |
Committee |
|
|
|
|
Board | (1) | Audit | Remuneration | Nominations | |
Corporate Governance |
|
||||||||||||||||||||
| Anthony Habgood (Chair) |

|
7/7 | – | 3/3 | 4/4 | 6/6 | Board Committee membership key
| |||||||||||||||||||||||||||
| Erik Engstrom |
– | 7/7 | – | – | – | – | ||||||||||||||||||||||||||||
| Nick Luff |
– | 7/7 | – | – | – | – | ||||||||||||||||||||||||||||
| Wolfhart Hauser |

|
7/7 | – | 3/3 | 4/4 | 6/6 | ||||||||||||||||||||||||||||
| Adrian Hennah |

|
7/7 | 4/4 | – | 4/4 | 6/6 | ||||||||||||||||||||||||||||
| Marike van Lier Lels (2) |

|
6/7 | 1/2 | – | 3/4 | 5/6 | ||||||||||||||||||||||||||||
| Robert MacLeod (3) |

|
7/7 | – | 3/3 | 1/1 | 6/6 | ||||||||||||||||||||||||||||
| Carol Mills (4) |

|
2/2 | 1/1 | – | – | 2/2 | ||||||||||||||||||||||||||||
| Linda Sanford |

|
7/7 | – | 3/3 | – | 6/6 | ||||||||||||||||||||||||||||
| Ben van der Veer (4) |

|
2/2 | – | – | – | 2/2 | ||||||||||||||||||||||||||||
| Andrew Sukawaty (5) |

|
5/5 | 3/3 | – | – | 4/4 | ||||||||||||||||||||||||||||
| Suzanne Wood |

|
7/7 | 4/4 | – | – | 6/6 | ||||||||||||||||||||||||||||
| Charlotte Hogg (6) |
|
– | – | – | – | – |
| (1) | In addition to the seven scheduled meetings, serving Directors also attended two full-day strategy and business review meetings. |
| (2) | Ms van Lier Lels stepped down as a member of the Audit Committee on 6 June 2019, to focus on her responsibilities as Workforce Engagement Director. She was unable to attend the February Board and Committee meetings due to unforeseen personal circumstances. |
| (3) | Robert MacLeod was appointed to the Nominations Committee on 25 September 2019. |
| (4) | Ms Mills and Mr van der Veer each stepped down as a member of the Board on 25 April 2019. Ms Mills also stepped down as a member of the Audit Committee from that time. |
| (5) | Andrew Sukawaty was appointed as a member of the Board and Corporate Governance Committee on 25 April 2019, and as a member of the Audit Committee with effect from 6 June 2019. |
| (6) | Charlotte Hogg was appointed to the Board with effect from 16 December 2019. Therefore, she did not attend any Board or Committee meetings during the year. |
| RELX Annual report and financial statements 2019 | Corporate Governance Review | 79 | |
|
| ||
| 80 | RELX Annual report and financial statements 2019 | Governance | |
|
| ||
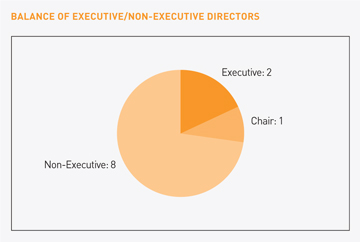
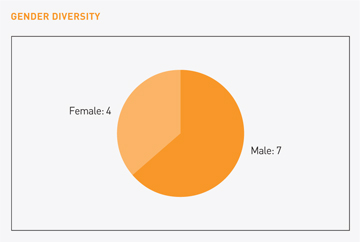
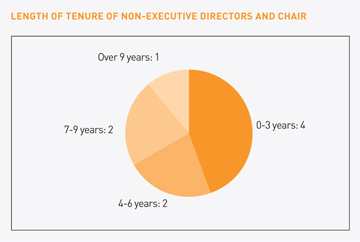
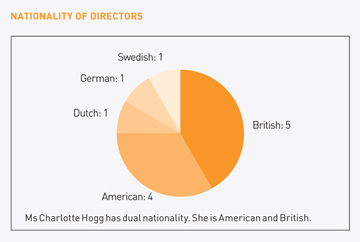
Balance of our Board as at 31 December 2019
|
| |
|
|
| RELX Annual report and financial statements 2019 | Corporate Governance Review | 81 | |
|
| ||
| 82 | RELX Annual report and financial statements 2019 | Governance | |
|
| ||
| RELX Annual report and financial statements 2019 | Corporate Governance Review | 83 | |
|
| ||
| 84 | RELX Annual report and financial statements 2019 | Governance | |
|
| ||
|
Viability statement |
||
|
Viability statement The Code requires Directors to assess the prospects of the Group over a period significantly longer than twelve months and to state whether they have a reasonable expectation that the Company will be able to continue in operation and meet its liabilities as they fall due over the period of their assessment.
Assessing the Group’s prospects The Group develops information-based analytics and decision tools for professional and business customers in the Scientific, Technical & Medical, Risk and Business Analytics, Legal and Exhibitions sectors. The Group has leading positions in long-term growth markets, deep customer understanding and has developed innovative solutions that often account for about 1% of our customers’ cost base but can have a significant and positive impact on the economics of the remaining 99%. Having effectively transitioned the business from print to digital, the Group is systematically migrating its information solutions toward higher value-add decision tools, adding broader data sets, embedding more sophisticated analytics and leveraging more powerful technology. We believe this evolution is improving our business profile and positions the Group for future business success.
The Group’s prospects are assessed through the annual strategy planning process. This process includes a review of assumptions made and assesses each business area’s longer-term plan. The resulting three-year strategy plan forms the basis for Group and divisional targets and in-year budgets. Objectives are set with consideration given to the economic and regulatory environment, and to customer trends, as well as incorporating risks and opportunities. The most recent three-year strategy business plan was agreed by the Directors in September 2019.
In assessing the Group’s prospects, our current position and principal risks are considered as follows:
Current position and business model ◾ Diversified business in terms of sectors, markets, customers, geographies and products and services so that we are not dependent on any one business, customer, region or product
◾ High percentage of subscription and recurring revenue streams
◾ Leading positions in long-term global growth markets
◾ Low working capital and capital investment requirements leading to high levels of cash generation
◾ Clear strategy focused on organic growth supplemented by selective acquisitions in higher growth areas
◾ Continued development of increasingly sophisticated information-based analytics and decision tools
◾ Expansion into higher growth adjacencies and geographies primarily through organic investment augmented with selective acquisitions
Further details on our strategy and 2019 progress are on pages 4 and 5.
Principal risks related to our business model ◾ Challenges to the intellectual property rights of content embedded in our products and services
◾ Disruption or loss of data sources that our businesses rely on due to regulation or other reasons
◾ Changes to the paid subscription model for our primary research business within Scientific, Technical and Medical
◾ Technological failure of our electronic platforms and networks
|
◾ Failure of our cyber security measures resulting in unauthorised access to our systems and breach of data privacy
Detailed descriptions of all principal and emerging risks and mitigations are on pages 58-61
Assessing the Group’s viability The three-year strategy plan for our businesses includes management’s assessment of the anticipated operational risks affecting the business and assumes that current economic conditions broadly persist, financing will be available on similar terms to those negotiated recently and interest rates will follow market expectations. Management then considers the viability of the business should unexpected events, linked to the principal and emerging risks, occur. To first make the assessment, the financial impact of each principal risk on revenue and cashflow is estimated. Owing to the diversified nature of the Group, no individual risk was estimated to have an impact necessary for a breach in the Group’s $3.0bn committed bank facility, broadly estimated at one third of total Group cashflow assuming no mitigating actions.
The assessment then considers various stress-test scenarios under which multiple risks occur simultaneously accompanied by an inability to access the debt capital markets to refinance scheduled liabilities as they become due, together with an increase in interest rates faster than currently expected. The resulting analysis, which assumes share buybacks and acquisition activity are suspended but dividends continue uninterrupted, then considers the impact on available headroom and whether any scenario results in breaching the covenant in the committed bank facility.
The worst-case stress case modelled a combination of the following risks: (a) the inability to use certain third-party data resources; (b) an adverse impact on revenue from a shift away from the paid subscription model; and (c) having our systems disrupted by a cyber security event. The analysis concluded that with the simultaneous occurrence of these three risks, no access to the debt capital markets and a rising interest rate environment, the Group would still have sufficient funds to trade, settle its liabilities as they come due and remain compliant with the covenant in its committed bank facility, whilst still paying dividends.
In addition to scenario modelling, the Directors bi-annually review the Group’s principal risks, assess the likelihood and impact of each risk together with the effectiveness of mitigating controls, and consider emerging risks. The Directors also receive regular updates from management on treasury, tax, acquisitions and divestments, and significant risk areas including information security, technology and legal and regulatory matters. Finally, separate from the annual strategy plan, the Directors periodically receive updates from business area management on their operations, prospects and risks. Whilst these reviews and discussions naturally focus more closely on the quantifiable risks facing the business within the three-year planning period, they also cover longer-term risks.
As a result of stress-testing the three-year strategy plan, supported by regular reviews of risk during the year, the Directors confirm that they have a reasonable expectation that the Group will be able to continue its operations and meet its liabilities as they fall due over the next three years and are not aware of any longer-term operational or strategic risks that would result in a different outcome from the three-year review. |
| RELX Annual report and financial statements 2019 | 85 | |
|
| ||
| 86 | RELX Annual report and financial statements 2019 | Governance | |
|
| ||
| RELX Annual report and financial statements 2019 | Report of the Nominations Committee | 87 | |
|
| ||
| 88 | RELX Annual report and financial statements 2019 | Governance | |
|
| ||
Directors’ Remuneration Report
The Directors’ Remuneration Report (the Report) has been prepared by the Remuneration Committee (the Committee) in accordance with the UK Corporate Governance Code, the UK Listing Rules and Schedule 8 of the Large and Medium-sized Companies and Groups (Accounts and Reports) Regulations 2008, as amended (the UK Regulations).
The Report was approved by the Board.
Introduction
The current remuneration policy was approved by shareholders at the 2017 Annual General Meetings (AGM) for three years and can be found at www.relx.com/go/remunerationpolicy or on pages 84 to 90 of the 2016 Annual Reports and Financial Statements. As a result, an updated remuneration policy is being proposed to shareholders for approval (by way of a binding vote) at the 2020 AGM, with the first awards under the new policy to be granted in the first quarter of 2021. The updated remuneration policy, which is proposed to apply for three years from the conclusion of the 2020 AGM, is set out on pages 90 to 96.
The implementation of the current remuneration policy during 2019 is described on pages 99 to 111 (the Annual Remuneration Report). Shareholders will be invited to vote (by way of a non-binding advisory vote) on the 2019 Annual Remuneration Report at the 2020 AGM.
Our report therefore has two parts, the first part starts immediately below and relates to the new proposed remuneration policy and the second part starts on page 97 and describes the implementation of the current remuneration policy in 2019.
Proposed new remuneration policy
The Committee reviewed the Directors’ current remuneration policy during 2019. In doing so, it took into account the Company’s desire to retain and attract top executive talent, promote the continued strong strategic and financial performance of the business and maintain executive alignment with long-term shareholder interests. The Committee considered feedback received from shareholders since the adoption of the current policy in 2017, as well as developments in UK corporate governance and trends in market practice. The Committee also reviewed the pay practices of the FTSE 30, reflective of the Company’s position around the middle of this group and considered the fact that, as a global data analytics and technology-driven business with half of its revenue derived from the US market, the Group primarily competes for talent with global information and technology companies.
In 2019, the Committee undertook a review of workforce remuneration and related policies and the alignment of incentives and rewards with culture. Further detail is set out on page 98. The Committee took this into account when considering the proposed new remuneration policy for Executive Directors. The Committee was also mindful to ensure that the proposed new remuneration policy is transparent, easy to understand, consistent with the Company’s purpose, values and strategy and provides an appropriate link to long-term performance.
Earlier this year, we consulted with shareholders (representing a total of c60% of our issued share capital) and shareholder representative bodies. I would like to express my gratitude for the feedback received, which confirmed our proposal to maintain the same overall incentive structure as previously and helped to shape the changes to the current policy which we have decided to propose. We had a high level of engagement and are pleased to report that virtually all investors who provided feedback indicated support for the proposed approach.
Aspects of the current policy which we are proposing to keep the same
Incentive structure: In our last remuneration policy review, we simplified our incentive structure by reducing the number of plans we operated to one Annual Incentive Plan (AIP) (with a share deferral element) and one Long Term Incentive Plan (LTIP). The Committee is comfortable with this simplified incentive structure and is therefore proposing to continue with it under the new policy.
Performance measures: The Committee proposes to use the same combination of financial performance measures for the incentive plans as these have supported consistent, predictable and strong financial performance by the business and significant value creation for shareholders over the last eight years. Our business strategy continues to be to grow the core business through organic investment and the build-out of new products, with bolt-on acquisitions where we are the natural owner, as well as portfolio rationalisation through selective divestments. The EPS, ROIC and TSR performance metrics for the LTIP align with, and support, our strategy by focussing on sustained earnings growth, return on invested capital and shareholder returns.
Discretion and recovery provisions: The Committee has discretion to vary the level of payout under the AIP and LTIP, taking into account RELX’s overall business performance including environmental, social and governance matters and value created for shareholders over the period and other relevant factors. AIP and LTIP are also subject to malus and claw-back provisions in case of materially misstated financial or other data, serious misconduct and breach of post-termination restrictive covenants.
| RELX Annual report and financial statements 2019 | Directors’ Remuneration Report | 89 | |
|
| ||
| 90 | RELX Annual report and financial statements 2019 | Governance | |
|
| ||
Remuneration Policy Report
Set out in this section is the Company’s proposed new remuneration policy for Directors, which, subject to approval by shareholders, will apply for three years from the conclusion of the RELX PLC AGM to be held on 23 April 2020. The key changes from the previous remuneration policy (which was first published on pages 84 to 90 of the 2016 Annual Reports and Financial Statements and was approved by shareholders at the April 2017 Annual General Meetings) and the rationale for the changes are explained in the Committee Chair’s introduction on pages 88 and 89.
Remuneration policy table – Executive Directors
All footnotes to the policy table can be found on page 93.
|
ANNUAL BASE SALARY
|
Purpose and link to strategy
| To recruit and retain the best executive talent globally to execute our strategic objectives at appropriate cost. |
Operation
Salaries for Executive Directors are set and reviewed annually by the Remuneration Committee (the Committee) with changes typically taking effect on 1 January. In exceptional circumstances, the Committee may review salaries more frequently.
When reviewing salaries, the Committee considers the executive’s role and sustained value to the Company in terms of skill, experience and overall contribution and the Company’s guidelines for salaries for all employees for the year. Periodically, competitiveness with companies which are comparable in respect of industry, size, international scope and complexity is also considered in order to ensure the Company’s ability to attract and retain executives.
| For the last eight years, Executive Directors’ salary increases have been 2.5% per annum. |
Performance framework
| N/A |
Maximum value
| Salary increases will continue to be aligned with the range of increases for the wider employee population and subject to annual all-employee guidelines. However, as for all employees, the Committee has discretion to exceed this to take account of individual circumstances such as change in responsibility, increases in scale or complexity of the business, inflation or alignment to market level. |
Recovery of sums paid
No provision.
|
RETIREMENT BENEFITS
|
Purpose and link to strategy
| Retirement plans are part of remuneration packages designed to recruit and retain the best executive talent at appropriate cost. |
Operation
Policy for new appointments
Executive Directors appointed after the effective date of this policy will receive pension benefits up to the value equivalent to the maximum level of pension benefits provided under the Company’s regular defined contribution pension plans as may be in effect or amended from time to time (currently capped at 11% of base salary in the UK). The defined contribution pension plans are designed to be competitive and sustainable long-term. Any amount payable may be paid wholly or partly as cash in lieu and may be subject to tax and social security deductions in various jurisdictions.
Transition arrangements for existing Executive Directors
The existing directors will transition from their current arrangements to the above new appointment policy by the end of 2022.
The CFO currently receives a company contribution paid as cash in lieu of pension. The CFO’s company contribution decreased by five percentage points to 20% of base salary from January 2020 and further decreases to 18% from January 2021, to 16% from January 2022 and from the end of 2022, he will be subject to the above new appointment policy (currently capped at 11% of base salary in the UK).
The CEO is a member of a UK legacy defined benefit pension scheme, accruing 1/30th of final year pensionable earnings for each year (pro-rated for part years) of service, with a normal retirement age of 60. In line with all UK defined benefit scheme members, the CEO’s contributions to the plan and fees he pays to participate in the plan (together the ‘Total Plan Fees’) have been increasing annually since 2011. However, the CEO now pays a higher percentage of pensionable earnings as Total Plan Fees in each calendar year than other legacy members. In 2019, his Total Plan Fees were 20% of pensionable earnings, up from 12.5% in 2018. His total Plan Fees are 25% in 2020 and increase to 30% in 2021 and to 35% in 2022. A cap applies of 2% per annum on the increase in the CEO’s pensionable earnings (in place since 2017). Like all other members of the legacy defined benefit pension scheme, the CEO is allowed to switch to the defined contribution plan at any time. At the end of 2022, the CEO will cease to accrue any further benefits under the legacy defined benefit pension scheme. After 31 December 2022, he will be subject to the above new appointment policy (currently capped at 11% of base salary in the UK).
| Performance framework |
| N/A |
| RELX Annual report and financial statements 2019 | Directors’ Remuneration Report | 91 | |
|
| ||
| 92 | RELX Annual report and financial statements 2019 | Governance | |
|
| ||
AIP CONTINUED
Performance framework
The AIP includes financial measures with a weighting of at least 85% and may also include non-financial measures with a weighting of up to 15%. Each measure is assessed separately.
| ◾ | The minimum payout is zero. |
| ◾ | Each measure is assessed independently and payout for each measure at threshold is 10% of the maximum opportunity for that measure. If the financial measures have a weighting of 100% and threshold is reached for each of the financial measures, the overall payout for the financial measures is 13.5% of salary. If the financial measures have a weighting of 85% and threshold is reached for each of the financial measures, the overall payout for the financial measures is 11.5% of salary. |
| ◾ | Payout for target performance is 135% of salary. |
Following an assessment of financial achievement, and scoring of any non-financial measures, the Committee agrees the overall level of earned incentive for each Executive Director.
Committee discretion applies.1,2,3
Maximum value
The maximum potential annual incentive is 200% of annual base salary. This includes the deferred share element but excludes dividend equivalents payable in respect of the deferred shares.
Recovery of sums paid
Claw-back applies.4
LONG TERM INCENTIVE PLAN (LTIP)
Purpose and link to strategy
The Long-Term Incentive Plan (LTIP) is designed to provide a long-term incentive for Executive Directors to achieve the key performance measures that support the Company’s strategy, and to align their interests with shareholders.
Why performance measures are chosen and how targets are set
Our strategic focus is on continuing to transform the core business through organic investment and the build-out of new products into adjacent markets and geographies, supplemented by selective portfolio acquisitions and divestments. The performance measures in the LTIP are chosen to support this strategy by focusing on sustained earnings growth, return on invested capital and shareholder return.
Targets are set with regard to previous results and internal and external forecasts for the performance period and the strategic plan for the business. They are designed to provide exceptional reward for exceptional performance, whilst allowing a reasonable expectation that reward at the lower end of the scale is attainable, subject to robust performance.
Operation
Annual awards of performance shares, with vesting subject to:
| ◾ | performance measured over three financial years |
| ◾ | continued employment (subject to the provisions set out in the Policy on payments for loss of office section) |
| ◾ | meeting shareholding requirements (450% of salary for the CEO and 300% of salary for the CFO) |
Executive Directors are to retain their net (after tax) vested shares for a holding period of two years after vesting.
Dividend equivalents accrued during the performance period are payable in respect of the performance shares that vest.
On a change of control, the default position is that awards vest on a pro-rated basis, subject to an assessment of performance against targets at that time. Alternatively, the Committee may determine that the awards will not vest and will instead be exchanged for equivalent awards in the acquiring company.
Performance framework
The performance measures are EPS, ROIC and relative TSR, weighted 40%:40%:20% respectively and assessed independently, such that a payout can be received under any one of the measures (or, for TSR, in respect of one of the three comparator groups).
| ◾ | The minimum payout is zero. |
| ◾ | Each measure is assessed independently and payout for each measure at threshold is 25% of the maximum opportunity for that measure. If only one measure vests at threshold, and it has a weighting of 40%, then the overall payout would be 10% of the maximum award. If only one measure with a weighting of 20% vests at threshold, the overall payout would be 5% of the maximum award. |
| ◾ | Payout in line with expectations is 50% of the maximum award. |
Dividend equivalents are not taken into account in the above payout levels.
Committee discretion applies.1,2,3
Maximum value
The maximum grant in any year is up to 450% of base salary for the CEO and up to 375% of base salary for other Executive Directors (not including dividend equivalents).
Recovery of sums paid
Claw-back applies.4
| RELX Annual report and financial statements 2019 | Directors’ Remuneration Report | 93 | |
|
| ||
| 94 | RELX Annual report and financial statements 2019 | Governance | |
|
| ||
Approach to recruitment remuneration – Executive Directors
When agreeing the components of a remuneration package on the appointment of a new Executive Director, or an internal promotion to the Board, the Committee would seek to align the package with the remuneration policy stated in the policy table.
The Committee’s general principle on recruitment is to offer a competitive remuneration package to attract high-calibre candidates from a global talent pool. Basic salary would be set at an appropriate level for the candidate, taking into account all relevant factors. As a data analytics and technology-driven business, with half of its revenue in the US, the Company primarily competes for talent with global information and technology companies.
The various components and the Company’s approach are as follows:
Standard package on recruitment*
To offer remuneration in line with the policy table (including the limits), taking into account the principles set out above.
Compensation for forfeited entitlements
The Committee may make awards and payments on hiring an external candidate to compensate him or her for entitlements forfeited on leaving the previous employer. If such a decision is made, the Committee will attempt to reflect previous entitlements as closely as possible using a variety of tools, including cash and share based awards. Malus and claw-back provisions will apply where appropriate. If necessary to facilitate the grant of awards, the Committee may rely on the one person exemption from shareholder approval in the UK Listing Rules.
Relocation allowances and expenses
The type and size of relocation allowances and expenses will be determined by the specific circumstances of the new recruit.
* The standard package comprises annual base salary, retirement benefits, other benefits, AIP and LTIP.
Shareholding requirement
The Executive Directors are subject to shareholding requirements. These are a minimum of 450% of annual base salary for the CEO and 300% of annual base salary for other Executive Directors. On joining or promotion to the Board, Executive Directors are given a period of time, typically up to five years, to build up to their requirement. On termination of employment, Executive Directors are to maintain their full shareholding requirement (or, if lower, their actual level of shareholding at the time of leaving) for two years after leaving employment.
Shares which count for shareholding purposes are shares beneficially owned by the Executive Director, their spouse, civil partner or dependent child and AIP deferred shares which are within their three-year deferral period, on a notional net of tax basis.
Policy on payments for loss of office
In line with the Company’s policy, the service contracts of the existing Executive Directors contain 12-month notice periods.
The circumstances in which an Executive Director’s employment is terminated will affect the Committee’s determination of any payment for loss of office, but it expects to apply the principles outlined in the table on the next page. The Committee reserves the right to depart from these principles where appropriate in light of any taxation requirements to which the Company or the Executive Director is subject (including, without limitation, section 409A of the US Internal Revenue Code), or other legal obligations.
| RELX Annual report and financial statements 2019 | Directors’ Remuneration Report | 95 | |
|
| ||
| 96 | RELX Annual report and financial statements 2019 | Governance | |
|
| ||
Remuneration policy table – Non-Executive Directors
FEES
Purpose and link to strategy
To enable RELX to recruit Non-Executive Directors with the right balance of personal skills and experience to make a major contribution to the Board and Committees of a global business which is listed in London, Amsterdam and New York.
Operation
RELX Chair: Receives an aggregate annual fee with no additional fees, for example, Committee Chair fees. The Committee determines the Chair’s fee on the advice of the Senior Independent Director.
Other Non-Executive Directors: Receive an annual fee with additional fees payable as appropriate for specific roles and duties. These additional fees include fees for the Senior Independent Director and Committee Chairs, for membership of Board Committees, as well as a workforce engagement fee and international travel fees. In future, other fees may be payable, for example attendance fees. The Board determines the level of fees, subject to applicable law.
Fees may be reviewed annually, although in practice they have changed on a less frequent basis. When reviewing fees, consideration is given to the time commitment required, the complexity of the role and the calibre of the individual. Periodically, comparative market data is also reviewed, the primary source for which is the practice of FTSE 30 companies, with reference also to the Euronext Amsterdam (AEX) index and US-listed companies.
Maximum value
The aggregate annual fee limit for fees paid to the Chair and the Non-Executive Directors is £2m. Additional fees for membership of or chairing Board Committees and assuming additional responsibilities such as acting as Senior Independent Director, are not subject to this maximum limit.
OTHER BENEFITS
Purpose and link to strategy
To provide competitive benefits at appropriate cost.
Operation
Other benefits for Non-Executive Directors are reviewed periodically and may include private medical cover, tax return preparation costs, secretarial benefits, car benefits, travel and related subsistence costs, including, where appropriate, the tax on such benefits.
Maximum value
There is no prescribed maximum amount.
| RELX Annual report and financial statements 2019 | Directors’ Remuneration Report | 97 | |
|
| ||
| 98 | RELX Annual report and financial statements 2019 | Governance | |
|
| ||
Broader employee reward
The Committee has previously reviewed certain aspects of wider-workforce remuneration (such as annual salary increase guidelines globally and executive share plan participation). In 2019 the Committee undertook a more wide-ranging review to increase its understanding of broader employee reward so that it can consider this to an even greater extent when making decisions about Executive Directors’ pay.
The Committee reviewed the RELX global reward philosophy, which aims to support the Company’s ability to attract, motivate and retain high performing employees. The Company’s reward principles are underpinned by external equity, internal equity and pay for performance and we aim to pay around the median of the relevant local operating market for base salary and benefits with opportunity towards the upper quartile for sustained superior performance. The Committee also considered and reviewed the following aspects of workforce remuneration and related policies:
| ◾ | key statistics on the composition of the RELX workforce such as location, gender, age and length of service; |
| ◾ | pay philosophy and the evolution of our pay practices, including pay equity processes; |
| ◾ | details of the pension plan arrangements in our top five countries by number of employees; |
| ◾ | a summary of our main benefits policies globally; |
| ◾ | participation data on annual incentives (sales and non-sales), including gender splits; |
| ◾ | participation data related to the executive share plans and local ‘all-employee’ share plans; |
| ◾ | Employee Opinion Survey responses on reward related questions. |
The Committee took into account its review of workforce remuneration when designing the proposed new remuneration policy for Executive Directors. The Committee will continue to review workforce remuneration as a regular agenda item each year.
The Committee also considered the alignment of incentives and rewards with culture and is satisfied that the incentive schemes drive the desired behaviours to support the Company’s purpose, values and strategy.
Our designated non-executive director responsible for workforce engagement, Marike van Lier Lels, met with employee representatives from Europe, US and Asia Pacific during 2019 in order to understand a wide-range of employee views. She reported back to the Board and the feedback and insights gathered formed part of the Board’s discussions and decision making. Further information on the workforce engagement process is provided in the Governance section on page 76. As part of this process, Ms van Lier Lels explained how executive remuneration aligned with wider pay policy.
As required under the Companies (Miscellaneous Reporting) Regulations 2018, we have included in the annual remuneration report ratios of the CEO’s 2019 single total figure of remuneration to the median, the 25th percentile and the 75th percentile UK employees ranked by total remuneration using prescribed methodology A (see page 109).
2020 Implementation of Remuneration Policy
In line with increases for the wider employee population, and consistent with the 2020 salary increase guidelines for UK-based employees, the Committee has approved 2020 salary increases for the Executive Directors of 2.5%. After taking into account the increasing pension Total Plan Fees, which the CEO pays as part of his ongoing membership of the legacy defined benefit pension plan, his 2020 salary after these increasing fees will decrease again in 2020 compared to 2019.
The Board conducted its biennial review of Non-Executive Directors’ fees at the end of 2019 and considered, among other things, relevant market data for the FTSE 30 in making its adjustments. The fees for 2020 are set out on page 103.
The audited sections of the Report are clearly marked.
Wolfhart Hauser
Chair, Remuneration Committee
| RELX Annual report and financial statements 2019 | Directors’ Remuneration Report | 99 | |
|
| ||
| 100 | RELX Annual report and financial statements 2019 | Governance | |
|
| ||
The total remuneration for Directors is set out in note 26 to the consolidated financial statements on page 168.
2019 Annual Incentive
Set out below is a summary of performance against each financial measure and non-financial KPO and the resulting annual incentive payout for 2019:
| Erik Engstrom | Nick Luff | |||||||||||||||||||||||||||||||||
| Performance measure |
Relative weighting |
Financial targets (1) |
Achievement |
Achievement % |
Payout % |
Weighted Payout % of target |
Weighted Payout % of target |
|||||||||||||||||||||||||||
| Threshold | Target | Maximum | ||||||||||||||||||||||||||||||||
| Revenue |
35% | £7,429 | £7,904 | £8,299 | £7,874 | 99.6% | 94.0% | 32.9% | 32.9% | |||||||||||||||||||||||||
| Adjusted net profit after tax |
35% | £1,692 | £1,800 | £1,890 | £1,808 | 100.5% | 105.0% | 36.8% | 36.8% | |||||||||||||||||||||||||
| Cash flow |
15% | £2,204 | £2,344 | £2,462 | £2,403 | 102.5% | 125.0% | 18.8% | 18.8% | |||||||||||||||||||||||||
| Non-financial Key Performance Objectives (KPOs) |
15% | |
A detailed description of the non-financial KPOs and achievement against those KPOs for each Executive Director is set out below. |
|
13.75% | 13.5% | ||||||||||||||||||||||||||||
| Total |
100% | 102.2% | 101.9% | |||||||||||||||||||||||||||||||
| Total AIP payout as % of salary |
||||||||||||||||||||||||||||||||||
| Cash |
100% | 102.2% | 101.9% | |||||||||||||||||||||||||||||||
| Deferred Shares |
50% | 51.1% | 51.0% | |||||||||||||||||||||||||||||||
| Total |
150% | 153.2% | 152.9% | |||||||||||||||||||||||||||||||
Some figures add up to different amounts than the totals due to rounding.
The Cash AIP (£1,275,714 for the CEO and £749,388 for the CFO) will be paid in Q1 2020 and the Deferred Shares (with a current value of £637,857 in the case of the CEO and £374,694 in the case of the CFO) will be released in Q1 2023. The release of Deferred Shares is not subject to any further performance conditions, but is subject to malus and claw-back.
| (1) | (On an equivalent basis (at actual exchange rates and after the net impact of acquisitions and disposals completed during the year). |
Non-financial measures (KPOs) – Erik Engstrom
| Non-financial measures (KPO) | Relative weighting % at target |
Achievement vs KPO | Payout % of target |
|||||||||
| Risk Mitigation |
3% | This KPO was almost fully achieved. | 2.75% | |||||||||
| ◾ Cyber security training provided to 100% of employees; enhanced social engineering testing (e.g. phishing simulations) of all staff combined with a mandatory re-training program; role-based security briefings held for three higher-risk groups. Target almost fully met. |
||||||||||||
| ◾ An end-to-end major security incident table-top simulation (including testing of low level operational elements) completed within one business area and results summarised to all other business areas and incorporated into the Incident Response Plan; crisis response/media training completed for two business areas. Target met. |
||||||||||||
|
◾ Further reinforce culture of integrity with RELX ‘Do The Right Thing’ principles developed with compliance leads across the business areas and incorporated into RELX Ethical Leader communications and online training. Target met. |
||||||||||||
| Customers | 3% | This KPO was almost fully achieved |
2.75% | |||||||||
| ◾ New Editorial Policy training rolled out for staff. Target met. |
||||||||||||
| ◾ Expanded online content on Corporate Responsibility for customer facing employees. Migrated to a new intranet and refreshed all related content including a new resource on talking to our customers about the SDGs. Target met. |
||||||||||||
|
◾ Accessibility Advisory Board developed. Accessibility Board created representing all business areas focused on standardising accessibility training, compliance models, automated testing and enterprise-wide communications. Target almost fully met. |
||||||||||||
| People | 3% | This KPO was almost fully achieved |
2.75% | |||||||||
| ◾ Additional inclusion initiatives launched; a dashboard to measure inclusion progress rolled out across the Group. Target met. |
||||||||||||
| ◾ Progress made against our UN Equal Pay International Coalition commitments with the completion of a job architecture project and its integration into new human resources information system and the implementation of an action plan following pay equity audits. Target met. |
||||||||||||
|
◾ Mental Health metrics developed utilising absence, percentage of annual leave taken and exit interview data. Expanded Well-being Champions Network. Target almost fully met. |
||||||||||||
| RELX Annual report and financial statements 2019 | Directors’ Remuneration Report | 101 | |
|
| ||
| 102 | RELX Annual report and financial statements 2019 | Governance | |
|
| ||
Multi-year incentives (granted under the Remuneration Policy in effect prior to the approval by shareholders of the current Remuneration Policy at the Annual General Meetings in April 2017)
Multi-year incentives with a performance period ended 31 December 2019 were the 2017–2019 cycles of BIP, LTIP and ESOS granted to Executive Directors. Following the simplification of the remuneration plans approved by shareholders at the Annual General Meetings in 2017, these are the final cycles of the BIP and, for Executive Directors, the ESOS.
The Committee assessed the performance measures for these awards and made an overall assessment of underlying business performance and other relevant factors. The vesting outcome resulting from this review is summarised below.
| LTIP: 2017–2019 cycle performance outcome
|
||||||||||||||||||||||||||||||
| Performance measure |
Weighting | Performance range and vesting levels set at grant (1) |
Achievement against the performance range |
Resulting vesting percentage |
||||||||||||||||||||||||||
| TSR over the three-year |
1/3rd | below median | 0% | Between median and | 59.5% | |||||||||||||||||||||||||
| performance period(2) |
median | 30% | upper quartile of | |||||||||||||||||||||||||||
| upper quartile | 100% | |
sterling and euro comparator groups just above median of US dollar group |
|
||||||||||||||||||||||||||
| Average growth in adjusted EPS over |
1/3rd | below 5% p.a. | 0% | 6.8% p.a | 62.5% | |||||||||||||||||||||||||
| the three-year performance period(3) |
5% p.a. | 33% | ||||||||||||||||||||||||||||
| 6% p.a. | 52.5% | |||||||||||||||||||||||||||||
| 7% p.a. | 65% | |||||||||||||||||||||||||||||
| 8% p.a. | 75% | |||||||||||||||||||||||||||||
| 9% p.a. | 85% | |||||||||||||||||||||||||||||
| 10% p.a. | 92.5% | |||||||||||||||||||||||||||||
| 11% p.a. and above | 100% | |||||||||||||||||||||||||||||
| ROIC in the third year of the |
1/3rd | below 12.5% | 0% | 13.7%(4) | 91% | |||||||||||||||||||||||||
| performance period(3) |
12.5% | 33% | ||||||||||||||||||||||||||||
| 12.75% | 52.5% | |||||||||||||||||||||||||||||
| 13.0% | 65% | |||||||||||||||||||||||||||||
| 13.25% | 75% | |||||||||||||||||||||||||||||
| 13.5% | 85% | |||||||||||||||||||||||||||||
| 13.75% | 92.5% | |||||||||||||||||||||||||||||
| 14.0% and above | 100% | |||||||||||||||||||||||||||||
| Total vesting percentage: |
71.0% | |||||||||||||||||||||||||||||
|
(1) Calculated on a straight-line basis for performance between the points. (2) In respect of the euro TSR comparator group, RELX NV shares were, subsequent to the merger of RELX NV into RELX PLC, replaced with Euronext Amsterdam listed RELX PLC shares priced in euros and, in respect of the US dollar TSR comparator group, RELX NV ADRs were, subsequent to the merger, replaced with RELX PLC ADRs. (3) Growth in adjusted EPS at constant currencies and ROIC are calculated as set out in the Chief Financial Officer’s report on pages 52 to 57 and note 10 to the consolidated financial statements on page 148, with adjustments made to remove the effect on ROIC of changes in exchange rates, pension deficits and accounting standards over the three-year performance period. (4) For 2019, ROIC on pages 55 and 56 of the Chief Financial Officer’s report of 13.6% equates to ROIC of 13.7% under the plan methodology after adjustments for changes in exchange rates, pension deficits and accounting standards and impact of acquisition related integration costs.
|
| |||||||||||||||||||||||||||||
| BIP: 2017–2019 cycle performance outcome (final cycle of the discontinued BIP)
|
| |||||||||||||||||||||||||||||
| Performance measure |
Weighting | Performance range and vesting levels set at grant (1) |
Achievement against the performance range |
Resulting vesting percentage |
||||||||||||||||||||||||||
| Average growth in adjusted EPS over |
50% | below 4% p.a. | 0% | 6.8% p.a. | 78% | |||||||||||||||||||||||||
| the three-year performance period(2) |
4% p.a. | 50% | ||||||||||||||||||||||||||||
| 6.5% p.a. | 75% | |||||||||||||||||||||||||||||
| 9% p.a. or above | 100% | |||||||||||||||||||||||||||||
| ROIC in the third year of the |
50% | below 12.5% | 0% | 13.7%(3) | 100% | |||||||||||||||||||||||||
| performance period(2) |
12.5% | 50% | ||||||||||||||||||||||||||||
| 13.0% | 75% | |||||||||||||||||||||||||||||
| 13.5% or above | 100% | |||||||||||||||||||||||||||||
| Total vesting percentage: |
89.0% | |||||||||||||||||||||||||||||
| (1) | Calculated on a straight-line basis for performance between the points. |
| (2) | Growth in adjusted EPS at constant currencies and ROIC are calculated as set out in the Chief Financial Officer’s report on pages 52 to 57 and note 10 to the consolidated financial statements on page 148, with adjustments made to remove the effect on ROIC of changes in exchange rates, pension deficits and accounting standards over the three-year performance period. |
| (3) | For 2019, ROIC on pages 55 and 56 of the Chief Financial Officer’s report of 13.6% equates to ROIC of 13.7% under the plan methodology after adjustments for changes in exchange rates, pension deficits and accounting standards and impact of acquisition related integration costs. |
| RELX Annual report and financial statements 2019 | Directors’ Remuneration Report | 103 | |
|
| ||
| 104 | RELX Annual report and financial statements 2019 | Governance | |
|
| ||
Total pension entitlements (audited)
Erik Engstrom is a member of the legacy UK defined benefit pension plan. Subject to approval of the new remuneration policy being put forward for shareholder approval at the 2020 AGM, he will cease to accrue benefits under this plan at the end of 2022, at which point he will receive pension benefits of equivalent value to the level of pension benefits provided under the Company’s regular defined contribution pension plans as may be in effect or amended from time to time (currently capped at 11% of base salary in the UK). Mr Engstrom’s contributions and participation fee (together, the Total Plan Fees), which are payable by him as part of his ongoing membership of the scheme, have been increasing annually since 2011. In 2019, his Total Plan Fees were 20% of his pensionable earnings (i.e. £246,353), up from 12.5% in 2018. His Total Plan Fees will increase to 25% of pensionable earnings in 2020, 30% in 2021 and 35% in 2022. Mr Engstrom is also subject to a cap of 2% on annual increases in pensionable earnings.
Nick Luff receives a cash allowance in lieu of pension, which reduced from 27% of salary to 25% of salary on 1 March 2019 and reduced to 20% of base salary on 1 January 2020 and will continue to reduce each year until the end of 2022, at which time Mr Luff will receive pension benefits of equivalent value to the level of pension benefits provided under the Company’s regular defined contribution pension plans as may be in effect or amended from time to time (currently capped at 11% of base salary in the UK).
Erik Engstrom – pension information
| Age at December 2019 | Normal retirement age | CEO’s Total Plan Fees | Accrued annual pension at 31 December 2019 |
2019 single figure pensions value | ||||
| 56 |
60 | £246,353 | £499,568 | £538,862(1) |
| (1) | The 2019 single figure pensions value is the difference between the accrued annual pension as at 31 December 2018 (adjusted for inflation) and the accrued annual pension as at 31 December 2019, multiplied by 20 in accordance with the UK Regulations and is net of the CEO’s Total Plan Fees. |
Scheme interests awarded during the financial year (audited)
| LTIP – PERFORMANCE SHARE AWARDS | ||||||||||||
| Basis on which award is made | Face value of award at grant(1) | Value of awards if vest in line with expectations(2) | Percentage of maximum that would be received if threshold performance achieved |
End of performance period | ||||||||
| Erik Engstrom | 450% of salary | £5,482,809 | £2,741,405 | If each measure pays out at threshold, the overall payout is 25% | 31 December 2021 | |||||||
| Nick Luff | 375% of salary | £2,690,533 | £1,345,267 | |||||||||
| AIP – DEFERRED SHARES | ||||||||||||
| Erik Engstrom | 1/3 of 2018 AIP payout | £634,639 | N/A. The release of AIP Deferred Shares in Q1 2022 is not subject to any further performance | |||||||||
| Nick Luff | 1/3 of 2018 AIP payout | £376,409 | conditions, but is subject to malus and claw-back. | |||||||||
| (1) | The face value of the LTIP awards and AIP Deferred Shares granted in February 2019 was calculated using the middle market quotation of a PLC ordinary share (£17.6975). This share price was used to determine the number of awards granted. |
| (2) | Vesting in line with expectations for LTIP is as per the performance scenario chart disclosed on page 87 of the 2016 Remuneration Report, i.e. 50%. |
The LTIP awards granted in 2019 are based on ROIC, EPS and TSR weighted 40%:40%:20% respectively and assessed independently. The targets and vesting scales applicable to these awards are set out on pages 97 and 98 of the 2018 Remuneration Report.
| RELX Annual report and financial statements 2019 | Directors’ Remuneration Report | 105 | |
|
| ||
| 106 | RELX Annual report and financial statements 2019 | Governance | |
|
| ||
Multi-year incentive interests (audited)
The tables below and on page 107 set out vested but unexercised and unvested options, unvested share awards and AIP deferred shares held by the Executive Directors including details of awards granted, options exercised and awards vested during the year of reporting.
All outstanding unvested options and share awards are subject to performance conditions. For disclosure purposes, any PLC ADRs awarded under the multi-year incentive plans are included as ordinary shares. Between 31 December 2019 and the date of this Report, there have been no changes in the options or share awards held by the Executive Directors.
Erik Engstrom
| OPTIONS | Year of grant |
|
No. of options held on 1 Jan 2019 |
|
No. of options 2019 |
|
Option price on date of grant |
|
No. of options exercised during 2019 |
|
Market price per share at exercise |
|
No. of options held on 31 Dec 2019 |
|
Unvested options vesting on |
|
Options exercisable until |
|||||||||||||||||||||||||||||||||||||||||||||||||||
| 2014 | 145,604 | £9.245 | 145,604 | 07 Apr 24 | ||||||||||||||||||||||||||||||||||||||||||||||||||||||||||||||||
| 158,166 | €10.286 | 158,166 | 07 Apr 24 | |||||||||||||||||||||||||||||||||||||||||||||||||||||||||||||||||
| 2015 | 114,584 | £11.520 | 114,584 | 02 Apr 25 | ||||||||||||||||||||||||||||||||||||||||||||||||||||||||||||||||
| 120,886 | €15.003 | 120,886 | 02 Apr 25 | |||||||||||||||||||||||||||||||||||||||||||||||||||||||||||||||||
| 2016 | (1) | 112,690 | £12.550 | 101,421 | 15 Mar 26 | |||||||||||||||||||||||||||||||||||||||||||||||||||||||||||||||
| 119,312 | €15.285 | 107,380 | 15 Mar 26 | |||||||||||||||||||||||||||||||||||||||||||||||||||||||||||||||||
| 2017 | 96,996 | £14.945 | 96,996 | Feb 20 | 27 Feb 27 | |||||||||||||||||||||||||||||||||||||||||||||||||||||||||||||||
| 102,405 | €16.723 | 102,405 | Feb 20 | 27 Feb 27 | ||||||||||||||||||||||||||||||||||||||||||||||||||||||||||||||||
| Total |
970,643 | 947,442 | ||||||||||||||||||||||||||||||||||||||||||||||||||||||||||||||||||
| SHARES(2) |
Year of grant |
No. of held on 1 Jan 2019 |
No. of shares 2019 |
Market price per |
No. of shares vested during 2019 |
Market price per |
No. of unvested shares held on 31 Dec 2019 |
End of performance period |
Date of vesting |
|||||||||||||||||||||||||||||||||||||||||||||||||||||||||||
| BIP |
2016 | (1) | 94,965 | €15.285 | 83,094 | €20.400 | ||||||||||||||||||||||||||||||||||||||||||||||||||||||||||||||
| 2017 | 81,781 | €16.723 | 81,781 | Dec 2019 | Feb 2020 | |||||||||||||||||||||||||||||||||||||||||||||||||||||||||||||||
| LTIP |
2016 | (1) | 112,690 | £12.550 | 77,305 | £17.698 | ||||||||||||||||||||||||||||||||||||||||||||||||||||||||||||||
| 119,312 | €15.285 | 81,848 | €20.400 | |||||||||||||||||||||||||||||||||||||||||||||||||||||||||||||||||
| 2017 | 96,996 | £14.945 | 96,996 | Dec 2019 | Feb 2020 | |||||||||||||||||||||||||||||||||||||||||||||||||||||||||||||||
| 102,405 | €16.723 | 102,405 | Dec 2019 | Feb 2020 | ||||||||||||||||||||||||||||||||||||||||||||||||||||||||||||||||
| 2018 | 179,318 | £14.915 | 179,318 | Dec 2020 | Feb 2021 | |||||||||||||||||||||||||||||||||||||||||||||||||||||||||||||||
| 178,482 | €16.870 | 178,482 | Dec 2020 | Feb 2021 | ||||||||||||||||||||||||||||||||||||||||||||||||||||||||||||||||
| 2019 | 309,807 | £17.698 | 309,807 | Dec 2021 | Feb 2022 | |||||||||||||||||||||||||||||||||||||||||||||||||||||||||||||||
| Total |
965,949 | 309,807 | 242,247 | 948,789 | ||||||||||||||||||||||||||||||||||||||||||||||||||||||||||||||||
| (1) | The performance outcomes for the 2016 ESOS options, BIP and LTIP were disclosed on pages 90 and 91 of the 2018 Remuneration Report. |
| (2) | In addition, Mr Engstrom has 35,860 AIP deferred shares (pre-tax) awarded in 2019 with a market price at award of £17.698. The release of these AIP deferred shares in February 2022 is not subject to any further performance conditions. Including these AIP deferred shares increases the number of shares awarded during 2019 to 345,667 and the number of unvested shares held on 31 December 2019 to 984,649. |
| RELX Annual report and financial statements 2019 | Directors’ Remuneration Report | 107 | |
|
| ||
| 108 | RELX Annual report and financial statements 2019 | Governance | |
|
| ||
Performance graphs
The graphs below show total shareholder returns for RELX calculated on the basis of the average share price in the 30 trading days before the respective year end and assuming dividends were reinvested. RELX’s performance is compared with the FTSE 100. The three-year chart covers the performance period of the 2017–2019 cycle of the LTIP.
| 3 years
|
5 years
|
10 years
| ||
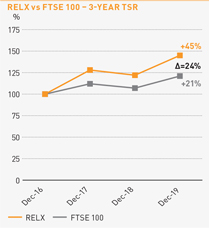
|
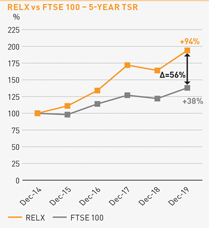
|
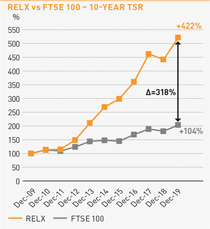
|
CEO historical pay table
The table below shows the historical CEO pay over a ten-year period.
| £’000 | 2010 | 2011 | 2012 | 2013 | 2014 | 2015 | 2016 | 2017 | 2018 | 2019 | ||||||||||||||||||||||||||||||||||||||||||||||||||||||||||||||||||
| Annualised base salary |
1,000 | 1,025 | 1,051 | 1,077 | 1,104 | 1,131 | 1,160 | 1,189 | 1,218 | 1,249 | ||||||||||||||||||||||||||||||||||||||||||||||||||||||||||||||||||
| Annual incentive payout as a % of maximum |
67% | 66% | 73% | 70% | 71% | 70% | 68% | 69% | 78% | 77% | ||||||||||||||||||||||||||||||||||||||||||||||||||||||||||||||||||
| Multi-year incentive vesting as a % of maximum |
0% | 0% | 70% | (1) | 96% | (1) | 90% | (1) | 97% | (1) | 97% | (1) | 92% | (1) | 81% | (1) | 81% | (1) | ||||||||||||||||||||||||||||||||||||||||||||||||||||||||||
| CEO total |
3,140 | 2,738 | 11,145 | (2) | 5,463 | 17,447 | (3) | 11,416 | (4) | 11,399 | (5) | 8,748 | (6) | 9,141 | (7) | 8,681 | (8) | |||||||||||||||||||||||||||||||||||||||||||||||||||||||||||
| (1) | The 2019, 2018, 2017, 2016 and 2015 percentages reflect BIP, LTIP and ESOS. The 2014 percentage reflects the final tranche of the discontinued Reed Elsevier Growth Plan (REGP), BIP and ESOS. The 2013 percentage reflects BIP and ESOS only and the 2012 percentage reflects BIP and the first tranche of the discontinued REGP. |
| (2) | The 2012 figure reflects the vesting of the first tranche of the discontinued REGP and includes the entire amount that was performance tested over the 2010–12 period, including the 50% of shares deferred until 2015 in accordance with the plan rules including £3m attributed to share price appreciation. |
| (3) | The 2014 figure includes the vesting of the second and final tranche of the discontinued REGP and includes £8.8m attributed to share price appreciation. |
| (4) | The 2015 figure includes £4.4m attributed to share price appreciation. |
| (5) | The 2016 figure includes £4.2m attributed to share price appreciation. |
| (6) | The 2017 figure includes £1.7m attributed to share price appreciation. |
| (7) | The 2018 figure includes £2.2m attributed to share price appreciation. The share award value has been restated for actual share prices and exchange rates applicable on the dates of vesting (see page 99 for further detail). |
| (8) | The 2019 figure includes £1.5m attributed to share price appreciation. |
| RELX Annual report and financial statements 2019 | Directors’ Remuneration Report | 109 | |
|
| ||
| 110 | RELX Annual report and financial statements 2019 | Governance | |
|
| ||
| RELX Annual report and financial statements 2019 | Directors’ Remuneration Report | 111 | |
|
| ||
| 112 | RELX Annual report and financial statements 2019 | Governance | |
|
| ||
This report has been prepared by the Audit Committee of RELX PLC and has been approved by the Board. It provides an overview of the membership, responsibilities and activities of the Committee.
Financial reporting
In discharging its responsibilities in respect of the 2019 interim and full-year financial statements, the Committee reviewed the following:
| AREAS OF SIGNIFICANT JUDGEMENT | PAGE REFERENCE IN ANNUAL REPORT | |
|
Specific areas of significant judgement focussed on by the Committee were: |
||
| ◾ Carrying values of goodwill and intangible assets: The significant judgements in respect of asset carrying values relate to the assumptions underlying the value in use calculations including discount rates and long-term growth assumptions. The Committee received and discussed reports from the RELX Financial Controller on the methodology and the basis of the assumptions used; |
151-154 | |
| ◾ Capitalisation of internally generated intangible assets: The capitalisation of costs related to the development of new products and business infrastructure, together with the useful economic lives applied to the resulting assets, requires the exercise of judgement. The Committee received reports from the RELX Financial Controller on the amounts capitalised and asset lives selected for major projects; |
153-154 | |
| ◾ Uncertain tax positions: Assessing potential liabilities across numerous jurisdictions is complex and requires judgement in making tax determinations. The Committee received and discussed reports from the RELX Head of Taxation on the potential liabilities identified and judgements applied; |
145 | |
| ◾ Pensions: The recognition of certain pension scheme liabilities is subject to judgement. The Committee received and discussed reports from the RELX Financial Controller on the methodology and the basis of the assumptions used. |
140-143 | |
| The Committee was satisfied that all judgements had been appropriately made.
|
||
| RELX Annual report and financial statements 2019 | Report of the Audit Committee | 113 | |
|
| ||
| 114 | RELX Annual report and financial statements 2019 | Governance | |
|
| ||
| RELX Annual report and financial statements 2019 | 115 | |
|
| ||
| 116 | RELX Annual report and financial statements 2019 | Governance | |
|
| ||
| RELX Annual report and financial statements 2019 | Directors’ Report | 117 | |
|
| ||
| 118 | RELX Annual report and financial statements 2019 | Governance | |
|
| ||

| RELX |
Annual report and financial statements 2019 |
119 |
and other information
| In this section | ||
| 120 |
Independent auditor’s report | |
| 128 |
Consolidated financial statements | |
| 133 |
Notes to the consolidated financial statements | |
| 175 |
||
| 120 | RELX Annual report and financial statements 2019 | Financial statements and other information | |
|
| ||
Independent auditor’s report to
the members of RELX PLC
OPINION
In our opinion:
| ◾ | RELX PLC and its subsidiaries, joint ventures and associates (“RELX”)’s group financial statements and parent company financial statements (the “financial statements”) give a true and fair view of the state of the group’s and of the parent company’s affairs as at 31 December 2019 and of the group’s profit for the year then ended; |
| ◾ | the group financial statements have been properly prepared in accordance with IFRSs as adopted by the European Union; |
| ◾ | the parent company financial statements have been properly prepared in accordance with United Kingdom Generally Accepted Accounting Practice; and |
| ◾ | the financial statements have been prepared in accordance with the requirements of the Companies Act 2006, and, as regards the group financial statements, Article 4 of the IAS Regulation. |
We have audited the financial statements of RELX PLC which comprise:
| Group | Parent company | |
| Consolidated income statement for the year then ended | Statement of financial position as at 31 December 2019 | |
| Consolidated statement of comprehensive income for the year then ended | Statement of changes in equity for the year then ended | |
| Consolidated statement of cash flows for the year then ended | Related notes 1 to 4 to the financial statements including a summary of significant accounting policies | |
| Consolidated statement of financial position as at 31 December 2019 | ||
| Consolidated statement of changes in equity for the year then ended | ||
| Related notes 1 to 29 to the financial statements, including a summary of significant accounting policies |
The financial reporting framework that has been applied in the preparation of the group financial statements is applicable law and International Financial Reporting Standards (IFRSs) as adopted by the European Union. The financial reporting framework that has been applied in the preparation of the parent company financial statements is applicable law and United Kingdom Accounting Standards, including FRS 101 “Reduced Disclosure Framework” (United Kingdom Generally Accepted Accounting Practice).
BASIS FOR OPINION
We conducted our audit in accordance with International Standards on Auditing (UK) (ISAs (UK)) and applicable law. Our responsibilities under those standards are further described in the Auditor’s responsibilities for the audit of the financial statements section of our report below. We are independent of the group and parent company in accordance with the ethical requirements that are relevant to our audit of the financial statements in the UK, including the FRC’s Ethical Standard as applied to listed public interest entities, and we have fulfilled our other ethical responsibilities in accordance with these requirements.
We believe that the audit evidence we have obtained is sufficient and appropriate to provide a basis for our opinion.
CONCLUSIONS RELATING TO PRINCIPAL RISKS, GOING CONCERN AND VIABILITY STATEMENT
We have nothing to report in respect of the following information in the annual report, in relation to which the ISAs (UK) require us to report to you whether we have anything material to add or draw attention to:
| ◾ | the disclosures in the annual report set out on pages 58 to 61 that describe the principal risks and explain how they are being managed or mitigated; |
| ◾ | the directors’ confirmation set out on page 58 in the annual report that they have carried out a robust assessment of the principal risks facing the entity, including those that would threaten its business model, future performance, solvency or liquidity; |
| ◾ | the directors’ statement set out on page 83 in the financial statements about whether they considered it appropriate to adopt the going concern basis of accounting in preparing them, and their identification of any material uncertainties to the entity’s ability to continue to do so over a period of at least twelve months from the date of approval of the financial statements. |
| ◾ | whether the directors’ statement in relation to going concern required under the Listing Rules in accordance with Listing Rule 9.8.6R(3) is materially inconsistent with our knowledge obtained in the audit; or |
| ◾ | the directors’ explanation set out on page 84 in the annual report as to how they have assessed the prospects of the entity, over what period they have done so and why they consider that period to be appropriate, and their statement as to whether they have a reasonable expectation that the entity will be able to continue in operation and meet its liabilities as they fall due over the period of their assessment, including any related disclosures drawing attention to any necessary qualifications or assumptions. |
| RELX Annual report and financial statements 2019 | Independent auditors’ report to the members of RELX PLC | 121 | |
|
| ||
| 122 | RELX Annual report and financial statements 2019 | Financial statements and other information | |
|
| ||
| RISK | OUR RESPONSE TO THE RISK | KEY OBSERVATIONS COMMUNICATED TO THE AUDIT COMMITTEE | ||
| Internally developed intangible assets The Group capitalised internally developed intangible assets of £333 million in the current year (2018: £304 million) and has a year end net book value of £1,264 million (2018: £1,217 million). As described in note 15 to the consolidated financial statements and in the audit committee report (page 112), the capitalisation of costs related to the development of new products and business infrastructure, together with the economic useful lives applied to the resulting assets, requires the exercise of significant judgement.
We focused on this area as it is inherently judgemental with respect to technical feasibility, intention and ability to complete the intangible asset, ability to use or sell the asset, ability to generate future economic benefits and ability to measure the costs reliably. As a result these expenditures may be inappropriately capitalised, amortised or valued.
|
We performed full and specific scope audit procedures over internally developed intangible assets in 4 locations, which covered 71% of the account balance. Procedures included obtaining an understanding of the processes which support the expenditure and subsequent capitalisation of internally developed intangible assets and evaluating their design, as well as testing controls for the capitalisation of internally generated intangible assets. For example, we tested controls over management’s review and approval of new capital projects and the capitalisation criteria for costs incurred for the projects.
Additionally, procedures included, among others (i) assessing the accounting policy and methodology for capitalisation of expenditures; (ii) evaluating the accuracy and valuation of amounts capitalised to assess that costs are directly attributable and necessary to create, produce, and prepare the asset to be capable of operating in the manner intended by management, which was done by assessing if capitalised costs related to an authorised capital project and met the criteria to be capitalised; and (iii) assessing the useful lives adopted based on related business cases and historical experience. |
Based on the procedures performed, we did not identify any evidence of material misstatement in the capitalisation of internally developed intangible assets. | ||
| Revenue recognition As described in note 2 to the consolidated financial statements, the group earns revenue (£7.9bn recorded in 2019, compared to £7.5bn recorded in 2018) from a variety of sources among the different business areas, including annual subscriptions, transactional usage and exhibition fees. The nature of the risk associated with the accurate recording of revenue varies.
We recognise that revenue is a key metric upon which the group is judged, that the group has annual internal targets, and that the group has incentive schemes that are partially impacted by revenue growth.
We have determined that there is a risk in each of the business areas related to the opportunity to commit fraud in the respective revenue streams through manual adjustments or override of controls by management. |
We performed full and specific scope audit procedures over revenue in 12 locations, which covered 82% of revenue. We performed procedures to address the specific risk in each business area. Procedures included, among others, (i) assessing the processes and testing controls over each significant revenue stream; (ii) evaluating the appropriateness of journal entries impacting revenue, as well as other adjustments made in the preparation of the financial statements; (iii) evaluating management’s controls over such adjustments; (iv) inspecting a sample of contracts to check that revenue recognition was in accordance with the contract terms and the group’s revenue recognition policies; (v) testing a sample of transactions around period end to test that revenue was recorded in the correct period; and (vi) for revenue streams that have judgemental elements, evaluating management’s assumptions. | Based on the procedures performed, we did not identify evidence of material misstatement in the revenue recognised in the year. | ||
| Finance systems The group has many IT systems that are vital to the ongoing operations and to the integrity of the financial reporting process. Owing to the global nature of the group and its operations, the applications, associated infrastructure and IT processes that support significant business and financial processes are spread across a number of locations. These are delivered by a mix of in-house teams and third party support providers some of whom reside in different countries from the physical location of the IT infrastructure or the location of the RELX business users. Additionally, due to the rapidly changing IT landscape, the group undergoes numerous IT system migrations. Understanding the IT environment including interfaces between them was an area of audit focus to assess if transactions were being processed accurately. |
We utilised professionals with specialised skills to support our evaluation of the design and operation of IT controls to address the group’s control objectives and financial reporting risks. Procedures included, among others, (i) holding enquiries of management to understand the IT environment and walking through the financial processes end-to-end in order to understand where IT systems were integral to the group accounting processes; (ii) performing data analytic procedures in certain locations and business areas to understand the flow of transactions and perform specific test procedures; (iii) testing the IT general controls environment for the key applications; (iv) where appropriate, receiving reports from the service auditors of the outsourced systems and evaluating the adequacy of the work performed and following up on matters arising, performing further procedures as necessary; (v) testing system migrations, including testing of controls surrounding the migration; and (vi) where required, testing compensating controls or performing alternative procedures to complement the controls based audit approach. | Based on the procedures performed, we have not identified any misstatements in the financial statements due to any limitations of the IT systems. Our understanding and testing of IT systems and controls supported our audit approach. | ||
| RELX Annual report and financial statements 2019 | Independent auditors’ report to the members of RELX PLC | 123 | |
|
| ||
| 124 | RELX Annual report and financial statements 2019 | Financial statements and other information | |
|
| ||
Changes from the prior year
Changes from the prior year include instructing one location to perform specified procedures around revenue manual journal entries in the current year. In the prior year, we performed procedures around the accounting for significant acquisitions made in the prior year, which are no longer applicable in the current year in those locations.
Involvement with component teams
In establishing our overall approach to the Group audit, we determined the type of work that needed to be undertaken at each of the components by us, as the primary audit engagement team, or by component auditors from other EY global network firms operating under our instruction. Of the six full scope components, audit procedures were performed on three of these directly by the primary audit team. For the six specific scope components, where the work was performed by component auditors, we determined the appropriate level of involvement to enable us to determine that sufficient audit evidence had been obtained as a basis for our opinion on the Group as a whole.
The Group audit team continued to follow a programme of planned visits that has been designed to ensure that the Senior Statutory Auditor, or another Group audit partner, visit all full scope locations and specific scope locations on a rotational basis. During the current year’s audit cycle, visits were undertaken by the primary audit team to the component teams in the United Kingdom, the Netherlands, the United States, France and Japan. These visits involved meeting local management and discussing the audit approach with the component audit team and any issues arising from their work. The Group audit team also participated in key discussions, via conference calls with all full and specific scope locations. The primary team interacted regularly with the component teams where appropriate during various stages of the audit, reviewed key working papers and were responsible for the scope and direction of the audit process. This, together with the additional procedures performed at Group level, gave us appropriate evidence for our opinion on the Group financial statements.
OUR APPLICATION OF MATERIALITY
We apply the concept of materiality in planning and performing the audit, in evaluating the effect of identified misstatements on the audit and in forming our audit opinion.
Materiality
The magnitude of an omission or misstatement that, individually or in the aggregate, could reasonably be expected to influence the economic decisions of the users of the financial statements. Materiality provides a basis for determining the nature and extent of our audit procedures.
We determined materiality for the group to be £90 million (2018: £90 million), which is 5% (2018: 5%) of profit before tax. We believe that profit before tax provides us with the best assessment of the requirements of the users of the financial statements.
We determined materiality for the Parent Company to be £90 million (2018: £90 million), which is 0.5% (2018: 0.5%) of equity.
Performance materiality
The application of materiality at the individual account or balance level. It is set at an amount to reduce to an appropriately low level the probability that the aggregate of uncorrected and undetected misstatements exceeds materiality.
On the basis of our risk assessments, together with our assessment of the Group’s overall control environment, our judgement was that performance materiality was 75% (2018: 75%) of our planning materiality, namely £68 million (2018: £67.5m). We have set performance materiality at this percentage due to our assessment of the control environment and the historic lack of significant audit findings.
Audit work at component locations for the purpose of obtaining audit coverage over significant financial statement accounts is undertaken based on a percentage of total performance materiality. The performance materiality set for each component is based on the relative scale and risk of the component to the group as a whole and our assessment of the risk of misstatement at that component. In the current year, the range of performance materiality allocated to components was £8.5 million to £53.5 million (2018: £19.4 million to £48.4 million).
Reporting threshold
An amount below which identified misstatements are considered as being clearly trivial.
We agreed with the Audit Committee that we would report to them all uncorrected audit differences in excess of £4.5 million (2018: £4.5 million), which is set at 5% of planning materiality, as well as differences below that threshold that, in our view, warranted reporting on qualitative grounds.
We evaluate any uncorrected misstatements against both the quantitative measures of materiality discussed above and in light of other relevant qualitative considerations in forming our opinion.
| RELX Annual report and financial statements 2019 | Independent auditors’ report to the members of RELX PLC | 125 | |
|
| ||
| 126 | RELX Annual report and financial statements 2019 | Financial statements and other information | |
|
| ||
Responsibilities of directors
As explained more fully in the directors’ responsibilities statement set out on page 117, the directors are responsible for the preparation of the financial statements and for being satisfied that they give a true and fair view, and for such internal control as the directors determine is necessary to enable the preparation of financial statements that are free from material misstatement, whether due to fraud or error.
In preparing the financial statements, the directors are responsible for assessing the group and parent company’s ability to continue as a going concern, disclosing, as applicable, matters related to going concern and using the going concern basis of accounting unless the directors either intend to liquidate the group or the parent company or to cease operations, or have no realistic alternative but to do so.
Auditor’s responsibilities for the audit of the financial statements
Our objectives are to obtain reasonable assurance about whether the financial statements as a whole are free from material misstatement, whether due to fraud or error, and to issue an auditor’s report that includes our opinion. Reasonable assurance is a high level of assurance, but is not a guarantee that an audit conducted in accordance with ISAs (UK) will always detect a material misstatement when it exists. Misstatements can arise from fraud or error and are considered material if, individually or in the aggregate, they could reasonably be expected to influence the economic decisions of users taken on the basis of these financial statements.
Explanation as to what extent the audit was considered capable of detecting irregularities, including fraud
The objectives of our audit, in respect to fraud, are; to identify and assess the risks of material misstatement of the financial statements due to fraud; to obtain sufficient appropriate audit evidence regarding the assessed risks of material misstatement due to fraud, through designing and implementing appropriate responses; and to respond appropriately to fraud or suspected fraud identified during the audit. However, the primary responsibility for the prevention and detection of fraud rests with both those charged with governance of the entity and management.
Our approach was as follows:
| ◾ | We obtained an understanding of the legal and regulatory frameworks that are applicable to the group and determined that the most significant are those that relate to the reporting framework (IFRS, FRS 101, the Companies Act 2006 and UK Corporate Governance Code) and the relevant tax compliance regulations in the jurisdictions in which the group operates. |
| ◾ | We understood how RELX PLC is complying with those frameworks by making enquiries of management, internal audit, those responsible for legal and compliance procedures and the company secretary. We corroborated our enquiries through our review of board minutes and papers provided to the Audit Committee. |
| ◾ | We assessed the susceptibility of the group’s financial statements to material misstatement, including how fraud might occur by meeting with management from various parts of the business to understand where it considered there was susceptibility to fraud. We also considered performance targets and their propensity to influence on efforts made by management to manage earnings. We considered the programmes and controls that the group has established to address risks identified, or that otherwise prevent, deter and detect fraud; and how senior management monitors those programmes and controls. Where the risk was considered to be higher, we performed audit procedures to address each identified fraud risk. These procedures included testing manual journals and were designed to provide reasonable assurance that the financial statements were free from fraud or error. |
| ◾ | Based on this understanding we designed our audit procedures to identify non-compliance with such laws and regulations. Our procedures involved: journal entry testing, with a focus on manual consolidation journals and journals indicating large or unusual transactions based on our understanding of the business; enquiries of legal counsel, group management, internal audit, business area management at all full and specific scope management; and focused testing. In addition, we completed procedures to conclude on the compliance of the disclosures in the annual report and accounts with all applicable requirements. |
| ◾ | Any instances of non-compliance with laws and regulations were communicated by/to components and considered in our audit approach, if applicable. |
A further description of our responsibilities for the audit of the financial statements is located on the Financial Reporting Council’s website at https://www.frc.org.uk/auditorsresponsibilities. This description forms part of our auditor’s report.
| RELX Annual report and financial statements 2019 | Independent auditors’ report to the members of RELX PLC | 127 | |
|
| ||
| 128 | RELX Annual report and financial statements 2019 | Financial statements and other information | |
|
| ||
| FOR THE YEAR ENDED 31 DECEMBER | Note | 2019 £m |
2018 £m |
2017 £m |
||||||||||||
| Revenue |
2 | 7,874 | 7,492 | 7,341 | ||||||||||||
| Cost of sales |
(2,755 | ) | (2,644 | ) | (2,628 | ) | ||||||||||
| Gross profit |
5,119 | 4,848 | 4,713 | |||||||||||||
| Selling and distribution costs |
(1,292 | ) | (1,191 | ) | (1,163 | ) | ||||||||||
| Administration and other expenses |
(1,767 | ) | (1,725 | ) | (1,682 | ) | ||||||||||
| Share of results of joint ventures |
41 | 32 | 37 | |||||||||||||
| Operating profit |
3 | 2,101 | 1,964 | 1,905 | ||||||||||||
| Finance income |
7 | 9 | 6 | 6 | ||||||||||||
| Finance costs |
7 | (314 | ) | (217 | ) | (205 | ) | |||||||||
| Net finance costs |
(305 | ) | (211 | ) | (199 | ) | ||||||||||
| Disposals and other non-operating items |
8 | 51 | (33 | ) | 15 | |||||||||||
| Profit before tax |
1,847 | 1,720 | 1,721 | |||||||||||||
| Current tax |
(382 | ) | (297 | ) | (439 | ) | ||||||||||
| Deferred tax |
44 | 5 | 374 | |||||||||||||
| Tax expense |
9 | (338 | ) | (292 | ) | (65 | ) | |||||||||
| Net profit for the year |
1,509 | 1,428 | 1,656 | |||||||||||||
| Attributable to: |
||||||||||||||||
| RELX PLC shareholders |
1,505 | 1,422 | 1,648 | |||||||||||||
| Non-controlling interests |
4 | 6 | 8 | |||||||||||||
| Net profit for the year |
1,509 | 1,428 | 1,656 | |||||||||||||
| Earnings per share |
||||||||||||||||
| FOR THE YEAR ENDED 31 DECEMBER | 2019 | 2018 | 2017 | |||||||||||||
| Basic earnings per share |
||||||||||||||||
| RELX PLC |
10 | 77.4p | 71.9p | 81.6p | ||||||||||||
| Diluted earnings per share |
||||||||||||||||
| RELX PLC |
10 | 76.9p | 71.4p | 81.0p | ||||||||||||
| RELX Annual report and financial statements 2019 | 129 | |
|
| ||
| 130 | RELX Annual report and financial statements 2019 | Financial statements and other information | |
|
| ||
Consolidated statement of cash flows
| FOR THE YEAR ENDED 31 DECEMBER | Note | 2019 £m |
2018 £m |
2017 £m |
||||||||||||
| Cash flows from operating activities |
||||||||||||||||
| Cash generated from operations |
11 | 2,724 | 2,555 | 2,526 | ||||||||||||
| Interest paid (including lease interest) |
(175 | ) | (179 | ) | (169 | ) | ||||||||||
| Interest received |
4 | 24 | 6 | |||||||||||||
| Tax paid (net) |
(464 | ) | (415 | ) | (449 | ) | ||||||||||
| Net cash from operating activities |
2,089 | 1,985 | 1,914 | |||||||||||||
| Cash flows from investing activities |
||||||||||||||||
| Acquisitions |
11 | (423 | ) | (935 | ) | (131 | ) | |||||||||
| Purchases of property, plant and equipment |
(47 | ) | (56 | ) | (51 | ) | ||||||||||
| Expenditure on internally developed intangible assets |
(333 | ) | (306 | ) | (303 | ) | ||||||||||
| Purchase of investments |
(8 | ) | (13 | ) | (10 | ) | ||||||||||
| Proceeds from disposals of property, plant and equipment |
2 | 4 | 1 | |||||||||||||
| Gross proceeds from business disposals |
82 | 34 | 84 | |||||||||||||
| Payments on business disposals |
(40 | ) | (29 | ) | (43 | ) | ||||||||||
| Dividends received from joint ventures |
34 | 30 | 38 | |||||||||||||
| Net cash used in investing activities |
(733 | ) | (1,271 | ) | (415 | ) | ||||||||||
| Cash flows from financing activities |
||||||||||||||||
| Dividends paid to shareholders |
13 | (842 | ) | (796 | ) | (762 | ) | |||||||||
| Distributions to non-controlling interests |
(9 | ) | (8 | ) | (10 | ) | ||||||||||
| Increase/(decrease) in short-term bank loans, overdrafts and commercial paper |
11 | 98 | 147 | (148 | ) | |||||||||||
| Issuance of term debt |
11 | 729 | 958 | 873 | ||||||||||||
| Repayment of term debt |
11 | (617 | ) | (211 | ) | (712 | ) | |||||||||
| Repayment of leases |
11 | (102 | ) | (95 | ) | (89 | ) | |||||||||
| Receipts in respect of subleases |
11 | 16 | 14 | 11 | ||||||||||||
| Disposal of non-controlling interest |
6 | – | – | |||||||||||||
| Repurchase of ordinary shares |
24 | (600 | ) | (700 | ) | (700 | ) | |||||||||
| Purchase of shares by Employee Benefit Trust |
24 | (37 | ) | (43 | ) | (39 | ) | |||||||||
| Proceeds on issue of ordinary shares |
29 | 21 | 32 | |||||||||||||
| Net cash used in financing activities |
(1,329 | ) | (713 | ) | (1,544 | ) | ||||||||||
| Increase/(decrease) in cash and cash equivalents |
11 | 27 | 1 | (45 | ) | |||||||||||
| Movement in cash and cash equivalents |
||||||||||||||||
| At start of year |
114 | 111 | 162 | |||||||||||||
| Increase/(decrease) in cash and cash equivalents |
27 | 1 | (45 | ) | ||||||||||||
| Exchange translation differences |
(3 | ) | 2 | (6 | ) | |||||||||||
| At end of year |
138 | 114 | 111 | |||||||||||||
| RELX Annual report and financial statements 2019 | 131 | |
|
| ||
| 132 | RELX Annual report and financial statements 2019 | Financial statements and other information | |
|
| ||
Consolidated statement of changes in equity
| Note | Share capital £m |
Share premium £m |
Shares held in treasury £m |
Translation £m |
Other reserves £m |
Shareholders’ equity £m |
Non- £m |
Total equity £m |
||||||||||||||||||||||||||||
| Balance at 1 January 2017 |
226 | 3,003 | (1,471 | ) | 727 | (215 | ) | 2,270 | 38 | 2,308 | ||||||||||||||||||||||||||
| Total comprehensive income for the year |
– | – | – | (507 | ) | 1,954 | 1,447 | 8 | 1,455 | |||||||||||||||||||||||||||
| Dividends paid |
13 | – | – | – | – | (762 | ) | (762 | ) | (10 | ) | (772 | ) | |||||||||||||||||||||||
| Issue of ordinary shares, net of expenses |
– | 32 | – | – | – | 32 | – | 32 | ||||||||||||||||||||||||||||
| Repurchase of ordinary shares |
– | – | (737 | ) | – | – | (737 | ) | – | (737 | ) | |||||||||||||||||||||||||
| Cancellation of shares |
24 | (4 | ) | – | 570 | – | (566 | ) | – | – | – | |||||||||||||||||||||||||
| Increase in share based remuneration reserve (net of tax) |
– | – | – | – | 42 | 42 | – | 42 | ||||||||||||||||||||||||||||
| Settlement of share awards |
– | – | 37 | – | (37 | ) | – | – | ||||||||||||||||||||||||||||
| Acquisitions |
– | – | – | – | – | – | 1 | 1 | ||||||||||||||||||||||||||||
| Disposal of business |
– | – | – | – | – | – | (15 | ) | (15 | ) | ||||||||||||||||||||||||||
| Exchange differences on translation of capital and reserves |
2 | 69 | (30 | ) | (50 | ) | 9 | – | (1 | ) | (1 | ) | ||||||||||||||||||||||||
| Balance at 1 January 2018 |
224 | 3,104 | (1,631 | ) | 170 | 425 | 2,292 | 21 | 2,313 | |||||||||||||||||||||||||||
| Total comprehensive income for the year |
– | – | – | 207 | 1,313 | 1,520 | 6 | 1,526 | ||||||||||||||||||||||||||||
| Dividends paid |
13 | – | – | – | – | (796 | ) | (796 | ) | (8 | ) | (804 | ) | |||||||||||||||||||||||
| Issue of ordinary shares, net of expenses |
24 | 134 | 114 | – | – | (227 | ) | 21 | – | 21 | ||||||||||||||||||||||||||
| Repurchase of ordinary shares |
– | – | (743 | ) | – | – | (743 | ) | – | (743 | ) | |||||||||||||||||||||||||
| Cancellation of shares |
24 | (68 | ) | (1,795 | ) | 1,601 | – | 262 | – | – | – | |||||||||||||||||||||||||
| Increase in share based remuneration reserve (net of tax) |
– | – | – | – | 35 | 35 | – | 35 | ||||||||||||||||||||||||||||
| Settlement of share awards |
– | – | 35 | – | (35 | ) | – | – | – | |||||||||||||||||||||||||||
| Acquisitions |
– | – | – | – | – | – | 11 | 11 | ||||||||||||||||||||||||||||
| Exchange differences on translation of capital and reserves |
– | (8 | ) | 4 | (3 | ) | 7 | – | – | – | ||||||||||||||||||||||||||
| Balance at 1 January 2019 |
290 | 1,415 | (734 | ) | 374 | 984 | 2,329 | 30 | 2,359 | |||||||||||||||||||||||||||
| Total comprehensive income for the year |
– | – | – | (82 | ) | 1,434 | 1,352 | 4 | 1,356 | |||||||||||||||||||||||||||
| Dividends paid |
13 | – | – | – | – | (842 | ) | (842 | ) | (9 | ) | (851 | ) | |||||||||||||||||||||||
| Issue of ordinary shares, net of expenses |
24 | 1 | 28 | – | – | – | 29 | – | 29 | |||||||||||||||||||||||||||
| Repurchase of ordinary shares |
– | – | (637 | ) | – | – | (637 | ) | – | (637 | ) | |||||||||||||||||||||||||
| Bonus issue of ordinary share |
24 | 4,000 | – | – | – | (4,000 | ) | – | – | – | ||||||||||||||||||||||||||
| Cancellation of bonus share |
24 | (4,000 | ) | – | – | – | 4,000 | – | – | – | ||||||||||||||||||||||||||
| Cancellation of shares |
24 | (5 | ) | – | 504 | – | (499 | ) | – | – | – | |||||||||||||||||||||||||
| Increase in share based remuneration reserve (net of tax) |
– | – | – | – | 33 | 33 | – | 33 | ||||||||||||||||||||||||||||
| Settlement of share awards |
– | – | 33 | – | (33 | ) | – | – | – | |||||||||||||||||||||||||||
| Acquisitions |
– | – | – | – | – | – | (1 | ) | (1 | ) | ||||||||||||||||||||||||||
| Put option |
– | – | – | – | (103 | ) | (103 | ) | – | (103 | ) | |||||||||||||||||||||||||
| Disposal of non-controlling interest |
– | – | – | – | 5 | 5 | 1 | 6 | ||||||||||||||||||||||||||||
| Exchange differences on translation of capital and reserves |
– | – | – | – | – | – | (1 | ) | (1 | ) | ||||||||||||||||||||||||||
| Balance at 31 December 2019 |
286 | 1,443 | (834 | ) | 292 | 979 | 2,166 | 24 | 2,190 | |||||||||||||||||||||||||||
| RELX Annual report and financial statements 2019 | 133 | |
|
| ||
| 134 | RELX Annual report and financial statements 2019 | Financial statements and other information | |
|
| ||
Notes to the consolidated financial statements
for the year ended 31 December 2019
1 Basis of preparation and accounting policies (continued)
Other significant accounting policies
The accounting policy in respect of revenue recognition is also significant in determining the financial condition and results of the Group. The application of this policy is straightforward, and is included in note 2.
Standards and amendments effective for the year
RELX adopted IFRS 16 Leases for the year ended 31 December 2018, a year earlier than its mandatory effective date. The impact of the adoption of IFRS 16 was reflected in the consolidated financial statements for the year ended 31 December 2018. Other interpretations and amendments to IFRS effective for 2019 have not had a significant impact on the Group’s accounting policies or reporting.
Standards, amendments and interpretations not yet effective
A number of amendments and interpretations have been issued which are not expected to have any significant impact on the accounting policies and reporting.
2 Revenue and segment analysis
| Accounting policy
The Group’s reported segments are based on the internal reporting structure and financial information provided to the Board.
Adjusted operating profit is the key segmental profit measure used by the Group in assessing performance. Adjusted operating profit is reconciled to operating profit on page 137.
Revenue arises from the provision of products and services under contracts with customers. In all cases, revenue is recognised to depict the transfer of promised goods or services to customers in an amount that reflects the consideration to which the entity expects to be entitled in exchange for those goods or services, and is recognised when the customer obtains control of the good or service.
Revenue is stated at the transaction price, which includes allowance for anticipated discounts and returns and excludes customer sales taxes and other amounts to be collected on behalf of third-parties.
Where the goods or services promised within a contract are distinct, they are identified as separate performance obligations and are accounted for separately.
Where separate performance obligations are identified, total revenue is allocated on the basis of relative stand-alone selling prices or management’s best estimate of relative value where stand-alone selling prices do not exist. Management estimates may include a cost-plus method or comparable product approach, but must be supported by objective evidence. A residual approach may be applied where it is not possible to derive a reliable management estimate for a specific component.
Revenue is recognised for the various categories as follows:
◾ Subscriptions – revenue comprises income derived from the periodic distribution or update of a product. Subscription revenue is generally invoiced in advance and recognised systematically over the period of the subscription. Recognition is either on a straight-line basis where the transaction involves the transfer of goods and services to the customer in a consistent manner over a specific period of time; or based on the value received by the customer where the goods and services are not delivered in a consistent manner.
◾ Transactional – revenue is recognised when control of the product is passed to the customer or the service has been performed. For exhibitions, revenue primarily comprises income from exhibitors and attendees at exhibitions. Exhibition revenue is recognised on occurrence of the exhibition.
◾ Advertising – revenue is recognised on publication or over the period of online display.
|
| RELX Annual report and financial statements 2019 | Notes to the consolidated financial statements | 135 | |
|
| ||
| 136 | RELX Annual report and financial statements 2019 | Financial statements and other information | |
|
| ||
Notes to the consolidated financial statements
for the year ended 31 December 2019
2 Revenue and segment analysis (continued)
| 2018 |
Scientific, Technical & Medical |
Risk & Business Analytics |
Legal |
Exhibitions |
Total |
|||||||||||||||
| Revenue by geographical market |
||||||||||||||||||||
| North America |
1,118 | 1,669 | 1,083 | 221 | 4,091 | |||||||||||||||
| Europe |
611 | 322 | 340 | 535 | 1,808 | |||||||||||||||
| Rest of world |
809 | 126 | 195 | 463 | 1,593 | |||||||||||||||
| Total revenue |
2,538 | 2,117 | 1,618 | 1,219 | 7,492 | |||||||||||||||
| Revenue by format |
||||||||||||||||||||
| Electronic |
2,094 | 2,030 | 1,338 | 51 | 5,513 | |||||||||||||||
| Face-to-face |
7 | 36 | 10 | 1,168 | 1,221 | |||||||||||||||
| |
437 | 51 | 270 | – | 758 | |||||||||||||||
| Total revenue |
2,538 | 2,117 | 1,618 | 1,219 | 7,492 | |||||||||||||||
| Revenue by type |
||||||||||||||||||||
| Subscriptions |
1,877 | 765 | 1,247 | – | 3,889 | |||||||||||||||
| Transactional |
615 | 1,322 | 365 | 1,219 | 3,521 | |||||||||||||||
| Advertising |
46 | 30 | 6 | – | 82 | |||||||||||||||
| Total revenue |
2,538 | 2,117 | 1,618 | 1,219 | 7,492 | |||||||||||||||
| 2017 | Scientific, Technical & Medical |
Risk & Business Analytics |
Legal |
Exhibitions |
Total |
|||||||||||||||
| Revenue by geographical market |
||||||||||||||||||||
| North America |
1,045 | 1,658 | 1,145 | 230 | 4,078 | |||||||||||||||
| Europe |
617 | 308 | 340 | 429 | 1,694 | |||||||||||||||
| Rest of world |
811 | 107 | 201 | 450 | 1,569 | |||||||||||||||
| Total revenue |
2,473 | 2,073 | 1,686 | 1,109 | 7,341 | |||||||||||||||
| Revenue by format |
||||||||||||||||||||
| Electronic |
1,995 | 1,967 | 1,384 | 42 | 5,388 | |||||||||||||||
| Face-to-face |
10 | 38 | 7 | 1,067 | 1,122 | |||||||||||||||
| |
468 | 68 | 295 | – | 831 | |||||||||||||||
| Total revenue |
2,473 | 2,073 | 1,686 | 1,109 | 7,341 | |||||||||||||||
| Revenue by type |
||||||||||||||||||||
| Subscriptions |
1,776 | 732 | 1,291 | 1 | 3,800 | |||||||||||||||
| Transactional |
646 | 1,301 | 389 | 1,108 | 3,444 | |||||||||||||||
| Advertising |
51 | 40 | 6 | – | 97 | |||||||||||||||
| Total revenue |
2,473 | 2,073 | 1,686 | 1,109 | 7,341 | |||||||||||||||
Around half of RELX’s revenue comes from subscription arrangements, and revenue for these is generally recognised on a straight-line basis over the time period covered by the agreement, in line with the provision of services. There are a number of multi-year contracts, mainly in Risk & Business Analytics, where revenue is recognised on the achievement of delivery milestones or other specified performance obligations. As at 31 December 2019, the aggregate amount of the transaction price of such contracts which relates to performance obligations which have not yet been delivered was approximately £162m (2018: £210m). It is expected that revenue will be recognised in relation to this amount over the next nine years.
| ANALYSIS OF REVENUE BY GEOGRAPHICAL ORIGIN | 2019 £m |
2018 £m |
2017 £m |
|||||||||
| North America |
4,308 | 4,013 | 3,998 | |||||||||
| Europe |
2,832 | 2,790 | 2,644 | |||||||||
| Rest of world |
734 | 689 | 699 | |||||||||
| Total |
7,874 | 7,492 | 7,341 | |||||||||
Revenue by geographical origin from the United Kingdom in 2019 was £1,320m (2018: £1,144m; 2017: £1,085m).
| RELX Annual report and financial statements 2019 | Notes to the consolidated financial statements | 137 | |
|
| ||
| 138 | RELX Annual report and financial statements 2019 | Financial statements and other information | |
|
| ||
Notes to the consolidated financial statements
for the year ended 31 December 2019
3 Operating profit
| Accounting policy Share based remuneration The fair value of share based remuneration is determined at the date of grant and recognised as an expense in the income statement on a straight-line basis over the vesting period, taking account of the estimated number of shares that are expected to vest. Market based performance criteria are taken into account when determining the fair value at the date of grant. Non-market based performance criteria are taken into account when estimating the number of shares expected to vest. The fair value of share based remuneration is determined by use of a binomial or Monte Carlo simulation model as appropriate. All of the Group’s share based remuneration is equity settled.
|
Operating profit is stated after charging/(crediting) the following:
| Note | 2019 £m |
2018 £m |
2017 £m |
|||||||||||||
| Staff costs |
||||||||||||||||
| Wages and salaries |
2,116 | 1,959 | 1,926 | |||||||||||||
| Social security costs |
230 | 215 | 213 | |||||||||||||
| Pensions |
6 | 120 | 135 | 95 | ||||||||||||
| Share based remuneration |
32 | 41 | 39 | |||||||||||||
| Total staff costs |
2,498 | 2,350 | 2,273 | |||||||||||||
| Depreciation and amortisation |
||||||||||||||||
| Amortisation of acquired intangible assets |
15 | 294 | 287 | 313 | ||||||||||||
| Share of joint ventures’ amortisation of acquired intangible assets |
1 | 1 | 1 | |||||||||||||
| Amortisation of internally developed intangible assets |
15 | 249 | 225 | 203 | ||||||||||||
| Depreciation of property, plant and equipment |
17 | 58 | 62 | 65 | ||||||||||||
| Depreciation of right-of-use assets |
82 | 77 | 75 | |||||||||||||
| Total depreciation and amortisation |
684 | 652 | 657 | |||||||||||||
| Other expenses and income |
||||||||||||||||
| Cost of sales including pre-publication costs and inventory expenses |
2,755 | 2,638 | 2,628 | |||||||||||||
| Short-term and low value lease expenses |
20 | 18 | 28 | |||||||||||||
| Operating lease rentals income |
(1 | ) | (3 | ) | (3 | ) | ||||||||||
The amortisation of acquired intangible assets is included within administration and other expenses.
The Group provides a number of share based remuneration schemes to Directors and employees. The principal share based remuneration schemes are the Executive Share Option Schemes (ESOS), the Long-Term Incentive Plan (LTIP), the Retention Share Plan (RSP) and the Bonus Investment Plan (BIP). Share options granted under ESOS are exercisable after three years and up to ten years from the date of grant at a price equivalent to the market value of the respective shares at the date of grant. Conditional shares granted under LTIP, RSP and BIP are exercisable after three years for nil consideration if conditions are met. Other awards principally relate to all employee share based saving schemes in the UK and the Netherlands. Further details are provided in the remuneration report on pages 88 to 111.
| RELX Annual report and financial statements 2019 | Notes to the consolidated financial statements | 139 | |
|
| ||
| 140 | RELX Annual report and financial statements 2019 | Financial statements and other information | |
|
| ||
Notes to the consolidated financial statements
for the year ended 31 December 2019
6 Pension schemes
| Accounting policy The expense of defined benefit pension schemes and other post-retirement employee benefits is determined using the projected unit credit method and charged in the income statement as an operating expense, based on actuarial assumptions reflecting market conditions at the beginning of the financial year. Actuarial gains and losses are recognised in full in the statement of comprehensive income in the period in which they occur.
Past service costs and credits are recognised immediately at the earlier of when plan amendments or curtailments occur and when related restructuring costs or termination benefits are recognised. Settlements are recognised when they occur.
Net pension obligations in respect of defined benefit schemes are included in the statement of financial position at the present value of scheme liabilities, less the fair value of scheme assets. Where schemes are in surplus, i.e. assets exceed liabilities, the net pension assets are separately included in the statement of financial position. Any net pension asset is limited to the extent that the asset is recoverable.
The expense of defined contribution pension schemes and other employee benefits is charged in the income statement as incurred.
Critical judgement and key source of estimation uncertainty At 31 December 2019, the Group operates defined benefit pension schemes in the UK and the US. These schemes require management to exercise judgement in estimating the ultimate cost of providing post-employment benefits, especially given the length of each scheme’s liabilities. Accounting for defined benefit pension schemes involves judgement about uncertain events, including the life expectancy of the members, salary and pension increases, inflation, the future operation of each scheme and the rate at which the future pension payments are discounted. Estimates for these factors are used in determining the pension cost and liabilities reported in the financial statements. The estimates made around future developments of each of the critical assumptions are made in conjunction with independent actuaries, and each scheme is subject to a periodic review by independent actuaries. Information regarding the more significant assumptions used for valuation is provided below, together with a sensitivity analysis.
|
A number of pension schemes are operated around the world. The largest defined benefit schemes as at 31 December 2019 were in the UK and the US, and are summarised below.
Major defined benefit schemes in place at 31 December 2019
The UK scheme is a final salary scheme and is closed to new hires. Members accrue a portion of their final pensionable earnings based on the number of years of service. The US scheme is a cash balance scheme and was closed to future accruals effective 1 January 2019.
Each of the major defined benefit schemes is administered by a separate fund that is legally separated from the Group. The trustees of the pension funds in the UK and plan fiduciaries of the US scheme are required by law to act in the interest of the funds’ beneficiaries. In the UK, the trustees of the pension fund are responsible for the investment policy with regard to the assets of the fund. The board of trustees consists of an equal number of company-appointed and member-nominated Directors. In the US, the fiduciary duties for the scheme are allocated between committees which are staffed by senior employees of the Group; the investment committee has the primary responsibility for the investment and management of plan assets. The funding of the Group’s major schemes reflects the different rules within each jurisdiction.
| RELX Annual report and financial statements 2019 | Notes to the consolidated financial statements | 141 | |
|
| ||
| 142 | RELX Annual report and financial statements 2019 | Financial statements and other information | |
|
| ||
Notes to the consolidated financial statements
for the year ended 31 December 2019
6 Pension schemes (continued)
The amount recognised in the statement of financial position in respect of defined benefit pension schemes at the start and end of the year and the movements during the year were as follows:
| 2019 | 2018 | |||||||||||||||||||||||
| UK £m |
US £m |
Total £m |
UK £m |
US £m |
Total £m |
|||||||||||||||||||
| Defined benefit obligation |
||||||||||||||||||||||||
| At start of year |
(3,772 | ) | (1,040 | ) | (4,812 | ) | (3,854 | ) | (1,075 | ) | (4,929 | ) | ||||||||||||
| Service cost |
(21 | ) | (3 | ) | (24 | ) | (27 | ) | (9 | ) | (36 | ) | ||||||||||||
| Past service credits/(cost) |
8 | 5 | 13 | (11 | ) | – | (11 | ) | ||||||||||||||||
| Interest on pension scheme liabilities |
(104 | ) | (42 | ) | (146 | ) | (98 | ) | (38 | ) | (136 | ) | ||||||||||||
| Actuarial (loss)/gain on financial assumptions |
(495 | ) | (116 | ) | (611 | ) | 91 | 85 | 176 | |||||||||||||||
| Actuarial gain/(loss) arising from experience assumptions |
22 | (5 | ) | 17 | 4 | 2 | 6 | |||||||||||||||||
| Contributions by employees |
(9 | ) | – | (9 | ) | (8 | ) | – | (8 | ) | ||||||||||||||
| Liabilities transferred on settlement |
– | 65 | 65 | – | – | – | ||||||||||||||||||
| Benefits paid |
120 | 77 | 197 | 131 | 56 | 187 | ||||||||||||||||||
| Exchange translation differences |
– | 41 | 41 | – | (61 | ) | (61 | ) | ||||||||||||||||
| At end of year |
(4,251 | ) | (1,018 | ) | (5,269 | ) | (3,772 | ) | (1,040 | ) | (4,812 | ) | ||||||||||||
| Fair value of scheme assets |
||||||||||||||||||||||||
| At start of year |
3,413 | 966 | 4,379 | 3,589 | 1,012 | 4,601 | ||||||||||||||||||
| Interest income on plan assets |
95 | 39 | 134 | 92 | 35 | 127 | ||||||||||||||||||
| Return on assets excluding amounts included in interest income |
304 | 166 | 470 | (184 | ) | (89 | ) | (273 | ) | |||||||||||||||
| Contributions by employer |
66 | 6 | 72 | 39 | 7 | 46 | ||||||||||||||||||
| Contributions by employees |
9 | – | 9 | 8 | – | 8 | ||||||||||||||||||
| Assets transferred on settlement |
– | (65 | ) | (65 | ) | – | – | – | ||||||||||||||||
| Benefits paid |
(120 | ) | (77 | ) | (197 | ) | (131 | ) | (56 | ) | (187 | ) | ||||||||||||
| Exchange translation differences |
– | (40 | ) | (40 | ) | – | 57 | 57 | ||||||||||||||||
| At end of year |
3,767 | 995 | 4,762 | 3,413 | 966 | 4,379 | ||||||||||||||||||
| Opening net deficit |
(359 | ) | (74 | ) | (433 | ) | (265 | ) | (63 | ) | (328 | ) | ||||||||||||
| Service cost |
(21 | ) | (3 | ) | (24 | ) | (27 | ) | (9 | ) | (36 | ) | ||||||||||||
| Net interest on net defined benefit obligation |
(9 | ) | (3 | ) | (12 | ) | (6 | ) | (3 | ) | (9 | ) | ||||||||||||
| Settlement and past service credits/(cost) |
8 | 5 | 13 | (11 | ) | – | (11 | ) | ||||||||||||||||
| Contributions by employer |
66 | 6 | 72 | 39 | 7 | 46 | ||||||||||||||||||
| Actuarial (losses)/gains |
(169 | ) | 45 | (124 | ) | (89 | ) | (2 | ) | (91 | ) | |||||||||||||
| Exchange translation differences |
– | 1 | 1 | – | (4 | ) | (4 | ) | ||||||||||||||||
| Net pension obligation |
(484 | ) | (23 | ) | (507 | ) | (359 | ) | (74 | ) | (433 | ) | ||||||||||||
| Impact of asset ceiling |
– | (13 | ) | (13 | ) | – | – | – | ||||||||||||||||
| Overall net pension obligation |
(484 | ) | (36 | ) | (520 | ) | (359 | ) | (74 | ) | (433 | ) | ||||||||||||
As at 31 December 2019, the defined benefit obligations comprised £5,016m (2018: £4,582m) in relation to funded schemes and £253m (2018: £230m) in relation to unfunded schemes.
The weighted average duration of defined benefit scheme liabilities is 19 years in the UK (2018: 19 years) and 13 years in the US (2018: 12 years). Deferred tax assets of £96m (2018: £86m) are recognised in respect of the pension scheme deficits.
A net pension asset has been recognised in relation to the US funded scheme after considering the guidance in IAS 19 – Employee Benefits and IFRIC 14. The split between net pension obligations and net pension assets is as follows:
| 2019 £m |
2018 £m |
|||||||
| Net pension asset recognised |
45 | 6 | ||||||
| Net pension obligation |
(565 | ) | (439 | ) | ||||
| Overall net pension obligation |
(520 | ) | (433 | ) | ||||
| RELX Annual report and financial statements 2019 | Notes to the consolidated financial statements | 143 | |
|
| ||
| 144 | RELX Annual report and financial statements 2019 | Financial statements and other information | |
|
| ||
Notes to the consolidated financial statements
for the year ended 31 December 2019
7 Net finance costs
| Accounting policy Borrowing costs that are directly attributable to the acquisition, construction or production of an asset that takes a substantial period of time to bring to use are capitalised. All other interest on borrowings is expensed as incurred. The cost of issuing borrowings is generally expensed over the period of borrowing so as to produce a constant periodic rate of charge.
|
| 2019 £m |
2018 £m |
2017 £m |
||||||||||
| Interest on short-term bank loans, overdrafts and commercial paper |
(20 | ) | (22 | ) | (10 | ) | ||||||
| Interest on term debt |
(266 | ) | (161 | ) | (154 | ) | ||||||
| Interest on lease liabilities |
(15 | ) | (14 | ) | (17 | ) | ||||||
| Total borrowing costs |
(301 | ) | (197 | ) | (181 | ) | ||||||
| Losses on loans and derivatives not designated as hedges |
– | (10 | ) | (9 | ) | |||||||
| Fair value losses on designated fair value hedge relationships |
– | (1 | ) | – | ||||||||
| Net financing charge on defined benefit pension schemes and other |
(13 | ) | (9 | ) | (15 | ) | ||||||
| Finance costs |
(314 | ) | (217 | ) | (205 | ) | ||||||
| Interest on bank deposits |
3 | 4 | 3 | |||||||||
| Interest income on net finance lease receivables |
2 | 2 | 2 | |||||||||
| Fair value gains on designated fair value hedge relationships |
1 | – | 1 | |||||||||
| Gains on loans and derivatives not designated as hedges |
3 | – | – | |||||||||
| Finance income |
9 | 6 | 6 | |||||||||
| Net finance costs |
(305 | ) | (211 | ) | (199 | ) | ||||||
A loss of £1m (2018: losses of £8m; 2017: gains of £63m) on interest rate derivatives designated as cash flow hedges was recognised in other comprehensive income and accumulated in the hedge reserve, and may be reclassified to the income statement in future periods. Gains of nil (2018: gains of £3m; 2017: gains of £65m) in total were transferred from the hedge reserve in the period. The movements in 2017 included gains of £78m related to foreign exchange movements on debt hedges which were reclassified immediately to the income statement and offset £78m of foreign exchange losses on the related debt.
The interest charge on term debt includes a charge of £99m in respect of the early redemption of bonds that were due to be repaid in October 2022. The redemption of these bonds took place in January 2020 and was committed to at 31 December 2019.
8 Disposals and other non-operating items
| Accounting policy Assets of businesses that are available for immediate sale in their current condition and for which a sales process is considered highly probable to complete are classified as assets held for sale and are carried at the lower of carrying value and fair value less costs to sell. Fair value is based on anticipated disposal proceeds, typically derived from firm or indicative offers from potential acquirers. Non-current assets are not amortised or depreciated following their classification as held for sale. Liabilities of businesses held for sale are also separately classified on the statement of financial position. Fair value movements in the venture capital portfolio are reported within disposals and other items – see note 16.
|
| 2019 £m |
2018 £m |
2017 £m |
||||||||||
| Revaluation of investments |
25 | (11 | ) | 5 | ||||||||
| Gain/(loss) on disposal of businesses and assets held for sale |
26 | (22 | ) | 10 | ||||||||
| Net gain/(loss) on disposals and other non-operating items |
51 | (33 | ) | 15 | ||||||||
| RELX Annual report and financial statements 2019 | Notes to the consolidated financial statements | 145 | |
|
| ||
| 146 | RELX Annual report and financial statements 2019 | Financial statements and other information | |
|
| ||
Notes to the consolidated financial statements
for the year ended 31 December 2019
9 Taxation (continued)
| 2019 £m |
2018 £m |
2017 £m |
||||||||||
| Current tax |
||||||||||||
| United Kingdom |
(141 | ) | (71 | ) | (104 | ) | ||||||
| Rest of world |
(241 | ) | (226 | ) | (335 | ) | ||||||
| Total current tax charge |
(382 | ) | (297 | ) | (439 | ) | ||||||
| Deferred tax |
44 | 5 | 374 | |||||||||
| Tax expense |
(338 | ) | (292 | ) | (65 | ) | ||||||
Cash tax paid in the year was £464m (2018: £415m; 2017: £449m), which is different to the tax expense for the year set out above.
There are a number of reasons why the cash tax payments in a particular year will be different from the tax expense in the accounts:
Deferred tax:
| ◾ | Tax expense includes deferred tax, which is an accounting adjustment arising from temporary differences; |
| ◾ | Temporary differences occur when an item has to be included in the income statement in one year but is taxed in another year; and |
| ◾ | For the purposes of acquisition accounting only, the Group recognises deferred tax liabilities arising on intangible assets. Any unwind of these deferred tax liabilities from the amortisation of intangible assets does not result in cash tax payments. |
Timing differences:
| ◾ | Tax payments relating to a particular year’s profits are typically due partly in the year and partly in the following year. |
Prior period adjustments:
| ◾ | Current tax expense is the best estimate at the end of the period of cash tax expected to be paid; and |
| ◾ | To the extent the final liability is higher or lower than that estimate, any cash tax impact will occur in a later period. |
Items recorded in equity and other comprehensive income:
| ◾ | Some of the benefits of tax deductions related to share based payments, pensions and hedging are credited to equity or other comprehensive income rather than to tax expense, and so the cash tax liability will be different to the current tax expense in the income statement in years when those deductions are available. |
Set out below is a reconciliation of the difference between tax expense for the period and the theoretical expense calculated by multiplying accounting profit by the applicable tax rate.
We believe the most meaningful applicable rate is that obtained by multiplying the accounting profits and losses of all consolidated entities by the applicable domestic rate in each of those entities’ jurisdictions.
The net tax expense charged on profit before tax differs from the theoretical amount that would arise using the weighted average of tax rates applicable to accounting profits and losses of the consolidated entities, as follows:
| 2019 | 2018 | 2017 | ||||||||||||||||||||||
| £m | % | £m | % | £m | % | |||||||||||||||||||
| Profit before tax |
1,847 | 1,720 | 1,721 | |||||||||||||||||||||
| Tax at average applicable rates |
(418 | ) | 22.6% | (361 | ) | 21.0% | (407 | ) | 23.6% | |||||||||||||||
| Tax effect of share of results of joint ventures |
10 | (0.5)% | 8 | (0.5)% | 7 | (0.4)% | ||||||||||||||||||
| Expenses not deductible for tax purposes |
(3 | ) | 0.2% | (24 | ) | 1.4% | (15 | ) | 0.9% | |||||||||||||||
| Non-deductible costs of share based remuneration |
(1 | ) | 0.1% | (1 | ) | 0.1% | (1 | ) | 0.1% | |||||||||||||||
| Non-deductible disposal-related gains and losses |
4 | (0.2)% | – | 0.0% | (36 | ) | 2.1% | |||||||||||||||||
| Deferred tax assets of the period not recognised |
(15 | ) | 0.8% | (24 | ) | 1.4% | (10 | ) | 0.6% | |||||||||||||||
| Change in recognition of deferred tax assets or liabilities |
12 | (0.6)% | (15 | ) | 0.9% | 16 | (0.9)% | |||||||||||||||||
| Other adjustments in respect of prior periods |
73 | (4.0)% | 13 | (0.8)% | 35 | (2.1)% | ||||||||||||||||||
| Exceptional tax credit |
– | – | 112 | (6.5)% | 346 | (20.1)% | ||||||||||||||||||
| Tax expense |
(338 | ) | 18.3% | (292 | ) | 17.0% | (65 | ) | 3.8% | |||||||||||||||
The weighted average applicable tax rate for the year was 22.6% (2018: 21.0%, 2017: 23.6%), reflecting the applicable rates in the countries where the Group operates. The Group’s future tax charge will be sensitive to the geographic mix of profits and losses and the tax rates and laws in force in the jurisdictions in which we operate.
| RELX Annual report and financial statements 2019 | Notes to the consolidated financial statements | 147 | |
|
| ||
| 148 | RELX Annual report and financial statements 2019 | Financial statements and other information | |
|
| ||
Notes to the consolidated financial statements
for the year ended 31 December 2019
9 Taxation (continued)
As a result of exemptions on dividends from subsidiaries and capital gains on disposal there are no significant taxable temporary differences associated with investments in subsidiaries, branches, associates and interests in joint arrangements.
Deferred tax assets in respect of tax losses and other deductible temporary differences have only been recognised to the extent that it is more likely than not that sufficient taxable profits will be available to allow the asset to be recovered. Accordingly, no deferred tax asset has been recognised in respect of unused trading losses and interest expenses of approximately £255m (2018: £213m) carried forward at year end. The deferred tax asset not recognised in respect of these losses and interest expenses is approximately £66m (2018: £52m). Of the unrecognised losses and interest expenses, £124m (2018: £93m) will expire if not utilised within ten years and £131m (2018: £121m) will expire after more than ten years or have no expiration date.
Deferred tax assets of approximately £6m (2018: £4m) have not been recognised in respect of tax losses and other temporary differences carried forward of £33m (2018: £24m), which can only be used to offset future capital gains.
10 Earnings per share
| Accounting policy Earnings per share (‘EPS’) is calculated by taking the reported net profit attributable to shareholders and dividing this by the total weighted average number of shares.
Adjusted earnings per share is calculated by dividing adjusted net profit attributable to RELX PLC shareholders by the total weighted average number of shares.
|
| EARNINGS PER SHARE – FOR THE YEAR ENDED 31 DECEMBER |
2019 |
2018 |
2017 |
|||||||||||||||||||||||||||||||||||||
| Net profit to RELX PLC shareholders £m |
Weighted average number of shares (millions) |
EPS (pence) |
Net profit attributable to RELX PLC shareholders £m |
Weighted average number of shares (millions) |
EPS (pence) |
Net profit attributable to RELX PLC shareholders £m |
Weighted average number of shares (millions) |
EPS (pence) |
||||||||||||||||||||||||||||||||
| Basic earnings per share |
1,505 | 1,943.5 | 77.4p | 1,422 | 1,977.2 | 71.9p | 1,648 | 2,019.4 | 81.6p | |||||||||||||||||||||||||||||||
| Diluted earnings per share |
1,505 | 1,956.2 | 76.9p | 1,422 | 1,990.8 | 71.4p | 1,648 | 2,035.2 | 81.0p | |||||||||||||||||||||||||||||||
The diluted figures are calculated after taking account of potential additional ordinary shares arising from share options and conditional shares.
| ADJUSTED EARNINGS PER SHARE | 2019 | 2018 | 2017 | |||||||||||||||||||||||||||||||||||||||
| Adjusted net profit attributable to RELX PLC shareholders £m |
Weighted average number of shares (millions) |
Adjusted EPS (pence) |
Adjusted net profit attributable to RELX PLC shareholders £m |
Weighted average number of shares (millions) |
Adjusted EPS (pence) |
Adjusted net profit attributable to RELX PLC shareholders £m |
Weighted average number of shares (millions) |
Adjusted EPS (pence) |
||||||||||||||||||||||||||||||||||
| Adjusted earnings per share |
1,808 | 1,943.5 | 93.0p | 1,674 | 1,977.2 | 84.7p | 1,620 | 2,019.4 | 80.2p | |||||||||||||||||||||||||||||||||
| RECONCILIATION OF ADJUSTED NET PROFIT ATTRIBUTABLE TO RELX PLC SHAREHOLDERS | 2019 £m |
2018 £m |
2017 £m |
|||||||||
| Net profit attributable to RELX PLC shareholders |
1,505 | 1,422 | 1,648 | |||||||||
| Adjustments (post-tax): |
||||||||||||
| Amortisation of acquired intangible assets |
321 | 322 | 356 | |||||||||
| Acquisition-related costs |
69 | 71 | 43 | |||||||||
| Net interest on net defined benefit pension obligation and other |
10 | 7 | 11 | |||||||||
| Disposals and other non-operating items |
(40 | ) | 19 | 1 | ||||||||
| Other deferred tax credits from intangible assets* |
(57 | ) | (55 | ) | (93 | ) | ||||||
| Exceptional tax credit |
– | (112 | ) | (346 | ) | |||||||
| Adjusted net profit attributable to RELX PLC shareholders |
1,808 | 1,674 | 1,620 | |||||||||
| * | Movements on deferred tax liabilities arising on acquired intangible assets that do not qualify for tax amortisation. |
| RELX Annual report and financial statements 2019 | Notes to the consolidated financial statements | 149 | |
|
| ||
| 150 | RELX Annual report and financial statements 2019 | Financial statements and other information | |
|
| ||
Notes to the consolidated financial statements
for the year ended 31 December 2019
12 Acquisitions
During the year, a number of acquisitions were made. The net assets of the businesses acquired are incorporated at their fair value to the Group. Provisional fair values of the consideration given and of the assets and liabilities acquired are summarised below.
| Fair value £m |
Fair value £m |
Fair value £m |
||||||||||
| Goodwill |
257 | 626 | 77 | |||||||||
| Intangible assets |
245 | 423 | 56 | |||||||||
| Property, plant and equipment |
1 | 5 | – | |||||||||
| Current assets |
20 | 24 | 3 | |||||||||
| Non current assets |
4 | 12 | – | |||||||||
| Current liabilities |
(53 | ) | (72 | ) | (16 | ) | ||||||
| Borrowings |
(6 | ) | (12 | ) | – | |||||||
| Deferred tax |
(44 | ) | (51 | ) | (2 | ) | ||||||
| Net assets acquired |
424 | 955 | 118 | |||||||||
| Consideration (after taking account of £32m (2018: £27m; 2017: £7m) net cash acquired) |
424 | 955 | 118 | |||||||||
| Less: consideration deferred to future years |
(10 | ) | (36 | ) | (1 | ) | ||||||
| Less: acquisition date fair value of equity interest |
(15 | ) | – | – | ||||||||
| Net cash flow |
399 | 919 | 117 | |||||||||
Goodwill, being the excess of the consideration over the net tangible and intangible assets acquired, represents benefits which do not qualify for recognition as intangible assets, including: the ability of a business to generate higher returns than individual assets; skilled workforces; and acquisition synergies that are specific to the Group. In addition, goodwill arises on the recognition of deferred tax liabilities in respect of intangible assets for which amortisation does not qualify for tax deductions.
The fair values of the assets and liabilities acquired in the last 12 months are provisional pending the completion of the valuation exercises. Final fair values will be incorporated in the 2020 consolidated financial statements. There were no significant adjustments to the provisional fair values of prior year acquisitions established in 2018.
The businesses acquired in 2019 contributed £51m to revenue, increased adjusted operating profit by £8m, decreased net profit by £9m (after charging £17m of integration costs and amortisation of acquired intangibles) and contributed £3m to net cash outflow from operating activities for the part year under the Group’s ownership and before taking account of acquisition financing costs. Had the businesses been acquired at the beginning of the year, on a pro forma basis the Group revenues, adjusted operating profit and net profit attributable to RELX PLC shareholders for the year would have been £7,897m, £2,487m and £1,501m respectively, before taking account of acquisition financing costs.
Since 31 December 2019, the Group has acquired or committed to acquire a number of businesses, for aggregate consideration of £0.6bn. These acquisitions include ID Analytics, a provider of credit and fraud solutions, and Emailage, a provider of email based fraud solutions, both of which will become part of Risk & Business Analytics.
13 Equity dividends
| ORDINARY DIVIDENDS PAID IN THE YEAR | 2019 £m |
2018 £m |
2017 £m |
|||||||||
| RELX PLC |
842 | 420 | 400 | |||||||||
| RELX NV |
– | 376 | 362 | |||||||||
| Total |
842 | 796 | 762 | |||||||||
The RELX NV amount shown relates to dividends paid prior to the corporate simplification.
Ordinary dividends declared and paid in the year ended 31 December 2019, in amounts per ordinary share, comprise: a 2018 final dividend of 29.7p (2018: 27.7p; 2017: 25.7p) and a 2019 interim dividend of 13.6p (2018: 12.4p; 2017: 11.7p), giving a total of 43.3p (2018: 40.1p; 2017: 37.4p).
The Directors of RELX PLC have proposed a final dividend of 32.1p (2018: 29.7p; 2017: 27.7p), giving a total for the financial year of 45.7p (2018: 42.1p; 2017: 39.4p). The total cost of funding the proposed final dividend is expected to be £620m, for which no liability has been recognised at the statement of financial position date.
The Employee Benefit Trust has currently waived the right to receive dividends on RELX PLC shares. This waiver has been applied to dividends paid in 2019, 2018 and 2017.
| RELX Annual report and financial statements 2019 | Notes to the consolidated financial statements | 151 | |
|
| ||
| 152 | RELX Annual report and financial statements 2019 | Financial statements and other information | |
|
| ||
Notes to the consolidated financial statements
for the year ended 31 December 2019
14 Goodwill (continued)
Impairment review
Impairment testing of goodwill and indefinite lived intangible assets is performed at least annually in accordance with the methodology described above. There were no charges for impairment of goodwill or indefinite lived intangible assets in 2019 (2018: nil).
Goodwill is compiled and assessed among groups of cash generating units, which represent the lowest level at which goodwill is monitored by management. Typically, acquisitions are integrated into existing business units, and the goodwill arising is allocated to the groups of cash generating units (CGUs) that are expected to benefit from the synergies of the acquisition. As the business areas have become increasingly integrated and globalised, the current CGU allocation reflects the global leverage of assets, skills, knowledge and technology platforms, and the monitoring of goodwill by management.
| GOODWILL | 2019 £m |
2018 £m |
||||||
| Scientific, Technical & Medical |
1,594 | 1,620 | ||||||
| Risk & Business Analytics |
3,186 | 3,283 | ||||||
| Legal |
1,428 | 1,465 | ||||||
| Exhibitions |
616 | 531 | ||||||
| Total |
6,824 | 6,899 | ||||||
The key assumptions used for each group of cash generating units are disclosed below:
| KEY ASSUMPTIONS | 2019 | 2018 | ||||||||||||||||||
| Pre-tax discount rate |
Nominal long-term market growth rate |
Pre-tax discount rate |
Nominal long-term market growth rate |
|||||||||||||||||
| Scientific, Technical & Medical |
9.4% | 3% | 10.0% | 3% | ||||||||||||||||
| Risk & Business Analytics |
10.0% | 3% | 11.5% | 3% | ||||||||||||||||
| Legal |
10.6% | 2% | 12.2% | 2% | ||||||||||||||||
| Exhibitions |
11.6% | 3% | 12.7% | 3% | ||||||||||||||||
The pre-tax discount rates used are based on the Group’s weighted average cost of capital, adjusted to reflect a risk premium specific to each business. The Group’s weighted average cost of capital is derived from a risk free rate, a market risk premium, a risk adjustment (beta) and a cost of debt adjustment. The key assumptions within the forecast growth in the cash flows over a forecast period of up to five years are revenue growth, operating margin and cash conversion. Revenue growth and operating profit margin forecasts for each CGU are derived from past results adjusted by management based on salient current and future considerations. Cash conversion rates for each CGU are based on historical cash conversion rates. Nominal long-term market growth rates, which are applied after the forecast period of up to five years, do not exceed the long-term average growth prospects for the sectors and territories in which the businesses operate.
A sensitivity analysis has been performed based on changes in key assumptions considered to be reasonably possible by management: an increase in the discount rate of 0.5%, a decrease in the compound annual growth rate for cash flow in the five-year forecast period of 2.0%, and a decrease in the nominal long-term market growth rates of 0.5%. The sensitivity analysis shows that no impairment charges would result from these scenarios.
| RELX Annual report and financial statements 2019 | Notes to the consolidated financial statements | 153 | |
|
| ||
| 154 | RELX Annual report and financial statements 2019 | Financial statements and other information | |
|
| ||
Notes to the consolidated financial statements
for the year ended 31 December 2019
15 Intangible assets (continued)
|
Market and £m |
Content, software and other £m |
Total acquired intangible assets £m |
Internally £m |
Total £m |
||||||||||||||||
| Cost |
||||||||||||||||||||
| At 1 January 2018 |
3,519 | 3,492 | 7,011 | 2,691 | 9,702 | |||||||||||||||
| Acquisitions |
310 | 113 | 423 | – | 423 | |||||||||||||||
| Additions |
– | – | – | 304 | 304 | |||||||||||||||
| Disposals/reclassified as held for sale |
(15 | ) | (11 | ) | (26 | ) | (148 | ) | (174 | ) | ||||||||||
| Exchange translation differences |
211 | 130 | 341 | 99 | 440 | |||||||||||||||
| At 1 January 2019 |
4,025 | 3,724 | 7,749 | 2,946 | 10,695 | |||||||||||||||
| Acquisitions |
161 | 84 | 245 | – | 245 | |||||||||||||||
| Additions |
– | – | – | 333 | 333 | |||||||||||||||
| Disposals/reclassified as held for sale |
(28 | ) | (57 | ) | (85 | ) | (130 | ) | (215 | ) | ||||||||||
| Exchange translation differences |
(158 | ) | (116 | ) | (274 | ) | (108 | ) | (382 | ) | ||||||||||
| At 31 December 2019 |
4,000 | 3,635 | 7,635 | 3,041 | 10,676 | |||||||||||||||
| Accumulated amortisation |
||||||||||||||||||||
| At 1 January 2018 |
1,907 | 3,046 | 4,953 | 1,555 | 6,508 | |||||||||||||||
| Charge for the year |
169 | 118 | 287 | 225 | 512 | |||||||||||||||
| Disposals/reclassified as held for sale |
(15 | ) | (11 | ) | (26 | ) | (111 | ) | (137 | ) | ||||||||||
| Exchange translation differences |
105 | 113 | 218 | 60 | 278 | |||||||||||||||
| At 1 January 2019 |
2,166 | 3,266 | 5,432 | 1,729 | 7,161 | |||||||||||||||
| Charge for the year |
182 | 112 | 294 | 249 | 543 | |||||||||||||||
| Disposals/reclassified as held for sale |
(28 | ) | (57 | ) | (85 | ) | (130 | ) | (215 | ) | ||||||||||
| Exchange translation differences |
(91 | ) | (103 | ) | (194 | ) | (71 | ) | (265 | ) | ||||||||||
| At 31 December 2019 |
2,229 | 3,218 | 5,447 | 1,777 | 7,224 | |||||||||||||||
| Net book amount |
||||||||||||||||||||
| At 31 December 2018 |
1,859 | 458 | 2,317 | 1,217 | 3,534 | |||||||||||||||
| At 31 December 2019 |
1,771 | 417 | 2,188 | 1,264 | 3,452 | |||||||||||||||
Included in content, software and other acquired intangible assets are assets with a net book value of £54m (2018: £80m) that arose on acquisitions completed prior to the adoption of IFRS that have not been allocated to specific categories of intangible assets. Internally developed intangible assets typically comprise software and systems development where an identifiable asset is created that is expected to generate future economic benefits.
Included in market and customer-related intangible assets are £114m (2018: £119m) of journal titles relating to Scientific, Technical & Medical determined to have indefinite lives based on an assessment of their historical longevity and stable market positions. Indefinite lived intangibles are tested for impairment at least annually. See note 14 for details of impairment testing.
| RELX Annual report and financial statements 2019 | Notes to the consolidated financial statements | 155 | |
|
| ||
| 156 | RELX Annual report and financial statements 2019 | Financial statements and other information | |
|
| ||
Notes to the consolidated financial statements
for the year ended 31 December 2019
17 Property, plant and equipment
| Accounting policy Property, plant and equipment are stated in the statement of financial position at cost less accumulated depreciation. No depreciation is provided on freehold land. Freehold buildings and long leaseholds are depreciated over their estimated useful lives up to a maximum of 50 years. Short leases are written off over the duration of the lease. Depreciation is provided on other assets on a straight-line basis over their estimated useful lives as follows:
– land and buildings: land – not depreciated; leasehold improvements – shorter of life of lease and 10 years;
– fixtures and equipment: plant – 3 to 20 years; office furniture, fixtures and fittings – 5 to 10 years; computer systems, communication networks and equipment – 3 to 7 years.
|
| 2019 | 2018 |
|||||||||||||||||||||||||
| Land and buildings £m |
Fixtures and equipment £m |
Total £m |
Land and buildings £m |
Fixtures and equipment £m |
Total £m |
|||||||||||||||||||||
| Cost |
||||||||||||||||||||||||||
| At start of year |
223 | 640 | 863 | 217 | 599 | 816 | ||||||||||||||||||||
| Acquisitions |
1 | – | 1 | – | 5 | 5 | ||||||||||||||||||||
| Capital expenditure |
5 | 42 | 47 | 5 | 51 | 56 | ||||||||||||||||||||
| Disposals/reclassified as held for sale |
(8 | ) | (59 | ) | (67 | ) | (8 | ) | (40 | ) | (48 | ) | ||||||||||||||
| Exchange translation differences |
(8 | ) | (21 | ) | (29 | ) | 9 | 25 | 34 | |||||||||||||||||
| At end of year |
213 | 602 | 815 | 223 | 640 | 863 | ||||||||||||||||||||
| Accumulated depreciation |
||||||||||||||||||||||||||
| At start of year |
146 | 519 | 665 | 137 | 485 | 622 | ||||||||||||||||||||
| Charge for the year |
9 | 49 | 58 | 9 | 53 | 62 | ||||||||||||||||||||
| Disposals/reclassified as held for sale |
(7 | ) | (59 | ) | (66 | ) | (6 | ) | (40 | ) | (46 | ) | ||||||||||||||
| Exchange translation differences |
(5 | ) | (17 | ) | (22 | ) | 6 | 21 | 27 | |||||||||||||||||
| At end of year |
143 | 492 | 635 | 146 | 519 | 665 | ||||||||||||||||||||
| Net book amount |
70 | 110 | 180 | 77 | 121 | 198 | ||||||||||||||||||||
No depreciation is provided on freehold land of £14m (2018: £14m).
Amounts relating to right-of-use assets under IFRS 16 can be found in note 23.
| RELX Annual report and financial statements 2019 | Notes to the consolidated financial statements | 157 | |
|
| ||
| 158 | RELX Annual report and financial statements 2019 | Financial statements and other information | |
|
| ||
Notes to the consolidated financial statements
for the year ended 31 December 2019
18 Financial instruments (continued)
Debt is issued to meet the funding requirements of various jurisdictions and in the currencies that are needed. It is recognised that debt can act as a natural translation hedge of earnings, net assets and net cash flow in currencies other than the reporting currency. For this reason, the majority of the Group’s net debt is denominated in US dollars and euros, reflecting the Group’s largest geographical markets.
There were no changes to the Group’s long-term approach to capital and liquidity management during the year.
The remaining contractual maturities for borrowings and derivative financial instruments are shown in the table below. The table shows undiscounted principal and interest cash flows and includes contractual gross cash flows to be exchanged as part of cross-currency interest rate swaps and forward foreign exchange contracts where there is a legal right of set-off.
| AT 31 DECEMBER 2019 | Contractual cash flow |
|||||||||||||||||||||||||||||||
| Carrying £m |
Within 1 year £m |
1-2 years £m |
2-3 years £m |
3-4 years £m |
4-5 years £m |
More than 5 years £m |
Total £m |
|||||||||||||||||||||||||
| Borrowings |
||||||||||||||||||||||||||||||||
| Fixed rate borrowings |
(5,293 | ) | (1,332 | ) | (528 | ) | (134 | ) | (732 | ) | (498 | ) | (2,791 | ) | (6,015 | ) | ||||||||||||||||
| Floating rate borrowings |
(779 | ) | (779 | ) | – | – | – | – | – | (779 | ) | |||||||||||||||||||||
| Lease liabilities |
(342 | ) | (104 | ) | (92 | ) | (62 | ) | (50 | ) | (32 | ) | (48 | ) | (388 | ) | ||||||||||||||||
| Derivative financial liabilities |
||||||||||||||||||||||||||||||||
| Interest rate derivatives |
(4 | ) | (1 | ) | – | – | – | (1 | ) | (2 | ) | (4 | ) | |||||||||||||||||||
| Cross-currency interest rate swaps |
(1 | ) | (41 | ) | (16 | ) | (16 | ) | (35 | ) | (15 | ) | (512 | ) | (635 | ) | ||||||||||||||||
| Forward foreign exchange contracts |
(29 | ) | (1,984 | ) | (351 | ) | (179 | ) | (34 | ) | – | – | (2,548 | ) | ||||||||||||||||||
| Derivative financial assets |
||||||||||||||||||||||||||||||||
| Interest rate derivatives |
35 | 19 | 10 | 8 | 8 | 3 | – | 48 | ||||||||||||||||||||||||
| Cross-currency interest rate swaps |
14 | 31 | 7 | 7 | 26 | 7 | 515 | 593 | ||||||||||||||||||||||||
| Forward foreign exchange contracts |
32 | 1,977 | 354 | 185 | 35 | – | – | 2,551 | ||||||||||||||||||||||||
| Total |
(6,367 | ) | (2,214 | ) | (616 | ) | (191 | ) | (782 | ) | (536 | ) | (2,838 | ) | (7,177 | ) | ||||||||||||||||
| AT 31 DECEMBER 2018 | Contractual cash flow | |||||||||||||||||||||||||||||||
| Carrying amount £m |
Within 1 year £m |
1-2 years £m |
2-3 years £m |
3-4 years £m |
4-5 years £m |
More than 5 years £m |
Total £m |
|||||||||||||||||||||||||
| Borrowings |
||||||||||||||||||||||||||||||||
| Fixed rate borrowings |
(5,315 | ) | (752 | ) | (610 | ) | (552 | ) | (879 | ) | (732 | ) | (2,555 | ) | (6,080 | ) | ||||||||||||||||
| Floating rate borrowings |
(690 | ) | (686 | ) | – | – | – | – | (4 | ) | (690 | ) | ||||||||||||||||||||
| Lease liabilities |
(360 | ) | (104 | ) | (92 | ) | (75 | ) | (47 | ) | (30 | ) | (63 | ) | (411 | ) | ||||||||||||||||
| Derivative financial liabilities |
||||||||||||||||||||||||||||||||
| Interest rate derivatives |
(15 | ) | (2 | ) | (2 | ) | (2 | ) | (2 | ) | (3 | ) | (8 | ) | (19 | ) | ||||||||||||||||
| Cross-currency interest rate swaps |
(1 | ) | (48 | ) | (21 | ) | (21 | ) | (21 | ) | (39 | ) | (557 | ) | (707 | ) | ||||||||||||||||
| Forward foreign exchange contracts |
(53 | ) | (1,498 | ) | (375 | ) | (181 | ) | (25 | ) | – | – | (2,079 | ) | ||||||||||||||||||
| Derivative financial assets |
||||||||||||||||||||||||||||||||
| Interest rate derivatives |
21 | 12 | 13 | 3 | 1 | 5 | 3 | 37 | ||||||||||||||||||||||||
| Cross-currency interest rate swaps |
13 | 33 | 8 | 8 | 8 | 25 | 553 | 635 | ||||||||||||||||||||||||
| Forward foreign exchange contracts |
13 | 1,473 | 361 | 173 | 26 | – | – | 2,033 | ||||||||||||||||||||||||
| Total |
(6,387 | ) | (1,572 | ) | (718 | ) | (647 | ) | (939 | ) | (774 | ) | (2,631 | ) | (7,281 | ) | ||||||||||||||||
The carrying amount of derivative financial liabilities comprises £4m (2018: £15m) in relation to fair value hedges, £13m (2018: £41m) in relation to cash flow hedges and £17m (2018: £13m) not designated as hedging instruments. The carrying amount of derivative financial assets comprises £50m (2018: £33m) in relation to fair value hedges, £27m (2018: £7m) in relation to cash flow hedges and £4m (2018: £7m) not designated as hedging instruments.
Other payables balance of £108m (2018: nil), including put options, are currently expected to be settled in 4 to 5 years.
| RELX Annual report and financial statements 2019 | Notes to the consolidated financial statements | 159 | |
|
| ||
| 160 | RELX Annual report and financial statements 2019 | Financial statements and other information | |
|
| ||
Notes to the consolidated financial statements
for the year ended 31 December 2019
18 Financial instruments (continued)
Credit risk
The Group seeks to manage interest rate risk and limit foreign exchange risks described above by the use of financial instruments and as a result has a credit risk from the potential non-performance by the counterparties to these financial instruments, which are unsecured. The amount of this credit risk is normally restricted to the amounts of any hedge gain and not the principal amount being hedged. The Group also has a credit exposure to counterparties for the full principal amount of cash and cash equivalents. Credit risks are controlled by monitoring the credit quality of these counterparties, principally licensed commercial banks and investment banks with strong long-term credit ratings, and the amounts outstanding with each of them.
The Group has treasury policies in place which do not allow concentrations of risk with individual counterparties and do not allow significant treasury exposures with counterparties which are rated lower than A-/A3 by Standard & Poor’s, Moody’s and Fitch. At 31 December 2019, cash and cash equivalents totalled £138m (2018: £114m), of which 93% (2018: 93%) was held with banks rated A-/A3 or better.
The Group also has credit risk with respect to trade receivables due from its customers, which include national and state governments, academic institutions and large and small enterprises including law firms, book stores and wholesalers. The concentration of credit risk from trade receivables is limited due to the large and broad customer base. Trade receivable exposures are managed locally in the business units where they arise. Where appropriate, business units seek to minimise this exposure by taking payment in advance and through management of credit terms. Expected credit losses are based on management’s assessment of the risk taking into account the ageing profile, experience and circumstance. The maximum exposure to credit risk is represented by the carrying amount of each financial asset, including derivative financial instruments, recorded in the statement of financial position.
Included within trade receivables are the following amounts which are past due, after considering loss allowance: past due up to one month £215m (2018: £181m); past due two to three months £108m (2018: £93m); past due four to six months £39m (2018: £37m); and past due greater than six months £45m (2018: £35m).
Hedge accounting
The hedging relationships that are designated under IFRS 9 – Financial Instruments with effect from 1 January 2018, and/or that were previously designated under IAS 39 – Financial Instruments are described below.
Fair value hedges
The Group has entered into interest rate swaps and cross-currency interest rate swaps to hedge the exposure to changes in the fair value of fixed rate borrowings due to interest rate and foreign currency movements which could affect the income statement. The table below details the designated fair value hedge relationships that were in place at 31 December 2019, swapping fixed rate term debt issues denominated in US dollars (USD) and euros to floating rate USD and euro debt respectively for the whole or part of their term, together with the related fixed and floating rates.
| FAIR VALUE HEDGE RELATIONSHIPS |
31 December £m |
31 December £m |
Fixed rate | Floating rate | ||||||||||||
| €550m loan notes and €550m interest rate swaps maturing 2020 |
(466 | ) | (494 | ) | 2.5% | LIBOR+1.1% | ||||||||||
| €500m bond and €500m interest rate swaps maturing 2021 |
(423 | ) | (449 | ) | 0.4% | LIBOR+0.3% | ||||||||||
| $700m bond and $700m interest rate swaps maturing 2023 |
(528 | ) | (549 | ) | 3.5% | LIBOR+0.8% | ||||||||||
| €500m bond and €500m interest rate swaps maturing 2024 |
(423 | ) | (449 | ) | 1.0% | LIBOR+0.7% | ||||||||||
| €600m bond and €600m/$669.3m cross-currency interest rate swaps maturing 2025 |
(505 | ) | (525 | ) | 1.3% | LIBOR+1.3% | ||||||||||
| $200m bond and $200m interest rate swaps maturing 2027 |
(151 | ) | (157 | ) | 7.2% | LIBOR+5.8% | ||||||||||
| (2,496 | ) | (2,623 | ) | |||||||||||||
| RELX Annual report and financial statements 2019 | Notes to the consolidated financial statements | 161 | |
|
| ||
| 162 | RELX Annual report and financial statements 2019 | Financial statements and other information | |
|
| ||
Notes to the consolidated financial statements
for the year ended 31 December 2019
18 Financial instruments (continued)
Gross borrowings as at 31 December 2019 included £19m (2018: £23m) in relation to fair value adjustments to borrowings previously designated in a fair value hedge relationship which were de-designated in 2008. The related derivatives were closed out on de-designation with a cash inflow of £62m. £3m (2018: £3m) of these fair value adjustments were amortised in the year as a reduction to finance costs.
Cash flow hedges
As part of the Group’s interest rate exposure management, it has entered into certain cross-currency interest rate derivatives, individual components of which have been accounted for as cash flow hedges (with the remaining components accounted for as fair value hedges, as described above). These comprised the following:
| 1 | Interest rate derivatives which swapped a fixed rate CHF 275m bond, issued in June 2013 and maturing in December 2018, to floating rate USD debt for the whole of its term. The component relating to the swap of fixed rate CHF coupons to fixed rate USD cash flows was accounted for as a cash flow hedge under IAS 39 and was de-designated on 31 December 2017. The gains which had accumulated in the cash flow hedge reserve up to the date of de-designation were reclassified to the income statement as part of finance costs during 2018. |
| 2 | Interest rate derivatives which swapped a fixed rate €600m bond, issued in May 2015 and maturing in May 2025, to floating rate USD debt for the whole of its term. The component relating to the swap of floating rate euro cash flows to floating rate USD cash flows (including credit margin) was accounted for as a cash flow hedge under IAS 39 up to 31 December 2017. From 1 January 2018 the component relating to the swap of the euro credit margin to USD is being accounted for a cash flow hedge under IFRS 9, with the amount associated with foreign currency basis spreads recorded in the cost of hedging reserve. |
As part of the Group’s foreign currency exposure management, it has entered into forward foreign exchange contracts which fix the exchange rate on a portion of future foreign currency subscription revenues forecast by the businesses for up to 50 months. These have been accounted for as cash flow hedges under IAS 39 and under IFRS 9 of the forecast foreign currency revenues, with gains and losses on the forward contracts deferred in the hedge reserve until the related revenue is recognised, at which time the accumulated gains and losses are reclassified to the income statement.
Movements in the hedge reserve in 2018 and 2019 and, with effect from 1 January 2018, the cost of hedging reserve, including gains and losses on cash flow hedging instruments, were as follows:
| Interest rate hedge reserve £m |
Cost
of £m |
Foreign hedge reserve £m |
Total £m |
|||||||||||||
| Hedge reserve at 31 December 2017: gains/(losses) deferred |
5 | – | (7 | ) | (2 | ) | ||||||||||
| Reclassification on 1 January 2018 |
(1 | ) | 1 | – | – | |||||||||||
| Losses arising in 2018 |
– | (8 | ) | (51 | ) | (59 | ) | |||||||||
| Amounts recognised in income statement |
(3 | ) | – | 20 | 17 | |||||||||||
| Hedge reserve at 31 December 2018: gains/(losses) deferred |
1 | (7 | ) | (38 | ) | (44 | ) | |||||||||
| (Losses)/gains arising in 2019 |
(1 | ) | – | 17 | 16 | |||||||||||
| Amounts recognised in income statement |
– | – | 35 | 35 | ||||||||||||
| Hedge reserve at 31 December 2019: (losses) /gains deferred |
– | (7 | ) | 14 | 7 | |||||||||||
All cash flow hedges were highly effective throughout the two years ended 31 December 2019.
A deferred tax credit of nil (2018: £8m) in respect of the above gains and losses at 31 December 2019 was also deferred in the hedge reserve.
Of the amounts recognised in the income statement in the year, losses of £35m (2018: £20m) were recognised in revenue, and gains of nil (2018: £3m) were recognised in finance costs. A tax credit of £6m (2018: £3m) was recognised in relation to these items.
The deferred gains and losses on foreign currency cash flow hedges at 31 December 2019 are currently expected to be recognised in the income statement in future years as shown in the table below, together with the principal amount of hedges relating to each year and their total carrying values included within derivative assets and liabilities in the statement of financial position:
|
Foreign |
Principal £m |
Carrying £m |
||||||||||
| 2020 |
7 | 502 | 5 | |||||||||
| 2021 |
2 | 394 | 2 | |||||||||
| 2022 |
4 | 221 | 4 | |||||||||
| 2023 |
1 | 34 | 1 | |||||||||
| Total |
14 | 1,151 | 12 | |||||||||
The cash flows for these hedges are expected to occur in line with the recognition of the gains and losses in the income statement, or in the preceding year. These cash flows are included in the table on page 158.
| RELX Annual report and financial statements 2019 | Notes to the consolidated financial statements | 163 | |
|
| ||
| 164 | RELX Annual report and financial statements 2019 | Financial statements and other information | |
|
| ||
Notes to the consolidated financial statements
for the year ended 31 December 2019
22 Borrowings
| Accounting policy Borrowings are recorded initially at fair value and subsequently carried at amortised cost, other than fixed rate borrowings in designated hedging relationships for which the carrying amount of the hedged portion of the borrowings is subsequently adjusted for the gain or loss attributable to the hedged risk. When the related derivative in such a hedging relationship expires, is sold or terminated, or no longer qualifies for hedge accounting, the cumulative change in fair value of the hedged borrowing is amortised in the income statement over the period to maturity of the borrowing using the effective interest method.
|
| 2019 | 2018 | |||||||||||||||||||||||||
| Falling due £m |
Falling due £m |
Total £m |
Falling due £m |
Falling due in £m |
Total £m |
|||||||||||||||||||||
| Financial liabilities measured at amortised cost: |
||||||||||||||||||||||||||
| Short-term bank loans, overdrafts and commercial paper |
779 | – | 779 | 686 | – | 686 | ||||||||||||||||||||
| Term debt |
716 | 1,792 | 2,508 | 614 | 1,808 | 2,422 | ||||||||||||||||||||
| Lease liabilities |
93 | 249 | 342 | 92 | 268 | 360 | ||||||||||||||||||||
| Term debt in fair value hedging relationships |
472 | 2,080 | 2,552 | – | 2,652 | 2,652 | ||||||||||||||||||||
| Term debt previously in fair value hedging relationships |
– | 233 | 233 | – | 245 | 245 | ||||||||||||||||||||
| Total |
2,060 | 4,354 | 6,414 | 1,392 | 4,973 | 6,365 | ||||||||||||||||||||
The total fair value of financial liabilities measured at amortised cost (excluding lease liabilities) is £3,491m (2018: £3,254m). The total fair value of term debt in fair value hedging relationships is £2,629m (2018: £2,742m). The total fair value of term debt previously in fair value hedging relationships is £276m (2018: £283m).
RELX PLC has given guarantees in respect of certain long-term and short-term borrowings issued by subsidiaries. Included within term debt above are debt securities issued by RELX Capital Inc., a 100% indirectly owned finance subsidiary of RELX PLC, which have been registered with the US Securities and Exchange Commission. RELX PLC has fully and unconditionally guaranteed these securities, which are not guaranteed by any other subsidiary of RELX PLC.
Analysis by year of repayment
| 2019 |
2018 | |||||||||||||||||||||||||||||||||
| Short-term £m |
Term debt £m |
Lease liabilities £m |
Total £m |
Short-term £m |
Term debt £m |
Lease liabilities £m |
Total £m |
|||||||||||||||||||||||||||
| Within 1 year |
779 | 1,188 | 93 | 2,060 | 686 | 614 | 92 | 1,392 | ||||||||||||||||||||||||||
| Within 1 to 2 years |
– | 425 | 87 | 512 | – | 508 | 87 | 595 | ||||||||||||||||||||||||||
| Within 2 to 3 years |
– | 33 | 57 | 90 | – | 451 | 70 | 521 | ||||||||||||||||||||||||||
| Within 3 to 4 years |
– | 658 | 47 | 705 | – | 688 | 42 | 730 | ||||||||||||||||||||||||||
| Within 4 to 5 years |
– | 433 | 29 | 462 | – | 669 | 27 | 696 | ||||||||||||||||||||||||||
| After 5 years |
– | 2,556 | 29 | 2,585 | – | 2,389 | 42 | 2,431 | ||||||||||||||||||||||||||
| After 1 year |
– | 4,105 | 249 | 4,354 | – | 4,705 | 268 | 4,973 | ||||||||||||||||||||||||||
| Total |
779 | 5,293 | 342 | 6,414 | 686 | 5,319 | 360 | 6,365 | ||||||||||||||||||||||||||
Short-term bank loans, overdrafts and commercial paper were backed up at 31 December 2019 by a $3,000m (£2,262m) committed bank facility, consisting of tranches of: $31m maturing in 2021, $1,219m maturing in 2022, $44m maturing in 2023 and $1,706m maturing in 2024. The committed bank facility was undrawn.
| RELX Annual report and financial statements 2019 | Notes to the consolidated financial statements | 165 | |
|
| ||
| 166 | RELX Annual report and financial statements 2019 | Financial statements and other information | |
|
| ||
Notes to the consolidated financial statements
for the year ended 31 December 2019
23 Lease arrangements (continued)
Lease liability
| 2019 £m |
2018 £m |
|||||||
| Current |
||||||||
| Property |
(87 | ) | (83 | ) | ||||
| Non-property |
(6 | ) | (9 | ) | ||||
| Non-current |
||||||||
| Property |
(242 | ) | (260 | ) | ||||
| Non-property |
(7 | ) | (8 | ) | ||||
| Total |
(342 | ) | (360 | ) | ||||
Interest expense on the lease liabilities recognised within finance costs was £15m (2018: £14m; 2017: £17m).
As at 31 December 2019, RELX was committed to leases with future cash outflows totalling £9m (31 December 2018: £40m) which had not yet commenced and as such are not accounted for as a liability as at 31 December 2019. A liability and corresponding right-of-use asset will be recognised for these leases at the lease commencement date.
RELX subleases vacant space available within its leased properties. IFRS 16 specifies conditions whereby a sublease is classed as a finance lease for the sub-lessor. The finance lease receivable balance held is as follows:
Short-term and low-value lease expenses have been disclosed in note 3.
| 2019 £m |
2018 £m |
|||||||
| Net finance lease receivable |
33 | 49 | ||||||
Interest income recognised in relation to finance lease receivables is disclosed in note 7.
24 Share capital, share premium and shares held in treasury
| Accounting policy Shares of RELX PLC that are repurchased and not cancelled are classified as shares held in treasury. The consideration paid, including directly attributable costs, is recognised as a deduction from equity. Shares of RELX PLC that are purchased by the Employee Benefit Trust are also classified as shares held in treasury, with the cost recognised as a deduction from equity.
|
||
RELX PLC
| CALLED UP SHARE CAPITAL – ISSUED AND FULLY PAID | No. of shares | 2019 £m |
No. of shares | 2018 £m |
||||||||||||
| At start of year |
2,011,043,101 | 290 | 1,123,682,106 | 162 | ||||||||||||
| Issue of ordinary shares |
3,059,558 | 1 | 1,580,885 | – | ||||||||||||
| Issue of bonus share |
1 | – | – | – | ||||||||||||
| Issue of ordinary shares in exchange for RELX NV shares |
– | – | 930,780,110 | 134 | ||||||||||||
| Cancellation of shares |
(33,300,001 | ) | (5 | ) | (45,000,000 | ) | (6 | ) | ||||||||
| At end of year |
1,980,802,659 | 286 | 2,011,043,101 | 290 | ||||||||||||
At the 2019 AGM shareholders approved the issue of a bonus share with £4bn nominal value. The share was subsequently cancelled via a capital reduction, creating £4bn of distributable reserves in RELX PLC to replace the RELX NV reserves lost in the corporate simplification.
| RELX Annual report and financial statements 2019 | Notes to the consolidated financial statements | 167 | |
|
| ||
| 168 | RELX Annual report and financial statements 2019 | Financial statements and other information | |
|
| ||
Notes to the consolidated financial statements
for the year ended 31 December 2019
25 Other reserves
| Hedge reserve 2019 £m |
Other £m |
Total £m |
Total 2018 £m |
|||||||||||||
| At start of year |
(36 | ) | 1,020 | 984 | 425 | |||||||||||
| Profit attributable to RELX PLC shareholders |
– | 1,505 | 1,505 | 1,422 | ||||||||||||
| Dividends paid |
– | (842 | ) | (842 | ) | (796 | ) | |||||||||
| Actuarial losses on defined benefit pension schemes |
– | (137 | ) | (137 | ) | (91 | ) | |||||||||
| Fair value movements on cash flow hedges |
16 | – | 16 | (59 | ) | |||||||||||
| Transfer to net profit from cash flow hedge reserve |
35 | – | 35 | 17 | ||||||||||||
| Tax recognised in other comprehensive income |
(8 | ) | 23 | 15 | 24 | |||||||||||
| Increase in share based remuneration reserve (net of tax) |
– | 33 | 33 | 35 | ||||||||||||
| Issue of ordinary shares, net of expenses |
– | – | – | (227 | ) | |||||||||||
| Bonus issue of ordinary share |
– | (4,000 | ) | (4,000 | ) | – | ||||||||||
| Cancellation of bonus share |
– | 4,000 | 4,000 | – | ||||||||||||
| Cancellation of shares |
– | (499 | ) | (499 | ) | 262 | ||||||||||
| Settlement of share awards |
– | (33 | ) | (33 | ) | (35 | ) | |||||||||
| Put option |
– | (103 | ) | (103 | ) | – | ||||||||||
| Disposal of non-controlling interests |
– | 5 | 5 | – | ||||||||||||
| Exchange translation differences |
– | – | – | 7 | ||||||||||||
| At end of year |
7 | 972 | 979 | 984 | ||||||||||||
Other reserves principally comprise retained earnings and the share based remuneration reserve.
26 Related party transactions
Transactions between RELX PLC and subsidiaries of the Group have been eliminated within the consolidated financial statements. Transactions with joint ventures were made on normal market terms of trading and comprise sales of goods and services of £4m (2018: £3m; 2017: £16m) and the rendering and receiving of goods and services of £0.1m (2018: £0.1m; 2017: £0.1m). As at 31 December 2019, amounts owed by joint ventures were £5m (2018: £2m; 2017: £2m) and amounts due to joint ventures were £0.5m (2018: £0.9m; 2017: £1m). See note 6 for details of the Group’s participation in defined benefit pension schemes.
Key management personnel are also related parties as defined by IAS 24 – Related Party Disclosures and comprise the Executive and Non-Executive Directors of RELX PLC. Key management personnel remuneration is set out below. For reporting purposes, salary, benefits and annual incentive payments are considered short-term employee benefits.
| KEY MANAGEMENT PERSONNEL REMUNERATION | 2019 £m |
2018 £m |
2017 £m | |||||||||
| Salaries, other short-term employee benefits and non-executive fees |
7 | 7 | 5 | |||||||||
| Post-employment benefits |
1 | 1 | 1 | |||||||||
| Share based remuneration* |
7 | 7 | 8 | |||||||||
| Total |
15 | 15 | 14 | |||||||||
| EXECUTIVE DIRECTORS | |
Salary £’000 |
|
|
Benefits £’000 |
|
|
Annual incentive |
|
|
Cost of share based |
|
|
Cost of pension provision |
* |
|
Total £’000 |
| ||||||||||
| Total Executive Directors |
2019 | 1,984 | 101 | 3,038 | 7,343 | 725 | 13,191 | |||||||||||||||||||||
| 2018 | 1,935 | 99 | 3,033 | 7,003 | 741 | 12,811 | ||||||||||||||||||||||
| 2017 | 1,889 | 101 | 1,964 | 8,205 | 983 | 13,142 |
| * | The figures for share based awards are calculated in accordance with the methodology set out in the UK Regulations. The figure for performance-related share based awards includes share price appreciation since the date the award was granted. Please see page 99 for further details. The cost of pension provision is calculated in accordance with the methodology set out in the UK Regulations. The amount is reduced by the Directors’ contributions and participation fee for defined benefit schemes and reduced by the payments made to defined contribution schemes or in lieu of pension. |
| RELX Annual report and financial statements 2019 | Notes to the consolidated financial statements | 169 | |
|
| ||
| 170 | RELX Annual report and financial statements 2019 | Financial statements and other information | |
|
| ||
Notes to the consolidated financial statements
for the year ended 31 December 2019
A full list of related undertakings (comprising subsidiaries, joint ventures, associates and other significant holdings) is set out below. All are 100% owned directly or indirectly by the Group except where percentage ownership denoted in (x%).
| RELX Annual report and financial statements 2019 | Notes to the consolidated financial statements | 171 | |
|
| ||
| 172 | RELX Annual report and financial statements 2019 | Financial statements and other information | |
|
| ||
Notes to the consolidated financial statements
for the year ended 31 December 2019
29 Related undertakings (continued)
| RELX Annual report and financial statements 2019 | Notes to the consolidated financial statements | 173 | |
|
| ||
| 174 | RELX Annual report and financial statements 2019 | Financial statements and other information | |
|
| ||
Notes to the consolidated financial statements
for the year ended 31 December 2019
29 Related undertakings (continued)
| RELX Annual report and financial statements 2019 | 175 | |
|
| ||

| 176
|
RELX Annual report and financial statements 2019 | Financial statements and other information
|

| RELX Annual report and financial statements 2019
|
177
|
|
Annual Report and Financial Statements
In this section
| ||
| 178 | RELX PLC statement of financial position | |
| 179 | RELX PLC statement of changes in equity | |
| 179 | RELX PLC accounting policies | |
| 180 | Notes to the RELX PLC financial statements | |
| 178 | RELX Annual report and financial statements 2019 | Financial statements and other information | |
|
| ||
RELX PLC statement of financial position
| AS AT 31 DECEMBER | Note |
2019 £m |
2018 £m |
|||||||||
| Non-current assets |
||||||||||||
| Investments in subsidiary undertakings |
1 | 18,318 | 18,314 | |||||||||
| Investments in joint ventures |
1 | – | – | |||||||||
| 18,318 | 18,314 | |||||||||||
| Current assets |
||||||||||||
| Cash and cash equivalents |
– | 1 | ||||||||||
| Trade and other receivables |
– | 1 | ||||||||||
| Receivables: amounts due from subsidiary undertakings |
1,662 | 1,536 | ||||||||||
| Total assets |
19,980 | 19,852 | ||||||||||
| Current liabilities |
||||||||||||
| Taxation |
– | 4 | ||||||||||
| Other payables |
102 | 109 | ||||||||||
| 102 | 113 | |||||||||||
| Net assets |
19,878 | 19,739 | ||||||||||
| Capital and reserves |
||||||||||||
| Share capital |
286 | 290 | ||||||||||
| Share premium |
1,443 | 1,415 | ||||||||||
| Shares held in treasury |
(739 | ) | (643 | ) | ||||||||
| Capital redemption reserve |
36 | 31 | ||||||||||
| Other reserves |
168 | 164 | ||||||||||
| Merger reserve |
11,150 | 15,150 | ||||||||||
| Net profit |
1,548 | 2,063 | ||||||||||
| Reserves |
5,986 | 1,269 | ||||||||||
| Shareholders’ equity |
19,878 | 19,739 | ||||||||||
The RELX PLC Company financial statements were approved by the Board of Directors and authorised for issue on 12 February 2020. They were signed on its behalf by:
| A J Habgood |
N L Luff | |
| Chair |
Chief Financial Officer |
| RELX Annual report and financial statements 2019 | 179 | |
|
| ||
| 180 | RELX Annual report and financial statements 2019 | Financial statements and other information | |
|
| ||
Notes to the RELX PLC financial statements
1 Investments
| Subsidiary undertaking £m |
Joint £m |
Total £m |
||||||||||
| At 1 January 2018 |
– | 3,027 | 3,027 | |||||||||
| Acquisition of interest in RELX Group plc not already owned |
18,310 | (3,027 | ) | 15,283 | ||||||||
| Equity instruments granted to employees of the Group |
4 | – | 4 | |||||||||
| At 1 January 2019 |
18,314 | – | 18,314 | |||||||||
| Equity instruments granted to employees of the Group |
4 | – | 4 | |||||||||
| At 31 December 2019 |
18,318 | – | 18,318 | |||||||||
The acquisition of the remaining RELX Group plc interest in 2018 relates to the transfer of RELX NV’s previously held interest in RELX Group plc as a result of the corporate simplification. Following the simplification, RELX Group plc is recognised as a 100% owned subsidiary of RELX PLC.
2 Related party transactions
All transactions with joint ventures, subsidiaries and the Group’s employees, which are related parties of RELX PLC, are reflected in these financial statements. Transactions with key management personnel including share based remuneration costs are set out in note 26 of the Group consolidated financial statements and details of the Directors’ remuneration are included in the Directors’ Remuneration Report on pages 88 to 111.
3 Contingent liabilities
There are contingent liabilities in respect of borrowings of subsidiaries guaranteed by RELX PLC as follows:
| 2019 £m |
2018 £m |
|||||||
| Contingent liabilities |
5,777 | 5,775 | ||||||
Financial instruments disclosures in respect of the borrowings covered by the above guarantees are given in note 18 of the Group’s consolidated financial statements.
4 Bonus share issue
At the 2019 AGM shareholders approved the issue of a bonus share with £4bn nominal value. The share was subsequently cancelled via a capital reduction, creating £4bn of distributable reserves in RELX PLC to replace the RELX NV reserves lost in the corporate simplification.

| RELX Annual report and financial statements 2019 | 181 | |
|
| ||
| Other financial information | ||
| In this section | ||
| 182 | Summary financial information in euros | |
| 183 | Summary financial information in US dollars | |
| 184 | Reconciliation of adjusted to GAAP measures | |
| 182 | RELX Annual report and financial statements 2019 | Financial statements and other information | |
|
| ||
Summary financial information in euros
Basis of preparation
The Group’s consolidated financial information is presented in sterling. The summary financial information is a simple translation of the Group’s consolidated financial statements into euros at the stated rates of exchange.
| EXCHANGE RATES FOR TRANSLATION | Income statement | Statement of financial position |
||||||||||||||||||||||||||
| 2019 | 2018 | 2017 | 2019 | 2018 | 2017 | |||||||||||||||||||||||
| Euro to sterling |
1.14 | 1.13 | 1.14 | 1.18 | 1.11 | 1.12 | ||||||||||||||||||||||
Consolidated income statement
| FOR THE YEAR ENDED 31 DECEMBER | 2019 €m |
2018 €m |
2017 €m |
|||||||||
| Revenue |
8,976 | 8,466 | 8,369 | |||||||||
| Operating profit |
2,395 | 2,219 | 2,172 | |||||||||
| Profit before tax |
2,106 | 1,944 | 1,962 | |||||||||
| Net profit attributable to RELX PLC shareholders |
1,716 | 1,607 | 1,879 | |||||||||
| Adjusted operating profit |
2,840 | 2,651 | 2,604 | |||||||||
| Adjusted profit before tax |
2,508 | 2,424 | 2,395 | |||||||||
| Adjusted net profit attributable to RELX PLC shareholders |
2,061 | 1,892 | 1,847 | |||||||||
| Adjusted earnings per ordinary share |
€1.060 | €0.957 | €0.915 | |||||||||
| Basic earnings per ordinary share |
€0.883 | €0.813 | €0.930 | |||||||||
| Net dividend per ordinary RELX PLC share paid in the year |
€0.494 | €0.453 | €0.426 | |||||||||
| Net dividend per ordinary RELX PLC share paid and proposed in relation to the financial year |
€0.521 | €0.476 | €0.449 | |||||||||
| Consolidated statement of cash flows
|
||||||||||||
| FOR THE YEAR ENDED 31 DECEMBER | 2019 €m |
2018 €m |
2017 €m |
|||||||||
| Net cash from operating activities |
2,381 | 2,243 | 2,182 | |||||||||
| Net cash used in investing activities |
(835 | ) | (1,436 | ) | (473 | ) | ||||||
| Net cash used in financing activities |
(1,515 | ) | (806 | ) | (1,760 | ) | ||||||
| Increase/(decrease) in cash and cash equivalents |
31 | 1 | (51 | ) | ||||||||
| Movement in cash and cash equivalents |
||||||||||||
| At start of year |
127 | 124 | 190 | |||||||||
| Increase/(decrease) in cash and cash equivalents |
31 | 1 | (51 | ) | ||||||||
| Exchange translation differences |
5 | 2 | (15 | ) | ||||||||
| At end of year |
163 | 127 | 124 | |||||||||
| Adjusted cash flow |
2,738 | 2,535 | 2,505 | |||||||||
| Consolidated statement of financial position
|
||||||||||||
| AS AT 31 DECEMBER | 2019 €m |
2018 €m |
2017 €m |
|||||||||
| Non-current assets |
13,386 | 12,928 | 11,673 | |||||||||
| Current assets |
2,885 | 2,609 | 2,475 | |||||||||
| Assets held for sale |
– | 1 | – | |||||||||
| Total assets |
16,271 | 15,538 | 14,148 | |||||||||
| Current liabilities |
7,018 | 5,906 | 5,224 | |||||||||
| Non-current liabilities |
6,669 | 7,010 | 6,333 | |||||||||
| Liabilities associated with assets held for sale |
– | 4 | – | |||||||||
| Total liabilities |
13,687 | 12,920 | 11,557 | |||||||||
| Net assets |
2,584 | 2,618 | 2,591 | |||||||||
| RELX Annual report and financial statements 2019 | 183 | |
|
| ||
| 184 | RELX Annual report and financial statements 2019 | Financial statements and other information | |
|
| ||
Reconciliation of adjusted to GAAP measures
The Group uses adjusted figures, which are not defined by generally accepted accounting principles (‘GAAP’) such as IFRS, as additional performance measures. These measures are used by management, alongside the comparable GAAP measures, in evaluating the business performance. The measures may not be comparable to similarly reported measures by other companies.
A reconciliation of non-GAAP measures to relevant GAAP measures is as follows:
| YEAR ENDED 31 DECEMBER | 2019 £m |
2018 £m |
||||||||||
| Operating profit |
2,101 | 1,964 | ||||||||||
| Adjustments: |
||||||||||||
| Amortisation of acquired intangible assets |
295 | 288 | ||||||||||
| Acquisition-related costs |
84 | 84 | ||||||||||
| Reclassification of tax in joint ventures |
12 | 11 | ||||||||||
| Reclassification of finance income in joint ventures |
(1 | ) | (1 | ) | ||||||||
| Adjusted operating profit |
2,491 | 2,346 | ||||||||||
| Profit before tax |
1,847 | 1,720 | ||||||||||
| Adjustments: |
||||||||||||
| Amortisation of acquired intangible assets |
295 | 288 | ||||||||||
| Acquisition-related costs |
84 | 84 | ||||||||||
| Reclassification of tax in joint ventures |
12 | 11 | ||||||||||
| Net interest on net defined benefit pension obligation and other |
13 | 9 | ||||||||||
| Disposals and other non-operating items |
(51 | ) | 33 | |||||||||
| Adjusted profit before tax |
2,200 | 2,145 | ||||||||||
| Tax charge |
(338 | ) | (292 | ) | ||||||||
| Adjustments: |
||||||||||||
| Deferred tax movements on goodwill and acquired intangible assets |
26 | 34 | ||||||||||
| Tax on acquisition-related costs |
(15 | ) | (13 | ) | ||||||||
| Reclassification of tax in joint ventures |
(12 | ) | (11 | ) | ||||||||
| Tax on net interest on net defined benefit pension obligation and other |
(3 | ) | (2 | ) | ||||||||
| Tax on disposals and other non-operating items |
11 | (14 | ) | |||||||||
| Other deferred tax credits from intangible assets* |
(57 | ) | (55 | ) | ||||||||
| Exceptional tax credit** |
– | (112 | ) | |||||||||
| Adjusted tax charge |
(388 | ) | (465 | ) | ||||||||
| Net profit attributable to RELX PLC shareholders |
1,505 | 1,422 | ||||||||||
| Adjustments (post-tax): |
||||||||||||
| Amortisation of acquired intangible assets |
321 | 322 | ||||||||||
| Acquisition-related costs |
69 | 71 | ||||||||||
| Net interest on net defined benefit pension obligation and other |
10 | 7 | ||||||||||
| Disposals and other non-operating items |
(40 | ) | 19 | |||||||||
| Other deferred tax credits from intangible assets* |
(57 | ) | (55 | ) | ||||||||
| Exceptional tax credit** |
– | (112 | ) | |||||||||
| Adjusted net profit attributable to RELX PLC shareholders |
1,808 | 1,674 | ||||||||||
| Cash generated from operations |
2,724 | 2,555 | ||||||||||
| Adjustments: |
||||||||||||
| Dividends received from joint ventures |
34 | 30 | ||||||||||
| Purchases of property, plant and equipment |
(47 | ) | (56 | ) | ||||||||
| Proceeds from disposals of property, plant and equipment |
2 | 4 | ||||||||||
| Expenditure on internally developed intangible assets |
(333 | ) | (306 | ) | ||||||||
| Payments in relation to acquisition-related costs |
63 | 77 | ||||||||||
| Pension recovery payment |
44 | 20 | ||||||||||
| Repayment of lease principal |
(86 | ) | (82 | ) | ||||||||
| Sublease payments received |
1 | 1 | ||||||||||
| Adjusted cash flow |
2,402 | 2,243 | ||||||||||
| * | Movements on deferred tax liabilities arising on acquired intangible assets that do not qualify for tax amortisation. |
| ** | In 2018 relates to the substantial resolution of certain prior year tax matters and deferred tax effect of tax rate reductions in the Netherlands and US. |

| RELX Annual report and financial statements 2019 | 185 |
| Shareholder information | ||
| In this section | ||
| 186 | Shareholder information | |
| 188 | Shareholder information and contacts | |
| IBC | 2020 financial calendar | |
| RELX Annual report and financial statements 2019 | Shareholder information | 187 | |
|
| ||
| 13 February |
Results announcement for the year ended 31 December 2019 | |
| 23 April |
Trading update issued in relation to the 2020 financial year | |
| 23 April |
Annual General Meeting – Amba Hotel , Strand, London WC2N 5HX | |
| 24 April |
Ex-dividend date – 2019 final dividend, ordinary shares and ADRs | |
| 27 April |
Record date – 2019 final dividend, ordinary shares and ADRs | |
| 13 May |
Dividend currency and DRIP election deadline | |
| 18 May |
Euro dividend equivalent announcement | |
| 28 May |
Payment date – 2019 final dividend, ordinary shares | |
| 2 June |
Payment date – 2019 final dividend, ADRs | |
| 23 July |
Interim results announcement for the six months to 30 June 2020 | |
| 30 July* |
Ex-dividend date – 2020 interim dividend, ordinary shares and ADRs | |
| 31 July* |
Record date – 2020 interim dividend, ordinary shares and ADRs | |
|
|
||
| * | Please note that these dates are provisional and subject to change. The 2020 Interim Dividend payment dates in respect of ordinary shares and ADRs will be confirmed by the Company in its 2020 Interim Results announcement, currently scheduled for release on 23 July 2020. |
Dividend history
The following tables set out dividends paid (or proposed) in relation to the three financial years 2017–2019.
| ORDINARY SHARES | pence per PLC ordinary share | Payment date | ||||||
| Final dividend for 2019** |
32.10 | 28 May 2020 | ||||||
| Interim dividend for 2019 |
13.60 | 2 September 2019 | ||||||
| Final dividend for 2018 |
29.70 | 4 June 2019 | ||||||
| Interim dividend for 2018 |
12.40 | 24 August 2018 | ||||||
| Final dividend for 2017 |
27.70 | 22 May 2018 | ||||||
| Interim dividend for 2017 |
11.70 | 25 August 2017 | ||||||
| **Proposed dividend, to be submitted for approval at the Annual General Meeting of RELX PLC in April 2020
|
||||||||
| ADRS | $ per PLC ADR | Payment date | ||||||
| Final Dividend for 2019*** |
*** | 2 June 2020 | ||||||
| Interim Dividend for 2019 |
0.16398 | 5 September 2019 | ||||||
| Final Dividend for 2018 |
0.37612 | 7 June 2019 | ||||||
| Interim Dividend for 2018 |
0.15914 | 29 August 2018 | ||||||
| Final dividend for 2017 |
0.37159 | 25 May 2018 | ||||||
| Interim dividend for 2017 |
0.15085 | 30 August 2017 | ||||||
| ***Payment | will be determined using the appropriate £/US$ exchange rate on 28 May 2020. |
Credits

www.relx.com


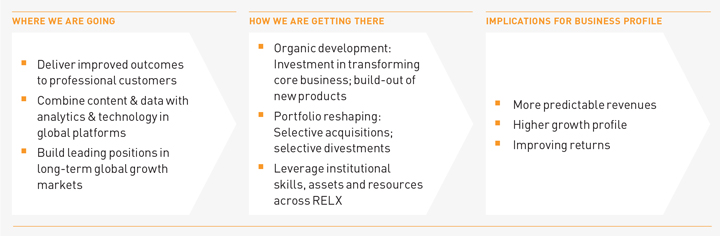
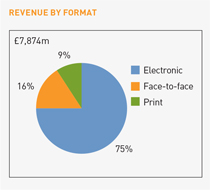
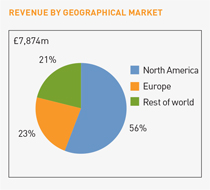
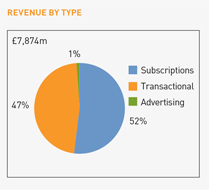
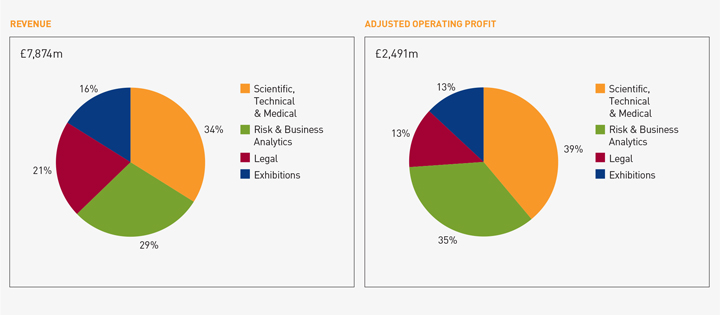


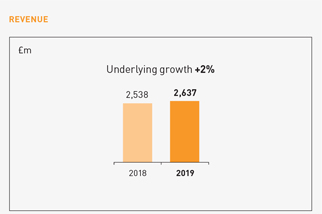
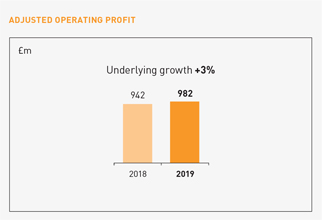


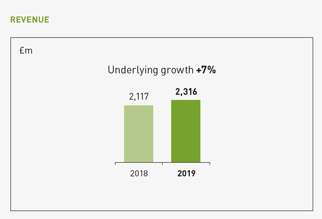
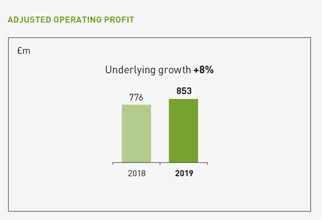


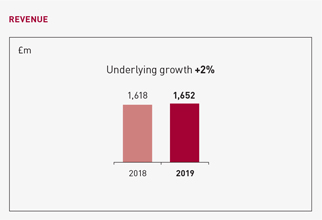
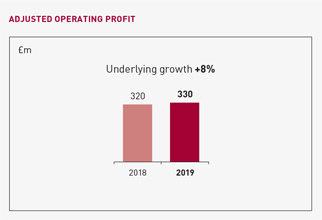


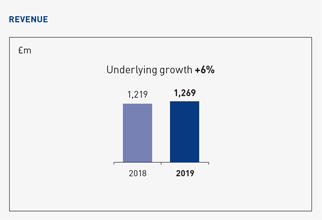
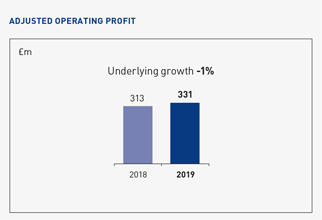


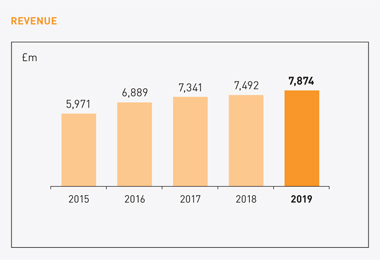
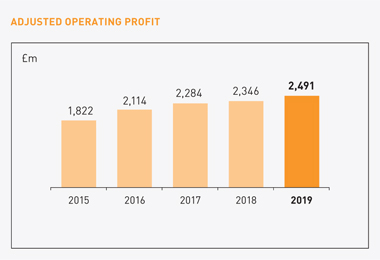

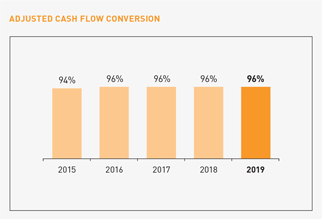

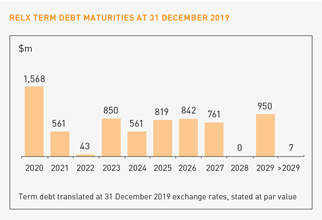
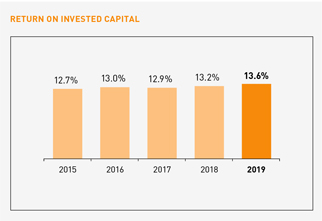


 Audit Committee
 Remuneration Committee
 Nominations Committee
 Corporate Governance Committee
 Committee Chair


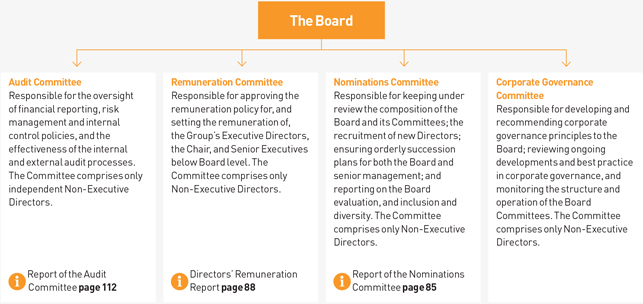
 Audit
Audit Remuneration
 Nominations
 Corporate Governance
 Committee Chair
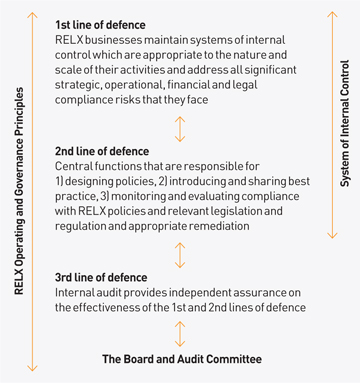
 www.relx.com. These include: