Exhibit 15.2
Annual Report and Financial Statements 2020
Exhibit 15.2
Annual Report and Financial Statements 2020
RELX is a global provider of information-based analytics and decision tools for professional and business customers.
We help researchers make new discoveries, doctors and nurses improve the lives of patients, and lawyers develop winning strategies. We prevent online fraud and money laundering, and help insurance companies evaluate and predict risk. Our events combine in-person and digital experiences to help customers learn about markets, source products and complete transactions.
In short, we enable our customers to make better decisions, get better results and be more productive.
Forward-looking statements
This Annual Report contains forward-looking statements within the meaning of Section 27A of the US Securities Act of 1933, as amended, and Section 21E of the US Securities Exchange Act of 1934, as amended. These statements are subject to risks and uncertainties that could cause actual results or outcomes of RELX PLC (together with its subsidiaries, “RELX”, “we” or “our”) to differ materially from those expressed in any forward-looking statement. We consider any statements that are not historical facts to be “forward-looking statements”. The terms “outlook”, “estimate”, “forecast”, “project”, “plan”, “intend”, “expect”, “should”, “will”, “believe”, “trends” and similar expressions may indicate a forward-looking statement. Important factors that could cause actual results or outcomes to differ materially from estimates or forecasts contained in the forward-looking statements include, among others: current and future economic, political and market forces; the impact of the Covid-19 pandemic as well as other pandemics or epidemics; changes in law and legal interpretations affecting RELX intellectual property rights and internet communications; regulatory and other changes regarding the collection, transfer or use of third-party content and data; changes in the payment model for our products; demand for RELX products and services; competitive factors in the industries in which RELX operates; ability to realise the future anticipated benefits of acquisitions; significant failure or interruption of our systems; exhibitors’ and attendees’ ability and desire to attend face-to-face events and availability of event venues; compromises of our data security systems or other unauthorised access to our databases; legislative, fiscal, tax and regulatory developments and political risks; exchange rate fluctuations; and other risks referenced from time to time in the filings of RELX PLC with the US Securities and Exchange Commission (SEC). You should not place undue reliance on these forward-looking statements, which speak only as of the date of this Annual Report. Except as may be required by law, we undertake no obligation to publicly update or release any revisions to these forward-looking statements to reflect events or circumstances after the date of this Annual Report or to reflect the occurrence of unanticipated events.
| RELX Annual report and financial statements 2020 | 1 | |
|
| ||
| 2 | RELX Annual report and financial statements 2020 | Overview | |
|
| ||
| ◾ | Our three largest business areas, Scientific, Technical & Medical, Risk and Legal, which together accounted for 95% of RELX revenue in 2020, reported combined revenue of £6,748m, up 2%, and adjusted operating profit of £2,245m, up 4%, for the year. All three business areas continued to deliver underlying revenue and adjusted operating profit growth. |
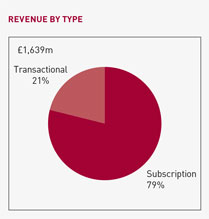
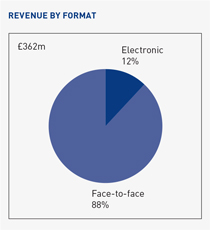
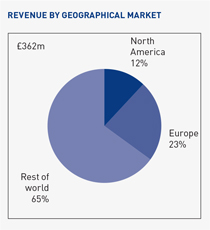
| ◾ | Exhibitions, which accounted for 5% of revenue in 2020, has been impacted significantly by the Covid-19 pandemic, with revenue of £362m, down 71%, and an adjusted operating loss of £164m (£331m profit). |
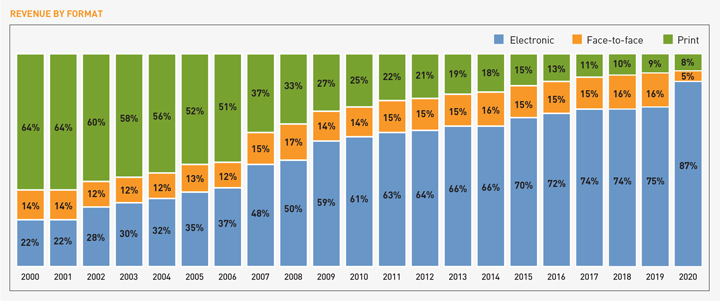
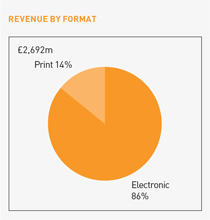
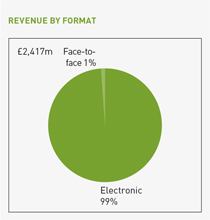
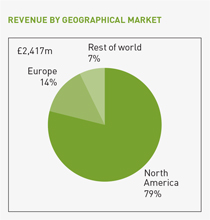
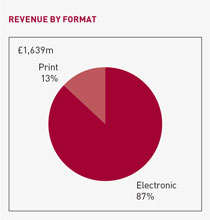
| ◾ | By format, electronic revenue across all divisions, representing 87% of the total, grew 4%. Print revenue, which represented 8% of the total, declined 14%, more steeply than in recent years, and face-to-face revenue, which represented around 5% of the total, was down by 73%. |
RELX financial summary
| REPORTED FIGURES | Change at | |||||||||||||||||||
| 2020 | 2019 | constant | Change | |||||||||||||||||
| For the year ended 31 December | £m | £m | Change | currencies | underlying | |||||||||||||||
| Revenue |
7,110 | 7,874 | -10% | -10% | -9% | |||||||||||||||
| Operating profit |
1,525 | 2,101 | -27% | |||||||||||||||||
| Profit before tax |
1,483 | 1,847 | -20% | |||||||||||||||||
| Net profit attributable to RELX PLC shareholders |
1,224 | 1,505 | -19% | |||||||||||||||||
| Net margin |
17.2% | 19.1% | ||||||||||||||||||
| Net borrowings |
6,898 | 6,191 | ||||||||||||||||||
| Reported earnings per share |
63.5p | 77.4p | -18% | |||||||||||||||||
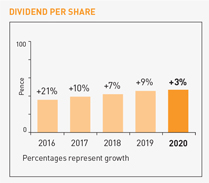
| Ordinary dividend per RELX PLC share |
47.0p | 45.7p | +3% | |||||||||||||||||
| ADJUSTED FIGURES | Change at | |||||||||||||||||||
| 2020 | 2019 | constant | Change | |||||||||||||||||
| For the year ended 31 December | £m | £m | Change | currencies | underlying | |||||||||||||||
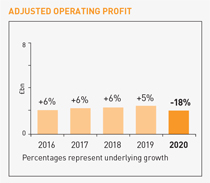
| Operating profit |
2,076 | 2,491 | -17% | -18% | -18% | |||||||||||||||
| Operating margin |
29.2% | 31.6% | ||||||||||||||||||
| Profit before tax |
1,916 | 2,200 | -13% | -15% | ||||||||||||||||
| Net profit attributable to RELX PLC shareholders |
1,543 | 1,808 | -15% | -16% | ||||||||||||||||
| Net margin |
21.7% | 23.0% | ||||||||||||||||||
| Cash flow |
2,009 | 2,402 | -16% | |||||||||||||||||
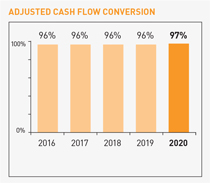
| Cash flow conversion |
97% | 96% | ||||||||||||||||||
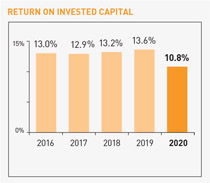
| Return on invested capital |
10.8% | 13.6% | ||||||||||||||||||
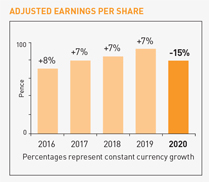
| Adjusted earnings per share |
80.1p | 93.0p | -14% | -15% | ||||||||||||||||
The shares of RELX PLC are traded on the London, Amsterdam and New York stock exchanges. RELX PLC and its subsidiaries, joint ventures and associates are together known as ‘RELX’.
RELX uses adjusted and underlying figures as additional performance measures. Adjusted figures primarily exclude the amortisation of acquired intangible assets and other items related to acquisitions and disposals, and the associated deferred tax movements. In 2020, we also excluded exceptional costs in the Exhibitions business. Reconciliations between the reported and adjusted figures are set out on page 188. Underlying growth rates are calculated at constant currencies, excluding the results of acquisitions until 12 months after purchase, and excluding the results of disposals and assets held for sale. Underlying revenue growth rates also exclude exhibition cycling. Constant currency growth rates are based on 2019 full-year average and hedge exchange rates.
| RELX Annual report and financial statements 2020 | 3 | |
|
| ||
| RELX Annual report and financial statements 2020 | 5 | |
|
| ||
| 6 | RELX Annual report and financial statements 2020 | Overview | |
|
| ||
Financial KPIs

|
|
| ||
|
|
|
Revenue by category
| RELX Annual report and financial statements 2020 | RELX business overview | 7 | |
|
| ||
| 8 | RELX Annual report and financial statements 2020 | Overview | |
|
| ||

|
Harnessing technology across RELX
Around 9,000 technologists, half of whom are software engineers, work at RELX. Annually, the company spends $1.5bn on technology. The combination of our rich data assets, technology infrastructure and knowledge of how to use next generation technologies, such as machine learning and natural language processing, allows us to create effective solutions for our customers. |
|
This project illustrates the power of the HPCC Systems platform and the Data Lake methodology to quickly extract valuable information and insight from readily available data. These metrics and visualisations were not developed in a vacuum. They are the result of an iterative methodology that layers knowledge upon knowledge to continuously extract deeper and deeper insights.
Roger Dev Senior Architect, LexisNexis Risk Solutions |
Helping advance research and provide the public with powerful analytics on global Covid-19 trends
Using HPCC Systems Data Lake Technology, RELX created a Covid-19 Tracker to monitor and report the progress of the Covid-19 virus and provide better contextual understanding of the pandemic’s evolution.
Using data from Johns Hopkins University (daily cases and deaths), the US Census Bureau (US population) and the UN DESA (world population), the tracker provides metrics and analysis for locations across the globe, with maps that drill down to country and regional levels, helping to understand how the virus is propagating.
The data is presented in a balanced, digestible form, using plain language, allowing individuals sufficient information and context to make reasonable decisions. For each location, the tracker includes a ‘Hot Spot’ module that identifies the worst outbreaks at any given time, infection rate trends, weekly statistics and commentaries. The animation controls show the progression of the virus in time and hence can help point to events that could have contributed to the rapid spread of the virus.
The HPCC Systems Covid-19 Tracker is a free resource and available to the public. It is used to advance research by partners at Oxford University and Florida Atlantic University.
The tracker runs on RELX’s HPCC Systems Data Lake platform. The Data Lake is a collaboration environment for universities and researchers to access, share and process data assets that enhance the metrics for the project. This allows easy incorporation of new data sources and a rapid transition from development to production.
Providing comprehensive, quality data during a fast-developing pandemic is a challenge. Public data sites often present raw statistics but provide little context with which to understand what exactly is happening and how the pandemic is spreading.
The teams behind the tracker wanted to delve deeper and provide commentary that was actionable as well as drill down to the narrowest location possible in order to make projections. In addition to daily cases, daily deaths and testing, the model integrates data on transportation and tourism infrastructure, hospitalisation, socioeconomic indicators, flight schedules, people density and people movements. |
30,000 +
over 30,000 unique visitors (as at November 2020)
Viewing data by region using the Covid-19 Tracker |
| RELX Annual report and financial statements 2020 | 9 | |
|
| ||

| +90%
Significant reduction in the fraud-to-sales ratio, with over 90% of users now rated as trusted, dramatically reducing potential friction on the customer experience
|
||||
| paysafecard online | LexisNexis ThreatMetrix helps paysafecard reduce fraud and friction for good customers
paysafecard is an online payment method that allows users to pay for goods and services securely and privately at a huge range of global online merchants in 50 markets. paysafecard vouchers are sold at more than 650,000 retail outlets, gas stations and grocery stores, providing a simple, prepaid alternative to online payments.
With a strong market position and a large customer base, paysafecard was a key target for fraudsters looking to exploit process and data loopholes, and test fraud defences. Fraudsters were using credentials stolen from high-profile data breaches to perpetrate payment fraud.
However, despite the need to address the payment threat from fraudsters, paysafecard also understands the potential impact on good customers. paysafecard enhanced its risk decisioning with new capabilities which enabled it to promote and reward positive, trusted behaviour while also detecting fraudulent payments in near real time.
Leveraging this trust, paysafecard could focus on reducing customer friction. False positives fell by approximately 70% while the business continued to grow. This led to happier customers while simultaneously reducing operational costs.
LexisNexis ThreatMetrix provided paysafecard with a layered defence solution, designed to enhance near real time fraud detection and risk-decisioning amidst a constantly evolving cybercrime landscape. Layering digital and physical identity intelligence with behavioural biometrics enabled paysafecard to detect high-risk and fraudulent payments, while recognising more transactions as trusted across the customer journey. |
LexisNexis ThreatMetrix has delivered remarkable product developments that have aligned closely with our internal drive to reduce fraud without impacting good customers. Recently released behavioural biometrics capabilities have further enhanced our ability to identify clusters of fraudulent accounts, adding an extra layer of precision to our fraud detection.
Hany Razi Head of Global Financial Crime Intelligence & Analytics Paysafe Group |
| 10 | RELX Annual report and financial statements 2020 | Overview | |
|
| ||

| Continuing to deliver for our customers
In what turns out to have been a truly extraordinary year the whole organisation rose to the challenge of maintaining high levels of customer service in hugely changed working conditions reflecting the quality and dedication of our staff around the world. |
| RELX Annual report and financial statements 2020 | 11 | |
|
| ||

| Read our stories on how we enable our customers to make better decisions, get better results and be more productive: relx.com/our-business/our-stories |

| 12
|
RELX Annual report and financial statements 2020 | Market segments
|

| RELX Annual report and financial statements 2020
|
13
|
| Market segments | ||||
| In this section | ||||
| 14 |
||||
| 20 |
||||
| 26 |
||||
| 32 |
||||
| RELX Annual report and financial statements 2020 | Scientific, Technical & Medical | 15 | |
|
| ||
| 16 | RELX Annual report and financial statements 2020 | Market segments | |
|
| ||
|
|
|
| RELX Annual report and financial statements 2020 | Scientific, Technical & Medical | 17 | |
|
| ||
| 18 | RELX Annual report and financial statements 2020 | Market segments | |
|
| ||

| HESI: Improving knowledge retention, increasing exam scores, and setting students up for career success as health professionals
98% overall pass rate in May 2018, an improvement of over 30 percentage points – 20 percentage points over the national average |
| RELX Annual report and financial statements 2020 | Scientific, Technical & Medical | 19 | |
|
| ||

|
The health assessment HESI and fundamentals HESI are really the tenets of nursing. They’re the basic building blocks and the students have to excel in those two areas. It’s a big part of the NCLEX.
Dr Kathleen Kelley Director of Undergraduate Nursing Education, Caldwell University
About HESI
HESI is a product suite of testing and test preparation solutions for nursing students that analyse and improve student performance, promote clinical judgement, and help students and the nursing programmes overall achieve even greater levels of success.
An outdoor lesson at Caldwell Campus
|
Caldwell University’s Bachelor of Nursing Degree (BSN) programme provides an exceptional curriculum to prepare nurses for professional practice.
In 2019 Caldwell University’s undergraduate nursing programme was named one of the top 10 nursing schools in New Jersey, with an impressive 95% of their 2019 graduates either working, enrolled in further education or serving in the military.
This success rate hasn’t always been the case. Before 2015 when Caldwell University implemented Elsevier’s HESI suite of products across its entire BSN curriculum, its National Council Licensure Examination (NCLEX) pass rates hovered under 60%. However, since incorporating HESI into its programme, it has seen exam scores rise into the high 90s. In May 2018 it achieved a 98% overall pass rate, 100% for BSN graduates and 94.7% for nursing as second degree. This represents an improvement of over 30 percentage points, 20 percentage points over the national average when compared with a pass rate for all candidates of 73%.
Under the leadership of Dr Kathleen Kelley, Director of Undergraduate Nursing Education, the faculty is now able to use HESI to test and analyse the data to make sure its programme outcomes are constantly adapted and on track to reach the highest possible pass rates.
HESI not only helps to prepare students to pass the critical NCLEX exam, but the data also help faculty understand how they can improve the programme by finding gaps in the curriculum based on students’ performance. HESI, for example, was instrumental in identifying that knowledge retention was their biggest challenge, enabling faculty to prioritise and address the issue.
Having identified these gaps, the faculty was also able to use other tools from Elsevier to develop a remediation strategy. Retention activities were developed for students during term breaks to help students achieve better test outcomes. Caldwell’s focus on high retention ensures students are set up for success both in terms of exams and in their future nursing careers.
The integration of Elsevier products throughout its curriculum also helps Caldwell see how it ranks compared with the national benchmark. With data from HESI exams, faculty continues to adapt its curriculum and shape its courses around the gaps that need to be addressed in student learning. By analysing the data from HESI exams, Caldwell continues to build on its students’ success. |
| RELX Annual report and financial statements 2020 | Risk | 21 | |
|
| ||
| 22 | RELX Annual report and financial statements 2020 | Market segments | |
|
| ||
|
|
|
| RELX Annual report and financial statements 2020 | Risk | 23 | |
|
| ||
| 24 | RELX Annual report and financial statements 2020 | Market segments | |
|
| ||

LexisNexis
Risk Solutions:
Redefining the consumer
insurance experience
<1 minute
Consumers can get renters and
auto quotes in less than a minute
and purchase in seven minutes
| RELX Annual report and financial statements 2020 | Risk | 25 | |
|
| ||

|
The team at LexisNexis Risk Solutions has been instrumental in helping us meet our aggressive timeline to launch a new insurance concept within mere months and gain acceptance with consumers. The data we use helps Toggle understand our customers better so that we can design a great experience, offer the right products and execute on our vision to be the insurance innovation leader and “we get you” brand.
Stephanie Lloyd Head of Toggle Insurance
About LexisNexis Risk Solutions
LexisNexis Risk Solutions provides data and analytics to help insurers automate critical business processes and deliver higher levels of customer experience.
Leveraging our vast data resources, including public and insurance contributory data, LexisNexis Risk Solutions drive 188m annual insurance purchase decisions across the entire policy lifecycle — from acquisition to renewal to claim.
San Francisco apartments |
Toggle, a Farmers Company, launched in 2018 to serve the next-generation insurance consumer with a brand new renters policy, has since expanded to offer an auto insurance quoting experience reimagined for the tech-savvy buyer.
The Woodland Hills, California-based insuretech is now offering renters policies in 70% of the addressable US insurance market and still growing.
A start-up within a long-standing, trusted insurance brand, the team at Toggle was tasked with reimagining the insurance buying journey, providing consumers with affordable, portable and highly customisable solutions that fit their daily lives. The team utilises next-level technology and user experiences typical of top-tier technology companies and designs products and services around modern lifestyles, attitudes and behaviours.
Toggle is committed to providing customers with easy to understand descriptions and known dependencies, along with choice, more control and confidence in their insurance purchase decisions. To help deliver a frictionless quote and policy bind experience, Toggle harnessed the power of LexisNexis Risk Solutions data and advanced analytics from the beginning of the transaction to the end.
The process starts with identity authentication to confirm individuals are who they say they are. Customers are then empowered to choose what’s best for them. Toggle’s relatable approach helps reduce the complexity of price options and give the consumer clarity about what’s covered by the policy, and LexisNexis’ prefill solutions help customers validate the accuracy of their information, rather than fill out a long form.
Using an arsenal of data and advanced analytics such as past claims, driving violations and vehicle history to better understand risk, Toggle can offer consumers renters and auto quotes in less than a minute and complete the whole binding process in five to seven minutes. This can help meet the needs of today’s time-starved consumer so they can quickly make informed insurance decisions. |
|
| RELX Annual report and financial statements 2020 | Legal | 27 | |
|
| ||
| 28 | RELX Annual report and financial statements 2020 | Market segments | |
|
| ||
|
|
|
| RELX Annual report and financial statements 2020 | Legal | 29 | |
|
| ||
| 30 | RELX Annual report and financial statements 2020 | Market segments | |
|
| ||

LexisNexis
PatentSight:
increasing patent
portfolio strength
and patent income
47.2%
increased patent portfolio strength
in IoT technologies since 2016;
the only player showing a clear
upwards quality development.
| RELX Annual report and financial statements 2020 | Legal | 31 | |
|
| ||

|
LexisNexis PatentSight software features empirically validated quality metrics and the well-presented analytics create transparency in the ever-increasing mass of global patent applications. The software provides insights on where to focus, enables us to report on the development of our patent portfolio and benchmarks against competitors. With PatentSight and their support team, we make better informed investment decisions on our IP portfolio.
Beat Weibel Chief IP Counsel, Siemens
About LexisNexis PatentSight
LexisNexis PatentSight provides patent analytics.
It is used by corporations, law firms and governmental institutions worldwide to stay ahead of the innovation curve and to uncover what their competitors are hatching long before they come to market.
IoT: Siemens best in class, Patent Quality Development based on selected technology fields: Data Security, ML&AI, Robotics, Smart City, AM, Autonomous Driving, Blockchain Data base: active only, patents only
Source: PatentSight, 2020-08-13 |
Siemens is a global powerhouse in the areas of electrification, automation and digitalisation. One of the world’s largest producers of energy-efficient, resource-saving technologies, the organisation is a leading supplier of systems for power generation and transmission, building and transportation infrastructure, industrial automation as well as medical diagnosis.
Beat Weibel, Siemens’ Chief Intellectual Property (IP) Counsel, always believed in quality over quantity. In 2013, when taking responsibility for Siemen’s patent portfolio, Beat set out to change the group’s intellectual property strategy from a volume-driven to a quality-driven approach. This new perspective was designed to yield a higher share of patents with tangible business outcomes while also delivering competitive insights to support strategic decision-making and stay ahead of the innovation curve.
PatentSight, a spin-off from WHU – Otto Beisheim School of Management, one of Germany’s leading business schools, developed the Patent Asset Index (PAI), a metric that differentiates high value patents from low value patents. Beat Weibel decided to use the PatentSight software to support Siemens’ strategic change.
First, Beat’s team needed to have sufficient confidence in PatentSights’ metrics and methodology before introducing them to the Siemens Board. They compared the PAI findings with Siemens’ own high value patents and those of competitors and found a high percentage match. This allowed the IP team to validate the use of PatentSight’s Patent Asset Index as a long-term, objective indicator for improved patent quality.
Managing IP based on quality metrics paid off. Siemens has achieved significant return on investment (ROI) on its IP portfolio with increased commercial utilisation of patents. Compared with other major software companies and Internet of Things (IoT) competitors, the PatentSight Asset Index shows Siemens is the only company to substantially and persistently increase its patent portfolio quality. The Siemens IP department has evolved into a strategic consulting unit supporting the entire business with quality-based innovation insights derived from LexisNexis PatentSight. |
|
| RELX Annual report and financial statements 2020 | Exhibitions | 33 | |
|
| ||
| 34 | RELX Annual report and financial statements 2020 | Market segments | |
|
| ||

|
|

| ||
|
|
|
| ||
| Machine tools and metalworking exhibition serving ASEAN | South East Asia’s one-stop market for the maritime community | International exhibition of environmental equipment, technologies and services | ||

|

|

| ||
|
|
|
| ||
| Innovations for smart sheet metal working | The East Coast’s largest pop culture convention | International trade fair for the building industry | ||

|

|

| ||
|
|
|
| ||
| The Middle East’s meeting place for the travel trade | Latin America’s exhibition for security products and solutions | An international exhibition dedicated to comfort & living technology | ||

|

|

| ||
|
|
|
| ||
| The North American jewellery industry’s premier event | International perfumery and cosmetics exhibition | Japan’s manufacturing industry trade event | ||

|

|

| ||
|
|
|
| ||
| Australia’s trade event for the retail industry | International Security Conference & Exhibition | China’s electronics manufacturing trade shows | ||

|

|

| ||
|
|
|
| ||
| International trade fair for the catering, restaurant and hotel trade | Premier global event for the travel industry | The world’s entertainment content market | ||

|

|

| ||
|
|
|
| ||
| The UK’s meeting place for the book industry | China’s business gifts & home fair | Japan’s comprehensive exhibition for smart and renewable energy
| ||
|
|

|
| RELX Annual report and financial statements 2020 | Exhibitions |
35 | |
|
| ||
| 36 | RELX Annual report and financial statements 2020 | Market segments | |
|
| ||

MIPIM:
Reimagining MIPIM as a
hybrid event in response
to the Covid-19 pandemic
Over
788,000
social reach
|
Challenging times call for innovative solutions, not least in the global property market, which has been impacted by Covid-19 in unprecedented ways.
Uniting the international real estate community around the twin goals of recovery and sustainability, MIPIM Paris Real Estate Week (14–17 September) enabled the industry to reconnect for the first time in 2020.
Reimagined as a hybrid event, the new format combined a safe physical gathering of over 1,100 senior real estate professionals, livestreamed across social media, with a sophisticated online platform, opening the content and meetings up to an additional 7,000 views by remote attendees from the world’s property sector.
Headlining an outstanding line-up of over 120 speakers were Apple co-founder, Steve Wozniak, and former French President, Nicolas Sarkozy. At the heart of the event was Propel by MIPIM, two days of thought-leadership, networking and deal making, devoted to innovation and digital transformation in the property sector. This was followed by the first-ever MIPIM Urban Forum, where leading public and private sector voices shared their visions of the post-Covid city and the MIPIM Awards which honoured the world’s most outstanding real estate projects.
Underpinning the physical event, and transforming its entire scope and reach, was the augmented digital platform. This enabled remote speakers to seamlessly join the live debates, and participants from all over the world to network with their peers, engage with the event’s essential content both live and on-demand, generate new leads, and arrange one to one meetings. The platform, which remained open for a month after the event, had over 2,000 registrants, delivered over 9,600 personal recommendations and generated 727 meeting requests. |
About MIPIM
MIPIM is the world’s premier property market.
Established in Cannes in 1990, it brings together the global leaders of the real estate industry including investors, political institutions, property companies, advisors and city administrators who attend to discover new large-scale projects, hold one-to-one business meetings, and learn the latest market trends and insights. Sister event MIPIM Asia was launched in Hong Kong in 2006 and is now an established real estate event for Asia Pacific real estate professionals. 2017 and 2018 each saw the launch of a dedicated event devoted to technology for the property sector, Propel by MIPIM, in New York and Paris respectively. MIPIM’s enhanced online marketplace supports its clients’ business needs and is expected to further extend the brand’s global reach and influence. |
| RELX Annual report and financial statements 2020 | Exhibitions | 37 | |
|
| ||

|
Combining a safe physical gathering (right) with a sophisticated online platform (left) |
| MIPIM Paris Real Estate Week was an innovative way of keeping the industry connected and informed at this difficult time. The opportunity to share expert insights and conduct critical business meetings physically and digitally was invaluable for Choose Paris Region and the future of the business of our companies.
Lionel Grotto CEO Choose Paris Region |

| 38 | RELX Annual report and financial statements 2020 | Corporate responsibility |
| RELX Annual report and financial statements 2020 | Corporate responsibility overview | 41 | |
|
| ||
Advancing
the RELX SDG
Resource Centre
In 2017, we launched the free RELX SDG Resource Centre to advance awareness,
understanding and implementation of the UN’s SDGs. In 2020, we increased the
amount of content on the site by 57% from 2019. This included curated special
issues to mark eight UN international days, such as World Environment Day,
the International Day for the Elimination of Violence Against Women, World
Mental Health Day and the International Day of Persons with Disabilities.
We also published 17 RELX SDG Graphics on the state of
knowledge underpinning all 17 of the global goals.
| 42 | RELX Annual report and financial statements 2020 | Corporate responsibility | |
|
| ||
| RELX Annual report and financial statements 2020 | Corporate responsibility overview | 43 | |
|
| ||
| 44 | RELX Annual report and financial statements 2020 | Corporate responsibility | |
|
| ||
| RELX Annual report and financial statements 2020 | Corporate responsibility overview | 45 | |
|
| ||
| 46 | RELX Annual report and financial statements 2020 | Corporate responsibility | |
|
| ||

|
Ten years of the RELX Environmental Challenge
Since 2011, the RELX Environmental Challenge has supported innovative solutions that improve sustainable access to safe water and sanitation where it is most at risk, advancing SDG 6 (Clean Water and Sanitation). The diversity of ideas, technologies and business models has been remarkable – from a social enterprise that uses the hydroenergy to pump water to high altitudes, and a system for harnessing ultraviolet light to purify water, to a new approach for emptying pit latrines safely and efficiently. |
|
Thanks to the RELX Environmental Challenge, we will be able to attract strategic partners working in the development sector on improved sanitation, including additional investors to get us to the next stage of growth.
Marc Aoun
Founder and General Manager, CUBEX S.A.L |
In 2020, a shortlist of seven projects was chosen from a record 170 applications from 44 countries. The $50,000 first-prize winner was CUBEX S.A.L, a Lebanese social enterprise whose mobile dewatering unit collects and treats sewage from septic systems in an ecologically safe and affordable way. The $25,000 second-prize winner was BlueTap, which has developed a 3D printed chlorine doser to improve access to high-quality drinking water in low-resource settings. Both winners received access to Science Direct, Elsevier’s leading platform of peer-reviewed literature to help advance their research.
The winners were announced at a virtual event celebrating ten years of the competition and exploring the next decade of water, sanitation and hygiene action. Featured speakers included: inaugural first prize winner of the RELX Environmental Challenge (2011), Dr Arup K. SenGupta, Chemical Engineering Professor at Lehigh University and Co-Founder of Drinkwell; Cheryl Hicks, CEO and Executive Director of the Toilet Board Coalition; Valeri Labi, Director of Water, Sanitation and Hygiene at iDE Ghana and a RELX Environmental Challenge judge; and Tim Brewer, Research Practice Lead at Water Witness International.
In addition to the two annual prizes, three past RELX Environmental Challenge Winners, CAWST, AIDFI and Sanergy, won a $25,000 special Partnership Prize for a collaborative project to create online training and outreach to support water and sanitation networks and practitioners in Africa and Colombia in the wake of the Covid-19 pandemic. |
Image caption (above): The mobile de-watering unit designed by CUBEX S.A.L, 2020 RELX Environmental Challenge first prize winner |
| RELX Annual report and financial statements 2020 | Corporate responsibility overview | 47 | |
|
| ||
| 48 | RELX Annual report and financial statements 2020 | Corporate responsibility | |
|
| ||
| RELX Annual report and financial statements 2020 | Corporate responsibility overview | 49 | |
|
| ||
| 50 | RELX Annual report and financial statements 2020 | Corporate responsibility | |
|
| ||
| RELX Annual report and financial statements 2020 | Corporate responsibility overview | 51 | |
|
| ||
| 52 | RELX Annual report and financial statements 2020 | Corporate responsibility | |
|
| ||
| ENVIRONMENTAL TARGETS | ||||||
| Focus area | Targets 2020 | 2020 Performance |
||||
| Climate change | Reduce Scope 1 and 2 location-based carbon emissions by 40% against a 2010 baseline | -64% | ||||
| Energy | Reduce energy and fuel consumption by 30% against a 2010 baseline | -52% | ||||
| Purchase renewable electricity equivalent to 100% of RELX’s global electricity consumption | 100% | |||||
| Waste | Decrease total waste generated at reporting locations by 40% against a 2010 baseline | -78% | ||||
| 90% of waste from reporting locations to be diverted from landfill | 93% | |||||
| Production paper* | 100% of RELX production papers, graded in PREPS, to be rated as ‘known and responsible sources’ | 100% | ||||
| Environmental Management System | Achieve ISO 14001 certification for 50% of the business by 2020 | 55% | ||||
| * | All paper we graded in 2020 – 92% of total production stock – was graded 3 or 5 stars (known and responsible sources). |
We have reported on all emission sources required under the Companies Act 2006 (Strategic Report and Directors’ Report) Regulations 2013. We have included emissions from all operating companies within the Group.
We have used the GHG Protocol Corporate Accounting and Reporting Standard (revised edition) and the data has been assured by an independent third party, Environmental data covers 12 months December to November. EY. Details on methodology and the assurance statement can be viewed in the 2020 Corporate Responsibility Report at www.relx.com/go/CRReport.
| NEW ENVIRONMENTAL TARGETS | ||||||
| Focus area |
Targets 2025 |
2019 Performance |
||||
| Climate change | Reduce Scope 1 and 2 location-based carbon emissions by 46% against a 2015 baseline | -26% | ||||
| Energy | Reduce energy and fuel consumption by 30% against a 2015 baseline | -21% | ||||
| Continue to purchase renewable electricity equivalent to 100% of RELX’s global electricity consumption | 96% | |||||
| Waste | Decrease waste sent to landfill from reporting locations to 35% below 2015 levels | -32% | ||||
| Production paper | 100% of RELX production papers to be graded in PREPS as ‘known and responsible sources’ or certified to FSC or PEFC by 2025 | 96% | ||||
| Environmental |
42% | |||||
| Management System |
Achieve Group ISO14001 certification across the business by 2025 |
|||||
| 100% of new office fit outs to achieve the RELX Sustainable Fit Out standard by 2025 | New target | |||||
The above table shows performance against the new targets using 2019 figures - the latest year in which performance was not impacted by Covid-19.
| 2020 investor and other recognition | ||||||
|
|
|
|
| |||
| Constituent of the Ethibel | CDP | Sustainalytics ESG Risk Rating | FTSE4Good Index | |||
| Sustainability Index | – Climate programme score: B | 1st percentile for | Included in | |||
| Included in | – Forest programme score: B | – Global Universe: 21 out of 13,559 | – FTSE4Good Global Index | |||
| – Excellence Europe | – Water programme score: B | – Media: 2 out of 275 | – FTSE4Good UK Index | |||
| – Excellence Global | – FTSE4Good Europe Index | |||||
|
|
|
|
| |||
| RE100 | Dow Jones Sustainability Index | ISO 14001 | STOXX Global ESG | |||
| – Member | Included in | – Certified | Leaders Indices | |||
| – Europe | – Included | |||||
| – World |
||||||
|
|
|
|
| |||
| ECPI Indices | Tortoise Responsibility100 | Workplace Pride Global | Bloomberg’s Gender-Equality | |||
| – Included | Index | Benchmark | Index | |||
| – 4th out of 100 | – Most Improved Private Sector | – Included | ||||
|
|
The use by RELX of any MSCI ESG RESEARCH LLC or its affiliates (“MSCI”) data, and the use of MSCI logos, trademarks, service marks or index names herein, do not constitute a sponsorship, endorsement, recommendation, or promotion of RELX by MSCI. MSCI SERVICES and data are the property of MSCI or its information providers, and are provided ‘as-is’ and without warranty. MSCI names and logos are trademarks or service marks of MSCI. | |||||
| MSCI ESG Ratings assessment |
||||||
| – AAA rating |
||||||

|
The full 2020 Corporate Responsibility Report is available at www.relx.com/go/CRReport |
| RELX Annual report and financial statements 2020 | Chief Financial Officer’s report | 55 | |
|
| ||
| 56 | RELX Annual report and financial statements 2020 | Financial review | |
|
| ||
| RELX Annual report and financial statements 2020 | Chief Financial Officer’s report | 57 | |
|
| ||
| 58 | RELX Annual report and financial statements 2020 | Financial review | |
|
| ||
| RELX Annual report and financial statements 2020 | Chief Financial Officer’s report | 59 | |
|
| ||
| 60 | RELX Annual report and financial statements 2020 | Financial review | |
|
| ||
| EXTERNAL RISKS | ||||
| Risk | Description and impact | Mitigation | ||
| Economy and market conditions |
Demand for our products and services may be adversely impacted by factors beyond our control, such as the economic environment in, and trading relations between, the United States, Europe and other major economies (including the evolution of the United Kingdom’s trading relationship with the European Union), political uncertainties, acts of war and civil unrest as well as levels of government and private funding provided to academic and research institutions. | Our businesses are focused on professional markets which have generally been more resilient in periods of economic downturn. We deliver information solutions, many on a subscription and recurring revenue basis, which are important to our customers’ effectiveness and efficiency. We operate diversified businesses in terms of sectors, markets, customers, geographies and products and services. We have extended our position in long-term global growth markets through organic new launches supported by the selective acquisition of small content and data sets. We continue to dispose of businesses that no longer fit our strategy. | ||
| We continuously monitor economic and political developments to assess their impact on our strategy which is designed to mitigate these risks. In response to specific uncertainties, our businesses engage in scenario planning and develop contingency plans where relevant. | ||||
| RELX Annual report and financial statements 2020 | Principal and emerging risks | 61 | |
|
| ||
| 62 | RELX Annual report and financial statements 2020 | Financial review | |
|
| ||
| STRATEGIC RISKS | ||||
| Risk | Description and impact | Mitigation | ||
| Customer acceptance of products | Our businesses are dependent on the continued demand by our customers for our products and services and the value placed on them. They operate in highly competitive and dynamic markets, and the means of delivery, customer demand for, and the products and services themselves, continue to change in response to rapid technological innovations, legislative and regulatory changes, the entrance of new competitors, and other factors. Failure to anticipate and quickly adapt to these changes, or to deliver enhanced value to our customers, could impact demand for our products and services and consequently adversely affect our revenue or the long-term returns from our investment in electronic product and platform initiatives. | We are focused on the needs and economics of our customers. We gain insights into our markets, evolving customers’ needs, the potential application of new technologies and business models, and the actions of competitors and disrupters. These insights inform our market strategies and operational priorities. We continuously invest significant resources in our products and services, and the infrastructure to support them. We leverage user centred design and development methods and customer analytics and invest in new and enhanced technologies to provide content and innovative solutions that help them achieve better outcomes and enhance productivity. | ||
| Acquisitions | We supplement our organic development with selected acquisitions. If we are unable to generate the anticipated benefits such as revenue growth and/or cost savings associated with these acquisitions this could adversely affect return on invested capital and financial condition or lead to an impairment of goodwill. | Acquisitions are made within the framework of our overall strategy, which emphasises organic development. We have a well formulated process for reviewing and executing acquisitions and for managing the post-acquisition integration. This process is underpinned with clear strategic, financial and ethical criteria. We closely monitor the integration and performance of acquisitions.
| ||
| OPERATIONAL RISKS | ||||
| Risk | Description and impact | Mitigation | ||
| Technology and business resilience |
Our businesses are dependent on electronic platforms and networks, primarily the internet, for delivery of our products and services. These could be adversely affected if our electronic delivery platforms, networks or supporting infrastructure experience a significant failure, interruption or security breach. | We have established procedures for the protection of our businesses and technology assets. These include the development and testing of business continuity plans, including IT disaster recovery plans and back-up delivery systems, to reduce business disruption in the event of major technology or infrastructure failure, terrorism or adverse weather incidents. | ||
| Face-to-face events | Face-to-face events are susceptible to economic cycles, communicable diseases, severe weather events and other natural disasters, terrorism and assignment of venues to alternative uses. Each or any of these may impact exhibitors’ and visitors’ desire and ability to travel in person to events and the availability of event venues. These factors each have the potential to reduce revenues, increase the costs of organising events and adversely affect cash flows and reputation. | We actively review our ability to host events considering the availability of venues and national and local regulations including those related to health, travel and security. Where regulations permit us to hold events, we take appropriate measures for the well being and safety of exhibitors, visitors and employees. The physical events being run are supported by enhanced digital services, including remote participation by both exhibitors and attendees. In addition, we are holding a number of standalone virtual events and are further developing and delivering complementary digital offerings in order to maintain our presence in the industry communities that we serve. | ||
| RELX Annual report and financial statements 2020 | Principal and emerging risks | 63 | |
|
| ||
| 64 | RELX Annual report and financial statements 2020 | Financial review | |
|
| ||
| FINANCIAL RISKS | ||||
| Risk | Description and impact | Mitigation | ||
| Tax | Our businesses operate globally, and our profits are subject to taxation in many different jurisdictions and at differing tax rates. The Organisation for Economic Co-operation and Development (OECD) is continuing to explore changes to the way in which profits are allocated for tax purposes between jurisdictions and other reforms with a view to obtaining consensus in 2021. As a result of the OECD’s work and other initiatives, tax laws that currently apply to our businesses may be amended by the relevant authorities or interpreted differently by them, and these changes could adversely affect our reported results. | We maintain an open dialogue with tax authorities and are vigilant in ensuring that we comply with current tax legislation. We have clear and consistent tax policies and tax matters are dealt with by a professional tax function, supported by external advisers. As outlined in the Chief Financial Officer’s report on page 58 we engage with tax authorities and international organisations. We continue to monitor further developments arising from the OECD process and consider potential impacts of proposals under various scenarios. The principles we adopt in our approach to tax matters can be found on our website at www.relx.com/go/taxprinciples. | ||
| Treasury | The RELX PLC consolidated financial statements are expressed in pounds sterling and are subject to movements in exchange rates on the translation of the financial information of businesses whose operational currencies are other than sterling. The United States is our most important market and, accordingly, significant fluctuations in the US dollar exchange rate could significantly affect our reported results. We also earn revenues and incur costs in a range of other currencies, including the euro and the yen, and significant fluctuations in these exchange rates could also significantly impact our reported results.
Macroeconomic, political and market conditions may adversely affect the availability and terms of short and long-term funding, volatility of interest rates, the credit quality of our counterparties, currency exchange rates and inflation. The majority of our outstanding debt instruments are, and any of our future debt instruments may be, publicly rated by independent rating agencies. Our borrowing costs and access to capital may be adversely affected if the credit ratings assigned to our debt are downgraded.
|
Our approach to capital structure and funding is described in the Chief Financial Officer’s report on pages 54 to 59. The approach to the management of treasury risks is described in note 18 to the consolidated financial statements. | ||
| REPUTATIONAL RISKS | ||||
| Risk | Description and impact | Mitigation | ||
| Ethics | As a global provider of professional information solutions to the STM, risk, legal and exhibitions markets we, our employees and major suppliers are expected to adhere to high standards of integrity and ethical conduct, including those related to anti-bribery and anti-corruption, fraud, sanctions, competition and principled business conduct. A breach of generally accepted ethical business standards or applicable laws could adversely affect our business performance, reputation and financial condition.
|
Our Code of Ethics and Business Conduct is provided to every employee and is supported by training and communication. It encompasses such topics as competing fairly, prohibiting corrupt business practice and fair employment practices and encouraging open and principled behaviour. We have well-established processes for monitoring, reporting and investigating instances of unethical conduct. Our major suppliers are required to adhere to our Supplier Code of Conduct.
| ||
The Strategic Report, as set out on pages 2 to 64, has been approved by the Board of RELX PLC.
| By order of the Board |
Registered Office | |
| Henry Udow |
1-3 Strand | |
| Company Secretary |
London | |
| 10 February 2021 |
WC2N 5JR |

| RELX Annual report and financial statements 2020 | 65 | |
| Governance | ||||
| In this section | ||||
| 66 |
||||
| 68 |
||||
| 70 |
||||
| 71 |
||||
| 90 |
||||
| 93 |
||||
| 115 |
||||
| 118 |
||||
| 66 | RELX Annual report and financial statements 2020 | Governance | |
|
| ||
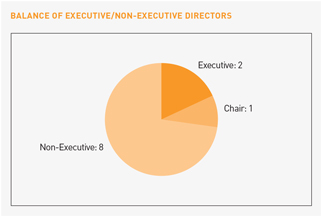
| Executive Directors | Non-Executive Directors | |||||||
|
|

|

| ||||||
|
Erik Engstrom (57) Chief Executive Officer
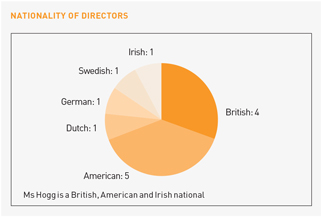
Appointed: Chief Executive Officer of RELX since November 2009. Joined as Chief Executive Officer of Elsevier in 2004. Other appointments: Non-Executive Director of Smith & Nephew plc and Bonnier Group. Past appointments: Prior to joining was a partner at General Atlantic Partners. Before that was President and Chief Operating Officer of Random House Inc and President and Chief Executive Officer of Bantam Doubleday Dell, North America. Began his career as a consultant with McKinsey. Served as a Non-Executive Director of Eniro AB and Svenska Cellulosa Aktiebolaget SCA. Education: Holds a BSc from Stockholm School of Economics, an MSc from the Royal Institute of Technology in Stockholm, and gained an MBA from Harvard Business School as a Fulbright Scholar. Nationality: Swedish |
Sir Anthony Habgood (74)
Chair
Appointed: June 2009 Other appointments: Chair of Preqin Holding Limited and Deputy Chair of RG Carter Holdings Limited. Past appointments: Previously was Chair of the Court of the Bank of England, Whitbread plc, Bunzl plc, Mölnlycke Health Care Limited and Norwich Research Partners LLP and served as Chief Executive of Bunzl plc, Chief Executive of Tootal Group plc and a Director of The Boston Consulting Group. Formerly Non-Executive Director of Geest plc, Marks and Spencer plc, National Westminster Bank plc, Powergen plc, SVG Capital plc, and Norfolk and Norwich University Hospitals Trust. Education: Holds an MA in Economics from Cambridge University, an MS in Industrial Administration from Carnegie Mellon University and an Honorary Doctorate of Civil Law from the University of East Anglia. He is a visiting Fellow at Oxford University. Nationality: British |
June Felix (64)
Non-Executive Director
Appointed: October 2020 Other appointments: Chief Executive Officer of IG Group Holdings plc. Member of the Board of Advisers of the London Technology Club. Past appointments: Served as a Non-Executive Director of IG Group Holdings plc from 2015 until the time of her appointment as Chief Executive Officer in October 2018. Previously she held various executive management positions at a number of large multinational businesses in Hong Kong, London and New York, including Verifone, IBM, Citibank and Chase Manhattan. Earlier in her career, June was a strategy consultant with Booz Allen Hamilton. Nationality: American | ||||||
|
|

|

| ||||||
|
Nick Luff (53) Chief Financial Officer
Appointed: September 2014 Other appointments: Non-Executive Director of Rolls-Royce Holdings plc. Past appointments: Prior to joining the Group was Group Finance Director of Centrica plc from 2007. Before that was Chief Financial Officer at The Peninsular & Oriental Steam Navigation Company (P&O) and its affiliated companies, having previously held a number of senior finance roles at P&O. Began his career as an accountant with KPMG. Formerly a Non-Executive Director of QinetiQ Group plc and Lloyds Banking Group plc. Education: Has a degree in Mathematics from Oxford University and is a qualified UK Chartered Accountant. Nationality: British
|
Wolfhart Hauser
(71)
Non-Executive Director Senior Independent Director Chair of the Remuneration Committee
Appointed: April 2013 Other appointments: Non-Executive Director of Associated British Foods plc. Past appointments: Chair of FirstGroup plc until July 2019. Chief Executive Officer of Intertek Group plc from 2005 until 2015. Prior to that he was Chief Executive Officer of TÜV Sud AG between 1998 and 2002 and Chief Executive Officer of TÜV Product Service GmbH for ten years. Formerly a Non-Executive Director of Logica plc. Education: Holds a master’s degree in Medicine from Ludwig-Maximilian- University Munich and a Medical Doctorate from Technical University Munich. Nationality: German
|
Charlotte Hogg
(50)
Non-Executive Director
Appointed: December 2019 Other appointments: Executive Vice President and Chief Executive Officer for the European Region of Visa Inc. Executive Director of Visa Europe Limited. Non-Executive Director of NowTeach and a Director of Kettlethorpe Sport Horses Limited. Past appointments: Chief Operating Officer at the Bank of England. Before that Head of Retail Banking for Santander UK, Managing Director UK and Ireland for Experian plc, and held senior roles at Morgan Stanley in New York and London. Nationality: British, American and Irish |
| RELX Annual report and financial statements 2020 | Board Directors | 67 | |
|
| ||
| 68 | RELX Annual report and financial statements 2020 | Governance | |
|
| ||

| Mark Kelsey | Kumsal Bayazit | Mike Walsh | Hugh M Jones IV | |||
| Chief Executive Officer | Chief Executive Officer | Chief Executive Officer | Chief Executive Officer | |||
| Risk | Scientific, Technical | Legal | Exhibitions | |||
| & Medical and Chair, | ||||||
| RELX Technology Forum | ||||||
|
|
|
|
| |||
| Joined in 1983. Appointed to current position in 2012. |
Joined in 2004. Appointed to current position in 2019. |
Joined in 2003. Appointed to current position in 2011. |
Joined in 2011. Appointed to current position in 2020. | |||
| Has held a number of senior positions across the Group over the past 30 years. Previously Chief Operating Officer and then Chief Executive Officer of Reed Business Information. Studied at Liverpool University and received his MBA from Bradford University. | Previously President, Exhibitions Europe, Chief Strategy Officer, RELX, and Executive Vice President of Global Strategy and Business Development for LexisNexis. Prior to that worked with Bain & Company in New York, Los Angeles, Johannesburg and Sydney. Holds an MBA from Harvard Business School and is a graduate of the University of California at Berkeley. | Previously CEO of LexisNexis US Legal Markets and Director of Strategic Business Development Home Depot. Prior to that was a practising attorney at Weil, Gotshal and Manges in Washington DC and served as a consultant with The Boston Consulting Group. Holds a Juris Doctor degree from Harvard Law School and is a graduate of Yale University. | Previously Group Managing Director, Accuity, ICIS, Cirium, and EG within Risk. Prior to that was Chief Executive Officer, Accuity. Holds an MBA from the Ross School of Business at the University of Michigan and is a graduate of Yale University. | |||
| RELX Annual report and financial statements 2020 | RELX Senior Executives | 69 | |
|
| ||
| RELX Annual report and financial statements 2020 | 71 | |
|
| ||
| 72 | RELX Annual report and financial statements 2020 | Governance | |
|
| ||
| RELX Annual report and financial statements 2020 | Corporate Governance Review | 73 | |
|
| ||
| 74 | RELX Annual report and financial statements 2020 | Governance | |
|
| ||
|
Board Committees
The structure of the Board’s main Committees and a
summary of their key responsibilities are set out below. All of the Committees have written Terms of Reference, which are available on our website,
Board Committees are principally supported by the Chief Executive Officer, Chief Financial Officer, Chief Legal Officer and Company Secretary, and the Chief Human Resources Officer, although senior managers within the Group are invited to attend meetings where appropriate. The Board’s annual programme and the agendas for the Committees are prepared by their respective Chairs with support from the Company Secretary.
|
||||
| RELX Annual report and financial statements 2020 | Corporate Governance Review | 75 | |
|
| ||
| 76 | RELX Annual report and financial statements 2020 | Governance | |
|
| ||
| RELX Annual report and financial statements 2020 | Corporate Governance Review | 77 | |
|
| ||
| 78 | RELX Annual report and financial statements 2020 | Governance | |
|
| ||
Stakeholder engagement
During the year, the Board considered our key stakeholders as a specific agenda item, and concluded that our list of key stakeholders remains unchanged from 2019, as set out below. It also confirmed that it had adequate visibility of the views of key stakeholders and considered these in its decision-making. Further detail on the nature and results of RELX’s engagement with its key stakeholders is included throughout our 2020 Corporate Responsibility Report.
| Stakeholder: Investors
| ||
| Why effective engagement is important: | Engagement with our investors helps them to understand our strategy, performance and governance arrangements, and to make informed and effective investment decisions concerning RELX. It also makes clear our prioritisation of the long-term in our decision-making and focus on delivery of consistent financial performance. Our investors provide us with input and feedback concerning the development and implementation of our strategy, and we consider their views when making investment decisions.
| |
| Principal forms of engagement with our investors in 2020, the outcomes of this engagement, how this is fed back to the Board, and how it impacted Board decision- making in 2020: | Engagement with our investors is undertaken by the Chair, the Senior Independent Director, Chief Executive Officer, Chief Financial Officer, Head of Investor Relations and the Director of Corporate Responsibility, as well as through our dedicated Investor Relations, Corporate Responsibility and Treasury teams. The Board receives regular updates on these interactions, which include key issues raised by investors, and discussions and outcomes from the completion of investor roadshows and ad hoc meetings with institutional shareholders on significant issues and our recent and proposed activities. The Board also receives an update on investor relations as a standing item at its meetings which includes: the Group’s share price performance, its total shareholder return performance and a review of analyst comments made in response to our scheduled results releases. RELX’s material communications to its investors, such as its trading results and updates, other regulatory announcements, our Annual Report and Accounts and Notice of AGM must be reviewed and approved by the Board under our corporate governance framework. As an alternative to direct interactions at the AGM, the Board encouraged shareholders to submit questions prior to it taking place. A number of questions were received and answered during the Chair’s audiocast on the day of the meeting.
Our engagement processes confirmed that RELX’s strategic and financial priorities are well understood by investors. They generally appreciate the consistency of RELX’s strategy, and our focus on the organic development of information-based analytics and decision tools that deliver enhanced value to our professional and business customers. The Board considered this when approving the RELX three-year strategy plan for 2021-2023, which leaves our strategic focus (as set out on page 72), and our priority use of cash generated by the Group, broadly unchanged. The Board also reviewed investor views on strategy when approving investment decisions, including those relating to new or emerging technologies, or acquisitions which were completed in 2020. Our investors’ focus has been on the impact of Covid-19 in four key areas: the resilience of our business model and any long-term impact of Covid-19; the in-year and future performance of our businesses; ensuring that RELX has sufficient liquidity and balance sheet strength to be viable over the long-term; and shareholder returns through our interim and final dividends, and our share buyback programme. Our investors vary substantially in their reasons for investing in RELX and in their appetite for risk. The Board considered these differing interests in its decision-making during the year.
The Group’s response to investor interest regarding the performance of our businesses was considered and addressed by the Board in its approval of our full-year and interim results announcements, and quarterly updates to the market. These highlighted the resilience of our Scientific, Technical & Medical (STM), Risk and Legal businesses, which held up well in the face of the pandemic, with good growth in electronic revenues, whilst acknowledging the significant current and future disruption faced by our Exhibitions business as a result of Covid-19 and associated restrictions put in place at a local level. In respect of our shareholder returns, the Board considered a range of investor and analyst views, balancing the impact of returns against stakeholder interests in other key RELX financial metrics. As a result of its deliberations, the Board declared an 2020 interim dividend of 13.6p per share (unchanged from the 2019 interim dividend rate), a final dividend of 33.4p per share, and suspended the Group’s share buyback programme, having completed £150m of the £400m initially approved at the beginning of 2020.
Similarly, in making the decision to issue debt securities in the first half of the year, the Board considered investor views and risk appetite relating to the Group’s viability, security of funding, liquidity and balance sheet strength. As a result, all of the Group’s debt security issuances were issued or put in place in the first half of 2020, giving the Group ample liquidity and balance sheet strength, and providing further comfort to the Directors when approving the Group’s 2020 Going Concern and Viability Statements.
The Board has also considered the views of the wider investment community when approving areas of focus for RELX’s environmental, social and governance activities, including actions that RELX can take to mitigate against the impact of climate change. It also considered RELX’s approach to compliance with the requirements of the Task Force on Climate-Related Financial Disclosures as a standalone agenda item for the first time in 2020.
| |
| RELX Annual report and financial statements 2020 | Corporate Governance Review | 79 | |
|
| ||
| 80 | RELX Annual report and financial statements 2020 | Governance | |
|
| ||
| Stakeholder: Customers
| ||
| Why effective engagement is important: | Our goal is to help customers make better decisions, get better results and be more productive. We can only do this by leveraging a deep understanding of their needs and views to create innovative solutions, which combine content and data with analytics and technology in global platforms. Collaborating closely with our customers allows us to understand where and how we can improve the quality of services and products which we provide them with, and ensures that we make accurate and targeted investment decisions (such as for developing new or emerging technologies or complementing our existing capabilities through acquisition activity). Customer acceptance of products is set out as a principal risk on page 62. Regular engagement with our customers has also remained extremely important at a time when many have been affected, to varying degrees, by Covid-19.
| |
| Principal forms of engagement with our customers in 2020, the outcomes of this engagement, how this is fed back to the Board, and how it impacted Board decision- making in 2020: | Our engagement with customers during the year took place mainly at an operational level within our business areas through face-to-face (where local law permitted this) and virtual meetings, customer training and workshops, ongoing dialogue through our dedicated sales and operations teams, customer relationship managers, and in respect of material customer issues, through our business area senior management teams. The Board received a number of online presentations during the year from customer-facing employees which detailed the nature of our customer engagement and the actions taken by the business areas as a result. In particular in 2020, the Board received regular reports from senior management on the impact of Covid-19 on key customers, including analysis by sector and geography, and their current and anticipated future demand for our products and services. The Board also received feedback concerning the resilience of the markets that we operate in over the short-term and, where relevant, the likelihood and rate of their recovery over the longer term. In addition, the Board reviewed customer survey data, Net Promoter Scores and customer usage volumes across our business areas.
There were few Board decisions made during the year which were not directly or indirectly linked to the future needs of our customers, or which resulted from their past and present demand for our products. Engagement with our customers confirmed that there is significant disparity in the extent to which they have been affected by Covid-19. The engagement feedback provided has assisted the Board in maintaining its understanding of customer and market trends, issues and likely future needs, and how these can be addressed. It was considered as part of Board strategy-related discussions during the year, and resulted in our strategic objectives remaining unchanged, as part of the Board’s approval of the three-year strategy plan for 2021-2023. Feedback from our customers also helped the Board and management to assess at what pace and in which areas RELX should build out new products and services, and where it should look to expand into higher growth adjacencies and geographies over varying time horizons. Customer demand impacts our financial performance, and was also considered by the Board in setting appropriate financial targets for 2021, assessing the amount of investment required for RELX to be able to meet its customers’ current and future needs, and for RELX to grow its customer base and market share across its business areas. It also helped management and the Board to recognise and identify areas requiring cost rationalisation.
Customer-related views, behaviours and profiles also assisted management and the Board in considering selected acquisitions of targeted data sets, analytics and assets in high-growth markets that support high-growth strategies, and which are natural additions to our existing businesses. As a result of these reviews, areas were identified in which potential acquisitions could supplement our customer offerings in certain sectors. Whilst a number of acquisitions and disposals were completed without requiring Board approval due to the level of consideration being paid or received for the target, the Board approved four significant acquisitions which completed in 2020. The first of these was SciBite, a provider of big data analytics for the pharmaceutical and healthcare industries, which will help our customers make faster, more effective research and development- based decisions through access to advanced text and data intelligence solutions. It also approved the acquisition of Shadow Health, a developer of virtual simulations in nursing and healthcare education, extending our extensive portfolio of digital health solutions available to our customers. The Board also approved acquisitions to complement our existing fraud prevention services within our Risk business. These included ID Analytics, a provider of credit and fraud risk solutions, and Emailage, a provider of email-based fraud prevention solutions.
| |
| RELX Annual report and financial statements 2020 | Corporate Governance Review | 81 | |
|
| ||
| 82 | RELX Annual report and financial statements 2020 | Governance | |
|
| ||
| Stakeholder: Community
| ||
| Why effective engagement is important: | Our focus on community includes those where we, our customers and suppliers work around the world, as well as the communities we serve, including in science, academia, risk, law and many other fields. We prioritise positive dialogue with our community stakeholders; they collectively provide our ‘licence to operate’. Our efforts are informed by our commitment to the United Nations Global Compact and its ten principles focused on human rights, labour, the environment and anti-corruption - all issues with wide societal impact.
| |
| Principal forms of engagement with the community in 2020, the outcomes of this engagement, how this is fed back to the Board, and how it impacted Board decision- making in 2020: | We contribute to our communities through our unique contributions to society (see pages 40 to 44), and through a comprehensive global community programme, RELX Cares. The RELX Cares mission is education for disadvantaged young people that aligns with our unique contributions including promoting science and health, protection of society, the rule of law and access to justice and fostering communities. RELX Cares promotes employee volunteering and each year staff have two days paid leave in order to undertake community work. A network of over 230 RELX Cares Champions across the Group ensures the vibrancy of this community engagement. In the wake of Covid-19, our people worked primarily from home, with limited opportunities for in-person, communal volunteer activities. In spite of this, responding to the pandemic was a key concentration and 26% of employees volunteered in the year, contributing 6,821 days in company time.
RELX Cares also features philanthropic giving. Given the challenge facing charities in an unprecedented year, we decided to suspend our usual funding application process. Instead, RELX Cares Champions allocated its budget to charities we funded in 2019 and 2018, allowing them to use the grants to aid their sustainability, including funds for both operational and project costs.
In accordance with the Business for Societal Impact model, we monitor the short- and long-term benefit of our community engagement. To increase transparency and awareness, we ask beneficiaries to report on their progress, sharing feedback on a RELX Cares section of our corporate internet. In addition, we survey RELX Cares volunteers to understand the impact of the programme on their personal development and how it affects the way they feel about working at RELX.
Another cornerstone of our community engagement is information provision. In 2020, this included making scientific articles, data and news, useful in the fight against coronavirus, freely available and aggregated on the RELX SDG Resource Centre. These included Elsevier’s Novel Coronavirus Centre with the latest medical and scientific information on Covid-19; LexisNexis Risk Solutions’ data set and interactive visualisations that provide insights on vulnerable populations and care capacity risks; and LexisNexis Legal and Professional’s coronavirus global media and news tracker with interactive charts. RELX also contributed to the World Health Organization’s Solidarity Response Fund and worked with Global Citizen to support the organisation’s major televised and live-stream event, One World: Together At Home.
Elsevier is a founding partner and leading contributor to Research4Life, providing a quarter of the material available. In 2020, there were over 1.1m Research4Life downloads from ScienceDirect, benefitting researchers in low- and middle-income countries. In the year, the Elsevier Foundation worked to improve access to healthcare and science in vulnerable communities and the LexisNexis Rule of Law Foundation supported projects that advance access to justice. LexisNexis Risk Solutions advanced pilots using its tools to help qualified citizens gain access to credit in Mexico and Colombia.
Responsibility for updating the Board on community engagement sits with the Chief Executive Officer. He is supported in this activity by the Group Head of Corporate Responsibility who in 2020 provided comprehensive feedback on RELX Cares and other activities to the Board, including key metrics, objectives and outcomes. Board feedback and support for community engagement shapes the direction of the programme and future plans which include evaluating the impact of the pandemic on volunteering and new ways to promote distance volunteering.
| |
| RELX Annual report and financial statements 2020 | Corporate Governance Review | 83 | |
|
| ||
| 84 | RELX Annual report and financial statements 2020 | Governance | |
|
| ||
Division of responsibilities
| Key roles of the Directors
Chair ◾ Provides leadership of the Board, and is responsible for its overall effectiveness in directing the Company
◾ Ensures that all Directors are sufficiently apprised of matters to make informed judgements, through the provision of accurate, timely and clear information
◾ Promotes high standards of corporate governance, demonstrates objective judgement and promotes a Board culture of openness and debate
◾ Sets the agenda and chairs meetings of the Board
◾ Chairs the Nominations and Corporate Governance Committees
◾ Facilitates constructive Board relations and the effective contribution of all of the Directors
◾ Ensures effective dialogue with shareholders
◾ Ensures the performance of the Board, its Committees and individual Directors is assessed annually
◾ Ensures effective induction and development of Directors
Chief Executive Officer ◾ Day-to-day management of the Group, within the delegated authority limits set by the Board
◾ Develops the Group’s strategy for consideration and approval by the Board
◾ Ensures that the decisions of the Board are implemented
◾ Informs and advises the Chair and Nominations Committee on executive succession planning
◾ Leads communication with shareholders
◾ Promotes and conducts the affairs of the Company with the highest standards of integrity, probity and corporate governance
|
Chief Financial Officer ◾ Day-to-day management of the Group’s financial affairs
◾ Responsible for the Group’s financial planning, reporting and analysis
◾ Ensures that a robust system of internal control and risk management is in place
◾ Maintains high-quality reporting of financial and environmental performance internally and externally
◾ Supports the Chief Executive Officer in developing and implementing strategy
Senior Independent Director ◾ Leads the Board’s annual assessment of the performance of the Chair
◾ Available to meet with shareholders on matters where usual channels are deemed inappropriate
◾ Deputises for the Chair, as necessary
◾ Serves as a sounding board for the Chair and acts as an intermediary between the other Directors, when necessary
Non-Executive Directors ◾ Bring an external perspective, and constructively challenge and provide advice to the Executive Directors
◾ Effectively contribute to the development of strategy
◾ Scrutinise the performance of management in meeting agreed goals and monitor the delivery of the Group’s strategy
◾ Serve as members of Board Committees and chair the Audit and Remuneration Committees | |
Chair and Chief Executive Officer
There is a clear separation of the roles of the Chair, who leads the Board, and the Chief Executive Officer, who is responsible for the day-to-day management of the Group, which are set out in writing and included above. The table above also illustrates the key responsibilities of the other Directors. This division of responsibilities, in addition to the matters reserved for the Board, Terms of Reference for each Board Committee and delegated authorities in place from the Board to the Chief Executive Officer and other Senior Executives which relate to the day-to-day management of the business, ensures that there are appropriate controls in place to prevent any individual from having unfettered powers of decision.
| RELX Annual report and financial statements 2020 | Corporate Governance Review | 85 | |
|
| ||
| 86 | RELX Annual report and financial statements 2020 | Governance | |
|
| ||
| RELX Annual report and financial statements 2020 | Corporate Governance Review | 87 | |
|
| ||
| 88 | RELX Annual report and financial statements 2020 | Governance | |
|
| ||
| RELX Annual report and financial statements 2020 | Corporate Governance Review | 89 | |
|
| ||
| RELX Annual report and financial statements 2020 | Report of the Nominations Committee | 91 | |
|
| ||
| 92 | RELX Annual report and financial statements 2020 | Governance | |
|
| ||
| RELX Annual report and financial statements 2020 | 93 | |
|
| ||
| 94 | RELX Annual report and financial statements 2020 | Governance | |
|
| ||
Broader employee considerations
In 2020, the Committee reviewed information on workforce remuneration and related policies, including:
| ◾ | key statistics on the composition of the RELX workforce such as location, gender, age and length of service; |
| ◾ | pay philosophy and the evolution of our pay practices, including pay equity processes; |
| ◾ | annual salary increase guidelines globally; |
| ◾ | details of the pension plan arrangements in our top five countries by number of employees; |
| ◾ | participation data on annual incentives (sales and non-sales) and share plans; |
| ◾ | Employee Opinion Survey responses and outcomes of pulse surveys conducted during the year, notably during the pandemic, to assess employees’ well-being and monitor the Company’s culture. |
When determining the remuneration for Executive Directors and Senior Executives, the Committee considers business and individual performance as well as other factors including broader employee reward.
The Committee is satisfied that the overall remuneration for Executive Directors is appropriate and fair having considered external and internal relativities.
The Committee is satisfied that the incentive schemes drive the desired behaviours to support the Company’s purpose, values and strategy.
Our designated Non-Executive Director responsible for workforce engagement, Marike van Lier Lels, met with employee representatives from Europe, US and Asia Pacific during 2020 in order to understand a wide range of employee views. She reported back to the Board and the feedback and insights gathered formed part of the Board’s discussions and decision-making. Further information on the workforce engagement process is provided in the Governance section on page 79. As part of this process, the changes to the Executive Directors’ Remuneration Policy and how executive remuneration aligns with wider pay policy were explained.
Remuneration Policy and implementation
An updated Remuneration Policy was approved by shareholders at the 23 April 2020 Annual General Meeting with 93.4% votes in favour. I would like to express again my gratitude for the feedback received during the engagement as we were developing the policy and for the high level of support for the new policy. The remuneration policy, which applies for three years from the conclusion of the 2020 AGM, as approved by shareholders, is set out on pages 108 to 114 of this report. The first awards under the new policy will be granted in the first quarter of 2021. The 2020 awards are subject to the policy approved by shareholders at the 2017 Annual General Meetings which can be found at www.relx.com or on pages 84 to 90 of the 2016 Annual Reports and Financial Statements.
Shareholders will be invited to vote (by way of an advisory vote) on the 2020 Annual Remuneration Report at the 2021 AGM.
Implementation of Remuneration Policy in 2021
In line with increases for the wider employee population, and consistent with the 2021 salary increase guidelines for UK-based employees, the Committee has approved 2021 salary increases for the Executive Directors of 2.5%.
As outlined in the 2019 report, the main changes for 2021 are summarised below. See further details on page 106.
| ◾ | The value of pension benefits for the CEO and CFO has decreased over the last several years, prior to the new UK Corporate Governance Code coming into force and will continue to do so, so that the value of their pension benefits will be aligned with the regular defined contribution plans (currently capped at 11% in the UK) by the end of 2022. The CEO is a member of a legacy defined benefit scheme and pays increasing participation fees (30% in 2021) and will cease to accrue further benefits under this scheme at the end of 2022. The CFO’s cash in lieu of pension is reduced to 18% of base salary for 2021 and will continue to decrease until the end of 2022. Further details can be found on page 100. |
| ◾ | The Annual Incentive Plan (AIP) payout at target performance is reduced from 150% to 135% of base salary. The maximum remains at 200% of base salary. The proportion of AIP deferred into shares for three years increases from one-third to 50% of the AIP earned. |
Alignment of incentives with strategy
Our long-term strategic priority is unchanged: the organic development of increasingly sophisticated information-based analytics and decision tools that deliver enhanced value to our customers, supplemented by selective acquisitions of targeted data, analytics and exhibition assets that support our organic growth strategies.
The performance measures in the incentive plans align with the strategy and the financial key performance indicators on page 6 of the annual report, by focusing on sustained earnings growth, return on invested capital and shareholder returns in the LTIP. The AIP is based on revenue, profit, cash flow and sustainability metrics and focuses on annual objectives and milestones and creates a platform for sustainable future performance.
The Committee also considers broader performance factors when determining payouts.
The performance measures are based on adjusted figures as they provide relevant information in assessing the Company’s performance, position and cash flows and we believe they track the core operational performance of RELX and how it contributes to shareholder value creation. The Annual Report includes a reconciliation of adjusted measures to IFRS measures.
Wolfhart Hauser
Chair, Remuneration Committee
| RELX Annual report and financial statements 2020 | Directors’ Remuneration Report | 95 | |
|
| ||
| 96 | RELX Annual report and financial statements 2020 | Governance | |
|
| ||
| 2020 Annual Incentive |
Early in the year as the pandemic started to take hold, the Committee considered that whilst the AIP targets for each business would remain unchanged, it was important that the three largest business areas continued to be managed consistently with their own best business interests and strategy for consistent growth, without incentives to curtail investments or take other actions in an effort to mitigate the Covid-19 pandemic’s effects on Exhibitions. The Committee determined to separate the performance of RELX excluding Exhibitions from the performance of Exhibitions in the AIP, assigning a weight of 85% for RELX excluding Exhibitions and 15% for Exhibitions, reflecting their respective weight in revenue and profit in 2019. The Committee also determined to set a cap on the payout on financial measures at 85% of target in case Exhibitions did not meet threshold performance.
Set out below is a summary of performance against each financial and non-financial measure and the resulting payout for 2020:
| Erik Engstrom | Nick Luff | |||||||||||||||||||||||||||||||||
| Relative weighting |
Financial targets (1) | Weighted Payout % of target |
Weighted Payout % of target |
|||||||||||||||||||||||||||||||
| Performance measure | Threshold | Target | Maximum | Achievement | Achievement % vs target |
Payout % vs target |
||||||||||||||||||||||||||||
| Revenue |
||||||||||||||||||||||||||||||||||
| RELX excl Exhibitions |
25.5% | 6,512 | 6,928 | 7,275 | 6,748 | 97.4% | 61.0% | 15.6% | 15.6% | |||||||||||||||||||||||||
| Exhibitions |
4.5% | 1,264 | 1,345 | 1,412 | 362 | 0% | 0% | 0% | 0% | |||||||||||||||||||||||||
| Revenue – Total |
30.0% | 51.9% | 15.6% | 15.6% | ||||||||||||||||||||||||||||||
| Adjusted net profit after tax |
||||||||||||||||||||||||||||||||||
| RELX excl Exhibitions |
25.5% | 1,553 | 1,652 | 1,734 | 1,675 | 101.4% | 114.0% | 29.1% | 29.1% | |||||||||||||||||||||||||
| Exhibitions |
4.5% | 258 | 274 | 288 | (132) | 0% | 0% | 0% | 0% | |||||||||||||||||||||||||
| Adj net profit after tax – Total |
30.0% | 96.9% | 29.1% | 29.1% | ||||||||||||||||||||||||||||||
| Cash flow |
||||||||||||||||||||||||||||||||||
| RELX excl Exhibitions |
25.5% | 1,965 | 2,090 | 2,195 | 2,222 | 106.3% | 150.0% | 38.3% | 38.3% | |||||||||||||||||||||||||
| Exhibitions |
4.5% | 296 | 315 | 331 | (213) | 0% | 0% | 0% | 0% | |||||||||||||||||||||||||
| Cash flow – Total |
30.0% | 127.5% | 38.3% | 38.3% | ||||||||||||||||||||||||||||||
| Financial measures |
90.0% | 92.1% | 82.9% | 82.9% | ||||||||||||||||||||||||||||||
| Impact of cap on payout (2) |
85.0% | 76.5% | 76.5% | |||||||||||||||||||||||||||||||
| Non-financial measures |
10% | |
A detailed description of the non-financial measures and achievement against those is set out on the next page. |
|
9.5% | 9.5% | ||||||||||||||||||||||||||||
| Total |
100% | 86.0% | 86.0% | |||||||||||||||||||||||||||||||
| Total AIP payout as % of salary |
||||||||||||||||||||||||||||||||||
| Cash |
100% | 86.0% | 86.0% | |||||||||||||||||||||||||||||||
| Deferred Shares |
50% | 43.0% | 43.0% | |||||||||||||||||||||||||||||||
| Total |
150% | 129.0% | 129.0% | |||||||||||||||||||||||||||||||
| (1) | On an equivalent basis (at actual exchange rates and after the net impact of acquisitions and disposals completed) |
| (2) | When targets were set, a cap on payout versus target for financial measures was set at 85% if Exhibitions fell below threshold performance. |
Some figures add up to different amounts than the totals due to rounding.
The Cash AIP (£1,100,873 for the CEO and £648,269 for the CFO) will be paid in Q1 2021 and the Deferred Shares (with a current value of £550,436 in the case of the CEO and £324,134 in the case of the CFO) will be released in Q1 2024. The release of Deferred Shares is not subject to any further performance conditions but is subject to malus and claw-back.
| RELX Annual report and financial statements 2020 | Directors’ Remuneration Report | 97 | |
|
| ||
| 98 | RELX Annual report and financial statements 2020 | Governance | |
|
| ||
| 2018–2020 LTIP | ||||||||||||||||||
| Set out below is a summary of performance against each measure of the LTIP cycle 1 January 2018–31 December 2020. As highlighted earlier, the targets remained unchanged from when these were set at the beginning of 2018.
| ||||||||||||||||||
| Performance measure | Weighting | Performance range and vesting levels set at grant(1) |
Achievement against the performance range |
Resulting vesting percentage | ||||||||||||||
| TSR over the three-year | 20% | below median | 0% | between median and | 30.2% | |||||||||||||
| performance period(2) | median | 25% | upper quartile of the | |||||||||||||||
| upper quartile | 100% | UK and European groups | ||||||||||||||||
| and below median of the | ||||||||||||||||||
| US peer group | ||||||||||||||||||
| Average growth in adjusted EPS over | 40% | below 5% p.a. | 0% | below threshold | 0% | |||||||||||||
| the three-year performance period (3) | 5% p.a. | 25% | ||||||||||||||||
| 6% p.a. | 50% | |||||||||||||||||
| 7% p.a. | 65% | |||||||||||||||||
| 8% p.a. | 75% | |||||||||||||||||
| 9% p.a. | 85% | |||||||||||||||||
| 10% p.a. | 92.5% | |||||||||||||||||
| 11% p.a. and above | 100% | |||||||||||||||||
| ROIC in the third year of the | 40% | below 12.0% | 0% | below threshold | 0% | |||||||||||||
| performance period (3) | 12.0% | 25% | ||||||||||||||||
| 12.4% | 50% | |||||||||||||||||
| 12.8% | 65% | |||||||||||||||||
| 13.2% | 75% | |||||||||||||||||
| 13.6% | 85% | |||||||||||||||||
| 14.0% | 92.5% | |||||||||||||||||
| 14.4% and above | 100% | |||||||||||||||||
| Total vesting percentage: | 6.0% | |||||||||||||||||
| (1) | Calculated on a straight-line basis for performance between the points. |
| (2) | In respect of the euro TSR comparator group, RELX NV shares were, subsequent to the merger of RELX NV into RELX PLC, replaced with Euronext Amsterdam listed RELX PLC shares priced in euros and, in respect of the US dollar TSR comparator group, RELX NV ADRs were, subsequent to the merger, replaced with RELX PLC ADRs. |
| (3) | Growth in adjusted EPS at constant currencies and ROIC are calculated as set out in the Chief Financial Officer’s report on pages 54 to 59 and note 10 to the consolidated financial statements on page 152, with adjustments made to remove the effect on ROIC of changes in exchange rates, pension deficits and accounting standards over the three-year performance period. |
| RELX Annual report and financial statements 2020 | Directors’ Remuneration Report | 99 | |
|
| ||
| 100 | RELX Annual report and financial statements 2020 | Governance | |
|
| ||
Total pension entitlements (audited)
Erik Engstrom is a member of the legacy UK defined benefit pension plan. He will cease to accrue benefits under this plan at the end of 2022, at which point he will receive pension benefits of equivalent value to the level of pension benefits provided under the Company’s regular defined contribution pension plans as may be in effect or amended from time to time (currently capped at 11% of base salary in the UK). Mr Engstrom’s contributions and participation fee (together, the Total Plan Fees), which are payable by him as part of his ongoing membership of the scheme, have been increasing annually since 2011. In 2020, his Total Plan Fees were slightly over 25% of his pensionable earnings (£331,100), up from 20% in 2019 and 12.5% in 2018. His Total Plan Fees will increase to 30% of pensionable earnings in 2021 and 35% in 2022. Mr Engstrom is also subject to a cap of 2% on annual increases in pensionable earnings.
Nick Luff receives a cash allowance in lieu of pension, which reduced from 27% of salary to 25% on 1 March 2019, 20% on 1 January 2020, 18% on 1 January 2021 and will reduce to 16% of salary on 1 January 2022, and from the end of 2022, Mr Luff will receive pension benefits of equivalent value to the level of pension benefits provided under the Company’s regular defined contribution pension plans as may be in effect or amended from time to time (currently capped at 11% of base salary in the UK).
Erik Engstrom – pension information
| Age at December 2020 | Normal retirement age | CEO’s Total Plan Fees | Accrued annual pension at 31 December 2020 |
2020 single figure pensions value | ||||
| 57 |
60 | £331,100 | £551,439 | £536,474(1) |
| (1) | The 2020 single figure pensions value is the difference between the accrued annual pension as at 31 December 2019 (adjusted for inflation) and the accrued annual pension as at 31 December 2020, multiplied by 20 in accordance with the UK Regulations and is net of the CEO’s Total Plan Fees. |
Scheme interests awarded during the financial year (audited)
| LTIP – PERFORMANCE SHARE AWARDS | ||||||||||||
| Basis on which award is made |
Face value of award at grant(1) | Value of awards if vest in line with expectations(2) | Percentage of maximum that would be received if threshold performance achieved |
End of performance period | ||||||||
| Erik Engstrom | 450% of salary | £5,619,874 | £2,809,937 | If each measure pays out at | 31 December | |||||||
| Nick Luff | 375% of salary | £2,757,793 | £1,378,896 | threshold, the overall payout is 25% | 2022 | |||||||
| AIP – DEFERRED SHARES | ||||||||||||
| Erik Engstrom | 1/3 of 2019 AIP payout | £637,853 | N/A. The release of AIP Deferred Shares in Q1 2023 is not subject to any | |||||||||
| Nick Luff | 1/3 of 2019 AIP payout | £374,687 | further performance conditions, but is subject to malus and claw-back. | |||||||||
| (1) | The face value of the LTIP awards and AIP Deferred Shares granted in February 2020 was calculated using the middle market quotation of a PLC ordinary share (£20.725). This share price was used to determine the number of awards granted. |
| (2) | Vesting in line with expectations for LTIP is as per the performance scenario chart disclosed on page 87 of the 2016 Remuneration Report, i.e. 50%. |
The LTIP awards granted in 2020 are based on ROIC, EPS and TSR weighted 40%:40%:20% respectively and assessed independently.
The targets and vesting scales applicable to these awards are set out on page 110 of the 2019 Remuneration Report.
| RELX Annual report and financial statements 2020 | Directors’ Remuneration Report | 101 | |
|
| ||
| 102 | RELX Annual report and financial statements 2020 | Governance | |
|
| ||
Multi-year incentive interests (audited)
The tables below and on page 103 set out vested but unexercised and unvested options, unvested share awards and AIP deferred shares held by the Executive Directors including details of awards granted, options exercised and awards vested during the year of reporting.
All outstanding unvested options and share awards are subject to performance conditions. For disclosure purposes, any PLC ADRs awarded under the multi-year incentive plans are included as ordinary shares. Between 31 December 2020 and the date of this Report, there have been no changes in the options or share awards held by the Executive Directors.
Erik Engstrom
| OPTIONS | Year of grant |
No. of options held on 1 Jan 2020 |
No. of options 2020 |
Option price on date of grant |
No. of options 2020 |
Market price per |
No. of options held on 31 Dec 2020 |
Unvested options vesting on |
Options exercisable until |
|||||||||||||||||||||||||||||||||||||||||||||||||||||||||||
| 2014 | 145,604 | £9.245 | 145,604 | 07 Apr 24 | ||||||||||||||||||||||||||||||||||||||||||||||||||||||||||||||||
| 158,166 | €10.286 | 158,166 | 07 Apr 24 | |||||||||||||||||||||||||||||||||||||||||||||||||||||||||||||||||
| 2015 | 114,584 | £11.520 | 114,584 | 02 Apr 25 | ||||||||||||||||||||||||||||||||||||||||||||||||||||||||||||||||
| 120,886 | €15.003 | 120,886 | 02 Apr 25 | |||||||||||||||||||||||||||||||||||||||||||||||||||||||||||||||||
| 2016 | 101,421 | £12.550 | 101,421 | 15 Mar 26 | ||||||||||||||||||||||||||||||||||||||||||||||||||||||||||||||||
| 107,380 | €15.285 | 107,380 | 15 Mar 26 | |||||||||||||||||||||||||||||||||||||||||||||||||||||||||||||||||
| 2017 | (1) | 96,996 | £14.945 | 85,356 | 27 Feb 27 | |||||||||||||||||||||||||||||||||||||||||||||||||||||||||||||||
| 102,405 | €16.723 | 90,116 | 27 Feb 27 | |||||||||||||||||||||||||||||||||||||||||||||||||||||||||||||||||
| Total |
947,442 | 923,513 | ||||||||||||||||||||||||||||||||||||||||||||||||||||||||||||||||||
| SHARES(2)(3) |
Year of grant |
No. of held on 1 Jan 2020 |
No. of shares 2020 |
Market price per share at award |
No. of shares during 2020 |
Market price per |
No. of held on 2020 |
End of performance period |
Date of vesting |
|||||||||||||||||||||||||||||||||||||||||||||||||||||||||||
| BIP |
2017 | (1) | 81,781 | €16.723 | 72,785 | €24.895 | ||||||||||||||||||||||||||||||||||||||||||||||||||||||||||||||
| LTIP |
2017 | (1) | 96,996 | £14.945 | 68,867 | £20.725 | ||||||||||||||||||||||||||||||||||||||||||||||||||||||||||||||
| 102,405 | €16.723 | 72,707 | €24.895 | |||||||||||||||||||||||||||||||||||||||||||||||||||||||||||||||||
| 2018 | 179,318 | £14.915 | 179,318 | Dec 2020 | Feb 2021 | |||||||||||||||||||||||||||||||||||||||||||||||||||||||||||||||
| 178,482 | €16.870 | 178,482 | Dec 2020 | Feb 2021 | ||||||||||||||||||||||||||||||||||||||||||||||||||||||||||||||||
| 2019 | 309,807 | £17.698 | 309,807 | Dec 2021 | Feb 2022 | |||||||||||||||||||||||||||||||||||||||||||||||||||||||||||||||
| 2020 | 271,164 | £20.725 | 271,164 | Dec 2022 | Feb 2023 | |||||||||||||||||||||||||||||||||||||||||||||||||||||||||||||||
| Total |
948,789 | 271,164 | 214,359 | 938,771 | ||||||||||||||||||||||||||||||||||||||||||||||||||||||||||||||||
| (1) | The performance outcomes for the 2017 ESOS options, BIP and LTIP were disclosed on pages 102 and 103 of the 2019 Remuneration Report. |
| (2) | In addition, Mr Engstrom has 35,860 AIP deferred shares (pre-tax) awarded in 2019 with a market price at award of £17.698. The release of these AIP deferred shares in February 2022 is not subject to any further performance conditions. Including these AIP deferred shares increases the number of shares awarded during 2019 to 345,667 and the number of unvested shares held on 31 December 2019 to 984,649. |
| (3) | In addition, Mr Engstrom has 30,777 AIP deferred shares (pre-tax) awarded in 2020 with a market price at award of £20.725. The release of these AIP deferred shares in February 2023 is not subject to any further performance conditions. Including these AIP deferred shares increases the number of shares awarded during 2020 to 301,941 and the number of unvested shares held on 31 December 2020 to 1,005,408. |
| RELX Annual report and financial statements 2020 | Directors’ Remuneration Report | 103 | |
|
| ||
| 104 | RELX Annual report and financial statements 2020 | Governance | |
|
| ||
Performance graphs
The graphs below show total shareholder returns for RELX calculated on the basis of the average share price in the 30 trading days before the respective year end and assuming dividends were reinvested. RELX’s performance is compared with the FTSE 100. The three-year chart covers the performance period of the 2018–2020 cycle of the LTIP.
| 3 years |
5 years |
10 years | ||
|
|
|
| ||
CEO historical pay table
The table below shows the historical CEO pay over a ten-year period.
| £’000 | 2011 | 2012 | 2013 | 2014 | 2015 | 2016 | 2017 | 2018 | 2019 | 2020 | ||||||||||||||||||||||||||||||||||||||||||||||||||||||||||||||||||
| Annualised base salary |
1,025 | 1,051 | 1,077 | 1,104 | 1,131 | 1,160 | 1,189 | 1,218 | 1,249 | 1,280 | ||||||||||||||||||||||||||||||||||||||||||||||||||||||||||||||||||
| Annual incentive payout as a % of maximum |
66% | 73% | 70% | 71% | 70% | 68% | 69% | 78% | 77% | 65% | ||||||||||||||||||||||||||||||||||||||||||||||||||||||||||||||||||
| Multi-year incentive vesting as a % of maximum |
0% | 70% | (1) | 96% | (1) | 90% | (1) | 97% | (1) | 97% | (1) | 92% | (1) | 81% | (1) | 81% | (1) | 6% | ||||||||||||||||||||||||||||||||||||||||||||||||||||||||||
| CEO total |
2,738 | 11,145 | (2) | 5,463 | 17,447 | (3) | 11,416 | (4) | 11,399 | (5) | 8,748 | (6) | 9,141 | (7) | 9,346 | (8) | 3,951 | (9) | ||||||||||||||||||||||||||||||||||||||||||||||||||||||||||
| (1) | The 2019, 2018, 2017, 2016 and 2015 percentages reflect BIP, LTIP and ESOS. The 2014 percentage reflects the final tranche of the discontinued Reed Elsevier Growth Plan (REGP), BIP and ESOS. The 2013 percentage reflects BIP and ESOS only and the 2012 percentage reflects BIP and the first tranche of the discontinued REGP. |
| (2) | The 2012 figure reflects the vesting of the first tranche of the discontinued REGP and includes the entire amount that was performance tested over the 2010–2012 period, including the 50% of shares deferred until 2015 in accordance with the plan rules including £3m attributed to share price appreciation. |
| (3) | The 2014 figure includes the vesting of the second and final tranche of the discontinued REGP and includes £8.8m attributed to share price appreciation. |
| (4) | The 2015 figure includes £4.4m attributed to share price appreciation. |
| (5) | The 2016 figure includes £4.2m attributed to share price appreciation. |
| (6) | The 2017 figure includes £1.7m attributed to share price appreciation. |
| (7) | The 2018 figure includes £2.2m attributed to share price appreciation. |
| (8) | The 2019 figure includes £2.2m attributed to share price appreciation. The share award value has been restated for actual share prices and exchange rates applicable on the dates of vesting. |
| (9) | The 2020 figure includes £51k attributed to share price appreciation. |
| RELX Annual report and financial statements 2020 | Directors’ Remuneration Report | 105 | |
|
| ||
| 106 | RELX Annual report and financial statements 2020 | Governance | |
|
| ||
| RELX Annual report and financial statements 2020 | Directors’ Remuneration Report | 107 | |
|
| ||
| 108 | RELX Annual report and financial statements 2020 | Governance | |
|
| ||
Remuneration Policy Report
Set out in this section is the Company’s Remuneration Policy for Directors, as approved by shareholders at the 23 April 2020 Annual General Meeting, and which is intended to apply for three years from the AGM and to awards granted from the first quarter of 2021. The policy is as reported in the 2019 annual report.
Remuneration policy table – Executive Directors
All footnotes to the policy table can be found on page 111.
ANNUAL BASE SALARY
Purpose and link to strategy
To recruit and retain the best executive talent globally to execute our strategic objectives at appropriate cost.
Operation
Salaries for Executive Directors are set and reviewed annually by the Remuneration Committee (the Committee) with changes typically taking effect on 1 January. In exceptional circumstances, the Committee may review salaries more frequently.
When reviewing salaries, the Committee considers the executive’s role and sustained value to the Company in terms of skill, experience and overall contribution and the Company’s guidelines for salaries for all employees for the year. Periodically, competitiveness with companies which are comparable in respect of industry, size, international scope and complexity is also considered in order to ensure the Company’s ability to attract and retain executives.
For the last eight years, Executive Directors’ salary increases have been 2.5% per annum.
Performance framework
N/A
Maximum value
Salary increases will continue to be aligned with the range of increases for the wider employee population and subject to annual all-employee guidelines. However, as for all employees, the Committee has discretion to exceed this to take account of individual circumstances such as change in responsibility, increases in scale or complexity of the business, inflation or alignment to market level.
Recovery of sums paid
No provision.
RETIREMENT BENEFITS
Purpose and link to strategy
Retirement plans are part of remuneration packages designed to recruit and retain the best executive talent at appropriate cost.
Operation
Policy for new appointments
Executive Directors appointed after the effective date of this policy will receive pension benefits up to the value equivalent to the maximum level of pension benefits provided under the Company’s regular defined contribution pension plans as may be in effect or amended from time to time (currently capped at 11% of base salary in the UK). The defined contribution pension plans are designed to be competitive and sustainable long-term. Any amount payable may be paid wholly or partly as cash in lieu and may be subject to tax and social security deductions in various jurisdictions.
Transition arrangements for existing Executive Directors
The existing directors will transition from their current arrangements to the above new appointment policy by the end of 2022.
The CFO currently receives a company contribution paid as cash in lieu of pension. The CFO’s company contribution decreased by five percentage points to 20% of base salary from January 2020 and further decreases to 18% from January 2021, to 16% from January 2022 and from the end of 2022, he will be subject to the above new appointment policy (currently capped at 11% of base salary in the UK).
The CEO is a member of a UK legacy defined benefit pension scheme, accruing 1/30th of final year pensionable earnings for each year (pro-rated for part years) of service, with a normal retirement age of 60. In line with all UK defined benefit scheme members, the CEO’s contributions to the plan and fees he pays to participate in the plan (together the ‘Total Plan Fees’) have been increasing annually since 2011. However, the CEO now pays a higher percentage of pensionable earnings as Total Plan Fees in each calendar year than other legacy members. In 2019, his Total Plan Fees were 20% of pensionable earnings, up from 12.5% in 2018. His total Plan Fees are 25% in 2020 and increase to 30% in 2021 and to 35% in 2022. A cap applies of 2% per annum on the increase in the CEO’s pensionable earnings (in place since 2017). Like all other members of the legacy defined benefit pension scheme, the CEO is allowed to switch to the defined contribution plan at any time. At the end of 2022, the CEO will cease to accrue any further benefits under the legacy defined benefit pension scheme. After 31 December 2022, he will be subject to the above new appointment policy (currently capped at 11% of base salary in the UK).
Performance framework
N/A
| RELX Annual report and financial statements 2020 | Directors’ Remuneration Report | 109 | |
|
| ||
| 110 | RELX Annual report and financial statements 2020 | Governance | |
|
| ||
AIP CONTINUED
Performance framework
The AIP includes financial measures with a weighting of at least 85% and may also include non-financial measures with a weighting of up to 15%. Each measure is assessed separately.
| ◾ | The minimum payout is zero. |
| ◾ | Each measure is assessed independently and payout for each measure at threshold is 10% of the maximum opportunity for that measure. If the financial measures have a weighting of 100% and threshold is reached for each of the financial measures, the overall payout for the financial measures is 13.5% of salary. If the financial measures have a weighting of 85% and threshold is reached for each of the financial measures, the overall payout for the financial measures is 11.5% of salary. |
| ◾ | Payout for target performance is 135% of salary. |
Following an assessment of financial achievement, and scoring of any non-financial measures, the Committee agrees the overall level of earned incentive for each Executive Director.
Committee discretion applies.1,2,3
Maximum value
The maximum potential annual incentive is 200% of annual base salary. This includes the deferred share element but excludes dividend equivalents payable in respect of the deferred shares.
Recovery of sums paid
Claw-back applies.4
LONG TERM INCENTIVE PLAN (LTIP)
Purpose and link to strategy
The Long-Term Incentive Plan (LTIP) is designed to provide a long-term incentive for Executive Directors to achieve the key performance measures that support the Company’s strategy, and to align their interests with shareholders.
Why performance measures are chosen and how targets are set
Our strategic focus is on continuing to transform the core business through organic investment and the build-out of new products into adjacent markets and geographies, supplemented by selective portfolio acquisitions and divestments. The performance measures in the LTIP are chosen to support this strategy by focusing on sustained earnings growth, return on invested capital and shareholder return.
Targets are set with regard to previous results and internal and external forecasts for the performance period and the strategic plan for the business. They are designed to provide exceptional reward for exceptional performance, whilst allowing a reasonable expectation that reward at the lower end of the scale is attainable, subject to robust performance.
Operation
Annual awards of performance shares, with vesting subject to:
| ◾ | performance measured over three financial years |
| ◾ | continued employment (subject to the provisions set out in the Policy on payments for loss of office section) |
| ◾ | meeting shareholding requirements (450% of salary for the CEO and 300% of salary for the CFO) |
Executive Directors are to retain their net (after tax) vested shares for a holding period of two years after vesting. Dividend equivalents accrued during the performance period are payable in respect of the performance shares that vest.
On a change of control, the default position is that awards vest on a pro-rated basis, subject to an assessment of performance against targets at that time. Alternatively, the Committee may determine that the awards will not vest and will instead be exchanged for equivalent awards in the acquiring company.
Performance framework
The performance measures are EPS, ROIC and relative TSR, weighted 40%:40%:20% respectively and assessed independently, such that a payout can be received under any one of the measures (or, for TSR, in respect of one of the three comparator groups).
| ◾ | The minimum payout is zero. |
| ◾ | Each measure is assessed independently and payout for each measure at threshold is 25% of the maximum opportunity for that measure. If only one measure vests at threshold, and it has a weighting of 40%, then the overall payout would be 10% of the maximum award. If only one measure with a weighting of 20% vests at threshold, the overall payout would be 5% of the maximum award. |
| ◾ | Payout in line with expectations is 50% of the maximum award. |
Dividend equivalents are not taken into account in the above payout levels.
Committee discretion applies.1,2,3
Maximum value
The maximum grant in any year is up to 450% of base salary for the CEO and up to 375% of base salary for other Executive Directors (not including dividend equivalents).
Recovery of sums paid
Claw-back applies.4
| RELX Annual report and financial statements 2020 | Directors’ Remuneration Report | 111 | |
|
| ||
| 112 | RELX Annual report and financial statements 2020 | Governance | |
|
| ||
Approach to recruitment remuneration – Executive Directors
When agreeing the components of a remuneration package on the appointment of a new Executive Director, or an internal promotion to the Board, the Committee would seek to align the package with the remuneration policy stated in the policy table.
The Committee’s general principle on recruitment is to offer a competitive remuneration package to attract high-calibre candidates from a global talent pool. Basic salary would be set at an appropriate level for the candidate, taking into account all relevant factors. As a data analytics and technology-driven business, with half of its revenue in the US, the Company primarily competes for talent with global information and technology companies.
The various components and the Company’s approach are as follows:
Standard package on recruitment*
To offer remuneration in line with the policy table (including the limits), taking into account the principles set out above.
Compensation for forfeited entitlements
The Committee may make awards and payments on hiring an external candidate to compensate him or her for entitlements forfeited on leaving the previous employer. If such a decision is made, the Committee will attempt to reflect previous entitlements as closely as possible using a variety of tools, including cash and share based awards. Malus and claw-back provisions will apply where appropriate. If necessary to facilitate the grant of awards, the Committee may rely on the one person exemption from shareholder approval in the UK Listing Rules.
Relocation allowances and expenses
The type and size of relocation allowances and expenses will be determined by the specific circumstances of the new recruit.
* The standard package comprises annual base salary, retirement benefits, other benefits, AIP and LTIP.
Shareholding requirement
The Executive Directors are subject to shareholding requirements. These are a minimum of 450% of annual base salary for the CEO and 300% of annual base salary for other Executive Directors. On joining or promotion to the Board, Executive Directors are given a period of time, typically up to five years, to build up to their requirement. On termination of employment, Executive Directors are to maintain their full shareholding requirement (or, if lower, their actual level of shareholding at the time of leaving) for two years after leaving employment.
Shares which count for shareholding purposes are shares beneficially owned by the Executive Director, their spouse, civil partner or dependent child and AIP deferred shares which are within their three-year deferral period, on a notional net of tax basis.
Policy on payments for loss of office
In line with the Company’s policy, the service contracts of the existing Executive Directors contain 12-month notice periods.
The circumstances in which an Executive Director’s employment is terminated will affect the Committee’s determination of any payment for loss of office, but it expects to apply the principles outlined in the table on the next page. The Committee reserves the right to depart from these principles where appropriate in light of any taxation requirements to which the Company or the Executive Director is subject (including, without limitation, section 409A of the US Internal Revenue Code), or other legal obligations.
| RELX Annual report and financial statements 2020 | Directors’ Remuneration Report | 113 | |
|
| ||
| 114 | RELX Annual report and financial statements 2020 | Governance | |
|
| ||
Remuneration policy table – Non-Executive Directors
FEES
Purpose and link to strategy
To enable RELX to recruit Non-Executive Directors with the right balance of personal skills and experience to make a major contribution to the Board and Committees of a global business which is listed in London, Amsterdam and New York.
Operation
RELX Chair: Receives an aggregate annual fee with no additional fees, for example, Committee Chair fees. The Committee determines the Chair’s fee on the advice of the Senior Independent Director.
Other Non-Executive Directors: Receive an annual fee with additional fees payable as appropriate for specific roles and duties. These additional fees include fees for the Senior Independent Director and Committee Chairs, for membership of Board Committees, as well as a workforce engagement fee and international travel fees. In future, other fees may be payable, for example attendance fees. The Board determines the level of fees, subject to applicable law.
Fees may be reviewed annually, although in practice they have changed on a less frequent basis. When reviewing fees, consideration is given to the time commitment required, the complexity of the role and the calibre of the individual. Periodically, comparative market data is also reviewed, the primary source for which is the practice of FTSE 30 companies, with reference also to the Euronext Amsterdam (AEX) index and US-listed companies.
Maximum value
The aggregate annual fee limit for fees paid to the Chair and the Non-Executive Directors is £2m. Additional fees for membership of or chairing Board Committees and assuming additional responsibilities such as acting as Senior Independent Director, are not subject to this maximum limit.
OTHER BENEFITS
Purpose and link to strategy
To provide competitive benefits at appropriate cost.
Operation
Other benefits for Non-Executive Directors are reviewed periodically and may include private medical cover, tax return preparation costs, secretarial benefits, car benefits, travel and related subsistence costs, including, where appropriate, the tax on such benefits.
Maximum value
There is no prescribed maximum amount.
| RELX Annual report and financial statements 2020 | 115 | |
|
| ||
| 116 | RELX Annual report and financial statements 2020 | Governance | |
|
| ||
| SPECIFIC COVID-19 CONSIDERATIONS | PAGE REFERENCE IN ANNUAL REPORT | |
| Specific Covid-19 areas discussed by the Committee throughout the year were: |
||
| ◾ The impact of Covid-19 on STM, Legal and Risk: The Committee discussed these business areas to ensure that there were no significant accounting judgements or exceptional items occurring as a result of Covid-19. |
88-89 | |
|
◾ Exhibition’s exceptional costs: In addition to the review of goodwill and intangible asset carrying values, and resulting impairment charges, as set out in the ‘Areas of significant judgement section’ above, the Committee also reviewed and discussed the judgements made around the recognition of cancelled event and restructuring costs to ensure that their recognition in 2020 is in line with the relevant accounting guidance. The nature of the costs was also reviewed to ensure that the presentation of these costs as exceptional is appropriate. |
141 | |
| ◾ Going concern and viability: Having reviewed liquidity and covenant compliance through the year, for half year and full year reporting, the Committee reviewed going concern and viability assumptions, including consideration of a range of downside scenarios. |
88-89 | |
| The Committee was satisfied that all the above items had been appropriately considered and presented in the Annual Report. A specific additional meeting was held in April 2020 to discuss potential issues arising from Covid-19, and the items listed above were additionally covered in all meetings subsequent.
|
||
| DISCLOSURE AND PRESENTATION | PAGE REFERENCE IN ANNUAL REPORT | |
| As well as considering the Annual Report as a whole (see ‘Fair, balanced and understandable’ section below) the Committee focused on the following areas of disclosure and presentation: |
||
| ◾ reviewed the critical accounting policies and compliance with applicable accounting standards, reviewed other disclosure requirements and received regular update reports on accounting and regulatory developments; |
137 | |
| ◾ reviewed the disclosures made in relation to internal control, risk management, the going concern statement and the viability statement. The Committee received and discussed reports from the RELX Head of Audit and Risk Management and the RELX Treasurer on the processes undertaken and assumptions used in formulating these disclosures. The going concern and viability statements were subject to an in depth review, including a detailed review and challenge of the various adverse scenarios modelled to ensure that the statements made in relation to going concern and viability are robust; |
85-89 | |
| ◾ considered the calculation and presentation of alternative performance measures in the Annual Report and Accounts and results announcement. This review included the presentation of the exceptional items presented in relation to Exhibitions, ensuring that the items included under this definition are costs which should be excluded from the adjusted measures to ensure that these measures reflect the core operational performance of the group. |
54-59, 188 | |
| The Committee was satisfied that all relevant disclosures have been appropriately made. |
||
FAIR, BALANCED AND UNDERSTANDABLE
The Committee considered whether the 2020 Annual Report is fair, balanced and understandable. In making this assessment, the Committee considered the following areas:
◾ The process for preparing the Annual Report, including the contributors, the internal review process and how feedback is addressed throughout the process;
◾ The business review narratives presented for each business area;
◾ The discussion of reported and underlying results throughout the report. This included the presentation of the impact of Covid-19, and in particular the presentation of Exhibitions results.
The Committee was satisfied that, taken as a whole, the Annual Report is fair, balanced and understandable. This conclusion has been reported to the Board.
The Committee also received detailed written and verbal reports from the external auditors on these matters. The Committee was satisfied with the explanations provided and conclusions reached.
Risk management and internal controls
With respect to their oversight of risk management and internal controls, the Committee has:
| ◾ | received and discussed regular reports summarising the status of the Group’s risk management activities, including the impact of Covid-19, identification of emerging risks and actions to mitigate risks, and the findings from internal audits and status of actions agreed with management. Areas of focus in 2020 included: changes to controls required as a result of home-working; cyber security; data |
| RELX Annual report and financial statements 2020 | Report of the Audit Committee | 117 | |
|
| ||
| RELX Annual report and financial statements 2020 | Directors’ Report | 119 | |
|
| ||
| 120 | RELX Annual report and financial statements 2020 | Governance | |
|
| ||
| RELX Annual report and financial statements 2020 | Directors’ Report | 121 | |
|
| ||


| RELX Annual report and financial statements 2020 | 123 | |
|
| ||
|
| ||
| Financial statements and other information | ||
| In this section | ||
| 124 | Independent auditors’ report | |
| 132 | Consolidated financial statements | |
| 137 | Notes to the consolidated financial statements | |
| 180 | 5 year summary | |
| 124 | RELX Annual report and financial statements 2020 | Financial statements and other information | |
|
| ||
Independent auditor’s report to
the members of RELX PLC
OPINION
In our opinion:
| ◾ | RELX plc’s group financial statements and parent company financial statements (the “financial statements”) give a true and fair view of the state of the group’s and of the parent company’s affairs as at 31 December 2020 and of the group’s profit for the year then ended; |
| ◾ | the group financial statements have been properly prepared in accordance with International Accounting Standards in conformity with the requirements of the Companies Act 2006 and International Financial Reporting Standards adopted pursuant to Regulation (EC) No 1606/2002 as it applies in the European Union; |
| ◾ | the parent company financial statements have been properly prepared in accordance with United Kingdom Generally Accepted Accounting Practice; and |
| ◾ | the financial statements have been prepared in accordance with the requirements of the Companies Act 2006. |
We have audited the financial statements of RELX plc (the ‘parent company’) and its subsidiaries (the ‘group’) for the year ended 31 December 2020 which comprise:
| Group | Parent company | |
| Consolidated income statement for the year ended 31 December 2020. | Statement of financial position as at 31 December 2020 | |
| Consolidated statement of comprehensive income for the year then ended | Statement of changes in equity for the year then ended | |
| Consolidated statement of cash flows for the year then ended | Related notes 1 to 4 to the financial statements including a summary of significant accounting policies | |
| Consolidated statement of financial position as at 31 December 2020 | ||
| Consolidated statement of changes in equity for the year then ended | ||
| Related notes 1 to 29 to the financial statements, including a summary of significant accounting policies |
The financial reporting framework that has been applied in the preparation of the group financial statements is applicable law and International Accounting Standards in conformity with the requirements of the Companies Act 2006 and International Financial Reporting Standards (IFRSs) adopted pursuant to Regulation (EC) No 1606/2002 as it applies in the European Union. The financial reporting framework that has been applied in the preparation of the parent company financial statements is applicable law and United Kingdom Accounting Standards including FRS 101 “Reduced Disclosure Framework” (United Kingdom Generally Accepted Accounting Practice) and in accordance with the provisions of the Companies Act 2006.
BASIS FOR OPINION
We conducted our audit in accordance with International Standards on Auditing (UK) (ISAs (UK)) and applicable law. Our responsibilities under those standards are further described in the Auditor’s responsibilities for the audit of the financial statements section of our report. We are independent of the group in accordance with the ethical requirements that are relevant to our audit of the financial statements in the UK, including the FRC’s Ethical Standard as applied to listed public interest entities, and we have fulfilled our other ethical responsibilities in accordance with these requirements.
We believe that the audit evidence we have obtained is sufficient and appropriate to provide a basis for our opinion.
CONCLUSIONS RELATING TO GOING CONCERN
In auditing the financial statements, we have concluded that the directors’ use of the going concern basis of accounting in the preparation of the financial statements is appropriate. Our evaluation of the directors’ assessment of the group and parent company’s ability to continue to adopt the going concern basis of accounting included:
| ◾ | In conjunction with our walkthrough of the Group’s financial close process, we confirmed our understanding of management’s Going Concern assessment process and also engaged with management early to ensure all key factors were considered in their assessment; |
| ◾ | We obtained management’s going concern assessment, including the cash forecast and covenant calculation for the going concern period which covers 18 months to 30 June 2022. The Group has modelled a number of adverse scenarios in their cash forecasts and covenant calculations in order to incorporate unexpected changes to the forecasted liquidity of the Group. |
| ◾ | We have tested the factors and assumptions included in each modelled scenario for the cash forecast and covenant calculation and we have tested the impact of Covid-19 included in each forecasted scenario. We considered the appropriateness of the methods used to calculate the cash forecasts and covenant calculations and determined through inspection and testing of the methodology and calculations that the methods utilised were appropriately sophisticated to be able to make an assessment for the entity. |
| RELX Annual report and financial statements 2020 | Independent auditors’ report to the members of RELX PLC | 125 | |
|
| ||
| 126 | RELX Annual report and financial statements 2020 | Financial statements and other information | |
|
| ||
The reporting components where we performed audit procedures accounted for 81% (2019: 84%) of the Group’s Profit before tax on an absolute basis, 85% (2019: 82%) of the Group’s Revenue and 74% (2019: 78%) of the Group’s Total assets. For the current year, the full scope components contributed 59% (2019: 60%) of the Group’s Profit before tax on an absolute basis, 80% (2019: 72%) of the Group’s Revenue and 66% (2019: 72%) of the Group’s Total assets. The specific scope component contributed 22% (2019: 24%) of the Group’s Profit before tax on an absolute basis, 5% (2019: 10%) of the Group’s Revenue and 8% (2019: 6%) of the Group’s Total assets. The audit scope of these components may not have included testing of all significant accounts of the component but will have contributed to the coverage of significant accounts tested for the Group. We also instructed one additional location to perform specified procedures over manual journal entries related to revenue, as described in the Risk section above.
Of the remaining components that together represent 19% of the Group’s profit before tax on an absolute basis, none are individually greater than 2% of the Group’s profit before tax. For these components, we performed other procedures, including analytical review, review of internal audit reports, and testing of consolidation journals, intercompany eliminations and foreign currency translation recalculations at the group level to respond to any potential risks of material misstatement to the Group financial statements.
The charts below illustrate the coverage obtained from the work performed by our audit teams.
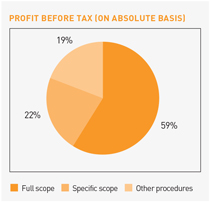
|
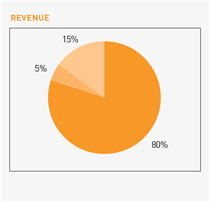
|
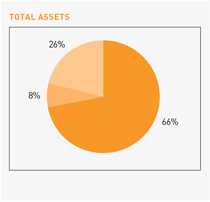
|
(1) Coverage of profit before tax measure on an absolute basis for each component (components with a loss would be added to both the numerator and denominator).
Changes from the prior year
As a result of the Covid-19 outbreak and resulting lockdown restrictions in all of the countries where full or specific scope audit procedures have been performed, we have modified our audit strategy to allow for the audit to be performed remotely at both the Group and component locations. This approach was supported through remote user access to the Group’s financial systems and the use of EY software collaboration platforms for the secure and timely delivery of requested audit evidence. The full and specific scope components have not changed from the prior year as these components remain the most significant to the Group and the coverage of the Group was consistent with the prior year audit. We have also revisited our procedures in respect of the Directors’ going concern assessment, taking into account the nature of the Group, its business model and related risks with procedures performed as listed above.
Involvement with component teams
In establishing our overall approach to the Group audit, we determined the type of work that needed to be undertaken at each of the components by us, as the primary audit engagement team, or by component auditors from other EY global network firms operating under our instruction. Of the six full scope components, audit procedures were performed on three of these directly by the primary audit team. For the six specific scope components, where the work was performed by component auditors, we determined the appropriate level of involvement to enable us to determine that sufficient audit evidence had been obtained as a basis for our opinion on the Group as a whole.
The Group audit team continued to follow a programme of planned visits that has been designed to ensure that the Senior Statutory Auditor, or another Group audit partner, visits all full scope and specific scope locations. During the current year’s audit cycle, due to Covid-19, the visits undertaken by the primary audit team were necessarily virtual visits. These visits were undertaken by the primary audit team to the component teams in the United Kingdom, Netherlands, United States, France, and Japan. These visits involved video call meetings with local management, and discussions on the audit approach with the component team and any issues arising from their work. The primary team interacted regularly with the component teams where appropriate during various stages of the audit, reviewed key working papers and were responsible for the scope and direction of the audit process. This, together with the additional procedures at Group level, gave us appropriate evidence for our opinion on the Group financial statements.
KEY AUDIT MATTERS
Key audit matters are those matters that, in our professional judgment, were of most significance in our audit of the financial statements of the current period and include the most significant assessed risks of material misstatement (whether or not due to fraud) that we identified. These matters included those which had the greatest effect on: the overall audit strategy, the allocation of resources in the audit; and directing the efforts of the engagement team. These matters were addressed in the context of our audit of the financial statements as a whole, and in our opinion thereon, and we do not provide a separate opinion on these matters.
| RELX Annual report and financial statements 2020 | Independent auditors’ report to the members of RELX PLC | 127 | |
|
| ||
| 128 | RELX Annual report and financial statements 2020 | Financial statements and other information | |
|
| ||
| RISK | OUR RESPONSE TO THE RISK | KEY OBSERVATIONS COMMUNICATED TO THE AUDIT COMMITTEE | ||
| Revenue recognition As described in note 2 to the consolidated financial statements, the group earns revenue (£7.9bn recorded in 2019, compared to £7.5bn recorded in 2018) from a variety of sources among the different business areas, including annual subscriptions, transactional usage and exhibition fees. The nature of the risk associated with the accurate recording of revenue varies.
We recognise that revenue is a key metric upon which the group is judged, that the group has annual internal targets, and that the group has incentive schemes that are partially impacted by revenue growth.
We have determined that there is a risk in each of the business areas related to the opportunity to commit fraud in the respective revenue streams through manual adjustments or override of controls by management. |
We performed full and specific scope audit procedures over revenue in 11 locations, which covered 85% of revenue. We performed procedures to address the specific risk in each business area. Procedures included, among others, (i) assessing the processes and testing controls over each significant revenue stream; (ii) evaluating the appropriateness of journal entries impacting revenue, as well as other adjustments made in the preparation of the financial statements; (iii) evaluating management’s controls over such adjustments; (iv) inspecting a sample of contracts to check that revenue recognition was in accordance with the contract terms and the group’s revenue recognition policies; (v) testing a sample of transactions around period end to test that revenue was recorded in the correct period; (vi) for revenue streams that have judgemental elements, evaluating management’s assumption;(vii) for certain revenue streams we obtained audit evidence through the execution of data analytics procedures, including a correlation of revenue to cash. | Revenue has been recognised appropriately in the year ended 31 December 2020 in accordance with IFRS 15: Revenue from Contracts with Customers. | ||
| Valuation of identifiable intangible assets for acquisitions As discussed in note 12 of the consolidated financial statements during the year ended 31 December 2020, the group completed acquisitions of £878 million with the most notable being ID Analytics and Emailage which were acquired for net consideration of $375 million and $480 million respectively. The transactions were accounted for as business combinations.
Auditing the Group’s acquisition accounting required significant auditor judgement due to the estimation uncertainty in determining the completeness and fair value of the identified intangible assets of the acquired businesses, which primarily consisted of developed technology and customer relationships. The estimation uncertainty was primarily due to the sensitivity of the underlying assumptions which were applied by management and their specialists in the excess-earnings and valuation models to measure the fair value of the identified intangible assets. The significant assumptions used to estimate the value of the identified intangible assets included discount rates, revenue growth rates, terminal growth rates, royalty rates, obsolescence rates, and retention rates. |
Our procedures included obtaining an understanding of the acquisition accounting processes and evaluating the design of, as well as testing internal controls over the relevant acquisition accounting process. This included testing the design and operating effectiveness of controls over management’s review of the valuation models and significant assumptions used to develop the estimates of fair value of the identified intangible assets as well as controls over the completeness and accuracy of data used in the valuation models and assumptions.
To test the estimated fair value of acquired intangible assets our audit procedures included, among others, evaluating the Group’s selection of valuation methodology and significant assumptions, evaluating the completeness and accuracy of the underlying data supporting the significant assumptions including the future cash flow assumptions and estimates, and assessing the competence, capabilities, and objectivity of management’s specialists. We compared the significant assumptions used to current industry, market and economic trends, obtained support to evaluate operating data, performed a sensitivity analysis to evaluate the assumptions that were most significant to the estimates and recalculated management’s estimates. We also involved our valuation specialists to assist with our evaluation of the methodology used by the Group and significant assumptions used in determining the fair value estimates. Our valuation specialists performed independent comparative calculations to estimate the discount rate and other key assumptions. |
In accordance with IFRS 3, the Group recognises the tangible and intangible assets acquired and liabilities assumed based on their estimated fair values. Determining these fair values required management to make significant estimates and assumptions, especially with respect to intangible assets. We believe that the significant underlying assumptions, selection of valuation methodology and judgements applied are appropriate.
Additionally, we have reviewed the related disclosures made by the Company and found them to be appropriate and in conformity with IFRS for the Group and FRS 101 for the Company. |
In the prior year, our auditor’s report included a key audit matter in relation to finance systems. In the current year, this was no longer identified as a key audit matter as it is no longer deemed to have the greatest effect on overall audit strategy, the allocation of resources or directing the efforts of the engagement team. This was due to the experience gained from prior audits and the reduced scale of migrations with an impact on that audit in the current year.
| RELX Annual report and financial statements 2020 | Independent auditors’ report to the members of RELX PLC | 129 | |
|
| ||
| 130 | RELX Annual report and financial statements 2020 | Financial statements and other information | |
|
| ||
Matters on which we are required to report by exception
In the light of the knowledge and understanding of the group and the parent company and its environment obtained in the course of the audit, we have not identified material misstatements in the strategic report or the directors’ report.
We have nothing to report in respect of the following matters in relation to which the Companies Act 2006 requires us to report to you if, in our opinion:
| ◾ | adequate accounting records have not been kept by the parent company, or returns adequate for our audit have not been received from branches not visited by us; or |
| ◾ | the parent company financial statements and the part of the Directors’ Remuneration Report to be audited are not in agreement with the accounting records and returns; or |
| ◾ | certain disclosures of directors’ remuneration specified by law are not made; or |
| ◾ | we have not received all the information and explanations we require for our audit. |
Corporate Governance Statement
The Listing Rules require us to review the directors’ statement in relation to going concern, longer-term viability and that part of the Corporate Governance Statement relating to the group and company’s compliance with the provisions of the UK Corporate Governance Statement specified for our review.
Based on the work undertaken as part of our audit, we have concluded that each of the following elements of the Corporate Governance Statement is materially consistent with the financial statements or our knowledge obtained during the audit:
| ◾ | Directors’ statement with regards to the appropriateness of adopting the going concern basis of accounting and any material uncertainties identified set out on page 88; |
| ◾ | Directors’ explanation as to its assessment of the company’s prospects, the period this assessment covers and why the period is appropriate set out on page 89; |
| ◾ | Directors’ statement on fair, balanced and understandable set out on page 121; |
| ◾ | Board’s confirmation that it has carried out a robust assessment of the emerging and principal risks set out on page 60; |
| ◾ | The section of the annual report that describes the review of effectiveness of risk management and internal control systems set out on page 86; and; |
| ◾ | The section describing the work of the audit committee set out on page 115. |
Responsibilities of directors
As explained more fully in the directors’ responsibilities statement set out on page 121, the directors are responsible for the preparation of the financial statements and for being satisfied that they give a true and fair view, and for such internal control as the directors determine is necessary to enable the preparation of financial statements that are free from material misstatement, whether due to fraud or error.
In preparing the financial statements, the directors are responsible for assessing the group and parent company’s ability to continue as a going concern, disclosing, as applicable, matters related to going concern and using the going concern basis of accounting unless the directors either intend to liquidate the group or the parent company or to cease operations, or have no realistic alternative but to do so.
Auditor’s responsibilities for the audit of the financial statements
Our objectives are to obtain reasonable assurance about whether the financial statements as a whole are free from material misstatement, whether due to fraud or error, and to issue an auditor’s report that includes our opinion. Reasonable assurance is a high level of assurance, but is not a guarantee that an audit conducted in accordance with ISAs (UK) will always detect a material misstatement when it exists. Misstatements can arise from fraud or error and are considered material if, individually or in the aggregate, they could reasonably be expected to influence the economic decisions of users taken on the basis of these financial statements.
Explanation as to what extent the audit was considered capable of detecting irregularities, including fraud
Irregularities, including fraud, are instances of non-compliance with laws and regulations. We design procedures in line with our responsibilities, outlined below, to detect irregularities, including fraud. The risk of not detecting a material misstatement due to fraud is higher than the risk of not detecting one resulting from error, as fraud may involve deliberate concealment by, for example, forgery or intentional misrepresentations, or through collusion. The extent to which our procedures are capable of detecting irregularities, including fraud is detailed below.
However, the primary responsibility for the prevention and detection of fraud rests with both those charged with governance of the company and management.
| RELX Annual report and financial statements 2020 | Independent auditors’ report to the members of RELX PLC | 131 | |
|
| ||
| 132 | RELX Annual report and financial statements 2020 | Financial statements and other information | |
|
| ||
| FOR THE YEAR ENDED 31 DECEMBER | Note | 2020 £m |
2019 £m |
2018 £m |
||||||||||||
| Revenue |
2 | 7,110 | 7,874 | 7,492 | ||||||||||||
| Cost of sales |
(2,487 | ) | (2,755 | ) | (2,644 | ) | ||||||||||
| Gross profit |
4,623 | 5,119 | 4,848 | |||||||||||||
| Selling and distribution costs |
(1,212 | ) | (1,292 | ) | (1,191 | ) | ||||||||||
| Administration and other expenses |
(1,901 | ) | (1,767 | ) | (1,725 | ) | ||||||||||
| Share of results of joint ventures |
15 | 41 | 32 | |||||||||||||
| Operating profit |
2, 3 | 1,525 | 2,101 | 1,964 | ||||||||||||
| Finance income |
7 | 3 | 9 | 6 | ||||||||||||
| Finance costs |
7 | (175 | ) | (314 | ) | (217 | ) | |||||||||
| Net finance costs |
(172 | ) | (305 | ) | (211 | ) | ||||||||||
| Disposals and other non-operating items |
8 | 130 | 51 | (33 | ) | |||||||||||
| Profit before tax |
1,483 | 1,847 | 1,720 | |||||||||||||
| Current tax |
(264 | ) | (382 | ) | (297 | ) | ||||||||||
| Deferred tax |
(11 | ) | 44 | 5 | ||||||||||||
| Tax expense |
9 | (275 | ) | (338 | ) | (292 | ) | |||||||||
| Net profit for the year |
1,208 | 1,509 | 1,428 | |||||||||||||
| Attributable to: |
||||||||||||||||
| RELX PLC shareholders |
1,224 | 1,505 | 1,422 | |||||||||||||
| Non-controlling interests |
(16 | ) | 4 | 6 | ||||||||||||
| Net profit for the year |
1,208 | 1,509 | 1,428 | |||||||||||||
| Earnings per share |
||||||||||||||||
| FOR THE YEAR ENDED 31 DECEMBER | 2020 | 2019 | 2018 | |||||||||||||
| Basic earnings per share |
||||||||||||||||
| RELX PLC |
10 | 63.5p | 77.4p | 71.9p | ||||||||||||
| Diluted earnings per share |
||||||||||||||||
| RELX PLC |
10 | 63.2p | 76.9p | 71.4p | ||||||||||||
| RELX Annual report and financial statements 2020 | 133 | |
|
| ||
| 134 | RELX Annual report and financial statements 2020 | Financial statements and other information | |
|
| ||
Consolidated statement of cash flows
| FOR THE YEAR ENDED 31 DECEMBER | Note | 2020 £m |
2019 £m |
2018 £m |
||||||||||||
| Cash flows from operating activities |
||||||||||||||||
| Cash generated from operations |
11 | 2,264 | 2,724 | 2,555 | ||||||||||||
| Interest paid (including lease interest) |
(179 | ) | (175 | ) | (179 | ) | ||||||||||
| Interest received |
7 | 4 | 24 | |||||||||||||
| Tax paid (net) |
(496 | ) | (464 | ) | (415 | ) | ||||||||||
| Net cash from operating activities |
1,596 | 2,089 | 1,985 | |||||||||||||
| Cash flows from investing activities |
||||||||||||||||
| Acquisitions |
11 | (869 | ) | (423 | ) | (935 | ) | |||||||||
| Purchases of property, plant and equipment |
(43 | ) | (47 | ) | (56 | ) | ||||||||||
| Expenditure on internally developed intangible assets |
(319 | ) | (333 | ) | (306 | ) | ||||||||||
| Purchase of investments |
(2 | ) | (8 | ) | (13 | ) | ||||||||||
| Proceeds from disposals of property, plant and equipment |
– | 2 | 4 | |||||||||||||
| Gross proceeds from business disposals and sale of investments |
54 | 82 | 34 | |||||||||||||
| Payments on business disposals |
(25 | ) | (40 | ) | (29 | ) | ||||||||||
| Dividends received from joint ventures |
31 | 34 | 30 | |||||||||||||
| Net cash used in investing activities |
(1,173 | ) | (733 | ) | (1,271 | ) | ||||||||||
| Cash flows from financing activities |
||||||||||||||||
| Dividends paid to shareholders |
13 | (880 | ) | (842 | ) | (796 | ) | |||||||||
| Distributions to non-controlling interests |
(6 | ) | (9 | ) | (8 | ) | ||||||||||
| (Decrease)/increase in short-term bank loans, overdrafts and commercial paper |
11 | (436 | ) | 98 | 147 | |||||||||||
| Issuance of term debt |
11 | 2,342 | 729 | 958 | ||||||||||||
| Repayment of term debt |
11 | (1,233 | ) | (617 | ) | (211 | ) | |||||||||
| Repayment of leases |
11 | (105 | ) | (102 | ) | (95 | ) | |||||||||
| Receipts in respect of subleases |
11 | 15 | 16 | 14 | ||||||||||||
| Disposal of non-controlling interest |
– | 6 | – | |||||||||||||
| Repurchase of ordinary shares |
24 | (150 | ) | (600 | ) | (700 | ) | |||||||||
| Purchase of shares by Employee Benefit Trust |
24 | (37 | ) | (37 | ) | (43 | ) | |||||||||
| Proceeds on issue of ordinary shares |
16 | 29 | 21 | |||||||||||||
| Net cash used in financing activities |
(474 | ) | (1,329 | ) | (713 | ) | ||||||||||
| (Decrease)/increase in cash and cash equivalents |
11 | (51 | ) | 27 | 1 | |||||||||||
| Movement in cash and cash equivalents |
||||||||||||||||
| At start of year |
138 | 114 | 111 | |||||||||||||
| (Decrease)/increase in cash and cash equivalents |
(51 | ) | 27 | 1 | ||||||||||||
| Exchange translation differences |
1 | (3 | ) | 2 | ||||||||||||
| At end of year |
88 | 138 | 114 | |||||||||||||
| RELX Annual report and financial statements 2020 | 135 | |
|
| ||
| 136 | RELX Annual report and financial statements 2020 | Financial statements and other information | |
|
| ||
Consolidated statement of changes in equity
| Note | Share capital £m |
Share premium £m |
Shares held in treasury £m |
Translation £m |
Other reserves £m |
Shareholders’ £m |
Non- £m |
Total equity £m |
||||||||||||||||||||||||||||
| Balance at 1 January 2018 |
224 | 3,104 | (1,631 | ) | 170 | 425 | 2,292 | 21 | 2,313 | |||||||||||||||||||||||||||
| Total comprehensive income for the year |
– | – | – | 207 | 1,313 | 1,520 | 6 | 1,526 | ||||||||||||||||||||||||||||
| Dividends paid |
13 | – | – | – | – | (796 | ) | (796 | ) | (8 | ) | (804 | ) | |||||||||||||||||||||||
| Issue of ordinary shares, net of expenses |
24 | 134 | 114 | – | – | (227 | ) | 21 | – | 21 | ||||||||||||||||||||||||||
| Repurchase of ordinary shares |
– | – | (743 | ) | – | – | (743 | ) | – | (743 | ) | |||||||||||||||||||||||||
| Cancellation of shares |
24 | (68 | ) | (1,795 | ) | 1,601 | – | 262 | – | – | – | |||||||||||||||||||||||||
| Increase in share based remuneration reserve (net of tax) |
– | – | – | – | 35 | 35 | – | 35 | ||||||||||||||||||||||||||||
| Settlement of share awards |
– | – | 35 | – | (35 | ) | – | – | – | |||||||||||||||||||||||||||
| Acquisitions |
– | – | – | – | – | – | 11 | 11 | ||||||||||||||||||||||||||||
| Exchange differences on translation of capital and reserves |
– | (8 | ) | 4 | (3 | ) | 7 | – | – | – | ||||||||||||||||||||||||||
| Balance at 1 January 2019 |
290 | 1,415 | (734 | ) | 374 | 984 | 2,329 | 30 | 2,359 | |||||||||||||||||||||||||||
| Total comprehensive income for the year |
– | – | – | (82 | ) | 1,434 | 1,352 | 4 | 1,356 | |||||||||||||||||||||||||||
| Dividends paid |
13 | – | – | – | – | (842 | ) | (842 | ) | (9 | ) | (851 | ) | |||||||||||||||||||||||
| Issue of ordinary shares, net of expenses |
24 | 1 | 28 | – | – | – | 29 | – | 29 | |||||||||||||||||||||||||||
| Repurchase of ordinary shares |
– | – | (637 | ) | – | – | (637 | ) | – | (637 | ) | |||||||||||||||||||||||||
| Bonus issue of ordinary share |
24 | 4,000 | – | – | – | (4,000 | ) | – | – | – | ||||||||||||||||||||||||||
| Cancellation of bonus share |
24 | (4,000 | ) | – | – | – | 4,000 | – | – | – | ||||||||||||||||||||||||||
| Cancellation of shares |
24 | (5 | ) | – | 504 | – | (499 | ) | – | – | – | |||||||||||||||||||||||||
| Increase in share based remuneration reserve (net of tax) |
– | – | – | – | 33 | 33 | – | 33 | ||||||||||||||||||||||||||||
| Settlement of share awards |
– | – | 33 | – | (33 | ) | – | – | – | |||||||||||||||||||||||||||
| Acquisitions |
– | – | – | – | – | – | (1 | ) | (1 | ) | ||||||||||||||||||||||||||
| Put option |
– | – | – | – | (103 | ) | (103 | ) | – | (103 | ) | |||||||||||||||||||||||||
| Disposal of non-controlling interest |
– | – | – | – | 5 | 5 | 1 | 6 | ||||||||||||||||||||||||||||
| Exchange differences on translation of capital and reserves |
– | – | – | – | – | – | (1 | ) | (1 | ) | ||||||||||||||||||||||||||
| Balance at 1 January 2020 |
286 | 1,443 | (834 | ) | 292 | 979 | 2,166 | 24 | 2,190 | |||||||||||||||||||||||||||
| Total comprehensive income for the year |
– | – | – | (265 | ) | 1,120 | 855 | (16 | ) | 839 | ||||||||||||||||||||||||||
| Dividends paid |
13 | – | – | – | – | (880 | ) | (880 | ) | (6 | ) | (886 | ) | |||||||||||||||||||||||
| Issue of ordinary shares, net of expenses |
24 | – | 16 | – | – | – | 16 | – | 16 | |||||||||||||||||||||||||||
| Repurchase of ordinary shares |
– | – | (87 | ) | – | – | (87 | ) | – | (87 | ) | |||||||||||||||||||||||||
| Increase in share based remuneration reserve (net of tax) |
– | – | – | – | 27 | 27 | – | 27 | ||||||||||||||||||||||||||||
| Settlement of share awards |
– | – | 34 | – | (34 | ) | – | – | – | |||||||||||||||||||||||||||
| Acquisitions |
– | – | – | – | 2 | 2 | (2 | ) | – | |||||||||||||||||||||||||||
| Exchange differences on translation of capital and reserves |
– | – | – | – | – | – | 2 | 2 | ||||||||||||||||||||||||||||
| Balance at 31 December 2020 |
286 | 1,459 | (887 | ) | 27 | 1,214 | 2,099 | 2 | 2,101 | |||||||||||||||||||||||||||
| RELX Annual report and financial statements 2020 | 137 | |
|
| ||
| 138 | RELX Annual report and financial statements 2020 | Financial statements and other information | |
|
| ||
Notes to the consolidated financial statements
for the year ended 31 December 2020
1 Basis of preparation and accounting policies (continued)
Other significant accounting policies
The accounting policy in respect of revenue recognition is also significant in determining the financial condition and results of the Group. The application of this policy is straightforward, and is included in note 2.
Standards and amendments effective for the year
The interpretations and amendments to IFRS effective for 2020 have not had a significant impact on the Group’s accounting policies or reporting.
Standards, amendments and interpretations not yet effective
A number of amendments and interpretations have been issued which are not expected to have any significant impact on the accounting policies and reporting.
2 Revenue, operating profit and segment analysis
| Accounting policy The Group’s reported segments are based on the internal reporting structure and financial information provided to the Board.
Adjusted operating profit is the key segmental profit measure used by the Group in assessing performance. Adjusted operating profit is reconciled to operating profit on page 188.
Revenue arises from the provision of products and services under contracts with customers. In all cases, revenue is recognised to depict the transfer of promised goods or services to customers in an amount that reflects the consideration to which the entity expects to be entitled in exchange for those goods or services, and is recognised when the customer obtains control of the good or service.
Revenue is stated at the transaction price, which includes allowance for anticipated discounts and returns and excludes customer sales taxes and other amounts to be collected on behalf of third-parties.
Where the goods or services promised within a contract are distinct, they are identified as separate performance obligations and are accounted for separately.
Where separate performance obligations are identified, total revenue is allocated on the basis of relative stand-alone selling prices or management’s best estimate of relative value where stand-alone selling prices do not exist. Management estimates may include a cost-plus method or comparable product approach, but must be supported by objective evidence. A residual approach may be applied where it is not possible to derive a reliable management estimate for a specific component.
Our subscription and Exhibition related revenue streams require payment in advance of the service being provided. Payment terms offered to customers are in line with the standard in the markets and geographies we operate in, and contracts do not contain significant financing components. Contracts for our transactional electronic revenue streams generally have payments that vary with volume of usage. Other than that, our contracts do not involve variable consideration.
Revenue is recognised for the various categories as follows:
◾ Subscriptions – revenue comprises income derived from the periodic distribution or update of a product. Subscription revenue is generally invoiced in advance and recognised systematically over the period of the subscription. Recognition is either on a straight-line basis where the transaction involves the transfer of goods and services to the customer in a consistent manner over a specific period of time; or based on the value received by the customer where the goods and services are not delivered in a consistent manner. ◾ Transactional – revenue is recognised when control of the product is passed to the customer or the service has been performed. For exhibitions, revenue primarily comprises income from exhibitors and attendees at exhibitions. Exhibition revenue is recognised on occurrence of the exhibition. ◾ Advertising – revenue is recognised on publication or over the period of online display.
|
| RELX Annual report and financial statements 2020 | Notes to the consolidated financial statements | 139 | |
|
| ||
| 140 | RELX Annual report and financial statements 2020 | Financial statements and other information | |
|
| ||
Notes to the consolidated financial statements
for the year ended 31 December 2020
2 Revenue, operating profit and segment analysis (continued)
| 2019 | Scientific, Technical & Medical |
Risk | Legal | Exhibitions | Total | |||||||||||||||
| Revenue by geographical market |
||||||||||||||||||||
| North America |
1,182 | 1,843 | 1,118 | 248 | 4,391 | |||||||||||||||
| Europe |
635 | 317 | 340 | 508 | 1,800 | |||||||||||||||
| Rest of world |
820 | 156 | 194 | 513 | 1,683 | |||||||||||||||
| Total revenue |
2,637 | 2,316 | 1,652 | 1,269 | 7,874 | |||||||||||||||
| Revenue by format |
||||||||||||||||||||
| Electronic |
2,214 | 2,264 | 1,400 | 51 | 5,929 | |||||||||||||||
| Face-to-face |
8 | 25 | 9 | 1,218 | 1,260 | |||||||||||||||
| |
415 | 27 | 243 | – | 685 | |||||||||||||||
| Total revenue |
2,637 | 2,316 | 1,652 | 1,269 | 7,874 | |||||||||||||||
| Revenue by type |
||||||||||||||||||||
| Subscriptions |
1,970 | 872 | 1,287 | – | 4,129 | |||||||||||||||
| Transactional |
622 | 1,428 | 359 | 1,269 | 3,678 | |||||||||||||||
| Advertising |
45 | 16 | 6 | – | 67 | |||||||||||||||
| Total revenue |
2,637 | 2,316 | 1,652 | 1,269 | 7,874 | |||||||||||||||
| 2018 | Scientific, Technical & Medical |
Risk | Legal | Exhibitions | Total | |||||||||||||||
| Revenue by geographical market |
||||||||||||||||||||
| North America |
1,118 | 1,669 | 1,083 | 221 | 4,091 | |||||||||||||||
| Europe |
611 | 322 | 340 | 535 | 1,808 | |||||||||||||||
| Rest of world |
809 | 126 | 195 | 463 | 1,593 | |||||||||||||||
| Total revenue |
2,538 | 2,117 | 1,618 | 1,219 | 7,492 | |||||||||||||||
| Revenue by format |
||||||||||||||||||||
| Electronic |
2,094 | 2,030 | 1,338 | 51 | 5,513 | |||||||||||||||
| Face-to-face |
7 | 36 | 10 | 1,168 | 1,221 | |||||||||||||||
| |
437 | 51 | 270 | – | 758 | |||||||||||||||
| Total revenue |
2,538 | 2,117 | 1,618 | 1,219 | 7,492 | |||||||||||||||
| Revenue by type |
||||||||||||||||||||
| Subscriptions |
1,877 | 765 | 1,247 | – | 3,889 | |||||||||||||||
| Transactional |
615 | 1,322 | 365 | 1,219 | 3,521 | |||||||||||||||
| Advertising |
46 | 30 | 6 | – | 82 | |||||||||||||||
| Total revenue |
2,538 | 2,117 | 1,618 | 1,219 | 7,492 | |||||||||||||||
Over half of RELX’s revenue comes from subscription arrangements, and revenue for these is generally recognised on a straight-line basis over the time period covered by the agreement, in line with the provision of services. There are a number of multi-year contracts, mainly in Risk, where revenue is recognised on the achievement of delivery milestones or other specified performance obligations. As at 31 December 2020, the aggregate amount of the transaction price of such contracts which relates to performance obligations which have not yet been delivered was approximately £146m (2019: £162m). It is expected that revenue will be recognised in relation to this amount over the next seven years.
| ANALYSIS OF REVENUE BY GEOGRAPHICAL ORIGIN | 2020 £m |
2019 £m |
2018 £m |
|||||||||
| North America |
4,192 | 4,308 | 4,013 | |||||||||
| Europe |
2,436 | 2,832 | 2,790 | |||||||||
| Rest of world |
482 | 734 | 689 | |||||||||
| Total |
7,110 | 7,874 | 7,492 | |||||||||
Revenue by geographical origin from the United Kingdom in 2020 was £1,176m (2019: £1,320m; 2018: £1,144m).
| RELX Annual report and financial statements 2020 | Notes to the consolidated financial statements | 141 | |
|
| ||
| 142 | RELX Annual report and financial statements 2020 | Financial statements and other information | |
|
| ||
Notes to the consolidated financial statements
for the year ended 31 December 2020
3 Operating profit
| Accounting policy Share based remuneration The fair value of share based remuneration is determined at the date of grant and recognised as an expense in the income statement on a straight-line basis over the vesting period, taking account of the estimated number of shares that are expected to vest. Market based performance criteria are taken into account when determining the fair value at the date of grant. Non-market based performance criteria are taken into account when estimating the number of shares expected to vest. The fair value of share based remuneration is determined by use of a binomial or Monte Carlo simulation model as appropriate. All of the Group’s share based remuneration is equity settled.
|
Operating profit is stated after charging/(crediting) the following:
| Note | 2020 £m |
2019 £m |
2018 £m |
|||||||||||||
| Staff costs |
||||||||||||||||
| Wages and salaries |
2,173 | 2,116 | 1,959 | |||||||||||||
| Social security costs |
232 | 230 | 215 | |||||||||||||
| Pensions |
6 | 125 | 120 | 135 | ||||||||||||
| Share based remuneration |
25 | 32 | 41 | |||||||||||||
| Total staff costs |
2,555 | 2,498 | 2,350 | |||||||||||||
| Depreciation and amortisation |
||||||||||||||||
| Amortisation of acquired intangible assets |
15 | 376 | 294 | 287 | ||||||||||||
| Share of joint ventures’ amortisation of acquired intangible assets |
– | 1 | 1 | |||||||||||||
| Amortisation of internally developed intangible assets |
15 | 319 | 249 | 225 | ||||||||||||
| Depreciation of property, plant and equipment |
17 | 60 | 58 | 62 | ||||||||||||
| Depreciation of right-of-use assets |
88 | 82 | 77 | |||||||||||||
| Total depreciation and amortisation |
843 | 684 | 652 | |||||||||||||
| Other expenses and income |
||||||||||||||||
| Cost of sales including pre-publication costs and inventory expenses |
2,487 | 2,755 | 2,638 | |||||||||||||
| Short-term and low value lease expenses |
21 | 20 | 18 | |||||||||||||
| Operating lease rentals income |
(1 | ) | (1 | ) | (3 | ) | ||||||||||
The amortisation of acquired intangible assets is included within administration and other expenses.
The Group provides a number of share based remuneration schemes to Directors and employees. The principal share based remuneration schemes are the Executive Share Option Schemes (ESOS), the Long-Term Incentive Plan (LTIP), the Retention Share Plan (RSP) and the Bonus Investment Plan (BIP). Share options granted under ESOS are exercisable after three years and up to ten years from the date of grant at a price equivalent to the market value of the respective shares at the date of grant. Conditional shares granted under LTIP, RSP and BIP are exercisable after three years for nil consideration if conditions are met. Other awards principally relate to all employee share based saving schemes in the UK and the Netherlands. Further details are provided in the remuneration report on pages 93 to 114.
Refer to note 2 for further detail on the exceptional costs in Exhibitions.
| RELX Annual report and financial statements 2020 | Notes to the consolidated financial statements | 143 | |
|
| ||
| 144 | RELX Annual report and financial statements 2020 | Financial statements and other information | |
|
| ||
Notes to the consolidated financial statements
for the year ended 31 December 2020
6 Pension schemes
| Accounting policy The expense of defined benefit pension schemes and other post-retirement employee benefits is determined using the projected unit credit method and charged in the income statement as an operating expense, based on actuarial assumptions reflecting market conditions at the beginning of the financial year. Actuarial gains and losses are recognised in full in the statement of comprehensive income in the period in which they occur.
Past service costs and credits are recognised immediately at the earlier of when plan amendments or curtailments occur and when related restructuring costs or termination benefits are recognised. Settlements are recognised when they occur.
Net pension obligations in respect of defined benefit schemes are included in the statement of financial position at the present value of scheme liabilities, less the fair value of scheme assets. Where schemes are in surplus, i.e. assets exceed liabilities, the net pension assets are separately included in the statement of financial position. Any net pension asset is limited to the extent that the asset is recoverable.
The expense of defined contribution pension schemes and other employee benefits is charged in the income statement as incurred.
Critical judgement and key source of estimation uncertainty At 31 December 2020, the Group operates defined benefit pension schemes in the UK and the US. These schemes require management to exercise judgement in estimating the ultimate cost of providing post-employment benefits, especially given the length of each scheme’s liabilities. Accounting for defined benefit pension schemes involves judgement about uncertain events, including the life expectancy of the members, salary and pension increases, inflation, the future operation of each scheme and the rate at which the future pension payments are discounted. Estimates for these factors are used in determining the pension cost and liabilities reported in the financial statements. The estimates made around future developments of each of the critical assumptions are made in conjunction with independent actuaries, and each scheme is subject to a periodic review by independent actuaries. Information regarding the more significant assumptions used for valuation is provided below, together with a sensitivity analysis.
|
A number of pension schemes are operated around the world. The largest defined benefit schemes as at 31 December 2020 were in the UK and the US, and are summarised below.
Major defined benefit schemes in place at 31 December 2020
The UK scheme is a final salary scheme and is closed to new hires. Members accrue a portion of their final pensionable earnings based on the number of years of service. The US scheme is a cash balance scheme and was closed to future accruals effective 1 January 2019.
Each of the major defined benefit schemes is administered by a separate fund that is legally separated from the Group. The trustees of the pension funds in the UK and plan fiduciaries of the US scheme are required by law to act in the interest of the funds’ beneficiaries. In the UK, the trustees of the pension fund are responsible for the investment policy with regard to the assets of the fund. The board of trustees consists of an equal number of company-appointed and member-nominated Directors. In the US, the fiduciary duties for the scheme are allocated between committees which are staffed by senior employees of the Group; the investment committee has the primary responsibility for the investment and management of plan assets. The funding of the Group’s major schemes reflects the different rules within each jurisdiction.
| RELX Annual report and financial statements 2020 | Notes to the consolidated financial statements | 145 | |
|
| ||
| 146 | RELX Annual report and financial statements 2020 | Financial statements and other information | |
|
| ||
Notes to the consolidated financial statements
for the year ended 31 December 2020
6 Pension schemes (continued)
The amount recognised in the statement of financial position in respect of defined benefit pension schemes at the start and end of the year and the movements during the year were as follows:
| 2020 | 2019 | |||||||||||||||||||||||||||
| UK £m |
US £m |
Total £m |
UK £m |
US £m |
Total £m |
|||||||||||||||||||||||
| Defined benefit obligation |
||||||||||||||||||||||||||||
| At start of year |
(4,251 | ) | (1,018 | ) | (5,269 | ) | (3,772 | ) | (1,040 | ) | (4,812 | ) | ||||||||||||||||
| Service cost |
(21 | ) | (3 | ) | (24 | ) | (21 | ) | (3 | ) | (24 | ) | ||||||||||||||||
| Past service credits |
– | 13 | 13 | 8 | 5 | 13 | ||||||||||||||||||||||
| Interest on pension scheme liabilities |
(85 | ) | (31 | ) | (116 | ) | (104 | ) | (42 | ) | (146 | ) | ||||||||||||||||
| Actuarial loss on financial assumptions |
(492 | ) | (99 | ) | (591 | ) | (495 | ) | (116 | ) | (611 | ) | ||||||||||||||||
| Actuarial gain/(loss) arising from experience assumptions |
60 | (13 | ) | 47 | 22 | (5 | ) | 17 | ||||||||||||||||||||
| Contributions by employees |
(8 | ) | – | (8 | ) | (9 | ) | – | (9 | ) | ||||||||||||||||||
| Liabilities transferred on settlement |
– | – | – | – | 65 | 65 | ||||||||||||||||||||||
| Benefits paid |
129 | 56 | 185 | 120 | 77 | 197 | ||||||||||||||||||||||
| Exchange translation differences |
– | 33 | 33 | – | 41 | 41 | ||||||||||||||||||||||
| At end of year |
(4,668 | ) | (1,062 | ) | (5,730 | ) | (4,251 | ) | (1,018 | ) | (5,269 | ) | ||||||||||||||||
| Fair value of scheme assets |
||||||||||||||||||||||||||||
| At start of year |
3,767 | 995 | 4,762 | 3,413 | 966 | 4,379 | ||||||||||||||||||||||
| Interest income on plan assets |
76 | 30 | 106 | 95 | 39 | 134 | ||||||||||||||||||||||
| Return on assets excluding amounts included in interest income |
291 | 135 | 426 | 304 | 166 | 470 | ||||||||||||||||||||||
| Contributions by employer |
63 | 7 | 70 | 66 | 6 | 72 | ||||||||||||||||||||||
| Contributions by employees |
8 | – | 8 | 9 | – | 9 | ||||||||||||||||||||||
| Assets transferred on settlement |
– | – | – | – | (65 | ) | (65 | ) | ||||||||||||||||||||
| Benefits paid |
(129 | ) | (56 | ) | (185 | ) | (120 | ) | (77 | ) | (197 | ) | ||||||||||||||||
| Exchange translation differences |
– | (34 | ) | (34 | ) | – | (40 | ) | (40 | ) | ||||||||||||||||||
| At end of year |
4,076 | 1,077 | 5,153 | 3,767 | 995 | 4,762 | ||||||||||||||||||||||
| Opening net deficit |
(484 | ) | (23 | ) | (507 | ) | (359 | ) | (74 | ) | (433 | ) | ||||||||||||||||
| Service cost |
(21 | ) | (3 | ) | (24 | ) | (21 | ) | (3 | ) | (24 | ) | ||||||||||||||||
| Net interest on net defined benefit obligation |
(9 | ) | (1 | ) | (10 | ) | (9 | ) | (3 | ) | (12 | ) | ||||||||||||||||
| Settlement and past service credits |
– | 13 | 13 | 8 | 5 | 13 | ||||||||||||||||||||||
| Contributions by employer |
63 | 7 | 70 | 66 | 6 | 72 | ||||||||||||||||||||||
| Actuarial (losses)/gains |
(141 | ) | 23 | (118 | ) | (169 | ) | 45 | (124 | ) | ||||||||||||||||||
| Exchange translation differences |
– | (1 | ) | (1 | ) | – | 1 | 1 | ||||||||||||||||||||
| Net pension obligation |
(592 | ) | 15 | (577 | ) | (484 | ) | (23 | ) | (507 | ) | |||||||||||||||||
| Impact of asset ceiling |
– | (47 | ) | (47 | ) | – | (13 | ) | (13 | ) | ||||||||||||||||||
| Overall net pension obligation |
(592 | ) | (32 | ) | (624 | ) | (484 | ) | (36 | ) | (520 | ) | ||||||||||||||||
As at 31 December 2020, the defined benefit obligations comprised £5,459m (2019: £5,016m) in relation to funded schemes and £271m (2019: £253m) in relation to unfunded schemes.
The weighted average duration of defined benefit scheme liabilities is 19 years in the UK (2019: 19 years) and 11 years in the US (2019: 13 years). Deferred tax assets of £125m (2019: £96m) are recognised in respect of the pension scheme deficits.
A net pension asset has been recognised in relation to the US funded scheme after considering the guidance in IAS 19 – Employee Benefits and IFRIC 14. The split between net pension obligations and net pension assets is as follows:
| 2020 £m |
2019 £m |
|||||||
| Net pension asset recognised |
47 | 45 | ||||||
| Net pension obligation |
(671 | ) | (565 | ) | ||||
| Overall net pension obligation |
(624 | ) | (520 | ) | ||||
| RELX Annual report and financial statements 2020 | Notes to the consolidated financial statements | 147 | |
|
| ||
| 148 | RELX Annual report and financial statements 2020 | Financial statements and other information | |
|
| ||
Notes to the consolidated financial statements
for the year ended 31 December 2020
7 Net finance costs
| Accounting policy Borrowing costs that are directly attributable to the acquisition, construction or production of an asset that takes a substantial period of time to bring to use are capitalised. All other interest on borrowings is expensed as incurred. The cost of issuing borrowings is generally expensed over the period of borrowing so as to produce a constant periodic rate of charge.
|
| 2020 £m |
2019 £m |
2018 £m |
||||||||||
| Interest on short-term bank loans, overdrafts and commercial paper |
(17 | ) | (20 | ) | (22 | ) | ||||||
| Interest on term debt |
(122 | ) | (266 | ) | (161 | ) | ||||||
| Interest on lease liabilities |
(12 | ) | (15 | ) | (14 | ) | ||||||
| Total borrowing costs |
(151 | ) | (301 | ) | (197 | ) | ||||||
| Losses on loans and derivatives not designated as hedges |
(13 | ) | – | (10 | ) | |||||||
| Fair value losses on designated fair value hedge relationships |
– | – | (1 | ) | ||||||||
| Net financing charge on defined benefit pension schemes and other |
(11 | ) | (13 | ) | (9 | ) | ||||||
| Finance costs |
(175 | ) | (314 | ) | (217 | ) | ||||||
| Interest on bank deposits |
2 | 3 | 4 | |||||||||
| Interest income on net finance lease receivables |
1 | 2 | 2 | |||||||||
| Fair value gains on designated fair value hedge relationships |
– | 1 | – | |||||||||
| Gains on loans and derivatives not designated as hedges |
– | 3 | – | |||||||||
| Finance income |
3 | 9 | 6 | |||||||||
| Net finance costs |
(172 | ) | (305 | ) | (211 | ) | ||||||
Gains of £3m (2019: losses of £1m; 2018: losses of £8m) on derivatives designated as cash flow hedges were recognised in other comprehensive income and accumulated in the hedge reserve, and may be reclassified to the income statement in future periods. Losses of £4m (2019: gains of nil; 2018: gains of £3m) in total were transferred from the hedge reserve in the period.
In 2019, the interest charge on term debt included a charge of £99m in respect of the early redemption of bonds that were due to be repaid in October 2022. The redemption of these bonds took place in January 2020 and was committed to at 31 December 2019.
8 Disposals and other non-operating items
| Accounting policy Assets of businesses that are available for immediate sale in their current condition and for which a sales process is considered highly probable to complete are classified as assets held for sale and are carried at the lower of carrying value and fair value less costs to sell. Fair value is based on anticipated disposal proceeds, typically derived from firm or indicative offers from potential acquirers. Non-current assets are not amortised or depreciated following their classification as held for sale. Liabilities of businesses held for sale are also separately classified on the statement of financial position. Fair value movements in the venture capital portfolio are reported within disposals and other items – see note 16.
|
| 2020 £m |
2019 £m |
2018 £m |
||||||||||
| Revaluation of investments |
151 | 25 | (11 | ) | ||||||||
| (Loss)/gain on disposal of businesses and assets held for sale |
(21 | ) | 26 | (22 | ) | |||||||
| Net gain/(loss) on disposals and other non-operating items |
130 | 51 | (33 | ) | ||||||||
The revaluation of investments relates mainly to venture fund investments, further details of which are provided in note 16.
| RELX Annual report and financial statements 2020 | Notes to the consolidated financial statements | 149 | |
|
| ||
| 150 | RELX Annual report and financial statements 2020 | Financial statements and other information | |
|
| ||
Notes to the consolidated financial statements
for the year ended 31 December 2020
9 Taxation (continued)
| 2020 £m |
2019 £m |
2018 £m |
||||||||||
| Current tax |
||||||||||||
| United Kingdom |
(80 | ) | (141 | ) | (71 | ) | ||||||
| Rest of world |
(184 | ) | (241 | ) | (226 | ) | ||||||
| Total current tax charge |
(264 | ) | (382 | ) | (297 | ) | ||||||
| Deferred tax |
(11 | ) | 44 | 5 | ||||||||
| Tax expense |
(275 | ) | (338 | ) | (292 | ) | ||||||
Cash tax paid (net) in the year was £496m (2019: £464m; 2018: £415m), which is different to the tax expense for the year set out above.
There are a number of reasons why the cash tax payments in a particular year will be different from the tax expense in the accounts:
| ◾ | Tax payments relating to a particular year’s profits are typically due partly in the year and partly in the following year. In 2020 there was an acceleration of instalment payments in the UK. |
| ◾ | Tax expense includes deferred tax, an accounting adjustment where an item is included in the income statement in one year but is taxed in another year. The acquisition of intangible assets often results in deferred tax liabilities, the unwind of which does not result in tax payments. |
| ◾ | Current tax expense is the best estimate at the end of the period of cash tax expected to be paid. To the extent the final tax liability is different, any cash tax impact will occur in a later period. |
| ◾ | Some of the benefits of tax deductions related to share based payments, pensions and hedging are credited to equity or other comprehensive income rather than to tax expense. |
Set out below is a reconciliation of the difference between tax expense for the period and the theoretical expense calculated by multiplying accounting profit by the applicable tax rate.
We believe the most meaningful applicable rate is that obtained by multiplying the accounting profits and losses of all consolidated entities by the applicable domestic rate in each of those entities’ jurisdictions.
The net tax expense charged on profit before tax differs from the theoretical amount that would arise using the weighted average of tax rates applicable to accounting profits and losses of the consolidated entities, as follows:
| 2020 | 2019 | 2018 | ||||||||||||||||||||||||||
| £m | % | £m | % | £m | % | |||||||||||||||||||||||
| Profit before tax |
1,483 | 1,847 | 1,720 | |||||||||||||||||||||||||
| Tax at average applicable rates |
(331 | ) | 22.3% | (418 | ) | 22.6% | (361 | ) | 21.0% | |||||||||||||||||||
| Tax effect of share of results of joint ventures |
3 | (0.2)% | 10 | (0.5)% | 8 | (0.5)% | ||||||||||||||||||||||
| Expenses not deductible for tax purposes |
18 | (1.2)% | (3 | ) | 0.2% | (24 | ) | 1.4% | ||||||||||||||||||||
| Non-deductible costs of share based remuneration |
(2 | ) | 0.1% | (1 | ) | 0.1% | (1 | ) | 0.1% | |||||||||||||||||||
| Non-deductible disposal-related gains and losses |
(2 | ) | 0.1% | 4 | (0.2)% | – | 0.0% | |||||||||||||||||||||
| Deferred tax assets of the period not recognised |
(19 | ) | 1.3% | (15 | ) | 0.8% | (24 | ) | 1.4% | |||||||||||||||||||
| Change in recognition and measurement of deferred tax |
14 | (0.9)% | 12 | (0.6)% | (15 | ) | 0.9% | |||||||||||||||||||||
| Other adjustments in respect of prior periods |
44 | (3.0)% | 73 | (4.0)% | 13 | (0.8)% | ||||||||||||||||||||||
| Exceptional tax credit |
– | – | – | – | 112 | (6.5)% | ||||||||||||||||||||||
| Tax expense |
(275 | ) | 18.5% | (338 | ) | 18.3% | (292 | ) | 17.0% | |||||||||||||||||||
The weighted average applicable tax rate for the year was 22.3% (2019: 22.6%; 2018: 21.0%), reflecting the applicable rates in the countries where the Group operates. The Group’s future tax charge will be sensitive to the geographic mix of profits and losses and the tax rates and laws in force in the jurisdictions in which we operate.
| RELX Annual report and financial statements 2020 | Notes to the consolidated financial statements | 151 | |
|
| ||
| 152 | RELX Annual report and financial statements 2020 | Financial statements and other information | |
|
| ||
Notes to the consolidated financial statements
for the year ended 31 December 2020
9 Taxation (continued)
As a result of exemptions on dividends from subsidiaries and capital gains on disposal there are no significant taxable temporary differences associated with investments in subsidiaries, branches, associates and interests in joint arrangements.
Deferred tax assets in respect of tax losses and other deductible temporary differences have only been recognised to the extent that it is more likely than not that sufficient taxable profits will be available to allow the asset to be recovered. Accordingly, no deferred tax asset has been recognised in respect of unused trading losses and interest expenses of approximately £297m (2019: £255m) carried forward at year end. The deferred tax asset not recognised in respect of these losses and interest expenses is approximately £81m (2019: £66m). Of the unrecognised losses and interest expenses, £168m (2019: £124m) will expire if not utilised within ten years and £129m (2019: £131m) will expire after more than ten years or have no expiration date.
In addition there were state and local tax losses of £94m (2019: £96m) where it is not more likely than not that these losses will be utilised. Of the unrecognised state and local losses, £44m (2019: £45m) will expire within ten years and £50m (2019: £51m) will expire after more than ten years. The deferred tax asset not recognised in respect of these losses is approximately £6m (2019: £6m).
Deferred tax assets of approximately £4m (2019: £6m) have not been recognised in respect of tax losses and other temporary differences carried forward of £23m (2019: £33m), which can only be used to offset future capital gains.
10 Earnings per share
| Accounting policy Earnings per share (‘EPS’) is calculated by taking the reported net profit attributable to shareholders and dividing this by the total weighted average number of shares.
Adjusted earnings per share is calculated by dividing adjusted net profit attributable to RELX PLC shareholders by the total weighted average number of shares.
|
| EARNINGS PER SHARE – FOR THE YEAR ENDED 31 DECEMBER |
2020 | 2019 | 2018 | |||||||||||||||||||||||||||||||||||||
| Net profit attributable to RELX PLC shareholders £m |
Weighted average number of shares (millions) |
EPS (pence) |
Net profit attributable to RELX PLC shareholders £m |
Weighted average number of shares (millions) |
EPS (pence) |
Net profit attributable to RELX PLC shareholders £m |
Weighted average number of shares (millions) |
EPS (pence) |
||||||||||||||||||||||||||||||||
| Basic earnings per share |
1,224 | 1,926.2 | 63.5p | 1,505 | 1,943.5 | 77.4p | 1,422 | 1,977.2 | 71.9p | |||||||||||||||||||||||||||||||
| Diluted earnings per share |
1,224 | 1,937.8 | 63.2p | 1,505 | 1,956.2 | 76.9p | 1,422 | 1,990.8 | 71.4p | |||||||||||||||||||||||||||||||
|
The diluted figures are calculated after taking account of potential additional ordinary shares arising from share options and conditional shares.
|
| |||||||||||||||||||||||||||||||||||||||
| ADJUSTED EARNINGS PER SHARE | 2020 | 2019 | 2018 | |||||||||||||||||||||||||||||||||||||
| Adjusted net profit attributable to RELX PLC shareholders £m |
Weighted average number of shares (millions) |
Adjusted EPS (pence) |
Adjusted net profit attributable to RELX PLC shareholders £m |
Weighted number of shares |
Adjusted EPS (pence) |
Adjusted net profit attributable to RELX PLC shareholders £m |
Weighted number of |
Adjusted EPS (pence) |
||||||||||||||||||||||||||||||||
| Adjusted earnings per share |
1,543 | 1,926.2 | 80.1p | 1,808 | 1,943.5 | 93.0p | 1,674 | 1,977.2 | 84.7p | |||||||||||||||||||||||||||||||
| RELX Annual report and financial statements 2020 | Notes to the consolidated financial statements | 153 | |
|
| ||
| 154 | RELX Annual report and financial statements 2020 | Financial statements and other information | |
|
| ||
Notes to the consolidated financial statements
for the year ended 31 December 2020
11 Statement of cash flows
| Accounting policy Cash and cash equivalents comprise cash balances, call deposits and other short-term highly liquid investments and are held in the statement of financial position at fair value. |
| RECONCILIATION OF OPERATING PROFIT TO CASH GENERATED FROM OPERATIONS | 2020 £m |
2019 £m |
2018 £m |
|||||||||||||
| Operating profit |
1,525 | 2,101 | 1,964 | |||||||||||||
| Share of results of joint ventures |
(15 | ) | (41 | ) | (32 | ) | ||||||||||
| Amortisation of acquired intangible assets |
376 | 294 | 287 | |||||||||||||
| Amortisation of internally developed intangible assets |
319 | 249 | 225 | |||||||||||||
| Depreciation of property, plant and equipment |
60 | 58 | 62 | |||||||||||||
| Depreciation of right-of-use assets |
88 | 82 | 77 | |||||||||||||
| Share based remuneration |
25 | 32 | 41 | |||||||||||||
| Total non-cash items |
868 | 715 | 692 | |||||||||||||
| Increase in inventories and pre-publication costs |
(18 | ) | (14 | ) | (7 | ) | ||||||||||
| Decrease/(increase) in receivables |
149 | (116 | ) | (89 | ) | |||||||||||
| (Decrease)/increase in payables |
(245 | ) | 79 | 27 | ||||||||||||
| Increase in working capital |
(114 | ) | (51 | ) | (69 | ) | ||||||||||
| Cash generated from operations |
2,264 | 2,724 | 2,555 | |||||||||||||
| CASH FLOW ON ACQUISITIONS | Note |
2020 £m |
2019 £m |
2018 £m |
||||||||||||
| Purchase of businesses |
12 | (864 | ) | (399 | ) | (919 | ) | |||||||||
| Deferred payments relating to prior year acquisitions |
(5 | ) | (24 | ) | (16 | ) | ||||||||||
| Total |
(869 | ) | (423 | ) | (935 | ) | ||||||||||
| RECONCILIATION OF NET BORROWINGS | Cash and cash equivalents £m |
Borrowings £m |
Related derivative financial instruments £m |
Finance lease receivable £m |
2020 £m |
2019 £m |
2018 £m |
|||||||||||||||||||||
| At start of year |
138 | (6,414 | ) | 52 | 33 | (6,191 | ) | (6,177 | ) | (5,042 | ) | |||||||||||||||||
| (Decrease)/increase in cash and cash equivalents |
(51 | ) | – | – | – | (51 | ) | 27 | 1 | |||||||||||||||||||
| Decrease/(increase) in short-term bank loans, overdrafts and commercial paper |
– | 436 | – | – | 436 | (98 | ) | (147 | ) | |||||||||||||||||||
| Issuance of term debt |
– | (2,342 | ) | – | – | (2,342 | ) | (729 | ) | (958 | ) | |||||||||||||||||
| Repayment of term debt |
– | 1,233 | – | – | 1,233 | 617 | 211 | |||||||||||||||||||||
| Repayment of leases |
– | 105 | – | (15 | ) | 90 | 86 | 81 | ||||||||||||||||||||
| Change in net borrowings resulting from cash flows |
(51 | ) | (568 | ) | – | (15 | ) | (634 | ) | (97 | ) | (812 | ) | |||||||||||||||
| Borrowings in acquired businesses |
– | (3 | ) | – | – | (3 | ) | (6 | ) | (12 | ) | |||||||||||||||||
| Remeasurement and derecognition of leases |
– | (8 | ) | – | – | (8 | ) | (28 | ) | (12 | ) | |||||||||||||||||
| Inception of leases |
– | (25 | ) | – | 1 | (24 | ) | (60 | ) | (28 | ) | |||||||||||||||||
| Fair value and other adjustments to borrowings and related derivatives |
– | (76 | ) | 72 | – | (4 | ) | (94 | ) | (25 | ) | |||||||||||||||||
| Exchange translation differences |
1 | (29 | ) | (5 | ) | (1 | ) | (34 | ) | 271 | (246 | ) | ||||||||||||||||
| At end of year |
88 | (7,123 | ) | 119 | 18 | (6,898 | ) | (6,191 | ) | (6,177 | ) | |||||||||||||||||
Net borrowings comprise cash and cash equivalents, loan capital, lease liabilities and receivables, promissory notes, bank and other loans, derivative financial instruments that are used to hedge certain borrowings and adjustments in respect of cash collateral received/paid. The Group monitors net borrowings as part of capital and liquidity management.
| RELX Annual report and financial statements 2020 | Notes to the consolidated financial statements | 155 | |
|
| ||
| 156 | RELX Annual report and financial statements 2020 | Financial statements and other information | |
|
| ||
Notes to the consolidated financial statements
for the year ended 31 December 2020
14 Goodwill
| Accounting policy On the acquisition of a subsidiary or business, the purchase consideration is allocated between the net tangible and intangible assets on a fair value basis, with any excess purchase consideration representing goodwill. Goodwill arising on acquisitions also includes amounts corresponding to deferred tax liabilities recognised in respect of acquired intangible assets.
Goodwill is recognised as an asset and reviewed for impairment when there is an indicator that the asset may be impaired and at least annually. Any impairment is recognised immediately in the income statement and not subsequently reversed.
On disposal of a subsidiary or business, the attributable amount of goodwill is included in the determination of the profit or loss on disposal.
At each statement of financial position date, the carrying amounts of tangible and intangible assets and goodwill are reviewed to determine whether there is any indication that those assets have suffered an impairment loss. If any such indication exists, the recoverable amount, which is the higher of value in use and fair value less costs to sell, of the asset is estimated in order to determine the extent, if any, of the impairment loss. Where the asset does not generate cash flows that are independent from other assets, value in use estimates are made based on the cash flows of the cash generating unit to which the asset belongs. Intangible assets with an indefinite useful life are tested for impairment at least annually and whenever there is any indication that the asset may be impaired.
If the recoverable amount of an asset or cash generating unit is estimated to be less than its net carrying amount, the net carrying amount of the asset or cash generating unit is reduced to its recoverable amount. Impairment losses are recognised immediately in the income statement in administration and other expenses.
Critical judgement and key source of estimation uncertainty The carrying amounts of goodwill and indefinite lived intangible assets in each business are reviewed for impairment at least annually. The carrying amounts of all other intangible assets are reviewed where there are indications of possible impairment. An impairment review involves a comparison of the carrying value of the asset with estimated values in use based on the latest management cash flow projections, approved by the Board. Key areas of judgement in estimating the values in use of businesses are the growth in cash flows over a forecast period of up to five years, the long-term growth rate assumed thereafter and the discount rate applied to the forecast cash flows. A description of the key assumptions and sensitivities is provided below.
|
| 2020 £m |
2019 £m |
|||||||
| At start of year |
6,824 | 6,899 | ||||||
| Acquisitions |
570 | 257 | ||||||
| Disposals |
(6 | ) | (64 | ) | ||||
| Exchange translation differences |
(164 | ) | (268 | ) | ||||
| At end of year |
7,224 | 6,824 | ||||||
The carrying amount of goodwill is after cumulative amortisation of £1,151m (2019: £1,178m), which was charged prior to the adoption of IFRS, and £9m (2019: £9m) of subsequent impairment charges recorded in prior years.
| RELX Annual report and financial statements 2020 | Notes to the consolidated financial statements | 157 | |
|
| ||
| 158 | RELX Annual report and financial statements 2020 | Financial statements and other information | |
|
| ||
Notes to the consolidated financial statements
for the year ended 31 December 2020
15 Intangible assets
| Accounting policy Intangible assets acquired as part of a business combination are stated in the statement of financial position at their fair value as at the date of acquisition, less accumulated amortisation. Internally generated intangible assets are stated in the statement of financial position at the directly attributable cost of creation of the asset, less accumulated amortisation.
Intangible assets acquired as part of business combinations comprise: market-related assets (e.g. trademarks, imprints, brands); customer-related assets (e.g. subscription bases, customer lists, customer relationships); editorial content; software and systems (e.g. application infrastructure, product delivery platforms, in-process research and development); contract-based assets (e.g. publishing rights, exhibition rights, supply contracts); and other intangible assets. Internally generated intangible assets typically comprise software and systems development where an identifiable asset is created that is probable to generate future economic benefits.
Intangible assets, other than journal titles determined to have indefinite lives, are amortised on a straight-line basis over their estimated useful lives. The estimated useful lives of intangible assets with finite lives are as follows: market and customer-related assets – 3 to 40 years; content, software and other acquired intangible assets – 3 to 20 years; and internally developed intangible assets – 3 to 10 years. Journal titles determined to have indefinite lives are not amortised and are subject to impairment review at least annually, including a review of events and circumstances to ensure that they continue to support an indefinite useful life.
Critical judgements and key sources of estimation uncertainty On acquisition of a subsidiary or business, the purchase consideration is allocated between the net tangible and intangible assets other than goodwill on a fair value basis, with any excess purchase consideration representing goodwill. The valuation of acquired intangible assets represents the estimated economic value in use, using standard valuation methodologies, including as appropriate, discounted cash flow, relief from royalty and comparable market transactions. Acquired intangible assets are capitalised and amortised systematically over their estimated useful lives, subject to impairment review. The assumptions used are subject to management judgement.
Appropriate amortisation periods are selected based on assessments of the longevity of the brands and imprints, the strength and stability of customer relationships, the market positions of the acquired assets and the technological and competitive risks that they face. Certain intangible assets in relation to acquired science and medical publishing businesses have been determined to have indefinite lives. The longevity of these assets is evidenced by their long-established and well-regarded journal titles, and their characteristically stable market positions. The assumptions used are subject to management judgement.
Development spend encompasses investment in new products and other initiatives, ranging from the building of online delivery platforms, to launch costs of new services, to building new infrastructure and applications. Launch costs and other ongoing operating expenses of new products and services are expensed as incurred. The costs of building product applications, platforms and infrastructure are capitalised as intangible assets, where the investment they represent has demonstrable value and the technical and commercial feasibility is assured. Costs eligible for capitalisation must be incremental, clearly identified and directly attributable to a particular project. The resulting assets are amortised over their estimated useful lives. Impairment reviews are carried out at least annually where indicators of impairment are identified. Judgement is required in the assessment of the potential value of a development project, the identification of costs eligible for capitalisation and the selection of appropriate asset lives. |
| RELX Annual report and financial statements 2020 | Notes to the consolidated financial statements | 159 | |
|
| ||
| 160 | RELX Annual report and financial statements 2020 | Financial statements and other information | |
|
| ||
Notes to the consolidated financial statements
for the year ended 31 December 2020
16 Investments
| Accounting policy Investments, other than investments in joint arrangements and associates, are stated in the statement of financial position at fair value. Changes in the fair value of investments held as part of the venture capital portfolio are reported in disposals and other non-operating items in the income statement. All items recognised in the income statement relating to investments, other than investments in joint arrangements and associates, are reported as disposals and other non-operating items.
Venture capital investments and equity investments represent interests in listed and unlisted securities. The fair value of listed securities is based on quoted prices in active markets. The fair value of unlisted securities is based on management’s estimate of fair value based on standard valuation techniques, including market comparisons and discounts of future cash flows, having regard to maximising the use of observable inputs and adjusting for risk. Advice from valuation experts is used as appropriate.
All joint arrangements are classified as joint ventures because the Group shares joint control and has rights to the net assets of the arrangements. Investments in joint ventures and associates are accounted for under the equity method and stated in the statement of financial position at cost as adjusted for post-acquisition changes in the Group’s share of net assets, less any impairment in value.
|
| 2020 £m |
2019 £m |
|||||||
| Investments in joint ventures |
103 | 118 | ||||||
| Venture capital investments |
259 | 133 | ||||||
| Total |
362 | 251 | ||||||
The value of venture capital investments and equity investments has been determined by reference to quoted prices in active markets, other observable market inputs or, when these are not available, by reference to inputs we believe would reflect the assumptions market participants would use. Venture capital investments include a £173m investment in Palantir Technologies Inc which listed on the Nasdaq during 2020. The valuation of the investment is based on Palantir’s share price on 31 December 2020 of $23.55. Gains and losses included in the consolidated income statement are provided in note 8.
An analysis of changes in the carrying value of investments in joint ventures is set out below:
| 2020 £m |
2019 £m |
|||||||
| At start of year |
118 | 104 | ||||||
| Share of results of joint ventures |
15 | 41 | ||||||
| Dividends received from joint ventures |
(31 | ) | (34 | ) | ||||
| Additions |
– | 24 | ||||||
| Disposals |
– | (11 | ) | |||||
| Exchange translation differences |
1 | (6 | ) | |||||
| At end of year |
103 | 118 | ||||||
Summarised aggregate information in respect of the Group’s share of joint ventures is set out below:
| RELX’s share | ||||||||
| 2020 £m |
2019 £m |
|||||||
| Revenue |
60 | 123 | ||||||
| Net profit for the year |
15 | 41 | ||||||
| Total assets |
84 | 112 | ||||||
| Total liabilities |
(45 | ) | (58 | ) | ||||
| Net assets |
39 | 54 | ||||||
| Goodwill |
64 | 64 | ||||||
| Total |
103 | 118 | ||||||
The Group’s consolidated other comprehensive income includes no income or losses relating to joint ventures in either period.
| RELX Annual report and financial statements 2020 | Notes to the consolidated financial statements | 161 | |
|
| ||
| 162 | RELX Annual report and financial statements 2020 | Financial statements and other information | |
|
| ||
Notes to the consolidated financial statements
for the year ended 31 December 2020
18 Financial instruments
| Accounting policy Financial instruments comprise investments (other than investments in joint ventures or associates), trade receivables, cash and cash equivalents, payables and accruals, borrowings and derivative financial instruments.
Investments (other than investments in joint ventures and associates) are described in note 16. The fair value of such investments is based on standard valuation techniques, including market comparisons and discounts of future cash flows, having regard to maximising the use of observable inputs and adjusting for risk. (These investments are typically classified as either Level 2 or 3 in the IFRS 13 fair value hierarchy).
Trade receivables are carried in the statement of financial position at invoiced value less allowance for expected credit losses. Expected credit losses are based on the ageing of trade receivables, experience and circumstance. Borrowings and payables are recorded initially at fair value and subsequently carried at amortised cost (other than fixed rate borrowings in designated hedging relationships for which the carrying amount of the hedged portion of the borrowings is subsequently adjusted for the gain or loss attributable to the hedged risk).
Derivative financial instruments are used to hedge interest rate and foreign exchange risks. Where an effective hedge is in place against changes in the fair value of fixed rate borrowings, the hedged borrowings are adjusted for changes in fair value attributable to the risk being hedged with a corresponding income or expense included in the income statement within finance costs. The offsetting gains or losses from remeasuring the fair value of the related derivatives are also recognised in the income statement within finance costs. When the related derivative expires, is sold or terminated, or no longer qualifies for hedge accounting, the cumulative change in fair value of the hedged borrowing is amortised in the income statement over the period to maturity of the borrowing using the effective interest method.
Changes in the fair value of derivative financial instruments that are designated and effective as hedges of future cash flows are recognised (net of tax) in other comprehensive income and accumulated in the hedge reserve. The fair value amounts relating to foreign currency basis spreads are recorded in a separate component of equity in the cost of hedging reserve. If a hedged firm commitment or forecasted transaction results in the recognition of a non-financial asset or liability, then, at the time that the asset or liability is recognised, the associated gains or losses on the derivative that had previously been recognised in other comprehensive income are included in the initial measurement of the asset or liability. For hedges that do not result in the recognition of an asset or a liability, amounts deferred in the hedge reserve are recognised in the income statement in the same period in which the hedged item affects net profit or loss. Any ineffective portion of hedges is recognised immediately in the income statement.
Cash flow hedge accounting is discontinued when a hedging instrument expires or is sold, terminated or exercised, or no longer qualifies for hedge accounting. At that time, any cumulative gain or loss on the hedging instrument recognised in other comprehensive income is either retained in the hedge reserve until the firm commitment or forecasted transaction occurs, or, where a hedged transaction is no longer expected to occur, is immediately credited or expensed in the income statement.
Derivative financial instruments that are not designated as hedging instruments are recorded in the statement of financial position at fair value, with changes in fair value recognised in the income statement.
The fair values of derivative financial instruments represent the replacement costs calculated using observable market rates of interest and exchange. The fair value of long-term borrowings is calculated by discounting expected future cash flows at observable market rates. (These instruments are accordingly classified as Level 2 in the IFRS 13 fair value hierarchy.)
|
The main financial risks faced by the Group are liquidity risk, market risk – comprising interest rate risk and foreign exchange risk – and credit risk. Financial instruments are used to finance the Group’s businesses and to manage interest rate and foreign exchange risks. The Group’s businesses do not enter into speculative derivative transactions. Details of financial instruments subject to liquidity, market and credit risks are described below.
Liquidity risk
The Group maintains a range of borrowing facilities and debt programmes to fund its requirements at competitive rates.
The balance of long-term debt, short-term debt and committed bank facilities is managed to provide security of funding, taking into account the cash generation cycle of the business and the uncertain size and timing of acquisition spend. To accommodate the significant free cash flow generated by the Group and to capitalise on an inexpensive source of funding, a meaningful portion of the overall debt portfolio is typically kept short-term as long as there exists acceptable liquidity in the commercial paper markets and sufficient capacity under committed credit lines. The Group’s treasury policies ensure adequate liquidity by requiring that (a) no more than $2bn of term debt matures in any 12-month period, (b) the sum of term debt maturing over the ensuing 12 months plus short-term borrowings is less than the sum of available cash plus committed facilities and (c) minimum levels of borrowing with maturities over three and five years are maintained.
The treasury policies ensure debt efficiency by (a) targeting certain levels of short-term borrowings across a given year, (b) maintaining a weighted average maturity of the gross debt portfolio of approximately five years and (c) minimising surplus cash balances. From time to time, based on cash flow and market conditions, the Group may redeem term debt early or repurchase outstanding debt in the open market.
| RELX Annual report and financial statements 2020 | Notes to the consolidated financial statements | 163 | |
|
| ||
| 164 | RELX Annual report and financial statements 2020 | Financial statements and other information | |
|
| ||
Notes to the consolidated financial statements
for the year ended 31 December 2020
18 Financial instruments (continued)
At 31 December 2020, the Group had access to a $3,000m committed bank facility, consisting of various tranches with maturities through to July 2024, which was undrawn, and an additional committed bank facility of c.$600m maturing in April 2021, which was also undrawn. These facilities back up short-term borrowings. All borrowings that mature within the next 18 months can be covered by the facility and by utilising available cash resources.
The committed bank facilities are subject to a financial covenant typical to the Group’s size and financial strength. The Group had significant headroom within this covenant for the year ended 31 December 2020. There are no financial covenants in any outstanding public bonds.
Market risk
The Group’s primary market risks are interest rate fluctuations and exchange rate movements. Derivatives are used to manage the risks associated with interest rate and exchange rate movements and the Group does not enter into speculative derivatives. Where the impact of derivatives on the income statement and the statement of financial position could be significant, hedge accounting is applied (subject to satisfying the required criteria) as described in ‘Hedge accounting’ below. Derivatives used by the Group for hedging a particular risk are not specialised and are generally available from numerous sources. The Group is also exposed to changes in the market value of its venture capital investments as described in note 16. The impact of market risks on net post-employment benefit obligations and taxation is excluded from the following market risk sensitivity analysis.
Interest rate exposure management
The Group’s interest rate exposure management policy aims to minimise interest costs with an acceptable level of year on year volatility. To achieve this, the Group uses fixed rate term debt and interest rate swaps to give a target mix of fixed rate and floating rate borrowings. Interest rate derivatives are used only to hedge an underlying risk and no net market positions are held.
At 31 December 2020, 65% of gross bank and bond borrowings were at fixed rate. A 100 basis point reduction in interest rates would result in an estimated decrease in net finance costs of £23m (2019: £31m), based on the composition of financial instruments including cash, cash equivalents, bank loans and commercial paper borrowings at 31 December 2020. A 100 basis point rise in interest rates would result in an estimated increase in net finance costs of £23m (2019: £31m).
The impact on net equity of a theoretical change in interest rates as at 31 December 2020 is restricted to the change in carrying value of floating rate to fixed rate interest rate derivatives in a designated cash flow hedge relationship and undesignated interest rate derivatives. A 100 basis point reduction in interest rates would result in an estimated decrease in net equity of £1m (2019: £1m) and a 100 basis point increase in interest rates would increase net equity by an estimated £1m (2019: £1m). The impact of a change in interest rates on the carrying value of fixed rate borrowings in a designated fair value hedge relationship would be offset by the change in carrying value of the related interest rate derivative. Fixed rate borrowings not in a designated hedging relationship are carried at amortised cost.
Foreign currency exposure management
Translation exposures arise on the earnings and net assets of individual businesses whose operational currencies are other than sterling. Some of these exposures are offset by denominating borrowings in US dollars, euros and other currencies. Currency exposures on transactions denominated in a foreign currency are generally hedged using forward contracts. In addition, recurring transactions and future investment exposures may be hedged, in advance of becoming contractual. The precise policy differs according to the specific circumstances of the individual businesses. Highly predictable future cash flows may be covered for transactions expected to occur during the next 24 months (50 months for the Scientific, Technical & Medical subscription businesses) within limits defined according to the period before the transaction is expected to become contractual. Cover takes the form of foreign exchange forward contracts. Further information is provided in ‘Cash flow hedges’ below.
A theoretical weakening of all currencies by 10% against sterling at 31 December 2020 would decrease the carrying value of net assets, excluding net borrowings, by £803m (2019: £749m). This would be offset to a degree by a decrease in net borrowings of £713m (2019: £526m). A strengthening of all currencies by 10% against sterling at 31 December 2020 would increase the carrying value of net assets, excluding net borrowings, by £803m (2019: £749m) and increase net borrowings by £713m (2019: £526m).
A retranslation of the Group’s net profit for the year, assuming a 10% weakening of all foreign currencies against sterling but excluding transactional exposures, would reduce net profit by £95m (2019: £129m). A 10% strengthening of all foreign currencies against sterling on this basis would increase net profit for the year by £95m (2019: £129m).
| RELX Annual report and financial statements 2020 | Notes to the consolidated financial statements | 165 | |
|
| ||
| 166 | RELX Annual report and financial statements 2020 | Financial statements and other information | |
|
| ||
Notes to the consolidated financial statements
for the year ended 31 December 2020
18 Financial instruments (continued)
The gains and losses on the borrowings and related derivatives designated as fair value hedges, which are included in the income statement as part of finance costs, together with the total carrying values of the borrowings and related derivatives included in the statement of financial position, for the three years ended 31 December 2020, 2019 and 2018 were as follows:
| GAINS/(LOSSES) ON BORROWINGS AND RELATED DERIVATIVES AND CARRYING VALUES |
1 January £m |
Fair
value £m |
Exchange £m |
31 December £m |
Carrying £m |
|||||||||||||||||||
| USD debt |
(13 | ) | (25 | ) | 2 | (36 | ) | (701 | ) | |||||||||||||||
| Related interest rate swaps |
13 | 25 | (2 | ) | 36 | 36 | ||||||||||||||||||
| – | – | – | – | (665 | ) | |||||||||||||||||||
| EUR debt |
(39 | ) | (47 | ) | 3 | (83 | ) | (1,467 | ) | |||||||||||||||
| Related interest rate swaps |
39 | 47 | (3 | ) | 83 | 83 | ||||||||||||||||||
| – | – | – | – | (1,384 | ) | |||||||||||||||||||
| Total relating to USD and EUR debt |
(52 | ) | (72 | ) | 5 | (119 | ) | (2,168 | ) | |||||||||||||||
| Total related interest rate swaps |
52 | 72 | (5 | ) | 119 | 119 | ||||||||||||||||||
| Net gain on borrowings and related derivatives/total carrying value |
– | – | – | – | (2,049 | ) | ||||||||||||||||||
| GAINS/(LOSSES) ON BORROWINGS AND RELATED DERIVATIVES AND CARRYING VALUES |
1 January £m |
Fair
value £m |
Exchange £m |
31 December £m |
Carrying £m |
|||||||||||||||||||
| USD debt |
13 | (26 | ) | – | (13 | ) | (699 | ) | ||||||||||||||||
| Related interest rate swaps |
(14 | ) | 27 | – | 13 | 13 | ||||||||||||||||||
| (1 | ) | 1 | – | – | (686 | ) | ||||||||||||||||||
| EUR debt |
(39 | ) | (2 | ) | 2 | (39 | ) | (1,853 | ) | |||||||||||||||
| Related interest rate swaps |
39 | 2 | (2 | ) | 39 | 39 | ||||||||||||||||||
| – | – | – | – | (1,814 | ) | |||||||||||||||||||
| Total relating to USD and EUR debt |
(26 | ) | (28 | ) | 2 | (52 | ) | (2,552 | ) | |||||||||||||||
| Total related interest rate swaps |
25 | 29 | (2 | ) | 52 | 52 | ||||||||||||||||||
| Net (loss)/gain on borrowings and related derivatives/total carrying value |
(1 | ) | 1 | – | – | (2,500 | ) | |||||||||||||||||
| GAINS/(LOSSES) ON BORROWINGS AND RELATED DERIVATIVES AND CARRYING VALUES |
1 January £m |
Fair
value £m |
Exchange £m |
31 December £m |
Carrying £m |
|||||||||||||||||||
| USD debt |
12 | – | 1 | 13 | (701 | ) | ||||||||||||||||||
| Related interest rate swaps |
(12 | ) | (1 | ) | (1 | ) | (14 | ) | (14 | ) | ||||||||||||||
| – | (1 | ) | – | (1 | ) | (715 | ) | |||||||||||||||||
| EUR debt |
(17 | ) | (21 | ) | (1 | ) | (39 | ) | (1,952 | ) | ||||||||||||||
| Related interest rate swaps |
17 | 21 | 1 | 39 | 39 | |||||||||||||||||||
| – | – | – | – | (1,913 | ) | |||||||||||||||||||
| Total relating to USD and EUR debt |
(5 | ) | (21 | ) | – | (26 | ) | (2,653 | ) | |||||||||||||||
| Total related interest rate swaps |
5 | 20 | – | 25 | 25 | |||||||||||||||||||
| Net loss on borrowings and related derivatives/total carrying value |
– | (1 | ) | – | (1 | ) | (2,628 | ) | ||||||||||||||||
All fair value hedges were highly effective throughout the three years ended 31 December 2020.
| RELX Annual report and financial statements 2020 | Notes to the consolidated financial statements | 167 | |
|
| ||
| 168 | RELX Annual report and financial statements 2020 | Financial statements and other information | |
|
| ||
Notes to the consolidated financial statements
for the year ended 31 December 2020
19 Inventories and pre-publication costs
| Accounting policy Inventories and pre-publication costs are stated at the lower of cost, including appropriate attributable overhead, and estimated net realisable value. Such costs typically comprise direct internal labour costs and externally commissioned editorial and other fees.
Pre-publication costs, representing costs incurred in the origination of content prior to publication, are expensed systematically reflecting the expected sales profile over the estimated economic lives of the related products, generally up to five years.
Annual reviews are carried out to assess the recoverability of carrying amounts.
|
| 2020 £m |
2019 £m | |||||||
| Raw materials |
2 | 2 | ||||||
| Pre-publication costs |
204 | 181 | ||||||
| Finished goods |
34 | 34 | ||||||
| Total |
240 | 217 | ||||||
20 Trade and other receivables
| Accounting policy Trade receivables are stated net of a loss allowance for expected credit losses.
|
| 2020 £m |
2019 £m | |||||||
| Trade receivables |
1,757 | 1,858 | ||||||
| Loss allowance |
(99 | ) | (88 | ) | ||||
| 1,658 | 1,770 | |||||||
| Prepayments and accrued income |
207 | 236 | ||||||
| Current tax receivable |
44 | 28 | ||||||
| Net finance lease receivable |
18 | 33 | ||||||
| Total |
1,927 | 2,067 | ||||||
Trade receivables are predominantly non-interest bearing and their carrying amounts approximate to their fair value.
The movements in the loss allowance during the year were as follows:
| 2020 £m |
2019 £m | |||||||
| At start of year |
88 | 87 | ||||||
| Charge for the year |
19 | 8 | ||||||
| Trade receivables written off |
(8 | ) | (4 | ) | ||||
| Exchange translation differences |
– | (3 | ) | |||||
| At end of year |
99 | 88 | ||||||
| RELX Annual report and financial statements 2020 | Notes to the consolidated financial statements | 169 | |
|
| ||
| 170 | RELX Annual report and financial statements 2020 | Financial statements and other information | |
|
| ||
Notes to the consolidated financial statements
for the year ended 31 December 2020
22 Borrowings (continued)
Analysis by year of repayment
| 2020 | 2019 | |||||||||||||||||||||||||||||||||
| Short-term £m |
Term debt £m |
Lease liabilities £m |
Total £m |
Short-term £m |
Term debt £m |
Lease liabilities £m |
Total £m |
|||||||||||||||||||||||||||
| Within 1 year |
307 | 448 | 92 | 847 | 779 | 1,188 | 93 | 2,060 | ||||||||||||||||||||||||||
| Within 1 to 2 years |
– | 32 | 47 | 79 | – | 425 | 87 | 512 | ||||||||||||||||||||||||||
| Within 2 to 3 years |
– | 651 | 44 | 695 | – | 33 | 57 | 90 | ||||||||||||||||||||||||||
| Within 3 to 4 years |
– | 1,082 | 37 | 1,119 | – | 658 | 47 | 705 | ||||||||||||||||||||||||||
| Within 4 to 5 years |
– | 673 | 28 | 701 | – | 433 | 29 | 462 | ||||||||||||||||||||||||||
| After 5 years |
– | 3,655 | 27 | 3,682 | – | 2,556 | 29 | 2,585 | ||||||||||||||||||||||||||
| After 1 year |
– | 6,093 | 183 | 6,276 | – | 4,105 | 249 | 4,354 | ||||||||||||||||||||||||||
| Total |
307 | 6,541 | 275 | 7,123 | 779 | 5,293 | 342 | 6,414 | ||||||||||||||||||||||||||
Short-term bank loans, overdrafts and commercial paper were backed up at 31 December 2020 by a $3,000m (£2,198m) committed bank facility, consisting of tranches of: $31m maturing in 2021, $1,263m maturing in 2023 and $1,706m maturing in 2024, and a JPY 62.5bn ($605m, £443m) committed bank facility maturing in 2021. The committed bank facilities were undrawn.
Analysis by currency
| 2020 | 2019 | |||||||||||||||||||||||||||||||||
| Short-term £m |
Term £m |
Lease liabilities £m |
Total £m |
Short-term £m |
Term £m |
Lease liabilities £m |
Total £m |
|||||||||||||||||||||||||||
| US dollars |
228 | 2,751 | 120 | 3,099 | 309 | 2,915 | 168 | 3,392 | ||||||||||||||||||||||||||
| £ sterling |
9 | – | 60 | 69 | – | – | 71 | 71 | ||||||||||||||||||||||||||
| Euro |
20 | 3,790 | 61 | 3,871 | 423 | 2,378 | 70 | 2,871 | ||||||||||||||||||||||||||
| Other currencies |
50 | – | 34 | 84 | 47 | – | 33 | 80 | ||||||||||||||||||||||||||
| Total |
307 | 6,541 | 275 | 7,123 | 779 | 5,293 | 342 | 6,414 | ||||||||||||||||||||||||||
Included in the US dollar amounts for term debt above is £560m (2019: £525m) of debt denominated in euros (€600m) (2019: €600m) that was swapped into US dollars on issuance and against which there are related derivative financial instruments, which, as at 31 December 2020, had a fair value of £70m (2019: £21m).
| RELX Annual report and financial statements 2020 | Notes to the consolidated financial statements | 171 | |
|
| ||
| 172 | RELX Annual report and financial statements 2020 | Financial statements and other information | |
|
| ||
Notes to the consolidated financial statements
for the year ended 31 December 2020
24 Share capital, share premium and shares held in treasury
| Accounting policy Shares of RELX PLC that are repurchased and not cancelled are classified as shares held in treasury. The consideration paid, including directly attributable costs, is recognised as a deduction from equity. Shares of RELX PLC that are purchased by the Employee Benefit Trust are also classified as shares held in treasury, with the cost recognised as a deduction from equity.
|
||
RELX PLC
| CALLED UP SHARE CAPITAL – ISSUED AND FULLY PAID | No. of shares | 2020 £m |
No. of shares | 2019 £m |
||||||||||||
| At start of year |
1,980,802,659 | 286 | 2,011,043,101 | 290 | ||||||||||||
| Issue of ordinary shares |
1,496,653 | – | 3,059,558 | 1 | ||||||||||||
| Issue of bonus share |
– | – | 1 | – | ||||||||||||
| Cancellation of shares |
– | – | (33,300,001 | ) | (5 | ) | ||||||||||
| At end of year |
1,982,299,312 | 286 | 1,980,802,659 | 286 | ||||||||||||
At the 2019 AGM shareholders approved the issue of a bonus share with £4bn nominal value. The share was subsequently cancelled via a capital reduction, creating £4bn of distributable reserves in RELX PLC to replace the RELX NV reserves lost in the corporate simplification.
| NUMBER OF ORDINARY SHARES | Year ended 31 December | |||||||||||||||
| Shares in issue (millions) |
Treasury shares (millions) |
2020 Shares in issue net of treasury shares (millions) |
2019 Shares in issue net of treasury shares (millions) |
|||||||||||||
| RELX PLC |
||||||||||||||||
| At start of year |
1,980.8 | (49.0 | ) | 1,931.8 | 1,961.9 | |||||||||||
| Issue of ordinary shares |
1.5 | – | 1.5 | 3.1 | ||||||||||||
| Repurchase of ordinary shares |
– | (7.8 | ) | (7.8 | ) | (33.5 | ) | |||||||||
| Net release of shares by the Employee Benefit Trust |
– | 0.5 | 0.5 | 0.4 | ||||||||||||
| At end of year |
1,982.3 | (56.3 | ) | 1,926.0 | 1,931.9 | |||||||||||
| * | At 31 December 2020 the total shares in issue net of treasury shares is 1,926,018,680 (2019: 1,931,782,622). |
During the year, RELX PLC repurchased 7.8m (2019: 33.5m; 2018: 26.9m) RELX PLC ordinary shares for an average price of 1,918p; these shares are held in treasury. The total consideration for the RELX PLC repurchases was £150m (2019: £600m).
The Employee Benefit Trust purchases RELX PLC shares which, at the trustees’ discretion, can be used in respect of the exercise of share options and to meet commitments under conditional share awards. During the year, the Employee Benefit Trust purchased 1.8m shares for a total cost of £37m (2019: £37m; 2018: £43m). At 31 December 2020, shares held by the Employee Benefit Trust were £97m (2019: £94m; 2018: £90m) at cost.
The issue of ordinary shares in the year relates to the exercise of share options.
All of the RELX PLC ordinary shares rank equally with respect to voting rights and rights to receive dividends, except for shares held in treasury, which do not attract voting or dividend rights. There are no restrictions on the rights to transfer shares.
At 31 December 2020, RELX PLC shares held in treasury related to 6,192,953 (2019: 6,753,010; 2018: 7,130,366) RELX PLC ordinary shares held by the Employee Benefit Trust; and 50,087,679 (2019: 42,267,027; 2018: 42,023,020) RELX PLC ordinary shares held by the parent company. No RELX PLC ordinary shares held in treasury were cancelled in 2020 (2019: 33.3m).
| RELX Annual report and financial statements 2020 | Notes to the consolidated financial statements | 173 | |
|
| ||
| 174 | RELX Annual report and financial statements 2020 | Financial statements and other information | |
|
| ||
Notes to the consolidated financial statements
for the year ended 31 December 2020
26 Related party transactions (continued)
| NON-EXECUTIVE DIRECTORS | 2020 £’000 |
2019 £’000 |
2018 £’000 |
|||||||||
| Fees and benefits |
1,558 | 1,569 | 1,634 | |||||||||
The remuneration of non-executive directors comprises fees for services, and benefits primarily relating to tax filing support in respect of filings resulting from their directorships. No deemed benefits were provided during 2020 to former Directors (2019: nil; 2018: nil). No loans, advances or guarantees have been provided on behalf of any Director. The aggregate gains made by Executive Directors on the exercise of options during 2020 were nil (2019: nil; 2018: nil).
27 Exchange rates
The following exchange rates have been applied in preparing the consolidated financial statements:
| Income statement | Statement
of financial position |
|||||||||||||||||||||||
| 2020 | 2019 | 2018 | 2020 | 2019 | ||||||||||||||||||||
| Euro to sterling |
1.12 | 1.14 | 1.13 | 1.12 | 1.18 | |||||||||||||||||||
| US dollar to sterling |
1.28 | 1.28 | 1.34 | 1.37 | 1.33 | |||||||||||||||||||
28 Approval of financial statements
The consolidated financial statements were approved and authorised for issue by the Board of Directors on 10 February 2021.
| RELX Annual report and financial statements 2020 | Notes to the consolidated financial statements | 175 | |
|
| ||
| 176 | RELX Annual report and financial statements 2020 | Financial statements and other information | |
|
| ||
Notes to the consolidated financial statements
for the year ended 31 December 2020
29 Related undertakings (continued)
| RELX Annual report and financial statements 2020 | Notes to the consolidated financial statements | 177 | |
|
| ||
| 178 | RELX Annual report and financial statements 2020 | Financial statements and other information | |
|
| ||
Notes to the consolidated financial statements
for the year ended 31 December 2020
29 Related undertakings (continued)
| RELX Annual report and financial statements 2020 | Notes to the consolidated financial statements | 179 | |
|
| ||
| 180 | RELX Annual report and financial statements 2020 | Financial statements and other information | |
|
| ||
| Note | 2020 £m |
2019 £m |
2018 £m |
2017 £m |
2016 £m |
|||||||||||||||||||
| RELX consolidated financial information |
||||||||||||||||||||||||
| Revenue |
7,110 | 7,874 | 7,492 | 7,341 | 6,889 | |||||||||||||||||||
| Reported operating profit |
1,525 | 2,101 | 1,964 | 1,905 | 1,708 | |||||||||||||||||||
| Adjusted operating profit |
1 | 2,076 | 2,491 | 2,346 | 2,284 | 2,114 | ||||||||||||||||||
| Reported net profit attributable to RELX PLC shareholders |
1,224 | 1,505 | 1,422 | 1,648 | 1,150 | |||||||||||||||||||
| Adjusted net profit attributable to RELX PLC shareholders |
1 | 1,543 | 1,808 | 1,674 | 1,620 | 1,473 | ||||||||||||||||||
| RELX PLC financial information |
||||||||||||||||||||||||
| Reported earnings per ordinary share (pence) |
63.5p | 77.4p | 71.9p | 81.6p | 55.8p | |||||||||||||||||||
| Adjusted earnings per ordinary share (pence) |
80.1p | 93.0p | 84.7p | 80.2p | 71.4p | |||||||||||||||||||
| Dividend per ordinary share (pence) |
2 | 47.0p | 45.7p | 42.1p | 39.4p | 35.95p | ||||||||||||||||||
| (1) | Adjusted figures are presented as additional performance measures used by management. A reconciliation of the adjusted measures to the comparable GAAP measures can be found on page 188. Adjusted measures are stated before amortisation of acquired intangible assets, the net financing cost on defined benefit pension schemes and acquisition-related items, exceptional tax credits, exceptional costs in the Exhibitions business in 2020 and in respect of attributable net profit, reflect a tax rate that excludes the effect of movements in deferred taxation assets and liabilities that are not expected to crystallise in the near term and includes the benefit of tax amortisation where available on acquired goodwill and intangible assets. Acquisition-related financing costs and profit and loss from disposal gains and losses and other non-operating items are also excluded from the adjusted figures. |
| (2) | Dividend per ordinary share is based on the interim dividend and proposed final dividend for the relevant year. |

| RELX Annual report and financial statements 2020 |
181 | |||
|
Annual Report and Financial Statements |
||||
| In this section |
||||
| 182 |
||||
| 183 |
||||
| 183 |
||||
| 184 |
| 182 | RELX Annual report and financial statements 2020 | Financial statements and other information | |
|
| ||
RELX PLC statement of financial position
| AS AT 31 DECEMBER | Note |
2020 £m |
2019 £m |
|||||||||
| Non-current assets |
||||||||||||
| Investments in subsidiary undertakings |
1 | 18,322 | 18,318 | |||||||||
| 18,322 | 18,318 | |||||||||||
| Current assets |
||||||||||||
| Receivables: amounts due from subsidiary undertakings |
1,711 | 1,662 | ||||||||||
| Total assets |
20,033 | 19,980 | ||||||||||
| Current liabilities |
||||||||||||
| Taxation |
12 | – | ||||||||||
| Other payables |
2 | 102 | ||||||||||
| 14 | 102 | |||||||||||
| Net assets |
20,019 | 19,878 | ||||||||||
| Capital and reserves |
||||||||||||
| Share capital |
286 | 286 | ||||||||||
| Share premium |
1,459 | 1,443 | ||||||||||
| Shares held in treasury |
(789 | ) | (739 | ) | ||||||||
| Capital redemption reserve |
36 | 36 | ||||||||||
| Other reserves |
172 | 168 | ||||||||||
| Merger reserve |
11,150 | 11,150 | ||||||||||
| Net profit |
1,051 | 1,548 | ||||||||||
| Reserves |
6,654 | 5,986 | ||||||||||
| Shareholders’ equity |
20,019 | 19,878 | ||||||||||
The RELX PLC Company financial statements were approved by the Board of Directors and authorised for issue on 10 February 2021. They were signed on its behalf by:
| A J Habgood |
N L Luff | |
| Chair |
Chief Financial Officer |
| RELX Annual report and financial statements 2020 | 183 | |
|
| ||
| 184 | RELX Annual report and financial statements 2020 | Financial statements and other information | |
|
| ||
Notes to the RELX PLC financial statements
1 Investments
| Subsidiary undertaking £m |
Total £m |
|||||||
| At 1 January 2019 |
18,314 | 18,314 | ||||||
| Equity instruments granted to employees of the Group |
4 | 4 | ||||||
| At 1 January 2020 |
18,318 | 18,318 | ||||||
| Equity instruments granted to employees of the Group |
4 | 4 | ||||||
| At 31 December 2020 |
18,322 | 18,322 | ||||||
2 Related party transactions
All transactions with joint ventures, subsidiaries and the Group’s employees, which are related parties of RELX PLC, are reflected in these financial statements. Transactions with key management personnel including share based remuneration costs are set out in note 26 of the Group consolidated financial statements and details of the Directors’ remuneration are included in the Directors’ Remuneration Report on pages 93 to 114.
3 Contingent liabilities
There are contingent liabilities in respect of borrowings of subsidiaries guaranteed by RELX PLC as follows:
| 2020 £m |
2019 £m |
|||||||
| Contingent liabilities |
6,516 | 5,777 | ||||||
Financial instruments disclosures in respect of the borrowings covered by the above guarantees are given in note 18 of the Group’s consolidated financial statements.
4 Bonus share issue
At the 2019 AGM shareholders approved the issue of a bonus share with £4bn nominal value. The share was subsequently cancelled via a capital reduction, creating £4bn of distributable reserves in RELX PLC to replace the RELX NV reserves lost in the corporate simplification.

| RELX Annual report and financial statements 2020 |
185 | |||
| Other financial |
||||
| information |
||||
| In this section |
||||
| 186 |
||||
| 187 |
||||
| 188 |
||||
| 186 | RELX Annual report and financial statements 2020 | Financial statements and other information | |
|
| ||
Summary financial information in euros
Basis of preparation
The Group’s consolidated financial information is presented in sterling. The summary financial information is a simple translation of the Group’s consolidated financial statements into euros at the stated rates of exchange.
| EXCHANGE RATES FOR TRANSLATION | Income statement | Statement of financial position |
||||||||||||||||||||||||||
| 2020 | 2019 | 2018 | 2020 | 2019 | 2018 | |||||||||||||||||||||||
| Euro to sterling |
1.12 | 1.14 | 1.13 | 1.12 | 1.18 | 1.11 | ||||||||||||||||||||||
Consolidated income statement
| FOR THE YEAR ENDED 31 DECEMBER | 2020 €m |
2019 €m |
2018 €m |
|||||||||
| Revenue |
7,963 | 8,976 | 8,466 | |||||||||
| Operating profit |
1,708 | 2,395 | 2,219 | |||||||||
| Profit before tax |
1,661 | 2,106 | 1,944 | |||||||||
| Net profit attributable to RELX PLC shareholders |
1,371 | 1,716 | 1,607 | |||||||||
| Adjusted operating profit |
2,325 | 2,840 | 2,651 | |||||||||
| Adjusted profit before tax |
2,146 | 2,508 | 2,424 | |||||||||
| Adjusted net profit attributable to RELX PLC shareholders |
1,728 | 2,061 | 1,892 | |||||||||
| Adjusted earnings per ordinary share |
€0.897 | €1.060 | €0.957 | |||||||||
| Basic earnings per ordinary share |
€0.712 | €0.883 | €0.813 | |||||||||
| Net dividend per ordinary RELX PLC share paid in the year |
€0.512 | €0.494 | €0.453 | |||||||||
| Net dividend per ordinary RELX PLC share paid and proposed in relation to the financial year |
€0.526 | €0.521 | €0.476 | |||||||||
| Consolidated statement of cash flows
|
||||||||||||
| FOR THE YEAR ENDED 31 DECEMBER | 2020 €m |
2019 €m |
2018 €m |
|||||||||
| Net cash from operating activities |
1,788 | 2,381 | 2,243 | |||||||||
| Net cash used in investing activities |
(1,314 | ) | (835 | ) | (1,436 | ) | ||||||
| Net cash used in financing activities |
(531 | ) | (1,515 | ) | (806 | ) | ||||||
| (Decrease)/increase in cash and cash equivalents |
(57 | ) | 31 | 1 | ||||||||
| Movement in cash and cash equivalents |
||||||||||||
| At start of year |
163 | 127 | 124 | |||||||||
| (Decrease)/increase in cash and cash equivalents |
(57 | ) | 31 | 1 | ||||||||
| Exchange translation differences |
(7 | ) | 5 | 2 | ||||||||
| At end of year |
99 | 163 | 127 | |||||||||
| Adjusted cash flow |
2,250 | 2,738 | 2,535 | |||||||||
| Consolidated statement of financial position
|
||||||||||||
| AS AT 31 DECEMBER | 2020 €m |
2019 €m |
2018 €m |
|||||||||
| Non-current assets |
13,295 | 13,386 | 12,928 | |||||||||
| Current assets |
2,547 | 2,885 | 2,609 | |||||||||
| Assets held for sale |
– | – | 1 | |||||||||
| Total assets |
15,842 | 16,271 | 15,538 | |||||||||
| Current liabilities |
4,899 | 7,018 | 5,906 | |||||||||
| Non-current liabilities |
8,590 | 6,669 | 7,010 | |||||||||
| Liabilities associated with assets held for sale |
– | – | 4 | |||||||||
| Total liabilities |
13,489 | 13,687 | 12,920 | |||||||||
| Net assets |
2,353 | 2,584 | 2,618 | |||||||||
| RELX Annual report and financial statements 2020 | 187 | |
|
| ||
| 188 | RELX Annual report and financial statements 2020 | Financial statements and other information | |
|
| ||
Reconciliation of adjusted to GAAP measures
The Group uses adjusted figures, which are not defined by generally accepted accounting principles (‘GAAP’) such as IFRS, as additional performance measures. These measures are used by management, alongside the comparable GAAP measures, in evaluating the business performance. The measures may not be comparable to similarly reported measures by other companies.
A reconciliation of non-GAAP measures to relevant GAAP measures is as follows:
| YEAR ENDED 31 DECEMBER | 2020 £m |
2019 £m |
||||||||||||||
| Operating profit |
1,525 | 2,101 | ||||||||||||||
| Adjustments: |
||||||||||||||||
| Amortisation of acquired intangible assets |
376 | 295 | ||||||||||||||
| Acquisition-related items |
(12 | ) | 84 | |||||||||||||
| Reclassification of tax in joint ventures |
5 | 12 | ||||||||||||||
| Reclassification of finance income in joint ventures |
(1 | ) | (1 | ) | ||||||||||||
| Exceptional costs in Exhibitions |
183 | – | ||||||||||||||
| Adjusted operating profit |
2,076 | 2,491 | ||||||||||||||
| Profit before tax |
1,483 | 1,847 | ||||||||||||||
| Adjustments: |
||||||||||||||||
| Amortisation of acquired intangible assets |
376 | 295 | ||||||||||||||
| Acquisition-related items |
(12 | ) | 84 | |||||||||||||
| Reclassification of tax in joint ventures |
5 | 12 | ||||||||||||||
| Net interest on net defined benefit pension obligation and other |
11 | 13 | ||||||||||||||
| Disposals and other non-operating items |
(130 | ) | (51 | ) | ||||||||||||
| Exceptional costs in Exhibitions |
183 | – | ||||||||||||||
| Adjusted profit before tax |
1,916 | 2,200 | ||||||||||||||
| Tax charge |
(275 | ) | (338 | ) | ||||||||||||
| Adjustments: |
||||||||||||||||
| Deferred tax movements on goodwill and acquired intangible assets |
35 | 26 | ||||||||||||||
| Other deferred tax credits from intangible assets* |
(78 | ) | (57 | ) | ||||||||||||
| Tax on acquisition-related items |
(6 | ) | (15 | ) | ||||||||||||
| Reclassification of tax in joint ventures |
(5 | ) | (12 | ) | ||||||||||||
| Tax on net interest on net defined benefit pension obligation and other |
(2 | ) | (3 | ) | ||||||||||||
| Tax on disposals and other non-operating items |
3 | 11 | ||||||||||||||
| Exceptional costs in Exhibitions |
(45 | ) | – | |||||||||||||
| Adjusted tax charge |
(373 | ) | (388 | ) | ||||||||||||
| Net profit attributable to RELX PLC shareholders |
1,224 | 1,505 | ||||||||||||||
| Adjustments (post-tax): |
||||||||||||||||
| Amortisation of acquired intangible assets |
395 | 321 | ||||||||||||||
| Other deferred tax credits from intangible assets* |
(78 | ) | (57 | ) | ||||||||||||
| Acquisition-related items |
(18 | ) | 69 | |||||||||||||
| Net interest on net defined benefit pension obligation and other |
9 | 10 | ||||||||||||||
| Disposals and other non-operating items |
(127 | ) | (40 | ) | ||||||||||||
| Exceptional costs in Exhibitions |
138 | – | ||||||||||||||
| Adjusted net profit attributable to RELX PLC shareholders |
1,543 | 1,808 | ||||||||||||||
| Cash generated from operations |
2,264 | 2,724 | ||||||||||||||
| Adjustments: |
||||||||||||||||
| Dividends received from joint ventures |
31 | 34 | ||||||||||||||
| Purchases of property, plant and equipment |
(43 | ) | (47 | ) | ||||||||||||
| Proceeds from disposals of property, plant and equipment |
– | 2 | ||||||||||||||
| Expenditure on internally developed intangible assets |
(319 | ) | (333 | ) | ||||||||||||
| Payments in relation to acquisition-related items |
67 | 63 | ||||||||||||||
| Pension recovery payment |
45 | 44 | ||||||||||||||
| Repayment of lease principal |
(89 | ) | (86 | ) | ||||||||||||
| Sublease payments received |
2 | 1 | ||||||||||||||
| Exceptional costs in Exhibitions |
51 | – | ||||||||||||||
| Adjusted cash flow |
2,009 | 2,402 | ||||||||||||||
| * | Movements on deferred tax liabilities arising on acquired intangible assets that do not qualify for tax amortisation. |
Refer to explanations on pages 55 and 58 for net adjusted interest and return on invested capital.

| RELX Annual report and financial statements 2020 |
189 | |||||
| Shareholder information |
| |||||
| In this section |
||||||
| 190 |
Shareholder information | |||||
| 192 |
Shareholder information and contacts | |||||
| IBC |
2021 financial calendar | |||||
| RELX Annual report and financial statements 2020 | Shareholder information | 191 | |
|
| ||
| 11 February |
Results announcement for the year ended 31 December 2020 | |
| 22 April |
Trading update issued in relation to the 2021 financial year | |
| 22 April |
Annual General Meeting | |
| 29 April |
Ex-dividend date – 2020 final dividend, ordinary shares and ADRs | |
| 30 April |
Record date – 2020 final dividend, ordinary shares and ADRs | |
| 18 May |
Dividend currency and DRIP election deadline | |
| 21 May |
Euro dividend equivalent announcement | |
| 3 June |
Payment date – 2020 final dividend, ordinary shares | |
| 8 June |
Payment date – 2020 final dividend, ADRs | |
| 29 July |
Interim results announcement for the six months to 30 June 2021 | |
| 5 Aug* |
Ex-dividend date – 2021 interim dividend, ordinary shares and ADRs | |
| 6 Aug* |
Record date – 2021 interim dividend, ordinary shares and ADRs | |
| * | Please note that these dates are provisional and subject to change. The 2021 interim dividend payment dates in respect of ordinary shares and ADRs will be confirmed by the Company in its 2021 Interim Results announcement, currently scheduled for release on 29July 2021. |
Dividend history
The following tables set out dividends paid (or proposed) in relation to the three financial years 2018–2020.
| ORDINARY SHARES | pence per PLC ordinary share | Payment date | ||||||
| Final dividend for 2020** |
33.40 | 3 June 2021 | ||||||
| Interim dividend for 2020 |
13.60 | 2 September 2020 | ||||||
| Final dividend for 2019 |
32.10 | 28 May 2020 | ||||||
| Interim dividend for 2019 |
13.60 | 2 September 2019 | ||||||
| Final dividend for 2018 |
29.70 | 4 June 2019 | ||||||
| Interim dividend for 2018 |
12.40 | 24 August 2018 | ||||||
**Proposed dividend, to be submitted for approval at the Annual General Meeting of RELX PLC in April 2021
| ADRS | $ per PLC ADR | Payment date | ||||||
| Final dividend for 2020*** |
*** | 8 June 2021 | ||||||
| Interim dividend for 2020 |
0.18081 | 8 September 2020 | ||||||
| Final dividend for 2019 |
0.395086 | 2 June 2020 | ||||||
| Interim dividend for 2019 |
0.16398 | 5 September 2019 | ||||||
| Final dividend for 2018 |
0.37612 | 7 June 2019 | ||||||
| Interim dividend for 2018 |
0.159141 | 29 August 2018 | ||||||
***Payment will be determined using the appropriate £/US$ exchange rate on 3 June 2021.
Credits


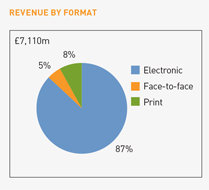
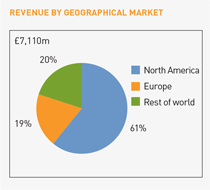
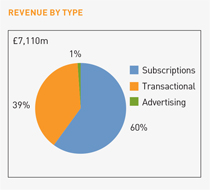

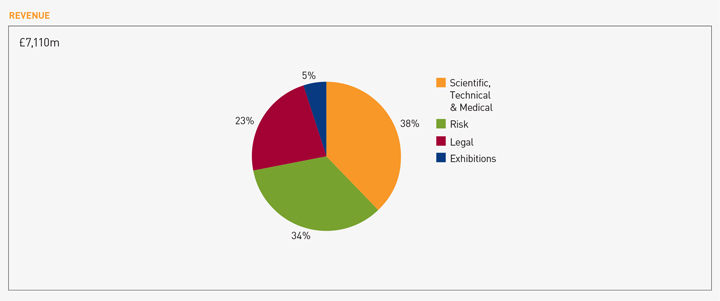


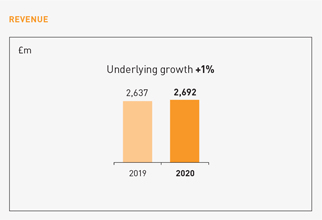
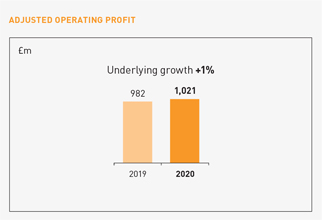


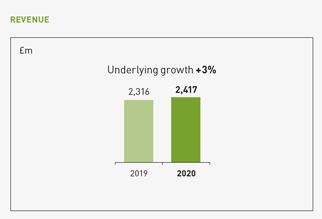
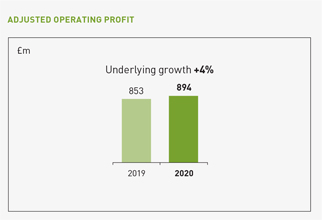


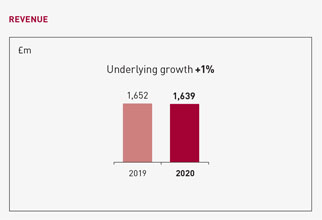
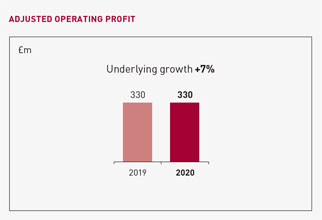


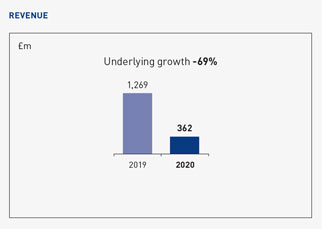
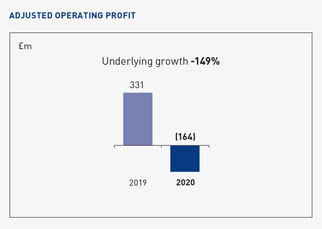


 https://www.relx.com/corporate-responsibility/engaging-others/policies-and-downloads/local-reporting-requirements. We invest in research to
identify causes of pay differences and regularly evaluate our policies and processes to ensure they are aligned to our inclusion strategy. We commit to building a robust framework for monitoring pay equity across the enterprise and
https://www.relx.com/corporate-responsibility/engaging-others/policies-and-downloads/local-reporting-requirements. We invest in research to
identify causes of pay differences and regularly evaluate our policies and processes to ensure they are aligned to our inclusion strategy. We commit to building a robust framework for monitoring pay equity across the enterprise and


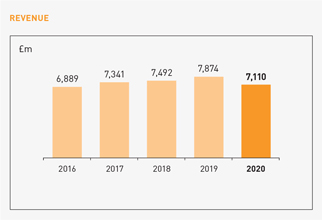
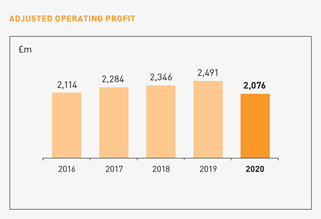
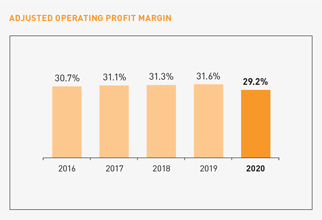
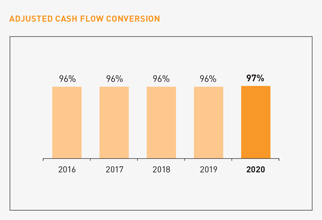

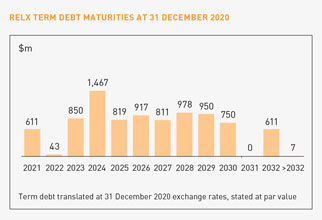
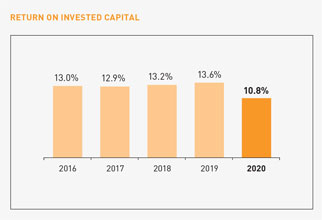


 Audit Committee
 Remuneration Committee
 Nominations Committee
 Corporate Governance Committee
 Committee Chair


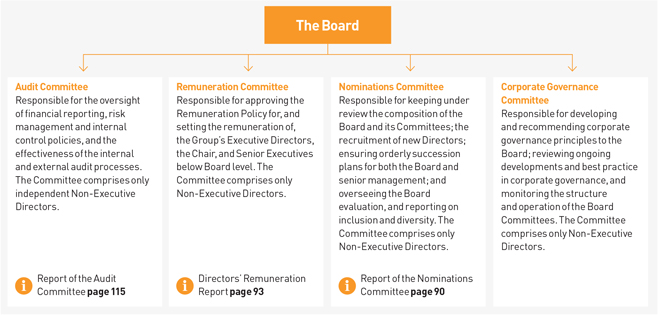


 Audit
Audit  Remuneration
  Nominations
  Corporate Governance
  Committee Chair