
© 2025 Insight. All Rights Reserved. 1 Insight Enterprises, Inc. Third Quarter 2025 Earnings Conference Call and Webcast
Insight Proprietary & Confidential. Do Not Copy or Distribute. © 2022 Insight Direct USA, Inc. All Rights Reserved. 2 © 2025 Insight Disclosures Safe harbor statement This presentation includes “forward-looking statements” within the meaning of the Private Securities Litigation Reform Act of 1995 related to Insight’s plans and expectations. Statements that are not historical facts, including those related to our expectations about future financial results and the assumptions related thereto, our expectations regarding future expected trends in the IT market and our opportunities for growth, are forward-looking statements. These forward-looking statements are subject to assumptions, risks and uncertainties which could cause actual results or future events to differ materially from such statements. Insight Enterprises, Inc. (the "Company") undertakes no obligation to update publicly or revise any of the forward-looking statements, except as otherwise required by law. More detailed information about forward-looking statements and risk factors is included in today’s press release and discussed in the Company’s most recently filed periodic reports and subsequent filings with the Securities and Exchange Commission. Non-GAAP measures This presentation will reference certain non-GAAP financial information as ‘Adjusted’. A reconciliation of non-GAAP financial measures presented in this document to our actual GAAP results is attached to the back of this presentation and included in the press release issued today, which you may find on the Investor Relations section of our website at investor.insight.com. These non-GAAP measures are used by the Company and its management to evaluate financial performance against budgeted amounts, to calculate incentive compensation, to assist in forecasting future performance and to compare the Company’s results to those of the Company’s competitors. The Company believes that these non-GAAP financial measures are useful to investors because they allow for greater transparency, facilitate comparisons to prior periods and the Company’s competitors’ results and assist in forecasting performance for future periods. These non-GAAP financial measures are not prepared in accordance with GAAP and may be different from non-GAAP financial measures presented by other companies. Non-GAAP financial measures should not be considered as a substitute for, or superior to, measures of financial performance prepared in accordance with GAAP. Constant currency In some instances, the Company refers to changes in net sales, gross profit, earnings from operations and Adjusted earnings from operations on a consolidated basis and in EMEA and APAC, as applicable, excluding the effects of fluctuating foreign currency exchange rates. In addition, the Company refers to changes in Adjusted diluted earnings per share on a consolidated basis excluding the effects of fluctuating foreign currency exchange rates. These are also considered to be non-GAAP measures. The Company believes providing this information excluding the effects of fluctuating foreign currency exchange rates provides valuable supplemental information to investors regarding its underlying business and results of operations, consistent with how the Company and its management evaluate the Company’s performance. In computing these changes and percentages, the Company compares the current year amount as translated into U.S. dollars under the applicable accounting standards to the prior year amount in local currency translated into U.S. dollars utilizing the weighted average translation rate for the current period.
Insight Proprietary & Confidential. Do Not Copy or Distribute. © 2025 Insight. All Rights Reserved. 3 Table of Contents • AI-First Solutions Integrator Strategy • Solutions at Work • Employer Awards • Partner Recognitions • Third Quarter 2025 Highlights and Performance • Debt • 2025 Outlook • Appendix
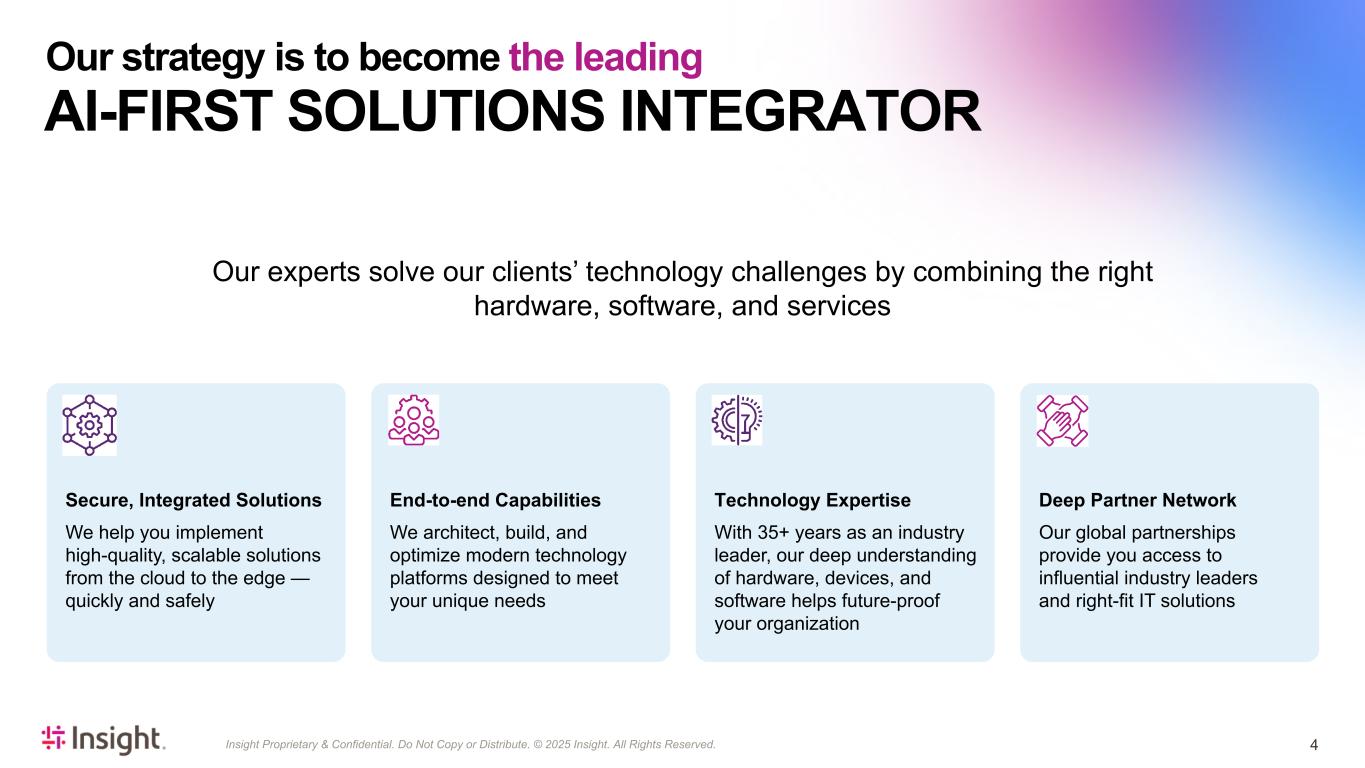
Insight Proprietary & Confidential. Do Not Copy or Distribute. © 2025 Insight. All Rights Reserved. Secure, Integrated Solutions We help you implement high-quality, scalable solutions from the cloud to the edge — quickly and safely End-to-end Capabilities We architect, build, and optimize modern technology platforms designed to meet your unique needs Technology Expertise With 35+ years as an industry leader, our deep understanding of hardware, devices, and software helps future-proof your organization Deep Partner Network Our global partnerships provide you access to influential industry leaders and right-fit IT solutions 4 Our experts solve our clients’ technology challenges by combining the right hardware, software, and services Our strategy is to become the leading AI-FIRST SOLUTIONS INTEGRATOR
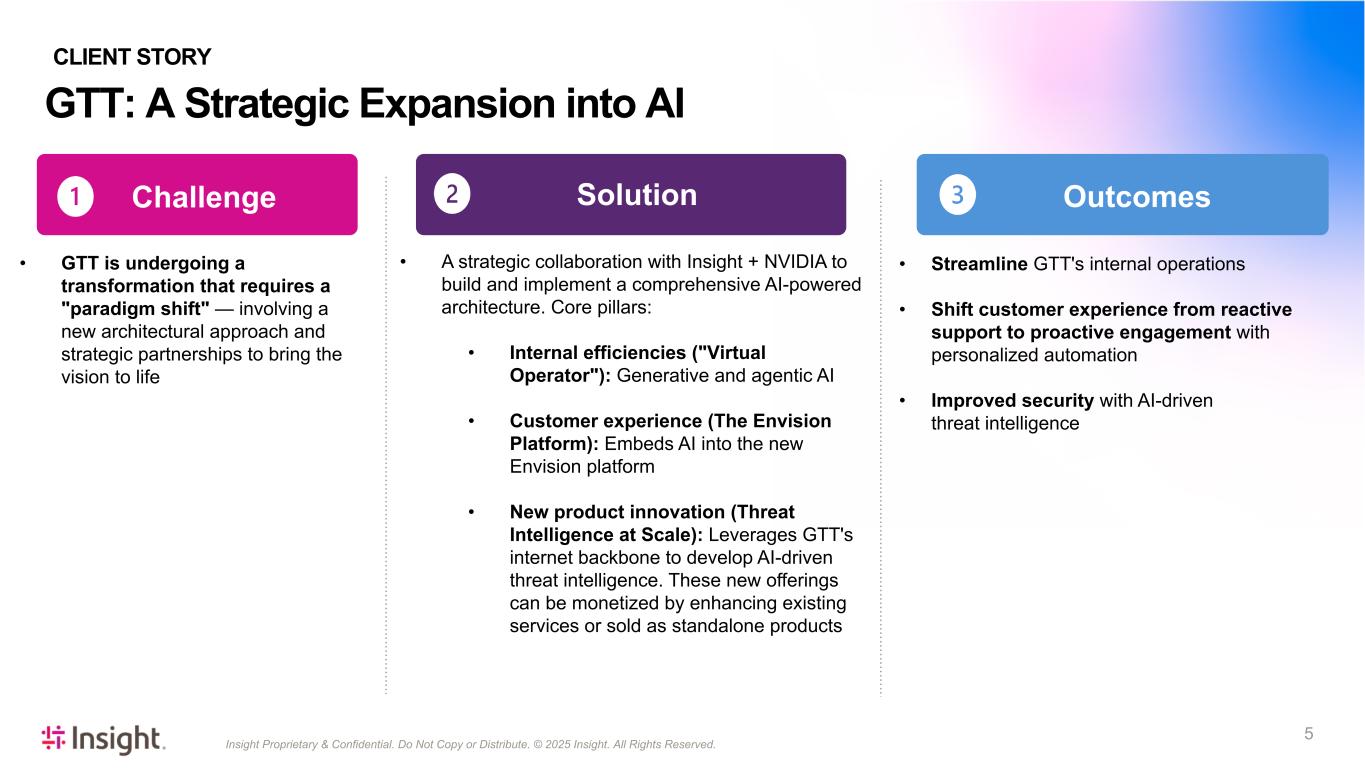
Insight Proprietary & Confidential. Do Not Copy or Distribute. © 2025 Insight. All Rights Reserved. 5 • GTT is undergoing a transformation that requires a "paradigm shift" — involving a new architectural approach and strategic partnerships to bring the vision to life • A strategic collaboration with Insight + NVIDIA to build and implement a comprehensive AI-powered architecture. Core pillars: • Internal efficiencies ("Virtual Operator"): Generative and agentic AI • Customer experience (The Envision Platform): Embeds AI into the new Envision platform • New product innovation (Threat Intelligence at Scale): Leverages GTT's internet backbone to develop AI-driven threat intelligence. These new offerings can be monetized by enhancing existing services or sold as standalone products • Streamline GTT's internal operations • Shift customer experience from reactive support to proactive engagement with personalized automation • Improved security with AI-driven threat intelligence GTT: A Strategic Expansion into AI CLIENT STORY Challenge Solution Outcomes
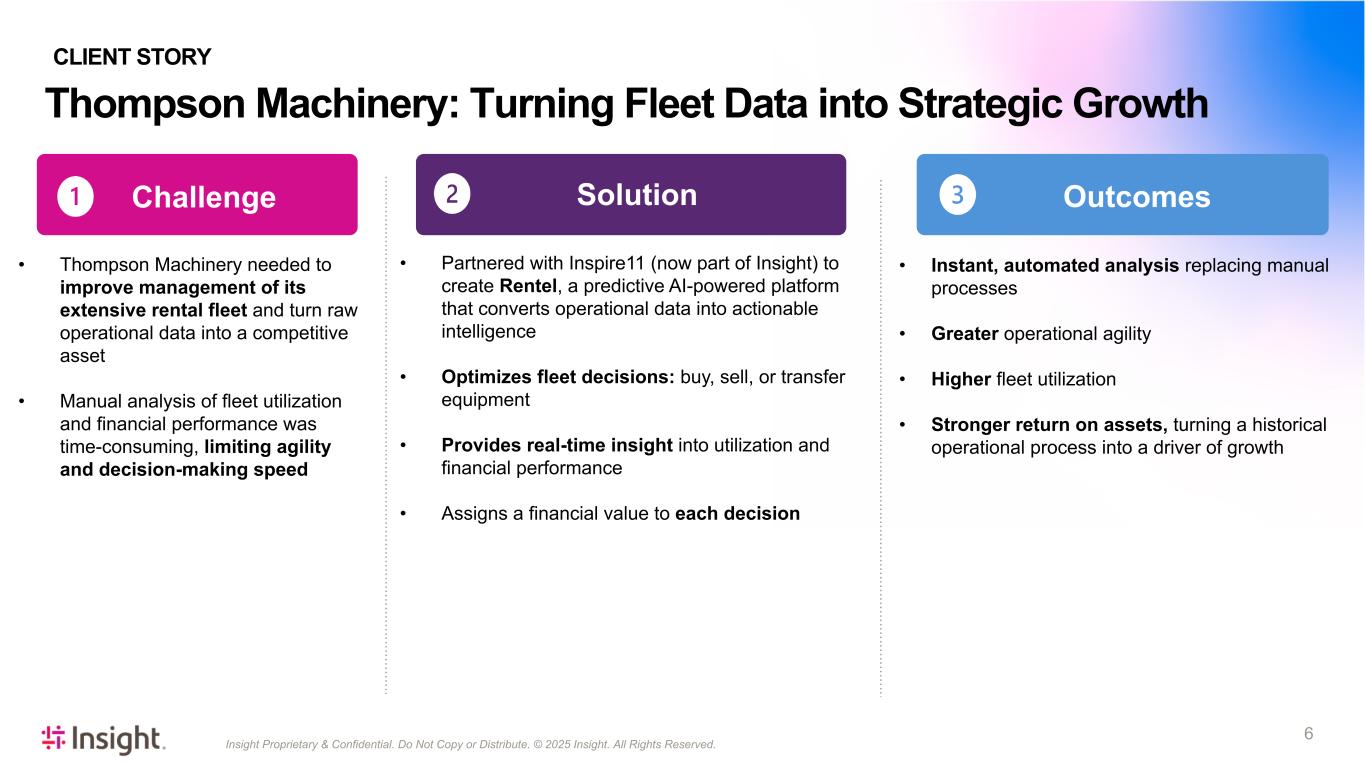
Insight Proprietary & Confidential. Do Not Copy or Distribute. © 2025 Insight. All Rights Reserved. 6 • Thompson Machinery needed to improve management of its extensive rental fleet and turn raw operational data into a competitive asset • Manual analysis of fleet utilization and financial performance was time-consuming, limiting agility and decision-making speed • Partnered with Inspire11 (now part of Insight) to create Rentel, a predictive AI-powered platform that converts operational data into actionable intelligence • Optimizes fleet decisions: buy, sell, or transfer equipment • Provides real-time insight into utilization and financial performance • Assigns a financial value to each decision • Instant, automated analysis replacing manual processes • Greater operational agility • Higher fleet utilization • Stronger return on assets, turning a historical operational process into a driver of growth Thompson Machinery: Turning Fleet Data into Strategic Growth CLIENT STORY Challenge Solution Outcomes
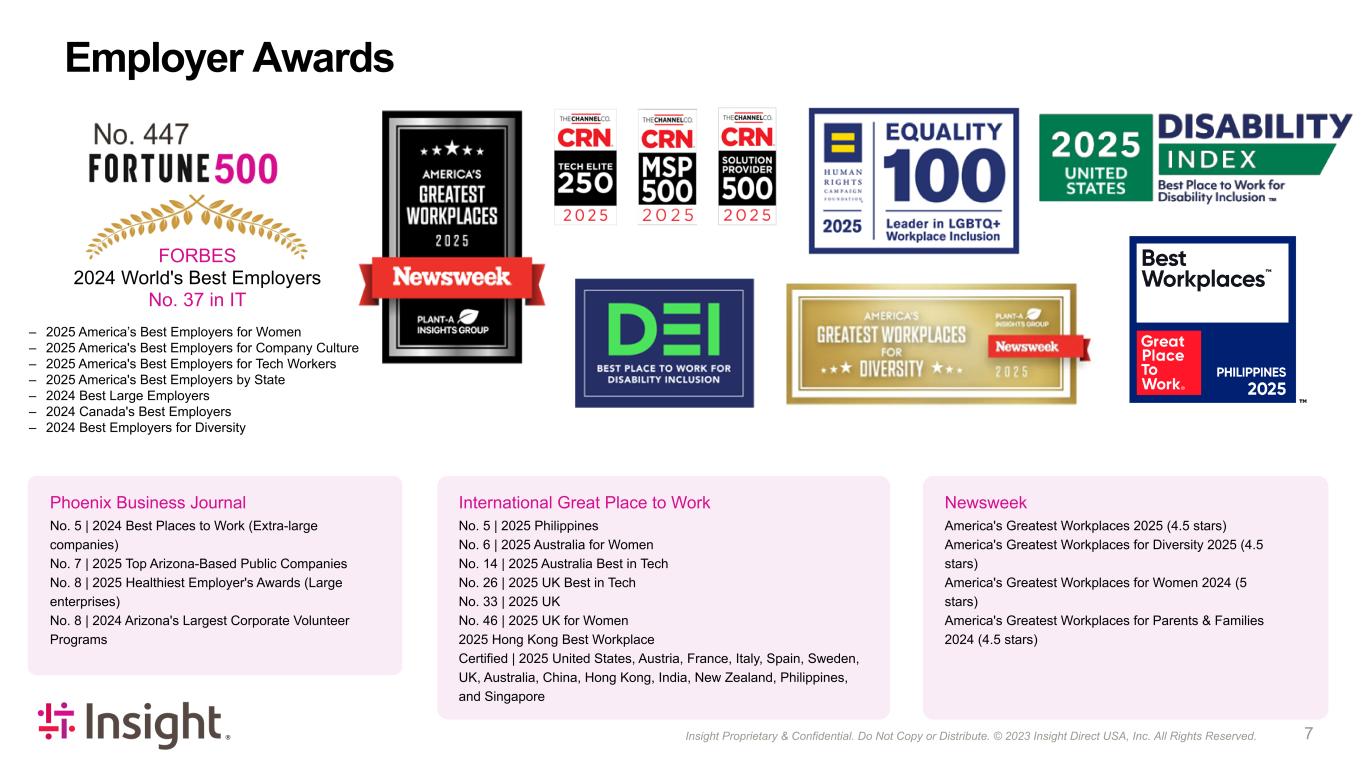
Insight Proprietary & Confidential. Do Not Copy or Distribute. © 2022 Insight Direct USA, Inc. All Rights Reserved. 73 Employer Awards – 2025 America’s Best Employers for Women – 2025 America's Best Employers for Company Culture – 2025 America's Best Employers for Tech Workers – 2025 America's Best Employers by State – 2024 Best Large Employers – 2024 Canada's Best Employers – 2024 Best Employers for Diversity Newsweek America's Greatest Workplaces 2025 (4.5 stars) America's Greatest Workplaces for Diversity 2025 (4.5 stars) America's Greatest Workplaces for Women 2024 (5 stars) America's Greatest Workplaces for Parents & Families 2024 (4.5 stars) Phoenix Business Journal No. 5 | 2024 Best Places to Work (Extra-large companies) No. 7 | 2025 Top Arizona-Based Public Companies No. 8 | 2025 Healthiest Employer's Awards (Large enterprises) No. 8 | 2024 Arizona's Largest Corporate Volunteer Programs International Great Place to Work No. 5 | 2025 Philippines No. 6 | 2025 Australia for Women No. 14 | 2025 Australia Best in Tech No. 26 | 2025 UK Best in Tech No. 33 | 2025 UK No. 46 | 2025 UK for Women 2025 Hong Kong Best Workplace Certified | 2025 United States, Austria, France, Italy, Spain, Sweden, UK, Australia, China, Hong Kong, India, New Zealand, Philippines, and Singapore FORBES 2024 World's Best Employers No. 37 in IT
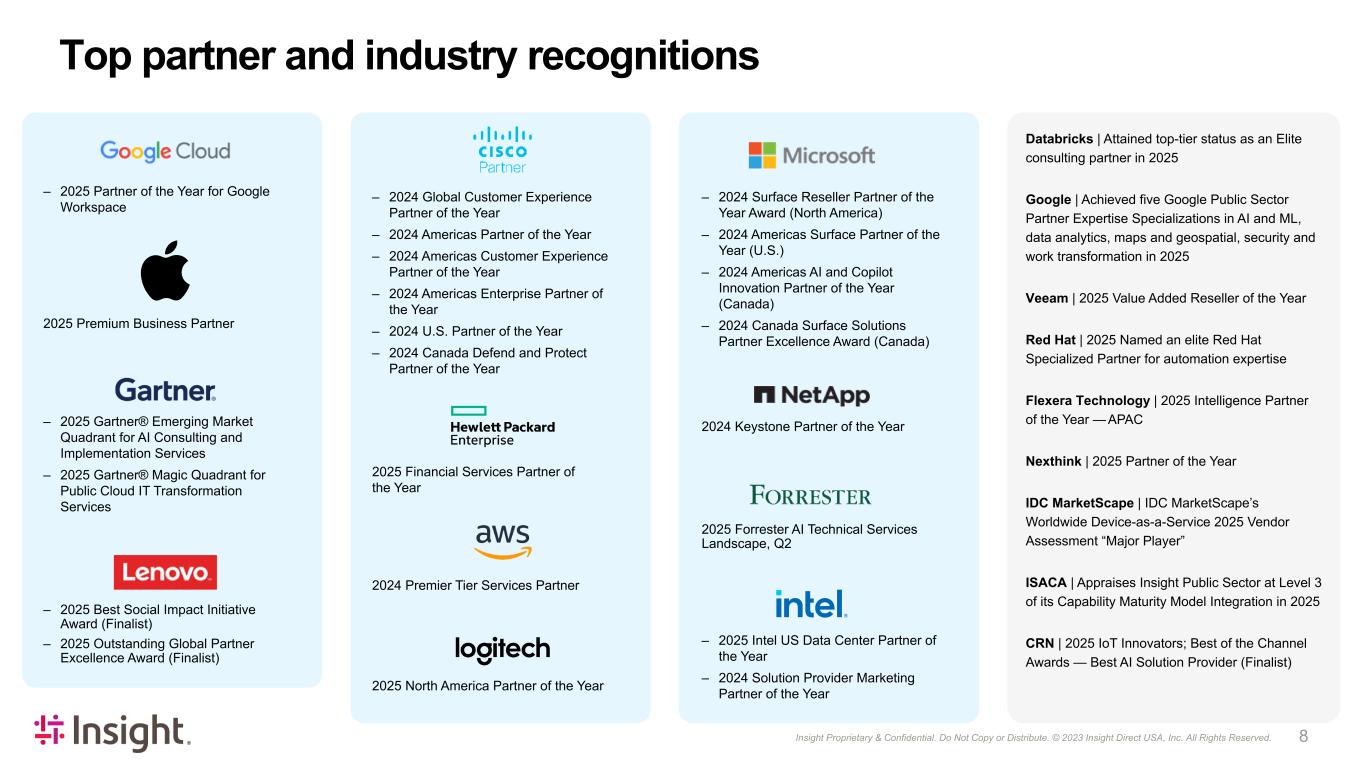
8Insight Proprietary & Confidential. Do Not Copy or Distribute. © 2023 Insight Direct USA, Inc. All Rights Reserved. Databricks | Attained top-tier status as an Elite consulting partner in 2025 Google | Achieved five Google Public Sector Partner Expertise Specializations in AI and ML, data analytics, maps and geospatial, security and work transformation in 2025 Veeam | 2025 Value Added Reseller of the Year Red Hat | 2025 Named an elite Red Hat Specialized Partner for automation expertise Flexera Technology | 2025 Intelligence Partner of the Year — APAC Nexthink | 2025 Partner of the Year IDC MarketScape | IDC MarketScape’s Worldwide Device-as-a-Service 2025 Vendor Assessment “Major Player” ISACA | Appraises Insight Public Sector at Level 3 of its Capability Maturity Model Integration in 2025 CRN | 2025 IoT Innovators; Best of the Channel Awards — Best AI Solution Provider (Finalist) Top partner and industry recognitions – 2025 Partner of the Year for Google Workspace – 2025 Gartner® Emerging Market Quadrant for AI Consulting and Implementation Services – 2025 Gartner® Magic Quadrant for Public Cloud IT Transformation Services – 2025 Best Social Impact Initiative Award (Finalist) – 2025 Outstanding Global Partner Excellence Award (Finalist) 2024 Premier Tier Services Partner – 2024 Global Customer Experience Partner of the Year – 2024 Americas Partner of the Year – 2024 Americas Customer Experience Partner of the Year – 2024 Americas Enterprise Partner of the Year – 2024 U.S. Partner of the Year – 2024 Canada Defend and Protect Partner of the Year 2025 Financial Services Partner of the Year 2025 North America Partner of the Year 2024 Keystone Partner of the Year – 2025 Intel US Data Center Partner of the Year – 2024 Solution Provider Marketing Partner of the Year 2025 Premium Business Partner – 2024 Surface Reseller Partner of the Year Award (North America) – 2024 Americas Surface Partner of the Year (U.S.) – 2024 Americas AI and Copilot Innovation Partner of the Year (Canada) – 2024 Canada Surface Solutions Partner Excellence Award (Canada) 2025 Forrester AI Technical Services Landscape, Q2
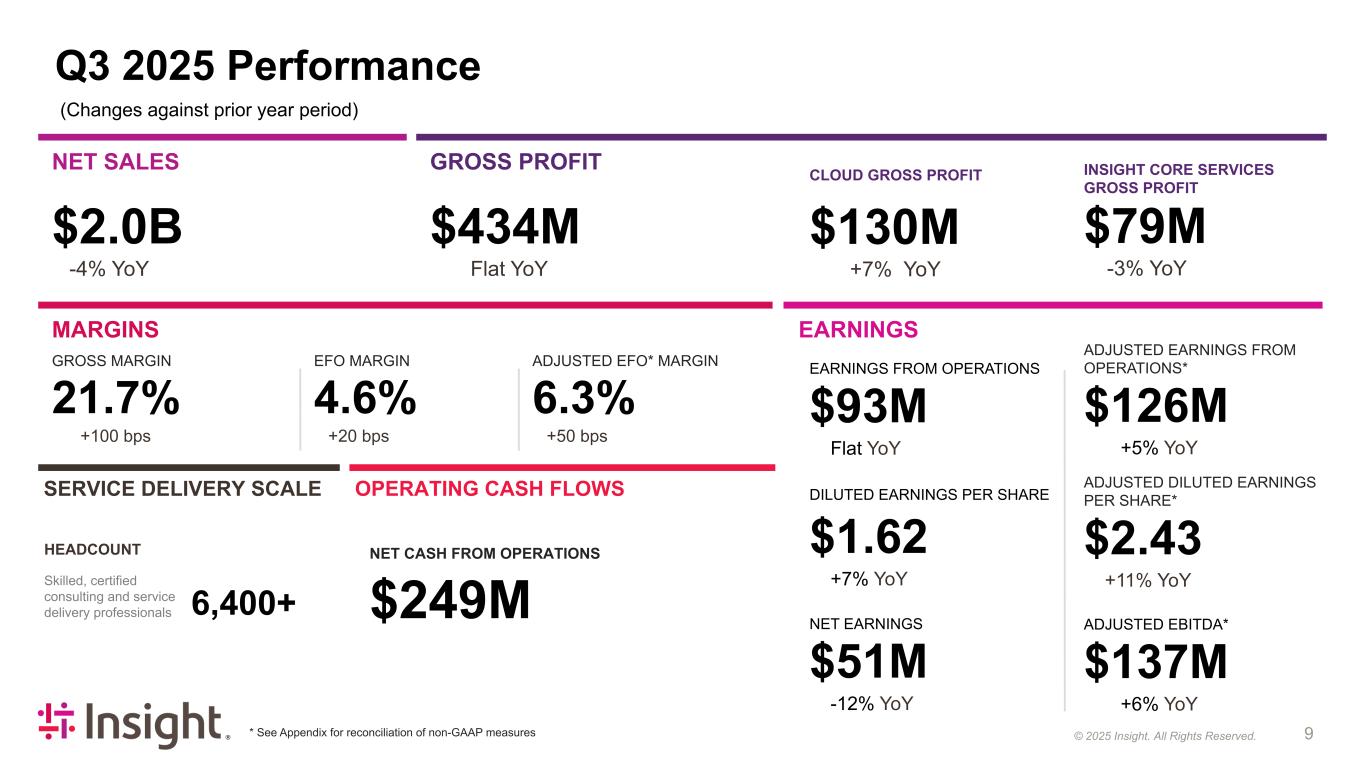
Insight Proprietary & Confidential. Do Not Copy or Distribute. © 2022 Insight Direct USA, Inc. All Rights Reserved. 9 © 2025 Insight Q3 2025 Performance (Changes against prior year period) * See Appendix for reconciliation of non-GAAP measures NET SALES $2.0B -4% YoY GROSS PROFIT $434M Flat YoY MARGINS GROSS MARGIN 21.7% +100 bps EFO MARGIN 4.6% +20 bps ADJUSTED EFO* MARGIN 6.3% +50 bps EARNINGS CLOUD GROSS PROFIT XD $130M +7% YoY INSIGHT CORE SERVICES GROSS PROFIT $79M -3% YoY EARNINGS FROM OPERATIONS EARNINGS FROM OPERATIONS X $93M Flat YoY DILUTED EARNINGS PER SHARE X $1.62 +7% YoY NET EARNINGS NET EARNINGS $51M -12% YoY ADJUSTED EARNINGS FROM OPERATIONS* $126M +5% YoY ADJUSTED DILUTED EARNINGS PER SHARE* $2.43 +11% YoY ADJUSTED EBITDA* $137M +6% YoY OPERATING CASH FLOWS NET CASH FROM OPERATIONS X $249M SERVICE DELIVERY SCALE HEADCOUNT Skilled, certified consulting and service delivery professionals 6,400+
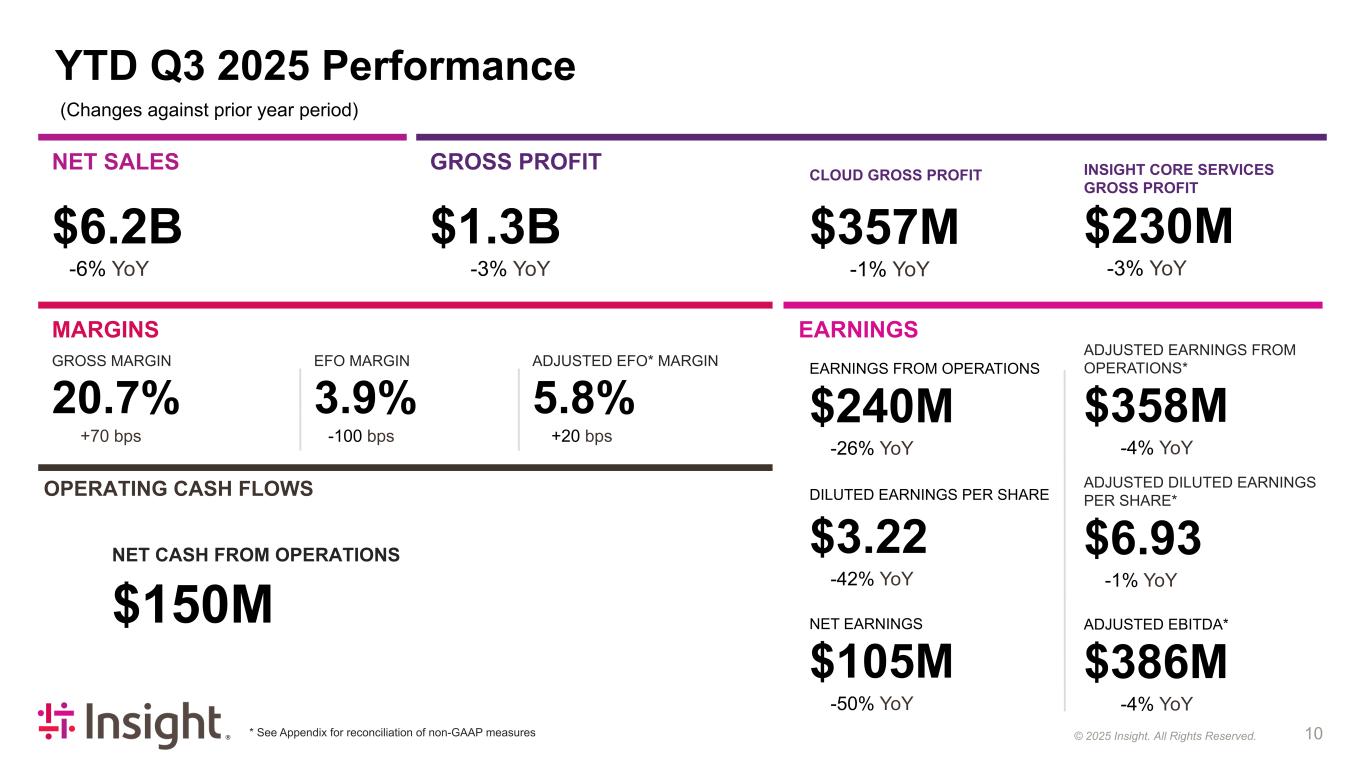
Insight Proprietary & Confidential. Do Not Copy or Distribute. © 2022 Insight Direct USA, Inc. All Rights Reserved. 10 © 2025 Insight YTD Q3 2025 Performance (Changes against prior year period) * See Appendix for reconciliation of non-GAAP measures NET SALES $6.2B -6% YoY GROSS PROFIT $1.3B -3% YoY MARGINS GROSS MARGIN 20.7% +70 bps EFO MARGIN 3.9% -100 bps ADJUSTED EFO* MARGIN 5.8% +20 bps EARNINGS CLOUD GROSS PROFIT XD $357M -1% YoY INSIGHT CORE SERVICES GROSS PROFIT $230M -3% YoY EARNINGS FROM OPERATIONS EARNINGS FROM OPERATIONS X $240M -26% YoY DILUTED EARNINGS PER SHARE X $3.22 -42% YoY NET EARNINGS NET EARNINGS $105M -50% YoY ADJUSTED EARNINGS FROM OPERATIONS* $358M -4% YoY ADJUSTED DILUTED EARNINGS PER SHARE* $6.93 -1% YoY ADJUSTED EBITDA* $386M -4% YoY NET CASH FROM OPERATIONS X $150M OPERATING CASH FLOWS
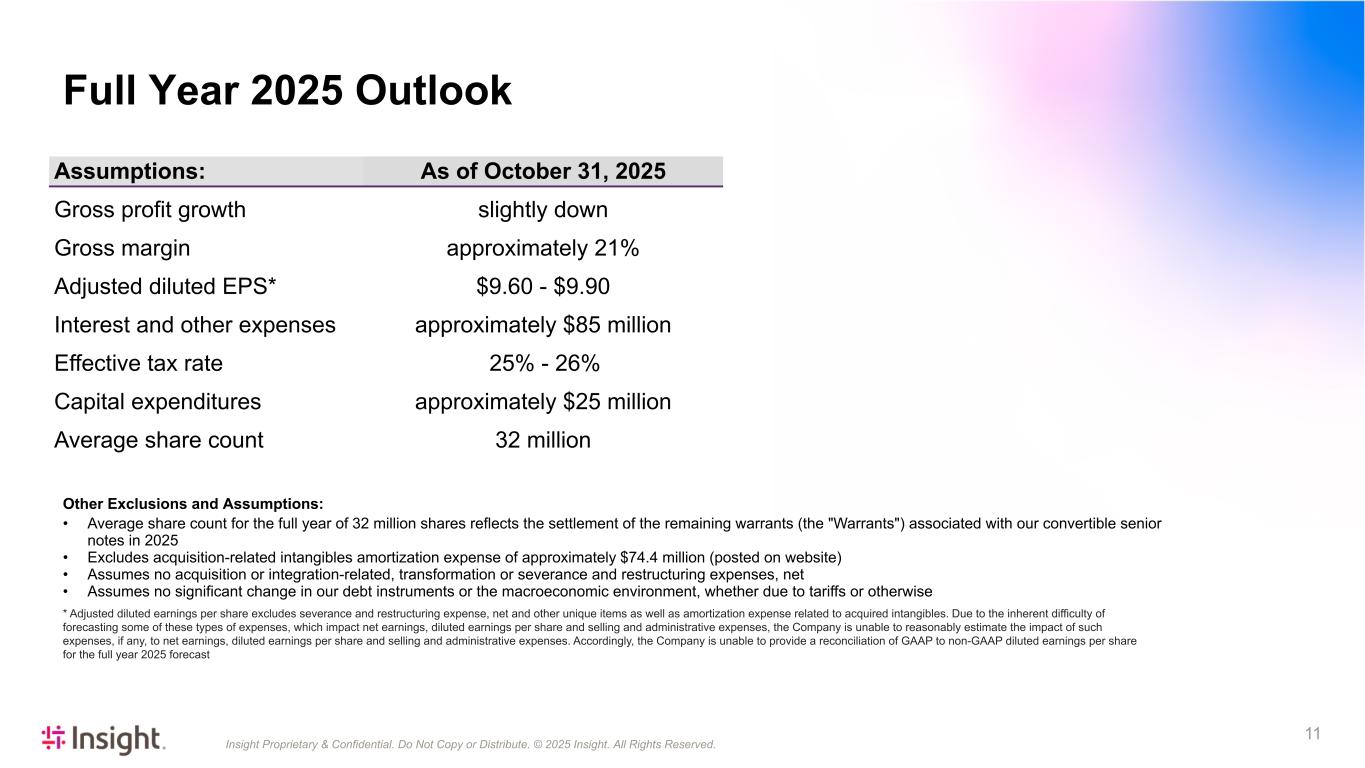
Insight Proprietary & Confidential. Do Not Copy or Distribute. © 2025 Insight. All Rights Reserved. 11 Assumptions: As of October 31, 2025 Gross profit growth slightly down Gross margin approximately 21% Adjusted diluted EPS* $9.60 - $9.90 Interest and other expenses approximately $85 million Effective tax rate 25% - 26% Capital expenditures approximately $25 million Average share count 32 million Other Exclusions and Assumptions: • Average share count for the full year of 32 million shares reflects the settlement of the remaining warrants (the "Warrants") associated with our convertible senior notes in 2025 • Excludes acquisition-related intangibles amortization expense of approximately $74.4 million (posted on website) • Assumes no acquisition or integration-related, transformation or severance and restructuring expenses, net • Assumes no significant change in our debt instruments or the macroeconomic environment, whether due to tariffs or otherwise * Adjusted diluted earnings per share excludes severance and restructuring expense, net and other unique items as well as amortization expense related to acquired intangibles. Due to the inherent difficulty of forecasting some of these types of expenses, which impact net earnings, diluted earnings per share and selling and administrative expenses, the Company is unable to reasonably estimate the impact of such expenses, if any, to net earnings, diluted earnings per share and selling and administrative expenses. Accordingly, the Company is unable to provide a reconciliation of GAAP to non-GAAP diluted earnings per share for the full year 2025 forecast Full Year 2025 Outlook

© 2025 Insight. All Rights Reserved. 12 Appendix
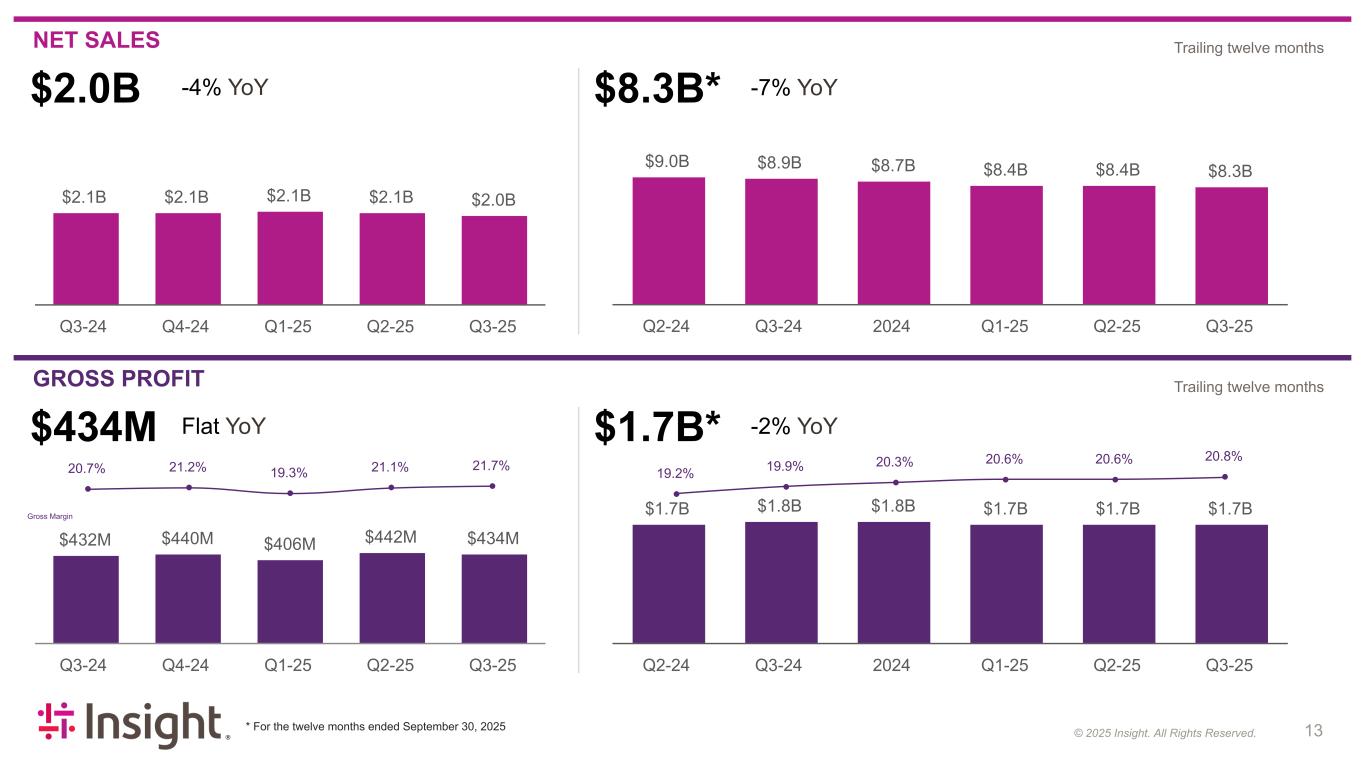
Insight Proprietary & Confidential. Do Not Copy or Distribute. © 2022 Insight Direct USA, Inc. All Rights Reserved. 13 © 2025 Insight NET SALES GROSS PROFIT * For the twelve months ended September 30, 2025 Trailing twelve months Trailing twelve months $2.0B -4% YoY $2.1B $2.1B $2.1B $2.1B $2.0B Q3-24 Q4-24 Q1-25 Q2-25 Q3-25 $9.0B $8.9B $8.7B $8.4B $8.4B $8.3B Q2-24 Q3-24 2024 Q1-25 Q2-25 Q3-25 $8.3B* -7% YoY $434M Flat YoY 20.7% 21.2% 19.3% 21.1% 21.7% $432M $440M $406M $442M $434M Q3-24 Q4-24 Q1-25 Q2-25 Q3-25 $1.7B* -2% YoY 19.2% 19.9% 20.3% 20.6% 20.6% 20.8% $1.7B $1.8B $1.8B $1.7B $1.7B $1.7B Q2-24 Q3-24 2024 Q1-25 Q2-25 Q3-25 Gross Margin
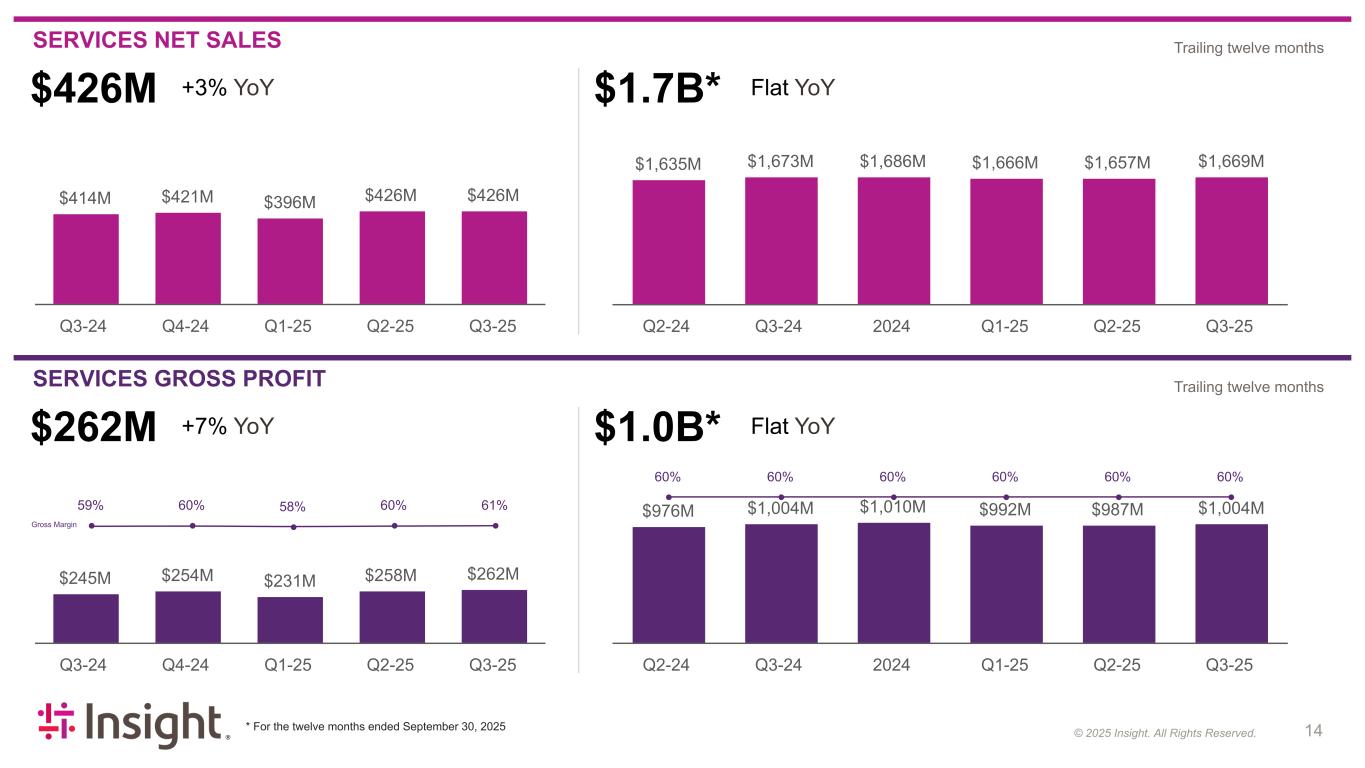
Insight Proprietary & Confidential. Do Not Copy or Distribute. © 2022 Insight Direct USA, Inc. All Rights Reserved. 14 © 2025 Insight Gross Margin SERVICES NET SALES SERVICES GROSS PROFIT * For the twelve months ended September 30, 2025 Trailing twelve months Trailing twelve months $426M +3% YoY $414M $421M $396M $426M $426M Q3-24 Q4-24 Q1-25 Q2-25 Q3-25 $1,635M $1,673M $1,686M $1,666M $1,657M $1,669M Q2-24 Q3-24 2024 Q1-25 Q2-25 Q3-25 $1.7B* Flat YoY $245M $254M $231M $258M $262M Q3-24 Q4-24 Q1-25 Q2-25 Q3-25 59% 60% 58% 60% 61% $262M +7% YoY $976M $1,004M $1,010M $992M $987M $1,004M Q2-24 Q3-24 2024 Q1-25 Q2-25 Q3-25 $1.0B* Flat YoY 60% 60% 60% 60% 60% 60%
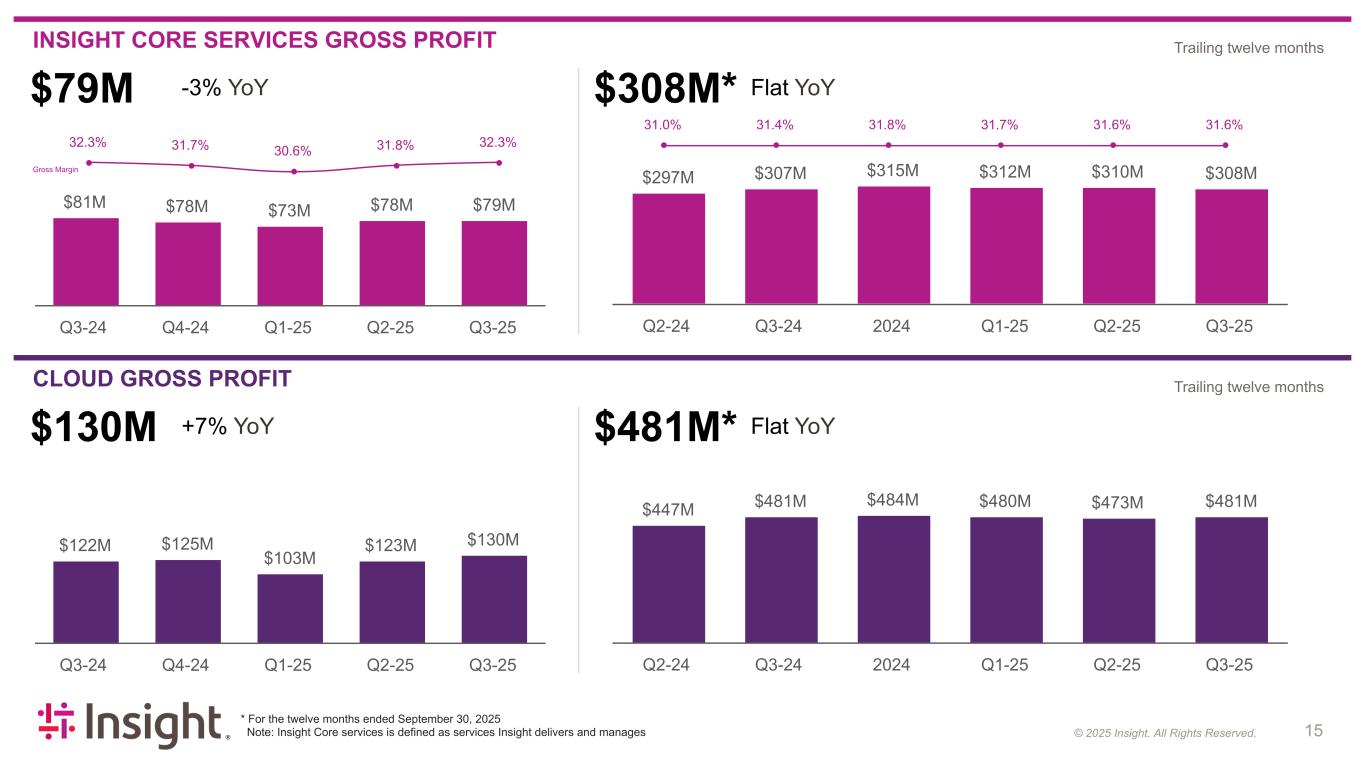
Insight Proprietary & Confidential. Do Not Copy or Distribute. © 2022 Insight Direct USA, Inc. All Rights Reserved. 15 © 2025 Insight INSIGHT CORE SERVICES GROSS PROFIT CLOUD GROSS PROFIT * For the twelve months ended September 30, 2025 Note: Insight Core services is defined as services Insight delivers and manages Trailing twelve months Trailing twelve months $81M $78M $73M $78M $79M Q3-24 Q4-24 Q1-25 Q2-25 Q3-25 32.3% 31.7% 30.6% 31.8% 32.3% $79M -3% YoY Gross Margin $297M $307M $315M $312M $310M $308M Q2-24 Q3-24 2024 Q1-25 Q2-25 Q3-25 31.0% 31.4% 31.8% 31.7% 31.6% 31.6% $308M* Flat YoY $122M $125M $103M $123M $130M Q3-24 Q4-24 Q1-25 Q2-25 Q3-25 $447M $481M $484M $480M $473M $481M Q2-24 Q3-24 2024 Q1-25 Q2-25 Q3-25 $130M +7% YoY $481M* Flat YoY
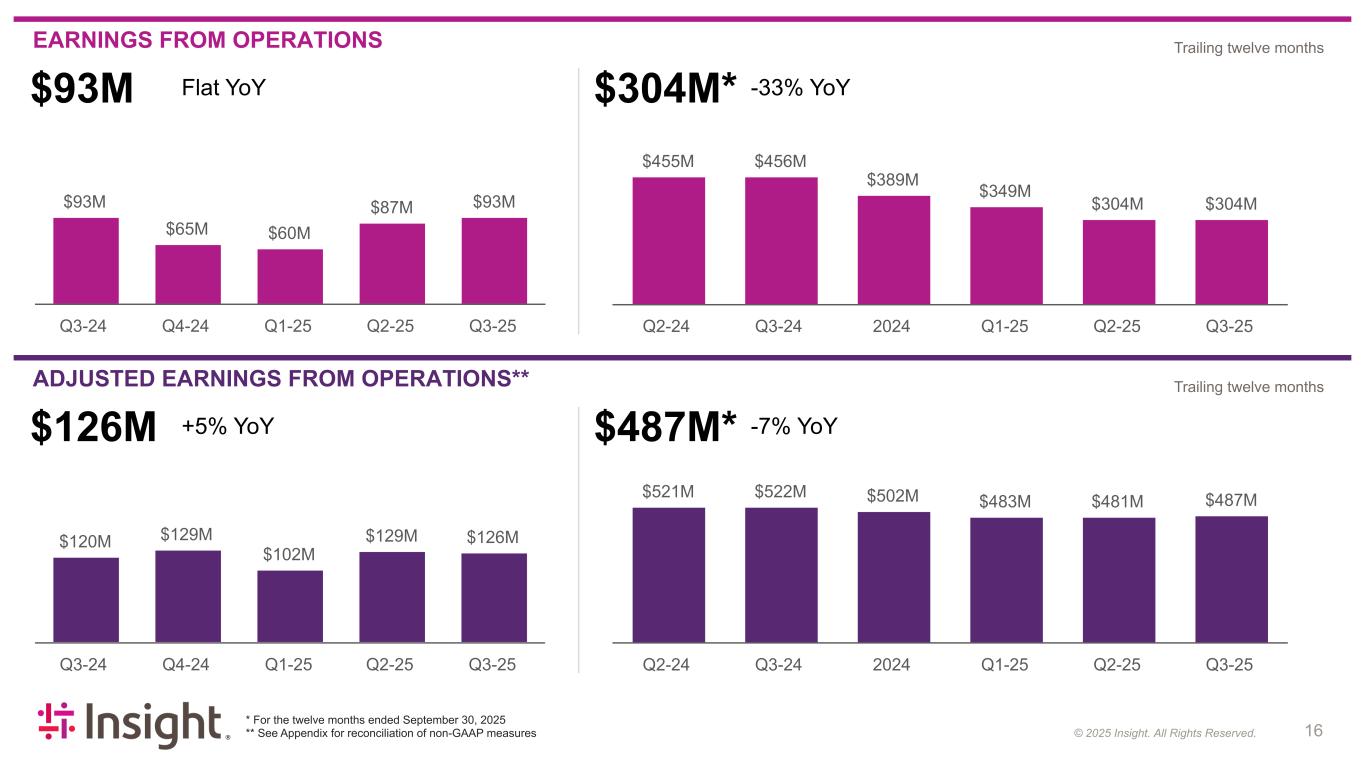
Insight Proprietary & Confidential. Do Not Copy or Distribute. © 2022 Insight Direct USA, Inc. All Rights Reserved. 16 © 2025 Insight EARNINGS FROM OPERATIONS ADJUSTED EARNINGS FROM OPERATIONS** * For the twelve months ended September 30, 2025 ** See Appendix for reconciliation of non-GAAP measures Trailing twelve months Trailing twelve months $93M $65M $60M $87M $93M Q3-24 Q4-24 Q1-25 Q2-25 Q3-25 $455M $456M $389M $349M $304M $304M Q2-24 Q3-24 2024 Q1-25 Q2-25 Q3-25 $93M Flat YoY $304M* -33% YoY $120M $129M $102M $129M $126M Q3-24 Q4-24 Q1-25 Q2-25 Q3-25 $126M +5% YoY $521M $522M $502M $483M $481M $487M Q2-24 Q3-24 2024 Q1-25 Q2-25 Q3-25 $487M* -7% YoY
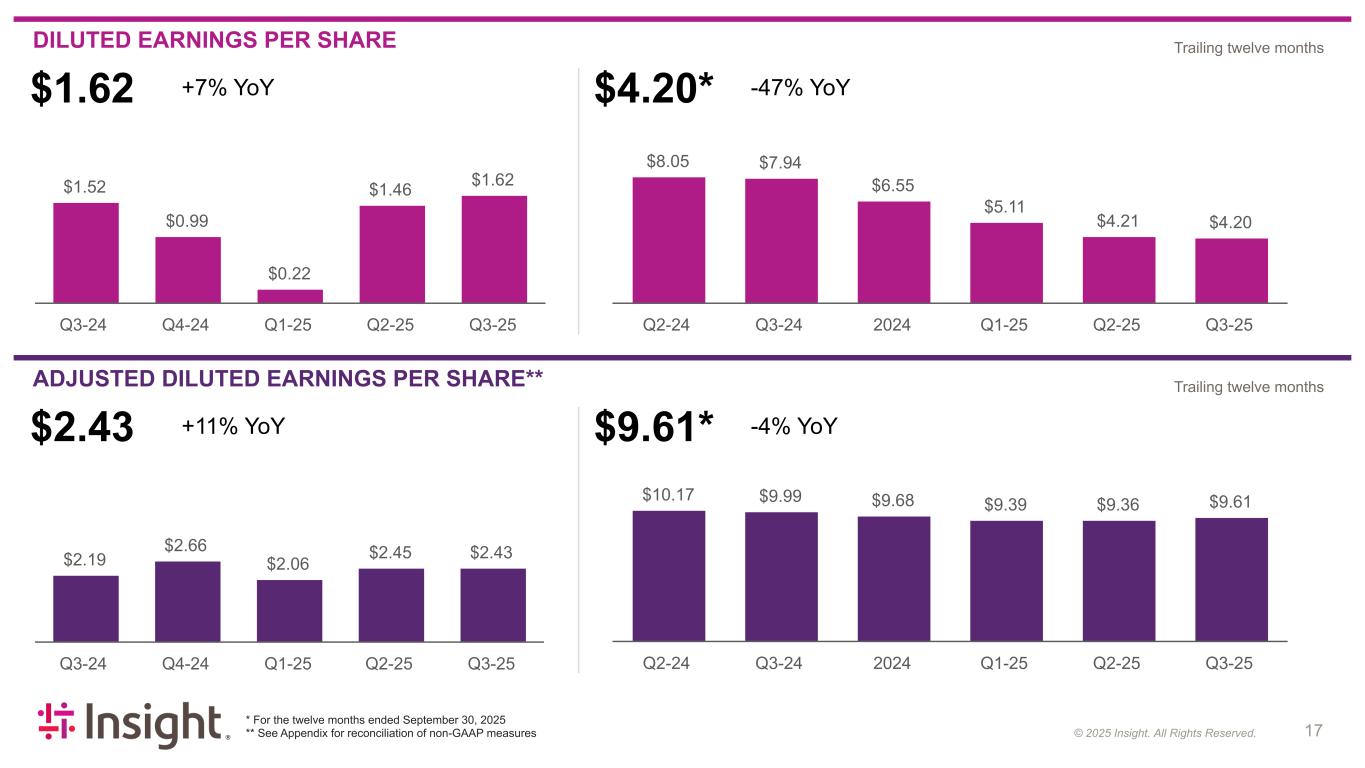
Insight Proprietary & Confidential. Do Not Copy or Distribute. © 2022 Insight Direct USA, Inc. All Rights Reserved. 17 © 2025 Insight DILUTED EARNINGS PER SHARE ADJUSTED DILUTED EARNINGS PER SHARE** * For the twelve months ended September 30, 2025 ** See Appendix for reconciliation of non-GAAP measures Trailing twelve months Trailing twelve months $1.52 $0.99 $0.22 $1.46 $1.62 Q3-24 Q4-24 Q1-25 Q2-25 Q3-25 $8.05 $7.94 $6.55 $5.11 $4.21 $4.20 Q2-24 Q3-24 2024 Q1-25 Q2-25 Q3-25 $2.19 $2.66 $2.06 $2.45 $2.43 Q3-24 Q4-24 Q1-25 Q2-25 Q3-25 $10.17 $9.99 $9.68 $9.39 $9.36 $9.61 Q2-24 Q3-24 2024 Q1-25 Q2-25 Q3-25 $1.62 +7% YoY $4.20* -47% YoY $2.43 +11% YoY $9.61* -4% YoY
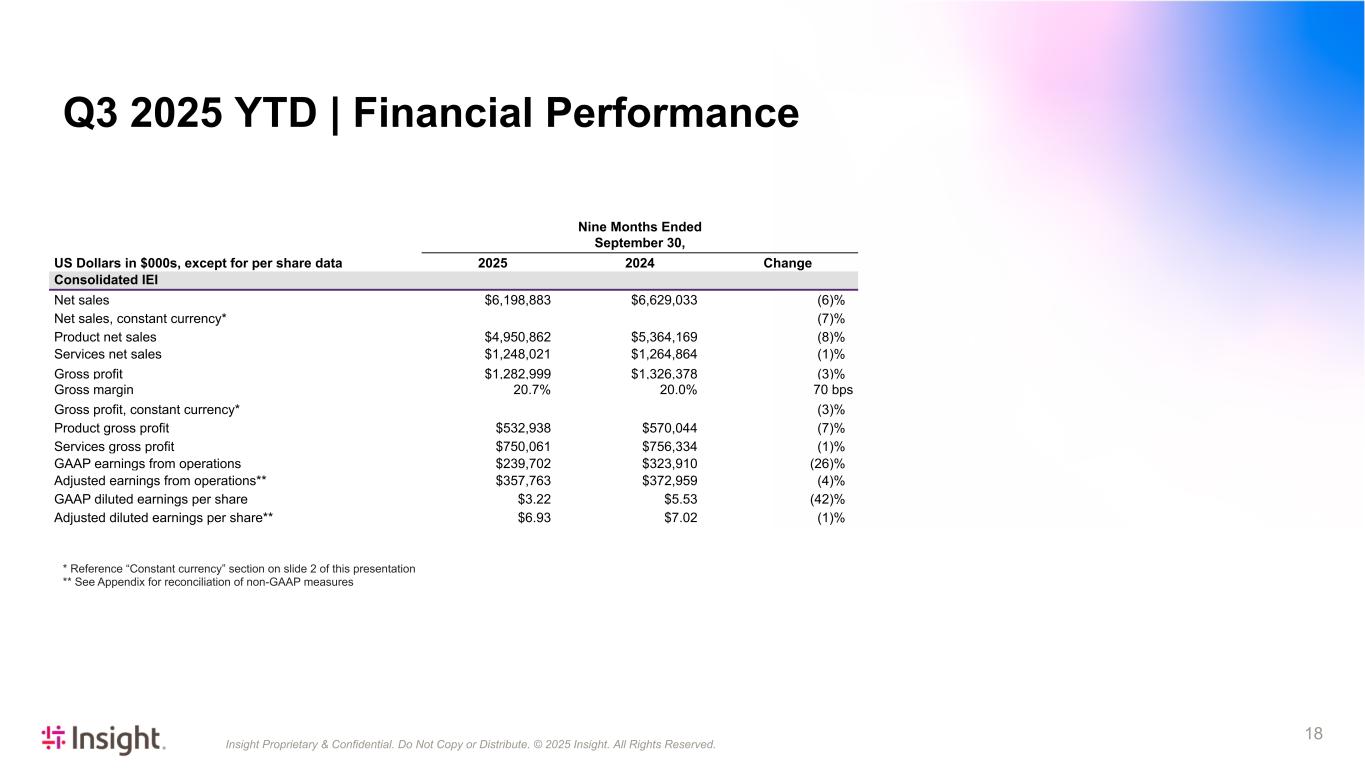
Insight Proprietary & Confidential. Do Not Copy or Distribute. © 2025 Insight. All Rights Reserved. 18 Nine Months Ended September 30, US Dollars in $000s, except for per share data 2025 2024 Change Consolidated IEI Net sales $6,198,883 $6,629,033 (6) % Net sales, constant currency* (7) % Product net sales $4,950,862 $5,364,169 (8) % Services net sales $1,248,021 $1,264,864 (1) % Gross profit $1,282,999 $1,326,378 (3) % Gross margin 20.7 % 20.0 % 70 bps Gross profit, constant currency* (3) % Product gross profit $532,938 $570,044 (7) % Services gross profit $750,061 $756,334 (1) % GAAP earnings from operations $239,702 $323,910 (26) % Adjusted earnings from operations** $357,763 $372,959 (4) % GAAP diluted earnings per share $3.22 $5.53 (42) % Adjusted diluted earnings per share** $6.93 $7.02 (1) % * Reference “Constant currency” section on slide 2 of this presentation ** See Appendix for reconciliation of non-GAAP measures Q3 2025 YTD | Financial Performance
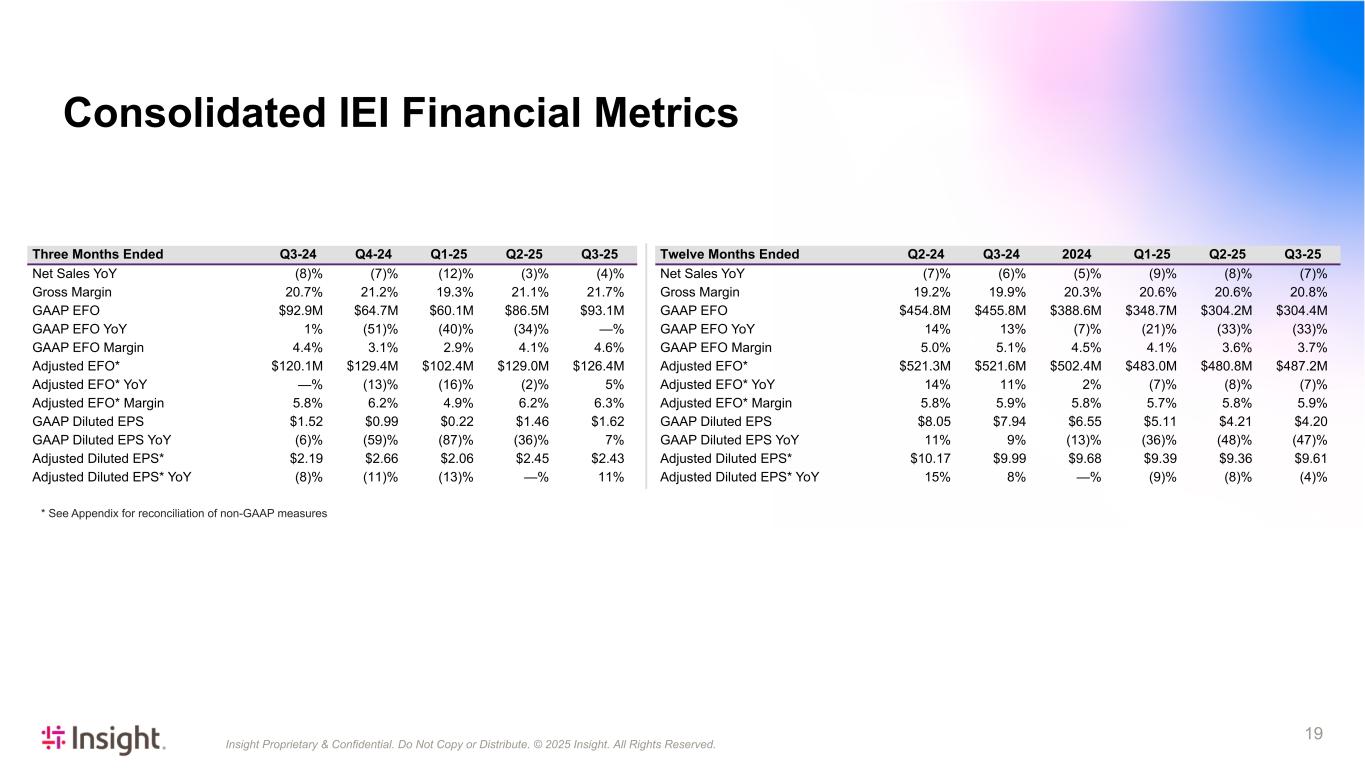
Insight Proprietary & Confidential. Do Not Copy or Distribute. © 2025 Insight. All Rights Reserved. 19 * See Appendix for reconciliation of non-GAAP measures Three Months Ended Q3-24 Q4-24 Q1-25 Q2-25 Q3-25 Net Sales YoY (8) % (7) % (12) % (3) % (4) % Gross Margin 20.7 % 21.2 % 19.3 % 21.1 % 21.7 % GAAP EFO $92.9M $64.7M $60.1M $86.5M $93.1M GAAP EFO YoY 1 % (51) % (40) % (34) % — % GAAP EFO Margin 4.4 % 3.1 % 2.9 % 4.1 % 4.6 % Adjusted EFO* $120.1M $129.4M $102.4M $129.0M $126.4M Adjusted EFO* YoY — % (13) % (16) % (2) % 5 % Adjusted EFO* Margin 5.8 % 6.2 % 4.9 % 6.2 % 6.3 % GAAP Diluted EPS $1.52 $0.99 $0.22 $1.46 $1.62 GAAP Diluted EPS YoY (6) % (59) % (87) % (36) % 7 % Adjusted Diluted EPS* $2.19 $2.66 $2.06 $2.45 $2.43 Adjusted Diluted EPS* YoY (8) % (11) % (13) % — % 11 % Twelve Months Ended Q2-24 Q3-24 2024 Q1-25 Q2-25 Q3-25 Net Sales YoY (7) % (6) % (5) % (9) % (8) % (7) % Gross Margin 19.2 % 19.9 % 20.3 % 20.6 % 20.6 % 20.8 % GAAP EFO $454.8M $455.8M $388.6M $348.7M $304.2M $304.4M GAAP EFO YoY 14 % 13 % (7) % (21) % (33) % (33) % GAAP EFO Margin 5.0 % 5.1 % 4.5 % 4.1 % 3.6 % 3.7 % Adjusted EFO* $521.3M $521.6M $502.4M $483.0M $480.8M $487.2M Adjusted EFO* YoY 14 % 11 % 2 % (7) % (8) % (7) % Adjusted EFO* Margin 5.8 % 5.9 % 5.8 % 5.7 % 5.8 % 5.9 % GAAP Diluted EPS $8.05 $7.94 $6.55 $5.11 $4.21 $4.20 GAAP Diluted EPS YoY 11 % 9 % (13) % (36) % (48) % (47) % Adjusted Diluted EPS* $10.17 $9.99 $9.68 $9.39 $9.36 $9.61 Adjusted Diluted EPS* YoY 15 % 8 % — % (9) % (8) % (4) % Consolidated IEI Financial Metrics
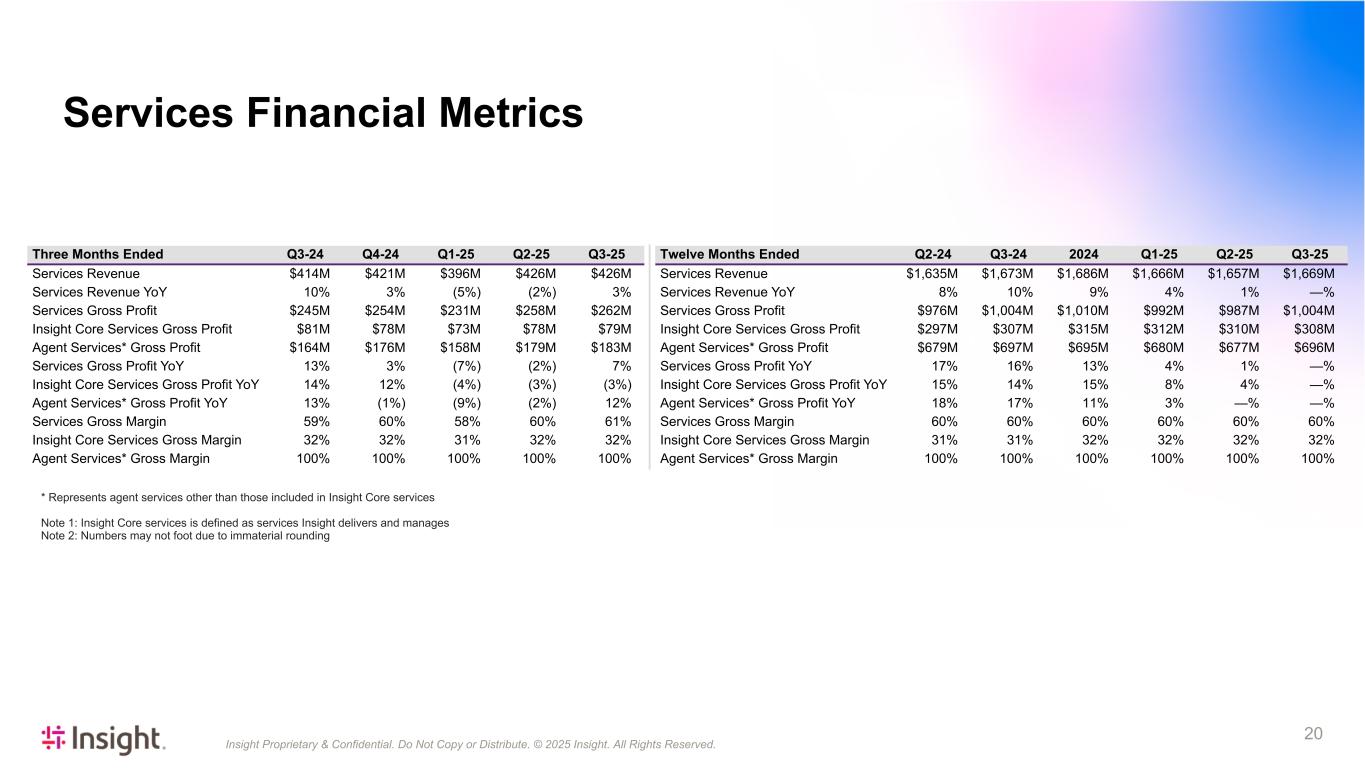
Insight Proprietary & Confidential. Do Not Copy or Distribute. © 2025 Insight. All Rights Reserved. 20 Three Months Ended Q3-24 Q4-24 Q1-25 Q2-25 Q3-25 Services Revenue $414M $421M $396M $426M $426M Services Revenue YoY 10% 3% (5%) (2%) 3% Services Gross Profit $245M $254M $231M $258M $262M Insight Core Services Gross Profit $81M $78M $73M $78M $79M Agent Services* Gross Profit $164M $176M $158M $179M $183M Services Gross Profit YoY 13% 3% (7%) (2%) 7% Insight Core Services Gross Profit YoY 14% 12% (4%) (3%) (3%) Agent Services* Gross Profit YoY 13% (1%) (9%) (2%) 12% Services Gross Margin 59% 60% 58% 60% 61% Insight Core Services Gross Margin 32% 32% 31% 32% 32% Agent Services* Gross Margin 100% 100% 100% 100% 100% Twelve Months Ended Q2-24 Q3-24 2024 Q1-25 Q2-25 Q3-25 Services Revenue $1,635M $1,673M $1,686M $1,666M $1,657M $1,669M Services Revenue YoY 8% 10% 9% 4% 1% —% Services Gross Profit $976M $1,004M $1,010M $992M $987M $1,004M Insight Core Services Gross Profit $297M $307M $315M $312M $310M $308M Agent Services* Gross Profit $679M $697M $695M $680M $677M $696M Services Gross Profit YoY 17% 16% 13% 4% 1% —% Insight Core Services Gross Profit YoY 15% 14% 15% 8% 4% —% Agent Services* Gross Profit YoY 18% 17% 11% 3% —% —% Services Gross Margin 60% 60% 60% 60% 60% 60% Insight Core Services Gross Margin 31% 31% 32% 32% 32% 32% Agent Services* Gross Margin 100% 100% 100% 100% 100% 100% * Represents agent services other than those included in Insight Core services Note 1: Insight Core services is defined as services Insight delivers and manages Note 2: Numbers may not foot due to immaterial rounding Services Financial Metrics
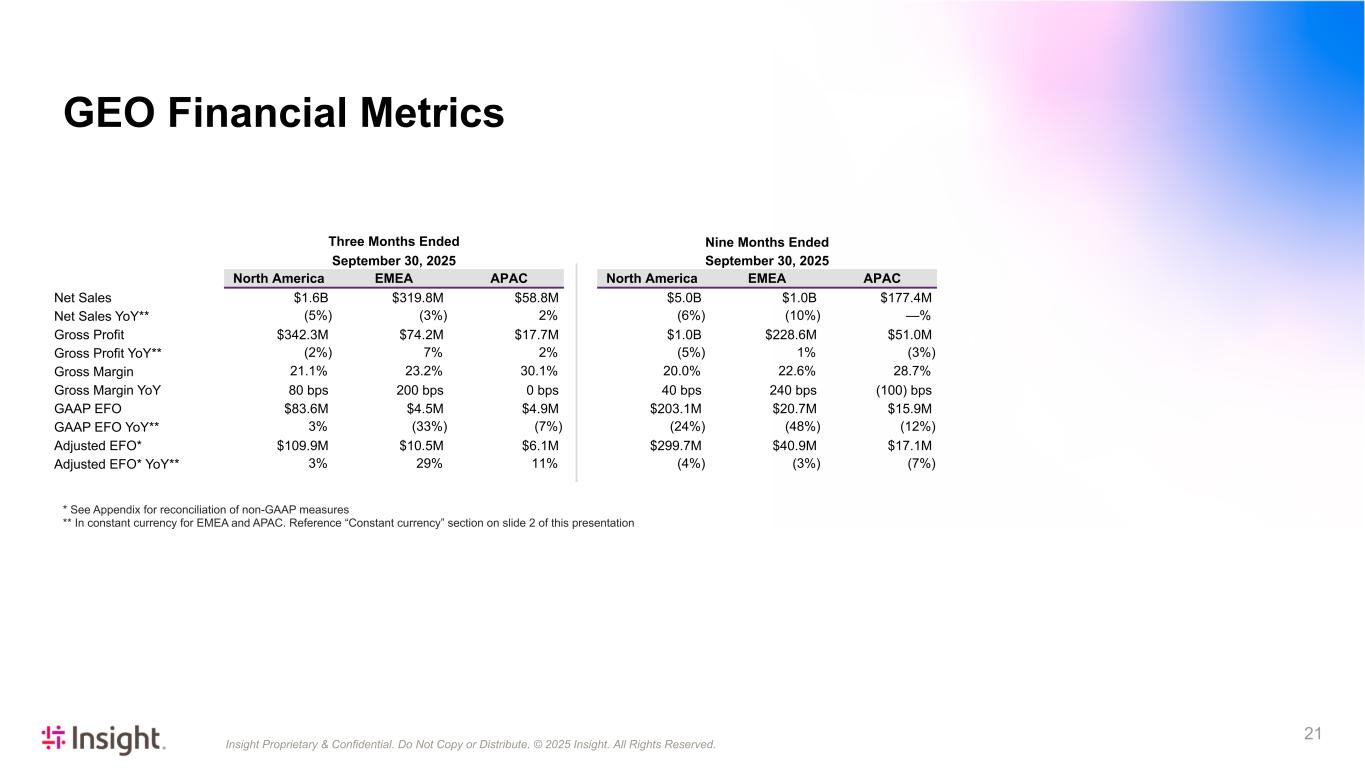
Insight Proprietary & Confidential. Do Not Copy or Distribute. © 2025 Insight. All Rights Reserved. 21 * See Appendix for reconciliation of non-GAAP measures ** In constant currency for EMEA and APAC. Reference “Constant currency” section on slide 2 of this presentation Nine Months Ended September 30, 2025 North America EMEA APAC $5.0B $1.0B $177.4M (6%) (10%) —% $1.0B $228.6M $51.0M (5%) 1% (3%) 20.0% 22.6% 28.7% 40 bps 240 bps (100) bps $203.1M $20.7M $15.9M (24%) (48%) (12%) $299.7M $40.9M $17.1M (4%) (3%) (7%) Three Months Ended September 30, 2025 North America EMEA APAC Net Sales $1.6B $319.8M $58.8M Net Sales YoY** (5%) (3%) 2% Gross Profit $342.3M $74.2M $17.7M Gross Profit YoY** (2%) 7% 2% Gross Margin 21.1% 23.2% 30.1% Gross Margin YoY 80 bps 200 bps 0 bps GAAP EFO $83.6M $4.5M $4.9M GAAP EFO YoY** 3% (33%) (7%) Adjusted EFO* $109.9M $10.5M $6.1M Adjusted EFO* YoY** 3% 29% 11% GEO Financial Metrics
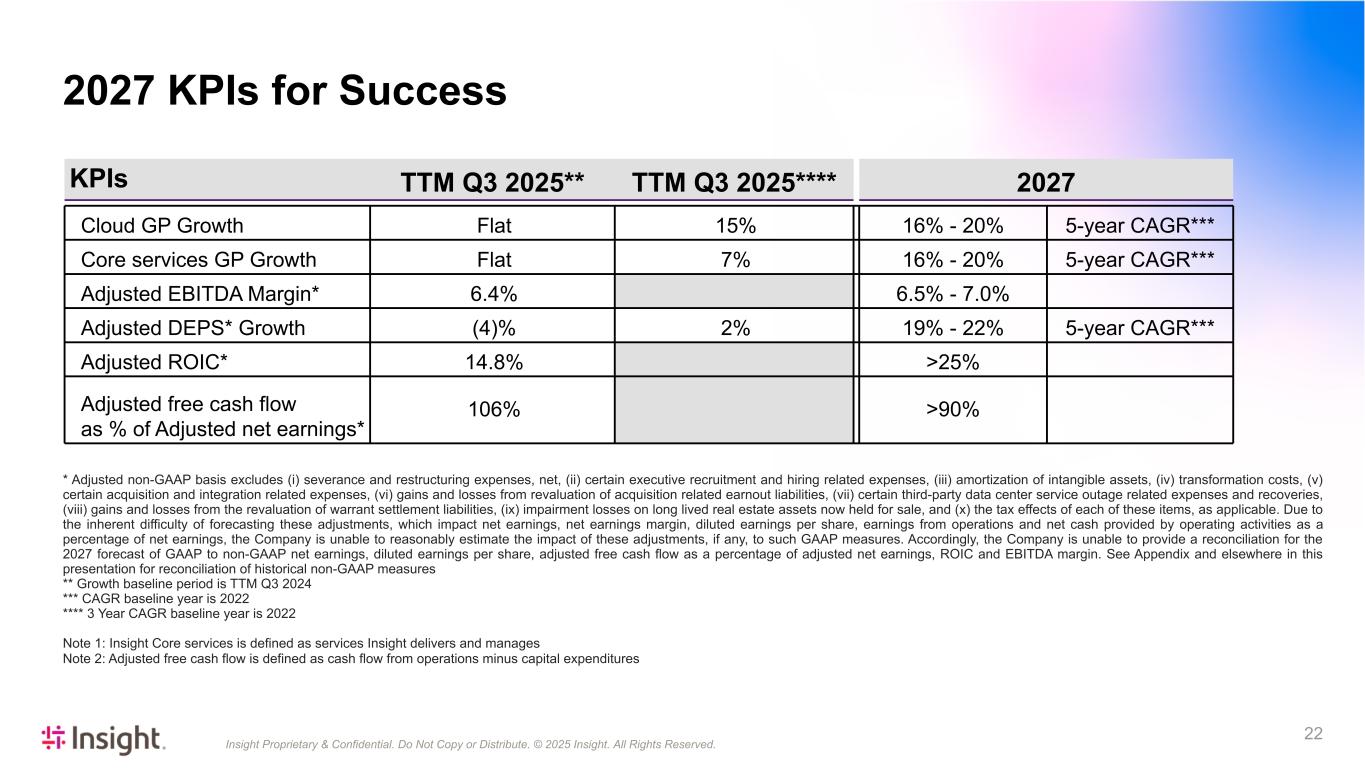
Insight Proprietary & Confidential. Do Not Copy or Distribute. © 2025 Insight. All Rights Reserved. 22 KPIs TTM Q3 2025** TTM Q3 2025**** 2027 Cloud GP Growth Flat 15% 16% - 20% 5-year CAGR*** Core services GP Growth Flat 7% 16% - 20% 5-year CAGR*** Adjusted EBITDA Margin* 6.4% 6.5% - 7.0% Adjusted DEPS* Growth (4)% 2% 19% - 22% 5-year CAGR*** Adjusted ROIC* 14.8% >25% Adjusted free cash flow as % of Adjusted net earnings* 106% >90% * Adjusted non-GAAP basis excludes (i) severance and restructuring expenses, net, (ii) certain executive recruitment and hiring related expenses, (iii) amortization of intangible assets, (iv) transformation costs, (v) certain acquisition and integration related expenses, (vi) gains and losses from revaluation of acquisition related earnout liabilities, (vii) certain third-party data center service outage related expenses and recoveries, (viii) gains and losses from the revaluation of warrant settlement liabilities, (ix) impairment losses on long lived real estate assets now held for sale, and (x) the tax effects of each of these items, as applicable. Due to the inherent difficulty of forecasting these adjustments, which impact net earnings, net earnings margin, diluted earnings per share, earnings from operations and net cash provided by operating activities as a percentage of net earnings, the Company is unable to reasonably estimate the impact of these adjustments, if any, to such GAAP measures. Accordingly, the Company is unable to provide a reconciliation for the 2027 forecast of GAAP to non-GAAP net earnings, diluted earnings per share, adjusted free cash flow as a percentage of adjusted net earnings, ROIC and EBITDA margin. See Appendix and elsewhere in this presentation for reconciliation of historical non-GAAP measures ** Growth baseline period is TTM Q3 2024 *** CAGR baseline year is 2022 **** 3 Year CAGR baseline year is 2022 Note 1: Insight Core services is defined as services Insight delivers and manages Note 2: Adjusted free cash flow is defined as cash flow from operations minus capital expenditures 2027 KPIs for Success
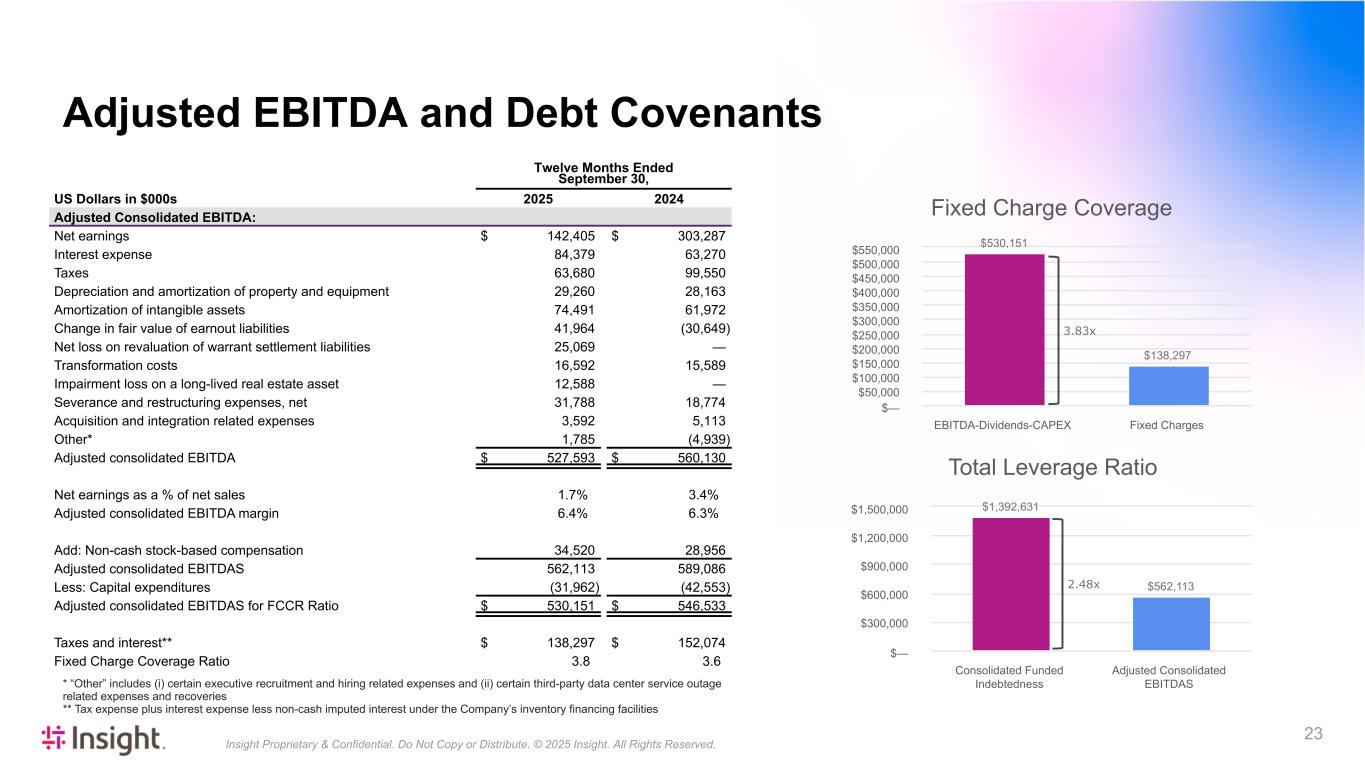
Insight Proprietary & Confidential. Do Not Copy or Distribute. © 2025 Insight. All Rights Reserved. 23 Adjusted EBITDA and Debt Covenants Twelve Months Ended September 30, US Dollars in $000s 2025 2024 Adjusted Consolidated EBITDA: Net earnings $ 142,405 $ 303,287 Interest expense 84,379 63,270 Taxes 63,680 99,550 Depreciation and amortization of property and equipment 29,260 28,163 Amortization of intangible assets 74,491 61,972 Change in fair value of earnout liabilities 41,964 (30,649) Net loss on revaluation of warrant settlement liabilities 25,069 — Transformation costs 16,592 15,589 Impairment loss on a long-lived real estate asset 12,588 — Severance and restructuring expenses, net 31,788 18,774 Acquisition and integration related expenses 3,592 5,113 Other* 1,785 (4,939) Adjusted consolidated EBITDA $ 527,593 $ 560,130 Net earnings as a % of net sales 1.7 % 3.4 % Adjusted consolidated EBITDA margin 6.4 % 6.3 % Add: Non-cash stock-based compensation 34,520 28,956 Adjusted consolidated EBITDAS 562,113 589,086 Less: Capital expenditures (31,962) (42,553) Adjusted consolidated EBITDAS for FCCR Ratio $ 530,151 $ 546,533 Taxes and interest** $ 138,297 $ 152,074 Fixed Charge Coverage Ratio 3.8 3.6 Fixed Charge Coverage $530,151 $138,297 EBITDA-Dividends-CAPEX Fixed Charges $— $50,000 $100,000 $150,000 $200,000 $250,000 $300,000 $350,000 $400,000 $450,000 $500,000 $550,000 Total Leverage Ratio $1,392,631 $562,113 Consolidated Funded Indebtedness Adjusted Consolidated EBITDAS $— $300,000 $600,000 $900,000 $1,200,000 $1,500,000 * “Other” includes (i) certain executive recruitment and hiring related expenses and (ii) certain third-party data center service outage related expenses and recoveries ** Tax expense plus interest expense less non-cash imputed interest under the Company’s inventory financing facilities 3.83x 2.48x
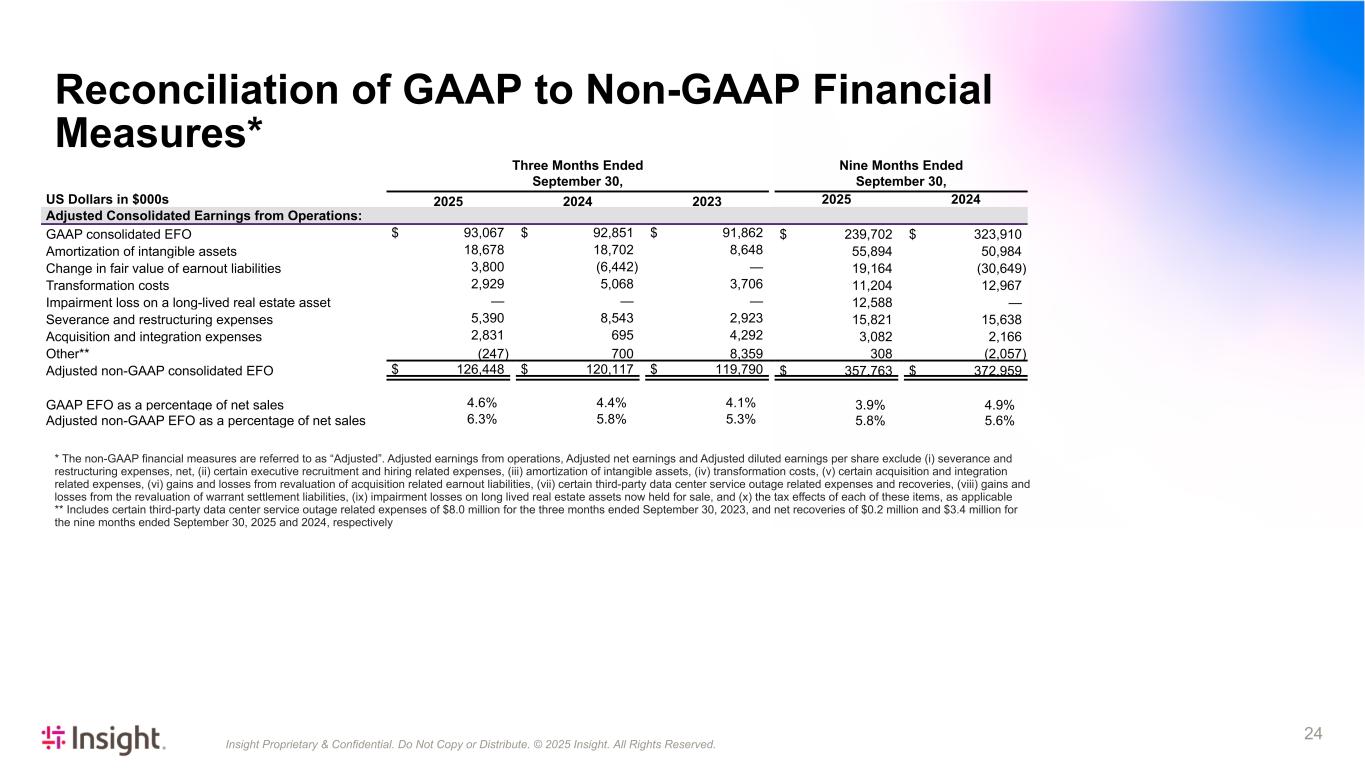
Insight Proprietary & Confidential. Do Not Copy or Distribute. © 2025 Insight. All Rights Reserved. 24 Three Months Ended September 30, Nine Months Ended September 30, US Dollars in $000s 2025 2024 2023 2025 2024 Adjusted Consolidated Earnings from Operations: GAAP consolidated EFO $ 93,067 $ 92,851 $ 91,862 $ 239,702 $ 323,910 Amortization of intangible assets 18,678 18,702 8,648 55,894 50,984 Change in fair value of earnout liabilities 3,800 (6,442) — 19,164 (30,649) Transformation costs 2,929 5,068 3,706 11,204 12,967 Impairment loss on a long-lived real estate asset — — — 12,588 — Severance and restructuring expenses 5,390 8,543 2,923 15,821 15,638 Acquisition and integration expenses 2,831 695 4,292 3,082 2,166 Other** (247) 700 8,359 308 (2,057) Adjusted non-GAAP consolidated EFO $ 126,448 $ 120,117 $ 119,790 $ 357,763 $ 372,959 GAAP EFO as a percentage of net sales 4.6 % 4.4 % 4.1 % 3.9 % 4.9 % Adjusted non-GAAP EFO as a percentage of net sales 6.3 % 5.8 % 5.3 % 5.8 % 5.6 % * The non-GAAP financial measures are referred to as “Adjusted”. Adjusted earnings from operations, Adjusted net earnings and Adjusted diluted earnings per share exclude (i) severance and restructuring expenses, net, (ii) certain executive recruitment and hiring related expenses, (iii) amortization of intangible assets, (iv) transformation costs, (v) certain acquisition and integration related expenses, (vi) gains and losses from revaluation of acquisition related earnout liabilities, (vii) certain third-party data center service outage related expenses and recoveries, (viii) gains and losses from the revaluation of warrant settlement liabilities, (ix) impairment losses on long lived real estate assets now held for sale, and (x) the tax effects of each of these items, as applicable ** Includes certain third-party data center service outage related expenses of $8.0 million for the three months ended September 30, 2023, and net recoveries of $0.2 million and $3.4 million for the nine months ended September 30, 2025 and 2024, respectively Reconciliation of GAAP to Non-GAAP Financial Measures*
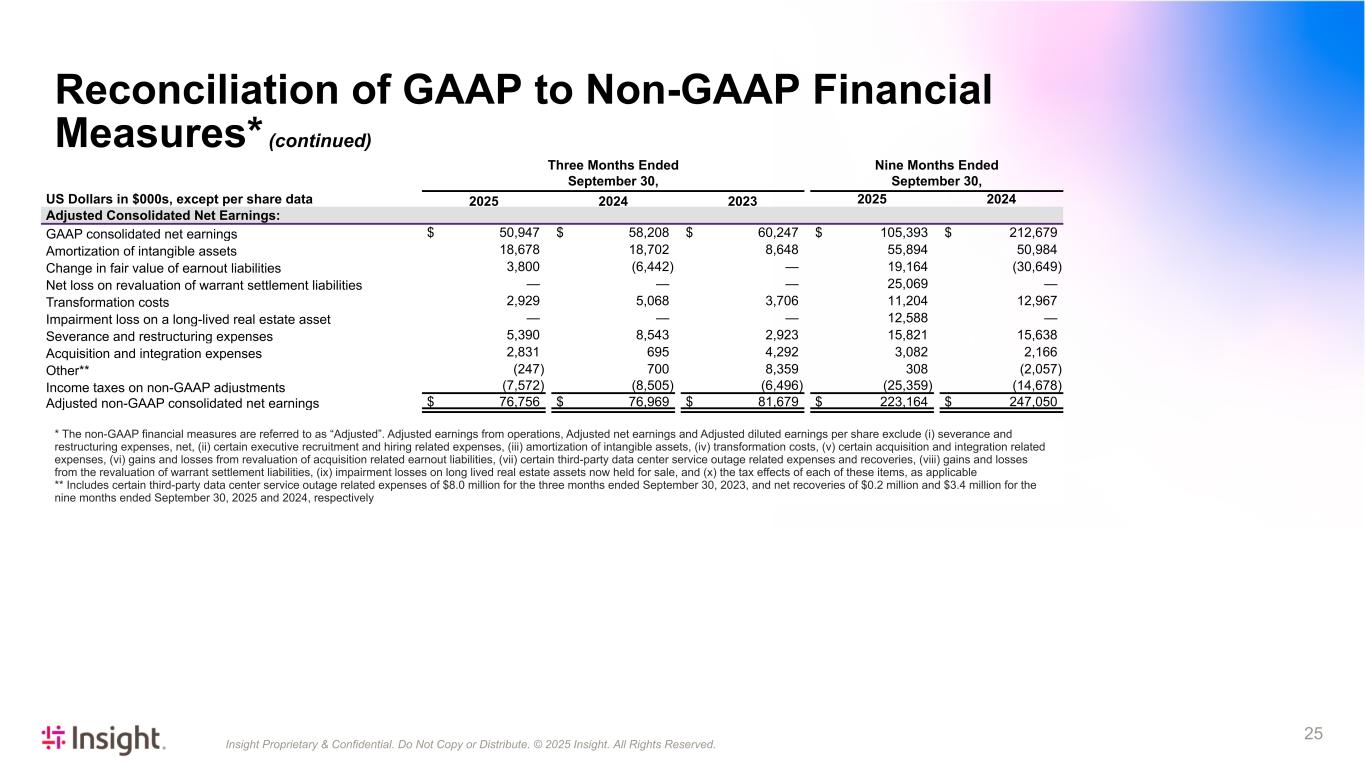
Insight Proprietary & Confidential. Do Not Copy or Distribute. © 2025 Insight. All Rights Reserved. 25 Three Months Ended September 30, Nine Months Ended September 30, US Dollars in $000s, except per share data 2025 2024 2023 2025 2024 Adjusted Consolidated Net Earnings: GAAP consolidated net earnings $ 50,947 $ 58,208 $ 60,247 $ 105,393 $ 212,679 Amortization of intangible assets 18,678 18,702 8,648 55,894 50,984 Change in fair value of earnout liabilities 3,800 (6,442) — 19,164 (30,649) Net loss on revaluation of warrant settlement liabilities — — — 25,069 — Transformation costs 2,929 5,068 3,706 11,204 12,967 Impairment loss on a long-lived real estate asset — — — 12,588 — Severance and restructuring expenses 5,390 8,543 2,923 15,821 15,638 Acquisition and integration expenses 2,831 695 4,292 3,082 2,166 Other** (247) 700 8,359 308 (2,057) Income taxes on non-GAAP adjustments (7,572) (8,505) (6,496) (25,359) (14,678) Adjusted non-GAAP consolidated net earnings $ 76,756 $ 76,969 $ 81,679 $ 223,164 $ 247,050 * The non-GAAP financial measures are referred to as “Adjusted”. Adjusted earnings from operations, Adjusted net earnings and Adjusted diluted earnings per share exclude (i) severance and restructuring expenses, net, (ii) certain executive recruitment and hiring related expenses, (iii) amortization of intangible assets, (iv) transformation costs, (v) certain acquisition and integration related expenses, (vi) gains and losses from revaluation of acquisition related earnout liabilities, (vii) certain third-party data center service outage related expenses and recoveries, (viii) gains and losses from the revaluation of warrant settlement liabilities, (ix) impairment losses on long lived real estate assets now held for sale, and (x) the tax effects of each of these items, as applicable ** Includes certain third-party data center service outage related expenses of $8.0 million for the three months ended September 30, 2023, and net recoveries of $0.2 million and $3.4 million for the nine months ended September 30, 2025 and 2024, respectively Reconciliation of GAAP to Non-GAAP Financial Measures* (continued)
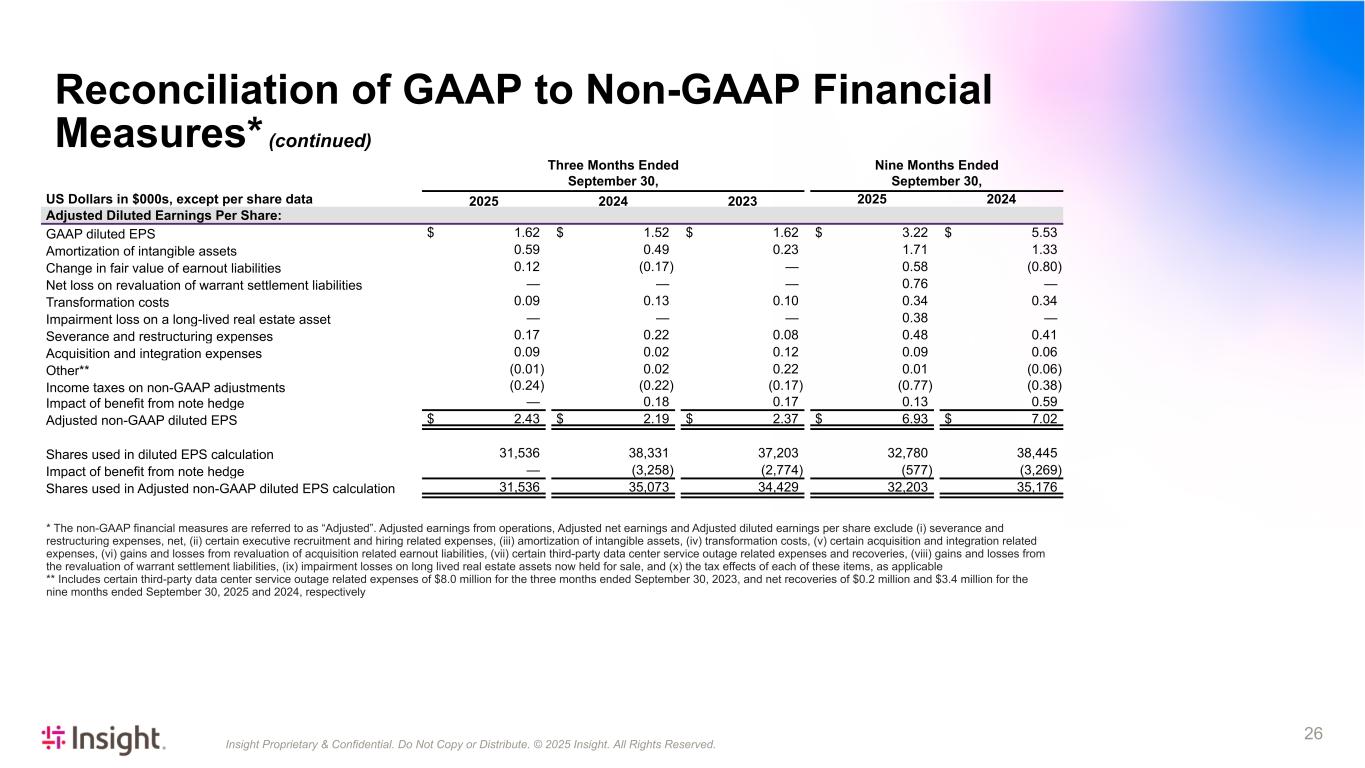
Insight Proprietary & Confidential. Do Not Copy or Distribute. © 2025 Insight. All Rights Reserved. 26 Three Months Ended September 30, Nine Months Ended September 30, US Dollars in $000s, except per share data 2025 2024 2023 2025 2024 Adjusted Diluted Earnings Per Share: GAAP diluted EPS $ 1.62 $ 1.52 $ 1.62 $ 3.22 $ 5.53 Amortization of intangible assets 0.59 0.49 0.23 1.71 1.33 Change in fair value of earnout liabilities 0.12 (0.17) — 0.58 (0.80) Net loss on revaluation of warrant settlement liabilities — — — 0.76 — Transformation costs 0.09 0.13 0.10 0.34 0.34 Impairment loss on a long-lived real estate asset — — — 0.38 — Severance and restructuring expenses 0.17 0.22 0.08 0.48 0.41 Acquisition and integration expenses 0.09 0.02 0.12 0.09 0.06 Other** (0.01) 0.02 0.22 0.01 (0.06) Income taxes on non-GAAP adjustments (0.24) (0.22) (0.17) (0.77) (0.38) Impact of benefit from note hedge — 0.18 0.17 0.13 0.59 Adjusted non-GAAP diluted EPS $ 2.43 $ 2.19 $ 2.37 $ 6.93 $ 7.02 Shares used in diluted EPS calculation 31,536 38,331 37,203 32,780 38,445 Impact of benefit from note hedge — (3,258) (2,774) (577) (3,269) Shares used in Adjusted non-GAAP diluted EPS calculation 31,536 35,073 34,429 32,203 35,176 * The non-GAAP financial measures are referred to as “Adjusted”. Adjusted earnings from operations, Adjusted net earnings and Adjusted diluted earnings per share exclude (i) severance and restructuring expenses, net, (ii) certain executive recruitment and hiring related expenses, (iii) amortization of intangible assets, (iv) transformation costs, (v) certain acquisition and integration related expenses, (vi) gains and losses from revaluation of acquisition related earnout liabilities, (vii) certain third-party data center service outage related expenses and recoveries, (viii) gains and losses from the revaluation of warrant settlement liabilities, (ix) impairment losses on long lived real estate assets now held for sale, and (x) the tax effects of each of these items, as applicable ** Includes certain third-party data center service outage related expenses of $8.0 million for the three months ended September 30, 2023, and net recoveries of $0.2 million and $3.4 million for the nine months ended September 30, 2025 and 2024, respectively Reconciliation of GAAP to Non-GAAP Financial Measures* (continued)
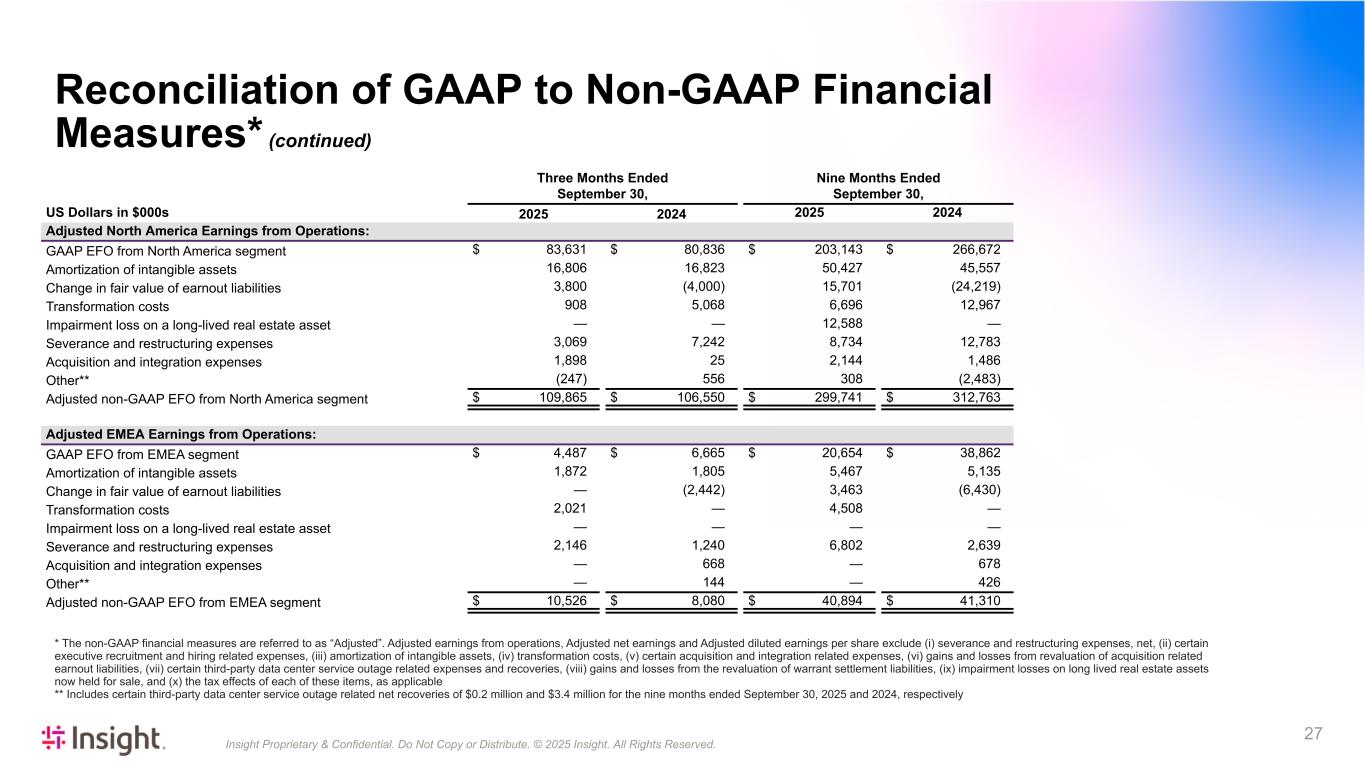
Insight Proprietary & Confidential. Do Not Copy or Distribute. © 2025 Insight. All Rights Reserved. 27 Three Months Ended September 30, Nine Months Ended September 30, US Dollars in $000s 2025 2024 2025 2024 Adjusted North America Earnings from Operations: GAAP EFO from North America segment $ 83,631 $ 80,836 $ 203,143 $ 266,672 Amortization of intangible assets 16,806 16,823 50,427 45,557 Change in fair value of earnout liabilities 3,800 (4,000) 15,701 (24,219) Transformation costs 908 5,068 6,696 12,967 Impairment loss on a long-lived real estate asset — — 12,588 — Severance and restructuring expenses 3,069 7,242 8,734 12,783 Acquisition and integration expenses 1,898 25 2,144 1,486 Other** (247) 556 308 (2,483) Adjusted non-GAAP EFO from North America segment $ 109,865 $ 106,550 $ 299,741 $ 312,763 Adjusted EMEA Earnings from Operations: GAAP EFO from EMEA segment $ 4,487 $ 6,665 $ 20,654 $ 38,862 Amortization of intangible assets 1,872 1,805 5,467 5,135 Change in fair value of earnout liabilities — (2,442) 3,463 (6,430) Transformation costs 2,021 — 4,508 — Impairment loss on a long-lived real estate asset — — — — Severance and restructuring expenses 2,146 1,240 6,802 2,639 Acquisition and integration expenses — 668 — 678 Other** — 144 — 426 Adjusted non-GAAP EFO from EMEA segment $ 10,526 $ 8,080 $ 40,894 $ 41,310 Reconciliation of GAAP to Non-GAAP Financial Measures* (continued) * The non-GAAP financial measures are referred to as “Adjusted”. Adjusted earnings from operations, Adjusted net earnings and Adjusted diluted earnings per share exclude (i) severance and restructuring expenses, net, (ii) certain executive recruitment and hiring related expenses, (iii) amortization of intangible assets, (iv) transformation costs, (v) certain acquisition and integration related expenses, (vi) gains and losses from revaluation of acquisition related earnout liabilities, (vii) certain third-party data center service outage related expenses and recoveries, (viii) gains and losses from the revaluation of warrant settlement liabilities, (ix) impairment losses on long lived real estate assets now held for sale, and (x) the tax effects of each of these items, as applicable ** Includes certain third-party data center service outage related net recoveries of $0.2 million and $3.4 million for the nine months ended September 30, 2025 and 2024, respectively
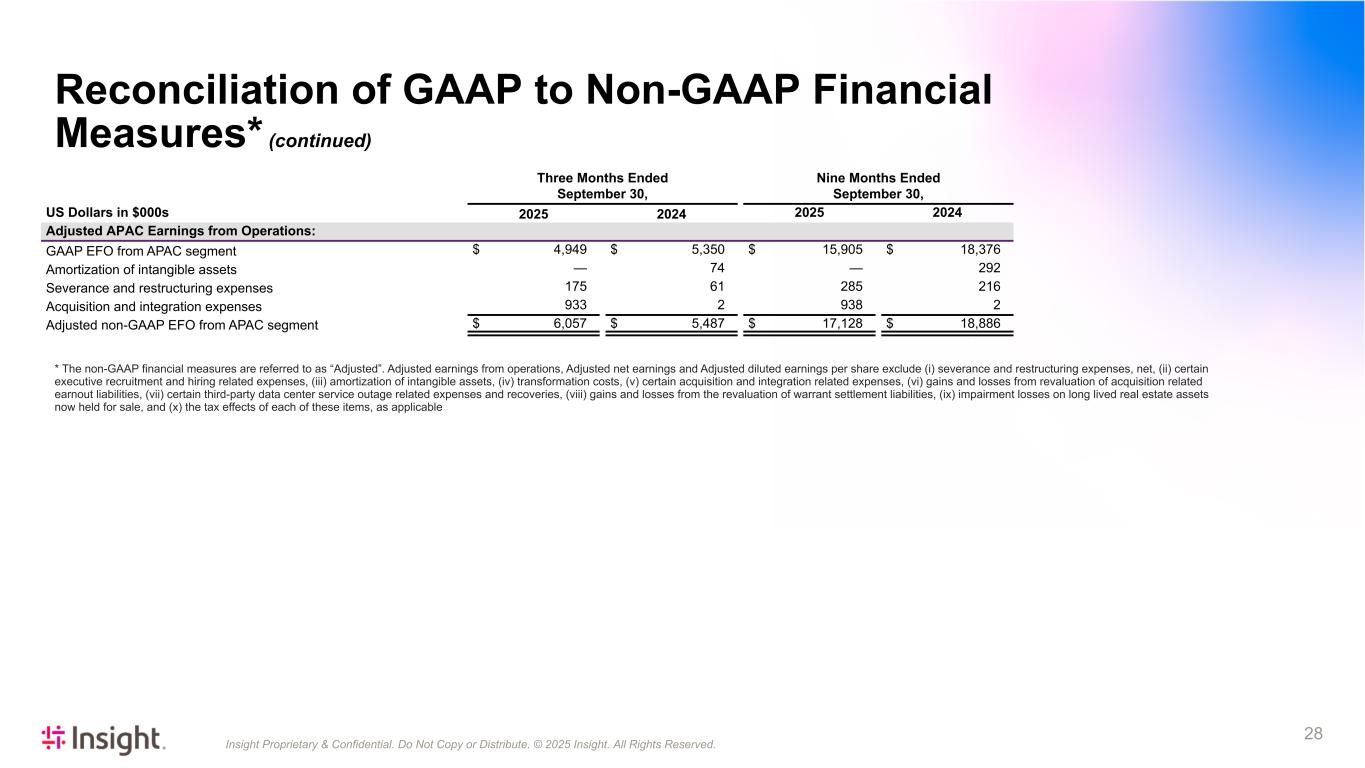
Insight Proprietary & Confidential. Do Not Copy or Distribute. © 2025 Insight. All Rights Reserved. 28 Three Months Ended September 30, Nine Months Ended September 30, US Dollars in $000s 2025 2024 2025 2024 Adjusted APAC Earnings from Operations: GAAP EFO from APAC segment $ 4,949 $ 5,350 $ 15,905 $ 18,376 Amortization of intangible assets — 74 — 292 Severance and restructuring expenses 175 61 285 216 Acquisition and integration expenses 933 2 938 2 Adjusted non-GAAP EFO from APAC segment $ 6,057 $ 5,487 $ 17,128 $ 18,886 * The non-GAAP financial measures are referred to as “Adjusted”. Adjusted earnings from operations, Adjusted net earnings and Adjusted diluted earnings per share exclude (i) severance and restructuring expenses, net, (ii) certain executive recruitment and hiring related expenses, (iii) amortization of intangible assets, (iv) transformation costs, (v) certain acquisition and integration related expenses, (vi) gains and losses from revaluation of acquisition related earnout liabilities, (vii) certain third-party data center service outage related expenses and recoveries, (viii) gains and losses from the revaluation of warrant settlement liabilities, (ix) impairment losses on long lived real estate assets now held for sale, and (x) the tax effects of each of these items, as applicable Reconciliation of GAAP to Non-GAAP Financial Measures* (continued)
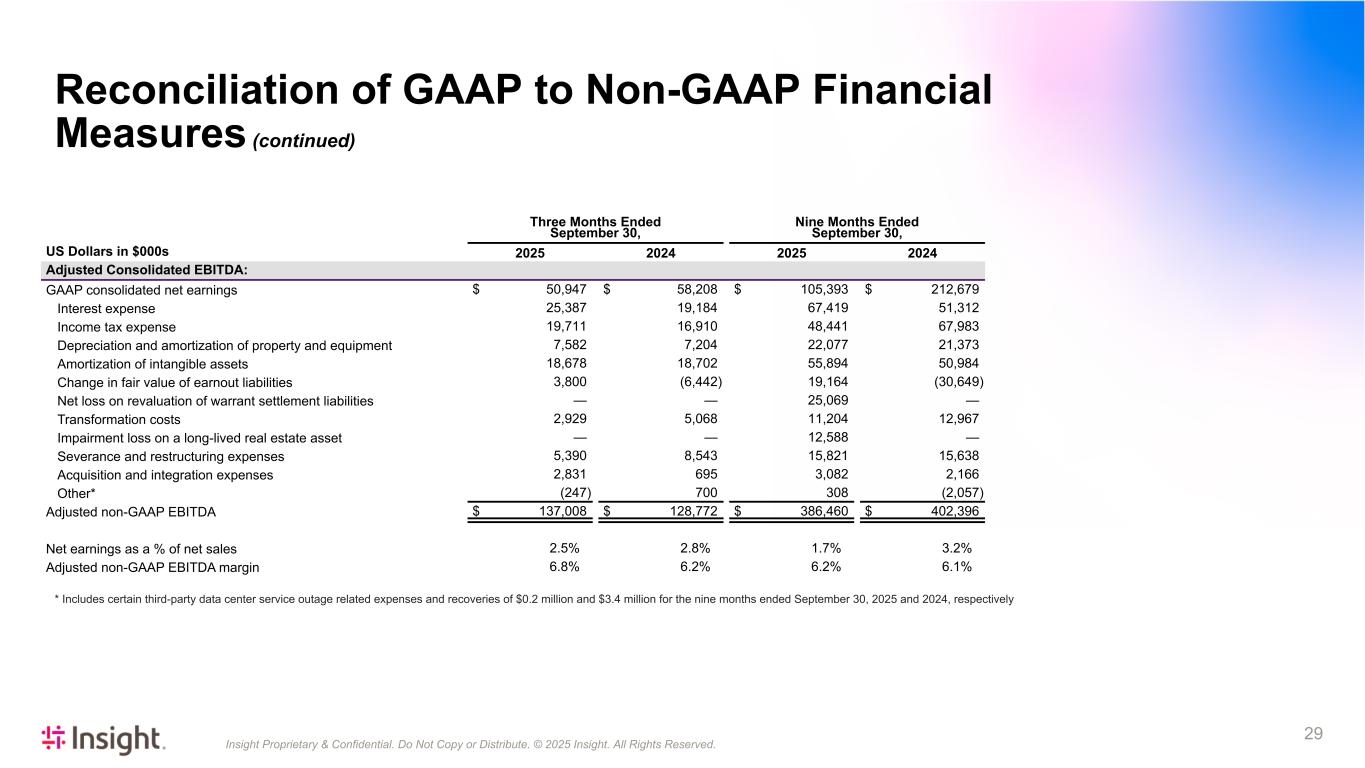
Insight Proprietary & Confidential. Do Not Copy or Distribute. © 2025 Insight. All Rights Reserved. 29 Three Months Ended Nine Months Ended September 30, September 30, US Dollars in $000s 2025 2024 2025 2024 Adjusted Consolidated EBITDA: GAAP consolidated net earnings $ 50,947 $ 58,208 $ 105,393 $ 212,679 Interest expense 25,387 19,184 67,419 51,312 Income tax expense 19,711 16,910 48,441 67,983 Depreciation and amortization of property and equipment 7,582 7,204 22,077 21,373 Amortization of intangible assets 18,678 18,702 55,894 50,984 Change in fair value of earnout liabilities 3,800 (6,442) 19,164 (30,649) Net loss on revaluation of warrant settlement liabilities — — 25,069 — Transformation costs 2,929 5,068 11,204 12,967 Impairment loss on a long-lived real estate asset — — 12,588 — Severance and restructuring expenses 5,390 8,543 15,821 15,638 Acquisition and integration expenses 2,831 695 3,082 2,166 Other* (247) 700 308 (2,057) Adjusted non-GAAP EBITDA $ 137,008 $ 128,772 $ 386,460 $ 402,396 Net earnings as a % of net sales 2.5 % 2.8 % 1.7 % 3.2 % Adjusted non-GAAP EBITDA margin 6.8 % 6.2 % 6.2 % 6.1 % * Includes certain third-party data center service outage related expenses and recoveries of $0.2 million and $3.4 million for the nine months ended September 30, 2025 and 2024, respectively Reconciliation of GAAP to Non-GAAP Financial Measures (continued)
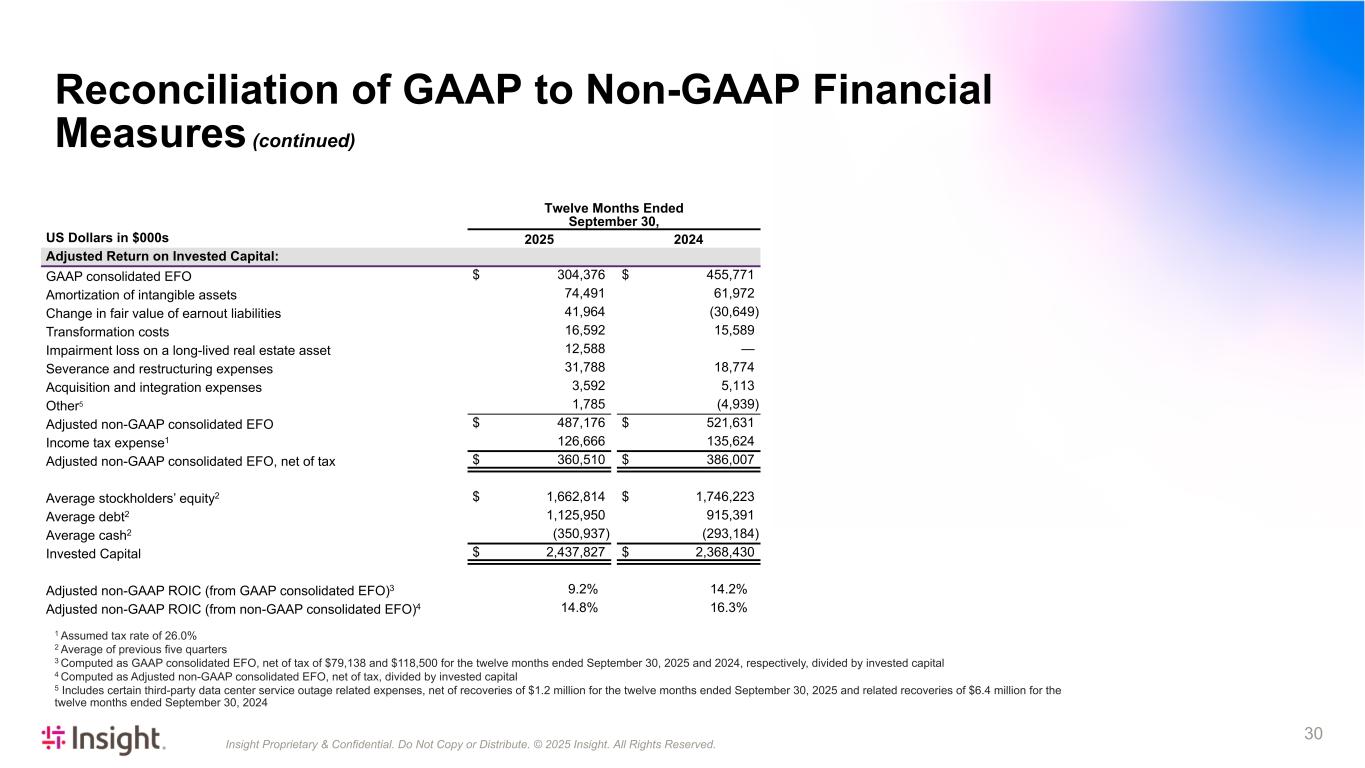
Insight Proprietary & Confidential. Do Not Copy or Distribute. © 2025 Insight. All Rights Reserved. 30 1 Assumed tax rate of 26.0% 2 Average of previous five quarters 3 Computed as GAAP consolidated EFO, net of tax of $79,138 and $118,500 for the twelve months ended September 30, 2025 and 2024, respectively, divided by invested capital 4 Computed as Adjusted non-GAAP consolidated EFO, net of tax, divided by invested capital 5 Includes certain third-party data center service outage related expenses, net of recoveries of $1.2 million for the twelve months ended September 30, 2025 and related recoveries of $6.4 million for the twelve months ended September 30, 2024 Twelve Months Ended September 30, US Dollars in $000s 2025 2024 Adjusted Return on Invested Capital: GAAP consolidated EFO $ 304,376 $ 455,771 Amortization of intangible assets 74,491 61,972 Change in fair value of earnout liabilities 41,964 (30,649) Transformation costs 16,592 15,589 Impairment loss on a long-lived real estate asset 12,588 — Severance and restructuring expenses 31,788 18,774 Acquisition and integration expenses 3,592 5,113 Other5 1,785 (4,939) Adjusted non-GAAP consolidated EFO $ 487,176 $ 521,631 Income tax expense1 126,666 135,624 Adjusted non-GAAP consolidated EFO, net of tax $ 360,510 $ 386,007 Average stockholders’ equity2 $ 1,662,814 $ 1,746,223 Average debt2 1,125,950 915,391 Average cash2 (350,937) (293,184) Invested Capital $ 2,437,827 $ 2,368,430 Adjusted non-GAAP ROIC (from GAAP consolidated EFO)3 9.2 % 14.2 % Adjusted non-GAAP ROIC (from non-GAAP consolidated EFO)4 14.8 % 16.3 % Reconciliation of GAAP to Non-GAAP Financial Measures (continued)
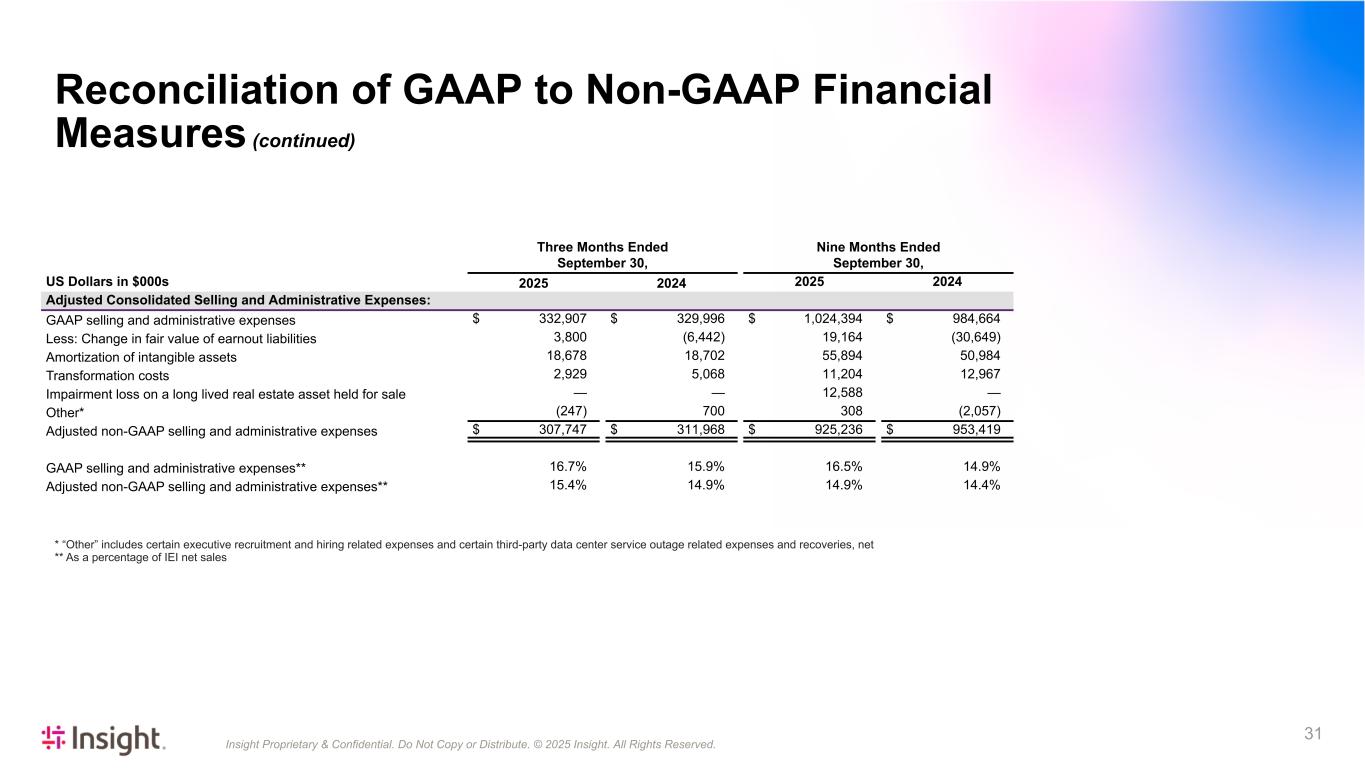
Insight Proprietary & Confidential. Do Not Copy or Distribute. © 2025 Insight. All Rights Reserved. 31 Three Months Ended September 30, Nine Months Ended September 30, US Dollars in $000s 2025 2024 2025 2024 Adjusted Consolidated Selling and Administrative Expenses: GAAP selling and administrative expenses $ 332,907 $ 329,996 $ 1,024,394 $ 984,664 Less: Change in fair value of earnout liabilities 3,800 (6,442) 19,164 (30,649) Amortization of intangible assets 18,678 18,702 55,894 50,984 Transformation costs 2,929 5,068 11,204 12,967 Impairment loss on a long lived real estate asset held for sale — — 12,588 — Other* (247) 700 308 (2,057) Adjusted non-GAAP selling and administrative expenses $ 307,747 $ 311,968 $ 925,236 $ 953,419 GAAP selling and administrative expenses** 16.7 % 15.9 % 16.5 % 14.9 % Adjusted non-GAAP selling and administrative expenses** 15.4 % 14.9 % 14.9 % 14.4 % $ 6,198,883 $ 6,629,033 * “Other” includes certain executive recruitment and hiring related expenses and certain third-party data center service outage related expenses and recoveries, net ** As a percentage of IEI net sales Reconciliation of GAAP to Non-GAAP Financial Measures (continued)
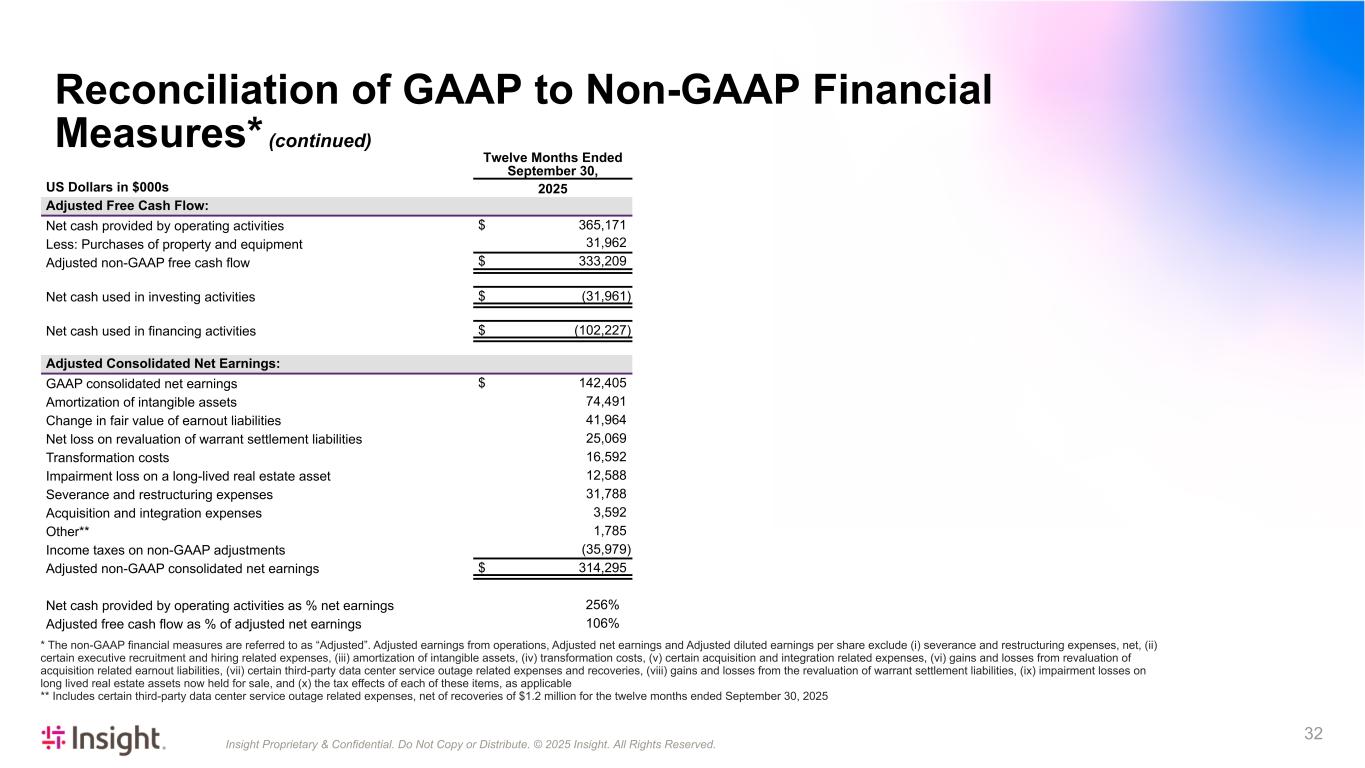
Insight Proprietary & Confidential. Do Not Copy or Distribute. © 2025 Insight. All Rights Reserved. 32 Twelve Months Ended September 30, US Dollars in $000s 2025 Adjusted Free Cash Flow: Net cash provided by operating activities $ 365,171 Less: Purchases of property and equipment 31,962 Adjusted non-GAAP free cash flow $ 333,209 Net cash used in investing activities $ (31,961) Net cash used in financing activities $ (102,227) Adjusted Consolidated Net Earnings: GAAP consolidated net earnings $ 142,405 Amortization of intangible assets 74,491 Change in fair value of earnout liabilities 41,964 Net loss on revaluation of warrant settlement liabilities 25,069 Transformation costs 16,592 Impairment loss on a long-lived real estate asset 12,588 Severance and restructuring expenses 31,788 Acquisition and integration expenses 3,592 Other** 1,785 Income taxes on non-GAAP adjustments (35,979) Adjusted non-GAAP consolidated net earnings $ 314,295 Net cash provided by operating activities as % net earnings 256 % Adjusted free cash flow as % of adjusted net earnings 106 % * The non-GAAP financial measures are referred to as “Adjusted”. Adjusted earnings from operations, Adjusted net earnings and Adjusted diluted earnings per share exclude (i) severance and restructuring expenses, net, (ii) certain executive recruitment and hiring related expenses, (iii) amortization of intangible assets, (iv) transformation costs, (v) certain acquisition and integration related expenses, (vi) gains and losses from revaluation of acquisition related earnout liabilities, (vii) certain third-party data center service outage related expenses and recoveries, (viii) gains and losses from the revaluation of warrant settlement liabilities, (ix) impairment losses on long lived real estate assets now held for sale, and (x) the tax effects of each of these items, as applicable ** Includes certain third-party data center service outage related expenses, net of recoveries of $1.2 million for the twelve months ended September 30, 2025 Reconciliation of GAAP to Non-GAAP Financial Measures* (continued)
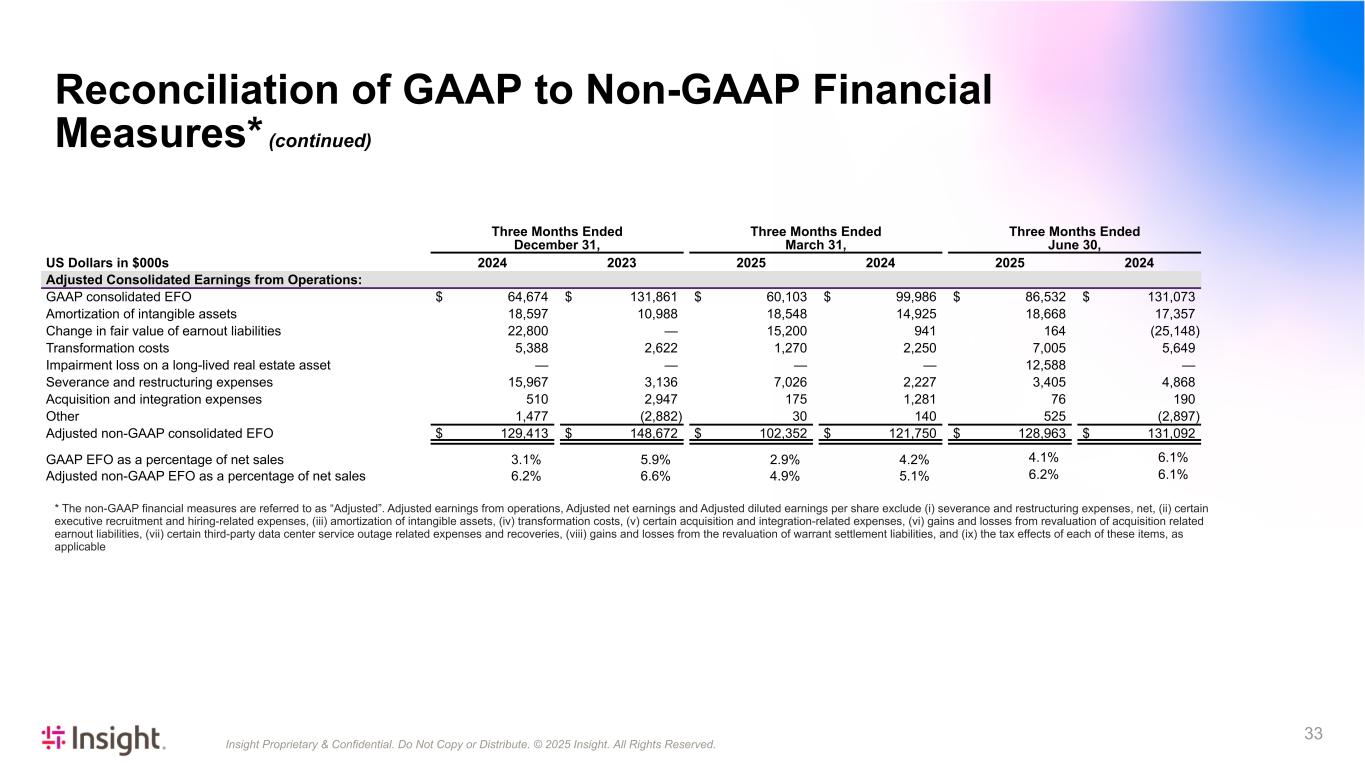
Insight Proprietary & Confidential. Do Not Copy or Distribute. © 2025 Insight. All Rights Reserved. 33 Three Months Ended Three Months Ended Three Months Ended December 31, March 31, June 30, US Dollars in $000s 2024 2023 2025 2024 2025 2024 Adjusted Consolidated Earnings from Operations: GAAP consolidated EFO $ 64,674 $ 131,861 $ 60,103 $ 99,986 $ 86,532 $ 131,073 Amortization of intangible assets 18,597 10,988 18,548 14,925 18,668 17,357 Change in fair value of earnout liabilities 22,800 — 15,200 941 164 (25,148) Transformation costs 5,388 2,622 1,270 2,250 7,005 5,649 Impairment loss on a long-lived real estate asset — — — — 12,588 — Severance and restructuring expenses 15,967 3,136 7,026 2,227 3,405 4,868 Acquisition and integration expenses 510 2,947 175 1,281 76 190 Other 1,477 (2,882) 30 140 525 (2,897) Adjusted non-GAAP consolidated EFO $ 129,413 $ 148,672 $ 102,352 $ 121,750 $ 128,963 $ 131,092 GAAP EFO as a percentage of net sales 3.1 % 5.9 % 2.9 % 4.2 % 4.1% 6.1% Adjusted non-GAAP EFO as a percentage of net sales 6.2 % 6.6 % 4.9 % 5.1 % 6.2% 6.1% * The non-GAAP financial measures are referred to as “Adjusted”. Adjusted earnings from operations, Adjusted net earnings and Adjusted diluted earnings per share exclude (i) severance and restructuring expenses, net, (ii) certain executive recruitment and hiring-related expenses, (iii) amortization of intangible assets, (iv) transformation costs, (v) certain acquisition and integration-related expenses, (vi) gains and losses from revaluation of acquisition related earnout liabilities, (vii) certain third-party data center service outage related expenses and recoveries, (viii) gains and losses from the revaluation of warrant settlement liabilities, and (ix) the tax effects of each of these items, as applicable Reconciliation of GAAP to Non-GAAP Financial Measures* (continued)
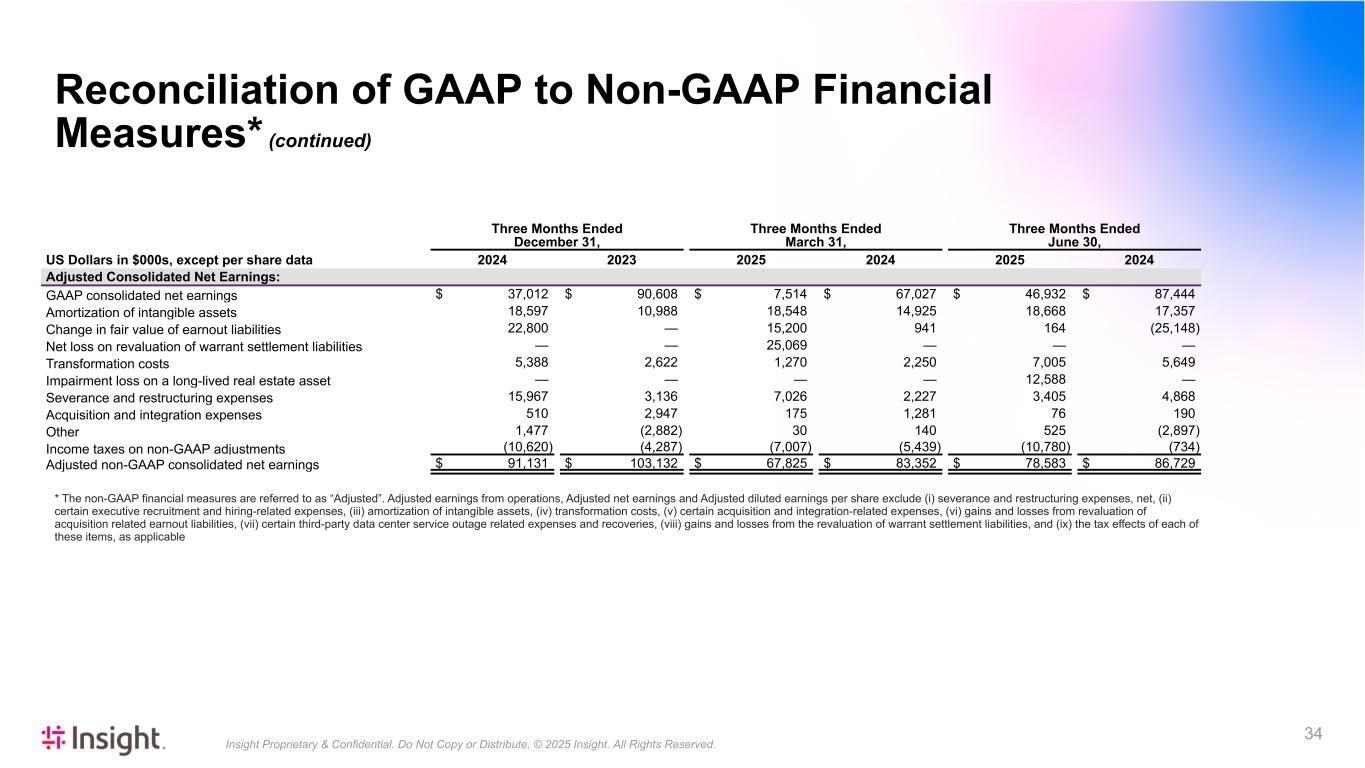
Insight Proprietary & Confidential. Do Not Copy or Distribute. © 2025 Insight. All Rights Reserved. 34 Three Months Ended Three Months Ended Three Months Ended December 31, March 31, June 30, US Dollars in $000s, except per share data 2024 2023 2025 2024 2025 2024 Adjusted Consolidated Net Earnings: GAAP consolidated net earnings $ 37,012 $ 90,608 $ 7,514 $ 67,027 $ 46,932 $ 87,444 Amortization of intangible assets 18,597 10,988 18,548 14,925 18,668 17,357 Change in fair value of earnout liabilities 22,800 — 15,200 941 164 (25,148) Net loss on revaluation of warrant settlement liabilities — — 25,069 — — — Transformation costs 5,388 2,622 1,270 2,250 7,005 5,649 Impairment loss on a long-lived real estate asset — — — — 12,588 — Severance and restructuring expenses 15,967 3,136 7,026 2,227 3,405 4,868 Acquisition and integration expenses 510 2,947 175 1,281 76 190 Other 1,477 (2,882) 30 140 525 (2,897) Income taxes on non-GAAP adjustments (10,620) (4,287) (7,007) (5,439) (10,780) (734) Adjusted non-GAAP consolidated net earnings $ 91,131 $ 103,132 $ 67,825 $ 83,352 $ 78,583 $ 86,729 * The non-GAAP financial measures are referred to as “Adjusted”. Adjusted earnings from operations, Adjusted net earnings and Adjusted diluted earnings per share exclude (i) severance and restructuring expenses, net, (ii) certain executive recruitment and hiring-related expenses, (iii) amortization of intangible assets, (iv) transformation costs, (v) certain acquisition and integration-related expenses, (vi) gains and losses from revaluation of acquisition related earnout liabilities, (vii) certain third-party data center service outage related expenses and recoveries, (viii) gains and losses from the revaluation of warrant settlement liabilities, and (ix) the tax effects of each of these items, as applicable Reconciliation of GAAP to Non-GAAP Financial Measures* (continued)
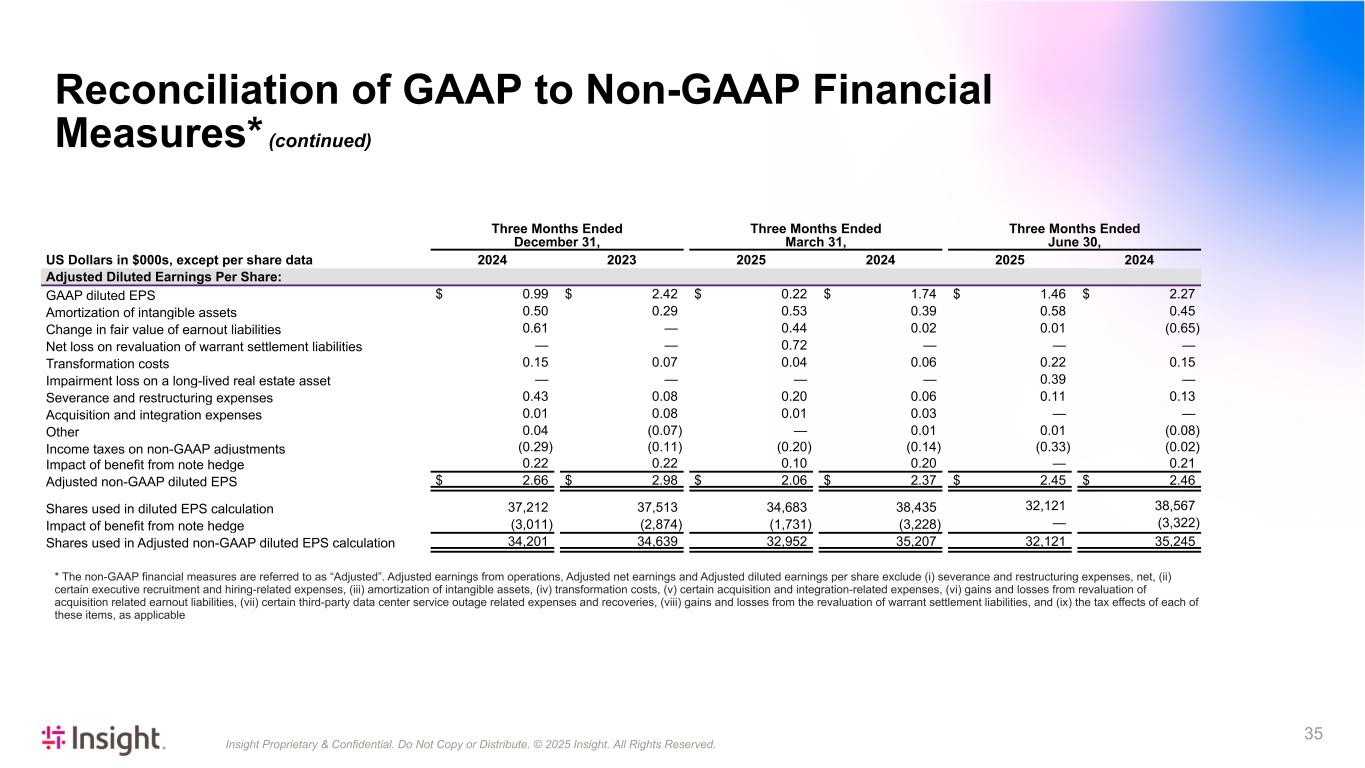
Insight Proprietary & Confidential. Do Not Copy or Distribute. © 2025 Insight. All Rights Reserved. 35 Three Months Ended Three Months Ended Three Months Ended December 31, March 31, June 30, US Dollars in $000s, except per share data 2024 2023 2025 2024 2025 2024 Adjusted Diluted Earnings Per Share: GAAP diluted EPS $ 0.99 $ 2.42 $ 0.22 $ 1.74 $ 1.46 $ 2.27 Amortization of intangible assets 0.50 0.29 0.53 0.39 0.58 0.45 Change in fair value of earnout liabilities 0.61 — 0.44 0.02 0.01 (0.65) Net loss on revaluation of warrant settlement liabilities — — 0.72 — — — Transformation costs 0.15 0.07 0.04 0.06 0.22 0.15 Impairment loss on a long-lived real estate asset — — — — 0.39 — Severance and restructuring expenses 0.43 0.08 0.20 0.06 0.11 0.13 Acquisition and integration expenses 0.01 0.08 0.01 0.03 — — Other 0.04 (0.07) — 0.01 0.01 (0.08) Income taxes on non-GAAP adjustments (0.29) (0.11) (0.20) (0.14) (0.33) (0.02) Impact of benefit from note hedge 0.22 0.22 0.10 0.20 — 0.21 Adjusted non-GAAP diluted EPS $ 2.66 $ 2.98 $ 2.06 $ 2.37 $ 2.45 $ 2.46 Shares used in diluted EPS calculation 37,212 37,513 34,683 38,435 32,121 38,567 Impact of benefit from note hedge (3,011) (2,874) (1,731) (3,228) — (3,322) Shares used in Adjusted non-GAAP diluted EPS calculation 34,201 34,639 32,952 35,207 32,121 35,245 * The non-GAAP financial measures are referred to as “Adjusted”. Adjusted earnings from operations, Adjusted net earnings and Adjusted diluted earnings per share exclude (i) severance and restructuring expenses, net, (ii) certain executive recruitment and hiring-related expenses, (iii) amortization of intangible assets, (iv) transformation costs, (v) certain acquisition and integration-related expenses, (vi) gains and losses from revaluation of acquisition related earnout liabilities, (vii) certain third-party data center service outage related expenses and recoveries, (viii) gains and losses from the revaluation of warrant settlement liabilities, and (ix) the tax effects of each of these items, as applicable Reconciliation of GAAP to Non-GAAP Financial Measures* (continued)
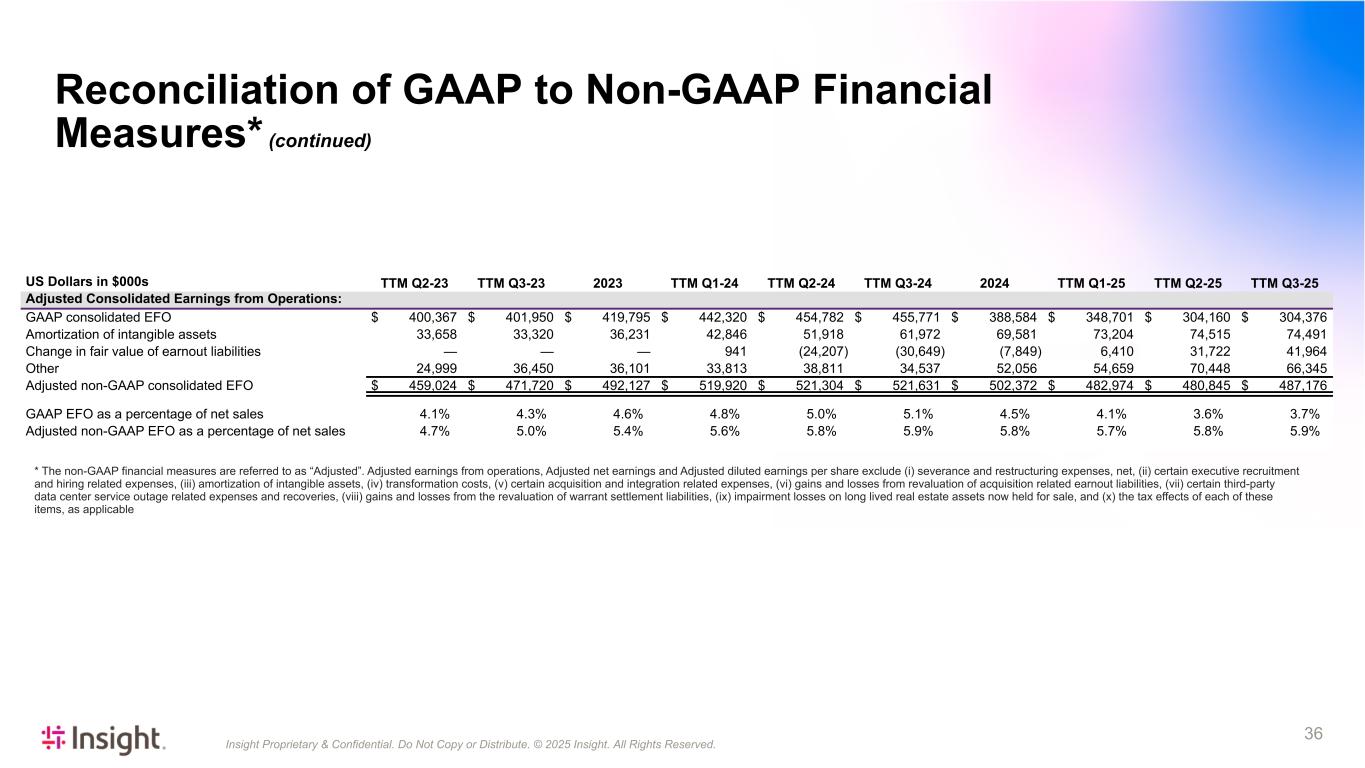
Insight Proprietary & Confidential. Do Not Copy or Distribute. © 2025 Insight. All Rights Reserved. 36 * The non-GAAP financial measures are referred to as “Adjusted”. Adjusted earnings from operations, Adjusted net earnings and Adjusted diluted earnings per share exclude (i) severance and restructuring expenses, net, (ii) certain executive recruitment and hiring related expenses, (iii) amortization of intangible assets, (iv) transformation costs, (v) certain acquisition and integration related expenses, (vi) gains and losses from revaluation of acquisition related earnout liabilities, (vii) certain third-party data center service outage related expenses and recoveries, (viii) gains and losses from the revaluation of warrant settlement liabilities, (ix) impairment losses on long lived real estate assets now held for sale, and (x) the tax effects of each of these items, as applicable US Dollars in $000s TTM Q2-23 TTM Q3-23 2023 TTM Q1-24 TTM Q2-24 TTM Q3-24 2024 TTM Q1-25 TTM Q2-25 TTM Q3-25 Adjusted Consolidated Earnings from Operations: GAAP consolidated EFO $ 400,367 $ 401,950 $ 419,795 $ 442,320 $ 454,782 $ 455,771 $ 388,584 $ 348,701 $ 304,160 $ 304,376 Amortization of intangible assets 33,658 33,320 36,231 42,846 51,918 61,972 69,581 73,204 74,515 74,491 Change in fair value of earnout liabilities — — — 941 (24,207) (30,649) (7,849) 6,410 31,722 41,964 Other 24,999 36,450 36,101 33,813 38,811 34,537 52,056 54,659 70,448 66,345 Adjusted non-GAAP consolidated EFO $ 459,024 $ 471,720 $ 492,127 $ 519,920 $ 521,304 $ 521,631 $ 502,372 $ 482,974 $ 480,845 $ 487,176 GAAP EFO as a percentage of net sales 4.1 % 4.3 % 4.6 % 4.8 % 5.0 % 5.1 % 4.5 % 4.1 % 3.6 % 3.7 % Adjusted non-GAAP EFO as a percentage of net sales 4.7 % 5.0 % 5.4 % 5.6 % 5.8 % 5.9 % 5.8 % 5.7 % 5.8 % 5.9 % Reconciliation of GAAP to Non-GAAP Financial Measures* (continued)
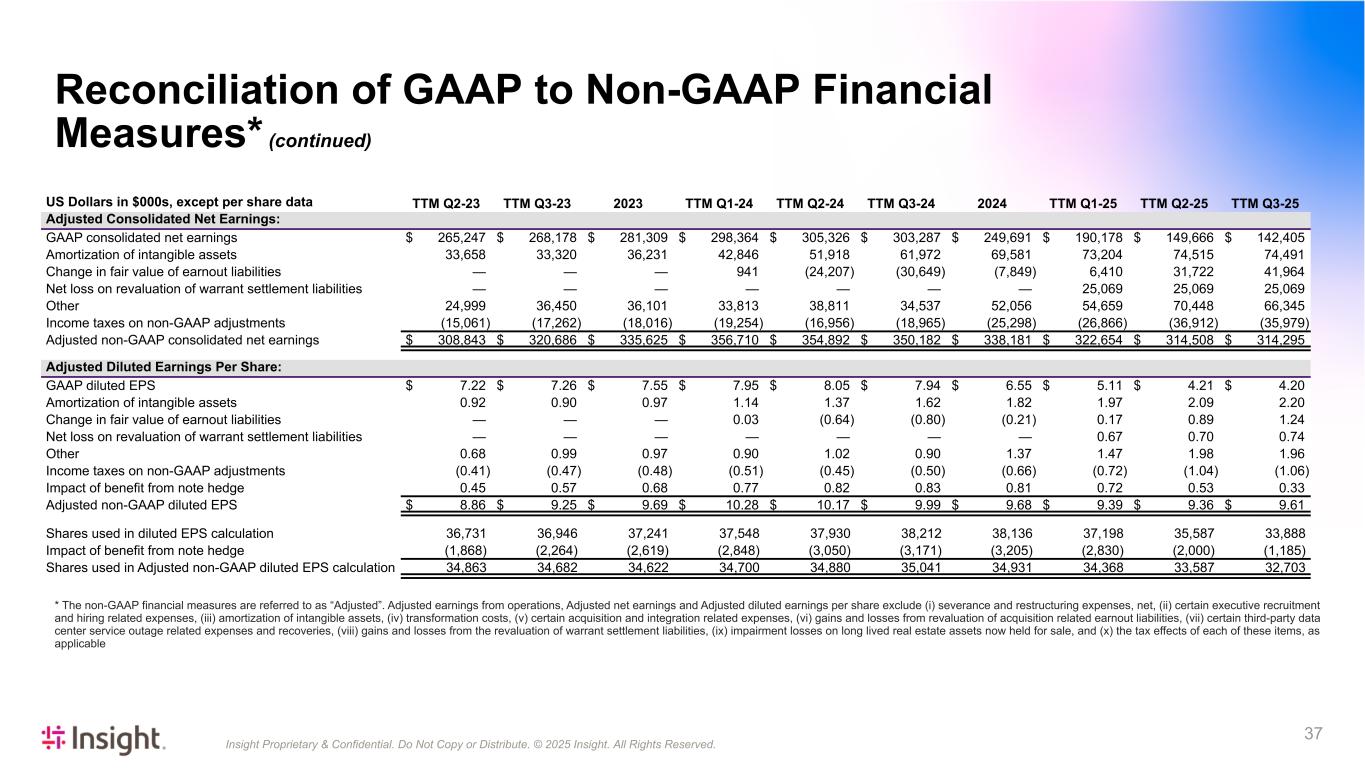
Insight Proprietary & Confidential. Do Not Copy or Distribute. © 2025 Insight. All Rights Reserved. 37 * The non-GAAP financial measures are referred to as “Adjusted”. Adjusted earnings from operations, Adjusted net earnings and Adjusted diluted earnings per share exclude (i) severance and restructuring expenses, net, (ii) certain executive recruitment and hiring related expenses, (iii) amortization of intangible assets, (iv) transformation costs, (v) certain acquisition and integration related expenses, (vi) gains and losses from revaluation of acquisition related earnout liabilities, (vii) certain third-party data center service outage related expenses and recoveries, (viii) gains and losses from the revaluation of warrant settlement liabilities, (ix) impairment losses on long lived real estate assets now held for sale, and (x) the tax effects of each of these items, as applicable US Dollars in $000s, except per share data TTM Q2-23 TTM Q3-23 2023 TTM Q1-24 TTM Q2-24 TTM Q3-24 2024 TTM Q1-25 TTM Q2-25 TTM Q3-25 Adjusted Consolidated Net Earnings: GAAP consolidated net earnings $ 265,247 $ 268,178 $ 281,309 $ 298,364 $ 305,326 $ 303,287 $ 249,691 $ 190,178 $ 149,666 $ 142,405 Amortization of intangible assets 33,658 33,320 36,231 42,846 51,918 61,972 69,581 73,204 74,515 74,491 Change in fair value of earnout liabilities — — — 941 (24,207) (30,649) (7,849) 6,410 31,722 41,964 Net loss on revaluation of warrant settlement liabilities — — — — — — — 25,069 25,069 25,069 Other 24,999 36,450 36,101 33,813 38,811 34,537 52,056 54,659 70,448 66,345 Income taxes on non-GAAP adjustments (15,061) (17,262) (18,016) (19,254) (16,956) (18,965) (25,298) (26,866) (36,912) (35,979) Adjusted non-GAAP consolidated net earnings $ 308,843 $ 320,686 $ 335,625 $ 356,710 $ 354,892 $ 350,182 $ 338,181 $ 322,654 $ 314,508 $ 314,295 Adjusted Diluted Earnings Per Share: GAAP diluted EPS $ 7.22 $ 7.26 $ 7.55 $ 7.95 $ 8.05 $ 7.94 $ 6.55 $ 5.11 $ 4.21 $ 4.20 Amortization of intangible assets 0.92 0.90 0.97 1.14 1.37 1.62 1.82 1.97 2.09 2.20 Change in fair value of earnout liabilities — — — 0.03 (0.64) (0.80) (0.21) 0.17 0.89 1.24 Net loss on revaluation of warrant settlement liabilities — — — — — — — 0.67 0.70 0.74 Other 0.68 0.99 0.97 0.90 1.02 0.90 1.37 1.47 1.98 1.96 Income taxes on non-GAAP adjustments (0.41) (0.47) (0.48) (0.51) (0.45) (0.50) (0.66) (0.72) (1.04) (1.06) Impact of benefit from note hedge 0.45 0.57 0.68 0.77 0.82 0.83 0.81 0.72 0.53 0.33 Adjusted non-GAAP diluted EPS $ 8.86 $ 9.25 $ 9.69 $ 10.28 $ 10.17 $ 9.99 $ 9.68 $ 9.39 $ 9.36 $ 9.61 Shares used in diluted EPS calculation 36,731 36,946 37,241 37,548 37,930 38,212 38,136 37,198 35,587 33,888 Impact of benefit from note hedge (1,868) (2,264) (2,619) (2,848) (3,050) (3,171) (3,205) (2,830) (2,000) (1,185) Shares used in Adjusted non-GAAP diluted EPS calculation 34,863 34,682 34,622 34,700 34,880 35,041 34,931 34,368 33,587 32,703 Reconciliation of GAAP to Non-GAAP Financial Measures* (continued)
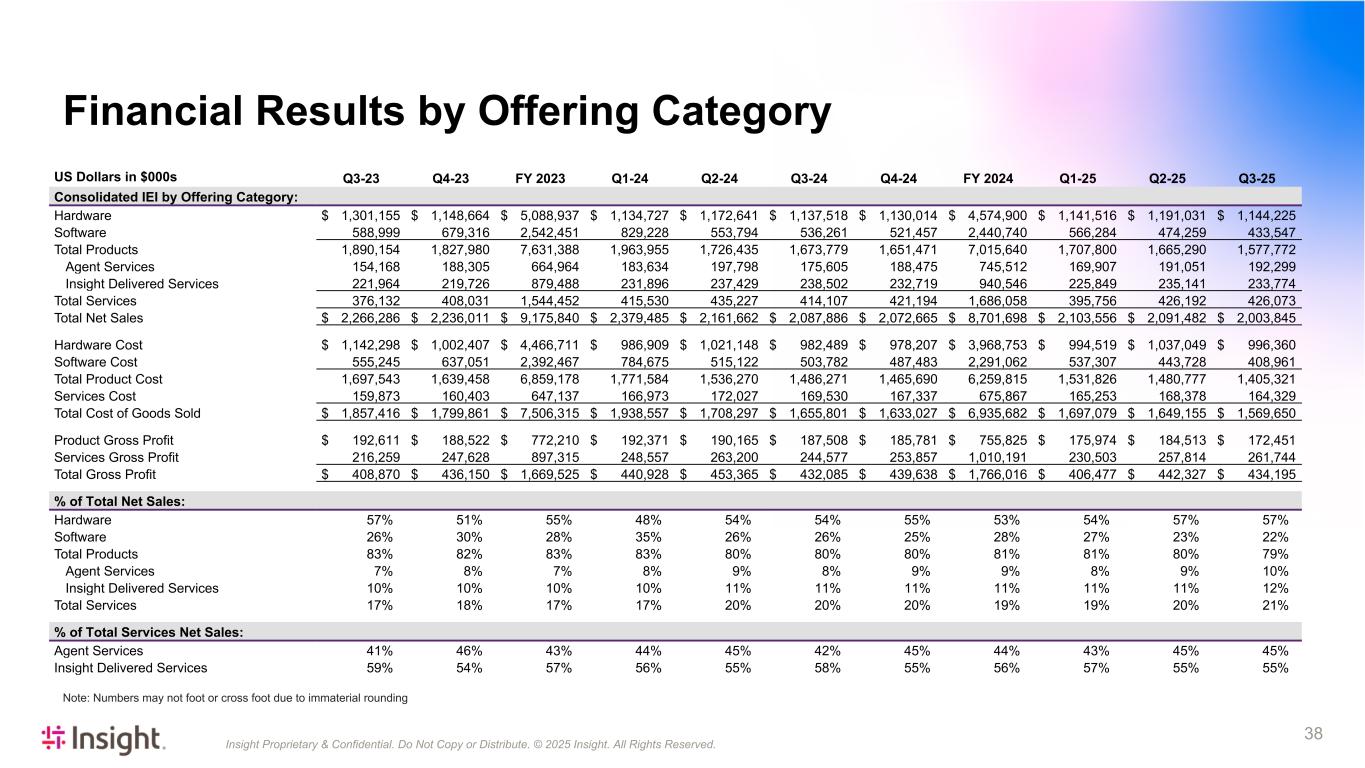
Insight Proprietary & Confidential. Do Not Copy or Distribute. © 2025 Insight. All Rights Reserved. 38 Financial Results by Offering Category US Dollars in $000s Q3-23 Q4-23 FY 2023 Q1-24 Q2-24 Q3-24 Q4-24 FY 2024 Q1-25 Q2-25 Q3-25 Consolidated IEI by Offering Category: Hardware $ 1,301,155 $ 1,148,664 $ 5,088,937 $ 1,134,727 $ 1,172,641 $ 1,137,518 $ 1,130,014 $ 4,574,900 $ 1,141,516 $ 1,191,031 $ 1,144,225 Software 588,999 679,316 2,542,451 829,228 553,794 536,261 521,457 2,440,740 566,284 474,259 433,547 Total Products 1,890,154 1,827,980 7,631,388 1,963,955 1,726,435 1,673,779 1,651,471 7,015,640 1,707,800 1,665,290 1,577,772 Agent Services 154,168 188,305 664,964 183,634 197,798 175,605 188,475 745,512 169,907 191,051 192,299 Insight Delivered Services 221,964 219,726 879,488 231,896 237,429 238,502 232,719 940,546 225,849 235,141 233,774 Total Services 376,132 408,031 1,544,452 415,530 435,227 414,107 421,194 1,686,058 395,756 426,192 426,073 Total Net Sales $ 2,266,286 $ 2,236,011 $ 9,175,840 $ 2,379,485 $ 2,161,662 $ 2,087,886 $ 2,072,665 $ 8,701,698 $ 2,103,556 $ 2,091,482 $ 2,003,845 Hardware Cost $ 1,142,298 $ 1,002,407 $ 4,466,711 $ 986,909 $ 1,021,148 $ 982,489 $ 978,207 $ 3,968,753 $ 994,519 $ 1,037,049 $ 996,360 Software Cost 555,245 637,051 2,392,467 784,675 515,122 503,782 487,483 2,291,062 537,307 443,728 408,961 Total Product Cost 1,697,543 1,639,458 6,859,178 1,771,584 1,536,270 1,486,271 1,465,690 6,259,815 1,531,826 1,480,777 1,405,321 Services Cost 159,873 160,403 647,137 166,973 172,027 169,530 167,337 675,867 165,253 168,378 164,329 Total Cost of Goods Sold $ 1,857,416 $ 1,799,861 $ 7,506,315 $ 1,938,557 $ 1,708,297 $ 1,655,801 $ 1,633,027 $ 6,935,682 $ 1,697,079 $ 1,649,155 $ 1,569,650 Product Gross Profit $ 192,611 $ 188,522 $ 772,210 $ 192,371 $ 190,165 $ 187,508 $ 185,781 $ 755,825 $ 175,974 $ 184,513 $ 172,451 Services Gross Profit 216,259 247,628 897,315 248,557 263,200 244,577 253,857 1,010,191 230,503 257,814 261,744 Total Gross Profit $ 408,870 $ 436,150 $ 1,669,525 $ 440,928 $ 453,365 $ 432,085 $ 439,638 $ 1,766,016 $ 406,477 $ 442,327 $ 434,195 % of Total Net Sales: Hardware 57 % 51 % 55 % 48 % 54 % 54 % 55 % 53 % 54 % 57 % 57 % Software 26 % 30 % 28 % 35 % 26 % 26 % 25 % 28 % 27 % 23 % 22 % Total Products 83 % 82 % 83 % 83 % 80 % 80 % 80 % 81 % 81 % 80 % 79 % Agent Services 7 % 8 % 7 % 8 % 9 % 8 % 9 % 9 % 8 % 9 % 10 % Insight Delivered Services 10 % 10 % 10 % 10 % 11 % 11 % 11 % 11 % 11 % 11 % 12 % Total Services 17 % 18 % 17 % 17 % 20 % 20 % 20 % 19 % 19 % 20 % 21 % % of Total Services Net Sales: Agent Services 41 % 46 % 43 % 44 % 45 % 42 % 45 % 44 % 43 % 45 % 45 % Insight Delivered Services 59 % 54 % 57 % 56 % 55 % 58 % 55 % 56 % 57 % 55 % 55 % Note: Numbers may not foot or cross foot due to immaterial rounding
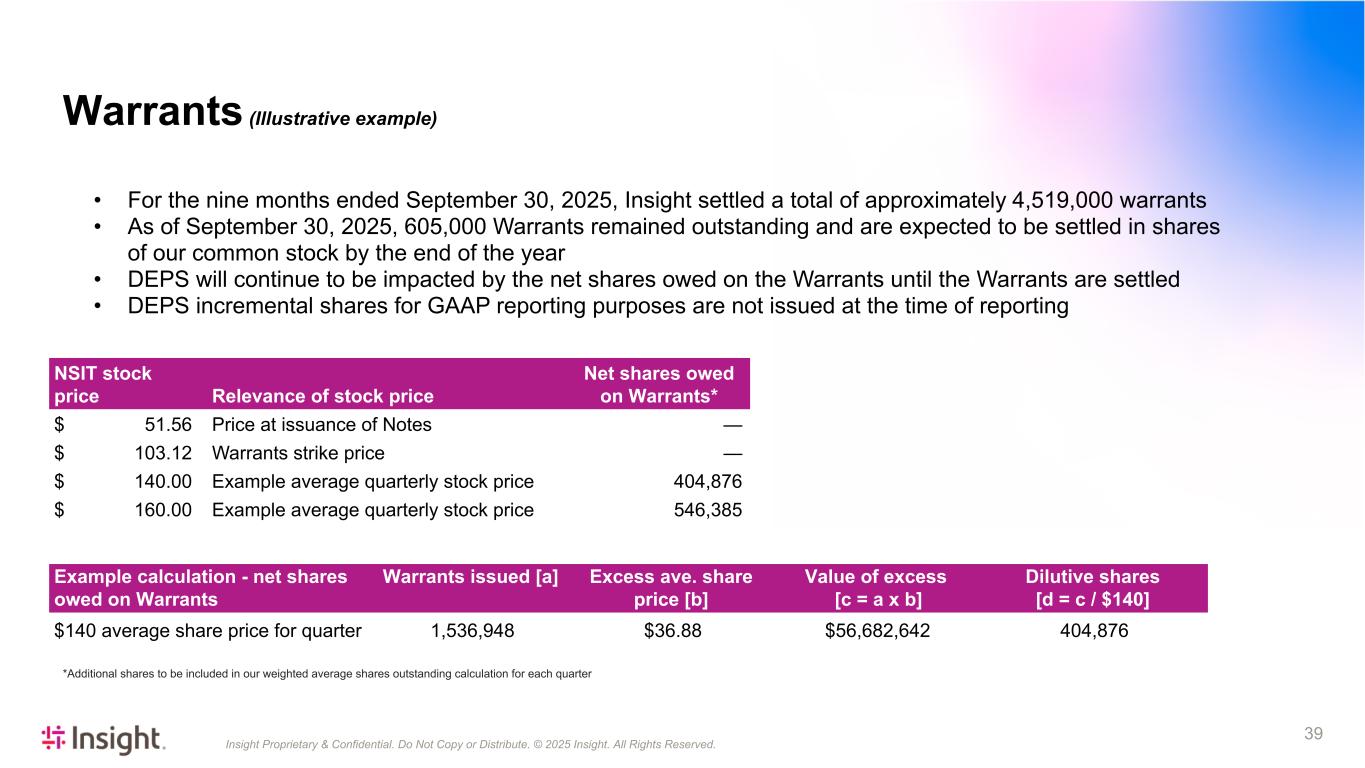
Insight Proprietary & Confidential. Do Not Copy or Distribute. © 2025 Insight. All Rights Reserved. 39 • For the nine months ended September 30, 2025, Insight settled a total of approximately 4,519,000 warrants • As of September 30, 2025, 605,000 Warrants remained outstanding and are expected to be settled in shares of our common stock by the end of the year • DEPS will continue to be impacted by the net shares owed on the Warrants until the Warrants are settled • DEPS incremental shares for GAAP reporting purposes are not issued at the time of reporting NSIT stock price Relevance of stock price Net shares owed on Warrants* $ 51.56 Price at issuance of Notes — $ 103.12 Warrants strike price — $ 140.00 Example average quarterly stock price 404,876 $ 160.00 Example average quarterly stock price 546,385 Example calculation - net shares owed on Warrants Warrants issued [a] Excess ave. share price [b] Value of excess [c = a x b] Dilutive shares [d = c / $140] $140 average share price for quarter 1,536,948 $36.88 $56,682,642 404,876 *Additional shares to be included in our weighted average shares outstanding calculation for each quarter Warrants (Illustrative example)