Please wait
UNITED STATES
SECURITIES AND EXCHANGE COMMISSION
Washington, D.C. 20549
FORM 6-K
REPORT OF FOREIGN PRIVATE ISSUER PURSUANT TO RULE 13a-16 OR
15d-16 UNDER THE SECURITIES EXCHANGE ACT OF 1934
For the month of March, 2026
Commission File Number: 1-13546
STMicroelectronics N.V.
(Name of Registrant)
WTC Schiphol Airport
Schiphol Boulevard 265
1118 BH Schiphol Airport
The Netherlands
(Address of Principal Executive Office)
Indicate by check mark whether the registrant files or will file annual reports under cover of Form 20-F or
Form 40-F.
Enclosure: STMicroelectronics’ 2025 Dutch Statutory Annual Report, including the 2025 IFRS Statutory Accounts.
tmicroelectronics N.v. annual report 2022
Table of Contents
STMicroelectronics N.V.'s Dutch annual report over 2025 consists of a message from the Managing Board on the financial year 2025 (Section 1), the management report (Section 2 through Section 5), the dividend policy (Section 6), the financial information (Section 7 through Section 9) and important dates (Section 10).
1.Message from our Managing Board on the financial year 2025
Dear Shareholder,
2025 was another challenging year for the end-markets we serve, characterized by continued inventory correction in Automotive and Industrial, in particular in the first part of the year. The second half was better with gradual improvement of the revenue trend and a return to year-on-year growth in the fourth quarter. During the year we began executing our previously announced program to reshape our global manufacturing footprint and resize our cost base while managing the Company through the challenging business environment. We continued to focus on our long-term innovation strategy, advancing the development of new proprietary technologies and designing new products into our customers’ next generations of systems and devices.
2025 review
In 2025, our net revenues decreased 11.1% to $11.8 billion, mainly driven by a strong decrease in Automotive and, to a lesser extent, in Industrial.
In more detail, on a year-over-year basis, Automotive revenues decreased 24%, Industrial was down 7%, while Personal Electronics increased 4% and Communications Equipment and Computer Peripherals were up 5%.
In April we detailed the Company-wide program to reshape our manufacturing footprint by focusing wafer fab investments towards 300mm silicon, 200mm silicon carbide, product mix capacity change and technology R&D, while resizing our global cost base. Increasing efficiency, automation, and use of AI will strengthen ST’s key technology R&D, design and high-volume assets for advanced manufacturing in Europe. This program aims to strengthen our capability to grow our revenues with an improved operating efficiency resulting in annual cost savings in the high triple-digit million-dollar range exiting 2027. Our strategic manufacturing initiatives remain aligned with our sustainability strategy and our commitment to sustainable manufacturing in terms of energy consumption, greenhouse gas emissions, air and water quality.
In July, we announced the acquisition of the MEMS business of NXP for up to US$950 million. The respective MEMS businesses of ST and NXP are strongly complementary in terms of technology and product portfolio, and the combined product offering will be well balanced across the Automotive, Industrial and Personal Electronics end markets. The closing of the deal was announced in February 2026.
Finally, we were pleased to announce after our May AGM the election of Werner Lieberherr and Simonetta Acri as new members of our Supervisory Board for three-year terms expiring at the end of the 2028 AGM, and, after our December EGM, the election of Armando Varricchio and Orio Bellezza as new members of our Supervisory Board for terms also expiring at the end of the 2028 AGM.
Optimized Strategy
Our strategy remains based on the same fundamentals. First, a value proposition for stakeholders focused on sustainable and profitable growth, providing differentiating enablers to customers and a strong commitment to sustainability.
Second, an optimized global integrated device manufacturer operating model, with highly skilled employees, a wide range of capabilities in proprietary, innovative technology and IP design, product and solution development, and advanced manufacturing (both in-house and with selected partners, including for China-for China) providing us with a strong competitive advantage and supply chain resilience for our customers.
These fundamentals continue to guide our market positioning and customer engagements, continuous and open innovation processes, product and IP design and technology R&D efforts and manufacturing investments.
ST-Specific Growth Drivers Beyond Cyclical Recovery
Beyond the evidence of a cycle recovery, ST will benefit from the following company specific growth drivers.
In Automotive, with our engaged customer programs in ADAS, SiC power devices and sensors, where our acquisition of NXP’s MEMS business will strengthen our leading position across the Automotive and Industrial segments.
In Industrial, with general-purpose MCUs.
In Personal Electronics, with our engaged customer programs in sensors and analog.
In Communications Equipment and Computer Peripherals, in data centers and AI servers, with cloud optical interconnect and power and analog. And in LEO satellite constellations, with the expansion of our customer base beyond the decade-long partnership with Starlink, via both new LEO constellation projects and new applications.
Lastly, ST is uniquely positioned to address the advanced robotic market, including the nascent humanoid robotics segment, through our broad product portfolio spanning MCUs, MEMS, optical sensors, GNSS and power management.
Our objective remains to restore profitability levels compatible with our operating model, while strengthening our strategic assets and continuing to invest in innovation to capture the revenue growth opportunities created by the long-term trends transforming the end markets we address.
We stand by our conviction that, together with our customers, partners and employees, ST will continue to be a key enabler of the transformation of all industries towards a smarter, safer and more sustainable future.
2.Corporate overview
In this annual report, references to "we", "us", "our", "the Company", "our Company" and "ST" are to STMicroelectronics N.V., references to "ST Group Company" are to any of STMicroelectronics N.V.'s direct or indirect subsidiaries, and references to the "Group" or "ST Group" are to STMicroelectronics N.V. and its direct and indirect subsidiaries.
Certain industry-specific, accounting, legal, or otherwise commonly used defined terms included in this annual report are defined in the "Certain definitions" table included in Appendix 11.6., and in the "ST Policies" table included in Appendix 11.7. for ease of reference. Some defined terms included in the relevant appendices have also been defined throughout the body of this document, as required for clarity.
2.1. History and development of STMicroelectronics
STMicroelectronics N.V. was formed and incorporated in 1987 as a result of the combination of the semiconductor business of SGS Microelettronica (then owned by Società Finanziaria Telefonica (S.T.E.T.), an Italian corporation) and the non-military business of Thomson Semiconductors (then owned by the former Thomson-CSF, now Thales, a French corporation). We completed our initial public offering in December 1994 with simultaneous listings on the Bourse de Paris (now known as “Euronext Paris”) and the New York Stock Exchange. In 1998, we also listed our shares on the Borsa Italiana (the Italian stock exchange).
We operated as SGS-Thomson Microelectronics N.V. until May 1998, when we changed our name to STMicroelectronics N.V. We are organized under the laws of The Netherlands, with our corporate legal seat in Amsterdam, The Netherlands, and our head offices at WTC Schiphol Airport, Schiphol Boulevard 265, 1118 BH Schiphol, The Netherlands. Our telephone number there is +31-20-654-3210. Our headquarters and operational offices are managed through our wholly owned subsidiary, STMicroelectronics International N.V., and are located at 39 Chemin du Champ des Filles, 1228 Plan-les-Ouates, Geneva, Switzerland. Our main telephone number there is +41-22-929-2929. Our agent for service of process in the United States related to our registration under the U.S. Securities Exchange Act of 1934, as amended, is Corporation Service Company (CSC), 80 State Street, Albany, New York, 12207. Our operations are also conducted through our various ST Group Companies, which are organized and operated according to the laws of their country of incorporation, and consolidated by STMicroelectronics N.V.
2.2. Organizational structure
We are organized in a matrix structure with geographic regions interacting with product lines, both supported by shared technology and manufacturing operations and by central functions, designed to enable us to be closer to our customers and to facilitate communication among the research and development (“R&D”), production, marketing and sales organizations.
While STMicroelectronics N.V. is our parent company, we conduct our global business through STMicroelectronics International N.V. and also conduct our operations through service activities from our subsidiaries. We provide certain administrative, human resources, legal, treasury, strategy, manufacturing, marketing, insurance and other overhead services to our consolidated subsidiaries pursuant to service agreements for which we recover the cost.
2.3. Product information
Semiconductor devices are electronic components that serve as the building blocks inside electronic systems and equipment. Semiconductor devices, generally known as “chips”, combine multiple transistors on a single piece of material to form a complete electronic circuit. With our portfolio of semiconductor products, we serve customers across the spectrum of electronics applications with innovative solutions.
We have a portfolio of power products and analog products, including sensors, signal channel devices and output power stages (discrete and/or integrated) as well as complete power management blocks. Our analog products, including both general purpose and application specific, can fulfill the needs of a wide range of designs and systems.
We also have digital products that are at the heart of electronics systems, including microcontrollers and microprocessors, ASICs and optical sensing solutions. Our full set of microcontrollers and microprocessors includes one of the industry’s broadest ranges of general-purpose microcontrollers serving all market segments, microprocessors addressing the industrial market, secure microcontrollers for mobile devices, wearables, banking, identification, industrial, automotive and Internet of Things (“IoT”) markets and a series of embedded processing solutions for our addressed end-markets (Automotive, Industrial, Personal Electronics and Communications Equipment, Computers and Peripherals, each as defined below).
We are one of the leading suppliers and innovators in the domain of semiconductor devices dedicated to automotive applications. Our offering includes a wide range of products, covering systems and functions from powertrain, chassis and safety, to audio, infotainment and telematics, as well as body and convenience. We offer automotive microcontrollers as well as solutions for ADAS and we provide automotive-grade MEMS as well as imaging solutions. Our portfolio also features a comprehensive range of analog and power solutions, including wide bandgap devices for hybrid and electric vehicles. The products are designed and manufactured specifically for automotive applications and complemented by a
large range of “automotive grade” standard products, both tested and guaranteed to perform under stringent automotive environmental conditions.
On top of our product design R&D spending, our principal investment and resource allocation decisions in the semiconductor business area are for expenditures on technology R&D as well as capital investments in front-end and back-end manufacturing facilities, which are planned at the corporate level; therefore, our product groups share common R&D for process technology and manufacturing capacity for some of their products.
As of December 31, 2025, our reportable segments within each product group were as follows:
•In our Analog, Power & Discrete, MEMS and Sensors ("APMS") product group:
oAnalog Products, MEMS and Sensors ("AM&S") reportable segment, comprised of ST analog products, MEMS sensors and actuators, and optical sensing solutions.
oPower and Discrete products ("P&D") reportable segment comprised of discrete and power transistor products.
•In our Microcontrollers, Digital ICs and RF products ("MDRF") product group:
oEmbedded Processing ("EMP") reportable segment, comprised of general-purpose and automotive microcontrollers, connected security products and custom processing products (automotive ADAS).
oRF Optical Communications ("RFOC") reportable segment, comprised of space, ranging & connectivity products, digital audio & signaling solutions and optical & RF COT.
Below is a description of our main categories of products as of December 31, 2025.
2.3.1. Analog, Power & Discrete, MEMS and Sensors ("APMS") product group
2.3.1.1. Analog Products, MEMS and Sensors ("AM&S") reportable segment
Analog Integrated Circuits
We develop a broad range of innovative smart power and analog ICs, comprising both application specific and general-purpose analog products. These serve a wide spectrum of markets and applications including automotive, smart grid, cloud computing, data servers, industrial automation, power conversion and personal electronics.
We are a leading supplier of analog semiconductors devices for automotive industry worldwide, enabling the electrification and digitalization of the car, and the pervasion of electronics in both traditional internal combustion engine vehicles as well as in electric cars, full or hybrid. Based on our proprietary BCD and VIPower technologies, we provide solutions for a range of car systems, such as battery management, traction engine, braking systems, airbag, door zone, e-fuse, and power management for ECUs.
In Industrial (as defined below) our product families include ASICs and ASSPs, covering motion control, power and energy management and factory automation. We continuously introduce new devices in our MasterGaN® and VIPerGaN families integrating a silicon driver and GaN power transistors in a single package. Our connectivity ICs range from wireline to wireless solutions. For wireline communication, we offer a complete family of transceivers compatible with different protocol standards used in the industry. Finally, we have a strong presence with our galvanic isolated gate drivers (also known as STGAP family) that are used both in industrial and automotive markets.
In Communications Equipment, Computers and Peripherals (as defined below) we serve our customers with power management solutions for data storage, as well as address the high power and high efficiency needs for servers and AI data centers.
In Personal Electronics (as defined below) we provide custom analog ICs, mainly power management ICs for battery powered devices. We deploy wireless charging solutions from low to high power across applications from smartphones to wearables, as well as display power management ICs and FingerTip touch screen controllers.
In General-Purpose Analog (as defined below) we have a wide product portfolio addressing all the market segments, spanning high-end analog front-end products, AC-DC and DC-DC converters, gate drivers for MOSFET, IGBT, SiC and GaN transistors, intelligent power switches, high & low side drivers, LED drivers, real-time clocks & timers, supervision and control ICs, as well as a comprehensive range of operational amplifiers (both low-voltage and high-voltage), comparators and current-sense amplifiers.
MEMS Sensors and Actuators
Our MEMS portfolio includes both sensors and actuators for a broad range of applications, including smartphones, personal devices, computers, automotive, industrial, healthcare and IoT.
MEMS sensors include motion MEMS (accelerometers, gyroscopes, magnetic sensors), environmental sensors (pressure, temperature and presence detection) and biosensors. We offer a unique sensor portfolio, from discrete to fully integrated solutions, high performance sensor fusion to improve the accuracy of multi-axis sensor systems in order to enable highly-demanding applications, such as navigation and location-based services, optical image stabilization and high-level quality products. Our latest range of smart sensors includes machine learning and edge AI processing capabilities built into the sensor enabling ultra-low power gesture recognition and tracking applications.
MEMS actuators include: (i) thermal and piezoelectric actuators for 2D and 3D printing in consumer, commercial and industrial market applications and (ii) piezoelectric actuators for applications such as smartphone camera autofocus, MEMS loudspeakers and image projection.
Optical Sensing Solutions
We have a broad portfolio of optical sensing solutions based on our proprietary differentiated technologies such as FlightSense, BrightSense and SafeSense by ST. These address various markets including 3D sensing for automotive applications such as in-cabin monitoring and occupant detection, as well as being used for industrial and consumer applications. Our optical sensing solutions are composed of both specialized components developed for dedicated customer systems, and full optical sense and illumination system solutions targeting multiple customers.
2.3.1.2. Power and Discrete products ("P&D") reportable segment
Discrete and Power Transistor
Our discrete and power transistors families include both power products and protection devices serving our end markets (Automotive, Industrial, Personal Electronics and Communications Equipment, and Computers and Peripherals, each as defined below).
Our leading-edge power technologies cater to both high-voltage and low-voltage applications. We combine a full range of packaging options with innovative die bonding technologies, utilizing both silicon and wide bandgap materials. Our portfolio includes silicon MOSFETs, SiC MOSFETs, IGBTs, thyristors, rectifiers, and power modules as well as a wide range of power bipolar transistors. We are expanding our offering based on wide bandgap materials with a full range of GaN-based power device solutions targeting a wide variety of applications.
Our portfolio of protection devices supports all industry requirements for electrical overstress and electrostatic surge protection, lightning surge protection and automotive protection. Our devices meet or
exceed international protection standards for electrical hazards on electronics boards found in the demanding markets we serve.
2.3.2. Microcontrollers, Digital ICs and RF products ("MDRF") product group
2.3.2.1. Embedded Processing ("EMP") reportable segment
General-purpose and automotive microcontrollers
Our general-purpose microcontroller product portfolio largely contains families of products based on 32-bit ARM®-based Cortex®-M0, -M0+, -M3, -M4, -M33, -M55, -M7 and -M85 with the ARM® TrustZone®. ST’s most powerful microcontroller to date, the STM32N6, with embedded ST’s proprietary neural processing unit, the neural-ART accelerator, was complemented in 2025 with another state-of-the-art high-performance microcontroller, STM32V8. The STM32V8, introduced in 2025, is the world’s first microcontroller built on the most advanced 18nm FD-SOI process technology, featuring embedded Phase Change Memory ("PCM") and a powerful Cortex®-M85 core. In 2025 we also introduced a new ultra-low-power product series, STM32U3, which leverage near-threshold technology, bringing the low power performance to an unprecedented level and expanding battery-powered applications’ battery life.
For each product family, a broad selection of features is available with respect to microcontroller performance, ultra-low-power, memory size, peripherals, and packaging. Numerous dedicated families include features such as our TouchGFX advanced 3D graphics, dedicated peripherals for industrial motor controls and digital power, security and safety features, and low-power wireless connectivity.
Our microprocessors product line targeting the industrial market features 64-bit processing and edge AI acceleration. Based on the Arm Cortex®-A35, these microprocessors run up to 1.5GHz, enhancing the main processing capability compared to first-generation devices. Additionally, they come with a dedicated Linux distribution.
The STM32 family based on the ARM® Cortex®-M and -A processors are designed to offer significant degrees of freedom to microcontroller and microprocessors users. The product range combines very high performance, real-time capabilities, digital signal processing, and low-power, low-voltage operation, while maintaining full integration and ease of development. We offer an unparalleled range of STM32 devices, accompanied by a vast choice of tools and software including support for industrial safety standard IEC 61508 SIL2/3, human machine interface.
In 2025, we continued to strengthen our STM32 microcontroller ecosystem with various software releases and updates of STM32Cube, using new modular foundation for visual studio code, as well as STM32 for entry-level graphics and TouchGFX. We also expanded our STM32 AI model zoo, which now has over 140 ready-made models for vision, audio, and sensing AI applications at the edge. It is the largest MCU-optimized model zoo library of its kind. This comprehensive portfolio makes our STM32 an ideal choice for enabling ever smarter objects for an increasingly broad range of applications.
Our automotive microcontroller portfolio supports ongoing transformation of the industry through electrification and digitalization of the car. We offer a complete portfolio of MCU products able to address all the needs, from local actuation and smart sensing to high-performance real-time processing with cross functional integration across multiple application domains.
Our Stellar family is a scalable ARM-based hardware architecture supporting real-time virtualization and automotive level safety ("ASIL-D"). It features a rich set of IOs and peripherals. The Stellar family is optimized for electrification, including x-in-1 vehicle motion control computer, zonal architectures and safety companion MCUs for safety critical subsystems, such as ADAS.
In 2025, we introduced Stellar MCUs with extensible memory, enhancing the flexibility of Stellar MCUs further, offering a unique value with more storage capacity for innovation while extending product lifetime with continuous over-the-air updates. This is made possible by leveraging our internally developed embedded non-volatile memory technology, phase-change memory, built on 28nm FD-SOI technology.
ST is the first to launch automotive qualified MCU devices embedded with this new emerging memory technology, since eFlash is reaching its limit in today’s process. This memory is the most mature and offers the smallest memory cell automotive-grade solution on the market, delivering more than twice the memory density and doubling the capacity in the same space. We also demonstrated our automotive ethernet support, delivering high-quality audio over the vehicle’s ethernet backbone, which significantly reduces vehicle weight by eliminating cabling.
Connected Security Products
We offer cutting-edge solutions for secure and connected applications, due to our STSECURE and ST25 portfolios. Security is particularly critical to near field communication ("NFC"), contactless and wired connectivity technologies that target payment, identification, access control and all secure transactions in mobile, industrial, consumer and automotive applications. Building upon our 30+ years experience in security, we offer a highly ambitious and coherent security portfolio, with the right level of protection from a basic identification of objects (tags and secure tags) to the most advanced security with our certified secure microcontrollers.
Our well-defined system-level architecture enables us to match our security strategy with current and future needs, like post-quantum cryptography, accelerating our pervasion in the security ecosystem. We offer security solutions for everybody, creating the opportunity to address customers for whom security is a must.
In 2025, thanks to our strategic collaboration with wireless technologies makers for our NFC-controller and secure element portfolio and the launch of our latest secure microcontroller for payment and ID applications, we have strengthened our position in mobile, banking and governmental markets. We launched the industry’s first secure ST25DA-C chip supporting new matter specification simplifying device commissioning through NFC tap-to-pair functionality. We also completed certification of our ST4SIM-300 embedded SIM ("eSIM") to GSMA SGP.32 IoT standard, supporting the deployment of billions of secure connected devices.
Our wide range of small density serial non-volatile memories has among the highest industry performance. The serial EEPROM family ranges from 1 Kbit to 32 Mbits and offers the most common serial interfaces to facilitate adoption: I²C, SPI and microwire. In 2025, we celebrated 20 years as the global leading supplier of EEPROMs and 40 billion units shipped worldwide. Since 2005, we have maintained our leadership position, fueled by innovation with, amongst others, the introduction this year of the EEPROM unique identifier family.
Custom Processing (Automotive ADAS)
We are a leading innovator in ADAS, dedicated to enhancing the passenger experience and helping to prevent or reduce the severity of traffic accidents. We manufacture cutting-edge ADAS SoCs that comply with the most stringent automotive quality and functional safety standards, enabling a safer and more reliable driving experience.
2.3.2.2. RF Optical Communications ("RFOC") reportable segment
Space
We leverage differentiated technologies and integrated device manufacturer ("IDM") model to deliver solutions across space-tech value chain. This comprises semiconductor solutions for geostationary satellites, low Earth orbit constellations, and ground infrastructure systems including user terminals. We have historically supported numerous European space initiatives, holding European Space Agency ("ESA") qualifications since its inception, and later adding the American QML-V certification.
By owning the entire semiconductor process — from design and development to manufacturing and testing — ST guarantees the quality, reliability, and performance essential for space applications and the
high-volume production LEO constellations require. For a decade, our BiCMOS chip technology has played a vital role in shaping the LEO connectivity landscape that is transforming global internet access.
Optical & RF COT
We offer RF, digital and mixed-signal ASICs, which are based on our proprietary FD-SOI, RF-SOI, and BiCMOS technologies, as well as foundry-based FinFET technologies, for satellite communications as well as networking infrastructure.
We also use our proprietary FD-SOI, RF-SOI, and BiCMOS technologies to provide RF and mmWave components for terrestrial communication, based on our know-how in analog and digital beamforming design techniques, to address massive MIMO antenna.
We also address the fast-growing market of cloud-optical interconnect in data centers based on our BiCMOS and SiPho technologies.
Digital Audio & Signaling Solutions
Our car infotainment portfolio includes comprehensive solutions for digital radios, audio amplification and positioning systems. We are a leader in the audio infotainment market, with a wide range of power amplifiers, from head units to premium audio, from telematics to AVAS.
The positioning portfolio includes families of SoC and RF solutions capable of receiving signals from different bands and multiple satellite constellations, enhancing the accuracy of the user's position even under poor satellite visibility conditions.
ST is also a leading provider of radio solutions for automotive infotainment systems and offers digital and analog terrestrial and satellite receivers, as well as multi-standard ICs designed to deliver world-class performance and functionality.
Ranging & connectivity
We are also developing new ranging and positioning products such as ultra-wide band and radar systems, as well as building connectivity products, including 60GHz contactless point-to-point communications over a short range. In 2025, we announced mass-production start for our ST67W module combining Wi-Fi 6, Bluetooth low energy 5.4 and Matter. It is the first product of ST’s collaboration with Qualcomm Technologies, Inc. announced in 2024, to simplify implementing wireless connectivity in systems containing STM32 MCUs.
3.Report of the Managing Board
In accordance with Dutch law, our management is entrusted to our managing board (our "Managing Board") under the supervision of our supervisory board (our "Supervisory Board"). Under our articles of association (the “Articles of Association”), the members of our Managing Board are appointed for a three-year term at our AGM, by a simple majority of the votes cast, provided quorum conditions are met, upon a non-binding proposal by our Supervisory Board, which term may be renewed one or more times. On May 22, 2024, our AGM was held (the "2024 AGM") and Mr. Jean-Marc Chery was reappointed as member of our Managing Board with the function of President and Chief Executive Officer (our "President and Chief Executive Officer" or "CEO"), for a three-year term expiring at our 2027 AGM. At our 2024 AGM Mr. Lorenzo Grandi was appointed as member of the Managing Board with the function of President and Chief Financial Officer (our "President and Chief Financial Officer" or "CFO"), for a three-year term expiring at our 2027 AGM. We continue to review and strengthen the succession planning for the Managing Board to ensure business continuity, taking into account, amongst others, the rapidly changing technological, social, economic and regulatory developments in our industry.
3.1. Statement of the members of our Managing Board
The members of our Managing Board hereby declare that, to the best of their knowledge, the statutory financial statements as of December 31, 2025, and for the year then ended, prepared under Title 9 of Book 2 of the Dutch Civil Code and in accordance with IFRS as adopted by the EU, provide a true and fair view of the assets, liabilities, financial position and profit or loss of STMicroelectronics N.V. and the undertakings included in the consolidation taken as a whole. Furthermore, the members of our Managing Board hereby also declare that the report of the Managing Board includes a true and fair view concerning the statement of financial position as of December 31, 2025. The report of the Managing Board also includes the development and performance of STMicroelectronics N.V. and the undertakings included in the consolidation taken as a whole, together with the principal risk and uncertainties they face.
| | | | | |
| Jean-Marc Chery, | Lorenzo Grandi, |
| Chairman of our Managing Board, | Member of our Managing Board, |
| President and Chief Executive Officer | President and Chief Financial Officer |
3.2. Business overview and performance
3.2.1. Results highlights for the year 2025
Our total available market is defined as “TAM”, while our serviceable available market is defined as “SAM” and represents the market for products sold by us (i.e., TAM excluding major devices such as microprocessors, graphics processing units / AI accelerators, DRAM and flash-memories, optoelectronics devices other than optical sensors, video processing and wireless application specific market products, such as baseband and application processors).
Based on industry data published by World Semiconductor Trade Statistics (“WSTS”), semiconductor industry revenues in 2025 increased on a year-over-year basis by approximately 26% for the TAM and by approximately 15% for the SAM, to reach approximately $792 billion and $279 billion, respectively.
Full year 2025 total revenues decreased 11.1% to 11.80 billion from $13.27 billion in 2024, as a result of an approximate 6% decrease in average selling prices, due to product mix and lower selling prices, and a 5% decrease in volumes. By reportable segments, AM&S revenues decreased 6.3%, driven by lower volumes of approximately 11%, partially offset by higher average selling prices of approximately 5% due to a more favorable product mix. P&D revenues decreased 31.5%, driven by lower average selling prices of approximately 29% due to a less favorable product mix and lower selling prices, and lower volumes of approximately 3%. EMP revenues decreased 7.1% due to lower volumes of approximately 4% and lower average selling prices of approximately 3% mainly driven by a less favorable product mix. RFOC revenues decreased by 4.9%, driven by lower average selling prices of approximately 19%, due to less favorable product mix, partially offset by higher volumes of approximately 14%.
Starting 2025, we engaged in a company-wide program aimed to reshape our manufacturing footprint by accelerating the wafer fab capacity to 300mm silicon (Agrate, Italy and Crolles, France) and 200mm silicon carbide (Catania, Italy) and resizing our global cost base. This program is expected to result in strengthening our capability to grow revenues with an improved operating efficiency. Impairment, restructuring charges and other related phase-out costs, totaled $376 million in 2025, of which $189 million of impairment charges, reflecting the comprehensive impairment test carried out during the year, which accounted for the majority of impairment charges recorded and relate to the company-wide program aimed at reshaping our manufacturing footprint and resizing our global cost base. In 2025, we also recorded $176 million of restructuring charges, of which $97 million for labor-related costs and $79 million for non-labor related costs. We also recorded $11 million of phase out costs. No impairment and restructuring charges related to the launch of the company-wide program were recorded in 2024.
We believe Gross Margin and Operating Margin provide useful information as they measure the profitability of our operations. Gross Margin is defined as gross profit divided by total revenues. Gross profit is calculated as total revenues minus cost of sales. Operating Margin is defined as operating profit divided by total revenues. Operating profit is calculated as gross profit net of operating expenses, other income and other expenses.
Our 2025 Gross Margin decreased 780 basis points to 29.3% from 37.1% in 2024, mainly due to lower manufacturing efficiencies and, to a lesser extent, sales price and mix, lower level of capacity reservations fees, negative currency effect and higher unused capacity charges. Our 2025 Gross profit includes $159 million impairment charges on productive assets, $91 million restructuring charges and $11 million of related phase-out costs, following the launch and subsequent execution of our company-wide program aimed to reshape our manufacturing footprint and resize our global cost base.
Operating Margin was 2.7% in 2025, a decrease of 1,000 bps from 12.7% in 2024, mainly driven by the combining effect of lower revenues and gross margin profitability. Operating profit in 2025 decreased to $320 million compared to $1,688 million in 2024. Operating profit in 2025 included $376 million impairment, restructuring charges and other related phase-out costs.
Our operating expenses, comprised of aggregated SG&A and R&D expenses, amounted to $3,435 million in 2025, slightly increasing from $3,375 million in the prior year. SG&A and R&D expenses include $84 million restructuring charges and $31 million impairment charges. Other income and expenses, net, was
$301 million in 2025 compared to $140 million in 2024, increasing mainly due to positive currency effects and lower start-up costs, partially offset by lower public funding.
Combined finance income and costs resulted in a net income of $228 million, compared to a net income of $616 million in 2024, and reflect in both years the IFRS accounting of our convertible bonds. The 2025 finance income included a gain of $14 million for the fair value adjustment of the embedded bondholders’ conversion options on outstanding convertible bonds (compared to a gain of $477 million in 2024).
Full year 2025 net profit was $299 million or $0.33 diluted earnings per share, compared to net profit of $1,987 million, or $2.19 diluted earnings per share for the full year 2024.
Net Capex (non-GAAP measure) was $1,792 million for the year 2025 compared to $2,531 million for the year 2024. The main driver of our capital expenditures is our efforts in investing in our SiC production facilities, our 300mm wafer front-end facilities, and in our back-end manufacturing capacity.
During 2025, our net cash increased by $555 million, with net cash from operating activities amounting to $2.57 billion. During 2025, we paid $367 million for the repurchase of ordinary shares, $321 million of cash dividends to our shareholders, $239 million for long-term financial debt repayment, and $750 million of repayment of convertible debt, partially offset by $156 million of proceeds from noncontrolling interest.
Our Net Capex, Free Cash Flow, Net Financial Position and Adjusted Net Financial Position are non-GAAP measures and are further described in Section 3.2.5. (Liquidity and financial position).
3.2.2. Business overview
We are a global semiconductor company that designs, develops, manufactures and markets a broad range of products used in a wide variety of applications for the four end-markets we address: Automotive, Industrial, Personal Electronics and Communications Equipment, Computers and Peripherals (each as defined below). For the Automotive and Industrial markets we address a wide customer base, particularly in Industrial, with a broad and deep product portfolio. In Personal Electronics and in Communications Equipment, Computers and Peripherals we have a selective approach both in terms of the customers we serve, as well as in the technologies and products we offer, while leveraging our broad portfolio to address high-volume applications.
Our diverse product portfolio includes discrete and general purpose components, ASIC, full-custom devices and semi-custom devices and ASSPs for analog, digital and mixed-signal applications. It benefits from a unique, strong foundation of proprietary and differentiated leading-edge technologies, supported by a comprehensive software development ecosystem. We use all prevalent function-oriented process technologies, including CMOS, bipolar and non-volatile memory technologies. In addition, by combining basic processes, we have developed advanced systems-oriented technologies that enable us to produce differentiated and application-specific products, including FD-SOI technology offering superior performance and power efficiency compared to bulk CMOS, BiCMOS and RF-SOI for mixed-signal and high-frequency wireless and wired communications applications, SiPho technology using silicon-based materials to develop photonic circuits, as well as BCD, VIPpower, and intelligent integrated gallium-nitride ("STI2GaN") technologies for smart power applications, power MOSFET, SiC and gallium-nitride GaN for high-efficiency systems, MEMS technologies for sensors and actuators, embedded non-volatile memory technologies for our microcontrollers and differentiated optical sensing technologies for our optical sensing solutions.
Further information on our business model is included in Section 2 (Corporate Overview) above and Sections 3.2.2.1. (Strategy and objectives) et seq. below.
3.2.2.1. Strategy and objectives
We are 48,000 creators and makers of semiconductor technologies mastering the semiconductor supply chain with state-of-the-art manufacturing facilities. As an integrated device manufacturer, we work with more than 200,000 customers and thousands of partners to design and build products, solutions, and ecosystems that address their challenges and opportunities and the need to enable and support a more sustainable world. Our technologies enable smarter mobility, more efficient power and energy management, and the wide-scale deployment of cloud-connected autonomous things.
Our strategy focuses on sustainable long-term value creation for the Company and its affiliated enterprises and takes into account the short-, medium- and longer-term evolution of the markets we serve and the environment and opportunities we see. It stems from key long-term trends in electronic systems. These key trends are: smart mobility, where we provide innovative solutions to help car manufacturers make driving safer, greener and more connected; power & energy: our technology and solutions enable industries to increase energy efficiency and support the use of renewable energy and cloud-connected autonomous things, which transform our lives and the objects we use with smart, connected devices for personal, business and industrial applications.
We are exposed to company-specific growth drivers including: (i) in Automotive: engaged customer programs in ADAS, silicon carbide power devices and sensors; (ii) in Industrial: general purpose MCUs; (iii) in Personal Electronics: engaged customer programs in sensors and analog; (iv) in Communication Equipment and Computer Peripherals: data centers, including cloud optical interconnect and Power and Analog for AI servers and data centers and low earth orbit ("LEO") satellites. We are also uniquely positioned to address humanoid robotics through our broad portfolio spanning MCUs, MEMS, optical sensors, global navigation satellite system ("GNSS") and power management.
Our global integrated device manufacturer operational model provides us with a wide range of capabilities in proprietary and innovative technology & IP design, product and solution development, and with advanced manufacturing - both in-house and with selected partners - providing us with a strong competitive advantage and supply chain resilience for our customers.
Our value proposition for stakeholders is focused on sustainable and profitable growth, providing differentiating enablers to customers and a strong commitment to sustainability. We are on track to be carbon neutral in all direct and indirect emissions (scopes 1 and 2), product transportation, business travel, and employee commuting emissions (our scope 3 focus), and to achieve our 100% renewable electricity sourcing goal by the end of 2027.
3.2.2.2. Employees
The tables below set forth the breakdown of employees by geographic area and category of main activity for the past two years.
| | | | | | | | | | | | | | | | | | | | |
| | 2025(1) | | 2024(1) | | 2024(2) |
| France | | 12,509 | | | 12,957 | | 11,528 | |
| Italy | | 12,645 | | | 12,726 | | | 12,745 | |
| Rest of Europe | | 1,133 | | | 1,215 | | | 1,169 | |
| Americas | | 710 | | | 816 | | | 821 | |
| Mediterranean (Malta, Morocco, Tunisia) | | 4,986 | | | 5,424 | | | 5,374 | |
| Asia | | 17,174 | | | 17,746 | | | 17,965 | |
| Total | | 49,157 | | | 50,884 | | | 49,602 | |
| | | | | | | | | | | | | | | | | | | | |
| | 2025(1) | | 2024(1) | | 2024(2) |
| Research and Development | | 9,461 | | | 9,624 | | | 9,257 | |
| Marketing and Sales | | 2,556 | | | 2,757 | | | 2,698 | |
| Manufacturing | | 30,546 | | | 31,742 | | | 31,133 | |
| Administration and General Services | | 3,388 | | | 3,427 | | | 3,323 | |
| Product Group Functions | | 3,206 | | | 3,334 | | | 3,192 | |
| Total | | 49,157 | | | 50,884 | | | 49,602 | |
(1) The total headcount disclosed in these columns has been calculated using the employee definition provided for in the CSRD guidance. As of 2025 ST has adopted the CSRD definition for its employee calculations moving forward.
(2) The total headcount disclosed in these columns has been calculated using the employee definition used by ST up until 2024.
Our future success will partly depend on our ability to continue to attract, retain and motivate highly qualified technical, marketing, engineering and management personnel, as well as on our ability to timely adapt the size and/or profile of our personnel to changing industry needs. Unions are represented at almost all of our manufacturing facilities and at several of our R&D sites. We use temporary employees if required during production spikes and, in Europe, during summer vacation. We have not experienced any significant strikes or work stoppages in recent years.
More detailed information on our employees can be found in Section 3.4.4.1.E.2. (Metrics - Characteristics of the undertaking’s employees).
3.2.2.3. Alliances with Customers and Industry Partnerships
We believe that customer alliances and industry partnerships are critical to our success in the semiconductor market. Customer alliances provide us with valuable systems and application know-how, anticipate architecture trends and access to markets for key products, while enabling our customers to gain access to our technologies and manufacturing infrastructure. We are actively working to expand the number of our customer alliances, targeting key global original equipment manufacturers ("OEMs") as well as emerging, innovative customers and partners around the globe.
From time to time we collaborate with other semiconductor industry companies, research organizations, universities, customers, experts and suppliers to further our R&D efforts. Such collaboration provides us with a number of important benefits, including acquisition of technical know-how, access to additional production capacities, sharing of costs and reductions in our own capital requirements.
3.2.2.4. Customers and Applications
We design, develop, manufacture and market thousands of products which we sell to over 200,000 customers. We emphasize a broad and balanced product portfolio, in the applications and regional markets we serve, which helps foster closer, strategic relationships with customers. Our major customers include (in alphabetical order) Apple, Bosch, Continental, Denso, HP, Mobileye, Samsung, SpaceX, Tesla and Vitesco. This broad product breadth provides opportunities to enable application solutions and to supply such customers’ requirements for all their product and technology needs. We also sell our products through our distribution channel.
In Automotive (as defined below), we have identified a significant evolution of the relationship with customers. Historically, semiconductor companies addressed the needs of carmakers mostly through tier 1 and/or tier 2 automotive industry suppliers with whom we work closely. In recent years there has been an accelerated transformation of the automotive industry driven by the electrification and the digitalization of vehicles, significantly increasing the amount and complexity of semiconductor products in vehicles. As a result, and following further from the supply chain challenges which arose during and after the COVID-19 pandemic, carmakers are taking a more direct role in the decision making and control of both
the semiconductor strategy and supply for their vehicles. Carmakers now have a more direct relationship with companies such as ours, notably playing a more active role in defining the specific solutions they require, as well as in certain instances engaging in direct co-operation agreements. We are committed to playing a major role in these new business models and we see multiple opportunities for co-operation with carmakers in this area, while also continuing to build on our co-operation with tier 1 and tier 2 automotive industry suppliers.
3.2.2.5. Sales, Marketing and Distribution
Our sales and marketing is organized by a combination of key accounts and regional sales units organized by market segment with the primary objective of accelerating sales growth and gaining market share. Emphasis is placed on strengthening the development of our global and major local accounts; boosting demand creation through an enhanced focus on geographical and key accounts coverage with strong technical and application expertise, supported application labs and competence centers. The mass market is covered through a joint effort with our distribution partners and local initiatives; establishing regional sales and marketing teams that are fully aligned with our end-markets and products strategies across our focused market segments: Automotive, Industrial Power and Energy, Industrial Smart industrials, Personal Electronics and Communications Equipment, Computers and Peripherals.
We have four regional sales organizations reporting to a global head of sales & marketing: Americas, Asia Pacific excluding China ("APeC"), China and Europe, Middle-East and Africa ("EMEA"). Our regional sales organizations have a similar structure to enhance global coordination and go-to-market activities. The sales and marketing teams are strongly focused on profitable revenue growth and business performance as well as on fostering demand creation, expanding the customer base, expanding products usage in customer applications (cross selling) and maximizing market share, anticipating new products needs and providing the best technical and application support in the field for our customers. The sales and marketing activities are supported by sales engineers, system marketing, product and technical marketing, application labs, competence centers, field application engineers and quality engineers.
Following our announcement in the first quarter of 2024 that we would complement the existing sales & marketing organization (the "Sales & Marketing" organization) by implementing a new segment marketing and application ("SM&A") organization, offering customers end-to-end system solutions based on our product and technology portfolio, covering our end markets, in 2025 we begun implementing five segment strategic programs (one per market segment):
•automotive ("Automotive");
•industrial power and energy ("Industrial PE");
•industrial smart industrials ("Industrial SI" and together with Industrial PE hereinafter "Industrial");
•personal electronics ("Personal Electronics"); and
•communications equipment, computers and peripherals ("Communications Equipment, Computers and Peripherals").
The regional Sales & Marketing organization remained unchanged.
We engage distributors and sales representatives to distribute and promote our products around the world. Typically, distributors handle a wide variety of products, including those that compete with ours. Our distributors have a dual role, the major one being the business development through demand creation and customer base expansion, the other is to assist in fulfilling the demand of our customers by servicing their orders. Most of our sales to distributors are made under specific agreements allowing for price protection and stock rotation for unsold merchandise. Sales representatives, on the other hand, generally do not offer products that compete directly with our products, but may carry complementary items manufactured by others.
At the request of certain customers, we also sell and deliver our products to EMS companies, which, on a contractual basis with our customers, incorporate our products into the application specific products they manufacture for our customers. We also sell products to original design manufacturers (“ODM”). ODMs manufacture products for our customers much like electronics manufacturing services companies do, but they also design applications for our customers, and in doing so themselves select the products and suppliers that they wish to purchase from.
In furtherance of our strong commitment to quality, our sales organizations include personnel dedicated to close monitoring and resolution of quality-related issues.
3.2.2.6. Research and Development
We believe that market driven R&D based on leading-edge products and technologies is critical to our success. We devote significant effort to R&D because we believe such investment can be leveraged into competitive advantages: about 19.25% of our employees work in R&D on product design/development and technology and, in 2025, we spent approximately 14.5% of our total revenues on R&D.
New developments in semiconductor technology can make end products significantly cheaper, smaller, faster, more reliable and embedded than their predecessors, with differentiated functionalities. They can enable significant value creation opportunities with their timely appearance on the market. Our innovations in semiconductor technology as well as in hardware and software contribute to the creation of successful products that generate value for us and our customers. Our complete design platforms, including a large selection of IP and silicon-proven models and design rules, enable the fast development of products designed to meet customer expectations in terms of reliability, quality, competitiveness in price and time-to-market. Through our R&D efforts, we contribute to making our customers’ products more efficient, more appealing, more reliable and safer.
Our technology R&D strategy is based on the development of differentiated technologies, allowing for a unique offer in terms of new products and enabling new applications opportunities. We draw on a rich pool of fabrication technologies for chips and products, including advanced digital CMOS on FD-SOI, embedded non-volatile memories, analog and mixed-signal, optical sensing, integrated photonics, MEMS, BCD for smart power, power transistors and diodes, power SiC and GaN processes, BiCMOS, and SiPho. This is well embedded in our strong packaging technologies portfolio, such as high pin count BGA, wafer level packaging, panel-level packaging, highly integrated sensor packages and leadframe package power products. We combine both front-end and back-end manufacturing and technology R&D under the same organization to ensure a smooth flow of information between our R&D and manufacturing organizations. We leverage significant synergies and shared activities between our product groups to cross-fertilize them. We also use silicon foundries and test and packaging suppliers ("OSATs").
We have advanced R&D and innovation centers which offer us a significant advantage in quickly and cost effectively introducing products. Furthermore, we have established a strong culture of partnerships and through the years have created a network of strategic collaborations with key customers, suppliers, competitors, and leading universities and research institutes around the world. We also play leadership roles in numerous projects running under the "Information Society Technologies" programs of the EU. We also participate in certain collaborative R&D and innovation programs established by the EU Commission, individual countries and local authorities in Europe (primarily in France and Italy) and in Singapore. We currently own over 21,000 active and pending patents worldwide.
The total amount of our R&D expenses was $1,713 million and $1,726 million in 2025 and 2024, respectively, while the total amount of R&D expenses capitalized amounted to $380 million and $354 million in 2025 and 2024, respectively.
3.2.2.7. Property, Plants and Equipment
We are an integrated device manufacturer with the ability to control and optimize the value chain, from semiconductor process development, chip design, testing and validation, wafer fabrication, to assembly, testing, and delivery to our customers. At ST, manufacturing is based on our owned and operated facilities in EMEA and in Asia, complemented by outsourcing in both front-end and back-end processes. This enables us to provide customers with an independent, flexible and robust manufacturing and supply chain, which aids in our success. In addition, our proprietary semiconductor process technologies highlighted above enable product differentiation. We believe that the combination of these two aspects represent a differentiating factor for our company as compared to fabless semiconductor companies and semiconductor foundries.
We currently operate fourteen main manufacturing sites around the world. Please refer to Appendix 11.5. for a list of our main manufacturing sites.
As of December 31, 2025, our front-end facilities had a total maximum capacity of approximately 140,000 wafer starts per week (200mm equivalent). The number of wafer starts per week varies from facility to facility and from period to period as a result of changes in product mix.
We own all of our manufacturing facilities, but certain facilities (Muar, Malaysia; Shenzhen, China; Kirkop, Malta; Toa Payoh and Ang Mo Kio, Singapore) are built on land subject to long-term leases.
We have historically subcontracted a portion of total manufacturing volumes to external suppliers. In 2025, we subcontracted approximately 25% of the value of our total silicon production to external foundries. Our plan is to continue sourcing silicon from external foundries and OSATs to give us flexibility in supporting our growth.
As of December 31, 2025, we had approximately $1,3 billion in outstanding orders for purchases of equipment (certain of which are subject to cancellation or amendment in accordance with their terms) and other assets for delivery in 2026. In 2025, our capital expenditure payments (defined as payments for purchases of tangible assets), net of proceeds from sales, capital grants and other contributions, was $1,844 million compared to $2,642 million in 2024. In the 2023-2025 period the ratio of capital expenditure payments, net of proceeds from sales, capital grants and other contributions to total revenues was about 20%.
3.2.2.8. Intellectual Property
Our success depends in part on our ability to obtain patents, licenses and other IP rights to protect our proprietary technologies and processes. Intellectual property ("IP") rights that apply to our various products include patents, copyrights, trade secrets, trademarks and mask work rights. We currently own over 21,000 active and pending patents worldwide.
We believe that our IP represents valuable assets. We rely on various IP laws, confidentiality procedures and contractual provisions to protect our IP assets and enforce our IP rights. To optimize the value of our IP assets, we have engaged in licensing our design technology and other IP, including patents, when consistent with our competitive position and our customers’ interests. We have also entered into broad-scope cross-licenses and other agreements which enable us to design, manufacture and sell semiconductor products using the IP rights of third parties and/or operating within the scope of IP rights owned by third parties.
From time to time, we are involved in IP litigation and infringement claims. Regardless of the validity or the successful assertion of such claims, we may incur significant costs with respect to the defense thereof, which could have a material adverse effect on our results of operations, cash flow or financial condition.
3.2.2.9. Backlog
Our sales are made primarily pursuant to standard purchase orders that are generally booked from one to eighteen months in advance of delivery. Quantities actually purchased by customers, as well as prices, are subject to variations between booking and delivery and, in some cases, to cancellation due to changes in customer needs or industry conditions. During periods of economic slowdown and/or industry overcapacity and/or declining selling prices, customer orders are not generally made far in advance of the scheduled shipment date. Such reduced lead time can diminish management’s ability to forecast production levels and revenues. When the economy rebounds, our customers may strongly increase their demands, which can result in capacity constraints due to a time lag when matching manufacturing capacity with such demand.
In addition, our sales are affected by seasonality, with the first half generally showing lowest revenue levels in the year, and the third or fourth quarter historically generating higher amounts of revenues partly as a result of the seasonal dynamics for smartphone applications dynamics.
We also sell certain products to key customers pursuant to frame contracts. Frame contracts are annual contracts with customers setting forth quantities and prices on specific products that may be ordered in the future. These contracts allow us to schedule production capacity in advance and allow customers to manage their inventory levels consistent with just-in-time principles while shortening the cycle times required to produce ordered products. Orders under frame contracts are also subject to a high degree of volatility, because they reflect expected market conditions which may or may not materialize. Thus, they are subject to risks of price reduction, order cancellation and modifications as to quantities actually ordered resulting in inventory build-ups.
Furthermore, developing industry trends, including customers’ use of outsourcing and their deployment of new and revised supply chain models, may reduce our ability to forecast changes in customer demand and may increase our financial requirements in terms of capital expenditures and inventory levels.
We entered 2025 with a backlog lower than we had entering 2024. For 2026, we entered the year with a backlog higher than what we had entering 2025.
3.2.2.10. Competition
Markets for our products are intensely competitive. We compete with major international semiconductor companies and while only a few companies compete with us in all of our product lines, we face significant competition from each of them. Smaller niche companies are also increasing their participation in the semiconductor market, and semiconductor foundry companies have expanded significantly, particularly in Asia. Competitors include manufacturers of standard semiconductor devices, ASICs and fully customized ICs, including both chip and board-level products, as well as customers who develop their own IC products and foundry operations. Some of our competitors are also our customers or suppliers. We compete in different product lines to various degrees on the basis of price, technical performance, product features, product system compatibility, customized design, availability, quality and sales and technical support. In particular, standard products may involve greater risk of competitive pricing, inventory imbalances and severe market fluctuations than differentiated products. Our ability to compete successfully depends on factors both within and outside our control, including successful and timely development of new products and manufacturing processes, product performance and quality, manufacturing yields and product availability, customer service, pricing, industry trends and general economic trends.
The semiconductor industry is characterized by the high costs associated with developing marketable products and manufacturing technologies as well as high levels of investment in production capabilities. As a result, the semiconductor industry has experienced, and is expected to continue to experience, significant vertical and horizontal consolidation among our suppliers, competitors and customers, which
could lead to erosion of our market share, impact our capacity to compete and require us to restructure our operations.
3.2.2.11. Public Funding
We receive public funding mainly from EU member states (including France, Italy and Malta) and China. Such funding is generally provided to encourage R&D and innovation activities, enhance industrialization, and contribute to Capex for certain strategic programs, as well as national, regional and local economic development. Our funding programs are classified under four general categories: funding for research, development and innovation (“RDI”) activities, funding for first industrial deployment ("FID") activities and capital investment for pilot lines, and tax credits. We benefit from tax credits for R&D activities in several countries which are generally available to all companies.
The main R&D, RDI and FID programs in which we are involved include: (i) Important Projects of Common European Interest ("IPCEI") which combines R&D, RDI as well as FID activities; (ii) Chips JU/ECS program, which combines all electronics related R&D activities and is operated by a joint undertaking formed by the EU, certain member states and industry; (iii) EU R&D projects within Horizon Europe (the EU's research and innovation framework); and (iv) national or regional programs for R&D and for industrialization in the electronics industries involving many companies and laboratories.
In December 2018, the European Commission announced the approval of the IPCEI on Microelectronics ("IPCEI ME"), a pan-European project initiated to foster research and innovation in microelectronics to be funded by Germany, France, Italy, the U.K. and Austria.
In our combined role as beneficiary of the IPCEI ME, we have recognized grants of €266.1 million for the period 2018-2022 in France (locally referenced as Nano2022) which was linked to technical objectives and associated achievements, and were allocated approximately €789 million for the period 2018-2024 in Italy. The IPCEI ME program significantly strengthened our leadership in key technologies. It has contributed to anticipating, accelerating, and securing our technological developments. The IPCEI ME program also has wide ranging, pan-European benefits on the microelectronics ecosystem from education to downstream industries.
In December 2021, we took part in a new IPCEI program, titled IPCEI on Microelectronics and Communication Technologies (“IPCEI ME/CT”). This new pan-European project, approved by the European Commission in June 2023, was initiated to foster research and innovation and kick-start the first industrialization of microelectronics. It involves ST in France (2022-2026), Italy (2023-2027) and Malta (2021-2026), as well as around 56 other companies across 14 European countries. In 2025 we recognized grants of €24.8 million and €163.7 million related to our respective participations in IPCEI ME and IPCEI ME/CT in Italy, €117 million related to our participation in IPCEI ME/CT, Chips JU/ECS and other national and European programs in France and $39.7 million related to our participation in IPCEI ME/CT in Malta.
On October 4, 2022, the European Commission approved, under EU State Aid rules, a support up to €292.5 million through the Italian Recovery and Resilience Plan for the construction of a new integrated SiC substrate manufacturing facility in Catania, Italy. In 2025 we recognized grants of €9.2 million related to this project.
On April 28, 2023, the European Commission approved, under EU State Aid rules, a French aid measure to support the Company and GlobalFoundries in the construction and operation of a front-end semiconductor production facility in Crolles, France. This project represents an overall projected cost of €7.5 billion for capital expenditure, maintenance and ancillary costs. The new facility will benefit from significant financial support of up to around €2.9 billion from France for GlobalFoundries and ST. In 2025 we received around €126 million in cash and recognized grants of €72 million from this program in Crolles, France, as a result of our program execution.
On May 31, 2024, the European Commission approved, under the EU State Aid rules, an Italian aid measure to support the Company in the construction and operation of an integrated chip manufacturing
plant for SiC power devices in Catania, Italy. The aid will take the form of a €2 billion direct grant to ST to support its planned investment of €5 billion in capital expenditure. The measure will strengthen Europe's security of supply, resilience and digital sovereignty in semiconductor technologies. The measure will also contribute to achieving the digital and green transitions. On October 13, 2025, the European Commission formally granted ST the status of Integrated Production Facility ("IPF") as referenced in the European Chips Act.
These projects are “first-of-a-kind” facilities in Europe in line with the ambitions and objectives of the European Chips Act.
On June 7, 2023, the Company and Sanan Optoelectronics jointly created SANAN, STMicroelectronics Co. Ltd. (“Sanan ST JV”), for high-volume 200mm SiC device manufacturing in China. This joint venture will make SiC devices exclusively for us, using our proprietary SiC manufacturing process technology, and will serve as a dedicated foundry to support the demand of our Chinese customers. The total amount for the full buildout of the joint venture’s future operations is expected to be about $3.2 billion, including capital expenditures of about $2.4 billion over a 5 year period as of 2023, for which Sanan ST JV receives local government support through a funding program with Chinese regional authorities.
3.2.2.12. Suppliers
We use three primary critical types of suppliers in our business: (i) equipment suppliers, (ii) material suppliers and (iii) external silicon foundries and test & packaging subcontractors. We also purchase third-party licensed technology from a limited number of providers.
In the front-end process, we use steppers, scanners, tracking equipment, strippers, chemo-mechanical polishing equipment, cleaners, inspection equipment, etchers, physical and chemical vapor-deposition equipment, implanters, furnaces, testers, probers and other specialized equipment. The manufacturing tools that we use in the back-end process include bonders, burn-in ovens, testers and other specialized equipment. The quality and technology of equipment used in the IC manufacturing process defines the limits of our technology. Demand for increasingly smaller chip structures means that semiconductor producers must quickly incorporate the latest advances in process technology to remain competitive. Advances in process technology cannot occur without commensurate advances in equipment technology, and equipment costs tend to increase as the equipment becomes more sophisticated.
Our manufacturing processes consume significant amounts of energy and use many materials, including silicon and SiC, GaN and glass wafers, lead frames, mold compound, ceramic packages and chemicals, gases and water. The prices of energy, such as electricity and natural gas, and many of these materials are volatile due to the specificity of the market, and other factors including geopolitics. We have therefore adopted a “multiple sourcing strategy” designed to protect us from the risk of price increases. The same strategy applies to energy and to supplies for the materials used by us to avoid potential material disruption of essential materials and to ensure the continuity of energy supply. Our “multiple sourcing strategy”, our financial risk monitoring as well as the robustness of our supply chain and strong partnership with suppliers are intended to mitigate these risks.
Finally, we also use external subcontractors to outsource wafer manufacturing and assembly and testing of finished products.
3.2.3. Key announcements
On March 9, 2026, we announced that we are entering high-volume production of our state-of-the-art silicon photonics-based PIC100 platform used by hyperscalers for optical interconnect for data centers and AI clusters.
On February 9, 2026, we announced an expanded strategic collaboration with Amazon Web Services ("Amazon") through a multi-year, multi-billion USD commercial engagement serving several product categories, to enable new high performance compute infrastructure for cloud and AI data centers.
On February 2, 2026, we announced the closing of the acquisition of NXP Semiconductors' MEMS sensor business, first announced on July 24, 2025. This transaction, focused on automotive safety and non-safety products and sensors for industrial applications, expands ST’s global sensors capabilities and strengthens our global sensors capabilities, unlocking new opportunities for development across automotive, industrial and consumer applications. The transaction was subject to customary closing conditions, including regulatory approvals, which have now been satisfied or waived, and closed on February 2, 2026.
On December 18, we held an Extraordinary General Meeting of Shareholders ("EGM"), in Amsterdam, the Netherlands. The proposed resolutions, all approved by our Shareholders were:
•the appointment of Mr. Armando Varricchio, as member of the Supervisory Board, for a term expiring at the end of the 2028 AGM; and
•the appointment of Mr. Orio Bellezza, as member of the Supervisory Board, for a term expiring at the end of the 2028 AGM.
On December 11, we announced that ST and the European Investment Bank ("EIB") have signed a €500 million financing agreement to boost Europe’s competitiveness and strategic autonomy. This represented the first tranche of a broader €1 billion credit line approved by the EIB in favor of ST.
On November 20, we announced that ST and TSE, a leading player in solar energy and agrivoltaics in France, have signed a 15-year Power Purchase Agreement ("PPA") to supply renewable electricity from solar parks to STMicroelectronics’ sites in France.
On November 18, we announced the introduction by ST of the industry’s first 18nm microcontroller for high-performance applications.
On October 21, we announced that ST and SP Group, a leading utilities group in the Asia Pacific and Singapore’s national grid operator, have commenced operations for Singapore’s largest industrial district cooling system at our Ang Mo Kio TechnoPark, reducing carbon emissions by up to 120,000 tonnes annually and cutting cooling electricity use by 20%. This energy-efficient system supports our goal of carbon neutrality by 2027 and earned Green Mark Platinum certification for sustainability and design excellence.
On September 17, we announced that we are advancing our next-generation Panel-Level Packaging technology with a new pilot line at our Tours, France site, operational by Q3 2026. This $60 million investment aims to boost our manufacturing efficiency and innovation for automotive, industrial, and consumer applications, reinforcing ST’s leadership in chip packaging and heterogeneous integration in Europe.
On August 20, we published our IFRS 2025 Semi Annual Accounts for the six-month period ended June 28, 2025 on our website and filed them with the Netherlands Authority for the Financial Markets (Authoriteit Financiële Markten).
On May 28, we held our AGM, in Amsterdam, the Netherlands. The proposed resolutions, all of which were approved by our Shareholders, were:
•the adoption of the Company's Statutory Annual Accounts for the year ended December 31, 2024, prepared in accordance with IFRS and filed with the Netherlands Authority for the Financial Markets on March 27, 2025;
•the distribution of a cash dividend of $0.36 per outstanding share of the Company’s common stock to be distributed in quarterly installments of $0.09 in each of the second, third and fourth quarters of 2025 and first quarter of 2026 to shareholders of record in the month of each quarterly payment;
•the adoption of the remuneration for the members of the Supervisory Board;
•the appointment of Mr. Werner Lieberherr, as member of the Supervisory Board, for a three-year term expiring at the end of the 2028 AGM, in replacement of Ms. Janet Davidson whose mandate has expired at the end of the 2025 AGM;
•the appointment of Ms. Simonetta Acri, as member of the Supervisory Board, for a three-year term expiring at the end of the 2028 AGM in replacement of Ms. Donatella Sciuto whose mandate has expired at the end of the 2025 AGM;
•the reappointment of Mrs. Ana de Pro Gonzalo, as member of the Supervisory Board, for a three-year term to expire at the end of the 2028 AGM;
•the reappointment of Mrs. Hélène Vletter-van Dort, as member of the Supervisory Board, for a three-year term to expire at the end of the 2028 AGM;
•the appointment of PricewaterhouseCoopers Accountants N.V. as the Company’s external auditor for the financial years 2026-2029;
•the appointment of PricewaterhouseCoopers Accountants N.V. to audit the Company’s sustainability reporting for the financial years 2026-2027, to the extent required by law;
•the approval of the stock-based portion of the compensation of the President and Chief Executive Officer;
•the approval of the stock-based portion of the compensation of the President and Chief Financial Officer;
•the authorization to the Managing Board, until the conclusion of the 2026 AGM, to repurchase shares, subject to the approval of the Supervisory Board;
•the delegation to the Supervisory Board of the authority to issue new common shares, to grant rights to subscribe for such shares, and to limit and/or exclude existing shareholders’ pre-emptive rights on common shares, until the end of the 2026 AGM;
•the discharge of the member of the Managing Board; and
•the discharge of the members of the Supervisory Board.
On April 10, we detailed our Company-wide program to reshape our manufacturing footprint and resize our global cost base and confirmed the annual cost savings target in the high triple-digit million-dollar range exiting 2027. Specifically, we disclosed further elements of our program to reshape our global manufacturing footprint.
On April 10, our Supervisory Board commented on statements made in the Italian press on April 9:
•accusations on the personal transactions made by the two members of our Managing Board on the eve of earnings releases are false. Stock sales done during our blackout period were made by our stock plan administrator, through an automatic procedure, to abide by Swiss tax rules for the Managing Board members and were legal and compliant with Company policy. On the class action under way, the Supervisory Board reviewed the processes and believes that ST has good defense against the allegations;
•the Supervisory Board unanimously approved the details of a Company-wide program to reshape our manufacturing footprint, accelerating ST’s wafer-fab capacity to 300mm silicon and 200mm silicon carbide, announced to the markets last year on October 31 and this year on January 30. This plan allows for a major improvement of the competitiveness of the Company; and
•the Supervisory Board expressed its renewed support to Jean-Marc Chery, Lorenzo Grandi, and the management team, notably in their capacity to execute the transformation during challenging times for the semiconductor industry.
On March 31, we announced the signature of an agreement on GaN technology development and manufacturing with Innoscience, the world leader in 8” GaN-on-Si (gallium nitride on silicon) high-performance low-cost manufacturing.
3.2.4. Financial outlook: Capital investment
Our policy is to modulate our capital spending according to the evolution of the semiconductor market. For 2026, we plan to invest between $2.0 to $2.2 billion in Net Capex (non-GAAP measure). Net Capex (non-GAAP measure) is further described in Section 3.2.5 (Liquidity and financial position).
Our Net Capex (non-GAAP measure) will support capacity additions for selected growth drivers and our manufacturing reshaping plan.
In particular:
•in Catania, Italy, the new high-volume fully vertically integrated 200mm silicon carbide manufacturing facility for power devices and modules, as well as test and packaging;
•in Chongqing, China, the new 200mm silicon carbide device manufacturing joint venture with Sanan Optoelectronics;
•in Crolles, France, 300mm wafer fab evolution for digital and Cloud Optical Interconnect;
•in Agrate, Italy, the ramp-up of the 300mm wafer fab to support analog mixed signal and smart power HCMOS; and
•capital investments in back-end facilities, which in 2026 will be largely focused on: (i) capacity growth on certain package families, (ii) the next generation of Panel-Level Packaging (PLP) technology through a pilot line in Tours, France, and (iii) selected investments for the modernization and expansion assembly and test operations.
The remaining part of our Net Capex (non-GAAP measure) covers the overall maintenance and efficiency improvements of our manufacturing operations and infrastructure, R&D activities, laboratories as well as the execution of our carbon neutrality programs.
We will continue to invest to support revenues growth and new products introduction, taking into consideration factors such as trends in the semiconductor industry, capacity utilization and our goal to become carbon neutral in all direct and indirect emissions (scopes 1 and 2), product transportation, business travel, and employee commuting emissions (our scope 3 focus), and to achieve our 100% renewable electricity sourcing goal by the end of 2027. We expect to need significant financial resources in the coming years for capital expenditures and for our investments in manufacturing and R&D. We plan to fund our capital requirements with cash provided by operating activities, available funds and support from third parties, and may have recourse to borrowings under available credit lines and, to the extent necessary or attractive based on market conditions prevailing at the time, the issuance of debt, convertible bonds or additional equity securities. A substantial deterioration of our economic results, and consequently of our profitability, could generate a deterioration of the cash generated by our operating activities. Therefore, there can be no assurance that, in future periods, we will generate the same level of cash as in prior years to fund our capital expenditure plans for expanding/upgrading our production facilities, our working capital requirements, our R&D and manufacturing costs.
We believe that we have the financial resources needed to meet our currently projected business requirements for the next twelve months, including capital expenditures for our manufacturing activities, working capital requirements, approved dividend payments, share buy-backs as part of our current repurchase program and the repayment of our debt in line with maturity dates.
3.2.5. Liquidity and financial position
We maintain an adequate cash position and a low debt-to-equity ratio to provide us with adequate financial flexibility. As in the past, our cash management policy is to finance our investment needs mainly with net cash generated from operating activities.
During 2025, our net cash increased by $555 million. The components of our net cash variation and the comparable period are set forth below:
| | | | | | | | | | | | | | |
| In millions of U.S. dollars | | 2025 | | 2024 |
| Net cash from operating activities | | 2,573 | | | 3,342 | |
| Net cash used in investing activities | | (423) | | | (4,096) | |
| Net cash used in financing activities | | (1,601) | | | (178) | |
| Effect of changes in exchange rates | | 6 | | | (8) | |
| Net cash increase (decrease) | | 555 | | | (940) | |
Net cash from operating activities
Net cash from operating activities is the sum of (i) net profit adjusted for non-cash items and (ii) changes in net working capital. The net cash from operating activities in 2025 was $2,573 million, decreasing compared to $3,342 million in the prior year, mainly due to lower net profit.
Net cash used in investing activities
Investing activities used $423 million of cash in 2025, decreasing compared to $4,096 million cash used in 2024, mainly due to lower payments for purchase of tangible assets, net of proceeds from sales of tangible assets, capital grants and other contributions, which totaled $1,844 million in 2025 ($2,642 million in 2024), and higher net proceeds from marketable securities and short-term deposits, which totaled $1,896 million in 2025. Capital investments for the year 2025 included (i) investments in advanced wafer fabs, such as the 300mm fab in Agrate, Italy, the 300mm fab in Crolles, France and ; (ii) SiC activities, primarily in Catania, Italy and China; and (iii) in selected programs of capacity growth in other front-end and back-end activities.
Net cash used in financing activities
Net cash used in financing activities was $1,601 million for 2025, compared to $178 million in 2024, and consisted mainly of $750 million of repayment of issued convertible bonds, $367 million repurchase of common stock, $321 million of dividends paid to our shareholders and $315 million repayment of financial debt including payment for lease liabilities, partially offset by $156 million of proceeds from noncontrolling interest.
Net Capex (non-GAAP measure)
Our Net Capex (non-GAAP measure) is derived from our U.S. GAAP Consolidated Statements of Cash Flows, which differs from our Consolidated Statements of Cash Flows under IFRS. Our Net Capex (non- GAAP measure) takes into consideration the effect of advances from capital grants received on prior periods allocated to property, plant and equipment in the reporting period. Net Capex is reported as part of our Free Cash Flow (non-GAAP measure).
Net Capex, a non-GAAP measure, is defined as (i) payment for purchase of tangible assets, as reported plus (ii) proceeds from sale of tangible assets, as reported plus (iii) proceeds from capital grants and other
contributions, as reported, plus (iv) advances from capital grants allocated to property, plant and equipment in the reporting period.
We believe Net Capex provides useful information for investors and management because annual capital expenditures budget includes the effect of capital grants. Our definition of Net Capex may differ from definitions used by other companies.
Our Net Capex (non-GAAP measure) is derived from our U.S. GAAP Consolidated Statements of Cash Flows, which reconciles with IFRS Consolidated Statements of Financial Position:
| | | | | | | | | | | | | | |
| In millions of U.S. dollars | | 2025 | | 2024 |
| Payment for purchase of tangible assets, as reported | | (2,111) | | | (3,088) | |
| Proceeds from sale of tangible assets, as reported | | 9 | | | 5 | |
| Proceeds from capital grants and other contributions, as reported | | 258 | | | 441 | |
| Advances from capital grants allocated to property, plant and equipment | | 52 | | | 111 | |
| Net Capex (non-GAAP measure) | | (1,792) | | | (2,531) | |
Net Capex decreased by $739 million, from $2,531 million in 2024 to $1,792 million in 2025, primarily due to lower payments for purchases of tangible assets.
Free cash flow (non-GAAP measure)
Our Free Cash Flow (non-GAAP measure) is derived from our U.S. GAAP Consolidated Statements of Cash Flows, which differs from our Consolidated Statements of Cash Flows under IFRS. Free Cash Flow, a non-GAAP measure, is defined as (i) net cash from operating activities plus, (ii) net Capex plus (iii) payment for purchase (and proceeds from sale) of intangible and financial assets and (iv) net cash paid for business acquisitions, if any.
We believe Free Cash Flow, a non-GAAP measure, provides useful information for investors and management because it measures our capacity to generate cash from our operating and investing activities to sustain our operations.
Free Cash Flow is a non-GAAP measure and does not represent total cash flow since it does not include the cash flows from, or used in, financing activities. Free Cash Flow reconciles with the total cash flow and the net cash increase (decrease) by including the payment for purchase of (and proceeds from matured) marketable securities and net investments in (and proceeds from) short-term deposits, the net cash from (used in) financing activities and the effect of changes in exchange rates while excluding the advances from capital grants received in prior periods and allocated to property, plant and equipment in the current reporting period. Our definition of Free Cash Flow may differ from definitions used by other companies.
Our Free Cash Flow is derived from our U.S. GAAP Consolidated Statements of Cash Flows; a reconciliation from the Consolidated Statement of Cash Flows as reported under IFRS is provided in the table below:
| | | | | | | | | | | | | | |
| | | | |
| In millions of U.S. dollars | | December 31,
2025 | | December 31,
2024 |
| Net cash from operating activities as reported under IFRS | | 2,573 | | | 3,342 | |
| Excluding U.S. GAAP/IFRS presentation differences: | | | | |
| Payment for withholding tax on vested shares | | 23 | | | 44 | |
| | | | |
| Payment for operating lease liabilities | | (64) | | | (67) | |
| | | | |
| | | | |
| | | | |
| | | | |
| Net cash from operating activities adjusted under IFRS | | 2,532 | | | 3,319 | |
| Net Capex (non-GAAP measure) | | (1,792) | | | (2,531) | |
| Payment for purchase of intangible assets, net of proceeds from sale | | (473) | | | (447) | |
| Payment for purchase of financial assets, net of proceeds from sale | | (2) | | | (53) | |
| Free Cash Flow (non-GAAP measure) | | 265 | | | 288 | |
Our Free Cash Flow was $265 million in 2025, compared to $288 million in 2024.
Capital resources
Net Financial Position and Adjusted Net Financial Position are non-GAAP measures, and they are derived from our U.S. GAAP Consolidated Balance Sheets, which differs from our Consolidated Statements of Financial Position under IFRS. Our Net Financial Position represents the difference between our total liquidity and our total financial debt. Our total liquidity includes cash and cash equivalents, restricted cash, if any, short-term deposits and quoted debt securities; our total financial debt includes interest-bearing loans and borrowings, including current portion, as represented in our consolidated statement of financial position. Adjusted Net Financial Position represents net financial position less advances from capital grants, to present the effect on total liquidity of advances received on capital grants for which capital expenditures have not been incurred yet. Net Financial Position and Adjusted Net Financial Position are non-GAAP measures but we believe they provide useful information for investors and management because they give evidence of our global position either in terms of net indebtedness or net cash by measuring our capital resources based on cash and cash equivalents, restricted cash, if any, short-term deposits and quoted debt securities and the total level of our financial debt.
Our definition of Net Financial Position may differ from definitions used by other companies and therefore comparability may be limited. Our Net Financial Position and Adjusted Net Financial Position are derived from our U.S. GAAP Consolidated Balance Sheets, which differs from the Consolidated Statement of Financial Position under IFRS. A reconciliation with the Consolidated Statement of Financial Position under IFRS is provided in the table below:
| | | | | | | | | | | | | | |
| In millions of U.S. dollars | | December 31,
2025 | | December 31,
2024 |
| Cash and cash equivalents | | 2,837 | | | 2,282 | |
| | | | |
| Short-term deposits | | 1,100 | | | 1,450 | |
| Government bonds issued by the U.S. Treasury | | 985 | | | 2,452 | |
| Total liquidity | | 4,922 | | | 6,184 | |
| Funding program loans from EIB | | (1,109) | | | (1,178) | |
| Credit Facility from Cassa Depositi e Prestiti SpA (“CDP SpA”) | | (170) | | | (208) | |
| Dual tranche senior unsecured convertible bonds | | (728) | | | (1,457) | |
| Other funding programs loans | | (3) | | | (5) | |
| Total financial debt, as reported under IFRS | | (2,010) | | | (2,848) | |
| Difference in dual-trench senior convertible debt amortized cost | | (21) | | | (41) | |
| Difference in the presentation of finance lease | | (102) | | | (64) | |
| Total U.S. GAAP/IFRS differences | | (123) | | | (105) | |
| Total financial debt, as reported under US GAAP | | (2,133) | | | (2,953) | |
| Net Financial Position (non-GAAP measure) | | 2,789 | | | 3,231 | |
| Advances from capital grants | | (333) | | | (385) | |
| Adjusted Net Financial Position (non-GAAP measure) | | 2,456 | | | 2,846 | |
Our Net Financial Position as of December 31, 2025, was a net cash position of $2,789 million, decreasing compared to a net cash position of $3,231 million as of December 31, 2024.
As of December 31, 2025, our financial debt as reported under IFRS was $2,010 million, composed of (i) $978 million of current portion of financial debt and (ii) $1,032 million of long-term debt. The breakdown of our total financial debt included: (i) $728 million in senior unsecured convertible bonds issued in 2020, (ii) $1,109 million in EIB Loans, (iii) $170 million in CDP SpA Loans and (iv) $3 million in loans from other funding programs.
The EIB Loans are comprised of three long-term amortizing credit facilities as part of our public funding programs. The first, signed in August 2017, is a €500 million loan, in relation to R&D and capital expenditures in the European Union. The entire amount was fully drawn in Euros, corresponding to $205 million outstanding as of December 31, 2025. The second one, signed in 2020, is a €500 million credit facility agreement with EIB to support R&D and capital expenditure programs in Italy and France. The amount was fully drawn in Euros representing $352 million outstanding as of December 31, 2025. In 2022, we signed a third long-term amortizing credit facility with EIB of €600 million. Of this amount, €300 million was withdrawn in Euros in 2022, and $300 million was withdrawn in U.S dollars during 2024, representing a total outstanding balance of $552 million as of December 31, 2025. In December 2025, we entered into a €500 million financing agreement with EIB to support the acceleration of R&D and high-volume chip manufacturing in Italy and France. This agreement represents the first tranche of a broader €1 billion credit line approved by EIB in our favor. Of this amount, €500 million was withdrawn in March 2026.
The CDP SpA Loans are comprised of two long-term credit facilities. The first, signed in 2021, is a €150 million loan, fully drawn in Euros, of which $44 million were outstanding as of December 31, 2025. The second one, signed in 2022, is a €200 million loan, fully drawn in Euros, of which $126 million was outstanding as of December 31, 2025.
On August 4, 2020, we issued $1.5 billion offering of senior unsecured convertible bonds (Tranche A for $750 million and Tranche B for $750 million, each, "Tranche A" and "Tranche B", respectively), due 2025 and 2027, respectively. Tranche A bonds were issued at 105.8% as zero-coupon bonds and Tranche B bonds were issued at 104.5% as zero-coupon bonds. The conversion price at issuance was $43.62 for Tranche A equivalent to a 47.5% conversion premium and $45.10 for Tranche B, equivalent to a 52.5% conversion premium. These conversion features correspond to an equivalent of 4,585 shares per each
Tranche A bond $200,000 par value and an equivalent of 4,435 shares per each Tranche B bond $200,000 par value. The bonds are convertible by the bondholders or are callable by us following contractual terms and schedule, if certain conditions are satisfied, on a net-share settlement basis, except if we elect a full-cash or full-share conversion as an alternative settlement. The net proceeds from the bond offering were $1,567 million, after deducting issuance costs. On August 4, 2025, we completed the full redemption of our Tranche A convertible bond.
Our long-term debt contains standard conditions but does not impose minimum financial ratios. We had unutilized committed medium-term credit facilities with core relationship banks totaling $640 million as of December 31, 2025.
Our current ratings with two major rating agencies that report on us on a solicited basis, are as follows: Standard & Poor’s (“S&P”): “BBB+” with negative outlook; Moody’s Investors Service (“Moody’s”): “Baa1” with stable outlook.
3.2.6. Financial risk management
We are exposed to changes in financial market conditions in the normal course of business due to our operations in different foreign currencies and our ongoing investing and financing activities. Our activities expose us to a variety of financial risks: market risk (including foreign exchange risk, fair value interest rate risk, cash flow interest rate risk and price risk), credit risk and liquidity risk. Our overall risk management program focuses on the unpredictability of financial markets and seeks to minimize potential adverse effects on our financial performance. We use derivative financial instruments to hedge certain risk exposures.
Financial risk management is carried out by our central treasury department ("Corporate Treasury”). Additionally, a Treasury Committee, chaired by our Chief Financial Officer, steers treasury activities and ensures compliance with corporate policies. Treasury activities are thus regulated by our policies, which define procedures, objectives and controls. The policies focus on managing financial risk in terms of exposure to market risk, credit risk and liquidity risk. Treasury controls are subject to internal audits. Most treasury activities are centralized, with any local treasury activities subject to oversight from our Corporate Treasury. Our Corporate Treasury identifies, evaluates and hedges financial risks in close cooperation with our subsidiaries. It provides written principles for overall risk management, as well as written policies covering specific areas, such as foreign exchange risk, interest rate risk, price risk, credit risk, use of derivative financial instruments, and investments of excess liquidity.
The majority of cash and cash equivalents is held in U.S. dollars and Euros and is placed with financial institutions rated at least a single “A” long-term rating from two of the major rating agencies, meaning at least A3 from Moody’s and A- from S&P or Fitch ratings, or better. These ratings are closely and continuously monitored in order to manage exposure to the counterparty’s risk. Hedging transactions are performed only to hedge exposures deriving from operating, investing and financing activities conducted in the normal course of business.
Foreign exchange risk
We conduct our business on a global basis in various major international currencies. As a result, we are exposed to adverse movements in foreign currency exchange rates, primarily with respect to the Euro. Foreign exchange risk mainly arises from recognized assets and liabilities at our subsidiaries and future commercial transactions.
Cash flow and fair value interest rate risk
Our interest rate risk arises from long-term borrowings. Borrowings issued at variable rates expose us to cash flow interest rate risk. Borrowings issued at fixed rates expose us to fair value interest rate risk.
Price risk
As part of its ongoing investing activities, we may invest in publicly traded equity securities and be exposed to equity security price risk. In order to hedge the exposure to this market risk, we may enter into certain derivative hedging transactions.
In December 2024, we participated to the IPO of Innoscience (Suzhou) which became public on the main segment of Hong Kong Stock Exchange. As a publicly traded equity instrument, Innoscience investment is measured at fair value through profit and loss, with a $76M unrealized gain recorded in 2025.
Credit risk
We select banks and/or financial institutions that operate with us based on the criteria of long-term rating from at least two major rating agencies and keeping a maximum outstanding amount per instrument with each bank not to exceed 20% of the total. For derivative financial instruments, management has established limits so that, at any time, the fair value of contracts outstanding is not concentrated with any individual counterparty.
We monitor the creditworthiness of our customers to which we grant credit terms in the normal course of business. If certain customers are independently rated, these ratings are used. Otherwise, if there is no independent rating, risk control assesses the credit quality of the customer, considering its financial position, past experience and other factors. The utilization of credit limits is regularly monitored. Sales to customers are primarily settled in cash, which mitigates credit risk. As of December 31, 2025 and 2024, no individual customer represented more than 10% of total trade accounts receivable. Any remaining concentrations of credit risk with respect to trade receivables are limited due to the large number of customers and their dispersion across many geographic areas.
Liquidity risk
Prudent liquidity risk management includes maintaining sufficient cash and cash equivalents, short-term deposits and marketable securities, the availability of funding from committed credit facilities and the ability to close out market positions. Our objective is to maintain a significant cash position and a low debt-to-equity ratio, which ensures adequate financial flexibility. Our liquidity management policy is to finance our investments with net cash from operating activities.
Management monitors rolling forecasts of our liquidity reserve based on expected cash flows.
3.3. Risk management and Internal control
The Managing Board is responsible for establishing and maintaining adequate internal risk management and control systems.
Those systems are based on the Company’s Code of Conduct, policies and procedures, operational specifications and, where applicable internationally recognized management systems (including ISO-based frameworks).
Our policies and procedures govern our internal operational, compliance and reporting processes and set forth principles, rules of behavior and conduct which are considered to be consistent with proper business management, in line with our mission and strategic objectives.
They describe the operational flow of actions to perform a task or activity, or to implement a policy within a given functional field. We perform a large number of control activities such as approvals, authorizations,
verifications, reconciliations, review of operating performance, security of assets and segregation of duties, which are deployed throughout the Company.
Our systems also contain monitoring and reporting activities as well as operational reviews.
The company's overall risk management framework as well as its main risk factors are described in Section 3.3.1. (Risk Management), specific internal control systems over financial reporting and sustainability reporting in Sections 3.3.2.1. (Internal control over financial reporting risks) and 3.3.2.2. (Internal control over sustainability reporting risks) respectively, and internal audit in Section 3.3.3. (Internal Audit). Section 3.3.4. (Statement on risk management and internal control systems) outlines the Managing Board assessment of the risk management and internal control systems.
3.3.1. Risk management
3.3.1.1. Risk management approach
Enterprise risk management framework
As a company operating globally in the semiconductor market, we are exposed to risks, particularly in the current environment of increased volatility, uncertainty, complexity and ambiguity. For a description of our risk factors, please refer to Section 3.3.1.2. (Risk factors). Our embedded approach to Enterprise Risk Management ("ERM") is formalized in a specific policy and is aligned with ISO 31000 (Risk Management).
This enables us to:
•execute our Company strategy, manage our performance, and capitalize on opportunities; and
•systematically identify, evaluate and treat specific risk scenarios.
Our ERM roadmap includes, in particular, deploying our ERM framework which is based on the following principles:
•addressing uncertainty explicitly;
•pragmatic and tailored to us;
•integral part of our processes and decision-making; and
•proactive, structured, dynamic, iterative and responsive to change.
Our ERM framework is described in the following chart:
ERM FRAMEWORK
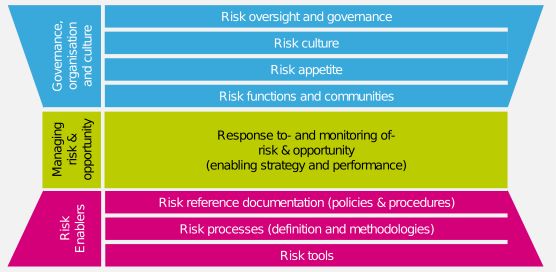
Risk governance and process
Our overall risk approach is managed by our Chief Audit & Risk Executive (our "Chief Audit & Risk Executive") under the direct responsibility of our Managing Board and the oversight of our Supervisory Board. The scope of this oversight role is detailed in our Supervisory Board charter.
The embedded ERM process takes a holistic view, combining both company-wide top-down and bottom-up perspectives, so that specific risk scenarios are addressed at the right level. Our risk assessments are performed on a residual basis, i.e. taking into account existing controls embedded in policies and procedures as well as other risk mitigation measures. Therefore, the risk maps are not designed to be exhaustive, and feature scenarios on an exception basis.
During 2025, we refreshed our Company risk assessment with the executive management team. The output from this exercise was a risk map linked to our strategic objectives, including redefined ‘priority 1’ risk scenarios.
Corporate risk owners (members of our Senior Management) as detailed in Section 5.4. (Managing Board) were appointed for each priority risk area to develop risk response plans adapted to changing external conditions, and enhance monitoring capabilities. The risk response plans are regularly reviewed by our Executive Committee and periodically discussed with the Audit Committee.
Each ST department completes its own risk assessment. This includes marketing and sales regions, product groups, manufacturing and technology, and corporate functions. In addition, we implemented further risk assessments on selected company strategic programs, including transformation programs. Finally, the DMA process and its results are embedded into our ERM process.
Our risk governance and process are described in the following chart:
RISK GOVERNANCE AND PROCESS
Risk appetite strategy
Risk management activities are governed by our risk appetite strategy, which is discussed annually at the Supervisory Board and its audit committee (our "Audit Committee").
The risk appetite strategy defines the level and nature of risks we are willing to take or accept to achieve our objectives, depending on associated expected rewards, opportunities, and costs.
Our risk appetite strategy depends on the nature of risks and defines four stances: averse, cautious, balanced and entrepreneurial. As an illustration, this means that we strive to reduce residual exposure to a level as low as reasonably practicable or limit exposure tolerating a controlled residual level where we adopt averse / cautious stances, respectively. This is the case for the following risk categories:
•corporate governance;
•product quality;
•environment (related to ST operations incl. climate change mitigation, water and pollution);
•social (including health & safety and working conditions);
•finance;
•legal, ethics & compliance; and
•cyber security.
The illustrative risk management measures we take with regard to these risk categories are further described in Section 3.3.1.3. (Illustrative risk management measures).
3.3.1.2. Risk Factors
Below is a list of the main risk factors we believe are related to the semiconductor industry and specifically related to our operations, which may affect our results, performance, and the ability of our management to predict the future of our Company. This list of main risk factors also includes risks that we have identified to be material, including through our double materiality assessment ("DMA") performed in 2025, as described further in Section 3.4.2.3.C. (Material impacts, risks and opportunities and their interaction with strategy and business model).
Summary of Risk Factors
Risks Related to the Semiconductor Industry Which Impact Us
•We, and the semiconductor industry as a whole, have been and may be further impacted by changes in, or uncertainty about, global, regional and local economic, political, legal, regulatory and social environments as well as climate change.
•We, and the semiconductor industry, operate at a global scale. Our global asset base and market footprint expose us to negative impacts of tariffs and /or trade barriers that may inhibit our ability to place products across regions.
•The semiconductor industry is cyclical and downturns in the semiconductor industry can negatively affect our results of operations and financial condition.
•Epidemics or pandemics may impact the global economy and could also adversely affect our business, financial condition and results of operations.
•We may not be able to match our production capacity to demand.
•Competition in the semiconductor industry is intense, and we may not be able to compete successfully if our product design technologies, process technologies and products do not meet market requirements. Furthermore, the competitive environment of the industry has resulted, and is expected to continue to result, in vertical and horizontal consolidation among our suppliers, competitors and customers, which may lead to erosion of our market share, impact our ability to compete and require us to restructure our operations.
Risks Related to Our Operations
•Our high fixed costs could adversely impact our results.
•Our capital needs are high compared to those competitors who do not manufacture their own products and we may need additional funding in the coming years to finance our investments, to purchase other companies or technologies developed by third parties or to refinance our maturing indebtedness.
•Our operating results depend on our ability to obtain quality supplies on commercially reasonable terms. As we depend on a limited number of suppliers for materials, equipment and technology, we may experience supply disruptions if suppliers interrupt supply, increase prices or experience material adverse changes in their financial condition.
•Our financial results can be affected by fluctuations in exchange rates, principally in the value of the U.S. dollar.
•Our operating results may vary significantly from quarter to quarter and annually and may also differ significantly from our expectations or guidance.
•If our external silicon foundries or back-end subcontractors fail to perform, this could adversely affect our business prospects, financial condition and results of operations.
•Our manufacturing processes are highly complex, costly and potentially vulnerable to impurities, disruptions or inefficient implementation of production changes or interruptions that can significantly increase our costs and delay product shipments to our customers.
•We may experience quality problems from time to time that can result in decreased sales and operating margin and product liability or warranty claims.
•Disruptions in our relationships with any one of our key customers or distributors, and/or material changes in their strategy or financial condition or business prospects, could adversely affect our results of operations.
•We may experience delays in delivering our product and technology roadmaps as well as transformation initiatives.
•Our computer systems, including hardware, software, information and cloud-based initiatives, are subject to attempted security breaches and other cybersecurity threats, which, if successful, could adversely impact our business.
•We may not be able to integrate or optimize the use of new technologies in a timely manner, which may place us at a competitive disadvantage against other industry players.
•We may be subject to theft, loss, or misuse of personal data about our employees, customers, or other third parties, which could increase our expenses, damage our reputation, or result in legal or regulatory proceedings.
•Our business is dependent in large part on continued growth in the industries and segments into which our products are sold and on our ability to retain existing customers and attract new ones. A market decline in any of these industries, our inability to retain and attract customers, or customer demand for our products which differs from our projections, could have a material adverse effect on our results of operations.
•Market dynamics have driven, and continue to drive us, to a strategic repositioning.
•We depend on collaboration with other semiconductor industry companies, research organizations, universities, customers and suppliers to further our R&D efforts, and our business and prospects could be materially adversely affected by the failure or termination of such alliances.
•We depend on patents to protect our rights to our technology and may face claims of infringing the IP rights of others.
•We operate in many jurisdictions with highly complex and varied tax regimes. Changes in tax rules, new or revised legislation or the outcome of tax assessments and audits could cause a material adverse effect on our results.
•We receive public funding, and a reduction in the amount available to us or demands for repayment could increase our costs and impact our results of operations.
•Some of our production processes and materials are environmentally sensitive, which could expose us to liability and increase our costs due to environmental, health and safety laws and regulations or because of damage to the environment.
•Climate change, increased focus on social impact, and related sustainability regulations and initiatives, including our commitment to become carbon neutral in all direct and indirect emissions (scopes 1 and 2), product transportation, business travel, and employee commuting emissions (our scope 3 focus), and to achieve our 100% renewable electricity sourcing goal by the end of 2027, could place additional burden on us and our operations.
•Individual customer use of certain products, which may differ from the anticipated uses of such products and result in differences in performance, including energy consumption, may lead to a failure to achieve our disclosed emission-reduction goals, adverse legal action or additional research costs.
•Loss of key employees and the inability to continuously recruit and retain qualified employees could hurt our competitive position.
•The interests of our controlling shareholder, which is in turn indirectly controlled by the French and Italian governments, may conflict with other investors’ interests. In addition, our controlling shareholder may sell our existing common shares or issue financial instruments exchangeable into our common shares at any time.
•Our shareholder structure and our preference shares may deter a change of control.
•Any decision to reduce or discontinue paying cash dividends to our shareholders could adversely impact the market price of our common shares.
•We are required to prepare financial statements under IFRS and we also prepare Consolidated Financial Statements under U.S. GAAP, and such dual reporting may impair the clarity of our financial reporting.
•There are inherent limitations on the effectiveness of our risk management and internal control(s) systems.
•Because we are subject to the corporate law of The Netherlands, U.S. investors might have more difficulty protecting their interests in a court of law or otherwise than if we were a U.S. company.
Risks Related to the Semiconductor Industry Which Impact Us
We, and the semiconductor industry as a whole, have been and may be further impacted by changes in, or uncertainty about, global, regional and local economic, political, legal, regulatory and social environments as well as climate change.
Changes in, and uncertainty about, economic, political, legal, regulatory and social conditions pose a risk as consumers and businesses may postpone spending in response to factors such as curtailment of trade and other business restrictions, financial market volatility, interest rate fluctuations, recessions, shifts in inflationary and deflationary expectations, lower capital and productivity growth, unemployment, negative news, declines in income or asset values, natural catastrophes or weather events, and/or other factors. Such global, regional and local conditions are volatile, subject to frequent change and could have a material adverse effect on customer and end-market demand for our products, thus materially adversely affecting our business and financial condition.
We may also experience a shortage of certain semiconductor composites and delays in shipments due to supply chain disruptions caused by geopolitical conflicts, natural catastrophes, extreme weather events, or punctual power outages, and sales of our products may be negatively impacted by such events, both directly and indirectly through a reduction of sales or production by our customers in or to affected areas or otherwise.
Geopolitical conflicts have additionally resulted in certain countries imposing sanctions. Further consequences of such conflicts could include a risk of further sanctions, embargoes, regional instability, geopolitical shifts and adverse effects on macro-economic conditions, currency exchange rates and financial markets. This could lead to disruption to international commerce and the global economy, and could have a negative effect on our ability to sell to, ship products to, collect payments from, and support customers in certain regions based on trade restrictions, embargoes, logistics restrictions and export control law restrictions.
We, and the semiconductor industry as a whole, face greater risks due to the international nature of the semiconductor business, including in the countries where we, our customers or our suppliers operate, such as:
•instability of foreign governments, including the threat of war, military conflict (including, among others, the recent escalation of armed conflict in the Middle-East), civil unrest, regime changes, mass migration and terrorist attacks;
•natural events such as severe weather, earthquakes and tsunamis, or the effects of climate change;
•epidemics or pandemics such as disease outbreaks and other health related issues;
•changes in, or uncertainty about, laws, regulations (including executive orders) and policies affecting trade and investment, including through the imposition of trade and travel restrictions, government sanctions, local practices which favor local companies and constraints on investment;
•complex and varying government regulations and legal standards, particularly with respect to export control regulations and restrictions, customs and tax requirements, data privacy, IP, anti-corruption, bribery, fraud and sanctions (including potential third-party product diversion risks into sanctioned countries or use for unauthorized purposes);
•differing practices of regulatory, tax, judicial and administrative bodies, including with regards to the interpretation of laws, governmental approvals, permits and licenses;
•water availability and availability of appropriate local water infrastructure, usage and consumption levels, as well as recycling and discharge practices;
•constraints in the supply of electricity as a result of cost increases, reliability of infrastructure or due to extreme weather events, leading to power outages; and
•changes in, or uncertainty about, labor laws and human rights and our ability to ensure compliance across our international supply chains.
We, and the semiconductor industry, operate at a global scale. Our global asset base and market footprint expose us to negative impacts of tariffs and /or trade barriers that may inhibit our ability to place products across regions.
Our global asset base and diversified market footprint expose us to adverse impacts from tariffs, trade restrictions, and protectionist policies. These barriers can limit our ability to efficiently place products across key regions, disrupt established supply chains, increase input costs, and reduce market access particularly in jurisdictions where we operate manufacturing hubs or export our products. These risks may be particularly acute in the semiconductor industry, where cyclical demand patterns and rapid technological changes can amplify economic headwinds.
The institution of trade tariffs globally, including the institution of any sector-specific tariffs, as well as the threat thereof, could negatively impact economic conditions, which could have negative repercussions for our business. In particular, trade protection and national security policies of the U.S. and Chinese governments, including tariffs, trade restrictions, export restrictions and the placing of companies on restricted entity lists, have and may continue to limit or prevent us from transacting business with certain of our Chinese customers or suppliers; limit, prevent or discourage certain of our Chinese customers or suppliers from transacting business with us; or make it more expensive to do so. If disputes were to arise under any of our agreements with other parties conducting business in China, the resolution of such dispute may be subject to the exercise of discretion by the Chinese government, or agencies of the Chinese government, which may have a material adverse effect on our business. In addition, we could face increased competition as a result of China's programs to promote a domestic semiconductor industry and supply chains (such as its 5-year plans, the China Standards 2035 campaign and related large scale
national and local public funding schemes). In the United States, the current administration is imposing and increasing tariffs on imports into the country, and may impose additional tariffs or further increase existing tariffs on imports into the country. Other countries are also imposing or increasing tariffs and may impose or increase existing tariffs or impose other restrictions on imports in response to these measures.
In addition, we may be subject to the imposition of sector-specific tariffs, such as the 100% tariff on imported, foreign-produced semi-conductor chips threatened by the current U.S. administration, or China’s related export controls. Any or all of these measures or restrictions may limit our ability to sell products in certain markets or source components from specific suppliers, potentially disrupting our supply chain and manufacturing capabilities and limiting our ability to service our customer base in a cost-effective manner.
Further, throughout 2025 the current U.S. administration initiated numerous investigations into products and industries under section 232 of the Trade Expansion Act of 1962. For example, in April 2025, the Department of Commerce launched an investigation into the national security impacts of imported semiconductors and semiconductor manufacturing equipment. This investigation may result in additional tariffs and trade restrictions that may adversely impact the semiconductor industry and our business. Similar investigations on other industries or products, including automotive, copper, steel, aluminium, critical minerals and aircraft, may also adversely impact the semiconductor industry and our business.
Changes in trade policy might also provoke retaliatory measures from affected countries, which could limit our ability to conduct business in those markets or decrease the number of customers purchasing our products. Consequently, we may face higher costs for components used in our products, increased manufacturing expenses, currency exchange rate volatility, and elevated prices for our products in foreign markets. Additionally, protectionist policies and regulations could encourage our customers to shift their operations or supply chains to their own countries or others, or require their contractors, subcontractors, and agents to do the same, potentially undermining our current levels of productivity and manufacturing efficiency and increasing manufacturing expenses, and currency exchange challenges.
The semiconductor industry is cyclical and downturns in the semiconductor industry can negatively affect our results of operations and financial condition.
The semiconductor industry is cyclical and has been subject to significant downturns from time to time, as a result of global economic conditions, and industry-specific factors, such as built-in excess capacity, fluctuations in product supply, product obsolescence and changes in end-customer preferences. See “— We, and the semiconductor industry as a whole, have been and may be further impacted by changes in, or uncertainty about, global, regional and local economic, political, legal, regulatory and social environments as well as climate change.”
Downturns are typically characterized by reduction in overall demand, accelerated erosion of selling prices, reduced revenues and high inventory levels, any of which could result in a significant deterioration of our results of operations. Such macro-economic trends typically relate to the semiconductor industry as a whole rather than to the individual semiconductor markets to which we sell our products. To the extent that industry downturns are concurrent with the timing of new increases in production capacity or introduction of new advanced technologies in our industry, the negative effects on our business from such industry downturns may also be more severe. We have experienced revenue volatility and market downturns in the past, and expect to experience them in the future, which could have a material adverse impact on our results of operations and financial condition.
The recent increase in inflation rates in the markets in which we operate may lead us to experience higher costs related to labor, energy, water, transportation, wafer and other raw materials costs from suppliers. Our suppliers may raise their prices, and in the competitive markets in which we operate we may not be able to make corresponding price increases to preserve our gross margins and profitability due to market conditions and competitive dynamics. Additionally, any such increase in prices may not be accepted by our customers.
Epidemics or pandemics may impact the global economy and could also adversely affect our business, financial condition and results of operations.
Epidemics or pandemics may result in authorities imposing, and businesses and individuals implementing, numerous measures to try to contain the disease, including travel bans and restrictions, shelter-in-place and stay-at-home orders, quarantines and social distancing guidelines. This may negatively impact the ability of our suppliers to deliver on their commitments to us, our ability to ship our products to our customers and general consumer demand for our products may be negatively impacted by the pandemic and/or government responses thereto.
In addition, our customers and suppliers may experience disruptions in their operations and supply chains, which could result in delayed, reduced, or cancelled orders or collection risks, and which may adversely affect our results of operations and financial condition.
During an epidemic or pandemic, governments may look to re-direct resources and implement austerity measures in the future to balance public finances, which could result in reduced economic activity. Any resulting economic downturn could reduce overall demand for our products, accelerate the erosion of selling prices, lead to reduced revenues and higher inventory levels, any of which could result in a significant deterioration of our results of operations and financial condition.
An epidemic or pandemic may also lead to increased disruption and volatility in capital markets and credit markets. Unanticipated consequences of an epidemic or pandemic and resulting economic uncertainty could adversely affect our liquidity and capital resources in the future.
We may not be able to match our production capacity to demand.
As a result of the cyclicality and volatility of the semiconductor industry, it is difficult to predict future developments in the markets we serve and, in turn, to estimate requirements for production capacity. If our markets, start-up or ramp-ups in manufacturing operations are not efficiently executed, major customers or certain product designs or technologies do not perform as well as we have anticipated, demand is impacted by factors outside of our or our customers’ control, or if there is otherwise any future excess capacity by us or other semiconductor manufacturers, we risk unused capacity charges, price erosion, write-offs of inventories and losses on products that may adversely impact our operating results, and we could be required to undertake restructuring and transformation measures that may involve significant charges and losses to our earnings.
Furthermore, during certain periods, the global supply of semiconductor industry fabrication capacity may not be sufficient to meet the demand for semiconductor products. We may also experience increased demand in certain market segments and product technologies and any future shortage of our capacity and the capacity of our sub-contractors may lead to an increase in the lead times of our delivery to customers, us being required to enter into agreements with our suppliers with onerous terms such as take-or-pay arrangements, or us being unable to service some of our customers, which may detrimentally affect our customer relationships and result in liability claims. Further, as a result of this supply imbalance, the industry in general may at times experience a high level of profitability and gross margins which may not be sustainable over the long-term.
Competition in the semiconductor industry is intense, and we may not be able to compete successfully if our product design technologies, process technologies and products do not meet market requirements. Furthermore, the competitive environment of the industry has resulted, and is expected to continue to result, in vertical and horizontal consolidation among our suppliers, competitors and customers, which may lead to erosion of our market share, impact our ability to compete and require us to restructure our operations.
We compete in different product lines to various degrees on certain characteristics, for example, price, technical performance, product features, product design, product availability, process technology,
manufacturing capabilities and sales and technical support. Given the intense competition in the semiconductor industry, if our products do not meet market requirements based on any of these characteristics, our business, financial condition and results of operations could be materially adversely affected. Our competitors may, among others, have a stronger presence in key markets and geographic regions, greater name recognition, larger customer bases, greater government support and greater financial, R&D, sales and marketing, manufacturing, distribution and technical resources than us. These competitors may be able to adapt more quickly to changes in the business environment, to new or emerging technologies and to changes in customer requirements.
Our product portfolio and roadmap evolution may additionally subject us to increased pressure from competitors. Variations in customer consumption patterns and product development trends, as well as any misalignment between our product development roadmap and that of our competitors, may impact our projections for areas particularly sensitive to market shifts.
The semiconductor industry is intensely competitive and characterized by the high costs associated with developing marketable products and manufacturing technologies as well as high levels of investment in production capabilities. As a result, the semiconductor industry has experienced, and is expected to continue to experience, significant vertical and horizontal consolidation among our suppliers, competitors and customers. Market consolidation initiatives, planned restructurings, and any other such actions in the semiconductor industry may be subject to stricter regulations in the jurisdictions in which we operate, which could erode our market share, negatively impact our ability to compete and require us to increase our R&D effort, engage in mergers and acquisitions and/or restructure our operations.
Risks Related to Our Operations
Our high fixed costs could adversely impact our results.
Our operations are characterized by high fixed or other costs which are difficult to reduce, including costs related to manufacturing (particularly as we operate our own manufacturing facilities) and the employment of our highly skilled workforce. When demand for our products decreases, competition increases or we fail to forecast demand accurately, we may be driven to reduce prices and we may not always be able to reduce our total costs in line with resulting revenue declines. As a result, the costs associated with our operations may not be fully absorbed, leading to unused capacity charges, higher average unit costs and lower gross margins, adversely impacting our results.
Our capital needs are high compared to those competitors who do not manufacture their own products and we may need additional funding in the coming years to finance our investments, to purchase other companies or technologies developed by third parties or to refinance our maturing indebtedness.
As a result of our choice to maintain control of a large portion of our manufacturing technologies and capabilities, we may require significant capital expenditure to maintain or upgrade our facilities if our facilities become inadequate in terms of capacity, flexibility and location. We monitor our capital expenditures taking into consideration factors such as trends in the semiconductor market, customer requirements and capacity utilization. These capital expenditures may increase in the future if we decide to upgrade or expand the capacity of our manufacturing facilities, purchase or build new facilities or increase investments supporting key strategic initiatives. For instance, we may be unable to successfully develop, maintain and operate large infrastructure projects. Such increased capital expenditures associated with large infrastructure projects and strategic initiatives might not achieve profitability or we may be unable to utilize infrastructure projects to full capacity. There can also be no assurance that future market demand and products required by our customers will meet our expectations. We also may need to invest in other companies, in IP and/or in technology developed either by us or by third parties to maintain or improve our position in the market or to reinforce our existing business. Failure to invest appropriately and in a timely manner or to successfully integrate any recent or future business acquisitions may prevent
us from achieving the anticipated benefits and could have a material adverse effect on our business and results of operations.
The foregoing may require us to secure additional financing, including through the issuance of debt, equity or both. The timing and the size of any new share or bond offering would depend upon market conditions as well as a variety of other factors. In addition, the capital markets may from time to time offer terms of financing that are particularly favorable. We cannot exclude that we may access the capital markets opportunistically to take advantage of market conditions. Any such transaction or any announcement concerning such a transaction could materially impact the market price of our common shares. If we are unable to access capital on acceptable terms, this may adversely affect our business and results of operations.
Our operating results depend on our ability to obtain quality supplies on commercially reasonable terms. As we depend on a limited number of suppliers for materials, equipment and technology, we may experience supply disruptions if suppliers interrupt supply, increase prices or experience material adverse changes in their financial condition.
Our ability to meet our customers’ demand to manufacture our products depends upon obtaining adequate supplies of quality materials on a timely basis and on commercially reasonable terms. Certain materials are available from a limited number of suppliers or only from a limited number of suppliers in a particular region. We purchase certain materials whose prices on the world markets have fluctuated significantly in the past and may fluctuate significantly in the future. Although supplies for most of the materials we currently use are adequate, shortages could occur in various essential materials due to interruption of supply or increased demand in the industry. For instance, geopolitical conflicts (such as the ongoing armed conflict in the Middle-East) could disrupt supply chains and cause shortages of certain semiconductor components and corresponding delays in shipments. Any such shortage may impact different geographical markets disproportionately, leading to shortages or unavailability of supplies in specific areas and higher transportation costs. In addition, the costs of certain materials may increase due to inflationary rates and market pressures and we may not be able to pass on such cost increases to our customers.
We also purchase semiconductor manufacturing equipment and third-party licensed technology from a limited number of suppliers and providers and, because such equipment and technology are complex, it is difficult to replace any one supplier or provider with another or to substitute one piece of equipment or type of technology for another. In addition, suppliers and providers may extend lead times, limit our supply, increase prices or change contractual terms related to certain manufacturing equipment and third-party licensed technology, any of which could adversely affect our results. Furthermore, suppliers and technology providers tend to focus their investments on providing the most technologically advanced equipment, materials and technology and may not be able to address our requirements for equipment, materials or technology of older generations. Although we work closely with our suppliers and providers to avoid such shortages, there can be no assurance that we will not encounter these problems in the future.
Consolidation among our suppliers or vertical integration among our competitors may limit our ability to obtain sufficient quantities of materials, equipment and/or technology on commercially reasonable terms and restrict the terms under which we engage in mergers and acquisitions. In certain instances, we may be required to enter into agreements with our suppliers with onerous terms, such as take-or-pay arrangements. If we are unable to obtain supplies of materials, equipment or technology in a timely manner or at all, or if such materials, equipment or technology prove inadequate or too costly, our results of operations could be adversely affected.
Our financial results can be affected by fluctuations in exchange rates, principally in the value of the U.S. dollar.
The U.S. dollar is the currency of the primary economic environment in which we operate, and the currency we use in our consolidated financial statements. A large part of our transactions are denominated in U.S. dollars, and revenues from external sales in U.S. dollars largely exceed revenues in any other currency. However, we incur a limited portion of our revenue and a significantly higher portion of our costs in currencies other than the U.S. dollar. A significant variation of the value of the U.S. dollar against the principal currencies that may have a material impact on us (primarily the Euro) could result in a favorable impact, net of hedging, on our net income in the case of an appreciation of the U.S. dollar, or in a negative impact, net of hedging, on our net income if the U.S. dollar depreciates relative to the Euro or certain other currencies. Any fluctuation in currency exchange rates could affect, and has in the past affected, our results of operations.
In order to reduce the exposure of our financial results to the fluctuations in exchange rates, our principal strategy has been to balance as much as possible the proportion of sales to our customers denominated in U.S. dollars with the amount of purchases from our suppliers denominated in U.S. dollars, thereby reducing the potential exchange rate impact of certain variable costs relative to revenues. In order to further reduce our exposure to U.S. dollar exchange rate fluctuations, we have hedged certain line items on our consolidated statements of income, in particular with respect to a portion of the cost of sales, the majority of the R&D expenses and certain selling, general & administrative (“SG&A”) expenses located in the Euro zone. We may also hedge certain manufacturing costs, included within the cost of sales, denominated in Singapore dollars. There can be no assurance that our hedging transactions will prevent us from incurring higher Euro-denominated manufacturing costs and/or operating expenses when translated into our U.S. dollar-based accounts.
Our operating results may vary significantly from quarter to quarter and annually and may also differ significantly from our expectations or guidance.
Our operating results are affected by a wide variety of factors that could materially and adversely affect revenues and profitability or lead to significant variability of our operating results from one period to the next. These factors include changes in demand from our key customers, capital requirements, inventory management, availability of funding and competition, new product developments, start of adoption of our new products by customers, technological changes, manufacturing or supplier issues and changes to effective tax rates. In addition, in periods of industry overcapacity or when our key customers encounter difficulties in their end-markets or product ramps, orders are more exposed to cancellations, reductions, price renegotiation or postponements, which in turn reduce our ability to forecast the next quarter or full year production levels, revenues and margins. Although backlog may provide an indication of future orders, quantities actually purchased by customers, as well as prices, are subject to variations between booking and delivery times and, in some cases, subject to cancellation due to changes in customer needs or industry conditions, as well as seasonality, among other things. As a result, we may not meet our financial targets, which could in turn have an impact on our reputation or brand. For these reasons and others that we may not yet have identified, our revenues and operating results may differ materially from our expectations or guidance as visibility is reduced.
If our external silicon foundries or back-end subcontractors fail to perform, this could adversely affect our business prospects, financial condition and results of operations.
We currently use external silicon foundries and back-end subcontractors for a portion of our manufacturing activities. Any limitation on the ability of our external silicon foundries and back-end subcontractors to satisfy our demand may be detrimental to our results of operations and ability to satisfy the demand of our customers. Likewise, if we are unable to meet our commitments to silicon foundries and back-end subcontractors, our results of operations could suffer. Prices for these services also vary depending on capacity utilization rates at our external silicon foundries and back-end subcontractors,
quantities demanded and product and process technology. Such outsourcing costs can vary materially and, in cases of industry shortages, can increase significantly, negatively impacting our business prospects, financial condition and results of operations.
Our manufacturing processes are highly complex, costly and potentially vulnerable to impurities, disruptions or inefficient implementation of production changes or interruptions that can significantly increase our costs and delay product shipments to our customers.
Our manufacturing processes are highly complex, require advanced and increasingly costly equipment and are continuously modified or maintained in an effort to improve yields and product performance and lower the cost of production.
Furthermore, impurities or other difficulties in the manufacturing process can lower yields, interrupt production or result in scrap. As system complexity and production changes have increased and sub-micron technology has become more advanced, manufacturing tolerances have been reduced and requirements for precision have become more demanding. We have from time to time experienced bottlenecks and production difficulties that have caused delivery delays and quality control problems. There can be no assurance that we will not experience bottlenecks, production, transition or other related difficulties in the future.
In addition, we are exposed to risks related to interruptions of our manufacturing processes. If any of our property or equipment is damaged or otherwise rendered unusable or inoperable due to accident, cyberattack or otherwise, this could result in interruptions which could have a material adverse effect on our business, financial condition and results of operations.
We may experience quality problems from time to time that can result in decreased sales and operating margin and product liability or warranty claims.
We sell complex products that may not in each case comply with specifications or customer requirements, or which may contain design or manufacturing defects that could cause personal injury, property damage or security risks that could be exploited by unauthorized third parties hacking, corrupting or otherwise obtaining access to our products, including to the software loaded thereon by us, our suppliers or our customers. Although our general practice is to contractually limit our liability to the repair, replacement or refund of defective products, we occasionally agree to contractual terms with key customers in which we provide extended warranties and, accordingly, we may face product liability, warranty, delivery failure, and/or other claims relating to our products that could result in significant expenses relating to compensation payments, product recalls or other actions related to such extended warranties and/or to maintain good customer relationships, which could result in decreased sales and operating margin and other material adverse effects on our business. Costs or payments we may make in connection with warranty and other claims or product recalls may equally adversely affect our results of operations.
There can be no assurance that we will be successful in maintaining our relationships with customers with whom we incur quality problems. Furthermore, if litigation occurs we could incur significant costs and liabilities to defend ourselves against any such claims. The industry has experienced a rise in premiums and deductibles with regards to insurance policies. These may continue to increase and insurance coverage may also correspondingly decrease. If litigation occurs and damages are awarded against us, there can be no assurance that our insurance policies will be available or adequate to protect us against such claims.
Disruptions in our relationships with any one of our key customers or distributors, and/or material changes in their strategy or financial condition or business prospects, could adversely affect our results of operations.
A substantial portion of our sales is derived from a limited number of customers and distributors. The level of sales booked by our customers and distributors varies year to year and there can be no assurance that our customers or distributors will continue to book the same level of sales with us that they have in the past, will continue to succeed in the markets they serve and will not purchase competing products over our products. Many of our key customers and distributors operate in cyclical businesses that are also highly competitive, and their own market positions may vary considerably.
In recent years, some of our customers have vertically integrated their businesses. Such vertical integrations may impact our business. Our relationships with the newly formed entities could be either reinforced or jeopardized by the integration. If we are unable to maintain or increase our market share with our key customers or distributors, or if they were to increase product returns or fail to meet payment obligations, our results of operations could be materially adversely affected.
In addition, certain of our products are customized to our customers’ specifications. If customers do not purchase products made specifically for them, we may not be able to recover a cancellation fee from our customers or resell such products to other customers. In addition, the occurrence of epidemic or pandemic outbreaks could affect our customers. The geographic spread of epidemics or pandemics may be difficult to predict and adverse public health impacts on our customers could negatively affect our results.
We may experience delays in delivering our product and technology roadmaps as well as transformation initiatives.
Our industry adapts to technological advancements and it is likely that new products, equipment, processes and service methods, including transformation initiatives related to digitalization, are in the process of being implemented. Any failure by us to manage our data governance processes could undermine our digitalization initiatives, and any failure by us to react to changes or advances in existing technologies and processes as we develop and invest in our product, technology and transformation roadmaps could materially delay the introduction of new solutions. If we are not able to execute on these roadmaps, including our digitalization strategies, on a timely basis or at an acceptable cost this could result in loss of competitiveness of our solutions, decreased revenue and a loss of market share.
Our computer systems, including hardware, software, information and cloud-based initiatives, are subject to attempted security breaches and other cybersecurity threats, which, if successful, could adversely impact our business.
We have, from time to time, detected and experienced attempts by others to gain unauthorized access to our computer systems and networks. The reliability and security of our information technology infrastructure and software, including our AI technology, and our ability to expand and continually update technologies, including to transition to cloud-based technologies, in response to our changing needs is critical to our business. In the current environment, there are numerous and evolving risks to cybersecurity, including criminal hackers, state-sponsored intrusions, terrorism, industrial espionage, employee malfeasance, vandalism and human or technological error. Computer hackers and others routinely attempt to breach the security of technology products, services, and systems, and those of our customers, suppliers, partners and providers of third-party licensed technology, and some of those attempts may be successful.
The attempts to breach our systems, including our cloud-based systems, and to gain unauthorized access to our information technology systems are becoming increasingly more sophisticated, are often well-financed, in some cases supported by state actors, and are designed to not only track, but also to evade detection. These attempts may include covertly introducing malware into our computers, including those in our manufacturing operations, and impersonating unauthorized users, among others. For instance, employees and former employees, in particular former employees who become employees of our competitors or customers, may misappropriate, use, publish or provide to our competitors or customers
our IP and/or proprietary or confidential business information. Also, third parties may attempt to register domain names similar to our brands or website, which could cause confusion and divert online customers away from our products.
Since the techniques used by cyber attackers change frequently and are often not recognized until launched against a target, we may be unable to anticipate these techniques or to implement adequate preventative measures. Our use of AI technology may also increase vulnerability to cybersecurity risks, including through unauthorized use or misuse of AI tools and bad inputs or logic or the introduction of malicious code incorporated into AI generated code. AI and machine learning also may be used for certain cybersecurity attacks, improving or expanding the existing capabilities of threat actors in manners we cannot predict at this time, resulting in greater risks of security incidents and breaches.
Such security incidents and breaches could result in, for example, unauthorized access to, disclosure, modification, misuse, loss, or destruction of our, our customer, or other third-party data or systems, theft of our trade secrets and other sensitive or confidential data, including personal information and IP, system disruptions, and denial of service. In the event of such breaches, we, our customers or other third parties could be exposed to potential liability, litigation, and regulatory action, as well as the loss of existing or potential customers, damage to our reputation, and other financial loss and such breaches could also result in losing existing or potential customers in connection with any actual or perceived security vulnerabilities in our systems. In addition, the cost and operational consequences of responding to breaches and implementing remediation measures could be significant. As these threats continue to develop and grow, we have been adapting and strengthening our security measures.
As a result of work-from-home policies that we have undertaken, there has been additional reliance placed on our IT systems and resources. The resulting reliance on these resources, and the added need to communicate by electronic means, could increase our risk of cybersecurity incidents.
Geopolitical instability has been associated with an increase in cybersecurity incidents. This may result in a higher likelihood that we may experience direct or collateral consequences from cybersecurity conflicts between nation-states or other politically motivated actors targeting critical technology infrastructure.
U.S. and foreign regulators have increased their focus on cybersecurity vulnerabilities and risks, and customers and service providers are increasingly demanding more rigorous contractual certification and audit provisions regarding cybersecurity and data governance. This may result in an increase of our overall compliance burden due to increasingly onerous obligations and leading to significant expense. There may also be shorter deadlines in which to notify the authorities of data breaches and ever-increasing fines and penalties for businesses that fail to respond swiftly and appropriately to cyberattacks. Any failure to comply could also result in proceedings against us by regulatory authorities or other third parties.
We continue to update and execute our security plans to protect data and infrastructure and to raise security awareness among those having access to our systems. However, these security measures cannot provide absolute security and there can be no assurance that our employee training, operational, and other technical security measures or other controls will detect, prevent or remediate security or data breaches in a timely manner or otherwise prevent unauthorized access to, damage to, or interruption of our systems and operations.
We regularly evaluate our IT systems and business continuity plan to make enhancements and periodically implement new or upgraded systems, including the transition and migration of our data systems to cloud-based platforms and critical system migration. Any delay in the implementation of, or disruption in the transition to different systems could adversely affect our ability to record and report financial and management information on a timely and accurate basis and could impact our operations and financial position. In addition, a miscalculation of the level of investment needed to ensure our technology solutions are current and up-to-date as technology advances and evolves could result in disruptions in our business should the software, hardware or maintenance of such items become out-of-date or obsolete and the costs of upgrading our cybersecurity systems and remediating damages could be substantial.
We may also be adversely affected by security breaches related to our equipment providers and providers of IT services or third-party licensed technology. As a global enterprise, we could also be impacted by existing and proposed laws and regulations, as well as government policies and practices related to cybersecurity, data privacy and data protection. Additionally, cyberattacks or other catastrophic events resulting in disruptions to or failures in power, information technology, communication systems or other critical infrastructure could result in interruptions or delays to us, our customers, or other third-party operations or services, financial loss, potential liability, damage to our reputation and could also affect our relationships with our customers, suppliers and partners. Refer to Section 3.3.1.3. (Illustrative risk management measures - Cyber security).
We may not be able to integrate or optimize the use of new technologies in a timely manner, which may place us at a competitive disadvantage against other industry players.
The semiconductor industry is highly competitive and characterized by constant and rapid technological change, short product lifecycles, significant price erosion and evolving standards. Accordingly, our financial performance and future prospects depend to a significant extent on our ability to develop and maximize the opportunities offered by new technologies available to our industry, such as AI or quantum.
At ST, AI is primarily focused on machine learning and deep learning technology. We leverage these technologies to interpret complex events, classify and segment data, and enable automated data flows. Such usages include automatic defect classification across front-end and back-end manufacturing lines, physical layout placement optimization, yield enhancements and automatic classification of expense notes, among others.
ST additionally relies on generative AI for content generation, conversational user experience and assisted reasoning. Some usages include AI-driven assistance for generating design rules checks in technology development, software development copilots that aid developers in code generation and maintenance, and knowledge-based assistants designed to improve efficiency by streamlining content retrieval, summarization, and content generation.
We have invested significant resources to the integration of AI capabilities to our operations. Should we be unable to successfully leverage the opportunities presented by AI and any other such new technological advances or should our governance processes prove to be insufficient to support the AI opportunities available to us, benefits of the implementation of any new such technologies may not materialize.
In addition, meeting evolving industry requirements, including the increasing use of AI and machine learning technologies, and introducing new products to the market in a timely manner and at prices that are acceptable to our customers are significant factors in determining our competitiveness and success. AI and machine learning are still in early stages, and the introduction and incorporation of AI technologies may result in unintended consequences or new or expanded risks and liabilities, including (i) adverse impact from deficient, inaccurate, or biased AI recommendations, (ii) AI technologies the company develops and adopts becoming obsolete earlier than planned, leading to there being no assurance that the company will realize the desired or anticipated benefits, (iii) use of AI applications increasing the risk of cybersecurity incidents, such as through unintended or inadvertent transmission of proprietary or sensitive information, or (iv) any laws, regulations or industry standards adopted in response to the emergence of AI, such as the EU's AI Act, becoming burdensome.
We may be subject to theft, loss, or misuse of personal data about our employees, customers, or other third parties, which could increase our expenses, damage our reputation, or result in legal or regulatory proceedings.
We have, from time to time, detected and experienced attempts by others to gain unauthorized access to our computer systems and networks, may experience successful breaches of our computer systems in the future, and may be adversely affected by security breaches related to our equipment providers and
providers of IT services or third-party licensed technology. See "— Our computer systems, including hardware, software, information and cloud-based initiatives, are subject to attempted security breaches and other cybersecurity threats, which, if successful, could adversely impact our business." The theft, loss, or misuse of personal data processed by us or for us, as a result of any such breaches or otherwise, could result in significantly increased security costs or potential liability, litigation and regulatory action, as well as the loss of existing or potential customers.
Further, with increasing digitalization, data privacy-related legislations are rapidly evolving around the globe which may have a negative impact on our business if interpreted or implemented in a manner that is inconsistent from country to country and inconsistent with the current policies and practices of our customers or business partners. We may also have to change the manner in which we contract with our business partners, store and transfer information and otherwise conduct our business, which could increase our costs and reduce our revenues.
Our business is dependent in large part on continued growth in the industries and segments into which our products are sold and on our ability to retain existing customers and attract new ones. A market decline in any of these industries, our inability to retain and attract customers, or customer demand for our products which differs from our projections, could have a material adverse effect on our results of operations.
The demand for our products depends significantly on the demand for our customers’ end products. Growth of demand in the industries and segments into which our products are sold fluctuates significantly and is driven by a variety of factors, including consumer spending, consumer preferences, the development and acceptance of new technologies and prevailing economic conditions. Changes in our customers’ markets and in our customers’ respective shares in such markets could result in slower growth and a decline in demand for our products. In addition, if projected industry growth rates do not materialize as forecasted, our spending on process and product development ahead of market acceptance could have a material adverse effect on our business, financial condition and results of operations.
Our business is dependent upon our ability to retain existing customers. In 2025 our largest customer, Apple, accounted for 17.7% of our total revenues. While we do not believe to be dependent on any one customer or group of customers, the loss of key customers or important sockets at key customers could have an adverse effect on our results of operations and financial condition.
Our existing customers’ product strategy may change from time to time and/or product specifications may change on short-time product life cycles and we have no certainty that our business, financial position and results of operations will not be affected. Our business is also dependent upon our ability to attract new customers. There can be no assurance that we will be successful in attracting and retaining new customers, or in adequately projecting customer demand for our products. Our failure to do so could materially adversely affect our business, financial condition and results of operations.
Market dynamics have driven, and continue to drive us, to a strategic repositioning.
In recent years, we have undertaken several initiatives to reposition our business. Our strategies to improve our results of operations and financial condition have led us, and may in the future lead us, to acquire businesses that we believe to be complementary to our own, to divest ourselves of or wind down activities that we believe do not serve our longer term business plans, or to enter into partnerships or joint ventures to enter into or strengthen our position in certain markets and increase our scale of operations. Our potential acquisition strategies depend in part on our ability to identify suitable acquisition targets, finance their acquisition, obtain approval by our shareholders and obtain required regulatory and other approvals. Our potential divestiture strategies depend in part on our ability to compete and to identify the activities in which we should no longer engage, obtain the relevant approvals pursuant to our governance process and then determine and execute appropriate methods to divest of them. Our actual or potential
partnerships and joint venture strategies depend in part on our ability to execute sales and operations plans alongside our partner or joint venture.
We are constantly monitoring our product portfolio and cannot exclude that additional steps in this repositioning process may be required. Furthermore, we cannot assure that any strategic repositioning of our business, including executed and possible future acquisitions, dispositions or partnerships and joint ventures, will be successful and will not result in impairment, restructuring charges and other related closure costs. The realization of our identified opportunities, including sustainability opportunities, may result in exposure to new risks. Should we not be able to anticipate these risks, or should the anticipated benefits not be realized from these opportunities, our business and strategy could be adversely affected.
Acquisitions, divestitures, partnerships and joint ventures involve a number of risks that could adversely affect our operating results and financial condition, including, in respect of acquisitions and divestitures, the inability for us to successfully integrate businesses or teams that we acquire with our culture and strategies on a timely basis or at all, and the potential requirement for us to record charges related to the goodwill or other long-term assets associated with the acquired businesses. There can be no assurance that we will be able to achieve the full scope of the benefits we expect from a particular acquisition, divestiture, partnership, joint venture or investment. Our business, financial condition and results of operations may suffer if we fail to coordinate our resources effectively to manage both our existing businesses and any acquired businesses. In addition, the financing of future acquisitions, divestitures, partnerships or joint ventures may negatively impact our financial position, including our ability to pay a dividend and/or repurchase our shares, and our credit rating and we could be required to raise additional funding.
We do not, and in the future may not, have a majority shareholding in all our joint ventures, and may have limited opportunity to intervene in the decision-making process of our joint ventures. The objectives of our associates and joint venture partners, their ability to meet their financial and/or contractual obligations, compliance with legal requirements, compliance to safety, health and environmental requirements and standards, behavior and ethical standards may result in disputes, litigation, sanctions and/or suspension of licenses which in turn may have a material adverse effect on our business, operating results, reputation, cash flows and financial condition, and may constrain the achievement of our objectives.
Other risks associated with acquisitions include the assumption of potential liabilities, disclosed or undisclosed, associated with the business acquired, which liabilities may exceed the amount of indemnification available from the seller, potential inaccuracies in the financials of the business acquired, and our ability to retain customers of an acquired entity, its business or industrialize an acquired process or technology. Identified risks associated with divestitures include loss of activities and technologies that may have complemented our remaining businesses or operations and loss of important services provided by key employees that are assigned to divested activities.
We depend on collaboration with other semiconductor industry companies, research organizations, universities, customers and suppliers to further our R&D efforts, and our business and prospects could be materially adversely affected by the failure or termination of such alliances.
Our success depends on our ability to introduce innovative new products and technologies to the marketplace on a timely basis. In light of the high levels of investment required for R&D activities, we depend in certain instances on collaborations with other semiconductor industry companies, research organizations, universities, customers and suppliers to develop or access new technologies.
Such collaboration provides us with a number of important benefits, including the sharing of costs, reductions in our own capital requirements, acquisitions of technical know-how and access to additional production capacities. However, there can be no assurance that our collaboration efforts will be successful and allow us to develop and access new technologies in due time, in a cost-effective manner and/or to meet customer demands. If a particular collaboration terminates before our intended goals are accomplished we may incur additional unforeseen costs, and our business and prospects could be
adversely affected. Furthermore, if we are unable to develop or otherwise access new technologies, whether independently or in collaboration with another industry participant, we may fail to keep pace with the rapid technology advances in the semiconductor industry, our participation in the overall semiconductor industry may decrease and we may also lose market share.
We depend on patents to protect our rights to our technology and may face claims of infringing the IP rights of others.
We depend on patents and other IP rights to protect our products and our manufacturing processes against misappropriation by others. The process of seeking patent protection can be long and expensive, and there can be no assurance that we will receive patents from currently pending or future applications. Even if patents are issued, they may not be of sufficient scope or strength to provide meaningful protection or any commercial advantage. In addition, effective IP protection may be unavailable or limited in some countries. Our ability to enforce one or more of our patents could be adversely affected by changes in patent laws, laws in certain foreign jurisdictions that may not effectively protect our IP rights or by ineffective enforcement of laws in such jurisdictions. Competitors may also develop technologies that are protected by patents and other IP and therefore either be unavailable to us or be made available to us subject to adverse terms and conditions. We have in the past used our patent portfolio to negotiate broad patent cross-licenses with many of our competitors enabling us to design, manufacture and sell semiconductor products, without concern of infringing patents held by such competitors. We may not in the future be able to obtain such licenses or other rights to protect necessary IP on favorable terms for the conduct of our business, and such failure may adversely impact our results of operations. Such cross-license agreements expire from time to time and there is no assurance that we can or we will extend them.
We have from time to time received, and may in the future receive, communications alleging possible infringement of third-party patents and other IP rights. Some of those claims are made by so-called non-practicing entities against which we are unable to assert our own patent portfolio to lever licensing terms and conditions. Competitors with whom we do not have patent cross-license agreements may also develop technologies that are protected by patents and other IP rights and which may be unavailable to us or only made available on unfavorable terms and conditions. We may therefore become involved in costly litigation brought against us regarding patents and other IP rights. IP litigation may also involve our customers who in turn may seek indemnification from us should we not prevail and/or who may decide to curtail their orders for those of our products over which claims have been asserted. Such lawsuits may therefore have a material adverse effect on our business. We may be forced to stop producing substantially all or some of our products or to license the underlying technology upon economically unfavorable terms and conditions or we may be required to pay damages for the prior use of third-party IP and/or face an injunction.
The outcome of IP litigation is inherently uncertain and may divert the efforts and attention of our management and other specialized technical personnel. Such litigation can result in significant costs and, if not resolved in our favor, could materially and adversely affect our business, financial condition and results of operations.
We operate in many jurisdictions with highly complex and varied tax regimes. Changes in tax rules, new or revised legislation or the outcome of tax assessments and audits could cause a material adverse effect on our results.
We operate in many jurisdictions with highly complex and varied tax regimes. Changes in tax rules, new or revised legislation or the outcome of tax assessments and audits could have a material adverse effect on our results.
In 2021, the Organization for Economic Cooperation and Development ("OECD") and the G20 Inclusive Framework on base erosion and profit shifting ("BEPS") agreed to a two-pillar solution to address the tax
challenges arising from the digitalization of the economy. Pillar I is a set of rules revisiting tax allocation rules in a changed economy. The intention is that a portion of a multinationals' residual profit is taxed in the jurisdiction where revenue is sourced.
Pillar II enforces a global minimum corporate income tax at an effective rate of 15% for large multinationals. On December 20, 2021 the OECD published the Global Anti-Base Erosion Model Rules ("GloBe Rules") for Pillar II. On December 22, 2021, the European Commission published a legislative proposal for Pillar II (the "EU Pillar II Directive" or "Pillar II").
On December 15, 2022, the Council formally adopted the EU Pillar II Directive. The EU Pillar II Directive aims at consistently implementing among all 27 member states the GloBe Rules. The majority of the EU Member States transposed the EU Pillar II Directive into their national laws and started applying the Pillar II measures as from the fiscal years beginning on or after December 31, 2023. The Netherlands transposed the Pillar II into its national legislation with effect from December 31, 2023 pursuant to the Dutch Minimum Tax Act 2024 (Wet minimumbelasting 2024). Pillar II legislation has also been implemented in countries outside of the EU with an impact in certain jurisdictions where the Group operates. We are continuously monitoring the Pillar II legislation and related guidance, which are still evolving and may have an impact on our global Pillar II tax charge in future periods.
The tax impact of the Pillar I rules is being monitored to determine the potential effect on our results and to ensure compliance when the legislation is effective
Our tax rate is variable and depends on changes in the level of operating results within various local jurisdictions and on changes in the applicable taxation rates of these jurisdictions, as well as changes in estimated tax provisions due to new events. We currently receive certain tax benefits or benefit from net operating losses cumulated in prior years in some countries, and these benefits may not be available in the future due to changes in the local jurisdictions or credits on net operating losses being no longer available due to either full utilization or expiration of the statute of limitations in such jurisdictions. As a result, our effective tax rate could increase and/or our benefits from carrying forward net operating losses could affect our deferred tax assets in certain countries in the coming years. In addition, the acquisition or divestiture of businesses in certain jurisdictions could materially affect our effective tax rate.
We evaluate our deferred tax asset position and the need for a valuation allowance on a regular basis. The ultimate realization of deferred tax assets is dependent upon, among other things, our ability to generate future taxable income that is sufficient to utilize in certain jurisdictions loss carry-forwards or tax credits before their expiration. The recorded amount of total deferred tax assets could be reduced, which could have a material adverse effect on our results of operations and financial position, if our estimates of projected future taxable income and benefits from available tax strategies are reduced as a result of a change in business condition or in management’s plans or due to other factors, such as changes in tax laws and regulations.
We are subject to the possibility of loss contingencies arising out of tax claims, assessment of uncertain tax positions and provisions for specifically identified income tax exposures. We are also subject to tax audits in certain jurisdictions. There can be no assurance that we will be successful in resolving potential tax claims that result from these audits, which could result in material adjustments in our tax positions. We record provisions on the basis of the best current understanding; however, we could be required to record additional provisions in future periods for amounts that cannot currently be assessed. Our failure to do so and/or the need to increase our provisions for such claims could have a material adverse effect on our results of operations and our financial position.
Our operating results can vary significantly due to impairment of goodwill, other intangible assets and equity investments booked pursuant to acquisitions and the timeframe required to foster and realize synergies thereof, joint venture agreements and the purchase of technologies and licenses from third parties, as well as to impairment of tangible assets due to changes in the business environment. Because the market for our products is characterized by rapidly changing technologies, significant changes in the semiconductor industry, and the potential failure of our business initiatives, our future cash flows may not
support the value of goodwill, tangible assets and other intangibles registered in our consolidated balance sheets.
We receive public funding, and a reduction in the amount available to us or demands for repayment could increase our costs and impact our results of operations.
We have in the past obtained public funding, primarily to support our proprietary R&D for technology investments and investments in cooperative R&D ventures, and expect to obtain public funding in the future, mainly from EU member states (including France, Italy and Malta) as well as from China. The public funding we receive is subject to periodic review by the relevant authorities and there can be no assurance that we will continue to benefit from such programs at current levels or that sufficient alternative funding will be available if we lose such support. If any of the public funding programs we participate in are curtailed or discontinued and we do not reduce the relevant R&D or other costs, this could have a material adverse effect on our business. Furthermore, to receive public funding we enter into agreements which require compliance with extensive regulatory requirements and set forth certain conditions relating to the funded programs. If we fail to meet the regulatory requirements or applicable conditions, we may, under certain circumstances, be required to refund previously received amounts, which could have a material adverse effect on our results of operations. If there are changes in the public funding we receive this could increase the net costs for us to, amongst others, continue investing in R&D at current levels and could result in a material adverse effect on our results of operations.
A change in the landscape in public funding may also affect our business. For example, the European Chips Act which entered into force on September 21, 2023, and is designed to bolster Europe’s competitiveness and resilience in semiconductor technologies and applications and any similar proposals in other regions, may provide public funding towards manufacturing activities of semiconductors. It is yet to be seen whether this would impact the amount of public funding currently available to us for our R&D or other investments and ventures, but any reduction in said funding will result in a material adverse effect on our results of operations. Further, this may result in new or existing competitors benefiting from such funding and could also have an impact on the competitive landscape in our industry.
Some of our production processes and materials are environmentally sensitive, which could expose us to liability and increase our costs due to environmental, health and safety laws and regulations or because of damage to the environment.
We are subject to various laws and regulations, as well as increasing focus from our stakeholders regarding environmental, health and safety matters, including the use, storage, discharge and disposal of chemicals, gases and other hazardous substances used in our operations. Addressing such focus from stakeholders, as well as compliance with such laws and regulations could adversely affect our manufacturing costs or product sales by requiring us to acquire costly equipment, materials or greenhouse gas allowances, or to incur other significant expenses in adapting our manufacturing processes or waste and emission disposal processes. In addition, we are working towards transitioning into an increasingly circular economy model through which we aim to continue to reduce our waste, and increase the use of recycled raw materials in our manufacturing processes. Failure to successfully implement such a model, or a reduction in stakeholder interest in circular economy models, may result in increased costs and stakeholder dissatisfaction.
Separately, several jurisdictions have recently sought to restrict the use of certain substances found in process chemicals, parts, components and other materials used in semiconductor manufacturing and which have limited technically and commercially feasible alternatives. Any such restriction in our ability to access materials necessary for the manufacturing of our products may adversely affect our results of operations. Furthermore, environmental claims or our failure to comply with present or future regulations could result in the assessment of damages or imposition of fines against us, suspension of production or a cessation of operations. Failure by us to control the use of, or adequately restrict the discharge of, chemicals or hazardous substances could subject us to future liabilities.
Climate change, increased focus on social impact, and related sustainability regulations and initiatives, including our commitment to become carbon neutral in all direct and indirect emissions (scopes 1 and 2), product transportation, business travel, and employee commuting emissions (our scope 3 focus), and to achieve our 100% renewable electricity sourcing goal by the end of 2027, could place additional burden on us and our operations.
As climate change issues become more pronounced, we may correspondingly face increased regulation and also expectations from our stakeholders to take actions beyond existing regulatory requirements to minimize our impact on the environment and mitigate climate change related effects.
The semiconductor manufacturing process has historically contributed to direct greenhouse gas emissions by utilizing perfluorocarbons, which may lead to new or increased regulation of such compounds. In order to address such regulation, we may be required to adapt our production processes or purchase additional equipment or carbon offsets, leading to increased costs. We are on track to be carbon neutral in all direct and indirect emissions (scopes 1 and 2), product transportation, business travel, and employee commuting emissions (our scope 3 focus), and to achieve our 100% renewable electricity sourcing goal by the end of 2027 (as further explained below in Section 3.4.3.1. (Climate Change)).
To meet these additional regulatory requirements, expectations, and goals, we will need to continue to deploy additional equipment, introduce process changes, utilize alternative suppliers and materials, and take other similar actions, some or all of which may require us to incur additional costs which could result in a material adverse effect on our results of operations and our financial condition. To address climate change mitigation of our own operations, we have purchased renewable energy and may from time to time purchase renewable energy and/or carbon credits. In addition, if we fail to meet these requirements, expectations, or goals, or foster additional sustainability initiatives, we may experience reputational and/or litigation risk which could impact our ability to attract and retain customers, employees, and investors, as well as restrict our access to public funding.
Further, our sites, as well as those of our partners along the supply chain, may be exposed to changing and/or increasing physical risks resulting from climate change that are either chronic (induced by longer-term shifts in climate patterns, such as sea level rise or constraints in the availability of water, changing temperature, wind or precipitation patterns) or acute (event-driven such as cyclones, hurricanes or heat waves). In the context of the transition to a lower-carbon economy, we will likely be exposed to further policy, legal, technology, and market transition risks. We have already seen further policy developments in this area in the form of Regulation (EU) 2020/852 of the European Parliament and of the Council of June 18, 2020 on the establishment of a framework to facilitate sustainable investment and amending Regulation (EU) 2019/2088 (the “EU Taxonomy Regulation”), which entered into force on July 12, 2020. As a result of the EU Taxonomy Regulation, we must disclose information on how and to what extent our activities are associated with economic activities that qualify as environmentally sustainable.
Enhanced focus on issues concerning the protection of human rights, labor laws, environmental justice and climate change are resulting in a more complex regulatory environment, leading to potential additional legal risks, penalties or taxes. Directive (EU) 2022/2464 of the European Parliament and of the Council of December 14, 2022 amending Regulation (EU) No 537/2014, Directive 2004/109/EC, Directive 2006/43/EC and Directive 2013/34/EU, as regards corporate sustainability reporting (the “CSRD”), which entered into force on January 5, 2023, as well as the European Sustainability Reporting Standards (“ESRS”) published on July 31, 2023, strengthen the rules regarding social and environmental information that is required to be reported. Refer to Section 3.4. (Sustainability statement)”.
The CSRD seeks to provide investors and other stakeholders with access to the information they need to assess investment risks arising from climate change, social impact, and other sustainability topics, including mandatory supply chain due diligence requirements and new third-party assurance obligations. Should our partners not comply with current regulations, their performance may detrimentally impact our own results on climate change mitigation, social impact, energy efficiency, water use, chemicals and
pollution management, or waste disposal. Moreover, if our partners are unable to meet our climate change, social impact and sustainability criteria, we may engage with alternative partners at a higher cost.
In addition, California’s climate disclosure laws, such as AB 1305 (the “Voluntary Carbon Market Disclosures Act”), impose requirements to disclose scope 1, 2, and 3 GHG emissions, climate-related financial risks, information relating to any net-zero or carbon-neutral claims made and project-specific information upon purchase or use of certain voluntary carbon credits in California.
Any of the above requirements may in the future overlap in scope and diverge in content with each other and/or the rules of other jurisdictions to which we may be subject. If our disclosure metrics relating to climate change and other sustainability topics are lower than those of our peers in the industry, or are otherwise regarded as insufficient, this may lead to reputational risk which may lead to onward financial repercussions such as a decrease in share price or difficulty in raising capital.
In parallel, environmental, social and governance ("ESG") practices, especially regarding equal opportunity, have been increasingly subject to political controversy in the United States, most recently as a result of various executive orders signed by the current U.S. administration, aimed at limiting equal opportunities initiatives in the workplace. Our policies and practices regarding equal access and other ESG-related matters, including previously established goals and initiatives, or disclosures that may be required by non-U.S. laws, may expose us to legal, reputational and other risks, including ESG and equal opportunity-related orders, investigations, legislation, litigation, media coverage and scrutiny, boycotts and negative publicity from investors and other stakeholders.
This enhanced focus and increased regulations and initiatives, as well as related stakeholder expectations, have been and may continue to be subject to rapid and extensive change or reversal, and have resulted and may result in conflicts between regulatory regimes and stakeholders.
Individual customer use of certain products, which may differ from the anticipated uses of such products and result in differences in performance, including energy consumption, may lead to a failure to achieve our disclosed emission-reduction goals, adverse legal action or additional research costs.
Our standard terms and conditions of sale state that our products are not intended for certain uses. Our calculations for the anticipated GHG emissions reductions from the use of our products are based on certain common but significant assumptions, such as that all products are powered by grid electricity. Misuse of our products, or any deviation from our products’ anticipated uses, could result in difference in performance, decrease in product lifespan, product malfunction and an increase in energy consumption. Any such instances of misuse may lead to a failure to achieve our disclosed emission-reduction goals, adverse publicity, and may lead to legal action.
Loss of key employees and the inability to continuously recruit and retain qualified employees could hurt our competitive position.
Our success depends to a significant extent upon our key executives and R&D, engineering, marketing, sales, manufacturing, support and other personnel. Our success also depends upon our ability to continue to identify, attract, retain and motivate highly trained and skilled engineering, technical and professional personnel in a competitive recruitment environment, as well our ability to ensure the smooth succession, including executive succession, and continuity of business with newly hired and promoted personnel. For instance, in highly specialized areas, it may become more difficult to retain employees.
Our employee hiring and retention also depend on our ability to build and maintain a workplace culture based on principles of equal treatment and opportunity and be viewed as an employer of choice. We intend to continue to devote significant resources to recruit, train and retain qualified employees, however, we may not be able to attract, obtain and retain these employees, which may affect our growth in future years and the loss of the services of any of these key personnel without adequate replacement or the inability to attract new qualified personnel could have a material adverse effect on us.
The interests of our controlling shareholder, which is in turn indirectly controlled by the French and Italian governments, may conflict with other investors’ interests. In addition, our controlling shareholder may sell our existing common shares or issue financial instruments exchangeable into our common shares at any time.
We understand that as of December 31, 2025, STMicroelectronics Holding N.V. (“ST Holding”), owned 250,704,754 shares, or approximately 27.5%, of our issued common shares. ST Holding may therefore be in a position to effectively control the outcome of decisions submitted to the vote at our shareholders’ meetings, including but not limited to the appointment of the members of our Managing and Supervisory Boards (the "Managing Board" and the "Supervisory Board", respectively).
We have been informed that ST Holding’s shareholders, each of which is ultimately controlled by the French or Italian government, are party to a shareholders agreement (the “STH Shareholders Agreement”), which governs relations between them. We are not a party to the STH Shareholders Agreement. The STH Shareholders Agreement includes provisions requiring the unanimous approval by the shareholders of ST Holding before ST Holding can vote its shares in our share capital, which may give rise to a conflict of interest between our interests and investors’ interests, on the one hand, and the (political) interests of ST Holding’s shareholders, on the other hand. Our ability to issue new shares or other securities giving access to our shares may be limited by ST Holding’s desire to maintain its shareholding at a certain level and our ability to buy back shares may be limited by ST Holding due to a Dutch law requiring one or more shareholders acquiring 30% or more of our voting rights to launch a tender offer for our outstanding shares.
The STH Shareholders Agreement also permits our respective French and Italian indirect shareholders to direct ST Holding to dispose of its stake in us at any time, thereby reducing the current level of their respective indirect interests in our common shares. Sales of our common shares or the issuance of financial instruments exchangeable into our common shares or any announcements concerning a potential sale by ST Holding could materially impact the market price of our common shares depending on the timing and size of such sale, market conditions as well as a variety of other factors.
Our shareholder structure and our preference shares may deter a change of control.
We have an option agreement in place with an independent foundation, whereby the foundation can acquire preference shares in the event of actions which the board of the independent foundation determines would be contrary to our interests, our shareholders and our other stakeholders and which in the event of a creeping acquisition or offer for our common shares are not supported by our Supervisory and Managing Boards. In addition, our shareholders have authorized us to issue additional capital within the limits of the authorization by our annual general meeting of shareholders (our “AGM”), subject to the requirements of our articles of association (the "Articles of Association"), without the need to seek a specific shareholder resolution for each capital increase. Accordingly, an issue of preference shares or new shares may make it more difficult for a shareholder to obtain control over our general meeting of shareholders. These anti-takeover provisions could substantially impede the ability of our shareholders to benefit from a change in control and, as a result, may materially adversely affect the market price of our ordinary shares and our investors’ ability to realize any potential change of control premium.
Any decision to reduce or discontinue paying cash dividends to our shareholders could adversely impact the market price of our common shares.
On an annual basis, our Supervisory Board, upon the proposal of the Managing Board, may propose the distribution of a cash dividend to the general meeting of shareholders. Any reduction or discontinuance by us of the payment of cash dividends at historical levels could cause the market price of our common shares to decline.
We are required to prepare financial statements under IFRS and we also prepare Consolidated Financial Statements under U.S. GAAP, and such dual reporting may impair the clarity of our financial reporting.
We use U.S. GAAP as our primary set of reporting standards. Applying U.S. GAAP in our financial reporting is designed to ensure the comparability of our results to those of our competitors, as well as the continuity of our reporting, thereby providing our stakeholders and potential investors with a clear understanding of our financial performance. As we are incorporated in The Netherlands and our shares are listed in Europe on Euronext Paris and on Borsa Italiana, we are subject to EU regulations requiring us to also report our results of operations and financial statements using IFRS.
As a result of the obligation to report our financial statements under IFRS, we prepare our results of operations using both U.S. GAAP and IFRS, which are currently not consistent. Such dual reporting can materially increase the complexity of our financial communications. Our financial position and results of operations reported in accordance with IFRS will differ from our financial position and results of operations reported in accordance with U.S. GAAP, which could give rise to confusion in the marketplace.
There are inherent limitations on the effectiveness of our risk management and internal control(s) systems
There can be no assurance that a system of risk management and internal control over financial and non-financial reporting, including one determined to be effective, will prevent or detect all misstatements. A control system, no matter how well designed and operated, can provide only reasonable, not absolute, assurance regarding the preparation and presentation of the financial statements and non-financial disclosures. Projections of the results of any evaluation of the effectiveness of internal control over financial reporting and non-financial reporting into future periods are subject to inherent risk. The relevant controls may become inadequate due to changes in circumstances or the degree of compliance with the underlying policies or procedures may deteriorate.
Similarly, the ST risk management framework cannot provide comprehensive assurance as to its effectiveness to prevent any failures to achieve operational objectives nor any losses, fraud, human error, misjudgments in decision-making or non-compliance with laws, regulations, permits and other authorizations or licenses.
Any such significant operational errors or delays could materially adversely affect our ability to conduct our business, which could adversely affect results of operations due to potentially higher expenses and/or lower revenues, creating liability for ST and/or our customers and/or negatively impact our reputation.
If we fail to comply with laws, regulations, permits and other authorizations or licenses, we could be fined or otherwise sanctioned by regulators, which may include directives to cease operations, fines and penalties as well as prosecution, which could harm our reputation and relationships with stakeholders and, in turn, have a material adverse impact on our business.
Because we are subject to the corporate law of The Netherlands, U.S. investors might have more difficulty protecting their interests in a court of law or otherwise than if we were a U.S. company.
Our corporate affairs are governed by our Articles of Association and by the laws governing corporations incorporated in The Netherlands. The rights of our investors and the responsibilities of members of our Managing and Supervisory Boards under Dutch law are not as clearly established as under the rules of some U.S. jurisdictions. Therefore, U.S. investors may have more difficulty in protecting their interests in the face of actions by our management, members of our Managing and Supervisory Boards or our controlling shareholders than U.S. investors would have if we were incorporated in the United States.
Our executive offices and a substantial portion of our assets are located outside the United States. In addition, ST Holding and most members of our Managing and Supervisory Boards are residents of jurisdictions other than the United States. As a result, it may be difficult or impossible for shareholders to effect service within the United States upon us, ST Holding, or members of our Managing or Supervisory Boards. It may also be difficult or impossible for shareholders to enforce outside the United States judgments obtained against such persons in U.S. courts, or to enforce in U.S. courts judgments obtained against such persons in courts in jurisdictions outside the United States. This could be true in any legal action, including actions predicated upon the civil liability provisions of U.S. securities laws. In addition, it may be difficult or impossible for shareholders to enforce, in original actions brought in courts in jurisdictions located outside the United States, rights predicated upon U.S. securities laws.
We have been advised by Dutch counsel that the United States and The Netherlands do not currently have a treaty providing for reciprocal recognition and enforcement of judgments (other than arbitration awards) in civil and commercial matters. With respect to choice of court agreements in civil or commercial matters, it is noted that the Hague Convention on Choice of Court Agreements entered into force in The Netherlands, but has not entered into force in the United States. As a consequence, a final judgment for the payment of money rendered by any federal or state court in the United States based on civil liability, whether or not predicated solely upon the federal securities laws of the United States, will not be enforceable in The Netherlands. However, if the party in whose favor such final judgment is rendered brings a new suit in a competent court in The Netherlands, such party may submit to The Netherlands court the final judgment that has been rendered in the United States. If The Netherlands court finds that the jurisdiction of the federal or state court in the United States has been based on grounds that are internationally acceptable and that proper legal procedures that are in accordance with the Dutch standards of proper administration of justice including sufficient safeguards (behoorlijke rechtspleging) have been observed, the court in The Netherlands would, under current practice, in principle give binding effect to the final judgment that has been rendered in the United States unless such judgment contradicts The Netherlands’ public policy and provided that the judgment by the foreign court is not incompatible with a decision rendered between the same parties by a Dutch court, or with a previous decision rendered between the same parties by a foreign court in a dispute that concerns the same subject and is based on the same cause, provided that the previous decision qualifies for acknowledgment in The Netherlands. Even if such a foreign judgment is given binding effect, a claim based thereon may, however, still be rejected if the foreign judgment is not or no longer formally enforceable.
3.3.1.3. Illustrative risk management measures
Corporate governance
Our adherence to the good principles of corporate governance is outlined in Section 5.1. (Commitment to the principles of good corporate governance). The Supervisory Board and its committees, and the Managing Board, through their structures, charters and activities ensure proper corporate governance as described in Section 5 (Corporate Governance).
Product quality
Quality is a key priority for us. Our vision is to elevate ST to the highest level of quality as an asset for our customers. We can achieve a high level of quality because our employees and management are committed to quality, focused on customer’s targets, and improvement programs are effective.
Global Quality and Reliability (“GQR”) is organized at Company level and embedded in all our organizations. The GQR leadership team brings together quality directors from across our entire business operations (front-end and back-end manufacturing, product groups, sales regions and corporate organizations) to deploy our quality strategy and quality programs throughout the Company.
We are continuously adapting to have the necessary advanced and innovative infrastructure and organization to ensure our products meet the highest quality and reliability requirements in the markets we address.
Our quality governance is based on our quality management system, part of our enterprise management system, as documented in our quality manual. It details how we implement processes allowing to meet the highest customer and standards requirements.
We adhere to internationally recognized quality management standards. We received our first company wide ISOTS16949 certification in 2003 and this certification was renewed every three years since that time. Since 2018, we have been certified IATF 16949:2016 and ISO 9001:2015 demonstrating our robust quality governance, effective quality management system and quality compliance across the Company. In 2025, we were certified ISO SAE 21434 confirming that we established a certified management system and governance which meets and complies with the requirements of the automotive industry in the field of cybersecurity process management within product development phases.
Environment (ST operations, including climate change mitigation, water and pollution)
Our approach to managing our Company in an environmentally responsible way (including climate change mitigation, water and pollution) is outlined in Section 3.4.3. (Environment).
Social (including health & safety and working conditions)
Our approach to protecting the health and safety and working conditions of our employees and onsite value chain workers is outlined in Section 3.4.4. (Social).
Finance
Our approach to financial risk management is outlined in Section 3.2.6. (Financial Risk Management).
Legal and ethics & compliance
Legal
ST operates in a complex and evolving legal and regulatory environment across multiple jurisdictions and aims to comply with applicable laws and regulations.
We maintain a dedicated legal department responsible for identifying and assessing legal risks, by monitoring relevant legal developments, drawing up internal guidance, policies and contractual standards, and supporting their implementation throughout the company. In addition, we consult with external legal advisors to complement our dedicated legal department.
Furthermore, our legal department collaborates with other ST departments to identify legal risks and implement appropriate safeguards. We conduct legal training to increase awareness of legal risks and share best practices throughout the company.
ST also collaborates transparently with (regulatory) authorities and as such gains insight into compliance expectations of such authorities and stays up to date with the implementation of and proposed changes to the regulatory landscape applicable to ST.
Ethics & compliance
We believe that conducting our business with the highest standard of integrity is essential to our long term success, and that compliance & ethics is everyone’s job and responsibility.
Our Code of Conduct embodies our values and principles, which are shared throughout the Company. ST Code of Conduct serves as the highest reference for guiding our behavior, decision-making, and activities. Our values are:
•integrity: we conduct our business with the highest ethical standards, honor our commitments, deliver on our promises, are loyal and fair, and stand up for what is right.
•people: we behave with openness, trust and simplicity; we are ready to share our knowledge, encourage everyone’s contribution, develop our people through empowerment, teamwork and training; each one of us is committed and personally involved in the continuous improvement process; and
•excellence: we strive for quality and customer satisfaction and create value for all our partners; we are flexible, encourage innovation, develop our competences, seek responsibility and are accountable for our actions; we act with discipline, base our decisions on facts, and focus on the priorities.
Further information on our approach to conducting business with the highest standard of integrity is outlined in Section 3.4.5. (Business conduct).
Cyber security
Cybersecurity risk management is an integral part of the overarching risk framework and seeks to identify and address fast-evolving cybersecurity threats. The management of cybersecurity risks is governed by the Executive Committee and receives regular oversight from the Audit Committee as a standing item.
We have a specialized Information Security team within the wider Digital Transformation and Information Technology department of the Company, which covers the following:
•program definition and steering;
•framework, which include third-party security;
•security awareness;
•architecture and engineering;
•protection of business applications;
•protection of business solutions (R&D, manufacturing and industrial solutions, business applications);
•protection of IT infrastructures;
•cybersecurity operations (such as risk-based vulnerability management); and
•detection and reactions to information security incidents, as part of the wider crisis management process.
In particular, within our Information Security team, the Cybersecurity Incident Response Team monitors on a continuous basis the evolving cyber threats, and detect and analyze incidents. Based on their initial assessments, any significant risk is escalated and would, if required, trigger the activation of a Corporate Crisis Team (a "CCT"). This CCT would lead the Company response (e.g. containment, forensic investigation, system restoration, and any associated business impact). The CCT would periodically inform the Executive Committee of any developments, and the Executive Committee would in-turn keep the Audit Committee and Supervisory Board informed.
In addition, we created a Third-Party Management function within our Global Procurement Organization, with the aim to embed cybersecurity risks in the overall management of third parties.
The maturity of our overall risk framework design and implementation, which includes cybersecurity risks, is periodically audited by a leading independent organization.
Furthermore, we have been ISO 22301 (Security and Resilience) certified since 2016. Throughout 2025, our continuous improvements have been subjected to both internal audits and external surveillance audits from the certification body. We have also been certified ISO SAE 21434 (Road Vehicles – Cybersecurity Engineering) since 2022, confirming that we established a certified management system and governance which meets and complies with the requirements of the automotive industry in the field of cybersecurity process management within product development phases.
3.3.1.4. Risks having had a significant financial impact during 2025
We operate on a worldwide basis in an economic environment impacted by many risk factors, which generates uncertainties on future economic conditions. In 2025, our activities were impacted by several risks, such as volatility in exchange rates, market downturn, and uncertainty regarding certain income tax positions. However, these risks did not have overall a material adverse impact on the Company’s financial results.
3.3.2. Internal control systems
Related to the ERM framework we have implemented two internal control systems regarding financial reporting and sustainability reporting, respectively.
3.3.2.1. Internal control system regarding financial reporting risks
We have a standard set of internal controls (including entity-level controls, business controls and IT controls) and procedures over financial reporting in place. These are based on criteria established in Internal Control — Integrated Framework issued by the Committee of Sponsoring Organizations of the Treadway Commission (“COSO”) in Internal Control-Integrated Framework (2013). These controls and procedures take into account identified risk factors that could potentially influence our operations and financial objectives.
3.3.2.2. Internal control system regarding sustainability reporting risks
For a description of our risk-based internal control system over sustainability reporting reference is made to Section 3.4.2.2.D. (Risk management and internal controls over sustainability reporting).
3.3.3. Internal Audit
Our internal audit organization (our "Corporate Audit") is independent of our management. Corporate Audit’s purpose is to strengthen our Company’s ability to create, protect, and sustain long-term value by providing the Supervisory Board and management with risk-based and objective assurance, advice, insight, and foresight.
Corporate Audit has defined its strategy that supports the strategic objectives and success of the Company. This strategy is periodically reviewed with the Audit Committee and Executive Management. .
Corporate Audit develops an annual audit plan, it applying risk-based assurance strategies tailored to address different risk categories and aiming at addressing a constantly changing environment and risk landscape. The annual plan is reviewed annually by our Audit Committee and approved by our Supervisory Board. Each year, the audit plan includes assurance and advisory assignments covering a variety of organizational units, processes and risks in the following manner:
•Financial reporting risks: Corporate Audit has defined its risk-based testing strategy of management controls (addressing both control design and operating effectiveness). It performs
its annual testing program based on an annual scoping exercise. The results of the control testing (including potential control deficiencies) are reported to a dedicated committee and the Audit Committee.
•Sustainability reporting risks: As the internal control system over sustainability reporting is being gradually deployed, Corporate Audit adapts its related assurance strategy. A risk-based testing of management control program is being deployed.
•Operational and compliance risks: The annual audit plan addresses operational and compliance risks, applying specific assurance strategies. More specifically, It takes into account the following typologies or risk: 1) risks inherent to the Company’s strategic plan and/or derived from the annual ERM Company risk assessment process; 2) risks related to specific regulations where audit activities are required; 3) risks related to activities covered with a cyclical approach. Audit findings and associated recommendations are reported to line management, the Managing Board and the Audit Committee.
Corporate Audit conducts its activities in conformance with the Institute of Internal Auditors' Global Internal Audit Standards.
3.3.4. Statement on risk management and internal control (systems)
The Managing Board recognizes the inherent limitations of internal risk management and control systems. Whilst the Company continuously works towards improving its processes and procedures, these systems cannot provide absolute certainty that all risks have been identified or are effectively managed.
We regularly evaluate the effectiveness of our internal controls and procedures and correspondingly advise our Audit Committee on the results of such evaluations, any changes to such internal controls and procedures. Specifically with regard to the controls and procedures over financial reporting, we also advise our Audit Committee on any significant deficiencies and material weaknesses in the design or operation of internal control over financial reporting, which are reasonably likely to affect our ability to record, process or summarize and report financial information to our auditors and to our Audit Committee. Likewise, any fraud, whether or not material, that involves management, or other employees who have a significant role in our internal control over financial reporting, are disclosed to our external auditors and to our Audit Committee, which informs our Supervisory Board.
Our internal risk management and control systems, including the structure and operation thereof, were discussed and evaluated on several occasions with our Audit Committee, and also discussed by our Supervisory Board, during 2025 (in accordance with best practice provision 1.4.1 of the Dutch Corporate Governance Code).
Statement by the Managing Board
Based on the information included in this Section 3.3. (Risk management and Internal Control), its assessment, and with reference to Best Practice Provision 1.4.3 of the 2025 Dutch Corporate Governance Code, the Managing Board states to the best of its knowledge:
1.that the management report provides sufficient insights into major failings in the effectiveness of the risk management framework and internal control systems;
2.that in relation to the Company’s financial reporting the internal control system over financial reporting operated effectively during 2025 and provides reasonable assurance that the Company’s financial reporting does not include any errors of material importance as of and for the 2025 financial year;
3.that, based on the current state of affairs, it is justified that the financial reporting is prepared on a going concern basis;
4.that the management report states those material risks and uncertainties, that are relevant to the expectation of the Company’s continuity for the period of twelve months after the preparation of the report;
5.that the internal control system over sustainability reporting provides limited assurance that Section 3.4. (Sustainability statement) of this report does not contain material inaccuracies; and
6.that the Managing Board at balance sheet date is not aware of any reason to conclude that the risk management framework does not provide comfort that the operational and compliance risks identified in Section 3.3.1.2. (Risk factors) of this management report are effectively managed, where 'comfort' is to be read as comfort considering our risk appetite, the strategy and complexity of our Company and inherent limitations to these systems.
Due to inherent limitations of risk management and internal control systems, the above does not imply that these systems and procedures provide absolute certainty as to the realization of strategic, operations, compliance and reporting objectives, nor that they can prevent all misstatements, inaccuracies, fraud, operational issues, and non-compliance with laws and regulations.
3.4. Sustainability statement
3.4.1 Introduction
As an integrated device manufacturer providing semiconductor devices, we handle most manufacturing in-house. We have over 48,000 employees and manufacturing sites worldwide. The manufacturing of semiconductor devices requires natural resources, water, energy, and chemicals, and is labor-intensive. Our strategy and business model take into account the material impacts we may have on the environment, our own workforce, our supply chain workers and our affected communities.
ST sustainability approach
Sustainability has been a guiding principle at ST for more than thirty years and is embedded in our activities. We implement programs and take action to manage our material impacts, opportunities, and risks within our own operations and relevant sections of our value chain. To minimize our impact on people, we put people first and prioritize health and safety, well-being and human and labor rights. We strive to minimize our impact on the environment by, inter alia, reducing our GHG emissions, reducing energy consumption and addressing water and waste related challenges.
At the heart of our strategy is a strong focus on identifying topics that matter to our business and stakeholders, through a DMA, which includes a review with our key stakeholders. Based on this DMA and taking into account stakeholder perspectives, our sustainability strategy, policies, programs, targets and objectives are regularly reviewed and adjusted as appropriate to manage identified material sustainability topics.
To address relevant material sustainability topics, ST has various management systems in place, which are aligned with international standards and/or proven practices. In that regard, relevant ST sites are ISO certified (e.g., ISO 45001: international standard for an occupational health and safety management system; ISO 14001: international standard for environmental management system and ISO 50001: international standard for energy management system). The relevant certifications are further indicated in Appendix 11.8.
We participate in the collective efforts of the industry to formulate solutions to global sustainability challenges. In this regard, we are a full member of the Responsible Business Alliance ("RBA"), an industry coalition dedicated to responsible business conduct in global supply chains. Our policies are aligned with the RBA Code of Conduct and relevant internationally recognized standards and instruments, including OECD Guidelines for Multinational Enterprises, UN Guiding Principles on Business and Human
Rights, UN Universal Declaration of Human Rights, ILO Declaration on Fundamental Principles and Rights at Work and ILO Fundamental Conventions. For an overview of ST's relevant sustainability policies, please refer to the policy overview table in Appendix 11.7.
In connection with our efforts on managing sustainability topics, in 2025 we were included in several sustainability indices, such as the Euronext Vigeo Eiris Europe 120 index, MSCI AAA(1), ISS ESG Prime, Ecovadis Platinum, FTSE4Good top 10% and Bloomberg top 5%. For 2025 we received a B score from the CDP both for climate change for water security. We remain a signatory of the United Nations ("UN") Global Compact and have been a signatory since 2000. Our sustainability programs are aligned with its ten principles and contribute to 11 of the 17 UN Sustainable Development Goals (“SDG”).
CSRD
On January 5, 2023, the CSRD entered into force, introducing obligations for companies to report on material sustainability topics and the ESRS, as introduced in 2023, set forth the required disclosures on environmental protection, social responsibility and treatment of employees, respect for human rights, anti-corruption and bribery, and equal treatment and opportunities.
Being a Directive, all EU Member States and EEA countries are required to implement the CSRD into domestic law. The deadline for such implementation was July 6, 2024. While certain EU member states have implemented the CSRD into domestic law, the Netherlands, has not yet done so. The legislative proposal to implement the CSRD into Dutch law was submitted to the Second Chamber of the Dutch Parliament for further parliamentary proceedings. This process is put on hold due to the developments around the Omnibus (defined below) which will amend the CSRD during the course of 2026. At the date hereof, there is no certainty on the effective date of the implementation of the CSRD into Dutch law. As we are a company incorporated and governed under Dutch law, this means that we are not legally required to report in accordance with the CSRD with respect to 2025. However, considering the current status of the CSRD implementation in the Netherlands and the potential retroactive effect thereof, we have prepared our sustainability statement for 2025 based on the general principles of the CSRD and included this statement in the current section of our Dutch annual report. There are no other entities in the ST Group that are legally required to report in accordance with the CSRD for this reporting year.
Our sustainability reporting approach is based on the most recent guidance on the CSRD and we have used estimates and assumptions where appropriate, as further detailed in the relevant sections of this sustainability statement. However, it should be noted, that the Dutch legislation implementing the CSRD is still in draft form and this legislation is still subject to further amendments, guidance and interpretation, and that the CSRD is still under development and its interpretation and application is evolving. Notably, on February 26, 2025, the European Commission adopted the omnibus simplification package (“Omnibus”) to reduce reporting burdens under, amongst others, the CSRD and EU Taxonomy Regulation, as it introduces changes to the reporting requirements through a substantial reduction of the ESRS datapoints. The provisional agreement on the text of the Omnibus was agreed on December 16, 2025 and published in the Official Journal of the European Union on February 26, 2026. The amendments following from the Omnibus became effective as per March 18, 2026.
Taking the aforementioned into account, including that this is the second year that we are voluntarily reporting under the CSRD, we note that our sustainability reporting approach may change in the coming years.
3.4.2 General sustainability disclosure (ESRS 2)
3.4.2.1 General basis for preparation (ESRS 2 BP 1 and BP 2)
(1) The use by ST of any MSCI ESG RESEARCH LLC or its affiliates (“MSCI”) data, and the use of MSCI logos, trademarks, service marks or index names herein, do not constitute a sponsorship, endorsement, recommendation, or promotion of ST by MSCI. MSCI services and data are the property of MSCI or its information providers and are provided ‘as-is’ and without warranty. MSCI names and logos are trademarks or service marks of MSCI.
ESRS
As referenced above, this sustainability statement has been drawn up in alignment with the CSRD and is based on the ESRS, with the use of all applicable phase-in options included in ESRS 1 Appendix C. It contains required disclosures on the material sustainability matters as assessed through a DMA conducted in 2025 ("2025 DMA") and on other matters for which disclosure is required under the ESRS.
Consolidated sustainability statement
ST has prepared this sustainability statement with a detailed review of its consolidated perimeter. As a result, its scope of consolidation is now extended to match that of the financial statement. In comparison to last year, ST was able to collect the energy and water consumption for all our sites during the reporting year, and estimated the waste related amounts. As disclosed in our 2024 DAR, the extension of the scope of consolidation to all our sites resulted in a minor impact on the full year value that is, less than 1% depending on the disclosures. In future years, from financial year 2026 onwards, two sites will be included in our environmental data collection (Chongqing (Sanan ST JV) and Catania's new 200mm SiC manufacturing facility) once they are in production, while the current employees are included in our social metrics for 2025.
The qualitative information in this sustainability statement covers ST’s own operations and relevant sections of its value chain, based on the outcomes of the 2025 DMA. A description of ST’s upstream and downstream value chain is further included in Section 3.4.2.3.A. (Strategy, business model and value chain).
In preparing this sustainability statement no specific information has been omitted, due to being assessed to be classified or sensitive information, nor has information relating to IP, know-how or the results of innovation, has been omitted.
Specific circumstances
Time horizons
The reporting period for the sustainability statement is consistent with the reporting period of the financial statements.
The time horizons referred to in the sustainability statement are based on the definition of the ESRS, unless specifically mentioned otherwise.
Value chain estimation
ST is not reporting any value chain data except with regard to scope 3 GHG emissions, where we have used estimations. In the case of GHG emissions, additional elements regarding the basis of preparation for the scope 3 categories along with the level of accuracy are described in the relevant environmental section.
We note that our ability to receive primary data from suppliers or other value chain partners is highly dependent on the evolution of external requirements, the ability of these stakeholders to calculate and provide the information to us and our variety of partners with operations worldwide. If the availability and quality of information from our value chain partners improve in the future we expect to enhance our methodology for value chain reporting.
Sources of estimation and outcome uncertainty
The preparation of this sustainability statement in accordance with the ESRS requires management to make estimates and assumptions.
The primary areas that required significant estimates and judgments by management include but are not limited to:
•scope 1, 2 and 3 GHG emissions, where any update on the GHG Protocol or emission factor database would have an impact on the total GHG emissions;
•scope 3 GHG emissions, which rely on various estimation methods without, at this stage, access to primary data from value chain stakeholders; and
•information on pollution of air and water along with waste classification, which are dependent on external regulations that are constantly evolving and on current measurement techniques, which could change over time.
Various data points stem from European regulations, such as the E-PRTR (European Pollutant Release and Transfer Register Regulation) on pollution in Section 3.4.3.2. (Pollution), and on the emission trading scheme in Section 3.4.3.1. (Climate change), and Annex III of Directive 2008/98/EC of the European Parliament and of the Council on waste for Section 3.4.3.4. (Waste and circular economy) where any change either in terms of threshold or categorization would have a direct impact on the amount reported in a fiscal year.
Similar to the previous year, estimates and judgments have been identified for all the disclosed targets and metrics and are further described in the relevant sections. When used, they are based on operational considerations linked to our manufacturing footprint, current state of the art in terms of measurement techniques or are driven by industry-specific limitations.
Forward-looking statement
This sustainability statement includes forward-looking statements based on disclosed assumptions about possible future events and possible actions by ST. This includes ambitions, objectives and targets. Estimates and judgments are continually evaluated and are based on historical experience and other factors, including expectations of future events that are believed to be reasonable under current circumstances.
In addition, ST operates on a worldwide basis in an economic environment impacted by many risk factors which generates uncertainties on future economic conditions that might impact ST’s forward-looking environmental and social performance.
Any such forward-looking statement involves uncertainties and is subject to change.
Changes in preparation and presentation of sustainability information
2025 being our second year of reporting under the ESRS, ST reports on the variations from reporting year 2024 compared to reporting year 2025. The variations are explained below each metric table.
For the reporting year 2025, only one prior period adjustment has been identified and relates to the amount of Nitrogen reported under E2-4 Pollutants emitted to water. 2025 being our second year of reporting under the ESRS, certain variations reflect minor adjustments performed between 2024 and 2025 following the evolution of our data collection and review processes. Metrics required under E2-5 have not been disclosed for the reporting year 2025, due to ongoing review of the data collection process.
Based on the Omnibus we have made use of the extended phase-in options provided in ESRS 1 Appendix C.
We expect our sustainability reporting (quantitative and qualitative) to keep evolving over time, as the ESRS are further being revised. More insights will be gained on market and assurance practices, and on our internal processes with the expansion of internal control over sustainability reporting.
Disclosures stemming from other legislation or generally accepted sustainability reporting pronouncements
We have included information from generally accepted sustainability reporting standards (e.g.,the GHG Protocol) and legislation (refer to Appendix 11.2.) in this sustainability statement.
Incorporation by reference
We used the option to incorporate information in this sustainability statement by reference, as defined in ESRS 1. The information that has been incorporated by reference is included in the table in Appendix 11.2.
We included references to external sources and links to websites (for example st.com) for information purpose only, noting that these references and links are not incorporated by reference into this sustainability statement.
Entity-specific information
All material IROs identified in the 2025 DMA stem from the sustainability topics included in the ESRS. Certain targets we have set, related to these IROs, include entity-specific information, as further described in the disclosure of the relevant target, marked as "entity-specific".
The targets are set based on the assumption of constant ST data activity (i.e. perimeter and production) and a consistent GHG computation methodology or regulatory framework over the 2024–2030 target period. To the extent relevant, any change is further described below each target and mainly relates to the update of the emission factors and a minor update of the perimeter for the water recycling target. The perimeter of each target is further described in Appendix 11.9., and might slightly differ from the consolidated financial and sustainability statement perimeter.
3.4.2.2. Governance
3.4.2.2.A. The role of, information provided to, and sustainability matters addressed by the administrative, management and supervisory bodies (GOV-1)
We have a two-tier governance structure, in accordance with Dutch law. Our management is entrusted to our Managing Board under the supervision of our Supervisory Board.
No representatives of our employees and other workers are included in our administrative, management and supervisory bodies.
Composition of the supervisory body and its responsibilities
Supervisory Board, Sustainability Committee and Audit Committee
Our Supervisory Board consists of 9 members, of whom 33.33% are female and 66.67% are male. Based on the independence criteria set for the members of our Supervisory Board, a majority of its members are considered independent. Further details on the composition and experience of our Supervisory Board members can be found in Section 4.1. (Composition of the Supervisory Board - Biographies), which includes their personal details and biographies.
Our Supervisory Board is responsible for overseeing the policies pursued by our Managing Board and supporting the Managing Board with its advice. The Supervisory Board has a sustainability committee (the "Sustainability Committee") which supports and advises the Supervisory Board in relation to its responsibilities in supervising, monitoring and advising on ST's sustainability strategy, targets, goals and overall sustainability performance.
The responsibilities of the Sustainability Committee, detailed in its charter available on st.com include, but are not limited to:
•monitoring and advising on sustainability policies and practices, including, but not limited to, social and environmental;
•monitoring and assessing sustainability developments and emerging trends in the semiconductor industry;
•reviewing stakeholders' feedback relating to sustainability;
•monitoring the sustainability performance of the Company;
•monitoring sustainability matters;
•monitoring and advising on the Company’s sustainability strategy, targets, goals, and overall sustainability performance; and
•monitoring that the sustainability strategy is aligned with the corporate strategy of the Company and vice versa.
The Supervisory Board has an audit committee (the "Audit Committee"), which assists the Supervisory Board in fulfilling its oversight responsibilities relating to corporate accounting, reporting practices, and the quality and integrity of ST's financial and non-financial reports.
The responsibilities of the Audit Committee in relation to non-financial reporting, detailed in its charter available on st.com include, but are not limited to:
•monitoring the non-financial reporting process and making proposals to safeguard the integrity of that process;
•monitoring the effectiveness of the Company’s internal control and risk management systems in relation to its non-financial reporting; and
•reviewing annual and interim financial statements and other non-financial information.
Composition of the administrative and management bodies and their responsibilities
Managing Board, Executive Committee, Senior Management and Corporate Affairs Committee
Our Managing Board consists of two male members - our President and Chief Executive Officer and our President and Chief Financial Officer - who are entrusted with the general management of our Company, including setting and implementing our sustainability strategy.
Our President and Chief Executive Officer chairs our Executive Committee, consisting of 8 members, of whom 12% are female and 88% are male. Our Executive Committee acts under the authority and responsibility of the Managing Board and in this respect manages our Company together with the Managing Board.
Further information on the composition and experience of our Managing Board and our Executive Committee can be found in Section 5.4. (Managing Board). Further details on the gender balance in our Managing Board and Executive Committee can be found in Section 5.5. (Dutch Gender Balance Act).
Our Senior Management consists of the members of our Managing Board, the members of our Executive Committee and our Executive Vice Presidents, totalling thirty-one members, of which 12.9% are female and 87.1% are male. Further information on the composition of our Senior Management as well as their experience can be found in Section 5.4. (Managing Board). Further details on the gender balance in our Senior Management can be found in Section 5.5. (Dutch Gender Balance Act).
The Corporate Affairs Committee, a sub-committee of the Executive Committee (the "Corporate Affairs Committee"), advises and supports the Managing Board and Executive Committee in relation to their respective responsibilities regarding, amongst others, (i) defining and aligning corporate communications
related to ST’s corporate social responsibility, ESG, compliance & ethics initiatives and activities; and (ii) assessing and recommending processes and policies related to such initiatives and activities.
Governance process to monitor, manage and oversee sustainability matters
We have reassessed, adjusted and formalized our governance processes to monitor, manage and oversee our material sustainability matters and specific related material IROs assessed in the 2025 DMA. In this regard we have enhanced and put in place specific sustainability programs and dedicated activities to manage our material sustainability matters, with relevant governance processes established to monitor and track the progress of our long-term targets and objectives. Within these programs and dedicated activities, reports are made to program boards composed of executives from various ST departments, and the overall status is shared on a quarterly basis with the Managing Board, the Executive Committee and the Senior Management.
Our Managing Board is responsible for formulating and directing our sustainability strategy and long-term sustainability targets, and the Supervisory Board is responsible for overseeing these activities.
On a quarterly basis, the Sustainability Committee, the Managing Board, the Executive Committee and the Senior Management, are updated on sustainability topics and ST's sustainability performance and targets by our President of Human Resources and Corporate Social Responsibility ("CHRO"), our Corporate Sustainability Group Vice President ("Group VP Sustainability") and relevant sustainability experts.
The Corporate Affairs Committee regularly informs the Managing Board and Executive Committee, updating them on relevant sustainability topics.
In 2025, we installed the Sustainability Statement Steering Committee ("Sustainability Statement SteerCo") consisting of our President and Chief Financial Officer, our CHRO, our Chief Ethics & Compliance Officer and our Executive Vice President, Chief Audit & Risk Executive, to oversee and provide guidance during the preparation of our sustainability statement. The scope of the Sustainability Statement SteerCo is compliance with the CSRD and underlying ESRS and EU Taxonomy Regulation. In 2025, its primary purpose was to review the outcome of the 2025 DMA, the quality and integrity of non-financial reporting and the fair representation of ST's sustainability performance. The role and scope of the Sustainability Statement SteerCo might evolve in the coming years, notably in alignment with the development of the ICSR framework, sustainability reporting legislation and other relevant legislation.
While the ERM framework covers the management and oversight of sustainability-related risks, we continue to evaluate how to expand it to further embed sustainability-related impacts and opportunities. Material risks assessed in the DMA are embedded in the Company priority risk map, which is updated annually, and are managed based on the ERM framework described in Section 3.3.1.1. (Risk management approach).
Sustainability target-setting
Annual targets and long-term targets are set by the Executive Committee and are supervised by the Sustainability Committee. Their performance is reviewed each quarter.
Our corporate sustainability department ("Corporate Sustainability") is responsible for coordinating the sustainability target-setting process. Sustainability-related targets are set and/or updated based on, amongst others, the outcomes of the DMA. Although there was no direct engagement with specific stakeholders in the target-setting process, the interests and views of our (external) key stakeholders are included in the DMA as described in Section 3.4.2.3.B. (Interests and views of stakeholders), and are taken into consideration by ST when setting or updating sustainability-related targets, based on the material IROs assessed in the DMA.
For each sustainability matter identified as material in the DMA, a person who is skilled and knowledgeable on the relevant sustainability matter is engaged to define sustainability-related targets as appropriate (“Goal Owners”). As relevant, the Goal Owners propose sustainability-related targets that
respond to the relevant respective material IROs, in collaboration with all relevant internal stakeholders (i.e., relevant ST departments whose perimeter is covered by the scope of the target). The Executive Committee reviews and approves the sustainability-related targets and presents them to the Sustainability Committee. Sustainability-related targets may change from time to time in accordance with the outcomes of each DMA. Any amendments to the targets follow the same process as the target-setting, including review and approval by the Executive Committee. ST's current sustainability targets and the material IROs they respond to are included in the IRO tables in Appendix 11.4. and Appendix 11.9.
Corporate Sustainability is in charge of monitoring the targets. The Group VP Sustainability is responsible for the definition of the key performance indicators (each a "KPI" and together, the "KPIs"), monitoring and quarterly reporting to management.
We disclose any changes made in the reporting year to previously set targets regarding a material sustainability matter in the relevant target disclosure section, relating to that specific sustainability matter. We review our targets on a regular basis and update where needed to reflect our sustainability strategy and to manage our material IROs effectively. This includes material sustainability matters for which we have not yet set targets. For a full overview of ST's current long-term sustainability targets, please refer to Appendix 11.9.
Sustainability expertise
Corporate Sustainability, as well as site sustainability teams and other local teams, include people with a sustainability focus and relevant sustainability knowledge who have a background in various social, environmental and safety topics, including climate change, pollution, water and waste, as well as work-related rights - such as working conditions and human rights regarding our own workforce and supply chain workers - and the rights of affected communities. Our Compliance, Ethics and Privacy Department consists of professionals with specialized knowledge on business conduct matters, including whistleblower protection, corruption and bribery. Furthermore, our internal Legal Department and Corporate External Reporting Department include professionals who are dedicated to non-financial reporting and who have extensive knowledge of the ESRS.
Addressing sustainability matters during 2025
In 2025, our CHRO and the Group VP Sustainability attended the quarterly Sustainability Committee meetings, together with representatives of relevant departments focusing on sustainability. Topics discussed included: customer and investors sustainability requirements, environmental, value chain and social aspects.
Furthermore, during 2025 the DMA results were communicated to and approved by the Executive Committee and were thereafter presented to the Audit Committee, which acknowledged the results. The material IROs identified in the 2025 DMA are addressed by specific programs or regular dedicated activities, and the Executive Committee and Supervisory Board are updated on their progress,
The priority risks, including sustainability-related risks, are considered in our strategy, and are monitored and managed in accordance with our ERM framework, by the Managing Board, Executive Committee and Senior Management under the oversight of the Supervisory Board.
When overseeing our strategy in 2025, our Management and Supervisory Board considered sustainability topics in general and more specifically certain IROs in specific cases or projects, such as those related to climate change, energy, chemicals and pollution prevention, labor rights of our own workforce, water and affected communities, and the health and safety our own workforce.
3.4.2.2.B. Integration of sustainability-related performance in incentive schemes (ESRS 2 GOV-3)
The remuneration policy of our Supervisory Board does not include sustainability-related performance.
The remuneration policy of our Managing Board, Executive Committee and Senior Management includes sustainability-related performance. More specifically, we have, amongst others, factored in climate-related considerations into their remuneration. The short-term incentive and long-term incentive program included a KPI for environment/climate (kCO2eq), aligned with our previous long-term sustainability targets. For more information on the performance against the environmental/climate KPI, we refer to Section 4.9.3.2. (Senior Management remuneration structure – Short-term 2025 incentive), Section 4.9.3.2. (Senior Management remuneration structure – Long-term incentive) and Note 7.6.20. (Equity).
For the disclosure required under ESRS 2 GOV-3 paragraphs 27 and 29, regarding how sustainability-related performance is included in incentive schemes of our Managing Board, Executive Committee and Senior Management, reference is made to the disclosure included in the remuneration report:
•Section 4.9.2.3. (Managing Board remuneration structure – Performance criteria 2025 short-term incentive) regarding the inclusion of sustainability-related performance criteria in the short-term incentive of our Managing Board and Section 4.9.2.3. (Managing Board remuneration structure – Long term incentive grant in 2025) regarding the inclusion of sustainability-related performance criteria in the 2025 long-term incentive of our Managing Board.
•Section 4.9.3.2. (Senior Management remuneration structure – Short-term incentive) regarding the inclusion of sustainability-related performance criteria in the short-term incentive of our Senior Management (including our Executive Committee) and Section 4.9.3.2. (Senior Management remuneration structure – Long-term incentive) regarding the inclusion of sustainability-related performance criteria in the long-term incentive of our Senior Management (including our Executive Committee).
3.4.2.2.C. Statement on due diligence (ESRS 2 GOV-4)
In line with our Code of Conduct, we have embedded responsible business conduct into our governance, strategy and business model. Our principles of responsible business conduct are informed by internationally recognized standards.
ST recognizes that conducting due diligence is an important element in managing our impacts on people and the environment. It allows us to identify, prevent, mitigate and address such impacts connected to our business. Our due diligence processes are based on, inter alia, the international instruments of the UN Guiding Principles on Business and Human Rights and the OECD Guidelines for Multinational Enterprises. Due diligence is an ongoing process, and we routinely evaluate our practices and policies, updating them as appropriate. For more information on the application of the main aspects and steps of our due diligence process as reflected in this sustainability statement, we refer to the sections in the table below.
| | | | | | | | | | | | | | | | | | | | | | | | | | | | | |
| Core Elements of Due Diligence | ESRS 2 | E1 | E2 | E3 | E5 | S1 | S2 | S3 | G1 |
|
| a) Embedding due diligence in governance, strategy and business model | 3.4.2.2.A. (GOV-1) 3.4.2.2.B. (GOV-3)
3.4.2.3.C. (SBM-3) | 3.4.2.2.B. (GOV-3)
3.4.3.1.A. (SBM-3) | | | | 3.4.4.1.A. (SBM-3) | 3.4.4.2 (SBM-3) | 3.4.4.3 (SBM-3) | 3.4.5
3.4.5.1 |
| b) Engaging with affected stakeholders in all key steps of the due diligence | 3.4.2.2.A. (GOV-1)
3.4.2.3.B. (SBM-2)
3.4.2.4.A. (IRO-1) | 3.4.3.1.A. (IRO-1) 3.4.3.1.B. | 3.4.3.2.A. (IRO-1) 3.4.3.2.B. | 3.4.3.3.A. (IRO-1) 3.4.3.3.B. | 3.4.3.4.A. (IRO-1)
3.4.3.4.B. | 3.4.4.1.A. (SBM-3)
3.4.4.1.B.
. | 3.4.4.2 (SBM-3)
3.4.4.2.A.
| 3.4.4.3 (SBM-3)
3.4.4.3.A.
| 3.4.5.2. (IRO-1) 3.4.5.3.A. |
| c) Identifying and assessing adverse impacts | 3.4.2.4. A. (IRO-1)
3.4.2.3.C. (SBM-3) | 3.4.3.1.A. (IRO-1; SBM-3) | 3.4.3.2.A. (IRO-1) | 3.4.3.3.A. (IRO-1) | 3.4.3.4.A. (IRO-1) | 3.4.4.1.A. (SBM-3)
3.4.4.1.C. | 3.4.4.2 (SBM-3)
3.4.4.2.A. |
3.4.4.3.A. | 3.4.5.2. (IRO-1)
3.4.5.3.B. |
| d) Taking actions to address adverse impacts | | 3.4.3.1.C.
3.4.3.1.A | 3.4.3.2.C. | 3.4.3.3.C. | 3.4.3.4.C. | 3.4.4.1.C. | 3.4.4.2.B. | 3.4.4.3.B. | 3.4.5.3.A. |
| e) Tracking the effectiveness of these efforts and communicating | | 3.4.3.1.C.
3.4.3.1.D. | 3.4.3.2.D. | 3.4.3.3.D. | 3.4.3.4.D. | 3.4.4.1.E. | 3.4.4.2.C. | 3.4.4.3.C. | 3.4.5.3.C. |
3.4.2.2.D. Risk management and internal controls over sustainability reporting (ESRS 2 GOV-5)
The risk management and internal control processes over financial reporting which are currently in place, have started to be applied to the sustainability reporting process and will be gradually further deployed in the coming years. ST is leveraging the COSO framework to establish internal controls over sustainability reporting ("ICSR") following the publication on March 30, 2023, of an interpretive report by COSO.
During 2025, ICSR were formalized with the design and execution of internal controls at corporate and local levels, covering environmental and social data in the sustainability statement along with the EU Taxonomy indicators. The features covered relate to completeness, integrity and accuracy of the data as well as the estimates.
Prioritization was notably set on completeness and reconciliation with the financial statements. The findings of the internal controls deployed were discussed internally with the relevant functions at local and corporate levels.
The progress made on the development of the ICSR framework has been reported to the Sustainability Statement SteerCo throughout 2025. In the coming years, ST will continue to expand the coverage and integrate the evaluation of the effectiveness of our internal controls and procedures and correspondingly inform our Audit Committee on the results of such evaluations.
3.4.2.3 Strategy (ESRS 2 SBM)
3.4.2.3.A. Strategy, business model and value chain (SBM-1)
Strategy relating to or affecting sustainability matters
Our strategy focuses on sustainable long-term value creation for the Company and its affiliated enterprises and takes into account the evolution of the markets we serve and the environment and opportunities we see. Our strategy stems from the following key long-term trends in electronic systems that drive the evolving requirements of our customers and our solutions across the four end markets we address (Automotive; Industrial; Personal Electronics; and Communications Equipment, Computers and Peripherals):
•smart mobility – providing innovative solutions to help car manufacturers make driving safer, more energy efficient and more connected;
•power and energy - delivering technology and solutions for power and energy management enable customers to increase energy efficiency everywhere and support the use of renewable energy sources; and
•cloud-connected autonomous things – supporting the proliferation of secure, connected, autonomous devices enabled by edge AI.
Our value proposition for our various stakeholders is:
•for our shareholders – returning value in line with our objectives, by working towards sustainable and profitable growth;
•for our customers – providing differentiating enablers, using an independent, reliable and secure supply chain; and
•for all stakeholders – committed to sustainability and upholding our values of integrity, prioritizing people and excellence.
As an IDM, we design, manufacture, and sell semiconductor devices. We handle most manufacturing in-house and tightly integrate our technology and product development with our manufacturing operations while providing our customers with the capacity, flexibility, and quality they need. Most of our employees are based in Europe - specifically Italy and France - as detailed in the table titled 'Overview by country' included in Section 3.4.4.1.E.2. (Metrics - Characteristics of the undertaking’s employees).
We are exposed to company-specific growth drivers including: (i) in Automotive: engaged customer programs in ADAS, silicon carbide power devices and sensors; (ii) in Industrial: general purpose MCUs; (iii) in Personal Electronics: engaged customer programs in sensors and analog; (iv) in Communication Equipment and Computer Peripherals: data centers, including cloud optical interconnect and Power and Analog for AI servers and data centers and low earth orbit ("LEO") satellites. We are also uniquely positioned to address humanoid robotics through our broad portfolio spanning MCUs, MEMS, optical sensors, global navigation satellite system ("GNSS") and power management.
Further details of our products and product groups can be found in Section 2.3. (Product information).
One of the main future challenges we foresee in relation to our sustainability matters is increased, dynamic and rapidly evolving sustainability regulatory requirements in areas such as water consumption and the use of hazardous substances. This could create challenges in terms of resources, operations and our manufacturing processes. Within our sustainability programs and dedicated actions, we have set up
specific projects to address these challenges and constantly monitor developments in this regard and how to effectively respond hereto.
Our business model and value chain
Our business model and value chain are presented in the below graph.
Our value chain is a comprehensive process that involves multiple stages, each contributing to the creation of high-quality semiconductor devices. Our three broad value chain sections are described as follows:
•Upstream value chain:
◦suppliers - ST purchases raw materials, equipment, energy, gas, chemicals, and services from many suppliers.
◦subcontractors - ST utilizes external silicon foundries and OSATs (together "subcontractors") to supplement its capacity in front-end manufacturing, electrical wafer sorting, and back-end manufacturing. These subcontractors help manage demand and expand production capabilities.
•ST own operations: ST is an IDM that designs, develops, manufactures, and markets a broad range of products used in a wide variety of applications for the four end-markets it addresses. ST's in-house operations include:
◦R&D concept and design: New products are created in a multi-step process including architecture conception, electrical layout, electrical and logic simulation, chip layout, and generation of the masks that will be used to etch the design in silicon.
◦front-end manufacturing: Manufacturing chips requires around 400 separate stages, starting with a plain wafer and resulting in the etching of several hundreds to thousands of dies.
◦electrical wafer sorting: Dies on the wafer are electrically tested to check that they meet the required specifications. This step is known as wafer sort or probe.
◦back-end manufacturing: The dies are cut from the wafer before being assembled in a package. The chips are then tested again prior to delivery to the customer, ensuring they are functional and reliable.
•Downstream value chain (distributors and customers):
◦product use and end of life (downstream value chain - distributors and customers). We offer a large portfolio of products suitable for the wide range of applications addressed by our customers. This stage includes distributing products to customers and ensuring that products meet the needs of various applications.
3.4.2.3.B. Interests and views of stakeholders (SBM-2)
Our diverse range of stakeholders can affect or be affected by our activities and products in different ways. Our key stakeholders are: employees, customers, suppliers (including supply chain workers), subcontractors (including their workers), investors and affected communities. Regular engagement with internal and external stakeholders is essential to assess their expectations.
We aim to maintain open communication and actively listen so we can integrate their feedback into our decision-making, as appropriate. We seek to integrate the interests and views of our stakeholders into our strategy and business model as they are taken into account when defining our sustainability strategy, ambitions, policies, programs and targets. Every year, we aim to review our sustainability materiality based on, amongst others, stakeholder feedback and external trends to anticipate changes and include stakeholder expectations in our considerations, through a DMA in accordance with the ESRS. The Sustainability Committee is responsible for reviewing stakeholders' feedback related to sustainability and through the DMA governance, the Executive Committee, Audit Committee and Supervisory Board are informed of the results of the stakeholder consultation.
In 2025, for the DMA, we consulted our stakeholders to:
•identify the sources of their interests and concerns;
•collect additional perspectives and support the identification and assessment of IROs; and
•check the completeness of the identified material sustainability matters.
The answers provided by our stakeholders were reviewed and analyzed and were considered in the DMA through which we identified the Company’s material sustainability matters.
For further details on the 2025 DMA reference is made to Section 3.4.2.4.A. (Impact, risk and opportunity management).
Our stakeholder engagement varies across our sites and all levels of the Company. Sites conduct specific actions depending on their activity, size, location and local culture. ST sites have regular exchanges with local stakeholders.
At corporate level, we conduct surveys as part of the double materiality exercise, involving all categories of stakeholders, covering pre-identified sustainability topics and giving stakeholders the opportunity to suggest additional topics they deem important.
Specifically with regard to our employees, we also conduct a biannual general engagement survey and a biannual survey on specific topics, gathering and responding to their feedback.
The table below lists certain main topics of interest identified through the 2025 surveys and examples of various types of engagement per category of stakeholder group:
| | | | | | | | |
ST stakeholder group | How we gather feedback | Highest rated topics from 2025 stakeholder consultation |
Employees, employee representatives | Employee surveys and workshops training, intranet with global and local content | Employees: Own workforce: health and safety, pollution of air, water, soil, climate change mitigation Own workforce: human rights. Own workforce: equal treatment and opportunity for all Employee representative: climate change mitigation, water management Own workforce: labor rights and working conditions and human rights, corruption and bribery |
Customers | Trade shows and technology days seminars, conferences, workshops site visits, meetings, audit | Climate change mitigation, Own workforce: Human rights, corruption and bribery Own workforce: health and safety, pollution of air, water, soil |
Investors, analysts, shareholders | Capital market days regulatory filings and reports ESG questionnaires and meetings | Climate change mitigation, energy Biodiversity: impact and dependencies, climate change adaptation Own workforce: labor rights and working conditions |
Suppliers | Adherence to ST business ethics and responsible business conduct and compliance with RBA code of conduct, training, audits and interviews, supplier events | Supplier relationship management Own workforce: health and safety Workers in the value chain: health and safety, climate change mitigation, pollution of air, water, soil |
Media | Press releases and interviews conferences and conventions social networks, website | Artificial intelligence Own Workforce: data privacy Workers in the value chain: data privacy, energy Affected communities: civil and political rights |
Affected communities | Local partnerships conferences, conventions, making donations, training, volunteering, local initiatives | Water management, climate change adaptation, climate change mitigation Own workforce: health and safety Own workforce: equal treatment and opportunity for all |
| | | | | | | | |
| Non-profit organizations | Local partnerships conferences, conventions, making donations, training, volunteering, local initiatives | Waste management, artificial intelligence, own workforce: health and safety, workers in the value chain: health and safety, climate change adaptation |
Industry associations | Public-private partnerships activities Participation in industry consortiums and working groups meetings, conferences, seminars | Pollution of air, water, soil, waste management, responsible mineral sourcing, energy, management of hazardous materials |
Schools, research and academic institutions | Internships, scholarships, PhDs joint R&D projects, joint labs conferences, technical seminars | Climate change mitigation Own workforce: health and safety, energy, corruption and bribery, management of hazardous materials |
National and local authorities* | Partnerships with municipalities correspondence and visits annual report | Climate change mitigation, climate change adaptation, pollution of air, water, soil. Management of hazardous materials, water management |
While we have various engagements with our stakeholders, we routinely seek ways to improve our processes. In 2025 we standardized stakeholder engagement throughout the Company and deployed a more structured and effective stakeholder engagement method, specifically regarding sustainability topics, across relevant ST departments and sites. The main principles of this enhanced structured stakeholder engagement are described in the Stakeholder Engagement Policy available on st.com.
Relevant ST sites have completed a mapping exercise to identify their local stakeholders. Subsequently, these sites will implement stakeholder engagement approaches taking into account local priorities and needs and will actively engage with their priority stakeholders to foster meaningful dialogue and collaboration. In 2025, relevant ST departments regularly engaged with various stakeholders. Quarterly meetings are held with Corporate Sustainability to review updates, inputs and stakeholder expectations.
3.4.2.3.C. Material impacts, risks and opportunities and their interaction with our strategy and business model (SBM-3)
The IROs regarding environmental, social and governance sustainability matters, identified and assessed as material through the 2025 DMA are listed and described in more detail in Appendix 11.4. (IRO Tables (SBM-3)).
Current and anticipated effects of material IROs on our business model, value chain, strategy and decision-making are detailed in the description of each IRO (refer to Section 3.4.2.4. (Impact, risk and opportunity management)). The IRO description also details how material impacts affect people or the environment. Our response to these effects is embedded in our long-term sustainability targets, associated programs and related key actions detailed in this sustainability statement.
Our strategy and business model currently address material negative impacts and risks, and allow the Company to take advantage of material opportunities. The connection between identified impacts, risks and opportunities, and our business model and strategy is made through our sustainability target-setting process. The resilience of our strategy and business model regarding our capacity to address material impacts and risks seize material opportunities will be regularly assessed by monitoring targets (insofar such targets have been set) and associated programs or related key actions. This assessment is conducted through regular tracking of the Company's progress towards reaching its targets, at least annually. Furthermore, this assessment is conducted by performing an annual evaluation of targets against outcomes of the annual DMA, ensuring that identified material IROs are effectively addressed via existing targets, programs and/or actions, taking into account the relevant time horizons applied in the DMA for the material IROs. Based on these assessments, the Company updates targets and associated programs and/or actions as appropriate to support the resilience of our strategy and business model.
Based on the 2025 DMA, the Company has not identified any short-term material risks or opportunities, therefore, there are no related current financial effects to report.
3.4.2.3.D. Disclosure Requirements in ESRS covered by ST’s sustainability statement (IRO-2)
The sustainability disclosures included in this sustainability statement have been considered relevant based on their significance in explaining ST's approach to sustainability and our management of the material IROs assessed in the 2025 DMA.
A table showing the disclosure requirements covered by the sustainability statement is included in Appendix 11.1. A table showing the data points derived from other EU legislation is included in Appendix 11.2.
3.4.2.4. Impact, risk and opportunity management
3.4.2.4.A. Description of the process to identify and assess material impacts, risks and opportunities (IRO-1)
Introduction
As a fundamental element of our preparation for the CSRD reporting, we have performed a DMA pursuant to the ESRS.
At ST, ERM is designed and implemented to enable the Company to set and execute its strategy by identifying, evaluating and treating specific risk scenarios while capitalizing on opportunities. We recognize the need to support coherence between the assessment and management of different types of risks, including the sustainability-related risks. Therefore, we have adopted the ERM process in the DMA and leveraged our ERM methodology, which has been further developed and adjusted as necessary to accommodate ESRS specificities.
Material risks identified in the DMA are embedded in the Company priority risk map, which is updated annually. Based on our ERM methodology, risks are prioritized based on the combination of criticality and possible improvement to be implemented (i.e. whether and how additional mitigation measures should be implemented). In the coming years, ST will assess how to more explicitly embed material impacts and opportunities as identified through the DMA in the ERM framework.
DMA governance
The DMA process and results were overseen by the Sustainability Statement SteerCo. The results and conclusions were communicated to and approved by the Executive Committee. Finally, the DMA outcome was presented to the Audit Committee of the Supervisory Board, which acknowledged the results.
DMA process
The 2025 DMA process consisted of the following steps:
DMA scope
Based on our business model and taking into account the sustainability topics covered by the ESRS, we identified the following nineteen sustainability matters as relevant for ST, which remain unchanged compared to those identified in 2024:
The nineteen sustainability matters relevant to ST formed the basis for the identification of our impacts on people and the environment, as well as the risks and opportunities to our company.
To conduct a comprehensive DMA, the sub-topics and sub-sub-topics referenced in the ESRS were systematically considered in light of our specific business model, strategy and value chain. IROs were identified considering relevant dimensions including different activities, business relationships and geographies, while leveraging the expertise of our ST subject matter experts.
Moreover, when relevant, interdependencies were identified and documented (e.g., when an impact might be the cause of a risk or an opportunity). Dependencies on the availability of natural and social resources were also identified and documented for each IRO.
Our value chain is summarized in the below chart, while a detailed overview of our value chain is included in Section 3.4.2.3.A. (Strategy, business model and value chain).
Leveraging stakeholder consultation
Further to the general description on ST's stakeholder engagement (Section 3.4.2.3.B. Strategy - Interests and views of stakeholders), this section refers to the specific role of stakeholder engagement as part of the DMA. ST engages with stakeholders to identify the sustainability matters that are most significant to them.
The main objectives of the stakeholder consultation were to:
•collect additional perspectives to support the identification and assessment of material impacts, risks and opportunities; and
•ease the identification of stakeholder’s sources of interest and concerns.
Moreover, the stakeholder consultation supported the completeness of the identified relevant sustainability matters.
The stakeholder consultation was conducted leveraging a variety of channels:
•a selection of external stakeholders (customers; industry associations; investors, analysts and shareholders; national and local authorities; non-profit organizations; schools; research and academic institutions; affected communities; and suppliers) were directly consulted through a dedicated survey;
•internal stakeholders (comprising of different categories of ST management and employees) were also directly consulted through a dedicated survey;
•a data analytics platform was leveraged to conduct a research-based consultation collecting additional inputs from a wide range of media; and
•inputs from non-profit organizations, media and schools, research and academic institutions were used to embed silent stakeholders' views in the consultation outcome. Silent stakeholders are those who may not actively voice their opinions (e.g., nature) but could be impacted by our activities.
Both the survey-based and research-based consultations covered the ESRS topics.
In processing the outcome of the stakeholder consultation, each above-mentioned stakeholder group was assigned a weight based on its ability to influence ST decisions and the representativeness of the responding group. These weights were applied to the views expressed by each stakeholder group on individual sustainability matters to produce an overall ranking of stakeholder perceptions by sustainability matter.
Overall, the stakeholder consultation outcome was consistent with our internal DMA. The topics evaluated at high score by our stakeholders were also assessed as material in the 2025 DMA, confirming alignment between their views and our DMA outcome.
Leveraging the DMA methodology and a thorough assessment of impacts, risks, and opportunities, ST proactively identified additional material sustainability matters that were not indicated as material by our stakeholders.
Preliminary IROs review
In 2024, based on our ESRS topical review, knowledge of our value chain and business, an understanding of stakeholder perceptions and the information we obtained during our 2023 preparations for CSRD reporting, we identified an initial list of IROs clustered into our nineteen sustainability matters, which was then reviewed with our ST subject matter experts.
As part of our 2025 improvement efforts, we undertook a rationalization process to enhance the conciseness and clarity of the list of IROs (which included, amongst others, rewording of certain IROs). and drafted a baseline for IRO quantification by leveraging available internal and external information.
Leveraging subject matter expertise
As in 2024, we leveraged the expertise of our ST subject matter experts in 2025 to review the IROs list and DMA scope and conclude on IROs materiality. These experts contributed throughout the DMA process by providing their expertise and relevant qualitative and quantitative information to support the IRO assessment.
Assumptions and approach for IROs quantification and assessment were formalized and the DMA outcome was subsequently presented and discussed in dedicated ESG workshops with ST subject matter experts from the relevant departments.
Additional consistency checks and review
Following the workshops, we conducted further reviews and consistency checks, and finalized the list of IROs and their respective assessments.
Validation
The 2025 DMA results and conclusions were communicated to and approved by the Executive Committee. The 2025 DMA results were ultimately presented to the Audit Committee of the Supervisory Board which acknowledged the results.
ERM-aligned DMA methodology
IRO assessments: general principles
The methodology for both the impact and financial materiality is consistent with our ERM framework.
The identified actual (negative and positive) impacts on people and the environment were assessed based on magnitude of impact (four levels from low to very high).
The identified potential (negative and positive) impacts on people and the environment, as well as the risks and opportunities for the Company were assessed based on the two following criteria:
•likelihood of occurrence: four levels from unlikely to almost certain likelihood; and
•magnitude of impact: four levels from low to very high magnitude.
The combination of likelihood and magnitude provided four degrees of materiality, which are represented in the criticality matrix, with a color code ranging from white to dark blue.
The IROs in the dark blue area are deemed material for the purpose of the CSRD.
The below matrix is an illustration of such criticality matrix.
Methodological specificities
Both for impact and financial materiality, IROs were assessed on a residual basis (i.e. taking into account existing mitigating measures).
Assessments were performed across different time horizons, ranging from short-term (within the current reporting year) and mid-term (from one to five years) to long-term (beyond five years), with the exception of climate-related IROs for which the time scale was extended with long term defined as beyond ten years.
Any IROs not assessed as material on a residual basis across the three-time horizons, were further assessed on an inherent basis (i.e., without taking into account the existing mitigating measures). Inherent assessments were performed over a long-term time horizon therefore considering the highest cumulated effect.
Regarding the impact materiality, the magnitude of (negative and positive) impacts on people and the environment was assessed using a combination of the following sub-criteria:
•scale: how grave the negative impact is or how beneficial the positive impact is for people or the environment;
•scope: how widespread the negative or positive impacts are; and
•irremediable character: the extent to which the impact can be remediated (for negative impacts only).
In 2025, in line with our ongoing improvement efforts, we worked on establishing a baseline for quantifying the IRO assessments. The magnitude of impacts, risks and opportunities, was assessed using both quantitative and qualitative considerations based on the available information and data.
As required by the ESRS, the quantification of risks and opportunities aimed to identify their potential financial impacts on our activities. Assumptions and approaches for quantifying each IRO and related assessment were formalized and documented.
Where relevant, available insights from internal data and/or from our existing due diligence process with regard to the value chain (e.g., in the context of the RBA, further described in Section 3.4.4.2.A. (Policies related to supply chain workers) were leveraged in the assessment process.
From a quantitative standpoint, the estimated financial magnitude of risk and opportunities towards ST was determined and assessed based on their potential effects on the Company net income.
We followed the ESRS-defined methodological exceptions, in particular in relation to potential negative human rights impacts. Based on these exceptions, the magnitude of the impact takes precedence over its likelihood.
Combining impact and financial materialities to obtain the double materiality
Impact and financial materialities were combined in the following manner:
Each sustainability matter was positioned on the above impact or financial materiality matrix based on its highest-rated IRO. Ultimately, a sustainability matter was considered to be material when at least one IRO was assessed as material.
In the final double materiality matrix, any sustainability matter positioned in the dark green area is deemed material, whether from an impact materiality standpoint, a financial materiality standpoint, or both.
DMA results
In 2025, thirteen out of the nineteen sustainability matters related to ESRS E1, E2, E3, E5, S1, S2, S3 and G1 were assessed as material as outlined in the following table and matrix. The same thirteen sustainability matters were assessed as material in 2024.
Four of these thirteen material sustainability matters were assessed as material on an inherent basis: "Own workforce: Health and Safety," "Own workforce: Equal treatment and opportunities for all," "Whistleblowing," and "Corruption and Bribery". On a residual basis, considering the mitigating measures and programs already in place, these four sustainability matters were assessed as non-material.
The remaining nine material sustainability matters remained material on a residual basis, as in 2024.
Six of these nineteen sustainability matters were assessed as non material: Biodiversity; Workers in the value chain: Health and Safety; Workers in the value chain: Equal treatment and opportunities for all; Consumers and end users; Supplier relationship management; and Political engagement and industrial association.
The tables outlining the 2025 DMA material IROs, along with the associated programs, dedicated actions, and (entity-specific) targets set to address these IROs, are included in Appendix 11.4.
* = Sustainability matters material on an inherent basis (while not material on a residual basis)
3.4.3. Environment
ST is dedicated to managing its business in an environmental responsible way. This section outlines our material IROs, approach, policies, actions and targets in this regard, focussing on climate change, pollution and chemicals, water and waste.
Approach to environmental responsibility
As an IDM, we handle most manufacturing in-house and also outsource part of the manufacturing to our subcontractors. The manufacture of semiconductor devices requires natural resources, water, energy and chemical substances, and can have a negative impact on the environment. Minimizing our overall environmental footprint is a priority for ST, our strategy and business model take into account managing our greenhouse gas emissions, energy use, chemical use, water consumption and waste generation.
Policies
Our approach to the environment is laid out in our Global Environmental Policy, which includes our Global Water Policy, and is incorporated into our strategy. This policy is available on st.com and is applied at global level and applicable to all ST entities and all ST employees. For an overview of relevant policies reference is made to the policy overview table in Appendix 11.7.
Our Global Environmental Policy details, inter alia, our ambition to reduce our negative environmental impacts, and risks arising from our own operations and those of our suppliers and utilize environmental opportunities through various key actions, and states various of our goals, such as to:
•maintain an environmental management system based on standards and proven practices throughout the Company;
•implement control measures and audits to check that appropriate environmental procedures are carried out and to identify and prioritize areas for improvement;
•maintain relevant environmental certifications for all our manufacturing and large R&D sites worldwide;
•comply with environmental regulations and other requirements globally and locally;
•pursue improvement in our environmental performance;
•provide appropriate training for our employees and provide all necessary information to our stakeholders; and
•develop long-term partnerships with suppliers committed to responsible environmental standards and practices.
Our Global Water Policy, embedded in our Global Environmental Policy, more specifically, details our ambition to manage water-related impacts, including impacts of water pollution, through various key actions, such as:
•applying water governance at all manufacturing sites, including water use, discharge, quality, and regulatory compliance; and
•regularly evaluating water flows and water balance.
Governance
Our CHRO is accountable for the implementation of the Global Environmental Policy implementation. Various dedicated teams are involved in the implementation of the Global Environmental Policy, such as
corporate environmental team regarding, amongst others, the development of programs and procedures that enable us to work towards our environmental objectives, local ST site sustainability committees regarding, amongst others, the development of a roadmap based on the needs of their respective sites and CCFS regarding, amongst others, the implementation of relevant actions.
Our manufacturing sites have an EHS steering committee responsible for implementing the Global Environmental Policy. Each EHS steering committee includes representatives from various relevant departments and meets regularly to review relevant topics, such as environmental performance and/or compliance with local and national environmental standards and requirements. The outcomes of these reviews are shared with site management and appropriate actions are implemented where necessary.
ST environmental management system
Our environmental management system is aligned with international standards, including ISO 14001 and ISO 50001. Our performance and management systems are evaluated annually through third-party surveillance audits, and we aim to renew our certifications every three years. Our main manufacturing sites are certified.
ISO 14001 is an internationally recognized framework that helps organizations improve their environmental performance. It establishes a systematic approach for organizations to improve energy efficiency and decrease GHG emissions, reduce and recycle waste, conserve water, and control pollutants. This framework encourage improvement in environmental performance and compliance with environmental regulations and best practices. ISO 50001 sets a standard for energy management, improving energy efficiency and reducing related consumption, thereby contributing to climate change mitigation.
Availability of policy
ST’s employees, suppliers, partners and other stakeholders are key stakeholders in the Global Environmental Policy, which includes our Global Water Policy, and required for its successful implementation. Training and information sharing sessions are deployed. Our Global Environmental Policy is available on st.com for everybody, including potentially affected stakeholders and stakeholders who need to help implement it, and All ST's environmental procedures implementing the policy commitments are available to ST’s employees via our internal platforms.
3.4.3.1. Climate change (E1)
Climate related IROs (SBM-3)
The following table lists the IROs related to climate change we have identified and assessed as material in our 2025 DMA, including the programs or dedicated actions and (entity-specific) targets, we have in place to address such IROs.
| | | | | | | | | | | | | | | | | | | | | | | |
E1 – Climate change mitigation |
Description | Type of IRO | Actual/ Potential | Value chain segment | Time horizon | Material on a residual(1) or inherent(2) basis | ST response | Targets |
Negative impact from ST on the environment due to its GHG emissions, contributing to climate change | Negative impact | Actual | Own operations | Short term | Residual basis | ST’s decarbonization program | We aim to achieve a 20% overall reduction in absolute scope 1 and 2 emissions by 2030 versus 2024.
We aim to abate at least 90% of our CAPG emissions by 2030 (entity-specific).
We aim to achieve a 10% reduction in our Scope 3 upstream GHG emissions by 2030, and a 20% reduction by 2035, versus 2024.
|
Negative impact from suppliers on the environment due to their GHG emissions, contributing to climate change | Negative impact | Actual | Upstream | Short term | Residual basis | ST’s decarbonization program |
Negative impact from foundries and OSATs on the environment due to their GHG emissions, contributing to climate change | Negative impact | Actual | Upstream | Short term | Residual basis | ST’s decarbonization program |
Negative impact from GHG emissions generated by distributors and customers activities, and other downstream emissions contributing to climate change | Negative impact | Actual | Downstream | Short term | Residual basis | ST's decarbonization program | No target in place |
| | | | | | | | | | | | | | | | | | | | | | | |
Risk of increased carbon offsetting needs to deliver ST carbon neutrality commitments by 2027 leading to higher costs, reduced stakeholder engagement (i.e. customers, investors, and talents) and damaging Company's reputation | Transition Risk | Potential | Own operations | Long term | Inherent basis | ST’s decarbonization program | We aim to achieve a 20% overall reduction in absolute scope 1 and 2 emissions by 2030 versus 2024.
We aim to abate at least 90% of our CAPG emissions by 2030 (entity-specific).
We aim to achieve a 10% reduction in our Scope 3 upstream GHG emissions by 2030, and a 20% reduction by 2035, versus 2024.
|
Risk of ST not being able to influence suppliers to reduce their GHG emissions, affecting ST's scope 3 performance | Transition Risk | Potential | Upstream | Mid term | Residual basis | ST’s decarbonization program |
Risk of ST not being able to influence foundries and OSATs to reduce their GHG emissions, affecting ST's scope 3 performance | Transition Risk | Potential | Upstream | Long term | Residual basis | ST’s decarbonization program |
Risk of ST not being able to influence distributors and customers to reduce their GHG emissions and downstream emissions, affecting ST's scope 3 performance | Transition Risk | Potential | Downstream | Long term | Residual basis | ST's decarbonization program | No target in place |
(1) "Residual" refers to the materiality assessment that takes into account existing mitigation measures.
(2) "Inherent" refers to the materiality assessment without taking into account any existing mitigation measures
| | | | | | | | | | | | | | | | | | | | | | | |
E1 – Climate change adaptation |
Description | Type of IRO | Actual/ Potential | Value chain segment | Time horizon | Material on a residual(1) or inherent(2) basis | ST response | Targets |
Risk of natural catastrophes due to chronic and/or acute climate-related events damaging ST assets and / or local infrastructures in the vicinity (esp. utilities), leading to business interruption | Physical Risk | Potential | Own operations | Long term | Residual basis | ST’s climate adaptation activity | No target in place |
Risk of natural catastrophes due to chronic and/or acute climate-related events damaging suppliers' assets and / or local infrastructures in the vicinity (esp. utilities), disrupting ST's operations | Physical Risk | Potential | Upstream | Long term | Residual basis | ST's responsible supply chain program | No target in place |
| | | | | | | | | | | | | | | | | | | | | | | |
Risk of natural catastrophes due to chronic and/or acute climate-related events damaging foundries and OSATs' assets and / or local infrastructures in the vicinity (esp. utilities), disrupting ST's operations | Physical Risk | Potential | Upstream | Long term | Residual basis | ST’s responsible supply chain program | No target in place |
Risk of natural catastrophes due to chronic and/or acute climate-related events damaging distributors' and customers' assets and / or local infrastructures in the vicinity (esp. utilities), leading to business loss for ST | Physical Risk | Potential | Downstream | Long term | Residual basis | ST's climate adaptation activity | No target in place |
(1) "Residual" refers to the materiality assessment that takes into account existing mitigation measures.
(2) "Inherent" refers to the materiality assessment without taking into account any existing mitigation measures.
| | | | | | | | | | | | | | | | | | | | | | | |
E1 – Energy |
Description | Type of IRO | Actual/ Potential | Value chain segment | Time horizon | Material on a residual(1) or inherent(2) basis | ST response | Targets |
Risk of increased energy costs for ST directly due to climate-related factors or indirectly, through increased procurement prices of raw materials, services and products affecting the Company's operating margin | Transition Risk | Potential | Own operations | Long term | Residual basis | ST’s decarbonization program | We aim to adopt 100% renewable electricity by 2027 through energy procurement and renewable energy installations and maintain this percentage each year thereafter.
We aim to annually save energy, achieving cumulative energy savings of 100 GWh by 2035, versus the baseline year 2024 (entity-specific).
|
| Risk of ST not being able to secure ramp-up of electricity share from PPAs contracts or insufficient access to EAC due to increasing demand leading to higher costs and reputational damages | Transition risk | Potential | Own operations | Long term | Inherent basis | ST’s decarbonization program |
Opportunity to further reduce ST's energy consumption or benefit from the development of renewable energy sources through PPAs, leading to increased Company's profitability | Transition opportunity | Potential | Own operations | Long term | Residual basis | ST’s decarbonization program |
(1) "Residual" refers to the materiality assessment that takes into account existing mitigation measures.
(2) "Inherent" refers to the materiality assessment without taking into account any existing mitigation measures
3.4.3.1.A. Climate-related impacts, risks and opportunities
Addressing climate-related physical risks
For climate-related physical risks, we have commissioned analyses conducted by third parties over the past years in order to understand the implications of climate change in terms of resilience of our strategy and business model.
In 2021, we commissioned a study from an expert third-party (an environmental consultancy firm), which has been a valuable resource to help us understand the characteristics and implications of water scarcity on our operations. Additionally, in 2023, we commissioned an update of a science-based study (the "Climate Study") from an expert third-party to assess the current and future climate risks on 155 assets (including all our main sites and those of our key manufacturing and logistics partners in our supply chain, located in 25 countries).
This Climate Study has provided an overview of the inherent climate-related risks for the assets in scope.
The analysis was based on two climate change scenarios defined by the United Nations Intergovernmental Panel on Climate Change (the "IPCC"):
• an intermediate emissions scenario: SSP2-4.5 (mid-century warming of 1.6 to 2.5°C, end of century warming of 2.1 to 3.5°C versus preindustrial era); and
• a very high emissions scenario: SSP5-8.5 (mid-century warming of 1.9 to 3°C, end of century warming of 3.3 to 5.7°C versus pre-industrial era).
Specifically for each scenario and for each of the 155 assets, climate projections on 2030 and 2050 time horizons show likely evolutions across a range of indicators based on the EU Taxonomy classification of climate-related hazards, which might be temperature-related, wind-related, water-related or solid-mass erosion-related, including more specifically: cyclonic and non-cyclonic wind gusts; coastal and riverine floods; number of heavy precipitation days; freezing conditions such as cold wave duration and number of frost days; extreme heat conditions, including heatwave duration and number of hot days; drought including dry wave duration and water stress; and landslide.
Building on these initial inherent risk analyses, ST has been working to define the methodology and gather additional technical data from an expert third party and ST subject matter experts necessary to assess the residual exposure of its manufacturing infrastructure to heat risks. A pilot analysis of residual exposure to heat risks of one site was completed in 2024. Throughout 2025, we worked to complete the analyses for the remaining sites. Thresholds and indicators are currently being defined to finalize the assessment of residual exposure to heat risks. Based on this assessment, ST will evaluate whether the development of adaptation plans is necessary.
Ultimately, these different climate-related analyses feed our site-level business interruption risk assessments and business impact analyses, as well as our site resilience index.
While the conducted analyses were based on the latest climate modelling techniques, results inherently entail uncertainties in the assessment process.
Addressing climate-related transition risks
Consistent with 2024, our 2025 DMA identified a number of IROs related to the transition to a lower carbon economy.
To identify transition risks and opportunities, we first leveraged the analysis we previously conducted under the TCFD. In this context, we identified transition risks and opportunities around market, policy and regulations, infrastructure robustness, resource efficiency, energy source and image TCFD categories considering potential climate-related transition events. These potential transition events and associated transition risks and opportunities were initially identified based on input from key ST subject matter experts, as well as the key characteristics of our IDM business model.
The identified climate-related transition risks and opportunities were built upon in the 2025 DMA process and further completed and assessed based on quantitative and qualitative considerations including additional input from our subject matter experts and available data and information.
Overall, the potential climate related transition events included potential changes in laws and regulations (e.g., public authorities decisions, new regulations, new carbon pricing mechanisms); supply market dynamics (e.g., evolution of energy prices, availability of renewable energy sources, products, services and raw materials cost variation); end-market dynamics (e.g., customers behaviors versus climate change); and, more broadly, stakeholder perception of our carbon neutrality performance.
From a risk management standpoint, we assessed a climate scenario consistent with the UN Paris Agreement (i.e. strictly limiting global warming to 1.5°C with no or limited overshoot) to be unlikely based on current and evolving environmental context and associated uncertainties.
Simultaneously, regarding transition opportunities, we are actively investing in developing and launching new products which aim to enable sustainability-related applications and devices, as further described in Section 3.4.3.5. (EU Taxonomy Regulation).
Continuous resilience assessment
The resilience of our IDM strategy and business model in relation to climate change will be regularly assessed through the monitoring of related targets.
Climate scenarios for determining material physical and, where relevant, transition risks were evaluated across the short, medium and long-term. Consistent time horizons were considered to set related targets.
Transition plan for climate change mitigation
We have not yet adopted a complete transition plan for climate change mitigation that meets all the elements contemplated by the ESRS. We are continuing to further develop such plan. The following elements of our contemplated transition plan for climate change mitigation were approved by our Executive Committee in 2024, and we are already actively taking steps on these topics, as detailed further below:
•decarbonization of our own operations;
•decarbonization of our supply chain; and
•development of technologies and products that aim to reduce GHG emissions across their life cycle.
Each of these topics are covered in our policies (further details included in Section 3.4.3.1.B. Policies related to climate change mitigation and adaptation), with the actions included and deployed in action plans. We have also set targets on the first two elements: our targets on GHG emissions reduction (further details included in Section 3.4.3.1.C. Actions, targets and resources in relation to climate change policies). These targets and identified decarbonization levers are key elements for us to develop further within our transition plan for climate change mitigation.
We aim to finalize our transition plan for climate change mitigation within the applicable legal framework, in the coming years and we will continue to report on our progress. In 2025, we enhanced our carbon neutrality program to include supply chain decarbonization, strengthening the governance regarding our decarbonization efforts and subsequently renamed the program: decarbonization program.
We are not excluded from the EU Paris-aligned Benchmarks.
3.4.3.1.B. Policies related to climate change mitigation and adaptation
Our approach and policies
Our Global Environmental Policy states our approach to managing environmental impacts, risks and opportunities through various key actions. This policy is available on st.com, for everybody, including potentially affected stakeholders and stakeholders who need to help implement it, and applied at global level and applicable to all ST entities and all employees. Our CHRO is accountable for its implementation.
Climate change mitigation and climate change adaptation are an integral part of our Global Environmental Policy.
To mitigate potential negative impacts on the environment due to GHG emissions in our own operations, our Global Environmental Policy details our aim to minimize our direct GHG emissions, as well as to maintain relevant environmental certifications for all our manufacturing and large R&D sites worldwide and to provide appropriate training and relevant information to our employees. Additionally, it includes our ambition to implement robust internal and external operational controls, and audits to check that environmental procedures are carried out and to identify and prioritize areas for improvement.
To mitigate potential negative impacts on the environment due to GHG emissions in our supply chain, our Global Environmental Policy details our dedication to minimize our upstream GHG emissions, to develop long-term partnership with suppliers that have responsible environmental standards and practices, while regularly engaging with and providing relevant information to our stakeholders.
Regarding the energy-related IROs, the policy states our ongoing objective to manage energy consumption, improve energy efficiency, and source renewable energy.
Finally, regarding climate change adaptation, the Global Environmental Policy states our ambition to define and implement climate change adaptation plans, if necessary, to address relevant climate-related risks.
3.4.3.1.C. Actions, targets and resources in relation to climate change policies
3.4.3.1.C.1. Climate change mitigation
In 2020, we announced our commitment to become carbon neutral by 2027, with an intermediate milestone in 2025, of 50% overall reduction in absolute scope 1 and scope 2 market-based GHG emissions by 2025 versus the baseline year 2018(1), endorsed by the Science Based Targets Initiative ("SBTi").
In 2024 we set an additional target: (i) to achieve a 20% (in absolute: 142 ktCO2eq) overall reduction in absolute scope 1 and scope 2 market-based GHG emissions by 2030 versus the baseline year 2024 ; as well as (ii) the target to achieve a 10% (in absolute: 384 ktCO2eq) reduction in our scope 3 upstream GHG emissions by 2030, and a 20% (in absolute: 768 ktCO2eq) reduction by 2035, versus the baseline year 2024.
We have set the baseline value against which the progress toward the targets is measured, to be representative in terms of site activities covered and the influences from external factors such as emission factors from reference database evolution. Specifically with regard to the target relating to our scope 3 upstream emissions, we have sought to make it representative in terms of procurement activities covered and the influences from external factors, by assessing impacts of future eventual changes, including technology and outsourcing model potential impact related to target time horizon.
Progress toward these targets is monitored quarterly as part of ST's decarbonization program (refer to Appendix 11.10.) and as described in Section 3.4.2.2. (Governance ).
(1) This intermediate milestone is outside of the assurance scope.
These additional targets have not yet been assessed to be science based or compatible with limiting global warming to 1.5 degree. This assessment is ongoing, taking into consideration the current and evolving challenging environmental context and associated uncertainties.
Climate change mitigation: actions and targets to reduce GHG emissions from ST operations (scope 1 and scope 2)
As part of its actions to mitigate climate change within its operations, ST aims to achieve a 20% overall reduction in absolute scope 1 and scope 2 (market based) GHG emissions by 2030 compared with the baseline year 2024.
Scope 1 and Scope 2 GHG emissions reduction target
| | | | | | | | | | | |
| In tCO2eq | December 31, 2024 (base year) | December 31, 2025 | December 31, 2030 (target year) |
Total Scope 1 and Scope 2 GHG emissions (1) | 709,483 | | 599,878 | | 567,586 | |
| Scope 1 and Scope 2 GHG emissions reduction rate | — | % | 15 | % | 20 | % |
(1) 14 manufacturing sites, 3 R&D sites and 1 EWS site
The total scope 1 and scope 2 GHG emissions decreased by 15% versus 2024, which is ahead of the linear trajectory towards the 20% reduction by 2030. The reduction is attributable to the actions described in the levers sections below. The metrics used as part of this target are the Gross scope 1 GHG emissions and Gross scope 2 GHG emissions, which are described in their respective sections.
The scope for the target includes ST's operation only covering ST's fourteen main manufacturing sites, three large R&D sites and one EWS site, as detailed in the table included in Appendix 11.9.
As part of this combine scope 1 and scope 2 target, we aim to address the negative impact on the environment, due to GHG emissions linked to our own operations, contributing to climate change, through actions and targets associated with three decarbonization levers:
•decrease climate adverse process gases (“CAPG”) emissions;
•purchase renewable energy; and
•improve energy efficiency.
Progress towards the scope 1 and scope 2 target is monitored using the absolute scope 1 and scope 2 emissions calculated annually. The decarbonization levers are monitored both individually and in relation to the scope 1 and 2 reduction target, as they directly support its achievement. These levers are described in sections below.
Decarbonization lever 1: Decrease climate adverse process gases (“CAPG”) emissions (entity-specific target)
The use of CAPG is inherent to the semiconductor industry, as there are currently no alternative substances for some parts of the semiconductor foundry manufacturing process. CAPG are gases with a high global warming potential used in production processes. ST is collaborating within the semiconductor sector with industry experts, partners and suppliers to find technical solutions for decreasing the quantities of CAPG used in our industry or replacing GHG intensive CAPG with lower GHG intensive ones.
The GHG emitted by the use of CAPG accounts for the highest share of our direct GHG emissions (scope 1). It is therefore a central part of our environmental strategy to reduce their use and to ensure that they are treated appropriately before being released into the atmosphere.
CAPG abatement related target
| | | | | | | | | | | |
| In tCO2eq | December 31. 2024 (base year) | December 31, 2025 | December 31, 2030 (target year) |
| CAPG abatment rate (in %) | 76 | % | 83 | % | 90 | % |
ST aims to abate at least 90% of its CAPG GHG emissions by 2030 versus 2024, by installing point of use CAPG abatement systems in our manufacturing sites. In 2025 we abated 83% of CAPG related GHG emissions, compared to 76% in 2024, covering our fourteen main manufacturing sites, three large R&D sites and one EWS site, as detailed in the table included in Appendix 11.9. This increase of CAPG abatement rate reflects the investment effort and the installation of new abatement systems, notably in Ang Mo Kio (Singapore) and Catania (Italy). It also indicates that progress is in line with the planned trajectory toward the 2030 target.
These abatement systems treat and destroy CAPG molecules before emission in the air, thus decreasing the GHG impact of our manufacturing process. This entity-specific target is based on conclusive scientific evidence, as the impact of CAPG abatement systems on GHG emissions from CAPG is defined in the IPCC-2019 standard and Appendix 11.6.
The CAPG abatement rate is defined as the difference between emissions without abatement systems and emissions with abatement systems, divided by emissions without abatement systems, expressed in percentage. The 90% abatement ratio has been calculated simulating the effect of all new abatement systems planned to be installed by 2030. Our target is aligned with the current sectorial guidance from the World Semiconductor Council (WSC), which has committed to achieve a PFC reduction rate of 85% by 2030. The definition of the target is based on the current status of ST's business.
Progress toward the target is tracked through a dedicated decarbonization program, which includes a workstream focused on CAPG abatement systems installation. On a quarterly basis, this ST program team reviews the thermal process unit (TPU) installation plan, assesses progress against the abatement trajectory, and identifies any corrective actions needed to stay on track for the 2030 target.
The GHG reduction associated with this lever is estimated to represent around half of the total emission reductions of our Scope 1 and 2 reduction target between 2024 and 2030. It is therefore one of the two principal levers driving decarbonization in our own operations. The methodology to compute the GHG emission is further described in Section 3.4.3.1.D. (Metrics related to climate change mitigation and adaptation - Gross scope 1 GHG emissions from the consolidated accounting group).
Decarbonization lever 2: Purchase renewable energy
Our second lever on GHG emission reduction in our own operations is sourcing renewable energy, in order to decrease our scope 2 market-based GHG emissions. We aim to transition to 100% renewable electricity sourcing by the end of 2027 and maintaining this percentage each year thereafter. This target is based on conclusive scientific evidence on the impact of renewable energy on GHG emission.
The main actions to reach 100% of renewable electricity procurement by 2027 are:
•define and follow a roadmap to increase the share of renewable electricity through PPAs. In 2025, two new PPAs began supplying renewable electricity to ST, in France and in Italy. One PPA will begin in 2026, in Malaysia;
•procure unbundled EACs. We manage and monitor an annual roadmap, budget and action plan for our Global Procurement Organization to procure EACs on all relevant locations; and
•whenever possible, implement onsite installations for renewable energy production. Two sites are planned to benefit from such installations in the coming years.
Renewable electricity rate
| | | | | | | | | | | |
| In percentage | December 31, 2024 (base year) | December 31, 2025 | December 31, 2027 (target year) |
| Renewable electricity rate | 84 | % | 86 | % | 100 | % |
The percentage of renewable electricity is the ratio between the total renewable electricity and the total electricity consumption. Our baseline 2024 value for renewable electricity is 84%, renewable electricity sourced in 2025 is 86%. This increase reflects the new PPA's providing renewable electricity (see above) and new Green electricity contracts.
This ratio is reviewed quarterly and our progress is in line with our 2020 commitment to reach carbon neutrality by 2027 with 100% electricity coming from renewable sources. The performance trends are stable with no significant changes identified towards achieving our target.
Renewable electricity means purchased or self-generated electricity coming from recognized renewable sources, such as solar, wind, hydro or geothermal. We consider as renewable electricity, electricity sourced through renewable contractual instruments signed by ST: onsite electricity generation from solar panel, renewable PPA, Green electricity contracts and unbundled EAC.
The scope for this energy target includes ST's operations only, covering ST's fourteen main manufacturing sites, three large R&D sites and one EWS site, as detailed in the table included in Appendix 11.9.
The GHG reduction associated with this lever is estimated to represent around half of the total emission reductions of our Scope 1 and 2 reduction target between 2024 and 2030.
Decarbonization lever 3: Improve energy efficiency (entity-specific target)
ST is investing in energy savings projects, in order to improve energy efficiency, and to reduce our scope 1 and 2 GHG emissions. ST also takes decarbonization actions in its own operations by implementing energy conservation projects, that improve energy efficiency at equivalent production levels, by monitoring energy consumption and productions, and regular maintenance and upgrade of its facilities equipment in ST manufacturing sites.
In this regard ST set an entity-specific target to annually save energy, achieving cumulative energy savings of 100 GWh by 2035, versus the baseline year 2024.
Energy savings target
| | | | | | | | | | | |
| In Gigawatt-hour | December 31, 2024 (base year) | December 31, 2025 | December 31, 2035 (target year) |
| Energy saving (Cumulative) | — | | 14 | | 100 | |
Implementation of energy conservation projects started in 2025. As of 31 December 2025, the energy savings achieved amount to 14 GWh. ST considers this performance to be in line with the target pathway, as only completed projects are included in the reported savings.
ST follows these projects closely throughout their lifecycle (pre‑execution, execution and post‑execution). The typical process includes:
•project identification at site level (including feasibility studies and metering requirements);
•project completion at site, including installation and commissioning;
•once the site has completed the project and can share metered or calculated data, ST adjusts the initial savings projection based on actual performance; and
•start of counting when the measurement instrument (e.g., meter or monitoring system) is fully operational and capable of providing reliable data.
Projects are accounted for only when they are considered complete with the right measurement capabilities in place, and savings are reported for a full year after completion. For example, if a project is completed on 30 September 2025 and the associated metering is ready to calculate savings, the savings are recorded from Q4 2025 until the end of Q3 2026, it means in the above table, and in this case, only one quarter of saving would be accounted for, and the remaining quarters will be accounted for in the next reporting period.
The energy saving target relates to the absolute volume of energy consumption saved annually and has been set by taking into account the list of energy conservation projects included in sites' budget plan, accordingly, a cumulative saving of 100 GWh by 2035, versus the baseline year 2024, has been estimated. The baseline value is zero. In defining the target the following main assumption has been taken into account: that there will be no significant change in facilities installations, which negatively affects the execution of the intended actions needed to reach the target.
The scope for this energy target includes ST's fourteen main manufacturing sites, three large R&D sites and one EWS site, as detailed in the table included in Appendix 11.9.
The GHG reduction associated with this lever contributes to a lesser extent to the total emission reductions required to achieve our combined Scope 1 and 2 reduction target between 2024 and 2030.
In order to reach this energy saving target by 2035 we are taking the following actions:
•we conduct regular maintenance on our facilities equipment and arrange expert third-party review of our assets to identify opportunities for improvement of energy efficiency;
•install digital monitoring systems for energy in all our manufacturing sites; to ensure that energy consumption and the effect of savings projects can be properly tracked and measured;
•arrange regular ISO 50001 certification audit and certification by a third-party of our main manufacturing sites, to validate that an adequate energy management system is in place and that annual optimization targets are set in each of those sites;
•create a company roadmap for energy saving, with a fixed cumulative target of 100 GWh by 2035. Monitor progress monthly to ensure full alignment and make adjustments as needed, and
•conduct annual projects to assess and upgrade the least energy efficient facilities equipment, whereby the annual investment for this reporting year is included in section Financial resources related to climate change below.
New installations that bring energy savings are followed through meters and digital monitoring systems. Energy savings are maintained over the expected life of the equipment. The methodologies used to estimate savings are based on calculations and metered data under ST’s energy management system (including ISO 50001‑certified sites).
Climate change mitigation: actions and targets to reduce GHG emissions from ST supply chain (scope 3)
Complementing ST actions to mitigate climate change within its own operations, ST aims to work with its partners in its supply chain to encourage them to reduce their GHG emissions.
ST has launched a supply chain decarbonization program aimed at reducing scope 3 emissions associated with the purchase of goods and services. ST identified its 50 highest-emitting tier-1 suppliers, as well at its top subcontractors for wafer foundries and backend packages, and initiated engagement with them under this program.
For overall reduction of our carbon footprint, the scope includes goods and services suppliers of ST, procurement being accounted in scope 3.1 and scope 3.2. ST aims to achieve a 10% reduction in its scope 3 upstream GHG emissions by 2030, and a 20% reduction by 2035, versus the baseline year 2024. The scope of the reduction target is identical to the inventory of the carbon footprint calculation for scope 3.1 to scope 3.8 categories. with specific focus on decarbonization on goods and services procurement (scope 3.1 and 3.2 categories). This target is based on conclusive scientific evidence, namely using IPCC.
This target is set based on, amongst others:
•the GHG Protocol Guidance for scope 3 calculation to manage carbon accounting for scope;
•a review of our suppliers' public targets on GHG reduction by 2030; and
•the strategy and roadmap for the decarbonization of our supply chain.
Scope 3 upstream GHG emissions reduction target
| | | | | | | | | | | | | | |
| In tCO2eq | December 31, 2024 (base year) | December 31, 2025 (actual) | December 31, 2030 (target) | December 31, 2035 (target) |
Total scope 3 GHG emissions (1) | 3,837,356 | | 3,648,510 | | 3,453,620 | | 3,069,885 | |
| Scope 3 GHG emissions reduction rate | — | | 5 | % | 10 | % | 20 | % |
(1) Consolidated perimeter for scope 3.1, 3.2, 3.4, 3.6 and 14 manufacturing sites, 3 R&D sites and 1 EWS site for scopes 3.3, 3.5 and 3.7
As of December 31, 2025, the reduction rate observed is driven by business effects, as the actions described below require time to deliver full impact. For methodology refer to Section 3.4.3.1.D. (Metrics related to climate change mitigation and adaptation - Gross scope 3 GHG emissions).
To meet this target by 2035, ST has identified three levers and takes the following actions:
Lever 1: review and reduce GHG emissions from our top five subcontractors for wafer foundries and backend packages
An assessment of subcontractors for their GHG impact and GHG reduction roadmap has been completed, giving ST an understanding of its suppliers' maturity and roadmap towards reducing their GHG emissions.
In 2025, ST shared its long‑term decarbonization goals with its top subcontractors for wafer foundries and for backend packages. ST also requested these subcontractors to provide annual information on their climate change mitigation performance.
The GHG reduction associated with this lever is estimated to account for a significant but not dominant share of the total emission reductions required to achieve our Scope 3 GHG reduction target by 2030, representing roughly one quarter of the expected Scope 3 reductions.
Lever 2: review and reduce GHG emissions from top fifty goods and services suppliers
An assessment of goods and services suppliers for their GHG impact and GHG reduction roadmap has been completed, giving ST an understanding of its supplier maturity and roadmap towards reducing their GHG emissions.
In 2025 ST shared a decarbonization engagement charter to its top 50 most GHG emissive suppliers, (based on 2023 data) with a large majority of them endorsing it. This charter focuses on six main areas, including climate performance disclosure, SBTi‑aligned targets, increased use of renewable energy, product carbon footprint data sharing, circular‑economy solutions, and solutions that help reduce ST’s direct emissions.
This lever is expected to be the main driver of our Scope 3 emission reductions. Based on our current assessments, engagement with our top fifty goods and services suppliers is estimated to account for the majority (around two‑thirds) of the total emission reductions required to achieve our Scope 3 GHG reduction target by 2030.
Lever 3: engage with all suppliers on GHG reduction opportunities
To increase supplier awareness of ST decarbonization targets, in 2024, we have implemented various sustainability e-learnings for the Global Procurement Organization.
In 2025, ST deployed a supplier engagement program that includes inviting its 200 most GHG‑emissive suppliers to disclose and share primary climate data with ST, in order for ST to monitor the evolution of the supply chain carbon footprint over time. The program also includes a communication campaign sharing ST’s sustainability ambitions and long‑term goals.
.
To engage with suppliers towards decarbonization, ST continues to integrate carbon reduction criteria into its procurement processes (such as our tendering, new supplier onboarding and supplier evaluation and monitoring processes).
The GHG reduction associated with this broader engagement lever is estimated to complement the impact of the first two levers, accounting for the remaining share of the Scope 3 emission reductions required to achieve our target by 2030.
These targets and levers have been set based on consultations with internal stakeholders working on the topics, including finance, manufacturing & technology, global purchasing, central facilities and sustainabilities ("CCFS") and corporate sustainability ("CSO") and validated by executive management. Refer to Section 3.4.2.2. (Governance).
Financial resources related to climate change
CapEx related to climate change mitigation actions
| | | | | | | | |
| In millions of U.S. dollars | December 31, 2025 | December 31, 2024 |
| Financial resources allocated to action plan (CapEx) | 39 | 28 |
As of December 31, 2025, the total CapEx related to climate change mitigation actions amounted to $39 million ($28 million in 2024) mainly driven by new energy saving projects (including district cooling system) and CAPG abatement systems installation. This amount has also been considered in our eligible CapEx as individual measures. Please refer to Section 3.4.3.5. (EU Taxonomy) for further information.
OpEx related to climate change mitigation actions
| | | | | | | | |
| In millions of U.S. dollars | December 31, 2025 | December 31, 2024 |
| Financial resources allocated to action plan (OpEx) | 6 | 6 |
As of December 31, 2025, the total OpEx related to climate change mitigation actions amounted to $6 million mainly driven by the purchase of energy certificates. The amount is reported within the line "Power and gas" in Note 7.6.28. (Expenses by nature) of our consolidated financial statements (please refer to Section 7 (Consolidated financial statements).
Future financial resources related to climate change
Please refer to Section 3.2.4. (Performance - Financial Outlook: Capital Investment) for CapEx and Note 7.6.37. (Commitments, contingencies, claims and legal proceedings) for OpEx.
3.4.3.1.C.2. Carbon neutrality
We aim to be carbon neutral each year from 2027, in all direct and indirect emissions (scopes 1 and 2), product transportation, business travel, and employee commuting emissions (our scope 3 focus).
Intermediate milestones of carbon neutrality target
As intermediate milestones to be achieved by 2025, ST had committed to (i) decrease scope 1 + scope 2 market-based GHG emissions by 50% versus the 2018 baseline value2 and (ii) to source 80% renewable electricity. These intermediate milestones were endorsed by the Science Based Targets Initiative ("SBTi"). These milestones have been achieved in 2025.
Carbon neutrality target
| | | | | | | | | | | |
| In tCO2eq | December 31, 2024 | December 31, 2025 | December 31, 2027 (target year) |
Total GHG emission (market-based) (1) | 929,830 | | 779,619 | | 0 |
(1) The reporting perimeter is aligned with the perimeter used for the Scope 1, 2 and 3 emission reduction targets, for the identified categories.
To achieve carbon neutrality by the end of 2027, ST will offset its residual GHG emissions from its own operations through purchasing of carbon credits, considering recognized quality standards for carbon credits from GHG emissions reduction projects. No carbon credit has been purchased nor cancelled in 2025. Please refer to the disclosure Intended amount of GHG emission reductions or removals to be financed in the future through carbon credits purchases (E1-7) in Section 3.4.3.1.D. (Metrics related to climate change mitigation and adaptation) for additional information on ST's intention to finance climate change mitigation projects through the purchase of carbon credits.
The decrease observed between 2024 and 2025 is driven by reduction across all scopes, with nearly half of the effect coming from scope 1.
(2) These intermediate milestones are outside of the assurance scope.
3.4.3.1.C.3. Climate change adaptation
As mentioned above, building on the initial inherent risk analyses provided by the Climate Study, ST has been working to define the methodology and gather additional technical data necessary to assess the residual exposure of its manufacturing infrastructure to heat risks. A first pilot analysis of one site’s residual exposure to heat risks was completed in 2024. Throughout 2025, we have been working to complete the analyses for the remaining sites. We aim to define thresholds and indicators to finalize the assessment of residual heat risk exposure. These actions are ongoing.
3.4.3.1.D. Metrics related to climate change mitigation and adaptation
Energy consumption and mix (E1-5)
Total energy consumption
| | | | | | | | |
| In Megawatt-hour | December 31, 2025 | December 31, 2024 |
| Fuel consumption from coal and coal products | — | | — |
| Fuel consumption from crude oil and petroleum products | 10,220 | 7,023 |
| Fuel consumption from natural gas | 297,202 | 284,239 |
| Fuel consumption from other fossil sources | — | | — |
| Consumption of purchased or acquired electricity, heat, steam, and cooling from fossil sources | 419,876 | 340,811 |
| Total energy consumption from fossil sources | 727,298 | 632,073 |
| Total energy consumption from nuclear sources | 117,696 | 74,394 |
| Fuel consumption from renewable sources | — | | — |
| Consumption of purchased or acquired electricity, heat, steam, and cooling from renewable sources | 2,669,549 | 2,643,981 |
| Consumption of self-generated non-fuel renewable energy | 5,753 | 6,071 |
| Total energy consumption from renewable sources | 2,675,302 | 2,650,052 |
| Total energy consumption | 3,520,297 | 3,356,519 |
| Total energy consumption from activities in high climate impact sectors | 3,520,297 | 3,356,519 |
In this reporting year, ST’s total energy consumption amounted to 3,520,297 MWh out of which 727,298 MWh related to fossil sources, 117,696 MWh related to nuclear sources and 2,675,302 MWh related to renewable sources. Total energy consumption increased by approximately 5% versus previous year, mainly driven by the ramp up of the district cooling system in Singapore. In addition, this year the total amount includes the consolidated financial statement perimeter as presented in the general basis for preparation in Section 3.4.2.1. (General basis for preparation (ESRS 2 BP 1 and BP 2).
While the total energy consumption remains stable between 2024 and 2025, the allocation of energy by source (fossil, nuclear and renewable) has changed due to operational considerations and contractual instruments.
First, the energy certificate coverage has been revised at site level to reflect operational decisions taken in 2025. In some countries with a high share of nuclear generation in the residual grid mix, the reduction in certificate coverage results in higher proportion of our electricity consumption being attributed to nuclear sources.
Second, purchased district-cooling water is classified according to the energy mix of the provider and related country of operations. As such, in Singapore, as the district cooling system is predominantly supplied by fossil-based generation, the associated consumption is reported as energy from fossil sources. This contributes to an observed increase in our reported total energy consumption from fossil
sources. This increase in reported fossil energy does not reflect the energy efficiency of the district-cooling water system observed at site level. The use of centralized district cooling provides efficiency benefits at system level (e.g., reduced on-site electricity use), which are not yet visible in the above table.
In addition, the planned start of the new power purchase agreement in Malaysia was postponed from 2025 to 2026. This postponement also contributed to the higher share of non‑renewable energy in ST’s overall energy mix.
Finally, the variations on energy source allocation are also partially driven by the update of electricity mix factors using the latest available data from the IEA database.
The reported amounts correspond either to meter reading, invoices, estimates or certificates received from external providers. For non-manufacturing sites, electricity and natural gas consumptions are determined either by direct measurement (based on invoices from suppliers) or by estimation using data from a similar site with comparable employee numbers and geographic location. This methodology is applied consistently across non-manufacturing sites and represents less than 0.5% of STMicroelectronics’ total energy consumption.
As a manufacturer of semiconductor devices which are electronic components, ST activities belong to the NACE code 26.11 "Manufacture of electronic component". According to the Commission delegated Regulation (EU) 2022/1288 and in Annex I to Regulation (EC) No 1893/2006 of the European Parliament and of the Council, the NACE code 26.11 “Manufacture of electronic component” is classified in section C-Manufacturing. This section C-Manufacturing is considered as a high climate impact sector. As such, the entire perimeter of ST activities is considered as operating in high climate impact sector.
As ST has all its operations in high climate sector, it has disaggregated the total energy consumption from fossil sources by consumption from crude oil and petroleum products 10,220 MWh (7,023 MWh in 2024), from natural gas 297,202 MWh (284,239 MWh in 2024) and from consumption of purchased or acquired electricity, heat, steam, or cooling from fossil sources 419,876 MWh (340,811 MWh in 2024). ST does not consume fuel from coal and coal products nor from other fossil sources.
Energy mix in percentage
| | | | | | | | |
| In percentage | December 31, 2025 | December 31, 2024 |
| Share of fossil sources in total energy consumption | 21 | % | 19 | % |
| Share of nuclear sources in total energy consumption | 3 | % | 2 | % |
| Share of renewable sources in total energy consumption | 76 | % | 79 | % |
| 100 | % | 100 | % |
As of December 31, 2025, the share of renewable energy in ST overall energy mix amounted to 76%.
ST’s energy consumption from renewable sources amounted to 2,675,302 MWh and relates to three different type of sources (i) onsite generation from solar panels, (ii) offsite power purchase agreement and (iii) Energy Attributes Certificates ("EACs"). ST does not consume fuel from renewable sources including biomass or other related type.
While onsite renewable energy generation, offsite power purchase agreement ("PPAs") and the overall volume of purchased EACs remained stable over the period, the observed slight decrease in the share of renewable sources in total energy consumption is mainly driven by changes at site level.
Specifically, adjustments in the EAC coverage of the individual sites directly affect the portion of electricity that is attributed to residual grid electricity consumption. When EAC coverage decreases at a given site, a larger share of its electricity consumption is allocated to the country-specific residual grid mix which is based on national electricity mix factors. The year-on-year variations in our renewable versus non-renewable split therefore largely reflect these site-level EAC allocation changes and the underlying residual mix factors applied in each country.
Energy production
| | | | | | | | |
| In Megawatt-hour | December 31, 2025 | December 31, 2024 |
| Non-renewable energy production | — | | — |
| Renewable energy production | 5,753 | 6,071 |
At ST, we do not produce non-renewable energy for our operations. Certain of our sites have onsite generators that are able to produce non-renewable energy in case of emergency situation. The amount of energy produced in this reporting year is considered as not material. None of ST's sites are using coal to produce energy. In this reporting year, we produced renewable energy for a total of 5,753 MWh. It mainly comes from the installation of solar panels. The amount of renewable energy produced onsite decreased slightly compared with 2024, reflecting minor year‑on‑year variations in solar generation.
Energy intensity based on net revenue
| | | | | | | | |
| In Megawatt-hour per millions of U.S. dollars | December 31, 2025 | December 31, 2024 |
| Total energy consumption per net revenue | 298 | | 253 | |
The energy intensity amounted to 298 MWh per million of U.S. dollars, where the numerator is ST total energy consumption and the denominator is ST total revenues as reported on the consolidated income statement for the year ended December 31, 2025 in Section 7.1. (Consolidated income statement). The change is mainly explained by a combination of lower net revenue and moderately higher total energy consumption.
Gross scope 1,2,3 and Total GHG emissions (E1-6)
Gross scope 1 GHG emissions from the consolidated accounting group
| | | | | | | | |
| In tCO2eq | December 31, 2025 | December 31, 2024 |
| Scope 1 GHG emissions | 471,546 | | 538,136 | |
| % of Scope 1 GHG emissions from regulated emission trading schemes | 1 | % | — | % |
As of December 31 2025, the total amount of scope 1 GHG emissions in tCO2eq amounted to 471,546, for ST consolidated accounting group. as described in Section 3.4.2.1. (General basis for preparation (ESRS 2 BP 1 and BP 2)) . The reduction compared to 2024, is the result of two main elements: i) an increase due to methodological refinement with the update of global warming potential factors source and HTF computation, and (ii) a decrease due to operational considerations with lower production volumes and the positive effect of CAPG abatement system installed in 2024. The latter is described in Section 3.4.3.1.C.1. (Climate change mitigation).
To compute our scope 1 GHG emissions, the principles, requirements and guidance provided by the GHG Protocol Corporate Standard were applied.
ST computed the emissions of CO2, CH4, N2O, HFC, PFC, SF6 and NF3. For PFCs, emission factors from the IPCC 6th Assessment Report (2023) were used and integrated into a calculation tool. With regards to calculation methods, ST followed the IPCC-2019 Standard – Chapter 6: Electronics Industry Emissions and specifically tier 2c and GWP100 values as per application requirement 39 of the ESRS E1. ST does not have any biogenic emissions. The tier 2c method distinguishes process types for all GHGs, and considers wafer sizes, i.e. between ≤ 200 mm and 300 mm. In addition, the method provides estimates of the quantities of fluorinated compounds exhausted from tools which are connected to emission control systems.
For scope 1 GHG emissions, ST calculated GHG emissions from stationary combustion, mobile combustion, process emissions and fugitive emissions. ST used two activity data “energy related emissions” with the emission factor database of the International Energy Agency ("IEA") as emission factor source and PFC consumption and HFC leakages with IPCC Sixth (AR6) Assessment report of the IPCC. These calculations include emissions from non-renewable fuel consumption. In 2025, ST updated its GWP factors from IPCC AR5 to IPCC AR6, which contributed to an increase of the scope 1 GHG emissions.
Similar to previous year, ST did consider GHG related to Heat Transfer Fluids ("HTF") which are considered fugitive emissions. HTF is a refrigerant used in a closed loop which is not supposed to leak, however it might be partly released or discharged during maintenance. In 2024, due to inability to measure accurately the related emissions, and lack of standards and guidance regarding the GWP of all the fluids, ST made a preliminary estimate out of its total scope 1 emissions based on external source (the estimate of 19% of total scope 1 emissions was used).In 2025, ST refined its estimate by integrating operational and site-specific data into the modelling. HTF are generally not used as part of our semiconductor process steps, except for a few specific cases where they are used in closed process equipment. They are primarily employed in point of use chiller and cooling equipment, and associated emissions therefore mainly relate to their evaporation.
In 2025, the total amount of GHG emissions related to HTF is estimated at 131,690 tCO2eq (101,810 tCO2eq in 2024) which explains part of the variation observed between 2024 and 2025 data. The 2025 estimate is based on a refined HTF methodology, moving from a high-level approximation to a more granular, site‑specific approach relying on HTF consumption data.
This approach still involves assumptions, in particular regarding: (i) the share of HTF consumption attributable to refilling or maintenance, and (ii) the application of the same GWP (i.e. the highest available) across nearly all HTF types.
While these changes provide a more granular and robust approach to estimating GHG emissions related to HTF, the total emissions included in our Scope 1 GHG inventory remain subject to uncertainty because of the impossibility to measure evaporation in the environment at pipe gaskets. In addition, comparability over time may be affected in subsequent reporting periods, should further refinements to key assumptions be implemented.
In this reporting year, 1% of our scope 1 GHG emissions were covered by regulated Emission Trading Schemes ("ETS"). It includes GHG emissions related to new installations subject to EU ETS and to a lesser extent non-EU ETS in Shenzhen where a pilot ETS scheme is in place.
The percentage is calculated using the GHG Emissions in (tCO2eq) from EU ETS, and non-EU installations divided by the Scope 1 GHG emissions (tCO2eq). For these installations, Scope 1 emissions are calculated in accordance with the applicable ETS rules (e.g., EU ETS), and the same accounting period is used for ETS‑reported and total Scope 1 emissions.
Gross scope 2 GHG emissions from the consolidated accounting group
| | | | | | | | |
| In tCO2eq | December 31, 2025 | December 31, 2024 |
| Location-based Scope 2 GHG emissions | 818,642 | | 864,057 | |
| Market-based Scope 2 GHG emissions | 136,788 | | 171,347 | |
In this reporting year, the total amount of scope 2 GHG emissions for ST amounted to 818,642 tCO2eq with a location-based approach and to 136,788 tCO2eq with a market-based approach. ST’s scope 2 emissions decreased by around 5 % on a location‑based basis and by approximately 20 % on a market‑based basis versus previous year reporting period. This location-based scope 2 decrease is mainly explained by lower energy consumption and related update of IEA electricity grid generation factors, which have decreased for most of the locations in scope. The market-based scope 2 decrease reflects the impact on the district cooling set-up and the related emission factor used (i.e. supplier specific) and the increased coverage of EACs in certain countries where electricity grid is mainly sourced from fossil energy.
To compute our location-based and market-based scope 2 GHG emissions, the principles, requirements and guidance provided by the GHG Protocol scope 2 guidance were considered. As such, the location-based amount reflects the average emissions intensity of grids on which energy consumption occurs while the market-based method reflects emissions from electricity that ST was able to drive. The latter, derives emission factors from contractual instruments whenever available. When such emission factors are not available, ST applies grid-average emission factors from recognized databases, primarily those of the IEA and ADEME.
For location-based approach, the amount includes purchased electricity, super-heated water and district-cooling water consumed by ST during the reporting period. For electricity related emissions, the International Energy Agency database of emissions factors was used for all countries except for France, where ADEME, the French Agency for Ecological Transition dataset was used. For super-heated water used on two of our sites, the emissions factor provided by the supplier was used. For district cooling water, ST defined a specific emission factor of chilled water based on district cooling installation specificities and local grid emission factor.
For the market-based approach, on top of super-heated water, district-cooling water and electricity from grid, ST considered four types of renewable electricity instruments: EACs, offsite PPAs for three countries, Green electricity contract for three sites and onsite generation for three sites coming from solar panels. ST defined at corporate level a renewable procurement strategy whereby the certificates are acquired at country level and subsequently allocated by ST to specific sites in that country, based on each site’s forecasts. Green electricity contracts, by contrast, are signed directly at site level. EACs can be procured whether unbundled i.e. separately from the underlying energy produced or bundled.
GHG emissions other than CO2 (e.g., CH4 or N2O) are included from location-based grid average emissions factors and from the market-based method information used in the computation of ST scope 2 GHG emissions.
Gross scope 3 GHG emissions
| | | | | | | | |
| In tCO2eq | December 31, 2025 | December 31, 2024 |
| 1 Purchased goods and service | 2,872,353 | | 2,903,098 | |
| 2 Capital goods | 325,980 | | 449,764 | |
| 3 Fuel and energy-related activities | 268,618 | | 259,815 | |
| 4 Upstream transportation and distribution | 88,087 | | 126,762 | |
| 5 Waste generated in operations | 3,907 | | 4,332 | |
| 6 Business traveling | 30,471 | | 39,182 | |
| 7 Employee commuting | 70,770 | | 54,403 | |
| 8 Upstream leased assets | — | | — | |
| Total Gross indirect Scope 3 upstream GHG emissions | 3,660,187 | | 3,837,356 | |
ST has disclosed in the above table the scope 3 GHG emissions for categories that are a priority for ST. This prioritization is based on the targets defined this reporting year. Please refer to Section 3.4.3.1.C. (Actions, targets and resources in relation to climate change policies).
ST considered the GHG Protocol guidance related to companies producing intermediate products and other elements further detailed below. ST is not reporting on scope 3.11 (GHG related to the use of sold products) for this reporting period in accordance with ESRS standards.
The determination of GHG emissions related to the use of sold products presents a high level of complexity and uncertainty. The complexity lies in the integration of semiconductor devices in end-products and its consequent impact on GHG during usage. Semiconductor devices have many potential downstream applications each with a different GHG emissions profile. This variability requires ST to make significant and multiple assumptions in order to model the downstream emissions associated with the various possible end applications. Additionally, current standards and industry associations provide no guidance to support these complex calculations.
Additional work has been performed in 2025 to assess in detail the collection of use-phase related data and ST investigated the possibility to engage with external stakeholders. ST notably defined a potential methodology and applied it on a sample. This analysis demonstrated that due to significant data limitations, high variability in key parameters, and the inherent complexity of ST’s intermediate products, it is not possible to produce a reliable and representative estimate of Scope 3.11 emissions in line with ESRS requirements. The high-level measurement uncertainty cannot meet the ESRS 1 Appendix B criteria (“ Qualitative characteristics of information”). In accordance with ESRS standards related to ESRS E1 7.2 and the Appendix B, the usefulness of the information is undermined by the significant assumptions and estimates that cannot be accurately explained, hence ST cannot report Scope 3.11 emissions. ST will monitor ongoing regulations development and might adjust its approach accordingly in future years.
To compute scope 3 reported amounts, ST considered the principles, requirements and guidance provided by the GHG Protocol "Corporate Value Chain (Scope 3) Accounting and Reporting Standard" along with the GHG Protocol "Technical Guidance for calculating Scope 3 emissions". The fifteen scope 3 categories from this standard have been screened.
The reporting boundaries considered in the calculation methods cover the consolidated perimeter as detailed in the Basis of preparation.
The calculation methods for estimating the GHG emissions either follow a spend-based approach or a distance-based or an average-data method, as described in the GHG Protocol.
Emission factors from various databases were used: IEA, US Environmental Protection Agency ("EPA") Supply Chain, Defra, ADEME, and Ecoinvent. Supplier specific emission factors were used when available. These database were updated based on the latest version available as of September 30, 2025. Databases are retained based on the following approach:
•Reputation and recognition: use of databases published by globally recognized and reputable institutions;
•Methodological and data transparency: clear documentation of calculation methodologies, data sources and collection methods.
With limited guidance available from current reporting standards on the treatment of radiative forcing from aviation (non‑CO₂ effects such as contrails), ST has decided, for the reporting year, to continue using emissions factors for flights that include the impact of aviation contrails. Defra database is used as it is providing emission factors including this component. This methodological choice affects categories 3.4 “Upstream transportation and distribution”, 3.6 “Business travel”, and 3.9 “Downstream transportation and distribution", and is consistent with previous year approach.
ST has customized its environmental tool to compute carbon related emissions, combined with the use of data analytic and visualization software.
As of December 31, 2025:
•scope 3.1 amounted to 2,872,353 tCO2eq and relates to the GHG emissions of our purchased goods and services. Based on the GHG Protocol, two main approaches have been considered, the spend-based method and the average-data method, with a priority on average-data method when information on emission factor related to specific goods or services category was available along with quantity associated to relevant activity data. We have screened all relevant spend categories.The small decrease is mainly triggered by the emission factor update performed as the activity data / spend amount are stable compared to previous year.
•scope 3.2 amount to 325,980 tCO2eq and relates to the GHG emissions of our equipment, building or IT related services, invoiced in 2025. It excludes capital expenditure that are recognized or accrued in the financial statements but not yet invoiced. The same approach and methodology as for the scope 3.1 was used. The decrease observed is consistent with a reduction of related investments (refer to Section 7.6.10. Property, plant and equipment);
•scope 3.3 amount to 268,618 tCO2eq and relates to GHG emissions of fuel and energy-related activities not accounted for in scope 1 or scope 2. It includes fuel consumed by leased company cars, other fuel consumed by power generators and gas from boilers or power back-up generators or catering equipment, and super-heated water. It also includes transmission and distribution losses related to ST electricity consumption. Emission factors applied on these categories are related to energy upstream phase (production and transport). The location-based methodology is used along with average-data method. The increase is mainly driven by the ramp up of the district cooling system in Singapore. Refer to Section 3.4.3.1.D. (Metrics related to climate change mitigation and adaptation - Energy consumption and mix (E1-5)) for additional details;
•scope 3.4 amount to 88,087 tCO2eq and relates to the GHG emissions of our products' logistic flows and storage activities. The distance-based methodology described in the GHG Protocol was followed for our logistic flows and the spend-based approach was used for our storage activities. The decrease observed this year is mainly driven by the update of emissions factor database and reduction in transportation activity (mostly distance-based);
•scope 3.5 amount to 3,907 tCO2eq and relates to the GHG emissions from third-party disposal and treatment of waste generated by ST. It includes emissions from disposal of solid waste and wastewater. Based on the GHG Protocol, the waste-type specific method was followed. The decrease is mainly due to changes in waste mix, as described in Section 3.4.3.4.D.2. (Metrics);
•scope 3.6 amount to 30,471 tCO2eq and relates to the GHG emissions from the transportation of employees for business related activities in vehicle owned or operated by third-parties such as aircraft, trains, shuttles, taxi, car rental. Based on the GHG Protocol, the distance-based and the spend-based methods were followed. The variation observed is due to less business travel in 2025 compared to 2024, partially counterbalanced by the change of database as stated above;
•scope 3.7 amount to 70,770 tCO2eq and relates to the GHG emissions from the transportation of employees between their home and their place of work. It includes various transportation modes: automobile including carpooling, bus, rail, tramway, subway and motorcycles. Based on the GHG Protocol, the distance-based method was followed. The increase observed in 2025 is mainly due to the coverage of the consolidated perimeter, as 10% of scope 3.7 data have been estimated due to missing information on employee commuting. The methodology defined is based on extrapolation of available employee commuting data for similar geographical areas;
•scope 3.8 is not applicable for ST as of December 31, 2025. Where ST does have upstream leased assets such as building or equipment, they are considered under IFRS as finance leases and as such shall be accounted in scope 2.
Some categories were not relevant for ST such as categories 3.13, 3.14 and 3.15.
Other categories were not disclosed considering the criteria provided by ESRS to identify the significance i.e. magnitude of GHG emissions, influence, related transition risks and opportunities and stakeholder views. This is valid for the following categories: scope 3.9, 3.10 and 3.12.
We have not received primary data obtained from suppliers or other value chain partners. Scope 3 calculation methods used rely on estimates with limited guidance available from the standards. The variability of the scope 3 disclosed amounts exists and underlying numbers might be adjusted in the coming years following potential revision of the standard, specific data received by value chain stakeholders or precision on emission factors.
In addition, our ability to receive primary data from suppliers or other value chain partners is highly dependent from the evolution of external requirements, the ability of these stakeholders to calculate and provide the information to us and our variety of partners with operations worldwide. If the availability and quality of information from our value chain partners improves in the future we envisage to enhance our methodology for value chain reporting. As our maturity is increasing, we expect the scope 3 to remain an estimated amount with high variability, for the coming reporting years.
The total amounts of GHG emissions, included in this statement, are also subject to this variability as they include scope 3 GHG emissions.
Total GHG emissions
| | | | | | | | |
| In tCO2eq | December 31, 2025 | December 31, 2024 |
| Total GHG emission (location-based) | 4,950,375 | | 5,239,549 | |
| Total GHG emission (market-based) | 4,268,521 | | 4,546,839 | |
Decrease, in both location-based and market-based, is consistent with the decrease observed for each scope, and is mainly attributable to scope 3. Please refer to the table below Total GHG emissions disaggregated by scope.
GHG intensity based on net revenue
| | | | | | | | |
| tCO2eq per millions of U.S. dollars | December 31, 2025 | December 31, 2024 |
| Total GHG emissions (location-based) per net revenue | 420 | 395 |
| Total GHG emissions (market-based) per net revenue | 362 | 343 |
As of December 31, 2025, the GHG intensity based on net revenue amounted to 420 tCO2eq per millions of U.S. dollars, using the location-based approach to compute GHG emissions and to 362 tCO2eq per millions of U.S. dollars using the market-based approach to compute GHG emissions where the numerator is ST total GHG emissions (location-based and market-based respectively) and the denominator is ST total revenues as reported on the consolidated income statement (Section 7.1 Consolidated income statement) for the year ended December 31, 2025.
The higher GHG intensity is mainly due to total GHG emissions decreasing less than net revenue, reflecting the non-linear impact of incompressible fixed energy and operational costs at manufacturing sites.
Total GHG emissions disaggregated by scope
| | | | | | | | | | | | | | |
| Retrospective | Target year |
| In tCO2eq | December 31, 2024
(base year) | December 31, 2025 | % 2025/2024 | 2030 |
| Scope 1 GHG emissions | | | | |
| Scope 1 GHG emissions from the consolidated accounting group | 538,136 | | 471,546 | | (12) | % | N/A |
| % of Scope 1 GHG emissions from regulated emission trading schemes | — | % | 1 | % | | N/A |
| Scope 2 GHG emissions | | | | |
| Location-based Scope 2 GHG emissions from the consolidated accounting group | 864,057 | | 818,642 | | (5) | % | N/A |
| Market-based Scope 2 GHG emissions from the consolidated accounting group | 171,347 | | 136,788 | | (20) | % | N/A |
| Subtotal Scope 1 and market-based Scope 2 GHG emissions | 709,483 | | 608,335 | | (14) | % | 567,586 | |
| Significant scope 3 GHG emissions | | | | |
| Total Gross indirect (Scope 3) GHG emissions (tCO2eq) | 3,837,356 | | 3,660,187 | | (5) | % | 3,453,620 | |
| 1 Purchased goods and service | 2,903,098 | | 2,872,353 | | (1) | % | N/A |
| 2 Capital goods | 449,764 | | 325,980 | | (28) | % | N/A |
| 3 Fuel and energy-related activities | 259,815 | | 268,618 | | 3 | % | N/A |
| 4 Upstream transportation and distribution | 126,762 | | 88,087 | | (31) | % | N/A |
| 5 Waste generated in operations | 4,332 | | 3,907 | | (10) | % | N/A |
| 6 Business traveling | 39,182 | | 30,471 | | (22) | % | N/A |
| 7 Employee commuting | 54,403 | | 70,770 | | 30 | % | N/A |
| 8 Upstream leased assets | — | | — | | | N/A |
| Total GHG emissions | | | | |
| Total GHG emission (location-based) | 5,239,549 | | 4,950,375 | | (6) | % | |
| Total GHG emission (market-based) | 4,546,839 | | 4,268,521 | | (6) | % | |
Intended amount of GHG emission reductions or removals to be financed in the future through carbon credits purchases (E1-7)
In line with our Global Environmental Policy and climate strategy, ST focuses on reducing greenhouse gas emissions within its own operations and value chain, for example through CAPG reduction, increased use of renewable electricity and energy efficiency measures. Any support to GHG mitigation projects outside our value chain through carbon credits is treated separately from our GHG inventory and targets.
As of December 31, 2025, ST did not purchase nor retire any carbon credit. However, ST is planning to offset its residual GHG emissions from its own operations through the purchase of carbon credits in line with its carbon neutrality claim, by the end of 2027. This claim is accompanied by GHG emission
reduction targets as disclosed in the Target Section 3.4.3.1.C.1. (Climate change mitigation), and the reliance on carbon credits does not impede the GHG emission reduction targets set on our own operations and value chain.
Intended amount of GHG emission reduction or removal to be financed in the future through carbon credits purchase
| | | | | |
| In tCO2eq | 2026 to 2027 |
| GHG emissions outside the value chain planned to be financed and retired in the future | 814,000 | |
ST intends to finance around 814,000 tCO2eq GHG emission reductions or removals between 2026 and 2027 from climate change mitigation projects outside its value chain through the purchase of carbon credits. With the support of an external party, ST has designed a potential portfolio of carbon offset projects type combining avoidance and removal, local impact with a mix of nature-based and technical-based solutions.
In 2025, we have launched a request for information to identify suppliers that would best match ST business requirements and confirm volume availability on the market. One of our criteria was to ensure projects would align with recognized quality standards. In parallel, we have defined a roadmap and corresponding budget for offsetting our residual emissions. In 2026, we will begin offsetting a portion of our residual GHG emissions and report accordingly on related carbon credit purchase and cancellations in our next annual report.
3.4.3.2. Pollution and Chemicals (E2)
It is our priority to responsibly manage chemicals and replace hazardous substances wherever possible. We carefully manage the chemical substances and materials we use throughout our operations. This allows us to monitor and address our impacts on people and the environment and to comply with legal and customer requirements.
3.4.3.2. Pollution related IROs (SBM-3)
The following table lists the IROs related to pollution and chemicals we have identified and assessed as material in our 2025 DMA, including the programs or dedicated actions and (entity-specific) targets, we have in place to address such IROs.
| | | | | | | | | | | | | | | | | | | | | | | |
E2 – Pollution and chemicals |
Description | Type of IRO | Actual/ Potential | Value chain segment | Time horizon | Material on a residual(1) or inherent(2) basis | ST response | Targets |
Negative impact from ST on local natural ecosystems caused by existing and / or accidental pollution (e.g., hazardous chemicals and gases use and handling) of soil, air, water, living organisms, and food resources | Negative impact | Actual | Own operations | Short term | Residual basis | ST’s pollution prevention program | We aim to further decrease Volatile Organic Compound (VOC) emissions from ST’s manufacturing sites, to achieve an overall 70% absolute reduction by 2030 versus 2024. |
Negative impact from the suppliers on local natural ecosystems caused by existing and / or accidental pollution (e.g., hazardous chemicals and gases use and handling) of soil / air / water / living organisms and food resources | Negative impact | Actual | Upstream | Short term | Residual basis | ST's responsible supply chain program | No target in place |
| | | | | | | | | | | | | | | | | | | | | | | |
Potential negative impact from foundries and OSATs on local natural ecosystems caused by accidental pollution (e.g., hazardous chemicals and gases use and handling) of soil, air, water, living organisms, and food resources | Negative impact | Potential | Upstream | Mid term | Residual basis | ST's responsible supply chain program | No target in place |
Risk of ST not being able to substitute hazardous materials (substances of concern and very high concern) and heavy metals (e.g., lead) in processes and products, in line with increasing customers' requirements and/or enactment or reinforcement of regulations banning, restricting, or reinforcing related obligations, resulting in additional costs leading to unmet customers' / other stakeholders' expectations | Risk | Potential | Own operations | Long term | Residual basis | ST’s substances and chemicals program | We aim, alongside our efforts to continuously assess substances of very high concern and substitution, to make all products manufactured at ST 98% halogen-free by 2035 (entity-specific). |
(1) "Residual" refers to the materiality assessment that takes into account existing mitigation measures.
(2) "Inherent" refers to the materiality assessment without taking into account any existing mitigation measures.
3.4.3.2.A. Processes to identify and assess material pollution-related impacts, risks and opportunities
We have screened our sites and operations and identified material negative pollution-related impacts on local natural ecosystems that may arise from the nature of our manufacturing activities, as an IDM. The assessment considered the mitigating measures already in place to identify and address air, water, and soil contamination, and identified de-pollution needs at specific site locations.
We have assumed that our subcontractors might also generate material negative pollution-related impacts on local natural ecosystems due to the nature of their activities which are similar to ours and geographical locations.
For both our own operations and those of our subcontractors, magnitude and likelihood were assessed by considering the various types of chemicals used in the semiconductor manufacturing process, the mitigation measures in place and past pollution-related incidents.
For our suppliers, we assessed negative pollution-related impacts resulting from their activities, considering both known existing pollution cases (based on limited publicly available information) and potential impacts arising from the broad range of activities they provide to us.
Regarding materials, we strive to reduce the use of hazardous substances and to find substitutes. We assessed the related identified risk considering the complexity of our manufacturing processes and the current state of pollution management technology.
Engagement with affected communities
We believe that conducting consultation, including with affected communities, is essential for working towards common goals and addressing pollution-related challenges. Our engagement with affected communities takes place on an ad hoc basis as needed, based on the engagement process described in Section 3.4.2.3.B. (Interests and views of stakeholders). ST sites actively engage with communities and national and local authorities, according to their specific needs and the local context. This can include local non-governmental organizations ("NGOs"), community organizations or town hall events to address community concerns. Engagement with affected communities is implemented based on ST's Sustainability Stakeholder Engagement Policy. ST sites consider local circumstances in the deployment of this policy. This engagement aims to provide relevant insights which can inform decision making processes at local level and improve our ability to manage and mitigate pollution-related negative impacts effectively.
3.4.3.2.B. Policies related to pollution
Our Global Environmental Policy outlines our ambition to minimize our negative environmental impacts, and risks arising from our own operations and those of our suppliers. We aim to achieve this through our actions on pollution prevention and actions to minimize the impact of certain chemical substances on people and the environment. Through our stakeholder engagement, as described in Section 3.4.2.3.B. (Interests and views of stakeholders) we are informed of the interests of our key stakeholders, whose interests are taken into consideration by ST when setting policies concerning pollution.
Pollution management is an integral part of the Global Environmental Policy. Relevant key elements included in the policy are our commitment (i) to strive for pollution prevention, (ii) to have a pollution and chemicals management system based on standards and best practices and therefore maintaining relevant environmental certifications (namely ISO 14001) of relevant ST manufacturing sites and large R&D sites worldwide, including processes for monitoring; and (iii) to minimize the impact of chemical substances on people and the environment.
To monitor and minimize the negative impacts on the environment (caused by existing and/or accidental pollution) resulting from ST's own operation, our Global Environmental Policy outlines a commitment to
implement and maintain control measures, and audits to check environmental procedures applicable to pollution prevention and chemical use are carried out and to identify and prioritize areas for improvement.
To monitor and minimize the negative impacts on the environment (caused by existing and/or accidental pollution) resulting from ST's suppliers' and subcontractors' operations, our Global Environmental Policy outlines our commitment to develop long-term relationships with ST’s suppliers and partners, particularly those with the highest environmental standards and practices.
ST's Global Water Policy details our ambition to manage water-related impacts, including water pollution, across our own operations and those of our major subcontractors. The policy is available on st.com, for everybody, including to potentially affected stakeholders and stakeholders who need to help implement it. Further details of this policy are included in Section 3.4.3.3.B. (Policies related to water).
In connection with our ambition regarding pollution management and chemicals use referenced in the Global Environmental Policy, we have several procedures relating to the mitigation of negative impacts related to emissions in air and water and to avoid accidental release into soil. Those procedures, applicable to all ST manufacturing sites and to selected non-manufacturing sites, are imposed to:
•be compliant with relevant legal requirements at local level, employees’ health and safety, adequate protection and reduced emissions to the environment, whatever chemical substances and gases are used onsite; and
•control the concentration and/or quantity of pollutants in its air emissions, industrial wastewater emissions and to seek to prevent accidental discharges into soil and groundwater so that levels are maintained below the legal limits laid down in applicable laws and regulations, or in the permits or authorizations.
Substances of concern and very high concern
ST's approach to chemical use, referenced in the Global Environmental Policy, is to substitute and minimize the use of hazardous materials (substances of concern or "SoCs" and very high concern) and heavy metals where feasible, and to phase out certain substances of very high concern where our inability to substitute represents a material risk for the Company. Therefore, ST has set operational procedures applicable to our relevant manufacturing sites and to selected non-manufacturing sites, including procedures addressing:
•the optimization of chemical products consumption; and
•the production of a list of legally banned, regulated, exempted and declarable chemical substances.
As per our policy and relevant operational procedures, we apply a hierarchy of safety controls approach to our chemical management procedure. When specific chemicals or materials cannot be eliminated or substituted with less hazardous alternatives, we implement engineering measures and administrative controls and provide personal protective equipment ("PPE") to reduce workers’ and environmental exposure.
Avoiding incidents and emergency situations
In line with our commitments included in our Global Environmental Policy to maintain relevant environmental certifications for relevant manufacturing and large R&D sites and to comply with global and local environmental regulations, we have certain procedures to manage, prevent and reduce the risk of incidents and emergency situations occurring as much as possible. These procedures, applicable to ST manufacturing sites and to selected non-manufacturing sites, require these sites to:
•take certain precautions aimed at prevention of accidental out-of-compliance air and wastewater emissions (emissions amounts emitted above limits laid down in laws and regulations, or in the relevant permits or authorizations), thus reducing negative impacts;
•implement prevention and monitoring measures for equipment that could potentially contaminate soil;
•prepare and update a Spill Control Plan, if required by law;
•apply the precautionary principle (as set out in Principle 15 of the Rio Declaration); and
•apply a resilience management framework including crisis-related and business continuity-related elements to withstand and recover from events, shocks and crises, as quickly and strongly as possible.
Additionally, the Global Environmental Policy includes our dedication to provide appropriate training to all relevant employees, such as fire trainings, chemical risk trainings or environmental trainings, and to provide relevant and applicable information to our stakeholders.
3.4.3.2.C. Actions and resources related to pollution
ST implements various actions aimed at addressing material negative impacts and risks related to pollution. All the following actions are continuous and ongoing to reach the objectives of our related policies and relevant targets, covering the same time horizons as the targets included in Section 3.4.3.2.D. (Metrics and targets related to pollution).
We recognize the importance of reducing environmental emissions to minimize the potential pollution effect we could have, and we have made it a priority to do so in the domains of air, water, and waste. Our approach includes treating emissions where possible and implementing replacement programs for hazardous substances throughout our own operations to reduce our environmental impact.
ST has set EHS criteria in operational procedures for the monitoring of chemicals, substances, emissions to air and wastewater. ST performs regular groundwater analysis to control risks of pollution to soil and groundwater. These procedures are applicable to all ST manufacturing sites and selected non-manufacturing sites depending on their chemical substances use.
ST aims to perform internal corporate EHS audits every three years on all manufacturing sites and selected non-manufacturing sites to check corporate operational procedures are implemented and applied correctly. In this regard, during 2025 internal corporate EHS audits were performed and local action plans were defined by the sites. In addition, sites reported on the progress of the execution of defined action plans related to all audits, including prior years' audits.
ST also operates a program of third-party EHS compliance audits at all ST manufacturing sites, and other selected sites.
At each of our manufacturing sites, local (sustainability) teams and EHS champions are responsible for the following pollution related activities:
•deploying the onsite strategy and programs;
•supporting site management in defining local targets and KPIs;
•monitoring and reporting performance to corporate;
•sharing best practices; and
•engaging with site stakeholders.
ST has dedicated teams on each manufacturing site which work on the adequate functioning of and promote improvement ST's air and water treatment systems.
At each of our manufacturing sites, a chemical committee meets regularly to review and evaluate best management practices for identified hazards. The committee uses a comprehensive approach to make
decisions on chemical usage. This includes evaluating chemical compositions, hazards, use conditions, engineering controls, medical recommendations, and industrial hygiene requirements. Risk management measures, PPE, waste management, administrative controls, and training requirements are also considered. By applying this process, we can identify critical substances when they are introduced or reclassified. Modifications to existing processes and emissions treatment facilities are also considered and implemented as appropriate.
ST adheres to the RBA Code of Conduct, by setting high standards, conducting thorough audits, providing training, fostering collaboration, emphasizing transparency, and promoting improvement. This approach helps us in our efforts to address the potential impact from pollution generated by our manufacturing processes and supports the overall goal of sustainable development in the supply chain. The RBA framework covers our upstream supply chain, in addition to ST manufacturing sites.
Water
ST's water management process prioritizes proven practices of water management to address the potential impact from pollution of water generated by our manufacturing processes. Action plans have been defined at site level with dedicated experts to help implement actions locally. Further details can be found in Section 3.4.3.3.C. (Actions and resources related to water).
ST’s performance and management systems are evaluated annually through third-party surveillance audits, and we aim to renew our certifications every three years. ST’s major manufacturing sites are ISO certified (please refer to Appendix 11.8. and st.com for an overview).
Additionally, using available proven technologies ST maintains the treatment of wastewater discharge in order to minimize the presence of pollutants and substances of concern in its effluents, amongst others, to be compliant with local regulations. More information can be found in Sections 3.4.3.3.C. (Actions and resources related to water) and Section 3.4.3.4.C. (Actions and resources related to waste).
Air
To further reduce its environmental impact, ST has implemented an air emission abatement program that focuses on reducing emissions of VOCs and covers all ST manufacturing sites. The program includes the use of advanced technologies and processes to capture and treat air emissions from manufacturing processes, as well as ongoing monitoring to check that installations are working effectively. By reducing VOC emissions and reducing the use of other VOC-emitting materials and chemical products, ST is able to minimize and address its impact on the environment and protect the health and safety of its employees and that of local communities. The program also anticipates compliance with possible future stricter regulation on emissions. These actions are undertaken to, amongst others, reach the VOC reduction target as detailed further in Section 3.4.3.2.D. (Metrics and targets related to pollution).
Chemicals
ST has a proactive approach to reduce the use of hazardous substances (including some heavy metals), including substances of very high concern in its processes and final products to help safeguard the health and safety of its stakeholders, while reducing its environmental footprint. These actions are undertaken at all our manufacturing and R&D sites, mainly all ST entities worldwide, that use chemicals and/or purchase any materials containing hazardous substances. In implementing these actions, we also work with our relevant supply chain actors as appropriate.
Examples of such actions include:
•the reduction of the length and complexity of certain manufacturing processes leading to a decrease in chemical consumption;
•the implementation of replacement programs for hazardous substances, including substances of very high concern, throughout our own operations: we search for the best solutions using technology and innovation to replace hazardous materials in our manufacturing processes;
•the elimination of the use of restricted substances in the manufacturing of our products through new designs and reduced dimensions. For example, ST is using ECOPACK which is a grading system to classify environmental compliance of products, as part of its product strategy. This action is implemented in ST’s own operations specifically at design and process stages. This supports ST in its efforts to address its potential risk of not being able to substitute hazardous materials in ST processes and products;
•specifically to reach our voluntary target to make all products manufactured within ST's own operations 98% halogen-free by 2035, as further detailed in Section 3.4.3.2.D.1. (Metrics and targets related to pollution), in 2025 we formalized the prioritization of some materials, following a preliminary assessment in 2024 to identify the materials needing replacement;
•the requirement towards our suppliers to adhere to the EHS-regulated substances list, which specifies a large number of substances regulated by legislation and which is regularly reviewed. ST also requires its suppliers to confirm their compliance to such list through analytical certificates, safety data sheets, and commitments. This supports ST's efforts to address (i) its potential pollution impact in its value chain; (ii) its potential risk of being unable to substitute hazardous materials in its processes or products; (iii) changing customer perceptions and potentially stricter regulations on the use of hazardous materials in ST's processes or products. This specific action is applicable to ST suppliers and subcontractors and, by extension, all ST sites receiving and purchasing products and materials from these stakeholders are affected; and
•the provision of transparency to our customers on hazardous materials in ST's products, by issuing material declarations for such products. In these product declarations we report the full material disclosure of substances included in these products, based on IPC 1752 format. For substances of very high concern a specific disclosure is available within the material declaration.
3.4.3.2.D. Metrics and targets related to pollution
3.4.3.2.D.1. Targets related to pollution
As per our Global Environmental Policy, we are dedicated to limiting soil, air, and water pollution risks. We do this by, amongst others, implementing state-of-the-art technologies to tackle emissions (in water and air) and by regularly assessing the use and potential substitution of hazardous materials, such as substances of very high concern, to address potential negative impact from our operations on local natural ecosystems caused by, amongst others, air emissions. The targets were developed by ST's Quality Manufacturing & Technology and Corporate Sustainability teams and validated by Senior Management. No external stakeholders were directly involved in the target-setting process.
Pollution-related target
In 2024 we set a voluntary target to decrease VOC air emissions from ST's fourteen main manufacturing sites, three large R&D sites and one EWS site (as detailed in the table included in Appendix 11.9.) to achieve 70% absolute reduction in kg by 2030 versus 2024, building on emissions reductions already achieved in past years.
Progress toward these targets is monitored quarterly, as part of ST’s pollution prevention program (refer to Appendix 11.10.) and as described in Section 3.4.2.2. (Governance ),
VOC reduction target
| | | | | | | | | | | |
| In kilogram | December 31, 2024 (base year) | December 31, 2025 | December 31, 2030 (target) |
| VOC emissions | 264,613 | | 253,872 | 79,384 | |
| VOC emissions reduction rate (in %) | — | % | 4 | % | 70 | % |
This target focuses on delivering a reduction of VOC air emissions in absolute kg value in comparison with 2024 levels, taking into account expected production growth.
The baseline value, reported in base year 2024, is 264,613 kg of VOC (i.e. 265 tons), covering our main manufacturing sites and major R&D sites as further detailed in Appendix 11.9. VOC air emissions in 2025 is 253,872 kg, resulting in an absolute reduction of 4% versus 2024 mainly driven by operational activities.
VOC air emissions are measured by monitoring (periodic measurements) or online monitoring by an accredited laboratory (through automated measuring systems).
By setting this target, ST addresses the prevention and control of air pollutants and substances emission, by reducing air pollutants emitted by ST operations, which subsequently contributes to reducing emissions of substances of concern.
The target has been defined by using 2024 forecasted VOC air emissions and simulating implementation of (new) VOC abatement systems in three specific manufacturing sites, while keeping the existing VOC abatement systems in the other manufacturing sites. The reduction of the VOC is not expected to be linear, as the installation of the equipments is part of a project executed in several steps over several years. Once the new VOC abatement systems will be implemented, VOC emissions at these sites should decrease significantly, and the impact on absolute reduction of VOC emissions will be reflected. In addition new manufacturing facilities will be designed with solvent exhaust segregation and VOC abatement systems will be used to treat these exhaust. This assessment indicates that a reduction of VOC air emissions from ST’s own operations of around 70% in 2030 versus 2024 is achievable.
This target is based on scientific evidence regarding the negative impact of VOC emissions on human health and the environment.
Chemicals related target (entity-specific)
With regard to the use of hazardous materials, including substances of concern and very high concern, in our manufacturing processes and products, in 2024 we set a voluntary entity-specific target to make all sold products manufactured within ST's own operations 98% halogen-free by 2035, alongside our efforts to regularly assess the use and potential substitution of substances of very high concern.
Progress toward these targets is monitored quarterly, as part of ST's substances and chemicals program (refer to Appendix 11.10.) and as described in Section 3.4.2.2. (Governance ),
Halogen free target
| | | | | | | | | | | |
| In percentage | December 31, 2024 (base year) | December 31, 2025 | December 31, 2035 (target year) |
| Halogen free sold products rate | 93 | % | 95 | % | 98 | % |
The target, applicable between 2024 and 2035, is relative, expressed in a percentage of the total volume of sold products manufactured within ST’s own operations. The baseline value, is 93% of sold products manufactured within ST’s own operations in 2024 are halogen-free. In 2025 95% of sold products manufactured within ST’s own operations are halogen-free. The variation is mainly explained by product mix variations as explained below.
For determining the percentage of halogen-free products, the ratio between sold products which are halogen-free and all sold products manufactured within ST's own operations is calculated. A product is called halogen free when chlorine, bromine, and/or fluorine are below a certain threshold whether combined or in isolation. Thresholds are defined by our ECOPACK classification (refer to Appendix 11.6.).
To set this target, we examined the likely potential improvement from this baseline until 2035, accounting for products that contain halogenated mold compounds that can be qualified with new materials. The 98% target was set accordingly.
The halogen-free monitoring methodology for this target is based on an ST specific methodology. As per December 31, 2025, the target is on track, with increase of halogen free product proportion compared to December 31, 2024. This increase is mainly due to the New Product Introduction, which intends to replace non-halogen free materials, by alternative halogen-free materials.
As part of our roadmap to reach 98% halogen‑free products by 2035, we have prioritized major back‑end product families using these materials and are working with our suppliers to qualify halogen‑free alternatives. As qualifying new halogen‑free materials and, where necessary, switching suppliers requires time due to extensive quality process and reliability testing, the effect on the share of halogen-free products will continue to appear progressively over time, supporting our 2035 target.
By setting this target, ST aims to prevent and control the emissions of pollutants and substances:
•by reducing halogenated materials in products, ST aims to limit halogen emissions to air;
•by reducing halogenated materials in products, ST aims to limit halogenated solid waste production from the manufacturing process and the products' end of life and thus limiting any release to soil; and
•by reducing emissions of substances of concern through the increase of halogen free products.
This target has been set based on scientific evidence that halogenated compounds, which are substances of concern, have a negative impact on the environment and human health.
3.4.3.2.D.2. Metrics
Pollution of air, water and soil (E2-4)
Pollutant emitted to water
| | | | | | | | | | | |
| In kilogram | | December 31, 2025 | December 31, 2024 |
| Pollutant emitted to water | Annual threshold as per E-PRTR | Global amount greater than annual threshold | Global amount greater than annual threshold |
| Chlorides (as total Cl) | 2,000,000 | 0 | 2,020,992 |
| Fluorides (as total F) | 2,000 | 112,218 | 115,864 |
| Total nitrogen | 50,000 | 161,086 | 188,839 |
| Total organic carbon (TOC) (as total C or COD/3) | 50,000 | 54,177 | 59,655 |
| Total phosphorous | 5,000 | 9,545 | 7,517 |
| Copper and compounds (as Cu) | 50 | 2,113 | 1,797 |
| Zinc and compounds (as Zn) | 100 | 495 | 285 |
| Phenols (as total C) | 20 | 443 | 0 |
| Nickel and compounds (as Ni) | 20 | 130 | 92 |
| Arsenic and compounds (as As) | 5 | 84 | 61 |
| Cadmium and compounds (as Cd) | 5 | 70 | 51 |
| Lead and compounds (as Pb) | 20 | 35 | 32 |
| Mercury and compounds (as Hg) | 1 | 2 | 3 |
Pollutant emitted to air
| | | | | | | | | | | |
| In kilogram | | December 31, 2025 | December 31, 2024 |
| Pollutant emitted to air | Annual threshold as per E-PRTR | Global amount greater than annual threshold | Global amount greater than annual threshold |
| Non-methane volatile organic compounds (NMVOC) | 100,000 | 137,902 | 142,031 |
| Vinyl chloride | 1,000 | 91,944 | 89,082 |
As of December 31, 2025, ST emitted consolidated amount of water and air pollutants which exceeded the applicable threshold at site level. ST performed an analysis of the relevant pollutants listed in Annex II of the European Pollutant Release and Transfer Register Regulation (“E-PRTR”). ST performed an analysis to identify the number of pollutants locally measured out of the 91 pollutants listed in E-PRTR Annex II. This analysis is based on the Annex II of Regulation (EC) No 166/2006 and is consistent with the list used in 2024. The pollutants measured at site level are driven by local environmental permits. ST is monitoring E-PRTR developments notably newly published Regulation (EU) 2024/1244, whose updated Annex II will apply from 1 January 2028.
The amounts were consolidated and included only the emissions from facilities for which the applicable threshold value specified in Annex II of Regulation (EC) No 166/2006 was exceeded. As an example, for chloride, only one site exceeded the annual E-PRTR threshold in 2024 and the total amount of chloride for this site was presented in the table above. In 2025, this site managed to reduce its chlorides emissions to a level below the annual threshold, which resulted in zero in the table above. Where for fluorides, several sites exceeded the threshold both in 2024 and in 2025, and the amounts presented in the table above include the sum of their related emissions for each year.
With regards to soil pollutants, they are not released by any ST manufacturing site according to the E-PRTR definition. E-PRTR defines soil pollutants as substances that are introduced into the soil. In the context of ST’s manufacturing processes, there is no significant pathway for these substances to become direct soil pollutants. ST sites adhere to environmental standards and controls, governing the handling, storage, and disposal of chemicals and other materials, and these processes are designed to minimize pollution, including soil pollution.
Overall, the variations between 2024 and 2025 related to pollutant emitted to water can be explained by production volume, decreased or increased need of wastewater treatment and corrected calculation related to conversion factor (for nitrogen) for one site. The 2024 total nitrogen figure has been restated from 111,040 kg to 188,839 kg to ensure year‑on‑year comparability.
The emissions of nitrogen and phosphorus (pollutant emitted to water) correspond to the emissions from the last treatment plant in which ST wastewater is treated, whether the waste water treatment plant is located within the ST premises or outside and whether it is public or private.
The pollutants emitted to air remained stable compared to 2024. The sites contributing to the amounts are similar to the previous year.
The monitoring and measurement methods of pollutant related to air or water depend on ST's policies and the environmental regulations in force in the country where the site is located. All relevant sites are subject to local permits. These permits include pollutants to be measured in line with local regulations. It also includes monitoring and control plan identifying the emission points to be monitored, the parameters, the monitoring frequency and the associated analytical methods.
The specific procedures by which external laboratories conduct the analytical measurements are displayed in each lab report. EU Best Available Techniques Reference Documents ("BREF") standards and other standards, where applicable, are required to be taken into consideration by local authorities in listing the parameters to be monitored, the monitoring frequency and the emission thresholds.
The local teams rely on external accredited laboratories to conduct periodical analyses identified by the monitoring plan as defined in ST policies. EHS local teams conduct emissions monitoring campaigns by sending sampling and analysis to external laboratories compliant with local environmental requirements. The frequency of the monitoring campaign depends on the sites or the pollutant. In any case, pollutants are measured at least on an annual basis and sometimes monthly, quarterly or bi-annually depending on local regulations. ST does not use estimates but direct measurement via monitoring systems calibrated by an external party for two manufacturing sites and periodic measurements performed by laboratories for the remaining perimeter.
In addition, spot measures are performed outside the period emissions measurement defined by the monitoring plan. For these measurements, the local teams also rely on external laboratories to perform analyses.
With regards to emissions to water, they relate to wastewater with two main destinations:
•water discharge to sewer; and
•water discharge to surface water.
Sites can release their wastewater to sewer or surface water, depending on the wastewater treatment plant network design implemented onsite. The monitoring can be measured on a daily basis when there is a local wastewater treatment plant.
ST does not generate nor use micro-plastics during production processes. It does not either procure, and does not have microplastics that leave the facilities as emissions, as products, or as part of products or services.
Substances of concern and substances of very high concern (E2-5)
As part of its operating procedures, and in light of chemical regulations, ST is monitoring the list of substances of concern ("SOCs") coming from the Adaptation to Technical Progress 18 Table of the Regulation (EC) No 1272/2008 on the classification, labelling and packaging of substances and mixtures (CLP Regulation), as published by the European Chemicals Agency ("ECHA").
Additionally, substances of very high concern ("SVHCs") are substances that meet the criteria laid out in Article 57 of Regulation (EC) No 1907/2006 ("REACH"). This list of substances is identified in accordance with Article 59(1) of that regulation, and is published by the ECHA.
ST procures materials that may contain SOCs and SVHCs (e.g., raw materials, chemicals, and packaging). During ST’s operations, these substances may be used directly or may undergo processes that consume, transform, or release them. Following these operational steps, SOCs and SVHCs may remain in the final product or be present in emissions (air or water) or waste streams. ST does not manufacture any new SOCs or SVHCs as part of its operations.
A key area of complexity in the reporting process is designing an effective model to collect information from suppliers across a broad range of procured materials. This complexity is compounded by evolving external regulations and changes in measurement techniques, as highlighted in ST’s 2024 Annual Report under General Basis of Preparation – Sources of estimation and outcome uncertainty.
ST acknowledges the importance of this topic to its external stakeholders and is actively enhancing its data collection and management processes in response to this. In 2025, ST initiated a detailed review of its data collection process for this disclosure, which is still ongoing as the organization advances in its ESRS reporting maturity. At this stage, the robustness of the underlying data for SOCs and SVHCs metrics remains under review as the estimates depend heavily on supplier-provided information that often comes in broad concentration ranges for certain substances within mixtures.
This review requires further attention in 2026 and the assumptions taken last year may need to be revisited based on the continued analysis on data and processes.
3.4.3.3. Water (E3)
ST’s general water management approach
Addressing the challenges of water scarcity and wastewater treatment across our operations is part of our strategy. Population growth and climate change make it increasingly important to protect this shared natural resource. Our water management approach includes water stress assessments (performed by a third party on a inherent basis), conservation programs, water efficiency, and wastewater treatment. We strive to implement solutions to reduce water extraction and consumption, and we work closely with various stakeholders in the local communities where we operate.
Water related IROs (SBM-3)
The following table lists the IROs related to water we have identified and assessed as material in our 2025 DMA, including the programs or dedicated actions and (entity-specific) targets, we have in place to address such IROs.
| | | | | | | | | | | | | | | | | | | | | | | |
E3 – Water |
Description | Type of IRO | Actual/ Potential | Value chain segment | Time horizon | Material on a residual(1) or inherent(2) basis | ST response | Targets |
Risk of increased water shortage or restrictions on water discharge for ST due to climate change-induced conditions/events, or due to decisions from public authorities imposing restrictions, leading to business interruption and higher costs | Risk | Potential | Own operations | Mid term | Residual basis | ST’s water program | We aim to have an annual water recycling rate of at least 60% by 2035 through implementing innovative programs (entity-specific).
We aim to annually save water reaching 6 million cubic meters of water saved by 2035 versus 2024 (entity-specific). |
Risk of increased water shortage or restrictions on water discharge for foundries and OSATs due to climate change-induced conditions/events, or due to decisions from public authorities imposing restrictions , leading to business interruption, thereby affecting ST's operations | Risk | Potential | Upstream | Long term | Residual basis | ST's responsible supply chain program | No target in place |
(1) "Residual" refers to the materiality assessment that takes into account existing mitigation measures.
(2) "Inherent" refers to the materiality assessment without taking into account any existing mitigation measures.
3.4.3.3.A. Processes to identify and assess material water-related impacts, risks and opportunities
The water study performed in 2021 by an expert third-party, and the Climate Study, helped us understand the characteristics and impact of water scarcity.
The above analyses served as input for our 2025 DMA and considering that the manufacturing of semiconductors is water intensive, we have identified two potential material risks of increased water shortage for our own operations and for those of our subcontractors which carry out the same manufacturing activities as us.
The identification and management of these water-related risks are governed by our Global Environmental and Water Policy outlined in Section 3.4.3. (Environment - Policies).
Engagement with affected communities
For information on our engagement with affected communities, please refer to Section 3.4.2.3.B. (Interests and views of stakeholders).
We believe that conducting consultation, including with affected communities, is essential for working towards common goals and addressing water-related challenges. ST sites actively engage with affected communities in various ways and according to their specific needs and local context. This can include local NGOs, community organizations or town hall events to address community concerns. These engagements, although not standardized across all sites, provide critical insights that inform our decisions and activities aimed at managing our water-related risks.
For example, as part of the expansion of our site in Crolles, France, thorough research was conducted to understand and communicate our impacts in areas such as noise and water. A public consultation was held to present the project, allowing local stakeholders to understand the expansion and to voice any potential concerns. It included web conferences and open meetings with local stakeholders and employees. A dedicated project website was established, allowing stakeholders to ask questions and provide feedback.
3.4.3.3.B. Policies related to water
Our Global Water Policy details our ambitions to manage water-related risks, including risks of water shortages, across own operations and our expectations on water management towards our major subcontractors.
This policy is available on st.com for everybody, including potentially affected stakeholders and stakeholders who need to help implement it, and applies globally to all ST entities and all ST employees. ST’s CHRO is accountable for its implementation. Through our stakeholder engagement, as described in Section 3.4.2.3.B. (Interests and views of stakeholders) we are informed of the interests of our key stakeholders, which are taken into consideration by ST when setting the Global Water Policy.
The policy reflects our approach to managing water within our operations and supply chain. It states ST's ambitions for improved water efficiency and recycling, which rely on the establishment of water governance and the implementation of monitoring strategies. The Global Water Policy covers the following matters: (i) ST's use and sourcing of water in its own operations and (ii) ST water treatment as a step towards more sustainable sourcing. The policy is based on four key principles:
•commit to water preservation;
•managing water risks and opportunities;
•development of solutions that enable effective water management practices; and
•engaging with stakeholders.
The various initiatives we are engaged in to address water-related risks, and to achieve enhanced monitoring are detailed throughout the policy document.
As part of our water management approach, which includes action plans to monitor ST's water consumption and increase recycling rates, thus mitigating risk on water shortages in ST operations. We have certifications for ISO 14001, as detailed in Appendix 11.8. Our manufacturing site in Shenzhen, China, is AWS platinum certified. ST is a member of the RBA, whose goal is to engage with suppliers and subcontractors to foster water management best practices, thus, amongst others, mitigating risk on water shortages in our supply chain. The RBA requires its members to implement a water management program that documents, characterizes, and monitors water sources, use and discharge; seeks opportunities to conserve water; and controls channels of contamination.
ST acknowledges that collaboration, education, and a comprehensive approach are fundamental for the effective management of water.
ST actively participates in industry best practice coalitions, such as the AWS, which provides a globally recognized framework to guide water management best-practices at ST manufacturing sites, including engaging with communities. Being a member of the AWS contributes to two main objectives included in the Global Water Policy: managing water risks and opportunities across ST operations and engaging with stakeholders.
ST engages in dialogue with communities located in areas in which we operate to understand their water-related challenges and expectations such as those described in Section 3.4.4.3.B. (Actions).
As mentioned in our Global Water Policy, ST acknowledges that water is a valuable and finite resource that is essential for people, society, communities, biodiversity, and the environment as a whole. ST is committed to managing its water use responsibly and sustainably, minimizing our impact on water resources.
As part of the policy ST:
•uses local water resources and converts a major proportion into ultra-pure water for its manufacturing processes and discharge all of them after treatment and control;
•applies strict water governance across all its plants, including water use, discharge, quality, and adherence to applicable laws and regulations;
•evaluates water flows and balance, enhancing water circularity, implementing smart monitoring strategies, seeking water-related innovations, investing to reduce its reliance on freshwater resources and improving operational resilience. ST follows rigorous procedures for the protection of water, rainwater, soil, and groundwater to preserve the natural environment and minimize any environmental risks; and
•aims to develop partnerships with customers to innovate in water management, efficiency, recycling, or treatment.
ST's Global Water Policy requires that water-management best practices be applied at all ST manufacturing sites, including the six sites located in high water stress areas, which include R&D sites as well as manufacturing sites.
3.4.3.3.C. Actions and resources related to water
To achieve the objectives of the Global Water Policy, ST has a water management process in place, that prioritizes best practices of water management and mitigation of risks of water shortages that could disrupt operations for both ST's and its subcontractors. The process includes documentation, characterization and monitoring of water sources, consumption and discharging, identifying opportunities to conserve water, and controlling channels of contamination.
ST’s performance and management systems are evaluated annually through third-party surveillance audits, and we aim to renew our certifications every three years. ST’s major manufacturing sites are ISO 14001 certified , as detailed in Appendix 11.8. An overview of the certificates is also available on st.com.
This comprehensive approach helps to reduce ST’s environmental impact and supports the overall goal of sustainable development in the supply chain. We expect all our suppliers and subcontractors to have business practices and processes aligned with our Code of Conduct, the ISO standards and/or with the RBA Code of Conduct. Our largest manufacturing sites, and our suppliers' and subcontractors' sites identified as high risk, are subject to RBA third-party audits.
ST implements actions on all its manufacturing sites to improve water efficiency across its operations. Manufacturing semiconductors requires a large volume of water; we therefore strive to improve water efficiency across our operations. All of the following actions are continuous and ongoing to achieve the objectives of relevant policies and targets.
Action plans have been defined at site level, through dedicated water roadmaps for manufacturing sites, with designated water champions to help implement actions locally. Each site is responsible for creating its own roadmap according to the local context.
Some examples of actions implemented by ST manufacturing sites to reduce their water consumption include:
•proper monitoring of water consumption, for example through the implementation of smart water metering systems that identify consumption inefficiencies, leaks and water wastage;
•process optimization such as minimizing and standardizing water consumption in manufacturing
equipment in idle mode;
•improvement of drain segregation to increase recycling rates;
•recycling water issued from different technical systems including reverse osmosis and ultra
filtration systems;
•reuse of recycled water for internal industrial purposes such as cooling towers, scrubbers for air
emission treatment, and thermal processing units;
•addition of new wastewater management system to recycle water to produce ultra-pure water (see example below); and
•treatment of wastewater onsite or at municipal treatment plants prior to discharging it. Our manufacturing sites are continually improving their treatment of wastewater and the quality of
water discharge, which is carefully controlled and monitored online.
ST is engaged in various innovative projects to increase its water recycling rates. For example, at our site in Crolles, France, we started a pilot line to recycle part of the final aqueous discharges from the wastewater treatment plant. This involved launching a project to set up a recycling unit with the aim of producing ultra-pure water. This ultra-pure water can then be used in the manufacture of softened water and ultra-pure water, reducing the use of municipal water for industrial purposes. This process increases the water-recycling rate per hour.
In 2025 the ST site in Malta updated its wastewater treatment process, to recycle water used in manufacturing and domestic applications, enabling its integration into the ultra-pure water manufacturing process.
In parallel, we are a member of ESIA, the European arm of the WSC. As part of the WSC, ESIA is playing a leading role in advancing initiatives at the WSC ESH committee, including regarding water management. Through this unique forum, the global semiconductor industry is working together on collaborative approaches relating to, amongst others, resource conservation.
All ST manufacturing sites, including the ST sites located in areas at water-risk, including areas of high-water stress, aim to improve their water management practices through the actions and certifications detailed above.
Finally, ST encourages its managers and employees to join volunteering initiatives aimed at improving access to safe drinking water for the communities located in the areas where we operate.
3.4.3.3.D. Metrics and targets related to water
3.4.3.3.D.1. Targets related to water (entity-specific)
In 2024, we set a voluntary entity-specific target to achieve an annual water recycling rate of at least 60% by 2035. Additionally, it is our aim to annually save water reaching 6 million cubic meters of water saved by 2035 versus 2024.
In line with our Global Water Policy commitments embedded in our Global Environmental Policy, these targets address the risk of water shortage and challenges of wastewater treatment.
Although no scientific evidence was used in setting these targets, based on the high-water consumption required in the manufacturing of semiconductor devices, lowering our water consumption is a continuous focus for ST.
In 2024, these entity-specific targets related to ST’s own operations: our fourteen main manufacturing sites, and one EWS site. In 2025, the target scope perimeter has increased to include the three large R&D sites as detailed in the table included in Appendix 11.9., with limited impact on the total 2024 amounts considering the sites activities and explained in the below paragraphs.
Progress toward these targets is monitored quarterly, as part of ST's water program (refer to Appendix 11.10.) and as described in Section 3.4.2.2. (Governance ).
Water recycling target
ST aims to have an annual water recycling rate of at least 60% by 2035.
| | | | | | | | | | | |
| In percentage (%) | December 31, 2024 (base year) | December 31, 2025 | December 31, 2035 (target year) |
| Water recycling rate | 53 | % | 51 | % | 60 | % |
The target related to our annual water recycling rate is relative to the total amount of water used annually, expressed as a percentage. The baseline value, reported in base year 2024, was 54% of water recycling rate based on below explained formula taking into account external recycling and based on initial perimeter of fifteen manufacturing sites. Based on the new perimeter, the baseline for the eighteen sites has been adjusted to 53%. In 2025 the water recycling rate was 51%.
As of December 31, 2025, ST considers progress towards the water recycling target to be on track. Several recycling projects are planned for coming years and are expected to increase the recycling rate. A temporary decrease has been observed due to transition phases where old equipment is decommissioned while new equipment is not yet fully operational; the recycling rate is expected to increase once new installations are fully functioning.
The water recycling target has been calculated starting from 2024 baseline and applying the saving in cubic meter per year anticipated by all existing projects included in our sites' budget plan. Simulating the recycling, after implementation of all these projects, the final result obtained was a 60% recycling rate by 2035.
The water recycling rate is accounting for both internal and external recycling and is computed as follows: C+R / W+C+R, whereby: (i) C = onsite reused and recycled wastewater used; (ii) R = externally reused and recycled wastewater used; and (iii) W= external sources of water used (including rainwater). The C is equivalent to the total water recycled presented in the E3-4 water consumption, where the water
consumption is also described. The R and W are collected via the dedicated meters at site level and reported monthly.
Water savings target
ST has set a voluntary water saving target to achieve cumulative savings of 6 million cubic meters of water by 2035 compared to the 2024 base year.
| | | | | | | | | | | |
| In m3 | December 31, 2024 (base year) | December 31, 2025 | December 2035 (target year) |
| Water saving (Cumulative) | — | | 959,147 | | 6,000,000 | |
As these projects started as of 2025, the baseline value of 2024 was 0 cubic meters of water saved. In 2025, 959,147 cubic meters of water were saved due to seventeen projects. This result is in line with the target trajectory defined by all projects.
The target is absolute and measured in cubic meters of water saved, based on the contribution of water‑saving projects implemented at sites. The water saving target relates to the absolute volume of water consumption saved annually and has been set by taking into account the list of water saving projects included in sites' budget plan, accordingly, a cumulative saving of 6 million cubic meters of water has been estimated.
Projects savings are accounted for after project completion, and once measurement instruments are operational. Savings are reported for a full year after completion. For example, if a project is completed on September 30, 2025, the savings are recorded from Q4 2025 until the end of Q3 2026. It means in the above table, and in this case, only one quarter saving has been accounted for, and the remaining quarters will be accounted for in the next reporting period. The target is monitored monthly at site level and consolidated quarterly to ensure full alignment and to make adjustments as needed regarding project timeline and target trajectory.
Facility projects that contribute to the water recycling and water saving targets follow a structured lifecycle (pre‑execution, execution and post‑execution). At site level, projects are identified and assessed for feasibility, and appropriate indicators, monitoring methods and metering requirements are defined. After implementation, savings and recycling contributions are measured (using direct, indirect or engineering‑based methods), monitored for at least one year and accounted for one year as explained above.
By setting this target, ST addresses the management of material impacts, risks and opportunities related to areas at water risk and those at high water-stress, and reducing water consumption, in line with the focus of our Global Water Policy, detailed in Section 3.4.3.3.B. (Policies related to water).
3.4.3.3.D.2. Metrics
Water consumption (E3-4)
Water consumption
| | | | | | | | |
| In cubic meter | December 31, 2025 | December 31, 2024 |
| Total water consumption | 5,051,321 | | 5,072,354 | |
| Total water consumption in areas at water risk (incl. areas of high-water stress) | 1,402,552 | | 1,391,169 | |
| Total water recycled | 15,374,447 | | 15,927,655 | |
| Total water stored | 17,767 | | 14,124 | |
| Changes in water storage | — | | — | |
| Water intensity ratio : total water consumption in its own operations in m3 per million USD net revenue | 428 | | 382 | |
In 2025, the total water consumption of ST amounted to 5,051,321 m3 out of which 1,402,552 m3 in areas at water risk which include areas of high-water stress. Water consumption is stable compared to prior year, consistent with stability of global operations. This year the total amount include the consolidated financial statement perimeter as presented in the Section 3.4.2.1. (General basis for preparation (ESRS 2 BP 1 and BP 2)). The data is sourced from direct measurements or calculated from measurements notably regarding raw water incoming. In very few cases, the data is estimated for the recycled volume (3% of the total value is estimated) or the discharge water amount (1% of the total value is estimated).
Water consumption
The water consumption represents the amount of water drawn into the boundaries of the undertaking (or facility) and not discharged back to the water environment or a third-party over the course of the reporting period. At ST, the amounts of water drawn into the boundaries are sourced from direct measurement (i.e. meter reading) and water discharge amounts are either sources from direct measurement (upon the existence of a flow meter at site level), result from a ratio determined at the site level, invoices or estimation. The ratio used depends on various factors, such as the rate of water evaporation and the irrigation system. Water discharges can come from discharge in surface water or discharge in sewers.
For the non-manufacturing sites, ST adopted a conservative approach and considered the full water withdrawal as consumed. The water withdrawal is determined either by direct measurement (based on the invoice received from the supplier) or by estimation using data from a similar site with comparable employee numbers and geographic location. This methodology is applied consistently across the non-manufacturing sites, and it represents less than 1% of the total amount.
Water consumption in areas at water risks
In 2025, the areas of high-water stress identified in 2024 using the Aqueduct Water Risk Atlas tool of the World Resources Institute were reviewed to ensure consistency and identify any change. Areas at water risk and areas of high-water stress have been identified following the definition from the Annex of the CSRD. Six sites, out of which two main R&D sites, were present in areas at water risk in 2024 and remain in 2025. No additional sites have been identified in 2025.
Water recycled
As of December 31, 2025, total water recycled amount to 15,374,447 (15,927,655 m3 as of December 31, 2024). The decrease is consistent with the decrease of water consumption and production variations.
Water recycled is defined as water that has been used more than once before being discharged from the undertaking, so that water demand is reduced. The total water recycled is calculated based on the difference between the total of water needs (or used) and the total water withdrawn (from wells or city aqueduct). As such it derives from a combination of direct measurement and the use of a specific ratio as explained for water consumption.
Water stored
As of December 31, 2025, total water stored amount to 17,767 (14,124 m3 as of December 31, 2024). The water volume considered for water storage corresponds to the total amount of water held in water tanks for fire safety purposes. An external body is monitoring these tanks, as part of ST property damage and business interruption insurance program. It provides a report including water volumes. The variation on total water stored is due to a review of our storage capacity done in 2025. The capacity related to our water tanks did not change between 2024 and 2025. As such, the change in water storage is nil. Indeed, the change in water storage under normal conditions are not significant as mainly due to limited evaporation or ad-hoc needs during the year.
3.4.3.4. Waste and circular economy (E5)
ST general approach and commitments to waste and circular economy
We strive to reduce waste by minimizing resource consumption, recycling, and implementing circular economy programs.
Generating waste is an inevitable part of our operations. Recognizing this, we have developed a waste management strategy to limit our negative impacts. We focus on the classification, separation, and safe disposal of waste using an approach driven by local regulations and company policy. Our priority is to reduce, prepare for reuse, and recycle and we consider landfill and incineration to be a last resort.
Waste related IROs (SBM-3)
The following table lists the IROs related to waste we have identified and assessed as material in our 2025 DMA, including the programs or dedicated actions and (entity-specific) targets, we have in place to address such IROs.
| | | | | | | | | | | | | | | | | | | | | | | |
E5 – Waste and circular economy |
Description | Type of IRO | Actual/ Potential | Value chain segment | Time horizon | Material on a residual(1) or inherent(2) basis | ST response | Targets |
Negative impact from ST on the environment from waste directed to disposal (i.e. landfill, incineration) | Negative impact | Actual | Own operations | Short term | Residual basis | ST’s waste and circular economy program | We aim, each year, to reuse, recycle, and recover at least 95% of our waste, and to limit waste disposal to below 5% |
| Negative impact from suppliers, foundries and OSATs on the environment from waste directed to disposal (i.e. landfill, incineration) | Negative impact | Actual | Upstream
| Short term | Residual basis | ST's responsible supply chain program | No target in place |
| Potential negative impact on the environment at the end of life of our products due to the residual presence of harmful materials | Negative impact | Potential | Own operations | Long term | Inherent basis | ST’s substances and chemicals program | No target in place |
(1) "Residual" refers to the materiality assessment that takes into account existing mitigation measures.
(2) "Inherent" refers to the materiality assessment without taking into account any existing mitigation measures.
3.4.3.4.A. Processes to identify and assess material waste-related impacts, risks and opportunities
We screened our sites and identified material negative impacts on the environment from waste directed to disposal generated by our own operations and subcontractors' activities due to the nature of related manufacturing processes and limited capacity of recycling infrastructures. To identify material waste-related impacts, risks and opportunities for our suppliers, we also considered the broad range of activities they provide to us.
Based on the analysis conducted, waste directed to disposal generated by our own operations is lower compared to that generated by subcontractors and suppliers. However, the materiality of our own operations is primarily driven by the total volume of waste produced.
Regarding residual presence of harmful materials in our products, we recognize the importance of this topic and the potential negative environmental impacts. Our assessment considered the current state of waste management technology as well as the breadth of our product portfolio.
Engagement with affected communities
For our engagement with our affected communities reference is made to Section 3.4.2.3.B. (Interests and views of stakeholders). We believe that conducting consultation, including with affected communities, is essential for working towards common goals and addressing waste-related challenges. ST sites actively engage with affected communities in various ways and according to their specific needs and the local context. This can include local NGOs, community organizations or town hall events to address community concerns. These engagements, although not standardized across all sites, provide critical insights that inform our decisions and activities aimed at managing our waste-related impacts and risks.
3.4.3.4.B. Policies related to waste
Our Global Environmental Policy, which is available on st.com for everybody, including to potentially affected stakeholders and stakeholders who need to help implement it, states the company's commitments to limit impacts on the environment, and supports ST's response to and management of its potential negative impacts on the environment resulting from generation of residual waste from our own operations, from the operations of our suppliers and subcontractors, and the residual presence of harmful materials in the products.
Waste management and the introduction of circular economy principles to ST activities are integral parts of our Global Environmental Policy, highlighted below:
•strive for pollution prevention, reduced consumption of natural resources, reduction of waste, maximized recycling and circular economy, biodiversity protection and minimized impact of chemical substances on people and the environment; and
•incorporate environmental criteria into all stages of product life cycle, from the design phase to
procurement, manufacturing, sales, and end of life.
ST's efforts are focused on prioritizing reduction, preparation for reuse, recycling and recovery in the waste hierarchy, and to consider landfilling and incineration as a last resort. This policy therefore aims to address the generation of residual waste and waste sent to landfill.
To monitor and manage the potential negative impacts on the environment (landfill, waste treatment) resulting from generation of residual waste from our own operations, from the operations of our suppliers and subcontractors, and the residual presence of harmful materials in the products, our Global Environmental Policy states commitments to implement control measures, and audits to check that environmental procedures applicable to waste are carried out; to identify and prioritize areas for improvement; and to improve ST's environmental performance.
As referenced in our Global Environmental Policy, we strive to develop long term relationships with our suppliers and subcontractors choosing those with the highest responsible environmental standards and practices, which helps us to address a range of environment issues, including, materially, potential negative impacts from our residual waste and certain substances at the end of life of our products. This objective notably involves participating in industrial programs.
As mentioned in our Global Environmental Policy, we are committed to maintain relevant environmental certifications for our sites, namely ISO 14001 certification and the RBA standard. These standards apply to our operational procedures regarding residual waste from our own operations, from the operations of our suppliers and subcontractors and our management systems are designed to comply with them.
ST employees, suppliers, partners and other stakeholders are important for successful implementation of the policy, and therefore ST seeks to:
•provide appropriate training to all our employees and all necessary information to our stakeholders;
•develop long term relationships with our suppliers and partners choosing those with the highest
environmental standards and practices;
•promote environmental responsibility amongst employees; and
•transparently communicate ST's environmental policies, practices, and impact to
stakeholders.
3.4.3.4.C. Actions and resources related to waste
We implemented tailored actions related to waste and circular economy to address its negative impacts on the environment arising from our own operations and, where relevant, from the operations of our suppliers and subcontractors, arising from residual internal waste and residual presence of harmful materials in our products at the end of their life. All actions are continuous and ongoing to achieve the objectives and targets set in connection with related policies and in 2025 have contributed to ST reaching its target as referenced in Section 3.4.3.4.D.1.(Targets related to waste).
Our waste management process prioritizes recycling over disposal in the manufacturing process to address one of its potential negative impacts by avoiding landfill and incineration. Specific site-level action plans, comprising the actions referenced below, have been defined, amongst others, to increase recycling rates. ST’s performance and management systems are evaluated annually through third-party surveillance audits, and we aim to renew our certifications every three years. ST’s major manufacturing sites are all certified (please refer to Appendix 11.8. and st.com for an overview of these certifications).
ST addresses negative impact from waste from suppliers’ and subcontractors’ operations by requiring suppliers and subcontractors to adhere to RBA standards and to implement a systematic approach to identify, label, manage, reduce and responsibly recycle or dispose of waste.
Considering the waste hierarchy, ST implements various actions to reduce waste generation and prepare waste for reuse across all its manufacturing sites (please refer to Appendix 11.5. and st.com for an overview of these sites).
Examples of ST's continuous actions in 2025 include:
•the reduction of liquid and hazardous waste generation, at the Crolles site, France, the teams implemented a project to reduce chemical consumption, resulting in a reduction of waste generation during the wet process; and
•at the Rousset site, France, propylene wafer boxes used to ship wafers from our suppliers to our site, which have become waste for us, are sent for cleaning and then reused in the semiconductor value chain.
Considering the waste hierarchy, ST also implements actions to enhance recycling and recovery of waste generated from its manufacturing sites, to address one of its potential negative impacts by reducing and reusing waste generated within its operations. ST strives to increase recycling rates and implement solutions to create value from waste generated by our activities, by converting waste into secondary raw materials that can be used in other industries.
Examples of ST's continuous actions in 2025 include:
Waste generated in the manufacturing process:
•recycling of paper, card box, plastics, wood and plastic packaging trays deployed in most of ST sites for many years;
•recycling sludge waste into secondary raw materials and building materials is exemplified by our site in Ang Mo Kio, Singapore, which partners with ESGL Holdings Limited. The sludge was used to develop a new material called newspar, which replaces fluospar, a critical raw material. Newspar is applied in the production of construction material;
•recycling of metals through dismantling electronic waste and scrapped devices, with different partners across ST operations;
•at the Crolles site, recycling of silicons and metals from scrapped devices to limit extraction and transportation of virgin materials. The scrapped wafers are sent to a foundry, where they are added to aluminum during the melting process. The resulting aluminum is used in automotive, aeronautics and solar panel manufacturing; and
•recycling of spent resin to transform it into construction materials, for example at ST's Shenzhen and Calamba sites, the waste is used in brick production, while at the ST Muar site, it is utilized for road construction materials, extending the useful life of resources.
Beyond manufacturing waste:
ST has taken action to manage waste generated in supporting areas, including:
•implementation of organic waste composting to reduce the amount of waste sent to landfills;
•improvement of waste segregation in administrative areas and increasing awareness of effective separation at the source of waste generation reduces the amount of disposed waste; and
•donation and recycling of various technology hardware.
ST also implements programs to address end-of -life management at a global level in our own operations:
•implementation of ECOPACK processes and classification to monitor the substances used in our products, and to take action on replacement of certain harmful materials where feasible, which in turn facilitates end of life and recycling when our devices are disposed of and
•improving end-of-life management and recycling through ST's Product Sustainability Program. This program aims to promote circularity and recycling initiatives, potentially leading to new services provided to customers, or any initiatives increasing levels of recycled materials in products. In 2025, the program has established the strategy for more recycled content in ST products, considering the list of critical and strategic raw materials, customer needs and evolution of legislation. Various key customers interested to collaborate in end of life projects and other projects related to circularity were identified and some opportunities are currently under evaluation.
Collaboration:
ST continues to participate in collaborative R&D projects that aim to integrate end-of-life management constraints into the development and design processes of electronic products to address negative impacts including the residual presence of harmful materials and dependencies on finite resources, such as:
•In 2025, for the project EECONE (European Ecosystem for Green Electronic) ST participated as a semiconductor and substrate data provider, mapping raw materials and waste flows at each stage. As an industrial partner, ST contributes to developing and testing new recycling solutions and circular loops by reintroducing recycled materials into its production chains. ST also provides specific industrial cases to implement and validate the feasibility of innovative recycling solutions.
•ST joined another European project: GENESIS (Generate in Europe a Sustainable Industry for Semiconductor), which aims to improve resource efficiency and reduce the environmental footprint of IC manufacturing through enhanced process sustainability, increased recyclability, reduction of critical raw materials and toxic compounds, and implementation of solutions for material recovery.
Transparency:
Based on, amongst others, the RBA Code of Conduct, ST identifies, labels and manages waste, chemicals and other materials posing a hazard to people or the environment to ensure their safe handling, movement, storage, use, recycling or preparation for reuse, and disposal. Hazardous waste data is tracked and documented. Application of the RBA framework is assessed and verified through dedicated RBA audits.
3.4.3.4.D. Metrics and targets related to waste
3.4.3.4.D.1.Targets related to waste
ST has set a voluntary target to, recycle, recover and prepare for reuse at least 95% of our waste, and to limit waste disposal to below 5% per year. This target relates primarily to the preparation for reuse, recycling and other recovery layers of the waste hierarchy, and to the minimization of disposal (landfill and incineration without energy recovery).
Waste related target
| | | | | | | | |
| In percentage | December 31, 2024 | December 31, 2025 |
| Waste prepared for reuse, recycled and recovered | 97 | % | 97 | % |
| Waste disposal rate | 3 | % | 3 | % |
Our performance in 2025 was the same as in 2024, with a 97% recycling, recovery and preparation for reuse rate, with a waste disposal rate of 3%. As in 2024, the target was achieved in 2025 as disposal rate remained below 5% and the recycling, recovery, and preparation for reuse rate remained above 95%.
In line with our Global Environmental Policy, this target addresses our impact on the environment resulting from generation of residual internal waste by reducing resource consumption, increasing recycling and implementing circular economy programs.
The target level, scope, and calculation methodology were first defined in 2024 and remain unchanged in 2025. This target is relative to total waste generated per year and is expressed as a percentage. This target relates to ST own operations: our fourteen main manufacturing sites, three large R&D sites and one EWS site, as detailed in the table included in Appendix 11.9.
By setting this target, we address resource outflows and in particular waste management: the target is aimed at reducing the waste generation, maintaining our very high rates of preparation for reuse, recycle and recovery through extending the lifecycle of materials, and aimed at maintaining our performance in limiting the amount of waste disposed in landfills.
No specific scientific evidence was used in setting this target, rather this target was deduced by maintaining the current performance, promoting waste segregation and diversification in manufacturing sites and considering new opportunities of recycling for the remaining waste today at landfill.
Waste management options are influenced by external factors, notably local legal requirements and the availability and capabilities of recycling and recovery facilities in the regions where ST operates. Certain strictly regulated waste types must be sent to landfill or incineration without energy recovery. Due to these waste types, ST will always retain a residual fraction of waste going to disposal and therefore cannot reach 100 % diversion. Please refer to Section 3.4.3.4.D.2. (Metrics - Resource outflows (E5-5)) for details.
Waste management performance is measured through diversion and disposal rates, expressed as percentages of total waste generated from ST Operations. For each reporting year, ST calculates the diverted rate as the volume of waste sent to preparing for re‑use, recycling and incineration with energy recovery divided by total waste generated, and the disposal rate as the volume of waste sent to landfill and incineration without energy recovery divided by total waste generated.
Progress toward these targets is monitored quarterly, as part of ST’s waste & circular economy program (refer to Appendix 11.10.) and as described in Section 3.4.2.2. (Governance ).
3.4.3.4.D.2. Metrics
Resource outflows (E5-5)
As per the DMA, the matter associated with resource outflows which is material for ST relates to the management of waste from our own operations.
Total waste diverted from and directed to disposal
| | | | | | | | |
| In kilogram | December 31, 2025 | December 31, 2024 |
| Total amount of waste by weight diverted from disposal | 71,703,683 | | 74,499,266 | |
| Total amount of waste by weight directed to disposal | 3,036,499 | | 2,194,100 | |
| Total amount of waste generated | 74,740,182 | | 76,693,366 | |
As of December 31, 2025, ST generated a total amount of waste of 74,740,182 kg, out of which 71,703,683 kg of waste by weight diverted from disposal and 3,036,499 kg of waste by weight directed to disposal. The changes from 2024 are explained below under the relevant detailed tables.
For non-manufacturing sites, the quantity of waste generated is very low. Due to the difficulty in obtaining the exact measurement of waste generated by these sites, ST decided to estimate that amount. Based on the direct measurement of two of the biggest non-manufacturing sites, ST determined an average of waste generated per employee and applied it consistently across all the smaller non-manufacturing sites. The total estimated represents less than 1% of the total waste generated by ST. For 2025, ST included this estimation under the categories non-hazardous waste, waste directed to disposal, waste non-recyclable and waste by weight directed to disposal by landfilling in the tables below.
Waste, per the ESRS definition is understood as any substance or object which the holder discards or intends or is required to discard.
Total hazardous and non-hazardous waste
| | | | | | | | |
| In kilogram | December 31, 2025 | December 31, 2024 |
| Total amount of hazardous waste | 31,207,889 | | 30,231,630 | |
| Total amount of non-hazardous waste | 43,532,293 | | 46,461,736 | |
| Total amount of waste generated | 74,740,182 | | 76,693,366 | |
In this reporting year, ST generated a total amount of waste of 74,740,182 kg, out of which 31,207,889 kg of hazardous waste. The increase of the hazardous waste is due to operational considerations around maintenance and management of quality of water.
Breakdowns on the hazardous waste directed to or diverted from disposal along with non-hazardous waste directed to or diverted from disposal are presented in tables below.
Hazardous waste follows the standard definition i.e. waste which displays one or more of the hazardous properties listed in Annex III of Directive 2008/98/EC of the European Parliament and of the Council on waste.
Total recyclable and non-recyclable waste
| | | | | | | | |
| In kilogram | December 31, 2025 | December 31, 2024 |
| Total amount of recyclable waste | 58,936,355 | | 61,357,836 | |
| Total amount of non-recyclable waste | 15,803,827 | | 15,335,530 | |
| Total amount of waste generated | 74,740,182 | | 76,693,366 | |
| Percentage of non-recyclable waste | 21 | % | 20 | % |
The total amount of non-recycled waste amounted to 15,803,827 kg representing 21% of the total amount of waste in this reporting year. This amount increased versus prior year due to the inclusion of the non-manufacturing sites amount, and operational constraints from waste treatment providers. Non-recycled waste includes waste diverted from disposal due to preparation for reuse and other recovery operations, as well as waste directed to disposal.
The following waste streams are captured in our environmental system: process waste (e.g., acids, chemicals, oil), treatment waste (e.g., filters, grease), toxic and toxic building waste (e.g., asbestos, UV tubes, arsenic contamination items), equipment waste (e.g., tools used in plants), packing and packaging waste (e.g., cardboard boxes, glass container, wood pallets), paper waste (e.g., printout, office form) and other waste (e.g., cafeteria or canteen waste).
Each site is responsible for classifying and segregating its waste according to the classification system used in its national, regional or local laws. It includes determining the level of contaminants in the waste via chemical analysis, and managing each type as a distinct waste stream.
The information are included in a waste manifest provided by waste treatment third-party provider. This formal, legally required document is used to track hazardous or regulated waste from generation to final treatment or disposal. It represents the primary data source providing both the classification of waste into the requested categories (e.g., recycled, disposed, incinerated with or without energy recovery) and the total weights for each stream. The type of treatment of the waste, whether diverted from disposal or directed to disposal, is provided by the external vendor.
The related data are collected monthly in an environmental tool used by the sites. Depending on the type of waste and the site, volumes of waste generated by a site can be either estimated based on history, weighed onsite or weighed on waste treatment plant’s site. In the latter case, volumes are communicated to local teams via invoices, waste manifest or receipt slips. In any case, the amount estimated or weighed are being reconciled with invoices or waste manifest. The late reception of certain invoices by external providers, sometimes due to national legislation, result in potential estimated amounts in quarterly reporting. As estimate, the last weighted available amount by an external vendor is used. However, for consolidated reporting year 2025 data, no estimated amount were used as reconciliation with invoices or waste manifests have been performed for all the sites in the perimeter.
ST does not generate any radioactive waste.
Breakdown of total amount of waste by weight diverted from disposal by recovery operation types
| | | | | | | | |
| In kilogram | December 31, 2025 | December 31, 2024 |
| Total amount of hazardous waste by weight diverted from disposal due to preparation for reuse | 3,556,499 | | 3,077,146 | |
| Total amount of hazardous waste by weight diverted from disposal due to recycling | 20,919,815 | | 20,356,882 | |
| Total amount of hazardous waste by weight diverted from disposal due to other recovery operations | 5,582,792 | | 5,739,058 | |
| Total amount of hazardous waste by weight diverted from disposal | 30,059,106 | | 29,173,086 | |
| Total amount of non-hazardous waste by weight diverted from disposal due to preparation for reuse | 445,581 | | 561,634 | |
| Total amount of non-hazardous waste by weight diverted from disposal due to recycling | 38,016,539 | | 41,000,954 | |
| Total amount of non-hazardous waste by weight diverted from disposal due to other recovery operations | 3,182,457 | | 3,763,592 | |
| Total amount of non-hazardous waste by weight diverted from disposal | 41,644,577 | | 45,326,180 | |
| Total amount of waste by weight diverted from disposal | 71,703,683 | | 74,499,266 | |
Out of the total of waste diverted from disposal, 30,059,106 kg relate to hazardous waste and 41,644,577 kg relate to non-hazardous waste. Compared to previous year, the former increased while the latter decreased. For hazardous waste, diversion rose due to higher volumes being prepared for reuse and recycled; this improvement is mainly driven by new waste management methods for certain waste streams that were previously treated as directed to disposal. By contrast, diversion of non-hazardous waste decreased mainly due to changes in waste mix and the reduced availability of certain waste treatment vendor specialized in recycling.
Above table presents the total amount by weight of hazardous waste and non-hazardous waste diverted from disposal in this reporting year, broken down by different recovery operations: preparation for reuse, recycling and other recovery operations.
Preparing for re-use needs to be understood as checking, cleaning or repairing recovery operations, by which products or components of products that have become waste are prepared so that they can be re-used without any other pre-processing. This definition follows the Directive 2008/98/EC of the European Parliament and of the Council of 19 November 2008 on waste.
The recycling waste amount captures any recovery operation by which waste materials are reprocessed into products, materials or substances whether for the original or other purposes. It does not include energy recovery and the reprocessing into materials that are to be used as fuels.
Other recovery operations represent any operation the principal result of which is waste serving a useful purpose by replacing other materials which would otherwise have been used to fulfil a particular function, or waste being prepared to fulfil that function, in the plant or in the wider economy. At ST, other recovery operations include hazardous waste and non-hazardous waste being burnt. This operation covers thermal treatment of waste with recovery of the combustion heat.
Breakdown of total amount of waste by weight directed to disposal by waste treatment types
| | | | | | | | |
| In kilogram | December 31, 2025 | December 31, 2024 |
| The amount of hazardous waste by weight directed to disposal by incineration | 988,139 | | 838,080 | |
| The amount of hazardous waste by weight directed to disposal by landfilling | 160,644 | | 220,464 | |
| The amount of hazardous waste by weight directed to disposal by other disposal operations | - | - |
| The amount of hazardous waste by weight directed to disposal | 1,148,783 | | 1,058,544 | |
| The amount of non-hazardous waste by weight directed to disposal by incineration | 92,580 | | 177,990 | |
| The amount of non-hazardous waste by weight directed to disposal by landfilling | 1,795,136 | | 957,566 | |
| The amount of non-hazardous waste by weight directed to disposal by other disposal operations | - | - |
| The amount of non-hazardous waste by weight directed to disposal | 1,887,716 | | 1,135,556 | |
| Total amount of waste by weight directed to disposal | 3,036,499 | | 2,194,100 | |
Out of the total of waste directed to disposal, 1,148,783 kg relate to hazardous and 1,887,716 kg relate to non-hazardous waste. Between 2024 and 2025, the total amount of waste directed to disposal increased. For hazardous waste, the increase is primarily due to changes in available treatment routes, which led to higher volumes being sent to incineration. This was partly offset by successful change in waste management practices and the availability of alternative treatments, which reduced hazardous waste sent to landfill. For non-hazardous waste, the increase was mainly driven by the inclusion of non-manufacturing sites, and their related classification in waste by weight directed to disposal by landfilling, and by the temporary unavailability of the usual recovery or recycling routes. Above table presents the total amount by weight of hazardous waste and non-hazardous waste directed to disposal in this reporting year broken down by waste treatment type such as incineration, landfill and other disposal operations.
Incineration refers to the controlled burning of waste at high temperature without recovery of the combustion heat generated. Landfill relates to a waste disposal site for the deposit of the waste onto or into land.
Waste at ST does not follow any other disposal operations.
3.4.3.5. EU Taxonomy
3.4.3.5.1. The EU Taxonomy Regulation
On July 12, 2020, the EU Taxonomy Regulation entered into force. The EU Taxonomy Regulation establishes the basis for a classification system to determine which economic activities can be considered environmentally sustainable. The EU Taxonomy Regulation is part of the EU's overall efforts to reach the objectives of the European Green Deal, Europe's strategy towards climate neutrality in 2050. The EU Taxonomy Regulation is designed as a transparency tool to help companies and investors make sustainable investment decisions, with the overall purpose to steer financing towards more sustainable economic activities. Pursuant to the EU Taxonomy Regulation, we are required to disclose information on how and to what extent our activities qualify as environmentally sustainable. The EU Taxonomy Regulation was implemented in phases and is likely to further develop over the coming years.
Consequently, disclosure obligations under the EU Taxonomy Regulation will develop over the coming years. This particularly holds true as the EU Taxonomy Regulation is subject to the Omnibus Proposal. On July 4, 2025, the European Commission adopted a Delegated Act amending the existing Taxonomy Disclosures and Climate and Environmental Delegated Acts (Commission Delegated Regulation (EU) 2026/73). ST has taken these amendments into account, with the only noticeable change being the use of the new reporting templates.
Environmental objectives
The EU Taxonomy Regulation defines overarching conditions which an economic activity must meet to be considered environmentally sustainable and focuses on six environmental objectives, being (i) climate change mitigation, (ii) climate change adaptation, (iii) the sustainable use and protection of water and marine resources, (iv) the transition to a circular economy, (v) pollution prevention and control and (vi) the protection and restoration of biodiversity and ecosystems. For these environmental objectives, several delegated acts have been issued containing technical screening criteria (“Taxonomy technical screening criteria”), which specify environmental performance requirements for the economic activities to be classified as environmentally sustainable (“EU Taxonomy Delegated Acts”).
On January 1, 2022, the EU Taxonomy Delegated Act on climate change mitigation and climate change adaptation entered into force. The EU Taxonomy Delegated Acts on the other four environmental objectives entered into force on January 1, 2024, as well as the amended EU Taxonomy Delegated Acts on climate change mitigation and climate change adaptation (the "Climate Delegated Acts").
Eligibility and alignment
From 2022 onwards, as a non-financial undertaking, we have to disclose information on our economic activities which are eligible (“Taxonomy-eligible”), non-eligible ("Taxonomy non-eligible") and aligned (“Taxonomy-aligned“) under the EU Taxonomy Regulation.
An economic activity can be considered Taxonomy-eligible when the economic activity is described as such in the relevant EU Taxonomy Delegated Act. To assess whether the relevant economic activity can also be considered Taxonomy-aligned, an additional evaluation must be made to identify if the overarching Taxonomy technical screening criteria are met. Economic activities that are not described in the EU Taxonomy Delegated Acts are considered Taxonomy non-eligible.
3.4.3.5.2. Applicability of the EU Taxonomy Regulation to ST
As a listed company the EU Taxonomy Regulation is applicable to us, and subsequently, we must disclose information on how and to what extent our economic activities are associated with economic activities that qualify as environmentally sustainable under the EU Taxonomy Regulation.
For 2025, the review of our economic activities for Taxonomy-eligibility under the environmental objectives listed in the EU Taxonomy Delegated Acts has not resulted in any change compared to our reporting over 2024. While some of our activities are eligible in relation to climate change mitigation and climate change adaptation, they are not eligible as regards the other four environmental objectives described in the EU Taxonomy Delegated Acts.
For 2025 in relation to climate change mitigation, we hereinafter include disclosure of: Taxonomy-eligible and Taxonomy-aligned economic activities, within our turnover, capital expenditure and operating expenditure.
The following disclosures pursuant to the EU Taxonomy Regulation are based on the most recent interpretations of the EU Taxonomy Regulation as published by the European Commission. Acknowledging that the EU Taxonomy Regulation is still under development and its interpretation and
application is evolving, our disclosure approach under the EU Taxonomy Regulation might consequently evolve accordingly.
Environmentally sustainable activities
Under the EU Taxonomy Regulation an economic activity is considered environmentally sustainable (“EU Taxonomy-aligned”) if it meets the following conditions:
(1)provides a substantial contribution to one of the six above-mentioned environmental objectives;
(2)does not significantly harm any of the other environmental objectives (i.e. does not support one environmental objective at the expense of progress on another environmental objective) (“DNSH”); and
(3)complies with internationally recognized minimum safeguards (e.g., OECD Guidelines for Multinational Enterprises, UN Guiding Principles on Business and Human Rights) (“MSS”).
We assessed our economic activities against the EU Taxonomy Regulation classification system in various steps, amongst others: (i) identifying the economic activities relevant for the EU Taxonomy Regulation disclosure, (ii) performing a Taxonomy-eligibility assessment based on the relevant EU Taxonomy Delegated Act, and (iii) assessing Taxonomy-alignment of the economic activities. For the disclosure of Taxonomy-eligibility and Taxonomy-alignment we assessed the proportion of our turnover, capital expenditure and operating expenditure, related to environmentally sustainable activities.
Enabling economic activity
We believe that the semiconductor industry plays a key role as a strategic enabler of a low carbon society as well as to manage the transition towards carbon neutrality. As part of our value proposition, we aim at designing and manufacturing products that are power efficient and support our customers in developing technologies that have low carbon footprint. Low carbon applications such as electric mobility, renewable energies, smart cities, or smart building have been and remain strategic markets for us. We are a market leader in the design and manufacturing of power solutions and motor control enabling products, in which there are ample opportunities for short-term impact on GHG emissions. We are also a market leader in terms of ultra-low power ICs such as sensors or microcontrollers.
While some sectors contribute directly to climate change mitigation and climate change adaptation, we, as an intermediate product manufacturer, enable “the manufacturing of low-carbon technologies”, which activity is also covered by the EU Taxonomy Regulation classification system. Our activities which aim at contributing to climate change mitigation and climate change adaptation, are the manufacturing of electronic components that enable other sustainable economic activities and applications. The relevant EU Taxonomy Delegated Act lists economic activities that may be considered taxonomy-eligible based on associated so-called NACE codes. For our Taxonomy-eligibility we report on NACE code 26: “Manufacture of computer, electronic and optical products”; and NACE code 26.11: “Manufacture of electronic components”. NACE code 26.11 is considered relevant for the semiconductor market as confirmed in the guidance published on the interpretation of the EU Taxonomy Regulation by the European Commission in October 2022. For financial year 2025, we therefore continue reporting under activity 3.6 of the EU Taxonomy Delegated Act on Manufacture of low carbon technologies.
Our EU Taxonomy-eligibility assessment
In our Taxonomy-eligibility assessment we identified all our products, which aim at contributing substantially to climate change mitigation. These products are divided into the following four product categories: (i) products that have a low carbon manufacturing footprint compared to similar products of a previous generation, (ii) products that have low power consumption or low power loss characteristics compared to similar products manufactured by us or others, (iii) products that bring an advantage to run a low GHG emission end application or (iv) products that bring an advantage to improve efficiency of high GHG emitting end applications.
With regard to climate change adaptation, we constantly assess how our products could contribute to climate change adaption and potentially qualify under the relevant EU Taxonomy criteria. For the year ended December 31, 2025, Capital expenditure related to the implementation of climate change adaptation solutions is not significant.
3.4.3.5.3. Taxonomy-eligible economic activities related to climate change mitigation
Our approach towards application of the EU Taxonomy Regulation for the relevant KPIs: turnover, capital expenditure and operating expenditure for EU Taxonomy reporting purposes is reflected below.
Turnover of Taxonomy-eligible economic activities
In our Taxonomy-eligibility assessment all our product lines have been reviewed. Products falling into one of the four product categories referenced above are considered Taxonomy-eligible and we have included the relevant turnover generated from those products in the Taxonomy turnover calculation.
This assessment resulted in a turnover of Taxonomy-eligible economic activities amounting to 44% of our total revenues reported for the financial year 2025, whereby the denominator is based on our total revenues as reported on the consolidated income statement for the year ended December 31, 2025, while the numerator is based on the total net turnover of our products considered as Taxonomy-eligible. This is increasing compared to 40% for the financial year 2024 due to the product mix of existing eligible products and newly eligible products.
Capital expenditure of Taxonomy-eligible economic activities
To determine the Taxonomy-eligible portion of our capital expenditure the following has been taken into account:
•investments in our technologies, which have been directly associated with Taxonomy-eligible product lines based on our capital expenditure plan for each technology;
•individual measures, such as investments for our carbon neutrality program or investments related to energy efficiency of our processes;
•investments related to IP or licenses or capitalized development costs, which have been classified as Taxonomy-eligible based on the relevant product line; and
•lease of buildings and equipment which have been considered as fully or partially Taxonomy-eligible.
For determining the Taxonomy-eligible portion of the capital expenditure, the denominator is determined based on the 2025 additions to property, plants and equipment (including rights of use for leased assets), intangible assets (including capitalized development costs), as reported in Notes 7.6.10, 7.6.11 and 7.6.12 of our consolidated financial statements for the year ended December 31, 2025.
Furthermore, the numerator equals the part of the capital expenditure (including IFRS 16 leases) related to assets or processes that (i) are associated with Taxonomy-eligible economic activities, (ii) are part of a capital expenditure plan to expand Taxonomy-eligible economic activity, and (iii) are individual measures enabling economic activities to become low-carbon or to lead to GHG reduction.
This results in a capital expenditure of Taxonomy-eligible economic activities amounting to 49% of our total capital expenditure for the financial year 2025, constant with the ratio published for the financial year 2024 (49%).
Operating expenditure of Taxonomy-eligible economic activities
For determining the operating expenditure of Taxonomy-eligible economic activities, the denominator is determined based on R&D expenses, as reported in our consolidated income statement for the year ended December 31, 2025, after deducting depreciation and amortization, certain expenses and overheads, which are not directly associated with the development of new products or technologies.
Furthermore, the numerator equals to the part of the operating expenditure included in the denominator that is any of the following: (a) related to assets or processes associated with Taxonomy-eligible economic activities, (b) part of the capital expenditure plan to expand Taxonomy-eligible economic activities. For the numerator, we reviewed each R&D project with the following approach:
•each R&D project linked to a product line classified as Taxonomy-eligible resulted in Taxonomy-eligible operating expenditure; and
•for the remaining R&D projects serving multiple product lines or technologies, we applied relevant allocation keys taking into account, amongst others, the above mentioned Taxonomy-eligible portion of our turnover.
This assessment results in operating expenditure of Taxonomy-eligible economic activities amounting to 46% of our total operating expenditure for the financial year 2025, slightly lower than the ratio published for the financial year 2024 (48%). This decrease is primarily driven by R&D projects portfolio.
3.4.3.5.4. Taxonomy-aligned activities related to climate change mitigation
For financial year 2025, ST is not in a position of being compliant with substantial contribution criteria and is reporting consequently 0% in terms of alignment for the three KPIs.
As mentioned above, Taxonomy-alignment implies that the economic activities comply with the following three conditions:
•providing a substantial contribution to one of the six environmental objectives;
•complying with the DNSH criteria; and
•complying with the minimum safeguards criteria.
As we report within the 3.6 Manufacture of other low carbon technologies, ST must comply with the following principles of the Taxonomy technical screening criteria:
•the economic activity manufactures technologies that are aimed at and demonstrate substantial life cycle GHG emission savings compared to the best performing alternative technology/product/solution available on the market;
•life-cycle GHG emission savings are calculated using Commission Recommendation 2013/179/EU(100) or, alternatively, ISO 14067:2018(101) or ISO 14064-1:2018(102); and
•quantified life-cycle GHG emission savings are verified by an independent third-party.
While ST has managed to certify its LCA methodology in 2024 according to ISO 14067:2018 Annex C - CFP Systematic Approach for Design and Manufacturing of semiconductor products on our manufacturing
sites, the other elements of compliance cannot be met. The certification is valid for 2024, 2025 and 2026, with surveillance audits in 2025 and 2026; the 2025 audit conclusion is consistent with the prior year’s conclusion. As the European Commission has still not published a dedicated semiconductor economic activity within the EU Taxonomy regulation and no additional guidance was provided on the economic activity 3.6, similar to last year, ST can not report on alignment.
ST will continue to monitor carefully any future developments, and we expect that our reporting will continue to evolve over time.
3.4.3.5.5. Future developments
There is still currently limited guidance published on the interpretation of various elements of the EU Taxonomy Regulation. While we have carefully balanced our assessment and disclosures on the EU Taxonomy Regulation, taking into account the latest publications, this reporting may still differ from future disclosures as more guidance becomes available over time.
In the coming years, we will continue to report under the EU Taxonomy Regulation regarding our Taxonomy-eligible and to the extent feasible our Taxonomy-aligned economic activities. This entails a further and continuous review of our products, do no significant harm procedures and minimum safeguards assessment. Recently released guidance on the EU Taxonomy Regulation could result in updated approach notably related to the DNSH pollution prevention and control criteria or the definition of the operating expenditure. We expect that our reporting will evolve over time as more insights will be gained on how best to comply with the EU Taxonomy Regulation.
3.4.3.5.6. EU Taxonomy reporting tables
3.4.3.5.6.1. Proportion of turnover, CapEx, OpEx from products or services associated with Taxonomy-eligible or Taxonomy-aligned economic activities – disclosure covering year 2025 (summary KPIs)
| | | | | | | | | | | | | | | | | | | | | | | | | | | | | | | | | | | | | | | | | | | | | | | |
| Financial year 2025 | | | | | | | | | | | | | | |
| KPI | Total | Proportion of Taxonomy-eligible activities | Taxonomy-aligned activities | Proportion of Taxonomy-aligned activities | Breakdown by environmental objectives of Taxonomy-aligned activities | Proportion of enabling activities | Proportion of transitional activities | Not assessed activities considered non-material | Taxonomy-aligned activities in previous financial year (N-1) | Proportion of Taxonomy-aligned activities in previous financial year (N-1) |
| Climate Change Mitigation | Climate Change Adaptation | Water | Circular Economy | Pollution | Biodiversity |
| mUSD | % | mUSD | % | % | % | % | % | % | % | % | % | % | mUSD | % |
| Turnover | 11,800 | | 44 | % | — | | — | % | — | % | n.a | n.a | n.a | n.a | n.a | — | % | n.a | n.a | — | | — | % |
| CapEx | 2,120 | | 49 | % | — | | — | % | — | % | n.a | n.a | n.a | n.a | n.a | — | % | n.a | n.a | — | | — | % |
| OpEx | 1,515 | | 46 | % | — | | — | % | — | % | n.a | n.a | n.a | n.a | n.a | — | % | n.a | n.a | — | | — | % |
3.4.3.5.6.2. Proportion of turnover, CapEx, OpEx from products or services associated with Taxonomy-eligible or Taxonomy-aligned economic activities – disclosure covering year 2025 (activity breakdown)
Turnover
| | | | | | | | | | | | | | | | | | | | | | | | | | | | | | | | | | | | | | | | | |
| Reported KPI - Turnover | | | | | | | | | | | | |
| Financial year 2025 | | | | | | | | | | | | |
| Economic Activities | Code | Taxonomy-eligible KPI (Proportion of Taxonomy-eligible Turnover) | Taxonomy-aligned KPI (monetary value of Taxonomy-aligned Turnover) | Taxonomy-aligned KPI (Proportion of Taxonomy-aligned Turnover) | Environmental objective of Taxonomy-aligned activities | Enabling activity | Transitional activity | Proportion of Taxonomy-aligned in Taxonomy-eligible |
| Climate Change Mitigation | Climate Change Adaptation | Water | Circular Economy | Pollution | Biodiversity |
| | % | mUSD | % | % | % | % | % | % | % | (E where applicable) | (T where applicable) | % |
| Manufacture of other low carbon technologies | CCM 3.6 | 44 | % | — | | — | % | — | % | n.a | n.a | n.a | n.a | n.a | — | % | n.a | — | % |
| Sum of alignment per objective | | | | n.a | n.a | n.a | n.a | n.a | n.a | | | |
| Total KPI - Turnover | 44 | % | — | | — | % | — | | n.a | n.a | n.a | n.a | n.a | — | % | n.a | — | % |
Capital Expenditure
| | | | | | | | | | | | | | | | | | | | | | | | | | | | | | | | | | | | | | | | | |
| Reported KPI - CapEx | | | | | | | | | | |
| Financial year 2025 | | | | | | | | | | | | |
| Economic Activities | Code | Taxonomy-eligible KPI (Proportion of Taxonomy-eligible CapEx) | Taxonomy-aligned KPI (monetary value of Taxonomy-aligned CapEx) | Taxonomy-aligned KPI (Proportion of Taxonomy-aligned CapEx) | Environmental objective of Taxonomy-aligned activities | Enabling activity | Transitional activity | Proportion of Taxonomy-aligned in Taxonomy-eligible |
| Climate Change Mitigation | Climate Change Adaptation | Water | Circular Economy | Pollution | Biodiversity |
| | % | mUSD | % | % | % | % | % | % | % | (E where applicable) | (T where applicable) | % |
| Manufacture of other low carbon technologies | CCM 3.6 | 49 | % | — | | — | % | n.a | n.a | n.a | n.a | n.a | n.a | — | % | n.a | — | % |
| Sum of alignment per objective | | | | n.a | n.a | n.a | n.a | n.a | n.a | | | |
| Total KPI CapEx | 49 | % | — | | — | % | n.a | n.a | n.a | n.a | n.a | n.a | — | % | n.a | — | % |
Operating expenditure
| | | | | | | | | | | | | | | | | | | | | | | | | | | | | | | | | | | | | | | | | |
| Reported KPI - OpEx | | | | | | | | | | |
| Financial year 2025 | | | | | | | | | | | | |
| Economic Activities | Code | Taxonomy-eligible KPI (Proportion of Taxonomy-eligible OpEx) | Taxonomy-aligned KPI (monetary value of Taxonomy-aligned OpEx) | Taxonomy-aligned KPI (Proportion of Taxonomy-aligned OpEx) | Environmental objective of Taxonomy-aligned activities | Enabling activity | Transitional activity | Proportion of Taxonomy-aligned in Taxonomy-eligible |
| Climate Change Mitigation | Climate Change Adaptation | Water | Circular Economy | Pollution | Biodiversity |
| | % | mUSD | % | % | % | % | % | % | % | (E where applicable) | (T where applicable) | % |
| Manufacture of other low carbon technologies | CCM 3.6 | 46 | % | — | | — | % | n.a | n.a | n.a | n.a | n.a | n.a | — | % | n.a | — | % |
| Sum of alignment per objective | | | | n.a | n.a | n.a | n.a | n.a | n.a | | | |
| Total KPI - OpEx | 46 | % | — | | — | % | n.a | n.a | n.a | n.a | n.a | n.a | — | % | n.a | — | % |
3.4.4. Social
ST aims to conduct business in a socially responsible manner. This section outlines our material IROs, approach, policies, actions, targets and stakeholder engagement practices in this regard, focussing on our own workforce, supply chain workers, and affected communities.
Approach to social responsibility
As an IDM, we handle most manufacturing in-house and also outsource part of the manufacturing to our subcontractors. The manufacture of semiconductor devices requires natural resources, use of chemicals, and is labor-intensive. Our strategy and business model take into account the material impacts we may have on our own workforce, supply chain workers and affected communities. Preventing negative impact on people is a priority for ST.
In this regard we focus on:
•upholding high standards in health and safety, human and labor rights, having a compliance framework with regard to data privacy, making efforts to create equal opportunities and equal treatment and providing continuous employee training and development;
•encouraging social responsible conduct towards supply chain workers by our suppliers through the RBA Code of Conduct and related audits; and
•engagement with our own workforce, supply chain workers and local communities
Policies related to social matters
Our approach to social responsibility is embedded in various policies aligned with ST’s Code of Conduct and the Responsible Business Alliance (RBA) Code of Conduct. Such policies include:
•Corporate Social Responsibility Policy;
•Corporate Labor and Human Rights Procedure;
•Corporate Occupational Health and Safety Policy;
•Supply Chain Responsibility Standard Operating Procedure;
•Policy Statement on Conflict Minerals and Responsible Minerals Sourcing;
•Privacy Policy.
These policies cover, amongst others:
•Prohibition of forced labor, discrimination, and harassment;
•Fair working conditions, wages, and benefits;
•Employee well-being and safety;
•Responsible sourcing and conflict minerals management;
•Processing and protection of personal data.
All policies apply globally to all ST entities and all ST employees. For an overview of relevant policies reference is made to the policy overview table in Appendix 11.7.
Actions, targets and progress
We take various actions to manage our social performance, such as regular audits of our own operations and our suppliers against RBA standards, providing employee training on human and labor rights, health and safety and making a grievance channel, the ST Ethics Hotline available.
An overview of the relevant targets and the progress towards those targets is included in Section 3.4.4.1.E. (Metrics and targets related to own workforce).
3.4.4.1 Own workforce (S1)
Own workforce related IROs (SBM-3)
The following table lists the IROs related to our own workforce we have identified and assessed as material in our 2025 DMA, including the programs or dedicated actions and (entity-specific) targets, we have in place to address such IROs.
| | | | | | | | | | | | | | | | | | | | | | | |
S1 – Own workforce |
Description | Type of IRO | Actual/ Potential | Value chain segment | Time horizon | Material on a residual(1) or inherent(2) basis | ST response | Targets |
| Potential negative impact from ST on own workforce due to difficulties in securing labor rights (e.g., excessive working hours, adequate wages) and human rights (e.g., forced and/or bonded labor, young workers labor, inadequate housing) | Negative impact | Potential | Own operations | Short term | Residual basis | ST’s labor and human rights program | We aim to achieve RBA platinum recognition during closure audits for all majority-owned main manufacturing sites by 2030 (entity-specific). A platinum recognition counts until the next closure audit if the closure audit is conducted within 18 months of the initial audit (as per RBA rules) |
| Potential negative impact from ST on own workforce due to leakage of personal information related to employees, either from ST or third parties, leading to harmful consequences for individuals concerned (e.g., fraud, blackmail, identity theft, harassment, etc.) | Negative impact | Potential | Own operations | Long term | Inherent basis | ST’s data privacy program | No target in place |
| | | | | | | | | | | | | | | | | | | | | | | |
S1 – Own workforce |
Description | Type of IRO | Actual/ Potential | Value chain segment | Time horizon | Material on a residual(1) or inherent(2) basis | ST response | Targets |
| Risk of human rights violations (including forced/bonded labor, young workers labor, inadequate housing) for ST own workforce, leading to allegations, litigation, fines, or penalties, as well as affecting Company's attractiveness | Risk | Potential | Own operations | Long term | Inherent basis | ST’s labor and human rights program | We aim to achieve RBA platinum recognition during closure audits for all majority-owned main manufacturing sites by 2030 (entity-specific). A platinum recognition counts until the next closure audit if the closure audit is conducted within 18 months of the initial audit (as per RBA rules) |
| Potential negative impact from ST on own workforce due to worked-related occupational injuries, illnesses (e.g., repetitive strain injuries), and / or poor well-being in the workplace | Negative impact | Potential | Own operations | Long term | Inherent basis | ST’s health and safety program | We aim, each year, to achieve a Total Recordable Case rate of 0.75 or less for work-related injuries and illnesses, including onsite value chain workers (entity-specific). |
| Potential negative impact from ST on own workforce related to unequal pay, discrimination and / or harassment in the workplace | Negative impact | Potential | Own operations | Long term | Inherent basis | ST’s equal treatment program | We aim to maintain an adjusted gender pay gap below 5% at company level each year (entity-specific).
We aim for the representation of women in management and Senior Management roles to be at least 25% by 2035 (entity-specific).
|
(1) "Residual" refers to the materiality assessment that takes into account existing mitigation measures.
(2) "Inherent" refers to the materiality assessment without taking into account any existing mitigation measures.
3.4.4.1.A. Material impacts, risks and opportunities and their interaction with strategy and business model (ESRS 2 SBM-3)
All employees and non-employees within our own workforce could be subject to the material negative impacts as assessed in the 2025 DMA. The various types of employees and non-employees included in our own workforce are listed in the various tables, and related explanatory disclosure, in Section 3.4.4.1.E.2. (Metrics - Characteristics of the undertaking's employees - Overview by category of employee (permanent versus temporary) and gender and Characteristics of non-employee workers in the undertaking’s own workforce).
The material negative impacts on our own workforce, as assessed in the 2025 DMA, are mostly related to our business model as an IDM with many employees and manufacturing sites worldwide, including in Asia.
The material negative impacts on our own workforce as assessed in the 2025 DMA, relate to:
•labor and human rights: we recognize that if labor and human rights violations were to occur, the magnitude of such impact would be severe. However, the likelihood of such occurrence is low due to the mitigating measures we have in place. We concluded on the materiality of this potential negative impact considering the ESRS 1 provision which states that for potential negative human rights impacts, the severity of the impact takes precedence over its likelihood;
•protection of personal data: we recognize that protecting employees' personal data is a widespread subject relevant across all geographies where ST is present. ST has established a personal data protection program and developed control objectives. Based on our current mitigating measures, this potential negative impact has been assessed as non-material on a residual basis, while we recognize its materiality on an inherent basis, assessed as if no mitigation were implemented;
•health and safety: we recognize the importance of our own workforce's health and safety, with inherent risks depending on the type of manufacturing. The mitigating measures we have in place sustain the non-materiality of this potential negative impact on a residual basis, while we recognize its materiality on an inherent basis, assessed as if no mitigating measures were implemented; and
•equal treatment of employees: we may face challenges related to equal treatment of employees which could be influenced by the local context. The mitigating measures we have in place sustain the non-materiality of this potential negative impact on a residual basis, while we recognize its materiality on an inherent basis, assessed as if no mitigating measures were implemented.
Regarding the risk of human rights violations, the materiality is primarily driven by bonded labor. Child labor is considered less likely in the semiconductor industry due to the complexity of our manufacturing processes and the equipment used.
The risk of forced labor is mainly relevant to our manufacturing sites in Asia, where it is considered widespread in the manufacturing industry, a labor-intensive sector, particularly in our back-end manufacturing sites. We have various effective mitigation measures in place; therefore, this risk is considered material on an inherent basis, assessed as if no mitigating measures were implemented.
When assessing the IROs, we considered all groups that might be negatively impacted without focusing on any specific group.
In the 2025 DMA only one risk was identified as material with regard to our own workforce. This risk was assessed not to be triggered by dependencies on social resources, such as people in our own workforce. Instead, this risk may stem from the potential negative impact that we could have on our own workforce concerning difficulties in securing labor rights.
3.4.4.1.B. Engagement with own workforce
3.4.4.1.B.1. Engagement in policy setting
When setting policies concerning ST's own workforce, their interests are considered in the sense that the objective of these policies is to maintain a culture free of discrimination and harassment, where individuals are treated with respect and dignity, and to provide a safe and healthy workplace, in which their legal rights and interests are respected. We are informed of their interests through, amongst others, our stakeholder engagement with regard to our own workers as described in Section 3.4.2.3.B. (Strategy - Interests and views of stakeholders).
3.4.4.1.B.2. Processes for engaging with own workforce and workers’ representatives about impacts
In 2025, our own workforce remained a key stakeholder group, whose perspectives were taken into account when defining our material topics and IROs and as such influences our strategy (refer to Section 3.4.2.3.B. (Strategy – Interests and views of stakeholders)).
Workforce engagement covers topics such as working conditions, labor rights, privacy, health and safety, wages, benefits, equal opportunities, and sustainability. Engagement with employees in our own workforce and workers' representatives primarily takes place at a local level, but is coordinated globally under the oversight of the CHRO to inform strategy and policies. We engage with the people in our own workforce and workers’ representatives via various channels and at various levels within ST.
Employee survey – global engagement
Our main corporate engagement channel is a global employee survey, which we intend to conduct every two years. Feedback is analyzed regionally and functionally to develop action plans, which are discussed with teams and employees, monitored regularly, and adjusted based on survey cycles.
Our equal treatment index in our global employee survey covers various topics, such as discrimination, inclusion, belonging and equal opportunities.This helps us gain insights into the perspectives of our employees. To capture diverse perspectives, focused surveys are conducted in collaboration with Employee Resource Groups ("ERGs"). In 2025 a global company-wide disability survey was launched , allowing us to identify certain physical, digital, and social barriers in the workplace. Based on these findings, we organized a disability inclusion webinar created an accessibility checklist for site assessments, held a brainstorming workshop and finalized a multiyear disability inclusion roadmap covering amongst others recruiting, accessibility and culture. We also issued internal digital accessibility guidelines for future training content.
In addition to this biennual global employee survey, specific topical surveys are also sent out to employees bi-annually to gather their insights and thoughts on particular topics.
Local engagement with own workforce
Various ST sites have implemented tools and channels to engage employees on actual and potential impacts and their management. These include suggestion systems where employees can submit improvement ideas, which are regularly reviewed by committees comprising subject matter experts, HR, sustainability champions, and managers. The implementation of suggestions is evaluated based on criteria such as criticality and feasibility, and employees can track the status of their submissions through the platform. Implemented suggestions are communicated to employees via local channels.
ST sites also host in-person events to facilitate direct engagement between management and employees. These events, sometimes focused on specific topics such as RBA Day or Sustainability Week, provide opportunities for employees to ask questions and give feedback on their work environment and conditions, receiving immediate feedback from management. ERGs also hold regular meetings with site
management to discuss specific topics, such as career development with the HR director and the WISE ERG.
Engagement with vulnerable or marginalized people in our workforce
We strive to understand and address the perspectives of our workforce, particularly those who may be vulnerable or marginalized. Our Corporate Labor and Human Rights Procedure require sites, among others, (i) to provide work environments adapted to the needs of employees with disabilities and/or medical conditions, tailored to the individual circumstances and taking into account local laws, (ii) to make reasonable accommodations for pregnant and nursing workers based on a personalized risk assessment to maintain a safe supportive work environment; and (iii) to inform form foreign migrant workers through pre-departure training, post-arrival surveys, and communications in their native languages in order to be able to address concerns promptly.
To promote inclusion, we have established ERGs, which are voluntary, employee-led groups representing minorities or people with shared characteristics and their allies and are intended to provide safe spaces for members to share experiences, informing leadership and support professional development. During 2025, we continued to focus on employee engagement and fostering inclusion in the workplace through, amongst others, our established ERGs, which bring together minorities, individuals with shared characteristics, and their allies to provide a safe space for sharing experiences, informing leadership, and supporting professional growth; by continuing to prioritize employee voices, including those of our younger employees through our global “Blossom” program, which encourages creativity, idea sharing, and open dialogue; and through our mentorship program, which remained a key tool for personal and professional development, accessible to all employees and particularly empowering for women.
Engagement with workers representatives
Engagement with workers’ representatives is also an important part of our approach. Many sites hold regular meetings (at least quarterly) between HR, general managers, sustainability champions (as appropriate), and workers’ representatives to discuss workers' concerns. Meeting minutes are shared with employees through workers' representatives communication, and progress on issues is reviewed in subsequent meetings.
3.4.4.1.C. Policies and actions related to own workforce
In our 2025 DMA, we assessed negative impacts on our own workforce to be potential and material on an inherent basis, except for the negative impact on labor rights, which is material on a residual basis by exception (according to ESRS 1, where for potential negative human rights impacts, the severity of the impact takes precedence over its likelihood).
This section describes the various policies and key actions we take to address and mitigate the identified potential material negative impacts and risk.
The actions and action plans described in this paragraph relate to our own workforce, are applicable to all ST sites, and are continuous and ongoing to reach the objectives and targets set in connection with related policies.
Through our Ethics Hotline we identify what action is needed and appropriate in response to a negative impact. The Ethics Hotline is further detailed in Section 3.4.5.3.A. (Business conduct policies and corporate culture).
3.4.4.1.C.1. Labor and Human Rights
Our approach and policies
We aim to uphold the highest standards of labor and human rights, placing it at the core of our strategy and culture. We manage this by developing and implementing due diligence programs to identify, prevent, mitigate, and remediate actual and potential adverse impacts on our workforce and risks to our business.
Our due diligence program for our own operations is based on the following elements:
•embedding responsible business conducts into policies;
•identifying and assessing adverse impacts (including through audit programs and engagement with our own workforce through various channels described in more detail in Section 3.4.4.1.B.2. Processes for engaging with own workforce and workers’ representatives about impacts);
•ceasing, preventing, and mitigating adverse impacts by identifying the root causes, implementing corrective measures and providing remediation, as appropriate; and
•tracking implementation and results.
Embedding responsible business conducts into policies
ST is dedicated to responsible business conduct, in line with our Code of Conduct and related policies and procedures such as our Corporate Social Responsibility Policy and our Corporate Labor and Human Rights Procedure. Our policies are informed by relevant internationally recognized standards, including the UN Guiding Principles on Business, and Human Rights, the OECD Guidelines for Multinational Enterprises, and the ILO Declaration on Fundamental Principles and Rights at Work. Additionally, we have embedded in our policies the RBA Code of Conduct, which is an industry standard that covers our material matters. Our policies related to labor and human rights set out our aim that all employees and workers are treated with respect and dignity and that secure labor and human rights conditions are provided.
Our policies focus on:
•prohibition of all forms of forced labor, child labor - including bonded, trafficked or slave labor - discrimination and harassment;
•implementation of a fair organization of working time, wages, benefits, and working conditions;
•respect for freedom of association and collective bargaining;
•privacy of personal information; and
•enhancement of employee well-being and safety.
Actions related to labor and human rights
To mitigate the negative impacts identified for labor and human rights, including the material risk of human rights violations (primarily forced labor, including bonded labor) in certain manufacturing locations, we undertake the actions described below.
These actions include, among others, our human rights policy and standards, human rights due diligence processes, audits and assessments at manufacturing sites in high‑risk regions, training for relevant employees, and grievance and remediation mechanisms. In carrying out these actions, our efforts are aligned with the general principles for conducting human rights due diligence. These actions are ongoing and are designed to support the achievement of the targets and objectives set out in our related policies and to specifically mitigate the identified risk of human rights violations in our own workforce.
Risk assessments
We perform the following risk assessments on a yearly basis, whereby in 2025 the risk assessments have been performed at our major sites, covering the vast majority of our own workforce, to identify and assess actual or potential adverse human rights impacts:
•a corporate assessment of the inherent risks related to our activities and locations conducted by Corporate Sustainability;
•site-specific assessments to identify the labor and human rights impacts associated with local operations at our major sites, conducted by site sustainability champions; and
•RBA self-assessment questionnaires, which include a section on human rights.
Monitoring tool
In 2025, social performance at ST sites was monitored monthly using specific reporting tools, such as working hours and leave reports. Throughout the year, we also regularly monitored and reviewed site performance against specific objectives and targets. Sites set their objectives in alignment with the Company’s policy deployment framework, which includes annual priorities, top-level goals, and the overall sustainability strategy. These site-level objectives were further cascaded into the personal goals of the relevant team members, ensuring clear accountability and focused efforts to advance social sustainability across the organization.
In accordance with our Corporate Labor and Human Rights Procedure, sites are required to implement corrective measures to address any identified gaps, including proactive and follow-up actions, as outlined in the corrective action plan process described above.
Audit and corrective action plans
Our risk assessments and monitoring tools are supported by an audit framework that has been in place for over ten years, comprising two programs: (i) RBA third-party audits which we aim to conduct at least every 2 years at our main manufacturing sites; and (ii) internal corporate labor and human rights audits conducted by Corporate Sustainability which we aim to conduct at least once every three years at our main manufacturing sites.
When findings arise, sites must develop corrective action plans addressing root causes to prevent recurrence and mitigate adverse human rights impacts. These corrective actions may include policy or procedure changes, communication or training, and impact measurements. Corrective actions must be
identified and implemented within twelve months. Corporate Sustainability holds quarterly meetings to review the progress.
RBA closure audits occur between twelve and eighteen months after the initial audit to verify corrective actions and close gaps. New non-conformances found during closure audits are addressed with additional action plans.
Examples of corrective action plans implemented in 2025 include:
•Employment contract compliance: An audit revealed that certain foreign migrant workers had expired employment contracts without proper extensions, due to a process handover failure. Immediate corrective actions included scanning all contracts, issuing addendums for valid permits, and ensuring new contracts are provided upon renewal. Preventive measures taken concerned updating recruitment policies, training HR personnel, conducting regular audits of personnel files, and establishing a dashboard to monitor contract expirations. These corrective actions were undertaken to restore compliance and prevent reoccurrence.
•Reimbursement of prohibited employment fees: Another audit found that some workers had paid passport renewal fees, which were not reimbursed within the required timeframe, and repatriation of transport costs were inconsistently covered. Root causes included a reactive reimbursement process and gaps in the management system that led to inconsistent handling of transportation fee reimbursements. Corrective actions taken involved launching investigations to identify eligible employees for repayment and developing proactive processes to ascertain passport renewal fees and repatriation transport costs are paid in advance or reimbursed within the required timeframe. Additionally, relevant personnel were enrolled in training and workshops to enhance their knowledge and compliance.
These examples demonstrate the Company’s ability to address audit findings through targeted corrective and preventive actions and improvement in labor and human rights compliance across its sites.
Training and awareness, tracking effectiveness
During 2025, we provided labor and human rights training to employees at our manufacturing sites. We also designed and implemented tools to communicate social responsibility standards and address employee questions. This training was provided to new hires during onboarding and refreshed annually. We review the effectiveness of our policies and training initiatives through internal corporate labor human rights audits conducted by Corporate Sustainability, as well as external audits, to ensure they meet the needs of our workforce.
Actions taken in this regard in 2025 based on audit results include:
•The update of our Corporate Labor and Human Rights Procedure to clarify that non-exempt employees are strictly excluded from any training fee reimbursement requests, since audit results indicated that the previous wording, which referred only to exempt employees, was not sufficiently clear.
•In our French sites, the introduction of an annual online refresher training on labor and human rights, including questions to assess employees’ comprehension of the topic. A score of 100% is required to complete the training.
Resources to take action
During 2025, our trained labor and human rights auditors conducted annual audits at ST sites with resources allocated by Corporate Sustainability. Several departments involved included, but are not
limited to, Human Resources; Environment, Health & Safety; Global Procurement Organization; Compliance, Ethics & Privacy, and Sales and Marketing.
The labor and human rights program was managed by people with a sustainability focus and labor and human rights knowledge, within Corporate Sustainability. General managers at major sites ensured compliance with our, Corporate Labor and Human Rights Procedure, supported by Human Resources directors. Local champions across departments helped implement sustainability and labor and human rights initiatives.
3.4.4.1.C.2. Health and Safety
Our approach and policies
We promote a culture of health, safety and well-being for our employees and subcontractors. We have a proactive approach towards occupational health and safety (“OH&S”), as prevention and anticipation are key. Our Corporate Occupational Health and Safety Policy ("Corporate OH&S Policy") outlines the main principles to establish, implement, maintain and improve our OH&S management system, which supports ST's response to potential negative impacts on our workforce.
This policy is applicable to all ST employees, departments, products, sites, and activities worldwide, as well as to onsite value chain workers or individuals under ST’s supervision. The implementation of the policy is overseen by our CHRO and it is available on st.com and so is available to potentially affected stakeholders and stakeholders who need to help implement it.
Health and safety is a priority for us, to manage potential negative impacts on our workforce. Safety is an ST value that must never be compromised. We endeavor to provide a safe and healthy workplace for our workforce in all our sites worldwide, to prevent work-related occupational injuries and illnesses. We believe it is essential to invest in healthcare and the well-being of our workforce for a positive and productive working environment. These values are shared and reinforced across all our sites.
Safety is the result of our management system and attitudes. We have developed an OH&S management system throughout our Company, and promote this to build a culture conducive to the prevention of occupational risks, based on the leadership of our management. In leading by example and demonstrating visible engagement and involvement with the OH&S management system, our management actively promotes such culture. Regular training of our employees raises levels of health and safety awareness, supporting them to perform their job safely, and enhances prevention. Recognizing and promoting the safest behaviors and encouraging shared vigilance and responsibility for taking care of each person’s own and other’s safety further strengthens our ‘Safety First’ culture.
We strive to meet and exceed relevant OH&S local and international legal requirements at all our sites. Our main manufacturing sites and largest non-manufacturing sites are ISO 45001 certified which provides alignment and a framework for OH&S management which covers workplace accident prevention. Our current certifications are included in Appendix 11.8. and can be found on st.com.
We promote a healthy lifestyle and have set up employee health and well-being programs such as for psychosocial risk prevention and assistance.
Actions for Health and Safety
Health and safety management system
Our programs and proactive measures strengthen our safety culture, enhance performance, prevent injuries, and support the health and well-being of our workforce. Our health and safety performance and management systems are evaluated annually through third-party surveillance audits and certifications are set to be renewed every three years.
Corporate Sustainability also runs an internal corporate EHS audit program to assess site performance against the EHS objectives, programs and procedures. Managers conduct regular safety visits, inspections and safety training, including evacuation drills. We encourage reporting and investigation of near-misses, hazards, and unsafe behaviors and conditions as part of our proactive approach. We aim to conduct thorough, structured and objective investigations of all incidents and share best practices. Human, financial and technological resources are allocated to achieve these goals and to maintain the OH&S management system.
The health of all employees working with chemical substances is monitored through a medical surveillance program, which includes biomonitoring. As an additional precaution, we regularly analyze the air in work areas to verify that our risk management measures are effective.
To support our employees ST sites also implement health programs tailored to local laws and requirements.
STCare
During 2025 our STCare program supported the well-being of our employees. We implemented measures to reduce risk and assist our people. Every quarter, we monitored four key metrics globally and regionally with the aim of preventing mental health issues and ensuring our metrics meet our defined standards of acceptability across four areas: stress levels, anxiety levels, depression levels, risk of burnout.
As part of our STCare program, to gain insights into employee well-being and productivity across our sites, we have created a well-being index, based on ten criteria including working environment, people, culture, working time, and workload management. During 2025 sites used this tool to self-assess and identify areas for improvement. The 2025 well-being self assessments showed improvements mainly related to culture, workload management and offered well-being services, compared to prior year self assessments. During 2025 ST best practices were shared between sites concerning, amongst others, health, work environment and work life balance initiatives.
Through our continuing partnership with Eutelmed our employees had access to the healthcare platform which provides 24/7 access to dedicated confidential assistance.
The STCare program provides various trainings for ST employees, including managers. More specifically, in 2025 an online training titled “Dealing with Anxiety” was introduced.
Training and awareness
In 2025, ST’s Safety First program, launched in 2013 and based on the principle that 90% of accidents can be avoided, continued to strengthen our safety culture. During 2025, we reinforced safe behaviors and working conditions through visits, training, audits, communication and sharing of best practices.
Training remained a critical component in both preventing and remediating incidents. In 2025, we continued to provide corporate e-learning and local training sessions to address risks and opportunities, legal requirements, and prepare for emergency situations.
Throughout 2025, we organized numerous safety events across our sites, open to all employees. These included safety weeks and various activities aimed at promoting continuous improvement. The overall goal during 2025 remained to raise health and safety awareness, explore new ideas, and share best practices with a strong focus on prevention. For example, in 2025, our sites observed the World Day for Safety and Health at Work, an international event endorsed by the United Nations. Events and activities are designed to further enhance employees’ safety awareness.
Measuring effectiveness
In 2025, we used a range of safety indicators to measure and evaluate the effectiveness of our management systems on a quarterly basis at both site and corporate levels. This included assessing
operational controls such as emergency response and identifying necessary modifications or new controls. These safety indicators allowed us to measure the effectiveness of implemented actions and measures during the reporting year. Further details can be found in Section 3.4.4.1.E.2. (Metrics - Health and safety metrics (S1-14)).
Hierarchy of controls
The hierarchy of controls remained central to our OH&S management system, throughout 2025, guiding risk assessment and mitigation. Managers regularly conducted site visits and investigations to identify potential hazards and unsafe acts and conditions, enabling them to determine appropriate preventive actions. When incidents occurred, safety professionals investigated the root causes and, where appropriate, involved the injured employee’s manager to help determine corrective and preventive measures.
Resources to take action
In 2025, ST allocated appropriate resources to maintain the OH&S management system and achieve health and safety goals. Our health and safety programs were managed by people with a sustainability focus and EHS knowledge within Corporate Sustainability and other ST departments, including subject matter experts and OH&S auditors who manage our internal corporate EHS audit program. These departments are, supported by site managers, EHS managers and engineers. Regular safety visits and awareness events were conducted across sites.
3.4.4.1.C.3.Equal treatment and opportunities for all
Our approach and policies
We believe that equal treatment of our employees and creating opportunities for all has a positive impact on innovation and stakeholder engagement as well as personal and Company growth.
We endeavor to foster a diverse and inclusive workplace. We aim to recruit and retain a diverse workforce, reflecting society. We aim for equity in career development, career opportunities, and equal remuneration. We seek to build an inclusive culture that values our employees and interested stakeholders and addresses bias and stereotypes. We aim to maintain a culture free from discrimination and harassment where individuals are treated with respect and dignity. Our policies include prohibition of discrimination on the grounds of race, color, ethnic or social background, national origin, age, gender, physical characteristics, disability, political opinion or affiliation, religion, gender identity or expression, sexual orientation, marital or maternity status, union affiliation or any other non work-related personal characteristic.
These ambitions and company values are outlined in ST's Code of Conduct, Corporate Social Responsibility Policy and Corporate Labor and Human Rights Procedure, and apply to all employees in order to manage potential negative impacts such as unequal pay or chances of progression. These policies are available on st.com and our intranet, for everybody, including to potentially affected stakeholders and stakeholders who need to help implement it. The implementation and monitoring of the Corporate Social Responsibility Policy and connected operational procedures is executed through our management systems and is overseen by our CHRO. Our policy on equal treatment and opportunities is implemented through equal treatment and opportunities strategy and programs.
Actions related to equal treatment and opportunities for all
Our equal treatment strategy comprises the following: strengthening diversity, growing equity and developing inclusion.
ST is dedicated to attracting, developing, and retaining a diverse and talented workforce and providing equal opportunities for all employees based on their behavior, skills and abilities. Decisions concerning
recruitment and selection, job assignment, remuneration and benefits, rewards, opportunity for training and development, transfer or promotion, must be based on a fair assessment of an individual’s qualifications, skills and ability, as well as past and current performance. Decisions concerning termination and discipline must be based on a fair assessment, proportionate to the circumstances of the issue, nature of the misconduct, consequences thereof and other relevant considerations (such as severity, intention, past cases, seniority of the wrongdoer, etc.). Sites are required, to implement a process for regularly reviewing these practices to ensure they are free from discrimination.
Gender pay ratio
In 2025, our objective remained to safeguard equity in development, career opportunities, and remuneration. During the year, we monitored our gender pay ratio quarterly, comparing women’s and men’s salaries by job level across all countries where we operate. The ratio is disclosed in Section 3.4.4.1.E.2. (Metrics - Compensation metrics S1-16).
Adjusted gender pay gap
During 2025, we continued to use the adjusted gender pay gap index to monitor and detect any pay gaps in line with our ambition to reach parity, monitoring any pay gaps that persist in certain job grades and countries. The index is used to report and track any gaps, and enabled Human Resources to gain a better understanding of the situation and make corrections where necessary. When an unjustified gap was detected, focused areas were identified, and relevant regions and departments collaborated with the aim to close the gaps within a set timeframe. In this regard, certain regions allocate a specific budget to close any such unjustified gap. Further details on our adjusted gender pay gap can be found in Section 3.4.4.1.E.1. (Own workforce - Compensation metrics).
Flexible working
In 2025, we continued to implement our company-wide framework for flexible working arrangements, enabling employees to work from home or other locations in compliance with local regulations. We believe that hybrid work can enhance quality of life and support talent attraction and retention.
Training and awareness
During 2025, we continued to reinforce an inclusive mindset, through equal-treatment and equal-opportunities e-learning and unconscious bias workshops, encouraging employees to speak up and training managers on transparency. We continued to develop female leaders through the WIL and AWIL leadership training programs, allowing us to keep building a pipeline for executive management roles.
During 2025, we repeated our inclusive internal communication guidelines, highlighting that inclusive communication extends beyond avoiding offensive terms and includes non-stereotypical, unbiased, and gender-neutral language, as well as proper acknowledgement of people and cultures.
Measuring effectiveness
In 2025, aligned with our equal treatment and opportunities strategy, Corporate Sustainability established company-wide sustainability priorities and goals. These are reviewed annually and are cascaded throughout the company via our annual objectives process and monitored using our sustainability scorecard, which is presented at quarterly executive meetings. One example is our global unconscious bias training, implemented to cultivate an inclusive mindset across the organization. At the beginning of the year, we identified the required training actions and set regional training targets, which were communicated to the respective regional learning and development coordinators responsible for deploying the training within their scope. Progress against these objectives was tracked and monitored through review calls with the regional learning and development teams.
Resources to take action
In 2025, the various actions related to equal treatment and opportunities were managed by people with a sustainability focus and knowledge on equal treatment and opportunities within Corporate Sustainability and other relevant ST departments. The ethics hotline, overseen jointly by the Compliance, Ethics & Privacy and Corporate Audit and Risks departments, served as the primary channel for reporting ethical concerns. The Code of Conduct, managed by Compliance, and Ethics & Privacy, offered clear guidance to support our equal treatment principles. Together, these resources helped reinforce the implementation of our strategy.
Quarterly gender pay gap reports were issued by the Corporate Compensation and Benefits Department and shared with HR, further described in the Adjusted gender pay gap section. ERG's (WISE, STAND and ABLE) were encouraged to raise equal opportunity concerns with the equal treatment program manager and sponsors. To support career development, employees had access to ST’s internal coaching offices with our 30+ coaches, complemented by an internal mentoring program tailored to employee needs. In 2025, we hosted webinars for mentors focusing on gender-sensitive practices to promote equitable and inclusive guidance.
3.4.4.1.C.4. Data privacy
Our approach and policies
Data privacy encompasses the broader framework of rights and regulations that govern how personal data should be handled and protected.
As an employer, our obligations under personal data protection laws and regulations are to safeguard the protection of employees' personal data and the lawful processing of their personal data. These obligations are structured around four main principles: obligation to inform, purpose limitation and data minimization, and data security measures.
To this end and based on the GDPR framework, we have established a personal data protection compliance program, which includes policies and procedure guidelines. Furthermore, we have developed privacy control objectives making usage of the following ‘best practice’ frameworks:
•generally accepted privacy principles - issued by the American Institute Certified Public Accountants and Canadian Institute of Chartered Accountants;
•National Institute of Standards and Technology ("NIST") SP800-R53 privacy control catalog;
•ISO/IEC 27701:2019.
We process workers' personal data globally and our commitment to its protection is anchored in the ST Code of Conduct, which establishes basic rules for responsible data handling for all employees and provides guidance and references to other applicable policies.
We have put in place a set of policies that constitute the framework for our handling and protection of personal data across all entities globally. These policies contain several provisions on our processing of personal data, including but not limited to rules on processing personal data, transparency, the rights of the data subjects, handling of complaints and personal data breaches, transfer of personal data to third parties, as well as supervision and compliance.
The Head of our Corporate Privacy Department is accountable for the implementation of relevant policies and operational procedures, while the relevant regional heads of Human Resources are accountable for applying and complying with the law, internal policies and operational procedures.
Actions related to data privacy
We prioritize the protection of personal data and seek to foster a culture of awareness and compliance among our employees. To this end, during the reporting year we offered mandatory training and organize
awareness activities specifically focused on personal data protection. Our personal data protection training is required every two years for all employees globally who handle personal data at any level. This helps our team to remain up-to-date with the latest regulations, best practices, and organizational policies regarding data protection. Additionally, new employees at ST are required to complete the general personal data protection training as part of their onboarding process.
Information and cybersecurity
In 2025, to reduce the likelihood of data breaches (i.e. cyber incidents involving unauthorized access to, disclosure of, or the accidental or unlawful destruction, alteration, or loss of personal data). ST has adopted various cybersecurity measures. We conducted global campaigns and training sessions to raise employee awareness of cyber risks and threats and to enhance preparedness. To address exposure to cyber incidents, we have invested in the ability to detect and respond to cyber incidents, to manage and reduce relevant vulnerabilities, and to reduce the time needed to recover in case of incidents. In addition, we proactively monitor threats, vulnerabilities, and effectiveness of security controls.
Resources to take action
In 2025, ST allocated resources and invested in information security to ensure proper implementation and compliance with data privacy and security policies. Data privacy was overseen by the Corporate Compliance, Ethics & Privacy Department, overseen by the Head of Global Privacy, while information security, including cybersecurity, was managed by the Information Security team within the wider Digital Transformation and Information Technology Department.
Data privacy process
For data privacy we have implemented a specific procedure for handling of reports of personal data breaches, which all employees handling personal data have been informed of through mandatory learning as well as information and awareness activities. All incidents that may constitute a breach of confidentiality, availability, or integrity are to be reported through a designated channel as soon as possible. When a breach is reported, relevant resources (e.g., Cybersecurity Incident Response Team ("CSIRT") and Head of Global Privacy) are immediately notified to ensure that we can assess and handle the breach in a timely manner.
3.4.4.1.D. Processes to remediate negative impacts and channels for own workforce to raise concerns
Where we have caused or contributed to a material negative impact on people in our own workforce, we take corrective actions and provide remedy as relevant.
These remediation actions consider the principles as included in the RBA Code of Conduct and as such tailored to relevant internationally recognized standards as further described in section 3.4.4.1. C. (Policies and actions related to own workforce).
Such corrective actions are based on (i) corrective action plans that we put in place after such material negative impact has come to our attention, through internal and/or external audits (described under Section 3.4.4.1.C. (Policies and actions related to own workforce) or (ii) assessments of concerns raised via any available channel to raise concerns.
Corrective Action Plans
Corrective action plans are established to close gaps between an identified issue and ST’s social sustainability standards, such as human rights standards, health and safety standards, equal treatment
standards, as identified in internal/external audits. Corrective action plans include requirements from our sites to implement measures to readdress any wrongdoing to people from our workforce caused by a gap with our labor and human rights principles, health and safely principles, equal treatment principles and otherwise. The proposed measures are established on an ad hoc basis depending on the specifics of the situation and the available remediation options. Evidence is gathered and reviewed for each suggested corrective action plan to ensure successful implementation.
We regularly develop and implement measures to prevent, mitigate or address any actual or potential negative impacts on our workforce that we might have caused or contributed to.
Specifically with regard to unequal pay, our general approach towards contributing to remedy to unequal pay is covered by our gender pay gap process (as described in Section 3.4.4.1.E.1. Targets related to managing material negative impacts, advancing positive impacts, and managing material risks and opportunities - Target related to equal treatment and opportunities for all - adjusted gender pay gap below 5% (entity-specific)). We value employee contributions and our objective is to safeguard equity in development, career opportunities, and remuneration.
In addition to the above, sites must also provide remedy on an ad hoc basis to remediate situations misaligned with our commitments to labor and human rights.
To support timely and effective closure of corrective action plans, ST has put in place a dedicated team to manage the execution of corrective action plans across manufacturing sites, collaborating with relevant site representatives and Corporate Sustainability.
Ethics Hotline
ST promotes a ‘speak up’ culture, allowing any employee or interested third party, internal and external stakeholders to raise, in good faith without fear of retaliation, any concerns they might have of a potential violation of: ST’s Code of Conduct, applicable laws, the Company’s policies or values. Further information on the Ethics Hotline is included in Section 3.4.5.3.A. (Business conduct policies and corporate culture). Disclosure on reported work-related incidents, complaints, and severe human rights impacts within its own workforce, and any related material fines, sanctions or compensation for the reporting period, is included in Section 3.4.5.3.A. (Business conduct policies and corporate culture).
Tracking effectiveness
We audit practices and policies at our major sites against our Corporate Labor and Human Rights Procedure at least every three years or when significant changes occur. This includes an assessment of site performance related to grievance mechanism communications and workers’ awareness as part of the interview process. In addition, records are analyzed to identify any potential evidence of retaliation against workers.
Some of the engagement channels described above are also used by employees to raise grievances from workers’ representatives (trade unions) meetings and grievances raised through communities.
3.4.4.1.E. Metrics and targets related to own workforce
3.4.4.1.E.1. Targets related to managing material negative impacts, advancing positive impacts, and managing material risks and opportunities
Target related to health and safety (entity-specific)
We aim to provide safe and healthy workplaces for all people in every ST site worldwide
As part of our commitment to put safety first, as described in our Corporate OH&S Policy, we have set an entity-specific annual target to achieve a Total Recordable Case Rate (“TRC Rate”) of 0.75 or less for work-related injuries and illnesses of our own workforce (employees and non-employees), including onsite value chain workers, throughout our operations worldwide.
Total Recordable Case Rate target (TRC Rate)
| | | | | | | | | | | |
| Rate | December 31st, 2024 (baseline) | December 31st, 2025 | Target |
| TRC rate | 0.65 | | 0.47 | | 0.75 | |
The base year for this target is 2024 at the end of which the baseline value, i.e. the TRC Rate, was 0.65. As of December 31, 2025 the TRC Rate for this target was 0.47. The 2025 TRC Rate of 0.47 is well below the annual target of 0.75, indicating that ST is currently meeting and exceeding this target.
The scope of the target is reviewed annually; in 2025 it was expanded to include our Chongqing (Sanan ST JV) site, in addition to the sites already in scope in 2024.
The improvement from 0.65 in 2024 to 0.47 in 2025 reflects the effect of our structured and mature OH&S management system, refer to Section 3.4.4.1.E.2. ( Metrics - Health and safety metrics (S1-14) ) for details, and a focus on proactive prevention. We deploy yearly field safety visits, aimed at enforcing safety rules, identifying and mitigating potential risks, anticipating unsafe acts and unsafe conditions as early as possible, rather than reacting after incidents occur. We share events and good practices on a monthly basis via dedicated meetings or company communication channels. In addition, corporate EHS internal audits are regularly conducted, checking compliance with company programs, procedures and policies, and verifying adequate deployment and awareness at site level.
We follow the OSHA for recording and tracking work-related injuries and illnesses in an online tool and adjusted it for coherence with the metrics (Refer to Section 3.4.4.1.E.2. ( Metrics - Health and safety metrics (S1-14) )). It covers our own workforce, including onsite value chain workers.
The methodology used to calculate the TRC Rate is the following:
•TRC Rate for employees and non-employees = (number of work-related injuries and illnesses * 1,000,000) / (number of working hours);
•TRC Rate for onsite value chain workers = (number of work-related injuries and illnesses * 500) / (number of full time equivalent employees);
•The Total Recordable Case Rate is calculated by dividing the total number of recordable cases (including employees, non-employees, and value chain workers) by the total number of working hours (for employees, non-employees, and value chain workers), and then multiplying the result by 1,000,000.
To determine the number of working hours we use a mix of data available via our automatic badging systems or an estimate, as described in more detail in Section 3.4.4.1.E.2. ( Metrics - Health and safety metrics (S1-14) ).
Progress toward these targets is monitored quarterly, as part of ST’s health & safety program (refer to Appendix 11.10.) and as described in Section 3.4.2.2. (Governance ).
Target related to working conditions and other related rights (entity-specific)
As part of our commitment to respect labor and human rights across the Company, laid down in our Corporate Social Responsibility Policy and Corporate Labor and Human Rights Procedure (each as defined in Appendix 11.7.) we have set an entity-specific target, in 2024, to achieve RBA Platinum recognition during closure audits or initial audits if no findings for eleven manufacturing sites (as detailed in the table included in Appendix 11.9.) by the end of 2030. A platinum recognition counts until the next closure audit if the closure audit is conducted within 18 months of the initial audit (as per RBA rules).
The definition of RBA Platinum status and the counting rules described above are consistent with those applied in 2024; therefore, the number of Platinum sites is directly comparable year‑on‑year. However, the methodology has been clarified versus prior year reporting and is further detailed below.
RBA Platinum recognition related target
| | | | | | | | | | | |
| RBA certification by site | December 31, 2024 (base year) | December 31, 2025 | December 31, 2030 (target year) |
| Number of sites which had received a platinum recognition | 10 | 10 | 11 |
| Total number of sites in scope | 11 | 11 | 11 |
As of December 31, 2025 10 out of our 11 manufacturing sites are recognized as Platinum considering these sites had received an RBA Platinum recognition during closure audits or initial audits in the past. The number is similar to last year as these ten sites are the same as last year.
This target is based on third-party RBA audits on verification of compliance with RBA standards on labor rights (including excessive working hours and adequate wages), and on human rights (including all forms of forced/bonded labor, child labor, student workers, inadequate housing).
A site is counted as holding a Platinum status in the reporting year, based on the following approach and in line with the RBA code:
• A Platinum recognition remains valid until the next closure audit, provided that the closure audit is carried out within 18 months of the initial audit.
•When Platinum is achieved during an initial audit, the next closure audit can take place up to 42 months after that initial audit: a new initial audit must occur within 24 months, followed by an additional 18‑month period allowed to conduct the closure audit.
•In practice, some initial audits may exceed the 24‑month interval due to limited availability of RBA‑approved auditors. Where this occurs, ST continues to recognize the Platinum status if the subsequent closure audit is completed within 18 months, consistent with the intent of the RBA rules.
At the end of 2025, six sites hold a valid RBA Platinum certificate and four sites are considered Platinum based on the outcome of their last closure audit and compliance with the 18 months closure audit timeframe. Two out of the four sites had an initial audit in 2025 and obtained Silver and Gold recognition which certificate is valid as of December 31, 2025. Their closure audits are planned for 2026.
We aim to conduct these audits every two years on all our majority-owned main manufacturing sites. To achieve RBA platinum recognition, the site must score 200/200, which means that either there were no findings or, that all findings are closed. The audit data and findings are recorded and tracked in the RBA's online platform. Progress toward these targets is monitored quarterly, as part of ST’s labor & human rights program (refer to Appendix 11.10.) and as described in Section 3.4.2.2. (Governance ).
Target related to equal treatment and opportunities for all - adjusted gender pay gap below 5% (entity-specific)
We value employee contributions and aim to maintain an environment free of any kind of discrimination. Our objective, based on our Code of Conduct, Corporate Social Responsibility Policy, and our Corporate Labor and Human Rights Procedure is to safeguard equity in development, career opportunities and remuneration, including the right to equal pay for work of equal value regardless of gender.
In connection with this objective, in 2024 we set an entity-specific annual target to maintain an adjusted gender pay gap below 5% throughout our operations. In 2025 this adjusted gender pay gap was 2.3%, compared to the baseline value of -1.8% in the 2024 base year. This small gap illustrates our commitment to equal pay for equal work. While the overall gap is small, we identified some areas to focus on and the relevant regions and organizations are working on closing these gaps.
We monitor our adjusted gender pay gap each quarter, comparing women's and men's average salaries plus variables, by job level for each country where we operate ((men's salary - women's salary / men's salary) x100)). Global averages for each employee category are calculated weighted by country and headcount in the job level
The table below shows the adjusted pay gap per group of employee in 2025 and 2024.
| | | | | | | | |
| 2025 | 2024 |
Operators(1) | (1.0)% | (4.2)% |
Non-Exempts(2) | 4.3% | (3.3)% |
Exempts(3) | 3.1% | 0.3% |
Employees(4) | 2.3% | (1.8)% |
(1) Operators are employees working in production operations.
(2) Non-Exempts are Employees who hold positions normally requiring higher education and who are eligible for overtime compensation.
(3) Exempts are employees who hold positions normally requiring graduate or post graduate education and who are not eligible to overtime compensation.
(4) The population considered for the adjusted pay gap includes only Regular Full-Time active employees. Individuals on leave, as well as apprentices, assignees, expatriates, and those on local plus contracts are excluded. Employees with less than one year of seniority and senior management are also excluded. This ensures that an accurate comparison of remuneration (Base Salary and Premiums Paid during the year) is made.
The data is extracted from our Human Resources database, which covers all ST operations worldwide. We monitor our adjusted gender pay gap each quarter.
Target related to equal treatment and opportunities for all - gender distribution (entity-specific)
We recognize the negative impacts that workplace discrimination, harassment, and unequal opportunities can have on our workforce and their careers. In alignment with our dedication to maintain a culture free of discrimination and harassment, as stated in our Code of Conduct, Corporate Social Responsibility Policy and in our Corporate Labor and Human Rights Procedure, we foster an inclusive workplace where equity and respect are supported.
In connection herewith, we have set an entity-specific target, in 2024, for the representation of women (i) in management roles to reach at least 25% by 2035; and (ii) in Senior Management roles to reach at least 25% by 2035, both throughout our operations worldwide. This target is based on ST’s internal DEI ambitions and industry practice, rather than on a specific external ‘science‑based’ methodology.
Equal treatment (Diversity, Equity and Inclusion): Women in management target
| | | | | | | | | | | |
| In percentage | December 31, 2024 (base year) | December 31, 2025 | December 31, 2035 (target year) |
| Women in management roles | 21 | % | 22 | % | 25 | % |
| Women in Senior Management roles | 10 | % | 13 | % | 25 | % |
The target level, scope and calculation methodology have not changed since their definition in 2024. The base year for this target is 2024. As of December 31, 2025, we had 22% women in management and 13% women in Senior Management, compared to 21% women in management and 10% women in Senior Management in 2024. Women in management refers to women in middle management up to and including Senior Management, while women in Senior Management is further described in Section 3.4.4.1.E.2. (Metrics - Equal treatment metrics (S1-9)).
The Equal Treatment and Opportunity team, which is part of the Human Resources and Sustainability organization, monitors the representation of women. Progress toward these targets is monitored quarterly, as part of ST’s equal treatment and opportunities program (refer to Appendix 11.10.) and as described in Section 3.4.2.2. (Governance ).
3.4.4.1.E.2. Metrics
Characteristics of the undertaking’s employees (S1-6)
In the below table, ST is providing the key characteristics of its employees whether by gender or by country or by type of employment.
This view serves as a basis for all the other qualitative disclosures made in this report and is aligned when it comes to definition of employees. It is also serving as a basis for calculation for other metrics to be disclosed under other disclosures requirements in this Social section.
Employee benefits liabilities are further detailed in Note 7.6.23. of our consolidated financial statements and employee benefits expenses are further detailed in Note 7.6.28. of our consolidated financial statements.
As mentioned in Section 3.4.2.1. (General basis for preparation (ESRS 2 BP 1 and BP 2)), Chongqing (Sanan ST JV) and Catania's new 200mm SiC manufacturing facility employees are included in the social metrics for the year ended as of December 31, 2025.
Overview by gender
| | | | | | | | |
| In headcount | December 31, 2025 | December 31, 2024 |
| Male | 32,226 | | 33,182 | |
| Female | 16,931 | | 17,702 | |
| Total employees | 49,157 | | 50,884 | |
| Average number of employees | 50,301 | | 51,961 | |
As of December 31, 2025, ST had 49,157 employees (50,884 as of December 31, 2024) out which 32,226 are male and 16,931 are female (33,182 male and 17,702 female as of December 31, 2024) . No employee reported “other” and all employees reported their gender as of December 31,2025. The change in the number of employees is primarily due to the restructuring program. Please refer to the Note 7.6.23. (Employee benefits).
The numbers presented above include our employees registered as active, as well as on leave, and are reported in headcount. They are presented at the end of the reporting period i.e. December 31, 2025.
The average number of employees was 50,301 in this reporting year (51,961 in 2024).
ST considers as employee, any person with an employment contract with ST in accordance with national laws or practice. ST has performed a legal and Human Resources review of the national laws and local practices to ensure consistency of the definition across its locations. As such, certain categories such as intern have not been considered as employee but as non-employee upon consolidation of our 2025 reporting year numbers. Note however that our apprentices are considered as employees.
Overview by country
| | | | | | | | |
| In headcount | December 31, 2025 | December 31, 2024 |
| France | 12,509 | | 12,957 | |
| Italy | 12,645 | | 12,726 | |
| Others | 24,003 | | 25,201 | |
| Total | 49,157 | | 50,884 | |
Due to its worldwide footprint and global markets, ST is present in 40 countries with the majority being in France and Italy, in line with our manufacturing footprint.
Overview by category of employee (permanent versus temporary) and gender
| | | | | | | | | | | |
| In headcount | | | December 31, 2025 |
| Female | Male | Total |
| Number of permanent employees | 16,274 | | 31,278 | | 47,552 | |
| Number of temporary employees | 657 | | 948 | | 1,605 | |
| Number of full-time employees | 15,997 | | 31,740 | | 47,737 | |
| Number of part-time employees | 934 | | 486 | | 1,420 | |
| Number of employees | 16,931 | | 32,226 | | 49,157 | |
| | | | | | | | | | | |
| In headcount | | | December 31, 2024 |
| Female | Male | Total |
| Number of permanent employees | 16,883 | | 32,241 | | 49,124 | |
| Number of temporary employees | 819 | | 941 | | 1,760 | |
| Number of full-time employees | 16,757 | | 32,707 | | 49,464 | |
| Number of part-time employees | 945 | | 475 | | 1,420 | |
| Number of employees | 17,702 | | 33,182 | | 50,884 | |
The table above presents the breakdown of our female and male employees according to their type of employment (permanent versus temporary). At ST in this reporting year, there is no non-guaranteed hours employee.
Most of ST employees are permanent and full-time. Part-time employees are mainly the result of employees’ requests where temporary employees represent generally apprentice or expatriate.
Employee’s turnover
| | | | | | | | |
| In headcount | 2025 | 2024 |
| The total number of employees who have left ST during the reporting period. | 2,999 | | 3,015 | |
| The rate of employee turnover in the reporting period | 6 | % | 6 | % |
During the reporting period, 2,999 employees left ST which is in line with previous year. This number of employees who have left ST during the reporting period is considered as normal fluctuation. It includes employees’ resignation, termination from ST, retirement or death. 64% (75% in 2024) of the total is represented by employees voluntarily leaving ST. The rate of employee turnover is calculated based on this number out of the average number of employees during the reporting period.
Characteristics of non-employee workers in the undertaking’s own workforce (S1-7)
Non-employee workers
| | | | | | | | |
| In headcount | December 31, 2025 | December 31, 2024 |
| Total number of non-employees in ST’s workforce | 4,431 | | 3,015 | |
As of December 31, 2025, ST had 4,431 non-employees (headcount) in its own workforce (3,015 as of December 31, 2024). Non-employees include intern or thesis student, agency or temporary workers, and contractors. It includes non-employees that are on leave. All the data presented in the table above are actual data captured in our Human Resources system. The main reason for the increase is the number of contractors working on the Catania's new 200mm SiC manufacturing facility site in 2025.
The total includes self-employed people represented by contractors working for ST during the reporting year. This is considering the definition provided by the standard and related application requirements i.e. contractors hired to perform work that would otherwise be carried out by an employee, or to perform work in a public area (for example, on a road, on the street) or to deliver the work/service directly at the workplace of a client of the organization. In addition, it also includes people who have been considered as primarily engaged in employment activities as per the standard definition, in line with NACE code N78. It means their work is under the direction of ST. It includes people who filled in for employees who were temporarily absent (due to illness, holiday, parental leave, etc.).
Equal treatment metrics (S1-9)
Gender distribution at top management level
| | | | | | | | |
| In headcount | | December 31, 2025 |
| Male | 27 | 87 | % |
| Female | 4 | 13 | % |
| Total | 31 | 100 | % |
| | | | | | | | |
| In headcount | | December 31, 2024 |
| Male | 28 | 90 | % |
| Female | 3 | 10 | % |
| Total | 31 | 100 | % |
As of December 31, 2025, 4 female employees were included in ST top management, which represents 13% of the total. The increase of one woman compared to previous year relates to the nomination of Marie Heriz as Executive Vice President, Embedded Processing Sub-group in September 2025. Please refer to Section 5.4. (Managing Board) for the definition of our top management, it includes our Managing Board, Presidents and Executive Vice Presidents.
Distribution of employees by age group
| | | | | | | | |
| In headcount | | December 31, 2025 |
| Under 30 years old | 9,221 | | 19 | % |
| 30-50 years old | 24,878 | | 51 | % |
| Over 50 years old | 15,058 | | 31 | % |
| Total employees | 49,157 | | 100 | % |
*Due to rounding, the total percentage may differ
| | | | | | | | |
| In headcount | | December 31, 2024 |
| Under 30 years old | 10,980 | | 21 | % |
| 30-50 years old | 25,728 | | 51 | % |
| Over 50 years old | 14,176 | | 28 | % |
| Total employees | 50,884 | | 100 | % |
As of December 31, 2025, more than half of ST employees were aged between 30 and 50 years old.
The change in the age categories is mainly due to aging of employees and reflects the demographic trends of the countries where ST operates.
Adequate wage (S1-10)
ST seeks to offer a competitive compensation and benefits package based on industry survey results in the regions where we operate. At a minimum, ST aims to comply with applicable wage laws and collective bargaining agreements, including minimum wages, overtime hours, and legally mandated benefits.
We also attach importance to the standard of living of its employees. With this in mind, and in the context of the CSRD, ST collected and analyzed the remuneration of all its employees across the entire company. The results show that no ST employee earns less than the adequate wage as defined in the new European CSRD regulation.
Health and safety metrics (S1-14)
Health and safety
| | | | | | | | | | | | | | |
| December 31, 2025 | December 31, 2024 |
| EMPLOYEES | NON-EMPLOYEES | EMPLOYEES | NON-EMPLOYEES |
| People covered by ST’s health and safety management system (% in headcount) | 84% | 88% |
| People covered by a health and safety management system which has been internally audited and/or audited or certified by an external party (%) | 84% | 88% |
| Number of fatalities as a result of work-related injuries | 0 | 0 | 0 | 0 |
| Number of fatalities as a result of work-related ill health | 0 | 0 | 0 | 0 |
| Number of fatalities as a result of work-related injuries of other workers working on ST’s sites | — | | — | | — | | — | |
| Number of fatalities as a result of work-related ill health of other workers working on ST’s sites | — | | — | | — | | — | |
| Number of recordable work-related accidents | 43 | 0 | 52 | 0 |
| Rate of recordable work-related accidents | 0.47 | 0 | 0.54 | 0 |
| Number of cases of recordable work-related ill health, subject to legal restrictions on the collection of data | 0 | — | | 6 | — | |
| Number of days lost to work-related injuries and fatalities from work-related accidents, work-related ill health and fatalities from ill health | 1,122 | | — | | 1,730 | — | |
At ST, 84% of our own workforce is covered by a health and safety management system on a headcount basis (88% in 2024). The variation is mainly due to two sites not certified, one with increased number of non-employees and one being new to the perimeter. The own workforce includes our employees and our non-employees as per the standards definition. ST strategy is to ensure the coverage of our own workforce and supply chain workers present in manufacturing sites and large non-manufacturing sites. In addition, our health and safety management systems are based on the recognized standard ISO 45001. ISO 45001 is an international standard for occupational health and safety management systems. All ISO 45001 certified sites are audited on a yearly basis by an external certification body. We aim to renew the certification every three years. The certificates are disclosed on our company website.
Similar to last year, ST has no fatality because of work-related injuries nor because of work-related ill health for both our own workforce and supply chain workers in 2025. Work-related injuries and work-related ill health arise from exposure to hazards at work and follow the definition of the standard. Work-related injury or ill health that results in any of the following: (i) death, days away from work, restricted work or transfer to another job, medical treatment beyond first aid, or loss of consciousness; or (ii) significant injury or ill health diagnosed by a physician or other licensed healthcare professional, even if it does not result in death, days away from work, restricted work or job transfer, medical treatment beyond first aid, or loss of consciousness.
The number of recordable work-related accidents amounted to 43 for ST employees with a rate of 0.47 in this reporting year (52 for ST employees with a rate of 0.54 in 2024) . Forty percent of the accidents relate to slipping, tripping or falling in common areas (Half of the accidents in 2024). Prevention campaigns have been conducted over the year to target these types of accidents explaining the light decrease. The computation follows the standard guidance. The rates represent the number of respective cases per one million hours worked. It indicates the number of work-related accidents per 500 full time people in the workforce over a 1-year timeframe. Most of our locations derive the number of hours worked via automatic badging. When it is not possible, the number of hours worked is estimated on the basis of theoretical standard worked hours to which hours of absences are removed. There was no recordable work-related accident for ST non-employees.
In this reporting year, ST had no case of recordable work-related ill-health subject to legal restrictions on the collection of data (6 in 2024). Significant efforts focusing on ergonomics and automation actions during the past year is the main reason of this decrease in 2025. Work-related illnesses include both acute and chronic illnesses, such as, but not limited to, Musculoskeletal disorders, skin and respiratory diseases, cancers, diseases caused by physical agents (e.g., noise-induced hearing loss, vibration-caused diseases), mental illnesses. It is aligned with ILO list of occupational diseases. The cases disclosed relate to cases notified to ST or identified by ST through medical surveillance during the reporting period.
The number of days lost to work-related injuries and fatalities from work-related accidents, work-related ill health and fatalities from ill health amounted to 1,122 in this reporting year (1,730 in 2024) for ST employees. The decrease is due to a combination of fewer cases with fewer days being taken for each case, except for three cases accounting for a large proportion of the total days lost. It includes the first full day and the last day of absence based on calendar days. Thus, days on which the affected individual is not scheduled for work (for example, weekends, public holidays) will count as lost days.
In addition to the definition of employees and non-employees provided earlier in this section, certain value chain workers are working on ST's sites, but are not included in ST’s own workforce. It includes: workers from a supplier providing goods or services to ST; and workers of an equipment supplier who, at one or more of ST’s workplaces, perform regular maintenance on the supplier’s equipment (for example, photocopier). For the value chain workers, there was as of December 31, 2025 no fatalities as a result of work-related injuries and work-related ill health.
Compensation metrics (S1-16)
Gender pay gap – All employees
We value employee contributions and aim to maintain an environment free of any kind of discrimination. Our objective is to safeguard equity in development, career opportunities, and remuneration.
The unadjusted gender pay gap within ST, as defined by the CSRD, calculated as the difference between men's average hourly wage and women's average hourly wage (without considering geographical location or job level differences), expressed as a percentage of men's average hourly wage, is 32%.
| | | | | |
| |
% of the average pay level of male employees | All employees |
Gender pay gap | 32% |
This pay gap is mainly due to a higher proportion of men at higher levels of responsibility, combined with a relatively higher proportion of women in operator roles in countries such as China, Malaysia, Morocco, Philippine and Singapore where we have significant manufacturing activities. All Employees (Active, Leave and Leave with Pay at the end of the reporting period) are included consistent with S1-6 Employees Definition.
Remuneration ratio
| | | | | |
| |
Annual total remuneration ratio of the highest paid individual to the median annual total remuneration for all employees | 92 |
We have a global workforce operating in over 40 countries. Based on CSRD requirements, the above ratio has been calculated considering employees working in all these countries, including China, Malaysia, Morocco, Philippines and Singapore where we have significant manufacturing activities, and which represent approximately 37% of our global population as of December 31, 2025. Calculation below:
Annual total remuneration for the undertaking’s highest paid individual(1)
_______________________________________________________
Median employee annual total remuneration (excluding the highest – paid individual)(2)(3)
(1) The annual total remuneration for the highest-paid individual and for the other Employees is comprised of base salary, cash benefits, benefits in kind including Pension amounts, and all other direct remuneration, such as short- and long-term remuneration paid, as presented in Section 4.9. (Remuneration Report) of this document.
(2) All Employees (Active, Leave and Leave with Pay at the end of the reporting period) are included consistent with S1-6 Employees Definition.
(3) Remuneration has been annualized for employees whom did not work the full reporting period.
An overview of incidents, complaints and severe human rights impacts is reported in Section 3.4.5.3.A. (Business conduct policies and corporate culture).
3.4.4.2. Workers in the supply chain (S2)
Our ambition is to source and purchase goods and services from suppliers and subcontractors who share our values of respecting people and the environment, as outlined in our Code of Conduct.
The disclosures in this section apply to all our suppliers and subcontractors providing goods or services to ST, either through direct business relationships or through our supply chain.
Our suppliers include large-scale manufacturing subcontractors, material suppliers, and equipment and spare-parts suppliers, smaller scale onsite service providers and labor agencies. Our subcontractors are our foundries and OSATs, i.e. our outsourced manufacturing partners, which are a critical subgroup of our suppliers. More information about our upstream value chain is provided in Section 3.4.2.3.A. (Strategy, business model and value chain).
This section about workers in the supply chain includes information about our upstream value chain. For ease of reading we use the generic word "suppliers" instead of upstream value chain. If the information only concerns subcontractors we have indicated this in the relevant disclosure.
As we have an extensive global supply chain with over 6,000 direct suppliers worldwide, we aim to systematically assess and mitigate sustainability negative impacts and risks in our operations and supply chain. Through the use of the RBA Code of Conduct (as described in Section 3.4.4.1.C. Policies related to our own workforce) as our supplier code of conduct we seek to manage impacts and risks throughout our supply chain.
Our responsible supply chain program runs across all our operations and throughout the life cycle of our supplier relationship. We monitor our suppliers using social, environmental, and governance criteria, auditing those that are classified as high risk. This enables us to mitigate major risks and impacts, with a focus on, inter alia, supply chain workers' health and safety, unfair working conditions and human rights, including forced labor of workers and child labor.
In implementing our policies, actions and targets we focus on those activities in the supply chain where we can make an impact, and therefore our actions and targets are mostly directed at our tier one suppliers.
Based on the Omnibus we are making use of the phase-in option regarding the disclosures required under ESRS S2 – workers in the value chain. Therefore for this reporting year we focus on the main elements of ESRS S2 and have included the information required under ESRS 2 section 17.
Supply chain workers related IROs (SBM-3)
The following table lists the IROs related to supply chain workers we have identified and assessed as material in our 2025 DMA, including the programs we have in place to address such IROs.
| | | | | | | | | | | | | | | | | | | | | | | |
S2 – Workers in the supply chain |
Description | Type of IRO | Actual/ Potential | Value chain segment | Time horizon | Material on a residual(1) or inherent(2) basis | ST response | Targets |
Potential negative impact from suppliers on their workers due to human rights violations (forced labor including bonded labor, child labor and young workers) | Negative impact | Potential | Upstream | Short term | Residual basis | ST’s responsible supply chain program | Target-setting in process |
Potential negative impact from foundries and OSATs on their workers due to human rights violations (forced labor including bonded labor, child labor and young workers) | Negative impact | Potential | Upstream | Mid term | Residual basis | ST’s responsible supply chain program |
Risk of human rights violations (e.g., forced and bonded labor, child and young workers labor) for suppliers', foundries' and OSATs' workers (including raw materials providers they buy from), leading to trade compliance issues (e.g., import bans), allegations, litigation, fines, or penalties towards ST and business loss | Risk | Potential | Upstream
| Long term | Residual basis | ST’s responsible supply chain program |
(1) "Residual" refers to the materiality assessment that takes into account existing mitigation measures.
(2) "Inherent" refers to the materiality assessment without taking into account any existing mitigation measures.
3.4.4.2.A. Policies related to supply chain workers
Supply Chain Responsibility SOP - RBA Code of Conduct - Supplier Code of Conduct
Aligned with our Code of Conduct, we aim to work with suppliers who share our values of respecting people and the environment and driving business with integrity and excellence.
Our Supply Chain Responsibility Standard Operating Procedure establishes a framework for managing social and environmental due diligence in ST’s supply chain. It is aligned with the RBA Code of Conduct, which we adopted as our supplier code of conduct. The RBA Code of Conduct explicitly prohibits any form of forced labor, human trafficking and child labor, and addresses the safety of workers as well as precarious work and unfair working conditions. All new tier-one suppliers must acknowledge, commit to and agree to comply with the RBA Code of Conduct.
Our supply chain due diligence process seeks to identify, prevent, mitigate, and account for how we address risks and potential negative impacts on supply chain workers (including potential negative impacts related to child labor, young workers and forced labor) and on the environment.
Policy Statement on Conflict Minerals
Furthermore, specifically with regard to supply chain actors at the origin of ST's supply chain (i.e. mines and smelter workers) involved in the sourcing of certain raw minerals (such as Tantalum, Tungsten, Tin and Gold) needed to manufacture semiconductors, we have put in place a Policy Statement on Conflict Minerals and Responsible Minerals Sourcing (available on st.com) and an internal procedure on Conflict Minerals Management and Responsible Mineral Sourcing, aligned with the RBA standards, based on the OECD Due Diligence Guidance for Responsible Supply Chains of Minerals from Conflict-Affected and High-Risk Areas. This policy statement and internal procedure more specifically cover how we address social (including human rights) and environmental adverse impacts that may be associated with the extraction of these minerals.
3.4.4.2.B. Taking action on material impacts on supply chain workers, and approaches to managing material risks and pursuing material opportunities related to supply chain workers
Engagement
Sustainability supplier audit – worker interviews
As described in more detail below, we deploy the RBA due diligence program, through which, amongst others, engagement with supply chain workers takes place. Also during 2025 direct engagement with our supply chain workers took place during RBA supplier audits, described in more detail in Section 3.4.4.1.C. (Policies and actions related to own workforce), conducted at supplier facilities which ST has identified as being at high sustainability risk. This onsite audit systematically included worker interviews, which are conducted privately and under confidentiality and allow the auditor to collect information about, amongst others, the working conditions, worker treatment, adherence to labor and human rights. During this interview process, the auditor also systematically verified that workers have access to a misconduct reporting hotline or alternative channels that enable them to provide feedback under confidentiality and anonymously.
In addition to the formal interviews, the audit also included brief informal discussions with workers at their workstation and other areas in the facility, such as dormitories and canteens.
Onsite supply chain worker awareness on RBA
For supply chain workers present on our sites, direct communication during their induction training and regular refresher training, included information sharing on health and safety rules, our Code of Conduct, the RBA Code of Conduct and our Ethics Hotline.
Remediation
Depending on the outcome of the audit and the material negative impact assessed, suppliers are required to set up and deploy appropriate remediation actions in connection with material negative impacts assessed during the audit process (RBA audit and internal corporate EHS or labor human rights audits, as described in Section 3.4.4.1 C. Policies and actions related to own workforce above).
Raising concerns
Supply chain workers can raise concerns via multiple channels, which are intended to allow anonymous reporting and provide protection against retaliation. Any feedback from workers which we receive through these channels gives us some insight into material topics for supply chain workers.
ST
The ST Ethics Hotline described in Section 3.4.5.3.A (Business conduct policies and corporate culture) is available to all internal and external stakeholders, including supply chain workers.
Supplier channels
In addition, and aligned with the RBA Code of Conduct, we expect our suppliers to also have a channel in place through which supply chain workers can raise concerns and share feedback safely, anonymously and without fear of retaliation. During RBA audits it is assessed whether the supplier has an adequate and
effective grievance mechanism. If this is not the case, the supplier is required to set up a corrective action plan for implementing such a mechanism.
Third-party grievance channels
Supply chain workers can also report grievances through third-party grievance channels, such as: (i) RBA Voices (accessible via the RBA website) available for workers of RBA members and their suppliers, and (ii) RBA's Responsible Minerals Initiative ('RMI") grievance mechanism specifically related to mine and smelter activities (accessible via the RMI website).
Responsible supply chain program
As part of our responsible supply chain program, we take actions that seek to identify, prevent, mitigate and account for how we address material negative impact on supply chain workers and to manage related material risks for ST. All actions are continuous and ongoing to reach the objectives and targets set in connection with related policies.
Through risk evaluations performed during the reporting year, both with regard to (proposed) new suppliers before their onboarding, as well as our existing tier one suppliers, we have identified our suppliers at risk in terms of sustainability, including human rights. In order to manage the suppliers at high risk, we have deployed the RBA due diligence program and have requested that they:
•sign a commitment letter agreeing to: (i) comply with the RBA Code of Conduct, (ii) complete self-assessment questionnaires, (iii) accept RBA second- or third-party audits and (iv) close main non-conformances within a predefined timeline;
•complete a self-assessment questionnaire to enable us to identify areas that require attention and potential corrective actions; and
•participate in RBA audits and to close non-conformances by executing any agreed corrective actions within a predefined timeline, verified through a closure audit or closure verification.
We deploy the same due diligence methodology, when we receive a grievance via one of the channels as described above or any public alert on potential supplier harm including human rights violation.
Responsible minerals sourcing program
As a member of the RMI we run a responsible minerals sourcing program, focused on 3TG (Tantalum, Tungsten, Tin, Gold), through which we require relevant suppliers in scope to use minerals (e.g., 3TGsC (Tantalum, Tungsten, Tin, Gold and Cobalt) originating from smelters that conform to the Responsible Minerals Assurance Process ("RMAP") standard and we aim to remove non-compliant smelters from our supply chain. To determine whether they fall within the scope of our responsible minerals sourcing program, we have taken the following actions in the reporting year:
•we screened each new supplier; and
•we pre-assessed new raw materials.
Subsequently we have requested in-scope suppliers to:
•complete a questionnaire regarding our requirements on responsible minerals sourcing; and
•provide us with their updated compliant Conflict Minerals Reporting Template ("CMRT"), when relevant.
During the reporting year we voluntarily started to extend the program to include the data collection for copper and nickel by use of the Extended Minerals Reporting Template ("EMRT" ) and for aluminium by use of the Additional Minerals Reporting Template ("AMRT") in an effort to gain further transparency in the supply chain of these minerals.
Supplier performance management
Sustainability performance is integrated into our supplier performance management model. ST experts regularly evaluate supplier overall performance in various domains, including sustainability and compliance with the RBA standards. A negative performance score may lead to a decrease of the supplier's market share or termination of the business relationship.
Training
The deployment of our supply chain due diligence program is accompanied by appropriate trainings for our suppliers and for our procurement and sourcing teams.
In 2025 internal sustainability trainings covered, amongst others, the following topics: general sustainability concepts, ST sustainability strategy, GHG emissions reduction and human rights risks, including child and forced labor. In 2025, the supplier training program has continued via the RBA-Academy e-learning platform as well as via online live training provided by ST internal specialists.
Collaboration with industry peers and subject experts
We recognize the importance of collaboration and knowledge sharing with peers through business associations, alliances and networks, to advance labor and human rights practices and enhance the integration of human rights into corporate policies and practices. Our senior director of corporate social responsibility ("Corporate Social Responsibility" or "CSR") is a member of the board of directors of the RBA. ST is a member of Entreprise pour les Droits de l’Homme, a French business association for human rights.
3.4.4.2.C. Targets related to workers in our supply chain (entity-specific)
In line with our efforts to have sustainable operations across our supply chain, our ambition is to apply a zero-tolerance approach to child and forced labor in our supply chain.
We are in the process of setting targets for our tier 1 suppliers (including our subcontractors) in relation to conducting regular sustainability audits of tier one suppliers’ facilities at high risk.
We continue to work on finalizing baseline data and monitoring methodologies and will report on progress in future reports.
3.4.4.3. Affected communities (S3)
Based on the Omnibus we are making use of the phase-in option regarding the disclosures required under ESRS S3 – Affected Communities. Therefore for this reporting year we focus on the main elements of ESRS S2 and have included the information required under ESRS 2 section 17.
Affected communities related IROs (SBM-3)
The following table lists the IROs related to affected communities we have identified and assessed as material in our 2025 DMA, including the programs or dedicated actions and (entity-specific) targets, we have in place to address such IROs.
| | | | | | | | | | | | | | | | | | | | | | | |
S3 – Affected communities |
Description | Type of IRO | Actual/ Potential | Value chain segment | Time horizon | Material on a residual(1) or inherent(2) basis | ST response | Targets |
Negative impact from ST on other users from energy consumption due to the Company's scale | Negative impact | Actual | Own operations | Short term | Residual basis | ST’s decarbonization program, ST’s stakeholder engagement activity | We aim to adopt 100% renewable electricity by 2027 through energy procurement and renewable energy installations and maintain this percentage each year thereafter.
We aim to annually save energy, achieving cumulative energy savings of 100 GWh by 2035, versus the baseline year 2024 (entity-specific). |
Negative impact from suppliers on other users from their energy consumption | Negative impact | Actual | Upstream | Short term | Residual basis | ST's decarbonization program | No target in place(3) |
Negative impact from foundries and OSATs on other users from their energy consumption | Negative impact | Actual | Upstream | Short term | Residual basis | ST's decarbonization program | No target in place(3) |
Negative impact from ST on other users from its water consumption due to the Company's scale | Negative impact | Actual | Own operations | Short term | Residual basis | ST’s water program, ST’s stakeholder engagement activity | We aim to certify 100% of our manufacturing sites through the Alliance for Water Stewardship (AWS) by 2035 (entity-specific). |
| | | | | | | | | | | | | | | | | | | | | | | |
Negative impact from suppliers on other users from their water consumption | Negative impact | Actual | Upstream | Short term | Residual basis | ST's responsible supply chain program | No target in place(3) |
Negative impact from OSATs and foundries on other users from their water consumption | Negative impact | Actual | Upstream | Short term | Residual basis | ST's responsible supply chain program | No target in place(3) |
(1) "Residual" refers to the materiality assessment that takes into account existing mitigation measures.
(2) "Inherent" refers to the materiality assessment without taking into account any existing mitigation measures.
(3) ST engages with its suppliers, OSATs and foundries to manage these negative impacts on affected communities and is working on setting targets in this regard. The process is complex, amongst others, due to the substantial number of actors in our supply chain across the world.
3.4.4.3.A. Policies related to affected communities
Global Environmental Policy and Global Water Policy
In relation to water and energy topics, ST's ambition is to manage its business operations responsibly within the communities where it operates. We strive to make responsible use of shared natural resources, such as water and energy, and aim to minimize any negative impact from our operations on local affected communities, through careful natural resources management and partnerships.
ST own operations
As stated in the Global Environmental Policy, environmental responsibility is integrated into the Company activities, as evidenced through our ambitions to (i) regularly engage with our stakeholders; and (ii) manage energy consumption, improve energy efficiency, and source renewable energy.
With regard to addressing the abovementioned negative impact on water availability for local affected communities, our Global Water Policy details (i) our ambitions to manage water within our operations and (ii) our expectations towards our major subcontractors on water management. More details about our Global Water Policy are included in Section 3.4.3.3.A. (Processes to identify and assess material water-related impacts, risks and opportunities).
Supply chain
In addressing the abovementioned negative impact related to our subcontractors operations and tier 1 suppliers, as per our Global Environmental Policy, we expect our subcontractors and suppliers to comply with the RBA Code of Conduct, which we adopted as our supplier code of conduct, by working to reduce their use of natural resources, by seeking opportunities to conserve water and energy and by engaging with their stakeholders, including their workers and workers' representatives.
3.4.4.3.B. Actions
Engagement
Through our structured stakeholder engagement approach, ST sites actively engage with affected communities in various ways (e.g., in public meetings) and based on the specific local context and needs, either on a regular or ad hoc (i.e. project). ST is part of the AWS, which provides a best practice standard to guide water management, based on which relevant ST sites develop processes for engaging the site's stakeholders, including affected communities. As part of the ISO 14001 and ISO 50001 certification standards, we engage with a variety of stakeholders, including our affected communities, to understand the effectiveness of our systems to, inter alia, manage our impacts on energy and water consumption.
Corporate Water program – water management
Our Corporate Water Program, focusing on effective water management, is deployed at all our manufacturing sites and aims to minimize our water footprint and monitor water-related risks. Full details of our actions related to water management can be found in Section 3.4.3.3.C. (Actions and resources related to water).
Corporate Decarbonization program
ST has a specific program in place to manage decarbonization activities, including its energy consumption. Additionally, in 2025, ST sent a charter of decarbonization to selected suppliers which focuses, amongst other topics, on improving energy efficiency. Further details are included in Section 3.4.3.1.C. (Actions, targets and resources in relation to climate change policies).
RBA Code of Conduct as ST's supplier code of conduct
ST applies the RBA Code of Conduct as its supplier code of conduct. To manage the identified material impact of our subcontractors and suppliers on the water and energy availability for local affected communities our subcontractors and suppliers are expected to have a water and energy management system in place, to, inter alia, manage water and energy consumption. In this regard we take various actions, such as:
•maintaining regular contact with our subcontractors to reinforce our expectation to apply water and energy related strategies and management systems as stated in our Global Water Policy;
•actively monitoring the ISO14001 certification status of our subcontractors, assessing comprehensive coverage of water consumption and wastewater discharge management programs;
•actively monitoring the ISO 50001 certification status of our subcontractors, assessing comprehensive coverage of energy management programs; and
•in 2025, building on the 2024 water management assessment, by deploying a targeted water survey amongst our high-water risk suppliers and subcontractors to further evaluate their water-related practices and challenges. The analysis of the survey's responses will aim at gaining a deeper understanding of suppliers' and subcontractors' water management systems.
3.4.4.3.C. Targets related to affected communities
Target - related to affected communities - AWS certification (entity-specific)
In 2024 we set an entity-specific target to achieve AWS certification for 100% of ST's fourteen main manufacturing sites and one EWS site (as detailed in the table included in Appendix 11.9.) by 2035, to support our efforts to mitigate negative impacts on local communities by our sites meeting high standards of water stewardship.
The AWS is a global membership-based network of businesses, NGOs and the public sector. The AWS international standard provides a framework for major water users to understand their water use and impacts, and to work collaboratively and transparently for sustainable water management within a catchment context. The AWS certification process includes independent third-party certification and emphasizes stakeholder engagement and as such requires a thorough understanding of relevant stakeholders, their water-related challenges, and the site's ability to influence beyond its immediate operations.
AWS certification target
| | | | | | | | | | | |
| | December 31, 2024 (base year) | December 31, 2025 | December 2035 (target year) |
| Percentage of certified sites | 7 | % | 7 | % | 100 | % |
The base year for this target is 2024. One out of our fifteen manufacturing sites in scope was AWS certified, representing 7%. As of December 31, 2025, the same site is still certified.
In 2025, ST developed a roadmap to certify all in‑scope sites by 2035 and, based on this roadmap, initiated a specific certification project for a second manufacturing site. Progress towards the target is monitored by CCFS.
A manufacturing site is considered AWS‑certified once it has received a valid AWS certificate from the external certification body. The number of certified sites is reported annually as a percentage of the total number of manufacturing sites in scope.
Target related to affected communities - energy
Our targets to manage our energy consumption allow us to, among others, manage the negative impact we can have on other users due to our scale. Please refer to 3.4.3.1.C.1. (Climate change mitigation - Decarbonization lever 2: Purchase renewable energy - Decarbonization lever 3: Improve energy efficiency (entity-specific target)).
3.4.5. Business conduct (Governance - G1)
Approach
We aim to manage our business operations in an ethically responsible way. Conducting business with the highest ethical standards is a priority for ST as laid down in our Code of Conduct.
Policy
Our Code of Conduct sets forth the Company’s values and provides clear guidelines and expectations on how business is conducted at ST, to foster a culture of integrity. ST has also set policies related to anti-bribery, anti-corruption, and whistleblowing: ST’s Anti-bribery and Corruption Policy, ST’s Conflict of Interest Policy and ST’s Speak-up Policy.
These policies are applied at global level and are applicable to all ST entities and all ST employees. For an overview of the relevant key elements of these policies please refer to the policy overview table in Appendix 11.7.
Governance
Please refer to Appendix 11.7. for an overview of the function responsible for implementation of the policies.
Availability of policies
ST’s Code of Conduct, ST’s Anti-bribery and Corruption Policy, Conflict of Interest Policy and ST’s Speak-up Policy are available on st.com for everybody, including potentially affected stakeholders and stakeholders who need to help implement it. Moreover, all ST’s procedures implementing the commitments of these policies are available to ST’s employees via ST’s internal platforms.
Business conduct related IROs (G1)
The following table lists the IROs related to business conduct we have identified and assessed as material in our 2025 DMA, including the programs or dedicated actions, we have in place to address such IROs.
| | | | | | | | | | | | | | | | | | | | | | | |
G1 – Governance |
Description | Type of IRO | Actual/ Potential | Value chain segment | Time horizon | Material on a residual(1) or inherent(2) basis | ST response | Targets |
Risk that the whistleblowing program is not known or used by ST workforce, leading to unidentified or unresolved issues, reputational damages and retention issues | Risk | Potential | Own operations | Long term | Inherent basis | ST’s whistleblowing program | No target in place |
Risk of bribery or corruption (active or passive) concerning ST own workforce, which would expose ST to reputational, financial, and other liabilities | Risk | Potential | Own operations | Long term | Inherent basis | ST’s anti-bribery and anti-corruption program | No target in place |
(1) "Residual" refers to the materiality assessment that takes into account existing mitigation measures.
(2) "Inherent" refers to the materiality assessment without taking into account any existing mitigation measures
3.4.5.1. The role of the administrative, management and supervisory bodies
The role of our administrative, management and supervisory bodies in relation to business conduct is to promote business integrity by leading by example. They reinforce that ST is committed to conducting business with the highest standards of integrity and in compliance with applicable laws, wherever ST operates, as set forth in ST's Code of Conduct and to encourage reporting of behavior considered to be contrary to its principles. The commitment of our President and Chief Executive Officer to the principles of business conduct is, amongst others, evidenced by his signature of the introduction of the Code of Conduct.
The members of our administrative, management and supervisory bodies are regularly informed and/or trained by our Chief Ethics & Compliance Officer on business conduct matters as part of the Corporate Compliance, Ethics & Privacy program, such as: bribery and corruption, conflict of interest, gifts, meals / entertainment, insider trading, discrimination and harassment and privacy. The content of such informative or training sessions is adapted based on the audience.
3.4.5.2. Description of the processes to identify and assess material impacts, risks and opportunities
Regarding business conduct, we have identified two material potential risks that refer to our own operations in all geographical areas where ST has a presence:
•whistleblowing: we recognize the importance of being alerted of situations, allegations, or concerns from our own workforce in order to conduct related assessments or investigations; therefore, we continuously reinforce the importance of our whistleblowing program, encouraging our workforce to use it in order to mitigate the related risks; and
•bribery and corruption: we recognize the importance of complying with applicable anti-bribery and anti-corruption regulations; based on our programs and mitigating measures, we have assessed that cases of non-compliance would only occur on an inherent basis, as if no mitigating measures were implemented.
These risks have been identified based on internal stakeholder engagement, review of our whistleblowing records and our compliance systems.
3.4.5.3. Business conduct
3.4.5.3.A. Business conduct policies and corporate culture
The corporate culture and business conduct applied at ST is a structured framework based on three pillars: prevention, detection and correction. As set forth in our Code of Conduct, we are committed to conducting business with the highest standards of integrity and in compliance with applicable laws and regulations, wherever we operate.
Our Code of Conduct is signed by our President and Chief Executive Officer and is applicable to all our employees, including senior managers. It sets clear expectations on the way we conduct business and make our decisions, fostering a culture of integrity. We expect all our employees, including senior managers, to comply with our Code of Conduct and related policies, to adhere and advocate for integrity in the workplace. Our Code of Conduct provides that if any employee or senior manager acts in contravention of the principles it sets forth, we will take appropriate steps in terms of the procedures in place for fair disciplinary action. In cases of severe breaches, such action may include dismissal.
Our Code of Conduct is available for all employees and interested stakeholders, on our website in the corporate governance section, at https://investors.st.com/governance/compliance-ethics-privacy. It is
translated in the ten most spoken languages within the ST group: French, Italian, English, German, Arabic, Chinese, Korean, Japanese, Malay, and Portuguese. The implementation of the Code of Conduct is overseen by our Chief Ethics & Compliance Officer.
We have amended, and will continue to amend, our Code of Conduct and related policies as needed to reflect regulatory and other changes. In January 2026 we released an updated version of our Code of Conduct to include, among others, specific guidance on trade compliance and the responsible use of AI, as well as practical simplified guidance clarifying ST's expectations in other key areas covered by our Code of Conduct. We also redesigned our Code of Conduct to enhance readability and engagement.
When entering a business relationship with a stakeholder, we ensure this counterpart is aligned and has similar standards as set in our Code of Conduct.
The established policies and procedures regarding business conduct and corporate culture, the implementation of which is overseen by our Chief Ethics & Compliance Officer (where it regards the Speak-up Policy: jointly with the Chief Audit & Risk Executive; and where it regards the Insider Trading Policy, jointly with the General Counsel), apply to all ST entities and all ST employees, and are designed to prevent and mitigate risks with regards to inter alia to anti-bribery, anti-corruption, and whistleblowing:
•ST's Anti-Bribery and Corruption Policy (the "Anti-Bribery and Corruption Policy"), which sets forth a zero-tolerance policy towards any form of corruption, regardless of the identity or position of the originator or recipient of any bribe. It is strictly forbidden for anybody in ST to use ST funds or assets to make a political contribution. The policy is consistent with the UN Convention against Corruption. Our Anti-Bribery and Corruption Policy is available on st.com for all employees and interested stakeholders, and provide clear definitions regarding instances of bribery and corruption and include detailed descriptions of ST’s rules for engaging with third parties.
•ST's Conflict of Interest Policy, which provides a framework for the transparent reporting and management of any potential conflict of interest. The policy requires all ST employees, regardless of the identity or position, to behave in the interests of ST. As a matter of integrity and transparency, all ST employees are expected to identify and disclose any actual, perceived or even potential situations of conflict between their personal interest and the interest of ST and recuse themselves from any decision-making process regarding the relevant situation. The policy is available on our intranet.
•Speak-up Policy, which includes information on ST Ethics Hotline available via our website st.com to all, including to ST employees and interested third parties, and to stakeholders who need to help implement it, to report concerns of wrongdoing, relating to perceived or actual risks and to remediate any situation that may deviate from expectations (our "Speak-up Policy"). Any ST employee or any other interested third-party who observe a conduct that seems to (or does) violate or deviate from the values and principles set forth in ST’s Code of Conduct, policies, procedures and/or applicable laws, are encouraged and expected to raise the concern and speak up. The policy applies to all reported concerns worldwide, as well as related assessments and investigations in relation thereof.
•Third-party due diligence procedure, which provides a general framework and guidance for the assessment of ethical, compliance, regulatory and reputational risks of third parties doing or seeking to do business with ST. The policy is available on our intranet.
•Insider Trading Policy, which aims at preventing the unlawful use of non-public material information by ST employees (the "Insider Trading Policy"). The policy applies to the members of our Supervisory Board and Managing Board, and is available on our intranet.
•Donation, Fundraising and Sponsorship procedure, which provides a general framework and guidance concerning the selection, evaluation, authorization, monitoring and reporting of any donations, fundraising and sponsorships carried out from time to time by or on behalf of ST or which are endorsed by ST. The procedure is available on our intranet.
•Gifts, Meals and Entertainment procedure complements ST’s Anti-Bribery and Corruption Policy and Conflict of Interest Policy by providing a framework and guidance on how to give and/or receive gifts, meals and entertainment in a business context, and establishing the process for reporting Gifts, Meals and Entertainment.The policy is available on our intranet.
Identifying, reporting and investigating of concerns
Speak-up and reporting of concerns
Maintaining a culture of transparency and ethical behavior is crucial to our success. Therefore, we encourage our employees and other internal and external stakeholders to speak-up and report any concerns they might have.
As per our Speak-up Policy, concerns can be reported via:
•the Ethics Hotline;
•the Chief Ethics & Compliance Officer and/or the Chief Audit & Risk Executive; or
•selected managers (such as country manager, site manager and/or regional / country or site Human Resources manager).
All concerns are processed through the Ethics Hotline, including concerns reported to the Chief Ethics & Compliance Officer and Chief Audit & Risk Executive and selected managers. The Ethics Hotline is our reporting mechanism tool enabling any ST employee and any other internal or external stakeholders to report a concern, including incidents of bribery and corruption.
The Ethics Hotline is the mechanism through which we are able to identify and investigate concerns about unlawful behavior or behavior allegedly in contradiction with our Code of Conduct, policies and procedures, including incidents of bribery and corruption. The Ethics Hotline:
•is hosted by an independent qualified third-party, which is a global whistleblowing solution provider, on behalf of ST;
•is accessible online or by phone to everybody, including ST employees and any other internal or external stakeholders;
•is available 24/7 in more than 27 languages;
•allows for the reporting of all concerns, ensuring confidentiality and, whenever required, anonymity; and
•is managed in accordance with the GDPR, ensuring that information reported is treated confidentially and securely.
Concerns raised are managed by dedicated and independent departments. Our departments in charge of the management of the Ethics Hotline are our Compliance, Ethics and Privacy Department and our Corporate Audit Department. The governance regarding the management of the Ethics Hotline and handling of incoming concerns ensures independence and transparency of the departments in charge.
The Speak-up Policy outlines how ST employees and any other internal or external stakeholder may report concerns and by whom those concerns will be handled. Each concern received is taken seriously and triggers the opening of a case and related assessment and/or investigation. All parties involved in an assessment and/or investigation of a case are protected from retaliation.
Once a concern is raised, an evaluation of the situation is made to determine the department, which will assess and/or investigate the reported situation. Only ST employees, who are duly authorized by the Chief Ethics & Compliance Officer and/or the Chief Audit & Risk Executive, conduct any form of assessment or investigation steps in relation to any concern(s). The investigation of a case is allocated by the Chief Ethics & Compliance Officer and/or the Chief Audit & Risk Executive after reviewing the situation and determining the parties involved, to ensure the verifications are performed by trained employees, who are independent to the reported situation. For business incidents relating to bribery and corruption, either the Chief Ethics & Compliance Officer or the Chief Audit & Risk Executive, will be in charge of the verifications.
The Ethics Hotline operator promptly notifies the Chief Ethics & Compliance Officer and the Chief Audit & Risk Executive of a received concern.
The process of how such concern is managed is outlined by the Speak-up Policy and involves:
•acknowledgement of receipt of the reported concern(s) to the whistleblower/reporter within 7 days following such report; and
•the receipt of a concern triggers the opening of a case to be assessed and it is determined whether immediate protective mechanisms need to be undertaken. The assessment will determine whether an internal investigation is needed. The results of an assessment and/or internal investigation are documented in writing, including findings and related conclusions. Recommendations on actions to be taken in relation to this concern can be issued by the investigative team to the ultimate decision maker.
Reported concerns - Incidents, complaints and severe human rights impacts (S1-17)
In 2025, a total of 397* concerns were filed through the available channels for the people in ST's own workforce (376 in 2024). This increase can be partially explained by the ongoing awareness-raising efforts within ST thanks to more frequent references made in various channels (e.g., trainings, intranet articles, Viva Engage posts) and with the first Ethics Day event taking place during the reporting year. Out of these 397, two cases reported in 2025 relate to events from previous year i.e. 2024.
From the previous reporting year (i.e. 2024) 50 cases were still under review and carried over to the reporting year 2025, presenting a decrease versus previous year mainly due the efforts set by the Corporate teams in charge of driving the program. On December 31, 2025, there were 41 cases still under review. The outcome of these cases will be reported on in our next annual report, to the extent that they are relevant for this disclosure. The table below provides more detailed information.
Reported concerns - Incidents, complaints and severe human rights impacts
| | | | | | | | |
| December 31, 2025 | December 31, 2024 |
| Number of cases under review as of January 1st | 50 | 77 |
| Number of complaints filed through channels for people in own workforce to raise concerns during the year | 397* | 376 |
| Total number of incidents reported as discrimination (including harassment) | 42 | 48 |
| Number of severe human rights incidents connected to own workforce | 0 | 0 |
| Number of cases of non-respect of the UN Guiding Principles on Business and Human Rights | 0 | 0 |
| Number of cases of non-respect of the ILO Declaration on Fundamental Principles and Rights at Work | 0 | 0 |
| Number of cases of non-respect of the OECD Guidelines for Multinational Enterprises | 0 | 0 |
| Number of cases still under review as of December 31st | 41 | 50 |
*Out of these 397, two cases reported in 2025 relate to event from previous year i.e. 2024.
In 2025, 42 incidents containing the words “harassment” or “discrimination” were reported, compared to 48 in 2024. This decrease could be correlated to specific campaigns conducted to raise awareness on discrimination and harassment in regions where most cases reported. Of these incidents, 28 were unconfirmed, 8 remained under assessment as of December 31, 2025, and 6 were confirmed as harassment or discrimination, leading to appropriate actions. This covers work-related incidents reported notably as discrimination on the grounds of gender, racial or ethnic origin, nationality, religion or belief, disability, age sexual orientation, involving internal and/or external stakeholders across ST's operations in
the reporting period. This also includes incidents of harassment as a specific form of discrimination. These incidents can be reported via the channels described previously.
No severe human rights incidents connected to ST's own workforce were reported in 2025 and consequently there was no incident representing case of non-respect of the UN Guiding Principles on Business and Human Rights neither of non-respect of the ILO Declaration of Fundamental Principles and Rights at Work nor of non-respect of the OECD Guidelines for Multinational Enterprises.
Severe human rights incidents include instances of lawsuits, formal complaints through ST or third- party complaint mechanisms, serious allegations in public reports or the media, where these are connected to the ST’s own workforce. It also includes the fact of the incidents is not disputed by ST, as well as any other severe impacts of which ST is aware.
There were no fines, penalties and compensation for damages as a result of the incidents and complaints disclosed above.
No retaliation
We oppose any form of retaliation against anybody, including whistleblowers or witnesses, reporting or taking part in the assessment of reported concerns in good faith. A strict non-retaliation policy is included in our Code of Conduct and in our Speak-up Policy. We have monitoring mechanisms and measures in place with regard to our non-retaliation policy. Any suspicion of retaliation is promptly investigated, and appropriate disciplinary actions may be taken based on the results of investigation to maintain a safe and supportive environment for all employees. We are subject to the EU Whistleblowing Directive and apply this directive to the ST group worldwide as described in our Speak-up Policy.
Training on business conduct – raising awareness
ST employees are trained on ST's Code of Conduct, either onsite or online. This training is mandatory upon hiring for each employee. Annual refreshers of this training are deployed.
Additional trainings on various specific business conduct topics are provided via e-learnings and in person sessions. Topics may include, but are not limited to, ST's Code of Conduct, conflict of interests, anti-bribery and corruption, harassment and discrimination and data privacy. All e-learnings regarding business conduct are available in various languages.
Furthermore, internal guidance and practical information on business conduct matters are provided via various ST communication channels, such as our website st.com, an intranet site, a dedicated mobile application and onsite visuals.
Specifically, regarding incidents of bribery and corruption
The prevention of incidents of bribery and corruption is organized through proactive communication, awareness and training programs. The compliance, ethics and privacy training, communication and awareness program, includes a mix of in-person and online sessions on anti-bribery and corruption, coupled with quizzes and awareness content posted on our internal channels. This program is regularly updated based on various criteria, such as the evolution of our bribery and corruption risk mapping and any organizational changes, auditing and monitoring results, and internal alerts received.
3.4.5.3.B. Prevention and detection of corruption and bribery (G1-3)
Prevention and detection of corruption and bribery
| | | | | | | | | | | | | | | | | | | | |
| | | | | December 31, 2025 |
| At-risk functions | Managers from at risk function | Administrative, management and supervisory bodies | Other own workers |
|
| | | Executives | Corporate staff | Supervisory body (Board) | |
| Training coverage | | | | | | |
| Total (FTE) | 1,150 | | 379 | | 8 | | 22 | | 9 | | 21,950 | |
| Total receiving training | 979 | | 309 | | 8 | | 22 | | 9 | | 18,175 | |
| Percentage receiving training | 85 | % | 82 | % | 100 | % | 100 | % | 100 | % | 83 | % |
| Delivery method and duration | | | | | | |
| Classroom training in hours | - | - | 0.5 | 0.5 | 0.5 | 0 |
| Computer-based training in hour | 0.5 | 0.5 | 0.5 | 0.5 | 0 | 0.5 |
| Voluntary computer-based training in hour |
| How often training is required | Every 2 years | Every 2 years | Annually | Annually | Annually | Every 2 years |
| | | | | | | | | | | | | | | | | | | | |
| | | | | December 31, 2024 |
| At-risk functions | Managers from at risk function | Administrative, management and supervisory bodies | Other own workers |
|
| | | Executives | Corporate staff | Supervisory body (Board) | |
| Training coverage | | | | | | |
| Total (FTE) | 1,229 | | 408 | | 8 | | 22 | | 9 | | 24,697 | |
| Total receiving training | 904 | | 288 | | 8 | | 22 | | 9 | | 16,965 | |
| Percentage receiving training | 74 | % | 71 | % | 100 | % | 100 | % | 100 | % | 69 | % |
| Delivery method and duration | | | | | | |
| Classroom training in hours | - | - | 0.5 | 0.5 | 0.5 | - |
| Computer-based training in hour | 0.5 | 0.5 | - | - | - | 0.5 |
| Voluntary computer-based training in hour |
| How often training is required | Every 2 years | Every 2 years | Annually | Annually | Annually | Every 2 years |
In this reporting year, 85% of functions-at-risk were covered by training programs, compared to 74% in 2024. The training is deployed on a rolling two‑year cycle. The 2025 data cover a more complete portion of this deployment period than the 2024 data. Therefore, the apparent higher participation in 2025 does not reflect a significantly higher participation rate, but rather the natural progression and completion of the full two‑year deployment.
This reporting year 100% of members of the administrative, management and supervisory bodies were covered and trained on prevention and corruption and bribery, as in 2024.
Regarding other own workers category, the observed increase of the percentage of received trainings can also be explained by the deployment of the training over a two-year cycle.
‘Functions-at-risk’ means those functions deemed to be at risk of corruption and bribery as a result of its tasks and responsibilities. Other own workers category represents workers except ST operators (i.e. working in manufacturing operations). Most exposed functions are identified based, for example but without limitation, on the nature of the job, the exposure to third parties, the concerned transactions, their interactions with third parties’ business partners, the business location, etc.
The trainings are held annually for ST administrative, management and supervisory bodies. They must be executed every two years for at risk-functions and managers in at-risk functions, as well as for other ST employees. Training programs are deployed on a two-year rolling basis with the objective to address the entire targeted population over this two-year period. No change in the approach has been implemented in 2025.
The Refresher Code of Conduct training (incl. ABC) is a computer-based training, divided in micro modules with the ambition to be deployed bi-annually. A learner will have to review the full content of the Code (part of the CE&P program) within a period of 2 years. In addition, specific longer formats, also computer-based, are available to all employees including top management (Executives and Corporate staff) at any time. Those longer formats are not mandatory.
Training content includes:
•a definition of corruption and bribery;
•ST policy related to corruption and bribery;
•case studies to practice the prevention and detection of corruption and bribery; and
•knowledge test to confirm learners' understanding.
Prevention, detection and addressing
Prevention of bribery and corruption is achieved through multiple channels:
•third-parties are subject to specific business integrity due diligence before ST initiates any business dealings with them.
•employees and third-parties are informed and trained to recognize possible bribery and corruption situations and to take appropriate action.
•the Ethics Hotline is available to everyone, including all employees and third parties. and
•risk mapping, is performed annually on a global basis, as required by local laws.
Detection of bribery and corruption is also achieved through multiple channels:
•ST receives reports of potential misconduct through the Ethics Hotline and assess and/or investigate the reported matters; and
•the internal control activities, both monitoring and auditing, verifies the effectiveness of the anti-bribery and anti-corruption measures put in place by ST.
Addressing concerns and correcting incidents
In Section 3.4.5.3.A.(Business conduct policies and corporate culture ) a description is included of how we address concerns raised through the Ethics Hotline (as defined in ST's Code of Conduct).
Bribery and corruption incidents are addressed through ST’s disciplinary system. The disciplinary system is made up of the measures that ST reserves the right to impose when it ascertains misconduct, which include failure to comply with the disciplinary rules set out in ST's Code of Conduct, the policies, the procedures, as well as anti-bribery and anti-corruption laws and regulations applicable to ST. The disciplinary sanctions are proportionate to the misconduct and are applied following the conclusion of a disciplinary procedure as required in the relevant country.
Ensuring independent process
In addition to the general governance structure of the management of the Ethics Hotline, relevant precautions are taken to enable independent processing of a concerns as described in Section 3.4.5.3.A.(Business conduct policies and corporate culture ).
Reporting to management and supervisory body
The Company collects and tracks information from the Ethics Hotline to periodically analyze, report on and address any patterns of misconduct. Such analysis and reporting are always conducted in a manner that preserves the confidentiality of the reports received and of the investigations carried out and protects the people involved and maintains the security of the information collected.
Reporting to the Executive Committee and Supervisory Board on specific instances takes place only where there is a specific need to know in order to address the root causes and/or the consequences of a
misconduct; such reporting preserves in any case, to the maximum extent permissible, the confidentiality of the reporting, of the people involved in the investigation and of its outcome, as well as the information collected during the course of the investigations, which are treated in a secured manner.
3.4.5.3.C. Metrics related to corruption and bribery (G1-4)
Incidents of corruption or bribery
| | | | | | | | |
| December 31, 2025 | December 31, 2024 |
| Number of convictions for violation of anti-corruption and anti-bribery laws | 0 | 0 |
| Amount of fines for violation of anti-corruption and anti-bribery laws (monetary) | 0 | 0 |
In this reporting year, there were no conviction nor fines for violation of anti-corruption and anti-bribery laws. As such, there was no specific action that had to be taken to address breaches in procedures and standards of anti-corruption and anti-bribery in that regard.
4. Report of the Supervisory Board
The supervision of the policies and actions of our Managing Board is entrusted to our Supervisory Board, which, in a two-tier corporate structure under Dutch law, is a separate body and fully independent from our Managing Board. In fulfilling their duties under Dutch law, our Supervisory Board members serve the best interests of ST and its business, taking into consideration the interests of all ST shareholders and other stakeholders.
Our Supervisory Board supervises, monitors and advises our Managing Board in performing its management tasks and setting the direction of our affairs and business, including with regard to the Company’s strategy for sustainable long term value creation and the implementation thereof, the Company’s risk culture, risk appetite, and main risks associated with the strategy. Among other matters our Supervisory Board supervises the structure and management of systems of internal business controls, risk management, strategy and the financial and non-financial reporting process. In addition, it determines the remuneration of the members of the Managing Board within the remuneration policy adopted by the General Meeting of Shareholders.
The members of our Supervisory Board are carefully selected based on their combined experience, expertise, knowledge, as well as the business in which we operate. Our Supervisory Board is empowered to recommend to the general meeting of shareholders, people to be appointed as members of our Supervisory Board and our Managing Board.
In performing its duties, our Supervisory Board is advised and assisted by the following committees: the strategic committee (the "Strategic Committee"), the Audit Committee, the compensation committee (the "Compensation Committee"), the nominating and corporate governance committee (the "Nominating and Corporate Governance Committee") and the Sustainability Committee. The committees all report to our Supervisory Board. Only members of the Supervisory Board can be committee members.
Our Supervisory Board has determined, based on the evaluation of an ad-hoc committee, the following independence criteria for its members: Supervisory Board members must not have any material relationship with STMicroelectronics N.V., or any of its consolidated subsidiaries, or its management. A “material relationship” can include commercial, industrial, banking, consulting, legal, accounting, charitable and familial relationships, among others, but does not include a relationship with direct or indirect shareholders. As a result, we have deviated from the independence criteria as included in best practice provision 2.1.8 of the Dutch Corporate Governance Code, specifically item vii. of this best practice provision, which states that a supervisory board member is not independent if he/she (or his/her registered partner or other life companion, foster child or relative by blood or marriage up to the second degree as defined under Dutch law) is a member of the management board — or is a representative in
some other way — of a legal entity which holds at least 10% of our shares, unless such entity is a member of our Group. Our independence criteria however comply with corporate governance listing standards of the New York Stock Exchange.
Our Supervisory Board also adopted specific criteria to assess the independence of its members, which can be found in Annex A to the Supervisory Board charter as available on investors.st.com/supervisoryboardcharter. On that basis, our Supervisory Board concluded that the majority of its members qualify as independent based on the criteria set forth above.
The Supervisory Board is pleased to report on its committees and its various activities in 2025.
4.1. Composition of the Supervisory Board
Our Supervisory Board advises our Managing Board and is responsible for supervising the policies pursued by our Managing Board, the manner in which the Managing Board implements the sustainable long-term value creation strategy and the general course of our affairs and business. In performing its duties, our Supervisory Board shall be guided by the interests of our Company and its business; it shall take into account the relevant interests of all stakeholders (including our shareholders). The Supervisory Board is responsible for the quality of its own performance.
Our Supervisory Board consists of such number of members as is resolved by our AGM upon a non-binding proposal of our Supervisory Board, with a minimum of six members. Decisions by our AGM concerning the number and the identity of our Supervisory Board members are taken by a simple majority of the votes cast at a meeting, provided quorum conditions are met.
Our Supervisory Board was composed of the following nine members as of December 31, 2025(1):
| | | | | | | | | | | | | | | | | | | | | | | | | | | | | | | | | | | | | | |
Name(1) | | Position | | Year First
Appointed | | Term
Expires | | Nationality | | Gender | | Age |
| Nicolas Dufourcq | | Chairman | | 2015 | | 2027 | | French | | Male | | 62 |
Armando Varricchio (2) | | Vice-Chairman | | 2025 | | 2028 | | Italian | | Male | | 64 |
Simonetta Acri (3) | | Member | | 2025 | | 2028 | | Italian | | Female | | 60 |
Orio Bellezza (2) | | Member | | 2025 | | 2028 | | Italian | | Male | | 66 |
Pascal Daloz (1) | | Member | | 2024 | | 2027 | | French | | Male | | 60 |
| Ana de Pro Gonzalo | | Member | | 2020 | | 2028 | | Spanish | | Female | | 58 |
Werner Lieberherr (3) | | Member | | 2025 | | 2028 | | Swiss | | Male | | 65 |
| Frédéric Sanchez | | Member | | 2017 | | 2026 | | French | | Male | | 65 |
| Hélène Vletter-van Dort | | Member | | 2023 | | 2028 | | Dutch | | Female | | 61 |
(1)Mr. Maurizio Tamagnini was a member of our Supervisory Board until his resignation effective March 19, 2025. Ms. Janet Davidson, Ms. Donatella Sciuto and Mr. Paolo Visca were members of our Supervisory Board until May 28, 2025, on which date their term expired.
(2) Mr. Orio Bellezza and Mr. Armando Varricchio were appointed as members of our Supervisory Board on December 18, 2025.
(3) Ms. Simonetta Acri and Mr. Werner Lieberherr were appointed as members of our Supervisory Board on May 28, 2025.
Resolutions of our Supervisory Board require the approval of at least three-quarters of its members in office, with each member being entitled to one vote. Our Supervisory Board must meet upon request by two or more of its members or by our Managing Board. In 2025, our Supervisory Board met 12 times), including to approve our quarterly, semi-annual and annual accounts and their release. In 2025, the average attendance rate for the meetings of our Supervisory Board was 90%. Our Supervisory Board has adopted (i) a Supervisory Board charter, (ii) a profile for the Supervisory Board based on which proposed new members of the Supervisory Board are selected (both of which are available on our website (www.st.com)), (iii) a diversity policy for the composition of the Managing Board, the Executive Committee and the Supervisory Board, and (iv) a selection criteria and appointment procedure for the Supervisory and Managing Board members.
Our Supervisory Board may make a proposal to our AGM for the suspension or dismissal of one or more of its members. Each member of our Supervisory Board shall retire no later than three years after appointment, as described in our Articles of Association, but may be reappointed following the expiration of his/her term of office. Pursuant to Dutch law, there is no mandatory retirement age for members of our Supervisory Board. Members of the Supervisory Board may be suspended or dismissed by our AGM. Certain of our Supervisory Board members are proposed by and may retain certain relationships with our direct or indirect shareholders represented through our major shareholder.
Biographies
Nicolas Dufourcq has been a member of our Supervisory Board since May 2015, its chairman from June 2017 to June 2020, its vice-chairman from June 2020 to May 2023, and currently serves as its chairman. He serves on our Supervisory Board’s Compensation Committee, Strategic Committee, Sustainability Committee and Nominating and Corporate Governance Committee. Mr. Dufourcq is a graduate of HEC (Hautes Etudes Commerciales) and ENA (Ecole Nationale d’Administration). He began his career at the French Ministry of Finance and Economics before joining the Ministry of Health and Social Affairs in 1992. In 1994, he joined France Telecom, where he created the multimedia division, before going on to chair Wanadoo, the firm’s listed internet and yellow pages subsidiary. After joining the Capgemini Group in 2003, he was made responsible for the central and southern Europe region, successfully leading their financial turnaround. He was appointed chief financial officer of the Group and member of the Executive Committee in September 2004. In 2005, he was named deputy Chief Executive Officer in charge of finance, risk management, IT, delivery, purchases and LEAN program and, in 2007, also in charge of the follow-up of the group’s major contracts. On February 7, 2013, Mr. Dufourcq was appointed chief executive officer of Bpifrance (Banque Publique d’Investissement). Nicolas Dufourcq is also a member of the board of directors of Stellantis.
Armando Varricchio has been a member of our Supervisory Board since December 18, 2025 and currently serves as its vice-chairman. He has a comprehensive knowledge of international relations and global economic issues. In his four-decade diplomatic service he has played a pivotal role in policy making and high-level negotiations both at national and European level. He has been a senior member of Italian and European official delegations at numerous international summits with heads of state and government. He is currently the most senior foreign service official in the Italian Ministry of Foreign Affairs. He was most recently ambassador of Italy to the Federal Republic of Germany (2021-2025), and previously ambassador to the United States and Serbia. He served as national security advisor to the Italian Prime Minister and Personal Representative (“Sherpa”) for the G7 and G20, diplomatic advisor to the president of the Italian Republic, sherpa at the G7/8 summits for the EU and chief diplomatic advisor to the president of the European Commission. He has been bestowed by the president of the Republic of Italy with the honor of Knight of Grand Cross - the highest Italian award. Armando Varricchio holds a master’s degree in international relations from the University of Padua.
Simonetta Acri has been a member of our Supervisory Board since May 2025. She serves on our Supervisory Board’s Audit Committee and Compensation Committee. She is an independent board member at several companies and a senior corporate finance advisor since 2023. She is a senior advisor at Cherry Bank, and sits on the boards of BdM Banca, 21Invest SGR Private Equity Fund and Defence Tech. She has extensive experience in the banking and financial services sector, with a strong track record in corporate finance, risk management, and regulatory compliance. She previously held executive management positions at SACE, Italy’s Export Credit Agency and insurance & finance group, including chief MID Market Officer and Member of the Executive Committee between 2019 and 2022. She has been actively involved in initiatives aligned with the European Green New Deal, advocating for responsible investment strategies that prioritize climate resilience and sustainable development. She previously held corporate finance management positions at several firms including Deutsche Bank and Morgan Grenfell. Ms. Acri holds a master’s degree in political science and international affairs from the University of Padua.
Orio Bellezza has been a member of our Supervisory Board since December 18, 2025. He is the chairman of the board of graphene-based optoelectronics startup 2D photonics. He has extensive experience in the semiconductor industry, with about 40 years at STMicroelectronics, including in several leadership roles, where he last held the position of President, Technology, Manufacturing, Quality and Supply chain until July 2023. Previous positions included 'Executive Vice-President, Front-End Manufacturing', focusing on the expansion and rationalization of ST’s global manufacturing infrastructure; 'Flash Memory and R&D General Manager' focusing on the operations and development of memory, BCD and MEMS; and 'Central R&D Group Vice President'. He had previously occupied multiple technical and management functions since joining ST in 1984. Orio Bellezza holds a master’s degree in chemistry from Milan State University.
Pascal Daloz has been a member of our Supervisory Board since May 2024. Mr. Daloz has been Chief Executive Officer of Dassault Systèmes, world leader in virtual universes and a global top ten software company, since January 2024. Having acquired an extensive experience in strategy and technology innovation management with investment banks and consultancy firms, Mr. Daloz joined Dassault Systèmes in 2001 as Vice President Research, Strategy and Market development. He became Vice President, Strategy and Business Development in 2003, Executive Vice President, Strategy and Marketing in 2007, Executive Vice President, Corporate Strategy and Market Development in 2010, and then Executive Vice President, Brands and Corporate Development in 2014. In 2018, Mr. Daloz became head of Corporate Finance and Strategy. Mr Daloz was Dassault Systèmes’ Chief Operating Officer and Head of the Operations Executive Committee from 2020 to 2023, and deputy chief operating officer in 2023, orchestrating the transformation of all strategic functions, with the aim for Dassault Systèmes to become the world leader in three key sectors of the economy: Manufacturing Industries, Life Sciences and Healthcare, Infrastructure and Cities. He serves as Chairman of MEDIDATA, world leader in clinical trials, of 3DS OUTSCALE, the cloud services company founded by Dassault Systèmes, and of CENTRIC PLM, the market-leading product lifecycle management brand for consumer goods. Mr. Daloz is an independent member of the Board of Directors of Sopra-Steria. He is an alumnus from the Ecole des Mines de Paris (France).
Ana de Pro Gonzalo has been a member of our Supervisory Board since June 2020. She chairs our Supervisory Board’s Audit Committee and serves on our Supervisory Board’s Sustainability Committee. She has been an independent non-executive director for Mobico Group PLC (formerly National Express Group PLC) since October 2019 and a member of its audit committee and remuneration committee and she serves as independent non-executive director of Novartis A.G. and as a member of its audit and risk committees since March 2022. Until December 2020, she was chief financial officer of Amadeus IT Holding (a world leading technology provider and transaction processor for the global travel and tourism industry), with global responsibility for financial management and control for the Amadeus group. She was appointed in this role in February 2010 and was also a member of the Amadeus executive management team. From 2002 to 2010, Ms. De Pro Gonzalo was corporate general manager at Sacyr Vallehermoso and was instrumental in leading the international expansion of one of the major construction groups in the world. From 1994 to 2002, Ms. De Pro Gonzalo was deputy general manager and finance director at Metrovacesa, and from 1990 to 1994 she was a senior auditor at Arthur Andersen. She has been independent non-executive director for Merlin Properties, S.A. from 2015-2017 and for Indra Sistemas S.A. from 2020-2022. Since June 2019, Ms. De Pro Gonzalo is an independent member of the non-profit Global Steering Group for Impact Assessment (Consejo Asesor Nacional Español) and member of the board of trustees of foundation Juan XXIII for the people with special intellectual needs since October 2020. She has been appointed as of December 4th, 2024 to the Board of Gavi, the Vaccine Alliance, an international organization with the goal of increasing equitable & sustainable use of vaccines to save lives and protect people’s health. Ana de Pro Gonzalo holds a bachelor in science degree in Business Studies, specializing in auditing, from Universidad Complutense de Madrid, and completed IESE Business School’s general management executive program.
Werner Lieberherr has been a member of our Supervisory Board since May 2025. He serves on our Supervisory Board’s Audit Committee, Strategic Committee and Sustainability Committee. He has been chief executive officer of MorGen Energy, a developer of large-scale green hydrogen ecosystems, fully
owned by Trafigura, since March 2025. With extensive international leadership experience across energy, aerospace, and automotive industries in the US, Europe and Asia, he joined MorGen after five years as chief executive officer of Landis+Gyr AG. He previously led the MANN+HUMMEL Group and served as chief executive officer of B/E Aerospace, Inc. Following B/E Aerospace’s acquisition by Rockwell Collins in 2017, he played a key role in its integration and later in Rockwell Collins’ acquisition by United Technologies. Earlier in his career, Werner spent 16 years in management roles at ABB and Alstom Power. As a global citizen, he has spent more than 20 years in the US, bringing in-depth knowledge of U.S. market dynamics and customer needs to the board. Werner Lieberherr holds a degree in operations research & industrial engineering from ETH Zurich and a master of business administration ("MBA") from the Kellogg Graduate School of Management in Chicago.
Frédéric Sanchez has been a member of our Supervisory Board since June 2017. He chairs our Supervisory Board’s Compensation Committee and serves also on our Supervisory Board’s Audit Committee, Strategic Committee and Nominating & Corporate Governance Committee. Mr. Sanchez is the chairman of Fives’ executive board, an industrial engineering group with heritage of over 200 years of engineering excellence and expertise. Fives designs and supplies machines, process equipment and production lines for the world’s largest industrial groups in various sectors such as aluminium, steel, glass, automotive, logistics, aerospace, cement and energy, in both developing and developed countries. Mr. Sanchez started his career in 1985 with Renault in Mexico, then in the U.S. In 1987 he became a mission manager at Ernst & Young. In 1990 he joined Fives-Lille group, in which he held various positions before being appointed chief financial officer in 1994 and becoming chief operating officer in 1997. In 2002, the “Compagnie de Fives-Lille” (renamed Fives in 2007) was created, with a management and supervisory board chaired by Mr. Sanchez. In 2018, Fives became a French simplified joint stock company (société par actions simplifiée) and Mr. Sanchez its chairman and chief executive officer. Within MEDEF (French Business Confederation), Mr. Sanchez is president of MEDEF International, and president of the Council of Entrepreneurs France-Japan, France-United Arab Emirates and France-Bahrain. Mr. Sanchez is an administrator of Orange, Thea and Bureau Veritas and he is honorary co-president of the Alliance Industrie du Futur. Frédéric Sanchez graduated from HEC Business School (1983) and Sciences-Po Paris (1985) and he also holds a master's degree in Economics from Université Paris-Dauphine (1984).
Hélène Vletter-van Dort has been a member of our Supervisory Board since May 24, 2023. She chairs our Supervisory Board’s Nominating and Corporate Governance Committee and serves on our Supervisory Board’s Audit, Compensation and Sustainability Committees. Ms. Vletter-van Dort is a partner at De Bestuurskamer (since 2022) and a professor of financial law and governance at Erasmus School of Law, Rotterdam (since 2004). She holds a bachelors degree and a masters degree in corporate and commercial law from the University of Leiden and a doctorate from the Utrecht University. Ms. Vletter-van Dort has been the chairperson of the board of Intertrust NV from 2015 until 2022. She has been a member of the board of Fortis Bank Netherlands (from 2008 until 2010) and member of its risk committee and remuneration committee. Ms. Vletter-van Dort has been a member of the board of the Dutch Central Bank and chair of its committee on supervisory policy (from 2010 until 2014). She has been a member of the Dutch Monitoring Committee Corporate Governance (from 2009 until 2018) and, from 2017 until 2019, a member of the board of Barclays Bank Plc and chair of its remuneration committee. From 2015 - 2023, Ms. Vletter-van Dort has been a member of the board of NN Group NV and, since 2019, vice-chair as well as chair of its remuneration committee. She has also been a member of the board of the Nyenrode Business University and served on its audit committee and chairs its education and research committee (2022-2025). She is also a member of the board of the Dutch Foundation for Public Broadcasting, NPO (since 2020), Anthos Fund & Asset Management (since 2021) and Nyenrode Business University (since 2022) and serves on its audit committee and chairs its education & research committee. From 2018 - 2024, she was the chairperson of Stichting Luchtmans, protective foundation Koninklijke Brill NV, a 335-year old listed publisher.
4.2. Meetings and activities of the Supervisory Board
4.2.1. Activities of the Supervisory Board
Our Supervisory Board held 9 meetings in 2025, of which all were held in the presence of the members of the Managing Board and other select members of our Senior Management, with the exception of the evaluation of the functioning of our Managing Board, Supervisory Board, its committees and its individual members as described below.
The items discussed in those meetings included recurring subjects such as our annual budget, financial performance, annual report on Form 20-F as well as its statutory annual accounts, objectives and results, strategy and sustainable long-term value creation, operations review, reports of the various committees of our Supervisory Board, the convocation of our AGM, the risks of our business and the assessment by our Managing Board of the structure of our internal risk management and control systems, as well as any significant changes thereto, corporate governance requirements and developments and the compensation of the members of our Managing Board. Certain Supervisory Board meetings also included presentations by senior executive management. In 2025 the developments on the CSRD and its implementation into Dutch national legislation have been closely monitored and the Company’s preparations to become compliant have been discussed in the meetings of the Supervisory Board.
Outside the Supervisory Board meetings, the Chairman and other members of our Supervisory Board had regular contact with the members of our Managing Board, and other members of our Senior Management.
In accordance with the best practice provisions 2.2.6 and 2.2.7 of the Dutch Corporate Governance Code, on an annual basis our Supervisory Board undertakes to perform an evaluation of the functioning of the Supervisory and Managing Boards. Once every three years, this evaluation is conducted by an independent external advisor, whose mission is to assist the Supervisory Board in this evaluation through, among other things, conducting interviews with individual members of the Supervisory and Managing Boards and facilitating discussions within the Supervisory Board on the functioning of the boards, and the Supervisory Board's committees, including an evaluation of the involvement of each member, the culture within the Supervisory Board and the relationship between the Supervisory Board and the Managing Board. The internal evaluation for the year ended December 31, 2025, is ongoing at the time of this report.
4.2.2. Membership and Attendance
As of December 31, 2025, the composition of the five standing committees of our Supervisory Board was as follows: (i) Ms. Ana de Pro Gonzalo is the chair of the audit committee of the Supervisory Board (the "Audit Committee"), and Ms. Simonetta Acri, Mr. Werner Lieberherr, Mr. Frédéric Sanchez and Ms. Hélène Vletter-van Dort are members of the Audit Committee; (ii) Mr. Frédéric Sanchez is the chair of the compensation committee of the Supervisory Board (the "Compensation Committee"), and Ms. Simonetta Acri, Mr. Nicolas Dufourcq, Mr. Armando Varricchio and Ms. Hélène Vletter-van Dort are members of the Compensation Committee; (iii) Ms. Hélène Vletter-van Dort is the chair of the nominating and corporate governance committee of the Supervisory Board (the "Nominating and Corporate Governance Committee"), and Mr. Nicolas Dufourcq, Mr. Armando Varricchio and Mr. Frédéric Sanchez are members of the Nominating and Corporate Governance Committee; (iv) Mr. Nicolas Dufourcq is the chair of the strategic committee of the Supervisory Board (the "Strategic Committee") and Mr. Werner Lieberherr, Mr. Armando Varricchio and Mr. Frédéric Sanchez are members of the Strategic Committee; and (v) Ms. Hélène Vletter-van Dort is the chair of the sustainability committee of the Supervisory Board (the "Sustainability Committee"), and Mr. Orio Bellezza, Mr. Nicolas Dufourcq, Ms. Ana de Pro Gonzalo, Mr. Werner Lieberherr and Mr. Armando Varricchio are members of the Sustainability Committee.
Detailed information on attendance at full Supervisory Board and Supervisory Board committee meetings during 2025 is as follows:
| | | | | | | | | | | | | | | | | | | | | | | | | | | | | | | | | | | | | | | | | | | | | | | | | | | | | | | | | |
| Number of Meetings Attended in 2025 | Supervisory Board | | % Attendance | | Audit Committee | | % Attendance | | Compensation Committee | | % Attendance | Strategic Committee | | % Attendance | | Nominating
and Corporate
Governance
Committee | | %
Attendance | Sustainability
Committee | % Attendance | | |
| Nicolas Dufourcq | | 12 | | | 100% | | | — | | | — | | | 2 | | | 100 | 1 | | | 100% | | | 7 | | | 100% | 4 | 100% | | |
Armando Varricchio(1) | | — | | | — | | | — | | | — | | | — | | | — | — | | | — | | | — | | | — | — | — | | |
Simonette Acri(2) | | 5 | | | 100% | | | 5 | | | 100% | | | 1 | | | 100% | — | | | — | | | — | | | — | — | — | | |
Orio Bellezza(1) | | — | | | — | | | — | | | — | | | — | | | — | — | | | — | | | — | | | — | — | — | | |
| Pascal Daloz | | 7 | | | 58% | | | — | | | — | | | — | | | — | — | | | — | | | — | | | — | — | — | | |
Janet Davidson(3) | | 7 | | | 100% | | | 5 | | | 100% | | | — | | | — | — | | | — | | | — | | | — | 2 | 100% | | |
| Ana de Pro Gonzalo | | 12 | | | 100% | | | 10 | | | 100% | | | — | | | 100 | — | | | — | | | — | | | — | — | — | | |
Werner Lieberherr(2) | | 5 | | | 100% | | | 5 | | | 100% | | | — | | | — | 1 | | | 100% | | | — | | | — | 2 | 100% | | |
| Frédéric Sanchez | | 12 | | | 100% | | | 10 | | | 100% | | | 2 | | | —% | 1 | | | 100% | | | 7 | | | 100% | — | — | | |
Donatella Sciuto(3) | | 4 | | | 57% | | | 5 | | | 100% | | | 1 | | | 100% | — | | | — | | | — | | | — | — | — | | |
Maurizio Tamagnini(4) | | 2 | | | 100% | | | — | | | — | | | — | | | — | — | | | — | | | 1 | | | 100% | 1 | 100% | | |
Paola Visca(4) | | 7 | | | 70% | | | — | | | — | | | — | | | — | — | | | — | | | 2 | | | 67% | — | — | | |
| Hélène Vletter-van Dort | | 12 | | | 100% | | | 10 | | | 100% | | | 2 | | | 100% | — | | | — | | | 7 | | | 100% | 4 | 100% | | |
(1) Mr. Orio Bellezza and Mr. Armando Varricchio were appointed as member of our Supervisory Board on December 18, 2025.
(2) Ms. Simonetta Acri and Mr. Werner Lieberherr were appointed as members of our Supervisory Board on May 28, 2025.
(3) Ms. Janet Davidson and Ms. Donatella Sciuto were members of our Supervisory Board until May 28, 2025, on which date their term expired.
(4) Mr. Maurizio Tamagnini and Mr. Paolo Visca were members of our Supervisory Board until their resignation effective March 19, 2025 and October 1, 2025 respectively.
4.3. Audit Committee
Our Audit Committee assists the Supervisory Board in fulfilling its oversight responsibilities relating to corporate accounting, reporting practices, the quality and integrity of our financial reports, as well as our auditing practices, legal and regulatory related risks, execution of our auditors’ recommendations regarding corporate auditing rules and the independence of our external auditors.
Our Audit Committee met 10 times during 2025. At many of the Audit Committee’s meetings, the committee received presentations on current financial and accounting issues and had the opportunity to discuss with our Chief Executive Officer, Chief Financial Officer, Chief Accountant, Chief Audit & Risk Executive, President, Legal Counsel, Chief Ethics & Compliance Officer and our external auditors. Our Audit Committee also proceeded with its annual review of our internal audit function. Our Audit Committee reviewed our annual consolidated financial statements in U.S. GAAP for the year ended December 31, 2025, and the results press release was published on January 29, 2026. Furthermore, our Audit Committee also reviewed our annual consolidated financial statements under IFRS, as adopted by the EU, for the year ended December 31, 2025. In 2025, the Audit Committee further monitored the sustainability reporting process, including the set-up of the Company’s related internal control and risk management systems.
Our Audit Committee approved the compensation of our external auditors for 2025, reviewed and monitored their independence, and discussed the scope of their audit, audit related and non-audit related services for 2025.
Our Audit Committee regularly reviewed management’s conclusions as to the effectiveness of internal control over financial reporting and supervised the implementation of our corporate ERM process.
As part of each of its quarterly meetings, our Chief Ethics & Compliance Officer, together with our Chief Audit & Risk Executive, presented to and discussed with the Audit Committee the Company’s whistleblowing program activities and trends, including, as deemed relevant in connection with the Company’s disclosure obligations, the main findings of investigation reports and follow-up actions in relation thereto.
4.4. Compensation Committee
Our Compensation Committee advises our Supervisory Board in relation to the compensation of the members of the Supervisory and Managing Boards, the variable portion of such compensation based on performance criteria recommended by our Compensation Committee. Our Compensation Committee also reviews the stock-based compensation plans for our Senior Management and key employees. Our Compensation Committee met twice in 2025.
Among its main activities, in 2025 our Compensation Committee: (i) reviewed the remuneration for the members of the Supervisory Board, which was submitted to and approved by the 2025 AGM; (ii) reviewed the results of the performance targets relating to the bonus of our President and Chief Executive Officer and of our President and Chief Financial Officer for the fiscal year ending on December 31, 2024; (iii) discussed the performance targets relating to the bonus of our President and Chief Executive Officer and of our President and Chief Financial Officer for the fiscal year ending on December 31, 2025; and (iv) established, on behalf and with the approval of the entire Supervisory Board, the applicable performance criteria, which must be met by senior managers and selected key employees participating in the employee stock award plans to benefit from such awards (for the 2024 unvested stock award plan, these performance criteria are further described below in Section 4.9.2. (Managing Board remuneration structure).
4.5. Strategic Committee
Our Strategic Committee advises the Supervisory Board on and monitor key developments within the semiconductor industry, our overall strategy for sustainable long-term value creation, and the long-term planning and budgeting. Our Strategic Committee met once in 2025 to discuss our strategy and review our three-year plan. In addition, there were strategic discussions, many of which occurred at extended Supervisory Board meetings and involved all Supervisory Board members.
4.6. Nominating and Corporate Governance Committee
Our Nominating and Corporate Governance Committee advises the Supervisory Board on the selection criteria and procedures relating to the appointment of members to our Supervisory and Managing Boards, and the review of principles relating to corporate governance. Our Nominating and Corporate Governance Committee met 7 times during 2025 to discuss succession planning for our Supervisory and Managing Boards, best practices regarding corporate governance, and the update of our corporate governance documents.
4.7. Sustainability Committee
Our Sustainability Committee advises and supports the Supervisory Board in relation to its responsibilities in supervising, monitoring and advising on the Company's sustainability strategy, targets, goals and overall sustainability performance. Our Sustainability Committee met 4 times in 2025 to discuss our overall sustainability strategy, as well as our sustainability performances and reporting.
4.8. Secretariat and Controllers
Our Supervisory Board appoints a secretary (the "Secretary") and vice secretary (the "Vice Secretary"). Furthermore, the Managing Board makes an executive secretary (the "Executive Secretary") available to our Supervisory Board, who is also appointed by the Supervisory Board. The Secretary, Vice Secretary and Executive Secretary constitute the secretariat of the Supervisory Board (the "Secretariat"). The mission of the Secretariat is primarily to organize meetings, to ensure the continuing education and training of our Supervisory Board members and to maintain record keeping. Our Chief Ethics & Compliance Officer, Philippe Dereeper, serves as Executive Secretary for our Supervisory Board, and for each of the five standing committees of our Supervisory Board. Ms. Charlotte Fadlallah serves as Secretary and Ms. Alessia Allegretti serves as Vice Secretary. Ms. Fadlallah also serves as managing director of ST Holding.
Our Supervisory Board also appoints two financial experts (the “Controllers”). The mission of the Controllers is primarily to assist our Supervisory Board in evaluating our operational and financial performance, business plan, strategic initiatives and the implementation of Supervisory Board decisions, as well as to review the operational reports provided under the responsibility of the Managing Board. The Controllers generally meet once a month with the management of the Company and report to our full Supervisory Board. The current Controllers are Mr. Samuel Dalens and Mr. Paolo Bonazzi. Mr. Dalens also serves as a member of the supervisory board of ST Holding. The STH Shareholders Agreement between our principal indirect shareholders contains provisions with respect to the appointment of the Secretary, Vice Secretary and Controllers.
4.9. Remuneration report
4.9.1. Supervisory Board remuneration
On December 1, 2019, a Dutch act implementing the revised EU Shareholders’ Rights Directive (2017/828/EU) (“SRDII”) took effect in The Netherlands. As we are incorporated under the laws of The
Netherlands and our common shares are admitted to trading on regulated markets in the EU, we were required, inter alia, to update the remuneration policy accordingly with respect to the compensation of the Supervisory Board members and to comply with the respective disclosure requirements introduced to the Dutch Civil Code. In connection therewith, we present in this section certain comparative information on our performance relative to the compensation of the Supervisory Board members.
4.9.1.1. Supervisory Board Remuneration Policy
Our Articles of Association provide that the compensation of our Supervisory Board members is determined by our general meeting of shareholders. The remuneration policy for the Supervisory Board members, compliant with the requirements under the Dutch Civil Code, following the implementation of SRDII, was approved at the 2024 the AGM with a vote percentage in favor of the policy of 98.28% and the remuneration for the members of the Supervisory Board, in line with the remuneration policy, was approved by the 2025 AGM with a vote percentage in favor of such remuneration of 99.39%.
4.9.1.2. Compensation paid to current and former Supervisory Board members in financial year 2025
The annual compensation of the Supervisory Board members is comprised of an annual fee and an attendance fee, promoting effective and independent supervision in the interest of the Company and the long-term success of the Company. There is no variable compensation nor stock-based compensation awarded to the members of our Supervisory Board.
The aggregate compensation for current and former members of our Supervisory Board with respect to service in 2025 was €963,178 before any applicable withholding or other taxes, as set forth in the following table. No reimbursement fees were paid to members of our Supervisory Board in 2025.
| | | | | | | | | | | | | | | | | |
| Supervisory Board Members Fees | | Annual
Fees (Euro) | | | Attendance
Fees (Euro) | | Total (Euro) |
Nicolas Dufourcq (1) | | € | — | | | | | € | — | | | | € | — | |
Armando Varricchio(2) | | € | 55,137 | | | | | € | — | | | | € | 55,137 | |
Simonetta Acri(3) | | € | 58,000 | | | | | € | 29,000 | | | | € | 87,000 | |
Orio Bellezza(2) | | € | 22,055 | | | | | € | — | | | | € | 22,055 | |
| Pascal Daloz | | € | 45,000 | | | | | € | 18,000 | | | | € | 63,000 | |
Janet Davidson(4) | | € | — | | | | | € | 32,000 | | | | € | 32,000 | |
| Ana de Pro Gonzalo | | € | 100,000 | | | | | € | 71,000 | | | | € | 171,000 | |
Werner Lieberherr(3) | | € | 63,000 | | | | | € | 39,000 | | | | € | 102,000 | |
| Frédéric Sanchez | | € | 83,000 | | | | | € | 86,000 | | | | € | 169,000 | |
Donatella Sciuto(4) | | € | — | | | | | € | 30,000 | | | | € | 30,000 | |
Maurizio Tamagnini(5) | | € | — | | | | | € | 12,000 | | | | € | 12,000 | |
Paolo Visca(4) | | € | 18,986 | | | | | € | 23,000 | | | | € | 41,986 | |
| Hélène Vletter-van Dort | | € | 98,000 | | | | | € | 80,000 | | | | € | 178,000 | |
| Total | | € | 543,178 | | | | | € | 420,000 | | | | € | 963,178 | |
(1)Mr. Dufourcq waived his rights to receive any compensation from the Company in relation to his mandate as a member of the Supervisory Board or otherwise.
(2) Mr. Orio Bellezza and Mr. Armando Varricchio were appointed as member of our Supervisory Board on December 18, 2025.
(3) Ms. Simonetta Acri and Mr. Werner Lieberherr were appointed as members of our Supervisory Board on May 28, 2025.
(4) Ms. Janet Davidson and Ms. Donatella Sciuto were members of our Supervisory Board until May 28, 2025, on which date their term expired.
(5) Mr. Maurizio Tamagnini and Mr. Paolo Visca were members of our Supervisory Board until their resignation effective March 19, 2025 and October 1, 2025 respectively.
4.9.1.3 Supervisory Board remuneration comparison
Set forth in the following table is the annual change over the last five years of (i) the average remuneration of our Supervisory Board members, (ii) the performance of the Company (based on US GAAP where relevant) and (iii) the average remuneration of our indirect employees (i.e., all indirect employees other than the members of our Senior Management, including the members of our Managing Board).
| | | | | | | | | | | | | | | | | | | |
| In U.S. dollars | 2025 | | 2024 | | 2023 | 2022 | 2021 |
| Supervisory Board members remuneration | | | | | | | |
Average remuneration of Supervisory Board members(1) | $ | 94,367 | | | $ | 112,082 | | | $ | 119,413 | | $ | 113,985 | | $ | 114,775 | |
| Company performance | | | | | | | |
| Net revenues (amounts in millions) | $ | 11,800 | | | $ | 13,269 | | | $ | 17,286 | | $ | 16,128 | | $ | 12,761 | |
| Operating income - US GAAP (amounts in millions) | $ | 175 | | | $ | 1,676 | | | $ | 4,611 | | $ | 4,439 | | $ | 2,419 | |
| Employee remuneration | | | | | | | |
Average remuneration(2) of all global indirect employees (FTE basis)(3) | $ | 122,100 | | | $ | 114,400 | | | $ | 114,100 | | $ | 109,600 | | $ | 111,200 | |
(1)Using the Euro per U.S. dollar exchange rate on December 31, 2025 of €1 = $1.1757.
(2)Remuneration is defined as all remuneration paid to indirect employees including base salary, variable compensation in both cash and shares, social premiums, pension, expense allowances and benefits in kind. The average is calculated by taking the sum of remuneration costs and dividing by the average number of full-time equivalent indirect employees over the period.
(3)Global indirect employees are all employees other than those directly manufacturing our products, excluding Senior Management. “FTE” refers to full time equivalent.
In connection with the above table and to provide insight in the correlation between the remuneration of each Supervisory Board member and the Company performance as well as the average remuneration of all global indirect employees (FTE basis) over the past five years, the table below sets forth the remuneration (including attendance fees) of each Supervisory Board member for the past five years:
| | | | | | | | | | | | | | | | | | | | |
Supervisory Board Members Fees (1) | | 2025 | 2024 | 2023 | 2022 | 2021 |
Nicolas Dufourcq(2) | $ | — | — | — | — | — |
| Ana de Pro Gonzalo | $ | 171,000 | 167,343 | 175,256 | 172,401 | 171,030 |
Armando Varricchio(3) | $ | 55,137 | N/A | N/A | N/A | N/A |
Donatella Sciuto(5) | $ | 30,000 | 111,736 | 113,242 | 103,548 | N/A |
| Frédéric Sanchez | $ | 169,000 | 113,814 | 117,556 | 108,885 | 113,265 |
| Hélène Vletter-van Dort | $ | 178,000 | 128,366 | 94,908 | N/A | N/A |
Janet Davidson(4) | $ | 32,000 | 119,531 | 126,723 | 121,695 | 117,229 |
Maurizio Tamagnini(6) | $ | 12,000 | 179,296 | 191,433 | 181,475 | 181,224 |
Orio Bellezza(3) | $ | 22,055 | N/A | N/A | N/A | N/A |
Paolo Visca(6) | $ | 41,986 | 101,861 | 98,143 | N/A | N/A |
Pascal Daloz(7) | $ | 63,000 | 76,395 | N/A | N/A | N/A |
Simonetta Acri(4) | $ | 87,000 | N/A | N/A | N/A | N/A |
Werner Lieberherr(4) | $ | 102,000 | N/A | N/A | N/A | N/A |
(1) These amounts are in US dollars using the Euro per US dollar exchange rate on December 31, 2025 of €1 = $1.1757 and include a fixed annual compensation for the members’ mandate, together with attendance fees from January 1 until December 31 of the relevant year.
(2) Mr. Dufourcq waived his rights to receive any compensation from the Company in relation to his mandate as a member of the Supervisory Board or otherwise.
(3) Mr. Orio Bellezza and Mr. Armando Varricchio were appointed as member of our Supervisory Board on December 18, 2025.
(4) Ms. Simonetta Acri and Mr. Werner Lieberherr were appointed as members of our Supervisory Board on May 28, 2025.
(5) Ms. Janet Davidson and Ms. Donatella Sciuto were members of our Supervisory Board until May 28, 2025, on which date their term expired.
(6) Mr. Maurizio Tamagnini and Mr. Paolo Visca were members of our Supervisory Board until their resignation effective March 19, 2025 and October 1, 2025 respectively.
We do not have any service agreements with any of the members of our Supervisory Board. We did not extend any loans or overdrafts to any of our Supervisory Board members. Furthermore, we have not guaranteed any debts or concluded any leases with any of our Supervisory Board members or their families. No share awards or stock options were granted to Supervisory Board members.
For further details on the compensation of the members of our Supervisory Board we refer to Note 7.6.35 to our consolidated financial statements.
4.9.2. Managing Board remuneration
For details on the performance of ST in 2025, we refer to the Business overview in Section 3.2.1. (Report of the Managing Board - Business Overview and Performance - Results highlights for the year 2025).
4.9.2.1. Guiding principles of Managing Board Compensation
Amongst others, the following key principles are considered by the Supervisory Board to determine the remuneration structure of the members of the Managing Board:
•alignment with the Company’s strategy: the compensation package should be strongly linked to the achievement of targets that are indicators of the execution of the Company’s business strategy.
•improving the performance of the Company: most of the compensation (excluding base salary, benefits, and pensions) is directly linked to the Company’s performance through variable pay incentives. These incentives are based on ambitious performance conditions that include a mix of internal and external criteria as well as relative performance conditions against peers. For details
on the performance of the Company in 2025, we refer to the Business overview in Section 3.2.1. (Results highlights for the year 2025).
•enhancing long-term creation of shareholder value: to strengthen the alignment with the interests of the shareholders and to enhance the sustainable long-term value creation of the Company, the compensation structure includes short-term and long-term variable remuneration either in cash or in shares or a combination thereof.
•promoting sustainable corporate development: to ensure that the Company is managed in a sustainable and responsible manner for the common good, the remuneration includes non-financial performance conditions related to corporate social responsibility and environmental, social, and governance factors. Both short- and long-term incentive include performance conditions promoting ST’s sustainable growth.
•retaining and motivating key employees: the compensation package should be competitive, ensuring remuneration levels are determined by reference internally between the Company’s senior managers and externally against the Peer Group.
In accordance with the key principles of the Company’s remuneration structure, the total remuneration of the members of our Managing Board, takes into consideration factors such as the size and complexity of our Company, our global presence and that of our customers, the pace of change in our industry, the Company’s value proposition, strategy and goal of sustainable long-term value creation, and the need to recruit and retain key personnel.
4.9.2.2. Managing Board remuneration policy
The remuneration of the members of our Managing Board is determined by our Supervisory Board on the advice of the Compensation Committee.
In compliance with the disclosure requirements in the Dutch Civil Code, we present in this section certain comparative information on our performance relative to the compensation of the members of our Managing Board.
The Compensation Committee advises the Supervisory Board in reviewing the remuneration package of the members of our Managing Board, both in the context of the Company performance and against the Peer Group and relevant market index. Before setting targets for the members of our Managing Board, the Compensation Committee carries out scenario analyses of the possible financial outcomes of meeting target levels.
Set forth in the table below is the list of companies retained for the Peer Group compensation analysis used for the remuneration policy for the Managing Board:
| | | | | |
Analog Devices | ON Semiconductor |
Infineon | Texas Instruments |
Monolithic Power Systems | Vishay |
Microchip | Rohm |
NXP Semiconductors | Renesas |
Should one of the Peer Group companies in the above table not publish financial results for any reason, the companies Diodes and/or Melexis would replace the missing company.
The remuneration of the members of our Managing Board is bound by the remuneration policy as adopted by our 2024 AGM, with a majority of votes of 94.53% in favor, for a duration of a maximum of four years (the "2024 Remuneration Policy"). Under the terms of the Dutch Civil Code, the remuneration policy
for the Managing Board shall be submitted to the AGM for adoption at least every four years after its adoption. A resolution to adopt the remuneration policy requires a majority of at least 75% of the votes cast. At the 2025 AGM, 93.44% of voting shareholders voted in favor of the remuneration report.
The 2024 Remuneration Policy for the Managing Board contains the following key features, which are the same as those included in the prior remuneration policy for the Managing Board adopted by our 2021 AGM:
•a link between Managing Board remuneration and long-term company strategy;
•a short-term incentive structure (fully paid in cash) featuring disclosure of criteria and threshold, targets, and maximum performance levels;
•corporate social responsibility criteria among performance conditions for both the short-term and long-term incentive in line with our objectives of promoting sustainable corporate development;
•enhanced disclosure of long-term incentive (share-settled) performance conditions and threshold and target performance levels as well as the remaining outstanding shares (which are not yet vested);
•a three-year performance period for long-term incentives (as compared to one year previously), with vesting based on performance measured over the three-year performance period, to improve alignment of Managing Board remuneration with our objective of enhancing long-term shareholder value;
•disclosure regarding early vesting provisions for the unvested stock awards;
•the implementation of share ownership guidelines for the Managing Board; and
•claw-back provisions in order to reclaim payments after they have been awarded or to withhold remuneration under specific conditions.
4.9.2.3.Managing Board remuneration structure
The remuneration structure is reflective of the level of responsibility of the Managing Board and each of the members of the Managing Board. The remuneration structure is further aligned to the Company’s current context while remaining competitive and providing an incentive to promote the Company’s performance over the medium to long-term and is in line with the Company’s corporate interest and the interests of all its stakeholders.
The Supervisory Board, upon proposal from the Compensation Committee, determines the remuneration structure and remuneration amounts for the members of our Managing Board, based on the analysis of the theoretical maximum total direct remuneration (i.e., sum of base salary, maximum short-term incentive, and maximum long-term incentive).
The remuneration package of each member of our Managing Board, our President and Chief Executive Officer, and our President and Chief Financial Officer, respectively, is comprised of the following:
•a base salary; and
•variable components, linked to performance:
◦a short-term incentive for our President and Chief Executive Officer of up to 210% of base salary which is fully paid in cash and for our President and Chief Financial Officer of up to 150% of base salary, which is fully paid in cash; and
◦a long-term incentive through the grant of stock awards, up to a maximum of 100,000 shares for our President and Chief Executive Officer and up to a maximum of 90,000 shares for our President and Chief Financial Officer.
The sum of these three elements represents the maximum total direct remuneration for the members of our Managing Board.
The above-mentioned three elements of the maximum total direct remuneration of the members of our Managing Board are further described below.
Base salary
The purpose of the base salary is to provide a fixed level of earnings and to attract and retain the members of our Managing Board. It is a key component of overall remuneration, particularly as the short-term incentive is expressed as a percentage of base salary. The Company seeks to determine a fair and competitive base salary as compared to the Peer Group based on several factors.
Short-term incentive
The purpose of the short-term incentive is to motivate the members of our Managing Board to achieve financial and commercial objectives consistent with and supportive of the Company’s strategy and to create a tangible link between annual performance and individual pay opportunity.
In accordance with the 2024 Remuneration Policy, (i) the short-term incentive of our President and Chief Executive Officer is fully paid in cash up to a maximum of 210% of the base salary for the relevant year, and (ii) the short-term incentive of our President and Chief Financial Officer is fully paid in cash up to a maximum of 150% of the base salary for the relevant year, all subject to the assessment and achievement of a number of performance conditions which are set annually by the Compensation Committee of our Supervisory Board.
The short-term incentive is subject to annual performance measurement of a unique set of 4 to 7 predefined criteria (both financial and non-financial) and a performance matrix both for financial and non-financial criteria that explicitly outline threshold and target outcomes (as well as over-performance conditions for financial criteria).
Performance measures and weightings are reviewed annually by the Compensation Committee. The recommendations made by the Compensation Committee regarding scorecard targets and weightings are designed to support the delivery of the Company’s strategy. The Supervisory Board, upon recommendation by the Compensation Committee, retains the ability to adjust performance measure targets and weightings year-by-year within the overall target and maximum pay-outs approved in the remuneration policy.
The Supervisory Board, upon the recommendation of its Compensation Committee, sets the conditions and performance criteria that must be met by the members of our Managing Board for the attribution of their short-term incentive (which is paid in the subsequent year).
These performance conditions will enable the Supervisory Board to conduct a holistic and comprehensive assessment of the annual performance of the members of our Managing Board. The combination of financial and non-financial criteria is well balanced in terms of external and internal criteria and reflect the challenging objectives set by the Compensation Committee in line with the Company's ambitious long-term vision and business strategy.
Performance criteria 2025 short-term incentive
The financial performance criteria for 2025 set by the Supervisory Board were as follows (based on US GAAP):
•market share evolution (before acquisition impact), which is measured by assessing the Company’s relative positioning and competitiveness in relation to its market and its industry peers
and how fast the Company grows its revenues compared to its competitors. Market share is assessed on the basis of industry data published by the WSTS.
•revenue growth, which represents the total amount of income generated by the Company’s operations;
•operating income (before impairment, restructuring charges and other related phase-out costs), which is an important yardstick of profit measurement and reflects the operating performance of the business which does not take into consideration non-operating gains or losses suffered by business, the impact of financial leverage and tax factors; and
•net operating cash flow (before acquisition and restructuring cash out), which is a liquidity metric that evaluates whether the Company has enough liquidity to meet its debt obligations. This metric helps assess the financial soundness of the Company in terms of liquidity risk, financial risk, credit risk and business risk.
The non-financial performance criteria for 2025 set by the Supervisory Board were as follows:
•execution of of company-wide program announced in October 2024 to reshape our manufacturing footprint and resize our global cost base ("Reshaping and Resizing");
•execution of the China-for-China operating model to support domestic China growth notably with localized scalable manufacturing networks; and
•sustainability/corporate social responsibility index, which is divided into four criteria related to:
◦health and safety: measured against the safety performance (employees and contractors);
◦environment/climate: measured against greenhouse gas emissions (kCO2 equivalent);
◦diversity and inclusion: measured against gender ratio among management levels; and
◦people management: measured against the employee survey (engagement index).
The weight of the sustainability/corporate social responsibility index is designed to remain stable over time, however the individual sub-components used to form the sustainability/corporate social responsibility index may evolve in the future to address sustainability priorities facing the Company and society.
The targets associated to each of the criteria used for the sustainability / corporate social responsibility index for the short-term incentive are consistent with the sustainability KPI definition, scope and targets of the Company that were in force at the time of the target-setting.
Calculation of payout
The tables below set forth the calculation methodology for the pay-out of the short-term incentive to the members of our Managing Board.
As described in Table A1 below, the final pay-out of the short-term incentive for our President and Chief Executive Officer is calculated by measuring the performance of each condition, then adding the sums of the corresponding pay-out, taking into account any applicable caps. The sum is then multiplied by the base salary to determine the final short-term incentive pay-out.
Table A1: Pay-out according to performance for each performance criterion for our President and Chief Executive Officer.
| | | | | | | | | | | | | | |
| Pay-out as a percentage of base salary |
Annual short-term incentive performance criteria financial year 2025 for the President and Chief Executive Officer (to be paid in 2026) | Performance
below threshold | Performance
above or
equal to
threshold
and below
target | Performance
above or
equal to
target and
below stretch | Performance
above stretch |
| Financial performance conditions | | | | |
•Market share evolution (before acquisition impact) | 0% | 15% | 30% | 45% |
•Revenue growth | 0% | 20% | 40% | 60% |
•Operating income (before impairment, restructuring charges and other related phase-out costs) | 0% | 20% | 40% | 60% |
•Net operating cash flow (before acquisition and restructuring cash out) | 0% | 20% | 40% | 60% |
| Sub-total for financial performance conditions | 0% | 75% | 150% | Capped at 150%(1) |
| Non-financial performance conditions | | | | |
•Execute "Reshaping and Resizing" | 0% | 15% | 30% | 30% |
•Execute "China for China" program | 0% | 5% | 10% | 10% |
•Sustainability/corporate social responsibility index | 0% | 10% | 20% | Capped at 20% |
| Sub-total for non-financial performance conditions | 0% | 30% | 60% | 60%(2) |
| Total | 0% | 105% | 210% | Short-term incentive pay-out capped at 210% |
(1)Over-performance for certain financial conditions can balance the potential under-performance of other financial conditions if performance exceeds stretch targets, without exceeding a maximum pay-out of 150% of base salary in relation to the portion of the short-term incentive dependent on financial performance criteria.
(2)No stretch targets are defined for non-financial performance criteria.
As described in Table A2 below, the final pay-out of the short-term incentive for our President and Chief Financial Officer, is calculated by measuring the performance of each condition, then adding the sums of the corresponding pay-out, taking into account any applicable caps. The sum is then multiplied by the base salary to determine the final short-term incentive pay-out.
Table A2: Pay-out according to performance for each performance criterion for our President and Chief Financial Officer.
| | | | | | | | | | | | | | |
| Pay-out as a percentage of base salary |
| Annual short-term incentive performance criteria financial year 2025 for the President and Chief Financial Officer (to be paid in 2026) | Performance below threshold | Performance above or equal to threshold and below target | Performance above or equal to target and below stretch | Performance above stretch |
| Financial performance conditions | | | | |
•Market share evolution (before acquisition impact) | 0% | 12% | 21% | 32% |
•Revenue growth | 0% | 14% | 29% | 43% |
•Operating income (before impairment, restructuring charges and other related phase-out costs) | 0% | 14% | 29% | 43% |
•Net operating cash flow (before acquisition and restructuring cash out) | 0% | 14% | 29% | 43% |
| Sub-total for financial performance conditions | 0% | 54% | 108% | Capped at 108%(1) |
| Non-financial performance conditions | | | | |
•Execute "Reshaping and Resizing" | 0% | 10% | 21% | 21% |
•Execute "China for China" program | 0% | 4% | 7% | 7% |
•Sustainability/corporate social responsibility index | 0% | 7% | 14% | Capped at 14% |
| Sub-total for non-financial performance conditions | 0% | 21% | 42% | 42%(2) |
| Total | 0% | 75% | 150% | Short-term incentive pay-out capped at 150% |
(1)Over-performance for certain financial conditions can balance the potential under-performance of other financial conditions if performance exceeds stretch targets, without exceeding a maximum pay-out of 108% of base salary in relation to the portion of the short-term incentive dependent on financial performance criteria.
(2)No stretch targets are defined for non-financial performance criteria.
Set forth in the following Table A3, Chart A3.1 and Chart A3.2 is the weight set for 2025 for each of the performance criteria that have been assessed by the Supervisory Board in March 2026 for the attribution of the 2025 short-term incentive (to be paid in 2026 to each of the members of the Managing Board):
Table A3: Performance criteria with target weighting and pay-out
| | | | | | | | | | | | | | |
Annual short-term incentive performance criteria financial year 2025 (to be paid in 2026) | Target Weighting(as a % of total weighting for performance criteria) | Target pay-out (as a % of base salary) |
Financial performance conditions (based on US GAAP) | CEO | CFO | CEO | CFO |
•Market share evolution (before acquisition impact) | 14% | 14% | 30% | 21% |
•Revenue growth | 19% | 19% | 40% | 29% |
•Operating income (before impairment, restructuring charges and other related phase-out costs) | 19% | 19% | 40% | 29% |
•Net operating cash flow (before acquisition and restructuring cash out) | 19% | 19% | 40% | 29% |
| Sub-total for financial performance conditions | 71% | 71% | 150% | 108% |
| Non-financial performance conditions | | | | |
•Execute "Reshaping and Resizing" | 14% | 14% | 30% | 21% |
•Execute "China for China" program | 5% | 5% | 10% | 7% |
•Sustainability/corporate social responsibility index | 10% | 10% | Capped at 20% | Capped at 14% |
Sub-total for non-financial performance conditions | 29% | 29% | 60% | 42% |
Total | 100% | 100% | 210% | 150% |
Chart A3.1: Performance criteria with target weighting at target pay-out for our President and Chief Executive Officer
Chart A3.2: Performance criteria with target weighting at target pay-out for our President and Chief Financial Officer
Assessment of the 2025 short-term incentive
The evaluation and assessment of the fulfillment of conditions and performance criteria were completed by the Compensation Committee on March 25, 2026, in order to determine the amount of the 2025 short-term incentive.
The amount of the 2025 short-term incentive (to be paid in 2026) of the members of our Managing Board, is EUR 1,730,000 (gross), of which (i) EUR 1,100,000 for our President and Chief Executive Officer, which is 100% of his base salary, representing a global achievement rate of 100% (out of the maximum of 210%) and (ii) EUR 630,000 for our President and Chief Financial Officer, which is 70% of his base salary, representing a global achievement rate of 70% (out of the maximum of 150%).
The assessment of the fulfillment of conditions and performance criteria is further described below in Tables C.1 and C.2, respectively, where it concerns our President and Chief Executive Officer and our President and Chief Financial Officer, respectively. Furthermore, Table C.3. provides more details on the assessment of the sustainability/corporate social responsibility index. The assessment of the other two non-financial performance conditions has been done based on a set of specific KPIs for which details cannot be fully disclosed due to their sensitive nature. However some further information is nevertheless provided herein:
•the assessment of the criteria related to the "Execution of the company-wide program announced in October 2024 to reshape our manufacturing footprint and resize our global cost base" reflects notably: (i) the amount of OpEx savings achieved in 2025 compared to the pre-set target (as disclosed previously, ST expects annual OpEx savings totaling $300 to 360 million, exiting 2027, compared to the cost base of 2024); as well as (ii) the timing of completion (compared to pre-set targets) of transfers of certain process technologies from certain 200mm silicon fabs to other fabs either in 200mm or 300mm in the context of this program;
•the assessment of the criteria related to the "Execution of the China-for-China operating model" reflects notably: (i) the timing of the start of manufacturing (compared to a pre-set target) in the joint-venture between ST and Sanan Optoelectronics, as well as (ii) the timing of delivery of certain products and qualification (compared to pre-set targets) of certain technologies in the context of ST's partnership with HHGrace.
The Compensation Committee determined that based on the 2025 performance of our President and Chief Executive Officer:
(1)for our President and Chief Executive Officer, the financial performance criteria have been assessed as follows: market share evolution (performance below threshold, payout of 0%), revenue growth (performance equal to threshold, payout of 20%), operating income (performance below threshold, payout of 0%), net operating cash flow (performance equal to threshold, payout of 20%), as further detailed in the table below;
(2)for our President and Chief Executive Officer, the non-financial performance criteria have been assessed as follows: execute Reshaping and Resizing (performance equal to target, payout of 30%), execute China for China (performance equal to target, payout of 10%), sustainability/corporate social responsibility index (performance equal to target, payout of 20%), capped at 60%.
Table C.1 The table below sets forth the assessment of the performance criteria for the 2025 short-term incentive for our President and Chief Executive Officer
| | | | | | | | | | | | | | | | | | | | | | | | | | |
| Pay-out as a percentage of base salary for the President and Chief Executive Officer |
| Annual short-term incentive performance criteria | Performance above or equal to threshold and below target(1) | Performance above or equal to target and below stretch | Performance above stretch | Achievement over 2025 (2) |
financial year 2025 (to be paid in 2026) |
Financial performance conditions(2) | | | | | | | | |
o Market share evolution (before acquisition impact)
(rank within the Peer Group) | 6th or 5th | 15% | 4th | 30% | Better than 4th | 45% | 10th rank | 0% |
| o Revenue growth (in millions of U.S. dollars) | >=11,500 | 20% | >=13,333 | 40% | >=13,739 | 60% | 11,800 | 20% |
| o Operating income (before impairment, restructuring charges and other related phase-out costs) (in millions of U.S. dollars) | >=675 | 20% | >=1,336 | 40% | >=1,693 | 60% | 551 | 0% |
| o Net operating cash flow (before acquisition and restructuring cash out) (in millions of U.S. dollars) | >=253 | 20% | >=635 | 40% | >=747 | 60% | 353 | 20% |
| Sub-total for financial performance conditions | | 75% | | 150% | | Capped at 150%(3) | | 40% |
| Non-financial performance conditions | | | | | | | | |
| o Execute "Reshaping and Resizing" program | | 15% | | 30% | | 30% | At target | 30% |
| o Execute "China for China" program | | 5% | | 10% | | 10% | At target | 10% |
o Sustainability/corporate social responsibility index | | 10% | | 20% | | Capped at 20% | | 22% Capped at 20% |
| Sub-total for non-financial performance conditions | | 30% | | 60% | | Capped at 60% | | 60% |
| Total | | 105% | | 210% | | Capped at 210% | Overall score | 100% |
(1) The threshold acts as a trigger point: if the performance does not exceed the threshold, no payment will be made under the applicable criteria.
(2) Based on US GAAP where relevant.
(3) Over-performance for financial conditions can balance the potential under-performance of other financial conditions if performance exceeds stretch targets, without exceeding a maximum pay-out of 150% of base salary regarding the portion of the short-term incentive dependent on financial performance criteria.
The Compensation Committee determined that based on the 2025 performance of our President and Chief Financial Officer:
(1)for our President and Chief Financial Officer, the financial performance criteria have been assessed as follows: market share evolution (performance below threshold, payout of 0%), revenue growth (performance equal to threshold, payout of 14%), operating income (performance below threshold, payout of 0%), net operating cash flow (performance equal to threshold, payout of 14%), as further detailed in the table below;
(2)for our President and Chief Financial Officer, the non-financial performance criteria have been assessed as follows: execute "Reshaping and Resizing" program (performance equal to target, payout of 21%), execute "China for China" program (performance equal to target, payout of 7%), sustainability/corporate social responsibility index (performance equal to target, payout of 14%), capped at 42%.
Table C.2 The table below sets forth the assessment of the performance criteria for the 2025 short-term incentive for our President and Chief Financial Officer
| | | | | | | | | | | | | | | | | | | | | | | | | | |
| Pay-out as a percentage of base salary for the President and Chief Financial Officer |
Annual short-term incentive performance criteria financial year 2025 (to be paid in 2026) | Performance above or equal to threshold and below target(1) | Performance above or equal to target and below stretch | Performance above stretch | Achievement over 2025(2) |
|
Financial performance conditions(3) | | | | | | | | |
o Market share evolution (before acquisition impact)
(rank within the Peer Group) | 6th or 5th | 12% | 4th | 21% | Better than 4th | 32% | 10th rank | 0% |
| o Revenue growth (in millions of U.S. dollars) | >=11,500 | 14% | >=13,333 | 29% | >=13,739 | 43% | 11,800 | 14% |
| o Operating income (before impairment, restructuring charges and other related phase-out costs) (in millions of U.S. dollars) | >=675 | 14% | >=1,336 | 29% | >=1,693 | 43% | 551 | 0% |
| o Net operating cash flow (before acquisition and restructuring cash out) (in millions of U.S. dollars) | >=253 | 14% | >=635 | 29% | >=747 | 43% | 353 | 14% |
| Sub-total for financial performance conditions | | 54% | | 108% | | Capped at 108%(3) | | 28% |
| Non-financial performance conditions | | | | | | | | |
| o Execute "Reshaping and Resizing" program | | 10% | | 21% | | 21% | At target | 21% |
| o Execute "China for China" program | | 4% | | 7% | | 7% | At target | 7% |
o Sustainability/corporate social responsibility index | | 7% | | 14% | | Capped at 14% | | 16% Capped at 14% |
Sub-total for non-financial performance conditions | | 21% | | 42% | | Capped at 42% | | 42% |
Total | | 75% | | 150% | | Capped at 150% | Overall score | 70% |
(1) The threshold acts as a trigger point: if the performance does not exceed the threshold, no payment will be made under the applicable criteria.
(2) Based on US GAAP where relevant.
(3) Over-performance for financial conditions can balance the potential under-performance of other financial conditions if performance exceeds stretch targets, without exceeding a maximum pay-out of 108% of base salary regarding the portion of the short-term incentive dependent on financial performance criteria
Table C.3. The table below sets forth the detailed assessment of the sustainability/ corporate sustainability responsibility index for our President and Chief Executive Officer and President and Chief Financial Officer:
| | | | | | | | | | | | | | | | | | | | |
| Performance indicators | Weight | Threshold (1) | Target | Stretch | Achievement | |
| | payout 50% | payout 100% | payout 125% | 2025 results | 2025 Payout |
| Employee Safety Recordable Case(3) | 20% | 0.18 | 0.15 | 0.12 | 0.09 | 125.0% |
| GHG emissions (kTCO2 equivalent)(4) | 40% | 1035 | 915 | 795 | 798 | 124.4% |
| % women managers to senior managers (year end) | 20% | 18% | 19.5% | 21% | 20% | 103.3% |
| Employee survey - Engagement index | 20% | 74% | 78% | 82% | 82% | 125.0% |
| | | | | Overall score | 120.4% capped at 100%(2) |
(1) The payout is 0 below threshold, linear between threshold and target, between target and stretch, and capped at stretch.
(2) The total payout of the Corporate Sustainability index condition is 120.6%, capped at 100%.
(3) The Employee Safety Recordable Case is calculated based on the OSHA and differs from health and safety metrics included in Section 3.4.4.1 G (Own workforce - Targets and Metrics) which are based on the CSRD.
(4) The calculation of GHC emissions is covering the following scopes: GHC scopes 1, 2, and transport scope 3 (3.4 Upstream transportation & distribution, 3.6 business travel, 3.7 employee commuting).
Long-term incentive
The purpose of the long-term incentive is to motivate the members of our Managing Board, to deliver long-term shareholder value through long-term profitability and share price growth.
The terms of this long-term incentive are included in the long-term incentive plan approved at the 2024 AGM, allowing for grants of unvested stock awards in 2024, 2025 and 2026. The vesting of unvested stock awards is subject to the achievement of performance conditions and calculated over a three-year performance period. Grants of unvested stock awards made in 2024, 2025 and 2026will fully vest, subject to performance conditions, in 2027, 2028 and 2029 respectively.
Award levels are determined annually by the Compensation Committee within the maximum amounts set by the Supervisory Board. In accordance with the resolution adopted by our AGM the maximum annual grant to be allowed (i) in relation to the President and Chief Executive Officer’s stock award for 2025 and 2026 is 100,000 unvested stock awards subject to performance criteria, and (ii) in relation to the President and Chief Financial Officer’s stock award for 2025 and 2026 is 90,000 unvested stock awards subject to performance criteria.
The Supervisory Board, upon recommendation of the Compensation Committee, determines whether the performance criteria are met and concludes whether and to which extent the members of our Managing Board, are entitled to any stock awards under the long-term incentive plan. Scorecard targets are not disclosed prospectively as it would require the disclosure of commercially sensitive information. Scorecard targets will be disclosed, as relevant, only when they are no longer deemed to be commercially sensitive.
Long-term incentive grant in 2025
For the 2025 long-term incentive, the performance criteria used for the assessment of the Managing Board members are:
•revenue growth;
•operating margin; and
•sustainability/corporate social responsibility index, which was comprised of the following KPIs (including two external criteria):
◦environment/climate: measured against greenhouse gas emissions (kCO2 equivalent);
◦diversity, inclusion and people engagement: measured against gender ratio among management levels;
◦investor ESG index: measured against the Dow Jones sustainability indices; and
◦carbon rating: measured against the Carbon Disclosure Project carbon rating.
The targets associated to the two internal criteria (environment / climate and diversity and inclusion) are consistent with long term public commitments of the Company.
Set forth in the following Table B1 and Chart B1 is the weight set for each of the performance criteria that will be assessed by the Supervisory Board over the three-year performance period for the attribution of the relevant long-term incentive grant in 2025. Table B2 sets out the shares to vest at the end of the three-year vesting period based on performance.
Table B1: Long-term incentive performance criteria and target weighting over the three-year performance period
| | | | | |
Long-term incentive plan performance criteria to be assessed over a 3-year period | Target Weighting
(as % of maximum
achievement score) |
| Revenue growth (financial year 2027 versus financial year 2024 in comparison to Peer Group) | 33.33% |
| Operating margin ratio before restructuring (average for the 2025 – 2027 period) | 33.33% |
Sustainability/corporate social responsibility index | 33.33% |
| Maximum achievement score | 100%
which corresponds to a
maximum of (i) 100,000 unvested stock awards with regard to the CEO and (ii) 90,000 unvested stock awards with regard to the CFO |
Chart B1: Long-term incentive performance criteria and target weighting over the three-year performance period
Table B2: Shares to vest at the end of the three-year vesting period according to performance for each performance criterion
| | | | | | | | | | | | | | |
| Shares to vest as a percentage of maximum award |
Long-term incentive plan performance criteria to be assessed over a three-year performance period | Performance
below
threshold | Performance
equal to
threshold | Performance
above threshold
and below target | Performance
above or at
target |
Revenue growth (financial year 2027 versus financial year 2024 in comparison to Peer Group) | 0% | 16.67% | 25% | 33.33% |
Operating margin ratio before restructuring (average for the 2025 – 2027 period) | 0% | 16.67% | 16.67% | 33.33% |
| Sustainability/ corporate social responsibility index | 0% | 16.67% | 16.67% | 33.33% |
| Total | 0% | 50% | 58.34% | 100% |
Vesting schedule for outstanding awards
Set forth in the following Table B3 is an overview of the outstanding awards that have been granted to the members of our Managing Board in accordance with the long-term incentive plan adopted by the 2021 AGM and the long-term incentive plan adopted by the 2024 AGM. For the purposes of the vesting schedule table below, a hypothetical achievement rate of 100% of performance conditions is used.
Table B3: Vesting schedule for the 2023, 2024 and 2025 long-term incentive grants
| | | | | | | | | | | | | | | | | | | | | | | | | | | | | |
| Name and principal position | Grant date | Final vesting date | Max. number of shares that can be granted | Number of shares that have been granted based on performance conditions achievement | Share price at grant (in $) | 2026 vesting | 2027 vesting | 2028 vesting | Unvested shares as of end of 2025 |
Jean-Marc Chery President and Chief Executive Officer | July 23, 2025 | AGM date for 2028 | 100,000 | 100,000 | $31.77 | | | 100,000(1) | 100,000 |
| July 24, 2024 | AGM date for 2027 | 100,000 | 100,000 | $33.47 | | 100,000(1) | | 100,000 |
| July 26, 2023 | AGM date for 2026 | 100,000 | 100,000 | $51.55 | 100,000(1) | | | 100,000 |
| Total vesting | | | | | | | | 300,000 |
Lorenzo Grandi President and Chief Financial Officer | July 23, 2025 | AGM date for 2028 | 90,000 | 80,000 | $31.77 | | | 80,000(1) | 80,000 |
| July 24, 2024 | AGM date for 2027 | 90,000 | 75,000 | $33.47 | | 75,000(1) | | 75,000 |
Total vesting | | | | | | | | 155,000 |
(1) In the event of 100% achievement of performance criteria to be assessed by the Supervisory Board.
Assessment of performance criteria for 2023 long-term incentive grant
The evaluation and assessment of the fulfillment of conditions and performance criteria for the 2023 long-term incentive grant, were completed by the Compensation Committee of our Supervisory Board on March 25, 2026, whereby the shares granted under the 2023 long-term incentive grant amount to 33,333.
Table B4 below sets forth the assessment of the performance criteria for the 2023 long-term incentive grant to our President and Chief Executive Officer, who at that time was the sole member of our Managing Board.
| | | | | | | | | | | | | | | | | | | | | | | | | | |
| 2023 Long-term incentive grant to our President and Chief Executive Officer |
Long-term incentive performance criteria financial year 2023 (to be paid in 2026) | Performance above or equal to threshold and below target(1) | Performance above or equal to target and below stretch | Performance above stretch | Achievement over 2025 |
|
Financial performance conditions |
Evolution of Sales of FY 2025 versus FY 2022 (rank within Peer Group)(2) | Between 6th (included) and 4th (excluded) | 16.66% | At 4th or better | 33.33% | At 4th or better | 33.33% | 10th rank | 0% |
Average of Operating Income before restructuring expressed as a % of sales of cumulated period from FY 2023 to FY 2025 | Between 26.2% (including) and 29.4% (excluding) | 16.66% | >=15.5% | 33.33% | >=20.80% | 33.33% | 16.31% | 0% |
| Non-financial performance conditions |
Sustainability/corporate social responsibility index | At Threshold (>=60%) | 16.66% | >=80% (target) | 33.33% | >=80% (target) | 33.33% | 93.6% | Capped at 33.33% |
Total | | 50% | | 100% | | Capped at 100% | | 33.33% which corresponds to 33,333 unvested stock awards |
(1) The threshold acts as a trigger point: if the performance does not exceed the threshold, no payment will be made under the applicable criteria.
(2) In case of #5 ranking, the shares grant will be 25%.
The achievement of the performance conditions related to the sustainability/corporate social responsibility index is measured as follows:
| | | | | | | | | | | | | | | | | | | | | | |
Performance indicators related to the sustainability/corporate social responsibility index | Weight | | Threshold | Target | Stretch | | Achievement |
| (payout 60%) | (payout 80%) | (payout 100%) | | 2025 results | 2025 score |
GHG emissions (kTCO2 equivalent)(1) | 40% | | 1035 | 915 | 795 | | 798 | 99.5% |
% women managers to senior managers (year end) | 20% | | 16% | 18% | 20% | | 16.9% | 69% |
In major 8 ESG leadership indices(2) | 40% | | In 4 indices at least 2 years | In 5 or & Indices at least 2 years | In 7 or 8 Indices at least 2 years | | In 8 indices | 100% |
| | | | | | | Overall score | 93.60% |
(1) The calculation is including GHG scopes 1, 2, and transport scope 3 (3.4 Product transportation, 3.6 Business travel, 3.7 Employee commuting)
(2) The ESG leadership indices are: Sustainalytics low risk, MSCI AAA, ISS ESG Prime, CDP Climate B, CDP Water B, Ecovadis Gold, Refinitiv top 10% and FTSE4Good Top 10%.
Share ownership guidelines
The members of the Managing Board are expected to build up shareholding in ST equal to 1.5 times their base salary in line with the 2024 Remuneration Policy.
Claw-back provisions under Dutch law
All performance-related remuneration awarded to the members of our Managing Board, are subject to the following claw-back provisions, in accordance with Dutch law. If the Supervisory Board considers that there is a significant downward restatement of the Company's financial results, breach of duty from the members of our Managing Board, or where remuneration has been paid based upon incorrect information about the achievement of the goals on which the remuneration was based or the circumstances on which the short-term incentive was dependent, it may, in its discretion, within two years of the performance-related remuneration of the members of our Managing Board vesting or being paid:
•require the members of our Managing Board to repay to the Company an amount equal to the after-tax value of some or all of any short-term cash incentive or the Company's shares that were granted; and/or
•require the Company to withhold from, or offset against, any other remuneration to which the members of our Managing Board may be or become entitled in connection with its employment such an amount as the Supervisory Board considers appropriate.
When reaching its decision, the Supervisory Board will take into account the significance of the breach of duty and in addition, the Supervisory Board may take other actions in relation to the statutory provision e.g., claim for damages.
During 2025, no claw-backs occurred.
The members of our Managing Board, may also receive other types of remuneration other than the above-mentioned performance-related remuneration policy, as further described in the 2024 Remuneration Policy. Other types of remuneration described in the 2024 Remuneration Policy are. amongst others. social premiums, benefits in kind (including a company car), pension contributions and miscellaneous allowances.
Statement of Compliance with Section 303A.14 of the New York Stock Exchange Listed Company Manual
In accordance with the applicable provisions of the New York Stock Exchange Listed Company Manual providing for the recovery of erroneously awarded incentive-based compensation, the Company has adopted a statement of compliance which provides for recovery of erroneously awarded incentive-based compensation (including both cash and equity compensation) received by current and former executive officers, which includes the members of our Managing Board, during a three-year look back period following an accounting restatement. The Company did not have any restatement of financial statements that required a recovery of erroneously awarded compensation for the financial year ended December 31, 2025, nor up to the date of this report.
4.9.2.4. Compensation paid to the members of our Managing Board in financial year 2025
The members of our Managing Board received compensation in the form of a base salary, short-term incentive, long-term incentive grant (unvested stock awards), social premiums, benefits in kind (including a company car), pension contributions and miscellaneous allowances.
The remuneration report relating to financial year 2024 was approved by the 2025 AGM with a vote percentage in favor of 93.44%. Amongst others, taking this high percentage of votes in favor into account, a similar approach was taken for the allocation of remuneration of the members of our Managing Board, over financial year 2025, in accordance with the remuneration policy as adopted in the 2024 AGM.
Set forth in the following table and chart is an overview of the total compensation of the members of our Managing Board, paid in 2025:
| | | | | | | | | | | | | | |
| | | President | President |
| | | and Chief Executive Officer | and Chief Financial Officer |
Base salary | | | $ | 1,279,752 | | $ | 1,047,070 | |
Variable components | Short-term incentive(1) | | $ | 779,140 | | $ | 271,460 | ⁽²⁾ |
| Long-term incentive(3) | | $ | 2,307,081 | ⁽⁴⁾ | $ | — | ⁽⁵⁾ |
Other components | Benefits | | $ | 135,107 | | $ | 114,168 | |
| Social security contributions(6) | | $ | 807,785 | | $ | 273,545 | |
| Pensions(7) | | $ | 331,629 | | $ | 1,101,582 | |
| Miscellaneous allowances(8) | | $ | — | | $ | — | |
| Termination benefits(8) | | $ | — | | $ | — | |
Total | | | $ | 5,640,495 | | $ | 2,807,825 | |
(1) Short-term incentive includes the amount paid in cash in 2025 based on 2024 performance (the achievement rate was 60% for our President and Chief Executive Officer and 42% for our President and Chief Financial Officer) The short-term incentive based on 2025 performance will be determined by the Compensation Committee and will be paid in 2026.
(2) The short-term incentive paid to our President and Chief Financial Officer, as presented in this table, reflects an adjusted short-term incentive for the period starting from his appointment as a member of the Managing Board on May 22, 2024.
(3) The members of our Managing Board were granted, in accordance with the 2024 Remuneration Policy and subsequent shareholder authorizations, (i) with regard to the President and Chief Executive Officer: up to a maximum of 100,000 unvested stock awards, subject to performance criteria, and (ii) with regard to the President and Chief Financial Officer up to a maximum of 90,000 unvested stock awards, subject to performance criteria. The vesting of such stock awards is conditional upon the members of our Managing Board continued service with us.
(4) The long-term incentive corresponds to the grant of shares in 2022 (100,000 shares) that have vested in full in May 2025 based on the 3-year performance, with a payout of 91.667% based on the achievement of the plan’s performance conditions.
(5) For this financial year 2025, the long-term incentive is not relevant to our President and Chief Financial Officer, as he was appointed as member of the Managing Board on May 22, 2024. The first long-term incentive grant to our President and Chief Financial Officer occurred in July 2024, therefore the first vesting, depending on the assessment of the performance conditions by the Compensation Committee and the Supervisory Board after the 3-year performance period, will take place in 2027.
(6) The employer social security contributions relate to the fixed and variable remuneration, including the unvested stock awards.
(7) Complementary pension plan for certain of the Company's key executives.
(8) There were no miscellaneous allowances nor termination benefits paid to the members of our Managing Board in 2025.
During 2025, the members of our Managing Board did not have any stock options and did not purchase any shares in the Company. During 2025, the members of our Managing Board sold 52,810 shares (all of which have been sold automatically from the relevant account to pay the taxes related to their vesting, through a sell-to-cover mechanism applied by default by ST).
4.9.2.5. Evolution of paid remuneration to the Managing Board
Our President and Chief Financial Officer has been appointed as member of our Managing Board per May 22, 2024, therefore the below Table C1 only includes the evolution of the total paid compensation of our President and Chief Executive Officer from 2023 to 2025, while Table C2 includes the evolution of the total paid compensation of our President and Chief Financial Officer for 2024 and 2025:
Table C1 Evolution of total paid compensation of our President and Chief Executive Officer
| | | | | | | | | | | | | | | | | | | | |
| President and Chief Executive Officer | | 2025 | 2024 | | 2023 |
| Base salary | | | $ | 1,279,752 | | $ | 1,172,200 | | | $ | 1,213,544 | |
| Variable components | Short-term incentive(1) | | $ | 779,140 | | $ | 2,458,745 | | | $ | 2,819,125 | |
| Long-term incentive(2) | | $ | 2,307,082 | | $ | 4,255,388 | | | $ | 1,838,364 | |
Other components | Benefits | | $ | 135,107 | | $ | 120,885 | | | $ | 117,737 | |
| Social security contributions(3) | | $ | 807,785 | | $ | 1,058,494 | | | $ | 877,128 | |
| Pensions | | $ | 331,629 | | $ | 399,449 | | | $ | 435,717 | |
| Miscellaneous allowances(4) | | $ | — | | $ | — | | | $ | — | |
| Termination benefits | | $ | — | | $ | — | | | $ | — | |
| Total | | | $ | 5,640,495 | | $ | 9,465,161 | | | $ | 7,301,615 | |
(1) As of 2021 with the implementation of the remuneration policy of the Managing Board adopted at the 2021 AGM, the short-term incentive is paid fully in cash. The short-term incentive related to 2025, 2024 and 2023 was approved by the Compensation Committee and Supervisory Board with respect to the 2025, 2024 and 2023 financial year, respectively, based on the evaluation and assessment of the actual fulfillment of a number of predefined objectives for such year. The short-term incentive related to a relevant year is paid in the subsequent year, i.e. the short-term incentive related to the 2025, 2024 and 2023 financial year, respectively, is paid in 2026, 2025 and 2024.
(2) Following the Board's approval of the achievement of the performance conditions, the number of shares definitively acquired under the terms of the plans was as follows 36,000 shares in 2023, 100,000 shares in 2024 and 91,667 shares in 2025. The evolution of the number of shares acquired each year, is linked to the decision made by the Supervisory Board to transition from long-term incentive plans with annual vesting over a three-year performance period (long-term incentive grants before 2021) to long-term incentive plans with one-time vesting after a three-year performance period (long-term incentive grants since 2021).
(3) The social security contributions relate to the fixed and variable remuneration, including the unvested stock awards.
(4) There were no miscellaneous allowances nor termination benefits in the years 2025, 2024 and 2023.
Table C2 Evolution of total paid compensation of our President and Chief Financial Officer
| | | | | | | | | | | |
| President and Chief Financial Officer | 2025 | 2024 |
| Base salary | | $ | 1,047,070 | | $ | 585,475 | |
| Variable components | Short-term incentive(1) | $ | 271,460 | | $ | — | |
| | Long-term incentive(2) | $ | — | | $ | — | |
| Other components | Benefits | $ | 114,168 | | $ | 67,850 | |
| | Social security contributions(3) | $ | 273,545 | | $ | 200,801 | |
| Pensions | $ | 1,101,582 | | $ | 947,460 | |
| | Miscellaneous allowances(4) | $ | — | | $ | — | |
| | Termination benefits | $ | — | | $ | — | |
| Total | | $ | 2,807,825 | | $ | 1,801,586 | |
(1) The short-term incentive paid to our President and Chief Financial Officer, as presented in this table, reflects an adjusted short-term incentive for the period starting from his appointment as a member of the Managing Board on May 22, 2024.
(2) For financial years 2024 and 2025, the long-term incentive is not relevant to our President and Chief Financial Officer, as he was appointed as member of the Managing Board on May 22, 2024. The first long-term incentive grant to our President and Chief Financial Officer occurred in July 2024, therefore the first vesting, depending on the assessment of the performance conditions by the Compensation Committee and the Supervisory Board after the three-year performance period, will take place in 2027.
(3) The social security contributions relate to the fixed and variable remuneration, including the unvested stock awards.
(4) There were no miscellaneous allowances nor termination benefits in the years 2025 and 2024.
4.9.2.6. Overview of the total compensation paid or owed to the members of our Managing Board, over financial years 2025, 2024, 2023
Set forth in the following table is the total compensation paid or owed to the members of our Managing Board, in office over financial years 2025, 2024 and 2023:
| | | | | | | | | | | | | | | | | | | | | | | | | | | | | |
| | | Variable components | Other components(1) | | | |
| Name and title | Year | Base | Short-term | Long-term | Benefits | Social | Pensions | Total | Fixed/ |
| salary | Incentives (2) | Incentives(3) | security | Variable |
| | | contributions(4) | remuneration |
| Jean-Marc Chery | 2025 | $1,279,752 | $1,267,530 | $2,307,082 | $135,107 | $807,785 | $331,629 | $6,128,885 | 42% fixed/ 58% variable |
| President and Chief Executive Officer |
| 2024 | $1,172,200 | $686,730 | $4,255,388 | $120,885 | $1,058,494 | $399,449 | $7,693,146 | 36% fixed/ 64% variable |
|
| 2023 | $1,213,544 | $2,487,766 | $1,838,364 | $117,737 | $877,128 | $435,717 | $6,970,256 | 38% fixed / 62% variable |
|
| Lorenzo Grandi | 2025 | $1,047,070 | $725,949 | ___ | $114,168 | $273,545 | $1,101,582 | $3,262,314 | 74% fixed/26% variable (5) |
| President and Chief Financial Officer |
| 2024 | $585,475 | 239,263 | ___ | $67,850 | $200,801 | $947,460 | $2,040,849 | 88% fixed/12% variable (5) |
|
(1) There were no miscellaneous allowances nor termination benefits in the years 2025, 2024 and 2023.
(2) As of 2021 with the implementation of the remuneration policy for our Managing Board adopted at the 2021 AGM, the short-term incentive is paid fully in cash. The short-term incentive related to 2025, 2024 and 2023 was approved and granted by the Compensation Committee and Supervisory Board with respect to the 2025, 2024 and 2023 financial year, respectively, based on the evaluation and assessment of the actual fulfillment of a number of pre-defined objectives for such year. The short-term incentive related to a relevant year is paid in the subsequent year, i.e. the short-term incentive related to the 2025, 2024 and 2023 financial year, respectively, is paid in 2026, 2025 and 2024. The achievement rate for the 2025 short-term incentive (to be paid in 2026), based on 2025 performance, is (i) 100% in cash out of maximum of 210% for our President and Chief Executive Officer and (ii) 70% in cash out of maximum of 150% for our President and Chief Financial Officer. The achievement rate for the 2024 short-term incentive (paid in 2025), based on 2024 performance, was (i) 60% in cash out of maximum of 210% for our President and Chief Executive Officer and (ii) 42% in cash out of maximum of 150% for our President and Chief Financial Officer. The achievement rate for the 2023 short-term incentive (paid in 2024), based on 2023 performance, was 205% out of maximum of 210% for our President and Chief Executive Officer.
(3) Following the Supervisory Board's approval of the achievement of the performance conditions, the number of shares definitively acquired under the terms of the long-term incentive plans was as follows: 36,000 shares in 2023, 100,000 shares in 2024 and 91,667 shares in 2025. The evolution of the number of shares acquired each year, is linked to the decision made by the Supervisory Board to transition from long-term incentive plans with annual vesting over a three-year performance period (long-term incentive grants before 2021) to long-term incentive plans with one-time vesting after a three-year performance period (long-term incentive grants since 2021).
(4) The social security contributions relate to the fixed and variable remuneration, including the unvested stock awards.
(5) As our President and Chief Financial Officer was appointed as member of the Managing Board on May 22, 2024, this table does not include any long-term variable remuneration, since in his current position as member of the Managing Board, he will be eligible to receive any long-term incentive as of 2027, subject to the assessment of the performance conditions by the Compensation Committee and the Supervisory Board.
4.9.2.7 Compensation provisions in the event of termination or departure of the members of our Managing Board
The members of the Managing Board are appointed by the AGM for a three-year term, which term is renewable. Our President and Chief Executive Officer was reappointed at the 2024 AGM and our President and Chief Financial officer was appointed at the 2024 AGM, both for a three-year term, expiring at the 2027 AGM. The agreements with the members of the Managing Board may be a mandate
agreement or an employment agreement. Although the relationship between a member of the Managing Board and a listed Dutch company will be treated as a mandate agreement and not as an employment agreement, existing employment agreements between the Company and a member of the Managing Board will remain in effect.
Our President and Chief Executive Officer has two employment agreements with us, first with the Company, which relates to his activities as member of our Managing Board and representative of the Company, and the second agreement with one of our legal entities in Switzerland, which relates to his activities as President and Chief Executive Officer, the executive incentive program ("EIP"), pension and other items covered by the remuneration policy for our Managing Board (the "CEO Agreements"). The CEO Agreements can be terminated with a notice period of 6 months if terminated by the Company or 3 months if terminated by our President and Chief Executive Officer.
Our President and Chief Financial Officer has one employment agreement with one of our legal entities in Switzerland, which relates to his activities as President and Chief Financial Officer, the EIP, pension and other items covered by the 2024 Remuneration Policy (the "CFO Agreement"). The CFO Agreement can be terminated with a notice period of 3 months, if terminated by the Company, or 3 months if terminated by the President and Chief Financial Officer.
Severance clause
Pursuant to the CEO Agreements, our President and Chief Executive Officer will be entitled to a severance payment if his employment is terminated at the initiative of the Company, other than for cause, considering amongst others, his critical role in the Company and his seniority. The severance payment will be equal to a gross lump sum payment in the amount of two times his latest gross annual salary, plus the short-term incentive (being the average of the short-term incentive received in the last three years) subject to any and all applicable legal, regulatory and/or contractual deductions.
Any severance payments made will be disclosed in the remuneration report in the annual report of the financial year that this amount relates to, as well as the reason for the severance payment.
Vesting of stock awards in the event of termination or departure
In the event of termination of the employment or departure of the members of our Managing Board, their stock awards will either (i) be forfeited in full, (ii) accelerate in vesting or (iii) continue vesting, as shown in the table below.
| | | | | | | | | | | | | | | | | |
| | | Termination by the Company |
| Resignation | Retirement | Not in connection with change of control or serious or gross misconduct | In connection with change of control | In connection with serious or gross misconduct |
Outcome of unvested stock awards | Forfeited in full | Continuation of vesting | Accelerated vesting | Accelerated vesting | Forfeited in full |
Set forth in the table below is an overview of the compensation of our President and Chief Executive Officer in the event of his termination or departure, as applicable.
| | | | | | | | | | | | | | | | | |
| Resignation | Retirement | Termination by the Company |
Not in connection with change of control or serious or gross misconduct | In connection with change of control | In connection
with serious or
gross misconduct |
| Severance Clause | Not applicable | Not applicable | 2 times the annual base salary plus average short-term incentive over the last 3 years | 2 times the annual base salary plus average short-term incentive over the last 3 years | Not applicable |
4.9.3. Senior Management remuneration
4.9.3.1.Guiding principles of Senior Management compensation
The Managing Board determines the remuneration structure of the Senior Management based on, amongst others, the same key principles that the Supervisory Board considers when determining the remuneration structure of the Managing Board. These key principles are described above in Section 4.9.2.3. (Managing Board remuneration - Guiding principles of Managing Board compensation).
In accordance with the key principles, the total remuneration of the Senior Management takes into consideration factors such as the size and complexity of the Company, our global presence and that of our customers, the pace of change in our industry, the Company’s value proposition, strategy and goal of sustainable long-term value creation, and the need to recruit and retain key personnel.
4.9.3.2.Senior Management remuneration structure
The structure of our remuneration for our (i) Managing Board, (ii) Senior Management, and (iii) certain other groups of senior employees is aligned and consists of a base salary, short-term incentive and long-term incentive, under specified conditions. The standard benefits for the aforementioned groups are also aligned.
The Managing Board determines the remuneration structure and remuneration amounts for our Senior Management based on the analysis of the theoretical maximum total direct remuneration (i.e., sum of base salary, maximum short-term incentive, and maximum long-term incentive).
The remuneration package of the Senior Management is comprised of the following:
•base salary; and
•variable components, linked to performance:
◦a short-term incentive which is fully paid in cash.
◦a long-term incentive through the grant of stock awards, that are included in the long-term incentive plan approved at the AGM.
The sum of these three elements represents the maximum total direct remuneration for the Senior Management.
Base Salary
The purpose of the base salary is to provide a fixed level of earnings and to attract and retain talent. It is a key component of overall remuneration, particularly as the short-term incentive is expressed as a percentage of base salary.
Short-term incentive
The short-term incentive based on the corporate EIP, entitles selected executives, including the members of Senior Management, to an annual short-term incentive. This short-term incentive is based upon the assessment of the achievement of individual, organizational and Company objectives that are set on an annual basis and focused on, inter alia, return on net assets, customer service, profit, cash flow and market share. The maximum amount awarded under the short-term incentive is based upon a percentage of the executive’s salary and the overall achievement of the relevant objectives on an annual basis.
As in 2024, the 2025 short-term incentive includes a sustainability/corporate social responsibility index for Senior Management, as part of our efforts to include corporate social responsibility into the performance
framework of our Senior Management. For Executive Committee members and Executive Vice Presidents, the weight of the sustainability/corporate social responsibility index ranges is 10%. The sustainability / corporate social responsibility index is divided into four criteria related to health and safety, environment, diversity and inclusion, and people engagement.
For the 2025 short-term incentive, the sustainability/corporate social responsibility index was comprised of the following KPIs:
•health and safety: measured against the safety performance (employees and contractors);
•environment/climate: measured against greenhouse gas emissions (kCO2 equivalent);
•diversity and inclusion: measured against gender ratio among management levels; and
•people management: measured against the employee survey (engagement index).
The weight of the sustainability/corporate social responsibility index is designed to remain stable over time, however the individual sub-components used to form the sustainability/corporate social responsibility index may evolve in the future to address sustainability priorities facing the Company and society.
Long-term incentive
The purpose of the long-term incentive, through the grant of stock awards, is to motivate the Senior Management to deliver sustainable long-term shareholder value through long-term profitability and share price growth.
In accordance with the current long-term incentive plan, and similar to the Managing Board, stock awards granted to members of our Senior Management under the long-term incentive plan vest over a three-year performance period, more specifically:
•the vesting of the majority of unvested stock awards in respect of the Executive Committee, is subject to the achievement of performance conditions and calculated over a three-year performance period. Grants of unvested stock awards made in 2023, 2024 and 2025 will fully vest, subject to performance conditions, in 2026, 2027 and 2028 respectively, provided also that the eligible employee is still an employee of the Company at such time; and
•the vesting of the majority of unvested stock awards in respect of the Executive Vice Presidents, is subject to the achievement of performance conditions and calculated over a three-year performance period. Grants of unvested stock awards made in 2024 and 2025 will fully vest, subject to performance conditions, in 2027 and 2028 respectively, provided also that the eligible employee is still an employee of the Company at such time.
The Supervisory Board determines whether the performance criteria are met and concludes whether and to which extent all eligible employees are entitled to any stock awards under the long-term incentive plan.
From 2021, a new sustainability/corporate social responsibility index has been introduced among the performance conditions for the long-term incentive. For the 2025 long-term incentive, the sustainability/corporate social responsibility index comprised of the following KPIs:
•environment/climate: measured against the greenhouse gas emissions (kCO2 equivalent);
•diversity and inclusion: measured against gender ratio among management levels;
•ESG investor index: measured against the Dow Jones sustainability indices; and
•carbon rating agency: measured against the Carbon Disclosure Project carbon rating.
The weight of the sustainability/corporate social responsibility index is designed to remain stable for future grants, however the individual sub-components used to form the sustainability/corporate social responsibility index may evolve in the future to address sustainability priorities facing the Company and society.
Pension plan, life and medical insurance
Our Supervisory Board has approved the establishment of a complementary pension plan for certain key executives as selected by the members of our Managing Board, according to the general criteria of eligibility and service as determined by the Supervisory Board upon the proposal of its Compensation Committee. With respect to such complementary pension plan, we have set up an independent foundation under Swiss law which manages the plan and to which we make contributions. Pursuant to this plan, in 2025, we made a contribution of approximately $1.43 million to the plan of the members of our Managing Board, and of $0.59 million to the plan for all beneficiaries other than the members of our Managing Board. The amount of pension plan payments made for other beneficiaries, such as former employees retired in 2025 and/or no longer salaried in 2025, was $1.02 million.
The members of our Senior Management, including the members of our Managing Board, were covered in 2025 under certain group life and medical insurance programs provided by us. The aggregate additional amount set aside by us in 2025 to provide pension, retirement or similar benefits to our Senior Management, including the members of our Managing Board, including the amounts allocated to the complementary pension plan described above, is estimated to have been approximately $8.12 million, which includes statutory employer contributions for state run retirement, similar benefit programs and other miscellaneous allowances.
4.9.3.3.Compensation paid to the Senior Management in 2025, 2024 and 2023
Base salary
Over the last three years the base salary paid to the Senior Management (including the members of the Managing Board) is:
| | | | | | | | | | | | | | | | | |
| 2025(1) | | 2024(2) | | 2023(3) |
Senior Management base salary | $20,539,517 | | $ | 18,264,979 | | | $19,225,024 |
(1) Including amounts paid in 2025 to our former Executive Vice President, Analog sub-group, Analog, Power & Discrete, MEMS and Sensors Group, Matteo Lo Presti and our former Executive Vice President, Chief Procurement Officer, Geoff West who left the Company in 2025. During 2025, our Senior Management consisted of 32 members.
(2) Including amounts paid in 2024 to our former President, Automotive and Discrete Group, Marco Monti, who left the Company in 2024. During 2024, our Senior Management consisted of 31 members.
(3) Including the amounts paid in 2023 to our former President, Technology, Manufacturing, Quality and Supply Chain, Orio Bellezza; former Executive Vice President Front-End Manufacturing, Analog and Power, Michael Hummel and former Executive Vice President, MEMS Sub-Group Analog, MEMS and Sensors Group, Andrea Onetti. During 2023, our Senior Management consisted of 34 members.
Short-term incentive
The amounts paid in 2025 to our Senior Management (including the members of the Managing Board) pursuant to the short-term incentive represented approximately 14.81% of the total compensation paid to our Senior Management and are further detailed below:
| | | | | | | | | | | | | | | | | | | | | | | | | | | | | | | | | | | | | | |
| | Bonus paid in 2025 (2024 performance)(1) | | | Bonus paid in 2024 (2023 performance)(2) | | | Bonus paid in 2023 (2022 performance)(3) | |
| Short-term incentive (cash) amount | | $9,889,099 | | | $18,891,495 | | | $19,654,870 | |
Ratio short-term incentive / (base
salary + short-term incentive) | | | 32.5 | % | | | 50.84 | % | | | 50.55 | % |
(1)Including amount paid in 2025 to our former Executive Vice President, Analog sub-group, Analog, Power & Discrete, MEMS and Sensors Group, Matteo Lo Presti and to our former Executive Vice President, Chief Procurement Officer, Geoff West who left the Company in 2025.
(2)Including amounts paid in 2024 to our former President, Automotive and Discrete Group, Marco Monti; our former President, Technology, Manufacturing, Quality and Supply Chain, Orio Bellezza; our former Executive Vice President, Power Transistor subgroup within ST's Automotive and Discrete Group, Edoardo Merli; our former Executive Vice President Front-End Manufacturing, Analog and Power, Michael Hummel.
(3)Including amounts paid in 2023 to our former President, Technology, Manufacturing, Quality and Supply Chain, Orio Bellezza; former Executive Vice President Front-End Manufacturing, Analog and Power, Michael Hummel and former Executive Vice President, MEMS Sub-Group Analog, MEMS and Sensors Group, Andrea Onetti.
Long-term incentive
The second part of the variable component is the long-term incentive which links the long-term interests of the Senior Management with the shareholders’ and investors’ interests.
The amounts paid in 2025 to our Senior Management (including the member of the Managing Board, our President and Chief Executive Officer) pursuant to the long-term incentive represented approximately 32.10% of the total compensation paid to our Senior Management and are further detailed below:
| | | | | | | | | | | |
| Long-term incentives paid in 2025(1) | Long-term incentives paid in 2024(2) | Long-term incentives paid in 2023(3) |
| Long-term incentive amount | $21,433,505 | $42,029,100 | $ 50,010,449 |
Ratio long-term incentive / base salary | 104.35% | 230.11% | 260.13% |
Ratio long-term incentive / (short-term incentive + long term incentive) | 68.43% | 68.99% | 71.79% |
(1) Including amount paid in 2025 to our former Executive Vice President, Analog sub-group, Analog, Power & Discrete, MEMS and Sensors Group, Matteo Lo Presti and our former Executive Vice President, Chief Procurement Officer, Geoff West who left the Company in 2025.
(2) Including amounts paid in 2024 to our former President, Automotive and Discrete Group, Marco Monti; our former President, Technology, Manufacturing, Quality and Supply Chain, Orio Bellezza; our former Executive Vice President, Power Transistor subgroup within ST's Automotive and Discrete Group, Edoardo Merli; our former Executive Vice President Front-End Manufacturing, Analog and Power, Michael Hummel.
(3) Including amounts paid in 2023 to our former President, Technology, Manufacturing, Quality and Supply Chain, Orio Bellezza; former Executive Vice President Front-End Manufacturing, Analog and Power, Michael Hummel and former Executive Vice President, MEMS Sub-Group Analog, MEMS and Sensors Group, Andrea Onetti.
Total compensation
The following table sets forth the total amount paid as compensation in 2025, 2024 and 2023 to our Senior Management (including the members of the Managing Board) as of December 31 of each year, before applicable withholding taxes and social contributions:
| | | | | | | | | | | | | | | | | | | | | | | | | | | | | | | | | | | | | | | | | | | | | | | | | | | | | | |
| | | | | Variable components | | Other components(1) | | | | | |
| Year | | Base salary | | Short-term Incentives (5) | | | Long-term Incentives (6) | | Benefits | | Social security contri-butions | | Pensions | | Termination benefits | | | Total | | Fixed/ Variable remune-ration |
2025(2) | | $20,539,517 | | $9,889,099 | $21,433,505 | | $1,806,997 | | $9,442,395 | | $2,028,490 | | $1,637,482 | | | $66,777,485 | | 53% fixed / 47% variable |
2024(3) | | $18,264,979 | | $18,891,495 | | $42,029,100 | | $2,280,421 | | $12,560,478 | | $2,530,968 | | $11,434,984 | | | $107,992,425 | | 43% fixed / 57% variable |
2023(4) | | $19,225,024 | | $19,654,870 | | $50,010,449 | | $1,659,639 | | $10,555,981 | | $1,474,372 | | $6,203,607 | | | $108,783,942 | 36% fixed / 64% variable |
(1) There were no miscellaneous allowances in the years 2025, 2024, and 2023.
(2) Including amounts paid in 2025 to our former Executive Vice President, Analog sub-group, Analog, Power & Discrete, MEMS and Sensors Group, Matteo Lo Presti and our former Executive Vice President, Chief Procurement Officer, Geoff West who left the Company in 2025.
(3) Including amounts paid in 2024 to our former President, Automotive and Discrete Group, Marco Monti; our former President, Technology, Manufacturing, Quality and Supply Chain, Orio Bellezza; our former Executive Vice President, Power Transistor subgroup within ST's Automotive and Discrete Group, Edoardo Merli.
(4) Including amounts paid in 2023 to our former President, Technology, Manufacturing, Quality and Supply Chain, Orio Bellezza; former Executive Vice President Front-End Manufacturing, Analog and Power, Michael Hummel and former Executive Vice President, MEMS Sub-Group Analog, MEMS and Sensors Group, Andrea Onetti.
(5) The evolution between 2024 and 2025 is largely attributable to a lower achievement rate of the performance conditions in 2025, leading to a reduced short‑term incentive payout.
(6) The evolution between 2024 and 2025 is mainly explained by the evolution of the ST Microelectronics share price at the vesting
date of each long term incentive plan.
We did not extend any loans or overdrafts to the members of our Managing Board, nor to any other member of our Senior Management. Furthermore, we have not guaranteed any debts or concluded any leases with the members of our Managing Board, nor with any other member of our Senior Management or their families.
For further details on the compensation of our Senior Management we also refer to Note 7.6.35 (Earnings per share) to our consolidated financial statements.
Senior Management (and the compensation related hereto in this Section 4.9.3.2. Senior Management remuneration structure) refers to:
•the members of the Managing Board;
•the members of the Executive Committee (including the members of the Managing Board) of the Company; and
•the Executive Vice Presidents of the Company.
We also include below, for comparative purposes in Section 4.9.3.4. below (i) compensation paid to the Executive Committee (excluding the members of the Managing Board,) in financial years 2054, 2024 and 2023, and in Section 4.9.3.5. (ii) compensation paid to the Executive Vice Presidents in financial years 2025, 2024 and 2023.
4.9.3.4. Compensation paid to the Executive Committee (excluding the members of the Managing Board)
Base salary
The base salary paid to the Executive Committee (excluding the members of the Managing Board) in financial years 2025, 2024 and 2023 is:
| | | | | | | | | | | | | | | | | | | | |
| | 2025 | | 2024(1) | | 2023(2) |
Executive Committee base salary | | $5,962,032 | | $5,952,378 | | $6,782,818 |
(1) Including amounts paid in 2024 to our President and Chief Financial Officer prior to his appointment as member of our Managing Board on May 22, 2024 and our former President, Automotive and Discrete Group, Marco Monti; our former President, Technology, Manufacturing, Quality and Supply Chain, Orio Bellezza.
(2) Including amounts paid in 2023 to our former President, Technology, Manufacturing, Quality and Supply Chain, Orio Bellezza.
Short-term incentive
The amounts paid in financial years 2025, 2024 and 2023 to the Executive Committee (excluding the members of the Managing Board) pursuant to the short-term incentive are further detailed below:
| | | | | | | | | | | | | | |
| | Bonus paid in 2025 (2024 performance)(1) | Bonus paid in 2024 (2023 performance)(2) | Bonus paid in 2023 (2022 performance)(3) |
Short-term incentive (cash) amount | | $3,568,885 | $9,043,380 | $8,553,348 |
Ratio short-term incentive / (base salary + Short-term incentive) | | 37% | 60% | 56% |
(1)Including amounts paid in 2025 to our President and Chief Financial Officer for the adjusted short-term incentive for the period prior to his appointment as a member of the Managing Board on May 22, 2024.
(2)Including amounts paid in 2024 to our President and Chief Financial Officer prior to his appointment as member of our Managing Board on May 22, 2024 and our former President, Automotive and Discrete Group, Marco Monti; our former President, Technology, Manufacturing, Quality and Supply Chain, Orio Bellezza.
(3)Including amounts paid in 2023 to our former President, Technology, Manufacturing, Quality and Supply Chain, Orio Bellezza.
Long-term incentive
The amounts paid in financial years 2025, 2024 and 2023 to the Executive Committee (excluding the members of the Managing Board) pursuant to the long-term incentive are further detailed below:
| | | | | | | | | | | |
| Long-term incentives paid in 2025(1) | Long-term incentives paid in 2024(2) | Long-term incentives paid in 2023(3) |
Long-term incentive amount | $7,468,038 | $18,500,090 | $21,024,493 |
Ratio long-term incentive / base salary | 125% | 311% | 310% |
Ratio long-term incentive / (short-term incentive + long-term incentive) | 68% | 67% | 71% |
(1) Including amounts paid in 2025 to our President and Chief Financial Officer prior to his appointment as member of our Managing Board on May 22, 2024.
(2) Including amounts paid in 2024 to our President and Chief Financial Officer prior to his appointment as member of our Managing Board on May 22, 2024 and our former President, Automotive and Discrete Group, Marco Monti; our former President, Technology, Manufacturing, Quality and Supply Chain, Orio Bellezza.
(3) Including amounts paid in 2023 to our former President, Technology, Manufacturing, Quality and Supply Chain, Orio Bellezza.
Total Compensation
The following table sets forth the total amount paid as compensation in financial years 2025, 2024 and 2023, to the Executive Committee (excluding the members of the Managing Board) as of December 31, before applicable withholding taxes and social contributions:
| | | | | | | | | | | | | | | | | | | | | | | | | | | | | | | | | | | | | |
| | | | Variable components | | Other components(1) | | | | | |
Year | | Base salary | | Short-term Incentives | Long-term Incentives | | Benefits | Social security contributions | Pensions | Termina-tion benefits | | Total | | Fixed/ Variable remuneration |
2025(2) | | $5,962,032 | | $3,568,885 | $7,468,038 | $734,415 | $2,797,420 | $595,279 | $2,221 | | $21,128,291 | | 48% fixed/ 52% variable |
2024(3) | | $5,952,378 | | $9,043,380 | $18,500,090 | | $1,422,243 | $4,639,390 | $1,184,059 | $7,795,680 | | $48,537,220 | | 43% fixed/ 57% variable |
2023(4) | | $6,782,818 | | $8,553,348 | $21,024,493 | | $879,991 | $3,612,613 | $1,038,655 | $2,638,475 | | $44,530,393 | | 34% fixed/
66% variable |
(1) There were no miscellaneous allowances in the years 2025, 2024, and 2023.
(2) Including amounts paid in 2025 to our President and Chief Financial Officer prior to his appointment as member of our Managing Board on May 22, 2024 and to our former President, Automotive and Discrete Group, Marco Monti.
(3) Including amounts paid in 2024 to our President and Chief Financial Officer prior to his appointment as member of our Managing Board on May 22, 2024; to our former President, Automotive and Discrete Group, Marco Monti and to our former President, Technology, Manufacturing, Quality and Supply Chain, Orio Bellezza.
(4) Including amounts paid in 2023 to our former President, Technology, Manufacturing, Quality and Supply Chain, Orio Bellezza.
4.9.3.5. Compensation paid to the Executive Vice Presidents
The base salary paid to the Executive Vice Presidents in financial years 2025, 2024 and 2023 is:
| | | | | | | | | | | | | | | | | | | | |
| | 2025(1) | 2024(2) | | 2023(3) | |
Executive Vice Presidents base salary | | $12,250,663.00 | $10,554,925 | | $11,228,661 | |
(1) Including amounts paid in 2025 to our former Executive Vice President, Analog sub-group, Analog, Power & Discrete, MEMS and Sensors Group, Matteo Lo Presti and to our former Executive Vice President, Chief Procurement Officer, Geoff West who left the Company in 2025.
(2) Including amounts paid in 2024 to our former Executive Vice President, Power Transistor subgroup within ST's Automotive and Discrete Group Edoardo Merli.
(3) Including amounts paid in 2023 to our former Executive Vice President Front-End Manufacturing, Analog and Power, Michael Hummel and former Executive Vice President, MEMS Sub-Group Analog, MEMS and Sensors Group, Andrea Onetti.
Short-term incentive
The amounts paid in financial years 2025, 2024 and 2023 to the Executive Vice Presidents pursuant to the short-term incentive are further detailed below:
| | | | | | | | | | | | | | |
| | Bonus paid in 2025 (2024 performance)(1) | Bonus paid in 2024 (2023 performance)(2) | Bonus paid in 2023 (2022 performance)(3) |
Short-term incentive (cash) amount | | $5,269,614 | $7,389,370 | $8,282,397 |
Ratio short-term incentive / (base salary + Short-term incentive) | | 30% | 41% | 42% |
(1) Including amounts paid in 2025 to our former Executive Vice President, Analog sub-group, Analog, Power & Discrete,
MEMS and Sensors Group, Matteo Lo Presti and to our former Executive Vice President, Chief Procurement Officer, Geoff West who left the Company in 2025.
(2) Including amounts paid in 2024 to our former Executive Vice President, Power Transistor subgroup within ST's Automotive and Discrete Group Edoardo Merli; and our former Executive Vice President Analog & Power Front-End Manufacturing, Michael Hummel.
(3) Including amounts paid in 2023 to our former Executive Vice President Front-End Manufacturing, Analog and Power, Michael Hummel and former Executive Vice President, MEMS Sub-Group Analog, MEMS and Sensors Group, Andrea Onetti.
Long-term incentive
The amounts paid in financial years 2025, 2024 and 2023 to the Executive Vice Presidents pursuant to the long-term incentive are further detailed below:
| | | | | | | | | | | |
| Long-term incentives paid in 2025(1) | Long-term incentives paid in 2024(2) | Long-term incentives paid in 2023(3) |
Long-term incentive amount | $11,658,385 | $19,273,622 | $27,147,593 |
Ratio long-term incentive / base salary | 95% | 183% | 242% |
Ratio long-term incentive / (short-term incentive + long-term incentive) | 69% | 72% | 77% |
(1) Including amounts paid in 2025 to our former Executive Vice President, Analog sub-group, Analog, Power & Discrete, MEMS and Sensors Group, Matteo Lo Presti and to our former Executive Vice President, Chief Procurement Officer, Geoff West who left the Company in 2025.
(2) Including amounts paid in 2024 to our former Executive Vice President, Power Transistor subgroup within ST's Automotive and Discrete Group Edoardo Merli; and our former Executive Vice President Analog & Power Front-End Manufacturing, Michael Hummel.
(3) Including amounts paid in 2023 to our former Executive Vice President Front-End Manufacturing, Analog and Power, Michael Hummel and former Executive Vice President, MEMS Sub-Group Analog, MEMS and Sensors Group, Andrea Onetti.
Total Compensation
The following table sets forth the total amount paid as compensation in financial years 2025, 2024 and 2023, to the Executive Vice Presidents as of December 31 of each year, before applicable withholding taxes and social contributions:
| | | | | | | | | | | | | | | | | | | | | | | | | | | | | | | | | | | | | | | | | | | | | | | | | | |
| | | | | Variable components | | | Other components(1) | | | | | |
Year | | Base salary | Short-term Incentives | Long-term Incentives | | | Benefits | Social security contributions | Termination benefits | | Total | | Fixed/ Variable remuneration |
2025(2) | | $12,250,663 | | $5,269,614 | $11,658,385 | | | $823,307 | $5,563,644 | $1,635,261 | | $37,200,874 | | 54% fixed / 46% variable |
2024(3) | | $10,554,925 | | $7,389,370 | $19,273,622 | | | $669,443 | $6,661,794 | $3,639,304 | | $48,188,458 | | 45% fixed / 55% variable |
2023(4) | | $11,228,661 | | $8,282,397 | $27,147,593 | | | $661,911 | $6,066,240 | $3,565,133 | | $56,951,935 | | 38% fixed / 62% variable |
(1) There were no miscellaneous allowances in the years 2025, 2024, and 2023.
(2) Including amounts paid in 2025 to our former Executive Vice President, Analog sub-group, Analog, Power & Discrete, MEMS and Sensors Group, Matteo Lo Presti and to our former Executive Vice President, Chief Procurement Officer, Geoff West who left the Company in 2025.
(3) Including amounts paid in 2024 to our former Executive Vice President, Power Transistor subgroup within ST's Automotive and Discrete Group Edoardo Merli; and our former Executive Vice President Analog & Power Front-End Manufacturing, Michael Hummel.
(4) Including amounts paid in 2023 to our former Executive Vice President Front-End Manufacturing, Analog and Power, Michael Hummel and former Executive Vice President, MEMS Sub-Group Analog, MEMS and Sensors Group, Andrea Onetti.
4.9.4. Remuneration comparison between the Managing Board, the Executive Committee (excluding the members of the Managing Board), the Executive Vice Presidents and indirect employees
Set forth in the following table is the annual change over the last five years of (i) the remuneration of the members of the Managing Board, (ii) the remuneration of the Executive Committee (excluding the members of the Managing Board), (iii) the remuneration of the Executive Vice Presidents, (iv) the average remuneration of all our indirect employees other than the members of our Senior Management, including the members of the Managing Board, and (v) the performance of the Company (based on US GAAP where relevant). The average is calculated by taking the sum of remuneration costs and dividing by the average number of full-time equivalent indirect employees over the period. The table below also shows the pay ratio between our Managing Board, the Executive Committee (excluding the members of the Managing Board), the Executive Vice Presidents and our indirect employees.
| | | | | | | | | | | | | | | | | | | | | | | |
| 2025 | 2024 | | 2023 | | 2022 | 2021 |
Managing Board remuneration | | | | | | | |
Total remuneration of the members of the Managing Board (A) (amounts in thousands USD)(1) | $8,448 | $11,267 | | $7,302 | | $7,218 | $7,559 |
Evolution of the remuneration of the members of the Managing Board | (25)% | 54% | | 1% | | (5)% | 32% |
Executive Committee (excluding the members of the Managing Board) remuneration | | | | | | | |
Average remuneration of the Executive Committee (excluding the members of the Managing Board) (B) (amounts in thousands USD)(2)(7) | $3,521 | $6,067 | | $4,948 | | $4,250 | $4,381 |
Evolution of average remuneration of the Executive Committee (excluding the members of the Managing Board) | (42)% | 23% | | 16% | | (3)% | 23% |
| Ratio A versus B | 2.4 | 1.86 | | 1.48 | | 1.7 | 1.73 |
| Executive Vice Presidents remuneration | | | | | | | |
Average remuneration of the Executive Vice Presidents (C) (amounts in thousands USD)(3)(4) | $1,488 | $2,095 | | $2,373 | | $2,256 | $2,779 |
| Evolution of the average remuneration of the Executive Vice Presidents | (29)% | (12)% | | 5% | | (19)% | 34% |
| Ratio A versus C | 5.68 | 5.38 | | 3.08 | | 3.2 | 2.72 |
Employee remuneration(5) | | | | | | | |
Average remuneration of all global indirect employees (FTE basis) (D)(6) | $122,100 | $114,400 | | $114,100 | | $109,600 | $111,200 |
| Evolution of the average remuneration of all global indirect employees (FTE basis) | 7% | —% | | 4% | | (1)% | 13% |
Ratio A versus D | 69.19 | 98.49 | | 64 | | 65.9 | 68 |
| Ratio B versus D | 28.84 | 53.03 | | 43.4 | | 38.8 | 39.4 |
| Ratio C versus D | 12.19 | 18.31 | | 20.8 | | 20.6 | 25 |
| Company's performance | | | | | | | |
Net revenues (amounts in millions) | $11,800 | $13,269 | | $17,286 | | $16,128 | $12,761 |
| Evolution of the revenues | (11)% | (23)% | | 7% | | 26% | 25% |
Operating income (amounts in millions) | $175 | $1,676 | | $4,611 | | $4,439 | $2,419 |
| Evolution of the Operating income | (90)% | (64)% | | 4% | | 84% | 83% |
(1) Total Managing Board remuneration for 2023 includes the remuneration to the, at that time, sole member of our Managing Board, whereas the total Managing Board remuneration for 2024 includes the remuneration of the President and Chief
Executive Officer and the remuneration of the President and Chief Financial Officer as per his appointment to the Managing Board on May 22, 2024.
(2) Average remuneration of our Executive Committee includes: (i) amounts paid in 2024 to our Chief Financial Officer before his appointment to the Managing Board, our former President, Automotive and Discrete Group, Mario Monti and (ii) amounts paid in 2024 and 2023 to our former President, Technology, Manufacturing, Quality and Supply Chain, Orio Bellezza.
(3) Average remuneration of our Executive Vice Presidents includes amounts paid in 2025 to our former Executive Vice President Analog sub-group, Analog, Power & Discrete, MEMS and Sensors Group, Matteo Lo Presti and to our former Executive Vice President, Chief Procurement Officer, Geoff West who left the Company in 2025.
(4) Average remuneration of our Executive Vice Presidents includes amounts paid in 2024 to our former Executive Vice President Power Transistor and Discrete Group Edoardo Merli and for 2024 and 2023 to our former Executive Vice President Front-End Manufacturing, Analog and Power, Michael Hummel and former Executive Vice President, MEMS Sub-Group Analog, MEMS and Sensors Group, Andrea Onetti.
(5) Employee remuneration is defined as all remuneration paid to our indirect employees including base salary, variable compensation in both cash and shares, social premiums, pension, expense allowances and benefits in kind. The average is calculated by taking the sum of remuneration costs and dividing by the average number of full-time equivalent indirect employees over the period.
(6) Global indirect employees are all employees other than those directly manufacturing our products, excluding Senior Management. “FTE” refers to full time equivalent.
(7) The variation in 2024 is mainly driven by the termination benefits granted in that specific year and share price increase for long-term incentive pay-out.
4.9.5. Share ownership
None of the members of our Supervisory Board, Managing Board or Senior Management holds shares or options to acquire shares representing more than 1% of our issued share capital.
4.9.6. Stock awards and options
Our stock-based compensation plans are designed to incentivize, attract and retain our executives and key employees by aligning compensation with our performance and the evolution of our share price. Since 2005, we have adopted long-term incentive plans based on stock awards for our management as well as key employees. Furthermore, until 2012, the Compensation Committee (on behalf of the Supervisory Board and with its approval) granted stock-based awards (the options to acquire common shares in the share capital of the Company) to the members and professionals of the Supervisory Board.
Pursuant to the shareholders’ resolutions adopted by our general meetings of shareholders, our Supervisory Board, upon the proposal of the Managing Board and the recommendation of the Compensation Committee, took the following actions:
•approved conditions relating to our 2025 unvested stock award allocation under the 2024 Unvested Stock Award Plan, including restriction criteria linked to our performance (for selected employees);
•approved conditions relating to our 2024 unvested stock award allocation under the 2021 Unvested Stock Award Plan, including restriction criteria linked to our performance (for selected employees); and
•approved conditions relating to our 2023 unvested stock award allocation under the 2021 Unvested Stock Award Plan, including restriction criteria linked to our performance (for selected employees).
The sale or purchase of shares of our stock by the members or professionals of our Supervisory Board, the members of our Managing Board, and all our employees are subject to an internal policy which involves, inter alia, certain blackout periods.
5. Corporate Governance
5.1. Commitment to the principles of good corporate governance
Our consistent commitment to good corporate governance principles is evidenced by:
•our corporate organization under Dutch law that entrusts our management to a Managing Board acting under the supervision and control of a Supervisory Board totally independent from the Managing Board. Members of our Managing Board and of our Supervisory Board are appointed and dismissed by our shareholders;
•our early adoption of policies on important issues such as business ethics and conflicts of interest and strict policies to comply with applicable regulatory requirements concerning financial reporting, insider trading and public disclosures;
•our compliance with Dutch securities laws, because we are a company incorporated under the laws of The Netherlands, and, as applicable, our compliance with American, French and Italian securities laws, because our shares are listed in these jurisdictions, in addition to our compliance with the corporate, social and financial laws applicable to our subsidiaries in the countries in which we do business;
•our broad-based activities in the field of corporate social responsibility, encompassing environmental, social, health, safety, educational and other related issues including our corporate governance statement which evidences our policy objectives with respect to diversity as well as the results of implementing our diversity policy for the year ended December 31, 2025;
•our implementation of a non-compliance reporting channel (managed by an independent third-party). We encourage everyone, including external business partners, to express, in good faith, any concerns they might have regarding possible violations of our Code of Conduct, our policies, or the law (including, without limitations, any concerns regarding accounting, internal controls or auditing matters). Our Speak-up Policy is communicated to all employees and includes, in addition to internal local and corporate reporting channels, an independent multilingual Ethics Hotline;
•our Corporate Ethics Committee and Local Ethics Committees, whose mandate is to provide support to our management in its efforts to foster a business ethics culture consistent across regions, functions and organizations;
•our Chief Ethics & Compliance Officer, who reports to our Chief Executive Officer, also acts as Executive Secretary to our Supervisory Board, and is jointly responsible with our Chief Audit & Risk Executive for our Ethics Hotline and related investigations; and
•our Chief Audit & Risk Executive, who reports directly to our Audit Committee for Internal Audit and directly to our Chief Financial Officer for ERM and Resilience (business continuity and crisis management), is also jointly responsible with our Chief Ethics & Compliance Officer for our Ethics Hotline and related investigations.
As a Dutch listed company, we are subject to the Dutch Corporate Governance Code, which is publicly available at www.mccg.nl. We are committed to informing our shareholders of any significant changes in our corporate governance policies and practices at our AGM. Along with our Supervisory Board charter (which we last updated in December 2025 and which also includes the charters of our Supervisory Board committees) and our Code of Conduct, the current version of our Corporate Governance Charter is posted on our website (investors.st.com), and these documents are available in print to any shareholder who may request them.
As required by article 2:391a(1) jo. article 3(1) of the Decree on the content of the management report and the Dutch Corporate Governance Code, our Corporate Governance Charter includes information on the broad outline of our corporate governance structure and our compliance with the Dutch Corporate Governance Code.
Our Supervisory Board is carefully selected based upon the combined experience and expertise of its members. In fulfilling their duties under Dutch law, Supervisory Board members serve the best interests of the Company and its business, taking into consideration the interests of all our shareholders and other stakeholders, and must act independently in their supervision of our management. Our Supervisory Board
has adopted criteria to assess the independence of its members in accordance with corporate governance listing standards of the New York Stock Exchange.
Our Supervisory Board has on various occasions discussed Dutch corporate governance standards, the implementing rules and corporate governance standards of the SEC and of the New York Stock Exchange, as well as other corporate governance standards. The Supervisory Board has determined, based on the evaluations by an ad hoc committee, the following independence criteria for its members: Supervisory Board members must not have any material relationship with STMicroelectronics N.V., or any of our consolidated subsidiaries, or our management. A “material relationship” can include commercial, industrial, banking, consulting, legal, accounting, charitable and familial relationships, among others, but does not include a relationship with direct or indirect shareholders.
We believe we are fully compliant with all material corporate governance standards of the New York Stock Exchange, to the extent possible for a Dutch company listed on Euronext Paris, Borsa Italiana, as well as the New York Stock Exchange.
Because we are a Dutch company, the Audit Committee is an advisory committee to the Supervisory Board, which reports to the Supervisory Board, and our general meeting of shareholders appoints our statutory auditors. Our Audit Committee has established a charter outlining its duties and responsibilities with respect to, among others, the monitoring of our accounting, auditing, financial reporting and the appointment, retention and oversight of our external auditors. In addition, our Audit Committee has established procedures for the receipt, retention and treatment of complaints regarding accounting, internal accounting controls or auditing matters, and the confidential anonymous submission by our employees regarding questionable accounting or auditing matters.
Pursuant to our Supervisory Board charter, the Supervisory Board is responsible for handling and deciding on potential reported conflicts of interests between the Company and members of the Supervisory Board, as well as the Managing Board.
The members of our Managing Board may not serve on the board of a public company without the prior approval of our Supervisory Board. Pursuant to the Supervisory Board charter, the members of our Managing Board must inform our Supervisory Board of any (potential) conflict of interest and pursuant to such charter and Dutch law, any Managing Board resolution regarding a transaction in relation to which the members of our Managing Board have a conflict of interest must be approved and adopted by our Supervisory Board. Should our entire Supervisory Board also have a conflict of interest, the resolution must be adopted by our shareholders’ meeting pursuant to Dutch law. We are not aware of any potential conflicts of interests between the private interest or other duties of our Managing Board members and our senior managers and their duties to us.
5.2. General meeting of shareholders
Our ordinary general meetings of shareholders are held at least annually, within six months after the close of each financial year, in Amsterdam, Haarlemmermeer (Schiphol Airport), Rotterdam or The Hague, The Netherlands. Extraordinary general meetings of shareholders may be held as often as our Supervisory Board deems necessary, and must be held upon the written request of registered shareholders or other persons entitled to attend general meetings of shareholders of at least 10% of the total issued share capital to our Managing Board or our Supervisory Board specifying in detail the business to be dealt with. Such written requests may not be submitted electronically. If the Managing Board or the Supervisory Board does not convene the general meeting of shareholders within six weeks of such a request, the aforementioned shareholders or individuals may be authorized by a competent judicial authority.
Notice of general meetings of shareholders shall be given by our Managing Board or by our Supervisory Board or by those who according to the law or our Articles of Association are entitled thereto. The notice shall be given in such manner as shall be authorized or required by law (including but not limited to a written notice, a legible and reproducible message sent by electronic means and an announcement published by electronic means), as well as in accordance with the regulations of a stock exchange where
our shares are officially listed at our request. In addition, shareholders and other persons entitled to attend our General Meetings of Shareholders that are registered in our share register shall be notified by letter that the meeting is being convened. The notice convening our general meeting of shareholders shall be given with due observance of the statutory notice period, which is currently 42 days prior to the meeting.
The notice of our general meeting of shareholders states the business to be transacted as well as other information prescribed by law and our Articles of Association. The agenda is fixed by the author of the notice of the meeting; however, one or more shareholders or other persons entitled to attend general meetings of shareholders representing at least one-tenth of our issued share capital may, provided that the request was made at least five days prior to the date of convocation of the meeting, request that proposals be included on the agenda. Notwithstanding the previous sentence, proposals of persons who are entitled to attend general meetings of shareholders will be included on the agenda, if such proposals are made in writing to our Managing Board within a period of sixty days before that meeting by persons who are entitled to attend our General Meetings of Shareholders who, solely or jointly, represent at least 1% of our issued share capital or a market value of at least €50 million. The requests referred to in the previous two sentences may not be submitted electronically. The aforementioned requests must comply with conditions stipulated by our Managing Board, subject to the approval of our Supervisory Board, which shall be posted on our website. Pursuant to Dutch law, a shareholder requesting discussion of an agenda item must disclose to us its entire beneficial interest (long and short position). We are required to disclose this interest on our website.
Dutch law prescribes a fixed registration date of 28 days prior to the date of the General Meeting of Shareholders, which means that shareholders and other persons entitled to attend our General Meetings of Shareholders are those persons who have such rights at such date and, as such, are registered in a register designated by our Managing Board, regardless of who is a shareholder or otherwise a person entitled to attend our general meeting of shareholders at the time of the meeting if a registration date would not be applicable.
Unless otherwise required by our Articles of Association or Dutch law, resolutions of our General Meetings of Shareholders require the approval of a majority of the votes cast at a meeting at which at least fifteen percent of the issued and outstanding share capital is present or represented. If a quorum is not present, a further meeting can be convened which shall be entitled, irrespective of the share capital represented, to pass a resolution. We may not vote our shares held in treasury. Blank and invalid votes shall not be counted.
In general, the most important items of our General Meetings of Shareholders are:
•the adoption of our annual accounts;
•the adoption of a dividend;
•the discharge of the members of our Managing Board and Supervisory Board;
•the adoption of the compensation policy of our Managing Board;
•the determination of the compensation of the members of our Supervisory Board;
•the appointment, suspension and dismissal of the members of our Managing Board;
•the appointment, suspension and dismissal of the members of our Supervisory Board;
•the appointment of our auditors;
•the authorization to our Managing Board to repurchase shares;
•the issuance of shares and the granting of rights to subscribe for shares (option rights) as well as the delegation of these authorities to our Supervisory Board;
•approving resolutions of our Managing Board as referred to below under “Managing Board”; and
•resolutions regarding the amendment of our Articles of Association, our liquidation, legal merger and legal demerger.
Under Dutch law, our general meeting of shareholders has the authority to adopt our statutory annual accounts as prepared by our Managing Board. Our general meeting of shareholders does not have the authority to amend our statutory annual accounts as prepared by our Managing Board. Our general meeting of shareholders can:
i. either adopt our statutory annual accounts in the form as prepared by our Managing Board; or
ii. instruct our Managing Board to amend our statutory annual accounts before adopting these annual accounts; or
iii. not adopt the statutory annual accounts.
If our general meeting of shareholders instructs our Managing Board to amend our statutory annual accounts, our Managing Board is required to make the necessary amendments, unless the instruction contravenes the provisions of reasonableness and fairness (redelijkheid en billijkheid). Furthermore, the instruction must not contravene with the applicable presentation rules for the statutory annual accounts, including requirements of consistency and balance continuity. If there are multiple options, our general meeting of shareholders is authorized to decide with due observance of said limits.
If there are doubts regarding the correctness of our statutory annual accounts, the annual report and the other information, a petition for revision of our statutory annual accounts can be filed with the Enterprise Chamber (Ondernemingskamer) of the Amsterdam Court of Appeal in The Netherlands by each interested party on the basis of non-compliance with the applicable presentation requirements for the statutory annual accounts, the annual report and/or the other information prescribed by the EU IFRS regime, Title 9 of Book 2 of the Dutch Civil Code and/or the Dutch Financial Markets Supervision Act (Wet op het financieel toezicht). The petition must state in which respect the documents require revision. The petition can also be filed by the Advocate General (advocaat-generaal) of the Amsterdam Court of Appeal on the basis of public interest as well as the AFM with due observance of Section 4 of the Dutch Financial Markets Supervision Act.
5.3. Supervisory Board
Our Supervisory Board advises our Managing Board and is responsible for supervising the policies pursued by our Managing Board, the manner in which the Managing Board implements the sustainable long-term value creation strategy and the general course of our affairs and business. Our Supervisory Board consists of such number of members as is resolved by our general meeting of shareholders upon a non-binding proposal of our Supervisory Board, with a minimum of six members. Decisions by our shareholders concerning the number and the identity of our Supervisory Board members are taken by a simple majority of the votes cast at a meeting, provided quorum conditions are met.
Under Dutch law, certain statutory provisions limit the number of supervisory positions that members of our Supervisory Board may hold. A member of our Supervisory Board can only be appointed as such if he/she does not hold more than four supervisory positions at other so-called “large” Dutch entities. In this connection, the position of chairman equals two positions. The term supervisory position means the position of supervisory director or non-executive director. Supervisory positions at several entities belonging to the same group constitute one position, and supervisory positions at non-Dutch entities are not taken into account. Furthermore, an appointment by the Enterprise Chamber (Ondernemingskamer) of the Amsterdam Court of Appeal as part of corporate inquiry proceedings is not taken into account. For purposes of the foregoing, ”large” Dutch entities are Dutch limited liability companies, private companies with limited liability and foundations which meet at least two of the following three criteria (“‘Large Dutch Entities”): (i) the value of the assets according to the consolidated statement of financial position with explanatory notes exceeds €20 million; (ii) the net turnover for the financial year exceeds €40 million; or (iii) there are, on average, 250 or more employees during the financial year.
In The Netherlands, companies such as ours are expected to pursue a policy of having a balanced participation by men and women in supervisory boards. We have balanced participation by men and women on our Supervisory Board and currently, our Supervisory Board comprises nine members of which 4 are female and 5 are male.
In accordance with the criteria as reflected in our Supervisory Board charter and diversity policy, members of our Supervisory Board are selected on the basis of their specific business, financial, technical and/or legal expertise, prior professional experience, soundness of judgment, ability to make analytical enquiries and willingness to devote the time required to adequately perform their activities as Supervisory Board members. The object of our diversity policy is to have a diverse composition of our Supervisory Board in the areas that are relevant to us, such as nationality, experience, background, gender and age. Our Supervisory Board endorses the principle of a diversified Supervisory Board, including the aforementioned statutory gender balance rules, within the scope of the criteria as reflected in our Supervisory Board charter and diversity policy. We will continue to ensure an appropriate balance as recommended by the aforementioned statutory gender balance rules. The Supervisory Board meets the other criteria as set forth in their Charter as well, resulting in a diversified composition of the Supervisory Board.
The responsibilities of our Supervisory Board include (but are not limited to):
•supervising, monitoring, and advising our Managing Board on: (i) our performance, (ii) our strategy and risks inherent to our business activities, (iii) the structure and management of the internal risk management and control systems, and (iv) compliance with legislation and regulations;
•disclosing, complying with and enforcing our corporate governance structure;
•selecting and recommending the appointment of the member(s) of the Managing Board;
•proposing the compensation policy for the member(s) of our Managing Board (such policy to be adopted by our General Meeting of Shareholders), fixing the compensation annually and the contractual terms and conditions of employment of the member(s) of our Managing Board (in accordance with the said compensation policy);
•electing and recommending the appointment of the members of our Supervisory Board and proposing their remuneration;
•evaluating and assessing the functioning of our Managing Board, our Supervisory Board, and their individual members (including the evaluation of our Supervisory Board’s profile and the introduction, education and training program);
•handling, and deciding on, potential reported conflicts of interest between us on the one hand and members of our Supervisory Board, our Managing Board, our external auditor and our (major) shareholder(s) on the other hand;
•selecting and recommending the appointment of our external auditor upon proposal by our Audit Committee;
•reviewing and approving our whistleblower procedures upon approval by the Audit Committee;
•handling, and deciding on, reported alleged irregularities that relate to the functioning of our Managing Board;
•approving decisions by our Managing Board as referred above under “Managing Board”;
•supervising the adoption and implementation by our Managing Board on a consolidated basis of strategic pluri-annual plans and annual budgets in line with the decisions of our Supervisory Board;
•on an annual basis, the renewal of the authorization by our Managing Board to issue guarantees to companies whose accounts are consolidated by us, as well as guarantees granted to third parties including nonconsolidated subsidiaries of us; and
•declaring independently as well as proposing to our general meeting of shareholders to declare, distributions out of our share premium reserve and other reserves available for shareholder distributions under Dutch law.
Our Supervisory Board charter, as posted on our website, contains detailed provisions on the reporting and handling of (potential) conflicts of interest.
For information on the identity of our Supervisory Board members, including its committees, as well as the compensation of the members of our Supervisory Board, see the report of our Supervisory Board. We believe that at least one member of our Supervisory Board can be regarded as a financial expert.
For information on the role and identity of the committees of our Supervisory Board, see the report of our Supervisory Board.
5.4. Managing Board
In accordance with Dutch law, our management is entrusted to the Managing Board under the supervision of our Supervisory Board. Mr. Jean-Marc Chery and Mr. Lorenzo Grandi are currently the members of our Managing Board with the functions of President and Chief Executive Officer and President and Chief Financial Officer. Under our Articles of Association, the members of our Managing Board are appointed for a three-year term, upon a non-binding proposal by our Supervisory Board, at our AGM (by a simple majority of the votes cast, provided quorum conditions are met), which term may be renewed one or more times.
In The Netherlands, companies such as ours are expected to pursue a policy of having a balanced participation by men and women in managing boards. Where seats on a managing board are to be divided among individuals, balanced participation is deemed to exist if at least 30% of the seats are taken by men and at least 30% by women. While as of our 2024 AGM our Managing Board consists of two members, since its creation in 1987, our Managing Board has always been comprised of a sole member, and therefore we have not yet put in place a diversity policy for our Managing Board.
Our shareholders may suspend or dismiss one or more members of our Managing Board, in accordance with the procedures laid down in our Articles of Association. Under Dutch law, our Managing Board is entrusted with our general management and the representation of our Company. Our Managing Board must seek prior approval from our shareholders for decisions regarding a significant change in the identity or nature of the Company. Under our Articles of Association and our Supervisory Board charter, our Managing Board must also seek prior approval from our Supervisory Board for certain other decisions with regard to the Company and our direct or indirect subsidiaries.
The members of our Managing Board may not serve on the board of a public company without the prior approval of our Supervisory Board. Pursuant to our Supervisory Board charter, the members of our Managing Board must inform our Supervisory Board of any (potential) conflict of interest and pursuant to such charter and Dutch law, any Managing Board resolution regarding a transaction in relation to which the members of our Managing Board have a conflict of interest must be approved and adopted by our Supervisory Board. Should our entire Supervisory Board also have a conflict of interest, the resolution must be adopted by our shareholders pursuant to Dutch law. Note 7.6.37 of our consolidated financial statements includes a table summarizing related party transactions. We are not aware of any potential conflicts of interests between the private interest or other duties of our Supervisory Board members, our Managing Board members and our senior managers and their duties to us that were of material significance to the Company, or to the relevant member of the Supervisory Board, to the relevant member of the Managing Board, or to any of our senior managers. All transactions with related parties have been taken place at arms’ length and were in compliance with best practice provision 2.7.4 of the Dutch Corporate Governance Code.
Pursuant to our Articles of Association and the Supervisory Board charter, the following decisions by our Managing Board with regard to the Company and any of our direct or indirect subsidiaries (an “ST Group Company”) require prior approval from our Supervisory Board: (i) any modification of our or any ST Group Company’s Articles of Association or other constitutional documents, other than those of wholly owned subsidiaries; (ii) other than for wholly owned subsidiaries, any change in our or any ST Group Company’s authorized share capital or any issue, acquisition or disposal by us — with the exception of shares in our share capital acquired in order to transfer these shares under employee stock option or stock purchase plans — or any ST Group Company of own shares or change in share rights and any issue of instruments resulting in a share in the capital of any ST Group Company or its profits (iii) the liquidation or dissolution of the Company or any ST Group Company or the disposal of all or a substantial and material part of our business or assets, or those of any ST Group Company, or of any shares in any ST Group Company; (iv) any merger, acquisition or joint venture agreement (and, if substantial and material, any agreement relating to IP) to which we or any ST Group Company is, or is proposed to be, a party, as well as the formation of new companies by us or any ST Group Company (with the understanding that only acquisitions above $25 million per transaction are subject to prior Supervisory Board approval); (v) our draft consolidated statement of financial position and consolidated financial statements, as well as our and any ST Group Company’s profit distribution policies; (vi) entering into any agreement that may qualify as a related party transaction, including any agreement between us or any ST Group Company and any of our major shareholders; (vii) the appointment of members of the Executive Committee; (viii) the key parameters of our pluri-annual plans and our consolidated annual budgets, as well as any significant modifications to said plans and budgets, or any one of the matters set forth in our Articles of Association and not included in the approved plans or budgets; (ix) operations which have to be submitted for Supervisory Board prior approval even if their financing was already provided for in the approved annual budget; (x) our quarterly, semi-annual and annual consolidated financial statements prepared in accordance with U.S. GAAP and, as required, according to IFRS; (xi) the exercise of any shareholder right in a ST joint venture company, which is a company (a) with respect to which we hold directly or indirectly either a minority equity position in excess of 25% or a majority position without the voting power to adopt extraordinary resolutions, or (b) in which we directly or indirectly participate and such participation has a value of at least one-third of our total assets according to the Consolidated Statement of Financial Position and notes thereto in our most recently adopted (statutory) annual accounts, with the understanding, for the avoidance of doubt, that decisions of the Managing Board regarding the general management and/or operations of such ST joint venture company are not subject to Supervisory Board approval and that the Managing Board reports to the Supervisory Board on the operations of the ST joint venture companies as part of its regular reporting to the Supervisory Board and in principle at least every six months; (xii) the strategy of our company; (xiii) the annual internal audit plan and the appointment, replacement, reassignment and dismissal of our Chief Audit & Risk Executive; (xiv) all proposals to be submitted to a vote at the AGM; (xv) the formation of all companies, acquisition or sale of any participation and conclusion of any cooperation and participation agreement; (xvi) all our pluri-annual plans and the budget for the coming year (covering investment policy, policy regarding R&D, and commercial policy and objectives, general financial policy and policy regarding personnel); and (xvii) all acts, decisions or operations covered by the foregoing and constituting a significant change with respect to decisions already approved by the Supervisory Board or not provided for in the above list and as specifically laid down by a Supervisory Board resolution to that effect.
Senior Management
General management of our business
The members of our Managing Board are entrusted with our general management and is supported in his tasks by our Executive Committee and Executive Vice Presidents, who together constitute our Senior Management.
As a company committed to good governance, we hold corporate meetings on a regular basis. Such meetings, which involve the participation of several members of our Senior Management include:
•Executive Committee, which meets once every month and oversees the general strategy and is responsible for the risk management of the Company.
•Corporate Operations Review, which meets twice per quarter to review monthly results, short-term forecasts and monthly business results.
•Corporate Staff Meeting, which meets once per quarter to review the business in its entirety and to plan and forecast for the next quarter and beyond.
Executive Committee
The Executive Committee, established on May 31, 2018, has been established to support the Managing Board in their tasks and to improve the corporate governance of the Company consistent with evolving Dutch practice, acts under the authority and responsibility of the Managing Board and in this respect manages the Company. The Managing Board remains legally responsible for the management of the Company. The responsibilities of the Executive Committee include overseeing the general strategy as well as the risk management in connection with the Company’s activities, operational and financial objectives and financial reporting processes. The Executive Committee adopts resolutions based on consensus, or if no consensus can be reached, by a majority of the votes cast by the members of the Managing Board including the vote of the chairman of the Executive Committee.
The chairman of the Executive Committee is our President and Chief Executive Officer and he thus serves as the primary interface between the Executive Committee and the Supervisory Board. Members of the Executive Committee are appointed by the Managing Board subject to the approval of the Supervisory Board. Members of the Executive Committee can be suspended and dismissed by the Managing Board without prior approval by the Supervisory Board.
The Executive Committee was composed of the following nine members as of December 31, 2025, as set forth in the table below.
| | | | | | | | | | | | | | | | | | | | | | | | | | |
| Name | | Position | | Years with
Company | | Years in
Semi-
Conductor
Industry | | Age |
| Jean-Marc Chery | | President and Chief Executive Officer | | 41 | | 41 | | 65 |
| Marco Cassis | | President, Analog, Power & Discrete, MEMS and Sensors Group | | 38 | | 38 | | 62 |
| Rajita D'Souza | | President, Human Resources, Corporate Social Responsibility | | 5 | | 5 | | 53 |
| Remi El-Ouazzane | | President, Microcontrollers and Digital ICs and RF products Group | | 4 | | 28 | | 52 |
| Lorenzo Grandi | | President and Chief Financial Officer | | 38 | | 38 | | 64 |
| Fabio Gualandris | | President, Quality, Manufacturing and Technology | | 37 | | 38 | | 66 |
| Steven Rose | | President, Legal Counsel and Public Affairs | | 34 | | 34 | | 63 |
| Jerome Roux | | President, Sales and Marketing | | 34 | | 38 | | 60 |
Detailed biographies of our Executive Committee members are available on our website www.st.com.
Executive Vice Presidents
The group of Executive Vice Presidents consisted of the following people as of December 31, 2025: | | | | | | | | | | | | | | | | | | | | | | | | | | |
Name(1)(3) | | Position | | Years with
Company | | Years in
Semi-
Conductor
Industry | | Age |
| Michael Anfang | | Executive Vice President, Sales & Marketing, Europe, Middle East and Africa Region (EMEA) | | 27 | | 35 | | 57 |
| Mario Aleo | | Executive Vice President, Power & Discrete Sub-Group - Analog, Power & Discrete, MEMS and Sensors Group | | 24 | | 24 | | 56 |
| Christophe Ayela | | Executive Vice President, Analog & Power Front-End Manufacturing | | 35 | | 35 | | 59 |
| Alexandre Balmefrezol | | Executive Vice President, Analog & Power Front-End Manufacturing | | 28 | | 28 | | 51 |
| Stefano Cantù | | Executive Vice President, Strategic Corporate Programs Office | | 31 | | 31 | | 57 |
| Henry Cao | | Executive Vice President, Sales & Marketing, China Region | | 5 | | 5 | | 52 |
| Alessandro Cremonesi | | Executive Vice President, Chief Innovation Officer and General Manager System Research and Applications Group | | 41 | | 41 | | 67 |
| Alberto Della Chiesa | | Executive Vice President Supply Chain | | 37 | | 37 | | 61 |
| Ricardo De Sa Earp | | Executive Vice President, General-Purpose Microcontroller sub-group within ST's Microcontrollers, Digital ICs and RF products Group | | 28 | | 28 | | 62 |
| Franck Freymond | | Executive Vice President, Chief Audit & Risk Executive | | 15 | | 15 | | 57 |
| Fabrice Gomez | | Executive Vice President, Head of Back-End Manufacturing & Technology | | 13 | | 13 | | 57 |
Maria Heriz(2) | | Executive Vice President, Embedded Processing Sub-Group, Microcontrollers, Digital ICs and RF Products Group | | 1 | | 25 | | 48 |
| Frédérique Le Grevès | | Executive Vice President, Europe and France Public Affairs, President of STMicroelectronics France | | 5 | | 5 | | 58 |
| Claudia Levo | | Executive Vice President, Integrated Marketing & Communications | | 14 | | 16 | | 60 |
| Laurent Malier | | Executive Vice President Digital Front-End Manufacturing and Technology | | 10 | | 31 | | 58 |
Thomas Morgenstern (2) | | Executive Vice President, Global Technology Manufacturing | | 1 | | 28 | | 57 |
| Hiroshi Noguchi | | Executive Vice President, Sales & Marketing, Asia Pacific Region excluding China (APeC) | | 18 | | 18 | | 50 |
| Giuseppe Notarnicola | | Executive Vice President, Treasury, Insurance, M&A, IP BU, and Italy Public Affairs | | 20 | | 20 | | 64 |
| Rino Peruzzi | | Executive Vice President, Sales & Marketing, Americas and Global Key Account Cluster | | 27 | | 27 | | 60 |
| Jerome Ramel | | Executive Vice President, Corporate Development and Integrated External Communication | | 2 | | 26 | | 52 |
| Chouaib Rokbi | | Executive Vice President, Digital Transformation and Information Technology, and Global Procurement | | 25 | | 25 | | 54 |
| Bertrand Stoltz | | Executive Vice President, Corporate Finance, Asia Public Affairs | | 31 | | 31 | | 55 |
| Nicolas Yackowlew | | Executive Vice President, Product Quality & Reliability | | 30 | | 31 | | 56 |
(1)Our former Executive Vice President, Analog sub-group, Analog, Power & Discrete, MEMS and Sensors Group, Mr. Matteo Lo Presti and Executive Vice President, Chief Procurement Officer, Geoff West left the Company in 2025.
(2)Mr. Thomas Morgenstern, our Executive Vice President, Manufacturing, and Ms. Maria Heriz, our Executive Vice President, Embedded Processing Sub-Group, Microcontrollers, Digital ICs and RF Products Group, were appointed as members of our Senior Management on September 1, 2025 and September 15, 2025, respectively.
(3)Mr. Philippe Dereeper, our Chief Ethics & Compliance Officer and Executive Secretary of our Supervisory Board, Mr. Simone Ferri, our Executive Vice President, MEMS Sub-Group General Manager, and Mr. Vincent Fraisse, our Executive Vice President, RF Optical Communication Sub-Group General Manager, were each appointed Executive Vice President in January 2026.
Detailed biographies of our Executive Vice Presidents are available on our website www.st.com.
5.5. Dutch Gender Balance Act
On January 1, 2022, the Dutch Gender Balance Act (Wet evenwichtige man-vrouw verhouding, “GBA”) promoting gender balance within the management of large companies entered into force. Pursuant to the GBA, below we report on (i) the current composition of our Supervisory Board, Managing Board and our Senior Management (as defined in Section 5.4 Managing Board) in number of men and women, (ii) the gender balance target that we have set for our Supervisory Board and our Senior Management, (iii) our action plan to reach these gender balance targets; (iv) the results of our efforts in meeting the set gender balance targets. For the purpose of reporting under the GBA, we consider our Senior Management to be our sub-top as referenced in the GBA.
We operate in an industry in which women are traditionally under-represented, and it is a priority for us to attract, retain and grow our female talent pool. We aim to encourage girls to choose technical studies at an early stage in their education, helping us to address the shortage of women in technical positions. In 2025 we continued to promote diversity in STEM (Science, Technology, Engineering and Mathematics) functions. We organized local initiatives that raise awareness among people about the importance of STEM related subjects.
Composition of our Supervisory Board, Managing Board and Senior Management indicated in number of men and women
On December 31, 2025, our Managing Board consisted of two males, our President and Chief Executive Officer and our President and Chief Financial Officer.
On December 31, 2025, our Supervisory Board consisted of 9 members, of which 3 female (33.33%) and 6 male (66.67%). Please refer to Section 4.1. (Report of the Supervisory Board - Composition of the Supervisory Board) for further details on the composition of our Supervisory Board.
On December 31, 2025, our Senior Management consisted of 31 members, of which 4 female (12.9%) and 27 male (87.1%). More specifically, on December 31, 2025, our Executive Committee consisted of 8 members, of which 1 female (12.5%) and 7 male (87.5%), and our Executive Vice Presidents as a group consisted of 23 members, of which 3 female (13%) and 20 male (87%). Please refer to Section 5.4. (Managing Board) for further details on the composition of our Senior Management.
Gender balance target for our Supervisory Board, Managing Board and Senior Management
Gender balance target Managing Board. Our Managing Board has historically consisted of one person until May 22, 2024, as of which date our Managing Board consists of 2 male members. Since the change in the composition of our Managing Board is relatively new, we have not yet set a gender balance target for our Managing Board. Considering that at this point we deem continuity in the current composition of our Managing Board to best serve the interests of the Company, we will for now not be setting any particular diversity target specifically for the composition of our Management Board.
Gender balance target Supervisory Board. As stated in our diversity policy for our Supervisory Board, the gender balance target for our Supervisory Board is that at least 30% of its members is male and at least
30% is female. On December 31, 2025, our target was exceeded for both the male and female members of our Supervisory Board as mentioned above.
Gender balance target Senior Management. Our gender balance target for our Senior Management is that at least 25% is female and at least 25% is male by 2035, to ensure a more balanced ratio of male and female members within our Senior Management. The same target applies respectively to our Executive Committee, and to our Executive Vice Presidents as a group.
Gender balance action plan
•Managing Board. We do not yet have a gender balance action plan in place for our Managing Board nor a gender balance target, since until May 22 2024 our Managing Board historically consisted of one member only.
•Supervisory Board. No specific gender balance action plan is in place for our Supervisory Board as in its current composition our gender balance targets for our Supervisory Board are met and even exceeded.
•Senior Management. We have implemented a gender balance action plan to achieve the above mentioned gender balance target for a more balanced ratio of male and female members in our Senior Management. This plan is applied respectively to our Executive Committee and to our Executive Vice Presidents as a group.
We are committed to strengthening the role of women in building the future of our Company and have therefore accelerated the relevant programs aimed at increasing the proportion of women in management roles. Programs such as the WIL and AWIL programs play a key role in preparing the pipeline of women in management roles within our Company to ultimately reach the above mentioned gender balance target in our Senior Management, in our Executive Committee and in our Executive Vice Presidents as a group.
The WIL program launched in 2015 for junior and middle management aims to prepare the next generation of female leaders. The AWIL program, launched in 2021 is aimed at senior female managers and directors to identify their leadership style and increase their visibility and recognition within our Company. Both programs consist of training, coaching and mentoring.
Results
Supervisory Board. With regard to our Supervisory Board, the gender balance target of at least 30% male and at least 30% female has been exceeded.
Senior Management. Our WIL and AWIL programs accelerate the development of women for leadership positions in our Company. We continue to make progress in women representation at all management levels.
The female representation within our Senior Management increased compared to December 31, 2024. More specifically per December 31, 2025: (i) the female representation in our Senior Management increased from 10% to 12.9%; (ii) the female representation in our Executive Committee increased from 12% to 12.5% and (iii) the female representation in our Executive Vice Presidents as a group increased from 9% to 13%.
We remain dedicated to increasing the representation of women in executive levels, both by increasing the internal pool and building an external one with sourcing partners.
5.6. Indemnification of members of our Managing Board and Supervisory Board
To the extent permitted by Dutch law, members of our Managing Board and Supervisory Board as well as our officers or agents shall be indemnified by us against expenses, such as the reasonable costs of
defending claims, as stated in our Articles of Association. Under certain circumstances, there will be no entitlement to this reimbursement. We hold a Director and Officer liability insurance for the members of our Managing Board and Supervisory Board as well as our officers.
5.7. Risk Management and Control Systems
For our statement on the main features of our risk management and control systems and of the group of which the financial data are included in our annual accounts, please refer to Section 3.3. (Risk Management and Internal Control).
5.8. Required information Article 10 Takeover Directive
The EU Takeover Directive requires that listed companies publish additional information providing insight into defensive structures and mechanisms which they apply. The relevant provision has been implemented into Dutch law by means of the Decree on Article 10 of the Takeover Directive of April 5, 2006. Pursuant to this decree, Dutch companies whose securities have been admitted to trading on a regulated market have to include information in their annual report which could be of importance for persons who are considering taking an interest in the company.
This information comprises amongst other things:
• the capital structure of the company;
• restrictions on the transfer of securities and on voting rights;
• special powers conferred upon the holders of certain shares;
• the rules governing the appointment and dismissal of board members and the amendment of the Articles of Association;
• the rules on the issuing and the repurchasing of shares by the company;
• significant agreements to which the company is a party and which contain change of control rights (except where their nature is such that their disclosure would be seriously prejudicial to the company); and
• agreements between the Company and its board members or employees providing for a “golden parachute”.
Capital structure
The authorized share capital of STMicroelectronics N.V. is €1,809,600,000 consisting of 1,200,000,000 common shares and 540,000,000 preference shares, each with a nominal value of €1.04. As of December 31, 2025, the number of common shares issued was 911,281,920 shares (December 31, 2024: 911,281,920 shares).
As of December 31, 2025, the number of common shares outstanding was 888,768,152 shares (December 31, 2024: 898,175,408 shares). There were no preference shares issued as of December 31, 2025, and December 31, 2024, respectively.
Restrictions on the transfer of shares
We do not have restrictions on the transfer of our common and preference shares, provided that Stichting Continuïteit ST, if it holds preference shares, requires our consent to sell or otherwise dispose of preference shares or voting rights attached thereto.
Holdings in us that are subject to a disclosure obligation
For information on holdings in us that are subject to a disclosure obligation pursuant to chapter 5.3 of the Dutch Financial Markets Supervision Act (“Wet op het financieel toezicht”), please refer to Section 5.12. (Major Shareholders).
Special controlling rights
We do not have special controlling rights attached to our common or preference shares.
Control of employees share/option schemes
We do not have any scheme granting rights to employees to subscribe for or acquire shares in our share capital or the share capital of one of our subsidiaries where the control is not directly exercised by the employees. However, key employees as determined by our unvested share award plans are granted share awards (as part of their compensation) with a staggered vested schedule pursuant to our determined criteria. For more information on employees share/option schemes, see the remuneration report in Section 4.9. (Remuneration Report).
Restrictions on voting rights
We do not have any restrictions on voting rights nor have we cooperated in the issuance of depository receipts for shares.
Agreements with shareholders that may give rise to restrictions on the transfer of shares or restrictions of voting rights
We do not have any agreements with shareholders that may give rise to restrictions on the transfer of shares or restrictions of voting rights. However, please see below in Section 5.13. (Shareholders’ Agreements) for certain information on shareholders’ agreements regarding us to which we are not a party.
Provisions on appointment and dismissal of members of our Managing Board and Supervisory Board and amendment of our Articles of Association
Please see the information included above in Section 5.3. (Supervisory Board) and Section 5.4. (Managing Board) with respect to the appointment and dismissal of the members of our Managing Board and Supervisory Board.
Our Articles of Association can be amended by our general meeting of shareholders, upon the proposal of our Supervisory Board, by a simple majority of the votes cast at a meeting where at least 15% of the issued and outstanding share capital is present or represented. If a quorum is not present, a further meeting can be convened which shall, irrespective of the share capital represented, to pass a resolution. If the relevant amendment affects the rights of holders of common shares or holders of preference shares, the approval of the meeting of holders of common shares and the meeting of holders of preference shares, respectively, is required.
Authority of the Managing Board and Supervisory Board regarding the issuance and repurchase of shares
Pursuant to our Articles of Association, our Managing Board does not have the authority to issue shares or grant rights to subscribe for shares. Our Supervisory Board has this authority. Our 2025 AGM
authorized our Supervisory Board, until the conclusion of the 2026 AGM, to resolve upon: (i) the issuance of common shares or the granting of rights to subscribe for common shares in our share capital, up to a maximum of 10% of our issued common share capital as per December 31, 2024, but not exceeding the limits of the authorized share capital, (ii) the terms and conditions of an issuance of common; and (iii) the limitation and/or exclusion of pre-emptive rights of existing shareholders upon issuance of common shares or rights to subscribe for such shares.
Pursuant to a shareholders’ resolution adopted at our 2025 AGM, our Managing Board, subject to the approval of our Supervisory Board, was authorized, until the conclusion of the 2026 AGM, to acquire common shares and/or preference shares subject to the limits of Dutch law and our Articles of Association and in accordance with the acquisition price conditions set forth in such shareholders’ resolution. Furthermore, our Articles of Association provide that we shall be able to acquire shares in our own share capital in order to transfer these shares under employee stock option or stock purchase plans, without an authorization of our general meeting of shareholders
Significant agreements to which we are a party and which contain change of control rights
On August 4, 2020, we issued senior unsecured bonds, in two tranches, one of $750 million with a maturity of 5 years and one of $750 million with a maturity of 7 years, convertible into new or existing common shares in our share capital. Pursuant to the terms and conditions of the senior bonds (the “Conditions”), bondholders have certain conversion rights and redemption rights upon a change of control, all as provided in the Conditions. The first tranche of $750 million of these senior unsecured bonds was reimbursed on August 4, 2025.
Agreements with our President and Chief Executive Officer regarding distributions upon the termination of his employment contract in connection with a public offer on us
The CEO Agreements, provide for distributions upon termination of his employment agreements upon a change of control, amongst others, pursuant to a takeover bid, as further described in Section 4.9.2.7. (Compensation provisions in the event of termination or departure of the members of our Managing Board - Table of the compensation in the event of termination or departure of the members of our Managing Board).
Stichting Continuïteit ST — our preference shares
We have an option agreement with an independent foundation, Stichting Continuïteit ST (the “Stichting”), regarding our preference shares. This is a common practice used by a majority of publicly traded Dutch companies. Our Managing Board and our Supervisory Board, along with the board of the Stichting, have declared that they are jointly of the opinion that the Stichting is independent of us. The option agreement provides for the issuance of up to a maximum 540,000,000 preference shares. Any such shares would be issued to the Stichting upon its request and in its sole discretion and upon payment of at least 25% of the par value of the preference shares to be issued.
The Stichting would have the option, which it shall exercise in its sole discretion, to take up the preference shares. The shares would be issuable in the event of actions which the board of the Stichting determines would be contrary to our interests, our shareholders and our other stakeholders and which in the event of a creeping acquisition or offer for our common shares are not supported by our Managing Board and Supervisory Board. The preference shares may remain outstanding for no longer than two years.
No preference shares have been issued to date. The effect of the preference shares may be to deter potential acquirers from effecting an unsolicited acquisition resulting in a change of control as well as to create a level-playing field in the event actions which are considered to be hostile by our Managing Board and our Supervisory Board, as described above, occur and which the board of the Stichting determines to be contrary to our interests and our shareholders and other stakeholders.
The board of the Stichting is currently comprised of the following three members:
•Professor S.C.J.J. Kortmann, a well-known professor at law at the Radboud University in Nijmegen, The Netherlands, as Chairman of the Board;
•Mr. F. Ago, a well-known and experienced attorney at law in Italy; and
•Mr. E.G. Alphandéry, a professor of economics and former French Minister of Economy.
All members of the board of the Stichting are independent from the Company.
5.9. Shares without voting rights and shares which do not give any or only a limited right to share in the profits or reserves
We do not have any shares without voting rights or shares which do not give any or only a limited right to share in the profits or reserves of the Company.
5.10. Code of Conduct
Our Code of Conduct is designed to promote and reflect our engagement to honest and ethical business conduct. It sets clear expectations for how we conduct business and make decisions, fostering a culture of trust, integrity, respect and accountability.
Our Code of Conduct embodies and is structured around the three core values of our Company: integrity, people and excellence (as further detailed in Section 3.3.1.3. (Illustrative risk management measures – Legal and ethics & compliance)). In line with applicable laws and regulations, integrity, respect and accountability are at the core of our decision-making process and ethical culture.
The culture within the Company is monitored through, inter alia, the results of our employee engagement survey, pulse surveys as well as reports made to our Ethics Hotline, in order to assess trends and take corresponding actions, including setting priorities and updating our risk mapping.
To guide our employees in their day-to-day activities and support ethical decision-making, the Code of Conduct (together with the associated policies and procedures) contains practical examples of how ST’s values are applied in practice, while the related policies and procedures translate these values in specific actions. An overview of relevant policies is included in Section 3.4.5.3.A. (Business conduct - Business conduct policies and corporate culture).
Our Code of Conduct applies to all our employees, including senior managers, whom we expect to comply with our Code of Conduct and related policies, and to adhere to and advocate for integrity in the workplace.
We have amended and will continue to review and amend our Code of Conduct and related policies, as needed, to reflect regulatory and other changes. In January 2026 we released an updated version of our Code of Conduct to include, among others, specific guidance on trade compliance and the responsible use of AI, as well as practical simplified guidance clarifying ST's expectations in other key areas covered by our Code of Conduct. We also redesigned our Code of Conduct to enhance readability and engagement.
ST employees are required to complete training on ST's Code of Conduct upon joining the Company, whether delivered onsite or online. To reinforce awareness and ensure continued ethical business conduct, mandatory annual refresher training is provided to employees.
ST recognizes the important contribution corporate culture can have in sustainable long-term value creation. By fostering and upholding a culture of integrity, respect and accountability, we are building trust together and creating sustainable long-term value for all our stakeholders. Trust is the foundation of lasting success, enabling teamwork, collaboration and innovation. ST intends to continue to engage with
employees and other stakeholders to ensure the values of the Company are translated into everyday behaviors.
Our Code of Conduct also encourages our employees (or any interested third-party) to speak up and express any concern they may have in good faith, without fear of retaliation.
Our Code of Conduct provides that if any employee or senior manager acts in contravention of the principles it sets forth, we will take appropriate steps in terms of the procedures in place for fair disciplinary action. In cases of severe breaches, such action may include dismissal. Our Code of Conduct is available on our website in the Ethics & Compliance page and Corporate Governance section, on st.com.
Further information on our business conduct in line with our values laid down in our Code of Conduct and related policies, is included in Section 3.4.5. (Business Conduct (Governance – G1)).
5.11. Deviations from the Dutch Corporate Governance Code
According to the Dutch Corporate Governance Code, we are required to publish a list of current deviations from the Dutch Corporate Governance Code, and an explanation why we do not comply, the so-called comply-or-explain-principle. Because we are listed on the New York Stock Exchange, we are required to comply with the U.S. Sarbanes-Oxley Act of 2002, as well as listing rules of the New York Stock Exchange, and the rules and regulations promulgated by the SEC. For the full text of (i) the U.S. Sarbanes-Oxley Act of 2002, please see www.govinfo.gov, (ii) the listing rules of the New York Stock Exchange, please see nyseguide.srorules.com/listed-company-manual and (iii) the rules and regulations promulgated by the SEC, please see www.sec.gov.
We comply with such principles and best practice provisions of the Dutch Corporate Governance Code or explain why we deviate from such principles or provisions. We comply with the Dutch Corporate Governance Code principles and best practice provisions, with the exception of the following best practice provisions:
•best practice provision 2.1.7: As explained in the report of our Supervisory Board, our criteria deviate from the independence criteria as included in best practice provision 2.1.7 of the Dutch Corporate Governance Code, specifically item iii. of such best practice provisions (and therewith also best practice provision 2.1.10 of the Dutch Corporate Governance Code), but are in conformity with governance listing standards of the New York Stock Exchange and our Corporate Governance Charter as approved by our shareholders in the 2004 AGM. This departure is expected to continue for more than one financial year;
•best practice provision 2.2.2: The term of office of Supervisory Board members may from time to time exceed the maximum term mentioned in the Dutch Corporate Governance Code. However, if the maximum term is exceeded, this is always approved by our shareholders as members of our Supervisory Board are appointed by our general meeting of shareholders. As mentioned in our Supervisory Board charter, we consider that it may not always be in our best interests to limit the number of terms members may serve on our Supervisory Board. However, none of the current members of our Supervisory Board currently exceed the maximum term mentioned in the Dutch Corporate Governance Code;
•best practice provision 2.2.8: The main findings and conclusions of the evaluations and what has been or will be done with the conclusions from the evaluations have not been included in the report of the Supervisory Board as the evaluations are still ongoing at the time of this report.
•best practice provision 3.1.2.vi.: No specific holding term of five years apply to the unvested stock awards granted to the members of our Managing Board, under the long-term incentive plan. This element is part of the employment conditions on the basis of which the members of the Managing Board accepted their responsibilities. Those conditions are among others based on the
international context in which we operate, industry standards and applicable laws, and in line with our remuneration policy adopted by our 2021 AGM and renewed by our 2024 AGM;
•best practice provision 3.2.3: As described in Section 4.9.2.7. (Compensation provisions in the event of termination or departure of the members of our Managing Board), the remuneration in the event of dismissal of our President and Chief Executive Officer, exceeds one year’s salary. The remuneration in the event of dismissal shall be paid only if the employment agreement is terminated by us. This element is part of the employment conditions on the basis of which our President and Chief Executive Officer accepted his responsibilities. Those conditions are among others based on the international context in which we operate, industry standards and applicable laws, and in line with our, at that time, remuneration policy as approved by our 2005 AGM, and approved by our 2024 AGM. This departure is expected to continue for more than one financial year;
•best practice provision 3.4.1: We believe we comply with most elements of this best practice provision but do not disclose certain select compensation information, among others, to the extent that we believe it is competitively sensitive information that if disclosed could harm our ability to attract and retain executives and other key personnel; and
•best practice provision 3.4.1. iv.: The pay ratio disclosed in Section 4.9.4. (Remuneration comparison between the Managing Board, the Executive Committee (excluding the members of our Managing Board), the Executive Vice Presidents and employees) uses the calculation methodology in line with our previous years' disclosure. As per financial year 2024, the Dutch Corporate Governance Code prescribes an alternate calculation methodology compared to that used for our previous years and the CSRD, which is the basis for our sustainability reporting over financial year 2025, prescribes yet another alternate calculation methodology which will also differ from the calculation methodology in the Dutch Corporate Governance Code. In order to safeguard clarity and consistency of disclosures of the pay ratio within the Company, for financial year 2025, we report on the pay ratio in line with previous years' disclosure in Section 4.9.4. (Remuneration comparison between the Managing Board, the Executive Committee (excluding the members of our Managing Board), the Executive Vice Presidents and employees and, in addition, we also report such ratio in compliance with the CSRD in Section 3.4.4.1. (Own workforce).
5.12. Major Shareholders
Holders of our shares (including certain comparable instruments, such as instruments with a value (partly) dependent on shares or distributions on shares, or contracts creating an economic position similar to shares) or voting rights (including potential interests, such as via options or convertible bonds) may have disclosure obligations under Dutch law. Any person or entity whose direct or indirect interest in our share capital or voting rights (including potential interest) reaches, exceeds or falls below a certain threshold must make a disclosure to the AFM immediately. The threshold percentages are 3%, 5%, 10%, 15%, 20%, 25%, 30%, 40%, 50%, 60%, 75% and 95%. If a person’s direct or indirect interest in the share capital or voting rights passively reaches, exceeds or falls below the abovementioned thresholds (e.g., as a result of a change in the capital of the company), the person in question must give notice to the AFM no later than the fourth trading day after the AFM has published the change in the share capital and/or voting rights in the public register. In addition, a notification requirement applies in respect of shares with special statutory rights (e.g., priority shares), regardless of the abovementioned percentages.
Furthermore, each person who is or ought to be aware that the substantial holding he holds in the Company, reaches, exceeds or falls below any of the abovementioned thresholds vis-à-vis his most recent notification to the AFM, which change relates to the composition of the notification as a result of certain acts (e.g., (i) the exchange of certain financial instruments for shares or depositary receipts for shares, (ii) the exchange of shares for depositary receipts for shares, or (iii) as a result of the exercise of
rights pursuant to a contract for the acquisition of voting rights) must give notice to the AFM no later than the fourth trading day after he became or ought to be aware of this change.
For the purpose of calculating the percentage of capital interest or voting rights, among others, the following interests must be taken into account: (i) those directly held by him; (ii) those held by his controlled undertakings for purposes of the Dutch Financial Supervision Act; (iii) shares held by a third-party for such person’s account and the votes such third-party may exercise; (iv) the votes held by a third-party if such person has concluded an oral or written voting agreement with such party which provides for a lasting common policy on voting; (v) the votes held by a third-party if such person has concluded an oral or written agreement with such party which provides for a temporary and paid transfer of the votes; and (vi) the votes which a person may exercise as a proxy but in his own discretion. A person who has a 3% or larger interest in the share capital or voting rights and who ceases to be a controlled undertaking must without delay notify the AFM. As of that moment, all notification obligations under the Dutch Financial Supervision Act will become applicable to the former controlled undertaking itself. The management company of a common fund (beleggingsfonds) shall be deemed to have the disposal of the shares held by the depositary and the related voting rights. The depositary of a common fund shall be deemed not to have the disposal of shares or voting rights. Furthermore, special rules apply to the attribution of the ordinary shares which are part of the property of a partnership or other community of property. A holder of a pledge or right of usufruct in respect of our shares can also be subject to a notification obligation if such person has, or can acquire, the right to vote on our shares. If a pledgor or usufructuary acquires such voting rights, this may also trigger a notification obligation for the holder of our shares. A person is also deemed to hold shares if he has a financial instrument (i) whose rise in value depends in part on the rise in value of the underlying shares or on dividend or other payments on those shares (in other words, a long position must be held in those shares), and (ii) which does not entitle him to acquire shares in a listed company (i.e., it is a cash-settled financial instrument). In addition, a person who may, by virtue of an option, be obliged to buy shares in a listed company is also equated with a shareholder. Moreover, a person who has entered into a contract (other than a cash-settled financial instrument) that gives him an economic position comparable to that of a shareholder in a listed company is also deemed to hold shares for the purposes of the disclosure obligation.
The holder of a financial instrument representing a short position in our shares is required to notify the AFM if such short position, expressed in a capital percentage, reaches or crosses a threshold percentage. The threshold percentages are the same as referred to above in this section. Short position refers to the gross short position (i.e., a long position held by the holder cannot be offset against the short position). There is also a requirement to notify the AFM of the net short position (i.e., long positions are offset against short positions) if such short position, expressed in a capital percentage, reaches or crosses a threshold percentage. The threshold percentages are 0.2% and each 0.1% above that. Notifications as of 0.5% and each 0.1% above that will be published by the AFM. The notification shall be made no later than 3:30 pm CET on the following trading day.
Under Dutch law, the members of our Managing Board and each of the members of our Supervisory Board must without delay notify the AFM of any changes in his interest or potential interest in our share capital or voting rights. Under the European Market Abuse Regulation, the members of our Managing Board, the members of the Executive Committee and each of the members of our Supervisory Board, as well as any other person who would have the power to take managerial decisions affecting the future developments and business prospects of the Company having regular access to inside information relating, directly or indirectly, to the Company, must notify the AFM of any transactions conducted for his or her own account relating to the shares or in financial instruments the value of which is also based on the value of the shares. In addition, certain persons who are closely associated with members of the Managing Board, the Executive Committee and Supervisory Board or any of the other persons as described above, are required to notify the AFM of any transactions conducted for their own account relating to the shares or in financial instruments the value of which is also based on the value of the shares.
The AFM publishes all notifications on its public website (www.afm.nl). Non-compliance with the notification obligations under European or Dutch law can lead to imprisonment or criminal fines, or
administrative fines or other administrative sanctions. In addition, non-compliance with these notification obligations may lead to civil sanctions, including, without limitation, suspension of the voting rights attaching to our shares held by the offender for a maximum of three years, (suspension and) nullification of a resolution adopted by our shareholders’ meeting (if it is likely that such resolution would not have been adopted if the offender had not voted) and a prohibition for the offender to acquire our shares or votes for a period of no more than five years. Shareholders are advised to consult with their own legal advisers to determine whether notification obligations apply to them.
The following table sets forth certain information with respect to the ownership of our issued common shares as of December 31, 2025, based on information available to us:
| | | | | | | | | | | | | | |
| | Common Shares Owned |
| Shareholders | | Number | | % |
| STMicroelectronics Holding N.V. (“ST Holding”) | | 250,704,754 | | | 27.5 |
Public (1) | | 638,063,396 | | | 70.0 |
| Treasury shares | | 22,513,768 | | | 2.5 |
| Total | | 911,281,918 | | | 100.0 |
(1)According to the report available on Schedule 13G filed with the SEC on April 23, 2025, we understand that as of December 31, 2025 BlackRock, Inc. is the beneficial owner of 47,511,809 of our common shares (representing approximately 5.2 % of our issued common shares).
We are not aware of any significant change over the past three years in the percentage ownership of our shares by ST Holding, our major shareholder. ST Holding does not have any different voting rights from those of our other shareholders.
According to the report on Schedule 13G (“2024 ST Holding 13G”) jointly filed with the SEC on February 14, 2024, by ST Holding, Bpifrance Participations S.A., a successor to its former wholly-owned subsidiary FT1CI, (“Bpifrance”), the Italian Ministry of the Economy and Finance (the “MEF” and together with Bpifrance hereinafter the “STH Shareholders”), Caisse des d'epots et consignations (“CDC”), EPIC BpiFrance (“EPIC”) and Bpifrance S.A., the Italian government and the French government, each indirectly through the MEF and Bpifrance, respectively, held 13.9% of our share capital as of December 31, 2024. The ownership percentages of each the MEF and Bpifrance are based on 902,771,081 shares outstanding as of December 31, 2023. Bpifrance is 99.9% owned by Bpifrance S.A., in which CDC and EPIC each hold a 49.2% participation. Below is a brief summary of certain details from the 2024 ST Holding 13G.
All transactions with major shareholders were in compliance with best practice provision 2.7.5 of the Dutch Corporate Governance Code.
5.13. Shareholders’ Agreements
5.13.1. STH Shareholders’ Agreement
The filers of the 2024 ST Holding 13G have entered into the STH Shareholders' Agreement which governs relations between them, including for certain matters relating to the ownership of our shares and the actions of our management to the extent shareholder approval is required. Below is a brief summary of certain details from the 2024 ST Holding 13G.
5.13.1.1. Standstill
The STH Shareholders’ Agreement contains a standstill provision that precludes any of the parties and the parties’ affiliates from acquiring, directly or indirectly, any of our common shares or any instrument providing for the right to acquire any of our common shares other than through ST Holding. The standstill is in effect for as long as such party holds our common shares through ST Holding. The parties agreed to
continue to hold their stakes in us at all times through the current holding structure of ST Holding, subject to certain limited exceptions.
5.13.1.2. Corporate Governance
The STH Shareholders’ Agreement provides for a balanced corporate governance between the STH Shareholders for the duration of the “Balance Period”, despite actual differences in indirect economic interest in us. The “Balance Period” lasts as long as each STH Shareholder owns at any time a voting stake in ST Holding equal to at least 47.5% of the total voting stakes of ST Holding.
Managing and Supervisory Board members can only be appointed by the general meeting of shareholders upon a proposal by the Supervisory Board. The Supervisory Board passes resolutions, including on such a proposal, by at least three quarters of the votes of the members in office. The STH Shareholders Agreement, to which we are not a party, furthermore provides that: (i) each of the STH Shareholders, Bpifrance, on the one hand, and the MEF, on the other hand, may propose the same number of members for election to the Supervisory Board by our shareholders, and ST Holding shall vote in favor of such members; and (ii) any decision relating to the voting rights of ST Holding shall require the unanimous approval of the STH Shareholders. ST Holding may therefore be in a position to effectively control actions that require shareholder approval, including, as discussed above, the proposal of six out of nine members for election to our Supervisory Board (three members by each STH Shareholder) and the appointment of our Managing Board, as well as corporate actions, and the issuance of new shares or other securities. As a result of the STH Shareholders Agreement, the Chairman of our Supervisory Board is proposed by an STH Shareholder for a three-year term, and the Vice-Chairman of our Supervisory Board is proposed by the other STH Shareholder for the same period, and vice-versa for the following three-year term. The STH Shareholder proposing the appointment of the Chairman may furthermore propose the appointment of the Assistant Secretary of our Supervisory Board, and the STH Shareholder proposing the appointment of Vice-Chairman proposes the appointment of the Secretary of our Supervisory Board. Finally, each STH Shareholder also proposes the appointment of a financial controller to the Supervisory Board.
The STH Shareholders furthermore agreed that during the Balance Period, any other decision, to the extent that a resolution of ST Holding is required, must be pursuant to the unanimous approval of the shareholders of ST Holding.
At the end of the Balance Period i.e., once a shareholder’s voting stake in ST Holding has decreased under the 47.5% threshold, such STH Shareholder being thereafter referred to as “minority shareholder” and the other one being referred to as “majority shareholder”, the members of our Supervisory Board and those of ST Holding designated by the minority shareholder of ST Holding will, pursuant to the Shareholders’ Agreement, immediately resign upon request of ST Holding’s majority shareholder.
After the end of the Balance Period, unanimous approval by the shareholders of ST Holding remains required to approve:
•as long as any of the STH Shareholders indirectly owns at least the lesser of 3% of our issued and outstanding share capital or 10% of the STH Shareholders’ aggregate stake in us at such time, with respect to ST Holding, any changes to the Articles of Association, any issue, acquisition or disposal of shares in ST Holding or change in the rights of its shares, its liquidation or dissolution and any legal merger, demerger, acquisition or joint venture agreement to which ST Holding is proposed to be a party;
•as long as any of the STH Shareholders indirectly owns at least 33% of the STH Shareholders’ aggregate stake in us, certain changes to our Articles of Association (including any alteration in our authorized share capital, or any issue of share capital and/or financial instrument giving the right to subscribe for our common shares, changes to the rights attached to our shares, changes to the preemptive rights, issues relating to the form, rights and transfer mechanics of the shares, the composition and operation of the Managing and Supervisory Boards, matters subject to the
Supervisory Board’s approval, the Supervisory Board’s voting procedures, extraordinary General Meetings of Shareholders and quorums for voting at General Meetings of Shareholders);
•any decision to vote our shares held by ST Holding at our general meeting of shareholders with respect to any substantial and material merger decision. In the event of a failure by the STH Shareholders to reach a common decision on the relevant merger proposal, our shares attributable to the minority shareholder and held by ST Holding will be counted as present for purposes of a quorum of shareholders at one of our General Meeting of Shareholders, but will not be voted (i.e., will be abstained from the vote in a way that they will not be counted as a negative vote or as a positive vote);
•in addition, the minority shareholder will have the right to designate at least one member of the list of candidates for the Supervisory Board to be proposed by ST Holding if that shareholder indirectly owns at least 3% of our total issued and outstanding share capital, with the majority STH Shareholder retaining the right to appoint that number of members to the Supervisory Board that is at least proportional to such majority shareholder’s voting stake.
Finally, at the end of the Balance Period, the unanimous approval required for other decisions taken at the STMicroelectronics N.V. level shall only be compulsory to the extent possible, taking into account the actual power attached to the direct and indirect shareholding together held by the STH Shareholders in our Company.
5.13.1.3. Ownership of ST Shares
The STH Shareholders Agreement provides that each STH Shareholder retains the right to direct ST Holding to dispose of its stake in us at its sole discretion pursuant to the issuance of financial instruments, an equity swap, a structured finance deal or a straight sale; however, except in the case of a public offer, no sales by any party to the STH Shareholders Agreement may be made of any of our shares or any shares of Bpifrance or ST Holding to any of our top ten competitors or any company controlling such a competitor. The STH Shareholders Agreement also requires all of the parties to the STH Shareholders Agreement to hold their stakes in us at all time through the current holding structure of ST Holding, subject to certain limited exceptions, and precludes all such parties and their affiliates from acquiring any of our common shares other than through ST Holding.
5.13.1.4. Change of Control Provision
The STH Shareholders Agreement provides for tag-along rights, pre-emptive rights, and provisions with respect to a change of control of any of the STH Shareholders, on the one hand, and the Italian Ministry of the Economy and Finance, on the other hand. The STH Shareholders may transfer shares of ST Holding, to any of their respective affiliates, which could include entities ultimately controlled by the Italian government or the French government.
5.13.1.5. Deadlock
In the event of a disagreement that cannot be resolved between the parties as to the conduct of the business and actions contemplated by the STH Shareholders’ Agreement, each party has the right to offer its interest in ST Holding to the other, which then has the right to acquire, or to have a third-party acquire, such interest. If neither party agrees to acquire or have acquired the other party’s interest, then together the parties are obligated to try to find a third-party to acquire their collective interests, or such part thereof as is suitable to resolve the deadlock.
5.13.1.6. Duration
The STH Shareholders’ Agreement will remain in force as long as the MEF, on the one hand and Bpifrance, on the other hand, are shareholders of ST Holding.
6. Dividend Policy
Our dividend policy reads as follows: “STMicroelectronics seeks to use its available cash in order to develop and enhance its position in a competitive semiconductor market while at the same time managing its cash resources to reward its shareholders for their investment and trust in STMicroelectronics. Based on its results, projected capital requirements as well as business conditions and prospects, the Managing Board proposes on an annual basis to the Supervisory Board, whenever deemed possible and desirable in line with STMicroelectronics’ objectives and financial situation, the distribution of a quarterly cash dividend, if any. The Supervisory Board, upon the proposal of the Managing Board, decides or proposes on an annual basis, in accordance with this policy, which portion of the profits or distributable reserves shall not be retained in reserves to fund future growth or for other purposes and makes a proposal concerning the amount, if any, of the quarterly cash dividend.”
On May 28, 2025, our shareholders approved a cash dividend of US$0.36 per outstanding share of our common stock, which was distributed in quarterly installments of US$0.09 in each of the second, third and fourth quarters of 2025 and will also be distributed in the first quarter of 2026. Future dividends, if any, and their timing and amounts may be affected by our accumulated profits, our capacity to generate cash flow, our financial situation, the general economic situation and prospects and any other factors that the Supervisory Board, upon the recommendation of our Managing Board, shall deem important. For a history of dividends paid by us to our shareholders, see Note 7.6.20.6. (Dividends) of our consolidated financial statements.
7. Consolidated financial statements
7.1. Consolidated income statement
| | | | | | | | | | | | | | | | | | | | |
| | | | Year ended |
| In millions of U.S. dollars, except per share amount | | Notes | | December 31, 2025 | | December 31, 2024 |
| Sales | | 7.6.26 | | 11,754 | | | 13,217 | |
| Other revenues | | 7.6.26 | | 46 | | | 52 | |
| Total revenues | | | | 11,800 | | | 13,269 | |
| Cost of sales | | 7.6.28 | | (8,346) | | | (8,346) | |
| Gross profit | | | | 3,454 | | | 4,923 | |
| Selling, general and administrative expenses | | 7.6.28 | | (1,722) | | | (1,649) | |
| Research and development expenses | | 7.6.28 | | (1,713) | | | (1,726) | |
| Other income | | 7.6.29 | | 354 | | | 280 | |
| Other expenses | | 7.6.30 | | (53) | | | (140) | |
| Operating profit | | | | 320 | | | 1,688 | |
| Finance income | | 7.6.31 | | 313 | | | 780 | |
| Finance costs | | 7.6.32 | | (85) | | | (164) | |
| Profit before income tax | | | | 548 | | | 2,304 | |
| Income tax expense | | 7.6.34 | | (235) | | | (309) | |
| Net profit | | | | 313 | | | 1,995 | |
| Attributable to: | | | | | | |
| The equity holders of the parent | | | | 299 | | | 1,987 | |
| Noncontrolling interest | | | | 14 | | | 8 | |
| Net profit | | | | 313 | | | 1,995 | |
| Earnings per share attributable to the equity holders of the parent | | | | | | |
| Earnings per share (Basic) | | 7.6.35 | | 0.33 | | | 2.20 | |
| Earnings per share (Diluted) | | 7.6.35 | | 0.33 | | | 2.19 | |
The accompanying notes are an integral part of these consolidated financial statements.
7.2. Consolidated statement of comprehensive income
| | | | | | | | | | | | | | | | | | | | |
| | | | Year ended |
| In millions of U.S. dollars | | Notes | | December 31,
2025 | | December 31,
2024 |
| Net profit | | | | 313 | | 1,995 |
| Other comprehensive income (loss), net of tax: | | | | | | |
| Items that will not be reclassified to profit or loss | | | | | | |
Changes in Fair value of equity instruments at FVOCI (1) | | 7.6.14.1 | | — | | (2) |
| Income tax effect | | | | — | | — |
Net changes in Fair value of equity instruments at FVOCI (1) | | 7.6.14.1 | | — | | (2) |
| Re-measurements of employee benefit obligations | | 7.6.23 | | 25 | | (1) |
| Income tax effect | | | | (1) | | (1) |
Re-measurements of employee benefit obligations, net
of tax | | | | 24 | | (2) |
| | | | | | |
| | | | | | |
| | | | | | |
| Total items that will not be reclassified to profit or loss | | | | 24 | | (4) |
| | | | | | | |
| Items that may be subsequently reclassified to profit or loss | | | | | | |
| Exchange differences on translation of foreign operations | | | | 516 | | (236) |
| Cash flow hedges | | 7.6.33 | | 112 | | (106) |
| Income tax effect | | | | (16) | | 13 |
| Net movement on cash flow hedges | | | | 96 | | (93) |
Changes in Fair value of debt instruments at FVOCI (1) | | 7.6.14.1 | | 15 | | 1 |
| Income tax effect | | | | (2) | | — |
Net changes in Fair value of debt instruments at FVOCI (1) | | | | 13 | | 1 |
| | | | | | |
| | | | | | |
| | | | | | |
Total items that may be subsequently reclassified to profit or
loss | | | | 625 | | (328) |
| Other comprehensive income (loss), net of tax | | | | 649 | | (332) |
| | | | | | | |
| Total comprehensive income, net of tax | | | | 962 | | 1,663 |
| | | | | | | |
| Attributable to: | | | | | | |
| The equity holders of the parent | | | | 947 | | 1,655 |
| Noncontrolling interest | | | | 15 | | 8 |
| Total comprehensive income, net of tax | | | | 962 | | 1,663 |
(1)FVOCI: Fair Value through Other Comprehensive Income.
The accompanying notes are an integral part of these consolidated financial statements
7.3. Consolidated statement of financial position
| | | | | | | | | | | | | | | | | | | | |
| In millions of U.S. dollars | | Notes | | December 31,
2025 | | December 31,
2024 |
| Non-current assets | | | | | | |
| Property, plant and equipment | | 7.6.10 | | 11,062 | | | 10,889 | |
| Goodwill | | 7.6.13 | | 297 | | | 272 | |
| Intangible assets | | 7.6.12 | | 1,596 | | | 1,516 | |
| | | | | | |
| Other non-current financial assets | | 7.6.14.1 | | 190 | | | 108 | |
| Deferred tax assets | | 7.6.34 | | 303 | | | 326 | |
| Other non-current assets | | 7.6.15 | | 1,218 | | | 905 | |
| Total non-current assets | | | | 14,666 | | | 14,016 | |
| Current assets | | | | | | |
| Inventories | | 7.6.16 | | 3,131 | | | 2,806 | |
| Trade accounts receivable | | 7.6.17 | | 1,745 | | | 1,749 | |
| Other current financial assets | | 7.6.14.1 | | 1,061 | | | 2,464 | |
| Other receivables and assets | | 7.6.18 | | 1,392 | | | 997 | |
| Short-term deposits | | 7.6.14.1 | | 1,100 | | | 1,450 | |
| | | | | | |
| Cash and cash equivalents | | 7.6.19 | | 2,837 | | | 2,282 | |
| Total current assets | | | | 11,266 | | | 11,748 | |
| Total assets | | | | 25,932 | | | 25,764 | |
| | | | | | | |
| Equity | | | | | | |
| Equity attributable to the equity holders of the parent | | | | 18,877 | | | 18,435 | |
| Noncontrolling interest | | | | 397 | | | 230 | |
| Total equity | | 7.6.20 | | 19,274 | | | 18,665 | |
| Non-current liabilities | | | | | | |
| Interest-bearing loans and borrowings | | 7.6.14.3 | | 1,032 | | | 1,165 | |
| Other non-current financial liabilities | | 7.6.14.2 | | 241 | | | 228 | |
| Employee benefits | | 7.6.23 | | 551 | | | 462 | |
| Deferred tax liabilities | | 7.6.34 | | 155 | | | 100 | |
| | | | | | |
| Other non-current liabilities | | 7.6.22 | | 576 | | | 627 | |
| Total non-current liabilities | | | | 2,555 | | | 2,582 | |
| Current liabilities | | | | | | |
| Interest-bearing loans and borrowings – current portion | | 7.6.14.3 | | 978 | | | 1,683 | |
| Trade accounts payable | | 7.6.24 | | 1,487 | | | 1,323 | |
| Other payables and accrued liabilities | | 7.6.24 | | 506 | | | 420 | |
| Employee benefits – current portion | | 7.6.23 | | 923 | | | 833 | |
| Current provisions | | 7.6.21 | | 38 | | | 3 | |
| Other current financial liabilities | | 7.6.14.2 | | 134 | | | 189 | |
| Income tax payable | | 7.6.34 | | 37 | | | 66 | |
| Total current liabilities | | | | 4,103 | | | 4,517 | |
| Total equity and liabilities | | | | 25,932 | | | 25,764 | |
The accompanying notes are an integral part of these consolidated financial statements
7.4. Consolidated statement of changes in equity
For the year ended December 31, 2025
| | | | | | | | | | | | | | | | | | | | | | | | | | | | | | | | | | | | | | | | | | | | | | | | | | | | | | | | |
| In millions of U.S. dollars | | Notes | | Ordinary
shares | | Capital
surplus | | Treasury
shares | | Other
reserves | | Retained
earnings | | Equity
attributable to
the equity
holders of the
parent | | Non
controlling
interest | | Total
equity |
| As of January 1, 2025 | | | | 1,157 | | | 2,283 | | | (491) | | | 2,169 | | | 13,317 | | | 18,435 | | | 230 | | | 18,665 | |
| Net profit | | | | — | | | — | | | — | | | — | | | 299 | | | 299 | | | 14 | | | 313 | |
Other comprehensive income, net of
tax | | | | — | | | — | | | — | | | 648 | | | — | | | 648 | | | 1 | | | 649 | |
| Total comprehensive income | | | | — | | | — | | | — | | | 648 | | | 299 | | | 947 | | | 15 | | | 962 | |
| | | | | | | | | | | | | | | | | | |
| Capital contribution from noncontrolling interest | | 7.6.8.7 | | — | | | — | | | — | | | — | | | — | | | — | | | 156 | | | 156 | |
Transfer of cash flow hedge reserve to
inventories | | 7.6.14.4 | | — | | | — | | | — | | | (4) | | | — | | | (4) | | | — | | | (4) | |
| Repurchase of common stock | | 7.6.20.3 | | — | | | — | | | (367) | | | — | | | — | | | (367) | | | — | | | (367) | |
| Employee share award scheme | | 7.6.20.5 | | — | | | — | | | 221 | | | 188 | | | (221) | | | 188 | | | — | | | 188 | |
| Dividends | | | | — | | | — | | | — | | | — | | | (322) | | | (322) | | | (4) | | | (326) | |
| As of December 31, 2025 | | | | 1,157 | | | 2,283 | | | (637) | | | 3,001 | | | 13,073 | | | 18,877 | | | 397 | | | 19,274 | |
The accompanying notes are an integral part of these consolidated financial statements
For the year ended December 31, 2024
| | | | | | | | | | | | | | | | | | | | | | | | | | | | | | | | | | | | | | | | | | | | | | | | | | | | | | | | |
| In millions of U.S. dollars | | Notes | | Ordinary
shares | | Capital
surplus | | Treasury
shares | | Other
reserves | | Retained
earnings | | Equity
attributable to
the equity
holders of the
parent | | Non
controlling
interest | | Total
equity |
| As of January 1, 2024 | | | | 1,157 | | | 2,283 | | | (377) | | | 2,281 | | | 11,898 | | | 17,242 | | | 122 | | | 17,364 | |
| | | | | | | | | | | | | | | | | | |
| | | | | | | | | | | | | | | | | | |
| Net profit | | | | — | | | — | | | — | | | — | | | 1,987 | | | 1,987 | | | 8 | | | 1,995 | |
Other comprehensive income, net of
tax | | | | — | | | — | | | — | | | (332) | | | — | | | (332) | | | — | | | (332) | |
| Total comprehensive income | | | | — | | | — | | | — | | | (332) | | | 1,987 | | | 1,655 | | | 8 | | | 1,663 | |
| | | | | | | | | | | | | | | | | | |
| Capital contribution from noncontrolling interest | | 7.6.8.7 | | — | | | — | | | — | | | — | | | — | | | — | | | 104 | | | 104 | |
Transfer of cash flow hedge reserve to
inventories | | 7.6.14.4 | | — | | | — | | | — | | | 9 | | | — | | | 9 | | | 1 | | | 10 | |
| Repurchase of common stock | | 7.6.20 | | — | | | — | | | (359) | | | — | | | — | | | (359) | | | — | | | (359) | |
| Employee share award scheme | | 7.6.20.5 | | — | | | — | | | 245 | | | 211 | | | (245) | | | 211 | | | — | | | 211 | |
| Dividends | | | | — | | | — | | | — | | | — | | | (323) | | | (323) | | | (5) | | | (328) | |
| | | | | | | | | | | | | | | | | | |
| As of December 31, 2024 | | | | 1,157 | | | 2,283 | | | (491) | | | 2,169 | | | 13,317 | | | 18,435 | | | 230 | | | 18,665 | |
The accompanying notes are an integral part of these consolidated financial statements
7.5. Consolidated statement of cash flows | | | | | | | | | | | | | | | | | | | | |
| | | | Year ended |
| In millions of U.S. dollars | | Note | | December 31,
2025 | | December 31,
2024 |
| Cash flows from operating activities | | | | | | |
| Net profit | | | | 313 | | | 1,995 | |
| Items to reconcile net profit and cash flows from operating activities: | | | | | | |
| Depreciation and amortization | | 7.6.10 | | 2,139 | | | 2,056 | |
| Impairment charges and write-off of non-financial assets and non-cash restructuring charges | | | | 299 | | | 94 | |
| Interest and amortization of issuance costs on convertible bonds | | 7.6.32 | | 21 | | | 25 | |
| Change in fair value of embedded non-equity derivative instruments | | 7.6.14.5 | | (12) | | | (432) | |
| (Gain) loss on financial instruments, net | | 7.6.31 | | (76) | | | 1 | |
| Share-based compensation | | 7.6.28 | | 193 | | | 222 | |
| Other non-cash items | | | | (164) | | | (172) | |
| Deferred income tax | | 7.6.34 | | 31 | | | 121 | |
| Changes in net working capital: | | | | | | |
| Movement of trade receivables, net | | 7.6.17 | | 5 | | | (32) | |
| Movement of inventories, net | | 7.6.16 | | (172) | | | (167) | |
| Movement of trade payables | | 7.6.24 | | 83 | | | (35) | |
| Movement of other assets and liabilities, net | | | | (19) | | | (266) | |
| Interests paid | | | | (65) | | | (79) | |
| Interests received | | | | 138 | | | 208 | |
| Income tax paid | | 7.6.34 | | (141) | | | (197) | |
| Net cash from operating activities | | | | 2,573 | | | 3,342 | |
| Cash flows used in investing activities | | | | | | |
| Payments for purchases of tangible assets | | 7.6.10 | | (2,111) | | | (3,088) | |
| Proceeds from capital grants and other contributions | | | | 258 | | 441 |
| Proceeds from sale of tangible assets | | 7.6.10 | | 9 | | | 5 | |
| Net proceeds from (investments in) short-term deposits | | 7.6.14.1 | | 350 | | | (225) | |
| Payment for purchase of marketable securities | | 7.6.14.1 | | (354) | | | (2,980) | |
| Proceeds from matured marketable securities | | 7.6.14.1 | | 1,900 | | | 2,251 | |
| Payment for purchase of intangible assets | | 7.6.12 | | (473) | | | (447) | |
| Payment for purchase of financial assets | | 7.6.14.1 | | (2) | | | (53) | |
| | | | | | |
| | | | | | |
| | | | | | |
| | | | | | |
| Net cash used in investing activities | | | | (423) | | | (4,096) | |
| Cash flows from (used in) financing activities | | | | | | |
| Proceeds from interest-bearing loans and borrowings | | 7.6.14.3 | | — | | | 300 | |
| | | | | | |
| Repayment of interest-bearing loans and borrowings | | 7.6.14.3 | | (239) | | | (203) | |
| Repayment of issued convertible bonds | | 7.6.14.3 | | (750) | | | — | |
| Payment of lease liabilities | | 7.6.14.3 | | (76) | | | (71) | |
| Repurchase of ordinary shares | | 7.6.20.3 | | (367) | | | (359) | |
| Dividends paid to equity holders of the parent | | 7.6.20.6 | | (321) | | | (288) | |
| Dividends paid to noncontrolling interest | | 7.6.20.6 | | (4) | | | (5) | |
| Proceeds from noncontrolling interest | | 7.6.8.7 | | 156 | | | 104 | |
| Proceeds from advances on capital grants | | | | — | | 344 |
| | | | | | |
| Net cash used in financing activities | | | | (1,601) | | | (178) | |
| Effect of changes in exchange rates | | 7.6.38 | | 6 | | | (8) | |
| Net cash increase (decrease) | | | | 555 | | | (940) | |
| Cash and cash equivalents at the beginning of the period | | 7.6.19 | | 2,282 | | | 3,222 | |
| Cash and cash equivalents at the end of the period | | 7.6.19 | | 2,837 | | | 2,282 | |
The accompanying notes are an integral part of these consolidated financial statements
7.6. Notes to the consolidated financial statements
7.6.1. Corporate information
STMicroelectronics N.V. (“the Company”), with Commercial Register No. 33194537 and RSIN 008751171, is organized under the laws of the Netherlands with its corporate legal seat in Amsterdam, the Netherlands, and head offices at WTC Schiphol Airport, Schiphol Boulevard 265, 1118 BH Schiphol, the Netherlands. Headquarters and operational offices are managed through STMicroelectronics International N.V., a wholly owned subsidiary of STMicroelectronics N.V., and are located at 39, Chemin du Champ des Filles, 1228 Plan-les-Ouates, Geneva, Switzerland.
The Group is a global semiconductor group of companies that designs, develops, manufactures and markets a broad range of products, including discrete and general purpose components, ASICs, full-custom devices and semi-custom devices and ASSPs for analog, digital and mixed-signal applications. In addition, the Group participates in the manufacturing value chain of smartcard products, which includes the production and sale of both silicon chips and smartcards.
The Group’s products are used in a wide variety of applications for the four end-markets the Group addresses: automotive, industrial, personal electronics and communications equipment, computers and peripherals. For the automotive and industrial markets, the Group addresses a wide customer base, particularly in industrial, with a broad and deep product portfolio. In personal electronics and communications equipment, computers and peripherals, the Group has a selective approach both in terms of the customers the Group serves, as well as in the technologies and products it offers.
The Company is a publicly traded company, listed on the New York Stock Exchange, on Euronext Paris and on the Borsa Italiana.
These consolidated financial statements have been approved by the Supervisory Board on March 25, 2026 for submission to the AGM.
7.6.2. Basis of preparation
The consolidated financial statements have been prepared on a historical cost basis, except for derivative financial instruments, debt and equity financial assets that have been measured at fair value. The consolidated financial statements are presented in dollars of the United States of America and all values are rounded to the nearest million ($ million) except when otherwise stated. Under Article 35 of the Company’s Articles of Association, the financial year extends from January 1 to December 31, which is the period-end of each fiscal year.
7.6.3. Statement of compliance
These consolidated financial statements are prepared for Dutch statutory purposes in accordance with IFRS as adopted by the EU. These consolidated financial statements also comply with article 362.9 of Book 2 of the Dutch Civil Code. For internal and external financial reporting purposes, the Group uses generally accepted accounting principles in the United States (“U.S. GAAP”) as its primary set of reporting standards.
7.6.4. Basis of consolidation
The consolidated financial statements comprise the financial statements of the Group for the year ended December 31, 2025.
Subsidiaries are fully consolidated from the date of acquisition, being the date on which the Group obtains control and continues to be consolidated until the date that such control ceases. Subsidiaries are all entities over which the Group has control. The Group controls an entity when the Group is exposed to, or has rights to, variable returns from its involvement with the entity and has the ability to affect those returns through its power to direct the activities of the entity. If the Group loses control over a subsidiary, it:
•derecognizes the assets (including goodwill) and liabilities of the subsidiary;
•derecognizes the amount of any noncontrolling interest;
•derecognizes the cumulative translation differences recorded in equity;
•decognizes the fair value of the consideration received;
•decognizes the fair value of any investment retained;
•recognizes any surplus or deficit in profit or loss; and
•reclassifies the parent’s share of components previously recognized in other comprehensive income to profit or loss.
The financial statements of the subsidiaries are prepared for the same reporting period as the parent company, using consistent accounting policies. All intra-group assets and liabilities, equity, income, expenses and cash flows resulting from intra-group transactions are eliminated in full on consolidation.
Noncontrolling interest is the share of equity in a subsidiary not attributable, directly or indirectly, to the parent company. Noncontrolling interest is presented separately in the consolidated income statement, consolidated statement of comprehensive income, consolidated statement of financial position and consolidated statement of changes in equity respectively.
Changes in a parent’s ownership interest in a subsidiary that do not result in a loss of control are accounted for as equity transactions.
In assessing control, the Group takes into consideration the design and purpose of the activities of the investee, the power it exercises over the investee, through voting or other contractual rights, together with its exposure and rights to variable returns and how its power over the investee affect the amounts.
7.6.5. Changes in accounting policies
The accounting policies adopted are consistent with those followed in the preparation of the Group’s annual financial statements for the year ended December 31, 2024. The following amended standard was effective and adopted on January 1, 2025 with no material effect on the Group’s consolidated financial statements:
•Amendments to IAS 21: The Effects of Changes in Foreign Exchange Rates: Lack of exchangeability
7.6.6. Standards and amendments issued but not yet effective
Standards and amended standards issued but not yet effective up to the date of issuance of these consolidated financial statements are listed below. The detailed descriptions of new or amended standards and interpretations issued are those that the Group reasonably expects to have an impact on disclosures, financial position or performance when applied at a future date. The Group intends to adopt the new or amended guidance when effective.
Amendments to the Classification and Measurement of Financial instruments (IFRS 9 and IFRS 7): the amendments clarify that a financial liability is derecognized on the settlement date, which is when the related obligation is discharged or cancelled or expires or the liability otherwise qualifies for derecognition. The amendments also clarify how to assess the contractual cash flow characteristics of financial assets that include environmental, social and governance (ESG)-linked features and other similar contingent features. Additional disclosures are required under IFRS 7 for financial assets and liabilities with contractual terms that reference a contingent event (including those that are ESG-linked), and equity instruments classified at fair value through other comprehensive income. The amendments also clarify the treatment of non-recourse assets and contractually linked instruments. IFRS 9 and IFRS 7, as amended, were endorsed by the EU in May 2025. The amendments are effective for annual periods starting January 1, 2026. Early adoption is permitted, with an option to early adopt the amendments for contingent features only. The Group will apply the amended guidance when effective and does not expect the amended guidance to have a material impact on its consolidated financial statements.
Amendments to IFRS 9 and IFRS 7 related to Contracts Referencing Nature-dependent Electricity: the amendments are aimed to help entities to better report the financial effects of nature-dependent
electricity contracts, which are often structured as power purchase agreements ("PPA"), in the light of the increased use of these contracts. The IASB has made targeted amendments to IFRS 9 and IFRS 7, which includes:
•clarifying the application of the "own" use" requirements;
•permitting hedge accounting if these contracts are used as hedging instruments; and
•adding new disclosures requirements to enable investors to understand the effect of these contracts on the entity's financial performance and cash flows.
IFRS 9 and IFRS 7, as amended, were endorsed by the EU in June 2025. The amendments are effective for annual periods starting January 1, 2026. Early adoption is permitted. The Group will apply the amended guidance when effective and does not expect the amended guidance to have a material impact on its consolidated financial statements.
IFRS 18, Presentation and Disclosure in Financial Statements: the IASB issued in April 2024 a new standard to enhance comparability and transparency when entities report economic performance. IFRS 18 focuses on the statement of profit or loss and introduces key new concepts which relate to: the structure of the statement of profit or loss; new disclosures for certain performance measures (management-defined performance measures); enhanced principles on aggregation and disaggregation which apply to the primary financial statements and related notes. IFRS 18 is intended to replace IAS 1, while many of IAS 1 principles are retained, with limited changes. IFRS 18 was endorsed by the EU in February 2026. The new standard is effective for annual and interim periods starting January 1, 2027, including comparative information. The Group will apply the amended guidance when effective and is currently finalizing its assessment of the impact IFRS 18 will have on its consolidated financial statements, and more specifically on its consolidated income statement.
The following new standards and amended standards are not expected to have a material impact on the accounting policies, financial position or performance of the Group:
•Amendments to IAS 21, The Effects of Changes in Foreign Exchange Rates: Translation to a Hyperinflationary Presentation Currency.
•IFRS 19: Subsidiaries without Public Accountability: Disclosures, including amendments issued in August 2025.
•Annual improvements Volume 11 (issued on July 18, 2024).
7.6.7. Summary of material accounting policies
7.6.7.1. Business combinations and goodwill
The Group applies the acquisition method to account for business combinations. The consideration transferred in a business combination (including any deferred and contingent consideration) is measured at fair value. Acquisition-related costs are expensed as incurred.
Each identifiable asset and liability are, with limited exceptions as set forth in the purchase accounting method, measured initially at the acquisition-date fair value. Only components of noncontrolling interest that constitute a present ownership interest and entitle their holder to a proportionate share of the entity’s net assets in the event of liquidation are measured at either fair value or at the present ownership interests’ proportionate share of the acquiree’s net identifiable assets. All other components of noncontrolling interest are measured at their acquisition date fair value.
Goodwill arises when there is a positive difference between:
•the aggregate of consideration transferred, any noncontrolling interest in the acquiree and, in a business combination achieved in stages, the acquisition-date fair value of the acquirer’s previously held equity interest in the acquiree; and
•the fair value of the net identifiable assets acquired.
Goodwill is initially recorded at cost. If the acquirer has made a gain from a bargain purchase, that gain is recognized in the consolidated income statement.
After initial recognition, goodwill is not subject to amortization but is tested at least annually for impairment. For the purpose of impairment testing, goodwill acquired in a business combination is, from the acquisition date, allocated to each of the Group’s cash generating units (“CGU”) that are expected to benefit from the synergies of the combination, irrespective of whether other assets or liabilities of the acquiree are assigned to those units.
A cash-generating unit is the smallest identifiable group of assets that generates cash inflows that are largely independent of the cash inflows from other assets or groups of assets.
Goodwill impairment tests are undertaken annually or more frequently if events or changes in circumstances indicate a potential impairment. The impairment test determines whether the recoverable amount of each cash-generating unit, which is the higher of its assets’ fair value less costs of disposal and its value in use, is lower than its total carrying amount. If lower, an impairment loss is recognized for the excess of the carrying amount over the recoverable amount. If the impairment loss exceeds the book value of goodwill, allocation is made on a pro rata basis over the remaining assets of the CGU. In determining the value in use of a cash-generating unit, the Group usually estimates the expected discounted future cash flows associated with the unit. Significant management judgments and estimates are used in forecasting the future discounted cash flows, including: the applicable industry’s sales volume forecast and selling price evolution, the cash-generating unit’s market penetration and its revenue evolution, the market acceptance of certain recent technologies and products, or the relevant cost structure. The pre-tax discount rates applied are based on various scenarios incorporating a weighted average cost of capital and the perpetuity rates used in calculating cash flow terminal values.
7.6.7.2. Foreign currency translation
The U.S. dollar is the functional currency for the Company and the presentation currency for the Group, which is the currency of the primary economic environment in which the Group operates. The worldwide semiconductor industry uses the U.S. dollar as a currency of reference for actual pricing in the market. Furthermore, the majority of the Group’s transactions are denominated in U.S. dollars, and revenues from external sales in U.S. dollars largely exceed revenues in any other currency. However, certain significant costs are largely incurred in the countries of the Eurozone and other non-U.S. dollar currency areas.
The functional currency of each subsidiary throughout the Group is either the local currency or the U.S. dollar, determined on the basis of the economic environment in which each subsidiary operates. For consolidation purposes, assets and liabilities included in the statement of financial position of the Group’s subsidiaries having the local currency as functional currency are translated into the presentation currency of the Group at current rates of exchange at the reporting date. Income and expense items and cash flow items are translated at the monthly exchange rate in which they are recognized. The currency translation adjustments (“CTA”) generated by the conversion of the financial position and results of operations from local functional currencies are reported as a component of other comprehensive income in the consolidated statement of comprehensive income and the consolidated statement of changes in equity.
Goodwill and fair value adjustments arising on the acquisition of a foreign entity are treated as assets and liabilities of the foreign entity and translated into the presentation currency of the Group at closing rate. Exchange differences arising are recognized in other comprehensive income.
Assets, liabilities, revenues, expenses, gains or losses arising from transactions denominated in foreign currency are recorded in the functional currency of the recording entity at the prevailing exchange rate. At each reporting date, monetary assets and liabilities denominated in a currency other than the recording entity’s functional currency are re-measured into the functional currency at the exchange rate prevailing at
the reporting date. The related exchange gains and losses are recorded in the consolidated income statement as “Other income” or “Other expenses”.
7.6.7.3. Revenue recognition
Arrangements with customers are considered contracts if all the following criteria are met: (a) parties have approved the contract and are committed to perform their respective obligations; (b) each party’s rights regarding the goods or services to be transferred can be identified; (c) payment terms for the goods or services to be transferred can be identified; (d) the contract has commercial substance and (e) collectability of the consideration is probable. The Group recognizes revenue from products sold to a customer, including distributors, when it satisfies a performance obligation by transferring control over a product to the customer. The Group may also enter into several multi-annual capacity reservation and volume commitment arrangements with certain customers. These agreements constitute a binding commitment for the customers to purchase and for the Group to supply allocated commitment volumes in exchange for additional consideration. The consideration related to commitment fees is reported as revenues from sale of products as it is usually based on delivered quantities.
In certain circumstances, the Group may enter into arrangements that concern principally revenues from services where the performance obligation is satisfied over time. The objective when allocating the transaction price is to allocate the transaction price to each performance obligation (or distinct good or service) in an amount that depicts the amount of consideration to which the Group expects to be entitled in exchange for transferring the promised goods or services to the customer. The payment terms typically range between 30 to 90 days. Certain customers require the Group to hold inventory as consignment in their hubs and only purchase inventory when they require it. Revenue for sales of such inventory is recognized when, at the customer’s option, the products are withdrawn from the consignment and the Group satisfies a performance obligation by transferring control over a product to the customer.
Consistent with standard business practice in the semiconductor industry, price protection is granted to distribution customers on their existing inventory of the Group’s products to compensate them for changes in market prices. The Group accrues a provision for price protection based on a rolling historical price trend computed monthly as a percentage of gross distributor sales. This historical price trend represents differences in recent months between the invoiced price and the final price to the distributor, adjusted to accommodate a significant change in the selling price. The short outstanding inventory time, visibility into the inventory product pricing and long distributor pricing history have enabled the Group to reliably estimate price protection provisions at period-end. The Group records the accrued amounts as a deduction of “Sales” in the consolidated income statement at the time of the sale.
The Group’s customers occasionally return the Group’s products for technical reasons. The Group’s standard terms and conditions of sale provide that if the Group determines that products do not conform, the Group will repair or replace the non-conforming products, or issue a credit note or rebate of the purchase price. Quality returns are identified shortly after sale in customer quality control testing. The Group records the accrued amounts as a deduction of “Sales” in the consolidated income statement, using contractual and historical information.
The Group records a provision for warranty costs as a charge in “Cost of sales” in the consolidated income statement, based on historical trends of warranty costs incurred as a percentage of sales, which management has determined to be a reasonable estimate of the probable losses to be incurred for warranty claims in a period. Any potential warranty claims are subject to the Group’s determination that the Group is at fault for damages, and such claims usually must be submitted within a short period of time following the date of sale. This warranty is given in lieu of all other warranties, conditions or terms expressed or implied by statute or common law. The Group’s contractual terms and conditions typically limit its liability to the sales value of the products which gave rise to the claims.
The Group’s insurance policy relating to product liability covers third-party physical damages and bodily injury, indirect financial damages as well as immaterial non-consequential damages caused by defective products.
In addition to product sales, the Group enters into arrangements with customers consisting in transferring licenses or related to license services. When the license is a right to use the Group’s intellectual property as it exists at the time the license is granted, the corresponding revenue is recognized at a point in time. The revenue generated from these arrangements are reported on the line “Other revenues” of the consolidated income statement.
7.6.7.4. Other significant categories of income
Funding
The Group receives funding mainly from governmental entities and income is recognized when all contractual conditions for receipt of these funds are fulfilled and eligible expenditures incurred. Such funding is generally provided to encourage research, development and other innovation activities, industrialization deployment and local economic development. The conditions to receive government funding may include eligibility restrictions, approval by the local governmental authorities, annual budget appropriations, compliance with regulations, as well as specifications regarding objectives and results. Certain specific contracts include obligations to maintain a minimum level of employment and investment during a certain period of time. There could be penalties if these objectives are not fulfilled. Other contracts contain penalties for breach of contract, which may result in repayment obligations. Funding related to these contracts is recorded when the conditions required by the contracts are met.
The Group’s funding programs are classified under two general categories: funding for research, development and other innovative activities, including first industrialization deployment initiatives, and capital investments. The Group also benefits from tax credits for R&D activities in several countries (primarily in France) as they are generally available to all companies.
Funding for research, development and other innovative activities
Funding for research, development and innovative activities is the most common form of funding that the Group receives. Public funding for such activities is recorded as “Other income” in the Group’s consolidated income statement. The funding is recognized ratably as the related costs are incurred once the agreement with the respective governmental agency has been signed and all applicable conditions are met. Other government assistance, such as funding received for industrialization deployment and local economic development in certain regions, are reported as a deduction of cost of sales or other operating expenses according to the underlying costs eligible to the grants.
The Group receives certain specific project-related research tax credits – “Crédit Impôt Recherche” – in the French tax jurisdiction. The Group considers the tax credits received as government grants based on the fact that the tax credits are received independently from tax payments of the Group. The Group recognizes these credits as long-term or short-term receivables depending on the expected time of collection. These credits are deducted from “Research and development” (R&D) in the consolidated income statement or recorded as a reduction of intangible assets, as described in Note 7.6.7.5.
Capital investments
Capital investment funding is recorded as a reduction of “Property, plant and equipment” in the consolidated statement of financial position when the Group has incurred the eligible capital expenditures and when all conditions for eligibility have been fulfilled. Advances from capital grants received on capital investments that have not been incurred yet are reported in the line "Other non-current liabilities" in the
consolidated statement of financial position. Capital investment funding is recognized in the Group’s consolidated income statement by offsetting the depreciation charges of the funded assets during their useful lives. The Group also receives funding, which can be recovered through the reduction of various government liabilities, including income tax, value-added tax and employee-related social charges.
When the funding has been classified as a long-term receivable with no tax attribute or legal restriction, it is reflected in the consolidated statement of financial position at its discounted net present value. The subsequent accretion of the discount is recorded as a non-operating income in “Finance income”.
Finance income
Finance income is calculated by applying the effective interest rate to the gross carrying amount of a financial asset, except for financial assets that subsequently become credit-impaired. For credit-impaired financial assets, the effective interest rate is applied to the amortized cost of the financial asset.
7.6.7.5. Research and development
R&D expenditures include costs incurred by the Group, the Group’s share of costs incurred by other R&D interest groups and costs associated with co-development contracts. Research costs are expensed as incurred.
Expenditures incurred on development projects, mainly related to the design and testing of new or improved products controlled by the Group, are recognized as “Intangible assets” in the consolidated statement of financial position when it is probable that the project will be a success considering its economic profitability and technological feasibility, and costs can be measured reliably, as described in Note 7.6.7.10. Certain research tax credits are also recognized as a reduction of intangible assets for the portion that can be reliably allocated to development projects. Development expenditures recognized as assets are amortized, when ready for their intended use, over their estimated useful lives, not exceeding five years (refer to Note 7.6.7.10). Development costs that do not meet the capitalization criteria are expensed as incurred. Development expenditures recognized as expenses are not recognized as assets in a subsequent period. Amortization expense recognized on capitalized development costs in use is recorded as “Cost of sales” in the consolidated income statement. Amortization expense on technologies and licenses purchased by the Group from third parties or acquired in a business combination to facilitate the Group’s R&D activities is recorded as “Research and development” in the consolidated income statement.
An impairment test is performed whenever a triggering event questions the future recoverability, or at least annually, for the capitalized development projects still not in use. A loss is recognized in the consolidated income statement as “Cost of sales” for the amount by which the asset’s carrying amount exceeds its recoverable amount.
7.6.7.6. Current and deferred income tax
Income tax in the consolidated income statement for the period comprises current and deferred income tax. Income tax expense represents the income tax expected to be paid related to the current year taxable profit in each tax jurisdiction. Management periodically evaluates positions taken in tax returns with respect to situations in which applicable tax regulation is subject to interpretation. The Group determines whether it is probable that the taxing authorities will accept an uncertain tax treatment that has been taken or is expected to be taken on a tax return and the accounting for income tax is determined consistently with that tax treatment. If the Group concludes it is not probable that the treatment will be accepted, the effect of the uncertainty is reflected in its income tax accounting in the period in which that determination is made. The Group measures the impact of the uncertainty using the method that best
predicts the resolution of the uncertainty; either the most likely amount method or the expected value method. In most cases, the Group applies the most likely amount method to determine the amount of uncertainty to be reflected in the consolidated financial statements, as the assessment generally relies on probabilities of possible outcomes that are either binary or concentrated on one value.
Deferred tax assets and liabilities are recorded for temporary differences arising between the book and tax bases of assets and liabilities and for the benefits of tax credits and operating loss carry-forwards. However, deferred income tax is not accounted for if it arises from initial recognition of an asset or liability in a transaction other than a business combination that, at the time of the transaction, affects neither accounting nor taxable profit or loss. For deferred tax related to assets and liabilities arising from a single transaction that, on initial recognition, give rise to equal amounts of taxable and deductible temporary differences. Moreover, deferred tax liabilities are not recognized if they arise from the initial recognition of goodwill. Deferred income tax is determined using tax rates and laws that have been enacted or substantively enacted by the reporting date and are expected to apply when the related deferred income tax asset is realized or the deferred income tax liability is settled. Deferred income tax assets are recognized to the extent that it is probable that future taxable profit will be available against which the temporary differences can be utilized.
The Group has determined that the global minimum top-up tax, which it may be required to pay under the OECD Pillar Two provisions as enacted in the tax legislation where the Group operates is an income tax under the scope of IAS 12. The Group applies the exception to recognizing and disclosing information about deferred tax assets and liabilities related to Pillar Two income taxes, as provided in the amendments to IAS 12 issued in May 2023.
Items recognized in other comprehensive income or directly in equity are recognized net of tax. Income taxes are recognized as cash flows from operating activities in the consolidated statement of cash flows.
7.6.7.7. Earnings per share
Basic earnings per share ("EPS") are calculated by dividing the net earnings attributable to the equity holders of the parent company by the weighted average number of ordinary shares outstanding during the period. Diluted EPS are calculated by dividing the net earnings attributable to the equity holders of the parent company (adding-back finance costs, net of tax effects, related to convertible debt if determined to be dilutive) by the weighted average number of ordinary shares and potential ordinary shares outstanding during the period. The weighted average shares used to compute diluted EPS include the incremental shares of ordinary shares related to unvested shares and convertible debt to the extent such incremental shares are dilutive. Unvested shares with performance conditions are included in the diluted EPS calculation if their conditions have been met at the reporting date and if the awards are dilutive. If all the conditions have not been satisfied by the end of the period, the number of contingently issuable shares included in the diluted EPS is based on the number of shares that would be issuable if the end of the period were the end of the contingency period.
7.6.7.8. Cash and cash equivalents
Cash and cash equivalents include cash on hand, deposits held at call with external financial institutions and other short-term highly liquid investments with effective maturities of three months or less. They are readily convertible to known amounts of cash and so near their maturity that they present insignificant risk of changes in value because of changes in interest rates.
Short-term deposits representing cash equivalents with maturity beyond three months and below one year are reported as current assets in the line “Short-term deposits” of the consolidated statement of financial position.
7.6.7.9. Inventories
Inventories are stated at the lower of cost and net realizable value. Actual cost is based on an adjusted standard cost, which approximates cost on a first-in, first-out basis for all categories of inventory (raw materials, work-in-process, finished products). Actual cost is therefore dependent on the Group’s manufacturing performance and is based on the normal utilization of its production capacity. In case of underutilization of manufacturing facilities, the costs associated with unused capacity are not included in the valuation of inventories but charged directly to cost of sales. Net realizable value is based upon the estimated selling price in the ordinary course of business, less reasonably predictable costs of completion, disposal and transportation.
As described in Note 7.6.7.15, the Group hedges a portion of its Euro-denominated front-end manufacturing costs of semi-finished goods. The Group may also hedge certain Singapore dollar-denominated forecasted transactions. The Group adjusts the initial carrying amount of inventory by the cumulative amount of the hedging instrument fair value changes recorded as other comprehensive income for settled hedging transactions.
Inventory reserve is estimated for excess uncommitted inventory based on historical sales data, order backlog and production plans. The Group performs, on a continuous basis, write-offs of inventories, which have the characteristics of slow-moving, old production dates and technical obsolescence. The Group evaluates its inventory to identify obsolete or slow-selling items, as well as inventory that is not of saleable quality and records a specific reserve if the Group estimates the inventory will eventually be written-off. Inventory associated with obsolete or uncommitted inventory is expensed to “Cost of sales” in the consolidated income statement.
7.6.7.10. Intangible assets with definite useful lives
Intangible assets acquired separately are recognized at cost in the consolidated statement of financial position and include technologies and licenses purchased from third parties and purchased software. The cost of intangible assets acquired in a business combination is the acquisition-date fair value.
Expenditures incurred on development projects, mainly related to the design and testing of new or improved products controlled by the Group, and internally generated software developed for the Group’s internal use are recognized as intangible assets when the Group can demonstrate all of the following:
•the technical feasibility of completing the item under development so that it will be available for use or sale;
•its intention to complete the item under development and ability to use it or sell it;
•how the item under development will generate probable future economic benefits;
•the availability of adequate technical, financial and other resources to complete the development and to use or sell the item under development; and
•its ability to measure reliably the expenditures attributable to the project during its development.
Refer to Note 8.3.13 for composition of Company’s legal reserves, which includes capitalized development costs and internally developed software.
Expenditures incurred on development projects that do not meet these criteria and all research activities are recognized as expenses when incurred.
Development costs are amortized, when the development is complete, on a straight-line basis over the period of their expected benefits, not exceeding three years.
Amortization begins when the intangible asset is available for its intended use. Amortization reflects the pattern in which the asset’s economic benefits are consumed, which usually consists in applying the
straight-line method to allocate the cost of the intangible asset over the estimated useful life. The amortization period and the amortization method for an intangible asset with a definite useful life are reviewed at least at each financial year end.
A summary of the policies applied to the Group’s intangible assets is as follows:
| | | | | | | | | | | | | | | | | | | | | | | | | | |
| | Technologies and
licenses | | Purchased software | | Internally
developed
software | | Capitalized
development
costs |
| Useful lives | | Definite | | Definite | | Definite | | Definite |
| Amortization method used | | Straight line basis over estimated useful life / 3-10 years | | Straight line basis over estimated useful life / Max 4 years | | Straight line basis over estimated useful life / Max 4 years | | Straight line basis over estimated useful life / 3-5 years |
| Internally generated or acquired | | Acquired | | Acquired | | Internally generated | | Internally generated |
Intangible assets not ready for use, such as some capitalized development expenditures, are tested annually for impairment. The carrying value of intangible assets with definite useful lives and subject to amortization is assessed for impairment at the level of a CGU whenever there is an indication that intangible assets may be impaired. An impairment loss is recognized in the consolidated income statement for the amount by which the carrying amount exceeds the recoverable amount. The recoverable amount is the higher of an asset’s fair value less costs of disposal and value in use. In determining recoverability, the Group usually estimates the value in use based on the projected discounted future cash flows associated with the intangible assets. The Group makes maximum use of market inputs and minimizes the use of unobservable inputs when measuring fair value. Prior impairment charges on intangible assets other than goodwill are reviewed for possible reversal at each reporting date.
7.6.7.11. Property, plant and equipment
Property, plant and equipment are stated at historical cost, net of public funding, accumulated depreciation and any impairment losses. Property, plant and equipment acquired in a business combination are recognized at fair value at the acquisition date. Major additions and improvements are capitalized, while minor replacements and repairs are expensed and reported as “Cost of sales”, “Selling, general and administrative expenses”, or “Research and development expenses” in the consolidated income statement according to their intended use.
Land is not depreciated. Depreciation on fixed assets is computed using the straight-line method over the following estimated useful lives:
| | | | | | | | |
| Nature of tangible asset | | Estimated
useful life |
| Buildings | | 33 years |
| Facilities & leasehold improvements | | 5-10 years |
| Machinery and equipment | | 2-10 years |
| Computer and R&D equipment | | 3-6 years |
| Other | | 2-5 years |
The Group evaluates in each period whether the assets’ useful lives should be reviewed, and adjusted if appropriate, at the end of each reporting period. The Group also evaluates in each period whether there is a reason to suspect that tangible assets or groups of assets might not be recoverable. Several impairment indicators exist for making this assessment such as: restructuring plans, significant changes
in the technology, market, economic or legal environment in which the Group operates, available evidence of obsolescence of the asset, or indication that its economic performance is, or will be, worse than expected. For the purposes of assessing impairment, assets are grouped at the lowest levels for which there are separately identifiable cash flows (cash-generating units). An impairment loss is recognized in the consolidated income statement for the amount by which the carrying amount of the asset or the cash-generating unit exceeds its recoverable amount. The recoverable amount is the higher of an asset’s fair value less costs of disposal and value in use. The fair value is usually estimated by the Group based on independent market appraisals and the value in use by applying the income approach. The Group makes maximum use of market inputs and minimizes the use of unobservable inputs when measuring fair value.
When property, plant and equipment are retired or otherwise disposed of, the net book value of the assets is removed from the Group’s books and the net gain or loss is included in “Other income” or “Other expenses” in the consolidated income statement.
7.6.7.12. Leases
The Group assesses at contract inception whether a contract implying the use of an asset is, or contains, a lease, which is the case if the contract conveys the right to control the use of an identified asset for a period of time in exchange for consideration. The Group recognizes right-of-use assets at the commencement date of the lease as a category of “Property, plant and equipment” in the consolidated statement of financial position. The corresponding lease liabilities are reported on the line “Other non-current financial liabilities” on the consolidated statement of financial position when payment is expected beyond twelve months, and in the line “Other current financial liabilities” for the current portion of the lease obligations. Lease arrangements with a sum of lease payments not exceeding $5,000 or a total duration lower than twelve months without a purchase option are excluded from capitalization.
The right-of-use asset is initially measured at cost, and subsequently at cost less accumulated depreciation and any impairment losses or adjusted for certain re-measurements of the lease liability when deemed necessary. For income statement purposes, the depreciation charge on right-of-use assets is recorded on a straight-line basis over the lease period and reported as “Cost of sales”, “Selling, general and administrative expenses”, or “Research and development expenses” in the consolidated income statement according to the intended use of the leased asset.
The lease liability is initially measured at the present value of the lease payments that are not paid at the commencement date, discounted using the interest rate implicit in the lease or, if that rate cannot be readily determined, the Group’s incremental borrowing rate. Generally, the Group uses its incremental borrowing rate as the discount rate. The lease liability is subsequently increased by the interest cost of the lease liability and decreased by the lease payments. The interest cost is reported in the line “Finance costs” of the consolidated income statement. The Group has applied judgment to determine the lease term for some lease contracts with renewal options. The assessment of whether the Group is reasonably certain to exercise such options impacts the lease term, which affects the amount of reported lease liabilities and corresponding right-of-use assets. The carrying amount of lease liabilities is remeasured if there is a modification, a change in the lease term, a change in the lease payments or a change in the assessment of an option to purchase the underlying asset. Variable lease payments based on an index or a rate are initially measured using the index or rate as of the commencement date. Potential future increases in variable lease payments based on an index or rate are not included in the lease liability until they take effect. When adjustments to lease payments based on an index or rate take effect, the lease liability is reassessed and adjusted against the right-of-use asset.
For cash flow presentation purposes, cash payments for the principal portion of the lease liabilities are reported as cash flows used in financing activities. The interest expense recorded on the subsequent measurement of lease liabilities are reported within cash flows from operations, consistent with the
Group’s cash flow presentation for interest paid. Short-term lease payments and payments for leases of low-value assets are reported as operating outflows.
7.6.7.13. Financial Assets
7.6.7.13.1. Offsetting financial instruments
Financial assets and liabilities are offset and the net amount reported in the consolidated statement of financial position when there is a legally enforceable right to offset the recognized amounts and there is an intention to settle on a net basis or realize the asset and settle the liability simultaneously.
7.6.7.13.2. Classification
The Group classifies its financial assets according to the following measurement categories:
•those measured at fair value, either at FVOCI or at FVPL; and
•those measured at amortized cost.
Publicly traded equity securities are measured at FVPL (fair value through profit and loss) while the Group has made the irrevocable election to measure equity securities with no readily determinable fair value at FVOCI, with subsequent changes in fair value not recycled through earnings. Derivative instruments that are not designated as hedging instruments are measured at FVPL. Debt instruments, loans and receivables are measured at amortized cost or FVOCI, depending on the Group’s business model in managing the assets. When the contractual terms of cash flows do not solely correspond to payments of principal and interest (the “SPPI criterion”), the financial asset is mandatorily measured at FVPL.
7.6.7.13.3. Recognition and measurement
Regular purchases and sales of financial assets are recognized on the trade date, which is the date the Group commits to purchase or sell the asset. Investments are initially recognized at fair value plus transaction costs for all financial assets not carried at fair value through profit or loss. Financial assets carried at fair value through profit or loss are initially recognized at fair value, and transaction costs are expensed in the consolidated income statement. Financial assets are derecognized when the rights to receive cash flows from the investments have expired or have been transferred and the Group has transferred substantially all risks and rewards of ownership.
Debt instruments
Subsequent measurement of debt instruments depends on the Group’s business model for managing the asset and its cash flow characteristics. The contractual cash flows related to all debt instruments held by the Group meet the SPPI criterion. There are two measurement categories into which the Group classifies its debt instruments:
•Amortized cost: Assets that are held for collection of contractual cash flows are measured at amortized cost. These assets typically correspond to trade accounts receivable, other receivables, long-term loans and long-term receivables. They are reported as current, except for maturities greater than twelve months after the reporting date, which are classified as non-current.
•FVOCI: Assets that are held for collection of contractual cash flows or for selling are measured at FVOCI. Movements in the carrying amount are taken through OCI, except for the recognition of
impairment losses, interest income and foreign exchange gains and losses, which are recognized in the consolidated income statement. When the financial asset is derecognized, the cumulative gain or loss previously recognized in OCI is recycled from equity to earnings, within “Other income” or “Other expenses” in the consolidated income statement, when the transactions for such instruments are related to the Group’s operating activities. Gains and losses arising from financial assets not related to the operating activities of the Group are presented within “Finance income” and “Finance costs” in the consolidated income statement. Debt instruments measured at FVOCI are included in non-current assets unless management intends to dispose of the investment within twelve months after the reporting date or if they represent investments of funds available for current operations.
Equity securities
The Group subsequently measures all equity securities at fair value. The Group has elected to irrevocably measure equity securities with no readily determinable fair value at FVOCI, with no subsequent reclassification of fair value gains and losses, including impairment, from equity to earnings following the derecognition of the financial assets.
Gains and losses arising from changes in the fair value of publicly traded equity securities, which are measured at FVPL, are presented in the consolidated income statement within “Other income” or “Other expenses” in the period in which they arise, when the transactions for such instruments are related to the Group’s operating activities. Gains and losses arising from changes in fair value of these financial assets not related to the operating activities of the Group are presented within “Finance income” and “Finance costs” in the consolidated income statement.
7.6.7.13.4. Impairment of financial assets
The Group assesses on a forward-looking basis the expected credit losses associated with its debt instruments carried at amortized cost and FVOCI. The impairment methodology applied depends on whether there has been a significant increase in credit risk. The impairment methodology by category of financial assets is further described in Note 7.6.38.
For trade receivables, the Group applies the simplified approach required by IFRS 9, which requires expected lifetime credit losses to be recognized from initial recognition of the receivables as further described in Note 7.6.17.
7.6.7.14. Trade accounts receivable
Trade accounts receivable are amounts due from customers for goods sold or services rendered to third parties in the ordinary course of business. The accounts receivable are recognized initially at transaction price and subsequently measured at amortized cost using the effective interest method, less provision for expected credit losses. The carrying amount of the asset is reduced through the use of a credit loss allowance, and the amount of the credit loss is recognized as “Selling, general and administrative expenses” in the consolidated income statement. When a trade receivable is uncollectible, it is written-off against the impairment account for trade receivables. Subsequent recoveries of amounts previously written off are credited against “Selling, general and administrative expenses” in the consolidated income statement. The impairment policies on trade receivables are further described in Note 7.6.38.
In the event of sales of receivables and factoring, the Group derecognizes the receivables and accounts for them as a sale only to the extent that the receivables have been transferred outside the consolidated group and the Group has transferred substantially all the risks and rewards of ownership of the receivables.
7.6.7.15. Derivative financial instruments and hedging activities
Derivative financial instruments are classified as financial instruments measured at FVPL unless they are designated as effective hedging instruments. All derivatives are carried as assets when their fair values are positive and as liabilities when their fair values are negative.
Derivative financial instruments not designated as a hedge
The worldwide operations of the Group lead to an exposure to adverse movements in foreign currency exchange rates. The Group enters into foreign currency forward contracts and currency options to reduce its exposure to changes in exchange rates and the associated risk arising from the denomination of certain assets and liabilities in foreign currencies at the Group’s subsidiaries. In addition, forward contracts and currency options, including collars, are also used by the Group to reduce its exposure to U.S. dollar fluctuations in Euro-denominated forecasted intercompany transactions that cover a large part of R&D expenditures and certain corporate expenses incurred by subsidiaries on behalf of STMicroelectronics International N.V. These intercompany transactions are not closely linked to ultimate transactions with third parties and consequently, these derivatives do not qualify as hedging instruments under the requirements of IFRS 9.
These derivative financial instruments are initially and subsequently recorded at fair value. Fair value adjustments and realized gains and losses are recognized in the consolidated income statement in the line “Other income” or “Other expenses”.
Derivative financial instruments designated as hedge
These instruments correspond to forward currency contracts and currency options, including collars, which are entered into by the Group to hedge exposure to foreign currency fluctuations.
For the purpose of hedge accounting, the hedging transactions are classified as cash flow hedge as they hedge exposure to variability in cash flows of highly probable forecasted transactions.
The following criteria must be in place before the Group applies hedge accounting:
•at the inception of the transaction, the Group formally documents the economic relationship between hedging instruments and hedged items, as well as its risk management objectives and strategy for undertaking the hedge;
•the Group also documents its assessment, both at hedge inception and on an ongoing basis, of whether the derivatives that are used in hedging transactions are highly effective in offsetting changes of cash flows of hedged items; and
•the highly probable forecasted transactions designated as hedged items will ultimately affect the consolidated income statement.
To further reduce its exposure to U.S. dollar exchange rate fluctuations, the Group hedges a portion of its Euro-denominated forecasted purchases of products with underlying front-end manufacturing production costs of semi-finished goods incurred in Euros, since these transactions are considered highly probable to occur and are closely linked to ultimate transactions with third parties. The Group may also hedge certain Singapore dollar-denominated manufacturing forecasted transactions.
These derivative financial instruments are initially recognized at fair value. The effective portion of the gain or loss on the hedging instrument is recognized in other comprehensive income. The Group has elected to designate the full change in fair value, including the time value of options or combination of options, as the hedging instrument.
7.6.7.16. Employee benefits
The Group operates various post-employment schemes, including both defined benefit and defined contribution pension plans.
Pension obligations
The Group sponsors various pension schemes for its employees. These schemes conform to local regulations and practices of the countries in which the Group operates. Defined benefit pension plans define amounts of pension benefits that employees will receive on retirement, usually dependent on one or more factors such as age, years of service and compensation. The liability recognized in the line “Employee benefits” in the consolidated statement of financial position in respect of defined benefit pension plans is the present value of the defined benefit obligation at the reporting date less the fair value of plan assets. Significant estimates are used in determining the assumptions incorporated in the calculation of the pension obligations, which is supported by input from independent actuaries. The defined benefit obligation is calculated annually using the projected unit credit method. The present value of the defined benefit obligation is determined by discounting the estimated future cash outflows using in most cases interest rates of high-quality corporate bonds that are denominated in the currency in which the benefits will be paid, and that have terms to maturity approximating the terms of the related pension obligation.
Actuarial gains and losses arising from experience adjustments and changes in actuarial assumptions are charged or credited to equity in other comprehensive income in the period in which they arise. Past service costs are recognized immediately in profit or loss.
For defined contribution plans, the Group pays contributions to publicly or privately administered pension insurance plans on a mandatory, contractual or voluntary basis. The Group has no further payment obligations once the contributions have been paid. The contributions are recognized as employee benefit expense when they are due. Prepaid contributions are recognized as an asset to the extent that a cash refund or a reduction in the future payments is available.
Other long-term employee benefits
The Group provides long-term employee benefits such as seniority awards in certain countries. The entitlement to these benefits is usually conditional on the employee completing a minimum service period. The expected costs of these benefits are accrued over the period of employment. Actuarial gains and losses arising from experience adjustments, and changes in actuarial assumptions, are charged or credited to earnings in the period of change. These obligations are valued annually with the assistance of independent qualified actuaries.
Termination benefits
Termination benefits are payable when employment is terminated by the Group before the normal retirement date, or whenever an employee accepts voluntary termination in exchange for these benefits. The Group recognizes termination benefits at the earlier of the following dates: (a) when the Group can no longer withdraw the offer of those benefits; and (b) when the entity recognizes costs for a restructuring that is within the scope of IAS 37 and involves the payment of termination benefits. Benefits falling due more than twelve months after the reporting date are discounted to present value.
Profit-sharing and bonus plans
The Group recognizes a liability and an expense for bonuses and profit-sharing plans when it is contractually obliged or where there is a past practice that has created a constructive obligation.
Share-based compensation
All the share plans of the Group are equity settled.
The fair value of the employee services received in exchange for the grant of share-based awards is recognized as an expense and as a corresponding increase in shareholders’ equity. The total amount to be expensed over the vesting period, which is the period over which all of the specified vesting conditions are to be satisfied, is determined by reference to the fair value of awards granted is measured based on the market price of the underlying shares at the date of grant, as observed on the New York Stock Exchange, reduced by the present value of the dividends expected to be paid on the shares during the requisite service period. No other features of the equity instruments granted is incorporated in the fair value measurement. Non-market performance and service conditions are included in assumptions about the number of instruments that are expected to vest. Any applicable employee social charges are also expensed ratably over the same period as the share-based compensation expense.
At the end of each reporting period, the Group revises its estimates of the number of instruments that are expected to vest based on the non-market vesting conditions. It recognizes the impact of the revision to original estimates, if any, in the consolidated income statement, with a corresponding adjustment to equity.
7.6.7.17. Financial Debt
Bank loans
Bank loans are recognized initially at fair value, net of transaction costs incurred, if any. They are subsequently stated at amortized cost; any difference between the proceeds (net of transaction costs) and the redemption value is recognized within “Finance costs” in the consolidated income statement over the period of the borrowings using the effective interest method.
Borrowings are classified as current liabilities unless the Group has at the reporting date an unconditional right to defer settlement of the liability for at least twelve months after the reporting date.
Hybrid financial instruments
The Group issued in 2020 convertible bonds that can be converted to share capital at the option of the holder and that are callable by the Group, in certain events and circumstances, but for which the number of shares to be issued does vary.
The issuer’s call option and the bondholder’s conversion option are embedded non-equity derivative instruments and are recognized separately from the debt host contract. Upon initial recognition, the derivatives are measured at fair value, and the debt is measured as a residual amount. The debt is subsequently measured at amortized cost using the effective interest method. The embedded derivatives are measured at fair value through profit and loss, with changes in fair value reported in the line “Finance costs” or “Finance income” in the consolidated income statement.
7.6.7.18. Equity
Ordinary share capital
The Company has issued ordinary shares that are classified as equity. Incremental external costs that are directly attributable to the issuance of these shares are recognized in equity, net of tax.
Treasury shares
Own equity instruments which are acquired (treasury shares) are deducted from equity for the consideration paid including any directly attributable incremental costs (net of taxes). No gain or loss is recognized in the income statement on the purchase, sale, issue or cancellation of the Company’s own equity instruments.
Dividends on ordinary share capital
Dividends on ordinary shares are recognized as a liability and deducted from equity when they are approved by the Company’s shareholders.
Dividends for the year that are approved after the reporting date are dealt with as an event after the reporting date.
7.6.7.19. Trade payables
Trade accounts payable are obligations to pay for goods or services that have been acquired in the ordinary course of business from suppliers. Trade payables are recognized initially at fair value and subsequently measured at amortized cost using the effective interest method when maturity of the payables exceeds one year.
7.6.7.20. Provisions
Provisions for restructuring costs and legal claims, if any, are recognized when: the Group has a present legal or constructive obligation as a result of past events; it is probable that an outflow of resources embodying economic benefits will be required to settle the obligation; and the amount has been reliably estimated. Provisions are not recognized for future operating losses.
If the effect of time value of money is material, provisions are discounted using a current pre-tax rate that reflects current market assessments of the time value of money and, when appropriate, the risk specific to the obligation. The increase in the provision due to passage of time is recognized as finance cost.
7.6.7.21. Contingencies
The Group is subject to the possibility of loss contingencies arising in the ordinary course of business. These include but are not limited to: warranty cost on the products of the Group, breach of contract claims, claims for unauthorized use of third-party IP, tax claims and provisions for specifically identified income tax exposures as well as claims for environmental damages. In determining loss contingencies, the Group considers the likelihood of a loss of an asset or the incurrence of a liability as well as the ability to reasonably estimate the amount of such loss or liability. The Group regularly evaluates claims to determine whether provisions need to be recorded based on the most current information available to the Group. Changes in these evaluations could result in adverse, material impact on the Group’s results of operations, cash flows or its financial position for the period in which they occur.
7.6.7.22. Segment reporting
Operating segments are defined as a component of the entity that (i) engages in business activities from which it may earn revenues and incur expenses, (ii) whose operating results are regularly reviewed by the entity’s Chief Operating Decision Maker ("CODM") - members of the Managing Board under the oversight of the Supervisory Board, to make decisions about resources to be allocated to the segments and assess its performance and (iii) for which discrete financial information is available.
For the computation of the segments’ internal financial measurements, the Group uses certain internal rules of allocation for the costs not directly chargeable to the segments, including cost of sales, SG&A expenses, and a part of R&D expenses. In compliance with the Group’s internal policies, certain costs are not allocated to the segments, but reported in “Others”. Those comprise unused capacity charges, including incidents leading to power outage, certain unallocated impairment, restructuring charges and other related phase-out costs, management reorganization expenses, start-up costs, and other unallocated income (expenses) such as: strategic or special R&D programs, certain corporate-level operating expenses, patent claims and litigations, and other costs that are not allocated to reportable segments, as well as operating earnings of other products.
Wafer costs are allocated to the segments based on actual cost. From time to time, with respect to specific technologies, wafer costs are allocated to segments based on market price.
7.6.8. Critical accounting estimates and judgments
Estimates and judgments are continually evaluated and are based on historical experience and other factors, including expectations of future events that are believed to be reasonable under current circumstances. The Group operates on a worldwide basis in an economic environment impacted by many risk factors, which generates uncertainties on future economic conditions. These risk factors include, but are not limited to, macro-economic factors such as inflationary trends, volatility in exchange rates and prices, tariffs and trade tensions, shifting global trade patterns and geopolitical risks and uncertainties from military conflicts, as well as sustainability and climate change specific risks, which may have an impact on the Group’s forward-looking growth and financial outlook. The Group operated in 2025 with solid fundamentals and a strong capital structure. There are no conditions and events which raise substantial doubt about the Group’s ability to continue as a going concern, in light with: its current financial condition, including its liquidity sources; its obligations – due or anticipated; the funds necessary to maintain the Group’s operations; and other conditions and events, if any.
The uncertainties arisen from these business conditions have been factored, when relevant, in the critical accounting estimates and judgments made in preparing these consolidated financial statements, on the basis of all known facts and circumstances and reasonable and supportable forecast of future conditions. These assumptions do not significantly differ from past experience or external sources of information, when available and relevant. However, the impact on future economic performance cannot be fully determined and is closely monitored on an on-going basis by means of different scenarios.
Except for the launch of the Group's company-wide program to reshape its manufacturing footprint and reduce its cost base, as further described in Note 7.6.8.3, no other events or changes in circumstances indicated in 2025 that the carrying amount of major tangible assets, including lease right-of-use assets, might not be recoverable or that useful lives might not be appropriate. The Group also reviewed the recoverability of its intangible assets, including capitalized development costs. On the latter, the Group recorded a total impairment charge of $67 million in 2025. Refer to Note 7.6.12 for further details on amounts capitalized, amortized and impaired during the year.
There is no major contingency to be reported as of December 31, 2025. The tax loss carryforwards capitalized as deferred tax assets are deemed recoverable in all major tax jurisdictions. To consider any potentially increased risk of default on accounts receivable, the Group adjusted the expected credit loss
assumptions to reflect current conditions, reasonable and supportable forecast of future conditions and how current uncertainties may impact customers’ and other debtors’ future credit quality. This reassessment did not have any material effect on the expected credit loss allowances reported by the Group on its major categories of financial assets as of December 31, 2025.
The Group makes estimates and assumptions concerning the future. The resulting accounting estimates will, by definition, seldom equal the related actual results. Estimates and assumptions that have a significant risk of causing material adjustments to the carrying amounts of assets and liabilities within the next financial year are described below.
7.6.8.1. Right-of-use assets and lease liabilities
Significant assumptions and judgments may be made in applying the requirements of lease accounting, such as the exercise of extension or renewal options and the determination of applicable discount rates.
The Group determines the lease term as the non-cancellable term of the lease, together with any periods covered by an option to extend the lease if it is reasonably certain to be exercised, or any periods covered by an option to terminate the lease, if it is reasonably certain not to be exercised.
The Group has elected not to recognize right-of-use assets and lease liabilities for some leases of low-value and for leases which term ends within 12 months with no purchase option at the date of initial application (primarily for certain office and IT small equipment). The Group leases land, buildings, cars and certain equipment (including IT equipment) which have remaining lease terms between less than one year and 65 years. Certain lease contracts contain options to extend the leases by up to 30 years. The Group applies judgment in evaluating if and when it is reasonably certain for the Group to exercise that option. In addition, the Group made an accounting policy election for all the asset classes to not account for short-term leases, as described in Note 7.6.7.12. The Group considers all relevant factors that create an economic incentive to exercise any existing option to extend or renew a lease arrangement. After the commencement date, the Group reassesses the lease term if there is a significant event or change in circumstances that is within its control and affects its ability to exercise or not exercise the option. In most cases, the Group has included the extension or renewal option as part of the lease term of plants, buildings and equipment when the controlled use of the leased assets is significant and critical to its operations. These leases generally include a non-cancellable period and there will be a significant negative effect on the normal course of the Group’s business, should a replacement not be readily available.
In calculating the present value of lease payments, the rate implicit in the lease should be used whenever that rate is readily determinable. In most cases, this rate is not readily determinable and the Group uses its incremental borrowing rate, which is derived from information available at the lease commencement date. The Group gives consideration to its recent debt issuance as well as publicly available data for instruments with similar characteristics when calculating its incremental borrowing rates. Due to immateriality of any intra-quarter discount rate changes, the Group determines the discount rate based on the mid-quarter date.
Lease term and discount rate are as follows:
| | | | | | | | | | | | | | |
| | As of December 31,
2025 | | As of December 31,
2024 |
| Weighted average remaining lease term (in years) | | 8 | | 9 |
| Weighted average discount rate | | 3.47% | | 3.82% |
7.6.8.2. Income taxes
The Group is required to make estimates and judgments in determining income tax for the period, comprising current and deferred income tax. The Group needs to assess the income tax expected to be paid or the income tax benefit expected to be received related to the current year earnings in each tax jurisdiction and recognizes deferred income tax for temporary differences arising between the tax bases of assets and liabilities and their carrying amount in the consolidated financial statements, except when the initial recognition exception applies, as described in Note 7.6.7.6. Furthermore, the Group is required to assess all material open income tax positions in all tax jurisdictions to determine any uncertain tax positions, and to record a provision for those, if any.
The Group is also required to assess the likelihood of recovery of its deferred tax assets originated by the net operating losses carried forward. This assessment requires the exercise of judgment with respect to, among other things, benefits that could be realized from available tax strategies and future taxable income, as well as other positive and negative factors. The ultimate realization of deferred tax assets is dependent upon, among other things, the Group’s ability to generate future taxable income that is sufficient to utilize loss carry-forwards or tax credits before their expiration or the Group’s ability to implement prudent and feasible tax planning strategies.
As of December 31, 2025, the Group reported deferred tax assets of $303 million (2024: $326 million) on the consolidated statement of financial position. A significant portion of these deferred tax assets was recorded in relation to net operating losses incurred in certain tax jurisdictions. These net operating losses may not be realizable before their expiration, unless the Group is capable of identifying favorable tax strategies.
The Group could reduce the amount of total deferred tax assets, resulting in a decrease in the total assets and, consequently, in equity, if the estimates of projected future taxable income and benefits from available tax strategies are reduced as a result of a change in the assessment or due to other factors, or if changes in current tax regulations are enacted that impose restrictions on the timing or extent of the Group’s ability to utilize net operating losses and tax credit carry-forwards in the future. In 2025, the Group recorded a $53 million income tax expense resulting from changes in the recognition of unrecognized tax losses. A change in the tax rates applicable in the various jurisdictions or unfavorable outcomes of any ongoing tax audits could have a material impact on the future tax provisions in the periods in which these changes could occur.
Pillar II legislation has been enacted in certain jurisdictions in which the Group operates (the Netherlands, the majority of the European Countries and Switzerland). The legislation is effective for the Group's financial year beginning January 1, 2024. The Group is in the scope of the Pillar II legislation.
The assessment of the 2025 exposure to Pillar II income taxes is based on the most recent tax filings, 2025 draft country-by-country reporting prepared based on the US GAAP financial statements for the constituent entities in the Group. Based on the assessment, the Pillar II effective tax rates in most of the jurisdictions are above 15%. However, there is a limited number of jurisdictions where the transitional safe harbour relief does not apply and the Pillar II effective tax rate is slightly below 15%. Therefore, the Group has recorded a tax exposure to Pillar II income taxes of $2 million ($9 million as of December 31, 2024) in those jurisdictions. The Group is continuously monitoring the Pillar II legislation and related guidance which are still evolving and may have an impact on the Group's Pillar II tax charge in future periods.
The Group operates in many jurisdictions with highly complex and varied tax regimes. Management applies professional judgment in assessing whether relevant tax authorities will accept reported tax treatments under tax law. Those uncertainties may arise when tax laws are not clear or not consistently understood, which generates ambiguity in the tax law interpretations and application. Those uncertainties are particularly present in tax jurisdictions or tax regimes where the expected amount to be paid or the expected tax benefit to be recognized arise from complex, lengthy and technical negotiations or require possible settlements involving a high degree of subjectivity and discretion.
Assumptions and estimates used in the assessment of uncertainties over income tax treatments include, but are not limited to: whether certain income tax treatments are considered jointly or separately when assessing their degree of uncertainty; the assumptions the Group makes about the examination of tax
treatments by taxing authorities; how the Group determines taxable profits, deductions taken on tax returns, unused tax losses, unused tax credits, applicable tax rates, the probability of acceptance of these income tax treatments by the relevant taxing authorities or on the contrary to what extent the income tax treatments as applied by the Group may be disallowed, including the outcome of unresolved disputes or settlements on existing tax audits; and consideration of changes in facts and circumstances requiring a reassessment of applied judgments and assumptions.
As of December 31, 2025 and December 31, 2024, the Group reported unrecognized tax benefits for uncertain tax treatments totaling $142 million and $42 million, respectively. $75 million has been classified as a reduction of the deferred tax assets ($19 million as of December 31, 2024). Additionally, accrued interest and penalties amounted to $23 million as of December 31, 2025 ($6 million as of December 31, 2024) are classified as other non-current liabilities. The tax years that remain open for review in the Group’s major tax jurisdictions are from 1997 to 2025.
As of December 31, 2025, the Group is under audit in certain countries with respect to transfer pricing. Uncertain tax positions have been recognized and measured in accordance with IFRIC 23 provisions, based on the Group’s assessment of the technical merits of its transfer pricing policies and the likelihood of sustainment upon examination. Notwithstanding an increasing level of scrutiny that has resulted in tax reassessments received in certain jurisdictions, the Group remains confident that its transfer pricing methodology is appropriate and consistent with applicable tax rules and OECD principles, and that it is probable that the positions taken will be sustained upon resolution of these matters.
7.6.8.3. Impairment of non-financial assets
An impairment exists when the carrying value of an asset or a cash generating unit exceeds its recoverable amount, which is the higher of its fair value less costs of disposal and its value in use. The fair value less costs of disposal calculation is based on observable market prices less incremental costs of disposing the asset, in order to measure the price at which the asset could be sold in an orderly transaction between market participants at the measurement date. In case observable market prices are not available, fair value less costs of disposal is measured based on data from binding sales transactions in arm’s length transactions of similar assets. Management applies professional judgment when testing certain assets or CGUs for impairment and uses critical assumptions when assessing whether impairment indicators exist and at which level the impairment test must be conducted.
In 2025, the Group engaged in a company-wide program aimed to reshape its manufacturing footprint by accelerating the wafer fab capacity to 300mm Silicon and 200mm Silicon Carbide and resizing its global cost base. The Group recorded a total impairment charge of $189 million in 2025 for its company-wide program, of which $151 million related to the manufacturing reshaping program and reported on the line "Cost of sales" in the consolidated income statement for the year ended December 31, 2025 following the impairment test ($27 million on buildings, $83 million on facilities and $41 million on equipment to be disposed of upon execution of the manufacturing reshaping program). The impairment charges were not allocated to any specific reportable segment.
Following the announcement of the launch of its reshaping plan in April 2025, the Group identified indeed certain impairment indicators which triggered an impairment test on its manufacturing activities impacted by the program, primarily in France and in Italy. The impairment test was conducted at the level of identified CGUs, for 150mm Silicon Carbide activities and 200mm Silicon activities, respectively. The identified CGUs were tested for impairment on a standalone basis, since management believes they correspond to the smallest identifiable group of assets that generates cash inflows that are largely independent of the cash inflows from other assets or group of assets. Each identified CGU includes building, facilities and equipment but does not include goodwill or other category of non-financial assets.
The key-assumptions used to assess value-in-use were based on the most recent forecasted plans of each tested CGU. Expected cash flows were discounted at a pre-tax rate of 14%, corresponding to the pre-tax weighted cost of capital applicable to these activities. For each identified CGU, the recoverable amount was estimated on the basis of fair value less costs of disposal. Fair value less costs of disposal
was estimated at $140 million and $201 million, respectively. Fair value was measured based on an income approach, which corresponds to a Level 3 measurement hierarchy. This income approach models, from a market participant's perspective, the theoretical income generated from the right of use for productive purposes in the semiconductor industry of equipment and fully integrated infrastructures included in the tested CGUs. Refer to Note 7.6.10 for further details on impairment losses on property, plant and equipment.
For the current year’s annual impairment test on goodwill, the recoverable amount of the CGUs was determined based on value-in-use calculations which exceeded carrying amount, as further described in Note 7.6.13.
Non-financial assets are tested or reviewed for impairment in accordance with accounting policies stated in Notes 7.6.7.1, 7.6.7.10, 7.6.7.11 and 7.6.7.12. In 2025, the Group also recorded a $20 million impairment charge on a license under joint development with a third party, for which future use is no longer expected, and a $18 million impairment charge on non-financial assets with no alternative future use, of which $10 million following the decision to rationalize certain R&D activities within the scope of the cost base resizing pillar. Management judgment is necessary to estimate future sales and expenses, which underlie the discounted future cash flow projections. Factors such as changes in the planned use of property, plant and equipment, the closure of facilities, the change in the use or in the market acceptance of certain new technologies, could result in shortened useful lives or impairment charges to be recognized in the period in which such determination is made.
7.6.8.4. Pension obligations
The Group sponsors various pension schemes for its employees. The expense incurred under the defined benefit pension plans is based upon statistical and actuarial calculations and is impacted by assumptions on discount rates used to reach the present value of future pension liabilities, expected return that will be made on existing pension assets, future salary increases as well as future pension increases and statistical-based assumptions covering future withdrawals of participants from the plan and estimates of life expectancy. Refer to Note 7.6.23.
The actuarial assumptions used may differ materially from actual results due to changes in market and economic conditions, higher or lower withdrawal rates or longer or shorter life spans of participants and may significantly impact the amount of pension costs and pension liabilities to be recognized in the period in which such determination is made.
7.6.8.5. Capitalized development costs
Development costs are capitalized in accordance with the accounting policy described in notes 7.6.7.5. and 7.6.7.10. Initial capitalization of costs is based on management’s judgment that economic profitability and technological feasibility are confirmed, usually when a product or technology has reached a certain maturity level in product life cycle model used by the Group. In determining the projects to be capitalized, management makes assumptions regarding the expected future cash generation of the project and the expected period of benefits. As of December 31, 2025, the carrying amount of capitalized development costs was $1,272 million (2024: $1,170 million). Refer to Note 7.6.12 for disclosure of amounts capitalized, amortized and impaired during the period.
7.6.8.6. Inventory obsolescence reserves and normal manufacturing capacity thresholds
Inventory is stated at the lower of cost or net realizable value. Actual cost is based on an adjusted standard cost which approximates cost on a first-in, first-out basis for all categories of inventory (raw materials, work-in-process, finished products). Actual cost is therefore dependent on the Group’s manufacturing performance and is based on the normal utilization of its production capacity. In case of underutilization of manufacturing facilities, the costs associated with unused capacity are not included in the valuation of inventories but charged directly to cost of sales. For the year ended December 31, 2025, the unused capacity charges amounted to $416 million compared to $370 million for the year ended December 31, 2024. Net realizable value is the estimated selling price in the ordinary course of business, less predictable costs of completion, disposal and transportation. Refer to Note 7.6.16.
Reserve for obsolescence is estimated for excess uncommitted inventory based on historical sales data, order backlog and production plans. The Group performs, on a continuous basis, inventory write-offs of inventories, which have the characteristics of slow-moving, old production dates and technical obsolescence. The Group evaluates its inventory to identify obsolete or slow-selling items, as well as inventory that is not of saleable quality and records a specific reserve if the Group estimates the inventory will eventually be written off.
7.6.8.7. Control assessment and consolidation
An entity is fully consolidated and considered as a subsidiary when the Group controls the investee, which is when the Group has all of the following: (i) power over the investee, (ii) exposure, or rights, to variable returns from its involvement with the investee and; (iii) the ability to use its power over the investee to affect the amount of the investor's returns. In most cases, it is clear that the Group has control through a major equity stake conferring the majority of voting rights, requiring consolidation. Investments in subsidiaries are listed in Note 7.6.9.
In 2023, the Group and Sanan Optoelectronics jointly created Sanan ST JV for high-volume 200mm SiC device manufacturing activities in China. The purpose of the entity is to support the rising demand for the Group's SiC devices for car electrification and industrial power and energy applications in China. With the creation and future operations of Sanan ST JV, the Group seeks to create a fully integrated vertical value chain aiming at serving the Chinese electrification market. Sanan Optoelectronics will build a separate 200mm SiC substrate manufacturing facility to fulfill Sanan ST JV's needs. Sanan ST JV will produce SiC devices exclusively for the Group, using the Group's proprietary SiC manufacturing process technology and know how and serving as a dedicated foundry to support the Group's demand for Chinese customers.
The Group fully consolidates Sanan ST JV, with the recognition of 51% noncontrolling interest. Noncontrolling interest amounted to $312 million as of December 31, 2025 compared to $156 million as of December 31, 2024. This increase includes a $156 million contribution from Sanan Optoelectronics to Sanan JV's capital increase in 2025. Profit and loss reported by Sanan ST JV for the year ended December 31, 2025 and 2024 were not significant. The carrying amount of Sanan ST JV's main assets and liabilities, together with their classification in the consolidated statement of financial position as of December 31, 2025 and 2024, are separately disclosed in Note 7.6.10 and Note 7.6.22.
The total amount for the full build out of the joint venture will also be financed by local government support and loans or further support from stockholders to the joint venture.
7.6.9. Investments in subsidiaries
The following table lists the Company’s consolidated subsidiaries and its percentage ownership as of December 31, 2025:
| | | | | | | | |
| Legal Seat | Name | Percentage ownership
(direct or indirect) |
| Australia, Sydney | STMicroelectronics PTY Ltd | 100 | |
| Austria, Graz | STMicroelectronics Austria GmbH | 100 | |
| Belgium, Diegem | STMicroelectronics Belgium N.V. | 100 | |
| Brazil, Sao Paulo | STMicroelectronics Ltda | 100 | |
| Canada, Ottawa | STMicroelectronics (Canada), Inc. | 100 | |
| China, Beijing | STMicroelectronics (Beijing) R&D Co. Ltd | 100 | |
| China, Chongqing | SANAN, STMicroelectronics Co., Ltd. | 49 | |
| China, Shanghai | STMicroelectronics (China) Investment Co. Ltd | 100 | |
| China, Shenzhen | Shenzhen STS Microelectronics Co. Ltd | 60 | |
| China, Shenzhen | STMicroelectronics (Shenzhen) R&D Co. Ltd | 100 | |
| Czech Republic, Prague | STMicroelectronics Design and Application s.r.o. | 100 | |
| Denmark, Aarhus | STMicroelectronics A/S | 100 | |
| Egypt, Cairo | STMicroelectronics Egypt SSC | 100 | |
| Finland, Nummela | STMicroelectronics Finland Oy | 100 | |
| France, Crolles | STMicroelectronics (Crolles 2) SAS | 100 | |
| France, Grenoble | STMicroelectronics (Alps) SAS | 100 | |
| France, Grenoble | STMicroelectronics (Grenoble 2) SAS | 100 | |
| France, Le Mans | STMicroelectronics (Grand Ouest) SAS | 100 | |
| France, Montrouge | STMicroelectronics France SAS | 100 | |
| France, Rousset | STMicroelectronics (Rousset) SAS | 100 | |
| France, Tours | STMicroelectronics (Tours) SAS | 100 | |
| Germany, Aschheim-Dornach | STMicroelectronics GmbH | 100 | |
| Germany, Aschheim-Dornach | STMicroelectronics Application GmbH | 100 | |
| Hong Kong, Kowloon | STMicroelectronics Ltd | 100 | |
| India, Noida | STMicroelectronics Pvt Ltd | 100 | |
| Israel, Netanya | STMicroelectronics Limited | 100 | |
| Italy, Agrate Brianza | STMicroelectronics S.r.l. | 100 | |
| Italy, Naples | STMicroelectronics Services S.r.l. | 100 | |
| Japan, Tokyo | STMicroelectronics KK | 100 | |
| Malaysia, Kuala Lumpur | STMicroelectronics Marketing SDN BHD | 100 | |
| Malaysia, Muar | STMicroelectronics SDN BHD | 100 | |
| Malaysia, Muar | STMicroelectronics Services Sdn.Bhd. | 100 | |
| Malta, Kirkop | STMicroelectronics (Malta) Ltd | 100 | |
| Mexico, Guadalajara | STMicroelectronics Marketing, S. de R.L. de C.V. | 100 | |
| Morocco, Casablanca | STMicroelectronics (MAROC) SAS, a associé unique | 100 | |
| The Netherlands, Amsterdam | STMicroelectronics Finance B.V. | 100 | |
| The Netherlands, Amsterdam | STMicroelectronics Finance II N.V. | 100 | |
| The Netherlands, Amsterdam | STMicroelectronics International N.V. | 100 | |
| Philippines, Calamba | STMicroelectronics, Inc. | 100 | |
| Philippines, Calamba | Mountain Drive Property, Inc. | 40 | |
| Singapore, Ang Mo Kio | STMicroelectronics Asia Pacific Pte Ltd | 100 | |
| Singapore, Ang Mo Kio | STMicroelectronics Pte Ltd | 100 | |
| Slovenia, Ljubljana | STMicroelectronics d.o.o. | 100 | |
| Spain, Barcelona | STMicroelectronics Iberia S.A. | 100 | |
| Sweden, Jönköping | STMicroelectronics Software AB | 100 | |
| Sweden, Kista | STMicroelectronics AB | 100 | |
| Sweden, Norrköping | STMicroelectronics Silicon Carbide AB | 100 | |
| Switzerland, Geneva | STMicroelectronics Re S.A. | 100 | |
| Switzerland, Geneva | STMicroelectronics S.A. | 100 | |
| Thailand, Bangkok | STMicroelectronics (Thailand) Ltd | 100 | |
Tunisia, Ariana | STMicroelectronics Tunisie | 100 | |
| United Kingdom, Marlow | STMicroelectronics (Research & Development) Limited | 100 | |
| United Kingdom, Marlow | STMicroelectronics Limited | 100 | |
| United States, Coppell | STMicroelectronics Inc. | 100 | |
| United States, Coppell | STMicroelectronics (North America) Holding, Inc. | 100 | |
7.6.10. Property, plant and equipment
Property, plant and equipment consisted of the following:
| | | | | | | | | | | | | | | | | | | | |
| | As of December 31, 2025 |
| In millions of U.S. dollars | | Gross value | | Accumulated
depreciation | | Net
value |
| Land | | 142 | | | — | | | 142 | |
| Buildings | | 1,615 | | | (743) | | | 872 | |
| Lease right-of-use assets | | 511 | | | (173) | | | 338 | |
| Facilities and leasehold improvements | | 5,088 | | | (3,743) | | | 1,345 | |
| Machinery and equipment | | 24,092 | | | (18,099) | | | 5,993 | |
| Computer and R&D equipment | | 454 | | | (382) | | | 72 | |
| Other tangible assets | | 126 | | | (107) | | | 19 | |
| Construction in progress | | 2,281 | | | — | | | 2,281 | |
| Total | | 34,309 | | | (23,247) | | | 11,062 | |
| | | | | | | | | | | | | | | | | | | | |
| | As of December 31, 2024 |
| In millions of U.S. dollars | | Gross value | | Accumulated
depreciation | | Net
value |
| Land | | 118 | | | — | | | 118 | |
| Buildings | | 1,393 | | | (620) | | | 773 | |
| Lease right-of-use assets | | 483 | | | (179) | | | 304 | |
| Facilities and leasehold improvements | | 4,498 | | | (3,145) | | | 1,353 | |
| Machinery and equipment | | 22,264 | | | (15,913) | | | 6,351 | |
| Computer and R&D equipment | | 407 | | | (336) | | | 71 | |
| Other tangible assets | | 114 | | | (94) | | | 20 | |
| Construction in progress | | 1,899 | | | — | | | 1,899 | |
| Total | | 31,176 | | | (20,287) | | | 10,889 | |
Changes in the net carrying amount of property, plant and equipment are detailed as follows:
| | | | | | | | | | | | | | | | | | | | | | | | | | | | | | | | | | | | | | | | | | | | | | | | | | | | | | | | |
| In millions of U.S. dollars | | Land | | Buildings | | Lease
Right-
of-use
assets | | Facilities and
leasehold
improvements | | Machinery
and
equipment | | Computer
and R&D
equipment | | Other
tangible
assets | | Construction
in progress | | Total |
| Balance as of December 31, 2023 | | 118 | | | 703 | | | 333 | | | 1,238 | | | 6,381 | | | 91 | | | 18 | | | 1,712 | | | 10,594 | |
| Additions | | 3 | | | 3 | | | 59 | | | 52 | | | 465 | | | 17 | | | 4 | | | 2,092 | | | 2,695 | |
| Capital grants and other contributions | | — | | | — | | | — | | | (105) | | | (193) | | | (3) | | | — | | | (91) | | | (392) | |
| Transfers | | 2 | | | 145 | | | — | | | 420 | | | 1,187 | | | — | | | 5 | | | (1,759) | | | — | |
| | | | | | | | | | | | | | | | | | |
| Impairment / Write-Offs | | — | | | — | | | — | | | (2) | | | (6) | | | — | | | — | | | — | | | (8) | |
| Depreciation expense | | — | | | (40) | | | (75) | | | (183) | | | (1,412) | | | (32) | | | (7) | | | — | | | (1,749) | |
| Foreign currency translation | | (5) | | | (38) | | | (13) | | | (67) | | | (71) | | | (2) | | | — | | | (55) | | | (251) | |
| Balance as of December 31, 2024 | | 118 | | | 773 | | | 304 | | | 1,353 | | | 6,351 | | | 71 | | | 20 | | | 1,899 | | | 10,889 | |
| Additions | | 1 | | | 3 | | | 99 | | | 71 | | | 448 | | | 23 | | | 3 | | | 1,543 | | | 2,191 | |
| Capital grants and other contributions | | — | | | (3) | | | — | | | (39) | | | (229) | | | — | | | — | | | (275) | | | (546) | |
| Transfers | | 10 | | | 80 | | | (8) | | | 110 | | | 826 | | | 3 | | | 2 | | | (1,023) | | | — | |
| Disposals | | — | | | — | | | — | | | — | | | (1) | | | — | | | — | | | (2) | | | (3) | |
| Impairment / Write-Offs | | — | | | (32) | | | — | | | (87) | | | (56) | | | — | | | — | | | — | | | (175) | |
| Depreciation expense | | — | | | (34) | | | (71) | | | (206) | | | (1,478) | | | (30) | | | (8) | | | — | | | (1,827) | |
| Foreign currency translation | | 13 | | | 85 | | | 14 | | | 143 | | | 132 | | | 5 | | | 2 | | | 139 | | | 533 | |
| Balance as of December 31, 2025 | | 142 | | | 872 | | | 338 | | | 1,345 | | | 5,993 | | | 72 | | | 19 | | | 2,281 | | | 11,062 | |
In 2023, the Group signed a frame agreement with the European, French and Italian authorities for a public funding program associated with the capacity expansion in some of its manufacturing facilities in France and Italy.
In the year ended December 31, 2025, capital investment funding totaled $546 million (2024: $392 million) and were accounted for as a reduction of the gross value of the related tangible assets. The impact of capital funding on depreciation expense for the year ended December 31, 2025 was a reduction of $124 million (2024: $76 million). In 2025, the Group sold owned property, plant and equipment for cash proceeds of $9 million. In 2024, property, plant and equipment sold amounted to $5 million.
In 2023, the Group and Sanan Optoelectronics jointly created Sanan ST JV for high-volume 200mm SiC device manufacturing in China, as described in Note 7.6.8.7. Sanan ST JV was fully consolidated as of December 31, 2025 and December 31, 2024. As of December 31, 2025, and December 31, 2024, a total amount of $433 million and $316 million respectively, was included on the line "Property, plant and equipment" of the consolidated statement of financial position from Sanan ST JV consolidation.
In 2025, the Group recorded a total $169 million impairment charge on buildings ($30 million), facilities ($86 million) and machinery and equipment ($53 million), primarily related to the manufacturing reshaping program as described in Note 7.6.8.3. In 2025, the Group also recorded a total $6 million charge for write-offs on non-financial assets.
7.6.11. Leases
The Group leases land, buildings, cars and certain equipment (including IT equipment) which have remaining lease terms between less than one year and 65 years.
The consolidated statement of financial position shows the following amounts relating to leases:
| | | | | | | | | | | |
| In millions of U.S. dollars | December 31, 2025 | | December 31, 2024 |
| Right-of-use assets | | | |
| Land | 71 | | | 66 | |
| Buildings | 213 | | | 188 | |
| Machinery and equipment | 33 | | | 30 | |
| Computer and R&D equipment | 1 | | | 3 | |
| Other | 20 | | | 17 | |
| Total | 338 | | | 304 | |
Additions to the right-of-use assets during the 2025 financial year were $99 million (2024: $59 million). Expenses related to short‐term leases were $11 million as of December 31, 2025 (2024: $14 million). Low‐value leases were not significant in 2025 and 2024. Interest expense (included in finance cost described in Note 7.6.32) was $11 million as of December 31, 2025 (2024: $12 million). Cash outflows for leases totaled $87 million for the year ended December 31, 2025 (2024: $83 million).
Maturities of lease liabilities are as follows:
| | | | | | | | |
| In millions of U.S. dollars | | December 31, 2025 |
| 2026 | | 108 | |
| 2027 | | 78 | |
| 2028 | | 37 | |
| 2029 | | 28 | |
| 2030 | | 20 | |
| Thereafter | | 126 | |
| Total future undiscounted cash outflows | | 397 | |
| Effect of discounting | | (73) | |
| Total lease liabilities | | 324 | |
| | | | | | | | |
| In millions of U.S. dollars | | December 31, 2024 |
| 2025 | | 79 | |
| 2026 | | 50 | |
| 2027 | | 57 | |
| 2028 | | 26 | |
| 2029 | | 21 | |
| Thereafter | | 111 | |
| Total future undiscounted cash outflows | | 344 | |
| Effect of discounting | | (64) | |
| Total lease liabilities | | 280 | |
Depreciation expense in the consolidated income statement shows the following amounts relating to leases:
| | | | | | | | | | | |
| In millions of U.S. dollars | December 31, 2025 | | December 31, 2024 |
| Depreciation expense on right-of-use assets | | | |
| Land | 3 | | | 2 | |
| Buildings | 51 | | | 52 | |
| Machinery and equipment | 5 | | | 6 | |
| Computer and R&D equipment | 2 | | | 6 | |
| Other | 10 | | | 9 | |
| Total | 71 | | | 75 | |
Reported amounts related to lease arrangements are further described in Notes 7.6.10, 7.6.14 and 7.6.32.
7.6.12. Intangible assets
Intangible assets consisted of the following:
| | | | | | | | | | | | | | | | | | | | |
| | As of December 31, 2025 |
| In millions of U.S. dollars | | Gross value | | Accumulated
amortization | | Net value |
| Purchased technologies and licenses | | 774 | | | (589) | | | 185 | |
| Purchased software | | 396 | | | (337) | | | 59 | |
| Internally developed software | | 85 | | | (70) | | | 15 | |
| Capitalized development costs | | 3,979 | | | (2,707) | | | 1,272 | |
| Intangibles in progress | | 65 | | | — | | | 65 | |
| Total | | 5,299 | | | (3,703) | | | 1,596 | |
| | | | | | | | | | | | | | | | | | | | |
| | As of December 31, 2024 |
| In millions of U.S. dollars | | Gross value | | Accumulated
amortization | | Net value |
| Purchased technologies and licenses | | 766 | | | (577) | | | 189 | |
| Purchased software | | 368 | | | (293) | | | 75 | |
| Internally developed software | | 116 | | | (102) | | | 14 | |
| Capitalized development costs | | 3,678 | | | (2,508) | | | 1,170 | |
| Intangibles in progress | | 68 | | | — | | | 68 | |
| Total | | 4,996 | | | (3,480) | | | 1,516 | |
In the year ended December 31, 2025, specific project-related funding totaled $31 million (2024: $31 million) and were accounted for as a reduction of the gross value of related capitalized development costs.
Changes in the net carrying amount are detailed as follows:
| | | | | | | | | | | | | | | | | | | | | | | | | | | | | | | | | | | | | | |
| In millions of U.S. dollars | | Purchased
technologies
and licenses | | Purchased
software | | Internally
developed
software | | Capitalized
development
costs | | Intangibles
in progress | | Total |
| Balance as of December 31, 2023 | | 217 | | 84 | | 10 | | 1,098 | | 56 | | 1,465 |
| Additions | | 20 | | 11 | | — | | 354 | | 63 | | 448 |
| | | | | | | | | | | | |
| | | | | | | | | | | | |
| Impairment / Write-offs | | (7) | | — | | — | | (77) | | (2) | | (86) |
| Transfers | | 16 | | 23 | | 10 | | — | | (49) | | — |
| Amortization expense | | (56) | | (40) | | (6) | | (205) | | — | | (307) |
| Foreign currency translation | | (1) | | (3) | | — | | — | | — | | (4) |
| Balance as of December 31, 2024 | | 189 | | 75 | | 14 | | 1,170 | | 68 | | 1,516 |
| Additions | | 45 | | 9 | | — | | 380 | | 41 | | 475 |
| | | | | | | | | | | | |
| | | | | | | | | | | | |
| Impairment / Write-offs | | — | | — | | — | | (67) | | (20) | | (87) |
| Transfers | | 4 | | 13 | | 7 | | — | | (24) | | — |
| Amortization expense | | (55) | | (40) | | (6) | | (211) | | — | | (312) |
| Foreign currency translation | | 2 | | 2 | | — | | — | | — | | 4 |
| Balance as of December 31, 2025 | | 185 | | 59 | | 15 | | 1,272 | | 65 | | 1,596 |
For the year ended December 31, 2025, additions of intangible assets amounted to $475 million (2024: $448 million).
The 2025 amortization expense included $247 million (2024: $235 million) in costs of sales, $33 million (2024: $38 million) in R&D expenses and $32 million (2024: $34 million) in selling, general and administrative expenses.
Development costs capitalized on projects that are still in progress and therefore not yet amortized amounted to $901 million as of December 2025 (2024: $805 million).
The impairment and write-offs for 2025 amounted to $87 million, of which, $67 million recorded in the line Cost of sales and $20 million recorded in the line Research and development expenses on the consolidated income statement. Amounts reported in cost of sales correspond to write-offs of capitalized development costs related to certain projects that were cancelled. The $20 million amount recorded in R&D expenses relates to a license under joint development with a third party, for which future use is no longer expected. The impairment and write-offs for 2024 amounted to $86 million, recorded in costs of sales for $77 million, resulting from write-offs of capitalized development costs related to certain projects that were cancelled, and in R&D expenses for $9 million for certain technologies acquired with no alternative future use, primarily following the annual impairment test performed in 2024. The key-assumptions used for value-in-use calculations are based on the most recent budget of each CGU tested. Management determined budgeted Gross Margin based on past performance, and its expectations for the market development.
7.6.13. Goodwill
Following the Group's reorganization announced in January 2024 into four reportable segments, the Group has made further progress in analyzing its global product portfolio, resulting in additional adjustments to its segments, effective starting January 1, 2025. Existing goodwill was allocated to the new reportable segments, with comparative information adjusted accordingly. These changes to segment reporting did not change the Group's CGUs and the level at which goodwill is tested for impairment on an annual basis or more frequently if and when impairment indicators exist.
Goodwill allocated to the new reportable segments and changes in the carrying amount of goodwill were as follows:
| | | | | | | | | | | | | | | | | | | | | | | | | | | | | | | | |
| In millions of U.S. dollars | | AM&S | | P&D | | EMP | | RFOC | | Total |
| As of December 31, 2023 | | 2 | | | 76 | | | 99 | | | 108 | | | 285 | |
| Write-off | | (1) | | | — | | | — | | | — | | | (1) | |
| Foreign currency translation | | — | | | (6) | | | (3) | | | (3) | | | (12) | |
| As of December 31, 2024 | | 1 | | | 70 | | | 96 | | | 105 | | | 272 | |
| | | | | | | | | | |
| Foreign currency translation | | | | 11 | | | 7 | | | 7 | | | 25 | |
| As of December 31, 2025 | | 1 | | | 81 | | | 103 | | | 112 | | | 297 | |
As of December 31, 2025, the gross value of goodwill was $342 million (2024: $317 million) and the accumulated impairment was $45 million (2024: $45 million).
Goodwill is allocated to the Group’s CGUs and tested for impairment at one level below operating segments. The recoverable amount of a CGU is determined based on value-in-use calculations. These calculations use cash flow projections based on financial budgets and management’s best estimates about future developments, as well as market and customer assumptions.
The Group tests whether goodwill has suffered any impairment on an annual basis during the second half of each year. In the 2025 and 2024 reporting periods, no goodwill impairment was recorded for any of the Group’s CGUs. For the annual impairment test, the key-assumptions used for value-in-use calculations are based on the most recent five-year plan of each CGU tested. The average perpetuity growth rate was 1.5% (2024: 1.5%) and discount rate was from 14% (2024: 14%) pre-tax and inferred from the observable volatility of share prices for comparable companies in the semiconductor industry. These assumptions have been used, as applicable, for the analysis of each CGU within the operating segments. Management determined budgeted Gross Margin based on past performance, and its expectations for the market development. The average yearly growth rates used are consistent with the forecast included in industry reports. The discount rates used are pre-tax and reflect specific risks relating to the relevant CGUs. No reasonably possible change in key assumptions would lead to a significant impairment loss.
7.6.14. Other financial assets and financial liabilities
7.6.14.1. Other financial assets
| | | | | | | | | | | | | | |
| In millions of U.S. dollars | | December 31,
2025 | | December 31,
2024 |
| Other financial assets (including derivatives) | | | | |
| Other financial assets | | | | |
| Quoted debt securities at FVOCI | | 985 | | 2,452 |
| Unquoted equity securities at FVOCI | | 25 | | 20 |
| Quoted equity securities at FVPL | | 137 | | 64 |
| Other financial assets at FVPL | | 28 | | 24 |
| Total other financial assets | | 1,175 | | 2,560 |
| Current | | 985 | | 2,452 |
| Non-current | | 190 | | 108 |
| Derivative financial instruments | | | | |
| Cash flow hedges | | | | |
| Foreign exchange forward contracts | | 45 | | — |
| Currency collars | | 5 | | — |
| Derivatives not designated as hedges | | | | |
| Foreign exchange forward contracts | | 25 | | 10 |
| Currency collars | | 1 | | — |
| | | | |
| | | | |
| Embedded call option - Senior unsecured convertible bonds issued on August 4, 2020 (Tranche B) | | — | | 2 |
| Total derivatives financial instruments | | 76 | | 12 |
| Current | | 76 | | 12 |
| Non-current | | — | | — |
| Total other financial assets (including derivatives) | | 1,251 | | 2,572 |
| Total current | | 1,061 | | 2,464 |
| Total non-current | | 190 | | 108 |
Risk management policies relating to credit risk exposure to derivatives counterparties are further described in Note 7.6.38.
Movements in other financial assets (excluding derivatives) recorded in 2025 are summarized as follows:
| | | | | | | | | | | | | | | | | | | | | | | | | | | | | | | | | | | | | | | | | | | | | | |
| In millions of U.S. dollars | | January 1, 2025 | | Change
in fair
value
included
in OCI | | Change in
fair value
included
in income
statement | | Increase | | Sale /
Settlement | | Accretion | | | | December 31, 2025 |
Government bonds issued by
the U.S. Treasury | | 2,452 | | 15 | | — | | 354 | | (1,900) | | 64 | | | | 985 |
Quoted equity
instruments at FVPL | | 64 | | — | | 76 | | | | (3) | | — | | | | 137 |
Sub-total Quoted debt
and equity securities | | 2,516 | | 15 | | 76 | | 354 | | (1,903) | | 64 | | | | 1,122 |
Unquoted equity
securities at FVOCI | | 20 | | — | | — | | 5 | | — | | — | | | | 25 |
Other financial
assets at FVPL | | 24 | | — | | — | | 4 | | — | | — | | | | 28 |
Total other financial
assets (excluding
derivatives) | | 2,560 | | 15 | | 76 | | 363 | | (1,903) | | 64 | | | | 1,175 |
*OCI: Other comprehensive income
Movements in other financial assets (excluding derivatives) recorded in 2024 are summarized as follows:
| | | | | | | | | | | | | | | | | | | | | | | | | | | | | | | | | | | | | | | | | | | | | | |
| In millions of U.S. dollars | | January 1, 2024 | | Change in
fair value
included in
OCI* | | Change in
fair value
included in
income
statement | | Purchase | | Proceeds at
maturity | | Accretion | | | | December 31, 2024 |
Government bonds issued by
the U.S. Treasury | | 1,635 | | | 1 | | | — | | | 2,980 | | | (2,251) | | | 87 | | | | | 2,452 | |
Quoted equity
instruments at FVPL | | 13 | | | — | | | — | | | 51 | | | — | | | — | | | | | 64 | |
Sub-total Quoted debt
and equity securities | | 1,648 | | | 1 | | | — | | | 3,031 | | | (2,251) | | | 87 | | | | | 2,516 | |
Unquoted equity
securities at FVOCI | | 22 | | | (2) | | | — | | | — | | | — | | | — | | | | | 20 | |
Other financial
assets at FVPL | | 18 | | | — | | | 3 | | | 3 | | | — | | | — | | | | | 24 | |
Total other financial
assets (excluding
derivatives) | | 1,688 | | | (1) | | | 3 | | | 3,034 | | | (2,251) | | | 87 | | | | | 2,560 | |
*OCI: Other comprehensive income
Investments held in debt securities
As of December 31, 2025, the Group held $985 million of U.S. Treasury debt securities. The debt securities have a rating of AAA/AA+/AA+ from Moody’s, S&P and Fitch, respectively and an average maturity of 2.31 years. The debt securities were reported as current assets on the line “Other current financial assets” on the consolidated statement of financial position as of December 31, 2025, since they represented investments of funds available for current operations.
Marketable securities totaling $350 million at principal amount were transferred to financial institutions as part of short-term securities lending transactions, in compliance with corporate policies. The Group, acting as the securities lender, does not hold any collateral in this unsecured securities lending transactions. The Group retains effective control on the transferred securities.
The Group applies a forward-looking expected credit loss (ECL) approach on all debt financial assets not held at FVPL. For debt securities at FVOCI, the ECL is based on a 12-month expected credit loss basis.
The 12-month ECL is the portion of lifetime ECLs that results from default events on a financial instrument that are possible within 12 months after the reporting date. The Group’s quoted debt instruments at FVOCI comprise solely U.S. Treasury debt securities, which have low credit risk. Consequently, the Group has considered that the ECLs on these investments are insignificant.
Investments held in equity securities
As of December 31, 2025, the Group also had investments in quoted equity securities for an aggregate value of $137 million, measured at FVPL (December 31, 2024: $64 million).
In December 2024, the Group participated to the IPO of Innoscience (Suzhou) which became public on the main segment of Hong Kong Stock Exchange. Innoscience (Suzhou) investment amounted to $127 million as of December 31, 2025 ($51 million as of December 31, 2024). As a publicly traded equity instrument, Innoscience investment is measured at fair value through profit or loss, with a $76 million unrealized gain recognized as finance income in the year ended December 31, 2025.
As of December 31, 2025, the Group also reported other financial assets for an aggregate value of $28 million (December 31, 2024: $24 million).
The Group irrevocably elected to measure at FVOCI unquoted equity securities for an aggregate value of $25 million (December 31, 2024: $20 million). Since these are long-term investments, the Group considers this classification, which implies that changes in fair value are not subsequently recycled to profit or loss, to be more relevant.
The changes in fair value reported on the Group’s investments held in equity securities measured at FVOCI for the years ended December 31, 2025 and December 31, 2024 were not material.
Short-term deposits
To optimize the return yield on its short-term investments, the Group invested $1,100 million of available cash in short-term deposits as of December 31, 2025, compared to $1,450 million as of December 31, 2024. These short-term deposits had a maturity beyond three months and below one year and no significant risk of changes in fair value. They are reported in the line “Short-term deposits” of the consolidated statement of financial position.
7.6.14.2. Other financial liabilities
| | | | | | | | | | | | | | |
| In millions of U.S. dollars | | December 31,
2025 | | December 31,
2024 |
| Lease financial liabilities | | 324 | | | 280 | |
| Deferred and contingent consideration on business acquisitions | | 18 | | | 15 | |
| Derivative financial instruments | | | | |
| Cash flow hedges | | | | |
| Foreign exchange forward contracts | | 1 | | | 45 | |
| Currency collars | | — | | | 9 | |
| Derivatives not designated as hedges | | | | |
| Foreign exchange forward contracts | | 13 | | | 29 | |
| Currency collars | | — | | | 6 | |
| Embedded conversion option - Senior unsecured convertible bonds issued on August 4, 2020 (Tranche A) | | — | | | 4 | |
| Embedded conversion option - Senior unsecured convertible bonds issued on August 4, 2020 (Tranche B) | | 19 | | | 29 | |
| Total other financial liabilities (including derivatives) | | 375 | | | 417 | |
| Total current | | 134 | | | 189 | |
| Total non-current | | 241 | | | 228 | |
Risk management policies relating to credit risk exposure to derivatives counterparties are further described in Note 7.6.38. Lease financial liabilities are further described in Note 7.6.11.
7.6.14.3. Interest-bearing loans and borrowings
| | | | | | | | | | | | | | |
| In millions of U.S. dollars | | December 31,
2025 | | December 31,
2024 |
| Funding program loans from European Investment Bank ("EIB"): | | | | |
| 2.69% due 2028, floating interest rate at Euribor + 0.589% | | 90 | | | 106 | |
| 2.61% due 2029, floating interest rate at Euribor + 0.564% | | 115 | | | 127 | |
| 2.56% due 2031, floating interest rate at Euribor + 0.473% | | 236 | | | 244 | |
| 2.58% due 2031, floating interest rate at Euribor + 0.550% | | 116 | | | 120 | |
| 2.73% due 2033, floating interest rate at Euribor + 0.558% | | 282 | | | 281 | |
| 5.07% due 2034, floating interest rate at Secured Overnight Financing Rate +0.939% | | 270 | | | 300 | |
| Credit Facility from Cassa Depositi e Prestiti SpA ("CDP SpA") | | | | |
| 2.84% due 2027, floating interest rate at Euribor + 0.690% | | 44 | | | 65 | |
| 2.65% due 2028, floating interest rate at Euribor + 0.550% | | 59 | | | 69 | |
| 2.95% due 2029, floating interest rate at Euribor + 0.850% | | 67 | | | 74 | |
| Dual tranche senior unsecured convertible bonds | | | | |
| Zero-coupon, due 2025 (Tranche A) | | — | | | 742 | |
| Zero-coupon, due 2027 (Tranche B) | | 728 | | | 715 | |
| Other Funding program loans: | | | | |
| 0.25% (weighted average), due 2026-2028, fixed interest rate | | 3 | | | 5 | |
| | | | |
| | | | |
| Total interest-bearing loans and borrowings | | 2,010 | | | 2,848 | |
| Total current | | 978 | | | 1,683 | |
| Total non-current | | 1,032 | | | 1,165 | |
Interest-bearing loans and borrowings are denominated in the following currencies:
| | | | | | | | | | | | | | |
| In millions of U.S. dollars | | December 31,
2025 | | December 31,
2024 |
| U.S. Dollar | | 998 | | | 1,757 | |
| Euro | | 1,012 | | | 1,091 | |
| Total | | 2,010 | | | 2,848 | |
The EIB Loans denominated in Euros, but drawn in U.S. dollars, are classified as U.S. dollar denominated debt.
Aggregate contractual maturities of interest-bearing loans and borrowings outstanding, excluding repayments of coupons and interests, are as follows:
| | | | | | | | | | | | | | |
| In millions of U.S. dollars | | December 31,
2025 | | December 31,
2024 |
| 2026 | | 250 | | | — | |
| 2027 | | 984 | | | 975 | |
| 2028 | | 219 | | | 224 | |
| 2029 | | 170 | | | 962 | |
| 2030 | | 124 | | | 197 | |
| 2031 | | 124 | | | 154 | |
| Thereafter | | 161 | | | 379 | |
| Total | | 2,032 | | | 2,891 | |
The difference between the total aggregated future maturities in the preceding table and the total carrying amount of interest-bearing loans and borrowings is due to unamortized debt discount and issuance costs on the dual tranche senior unsecured convertible bonds.
Senior convertible bonds
On August 4, 2020, the Company issued $1,500 million in principal amount of dual tranche senior unsecured convertible bonds (Tranche A for $750 million and Tranche B for $750 million), due 2025 and 2027, respectively. Tranche A bonds were issued at 105.8% as zero-coupon bonds while Tranche B bonds were issued at 104.5% as zero-coupon bonds. The conversion price at issuance was $43.62 for Tranche A, equivalent to a 47.5% conversion premium and $45.10 for Tranche B, equivalent to a 52.5% conversion premium. These conversion features correspond to an equivalent of 4,585 shares per each Tranche A bond $200,000 par value and an equivalent of 4,435 shares per each Tranche B bond $200,000 par value. The bonds are convertible by the bondholders or are callable by the issuer upon certain conditions, on a net-share settlement basis, except if the issuer elects a full-cash or full-share conversion as an alternative settlement. The net proceeds from the bond offering were $1,567 million, after deducting issuance costs paid by the Group.
The issuer’s call option and the holder’s conversion option have been identified as embedded non-equity derivative instruments, resulting in the recognition of the options separately from the debt host contract. Upon initial recognition, the derivatives were measured at fair value based on the income approach, the debt being determined as a residual amount of the $1.5 billion total proceeds. The value of the issuer’s call option was deemed to be nil at initial recognition. The value of the holder’s conversion option was estimated at $219 million at issuance date, which determined the initial recognition of the liability component at $1,358 million before allocation of issuance costs. The fair value measurement of the embedded derivative instruments corresponded to a Level 3 fair value hierarchy measurement, which is further described in Note 7.6.14.5. The Company elected to allocate issuance costs, totaling $10 million, to the debt component. The debt was subsequently measured at amortized cost using the effective interest method.
On August 4, 2025, Tranche A bonds were fully settled in cash for their principal amount of $750 million, since Tranche A reached maturity while the conversion options were out-of-the money. As per contractual terms, the bondholders have full conversion rights on Tranche B bonds starting August 2024 and Tranche B bonds are callable by the Company with a 130% contingent feature, with the exercise of its call rights being preceded by the release, by the Company, of an Optional Redemption Notice.
Starting August 2024 for Tranche B convertible bonds, the bondholders have full conversion rights. Consequently, the non-equity embedded derivative instruments and liability component were reported on the line Other current financial liabilities for an amount of $19 million and on the line Interest-bearing loans and borrowings – current portion for an amount of $728 million, respectively, of the consolidated statement of financial position as of December 31, 2025.
Reconciliation of liabilities arising from financing activities
The reconciliation for the year ended December 31, 2025 is as follows:
| | | | | | | | | | | | | | | | | | | | | | | | | | | | | | | | |
| In millions of U.S. dollars | | Interest-
bearing
loans and
borrowings | | Other
non-
current
financial
liabilities* | | Interest-
bearing
loans and
borrowings
– current
portion | | Other
current
financial
liabilities** | | Total |
| December 31, 2024 | | 1,165 | | | 213 | | | 1,683 | | | 100 | | | 3,161 | |
| Cash flows | | — | | | — | | | (989) | | | (87) | | | (1,076) | |
| Non-cash changes: | | | | | | | | | | |
| New leases | | — | | | 41 | | | — | | | 57 | | | 98 | |
| Accreted finance costs | | — | | | 8 | | | 21 | | | 3 | | | 34 | |
| Fair value changes | | — | | | — | | | — | | | (14) | | | (14) | |
| Reclassification | | (224) | | | (51) | | | 224 | | | 51 | | | — | |
| Foreign currency translation | | 91 | | | 12 | | | 39 | | | 10 | | | 150 | |
| December 31, 2025 | | 1,032 | | | 223 | | | 978 | | | 120 | | | 2,353 | |
* ”Other non-current financial liabilities” reported above do not include deferred and contingent consideration, as they relate to
business acquisitions.
** ”Other current financial liabilities” reported above correspond to the current portion of the lease liability for an amount of $101 million and Tranche B bondholder’s conversion option for an amount $19 million as of December 31, 2025.
Derivatives are not reported in the above table as they relate to operating activities. Lease financial liabilities are further
described in Note 7.6.11 and convertible bonds are further described in Note 7.6.14.3.
The reconciliation for the year ended December 31, 2024 is as follows:
| | | | | | | | | | | | | | | | | | | | | | | | | | | | | | | | |
| In millions of U.S. dollars | | Interest-
bearing
loans and
borrowings | | Other
non-
current
financial
liabilities* | | Interest-
bearing
loans and
borrowings
– current
portion | | Other
current
financial
liabilities** | | Total |
| December 31, 2023 | | 1,159 | | | 243 | | | 1,640 | | | 578 | | | 3,620 | |
| Cash flows | | 300 | | | — | | | (203) | | | (83) | | | 14 | |
| Non-cash changes: | | | | | | | | | | |
| New leases | | — | | | 25 | | | — | | | 31 | | | 56 | |
| Accreted finance costs | | — | | | — | | | 25 | | | — | | | 25 | |
| Fair value changes | | — | | | — | | | — | | | (477) | | | (477) | |
| Reclassification | | (264) | | | (46) | | | 264 | | | 58 | | | 12 | |
| Foreign currency translation | | (30) | | | (9) | | | (43) | | | (7) | | | (89) | |
| December 31, 2024 | | 1,165 | | | 213 | | | 1,683 | | | 100 | | | 3,161 | |
* ”Other non-current financial liabilities” and “Other current financial liabilities” reported above do not include deferred and contingent consideration, as they relate to business acquisitions.
** ”Other current financial liabilities” reported above correspond to the current portion of the lease liability for an amount of $70 million and Tranche A and Tranche B on bondholder’s conversion option for an amount $33 million as of December 31, 2024.
Derivatives are not reported in the above table as they relate to operating activities. Lease financial liabilities are further described in Note 7.6.11 and convertible bonds are further described in Note 7.6.14.3
The Group’s long-term debt contained standard conditions but does not impose minimum financial ratios. The Group had unutilized committed medium-term credit facilities with core relationship banks totaling $640 million as of December 31, 2025.
As of December 31, 2025 the Group also had three long-term amortizing credit facilities with EIB as part of R&D funding programs and two long-term facilities with CDP SpA.
EIB facilities
The first credit facility, signed in August 2017, is a €500 million loan, in relation to R&D and capital expenditures in the EU, fully drawn in Euros, of which $205 million was outstanding as of December 31, 2025 (December 31, 2024: $233 million). The second one, signed in 2020, is a €500 million credit facility agreement to support R&D and capital expenditure programs in Italy and France. It was fully drawn in Euros in 2021, representing $352 million outstanding as of December 31, 2025 (December 31, 2024: $364 million). In 2022, the Group signed a third long-term amortizing credit facility with EIB of €600 million. Of this amount, €300 million was withdrawn in Euros in 2022, and $300 million was withdrawn in U.S dollars in 2024, representing and outstanding balance of $552 million as of December 31, 2024 (December 31, 2024: $581 million). In December 2025, the Group entered into a €500 million financing agreement with EIB to support the acceleration of R&D and high-volume chip manufacturing in Italy and France. This agreement represents the first tranche of a broader €1 billion credit line approved by EIB in favor of the Group. Of this amount, €500 million was withdrawn in March 2026.
CDP SpA facilities
The first credit facility, signed in 2021, is a €150 million loan, fully drawn in Euros, of which $44 million were outstanding as of December 31, 2025 (December 31, 2024: $65 million). The second one, signed in 2022, is a €200 million loan, fully drawn in Euros, of which $126 million was outstanding as of December 31, 2025 (December 31, 2024: $143 million).
As of December 31, 2024 the Group had three long‐term amortizing credit facilities with the EIB as part of R&D funding programs and two long-term facility with CDP SpA.
7.6.14.4. Hedging activities and derivatives
Derivative instruments not designated as hedge
The Group conducts its business on a global basis in various major international currencies. As a result, the Group is exposed to adverse movements in foreign currency exchange rates, primarily with respect to the Euro. Foreign exchange risk mainly arises from future commercial transactions and recognized assets and liabilities at the Group’s subsidiaries. The Group enters into currency forward contracts to reduce its exposure to changes in exchange rates and the associated risk arising from the denomination of certain assets and liabilities in foreign currencies at the Group’s subsidiaries. These instruments do not qualify as hedging instruments and are marked-to-market at each period-end with the associated changes in fair value recognized in “Other income” or “Other expenses” of the consolidated income statement.
To reduce its exposure to U.S. dollar exchange rate fluctuations, the Group also hedges certain Euro-denominated forecasted transactions that cover at reporting date a large part of its R&D and SG&A expenses through the use of currency forward contracts and currency options, including collars. These instruments do not qualify as hedging instruments and are marked-to-market at each period-end with the associated changes in fair value recognized in “Other income” or “Other expenses” of the consolidated income statement.
The notional amount of these financial instruments amounted to $2,389 million in 2025 (2024: $2,337 million). The principal currencies covered at the end of the year 2025 are Euro, the China Yuan Renminbi, the Singapore dollar, the Indian rupee, the Japanese yen, the Swiss franc, the Malaysian ringgit, the British pound, the Philippines peso, the Taiwan dollar, the South Korean won, the Swedish Krona, the Moroccan dirham, the Australian dollar and the Hong Kong dollar.
Foreign currency forward contracts and currency options, including collars, not designated as cash flow hedge outstanding as of December 31, 2025 had remaining terms of 5 days to 11 months, maturing on average after 96 days.
Foreign currency forward contracts and currency options, including collars, not designated as cash flow hedge outstanding as of December 31, 2024 had remaining terms of 2 days to 20 months, maturing on average after 95 days.
Derivative instruments designated as cash flow hedge
To reduce its exposure to U.S. dollar exchange rate fluctuations, the Group hedges certain Euro-denominated forecasted transactions that cover at reporting date a portion of its front-end manufacturing costs of semi-finished goods through the use of currency forward contracts and currency options, including collars. The Group may also hedge certain manufacturing transactions denominated in Singapore dollars.
The principles regulating the hedging strategy for derivatives designated as cash flow hedge is to hedge up to 70% of the total forecasted transactions of the following quarter for these manufacturing costs. In order to follow a dynamic hedge strategy, the Group may change the percentage of the designated hedged item within the limit of 100% of the forecasted transaction. The maximum length of time over which the Group could hedge its exposure to the variability of cash flows for forecasted transactions is 24 months.
These derivative instruments are designated and qualified as cash flow hedges. Hedge effectiveness is determined at the inception of the hedge relationship, and through periodic prospective effectiveness assessments to ensure that an economic relationship exists between the hedged item and the hedging instrument. The Group enters into hedge relationships where the critical terms of the hedging instrument match with the terms of the hedged item, which ensures a 1:1 hedge ratio on a monthly basis. The Group therefore performs a qualitative assessment of effectiveness. If changes in circumstances affect the terms of the hedged item such that the critical terms no longer match with the critical terms of the hedging instrument, the Group uses the hypothetical derivative method to assess effectiveness. Ineffectiveness may arise if the timing of the forecast transaction changes from what was originally estimated, which cannot occur as the Group designates as hedged items forecasted intercompany transactions denominated in foreign currency over which the Group has full oversight, control, and visibility. Ineffectiveness may arise only if there are changes in the credit risk of the counterparty.
The derivative instruments designated as cash flow hedges are reflected at fair value in the consolidated statement of financial position. The unrealized gain or loss from the effective portion of the hedge is reported in other comprehensive income and is reclassified into earnings in the same period in which the hedged transaction affects earnings, and within the same consolidated income statement line item as the impact of the hedged transaction.
For the year ended December 31, 2025, the Group recorded a decrease in cost of sales of $35 million (2024: decrease of $13 million) related to the realized gain incurred on such hedged transactions. No significant ineffective portion of the hedge was recorded on the lines “Other income” or “Other expenses” for the years ended December 31, 2025 and 2024.
The notional amount of foreign currency forward contracts and currency options, including collars, designated as cash flow hedge amounted to $1,594 million (2024: $1,624 million). The forecasted transactions hedged as of December 31, 2025 were determined to be highly probable of occurring.
As of December 31, 2025, the amount of net deferred gains on derivative instruments included in the cash flow hedge reserve in equity was $49 million (2024: net deferred gains of $56 million), of which $49 million were expected to be reclassified as earnings during the next 12 months based on the monthly forecasted semi-finished manufacturing costs.
Foreign currency forward contracts and currency options, including collars, designated as cash flow hedge outstanding as of December 31, 2025, had remaining terms of 7 days to 10 months, maturing on average after 119 days.
Foreign currency forward contracts and currency options, including collars, designated as cash flow hedge outstanding as of December 31, 2024, had remaining terms of 6 days to 19 months, maturing on average after 162 days.
As of December 31, 2025, the Group had the following outstanding derivative instruments that were entered into to hedge Euro-denominated and Singapore-Dollar-denominated forecasted transactions:
| | | | | | | | | | | | | | |
| | Notional amount for hedge on
forecasted manufacturing costs
transactions |
| | In millions of
Euros | | In millions of
Singapore Dollars |
| Forward contracts | | 763 | | | — | |
| Currency collars | | 593 | | | — | |
As of December 31, 2024, the Group had the following outstanding derivative instruments that were entered into to hedge Euro-denominated and Singapore-Dollar-denominated forecasted transactions:
| | | | | | | | | | | | | | |
| | Notional amount for hedge on
forecasted manufacturing costs
transactions |
| | In millions of
Euros | | In millions of
Singapore Dollars |
| Forward contracts | | 1,063 | | | 168 | |
| Currency collars | | 380 | | | — | |
Cash flow and fair value interest rate risk
The Group’s interest rate risk arises from long-term borrowings. Borrowings issued at variable rates expose the Group to cash flow interest rate risk. Borrowings issued at fixed rates expose the Group to fair value interest rate risk.
The Group analyzes its interest rate exposure on a dynamic basis. Various scenarios are simulated taking into consideration refinancing, renewal of existing positions, alternative financing and hedging. The Group invests primarily on a short-term basis and as such its liquidity is invested in floating interest rate instruments. As a consequence, the Group is exposed to interest rate risk due to potential mismatch between the return on its short-term floating interest rate investments and the portion of its long-term debt issued at fixed rate.
Other market risk
As part of its ongoing investing activities, the Group may invest in publicly traded equity securities and be exposed to equity security price. In order to hedge the exposure to this market risk, the Group may enter into certain derivative hedging transactions.
In December 2024, the Group participated to the IPO of Innoscience (Suzhou) which became public on the main segment of Hong Kong Stock Exchange. As a publicly traded equity instrument, Innoscience investment is measured at fair value through profit or loss, with a $76 million unrealized gain, as described in Note 7.6.14.1 and Note 7.6.31.
Credit risk and the Group’s impairment policies on financial assets are further described in Note 7.6.7.13 and Note 7.6.38.
Offsetting financial assets and financial liabilities
The Group entered into currency collars as combinations of two options, which are reported, for accounting purposes, on a net basis. As of December 31, 2025, the fair value of these collars represented assets for a net amount of $6 million (composed of $7 million asset net of a $1 million liability) and liabilities for a net amount of $1 million (composed of $2 million liability offset with a $1 million asset). In addition, the Group entered into other derivative instruments, primarily forward contracts, which are governed by standard International Swaps and Derivatives Association agreements and are compliant with Protocols of the European Market Infrastructure Regulation and the ISDA 2018 U.S. Resolution Stay Protocol, which are not offset in the statement of financial position and representing total assets of $70 million and liabilities of $14 million as of December 31, 2025.
Risk management policies relating to credit risk exposure to derivatives counterparties is further described in Note 7.6.38.
7.6.14.5. Fair values
Set out below is a comparison by class of the carrying amounts and fair value of the Group’s financial instruments that are carried in the consolidated financial statements.
| | | | | | | | | | | | | | | | | | | | | | | | | | |
| | Carrying amount | | Fair value |
| In millions of U.S. dollars | | December 31,
2025 | | December 31,
2024 | | December 31,
2025 | | December 31,
2024 |
| Financial assets | | | | | | | | |
| Short-term deposits | | 1,100 | | | 1,450 | | | 1,100 | | | 1,450 | |
| Trade accounts receivable | | 1,745 | | | 1,749 | | | 1,745 | | | 1,749 | |
| Other receivables and assets | | 1,392 | | | 997 | | | 1,392 | | | 997 | |
| Quoted financial instruments | | 1,150 | | | 2,540 | | | 1,150 | | | 2,540 | |
| Unquoted equity securities | | 25 | | | 20 | | | 25 | | | 20 | |
| | | | | | | | |
| Embedded call option - Senior unsecured convertible bonds issued on August 4, 2020 (Tranche B) | | — | | | 2 | | | — | | | 2 | |
| Derivative financial assets | | 76 | | | 10 | | | 76 | | | 10 | |
Cash equivalents (1) | | 2,264 | | | 1,611 | | | 2,264 | | | 1,611 | |
| Financial liabilities | | | | | | | | |
| Interest-bearing loans and borrowings (excluding senior unsecured convertible bonds) | | 1,282 | | | 1,391 | | | 1,282 | | | 1,391 | |
Senior unsecured convertible bonds issued on August 4, 2020 (2) | | 728 | | | 1,457 | | | 731 | | | 1,442 | |
Embedded conversion option - Senior unsecured convertible bonds issued on August 4, 2020 (Tranche A) (2) | | — | | | 4 | | | — | | | 4 | |
Embedded conversion option - Senior unsecured convertible bonds issued on August 4, 2020 (Tranche B) (2) | | 19 | | | 29 | | | 19 | | | 29 | |
| Finance leases | | 324 | | | 280 | | | 324 | | | 280 | |
| Contingent consideration on business acquisitions | | 18 | | | 15 | | | 18 | | | 15 | |
| Trade accounts payable | | 1,487 | | | 1,323 | | | 1,487 | | | 1,323 | |
| Other payables and accrued liabilities | | 506 | | | 420 | | | 506 | | | 420 | |
| Derivative financial liabilities | | 14 | | | 89 | | | 14 | | | 89 | |
(1) Cash equivalents primarily correspond to deposits at call with banks, money market funds and other short-term investments.
(2) The carrying amount of the senior unsecured convertible bonds issued on August 4, 2020 and outstanding as of December 31, 2025 and December 31, 2024 corresponds to the liability component only, since, at initial recognition, an amount of $219 million was separately recognized as embedded derivative financial instruments. The fair value of the senior convertible bonds includes the fair value of all embedded derivatives.
The fair value of financial assets and liabilities are included at the price at which the instrument could be sold in an orderly transaction between market participants at the measurement date. The following methods and assumptions were used to estimate fair value:
•for trade accounts receivable, cash equivalents, short-term deposits, trade accounts payable, other payables and accrued liabilities, the carrying amounts reflected in the consolidated financial statements are reasonable estimates of fair value due to the relatively short period of time between the origination of the instruments and their expected realization.
•other receivables and assets approximate their carrying amounts due either to their short-term maturities or to the fact that they are recorded at their net present value.
•financial investments (debt and equity securities):
◦the fair value of quoted debt and equity securities is determined based upon quoted market prices for identical instruments;
◦the fair value of unquoted equity securities is based on the valuation of the underlying instruments on a new round of third-party financing or upon liquidation;
•the fair value of interest-bearing loans and borrowings, including lease liabilities but excluding senior unsecured convertible bonds, is determined by estimating future cash flows on a borrowing-by-borrowing basis and discounting these future cash flows using the Group’s incremental borrowing rates for similar types of arrangements;
•the senior unsecured convertible bonds issued on August 4, 2020, and outstanding as of December 31, 2025, and December 31, 2024, have been trading on the open market segment on the Frankfurt Stock Exchange since issuance. The fair value of these instruments is the observable price of the bonds on that market;
•the fair value of derivative instruments is determined based upon quoted market prices for similar instruments; and
•the bondholders’ conversion option and the issuer’s soft call embedded in the senior unsecured convertible bonds are measured at fair value based on the income approach using Bloomberg’s option pricing model, which can be assimilated to a Black & Scholes model for pricing stock options. This model has been elected as the best indication of fair value since it maximizes the use of observable market-based inputs.
Fair value hierarchy
The Group uses the following hierarchy for determining and disclosing the fair value of financial instruments by valuation technique:
•level 1: quoted (unadjusted) prices in active markets for identical assets or liabilities.
•level 2: other techniques for which all inputs which have a significant effect on the recorded fair value are observable, either directly or indirectly.
•level 3: techniques which use inputs which have a significant effect on the recorded fair value that are not based on observable market data.
For assets and liabilities that are recognized in the financial statements at fair value on a recurring basis, the Group determines whether transfers have occurred between levels in the hierarchy by re-assessing categorization (based on the lowest level input that is significant to the fair value measurement as a whole) at the end of each reporting period.
As of December 31, 2025, the Group held the following assets and liabilities measured at fair value:
| | | | | | | | | | | | | | | | | | | | | | | | | | |
| In millions of U.S. dollars | | December 31,
2025 | | Level 1 | | Level 2 | | Level 3 |
| Assets measured at fair value | | | | | | | | |
| Financial assets at FVPL | | | | | | | | |
| Foreign exchange forward contracts | | 25 | | | — | | | 25 | | | — | |
| Currency collars | | 1 | | | — | | | 1 | | | — | |
| Quoted equity securities at FVPL | | 137 | | | 137 | | | — | | | — | |
| Other financial assets at FVPL | | 28 | | | 28 | | | — | | | — | |
| Cash equivalents - Short-term investments | | 313 | | | — | | | 313 | | | — | |
| Cash flow hedges | | | | | | | | |
| Foreign exchange forward contracts | | 45 | | | — | | | 45 | | | — | |
| Currency collars | | 5 | | | — | | | 5 | | | — | |
| Quoted debt securities measured at FVOCI | | | | | | | | |
| Government bonds issued by the U.S. Treasury | | 985 | | | 985 | | | — | | | — | |
| Unquoted equity securities measured at FVOCI | | 25 | | | — | | | — | | | 25 | |
| Total assets | | 1,564 | | | 1,150 | | | 389 | | | 25 | |
| Liabilities measured at fair value | | | | | | | | |
| Derivative instruments | | | | | | | | |
| Foreign exchange forward contracts | | 13 | | | — | | | 13 | | | — | |
| | | | | | | | |
| Cash flow hedges | | | | | | | | |
| Foreign exchange forward contracts | | 1 | | | — | | | 1 | | | — | |
| | | | | | | | |
| Embedded conversion options | | 19 | | | — | | | — | | | 19 | |
| Contingent consideration on business acquisitions | | 18 | | | — | | | — | | | 18 | |
| Total liabilities | | 51 | | | — | | | 14 | | | 37 | |
During the reporting period ending December 31, 2025, there was no transfer between Level 1 and Level 2 fair value measurements, and no transfer into and out of Level 3 fair value measurements.
As of December 31, 2024, the Group held the following assets and liabilities measured at fair value:
| | | | | | | | | | | | | | | | | | | | | | | | | | |
| In millions of U.S. dollars | | December 31,
2024 | | Level 1 | | Level 2 | | Level 3 |
| Assets measured at fair value | | | | | | | | |
| Financial assets at FVPL | | | | | | | | |
| Foreign exchange forward contracts | | 10 | | | — | | | 10 | | | — | |
| Currency collars | | — | | | — | | | — | | | — | |
| Quoted equity securities at FVPL | | 64 | | | 64 | | | — | | | — | |
| Other financial assets at FVPL | | 24 | | | 24 | | | — | | | — | |
| Embedded call options | | 2 | | | — | | | — | | | 2 | |
| Cash flow hedges | | | | | | | | |
| Foreign exchange forward contracts | | — | | | — | | | — | | | — | |
| Currency collars | | — | | | — | | | — | | | — | |
| Quoted debt securities measured at FVOCI | | | | | | | | |
| Government bonds issued by the U.S. Treasury | | 2,452 | | | 2,452 | | | — | | | — | |
| Unquoted equity securities measured at FVOCI | | 20 | | | — | | | — | | | 20 | |
| Total assets | | 2,572 | | | 2,540 | | | 10 | | | 22 | |
| Liabilities measured at fair value | | | | | | | | |
| Derivative instruments | | | | | | | | |
| Foreign exchange forward contracts | | 29 | | | — | | | 29 | | | — | |
| Currency collars | | 6 | | | — | | | 6 | | | — | |
| Cash flow hedges | | | | | | | | |
| Foreign exchange forward contracts | | 45 | | | — | | | 45 | | | — | |
| Currency collars | | 9 | | | — | | | 9 | | | — | |
| Embedded conversion options | | 33 | | | — | | | — | | | 33 | |
| Contingent consideration on business acquisitions | | 15 | | | — | | | — | | | 15 | |
| Total liabilities | | 137 | | | — | | | 89 | | | 48 | |
During the reporting period ending December 31, 2024, there was no transfer between Level 1 and Level 2 fair value measurements, and no transfer into and out of Level 3 fair value measurements.
Financial instruments in Level 1
The fair value of financial instruments traded in active markets is based on quoted market prices at the balance sheet date. A market is regarded as active if quoted prices are readily and regularly available from an exchange, dealer, broker, industry group, pricing service or regulatory agency, and those prices represent actual and regularly occurring market transactions on an arm’s length basis. The quoted market price used for financial assets held by the Group is the current bid price. These instruments are included in Level 1.
Financial instruments in Level 2
The fair value of financial instruments that are not traded in active markets (for example over the counter derivatives) is determined by using valuation techniques. These valuation techniques maximize the use of observable market data when available and rely as little as possible on entity’s specific estimates. If all significant inputs required to fair value an instrument are observable, the instrument is included in Level 2. If one or more of the significant inputs is not based on observable market data, the instrument is included in Level 3. Specific valuation techniques used to value financial instruments include:
•Quoted market prices or dealer’s quotes for similar instruments; and
•The fair value of foreign exchange forward contracts when determined using forward exchange rates at the balance sheet date, with the resulting value discounted back to present value.
As of December 31, 2025, the Group held $313 million short-term investments classified as cash equivalents. These short-term investments were measured at fair value classified as a Level 2 measurement hierarchy. These financial assets were reported as cash equivalents due to their high level of liquidity, their readily convertibility into known amount of cash, and insignificant risk of changes in value.
Financial instruments in Level 3
For financial assets measured at fair value using significant unobservable inputs (Level 3), the reconciliation between January 1, 2025 and December 31, 2025 is presented as follows:
| | | | | | | | |
| In millions of U.S. dollars | | Fair value measurements using
significant unobservable inputs (Level 3) |
| As of January 1, 2025 | | 22 | |
| | |
| | |
| | |
| | |
| | |
| Change in fair value of the embedded call option of the senior unsecured convertible bonds issued on August 4, 2020 (Tranche A and Tranche B) | | (2) | |
| | |
| | |
| | |
| Purchase of unquoted equity securities at FVOCI | | 5 | |
| As of December 31, 2025 | | 25 | |
| Amount of net loss included in the 2025 income statement attributable to assets still held at the reporting date | | (2) | |
For financial liabilities measured at fair value using significant unobservable inputs (Level 3), the reconciliation between January 1, 2025 and December 31, 2025 is presented as follows: | | | | | | | | |
| In millions of U.S. dollars | | Fair value measurements using
significant unobservable inputs (Level 3) |
| As of January 1, 2025 | | (48) | |
| | |
| | |
| | |
| | |
| Change in fair value of the embedded conversion option of the senior unsecured convertible bonds issued on August 4, 2020 (Tranche A and Tranche B) | | 14 | |
| | |
| | |
| | |
| Currency translation adjustment | | (3) | |
| | |
| As of December 31, 2025 | | (37) | |
| Amount of net gain included in the 2025 income statement attributable to assets still held at the reporting date | | 14 | |
The following table shows the impact on the income statement of the valuation of the embedded derivative instruments outstanding as of December 31, 2025:
| | | | | | | | |
| In millions of U.S. dollars | | |
| Asset (liability) value as of December 31, 2024 | | (31) | |
| Gains (losses) recognized in the consolidated income statement | | 12 | |
| Asset (liability) value as of December 31, 2025 | | (19) | |
Contingent consideration reported as liabilities on the consolidated statement of financial position as of December 31, 2025 and December 31, 2024 is based on the probability that the milestones defining the variable components of the consideration will be achieved.
The change in fair value amounting to $14 million on the embedded bondholders’ conversion options was reported as “Finance income” in the consolidated income statement ended December 31, 2025. The change in fair value amounting to $2 million on the embedded issuer’s call options was reported as “Finance loss” in the consolidated income statement ended December 31, 2025.
The model used to price the derivative instruments embedded in the senior unsecured convertible bonds issued on August 4, 2020 (Tranche A and Tranche B) included the following inputs:
•the risk-free interest rate for comparable maturities;
•the reference price for the Company’s ordinary shares as traded on the New York Stock Exchange;
•the exercise price;
•the dividend expected to be paid on the Company’s ordinary shares over the life of the option;
•the volatility of the Company’s ordinary shares; and
•the duration of the option.
Sensitivity to the share price variations is further described in Note 7.6.38. Implied volatility should be considered an unobservable input due to the lack of market data (stock exchange listing of the bond option) for a time horizon equal to the duration of the option. The figure is, therefore, an assumption based on the volatility implied by the price of the financial instrument, as negotiated at the issue stage, and market volatility for the nearest time horizon.
The prices of the bondholders’ conversion options are sensitive to implied volatility. The table below shows a sensitivity analysis of the net carrying amount of the embedded conversion options in relation to a series of changes expressed in percentage point terms of volatility.
| | | | | | | | | | | | | | | | | | | | | | | | | | | | | | | | | | | | | | |
| Change in volatility of the Company’s ordinary shares | | -10 p.p. | | - 8 p.p. | | -5 p.p. | | +5 p.p. | | +8 p.p. | | +10 p.p. |
| Change in the net carrying amount of the bondholders’ conversion options | | (13) | | | (11) | | | (7) | | | 8 | | | 13 | | | 17 | |
| Net carrying amount of the embedded conversion options | | 6 | | | 8 | | | 12 | | | 27 | | | 32 | | | 36 | |
For financial assets measured at fair value using significant unobservable inputs (Level 3), the reconciliation between January 1, 2024 and December 31, 2024 is presented as follows:
| | | | | | | | |
| In millions of U.S. dollars | | Fair value measurements using
significant unobservable inputs (Level 3) |
| As of January 1, 2024 | | 70 | |
| | |
| | |
| | |
| | |
| | |
| Change in fair value of the embedded call option of the senior unsecured convertible bonds issued on August 4, 2020 (Tranche A and Tranche B) | | (46) | |
| | |
| Change in fair value of unquoted equity securities measured at FVOCI | | (2) | |
| | |
| | |
| | |
| | |
| | |
| As of December 31, 2024 | | 22 | |
Amount of net gains included in the 2024 income statement
attributable to assets still held at the reporting date | | (46) | |
For financial liabilities measured at fair value using significant unobservable inputs (Level 3), the reconciliation between January 1, 2024 and December 31, 2024 is presented as follows:
| | | | | | | | |
| In millions of U.S. dollars | | Fair value measurements using
significant unobservable inputs (Level 3) |
| As of January 1, 2024 | | (530) | |
| | |
| | |
| | |
| | |
| Change in fair value of the embedded conversion option of the senior unsecured convertible bonds issued on August 4, 2020 (Tranche A and Tranche B) | | 477 | |
| | |
| | |
| | |
| | |
| Payments made in connection with business acquisitions | | 5 | |
| | |
| | |
| | |
| As of December 31, 2024 | | (48) | |
Amount of net losses included in the 2024 income statement
attributable to liabilities still held at the reporting date | | 477 | |
The following table shows the impact on the income statement of the valuation of the embedded derivative instruments outstanding as of December 31, 2024:
| | | | | | | | |
| In millions of U.S. dollars | | |
| Asset (liability) value as of December 31, 2023 | | (462) | |
| | |
| Gains (losses) recognized in the consolidated income statement | | 431 | |
| Asset (liability) value as of December 31, 2024 | | (31) | |
The change in fair value amounting to $46 million on the embedded bondholders’ conversion option was reported as “Finance costs” in the consolidated income statement ended December 31, 2024. The change in fair value amounting to $477 million on the embedded issuer’s call option was reported as “Finance income” in the consolidated income statement ended December 31, 2024.
The table below shows a sensitivity analysis as of December 31, 2024 of the net carrying amount of the embedded conversion options in relation to a series of changes expressed in percentage point terms of volatility.
| | | | | | | | | | | | | | | | | | | | | | | | | | | | | | | | | | | | | | |
| Change in volatility of the Company’s ordinary shares | | -10 p.p. | | - 8 p.p. | | -5 p.p. | | +5 p.p. | | +8 p.p. | | +10 p.p. |
| Change in the net carrying amount of the bondholders’ conversion options | | (22) | | | (18) | | | (12) | | | 14 | | | 23 | | | 29 | |
| Net carrying amount of the embedded conversion options | | 11 | | | 15 | | | 21 | | | 47 | | | 56 | | | 62 | |
7.6.15. Other non-current assets
Other non-current assets consisted of the following:
| | | | | | | | | | | | | | |
| In millions of U.S. dollars | | December 31,
2025 | | December 31,
2024 |
| | | | |
| Public funding receivables | | 541 | | | 375 | |
| Taxes and other receivables from government agencies | | 46 | | | 26 | |
| Research tax credit receivable | | 339 | | | 231 | |
| Prepayments and deposits to third parties | | 234 | | | 213 | |
| Other non-current assets | | 58 | | | 60 | |
| Total | | 1,218 | | | 905 | |
The Group holds long-term receivables with the objective to collect the contractual cash flows and therefore, these receivables are measured subsequently at amortized cost using the effective interest method.
Public funding receivables correspond to receivables related to public funding scheme for research, development, innovation and first industrial deployment activities.
In 2025 and 2024, the Group entered into factoring transactions to accelerate the realization in cash of certain long-term receivables. The Group sold without recourse $66 million and $87 million of these receivables in the years ended December 31, 2025 and 2024 respectively, with a financial cost of $2 million and $4 million respectively.
Prepayments and deposits to third parties relate to long-term supply agreements involving purchase of raw materials, capacity commitments, cloud-hosting arrangements, and other services.
The major portion of other long-term receivables to which the expected credit loss model applies are long-term State receivables. Due to the existing history of zero-default on receivables originated by governments, the expected credit loss is assumed to be negligible as of December 31, 2025, and 2024. Other non-current assets presented in the table above on the line "Other non-current assets" are composed of individually not significant amounts not deemed to have exposure of default. Consequently, no significant expected credit loss allowance was reported on other non-current assets at reporting date.
The carrying amounts of the Group’s non-current assets are denominated in the following currencies:
| | | | | | | | | | | | | | |
| In millions of U.S. dollars | | December 31,
2025 | | December 31,
2024 |
| U.S. dollars | | 228 | | | 207 | |
| Euro | | 982 | | | 691 | |
| Japanese Yen | | 2 | | | 2 | |
| Other currencies | | 6 | | | 5 | |
| Total | | 1,218 | | | 905 | |
7.6.16. Inventories
Inventories consisted of the following:
| | | | | | | | | | | | | | |
| In millions of U.S. dollars | | December 31,
2025 | | December 31,
2024 |
| Raw materials | | 418 | | | 348 | |
| Work-in-process | | 1,841 | | | 1,696 | |
| Finished products | | 872 | | | 762 | |
| Total | | 3,131 | | | 2,806 | |
Write-offs of inventories were recognized in cost of sales as an expense and amounted to $108 million in 2025 (2024: $92 million). Further impact related to inventories on the consolidated income statement is provided in Note 7.6.28.
The carrying amount of inventories is presented net of a reserve for obsolescence items of $220 million as of December 31, 2025 (2024: $167 million).
7.6.17. Trade accounts receivable
Trade accounts receivable consisted of the following:
| | | | | | | | | | | | | | |
| In millions of U.S. dollars | | December 31,
2025 | | December 31,
2024 |
| Trade accounts receivable | | 1,767 | | | 1,768 | |
| Loss allowance | | (22) | | | (19) | |
| Total | | 1,745 | | | 1,749 | |
Trade receivables are amounts due from customers for goods sold or services performed in the ordinary course of business. Trade receivables are non-interest bearing with payment terms that typically range between 30 and 90 days. They are all classified as current. The Group holds the trade receivables with the objective to collect the contractual cash flows and, therefore, trade receivables are measured subsequently at amortized cost. The Group does not expect to have any significant contracts where the period between the transfer of the promised goods or services to the customer and payment by the customer exceeds one year. As a consequence, the Group does not adjust any of the transaction prices for the time value of money and no significant transaction with customers includes significant financing component. Due to the short-term nature of trade receivables, their carrying amount is considered to be the same as their fair value.
As described in Note 7.6.38, the Group monitors the creditworthiness of its customers to which it grants credit terms in the normal course of business. If certain customers are independently rated, these ratings are used. Otherwise, if there is no independent rating, risk control assesses the credit quality of the customer, considering its financial position, past experience and other factors. Individual risk limits are set based on internal and external ratings in accordance with limits set by management. The utilization of credit limits is regularly monitored. Sales to customers are primarily settled in cash.
The Group uses a lifetime expected loss allowance for all trade receivables based on failure rates, as applied to the gross amounts of trade accounts receivable. The model includes reasonable assumptions about future credit trends. The historical loss rates are adjusted to reflect current and forward-looking information on macro-economic factors affecting the ability of the Group’s customers to settle the receivables. In addition to the factors already embedded in the failure rates, as applied on trade accounts receivable, the Group has identified cyclicality and uncertainties around continued growth for the semiconductor industry and its serviceable available market to be the most relevant factors. These macro-economic factors are weighted into different economic scenarios, in line with estimates and
methodologies applied by other business entities, including financial institutions. These scenarios range from upside scenario (above-trend economic growth) to severe downside (recession). On that basis, the loss allowance as of December 31, 2025 and December 31, 2024 was determined as follows:
| | | | | | | | | | | | | | | | | | | | | | | | | | | | | | | | |
| | | | | | Past due |
| In millions of U.S. dollars | | Total | | No
past-due | | Less than
a month | | Between
1 and 6
months | | Over 6
months |
| December 31, 2025 | | | | | | | | | | |
| Expected loss rate | | | | 1 | % | | 1 | % | | 10 | % | | 100 | % |
| Trade receivables – Gross carrying amount | | 1,767 | | | 1,679 | | | 77 | | | 8 | | | 3 | |
| Loss allowance | | (22) | | | (17) | | | (1) | | | (1) | | | (3) | |
| Trade receivables – Net carrying amount | | 1,745 | | | 1,662 | | | 76 | | | 7 | | | — | |
| December 31, 2024 | | | | | | | | | | |
| Expected loss rate | | | | 1 | % | | 1 | % | | 10 | % | | 100 | % |
| Trade receivables – Gross carrying amount | | 1,768 | | | 1,690 | | | 73 | | | 4 | | | 1 | |
| Loss allowance | | (19) | | | (17) | | | (1) | | | — | | | (1) | |
| Trade receivables – Net carrying amount | | 1,749 | | | 1,673 | | | 72 | | | 4 | | | — | |
The loss allowance for trade accounts receivable as of December 31, 2025 and December 31, 2024 reconcile to the opening loss allowance as follows:
| | | | | | | | |
| In millions of U.S. dollars | | |
| As of December 31, 2023 | | 19 | |
| Additions | | 1 | |
| Reversals | | (1) | |
| As of December 31, 2024 | | 19 | |
| Additions | | 7 | |
| Reversals | | (4) | |
| As of December 31, 2025 | | 22 | |
Gross trade accounts receivable are denominated in the following currencies:
| | | | | | | | | | | | | | |
| In millions of U.S. dollars | | December 31,
2025 | | December 31,
2024 |
| U.S. dollars | | 1,614 | | | 1,622 | |
| Euro | | 35 | | | 43 | |
| Japanese Yen | | 118 | | | 103 | |
| | | | |
| Total | | 1,767 | | | 1,768 | |
The maximum exposure to credit risk was the fair value of trade accounts receivable, net of expected credit losses as of December 31, 2025 and December 31, 2024.
7.6.18. Other receivables and assets
Other receivables and assets consisted of the following:
| | | | | | | | | | | | | | |
| In millions of U.S. dollars | | December 31,
2025 | | December 31,
2024 |
| Public funding receivables | | 678 | | | 391 | |
| Advances and deferred charges | | 207 | | | 210 | |
| Taxes and other government receivables | | 326 | | | 254 | |
| Loans and deposits | | 26 | | | 14 | |
| Interest receivable | | 35 | | | 29 | |
| Other current assets | | 120 | | | 99 | |
| Total | | 1,392 | | | 997 | |
The Group participates in public funding programs in several jurisdictions associated with research, development, innovation and other first industrialization deployment activities.
Taxes and other government receivables include receivables related to value-added tax, primarily in European tax jurisdictions.
Advances and deferred charges include prepaid amounts associated with multi-annual supply and service agreements.
The Group applies a forward-looking expected credit losses model on all financial assets measured at amortized cost, excluding trade accounts receivable. The major portion of other receivables and assets to which this expected credit loss model applies corresponds to governmental receivables. Due to the short maturity of these receivables and the existing history of zero-default on receivables originated by governments, the expected credit loss is assumed to be negligible as of December 31, 2025, and December 31, 2024. Other receivables, excluding receivables from government agencies, are composed of individually insignificant amounts at exposure of default. Consequently, no significant loss allowance was reported on other receivables and assets as of December 31, 2025 and December 31, 2024.
The carrying amounts of the Group’s other receivables and assets are denominated in the following currencies:
| | | | | | | | | | | | | | |
| In millions of U.S. dollars | | December 31,
2025 | | December 31,
2024 |
| U.S. dollars | | 445 | | | 302 | |
| Euro | | 908 | | | 663 | |
| Other currencies | | 39 | | | 32 | |
| Total | | 1,392 | | | 997 | |
The maximum exposure to credit risk was the fair value of other receivables and assets, net of expected credit losses, as of December 31, 2025 and December 31, 2024.
7.6.19. Cash and cash equivalents
Cash and cash equivalents consisted of the following:
| | | | | | | | | | | | | | |
| In millions of U.S. dollars | | December 31,
2025 | | December 31,
2024 |
| Cash at bank and on hand | | 573 | | | 671 | |
| Deposits at call with banks and money market funds | | 2,264 | | | 1,611 | |
| Total | | 2,837 | | | 2,282 | |
Cash equivalents primarily correspond to deposits at call with banks, money market funds and other short-term investments. Cash and cash equivalents as reported on the consolidated statement of financial position as of December 31, 2025 and December 31, 2024 included cash and cash equivalents from Sanan ST JV, as described in Note 7.6.8.7, totaling $463 million and $345 million, respectively. As of December 31, 2025, cash equivalents of Sanan ST JV included $313 million short-term investments measured at fair value.
7.6.20. Equity
7.6.20.1. Outstanding shares
The authorized share capital of the Company is €1,810 million consisting of 1,200,000,000 common shares and 540,000,000 preference shares, each with a nominal value of €1.04. As of December 31, 2025, the number of common shares issued was 911,281,920 shares (December 31, 2024: 911,281,920 shares).
As of December 31, 2025, the number of common shares outstanding was 888,768,152 shares (December 31, 2024: 898,175,408 shares).
7.6.20.2. Preference shares
The 540,000,000 preference shares, when issued, will entitle a holder to full voting rights and to a preferential right to dividends and distributions upon liquidation.
The Company is a party to an option agreement regarding the preference shares with the Stichting, entered into on January 22, 2007, with a duration of ten years, an agreement which was extended for additional ten years in October 2016. The Supervisory and Managing Boards, along with the board of the Stichting, have declared that they are jointly of the opinion that the Stichting is independent of the Company. The option agreement provides for the issuance of up to a maximum 540,000,000 preference shares. Any such shares would be issued to the Stichting upon its request and in its sole discretion and upon payment of at least 25% of the par value of the preference shares to be issued. The shares would be issuable in the event of actions which the board of the Stichting determines would be contrary to the Company’s interests, shareholders and other stakeholders and which, in the event of a creeping acquisition or offer for the Company’s common shares, are not supported by the Company’s Supervisory and Managing Boards. The preference shares may remain outstanding for no longer than two years. The effect of the preference shares may be to deter potential acquirers from effecting an unsolicited acquisition resulting in a change of control as well as to create a level-playing field in the event actions which are considered to be hostile by the Supervisory and Managing Boards, as described above, occur and which the board of the Stichting determines to be contrary to the Company’s interests, shareholders and other stakeholders.
There were no preference shares issued as of December 31, 2025 and December 31, 2024.
7.6.20.3. Treasury shares
As of December 31, 2025, the Company owned 22,513,768 shares classified as treasury stock in the consolidated statement of equity compared to 13,106,512 shares as of December 31, 2024.
The treasury shares have been originally designated for allocation under the Company’s share-based remuneration programs. During the years ended December 31, 2025 and 2024, 5,103,210 and 5,542,756 of these treasury shares, respectively, were transferred to employees under the Company’s share-based remuneration programs.
On July 1, 2021, the Company announced the launch of a share buy-back program of up to $1,040 million to be executed within a three-year period. Under this share buy-back program, the Company purchased approximately 4.1 million shares of its outstanding common stock for a total of $175 million during the first half of 2024, from January until the program concluded in June. During 2023, the Company purchased approximately 7.6 million shares of its outstanding common stock for $346 million under this program.
On June 21, 2024, the Company announced the launch of a new share buy-back plan comprising two programs of up to $1,100 million to be executed within a three-year period. During 2025, the Company purchased approximately 14.5 million shares of its outstanding common stock under this program, for $367 million. During 2024, the Company purchased approximately 6 million shares of its outstanding common stock under this program for $184 million.
7.6.20.4. Unvested share awards for the Employees
On an annual basis, the Compensation Committee (on behalf of the Supervisory Board and with its approval) grants stock-based awards to the senior executives and selected employees (the “Employee Plan”). The awards are granted for services rendered under the Employee Plan. There are two types of unvested shares: (1) shares granted to employees, which are subject only to service conditions and vest over the requisite service period, and (2) shares granted to executives and other selected employees, for which vesting is subject to service and performance conditions.
For awards granted in 2023, 2024 and 2025, that are outstanding as of December 31, 2025, the performance conditions consist of two external targets (sales evolution and operating income compared to a basket of competitors) weighting for two thirds of the total number of awards granted, and of one internal target (Company’s sustainability and diversity performance), weighting for one third of the total number of awards granted. Sustainability and diversity performance include environment/climate, diversity and inclusions indicators, ESG investor index and carbon rating.
The majority of stock awards granted to executives is subject to three years cliff vesting, and a substantial portion of awards granted to employees of certain seniority is subject to the same vesting terms. All other awards, including those granted to other employees, vest over a graded three years service period (32% as of the first anniversary of the grant, 32% as of the second anniversary of the grant and 36% as of the third anniversary of the grant).
A summary of the unvested share activity by plan for the year ended December 31, 2025 is presented below:
| | | | | | | | | | | | | | | | | | | | | | | | | | | | | | | | | | | | | | |
| Allocation under | | Unvested
as of
December 31,
2024 | | Granted | | Forfeited /
waived | | Vested | | Cancelled on failed vesting conditions | | Unvested
as of
December 31,
2025 |
| 2022 Employee Plan | | 2,279,312 | | | — | | | (14,108) | | | (2,256,871) | | | (8,333) | | | — | |
| 2023 Employee Plan | | 3,736,503 | | | — | | | (39,107) | | | (1,532,759) | | | — | | | 2,164,637 | |
| 2024 Employee Plan | | 7,597,494 | | | — | | | (145,984) | | | (1,311,529) | | | (678,130) | | | 5,461,851 | |
| 2025 Employee Plan | | — | | | 7,880,820 | | | (36,677) | | | (2,051) | | | — | | | 7,842,092 | |
| Total | | 13,613,309 | | | 7,880,820 | | | (235,876) | | | (5,103,210) | | | (686,463) | | | 15,468,580 | |
The grant date weighted average fair value of unvested shares granted to employees under the 2022 Employee Plan (6,531,345 shares) was $35.92. On March 22, 2023, the Compensation Committee approved the statement that with respect to the shares subject to performance conditions and graded
vesting (2,605,521 shares), all three performance conditions were fully met. For awards subject to performance conditions and three years cliff vesting (100,000 shares), the Compensation Committee approved the statement that 92% of the performance conditions were fully met. Consequently, the compensation expense recorded on the 2022 Employee Plan reflects the above statements.
The grant date weighted average fair value of unvested shares granted to employees under the 2023 Employee Plan (5,449,135 shares) was $50.96. On March 20, 2024, the Compensation Committee approved the statement that with respect to the shares subject to performance conditions and graded vesting (2,009,952 shares), all three performance conditions were fully met. Consequently, the compensation expense recorded on the 2023 Employee Plan reflects the statement that – for the portion of shares subject to performance conditions and graded vesting – 100% of the awards granted will ultimately vest, as far as the service condition is met. On March 25, 2026, the Compensation Committee approved the statement that with respect to the shares subject to three years cliff vesting and performance conditions (532,000 shares), 1 out 3 performance conditions was fully met. Consequently, the compensation expense recorded on the 2023 Employee Plan reflects the above statements.
The grant date weighted average fair value of unvested shares granted to employees under the 2024 Employee Plan (7,627,070 shares) was $37.69. On March 26, 2025, the Compensation Committee approved the statement that with respect to the shares subject to performance conditions and graded vesting (1,021,656 shares), one out of three performance conditions were met. For awards subject to performance conditions and three years cliff vesting (2,570,980 shares), the Company estimated as of December 31, 2025 that 33% of these awards are expected to vest. Consequently, the compensation expense recorded on the 2024 Employee Plan reflects the statement that – for the portion of shares subject to performance conditions (whether with graded vesting or three years cliff vesting) –33% of the awards granted will ultimately vest, as far as the service condition is met. The final measurement of these conditions is expected to occur in 2027 for shares subject to three years cliff vesting.
The grant date weighted average fair value of unvested shares granted to employees under the 2025 Employee Plan (7,880,820 shares) was $30.56. Moreover, for the portion of the shares subject to performance conditions with three years cliff vesting (3,097,825 shares), the Company estimated the number of awards expected to vest by assessing the probability of achieving the performance conditions. As of the date these consolidated financial statements were issued, the Compensation Committee of the Supervisory Board had not yet made a final determination regarding the achievement of the performance conditions. The Company estimated as of December 31, 2025 that 33% of the awards subject to performance conditions will vest. Therefore, the compensation expense recorded for the 2025 Employee Plan reflects the expected vesting of 33% of the awards granted, provided the service condition is met. The estimate of the expected number of awards to be vested upon achievement of the performance conditions is subject to change. The final measurement of these conditions is expected to occur in the first half of 2028.
The following table illustrates the classification of pre-payroll tax and social contribution stock-based compensation expense included in the consolidated income statement for the year ended December 31, 2025 and 2024:
| | | | | | | | | | | | | | |
| In millions of U.S. dollars | | December 31,
2025 | | December 31,
2024 |
| Cost of sales | | 38 | | | 42 | |
| Research and development expenses | | 60 | | | 69 | |
| Selling, general and administrative expenses | | 95 | | | 111 | |
| Total pre-payroll tax and social contribution compensation | | 193 | | | 222 | |
The grant date fair value of the shares vested in 2025 totaled $212 million compared to $231 million in 2024.
Stock-based compensation, excluding payroll tax and social contribution, capitalized as part of inventory was $14 million as of December 31, 2025, compared to $14 million as of December 31, 2024. As of December 31, 2025, there was $200 million of total unrecognized compensation cost related to the grant of unvested shares, which is expected to be recognized over a weighted average period of approximately 10 months.
The total deferred income tax benefit recognized in the consolidated income statement related to unvested share-based compensation expense amounted to $10 million for the year ended December 31, 2025, compared to $10 million for the year ended December 31, 2024.
7.6.20.5. Other reserves
Other reserves include the following components as of December 31, 2025:
| | | | | | | | | | | | | | | | | | | | | | | | | | | | | | | | | | | | | | |
| In millions of U.S. dollars | | Share-based
compensation
reserve | | Fair value
reserve of
financial
assets at
FVOCI | | Cash Flow
Hedge (CFH)
reserve | | Foreign
currency
translation
reserve | | Employee
benefit plan
reserve | | Total other
reserves |
| As of December 31, 2023 | | 1,832 | | | (13) | | | 33 | | | 564 | | | (135) | | | 2,281 | |
| Employee share award scheme | | 211 | | | — | | | — | | | — | | | — | | | 211 | |
| Net movement recognized in the statement of comprehensive income | | — | | | (1) | | | (93) | | | (236) | | | (2) | | | (332) | |
| Transfer of cash flow hedge reserve to inventories | | — | | | — | | | 9 | | | — | | | — | | | 9 | |
| As of December 31, 2024 | | 2,043 | | | (14) | | | (51) | | | 328 | | | (137) | | | 2,169 | |
| Employee share award scheme | | 188 | | | — | | | — | | | — | | | — | | | 188 | |
| Net movement recognized in the statement of comprehensive income | | — | | | 13 | | | 96 | | | 515 | | | 24 | | | 648 | |
| Transfer of cash flow hedge reserve to inventories | | — | | | — | | | (4) | | | — | | | — | | | (4) | |
| As of December 31, 2025 | | 2,231 | | | (1) | | | 41 | | | 843 | | | (113) | | | 3,001 | |
Share-based compensation reserve: The share-based compensation reserve is used to recognize the value of equity-settled share-based payment to employees, including key management personnel, as part of their remuneration. Refer to Note 7.6.20.4 for further details on these share-based compensation programs.
Fair value reserve of financial assets at FVOCI: This reserve records fair value changes on debt and equity securities measured at FVOCI. Refer to Note 7.6.14.1 for further details on these financial assets.
Cash Flow hedge reserve: The cash flow hedge reserve contains the effective portion of the cash flow hedge relationship outstanding as of year-end. Refer to Note 7.6.14.4 for further details on these hedge transactions.
Foreign currency translation reserve: The foreign currency translation reserve is used to record exchange differences arising from the translation of the financial statements for subsidiaries which functional currency is different from the U.S. dollar.
Employee benefit plan reserve: The employee benefit plan reserve is used to recognize the actuarial gains and losses and past service cost of post-employment pension plans. Refer to Note 7.6.23 for further details on these employee benefit plans.
7.6.20.6. Dividends
The Company is governed under the laws of the Netherlands. The Articles of Association provide that the net result for the year, after deduction of (i) any amount to set up and maintain reserves required by Dutch
Law and the Articles of Association, (ii) if any of the Company's preference shares are issued and outstanding, the dividend to be paid to the holders of preference shares and (iii) the aforementioned allocation to the reserve fund, is subject to the disposition by the AGM.
The AGM held on May 28, 2025, authorized the distribution of a cash dividend of $0.36 per outstanding share of the Company’s common stock, to be distributed in quarterly installments of $0.09 in each of the second, third and fourth quarters of 2025 and first quarter of 2026. An amount of $81 million corresponding to the first installment, $80 million corresponding to the second installment and $71 million corresponding to the third installment were paid as of December 31, 2025. The amounts of $9 million corresponding to the remaining portion of the third installment and $80 million corresponding to the remaining installment were presented in the line “Other payables and accrued liabilities” of the consolidated statement of financial position as of December 31, 2025.
The 2024 AGM held on May 22, 2024 authorized the distribution of a cash dividend of $0.36 per outstanding share of the Company’s common stock, to be distributed in quarterly installments of $0.09 in each of the second, third and fourth quarters of 2024 and first quarter of 2025. The amounts of $81 million corresponding to the first installment, $81 million corresponding to the second installment and $72 million corresponding to the third installment were paid in 2024. An amount of $9 million corresponding to the remaining portion of the third installment and $80 million corresponding to the fourth installment were paid in 2025.
The 2023 AGM held on May 25, 2023 authorized the distribution of a cash dividend of $0.24 per outstanding share of the Company’s common stock, to be distributed in quarterly installments of $0.06 in each of the second, third and fourth quarters of 2023 and first quarter of 2024. The amounts of $55 million corresponding to the first installment, $54 million corresponding to the second installment and $54 million corresponding to the third installment were paid in 2023. An amount of $54 million corresponding to the fourth installment was paid in 2024.
7.6.20.7. Legal reserves
Refer to Note 8.3.13 for the composition of the Company’s legal reserves.
7.6.21. Provisions
Movements in provisions during the year ended December 31,2025 are detailed as follows:
| | | | | | | | | | | | | | |
| In millions of U.S dollars | | Restructuring | | Warranty and product Guarantee |
| As at December 31, 2023 | | — | | 4 |
| Charges incurred in 2024 | | — | | 3 |
| Amounts paid | | — | | (4) |
| As at December 31, 2024 | | — | | 3 |
| Charges incurred in 2025 | | 35 | | 5 |
| Amounts paid | | — | | (5) |
| As at December 31, 2025 | | 35 | | 3 |
| Current 2025 | | 35 | | 3 |
| Non-current 2025 | | — | | — |
Restructuring provisions
Starting 2025, the Group engaged in a company-wide program aimed to reshape its manufacturing footprint by accelerating the wafer fab capacity to 300mm Silicon (Agrate, Italy and Crolles, France) and 200mm Silicon Carbide (Catania, Italy) and resizing its global cost base. This program is expected to result in strengthening the Group's capability to grow revenues with an improved operating efficiency. Following the announcement of the launch of its reshaping plan in April 2025, the Group identified certain impairment indicators which triggered an impairment test on its manufacturing activities impacted by the program, as further described in Note 7.6.10.
In 2025, the Group recorded restructuring charges totaling $176 million, of which $97 million related to employee voluntary termination benefits, including consulting and legal advice costs. The Group reported $46 million liabilities for employee termination benefits as part of the restructuring program, as further described in Note 7.6.23.
In 2025, the Group also recorded $79 million related to non-labor costs incurred on the manufacturing reshaping program, of which contract termination costs totaling $69 million in consideration of the Group's reshape of its manufacturing footprint. Out of the total $69 million contract termination costs, a provision amounting to $32 million was recorded in the line "Current provisions" of the consolidated statement of financial position as of December 31, 2025 for cancellation fees to early terminate a long-term supply agreement. The reminder $37 million contract termination costs related to the write-off of advances paid on these long-term supplies. As of December 31, 2025, the Group also reported a $3 million clawback provision related to public funding that may be reimbursed in one of the location impacted by the restructuring program.
Warranty and product guarantee
The Group's customers occasionally return the Group's products for technical reasons. The Group's standard terms and conditions of sale provide that if the Group determines that products do not conform, the Group will repair or replace the non-conforming products, or issue a credit or rebate of the purchase price. Quality returns are identified shortly after sale in customer quality control testing. Quality returns are usually associated with end-user customers, not with distribution channels.
7.6.22. Other non-current liabilities
Other non-current liabilities consisted of the following:
| | | | | | | | | | | | | | |
| In millions of U.S. dollars | | December 31,
2025 | | December 31,
2024 |
| Liabilities related to public funding | | 124 | | | 172 | |
| Advances received on capital grants | | 333 | | | 385 | |
| Advances from customers | | 14 | | | 12 | |
| Non-current tax liabilities | | 90 | | | 24 | |
| Others | | 15 | | | 34 | |
| Total | | 576 | | 627 |
Advances received on capital grants relate to Sanan ST JV, the Group and Sanan Optoelectronics created in 2023 for high-volume 200mm SiC device manufacturing activities in China and that the Group fully consolidates. This entity is a party to a regional public funding program, primarily consisting in capital grants received on eligible capital expenditures (infrastructures and equipment). As of December 31, 2025, the Group received $333 million of advances ($385 million as of December 31, 2024) on these capital grants while the capital expenditures had not been incurred yet. Consequently, these advances were reported as non-current liabilities in the consolidated statement of financial position as of December 31, 2025 and as of December 31, 2024.
Advances from customers are primarily related to multi-annual capacity reservation and volume commitment agreements signed in 2025 with certain customers, as described in Note 7.6.24.
Non-current tax liabilities for $90 million as of December 31, 2025 ($24 million as of December 31, 2024) are related to uncertain tax positions with respect to tax audit on transfer pricing in certain countries.
7.6.23. Employee benefits
Employee benefits liabilities are detailed as follows:
| | | | | | | | | | | | | | |
| In millions of U.S. dollars | | December 31,
2025 | | December 31,
2024 |
| Retirement benefit obligation liability | | 372 | | | 346 | |
| Other long-term employee benefits | | 142 | | | 112 | |
| Other employee benefits liabilities | | 68 | | | 50 | |
| Salaries and wages | | 612 | | | 569 | |
| Social charges on salaries and wages | | 234 | | | 216 | |
| Restructuring liabilities | | 46 | | | — | |
| Total employee benefits liabilities | | 1,474 | | | 1,293 | |
| Non-current assets | | 3 | | | 2 | |
| Current liabilities | | 923 | | | 833 | |
| Non-current liabilities | | 551 | | | 462 | |
Restructuring liabilities
In 2025, the Group recorded restructuring charges totaling $176 million, of which $97 million related to employee voluntary termination benefits, including consulting and legal advice costs. The employee termination benefits are accrued on the balance sheet at the date the employees irrevocably accept the offer to leave the Group. As of December 31, 2025, the Group reported $46 million liabilities for employee termination benefits as part of the restructuring program.
Pensions
The Group has a number of defined benefit pension plans covering employees in various countries. The defined benefit plans provide pension benefits based on years of service and employee compensation levels. The Group uses December 31 as measurement date for all its plans. Eligibility is generally determined in accordance with local statutory requirements. In 2025 and 2024, the major defined benefit pension plans and long-term employee benefit plans were in the USA (retirement plan closed to new entrants and future accrual), France (retirement indemnities), Switzerland (retirement pension system), United Kingdom (retirement benefit scheme closed to new entrants and future accrual) and Italy (termination indemnity plan (“TFR”) generated before July 1, 2007).
The amounts recognized in the statement of financial position are determined as follows:
| | | | | | | | | | | | | | |
| In millions of U.S. dollars | | December 31,
2025 | | December 31,
2024 |
| Benefit obligations wholly or partially funded | | (784) | | | (712) | |
| Fair value of plan assets | | 707 | | | 646 | |
| Benefit obligations wholly unfunded | | (287) | | | (260) | |
| Asset ceiling | | (8) | | | (20) | |
| Total pension liabilities | | (372) | | (346) |
The movements in the pension liability are as follows:
| | | | | | | | | | | | | | |
| In millions of U.S. dollars | | 2025 | | 2024 |
| Beginning of the year | | 346 | | 357 |
| Exchange difference | | 38 | | (15) |
| Pension expense | | 50 | | 47 |
| Contributions paid | | (38) | | (40) |
| Remeasurement (gain) / loss recognized in OCI | | (24) | | (3) |
| | | | |
| End of the year | | 372 | | 346 |
Changes in defined benefit obligations are as follows:
| | | | | | | | | | | | | | |
| In millions of U.S. dollars | | 2025 | | 2024 |
| Beginning of the year | | 972 | | 991 |
| Service cost | | 38 | | 32 |
| Interest cost | | 39 | | 36 |
| Employee contributions | | 7 | | 6 |
| Plan amendment | | 6 | | 3 |
| Actuarial (gain) loss – Experience | | — | | 2 |
| Actuarial (gain) loss – Demographic assumptions | | 2 | | 8 |
| Actuarial (gain) loss – Financial assumptions | | (11) | | (21) |
| Effect of curtailment | | (8) | | — |
| Benefits paid | | (48) | | (51) |
| Effect of foreign exchange translation | | 74 | | (34) |
| | | | |
| End of the year | | 1,071 | | 972 |
Defined benefit obligations by main geographical locations are as follows:
| | | | | | | | | | | | | | |
| In millions of U.S. dollars | | 2025 | | 2024 |
| France | | 204 | | 181 |
| Italy | | 79 | | 75 |
| Switzerland | | 253 | | 216 |
| United Kingdom | | 117 | | 110 |
| United States | | 326 | | 308 |
| Other countries | | 92 | | 82 |
| End of the year | | 1,071 | | 972 |
Changes in plan assets are as follows:
| | | | | | | | | | | | | | |
| In millions of U.S. dollars | | 2025 | | 2024 |
| Beginning of the year | | 646 | | | 654 | |
| Interest income | | 28 | | | 26 | |
| Employer contribution | | 21 | | | 25 | |
| Employee contribution | | 7 | | | 6 | |
| Benefits paid | | (31) | | | (37) | |
| Actuarial gain (loss) | | 1 | | | (10) | |
| Effect of foreign exchange translation | | 35 | | | (18) | |
| End of the year | | 707 | | | 646 | |
The actual return on plan assets in 2025 was a gain of $29 million (2024: gain of $16 million). In 2025, the theoretical interest income on plan assets was a gain of $28 million (2024: gain of $26 million) resulting in a gain on plan assets of $1 million (2024: loss of $10 million).
Plan assets by main geographical locations are as follows:
| | | | | | | | | | | | | | |
| In millions of U.S. dollars | | 2025 | | 2024 |
| France | | 3 | | | 3 | |
| Switzerland | | 230 | | | 186 | |
| United Kingdom | | 123 | | | 130 | |
| United States | | 287 | | | 273 | |
| Other countries | | 64 | | | 54 | |
| End of the year | | 707 | | | 646 | |
The effects of the asset ceiling are as follows:
| | | | | | | | | | | | | | |
| In millions of U.S. dollars | | 2025 | | 2024 |
| Beginning of the year | | (20) | | | (20) | |
| Effect of asset ceiling recognized during the year | | 12 | | | 1 | |
| Effect of foreign exchange translation | | — | | | (1) | |
| End of the year | | (8) | | | (20) | |
The amounts recognized in the income statement related to pensions are as follows:
| | | | | | | | | | | | | | |
| In millions of U.S. dollars | | 2025 | | 2024 |
| Current service cost | | 38 | | | 32 | |
| Scheme expenses | | 2 | | | 1 | |
| Plan amendments cost / (credit) | | 6 | | | 3 | |
| Plan curtailments cost / (credit) | | (8) | | | — | |
| Net interest cost | | 12 | | | 11 | |
| Interest cost | | 39 | | | 36 | |
| Interest income | | (28) | | | (26) | |
| Interest on asset ceiling | | 1 | | | 1 | |
| Total pension costs | | 50 | | | 47 | |
The Group’s detailed pension plan asset allocation including the fair value measurements of those plan assets as of December 31, 2025 is as follows:
| | | | | | | | | | | | | | | | | | | | | | | | | | |
| In millions of U.S. dollars | | Total | | Quoted
Prices in
Active
Markets for
Identical
Assets
(Level 1) | | Significant
Other
Observable
Inputs
(Level 2) | | Significant
Unobservable
Inputs
(Level 3) |
| Cash and cash equivalents | | 17 | | | 17 | | | — | | | — | |
| Equity securities | | 185 | | | 72 | | | 97 | | | 16 | |
| Government debt securities | | 80 | | | — | | | 80 | | | — | |
| Corporate debt securities | | 95 | | | — | | | 95 | | | — | |
| Investment funds | | 65 | | | 17 | | | 47 | | | 1 | |
| Real estate (1) | | 62 | | | — | | | 8 | | | 54 | |
| Other (mainly insurance assets) (2) | | 203 | | | — | | | 10 | | | 193 | |
| Total | | 707 | | | 106 | | | 337 | | | 264 | |
(1) Level 3 real estate assets are valued at their earnings value, which is based on the capitalization of sustainably realizable rents, specifically from the rental status as at the balance sheet date.
(2) In 2025, Trustees of the United Kingdom pension plans entered into an agreement with an insurer for the bulk annuity purchase of the plans, covering 100% of the plan’s members. This agreement, or buy-in, resulted in an exchange of plan assets for an annuity that covers the plan’s future projected benefit obligations. The initial value equals the premium paid to the insurer, and subsequent fair-value changes reflect current buy-in pricing assumptions (inflation and discount rates tied to gilt curves). The largest component of other assets reflect those bulk annuity contracts (buy-ins).
The Group’s detailed pension plan asset allocation including the fair value measurements of those plan assets as of December 31, 2024 is as follows:
| | | | | | | | | | | | | | | | | | | | | | | | | | |
| In millions of U.S. dollars | | Total | | Quoted
Prices in
Active
Markets for
Identical
Assets
(Level 1) | | Significant
Other
Observable
Inputs
(Level 2) | | Significant
Unobservable
Inputs
(Level 3) |
| Cash and cash equivalents | | 7 | | | 7 | | | — | | | — | |
| Equity securities | | 91 | | | 1 | | | 90 | | | — | |
| Government debt securities | | 63 | | | — | | | 63 | | | — | |
| Corporate debt securities | | 94 | | | — | | | 77 | | | 17 | |
| Investment funds | | 106 | | | 16 | | | 90 | | | — | |
| Real estate | | 10 | | | — | | | 10 | | | — | |
| Other (mainly insurance assets) | | 275 | | | — | | | 60 | | | 215 | |
| Total | | 646 | | | 24 | | | 390 | | | 232 | |
The majority of plans (in the United Kingdom, United States and Switzerland) are governed by an independent board of trustees, which includes employer representatives.
In 2025, Trustees of the United Kingdom pension plans entered into an agreement with an insurer for the bulk annuity purchase of the plans, covering 100% of the plan’s members. This agreement, or buy-in, resulted in an exchange of plan assets for an annuity that covers the plan’s future projected benefit obligations. The fair value of the buy-in contract is set equal to the defined benefit that it covers.
The Group’s investment strategy for its pension plans is to optimize the long-term investment return on plan assets in relation to the liability structure to maintain an acceptable level of risk while minimizing the cost of providing pension benefits and maintaining adequate funding levels in accordance with applicable rules in each jurisdiction.
The Group’s practice is to periodically conduct a review in each subsidiary of its asset allocation strategy, in such a way that the asset allocation is in line with the targeted asset allocation within reasonable boundaries. The Group’s asset portfolios are managed in such a way as to achieve adapted diversity. The Group does not manage any assets internally.
After considering the funded status of the Group’s defined benefit plans, movements in the discount rate, investment performance and related tax consequences, the Group may choose to make contributions to its pension plans in any given year in excess of required amounts. In 2025, the Group’s contributions to plan assets were $21 million (2024: $25 million) and it expects to contribute cash of $31 million in 2026.
The expected benefit payments, which reflect expected future service, as appropriate, but exclude plan expenses of the defined benefit obligations as of December 31, 2025, are as follows:
| | | | | | | | |
| In millions of U.S. dollars | | Expected benefit payments |
| 2026 | | 79 |
| 2027 | | 77 |
| 2028 | | 62 |
| 2029 | | 68 |
| 2030 | | 75 |
| Thereafter | | 431 |
Other long-term employee benefits
Other long-term employee benefits include seniority and loyalty award programs. The movements in the other long-term employee benefits liability are as follows:
| | | | | | | | | | | | | | |
| In millions of U.S. dollars | | 2025 | | 2024 |
| Beginning of the year | | 112 | | | 102 | |
| Service cost | | 26 | | | 23 | |
| Interest cost | | 4 | | | 3 | |
| | | | |
| Actuarial (gain) loss – Experience | | 3 | | | 2 | |
| Actuarial (gain) loss – Demographic assumptions | | 2 | | | — | |
| Actuarial (gain) loss – Financial assumptions | | (7) | | | (1) | |
| Benefits paid | | (15) | | | (12) | |
| | | | |
| Effect of foreign exchange translation | | 17 | | | (5) | |
| End of the year | | 142 | | | 112 | |
The amounts recognized in the income statement related to other long-term benefits are as follows:
| | | | | | | | | | | | | | |
| In millions of U.S. dollars | | 2025 | | 2024 |
| Current service cost | | 26 | | | 23 | |
| | | | |
| | | | |
| | | | |
| Net interest cost | | 3 | | | 4 | |
| Interest cost | | 4 | | | 3 | |
| Immediate recognition of (gains) losses | | (1) | | | 1 | |
| Total other long-term benefits costs | | 29 | | | 27 | |
Assumptions
The weighted average assumptions used in the determination of pension and other long-term obligations are as follows:
| | | | | | | | | | | | | | |
| | 2025 | | 2024 |
| Discount rate | | 3.97 | % | | 3.87 | % |
| Inflation rate | | 1.95 | % | | 1.87 | % |
| Future salary increase | | 2.90 | % | | 2.43 | % |
The discount rate was determined by reference to high quality corporate bond rates applicable to the respective country of each plan and estimated terms of the defined benefit obligation. As required by IAS 19, and for pension plans with plan assets, the interest income on plan assets is set equal to the corresponding discount rate.
The average duration of Defined Benefit Obligations is 11 years in 2025 (2024: 11 years).
As of December 31, 2025, an increase of the discount rate of 0.50% would have resulted in a reduction of the Defined Benefit Obligations of $60 million and a decrease of the discount rate of 0.50% would have resulted in an increase of the Defined Benefit Obligations by $65 million. An increase of the inflation rate of 0.50% would have resulted in an increase of the Defined Benefit Obligations of $9 million and a decrease of the inflation rate of 0.50% would have resulted in a decrease of the Defined Benefit Obligations of $8 million. An increase of the life expectancy of one year would have resulted in an increase of the Defined Benefit Obligations of $13 million and a decrease of the life expectancy of one year would have resulted in a decrease of the Defined Benefit Obligations of $13 million. These sensitivity analyses are based on a change in an assumption while holding all other assumptions constant. When calculating the sensitivity of the defined benefit obligation to significant actuarial assumptions, the same
method has been applied as when calculating the pension liability recognized within the consolidated statement of financial position.
Assumptions regarding future mortality experience are set based on advice from published statistics and experience in each territory.
Defined contribution plans
The Group has certain defined contribution plans, which accrue benefits for employees on a pro-rata basis during their employment period based on their individual salaries. In 2025, the annual cost of these plans amounted to approximately $119 million (2024: $117 million).
7.6.24. Trade accounts payable, other payables and accrued liabilities
| | | | | | | | | | | | | | |
| In millions of U.S. dollars | | December 31,
2025 | | December 31,
2024 |
| Trade accounts payable | | 1,487 | | | 1,323 | |
| Dividends due to shareholders | | 89 | | | 88 | |
| Taxes other than income taxes | | 95 | | | 79 | |
| Advances from customers | | 83 | | | 89 | |
| Liabilities related to public funding | | 113 | | | 42 | |
| Royalties | | 24 | | | 22 | |
| | | | |
| Interest payable | | 15 | | | 22 | |
| Utilities services | | 16 | | | 11 | |
| Freight services | | 4 | | | 4 | |
| Other accrued liabilities | | 67 | | | 63 | |
| Total other payables and accrued liabilities | | 506 | | | 420 | |
Current liabilities related to public funding included $2 million grants subject to a financial return ($2 million as of December 2024).
Advances from customers are primarily related to multi-annual capacity reservation and volume commitment agreements signed with certain customers. Some of these arrangements include take-or-pay clauses, according to which the Group is entitled to receive the full amount of the contractual committed fees in case of non-compliant orders from those customers. Certain agreements include penalties in case the Group is not able to fulfill its contractual obligations. No significant provision for those penalties was reported on the consolidated statement of financial position as of December 31, 2025 and December 31, 2024.
7.6.25. Significant categories of income
| | | | | | | | | | | | | | |
| In millions of U.S. dollars | | December 31,
2025 | | December 31,
2024 |
| Sales of products and services | | 11,754 | | | 13,217 | |
| License revenue and patent royalty income | | 46 | | | 52 | |
| Research tax credits recognized as a reduction of Research & Development expenses | | 91 | | | 109 | |
| Public funding recognized in Other income | | 219 | | | 266 | |
| Finance income | | 313 | | | 780 | |
| Total | | 12,423 | | | 14,424 | |
7.6.26. Revenues
7.6.26.1. Nature of goods and services
The Group designs, develops, manufactures and markets a broad range of products, including discrete and standard commodity components, ASICs, full-custom devices and semi-custom devices and ASSPs for analog, digital and mixed-signal applications. In addition, the Group participates in the manufacturing value chain of smartcard products, which includes the production and sale of both silicon chips and smartcards.
The principal activities — separated by reportable segments — from which the Group generates its revenues are described in Note 7.6.27.
Other revenues consist of license revenue, service revenue related to transferring licenses, patent royalty income, sale of scrap materials and manufacturing by-products.
While the majority of the Group’s sales agreements contain standard terms and conditions, the Group may, from time to time, enter into agreements that contain multiple performance obligations or terms and conditions. Those agreements concern principally the revenues from services, where the performance obligation is satisfied over time. The objective when allocating the transaction price is to allocate the transaction price to each performance obligation (or distinct good or service) in an amount that depicts the amount of consideration to which the Group expects to be entitled in exchange for transferring the promised goods or services to the customer.
7.6.26.2. Revenue recognition and disaggregation
The Group recognizes revenue from products sold to a customer, including distributors, when it satisfies a performance obligation at a point in time by transferring control over a product to the customer. This usually occurs at the time of shipment. The performance obligations included in contracts for the sale of goods contracts have the original expected length of less than one year. The transaction price is determined based on the contract terms, adjusted for price protection if applicable. The revenues from services are usually linked to performance obligations transferred over time and are recognized in line with the contract terms.
In 2025, 2024, and 2023, the Group had signed several multi-annual capacity reservation and volume commitment arrangements with certain customers. These agreements constitute a binding commitment for the customers to purchase and for the Group to supply allocated committed volumes in exchange for additional consideration. The consideration related to commitment fees is reported as revenues from sale of products as it is usually based on delivered quantities. Advances from customers received as part of those agreements are described in Note 7.6.22 and 7.6.24.
The payment terms typically range between 30 to 90 days.
The Group’s consolidated total revenues disaggregated by operating segment are presented in Note 7.6.27. The following table presents the Group’s consolidated total revenues disaggregated by geographical region of shipment, nature and market channel.
| | | | | | | | | | | | | | |
| In millions of U.S. dollars | | December 31,
2025 | | December 31,
2024 |
Total revenues by geographical region of shipment (1) | | | | |
| EMEA | | 2,449 | | | 3,329 | |
| Americas | | 1,896 | | | 2,106 | |
| Asia Pacific | | 7,455 | | | 7,834 | |
| Total revenues | | 11,800 | | | 13,269 | |
| Total revenues by nature | | | | |
| Revenues from sale of products | | 11,561 | | | 13,021 | |
| Revenues from sale of services | | 193 | | | 196 | |
| Other revenues | | 46 | | | 52 | |
| Total revenues | | 11,800 | | | 13,269 | |
Total revenues by market channel (2) | | | | |
| OEM | | 8,539 | | | 9,629 | |
| Distribution | | 3,261 | | | 3,640 | |
| Total revenues | | 11,800 | | | 13,269 | |
(1) Total revenues by geographical region of shipment are classified by location of customer invoiced or reclassified by shipment destination in line with customer demand. For example, products ordered by U.S.-based companies to be invoiced to Asia Pacific affiliates are classified as Asia Pacific revenues. Furthermore, the Group, among the different periods, may be affected by shifts in shipments from one location to another, as requested by customers.
(2) OEM are the end-customers to which the Group provides direct marketing application engineering support, while Distribution refers to the distributors and representatives that the Group engages to distribute its products around the world.
The Group does not disclose the value of unsatisfied performance obligations for (i) contracts with an original expected length of one year or less and (ii) contracts for which the Group recognizes revenue at the amount to which the Group has the right to invoice for services performed.
In 2025, the Group’s largest customer, Apple Inc., represented 17.7% (2024: 14.5%) of consolidated total revenues, reported in AM&S, P&D, EMP and RFOC reportable segments.
7.6.27. Segment information
Following the Group's reorganization announced in January 2024 into four reportable segments, the Group has made further progress in analyzing its global product portfolio, resulting in additional adjustments to its segments, effective starting January 1, 2025. Prior periods have been adjusted accordingly. The changes are as follows:
•In Analog, Power & Discrete, MEMS and Sensors (APMS) Product Group:
•the transfer of VIP power products from Power and Discrete products (“P&D”) reportable segment to Analog products, MEMS and Sensors (“AM&S”) reportable segment
•In Microcontrollers, Digital ICs and RF products (MDRF) Product Group:
◦the newly created ‘Embedded Processing’ reportable segment includes the former ‘MCU’ segment (excluding the RF ASICs mentioned below) as well as Custom Processing products (Automotive ADAS products).
◦the newly created ‘RF Optical Communications’ reportable segment includes the former ‘D&RF’ segment (excluding Automotive ADAS products) as well as some RF ASICs which were previously part of the former ‘MCU’ segment.
The Group believes these adjustments are critical for implementing synergies and optimizing resources, which are necessary to fully deliver the benefits expected from its new organization.
As of December 31, 2025, reportable segments, within each product group, were as follows:
•In Analog, Power & Discrete, MEMS and Sensors ("APMS") product group:
◦Analog products, MEMS and Sensors ("AM&S"), comprised of ST analog products, MEMS sensors and actuators, and optical sensing solutions.
◦Power and Discrete products ("P&D"), comprised of discrete and power transistor products.
•In Microcontrollers, Digital ICs and RF products ("MDRF") product group:
◦Embedded Processing ("EMP"), comprised of general-purpose and automotive microcontrollers, connected security products and Custom Processing Products (Automotive ADAS).
◦RF Optical Communications ("RFOC"), comprised of Space, Ranging & Connectivity products, Digital Audio & Signaling Solutions and Optical & RF COT.
Total revenues of "Others" include revenues from sales assembly services and other revenues. For the computation of the segments’ internal financial measurements, the Group uses certain internal rules of allocation for the costs not directly chargeable to the segments, including cost of sales, SG&A expenses and a part of R&D expenses. In compliance with the Group’s internal policies, certain costs are not allocated to the segments, but reported in “Others”. Those comprise unused capacity charges, including incidents leading to power outage, certain unallocated impairment, restructuring charges and other related phase-out costs, management reorganization costs, start-up costs, and other unallocated income (expenses) such as: strategic or special R&D programs, certain corporate-level operating expenses, patent claims and litigations, and other costs that are not allocated to reportable segments, as well as operating earnings of other products.
Wafer costs are allocated to the segments based on actual cost. From time to time, with respect to specific technologies, wafer costs are allocated to segments based on market price.
The segment information presented below under IFRS reflects the way the CODM monitors the performance of each segment and how resources are allocated to segments, which is based on the Group's primary financial reporting framework (U.S. GAAP).
The following tables present the Group’s consolidated total revenues and consolidated operating income by reportable segment.
Total revenues by reportable segment:
| | | | | | | | | | | | | | |
| In millions of U.S. dollars | | December 31,
2025 | | December 31,
2024 |
| AM&S | | 5,085 | | | 5,429 | |
| P&D | | 1,685 | | | 2,461 | |
| EMP | | 3,580 | | | 3,853 | |
| RFOC | | 1,436 | | | 1,511 | |
| Total revenues of reportable segments | | 11,786 | | | 13,254 | |
| Others | | 14 | | | 15 | |
| Total revenues | | 11,800 | | | 13,269 | |
Operating profit by reportable segment:
| | | | | | | | | | | | | | |
| In millions of U.S. dollars | | December 31,
2025 | | December 31,
2024 |
| AM&S | | 614 | | | 675 | |
| P&D | | (279) | | | 456 | |
| EMP | | 532 | | | 493 | |
| RFOC | | 263 | | | 562 | |
| Sub-total operating profit of reportable segments | | 1,130 | | | 2,186 | |
| Unallocated impairment, restructuring charges and other related phase-out costs | | (376) | | | — | |
| Unused capacity charges | | (416) | | | (370) | |
| Unallocated manufacturing results | | (164) | | | (61) | |
| Start-up costs | | (7) | | | (69) | |
| Cancellation and postponement fees | | — | | | (18) | |
Strategic and other research and development programs and other non-allocated provisions (2) | | (11) | | | (7) | |
IFRS/U.S. GAAP Adjustments (1): | | | | |
| Net impact of capitalized development costs | | 103 | | | 72 | |
| Derivative instruments not designated as hedge instruments under IFRS | | 54 | | | (45) | |
| IFRIC 21 adjustment on levies | | — | | | (1) | |
| Employee benefits adjustments | | 8 | | | 13 | |
| Asset acquisition tax incentives | | (9) | | | (19) | |
| IFRS 16 adjustment on lease expenses | | 8 | | | 7 | |
| Operating profit | | 320 | | | 1,688 | |
(1)The operating profit allocated by reportable segments as reported in the above table is based on the Group’s primary financial reporting framework (U.S. GAAP) and reflects the way the CODM monitors the operating performance of each segment.
(2)Includes unallocated income and expenses such as certain corporate-level operating expenses and other income (costs) that are not allocated to the reportable segments.
The Group does not disclose any information regarding assets or non-cash expenses, including depreciation and amortization, for its reportable segments. Such information is not reviewed by the CODM to assess segment performance or to make decisions about resources to be allocated to each segment.
The following is a summary of operations by entities located within the indicated geographic areas for 2025 and 2024. Total revenues represent sales to third parties from the country in which each subsidiary is domiciled. The Group is incorporated under Dutch law with head offices located in the Netherlands while the Group’s operational office and headquarters are located in Switzerland. Non-financial assets consist of property, plant and equipment, net, a significant portion of which is purchased through the Group's head offices and subsequently operated by the Group's subsidiaries. Property, plant and equipment expenditures is mainly attributable to front-end and back-end facilities located in the different countries in which the Group operates. As such, the Group mainly allocates capital spending resources according to geographic areas rather than along product segment areas.
Total revenues by geographical area:
| | | | | | | | | | | | | | |
| In millions of U.S. dollars | | December 31,
2025 | | December 31,
2024 |
| Switzerland | | 2,948 | | | 3,944 | |
| France | | 112 | | | 147 | |
| Italy | | 35 | | | 34 | |
| USA | | 1,520 | | | 1,668 | |
| Singapore | | 6,563 | | | 6,808 | |
| Japan | | 612 | | | 657 | |
| Other countries | | 10 | | | 11 | |
| Total | | 11,800 | | | 13,269 | |
Non-current assets other than other non-current financial assets and deferred tax assets:
| | | | | | | | | | | | | | |
| In millions of U.S. dollars | | December 31,
2025 | | December 31,
2024 |
| Netherlands | | 4,093 | | | 4,186 | |
| Switzerland | | 1,740 | | | 1,597 | |
| France | | 2,009 | | | 2,017 | |
| Italy | | 3,253 | | | 2,677 | |
| Other European Countries | | 234 | | | 214 | |
| USA | | 51 | | | 60 | |
| China | | 685 | | | 586 | |
| Malaysia | | 424 | | | 471 | |
| Singapore | | 1,401 | | | 1,493 | |
| Other countries | | 283 | | | 281 | |
| Total | | 14,173 | | | 13,582 | |
7.6.28. Expenses by nature
Expenses recorded as cost of sales, R&D and SG&A are detailed as follows:
| | | | | | | | | | | | | | |
| In millions of U.S. dollars | | December 31,
2025 | | December 31,
2024 |
| Depreciation and amortization | | 2,139 | | | 2,056 | |
| Employee benefit expenses | | 4,050 | | | 3,990 | |
| Purchase of materials | | 2,610 | | | 2,908 | |
| Power and Gas | | 452 | | | 516 | |
| Freight | | 99 | | | 115 | |
| Purchase of subcontracting services | | 1,547 | | | 1,583 | |
| Changes in inventories | | (172) | | | (167) | |
| Transportation | | 76 | | | 96 | |
| Impairment and write-off charges | | 262 | | | 86 | |
| Royalties and patents | | 109 | | | 106 | |
| Advertising costs | | 20 | | | 25 | |
| Restructuring charges and other related phase-out costs | | 187 | | | — | |
| Other expenses | | 402 | | | 407 | |
| Total cost of sales, selling, general and administrative, and research and development expenses | | 11,781 | | | 11,721 | |
Employee benefit expenses are detailed as follows:
| | | | | | | | | | | | | | |
| In millions of U.S. dollars | | December 31,
2025 | | December 31,
2024 |
| Wages and salaries | | 2,917 | | | 2,971 | |
| Payroll taxes and other social contribution charges | | 663 | | | 606 | |
| Share-based compensation expense | | 193 | | | 222 | |
| Employee termination benefits | | 79 | | | — | |
| Pensions and other long-term benefits expense | | 198 | | | 191 | |
| Total employee benefit expenses | | 4,050 | | | 3,990 | |
| Of which included in: | | | | |
| Cost of sales | | 1,759 | | | 1,717 | |
| Selling, general and administrative expenses | | 1,099 | | | 1,083 | |
| Research and development expenses | | 1,192 | | | 1,190 | |
7.6.29. Other income
Other income consisted of the following:
| | | | | | | | | | | | | | |
| In millions of U.S. dollars | | December 31,
2025 | | December 31,
2024 |
| R&D funding | | 219 | | | 266 | |
| Foreign exchange forward contracts and other currency derivatives | | 73 | | | 9 | |
| Net foreign exchange gain | | 56 | | | — | |
| Gain on sale of non-current assets | | 6 | | | 5 | |
| Total other income | | 354 | | | 280 | |
The Group receives public funding from governmental bodies in several jurisdictions. Public funding for research, development and other innovation programs is recognized ratably as the related costs are incurred once the agreement with the respective governmental body has been signed and all applicable conditions have been met.
Foreign exchange gains, net of foreign exchange forward contracts and other currency derivatives, represent the portion of exchange rate changes on transactions denominated in currencies other than a subsidiary’s functional currency and the changes in fair value of derivative instruments which are not designated as hedge, as described in Note 7.6.14.4.
7.6.30. Other expenses
Other expenses consisted of the following:
| | | | | | | | | | | | | | |
| In millions of U.S. dollars | | December 31,
2025 | | December 31,
2024 |
| Start-up costs | | 7 | | | 69 | |
| Foreign exchange forward contracts and other currency derivatives | | 32 | | | 42 | |
| Net foreign exchange loss | | — | | | 3 | |
| Patent costs | | 5 | | | 5 | |
| Cancellation and postponement fees | | 6 | | | 18 | |
| Other expenses | | 3 | | | 3 | |
| Total other expenses | | 53 | | | 140 | |
Start-up costs represent costs incurred in the ramp-up phase of the Group’s newly integrated manufacturing activities.
Foreign exchange losses, net of foreign exchange forward contracts and other currency derivatives, represent the portion of exchange rate changes on transactions denominated in currencies other than a subsidiary’s functional currency and the changes in fair value of derivative instruments which are not designated as hedge, as described in Note 7.6.14.4.
Patent costs mainly include legal and attorney fees and payment for claims, patent pre-litigation consultancy and legal fees. They are reported net of settlements, if any, which primarily include reimbursements of prior patent litigation costs.
Cancellation and postponement fees are costs incurred when purchases for committed equipment or planned services are cancelled or postponed.
7.6.31. Finance income
Total finance income consisted of the following:
| | | | | | | | | | | | | | |
| In millions of U.S. dollars | | December 31,
2025 | | December 31,
2024 |
| | | | |
| | | | |
| Change in fair value of the conversion option of Tranche A convertible bonds issued on August 4, 2020 | | 4 | | | 225 | |
| Change in fair value of the conversion option of Tranche B convertible bonds issued on August 4, 2020 | | 10 | | | 252 | |
| Change in fair value on equity securities at FVPL | | 76 | | | — | |
| Nominal interest income on quoted debt securities | | 110 | | | 63 | |
| Other finance income | | 113 | | | 240 | |
| Total finance income | | 313 | | | 780 | |
As described in Note 7.6.14.3, the change in fair value of the non-equity derivative instruments corresponding to the bondholders’ conversion option and the issuer’s call option embedded in the unsecured senior convertible bonds issued on August 4, 2020, generated an income of $14 million and a loss of $2 million respectively, for the year ended December 31, 2025 compared to a loss of $46 million and an income of $477 million respectively, for the year ended December 31, 2024.
In December 2024, the Group participated to the IPO of Innoscience (Suzhou) which became public on the main segment of Hong Kong Stock Exchange. As a publicly traded equity instrument, Innoscience investment is measured at fair value through profit or loss, with a $76 million unrealized gain recognized as finance income in the year ended December 31, 2025.
Other finance income is related to cash and cash equivalents and short-term deposits.
7.6.32. Finance costs
Total finance costs consisted of the following:
| | | | | | | | | | | | | | |
| In millions of U.S. dollars | | December 31,
2025 | | December 31,
2024 |
| Interest on Senior Bonds | | 20 | | | 24 | |
| Amortization of issuance costs on Senior Bonds | | 1 | | | 1 | |
| | | | |
| | | | |
| Change in fair value of the call option of Tranche A convertible bonds issued on August 4, 2020 | | — | | | 14 | |
| Change in fair value of the call option of Tranche B convertible bonds issued on August 4, 2020 | | 2 | | | 32 | |
| Interests on lease liabilities | | 11 | | | 12 | |
| Interests on long-term loans and borrowings | | 48 | | | 77 | |
| Bank charges and commissions | | 3 | | | 3 | |
| Other finance expense | | — | | | 1 | |
| Total finance costs | | 85 | | | 164 | |
No borrowing costs were capitalized in 2025 and 2024.
Leases are further described in Note 7.6.11.
7.6.33. Components of other comprehensive income
| | | | | | | | | | | | | | |
| In millions of U.S. dollars | | December 31,
2025 | | December 31,
2024 |
| Cash flow hedges: | | | | |
| Gains / (losses) arising during the year | | 159 | | | (96) | |
Reclassification adjustments for (gains) / losses included in the
income statement | | (47) | | | (10) | |
| Total | | 112 | | | (106) | |
7.6.34. Income tax
The major components of income tax benefit (expense) for the years ended December 31, 2025 and 2024 are:
Consolidated income statement
| | | | | | | | | | | | | | |
| In millions of U.S. dollars | | December 31,
2025 | | December 31,
2024 |
| The Netherlands taxes – current | | — | | | — | |
| Foreign taxes – current | | (160) | | | (185) | |
| Current taxes | | (160) | | | (185) | |
| The Netherlands taxes – deferred | | — | | | — | |
| Foreign deferred taxes | | (75) | | | (124) | |
| Deferred taxes | | (75) | | | (124) | |
| Income tax expense | | (235) | | | (309) | |
Consolidated statement of other comprehensive income (deferred tax related to items charged or credited directly to equity during the year).
| | | | | | | | | | | | | | |
| In millions of U.S. dollars | | December 31,
2025 | | December 31,
2024 |
| Cash Flow Hedge | | (16) | | | 13 | |
| Re-measurements of employee benefit obligations | | (1) | | | (1) | |
| Debt instruments at FVOCI | | (2) | | | — | |
| Income tax credited (charged) directly to equity | | (19) | | | 12 | |
A reconciliation between income tax benefit and the product of income before tax multiplied by The Netherlands’ statutory tax rate for the years ended December 31, 2025 and 2024 is as follows:
| | | | | | | | | | | | | | |
| In millions of U.S. dollars | | December 31,
2025 | | December 31,
2024 |
| Gain (loss) before income tax | | 548 | | | 2,304 | |
| Income tax benefit (expense) at The Netherlands’ statutory tax rate of 25.8% (2024: 25.8%) | | (141) | | | (594) | |
| Permanent differences and other non-deductible, non-taxable items | | 4 | | | 59 | |
| | | | |
| Change in deferred tax assets recognition | | (84) | | | (14) | |
| Effect of changes in tax laws and similar | | (3) | | | — | |
| Current year tax credits | | 32 | | | 37 | |
| Other tax and credits | | (26) | | | (15) | |
| Benefits from tax holidays | | 45 | | | 29 | |
| Current year tax risk | | (82) | | | (3) | |
| Earnings (losses) of subsidiaries taxed at different rates | | 20 | | | 192 | |
| Income tax expense | | (235) | | | (309) | |
During the year ended December 31, 2025, the variation on the change in deferred tax assets recognition relates to the assessment of the recoverability of the deferred tax assets. The Group did not recognize deferred tax assets on net operating losses and tax credits for an amount of $53 million (2024: $21 million).
The variation on uncertain tax positions of $82 million is related to tax audits in certain countries with respect to transfer pricing.
The tax holidays represent a tax exemption period aimed at attracting foreign technological investment in certain tax jurisdictions. These agreements are present in various countries and include programs that reduce up to 100% of taxes in years affected by the agreements. The Group’s tax holidays expire at various dates through the year ending December 31, 2030.
For a particular tax-paying component of the Group and within a particular tax jurisdiction, all deferred tax assets and liabilities are offset and presented as a single amount. The Group does not offset deferred tax assets and liabilities attributable to different tax-paying components or to different tax jurisdictions.
| | | | | | | | | | | | | | | | | | | | | | | | | | | | | | | | |
| In millions of U.S. dollars | | December 31,
2024 | | Exchange
differences | | Income tax
charged
directly
to equity | | Income
statement
benefit
(expense) | | December 31,
2025 |
| Deferred tax assets | | | | | | | | | | |
| Tax loss carryforwards, tax credits and other tax attributes | | 289 | | | 23 | | | — | | | (84) | | | 228 | |
| Fixed asset depreciation | | 57 | | | — | | | — | | | 22 | | | 79 | |
| Receivables for government funding | | 186 | | | 28 | | | — | | | 25 | | | 239 | |
| Pension | | 65 | | | 6 | | | (1) | | | (4) | | | 66 | |
| Lease liabilities | | 59 | | | 31 | | | — | | | (22) | | | 68 | |
| Other | | 151 | | | 4 | | | (2) | | | 61 | | | 214 | |
| Total deferred tax assets | | 807 | | | 92 | | | (3) | | | (2) | | | 894 | |
| Deferred tax liabilities | | | | | | | | | | |
| Accelerated tax depreciation | | (53) | | | (1) | | | — | | | (22) | | | (76) | |
| Acquired intangible assets | | (26) | | | (1) | | | — | | | (6) | | | (33) | |
| Advances of government funding | | (237) | | | (37) | | | — | | | (49) | | | (323) | |
| Capitalized development cost | | (170) | | | — | | | — | | | (14) | | | (184) | |
| Right-of-use assets | | (59) | | | (30) | | | — | | | 22 | | | (67) | |
| Other | | (36) | | | (7) | | | (16) | | | (4) | | | (63) | |
| Total deferred tax liabilities | | (581) | | | (76) | | | (16) | | | (73) | | | (746) | |
| Net deferred tax | | 226 | | | 16 | | | (19) | | | (75) | | | 148 | |
The balance represents management’s assessment of the likelihood of future realization of the net DTA recognized in the period against future taxable profit.
The line other deferred tax assets is primarily composed of deferred tax assets related to inventory, stock awards and commercial accruals.
| | | | | | | | | | | | | | | | | | | | | | | | | | | | | | | | |
| In millions of U.S. dollars | | December 31,
2023 | | Exchange
differences | | Income tax
charged
directly
to equity | | Income
statement
benefit
(expense) | | December 31,
2024 |
| Deferred tax assets | | | | | | | | | | |
| Tax loss carryforwards, tax credits and other tax attributes | | 309 | | | (11) | | | — | | | (9) | | | 289 | |
| Fixed asset depreciation | | 61 | | | (3) | | | — | | | (1) | | | 57 | |
| Receivables for government funding | | 155 | | | (13) | | | — | | | 44 | | | 186 | |
| Pension | | 68 | | | (4) | | | (1) | | | 2 | | | 65 | |
| Lease Liabilities | | 66 | | | (15) | | | — | | | 8 | | | 59 | |
| Other | | 154 | | | (1) | | | 13 | | | (15) | | | 151 | |
| Total deferred tax assets | | 813 | | | (47) | | | 12 | | | 29 | | | 807 | |
| Deferred tax liabilities | | | | | | | | | | |
| Accelerated tax depreciation | | (40) | | | — | | | — | | | (13) | | | (53) | |
| Acquired intangible assets | | (24) | | | — | | | — | | | (2) | | | (26) | |
| Advances of government funding | | (185) | | | 15 | | | — | | | (67) | | | (237) | |
| Capitalized development cost | | (123) | | | — | | | — | | | (47) | | | (170) | |
| Right-of-use assets | | (65) | | | 15 | | | — | | | (9) | | | (59) | |
| Other | | (22) | | | 1 | | | — | | | (15) | | | (36) | |
| Total deferred tax liabilities | | (459) | | | 31 | | | — | | | (153) | | | (581) | |
| Net deferred tax | | 354 | | | (16) | | | 12 | | | (124) | | | 226 | |
The line other deferred tax assets is primarily composed of deferred tax assets related to inventory, stock awards and commercial accruals.
As of December 31, 2025, the Group has tax loss carry forwards, investment tax credits and other tax attributes that expire starting 2026 out of which a deferred tax assets of $304 million are recognized, the expiry of the deferred tax assets as follows:
| | | | | | | | |
| Year | | In millions of U.S. dollars |
| 2026 | | 5 | |
| 2027 | | 5 | |
| 2028 | | 5 | |
| 2029 | | 4 | |
| 2030 | | 19 | |
| Thereafter | | 266 | |
| Total | | 304 | |
The amount reported on the line “Thereafter” includes a tax loss carried forward which will expire in 2032 for $80 million. The remaining amount has no expiration date.
As of December 31, 2024, the Group has deferred tax assets on tax loss carry forwards and investment credits that expire starting 2024, as follows:
| | | | | | | | |
| Year | | In millions of U.S. dollars |
| 2025 | | 3 | |
| 2026 | | 10 | |
| 2027 | | 13 | |
| 2028 | | 14 | |
| 2029 | | 15 | |
| Thereafter | | 254 | |
| Total | | 309 | |
The amount reported on the line “Thereafter” includes tax credit which will expire in 2030 for $64 million. The remaining amount has no expiration date.
As of December 31, 2025, deferred tax assets not recognized in the statement of financial position amounted to $765 million (2024: $699 million) and are mainly composed of the followings:
•$239 million (2024: $234 million) relating to an agreement granting the Group certain tax credits for capital investments purchased through the year ended December 31, 2006. Any unused tax credits granted under the agreement will be impacted by a legal inflationary index of 2.21% (2024: 3.45%). The credits may be utilized depending on the Group meeting certain program criteria. The credit may be utilized depending on the Company meeting certain program criteria and have no expiration date. In addition to this agreement, from 2007 onwards, the Group has continued and will continue to receive tax credits on the yearly capital investments, which may be used to offset that year’s tax liabilities and increases by the legal inflationary rate. However, pursuant to the inability to use these credits currently and in future years, the Group did not recognize in 2025 and in 2024 these deferred tax assets in the statement of financial position.
•$231 million (2024: $213 million) of tax loss carry forwards generated in on-going operations or corresponding to net operating losses acquired in business combinations, whose recovery was not considered probable. The majority of these unrecognized tax loss carry forwards has no expiry date.
•$295 million (2024: $252 million) relating to the deferred tax assets not recognized on the tax credit granted to the Group for certain technological activities for an amount of $133 million expiring in 2030 and the impact of the conclusion of discussions with the tax authorities for intangibles recognized for tax purposes for $162 million expiring on a linear basis until 2029.
No deferred tax liability is recognized on temporary differences of $432 million relating to the unremitted earnings of subsidiaries as the Group is able to control the timings of the reversal of these temporary differences and it is probable that they will not reverse in the foreseeable future. As of December 31, 2025, a deferred tax liability of $8 million was recognized on the amount of earnings expected to be repatriated in the foreseeable future.
Pillar II income taxes
Pillar II legislation has been enacted in certain jurisdictions in which the Group operates (Netherlands, the majority of the European Countries and Switzerland). The legislation is effective for the Group's financial year beginning January 1, 2024.
The Group applies the exception to recognizing and disclosing information about deferred tax assets and liabilities related to Pillar Two income taxes, as provided in the amendments to IAS 12 issued in May 2023.
The assessment of the 2025 exposure to Pillar II income taxes is based on the most recent tax filings, 2025 draft country-by-country reporting and the US GAAP financial statements for the constituent entities
in the Group. Based on the assessment, the Pillar II effective tax rates in most of the jurisdictions are above 15%. However, there is a limited number of jurisdictions where the transitional safe harbour relief does not apply and the Pillar II effective tax rate is slightly below 15%. Therefore, the Group has recorded a current tax expense related to Pillar II income taxes of $2 million in those jurisdictions ($9 million as of December 31, 2024). The Group is continuously monitoring the Pillar II legislation and related guidance which are still evolving and may have an impact on the Group's Pillar II tax charge in future periods.
7.6.35. Earnings per share
For the year ended December 31, 2025 and December 31, 2024, earnings per share (“EPS”) were calculated as follows:
| | | | | | | | | | | | | | |
| In millions of U.S. dollars except earnings per share data | | December 31,
2025 | | December 31,
2024 |
| Basic EPS | | | | |
| Net profit attributable to the equity holder of the parent as reported | | 299 | | | 1,987 | |
| Weighted average shares outstanding | | 893,291,706 | | | 901,210,072 | |
| Basic EPS | | 0.33 | | | 2.20 | |
| Diluted EPS | | | | |
| Net profit attributable to the equity holder of the parent as reported | | 299 | | | 1,987 | |
| Weighted average shares outstanding | | 893,291,706 | | | 901,210,072 | |
| Dilutive effect of stock awards | | 3,665,694 | | | 6,264,544 | |
| Number of shares used for diluted EPS | | 896,957,400 | | | 907,474,616 | |
| Diluted EPS | | 0.33 | | | 2.19 | |
There was no dilutive effect of the senior unsecured convertible bonds issued on August 4, 2020 in the 2025 and 2024 diluted Earnings per Share since the conversion features were out-of-the-money.
7.6.36. Related party transactions
The below table summarizes transactions incurred in 2025 and 2024 with companies for which certain members of the Group’s management perform similar policy making functions. These include, but are not limited to: Capgemini, Dassault Systèmes, Orange, Politecnico di Milano and Sopra Steria. Each of the aforementioned arrangements and transactions is negotiated without the personal involvement of the Supervisory Board members and are made in line with market practices and conditions. The amounts reported on the below table correspond to transactions up to the date members of the Group's management hold these similar functions.
| | | | | | | | | | | | | | |
| In millions of U.S. dollars | | December 31,
2025 | | December 31,
2024 |
| | | | |
| Purchases of goods and services and other contributions made to entities controlled by key management personnel | | 49 | | | 29 | |
| | | | |
| Accounts payable from entities controlled by key management personnel | | 8 | | | 4 | |
The Group did not hold any significant equity-method investments as of December 31, 2025 and 2024. Consequently, the Group did not report any material transaction with this type of investees in the corresponding years.
The Group made a cash contribution of $1 million for the year ended December 31, 2025 to the ST Foundation, a non-profit organization established to deliver and coordinate independent programs in line with its mission. A cash contribution of $1 million was made for the year ended December 31, 2024. Certain members of the Foundation’s Board are senior members of the Group’s management.
In 2025 and 2024, the total remuneration paid to the members of the Managing Board and to the other executive officers was as follows:
| | | | | | | | | | | | | | | | | | | | | | | | | | | | | | | | | | | | | | | | | | | | | | | | | | | | | | |
| | Short-term benefits | | Post- | | | | | | Share-
based
payments | | |
For the year ended December 31,
2025, in U.S. dollars | | Base Salary | | Bonus | | Benefits | | Social security contributions (1) | | employment benefits Pensions (2) | | | | Termination
benefits | | Unvested
stock
awards | | | | Total |
Members of the Managing Board (3) | | 2,326,822 | | 1,050,600 | | 249,275 | | 1,081,330 | | 1,433,211 | | | | — | | | 2,307,082 | | | | 8,448,320 |
| Executive Committee (excluding members of the Managing Board) | | 5,962,032 | | 3,568,885 | | 734,415 | | 2,797,420 | | 595,279 | | | | 2,221 | | 7,468,038 | | | | 21,128,290 |
| Executive Vice Presidents | | 12,250,663 | | | 5,269,614 | | | 823,307 | | | 5,563,645 | | | — | | | | | 1,635,261 | | | 11,658,385 | | | | | 37,200,875 | |
| Senior Management total remuneration | | 20,539,517 | | 9,889,099 | | 1,806,997 | | 9,442,395 | | 2,028,490 | | | | 1,637,482 | | 21,433,505 | | | | 66,777,485 |
| | | | | | | | | | | | | | | | | | | | | | | | | | | | | | | | | | | | | | | | | | | | | | | | | | | | | | |
| | Short-term benefits | | Post- | | | | | | Share-
based
payments | | |
For the year ended December 31,
2024, in U.S. dollars | | Base Salary | | Bonus | | Benefits | | Social security contributions (1) | | employment benefits Pensions (2) | | | | Termination
benefits | | Unvested
stock
awards | | | | Total |
Members of the Managing Board (3) | | 1,757,675 | | | 2,458,745 | | | 188,735 | | | 1,259,295 | | | 1,346,909 | | | | | — | | | 4,255,388 | | | | | 11,266,747 | |
| Executive Committee (excluding members of the Managing Board) | | 5,952,378 | | | 9,043,380 | | | 1,422,243 | | | 4,639,390 | | | 1,184,059 | | | | | 7,795,680 | | | 18,500,090 | | | | | 48,537,220 | |
| Executive Vice Presidents | | 10,554,925 | | | 7,389,370 | | | 669,443 | | | 6,661,794 | | | — | | | | | 3,639,304 | | | 19,273,622 | | | | | 48,188,459 | |
| Senior Management total remuneration | | 18,264,978 | | | 18,891,495 | | | 2,280,421 | | | 12,560,479 | | | 2,530,968 | | | | | 11,434,984 | | | 42,029,100 | | | | | 107,992,426 | |
(1)Include compulsory contribution to pension plans
(2)Complementary pension plan for Senior Management
(3)The compensation paid to our President and Chief Financial Officer as included in this table concerns his compensation received since his appointment as member of the Managing Board on May 22, 2024.
The Group’s 32 Senior Management members were granted in 2025 for free 1,942,000 unvested shares subject to the achievement of performance objectives and service conditions being met. The weighted average grant date fair value of unvested shares granted to employees under the 2025 Employee Plan was $30.56.
The Group’s 31 Senior Management members were granted in 2024 for free 1,930,000 unvested shares subject to the achievement of performance objectives and service conditions being met. The weighted average grant date fair value of unvested shares granted to employees under the 2024 Employee Plan was $37.69.
The bonus paid to the executive officers corresponds to a Corporate EIP that entitles selected executives to a yearly bonus based upon the assessment of the achievement of individual, organizational and company objectives that are set on an annual basis and focused, inter alia, on return on net assets, customer service, profit, cash flow and market share. The maximum bonus awarded under the EIP is based upon a percentage of the executives’ salary and the overall achievement of the above objectives on an annual basis.
The Supervisory Board has approved the establishment of a complementary pension plan for certain key executives as selected by the members of the Managing Board, according to the general criteria of eligibility and service as determined by the Supervisory Board upon the proposal of its Compensation Committee. With respect to such complementary pension plan, the Group set up an independent foundation under Swiss law which manages the plan and to which we make contributions. Pursuant to this plan, in 2025, the Group made a contribution of approximately $1.43 million to the plan of the members of our Managing Board and of $0.59 million to the plan for all beneficiaries other than the members of our Managing Board. The amount of pension plan payments made for other beneficiaries, such as former employees retired in 2025 and/or no longer salaried in 2025, was $1.02 million.
The members of Senior Management, including the members of the Managing Board were covered in 2025 under certain group life and medical insurance programs provided by the Group. The aggregate additional amount set aside by the Group in 2025 to provide pension, retirement or similar benefits to Senior Management, including the members of the Managing Board, including the amounts allocated to the complementary pension plan described above, is estimated to have been approximately $8.12 million, which includes statutory employer contributions for state run retirement, similar benefit programs and other miscellaneous allowances.
The Group did not extend any loans or overdrafts to the members of the Managing Board, nor to any other member of Senior Management. Furthermore, the Group has not guaranteed any debts or concluded any leases with the members of the Managing Board, nor with any other member of Senior Management or their families.
Individual remuneration paid to Supervisory Board members in 2025 and 2024 was recorded as follows:
| | | | | | | | | | | | | | |
| In Euros | | 2025 (1) | | 2024 (1) |
Nicolas Dufourcq (1) | | — | | | — | |
Armando Varricchio(2) | | 55,137 | | | — | |
Simonetta Acri(3) | | 87,000 | | | — | |
Orio Bellezza(2) | | 22,055 | | | — | |
Pascal Daloz(6) | | 63,000 | | | 73,500 | |
Janet Davidson(4) | | 32,000 | | | 115,000 | |
Yann Delabrière(6) | | — | | | 10,000 | |
| Ana de Pro Gonzalo | | 171,000 | | | 161,000 | |
Werner Lieberherr(3) | | 102,000 | | | — | |
| Frédéric Sanchez | | 169,000 | | | 109,500 | |
Donatella Sciuto(4) | | 30,000 | | | 107,500 | |
Maurizio Tamagnini(5) | | 12,000 | | | 172,500 | |
Paolo Visca(5) | | 41,986 | | | 98,000 | |
| Hélène Vletter-van Dort | | 178,000 | | | 123,500 | |
| | | 963,178 | | | 970,500 | |
(1)Mr. Dufourcq waived his rights to receive any compensation from the Company in relation to his mandate as a member of the Supervisory Board or otherwise.
(2)Mr. Orio Bellezza and Mr. Armando Varricchio were appointed as member of our Supervisory Board on December 18, 2025.
(3)Ms. Simonetta Acri and Mr. Werner Lieberherr were appointed as members of our Supervisory Board on May 28, 2025.
(4)Ms. Janet Davidson and Ms. Donatella Sciuto were members of our Supervisory Board until May 28, 2025, on which date their term expired.
(5)Mr. Maurizio Tamagnini and Mr. Paolo Visca were members of our Supervisory Board until their resignation effective March 19, 2025 and October 1, 2025 respectively.
(6)Mr. Yann Delabrière was a member of our Supervisory Board until May 22, 2024, on which date his term expired and on such date Mr. Pascal Daloz was appointed as a new member of our Supervisory Board.
No share awards were granted to Supervisory Board members and professionals in 2025 and 2024.
7.6.37. Commitments, contingencies, claims and legal proceedings
Commitments
The Group’s commitments relate to multi-annual agreements with suppliers when there is a fixed, non-cancelable commitment or when minimum payments are due on a committed delivery schedule. These commitments are primarily comprised of purchase commitments for outsourced foundry wafers ($0.8 billion), firm contractual commitments related to power purchase and minimum energy efficiency, as part of the Group's actions to become carbon neutral by 2027 on scope 1 and 2 and focusing on product transportation, business travel and employee commuting emissions for scope 3 ($1.3 billion), and firm contractual commitments related primarily to cloud services ($0.3 billion).
Contingencies
The Group is subject to possible loss contingencies arising in the ordinary course of business. These include but are not limited to: product liability claims and/or warranty cost on the products of the Group, contractual disputes, indemnification claims, claims for unauthorized use of third-party intellectual property, employee grievances, tax claims beyond assessed uncertain tax positions and environmental damages. The Group is also exposed to numerous legal risks including potential product recalls, environmental, shareholder rights, tariffs and export control regulations, anti-trust, anti-corruption, competition as well as other compliance risks and regulations. The Group may also face claims in the event of breaches of law committed by individual employees or third parties. In determining loss
contingencies, the Group considers the likelihood of the occurrence of a liability at the date of the consolidated financial statements as well as the ability to reasonably estimate the amount of such loss or liability. The Group records a provision for a loss contingency when information available before the consolidated financial statements are issued or are available to be issued indicates that it is probable that an asset has been impaired or a liability has been incurred at the date of the consolidated financial statements and when the amount of loss can be reasonably estimated. The Group regularly re-evaluates any potential losses and claims to determine whether provisions need to be adjusted based on the most current information available to the Group. Changes in these evaluations could result in an adverse material impact on the Group's results of operations, cash flows or its financial position for the period in which they occur.
Claims and legal proceedings
On August 23, 2024, two lawsuits were filed against the Group, and its CEO and CFO, in the United States District Court for the Southern District of New York alleging that the Group provided excessively positive statements to investors concerning 2024 expected revenue and issued false or misleading statements or concealed negative facts regarding the Group's business, operations, and prospects, in violation of U.S. securities laws. The lawsuits were consolidated into a single lawsuit and thereafter the plaintiff filed amended complaints asserting claims for violation of Sections 10(b) and 20(a) of the Securities Exchange Act, and expanding the purported class period from March 14, 2023, to January 29, 2025. The Group and its CEO and CFO moved to dismiss the lawsuit which motion was denied by the Court on September 15, 2025. The Group and its CEO and CFO believe that they have strong legal defenses against the allegations in the amended complaints and will vigorously defend themselves in court.
The Group has received and may in the future receive communications alleging possible infringements of third-party patents or other third-party intellectual property rights. Furthermore, the Group from time to time enters into discussions regarding a broad patent cross license arrangement with other industry participants. There is no assurance that such discussions may be brought to a successful conclusion and result in the intended agreement. The Group may become involved in costly litigation brought against the Group regarding patents, mask works, copyrights, trademarks or trade secrets. In the event that the outcome of any litigation would be unfavorable to the Group, the Group may be required to take a license to third-party patents and/or other intellectual property rights at economically unfavorable terms and conditions, and possibly pay damages for prior use and/or face an injunction, all of which individually or in the aggregate could have a material adverse effect on the Group’s results of operations, cash flows, financial position and/or ability to compete.
On December 4, 2023, a jury in the United States District Court for the Western District of Texas in Waco, Texas (USA) returned a verdict in a patent infringement lawsuit in favor of the plaintiff, Purdue University. On June 7, 2024, the Court accepted the jury's verdict and entered a judgment against the Group in the amount of $32 million. Thereafter, the Group filed several post-trial motions challenging the verdict. In the event the Court denies the Group's post-trial motions, the Group intends to appeal to the U.S. Court of Appeals for the Federal Circuit in Washington DC. The risk on this case is considered possible with the possible loss currently estimated at $32 million.
The Group has contractual commitments to various customers which could require the Group to incur costs to repair or replace defective products it supplies to such customer. The duration of these contractual commitments varies and, in certain cases, is indefinite. The Group is otherwise also involved in various lawsuits, claims, inquiries, inspections, investigations and/or proceedings incidental to its business and operations. Such matters, even if not meritorious, could result in the expenditure of significant financial or managerial resources. Any of the foregoing could have a material adverse effect on the Group’s results of operations, cash flows or its financial position.
As of December 31, 2025 and 2024, respectively, provisions for estimated probable losses with respect to claims and legal proceedings were not considered material.
Other Contingencies
The Group regularly evaluates claims and legal proceedings together with their related probable losses to determine whether they need to be adjusted based on the current information available to the Group. There can be no assurance that its recorded reserves or insurance policies will be sufficient to cover the extent of its potential liabilities. Legal costs associated with claims are expensed as incurred. In the event of litigation which is adversely determined with respect to the Group’s interests, or in the event the Group needs to change its evaluation of a potential third-party claim, based on new evidence or communications, a material adverse effect could impact its operations or financial condition at the time it were to materialize.
7.6.38. Financial risk management objectives and policies
The Group is exposed to changes in financial market conditions in the normal course of business due to its operations in different foreign currencies and its ongoing investing and financing activities. The Group’s activities expose it to a variety of financial risks: market risk (including foreign exchange risk, fair value interest rate risk, cash flow interest rate risk and price risk), credit risk and liquidity risk. The Group’s overall risk management program focuses on the unpredictability of financial markets and seeks to minimize potential adverse effects on the Group’s financial performance. The Group uses derivative financial instruments to hedge certain risk exposures.
Financial risk management is carried out by a central treasury department (Corporate Treasury). Additionally, a treasury committee, chaired by the Chief Financial Officer, steers treasury activities and ensures compliance with corporate policies. Treasury activities are thus regulated by the Group’s policies, which define procedures, objectives and controls. The policies focus on the managing financial risk in terms of exposure to market risk, credit risk and liquidity risk. Treasury controls are subject to internal audits. Most treasury activities are centralized, with any local treasury activities subject to oversight from Corporate Treasury. Corporate Treasury identifies, evaluates and hedges financial risks in close cooperation with the Group’s subsidiaries. It provides written principles for overall risk management, as well as written policies covering specific areas, such as foreign exchange risk, interest rate risk, price risk, credit risk, use of derivative financial instruments, and investments of excess liquidity. The majority of cash and cash equivalents is held in U.S. dollars and Euros and is placed with financial institutions rated at least a single “A” long-term rating from two of the major rating agencies, meaning at least A3 from Moody’s and A- from S&P and Fitch ratings, or better. These ratings are closely and continuously monitored in order to manage exposure to the counterparty’s risk. Hedging transactions are performed only to hedge exposures deriving from operating, investing and financing activities conducted in the normal course of business.
Market risk
Foreign exchange risk
The Group conducts its business on a globally in various major international currencies. As a result, the Group is exposed to adverse movements in foreign currency exchange rates, primarily regarding the Euro. Foreign exchange risk mainly arises from recognized assets and liabilities at the Company’s subsidiaries and future commercial transactions.
Management has set up a policy to require the Group's subsidiaries to hedge their entire foreign exchange risk exposure with the Group through financial instruments transacted or overseen by Corporate Treasury. Subsidiaries used forward contracts and purchased currency options to manage their foreign exchange risk arising from foreign-currency-denominated assets and liabilities. Foreign exchange risk arises when recognized assets and liabilities are denominated in a currency that is not the entity’s functional currency. These instruments do not qualify as hedging instruments for accounting purposes.
Forward contracts and currency options, including collars, are also used by the Group to reduce its exposure to U.S. dollar fluctuations in Euro-denominated forecasted intercompany transactions that cover a large part of its R&D and corporate costs as well as a portion of its front-end manufacturing production costs for semi-finished goods. The Group also hedges through the use of currency forward contracts certain Singapore dollar-denominated manufacturing forecasted transactions. The derivative instruments used to hedge these forecasted transactions meet the criteria for designation as cash flow hedge. The hedged forecasted transactions have a high probability of occurring for hedge accounting purposes.
It is the Group’s policy to have the foreign exchange exposures in all the currencies hedged month by month against the monthly standard rate. At each month end, the forecasted flows for the coming month are hedged together with the fixing of the new standard rate. For this reason, the hedging transactions will have an exchange rate very close to the standard rate at which the forecasted flows will be recorded in the following month. As such, the foreign exchange exposure of the Group, which consists of the balance sheet positions and other contractually agreed transactions, is always close to zero and any movement in the foreign exchange rates will therefore not influence the exchange effect on items of the consolidated income statement. Any discrepancy between the forecasted values and the actual results is constantly monitored and prompt actions are taken, if needed.
The hedging activity of the Group and the impact on the financial statements is described in detail in Note 7.6.14.4.
The following sensitivity analysis was based on recognized assets and liabilities, including non-monetary items, of the Company and its subsidiaries. Equity would have been approximately $117 million higher/lower (2024: $98 million higher/lower) if the Euro strengthened/weakened by 300 basis points against the U.S. dollar, arising mainly from translation of net assets from subsidiaries whose functional currency is the Euro.
As of December 31, 2025 if the Euro/U.S. dollar exchange rate had strengthened by 300 basis points with all other variables held constant, net result for the year would have been $52 million higher (2024: $61 million higher), mainly as a result of foreign exchange gains on outstanding derivative instruments. If the Euro/U.S. dollar exchange rate had weakened by 300 basis points with all other variables held constant, impact in net income would have been $50 million lower (2024: $68 million lower), mainly due to foreign exchange losses on outstanding derivative instruments.
Cash flow and fair value interest rate risk
The Group’s interest rate risk arises from long-term borrowings. Borrowings issued at variable rates expose the Group to cash flow interest rate risk. Borrowings issued at fixed rates expose the Group to fair value interest rate risk.
The Group analyzes its interest rate exposure on a dynamic basis. Various scenarios are simulated taking into consideration refinancing, renewal of existing positions, alternative financing and hedging. The Group invests primarily on a short-term basis and as such its liquidity is invested in floating interest rate instruments. As a consequence, the Group is exposed to interest rate risk due to potential mismatch between the return on its short-term floating interest rate investments and the portion of its long-term debt issued at fixed rate.
As of December 31, 2025 and 2024, if interest rates had been 20 basis points higher/lower with all other variables held constant, net income for the year would have been $3 million higher/lower respectively, mainly as a result of a high level of liquid assets in relation to debt, with no material impact on equity.
During 2025 and 2024, the Group’s borrowings at variable rate were denominated in Euros and in U.S. dollars.
Price risk
As part of its ongoing investing activities, the Group may invest in publicly traded equity securities and be exposed to equity security price risk. In order to hedge the exposure to this market risk, the Group may enter into certain derivative hedging transactions.
In December 2024, the Group participated to the IPO of Innoscience (Suzhou) which became public on the main segment of Hong Kong Stock Exchange. As a publicly traded equity instrument, Innoscience investment is measured at fair value through profit or loss, with a $76 million unrealized gain, as described in Note 7.6.14.1 and Note 7.6.31.
The measurement for accounting purposes of the embedded derivative instruments of the senior unsecured convertible bonds issued on August 4, 2020 is dependent on various factors including the performance of STMicroelectronics ordinary shares. With respect to the valuation of the embedded issuer’s call options as of December 31, 2025, if the price of the Company’s ordinary shares, as measured on the New York Stock Exchange, with other valuation inputs remaining equal, increases by 10%, the value of the embedded call options would increase by $1 million (2024: increase of $1 million), whereas for a decrease of 10% in the share price, the value of the embedded call options would decrease by $1 million (2024: decrease of $1 million). With respect to the valuation of the embedded bondholders’ conversion options as of December 31, 2025, if the price of the Company’s ordinary shares, as measured on the New York stock exchange, with other valuation inputs remaining equal, increases by 10%, the value of the embedded conversion options would increase by $10 million (2024: increase of $16 million), whereas for a decrease of 10% in the share price, the value of the embedded conversion options would decrease by $7 million (2024: decrease of $12 million). Details of the sensitivity of the other valuation factors, more specifically implied volatility, are presented in Note 7.6.14.5.
Credit risk
Credit risk is the risk that a counterparty will not meet its obligations under a financial instrument or customer contract, leading to a financial loss. Credit risk typically arises from cash and cash equivalents, contractual cash flows of debt investments carried at amortized cost, measured at FVOCI and at FVPL, the counterparty of derivative financial instruments and deposits with banks and financial institutions, as well as credit exposure to customers, including outstanding receivables.
The Group is exposed to credit risk from its operating activities (primarily for trade receivables) and from its financing activities, including deposits with banks and financial institutions, foreign exchange transactions and other financial instruments.
Credit risk is managed at the Group level. The Group selects banks and/or financial institutions that operate with the Group based on the criteria of long-term rating from at least two major rating agencies and keeping a maximum outstanding amount per instrument with each bank not to exceed 20% of the total. For derivative financial instruments, management has established limits so that, at any time, the fair value of contracts outstanding is not concentrated with any individual counterparty.
The Group monitors the creditworthiness of its customers to which it grants credit terms in the normal course of business. If certain customers are independently rated, these ratings are used. Otherwise, if there is no independent rating, risk control assesses the customer's credit quality, considering its financial position, past experience, and other factors. The utilization of credit limits is regularly monitored. Sales to customers are primarily settled in cash, which mitigates credit risk. As of December 31, 2025 and 2024, no individual customer represented more than 10% of total trade accounts receivable. Any remaining concentrations of credit risk with respect to trade receivables are limited due to the large number of customers and their dispersion across many geographic areas.
The Group’s investments in instruments carried at amortized cost primarily include long-term receivables towards government bodies. As such, they are investments with immaterial credit loss. Any remaining receivable is of low credit risk and is individually not significant. The credit ratings of the investments are monitored for credit deterioration.
The Group has three types of financial assets that are subject to the expected credit loss model:
•Trade receivables for sales of goods and services, as described in Note 7.6.17;
•Debt securities measured at FVOCI, as described in Note 7.6.14.1; and
•Debt investments, primarily long-term receivables, carried at amortized cost, as described in Note 7.6.15 and Note 7.6.18.
The impairment methodology by category of financial assets is further described in each respective note. While cash and cash equivalents are also subject to the impairment requirements of IFRS 9, the identified impairment loss is deemed to be immaterial. The maximum exposure for all financial assets is their carrying amount.
Liquidity risk
Prudent liquidity risk management includes maintaining sufficient cash and cash equivalents, short-term deposits and marketable securities, the availability of funding from committed credit facilities and the ability to close out market positions. The Group’s objective is to maintain a significant cash position and a low debt-to-equity ratio, which ensure adequate financial flexibility. Liquidity management policy is to finance the Group’s investments with net cash from operating activities.
Management monitors rolling forecasts of the Group’s liquidity reserve based on expected cash flows.
A maturity analysis of interest-bearing loans and borrowings is shown in Note 7.6.14.3.
Capital risk management
The Group’s objectives when managing capital are to safeguard the Group’s ability to continue as a going concern in order to create value sustainable value, benefits and returns for its stakeholders, as to maintain an optimal capital structure. In order to maintain or adjust its capital structure, the Group may review the amount of dividends paid to shareholders, return capital to shareholders, or issue new shares.
Consistent with other peers in the industry, the Company monitors capital on the basis of the net debt-to-equity ratio. This ratio is calculated as the net financial position of the Company, defined as the difference between total cash position (cash and cash equivalents, short-term deposits, marketable securities and restricted cash, if any) and total financial debt (short-term and long-term debt), divided by total parent company stockholders’ equity.
7.6.39. Subsequent events
On February 2, 2026, the Group completed the acquisition of NXP Semiconductors' MEMS sensors business. Announced in July 2025, and subject to customary closing conditions, including regulatory approvals, which have now been satisfied or waived, this transaction, focused on automotive safety and non-safety products and sensors for industrial applications, expands the Group's global sensors capabilities. The MEMS businesses of the Group and NXP are strongly complementary in terms of technology and product portfolio, with the combined product offering to be well balanced across automotive, industrial and consumer end markets.
The all-cash transaction includes an upfront payment of $900 million, before closing adjustments, and up to $50 million subject to the achievement of specified technical milestones. Given the close proximity of the completion of the transaction to the date the financial statements are issued, the purchase price allocation and the fair value of the consideration have not been determined yet. These assessments will be completed in 2026, in accordance with the acquisition method applicable to business combinations.
On February 6, 2026, the Group issued warrants to Amazon Web Services ("Amazon") for the acquisition of up to 24.8 million ordinary shares of the Group. The warrants will vest in tranches over the term of the agreement, with vesting substantially tied to payments for the Group's products and services purchased
by Amazon and its affiliates. Amazon may exercise the warrants in one or more transactions over a seven-year period from the issue date at an initial exercise price of $28.38.
8. Company’s financial statements
8.1. Company’s statement of financial position
| | | | | | | | | | | | | | | | | | | | |
| In millions of U.S. dollars (before proposed appropriation of result) | | Notes | | December 31,
2025 | | December 31,
2024 |
| Assets | | | | | | |
| Non-current assets | | | | | | |
| Lease right-of-use assets | | 8.3.4 | | 39 | | | 6 | |
| Goodwill | | 8.3.6 | | 56 | | | 48 | |
| Intangible assets | | 8.3.5 | | 20 | | | 18 | |
| Investments in subsidiaries | | 8.3.6 | | 11,291 | | | 10,622 | |
| | | | | | |
| Other non-current financial assets | | 8.3.7.1 | | 25 | | | 20 | |
| Group companies long-term loans | | 8.3.10 | | — | | | 50 | |
| Total non-current assets | | | | 11,431 | | | 10,764 | |
| Current assets | | | | | | |
| Group companies interest-bearing short-term loans | | 8.3.10 | | 4,344 | | | 4,377 | |
| Other group companies receivables | | 8.3.11 | | 243 | | | 89 | |
| Other current financial assets | | 8.3.7.1 | | 955 | | | 2,435 | |
| Other receivables and assets | | | | 63 | | | 52 | |
| Short-term deposits | | 8.3.8 | | 3,029 | | | 2,795 | |
| Cash | | 8.3.9 | | 298 | | | 406 | |
| Total current assets | | | | 8,932 | | | 10,154 | |
| Total assets | | | | 20,363 | | | 20,918 | |
| Equity and liabilities | | | | | | |
| Equity | | 8.3.12 | | | | |
| Issued and paid-in capital | | | | 1,114 | | | 985 | |
| Additional paid-in capital | | | | 2,283 | | | 2,283 | |
| Retained earnings | | | | 13,200 | | | 11,755 | |
| Treasury shares | | | | (637) | | | (491) | |
| Legal reserves | | | | 2,618 | | | 1,916 | |
| Result for the year | | | | 299 | | | 1,987 | |
| Total equity | | | | 18,877 | | | 18,435 | |
| Non-current liabilities | | | | | | |
| Interest-bearing loans and borrowings | | 8.3.14 | | 240 | | | 270 | |
| Other non-current financial liabilities | | 8.3.7.2 | | 1 | | | 2 | |
| Other non-current liabilities | | | | 7 | | | 4 | |
| Total non-current liabilities | | | | 248 | | | 276 | |
| Current liabilities | | | | | | |
| Interest-bearing loans and borrowings – current portion | | 8.3.14 | | 758 | | | 1,487 | |
| Other current financial liabilities | | 8.3.7.2 | | 57 | | | 37 | |
| Group companies short-term notes payables | | 8.3.11 | | 41 | | | 36 | |
| Other group companies payables | | 8.3.11 | | 263 | | | 521 | |
| Other payables and accrued liabilities | | 8.3.13 | | 119 | | | 105 | |
| Income tax payable | | | | — | | | 21 | |
| Total current liabilities | | | | 1,238 | | | 2,207 | |
| Total equity and liabilities | | | | 20,363 | | | 20,918 | |
The accompanying notes are an integral part of these Company’s financial statements.
8.2. Company’s income statement
| | | | | | | | | | | | | | | | | | | | |
| | | | Year ended |
| In millions of U.S. dollars | | Notes | | December 31,
2025 | | December 31,
2024 |
| Selling expenses | | | | (1) | | | (1) | |
| General and administrative expenses | | 8.3.16 | | (31) | | | (33) | |
| Other income | | 8.3.19 | | — | | | 46 | |
| Other expenses | | 8.3.20 | | (50) | | | (3) | |
| Income (loss) from operations | | | | (82) | | | 9 | |
| Finance income | | 8.3.17 | | 428 | | | 994 | |
| Finance costs | | 8.3.18 | | (41) | | | (94) | |
| Income before taxes | | | | 305 | | | 909 | |
| Income tax expense | | | | (54) | | | (81) | |
| Income after tax | | | | 251 | | | 828 | |
| Net income from affiliated companies | | 8.3.6 | | 48 | | | 1,159 | |
| Net income | | | | 299 | | | 1,987 | |
The accompanying notes are an integral part of these Company’s financial statements.
8.3. Notes to Company’s financial statements
8.3.1. General
A description of the Company, its activities and group structure are included in the consolidated financial statements, prepared on the basis of accounting policies that conform to IFRS as endorsed by the EU. The Company holds investments in subsidiaries operating in the semiconductor manufacturing industry.
8.3.2. Basis of Presentation
The Company’s financial statements have been prepared in accordance with article 9 of Book 2 of the Dutch Civil Code. In accordance with the provisions of article 362 sub 8 of Book 2 of the Dutch Civil code, the accounting policies used are the same as those used in the notes to the consolidated financial statements prepared under IFRS as adopted by the EU, unless otherwise stated. The financial statements were authorized on March 25, 2026.
In accordance with article 362 paragraph 8 of Book 2 of the Dutch Civil Code, the Company has prepared its financial statements in accordance with accounting principles generally accepted in The Netherlands applying the accounting principles as adopted in the consolidated financial statements and further described in detail in the consolidated financial statements Note 7.6.7.
The functional and presentation currency of the Company is the U.S. dollar.
All balances and values are in millions of U.S. dollars, except as otherwise noted.
The accounting policies adopted are consistent with those of the previous financial year.
8.3.3. Summary of material accounting policies
Subsidiaries
Subsidiaries are all entities over which the Company has control. The Company controls an entity when the Company is exposed to, or has rights to, variable returns from its involvement with the entity and has the ability to affect those returns through its power to direct the activities of the entity.
Valuation of Subsidiaries
Investments in subsidiaries are stated at net asset value as the Company effectively controls the operational and financial activities of these investments. The net asset value is determined on the basis of the IFRS accounting principles applied by the Company in its consolidated financial statements.
Amounts due from group companies are stated initially at fair value and subsequently at amortized cost. Amortized cost is determined using the effective interest rate. The Company recognizes a credit loss for financial assets (such as a loan) based on an expected credit loss (ECL) model based first on estimated credit losses expected to occur in the coming twelve months and lifetime expected credit losses after a significant decrease in credit quality or when the simplified model can be used. For intercompany receivables the ECL would be applicable as well, however this could cause differences between equity in the consolidated and separate financial statements. For this reason, the Company elected to eliminate these differences through the respective receivable account in the separate financial statements.
For intercompany financial guarantees issued by the Company, there is no expected default and therefore the financial guarantees are not recognized. Guarantees given by the Company to its subsidiaries are further described in Note 8.3.15.
8.3.4. Leases
A reconciliation of opening and closing right-of-use assets is provided below:
| | | | | | | | | | | | | | |
| In millions of U.S. dollars | | December 31, 2025 | | December 31, 2024 |
| Right-of-use assets | | | | |
| Buildings | | 37 | | 27 |
| Land | | 3 | | — | |
| | | | |
| Total | | 40 | | 27 |
| Depreciation right-of-use assets | | | | |
| Buildings | | (1) | | | (21) | |
| | | | |
| Balance as of December 31, 2025 | | (1) | | | (21) | |
| Carrying amount | | 39 | | 6 |
| | | | | | | | | | | | |
| In millions of U.S. dollars | Land | Buildings | | Total |
| Movement: | | | | |
| Balance as of January 1, 2025 | — | | 6 | | | 6 | |
| Additions | 3 | | 33 | | | 36 | |
| Depreciation expense | — | | (3) | | | (3) | |
| Balance as of December 31, 2025 | 3 | | 36 | | | 39 | |
| | | | |
Maturities of lease liabilities are as follows:
| | | | | | | | |
| In millions of U.S. dollars | | December 31, 2025 |
| 2026 | | 38 | |
| 2027 | | 1 | |
| | |
| | |
| | |
| | |
| Total future undiscounted cash outflows | | 39 | |
| Effect of discounting | | — | |
| Total lease liabilities | | 39 | |
| | | | | | | | |
| In millions of U.S. dollars | | December 31, 2024 |
| 2025 | | 4 | |
| 2026 | | 2 | |
| | |
| | |
| | |
| Total future undiscounted cash outflows | | 6 | |
| Effect of discounting | | — | |
| Total lease liabilities | | 6 | |
8.3.5. Intangible assets
| | | | | | | | |
| In millions of U.S. dollars | | Internally developed
software |
| Acquisition and production cost: | | |
| Balance as of January 1, 2025 | | 82 | |
| Additions | | 8 | |
| Write off | | (33) | |
| Balance as of December 31, 2025 | | 57 | |
| Accumulated amortization: | | |
| Balance as of January 1, 2025 | | (64) | |
| Amortization expense | | (6) | |
| Write off | | 33 | |
| Balance as of December 31, 2025 | | (37) | |
| Net book value | | |
| As of December 31, 2025 | | 20 | |
| As of December 31, 2024 | | 18 | |
8.3.6. Investments in subsidiaries and goodwill
| | | | | | | | | | | | | | |
| In millions of U.S. dollars | | 2025 | | 2024 |
| Beginning of the year | | 10,622 | | | 11,109 | |
| Result from subsidiaries | | 48 | | | 1,159 | |
| Changes in other reserves of subsidiaries | | 175 | | | (87) | |
| Dividends paid | | (255) | | | (1,541) | |
| Capital increase | | 186 | | | 220 | |
| | | | |
| Translation effect of exchange rates of subsidiaries | | 515 | | | (238) | |
| End of the year | | 11,291 | | | 10,622 | |
The following table lists the Company’s consolidated subsidiaries and percentage of ownership as of December 31, 2025:
| | | | | | | | | | | | | | |
| Legal Seat | | Name | | Percentage ownership
(direct or indirect) |
| | | | December 31, 2025 |
| Australia, Sydney | | STMicroelectronics PTY Ltd | | 100 |
| Austria, Graz | | STMicroelectronics Austria GmbH | | 100 |
| Belgium, Diegem | | STMicroelectronics Belgium N.V. | | 100 |
| Brazil, Sao Paulo | | STMicroelectronics Ltda | | 100 |
| Canada, Ottawa | | STMicroelectronics (Canada), Inc. | | 100 |
| China, Beijing | | STMicroelectronics (Beijing) R&D Co. Ltd | | 100 |
| China, Chongqing | | SANAN, STMicroelectronics Co., Ltd. | | 49 |
| China, Shanghai | | STMicroelectronics (China) Investment Co. Ltd | | 100 |
| China, Shenzhen | | Shenzhen STS Microelectronics Co. Ltd | | 60 |
| China, Shenzhen | | STMicroelectronics (Shenzhen) R&D Co. Ltd | | 100 |
| Czech Republic, Prague | | STMicroelectronics Design and Application s.r.o. | | 100 |
| Denmark, Aarhus | | STMicroelectronics A/S | | 100 |
| Egypt, Cairo | | STMicroelectronics Egypt SSC | | 100 |
| Finland, Nummela | | STMicroelectronics Finland Oy | | 100 |
| France, Crolles | | STMicroelectronics (Crolles 2) SAS | | 100 |
| France, Grenoble | | STMicroelectronics (Alps) SAS | | 100 |
| France, Grenoble | | STMicroelectronics (Grenoble 2) SAS | | 100 |
| France, Le Mans | | STMicroelectronics (Grand Ouest) SAS | | 100 |
| France, Montrouge | | STMicroelectronics France SAS | | 100 |
| France, Rousset | | STMicroelectronics (Rousset) SAS | | 100 |
| France, Tours | | STMicroelectronics (Tours) SAS | | 100 |
| Germany, Aschheim-Dornach | | STMicroelectronics GmbH | | 100 |
| Germany, Aschheim-Dornach | | STMicroelectronics Application GmbH | | 100 |
| Hong Kong, Kowloon | | STMicroelectronics Ltd | | 100 |
| India, Noida | | STMicroelectronics Pvt Ltd | | 100 |
| Israel, Netanya | | STMicroelectronics Limited | | 100 |
| Italy, Agrate Brianza | | STMicroelectronics S.r.l. | | 100 |
| Italy, Naples | | STMicroelectronics Services S.r.l. | | 100 |
| Japan, Tokyo | | STMicroelectronics KK | | 100 |
| Malaysia, Kuala Lumpur | | STMicroelectronics Marketing SDN BHD | | 100 |
| Malaysia, Muar | | STMicroelectronics SDN BHD | | 100 |
| Malaysia, Muar | | STMicroelectronics Services Sdn.Bhd. | | 100 |
| Malta, Kirkop | | STMicroelectronics (Malta) Ltd | | 100 |
| Mexico, Guadalajara | | STMicroelectronics Marketing, S. de R.L. de C.V. | | 100 |
| Morocco, Casablanca | | STMicroelectronics (MAROC) SAS, a associé unique | | 100 |
| The Netherlands, Amsterdam | | STMicroelectronics Finance B.V. | | 100 |
| The Netherlands, Amsterdam | | STMicroelectronics Finance II N.V. | | 100 |
| The Netherlands, Amsterdam | | STMicroelectronics International N.V. | | 100 |
| Philippines, Calamba | | STMicroelectronics, Inc. | | 100 |
| Philippines, Calamba | | Mountain Drive Property, Inc. | | 40 |
| Singapore, Ang Mo Kio | | STMicroelectronics Asia Pacific Pte Ltd | | 100 |
| Singapore, Ang Mo Kio | | STMicroelectronics Pte Ltd | | 100 |
| Slovenia, Ljubljana | | STMicroelectronics d.o.o. | | 100 |
| Spain, Barcelona | | STMicroelectronics Iberia S.A. | | 100 |
| Sweden, Jönköping | | STMicroelectronics Software AB | | 100 |
| Sweden, Kista | | STMicroelectronics AB | | 100 |
| Sweden, Norrköping | | STMicroelectronics Silicon Carbide AB | | 100 |
| Switzerland, Geneva | | STMicroelectronics Re S.A. | | 100 |
| Switzerland, Geneva | | STMicroelectronics S.A. | | 100 |
| Thailand, Bangkok | | STMicroelectronics (Thailand) Ltd | | 100 |
| Tunisia, Ariana | | STMicroelectronics Tunisie | | 100 |
| United Kingdom, Marlow | | STMicroelectronics (Research & Development) Limited | | 100 |
| United Kingdom, Marlow | | STMicroelectronics Limited | | 100 |
| United States, Coppell | | STMicroelectronics Inc. | | 100 |
| United States, Coppell | | STMicroelectronics (North America) Holding, Inc. | | 100 |
| | | | |
Goodwill
| | | | | | | | | | | | | | | | |
| In millions of U.S. dollars | | Power & Discrete (P&D) | | | | Total |
| As of January 1, 2025 | | 48 | | | | | 48 | |
| | | | | | |
| Foreign currency translation | | 8 | | | | | 8 | |
| As of December 31, 2025 | | 56 | | | | | 56 | |
As of December 31, 2025, the gross value of goodwill was $56 million ($48 million in 2024), with no impairment recorded in 2025 and 2024.
8.3.7. Other financial assets and financial liabilities
8.3.7.1. Other financial assets
Movements on other financial assets are presented as follows:
| | | | | | | | |
| In millions of U.S. dollars | | December 31,
2025 |
| Beginning of the year | | 2,455 | |
| Purchase of government bonds issued by the U.S. Treasury | | 344 | |
| Proceeds at maturity of government bonds issued by the U.S. Treasury | | (1,900) | |
| Accretion | | 63 | |
| Change in fair value of debt securities issued by the U.S. Treasury | | 15 | |
| Purchase (sale) of unquoted equity securities | | 5 | |
| | |
| Change in fair value of the embedded call option of the senior unsecured convertible bonds issued on August 4, 2020, Tranche B | | (2) | |
| End of the year | | 980 | |
| Less: non-current portion | | (25) | |
| Current portion | | 955 | |
| | | | | | | | |
| In millions of U.S. dollars | | December 31,
2024 |
| Beginning of the year | | 1,684 | |
| Purchase of government bonds issued by the U.S. Treasury | | 2,980 | |
| Proceeds at maturity of government bonds issued by the U.S. Treasury | | (2,251) | |
| Accretion | | 87 | |
| Change in fair value of debt securities issued by the U.S. Treasury | | 1 | |
| Purchase of unquoted equity securities | | — | |
| Change in fair value of the embedded call option of the senior unsecured convertible bonds issued on August 4, 2020, Tranche A | | (14) | |
| Change in fair value of the embedded call option of the senior unsecured convertible bonds issued on August 4, 2020, Tranche B | | (32) | |
| End of the year | | 2,455 | |
| Less: non-current portion | | (20) | |
| Current portion | | 2,435 | |
Investments held in debt securities
As of December 31, 2025, the Company held $955 million of U.S. Treasury debt securities. The debt securities have an average rating of AAA/AA+/AA+ from Moody’s, S&P and Fitch, respectively, with an average maturity of 2.31 years. The debt securities were reported as current assets on the line “Other current financial assets” on the Company’s statement of financial position as of December 31, 2025, since they represented investments of funds available for current operations.
Marketable securities totaling $350 million at principal amount were transferred to financial institutions as part of short-term securities lending transactions, in compliance with corporate policies. The Company, acting as the securities lender, does not hold any collateral in this unsecured securities lending transaction. The Company retains effective control on the transferred securities.
The Company applies a forward‐looking expected credit loss (ECL) approach on all debt financial assets not held at FVPL. For debt securities at FVOCI, the ECL is based on the 12‐month expected credit loss basis. The 12‐month ECL is the portion of lifetime ECLs that results from default events on a financial instrument that are possible within 12 months after the reporting date. The Company’s quoted debt instruments at FVOCI comprise solely U.S Treasury debt securities, which have low credit risk. Consequently, the Company has considered that the ECLs on these investments are insignificant.
Investments held in equity securities
The Company irrevocably elected to measure at FVOCI unquoted equity securities for an aggregate value of $25 million (December 31, 2024: $20 million). Since these are strategic investments, the Company considers this classification, which implies that changes in fair value are not subsequently recycled to earnings, to be more relevant.
Financial assets include the following:
| | | | | | | | | | | | | | |
| In millions of U.S. dollars | | December 31,
2025 | | December 31,
2024 |
| Quoted securities: | | | | |
| Debt securities issued by the U.S. Treasury | | 955 | | | 2,433 | |
| Unquoted equity securities: | | | | |
| Unquoted equity securities | | 25 | | 20 |
| | | | |
| Embedded call option - Senior unsecured convertible bonds issued on August 4, 2020 (Tranche B) | | — | | | 2 |
| Total | | 980 | | | 2,455 | |
Financial assets are denominated in the following currencies:
| | | | | | | | | | | | | | |
| In millions of U.S. dollars | | December 31,
2025 | | December 31,
2024 |
| Euro | | 5 | | | 6 | |
| U.S. dollars | | 975 | | | 2,449 | |
| Total | | 980 | | | 2,455 | |
For further details on Group’s financial assets, refer to Note 7.6.14.1 of the consolidated financial statements of the Group.
8.3.7.2. Other financial liabilities
Movements on other financial liabilities are presented as follows:
| | | | | | | | |
| In millions of U.S. dollars | | December 31,
2025 |
| Beginning of the year | | 39 | |
| Change in fair value of the embedded conversion option of the senior unsecured convertible bonds issued on August 4, 2020, Tranche A | | (4) | |
| Change in fair value of the embedded conversion option of the senior unsecured convertible bonds issued on August 4, 2020, Tranche B | | (10) | |
| Lease financial liabilities | | 36 | |
| Lease payments | | (3) | |
| End of the year | | 58 | |
| Less current portion | | (57) | |
| Non-current portion | | 1 | |
Since August 2024, for Tranche B convertible bonds, the bondholders have full conversion rights. Consequently, Tranche B was reported on the current portion. On August 4, 2025, Tranche A bonds were fully settled in cash for their principal amount of $750 million, since Tranche A reached maturity while the conversion options were out-of-the money.
| | | | | | | | |
| In millions of U.S. dollars | | December 31,
2024 |
| Beginning of the year | | 522 | |
| Change in fair value of the embedded conversion option of the senior unsecured convertible bonds issued on August 4, 2020, Tranche A | | (225) | |
| Change in fair value of the embedded conversion option of the senior unsecured convertible bonds issued on August 4, 2020, Tranche B | | (252) | |
| Lease payments | | (6) | |
| End of the year | | 39 | |
| Less current portion | | (37) | |
| Non-current portion | | 2 | |
Financial liabilities include the following:
| | | | | | | | | | | | | | |
| In millions of U.S. dollars | | December 31,
2025 | | December 31,
2024 |
| | | | |
| Embedded conversion option - Senior unsecured convertible bonds issued on August 4, 2020 (Tranche A) | | — | | | 4 | |
| Embedded conversion option - Senior unsecured convertible bonds issued on August 4, 2020 (Tranche B) | | 19 | | | 29 | |
| Lease financial liabilities | | 39 | | | 6 | |
| Total financial liablities | | 58 | | | 39 | |
| Total current | | (57) | | | (37) | |
| Total non-current | | 1 | | 2 |
8.3.8. Short-term deposits
To optimize the return yield on its short-term investments, the Company invested in short-term deposits as follows:
| | | | | | | | | | | | | | |
| | December 31,
2025 | | December 31,
2024 |
| Short-term deposits beyond three months and below one year | | 1,100 | | | 1,450 | |
| Deposits at call with banks and money market funds | | 1,929 | | | 1,345 | |
| Total Short-term deposits | | 3,029 | | | 2,795 | |
Short-term deposits are composed of deposits at call with banks, money market funds and short-term deposits with maturity beyond three months and below one year with no significant risk of changes in fair value. Deposits at call with banks and money market funds are reported as cash and cash equivalents in the consolidated statement of financial position, in compliance with IFRS. Cash and cash equivalents of the Group are further described in Note 7.6.7.8 and Note 7.6.19 of the Group's consolidated financial statements.
8.3.9. Cash
| | | | | | | | | | | | | | |
| | | December 31,
2025 | | December 31,
2024 |
| Cash at bank and on hand | | 298 | | | 406 | |
| | | | |
8.3.10. Group companies interest-bearing short-term loans
Group companies short-term loans consisted of the following:
| | | | | | | | | | | | | | |
| In millions of U.S. dollars | | December 31,
2025 | | December 31,
2024 |
| STMicroelectronics Ltd. (Israel) | | | | |
| Loan due 2026 bearing interest at 3-month SOFR | | 4 | | | — | |
| Loan due 2025 bearing interest at 3-month SOFR | | — | | | 4 | |
| STMicroelectronics A/S (Denmark) | | | | |
| Loan due 2026 bearing interest at 3-month CIBOR + 0.50% | | 2 | | | — | |
| Loan due 2025 bearing interest at 3-month CIBOR + 0.50% | | — | | | 1 | |
| STMicroelectronics Finance II N.V. (The Netherlands) | | | | |
| Loan due 2026 bearing interest at 1-month SOFR + 0.25% | | 4,277 | | | — | |
| Loan due 2025 bearing interest at 1-month SOFR + 0.25% | | — | | | 4,332 | |
| STMicroelectronics Ltd (Hong Kong) | | | | |
| Loan due 2026 bearing 0% interest | | 50 | | | — | |
| STMicroelectronics S.A.S. (Morocco) | | | | |
| Loan due 2025 bearing interest at 6-month EURIBOR+ 0.25% | | — | | | 31 | |
| STMicroelectronics Silicon Carbide AB (Sweden) | | | | |
| Loan due 2026 bearing interest at 6-month STIBOR+ 0.10% | | 11 | | | — | |
| Loan due 2025 bearing interest at 6-month STIBOR+ 0.10% | | — | | | 9 | |
| Total short-term intercompany loans | | 4,344 | | | 4,377 | |
| | | | | | | | | | | | | | |
| In millions of U.S. dollars | | December 31,
2025 | | December 31,
2024 |
| STMicroelectronics Ltd (Hong Kong) | | | | |
| Loan due 2026 bearing 0% interest | | | | 50 | |
| Total long-term intercompany loans | | — | | | 50 | |
Fair value of Group companies short-term loans is not materially different from net book value.
8.3.11. Other Group companies receivables and payables
| | | | | | | | | | | | | | |
| In millions of U.S. dollars | | December 31,
2025 | | December 31,
2024 |
| Other group companies receivables | | 243 | | | 89 | |
| Total group companies receivables | | 243 | | | 89 | |
| Other group companies payables | | 263 | | | 521 | |
| Group companies short-term notes payable | | 41 | | | 36 | |
| Total group companies payables | | 304 | | | 557 | |
Group companies short-term notes payable consisted of the following:
| | | | | | | | | | | | | | |
| In millions of U.S. dollars | | December 31,
2025 | | December 31,
2024 |
| STMicroelectronics Ltd. (The United Kingdom) | | | | |
| Note due 2026 bearing interest at 3-month SONIA+ 0.25% | | 7 | | | — | |
| Note due 2025 bearing interest at 3-month SONIA+ 0.25% | | — | | | 6 | |
| STMicroelectronics Software AB (Sweden) | | | | |
| Note due 2026 bearing interest at 3-month STIBOR + 0.75% | | 2 | | | — | |
| Note due 2025 bearing interest at 3-month STIBOR + 0.75% | | — | | | 2 | |
| STMicroelectronics R&D Ltd (The United Kingdom) | | | | |
| Note due 2026 bearing interest at 3-month SONIA + 0.25% | | 16 | | | — | |
| Note due 2025 bearing interest at 3-month SONIA + 0.25% | | — | | | 15 | |
| STMicroelectronics Finance B.V. (The Netherlands) | | | | |
| Note due 2026 bearing interest at 3-month EURIBOR + 0.558% | | 12 | | | — | |
| Note due 2025 bearing interest at 3-month EURIBOR + 0.558% | | — | | | 8 | |
| STMicroelectronics Finland OY (Finland) | | | | |
| | | | |
| Note due 2025 bearing interest at 12-month EURIBOR + 0.25% | | — | | | 1 | |
| | | | |
| | | | |
| STMicroelectronics SA (Switzerland) | | | | |
Note due 2026 bearing interest at 4.13%
| | 4 | | | — | |
| Note due 2025 bearing interest at 4.89% | | — | | | 4 | |
| Total short-term intercompany notes payable | | 41 | | | 36 | |
—
8.3.12. Equity
| | | | | | | | | | | | | | | | | | | | | | | | | | | | | | | | | | | | | | | | | | | | |
| In millions of U.S. dollars | | Issued
and
paid-in
capital | | Additional
paid-in
capital | | Retained
earnings | | Treasury
shares | | Legal
reserves | | Result
for
the year | | Total |
| Balance January 1, 2025 | | 985 | | | 2,283 | | | 11,755 | | | (491) | | | 1,916 | | | 1,987 | | | 18,435 | |
| 2024 Net income | | — | | | — | | | 1,987 | | | — | | | — | | | (1,987) | | | — | |
| Transfer to (from) legal reserve | | — | | | — | | | (187) | | | — | | | 187 | | | — | | | — | |
| Repurchase of common stock | | — | | | — | | | — | | | (367) | | | — | | | — | | | (367) | |
| Stock-based compensation | | — | | | — | | | (33) | | | 221 | | | — | | | — | | | 188 | |
| | | | | | | | | | | | | | |
| | | | | | | | | | | | | | |
| Changes in fair value of financial assets measured at FVOCI | | — | | | — | | | 13 | | | — | | | — | | | — | | | 13 | |
| Dividends | | — | | | — | | | (322) | | | — | | | — | | | — | | | (322) | |
| 2025 Net income | | — | | | — | | | — | | | — | | | — | | | 299 | | | 299 | |
| Cash flow hedge reserve, net of tax | | — | | | — | | | 96 | | | — | | | — | | | — | | | 96 | |
| Transfer of cash flow hedge reserve to inventories | | — | | | — | | | (4) | | | — | | | — | | | — | | | (4) | |
| AOCI - Pension plan | | — | | | — | | | 24 | | | — | | | — | | | — | | | 24 | |
| Translation adjustment* | | 129 | | | — | | | (129) | | | — | | | 515 | | | — | | | 515 | |
| Balance December 31, 2025 | | 1,114 | | | 2,283 | | | 13,200 | | | (637) | | | 2,618 | | | 299 | | | 18,877 | |
* The share capital of STMicroelectronics is denominated in Euros and the period-end balance is translated into U.S. dollars at the year-end exchange rate (Euro/USD 1.1757). The translation differences are taken to retained earnings.
| | | | | | | | | | | | | | | | | | | | | | | | | | | | | | | | | | | | | | | | | | | | |
| In millions of U.S. dollars | | Issued
and
paid-in
capital | | Additional
paid-in
capital | | Retained
earnings | | Treasury
shares | | Legal
reserves | | Result
for
the year | | Total |
| | | | | | | | | | | | | | |
| | | | | | | | | | | | | | |
| Balance January 1, 2024 | | 1,047 | | | 2,283 | | | 8,168 | | | (377) | | | 2,136 | | | 3,985 | | | 17,242 | |
| 2023 Net income | | — | | | — | | | 3,985 | | | — | | | — | | | (3,985) | | | — | |
| Transfer to (from) legal reserve | | — | | | — | | | (16) | | | — | | | 16 | | | — | | | — | |
| Repurchase of common stock | | — | | | — | | | — | | | (359) | | | — | | | — | | | (359) | |
| Stock-based compensation | | — | | | — | | | (34) | | | 245 | | | — | | | — | | | 211 | |
| | | | | | | | | | | | | | |
| | | | | | | | | | | | | | |
| Changes in fair value of financial assets measured at FVOCI | | — | | | — | | | (1) | | | — | | | — | | | — | | | (1) | |
| Dividends | | — | | | — | | | (323) | | | — | | | — | | | — | | | (323) | |
| 2023 Net income | | — | | | — | | | | | — | | | — | | | 1,987 | | | 1,987 | |
| Cash flow hedge reserve, net of tax | | — | | | — | | | (93) | | | — | | | — | | | — | | | (93) | |
| Transfer of cash flow hedge reserve to inventories | | — | | | — | | | 9 | | | — | | | — | | | — | | | 9 | |
| AOCI - Pension plan | | — | | | — | | | (2) | | | — | | | — | | | — | | | (2) | |
| Translation adjustment* | | (62) | | | — | | | 62 | | | — | | | (236) | | | — | | | (236) | |
| Balance December 31, 2024 | | 985 | | | 2,283 | | | 11,755 | | | (491) | | | 1,916 | | | 1,987 | | | 18,435 | |
* The share capital of STMicroelectronics is denominated in Euros and the period-end balance is translated into U.S. dollars at the year-end exchange rate (Euro/USD 1.0394). The translation differences are taken to retained earnings.
The authorized share capital of the Company is €1,810 million consisting of 1,200,000,000 common shares and 540,000,000 preference shares, each with a nominal value of €1.04. As of December 31, 2025 the number of common shares issued was 911,281,920 shares (December 31, 2024: 911,281,920 shares).
As of December 31, 2025, the number of shares of common stock outstanding was 888,768,152 shares (December 31, 2024: 898,175,408 shares).
The Euros equivalent of the issued share capital as of December 31, 2025 amounts to €947,733,197 (2024: €947,733,197). For the changes in issued and paid-in-capital, additional paid-in-capital and retained earnings, see the Group’s consolidated financial statements.
The cumulative amount of legal reserves as of December 31, 2025 is split as follows: $1,292 million of capitalized development expenditures and internally developed software expenditures, $442 million of subsidiaries non distributable reserves, $843 million of currency translation adjustment gain and $41 million unrealized gain on derivatives.
The cumulative amount of legal reserves as of December 31, 2024 is split as follows: $1,188 million of capitalized development expenditures and internally developed software expenditures, $400 million of subsidiaries non distributable reserves, $328 million of currency translation adjustment gain.
Treasury shares
As of December 31, 2025, the Company owned 22,513,768 shares classified as treasury shares in the Company’s statement of equity compared to 13,106,512 shares as of December 31, 2024.
The treasury shares have been originally designated for allocation under the Company’s share-based remuneration programs. During the years ended December 31, 2025 and 2024, 5,103,210, and
5,542,756 of these treasury shares, respectively, were transferred to employees under the Company’s share-based remuneration programs.
On July 1, 2021, the Company announced the launch of a share buy-back program of up to $1,040 million to be executed within a three-year period. Under this share buy-back program, the Company purchased approximately 4.1 million shares of its outstanding common stock for a total of $175 million during the first half of 2024, from January until the program concluded in June. During 2023, the Company purchased approximately 7.6 million shares of its outstanding common stock for $346 million under this program.
On June 21, 2024, the Company announced the launch of a new share buy-back plan comprising two programs of up to $1,100 million to be executed within a three-years period. During 2025, the Company purchased approximately 14.5 million shares of its outstanding common stock under this program for $367 million. During 2024, the Company purchased approximately 6 million shares of its outstanding common stock under this program for $184 million.
Non Distributable Reserve
The amount of the non-distributable reserve was $3,732 million and $2,901 million in the year 2025 and 2024, respectively, and it represents the amount of issued and paid-in capital and legal reserves of the Company.
8.3.13. Other payables and accrued liabilities
Other payables and accrued liabilities consisted of:
| | | | | | | | | | | | | | |
| In millions of U.S. dollars | | December 31,
2025 | | December 31,
2024 |
| Dividends payable to Shareholders | | 89 | | | 88 | |
| | | | |
| | | | |
| Trade payable | | 3 | | | 3 | |
| Other liabilities | | 27 | | | 14 | |
| Total other payables and accrued liabilities | | 119 | | | 105 | |
8.3.14. Interest-bearing loans and borrowings
Interest-bearing loans and borrowings consisted of the following:
| | | | | | | | | | | | | | |
| In millions of U.S. dollars | | December 31,
2025 | | December 31,
2024 |
| Funding program loans from European Investment Bank ("EIB"): | | | | |
| 5.07% due 2034, floating interest rate at Secured Overnight Financing Rate +0.939% | | 270 | | | 300 | |
| Dual tranche senior unsecured convertible bonds: | | | | |
| Zero-coupon, due 2025 (Tranche A) | | — | | | 742 | |
| Zero-coupon, due 2027 (Tranche B) | | 728 | | | 715 | |
| | | | |
| | | | |
| Total interest bearing loans and borrowings | | 998 | | | 1,757 | |
| Total current | | 758 | | | 1,487 | |
| Total non-current | | 240 | | | 270 | |
Movements on interest-bearing loans and borrowings are presented as follows:
| | | | | | | | | | | | | | |
| In millions of U.S. dollars | | December 31,
2025 | | December 31,
2024 |
| Balance at beginning of the year | | 1,757 | | | 1,432 | |
| Repayment zero-coupon, due 2025 (Tranche A) | | (750) | | | — | |
| Amortization of issuance costs | | 1 | | | 1 | |
| Amortization of discounted value | | 20 | | | 24 | |
| Repayment loans from European Investment Bank ("EIB") | | (30) | | | 300 | |
| | | | |
| Balance at the end of the year | | 998 | | | 1,757 | |
| | | | |
Senior convertible bonds
On August 4, 2020, the Company issued $1,500 million in principal amount of dual tranche senior unsecured convertible bonds (Tranche A for $750 million and Tranche B for $750 million), due 2025 and 2027, respectively. Tranche A bonds were issued at 105.8% as zero-coupon bonds while Tranche B bonds were issued at 104.5% as zero-coupon bonds. The conversion price at issuance was $43.62 for Tranche A, equivalent to a 47.5% conversion premium and $45.10 for Tranche B, equivalent to a 52.5% conversion premium. These conversion features correspond to an equivalent of 4,585 shares per each Tranche A bond $200,000 par value and an equivalent of 4,435 shares per each Tranche B bond $200,000 par value. The bonds are convertible by the bondholders or are callable by the issuer upon certain conditions, on a net-share settlement basis, except if the issuer elects a full-cash or full-share conversion as an alternative settlement. The net proceeds from the bond offering were $1,567 million, after deducting issuance costs payable by the Group.
The issuer’s call option and the holder’s conversion option have been identified as embedded non-equity derivative instruments, resulting in the recognition of the options separately from the debt host contract. Upon initial recognition, the derivatives were measured at fair value based on the income approach, the debt being determined as a residual amount of the $1.5 billion total proceeds. The value of the issuer’s call option was deemed to be nil at initial recognition. The value of the holder’s conversion option was estimated at $219 million at issuance date, which determined the initial recognition of the liability component at $1,358 million before allocation of issuance costs. The fair value measurement of the embedded derivative instruments corresponded to a Level 3 fair value hierarchy measurement. The Company elected to allocate issuance costs, totaling $10 million, to the debt component. The debt was subsequently measured at amortized cost using the effective interest method.
On August 4, 2025, Tranche A bonds were fully settled in cash for their principal amount of $750 million, since Tranche A reached maturity while the conversion options were out-of-the money. As per contractual terms, the bondholders have full conversion rights on Tranche B bonds starting August 2024 and Tranche B bonds are callable by the Company with a 130% contingent feature, with the exercise of its call rights being preceded by the release, by the Company, of an Optional Redemption Notice.
Starting August 2024 for Tranche B convertible bonds, the bondholders have full conversion rights. Consequently, the non-equity embedded derivative instruments and liability component were reported on the line Other current financial liabilities for an amount of $19 million as of December 31, 2025 (December 31, 2024: $29 million) and on the line Interest-bearing loans and borrowings – current portion for an amount of $728 million as of December 31, 2025 (December 31, 2024: $715 million).
Fair values
| | | | | | | | | | | | | | | | | | | | | | | | | | |
| | Carrying amount | | Fair value |
| In millions of U.S. dollars | | December 31, 2025 | | December 31, 2024 | | December 31, 2025 | | December 31, 2024 |
| Financial assets | | | | | | | | |
| Other receivables and assets | | 63 | | 52 | | 63 | | 52 |
| Quoted financial instruments | | 955 | | 2,433 | | 955 | | 2,433 |
| Unquoted equity securities | | 25 | | 20 | | 25 | | 20 |
| | | | | | | | |
| Embedded call option - Senior unsecured convertible bonds issued on August 4, 2020 (Tranche B) | | — | | 2 | | — | | 2 |
| Cash | | 298 | | 406 | | 298 | | 406 |
| Deposits at call with banks and money market funds | | 1,929 | | 1,345 | | 1,929 | | 1,345 |
| Short-term deposits beyond three months and below one year | | 1,100 | | 1,450 | | 1,100 | | 1,450 |
| Financial liabilities | | | | | | | | |
| Interest-bearing loans and borrowings (excluding senior unsecured convertible bonds) | | 270 | | 300 | | 270 | | 300 |
| Lease liabilities | | 39 | | 6 | | 39 | | 6 |
| Other payables and accrued liabilities | | 119 | | 105 | | 119 | | 105 |
Senior unsecured convertible bonds issued on August 4, 2020 (1) | | 728 | | 1,457 | | 731 | | 1,442 |
| Embedded conversion option - Senior unsecured convertible bonds issued on August 4, 2020 (Tranche A) | | — | | 4 | | — | | 4 |
| Embedded conversion option - Senior unsecured convertible bonds issued on August 4, 2020 (Tranche B) | | 19 | | 29 | | 19 | | 29 |
(1) The carrying amount of the senior unsecured convertible bonds issued on August 4, 2020 and outstanding as of December 31, 2025 and December 31, 2024 corresponds to the liability component only, since, at initial recognition, an amount of $219 million was separately recognized as embedded derivative financial instruments. The fair value of the senior convertible bonds includes the fair value of all embedded derivatives.
8.3.15. Guarantees and contingencies
Guarantees given by the Company to its affiliates for the benefit of third parties amounted to approximately $1,457 million as of December 31, 2025 (2024: $1,508 million), out of which STMicroelectronics Finance B.V.’s obligation relates to three credit facilities with EIB and two credit facilities with CDP SpA.
EIB facilities
The first credit facility, signed in August 2017, is a €500 million loan, in relation to R&D and capital expenditures in the EU, fully drawn in Euros, of which $205 million was outstanding as of December 31, 2025 (December 31, 2024: $233 million). The second one, signed in 2020, is a €500 million credit facility agreement to support R&D and capital expenditure programs in Italy and France. It was fully drawn in Euros in 2021, representing $352 million outstanding as of December 31, 2025 (December 31, 2024: $364 million). In 2022, the Group signed a third long-term amortizing credit facility with EIB of €600 million. Of this amount, €300 was withdrawn in Euros in 2022, and $300 million was withdrawn in U.S dollars during 2024, representing and outstanding balance of $552 million as of December 31, 2025 (December 31, 2024: $581 million). In December 2025, the Group entered into a €500 million financing agreement with EIB to support the acceleration of R&D and high-volume chip manufacturing in Italy and France. This agreement represents the first tranche of a broader €1 billion credit line approved by EIB in favor of the Group. Of this amount, €500 million was withdrawn in March 2026.
CDP SpA facilities
The first credit facility, signed in 2021, is a €150 million loan, fully drawn in Euros, of which $44 million were outstanding as of December 31, 2025 (December 31, 2024: $65 million). The second one, signed in 2022, is a €200 million loan, fully drawn in Euros, of which $126 million was outstanding as of December 31, 2025 (December 31, 2024: $143 million).
As from August 22, 2013, the Company assumes joint and several liabilities for all debts arising from legal acts for STMicroelectronics International N.V., STMicroelectronics Finance II N.V. and STMicroelectronics Finance B.V., all in accordance with article 403 of Book 2 of the Dutch Civil Code.
There is no other type of contingencies as of December 31, 2025 and 2024.
8.3.16. General and administrative expenses
General and administrative expenses are the administrative costs related to the operations of the holding company, which consisted of the following:
| | | | | | | | | | | | | | |
| In millions of U.S. dollars | | December 31,
2025 | | December 31,
2024 |
| Employees benefits | | (6) | | | (6) | |
| Amortization | | (6) | | | (6) | |
| Depreciation | | — | | | (1) | |
| Insurance | | (12) | | | (13) | |
| Other | | (7) | | | (7) | |
| Total | | (31) | | | (33) | |
The average number of persons employed by the Company during the year ended December 31, 2025 was 17 out of which 7 outside The Netherlands (2024: 18 out of which 7 outside The Netherlands).
8.3.17. Finance income
| | | | | | | | | | | | | | |
| In millions of U.S. dollars | | December 31,
2025 | | December 31,
2024 |
| | | | |
| | | | |
| | | | |
| Change in fair value of the conversion option of Tranche A convertible bonds issued on August 4, 2020 | | 4 | | | 225 | |
| Change in fair value of the conversion option of Tranche B convertible bonds issued on August 4, 2020 | | 10 | | | 252 | |
| Interest income on quoted debt securities | | 110 | | | 63 | |
| | | | |
| Interest income on group receivable short-term loans | | 204 | | | 235 | |
| Other finance income | | 100 | | | 219 | |
| Total finance income | | 428 | | | 994 | |
As described in Note 8.3.7 the change in fair value of the non-equity derivative instruments corresponding to the bondholders’ conversion option and the issuer’s call option embedded in the unsecured senior convertible bonds issued on August 4, 2020, generated a gain of $14 million and an expense of $2 million respectively, for the year ended December 31, 2025 compared a loss of $46 million and an income of $477 million respectively, for the year ended December 31, 2024.
8.3.18. Finance cost
| | | | | | | | | | | | | | |
| In millions of U.S. dollars | | December 31,
2025 | | December 31,
2024 |
| | | | |
| Interest on Senior Bonds | | (20) | | | (24) | |
| Amortization of issuance costs on Senior Bonds | | (1) | | | (1) | |
| | | | |
| | | | |
| Change in fair value of the call option of Tranche A convertible bonds issued on August 4, 2020 | | — | | | (14) | |
| Change in fair value of the call option of Tranche B convertible bonds issued on August 4, 2020 | | (2) | | | (32) | |
| Interests on long-term loans and borrowings | | (14) | | | (18) | |
| Interest expenses on group companies short-term notes payable | | (2) | | | (3) | |
| Other finance costs | | (2) | | | (2) | |
| Total finance cost | | (41) | | | (94) | |
8.3.19. Other income
Other income consisted of the following:
| | | | | | | | | | | | | | |
| In millions of U.S. dollars | | December 31,
2025 | | December 31,
2024 |
| Net foreign exchange gain | | — | | | 46 | |
| Total other income | | — | | | 46 | |
8.3.20. Other expenses
Other expenses consisted of the following:
| | | | | | | | | | | | | | |
| In millions of U.S. dollars | | December 31,
2025 | | December 31,
2024 |
| Loss on sale of financial Investments | | — | | | (1) | |
| Net foreign exchange loss | | (46) | | | — | |
| Other expenses | | (4) | | | (2) | |
| Total other expense | | (50) | | | (3) | |
8.3.21. Contractual obligations
The Company’s contractual obligations as of December 31, 2025 were as follows:
| | | | | | | | | | | | | | | | | | | | | | | | | | | | | | | | | | | | | | | | | | | | |
| In millions of U.S. dollars | | Total | | 2026 | | 2027 | | 2028 | | 2029 | | 2030 | | There-
after |
Senior convertible bonds, Tranche B (1) | | 750 | | | — | | | 750 | | | — | | | — | | | — | | | — | |
| Loans from European Investment Bank | | 270 | | | 30 | | | 30 | | | 30 | | | 30 | | | 30 | | | 120 | |
| Pension obligations | | 4 | | | — | | | — | | | — | | | — | | | — | | | 4 | |
| Lease liabilities | | 39 | | | 38 | | | 1 | | | — | | | — | | | — | | | — | |
| Total | | 1,063 | | | 68 | | | 781 | | | 30 | | | 30 | | | 30 | | | 124 | |
(1)Starting August 2024 for Tranche B convertible bonds, the bondholders will have full conversion rights. The table reports the repayment obligation based on the original contractual maturity of the Tranche in 2027
8.3.22. Related party transactions
There were no material transactions with significant related parties during the years ended December 31, 2024 and 2024.
Remuneration to managing board and supervisory board members
For details on the remuneration to the Managing Board and Supervisory Board members, see the consolidated financial statements of the Company (Note 7.6.36).
8.3.23 Auditors’ fees
The following audit fees were allocated to the period:
| | | | | | | | | | | | | | |
| In thousands of U.S. dollars | | December 31,
2025 | | December 31,
2024 |
| Audits of consolidated and statutory financial statements | | 6,220 | | | 5,775 | |
| Other assurance services | | 1,255 | | | 1,236 | |
| Non-audit services | | 57 | | | 7 | |
| | | | |
| Total | | 7,532 | | | 7,018 | |
The fees listed above relate only to the procedures applied to the Company and its consolidated group entities by Ernst & Young. The procedures were applied by audit firm’s member of the EY network. In 2025, the fees related to services provided by Ernst & Young Accountants LLP for the audit of the statutory annual accounts totaled $180,705 ($180,705 in 2024).
8.3.24. Proposed cash dividend
Upon the proposal of the Managing Board, the Supervisory Board will propose to the 2026 AGM in line with the Company's Dividend Policy, to declare a cash dividend of US$0.36 per outstanding share of the Company’s common stock, to be distributed in quarterly installments of US$0.09 in each of the second, third and fourth quarter of 2026 and first quarter of 2027 to shareholders of record in the month of each quarterly payment, as further described in the General Meeting of Shareholders agenda and explanatory notes thereto.
March 26, 2026
THE MANAGING BOARD
Jean-Marc Chery (President and Chief Executive Officer, Chairman)
Lorenzo Grandi (President and Chief Financial Officer)
THE SUPERVISORY BOARD
Nicolas Dufourcq (Chairman)
Armando Varricchio
Simonetta Acri
Orio Bellezza
Pascal Daloz
Ana de Pro Gonzalo
Werner Lieberherr
Frédéric Sanchez
Hélène Vletter-van Dort
9. Other information
9.1. Auditors’ report
The report of the auditors, EY Accountants B.V., is presented on the following pages in this annual report.
9.2. Appropriation of results – provisions in Company’s Articles of Association
The Supervisory Board, upon the proposal of the Managing Board, is allowed to allocate net profit to a reserve fund. The Articles of Association provide that the net result for the year, after deduction of (i) any amount to set up and maintain reserves required by Dutch Law and the Articles of Association, (ii) if any of our preference shares are issued and outstanding, the dividend to be paid to the holders of preference shares and (iii) the aforementioned allocation to the reserve fund, is subject to the disposition by the General Meeting of Shareholders.
In the case that a net loss for the year exceeds retained earnings, no dividend payments are allowed until the loss has been recovered from net profit(s) in future years.
9.3. Branches
The Company has a branch in Switzerland, located at 39 Chemin du Champ des Filles, 1228 Plan-les-Ouates, Geneva. Switzerland.

| | | | | | | | |
EY Accountants B.V. Prof.Dr.Dorgelolaan 12 5613 AM Eindhoven, Netherlands Postbus 455 5600 AL Eindhoven, Netherlands
|
| Tel: +31 88 407 10 00 ey.com
|
Independent auditor’s report
To: the shareholders and supervisory board of STMicroelectronics N.V.
Report on the audit of the financial statements 2025 included in the annual report
Our opinion
We have audited the accompanying financial statements for the financial year ended 31 December 2025 of STMicroelectronics N.V. based in Amsterdam, the Netherlands. The financial statements comprise the consolidated financial statements and the company financial statements.
In our opinion:
•The consolidated financial statements give a true and fair view of the financial position of STMicroelectronics N.V. as at 31 December 2025 and of its result and its cash flows for 2025 in accordance with International Financial Reporting Standards as adopted in the European Union (EU-IFRSs) and with Part 9 of Book 2 of the Dutch Civil Code
•The company financial statements give a true and fair view of the financial position of STMicroelectronics N.V. as at 31 December 2025 and of its result for 2025 in accordance with Part 9 of Book 2 of the Dutch Civil Code
The consolidated financial statements comprise:
•The consolidated statement of financial position as at 31 December 2025
•The following statements for 2025: the consolidated income statement, the consolidated statements of comprehensive income, changes in equity and cash flows
•The notes comprising material accounting policy information and other explanatory information
The company financial statements comprise:
•The company’s statement of financial position 31 December 2025
•The company’s income statement 2025
•The notes comprising a summary of the accounting policies and other explanatory information
Basis for our opinion
We conducted our audit in accordance with Dutch law, including the Dutch Standards on Auditing.
Our responsibilities under those standards are further described in the Our responsibilities for the audit of the financial statements section of our report.
We are independent of STMicroelectronics N.V. in accordance with the EU Regulation on specific requirements regarding statutory audit of public-interest entities the Wet toezicht accountantsorganisaties (Wta, Audit firms supervision act), the Verordening inzake de onafhankelijkheid van accountants bij assurance-opdrachten (ViO, Code of Ethics for Professional Accountants, a regulation with respect to independence) and other relevant independence regulations in the Netherlands. Furthermore, we have complied with the Verordening gedrags- en beroepsregels accountants
(VGBA, Dutch Code of Ethics for Professional Accountants).
We believe the audit evidence we have obtained is sufficient and appropriate to provide a basis for our opinion.
| | |
EY Accountants B.V. is a private limited liability company with registered office and principal place of business at Boompjes 258, 3011 XZ Rotterdam, the Netherlands and registered with the Chamber of Commerce number 92704093. Our services are subject to general terms and conditions, which inter alia contain a limitation of liability clause and a choice of forum. |
392
Information in support of our opinion
We designed our audit procedures in the context of our audit of the financial statements as a whole and in forming our opinion thereon. The following information in support of our opinion and any findings were addressed in this context, and we do not provide a separate opinion or conclusion on these matters.
Our understanding of the business
STMicroelectronics N.V. (“the company”, and, together with its consolidated subsidiaries, “the group”) is a global semiconductor manufacturer operating in a broad range of markets. We paid specific attention in our audit to a number of areas driven by the operations of the group and our risk assessment.
We determined materiality and identified and assessed the risks of material misstatement of the financial statements, whether due to fraud or error in order to design audit procedures responsive to those risks and to obtain audit evidence that is sufficient and appropriate to provide a basis for our opinion.
Materiality
| | | | | |
| Materiality | USD 94 million (2024: USD 90 million). |
| Benchmark applied | 5% (rounded) of pretax income, adjusted for the accounting of the convertible bonds. |
| Explanation | Based on our professional judgement we have considered earnings-based measures as the appropriate basis to determine materiality.
We considered that the pretax income, adjusted for accounting
(fair value remeasurement) of convertible bonds is an important benchmark for the users of the financial statements, given the nature of the business and the characteristics of the company. Due to the significant lower results in 2025 the materiality is based on the 2024 figures, which we challenged against the average results of the past three years and based on the management expectation that the pretax income will return to 2024 levels in 2027, with further improvements forecasted for 2028. |
We have also taken into account misstatements and/or possible misstatements that in our opinion are material for the users of the financial statements for qualitative reasons.
We agreed with the supervisory board that misstatements in excess of USD 4.7 million, which are identified during the audit, would be reported to them, as well as smaller misstatements that in our view must be reported on qualitative grounds.
Scope of the group audit
STMicroelectronics N.V. is at the head of a group of entities. The financial information of this group is included in the financial statements.
We are responsible for planning and performing the group audit to obtain sufficient appropriate audit evidence regarding the financial information of the entities or business units within the group as a basis for forming an opinion on the financial statements. We are also responsible for the direction, supervision, review and evaluation of the audit work performed for purposes of the group audit. We bear the full responsibility for the auditor’s report.
Based on our understanding of the group and its environment, the applicable financial framework and the group’s system of internal control, we identified and assessed risks of material misstatement of the financial statements and the significant accounts and disclosures. Based on this risk assessment,
we determined the nature, timing and extent of audit work performed, including the entities or business units within the group (components) at which to perform audit work. For this determination we considered the nature of the relevant events and conditions underlying the identified risks of material misstatements for the financial statements, the association of these risks to components and the materiality or financial size of the components relative to the group. We have worked closely together with the team in Switzerland in performing audit work in respect of our audit approach including group risk assessment; and in directing, supervising, reviewing and/or coordinating the work of the component teams. We communicated the audit work to be performed and identified risks through instructions for component auditors as well as requesting component auditors to communicate matters related to the financial information of the component that is relevant to identifying and assessing risks.
We have:
•Performed audit procedures ourselves at parent company STMicroelectronics N.V., located in the Netherlands which was assigned a full scope
•Used the work of other EY auditors when auditing entities in Switzerland, France, Singapore and Italy which were assigned a full scope
•Used the work of other EY auditors when auditing entities in US, Japan, Malaysia, Malta, Philippines and China which were assigned a specific scope
This resulted in a coverage of 94% of the profit before tax, 99.9% of revenue and 98% of total assets.
For other components, we performed specified audit procedures and analytical procedures to corroborate that our risk assessment and scoping remained appropriate throughout the audit.
We performed site visits to meet with local management and component teams, observe the component operations, discuss the group risk assessment and the risks of material misstatements for
EY Switzerland, EY Italy and EY Malta. We reviewed and evaluated the adequacy of the deliverables from component auditors and reviewed key working papers for selected components to address the risks of material misstatement. We held planning meetings, key meetings required based on circumstances and we attended closing meetings with local management and component teams for all full and specific scope components. During these meetings and calls, amongst others, the planning, procedures performed based on risk assessments, findings and observations were discussed and any further work deemed necessary by the primary or component team was then performed.
By performing the audit work mentioned above at the entities or business units within the group, together with additional work at group level, we have been able to obtain sufficient and appropriate audit evidence about the group’s financial information to provide an opinion on the financial statements.
Teaming and use of specialists
We ensured that the audit teams both at group and at component levels included the appropriate skills and competences which are needed for the audit of a listed client in the Semiconductor industry.
We included specialists in the areas of IT audit, forensics and income tax and have made use of our own valuations and actuarial experts.
Our focus on climate-related risks and the energy transition
Climate change and the energy transition are high on the public agenda. Issues such as CO2 reduction impact financial reporting, as these issues entail risks for the business operation, the valuation of assets and provisions or the sustainability of the business model and access to financial markets of companies with a larger CO2 footprint.
The managing board summarized the STMicroelectronics N.V.’s commitments and obligations, and reported in the Section 3.3.1.2 and 3.4 of the report of the managing board how STMicroelectronics N.V. is addressing climate-related and environmental risks. Furthermore, we refer to Section 3.4 of the report of the managing board where the managing board discloses its assessment and implementation plans in connection to climate-related risks and the effects of energy transition.
As part of our audit of the financial statements, we evaluated the extent to which climate-related risks and the effects of the energy transition and the company’s commitments and (constructive) obligations, are taken into account in estimates and significant assumptions Furthermore, we read the report of the managing board and considered whether there is any material inconsistency between the non-financial information in Section 3.3.1.2 and 3.4 and the financial statements.
Based on the audit procedures performed, we do not deem climate-related risks to have a material impact on the financial reporting judgements, estimates or significant assumptions as at
31 December 2025.
Our focus on fraud and non-compliance with laws and regulations
Our responsibility
Although we are not responsible for preventing fraud or non-compliance and we cannot be expected to detect non-compliance with all laws and regulations, it is our responsibility to obtain reasonable assurance that the financial statements, taken as a whole, are free from material misstatement,
whether caused by fraud or error. The risk of not detecting a material misstatement resulting from fraud is higher than for one resulting from error, as fraud may involve collusion, forgery, intentional omissions, misrepresentations, or the override of internal control.
Our audit response related to fraud risks
We identified and assessed the risks of material misstatements of the financial statements due to fraud. During our audit we obtained an understanding of the company and its environment and the components of the system of internal control, including the risk assessment process and the managing board’s process for responding to the risks of fraud and monitoring the system of internal control and how the supervisory board exercises oversight, as well as the outcomes. We refer to Section 3.2.6 and 3.3.1 of the report of the managing board for managing board’s risk assessment after consideration of potential fraud risks.
We evaluated the design and relevant aspects of the system of internal control and in particular the fraud risk assessment, as well as the code of conduct, whistle blower procedures and incident registration.
We evaluated the design and the implementation and, where considered appropriate, tested the operating effectiveness, of internal controls designed to mitigate fraud risks.
As part of our process of identifying fraud risks, we evaluated fraud risk factors with respect to financial reporting fraud, misappropriation of assets and bribery and corruption in close co-operation with our forensic and legal specialists. We evaluated whether these factors indicate that a risk of material misstatement due to fraud is present.
We incorporated elements of unpredictability in our audit. We also considered the outcome of our other audit procedures and evaluated whether any findings were indicative of fraud or non-compliance.
We addressed the risks related to management override of controls, as this risk is present in all organizations. For these risks we have, among other things, performed procedures to evaluate whether the selection and application of accounting policies by the company, particularly those relating to subjective measurements and complex transactions, as disclosed in Note 7.6.8 “Critical accounting estimates and judgements” to the financial statements. We have also used data analysis to identify and address high-risk journal entries and other adjustments made in the financial reporting process.
We evaluated the business rationale (or the lack thereof) of significant extraordinary transactions, including those with related parties.
The following fraud risks identified required significant attention during our audit.
| | | | | |
| Presumed risks of fraud in revenue recognition |
| Fraud risk | We presumed that there is risk of fraud in revenue recognition. We evaluated that the risk of side arrangements entered into by the managing board to induce future sales with distributors and without knowledge of the finance department in particular give rise to such risks. |
| Our audit approach | We describe the audit procedures responsive to the presumed risk of fraud in revenue recognition in the description of our audit approach for the key audit matter revenue recognition. |
We considered available information and made enquiries of relevant executives, directors, internal audit, legal, compliance, human resources and regional directors and the supervisory board.
The fraud risks we identified, enquiries and other available information did not lead to specific indications for fraud or suspected fraud potentially materially impacting the view of the financial statements.
Our audit response related to risks of non-compliance with laws and regulations
We performed appropriate audit procedures regarding compliance with the provisions of those laws and regulations that have a direct effect on the determination of material amounts and disclosures in the financial statements. Furthermore, we assessed factors related to the risks of non-compliance with laws and regulations that could reasonably be expected to have a material effect on the financial statements from our general industry experience, through discussions with managing board, reading minutes, inspection of internal audit and compliance reports, and performing substantive tests of details of classes of transactions, account balances or disclosures. Reference is made to Note 7.6.37, “commitments, contingencies, claims and legal proceedings” to the financial statements.
We also inspected lawyers’ letters and remained alert to any indication of (suspected) non-compliance throughout the audit. We have been informed by management that there was no correspondence with regulatory authorities. Finally, we obtained written representations that all known instances of non-compliance with laws and regulations have been disclosed to us.
Our audit response related to going concern
As disclosed in Section “Critical accounting estimates and judgements” in Note 7.6.8 to the financial statements, the financial statements have been prepared on a going concern basis. When preparing the financial statements, the managing board made a specific assessment of the company’s ability to continue as a going concern and to continue its operations for the foreseeable future.
We discussed and evaluated the specific assessment with the managing board exercising professional judgment and maintaining professional skepticism.
We considered whether the managing board’s going concern assessment, based on our knowledge and understanding obtained through our audit of the financial statements or otherwise, contains all relevant events or conditions that may cast significant doubt on the company’s ability to continue as a going concern. If we conclude that a material uncertainty exists, we are required to draw attention in our auditor’s report to the related disclosures in the financial statements or, if such disclosures are inadequate, to modify our opinion.
Based on our procedures performed, we did not identify material uncertainties about going concern or the managing board’s use of the going concern basis of accounting. Our conclusions are based on the audit evidence obtained up to the date of our auditor’s report. However, future events or conditions may cause a company to cease to continue as a going concern.
Our key audit matters
Key audit matters are those matters that, in our professional judgment, were of most significance in our audit of the financial statements. We have communicated the key audit matters to the supervisory board. The key audit matters are not a comprehensive reflection of all matters discussed.
A new key audit matter Uncertain tax positions has been defined.
| | | | | |
| Improper revenue recognition due to side arrangements with distributors |
| Risk | As described in Note 7.6.26 to the consolidated financial statements, the company recognized total revenues of USD 11,800 million as of 31 December 2025.
The company recognizes revenue from products sold to customers, which includes Original Equipment Manufacturers (OEMs) and distributors, amounting to
USD 8,539 million and USD 3,261 million, respectively.
Auditing the company’s revenue requires significant attention of the audit team, since it is a key financial metric, with a large volume of transactions and multiple market channels. In addition, we consider the risk of side arrangements with distributors not appropriately accounted for as a fraud risk, also as a result of management override of controls. As a result, we considered the risk of improper revenue recognition due to side arrangements with distributors as a key audit matter. |
| Our audit approach | We obtained an understanding, evaluated the control design and tested the operating effectiveness of controls over the company’s revenue recognition process,
including the processes to detect side arrangements. Additionally, we inspected and evaluated the managing board’s assessment of non-standard terms and conditions, and certifications completed by the company’s sales organization. We also performed procedures to evaluate the design and operation of IT processes, including testing of IT general controls and application controls and the data and reports used in the execution of certain controls.
Our substantive audit procedures included, among others, circulation of terms and conditions confirmations with selected customers, searching for indications of side arrangements through inquiry and substantive testing procedures, test significant non-automated adjustments to revenue and perform additional inquiries of key members of the commercial managing board. We have evaluated the appropriateness of the company’s revenue recognition policies in accordance with IFRS 15 “Revenue from Contracts with Customers” and whether the policies have been applied consistently or whether changes, if any, are appropriate in the circumstances.
We also assessed the adequacy of the company’s revenue disclosure in the financial statements. |
| Key observations | We consider that the company’s revenue recognition accounting policies were appropriately applied and disclosed in the consolidated financial statements.
|
| | | | | |
| Recoverability of deferred tax assets |
| Risk | At 31 December 2025 the company recognized net deferred tax assets of USD 148 million. As explained in note 7.6.34 to the consolidated financial statements,
the company performs an evaluation of the likelihood that future taxable income will be generated in an amount sufficient to utilize such deferred tax assets prior to their expiration, and, after having considered positive and negative available evidence, records a valuation allowance for any deferred tax assets when it is more likely than not they will not be realized.
Assessing the recognition of and recoverability of deferred tax assets involves significant judgement and estimates, including, among others: the prospective financial information used by the managing board in order to assess future taxable income, transfer pricing policies and the timing of reversal of temporary differences. These assumptions have a high degree of uncertainty and subjectivity, since they are dependent on the outcome of future events. Consequently, we identified this as a key audit matter. |
| Our audit approach | We obtained an understanding, evaluated the control design, and tested the operating effectiveness of management’s controls around, amongst others: the calculation of the gross amount of deferred tax assets recorded, the preparation of the prospective financial information used to determine the company’s future taxable income and the assessment of valuation allowance needed for deferred tax assets not deemed recoverable.
We involved tax professionals to assist with our procedures in evaluating management's weighting of available positive and negative evidence used in their assessment of the realizability of deferred tax assets. Among other procedures, we evaluated the timing of the reversal of the temporary differences and management’s prospective financial information used to determine future taxable income and its consistency with current transfer pricing policies. We compared management’s projections with the actual results of prior periods, as well as management’s consideration of current and expected industry and economic trends.
We also evaluated the company’s income tax disclosures included in Note 7.6.34 to the consolidated financial statements in relation to these matters. |
| Key observations | We consider that the company’s accounting policies related to deferred tax assets were appropriately applied and disclosed in the consolidated financial statements. |
| | | | | |
| Uncertain tax positions |
| Risk | At 31 December 2025 the company reported uncertain tax positions, as described in note 7.6.7.6 and 7.6.8.2 to the consolidated financial statements.
For the current year audit, we have assessed that there is an increased level of risk related to management’s assessment of uncertain tax positions due to tax audits in France and Italy which were received at the end of 2024 (for France) and in 2025
(for Italy). Those related controversies continue to evolve in 2025 (and beyond) through a simultaneous tax audit, mainly focused on the transfer price applied by the Company. Both jurisdictions are challenging the current methodology substantially based on cost plus versus profit split.
Assessing uncertain tax positions involves significant judgement and estimates and complex considerations of tax regulations in multiple jurisdictions and evaluation of the likelihood of different scenarios. Due to the complexity and inherent uncertainty, we identified this as a key audit matter. |
| Our audit approach | We obtained an understanding, evaluated the control design and tested the operating effectiveness of management’s controls around the assessment of uncertain tax positions. We involved tax professionals to assist with our procedures in evaluating the measurement and completeness of uncertain tax positions assessed by management. Among other procedures, we assessed the reasonableness of management’s judgement in establishing the likelihood of occurrence of different scenarios applicable to the most significant uncertain tax positions and in the calculation of the related financial impact. We evaluated and challenged the company’s judgments and estimates of uncertain tax positions resulting from ongoing local tax audits, legislative developments and relevant historical and recent judgments. |
| Key observations | We consider that the company’s assessment of uncertain tax positions are appropriately applied and disclosed in the consolidated financial statements.
|
Report on other information included in the annual report
The annual report contains other information in addition to the financial statements and our auditor’s report thereon.
Based on the following procedures performed, we conclude that the other information:
•Is consistent with the financial statements and does not contain material misstatements
•Contains the information as required by Part 9 of Book 2 of the Dutch Civil Code for the management report (excluding the sustainability statement) and the other information as required by Part 9 of Book 2 of the Dutch Civil Code and as required by Sections 2:135b and 2:145 sub‑section 2 of the Dutch Civil Code for the remuneration report
We have read the other information. Based on our knowledge and understanding obtained through our audit of the financial statements or otherwise, we have considered whether the other information contains material misstatements. By performing these procedures, we comply with the requirements of
Part 9 of Book 2: and Section 2:135b sub-Section 7 of the Dutch Civil Code and the Dutch Standard 720. The scope of the procedures performed is substantially less than the scope of those performed in our audit of the financial statements.
The managing board is responsible for the preparation of the other information, including the management report in accordance with Part 9 of Book 2 of the Dutch Civil Code and other information required by Part 9 of Book 2 of the Dutch Civil Code. The managing board and the supervisory board are responsible for ensuring that the remuneration report is drawn up and published in accordance with Sections 2:135b and 2:145 sub‑section 2 of the Dutch Civil Code.
Description of responsibilities regarding the financial statements
Responsibilities of the managing board and the supervisory board for the financial statements
The managing board is responsible for the preparation and fair presentation of the financial statements in accordance with EU-IFRSs and Part 9 of Book 2 of the Dutch Civil Code. Furthermore, the managing board is responsible for such internal control as the managing board determines is necessary to enable the preparation of the financial statements that are free from material misstatement, whether due to fraud or error.
As part of the preparation of the financial statements, the managing board is responsible for assessing the company’s ability to continue as a going concern. Based on the financial reporting framework mentioned, the managing board should prepare the financial statements using the going concern basis of accounting unless the managing board either intends to liquidate the company or to cease operations, or has no realistic alternative but to do so. The managing board should disclose events and circumstances that may cast significant doubt on the company’s ability to continue as a going concern in the financial statements.
The supervisory board is responsible for overseeing the company’s financial reporting process.
Our responsibilities for the audit of the financial statements
Our objective is to plan and perform the audit engagement in a manner that allows us to obtain sufficient and appropriate audit evidence for our opinion.
Our audit has been performed with a high, but not absolute, level of assurance, which means we may not detect all material misstatements, whether due to fraud or error during our audit.
Misstatements can arise from fraud or error and are considered material if, individually or in the aggregate, they could reasonably be expected to influence the economic decisions of users taken on the basis of these financial statements. The materiality affects the nature, timing and extent of our audit procedures and the evaluation of the effect of identified misstatements on our opinion.
We have exercised professional judgment and have maintained professional skepticism throughout the audit, in accordance with Dutch Standards on Auditing, ethical requirements and independence requirements. The Information in support of our opinion section above includes an informative summary of our responsibilities and the work performed as the basis for our opinion.
Our audit further included among others:
•Performing audit procedures responsive to the risks identified, and obtaining audit evidence that is sufficient and appropriate to provide a basis for our opinion
•Obtaining an understanding of internal control relevant to the audit in order to design audit procedures that are appropriate in the circumstances, but not for the purpose of expressing an opinion on the effectiveness of the company’s internal control
•Evaluating the appropriateness of accounting policies used and the reasonableness of accounting estimates and related disclosures made by the managing board
•Evaluating the overall presentation, structure and content of the financial statements, including the disclosures
•Evaluating whether the financial statements represent the underlying transactions and events in a manner that achieves fair presentation
Communication
We communicate with the supervisory board regarding, among other matters, the planned scope and timing of the audit and significant audit findings, including any significant findings in internal control that we identify during our audit.
In this respect we also submit an additional report to the audit committee of the supervisory board in accordance with Article 11 of the EU Regulation on specific requirements regarding statutory audit of public-interest entities. The information included in this additional report is consistent with our audit opinion in this auditor’s report.
We provide the supervisory board with a statement that we have complied with relevant ethical requirements regarding independence, and to communicate with them all relationships and other matters that may reasonably be thought to bear on our independence, and where applicable, related safeguards.
From the matters communicated with the supervisory board, we determine the key audit matters: those matters that were of most significance in the audit of the financial statements. We describe these matters in our auditor’s report unless law or regulation precludes public disclosure about the matter or when, in extremely rare circumstances, not communicating the matter is in the public interest.
Report on other legal and regulatory requirements and ESEF
Engagement
We were engaged by the supervisory board as auditor of STMicroelectronics N.V. on 17 June 2020,
for the years 2020-2025, and have operated as statutory auditor ever since the financial year 2016.
No prohibited non-audit services
We have not provided prohibited non-audit services as referred to in Article 5(1) of the EU Regulation on specific requirements regarding statutory audit of public-interest entities.
European Single Electronic Reporting Format (ESEF)
STMicroelectronics N.V. has prepared the annual report in ESEF. The requirements for this are set out in the Delegated Regulation (EU) 2019/815 with regard to regulatory technical standards on the specification of a single electronic reporting format (hereinafter: the RTS on ESEF).
In our opinion the annual report prepared in the XHTML format, including the (partially) marked-up consolidated financial statements as included in the reporting package by Microelectronics N.V.,
complies in all material respects with the RTS on ESEF.
The managing board is responsible for preparing the annual report, including the financial statements,
in accordance with the RTS on ESEF, whereby the managing board combines the various components into a single reporting package.
Our responsibility is to obtain reasonable assurance for our opinion whether the annual report in this reporting package complies with the RTS on ESEF.
We performed our examination in accordance with Dutch law, including Dutch Standard 3950N, ”Assurance-opdrachten inzake het voldoen aan de criteria voor het opstellen van een digitaal verantwoordingsdocument” (assurance engagements relating to compliance with criteria for digital reporting). Our examination included amongst others:
•Obtaining an understanding of the entity’s financial reporting process, including the preparation of the reporting package
•Identifying and assessing the risks that the annual report does not comply in all material respects with the RTS on ESEF and designing and performing further assurance procedures responsive to those risks to provide a basis for our opinion, including:
•Obtaining the reporting package and performing validations to determine whether the reporting package containing the Inline XBRL instance document and the XBRL extension taxonomy files, has been prepared in accordance with the technical specifications as included in the RTS on ESEF
•Examining the information related to the consolidated financial statements in the reporting package to determine whether all required mark-ups have been applied and whether these are in accordance with the RTS on ESEF
Eindhoven, 26 March 2026
EY Accountants B.V.
signed by M. Moolenaar
Limited assurance report of the independent auditor on the sustainability statement
To: the shareholders and the supervisory board of STMicroelectronics N.V.
Our conclusion
We have performed a limited assurance engagement on the consolidated sustainability statement for 2025 of STMicroelectronics N.V. based in Amsterdam, the Netherlands in Section 3.4 Sustainability Statement of the accompanying report of the managing board including the information incorporated in the sustainability statement by reference (hereinafter: the sustainability statement).
Based on our procedures performed and the evidence obtained, nothing has come to our attention that causes us to believe that the sustainability statement is not, in all material respects:
•Prepared in accordance with the European Sustainability Reporting Standards (ESRS) as adopted by the European Commission and compliant with the double materiality assessment process carried out by STMicroelectronics N.V. to identify the information reported pursuant to the ESRS; and
•Compliant with the reporting requirements provided for in Article 8 of Regulation (EU) 2020/852 (Taxonomy Regulation).
Our conclusion has been formed on the basis of the matters outlined in this limited assurance report.
Basis for our conclusion
We have performed our limited assurance engagement on the sustainability statement in accordance with Dutch law, including Dutch Standard 3810N, “Assurance-opdrachten inzake duurzaamheidsverslaggeving” (Assurance engagements relating to sustainability reporting), which is a specified Dutch standard that is based on the International Standard on Assurance Engagements (ISAE) 3000 (Revised), “Assurance engagements other than audits or reviews of historical financial information”.
Our assurance engagement was aimed to obtain a limited level of assurance that the sustainability statement is free from material misstatements. The procedures vary in nature and timing from, and are less in extent, than for a reasonable assurance engagement. Consequently, the level of assurance obtained in a limited assurance engagement is substantially lower than the assurance that would have been obtained had a reasonable assurance engagement been performed.
Our responsibilities in this regard are further described in the section “Our responsibilities for the limited assurance engagement on the sustainability statement” of our report.
We are independent of STMicroelectronics N.V. in accordance with the Verordening inzake de onafhankelijkheid van accountants bij assurance-opdrachten (ViO, Code of Ethics for Professional Accountants, a regulation with respect to independence) and other relevant independence regulations in the Netherlands. This includes that we do not perform any activities that could result in a conflict of interest with our independent assurance engagement and we are not involved in the preparation of the sustainability statement, as doing so may compromise our independence.
Furthermore, we have complied with the Verordening gedrags- en beroepsregels accountants (VGBA, Dutch Code of Ethics for Professional Accountants). The ViO and VGBA are at least as demanding as the International code of ethics for professional accountants (including International independence standards) of the International Ethics Standards Board for Accountants (the IESBA Code) as relevant to limited assurance engagements on sustainability statements of public interest entities in the European Union.
We believe that the assurance evidence we have obtained is sufficient and appropriate to provide a basis for our conclusion.
Inherent limitations associated with measurement or evaluation of sustainability information
Significant uncertainties affecting the quantitative metrics and monetary amounts
Section 3.4.2.1 General basis for preparation (ESRS 2 BP 1 and BP 2), Sources of estimation and outcome uncertainty in the sustainability statement identifies the quantitative metrics and monetary amounts that are subject to a high level of measurement uncertainty and discloses information about the sources of measurement uncertainty and the assumptions, approximations and judgements STMicroelectronics N.V. has made in measuring these in compliance with the ESRS.
Furthermore, the disclosure in section 3.4.3.1 Climate Change (E1), Gross Scope 3 GHG emissions, explains the inherent limitations regarding why STMicroelectronics N.V. is unable to make reasonable assumptions for estimating the amount of GHG emissions for Scope 3 Category 11.
Comparability may be limited for entity-specific sustainability information
STMicroelectronics N.V. provides additional entity-specific sustainability information referenced in Section 3.4.2.1 General basis for preparation (ESRS 2 BP 1 and BP 2). The comparability ofentity-specific sustainability information between entities and over time may be affected by the absence of a uniform practice or availability of external information sources to measure or evaluate this information that can support comparability. This allows for the application of different, but acceptable, measurement techniques.
Inherent limitations of a double materiality assessment process
The sustainability statement may not include every impact, risk and opportunity or additional entity-specific disclosure that each individual stakeholder (group) may consider important in its own particular assessment.
Inherent limitations of forward-looking information
In reporting forward-looking information in accordance with the ESRS, managing board describes the underlying assumptions and methods of producing the information, as well as other factors that provide evidence that it reflects the actual plans or decisions made by STMicroelectronics N.V. (actions).
Forward-looking information relates to events and actions that have not yet occurred and may never occur. The actual outcome is likely to be different since anticipated events frequently do not occur as expected.
Comparative information not assured
Sustainability information for 2023 and prior years included in the sustainability statement, has not been part of this limited assurance engagement. Consequently, we do not provide any assurance on the comparative information and thereto related disclosures in the sustainability statement for 2023 and prior years.
Our conclusion is not modified in respect of this matter.
Responsibilities of the managing board and the supervisory board for the sustainability statement
The managing board is responsible for the preparation of the sustainability statement in accordance with the ESRS, including the double materiality assessment process carried out by STMicroelectronics N.V. as the basis for the sustainability statement and disclosure of material impacts, risks and opportunities in accordance with the ESRS. As part of the preparation of the sustainability statement, the managing board is responsible for compliance with the reporting requirements provided for in Article 8 of Regulation (EU) 2020/852 (Taxonomy Regulation).
The managing board is also responsible for selecting and applying additional entity-specific disclosures to enable users to understand STMicroelectronics N.V.’s sustainability-related impacts, risks or opportunities and for determining that these additional entity-specific disclosures are suitable in the circumstances and in accordance with the ESRS.
Furthermore, the managing board is responsible for such internal control as it determines is necessary to enable the preparation of the sustainability statement that is free from material misstatement, whether due to fraud or error.
The supervisory board is responsible for overseeing the sustainability reporting process including the double materiality assessment process carried out by STMicroelectronics N.V.
Our responsibilities for the limited assurance engagement on the sustainability statement
Our responsibility is to plan and perform the limited assurance engagement in a manner that allows us to obtain sufficient and appropriate assurance evidence for our conclusion.
We apply the applicable quality management requirements pursuant to the Nadere voorschriften kwaliteitsmanagement (NVKM, regulations for quality management) and the International Standard on Quality Management (ISQM) 1, and accordingly maintain a comprehensive system of quality management including documented policies and procedures regarding compliance with ethical requirements, professional standards and other relevant legal and regulatory requirements.
Our limited assurance engagement included amongst others:
•Performing inquiries and an analysis of the external environment and obtaining an understanding of relevant sustainability themes and issues, the characteristics of STMicroelectronics N.V., its activities and the value chain and its key intangible resources in order to assess the double materiality
assessment process carried out by STMicroelectronics N.V. as the basis for the sustainability statement and disclosure of all material sustainability-related impacts, risks and opportunities in accordance with the ESRS
•Obtaining through inquiries a general understanding of the internal control environment, STMicroelectronics N.V.’s processes for gathering and reporting entity-related and value chain information, the information systems and STMicroelectronics N.V.’s risk assessment process relevant to the preparation of the sustainability statement and for identifying STMicroelectronics N.V.’s activities, determining eligible and aligned economic activities and prepare the disclosures provided for in Article 8 of Regulation (EU) 2020/852 (Taxonomy Regulation), without obtainingassurance information about the implementation or testing the operating effectiveness of controls
•Assessing the double materiality assessment process carried out by STMicroelectronics N.V. and identifying and assessing areas of the sustainability statement, including the disclosures provided for in Article 8 of Regulation (EU) 2020/852 (Taxonomy Regulation), where misleading or unbalanced information or material misstatements, whether due to fraud or error, are likely to arise (‘selected disclosures’). Designing and performing further assurance procedures aimed at assessing that the sustainability statement is free from material misstatements responsive to this risk analysis.
•Considering whether the description of the double materiality assessment process in the sustainability statement made by the managing board appears consistent with the process carried out by STMicroelectronics N.V.
•Determining the nature and extent of the procedures to be performed for locations. For this, the nature, extent and/or risk profile of these sites are decisive. Based thereon we selected the Crolles and Kirkop sites to visit. The visits to Crolles and Kirkop are aimed at, on a local level, obtaining understanding of the control environment and reporting processes to corporate level related to sustainability information
•Performing analytical review procedures on quantitative information in the sustainability statement, including consideration of data and trends
•Assessing whether STMicroelectronics N.V.’s methods for developing estimates are appropriate and have been consistently applied for selected disclosures. We considered data and trends; however our procedures did not include testing the data on which the estimates are based or separately developing our own estimates against which to evaluate the managing board’s estimates
•Analyzing, on a limited sample basis, relevant internal and external documentation available to STMicroelectronics N.V. (including publicly available information or information from actors throughout its value chain) for selected disclosures
•Reading the other information in the annual report to identify material inconsistencies, if any, with the sustainability statement
•Considering whether the disclosures provided to address the reporting requirements provided for in Article 8 of Regulation (EU) 2020/852 (Taxonomy Regulation) for each of the environmental objectives, reconcile with the underlying records of STMicroelectronics N.V. and are consistent or coherent with the sustainability statement, appear reasonable, in particular whether the eligible economic activities meet the cumulative conditions to qualify as aligned and whether the technical screening criteria are met, and whether the key performance indicators disclosures have been defined and calculated in accordance with the Taxonomy delegated acts, and comply with the reporting requirements provided for in Article 8 of Regulation (EU) 2020/852 (Taxonomy Regulation), including the format in which the activities are presented
•Considering the overall presentation, structure and fundamental qualitative characteristics of information (relevance and faithful representation: complete, neutral and accurate) reported in the
sustainability statement, including the reporting requirements provided for in Article 8 of Regulation (EU) 2020/852 (Taxonomy Regulation)
•Considering, based on our limited assurance procedures and evaluation of the evidence obtained, whether the sustainability statement as a whole is free from material misstatements and prepared in accordance with the ESRS.
Communication
We communicate with the supervisory board regarding, among other matters, the planned scope and timing of the assurance engagement and significant findings that we identify during ourassurance engagement.
Amsterdam, 26 March 2026
EY Accountants B.V.
signed by J. Niewold
10. Important dates
May 27, 2026: General Meeting of Shareholders.
Please consult our website www.st.com for the latest important dates.
11. APPENDICES
Appendix 11.1. Disclosure Requirements in the ESRS covered by our sustainability statement (IRO-2)
| | | | | | | | |
Environmental Standards Disclosure requirement | | Section reference |
ESRS E1 - Climate change |
ESRS 2 GOV - 3 | Integration of sustainability-related performance in incentive schemes | 3.4.2.2.B. |
E1-1 | Transition plan for climate change mitigation | 3.4.3.1.A. |
ESRS 2 SBM-3 | Material impacts, risks and opportunities and their interaction with strategy and business model | 3.4.2.3.C. |
ESRS 2 IRO-1 | Description of the processes to identify and assess material climate-related impacts, risks and opportunities | 3.4.2.4.A. |
E1-2 | Policies related to climate change mitigation and adaptation | 3.4.3.1.B. |
E1-3 | Actions and resources in relation to climate change policies | 3.4.3.1.C. |
E1-4 | Targets related to climate change mitigation and adaptation | 3.4.3.1.C. |
E1-5 | Energy consumption and mix | 3.4.3.1.D. |
E1-6 | Gross Scopes 1, 2, 3 and Total GHG emissions | 3.4.3.1.D. |
| | | | | | | | |
Environmental Standards Disclosure requirement | | Paragraph reference |
ESRS E2 - Pollution |
ESRS 2 IRO-1 | Description of the processes to identify and assess material pollution-related impacts, risks and opportunities | 3.4.3.2.A |
E2-1 | Policies related to pollution | 3.4.3.2.B
|
E2-2 | Actions and resources related to pollution | 3.4.3.2.C |
E2-3 | Targets related to pollution | 3.4.3.2.D.1 |
E2-4 | Pollution of air, water and soil | 3.4.3.2.D.2 |
E2-5 | Substances of concern and substances of very high concern | 3.4.3.2.D.2 |
| | | | | | | | |
Environmental Standards Disclosure requirement | | Section reference |
ESRS E3 – Water |
ESRS 2 IRO-1 | Description of the processes to identify and assess material water and marine resources-related impacts, risks and opportunities | 3.4.3.3.A |
E3-1 | Policies related to water and marine resources | 3.4.3.3.B
|
E3-2 | Actions and resources related to water and marine resources | 3.4.3.3.C |
E3-3 | Targets related to water and marine resources | 3.4.3.3.D.1 |
E3-4 | Water consumption | 3.4.3.3.D.2 |
| | | | | | | | |
Environmental Standards Disclosure requirement | | Paragraph reference |
ESRS E5 – Waste |
ESRS 2 IRO-1 | Description of the processes to identify and assess material resource use and circular economy-related impacts, risks and opportunities | 3.4.3.4.A |
E5-1 | Policies related to resource use and circular economy | 3.4.3.4.B
|
E5-2 | Actions and resources related to resource use and circular economy | 3.4.3.4.C |
E5-3 | Targets related to resource use and circular economy | 3.4.3.4.D.1 |
E5-5 | Resource outflows | 3.4.3.4.D.2 |
| | | | | | | | |
Social Standards Disclosure requirement | | Section reference |
ESRS S1 – Own Workforce |
ESRS 2 SBM-2 | Interests and views of stakeholders | 3.4.2.3.B. |
ESRS 2 SBM-3 | Material impacts, risks and opportunities and their interaction with strategy and business model | 3.4.4.1.A
|
S1-1 | Policies related to own workforce | 3.4.4.1.C |
S1-2 | Processes for engaging with own workers and workers’ representatives about impacts | 3.4.4.1.B.2. |
S1-3 | Processes to remediate negative impacts and channels for own workers to raise concerns | 3.4.4.1.D. |
S1-4 | Taking action on material impacts on own workforce, and approaches to mitigating material risks and pursuing material opportunities related to own workforce, and effectiveness of those actions | 3.4.4.1.C. |
S1-5 | Targets related to managing material negative impacts, advancing positive impacts, and managing material risks and opportunities | 3.4.4.1.E.1 |
S1-6 | Characteristics of the undertaking’s employees | 3.4.4.1.E.2. |
S1-7 | Characteristics of non-employee workers in the undertaking’s own workforce | 3.4.4.1.E.2. |
S1-9 | Diversity metrics | 3.4.4.1.E.2. |
S1-10 | Adequate wages | 3.4.4.1.E.2. |
S1-14 | Health and safety metrics | 3.4.4.1.E.2. |
S1-16 | Compensation metrics (pay gap and total compensation) | 3.4.4.1.E.2. |
S1-17 | Incidents, complaints and severe human rights impacts | 3.4.5.3.A. |
| | | | | | | | |
Social Standards Disclosure requirement | | Paragraph reference |
ESRS S2 – Workers in the Supply Chain - use of phase-in provision in accordance with Appendix C of ESRS 1 and disclosing based on article 17 of ESRS 2 |
Article 17 of ESRS 2 | Workers in the Supply Chain | 3.4.4.2.A - 3.4.4.2.C |
| | | | | | | | |
Social Standards Disclosure requirement | | Section reference |
ESRS S3 – Affected Communities - use of phase-in provision in accordance with Appendix C of ESRS 1 and disclosing based on article 17 of ESRS 2 |
Article 17 of ESRS 2 | Affected Communities | 3.4.4.3.A - 3.4.4.3.C |
| | | | | | | | |
Governance Standards Disclosure requirement | | Section reference |
ESRS G1 – Business Conduct |
ESRS 2 GOV-1 | The role of the administrative, management and supervisory bodies | 3.4.5.1. |
ESRS 2 IRO-1 | Description of the processes to identify and assess material impacts, risks and opportunities | 3.4.5.2.
|
G1-1 | Business conduct policies and corporate culture | 3.4.5.3.A. |
G1-3 | Prevention and detection of corruption and bribery | 3.4.5.3.B. |
G1-4 | Incidents of corruption or bribery | 3.4.5.3.C. |
Appendix 11.2. Other EU legislation
| | | | | | | | | | | |
Other EU legislation Appendix B Disclosure requirement | Data Point | Legislation | Cross-reference / Not applicable / Not material / Phased-in1 |
ESRS 2, GOV-1 | 21 (d) Board’s gender diversity | SFDR/BRR | 3.4.2.2.A. |
| 21 (e) Percentage of board members who are independent | BRR | 3.4.2.2.A. |
ESRS 2, GOV-4 | 30 Statement on due diligence | SFDR | 3.4.2.2.C. |
ESRS 2, SBM-1 | 40 (d) (i) Involvement in activities related to fossil fuel activities | SFDR/P3/BRR | Not applicable |
| 40 (d) (ii) Involvement in activities related to chemical production | SFDR/BRR | Not applicable |
| 40 (d) (iii) Involvement in activities related to controversial weapons | SFDR/BRR | Not applicable |
| 40 (d) (iv) Involvement in activities related to cultivation and production of tobacco | BRR | Not applicable |
ESRS E1-1 | 14 Transition plan to reach climate neutrality by 2050 | EUCL | 3.4.3.1.A. |
| 16 (g) Undertakings excluded from Paris-aligned benchmarks | P3/BRR | 3.4.3.1.A. |
ESRS E1-4 | 34 GHG emission reduction targets | SFDR/P3/BRR | 3.4.3.1.C.1. |
ESRS E1-5 | 38 Energy consumption from fossil sources disaggregated by sources (only high climate impact sectors) | SFDR | 3.4.3.1.D. |
| 37 Energy consumption and mix | SFDR | 3.4.3.1.D. |
| 40-43 Energy intensity associated with activities in high climate impact sectors | SFDR | 3.4.3.1.D. |
| ESRS E1-6 | 44 Gross scope 1, 2, 3, and total GHG emissions | SFDR/P3/BRR | 3.4.3.1.D. |
| 53-55 Gross GHG emissions intensity | SFDR/P3/BRR | 3.4.3.1.D. |
| | | | | | | | | | | |
ESRS E1-7 | 56 GHG removals and carbon credits | EUCL | Not applicable |
ESRS E1-9 | 66 Exposure of the benchmark portfolio to climate-related physical risks | BRR | Phased-in |
| 66 (c) Disaggregation of monetary amounts by acute and chronic physical risk; location of significant assets at material physical risk | P3 | Phased-in |
| 67 (c) Breakdown of the carrying value of its real estate assets by energy-efficiency classes | P3 | Phased-in |
| 69 Degree of exposure of the portfolio to climate-related opportunities | BRR | Phased-in |
ESRS E2-4 | 28 Amount of each pollutant listed in annex II of the E-PRTR regulation emitted to air, water, and soil | SFDR | 3.4.3.2.D.2. |
ESRS E3-1 | 9 Water and marine resources | SFDR | 3.4.3.3.B. |
| 13 Dedicated policy | SFDR | Not material |
| 14 Sustainable oceans and seas | SFDR | Not material |
ESRS E3-4 | 28 (c) Total water recycled and reused | SFDR | 3.4.3.3.D.2. |
| 29 Total water consumption in m3 per net revenue on own operations | SFDR | 3.4.3.3.D.2. |
ESRS E4, IRO-1 (ESRS 2) | 16 (a) (i) Activities negatively affecting biodiversity-sensitive areas | SFDR | Not material |
| 16 (b) Land degradation, desertification, or soil sealing | SFDR | Not material |
| 16 (c) Threatened species | SFDR | Not material |
ESRS E4-2 | 24 (b) Sustainable land/agriculture practices or policies | SFDR | Not material |
| 24 (c) Sustainable oceans/seas practices or policies | SFDR | Not material |
| | | | | | | | | | | |
| 24 (d) Policies to address deforestation | SFDR | Not material |
ESRS E5-5 | 37 (d) Non-recycled waste | SFDR | 3.4.3.4.D.2. |
| 39 Hazardous waste and radioactive waste | SFDR | 3.4.3.4.D.2. |
ESRS S1, SBM-3 (ESRS 2) | 14 (f) Risk of incidents of forced labor | SFDR | 3.4.4.1.A. |
| 14 (g) Risk of incidents of child labor | SFDR | 3.4.4.1.A. |
ESRS S1-1 | 20 Human rights policy commitments | SFDR | 3.4.4.1.C.1. |
| 21 Due diligence policies on issues addressed by the fundamental International Labor Organisation Conventions 1 to 8 | BRR | 3.4.4.1.C. |
| 22 Processes and measures for preventing trafficking in human beings | SFDR | 3.4.4.1.C.1. |
| 23 Workplace accident prevention policy or management system | SFDR | 3.4.4.1.C.1. |
ESRS S1-3 | 32 (c) Grievance/complaints-handling mechanisms | SFDR | 3.4.4.1.D.1. |
| ESRS S1-14 | 88 (b) and (c) Number of fatalities and number and rate of work-related accidents | SFDR/BRR | 3.4.4.1.E.2. |
| 88 (e) Number of days lost to injuries, accidents, fatalities, or illness | SFDR | 3.4.4.1.E.2. |
| ESRS S1-16 | 97 (a) Unadjusted gender pay gap | SFDR/BRR | 3.4.4.1.E.2. |
| 97 (b) Excessive CEO pay ratio | SFDR | 3.4.4.1.E.2. |
| ESRS S1-17 | 103 (a) Incidents of discrimination | SFDR | 3.4.5.3.A. |
| 104 (a) Non-respect of UNGPs on Business and Human Rights, ILO principles, or OECD guidelines | SFDR/BRR | 3.4.5.3.A. |
| | | | | | | | | | | |
ESRS S2, SBM-3 (ESRS 2) | 11 (b) Significant risk of child labor or forced labor in the value chain | SFDR | Phased-in |
| ESRS S2-1 | 17 Human rights policy commitments | SFDR | Phased-in |
| 18 Policies related to value chain workers | SFDR | Phased-in |
| 19 Non-respect of UNGPs on Business and Human Rights, ILO principles, or OECD guidelines | SFDR/BRR | Phased-in |
| 19 Due diligence policies on issues addressed by the fundamental International Labor Organisation Conventions 1 to 8 | BRR | Phased-in |
| ESRS S2-4 | 36 Human rights issues and incidents connected to its upstream and downstream value chain | SFDR | Phased-in |
| ESRS S3-1 | 16 Human rights policy commitments | SFDR | Phased-in |
| 17 Non-respect of UNGPs on Business and Human Rights, ILO principles, or OECD guidelines | SFDR/BRR | Phased-in |
| ESRS S3-4 | 36 Human rights issues and incidents | SFDR | Phased-in |
| ESRS S4-1 | 16 Policies related to consumers and end-users | SFDR | Not material |
| 17 Non-respect of UNGPs on Business and Human Rights and OECD guidelines | SFDR/BRR | Not material |
| ESRS S4-4 | 35 Human rights issues and incidents | SFDR | Not material |
| ESRS G1-1 | 10 (b) United Nations Convention against Corruption | SFDR | 3.4.5.3.A. |
| 10 (d) Protection of whistleblowers | SFDR | 3.4.5.3.A. |
| | | | | | | | | | | |
| ESRS G1-4 | 24 (a) Fines for violation of anti-corruption and anti-bribery laws | SFDR/BRR | 3.4.5.3.C. |
| 24 (b) Standards of anti-corruption and anti-bribery | SFDR | 3.4.5.3.C. |
Note (1):
•Cross-reference: means the reference to the section in which the data point is disclosed;
•Not applicable: means that the data point is not applicable to us;
•Not material: means that the data point is not material to us based on 2025 DMA;
•Phased-in: means that we made use of the phase-in option of the disclosure requirements as per ESRS 1, paragraph 137 and its Appendix C.
Appendix 11.3. Incorporation by reference
| | | | | | | | |
I Disclosure requirement (including datapoint) | | Section reference |
|
Composition and diversity of the Supervisory Board (ESRS 2 – 20(a); ESRS 2 DR 21(a)(c)(d)(e)) | Report of the Supervisory Board - Composition of the Supervisory Board Corporate Governance – Dutch Gender Balance Act
| 4.1. 5.5. |
Composition and diversity of the Managing Board and Executive Board (ESRS 2 – 20(a); ESRS 2 21(a)(c)(d)(e)) | Corporate Governance – Managing Board Corporate Governance – Dutch Gender Balance Act
| 5.4. 5.5. |
Composition and diversity of Senior Management (ESRS 2 – 20(a); ESRS 2 21(a)(c)(d)) | Corporate Governance – Managing Board Corporate Governance – Dutch Gender Balance Act
| 5.4. 5.5. |
Integration of sustainability-related performance in incentive schemes for Managing Board (ESRS 2 – 29) | Managing Board remuneration structure – Performance criteria short-term 2025 incentive Managing Board remuneration structure – Long term incentive grant in 2025 | 4.9.2.3. 4.9.2.3. |
Integration of sustainability-related performance in incentive schemes for Senior Management (ESRS 2 – 29) | Senior Management remuneration structure – Short-term incentive Senior Management remuneration structure – Long-term incentive | 4.9.3.2. 4.9.3.2. |
Integration of sustainability-related performance in incentive schemes for Senior Management (E1- 13) | Senior Management remuneration structure – Short-term incentive Senior Management remuneration structure – Long-term incentive Notes to the Consolidated Financial Statements - Equity | 4.9.3.2. 4.9.3.2. 7.6.20. |
Strategy, business model and value chain (ESRS 2 – 40(a) | Corporate overview - Product information | 2.3. |
Actions and resources in relation to climate change policies – significant amounts of CapEx and OpEx (E1 – 29(c) | Business Overview and Performance - Financial Outlook: Capital Investment Notes to the Consolidated Financial Statements - Subsequent events | 3.2.4. 7.6.39. |
| | | | | | | | |
Remuneration metrics (S1 – AR 101) | Remuneration comparison between the Managing Board, the Executive Committee (excluding the members of the Managing Board), the Executive Vice Presidents and indirect employees
| 4.9.4 |
Characteristics of the undertaking’s employees metrics (S1 - 50(f)) | Notes to the Consolidated Financial Statements - Employee benefits Notes to the consolidated Financial Statements - Employee benefit expenses | 7.6.23. 7.6.28. |
Appendix 11.4. IRO tables (SBM-3)
The following tables list the IROs we have identified and assessed as material in our 2025 DMA, including programs or dedicated actions and (entity-specific) targets, we have in place to address such IROs.
| | | | | | | | | | | | | | | | | | | | | | | |
E1 – Climate change mitigation |
Description | Type of IRO | Actual/ Potential | Value chain segment | Time horizon | Material on a residual(1) or inherent(2) basis | ST response | Targets |
Negative impact from ST on the environment due to its GHG emissions, contributing to climate change | Negative impact | Actual | Own operations | Short term | Residual basis | ST’s decarbonization program | We aim to achieve a 20% overall reduction in absolute scope 1 and 2 emissions by 2030 versus 2024.
We aim to abate at least 90% of our CAPG emissions by 2030 (entity-specific).
We aim to achieve a 10% reduction in our Scope 3 upstream GHG emissions by 2030, and a 20% reduction by 2035, versus 2024.
|
Negative impact from suppliers on the environment due to their GHG emissions, contributing to climate change | Negative impact | Actual | Upstream | Short term | Residual basis | ST’s decarbonization program |
Negative impact from foundries and OSATs on the environment due to their GHG emissions, contributing to climate change | Negative impact | Actual | Upstream | Short term | Residual basis | ST’s decarbonization program |
| | | | | | | | | | | | | | | | | | | | | | | |
E1 – Climate change mitigation |
Description | Type of IRO | Actual/ Potential | Value chain segment | Time horizon | Material on a residual(1) or inherent(2) basis | ST response | Targets |
Negative impact from GHG emissions generated by distributors and customers activities, and other downstream emissions contributing to climate change | Negative impact | Actual | Downstream | Short term | Residual basis | ST’s decarbonization program | No target in place |
| | | | | | | | | | | | | | | | | | | | | | | |
E1 – Climate change mitigation |
Description | Type of IRO | Actual/ Potential | Value chain segment | Time horizon | Material on a residual(1) or inherent(2) basis | ST response | Targets |
Risk of increased carbon offsetting needs to deliver ST carbon neutrality commitments by 2027 leading to higher costs, reduced stakeholder engagement (i.e. customers, investors, and talents) and damaging Company's reputation | Transition Risk | Potential | Own operations | Long term | Inherent basis | ST’s decarbonization program | We aim to achieve a 20% overall reduction in absolute scope 1 and 2 emissions by 2030 versus 2024.
We aim to abate at least 90% of our CAPG emissions by 2030 (entity-specific).
We aim to achieve a 10% reduction in our Scope 3 upstream GHG emissions by 2030, and a 20% reduction by 2035, versus 2024.
|
Risk of ST not being able to influence suppliers to reduce their GHG emissions, affecting ST's scope 3 performance | Transition Risk | Potential | Upstream | Mid term | Residual basis | ST’s decarbonization program |
Risk of ST not being able to influence foundries and OSATs to reduce their GHG emissions, affecting ST's scope 3 performance | Transition Risk | Potential | Upstream | Long term | Residual basis | ST’s decarbonization program |
| | | | | | | | | | | | | | | | | | | | | | | |
E1 – Climate change mitigation |
Description | Type of IRO | Actual/ Potential | Value chain segment | Time horizon | Material on a residual(1) or inherent(2) basis | ST response | Targets |
Risk of ST not being able to influence distributors and customers to reduce their GHG emissions and downstream emissions, affecting ST's scope 3 performance | Transition Risk | Potential | Downstream | Long term | Residual basis | ST’s decarbonization program | No target in place |
(1) "Residual" refers to the materiality assessment that takes into account existing mitigation measures.
(2) "Inherent" refers to the materiality assessment without taking into account any existing mitigation measures.
| | | | | | | | | | | | | | | | | | | | | | | |
E1 – Climate change adaptation |
Description | Type of IRO | Actual/ Potential | Value chain segment | Time horizon | Material on a residual(1) or inherent(2) basis | ST response | Targets |
Risk of natural catastrophes due to chronic and/or acute climate-related events damaging ST assets and / or local infrastructures in the vicinity (esp. utilities), leading to business interruption | Physical Risk | Potential | Own operations | Long term | Residual basis | ST’s climate adaptation activity | No target in place |
Risk of natural catastrophes due to chronic and/or acute climate-related events damaging suppliers' assets and / or local infrastructures in the vicinity (esp. utilities), disrupting ST's operations | Physical Risk | Potential | Upstream | Long term | Residual basis | ST's responsible supply chain program | No target in place |
| | | | | | | | | | | | | | | | | | | | | | | |
E1 – Climate change adaptation |
Description | Type of IRO | Actual/ Potential | Value chain segment | Time horizon | Material on a residual(1) or inherent(2) basis | ST response | Targets |
Risk of natural catastrophes due to chronic and/or acute climate-related events damaging foundries and OSATs' assets and / or local infrastructures in the vicinity (esp. utilities), disrupting ST's operations | Physical Risk | Potential | Upstream | Long term | Residual basis | ST's responsible supply chain program | No target in place |
Risk of natural catastrophes due to chronic and/or acute climate-related events damaging distributors' and customers' assets and / or local infrastructures in the vicinity (esp. utilities), leading to business loss for ST | Physical Risk | Potential | Downstream | Long term | Residual basis | ST’s climate adaptation activity | No target in place |
(1) "Residual" refers to the materiality assessment that takes into account existing mitigation measures.
(2) "Inherent" refers to the materiality assessment without taking into account any existing mitigation measures.
| | | | | | | | | | | | | | | | | | | | | | | |
E1 – Energy |
Description | Type of IRO | Actual/ Potential | Value chain segment | Time horizon | Material on a residual(1) or inherent(2) basis | ST response | Targets |
Risk of increased energy costs for ST directly due to climate-related factors or indirectly, through increased procurement prices of raw materials, services and products affecting the Company's operating margin | Transition Risk | Potential | Own operations | Long term | Residual basis | ST’s decarbonization program | We aim to adopt 100% renewable electricity by 2027 through energy procurement and renewable energy installations and maintain this percentage each year thereafter.
We aim to annually save energy, achieving cumulative energy savings of 100 GWh by 2035, versus the baseline year 2024 (entity-specific).
|
Risk of ST not being able to secure ramp-up of electricity share from PPAs contracts or insufficient access to EAC due to increasing demand leading to higher costs and reputational damages | Transition Risk | Potential | Own operations | Long term | Inherent basis | ST’s decarbonization program |
Opportunity to further reduce ST's energy consumption or benefit from the development of renewable energy sources through PPAs, leading to increased Company's profitability | Transition Opportunity | Potential | Own operations | Long term | Residual basis | ST’s decarbonization program |
(1) "Residual" refers to the materiality assessment that takes into account existing mitigation measures.
(2) "Inherent" refers to the materiality assessment without taking into account any existing mitigation measures.
| | | | | | | | | | | | | | | | | | | | | | | |
E2 – Pollution and chemicals |
Description | Type of IRO | Actual/ Potential | Value chain segment | Time horizon | Material on a residual(1) or inherent(2) basis | ST response | Targets |
Negative impact from ST on local natural ecosystems caused by existing and / or accidental pollution (e.g., hazardous chemicals and gases use and handling) of soil, air, water, living organisms, and food resources | Negative impact | Actual | Own operations | Short term | Residual basis | ST’s pollution prevention program | We aim to further decrease Volatile Organic Compound (VOC) emissions from ST’s manufacturing sites, to achieve an overall 70% absolute reduction by 2030 versus 2024. |
Negative impact from the suppliers on local natural ecosystems caused by existing and / or accidental pollution (e.g., hazardous chemicals and gases use and handling) of soil / air / water / living organisms and food resources | Negative impact | Actual | Upstream | Short term | Residual basis | ST's responsible supply chain program | No target in place |
| | | | | | | | | | | | | | | | | | | | | | | |
E2 – Pollution and chemicals |
Description | Type of IRO | Actual/ Potential | Value chain segment | Time horizon | Material on a residual(1) or inherent(2) basis | ST response | Targets |
Potential negative impact from foundries and OSATs on local natural ecosystems caused by accidental pollution (e.g., hazardous chemicals and gases use and handling) of soil, air, water, living organisms, and food resources | Negative impact | Potential | Upstream | Mid term | Residual basis | ST's responsible supply chain program | No target in place |
Risk of ST not being able to substitute hazardous materials (substances of concern and very high concern) and heavy metals (e.g., lead) in processes and products, in line with increasing customers' requirements and/or enactment or reinforcement of regulations banning, restricting, or reinforcing related obligations, resulting in additional costs leading to unmet customers' / other stakeholders' expectations | Risk | Potential | Own operations | Long term | Residual basis | ST’s substances and chemicals program | We aim, alongside our efforts to continuously assess substances of very high concern and substitution, to make all products manufactured at ST 98% halogen-free by 2035 (entity-specific). |
(1) "Residual" refers to the materiality assessment that takes into account existing mitigation measures.
(2) "Inherent" refers to the materiality assessment without taking into account any existing mitigation measures.
| | | | | | | | | | | | | | | | | | | | | | | |
E3 – Water |
Description | Type of IRO | Actual/ Potential | Value chain segment | Time horizon | Material on a residual(1) or inherent(2) basis | ST response | Targets |
Risk of increased water shortage or restrictions on water discharge for ST due to climate change-induced conditions/events, or due to decisions from public authorities imposing restrictions, leading to business interruption and higher costs | Risk | Potential | Own operations | Mid term | Residual basis | ST’s water program | We aim to have an annual water recycling rate of at least 60% by 2035 through implementing innovative programs (entity-specific).
We aim to annually save water reaching 6 million cubic meters of water saved by 2035 versus 2024 (entity-specific). |
Risk of increased water shortage or restrictions on water discharge for foundries and OSATs due to climate change-induced conditions/events, or due to decisions from public authorities imposing restrictions , leading to business interruption, thereby affecting ST's operations | Risk | Potential | Upstream | Long term | Residual basis | ST's responsible supply chain program | No target in place |
(1) "Residual" refers to the materiality assessment that takes into account existing mitigation measures.
(2) "Inherent" refers to the materiality assessment without taking into account any existing mitigation measures.
| | | | | | | | | | | | | | | | | | | | | | | |
E5 – Waste and circular economy |
Description | Type of IRO | Actual/ Potential | Value chain segment | Time horizon | Material on a residual(1) or inherent(2) basis | ST response | Targets |
Negative impact from ST on the environment from waste directed to disposal (i.e. landfill, incineration) | Negative impact | Actual | Own operations | Short term | Residual basis | ST’s waste and circular economy program | We aim, each year, to reuse, recycle, and recover at least 95% of our waste, and to limit waste disposal to below 5%. |
Negative impact from suppliers, foundries and OSATs on the environment from waste directed to disposal (i.e. landfill, incineration) | Negative impact | Actual | Upstream
| Short term | Residual basis | ST's responsible supply chain program | No target in place |
Potential negative impact on the environment at the end of life of our products due to the residual presence of harmful materials | Negative impact | Potential | Own operations | Long term | Inherent basis | ST’s substances and chemicals program | No target in place |
(1) "Residual" refers to the materiality assessment that takes into account existing mitigation measures.
(2) "Inherent" refers to the materiality assessment without taking into account any existing mitigation measures.
| | | | | | | | | | | | | | | | | | | | | | | |
S1 – Own workforce |
Description | Type of IRO | Actual/ Potential | Value chain segment | Time horizon | Material on a residual(1) or inherent(2) basis | ST response | Targets |
Potential negative impact from ST on own workforce due to difficulties in securing labor rights (e.g., excessive working hours, adequate wages) and human rights (e.g., forced and/or bonded labor, young workers labor, inadequate housing) | Negative impact | Potential | Own operations | Short term | Residual basis | ST’s labor and human rights program | We aim to achieve RBA platinum recognition during closure audits for all majority-owned main manufacturing sites by 2030 (entity-specific). A platinum recognition counts until the next closure audit if the closure audit is conducted within 18 months of the initial audit (as per RBA rules). |
Potential negative impact from ST on own workforce due to leakage of personal information related to employees, either from ST or third parties, leading to harmful consequences for individuals concerned (e.g., fraud, blackmail, identity theft, harassment, etc.) | Negative impact | Potential | Own operations | Long term | Inherent basis | ST’s data privacy program | No target in place |
| | | | | | | | | | | | | | | | | | | | | | | |
S1 – Own workforce |
Description | Type of IRO | Actual/ Potential | Value chain segment | Time horizon | Material on a residual(1) or inherent(2) basis | ST response | Targets |
Risk of human rights violations (including forced/bonded labor, young workers labor, inadequate housing) for ST own workforce, leading to allegations, litigation, fines, or penalties, as well as affecting Company's attractiveness | Risk | Potential | Own operations | Long term | Inherent basis | ST’s labor and human rights program | We aim to achieve RBA platinum recognition during closure audits for all majority-owned main manufacturing sites by 2030 (entity-specific). A platinum recognition counts until the next closure audit if the closure audit is conducted within 18 months of the initial audit (as per RBA rules). |
Potential negative impact from ST on own workforce due to worked-related occupational injuries, illnesses (e.g., repetitive strain injuries), and / or poor well-being in the workplace | Negative impact | Potential | Own operations | Long term | Inherent basis | ST’s health and safety program | We aim, each year, to achieve a Total Recordable Case rate of 0.75 or less for work-related injuries and illnesses, including onsite value chain workers (entity-specific). |
Potential negative impact from ST on own workforce related to unequal pay, discrimination and / or harassment in the workplace | Negative impact | Potential | Own operations | Long term | Inherent basis | ST’s equal treatment program | We aim to maintain an adjusted gender pay gap below 5% at company level each year (entity-specific).
We aim for the representation of women in management and Senior Management roles to be at least 25% by 2035 (entity-specific).
|
(1) "Residual" refers to the materiality assessment that takes into account existing mitigation measures.
(2) "Inherent" refers to the materiality assessment without taking into account any existing mitigation measures.
| | | | | | | | | | | | | | | | | | | | | | | |
S2 – Workers in the supply chain |
Description | Type of IRO | Actual/ Potential | Value chain segment | Time horizon | Material on a residual(1) or inherent(2) basis | ST response | Targets |
Potential negative impact from suppliers on their workers due to human rights violations (forced labor including bonded labor, child labor and young workers) | Negative impact | Potential | Upstream | Short term | Residual basis | ST’s responsible supply chain program | Target-setting in process |
Potential negative impact from foundries and OSATs on their workers due to human rights violations (forced labor including bonded labor, child labor and young workers)
| Negative impact | Potential | Upstream | Mid term | Residual basis | ST’s responsible supply chain program |
Risk of human rights violations (e.g., forced and bonded labor, child and young workers labor) for suppliers', foundries' and OSATs' workers (including raw materials providers they buy from), leading to trade compliance issues (e.g., import bans), allegations, litigation, fines, or penalties towards ST and business loss | Risk | Potential | Upstream
| Long term | Residual basis | ST’s responsible supply chain program |
(1) "Residual" refers to the materiality assessment that takes into account existing mitigation measures.
(2) "Inherent" refers to the materiality assessment without taking into account any existing mitigation measures.
| | | | | | | | | | | | | | | | | | | | | | | |
S3 – Affected communities |
Description | Type of IRO | Actual/ Potential | Value chain segment | Time horizon | Material on a residual(1) or inherent(2) basis | ST response | Targets |
| Negative impact from ST on other users from energy consumption due to the Company's scale | Negative impact | Actual | Own operations | Short term | Residual basis | ST’s decarbonization program, ST’s stakeholder engagement activity | We aim to adopt 100% renewable electricity by 2027 through energy procurement and renewable energy installations and maintain this percentage each year thereafter.
We aim to annually save energy, achieving cumulative energy savings of 100 GWh by 2035, versus the baseline year 2024 (entity-specific). |
| Negative impact from suppliers on other users from their energy consumption | Negative impact | Actual | Upstream | Short term | Residual basis | ST's decarbonization program | No target in place |
| Negative impact from foundries and OSATs on other users from their energy consumption | Negative impact | Actual | Upstream | Short term | Residual basis | ST's decarbonization program | No target in place |
| Negative impact from ST on other users from its water consumption due to the Company's scale | Negative impact | Actual | Own operations | Short term | Residual basis | ST’s water program,
ST’s stakeholder engagement activity | We aim to certify 100% of our manufacturing sites through the Alliance for Water Stewardship (AWS) by 2035 (entity-specific). |
| | | | | | | | | | | | | | | | | | | | | | | |
S3 – Affected communities |
Description | Type of IRO | Actual/ Potential | Value chain segment | Time horizon | Material on a residual(1) or inherent(2) basis | ST response | Targets |
| Negative impact from suppliers on other users from their water consumption | Negative impact | Actual | Upstream | Short term | Residual basis | ST’s responsible supply chain program | No target in place |
| Negative impact from OSATs and foundries on other users from their water consumption | Negative impact | Actual | Upstream | Short term | Residual basis | ST’s responsible supply chain program | No target in place |
(1) "Residual" refers to the materiality assessment that takes into account existing mitigation measures.
(2) "Inherent" refers to the materiality assessment without taking into account any existing mitigation measures.
| | | | | | | | | | | | | | | | | | | | | | | |
G1 – Governance |
Description | Type of IRO | Actual/ Potential | Value chain segment | Time horizon | Material on a residual(1) or inherent(2) basis | ST response | Targets |
Risk that the whistleblowing program is not known or used by ST workforce, leading to unidentified or unresolved issues, reputational damages and retention issues | Risk | Potential | Own operations | Long term | Inherent basis | ST’s whistleblowing program | No target in place |
Risk of bribery or corruption (active or passive) concerning ST own workforce, which would expose ST to reputational, financial, and other liabilities | Risk | Potential | Own operations | Long term | Inherent basis | ST’s anti-bribery and anti-corruption program | No target in place |
(1) "Residual" refers to the materiality assessment that takes into account existing mitigation measures.
(2) "Inherent" refers to the materiality assessment without taking into account any existing mitigation measures.
Appendix 11.5. ST main manufacturing sites
We are an integrated device manufacturer with the ability to control and optimize the value chain, from semiconductor process development, chip design, testing and validation, wafer fabrication, to assembly, testing, and delivery to our customers. At ST, manufacturing is based on our owned and operated facilities in EMEA and in Asia, complemented by outsourcing in both front-end and back-end processes. This enables us to provide customers with an independent, flexible and robust manufacturing and supply chain, which aids in our success. In addition, our proprietary semiconductor process technologies highlighted above enable product differentiation. We believe that the combination of these two aspects represent a differentiating factor for our company as compared to fabless semiconductor companies and semiconductor foundries.
We currently operate fourteen main manufacturing sites around the world. The table below sets forth certain information with respect to our current main manufacturing facilities, products and technologies. Front-end manufacturing facilities are fabs and back-end facilities are assembly, packaging and final testing plants.
| | | | | | | | | | | | | | |
Location(1) (6) | | Products | | Technologies |
Front-end facilities (2) | | | | |
Agrate, Italy(3) | | Application-specific, MEMS, smart power and analog ICs | | Fab 1: 200mm, BCD and MEMS Fab 2: 200mm, advanced BCD and integrated GaN power ICs Fab 3: 300mm, analog CMOS, BCD, and embedded non-volatile memories |
| | | | |
Ang Mo Kio, Singapore | | Application-specific, analog, commodity, MEMS, microcontrollers, non-volatile memories and power transistors | | Fab 1: 150mm, BCD, Bi-CMOS, Bipolar, CMOS logic, EEPROM, MEMS, microfluidics, power MOS and SiC power devices Fab 2: 200mm, advanced BCD, BCD, EEPROM, embedded non-volatile memories, power MOS and VIPowerTM |
| | | | |
Catania, Italy | | Application-specific, power transistors and smart power and analog ICs | | Site 1 Fab 1: 150mm, SiC power devices Fab 2: 200mm, advanced BCD, power MOS, SiC power devices, VIPowerTM and power GaN
Site 2 (SiC) Substrate manufacturing facility for the production in volume of 200mm SiC epitaxial substrate and SiC power devices |
| | | | |
Crolles, France(4) | | Application-specific, optical sensors, leading edge logic and non-volatile memories and microcontrollers | | Fab 1: 200mm, analog/RF, CMOS, Bi-CMOS and optical sensing Fab 2: 300mm, analog/RF, Bi-CMOS, bulk CMOS, embedded non-volatile memories, FD-SOI advanced CMOS and optical sensing |
| | | | | | | | | | | | | | |
Norrköping, Sweden | | Industrialization, research and development and SiC substrate | | SiC 150mm and 200mm wafers; N+ doped and semi insulated |
| | | | |
Rousset, France | | Application-specific and standard and secure microcontrollers | | Fab: 200mm, analog/RF, Bi-CMOS EEPROM, embedded non-volatile memories and CMOS and VIPowerTM |
| | | | |
Tours, France | | ASDTM power transistors, diodes, IPADTM and protection thyristors | | Fab 1: 150mm, Transil, Trisil, Schottky diodes and Thyristor/TRIACs Fab 2: 200mm IPD, power GaN and rectifiers |
| | | | |
Back-end facilities (2) | | | | |
Bouskoura, Morocco | | Discrete and standard, micro modules, power and power module, RF and subsystems | | Micromodules, power discrete, power automotive SMD, die packaging and SOIC (SSHD Flex manufacturing lines) |
| | | | |
Calamba, Philippines | | Application-specific and standard, MEMS | | Wire bond BGA, optical sensors module, MEMS sensors module, Automotive MEMS, wafer level packaging and QFN, LV SiP QFN |
| | | | |
Kirkop, Malta | | Application-specific, MEMS, microcontrollers | | MEMS sensors module, wire bond BGA flip chip BGA and QFP (SSHD). Fully automated, automation and robotization. |
| | | | |
Marcianise, Italy | | Secure microcontrollers and smartcards | | Reel-to-reel secure device provisioning and smartcards |
Muar, Malaysia | | Application-specific and standard, microcontrollers, space products | | Wire bond BGA, power automotive SMDs, QFP and SOIC and panel level packaging, QFP families, NEAP plating |
| | | | |
Rennes, France | | Application specific | | Rad-hard technologies, Ceramics hermetic wire bonding, flip chip ceramic, organic substrate, space and defense |
| | | | |
Shenzhen, China(5) | | Application-specific and standard, discrete, non-volatile memories, optical packages, power and power module, SiC, IGBT, Plasma dicing | | Optical sensors modules, power discrete, power automotive SMDs, power modules, flip chip CSP, power QFN, die packaging, and SOIC, KGD |
(1)This table does not include (i) the new 200mm SiC device manufacturing joint venture with Sanan Optoelectronics in Chongqing, China, as we announced on June 7, 2023; and (ii) the new high-volume 200mm SiC manufacturing facility for power devices and modules, as well as test and packaging, in Catania, Italy, as we announced on May 31, 2024. Sites not yet in production are not included in this year's sustainability statement, unless otherwise specified.
(2) Front-end manufacturing facilities are fabs and back-end facilities are assembly, packaging and final testing plants.
(3) Fab 3 is currently shared between the Company and Tower Semiconductor.
(4)The joint 300mm semiconductor manufacturing facility with GlobalFoundries Inc in Crolles, France, which has received European Commission approval, has a projected cost of €7.5 billion of capital expenditure, maintenance and ancillary costs and will benefit from financial support of up to roughly €2.9 billion from the State of France in line with the European Chips Act.
(5)Jointly owned with Shenzhen SEG Hi-Tech Industrial Company Limited, a subsidiary of Shenzhen Electronics Group.
(6)This list does not include our sites which have ancillary manufacturing activities, such as testing at our site in Toa
Payoh, Singapore, and R&D activities at our sites in Castelletto, Italy and Grenoble, France.
Appendix 11.6. Certain Definitions
| | | | | |
| ADEME | agence de la transition écologique (French Agency for Ecological Transition) |
AGM | annual general meeting of shareholders |
AI | artificial intelligence |
AM&S | analog products, MEMS and sensors |
APeC | Asia Pacific excluding China |
APMS | analog, power & discrete, MEMS and sensors |
ASIC | application-specific integrated circuit |
ASSP | application-specific standard product |
AWIL | advanced women in leadership |
AWS | alliance for water stewardship |
BEPS | base erosion and profit shifting |
| BGA | ball grid array |
Bi-CMOS | bipolar CMOS process technology |
| CapEx | capital expenditure |
| CAPG | climate adverse process gases, which are all gases used in production processes with C-F bond (PFC) and C-F-H bond (HFC), as well as other gases as SF6, NF3, N2O with a Global Warming Potential (GWP) having similar effects on climate change |
CCT | corporate crisis team |
| CCFS | central construction, facilities and services team |
| CDP SpA Loans | Cassa Depositi e Prestiti SpA Loans |
CE&P | compliance, ethics and privacy |
| CEO Agreements | employment contracts among ST and our President and Chief Executive Officer |
| CFO Agreement | employment contract among ST and our President and Chief Financial Officer |
| CHRO | President Human Resources and Corporate Social Responsibility |
CMOS | complementary metal-on silicon oxide semiconductors |
CMRT | conflict minerals reporting template |
| CO2eq | carbon dioxide equivalent, measured in kilograms (kCO2eq), tonnes (tCO2eq) or kilotonne (ktCO2eq) |
| COP21 | the twenty-first session of the conference of the parties to the United Nations framework convention on climate change |
| COSO | committee of sponsoring organizations of the treadway commission |
| CSO | corporate sustainability organization |
| Green electricity contract | legal agreements under which a supplier guarantees that a specific amount of electricity (or a defined percentage of consumption) is sourced from renewable energy technologies, evidenced by energy attribute certificates that are recognized in the relevant jurisdiction and purchased through the electricity contract. |
Group VP Sustainability | Corporate Sustainability Group Vice President |
| Corporate Water Program | program deployed at all ST's manufacturing sites, aiming to minimize ST's water footprint and to monitor water-related risks |
CSRD | EU Directive as regards corporate sustainability reporting (EU Directive 2022/2462) |
| | | | | |
| 2024 DAR | Dutch Annual Report applicable for the financial year 2024 |
D&RF | digital ICs and RF products |
DMA | double materiality assessment conducted in accordance with the ESRS |
| DMOS | double-diffused metal-oxide-semiconductors |
| DRAM | dynamic random-access memory |
| 2025 DMA | double materiality assessment applicable for the financial year 2025, and as further detailed in Section 3.4.2.4 (Impact, risk and opportunity management) |
E-PRTR | European Pollutant Release and Transfer Register Regulation |
EAC | energy attribute certificate |
| ECHA | European Chemicals Agency |
| ECOPACK | ST-trademarked grading system to classify environmental compliance of products |
| EEA | European Economic Area |
EEPROM | electrically erasable programmable read-only memory |
EFRAG | European financial reporting advisory group |
EHS | environmental, health and safety |
EIB Loans | European investment bank loans |
EMAS | eco-management and audit scheme |
EMEA | Europe, Middle-East and Africa |
EMIR | European market infrastructure regulation |
| ENGIE | ENGIE Renewable SEA Pte Ltd |
ERG | employee resource group |
ERM | enterprise risk management |
| ESG | environmental, social and governance |
ESIA | European semiconductor industry association |
ESRS | European sustainability reporting standards 2023/2772 |
| Ethics Hotline | mechanism through which ST is able identify and investigate concerns about unlawful behavior or behavior allegedly in contradiction to our Code of Conduct, policies and corporate procedures, including incidents of bribery and corruption. |
| EU Taxonomy Regulation | Regulation (EU) 2020/852 of the European Parliament and of the Council of June 18, 2020 on the establishment of a framework to facilitate sustainable investment and amending Regulation (EU) 2019/2088 |
| EU Pillar II Directive | European Commission-published legislative proposal for Pillar II |
| Euronext Paris | Bourse de Paris |
| European Pollutant Release and Transfer Register Regulation or E-PRTR | EU regulation concerning the establishment of a European pollutant release and transfer register (EU Regulation 166/2006) |
| ETS | emission trading schemes |
| EV | electric vehicle |
| EWS | electrical wafer sort |
FD-SOI | fully depleted silicon-on-insulator |
FID | first industrial deployment |
FVOCI | fair value through other comprehensive income |
FVPL | fair value through profit or loss |
| | | | | |
| this reporting year | the financial year ended December 31, 2025 |
GaN | gallium-nitride |
GBA | gender balance act |
| GDPR | general data protection regulation |
| GHG | greenhouse gas |
| GHG Protocol | GHG protocol corporate accounting and reporting standard |
| GloBe Rules | Global Anti-Base Erosion Model Rules |
| GRI | global reporting initiative |
| GWP | Global Warming Potential |
HFC | hydrofluorocarbons, refrigerant gas leakage |
| HTF | heat transfer fluids |
IC | integrated circuit |
| ICSR | internal control over sustainability reporting |
| IDM | integrated device manufacturer |
| IEA | International Energy Agency |
IFRS | international financial reporting standards |
| ILO | International Labour Organization |
| ILO Declaration | ILO declaration on fundamental principles and rights at work |
IP | intellectual property |
| IPCC | Intergovernmental Panel on Climate Change |
| IPCC-2019 standard | the 2019 Refinement to the 2006 IPCC guidelines for national greenhouse gas inventories |
IPCEI | important project of common European Interest |
| IPCEI - ME/CT | IPCEI on microelectronics and communication technologies |
IRO | impacts, risks and opportunities |
ISDA | international swaps and derivatives association |
| ISO | international organization for standardization |
KPIs | key performance indicators |
LCA | life cycle assessment |
MCU | microcontrollers |
MDRF | microcontrollers, digital ICs and RF products |
MEMS | micro-electro-mechanical systems |
MGP | minerals grievance platform |
Moody’s | Moody's Investors Service |
MOSFET | metal-on silicon oxide semiconductor field effect transistor |
| MSCI | MSCI ESG RESEARCH LLC or its affiliates |
| NACE | nomenclature for economic activities, the statistical classification of economic activities in the EU |
| NGO | non-governmental organization |
| NPU | neural processing unit |
ODMs | original design manufacturers |
OECD | the Organization for Economic Cooperation and Development |
| OECD Guidelines | OECD Guidelines for Multinational Enterprises |
OEMs | original equipment manufacturers |
OH&S | occupational health and safety |
| | | | | |
Ombinus | the proposal postponing the application of some reporting requirements in the CSRD and the transposition deadline and application of the CSDDD - Omnibus I - COM(2025)80 adopted by the European Commission on February 26, 2025 |
| OpEx | operating expense |
| OSATs | outsourced semiconductor assembly and test |
| OSHA | US Occupational Safety and Health Act of 1970 |
P&D | power and discrete products |
PFC | perfluorinated compounds |
PPA | power purchase agreement |
| QEM | quarterly executive meeting |
R&D | research and development |
RBA | the Responsible Business Alliance |
| RBA Code of Conduct | adopted as the ST supplier code of conduct |
| RBA Day | ST sites also host in-person events to facilitate direct engagement between management and employees. These events, sometimes focused on specific topics like RBA Day or Sustainability Week, provide opportunities for employees to ask questions and give feedback on their work environment and conditions, receiving immediate feedback from management |
RDI | research, development and innovation activities |
| REACH | EU Regulation concerning the Registration, Evaluation, Authorisation and Restriction of Chemicals (EU Regulation 1907/2006) |
RF-SOI | radio frequency silicon-on-insulator |
| Rio Declaration | the Rio Declaration on Environment and Development was adopted at the 1992 United Nations Conference on Environment and Development (UNCED), and consists of 27 principles to guide countries toward sustainable development, |
RMAP | responsible mineral assurance process |
RMI | responsible minerals initiative |
RMS | resilience management system |
| RoHS | EU Directive on the restriction of the use of certain hazardous substances in electrical and electronic equipment (EU Directive 2011/65) |
S&P’s | Standard & Poor's |
SAM | serviceable available market |
| Sanan ST JV | SANAN, STMicroelectronics Co.Ltd |
| SBTi | science based targets initiative, a registered charity and limited company in england and wales |
SDG | United Nations sustainable development goals |
SEC | U.S. Securities and Exchange Commission |
SG&A | selling, general and administrative |
SiC | silicon carbide |
| SM&A | segment marketing and application |
| SoC | system on a chip |
| SOC | substance of concern |
| Sustainability Statement Steerco | sustainability statement steering committee |
| | | | | |
| SVHC | substance of very high concern |
| ST Holding | STMicroelectronics Holding N.V, |
| STH Shareholders agreement | ST Holding's shareholders, each of which is ultimately controlled by the French or Italian government, are party to a shareholders agreement |
| Subcontractors | foundries and OSATs |
| Sustainability Week | ST sites also host in-person events to facilitate direct engagement between management and employees. These events, sometimes focused on specific topics like RBA Day or sustainability week, provide opportunities for employees to ask questions and give feedback on their work environment and conditions, receiving immediate feedback from management |
TAM | total available market |
| Taxonomy | EU Regulation on the establishment of a framework to facilitate sustainable investment (EU Regulation 2020/852) |
TCFD | taskforce on climate-related financial disclosure |
| TPM | third-party management |
| TRC | total recordable case |
TPU | thermal processing units |
| UN | United Nations |
| UNGPs | United Nations guiding principles on business and human rights |
UN Paris Agreement | Paris Agreement under the United Nations Framework Convention on Climate Change adopted on 12 December 2015 |
VAP | validated audit process |
VIPower | vertically integrated power |
VOCs | volatile organic compounds |
| Whistleblowing Directive | European Directive on the protection of persons who report breaches of union law (EU 2019/1937) |
WIL | women in leadership |
WISE | women inspiring supporting and empowering |
WSC | World Semiconductor Council |
WSTS | World Semiconductor Trade Statistics |
Appendix 11.7. ST policies and procedures referenced in the sustainability statement
| | | | | | | | | | | | | | | | | |
| ST Policy or procedure | Key content in relation to the IROs identified in the 2025 DMA | Scope | Most senior level in ST accountable for implementation | Availability to potentially affected stakeholders and stakeholders who need to help implement it (st.com / intranet) | Reference to relevant section in the sustainability statement |
| Anti-bribery and Corruption Policy | This policy sets forth ST's zero-tolerance towards any form of corruption or bribery. | All ST entities and all ST employees | Chief Ethics & Compliance Officer | st.com and ST intranet | 3.4.5. Business conduct (Governance - G1)
3.4.5.3 A. (G1 - Business conduct) |
| Code of Conduct | This Code of Conduct states ST’s commitment to conduct business with the highest standards of integrity and in compliance with applicable laws and regulations, and provides expectations and guidelines on how business is to be conducted. | All ST entities and all ST employees | Chief Ethics & Compliance Officer | st.com and ST intranet | Referenced throughout the sustainability statement, but namely in 3.4.5. Business conduct (Governance - G1) and in 3.4.5.3 A. (G1 - Business conduct) |
| Conflict of Interest Policy | This policy provides a framework for the transparent reporting and management of any potential conflict of interest. | All ST employees | Chief Ethics & Compliance Officer | ST intranet | 3.4.5. Business conduct (Governance - G1)
3.4.5.3 A. (G1 - Business conduct) |
| | | | | | | | | | | | | | | | | |
| ST Policy or procedure | Key content in relation to the IROs identified in the 2025 DMA | Scope | Most senior level in ST accountable for implementation | Availability to potentially affected stakeholders and stakeholders who need to help implement it (st.com / intranet) | Reference to relevant section in the sustainability statement |
Conflict Minerals Management and Responsible Mineral Sourcing Standard Operating Procedure | This procedure defines the way ST manages relevant conflict minerals issues and responsible mineral sourcing to comply with the applicable regulations and agreed customer requirements | ST organizations involved in ST conflict minerals and responsible mineral sourcing
programs and ST suppliers supplying relevant materials | Head of Global Quality and Reliability department | ST intranet | 3.4.4. Social
3.4.4.2.A. (S2 -Supply chain workers) |
| Corporate Labor and Human Rights Procedure | This procedure sets out the framework for deploying ST’s labor and human rights practices. | All ST majority-owned entities and their employees | CHRO | ST intranet | 3.4.4. Social
3.4.4.1 B.2. (S1 - Own workforce)
3.4.4.1 C. (S1 - Own workforce)
3.4.4.1 D.1. (S1 - Own workforce)
3.4.4.1 E.1. (S1 - Own workforce)
|
| | | | | | | | | | | | | | | | | |
| ST Policy or procedure | Key content in relation to the IROs identified in the 2025 DMA | Scope | Most senior level in ST accountable for implementation | Availability to potentially affected stakeholders and stakeholders who need to help implement it (st.com / intranet) | Reference to relevant section in the sustainability statement |
| Corporate Occupational Health and Safety Policy | This policy lays down the main principles to establish, implement, maintain and continuously improve ST’s Occupational Health and Safety management systems | All ST employees, ST entities, products, sites, and activities worldwide, as
well as onsite value chain workers or individuals under ST’s supervision. | CHRO | st.com and ST intranet | 3.4.4. Social
3.4.4.1 C.2 (S1 - Own Workforce)
3.4.4.1 E.1. (S1 - Own workforce) |
| Corporate Social Responsibility Policy | This policy addresses how ST takes social impact into account in the way it operates as a business. | All ST entities and all ST employees and workers, including students;
temporary, dispatched, outsourced and migrant workers; and on-site service providers | CHRO | st.com and ST intranet | 3.4.4. Social
3.4.4.1 C. (S1 - Own workforce)
3.4.4.1 E.1. (S1 - Own workforce) |
Donation, fundraising and sponsorship procedure | This procedure provides a general framework and guidance concerning the selection, evaluation, authorization, monitoring and reporting of any donations, fundraising and sponsorships | All ST entities and all ST employees | Chief Ethics & Compliance Officer | ST intranet | 3.4.5.3 A. (G1 - Business conduct) |
| | | | | | | | | | | | | | | | | |
| ST Policy or procedure | Key content in relation to the IROs identified in the 2025 DMA | Scope | Most senior level in ST accountable for implementation | Availability to potentially affected stakeholders and stakeholders who need to help implement it (st.com / intranet) | Reference to relevant section in the sustainability statement |
| Gifts, Meals and Entertainment procedure | This procedure complements ST’s Anti-Bribery and Corruption Policy and Conflict of Interest Policy by providing a framework and guidance on how to give and/or receive Gifts, Meals and Entertainment in a business context, and establishing the process for reporting Gifts, Meals and Entertainment. | All ST entities and all ST employees | Chief Ethics & Compliance Officer | ST intranet | 3.4.5.3 A. (G1 - Business conduct) |
| Global Environmental Policy | This policy states ST’s objective to limit environmental impacts and risks, and to utilize environmental opportunities through various key actions. | All ST entities and all ST employees | CHRO | st.com and ST intranet | 3.4.3. (Environment)
3.4.3.1 B. (E1 - Climate Change)
3.4.3.2 B. (E2 - Pollution)
3.4.3.2.D.1. (E2 - Pollution)
3.4.3.3.D.1. (E3 - Water)
3.4.3.4 B. (E5 - Waste)
3.4.3.4 D.1. (E5 - Waste)
3.4.4.3 A. (S3 - Affected communities) |
| | | | | | | | | | | | | | | | | |
| ST Policy or procedure | Key content in relation to the IROs identified in the 2025 DMA | Scope | Most senior level in ST accountable for implementation | Availability to potentially affected stakeholders and stakeholders who need to help implement it (st.com / intranet) | Reference to relevant section in the sustainability statement |
| Global Water Policy | This policy details ST’s ambition to manage water-related impacts, including impacts of water pollution, through various key actions. | All ST entities and all ST employees | CHRO | st.com and ST intranet | 3.4.3. (Environment)
3.4.3.2 B. (E2 - Pollution)
3.4.3.3 B. (E3 - Water)
3.4.3.3 C. (E3 - Water)
3.4.3.3 D.1. (E3 - Water)
3.4.4.3 A. (S3 - Affected communities)
|
| Insider Trading Policy | This policy is aimed at preventing the unlawful use of non-public material information by ST employees. | Supervisory Board and Managing Board and all ST employees | Chief Ethics & Compliance Officer and the General Counsel | ST intranet | 3.4.5.3.A. (G1 - Business conduct) |
| Policy Statement on Conflict Minerals and Responsible Minerals Sourcing | ST's statement on managing the issue of conflict minerals and responsible sourcing. | N/A | Head of Global Quality and Reliability department | st.com and ST intranet | 3.4.4. Social
3.4.4.2.A.(S2 - Supply chain workers) |
| | | | | | | | | | | | | | | | | |
| ST Policy or procedure | Key content in relation to the IROs identified in the 2025 DMA | Scope | Most senior level in ST accountable for implementation | Availability to potentially affected stakeholders and stakeholders who need to help implement it (st.com / intranet) | Reference to relevant section in the sustainability statement |
| Speak-up Policy | This policy includes information on ST Ethics Hotline available via our website st.com to all, including to ST employees and interested third parties, to report risks of misconduct, relating to perceived or actual risks and to remediate any situation that may deviate from expectations. | All ST entities and all ST employees | Chief Ethics & Compliance Officer and the Chief Audit & Risk Executive | st.com and ST intranet |
3.4.5 Business conduct (Governance - G1)
3.4.5.3.A. (G1 - Business conduct) |
| Stakeholder Engagement Policy | This policy describes ST’s ambitions on conducting stakeholder engagement in all relevant areas of
sustainability, including environmental and social topics. | All ST entities and all ST employees | CHRO | st.com and ST intranet | 3.4.2.3 B (ESRS 2 SBM-2 Interests and views of stakeholders)
3.4.3.2.A. (E2 - Pollution)
3.4.4. (Social) |
| | | | | | | | | | | | | | | | | |
| ST Policy or procedure | Key content in relation to the IROs identified in the 2025 DMA | Scope | Most senior level in ST accountable for implementation | Availability to potentially affected stakeholders and stakeholders who need to help implement it (st.com / intranet) | Reference to relevant section in the sustainability statement |
| Supply Chain Responsibility Standard Operating Procedure | This procedure establishes a common and transversal framework for managing social and environmental due diligence in ST’s supply chain | All ST entities and all ST’s suppliers | Head of our Global Procurement Organization | ST intranet | 3.4.4. Social
3.4.4.2.A. (S2 - Workers in the supply chain) |
| Third party due diligence procedure | General framework and guidance for the assessment of ethical, compliance, regulatory and reputational risks of third parties doing or seeking to do business with ST | All ST entities doing business or seeking to do business with a third party | Chief Ethics & Compliance Officer | ST intranet | 3.4.5.3.A. (G1 - Business conduct) |
Appendix 11.8. ST certifications
ST is ISO 9001, ISO 22301 and IATF 16949 certified company-wide. The below table lists certain specific ST site certifications.
| | | | | | | | | | | |
| ISO 45001 - Health and safety | ISO 14001 - Environment | ISO 50001 Energy |
| Manufacturing sites |
| Agrate, Italy | ✔ | ✔ | ✔ |
| Ang Mo Kio, Singapore | ✔ | ✔ | ✔ |
| Bouskoura, Morocco | ✔ | ✔ | ✔ |
| Calamba, Philippines | ✔ | ✔ | ✔ |
| Catania, Italy | ✔ | ✔ | ✔ |
| Crolles, France | ✔ | ✔ | ✔ |
| Kirkop, Malta | ✔ | ✔ | ✔ |
| Marcianise, Italy | ✔ | ✔ | X |
| Muar, Malaysia | ✔ | ✔ | ✔ |
Norrkoping, Sweden | ✔ | ✔ | X |
Rennes(1), France | ✔ | ✔ | ✔ |
| Rousset, France | ✔ | ✔ | ✔ |
| Shenzhen, China | ✔ | ✔ | ✔ |
| Tours, France | ✔ | ✔ | ✔ |
| Other sites |
| Castelletto, Italy | ✔ | ✔ | X |
| Greater Noida, India | ✔ | X | X |
| Grenoble, France | ✔ | ✔ | X |
| Loyang, Singapore | ✔ | ✔ | X |
| Napoli, Italy | ✔ | X | X |
| Toa Payoh, Singapore | ✔ | ✔ | ✔ |
Total | 20 | 18 | 13 |
(1) Rennes Space & High-Reliability Products
Appendix 11.9. Long-term sustainability targets
The below list contains our current long-term (entity-specific) sustainability targets.
| | | | | | | | | | | | | | | | | | | | | | | | | | |
| Sustainability matter | Target | ST perimeter | | | | | | |
Climate change mitigation (refer to Section 3.4.3.1.C.1. for further details) |
We aim to achieve a 20% overall reduction in absolute scope 1 and 2 emissions by 2030 versus 2024. We aim to abate at least 90% of our climate adverse process gases ("CAPG") emissions by 2030 (entity-specific). | Our fourteen main manufacturing sites, our R&D sites in Castelletto (Italy), Grenoble (France), Greater Noida (India), and our EWS site in Toa Payoh (Singapore). | | | | | | |
We aim to achieve a 10% reduction in our scope 3 upstream GHG emissions by 2030, and a 20% reduction by 2035, versus 2024. | Scope 3.1, 3.2, 3.4, 3.6: Consolidated perimeter Scope 3.3, 3.5, 3.7: Our fourteen main manufacturing sites, our R&D sites in Castelletto (Italy), Grenoble (France), Greater Noida (India), and our EWS site in Toa Payoh (Singapore). | | | | | | |
Energy (refer to Section 3.4.3.1.C.1. for further details) | We aim to adopt 100% renewable electricity by 2027 through energy procurement and renewable energy installations and maintain this percentage each year thereafter.
| Our fourteen main manufacturing sites, our R&D sites in Castelletto (Italy), Grenoble (France), Greater Noida (India), and our EWS site in Toa Payoh (Singapore). | | | | | | |
We aim to annually save energy, achieving cumulative energy savings of 100 GWh by 2035, versus the baseline year 2024 (entity-specific). | Our fourteen main manufacturing sites, our R&D sites in Castelletto (Italy), Grenoble (France), Greater Noida (India), and our EWS site in Toa Payoh (Singapore). | | | | | | |
Pollution (refer to Section 3.4.3.2.D.1. for further details) | We aim to further decrease VOC emissions from ST’s manufacturing sites, to achieve an overall 70% absolute reduction by 2030 versus 2024.
| Our fourteen main manufacturing sites, our R&D sites in Castelletto (Italy), Grenoble (France), Greater Noida (India), and our EWS site in Toa Payoh (Singapore). | | | | | | |
Chemicals (refer to Section 3.4.3.2.D.1. for further details) | We aim, alongside our efforts to continuously assess SVHC use and substitution, to make all products manufactured at ST 98% halogen-free by 2035 (entity-specific).
| Products manufactured within ST's own operations | | | | | | |
| | | | | | | | | | | | | | | | | | | | | | | | | | |
Water (refer to Section 3.4.3.3.D.1. for further details) | We aim to have an annual water recycling rate of at least 60% by 2035 through implementing innovative programs (entity-specific).
We aim to annually save water reaching 6 million cubic meters of water saved by 2035 versus 2024 (entity-specific).
| Our fourteen main manufacturing sites, our R&D sites in Castelletto (Italy), Grenoble (France), Greater Noida (India), and our EWS site in Toa Payoh (Singapore). | | | | | | |
Waste and circular economy (refer to Section 3.4.3.4.D.1. for further details) | We aim, each year, to reuse, recycle, and recover at least 95% of our waste, and to limit waste disposal to below 5%.
| Our fourteen main manufacturing sites, our R&D sites in Castelletto (Italy), Grenoble (France), Greater Noida (India), and our EWS site in Toa Payoh (Singapore). | | | | | | |
Own workforce: Working conditions and other related rights (refer to Section 3.4.4.1.E.1. for further details) | We aim to achieve RBA platinum recognition during closure audits for all majority-owned main manufacturing sites by 2030 (entity-specific). A platinum recognition counts until the next closure audit if the closure audit is conducted within 18 months of the initial audit (as per RBA rules) | Agrate (Italy);
Ang Mo Kio (Singapore);
Bouskoura (Morocco);
Calamba (Philippines);
Catania (Italy);
Crolles (France);
Kirkop (Malta);
Muar (Malaysia);
Rousset (France);
Shenzhen (China); and
Tours (France).
| | | | | | |
Own workforce: Health and safety (refer to Section 3.4.4.1.E.1. for further details) | We aim, each year, to achieve a TRC rate of 0.75 or less for work-related injuries and illnesses, including onsite value chain workers (entity-specific). | All ST sites and locations worldwide.
| | | | | | |
Own workforce: Equal treatment and opportunities for all (refer to Section 3.4.4.1.E.1. for further details) | We aim to maintain an adjusted gender pay gap below 5% at company level each year (entity-specific).
We aim for the representation of women in management and Senior Management roles to be at least 25% by 2035 (entity-specific).
| All ST sites and locations worldwide. | | | | | | |
| | | | | | | | | | | | | | | | | | | | | | | | | | |
Workers in the value chain: Working conditions and other related rights (refer to Section 3.4.4.2.C. for further details) | Target-setting in process
| N/A | | | | | | |
Affected communities (refer to Section 3.4.4.3.C. for further details) | We aim to certify 100% of our manufacturing sites through the AWS by 2035 (entity-specific).
| Our fourteen main manufacturing sites and our EWS site in Toa Payoh (Singapore). | | | | | | |
Appendix 11.10. ST Sustainability programs and activities addressing material IROs
All programs and activities are undertaken in implementation of our roadmap towards our sustainability goals and our actions regarding the relevant material IROs:
| | | | | | | | |
| Name | Type (Program/ Activity) | Description |
ST’s decarbonization program(1) | Program | ST’s decarbonization program aims to mitigate the impact of our activities on climate change, reduction of greenhouse gas emissions, across the value chain. |
| ST’s water program | Program | ST’s water program aims to manage water effectively wherever it is used at ST, minimizing our impact on the community through initiatives on water saving and water recycling. |
| ST’s waste & circular economy program | Program | ST’s waste & circular economy program aims to minimize resource consumption, with a focus on recycling, recovery and preparation for reuse, and on promoting adoption of circular economy programs. |
| ST’substances and chemicals program | Program | ST’s chemicals & substances program aims to minimize the environmental, health and safety impacts related to the chemicals and substances contained in our products and used in the manufacturing process. |
| ST’s pollution prevention program | Program | ST’s pollution prevention program aims to prevent soil, air, and water pollution risks and treat emissions accordingly. |
| ST’s health & safety program | Program | ST’s health & safety program aims to provide a safe and healthy workplace for all people in every ST site worldwide. |
| ST’s labor & human rights program | Program | ST’s labor & human rights program aims to ensure all workers are treated with the highest level of respect and dignity, maintaining high standards of labor and human rights across the company. |
(1) ST's carbon neutrality program was restructured during 2025 and was renamed as the Decarbonization program, to extend it to also cover our scope 3 upstream GHG emission reduction targets.
| | | | | | | | |
| Name | Type (Program/Activity) | Description |
| ST’s equal treatment and opportunities program | Program | ST’s equal treatment and opportunities program aims to foster a diverse, equitable and inclusive work environment where everyone can be a true version of themselves. |
| ST’s responsible supply chain program | Program | ST’s responsible supply chain program aims to assess and mitigate sustainability risks in our extended supply chain. |
| ST's product sustainability program | Program | ST's product sustainability program aims to maximize the positive impacts of our products, embedding sustainability criteria in every stage of the product lifecycle. |
| ST’s stakeholder engagement activity | Activity | ST’s stakeholder engagement activity aims to address the diverse interests and concerns of ST’s internal and external stakeholders in relevant areas of sustainability. |
| ST’s climate adaptation activity | Activity | ST’s climate adaptation activity aims to screen our assets versus future climate exposure to enhance the robustness of our manufacturing infrastructure. |
| ST’s data privacy program | Program | ST's data privacy program aims to ensure the protection of personal and sensitive data in compliance with applicable privacy laws and regulations. |
| ST’s whistleblowing program | Program | ST's whistleblowing program aims to provide a confidential and secure channel for employees and stakeholders to report concerns. It includes protection against retaliation. |
| ST’s anti-bribery and anti-corruption program | Program | ST's anti-bribery and anti-corruption program aims to prevent, detect, and address bribery and corruption risks, ensuring compliance with legal requirements and promoting ethical business conduct throughout the Company. |
SIGNATURES
Pursuant to the requirements of the Securities Exchange Act of 1934, the registrant has duly caused this report to be signed on its behalf by the undersigned, thereunto duly authorized.
| | | | | | | | | | | | | | | | | |
| | | | STMicroelectronics N.V. |
|
| | | |
| Date: | March 26, 2026 | | | By: | /s/ Lorenzo Grandi |
| | | |
| | Name: | Lorenzo Grandi |
| | Title: | Managing Director, President and Chief Financial Officer |