
Q1 FY2026 Financial Results Conference Call October 31, 2025 Nasdaq: STRT Jennifer Slater President and CEO Matthew Pauli Senior Vice President and CFO www.strattec.com .2
Safe Harbor Statement Safe Harbor Statement Certain statements contained in this presentation contain “forward-looking statements” within the meaning of the Private Securities Litigation Reform Act of 1995. These statements may be identified by the use of forward-looking words or phrases such as “anticipate,” “believe,” “could,” “expect,” “intend,” “may,” “planned,” “potential,” “should,” “will,” and “would.” Such forward-looking statements are inherently subject to many uncertainties in the Company’s operations and business environment. These uncertainties include general economic conditions, in particular, relating to the automotive industry, consumer demand for the Company’s and its customers’ products, competitive and technological developments, customer purchasing actions, changes in warranty provisions and customer product recall policies, work stoppages at the Company or at the location of its key customers as a result of labor disputes, foreign currency fluctuations, the impact of U.S. trade policies, tariffs and reactions to the same from foreign countries on costs and customer demand, matters adversely impacting the timing and availability of component parts and raw materials needed for the production of our products and the products of our customers and fluctuations in our costs of operation. Shareholders, potential investors and other readers are urged to consider these factors carefully in evaluating the forward-looking statements and are cautioned not to place undue reliance on such forward-looking statements. The forward-looking statements made herein are only made as of the date of this press presentation and the Company undertakes no obligation to publicly update such forward-looking statements to reflect subsequent events or circumstances occurring after the date of this presentation. In addition, such uncertainties and other operational matters are discussed further in the Company’s quarterly and annual filings with the Securities and Exchange Commission. Use of Non-GAAP Financial Metrics and Additional Financial Information In addition to reporting financial results in accordance with generally accepted accounting principles, or GAAP, Strattec provides Adjusted Non-GAAP information as additional information for its operating results. References to Adjusted Non-GAAP information are to non-GAAP financial measures. These measures are not required by, in accordance with, or an alternative for, GAAP and may be different from similarly titled non-GAAP financial measures used by other companies. Strattec’s management uses these measures to make strategic decisions, establish budget plans and forecasts, identify trends affecting Strattec’s business, and evaluate performance. Management believes that providing these non-GAAP financial measures to investors, as a supplement to GAAP financial measures, will help investors evaluate Strattec’s core operating and financial performance and business trends consistent with how management evaluates such performance and trends. Investors are encouraged to review the related GAAP financial measures and the reconciliation of these non-GAAP financial measures to their most directly comparable GAAP financial measures. The Company has provided reconciliations of comparable GAAP to non-GAAP measures in the supplemental slides of this presentation.
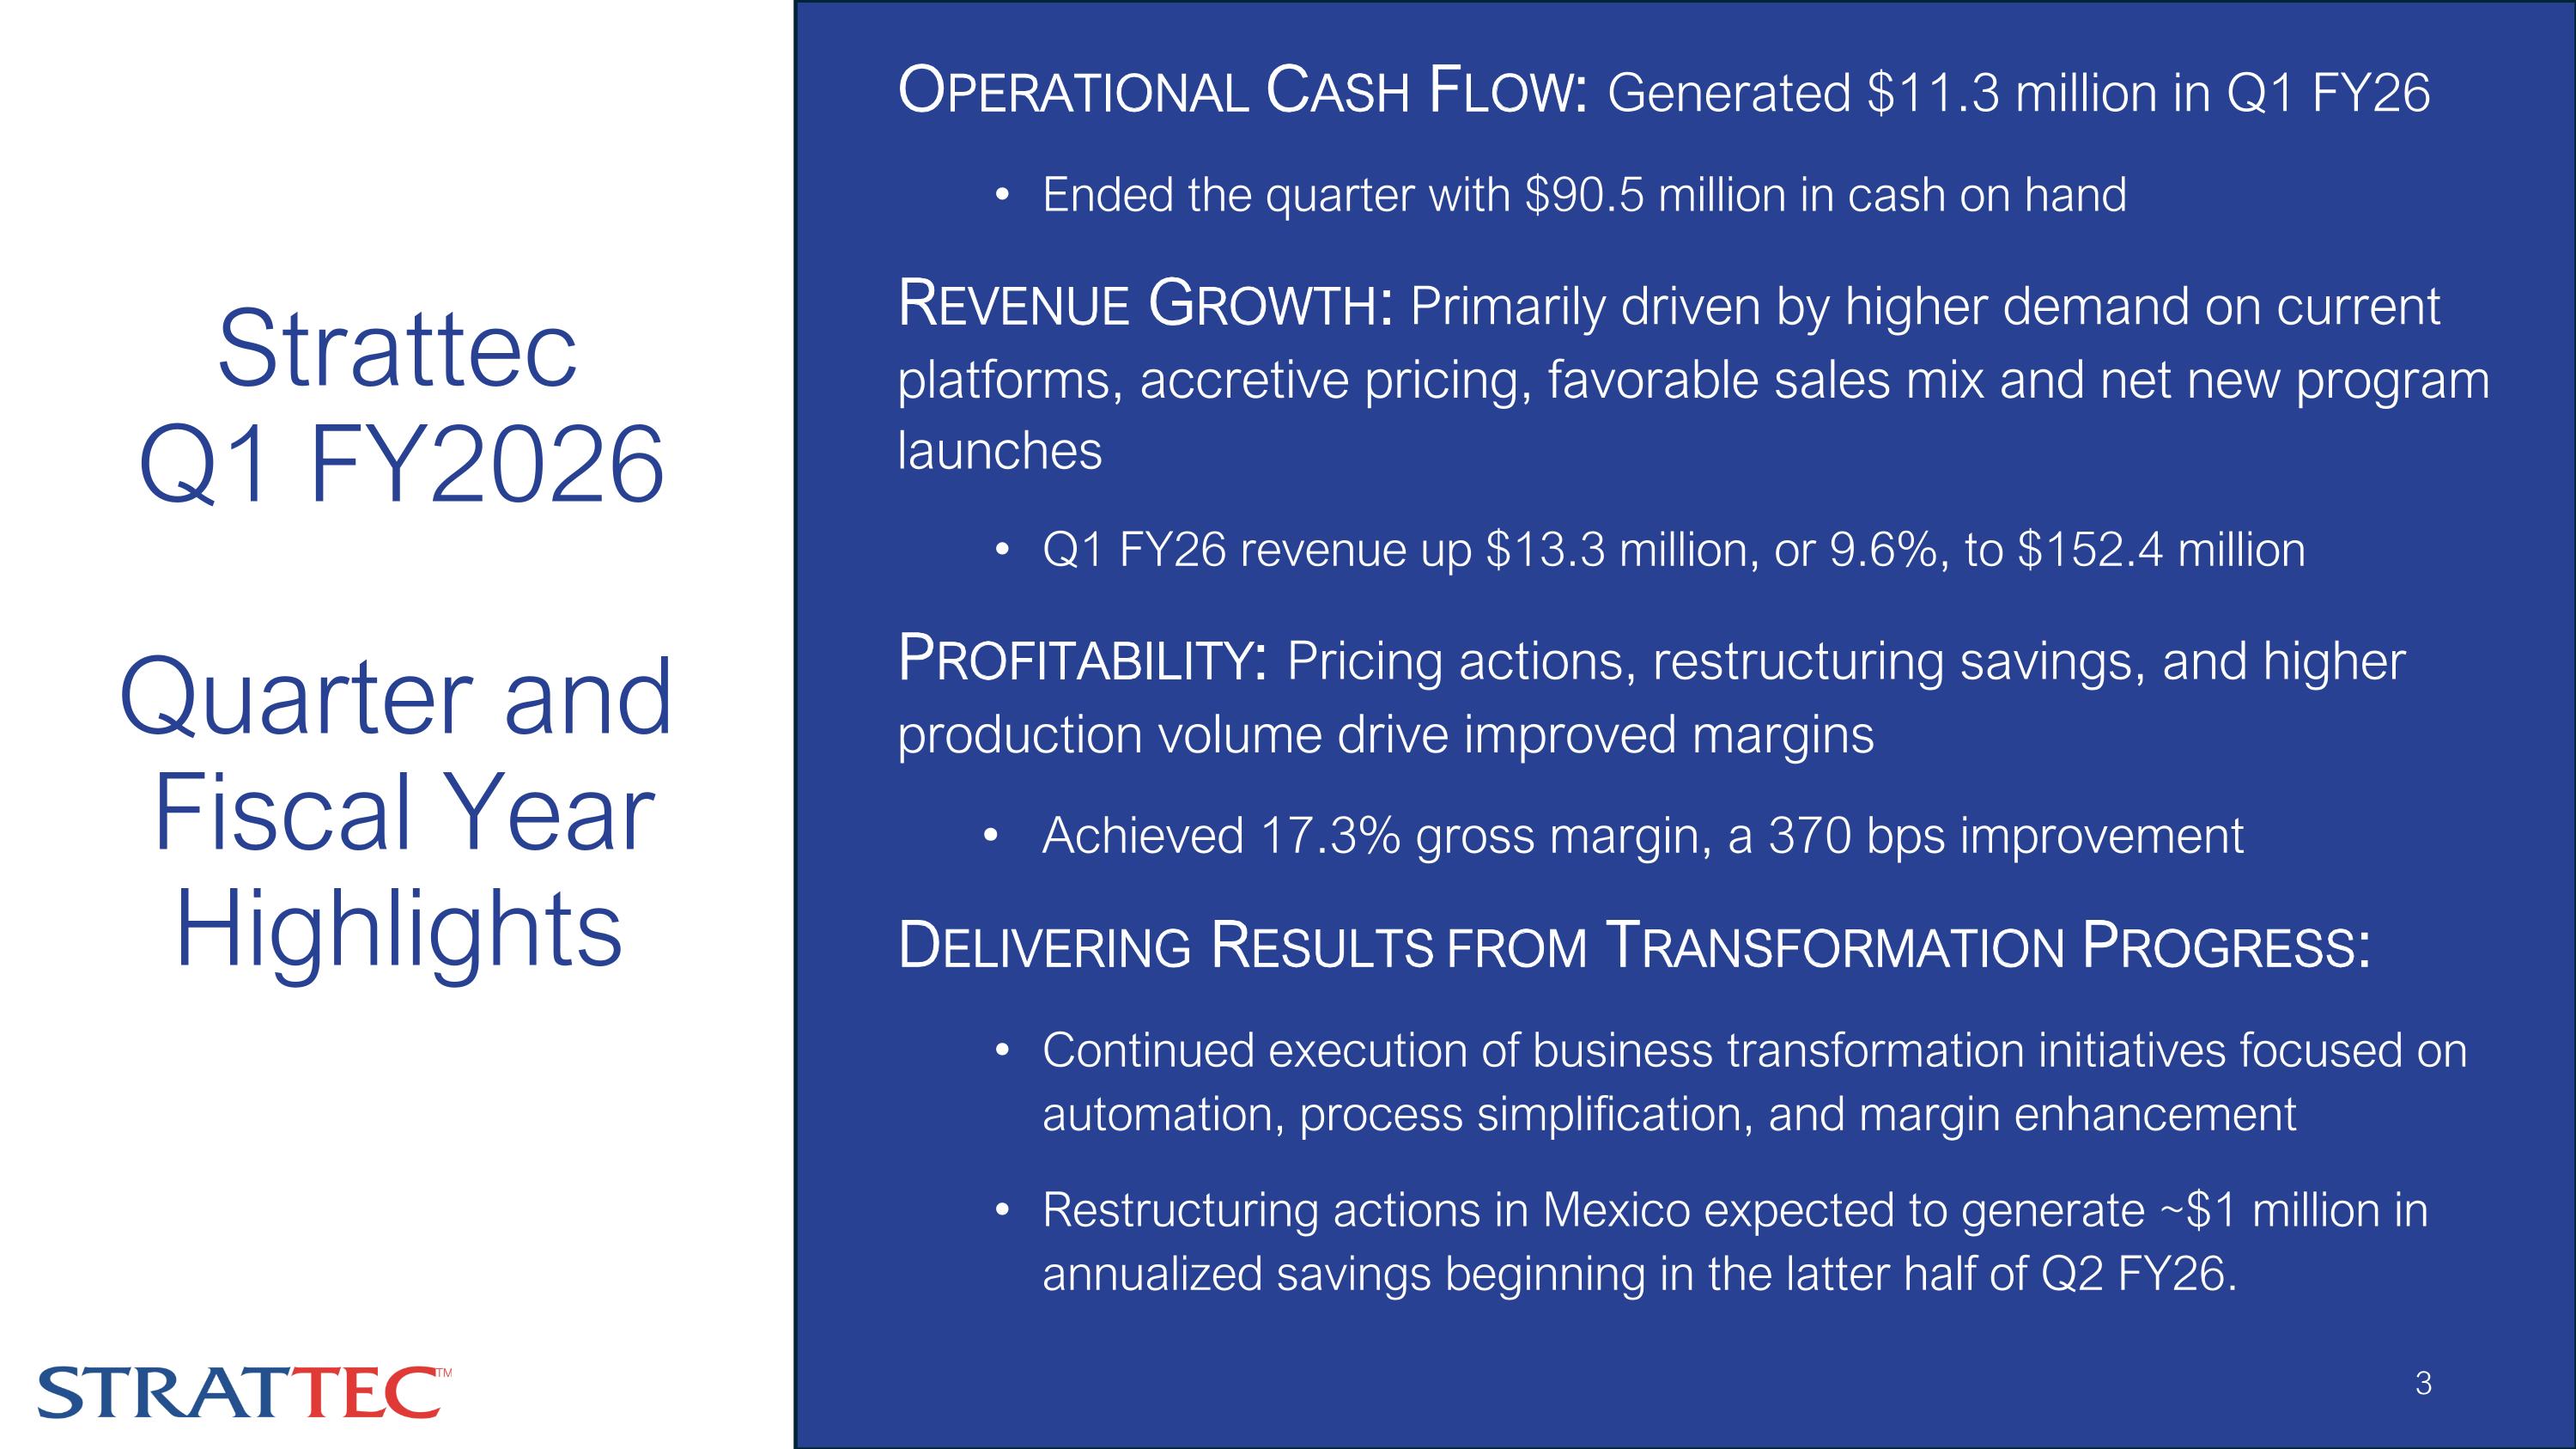
Operational Cash Flow: Generated $11.3 million in Q1 FY26 Ended the quarter with $90.5 million in cash on hand Revenue Growth: Primarily driven by higher demand on current platforms, accretive pricing, favorable sales mix and net new program launches Q1 FY26 revenue up $13.3 million, or 9.6%, to $152.4 million Profitability: Pricing actions, restructuring savings, and higher production volume drive improved margins Achieved 17.3% gross margin, a 370 bps improvement Delivering Results from Transformation Progress: Continued execution of business transformation initiatives focused on automation, process simplification, and margin enhancement Restructuring actions in Mexico expected to generate ~$1 million in annualized savings beginning in the latter half of Q2 FY26. Strattec Q1 FY2026 Quarter and Fiscal Year Highlights
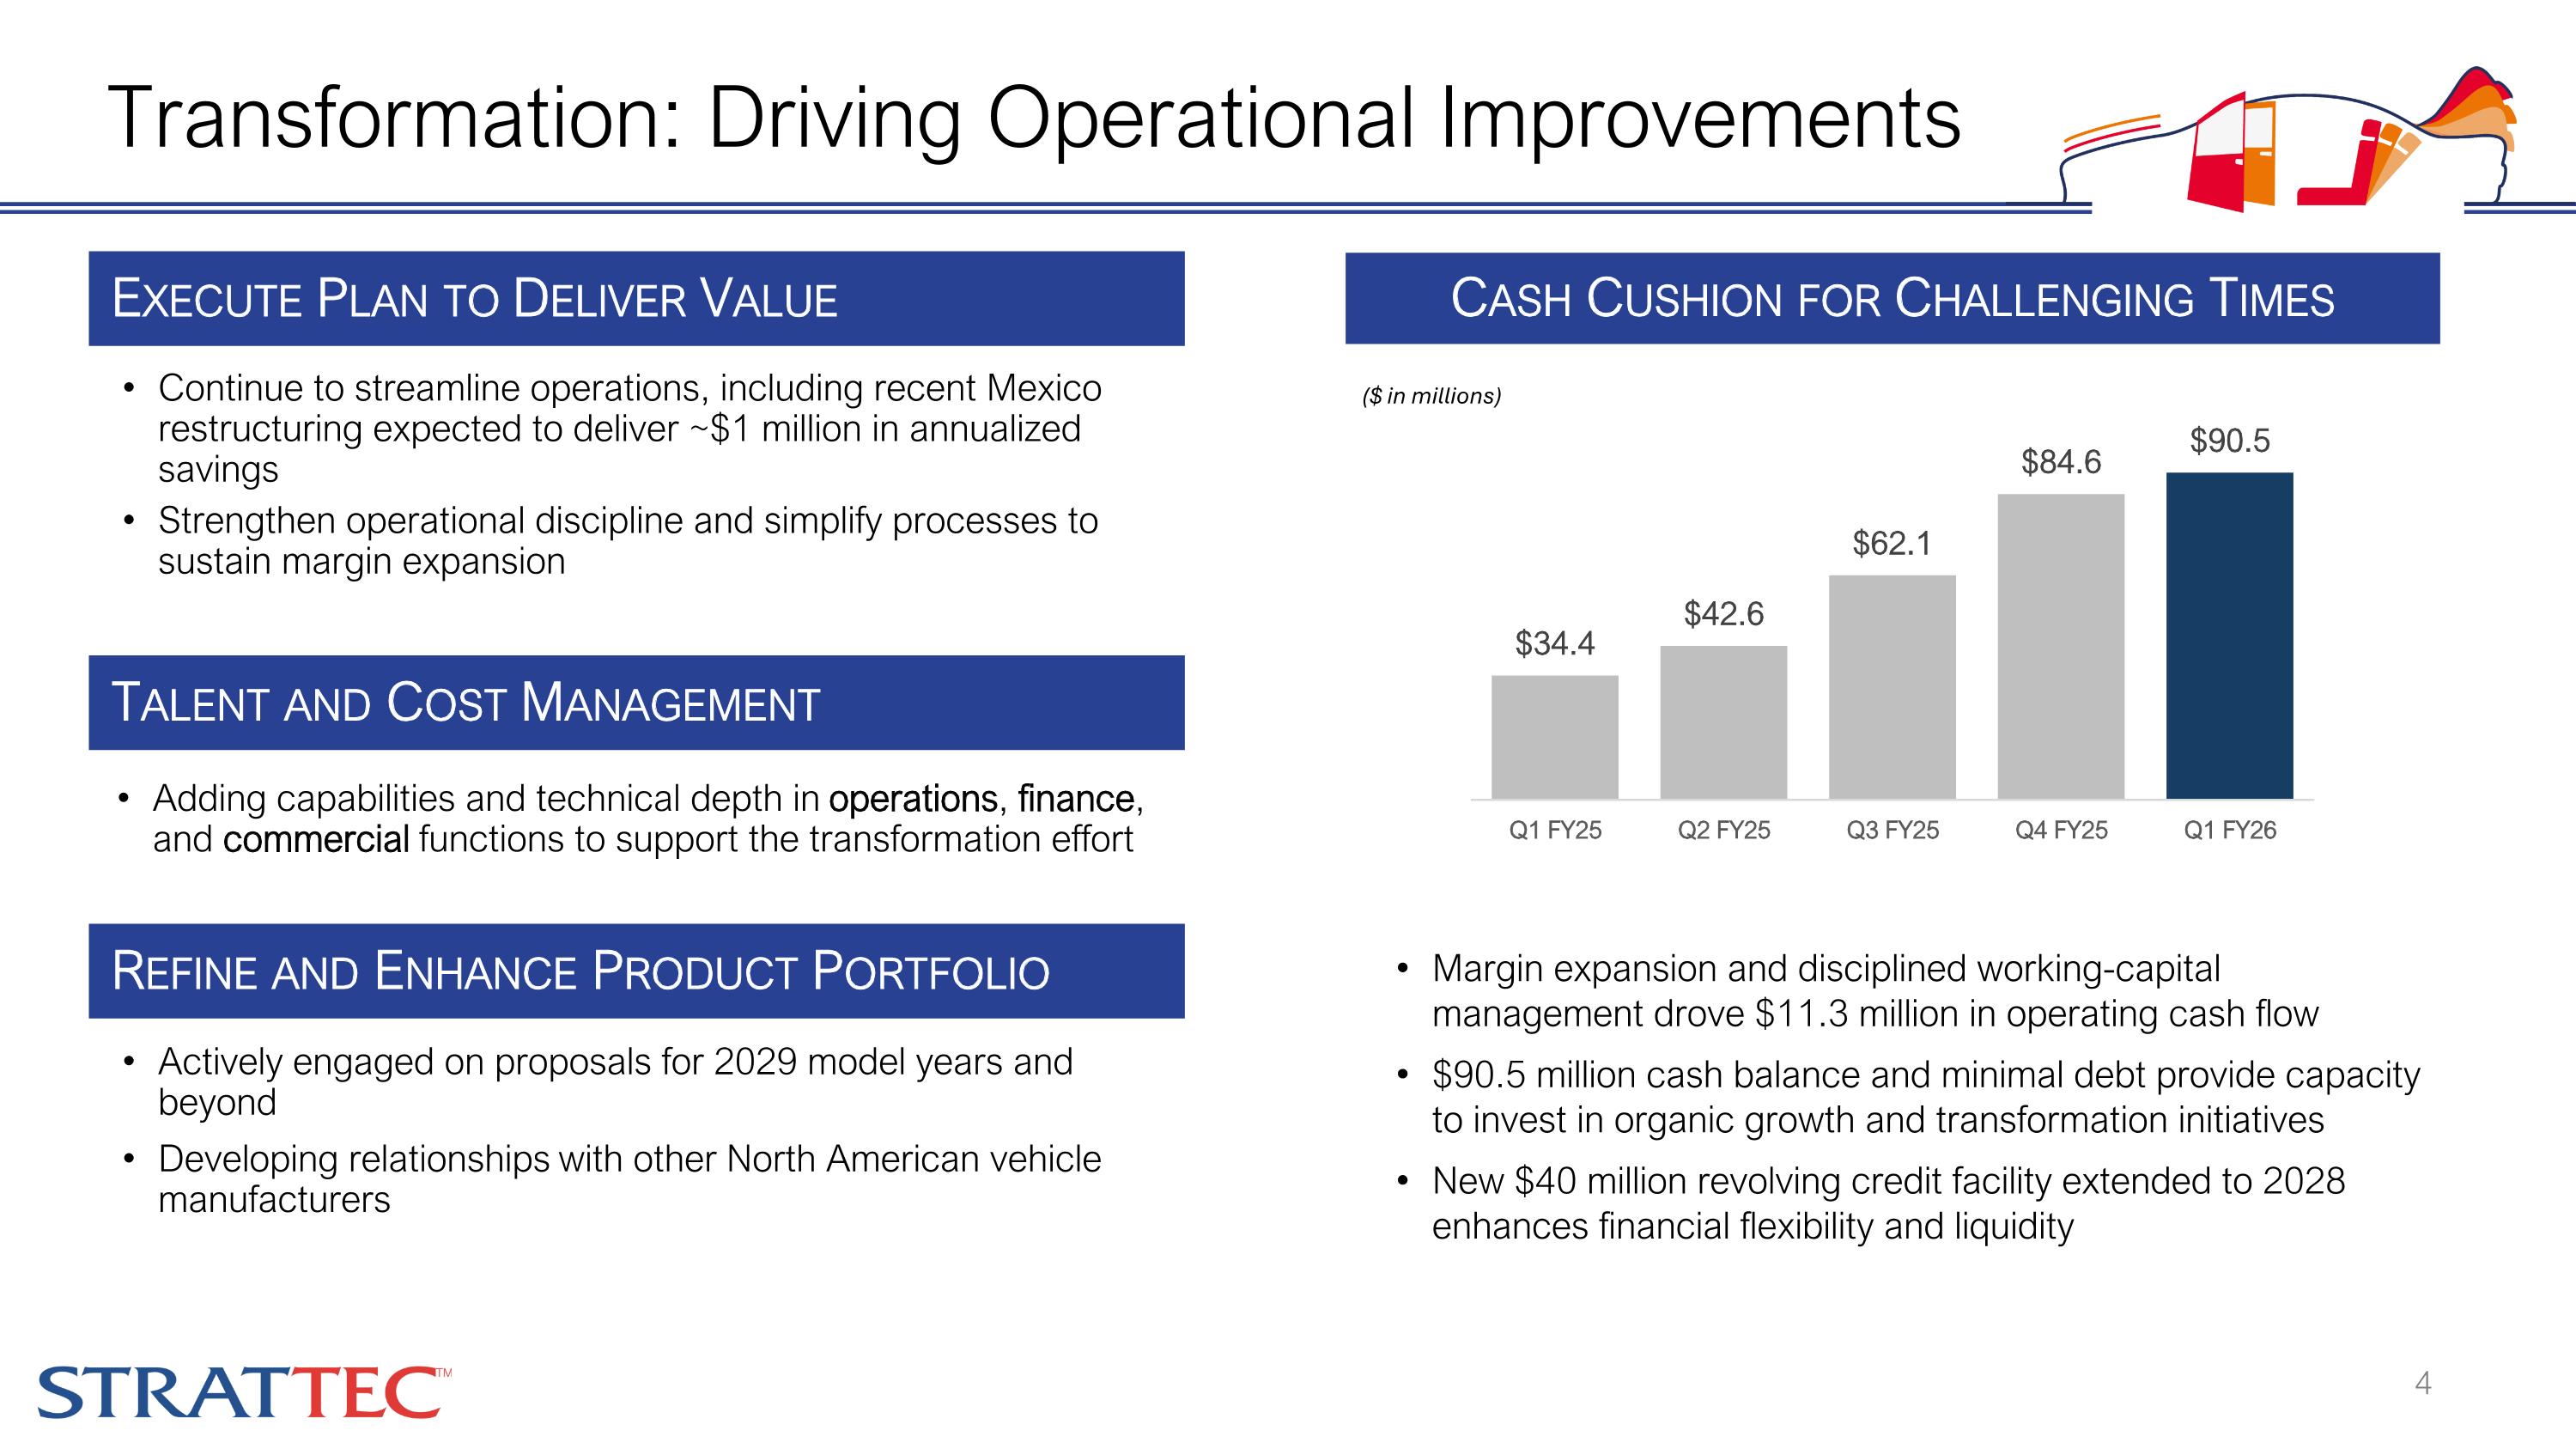
Transformation: Driving Operational Improvements Margin expansion and disciplined working-capital management drove $11.3 million in operating cash flow $90.5 million cash balance and minimal debt provide capacity to invest in organic growth and transformation initiatives New $40 million revolving credit facility extended to 2028 enhances financial flexibility and liquidity Cash Cushion for Challenging Times Execute Plan to Deliver Value Continue to streamline operations, including recent Mexico restructuring expected to deliver ~$1 million in annualized savings Strengthen operational discipline and simplify processes to sustain margin expansion Talent and Cost Management Adding capabilities and technical depth in operations, finance, and commercial functions to support the transformation effort Refine and Enhance Product Portfolio Actively engaged on proposals for 2029 model years and beyond Developing relationships with other North American vehicle manufacturers ($ in millions)
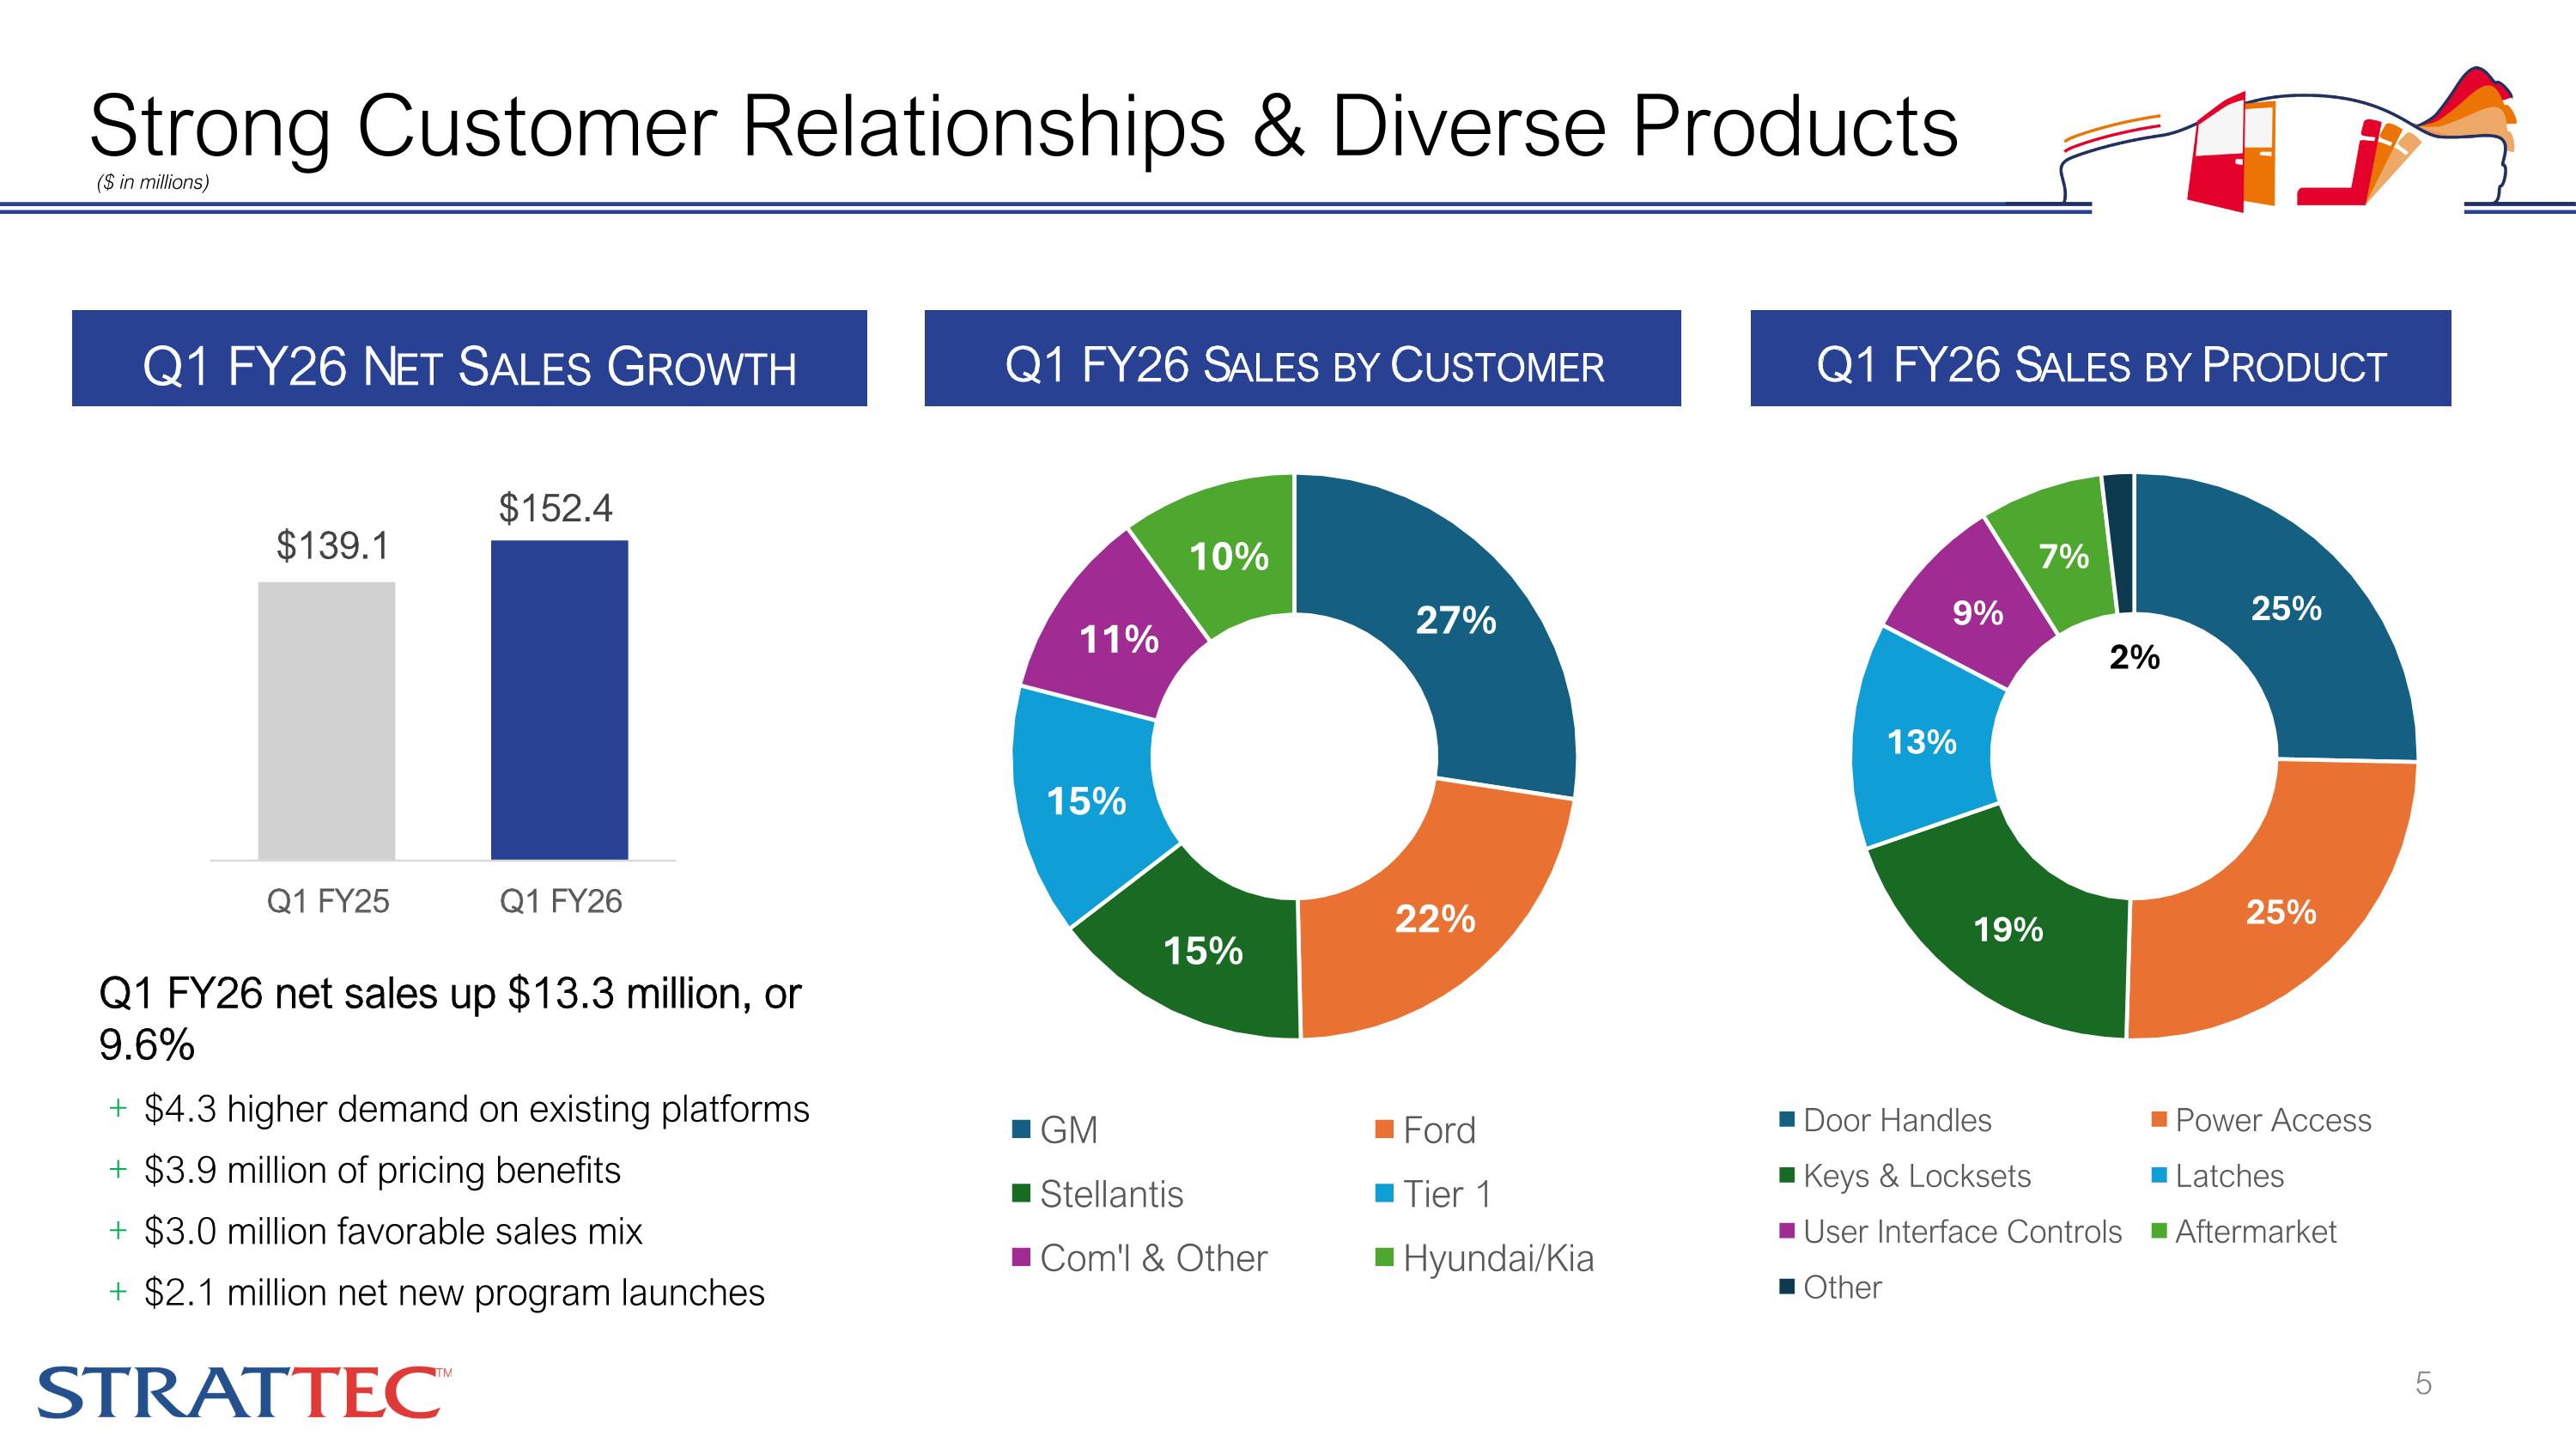
($ in millions) Strong Customer Relationships & Diverse Products Q1 FY26 Sales by Customer Q1 FY26 Sales by Product Q1 FY26 Net Sales Growth Q1 FY26 net sales up $13.3 million, or 9.6% $4.3 higher demand on existing platforms $3.9 million of pricing benefits $3.0 million favorable sales mix $2.1 million net new program launches
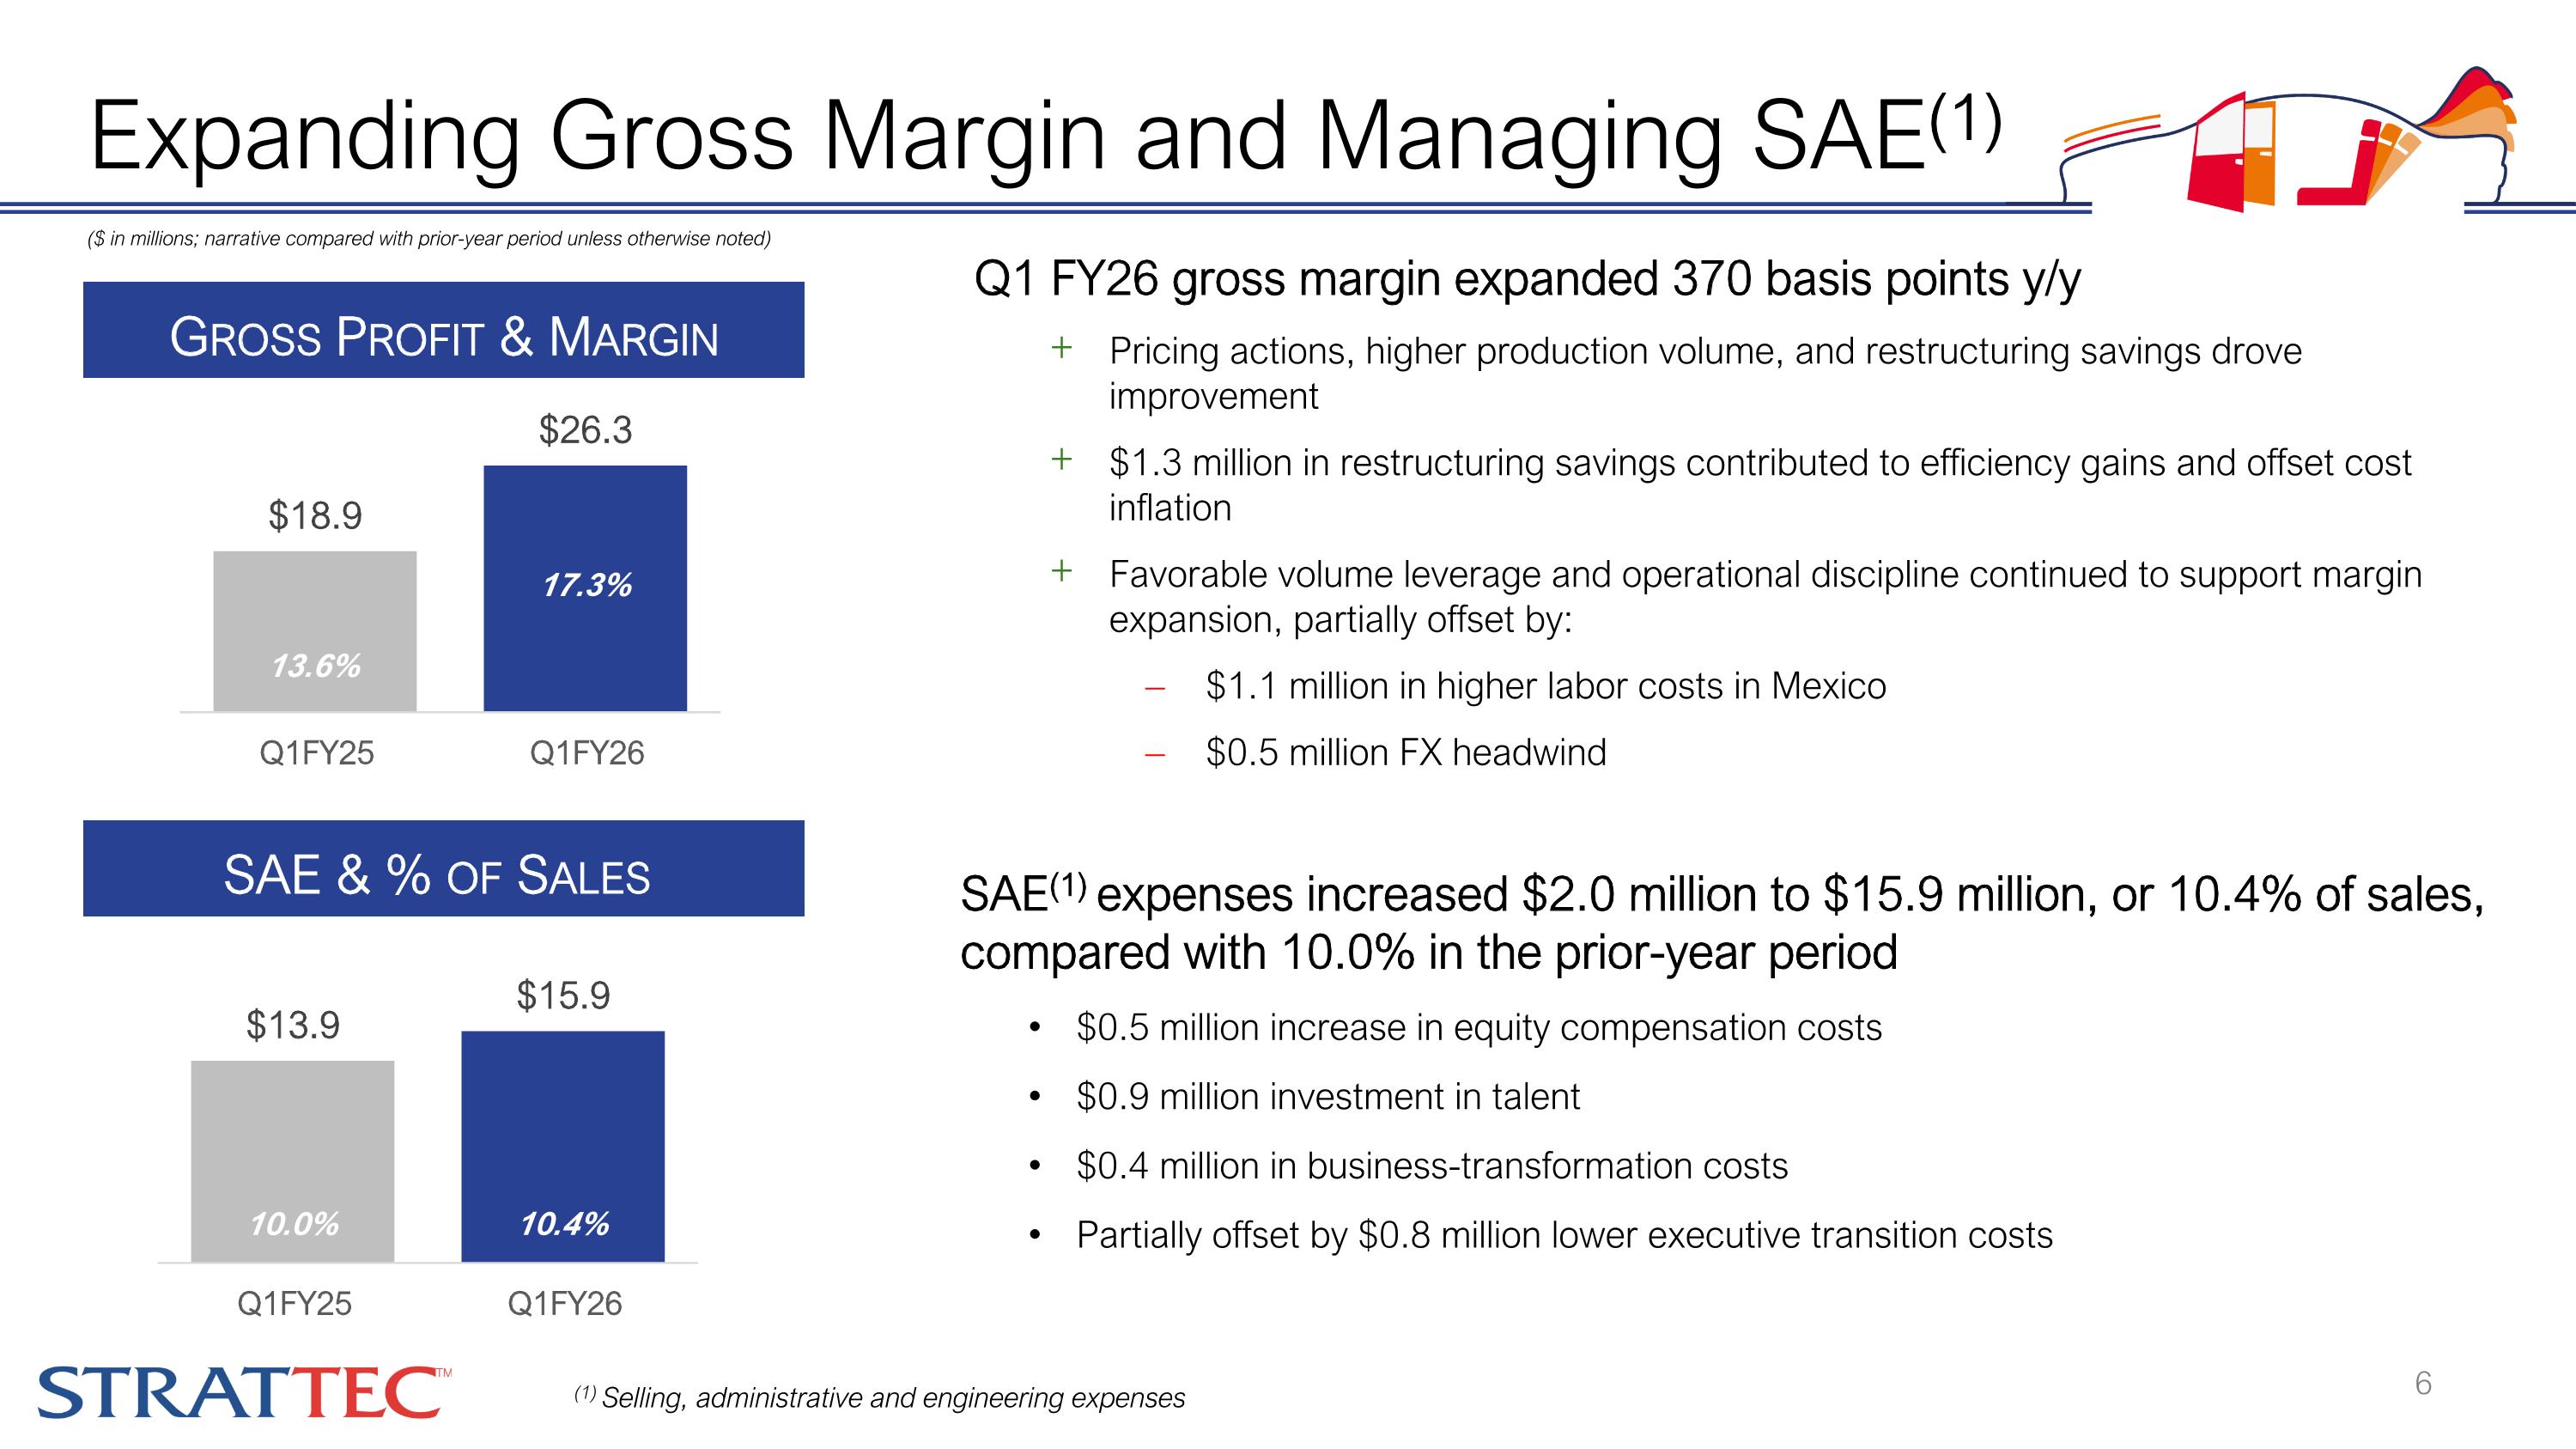
Q1 FY26 gross margin expanded 370 basis points y/y Pricing actions, higher production volume, and restructuring savings drove improvement $1.3 million in restructuring savings contributed to efficiency gains and offset cost inflation Favorable volume leverage and operational discipline continued to support margin expansion, partially offset by: $1.1 million in higher labor costs in Mexico $0.5 million FX headwind ($ in millions; narrative compared with prior-year period unless otherwise noted) Expanding Gross Margin and Managing SAE(1) Gross Profit & Margin 11.4% 13.2% 17.3% 13.6% 15.0% 12.2% SAE & % of Sales SAE(1) expenses increased $2.0 million to $15.9 million, or 10.4% of sales, compared with 10.0% in the prior-year period $0.5 million increase in equity compensation costs $0.9 million investment in talent $0.4 million in business-transformation costs Partially offset by $0.8 million lower executive transition costs (1) Selling, administrative and engineering expenses
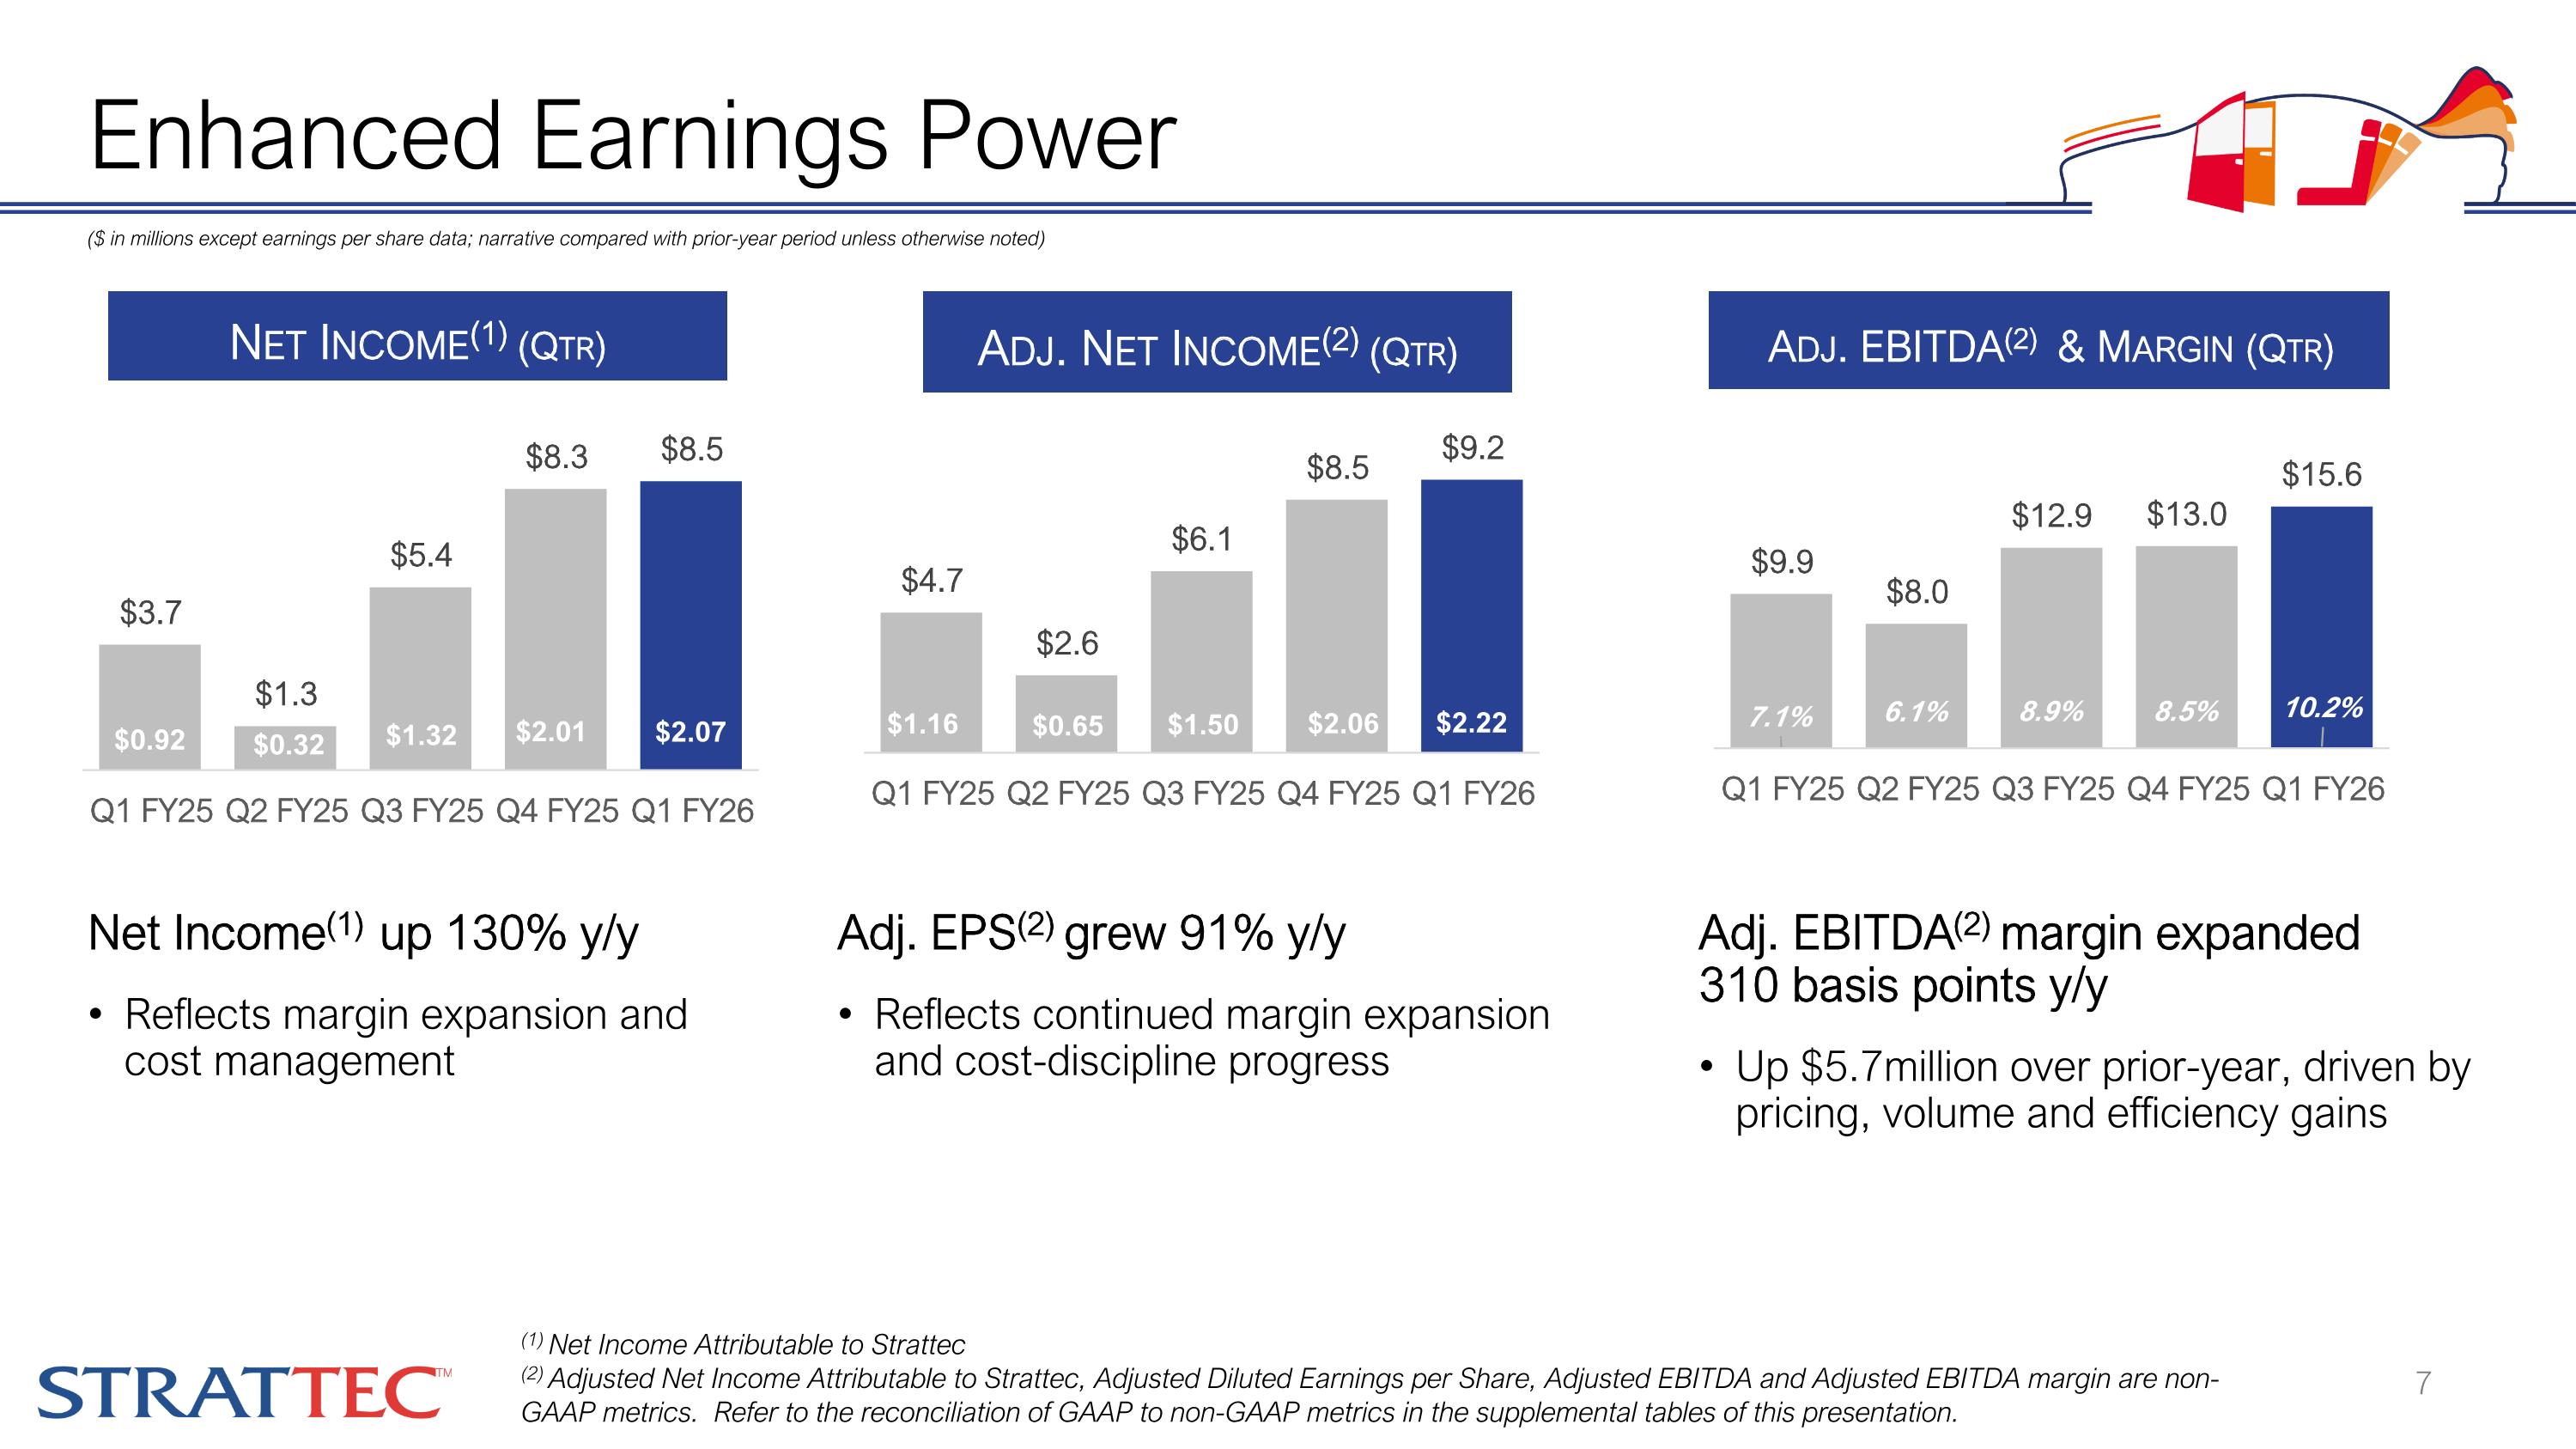
($ in millions except earnings per share data; narrative compared with prior-year period unless otherwise noted) Net Income(1) up 130% y/y Reflects margin expansion and cost management Enhanced Earnings Power (1) Net Income Attributable to Strattec (2) Adjusted Net Income Attributable to Strattec, Adjusted Diluted Earnings per Share, Adjusted EBITDA and Adjusted EBITDA margin are non-GAAP metrics. Refer to the reconciliation of GAAP to non-GAAP metrics in the supplemental tables of this presentation. Adj. Net Income(2) (Qtr) Net Income(1) (Qtr) Adj. EBITDA(2) & Margin (Qtr) Adj. EPS(2) grew 91% y/y Reflects continued margin expansion and cost-discipline progress Adj. EBITDA(2) margin expanded 310 basis points y/y Up $5.7million over prior-year, driven by pricing, volume and efficiency gains
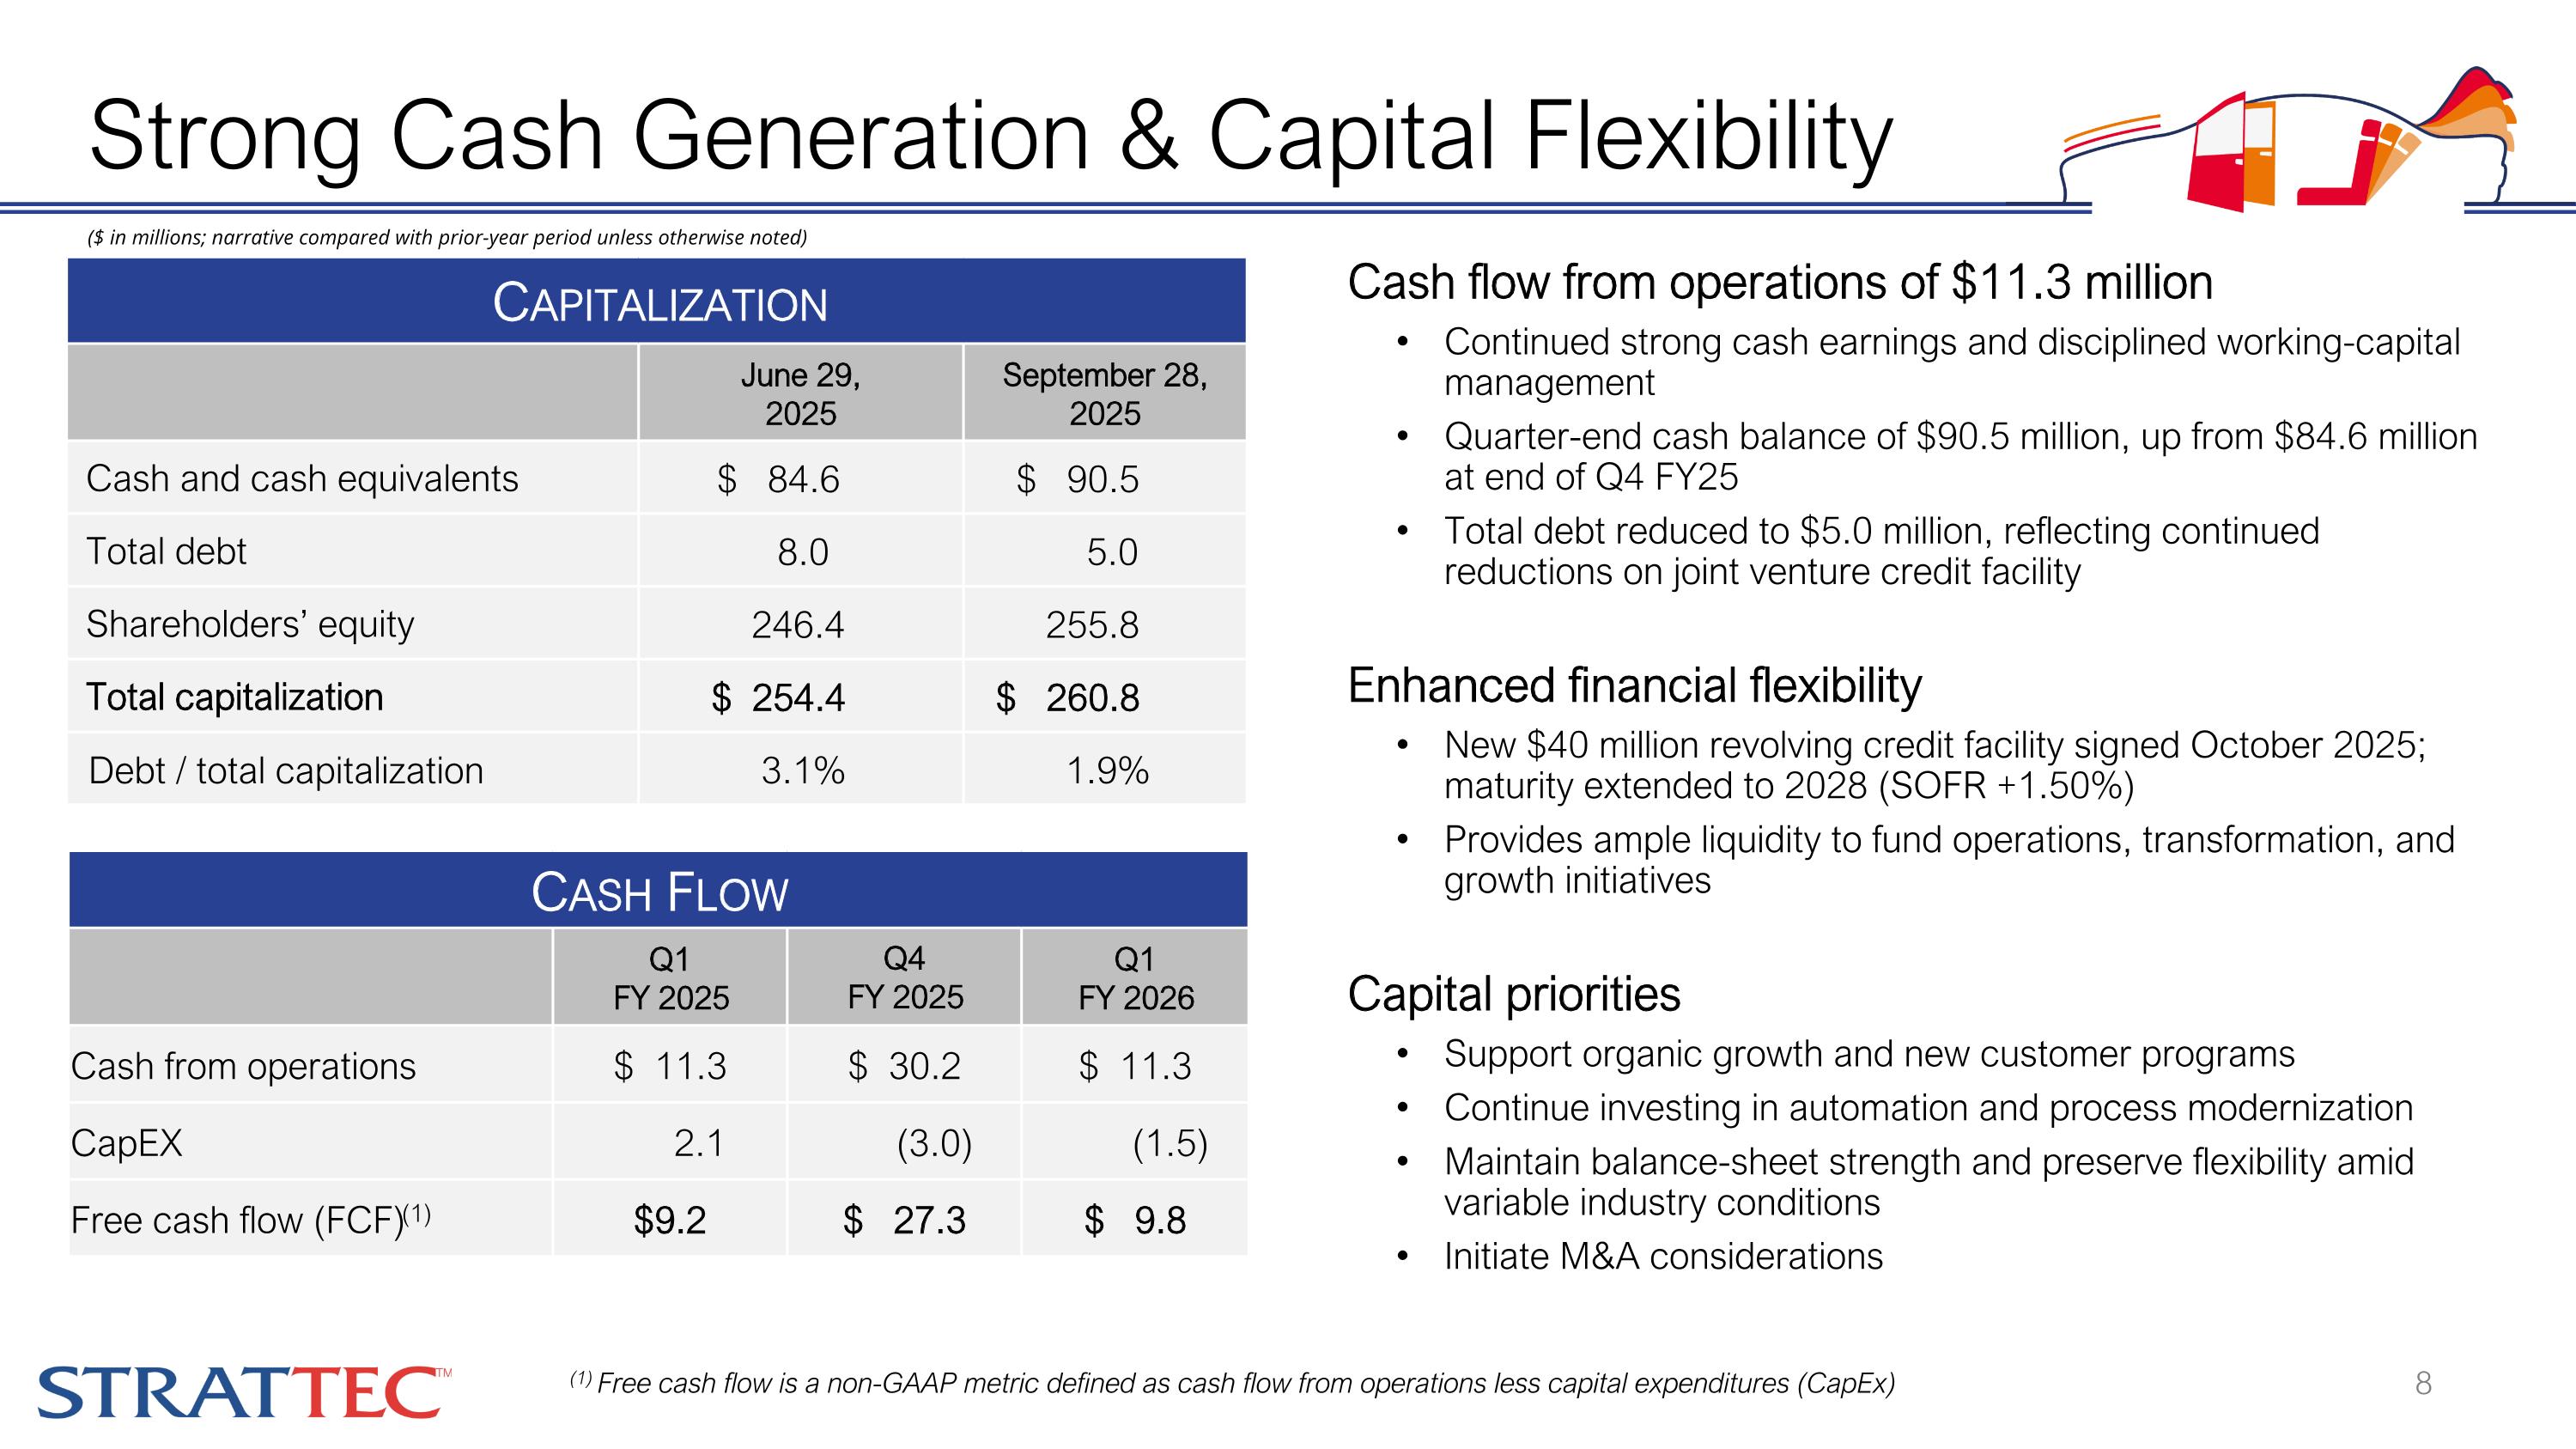
Cash flow from operations of $11.3 million Continued strong cash earnings and disciplined working-capital management Quarter-end cash balance of $90.5 million, up from $84.6 million at end of Q4 FY25 Total debt reduced to $5.0 million, reflecting continued reductions on joint venture credit facility Enhanced financial flexibility New $40 million revolving credit facility signed October 2025; maturity extended to 2028 (SOFR +1.50%) Provides ample liquidity to fund operations, transformation, and growth initiatives Capital priorities Support organic growth and new customer programs Continue investing in automation and process modernization Maintain balance-sheet strength and preserve flexibility amid variable industry conditions Initiate M&A considerations Capitalization June 29, 2025 September 28, 2025 Cash and cash equivalents $ 84.6 $ 90.5 Total debt 8.0 5.0 Shareholders’ equity 246.4 255.8 Total capitalization $ 254.4 $ 260.8 Debt / total capitalization 3.1% 1.9% ($ in millions; narrative compared with prior-year period unless otherwise noted) (1) Free cash flow is a non-GAAP metric defined as cash flow from operations less capital expenditures (CapEx) Strong Cash Generation & Capital Flexibility Cash Flow Q1 FY 2025 Q4 FY 2025 Q1 FY 2026 Cash from operations $ 11.3 $ 30.2 $ 11.3 CapEX 2.1 (3.0) (1.5) Free cash flow (FCF)(1) $9.2 $ 27.3 $ 9.8
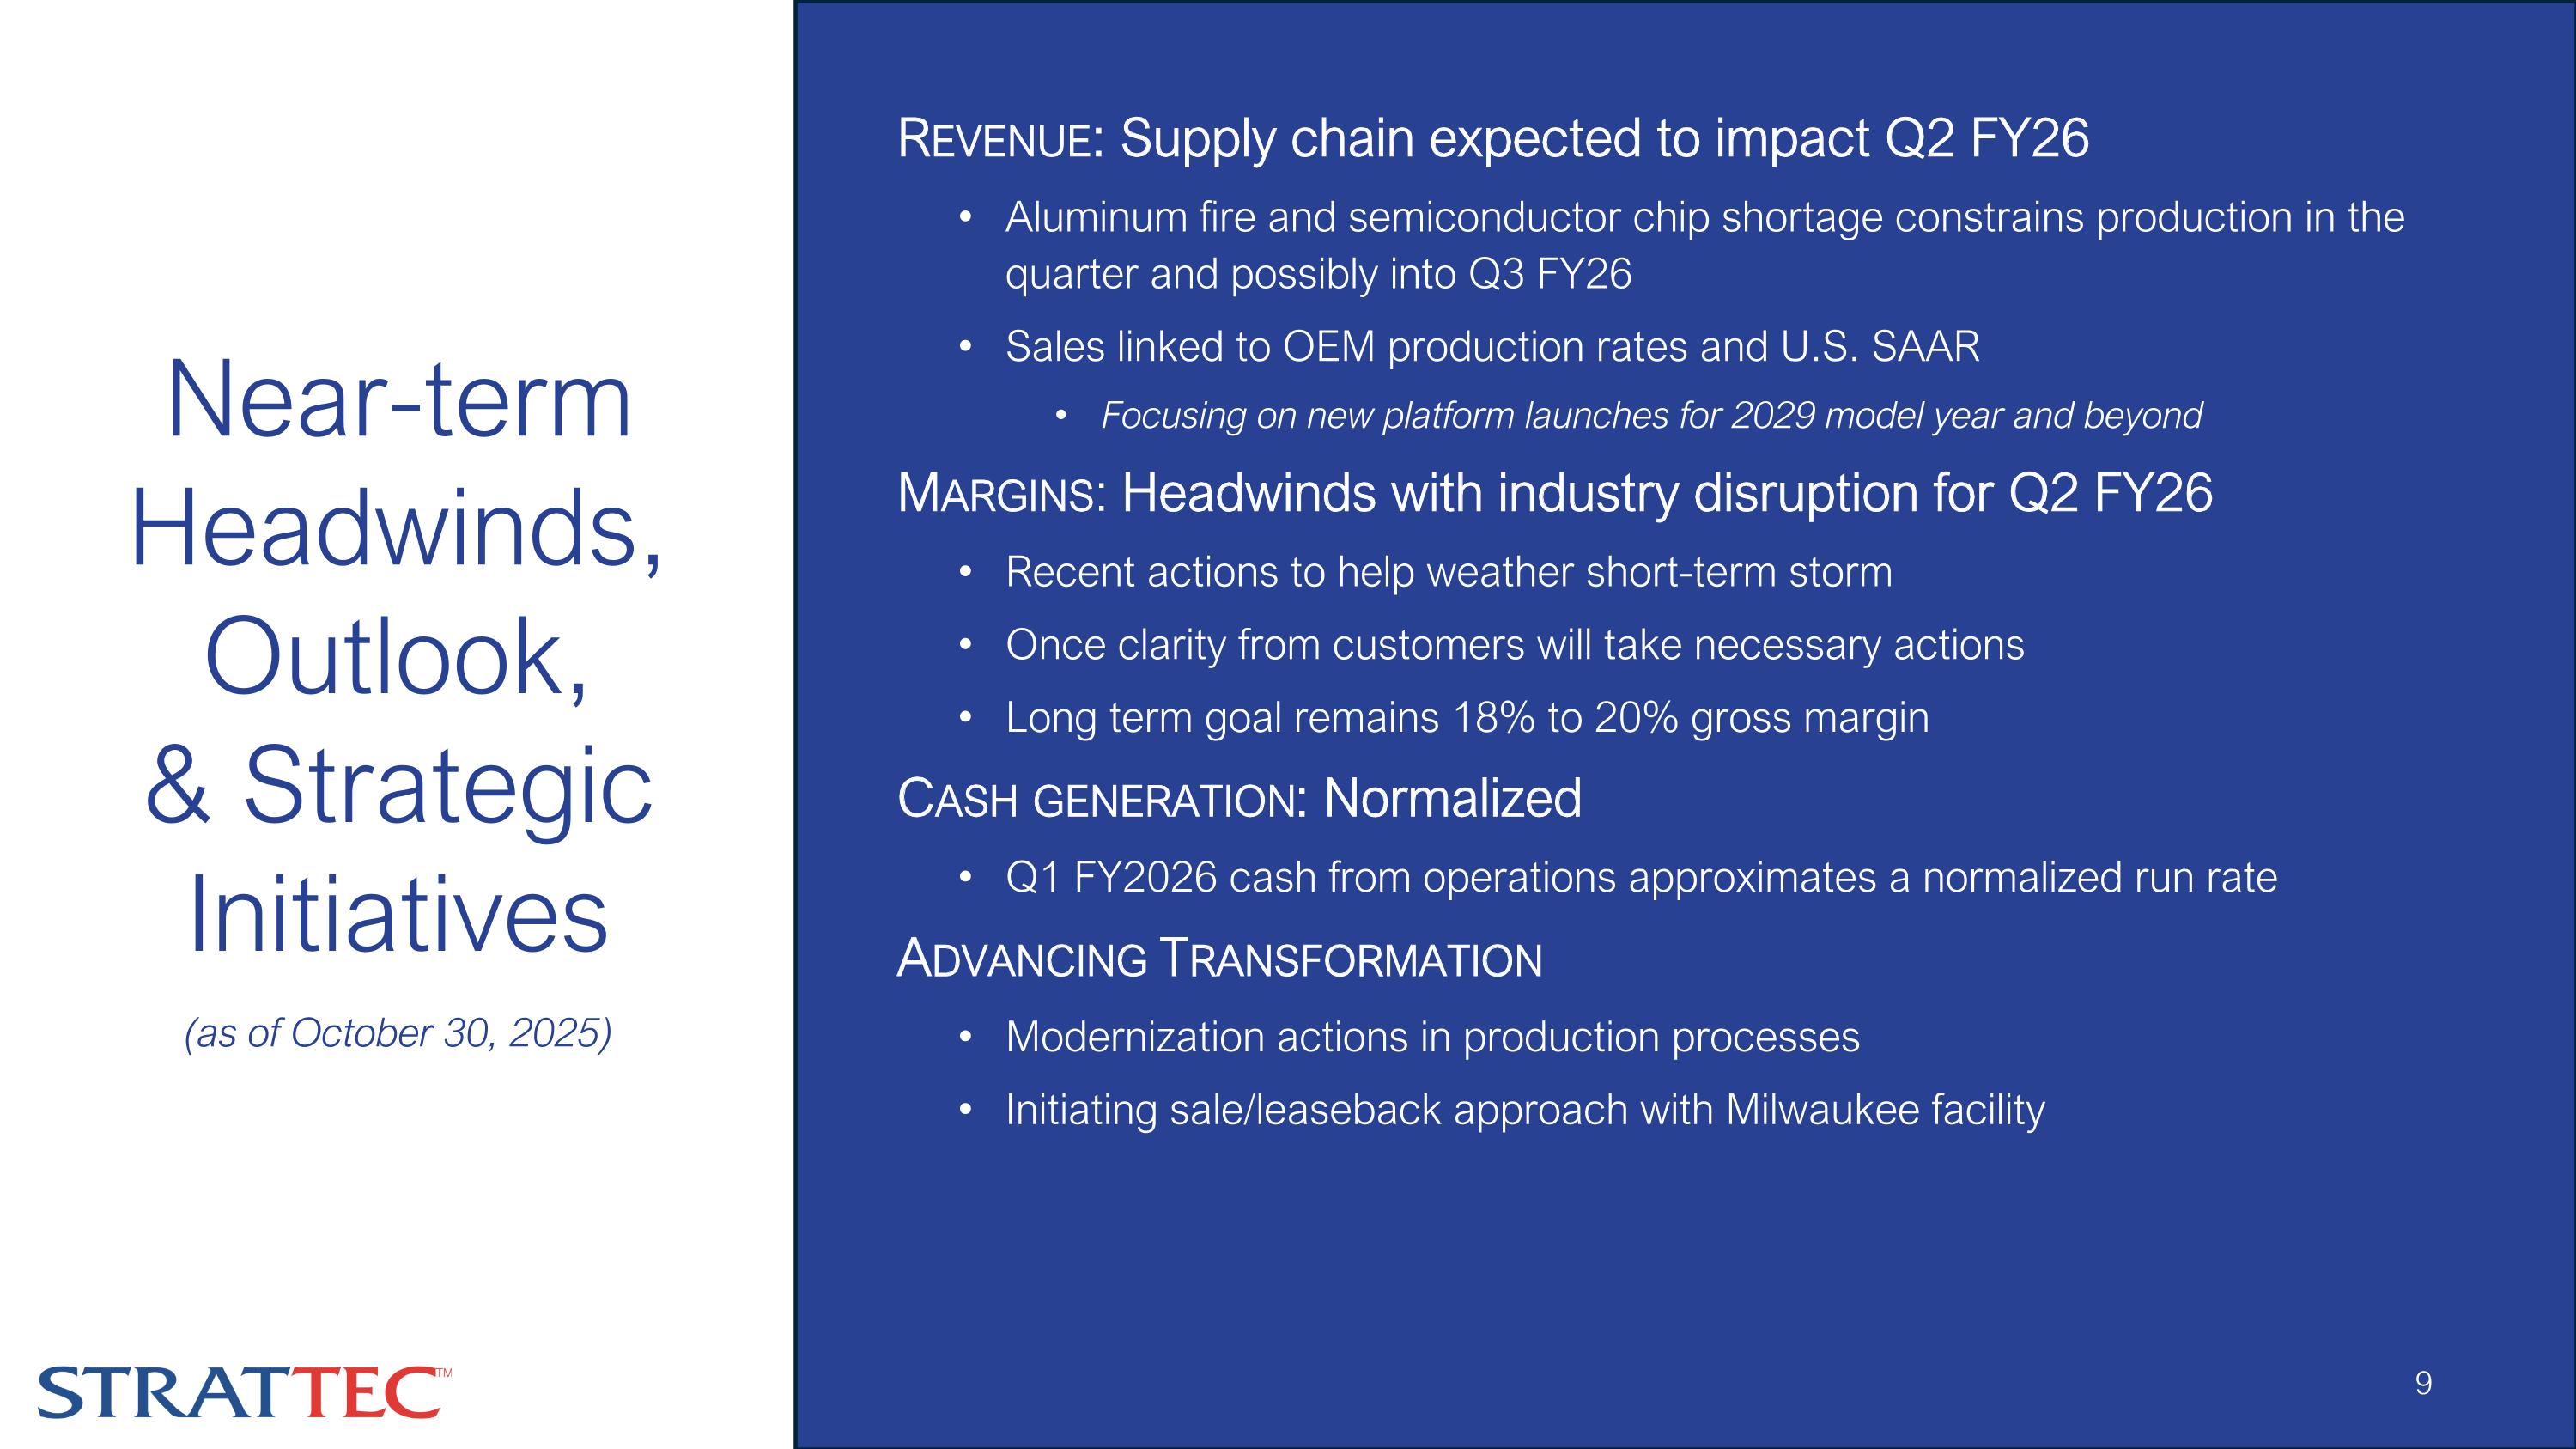
Revenue: Supply chain expected to impact Q2 FY26 Aluminum fire and semiconductor chip shortage constrains production in the quarter and possibly into Q3 FY26 Sales linked to OEM production rates and U.S. SAAR Focusing on new platform launches for 2029 model year and beyond Margins: Headwinds with industry disruption for Q2 FY26 Recent actions to help weather short-term storm Once clarity from customers will take necessary actions Long term goal remains 18% to 20% gross margin Cash generation: Normalized Q1 FY2026 cash from operations approximates a normalized run rate Advancing Transformation Modernization actions in production processes Initiating sale/leaseback approach with Milwaukee facility Near-term Headwinds, Outlook, & Strategic Initiatives (as of October 30, 2025)
www.strattec.com Q1 FY2026 Financial Results Supplemental Slides
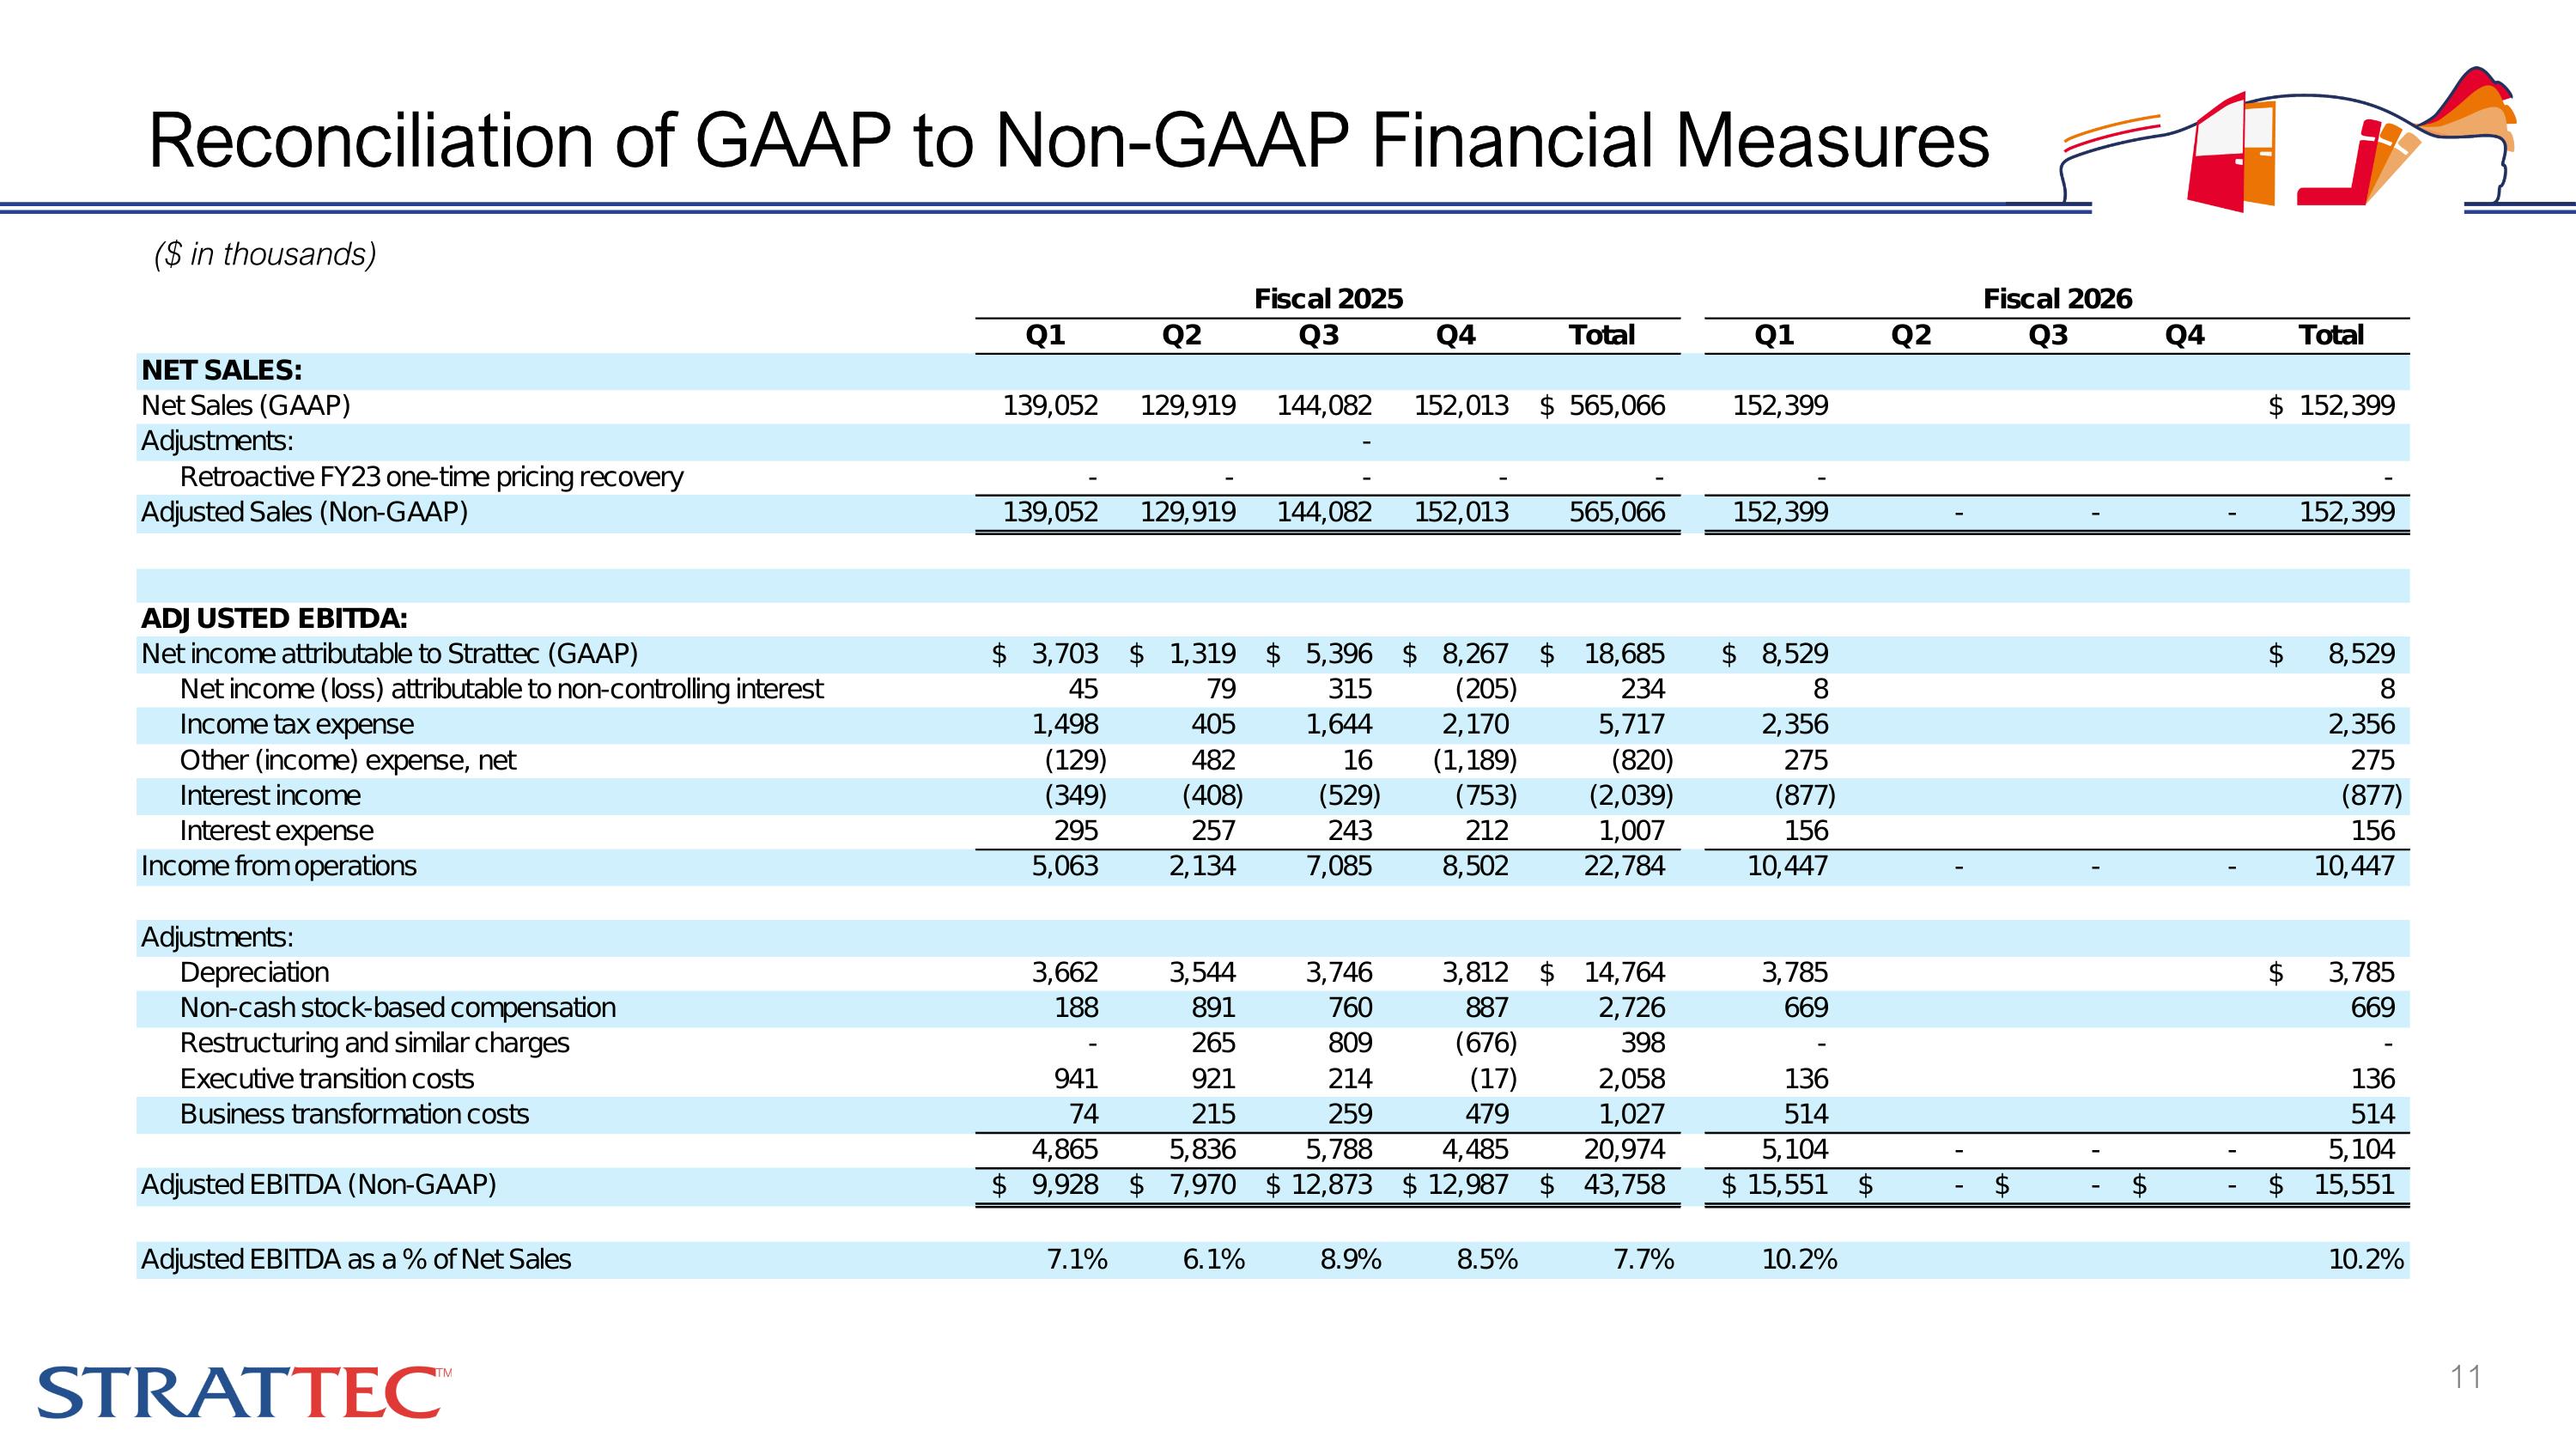
Reconciliation of GAAP to Non-GAAP Financial Measures ($ in thousands)
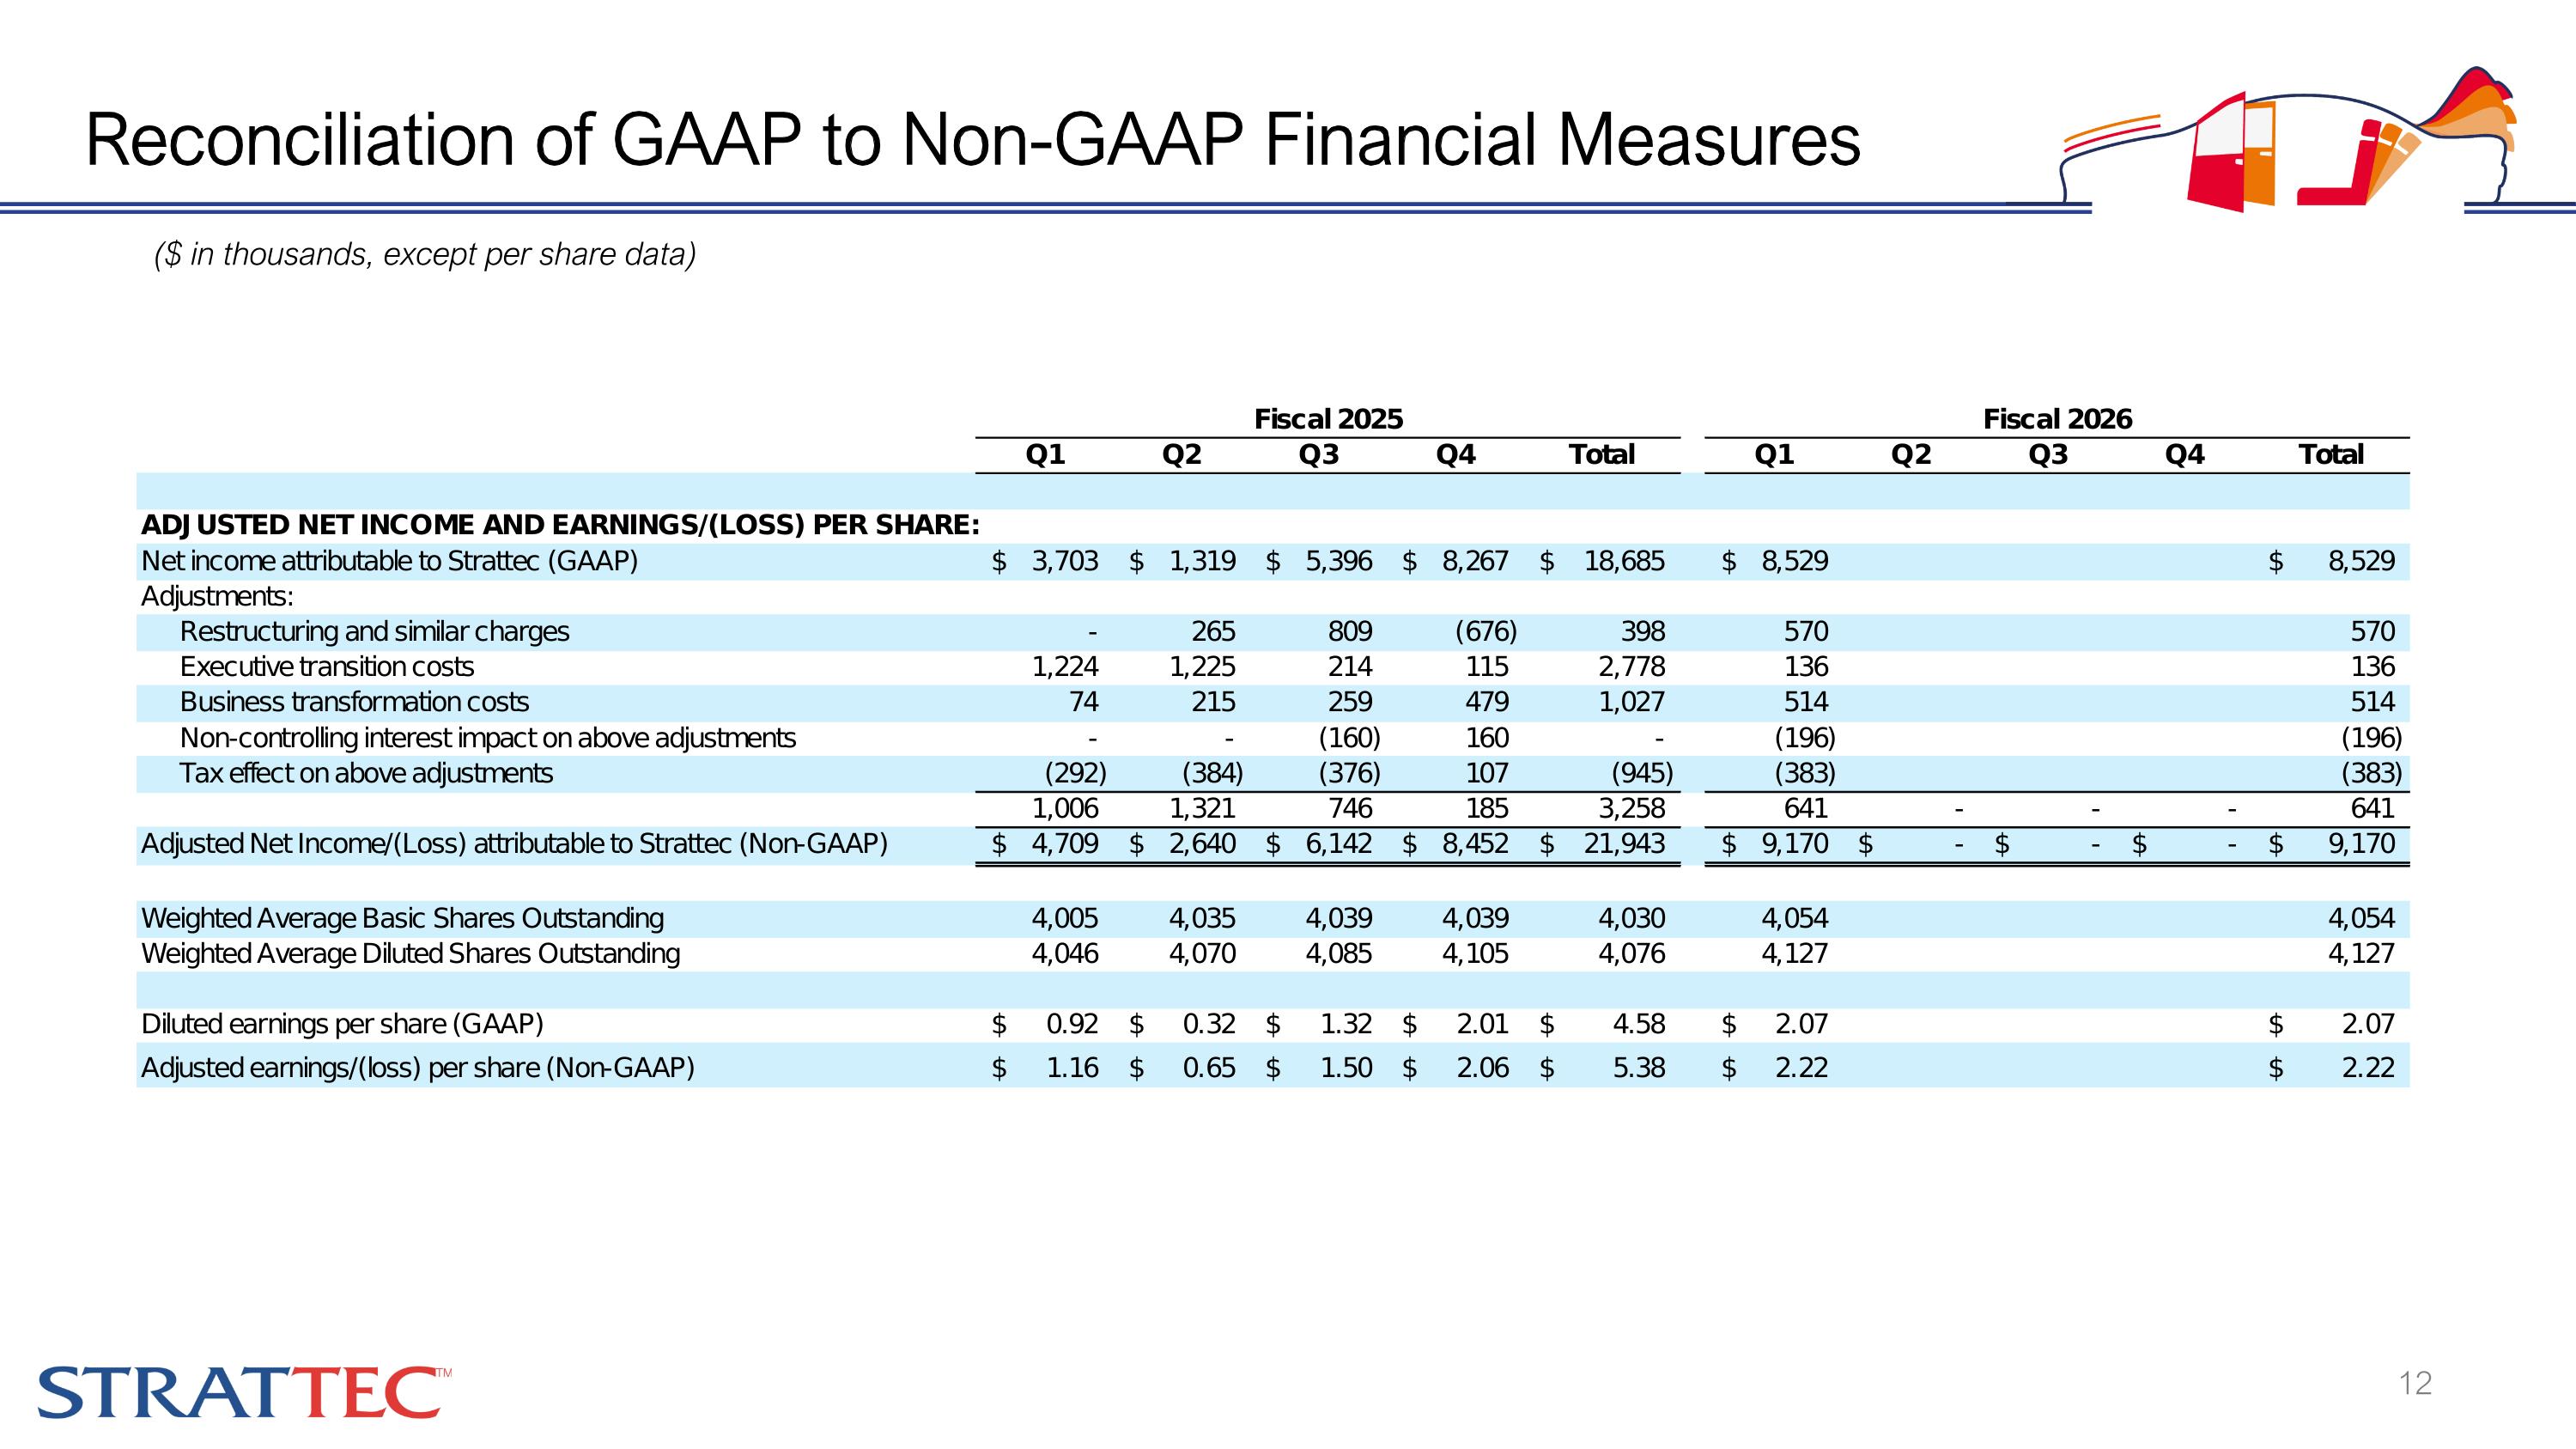
Reconciliation of GAAP to Non-GAAP Financial Measures ($ in thousands, except per share data)
Q1 FY2026 Financial Results October 31, 2025 Nasdaq: STRT www.strattec.com Investor Relations Contact: Deborah K. Pawlowski, Alliance Advisors IR 716-843-3908 dpawlowski@Allianceadvisors.com