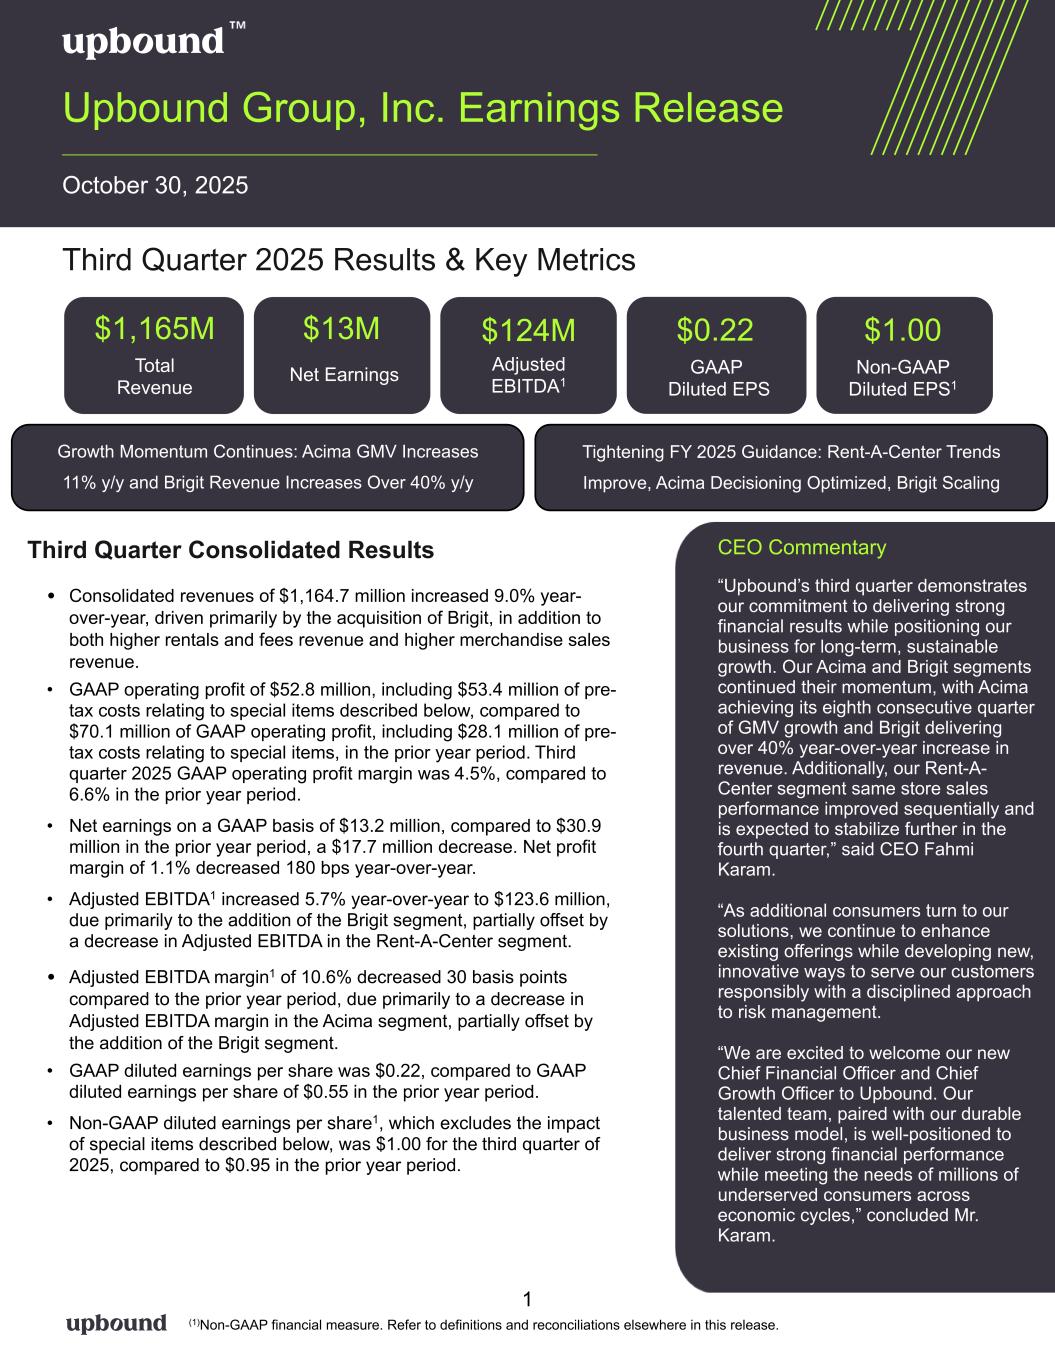
Growth Momentum Continues: Acima GMV Increases 11% y/y and Brigit Revenue Increases Over 40% y/y Tightening FY 2025 Guidance: Rent-A-Center Trends Improve, Acima Decisioning Optimized, Brigit Scaling Total Revenue CEO Commentary “Upbound’s third quarter demonstrates our commitment to delivering strong financial results while positioning our business for long-term, sustainable growth. Our Acima and Brigit segments continued their momentum, with Acima achieving its eighth consecutive quarter of GMV growth and Brigit delivering over 40% year-over-year increase in revenue. Additionally, our Rent-A- Center segment same store sales performance improved sequentially and is expected to stabilize further in the fourth quarter,” said CEO Fahmi Karam. “As additional consumers turn to our solutions, we continue to enhance existing offerings while developing new, innovative ways to serve our customers responsibly with a disciplined approach to risk management. “We are excited to welcome our new Chief Financial Officer and Chief Growth Officer to Upbound. Our talented team, paired with our durable business model, is well-positioned to deliver strong financial performance while meeting the needs of millions of underserved consumers across economic cycles,” concluded Mr. Karam. Upbound Group, Inc. Earnings Release October 30, 2025 Third Quarter 2025 Results & Key Metrics Third Quarter Consolidated Results • Consolidated revenues of $1,164.7 million increased 9.0% year- over-year, driven primarily by the acquisition of Brigit, in addition to both higher rentals and fees revenue and higher merchandise sales revenue. • GAAP operating profit of $52.8 million, including $53.4 million of pre- tax costs relating to special items described below, compared to $70.1 million of GAAP operating profit, including $28.1 million of pre- tax costs relating to special items, in the prior year period. Third quarter 2025 GAAP operating profit margin was 4.5%, compared to 6.6% in the prior year period. • Net earnings on a GAAP basis of $13.2 million, compared to $30.9 million in the prior year period, a $17.7 million decrease. Net profit margin of 1.1% decreased 180 bps year-over-year. • Adjusted EBITDA1 increased 5.7% year-over-year to $123.6 million, due primarily to the addition of the Brigit segment, partially offset by a decrease in Adjusted EBITDA in the Rent-A-Center segment. • Adjusted EBITDA margin1 of 10.6% decreased 30 basis points compared to the prior year period, due primarily to a decrease in Adjusted EBITDA margin in the Acima segment, partially offset by the addition of the Brigit segment. • GAAP diluted earnings per share was $0.22, compared to GAAP diluted earnings per share of $0.55 in the prior year period. • Non-GAAP diluted earnings per share1, which excludes the impact of special items described below, was $1.00 for the third quarter of 2025, compared to $0.95 in the prior year period. 1 (1)Non-GAAP financial measure. Refer to definitions and reconciliations elsewhere in this release. $1,165M Total Revenue GAAP Diluted EPS $0.22 Non-GAAP Diluted EPS1 Net Earnings $13M Adjusted EBITDA1 $1.00$124M
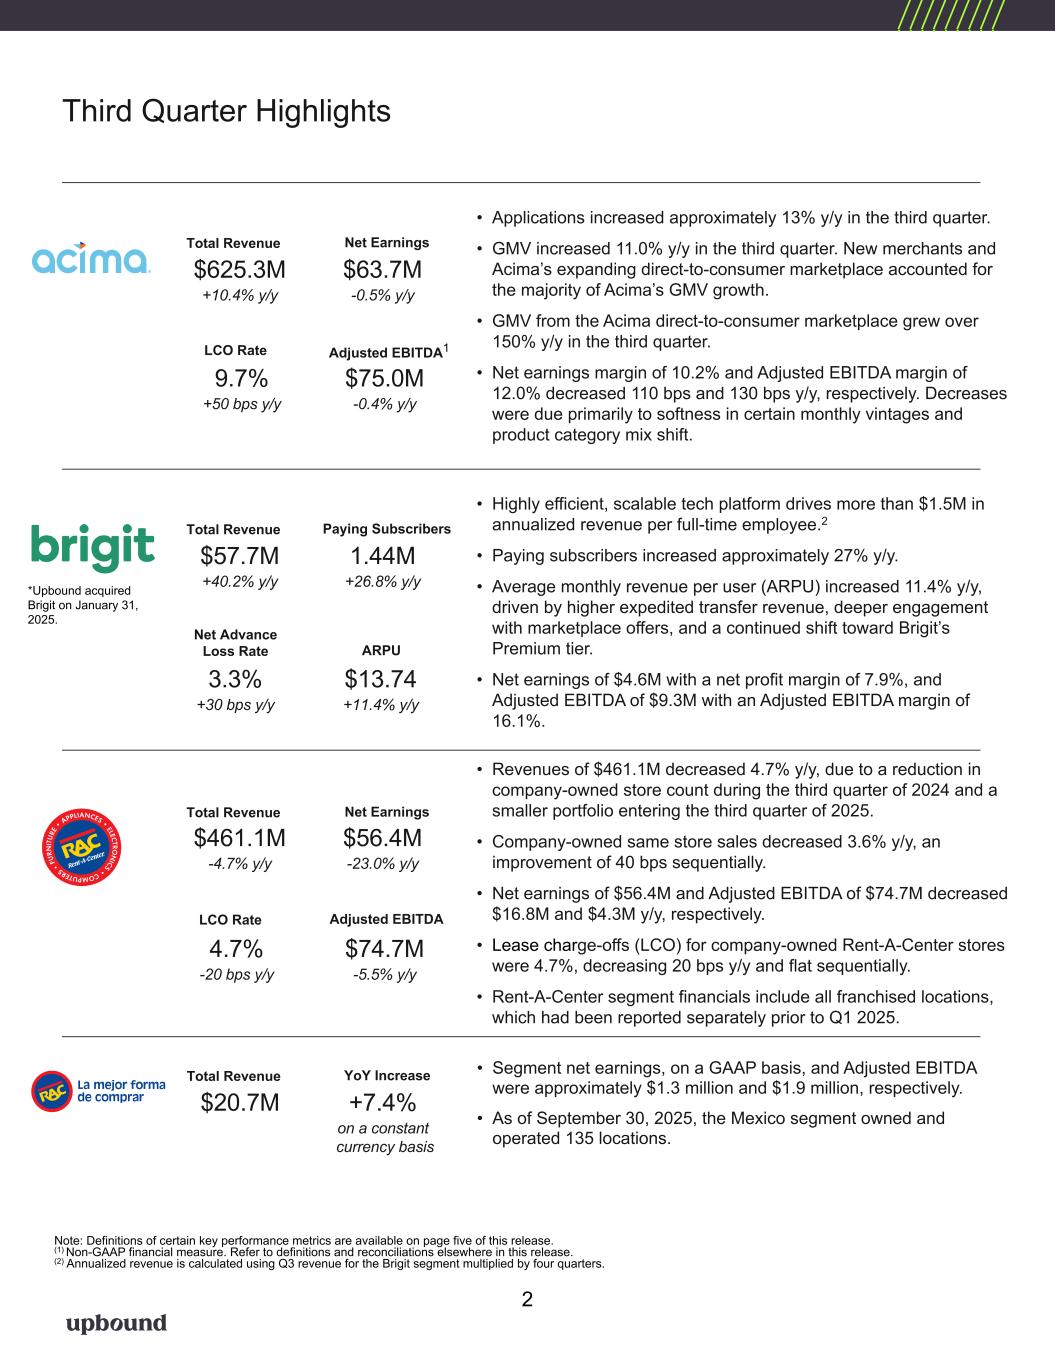
LCO Rate Third Quarter Highlights $625.3M +10.4% y/y Revenue YoY Increase$63.7M -0.5% y/y • Applications increased approximately 13% y/y in the third quarter. • GMV increased 11.0% y/y in the third quarter. New merchants and Acima’s expanding direct-to-consumer marketplace accounted for the majority of Acima’s GMV growth. • GMV from the Acima direct-to-consumer marketplace grew over 150% y/y in the third quarter. • Net earnings margin of 10.2% and Adjusted EBITDA margin of 12.0% decreased 110 bps and 130 bps y/y, respectively. Decreases were due primarily to softness in certain monthly vintages and product category mix shift. Total Revenue Net Earnings 9.7% +50 bps y/y $75.0M -0.4% y/y LCO Rate Adjusted EBITDA1 $461.1M -4.7% y/y Revenue YoY Increase $56.4M -23.0% y/y • Revenues of $461.1M decreased 4.7% y/y, due to a reduction in company-owned store count during the third quarter of 2024 and a smaller portfolio entering the third quarter of 2025. • Company-owned same store sales decreased 3.6% y/y, an improvement of 40 bps sequentially. • Net earnings of $56.4M and Adjusted EBITDA of $74.7M decreased $16.8M and $4.3M y/y, respectively. • Lease charge-offs (LCO) for company-owned Rent-A-Center stores were 4.7%, decreasing 20 bps y/y and flat sequentially. • Rent-A-Center segment financials include all franchised locations, which had been reported separately prior to Q1 2025. Total Revenue Net Earnings 4.7% -20 bps y/y $74.7M -5.5% y/y Adjusted EBITDA $57.7M +40.2% y/y 1.44M +26.8% y/y • Highly efficient, scalable tech platform drives more than $1.5M in annualized revenue per full-time employee.2 • Paying subscribers increased approximately 27% y/y. • Average monthly revenue per user (ARPU) increased 11.4% y/y, driven by higher expedited transfer revenue, deeper engagement with marketplace offers, and a continued shift toward Brigit’s Premium tier. • Net earnings of $4.6M with a net profit margin of 7.9%, and Adjusted EBITDA of $9.3M with an Adjusted EBITDA margin of 16.1%. Total Revenue Paying Subscribers 3.3% +30 bps y/y $13.74 +11.4% y/y Net Advance Loss Rate ARPU $20.7M +7.4% on a constant currency basis • Segment net earnings, on a GAAP basis, and Adjusted EBITDA were approximately $1.3 million and $1.9 million, respectively. • As of September 30, 2025, the Mexico segment owned and operated 135 locations. Total Revenue YoY Increase 2 Note: Definitions of certain key performance metrics are available on page five of this release. (1) Non-GAAP financial measure. Refer to definitions and reconciliations elsewhere in this release. (2) Annualized revenue is calculated using Q3 revenue for the Brigit segment multiplied by four quarters. *Upbound acquired Brigit on January 31, 2025.
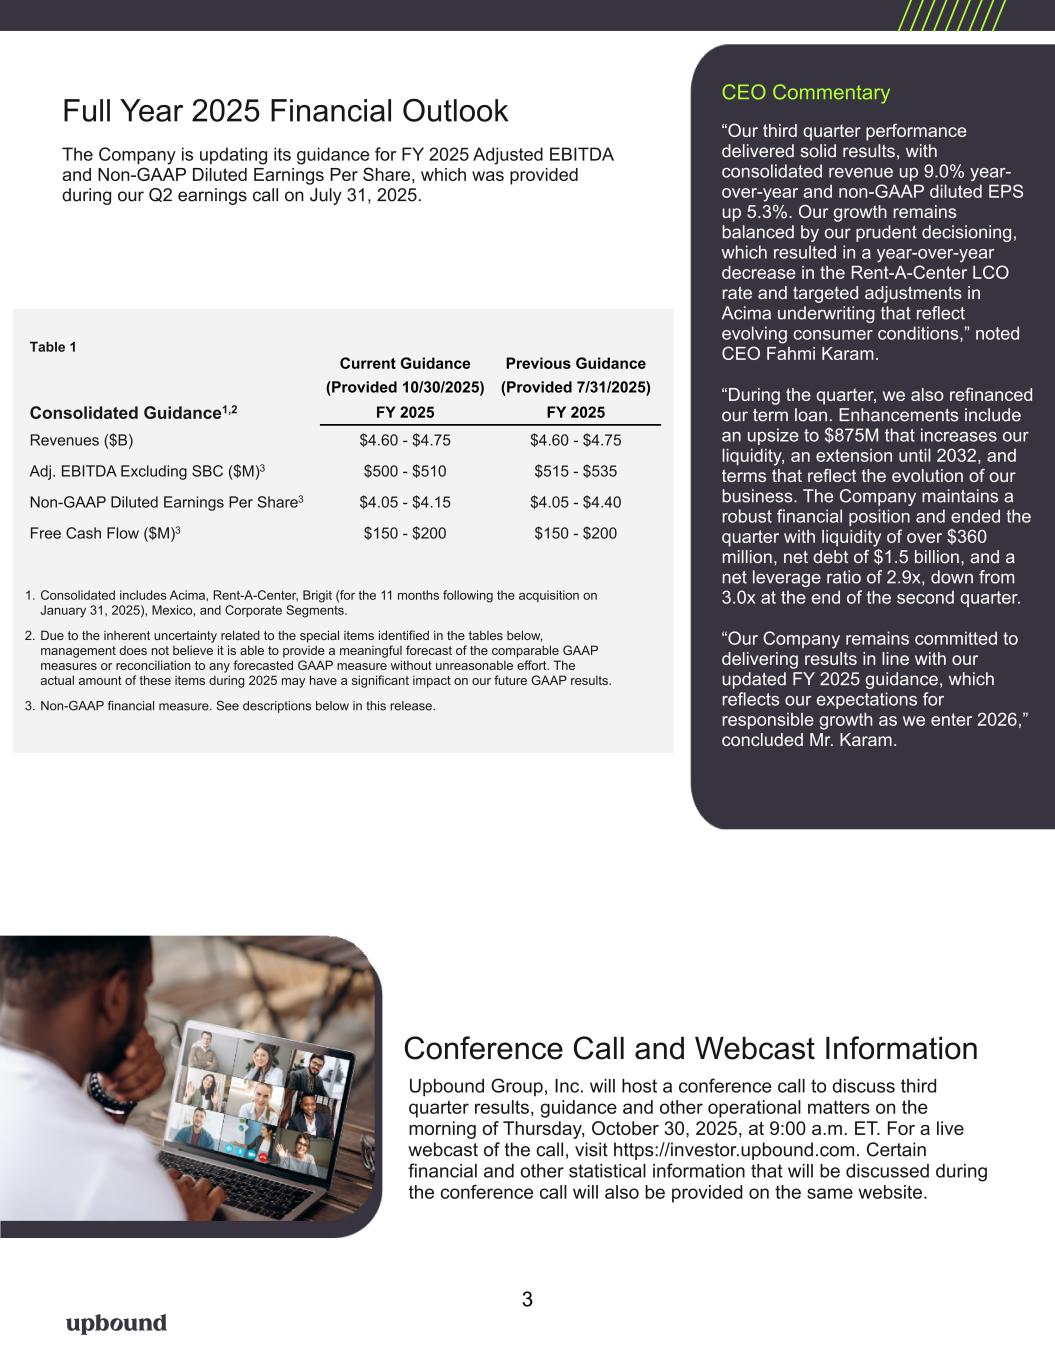
Full Year 2025 Financial Outlook The Company is updating its guidance for FY 2025 Adjusted EBITDA and Non-GAAP Diluted Earnings Per Share, which was provided during our Q2 earnings call on July 31, 2025. Conference Call and Webcast Information Upbound Group, Inc. will host a conference call to discuss third quarter results, guidance and other operational matters on the morning of Thursday, October 30, 2025, at 9:00 a.m. ET. For a live webcast of the call, visit https://investor.upbound.com. Certain financial and other statistical information that will be discussed during the conference call will also be provided on the same website. 1. Consolidated includes Acima, Rent-A-Center, Brigit (for the 11 months following the acquisition on January 31, 2025), Mexico, and Corporate Segments. 2. Due to the inherent uncertainty related to the special items identified in the tables below, management does not believe it is able to provide a meaningful forecast of the comparable GAAP measures or reconciliation to any forecasted GAAP measure without unreasonable effort. The actual amount of these items during 2025 may have a significant impact on our future GAAP results. 3. Non-GAAP financial measure. See descriptions below in this release. CEO Commentary “Our third quarter performance delivered solid results, with consolidated revenue up 9.0% year- over-year and non-GAAP diluted EPS up 5.3%. Our growth remains balanced by our prudent decisioning, which resulted in a year-over-year decrease in the Rent-A-Center LCO rate and targeted adjustments in Acima underwriting that reflect evolving consumer conditions,” noted CEO Fahmi Karam. “During the quarter, we also refinanced our term loan. Enhancements include an upsize to $875M that increases our liquidity, an extension until 2032, and terms that reflect the evolution of our business. The Company maintains a robust financial position and ended the quarter with liquidity of over $360 million, net debt of $1.5 billion, and a net leverage ratio of 2.9x, down from 3.0x at the end of the second quarter. “Our Company remains committed to delivering results in line with our updated FY 2025 guidance, which reflects our expectations for responsible growth as we enter 2026,” concluded Mr. Karam. 3 Table 1 Current Guidance Previous Guidance (Provided 10/30/2025) (Provided 7/31/2025) Consolidated Guidance1,2 FY 2025 FY 2025 Revenues ($B) $4.60 - $4.75 $4.60 - $4.75 Adj. EBITDA Excluding SBC ($M)3 $500 - $510 $515 - $535 Non-GAAP Diluted Earnings Per Share3 $4.05 - $4.15 $4.05 - $4.40 Free Cash Flow ($M)3 $150 - $200 $150 - $200
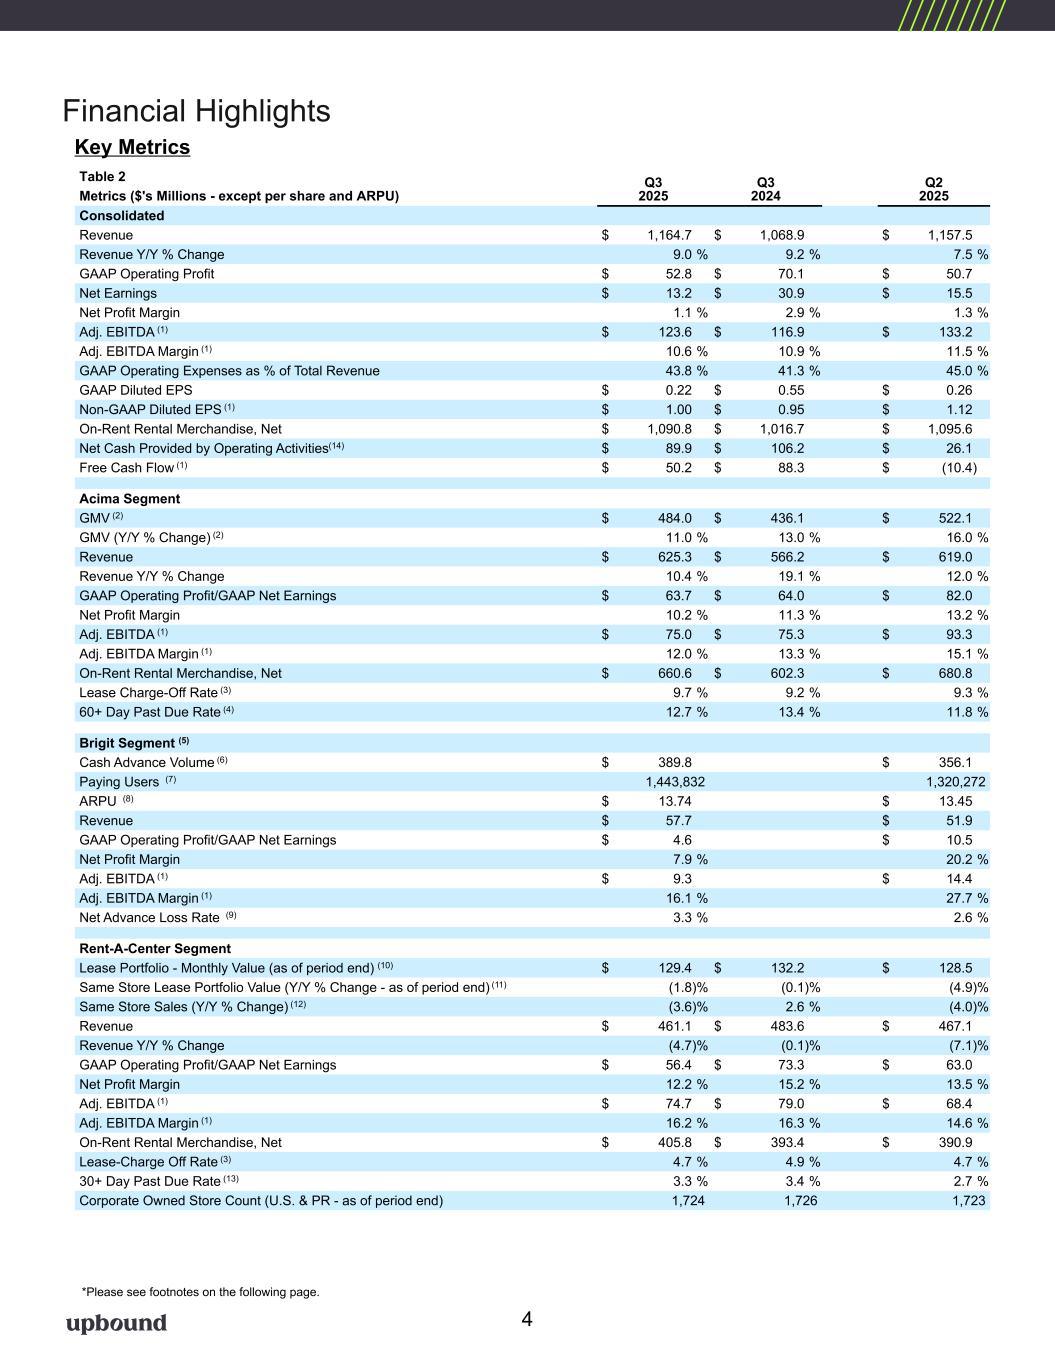
Table 2 Q3 2025 Q3 2024 Q2 2025Metrics ($'s Millions - except per share and ARPU) Consolidated Revenue $ 1,164.7 $ 1,068.9 $ 1,157.5 Revenue Y/Y % Change 9.0 % 9.2 % 7.5 % GAAP Operating Profit $ 52.8 $ 70.1 $ 50.7 Net Earnings $ 13.2 $ 30.9 $ 15.5 Net Profit Margin 1.1 % 2.9 % 1.3 % Adj. EBITDA (1) $ 123.6 $ 116.9 $ 133.2 Adj. EBITDA Margin (1) 10.6 % 10.9 % 11.5 % GAAP Operating Expenses as % of Total Revenue 43.8 % 41.3 % 45.0 % GAAP Diluted EPS $ 0.22 $ 0.55 $ 0.26 Non-GAAP Diluted EPS (1) $ 1.00 $ 0.95 $ 1.12 On-Rent Rental Merchandise, Net $ 1,090.8 $ 1,016.7 $ 1,095.6 Net Cash Provided by Operating Activities(14) $ 89.9 $ 106.2 $ 26.1 Free Cash Flow (1) $ 50.2 $ 88.3 $ (10.4) Acima Segment GMV (2) $ 484.0 $ 436.1 $ 522.1 GMV (Y/Y % Change) (2) 11.0 % 13.0 % 16.0 % Revenue $ 625.3 $ 566.2 $ 619.0 Revenue Y/Y % Change 10.4 % 19.1 % 12.0 % GAAP Operating Profit/GAAP Net Earnings $ 63.7 $ 64.0 $ 82.0 Net Profit Margin 10.2 % 11.3 % 13.2 % Adj. EBITDA (1) $ 75.0 $ 75.3 $ 93.3 Adj. EBITDA Margin (1) 12.0 % 13.3 % 15.1 % On-Rent Rental Merchandise, Net $ 660.6 $ 602.3 $ 680.8 Lease Charge-Off Rate (3) 9.7 % 9.2 % 9.3 % 60+ Day Past Due Rate (4) 12.7 % 13.4 % 11.8 % Brigit Segment (5) Cash Advance Volume (6) $ 389.8 $ 356.1 Paying Users (7) 1,443,832 1,320,272 ARPU (8) $ 13.74 $ 13.45 Revenue $ 57.7 $ 51.9 GAAP Operating Profit/GAAP Net Earnings $ 4.6 $ 10.5 Net Profit Margin 7.9 % 20.2 % Adj. EBITDA (1) $ 9.3 $ 14.4 Adj. EBITDA Margin (1) 16.1 % 27.7 % Net Advance Loss Rate (9) 3.3 % 2.6 % Rent-A-Center Segment Lease Portfolio - Monthly Value (as of period end) (10) $ 129.4 $ 132.2 $ 128.5 Same Store Lease Portfolio Value (Y/Y % Change - as of period end) (11) (1.8) % (0.1) % (4.9) % Same Store Sales (Y/Y % Change) (12) (3.6) % 2.6 % (4.0) % Revenue $ 461.1 $ 483.6 $ 467.1 Revenue Y/Y % Change (4.7) % (0.1) % (7.1) % GAAP Operating Profit/GAAP Net Earnings $ 56.4 $ 73.3 $ 63.0 Net Profit Margin 12.2 % 15.2 % 13.5 % Adj. EBITDA (1) $ 74.7 $ 79.0 $ 68.4 Adj. EBITDA Margin (1) 16.2 % 16.3 % 14.6 % On-Rent Rental Merchandise, Net $ 405.8 $ 393.4 $ 390.9 Lease-Charge Off Rate (3) 4.7 % 4.9 % 4.7 % 30+ Day Past Due Rate (13) 3.3 % 3.4 % 2.7 % Corporate Owned Store Count (U.S. & PR - as of period end) 1,724 1,726 1,723 Financial Highlights *Please see footnotes on the following page. Key Metrics 4

Financial Highlights (continued) (1) Non-GAAP financial measure. Refer to the explanations and reconciliations elsewhere in this release. (2) Gross Merchandise Volume (GMV): The Company defines Gross Merchandise Volume as the retail value in U.S. dollars of merchandise acquired by the Acima segment that is leased to customers through a transaction that occurs within a defined period, net of estimated cancellations as of the measurement date. (3) Lease Charge-Offs (LCOs): Represents charge-offs of the net book value of unrecoverable on-rent merchandise with lease-to-own customers who are past due. This is typically expressed as a percentage of revenues for the applicable period. For the Rent-A-Center segment, LCOs exclude Get It Now, Home Choice, and Franchise-owned Rent-A-Center locations. (4) 60+ Day Past Due Rate: Defined as the average number of accounts 60+ days past due as a % of total open leases. (5) Upbound acquired Brigit on January 31, 2025. (6) Cash Advance Volume: Defined as total advance originations during the period. (7) Brigit Paying Users: Represents Brigit customers who have an active Plus or Premium account, not delinquent (not 45 days past due) on a cash advance, and made at least 1 of the last 2 subscription payments. (8) ARPU: Average monthly revenue per Brigit Paying User, where Brigit Paying User is defined as in footnote 7 above. (9) Net Advance Loss: Represents charge-offs of customer cash advances that are 45+ days past due as a percentage of total cash advances originated in the period. (10) Lease Portfolio Value: Represents the aggregate dollar value of the expected monthly rental income associated with current active lease agreements from our Company-owned Rent-A-Center lease-to-own stores and e-commerce platform at the end of any given period. (11) Same Store Lease Portfolio Value: Represents the aggregate dollar value of the expected monthly rental income associated with current active lease agreements from our Company-owned Rent-A-Center lease-to-own stores that were operated by us for 13 months or more at the end of any given period. The Company excludes from the same store base any store that receives a certain level of customer accounts from closed stores or acquisitions. The receiving store will be eligible for inclusion in the same store base in the 30th full month following account transfer. (12) Same Store Sales (SSS): Same store sales generally represents revenue earned in Company-owned Rent-A-Center stores that were operated by us for 13 months or more and are reported on a constant currency basis as a percentage of total revenue earned in stores of the segment during the indicated period. The Company excludes from the same store sales base any store that receives a certain level of customer accounts from closed stores or acquisitions. The receiving store will be eligible for inclusion in the same store sales base in the 30th full month following account transfer. (13) 30+ Day Past Due Rate: Defined as the average number of accounts 30+ days past due as a % of total open leases for our Company-owned Rent-A-Center locations. (14) See Reconciliation of Net Cash Provided by Operating Activities to Free Cash Flow included in Table 13 of this earnings release for additional information. 5

About Upbound Group, Inc Upbound Group, Inc. (NASDAQ: UPBD), is a technology and data-driven leader in accessible and inclusive financial solutions that address the evolving needs and aspirations of underserved consumers. The Company’s customer-facing operating units include industry-leading brands such as Acima®, Brigit™, and Rent-A-Center® that facilitate consumer transactions across a wide range of store-based and digital channels in the United States, Mexico and Puerto Rico. Upbound Group, Inc. is headquartered in Plano, Texas. For additional information about the Company, please visit our website Upbound.com. Investor Contact Upbound Group, Inc. Jeff Chesnut SVP, IR & Corporate Development 972-801-1108 jeff.chesnut@upbound.com 6
Forward Looking Statements This press release, and the guidance above and the Company's related conference call contain forward-looking statements that involve risks and uncertainties. These statements are made under the "safe harbor" provisions of the U.S. Private Securities Litigation Reform Act of 1995. Such forward- looking statements generally can be identified by the use of forward-looking terminology such as "may," "will," "expect," "intend," "could," "estimate," "predict," "continue," "maintain," "should," "anticipate," "believe," or “confident,” or the negative thereof or variations thereon or similar terminology and including, among others, statements concerning (i) the Company's guidance for 2025 and future outlook, (ii) the impact of ongoing challenging macroeconomic conditions on the Company's business operations, financial performance, and prospects, (iii) the future business prospects and financial performance of the Company as a whole (which includes Bridge IT, Inc. (“Brigit”) following the closing of our acquisition of Brigit (the “Merger”) on January 31, 2025) and our segments, (iv) the Company’s growth strategies, (v) the Company's expectations, plans and strategy relating to its capital structure and capital allocation, including any share repurchases under the Company's share repurchase program, (vi) the potential impact of legal proceedings, governmental inquiries and investigations the Company is involved in, and (vii) other statements that are not historical facts. However, there can be no assurance that such expectations will occur. The Company's actual future performance could differ materially and adversely from such statements. Factors that could cause or contribute to these differences include, but are not limited to: (1) the possibility that costs, difficulties or disruptions related to the integration of Brigit operations into the Company’s other operations will be greater than expected; (2) the possibility that the anticipated benefits from the Brigit acquisition may not be fully realized or may take longer to realize than expected; (3) the Company’s ability to (i) effectively adjust to changes in the composition of its offerings and product mix as a result of acquiring Brigit and continue to maintain the quality of existing offerings and (ii) successfully introduce other new product or service offerings on a timely and cost-effective basis; (4) changes in the Company’s future cash requirements as a result of the Brigit acquisition, whether caused by unanticipated increases in capital expenditures or working capital needs, unanticipated liabilities or otherwise; (5) the Company’s ability to retain the talent and dedication of key employees of Brigit; (6) the general strength of the economy and other economic conditions affecting consumer preferences, spending and payment behaviors, including the availability of credit to the Company's target consumers and to other consumers, impacts from continued or renewed inflation, central bank monetary policy initiatives to address inflation concerns and a possible recession or slowdown in economic growth; (7) factors affecting the disposable income available to the Company's current and potential customers; (8) changes in the unemployment rate; (9) capital market conditions, including changes in interest rates and availability of funding sources for the Company; (10) changes in the Company's credit ratings; (11) difficulties encountered in managing the financial and operational performance of the Company's multiple business segments; (12) risks associated with pricing, value proposition and other changes to the Company’s consumer offerings and strategies being deployed in the Company's businesses; (13) the Company's ability to continue to effectively execute its strategic initiatives, including mitigating risks associated with any potential additional mergers and acquisitions, or lease-to-own refranchising opportunities; (14) the Company's ability to identify potential acquisition candidates, complete acquisitions and successfully integrate acquired companies, including Brigit; (15) failure to effectively manage the Company's operating labor and non-labor operating expenses, including merchandise losses for our lease-to-own offerings; (16) disruptions caused by the operation of the Company's information management systems or disruptions in the systems of the Company's host retailers or other third parties with whom the Company does business; (17) risks related to the Company's virtual lease-to-own business, including the Company's ability to continue to develop and successfully implement the necessary technologies; (18) the Company's ability to achieve the benefits expected from its integrated virtual and staffed third- party retailer offering and to successfully grow this business segment; (19) exposure to potential operating margin degradation due to the higher cost of merchandise and higher merchandise losses in the Company's Acima segment compared to our Rent-A-Center segment; (20) additional risks associated with the Company’s Brigit business and its consumer products and services, including managing losses and payment defaults, regulatory, licensing and other compliance risks, risks associated with Brigit’s reliance on regulated banks and on providers of third party data, technology and other third-party service providers; and other new risks for our Company; (21) litigation or administrative proceedings to which the Company is or may be a party to from time to time and changes in estimates relating to litigation reserves including, in each case in connection with the regulatory and litigation matters described in the Company’s most recent Form 10-K or Form 10-Q; (22) the Company’s compliance with applicable statutes and regulations governing the Company’s businesses, impacts from the enforcement of existing laws and regulations and the enactment of new laws and regulations adversely affecting the Company’s business, including in connection with the regulatory matters in which the Company is involved, and any legislative or other regulatory enforcement efforts or private party litigation or arbitration that seeks to re-characterize store-based or virtual lease-to-own transactions as credit sales and to apply consumer credit laws and regulations to the Company’s lease-to-own business or to apply credit laws to Brigit’s non-credit consumer offerings; (23) the Company's transition to more readily scalable “cloud-based” solutions; (24) the Company's ability to develop and successfully implement digital or e- commerce capabilities, including mobile applications; (25) the Company's ability to protect its proprietary intellectual property and to defend against allegations by third parties that any of the Company’s products, services or business activities may infringe against their intellectual property rights; (26) the Company's ability or that of the Company's host retailers or other third parties with whom the company does business to protect the integrity and security of customer, employee, supplier and host retailer or other third party information, which may be adversely affected by hacking, computer viruses, cybersecurity attacks or similar disruptions; (27) impairment of the Company's goodwill or other intangible assets; (28) disruptions in the Company's supply chain; (29) limitations of, or disruptions in, the Company's distribution network; (30) rapid inflation or deflation in the prices of the Company's lease-to-own products and other related costs; (31) allegations of product safety and quality control issues, including recalls of goods the Company leases to customers; (32) the Company's ability to execute, as well as, the effectiveness of, lease-to-own store consolidations, including the Company's ability to retain the revenue from customer accounts merged into another store location as a result of a store consolidation; (33) the Company's available cash flow and its ability to generate sufficient cash flow to continue paying dividends; (34) increased competition from traditional competitors, virtual lease-to-own competitors, online retailers, Buy-Now-Pay-Later, earned wage access and financial health technology competitors and other fintech companies and other competitors, including subprime lenders; (35) the Company's ability to identify and successfully market products and services that appeal to its current and future targeted customer segments and to accurately estimate the size of the total addressable market; (36) consumer preferences and perceptions of the Company's brands; (37) the Company’s ability to effectively provide consumers with additional products and services beyond lease-to-own and products and services currently offered by Brigit, including through third-party partnerships; (38) the Company's ability to retain the revenue associated with acquired lease-to-own customer accounts and enhance the performance of acquired stores; (39) the Company's ability to enter into new rental or lease purchase agreements and collect on existing rental or lease purchase agreements; (40) ongoing changes in tariff policies, including impacts from tariffs imposed by the current Presidential Administration on the price of imported goods, or consumer prices overall or other financial impacts of such tariffs or retaliatory tariffs enacted by U.S. trading partners on the Company’s costs or target consumers; (41) adverse changes in the economic conditions of the industries, countries or markets that the Company serves; (42) information technology and data security costs; (43) the impact of breaches in data security or other disturbances to the Company's information technology and other networks (44) changes in estimates relating to self-insurance liabilities and income tax reserves; (45) changes in the Company's effective tax rate; (46) fluctuations in foreign currency exchange rates; (47) the Company's ability to maintain an effective system of internal controls; and (48) the other risks detailed from time to time in the Company's SEC reports, including but not limited to, its Annual Report on Form 10-K for the year ended December 31, 2024, and in its subsequent Quarterly Reports on Form 10-Q and Current Reports on Form 8-K. You are cautioned not to place undue reliance on these forward-looking statements, which speak only as of the date of this press release. Except as required by law, the Company is not obligated to publicly release any revisions to these forward-looking statements to reflect the events or circumstances after the date hereof or to reflect the occurrence of unanticipated events. 7
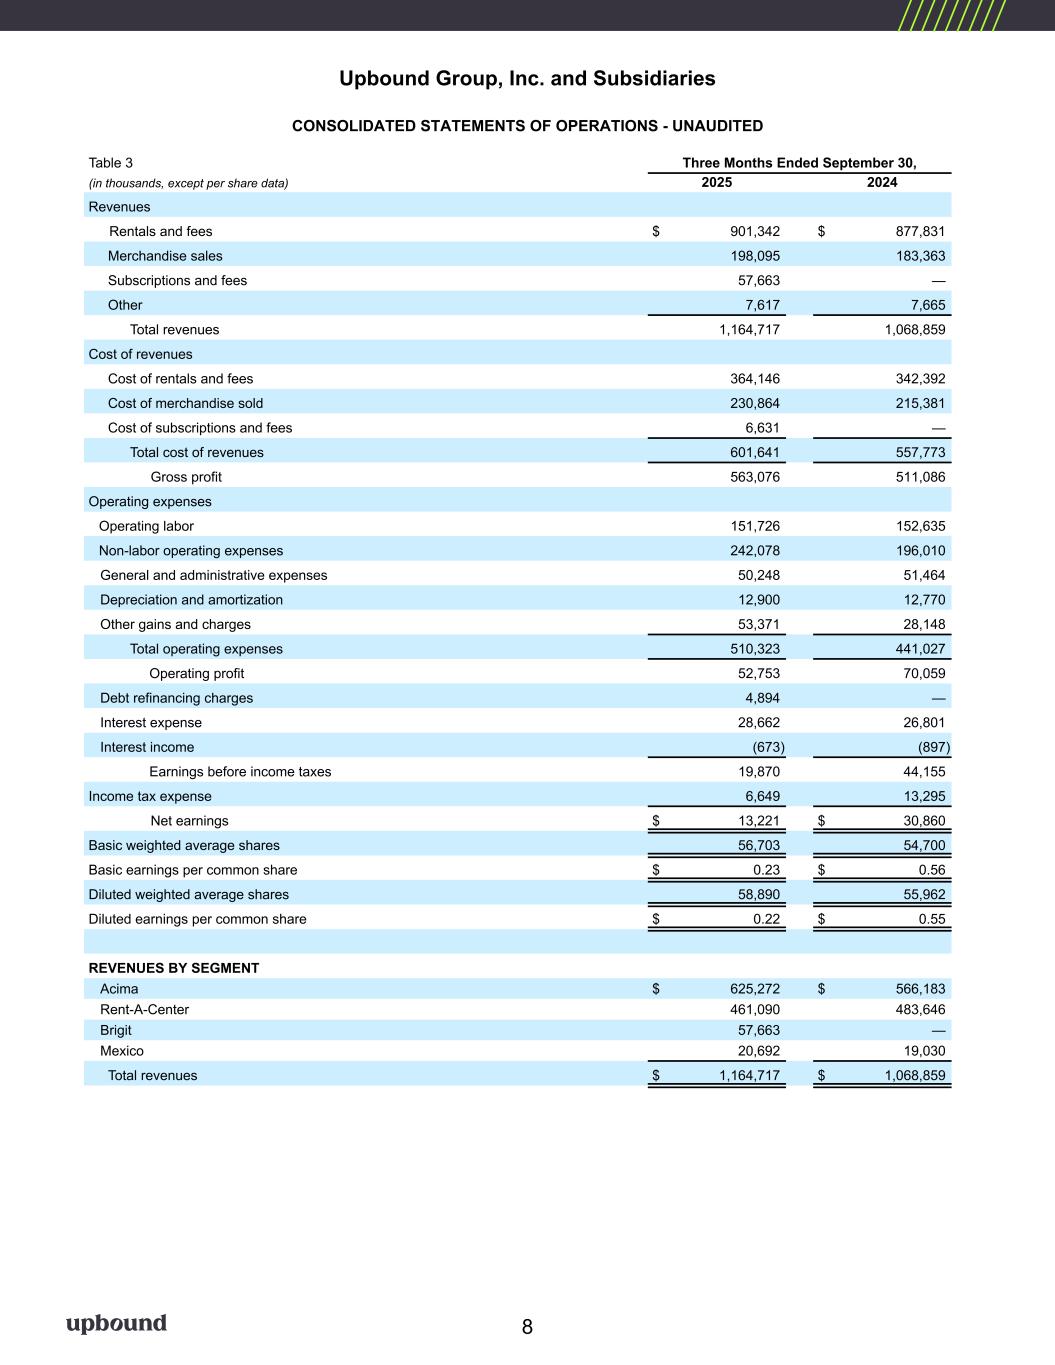
Upbound Group, Inc. and Subsidiaries CONSOLIDATED STATEMENTS OF OPERATIONS - UNAUDITED Table 3 Three Months Ended September 30, (in thousands, except per share data) 2025 2024 Revenues Rentals and fees $ 901,342 $ 877,831 Merchandise sales 198,095 183,363 Subscriptions and fees 57,663 — Other 7,617 7,665 Total revenues 1,164,717 1,068,859 Cost of revenues Cost of rentals and fees 364,146 342,392 Cost of merchandise sold 230,864 215,381 Cost of subscriptions and fees 6,631 — Total cost of revenues 601,641 557,773 Gross profit 563,076 511,086 Operating expenses Operating labor 151,726 152,635 Non-labor operating expenses 242,078 196,010 General and administrative expenses 50,248 51,464 Depreciation and amortization 12,900 12,770 Other gains and charges 53,371 28,148 Total operating expenses 510,323 441,027 Operating profit 52,753 70,059 Debt refinancing charges 4,894 — Interest expense 28,662 26,801 Interest income (673) (897) Earnings before income taxes 19,870 44,155 Income tax expense 6,649 13,295 Net earnings $ 13,221 $ 30,860 Basic weighted average shares 56,703 54,700 Basic earnings per common share $ 0.23 $ 0.56 Diluted weighted average shares 58,890 55,962 Diluted earnings per common share $ 0.22 $ 0.55 REVENUES BY SEGMENT Acima $ 625,272 $ 566,183 Rent-A-Center 461,090 483,646 Brigit 57,663 — Mexico 20,692 19,030 Total revenues $ 1,164,717 $ 1,068,859 8
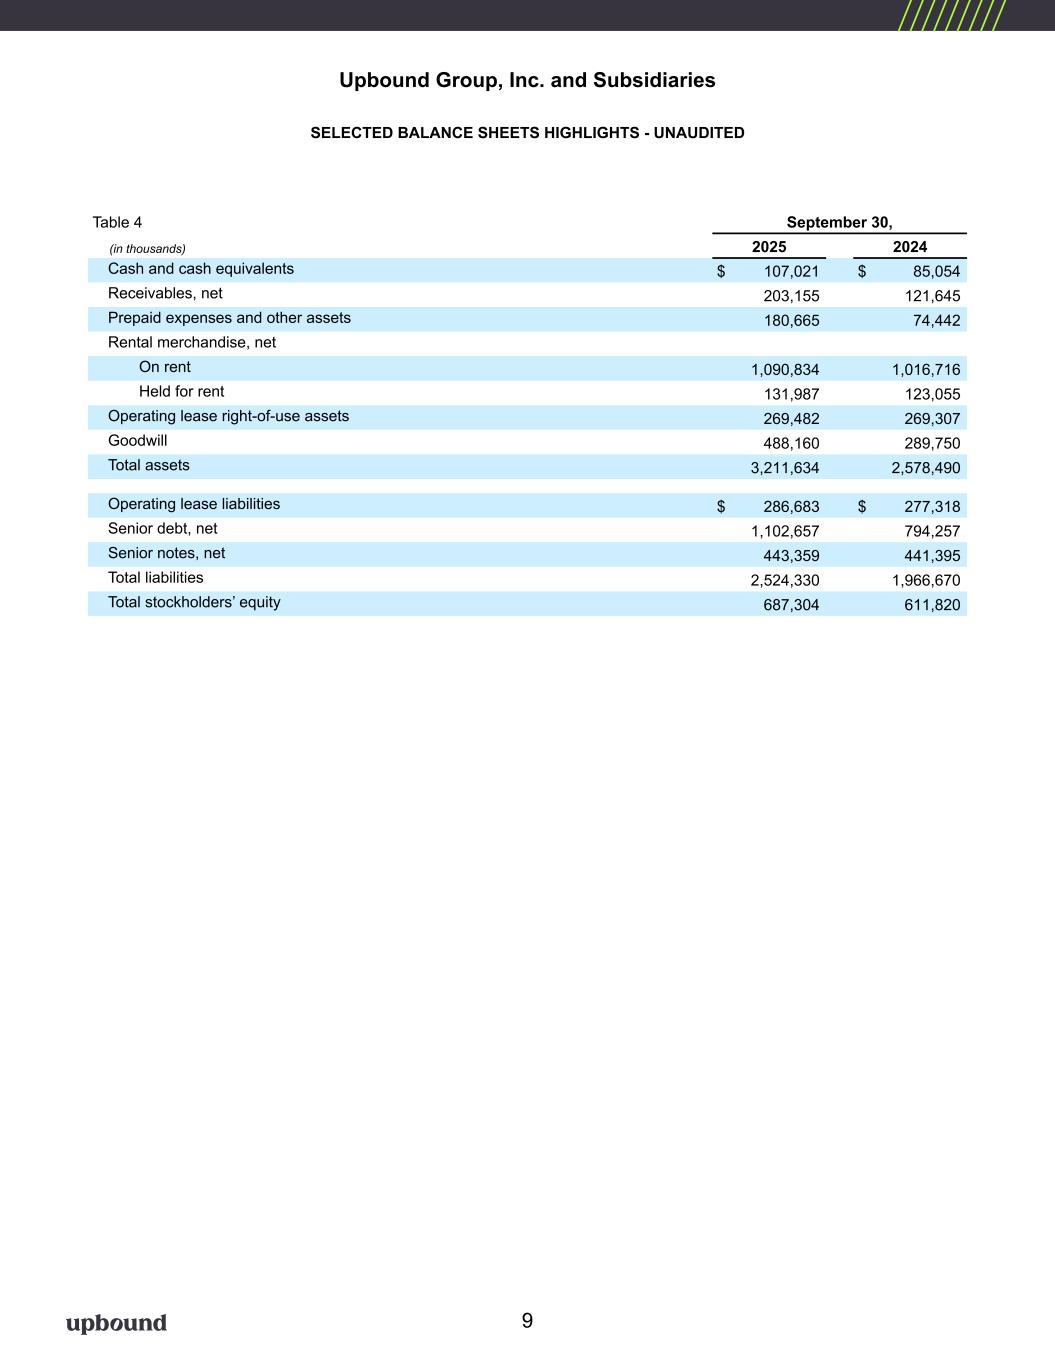
Upbound Group, Inc. and Subsidiaries SELECTED BALANCE SHEETS HIGHLIGHTS - UNAUDITED Table 4 September 30, (in thousands) 2025 2024 Cash and cash equivalents $ 107,021 $ 85,054 Receivables, net 203,155 121,645 Prepaid expenses and other assets 180,665 74,442 Rental merchandise, net On rent 1,090,834 1,016,716 Held for rent 131,987 123,055 Operating lease right-of-use assets 269,482 269,307 Goodwill 488,160 289,750 Total assets 3,211,634 2,578,490 Operating lease liabilities $ 286,683 $ 277,318 Senior debt, net 1,102,657 794,257 Senior notes, net 443,359 441,395 Total liabilities 2,524,330 1,966,670 Total stockholders’ equity 687,304 611,820 9
Non-GAAP Financial Measures This release and the Company's related conference call contain certain financial information determined by methods other than in accordance with U.S. Generally Accepted Accounting Principles (GAAP), including (1) Non-GAAP diluted earnings per share (net earnings or loss, as adjusted for special items (as defined below), net of taxes, divided by the number of shares of our common stock on a fully diluted basis), (2) Adjusted EBITDA (net earnings before interest, taxes, stock-based compensation, depreciation and amortization, as adjusted for special items) on a consolidated and segment basis, (3) Adjusted EBITDA margin (Adjusted EBITDA divided by total revenue) on a consolidated and segment basis, (4) Free Cash Flow (net cash provided by operating activities less capital expenditures and customer cash advances), (5) Net Debt (outstanding debt less cash and cash equivalents) and (6) Net Leverage Ratio (Net debt to Adjusted EBITDA (outstanding debt less cash and cash equivalents divided by trailing twelve months Adjusted EBITDA)). “Special items” refers to certain gains and charges we view as extraordinary, unusual or non-recurring in nature or which we believe do not reflect our core business activities. Special items are reported as Other Gains and Charges in our Consolidated Statements of Operations. For the periods presented herein, these special items are described in the quantitative reconciliation tables included below in this release. Because of the inherent uncertainty related to these special items, management does not believe it is able to provide a meaningful forecast of the comparable GAAP measures or reconciliation to any forecasted GAAP measure without unreasonable effort. These non-GAAP measures are additional tools intended to assist our management in comparing our performance on a more consistent basis for purposes of business decision-making by removing the impact of certain items management believes do not directly reflect our core operations. These measures are intended to assist management in evaluating operating performance and liquidity, comparing performance and liquidity across periods, planning and forecasting future business operations, helping determine levels of operating and capital investments and identifying and assessing additional trends potentially impacting our Company that may not be shown solely by comparisons of GAAP measures. Consolidated Adjusted EBITDA is also used as part of our incentive compensation program for our executive officers and others. We believe these non-GAAP financial measures also provide supplemental information that is useful to investors, analysts and other external users of our consolidated financial statements in understanding our financial results and evaluating our performance and liquidity from period to period. However, non-GAAP financial measures have inherent limitations and are not substitutes for, or superior to, GAAP financial measures, and they should be read together with our consolidated financial statements prepared in accordance with GAAP. Further, because non- GAAP financial measures are not standardized, it may not be possible to compare such measures to the non- GAAP financial measures presented by other companies, even if they have the same or similar names. 10
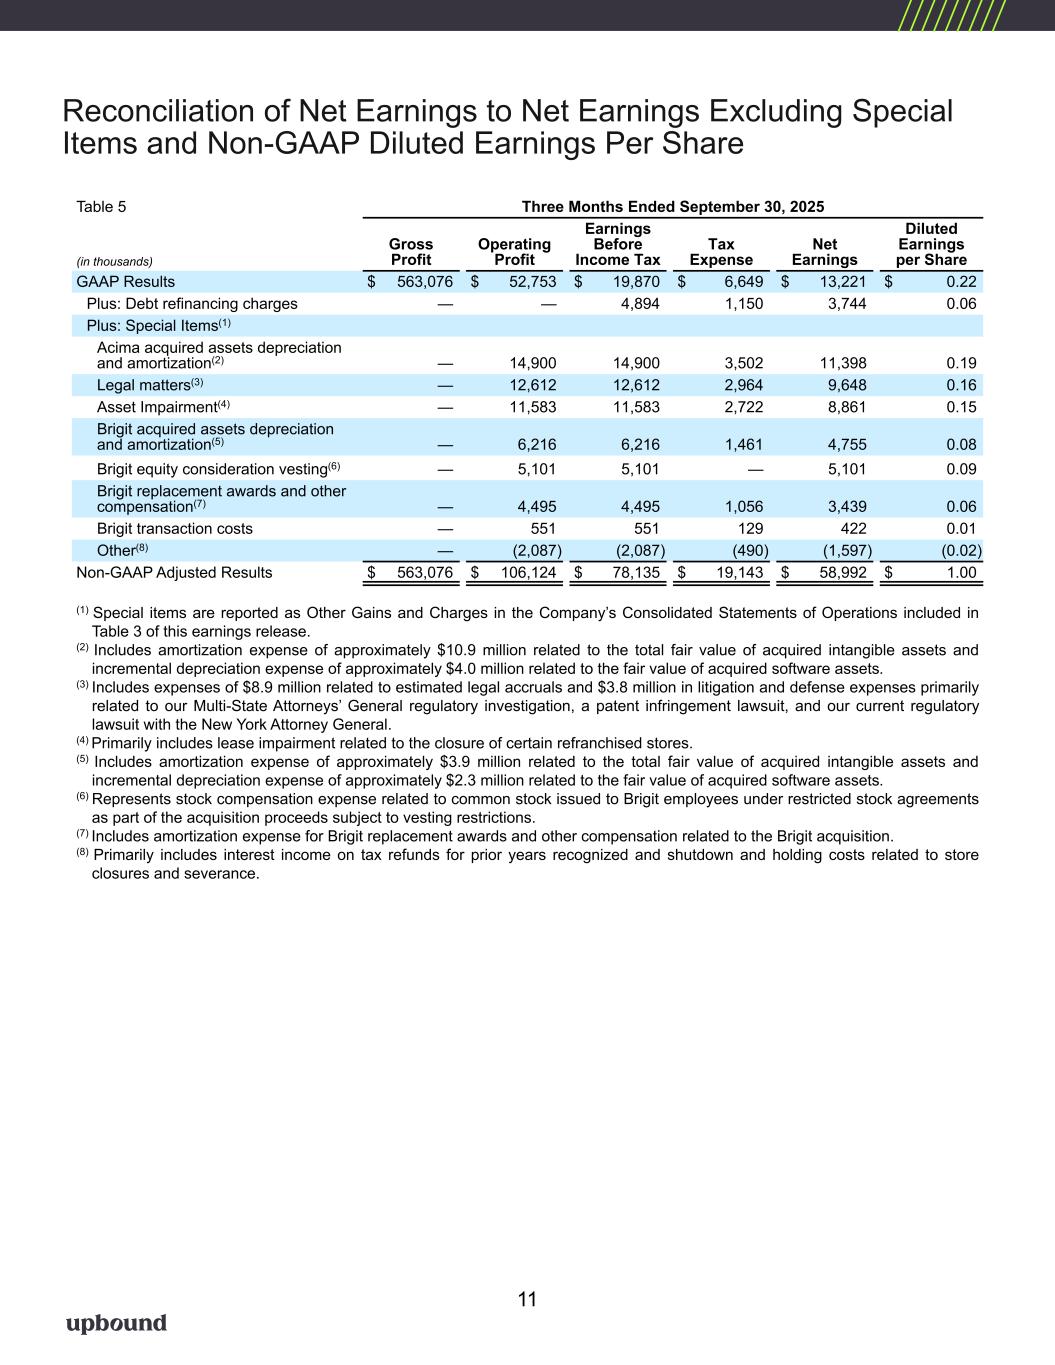
Reconciliation of Net Earnings to Net Earnings Excluding Special Items and Non-GAAP Diluted Earnings Per Share Table 5 Three Months Ended September 30, 2025 (in thousands) Gross Profit Operating Profit Earnings Before Income Tax Tax Expense Net Earnings Diluted Earnings per Share GAAP Results $ 563,076 $ 52,753 $ 19,870 $ 6,649 $ 13,221 $ 0.22 Plus: Debt refinancing charges — — 4,894 1,150 3,744 0.06 Plus: Special Items(1) Acima acquired assets depreciation and amortization(2) — 14,900 14,900 3,502 11,398 0.19 Legal matters(3) — 12,612 12,612 2,964 9,648 0.16 Asset Impairment(4) — 11,583 11,583 2,722 8,861 0.15 Brigit acquired assets depreciation and amortization(5) — 6,216 6,216 1,461 4,755 0.08 Brigit equity consideration vesting(6) — 5,101 5,101 — 5,101 0.09 Brigit replacement awards and other compensation(7) — 4,495 4,495 1,056 3,439 0.06 Brigit transaction costs — 551 551 129 422 0.01 Other(8) — (2,087) (2,087) (490) (1,597) (0.02) Non-GAAP Adjusted Results $ 563,076 $ 106,124 $ 78,135 $ 19,143 $ 58,992 $ 1.00 (1) Special items are reported as Other Gains and Charges in the Company’s Consolidated Statements of Operations included in Table 3 of this earnings release. (2) Includes amortization expense of approximately $10.9 million related to the total fair value of acquired intangible assets and incremental depreciation expense of approximately $4.0 million related to the fair value of acquired software assets. (3) Includes expenses of $8.9 million related to estimated legal accruals and $3.8 million in litigation and defense expenses primarily related to our Multi-State Attorneys’ General regulatory investigation, a patent infringement lawsuit, and our current regulatory lawsuit with the New York Attorney General. (4) Primarily includes lease impairment related to the closure of certain refranchised stores. (5) Includes amortization expense of approximately $3.9 million related to the total fair value of acquired intangible assets and incremental depreciation expense of approximately $2.3 million related to the fair value of acquired software assets. (6) Represents stock compensation expense related to common stock issued to Brigit employees under restricted stock agreements as part of the acquisition proceeds subject to vesting restrictions. (7) Includes amortization expense for Brigit replacement awards and other compensation related to the Brigit acquisition. (8) Primarily includes interest income on tax refunds for prior years recognized and shutdown and holding costs related to store closures and severance. 11
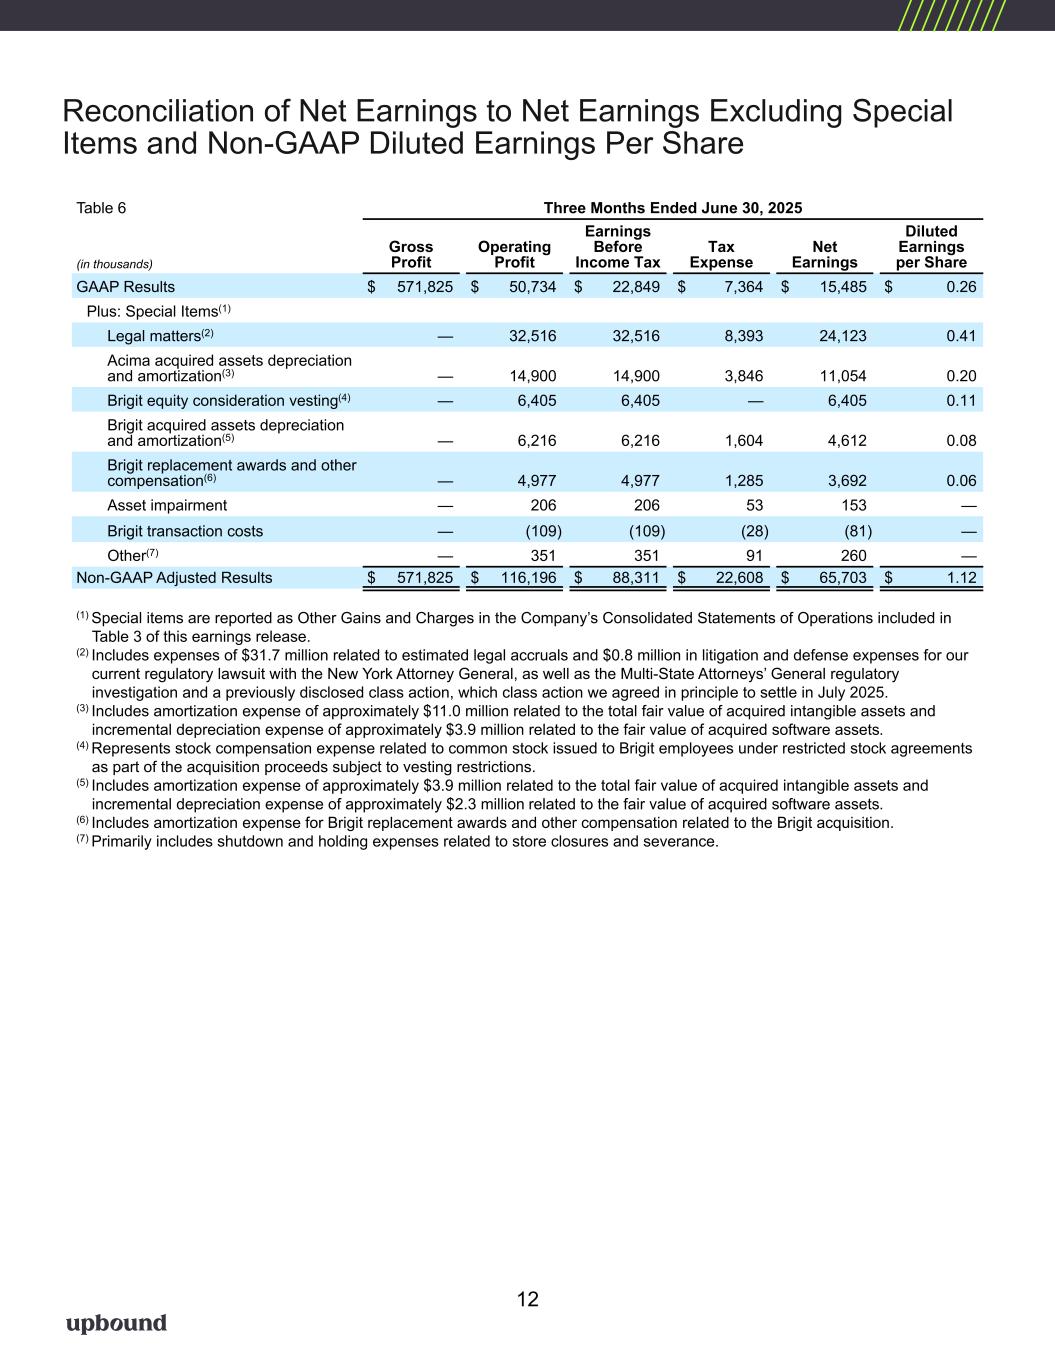
Reconciliation of Net Earnings to Net Earnings Excluding Special Items and Non-GAAP Diluted Earnings Per Share 12 Table 6 Three Months Ended June 30, 2025 (in thousands) Gross Profit Operating Profit Earnings Before Income Tax Tax Expense Net Earnings Diluted Earnings per Share GAAP Results $ 571,825 $ 50,734 $ 22,849 $ 7,364 $ 15,485 $ 0.26 Plus: Special Items(1) Legal matters(2) — 32,516 32,516 8,393 24,123 0.41 Acima acquired assets depreciation and amortization(3) — 14,900 14,900 3,846 11,054 0.20 Brigit equity consideration vesting(4) — 6,405 6,405 — 6,405 0.11 Brigit acquired assets depreciation and amortization(5) — 6,216 6,216 1,604 4,612 0.08 Brigit replacement awards and other compensation(6) — 4,977 4,977 1,285 3,692 0.06 Asset impairment — 206 206 53 153 — Brigit transaction costs — (109) (109) (28) (81) — Other(7) — 351 351 91 260 — Non-GAAP Adjusted Results $ 571,825 $ 116,196 $ 88,311 $ 22,608 $ 65,703 $ 1.12 (1) Special items are reported as Other Gains and Charges in the Company’s Consolidated Statements of Operations included in Table 3 of this earnings release. (2) Includes expenses of $31.7 million related to estimated legal accruals and $0.8 million in litigation and defense expenses for our current regulatory lawsuit with the New York Attorney General, as well as the Multi-State Attorneys’ General regulatory investigation and a previously disclosed class action, which class action we agreed in principle to settle in July 2025. (3) Includes amortization expense of approximately $11.0 million related to the total fair value of acquired intangible assets and incremental depreciation expense of approximately $3.9 million related to the fair value of acquired software assets. (4) Represents stock compensation expense related to common stock issued to Brigit employees under restricted stock agreements as part of the acquisition proceeds subject to vesting restrictions. (5) Includes amortization expense of approximately $3.9 million related to the total fair value of acquired intangible assets and incremental depreciation expense of approximately $2.3 million related to the fair value of acquired software assets. (6) Includes amortization expense for Brigit replacement awards and other compensation related to the Brigit acquisition. (7) Primarily includes shutdown and holding expenses related to store closures and severance.
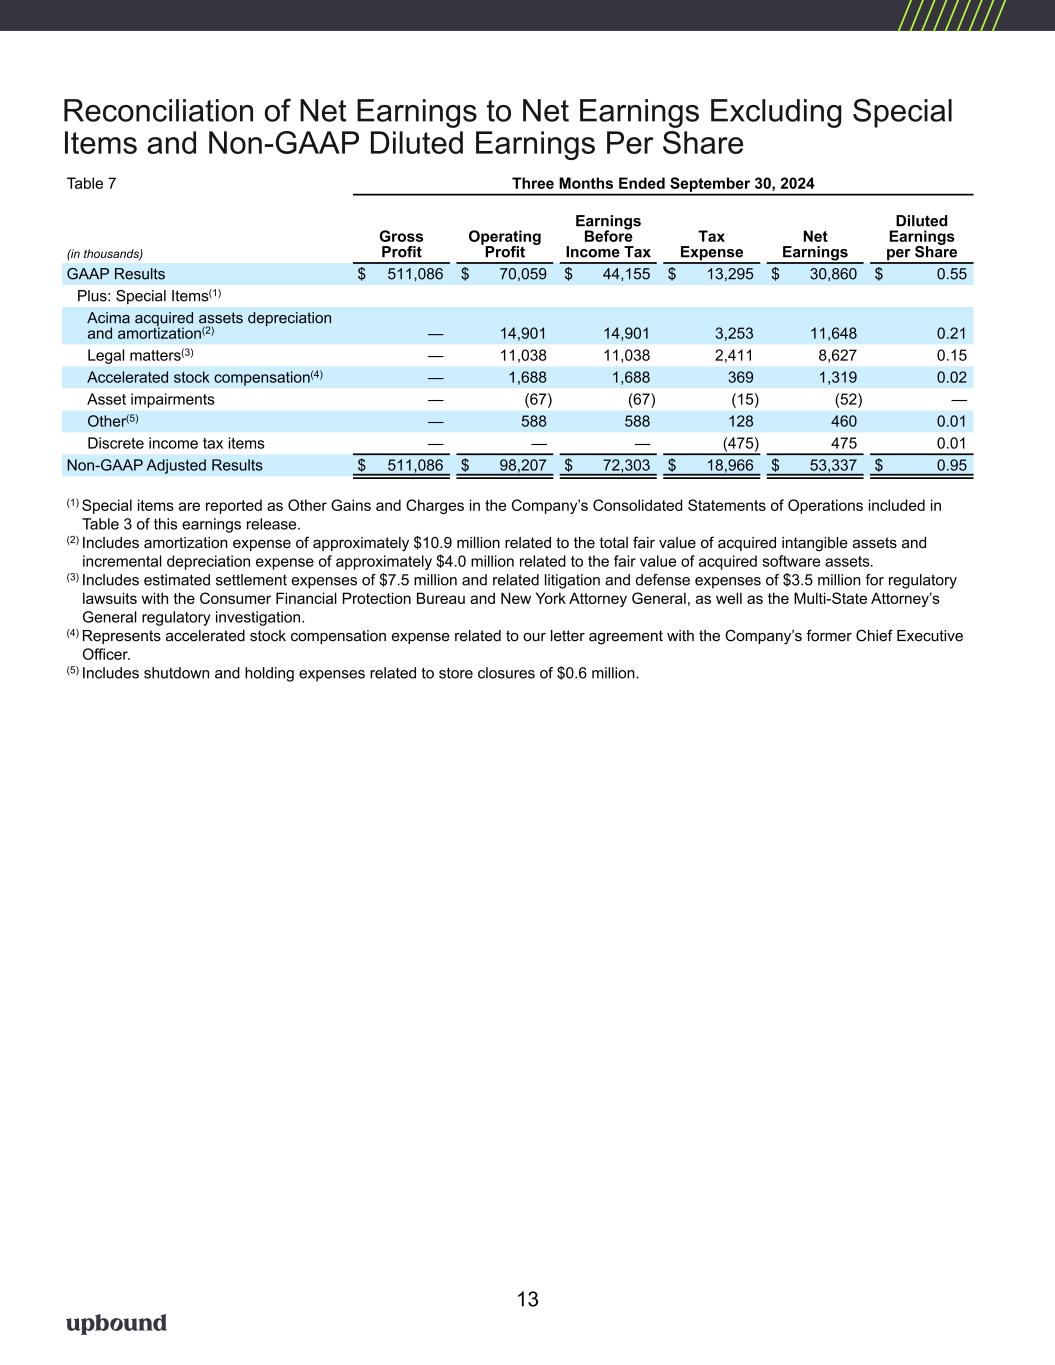
Reconciliation of Net Earnings to Net Earnings Excluding Special Items and Non-GAAP Diluted Earnings Per Share Table 7 Three Months Ended September 30, 2024 (in thousands) Gross Profit Operating Profit Earnings Before Income Tax Tax Expense Net Earnings Diluted Earnings per Share GAAP Results $ 511,086 $ 70,059 $ 44,155 $ 13,295 $ 30,860 $ 0.55 Plus: Special Items(1) Acima acquired assets depreciation and amortization(2) — 14,901 14,901 3,253 11,648 0.21 Legal matters(3) — 11,038 11,038 2,411 8,627 0.15 Accelerated stock compensation(4) — 1,688 1,688 369 1,319 0.02 Asset impairments — (67) (67) (15) (52) — Other(5) — 588 588 128 460 0.01 Discrete income tax items — — — (475) 475 0.01 Non-GAAP Adjusted Results $ 511,086 $ 98,207 $ 72,303 $ 18,966 $ 53,337 $ 0.95 (1) Special items are reported as Other Gains and Charges in the Company’s Consolidated Statements of Operations included in Table 3 of this earnings release. (2) Includes amortization expense of approximately $10.9 million related to the total fair value of acquired intangible assets and incremental depreciation expense of approximately $4.0 million related to the fair value of acquired software assets. (3) Includes estimated settlement expenses of $7.5 million and related litigation and defense expenses of $3.5 million for regulatory lawsuits with the Consumer Financial Protection Bureau and New York Attorney General, as well as the Multi-State Attorney’s General regulatory investigation. (4) Represents accelerated stock compensation expense related to our letter agreement with the Company’s former Chief Executive Officer. (5) Includes shutdown and holding expenses related to store closures of $0.6 million. 13
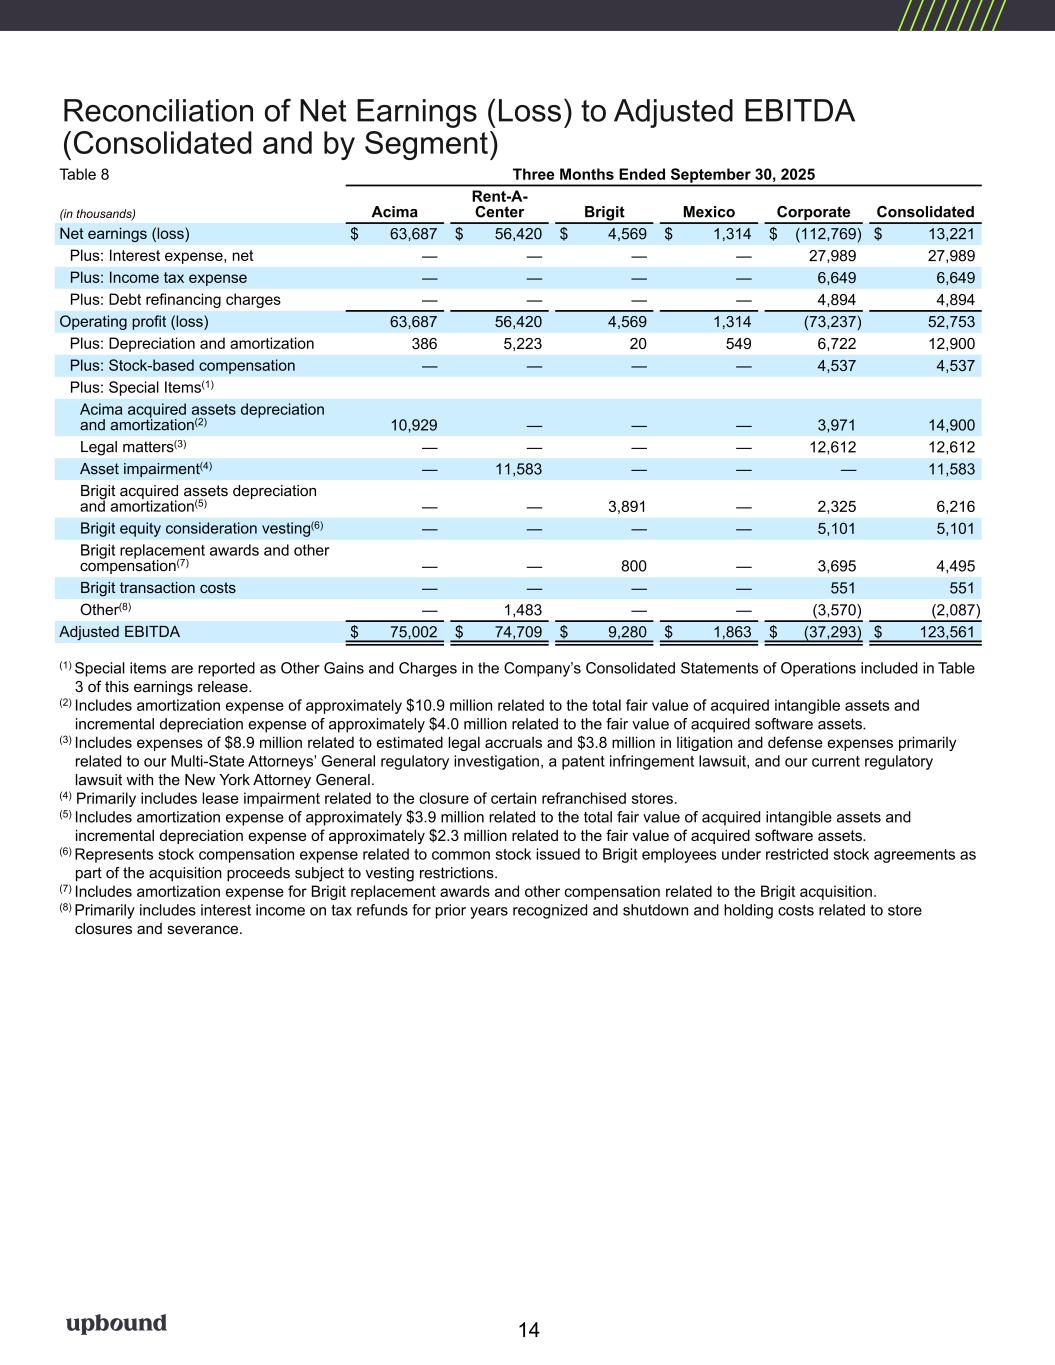
Reconciliation of Net Earnings (Loss) to Adjusted EBITDA (Consolidated and by Segment) Table 8 Three Months Ended September 30, 2025 (in thousands) Acima Rent-A- Center Brigit Mexico Corporate Consolidated Net earnings (loss) $ 63,687 $ 56,420 $ 4,569 $ 1,314 $ (112,769) $ 13,221 Plus: Interest expense, net — — — — 27,989 27,989 Plus: Income tax expense — — — — 6,649 6,649 Plus: Debt refinancing charges — — — — 4,894 4,894 Operating profit (loss) 63,687 56,420 4,569 1,314 (73,237) 52,753 Plus: Depreciation and amortization 386 5,223 20 549 6,722 12,900 Plus: Stock-based compensation — — — — 4,537 4,537 Plus: Special Items(1) Acima acquired assets depreciation and amortization(2) 10,929 — — — 3,971 14,900 Legal matters(3) — — — — 12,612 12,612 Asset impairment(4) — 11,583 — — — 11,583 Brigit acquired assets depreciation and amortization(5) — — 3,891 — 2,325 6,216 Brigit equity consideration vesting(6) — — — — 5,101 5,101 Brigit replacement awards and other compensation(7) — — 800 — 3,695 4,495 Brigit transaction costs — — — — 551 551 Other(8) — 1,483 — — (3,570) (2,087) Adjusted EBITDA $ 75,002 $ 74,709 $ 9,280 $ 1,863 $ (37,293) $ 123,561 (1) Special items are reported as Other Gains and Charges in the Company’s Consolidated Statements of Operations included in Table 3 of this earnings release. (2) Includes amortization expense of approximately $10.9 million related to the total fair value of acquired intangible assets and incremental depreciation expense of approximately $4.0 million related to the fair value of acquired software assets. (3) Includes expenses of $8.9 million related to estimated legal accruals and $3.8 million in litigation and defense expenses primarily related to our Multi-State Attorneys’ General regulatory investigation, a patent infringement lawsuit, and our current regulatory lawsuit with the New York Attorney General. (4) Primarily includes lease impairment related to the closure of certain refranchised stores. (5) Includes amortization expense of approximately $3.9 million related to the total fair value of acquired intangible assets and incremental depreciation expense of approximately $2.3 million related to the fair value of acquired software assets. (6) Represents stock compensation expense related to common stock issued to Brigit employees under restricted stock agreements as part of the acquisition proceeds subject to vesting restrictions. (7) Includes amortization expense for Brigit replacement awards and other compensation related to the Brigit acquisition. (8) Primarily includes interest income on tax refunds for prior years recognized and shutdown and holding costs related to store closures and severance. 14
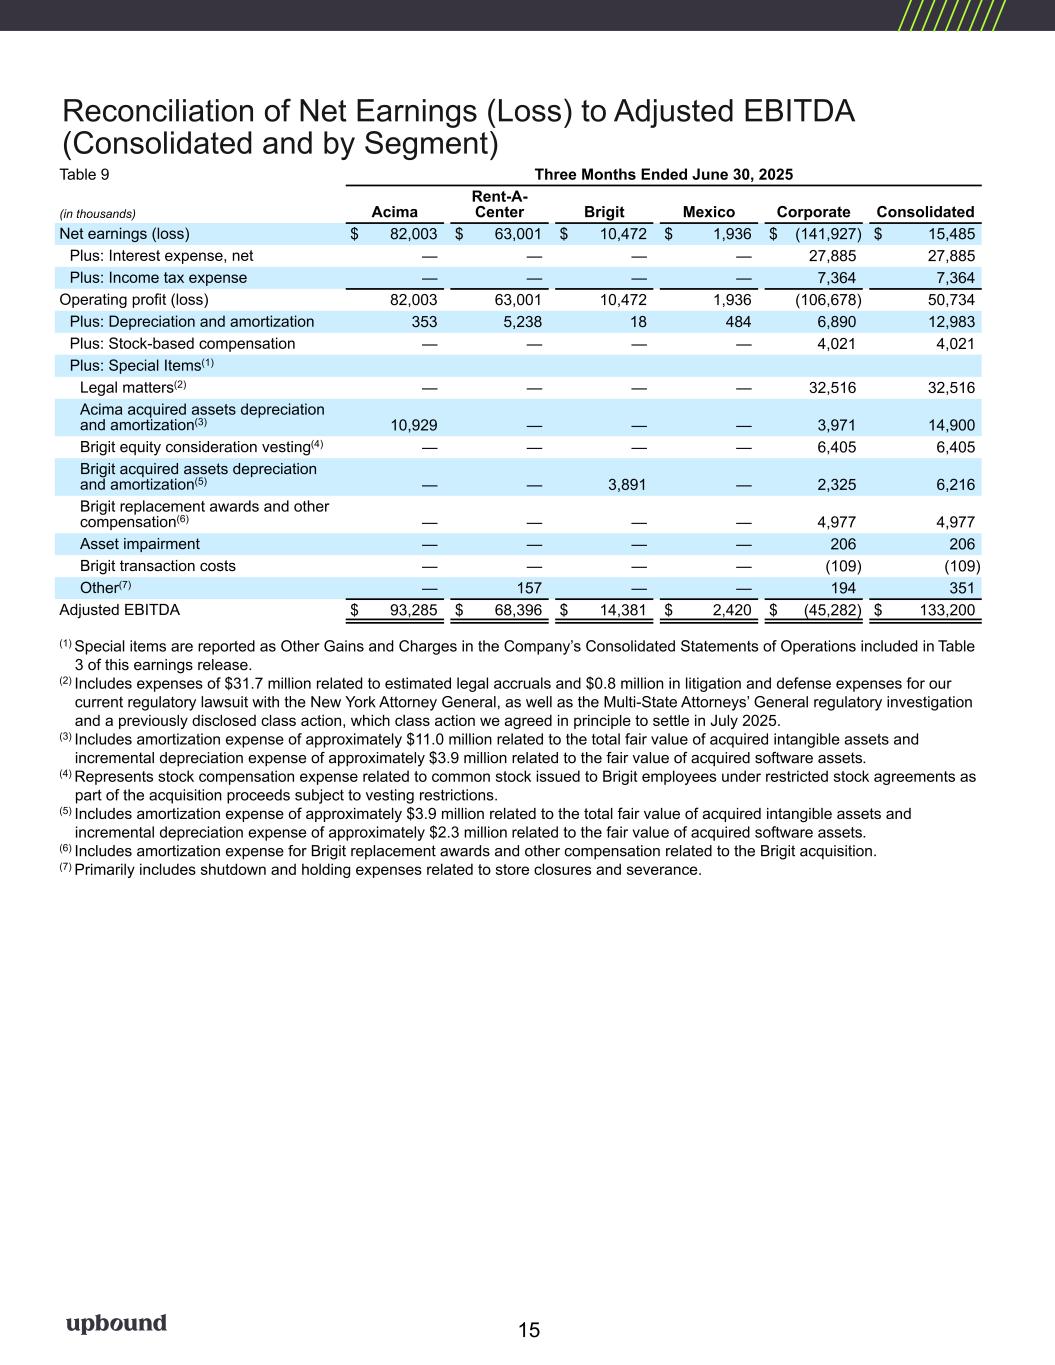
Reconciliation of Net Earnings (Loss) to Adjusted EBITDA (Consolidated and by Segment) 15 Table 9 Three Months Ended June 30, 2025 (in thousands) Acima Rent-A- Center Brigit Mexico Corporate Consolidated Net earnings (loss) $ 82,003 $ 63,001 $ 10,472 $ 1,936 $ (141,927) $ 15,485 Plus: Interest expense, net — — — — 27,885 27,885 Plus: Income tax expense — — — — 7,364 7,364 Operating profit (loss) 82,003 63,001 10,472 1,936 (106,678) 50,734 Plus: Depreciation and amortization 353 5,238 18 484 6,890 12,983 Plus: Stock-based compensation — — — — 4,021 4,021 Plus: Special Items(1) Legal matters(2) — — — — 32,516 32,516 Acima acquired assets depreciation and amortization(3) 10,929 — — — 3,971 14,900 Brigit equity consideration vesting(4) — — — — 6,405 6,405 Brigit acquired assets depreciation and amortization(5) — — 3,891 — 2,325 6,216 Brigit replacement awards and other compensation(6) — — — — 4,977 4,977 Asset impairment — — — — 206 206 Brigit transaction costs — — — — (109) (109) Other(7) — 157 — — 194 351 Adjusted EBITDA $ 93,285 $ 68,396 $ 14,381 $ 2,420 $ (45,282) $ 133,200 (1) Special items are reported as Other Gains and Charges in the Company’s Consolidated Statements of Operations included in Table 3 of this earnings release. (2) Includes expenses of $31.7 million related to estimated legal accruals and $0.8 million in litigation and defense expenses for our current regulatory lawsuit with the New York Attorney General, as well as the Multi-State Attorneys’ General regulatory investigation and a previously disclosed class action, which class action we agreed in principle to settle in July 2025. (3) Includes amortization expense of approximately $11.0 million related to the total fair value of acquired intangible assets and incremental depreciation expense of approximately $3.9 million related to the fair value of acquired software assets. (4) Represents stock compensation expense related to common stock issued to Brigit employees under restricted stock agreements as part of the acquisition proceeds subject to vesting restrictions. (5) Includes amortization expense of approximately $3.9 million related to the total fair value of acquired intangible assets and incremental depreciation expense of approximately $2.3 million related to the fair value of acquired software assets. (6) Includes amortization expense for Brigit replacement awards and other compensation related to the Brigit acquisition. (7) Primarily includes shutdown and holding expenses related to store closures and severance.
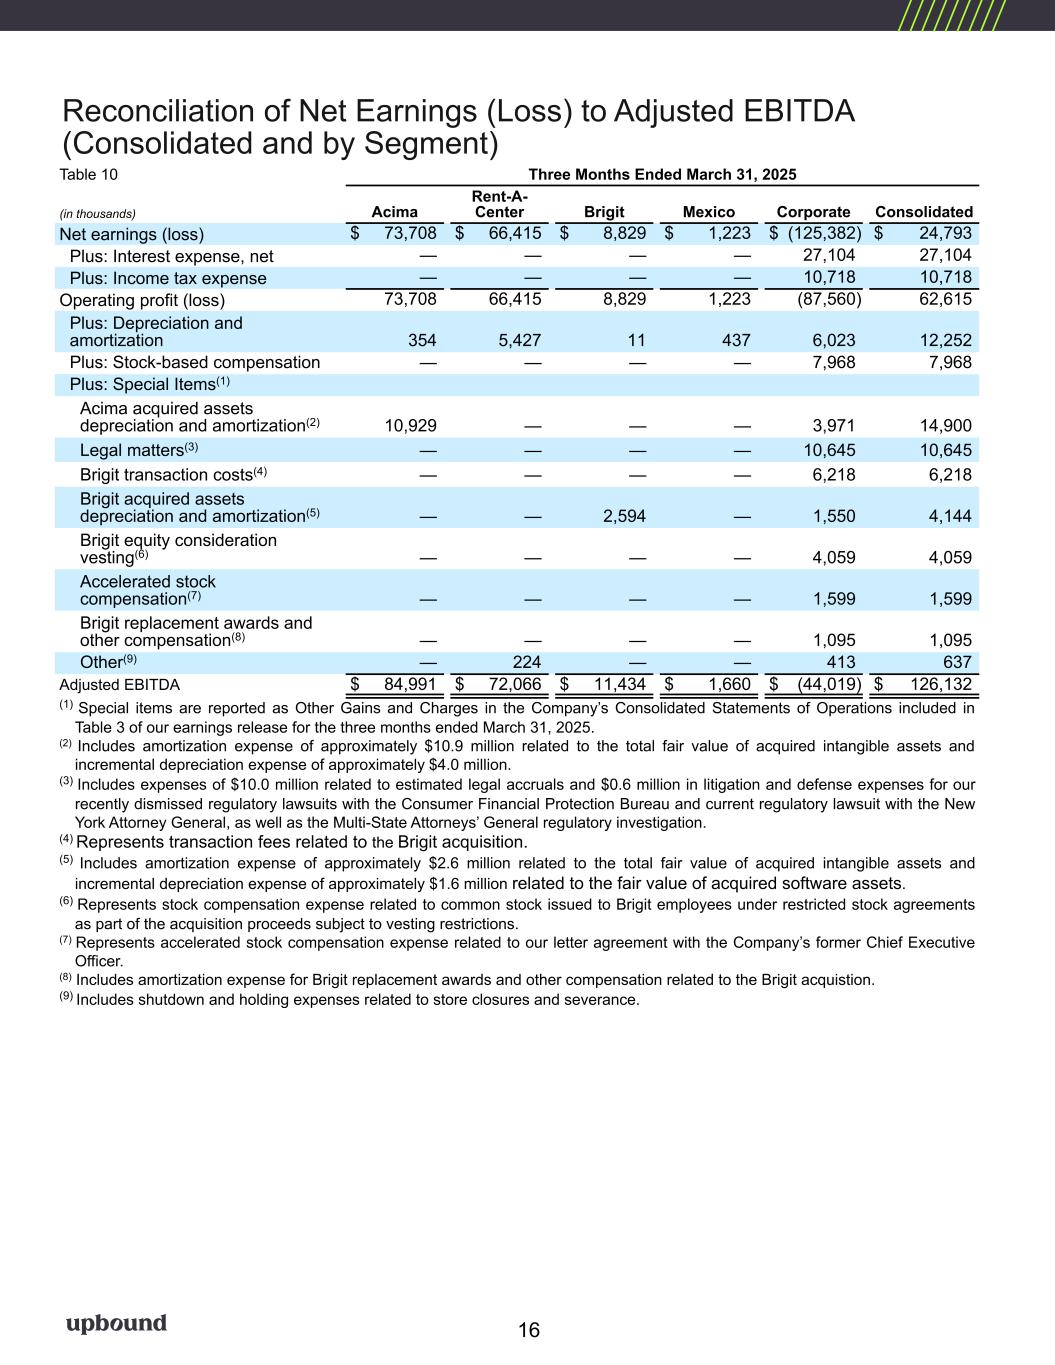
Reconciliation of Net Earnings (Loss) to Adjusted EBITDA (Consolidated and by Segment) 16 Table 10 Three Months Ended March 31, 2025 (in thousands) Acima Rent-A- Center Brigit Mexico Corporate Consolidated Net earnings (loss) $ 73,708 $ 66,415 $ 8,829 $ 1,223 $ (125,382) $ 24,793 Plus: Interest expense, net — — — — 27,104 27,104 Plus: Income tax expense — — — — 10,718 10,718 Operating profit (loss) 73,708 66,415 8,829 1,223 (87,560) 62,615 Plus: Depreciation and amortization 354 5,427 11 437 6,023 12,252 Plus: Stock-based compensation — — — — 7,968 7,968 Plus: Special Items(1) Acima acquired assets depreciation and amortization(2) 10,929 — — — 3,971 14,900 Legal matters(3) — — — — 10,645 10,645 Brigit transaction costs(4) — — — — 6,218 6,218 Brigit acquired assets depreciation and amortization(5) — — 2,594 — 1,550 4,144 Brigit equity consideration vesting(6) — — — — 4,059 4,059 Accelerated stock compensation(7) — — — — 1,599 1,599 Brigit replacement awards and other compensation(8) — — — — 1,095 1,095 Other(9) — 224 — — 413 637 Adjusted EBITDA $ 84,991 $ 72,066 $ 11,434 $ 1,660 $ (44,019) $ 126,132 (1) Special items are reported as Other Gains and Charges in the Company’s Consolidated Statements of Operations included in Table 3 of our earnings release for the three months ended March 31, 2025. (2) Includes amortization expense of approximately $10.9 million related to the total fair value of acquired intangible assets and incremental depreciation expense of approximately $4.0 million. (3) Includes expenses of $10.0 million related to estimated legal accruals and $0.6 million in litigation and defense expenses for our recently dismissed regulatory lawsuits with the Consumer Financial Protection Bureau and current regulatory lawsuit with the New York Attorney General, as well as the Multi-State Attorneys’ General regulatory investigation. (4) Represents transaction fees related to the Brigit acquisition. (5) Includes amortization expense of approximately $2.6 million related to the total fair value of acquired intangible assets and incremental depreciation expense of approximately $1.6 million related to the fair value of acquired software assets. (6) Represents stock compensation expense related to common stock issued to Brigit employees under restricted stock agreements as part of the acquisition proceeds subject to vesting restrictions. (7) Represents accelerated stock compensation expense related to our letter agreement with the Company’s former Chief Executive Officer. (8) Includes amortization expense for Brigit replacement awards and other compensation related to the Brigit acquistion. (9) Includes shutdown and holding expenses related to store closures and severance.
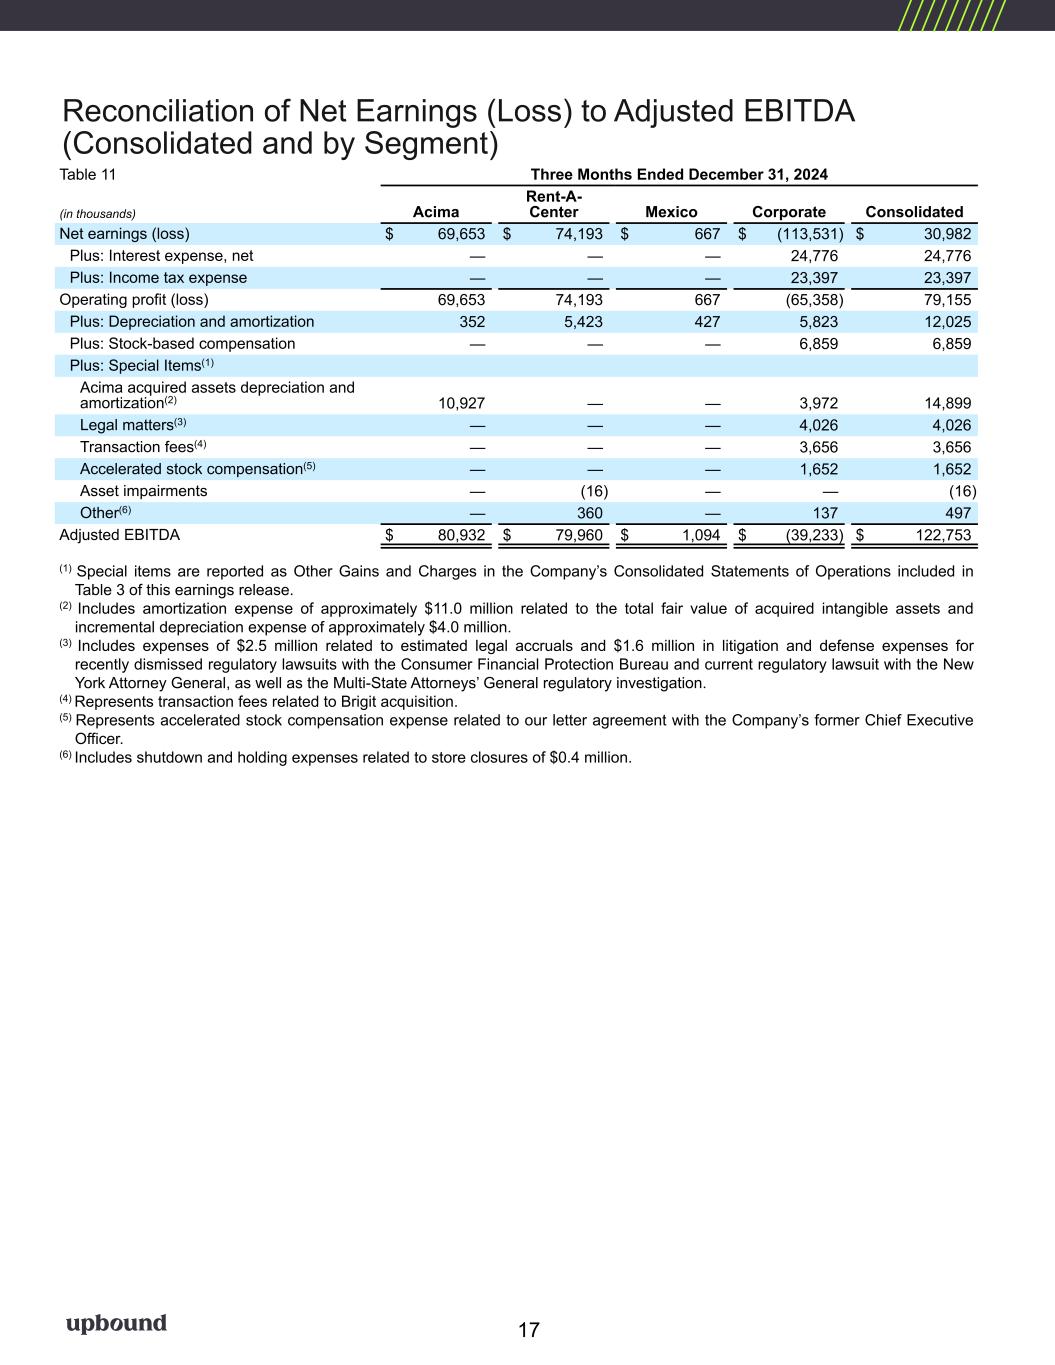
Reconciliation of Net Earnings (Loss) to Adjusted EBITDA (Consolidated and by Segment) 17 Table 11 Three Months Ended December 31, 2024 (in thousands) Acima Rent-A- Center Mexico Corporate Consolidated Net earnings (loss) $ 69,653 $ 74,193 $ 667 $ (113,531) $ 30,982 Plus: Interest expense, net — — — 24,776 24,776 Plus: Income tax expense — — — 23,397 23,397 Operating profit (loss) 69,653 74,193 667 (65,358) 79,155 Plus: Depreciation and amortization 352 5,423 427 5,823 12,025 Plus: Stock-based compensation — — — 6,859 6,859 Plus: Special Items(1) Acima acquired assets depreciation and amortization(2) 10,927 — — 3,972 14,899 Legal matters(3) — — — 4,026 4,026 Transaction fees(4) — — — 3,656 3,656 Accelerated stock compensation(5) — — — 1,652 1,652 Asset impairments — (16) — — (16) Other(6) — 360 — 137 497 Adjusted EBITDA $ 80,932 $ 79,960 $ 1,094 $ (39,233) $ 122,753 (1) Special items are reported as Other Gains and Charges in the Company’s Consolidated Statements of Operations included in Table 3 of this earnings release. (2) Includes amortization expense of approximately $11.0 million related to the total fair value of acquired intangible assets and incremental depreciation expense of approximately $4.0 million. (3) Includes expenses of $2.5 million related to estimated legal accruals and $1.6 million in litigation and defense expenses for recently dismissed regulatory lawsuits with the Consumer Financial Protection Bureau and current regulatory lawsuit with the New York Attorney General, as well as the Multi-State Attorneys’ General regulatory investigation. (4) Represents transaction fees related to Brigit acquisition. (5) Represents accelerated stock compensation expense related to our letter agreement with the Company’s former Chief Executive Officer. (6) Includes shutdown and holding expenses related to store closures of $0.4 million.
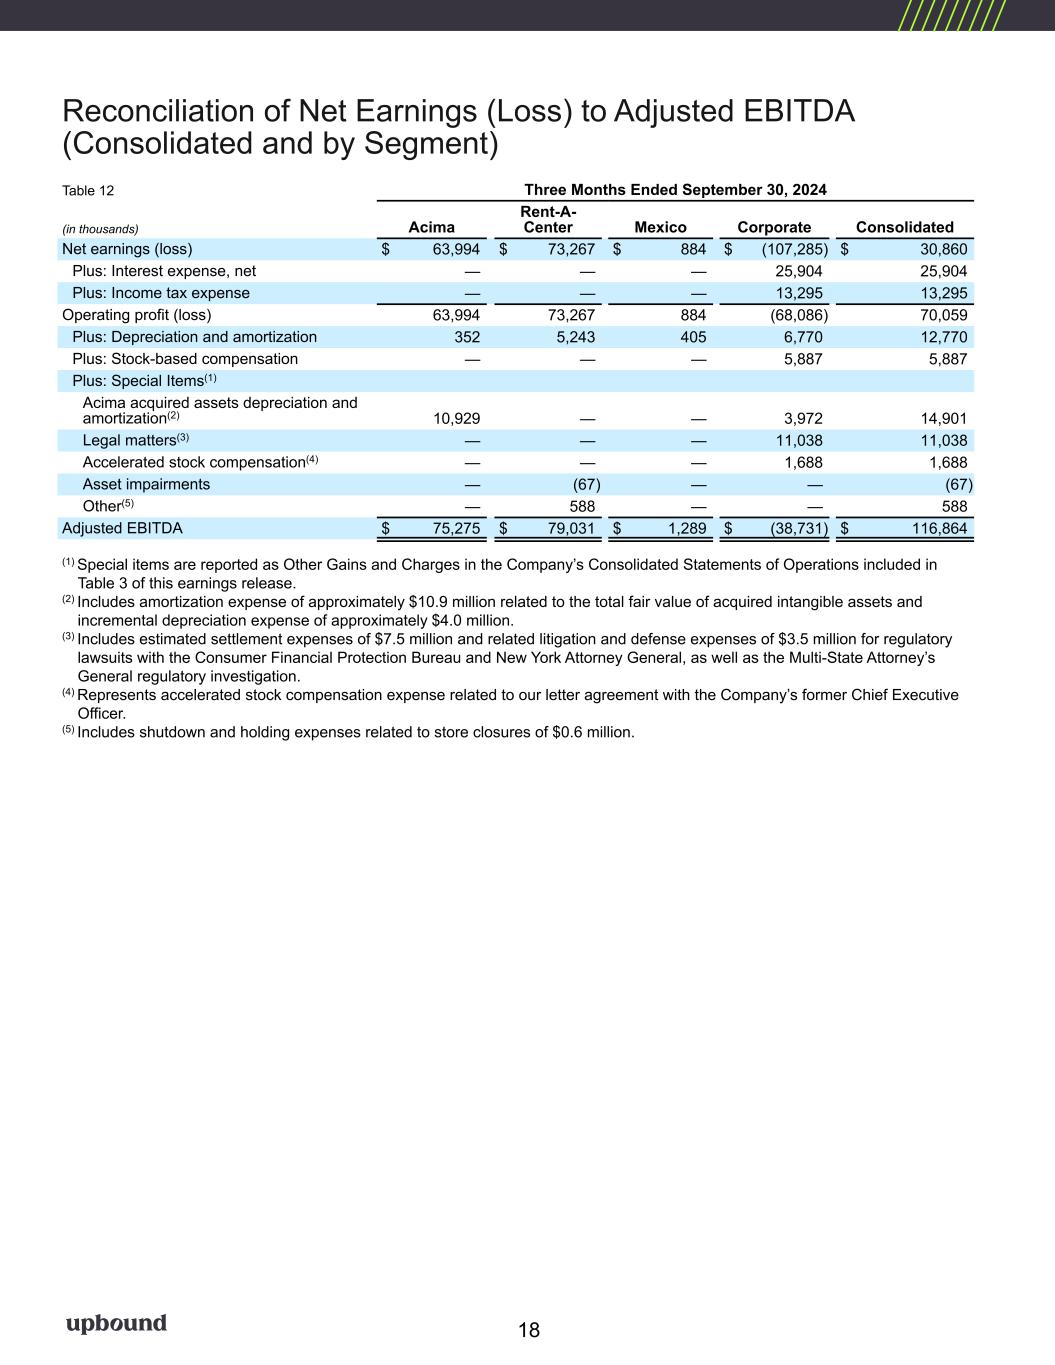
Reconciliation of Net Earnings (Loss) to Adjusted EBITDA (Consolidated and by Segment) Table 12 Three Months Ended September 30, 2024 (in thousands) Acima Rent-A- Center Mexico Corporate Consolidated Net earnings (loss) $ 63,994 $ 73,267 $ 884 $ (107,285) $ 30,860 Plus: Interest expense, net — — — 25,904 25,904 Plus: Income tax expense — — — 13,295 13,295 Operating profit (loss) 63,994 73,267 884 (68,086) 70,059 Plus: Depreciation and amortization 352 5,243 405 6,770 12,770 Plus: Stock-based compensation — — — 5,887 5,887 Plus: Special Items(1) Acima acquired assets depreciation and amortization(2) 10,929 — — 3,972 14,901 Legal matters(3) — — — 11,038 11,038 Accelerated stock compensation(4) — — — 1,688 1,688 Asset impairments — (67) — — (67) Other(5) — 588 — — 588 Adjusted EBITDA $ 75,275 $ 79,031 $ 1,289 $ (38,731) $ 116,864 (1) Special items are reported as Other Gains and Charges in the Company’s Consolidated Statements of Operations included in Table 3 of this earnings release. (2) Includes amortization expense of approximately $10.9 million related to the total fair value of acquired intangible assets and incremental depreciation expense of approximately $4.0 million. (3) Includes estimated settlement expenses of $7.5 million and related litigation and defense expenses of $3.5 million for regulatory lawsuits with the Consumer Financial Protection Bureau and New York Attorney General, as well as the Multi-State Attorney’s General regulatory investigation. (4) Represents accelerated stock compensation expense related to our letter agreement with the Company’s former Chief Executive Officer. (5) Includes shutdown and holding expenses related to store closures of $0.6 million. 18
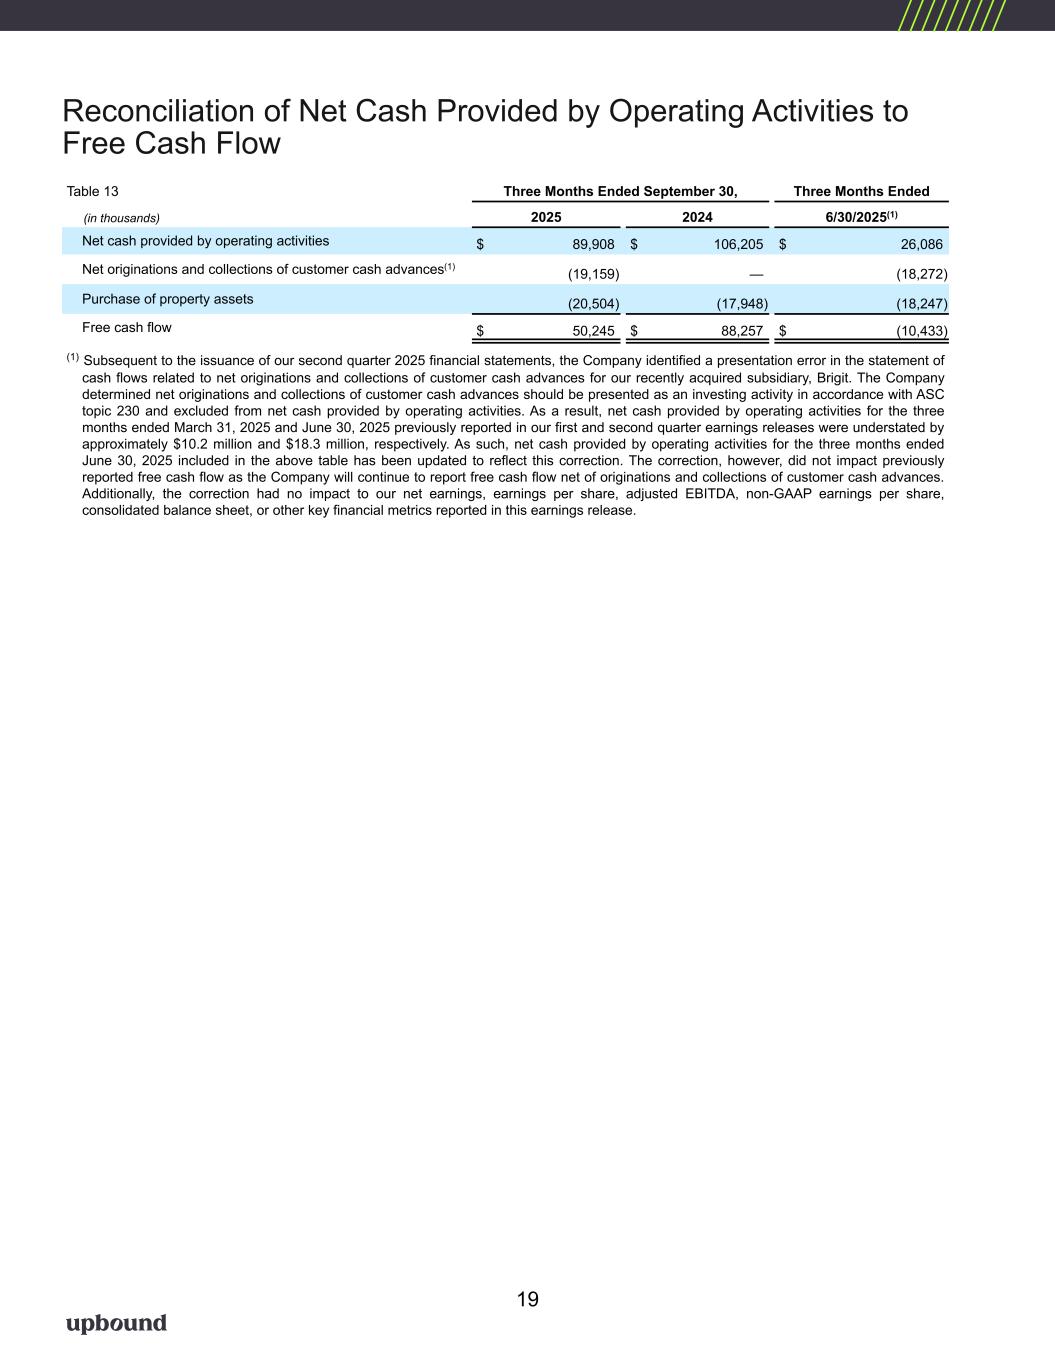
Reconciliation of Net Cash Provided by Operating Activities to Free Cash Flow Table 13 Three Months Ended September 30, Three Months Ended (in thousands) 2025 2024 6/30/2025(1) Net cash provided by operating activities $ 89,908 $ 106,205 $ 26,086 Net originations and collections of customer cash advances(1) (19,159) — (18,272) Purchase of property assets (20,504) (17,948) (18,247) Free cash flow $ 50,245 $ 88,257 $ (10,433) (1) Subsequent to the issuance of our second quarter 2025 financial statements, the Company identified a presentation error in the statement of cash flows related to net originations and collections of customer cash advances for our recently acquired subsidiary, Brigit. The Company determined net originations and collections of customer cash advances should be presented as an investing activity in accordance with ASC topic 230 and excluded from net cash provided by operating activities. As a result, net cash provided by operating activities for the three months ended March 31, 2025 and June 30, 2025 previously reported in our first and second quarter earnings releases were understated by approximately $10.2 million and $18.3 million, respectively. As such, net cash provided by operating activities for the three months ended June 30, 2025 included in the above table has been updated to reflect this correction. The correction, however, did not impact previously reported free cash flow as the Company will continue to report free cash flow net of originations and collections of customer cash advances. Additionally, the correction had no impact to our net earnings, earnings per share, adjusted EBITDA, non-GAAP earnings per share, consolidated balance sheet, or other key financial metrics reported in this earnings release. 19
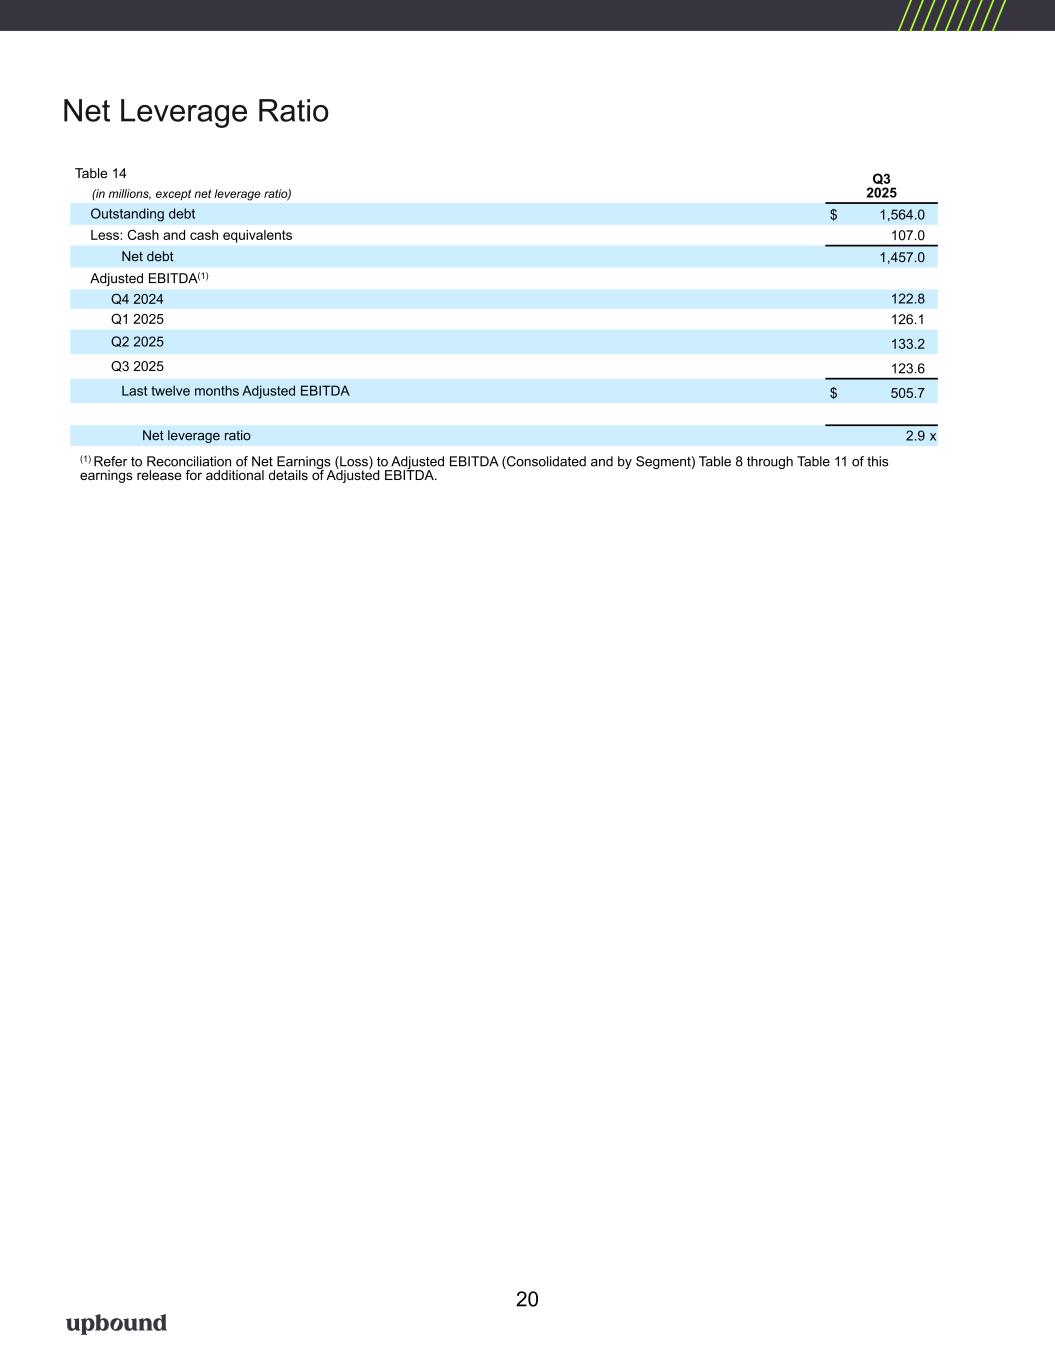
Table 14 Q3 2025 (in millions, except net leverage ratio) Outstanding debt $ 1,564.0 Less: Cash and cash equivalents 107.0 Net debt 1,457.0 Adjusted EBITDA(1) Q4 2024 122.8 Q1 2025 126.1 Q2 2025 133.2 Q3 2025 123.6 Last twelve months Adjusted EBITDA $ 505.7 Net leverage ratio 2.9 x (1) Refer to Reconciliation of Net Earnings (Loss) to Adjusted EBITDA (Consolidated and by Segment) Table 8 through Table 11 of this earnings release for additional details of Adjusted EBITDA. Net Leverage Ratio 20