Q3 2025 Earnings Presentation November 6, 2025 .2

This presentation contains forward-looking statements based on current expectations that involve a number of risks and uncertainties. The forward-looking statements are made pursuant to safe harbor provisions of the Private Securities Litigation Reform Act of 1995. A discussion of these forward-looking statements and risk factors that may affect them is set forth at the end of this presentation. The Company assumes no obligation to update any forward-looking statement in this presentation, except as required by law. Private Securities Litigation Reform Act of 1995 Safe Harbor for Forward-Looking Statements
Powering the world’s payments ecosystem ACI Worldwide, an original innovator in global payments technology, delivers transformative software solutions that power intelligent payments orchestration in real time so banks, billers, and merchants can drive growth while continuously modernizing their payment infrastructures, simply and securely. With over 50 years of trusted payments expertise, we combine our global footprint with a local presence to offer enhanced payment experiences to stay ahead of constantly changing payment challenges and opportunities.
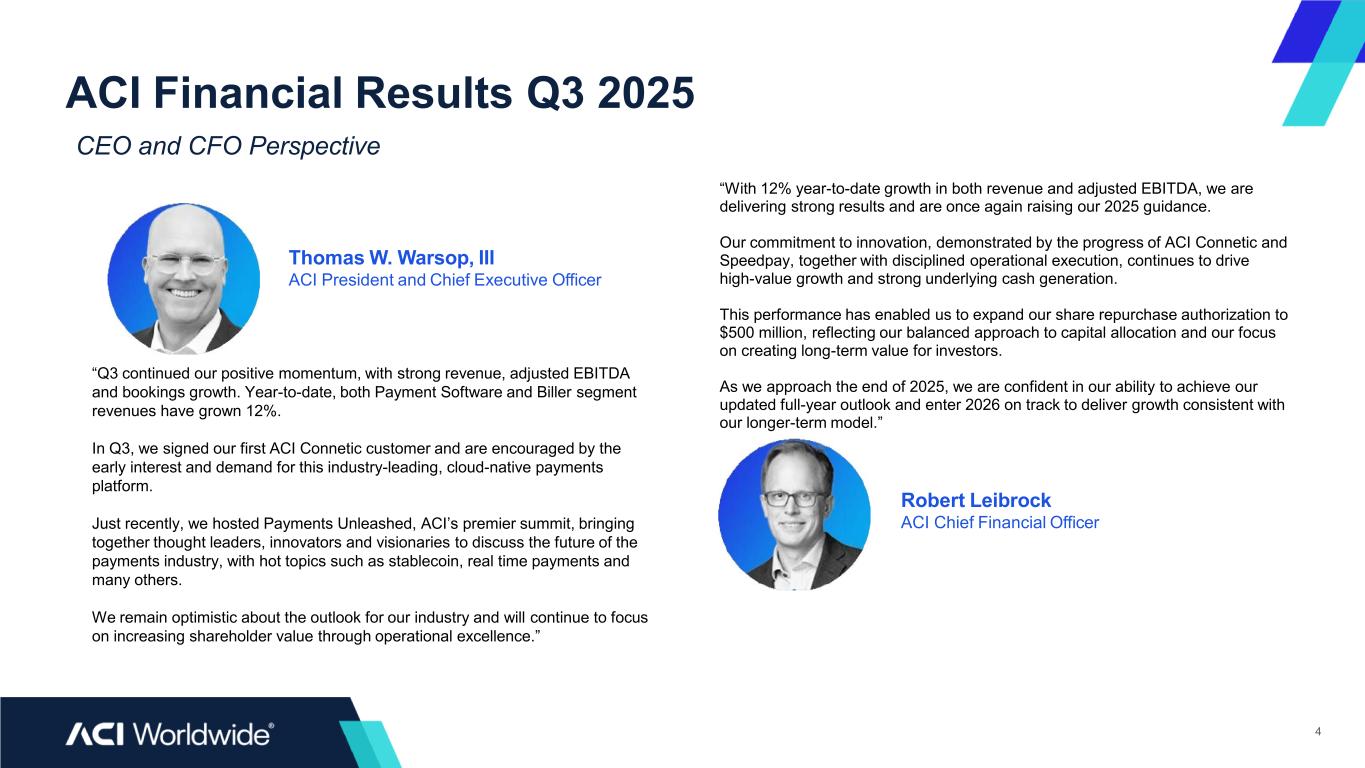
ACI Financial Results Q3 2025 4 “Q3 continued our positive momentum, with strong revenue, adjusted EBITDA and bookings growth. Year-to-date, both Payment Software and Biller segment revenues have grown 12%. In Q3, we signed our first ACI Connetic customer and are encouraged by the early interest and demand for this industry-leading, cloud-native payments platform. Just recently, we hosted Payments Unleashed, ACI’s premier summit, bringing together thought leaders, innovators and visionaries to discuss the future of the payments industry, with hot topics such as stablecoin, real time payments and many others. We remain optimistic about the outlook for our industry and will continue to focus on increasing shareholder value through operational excellence.” “With 12% year-to-date growth in both revenue and adjusted EBITDA, we are delivering strong results and are once again raising our 2025 guidance. Our commitment to innovation, demonstrated by the progress of ACI Connetic and Speedpay, together with disciplined operational execution, continues to drive high-value growth and strong underlying cash generation. This performance has enabled us to expand our share repurchase authorization to $500 million, reflecting our balanced approach to capital allocation and our focus on creating long-term value for investors. As we approach the end of 2025, we are confident in our ability to achieve our updated full-year outlook and enter 2026 on track to deliver growth consistent with our longer-term model.” Thomas W. Warsop, III ACI President and Chief Executive Officer Robert Leibrock ACI Chief Financial Officer CEO and CFO Perspective
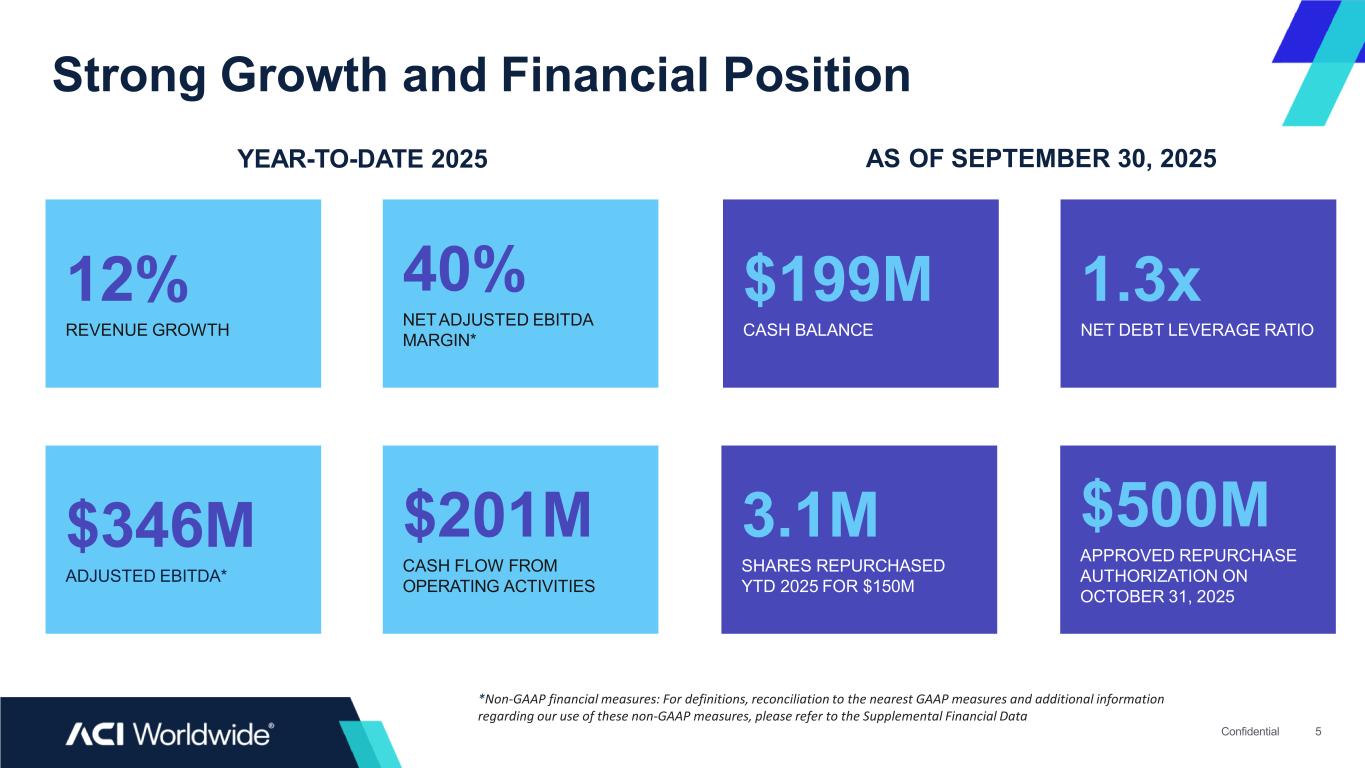
Strong Growth and Financial Position 5Confidential $199M CASH BALANCE 1.3x NET DEBT LEVERAGE RATIO 3.1M SHARES REPURCHASED YTD 2025 FOR $150M $500M APPROVED REPURCHASE AUTHORIZATION ON OCTOBER 31, 2025 12% REVENUE GROWTH 40% NETADJUSTED EBITDA MARGIN* $346M ADJUSTED EBITDA* $201M CASH FLOW FROM OPERATING ACTIVITIES YEAR-TO-DATE 2025 AS OF SEPTEMBER 30, 2025 *Non-GAAP financial measures: For definitions, reconciliation to the nearest GAAP measures and additional information regarding our use of these non-GAAP measures, please refer to the Supplemental Financial Data
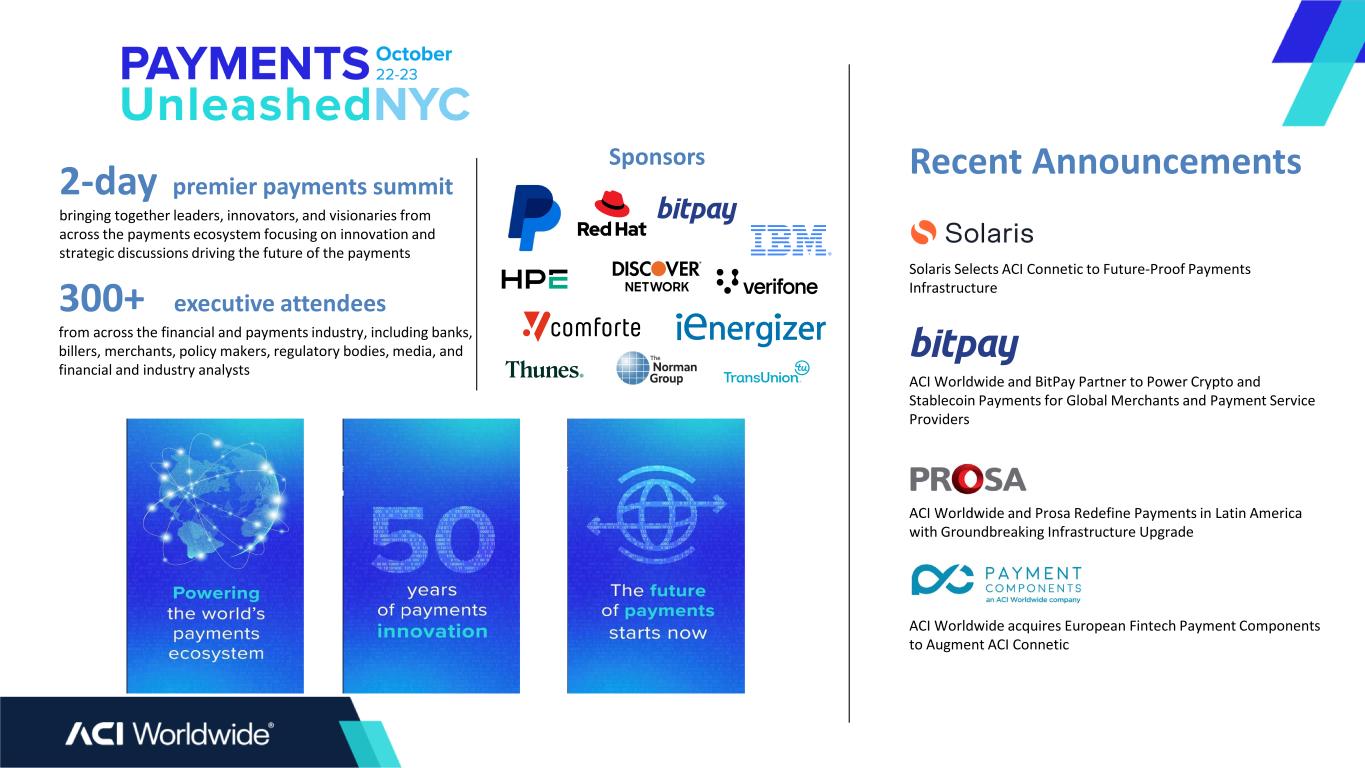
2-day premier payments summit bringing together leaders, innovators, and visionaries from across the payments ecosystem focusing on innovation and strategic discussions driving the future of the payments 300+ executive attendees from across the financial and payments industry, including banks, billers, merchants, policy makers, regulatory bodies, media, and financial and industry analysts Sponsors Recent Announcements Solaris Selects ACI Connetic to Future-Proof Payments Infrastructure ACI Worldwide and BitPay Partner to Power Crypto and Stablecoin Payments for Global Merchants and Payment Service Providers ACI Worldwide and Prosa Redefine Payments in Latin America with Groundbreaking Infrastructure Upgrade ACI Worldwide acquires European Fintech Payment Components to Augment ACI Connetic
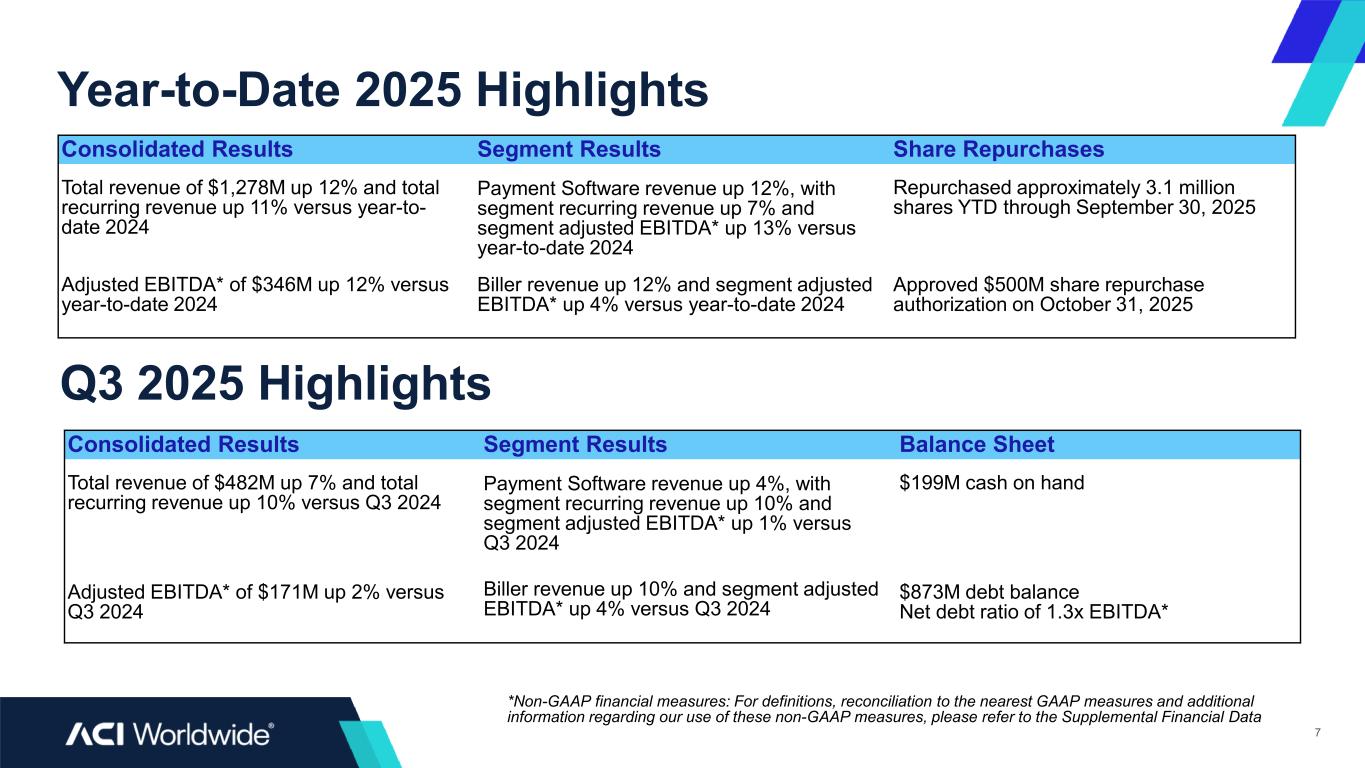
Q3 2025 Highlights Year-to-Date 2025 Highlights 7 Consolidated Results Segment Results Share Repurchases Total revenue of $1,278M up 12% and total recurring revenue up 11% versus year-to- date 2024 Payment Software revenue up 12%, with segment recurring revenue up 7% and segment adjusted EBITDA* up 13% versus year-to-date 2024 Repurchased approximately 3.1 million shares YTD through September 30, 2025 Adjusted EBITDA* of $346M up 12% versus year-to-date 2024 Biller revenue up 12% and segment adjusted EBITDA* up 4% versus year-to-date 2024 Approved $500M share repurchase authorization on October 31, 2025 Consolidated Results Segment Results Balance Sheet Total revenue of $482M up 7% and total recurring revenue up 10% versus Q3 2024 Payment Software revenue up 4%, with segment recurring revenue up 10% and segment adjusted EBITDA* up 1% versus Q3 2024 $199M cash on hand Adjusted EBITDA* of $171M up 2% versus Q3 2024 Biller revenue up 10% and segment adjusted EBITDA* up 4% versus Q3 2024 $873M debt balance Net debt ratio of 1.3x EBITDA* *Non-GAAP financial measures: For definitions, reconciliation to the nearest GAAP measures and additional information regarding our use of these non-GAAP measures, please refer to the Supplemental Financial Data
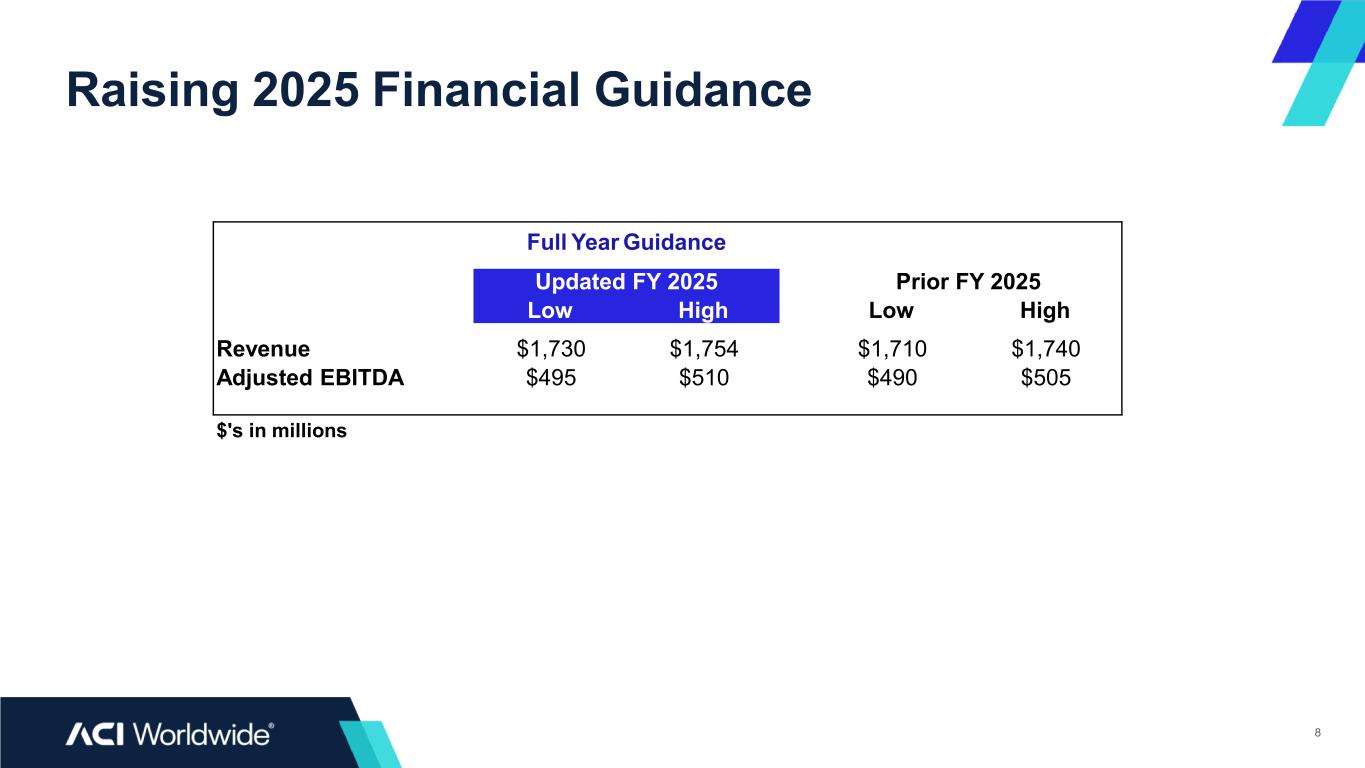
Raising 2025 Financial Guidance 8 Full Year Guidance Updated FY 2025 Prior FY 2025 Low High Low High Revenue $1,730 $1,754 $1,710 $1,740 Adjusted EBITDA $495 $510 $490 $505 $'s in millions
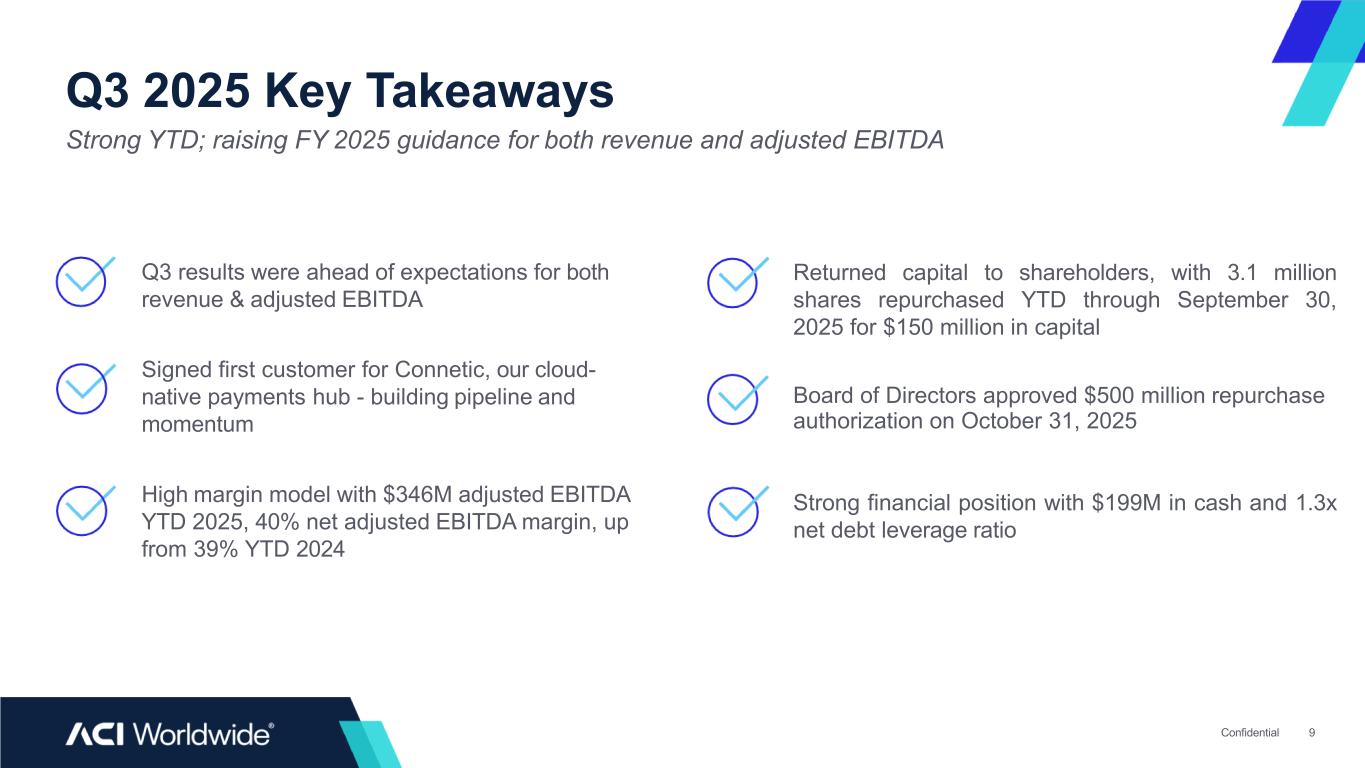
Q3 2025 Key Takeaways Strong YTD; raising FY 2025 guidance for both revenue and adjusted EBITDA Q3 results were ahead of expectations for both revenue & adjusted EBITDA Signed first customer for Connetic, our cloud- native payments hub - building pipeline and momentum High margin model with $346M adjusted EBITDA YTD 2025, 40% net adjusted EBITDA margin, up from 39% YTD 2024 Returned capital to shareholders, with 3.1 million shares repurchased YTD through September 30, 2025 for $150 million in capital Board of Directors approved $500 million repurchase authorization on October 31, 2025 Strong financial position with $199M in cash and 1.3x net debt leverage ratio Confidential 9
Supplemental Financial Data Confidential 10
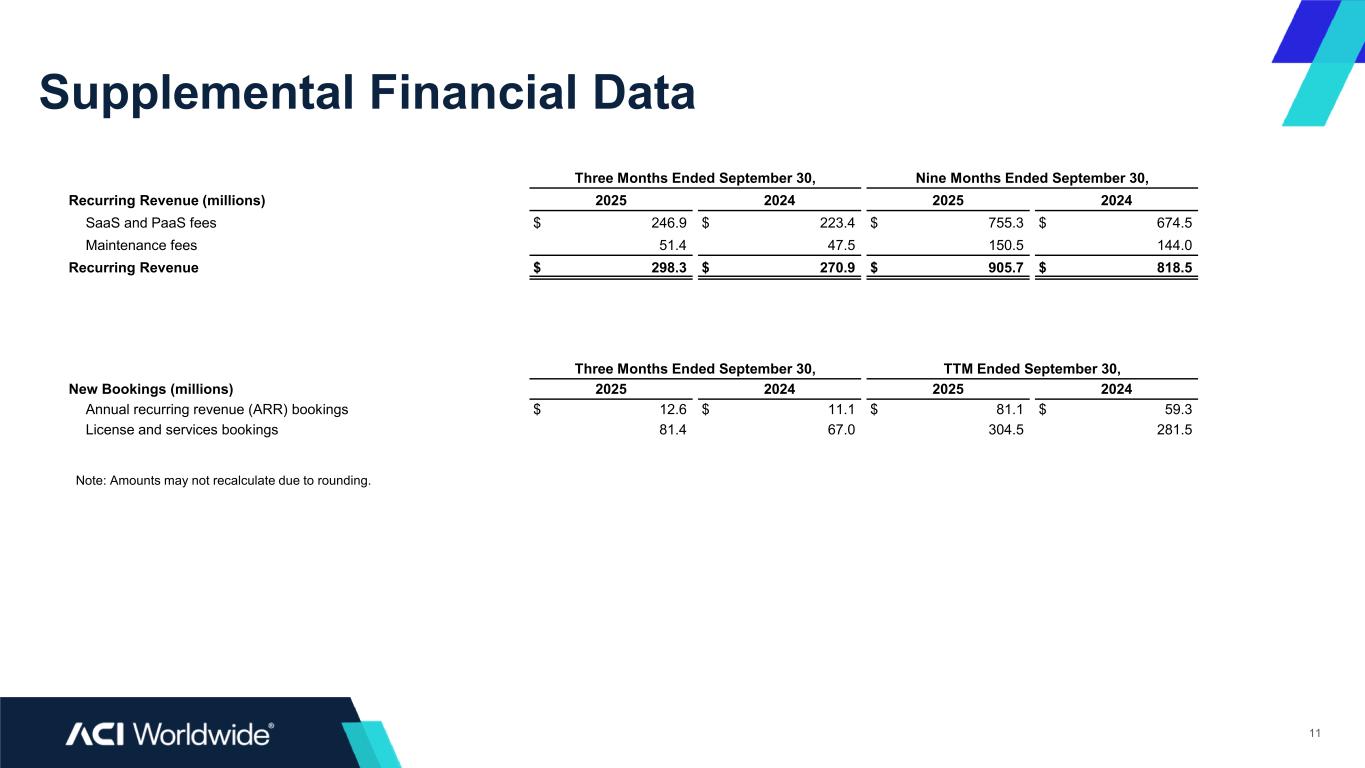
Supplemental Financial Data 11 Three Months Ended September 30, Nine Months Ended September 30, Recurring Revenue (millions) 2025 2024 2025 2024 SaaS and PaaS fees $ 246.9 $ 223.4 $ 755.3 $ 674.5 Maintenance fees 51.4 47.5 150.5 144.0 Recurring Revenue $ 298.3 $ 270.9 $ 905.7 $ 818.5 Three Months Ended September 30, TTM Ended September 30, New Bookings (millions) 2025 2024 2025 2024 Annual recurring revenue (ARR) bookings $ 12.6 $ 11.1 $ 81.1 $ 59.3 License and services bookings 81.4 67.0 304.5 281.5 Note: Amounts may not recalculate due to rounding.
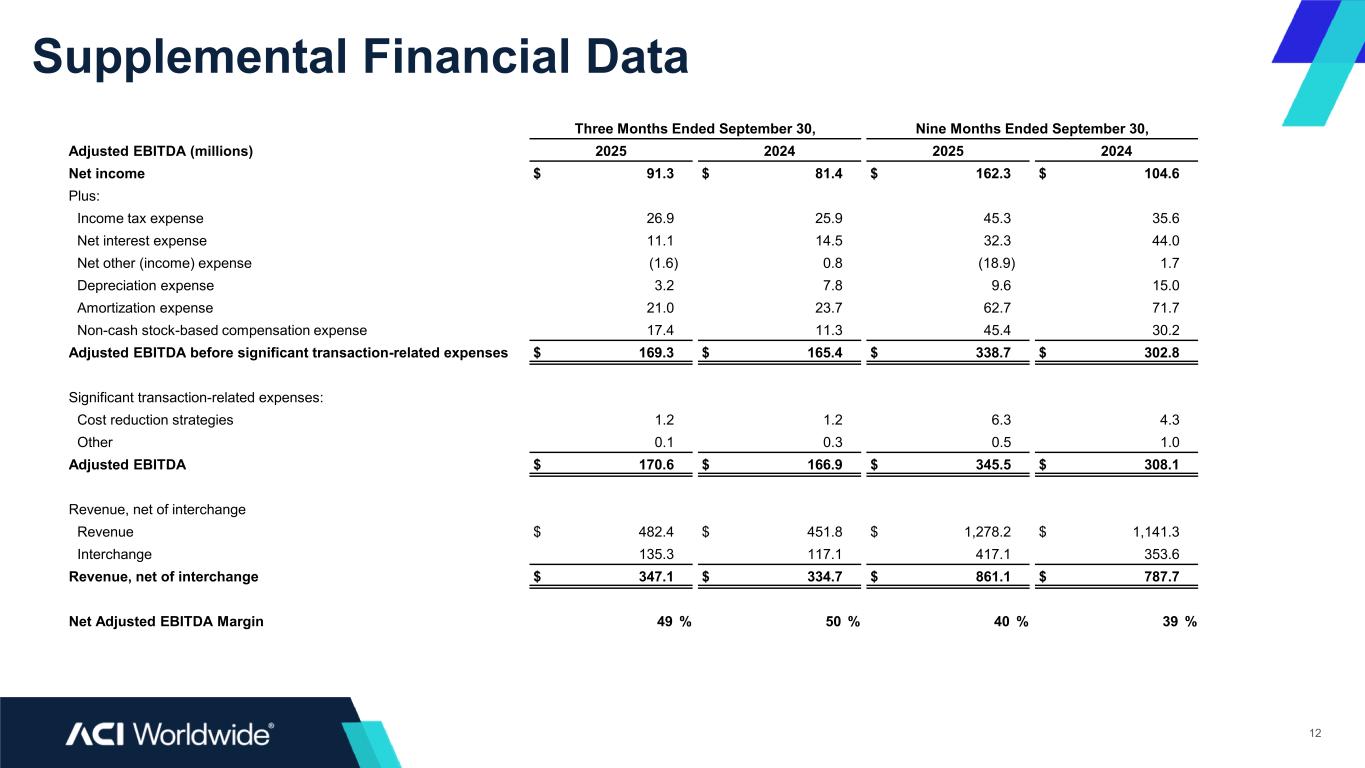
Supplemental Financial Data 12 Three Months Ended September 30, Nine Months Ended September 30, Adjusted EBITDA (millions) 2025 2024 2025 2024 Net income $ 91.3 $ 81.4 $ 162.3 $ 104.6 Plus: Income tax expense 26.9 25.9 45.3 35.6 Net interest expense 11.1 14.5 32.3 44.0 Net other (income) expense (1.6) 0.8 (18.9) 1.7 Depreciation expense 3.2 7.8 9.6 15.0 Amortization expense 21.0 23.7 62.7 71.7 Non-cash stock-based compensation expense 17.4 11.3 45.4 30.2 Adjusted EBITDA before significant transaction-related expenses $ 169.3 $ 165.4 $ 338.7 $ 302.8 Significant transaction-related expenses: Cost reduction strategies 1.2 1.2 6.3 4.3 Other 0.1 0.3 0.5 1.0 Adjusted EBITDA $ 170.6 $ 166.9 $ 345.5 $ 308.1 Revenue, net of interchange Revenue $ 482.4 $ 451.8 $ 1,278.2 $ 1,141.3 Interchange 135.3 117.1 417.1 353.6 Revenue, net of interchange $ 347.1 $ 334.7 $ 861.1 $ 787.7 Net Adjusted EBITDA Margin 49 % 50 % 40 % 39 %
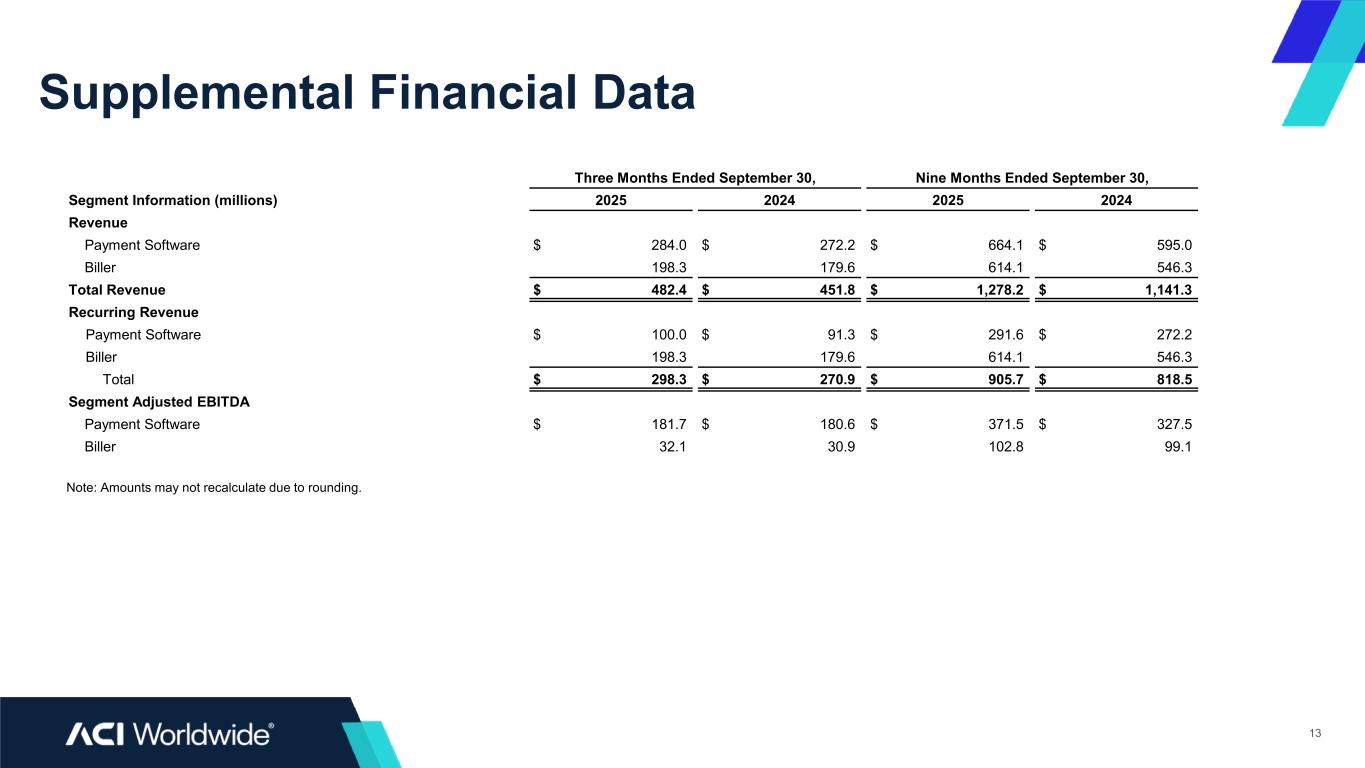
Supplemental Financial Data 13 Three Months Ended September 30, Nine Months Ended September 30, Segment Information (millions) 2025 2024 2025 2024 Revenue Payment Software $ 284.0 $ 272.2 $ 664.1 $ 595.0 Biller 198.3 179.6 614.1 546.3 Total Revenue $ 482.4 $ 451.8 $ 1,278.2 $ 1,141.3 Recurring Revenue Payment Software $ 100.0 $ 91.3 $ 291.6 $ 272.2 Biller 198.3 179.6 614.1 546.3 Total $ 298.3 $ 270.9 $ 905.7 $ 818.5 Segment Adjusted EBITDA Payment Software $ 181.7 $ 180.6 $ 371.5 $ 327.5 Biller 32.1 30.9 102.8 99.1 Note: Amounts may not recalculate due to rounding.
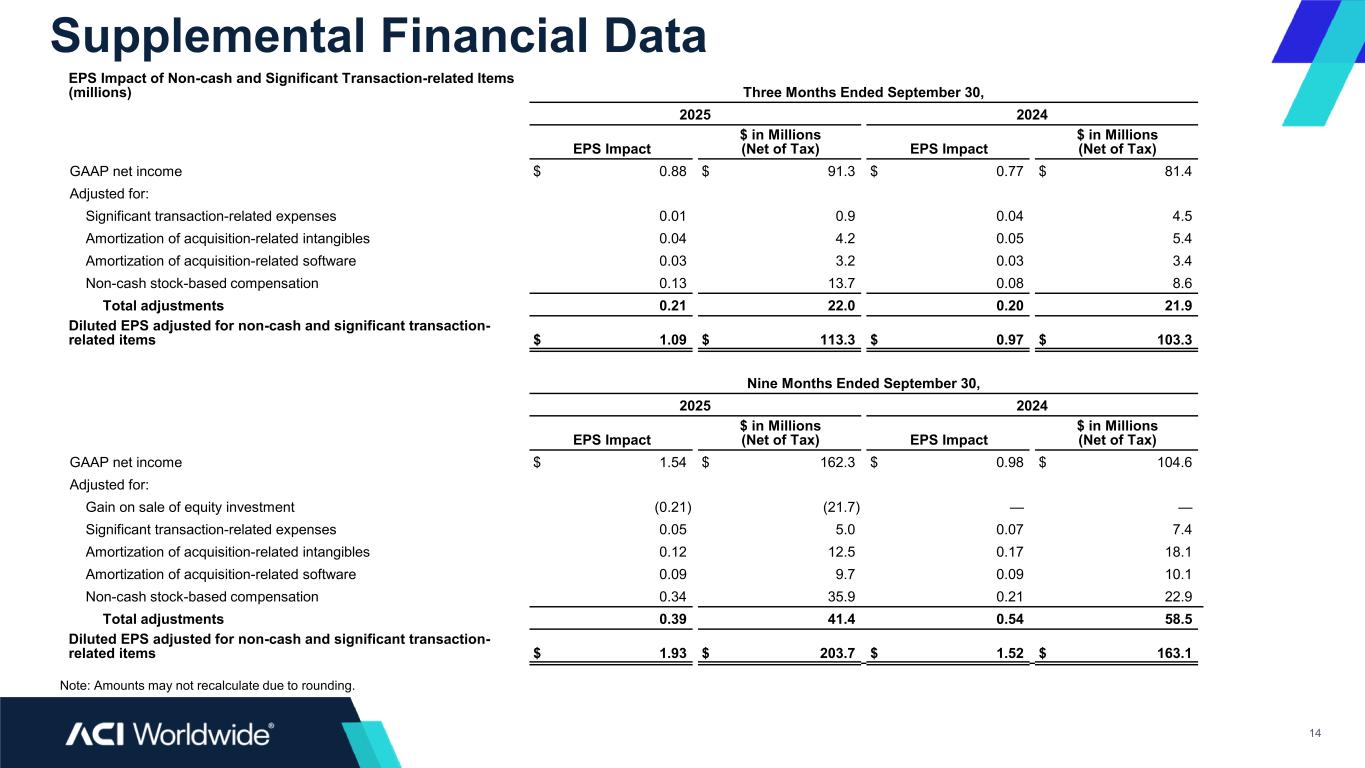
Supplemental Financial Data 14 EPS Impact of Non-cash and Significant Transaction-related Items (millions) Three Months Ended September 30, 2025 2024 EPS Impact $ in Millions (Net of Tax) EPS Impact $ in Millions (Net of Tax) GAAP net income $ 0.88 $ 91.3 $ 0.77 $ 81.4 Adjusted for: Significant transaction-related expenses 0.01 0.9 0.04 4.5 Amortization of acquisition-related intangibles 0.04 4.2 0.05 5.4 Amortization of acquisition-related software 0.03 3.2 0.03 3.4 Non-cash stock-based compensation 0.13 13.7 0.08 8.6 Total adjustments 0.21 22.0 0.20 21.9 Diluted EPS adjusted for non-cash and significant transaction- related items $ 1.09 $ 113.3 $ 0.97 $ 103.3 Note: Amounts may not recalculate due to rounding. Nine Months Ended September 30, 2025 2024 EPS Impact $ in Millions (Net of Tax) EPS Impact $ in Millions (Net of Tax) GAAP net income $ 1.54 $ 162.3 $ 0.98 $ 104.6 Adjusted for: Gain on sale of equity investment (0.21) (21.7) — — Significant transaction-related expenses 0.05 5.0 0.07 7.4 Amortization of acquisition-related intangibles 0.12 12.5 0.17 18.1 Amortization of acquisition-related software 0.09 9.7 0.09 10.1 Non-cash stock-based compensation 0.34 35.9 0.21 22.9 Total adjustments 0.39 41.4 0.54 58.5 Diluted EPS adjusted for non-cash and significant transaction- related items $ 1.93 $ 203.7 $ 1.52 $ 163.1
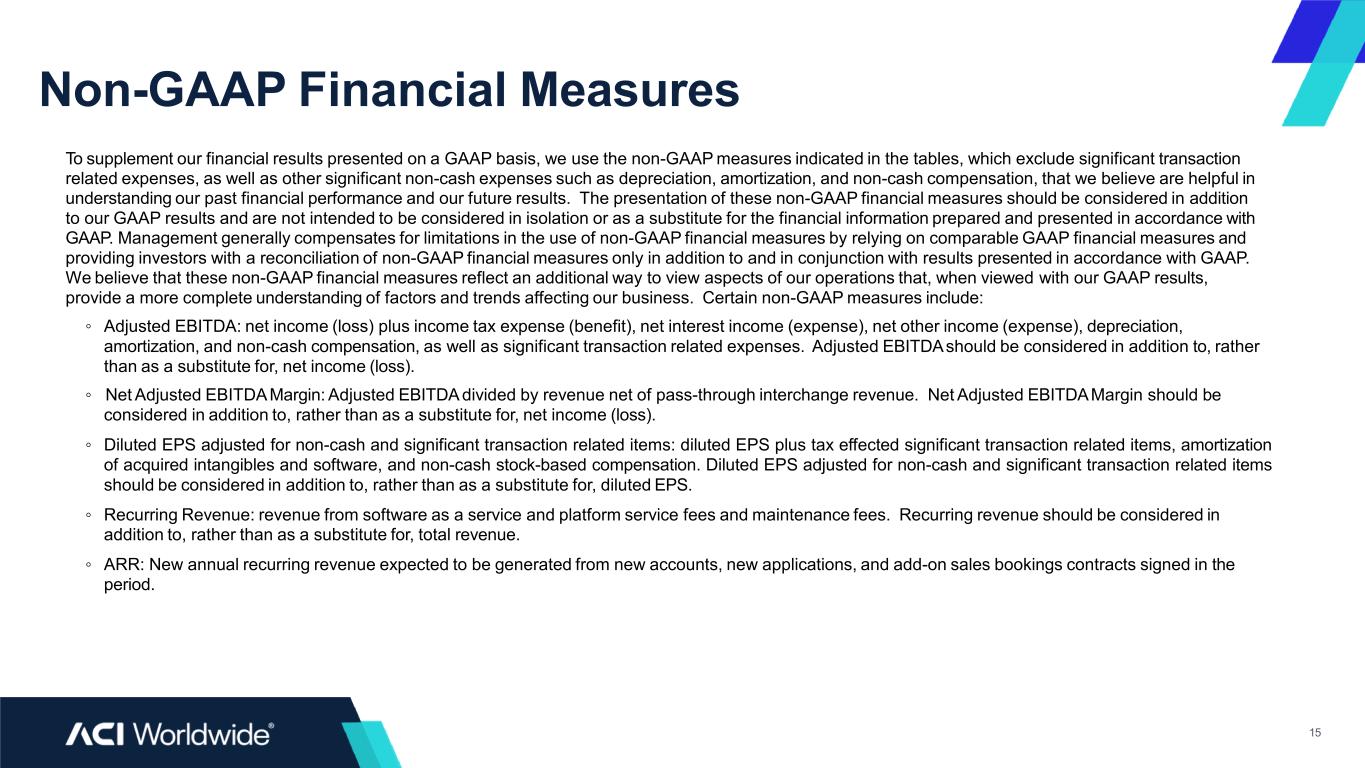
Non-GAAP Financial Measures 15 To supplement our financial results presented on a GAAP basis, we use the non-GAAP measures indicated in the tables, which exclude significant transaction related expenses, as well as other significant non-cash expenses such as depreciation, amortization, and non-cash compensation, that we believe are helpful in understanding our past financial performance and our future results. The presentation of these non-GAAP financial measures should be considered in addition to our GAAP results and are not intended to be considered in isolation or as a substitute for the financial information prepared and presented in accordance with GAAP. Management generally compensates for limitations in the use of non-GAAP financial measures by relying on comparable GAAP financial measures and providing investors with a reconciliation of non-GAAP financial measures only in addition to and in conjunction with results presented in accordance with GAAP. We believe that these non-GAAP financial measures reflect an additional way to view aspects of our operations that, when viewed with our GAAP results, provide a more complete understanding of factors and trends affecting our business. Certain non-GAAP measures include: ◦ Adjusted EBITDA: net income (loss) plus income tax expense (benefit), net interest income (expense), net other income (expense), depreciation, amortization, and non-cash compensation, as well as significant transaction related expenses. Adjusted EBITDAshould be considered in addition to, rather than as a substitute for, net income (loss). ◦ Net Adjusted EBITDAMargin: Adjusted EBITDA divided by revenue net of pass-through interchange revenue. Net Adjusted EBITDAMargin should be considered in addition to, rather than as a substitute for, net income (loss). ◦ Diluted EPS adjusted for non-cash and significant transaction related items: diluted EPS plus tax effected significant transaction related items, amortization of acquired intangibles and software, and non-cash stock-based compensation. Diluted EPS adjusted for non-cash and significant transaction related items should be considered in addition to, rather than as a substitute for, diluted EPS. ◦ Recurring Revenue: revenue from software as a service and platform service fees and maintenance fees. Recurring revenue should be considered in addition to, rather than as a substitute for, total revenue. ◦ ARR: New annual recurring revenue expected to be generated from new accounts, new applications, and add-on sales bookings contracts signed in the period.
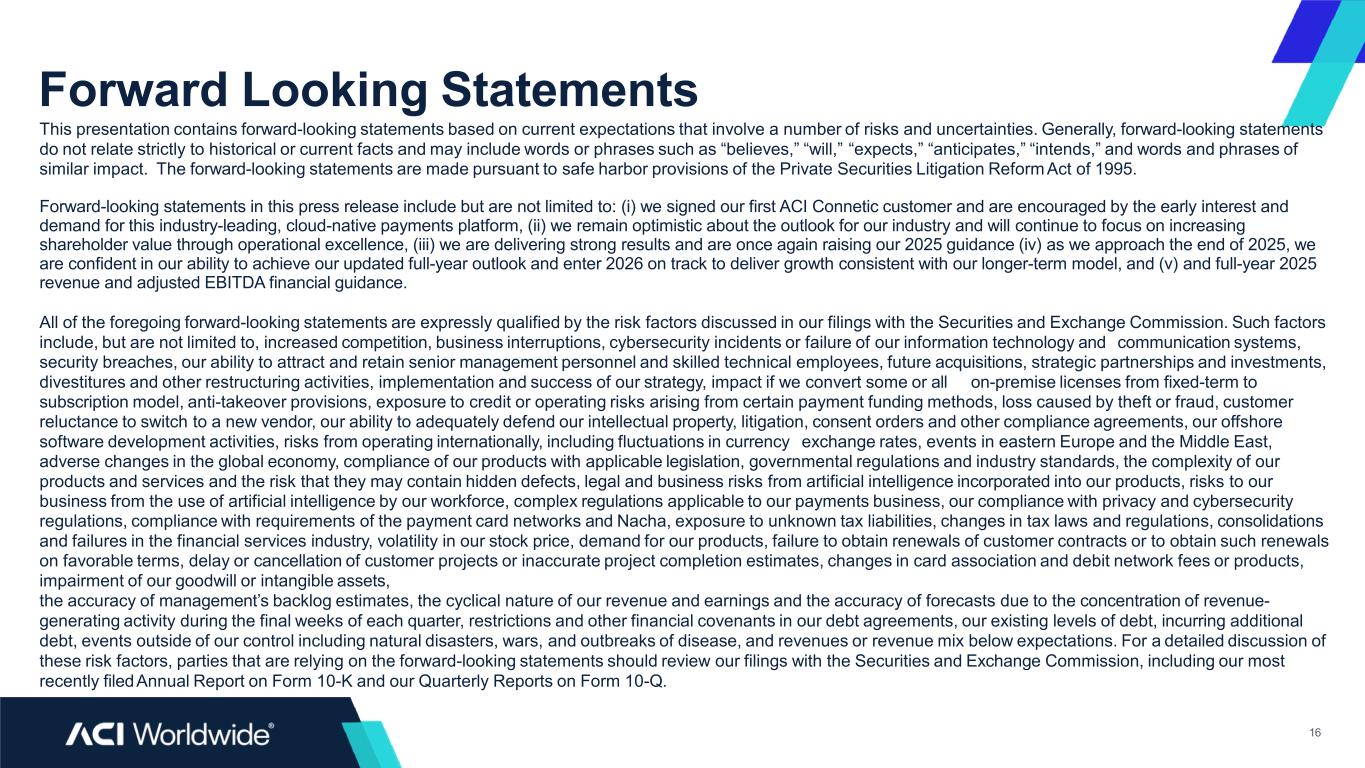
Forward Looking Statements 16 This presentation contains forward-looking statements based on current expectations that involve a number of risks and uncertainties. Generally, forward-looking statements do not relate strictly to historical or current facts and may include words or phrases such as “believes,” “will,” “expects,” “anticipates,” “intends,” and words and phrases of similar impact. The forward-looking statements are made pursuant to safe harbor provisions of the Private Securities Litigation ReformAct of 1995. Forward-looking statements in this press release include but are not limited to: (i) we signed our first ACI Connetic customer and are encouraged by the early interest and demand for this industry-leading, cloud-native payments platform, (ii) we remain optimistic about the outlook for our industry and will continue to focus on increasing shareholder value through operational excellence, (iii) we are delivering strong results and are once again raising our 2025 guidance (iv) as we approach the end of 2025, we are confident in our ability to achieve our updated full-year outlook and enter 2026 on track to deliver growth consistent with our longer-term model, and (v) and full-year 2025 revenue and adjusted EBITDA financial guidance. All of the foregoing forward-looking statements are expressly qualified by the risk factors discussed in our filings with the Securities and Exchange Commission. Such factors include, but are not limited to, increased competition, business interruptions, cybersecurity incidents or failure of our information technology and communication systems, security breaches, our ability to attract and retain senior management personnel and skilled technical employees, future acquisitions, strategic partnerships and investments, divestitures and other restructuring activities, implementation and success of our strategy, impact if we convert some or all on-premise licenses from fixed-term to subscription model, anti-takeover provisions, exposure to credit or operating risks arising from certain payment funding methods, loss caused by theft or fraud, customer reluctance to switch to a new vendor, our ability to adequately defend our intellectual property, litigation, consent orders and other compliance agreements, our offshore software development activities, risks from operating internationally, including fluctuations in currency exchange rates, events in eastern Europe and the Middle East, adverse changes in the global economy, compliance of our products with applicable legislation, governmental regulations and industry standards, the complexity of our products and services and the risk that they may contain hidden defects, legal and business risks from artificial intelligence incorporated into our products, risks to our business from the use of artificial intelligence by our workforce, complex regulations applicable to our payments business, our compliance with privacy and cybersecurity regulations, compliance with requirements of the payment card networks and Nacha, exposure to unknown tax liabilities, changes in tax laws and regulations, consolidations and failures in the financial services industry, volatility in our stock price, demand for our products, failure to obtain renewals of customer contracts or to obtain such renewals on favorable terms, delay or cancellation of customer projects or inaccurate project completion estimates, changes in card association and debit network fees or products, impairment of our goodwill or intangible assets, the accuracy of management’s backlog estimates, the cyclical nature of our revenue and earnings and the accuracy of forecasts due to the concentration of revenue- generating activity during the final weeks of each quarter, restrictions and other financial covenants in our debt agreements, our existing levels of debt, incurring additional debt, events outside of our control including natural disasters, wars, and outbreaks of disease, and revenues or revenue mix below expectations. For a detailed discussion of these risk factors, parties that are relying on the forward-looking statements should review our filings with the Securities and Exchange Commission, including our most recently filedAnnual Report on Form 10-K and our Quarterly Reports on Form 10-Q.

Confident1ia6l