THIRD QUARTER 2026 Wabtec Financial Results & Company Highlights .2
Forward Looking Statements & Non-GAAP Financial Information This communication contains “forward-looking” statements as that term is defined in Section 27A of the Securities Act of 1933 and Section 21E of the Securities Exchange Act of 1934, as amended by the Private Securities Litigation Reform Act of 1995. All statements, other than historical facts, including statements regarding Wabtec’s plans, objectives, expectations and intentions; Wabtec’s expectations about future sales, earnings and cash conversion; Wabtec’s projected expenses and cost savings associated with its Integration 3.0 initiatives and its portfolio optimization; Wabtec’s 5-year outlook; Wabtec’s expectations for evolving global industry, market and macro-economic conditions and their impact on Wabtec’s business; synergies and other expected benefits from Wabtec’s acquisitions; Wabtec’s expectations for production and demand conditions; and any assumptions underlying any of the foregoing, are forward-looking statements. Forward-looking statements concern future circumstances and results and other statements that are not historical facts and are sometimes identified by the words “may,” “will,” “should,” “potential,” “intend,” “expect,” “endeavor,” “seek,” “anticipate,” “estimate,” “overestimate,” “underestimate,” “believe,” “could,” “project,” “predict,” “continue,” “target” or other similar words or expressions. Forward-looking statements are based upon current plans, estimates and expectations that are subject to risks, uncertainties and assumptions. Should one or more of these risks or uncertainties materialize, or should underlying assumptions prove incorrect, actual results may vary materially from those indicated or anticipated by such forward-looking statements. The inclusion of such statements should not be regarded as a representation that such plans, estimates or expectations will be achieved. Important factors that could cause actual results to differ materially from such plans, estimates or expectations include, among others, (1) changes in general economic and/or industry specific conditions, including the impacts of significant recent shifts in trade policies (including the actual or threatened imposition of tariffs and retaliatory tariff measures) as well as tax programs, inflation, supply chain disruptions, foreign currency exchange and industry consolidation and market reactions to these factors; (2) changes in the financial condition or operating strategies of Wabtec's customers; (3) unexpected costs, charges or expenses resulting from acquisitions and potential failure to realize synergies and other anticipated benefits of acquisitions, including as a result of integrating acquired targets into Wabtec; (4) inability to retain and hire key personnel; (5) evolving legal, regulatory and tax regimes; (6) changes in the expected timing of projects; (7) a decrease in freight or passenger rail traffic; (8) an increase in manufacturing costs; (9) actions by third parties, including government agencies; (10) the impacts of epidemics, pandemics or similar public health crises on the global economy and, in particular, our customers, suppliers and end-markets, (11) potential disruptions, instability and volatility in global markets as a result of global military action, acts of terrorism or armed conflict, including Russia’s invasion of Ukraine and ongoing military conflicts in the Middle East; (12) cybersecurity and data protection risks and (13) other risk factors as detailed from time to time in Wabtec’s reports filed with the SEC, including Wabtec’s annual report on Form 10-K, periodic quarterly reports on Form 10-Q, current reports on Form 8-K and other documents filed with the SEC. The foregoing list of important factors is not exclusive. Any forward-looking statements speak only as of the date of this communication. Wabtec does not undertake any obligation to update any forward-looking statements, whether as a result of new information or development, future events or otherwise, except as required by law. Readers are cautioned not to place undue reliance on any of these forward-looking statements. This presentation as well as Wabtec’s earnings release and financial guidance mention certain non-GAAP financial performance measures, including adjusted gross profit, adjusted operating expenses, adjusted income from operations, adjusted interest and other expense, adjusted net income, adjusted operating margin, adjusted gross margin, adjusted income tax expense, adjusted earnings per diluted share, EBITDA and adjusted EBITDA, net debt and operating cash flow conversion rate. Wabtec defines EBITDA as earnings before interest, taxes, depreciation and amortization. Adjusted EBITDA is further adjusted for restructuring costs. Wabtec defines operating cash flow conversion as net cash provided by operating activities divided by net income plus depreciation and amortization including deferred debt cost amortization. While Wabtec believes these are useful supplemental measures for investors, they are not presented in accordance with GAAP. Investors should not consider non-GAAP measures in isolation or as a substitute for net income, cash flows from operations, or any other items calculated in accordance with GAAP. In addition, the non-GAAP financial measures included in this presentation have inherent material limitations as performance measures because they add back certain expenses incurred by the Company to GAAP financial measures, resulting in those expenses not being taken into account in the applicable non-GAAP financial measure. Because not all companies use identical calculations, Wabtec’s presentation of non-GAAP financial measures may not be comparable to other similarly titled measures of other companies. Included in this presentation are reconciliation tables that provide details about how adjusted results relate to GAAP results. Wabtec is not presenting a quantitative reconciliation of its forecasted GAAP earnings per diluted share to forecasted adjusted earnings per diluted share as it is unable to predict with reasonable certainty and without unreasonable effort the impact and timing of restructuring-related and other charges, including acquisition-related expenses and the outcome of certain regulatory, legal and tax matters; the financial impact of these items is uncertain and is dependent on various factors, including the timing, and could be material to Wabtec’s Consolidated Statement of Earnings. 2

3 RAFAEL SANTANA Chairman & Chief Executive Officer JOHN OLIN Executive Vice President & Chief Financial Officer KYRA YATES Vice President, Investor Relations Today’s Participants
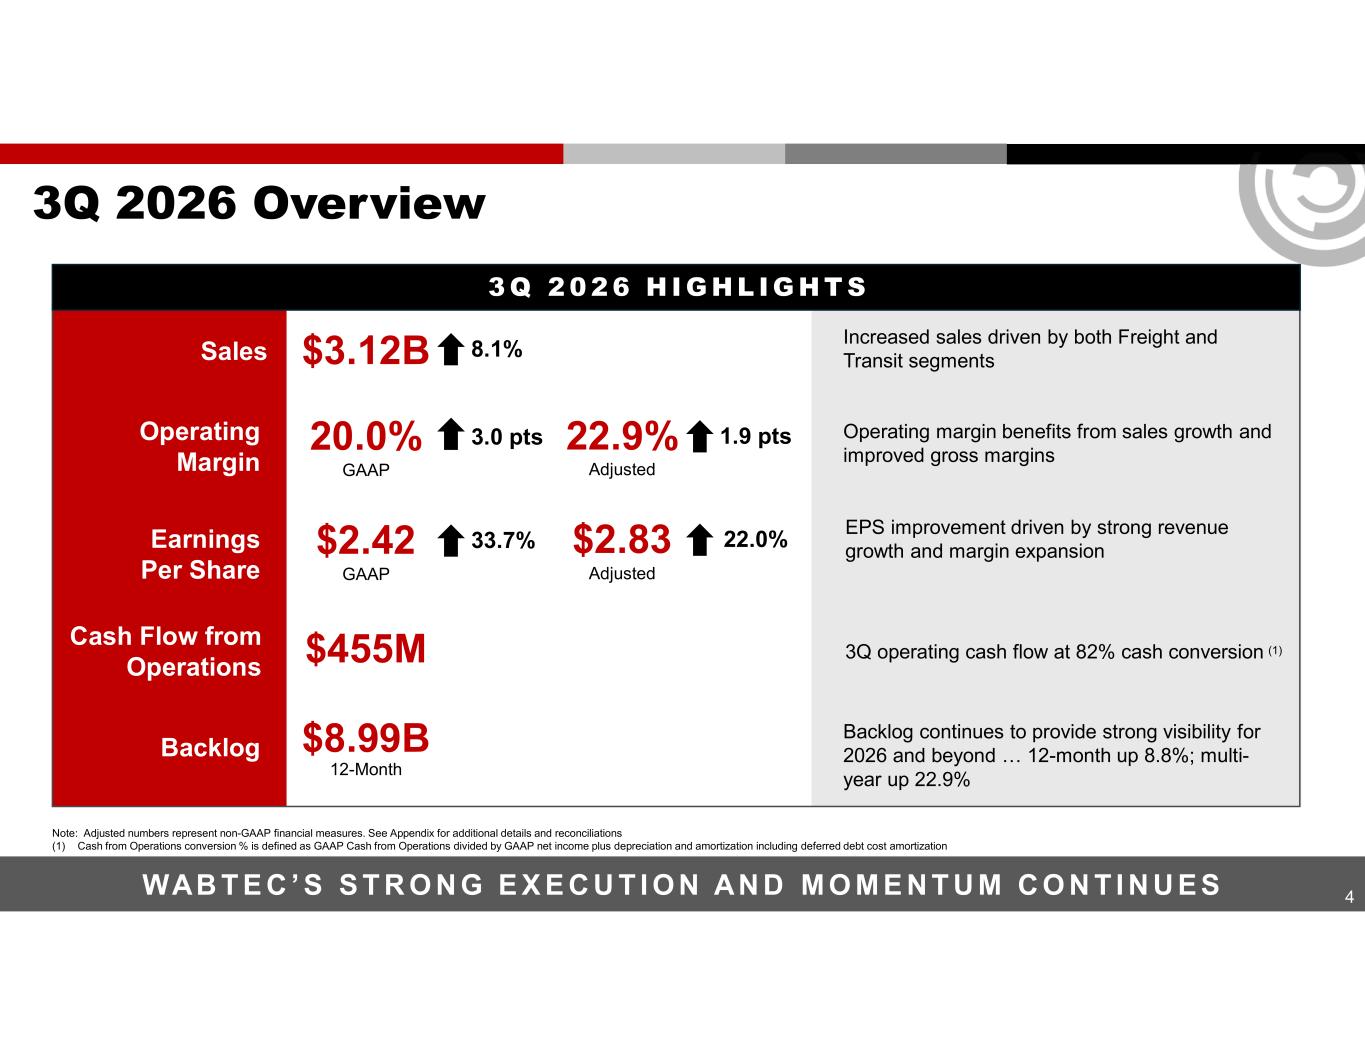
4 3Q 2026 Overview WAB T E C ’ S S T R O N G E X E C U T I O N AN D M O M E N T U M C O N T I N U E S Sales Increased sales driven by both Freight and Transit segments Operating margin benefits from sales growth and improved gross margins EPS improvement driven by strong revenue growth and margin expansion 3Q operating cash flow at 82% cash conversion (1) Backlog continues to provide strong visibility for 2026 and beyond … 12-month up 8.8%; multi- year up 22.9% Cash Flow from Operations $455M Backlog $8.99B 12-Month Operating Margin 20.0% GAAP 3.0 pts 22.9% Adjusted 1.9 pts Earnings Per Share $2.42 GAAP 33.7% $2.83 Adjusted 22.0% $3.12B 8.1% 3 Q 2 0 2 6 H I G H L IG H T S Note: Adjusted numbers represent non-GAAP financial measures. See Appendix for additional details and reconciliations (1) Cash from Operations conversion % is defined as GAAP Cash from Operations divided by GAAP net income plus depreciation and amortization including deferred debt cost amortization
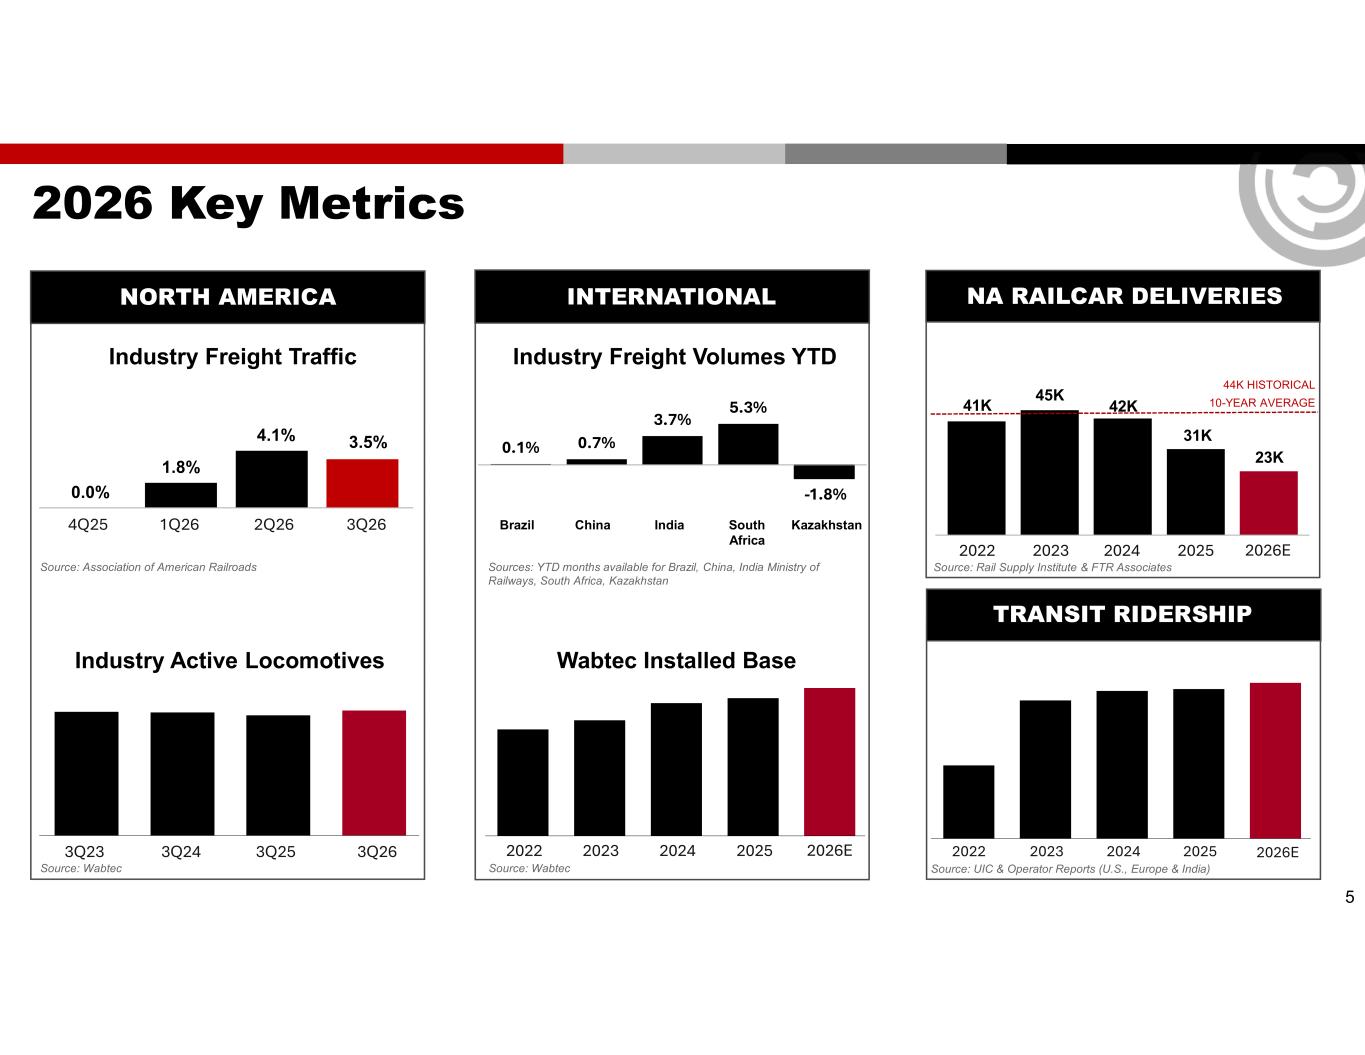
0.0% 1.8% 4.1% 3.5% 5 2026 Key Metrics 4Q25 1Q26 2Q26 3Q26 Industry Active Locomotives 3Q23 3Q24 3Q25 3Q26 Source: Association of American Railroads Source: Wabtec Industry Freight Traffic Source: UIC & Operator Reports (U.S., Europe & India) 2022 2023 2024 2025 Wabtec Installed Base 2022 2023 2024 2025 Industry Freight Volumes YTD Sources: YTD months available for Brazil, China, India Ministry of Railways, South Africa, Kazakhstan Brazil China India South Africa Kazakhstan Source: Wabtec TRANSIT RIDERSHIP NORTH AMERICA INTERNATIONAL NA RAILCAR DELIVERIES Source: Rail Supply Institute & FTR Associates 2022 2023 2024 2025 2026E 41K 45K 42K 31K 44K HISTORICAL 10-YEAR AVERAGE 23K 2026E 2026E 0.1% 0.7% 3.7% 5.3% -1.8%
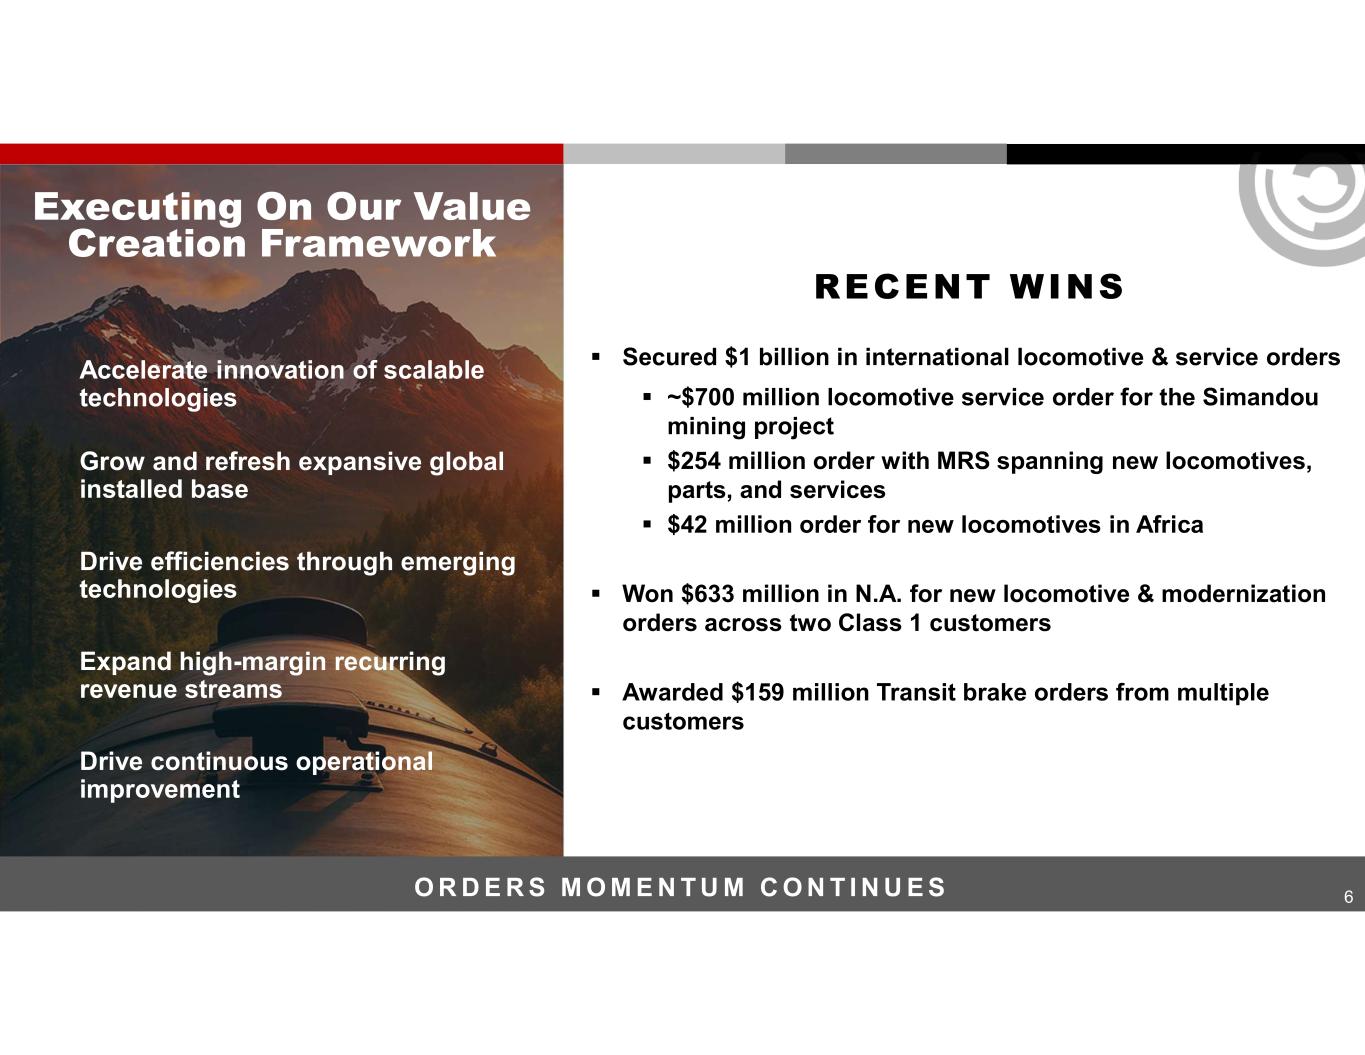
6 RECENT WINS Accelerate innovation of scalable technologies Grow and refresh expansive global installed base Drive efficiencies through emerging technologies Expand high-margin recurring revenue streams Drive continuous operational improvement Executing On Our Value Creation Framework O R D E R S M O M E N T U M C O N T I N U E S Secured $1 billion in international locomotive & service orders ~$700 million locomotive service order for the Simandou mining project $254 million order with MRS spanning new locomotives, parts, and services $42 million order for new locomotives in Africa Won $633 million in N.A. for new locomotive & modernization orders across two Class 1 customers Awarded $159 million Transit brake orders from multiple customers
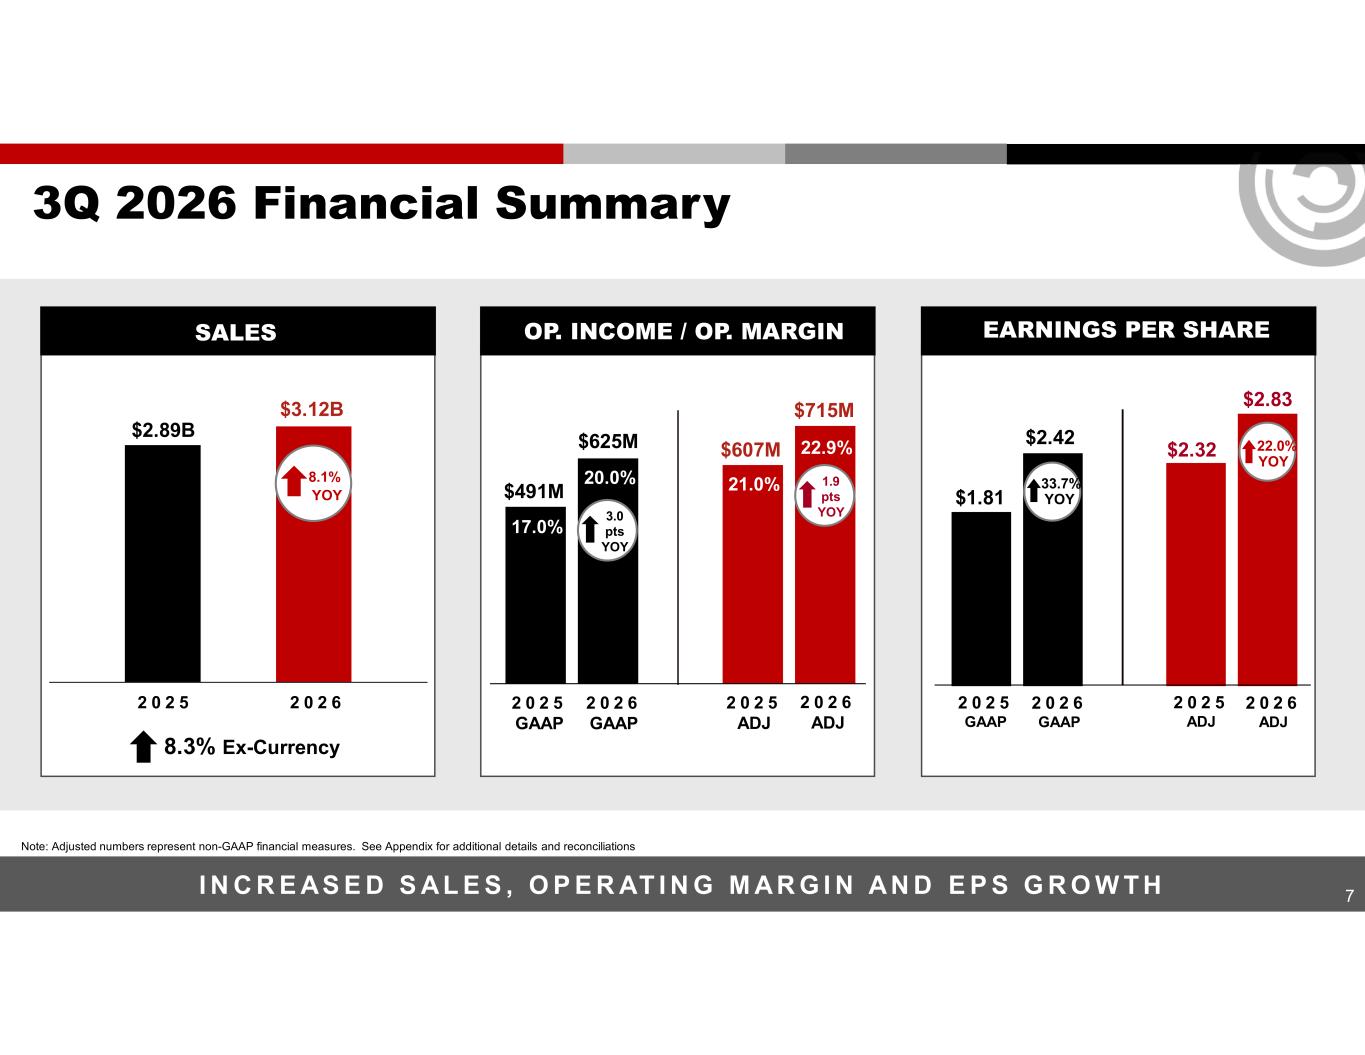
$1.81 $2.42 $2.32 $2.83 7 3Q 2026 Financial Summary I N C R E AS E D S AL E S , O P E R AT I N G M AR G I N AN D E P S G R O W T H Note: Adjusted numbers represent non-GAAP financial measures. See Appendix for additional details and reconciliations 2 0 2 5 GAAP 2 0 2 6 GAAP 2 0 2 5 ADJ 2 0 2 6 ADJ $491M 17.0% 20.0% $607M 21.0% $715M 22.9%$625M 2 0 2 5 2 0 2 6 2 0 2 5 GAAP 2 0 2 6 GAAP 2 0 2 5 ADJ 2 0 2 6 ADJ $3.12B $2.89B 8.1% YOY 33.7% YOY 22.0% YOY 8.3% Ex-Currency OP. INCOME / OP. MARGIN EARNINGS PER SHARESALES 3.0 pts YOY 1.9 pts YOY
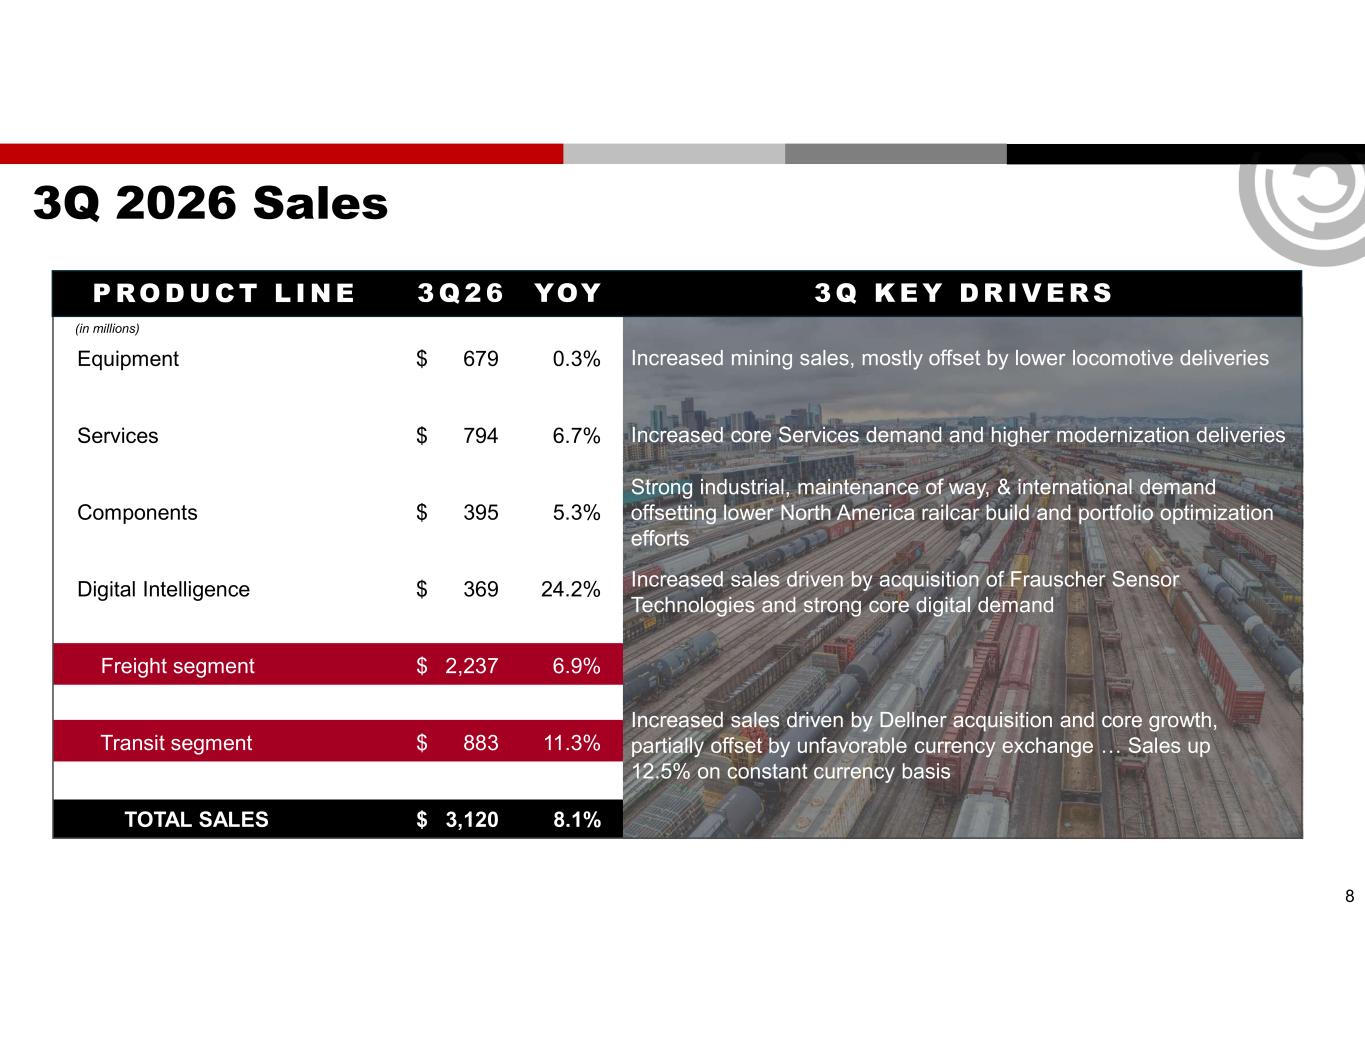
3Q 2026 Sales P RO D U CT L I N E 3 Q 2 6 YOY 3Q K E Y DR IV E RS (in millions) Equipment $ 679 0.3% Services $ 794 6.7% Components $ 395 5.3% Digital Intelligence $ 369 24.2% Freight segment $ 2,237 6.9% Transit segment $ 883 11.3% TOTAL SALES $ 3,120 8.1% Increased core Services demand and higher modernization deliveries Increased mining sales, mostly offset by lower locomotive deliveries Strong industrial, maintenance of way, & international demand offsetting lower North America railcar build and portfolio optimization efforts Increased sales driven by acquisition of Frauscher Sensor Technologies and strong core digital demand Increased sales driven by Dellner acquisition and core growth, partially offset by unfavorable currency exchange … Sales up 12.5% on constant currency basis 8
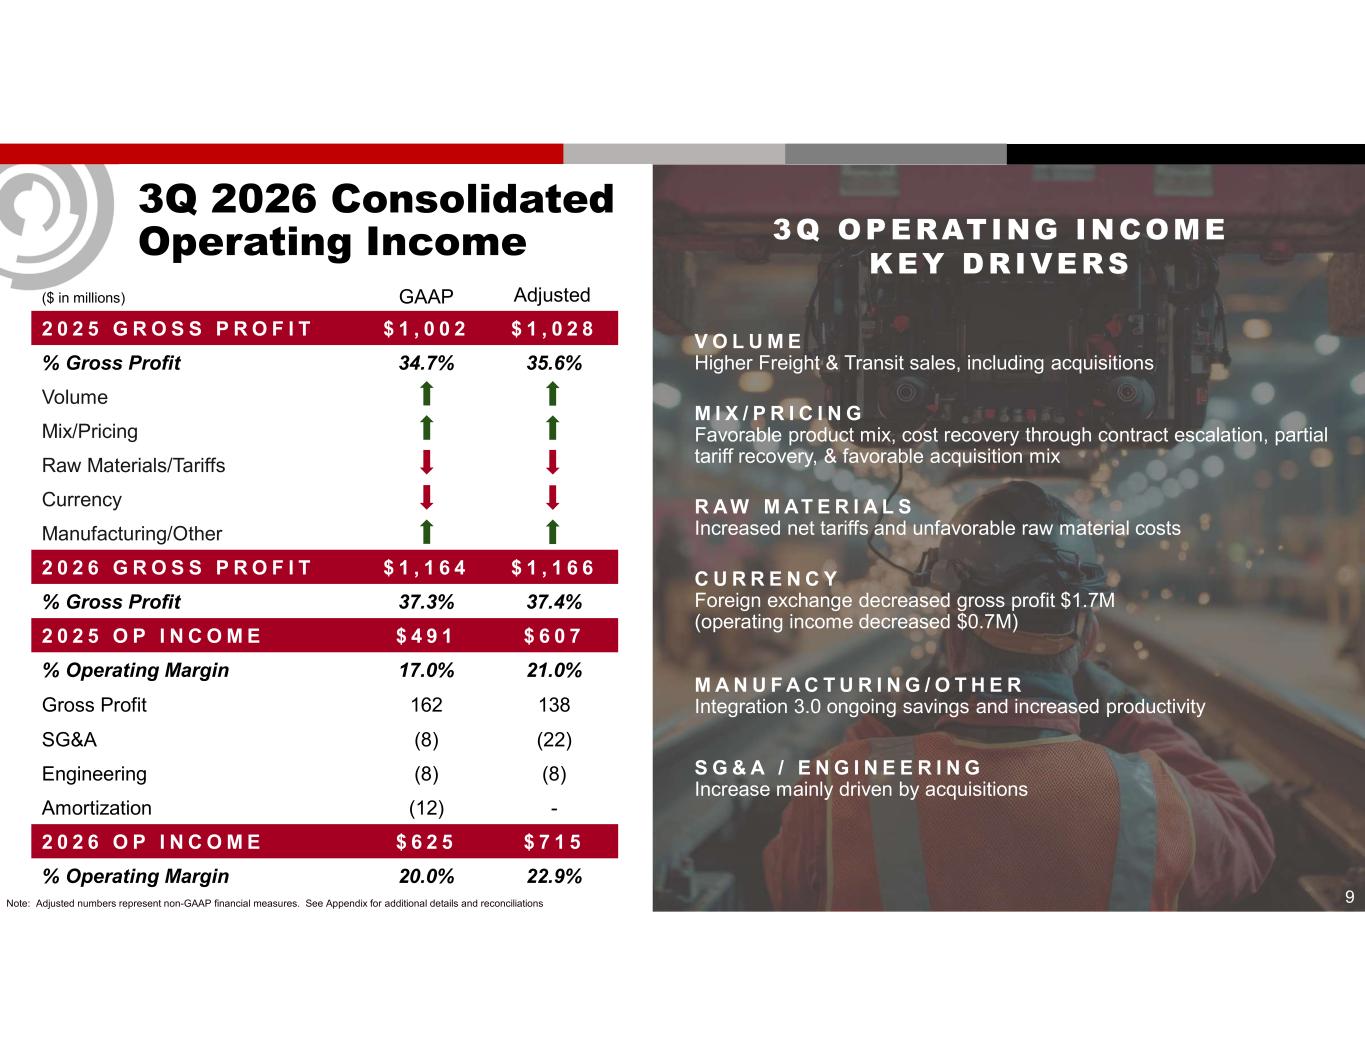
9 3Q 2026 Consolidated Operating Income ($ in millions) $ 1 , 0 2 8$ 1 , 0 0 22 0 2 5 G R O S S P R O F I T 35.6%34.7%% Gross Profit Volume Mix/Pricing Raw Materials/Tariffs Currency Manufacturing/Other $ 1 , 1 6 6$ 1 , 1 6 42 0 2 6 G R O S S P R O F I T 37.4%37.3%% Gross Profit $ 6 0 7$ 4 9 12 0 2 5 O P I N C O M E 21.0%17.0%% Operating Margin 138162Gross Profit (22)(8)SG&A (8)(8)Engineering -(12)Amortization $ 7 1 5$ 6 2 52 0 2 6 O P I N C O M E 22.9%20.0%% Operating Margin GAAP Adjusted Note: Adjusted numbers represent non-GAAP financial measures. See Appendix for additional details and reconciliations V O L U M E Higher Freight & Transit sales, including acquisitions M I X / P R I C I N G Favorable product mix, cost recovery through contract escalation, partial tariff recovery, & favorable acquisition mix R AW M AT E R I A L S Increased net tariffs and unfavorable raw material costs C U R R E N C Y Foreign exchange decreased gross profit $1.7M (operating income decreased $0.7M) M A N U F A C T U R I N G / O T H E R Integration 3.0 ongoing savings and increased productivity S G & A / E N G I N E E R I N G Increase mainly driven by acquisitions 3Q OPERATING INCOME KEY DRIVERS
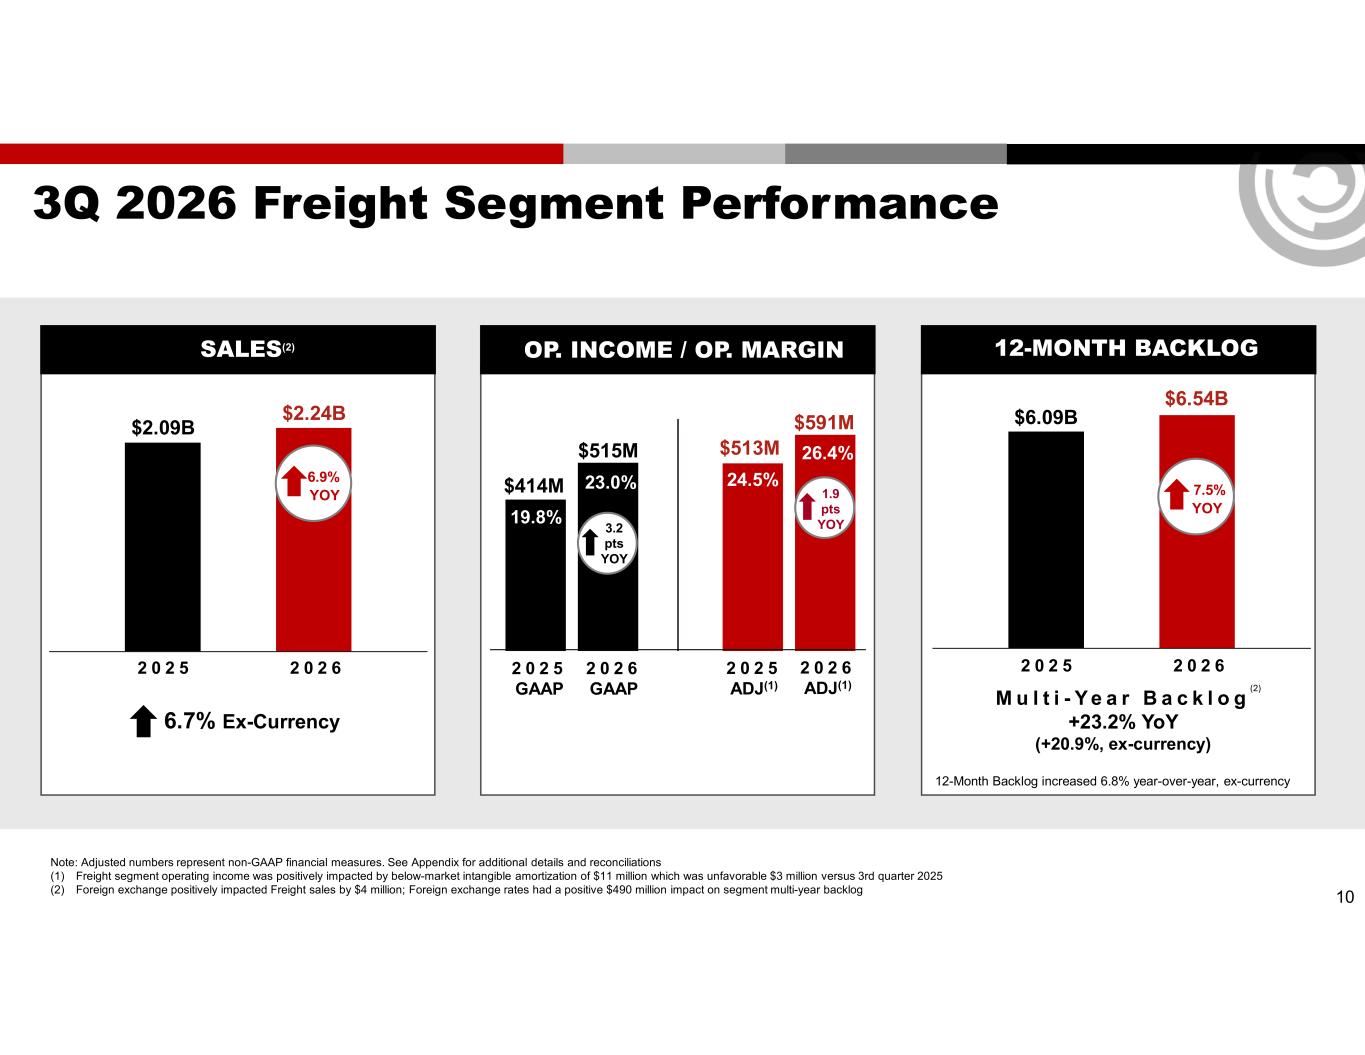
10 3Q 2026 Freight Segment Performance 2 0 2 5 GAAP 2 0 2 6 GAAP 2 0 2 5 ADJ(1) 2 0 2 6 ADJ(1) $414M 23.0% 19.8% $513M 24.5% $591M 26.4%$515M 2 0 2 5 2 0 2 6 $2.24B $2.09B 6.9% YOY 2 0 2 5 2 0 2 6 $6.54B $6.09B 7.5% YOY Note: Adjusted numbers represent non-GAAP financial measures. See Appendix for additional details and reconciliations (1) Freight segment operating income was positively impacted by below-market intangible amortization of $11 million which was unfavorable $3 million versus 3rd quarter 2025 (2) Foreign exchange positively impacted Freight sales by $4 million; Foreign exchange rates had a positive $490 million impact on segment multi-year backlog 12-Month Backlog increased 6.8% year-over-year, ex-currency M u l t i - Y e a r B a c k l o g +23.2% YoY (+20.9%, ex-currency) 6.7% Ex-Currency OP. INCOME / OP. MARGIN 12-MONTH BACKLOGSALES(2) 3.2 pts YOY 1.9 pts YOY (2)
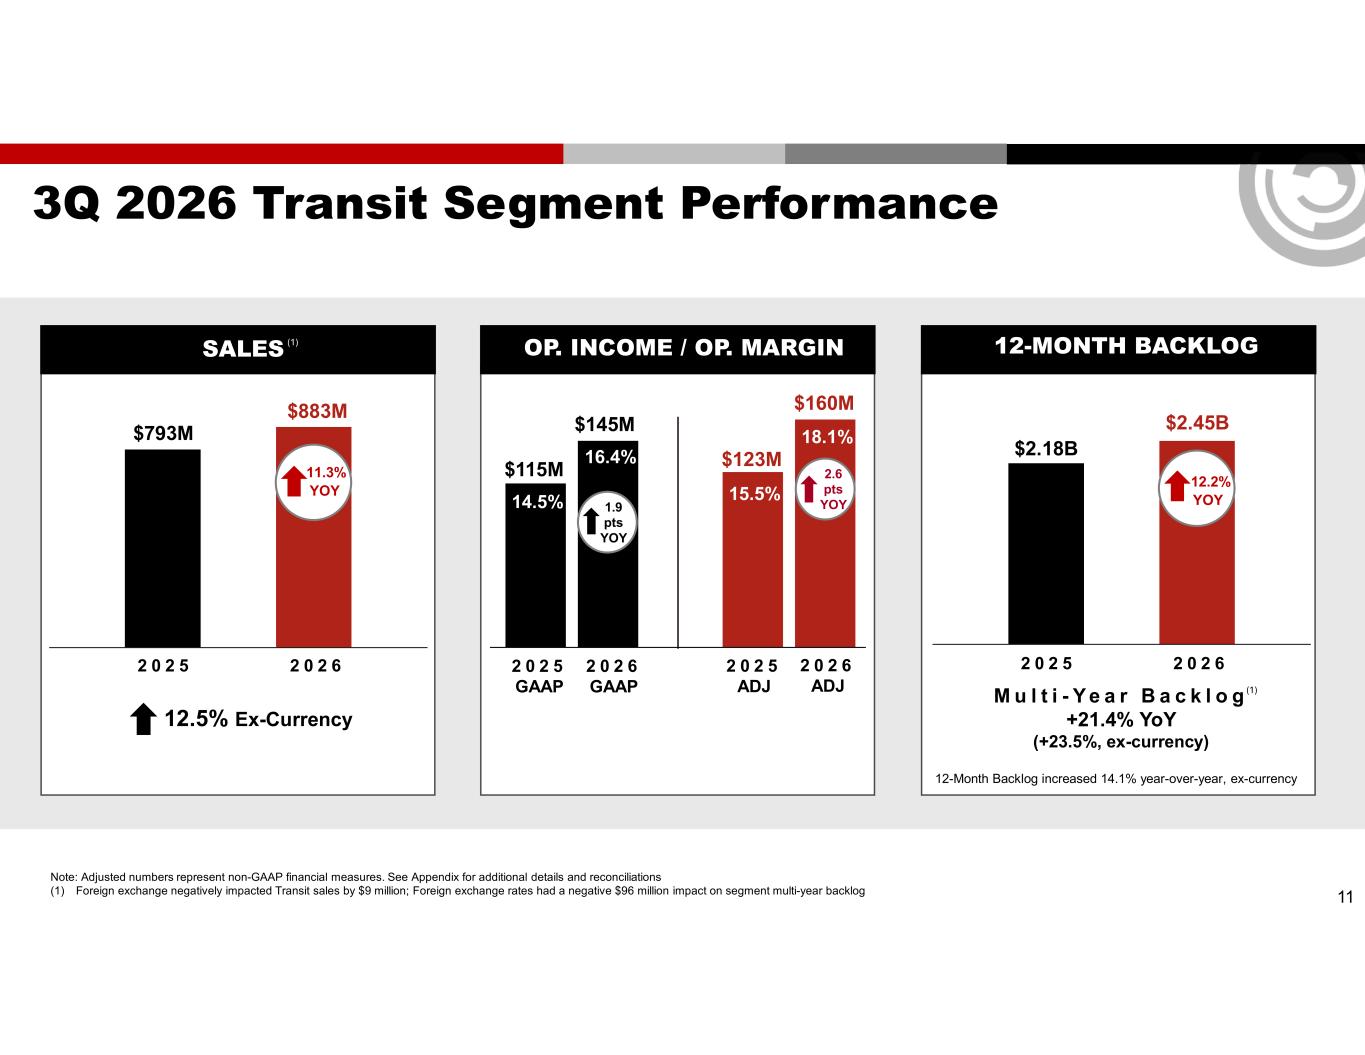
11 3Q 2026 Transit Segment Performance 2 0 2 5 GAAP 2 0 2 6 GAAP 2 0 2 5 ADJ 2 0 2 6 ADJ 2 0 2 5 2 0 2 6 2 0 2 5 2 0 2 6 12-Month Backlog increased 14.1% year-over-year, ex-currency M u l t i - Y e a r B a c k l o g +21.4% YoY (+23.5%, ex-currency) 12.5% Ex-Currency OP. INCOME / OP. MARGIN 12-MONTH BACKLOGSALES $115M 14.5% 16.4% $123M 15.5% $160M 18.1% $145M $883M $793M 11.3% YOY $2.45B $2.18B 12.2% YOY Note: Adjusted numbers represent non-GAAP financial measures. See Appendix for additional details and reconciliations (1) Foreign exchange negatively impacted Transit sales by $9 million; Foreign exchange rates had a negative $96 million impact on segment multi-year backlog 1.9 pts YOY 2.6 pts YOY (1) (1)
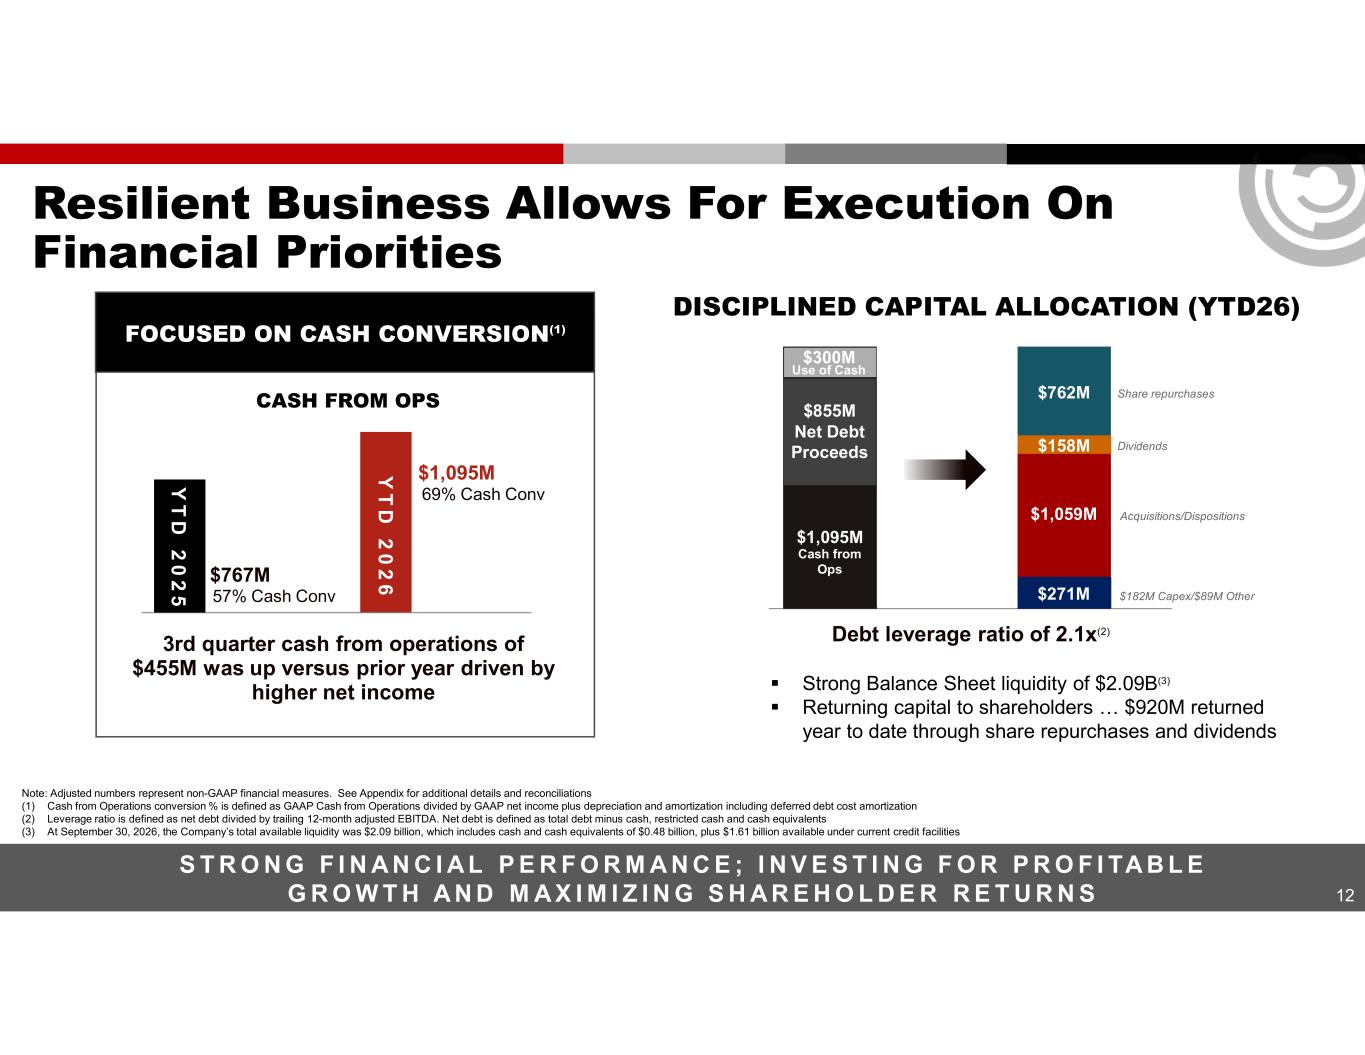
12 Resilient Business Allows For Execution On Financial Priorities S T R O N G F I N A N C I A L P E R F O R M A N C E ; I N V E S T I N G F O R P R O F I TA B L E G R O W T H A N D M A X I M I Z I N G S H A R E H O L D E R R E T U R N S 3rd quarter cash from operations of $455M was up versus prior year driven by higher net income 57% Cash Conv $767M $1,095MY T D 2 0 2 6 69% Cash Conv Y T D 2 0 2 5 Debt leverage ratio of 2.1x(2) FOCUSED ON CASH CONVERSION(1) DISCIPLINED CAPITAL ALLOCATION (YTD26) $1,095M Cash from Ops $1,059M $182M Capex/$89M Other Dividends$158M $271M $762M $855M Net Debt Proceeds Acquisitions/Dispositions Share repurchases Strong Balance Sheet liquidity of $2.09B(3) Returning capital to shareholders … $920M returned year to date through share repurchases and dividends Note: Adjusted numbers represent non-GAAP financial measures. See Appendix for additional details and reconciliations (1) Cash from Operations conversion % is defined as GAAP Cash from Operations divided by GAAP net income plus depreciation and amortization including deferred debt cost amortization (2) Leverage ratio is defined as net debt divided by trailing 12-month adjusted EBITDA. Net debt is defined as total debt minus cash, restricted cash and cash equivalents (3) At September 30, 2026, the Company’s total available liquidity was $2.09 billion, which includes cash and cash equivalents of $0.48 billion, plus $1.61 billion available under current credit facilities CASH FROM OPS $300M Use of Cash
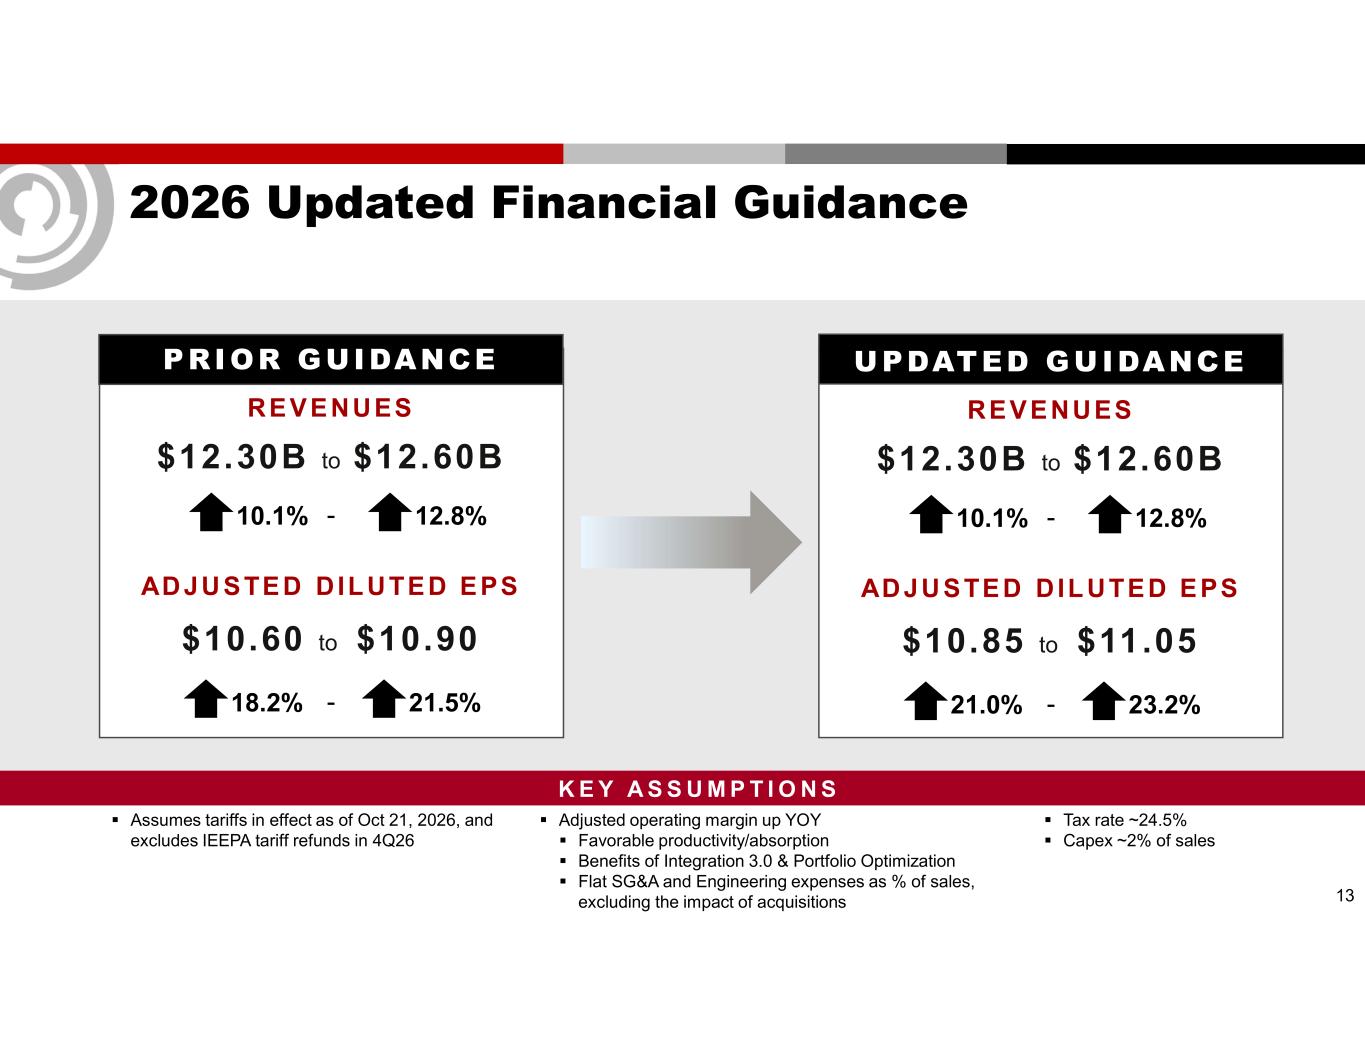
2026 Updated Financial Guidance PRIOR GUIDANCE REVENUES $12.30B to $12.60B ADJUSTED DIL UTED EPS $10.60 to $10.90 10.1% 12.8% 18.2% 21.5%- - 13 Assumes tariffs in effect as of Oct 21, 2026, and excludes IEEPA tariff refunds in 4Q26 UPDATED GUIDANCE REVENUES $12.30B to $12.60B ADJUSTED DIL UTED EPS $10.85 to $11.05 10.1% 12.8% 21.0% 23.2%- - Tax rate ~24.5% Capex ~2% of sales Adjusted operating margin up YOY Favorable productivity/absorption Benefits of Integration 3.0 & Portfolio Optimization Flat SG&A and Engineering expenses as % of sales, excluding the impact of acquisitions K E Y A S S U M P T I O N S
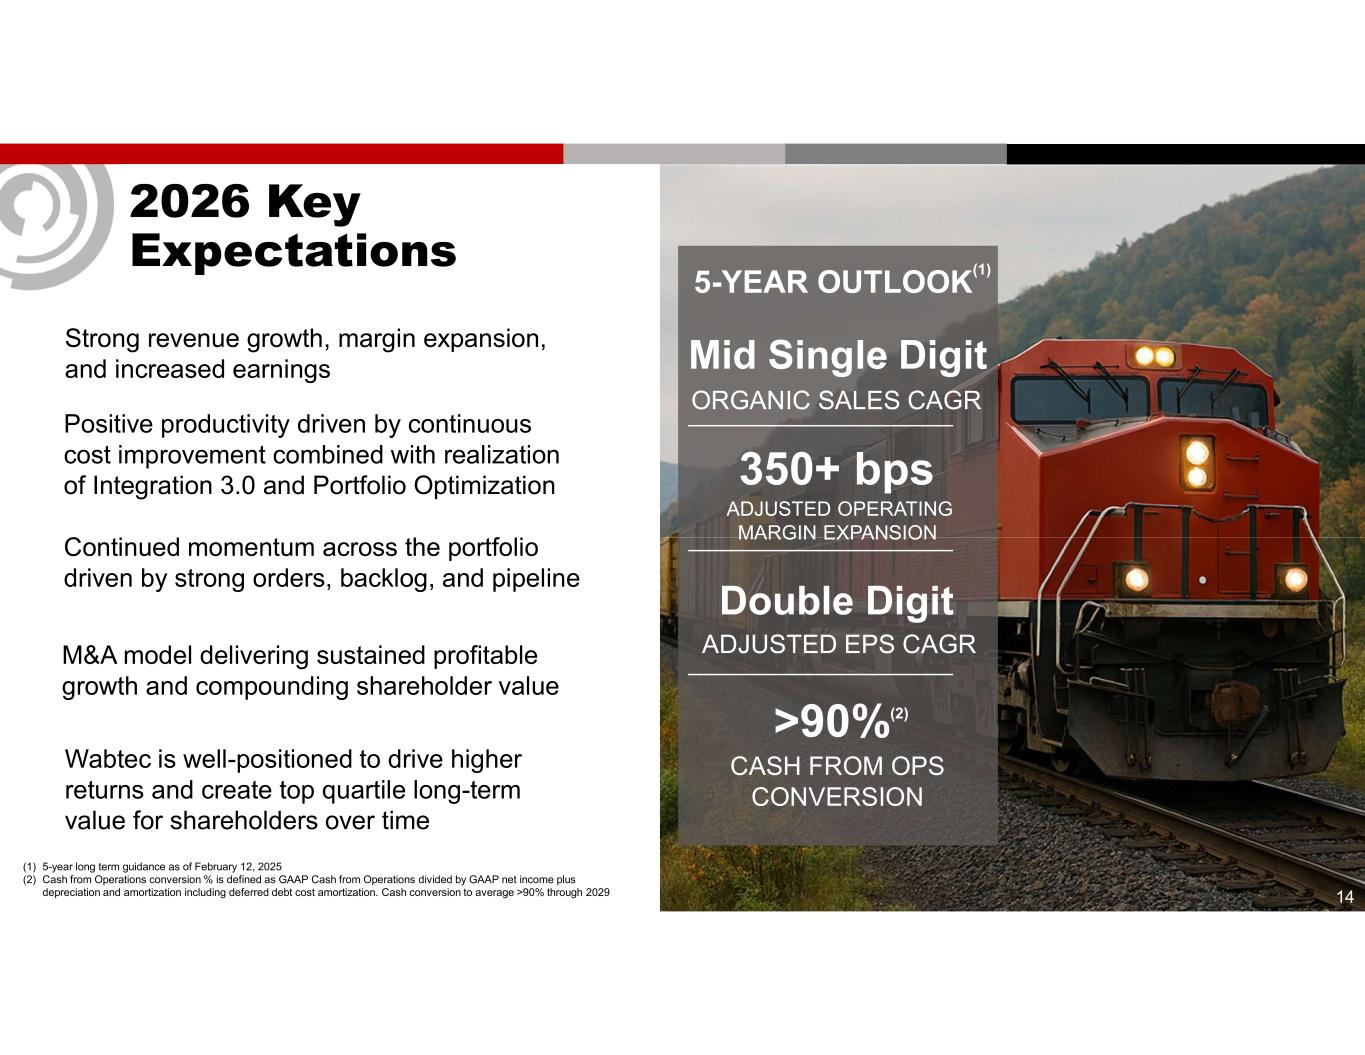
14 2026 Key Expectations Continued momentum across the portfolio driven by strong orders, backlog, and pipeline Positive productivity driven by continuous cost improvement combined with realization of Integration 3.0 and Portfolio Optimization Wabtec is well-positioned to drive higher returns and create top quartile long-term value for shareholders over time Strong revenue growth, margin expansion, and increased earnings 5-YEAR OUTLOOK (1) Mid Single Digit ORGANIC SALES CAGR Double Digit ADJUSTED EPS CAGR >90%(2) CASH FROM OPS CONVERSION 350+ bps ADJUSTED OPERATING MARGIN EXPANSION (1) 5-year long term guidance as of February 12, 2025 (2) Cash from Operations conversion % is defined as GAAP Cash from Operations divided by GAAP net income plus depreciation and amortization including deferred debt cost amortization. Cash conversion to average >90% through 2029 M&A model delivering sustained profitable growth and compounding shareholder value
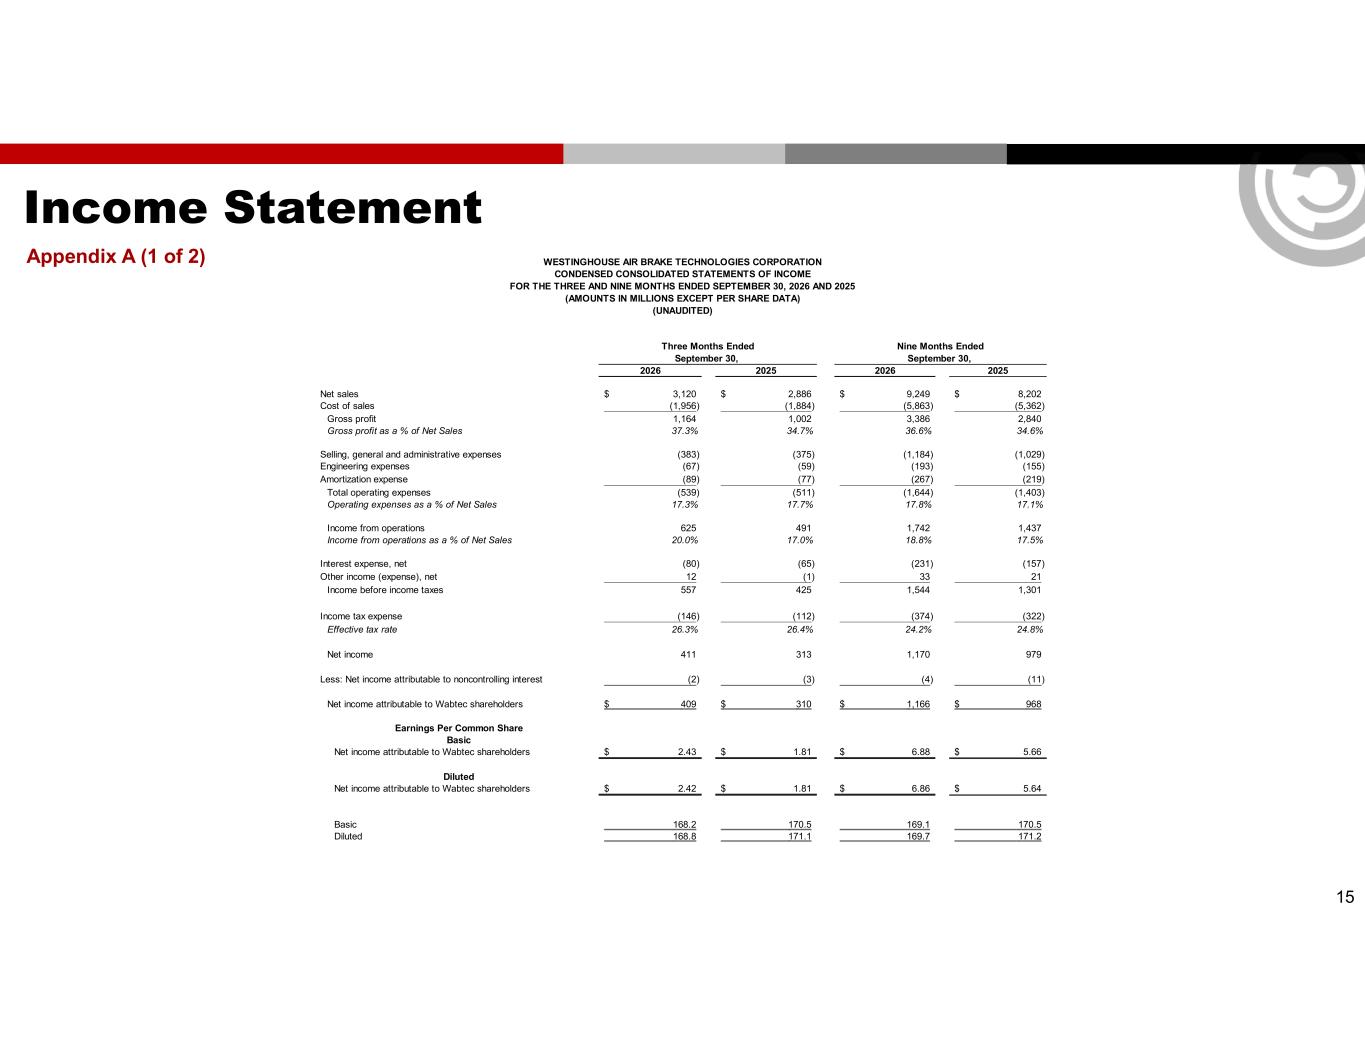
Income Statement Appendix A (1 of 2) 15 2026 2025 2026 2025 Net sales 3,120$ 2,886$ 9,249$ 8,202$ Cost of sales (1,956) (1,884) (5,863) (5,362) Gross profit 1,164 1,002 3,386 2,840 Gross profit as a % of Net Sales 37.3% 34.7% 36.6% 34.6% Selling, general and administrative expenses (383) (375) (1,184) (1,029) Engineering expenses (67) (59) (193) (155) Amortization expense (89) (77) (267) (219) Total operating expenses (539) (511) (1,644) (1,403) Operating expenses as a % of Net Sales 17.3% 17.7% 17.8% 17.1% Income from operations 625 491 1,742 1,437 Income from operations as a % of Net Sales 20.0% 17.0% 18.8% 17.5% Interest expense, net (80) (65) (231) (157) Other income (expense), net 12 (1) 33 21 Income before income taxes 557 425 1,544 1,301 Income tax expense (146) (112) (374) (322) Effective tax rate 26.3% 26.4% 24.2% 24.8% Net income 411 313 1,170 979 Less: Net income attributable to noncontrolling interest (2) (3) (4) (11) Net income attributable to Wabtec shareholders 409$ 310$ 1,166$ 968$ Earnings Per Common Share Basic Net income attributable to Wabtec shareholders 2.43$ 1.81$ 6.88$ 5.66$ Diluted Net income attributable to Wabtec shareholders 2.42$ 1.81$ 6.86$ 5.64$ Basic 168.2 170.5 169.1 170.5 Diluted 168.8 171.1 169.7 171.2 September 30, September 30, Three Months Ended Nine Months Ended WESTINGHOUSE AIR BRAKE TECHNOLOGIES CORPORATION CONDENSED CONSOLIDATED STATEMENTS OF INCOME FOR THE THREE AND NINE MONTHS ENDED SEPTEMBER 30, 2026 AND 2025 (AMOUNTS IN MILLIONS EXCEPT PER SHARE DATA) (UNAUDITED)
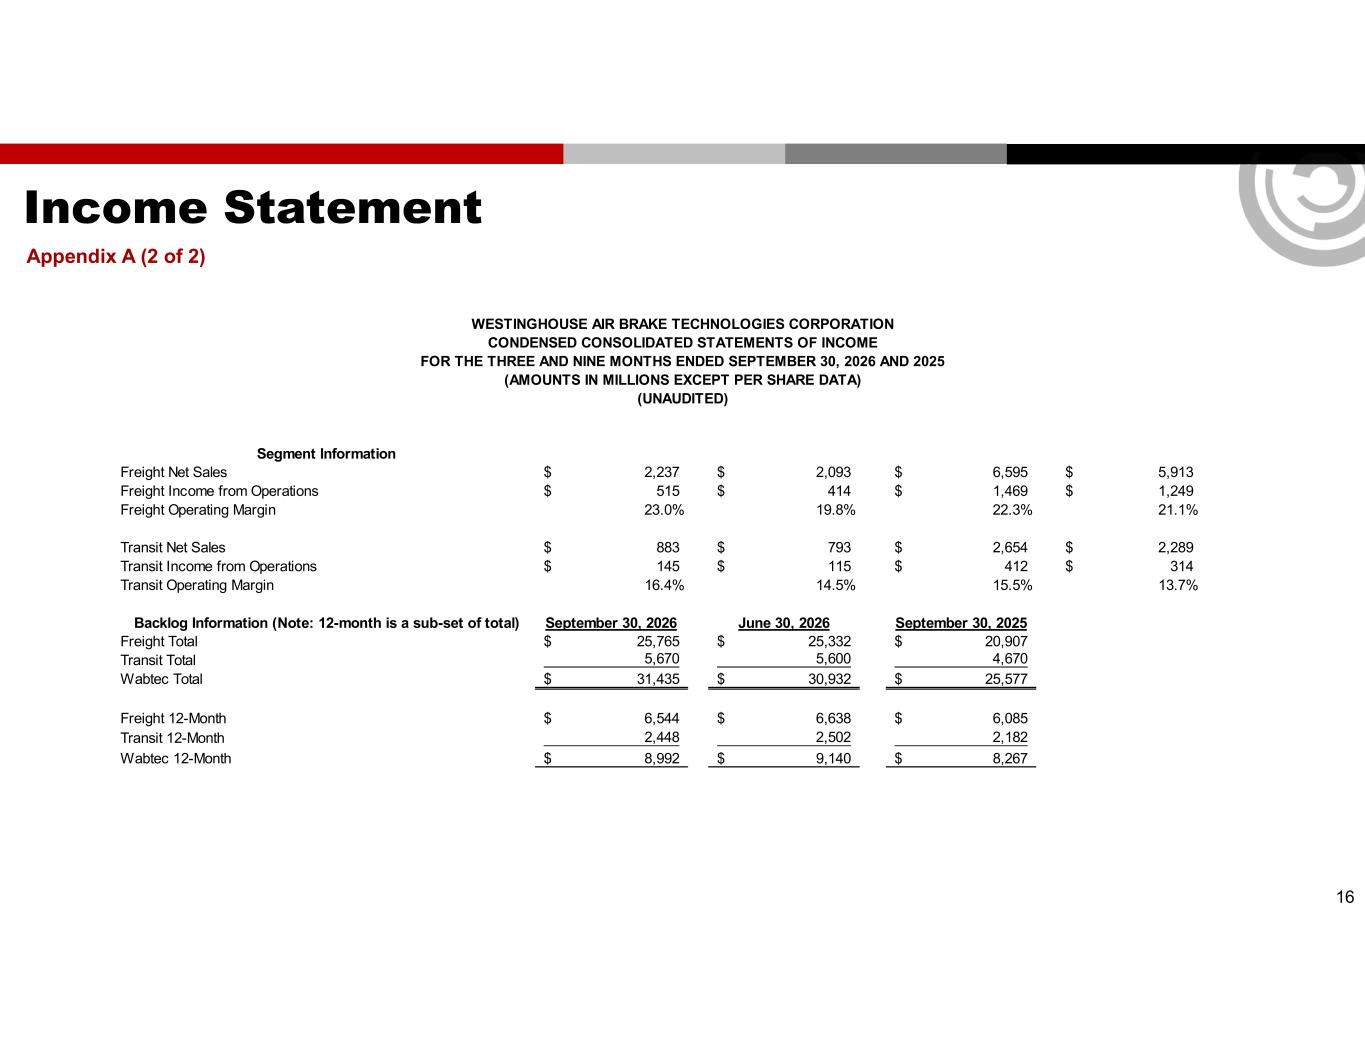
Income Statement Appendix A (2 of 2) 16 Segment Information Freight Net Sales 2,237$ 2,093$ 6,595$ 5,913$ Freight Income from Operations 515$ 414$ 1,469$ 1,249$ Freight Operating Margin 23.0% 19.8% 22.3% 21.1% Transit Net Sales 883$ 793$ 2,654$ 2,289$ Transit Income from Operations 145$ 115$ 412$ 314$ Transit Operating Margin 16.4% 14.5% 15.5% 13.7% Backlog Information (Note: 12-month is a sub-set of total) September 30, 2026 June 30, 2026 September 30, 2025 Freight Total 25,765$ 25,332$ 20,907$ Transit Total 5,670 5,600 4,670 Wabtec Total 31,435$ 30,932$ 25,577$ Freight 12-Month 6,544$ 6,638$ 6,085$ Transit 12-Month 2,448 2,502 2,182 Wabtec 12-Month 8,992$ 9,140$ 8,267$ WESTINGHOUSE AIR BRAKE TECHNOLOGIES CORPORATION CONDENSED CONSOLIDATED STATEMENTS OF INCOME FOR THE THREE AND NINE MONTHS ENDED SEPTEMBER 30, 2026 AND 2025 (AMOUNTS IN MILLIONS EXCEPT PER SHARE DATA) (UNAUDITED)
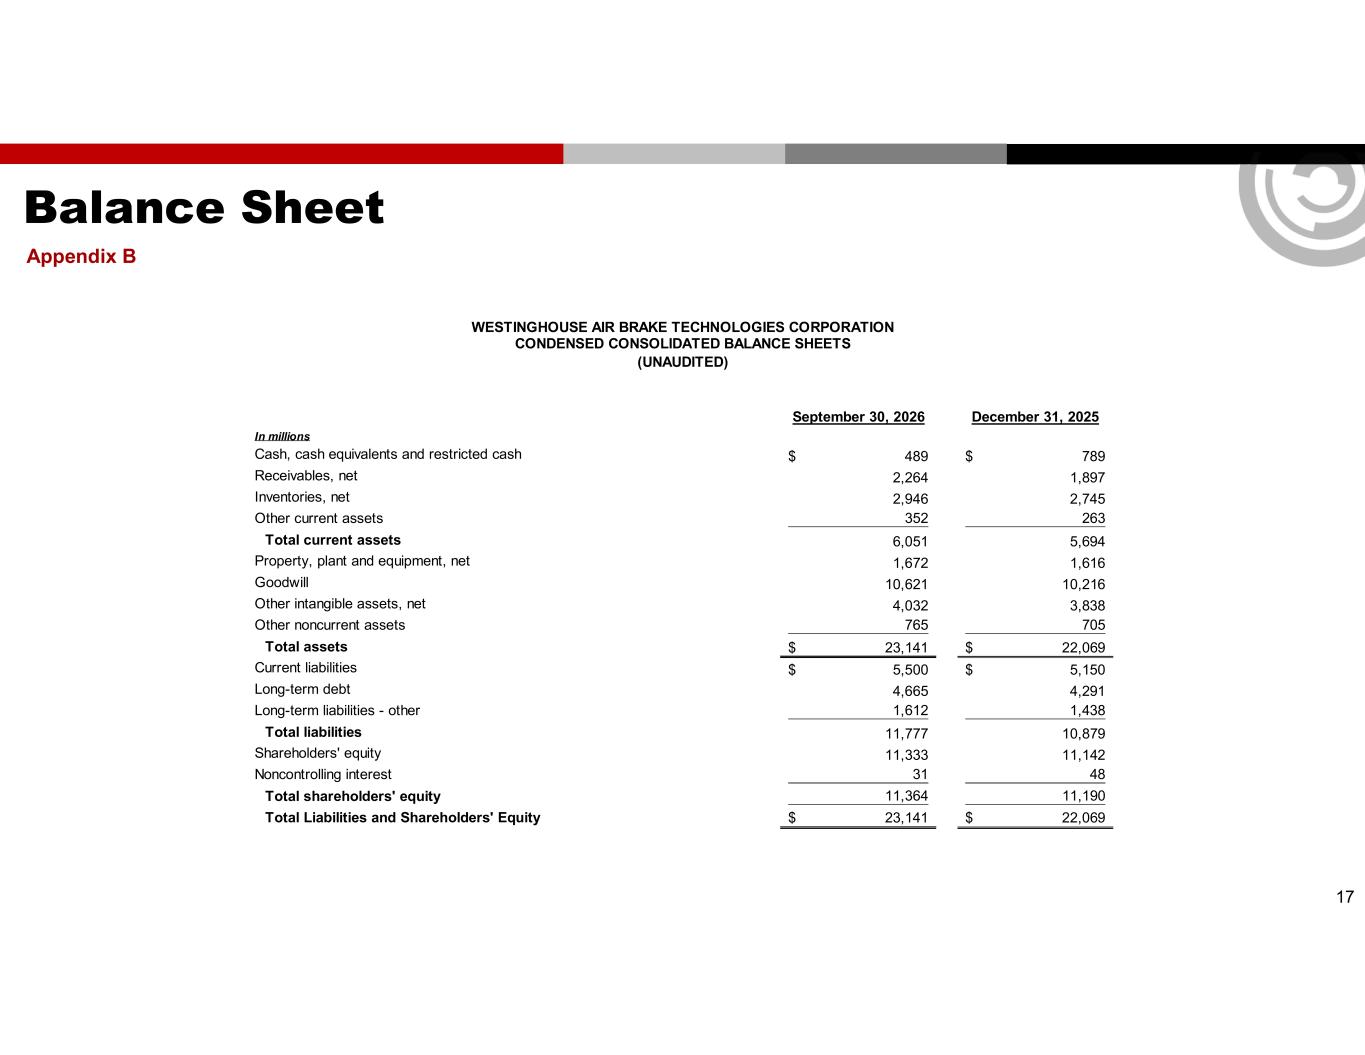
Balance Sheet Appendix B 17 September 30, 2026 December 31, 2025 In millions Cash, cash equivalents and restricted cash 489$ 789$ Receivables, net 2,264 1,897 Inventories, net 2,946 2,745 Other current assets 352 263 Total current assets 6,051 5,694 Property, plant and equipment, net 1,672 1,616 Goodwill 10,621 10,216 Other intangible assets, net 4,032 3,838 Other noncurrent assets 765 705 Total assets 23,141$ 22,069$ Current liabilities 5,500$ 5,150$ Long-term debt 4,665 4,291 Long-term liabilities - other 1,612 1,438 Total liabilities 11,777 10,879 Shareholders' equity 11,333 11,142 Noncontrolling interest 31 48 Total shareholders' equity 11,364 11,190 Total Liabilities and Shareholders' Equity 23,141$ 22,069$ WESTINGHOUSE AIR BRAKE TECHNOLOGIES CORPORATION CONDENSED CONSOLIDATED BALANCE SHEETS (UNAUDITED)
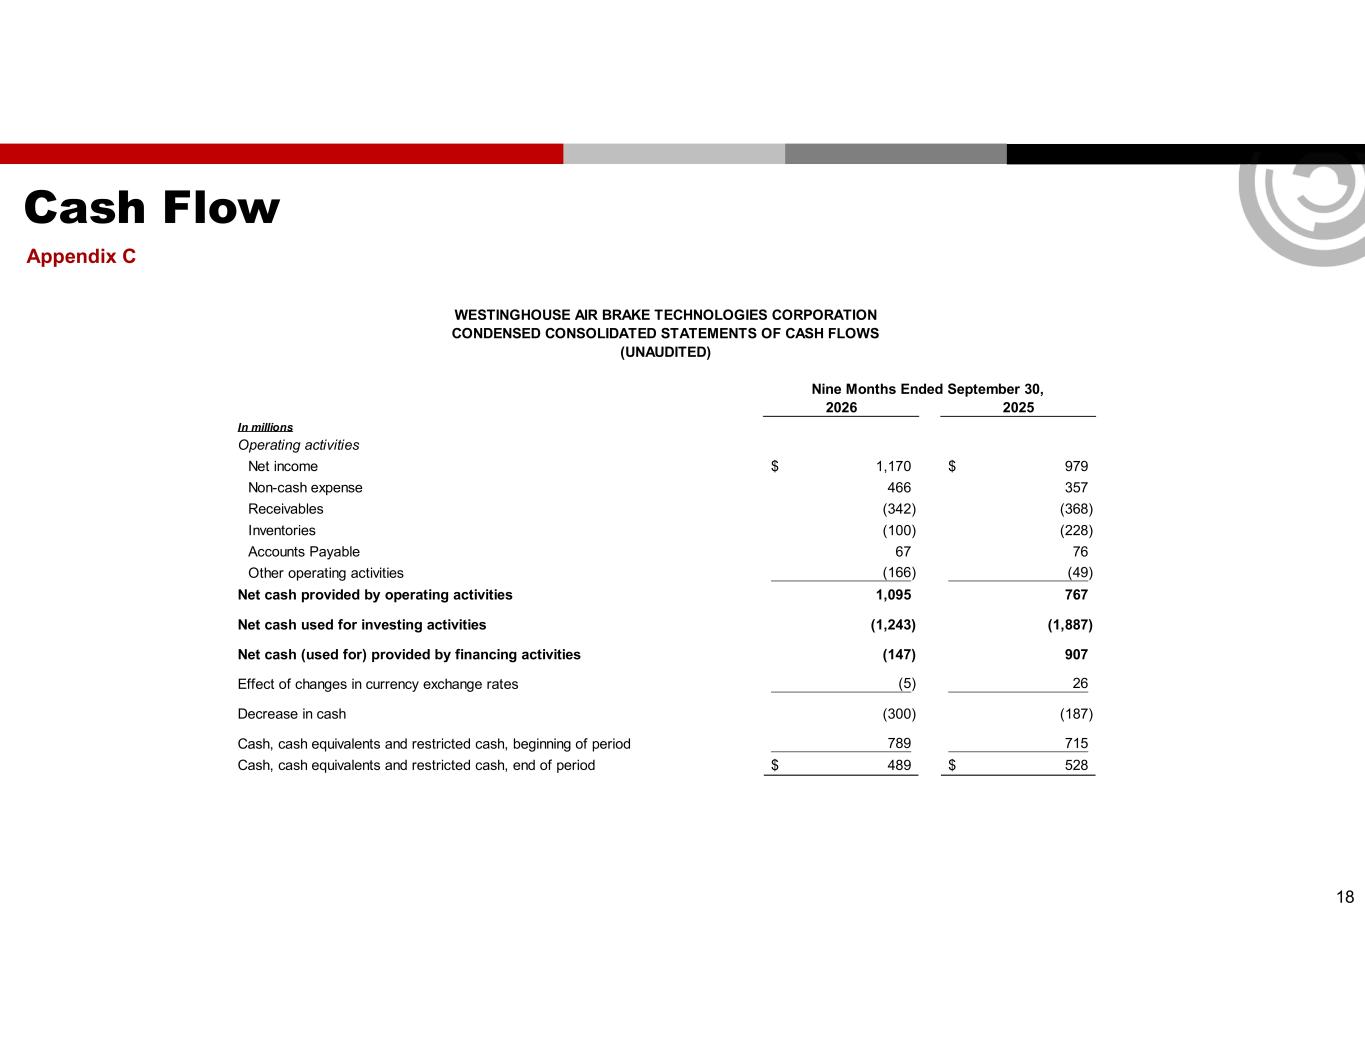
Cash Flow Appendix C 18 2026 2025 In millions Operating activities Net income 1,170$ 979$ Non-cash expense 466 357 Receivables (342) (368) Inventories (100) (228) Accounts Payable 67 76 Other operating activities (166) (49) Net cash provided by operating activities 1,095 767 Net cash used for investing activities (1,243) (1,887) Net cash (used for) provided by financing activities (147) 907 Effect of changes in currency exchange rates (5) 26 Decrease in cash (300) (187) Cash, cash equivalents and restricted cash, beginning of period 789 715 Cash, cash equivalents and restricted cash, end of period 489$ 528$ WESTINGHOUSE AIR BRAKE TECHNOLOGIES CORPORATION CONDENSED CONSOLIDATED STATEMENTS OF CASH FLOWS (UNAUDITED) Nine Months Ended September 30,
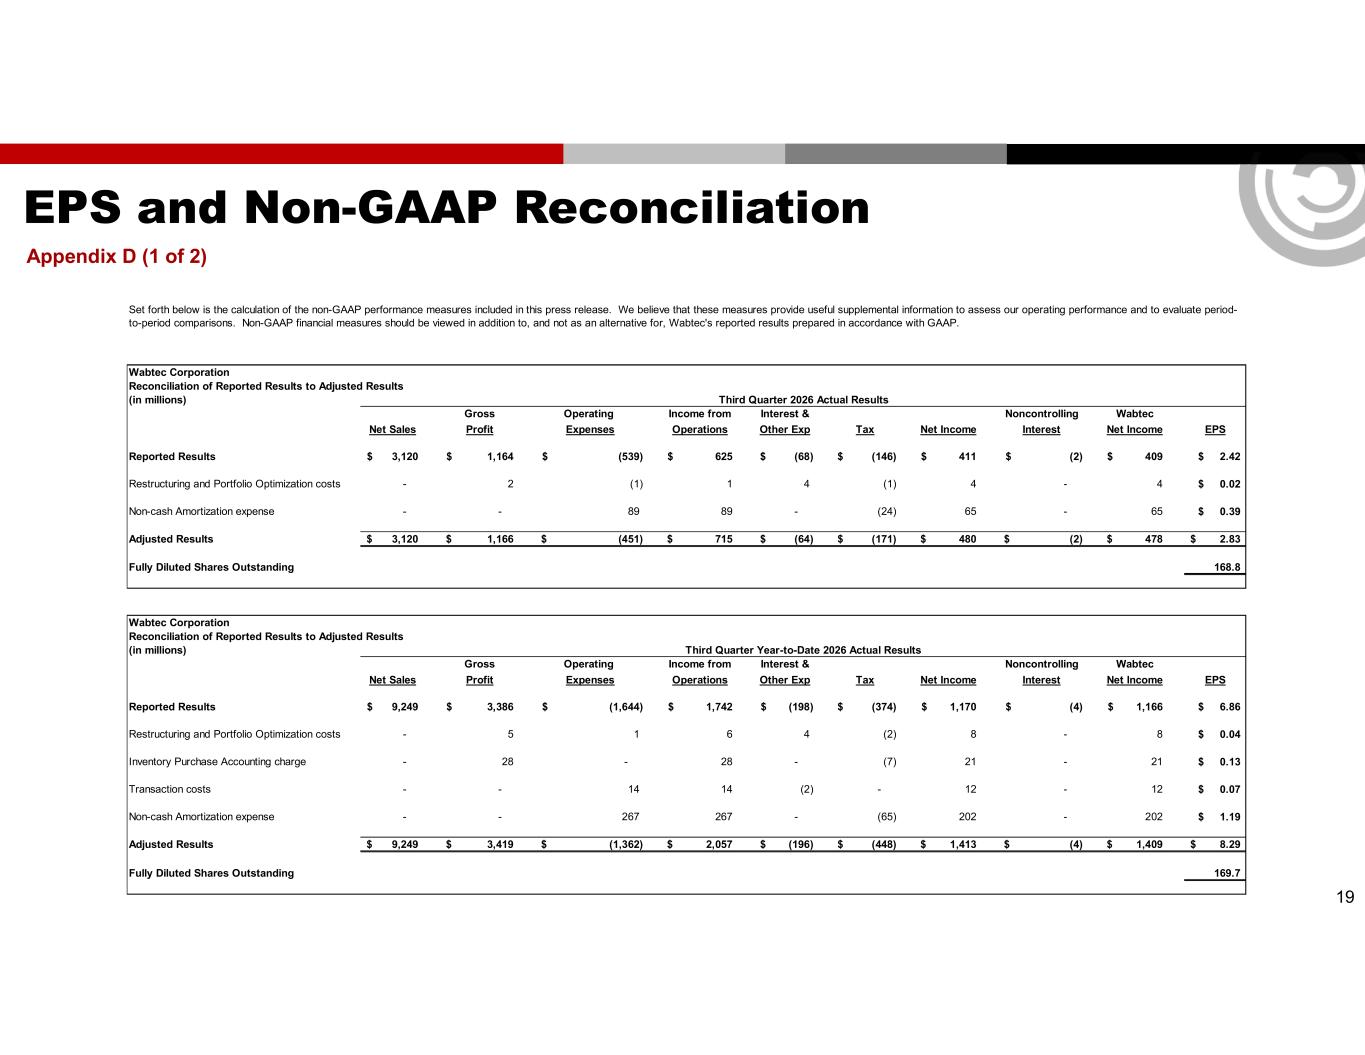
EPS and Non-GAAP Reconciliation Appendix D (1 of 2) 19 Wabtec Corporation Reconciliation of Reported Results to Adjusted Results (in millions) Gross Operating Income from Interest & Noncontrolling Wabtec Net Sales Profit Expenses Operations Other Exp Tax Net Income Interest Net Income EPS Reported Results 3,120$ 1,164$ (539)$ 625$ (68)$ (146)$ 411$ (2)$ 409$ 2.42$ Restructuring and Portfolio Optimization costs - 2 (1) 1 4 (1) 4 - 4 0.02$ Non-cash Amortization expense - - 89 89 - (24) 65 - 65 0.39$ Adjusted Results 3,120$ 1,166$ (451)$ 715$ (64)$ (171)$ 480$ (2)$ 478$ 2.83$ Fully Diluted Shares Outstanding 168.8 Wabtec Corporation Reconciliation of Reported Results to Adjusted Results (in millions) Gross Operating Income from Interest & Noncontrolling Wabtec Net Sales Profit Expenses Operations Other Exp Tax Net Income Interest Net Income EPS Reported Results 9,249$ 3,386$ (1,644)$ 1,742$ (198)$ (374)$ 1,170$ (4)$ 1,166$ 6.86$ Restructuring and Portfolio Optimization costs - 5 1 6 4 (2) 8 - 8 0.04$ Inventory Purchase Accounting charge - 28 - 28 - (7) 21 - 21 0.13$ Transaction costs - - 14 14 (2) - 12 - 12 0.07$ Non-cash Amortization expense - - 267 267 - (65) 202 - 202 1.19$ Adjusted Results 9,249$ 3,419$ (1,362)$ 2,057$ (196)$ (448)$ 1,413$ (4)$ 1,409$ 8.29$ Fully Diluted Shares Outstanding 169.7 Set forth below is the calculation of the non-GAAP performance measures included in this press release. We believe that these measures provide useful supplemental information to assess our operating performance and to evaluate period- to-period comparisons. Non-GAAP financial measures should be viewed in addition to, and not as an alternative for, Wabtec's reported results prepared in accordance with GAAP. Third Quarter 2026 Actual Results Third Quarter Year-to-Date 2026 Actual Results
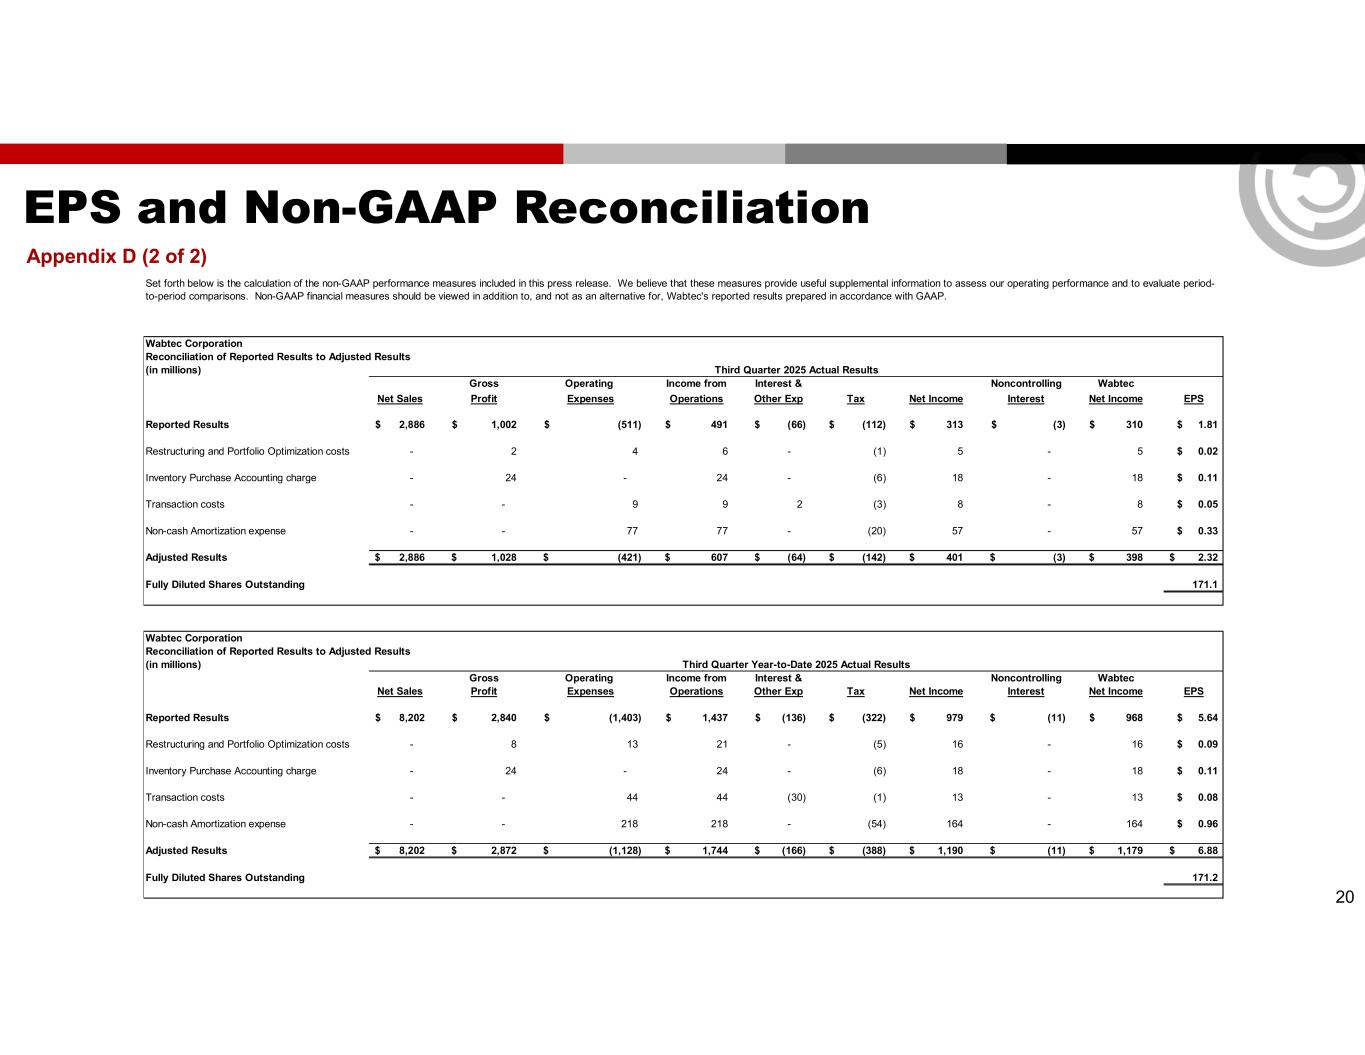
EPS and Non-GAAP Reconciliation Appendix D (2 of 2) 20 Wabtec Corporation Reconciliation of Reported Results to Adjusted Results (in millions) Gross Operating Income from Interest & Noncontrolling Wabtec Net Sales Profit Expenses Operations Other Exp Tax Net Income Interest Net Income EPS Reported Results 2,886$ 1,002$ (511)$ 491$ (66)$ (112)$ 313$ (3)$ 310$ 1.81$ Restructuring and Portfolio Optimization costs - 2 4 6 - (1) 5 - 5 0.02$ Inventory Purchase Accounting charge - 24 - 24 - (6) 18 - 18 0.11$ Transaction costs - - 9 9 2 (3) 8 - 8 0.05$ Non-cash Amortization expense - - 77 77 - (20) 57 - 57 0.33$ Adjusted Results 2,886$ 1,028$ (421)$ 607$ (64)$ (142)$ 401$ (3)$ 398$ 2.32$ Fully Diluted Shares Outstanding 171.1 Wabtec Corporation Reconciliation of Reported Results to Adjusted Results (in millions) Gross Operating Income from Interest & Noncontrolling Wabtec Net Sales Profit Expenses Operations Other Exp Tax Net Income Interest Net Income EPS Reported Results 8,202$ 2,840$ (1,403)$ 1,437$ (136)$ (322)$ 979$ (11)$ 968$ 5.64$ Restructuring and Portfolio Optimization costs - 8 13 21 - (5) 16 - 16 0.09$ Inventory Purchase Accounting charge - 24 - 24 - (6) 18 - 18 0.11$ Transaction costs - - 44 44 (30) (1) 13 - 13 0.08$ Non-cash Amortization expense - - 218 218 - (54) 164 - 164 0.96$ Adjusted Results 8,202$ 2,872$ (1,128)$ 1,744$ (166)$ (388)$ 1,190$ (11)$ 1,179$ 6.88$ Fully Diluted Shares Outstanding 171.2 Third Quarter Year-to-Date 2025 Actual Results Set forth below is the calculation of the non-GAAP performance measures included in this press release. We believe that these measures provide useful supplemental information to assess our operating performance and to evaluate period- to-period comparisons. Non-GAAP financial measures should be viewed in addition to, and not as an alternative for, Wabtec's reported results prepared in accordance with GAAP. Third Quarter 2025 Actual Results
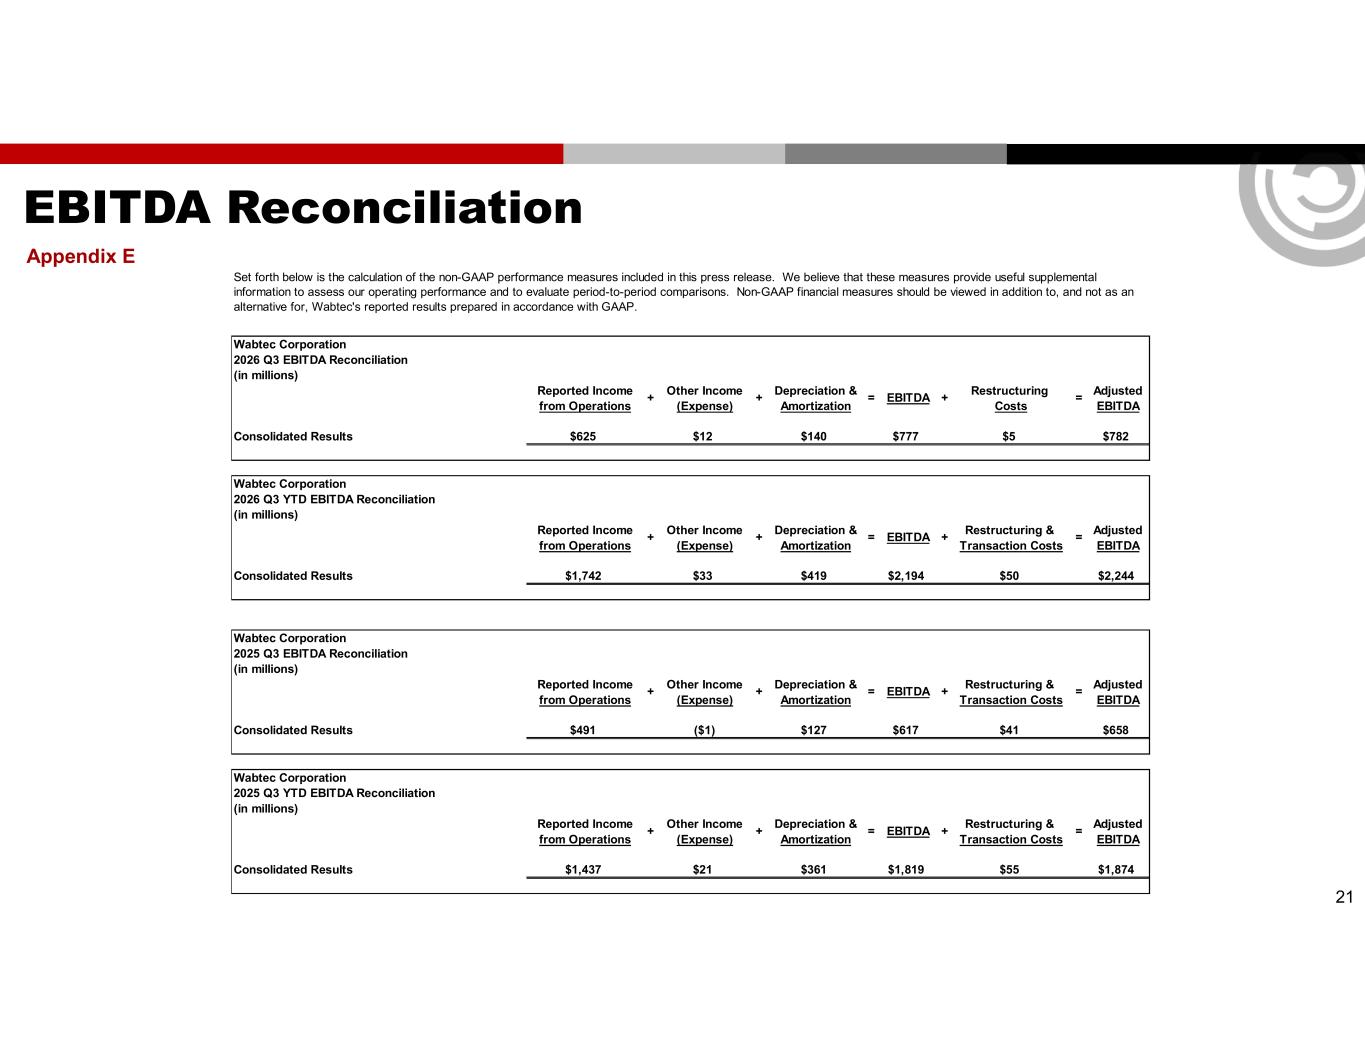
EBITDA Reconciliation Appendix E 21 Wabtec Corporation 2026 Q3 EBITDA Reconciliation (in millions) Reported Income Other Income Depreciation & Restructuring Adjusted from Operations (Expense) Amortization Costs EBITDA Consolidated Results $625 $12 $140 $777 $5 $782 Wabtec Corporation 2026 Q3 YTD EBITDA Reconciliation (in millions) Reported Income Other Income Depreciation & Restructuring & Adjusted from Operations (Expense) Amortization Transaction Costs EBITDA Consolidated Results $1,742 $33 $419 $2,194 $50 $2,244 Wabtec Corporation 2025 Q3 EBITDA Reconciliation (in millions) Reported Income Other Income Depreciation & Restructuring & Adjusted from Operations (Expense) Amortization Transaction Costs EBITDA Consolidated Results $491 ($1) $127 $617 $41 $658 Wabtec Corporation 2025 Q3 YTD EBITDA Reconciliation (in millions) Reported Income Other Income Depreciation & Restructuring & Adjusted from Operations (Expense) Amortization Transaction Costs EBITDA Consolidated Results $1,437 $21 $361 $1,819 $55 $1,874 =+ + = EBITDA + = =+ + = EBITDA + + + = EBITDA + Set forth below is the calculation of the non-GAAP performance measures included in this press release. We believe that these measures provide useful supplemental information to assess our operating performance and to evaluate period-to-period comparisons. Non-GAAP financial measures should be viewed in addition to, and not as an alternative for, Wabtec's reported results prepared in accordance with GAAP. + + = EBITDA + =
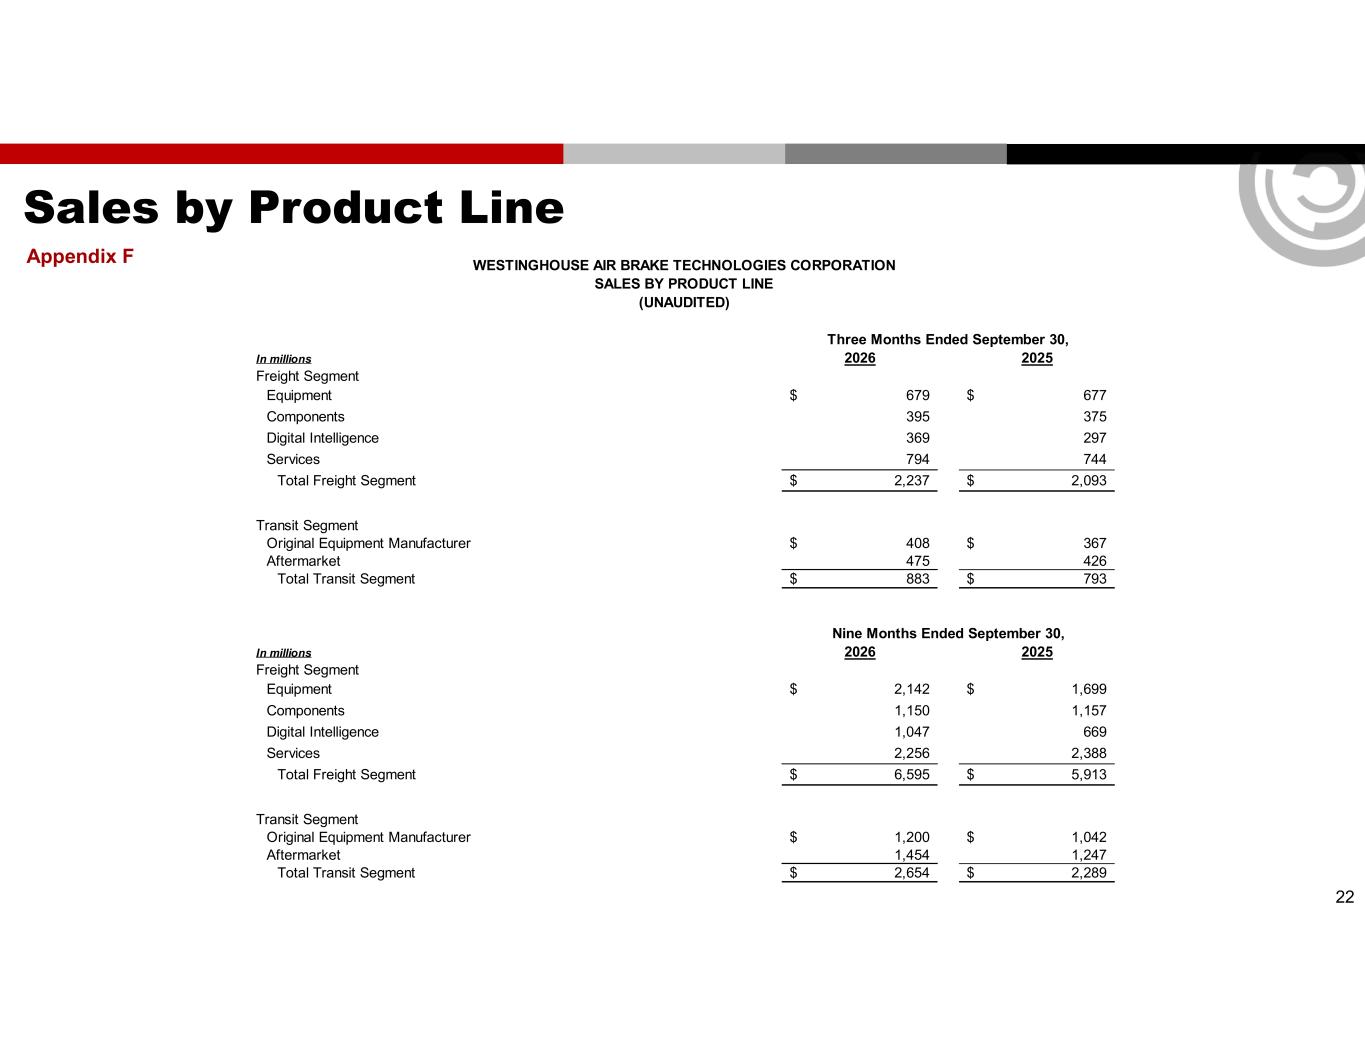
Sales by Product Line Appendix F 22 In millions 2026 2025 Freight Segment Equipment 679$ 677$ Components 395 375 Digital Intelligence 369 297 Services 794 744 Total Freight Segment 2,237$ 2,093$ Transit Segment Original Equipment Manufacturer 408$ 367$ Aftermarket 475 426 Total Transit Segment 883$ 793$ In millions 2026 2025 Freight Segment Equipment 2,142$ 1,699$ Components 1,150 1,157 Digital Intelligence 1,047 669 Services 2,256 2,388 Total Freight Segment 6,595$ 5,913$ Transit Segment Original Equipment Manufacturer 1,200$ 1,042$ Aftermarket 1,454 1,247 Total Transit Segment 2,654$ 2,289$ Nine Months Ended September 30, WESTINGHOUSE AIR BRAKE TECHNOLOGIES CORPORATION SALES BY PRODUCT LINE (UNAUDITED) Three Months Ended September 30,
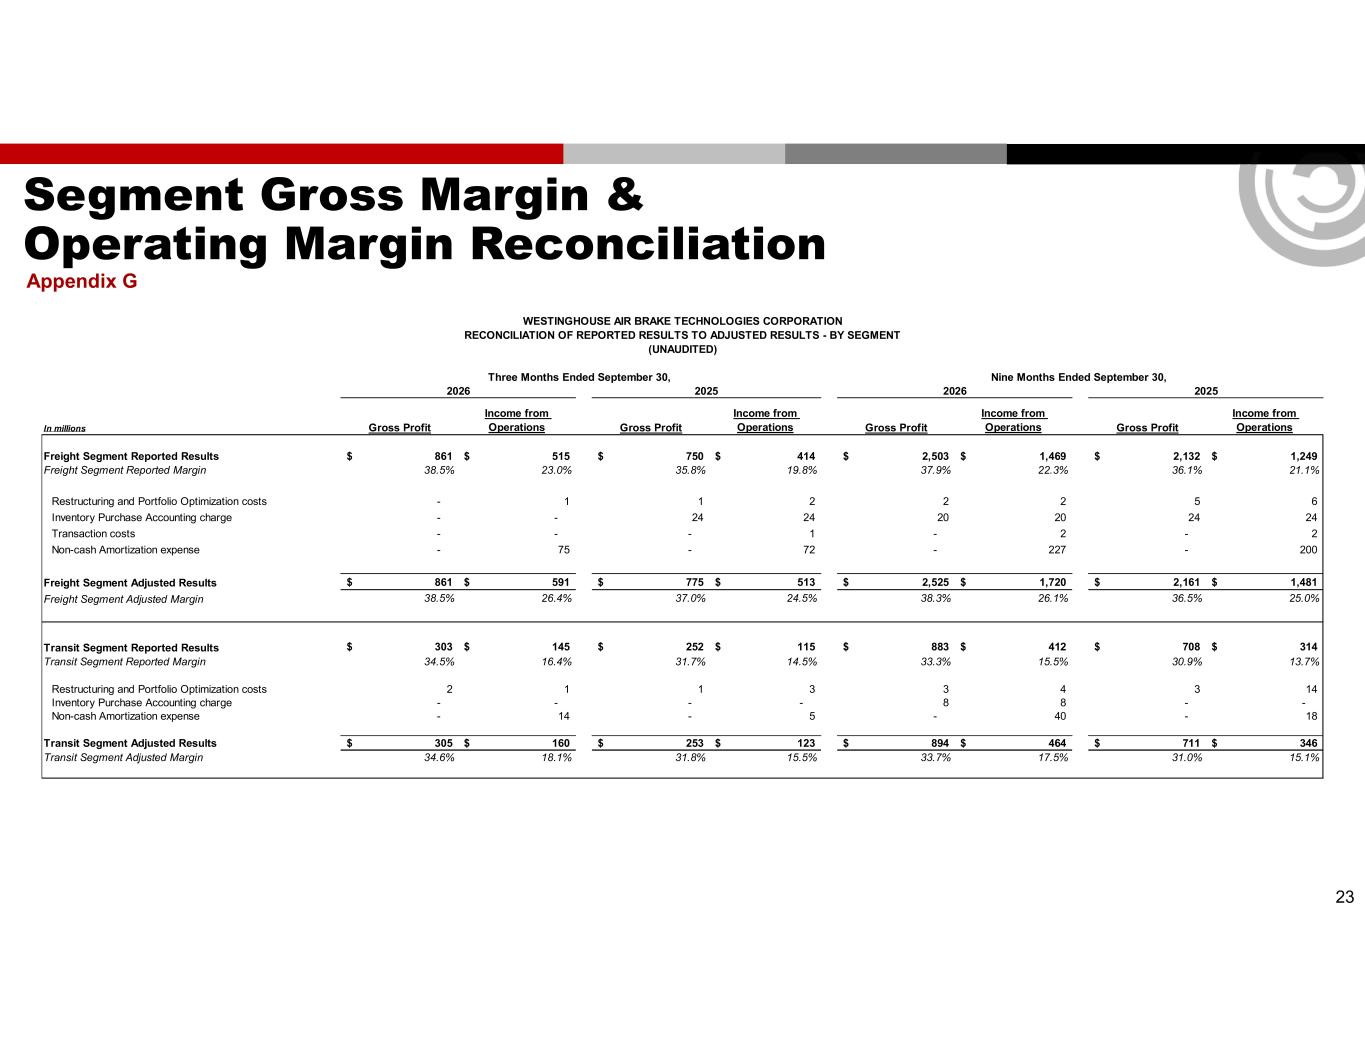
Segment Gross Margin & Operating Margin Reconciliation Appendix G 23 In millions Gross Profit Income from Operations Gross Profit Income from Operations Gross Profit Income from Operations Gross Profit Income from Operations Freight Segment Reported Results 861$ 515$ 750$ 414$ 2,503$ 1,469$ 2,132$ 1,249$ Freight Segment Reported Margin 38.5% 23.0% 35.8% 19.8% 37.9% 22.3% 36.1% 21.1% Restructuring and Portfolio Optimization costs - 1 1 2 2 2 5 6 Inventory Purchase Accounting charge - - 24 24 20 20 24 24 Transaction costs - - - 1 - 2 - 2 Non-cash Amortization expense - 75 - 72 - 227 - 200 Freight Segment Adjusted Results 861$ 591$ 775$ 513$ 2,525$ 1,720$ 2,161$ 1,481$ Freight Segment Adjusted Margin 38.5% 26.4% 37.0% 24.5% 38.3% 26.1% 36.5% 25.0% Transit Segment Reported Results 303$ 145$ 252$ 115$ 883$ 412$ 708$ 314$ Transit Segment Reported Margin 34.5% 16.4% 31.7% 14.5% 33.3% 15.5% 30.9% 13.7% Restructuring and Portfolio Optimization costs 2 1 1 3 3 4 3 14 Inventory Purchase Accounting charge - - - - 8 8 - - Non-cash Amortization expense - 14 - 5 - 40 - 18 Transit Segment Adjusted Results 305$ 160$ 253$ 123$ 894$ 464$ 711$ 346$ Transit Segment Adjusted Margin 34.6% 18.1% 31.8% 15.5% 33.7% 17.5% 31.0% 15.1% 2026 2025 2026 2025 WESTINGHOUSE AIR BRAKE TECHNOLOGIES CORPORATION RECONCILIATION OF REPORTED RESULTS TO ADJUSTED RESULTS - BY SEGMENT (UNAUDITED) Three Months Ended September 30, Nine Months Ended September 30,
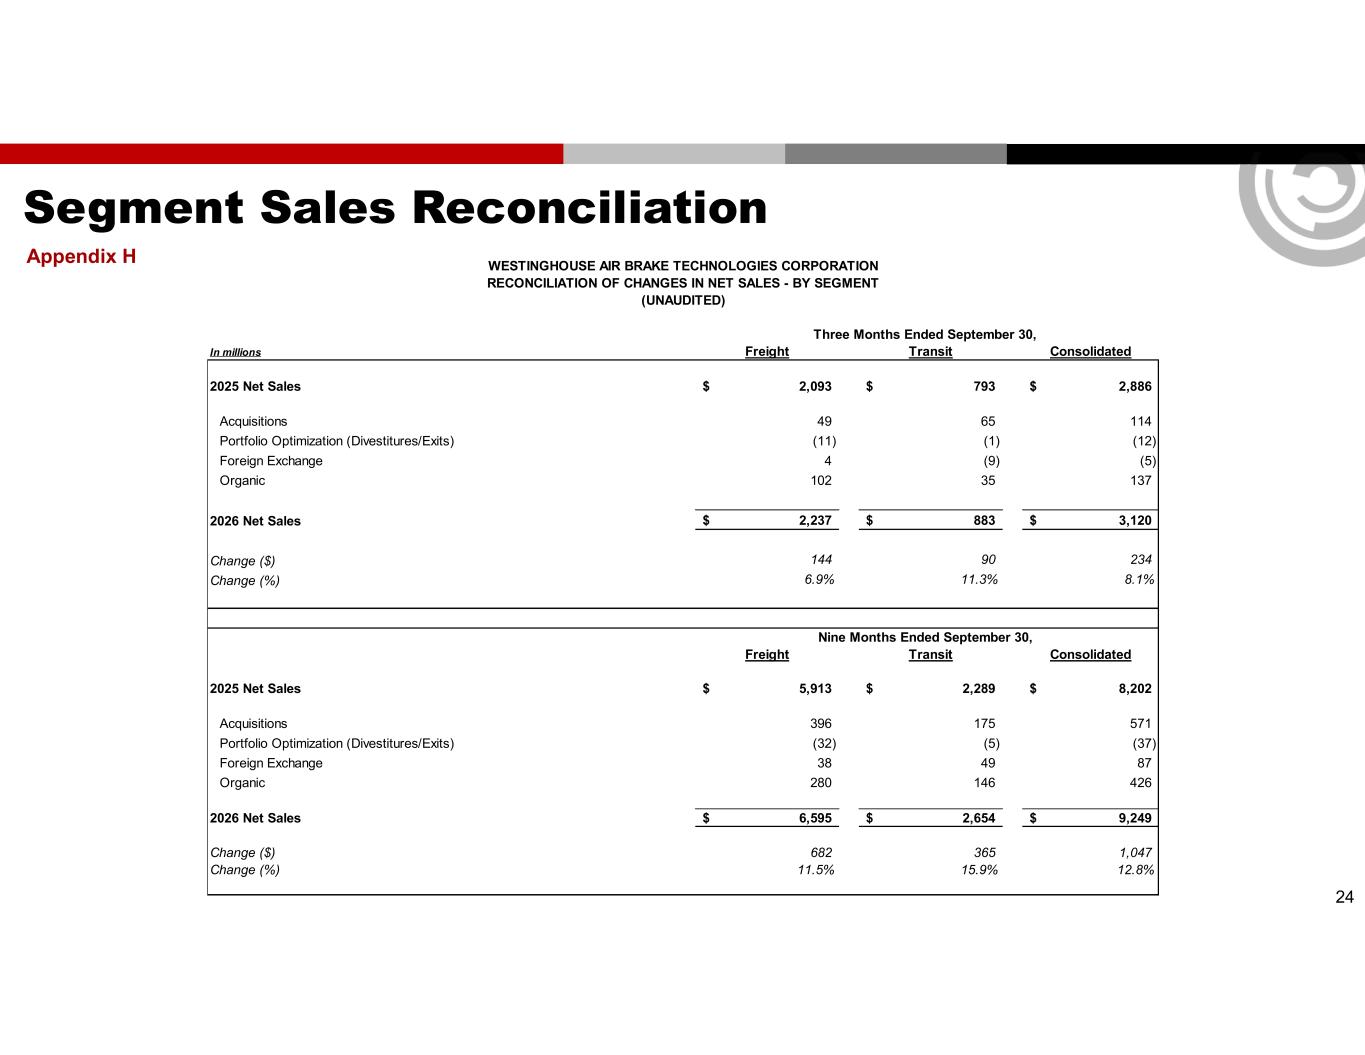
Segment Sales Reconciliation Appendix H 24 In millions Freight Transit Consolidated 2025 Net Sales 2,093$ 793$ 2,886$ Acquisitions 49 65 114 Portfolio Optimization (Divestitures/Exits) (11) (1) (12) Foreign Exchange 4 (9) (5) Organic 102 35 137 2026 Net Sales 2,237$ 883$ 3,120$ Change ($) 144 90 234 Change (%) 6.9% 11.3% 8.1% Freight Transit Consolidated 2025 Net Sales 5,913$ 2,289$ 8,202$ Acquisitions 396 175 571 Portfolio Optimization (Divestitures/Exits) (32) (5) (37) Foreign Exchange 38 49 87 Organic 280 146 426 2026 Net Sales 6,595$ 2,654$ 9,249$ Change ($) 682 365 1,047 Change (%) 11.5% 15.9% 12.8% Nine Months Ended September 30, WESTINGHOUSE AIR BRAKE TECHNOLOGIES CORPORATION RECONCILIATION OF CHANGES IN NET SALES - BY SEGMENT (UNAUDITED) Three Months Ended September 30,
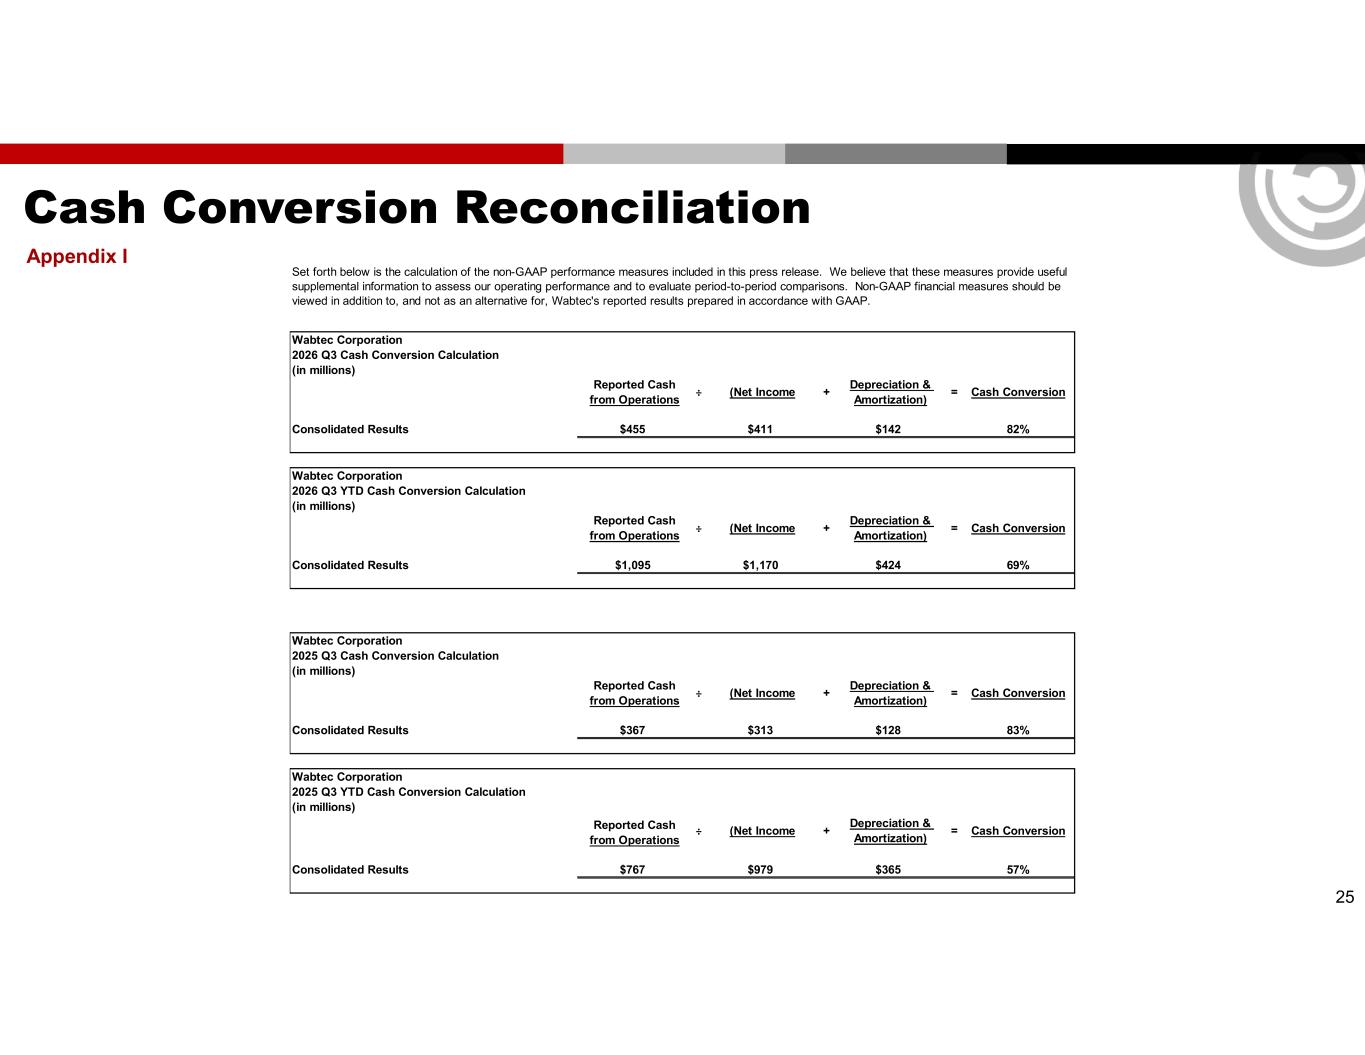
Cash Conversion Reconciliation Appendix I 25 Wabtec Corporation 2026 Q3 Cash Conversion Calculation (in millions) Reported Cash from Operations Consolidated Results $455 $411 $142 82% Wabtec Corporation 2026 Q3 YTD Cash Conversion Calculation (in millions) Reported Cash from Operations Consolidated Results $1,095 $1,170 $424 69% Wabtec Corporation 2025 Q3 Cash Conversion Calculation (in millions) Reported Cash from Operations Consolidated Results $367 $313 $128 83% Wabtec Corporation 2025 Q3 YTD Cash Conversion Calculation (in millions) Reported Cash from Operations Consolidated Results $767 $979 $365 57% Cash Conversion ÷ (Net Income + Depreciation & Amortization) = Cash Conversion ÷ (Net Income + Depreciation & Amortization) = Cash Conversion Set forth below is the calculation of the non-GAAP performance measures included in this press release. We believe that these measures provide useful supplemental information to assess our operating performance and to evaluate period-to-period comparisons. Non-GAAP financial measures should be viewed in addition to, and not as an alternative for, Wabtec's reported results prepared in accordance with GAAP. ÷ (Net Income + Depreciation & Amortization) = Cash Conversion ÷ (Net Income + Depreciation & Amortization) =