

 |
Integrated Report 2025 | ||||
About This Report
Content
The SAP Integrated Report 2025 presents our annual financial, environmental, social, and governance performance in a single integrated report (“SAP Integrated Report”) available at www.sapintegratedreport.com.
On the Integrated Report homepage, we also embedded the recommended disclosures of the Task Force on Climate-Related Financial Disclosures (TCFD).
Basis of Presentation
Our Combined Management Report is prepared in accordance with the German Commercial Code and the relevant German Accounting Standards. The Combined Management Report is also a management commentary complying with the International Financial Reporting Standards (IFRS) Practice Statement Management Commentary.
The report encompasses SAP SE and all subsidiaries which we control and, hence, include in our Consolidated Financial Statement according to IFRS. Joint arrangements and associates are not included in the sustainability reporting. Any further deviations for the sustainability reporting are specifically mentioned in the respective chapters. Our executive management has confirmed the effectiveness of our internal controls over financial reporting.
The social, environmental and governance data and information included in the Group Sustainability Statement of SAP Integrated Report is prepared in accordance with the European Sustainability Reporting Standards (ESRS), which require a report to provide a comprehensive picture of its material impacts, risks and opportunities and how these are managed.
Greenhouse gas data is prepared based on the Greenhouse Gas Protocol.
Data
All financial and non-financial data and information for the reporting period is reported utilizing SAP software solutions and sourced from the responsible business units.
The reporting period is fiscal year 2025. The report encompasses SAP SE and all subsidiaries of the SAP Group. To make this report as current as possible, we have included relevant information available up to the auditor’s opinion dated February 18, 2026. The report is available in English and German.
Independent Audit and Assurance
BDO AG Wirtschaftsprüfungsgesellschaft (BDO) has audited our Consolidated Financial Statements and our Combined Management Report. Information relating to the Group Sustainability Statement included in SAP’s Management Report an independent assurance engagement with limited assurance by BDO. Additionally, BDO has provided reasonable assurance on selected sustainability information in accordance with the International Standard on Assurance Engagements (ISAE) 3000 (Revised), a pertinent standard for the assurance of sustainability reporting. The Independent Auditor’s Report and the Assurance Reports of BDO for the Group Sustainability statement and selected sustainability information are available in the Independent Auditor’s Report section and in the Assurance Report of the Independent German Public Auditor on an Assurance Engagement to Obtain Limited and Reasonable Assurance in Relation to the Group Sustainability Statement section.
Concept and Realization
This report was designed by SAP and created with SAP S/4HANA software and the SAP Disclosure Management application.
| 2/326 |
|
Integrated Report 2025 | ||||
Contents
| To Our Stakeholders | 4 | |
| Combined Management Report | 35 | |
| Consolidated Financial Statements IFRS | 209 | |
| Additional Information | 319 |
| 3/326 |
|
Integrated Report 2025 | ||||
| To
Our Stakeholders |
Combined Management Report |
Consolidated
Financial Statements IFRS |
Additional Information | ||
To Our Stakeholders
| Letter from the CEO | 5 | |
| SAP Executive Board | 7 | |
| Investor Relations | 9 | |
| Report by the Supervisory Board | 11 | |
| Responsibility Statement | 21 | |
| Independent Auditor’s Report | 22 | |
| Assurance Report of the Independent German Public Auditor on an Assurance Engagement to Obtain Limited and Reasonable Assurance in Relation to the Group Sustainability Statement | 31 |
| 4/326 |
|
Integrated Report 2025 | ||||
| To
Our Stakeholders |
Combined Management Report |
Consolidated
Financial Statements IFRS |
Additional Information | ||
Letter from the CEO
Dear Fellow Shareholders,
2025 was an inflection point. In a rapidly transforming world, Business AI graduated from a possibility to an absolute necessity. With this shift, the application of AI in and across enterprises has become a central theme in our customers' strategies and, in turn, played a key role in all our stakeholder interactions - from our customers to our partners and our over 100,000 employees worldwide.
In this new reality, Business AI has become a critical tool for building resilience – financially, operationally, and in the transition to a more resource-efficient economy. By unleashing the full potential of Business AI, SAP is helping our customers navigate uncertainty and reimagine their mission-critical processes to reduce risk, build agile and resilient supply chains, and pursue sustainable growth.
This commitment to our customers' success is the engine of our growth, and our results for fiscal year 2025 clearly show that our strategy is working. Despite demanding global macroeconomic conditions, we not only achieved our revised 2025 financial outlook for Cloud Revenue as well as Cloud and Software Revenue. We also beat our Operating Profit and Free Cash Flow outlook in 2025. Looking back to our 2025 financial ambition set in 2020 – which we adapted over time to reflect evolving market conditions – we successfully delivered on our commitment.
Our Total Cloud Backlog grew by 30%1 to €77 billion in 2025, demonstrating impressive growth on an already large base. Throughout 2025, the Current Cloud Backlog consistently reached growth rates of around 25%1 or more year-on-year. Total Revenue grew by 11%1 and accelerated compared to the previous year. Thanks to our focus on efficiency, including internal AI adoption, Operating Profit increased by 31%2. We achieved a Free Cash Flow of €8.2 billion, nearly doubling year-on-year and demonstrating SAP’s financial strength.
Our performance in 2025 is the direct result of our holistic transformation. Facing an environment dominated by disruption, customers choose RISE with SAP for their cloud journey before broadening their footprint across our portfolio, proving the success of our “land and expand” model.
1 at constant currencies
2 Non-IFRS, at constant currencies
| 5/326 |
|
Integrated Report 2025 | ||||
| To
Our Stakeholders |
Combined Management Report |
Consolidated
Financial Statements IFRS |
Additional Information | ||
With our non-financial metrics, we fell below our target for our Customer Net Promoter Score (NPS). In contrast, our Employee Engagement Index rose 2 percentage points to 76%, and our carbon emissions continued to decline. In 2025, we also replaced the key metric “Women in Executive Roles” with the Business Health Culture Index. This index provides a more holistic view of our company culture. The score for this index was 81%, within our target range.
While our business delivered strong results, our share price performance reflected wider market volatility, declining 13% in 2025. Our focus, however, remains firmly on the long-term value that we are creating through our clear strategy and leadership in Business AI.
To that end, and to reinforce our commitment to shareholder returns, we are pleased to propose a 6.4% dividend increase compared to the previous year, to €2.50 per share. Additionally, we are initiating a new €10 billion share buyback program over the next two years.
Our AI momentum is built on concrete innovation. In 2025, we unveiled SAP Business Data Cloud, enabling companies to harmonize and govern both SAP and non-SAP data to create a powerful, trusted foundation for AI. We built a robust, open business data ecosystem in collaboration with new and existing partners that delivered flexibility and choice to our customers.
As we continued to fundamentally change how work gets done with our AI copilot Joule and its agents, we also addressed one of the key challenges companies experience when applying large language models in a business context. The fact that most business data is numeric means that enterprises need AI models that understand more than just words. With SAP RPT-1, we built a new kind of AI model that does exactly that, using this data to make high-quality predictions from just a small set of examples.
Responding to the shifting geopolitical landscape, we also further strengthened our commitment to digital sovereignty, data security and control. In Europe, we launched the continent's first comprehensive sovereign AI offering, providing customers with an end-to-end AI solution that enables them to operate under European governance frameworks, keep sensitive data within approved jurisdictions, and retain full oversight and decision rights.
Looking ahead to 2026, our confidence stems from the strong foundation we established in 2025. Based on a pipeline fueled by Business AI and SAP Business Data Cloud, we expect to maintain robust Cloud Revenue in a range between €25.8 billion to €26.2 billion. Importantly, we also continue to expect an acceleration of Total Revenue Growth not only in 2026 but through 2027, demonstrating the long-term momentum of our strategy.
Business AI and SAP Business Data Cloud will be key drivers of our growth. Our refreshed strategy for 2026 focuses on five strategic pillars that will create a major opportunity and fundamentally change how enterprises run.
| – | Reinventing the user experience with our AI copilot, Joule. |
| – | Embedding intelligent agents directly into business processes to automate tasks. |
| – | Developing high-impact AI applications for specific industries to create further value. |
| – | Powering our entire strategy with SAP Business Data Cloud, which provides the rich, contextual data that is essential for true Business AI. |
| – | Using AI to accelerate our customers’ move to the cloud. |
Our path to accelerated, profitable growth is clear. It begins with leading by example, making our own company more productive through the consistent use of Business AI across all functions. This allows us to grow our revenue faster than our costs and, in turn, reinvest in the areas that define our future. Our discipline extends to how we engage with the market, where we are streamlining processes and expanding our highly profitable partner channel to drive sustainable growth.
Ultimately, our success story is not just about technology; it is powered by our people. That is why we are further strengthening our growth culture, attracting world-class talent, and continuously upskilling our entire organization for the AI era. By ensuring our team has both the skills and the tools to innovate, we empower them to deliver the extraordinary outcomes our customers expect.
We have the strategy, the technology, and the team to lead in the era of Business AI. We continue to set the bar higher because in this new era, our ability to help enterprises grow and thrive has never been more important.
On behalf of the entire Executive Board, I extend my deepest gratitude to our dedicated teams, our customers and partners, and to you, our shareholders, for the trust you place in SAP.
Sincerely,
Christian Klein
CEO, SAP SE
| 6/326 |
|
Integrated Report 2025 | ||||
| To
Our Stakeholders |
Combined Management Report |
Consolidated
Financial Statements IFRS |
Additional Information | ||
SAP Executive Board
 |
Christian Klein Joined SAP: 1999 Other board memberships: | |
| Learn more about Christian Klein | ||
 |
Dominik
Asam Joined
SAP: 2023 Other board memberships: Supervisory Board, Bertelsmann Management SE and Bertelsmann SE & Co. KGaA, Gütersloh, Germany (not publicly listed) | |
| Learn more about Dominik Asam | ||
 |
Muhammad
Alam Joined SAP:
2022 | |
| Learn more about Muhammad Alam | ||
| 7/326 |
|
Integrated Report 2025 | ||||
| To
Our Stakeholders |
Combined Management Report |
Consolidated
Financial Statements IFRS |
Additional Information | ||
 |
Thomas
Saueressig Joined
SAP: 2004 Other board memberships: | |
| Learn more about Thomas Saueressig | ||
 |
Sebastian
Steinhaeuser Joined SAP: 2020 | |
| Learn more about Sebastian Steinhaeuser | ||
 |
Gina
Vargiu-Breuer Joined SAP: 2024 | |
| Learn more about Gina Vargiu-Breuer | ||
| 8/326 |
|
Integrated Report 2025 | ||||
| To
Our Stakeholders |
Combined Management Report |
Consolidated
Financial Statements IFRS |
Additional Information | ||
Investor Relations
SAP Share Performance amid Market Volatility
In 2025, SAP’s capital market communication took place in an environment shaped by macroeconomic and geopolitical uncertainty, as well as sector rotation within technology, which influenced market sentiment.
At the beginning of 2025, SAP stock outperformed the DAX and NASDAQ-100, supported by strong top-line momentum, backlog visibility, and solid operational execution, with SAP shares reaching €280.30, their high for the year, on February 13, 2025. However, as the year unfolded, sector rotation toward other technology segments, predominantly infrastructure-focused companies, compounded pressure on SAP stock. The SAP share price reached its annual low of €204.85 on November 25, 2025. By year end, SAP stock had declined approximately 13% from its January starting point, while the DAX and NASDAQ-100 posted gains of 22% and 21%, respectively. This trend reflected a combination of broader market dynamics as well as some Company-specific performance.
Overall, from an investor perspective, market sentiment toward SAP was cautious but constructive compared to its peer group. While near-term share price movements were impacted by sector rotation and macro volatility, investors continued to recognize SAP’s long-term strategic positioning, its disciplined execution, and long-term growth potential.
SAP Stock Versus Major Indexes (January 2, 2025, to December 30, 2025)
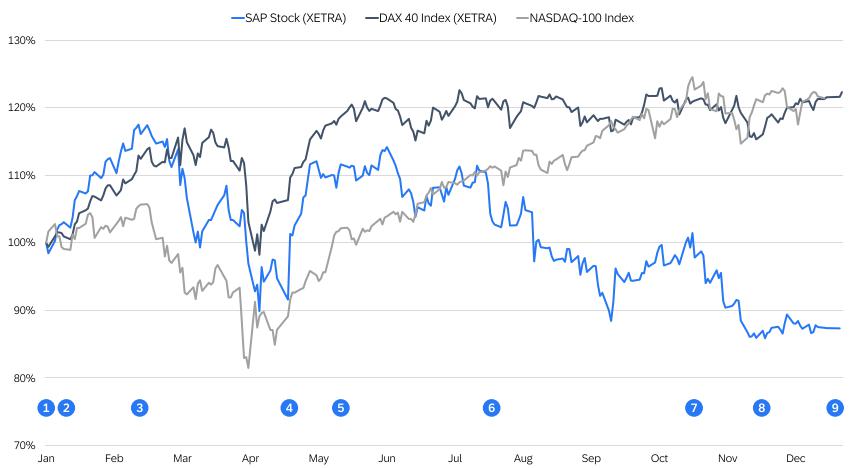
| 1. | January 2 – Closing price – €238.55 | 6. | July 22 – Q2 and half-year 2025 results |
| 2. | January 28 – Q4 and Full Year 2024 results | 7. | October 22 – Q3 2025 results |
| 3. | February 13 – Annual high in 2025 – €280.30 | 8. | November 25 – Annual low in 2025 – €204.85 |
| 4. | April 22 – Q1 2025 results | 9. | December 30 – Closing price – €208.35 |
| 5. | May 16 – Dividend payment – €2.35 |
| 9/326 |
|
Integrated Report 2025 | ||||
| To
Our Stakeholders |
Combined Management Report |
Consolidated
Financial Statements IFRS |
Additional Information | ||
Continuous Engagement with the Investment Community
Throughout the year, SAP maintained an active, transparent, and consistent dialogue with the capital markets. Members of the Executive Board and the Investor Relations (IR) team engaged with institutional investors, financial analysts, and retail shareholders across a broad geographic footprint to discuss SAP’s strategy, operational execution, financial performance, and long-term value creation. The IR team, together with senior management, continued to strengthen its engagement with the capital markets, connecting with current and potential investors. In total, we participated in approximately 40 global conferences and roadshows.
In May, we hosted the Financial Analyst Conference as part of the SAP Sapphire event in Orlando, Florida, United States, which attracted strong interest from investors and analysts worldwide. Earlier that month, SAP held the Annual General Meeting of Shareholders (AGM) in a virtual format, providing shareholders with the opportunity for direct exchange with the Executive Board and Supervisory Board.
We also continued our engagement on environmental, social, and governance (ESG) topics. SAP provided investors with comprehensive insights into its sustainability strategy, governance framework, and product portfolio. SAP’s performance in this area has been acknowledged by leading sustainability rating agencies. In addition, SAP conducted a corporate governance roadshow together with the Supervisory Board, further strengthening dialogue on governance-related matters.
SAP representatives engaged with retail shareholders at virtual and in-person events. The IR team and the Treasury team also maintained regular communication with the debt investor community.
A comprehensive range of information about SAP and its shares—such as financial disclosures, presentations, webcasts of key events, stock information, and an overview of the latest analyst consensus—is available on the Investor Relations website at www.sap.com/investors. Shareholders can reach the IR team directly by telephone and e-mail at investor@sap.com or via the LinkedIn channel SAP Investor Relations.
Shareholder Structure
Applying the definition accepted on the Frankfurt Stock Exchange, which excludes treasury stock from the free float, the free float as at December 31, 2025, stood at 84.0% (December 31, 2024: 83.8%).
SAP Free Float at 84.0%
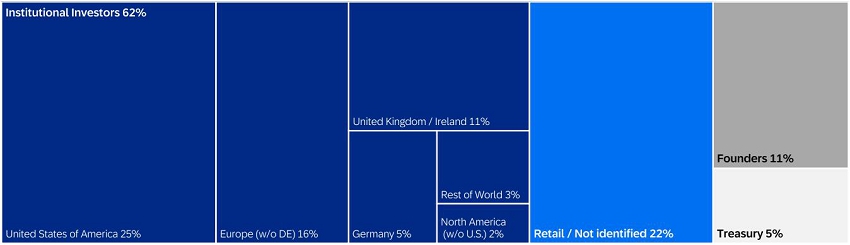
Source: Nasdaq, Inc., December 31, 2025
| 10/326 |
|
Integrated Report 2025 | ||||
| To
Our Stakeholders |
Combined Management Report |
Consolidated
Financial Statements IFRS |
Additional Information | ||
Report by the Supervisory Board
Dear Shareholders,
In the following, we would like to inform you about the work of the Supervisory Board in the fiscal year 2025.
Collaboration Between the Supervisory Board and the Executive Board
The Supervisory Board of SAP SE discharged the duties imposed on it by the law and by the Company’s Articles of Incorporation. It advised the Executive Board on an ongoing basis with regard to the running of the Company and it scrutinized and monitored the work of management.
The Supervisory Board received regular, full, and timely reports from the Executive Board, both from members in person and in written documents. The Supervisory Board and its various committees were also in regular exchange with senior internal officers. This ensured that we were always up to date, also between meetings, on the Company’s strategy, planning, business performance, risks, risk management, compliance (in other words, adherence to laws, to the Company’s Articles of Incorporation, and to internal policies), and on transactions of special significance for SAP. In its reports, the Executive Board also informed us in particular where business deviated from plan or target, and why. We questioned and probed the Executive Board’s reports to satisfy ourselves that the information it gave us was plausible. The information we received from the Executive Board met our requirements in full.
The Supervisory Board chairperson and the CEO were in regular contact, such that the Supervisory Board chairperson was always informed without delay about all material events. Moreover, the chairperson of the Supervisory Board and the CEO regularly discussed SAP’s strategy, business performance, risk position, risk management, and compliance.
Transactions that were submitted to us because they required the approval of the Supervisory Board whether by law, under the Articles of Incorporation, or according to the Company’s list of transactions requiring Supervisory Board consent, were approved by us after detailed examination and discussion with the Executive Board.
Dialogue with Investors
The Supervisory Board chairperson and the Lead Independent Director meet regularly with investors to explain SAP’s strategy and key decisions of the Supervisory Board and to obtain the investors’ feedback. The topics discussed are routinely published ahead of the Annual General Meeting in the letter from the chairperson of the Supervisory Board.
In 2025, these discussions primarily focused on SAP’s strategy, artificial intelligence, the terms of the settlement agreement that SAP had reached with the U.S. Department of Justice regarding compliance matters, succession planning for the Executive Board, diversity, Executive Board compensation, and the format of the Annual General Meeting.
Supervisory Board Meetings and Resolutions
In the past fiscal year, the Supervisory Board of SAP SE held four ordinary meetings and one extraordinary meeting at which we deliberated and resolved on the matters of relevance to the Company. Our plenary meetings and committee meetings were held as physical meetings, as video or telephone conferences, or as hybrid meetings, that is, meetings at which most of the members attend in person and the remaining members join online. Outside of these meetings, we adopted a total of 12 resolutions by correspondence vote. The following table provides an overview of the individual members’ attendance at the Supervisory Board’s plenary sessions and committee meetings in the year under review. This report also contains a table that shows in which format the meetings of the Supervisory Board and its committees were held.
| 11/326 |
|
Integrated Report 2025 | ||||
| To
Our Stakeholders |
Combined Management Report |
Consolidated
Financial Statements IFRS |
Additional Information | ||
Meeting Attendance of SAP Supervisory Board Members During Fiscal Year 2025
| Plenum | Committees | All Meetings | |||||
| Supervisory Board Members | Meetings | Attendance | Meetings | Attendance | Meetings | Attendance | Attendance in % |
| Dr. h.c. mult. Pekka Ala-Pietilä | 5 | 5 | 17 | 17 | 22 | 22 | 100% |
| Jakub Černý | 5 | 5 | 11 | 11 | 16 | 16 | 100% |
| Pascal Demat | 5 | 5 | 9 | 9 | 14 | 14 | 100% |
| Aicha Evans | 5 | 5 | 19 | 18 | 24 | 23 | 96% |
| Andreas Hahn | 5 | 5 | 12 | 12 | 17 | 17 | 100% |
| Prof. Dr. Ralf Herbrich | 5 | 4 | 11 | 11 | 16 | 15 | 94% |
| Margret Klein-Magar | 5 | 5 | 17 | 17 | 22 | 22 | 100% |
| Lars Lamadé | 5 | 5 | 10 | 10 | 15 | 15 | 100% |
| Jennifer Xin-Zhe Li | 5 | 5 | 16 | 15 | 21 | 20 | 95% |
| Qi Lu | 5 | 5 | 4 | 4 | 9 | 9 | 100% |
| César Martin | 5 | 5 | 13 | 13 | 18 | 18 | 100% |
| Gerhard Oswald | 5 | 5 | 15 | 15 | 20 | 20 | 100% |
| Friederike Rotsch | 5 | 5 | 19 | 19 | 24 | 24 | 100% |
| Nicolas Sabatier | 5 | 5 | 12 | 12 | 17 | 17 | 100% |
| Dr. Eberhard Schick | 5 | 5 | 16 | 16 | 21 | 21 | 100% |
| Nina Strassner LL.M. | 5 | 5 | 18 | 18 | 23 | 23 | 100% |
| Dr. Rouven Westphal | 5 | 5 | 22 | 22 | 27 | 27 | 100% |
| Gunnar Wiedenfels | 5 | 3 | 21 | 17 | 26 | 20 | 77% |
At their meetings, the Supervisory Board and the committees regularly deliberated on certain agenda items without the Executive Board in attendance, notably when those items pertained to the Executive Board itself, required internal discussion among Supervisory Board members alone, did not require the Executive Board to be present, and to allow for discussion between the Supervisory Board or its respective committee and the auditor without the Executive Board being present. This was the case for the five plenary sessions and for eight committee meetings in 2025. In addition, the shareholder representatives and the employee representatives independently discussed, at times with the CEO, the items on the respective agenda before each regular meeting. Where necessary, such deliberations also took place prior to circular correspondence votes.
The Supervisory Board addressed the following key topics during the year:
Expansion of the Executive Board
The new structure and expansion of the Executive Board was one of the key topics for the Supervisory Board at the beginning of the year. At the extraordinary meeting of the Supervisory Board on January 19, 2025, we discussed in depth the plans to expand the Executive Board. We extended Thomas Saueressig’s Executive Board contract for a further three years until the end of October 2028, and we appointed Sebastian Steinhaeuser to the Executive Board effective February 1, 2025. Since his appointment, Sebastian Steinhaeuser has been responsible for the new Strategy & Operations Board area, which aims to accelerate the implementation of strategic measures and simplify operations. At this meeting, the CEO also outlined the structure of the Extended Board, consisting of nine executives, which likewise took up its work on February 1, 2025. This new leadership body is tasked with advising the Executive Board, coordinating and preparing its decision-making, and representing SAP. Creating the new board allowed the role of chief revenue officer to be shared by two experienced leaders—Jan Gilg for the Americas region and SAP Business Suite, and Emmanuel (Manos) Raptopoulos for the Asia Pacific Japan (APAC) region, the Europe, Middle East, and Africa (EMEA) region, and the Middle and Eastern Europe (MEE) region—who now head Customer Success, the Company’s sales organization. Philipp Herzig was also appointed to the Extended Board as the new chief technology officer. The Supervisory Board endorses the Executive Board’s approach and its appointments to key roles, deeming them a crucial element in executing SAP’s strategy. In this context, the Supervisory Board also approved the necessary amendments to the Executive Board’s rules of procedure and schedule of responsibilities.
| 12/326 |
|
Integrated Report 2025 | ||||
| To
Our Stakeholders |
Combined Management Report |
Consolidated
Financial Statements IFRS |
Additional Information | ||
Artificial Intelligence (AI) and SAP Business Data Cloud
In 2025, the Executive Board and Supervisory Board looked in depth at SAP’s AI strategy and SAP Business Data Cloud, a cloud-based data platform that centrally and securely consolidates enterprise data from multiple sources, manages it, and makes it available for business processes, analytics, and AI applications. Given the significance of cybersecurity in this context, the Audit and Compliance Committee and the Technology and Strategy Committee received comprehensive written status reports on cybersecurity in April and November. At its ordinary meeting in April 2025, the Supervisory Board and the Executive Board discussed the Company’s holistic data strategy, which—by integrating SAP Business Data Cloud, AI technologies (SAP Business AI), SAP applications, and third-party solutions—enables customers to capture, analyze, and manage their business processes end to end. We continued our deliberations on these matters in our meetings on July 31 and November 6, 2025, in which we received the Executive Board’s progress reports on the AI-first, AI application, and go-to-market strategies. In November, the Executive Board reported on the status of SAP’s developments in the area of public cloud, in which the interaction between SAP applications, SAP Business Data Cloud, and SAP’s AI applications also plays a central role. We were also informed about the Company’s project to increase adoption of AI across SAP’s corporate functions. The Product and Technology Committee likewise devoted considerable attention to the topic of AI at all of its meetings.
New Regulatory Framework Under the EU Data Act
The EU Data Act poses significant challenges for many companies, particularly manufacturers of connected products, providers of related services, data holders, and cloud and edge service providers. One of these challenges stems from the requirement that the data from connected products and services be accessible and portable by way of standard, interoperable, and secure interfaces. This entails significant technical modifications and mechanisms to protect trade secrets, intellectual property rights, and personal data. IT companies in particular also face legal uncertainties in connection with customers’ rights to transfer their data, applications, and other digital assets to other service providers (“cloud switching”). At our meeting on July 31, 2025, we took an in-depth look at the new legal obligations under the EU Data Act, which came into force on September 12, 2025, and the Executive Board described how SAP would ensure that it complied with the Act while at the same time safeguarding the Company’s economic interests. When we met on November 6, 2025, the Executive Board gave us a brief update on the Company’s progress on implementing the new EU Data Act. We received an extensive meeting paper that set out in detail how SAP was implementing the new regulations at SAP, provided new insights into dealing with certain aspects of the Act, and described how other affected companies were addressing the new requirements contained in it.
Other key topics addressed at our meetings in 2025 notably included the following:
Meeting in February (Audit Meeting to Discuss the Financial Statements)
At our audit meeting on February 19, 2025, the Executive Board first gave us an account of business in fiscal year 2024 and reported on the material developments and challenges in each of the Board areas. Next, the Supervisory Board discussed the numerous executive orders issued by the new U.S. administration since the beginning of 2025 and their potential implications for SAP. The Executive Board then presented the 2025 finance plan to us, which we approved as recommended by both the Audit and Compliance Committee and the Finance and Investment Committee.
We also deliberated at this meeting on Executive Board compensation and approved the resolutions required under the current compensation system for the Executive Board for the financial years 2024 and 2025. Accordingly, we first determined performance against the defined targets for the short-term incentive (STI) 2024, and for the 2022 tranche of the SAP long-term incentive (LTI) 2020, and the payout for the 2021 tranche. For the Executive Board’s compensation in 2025, we set the performance targets for the STI 2025 and the grant amount for the 2025 tranche of the LTI 2024. As part of this process, we ascertained that, in terms of amount, structure, and objective criteria, the Executive Board members’ compensation for 2025 was reasonable and appropriate, and that it was proportionate to the Company’s financial situation, profit, and outlook. An opinion the Supervisory Board had obtained in advance from an independent outside compensation consultant informed our decision. We also resolved to increase the CEO’s target compensation as proposed by the Personnel and Governance Committee. The increase reflects developments in industry benchmarks, and the effects of this adjustment are presented in the compensation report. For more information about the STI 2024 and 2025, the LTI 2020, the LTI 2024, and the other elements of Executive Board compensation, see the Compensation Report.
The Supervisory Board then turned its attention to the SAP SE financial statements and the consolidated financial statements for 2024. Following the Audit and Compliance Committee’s recommendation, we approved the audit, the financial statements, and the consolidated financial statements for 2024. We endorsed, on the recommendation of the Finance and Investment Committee, the Executive Board’s proposal concerning the appropriation of retained earnings for 2024, and approved the compensation report for fiscal year 2024. Further, we adopted the proposed resolutions for the SAP SE Annual General Meeting of Shareholders on May 13, 2025. One of these proposals was the resolution, to be put to the vote at the Annual General Meeting, on the appointment
| 13/326 |
|
Integrated Report 2025 | ||||
| To
Our Stakeholders |
Combined Management Report |
Consolidated
Financial Statements IFRS |
Additional Information | ||
of BDO AG Wirtschaftsprüfungsgesellschaft (BDO) as auditor for 2025. As a precautionary measure, and following the Audit and Compliance Committee’s recommendation, this resolution included the proposal that BDO’s audit also cover the 2025 Group Sustainability Statement. Lastly, the chairpersons of the respective committees reported on the discussions that had taken place on their committees, and we explored some of these topics further.
Meeting in April
When we met on April 10, 2025, we first discussed the proposed extension of Christian Klein’s and Dominik Asam’s service contracts. The Supervisory Board later resolved on these matters by way of circular correspondence vote. Next, we looked at how the executive orders on diversity, equity, and inclusion (DEI) issued by the U.S. administration impacted SAP from a legal point of view. In particular, we discussed the “Women in Executive Roles” key performance indicator (KPI) for Executive Board compensation that was currently part of the LTI Plan, and whether it should be replaced with the “Business Health Culture Index” (BHCI) KPI going forward. This non-financial KPI indicates the extent to which SAP offers employees a working environment that promotes health, and supports their long-term employability and their active engagement in reaching our corporate goals. Since further clarification was required, the Supervisory Board decided to wait until the beginning of May to decide on the matter, at which time it resolved, by way of circular correspondence vote, to replace the existing KPI “Women in Executive Roles” with the BHCI and to amend the declaration of compliance as necessitated by the change. Also in our April meeting, the Supervisory Board was informed about further legal aspects of the U.S. administration’s executive orders, and discussed with the Executive Board possible measures to ensure that SAP complied with U.S. legal standards without violating compulsory DEI quotas required by German or EU law. In addition, the Executive Board gave an overview of the key developments and challenges in the first quarter, highlighting in particular the current uncertainty in the global economy, which had also resulted in SAP customers being more hesitant to invest in their IT. It also reported on the current status of the negotiations with the European Commission, which had accused SAP of engaging in anti-competitive conduct in the market for after-sales support and maintenance for on-premise software. The Executive Board expressly disagreed with the Commission’s assessment and described to us its cooperation with the Commission to clarify the matter. The Executive Board also elaborated on the Company’s detailed responses to the allegations, and informed us that the Commission was presently conducting an informal market test to collect feedback from customers and other market participants. Additionally, the responsible Board member provided us with a progress report on People Agenda, the HR strategy that included the rollout of the new HR operating model. Closing out this meeting, we discussed succession planning for the chairperson of the SAP Supervisory Board. Since the current chairperson’s term of office would end at the close of the 2026 Annual General Meeting, the Nomination Committee had devoted time to identifying the skills and expertise required of a successor and to the search for suitable candidates. We decided at this April meeting to nominate René Obermann for election to the Supervisory Board in 2026, with a view to him then assuming the chairperson role in 2027. To ensure a seamless handover, the Supervisory Board additionally resolved to propose to the 2026 Annual General Meeting that the current chairperson’s term of office be extended by one year. René Obermann combines expertise in technology and in Germany’s corporate governance system with extensive knowledge of SAP’s customers and markets.
Meeting in July
For its meeting on July 31, 2025, the Supervisory Board travelled to California, USA, where it also had the opportunity to visit SAP’s Silicon Valley development hub and see various software solutions developed there. During their trip to California, the members of the Supervisory Board were invited to visit technology company Zoox Inc. and Google Cloud Space, and to meet with SAP customers and partners. In addition to the focal topics already mentioned, we used this July meeting to discuss SAP’s acquisition of U.S. company SmartRecruiters, which has developed an AI-based platform that helps customers automate and optimize their talent acquisition process end to end. We approved the acquisition at our meeting on the recommendation of the Finance and Investment Committee, which had deliberated with the Executive Board at length on the opportunities and risks of this transaction at its own meeting the day before. Also on the agenda for this meeting was a presentation by a financial analyst, who gave us his view of SAP, its business, and its future prospects. Next, the members of the Extended and Executive Boards each reported on the latest developments in their respective Board areas and on the current go-to-market strategy and operating model for product development. The Executive Board then presented the progress made in executing the strategy over the past nine months, showcasing various focus programs, and gave us updates on the HR strategy implementation in the People & Culture area. Lastly, we turned to the recent review of the effectiveness of our work: Representatives of the external service provider we had engaged to assist with this review presented the interim findings of a questionnaire-based survey of the Supervisory Board members on their self-assessment of the efficiency, composition, and work of the Supervisory Board and its committees. We thereafter discussed the areas where the responses suggested room for improvements in our practices. One potential idea, for instance, was to allow more time between committee meetings for personal exchange among Supervisory Board members.
| 14/326 |
|
Integrated Report 2025 | ||||
| To
Our Stakeholders |
Combined Management Report |
Consolidated
Financial Statements IFRS |
Additional Information | ||
Meeting in November
When we met on November 6, 2025, the Supervisory Board approved various amendments to the rules of procedure of the Audit and Compliance Committee and of the Finance and Investment Committee. Notably, these amendments included the reassignment of the responsibility for preparing the Supervisory Board’s approval of the annual financial plan, for preparing the proposal to the Annual General Meeting of Shareholders on the appropriation of profits, and for receiving and reviewing the annual European Market Infrastructure Regulation (EMIR) report. The Supervisory Board also approved a change in the membership of the Nomination Committee, which involved Pekka Ala-Pietilä taking over as Committee chairperson from Gunnar Wiedenfels, who was leaving the Committee. Next, the external services provider tasked by us to review the Supervisory Board’s effectiveness presented the results of his survey of Executive Board members regarding collaboration with the Supervisory Board and on the knowledge and expertise on the Executive Board. The Supervisory Board thereafter discussed these results at length and identified specific measures to further enhance the effectiveness of the Supervisory Board and its committees, and of collaboration with the Executive Board. We also received a report at this meeting on the current status of the negotiations with the European Works Council on the amendments to the SAP Employee Involvement Agreement. We were subsequently informed about Margret Klein-Magar’s upcoming departure from the Supervisory Board effective December 31, 2025, due to her early retirement, and the process for electing her successor by the European Works Council was explained. We then discussed with the Executive Board its capital allocation strategy for the coming years including its plans for a new share buyback program that was scheduled to be ratified at the beginning of 2026. Following the recommendation of the Personnel and Governance Committee, we also approved the necessary adjustments to certain financial KPIs in the STI 2025 and in the relevant LTI plans and tranches, which are part of the Executive Board compensation package, so as to eliminate the effects of the SmartRecruiters acquisition. We also looked at the issue of sustainability at SAP in our November meeting. In this regard, the Executive Board updated us on the latest developments in the Company’s sustainability products, on customers’ expectations of those products, and on the Company’s own sustainability management. Further, we were informed about the so-called re-baselining with regard to SAP's goal of achieving net zero by 2030. Re-baselining refers to the recalculation of emissions in the base year—specifically, SAP's greenhouse gas emissions inventory—in order to establish a consistent reference point for tracking our progress in reducing emissions. This approach aims to ensure that progress is accurately reflected and not distorted by methodological or structural changes.
Resolutions by Correspondence Vote
In addition to those described above, we adopted several resolutions—which the relevant committees had deliberated on in advance and recommended to us—by way of a correspondence vote:
| – | February: Resolutions on SAP’s response to the EU Commission’s investigations into potential breaches of competition law. On this subject, written reports were provided at least once a month to the chairperson of the Supervisory Board and the chairperson of the Audit and Compliance Committee. |
| – | February: Approval of the updated skills matrix for the Supervisory Board, and of the Corporate Governance Statement for 2025 |
| – | March: Resolution on an internal corporate restructuring |
| – | April: Resolutions on the extension of Christian Klein’s and Dominik Asam’s Executive Board service contracts |
| – | May: Resolutions on 1) the LTI tranche 2025 and the replacement of the non-financial KPI “Women in Executive Roles,” 2) retaining the goal of at having at least two women on the Executive Board, and 3) updates to the Company’s Declaration of Compliance with the German Corporate Governance Code (the “Code”) |
| – | May: Update of the resolution on the appropriation of the 2024 retained earnings |
| – | October: Annual resolutions attesting to the independence of the shareholder members on the Supervisory Board, and on the adoption of the annual Declaration of Compliance with the Code |
| – | December: Resolutions on 1) replacing the Net Promoter Score (NPS) non-financial metric in the STI plan for Executive Board members with the new Cloud Customer Satisfaction (CSAT) KPI, effective from fiscal year 2026; 2) approving the new composition of certain committees as of January 1, 2026, following Margret Klein-Magar’s departure from the Supervisory Board on December 31, 2025, and taking into account her successor elected by the European Works Council; and 3) approving SAP’s conclusion of three major customer contracts, in line with the list of transactions requiring the Supervisory Board’s consent in the meaning of the German SE Implementation Act, section 19 |
| 15/326 |
|
Integrated Report 2025 | ||||
| To
Our Stakeholders |
Combined Management Report |
Consolidated
Financial Statements IFRS |
Additional Information | ||
Format of Meetings in Fiscal Year 2025
| Total Number of Meetings |
Thereof Physical Meetings | Thereof Hybrid Sessions | Thereof Telephone/Video Conferences | |
| Full Supervisory Board | 5 | 1 | 3 | 1 |
| Committees | ||||
| Personnel and Governance | 8 | 2 | 4 | 2 |
| Audit and Compliance | 9 | 0 | 51 | 4 |
| Product and Technology | 4 | 1 | 3 | 0 |
| Nomination | 7 | 0 | 2 | 5 |
| Finance and Investment | 7 | 2 | 31 | 2 |
| Government Security | 2 | 0 | 2 | 0 |
1 thereof one joint meeting of the Finance and Investment Committee and the Audit and Compliance Committee
The Work of the Supervisory Board Committees
The Committees again made a key contribution to the work of the Supervisory Board in 2025, notably by preparing relevant agenda items and resolutions for Supervisory Board meetings, by approving draft resolutions, and by regularly reporting on their deliberations and decisions. The following committees were in place during the year under review:
Personnel and Governance Committee, Audit and Compliance Committee, Finance and Investment Committee, Product and Technology Committee, Nomination Committee, and Government Security Committee.
For more information about the Supervisory Board committees, particularly their respective composition, tasks, and responsibilities, see the Corporate Governance Statement and the Corporate Governance section of SAP’s website.
Besides the matters described above, the committees focused primarily on the following topics in 2025:
| – | The Personnel and Governance Committee held five regular and three extraordinary meetings in the reporting year. In particular, the Committee, in fulfillment of the tasks assigned to it, carefully prepared the Supervisory Board’s deliberations and resolutions described above on Executive Board compensation; on the extension of Christian Klein’s and Dominik Asam’s Executive Board service contracts; and on the appointment of Sebastian Steinhaeuser to the Executive Board; and it approved draft resolutions. The Committee held an extraordinary meeting on April 28, 2025, where it discussed the Company’s approach in response to the U.S. government’s executive orders on DEI, and SAP’s voluntary targets for the Executive Board’s composition. At its ordinary meeting on July 30, 2025, the Committee deliberated in depth on succession planning for the Executive Board, which presented the Company’s new program for talent and leadership development and updated the Committee on potential successor candidates for the individual Board portfolios. With investor feedback in mind, the Committee members also discussed with the Executive Board the virtual format of the general meeting of shareholders and options for the AGM’s future format, before turning its attention to the matter of personal protection for the Executive Board members. When it met on November 5, 2025, the Committee was updated particularly on the current status of negotiations to amend the SAP Employee Involvement Agreement and deliberated on an adjustment to Executive Board compensation necessitated by the acquisition of SmartRecruiters. In addition, the Committee revisited the matter of succession planning for the Executive Board. The Supervisory Board has engaged a personnel consulting firm to search for potential candidates from outside the Company. This firm monitors the executive market and, based on the Committee’s guidelines, presents suitable candidates for specific Board positions. On December 9, 2025, the Committee convened for a further extraordinary meeting to prepare the Supervisory Board’s circular resolution on replacing the NPS metric in the STI plan for Executive Board members with the CSAT metric, as described above. |
| – | The Audit and Compliance Committee held nine meetings in 2025, one of which was a joint meeting with the Finance and Investment Committee. This schedule included one telephone conference per quarter to vote on the quarterly reporting, and one session per quarter to address regular and topical agenda items. A standing item on the agenda for its regular meetings gave the Audit and Compliance Committee the opportunity to hear from and discuss matters with the auditor without the Executive Board being present. The Committee thoroughly prepared the resolutions of the Supervisory Board for all topics assigned to it, as described above. Recurring agenda items included business performance in the respective quarter; the financial reporting process; the preparation of quarterly reports; and the quarterly reports due for publication. Other recurring meeting topics included the monitoring of SAP’s systems for risk management, internal control, and compliance. The Committee also dealt with current compliance-related matters on an ongoing basis. Further, it received regular updates on selected lawsuits SAP was involved in, and on the material legal risks (including tax risks). At its February 2025 meeting, the Committee prepared the |
| 16/326 |
|
Integrated Report 2025 | ||||
| To
Our Stakeholders |
Combined Management Report |
Consolidated
Financial Statements IFRS |
Additional Information | ||
| Supervisory Board’s resolutions on the 2024 financial statements of SAP SE and the SAP Group and on the proposal to r the Annual General Meeting of Shareholders regarding the election of the auditor. These resolutions were adopted by the Supervisory Board at the audit meeting. The Committee received an update on the regulatory developments on the EU Corporate Sustainability Reporting Directive and their implications for SAP’s Integrated Report. It was also advised about the status of the spot-check inspections by the German Federal Financial Supervisory Authority of the 2024 SAP SE financial statements and consolidated financial statements. The chief financial officer presented his strategy for the finance function and the associated financial planning for the years through 2028. The Committee chairperson was in regular contact with the auditor. The Committee monitored the independence of the auditor and the quality of the auditor’s work and of the audit itself. The Committee reported the outcome of its assessments to the full Supervisory Board. At its meeting in July, the Committee discussed the audit focus for 2025 with the auditor. The auditor attended the Audit and Compliance Committee meetings except for the joint meeting with the Finance and Investment Committee, and reported in depth on its audit work and on its quarterly audit of cloud revenue and of selected cloud and software agreements. |
| – | The Finance and Investment Committee held six regular meetings, one of which was a joint meeting with the Audit and Compliance Committee, and one extraordinary meeting in 2025. At a number of its meetings, the Committee looked at its recurring agenda items, which are: business performance (and analyzed specific performance indicators); product strategy and the product portfolio; the performance of acquired companies and of companies in which SAP has an ownership interest; SAP’s competitive environment; and communication with the financial markets. At the joint meeting of the Finance and Investment Committee and the Audit and Compliance Committee on January 18, 2025, the Committees discussed with the Executive Board the financial plan and the outlook for 2025. Having examined the workforce planning, revenue growth strategies, and profitability, among other aspects, the members of the two Committees concluded that they would recommend the financial plan, as presented, to the Supervisory Board for its approval. At the Finance and Investment Committee meeting on February 19, 2025, the Executive Board advised the Committee about the Company’s tax and liquidity strategy. The Committee voted to recommend the Executive Board’s proposal on the appropriation of retained earnings for 2024 to the Supervisory Board for submission to the Annual General Meeting. Besides its recurring agenda items, at its meeting on April 9, 2025, the Committee discussed SAP’s credit rating and its project to improve liquidity at SAP SE level. The Committee convened on July 25, 2025, for a full discussion on the capital allocation strategy with the Executive Board. At an extraordinary meeting held on July 30, 2025, the Committee scrutinized the Company’s plans to acquire SmartRecruiters. It probed all critical aspects before resolving to recommend these plans to the Supervisory Board. In November 2025, the Committee deliberated again on the capital allocation strategy and on the Executive Board’s plans for a new stock repurchase program; the Supervisory Board’s final decision on this program was adopted in January 2026. Presenting the Company’s new approach to venture capital investments, the Executive Board described the system it would use to identify promising companies, the regions that are relevant, and the team setup. At its last meeting of the year, the Committee deliberated on the preliminary financial plan for 2026, which the Executive Board presented. Preparation of the Supervisory Board’s resolution on the annual finance plan, which is adopted at the start of each new fiscal year, is one of the responsibilities that was transferred to the Finance and Investment Committee in the reporting year. |
| – | The Product and Technology Committee met four times in the reporting year. At its first meeting, on February 18, 2025, the Executive Board reported on AI and on the go-to-market strategy. Beyond this, the Committee dealt with matters related to SAP S/4HANA Cloud Public Edition, data integration, and data management. Reporting again on developments in AI, at the meeting on April 9, 2025, the Executive Board described the various AI scenarios and reported on how AI was being deployed, levels of adoption, and customer satisfaction. The Executive Board also reported on SAP’s measures to train its workforce on AI and on how the Company was using this technology internally. The Committee’s meeting on July 30, 2025, was open to all members of the Supervisory Board. At the meeting, the Supervisory Board received an update on product strategy and on the AI business. Among the matters the Executive Board reported on in its update were the latest industry trends, product innovations, and on how AI was changing work and development processes at SAP. At the meeting on November 5, 2025, the Executive Board reported on the next generation of spend management software. It also updated the Committee on innovation and research at SAP, and on the delivery of SAP Business Suite. |
| – | The Government Security Committee convened twice in the reporting year. At its meeting on February 17, 2025, the Committee received the annual report, required by law, on business and compliance activities as they relate to national security. It was also given a presentation on the Company’s strategy for sovereign cloud solutions and reviewed the activities of SAP subsidiaries SAP National Security Services (NS2) and Delos Cloud GmbH, which ensure the operation of sovereign cloud solutions for authorities in the United States and Germany respectively. The Committee returned to these matters for an in-depth discussion at its meeting on October 20, 2025, when it was also informed about certain of SAP’s business activities in India. |
| – | The Nomination Committee met seven times in the reporting year. At its meetings on January 26, February 18, March 28, and April 9, 2025, the Committee discussed the search for a suitable successor to the position of Supervisory Board chairperson. It was assisted by external personnel consultants, who, at the first two meetings in the reporting year, presented a shortlist of candidates whose profiles they had assessed, and aligned with the Committee on the next steps in the selection process. The |
| 17/326 |
|
Integrated Report 2025 | ||||
| To
Our Stakeholders |
Combined Management Report |
Consolidated
Financial Statements IFRS |
Additional Information | ||
| Committee used its meetings to review the shortlisted candidates’ profiles, select the individuals it wished members of the Supervisory Board to interview, and discuss the feedback it received about those interviews. When the Committee met in April 2025, the Committee resolved to recommend to the Supervisory Board that it propose René Obermann for election to the Supervisory Board at the 2026 Annual General Meeting of Shareholders. Provided that he was indeed elected and that his onboarding went well, René Obermann could then be elected as Supervisory Board chairperson in 2027. As reported above, the Supervisory Board approved this proposal, and its chairperson communicated the agreed procedure in his 2025 letter to shareholders prior the Annual General Meeting. At its September meeting, the Committee discussed the further succession planning and decided to engage an external personnel consultant to assist in the search for suitable candidates. When it convened on November 18, 2025, it deliberated on preparations for the Supervisory Board elections to be held during the Annual General Meeting in May 2026. The external personnel consultant, now engaged in the process, outlined his approach and selection criteria for identifying suitable candidates. Additionally, the chairperson of the Supervisory Board provided an update on preliminary discussions regarding potential candidates, which also involved the CEO. Then, on December 9, 2025, the Committee reviewed the shortlist prepared by the external personnel consultant, focusing particularly on candidates’ professional backgrounds and the outcomes of initial conversations held with them. The Committee members decided to proceed with in-person interviews with the proposed candidates in the near future as the next step in the process. |
The work of the committees and their regular reports at our plenary sessions ensured that we were kept fully informed about all matters covered by the committees and were able to discuss them thoroughly.
Conflicts of Interest
Members of the Supervisory Board and of the Executive Board had no conflicts of interest that required disclosure to the Supervisory Board under recommendation E.1 or E.2 of the German Corporate Governance Code. If such a conflict becomes apparent, it will be avoided by the Supervisory Board member concerned not taking part in the relevant discussions and not voting on the matter in question. Insofar as Supervisory Board members, during their tenure, hold executive positions at other companies or have a material shareholding in companies that have current business dealings with SAP, we do not consider their independence to be impaired. The extent of any such business dealings is small and, moreover, transactions are at arm’s length.
Training and Professional Development
The members of the Supervisory Board were once again offered various training and professional development opportunities throughout the year, with appropriate support from the Company. Where relevant, the Company routinely records individual presentations and training courses and places them on a specially configured platform for all Supervisory Board members to access. Onboarding training sessions and one-pagers were provided to new Supervisory Board members to give them essential information about the relevant corporate governance rules and stock market and capital market regulations. In addition, detailed presentations were offered on centralized cash management at SAP, and on the Company’s employee involvement agreement. During their meeting week in November, the members of the Supervisory Board were given the opportunity, at two interactive stations, to learn about Joule, the AI copilot developed and deployed by SAP, and to try it out for themselves between meetings. On December 11, 2025, the Supervisory Board attended a session about the organization and duties of the Company’s government affairs department. Supervisory Board members also had the chance to meet individually with members of the Executive Board to speak with them in detail about aspects of the work their particular Board area was doing.
SAP SE and Consolidated Financial Reports for 2025
BDO was reappointed as the SAP SE and SAP Group auditor for the reporting year at the Annual General Meeting of Shareholders on May 13, 2025, as proposed by the Supervisory Board on the recommendation of the Audit and Compliance Committee. To prepare for the eventuality that German law requires shareholders to ratify the Company’s choice of auditor for the sustainability report once the European Corporate Sustainability Reporting Directive (CSRD) has been transposed into national law, the Annual General Meeting of Shareholders was also asked to ratify this auditor. Prior to the proposed resolution being put to the Annual General Meeting of Shareholders, BDO had confirmed to the chairperson of the Supervisory Board and to the Audit and Compliance Committee that there were no circumstances that might prejudice, or raise any doubt concerning, its independence as the Company’s auditor. In this connection, BDO informed us of the extent of non-audit services that it had either provided to the Group in the past year or was engaged to provide in the year to come. The Supervisory Board agreed with BDO that it should report to the Supervisory Board and record in the auditor’s report any fact found during the audit that was inconsistent with the declaration given by the Executive Board and the Supervisory Board concerning implementation of the Code. On this basis, BDO examined the SAP SE financial statements prepared in accordance with the German Commercial Code, the consolidated financial statements prepared in accordance with International Financial Reporting Standards (IFRSs) as required by the German Commercial Code, section 315e, and the combined SAP Group and SAP SE management report prepared in accordance with the German Commercial
| 18/326 |
|
Integrated Report 2025 | ||||
| To
Our Stakeholders |
Combined Management Report |
Consolidated
Financial Statements IFRS |
Additional Information | ||
Code, and certified them without qualification. The auditor thus confirmed that, in its opinion and based on its audit in accordance with the applicable accounting principles, the SAP SE and consolidated financial statements give a true and fair view of the net assets, financial position, and results of operations of SAP SE and the SAP Group. The auditor also confirmed that the combined SAP SE and SAP Group management report is consistent with the corresponding financial statements and as a whole gives a suitable view of the position of SAP SE and the SAP Group and of foreseeable opportunities and risks. In accordance with section 317 (3a) of the German Commercial Code, the auditor also examined and confirmed that the renderings of the financial statements, the management report, the consolidated financial statements, and the combined management report contained in the files submitted on an electronic data carrier, which can be accessed via the secure client portal for SAP, and prepared for the purposes of disclosure comply in all material respects with the requirements of section 328 (1) of the German Commercial Code regarding the electronic reporting format (“ESEF format”). BDO also completed its audit of SAP’s internal control system over financial reporting as required by applicable U.S. rules and issued an unqualified audit opinion. The auditor stated in its opinion that it considers SAP's internal controls with respect to the consolidated financial statements to be effective in all material respects. Additionally, it provided assurance on the group sustainability statement (which includes SAP’s sustainability reporting under CSRD) in the combined management report, and on the compensation report, which it audited separately. All Audit and Compliance Committee members and Supervisory Board members received—initially in the form of drafts that were identical to the final documents—the documents concerning the financial statements mentioned above, the audit reports prepared by BDO in good time. In addition, the Executive Board presented its proposal on the appropriation of retained earnings to us. On February 18, 2026, the Executive Board prepared the financial accounts of SAP SE and the SAP Group for 2025, comprising the SAP SE financial statements, the consolidated financial statements, and the combined management report (including the group sustainability statement), and submitted them without delay to the Supervisory Board.
At its meeting on February 17, 2026, the Finance and Investment Committee discussed with the Executive Board the Executive Board’s proposal on the appropriation of retained earnings, and approved a draft proposal for the Supervisory Board. The Executive Board explained the financial statements of SAP SE and the SAP Group at the meeting of the Audit and Compliance Committee on February 17, 2026 (based on drafts identical to the final documents) and at the audit meeting of the Supervisory Board on February 18, 2026. Members of the Executive Board answered questions from the Committee and the Supervisory Board. At the Audit and Compliance Committee meeting, they also explained the compensation report and the Annual Report on Form 20-F prepared in accordance with the applicable U.S. standards.
After the Executive Board had explained the financial statements, the Audit and Compliance Committee and the Supervisory Board reviewed them (in the form of drafts identical to the final versions), taking BDO’s audit reports (or the drafts identical to the final versions) into account. The Audit and Compliance Committee then passed the compensation report on to the Supervisory Board for approval. The auditor attended both the Audit and Compliance Committee meeting and the audit meeting of the Supervisory Board in person to present the process and results of the audit in detail, and to explain its audit reports (or final draft reports). The auditor also reported that it had not identified any material weaknesses in SAP’s internal control and risk-management systems for financial reporting. Both the Audit and Compliance Committee and the Supervisory Board asked detailed questions about the form, scope, and results of the audit.
The Audit and Compliance Committee reported to the Supervisory Board on its own review of the financial statements of SAP SE and the SAP Group, its discussions with the Executive Board and with the auditor, and its supervision of the financial reporting process. It confirmed that, as part of its supervisory work, it had addressed the SAP Group’s internal control, risk management, and internal auditing systems, and found the systems to be effective.
The Audit and Compliance Committee and the Supervisory Board satisfied themselves that BDO had conducted the audit properly. In particular, they concluded that both the audit reports and the audit itself fulfilled the legal requirements. Based on the report and on the Audit and Compliance Committee’s recommendation, the Supervisory Board approved the results of the audit and, since there were no findings from our own examination, we gave our consent to the SAP SE financial statements, the consolidated financial statements, the combined Group management report, and adopted the compensation report pursuant to the German Stock Corporation Act, section 162. The financial statements and combined management report were thus formally adopted upon approval by the Supervisory Board. The Supervisory Board’s opinion of the Company and the Group coincided with that of the Executive Board as set out in the combined management report. The Supervisory Board considered the proposal presented by the Executive Board on the appropriation of retained earnings. We had regard to the requirements of dividends policy, the effects on the liquidity of SAP SE and the SAP Group, and the interests of the shareholders. We also discussed these matters with the auditor. We then endorsed the Executive Board’s proposal on the appropriation of retained earnings, in accordance with the Finance and Investment Committee's recommendation. The corporate governance statement pursuant to the German Commercial Code, sections 315d and 289f had been approved for publication by the Supervisory Board by way of correspondence vote prior to the audit meeting. Finally, we approved this present Report for submission to the Annual General Meeting of Shareholders.
| 19/326 |
|
Integrated Report 2025 | ||||
| To
Our Stakeholders |
Combined Management Report |
Consolidated
Financial Statements IFRS |
Additional Information | ||
Changes on the Executive Board and Supervisory Board in 2025
By resolution of the Supervisory Board on January 19, 2025, Thomas Saueressig’s service contract was extended for three years, until October 31, 2028. At the same meeting, Sebastian Steinhaeuser was appointed to the Executive Board for a term of three years, effective February 1, 2025. He leads the Strategy & Operations Board area. In May 2025, the Supervisory Board resolved to extend the service contract of SAP’s CEO, Christian Klein, who had already been given a three-year extension, by a further two years. He now has a five-year service contract until the end of April 2030. In May 2025, the Supervisory Board likewise extended the contract of SAP’s CFO, Dominik Asam, by two years, to the end of March 2028.
Having elected to take early retirement, Margret Klein-Magar stepped down from her role as an employee representative on the Supervisory Board on December 31, 2025. We are grateful to her for her many years of dedicated service on the Supervisory Board.
The Supervisory Board thanks the members of the Executive Board and the Extended Board for their commitment and for their constructive approach to our work throughout the year.
The Supervisory Board also thanks all employees for their hard work in 2025 and for their unwavering dedication to SAP.
On behalf of the Supervisory Board
Dr. h.c. mult. Pekka Ala-Pietilä
(Chairperson)
| 20/326 |
|
Integrated Report 2025 | ||||
| To
Our Stakeholders |
Combined Management Report |
Consolidated
Financial Statements IFRS |
Additional Information | ||
Responsibility Statement
To the best of our knowledge, and in accordance with the applicable reporting principles, the Consolidated Financial Statements give a true and fair view of the assets, finances, and operating results of the SAP Group, and the Combined Management Report of the Group and SAP SE includes a fair review of the development and performance of the business and the position of the Group and SAP SE, together with a description of the principal opportunities and risks associated with the expected development of the Group and SAP SE.
Walldorf, February 18, 2026
SAP SE
Walldorf, Germany
Executive Board of SAP SE
Christian Klein |
Muhammad Alam |
Dominik Asam |
Thomas Saueressig |
Sebastian Steinhaeuser |
Gina Vargiu-Breuer |
| 21/326 |
|
Integrated Report 2025 | ||||
| To
Our Stakeholders |
Combined Management Report |
Consolidated
Financial Statements IFRS |
Additional Information | ||
Independent Auditor’s Report
To SAP SE, Walldorf
REPORT ON THE AUDIT OF THE CONSOLIDATED FINANCIAL STATEMENTS AND OF THE COMBINED MANAGEMENT REPORT
AUDIT OPINIONS
We have audited the consolidated financial statements of SAP SE, Walldorf, and its subsidiaries (the group), which comprise the consolidated statement of financial position as at December 31, 2025, the consolidated income statements, consolidated statements of comprehensive income, consolidated statements of changes in equity and consolidated statements of cash flows for the financial year from January 1, 2025 to December 31, 2025, and notes to the consolidated financial statements, including material accounting policy information.
In addition, we have audited the combined management report (report on the position of the company and of the group) of SAP SE for the financial year from January 1, 2025 to December 31, 2025. In accordance with the German legal requirements, we have not audited the content of those parts of the combined management report listed in section “OTHER INFORMATION”.
In our opinion, on the basis of the knowledge obtained in the audit,
| – | the accompanying consolidated financial statements comply, in all material respects, with the IFRS Accounting Standards issued by the International Accounting Standards Board (IASB) (hereafter “IFRS Accounting Standards”) as well as adopted by the EU, and the additional requirements of German commercial law pursuant to § 315e (1) HGB [Handelsgesetzbuch: German Commercial Code] and, in compliance with these requirements, give a true and fair view of the assets, liabilities and financial position of the group as at December 31, 2025, and of its financial performance for the financial year from January 1, 2025 to December 31, 2025, and |
| – | the accompanying combined management report as a whole provides an appropriate view of the group’s position. In all material respects, this combined management report is consistent with the consolidated financial statements, complies with German legal requirements and appropriately presents the opportunities and risks of future development. Our opinion on the combined management report does not cover the content of those parts of the combined management report listed in section “OTHER INFORMATION”. |
Pursuant to § 322 (3) sentence 1 HGB (German Commercial Code), we declare that our audit has not led to any reservations relating to the legal compliance of the consolidated financial statements and of the combined management report.
BASIS FOR THE AUDIT OPINIONS
We conducted our audit of the consolidated financial statements and of the combined management report in accordance with § 317 HGB and the EU Audit Regulation (No. 537/2014, referred to subsequently as “EU Audit Regulation”) and in compliance with German Generally Accepted Standards for Financial Statement Audits promulgated by the Institut der Wirtschaftsprüfer [Institute of Public Auditors in Germany] (IDW). We conducted our audit of the consolidated financial statements in supplementary compliance with the International Standards on Auditing (ISAs). Our responsibilities under those requirements, principles and standards are further described in the “AUDITOR’S RESPONSIBILITIES FOR THE AUDIT OF THE CONSOLIDATED FINANCIAL STATEMENTS AND OF THE COMBINED MANAGEMENT REPORT” section of our auditor’s report. We are independent of the group entities in accordance with the requirements of European law and German commercial and professional law, and we have fulfilled our other German professional responsibilities in accordance with these requirements.
In addition, in accordance with Article 10 (2) letter (f) of the EU Audit Regulation, we declare that we have not provided non-audit services prohibited under Article 5 (1) of the EU Audit Regulation.
We believe that the audit evidence we have obtained is sufficient and appropriate to provide a basis for our audit opinions on the consolidated financial statements and on the combined management report.
| 22/326 |
|
Integrated Report 2025 | ||||
| To
Our Stakeholders |
Combined Management Report |
Consolidated
Financial Statements IFRS |
Additional Information | ||
KEY AUDIT MATTERS IN THE AUDIT OF THE CONSOLIDATED FINANCIAL STATEMENTS
Key audit matters are those matters that, in our professional judgment, were of most significance in our audit of the consolidated financial statements for the financial year from January 1, 2025 to December 31, 2025. These matters were addressed in the context of our audit of the consolidated financial statements as a whole, and in forming our audit opinion thereon; we do not provide a separate audit opinion on these matters.
We have identified the following matters as key audit matters to be disclosed in our auditor’s report:
| 1. | Cloud revenue recognition |
| 2. | Assessment of the Group’s uncertain tax treatments |
| 3. | Measurement of unlisted equity securities |
| 1. | CLOUD REVENUE RECOGNITION |
Matter
The Group generated revenue in 2025 of EUR 36,800 million, of which EUR 21,023 million relate to cloud revenues from fees earned from providing customers a cloud offering with software as a service, platform as a service, infrastructure as a service and/or premium cloud support through subscriptions for use of the Group’s cloud solutions. For most of the Group’s cloud offerings, measured both in volume and number, the customer is entitled to continuously access and use one or more cloud solutions for a specified term, therefore cloud revenue is recognized based on time elapsed and thus ratably over the term of access. However, some cloud business models are provisioned on a consumption basis where a customer commits to a fixed value of spend on cloud services throughout the contract term, but with the discretion to call off cloud services on an as needed basis. For those arrangements cloud revenue is recognized based on consumption as it best reflects the measure towards satisfaction of the performance obligation(s).
The evaluation of cloud revenue contracts bears an inherent risk of errors due to the complex nature of certain contracts. SAP defined detailed accounting policy guidelines in line with the applicable accounting standards and has established uniform processes throughout the group to manage the accounting for its cloud contracts. Applying them often requires significant management judgment, in particular with respect to whether certain agreements with the same customer are economically linked and need to be combined, whether the various services that are owed by the Group according to the contract qualify as separate performance obligations, the allocation of the transaction price of a customer contract to the performance obligations in the contract based on standalone-selling prices and the point in time at which the provision of services by the Group for the specific performance obligation commences.
Cloud revenue recognition is a key audit matter due to the significance of the cloud revenue and the high degree of complex judgment required.
The respective cloud revenue disclosures of the Group are contained in section “A.1 Revenue” of the notes to the consolidated financial statements.
Auditor’s Response and Observations
We evaluated the design and we tested the operating effectiveness of certain internal controls related to the revenue process, including controls related to the identification of certain economically linked agreements and separate performance obligations, the allocation of the transaction price to the performance obligations in certain contracts, and the point in time at which the provisioning of service commenced. We tested a sample of underlying contractual agreements and other related documents to evaluate the Group’s assessment of whether certain agreements were economically linked, the identified performance obligations, the allocation of the transaction price and the point in time at which the provision of service for the performance obligations identified commenced. We tested key contractual terms and conditions from the respective contracts to evaluate the identified performance obligations and the point in time at which the provision of service for the identified performance obligations commenced.
Based on the audit procedures we performed, we have found management’s judgments used for revenue recognition of cloud contracts, particularly in the area of assessing whether certain contracts are economically linked and need to be combined, identifying separate performance obligations, allocating the transaction price to the performance obligation, and assessing the point in time at which the provision of services commenced, acceptable.
| 23/326 |
|
Integrated Report 2025 | ||||
| To
Our Stakeholders |
Combined Management Report |
Consolidated
Financial Statements IFRS |
Additional Information | ||
| 2. | ASSESSMENT OF THE GROUP’S UNCERTAIN TAX TREATMENTS |
Matter
The Group disclosed contingent liabilities relating to tax uncertainties of EUR 1,187 million. The Group operates in multiple tax jurisdictions which continually revise and change tax laws with complexities and uncertainties due to different interpretations of these tax laws, especially relating to the deductibility of intercompany royalty payments and intercompany services. The identification, recognition, measurement and disclosure of certain income tax risks specifically related to the deductibility of intercompany royalty payments and intercompany services requires significant management judgment in determining key assumptions to be applied to the interpretation of tax laws, related regulations, case laws and mutual agreement procedures across multiple jurisdictions. Significant management judgment is also required to determine whether the deductibility of intercompany royalty payments and intercompany services is more-likely-than-not to be sustained. These management judgments demand a high degree of expertise, for which the Group regularly engages external experts to provide tax opinions to support their own risk assessment.
The respective disclosures regarding uncertain tax positions of the Group are contained in section “C.5 Income Taxes” of the notes to the consolidated financial statements.
Auditor’s Response and Observations
We involved internal experts with specialized skills and knowledge in taxation to evaluate the appropriateness of management’s methods and key assumptions used to estimate certain uncertain tax positions. For certain group business activities, we assessed the reasonableness and consistency of management’s judgment in the interpretation of relevant tax regulations. In addition, we evaluated the significant assumptions underlying the interpretation of relevant tax laws and related interpretations, relevant case law, and mutual agreement procedures in the respective tax jurisdictions. We assessed the reasonableness of conclusions reached regarding the identification, recognition, measurement and disclosure of certain uncertain tax positions related to the deductibility of intercompany royalty payments and intercompany services.
Based on the audit procedures we performed, we have found management’s judgments associated with the estimation of uncertain tax positions, specifically related to the deductibility of intercompany royalty payments and intercompany services, acceptable.
| 3. | MEASUREMENT OF UNLISTED EQUITY SECURITIES |
Matter
The Group holds unlisted equity securities held at fair value of EUR 6,324 million as of December 31, 2025, primarily relating to Sapphire Ventures investments. These investments in unlisted equity securities are classified as financial instruments at fair value through profit and loss requiring a recurring fair value measurement using significant unobservable inputs. The measurement of the fair value of certain investments is complex and, with regard to the assumptions made, highly dependent on management's estimates and judgments. This applies particularly to the significant measurement uncertainty associated with the fair value of such investments relating to significant unobservable inputs used, such as the selection of appropriate comparable company data, in deriving revenue multiples as well as forecasted performance of the investees.
The respective disclosures regarding the fair value measurement of unlisted equity securities of the Group are contained in sections “D.6 Equity Investments” and “F.2 Fair Value Disclosures on Financial Instruments” of the notes to the consolidated financial statements.
Auditor’s Response and Observations
We involved internal experts with specialized skills and knowledge in valuation to assist in assessing and evaluating the appropriateness of the valuation technique used for a selection of certain investments in unlisted equity securities relating to Sapphire Ventures investments. We tested the appropriateness of the valuation technique selected by comparing it to our expectation based on industry experience and knowledge of the investment. We assessed the source, reliability and relevance of evidence used in determining significant unobservable inputs and we evaluated the significant unobservable inputs considered in the recurring measurement of fair value by comparing them to historical and market information. In addition, we developed an independent range of acceptable fair value estimates utilizing available market information from third party sources to assess whether managements estimates are reasonable.
Based on the audit procedures we performed, we have found management’s judgments related to the fair value measurement of unlisted equity securities acceptable.
| 24/326 |
|
Integrated Report 2025 | ||||
| To
Our Stakeholders |
Combined Management Report |
Consolidated
Financial Statements IFRS |
Additional Information | ||
OTHER INFORMATION
The executive board and the supervisory board are responsible for the other information. The other information comprises:
| – | the combined non-financial statement provided in section “Group Sustainability Statement” of the combined management report |
| – | the separately published corporate governance statement, to which reference is made in section “Corporate Governance Fundamentals” of the combined management report |
| – | the disclosures extraneous to the combined management report and marked as unaudited |
| – | the annual report on Form 20-F and the other parts of the annual report, except for the audited financial statements and combined management report as well as our auditor’s report |
Our audit opinions on the consolidated financial statements and on the combined management report do not cover the other information, and consequently we do not express an opinion or any other form of assurance conclusion thereon.
In connection with our audit, our responsibility is to read the other information and thereby acknowledge whether the other information
| – | is materially inconsistent with the consolidated financial statements, with the combined management report, or our knowledge obtained in the audit or |
| – | otherwise appears to be materially misstated. |
If, based on the work we have performed, we conclude that there is a material misstatement of this other information, we are required to report that fact. We have nothing to report in this regard.
In addition, we were engaged to perform an independent assurance engagement on selected qualitative and quantitative sustainability disclosures, which is also other information of the combined management report 2025. In regard to the nature, extent and conclusions of this independent assurance engagement for specific other information we refer to our independent assurance report dated February 18, 2026.
RESPONSIBILITIES OF THE EXECUTIVE BOARD AND THE SUPERVISORY BOARD FOR THE CONSOLIDATED FINANCIAL STATEMENTS AND THE COMBINED MANAGEMENT REPORT
The executive board is responsible for the preparation of the consolidated financial statements that comply, in all material respects, with the IFRS Accounting Standards as adopted by the EU and the additional requirements of German commercial law pursuant to § 315e (1) HGB as well as the IFRSs as issued by the International Accounting Standards Board and that the consolidated financial statements, in compliance with these requirements, give a true and fair view of the assets, liabilities, financial position and financial performance of the group. In addition, the executive board is responsible for such internal control as the executive board has determined necessary to enable the preparation of consolidated financial statements that are free from material misstatement, whether due to fraud (i. e. fraudulent financial reporting and misappropriation of assets) or error.
In preparing the consolidated financial statements, the executive board is responsible for assessing the group’s ability to continue as a going concern. The executive board also have the responsibility for disclosing, as applicable, matters related to going concern. In addition, the executive board are responsible for financial reporting based on the going concern basis of accounting unless there is an intention to liquidate the group or to cease operations, or there is no realistic alternative but to do so.
Furthermore, the executive board is responsible for the preparation of the combined management report that, as a whole, provides an appropriate view of the group’s position and is, in all material respects, consistent with the consolidated financial statements, complies with German legal requirements, and appropriately presents the opportunities and risks of future development. In addition, the executive board is responsible for such arrangements and measures (systems) as the executive board has considered necessary to enable the preparation of a combined management report that is in accordance with the applicable German legal requirements, the German Accounting Standard number 20 (GAS 20) and the IFRS Practice Statement Management Commentary and to be able to provide sufficient appropriate evidence for the assertions in the combined management report.
The supervisory board is responsible for overseeing the group’s financial reporting process for the preparation of the consolidated financial statements and of the combined management report.
| 25/326 |
 |
Integrated Report 2025 | ||||
| To
Our Stakeholders |
Combined
Management Report |
Consolidated
Financial Statements IFRS |
Additional Information | ||
AUDITOR’S RESPONSIBILITIES FOR THE AUDIT OF THE CONSOLIDATED FINANCIAL STATEMENTS AND OF THE COMBINED MANAGEMENT REPORT
Our objectives are to obtain reasonable assurance about whether the consolidated financial statements as a whole are free from material misstatement, whether due to fraud or error, and whether the combined management report as a whole provides an appropriate view of the group’s position and, in all material respects, is consistent with the consolidated financial statements and the knowledge obtained in the audit, complies with the German legal requirements and appropriately presents the opportunities and
risks of future development, as well as to issue an auditor’s report that includes our opinions on the consolidated financial statements and on the combined management report.
Reasonable assurance is a high level of assurance, but is not a guarantee that an audit conducted in accordance with § 317 HGB and the EU Audit Regulation and in compliance with German Generally Accepted Standards for Financial Statement Audits promulgated by the Institut der Wirtschaftsprüfer (IDW) and supplementary compliance with the ISAs will always detect a material misstatement. Misstatements can arise from fraud or error and are considered material if, individually or in the aggregate, they could reasonably be expected to influence the economic decisions of users taken on the basis of these consolidated financial statements and this combined management report.
We exercise professional judgment and maintain professional skepticism throughout the audit. We also
| – | identify and assess the risks of material misstatement of the consolidated financial statements and of the combined management report, whether due to fraud or error, design and perform audit procedures responsive to those risks, and obtain audit evidence that is sufficient and appropriate to provide a basis for our audit opinions. The risk of not detecting a material misstatement resulting from fraud is higher than the risk of not detecting a material misstatement resulting from error, as fraud may involve collusion, forgery, intentional omissions, misrepresentations, or the override of internal controls. obtain an understanding of internal controls relevant to the audit of the consolidated financial statements and of arrangements and measures relevant to the audit of the combined management report in order to design audit procedures that are appropriate in the circumstances. |
| – | evaluate the appropriateness of accounting policies used by the executive board and the reasonableness of estimates made by the executive board and related disclosures. |
| – | conclude on the appropriateness of the executive boards’ use of the going concern basis of accounting and, based on the audit evidence obtained, whether a material uncertainty exists related to events or conditions that may cast significant doubt on the group’s ability to continue as a going concern. If we conclude that a material uncertainty exists, we are required to draw attention in the auditor’s report to the related disclosures in the consolidated financial statements and in the combined management report or, if such disclosures are inadequate, to modify our respective audit opinions. Our conclusions are based on the audit evidence obtained up to the date of our auditor’s report. However, future events or conditions may cause the group to cease to be able to continue as a going concern. |
| – | evaluate the overall presentation, structure and content of the consolidated financial statements, including the disclosures, and whether the consolidated financial statements present the underlying transactions and events in a manner that the consolidated financial statements give a true and fair view of the assets, liabilities, financial position and financial performance of the group in compliance with IFRS Accounting Standards as adopted by the EU as well as with the IFRS Accounting Standards, as issued by the International Accounting Standards Board and the additional requirements of German commercial law pursuant to § 315e (1) HGB. |
| – | plan and perform the group audit to obtain sufficient appropriate audit evidence regarding the financial information of the entities or business units within the group as a basis for forming the audit opinions on the consolidated financial statements and on the combined management report. We are responsible for the direction, supervision and review of the audit work performed for purposes of the group audit. We remain solely responsible for our audit opinions. |
| – | evaluate the consistency of the combined management report with the consolidated financial statements, its conformity with German law, and the view of the group’s position it provides. |
| – | perform audit procedures on the prospective information presented by the executive board in the combined management report. On the basis of sufficient appropriate audit evidence we evaluate, in particular, the significant assumptions used by the executive board as a basis for the prospective information, and evaluate the proper derivation of the prospective information from these assumptions. We do not express a separate opinion on the prospective information and on the assumptions used as a basis. There is a substantial unavoidable risk that future events will differ materially from the prospective information. |
| 26/326 |
|
Integrated Report 2025 | ||||
| To
Our Stakeholders |
Combined
Management Report |
Consolidated
Financial Statements IFRS |
Additional Information | ||
We communicate with those charged with governance regarding, among other matters, the planned scope and timing of the audit and significant audit findings, including any significant deficiencies in internal controls that we identify during our audit.
We also provide those charged with governance with a statement that we have complied with the relevant independence requirements and communicate with them all relationships and other matters that may reasonably be thought to bear on our independence, and, where applicable, the actions taken or safeguards applied to eliminate independence threats.
From the matters communicated with those charged with governance, we determine those matters that were of most significance in the audit of the consolidated financial statements of the current period and are therefore the key audit matters. We describe these matters in our auditor’s report unless law or regulation precludes public disclosure about the matter.
OTHER LEGAL AND REGULATORY REQUIREMENTS
REPORT ON INTERNAL CONTROL OVER FINANCIAL REPORTING IN THE CONSOLIDATED FINANCIAL STATEMENTS PURSUANT TO PCAOB
Opinion on Internal Control over Financial Reporting in the Consolidated Financial Statements
We have audited SAP SE’s (the “Company’s”) internal control over financial reporting as of December 31, 2025, based on criteria established in Internal Control — Integrated Framework (2013) issued by the Committee of Sponsoring Organizations of the Treadway Commission (the “COSO criteria”). In our opinion, the Company maintained, in all material respects, effective internal control over financial reporting as of December 31, 2025, based on the COSO criteria.
Executive Board’s and Supervisory Board’s Responsibility for the Internal Control over Financial Reporting in the Consolidated Financial Statements
The executive board is responsible for maintaining effective internal control over financial reporting and for its assessment of the effectiveness of internal control over financial reporting, included in Management’s Annual Report on Internal Control over Financial Reporting in the Consolidated Financial Statements.
A company’s internal control over financial reporting is a process designed to provide reasonable assurance regarding the reliability of financial reporting and the preparation of financial statements for external purposes in accordance with generally accepted accounting principles. A company’s internal control over financial reporting includes those policies and procedures that (1) pertain to the maintenance of records that, in reasonable detail, accurately and fairly reflect the transactions and dispositions of the assets of the company; (2) provide reasonable assurance that transactions are recorded as necessary to permit preparation of financial statements in accordance with generally accepted accounting principles, and that receipts and expenditures of the company are being made only in accordance with authorizations of management and directors of the company; and (3) provide reasonable assurance regarding prevention or timely detection of unauthorized acquisition, use, or disposition of the company’s assets that could have a material effect on the financial statements.
Because of its inherent limitations, internal control over financial reporting may not prevent or detect misstatements. Also, projections of any evaluation of effectiveness to future periods are subject to the risk that controls may become inadequate because of changes in conditions, or that the degree of compliance with the policies or procedures may deteriorate.
The supervisory board is responsible for overseeing SAP SE’s internal control over financial reporting in the consolidated financial statements.
Auditor’s Responsibility for the Internal Control over Financial Reporting in the Consolidated Financial Statements
Our responsibility is to express an opinion on SAP SE’s internal control over financial reporting based on our audit. We are a public accounting firm registered with the PCAOB and are required to be independent with respect to SAP SE in accordance with U.S. federal securities laws and the applicable rules and regulations of the Securities and Exchange Commission and the PCAOB.
We conducted our audit of internal control over financial reporting in accordance with the standards of the PCAOB. Those standards require that we plan and perform the audit to obtain reasonable assurance about whether effective internal control over financial reporting was maintained in all material respects. Our audit included obtaining an understanding of internal control over financial reporting, assessing the risk that a material weakness exists, and testing and evaluating the design and operating effectiveness of internal control based on the assessed risk. Our audit also included performing such other procedures as we considered necessary in the circumstances.
| 27/326 |
|
Integrated Report 2025 | ||||
| To
Our Stakeholders |
Combined
Management Report |
Consolidated
Financial Statements IFRS |
Additional Information | ||
We believe that our audit provides a reasonable basis for our opinion.
REPORT ON THE ASSURANCE ON THE ELECTRONIC RENDERING OF THE CONSOLIDATED FINANCIAL STATEMENTS AND THE COMBINED MANAGEMENT REPORT, PREPARED FOR PUBLICATION PURPOSES IN ACCORDANCE WITH § 317 (3A) HGB
Assurance Opinion
We have performed assurance work in accordance with § 317 (3a) HGB to obtain reasonable assurance as to whether the rendering of the consolidated financial statements and the combined management report (hereinafter the “ESEF documents”) contained in the electronic file “sap-2025-12-31-DE.xbri” and prepared for publication purposes complies in all material respects with the requirements of § 328 (1) HGB for the electronic reporting format (“ESEF format”). In accordance with German legal requirements, this assurance work extends only to the conversion of the information contained in the consolidated financial statements and the combined management report into the ESEF format and therefore relates neither to the information contained within these renderings nor to any other information contained in the file identified above.
In our opinion, the rendering of the consolidated financial statements and the combined management report contained in the electronic file identified above and prepared for publication purposes complies in all material respects with the requirements of § 328 (1) HGB for the electronic reporting format. Beyond this assurance opinion and our audit opinion on the accompanying consolidated financial statements and the accompanying combined management report for the financial year from January 1, 2025 to December 31, 2025, contained in the “Report on the audit of the consolidated financial statements and of the combined management report” above, we do not express any assurance opinion on the information contained within these renderings or on the other information contained in the file identified above.
Basis for the Assurance Opinion
We conducted our assurance work on the rendering of the consolidated financial statements and the combined management report contained in the file identified above in accordance with § 317 (3a) HGB and the IDW Assurance Standard: Assurance Work on the Electronic Rendering of Financial Statements and Management Reports, Prepared for Publication Purposes in Accordance with § 317 (3a) HGB (IDW AsS 410 (06.2022)). Our responsibility in accordance therewith is further described in the “Auditor’s Responsibilities for the Assurance Work on the ESEF Documents” section. Our audit firm has applied the requirements of the IDW Quality Management Standard: Requirements for Quality Management in the Audit Firm (IDW QMS 1 (09.2022)).
Responsibilities of the Executive Board and the Supervisory Board for the ESEF Documents
The executive board of the company is responsible for the preparation of the ESEF documents with the electronic renderings of the consolidated financial statements and the combined management report in accordance with § 328 (1) sentence 4 No. 1 HGB and for the tagging of the consolidated financial statements in accordance with § 328 (1) sentence 4 No. 2 HGB.
In addition, the executive board of the company is responsible for such internal controls that they have considered necessary to enable the preparation of ESEF documents that are free from material intentional or unintentional non-compliance with the requirements of § 328 (1) HGB for the electronic reporting format.
The supervisory board is responsible for overseeing the process for preparing the ESEF documents as part of the financial reporting process.
Auditor’s Responsibilities for the Assurance Work on the ESEF documents
Our objective is to obtain reasonable assurance about whether the ESEF documents are free from material intentional or unintentional non-compliance with the requirements of § 328 (1) HGB. We exercise professional judgment and maintain professional skepticism throughout the assurance work. We also
| – | identify and assess the risks of material intentional or unintentional non-compliance with the requirements of § 328 (1) HGB, design and perform assurance procedures responsive to those risks, and obtain assurance evidence that is sufficient and appropriate to provide a basis for our assurance opinion. |
| – | obtain an understanding of internal control relevant to the assurance on the ESEF documents in order to design assurance procedures that are appropriate in the circumstances, but not for the purpose of expressing an assurance opinion on the effectiveness of these controls. |
| – | evaluate the technical validity of the ESEF documents, i. e. whether the file containing the ESEF documents meets the requirements of the Delegated Regulation (EU) 2019/815, in the version in force at the date of the financial statements, on the technical specification for this electronic file. |
| 28/326 |
|
Integrated Report 2025 | ||||
| To
Our Stakeholders |
Combined
Management Report |
Consolidated
Financial Statements IFRS |
Additional Information | ||
| – | evaluate whether the ESEF documents provide an XHTML rendering with content equivalent to the audited consolidated financial statements and to the audited combined management report. |
| – | evaluate whether the tagging of the ESEF documents with Inline XBRL technology (iXBRL) in accordance with the requirements of Articles 4 and 6 of the Delegated Regulation (EU) 2019/815, in the version in force at the date of the financial statements, enables an appropriate and complete machine-readable XBRL copy of the XHTML rendering. |
FURTHER INFORMATION PURSUANT TO ARTICLE 10 OF THE EU AUDIT REGULATION
We were elected as auditor by the annual general meeting on May 13, 2025. We were engaged by the chairperson of the Audit and Compliance Committee on June 10, 2025. We have been the auditor of the consolidated financial statements of the SAP SE without interruption since the financial year 2023.
We declare that the audit opinions expressed in this auditor’s report are consistent with the additional report to the audit committee pursuant to Article 11 of the EU Audit Regulation (long-form audit report).
In addition to the financial statement audit of SAP SE, we have performed various financial statement audits at subsidiaries and have provided to group entities the following services that are not disclosed in the consolidated financial statements or in the combined management report for the audited entity or its controlled entities:
| – | reasonable assurance engagement on selected qualitative and quantitative sustainability disclosures of the Integrated Report 2025, |
| – | limited assurance engagement on the combined non-financial statement according to §§ 315b and c HGB in conjunction with §§ 289b to 289e HGB, |
| – | service organization attestation procedures, |
| – | audit of EMIR requirements according to § 32 (1) German Securities Trading Act (WpHG) in conjunction with § 3 Counterparty Audit Certificate Ordinance (GPrüfbV), |
| – | audit of the compensation report including related disclosures of SAP SE pursuant to the requirements of § 162 of the German Stock Corporation Act [AktG]. |
OTHER MATTER — USE OF THE AUDITOR’S REPORT
Our auditor’s report must always be read together with the audited consolidated financial statements and the audited combined management report as well as the assured ESEF documents. The consolidated financial statements and the combined management report converted to the ESEF format — including the versions to be published in the German Company Register — are merely electronic renderings of the audited consolidated financial statements and the audited combined management report and do not take their place. In particular, the ESEF report and our assurance opinion contained therein are to be used solely together with the assured ESEF documents provided in electronic form.
| 29/326 |
|
Integrated Report 2025 | ||||
| To
Our Stakeholders |
Combined
Management Report |
Consolidated
Financial Statements IFRS |
Additional Information | ||
GERMAN PUBLIC AUDITOR RESPONSIBLE FOR THE ENGAGEMENT
The German Public Auditor responsible for the engagement is Dr. Jens Freiberg.
Frankfurt am Main, February 18, 2026
BDO AG
Wirtschaftsprüfungsgesellschaft
| Dr. Jens Freiberg | Kamil Klinke |
| Wirtschaftsprüfer | Wirtschaftsprüfer |
| German Public Auditor | German Public Auditor |
| 30/326 |
|
Integrated Report 2025 | ||||
| To
Our Stakeholders |
Combined
Management Report |
Consolidated
Financial Statements IFRS |
Additional Information | ||
Assurance Report of the Independent German Public Auditor on an Assurance Engagement to Obtain Limited and Reasonable Assurance in Relation to the Group Sustainability Statement
Assurance Conclusion and Opinion
We have conducted a limited assurance engagement on the Group Sustainability Statement, taking into account, as set forth in the subsequent paragraph, the reasonable assurance engagement on the disclosures presented in section Basis for Preparation/Independent Assurance of the Group Sustainability Statement included in the combined management report, of SAP SE, Walldorf (hereinafter referred to as “SAP” or the “Group”) for the financial year from 1 January 2025 to 31 December 2025. The Group Sustainability Statement was prepared to fulfil the requirements of Directive (EU) 2022/2464 of the European Parliament and of the Council of 14 December 2022 (Corporate Sustainability Reporting Directive, CSRD) and Article 8 of Regulation (EU) 2020/852 as well as Articles 315b and 315c in conjunction with Articles 289b to 289e of the HGB [Handelsgesetzbuch: German Commercial Code] for a combined non-financial statement.
Based on the particular engagement, we have conducted a reasonable assurance engagement on the following disclosures presented in section Basis for Preparation/Independent Assurance of the Group Sustainability Statement (hereinafter referred to as “selected Own Workforce, E-Waste and Climate Change disclosures”):
Own Workforce
| – | Leadership Index |
| – | Employee Turnover |
E-Waste
| – | Waste from electrical and electronic equipment |
Climate Change
| – | Greenhouse Gas Emissions Scope 1 |
| – | Greenhouse Gas Emissions Scope 2 (market-based) |
| – | Greenhouse Gas Emissions Scope 2 (location-based) |
| – | Greenhouse Gas Emissions Scope 3 Upstream (location-based) |
| – | Greenhouse Gas Emissions Scope 3 Upstream (market-based) |
| – | Greenhouse Gas Emissions Scope 3 Downstream |
| – | Carbon Credits |
| – | Renewable energy (including certificates) |
| – | Total Energy Consumption |
| – | Gross Greenhouse Gas Emissions (location-based) |
| 31/326 |
|
Integrated Report 2025 | ||||
| To
Our Stakeholders |
Combined
Management Report |
Consolidated
Financial Statements IFRS |
Additional Information | ||
A reasonable assurance engagement on these disclosures fulfils the requirements for a limited assurance engagement and, in accordance with Recital 60 to the CSRD, thereby complies with the requirements of the CSRD relating to assurance of the Group Sustainability Statement.
Based on the procedures performed and the evidence obtained as part of our limited assurance engagement, nothing has come to our attention that causes us to believe that the accompanying Group Sustainability Statement, taking into account the selected Own Workforce, E-Waste and Climate Change disclosures in the Group Sustainability Statement subject to a reasonable assurance engagement, is not prepared, in all material respects, in accordance with the requirements of the CSRD and Article 8 of Regulation (EU) 2020/852, Articles 315b and 315c in conjunction with Articles 289b to 289e HGB for a combined non-financial statement and the supplementary criteria presented by the executive directors of the Group. This assurance conclusion includes that nothing has come to our attention that causes us to believe that:
| – | the accompanying Group Sustainability Statement does not comply, in all material respects, with the European Sustainability Reporting Standards (ESRS), including that the process carried out by the entity to identify information to be included in the Group Sustainability Statement (the materiality assessment) is not, in all material respects, in accordance with the description set out in section Double Materiality Assessment of the Group Sustainability Statement, or |
| – | the disclosures in the Group Sustainability Statement in section Sustainable Finance: EU Taxonomy Information do not comply, in all material respects, with Article 8 of Regulation (EU) 2020/852. |
In our opinion, on the basis of our reasonable assurance engagement, the selected Own Workforce, E-Waste and Climate Change disclosures in the Group Sustainability Statement were prepared, in all material respects, in accordance with the requirements applicable to these disclosures and the supplementary criteria presented by the executive directors of the Group.
Basis for the Assurance Conclusion and Opinion
We conducted our assurance engagement in accordance with International Standard on Assurance Engagements (ISAE) 3000 (Revised): Assurance Engagements Other Than Audits or Reviews of Historical Financial Information issued by the International Auditing and Assurance Standards Board (IAASB).
The procedures in a limited assurance engagement vary in nature and timing from, and are less in extent than for, a reasonable assurance engagement. Consequently, the level of assurance obtained is substantially lower than the assurance that would have been obtained had a reasonable assurance engagement been performed.
Our responsibilities under ISAE 3000 (Revised) are further described in the section “German Public Auditor's Responsibilities for the Assurance Engagement on the Group Sustainability Statement”.
We are independent of the entity in accordance with the requirements of European law and German commercial and professional law, and we have fulfilled our other German professional responsibilities in accordance with these requirements. Our audit firm has applied the requirements for a system of quality control as set forth in the IDW Quality Management Standard issued by the Institut der Wirtschaftsprüfer [Institute of Public Auditors in Germany] (IDW): Requirements for Quality Management in the Audit Firm (IDW QMS 1 (09.2022)) and in the International Standard on Quality Management (ISQM) 1 issued by the IAASB.
We believe that the evidence we have obtained is sufficient and appropriate to provide a basis for our assurance conclusion and opinion.
Responsibilities of the Executive Directors and the Supervisory Board for the Group Sustainability Statement
The executive directors of the Group are responsible for the preparation of the Group Sustainability Statement in accordance with the requirements of the CSRD and the applicable German legal and other European requirements as well as with the supplementary criteria presented by the executive directors of the Group and for designing, implementing and maintaining such internal control that they have considered necessary to enable the preparation of the Group Sustainability Statement in accordance with these requirements that is free from material misstatement, whether due to fraud (i. e., fraudulent sustainability reporting in the Group Sustainability Statement) or error.
This responsibility of the executive directors includes establishing and maintaining the materiality assessment process, selecting and applying appropriate reporting policies for preparing the Group Sustainability Statement, as well as making assumptions and estimates and ascertaining forward-looking information for individual sustainability-related disclosures.
The Supervisory Board is responsible for overseeing the process for the preparation of the Group Sustainability Statement.
| 32/326 |
|
Integrated Report 2025 | ||||
| To
Our Stakeholders |
Combined
Management Report |
Consolidated
Financial Statements IFRS |
Additional Information | ||
Inherent Limitations in Preparing the Group Sustainability Statement
The CSRD and the applicable German legal and other European requirements contain wording and terms that are subject to considerable interpretation uncertainties and for which no authoritative, comprehensive interpretations have yet been published. Therefore, the executive directors have disclosed their interpretations of such wording and terms in the Group Sustainability Statement. The executive directors are responsible for the reasonableness of these interpretations. As such wording and terms may be interpreted differently by regulators or courts, the legality of measurements or evaluations of sustainability matters based on these interpretations is uncertain.
These inherent limitations also affect the assurance engagement on the Group Sustainability Statement.
German Public Auditor's Responsibilities for the Assurance Engagement on the Group Sustainability Statement
Our objectives are
a) to express a limited assurance conclusion, based on the assurance engagement we have conducted, on whether any matters have come to our attention that cause us to believe that the Group Sustainability Statement, taking into account the selected Own Workforce, E-Waste and Climate Change disclosures in the Group Sustainability Statement subject to a reasonable assurance engagement, has not been prepared, in all material respects, in accordance with the CSRD, the applicable German legal and other European requirements and the supplementary criteria presented by the Group’s executive directors, and to issue an assurance report that includes our assurance conclusion on the Group Sustainability Statement, taking into account the selected Own Workforce, E-Waste and Climate Change disclosures in the Group Sustainability Statement subject to a reasonable assurance engagement.
b) to express a reasonable assurance opinion, based on the assurance engagement we have conducted on whether the selected Own Workforce, E-Waste and Climate Change disclosures in the Group Sustainability Statement are prepared, in all material respects, in accordance with the requirements applicable to these disclosures and the supplementary criteria presented by the executive directors of the Group.
As part of an assurance engagement in accordance with ISAE 3000 (Revised), we exercise professional judgment and maintain professional skepticism. We also:
| a) | for the limited assurance engagement |
| – | obtain an understanding of the process used to prepare the Group Sustainability Statement, including the materiality assessment process carried out by the entity to identify the disclosures to be reported in the Group Sustainability Statement. |
| – | identify disclosures where a material misstatement due to fraud or error is likely to arise, design and perform procedures to address these disclosures and obtain limited assurance to support the assurance conclusion. The risk of not detecting a material misstatement resulting from fraud is higher than the risk of not detecting a material misstatement resulting from error, as fraud may involve collusion, forgery, intentional omissions, misrepresentations or the override of internal control. In addition, the risk of not detecting a material misstatement in information obtained from sources not within entity’s control (value chain information) is ordinarily higher than the risk of not detecting a material misstatement in information obtained from sources within the entity’s control, as both the entity’s executive directors and we as practitioners are ordinarily subject to restrictions on direct access to the sources of the value chain information. |
| – | consider the forward-looking information, including the appropriateness of the underlying assumptions. There is a substantial unavoidable risk that future events will differ materially from the forward-looking information. |
| b) | for the reasonable assurance engagement |
| – | perform risk assessment procedures, including obtaining an understanding of the internal controls that are relevant to the assurance engagement on the selected Own Workforce, E-Waste and Climate Change disclosures in the Group Sustainability Statement in order to identify and assess the risks of material misstatement at the assertion level due to fraud or error, but not for the purpose of expressing an assurance opinion on the effectiveness of these internal controls of the Group. The risk of not detecting a material misstatement resulting from fraud is higher than the risk of not detecting a material misstatement resulting from error, as fraud may involve collusion, forgery, intentional omissions, misrepresentations, or override of internal control. In addition, the risk of not detecting a material misstatement in information obtained from sources in the value chain not within the entity’s control (value chain information) is ordinarily higher than the risk of not detecting a material misstatement in information obtained from sources within the entity’s control, as both the entity’s executive directors and we as practitioners are ordinarily subject to restrictions on direct access to the sources of the value chain information. |
| 33/326 |
|
Integrated Report 2025 | ||||
| To
Our Stakeholders |
Combined
Management Report |
Consolidated
Financial Statements IFRS |
Additional Information | ||
| – | evaluate the appropriate derivation of the forward-looking disclosures from the significant assumptions and the appropriateness of these assumptions. We do not express a separate assurance opinion either on the forward-looking disclosures nor on the assumptions on which they are based. There is a substantial unavoidable risk that future events will differ materially from the forward-looking disclosures. |
Summary of the Procedures Performed for the Limited Assurance Engagement by the German Public Auditor
A limited assurance engagement involves the performance of procedures to obtain evidence about the sustainability information. The nature, timing and extent of the selected procedures are subject to our professional judgment.
In performing our limited assurance engagement, we:
| – | evaluated the suitability of the criteria as a whole presented by the executive directors in the Group Sustainability Statement |
| – | inquired of the executive directors and relevant employees involved in the preparation of the Group Sustainability Statement about the preparation process, including the materiality assessment process carried out by the entity to identify the disclosures to be reported in the Group Sustainability Statement, and about the internal controls relating to this process |
| – | evaluated the reporting policies used by the executive directors to prepare the Group Sustainability Statement |
| – | evaluated the reasonableness of the estimates and related information provided by the executive directors. If, in accordance with the ESRS, the executive directors estimate the value chain information to be reported for a case in which the executive directors are unable to obtain the information from the value chain despite making reasonable efforts, our assurance engagement is limited to evaluating whether the executive directors have undertaken these estimates in accordance with the ESRS and assessing the reasonableness of these estimates, but does not include identifying information in the value chain that the executive directors were unable to obtain |
| – | performed analytical procedures and made inquiries in relation to selected information in the Group Sustainability Statement |
| – | conducted site visits at selected sites |
| – | considered the presentation of the information in the Group Sustainability Statement |
| – | considered the process for identifying taxonomy-eligible and taxonomy-aligned economic activities and the corresponding disclosures in the Group Sustainability Statement. |
Restriction of Use
We draw attention to the fact that the assurance engagement was conducted for the Group’s purposes and that the report is intended solely to inform the Group about the result of the assurance engagement. Consequently, it may not be suitable for any other purpose than the aforementioned. Accordingly, the report is not intended to be used by third parties for making (financial) decisions based on it. Our responsibility is to the Group alone. We do not accept any responsibility to third parties. Our assurance opinion is not modified in this respect.
Engagement Terms
Our professional liability is governed by no. 9 of the General Engagement Terms and Conditions for Auditors and Audit Firms (Allgemeine Auftragsbedingungen für Wirtschaftsprüferinnen, Wirtschaftsprüfer und Wirtschaftsprüfungsgesellschaften) of 1 January 2024, issued by the IDW (www.bdo.de/auftragsbedingungen).
Frankfurt am Main, February 18, 2026
BDO AG
Wirtschaftsprüfungsgesellschaft
| Signed by Dr. Jens Freiberg | Signed by Kamil Klinke |
| Wirtschaftsprüfer | Wirtschaftsprüfer |
| (German Public Auditor) | (German Public Auditor) |
| 34/326 |
|
Integrated Report 2025 | ||||
| To
Our Stakeholders |
Combined
Management Report |
Consolidated
Financial Statements IFRS |
Additional Information | ||
Combined Management Report
| General Information About This Combined Management Report | 37 | |
| Basis of Presentation | 37 | |
| Independent Audit and Assurance | 37 | |
| Forward-Looking Statements | 37 | |
| Strategy and Business Model | 39 | |
| Overview of SAP | 39 | |
| Our Purpose | 39 | |
| Our Vision | 39 | |
| Our Business Model | 40 | |
| Subsidiaries, Acquisitions, and Joint Ventures | 40 | |
| Our Product Strategy | 41 | |
| Our Customers | 45 | |
| Our Investments in Innovation | 46 | |
| Performance Management System | 47 | |
| Measures to Manage Our Financial Performance | 47 | |
| Measures to Manage Our Non-Financial Performance | 48 | |
| Value-Based Management | 49 | |
| Non-IFRS Financial Measures Cited in This Report | 49 | |
| Financial Performance: Review and Analysis | 56 | |
| Economy and the Market | 56 | |
| Performance Against Our Outlook for 2025 | 58 | |
| Operating Results (IFRS) | 59 | |
| Finances (IFRS) | 66 | |
| Assets (IFRS) | 70 | |
| Report on the Financial Performance of SAP SE | 71 | |
| Corporate Governance Fundamentals | 75 | |
| Corporate Governance Statement | 75 | |
| Changes in Management | 75 | |
| Information Concerning Takeovers | 75 | |
| Risk Management and Risks | 77 | |
| Our Risk Management | 77 | |
| Our Global Risk Management Governance Framework | 78 | |
| Our Global Risk Management Policy | 78 | |
| Our Global Risk Management Organization | 78 | |
| Risk Factors | 80 |
| 35/326 |
|
Integrated Report 2025 | ||||
| To
Our Stakeholders |
Combined
Management Report |
Consolidated
Financial Statements IFRS |
Additional Information | ||
| Expected Developments and Opportunities | 91 | |
| Economic Outlook for 2026 and Beyond | 91 | |
| Financial Targets and Prospects | 94 | |
| Outlook for SAP SE | 95 | |
| Opportunities | 96 | |
| Executive Board’s Overall Assessment of Opportunities and Risks | 98 | |
| Group Sustainability Statement | 99 | |
| About This Group Sustainability Statement | 99 | |
| Non-Financial Disclosures in SAP’s Combined Management Report | 100 | |
| Basis for Preparation | 101 | |
| Independent Assurance | 103 | |
| Sustainability Strategy and Governance | 104 | |
| Sustainability Strategy | 104 | |
| Sustainability Governance | 108 | |
| Double Materiality Assessment | 110 | |
| Methodology | 110 | |
| Evaluation | 110 | |
| Approval of the Double Materiality Assessment | 112 | |
| Results of the Double Materiality Assessment | 112 | |
| Integration into Overall Risk and Opportunity Management | 117 | |
| Specific IRO Disclosures on Environmental Topics | 117 | |
| Specific IRO Disclosures on Business Conduct Topics | 119 | |
| Environmental Information | 120 | |
| Sustainable Finance: EU Taxonomy Information | 120 | |
| Climate Change | 130 | |
| Resource Use and Circular Economy | 147 | |
| Social Information | 151 | |
| Human Rights | 151 | |
| Own Workforce | 154 | |
| Workers in the Value Chain | 181 | |
| Security, Cloud Compliance, and Data Protection and Privacy | 185 | |
| Responsible AI | 190 | |
| Governance Information | 195 | |
| Business Conduct | 195 | |
| Appendix | 200 | |
| ESRS Datapoints in Cross-Cutting and Topical Standards That Derive from Other EU Legislation | 200 | |
| Responsibility Statement | 208 |
| 36/326 |
|
Integrated Report 2025 | ||||
| To
Our Stakeholders |
Combined
Management Report |
Consolidated
Financial Statements IFRS |
Additional Information | ||
General Information About This Combined Management Report
Basis of Presentation
This Combined Management Report by the SAP Group (collectively, “we,” “us,” “our,” “SAP,” “Group,” or “Company”) and the management report of SAP SE have been prepared in accordance with sections 289, 289a, 289b, 289f, 298, 315, 315a, 315b, and 315d of the German Commercial Code and German Accounting Standard (GAS) No. 20.
Our sustainability information, which is a separate section in this Combined Management Report, is prepared under the Corporate Sustainability Reporting Directive (CSRD) and European Sustainability Reporting Standards (ESRS); we have followed these provisions on a voluntary basis.
We prepared our Sustainability Statement in accordance with sections 289 b–e and 315 b and c of the German Commercial Code in the form of a Group Sustainability Statement. The scope of consolidation applied in the Group Sustainability Statement is identical to that outlined in the Notes to the Consolidated Financial Statements, Note G.9.
For more information about SAP SE and its results of operations, financial position, and net assets, see the Report on the Financial Performance of SAP SE.
Unless otherwise stated, all the financial information in this report relates to the situation as at December 31, 2025, or the fiscal year that ended on that date. Furthermore, unless otherwise stated, all financial numbers in this Combined Management Report are based on continuing operations. For more information, including the results from discontinued operations, see the Notes to the Consolidated Financial Statements, Note (D.1).
Because the numbers presented throughout this report are rounded, they may not add up exactly to the totals we provide, and percentages may not precisely reflect the absolute amounts.
Independent Audit and Assurance
Our independent auditor, BDO AG Wirtschaftsprüfungsgesellschaft (BDO), audited SAP’s Combined Management Report. The Combined Management Report, with the exception of the Group Sustainability Statement, was audited with reasonable assurance. The Group Sustainability Statement was subject to an independent assurance engagement with limited assurance. Additionally, BDO has provided reasonable assurance on selected sustainability information.
For more information about the scope of the assurance and the underlying reporting criteria, see BDO’s Independent Auditor’s Report and Independent Auditor’s Report on an Limited Assurance Engagement of the Group Sustainability Statement.
Forward-Looking Statements
This Combined Management Report contains forward-looking statements and information based on the beliefs of, and assumptions made by, SAP management using information currently available to them. Any statements contained in this report that are not historical facts are forward-looking statements as defined in the U.S. Private Securities Litigation Reform Act of 1995. We have based these forward-looking statements on our current expectations, assumptions, and projections about future conditions and events. As a result, our forward-looking statements and information are subject to uncertainties and risks, many of which are beyond our control. If one or more of these uncertainties or risks materializes, or if management’s underlying assumptions prove incorrect, our actual results could differ materially from those described in or inferred from our forward-looking statements and information. We describe these risks and uncertainties in the Risk Management and Risks section.
The words “aim,” “anticipate,” “assume,” “believe,” “continue,” “could,” “counting on,” “is confident,” “development,” “estimate,” “expect,” “forecast,” “future trends,” “guidance,” “intend,” “may,” “might,” “outlook,” “plan,” “predict,” “project,” “seek,” “should,” “strategy,” “want,” “will,” “would,” and similar expressions as they relate to us are intended to identify such forward-looking statements. Such statements include, for example, those made in the Operating Results (IFRS) subsection; our quantitative and qualitative disclosures about market risk pursuant to the International Financial Reporting Standards (IFRS) accounting standards, namely IFRS 7 and related statements in our Notes to the Consolidated Financial Statements; Expected Developments and Opportunities and Risk Management and Risks sections; and other forward-looking information appearing in other parts of this report.
| 37/326 |
|
Integrated Report 2025 | ||||
| To
Our Stakeholders |
Combined
Management Report |
Consolidated
Financial Statements IFRS |
Additional Information | ||
To fully consider the factors that could affect our future financial results, both this report and our Annual Report on Form 20-F should be considered, as well as all our other filings and furnishings with the U.S. Securities and Exchange Commission (SEC). Readers are cautioned not to place undue reliance on these forward-looking statements, which speak only as of the date specified or the date of this report. We undertake no obligation to publicly update or revise any forward-looking statements as a result of new information that we receive about conditions that existed upon issuance of this report, future events, or otherwise, unless we are required to do so by law.
This report includes statistical data about the IT industry and global economic trends that comes from information published by sources including International Data Corporation (IDC), the European Central Bank (ECB), and the International Monetary Fund (IMF). This type of data represents only the estimates of IDC, the ECB, the IMF, and other sources of industry data. SAP does not adopt or endorse any of the statistical information provided by sources such as IDC, the ECB, the IMF, or other similar sources that is contained in this report. The data from these sources is subject to risks and uncertainties, and subject to change based on various factors, including those described above, in the Risk Management and Risks section, and elsewhere in this report. These and other factors could cause our results to differ materially from those expressed in the estimates made by third parties and SAP. We caution readers not to place undue reliance on this data.
| 38/326 |
|
Integrated Report 2025 | ||||
| To
Our Stakeholders |
Combined
Management Report |
Consolidated
Financial Statements IFRS |
Additional Information | ||
Strategy and Business Model
Overview of SAP
Founded in 1972, SAP is a global company headquartered in Walldorf, Germany. Our legal corporate name is SAP SE. For over 50 years, organizations have trusted SAP to bring out their best by uniting business-critical operations spanning finance, procurement, HR, supply chain, customer experience, and others. Today, the Company’s integrated applications aim to connect all parts of a business into an intelligent suite on a fully digital platform in the cloud, thereby replacing the process-driven legacy platform. The SAP Group has a global presence and employed more than 110,000 people as at December 31, 2025.
Our ordinary shares are listed on the Frankfurt Stock Exchange. American Depositary Receipts (ADRs) representing SAP SE ordinary shares are listed on the New York Stock Exchange (NYSE). SAP is a member of Germany’s DAX and TecDAX. Throughout 2025, SAP was among the most valuable companies on the DAX, and in Europe, based on market capitalization.
Our Purpose
At SAP, we remain steadfast in our purpose to “help the world run better and improve people’s lives. Together with our customers, we not only rise to meet today’s challenges, but we are also shaping the future by empowering each other to continuously improve and deliver better outcomes. We believe that progress depends on people and systems working together, and that technology is essential in addressing the most profound economic, environmental, and social challenges. Software and analytics help predict and prevent disasters, make cities smarter, and foster equity in the workplace. By leveraging innovative tools and business models, we help everyone in the SAP ecosystem make business decisions that have a lasting impact.
We recognize our role in minimizing carbon footprints, promoting human rights, and turning sustainability into a competitive advantage by combining applications, data, and AI into a single intelligent system. We are committed to providing AI solutions that are integral to our customers’ most critical business processes, and aim to ensure that these solutions are relevant, reliable, and responsible. Our solutions are designed to help anticipate risks and avert crises, enable smarter cities, and foster a world built on inclusion and equity. Together, we aim to bring out the best in the world around us.
Our Vision
Our vision of bringing out the best in every business reflects our commitment to transform organizations globally. Our commitment to this vision is based on three pillars:
Transform Your Business at Scale with AI
To stay competitive in a rapidly changing political, socioeconomic, and technological landscape, businesses need to continuously transform at scale. We help our customers drive end-to-end business transformation powered by AI. By creating one harmonized data layer and embedding AI-driven intelligence into core processes, our SAP Business Suite unlocks new pathways to organizational innovation and excellence to enhance agility and drive scalable growth.
Achieve More Across the Value Chain
We help companies leverage collective intelligence to become efficient, resilient, and agile across their entire value chain. By embedding AI and connecting end-to-end business processes—from finance to supply chains, and human resources to customer relations—we fuel efficient growth throughout their business networks. Our solutions aim to go beyond internal systems: they link businesses across enterprises and, by digitalizing transactions, foster transparent, resilient, and sustainable value chains.
Innovate Sustainably and with Confidence
Companies are looking to innovate without compromising ethical and security standards while pursuing sustainable business success. We help our customers innovate by embedding security and simple, transparent compliance controls into solutions, enabling them to decide where their data resides and who can access it. By connecting applications, data, and AI, we help companies drive sustainable action and measurable impact.
At SAP, our journey is one of continuous innovation and transformation. We are committed to delivering solutions that integrate seamlessly, evolve alongside our customers, and are ready to grow with their ambitions.
| 39/326 |
|
Integrated Report 2025 | ||||
| To
Our Stakeholders |
Combined
Management Report |
Consolidated
Financial Statements IFRS |
Additional Information | ||
Our Business Model3
Our business model, through which we implement our vision and strategy, can be summarized as follows:
We create value by first identifying the business needs of our customers and then developing and delivering a portfolio of cloud solutions, services, and support that address these needs. We strive to continuously improve our solutions, identify further business needs, and deliver enhanced value to our customers.
We derive revenue from fees charged to our customers for subscriptions to use our cloud solutions. Software licenses, on-premise support, consulting, development, training, and other services also contribute significant revenue.
For an overview of our product portfolio, see the Our Product Strategy section.
Subsidiaries, Acquisitions, and Joint Ventures
Subsidiaries
SAP SE is the ultimate parent company of the SAP Group. As at December 31, 2025, the SAP Group comprised 216 companies.
For a list of our subsidiaries, associates, and other equity investments, see the Notes to the Consolidated Financial Statements, Note (G.9).
Material Acquisitions
We continue to focus on organic investments in technology and innovations, which are intended to ensure that our product portfolio grows sustainably. Additionally, we may make targeted acquisitions to complement our solution offerings and improve coverage in key strategic markets.
On August 1, 2025, SAP announced its intent to acquire 100% of SmartRecruiters, a leading talent acquisition (TA) software provider. The transaction closed on September 11, 2025, following satisfaction of regulatory and other approvals.
For more information about SmartRecruiters, see the Notes to the Consolidated Financial Statements, Note (D.1).
Sapphire Ventures
In addition to our investments in organic growth and acquisitions, SAP also supports entrepreneurs who aspire to build industry-leading businesses through venture capital funds managed by Sapphire Ventures. Sapphire Ventures manages more than US$11 billion (over €9 billion) and has invested in more than 200 companies. It pursues opportunities in which it can help fuel enterprise growth by adding expertise, relationships, geographic reach, and capital. It places a particular focus on companies and venture funds in Europe, Israel, the United Kingdom, and the United States. Sapphire Ventures has committed to investing more than US$1 billion in the next generation of AI-powered enterprise technology startups.
3 Description of business model, inputs and outputs: ESRS 2 SBM-1 42 (a), (b).
| 40/326 |
|
Integrated Report 2025 | ||||
| To
Our Stakeholders |
Combined
Management Report |
Consolidated
Financial Statements IFRS |
Additional Information | ||
Our Product Strategy4
With the IT landscape continuing to transform at pace, SAP is seeing a clear shift in customer preferences toward the cloud—and toward solutions that are flexible, agile, scalable, and cost-effective. SAP understands the importance of helping customers embrace digital technologies to thrive in today’s dynamic business environment, and has therefore adopted a forward-thinking strategy for sustainable growth and innovation. This strategy also includes sovereign cloud offerings that enable governments and regulated industries to adopt cloud and AI with full control across data, operations, technology, and law, allowing them to innovate on their own terms and under their own governance. We recognize that every organization’s experience with the cloud can be unique and challenging. Yet many customers are already benefiting in many ways: for example, they can allocate personnel who used to manage internal IT teams to other tasks, and ensure online access to systems and data from any location. This shift to the cloud creates new customer requirements and hence new market opportunities that SAP can tap into.
| Generative and agentic AI are reshaping how businesses operate and how end-users engage with software. Across industries, AI is becoming the core driver of transformation, redefining business processes and unlocking untapped potential for innovation and growth. To address this latest technology shift, an integrated foundation that seamlessly brings together applications, data, and AI is essential: SAP’s flywheel. The flywheel captures momentum from continuous rotations across the three layers. Deeply integrated Business AI enhances our SAP Cloud ERP applications, which in turn generate richer, more accurate data. With our SAP Business Data Cloud solution, valuable business data from every part of the business feeds into a semantically rich data layer. | 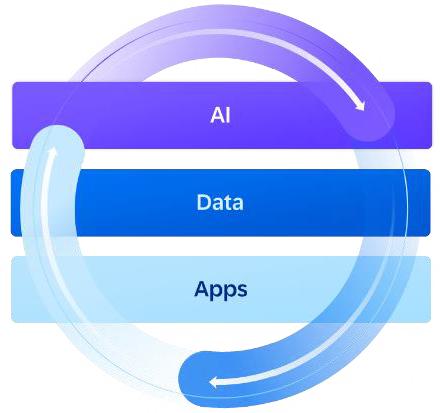 |
SAP Business Suite offers a comprehensive set of integrated solutions, in which applications, data, and AI work as one. It is the destination for all our customers.
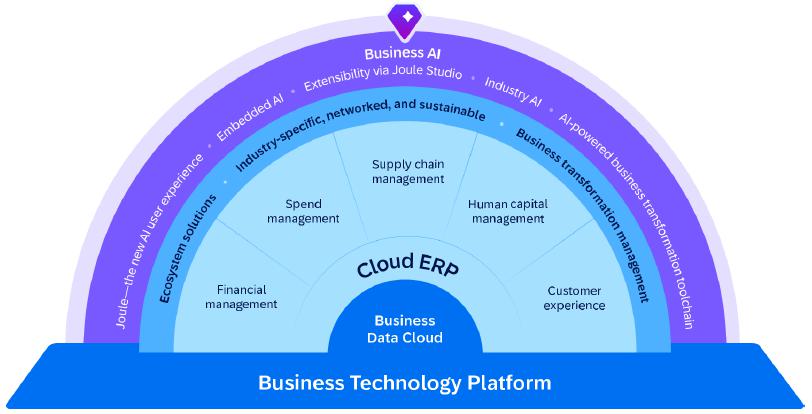
The Cloud ERP Suite metric is the subset of SAP Business Suite covering most of our strategic cloud solutions. For more information about Cloud ERP Suite, see the Performance Management System section. The remaining offerings are part of SAP’s extension suite, which supplements and extends the functional coverage of SAP’s solutions for the cloud.
To strengthen our position as a leading enterprise software company, we have adopted an AI-First, Suite-First strategy, which aims to ensure that our initiatives focus on our key differentiators.
AI-First means that we are not just adding AI capabilities to existing business processes, but adapting our approach to product development. We aim to embed Business AI in every application and business process to boost customer productivity, profitability, and innovation, based on the highest standards of responsible AI as outlined in our Global AI Ethics Policy. Central to this approach are Joule (our AI user experience layer), Joule Agents (AI systems that autonomously plan and execute workflows, connect
4 Amendments to strategy and business model: ESRS 2 SBM-2 45 c (i).
| 41/326 |
|
Integrated Report 2025 | ||||
| To
Our Stakeholders |
Combined
Management Report |
Consolidated
Financial Statements IFRS |
Additional Information | ||
departments, and optimize business processes while collaborating with users and providing insights), and SAP Business Data Cloud (which serves as the data platform across the SAP cloud portfolio, fueling AI capabilities with semantically rich data products).
At the same time, new agentic AI capabilities are reshaping the enterprise technology market, and business process execution is shifting from individual applications to an agentic AI layer that runs all critical processes and becomes the new user experience. To lead this next phase of our transformation, we will be focusing even more strongly on AI in 2026. This includes deploying Joule as the new AI user experience for every user; embedding agentic AI into end-to-end business processes to deliver value through AI assistants; codeveloping with customers to create next-generation AI-powered industry applications; establishing SAP Business Data Cloud as the foundational data layer for AI; and scaling adoption through our RISE with SAP and SAP GROW offerings.
For our cloud products, Suite-First describes our objective of delivering a consistent, or suite-like, experience across our portfolio. SAP Business Technology Platform (SAP BTP) serves as the foundation for this strategy, facilitating development, extensions, and integrations while maintaining a clean core, ensuring that our solutions remain adaptable and forward-looking.
SAP strives to help customers grow their businesses profitably, while at the same time minimizing the risks. To this end, SAP has two journeys, RISE with SAP and SAP GROW, which cater to different customer objectives and requirements. RISE with SAP is targeted at our installed base customers and helps them on their journey from legacy ERP systems to SAP Business Suite. SAP GROW is targeted at new SAP Business Suite customers across a broad market landscape, ranging primarily from those with revenues below €50 million to those with revenues in excess of €1 billion. The offering aims to help them grow their business and simplify work processes. Both journeys provide AI-enabled migration tools that ease our customers transition to SAP Business Suite with less effort.
To guide customers as they migrate to SAP Business Suite, we introduced an evolution of our SAP Services and Support portfolio. The modernized, tiered services and support engagement model will be brought to market in early 2026 and will offer three success plan options: the Foundational Success Plan, the Advanced Success Plan, and the Max Success Plan.
Products5
The pillars of SAP’s product strategy, and our development and innovations, are presented below.
SAP Business AI
SAP Business AI capabilities are available across SAP Business Suite and SAP BTP. SAP offers a wide range of embedded AI features built into core business processes across finance, spend, supply chain, procurement, human capital management, customer relationship management, and customer experience, and in IT and industries.
Joule and Joule Agents fundamentally transform how users interact with SAP’s enterprise applications. Joule serves as an intuitive AI experience layer, navigating applications, executing transactions, and orchestrating digital workforces of prebuilt and custom agents across both SAP and non-SAP systems. Joule Agents are able to take over complex tasks that span the enterprise. The SAP Knowledge Graph solution connects and contextualizes data from across the enterprise and enables Joule Agents to reason and act reliably across end-to-end processes. In 2025, we released 30 Joule Agents.
Our AI Foundation solution on SAP BTP ensures that AI models, trusted data, security, and extensibility are deeply embedded—empowering organizations to streamline processes, accelerate cloud transformation, and adopt responsible AI in a secure, scalable manner.
SAP Business Data Cloud
SAP Business Data Cloud is a fully managed software as a service (SaaS) solution that unifies and governs all SAP data and seamlessly connects with third-party data. It aims to enable customers to transform outcomes with intelligent applications, harmonize mission-critical data, and ensure that trusted data can be used as a foundation for successful agentic AI. The solution can help organizations simplify their data landscape with fully managed data and AI capabilities. It can also help organizations build their business data fabric and a connected, open ecosystem that preserves mission-critical business context across all data.
The key capabilities of SAP Business Data Cloud include: SAP Data Products, which are sets of fully managed and certified data and metadata from SAP applications; the SAP Analytics Cloud solution, which unites analytics and enterprise planning in a single product; the SAP Business Warehouse application, which brings mission-critical, historical data to the cloud and the entire data landscape; the SAP Datasphere solution, which gives customers a semantic layer to discover, share, and model the same trusted data across their business data fabric; SAP Business Data Cloud Intelligent Applications, which address specific business problems and can automate, adapt, and learn in real time; the SAP Databricks capability in SAP Business Data Cloud, which unifies
5 Description of significant groups of products and/or services offered: ESRS 2 SBM-1 40 a (i).
| 42/326 |
|
Integrated Report 2025 | ||||
| To
Our Stakeholders |
Combined
Management Report |
Consolidated
Financial Statements IFRS |
Additional Information | ||
data from SAP line-of-business applications, and structured and unstructured data, to accelerate advanced analytics and machine learning workloads; and the SAP Business Data Cloud Connect solution, which provides bidirectional, zero-copy data sharing in SAP Business Data Cloud with third-party data platforms such as Databricks, Google, and Snowflake. In 2025, we released hundreds of prebuilt, SAP-managed data products for SAP Business Data Cloud.
SAP Business Technology Platform
SAP Business Technology Platform (SAP BTP) is a unified platform designed to extend existing systems, integrate applications and business processes, and build AI-supported applications across the enterprise. As the foundation of SAP Business Suite, SAP BTP unlocks the full potential of our customers’ and partners’ applications, data, and AI.
One of SAP BTP’s key capabilities is SAP Build, which provides an intuitive, open, and unified application development and process automation solution environment for IT and citizen developers. SAP Build features the SAP Joule for Developers add-on and the Joule Studio capability, which allow users to incorporate AI into every aspect of SAP Build and Advanced Business Application Programming (ABAP) development, and to build custom Joule agents and skills. Also part of SAP BTP are SAP Integration Suite—a single scalable, AI-assisted integration platform as a service (iPaaS) to connect and automate business processes across SAP and third-party landscapes—and SAP BTP core capabilities for centralizing application lifecycle, interoperability, security, and administration.
Cloud ERP
SAP Cloud ERP provides software capabilities for finance, risk management, project management, procurement, manufacturing, supply chain management, asset management, R&D, and more. These include capabilities such as the SAP HANA in-memory database, data management, AI, and application lifecycle management—and SAP Cloud ERP solutions, which ease our customers’ transformation to the cloud. These solutions help customers adopt new business models by enabling them to leverage AI, machine learning, and other intelligent technologies for enhanced data analytics and automation.
Financial Management
SAP’s financial management solutions enable organizations to streamline financial operations, ensure compliance, and drive strategic decision-making. SAP delivers a comprehensive, integrated suite across the full spectrum of financial operations—from planning and analysis to the financial close, quote-to-cash, treasury and working capital management, tax and trade, and governance, risk, and compliance—empowering CFOs to elevate their finance organizations from transactional processors to strategic business partners. The SAP Taulia portfolio extends the working capital optimization capabilities in SAP Business Suite by helping businesses and their suppliers release funds trapped in the supply chain, thereby optimizing cash flow and unlocking growth opportunities. Leveraging embedded AI, trusted data, and streamlined processes, these solutions equip finance teams to operate more efficiently, anticipate changes, and lead with confidence.
Spend Management
SAP’s spend management solutions enable procurement teams to unlock real potential from AI and make better decisions with seamless and accessible data. Covering direct and indirect spend, travel and expenses, and external workforce management, these solutions give customers a unified view of their spend to reduce costs, mitigate risks, improve collaboration, and align spend decisions with business strategy. SAP Ariba applications provide a modern, AI-native suite of source-to-pay solutions designed to translate deep insights into seamless processes, ensuring productivity, accuracy, and an optimized employee experience. The SAP Concur portfolio contains solutions for integrated travel, expense, and invoice management. And SAP Fieldglass solutions help businesses find, engage, and manage their global external workforce.
Supply Chain Management
SAP’s portfolio of supply chain management solutions helps companies around the globe and across industries orchestrate their teams, processes, and systems—both internally and with trading partners—to build a stronger supply chain. By providing a comprehensive suite of AI-infused applications that integrate with ERP and adjacent line-of-business solutions, and which digitally connect with trading partner systems, SAP helps break down silos for more efficient, compliant, and responsive supply chains. And, by equipping companies with advanced analytics, operational insights, predictive signals, and recommended actions, it also helps them adapt to changing circumstances and exceed their expectations.
| 43/326 |
|
Integrated Report 2025 | ||||
| To
Our Stakeholders |
Combined
Management Report |
Consolidated
Financial Statements IFRS |
Additional Information | ||
Human Capital Management
SAP SuccessFactors solutions are designed to empower organizations to create an agile, future-ready workforce in a rapidly changing workplace, and help their employees work smarter and more efficiently. The SAP SuccessFactors portfolio includes an AI-enabled suite of cloud solutions that spans core HR, time tracking, payroll, talent acquisition and management, analytics, and employee experience management.
In September, SAP completed the acquisition of SmartRecruiters, a leading provider of enterprise-grade talent acquisition software. The SmartRecruiters platform will be integrated with the SAP SuccessFactors Human Capital Management (HCM) suite. This addition to the SAP SuccessFactors portfolio will help organizations manage the entire talent lifecycle, from sourcing to onboarding, with enhanced AI-enabled recruiting capabilities.
Customer Experience
SAP Customer Experience (SAP CX) is a comprehensive portfolio of marketing, commerce, sales, and service solutions that are natively integrated with SAP ERP and powered by SAP Business AI to deliver insights, operational efficiency, and scalable customer engagement from a single, unified platform. This integration can provide organizations with a governed, real-time view of their business to enrich customer interactions. Joule with embedded SAP CX AI agents can help marketing, sales, and service teams work faster and smarter by enhancing decision-making and proactively assisting and automating workflows.
Business Transformation Management
SAP’s business transformation management solutions help customers realize holistic, data-driven business transformation across several pillars: business processes with SAP Signavio, applications with SAP LeanIX, and people with WalkMe. The comprehensive approach to transformation that these solutions offer can unlock quantifiable business value for organizations, such as deep business insights, optimized IT landscapes, and help with getting their people on board with change.
SAP Signavio solutions, powered by AI, help organizations manage, analyze, and optimize their business processes to achieve the insights and agility they need for successful business transformations. By benchmarking current process landscapes against best practices, and acting on change recommendations, customers can define a target state, adapt their processes accordingly, and assess whether the outcomes they achieve align with their strategic goals.
With SAP LeanIX, customers can manage and transform their IT landscape. SAP LeanIX solutions enable organizations to create transparency over their IT environment, assess interdependencies and risks, and plan modernization initiatives so that they are well equipped to move toward their target IT landscape—supported by proven reference materials, best practices, and seamless integration with leading SAP and non-SAP solutions.
WalkMe offerings help organizations navigate technology change and maximize the return on their software investments by easing user onboarding in cloud solutions. WalkMe’s digital adoption platform delivers guidance, automation, and contextual AI assistance directly in the flow of work, enabling employees to complete workflows across applications, from SAP and beyond. WalkMe’s digital learning solution helps companies reskill their workforce by embedding training directly into the tools employees use every day.
Sustainability Management
SAP helps customers transform sustainability data into real business opportunities and operational efficiencies. The SAP Sustainability portfolio delivers ERP-centric, cloud-based, AI-enabled sustainability solutions for companies of all sizes and from all industries, and supports them by embedding sustainability into every aspect of their daily business operations. The portfolio includes the following offerings: SAP Sustainability Control Tower, SAP Sustainability Footprint Management, SAP Sustainability Data Exchange, and SAP Green Ledger.
Partners and the Ecosystem
The global SAP partner ecosystem plays a key role in delivering and extending our cloud and solution offerings. Our partners support the entire customer lifecycle—from selling and implementing to running and extending our solutions on SAP BTP—and enable customers to integrate, extend, and innovate across SAP Business Suite.
Services and Support
We continue to evolve our cloud-focused services and support portfolio to focus on customer adoption and consumption.
The foundation of the SAP Services and Support portfolio is SAP Enterprise Support, which provides tools and services, curated content, and mission-critical support. SAP Enterprise Support, cloud editions are included with cloud solution subscriptions.
| 44/326 |
|
Integrated Report 2025 | ||||
| To
Our Stakeholders |
Combined
Management Report |
Consolidated
Financial Statements IFRS |
Additional Information | ||
Customers who require more guidance from SAP can opt for incremental service plans, such as SAP Preferred Success and SAP Cloud Application Services, and professional services to address project-specific objectives, timelines, and plans.
To help customers who are planning to make an enterprise-wide transformational change, SAP offers SAP MaxAttention and SAP ActiveAttention services for tailored, long-term strategic engagement. Learning and user enablement is available throughout a customer’s journey and ranges from role-based digital content to expert-led live sessions, hands-on practical training, custom learning content, and certification.
Partnerships
SAP announced various partnerships in 2025.
| – | On May 20, SAP and Accenture announced an expansion of their partnership to help companies enable connected intelligence across the enterprise to drive speed and agility in the AI era through the new ADVANCE offering. |
| – | Also on May 20, SAP and Perplexity announced a partnership to extend SAP’s generative AI and search capabilities by bringing together unstructured and structured data. In addition, SAP and Palantir announced a partnership to facilitate joint customers’ cloud migration journeys and modernization programs by connecting the unified, context-rich data environment of SAP Business Data Cloud with Palantir’s Ontology and Artificial Intelligence Platform. |
| – | On May 27, SAP and Alibaba Group announced an extension of their strategic partnership to accelerate cloud transformation. |
| – | On September 19, SAP and ADP, a global leader in HR and payroll solutions, announced that they would partner to enable shared clients to run ADP Global Payroll in the cloud. |
| – | On September 24, SAP and OpenAI announced the launch of OpenAI for Germany, a partnership to bring SAP’s enterprise applications expertise and OpenAI’s leading AI technology to Germany’s public sector. In addition, SAP and Amazon Web Services (AWS), an Amazon.com company, announced plans to make SAP Sovereign Cloud capabilities available on the AWS European Sovereign Cloud, a new independent cloud for Europe. |
| – | Also on September 24, SAP and Alibaba announced plans to advance their strategic partnership with the phased launch of four SAP cloud solutions (SAP Cloud ERP, SAP Cloud ERP Private, SAP BTP, and SAP Integrated Business Planning) on Alibaba Cloud for Chinese enterprises in China. |
| – | On October 6, SAP and Google Cloud announced that they would expand their long-standing data and analytics partnership with the launch of SAP Business Data Cloud Connect for Google BigQuery—a new capability that aims to simplify access to mission-critical SAP data products from SAP Business Data Cloud through bidirectional, zero-copy data sharing. At the same time, SAP announced SAP Business Data Cloud Connect for Databricks. |
| – | On November 4, SAP and Snowflake, an AI data cloud company, announced the SAP Snowflake solution extension for SAP Business Data Cloud to bring Snowflake’s data and AI capabilities directly to SAP customers. SAP also announced SAP Business Data Cloud Connect for Snowflake, which will make it easier for customers to harmonize and govern mission-critical data wherever it resides. |
| – | On November 18, SAP announced new and expanded collaborations with Mistral AI, Bleu, and Capgemini at the Franco-German EU Summit on Digital Sovereignty. These partnerships aim to accelerate Europe’s digital transformation through secure, scalable, AI-driven sovereign cloud solutions that protect data and intellectual property. |
| – | On November 27, SAP announced the next stage of its vision for European digital sovereignty with the launch of EU AI Cloud. SAP now offers a truly full-stack sovereign cloud offering, empowering customers to select the right level of sovereignty and deployment for their needs, whether in SAP’s own data centers, on trusted European infrastructure, or as a fully managed solution on-site. |
Our Customers
We strive to maximize the value our customers derive from their investment in SAP and from their relationship with us. We do so at every touchpoint in their experience with us over the entire engagement lifecycle. Our customer-facing teams—across solutions, sales, services, customer engagement, ecosystem, and more—work together under an operating model that aims to harmonize internal processes with the goal of delivering improved outcomes for our customers.
Feedback from our customers is crucial to our journey together. To systematically gather and act on these insights, we have a company-wide Global Experience Management (XM) Program6 in place. This program aims to achieve a consistent end-to-end
6 Description of engagement with customers: ESRS 2 SBM-2 45 (a).
| 45/326 |
|
Integrated Report 2025 | ||||
| To
Our Stakeholders |
Combined
Management Report |
Consolidated
Financial Statements IFRS |
Additional Information | ||
experience for our customers by standardizing experience initiatives and methodologies to help identify and close any gaps. The head of Customer and Market Intelligence (CMI) in the Strategy & Operations Board area leads our global XM program, which includes the SAP Customer Loyalty Survey. The customer experience metric derived from this survey is a KPI in the short-term incentive component of Executive Board remuneration. Historically, this KPI is the Customer Net Promoter Score (NPS). Given the importance of our customers and their feedback to SAP, the customer experience KPI is one of our main non-financial KPIs and a performance measure in the short-term incentive component of Executive Board compensation.
In 2025, our Customer NPS decreased three points year over year to nine (2024: 12), which is below our target range of 12 to 16.
Starting in 2026, we will revise our customer experience framework and replace the customer net promoter score with the Cloud Customer Satisfaction (CSAT) KPI. For more information, especially for the differentiation between cloud and on-premise customers, see the Performance Management System section.
Policies, such as our Global Code of Ethics and Business Conduct for Employees, and the applicable General Terms and Conditions govern our relationships with our customers.
Our Investments in Innovation7
We are committed to scaling AI adoption across our organization to accelerate and optimize our innovation cycle. To drive competitive edge, the focus of our research and development (R&D) activities is on advancing our product portfolio. Our priorities here are to strengthen our AI foundation and seamlessly integrate our products. SAP’s strong commitment to R&D is reflected in our expenditure.
In the reporting year, our R&D expenditure increased year over year. Main driver was the higher, but disciplined, use of contingent workforce, which was partially offset by lower share-based payment expenses. For more information, see Financial Performance: Review and Analysis chapter. While our R&D expenditure increased in 2025, our R&D ratios slightly decreased due to the stronger acceleration in revenues. Our IFRS R&D ratio, which reflects R&D expenditure as a portion of total revenue, decreased 1.0 percentage points (pp) to 18.0% (2024: 19.1%). Our non-IFRS R&D ratio likewise decreased 1.0 pp year over year to 18.0% (2024: 19.0%). At the end of 2025, our total full-time equivalent (FTE) headcount in development was 37,965 (2024: 37,590). Measured in FTEs, our R&D headcount remained at 34% of total headcount (2024: 34%).
Total R&D expenditure not only includes our own personnel costs but also the external costs of work and services from the providers and cooperation partners we work with to deliver and enhance our products. We also incur external costs for the following:
| – | Translating, localizing, and testing products |
| – | Obtaining certification for products in different markets |
| – | Patent attorney services and fees |
| – | Consulting related to our product strategy |
| – | Professional development of our R&D workforce |
Patents
Our investment in R&D has resulted in numerous patents. As at December 31, 2025, SAP held almost 13,000 (2024: more than 13,000) validated patents worldwide. Of these, more than 600 (2024: more than 700) were granted and validated in 2025.
While our intellectual property is important to our success, we believe our business as a whole is not dependent on any particular patent or combination of patents.
Competitive Intangibles
The majority of (intangible) resources that are the basis for our current and future success do not appear in the book value of equity in our Consolidated Financial Statements. This is apparent from a comparison of the market capitalization of SAP SE (based on all issued shares), which was €256.0 billion at the end of 2025 (2024: €290.3 billion), with the book value of our equity in the Consolidated Financial Statements, which was €45.1 billion (2024: €45.8 billion). This means that the market capitalization of our equity is more than five times the book value.
7 Description of business model, inputs and outputs: ESRS 2 SBM-1 42 (a), (b).
| 46/326 |
|
Integrated Report 2025 | ||||
| To
Our Stakeholders |
Combined
Management Report |
Consolidated
Financial Statements IFRS |
Additional Information | ||
Performance Management System
In the reporting year, we used various measures to manage our performance on our primary financial objectives, which are growth and profitability, and on our primary non-financial objectives, which are customer loyalty, employee engagement, climate performance, and business health culture.
Measures to Manage Our Financial Performance
The following are the key measures we use to manage our operating and overall financial performance. Except for free cash flow, we report our key measures at both actual and constant currencies.
We use cloud revenue, cloud and software revenue, current cloud backlog (CCB), and total revenue to measure our progress toward our growth targets. Cloud revenue comprises the main revenues of our cloud business and is derived from fees earned from providing customers with software as a service (SaaS), platform as a service (PaaS), and infrastructure as a service (IaaS). Cloud and software revenue includes cloud revenue, software license revenue, and software support revenue. The vast majority of customers who purchase software licenses also enter into related support contracts with us that generate recurring support revenue after the software sale. Cloud revenue is our largest revenue stream, followed by software support revenue. For more information about our revenue measures, see the Notes to the Consolidated Financial Statements 2025, Note (A.1).
As of a specific key date, the CCB is the contractually committed cloud revenue we expect to recognize over the upcoming 12 months. It is therefore a subcomponent of our overall remaining performance obligations, as per IFRS 15.120. Contractual periods that are subject to a customer termination for convenience right without a significant early-termination fee, or that are subject to a termination right under applicable law, are excluded from our CCB. For our committed cloud business, we believe the CCB is a valuable indicator of our go-to-market success, as it reflects both new contracts and contract renewals.
To measure our profitability, we primarily use operating profit (non-IFRS) and free cash flow. Operating profit (non-IFRS) offers insight into our overall operational process efficiency and business performance, while free cash flow provides management with supplemental information for assessing our liquidity needs and position. Free cash flow is used to determine the cash flow remaining after all net expenditures required to maintain or expand our organic business have been paid off.
Besides the key measures mentioned above, SAP also uses various supporting measures to offer further insight into our financial performance. These include Cloud ERP Suite revenue,8 total cloud backlog (TCB),9 share of more predictable revenue,10 subscription revenue, cloud gross profit, and effective tax rate (non-IFRS).11 The subscription revenue measure, introduced in 2025, is the sum of cloud revenue and revenue from time-based on-premise software licenses, which allow our customers to use our software for a specific, predefined period, and the associated software support. Revenue from time-based on-premise licenses is recognized at a point in time, whereas revenue from the associated software support is recognized over time. We use the subscription revenue measure as an indicator of SAP’s revenues, most of which are recurring, across deployment models and offerings that for strategic reasons are sustained over time. It does not include software licenses and support revenue from our perpetual licenses. From 2026 onward, subscription revenue will replace the share of more predictable revenue. We report most of our supporting measures both at actual and constant currencies.
8 We use Cloud ERP Suite revenue as a metric to measure the growth of our portfolio of strategic cloud solutions. Cloud ERP Suite references those offerings that are tightly integrated with our core ERP solutions and are included in key commercial packages, such as RISE with SAP. The following offerings contribute to Cloud ERP Suite revenue: SAP S/4HANA Cloud, SAP Business Technology Platform, and core solutions for People & Culture and payroll, spend management, commerce, customer data solutions, business process transformation, and working capital management.
9 As of a specific key date, the TCB is the total contractually committed cloud revenue we expect to recognize. Thus, TCB and CCB are both subcomponents of our overall remaining performance obligations following IFRS 15.120. For our committed cloud business, we believe that the TCB and the CCB are valuable indicators of our go-to-market success, as they reflect both new contracts and contract renewals. Contractual periods that are subject to a customer termination for convenience right without a significant early-termination fee, or that are subject to a termination right under applicable law, are excluded from our CCB and TCB. For more information about how we calculate these numbers, see the Notes to the Consolidated Financial Statements, Note (A.1).
10 The share of more predictable revenue is the total of cloud revenue and software support revenue divided by total revenue.
11 We define our effective tax rate as the ratio of income tax expense (non-IFRS) to profit before tax (non-IFRS), expressed as a percentage.
| 47/326 |
|
Integrated Report 2025 | ||||
| To
Our Stakeholders |
Combined
Management Report |
Consolidated
Financial Statements IFRS |
Additional Information | ||
Measures to Manage Our Non-Financial Performance
The following are the key measures we used to manage our non-financial performance in the reporting year.
We measure customer experience because we believe that we can only achieve our financial goals if our customers are satisfied with and loyal to SAP and our solutions. We assess customer experience annually by means of a survey that tracks our customer experience KPI based on a dedicated question on the survey. Historically our KPI metric has been the customer net promoter score (NPS), which is measured with the standard, proprietary “likelihood to recommend” question. Its proprietary scoring methodology arrives at the final NPS by taking the difference between the percentage of “Promoters” and “Detractors”, which are categorized based on customers’ numerical rating from 0-10. “Promoters” are customers who rate their likelihood to recommend SAP with a 9 or 10 on the 11-point scale; “Detractors” are customers rating us as a 0-6. The NPS calculation method ignores “Passives” giving a score of 7 or 8, which is a significant limitation of the metric. Based on the NPS methodology’s subtractive calculation based on percentages of two groups, the range of achievable scores is–100 to +100, with the latter being the best achievable score for customer loyalty.
Starting in 2026, we will revise our customer experience KPI framework by switching from Customer NPS (Net Promoter Score) to Cloud Customer Satisfaction (Cloud CSAT). The Cloud CSAT metric is calculated as a “top 2-box” score, taking the percentage of customers who are “very satisfied” or “satisfied” with SAP, as indicated on a 5-point scale that provides response options from “very satisfied” to “very dissatisfied”. Consequently, the range of achievable scores is between 0 and 100, with the latter being the best achievable score for customer satisfaction as measured by the Cloud CSAT methodology.
The Cloud CSAT KPI is calculated based on feedback from our cloud customers. A cloud customer is a customer providing feedback either (1) explicitly about one of the cloud solutions that they have implemented and are operationally running, or (2) giving feedback about “SAP in general” while having implemented and operationally running either exclusively one or more cloud solution(s) or has a mixed portfolio that does not include certain pre-defined solutions, confirmed to be running as on-premise. If a customer runs any of the pre-defined on-premise solutions (ERP On-Prem, HANA On-Prem, S/4HANA On-Prem, HCM On-Prem, SAP Business Objects, SAP Business Warehouse), with none running on private cloud, they are treated as an on-premise customer and their rating score is not considered in the Cloud CSAT calculation. The revenue generated with cloud solutions in any mixed portfolio counts towards cloud revenue reported in our financial information. With this change, SAP aligns the KPI to our cloud-first strategy. In 2025, the Cloud CSAT score was 75%.
The Employee Engagement Index12 measures the satisfaction and commitment of our employees, how proud they are of our company, and how strongly they identify with SAP. Applying this measure is recognition that our growth strategy depends on having engaged employees. The index is expressed as a percentage of favorable responses to five questions in our #Unfiltered engagement survey and we report it as the average of the scores retrieved in each of the surveys we run in a fiscal year. The #Unfiltered program is based on a “continuous listening” approach that includes two data collections throughout the year. The average scores provide an assessment, for the full year, of our employees’ engagement level.
The Business Health Culture Index (BHCI)13 reflects the extent to which SAP provides a working environment that promotes health, supports long-term employability, and fosters active engagement in achieving corporate goals. The index score is the percentage of favorable responses to 10 questions in our #Unfiltered engagement survey and we report it as the average of the scores retrieved in each of the surveys we run in a fiscal year. In the reporting year, the BHCI replaced the Women in Executive Roles measure as one of our key non-financial performance indicators. In 2025, we added equal opportunities as a new component of the index and replaced one of the health and well-being questions so that the revised index gives a holistic view of the employee experience at SAP across key themes, making it a strong indicator of a healthy work environment.
The gross greenhouse gas emissions metric is used to measure greenhouse gas emissions along the value chain (Scope 1, Scope 2, and Scope 3 emissions relevant to SAP’s business model) as part of our net-zero commitment. We apply a market-based approach. Renewable energies, for example in the form of self-generated renewable electricity, investments in certified renewable energy certificates, long-term green electricity contracts (power purchase agreements), and renewable electricity purchased by our suppliers and customers, can count toward the reduction of greenhouse gas emissions. We define, measure, and report our greenhouse gas emissions according to the Greenhouse Gas (GHG) Protocol (in millions of tons of CO2 equivalents). The reporting also complies with ESRS.
In 2026, we intend to revise the methodology we use to calculate Scope 3 GHG emissions. We will replace our current methodology for calculating category 11 emissions from the use of sold products, which is based on the total amount of active maintenance contracts, with a forward-looking approach that considers the estimated emissions during the lifetime of all new systems sold within a specific period. This change aligns our approach more closely with the GHG Protocol. The revised calculation methodology will
12 Methodologies and significant assumptions behind the metric - Employee Engagement Index: ESRS 2 MDR-M 77 (a).
13 Methodologies and significant assumptions behind the metric - Business Health Culture Index: ESRS 2 MDR-M 77 (a).
| 48/326 |
|
Integrated Report 2025 | ||||
| To
Our Stakeholders |
Combined
Management Report |
Consolidated
Financial Statements IFRS |
Additional Information | ||
result in a significant decrease in reported emissions and therefore lead to a re-baselining in accordance with the GHG Protocol. Had this methodology been applied in the reporting year, our 2025 GHG emissions would have been 3,590 kilotons.
Value-Based Management
Our holistic view of the performance measures described above, and the associated analyses, together form the foundation of our value-based management. We use planning and control processes to manage the compilation of these key measures and their availability to our decision-makers across various management levels. SAP’s long-term strategic plans are the point of reference for our short- and medium-term planning and controlling processes. We initially identify future growth and profitability drivers at a highly aggregated level for the entire SAP Group.
In a first step, the financial plan’s growth ambition is determined by the Group’s comprehensive product portfolio, which is grouped into solution areas, and profitability drivers are allocated to functions such as development, marketing, sales, delivery, and administration.
In a second step, the planned total revenues and total expenses are allocated to the operating segments and the areas of functional responsibility of the individual members of the Executive Board (“Board area”). If one of these Board areas represents both a functional department and operating segments, planned revenues and expenses are allocated at segment level. Budget adjustments may be applied during the year to reflect changes in priorities, to achieve efficiency targets, and to reflect internal and external factors. Budget adjustments and the assessment of the performance are managed either at the Board area level if the Board area constitutes a single segment, or at the segment level if the Board area comprises several segments. The Executive Board member is responsible for distributing the budget within the Board area or at segment level as applicable. Based on an integrated portfolio process running in parallel to the budgeting process, we ensure aligned investment behavior across Board areas with regard to specific solution or sub-solution areas.
In a final step, customer-facing revenue targets and cost-of-sales and marketing targets are broken down into sales regions and market units.
Based on our detailed annual plans, we determine the budget for the respective fiscal year. We also have processes in place to forecast revenue and profit on a quarterly basis, to quantify whether we expect to realize our financial targets, and to identify any deviations from plan. We continuously monitor the affected operating segments and board areas in the SAP Group to analyze their developments and define any appropriate actions. Our entire network of planning, controlling, and reporting processes is implemented in integrated planning and information systems, based on SAP software, across all organizational units so that we can conduct the evaluations and analyses needed to make informed decisions. Financial targets for headcount and expenses are substantially based on our topline ambitions. If we determine that SAP’s topline plans are at material risk of not being achieved, we need to be agile and ensure that planned expenses are still properly aligned to the Company’s overall financial ambition.
Non-IFRS Financial Measures Cited in This Report
Explanation of Non-IFRS Measures
We disclose certain financial measures that are not prepared in accordance with IFRS and are therefore considered non-IFRS financial measures. Our non-IFRS financial measures may not correspond to non-IFRS financial measures that other companies report. The non-IFRS financial measures that we report should only be considered in addition to, and not as substitutes for, nor as superior to, our IFRS financial measures.
We believe that the supplemental historical and prospective non-IFRS financial information we disclose is useful to investors because it is used by our management, in addition to financial data prepared in accordance with IFRS, to gain a more transparent understanding of our past performance and our anticipated future results.
We use the non-IFRS measures consistently in our internal planning and forecasting, reporting, and compensation, as well as in our external communications, as follows:
| – | Our management primarily uses the non-IFRS measures, rather than the IFRS measures, as the basis for making financial, strategic, and operating decisions. |
| – | The variable components of our Executive Board members’ and employees’ remuneration are based on non-IFRS numbers rather than the respective IFRS measures. Although we exclude expenses related to regulatory compliance matters from non-IFRS results, starting in 2025 we no longer adjust for these expenses when determining the Executive Board members’ remuneration. |
| 49/326 |
|
Integrated Report 2025 | ||||
| To
Our Stakeholders |
Combined
Management Report |
Consolidated
Financial Statements IFRS |
Additional Information | ||
| – | The annual budgeting process for all management units is based on operating profit (non-IFRS) numbers rather than the respective IFRS financial measure. |
| – | All forecast and performance reviews with all senior managers globally are based on the non-IFRS measures, rather than the respective IFRS financial measures. |
| – | Both our internal performance targets and the guidance we provide to the capital markets are based on non-IFRS measures, rather than the respective IFRS financial measures. |
Our non-IFRS financial performance measures reflect adjustments based on the items below, as well as adjustments for the related income tax effects.
Operating Expense (Non-IFRS)
Numbers that are identified as operating expenses (non-IFRS) have been adjusted by excluding the following expenses:
| – | Acquisition-related charges |
| ■ | Amortization expense/impairment charges for intangibles acquired in business combinations, including goodwill, and certain stand-alone acquisitions of intellectual property (including purchased in-process research and development) |
| ■ | Settlements of preexisting business relationships in connection with a business combination |
| ■ | Acquisition-related third-party expenses |
| – | Restructuring expenses in accordance with IFRS. These costs are recognized when the Company has committed to a formal restructuring program, and a constructive obligation exists. For more information about our restructuring expenses, see the Notes to the Consolidated Financial Statements 2025, Note (B.6). |
| – | Expenses for regulatory compliance matters associated with the provision for (potential) penalties arising from certain ongoing governmental investigations into our business operations, which are described in the Notes to the Consolidated Financial Statements 2025, Note (G.3), and are strictly limited to the scope of IAS 37. |
| – | Expenses related to the Teradata litigation. These expenses include legal fees and expenses from settlements, or damages awarded in court, and are strictly limited to the scope of IAS 37. For more information about the Teradata litigation, see the Notes to the Consolidated Financial Statements 2025, Note G.3). |
We exclude certain acquisition-related expenses for the purpose of calculating operating profit (non-IFRS) and operating margin (non-IFRS) when evaluating SAP’s continuing operational performance, because these expenses generally cannot be changed or influenced by management after the relevant acquisition other than by disposing of the acquired assets. Since management at levels below the Executive Board does not influence these expenses, we generally do not consider these expenses for the purpose of evaluating the performance of management units. We also exclude restructuring expenses because they are volatile and generally cannot be influenced by management at levels below the Executive Board. Furthermore, we exclude expenses for regulatory compliance matters, as these expenses are non-recurring and relate to conduct that took place in prior performance periods, so that users of our consolidated financial statements and the combined management report can see the information that our management uses to manage the business.
Effective 2025, numbers that are identified as operating profit (non-IFRS) are adjusted by excluding expenses related to the Teradata litigation, since these fees and expenses are not indicative of our operating performance or management's allocation of resources to our ongoing business activities. By excluding these non-recurring expenses, SAP will provide additional insight into its operating performance, increase period-over-period comparability, and provide users of SAP’s financial statements the information that our management uses to manage the business.
Non-Operating Income, Net (Non-IFRS)
Numbers that are identified as non-operating income, net (non-IFRS) have been adjusted by excluding the following effects:
| – | Acquisition-related charges |
| ■ | Net disposal gains and losses arising from the sale of intangibles acquired in business combinations |
Consistent with the adjustments we make to our operating expenses (non-IFRS) by excluding amortization expenses and impairment charges for intangibles acquired in business combinations, we adjust our non-operating income, net (non-IFRS) by excluding disposal gains and losses arising from the sale of these intangibles. These net disposal gains and losses are not indicative of SAP’s operations. We believe that by excluding these gains and losses, we improve our period-over-period comparability.
| 50/326 |
|
Integrated Report 2025 | ||||
| To
Our Stakeholders |
Combined Management Report |
Consolidated
Financial Statements IFRS |
Additional Information | ||
Financial Income, Net (Non-IFRS)
Numbers that are identified as financial income, net (non-IFRS) have been adjusted by excluding the following gains and losses:
| – | Gains and losses from equity securities, net |
| § | Includes realized and unrealized effects from the disposal of equity securities, ongoing mark-to-market adjustments on marketable equity investments, changes in fair value of non-marketable equity securities, and others. |
Excluding gains and losses from equity securities, net, improves the period-over-period comparability by reducing volatility caused by share price fluctuation, market developments, and other factors beyond our control.
Effective Tax Rate (Non-IFRS)
The effective tax rate (non-IFRS) is presented for supplemental informational purposes only. We do not provide an outlook for the effective tax rate (IFRS) due to the uncertainty and potential variability of gains and losses associated with equity investments, which are reconciling items between the two effective tax rates (non-IFRS and IFRS). These items cannot be provided without unreasonable efforts, but they could have a significant impact on our future effective tax rate (IFRS).
Constant Currencies Information
We believe it is important for investors to have information that provides insight into the development of our sales. Revenue measures determined under IFRS provide information that is useful in this regard. However, both sales volume and currency effects impact period-over-period changes in sales revenue. We do not sell standardized units of products and services so we cannot provide relevant information on sales volume by providing data on the changes in product and service units sold. To provide additional information that may be useful to investors in breaking down and evaluating changes in sales volume, we present information about our revenue and about various values and components relating to operating profit that are adjusted for foreign currency effects. We calculate constant currency measures by translating foreign currencies using the average exchange rates from the comparative period instead of the current period. Constant currency values for our current cloud backlog and total cloud backlog measures use the closing exchange rate from the previous year’s corresponding key date instead of the average exchange rate.
Free Cash Flow
Among other measures, we use free cash flow to manage our overall financial performance. In 2025, we revised our definition of free cash flow so that it now includes the proceeds from sales of intangible assets and property, plant, and equipment, and therefore better reflects how SAP’s management evaluates the cash flow generated by operating activities after investments in long-term assets and leasing. We define free cash flow as net cash from operating activities adjusted for purchases of intangible assets and property, plant, and equipment; for proceeds from sales of intangible assets and property, plant, and equipment; and for payments of lease liabilities. Further impacting our free cash flow, effective 2025 we no longer include interest paid and interest received in net cash flows from operating activities. For more information, see the Notes to the Consolidated Financial Statements 2025, Note (IN.1). Prior year amounts were adjusted accordingly.
Usefulness of Non-IFRS Measures
We believe that our non-IFRS measures are useful to investors for the following reasons:
| – | Our non-IFRS measures provide investors with insight into management’s decision-making because management uses these measures to run our business and make financial, strategic, and operating decisions. We exclude the expense adjustments outlined above when making decisions to allocate resources. In addition, we use these non-IFRS measures to facilitate comparisons of SAP’s operating performance from period to period. |
| – | The non-IFRS measures provide investors with additional information that enables a comparison of year-over-year operating and non-operating performance by excluding certain direct effects of acquisitions, restructuring plans, regulatory compliance matters, the Teradata litigation, and gains and losses from equity securities, net. |
| – | Non-IFRS and non-GAAP (Generally Accepted Accounting Principles) measures are widely used in the software industry. In many cases, our non-IFRS measures may facilitate comparisons with our competitors’ corresponding non-IFRS and non-GAAP measures. |
| 51/326 |
|
Integrated Report 2025 | ||||
| To
Our Stakeholders |
Combined Management Report |
Consolidated
Financial Statements IFRS |
Additional Information | ||
Limitations of Non-IFRS Measures
Without being analyzed in conjunction with the corresponding IFRS measures, the non-IFRS measures are not indicative of our present and future performance primarily for the following reasons:
| – | While our profit (non-IFRS) numbers reflect the elimination of certain acquisition-related expenses, no eliminations are made for the additional revenue or other income that results from the acquisitions. |
| – | The acquisition-related amortization expense that we eliminate in deriving our profit (non-IFRS) numbers is a recurring expense that will impact our financial performance in future years. |
| – | The remaining acquisition-related charges that we eliminate in deriving our profit (non-IFRS) numbers are likely to recur if SAP enters into business combinations in the future. Similarly, the restructuring expenses that we eliminate in deriving our profit (non-IFRS) numbers are likely to recur if SAP restructures its operations in the future. |
| – | The expense adjustment for acquisition-related charges does not arise from a common conceptual basis. This is because the expense adjustment aims to improve comparability between post-acquisition periods and pre-acquisition periods. This should particularly be considered when evaluating our operating profit (non-IFRS) and operating margin (non-IFRS) numbers, as these combine our revenue and expenses (non-IFRS) despite the absence of a common conceptual basis. |
| – | Our restructuring charges resulted in significant cash outflows in the past and could do so in the future. |
| – | Expenses ascribed to regulatory compliance matters may include penalties and legal costs, and expenses ascribed to the Teradata Litigation may include legal costs, expenses from settlements, and damages awarded in court, all of which would impact the operating cash flows of the business. |
| – | The gains and losses from equity securities, net, that we eliminate in deriving our financial income, net (non-IFRS) numbers are recurring effects that have impacted our financial performance in the past and will do so in the future. Similarly, the acquisition-related effects related to the sale of intangibles arising from business combinations that we eliminate in deriving our non-operating income, net (non-IFRS) have impacted our financial performance in the past and could do so in the future. |
| – | Our realized net gains from equity securities resulted in significant cash inflows in the past and could do so in the future. |
We believe that constant currency measures have limitations, particularly as the currency effects that are eliminated constitute a significant element of our revenue and expenses and could materially impact our performance. We therefore limit our use of constant currency measures to the analysis of changes in volume as one element of the full change in a financial measure.
Despite these limitations, we believe that the presentation of our non-IFRS measures and the corresponding IFRS measures, together with the relevant reconciliations, provides useful information to management and investors about present and future business trends relating to our financial condition and results of operations.
| 52/326 |
|
Integrated Report 2025 | ||||
| To
Our Stakeholders |
Combined Management Report |
Consolidated
Financial Statements IFRS |
Additional Information | ||
Reconciliation of IFRS to Non-IFRS Financial Measures for 2025 and 2024
Reconciliation of Non-IFRS Revenue
| € millions, unless otherwise stated | 2025 | 2024 | ||
| IFRS | Currency Impact |
Non-IFRS Constant Currency |
IFRS | |
| Revenue Numbers | ||||
| Cloud | 21,023 | 637 | 21,661 | 17,141 |
| Software licenses | 990 | 31 | 1,020 | 1,399 |
| Software support | 10,525 | 229 | 10,754 | 11,290 |
| Software licenses and support | 11,515 | 259 | 11,774 | 12,689 |
| Cloud and software | 32,538 | 897 | 33,435 | 29,830 |
| Services | 4,262 | 107 | 4,369 | 4,346 |
| Total revenue | 36,800 | 1,004 | 37,804 | 34,176 |
Reconciliation of Non-IFRS Operating Expenses
| € millions, unless otherwise stated | 2025 | 2024 | ||||||
| IFRS | Adj. | Non-IFRS |
Currency Impact |
Non-IFRS Constant Currency |
IFRS | Adj. | Non-IFRS | |
| Operating Expense Numbers | ||||||||
| Cost of cloud | –5,480 | 214 | –5,266 | –4,660 | 78 | –4,582 | ||
| Cost of software licenses and support | –1,313 | 116 | –1,196 | –1,262 | 0 | –1,262 | ||
| Cost of cloud and software | –6,793 | 330 | –6,463 | –5,922 | 78 | –5,844 | ||
| Cost of services | –3,193 | 1 | –3,192 | –3,321 | 1 | –3,321 | ||
| Total cost of revenue | –9,986 | 331 | –9,655 | –9,243 | 79 | –9,165 | ||
| Gross profit | 26,814 | 331 | 27,145 | 705 | 27,851 | 24,932 | 79 | 25,011 |
| Research and development | –6,633 | 5 | –6,628 | –6,514 | 5 | –6,508 | ||
| Sales and marketing | –8,879 | 299 | –8,580 | –9,090 | 234 | –8,856 | ||
| General and administration | –1,633 | 163 | –1,470 | –1,435 | 27 | –1,409 | ||
| Restructuring | –3 | 3 | 0 | –3,144 | 3,144 | 0 | ||
| Other operating income/expense, net | –49 | 0 | –49 | –85 | 0 | –85 | ||
| Total operating expenses | –27,183 | 801 | –26,382 | –762 | –27,143 | –29,511 | 3,489 | –26,022 |
| 53/326 |
|
Integrated Report 2025 | ||||
| To
Our Stakeholders |
Combined Management Report |
Consolidated
Financial Statements IFRS |
Additional Information | ||
Reconciliation of Non-IFRS Profit Numbers, Income Tax Expense, and Key Ratios
| € millions, unless otherwise stated | 2025 | 2024 | ||||||
| IFRS | Adj. | Non-IFRS |
Currency Impact |
Non-IFRS Constant Currency |
IFRS | Adj. | Non-IFRS | |
| Profit Numbers | ||||||||
| Operating profit (loss) | 9,617 | 801 | 10,419 | 242 | 10,661 | 4,665 | 3,489 | 8,153 |
| Other non-operating income/expense, net | 118 | 0 | 118 | –298 | 0 | –298 | ||
| Finance income | 1,911 | –1,389 | 522 | 1,429 | –777 | 652 | ||
| Finance costs | –1,377 | 625 | –751 | –1,031 | 316 | –715 | ||
| Financial income, net | 534 | –764 | –230 | 398 | –461 | –63 | ||
| Profit (loss) before tax from continuing operations | 10,270 | 38 | 10,307 | 4,764 | 3,028 | 7,792 | ||
| Income tax expense | –2,944 | –198 | –3,142 | –1,614 | –899 | –2,513 | ||
| Profit (loss) after tax from continuing operations | 7,326 | –161 | 7,165 | 3,150 | 2,129 | 5,279 | ||
| Attributable to owners of parent | 7,161 | –5 | 7,156 | 3,124 | 2,162 | 5,286 | ||
| Attributable to non-controlling interests | 165 | –156 | 10 | 26 | –33 | –7 | ||
| Profit (loss) after tax1 | 7,326 | –161 | 7,165 | 3,150 | 2,129 | 5,279 | ||
| Attributable to owners of parent1 | 7,161 | –5 | 7,156 | 3,124 | 2,162 | 5,286 | ||
| Attributable to non-controlling interests1 | 165 | –156 | 10 | 26 | –33 | –7 | ||
| Key Ratios | ||||||||
| Operating margin (in %) | 26.1 | 28.3 | 28.2 | 13.6 | 23.9 | |||
| Effective tax rate (in %) | 28.7 | 30.5 | 33.9 | 32.3 | ||||
| Earnings per share, basic (in €) from continuing operations | 6.14 | 6.14 | 2.68 | 4.53 | ||||
| Earnings per share, basic (in €)1 | 6.14 | 6.14 | 2.68 | 4.53 | ||||
1 from continuing and discontinued operations
Reconciliation of Operating Cash Flow from Continuing Operations to Free Cash Flow
| € millions | 2025 | 2024 |
| Net cash flows from operating activities – continuing operations | 9,156 | 5,207 |
| Purchase of intangible assets and property, plant, and equipment | –739 | –797 |
| Proceeds from sales of intangible assets and property, plant, and equipment | 121 | 122 |
| Payments of lease liabilities | –299 | –310 |
| Free cash flow | 8,239 | 4,222 |
| Net cash flows from investing activities – continuing operations | –965 | –93 |
| Net cash flows from financing activities – continuing operations | –8,745 | –3,961 |
The free cash flow definition was revised in the reporting year to include proceeds from sales of intangible assets and property, plant, and equipment. For more information, see Free Cash Flow in the Performance Management System section. Additionally as of 2025, interest paid and interest received are no longer part of the net cash flows from operating activities. For more information, see the Notes to the Consolidated Financial Statements 2025, Note (IN.1). The comparison year has been retrospectively adjusted to conform with the new definition.
| 54/326 |
|
Integrated Report 2025 | ||||
| To
Our Stakeholders |
Combined Management Report |
Consolidated
Financial Statements IFRS |
Additional Information | ||
Non-IFRS Operating Expense Adjustments by Functional Areas
| € millions | 2025 | 2024 | ||||||||||
| IFRS |
Acquisition- |
Restructuring | RCM1 | Teradata litigation |
Non- IFRS |
IFRS |
Acquisition- |
Restructuring | RCM1 | Teradata litigation |
Non-IFRS | |
| Cost of cloud | –5,480 | 98 | 0 | 0 | 116 | –5,266 | –4,660 | 78 | 0 | 0 | 0 | –4,582 |
| Cost of software licenses and support | –1,313 | 0 | 0 | 0 | 116 | –1,196 | –1,262 | 0 | 0 | 0 | 0 | –1,262 |
| Cost of services | –3,193 | 1 | 0 | 0 | 0 | –3,192 | –3,321 | 1 | 0 | 0 | 0 | –3,321 |
| Research and development | –6,633 | 5 | 0 | 0 | 0 | –6,628 | –6,514 | 5 | 0 | 0 | 0 | –6,508 |
| Sales and marketing | –8,879 | 299 | 0 | 0 | 0 | –8,580 | –9,090 | 255 | 0 | –22 | 0 | –8,856 |
| General and administration | –1,633 | 8 | 0 | 0 | 155 | –1,470 | –1,435 | 16 | 0 | 11 | 0 | –1,409 |
| Restructuring | –3 | 0 | 3 | 0 | 0 | 0 | –3,144 | 0 | 3,144 | 0 | 0 | 0 |
| Other operating income/expense, net | –49 | 0 | 0 | 0 | 0 | –49 | –85 | 0 | 0 | 0 | 0 | –85 |
| Total operating expenses | –27,183 | 411 | 3 | 0 | 387 | –26,382 | –29,511 | 356 | 3,144 | –11 | 0 | –26,022 |
1 Regulatory compliance matters
Reconciliation of non-IFRS Profit Before Tax
| € millions | 2025 | 2024 |
| Profit before tax from continuing operations (IFRS) | 10,270 | 4,764 |
| Adjustment for acquisition-related changes | 411 | 356 |
| Adjustment for restructuring expenses | 3 | 3,144 |
| Adjustment for regulatory compliance matter expenses | 0 | –11 |
| Adjustment for the Teradata litigation expenses | 387 | 0 |
| Adjustment for gains and losses from equity securities, net | –764 | –461 |
| Profit before tax from continuing operations (non-IFRS) | 10,307 | 7,792 |
| 55/326 |
|
Integrated Report 2025 | ||||
| To
Our Stakeholders |
Combined Management Report |
Consolidated
Financial Statements IFRS |
Additional Information | ||
Financial Performance: Review and Analysis
Economy and the Market
World Economy
The global economy proved resilient in 2025, but remained subdued compared to its pre-pandemic average, reports the European Central Bank (ECB) in its most recent Economic Bulletin.1 Geopolitical tensions, particularly Russia’s war against Ukraine, and tariff negotiations remained major sources of uncertainty, weighing on the global economy. On the other hand, investments in artificial intelligence (AI), including semiconductors, strengthened global trade in technology products. Overall, economic growth was stronger in emerging market economies in 2025, with India standing out in particular.
Concerning the EMEA region in 2025, the ECB found that the economy grew more strongly in the euro area than expected and was mostly services-led. This applied particularly to the information and communication sector, while activity in industry and construction remained flat. All in all, the first half of the year was volatile due to frontloading in response to higher U.S. tariffs and related uncertainty. Only the second half of the year showed stronger domestic consumption and investment in connection with additional public spending on infrastructure and defense, particularly in Germany. Overall, the euro area economy also benefited from a robust labor market, with unemployment close to its historical low towards the end of 2025.
As for the Americas region and the United States, private consumption was more positive in 2025 than the ECB had previously expected. Investments in AI further supported U.S. economic growth. However, the federal government shutdown in the United States in the fourth quarter led to a decline mostly in services activity, but the manufacturing sector was also affected and could only partly offset the economic slowdown.
For the APJ region, the ECB reports that China’s economic activity grew moderately in both the services and the manufacturing sector in 2025. Domestic demand weakened yet export growth remained strong, with net exports contributing positively to economic progress. Toward the end of 2025, manufacturing activity contracted, whereas the services sector continued to expand, albeit more softly in the second half of the year.
1 European Central Bank, Economic Bulletin, Issue 8/2025, Publication Date: January 15, 2026.
The IT Market
The global IT market sustained its growth momentum in 2025, underpinned by accelerating investments in AI-enabled transformation, modernization of ERP platforms, and widespread cloud adoption across industries. According to International Data Corporation (IDC), “The AI age is ushering a new ERP product that is using AI technology to enhance and augment the functionality,” with intelligent automation, autonomous workflows, and embedded decision support now defining enterprise technology innovation.1
Throughout 2025, the convergence of AI and enterprise applications matured rapidly, with AI-enabled ERP systems emerging as a key investment priority. According to IDC, “IDC's May 2025 SaaS Path Survey finds 44% of organizations plan to invest in AI-powered ERP applications, while 22% plan to replace their current applications if generative AI (GenAI) is not included in the next release.”2 These shifts reflect growing demand for business systems that deliver real-time insights, reduce manual workloads, and support autonomous operations at scale. As AI reshaped competitive dynamics across the software industry, enterprises increasingly distinguished between platforms that could integrate and scale intelligence effectively and those at risk of falling behind, particularly in environments requiring high reliability, security and regulatory compliance.
At the same time, the global cloud market continued to evolve from a foundational utility into a dynamic ecosystem powering the next wave of enterprise innovation. “The convergence of AI and cloud will give rise to agentic platforms that autonomously manage everything from workload placement to security, enabling a new level of efficiency and strategic value,”3 predicts IDC. Demand for cloud-based ERP remained especially strong, driven by the need to deploy intelligent systems at scale while reducing infrastructure complexity and costs. In parallel, rising customer and regulatory demands for data sovereignty accelerated sovereign cloud discussions across Europe and other regulated markets, reflecting growing emphasis on data residency, compliance, and operational control as integral components of enterprise cloud strategies.
| 56/326 |
|
Integrated Report 2025 | ||||
| To
Our Stakeholders |
Combined Management Report |
Consolidated
Financial Statements IFRS |
Additional Information | ||
These trends reinforced cloud ERP’s role as the dominant deployment model in the digital enterprise landscape in 2025. As AI adoption accelerated across the IT stack, organizations increasingly pursued modular, composable systems anchored in the cloud, signaling a fundamental shift in how business software is designed, delivered, and operated.
1 IDC Worldwide Enterprise Resource Planning Applications Software Forecast, 2025-2029: AI Empowers the Future, September 2025, IDC #US53742525.
2 IDC MarketScape: Worldwide AI-Enabled Large Enterprise ERP Applications 2025 Vendor Assessment, October 2025, IDC #US52976925.
3 IDC FutureScape: Worldwide Cloud 2026 Predictions, October 2025, IDC #US53859425.
Impact on SAP
The year 2025 was a pivotal one for SAP, as the Company strengthened its leadership position in enterprise application software during a time of accelerated change across the IT landscape. In the face of macroeconomic uncertainty, driven in part by fluctuating trade policies and tariff volatility, SAP remained a trusted partner to both the world’s largest enterprises and smaller, fast-scaling businesses undergoing digital transformation.
During the year, customers increasingly looked to SAP not only for modernization but for solutions that could deliver tangible business value from AI within mission-critical processes. This reinforced SAP’s positioning as a leading AI-driven SaaS provider and reflected a broader shift in customer expectations toward scalable, outcome-oriented deployments. In particular, SAP’s approach to Business AI resonated with customers because it embeds AI directly into core business workflows and is powered by rich enterprise data, enabling customers to move beyond isolated use cases toward integrated, AI-enabled operations at scale.
At the same time, the broader IT market underwent a period of transition. Businesses continued to reassess their technology priorities in response to cost pressures, evolving architectural needs, and the rapid introduction of generative AI (gen AI) capabilities. This shift in focus from experimentation to value delivery favored vendors that could offer integrated platforms, operational flexibility, and enterprise-grade scale. SAP’s end-to-end portfolio, including RISE with SAP, SAP GROW, SAP Business Technology Platform (BTP), SAP Business Data Cloud, and Joule, aligned well with these evolving needs.
Geopolitical developments and increasing regulatory requirements also elevated data sovereignty from a compliance consideration to a strategic decision factor. Customers, particularly in regulated industries and the public sector, increasingly sought sovereign cloud solutions that deliver innovation while ensuring data residency, control, and regulatory compliance. These requirements are shaping customer cloud deployment decisions and operating models, reinforcing the importance of sovereign cloud capabilities as enterprises navigate a more fragmented global environment. SAP’s sovereign cloud strategy directly addresses these needs and represents a meaningful opportunity to support customers operating under heightened regulatory and geopolitical complexity.
As a result, SAP saw consistent momentum across its strategic product areas. Customers turned to our platform not only for modernization but also as a path to simplify operations and unlock new value through embedded intelligence.
| 57/326 |
|
Integrated Report 2025 | ||||
| To
Our Stakeholders |
Combined Management Report |
Consolidated
Financial Statements IFRS |
Additional Information | ||
Performance Against Our Outlook for 2025
As in previous years, our 2025 published financial outlook, except free cash flow and effective tax rate, is based on constant currencies. In this section, we therefore discuss performance against our outlook at constant currencies, unless otherwise stated. The results for 2024 are presented at actual currencies with the exception of growth rates, which are at constant currencies. For more information about our performance measures, see the Performance Management System section.
|
Strategic Objective |
KPI |
Results for 2024 |
Outlook for 2025 (Integrated Report 2024) |
Revised Outlook for 2025 (Q3 Quarterly Statement) |
Results for 2025 |
| Growth | Cloud revenue | €17.14 billion |
€21.6 billion to €21.9 billion |
€21.6 billion to €21.9 billion (Toward the lower end) |
€21.66 billion |
| Cloud and software revenue | €29.83 billion |
€33.1 billion to €33.6 billion |
€33.1 billion to €33.6 billion |
€33.44 billion | |
| Total revenue growth | 10% | To slightly accelerate | To slightly accelerate | 11% | |
| Current cloud backlog growth | 29% | To slightly decelerate | To slightly decelerate | 25% | |
| Profitability |
Operating profit (non-IFRS) |
€8.15 billion |
€10.3 billion to €10.6 billion |
€10.3 billion to €10.6 billion (Toward the upper end) |
€10.66 billion |
| Free cash flow1 | €4.22 billion | approx. €8.0 billion |
€8.0 billion to €8.2 billion |
€8.24 billion | |
| Customer loyalty | Customer NPS | 12 | 12 to 16 | 12 to 16 | 9 |
| Working environment | Business Health Culture Index | 80% | 80% to 82% | 80% to 82% | 81% |
| Employee engagement | Employee Engagement Index | 74% | 74% to 78% | 74% to 78% | 76% |
| Climate performance | Gross greenhouse gas emissons | 6.9 Mt | To steadily decrease carbon emissions across the relevant value chain | To steadily decrease carbon emissions across the relevant value chain | 6.3 Mt |
1 at actual currencies
Changes in our outlook within the year 2025 have been marked bold. The outlook for 2025 in our Q1 Quarterly Statement and Q2 Quarterly
Statement remained unchanged.
Financial Performance
Our current cloud backlog (contractually committed cloud revenue that we expect to recognize over the upcoming 12 months) reached €21.05 billion at actual currencies (€22.54 billion at constant currencies; 2024: €18.08 billion at actual currencies), which was an increase of 25% on a constant currency basis (2024: 29% at constant currencies). This represents a more pronounced slowdown in the growth rate than anticipated. Large transformational deals with high cloud revenue ramps in outer years and termination for convenience clauses required by law negatively impacted constant currency current cloud backlog growth by approximately 1pp.
The resulting cloud revenue grew from €17.14 billion (at actual currencies) in 2024 to €21.66 billion (at constant currencies) in 2025, in line with our revised guidance range toward the lower end of €21.6 billion to €21.9 billion. That represents an increase of 26% at constant currencies. Cloud and software revenue grew 12% at constant currencies to €33.44 billion (2024: €29.83 billion at actual currencies) and thus ended in line with our outlook range for 2025 of €33.1 billion to €33.6 billion. Total revenue on a constant currency basis grew 11% in 2025 to €37.80 billion (2024: €34.18 billion at actual currencies), thus marking a slight acceleration in the growth rate. For more information about revenue, see the Revenue section.
Non-IFRS operating profit in 2025 was €10.66 billion on a constant currency basis (2024: €8.15 billion at actual currencies), reflecting a strong increase of 31% at constant currencies. IFRS and non-IFRS operating profit and margin benefitted from a strong cloud revenue growth and from the results of the Company-wide restructuring program which was announced in January 2024 and concluded in early 2025. Non-IFRS operating profit came in above our revised guidance range toward the upper end of €10.3 billion to €10.6 billion at constant currencies. For more information about IFRS operating profit, see the Operating Profit and Operating Margin section
For the full year, free cash flow increased 95% to €8.24 billion (2024: €4.22 billion). The improvement compared to the prior year was mainly attributable to higher profitability and to lower payments for restructuring and share-based compensation. For more information about free cash flow, see the Analysis of Consolidated Statements of Cash Flow section.
The IFRS effective tax rate was 28.7% (2024: 33.9%) and the non-IFRS effective tax rate was 30.5% (2024: 32.3%). The IFRS effective tax rate is lower than the non-IFRS tax rate due to tax benefits from tax-exempt income.
| 58/326 |
|
Integrated Report 2025 | ||||
| To
Our Stakeholders |
Combined Management Report |
Consolidated
Financial Statements IFRS |
Additional Information | ||
Non-Financial Performance
In 2025, our Customer NPS decreased three points year over year to 9 (2024: 12), which is below our target range of 12 to 16. The Business Health Culture Index increased 1pp to 81% (2024: 80%), at the midpoint of the target range of 80% to 82%. The Employee Engagement Index for the full year 2025 increased 2pp year over year to 76% (2024: 74%), at the midpoint of the target range of 74% to 78%. Total carbon emissions decreased to 6.3 megatonnes (Mt) in 2025 (2024: 6.9 Mt), in line with our guidance for a steady decrease.
Executive Board’s Assessment
Despite a greater-than-expected deceleration of the cloud backlog growth rate to 25% at constant currencies, total cloud backlog performed strongly, increasing 30% at constant currencies to €77 billion, partially due to large transformational deals with high cloud revenue ramps in outer years. At the same time, we see SAP Business AI gaining momentum, with more than two-thirds of our cloud order entry containing SAP Business AI in the fourth quarter of 2025 and therefore increasing more than 20pp compared to the third quarter of 2025. This performance demonstrates the underlying momentum of our business, as well as our potential for the future.
Our ability to drive top line growth while exceeding our profitability and free cash flow expectations reflects the consistent execution against the outlook we provided at the beginning of the year. While the macroeconomic challenges persisted, we took deliberate steps to reinforce our foundation and align the business for durable, sustainable performance.
Overall, the course of business in the reporting year was favorable.
Operating Results (IFRS)14
This section on operating results (IFRS) discusses results only in terms of IFRS measures, so the IFRS numbers are not expressly identified as such.
We break our operations down into three regions: the Europe, Middle East, and Africa (EMEA) region, the Americas region, and the Asia Pacific Japan (APJ) region. We allocate revenue amounts to each region based on where the customer is located. For more information about revenue by geographic region, see the Notes to the Consolidated Financial Statements, Note (A.1).
Revenue
Total Revenue1
€ millions | change since previous year
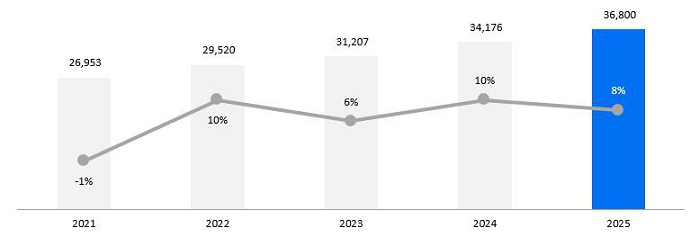
1 The numbers for 2020 were not restated as a result of the divestiture of Qualtrics in 2023. Therefore, the growth rate for 2021 does not reflect continuing operations.
Total revenue rose from €34,176 million in 2024 to €36,800 million in 2025, representing an increase of €2,625 million, or 8%. This increase was driven by the revenues generated by our cloud business.
Cloud and software revenue grew from € 29,830 million in 2024 to € 32,538 million in 2025, representing an increase of 9%. Cloud and software revenue represented 88% of total revenue in 2025 (2024: 87%). Subscription revenue increased 22% from €17,442 million in 2024 to €21,328 million in 2025. For more information about the definition of subscription revenue, see the Performance Management System section.
___________________________________
14 Revenue by sector, revenue by segment, and cost by segment: ESRS 2 SBM-1 40 (b), ESRS 2
AR 14. (c)
| 59/326 |
|
Integrated Report 2025 | ||||
| To
Our Stakeholders |
Combined Management Report |
Consolidated
Financial Statements IFRS |
Additional Information | ||
Revenue by Revenue Type
€ millions
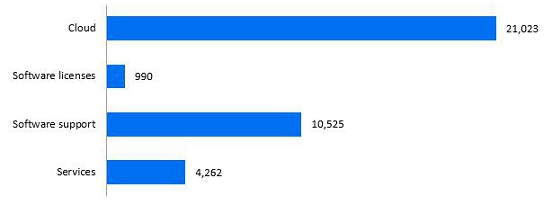
For a detailed description of our revenue types, see the Notes to the Consolidated Financial Statements, Note (A.1). For more information about our regional performance, see the Revenue by Region section.
Cloud Revenue1
€ millions | change since previous year
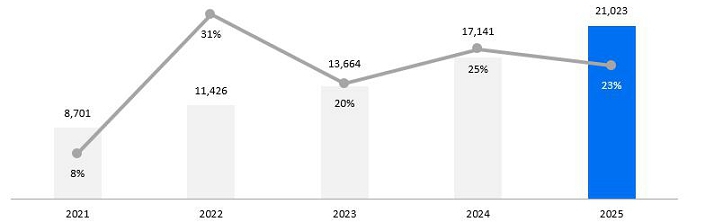
1 The numbers for 2020 were not restated as a result of the divestiture of Qualtrics in 2023. Therefore, the growth rate for 2021 does not reflect continuing operations.
Cloud revenue increased €3,883 million, or 23%, from €17,141 million in 2024 to €21,023 million in 2025, primarily fueled by Cloud ERP Suite revenue, which grew €3,954 million, or 28%, to €18,119 million in 2025 (2024: €14,165 million). Cloud ERP Suite contributed 86% to overall cloud revenue (2024: 83%). Cloud ERP Suite revenue growth benefitted from the accelerated transition of our customers to the cloud. Extension Suite cloud revenue grew from €2,436 million in 2024 to €2,559 million in 2025, representing an increase of 5%. In 2025, the IaaS cloud revenue declined €195 million, or 36%, to €345 million (2024: €540 million) in line with our strategic focus on SaaS / PaaS. For more information about Cloud ERP Suite, see the Performance Management System section.
The current cloud backlog increased €2.97 billion, or 16%, to €21.05 billion in 2025 (2024: €18.08 billion). Our total cloud backlog increased 22% from €63.29 billion in 2024 to €77.29 billion in 2025.
Software licenses and software support revenue decreased €1,174 million, or 9%, from €12,689 million in 2024 to €11,515 million in 2025.
Our software licenses revenue declined €409 million from €1,399 million in 2024 to €990 million in 2025. The continuous decline is in line with our cloud transformation.
Software support revenue decreased €765 million, or 7% from €11,290 million in 2024 to €10,525 million in 2025. The decline is attributable to the accelerated transition of our customers to the cloud.
Services revenue declined slightly, by €84 million, or 2%, from €4,346 million in 2024 to €4,262 million in 2025, mainly due to a decline in revenues from our training business. The strategic focus of our services business is to drive adoption of our cloud solutions.
| 60/326 |
|
Integrated Report 2025 | ||||
| To
Our Stakeholders |
Combined Management Report |
Consolidated
Financial Statements IFRS |
Additional Information | ||
Revenue by Region
Revenue by Region (Based on Customer Location)
€ millions
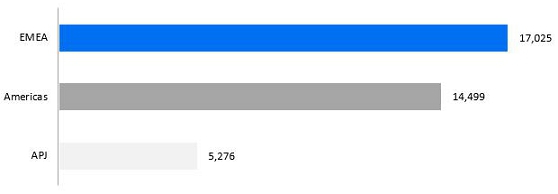
EMEA Region
In 2025, the EMEA region generated €17,025 million in revenue (2024: €15,575 million), which was 46% of our total revenue (2024: 46%) and an increase of 9%. Revenue in Germany increased 9% to €5,828 million (2024: €5,359 million). Germany contributed 34% (2024: 34%) of all EMEA region revenue. In the remaining countries of the EMEA region, revenue increased 10%. Among the remaining EMEA countries, the largest contributions came from France, the Netherlands, Switzerland, and the United Kingdom.
Cloud and software revenue generated in the EMEA region totaled €15,013 million (2024: €13,534 million), which represents 88% of all revenue from the region (2024: 87%). Cloud revenue in the EMEA region rose 29% to €8,876 million in 2025 (2024: €6,892 million). Notably, the cloud revenue performance was strong in France, Germany, Italy, Saudi Arabia, Spain, and the United Kingdom. Software licenses and software support revenue decreased 8% to €6,137 million in 2025 (2024: €6,643 million).
Americas Region
In 2025, 39% of our total revenue was generated in the Americas region (2024: 40%). Total revenue in the Americas region increased 5% to €14,499 million (2024: €13,808 million). Revenue in the United States increased 4% to €11,537 million (2024: €11,056 million). The United States contributed 80% (2024: 80%) of all revenue generated in the Americas region. In the remaining countries of the Americas region, revenue increased 8%. The remaining revenue in the Americas region was primarily generated in Brazil, Canada, and Mexico.
Cloud and software revenue generated in the Americas region totaled €12,744 million (2024: €11,987 million), which represents 88% of all revenue from the region (2024: 87%). Cloud revenue in the Americas region rose 15% to €9,075 million in 2025 (2024: €7,872 million). The United States contributed 79% of cloud revenue generated in the Americas region. Notably, the cloud revenue performance was strong in Brazil and the United States. Software licenses and software support revenue in the Americas region decreased 11% to €3,669 million in 2025 (2024: €4,116 million).
APJ Region
In 2025, 14% of our total revenue was generated in the APJ region (2024: 14%). Total revenue in the APJ region increased 10% to €5,276 million (2024: €4,793 million). Total revenue in Japan increased 13% to €1,569 million (2024: €1,388 million). Revenue from Japan accounted for 30% of all revenue generated in the APJ region (2024: 29%). In the remaining countries of the APJ region, revenue increased 9%. Revenue in the remaining countries of the APJ region was primarily generated in Australia, China, and India.
Cloud and software revenue in the APJ region totaled €4,781 million (2024: €4,308 million). That represents 91% of all revenue from the region (2024: 90%). Cloud revenue in the APJ region rose 29% to €3,072 million in 2025 (2024: €2,377 million). Notably, the cloud revenue performance was strong in China, India, Japan, and South Korea. Software licenses and software support revenue decreased 11% from €1,931 million in 2024 to €1,709 million in 2025.
Operating Profit and Operating Margin
Operating profit increased to €9,617 million and operating margin improved by 12.5pp to 26.1%. Operating profit was positively impacted by an increased contribution from cloud revenue and by lower total operating expenses.
| 61/326 |
|
Integrated Report 2025 | ||||
| To
Our Stakeholders |
Combined Management Report |
Consolidated
Financial Statements IFRS |
Additional Information | ||
The operating profit benefitted from a decline in restructuring expenses from €3,144 million in 2024 to €3 million in 2025. This decline is associated with the Company-wide restructuring program that was announced in January 2024 and concluded in early 2025 as planned. Under this program, SAP increased its focus on key strategic growth areas, particularly business AI, in 2025. For more information about the program, see the Notes to the Consolidated Financial Statements, Note (B.6).
Share-based payment expenses fell to €1,695 million (2024: €2,385 million), mainly due to a reduction in the SAP share price of more than €25 (compared to an increase of more than €95 in 2024), as well as a lower grant volume compared to prior years. Our 2024 share-based payment expenses included SAP’s temporary increased contribution (from 40% to 100% from October to December 2024) to the Own SAP Plan to recognize its employees’ contribution to SAP’s success in 2024. For more information about share-based payments, see the Notes to the Consolidated Financial Statements, Note (B.3).
In 2025, the operating profit was negatively impacted by higher termination benefits outside of restructuring plans. The respective expenses increased in 2025 compared to 2024 (2025: €238 million compared to 2024: €68 million), mainly due to €191 million in expenses recognized under the workforce transformation announced at the end of July 2025.
Furthermore, the operating profit was negatively impacted by a provision of €387 million (2024: €0 million) related to the Teradata litigation. For more information about the Teradata litigation, see the Notes to the Consolidated Financial Statements, Note (G.3).
A change in case law resulted in an increase in other taxes by €98 million (2024: €0 million) negatively affecting SAP’s operating profit in the third quarter of 2025. For more information about tax-related litigation, see the Notes to the Consolidated Financial Statements, Note (C.5) and Note (G.3).
Operating Profit1
€ millions | change since previous year
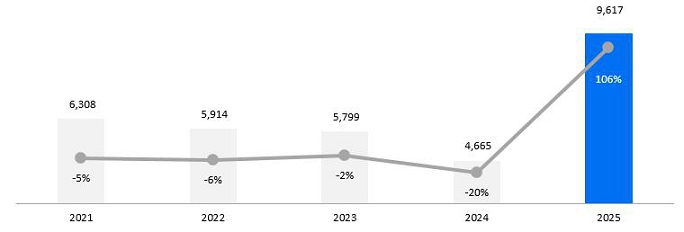
1 The numbers for 2020 were not restated as a result of the divestiture of Qualtrics in 2023. Therefore, the growth rate for 2021 does not reflect continuing operations.
Changes to the individual elements in our cost of revenue were as follows:
Cost of Cloud and Software
Cost of cloud and software consists primarily of costs for deploying and operating cloud solutions, the cost of developing custom solutions that address customers’ specific business requirements, and customer support costs.
In 2025, the cost of cloud and software increased 15% to €6,793 million (2024: €5,922 million) and our cloud margin increased 1.1pp from 72.8% in 2024 to 73.9% in 2025. This was attributable to strong revenue growth, primarily driven by Cloud ERP Suite revenue, paired with a slower growth in cost of cloud due to a scalable cloud infrastructure and operational efficiency. The increase in cost of cloud was mainly driven by higher volume and the associated additional expenses for procurement of instances for computing resources. The software licenses and software support margin was 88.6% in 2025, 1.5pp below the prior-year level (2024: 90.1%). Software licenses and software support revenue decreased 9% to €11,515 million (2024: €12,689 million), primarily attributable to a 29% decline in software license revenue. Software licenses and software support costs increased 4% year over year to €1,313 million (2024: €1,262 million) partially due to expenses related to the Teradata litigation.
Cost of Services
Cost of services consists primarily of the cost of consulting, premium services, and training courses. The cost of services decreased 4% in 2025 to €3,193 million (2024: €3,321 million). Our gross margin on services, which is defined as services profit as a percentage of services revenue, increased 1.5pp to 25.1% (2024: 23.6%). As our services business trends away from traditional software licensing and consulting revenue toward more revenue from cloud solutions, we continue to adjust our service delivery resources to support our cloud offerings.
| 62/326 |
|
Integrated Report 2025 | ||||
| To
Our Stakeholders |
Combined Management Report |
Consolidated
Financial Statements IFRS |
Additional Information | ||
Research and Development
Our research and development (R&D) expenses consist primarily of the personnel cost of our R&D employees, costs incurred for independent contractors whom we retain to assist in our R&D activities, data center infrastructure used for R&D activities, and depreciation of the computer hardware and amortization of the software we use for our R&D activities.
The R&D expense rose 2% to €6,633 million in 2025 from €6,514 million in 2024. This increase is primarily due to higher but disciplined use of contingent workforce in 2025. Lower share-based payment expenses partially offset the higher expenses for research and development. R&D expense as a percentage of total revenue decreased to 18.0% in 2025 (2024: 19.1%). For more information, see the Our Investments in Innovation section.
Sales and Marketing Expense
Sales and marketing expenses consist mainly of personnel costs, direct sales costs, and the cost of marketing our products and services.
Our sales and marketing expenses declined 2% from €9,090 million in 2024 to €8,879 million in 2025. This decrease is mainly attributable to reduced share-based payment expenses, partially offset by higher expenses for the SAP PartnerEdge program, which includes higher amortizations for sales commissions and higher costs for post-sales services. The ratio of sales and marketing expense to total revenue, expressed as a percentage, decreased 2.5pp in 2025 to 24.1% (2024: 26.6%).
General and Administration Expense
Our general and administration expenses consist mainly of personnel costs to support our finance and administration, human resources, and corporate functions.
General and administration expense increased 14% from €1,435 million in 2024 to €1,633 million in 2025. This increase is primarily due to higher but disciplined use of contingent workforce in 2025 as well as expenses related to the Teradata litigation. Lower share-based payment expenses partially offset the higher expenses for general and administration. The ratio of general and administration expense to total revenue increased by 0.2pp in 2025 to 4.4% (2024: 4.2%).
Segment Information
At year end 2025, SAP had two operating, reportable segments: the Applications, Technology & Support (ATS) segment and the Core Services segment.
| – | The ATS segment represents SAP’s cohesive product portfolio, which is holistically steered and commercialized. It primarily generates revenue from cloud subscriptions and support offerings, and it incurs costs for operating our cloud solutions and customer support. The revenue and cost for services arise from SAP’s training business, which is highly integrated with SAP’s product portfolio. |
| – | The Core Services segment supports SAP’s product portfolio by enabling customers to accelerate the adoption of innovations. Revenues are mainly generated from professional consulting services and premium support services. Cost is incurred primarily for the delivery of those services. The Core Services segment does not reflect the full services business. |
For more information about our segment reporting, see the Notes to the Consolidated Financial Statements, Note (C.1) and Note (C.2).
| 63/326 |
|
Integrated Report 2025 | ||||
| To
Our Stakeholders |
Combined Management Report |
Consolidated
Financial Statements IFRS |
Additional Information | ||
ATS
|
€ millions (non-IFRS) |
2025 | 2024 | ∆ in % | ∆ in % | |
|
Actual Currency |
Constant Currency |
Actual Currency |
Actual Currency |
Constant Currency | |
| Cloud | 21,023 | 21,661 | 17,141 | 23 | 26 |
| Software licenses | 990 | 1,020 | 1,399 | –29 | –27 |
| Software support | 10,525 | 10,754 | 11,290 | –7 | –5 |
| Software licenses and support | 11,515 | 11,774 | 12,689 | –9 | –7 |
| Cloud and software | 32,538 | 33,435 | 29,829 | 9 | 12 |
| Services | 309 | 316 | 418 | –26 | –24 |
| Total segment revenue | 32,847 | 33,751 | 30,248 | 9 | 12 |
| Cost of cloud | –5,084 | –5,276 | –4,446 | 14 | 19 |
| Cost of software licenses and support | –1,109 | –1,143 | –1,169 | –5 | –2 |
| Cost of cloud and software | –6,193 | –6,419 | –5,615 | 10 | 14 |
| Cost of services | –349 | –357 | –385 | –9 | –7 |
| Total cost of revenue | –6,542 | –6,775 | –6,000 | 9 | 13 |
| Segment gross profit | 26,305 | 26,976 | 24,248 | 8 | 11 |
| Other segment expenses | –12,959 | –13,328 | –12,995 | 0 | 3 |
| Segment profit (loss) | 13,345 | 13,647 | 11,253 | 19 | 21 |
In 2025, the Applications, Technology & Support segment significantly increased its cloud revenue by 23% (26% at constant currencies), driven by a strong performance of Cloud ERP Suite. At the same time, the cost of cloud increased moderately by 14% (19% at constant currencies).
Software support revenue decreased 7% (5% at constant currencies) to €10,525 million (2024: €11,290 million) and software licenses revenue decreased 29% (27% at constant currencies) to €990 million (2024: €1,399 million) as more of our existing customers chose our cloud offerings. Consequently, the Applications, Technology & Support segment recorded a total software licenses and support revenue of €11,515 million (2024: €12,689 million), representing a decline of 9% (7% at constant currencies).
As such, the total segment revenue increased 9% (12% at constant currencies) compared to the prior year, to €32,847 million (2024: €30,248 million). The total segment cost of revenue grew 9% (13% at constant currencies), mainly driven by an increase in cost of cloud. Other segment expenses remained stable (grew 3% at constant currencies) and ended 2025 at €12,959 million (2024: €12,995 million).
As a result, segment profit increased 19% (21% at constant currencies), from €11,253 million in 2024, to €13,345 million.
Core Services
|
€ millions (non-IFRS) |
2025 | 2024 | ∆ in % | ∆ in % | |
|
Actual Currency |
Constant Currency |
Actual Currency |
Actual Currency |
Constant Currency | |
| Services | 3,953 | 4,053 | 3,927 | 1 | 3 |
| Total segment revenue | 3,953 | 4,053 | 3,927 | 1 | 3 |
| Cost of cloud | –120 | –124 | –108 | 11 | 14 |
| Cost of software licenses and support | –39 | –40 | –49 | –21 | –19 |
| Cost of cloud and software | –159 | –164 | –158 | 1 | 4 |
| Cost of services | –2,773 | –2,843 | –2,850 | –3 | 0 |
| Total cost of revenue | –2,932 | –3,007 | –3,008 | –3 | 0 |
| Segment gross profit | 1,021 | 1,046 | 920 | 11 | 14 |
| Other segment expenses | –590 | –605 | –637 | –7 | –5 |
| Segment profit (loss) | 432 | 440 | 283 | 53 | 56 |
The Core Services segment closed 2025 with an increase in segment services revenue of 1% (3% at constant currencies).
| 64/326 |
|
Integrated Report 2025 | ||||
| To
Our Stakeholders |
Combined Management Report |
Consolidated
Financial Statements IFRS |
Additional Information | ||
The segment cost of services slightly decreased 3% (0% at constant currencies) during 2025. This decrease was primarily attributable to the positive cost development of SAP’s consulting and premium engagement business and lower share-based payment expenses. The efficiencies were predominantly driven by the restructuring program that was initiated in 2024 and concluded at the beginning of 2025, which led to a more favorable delivery mix. The other segment expenses declined 7% (5% at constant currencies).
Overall, the Core Services segment profit increased 53% (56% at constant currencies) to €432 million in 2025 (2024: €283 million).
Profit After Tax and Earnings per Share
In 2025, SAP’s profit after tax increased to €7,326 million (2024: €3,150 million) and basic earnings per share increased to €6.14 (2024: €2.68). The number of shares outstanding remained at 1,166 million in 2025 (2024: 1,166 million). For more information about SAP’s earnings per share and outstanding shares, see the Notes to the Consolidated Financial Statements, Note (C.6).
Earnings per Share1
€ | change since previous year
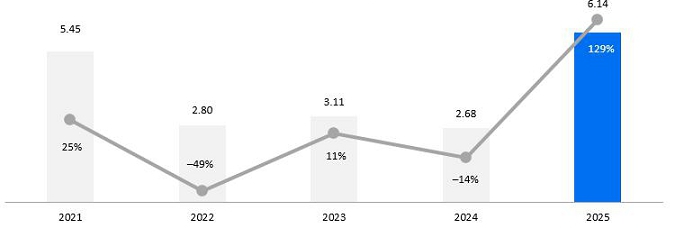
1 The numbers for 2020 were not restated as a result of the divestiture of Qualtrics in 2023. Therefore, the growth rate for 2021 does not reflect continuing operations.
The main drivers below operating profit that influenced profit after tax and earnings per share were as follows
Other Non-Operating Income/Expense, Net
Other non-operating income/expense, net, improved to €118 million (2024: –€298 million). This increase was mainly driven by changes in foreign exchange rates. For more information about Other non-operating income/expense, see the Notes to the Consolidated Financial Statements, Note (C.3).
Financial Income, Net
Financial income, net, improved to €534 million (2024: €398 million). Our finance income was €1,911 million (2024: €1,429 million) and our finance costs were €1,377 million (2024: €1,031 million).
Finance income primarily consists of interest income on investments in the amount of €428 million (2024: €631 million) and gains from IFRS 9-related fair value adjustments, mainly of Sapphire Ventures investments, and the disposal of equity securities totaling €1,393 million (2024: €779 million).
Finance costs mainly consist of interest expense on financial liabilities and from derivative instruments amounting to €492 million (2024: €545 million), and IFRS 9-related fair value adjustments or losses from disposal of Sapphire Ventures investments totaling €631 million (2024: €316 million). For more information about financing instruments, see the Notes to the Consolidated Financial Statements, Note (D.1) and Note (E.3).
Income Taxes
The effective tax rate in 2025 was 28.7% (2024: 33.9%). The year-over-year decrease mainly resulted from changes in withholding taxes. For more information about income taxes, see the Notes to the Consolidated Financial Statements, Note (C.5).
Dividend
We hold the view that our shareholders should benefit appropriately from the profit the Company made in 2025. Our dividend policy is to pay a dividend of at least 40% of the SAP Group’s non-IFRS profit after tax from continuing operations.
| 65/326 |
|
Integrated Report 2025 | ||||
| To
Our Stakeholders |
Combined Management Report |
Consolidated
Financial Statements IFRS |
Additional Information | ||
The Executive Board and the Supervisory Board of SAP SE will recommend to the Annual General Meeting of Shareholders in May 2026 a total dividend for 2025 of €2.50 per share (2024: €2.35). Based on this recommendation, the overall dividend payout ratio (which means the total distributed dividend as a percentage of non-IFRS profit after tax from continued operations) would be 41% (2024: 52%). The proposed dividend represents a 6% increase over the dividend for fiscal year 2024.
If the shareholders approve this recommendation, and based on the number of treasury shares as at December 31, 2025, the total amount distributed in dividends will be €2,919 million. The actual amount distributed could be different from this total amount, because the number of shares held as treasury stock might change before the Annual General Meeting of Shareholders. In 2025, we distributed €2,743 million in dividends.
For more information about the development of our profit after tax, see the section Profit After Tax and Earnings per Share.
Dividend per Share
€ | change since previous year
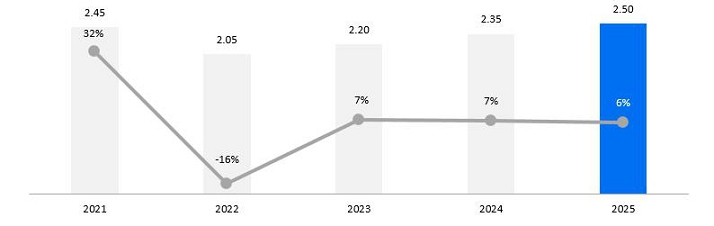
Finances (IFRS)
Overview
Global Financial Management
We use global centralized financial management to control liquid assets and monitor exposure to foreign exchange, interest rate, credit, and equity risk. The primary aim of our financial management is to maintain liquidity in the Group at a level that is adequate to always meet our financial obligations. The Treasury Department manages liquidity of most SAP entities centrally, for example by pooling excess cash, to optimize deployment of liquid assets across the SAP Group in accordance with our policies. This central approach ensures sufficient levels of liquid assets to keep SAP financially flexible. In addition, various committed and uncommitted credit facilities are available for additional liquidity, if required. For more information about these facilities, see the Credit Facilities section.
We manage liquidity, foreign exchange, interest rate, credit, and equity price risks on a Group-wide basis. We use selected derivatives exclusively for this purpose and not for speculation, which is defined as entering into a derivative instrument for which we do not have corresponding underlying transactions. The rules for the use of derivatives and other rules and processes concerning the management of financial risks are documented in our Treasury Guideline, which applies globally to all companies in the Group. For more information about the management of each financial risk and about our risk exposure, see the Notes to the Consolidated Financial Statements, Note (F.1) and Note (F.2).
Capital Structure Management
The primary objective of our capital structure management is to maintain a strong financial profile for investor, creditor, and customer confidence, and to support the growth of our business. We seek to maintain a capital structure that will enable us to cover our funding requirements through the capital markets at reasonable conditions, and in so doing, ensure a high level of financial flexibility. For more information about the capital structure and its analysis, see the Assets (IFRS) section and the Notes to the Consolidated Financial Statements, Note (E.1).
The long-term credit ratings for SAP SE are “A+” by S&P Global Ratings (stable outlook) and “A1” by Moody’s (stable outlook).
| 66/326 |
|
Integrated Report 2025 | ||||
| To
Our Stakeholders |
Combined Management Report |
Consolidated
Financial Statements IFRS |
Additional Information | ||
In May 2023, SAP announced a share repurchase program with an aggregate volume of up to €5 billion, which was completed on August 13, 2025. SAP had repurchased 26,010,591 shares at an average price of €188.24, resulting in a purchased volume of approximately €4.9 billion under the program.
On January 29, 2026, SAP announced a new share repurchase program with an aggregate volume of up to €10 billion which is expected to be completed by the end of 2027.
Liquidity Management
Our primary source of cash, cash equivalents, and current investments are funds generated from our business operations. Over the past several years, our principal use of cash has been to support operations and our capital expenditure requirements resulting from our growth, to quickly repay financial debt, to acquire businesses and investments in venture activities, to pay dividends on our shares, and to buy back SAP shares on the open market. On December 31, 2025, our cash, cash equivalents, and current investments were primarily denominated in euros and U.S. dollars. We generally invest only in the financial assets of issuers or funds with a minimum credit rating of BBB and pursue a policy of cautious investment characterized by wide portfolio diversification with a variety of counterparties, predominantly short-term investments, and standard investment instruments such as bank term deposits or money market funds. Our investments in financial assets of issuers with a credit rating lower than BBB were not material in 2025.
We believe that our liquid assets and expected cash flow from operations, combined with our undrawn credit facilities, are sufficient to meet our operating financing needs, capital expenditure, debt repayments, and capital returns to our shareholders in 2026. It may also be necessary to enter into financing transactions should additional funds be required to maintain flexibility.
Therefore, we continuously monitor funding options available in the capital markets and trends in the availability of funds, as well as the cost of such funding. In recent years, we were able to repay additional debt within a short period of time due to our persistently strong free cash flow. For more information about our financial debt, see the Financial Debt section.
Credit Facilities
Other sources of liquidity are available to us through various credit facilities, if required.
To retain high financial flexibility, SAP SE entered into a committed €3 billion syndicated revolving credit facility on March 8, 2023, with an initial term of five years plus two one-year extension options. The initial term of this facility was extended by two years until March 2030. A possible future utilization is not subject to any financial covenants. So far, we have not used, and do not currently foresee any need to use, this credit facility.
As at December 31, 2025, SAP SE had additional bilateral uncommitted credit facilities available totaling €1.15 billion which are currently not utilized. Several other SAP entities have credit facilities available that allow them to borrow funds at prevailing interest rates.
Financial Debt
Financial debt is defined as the nominal volume of bank loans, commercial paper, private placements, and bonds.
Maturity Profile of Financial Debts
€ millions
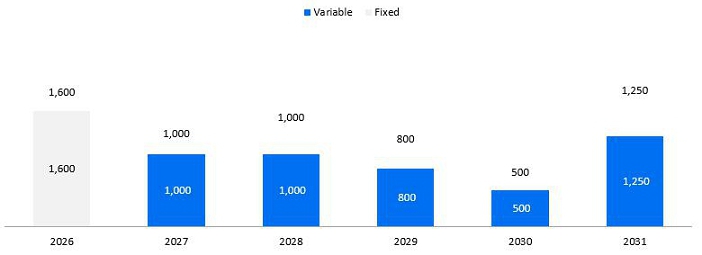
| 67/326 |
|
Integrated Report 2025 | ||||
| To
Our Stakeholders |
Combined Management Report |
Consolidated
Financial Statements IFRS |
Additional Information | ||
The nominal volume of financial debt on December 31, 2025, included amounts in euros (€6,150 million). On December 31, 2025, approximately 74% of the financial debt was held at variable interest rates, partially swapped from fixed into variable using interest rate swaps.
Financial Debt by Instrument
Financial Debt
€ millions
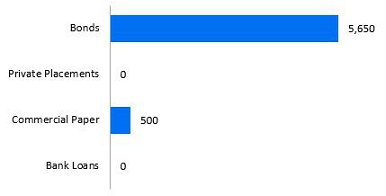
For more information about our financial debt, see the Notes to the Consolidated Financial Statements, Note (E.3).
Liquidity
Group Liquidity and Net Liquidity/Net Debt
| € millions | 2025 | 2024 | ∆ |
| Cash and cash equivalents | 8,220 | 9,609 | –1,390 |
| Current time deposits and debt securities | 1,311 | 1,471 | –160 |
| Group liquidity | 9,531 | 11,080 | –1,550 |
| Current financial debt | –1,600 | –3,639 | 2,039 |
| Non-current financial debt | –4,550 | –5,746 | 1,196 |
| Financial debt | –6,150 | –9,385 | 3,235 |
| Net liquidity (+)/net debt (–) | 3,381 | 1,695 | 1,685 |
| Lease liabilities | –1,684 | –1,715 | 31 |
| Net liquidity/net debt including lease liabilities | 1,697 | –19 | 1,716 |
Group liquidity consists of cash and cash equivalents (for example, cash at banks, money market funds, and time deposits with original maturities of three months or less) and current investments (for example, time deposits and debt securities with original maturities of greater than three months, and remaining maturities of less than one year included in current other financial assets). Group liquidity on December 31, 2025, primarily comprised amounts in euros and U.S. dollars.
The net decrease in group liquidity compared to 2024 is mainly due to repayments of borrowings, and the effects of foreign currency exchange rates on cash and cash equivalents, which were partially offset by a higher operating cashflow.
Net liquidity/net debt is group liquidity less financial debt. For more information about our liquidity, see the Notes to the Consolidated Financial Statements, Note (E.3).
For more information about the impact of cash, cash equivalents, current investments, and our financial liabilities on our income statements, see the analysis of our financial income, net, in the Profit After Tax and Earnings per Share section.
| 68/326 |
|
Integrated Report 2025 | ||||
| To
Our Stakeholders |
Combined Management Report |
Consolidated
Financial Statements IFRS |
Additional Information | ||
Development of Net Debt
| € millions | 2025 | 2024 | ||
| Net liquidity (+)/net debt (–) 12/31/2024 (PY: 12/31/2023) | Free Cash Flow | 1,695 | 3,521 | |
| Net cash flows from operating activities | 8,239 | 9,156 | 5,207 | |
| Capital expenditure | –739 | –797 | ||
| Proceeds from sales | 121 | 122 | ||
| Lease payments | –299 | –310 | ||
| Business combinations | –702 | –1,114 | ||
| Dividends | –2,743 | –2,565 | ||
| Treasury shares | –1,937 | –2,106 | ||
| Interest payments, net | –154 | 13 | ||
| Other | –1,018 | –277 | ||
| Net liquidity (+)/net debt (–) 12/31/2025 (PY: 12/31/2024) | 3,381 | 1,695 |
Analysis of Consolidated Statements of Cash Flow
| € millions | 2025 | 2024 | ∆ in % |
| Net cash flows from operating activities | 9,156 | 5,207 | 76 |
| Net cash flows from investing activities | –965 | –93 | >100 |
| Net cash flows from financing activities | –8,745 | –3,961 | >100 |
In 2025, cash inflows from operating activities increased €3,949 million to €9,156 million (2024: €5,207 million). This is particularly due to higher profitability, driven by continued revenue growth and improved collection effectiveness. In addition, lower restructuring payments (€0.8 billion in 2025 compared to €2.5 billion in 2024), lower share-based payments (€0.8 billion in 2025 compared to €1.3 billion in 2024), and slightly lower income taxes paid (€2.2 billion in 2025 compared to €2.3 billion in 2024) contributed to the cash flows from operating activities. Prepaid expenses and advance payments increased €0.6 billion in 2025. For more information see the Notes to the Consolidated Financial Statements, Note (A.2) for trade receivables, Note (B.3) for share-based payments, Note (B.6) for restructuring, Note (C.5) for income taxes, and Note (G.1) for prepaid expenses and advance payments. In Note G.1, we provide further information about the prepayments to hyperscalers.
Cash outflows from investing activities totaled €965 million in 2025, compared to €93 million in 2024. We decreased our short-term time deposits and debt instruments by €0.2 billion in 2025 (2024: decreased by €1.7 billion). We paid €0.7 billion, net of cash received, in 2025, chiefly to acquire SmartRecruiters, compared to €1.1 billion in 2024, which was mainly used for the acquisition of WalkMe. Capital expenditure on intangible assets and property, plant, and equipment slightly decreased to €0.7 billion (€0.8 billion in 2024). For more information about our capital expenditures, see the Assets (IFRS) section.
In 2025, free cash flow (for the definition, see the Performance Management System section) increased to €8,239 million (2024: €4,222 million). Since December 2024, our forecasted exposure hedging strategy has been aimed at reducing volatility from foreign currency fluctuations on the forecasted Free Cash Flow (FCF) of a calendar year. For more information, see the Notes to the Consolidated Financial Statements, Note (F.1).
Net cash outflows from financing activities were €8,745 million in 2025, compared to €3,961 million in 2024. In September 2024, SAP secured a short-term loan of €1.25 billion to finance the WalkMe acquisition, with flexible repayment terms through September 2025, which was paid back in March 2025. Further, in December 2025, we repaid a total of €1 billion raised in 2024 via bilateral credit lines and repaid early US$0.1 billion in U.S. private placements. Additionally, we repurchased shares with a volume of €1.9 billion in 2025 as part of our share buyback program. Apart from the buyback of shares, cash outflows in 2025 resulted from the repayment of €0.6 billion in Eurobonds, and US$0.3 billion in U.S. bonds upon maturity. In 2024, we repurchased shares worth €2.1 billion as part of the share buyback program. Further cash outflows in 2024 resulted from the repayment of €0.85 billion in Eurobonds, and US$0.32 billion in U.S. private placements upon maturity.
In 2025, we distributed €2,743 million in dividends, compared to €2,565 million in 2024.
| 69/326 |
|
Integrated Report 2025 | ||||
| To
Our Stakeholders |
Combined Management Report |
Consolidated
Financial Statements IFRS |
Additional Information | ||
Assets (IFRS)
Analysis of Consolidated Statements of Financial Position
Total assets decreased 5% year over year to €70,362 million (2024: €74,237 million).
Assets
Percent
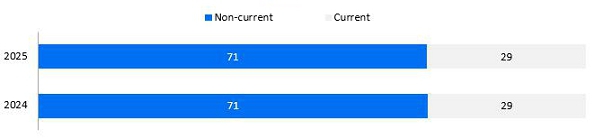
Total current assets decreased 5% in 2025 from €21,401 million to €20,256 million, mainly resulting from a decrease in cash and cash equivalents from €9,609 million to €8,220 million due to lower net borrowings.
Total non-current assets decreased 5% to €50,106 million (2024: €52,836 million). This change mainly resulted from a decrease in goodwill from €31,264 million to €29,014 million due to currency adjustments counteracting the goodwill additions from the SmartRecruiters acquisition, as well as a decrease in intangible assets from €2,706 million to €2,282 million due to depreciation.
Our investment in goodwill, intangible assets, and property, plant, and equipment (including additions from business combinations) amounted to €1,939 million in 2025 (2024: €2,506 million). Key components thereof were capital expenditures, mainly consisting of investments in building and real-estate as well as IT hardware, and goodwill additions from the SmartRecruiters acquisition. For more information about our investments, see Section D – Invested Capital of the Notes to the Consolidated Financial Statements.
Liabilities
Percent
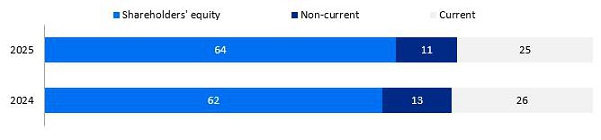
Current liabilities decreased 9% to €17,416 million in 2025 (2024: €19,082 million). This was mainly attributable to lower financial liabilities due to the repayment of bank loans and the settlement of bonds and other securities.
Total non-current liabilities decreased 16% to €7,873 million in 2025 compared to €9,349 million in 2024. This was mainly due to bond reclassifications from non-current to current liabilities. For more information about our financing activities in 2025, see the Finances (IFRS) section.
The equity ratio (that is, the ratio of shareholders’ equity to total assets) increased 2pp to 64% (2024: 62%).
| 70/326 |
|
Integrated Report 2025 | ||||
| To
Our Stakeholders |
Combined Management Report |
Consolidated
Financial Statements IFRS |
Additional Information | ||
Principal Investments Currently in Progress
In 2025, we finalized various construction projects and continued construction activities in several locations. We plan to finance all of these projects from operating cash flow. Our most important projects are listed below.
Construction Projects
| € millions | |||||
| Country | Location of Facility | Short Description | Estimated Total Cost | Costs Incurred as at 12/31/2025 | Estimated Completion Date |
| Germany | Walldorf | General renovation of headquarters building for approx. 1,600 employees | 232 | 138 | Q3 2027 |
| India | Bangalore | New office building for approx. 3,500 employees | 89 | 88 | Completed Q4 2025 |
| India | Bangalore | New office building for approx. 5,000 employees | 99 | 0 | Q3 2028 |
| Japan | Tokyo | Relocation and interior office build-out for approx. 650 employees | 24 | 0 | Q1 2027 |
There were no material divestitures of facilities within the reporting period.
Report on the Financial Performance of SAP SE
SAP SE is headquartered in Walldorf, Germany, and is the parent company of the SAP Group, which comprises 216 companies. SAP SE is the Group holding company and employs most of the Group’s Germany-based development and service and support personnel.
As the owner of the intellectual property in most SAP software, SAP SE derives its revenue mainly from software license fees it charges subsidiaries for the right to market and maintain SAP software solutions and bears the bulk of the Group-wide research and development expenses.
With effect from January 1, 2025, based on a merger agreement concluded on August 1, 2025, SAP SE took over all assets and liabilities of LeanIX GmbH, Bonn, Germany (“LeanIX”), pursuant to section 2 no.1 of the German Transformation Act (UmwG).
The difference between the acquisition cost of the LeanIX shares and the assets and liabilities carried at fair value has been recognized as goodwill on the balance sheet.
The SAP SE annual financial statements are prepared in accordance with the reporting standards in the German Commercial Code and the German Stock Corporation Act. The full SAP SE annual financial report and unqualified audit report are submitted to the operator of the Unternehmensregister (German Business Register) for publication and inclusion. It is available from SAP SE on request.
Product revenue and operating profit are defined as the most significant financial performance indicators with regard to SAP SE’s standalone financial statements.
Performance Against Our Outlook for 2025
| € millions | Results for 2024 |
Outlook for 2025 (Integrated report 2024) |
Results for 2025 |
| Product revenue | 15,125 | moderate increase | 16,059 |
| Operating profit | –442 | significant increase | 6,434 |
Product revenue and operating income are within our outlook for 2025.
The course of business for SAP SE was favorable in 2025.
| 71/326 |
|
Integrated Report 2025 | ||||
| To
Our Stakeholders |
Combined Management Report |
Consolidated
Financial Statements IFRS |
Additional Information | ||
Income
SAP SE’s income statement is classified following the nature of expense method and presents amounts in millions of euros.
SAP SE Income Statement − German Commercial Code (Short Version)
| € millions | 2025 | 2024 | |
| Total revenue | 22,913 | 21,412 | |
| Other operating income | 6,161 | 1,058 | |
| Cost of services and materials | –14,309 | –13,644 | |
| Personnel expenses | –3,077 | –3,690 | |
| Depreciation and amortization | –488 | –641 | |
| Other operating expenses | –4,766 | –4,937 | |
| Operating profit | 6,434 | –442 | |
| Finance income | 1,797 | 988 | |
| Income before taxes | 8,231 | 546 | |
| Income taxes | –1,124 | –180 | |
| Income after taxes | 7,107 | 366 | |
| Other taxes | –17 | –17 | |
| Net income | 7,090 | 349 |
The total revenue of SAP SE in 2025 was €22,913 million (2024: €21,412 million), an increase of 7%. Product revenue increased 6% to €16,059 million (2024: €15,125 million). As in previous years, product revenue was primarily generated from license fees paid by subsidiaries of SAP SE; therefore, the increase is attributable to higher cloud- and software revenues at the Group level.
Service revenue decreased 2% to €1,138 million in 2025 (2024: €1,165 million), while other revenue increased €593 million to €5,715 million (2024: €5,122 million). The increase in other revenue was primarily attributable to higher recharges of cloud infrastructure costs to affiliated companies.
SAP SE operating profit increased €6,876 million to €6,434 million (2024: –€442 million). Other operating income increased €5,103 million to €6,161 million (2024: €1,058 million). The year-over-year increase is primarily due to a profit of €4,197 million in gains from the disposal of affiliated companies as a result of the intra-Group share buybacks by SAP America Inc. and SAP Nederland B.V. and an intra-Group share transfer. In addition, currency exchange gains increased €625 million.
SAP SE cost of services and materials increased 5% to €14,309 million (2024: €13,644 million). Services received decreased €122 million to €11,665 million (2024: €11,787 million). The costs for licenses and commissions increased €784 million to €2,606 million (2024: €1,822 million).
SAP SE personnel expenses, mainly the labor cost of software developers, service and support employees, and administration staff employed by SAP SE, decreased 17% to €3,077 million (2024: €3,690 million), primarily due to an decrease in share-based compensation expenses and a decrease in headcount in the reporting year.
Other operating expenses decreased €171 million to €4,766 million (2024: €4,937 million). This decline is mainly attributable to a €1,505 million decrease in restructuring expenses which was partly offset by a €399 million increase in services purchased, €387 million in expenses related to the litigation with Teradata, and a €271 million increase in currency exchange losses.
Finance income was €1,797 million (2024: €988 million), representing a year-over-year increase of €809 million. This increase is primarily due to a €635 million increase in income from investments, a €352 million improvement in net interest income, and an €55 million decrease in write-downs on financial assets. The increase was partly offset by a €250 million decrease in results from profit and loss transfer agreements.
SAP SE income before taxes increased €7,685 million to €8,231 million (2024: €546 million). Income taxes increased €944 million to €1,124 million (2024: €180 million). After deducting taxes, the resulting net income was €7,090 million (2024: €349 million), representing an increase of €6,741 million year over year.
| 72/326 |
|
Integrated Report 2025 | ||||
| To
Our Stakeholders |
Combined Management Report |
Consolidated
Financial Statements IFRS |
Additional Information | ||
Assets and Financial Position
In 2025, SAP SE total assets closed at €48,996 million (2024: €47,786 million).
SAP SE Balance Sheet as at December 31 − German Commercial Code (Short Version)
| € millions | 2025 | 2024 | |
| Assets | |||
| Intangible assets | 1,614 | 659 | |
| Property, plant, and equipment | 1,654 | 1,562 | |
| Financial assets | 34,365 | 36,114 | |
| Fixed assets | 37,633 | 38,334 | |
| Accounts receivable and other assets | 6,405 | 5,914 | |
| Marketable securities and liquid assets | 2,993 | 1,709 | |
| Short-term assets | 9,398 | 7,623 | |
| Prepaid expenses and deferred charges | 1,369 | 951 | |
| Deferred taxes | 596 | 878 | |
| Total assets | 48,996 | 47,786 | |
| Equity and liabilities | |||
| Shareholders' equity | 18,079 | 13,638 | |
| Provisions | 2,960 | 2,947 | |
| Liabilities | 27,944 | 31,187 | |
| Deferred income | 13 | 14 | |
| Total shareholders' equity and liabilities | 48,996 | 47,786 |
Intangible assets increased €955 million year over year to €1,614 million (2024: €659 million), This increase was mainly caused by the addition of €1,023 million in goodwill and by additions of €217 million in intellectual property and other similar rights in connection with the LeanIX merger.
Financial assets decreased €1,749 million year over year to €34,365 million (2024: €36,114 million). This was mainly due to the disposal of shares in affiliated companies amounting to €3,146 million. Of this amount, €1,238 million was attributable to the LeanIX shares canceled as a result of the merger, €1,271 million was attributable to the share buyback of SAP America Inc., and €493 million was attributable to the share buyback of SAP Nederland B.V.. Additions to the shares in affiliated companies amounting to €1,502 million had an opposite effect: Of this amount, €922 million was attributable to capital contributions to subsidiaries and €502 million was attributable to the intra-Group transfer of SAP Italia shares.
The €491 million increase in accounts receivable and other assets was primarily the result of a €324 million increase in receivables from affiliated companies and a €150 million increase in other assets.
Marketable securities and liquid assets increased €1,284 million to €2,993 million (2024: €1,709 million).
SAP SE shareholders’ equity increased 33% to €18,079 million (2024: €13,638 million). Against outflows of €2,743 million associated with the payment of the dividend and €1,916 million for the repurchase of stock in treasury, there was a €7,090 million increase due to net income, and additions of €2,011 million from the issuance of treasury stock to serve the share-based payments of employees. The equity ratio (that is, the ratio of shareholders’ equity to total assets) at year end 2025 was 37% (2024: 29%).
Provisions increased €13 million to €2,960 million (2024: €2,947 million). Other provisions decreased €225 million to €2,145 million (2024: €2,370 million), primarily as the result of a €390 million decrease in other obligations toward employees and a €211 million decrease in provisions for share-based compensation. This was offset by a €387 million increase in provisions related to the Teradata litigation. Provisions for tax increased €240 million to €806 million (2024: €566 million).
Liabilities decreased €3,243 million to €27,944 million (2024: €31,187 million). This was primarily attributable to a decrease in liabilities to financial institutions of €2,250 million and to the scheduled repayment of a bond in the total amount of €600 million. The decrease was partly offset by a €251 million increase in trade payables.
| 73/326 |
|
Integrated Report 2025 | ||||
| To
Our Stakeholders |
Combined Management Report |
Consolidated
Financial Statements IFRS |
Additional Information | ||
The statements made for the SAP Group with respect to capital structure, capital expenditures, and liquidity are mainly equally applicable to SAP SE. For more information, see the Finances (IFRS) section and the Assets (IFRS) section.
Opportunities and Risks
SAP SE is subject to essentially the same opportunities and risks as the SAP Group. For more information, see the Risk Management and Risks section and the Expected Developments and Opportunities section.
| 74/326 |
|
Integrated Report 2025 | ||||
| To
Our Stakeholders |
Combined Management Report |
Consolidated
Financial Statements IFRS |
Additional Information | ||
Corporate Governance Fundamentals
Corporate Governance Statement
The German Commercial Code, section 315d in connection with section 289f, requires that, as a listed company, SAP SE publish a corporate governance statement either as part of our management report or on our website. The Executive Board and the Supervisory Board of SAP SE issued the Corporate Governance Statement on February 17, 2026, and published it on our website at www.sap.com/corporate-en/investors/governance.
Changes in Management
On January 28, 2025, SAP announced that:
| – | The Supervisory Board had extended Thomas Saueressig’s Executive Board contract for a further three years until October 2028. |
| – | The Supervisory Board had appointed Sebastian Steinhaeuser to the Executive Board, in the role of Chief Operating Officer, effective February 1, 2025. |
| – | The Executive Board had established, effective February 1, 2025, an Extended Board comprised of senior leaders from key functions to assist the Executive Board with advisory, coordination, and decision preparation. |
On May 5, 2025, SAP announced that:
| – | The Supervisory Board had extended Christian Klein’s Executive Board contract for a further two years until April 2030. |
| – | The Supervisory Board had extended Dominik Asam’s Executive Board contract for a further two years until March 2028. |
Information Concerning Takeovers
Information required under the German Commercial Code, sections 289a and 315a, with an explanatory report:
Composition of share capital: For information about the composition of SAP SE’s share capital as at December 31, 2025, see the Notes to the Consolidated Financial Statements, Note (E.2). Each share entitles the bearer to one vote. American depositary receipts (ADRs) representing our shares are listed on the New York Stock Exchange (NYSE) in the United States. ADRs are certificates representing non-U.S. shares and are traded on U.S. stock exchanges instead of the underlying shares. One SAP ADR corresponds to one SAP share.
Restrictions applying to share voting rights or transfers: SAP shares are not subject to transfer restrictions. SAP held 60,945,184 treasury shares on December 31, 2025 (see the Notes to the Consolidated Financial Statements, Note (E.2)). Treasury shares do not carry voting rights, dividend rights, or any other rights. We are not aware of any other restrictions applying to share voting rights or to share transfers.
Shareholdings that exceed 10% of the voting rights: We are not aware of any direct or indirect SAP SE shareholdings that exceed 10% of the voting rights.
Shares with special rights conferring powers of control: No SAP shareholder has special rights conferring powers of control.
Type of control over voting rights applying to employee shareholders who do not directly exercise their control rights: As with other shareholders, employee holders of SAP shares exercise their control rights in accordance with applicable law and the Articles of Incorporation. In votes on the formal approval of their acts at the Annual General Meeting of Shareholders, employee representatives on the Supervisory Board, as with all other members of the Supervisory Board, are prohibited from exercising the voting rights associated with their shares.
Requirements concerning appointments and dismissals of members of the Executive Board and amendments to the Articles of Incorporation: Conditions for the appointment and dismissal of members of the Executive Board and amendments to the Articles of Incorporation reflect the relevant provisions of applicable European and German law, including Council Regulation (EC) No. 2157/2001 on the Statute for a European Company (“SE Regulation”) and the German Stock Corporation Act. Under the Articles of Incorporation, the Executive Board consists of at least two members, who are appointed for a period of not more than five years by the Supervisory Board in accordance with the SE Regulation, articles 39 and 46. The Supervisory Board decides on the number of members of the Executive Board. Executive Board members may be reappointed for, or their term of office extended by, a maximum of five years. A simple majority of the Supervisory Board members is required for Executive Board appointments. In the
| 75/326 |
|
Integrated Report 2025 | ||||
| To
Our Stakeholders |
Combined Management Report |
Consolidated
Financial Statements IFRS |
Additional Information | ||
event of a tie, the chairperson of the Supervisory Board has the deciding vote. The Supervisory Board can appoint a chairperson of the Executive Board and one or more deputy chairpersons from among the members of the Executive Board. The Supervisory Board can revoke appointments to the Executive Board in accordance with the SE Regulation, article 9, and the German Stock Corporation Act, section 84, if compelling reasons exist, such as gross negligence on the part of the Executive Board member. If the Executive Board is short of a required member, one may be appointed in urgent cases by a court in accordance with the SE Regulation, article 9, and the German Stock Corporation Act, section 85. In accordance with the SE Regulation, article 59, and the German Stock Corporation Act, section 179, an amendment of the Articles of Incorporation requires a resolution of the General Meeting of Shareholders with a majority of at least three-quarters of the valid votes cast. For any amendments of the Articles of Incorporation that require a simple majority for stock corporations established under German law, however, the simple majority of the valid votes cast is sufficient if at least half of the subscribed capital is represented or, in the absence of such quorum, the majority prescribed by law (that is, two-thirds of the votes cast, pursuant to article 59 of the SE Regulation) is sufficient. Section 11 (2) of the Articles of Incorporation authorizes the Supervisory Board to amend the Articles of Incorporation where such amendments only concern the wording.
Authority to issue and repurchase shares: The Annual General Meeting of Shareholders on May 12, 2021, granted powers to the Executive Board, subject to the consent of the Supervisory Board, to issue convertible and/or warrant-linked bonds, profit-sharing rights and/or income bonds (or combinations of these instruments), and to grant conversion or option rights in respect of SAP SE shares representing a total attributable portion of the share capital of not more than €100 million secured by a corresponding amount of contingent capital. These powers will expire on May 11, 2026. The Executive Board is also authorized until May 12, 2030, to increase the share capital by not more than €250 million by issuing new shares against contributions in cash and to increase the share capital by not more than €250 million by issuing new shares against contributions in cash or in kind. For more information about the different tranches of authorized capital and the aforementioned contingent capital, see the Articles of Incorporation, section 4.
The Annual General Meeting of Shareholders on May 11, 2023, granted a power to the Executive Board in accordance with the German Stock Corporation Act, section 71 (1)(8), to buy back for treasury on or before May 10, 2028, SAP SE shares attributable in total to not more than €120 million of the share capital. This power is subject to the proviso that the shares repurchased, together with any shares that were previously acquired and are still held by SAP in treasury and any other shares controlled by SAP, must not in total exceed 10% of SAP’s share capital. Executive Board powers, such as those described to issue and repurchase stock and to grant rights of conversion and subscription to shares of SAP, are widely followed common practice among German companies such as SAP. These powers give the Executive Board the flexibility it needs, in particular, the option to use SAP shares as consideration in equity investments, raise funds on the financial markets at short notice on favorable terms, or return value to shareholders during the course of the year.
Material agreements with change-of control provisions: SAP SE has concluded the following material agreements with provisions that take effect in the event of a change of control, whether following a takeover bid or otherwise:
The terms of SAP’s existing syndicated €3 billion revolving credit facility include a change-of-control clause. For more information about this syndicated credit facility, see the Notes to the Consolidated Financial Statements, Note (F.1). This clause obliges SAP SE to notify the banks in case of a change of control. If, on receiving the notification, banks that represent at least two-thirds of the credit volume so require, the banks have the right to cancel the credit facility and demand complete repayment of the outstanding debt. If no continuation agreement is reached, the credit facility would end and the obligation to repay would become effective at an ascertainable time.
SAP had bonds totaling €5.65 billion outstanding as at December 31, 2025. For more information about SAP’s bonds, see the Notes to the Consolidated Financial Statements, Note (E.3). Under the terms agreed with the buyers, we are required to notify the buyers, without delay, of any change of control. If there is a change of control and SAP is consequently assigned a lower credit rating within a defined period, buyers are entitled to demand repayment.
We have entered into relationships with other companies to jointly develop and market new software products and cloud solutions. These relationships are governed by development and marketing agreements with the respective companies. Some of the agreements include provisions that, in the event of a change of control over one of the parties, give the other party a right to consent to the assignment of the agreement or to terminate it.
Change-of-control provisions in Executive Board compensation agreements: Agreements have been concluded with the members of the Executive Board of SAP SE concerning compensation in the event of a change of control. These agreements, which are customary internationally, are described in the Compensation Report. We have no analogous compensation agreements with our other employees.
| 76/326 |
|
Integrated Report 2025 | ||||
| To
Our Stakeholders |
Combined Management Report |
Consolidated
Financial Statements IFRS |
Additional Information | ||
Risk Management and Risks
Our Risk Management
Internal Control and Risk Management Systems15
As a global company, SAP is exposed to a broad range of risks across our business operations. Consequently, our Executive Board has established comprehensive internal control and risk management structures that enable us to identify and analyze risks early and take appropriate action. Our internal control and risk management systems are designed to identify potential events that could negatively impact the Company and to provide reasonable assurance regarding the operating effectiveness of our internal controls over our financial reporting.
These systems comprise numerous control mechanisms and are an essential element of our corporate decision-making process; they are therefore implemented across the entire Group as an integral part of SAP’s business processes. We have adopted an integrated internal control and risk management approach to help maintain appropriate and effective global risk management while also enabling us to aggregate risks and report on them transparently.
Appropriateness and Effectiveness of SAP’s Entire Internal Control and Risk Management System16
We have a governance model in place across the internal control and risk management systems, as well as a central software solution to store, maintain, and report all risk-relevant information. Furthermore, SAP monitors risks relating to material sustainability matters. The governance model, policies, guidelines, and control measures we have implemented relative to these topics are described in the respective chapters in this Combined Management Report. SAP continuously reviews and adjusts its entire internal control and risk management system as well as the policies and guidelines we have implemented regarding material sustainability topics. We considered the results from external audits, such as the audit of our internal control system for financial reporting and early risk detection system conducted by our auditor BDO, as well as internal sources, such as audit reports from our Global Risk & Assurance Services (GR&AS) team, to evaluate the effectiveness of our internal control and risk management systems. If issues are identified, SAP takes remedial action. While the non-financial internal control system has not yet reached the same maturity level as the financial internal control system, no material indication has come to our attention that SAP’s entire internal control and risk management system is not appropriate or effective.
Legal and Regulatory Requirements
Due to our public listings in both Germany and the United States, we are subject to both German and U.S. regulatory requirements that relate to internal controls and risk management over financial reporting, such as provisions in the German Stock Corporation Act, section 91 (2) and (3), the U.S. Sarbanes-Oxley Act (SOX) of 2002, specifically sections 302 and 404, and the German Corporate Governance Code. Hence, our Executive Board has established an early warning system (risk management system) to enable transparent risk disclosures and compliance with applicable regulations.
Risk Management Policy and Framework
The risk management policy issued by our Executive Board governs how we manage risk in line with the Company’s risk appetite and defines a methodology that is applied uniformly across all parts of the SAP Group.
We have developed and implemented a cybersecurity risk management program intended to protect the confidentiality, integrity, and availability of our critical systems, information, and our customers’ data. Our cybersecurity risk management program and processes are part of our risk management policy, and are aligned with the methodologies, reporting channels, and governance processes that apply across our enterprise risk management program to other legal, compliance, strategic, operational, and financial risk areas of the SAP Group.
15 Sustainability and sustainability reporting risk management and internal controls framework: ESRS 2 GOV-5 36 (a).
16 The appropriateness and effectiveness of SAP’s entire internal control and risk management system, except for the internal control system for financial reporting and early risk detection system, was neither part of the statutory audit nor the independent limited assurance engagement performed by our external auditor.
| 77/326 |
|
Integrated Report 2025 | ||||
| To
Our Stakeholders |
Combined Management Report |
Consolidated
Financial Statements IFRS |
Additional Information | ||
Risk Management Pillars
Our risk management system is based on the framework published by the Committee of Sponsoring Organizations of the Treadway Commission (COSO) entitled “Enterprise Risk Management – Integrating with Strategy and Performance.” Updated in 2017, this framework is built on four pillars, namely: a global risk management governance framework, a dedicated risk management policy, a global risk management organization, and a standardized risk management methodology.
In accordance with the COSO framework, SAP’s enterprise risk management covers risks in the areas of strategy, operations, finance, and compliance (the latter also covers ethical behavior, corporate governance, and sustainability).
Our Global Risk Management Governance Framework17
The risk management governance framework at SAP represents a comprehensive system of approaches and processes to ensure control through a clearly structured risk management system and a supporting risk culture. The risk culture is considered the basis of SAP’s risk management system. Risk culture at SAP comprises a system of values, beliefs, knowledge, attitudes, and understanding concerning risks and risk management as part of our corporate culture. To support and continuously foster SAP’s risk culture, we conduct risk activities for the entire SAP organization such as mandatory training in ethical behavior, code of conduct, and risk management.
Our Executive Board is responsible for ensuring the effectiveness of the internal control system and our risk management system. The effectiveness of both systems and their implementation in the different Board areas is monitored by each Executive Board member. The Audit and Compliance Committee of the Supervisory Board regularly monitors the effectiveness of SAP’s internal control and risk management systems. Our GR&AS organization regularly provides a status update on the internal control and the risk management systems to the Audit and Compliance Committee of the Supervisory Board. Every year, SAP’s external auditors assess whether the SAP Group early-warning system for risk detection is adequate to identify risks that might endanger our ability to continue as a going concern. Additional assurance is obtained through the external audit of the effectiveness of our system of internal controls over financial reporting.
Our Global Risk Management Policy
The risk management policy is reviewed annually and stipulates responsibilities for conducting risk management activities and defines reporting and monitoring structures. Our global SAP risk management policy clearly states that each employee is responsible for active engagement in the risk management process as well as for the continuous identification of risks, based upon clear rules of engagement in adherence to the policy. The risk management system primarily analyzes risks. Opportunities are assessed or analyzed where it is deemed appropriate.
Our Global Risk Management Organization
Our global risk management organization is responsible for implementing a Group-wide effective risk management system. Furthermore, GR&AS is responsible for the regular maintenance and implementation of our risk management policy, as well as the standardized internal and external risk reporting.
All GR&AS risk managers, working with assigned risk contacts in the relevant business units, identify and assess risks associated with material business operations and monitor the implementation and effectiveness of the measures chosen to mitigate risks.
Further financial risk management activities are performed, for example, by our Global Treasury and Global Tax departments. General legal risks are managed by the Global Legal department. Sanction and embargo-related risks are managed by the Export Control department, harassment and other HR-related issues by our Global Labor & Employee Relations Office, security- and cybersecurity-related risks by our SAP Global Security Office, and IP risks by our Global IP Office. Non-financial risks are reported jointly by GR&AS and SAP’s Sustainability and other involved organizations. All risks are tracked, maintained, and reported within SAP’s risk management system.
During the merger and acquisition and post-merger integration phase, newly acquired companies are subject to risk management performed by our Corporate Development Mergers and Acquisitions (M&A) function. Furthermore, for as long as the newly acquired companies are not integrated, their existing risk management structures are maintained or enhanced to comply with legal requirements.
SAP regularly reviews the exposure of its business units to potential compliance risks. Quantitative and qualitative internal data and external information, such as Transparency International’s Corruption Perceptions Index, are considered in our wider compliance risk
17 Sustainability and sustainability reporting risk management and internal controls framework: ESRS 2 GOV-5 36 (a).
| 78/326 |
|
Integrated Report 2025 | ||||
| To
Our Stakeholders |
Combined Management Report |
Consolidated
Financial Statements IFRS |
Additional Information | ||
analysis. Based on this information, we perform a detailed assessment for all SAP-relevant high-risk countries and derive local and global mitigations.
The GR&AS unit, led by the Chief Risk Officer (who also acts as Chief Audit Executive), combines internal audit, SOX, internal controls, and global governance, risk, and compliance activities. The Chief Risk Officer reports to our Group CFO and is responsible for SAP’s internal control and risk management programs. Additionally, the Office of Ethics & Compliance (OEC) and the Global Legal department continuously address compliance challenges and improve policies, guidelines, systems, and measures related to their implementation.
Internal Control and Risk Management System for Financial Reporting
The purpose of our system of internal control over financial reporting is to provide reasonable assurance that our financial reporting is reliable and compliant with generally accepted accounting principles. Because of the inherent limitations of internal controls over financial reporting, this system might not prevent or bring to light all potential misstatements in our financial statements.
Our internal control system consists of the internal control and risk management system for financial reporting (ICRMSFR), which also covers the broader business environment and is part of the overall risk management system of SAP. Using the current COSO Internal Control – Integrated Framework of 2013, we have defined and implemented internal controls along the value chain on a process and subprocess level to ensure that sound business objectives are set in line with SAP’s strategic, operational, financial, and compliance goals.
SAP’s ICRMSFR is based on our Group-wide risk management methodology. It includes organizational, control, and monitoring structures designed to ensure that data and information concerning our business is collected, compiled, and analyzed in accordance with applicable laws and properly reflected in our IFRS Consolidated Financial Statements.
Our ICRMSFR also includes policies, procedures, and measures designed to ensure compliance of SAP’s financial reports with applicable laws and regulations. We analyze new statutes, standards, and other pronouncements concerning IFRS accounting and its impact on our Group financial statements and the ICRMSFR. Failure to adhere to these would present a substantial risk to the compliance of our financial reporting. In addition, the ICRMSFR has both preventive and detective controls, including, for example, automated and non-automated reconciliations, segregated duties with two-person responsibility, authorization concepts in our software systems, and corresponding monitoring measures.
Our Global Accounting, Reporting & Tax (GAR&T) department codifies all accounting and reporting policies in SAP Group Accounting and SAP Global Revenue Recognition guidelines. These policies and corresponding corporate timelines define the closing process. Under this closing process, we prepare, predominantly through centralized or external services, the financial statements of all SAP entities for consolidation by GAR&T. GAR&T and other corporate departments are responsible for ensuring compliance with Group accounting policies and monitoring the accounting work. GAR&T reviews accounting standards and processes to ensure applicable updates are made to SAP’s financial reporting.
We have outsourced some tasks, such as the valuation of projected benefit obligations and share-based payouts, quarterly tax calculations for most entities, purchase price allocations in the context of asset acquisitions and business combinations, and the local statutory financial statements for a few of our subsidiaries. These outsourced tasks are subject to the same stringent requirements that are mandated for all our internally generated financially relevant information.
Based on an analysis of the design and operating effectiveness of our respective internal controls over financial reporting, a committee with leadership representation from Finance, Compliance, Legal, and IT presents the results of the assessment of the ICRMSFR effectiveness with respect to our IFRS consolidated financial statements as at December 31 each year to our Group CFO. The committee meets regularly to set the annual scope for the test of effectiveness, to assess and evaluate any weaknesses in the controls, and to determine measures to address them in time and adequately. The Audit and Compliance Committee of the Supervisory Board regularly scrutinizes the resulting assessments of the effectiveness of the internal controls over financial reporting with respect to the IFRS consolidated financial statements and corresponding disclosure notes.
The assessment, conducted by SAP and external audit, of the effectiveness of the ICRMSFR related to our IFRS consolidated financial statements concluded that, on December 31, 2025, the Group had an effective internal control system over financial reporting in place.
Additionally, and in compliance with German commercial law requirements, SAP maintains an internal control system beyond financial reporting. This is supported through automated controls (continuous control monitoring) as part of our business processes.
| 79/326 |
|
Integrated Report 2025 | ||||
| To
Our Stakeholders |
Combined Management Report |
Consolidated
Financial Statements IFRS |
Additional Information | ||
Internal Controls over Non-Financial and Sustainability Reporting18
The GR&AS unit is also responsible for ESG controls and global governance. GR&AS assists in the design and implementation of an ESG compliance framework supported by internal controls. The ESG compliance framework was developed through analysis of the reporting process, identification of possible risks, and mitigation of risks through controls. In the framework development process, high and medium level risks were prioritized. An analysis of our ESG external reporting process confirmed that internal controls mitigate the risk of gathering incorrect or inaccurate data. Identified risks and findings are reported to the business, and the respective business owners are required to address any gaps. Findings are further presented to Management, including members of the Executive Board, through a reporting process conducted three times annually. The accuracy of the reported disclosures is further ensured through multiple internal reviews of the Sustainability Statement.
Supporting Software Solution
We use our own risk management software, namely SAP governance, risk, and compliance (GRC) solutions powered by SAP HANA, to support the governance process. GR&AS risk managers record and track identified risks using our risk management software online and in real time to help create transparency across all known risks that exist in the Group, as well as to facilitate risk management and the associated risk reporting. These GRC solutions also support the risk-based approach of the ICRMSFR. Our continuous control monitoring activities are performed utilizing our GRC software as well. This information is available to managers through direct access to our SAP Fiori application for enterprise risk reporting, and in regularly issued reports, and is consolidated and aggregated for the quarterly risk reports to the Executive Board.
Risk Factors19
The following sections outline our risk categories and risk factors that we have identified and continuously track. To determine which risk factors pose the greatest threat to the viability of the SAP Group, we classify them as high, medium, or low based on 1) the likelihood that a risk factor will occur within the assessment horizon, and 2) the impact the risk factor would likely have on SAP’s business objectives were it to occur.
The scales for measuring these indicators are given in the following tables.
| Probability/Likelihood of Occurrence |
Description | Impact Level | Impact Definition | Impact | |
| 1% to 19% | Remote | Insignificant | Negligible negative impact on business, financial position, profit, and/or cash flows | From €0 to €25 million | |
| 20% to 39% | Unlikely | Minor | Limited negative impact on business, financial position, profit, and/or cash flows | From €25 million to €50 million | |
| 40% to 59% | Likely | Moderate | Some potential negative impact on business, financial position, profit, and/or cash flows | From €50 million to €100 million | |
| 60% to 79% | Highly Likely | Major | Considerable negative impact on business, financial position, profit, and/or cash flows | From €100 million to €500 million | |
| 80% to 99% | Near Certainty | Business-Critical | Detrimental negative impact on business, financial position, profit, and/or cash flows | From €500 million |
The combination of the likelihood of a risk factor and its impact on SAP’s reputation, business, financial position, profit, and/or cash flows leads to a subsequent classification as either “high,” “medium,” or “low.”
Insignificant |
Minor |
Moderate |
Major |
Business-Critical | ||||
| Probability | 80% to 99% | L | M | H | H | H | ||
| 60% to 79% | L | M | M | H | H | |||
| 40% to 59% | L | L | M | M | H | |||
| 20% to 39% | L | L | L | M | M | |||
| 1% to 19% | L | L | L | L | M | |||
| Impact | ||||||||
| L = Low Risk | M = Medium Risk | H = High Risk | ||||||
18 Sustainability and sustainability reporting risk management and internal controls framework: ESRS 2 GOV-5 36 (b) (c) (d) (e).
19 Sustainability and sustainability reporting risk management and internal controls framework: IRO-1 53 c (iii)
| 80/326 |
|
Integrated Report 2025 | ||||
| To
Our Stakeholders |
Combined Management Report |
Consolidated
Financial Statements IFRS |
Additional Information | ||
To further streamline our integrated report, we disclose material and relevant risk factors and focus on “major” and “business-critical” risk factors as per our assessment. Thus, the following risk factors are not included in the Integrated Report 2025 as they do not currently fall into either the “major” or “business-critical” category: Corporate Governance; Environment and Sustainability; Sales and Revenue Conditions; Liquidity; Use of Accounting Policies and Judgment; Currency, Interest Rate, and Share Price Fluctuation; Insurance and Venture Capital; Unauthorized Disclosure of Information; Investor Relations; Corporate Affairs; Marketing; Portfolio; SAP Strategy; Human Workforce.
The following table provides an overview of major and business-critical risk categories (together with the respective risk factors). Therein, risk factors are categorized with their net value (after the implementation of mitigations).
Overview of Risk Factors (Aggregated Statement for 2025)
| Probability | Impact | Risk Level | |
| Economic, Political, Social, and Regulatory Risks | |||
| Global Economic and Political Environment | Likely | Major | Medium |
| International Laws and Regulations | Unlikely | Business-Critical | Medium |
| Legal and IP | Unlikely | Major | Medium |
| Data Protection and Privacy | Likely | Major | Medium |
| Corporate Governance and Compliance Risks | |||
| Ethical Behavior | Unlikely | Major | Medium |
| Operational Business Risks | |||
| Sales and Services | Unlikely | Major | Medium |
| Partner Ecosystem | Unlikely | Major | Medium |
| Cloud Operations | Unlikely | Major | Medium |
| Cybersecurity and Security | Likely | Business-Critical | High |
| Technology and Products | Unlikely | Business-Critical | Medium |
| Strategic Risks | |||
| Market Share and Profit | Unlikely | Business-Critical | Medium |
| Mergers and Acquisitions | Remote | Insignificant | Low |
| Innovation | Unlikely | Major | Medium |
| 81/326 |
|
Integrated Report 2025 | ||||
| To
Our Stakeholders |
Combined Management Report |
Consolidated
Financial Statements IFRS |
Additional Information | ||
Economic, Political, Social, and Regulatory Risks
Global Economic and Political Environment: Uncertainty in the global economy and/or financial markets, and social and political instability caused by state-based conflicts, terrorist attacks, civil unrest, war, or international hostilities could lead to disruptions in our business.
As a global company, we are influenced by multiple external factors that are difficult to predict, may develop quickly, and are beyond our influence and control. These include, among others: crises affecting credit or liquidity markets; regional or global recessions; sharp fluctuations in commodity prices, currency exchange rates or interest rates; inflation or deflation; sovereign debt and bank debt rating downgrades; restructurings or defaults; adverse geopolitical events (such as Russia’s invasion of Ukraine and the Israel-Hamas conflict); rising military tensions around the world (such as the China-Taiwan tensions) and in particular within Europe’s borders; global policy including in the United States, the European Union (EU), Russia, and China; and global pandemic diseases such as COVID-19.
Any of these events could have an adverse effect on our reputation, business, competitive or financial position, profit, and cash flows.
SAP has established measures intended to address and mitigate the described risks and adverse effects. For example, we increased our share of more predictable revenue streams from cloud subscriptions and software support revenue streams, providing increased stability against financial volatility; and, supported by our global government affairs unit, we continuously monitor and evaluate global and political developments, to share insights and provide guidance to allow for proactive preparation and timely mitigation.
We cannot exclude the possibility that if any one or more of the risks associated with this risk factor were to occur, the impact could be major. We estimate the probability of occurrence to be likely, and classify this risk factor as medium.
International Laws and Regulations: Laws, regulatory requirements and standards in Germany, the United States, and elsewhere continue to be very stringent. Our international business activities and processes expose us to numerous and often conflicting laws and regulations, policies, standards, or other requirements, and sometimes even conflicting regulatory requirements.
The SAP Group has a global presence and operates in most countries of the world. As a European company domiciled in Germany with securities listed in Germany and the United States, we are subject to European, German, U.S., and other governance-related regulatory requirements of the countries we operate in.
Our business is subject to numerous risks inherent to international business operations and associated consequences, such as changes in tax laws, changes in external reporting standards, and the interpretation of the complex tax rules in certain countries, including but not limited to conflict and overlap among tax regimes as well as the introduction of new tax concepts that harm digitalized business models; discriminatory, protectionist, or conflicting fiscal policies and tax laws; import and export regulations and trade sanctions; counter or even conflicting sanctions; embargoes, including but not limited to country-specific software certification requirements; and newly emerging cybersecurity and environmental, social, and governance (ESG) compliance and disclosure laws.
As we expand into new countries and markets or extend our business activities in these markets, including emerging and high-risk markets, these risks could intensify. The application of the respective local laws and regulations to our business is sometimes unclear, subject to change over time, and often conflicting among jurisdictions. Additionally, these laws and government approaches to enforcement continue to change and evolve, just as our products and services continually evolve. Compliance with these varying laws and regulations (including, and in particular, global anti-trust regulations) could involve significant costs or require changes in our products or business practices. Non-compliance could result in the imposition of penalties or cessation of orders due to alleged non-compliant activity. Governmental authorities could use considerable discretion in applying these statutes and any imposition of sanctions against us could be material.
Any of these events could have a material adverse effect on our operations globally or in one or more countries or regions, which could have a material adverse effect on our business, financial position, profit, and cash flows.
SAP has established measures intended to address and mitigate the described risks and adverse effects. For example, we monitor new and increased regulatory requirements; continuously invest in, improve, and standardize our global processes, procedures, and solutions; proactively assess newly emerging regulatory initiatives; consult external economic and tax advisors, law firms, and authorities in the concerned countries; and take legal action when necessary.
We cannot exclude the possibility that if any one or more of the risks associated with this risk factor were to occur, the impact could be business-critical. We estimate the probability of occurrence to be unlikely, and classify this risk factor as medium.
| 82/326 |
|
Integrated Report 2025 | ||||
| To
Our Stakeholders |
Combined Management Report |
Consolidated
Financial Statements IFRS |
Additional Information | ||
Legal and IP: Claims and lawsuits against us, such as for IP infringements or breaches of contract, or our inability to obtain or maintain adequate licenses for third-party technology, or if we are unable to protect or enforce our own intellectual property, may result in adverse outcomes.
We have in the past, and believe that we will continue to be, subject to claims and lawsuits, including intellectual property infringement claims, as our solution portfolio grows; as we acquire companies with increased use of third-party code including open source code; as we expand into new industries with our offerings, resulting in greater overlap in the functional scope of offerings; and as non-practicing entities that do not design, manufacture, or distribute products assert intellectual property infringement claims. Also, we have been in the past, and believe that we may continue to be in the future, subject to claims and lawsuits alleging competition and antitrust law violations. Such allegations, for example, often arise from competitors and third parties claiming broad access rights to SAP data.
Moreover, protecting and defending our intellectual property is crucial to our success. The outcome of litigation and other claims or lawsuits is intrinsically uncertain.
We are subject to risks and associated consequences in the following areas, among others: data access and other antitrust-based claims, for example alleged lock-in effects, dependency in the aggregate on third-party technology, including cloud and Web services, that we embed in our products or that we resell to our customers; integration of open source software components from third parties into our software and the implications derived from it; inability to prevent third parties from obtaining, using, or selling without authorization what we regard as our proprietary technology and information; and the possibility that third parties might reverse-engineer or otherwise obtain and use technology and information that we regard as proprietary. Moreover, the laws and courts of certain countries might not offer effective means for us to enforce our legal or intellectual property rights and successfully defend allegations. Finally, SAP might face significant adverse rulings in commercial disputes or might not be able to collect or otherwise enforce all judgments awarded to it in legal proceedings. The outcome of litigation and other claims or lawsuits is intrinsically uncertain. Management’s view of the litigation might also change in the future. Actual outcomes of litigation and other claims or lawsuits could differ from the assessments made by management in prior periods, which are the basis for our accounting for these litigations and claims under IFRS.
Besides vigorously defending against unjustified claims, SAP has established measures intended to address and mitigate the described risks and adverse effects. For example, we: have introduced a global antitrust risk management policy and are strengthening our related processes; have various internal programs, such as internal policies, processes, and monitoring in place to assess and manage the risks associated with AI technologies and open source and third-party intellectual property; endeavor to protect ourselves in the respective third-party software agreements by obtaining certain rights in case such agreements are terminated; and are a party to certain patent cross-license agreements with third parties.
We cannot exclude the possibility that if any one or more of the risks associated with this risk factor were to occur, the impact could be major. We estimate the probability of occurrence to be unlikely, and classify this risk factor as medium.
Data Protection and Privacy: Non-compliance with increasingly complex and stringent, sometimes even conflicting, applicable data protection and privacy laws, or failure to meet the contractual requirements of SAP’s customers with respect to our products and services, could lead to civil liabilities and fines, as well as loss of customers.
As a global software and service provider, SAP is required to comply with local laws wherever it does business. One of the relevant European data protection laws is the General Data Protection Regulation. International data transfers to third countries that do not provide an adequate level of data protection require additional safeguards, including transfer risk assessments, to justify a transfer from the EU to a third country under the applicable EU Standard Contractual Clauses (SCC). In addition, other countries establish safeguards to justify data transfers to further countries, by implementing their own standard contractual clauses. Examples include Türkiye’s Personal Data Protection Law, China’s Personal Information Protection Law, and Saudi Arabia’s Personal Data Protection Law, which also imposes requirements regarding data localization.
Furthermore, data protection and privacy laws, regulations, and other standards around the world are evolving to better protect individuals’ personal information, particularly in marketing activities and tracking of online behavior. This may impose additional burdens for SAP due to increasing compliance standards that could restrict the use and adoption of SAP’s products and services (particularly cloud services) and make it more challenging and complex to meet customer expectations. These changing criteria also impact the compliant use of new technology, such as machine learning and Artificial Intelligence for product development and deployment of intelligent applications.
Non-compliance with applicable data protection and privacy laws by SAP or any of the subprocessors engaged by SAP while processing personal data could lead to risks. These include, among others: mandatory disclosure of breaches to affected individuals, customers, and data protection supervisory authorities; investigations and administrative measures by data protection supervisory authorities, such as the instruction to alter or stop non-compliant data processing activities, including the instruction to stop using
| 83/326 |
|
Integrated Report 2025 | ||||
| To
Our Stakeholders |
Combined Management Report |
Consolidated
Financial Statements IFRS |
Additional Information | ||
non-compliant subprocessors; or the possibility of damage claims by customers and individuals, contract terminations, and potential fines.
In addition, the German Federal Office for the Protection of the Constitution and security industry experts continue to warn of risks related to a globally growing number of cybersecurity attacks aimed at obtaining or violating company data including personal data.
Any of these events could have a material adverse effect on our reputation, business, financial performance, competitive or financial position, revenue, profit, and cash flows.
SAP has established measures intended to address and mitigate the described risks and adverse effects. For example, we: have implemented internal processes and measures to enable SAP to comply successfully and sufficiently with applicable data protection requirements; anchor data protection requirements in the mandatory product standards of SAP’s product development lifecycle; continuously review SAP’s existing standards and policies to address changes to applicable laws and regulations; continuously enhance our data center operations worldwide; actively monitor legal developments; engage with political stakeholders and government authorities; and provide clear governance and guidance on data handling, processing standards, and external communication as part of our data management framework, specifically incorporating aspects of new technologies such as those represented in embedded intelligence applications.
We cannot exclude the possibility that if any one or more of the risks associated with this risk factor were to occur, the impact could be major. We estimate the probability of occurrence to be likely, and classify this risk factor as medium.
Corporate Governance and Compliance Risks
Ethical Behavior: Our global business exposes us to risks related to unethical behavior and non-compliance with policies by employees, other individuals, partners, third parties, or entities associated with SAP.
SAP’s leadership position in the global market is founded on the long-term and sustainable trust of our stakeholders worldwide. Our overarching approach is one of corporate transparency, open communication with financial markets, regulators, and authorities, and adherence to recognized standards of business integrity. This commitment to recognized standards of business integrity is formalized in SAP’s Global Code of Ethical Business Conduct (CoEBC) and supporting policies and guidelines.
Risks and associated consequences to which SAP is subject include: non-compliance with policies; violation of compliance-related rules, regulations, and legal requirements including, but not limited to, antitrust, anticorruption, and antibribery legislation in Germany, the U.S. Foreign Corrupt Practices Act, the UK Bribery Act, and other applicable laws; collusion with external third parties; fraud and corruption; public sector transactions in territories exposed to a high risk of corruption; or increased exposure and impact on business activities in highly regulated industries, all of which may lead to civil or criminal charges, fines, or claims by affected parties as well as reputational damage.
Any of these events could have a material adverse effect on our reputation, business, competitive or financial position, profit, or cash flows. In 2025, SAP continued to strengthen its compliance program and related internal controls in accordance with regulatory expectations and requirements.
SAP has established measures intended to address and mitigate the described risks and adverse effects. For example, we: continuously evolve our comprehensive compliance program based on the three pillars of prevention, detection, and response; improve associated business processes, to prevent further and future violations; review partner business models, to mitigate risks of corruption while meeting agility requirements; conduct internal audits of our compliance programs related to bribery, corruption, and substantial fraud; annually reconfirm commitment to the CoEBC by SAP’s workforce (except where disallowed by applicable legal regulations); implement compliance policies and processes aimed at managing third parties and preventing misuse of third-party payments for illegal purposes, including the performance of compliance due diligence activities prior to the engagement of third parties; and launched a Partner Integrity Initiative aimed at examining the compliance programs of partners in SAP’s ecosystem and reviewing the SAP-related deals closed by them. The “Speak Out at SAP” whistleblower reporting tool is accessible to anyone, both within and outside of SAP, to raise confidentially—and, if desired, anonymously—their concerns on ethics and compliance related to our CoEBC and any law or regulation.
Despite our comprehensive and continuously evolving compliance programs and internal controls, intentional efforts of individuals to circumvent controls or engage in corruption, especially by way of collusion with other involved parties, cannot always be prevented.
We cannot exclude the possibility that if any one or more of the risks associated with this risk factor were to occur, the impact could be major. We estimate the probability of occurrence to be unlikely, and classify this risk factor as medium.
| 84/326 |
|
Integrated Report 2025 | ||||
| To
Our Stakeholders |
Combined Management Report |
Consolidated
Financial Statements IFRS |
Additional Information | ||
Operational Business Risks
Sales and Services: Sales and implementation of SAP software and services, including cloud, are subject to several significant risks sometimes beyond our direct control.
A core element of our business is the successful implementation of software and service solutions. The implementation of SAP software and cloud-based service deliveries is led by SAP, by partners, by customers, or by a combination thereof.
We are subject to risks and associated consequences in the following areas, among others: implementation risks caused by insufficient or incorrect information provided by customers, insufficient customer expectation management, including scope, integration capabilities and aspects, and a lack of purposeful selection, implementation, or utilization of SAP solutions; a lack of customer commitments and respective engagements; challenges to achieve a seamlessly integrated, sufficiently automated and aligned service delivery; unrenderable services committed during the sales stage; inadequate contracting and consumption models based on subscription models for services, support, and application management; deviations from standard terms and conditions; or statements concerning solution developments that might be misperceived by customers as commitments on future software functionalities.
Any of these events could have an adverse effect on our reputation, business, competitive or financial position, profit, and cash flows.
SAP has established measures intended to address and mitigate the described risks and adverse effects. For example, we: integrate risk management processes into SAP’s project management methods that are intended to safeguard implementations through coordinated risk and quality management programs; conduct ethical scope reviews and monitoring that are adapted as required as part of a clearly defined change request process together with respective project governance, steering, monitoring and controlling activities; and put in place a policy that clearly outlines communication rules on future functionalities as well as legal requirements for commitments to customers.
We cannot exclude the possibility that if any one or more of the risks associated with this risk factor were to occur, the impact could be major. We estimate the probability of occurrence to be unlikely, and classify this risk factor as medium.
Partner Ecosystem: If we are unable to scale, maintain, and enhance an effective partner ecosystem, revenue might not increase as expected.
An open and vibrant partner ecosystem is a fundamental pillar of our success and growth strategy. We have entered into partnership agreements that drive co-innovation on our platforms, profitably expand our routes to market to optimize market coverage, optimize cloud delivery, and provide high-quality services capacity in all market segments. Partners play a key role in driving market adoption of our entire solutions portfolio, by co-innovating on our platforms, embedding our technology, and reselling or implementing our software.
We are subject to risks and associated consequences in the following areas, among others: failure to establish and enable a network of qualified and fully committed partners; failure of partners to develop sufficient innovative solutions and content on our platforms or to provide high-quality products or services to meet customer expectations; failure of partners to embed our solutions sufficiently enough to profitably drive product adoption; failure of partners to adhere to applicable legal and compliance regulations; failure of partners to transform their business model in accordance with the transformation of SAP’s business model in a timely manner; and failure of partners to comply with contract terms in embargoed or high-risk countries.
If any of these risks materialize, this might adversely affect the demand for our products and services as well as the partner’s loyalty and ability to deliver. As a result, we might not be able to scale our business to compete successfully with other vendors, which could have an adverse effect on our reputation, business, competitive or financial position, profit, and cash flows.
SAP has established measures intended to address and mitigate the described risks and adverse effects. For example, we: develop and enhance a wide range of partner programs to retain existing and attract new partners; offer training opportunities for our partners; provide safeguarding services to customers and partners; introduced a partner delivery quality framework; and implemented a certification process for third-party solutions to ensure consistent high-quality and seamless integration.
We cannot exclude the possibility that if any one or more of the risks associated with this risk factor were to occur, the impact could be major. We estimate the probability of occurrence to be unlikely, and classify this risk factor as medium.
Cloud Operations: We may not be able to properly protect and safeguard our critical information and assets, business operations, cloud offerings and portfolio presentation, and related infrastructure against cyberattacks, insufficient infrastructure, disruption, or deficient performance.
SAP is highly dependent on the availability, integrity, and reliability of our infrastructure, including infrastructure provided by third-party business partners, and the software used in our cloud portfolio is inherently complex. Customers using our cloud services rely
| 85/326 |
|
Integrated Report 2025 | ||||
| To
Our Stakeholders |
Combined Management Report |
Consolidated
Financial Statements IFRS |
Additional Information | ||
on the security of our infrastructure to protect the availability of our services and the data that they store on our infrastructure. Threat actors are focused on attacking third-party product and service providers, such as SAP, as a means of compromising our and our downstream customers’ systems and data.
We are subject to risks and associated consequences in the following areas, among others: the cloud portfolio or strategic direction of cloud operations may not fully meet customer demands; customers’ cloud service demands may not match our data center capacity or control investments; capacity shortages could affect SAP’s ability to deliver and operate cloud services as expected by or committed to our customers; scalability demands on infrastructure and operation could lead to cost increases and margin impacts; hyperscaler or infrastructure instabilities and the lack of availability or comprehensive contractual agreements could lead to challenges in meeting service level agreement (SLA) commitments; we might lack sufficient “future skills” for delivering and operating hybrid environments; we might lack the automation, standardization, and tools to manage and optimize operations and infrastructure; local legal requirements or changes to data sovereignty may lead to customers relocating their landscapes to a different data center; the loss of the right to use hardware purchased or leased from third parties could affect our ability to provide our cloud applications; disruptions to SAP’s cloud applications portfolio (such as system outages or downtimes, SAP network failure due to human or other errors, security breaches, or variability in user traffic for cloud applications) could affect customer SLAs; hardware failures or system errors might result in data loss or corruption; partner co-location of data centers might not adhere to our quality standards; or we might not comply with applicable certification requirements, such as the Payment Card Industry Data Security Standard (PCI DSS).
Any of these events could have a material adverse effect on our reputation, business, competitive or financial position, profit, and cash flows.
SAP has established measures intended to address and mitigate the described risks and adverse effects. For example, we: consolidated and harmonized our data centers and our data protection measures, which included implementing security information and event management solutions as well as enforcing network access control; invest significantly in infrastructure and processes to ensure consistently secure operations of our cloud solutions while continuously improving resistance, resilience, reusability, and scalability towards a standardized and harmonized portfolio; continuously enhance our infrastructure landscape capabilities and deployment options, including harmonized, efficient, and highly repetitive migration services; adhere to stringent SLAs with hyperscalers to ensure a high-quality customer experience; increase transparency through our continuously enhanced and expanded SAP Trust Center, in an effort to provide an appropriate level of information, for example, regarding planned patching activities and associated downtimes; monitor and invest in the continuous enhancement of our disaster recovery and business continuity capabilities; continuously aim for a homogeneous landscape that supports the complex infrastructure, application, and security requirements so that we can deliver the required service level for cloud services in a cost-effective manner; set up physical access control systems at facilities, multilevel access controls, video surveillance management, security personnel in all critical areas, and recurring social engineering tests for SAP premises and data centers; control the access to information and information systems using authorization concepts that include managers and employees being regularly sensitized to the issues and given mandatory security and compliance trainings; adapt our cloud service delivery to local or specific market requirements (such as local or regional data centers) and comply with all local legal regulations regarding data protection and privacy as well as data security; establish contracts and SLAs with our public cloud partners to ensure that data security and privacy measures meet local regulatory and compliance standards and SAP’s own standards for data security and privacy; maintain strict internal policies and controls concerning utilization of our partner’s cloud infrastructure, including people, process, and technology standards required to enhance compliance and cyber resilience; closely monitor data center utilization, capacity, and pipeline for subsequent investment planning; regularly conduct risks reviews, disclosure requests, and audits to ensure public cloud providers meet SAP’s data privacy and security standards; ensure PCI-validated compliance through successful PCI DSS audits; invest in training and certifications concerning hyperscaler- and related next-generation technologies; and implement best-of-breed tools for IT operations management and automation.
We cannot exclude the possibility that if any one or more of the risks associated with this risk factor were to occur, the impact could be major. We estimate the probability of occurrence to be unlikely, and classify this risk factor as medium.
For related cybersecurity risks for cloud operations, see Cybersecurity and Security in the Risk Management and Risks section.
Cybersecurity and Security: Cybersecurity attacks or breaches, and security vulnerabilities in our infrastructure or services or those of our third-party partners could materially impact our business operations, products, and service delivery.
SAP delivers a full portfolio of solutions, hosts or manages elements of our customers’ businesses in the cloud, processes large amounts of data, and provides mobile solutions to users either directly or through partners and other third parties. This frequently involves incorporating third-party data, products, and services into SAP products and services. SAP operates complex cloud services across diverse architectures, with services implemented through SAP’s own cloud and data centers as well as through hyperscalers.
| 86/326 |
|
Integrated Report 2025 | ||||
| To
Our Stakeholders |
Combined Management Report |
Consolidated
Financial Statements IFRS |
Additional Information | ||
Our industry contends with a complex and evolving cybersecurity landscape, facing increasingly sophisticated attacks that can leverage AI and cloud scale or exploit known and unknown “zero-day” security vulnerabilities in our or our customers’ systems or software. These cybersecurity threats can arise from our or our customers’ failure to patch such vulnerabilities in a timely or effective manner. Geopolitical tensions can exacerbate such threats, and hybrid warfare between nation states can include cybersecurity attacks on private companies, targeting IT products, businesses, and the supply chain. Like many companies, SAP and certain of our third-party partners have experienced and expect to continue to experience cyberattacks and other security incidents that could affect our business. However, we are not aware of any such incidents that have had a material impact on our business.
When we become aware of unauthorized access to our systems or those of our third-party partners, we have action plans in place intended to identify and remediate the source and impact of such events.
The scanning tools we deploy across our networks and products regularly identify and track security vulnerabilities, which are prioritized based on known and anticipated risks, and our remediation activities aim to patch vulnerabilities within the designated timeframes.
While we have implemented patch management processes, we may be unable to comprehensively apply patches, or to confirm that mitigating measures address all vulnerabilities or that patches will be applied before exploitation by threat actors. Vulnerabilities may persist if customers do not apply patches, update systems, or authorize the service downtime required for patching by SAP. If attackers can exploit vulnerabilities before patches are installed or mitigating measures are implemented, significant compromises could impact our and our customers’ systems and data.
We could also experience material exposure to our business operations and service delivery due to disruptions in backups, in disaster recovery processes, or in business-continuity management processes, or as the result of malicious or inadvertent actions by employees, contractors, or other parties. Security threats may also exist due to delayed or insufficient responses to identified issues or other interdependencies such as cloud service providers and those threats beyond SAP’s cybersecurity infrastructure and protocols.
SAP and/or its partners may have inadequate security controls or insufficient compliance with existing controls, which could impact SAP’s and/or its partners’ ability to comply with applicable regulations and customer requirements. SAP and/or its partners could unknowingly introduce security threats and vulnerabilities if they have not established relevant security evaluation processes. Failure to integrate or maintain SAP’s cybersecurity framework and protocols with network systems obtained through acquisitions could also introduce cybersecurity vulnerabilities.
The foregoing and other events such as these could result in a loss of customers or customer opportunities, a diminished reputation in the marketplace, government investigations or enforcement actions, internal investigations, litigation including class actions, fines, or penalties, increased costs associated with remediation or compliance requirements, required changes to our business model or operations, and a host of other costs and losses, any or all of which could have a material adverse effect on our reputation, business, financial performance, competitive or financial position, profit, and cash flows.
We cannot exclude the possibility that if any one or more of the risks associated with this risk factor were to occur, the impact could be business-critical and materially impact our business and results. We estimate the probability of occurrence to be likely, and classify this risk factor as high.
Technology and Products: Our technology and products may experience undetected defects, coding or configuration errors, may not integrate as expected, or may not meet customer expectations.
We are subject to risks and associated consequences in the following areas, among others: failure of software products and services to fully meet market needs or customer expectations; failure of software products and services from acquired companies to fully comply with SAP quality standards; failure of new products, services, and cloud offerings, including third-party technologies, to comply with local standards and requirements; the possibility that new products, services, and cloud offerings or subsequent versions and updates to existing products, services, and cloud offerings might contain defects or security vulnerabilities, or might not be mature enough from the customer’s point of view for business-critical solutions, or might not be sufficiently secure after release or shipment despite all the due diligence SAP puts into quality; inability of algorithms to correctly adapt to evolving circumstances, which may lead to adverse decision-making processes in the context of AI-related technologies; and the inability to fulfil expectations of customers regarding time and quality in the defect resolution process.
Any of these events could have a material adverse effect on our reputation, business, competitive or financial position, profit, and cash flows.
SAP has established measures to address and mitigate the described risks and adverse effects, such as: a broad range of techniques, including project management, project monitoring, product standards and governance, and rigid and regular quality assurance measures certified to ISO 9001:2015; a holistic testing strategy to validate the state of quality and security for every
| 87/326 |
|
Integrated Report 2025 | ||||
| To
Our Stakeholders |
Combined Management Report |
Consolidated
Financial Statements IFRS |
Additional Information | ||
product before market introduction; the consideration of regular and direct customer feedback; and a comprehensive certification program designed to ensure that relevant third-party solutions are of consistently high quality.
We cannot exclude the possibility that if any one or more of the risks associated with this risk factor were to occur, the impact could be business-critical. We estimate the probability of occurrence to be unlikely, and classify this risk factor as medium.
Strategic Risks
Market Share and Profit: Our market share and profit could decline due to increased competition, market consolidation, technological innovation, and new business models in the software industry.
The market for cloud computing is increasingly competitive and is exhibiting strong growth relative to the market for on-premise solutions. To maintain or improve our operating results in the cloud business, it is important that we not only attract new customers but also that our existing customers renew their agreements with us when the initial contract term expires and purchase additional modules or additional capacity. Additionally, we need to bring innovations to the market in line with the demands of our ecosystem and ahead of our competitors, such as solutions to support new data-driven applications and the extension of our suite of intelligent technologies based on SAP Business Technology Platform (SAP BTP).
We are subject to risks and associated consequences in the following areas, among others: inability to deliver fully suitable solution and transformation services to our customers on the cloud transformation journey, both in cloud-only and hybrid scenarios; inability to successfully execute on our hyperscaler strategy; adverse, near-term revenue effects due to increasing cloud business and conversions from on-premise licenses to cloud subscriptions from existing SAP customers, which could have an adverse effect on related maintenance and services revenue; insufficient solution and service adoption together with increased complexity, as well as failures during the execution of our corporate strategy in the context of our portfolio for solutions and services, which could lead to a loss of SAP’s position as a leading cloud company and subsequently to reduced customer adoption; customers and partners being reluctant or unwilling to migrate and adapt to the cloud; customers considering cloud offerings from our competitors; strategic alliances among competitors; price pressure, cost increases, and loss of market share through traditional, new, and cooperating competitors and hyperscalers; and the inability to achieve the planned margin increase in time as planned.
Any of these events could have a material adverse effect on our reputation, business, competitive or financial position, profit, and cash flows.
SAP has established measures intended to address and mitigate the described risks and adverse effects. For example, we: share our overall long-term cloud strategy and our integration road map with our customers; continuously implement improvements to enhance our cloud solutions through our corporate strategy; demonstrate the benefits of our solution and services portfolio; enable and support our customers as they transition from on-premise to the cloud; balance the allocation of our strategic investments by evolving and protecting our core businesses and simultaneously developing new solutions, technologies, and business models; offer broader range of services to support and drive the digital transformation for our customers; continuously drive the solution integration and harmonization of data models to support integrated business processes, applications, and technology while focusing on resilience, profitability, and sustainability; enable our portfolio for hyperscalers to extend customer reach and further meet customer expectations; continue to move SAP HANA Enterprise Cloud towards a full-stack offering; and increase the share of high-value cloud application services to further improve the margin.
We cannot exclude the possibility that if any one or more of the risks associated with this risk factor were to occur, the impact could be business-critical. We estimate the probability of occurrence to be unlikely, and classify this risk factor as medium.
Mergers and Acquisitions: We might not acquire, integrate, or divest companies or their components effectively or successfully.
To expand and consolidate our business, we acquire and divest businesses, products, and technologies, and we expect to continue doing so in the future. Over time, some of these acquisitions have increased in size and in strategic importance for SAP. Management negotiation of potential acquisitions and divestures and the integration and carve-out of acquired businesses, products, or technologies demands time, focus, and resources of both management and the workforce, and exposes us to unpredictable operational difficulties.
We are subject to risks and associated consequences in the following areas, among others: incorrect information or assumptions during the due diligence process for acquisitions, divestitures, and other transactions; failure to integrate acquired technologies or solutions successfully and profitably into SAP’s solution portfolio and strategy; failure to successfully integrate acquired entities and their operations; failure to fulfill the needs of the acquired company’s customers or partners; failure to implement, restore, or maintain internal controls, disclosure controls, and procedures and policies within acquired companies; debt incurrence or
| 88/326 |
|
Integrated Report 2025 | ||||
| To
Our Stakeholders |
Combined Management Report |
Consolidated
Financial Statements IFRS |
Additional Information | ||
significant unexpected cash expenditures; impairment of goodwill and other intangible assets acquired in business combinations; and failure of acquired companies to comply with regulatory requirements..
We have in the past, and may in the future, choose to divest certain entities, businesses, or product lines. We may have difficulty obtaining terms acceptable to us. Additionally, we may have difficulty carving out portions of or entire businesses, we may incur a loss of revenue or experience a negative impact on margins, or we may not achieve the desired strategic and financial benefits. Such potential transactions may also delay achievement of our strategic objectives, cause us to incur additional expenses, disrupt customer, partner, and employee relationships, and may expose us to unanticipated or ongoing obligations and liabilities, including because of indemnification obligations. Further, during the pendency of a divestiture, we may be subject to risks such as a decline in the business to be divested, a loss of employees, customers, or suppliers, and the risk that the transaction may not close, any of which could have a material adverse effect on the business to be divested as well as our retained business. If a divestiture is not completed for any reason, we may not be able to find another buyer on the same terms, and we may have incurred significant costs without the corresponding benefit.
Any of these events could have a material adverse effect on our reputation, business, competitive or financial position, profit, and cash flows.
SAP has established measures intended to address and mitigate risks and adverse effects. For example, we: perform technical, operational, financial, and legal due diligence on the company or assets to be acquired or divested; identify, implement, and track risk mitigation measures for material transactions or integration risks; and conduct process, risk, and control analyses that are subsequently integrated into SAP’s processes and control framework and supported by mitigations as required by any specific circumstances to subsequently increase adherence to SAP’s standards and policies.
We cannot exclude the possibility that if any one or more of the risks associated with this risk factor were to occur, the impact could be insignificant. We estimate the probability of occurrence to be remote, and classify this risk factor as low.
Innovation: We might not be able to compete effectively if we strategize our solution portfolio ineffectively or if we are unable to keep up with rapid technological and product innovations, enhancements, new business models, and changing market expectations.
Our future success depends on our ability to keep pace with technological and process innovations and new business models, as well as on our ability to develop new products and services, enhance and expand our existing products and services portfolio, and integrate products and services we obtain through acquisitions. To be successful, we are required to adapt our products and our go-to-market approach to a cloud-based delivery and consumption model so as to satisfy increasing customer demand and to ensure an appropriate level of adoption, customer satisfaction, and retention.
We are subject to risks and associated consequences in the following areas, among others: inability to develop and sell new cloud products spanning various organizations on time and in line with market demands due to complexity in heterogeneous technical environments; inability to anticipate and develop technological improvements or succeed in adapting SAP products, services, processes, and business models to technological change, changing regulatory requirements, or emerging industry standards; a change in requirements of our customers and partners to strengthen the Intelligent Enterprise strategy; the possibility that our product and technology strategy might not be successful, or that our customers and partners might not adopt our technology platforms, applications, or cloud services quickly enough, or that they might consider other competing solutions in the market, or that they may leverage AI to produce their own solutions, or that our strategy might not match customers’ expectations and needs, specifically in the context of expanding the product portfolio into additional markets.
We are integrating AI into several of our products, including our suite of enterprise applications and SAP BTP, and we expect our use of AI across our portfolio to continue to grow. As with many innovations, AI presents risks and challenges that could affect its adoption and therefore our business. AI algorithms or training methodologies may be flawed. Data sets may be overbroad, insufficient, or contain biased information. Content generated by AI systems may be offensive, illegal, or otherwise harmful. Ineffective or inadequate AI development or deployment practices by SAP or our partners could result in incidents that impair the acceptance of AI solutions or cause harm to individuals, customers, or society, or result in our products and services not working as intended. Human review of certain outputs may be required, which could introduce error or inefficiencies to the intended use of our AI-enabled offerings. As a result of these and other challenges associated with innovative technologies, our implementation of AI systems could subject us to competitive harm, regulatory action, legal liability, and brand or reputational harm.
There is significant uncertainty surrounding the applications of intellectual property and privacy laws to AI technology. Intellectual property ownership and license rights, including copyright, surrounding AI technology have not been fully addressed by courts or other laws or regulations of the jurisdictions in which we operate, and our use of AI technology or integration of AI technology into our products and services may result in disputes with respect to ownership or intellectual property, or exposure to claims of copyright or other intellectual property misappropriation. In addition, our AI technology may involve the processing of personal and
| 89/326 |
|
Integrated Report 2025 | ||||
| To
Our Stakeholders |
Combined Management Report |
Consolidated
Financial Statements IFRS |
Additional Information | ||
other sensitive data and may be subject to laws, policies, legal obligations, and contractual requirements related to privacy, data protection, and information security. Various privacy laws extend rights to consumers (such as the right to obtain consent or delete certain personal data) and regulate automated decision making. An alleged or actual failure to meet these obligations may lead to regulatory investigations and fines or penalties; may require us to change our business practices or retrain our algorithms; or may prevent or limit our use of AI technology. It is also possible that we are held liable for intellectual property, privacy, or other legal violations of third-party AI technology that we use, and that we may not have full recourse for any damages that we suffer (for example, our use of third-party AI technology may be subject to limitations of liability or provide no liability coverage).
In addition, some AI scenarios present ethical issues or may have broad impacts on society, and there can be no assurance that our Global AI Ethics Policy or similar policies and procedures will be sufficient to address such issues. If we enable or offer AI solutions that have unintended consequences, unintended usage or customization by our customers and partners, or are controversial because of their impact on human rights, privacy, employment, or other social, economic, or political issues, we may experience reputational harm, adversely affecting our business and consolidated financial statements.
Any of these events could have a material adverse effect on our reputation, business, competitive or financial position, profit, and cash flows.
SAP has established measures intended to address and mitigate the described risks and adverse effects. For example, we: continuously align our organization, processes, products, delivery, commercial and consumption models, and services to changing markets and customer and partner demands; continuously benchmark, match, and challenge the entire portfolio; focus all investment decisions related to innovative technologies and solutions on portfolio compatibility and readiness as well as high customer value; explore future trends as well as the latest technologies; conduct wide-ranging market and technology analyses and research or co-innovation projects; and make strategic acquisitions in white spots of our portfolio.
We cannot exclude the possibility that if any one or more of the risks associated with this risk factor were to occur, the impact could be major. We estimate the probability of occurrence to be unlikely, and classify this risk factor as medium.
| 90/326 |
|
Integrated Report 2025 | ||||
| To
Our Stakeholders |
Combined Management Report |
Consolidated
Financial Statements IFRS |
Additional Information | ||
Expected Developments and Opportunities
Economic Outlook for 2026 and Beyond
Future Trends in the Global Economy
Until 2028, the global economy will grow at similar rates to 2025, projects the ECB in its most recent Economic Bulletin.1 This means that economic growth will be stronger than previously expected but remain below the pre-pandemic average. According to the ECB, this growth will probably continue to be services-led and subject to uncertainties about geopolitical tensions, global financial market sentiments, supply chain disruptions, and volatile international environments. Against this background, the ECB expects emerging market economies to grow relatively strongly, with India standing out in terms of robust economic activity and import growth.
As for the EMEA region, the ECB expects domestic demand in the euro area to remain the main economic driver throughout the projection horizon. Gains in real incomes and a resilient labor market could contribute positively to private consumption. On the other hand, additional public spending on infrastructure and defense, especially in Germany, higher profits, reduced uncertainty, and improved financing conditions might lead to expanding business investments. In addition, exports might also start picking up in 2026 due to a rebound in foreign demand and despite gradually unfolding impacts from higher tariffs.
Regarding the Americas region, the ECB finds that capital expenditures related to artificial intelligence and higher fiscal spending in the United States could strengthen domestic demand. It therefore presents a stronger growth outlook for the United States over the projection horizon.
In the APJ region, according to the ECB, economic growth in China will likewise be stronger than previously expected. On the one hand, this could be due to the recent United States-China trade agreement that reduces U.S. tariffs on Chinese imports. On the other hand, China’s new five-year plan puts emphasis on economic growth from 2026 onward, providing a large fiscal stimulus for stronger export dynamics. Activity in the Chinese services sector should continue to expand, but could soften. “In Japan, growth is projected to moderate from 1.1 percent in 2025 to 0.7 percent in 2026 and to 0.6 percent in 2027. This marks a small upward revision relative to the October figure, reflecting in part the fiscal stimulus package announced by the new government,”2 says the IMF.
1 European Central Bank, Economic Bulletin, Issue 8/2025, Publication Date: January 15, 2026.
2 International Monetary Fund (IMF), World Economic Outlook Update January 2026, Global Economy: Steady amid Divergent Forces (https://www.imf.org/-/media/files/publications/weo/2026/january/english/text.pdf), p. 4.
| 91/326 |
|
Integrated Report 2025 | ||||
| To
Our Stakeholders |
Combined Management Report |
Consolidated
Financial Statements IFRS |
Additional Information | ||
Economic Trends – GDP Growth Year Over Year
| Percent | 2025 | 2026p | 2027p |
| World | 3.3 | 3.3 | 3.2 |
| Advanced Economies | 1.7 | 1.8 | 1.7 |
| Emerging Markets and Developing Economies | 4.4 | 4.2 | 4.1 |
| Regions (according to IMF taxonomy) | |||
| Euro Area | 1.4 | 1.3 | 1.4 |
| Germany | 0.2 | 1.1 | 1.5 |
| Emerging and Developing Europe | 2.0 | 2.3 | 2.4 |
| Middle East and Central Asia | 3.7 | 3.9 | 4.0 |
| Sub-Saharan Africa | 4.4 | 4.6 | 4.6 |
| United States | 2.1 | 2.4 | 2.0 |
| Canada | 1.6 | 1.6 | 1.9 |
| Latin America and the Caribbean | 2.4 | 2.2 | 2.7 |
| Japan | 1.1 | 0.7 | 0.6 |
| Emerging and Developing Asia | 5.4 | 5.0 | 4.8 |
| China | 5.0 | 4.5 | 4.0 |
| p = projection | |||
| Source: International Monetary Fund (IMF), World Economic Outlook Update January 2026, Global Economy: Steady amid Divergent Forces (https://www.imf.org/-/media/files/publications/weo/2026/january/english/text.pdf), p. 11. | |||
The IT Market: Outlook for 2026 and Beyond
Looking ahead, the global IT market is expected to undergo sweeping changes driven by AI infrastructure modernization and outcome-based investment strategies. From compute-intensive cloud platforms to autonomous edge deployments, the next wave of IT growth will be defined by how well enterprises align technical investments with measurable business value.
Enterprise technology is entering a new phase of strategic transformation, with organizations now moving away from experimentation and toward measurable value realization in their AI investments. Industry analysts expect a major shift in enterprise AI strategy in the coming years on account of companies transitioning to scalable, value-driven deployments. As AI becomes foundational across functions, organizations are prioritizing platforms that can scale insights, automate workflows, and drive resilience.
One of the most significant forward-looking developments is the expected rise of enterprise agents. These are intelligent and autonomous software components that interpret complex business conditions and act independently. IDC predicts that, “by 2027, agentic automation will enhance capabilities in over 40% of enterprise applications.”1 Another IDC report notes that, “by 2027, G2000 agent use will jump 10x and token/call loads 1,000x, making agent vetting, orchestration, and optimization essential IT responsibilities.”2 This shift is expected to lay the foundation for next-generation AI operating models and transform a third of all business workflows. These agents, embedded within core ERP, supply chain, and finance systems, will go beyond automation to deliver adaptive, context-aware execution at scale.
From a platform perspective, the cloud continues to serve as the enabling foundation for this evolution. According to IDC, “ ‘As AI rapidly reshapes technology, cloud is evolving from a foundational utility to an intelligent, self-managing ecosystem,’ said Dave McCarthy, research vice president, Cloud and Edge Services at IDC. ‘The convergence of AI and cloud will give rise to agentic platforms that autonomously manage everything from workload placement to security, enabling a new level of efficiency and strategic value.’ ”3 IDC further predicts that, “By the end of this decade, the enterprise technology landscape will look radically different. The AI agent will become a new enterprise stock keeping unit (SKU), meaning a standardized, individually deployable and purchasable software capability purchased via marketplaces and powered by modular backend capabilities rather than monolithic SaaS platforms. User interfaces will still be critical to productivity but so will orchestration of more-or-less autonomous workflows. SaaS is not dead, but it is metamorphosing. The software industry is entering a new chapter defined by AI, automation, and outcome-based economics.”4
At the same time, geopolitical tensions and increasing regulatory fragmentation are driving growing demand for sovereign cloud solutions, as enterprises and public sector organizations seek to ensure data residency, compliance, and operational control while continuing to benefit from cloud-based innovation. These requirements are increasingly shaping customer cloud decisions and
| 92/326 |
|
Integrated Report 2025 | ||||
| To
Our Stakeholders |
Combined Management Report |
Consolidated
Financial Statements IFRS |
Additional Information | ||
deployment models, particularly in regulated and public sector environments, making sovereign cloud capabilities a necessary component of enterprise cloud strategies rather than a niche consideration.
AI economics is becoming a critical framework for evaluating enterprise technology investments. IDC believes that “2026 will be the year that all enterprises shift from initiating their artificial intelligence (AI) pivot and start to make investments in more advanced agentic AI systems; in more modern cloud, data, and connectivity solutions; and in strategies to ensure effective human and digital cooperation. The end goal is to improve the organization's resiliency, reaction time, and ability to expand through innovation, becoming a resilient AI-fueled business by 2030. The investments and actions of IT industry providers — large and small, old and new — will play a large role in determining whether enterprises are able to achieve full AI alignment, making infusion of AI into business and IT processes a repeatable and well-managed enterprise capability.”2 This shift is driving demand for robust value realization practices to ensure technology initiatives deliver tangible ROI.
Looking ahead, the global IT market is expected to be defined not only by growth in AI spending, which is forecasted to outpace overall tech investment, but also by how effectively organizations embed AI into business processes and restructure themselves around it. This next chapter of enterprise transformation will be led by companies that can operationalize AI, modernize core systems, and build the digital architecture for long-term competitive advantage.
1 IDC FutureScape: Worldwide AI-Enabled Enterprise Applications and Agents 2026 Predictions, October 2025, IDC #US53855925.
2 IDC FutureScape: Worldwide IT Industry 2026 Predictions, October 2025, IDC #US53858725.
3 IDC FutureScape: Worldwide Cloud 2026 Predictions, October 2025, IDC #US53859425.
4 IDC Blog, Is SaaS Dead? Rethinking the Future of Software in the Age of AI, December 2025.
Impact on SAP
Uncertainty is expected to remain a defining feature of the global business environment in 2026. Ongoing geopolitical tensions, shifts in trade policy, and the accelerating pace of AI and infrastructure innovation remain key challenges that may weigh on customer buying decisions going forward. Navigating external volatility will require companies to stay agile, resilient, and focused on execution.
The IT outlook suggests that enterprises will continue to prioritize platform consolidation, integrated data strategies, and AI readiness. Customers are expected to shift from fragmented experimentation toward more outcome-driven deployments, favoring solutions that can scale across the business. Against this backdrop, SAP will continue to position itself as a strategic partner for customers seeking to modernize their core systems, simplify their technology stack, and prepare for future disruption.
Concerns that enterprise software providers could struggle to translate AI innovation into scalable SaaS value are mitigated in SAP’s case by its ability to embed AI directly into mission-critical business processes, supported by deep business data and an integrated application landscape, as emphasized in management commentary during the year.
The Company enters 2026 with a strong share of more predictable revenue and clear focus on product innovation, operational discipline, and customer success. These foundations will support SAP’s long-term strategy and help drive continued momentum across its differentiated portfolio. Customer requirements for compliant, sovereign cloud deployments continue to expand, particularly in regulated industries and the public sector. SAP’s sovereign cloud strategy enables the Company to address these needs while continuing to deliver cloud-based innovation, reinforcing sovereign cloud as a growth opportunity rather than a constraint.
| 93/326 |
|
Integrated Report 2025 | ||||
| To
Our Stakeholders |
Combined Management Report |
Consolidated
Financial Statements IFRS |
Additional Information | ||
Financial Targets and Prospects
Outlook for 2026
Unless otherwise stated, all forward-looking statements, except free cash flow and effective tax rate, are at constant currencies. The results for 2025, except growth rates, are presented at actual currencies. For more information about our performance measures, see the Performance Management System section.
| Strategic Objective | KPI | Results for 2025 | Outlook for 2026 |
| Growth | Cloud revenue | €21.02 billion | €25.8 billion to €26.2 billion |
| Cloud and software revenue | €32.54 billion | €36.3 billion to €36.8 billion | |
| Total revenue growth | 11% | To accelerate through 2027 | |
| Current cloud backlog growth | 25% | To slightly decelerate | |
| Profitability | Operating profit (non-IFRS) | €10.42 billion | €11.9 billion to €12.3 billion |
| Free cash flow1 | €8.24 billion | Approximately €10 billion | |
| Customer satisfaction | Cloud CSAT2 | 75% | 75% to 76% |
| Working environment | Business Health Culture Index | 81% | 80% to 82% |
| Employee engagement | Employee Engagement Index | 76% | 74% to 78% |
| Climate performance | Gross greenhouse gas emissions3 | 3.6 Mt | To steadily decrease carbon emissions across the relevant value chain |
1 at actual currencies
2 From 2026, SAP is adopting Cloud CSAT as its new customer experience KPI. For more information, see the Performance Management System section.
3 In 2026, we will update the calculation methodology for Gross greenhouse gas emissions, which will result in a significant decrease in reported emissions and therefore lead to a rebaselining according to the Greenhouse Gas (GHG)-Protocol. The presented number of 3.6 Mt is already based on the updated calculation methodology. For more information, see the Performance Management System section.
Furthermore, SAP provides the following additional forward-looking information for selected metrics:
| – | An effective tax rate (non-IFRS) of approximately 29% (2025: 30.5%).20 |
| – | A slight increase in segment revenue (2025: €3.95 billion) and a moderate decrease in segment profit (2025: €0.43 billion) for the Core Services segment. This reflects SAP’s strategy for the Core Services segment to help customers adopt and consume innovation, maximize the benefits of the cloud, and realize the value of SAP Business Suite. |
Beyond the outlook for 2026, SAP expects:
| – | Total revenue growth to accelerate through 2027, driven by growth in cloud revenue and primarily Cloud ERP Suite. |
| – | Total operating expenses to grow at 80% to 90% of total revenue growth in 2027, supported by slightly declining sales and marketing, research and development, and general and administration expense ratios. These improvements include efficiency gains from the internal deployment of SAP’s AI solutions. |
| – | Software support revenue to decline at a faster rate in the coming years as customers increasingly shift to the cloud. |
Further, we aim to reduce our gross greenhouse gas (GHG) emissions by at least 90% across our relevant value chains by 2030 as part of our net-zero commitment. Our Net Zero 2030 target is dependent on the following elements, which are outside of SAP’s direct control: Progress and success of the decarbonization efforts of our suppliers; and changes in regulations, such as the revision of the SBTi standards, expected to be finalized in 2026; Due to the rapid development in the AI and general cloud infrastructure area and the resulting high energy needs it is unclear if this demand can be fully covered with renewable energy. Due to these uncertainties, we are monitoring our progress in achieving the net zero target by 2030 and are continuously evaluating whether adjustments might be necessary.
20 We do not provide an outlook for the effective tax rate (IFRS) due to the uncertainty and potential variability of gains and losses associated with equity securities, which are reconciling items between the two effective tax rates (non-IFRS and IFRS). These items cannot be provided without unreasonable effort but could have a significant impact on our future effective tax rate (IFRS).
| 94/326 |
|
Integrated Report 2025 | ||||
| To
Our Stakeholders |
Combined Management Report |
Consolidated
Financial Statements IFRS |
Additional Information | ||
Assumptions for Constant Currencies and Non-IFRS Financial Measures
SAP’s full-year 2026 business outlook, except free cashflow and effective tax rate, is at constant currencies. Where numbers are presented in actual currencies, these are likely to be affected by exchange rate fluctuations as the year progresses. See the table below for the expected currency impacts for the full year 2026. These expectations are based on the December 2025 level.
| In percentage points (pp) | FY 2026 |
| Cloud revenue growth | –3.0pp |
| Cloud and software revenue growth | –2.5pp |
| Operating profit growth (non-IFRS) | –3.5pp |
This includes an exchange rate of US$1.18 per euro.
The following table shows the estimates of the items that represent the differences between our non-IFRS financial measures and our IFRS financial measures for operating profit.
| € millions | Estimated Amounts for 2026 | Actual Amounts for 2025 |
| Acquisition-related charges | 340–420 | 411 |
| Restructuring | 0–20 | 3 |
| Regulatory compliance matters | 0 | 0 |
| Teradata litigation | 0 | 387 |
The differences between free cash flow as our non-IFRS financial measure and operating cash flow as our IFRS financial measure include estimated cash flows in 2026 for expenditures and proceeds from the sale of intangible assets and property, plant, and equipment, and expenditures for leasing of approximately –€1.1 billion (2025: –€0.9 billion).
Proposed Dividend
In 2026, we intend to pay a dividend of €2.50 per share (subject to shareholder approval at the Annual General Meeting of Shareholders in May 2026). For more information, see the Financial Performance: Review and Analysis section.
Outlook for SAP SE
The primary source of revenue for SAP SE is the license fees it charges subsidiaries for the right to market and maintain SAP software solutions. Consequently, the performance of SAP SE in operating terms is closely tied to the cloud and the software revenue of the SAP Group.
Due to the rise, at constant currencies, in cloud and software revenue anticipated for the SAP Group in 2026, we expect a moderate increase in product revenue for SAP SE.
Due to significantly high contributions to the operating profit in connection with intra-Group share buybacks and share transfer in 2025, and assuming that there are no such one-time effects related to acquisitions or other one-off events in 2026, we expect SAP SE’s operating profit to decrease significantly.
We expect that SAP SE will continue to receive investment income in the form of profit transfers and dividends from its subsidiaries. The growth we expect for the SAP Group should have a positive effect on this investment income. The outlook for the SAP Group with respect to liquidity, finance, investment, and dividend is equally applicable to SAP SE.
Among the assumptions underlying this outlook are those presented above concerning the economy and our expectations for the performance of the SAP Group.
| 95/326 |
|
Integrated Report 2025 | ||||
| To
Our Stakeholders |
Combined Management Report |
Consolidated
Financial Statements IFRS |
Additional Information | ||
Opportunities
Our customers choose SAP as a trusted partner for their digital business transformation. We have established a framework for opportunity management by evaluating and analyzing key areas such as current markets, external scenarios, economic conditions, and technological trends. We have also researched customer and product segmentation, growth drivers, and industry-specific factors for success. These combined insights play a key role for the Executive Board in the development of our market strategies. Our shareholder value relies heavily on a fine balance between risk mitigation and value-driven opportunities. Therefore, our governance model helps ensure that decisions are based on the expected return, the investment required, and the risk involved.
As far as opportunities are likely to occur, we have incorporated them into our business plans, our outlook for 2026, and our ambitions beyond 2026 for total revenue growth and operating profit growth as outlined in this report. Therefore, the following section focuses on future trends and events that might lead us to raise our outlook and our ambitions beyond 2026 should they develop more positively than anticipated in our forecasts.
SAP SE is the parent company of the SAP Group and earns most of its revenue from subscription fees, software license fees, and dividends paid by affiliates. Consequently, the opportunities described below also apply—directly or indirectly—to SAP SE.
Opportunities from Economic Conditions
Economic conditions clearly influence our business, financial position, profit, and cash flows. Should the global economy grow faster than is reflected in our plans today, our revenue and profit may surpass our current outlook and our ambitions beyond 2026 for total revenue growth and operating profit growth. Our medium-term planning considers changes in market conditions, based on known trends and as a result of the ongoing geopolitical and macroeconomic environments. Although we continue to be mindful of the negative aspects of the global situation, we take opportunities to further invest into our strategic growth areas.
Ongoing geopolitical tensions, increasingly unpredictable macroeconomic development and evolving regulatory requirements have elevated data sovereignty as a strategic imperative for governments and regulated industries worldwide. SAP is uniquely positioned to address accelerating demand and drive the adoption of cloud and AI through its vendor-neutral technology and sovereign cloud capabilities. SAP’s sovereign cloud strategy enables customers to modernize with cloud and AI while maintaining data governance, operational and technical autonomy, as well as regulatory compliance under their chosen jurisdiction.
For more information about future trends in the global economy and the IT market outlook, as well as their potential influence on SAP, see the beginning of this Expected Developments and Opportunities section.
Opportunities Through Innovation
Our continued growth through innovation is based on our ability to leverage research and development (R&D) resources effectively. We are accelerating innovation cycles, especially in our cloud solutions, and engaging even more closely with our customers to enable success. Specifically, we focus on ease of adoption and consumption so that customers can benefit from our software solutions, technologies, and platforms at reduced time to value.
Our aim is to bring our customers to SAP Business Suite, which includes our cloud ERP applications across financial management, spend management, supply chain management, human capital management, and customer experience. SAP Business Technology Platform (SAP BTP) represents the technical foundation of our modular SAP Business Suite and aims to enable our customers’ journey to a clean core. The SAP Business Data Cloud solution acts as the unifying data layer across SAP- and non-SAP applications. Advancements in generative AI represent an opportunity for SAP to enhance the value of our offering. Hence, SAP aims to continuously infuse its entire portfolio with SAP Business AI capabilities, embedding business AI in the context of customers’ own data and processes. Additionally, our own contextually aware AI copilot, Joule, aims to transform the way users interact with SAP software by leveraging Joule’s agentic capabilities.
We also see high growth potential in adjacent innovation areas: sustainability management, working capital management (accelerated through the SAP Taulia portfolio), and our Business Transformation Management portfolio (including SAP Signavio, SAP Taulia, and WalkMe solutions).
In addition, we continue to expand startup engagement in strategic opportunity areas, focusing on startups as customers and partners.
For more information about future opportunities in research and development for SAP, see the Strategy and Business Model section.
| 96/326 |
|
Integrated Report 2025 | ||||
| To
Our Stakeholders |
Combined Management Report |
Consolidated
Financial Statements IFRS |
Additional Information | ||
Opportunities from Our Strategy for Profitable Growth
SAP strives to generate profitable growth across our portfolio of products, solutions, and services to keep and improve our market position. Our aim is to continue to expand our addressable market by enhancing our portfolio and our new technologies and innovations. As an industry, we are benefiting from a secular trend toward digitalization, cloud, and the rise of AI, and are strengthening the market’s readiness to consume software in the cloud, including core business process platforms.
To positively affect the profitability of our cloud business, we set clear priorities to optimize efficiency in our cloud operations. Our operational excellence priorities include a focus on adoption and consumption of our product portfolio, leading to more efficient sales and marketing investment; a focused product portfolio leading to more effective R&D investment; more centralized business operations leading to end-to-end-optimization; and an accelerated workforce transformation leading to a future-ready workforce.
SAP seeks to establish new business models and leverage its expanding ecosystem of partners to achieve scale and maximize opportunities. Our two flagship offerings RISE with SAP and SAP GROW aim to guide customers transitioning to SAP Business Suite, but the journeys are distinct: RISE with SAP is tailored to the needs of enterprises with existing landscapes (often on-premise), while SAP GROW serves customers who are starting fresh in a greenfield approach.
We continuously sharpen our focus on suite sales and flexible consumption, aiming to capture the cross-sell potential of our suite while decreasing the cost of sales for the acquisition of net new customers and increasing customer lifetime value with existing customers.
Our strong focus on technical integration between our solutions aims to provide a seamless and delightful experience for our customers, enhancing the cross-sell potential of our suite portfolio and creating operational synergies.
Opportunities from Our Ecosystem
SAP’s global ecosystem spans a large and diverse network of partners with specialized expertise that supports customers across industries, regions, and business models. Partners play a central role in scaling SAP’s reach, complementing our portfolio with services and solutions that extend the value of SAP Business Suite and help customers adopt cloud innovations. By building innovative AI solutions on SAP’s business AI foundation, driving customer value through tailored use cases, and accelerating adoption, our partner ecosystem helps deliver the full value of SAP’s business AI strategy to customers.
Our ecosystem includes four primary partner types: independent software vendors (ISVs), who build solutions on or integrated with SAP technology to extend core functionality; sell partners, who broaden market coverage by selling, implementing, and supporting SAP solutions; service partners and system integrators, who accelerate customer adoption through implementation, integration, and business consulting services; and managed service providers (MSPs) or technology partners, who deliver outsourced or hosted environments that include SAP cloud solutions as part of fully managed service offerings.
We continue to invest in building partner talent and delivery capacity to meet growing customer demand for cloud transformation across SAP Business Suite. By developing extensions, industry solutions, and line-of-business innovations on SAP BTP, partners help customers tailor SAP solutions to their specific requirements and maximize the value of their SAP investment.
Partners also contribute to customer success by offering a wide range of SAP-aligned services—such as consulting, implementation, development, and operational support—that enable organizations to adopt the right mix of technologies for their business and industry. Through their expertise, geographic reach, and ability to address both existing and emerging customer needs, our partners support SAP’s market growth, help expand sales and services coverage, retain and grow the existing customer base, and address new market opportunities. Overall, this channel is growing in 2025 more than 1.5 times faster than our direct business, and hence we anticipate a substantial increase in the contribution from our ecosystem.
Opportunities from Our Own Workforce
Our employees drive innovation, provide value to our customers, and consistently enable our growth and profitability. We continuously invest in our people with the aim of retaining their high level of engagement, further strengthening their skills, fostering an agile and innovative organization, and ensuring a healthy, diverse, and inclusive workforce. By doing so, we anticipate improvements in our employee productivity and innovation capabilities.
Our outlook and medium-term prospects are based on certain assumptions regarding employee retention and our Business Health Culture Index. Should these develop at a rate that is better than expected, employee productivity and engagement may increase. A stronger-than-expected increase in the Employee Engagement Index may therefore be an opportunity that could positively impact our revenue, profit, and cash flows, enabling SAP to exceed our ambitions beyond 2026.
| 97/326 |
|
Integrated Report 2025 | ||||
| To
Our Stakeholders |
Combined Management Report |
Consolidated
Financial Statements IFRS |
Additional Information | ||
Executive Board’s Overall Assessment of Opportunities and Risks
Based on their impact level and likelihood of occurrence, the risks described in our aggregated risk report do not, in our view, individually or cumulatively threaten our ability to continue as a going concern. While individual risks, opportunities, and assessments may have changed during 2025, our overall risk profile and overall opportunities profile did not change materially compared to the prior year. Management remains confident that the Group’s earnings strength forms a solid basis for our future business development and provides the necessary resources to pursue the opportunities available to the Group. Based on our structured processes for early risk identification, we are confident that, in 2026, we can continue to counter the challenges arising from the risks in our current risk profile.
| 98/326 |
|
Integrated Report 2025 | ||||
| To
Our Stakeholders |
Combined Management Report |
Consolidated
Financial Statements IFRS |
Additional Information | ||
Group Sustainability Statement
About This Group Sustainability Statement
This section, and the information referenced in it, fulfill SAP SE’s duty to produce a non-financial statement (NFS) for the holding company, pursuant to section 289b–e of the German Commercial Code (HGB), and a non-financial group statement, pursuant to section 315b–c in conjunction with section 289c–e of the German Commercial Code (HGB), in the form of a combined non-financial statement. The relevant non-financial matters are referenced in the table below. The terms “non-financial statement” and “Group Sustainability Statement” are used interchangeably throughout the report.
The information in this Group Sustainability Statement has been prepared in accordance with the European Sustainability Reporting Standards (ESRS). SAP opted to apply these standards to prepare for the transposition of the EU Corporate Sustainability Reporting Directive (CSRD) into German law. As Germany’s government intends to implement the CSRD in national law and thus replace the duty to produce a non-financial statement with the duty to produce a sustainability statement prepared under ESRS, the ESRS take precedence over the reporting principles in German Accounting Standard (GAS) 20. This will remain the case until the CSRD is transposed into German law and for as long as we prepare our NFS under ESRS principles.
In line with the requirements of the CSRD, which the ESRS set out in detail, our Group Sustainability Statement contains the following sections: General Information with the subsections Sustainability Strategy and Governance, and Double Materiality Assessment, Environmental Information, Social Information, and Governance Information. The General Information section outlines our sustainability strategy and governance and describes our materiality assessment. The Environmental Information section contains our EU Taxonomy disclosures and disclosures about all material environmental topics. Material social and governance topics are presented in the Social and Governance Information sections, respectively.
This Group Sustainability Statement was subject to a limited assurance; reasonable assurance was provided on selected sustainability information reported. For more information, see the Basis for Preparation section.
| 99/326 |
|
Integrated Report 2025 | ||||
| To
Our Stakeholders |
Combined Management Report |
Consolidated
Financial Statements IFRS |
Additional Information | ||
Non-Financial Disclosures in SAP’s Combined Management Report
We determine which non-financial information has to be disclosed based on a materiality assessment we perform using internal and external input. For more information, see Double Materiality Assessment section.
The individual non-financial aspects to be covered by the non-financial statement are addressed in the following sections of our combined management report if material. No material risks according to section 289c (3) sentence numbers 3 and 4 HGB have been identified.
| Due
Diligence; Policies and Guidelines (Concepts) |
Measures
and Results, Including KPIs Relevant for Steering and Compensation |
References
to Consolidated Financial Statements | |
| Environmental Matters | E1 – Climate Change: Our Approach and Policies
E5 – Resource Use and Circular Economy: Our Approach and Policies |
KPI: Gross Greenhouse Gas Emissions
Performance Management System
Financial Performance: Review and Analysis: Performance Against Our Outlook for 2025
Expected Developments and Opportunities: Financial Targets and Prospects
E1 – Climate Change: Metrics on Material Topics |
|
| Employee Matters | S1 – Own Workforce: Our Approach
S1 – Own Workforce – Global People and Compliance: Our Approach and Policies
S1 – Own Workforce – Social Dialogue, Involvement of Works Councils: Our Approach and Policies
S1 – Own Workforce – Total Rewards: Our Approach and Policies
S1 – Own Workforce – Inclusion and Equal Opportunity: Our Approach and Policies
S1 – Own Workforce – People Development: Our Approach and Policies
S1 – Own Workforce – Health, Safety, and Well-Being: Our Approach and Policies |
KPI: Employee Engagement Index
Performance Management System
Financial Performance: Review and Analysis: Performance Against Our Outlook for 2025
Expected Developments and Opportunities: Financial Targets and Prospects
S1 – Own Workforce: Processes for Engaging with Our Own Workforce
KPI: Business Health Culture Index (BHCI)
Performance Management System
Financial Performance: Review and Analysis: Performance Against Our Outlook for 2025
Expected Developments and Opportunities: Financial Targets and Prospects
S1 – Own Workforce: Inclusion and Equal Opportunity |
Notes to the Consolidated Financial Statements, Note (B.1) |
| Social Matters | S2 – Workers in the Value Chain: Our Approach and Policies
Security, Cloud Compliance, and Data Protection and Privacy: Our Approach and Policies
Responsible AI: Our Approach and Policies |
KPI: Net Promoter Score (NPS)
Strategy and Business Model: Our Customers
Performance Management System
Financial Performance: Review and Analysis: Performance Against Our Outlook for 2025
KPI: Cloud Customer Satisfaction (Cloud CSAT)
Strategy and Business Model: Our Customers
Performance Management System
Expected Developments and Opportunities: Financial Targets and Prospects |
|
| Human Rights | Human Rights: Our Approach to Human Rights Due Diligence |
||
| Anti-Corruption and Bribery Matters | G1 – Business Conduct: Our Approach and Policies |
Notes to the Consolidated Financial Statements, Note (G.3) |
| 100/326 |
|
Integrated Report 2025 | ||||
| To
Our Stakeholders |
Combined Management Report |
Consolidated
Financial Statements IFRS |
Additional Information | ||
Basis for Preparation
The following should be borne in mind when reading the Group Sustainability Statement:
| – | The sustainability statement has been created on a consolidated basis. The scope of consolidation of our Sustainability Statement is the same as that of our financial statements. |
| – | The datapoints that derive from other EU legislation and are required by ESRS are presented in the Appendix. |
| – | We applied the time horizons as they are defined in ESRS 1: short term (up to one year), medium term (more than one and up to five years), and long term (more than five years). |
| – | Unless otherwise stated, SAP’s entire up- and downstream value chain is covered in the Group Sustainability Statement. |
| – | Whenever we have used the option to omit certain information because it was classified as sensitive or is information about intellectual property, know-how, or results of innovation, we have stated that fact in the respective section.We have not used the exemption from disclosure of impending developments or matters in the course of negotiation. |
| – | Unless otherwise stated, all the actions we present in this Group Sustainability Statement are ongoing. The same applies to progress on these actions in terms of continuous progress where not described otherwise. |
| – | Unless stated otherwise, a metric was not audited or validated by external experts other than our assurance provider in the course of the assurance engagement. |
| – | Since acquired companies that are still in the transition period (Taulia, Emarsys, Volume Integration, WalkMe, and SmartRecruiters) are not obliged to follow, nor do they follow, certain SAP policies, our action plans do not apply to them until they are fully integrated. Consequently, some metrics do not include those entities. Where this is the case, we list these entities in a footnote to the respective section. For the acquired companies not included in those metrics in 2024, please refer to our 2024 Group Sustainability Statement. |
| – | Metrics that require a gender breakdown in sections other than those related to the characteristics of our own workforce exclude employees whose gender is recorded as “Other”, “Not Reported” or “Not Disclosed,” due to the very low representation in these categories. |
| – | Compared to 2024, we amended or changed the following Metrics: |
| § | BHCI: we revised the BHCI definition by adding equal opportunities as a new component of the index and replacing one of the health and well-being questions. |
| § | Leadership Index (LI): we replaced the Leadership Trust Net Promoter Score with our new Leadership Index. |
| § | Employee in senior executive roles by gender: we now define senior executive roles as roles on the two organizational levels below the Executive Board that are at group executive, senior executive, or executive level. We also revised the respective target women in senior executive roles (WiSER) to measure the first two levels below the Executive Board, rather than the first three. Additionally, WiSER does not include employees in the United States. |
| § | Total number of employees involved in learning: we expanded the scope of employees who run training and development programs to account for training programs for students. This led to a revised headcount for 2024. |
| § | SAP Talk: SAP Talks are now held at least three times a year to set goals, check in on progress, and evaluate and agree on the impact the employee made in that year. We also revised how we determine the number of employees who had at least three SAP Talks. It is now based on the average percentage of employees with set goals and who received a performance evaluation for both the mid-year and annual reviews |
| § | We now also report Total gross indirect Scope 3 GHG Emissions Upstream and Downstream (market based emissions). Due to that change we also differentiate between category 3 and 8 location-based and market-based. Lastly we also separately report E-waste generated in operations. |
In 2026, we will update the calculation methodology of our Scope 3 GHG emissions for category 11 - the Use of Sold Products. The updated calculation methodology will result in a significant decrease in reported emissions and therefore lead to a re-baselining according to the GHG-Protocol. For further information see section Climate Change.
Where we use estimated value chain data for metrics, we added the
symbol next to the metric. The following table lists all relevant metrics.
| 101/326 |
|
Integrated Report 2025 | ||||
| To
Our Stakeholders |
Combined Management Report |
Consolidated
Financial Statements IFRS |
Additional Information | ||
| Metric | Section | Estimates Used for Value Chain Data | Planned Actions to Improve Accuracy |
| Scope 3 upstream and downstream emissions | Climate Change | See the description of our GHG emissions calculation methodology. | We are actively working on replacing conversion factors with real data |
The following metrics contain a certain level of uncertainty and hence assumptions, approximations, and judgments:
| Metric | Section | Measurement Uncertainty/Discretion |
| #Unfiltered survey metrics | Own Workforce | All surveys contain a certain level of uncertainty. Depending on the type and phrasing of questions, the timing of the surveys and the response rates the results can vary. The #Unfiltered survey contains multiple questions that address organizational, team, and individual factors, which allow to create different indexes to measure change. Survey items may change from time to time to reflect current events and relevant organizational priorities. Not all questions are asked each time we run the survey but are carefully selected by the respective team. |
| Stress satisfaction index | Own Workforce | The Stress-satisfaction-index survey contains three questions that ask participants about their stress and satisfaction levels and what would lower their stress and increase their satisfaction. The sample is representative of the entire SAP population and comprises 15% of the total SAP workforce. Measures can change over time, and the timing of the survey and response rates can vary. |
| Electrical and electronical equipment waste | Resource Use and Circular Economy | Our partners aim to use the specific quotas of the recycling sites. If this data is not available, regional quotas or other available country quotas are used for approximation. |
| GHG emissions calculation methodology | Climate Change | When primary data is not available, we use extrapolated data for our calculations and a spend-based approach for Scope 3 upstream. We are actively working to transition to primary data where possible. |
For easier identification of our metrics that contain a certain
level of uncertainty, we marked the respective disclosures with the symbol  and highlighted them with a light gray box. We also used this symbol to indicate definitions and the inputs we used for our
materiality assessment and other analyses, and similarly highlighted them with a light gray box.
and highlighted them with a light gray box. We also used this symbol to indicate definitions and the inputs we used for our
materiality assessment and other analyses, and similarly highlighted them with a light gray box.
In our second year of ESRS reporting, the presentation of sustainability information in our Integrated Report 2025 has evolved compared to prior years. The most significant changes are as follows:
| – | We introduced visuals and tables to improve readability, especially in the cross-cutting disclosures. |
| – | We use introductory visuals for each topical disclosure that (1) serves as index for it, and (2) summarizes the most important content. |
| – | We present all policies in standardized tables. In addition to the policy availability disclosed in topical chapters, all global policies are available to internal stakeholders through our new Policy Management Tool. For more information about the tool, see the Business Conduct section. |
To avoid duplication in our external reporting, we incorporate
information by reference in the Group Sustainability Statement. We mark these references with the symbol  . The references fulfill the requirements outlined by ESRS 1 and are listed in a reference table in the Appendix
(in the order in which they appear in the Statement).
. The references fulfill the requirements outlined by ESRS 1 and are listed in a reference table in the Appendix
(in the order in which they appear in the Statement).
| 102/326 |
|
Integrated Report 2025 | ||||
| To
Our Stakeholders |
Combined Management Report |
Consolidated
Financial Statements IFRS |
Additional Information | ||
Independent Assurance
SAP’s Group Sustainability Statement was subject to an independent assurance engagement with limited assurance. Additionally, our independent auditor BDO AG Wirtschaftsprüfungsgesellschaft (BDO) has provided reasonable assurance on selected sustainability information in accordance with the International Standard on Assurance Engagements (ISAE) 3000 (Revised). The key performance indicators (KPIs) subject to reasonable assurance are:
| Full Name of KPI | Abbreviation | Full Name of KPI | Abbreviation | |
| Own Workforce1 | E-Waste2 | |||
| Leadership Index | LI | Waste from electrical and electronic equipment | WEEE, e-waste | |
| Employee Turnover | ||||
| Climate Change3 | ||||
| Carbon Credits | Gross Greenhouse Gas Emissions (location-based) | Gross GHG Emissions (location-based) | ||
| Greenhouse Gas Emissions Scope 1 | GHG Emissions Scope 1 | Greenhouse Gas Emissions Scope 2 (location-based) | GHG Emissions Scope 2 (location-based) | |
| Greenhouse Gas Emissions Scope 2 (market-based) | GHG Emissions Scope 2 (market-based) | Greenhouse Gas Emissions Scope 3 Downstream | GHG Emissions Scope 3 Downstream | |
| Greenhouse Gas Emissions Scope 3 Upstream (location-based) | GHG Emissions Scope 3 Upstream (location-based) | Greenhouse Gas Emissions Scope 3 Upstream (market-based) | GHG Emissions Scope 3 Upstream (market-based) | |
| Renewable Energy (including certificates) | Total Energy Consumption | |||
1 The 2025 results for each KPI are: Employee Turnover 8.2%, Leadership Index 89%
2 The 2025 result for the KPI is: Waste from electrical and electronic equipment: 797 metric tons
3 The 2025 results for each KPI are: Carbon Credits 237 kt of total GHG removed or reduced; Gross GHG Emissions (location-based) 6,446 kt; GHG Emissions Scope 1 92 kt; GHG Emissions Scope 2 (location-based) 90 kt; GHG Emissions Scope 2 (market-based) 1 kt; GHG Emissions Scope 3 Downstream 4.9 million tons; GHG Emissions Scope 3 Upstream (location-based) 1.4 million tons; GHG Emissions Scope 3 Upstream (market-based) 1.3 million tons; Renewable Energy (including certificates) 233,600 MWh; Total Energy Consumption 610,700 MWh
For more information about the scope of the assurance and the underlying reporting criteria, see the Independent Auditor’s Report on a Limited Assurance Engagement of the Group Sustainability Statement.
| 103/326 |
|
Integrated Report 2025 | ||||
| To
Our Stakeholders |
Combined Management Report |
Consolidated
Financial Statements IFRS |
Additional Information | ||
Sustainability Strategy and Governance
Sustainability Strategy
In line with our purpose of helping the world run better and improving people’s lives, we aim to put sustainability at the core of every business. As an integral part of how we operate, sustainability is firmly anchored in our corporate strategy, governance, and Executive Board compensation system.
Sustainability is a key driver of business success and strategic differentiation. As a company, SAP aims to create a positive economic, environmental, and social impact while respecting planetary boundaries and human rights. We see ourselves as having a dual role in this regard:
1) SAP as an enabler: We strive to provide products and services that support our customers in driving their sustainability objectives along the supply chain, improving ESG transparency, and capitalizing on the related opportunities.
2) SAP as an exemplar: To live up to our corporate responsibility and build resilience, we strive to lead by example as a sustainability practitioner in our own operations and across our value chain.
Our performance has been recognized by sustainability ratings, rankings, and independent analysts.
Our sustainability strategy focuses on three main areas: environmental management, ethics and social responsibility, and the enabling cross-layer of holistic steering and reporting. These priorities reflect the topics that our double materiality assessment identified as material. For more information, see the Double Materiality Assessment section. SAP’s sustainability goals are set holistically across our entire business, and not at the level of specific groups of products or services, customer categories, markets, geographical areas, or stakeholder groups.
SAP’s sustainability agenda supports the United Nations Sustainable Development Goals (UN SDGs). We work with our customers and partners across several initiatives to contribute to these goals.
We have a dedicated business unit in the reporting line to our CEO that focuses specifically on driving sustainability impact at SAP and beyond. For more information, see the Sustainability Governance section.
To further evolve both our own sustainable performance along the value chain and the solutions we provide to our customers, we actively engage and collaborate with partners, suppliers, governments, non-governmental organizations (NGOs), investors, and others. For more information, see the Interests and Views of Stakeholders section.
SAP as an Enabler
Our vision as a provider of sustainability solutions is to enable customers to reach agility at scale, achieve resilience across their value chains and drive sustainability through their enterprise resource planning (ERP) systems. We serve global customers from 25 industries and work with them to create a more sustainable future. To achieve this, we deliver ERP-centric, cloud-based, AI-enabled sustainability solutions for companies of all sizes and industries, and we aim to support them by embedding sustainability into every aspect of their business operations. We are not aware of any of our products or services being banned in any market.
Our comprehensive portfolio of sustainability software and services
is designed to enable customers to rise to the business challenges of today and capitalize on opportunities across four
sustainability focus areas: sustainability management, carbon accounting, sustainable supply chains, and operational compliance,
with applications, data, and AI embedded into SAP Business Suite. For more information about our products, see the Incorporation
by Reference section of the Appendix .
To safeguard the ethical development, deployment, use, and sale of AI systems at SAP, we have guiding principles and policies in place. For more information, see the Responsible AI section.
SAP as an Exemplar
To reflect SAP’s strategic approach to sustainability and to meet the ambition we set out above, our sustainability efforts encompass dedicated programs and initiatives to address material topics not only in our own business operations and practices, but also across our value chain.
| 104/326 |
|
Integrated Report 2025 | ||||
| To
Our Stakeholders |
Combined Management Report |
Consolidated
Financial Statements IFRS |
Additional Information | ||
| – | Environmental management: lead the way to a nature- and climate-resilient future We are committed to lowering our emissions, reducing our resource use, and restoring ecosystems to foster a low-carbon, circular economy. SAP aims to achieve net-zero emissions along our value chain by 2030, in line with a science-based pathway compatible with limiting global warming to 1.5°C. In addition, we are committed to operating free of single-use plastics and ensuring zero electronic waste in our operations. We closely monitor progress toward our net-zero target, and regularly assess whether adjustments are needed to respond to changing circumstances, such as rising energy demand linked to artificial intelligence, and any deviations in supplier decarbonization trajectories that affect our overall footprint. For more information, see the Climate Change and Resource Use and Circular Economy sections. |
| – | Ethics and social responsibility: foster a just and inclusive economy We are committed to fostering a just and inclusive economy in which people and ethical AI thrive together, and to respecting and advancing human rights across our ecosystem. This means acting with integrity; ensuring ethical business practices and compliance; implementing human rights due diligence; safeguarding the ethical use of AI; and protecting data and privacy. Furthermore, we focus on providing decent work and fair labor conditions across SAP and its ecosystem by advancing the future of work in the age of AI, securing people-centric, healthy, and safe work environments, and providing adequate living wages. SAP also seeks to increase equitable access to economic opportunity, education, and employment by investing in future skills, promoting equality and inclusion, and other social responsibility programs. For more information, see the Business Conduct, Human Rights, Own Workforce, Workers in the Value Chain, Responsible AI, and Security, Cloud Compliance, and Data Protection and Privacy sections. |
| – | Holistic steering and reporting: manage sustainable business transformation To continue enhancing our sustainable business practices, we are committed to analyzing the positive and negative effects of our business operations on society and the environment throughout our value chain. These impacts can be quantified in monetary terms, since the impact data measures the value or cost to human well-being caused by business activities. These impacts are considered alongside financial metrics, at both corporate and business-unit level. For more information about how we monetize our impact, see the Double Materiality Assessment section. |
We are committed to making sustainability a part of who we are and how
we work at SAP. This commitment comes to life every day as more employees across all lines of business work on making our operations more
sustainable. In our #Unfiltered survey, 82% of SAP employees reported that they actively contributed to SAP’s sustainability goals
in 2025. To amplify our commitment, we work with SAP’s Sustainability Champions Network. This internal, global community comprises
more than 300 champions across regions and functions whose roles allow them to designate 10% of their working time to raising awareness
of and promoting engagement in sustainability initiatives, exchanging best practices, and acting as role models, multipliers, and motivators
to create a culture in which every action has a positive impact. For an overview of employee headcount, broken down by function and geographical
area, see the Own Workforce – Characteristics
of Our Own Workforce section and the Incorporation
by Reference section of the Appendix .
SAP is active only in the software and IT services sector, as
defined by the ESRS SEC1 sector classification standard. Therefore, a breakdown by sector (as specified by the ESRS standard) is not
necessary. For information about our total revenue, revenue by segment, and cost by segment, see the Incorporation
by Reference section of the Appendix .
Our Business Model
For information about our business model and its inputs and outputs,
see the Incorporation by Reference
section of the Appendix .
Value Chain
SAP’s core position in the value chain is to innovate, develop, and deliver solutions, and to support customers. For more information about our value chain, see the definition in the Double Materiality Assessment section.
Interests and Views of Stakeholders
At SAP, stakeholder engagement is an ongoing strategic process that strengthens our innovation, risk management, and sustainability efforts. We actively seek diverse perspectives to better understand the impacts of our business and to shape more resilient strategies. Engaging with stakeholders early helps us identify potential risks and jointly develop preventive and mitigation measures, and to ensure that our products and services are grounded in real-world needs. Input from stakeholders provides us with the external insights that help us continuously improve and innovate with purpose. To foster progress along our material topics, we have evolved our approach this year. Instead of gathering feedback on different sustainability topics through the SAP Sustainability Advisory Panel (whose regular members were renowned experts from across sectors), we shifted our focus and resources to engage with rightsholders to obtain subject-specific input on material topics, as set out in the table below.
| 105/326 |
|
Integrated Report 2025 | ||||
| To
Our Stakeholders |
Combined Management Report |
Consolidated
Financial Statements IFRS |
Additional Information | ||
For more information about the main adjustments to our strategy in 2025,
see the Incorporation by Reference
section of the Appendix . As continuous innovation and focus on
customer outcomes are always at the core of SAP’s strategy and part of our strategy evolution process, we do not expect these adjustments
to impact our relationship with or the interests of our stakeholders.
| Stakeholder Group | How We Interact | Purpose of Engagement and Key Interests of the Stakeholder Group |
| Own workforce | We engage with our own workforce in various ways. For more information, see the Own Workforce – Processes for Engaging with Our Own Workforce section. | To collect feedback, keep employees informed, provide employees opportunities to contribute and ensure that the human rights of our own employees are respected, through the prevention of discrimination and by ensuring health and safety, guaranteeing freedom of association and decent working conditions, preventing psychological, sexual, and physical harassment, and protecting their personal data. |
| Workers in the value chain |
We engage with our suppliers and their employees as follows: – With selected tier one suppliers, on living wages, – With on-site suppliers through our Environmental Management System (EMS) – With AI workers in the upstream value chain as part of a dedicated industry collaboration project with the Business for Social Responsibility (BSR) non-profit – By way of the SAP Supplier Code of Conduct – By way of procurement team surveys – By way of the Speak Out at SAP whistleblower tool (for more information, see the Workers in the Value Chain section) |
To ensure that our suppliers can uphold the human rights of workers in the value chain, by, for example, providing reasonable working hours and adequate wages, preventing any kind of harassment, and meeting occupational safety and data privacy standards. |
| Business partners and service providers |
Among the ways we engage with our business partners and suppliers are through our: – Interactive SAP Partner Portal – Virtual events – Partner Net Promoter Score (NPS) survey – Speak Out at SAP whistleblower tool |
To collect feedback and ensure that our business partners and service providers can uphold the human rights of their employees. |
| Customers | We engage with customers to support them in their sustainability efforts
with our sustainability offerings. In customer co-innovation processes, we gather input to make sure that our solutions help solve
real-world sustainability challenges. By replying to questions in our customers’ due diligence processes, we have the chance
to engage with them on our own sustainability performance. For more information about our engagement through the SAP Global
Customer Experience (XM) program, for example, see the Incorporation
by Reference section in the Appendix . |
To ensure that our products and services are grounded in real-world needs. Other sustainability-related engagements cover the human rights of our customers’ employees, their impact on SAP’s Scope 3 emissions, and product-related topics, such as privacy and bias in AI. |
| NGOs and academia |
We work with NGOs and academia as follows: – Through our engagement with BSR, World Business Council for Sustainable Development (WBCSD), We Mean Business Coalition (WMBC), World Economic Forum (WEF), econsense, UNESCO, and UN Global Compact, and other NGOs and sustainability-focused business coalitions – Through the SAP University Alliances program – Through the SAP AI Ethics Advisory Panel |
Our ongoing dialogue with NGOs, business coalitions, and academic institutions plays a crucial role in shaping our understanding of the current challenges we face as a society. We leverage this dialogue to better understand how stakeholders such as civil society, affected communities, and nature, as a silent stakeholder, are affected by our business operations, and how we can manage the impacts we have on them. Further, these forums allow us to exchange ideas and partner with other companies and organizations to drive joint initiatives such as the Partnership for Carbon Transparency (PACT). |
| Financial analysts and investors |
We engage with our investor community and financial analysts through: – Global conferences and roadshows – Annual General Meeting of Shareholders (AGM) – Virtual and in-person events |
We continue our dialogue with investors, focusing on environmental, social, and governance (ESG) topics, gathering their feedback, and providing them with insights into our sustainability policies and products. SAP’s leadership in this area has been recognized by major sustainability rating agencies. |
| Civil society including affected communities | To understand the key interests of communities affected by our business activities, we engage with them through intermediaries such as NGOs. | We work toward fostering a just and inclusive economy where people and technology thrive together. We discuss various sustainability-related interests with intermediaries of civil society and affected communities. Topics include climate change, the impacts of AI, and human rights. |
| Nature | We engage with NGOs to consider the interests of nature as a silent stakeholder. | We work toward lowering our emissions, reducing our resource use, and restoring ecosystems to foster a nature- and climate-resilient future. |
| 106/326 |
|
Integrated Report 2025 | ||||
| To
Our Stakeholders |
Combined Management Report |
Consolidated
Financial Statements IFRS |
Additional Information | ||
For more information about how our Executive Board and Supervisory Board are informed about the views and interests of stakeholders regarding SAP’s sustainability-related impacts, see the Sustainability Governance section.
Effects of Our Impacts, Risks, and Opportunities on SAP
The Global Strategy team works continuously on a global and consistent strategy for SAP that centers on our purpose, vision, goals, and portfolio focus. Experts and managers from across the Group were closely involved in our materiality assessment process. Further, we worked with our global risk management team to include and appropriately assess opportunities and risks, which we then integrated into SAP’s risk management system.
SAP has continuously adapted to changes in the business environment, leveraging our technological expertise to stay ahead of the curve. Our commitment to innovation and sustainability has allowed us to address environmental and social impacts as an enabler and exemplar while also capitalizing on emerging market trends. By establishing strong partnerships and investing in research and development, SAP has positioned itself as a leader in the digital transformation space, enabling it to navigate challenges and capitalize on opportunities in a rapidly evolving global marketplace. Our valuation on the capital markets clearly shows the trust investors have in the future success of our business. We believe that this trust is largely due to our ability as a company to adapt and innovate in the ways outlined above.
Strategic decision-making at SAP is primarily guided by a five-year financial planning cycle. The resulting strategic plan is reviewed annually at Board-level meetings. While our strategic planning is based on a medium-term horizon of five years, toward the end of the fiscal year we focus on our short-term priorities, which have a one-year horizon. The long-term horizon (beyond five years) is generally not part of our active strategic decision-making. For more information about how the Executive Board includes sustainability considerations in its decision-making, see the Sustainability Governance section.
Financial Effects
We are currently working on plans to increase the energy efficiency of selected locations. As we are still in the planning phase, no material savings in the meaning of IRO E1-IRO4 were realized in 2025. The same is true for other transformation measures related to this IRO. In 2025, we experienced no material costs due to fluctuating energy prices. The same is true for possible security attacks and breaches and related reputational damage. Lastly, we also observed no material measurable effect due to IRO AI-IRO3. However, we observed an increase in sales of our software solutions to manage, track, and report GHG emissions. For more information about the IROs mentioned above, see the Results of the Double Materiality Assessment in the Double Materiality Assessment section.
| 107/326 |
|
Integrated Report 2025 | ||||
| To
Our Stakeholders |
Combined Management Report |
Consolidated
Financial Statements IFRS |
Additional Information | ||
Sustainability Governance
To steer SAP’s sustainability performance and drive results for business, people, and the planet, we established a comprehensive governance structure that spans all levels and dimensions of the Company. The impacts, risks, and opportunities (IROs) that we identified as material in our comprehensive double materiality assessment are the foundation for this structure. In line with our approach of holistic steering and reporting, non-financial targets play an important role in decision-making, in the development and sale of our products, and in our internal business processes. Sustainability is therefore sponsored at Executive Board level by our CEO, our CFO, and our chief people officer and labor director.
The Executive Board and SAP’s sustainability leaders brief the Supervisory Board regularly (at least once a year) on the SAP Group’s sustainability strategy and the progress made in implementing it. These briefings, notably those to the full Supervisory Board, comprise information and updates about SAP’s material IROs and the management thereof. Oversight of SAP’s sustainability reporting is delegated to the Audit and Compliance Committee. For a full list of material IROs, see the Double Materiality Assessment section.
SAP’s ESG Steering Board plays a critical role in managing the Company’s corporate sustainability performance. Convened by SAP’s Global Head of Sustainability and consisting of senior executives from across the Company, it provides strategic guidance and cross-Company engagement for SAP’s holistic sustainability agenda, including strategic oversight of our IROs. The steering board meets at least twice a year, with at least one of the Executive Board sponsors participating in at least one of the meetings every year.
To show how we identify, manage, and steer the material IROs, we created the process shown below.
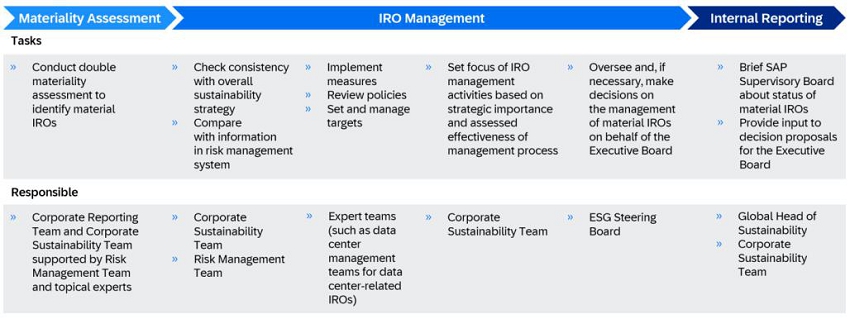
In addition to this process, steering-relevant KPIs such as our GHG emissions are steered and reported internally by our Controlling Team.
Teams of experts handle the operational management of IROs by implementing measures and by setting and managing goals. Changes to policies, targets, and action plans are addressed and implemented directly by those teams if possible. Where this is not possible, matters are escalated to the ESG Steering Board, which assesses whether Executive Board and/or Supervisory Board involvement is required. Regardless of whether the involvement of the Executive Board and/or Supervisory Board is required, the ESG Steering Board sends a status report to both. Each IRO when defined and rated by experts reflects the views and interests of stakeholders. By sharing the IROs with Executive Board and Supervisory Board members in the course of IRO management, we consider both boards informed about the views and interests of stakeholders.
For more information about the role and knowledge of SAP’s Supervisory
Board and Executive Board regarding sustainability, as well as their knowledge regarding business conduct and compliance, see the Incorporation
by Reference section in the Appendix . Information regarding
the role of the Executive Board and the Supervisory Board related to business conduct is provided separately in the Business
Conduct section.
As well as monitoring IROs according to the process above, the ESG Steering Board provides a forum for discussing the sustainability impacts of business decisions. Further, the Corporate Sustainability Team is actively involved in providing input to decision proposals for the Executive Board (such as assessments of the potential implications of proposed actions on social and environmental factors) to help it make informed decisions that reflect sustainability considerations and incorporate the material IROs. Likewise, the Supervisory Board is informed about the material IROs and briefed by the Global Head of Sustainability, which allows it to take those considerations into account during decision-making.
| 108/326 |
|
Integrated Report 2025 | ||||
| To
Our Stakeholders |
Combined Management Report |
Consolidated
Financial Statements IFRS |
Additional Information | ||
For information about the composition and diversity of the Executive
Board and the Supervisory Board, and about how Executive Board incentive plans integrate sustainability performance, see the Incorporation
by Reference section in the Appendix .
Statement on Due Diligence
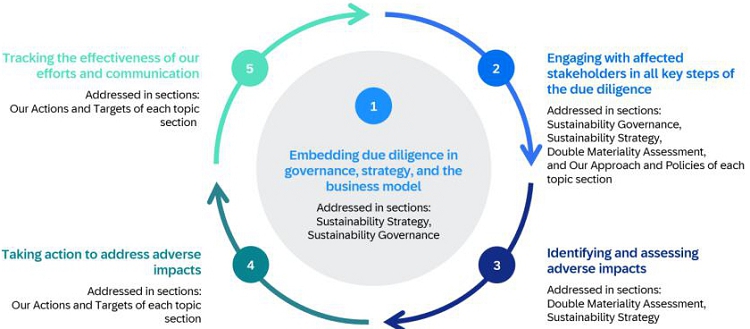
The due diligence processes that help us identify, prevent, mitigate, and address potential and actual negative impacts are described in the sections on the specific topics. The graphic above provides references to all sections covering these due diligence processes.
Risk Management and Internal Controls over Sustainability Reporting
For information about the main features and components of our risk management,
internal controls, and periodic reporting, see the Incorporation
by Reference section in the Appendix .
| 109/326 |
|
Integrated Report 2025 | ||||
| To
Our Stakeholders |
Combined Management Report |
Consolidated
Financial Statements IFRS |
Additional Information | ||
Double Materiality Assessment
In 2024, we conducted a comprehensive double materiality assessment following the requirements of the European Sustainability Reporting Standards (ESRS) under the Corporate Sustainability Reporting Directive (CSRD). When conducting the assessment, we adhered to the European Financial Reporting Advisory Group (EFRAG) implementation guidance 1. The 2024 assessment served as the basis for the reassessment we carried out in 2025. In this reassessment, we aimed to make IROs more concrete, and aligned them more closely to the ESRS requirements, which led to a reduction in the number of material IROs to 39. While this had no effect on the material topics we identified in 2024, the sub-sub-topics adequate wages (Own workforce), measures against violence and harassment in the workplace (Workers in the value chain), and responsible marketing practices (Consumers and end-users) are no longer material.
We describe below how we identify, assess, and prioritize our IROs to determine their materiality.
Methodology
To determine our material sustainability topics, we first identified the relevant and SAP-specific IROs for each ESRS sustainability topic. We based our assessment on the materiality results from previous years and considered all ESRS-relevant sustainability topics, sub-topics, and sub-sub-topics.
The assessment was carried out by our internal stakeholders and experts, and by the applicable business units. They and our sustainability team were involved throughout the process, from identifying and assessing the topics, to deriving the possible consequences of the material impacts, risks, and opportunities.
We distinguished between potential and actual positive and negative impacts, and risks and opportunities that derive from dependencies on natural, human, and social resources. The screening covers SAP’s value chain. In this context and in relation to the environmental, social, and governance topics, a negative impact is any effect caused by SAP that worsens the status quo; a positive impact is any effect caused by SAP that (1) improves the status quo, and (2) is not considered a mitigation of a negative impact.
We did not make any changes to this methodology in 2025, nor are any changes planned. A definitive timeline for a future revision has not been set. However, significant changes to our business model, operating environment, or similar would trigger a revision.
Evaluation
 Internal Experts
The materiality of the IROs we identified was assessed by internal experts from, for example, our Total Rewards and Data Center Management teams. We assigned the IROs related to a specific topic to the respective team or teams for assessment. While we selected these experts carefully, due to the nature of the materiality assessment their judgment determines its outcome. Consequently, the results of our materiality assessment are influenced by our choice of experts.
Impact Valuation Approach
We use the Value Balancing Alliance (VBA) methodology to measure and value the impact that SAP’s business activities have on society and the environment.
For this purpose, we follow the impact measurement and valuation approach. This approach refers to the process of first measuring the physical impact, typically by way of ESG indicators, and then using impact valuation factors to convert these indicators into monetary values. Attributing a monetary value to ESG indicators makes it easier to compare sustainability and financial metrics. It also allows material sustainability topics to be incorporated into financial accounting systems and, as a result, enables meaningful sustainability management in line with financial indicators.
SAP applies widely used, state-of-the-art science-based valuation factors to integrate non-financial, monetary performance indicators that companies, investors, and other stakeholders can use for comparison. Methods continue to mature year over year, and various challenges still need to be addressed.
Each IRO was screened and reviewed by an internal expert and cross-checked by the Sustainability team and the Risk Management team. As input parameters, SAP used internal and external data, such as risk assessment data under the German Supply Chain Act, and relevant literature. All IROs were assessed in line with the EFRAG Materiality Assessment Implementation Guidelines using the gross approach. For our initial assessment in 2024, besides drawing on in-house expertise, SAP also engaged with external experts
| 110/326 |
|
Integrated Report 2025 | ||||
| To
Our Stakeholders |
Combined Management Report |
Consolidated
Financial Statements IFRS |
Additional Information | ||
on the Sustainability Advisory Panel, which was dissolved the following year, to review the assessment results and provide us with valuable feedback. Despite adopting an AI-First, Suite-First strategy in 2025, aiming to embed Business AI into every application and business process, this change did not impact our material topics. The entity specific topic Responsible AI is already material from both impact and financial materiality perspectives. With no significant changes to our business model or material topics, our reassessment in 2025 did not require engagement with external or affected stakeholders.
To validate the experts’ assessment, we used the results from our internal VBA impact accounting and mapped them to the IROs. The VBA helps us measure environmental and social impacts and put a monetary value on them so that they can be compared with financial performance. To this end, we compared the results of the VBA and of our materiality assessment to verify that both arrive at the same materiality result when the financial threshold is applied. Impacts were assessed as follows:1
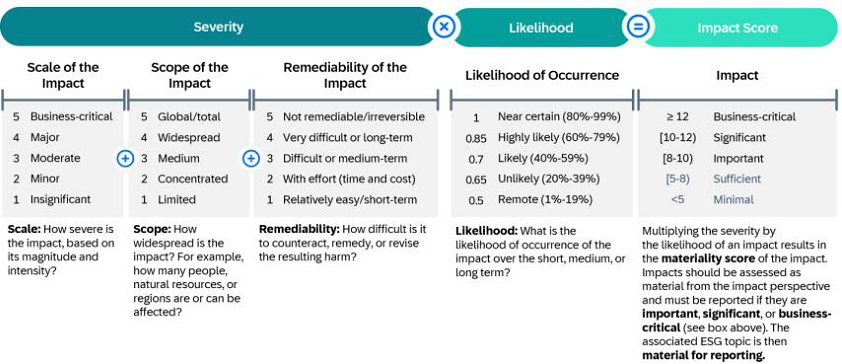
1 Example: If the scale of the impact is rated as 3, its scope as 5, and its remediability as 1, the resulting severity is 9. For actual impacts, the likelihood is disregarded and the severity score is taken as the impact score. In this example, the score of 9 means that the impact is “Important” and, therefore, material. For potential impacts, if the likelihood is “Remote,” the score of 9 is multiplied by 0.5 to give 4.5, which means that the impact is not material.
To understand the level of control SAP has over an impact, we assessed whether an impact derived from a business relationship, its position in the value chain, its scope (whether it affects a specific location or is global), and whether that impact was directly caused by SAP or whether SAP is linked to the impact indirectly through its business relations and value chain, for example. For topics that already had a higher relevance in prior years, such as emissions and employees, more IROs were included in the initial longlist than for other topics.
Risks and opportunities were assessed as follows:
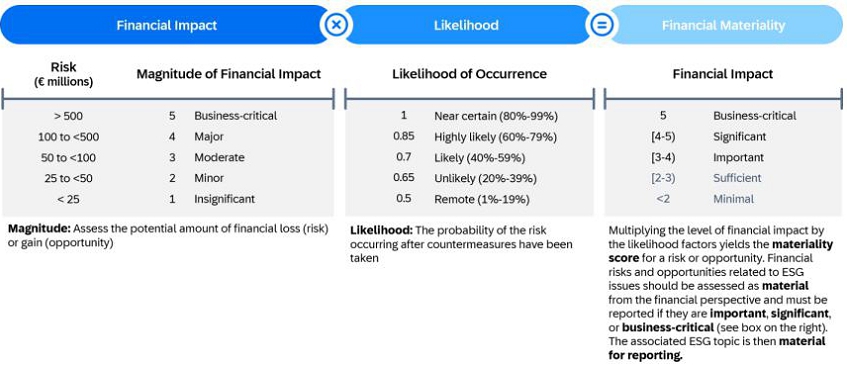
| 111/326 |
|
Integrated Report 2025 | ||||
| To
Our Stakeholders |
Combined Management Report |
Consolidated
Financial Statements IFRS |
Additional Information | ||
A list of risks and opportunities was created by our internal experts. This list considers current trends, the nature of their effects, business planning, and, in some cases, scenarios related to climate change, climate adaptation, and so on. When assessing the identified risks and opportunities, our experts considered also whether they arise from an impact or not. All results were subject to an additional review by our Risk Management team.
Approval of the Double Materiality Assessment
SAP’s CEO and CFO approved the initial materiality assessment, and our CFO approved the reassessment. After this initial approval, the ESG Steering Board is involved in the continuous assessment of the measures and targets related to the IROs. For more information, see the Sustainability Governance section.
Results of the Double Materiality Assessment
SAP discloses only the datapoints related to material IROs. In some cases, a specific section has been created to fulfill the disclosure requirements for a single sub-topic or sub-sub-topic. To determine whether a datapoint was material for us, we used the flow chart from ESRS 1 Appendix E.
The results of our materiality reassessment confirm the results of our 2024 assessment and show that the material topics for SAP remain environmental, social, governance, and entity-specific topics, and their associated impacts, risks, and opportunities.
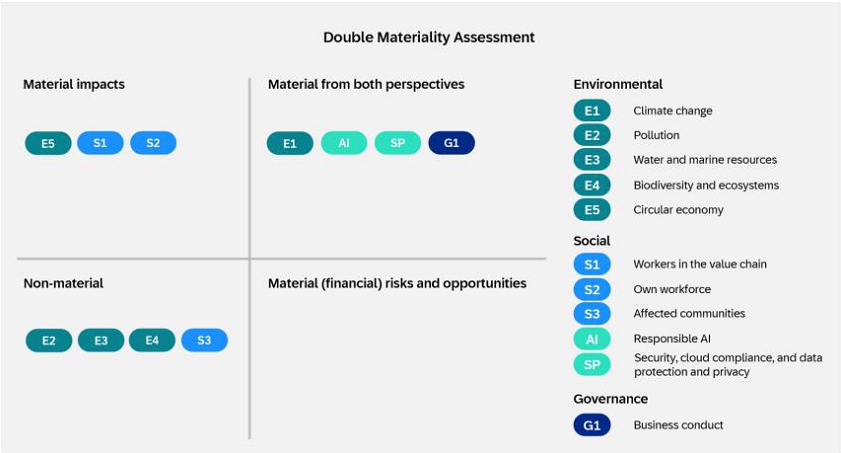
We assessed the IROs for each topic. The IRO with the highest score for the topic in question determined the quadrant in which that topic is placed in the graphic above.21 The graphics at the beginning of each of the topical sections indicate which sub-topics are material and where in that section the required disclosures are made. IROs that relate to the security, cloud compliance, data protection and privacy, and responsible AI topics are entity-specific and are therefore covered by entity-specific disclosures. The sections on all other IROs are covered by the predefined ESRS topical standards.
21 Example: For the E5 topic, at least one impact has been rated 8 or higher, while risks and opportunities have been rated at less than 3, rendering them not material. The E5 topic is therefore in the “Material impacts” quadrant.
| 112/326 |
|
Integrated Report 2025 | ||||
| To
Our Stakeholders |
Combined Management Report |
Consolidated
Financial Statements IFRS |
Additional Information | ||
The graphic below summarizes all material impacts SAP has on the outside world and the material risks and opportunities resulting from the topics covered by this Group Sustainability Statement. The IROs are sorted by topic, their relation to SAP’s strategy and business model, their location in the value chain, time horizon, and so on. In the table below, we also describe our value chain outcomes, which are:
| – | Tailored software and services |
| – | Efficient business processes |
| – | Increased scalability and flexibility |
The IRO identifier, as given in the table, is cited in each subsequent section in which the IRO is discussed.
| 113/326 |
|
Integrated Report 2025 | ||||
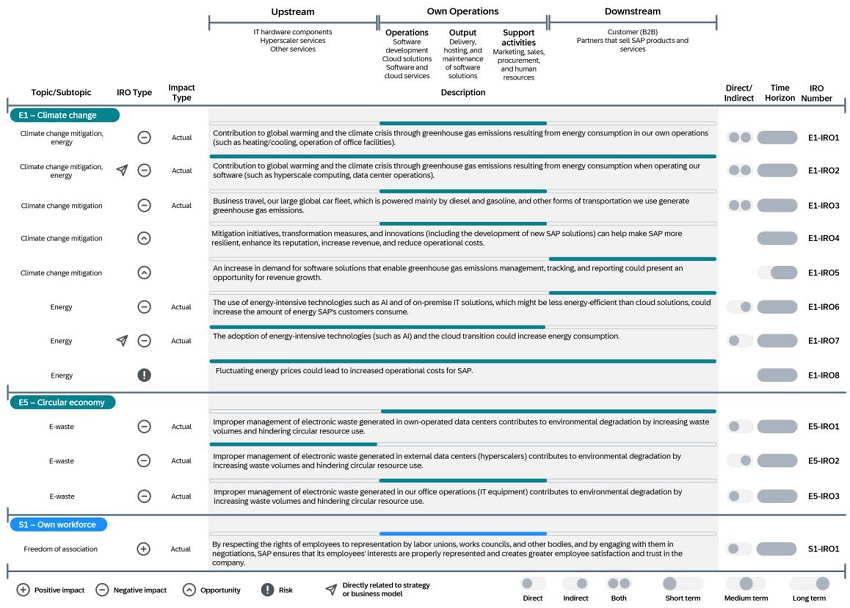
| 114/326 |
|
Integrated Report 2025 | ||||
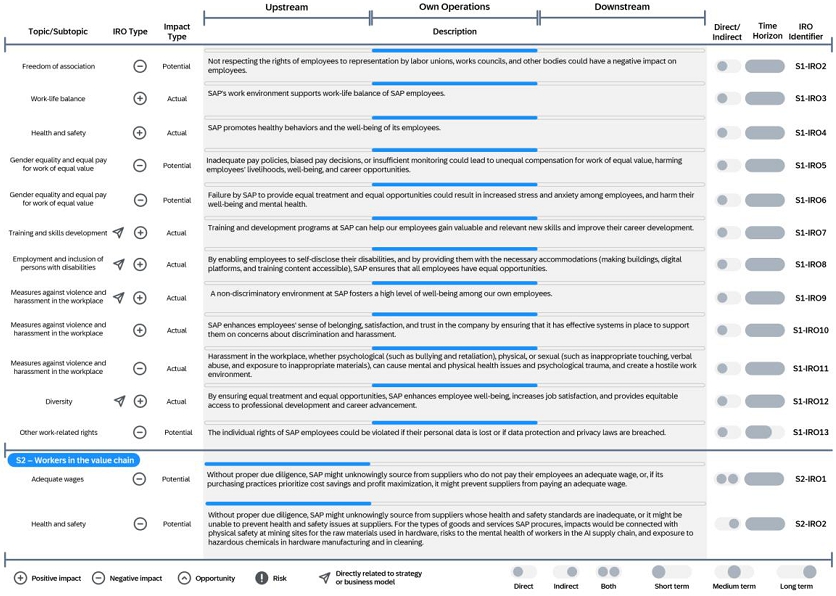
| 115/326 |
|
Integrated Report 2025 | ||||
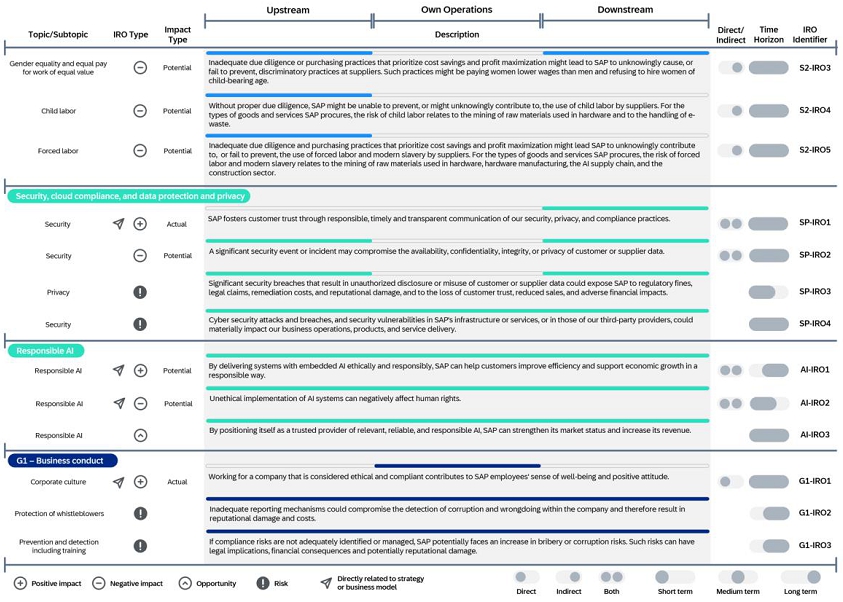
| 116/326 |
|
Integrated Report 2025 | ||||
| To
Our Stakeholders |
Combined Management Report |
Consolidated
Financial Statements IFRS |
Additional Information | ||
The environmental, social, and governance topics we used as input for our materiality assessment are already embedded in our corporate strategy.
The social topics are mainly global and are therefore considered across the SAP Group and value chain where relevant, and cannot be broken down by individual countries or regions.
Most of the IROs for environmental topics relate to our core business, and include software solutions, data management, energy availability and utilization, and electronic waste.
We continuously monitor and evaluate the effectiveness of all activities to manage our IROs. For more information, see the Sustainability Governance section.
Integration into Overall Risk and Opportunity Management
SAP uses standard risk management and reporting processes and schedules
to track IROs. All sustainability-related risks are integrated in corporate risk management system. We prioritize all risks using methods
aligned with ESRS and the German Supply Chain Act. For more information, see the Incorporation
by Reference section of our Appendix .
Specific IRO Disclosures on Environmental Topics
Climate Change
We identified eight material IROs pertaining to E1 Climate change and energy. Three of these material IROs (E1-IRO4, E1-IRO5, and E1-IRO8) are related to transitional events, which are further addressed in the Transition Risks and Opportunities section below.
Impact of Climate Change
Physical Risks
In 2025, SAP screened its activities to identify where it is exposed to climate hazards. The main physical risks for SAP are connected with our own operations and upstream value chain, particularly our own data centers and our colocation data centers, the continuous operation of which is critical to our business model. In this context, SAP conducted a state-of-the-art climate scenario analysis for those parts of the value chain that are connected with the main physical risks.
We selected three scenarios: the Intergovernmental Panel on Climate Change’s Shared Socioeconomic Pathway 1 (SSP1), Representative Concentration Pathway 1.9 (SSP1–RCP1.9), which limits global warming to less than 1.5°C above preindustrial levels); SSP2–RCP4.5, in which the temperature increases by between 2.5°C and 3°C by 2100; and SSP5–RCP8.5, in which it increases by more than 4°C by 2100.
We examined temperature, wind, and water-related chronic and acute risks that present a risk to SAP’s own and colocation data centers, and to our offices. To do so, we collected geospatial data for near-term (2020-2039), medium-term (2040-2059), and long-term (2080–2099) time horizons and ranked them from low to high; depending on the risk screened, we used geospatial data on country, state, or regional level. Physical risks at high-risk locations were further screened using the SSP5–RCP8.5 scenario for short- and medium-term horizons. We did not look at the long-term horizon because it exceeded the expected useful life of the assets in question as well as strategic planning horizons and capital allocation plans.
To measure the magnitude of the financial effects and obtain a monetary value, we used the SSP5–RCP8.5 results, and consulted subject-matter experts about the likely costs of repairing our infrastructure or, if necessary and possible, of proactively protecting it against specific risks. Our analysis did not identify any material financial effects from physical risks. We are not aware of any critical climate-related assumptions made in our consolidated financial statements that would need to be compatible with the assumptions in our climate scenario analysis.
Transition Risks and Opportunities
Referring to the recommendations of the Task Force on Climate Related Financial Disclosures (TCFD) on climate-related risks, SAP identified climate-related transition events.
To identify and assess transition risks and opportunities, we applied the TCFD transition risk categories in combination with NGFS (Network of Central Banks and Supervisors for Greening the Financial System) climate scenario – Net Zero 2050 NGFS which is
| 117/326 |
|
Integrated Report 2025 | ||||
| To
Our Stakeholders |
Combined Management Report |
Consolidated
Financial Statements IFRS |
Additional Information | ||
aligned with the state-of-the-art science. This scenario is in line with the Paris Agreement of limiting global warming to below 1.5 °C by the end of the century. When analyzing transition risks and opportunities, we covered our whole value chain.
The NGFS Net Zero 2050 scenario assumes that ambitious climate policies are introduced immediately. Under the scenario, CO2 removal is used to accelerate decarbonization, but is kept to the minimum possible and broadly in line with sustainable levels of bioenergy production, and net CO2 emissions reach zero around 2050.
This scenario is particularly relevant for assessing a company’s resilience, as it captures conditions in which regulatory, market, and societal pressures may intensify rapidly. Key inputs used in the analysis included carbon prices, energy price fluctuations, and narrative information about legal and policy changes. Key constraints were limited sensitivity, as the data is global rather than industry-specific, and reliance on narrative assumptions where quantitative projections were unavailable. In our assessment, we applied a near-term time horizon that considers risks and opportunities that could arise by 2040, which we deemed a reasonably foreseeable period considering the rapid technological advancements in the software industry. Anything beyond the near-term time horizon exceeds our strategic planning horizons and capital allocation plans.
We identified two material transition opportunities (E1-IRO4 – opportunities stemming from mitigation, transformation and innovation measures, and E1-IRO5 – the sale of SAP products), and one transition risk (energy price fluctuation). We are in the process of mitigating this risk by acquiring power purchase agreements (PPAs). SAP is not otherwise significantly exposed to transition risks, as it does not operate in high-climate-risk sectors. Other identified non-material transition risks are being addressed through our plan to adapt our data centers to future requirements.
Resilience Analysis
In 2025, we conducted a resilience analysis based on our climate scenario analysis. For information about the scope, time horizons, key assumptions, and uncertainties, see the Physical Risks and Transition Risks and Opportunities sections. In the analysis, we considered sites with high physical risks and the material transition risk of energy price fluctuation. The latter is already being mitigated by PPAs and energy management concepts. Consultations with our subject-matter experts confirmed that SAP is resilient and that no adjustments to our strategy or business model are required at this point in time. We regularly revisit and revise this assessment, also to factor in emerging climate scenario findings and technological developments that could enhance our resilience to various climate hazards.
Impact on Climate Change
SAP has screened its value chain to identify where significant potential and actual impacts of greenhouse gas (GHG) emissions are concentrated. Our analysis covers the parts of our value chain that we include in our GHG emission calculations. We are working on improving our data collection processes along the extended value chain.
We aim to reduce our gross GHG emissions (market-based) by at least 90% across the relevant value chain and reach net zero by 2030, which is compatible with limiting global warming to 1.5°C. We consider actual targets and actions to estimate the future carbon pathways required to achieve the Company’s net-zero transition plan. Our Net Zero 2030 target is dependent on the following elements which are outside of SAP’s direct control: (1) Progress and success of decarbonization efforts of our suppliers, (2) Changes in regulation such as the revision of the SBTi standards, expected to be finalized in 2026, and (3) Due to rapid development in the AI and general cloud infrastructure area and the resulting high energy needs it is unclear if this demand can be fully covered with renewable energy. Due to these uncertainties, we are monitoring our progress in achieving the net zero target by 2030 and are continuously evaluating whether adjustment might be necessary. For more information about our GHG emissions, see the Climate Change section.
Pollution
In 2024, SAP consulted its internal experts to identify potential pollution-related impacts, risks, and opportunities. As part of this process, a thorough review of our sites and business activities was conducted. It concluded that there were no material pollution-related IROs, notably those related to substances of concern and microplastics. Since our internal review did not report any significant IROs, SAP identified the entire topic as not material and did not conduct any external consultations. Our 2025 reassessment confirmed this outcome.
Water and Marine Resources
For its initial assessment in 2024, SAP consulted its internal experts who manage SAP offices, data centers, and colocations, to identify potential IROs. Given SAP’s business activities, water and marine resources were identified as not material. We nonetheless
| 118/326 |
|
Integrated Report 2025 | ||||
| To
Our Stakeholders |
Combined Management Report |
Consolidated
Financial Statements IFRS |
Additional Information | ||
continue to monitor this topic. In 2025, water withdrawn in our offices and our own data centers was 746 thousand cubic meters (in 2024: 682 thousand cubic meters). When we assessed materiality, we identified the water-stress parameters of the impacted locations from our risk assessment as not business-relevant. We reassess this topic periodically to account for new locations, changes in trends, and improved climate scenario analysis. Since our internal screening and the VBA results did not identify any substantial IROs, we did not carry out any external consultations.
Biodiversity
SAP conducted an internal screening using various biodiversity databases (such as Natura 2000 network (Europe), UNESCO World Heritage Sites, and Key Biodiversity Areas) to assess whether our own offices, data centers, and colocation data centers are in biodiversity-sensitive areas. Other parts of our value chain were not checked. Our screening found that two of our offices in Australia and one colocation data center in Dubai are inside, and 23 locations are close to (within one kilometer), a biodiversity-sensitive area. The only direct interference that SAP has in relation to biodiversity is consumption of space. Furthermore, SAP does not rely on biodiversity services; we therefore did not reflect it in the analysis. Consequently, we did not identify any material biodiversity-related impacts, risks, or opportunities. At most of our own sites, we employ environmentally responsible practices, such as commissioning energy-efficient data centers and implementing environmental management systems. We continuously monitor our environmental impact. Our consultation with internal experts identified no actual or potential dependency on biodiversity from any activities related to our business model. We therefore also did not identify any systemic or physical risk related to biodiversity. Similarly, we did not identify any biodiversity-related material transition risks or opportunities. As no material IROs were identified, no specific consultations with external experts were carried out or mitigation measures planned.
Resource Use and Circular Economy
In 2024, SAP consulted internal experts to identify potential IROs. We screened the resource inflow (procurements) and resource outflow (waste) topics in the context of SAP’s business activities. To differentiate between the most relevant waste streams, SAP identified IROs for both waste and e-waste. The business units that were involved in this process are, for procurements, the global procurement department; for the waste stream, the global facilities team; the units responsible for SAP IT equipment and SAP data center equipment; and the global cloud infrastructure and delivery team. The only material topic is e-waste, for which we have identified material impacts but no risks or opportunities. As our screening sufficiently covers the topic, we did not carry out any external consultations. Our 2025 reassessment confirmed this outcome.
Specific IRO Disclosures on Business Conduct Topics
As part of our initial assessment in 2024, we screened SAP’s corporate culture, the protection of whistleblowers, corruption and bribery (Office of Ethics and Compliance), political engagement (Government Affairs), the management of relationships with suppliers, including payment practices, and animal welfare (Global Procurement Organization) in the context of SAP’s business activities. These business units were involved in this process. Our evaluations took into account the location, activity, sector, and structure of the transactions. The materiality results show that, in line with SAP’s business, the only material topics for which we have identified material impacts, risks and opportunities, are corporate culture, protection of whistleblowers, and corruption and bribery.
Since we are a cloud-software company, we have not identified any IROs related to animal welfare that are material to SAP. Nor did we identify any material IROs relating to political engagement, the management of relationships with suppliers, or our payment practices. Here, we have robust policies in place governing political engagement and payment practices; these policies are strictly enforced.
As our screening sufficiently covered the topic, we did not carry out any external consultations. Our 2025 reassessment confirmed this outcome.
| 119/326 |
|
Integrated Report 2025 | ||||
| To
Our Stakeholders |
Combined Management Report |
Consolidated
Financial Statements IFRS |
Additional Information | ||
Environmental Information
In this section, we disclose information about SAP’s material impacts, risks, and opportunities (IROs) related to environmental topics and responsibility. For more information, see the sections Climate Change and Resource Use and Circular Economy.
Sustainable Finance: EU Taxonomy Information
In accordance with Article 8 of Regulation 2020/852 of the European Parliament and of the Council of the European Union (EU Taxonomy Regulation), we have included information about how and to what extent SAP’s activities are associated with economic activities that qualify as environmentally sustainable under this regulation.
On November 13, 2025, the European Parliament adopted its “omnibus package” on sustainability, which is designed to simplify sustainability reporting and due diligence obligations. In this context, a new delegated act to the Taxonomy Regulation (Regulation (EU) 2020/852) was published in the Official Journal of the European Union on January 8, 2026.
To ease the burden of implementing the new rules, reporting companies are permitted to make use of a transitional option. Accordingly, SAP will continue to apply the reporting requirements that were in effect until December 31, 2025, for the 2025 financial year (in accordance with Delegated Regulations (EU) 2021/2178, (EU) 2021/2139 and (EU) 2023/2486, each as in effect on December 31, 2025).
Our Approach and Policies
Assessment of Taxonomy Eligibility and Alignment
The EU Taxonomy is a classification system for sustainable activities, which distinguishes between “Taxonomy-eligible” and “Taxonomy-aligned” economic activities.
An activity is Taxonomy-eligible if it is described in relation to one of the six environmental objectives contained in the delegated acts, regardless of whether it meets the sustainability criteria.
The six environmental objectives are:
| – | Climate change mitigation |
| – | Climate change adaptation |
| – | Sustainable use and protection of water and marine resources |
| – | Transition to a circular economy |
| – | Pollution prevention and control |
| – | Protection and restoration of biodiversity and ecosystem |
To be Taxonomy-aligned, the economic activity must also:
| – | Contribute substantially to one of the environmental objectives |
| – | Not cause significant harm to the other environmental objectives (“Do no significant harm” [DNSH] criteria) |
| – | Comply with the minimum safeguards (OECD Guidelines, UN Guiding Principles on Business and Human Rights, and so on) |
The eligibility assessment for our activities in 2025 is in accordance with the requirements of the EU Taxonomy Regulation and reflects the changes published in the Environmental Delegated Acts and the amendments to the Climate Delegated Act. As a result, we have identified economic activities as relevant for disclosure, using the steps described above, and examined whether they qualify as Taxonomy-aligned.
| 120/326 |
|
Integrated Report 2025 | ||||
| To
Our Stakeholders |
Combined Management Report |
Consolidated
Financial Statements IFRS |
Additional Information | ||
To avoid double counting, we assign an activity that contributes substantially to multiple environmental objectives to the objective that is more relevant for SAP. Our activities are therefore assigned to the environmental objectives “Climate Change Mitigation” and “Transition to a Circular Economy”.
Our Actions and Targets
SAP’s Taxonomy-Eligible Economic Activities
We assessed the following activities as Taxonomy-eligible or -aligned in the reporting year:
1.2 Manufacture of electrical and electronic equipment
This activity covers expenditure on the purchase of electronic devices (laptops, smartphones, tablets, and monitors). As part of our assessment of this activity, we examined whether, based on the technical screening criteria, it potentially makes a substantial contribution to the transition to a circular economy. Based on the assessment criteria, the activity was assessed as Taxonomy-eligible, but not yet as Taxonomy-aligned.
3.3 Manufacture of low carbon technologies for transport
This economic activity includes the vehicles purchased for the SAP car fleet. In the second quarter of 2025, we began transitioning from purchased vehicles to leased vehicles. Since 2021, we have been converting our vehicle fleet to zero-emission models to advance our climate goals. As a result, most new company cars will be zero-emission from 2025 onward. This means that only battery-electric vehicles (BEVs) and—as a transitional solution only until 2026—selected plug-in hybrid models with an appropriate minimum electric range may be ordered. For vehicles purchased in 2025, SAP capitalized an amount of €129 million. For most of our electric vehicles, we were able to obtain the proof required for Taxonomy alignment from our suppliers, allowing us to report €49 million as Taxonomy-aligned.
6.5 Transport by motorbikes, passenger cars, and light commercial vehicles
Due to the transition that began in the second quarter of 2025—from predominantly purchased vehicles (see activity “3.3 Manufacture of low-carbon technologies for transport”) to leased vehicles for our company car fleet—we report the related expenses under this economic activity. Based on the specified assessment criteria, this activity was assessed as Taxonomy-eligible but not yet as Taxonomy-aligned.
7.1. Construction of new buildings
This activity includes expenditures incurred for new construction at SAP locations. In the 2025 financial year, these primarily related to new office buildings in Bangalore, India. Based on the specified assessment criteria of the environmental objectives of climate change mitigation (CCM 7.1) and circular economy (CE 3.1), the activity was assessed as Taxonomy-eligible but not as Taxonomy-aligned.
7.2 Renovation of existing buildings
This activity includes expenses incurred in the financial year for renovation work carried out; these are essentially renovation costs for the SAP sites in Walldorf, Germany, Shanghai and Beijing, China, and Tokyo, Japan. Based on the specified assessment criteria of the environmental objectives of climate change mitigation (CCM 7.2) and circular economy (CE 3.2), this activity was assessed as Taxonomy-eligible, but not as Taxonomy-aligned.
7.7 Acquisition and ownership of buildings
This activity covers the acquisition and use of real estate, which for SAP primarily relates to leasing buildings or office space. Based on the specified assessment criteria, this activity was assessed as Taxonomy-eligible but not yet as Taxonomy-aligned, and is being reported for the first time in the reporting year.
8.1 Data processing, hosting, and related activities
This economic activity includes our data centers and relevant cloud solutions that are not yet Taxonomy-aligned, due in part to the requirements regarding the global warming potential (GWP) of the refrigerants used for cooling systems in data centers. These refrigerants will be replaced at the end of their service life, according to our regular maintenance schedule, over the course of the next few years. Replacing them right away would create toxic waste and generate additional costs. Further requirements for Taxonomy alignment of this economic activity include an audit to ensure compliance with the European Code of Conduct on Data
| 121/326 |
|
Integrated Report 2025 | ||||
| To
Our Stakeholders |
Combined Management Report |
Consolidated
Financial Statements IFRS |
Additional Information | ||
Centre Energy Efficiency. The three-year audit ended in 2025; once our data centers meet the required GWP, a recertification audit will be conducted.
The data centers of our colocations and hyperscaler providers do not yet fully meet the criteria set out in the EU Taxonomy Regulation. However, our annual assessments, conducted in close collaboration with them, indicate continued progress toward meeting an increasing share of the relevant sustainability criteria.
Minimum Safeguards
The frameworks for minimum safeguards include the OECD Guidelines for Multinational Enterprises, the United Nations Guiding Principles on Business and Human Rights, and the core labor standards of the International Labour Organization (ILO). SAP has conducted a review of all the core topics included in the minimum safeguards to ensure compliance. Our global due diligence processes ensure that we uphold and meet all the requirements under the minimum safeguards.
| 122/326 |
|
Integrated Report 2025 | ||||
Revenues
| € millions, unless otherwise stated | |||||||||||||||||||
| Financial Year | 2025 | Substantial Contribution Criteria | DNSH Criteria (“Does Not Significantly Harm”) | ||||||||||||||||
| Economic Activities (1) | Code1 |
Turnover |
Pro- |
Climate Change Mitigation (5) |
Climate Change Adaptation (6) |
Water (7) |
Pollution (8) |
Circular Economy (9) |
Biodiversity (10) |
Climate |
Climate Change Adaptation (12) |
Water (13) |
Pollution (14) |
Circular Economy (15) |
Biodiversity (16) |
Minimum Safeguards (17) |
Proportion of Taxonomy- Aligned (A.1) or -Eligible (A.2) Turnover 2024 (18) |
Category Enabling activity (19) |
Category Transitional activity (20) |
| € | % | Y;N; N/EL |
Y;N; N/EL |
Y;N; N/EL |
Y;N; N/EL |
Y;N; N/EL |
Y;N; N/EL |
Y/N | Y/N | Y/N | Y/N | Y/N | Y/N | Y/N | % | E | T | ||
| A. Taxonomy-eligible activities | |||||||||||||||||||
| A.1. Environmentally sustainable activities (Taxonomy-aligned) | |||||||||||||||||||
| Turnover of environmentally sustainable activities (Taxonomy-aligned) (A.1) | - | - | - | - | - | - | - | - | - | - | - | - | - | - | - | - | |||
| Of which Enabling | - | - | - | - | - | - | - | - | - | - | - | - | - | - | - | - | E | ||
| Of which Transitional | - | - | - | - | - | - | - | - | - | - | - | T | |||||||
| A.2 Taxonomy-eligible but not environmentally sustainable activities (not Taxonomy-aligned activities) | |||||||||||||||||||
| EL; N/EL |
EL; N/EL |
EL; N/EL |
EL; N/EL |
EL; N/EL |
EL; N/EL |
||||||||||||||
| 8.1 Data processing, hosting, and related activities | CCM 8.1 | 20,522 | 56% | EL | N/EL | N/EL | N/EL | N/EL | N/EL | 49% | |||||||||
|
Turnover of Taxonomy-eligible but not environmentally sustainable activities (not Taxonomy-aligned activities) (A.2) |
20,522 | 56% | 56% | - | - | - | - | - | 49% | ||||||||||
| A. Turnover of Taxonomy-eligible activities (A.1+A.2) | 20,522 | 56% | 56% | - | - | - | - | - | 49% | ||||||||||
| B. Taxonomy-non-eligible activities | |||||||||||||||||||
| Turnover of Taxonomy-non-eligible activities (B) | 16,278 | 44% | |||||||||||||||||
| Total (A+B) | 36,800 | 100% | |||||||||||||||||
1 The code is the abbreviation of the relevant objective to which the economic activity is eligible to make a substantial contribution, plus the section number of the activity in the EU’s annex covering the objective:
| CCM: | Climate change mitigation |
| CCA: | Climate change adaptation |
| WTR: | Water and marine resources |
| CE: | Circular economy |
| PPC: | Pollution prevention and control |
| BIO: | Biodiversity and ecosystems |
| Y | – Yes, Taxonomy-aligned activity with the relevant environmental objective |
| N | – No, Taxonomy-eligible activity but not Taxonomy-aligned with the relevant environmental objective |
| N/EL | – Not eligible, Taxonomy-non-eligible activity for the relevant environmental objective |
| EL | – Taxonomy-eligible activity for the relevant environmental objective |
| 123/326 |
|
Integrated Report 2025 | ||||
| To
Our Stakeholders |
Combined Management Report |
Consolidated
Financial Statements IFRS |
Additional Information | ||
As outlined above, we have identified only one Taxonomy-relevant activity (CCM 8.1) to which revenues can be allocated. The increase in Taxonomy-eligible revenues for this activity, compared to the previous year, is primarily attributable to the growth of our cloud business relative to total revenues, which resulted in a higher share of Taxonomy-eligible revenues.
As part of this process, we took materiality aspects into account. Eligible revenue consists of revenue earned from providing the following services, which comply with the description of activity 8.1:
| – | Software as a service (SaaS) |
| – | Platform as a service (PaaS) |
| – | Infrastructure as a service (IaaS) |
These services make up our cloud revenues. Revenues that qualify as cloud revenue but cannot be classified as Taxonomy-eligible have been excluded. Total revenue is determined according to IFRS, and matches the total revenue presented in Consolidated Income Statements of SAP Group for the Years Ended December 31. For more information about how we recognize revenue, and about the components of revenue, see the Notes to the Consolidated Financial Statements, Note (A.1).
For a detailed description of the development and key drivers of SAP’s revenues, see the Performance Against Our Outlook for 2025 and Operating Results (IFRS) sections in our Combined Management Report.
| 124/326 |
|
Integrated Report 2025 | ||||
Capital Expenditures (CapEx)
| € millions, unless otherwise stated | |||||||||||||||||||
| Financial Year | 2025 | Substantial Contribution Criteria | DNSH Criteria (“Does Not Significantly Harm”) | ||||||||||||||||
| Economic Activities (1) | Code1 (2) |
CapEx2 (3) |
Pro-portion of CapEx (4) |
Climate Change Mitigation (5) |
Climate Change Adaptation (6) |
Water (7) |
Pollution (8) |
Circular Economy (9) |
Biodiversity (10) |
Climate Mitigation |
Climate Change Adaptation (12) |
Water (13) |
Pollution (14) |
Circular Economy (15) |
Biodiversity (16) |
Minimum Safeguards (17) |
Proportion of Taxonomy- Aligned (A.1) or -Eligible (A.2) CapEx 2024 (18) |
Category Enabling activity (19) |
Category Transitional activity (20) |
| € | % | Y;N; N/EL |
Y;N; N/EL |
Y;N; N/EL |
Y;N; N/EL |
Y;N; N/EL |
Y;N; N/EL |
Y/N | Y/N | Y/N | Y/N | Y/N | Y/N | Y/N | % | E | T | ||
| A. Taxonomy-eligible activities | |||||||||||||||||||
| A.1. Environmentally sustainable activities (Taxonomy-aligned) | |||||||||||||||||||
| 3.3 Manufacture of low carbon technologies for transport | CCM 3.3 | 49 | 3% | Y | Y | Y | Y | Y | Y | Y | Y | 4% | E | - | |||||
| CapEx of environmentally sustainable activities (Taxonomy-aligned) (A.1) | 49 | 3% | 3% | - | - | - | - | - | - | - | - | - | - | - | - | - | |||
| Of which Enabling | 49 | 3% | 3% | - | - | - | - | - | - | - | - | - | - | - | - | - | E | ||
| Of which Transitional | 0 | 0% | 0% | - | - | - | - | - | - | - | - | T | |||||||
| A.2 Taxonomy-eligible but not environmentally sustainable activities (not Taxonomy-aligned activities) | |||||||||||||||||||
| EL; N/EL |
EL; N/EL |
EL; N/EL |
EL; N/EL |
EL; N/EL |
EL; N/EL |
||||||||||||||
| 1.2 Manufacture of electrical and electronic equipment | CE 1.2 | 95 | 7% | N/EL | N/EL | N/EL | N/EL | EL | N/EL | 5% | |||||||||
| 3.3 Manufacture of low carbon technologies for transport | CCM 3.3 | 80 | 6% | EL | N/EL | N/EL | N/EL | N/EL | N/EL | 8% | |||||||||
| 6.5 Transport by motorbikes, passenger cars, and light commercial vehicles | CCM 6.5 | 103 | 7% | EL | N/EL | N/EL | N/EL | N/EL | N/EL | 4% | |||||||||
| 7.1. Construction of new buildings | CCM 7.1/ CE 3.1 | 31 | 2% | EL | N/EL | N/EL | N/EL | EL | N/EL | 2% | |||||||||
| 7.2 Renovation of existing buildings | CCM 7.2/ CE 3.2 | 86 | 6% | EL | N/EL | N/EL | N/EL | EL | N/EL | 3% | |||||||||
| 7.7 Acquisition and ownership of buildings3 | CCM 7.7 | 236 | 17% | EL | N/EL | N/EL | N/EL | N/EL | N/EL | - | |||||||||
| 8.1 Data processing, hosting, and related activities4 | CCM 8.1 | 196 | 14% | EL | N/EL | N/EL | N/EL | N/EL | N/EL | 13% | |||||||||
|
CapEx of Taxonomy-eligible but not environmentally sustainable activities (not Taxonomy-aligned activities) (A.2) |
827 | 58% | 51% | - | - | - | 7% | - | 37% | ||||||||||
| 125/326 |
|
Integrated Report 2025 | ||||
| € millions, unless otherwise stated | |||||||||||||||||||
| Financial Year | 2025 | Substantial Contribution Criteria | DNSH Criteria (“Does Not Significantly Harm”) | ||||||||||||||||
| Economic Activities (1) | Code1 (2) |
CapEx 2 (3) |
Pro-portion of CapEx (4) |
Climate Change Mitigation (5) |
Climate Change Adaptation (6) |
Water (7) |
Pollution (8) |
Circular Economy (9) |
Biodiversity (10) |
Climate Mitigation |
Climate Change Adaptation (12) |
Water (13) |
Pollution (14) |
Circular Economy (15) |
Biodiversity (16) |
Minimum Safeguards (17) |
Proportion of Taxonomy- Aligned (A.1) or -Eligible (A.2) CapEx 2024 (18) |
Category Enabling activity (19) |
Category Transitional activity (20) |
| € | % | Y;N; N/EL |
Y;N; N/EL |
Y;N; N/EL |
Y;N; N/EL |
Y;N; N/EL |
Y;N; N/EL |
Y/N | Y/N | Y/N | Y/N | Y/N | Y/N | Y/N | % | E | T | ||
| A. CapEx of Taxonomy-eligible activities (A.1+A.2) | 876 | 62% | 55% | - | - | - | 7% | - | 41% | ||||||||||
| B. Taxonomy-non-eligible activities | |||||||||||||||||||
| CapEx of Taxonomy-non-eligible activities (B) | 540 | 38% | |||||||||||||||||
| Total (A+B)5 | 1,416 | 100% | |||||||||||||||||
1 The code is the abbreviation of the relevant objective to which the economic activity is eligible to make a substantial contribution. For example: CCM – Climate Change Mitigation, plus the section number of the activity in the EU’s annex to the Taxonomy Regulation.
2 Activity assessment does not include Taulia, Emarsys, WalkMe, NS2 and SmartRecruiters.
3 First reporting in 2025, therefore no previous year figures available.
4 Numerator includes NS2.
5 Denominator includes SmartRecruiters.
| CCM: | Climate change mitigation |
| CCA: | Climate change adaptation |
| WTR: | Water and marine resources |
| CE: | Circular economy |
| PPC: | Pollution prevention and control |
| BIO: | Biodiversity and ecosystems |
| Y | – Yes, Taxonomy-aligned activity with the relevant environmental objective |
| N | – No, Taxonomy-eligible activity but not Taxonomy-aligned with the relevant environmental objective |
| N/EL | – Not eligible, Taxonomy-non-eligible activity for the relevant environmental objective |
| EL | – Taxonomy-eligible activity; N/EL – Taxonomy-non-eligible activity |
| 126/326 |
|
Integrated Report 2025 | ||||
| To
Our Stakeholders |
Combined Management Report |
Consolidated
Financial Statements IFRS |
Additional Information | ||
| Proportion of CapEx / Total CapEx | ||
| Taxonomy-Aligned per Objective | Taxonomy-Eligible per Objective | |
| CCM | 3% | 55% |
| CCA | 0% | 0% |
| WTR | 0% | 0% |
| CE | 0% | 15% |
| PPC | 0% | 0% |
| BIO | 0% | 0% |
Extent of the eligibility and alignment per environmental objective.
CCM: Climate change mitigation
CCA: Climate change adaptation
WTR: Water and marine resources
CE: Circular economy
PPC: Pollution prevention and control
BIO: Biodiversity and ecosystems
We have designated the costs as related to assets and processes associated with the activities listed in the CapEx table as Taxonomy-eligible. When identifying relevant costs and activities, we took materiality aspects into account. For more information about the individual activities, see the SAP’s Taxonomy-Eligible Economic Activities section above.
In line with the EU Taxonomy Regulation, the total capital expenditures presented in this section include additions to tangible and intangible assets accounted for under IAS 16, IAS 38, and IFRS 16, and additions to tangible and intangible assets (excluding additions to goodwill) resulting from business combinations.
Taxonomy-eligible capital expenditures relate to assets and processes that are associated with the economic activity 8.1 “Data processing, hosting, and related activities.” These expenses mainly comprise investments in SAP’s cloud infrastructure (IT hardware and software).
Additionally, Taxonomy-eligible capital expenditures include capitalized costs relating to the purchase of vehicles.
| 127/326 |
|
Integrated Report 2025 | ||||
Operational Expenditures (OpEx)
| € millions, unless otherwise stated | |||||||||||||||||||
| Financial Year | 2025 | Substantial Contribution Criteria | DNSH Criteria (“Does Not Significantly Harm”) | ||||||||||||||||
| Economic Activities (1) | Code1 (2) |
OpEx2 (3) |
Pro-portion of OpEx 2025 (4) |
Climate Change Mitigation (5) |
Climate Change Adaptation (6) | Water (7) | Pollution (8) | Circular Economy (9) | Biodiversity (10) | Climate Change Mitigation (11) |
Climate Change Adaptation (12) | Water (13) | Pollution (14) | Circular Economy (15) | Biodiversity (16) | Minimum Safeguards (17) | Proportion of Taxonomy-Aligned (A.1) or -Eligible (A.2) OpEx 2024 (18) | Category Enabling activity (19) | Category Transitional activity (20) |
| € | % | Y;N; N/EL |
Y;N; N/EL |
Y;N; N/EL |
Y;N; N/EL |
Y;N; N/EL |
Y;N; N/EL |
Y/N | Y/N | Y/N | Y/N | Y/N | Y/N | Y/N | % | E | T | ||
| A. Taxonomy-eligible activities | |||||||||||||||||||
| A.1. Environmentally sustainable activities (Taxonomy-aligned) | |||||||||||||||||||
| OpEx of environmentally sustainable activities (Taxonomy-aligned) (A.1) | - | - | - | - | - | - | - | - | - | - | - | - | - | - | - | - | |||
| Of which Enabling | - | - | - | - | - | - | - | - | - | - | - | - | - | - | - | - | E | ||
| Of which Transitional | - | - | - | - | - | - | - | - | - | - | - | T | |||||||
| A.2 Taxonomy-eligible but not environmentally sustainable activities (not Taxonomy-aligned activities) | |||||||||||||||||||
| EL; N/EL |
EL; N/EL |
EL; N/EL |
EL; N/EL |
EL; N/EL |
EL; N/EL |
||||||||||||||
| 8.1 Data processing, hosting, and related activities | CCM 8.1 | 2,294 | 24% | EL | N/EL | N/EL | N/EL | N/EL | N/EL | 21% | |||||||||
|
OpEx of Taxonomy-eligible but not environmentally sustainable activities (not Taxonomy-aligned activities) (A.2) |
2,294 | 24% | 24% | - | - | - | - | - | 21% | ||||||||||
| A. OpEx of Taxonomy-eligible activities (A.1+A.2) | 2,294 | 24% | 24% | - | - | - | - | - | 21% | ||||||||||
| B. Taxonomy-non-eligible activities | |||||||||||||||||||
| OpEx of Taxonomy-non-eligible activities (B) | 7,085 | 76% | |||||||||||||||||
| Total (A+B) | 9,379 | 100% | |||||||||||||||||
1 The code is the abbreviation of the relevant objective to which the economic activity is eligible to make a substantial contribution. For example: CCM – Climate Change Mitigation, plus the section number of the activity in the EU’s annex to the Taxonomy Regulation.
2 Activity assessment does not include Taulia, Emarsys, WalkMe and SmartRecruiters; NS2 is included in the numerator.
| CCM: | Climate change mitigation |
| CCA: | Climate change adaptation |
| WTR: | Water and marine resources |
| CE: | Circular economy |
| PPC: | Pollution prevention and control |
| BIO: | Biodiversity and ecosystems |
| Y | – Yes, Taxonomy-aligned activity with the relevant environmental objective |
| N | – No, Taxonomy-eligible activity but not Taxonomy-aligned with the relevant environmental objective |
| N/EL | – Not eligible, Taxonomy-non-eligible activity for the relevant environmental objective |
| EL | – Taxonomy-eligible activity; N/EL – Taxonomy-non-eligible activity |
| 128/326 |
|
Integrated Report 2025 | ||||
| To
Our Stakeholders |
Combined Management Report |
Consolidated
Financial Statements IFRS |
Additional Information | ||
We have designated the costs as related to assets and processes associated with the activities listed in the OpEx table as Taxonomy-eligible. When identifying relevant costs and activities, we took materiality aspects into account. For more information about each activity, see the SAP’s Taxonomy-Eligible Economic Activities section above.
Most of the costs related to activity “8.1 Data processing, hosting, and related activities“ are leasing expenses for hosting services provided by third parties. To a lesser extent, these costs also include expenses for the maintenance and repair of SAP’s cloud infrastructure.
According to the EU Taxonomy, total operating expenses mainly include the following non-capitalized cost elements: research and development, short-term leases, and maintenance and repairs relating to property, plant, and equipment. Other major expense components in Consolidated Income Statements of SAP Group for the Years Ended December 31, such as depreciation, utilities (for example, costs for heating and electricity consumption), and most general and administrative costs, restructuring, and sales and marketing costs do not meet the definition of operating expenses in the EU Taxonomy and are therefore not included.
For a detailed description of the development and key drivers of all operating expenses, see the Performance Against Our Outlook for 2025 and Operating Profit and Operating Margin sections in our Combined Management Report.
Nuclear and Fossil Gas Related Activities
The Delegated Regulation concerning economic activities in certain energy sectors extends the disclosures required to include information about activities in the nuclear energy and fossil gas sectors. At a small number of its sites in Germany, SAP operates combined heating, cooling and power generation facilities that use fossil gaseous fuels. Since the associated Taxonomy-eligible and aligned capital and operational expenditures are negligible, we do not disclose the operation of these facilities as an additional activity. We have no other fossil gas-related activities nor any nuclear energy activities to disclose.
| Row | Nuclear energy related activities | |
| 1. | The undertaking carries out, funds, or has exposures to research, development, demonstration and deployment of innovative electricity generation facilities that produce energy from nuclear processes with minimal waste from the fuel cycle. | NO |
| 2. | The undertaking carries out, funds, or has exposures to construction and safe operation of new nuclear installations to produce electricity or process heat, including for the purposes of district heating or industrial processes such as hydrogen production, as well as their safety upgrades, using the best available technologies. | NO |
| 3. | The undertaking carries out, funds, or has exposures to construction and safe operation of new nuclear installations to produce electricity or process heat, including for the purposes of district heating or industrial processes such as hydrogen production, as well as their safety upgrades, using best available technologies. | NO |
| Fossil gas related activities | ||
| 4. | The undertaking carries out, funds, or has exposures to construction or operation of electricity generation facilities that produce electricity using fossil gaseous fuels. | NO |
| 5. | The undertaking carries out, funds, or has exposures to construction, refurbishment, and operation of combined heat/cool and power generation facilities using fossil gaseous fuels. | NO |
| 6. | The undertaking carries out, funds, or has exposures to construction, refurbishment and operation of heat generation facilities that produce heat/cool using fossil gaseous fuels. | NO |
| 129/326 |
|
Integrated Report 2025 | ||||
| To
Our Stakeholders |
Combined Management Report |
Consolidated
Financial Statements IFRS |
Additional Information | ||
Climate Change
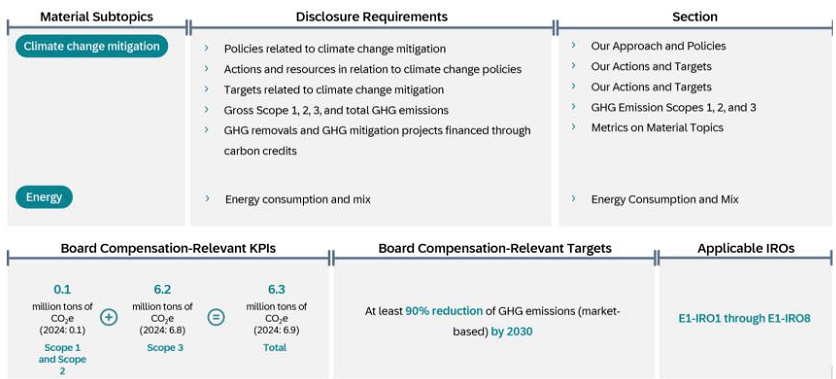
Greenhouse Gas (GHG) Emissions Calculation Methodology
Reporting Approach
Data for our Greenhouse Gas (GHG) indicators is collected and reported on a quarterly basis and is subject to external assurance for annual reporting (for more information, see Independent Assurance). Reporting on total energy consumption and data center electricity is based on the data collected for the calculation of our GHG emissions. All numbers are based on the metric system. Whenever we state “tons,” we mean metric tons.
Gross Greenhouse Gas Emissions
Definition
We define Gross Greenhouse Gas emissions (location-based) (Gross GHG emissions (location-based)) as the sum of all GHG emissions measured and reported as carbon dioxide equivalents (CO2e). We deduct renewable electricity from this amount to determine our Gross GHG emissions (market-based). For more information, see the Energy Consumption and Mix section.
Reporting Principles
SAP’s preparation of the GHG emissions data is based on the Corporate Accounting and Reporting Standard, the GHG (Greenhouse Gas) Protocol Scope 2 Guidance, and the Corporate Value Chain (Scope 3) Accounting and Reporting Standard of the World Resources Institute and World Business Council for Sustainable Development.
In alignment with the GHG Protocol Scope 2 Guidance, we report our Gross GHG emissions using the location-based and market-based calculation methods.
As set out in the GHG guidelines, we recognize that it might be necessary to redefine SAP’s GHG baseline, and the target set, in the event of material methodology changes. For more information about the planned changes, see the 2026 Outlook section.
Organizational Boundaries
SAP defines its organizational boundaries by applying the operational control approach as set out in the GHG Protocol.
Operational control is established when SAP has the full authority to introduce and implement its operating policies. The GHG emissions of all operations over which the Company has operational control, of all owned or leased facilities, and of all vehicles that the Company owns or operates are accounted for under GHG emissions. This number is based either on measurements or, where no measured data is available, on estimates and extrapolations.
| 130/326 |
|
Integrated Report 2025 | ||||
| To
Our Stakeholders |
Combined Management Report |
Consolidated
Financial Statements IFRS |
Additional Information | ||
Some of SAP’s leased facilities operate under full-service or multitenant leases. In these cases, SAP does not have access to actual energy consumption information. We include these facilities in our definition of operational control and account for them by estimating their energy consumption.
Data Consistency
Methodology Changes
We aim to continuously refine the methodology we use to calculate GHG emissions, and to increase the share of input data that is measured instead of extrapolated. For example, we change the source of activity data, add new activity types, and reflect changes in emission factors and in the approaches used to calculate GHG emissions. Since we define our methodology to the best of our knowledge and capabilities, we have defined a rebaselining policy, which sets the thresholds and criteria that trigger adjustments of the base and target year. We consider minor changes below the threshold to be improvements, and therefore apply them from the current year onward and do not adjust our data retrospectively. For more information about changes to the current year’s methodology, see Methodology and Further Details below, and for the changes we plan to make to the methodology in 2026, see the 2026 Outlook section.
Conversion Factors
The calculation of the GHG emissions is based on factors for conversion and extrapolation provided by the International Energy Agency (IEA), U.S. Environmental Protection Agency (EPA), UK Department for Environment, Food & Rural Affairs (DEFRA), Environment Canada, and the GHG Protocol, as internationally recognized authorities. We also use extrapolation factors based on our own reported data (from previous reporting periods) to determine an average consumption value per base unit (for example, liters of fuel per car for fleet vehicles, and electricity consumption per square meter for facilities).
Where relevant, our conversion factors consider CO2e for greenhouse gases. Global warming potential factors are based on the Sixth Assessment Report of the Intergovernmental Panel on Climate Change (IPCC). We report all our GHG emissions in CO2e , including the impact from CH4 and N2O, in our target-relevant greenhouse gas emissions Scope 1 (GHG emissions Scope 1), greenhouse gas emissions Scope 2 (location-based) (GHG emissions (location-based)), greenhouse gas emissions Scope 2 (market-based) (GHG emissions (market-based)), greenhouse gas emissions Scope 3 Upstream (GHG emissions Scope 3 Upstream), and greenhouse gas emissions Scope 3 Downstream (GHG emissions Scope 3 Downstream). The emission impact of refrigerants includes hydrofluorocarbons (HFCs) only. We review all our emissions and extrapolation factors annually and update them if required. In the current reporting year, sulfur hexafluoride (SF6), perfluorocarbons (PFC), and nitrogen trifluoride (NF3) emissions are not included in our disclosure, as these gases do not occur in SAP’s operations or value chain activities.
Methodology and Further Details
GHG Emissions Scope 1
Scope 1 refers to direct GHG emissions and is defined as emissions from sources that are owned or controlled by the organization. At SAP, the following sources come under Scope 1:
Stationary combustion in facilities: GHG emissions caused by gas and diesel combustion in heating systems and generators in SAP office buildings and data centers. GHG emissions are calculated based on the consumed fuel and applicable emissions factors. Where no measured data is available, stable values (kWh/m²) based on the previous year’s gas consumption data are used for extrapolation. Where no specific information is available, the natural gas reported by local sites is assumed to be at the lower heating value.
Refrigerants in facilities: The hydrofluorocarbon (HFC) emissions are caused by the loss of refrigerants used in cooling systems and air conditioning equipment. These emissions are extrapolated based on the number of server units in our internal data centers, and on office space equipped with air conditioning systems. All refrigerants are assumed to be HFC134a. Starting in 2025, we report emissions related to refrigerants in colocation data centers separately under Scope 3 Upstream.
Mobile combustion from company cars: GHG emissions from the combustion of fuel by company cars. In the context of GHG reporting, the term “company car” refers to all cars for which SAP permanently covers the fuel costs. GHG emissions are calculated based on fuel consumption. If detailed fuel data is not available in specific countries, stable values (liters/car) are used for extrapolation based on the number of company cars reported. The stable values for extrapolation are based on the previous year’s data.
Mobile combustion from corporate jets: GHG emissions caused by business trips with SAP-owned or chartered jets. GHG emissions are calculated based on actual fuel consumption.
| 131/326 |
|
Integrated Report 2025 | ||||
| To
Our Stakeholders |
Combined Management Report |
Consolidated
Financial Statements IFRS |
Additional Information | ||
Wood pellets: Alongside gas and diesel, we also use wood pellets to heat our buildings at our headquarters in Walldorf. Wood pellets are categorized as biogenic fuel. Hence, we have determined the impact of these carbon dioxide emissions to be net-zero, as the equivalent amount of carbon dioxide released through combustion was absorbed by the biomass (wood) during the growth phase. In alignment with the GHG Protocol, SAP reports these carbon dioxide emissions as out of scope. In 2025, wood pellets accounted for 0.1 kilotons of carbon dioxide emissions, compared to 0.4 kilotons in 2024. The reporting of these emissions is separate from the mandatory Scope 1 GHG emissions.
GHG Emissions Scope 2 (location- and market-based)
Scope 2 refers to indirect GHG emissions and is defined as GHG emissions from the consumption of purchased electricity, purchased steam, or other sources of energy generated upstream from the organization. We calculate GHG emissions Scope 2 following both a location-based and market-based approach. To calculate the GHG emissions Scope 2 (market-based), we have applied a portfolio approach to regional energy attribute certificates (EACs). For more information, see the Energy Consumption and Mix section.
At SAP, the following emission categories come under Scope 2:
Electricity in office buildings: GHG emissions are caused by the consumption of purchased electricity in office buildings. These GHG emissions are calculated based on building electricity consumption. CO2e conversion factors are updated annually based on country-specific grid factors. Where no measured data is available, stable values (kWh/m2) based on the previous year’s energy consumption data are used for extrapolation.
Electricity in SAP-owned data centers: GHG emissions are caused by the consumption of purchased electricity in SAP-owned and managed data centers. These GHG emissions are calculated based on data center electricity consumption (100% data coverage). CO2e conversion factors are updated annually based on country-specific grid factors.
E-mobility: These GHG emissions are from company cars that have electric drivetrains. Electricity consumption is calculated based on the number of electric cars per country, an average energy consumption value for electric cars, and an average mileage per year. GHG emissions are calculated based on country-specific emission factors.
Purchased chilled and hot water, and steam: GHG emissions are caused by the consumption of purchased heat or steam in office buildings (district heating). Our GHG emissions are calculated based on the consumption of district heating. Emission factors are updated annually. Where no measured data is available, stable values (kWh/m2) based on the previous year’s energy consumption data are used for extrapolation.
GHG Emissions Scope 3 Upstream and Downstream
Scope 3 refers to other indirect GHG emissions, which are defined as GHG emissions that are a consequence of the operations of an organization that it does not directly own or control. GHG emissions Scope 3 are divided into Upstream and Downstream emissions.
GHG Emissions Scope 3 Upstream
Purchased goods and services: This category encompasses all significant cradle-to-gate upstream emissions from SAP’s purchased goods and services, alongside services such as general waste and water disposal, hyperscaler services, and upstream transportation and distribution. For specific hyperscale providers, SAP has transitioned from secondary to primary data for Scope 3 emissions calculations, while continuing to use secondary data where primary data remains unavailable. To determine CO2e values based on the spend-based methodology, SAP partners with a specialized third-party provider that uses specific coefficients to convert U.S. dollar expenditures into kilograms of CO2e across various country-sector combinations and supply chain tiers. Starting 2025, emissions from fuel- and energy-related activities (not included in Scope 1 or 2) will be reported separately under category 3 of Scope 3 (99% data coverage).
Capital goods: This category includes all cradle-to-gate upstream emissions of purchased capital goods, such as buildings, data center and IT equipment, and cars (99% data coverage).
Fuel- and energy-related activities (not included in Scopes 1 or 2): This category includes emissions related to the production of fuels and energy that SAP purchased in the reporting period and that it consumed during that period, either directly or indirectly
| 132/326 |
|
Integrated Report 2025 | ||||
| To
Our Stakeholders |
Combined Management Report |
Consolidated
Financial Statements IFRS |
Additional Information | ||
(by purchasing colocation services). These emissions are calculated by applying related cradle-to-gate emission factors for each type of fuel or energy consumed. We distinguish between market- and location-based emissions by applying an upstream factor and an electricity transmission and distribution loss factor for the location-based calculation. For the market-based method, we consider renewable electricity and therefore apply only a transmission and distribution loss factor. Prior to 2025, this category was part of purchased goods and services (100% data coverage).
E-waste in operations: This category covers GHG emissions from e-waste. Starting in 2025, we use primary data to determine our e-waste emissions. These GHG emissions are calculated using data obtained from our IT asset disposition (ITAD) partners, and DEFRA emission factors. This new method ensures a more accurate and transparent calculation. To maintain consistency and avoid double counting, these emissions have been removed from the Purchased Goods and Services category where applicable (90% data coverage).
Business flights: The GHG emissions caused by business trips by airplane are calculated based on actual distance traveled and DEFRA factors. For 2025, we have applied the same DEFRA factor as in 2024. rather than the latest available factor. That way, we eliminate the effect of DEFRA’s adjustment of their aviation factors to account for reduced load factors as a consequence of the COVID-19 pandemic. In our view, this approach more accurately reflects the actual GHG emissions. In a next step, we determine an average emission factor per euro spent based on short-, medium-, and long-haul flight emission factors. For the CO2e calculation, this factor is applied to actual costs for business flights. Emission factors for business flights do not consider the radiative forcing factors (74% data coverage).
Rental cars: For the GHG emissions caused by business trips by rental car, we take an average emission factor from rental cars that is calculated based on actual distance traveled and actual costs incurred. This average emission factor is used for extrapolation based on the costs (86% data coverage).
Train travel: For the GHG emissions from business trips by train, we take an average emission factor from train travel that is based on actual distance traveled and actual costs incurred. This average factor is used for extrapolation based on costs. In Germany, business trips by train are considered carbon neutral, as they are offset by the fact that Deutsche Bahn’s long-distance trains run on 100% green electricity (47% data coverage).
Business trips by private car: The GHG emissions from business trips made in employee-owned cars and company cars without fuel cards are calculated based on the distance traveled by private car. This activity type does not include trips by company cars with fuel cards (100% data coverage).
Flexible Mobility: We also determine the GHG emissions from our Flexible Mobility commuting program. Employees taking part in this program receive a monthly budget that they can spend on various means of transportation, such as public transportation, rental cars, and rental bikes. The CO2e resulting from this program is calculated using a spend-based method similar to that described in the Purchased Goods and Services section (100% data coverage).
Employee commuting: This category covers the GHG emissions caused by employees commuting between their home and an SAP office location. It covers all modes of transportation, but does not include commutes by company car or as part of the Flexible Mobility program. To collect data for this category, we regularly conduct an SAP-wide, Qualtrics-based commuting survey in which we ask employees to specify the distance they travel to work, the number of days they work in the office per week, and the mode of transportation they use. To reflect changes in commuting behavior since the COVID-19 pandemic and the launch of SAP’s back-to-office policy, we conducted our latest commuting survey in the final quarter of 2025 and received approximately 13,500 valid responses (2022: 30,000). Although fewer in number, these responses are a better representation of current commuting habits because no longer include the “COVID-19 effect.” Commuting data for employees who did not respond and for quarterly updates is extrapolated based on the number of FTEs (12% data coverage).
Electricity in colocation data centers: These GHG emissions are caused by the consumption of purchased electricity in local computing centers whose building infrastructure is controlled and managed by external providers. SAP has control over only a small portion of the network and server infrastructure on which SAP software runs. CO2e conversion factors are updated annually based on country-specific grid factors. Electricity consumption for colocation data centers is calculated based on the power consumed by the IT infrastructure and a power usage effectiveness (PUE) factor. Where no data is available, average factors are applied. Due to the fact that SAP does not have full operational control over these facilities, we decided to reclassify colocation electricity emissions from Scope 2 to Scope 3.8 (upstream leased assets) in 2025. As a result, we no longer use renewable energy certificates to offset these market-based emissions. Instead, we are working closely with our colocation providers to move to 100% renewable electricity usage at the colocation site. Under the market-based method, we apply a zero emissions factor for those of our colocation providers who already state that their facilities run entirely on renewable electricity (94% data coverage).
| 133/326 |
|
Integrated Report 2025 | ||||
| To
Our Stakeholders |
Combined Management Report |
Consolidated
Financial Statements IFRS |
Additional Information | ||
Refrigerants in colocation data centers: The loss of refrigerants used in cooling systems and air conditioning equipment causes emissions of hydrofluorocarbons (HFCs). We extrapolate these emissions based on the number of server units in data centers, and on the amount of office space equipped with air conditioning systems. All refrigerants are assumed to be HFC134a (100% data coverage).
GHG Emissions Scope 3 Downstream
Use of sold products: GHG emissions are caused by our customers using on-premise SAP solutions. When calculating these emissions, we include only those on-premise solutions with active maintenance agreements; where maintenance agreements are inactive, we have no information about whether the corresponding solutions are still in use. To calculate emissions, we apply the global electricity emission factor from the IEA and the average regional PUEs at year-end, derived from SAP’s managed colocations to all systems whose maintenance agreements are active. Our emissions calculations do not include the energy consumed by customers’ on-premise systems that run in hyperscale data centers on 100% renewable energy (100% data coverage for systems with active maintenance contracts).
GHG emissions are calculated using a global electricity emission factor. The calculation covers all our major solutions, including on-premise software. The emission values for our cloud solutions are included in those for our own, our colocation, and our hyperscale providers’ data centers. Mobile solutions (for example, SAP apps running on customer IT equipment) are not included.
We aim to constantly improve our calculation method and will adapt the parameters we use when significant advances in technology and more accurate data sources become available.
Excluded GHG Emissions Scope 3 Upstream and Downstream
The following sources of GHG emissions Scope 3 Upstream and Downstream are not applicable or not material to SAP’s business operations: downstream transportation and distribution; processing of sold products; end-of-life treatment of sold products; downstream leased assets; franchises; and investments.
2026 Outlook
In 2026, we will update the calculation methodology for the Use of Sold Products KPI. The current methodology, which is based on the total amount of active maintenance contracts, will be replaced by a forward-looking approach that considers the estimated emissions during the lifetime of all new systems sold within a specific period. This change aligns our calculation approach more closely with the GHG Protocol.
The updated calculation methodology will result in a significant decrease in reported emissions and therefore lead to a rebaselining according to the GHG-Protocol. We anticipate an estimated reduction of 38% in downstream emissions in the base year 2023. Had this methodology been applied in the reporting year, our 2025 GHG emissions would have been 3,590 kilotons CO2e.
Our Approach and Policies
In light of the escalating effects of climate change and the global challenges it poses, climate action has been at the top of SAP’s corporate sustainability agenda for over a decade. As outlined in the Sustainability Strategy section, we aim to take climate action through our dual approach as an enabler and exemplar. By helping pave the way toward a low-carbon future for our customers, partners, and SAP, we seek to create positive impact while respecting planetary boundaries.
The following sections describe in detail how we mitigate negative impacts and risks, and how we pursue positive impacts and opportunities through our policies, actions, targets, and metrics.
Policies Related to Climate Change Mitigation
| SAP Global Environmental Policy | |
| IRO-relevant topics covered | Climate change mitigation, energy performance, and deployment of renewable energy sources |
| Accountability | CEO |
| Value chain coverage | Upstream, downstream, own operations |
| Applicability | SAP, its subsidiaries, and its partners |
In line with initiatives and standards such as the UN Sustainable Development Goals (SDGs), Science Based Targets initiative (SBTi), GHG Protocol, and ISO 14001, the SAP Global Environment Policy governs our efforts to manage the environmental IROs identified by the materiality assessment and to mitigate our GHG emissions. The policy is publicly available on SAP’s website, and places
| 134/326 |
|
Integrated Report 2025 | ||||
| To
Our Stakeholders |
Combined Management Report |
Consolidated
Financial Statements IFRS |
Additional Information | ||
importance on cooperation with suppliers, customers, and other stakeholders. It is regularly reviewed by internal lines of business and SAP’s leadership, and ultimate responsibility for it rests with the CEO. We are currently reworking our Global Environmental Policy and will publish the revised version in 2026.
Our Actions and Targets
Transition Plan for Climate Change Mitigation
Our net-zero commitment is the cornerstone of our climate change mitigation. Under this commitment, we aim to reduce our gross greenhouse gas (GHG) emissions (market-based) by at least 90%22 across the value chain by 2030. Our net-zero target has been validated and approved by the Science Based Targets initiative (SBTi), which also verified that it is compatible with limiting global warming to 1.5°C, as advocated by the Paris Agreement. We consider the base year for our net-zero target, 2023, to be representative because we did not witness any atypical events in that year, such as pandemics, major mergers and acquisitions, and extreme weather episodes.
Progress on our transition plan for climate change mitigation is monitored by the ESG Steering Board at a detailed IRO level, and is on track.
SAP’s ambitious climate change mitigation commitment has also been recognized by the investment market, as demonstrated by SAP’s inclusion in the EU Paris-aligned benchmarks.
| Target | Base Year | Target Year | Target Description |
| 1.5°C-aligned science-based target (SBT) | 2023: 6.9 million tons gross GHG emissions (market-based) |
2030: reduction in gross GHG emissions (market-based) by at least 90%, which corresponds to less than 0.7 million tons (near-term and long-term target)
2026: steady decrease in GHG emissions across relevant value chains
|
Reduce SAP’s gross GHG emissions (market-based) across our value chain (Scopes 1, 2, and 3) by at least 90% to reach net-zero by 2030. Remaining residual emissions will be neutralized by a maximum of 10% carbon removals.
Scope: GHG Protocol-aligned baseline, including Scope 1, Scope 2 market-based, and all business-relevant Scope 3 value chain emissions. For more information, see the Greenhouse Gas (GHG) Emissions Calculation Methodology section.
|
Net-Zero Target: Expected Impact of GHG Reduction Levers1
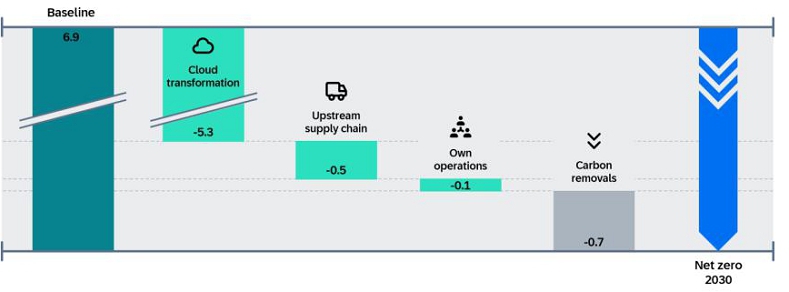
1. Expressed in millions of tons of CO2e.
SAP aims to reach its net-zero target by focusing on four GHG reduction levers:
– Cloud transformation
22 All acquisitions after the baseline year 2023 are not considered.
| 135/326 |
|
Integrated Report 2025 | ||||
| To
Our Stakeholders |
Combined Management Report |
Consolidated
Financial Statements IFRS |
Additional Information | ||
– Upstream supply chain
– Own operations
– Carbon removals
These reduction levers are set out in more detail in the Actions and Resources in Relation to Climate Change and Past and Continuous Efforts sections.
In all four areas, leveraging our own solution portfolio is fundamental to improving how we manage and plan our initiatives, resources, and value chain partner relationships to achieve net-zero by 2030. When modeling our reduction pathway to 2030, we considered future developments—such as the expected growth of the Company and the effects from our cloud strategy—and any planned methodology adjustments. Our transition plan is closely aligned with our business model and financial planning, and is informed by SAP’s business trajectory and financial forecasts. We incorporate estimated company growth and cloud development projections to formulate a comprehensive emissions plan that reflects anticipated developments and considers investments in reducing GHG emissions. Taking this approach allows us to ensure that our climate change mitigation actions are viewed not as separate initiatives but as an integrated element of our financial growth strategy, corporate risk management, technology adoption, and product portfolio development. The climate scenario analysis we conducted in 2025 has no implicit impact on our GHG reduction levers. By way of these levers, SAP envisions that its net-zero transition plan will steadily reduce its GHG emissions. If GHG emissions remain, SAP plans to leverage removals in line with the SBTi standard as explained above.
Our Net Zero 2030 target is dependent on the following elements which are outside of SAP’s direct control:
| – | Progress and success of the decarbonization efforts of our suppliers |
| – | Changes in regulation such as the revision of the SBTi standards, expected to be finalized in 2026 |
| – | Due to the rapid development in the AI and general cloud infrastructure area and the resulting high energy needs it is unclear if this demand can be fully covered with renewable energy |
Due to these uncertainties, we are monitoring our progress in achieving the net zero target by 2030 and are continuously evaluating whether adjustments might be necessary. For information about our 2025 GHG emissions performance, see the Metrics on Material Topics section.
EU Taxonomy Alignment
For information about SAP’s current and possible future alignment with the EU Taxonomy, see the Sustainable Finance: EU Taxonomy Information section in this Sustainability Statement.
Net-Zero Governance and Progress Measurement
Our commitment
to this transition plan is further demonstrated by the fact that it is reviewed at senior management level. SAP tracks its targets for
cutting GHG emissions using an established protocol that involves a regular assessment of GHG emissions to ensure timely analysis and
intervention whenever needed. Progress is reviewed at quarterly steering committee meetings, which are sponsored by SAP’s CEO and
CFO. After each quarterly assessment, the results, and any deviations from the plan, are documented. The insights gathered from each
review are used to perform the necessary adjustments to SAP’s targets to ensure they remain relevant and accurate as we strive
to make our business as sustainable as possible. Our ESG Steering Board, which has oversight over SAP’s sustainability performance,
reviews the Company’s climate performance twice a year. For more information, see the Sustainability
Governance section. The compensation system for our Executive Board members contains a net-zero target. For more information,
see the SAP Compensation Report 2025 and the Incorporation
by Reference section in the Appendix .
Climate Related Risks and Opportunities
In 2025, we conducted a climate scenario analysis to identify physical risks and transitional climate-related risks and opportunities. The analysis did not identify any business-critical physical risks for our offices, data centers, or colocations, or any material transition risks. For more information about the climate scenario analysis, see the Double Materiality Assessment section.
Our materiality assessment identified various opportunities relating to climate change, such as an increasing demand for software solutions that track GHG emissions. For more information, see the Double Materiality Assessment section.
Considering the risks and opportunities described above, we believe that our business model and strategy are resilient in the context of a changing climate.
| 136/326 |
|
Integrated Report 2025 | ||||
| To
Our Stakeholders |
Combined Management Report |
Consolidated
Financial Statements IFRS |
Additional Information | ||
SAP does not invest in or maintain significant carbon-intensive infrastructure that would lead to locked-in GHG emissions that could jeopardize our net-zero target. On the contrary, we are investing in transitioning our car fleet from combustion-type vehicles to electric vehicles, and our data centers and office buildings to renewable energy, and in other similar measures.
Actions and Resources in Relation to Climate Change
The table below summarizes our key initiatives to reduce GHG emissions in our own operations and our value chain.
| 137/326 |
|
Integrated Report 2025 | ||||
| To
Our Stakeholders |
Combined Management Report |
Consolidated
Financial Statements IFRS |
Additional Information | ||
| Action Name | Description | Expected Outcomes |
| Cloud Transformation | ||
|
Support cloud transformation and reduce product-in-use GHG emissions
Lever categories: Energy efficiency, renewable energy |
Most of our overall GHG emissions result from the use of our software. To address this, we aim to help our customers, hardware providers, and others make their operations more energy efficient.
Cloud transformation: moving our on-premise solutions to the cloud is the GHG reduction lever that will have the greatest impact.
– All SAP’s own data centers are powered by 100% renewable electricity.
– We are working with our suppliers, particularly our colocation partners, hyperscale providers, and our customers, to increase the share of renewable energy used upstream and downstream in our value chain.
– By seeking to obtain actual values rather than averages wherever possible, we will continuously improve the quality of the data we use to calculate our GHG emissions. For information about changes in our GHG Emissions Scope 3 Downstream, see the Metrics on Material Topics section.
By powering all data centers with 100% renewable electricity,1 we are helping our cloud customers reduce their overall GHG Emissions Scope 3 Upstream.
– We are developing a product carbon footprint calculation tool to give customers transparency on the carbon impact of their SAP applications that run in SAP’s owned and managed data centers and to answer the question as to how much our customers can reduce their environmental footprint by running SAP solutions on SAP’s self-operated, or on SAP-sourced (including hyperscale providers), infrastructure.
– We work with customers to optimize their on-premise landscapes so that they consume less energy (for example, we decommission legacy systems, archive unused data, consolidate business applications, and virtualize their system landscapes). These actions are executed at global level and cover GHG Emissions Scope 3 Downstream.
Regarding the use of AI, we currently do not see a significant increase in electricity consumption in our cloud infrastructure, as our AI solutions chiefly use structured data and therefore can be trained more efficiently than other models. For more information about possible uncertainties see the Net-Zero Target: Expected Impact of GHG Reduction Levers section.
|
The cloud transformation will help reduce SAP’s total carbon footprint significantly. Our goal is to reduce GHG emissions related to on-premise software by approximately 90% by 2030 compared to 2023. |
| Supply Chain | ||
|
Environmentally conscious procurement
Lever categories: circularity, energy efficiency, process improvements |
In our multiphased supply chain engagement program, we partner with (top) suppliers to procure low-carbon and energy-efficient products and services to reduce their environmental footprint throughout the supply chain.
Environmental requirements are embedded in our global procurement policies, processes, and decisions. Actions apply worldwide and cover emissions in line with the GHG Protocol Scope 3.1 (Upstream).
In this context, we recognize that there are interdependencies with our suppliers and their decarbonization strategies and timelines, which are beyond SAP’s direct control. In addition, the growing demand for energy due to the increasing use of artificial intelligence could have a negative impact on GHG emissions in the upstream supply chain which, due to the advances in this technology, cannot be evaluated fully at this time.
|
Our goal is to reduce GHG emissions related to procurement by around 90% by 2030 compared to 2023.
|
| Operations2 | ||
|
Global car fleet: transition to emission-free vehicles
Lever categories: electrification, energy efficiency, renewable energy |
Since 2021, we have been converting our fleet to one that is completely emission-free during use to bring us closer to our climate goals.
From 2025 onward, most new company cars for employees will be emission-free during use. This means that only battery electric vehicles (BEVs) and, as a transitional arrangement in 2025, selected plug-in hybrid models with a reasonable minimum electric range can be ordered. In 2025, we invested approximately €110 million in BEVs. However, due to different calculation methods, this figure differs from those provided in our EU Taxonomy CapEx table, see the Sustainable Finance: EU Taxonomy Information section.
We have also created various incentives to accelerate this transition. These include the following measures:
At our locations, employees can use our SAP-owned charging stations, which are powered with 100% renewable electricity.
In certain countries, we offer subsidies for home charging stations. We also reimburse electricity consumption on a flat-rate or actual basis and offer employees a discount or a higher budget if they choose an emission-free vehicle. We are looking to offer similar subsidies in almost all countries where we have a company car fleet.
We are continually expanding SAP’s global charging infrastructure.
These actions are at global level and cover GHG emissions Scope 1.
|
Our goal is to reduce GHG emissions related to the global car fleet by more than 90% by 2030 compared to 2023. |
1 The term “data center” refers to both SAP-owned and external data centers (colocation data centers and hyperscalers). We voluntarily reduce the non-renewable electricity consumption of our hyperscalers by procuring EACs on their behalf. Following the reclassification of colocation-related emissions from Scopes 1 and 2 to Scope 3, category 8
| 138/326 |
|
Integrated Report 2025 | ||||
| To
Our Stakeholders |
Combined Management Report |
Consolidated
Financial Statements IFRS |
Additional Information | ||
(Upstream Leased Assets), we now apply the same approach to address the non-renewable electricity consumption of our colocation providers as well. These certificates do not count toward our science-based net-zero target and contribute solely to our long-standing commitment to power all our data centers with 100% renewables.
2 Does not include Taulia and Volume Integration.
Past and Continuous Efforts
In recent years, we have focused our efforts on reducing our GHG emissions Scope 1 and Scope 2 (location- and market-based) and have therefore prioritized operational levers that can significantly reduce our direct carbon footprint.
| Operations | |
| Running SAP facilities with renewable energy |
Since 2014, SAP has been running all its offices and own data centers on 100% renewable electricity in alignment with our commitment to the RE100 global corporate renewable electricity initiative.1 Here, we use three strategic levers:
To foster renewable energy generation, we invest in high-quality EACs, certified by the EKOenergy organization.
We produce renewable electricity at selected SAP locations worldwide through solar panels (such as in Walldorf, Germany, Palo Alto, CA, in the United States, Bangalore, India, and Mougins, France). We are also in the process of implementing several power purchase agreements (PPAs) to increase the share of renewable electricity and to achieve price stability.
We have green tariffs in selected locations, such as Australia, to power our local facilities with renewable electricity (bundled EACs).
This approach allowed us to reduce the GHG emissions from our electricity consumption. Looking ahead, we aim to further expand the use of power purchase agreements when sourcing renewable electricity.
In 2025, we launched a pilot project to procure ISCC-certified biomethane certificates through the UK Green Gas Certification Scheme (GGCS) for our London office to mitigate stationary combustion emissions related to heating, explore renewable gas sourcing options, and evaluate the potential for expanding this approach to other locations where it is not viable to switch to electric heating systems. |
| ISO 50001 and ISO 14001 | Our headquarters in Germany, our offices in Sofia, Bulgaria, and all SAP-owned data centers (St. Leon-Rot and Walldorf in Germany, Colorado Springs, Colorado, and Newtown Square, Pennsylvania), operate energy management systems certified to ISO 50001:2018. At 45 sites in 25 countries, SAP has in place an environmental management system (EMS), certified to ISO 14001:2015, to responsibly analyze, manage, and continually improve our environmental performance. Our headquarters in Germany, all of our major offices across the world, and the data centers we own, operate an EMS. |
| Alternative commuting |
We continue to offer various programs aimed at changing commuting habits.
For instance, SAP offers employees in Germany a fixed monthly transportation budget, as an alternative to a company car, that they can use to pay for any mode of transportation to commute to work or use in their leisure time (bicycle, e-scooter, rental car, train, bus, and so on). In 2025 the program attracted around 2,200 employees (2,500 in 2024). We piloted a similar program in Switzerland. |
| Business flights and carbon pricing scheme |
SAP has implemented internal carbon pricing for business flights (GHG emissions Scope 3 Upstream). SAP uses the funds from this surcharge to make annual climate finance contributions and invest in removals. For more information, see the Beyond the Value Chain: SAP’s Investments in Its Climate Finance and Removal Portfolio section.
Using the EU ETS carbon prices as a reference, we have set a fixed surcharge of €100 on every business flight, irrespective of distance. Since the introduction of the scheme from 2015 to 2016, the surcharge has increased from €5 per flight to its current level, reflecting rising carbon prices and increasing costs of emissions avoidance, mitigation, and removal projects. This mechanism aims to incentivize organizational units and employees to reduce air travel and choose more sustainable transportation options.
The percentage of GHG emissions Scope 3 Upstream covered by our internal carbon pricing scheme is 10%. The surcharge level and use of proceeds are reviewed regularly to ensure alignment with SAP’s climate strategy and market developments. |
1 In 2025, we reclassified colocation-related emissions from Scopes 1 and 2 to Scope 3, category 8 (Upstream Leased Assets). As a result, these emissions are no longer reported under “own operations.” Similar to our approach to our hyperscale partners, we rely on our colocation providers’ efforts to increase the share of clean and renewable electricity used to power their data centers. To uphold our long-standing commitment to operate all SAP data centers with 100% renewable electricity, we continue to procure Energy Attribute Certificates (EACs) to cover the non-renewable electricity consumed by our colocation and hyperscale providers (these certificates do not count toward our 2030 net-zero target).
Future Efforts
SAP will continue to perform the current actions in line with its net-zero targets and plans to adapt its approach to take advantage of developments in technology and incorporate future actions that the specific lines of business might identify as critical. Moreover, as part of its net-zero and transition plans, SAP intends to limit its use of nature-based and technical removals to neutralize its residual value chain GHG emissions to reach its targets in line with SBTi’s Corporate Net-Zero Standard.
SAP plans to retire a maximum of 690,000 carbon removal credits and equivalent tons of CO2e in line with the SBTi criteria in 2030. A share of these removals will be generated by existing contractual agreements and long-term commitments such as SAP’s investment in the Livelihoods Carbon Funds (LCF). For more information, see the Beyond the Value Chain: SAP’s Investments in Its Climate Finance and Removal Portfolio section.
For information about our Net Zero 2030 target see Net-Zero Target: Expected Impact of GHG Reduction Levers section.
| 139/326 |
|
Integrated Report 2025 | ||||
| To
Our Stakeholders |
Combined Management Report |
Consolidated
Financial Statements IFRS |
Additional Information | ||
Metrics on Material Topics
SAP’s Climate Performance and Progress
In 2025, our Gross GHG emissions (market-based) decreased to 6.3 million tons of CO2e (2024: 6.9 million tons).
Our three key actions helped reduce our emissions as follows: reduction of 555 kilotons of CO2e from Scope 3 Downstream (associated with the cloud transformation); 60 kilotons of CO2e from purchased goods and services; 16 kilotons of CO2e from capital goods (supplier engagement); and 15 kilotons of CO2e from our car fleet transition (Own Operations). This decrease was slightly countered by an increase in Business Flights (+26 kilotons of CO2e) and commuting (+27 kilotons of CO2e).
For more information about how we plan to reduce GHG emissions, see the Actions and Resources in Relation to Climate Change and the Past and Continuous Efforts tables above.
SAP’s 2025 GHG Emissions Along the Value Chain23
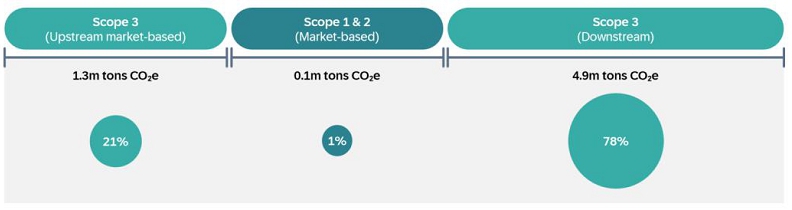
For more information about SAP’s GHG emissions Scopes 1, 2 (location- and market-based) and 3 Upstream and Downstream, see the Greenhouse Gas (GHG) Emissions Calculation Methodology section.
23 Note that, due to rounding, numbers in the graph may not add up precisely.
| 140/326 |
|
Integrated Report 2025 | ||||
| To
Our Stakeholders |
Combined Management Report |
Consolidated
Financial Statements IFRS |
Additional Information | ||
GHG Emissions Scopes 1, 224 (location- and market-based), and 3 Upstream and Downstream (location- and market-based), and Gross GHG Emissions (location- and market-based)
As part of our commitment to environmental responsibility, we employ a detailed approach to categorize our GHG emissions. We classify them by Scope 1, 2, or 3, and further disaggregate them by activity and source type.
| Retrospective | ||||||
| in kilotons CO2e | 2025 | 2024 | Percentage Change |
2023 (Base Year) |
2030 | Annual % Target / Base Year |
| Scope 1 GHG Emissions | ||||||
| Scope 1 GHG Emissions2 | 92 | 109 | –16% | 112 | - | - |
| Scope 1 GHG Emissions from regulated emission trading schemes | N/A | N/A | N/A | N/A | - | - |
| Scope 2 GHG Emissions | ||||||
| Scope 2 GHG Emissions (location-based)2 | 90 | 120 | –25% | 129 | - | - |
| Scope 2 GHG Emissions (market-based)2 | 1 | 1 | 50% | 1 | - | - |
| Scope 3 GHG Emissions | ||||||
| Total gross indirect Scope 3 GHG Emissions Upstream and Downstream (location-based) | 6,264 | 6,758 | –7% | 6,819 | - | - |
| Total gross indirect Scope 3 GHG Emissions Upstream and Downstream (market-based) | 6,239 | |||||
| 1 – Purchased goods and services3 | 902 | 962 | –6% | 907 | - | - |
| 2 – Capital goods3 | 188 | 204 | –8% | 178 | - | - |
| 3 – Fuel- and energy-related activities (location-based) | 53 | |||||
| 3 – Fuel- and energy-related activities (market-based) | 36 | |||||
| 5 – E-waste generated in operations | 0 | |||||
| 6 – Business travel3 | 134 | 108 | 24% | 83 | - | - |
| Business flights | 128 | 101 | 26% | 76 | - | - |
| Rental cars | 4 | 4 | –5% | 4 | - | - |
| Train travel | 1 | 1 | –41% | 1 | - | - |
| Business trips with private car | 2 | 2 | –3% | 2 | - | - |
| 7 – Employee commuting | 45 | 18 | 150% | 18 | - | - |
| Flexible mobility | 1 | 1 | 5% | 0 | - | - |
| Employee commuting | 44 | 17 | 159% | 18 | - | - |
| 8 – Upstream leased assets (location-based) | 32 | |||||
| Electricity in co-location data centers | 31 | |||||
| Refrigerants in co-location data centers | 0 | |||||
| 8 – Upstream leased assets (market-based) | 24 | |||||
| Electricity in co-location data centers | 24 | |||||
| Refrigerants in co-location data centers | 0 | |||||
| 11 – Use of sold products | 4,910 | 5,465 | –10% | 5,633 | - | - |
| Gross GHG Emissions | ||||||
| Gross GHG Emissions (location-based) | 6,446 | 6,986 | –8% | 7,059 | N/A | N/A |
| Gross GHG Emissions (market-based) | 6,332 | 6,868 | –8% | 6,932 | –90% | –13%1 |
1 This number is derived mathematically according to ESRS to show the average emission reduction per year that would be required to achieve a 90% reduction compared to the base year. This number does not reflect real reductions, which are not linear.
2 Does not include Taulia and Volume Integration.
3 Does not include Taulia, Emarsys and Volume Integration.
24 All our subsidiaries are consolidated, and no joint ventures exist. While we do hold interests in associates, we do not exercise operational control over them, therefore no breakdown is provided.
| 141/326 |
|
Integrated Report 2025 | ||||
| To
Our Stakeholders |
Combined Management Report |
Consolidated
Financial Statements IFRS |
Additional Information | ||
GHG Intensity per Net Revenue
| GHG intensity per net revenue | 2025 | 2024 | Change in % |
| Gross GHG Emissions (location-based) per net revenue1 | 240 | 280 | –14% |
| Gross GHG Emissions (market-based) per net revenue1 | 236 | 275 | –14% |
1 Kilotons CO2e/monetary unit.
| Connection to financial statement (€ millions) | 2025 | 2024 | Notes |
| Net revenue used to calculate GHG intensity1 | 26,814 | 24,932 | x |
| Net revenue (others) | 0 | 0 | x |
| Total net revenue (in consolidated financial statements)1 | 26,814 | 24,932 | x |
1 Gross profit as reported in the Consolidated Income Statements.
Energy Consumption and Mix
| in MWh (rounded to 100 MWh) | 2025 | 2024 | ||||
| Total Energy Consumption1 | 610,700 | 757,900 | ||||
| Energy from Fossil Sources |
Energy from Renewable Sources2 |
Energy from Nuclear Sources |
Energy from Fossil Sources |
Energy from Renewable Sources2 |
Energy from Nuclear Sources | |
| Total Energy Consumption1 | 377,100 | 233,600 | 0 | 447,900 | 310,000 | 0 |
| Scope 1 | ||||||
| Fuel consumption from natural gas and other sources | ||||||
| Stationary combustion3 | 80,100 | 1,900 | 0 | 92,600 | 1,100 | 0 |
| Mobile combustion from corporate cars (gasoline, diesel) | 281,500 | 0 | 0 | 339,900 | 0 | 0 |
| Mobile combustion from corporate jets (kerosene) | 7,200 | 0 | 0 | 7,900 | 0 | 0 |
| Scope 21 | ||||||
| Consumption of purchased or acquired electricity | ||||||
| Electricity in office buildings | 0 | 108,900 | 0 | 0 | 112,000 | 0 |
| Electricity in own data centers | 0 | 97,100 | 0 | 0 | 95,200 | 0 |
| E-mobility electricity | 0 | 24,400 | 0 | 0 | 12,700 | 0 |
| Consumption of purchased or acquired heat, steam, and cooling (district heating) | 8,300 | 0 | 0 | 7,500 | 0 | 0 |
1 Does not include Taulia and Volume Integration.
2 Refers to the consumption of (1) self-generated renewable energy (produced on-site), (2) the procurement of high-quality EACs, and starting 2025, (3) the procurement of biomethane (biogas) certificates. For a more detailed breakdown of this data, see the Disaggregation of Renewable Energy (including certificates) Sources table below.
3 This includes gas and oil heating systems in office buildings (owned and leased); the combustion of diesel in generators, and of gas in co-generation units and combined heat and power (CHP) systems. Our CHP system in Walldorf, Germany, uses wood pellets as a renewable source to generate heat.
| Share of Energy Consumed1 | 2025 | 2024 |
| Share of fossil sources in total energy consumption | 62% | 59% |
| Share of consumption from nuclear sources in total energy consumption | 0% | 0% |
| Share of renewable sources in total energy consumption | 38% | 41% |
1 Does not include Taulia and Volume Integration.
| 142/326 |
|
Integrated Report 2025 | ||||
| To
Our Stakeholders |
Combined Management Report |
Consolidated
Financial Statements IFRS |
Additional Information | ||
|
Disaggregation of Renewable Energy (including certificates) Sources1 (in MWh rounded to 100 MWh) |
2025 | 2024 |
| Fuel consumption for renewable energy sources including biomass | 1,900 | 1,100 |
| Consumption of purchased or acquired electricity, heat, steam and cooling from renewable sources | 230,300 | 307,600 |
| Consumption of self-generated non-fuel renewable energy | 1,300 | 1,300 |
1 Does not include Taulia and Volume Integration.
Renewable Electricity
We define renewable electricity as electricity generated from the wind, the sun, geothermal sources, sustainably sourced biomass (including biogas), and sustainable hydropower. As recommended by the Greenhouse Gas Protocol, the environmental reporting organization CDP, and the RE100 renewable electricity initiative, we substantiate all claims about our use of renewables by procuring the highest quality EACs available. The renewable electricity projects supporting these certificates must meet our strict criteria in terms of environmental integrity, reporting and verification. We have defined quality criteria for our procurement of renewable electricity to drive change in the electricity market and to avoid the risks caused by low-quality products. The key characteristics of our procurement guidelines are as follows:
Quality Criteria for SAP’s Procurements of Renewable Electricity
| Type of renewable electricity | Currently, SAP considers only solar photovoltaics (PV) and wind for its own renewable electricity sourcing. |
| Installation | The power plant producing the renewable electricity must not be older than 10 years. Where an old power plant has been renovated, the 10-year rule applies only to the additional electricity output due to increased efficiency. SAP strives to avoid procuring renewable electricity generated by government-supported power plants. |
| Vintage | The renewable electricity must be produced in the same year or the year preceding the reporting period to which it will be applied. |
| EKOenergy | All our purchased renewable electricity is certified by EKOenergy, a high-quality, internationally recognized not-for-profit ecolabel for renewable energy installations that fulfill additional sustainability criteria. By purchasing EKOenergy-certified electricity, we also contribute to EKOenergy’s Climate Fund, which finances solar projects tackling energy poverty. |
Calculation Methodology Applied to Contractual Instruments
For our science-based target (net zero by 2030) baseline, we account for GHG Emissions Scope 2 (market-based) in line with the GHG Protocol Scope 2 Guidance.
SAP proactively purchases contractual instruments such as EACs as credible evidence that we power all our facilities with 100% renewable electricity.
We calculate the amount of renewable electricity we use by adding together the amounts of renewable electricity:
- Produced on site
- Covered by unbundled EACs
- Sourced through local green tariff agreements.
The total of purchased EACs (bundled and unbundled) is the sum of all electricity consumed (excluding self-generated renewable electricity) from all electricity-related Scope 2 categories: electricity in office buildings, electricity in own data centers, and e-mobility (2025: 246,000 MWh).
We include only those EACs as substantiation of renewable electricity that have been verified by an official certificate or written confirmation from our EAC suppliers (100% data coverage).
For market-based reporting, we apply a region-based approach. Following this approach, we map the electricity our SAP sites consume to defined regions to ensure regional purchasing of EACs.
In 2025, contractual instruments allowed us to reduce our entire GHG Emissions Scope 2 (location-based) related to electricity consumption by 89 kilotons of CO2e.
| 143/326 |
|
Integrated Report 2025 | ||||
| To
Our Stakeholders |
Combined Management Report |
Consolidated
Financial Statements IFRS |
Additional Information | ||
| Contractual Instruments1 | 2025 | 2024 |
| GHG Emissions Scope 2 (location-based)2 | 90 | 120 |
| GHG Emissions Scope 2 (market-based)2 | 1 | 1 |
| Percentage of contractual instruments (location-based) | 98% | 99% |
1 Does not include Taulia and Volume Integration.
2 In kilotons of CO2e.
SAP’s energy contractual instruments can be disaggregated into unbundled and an insignificant portion of bundled instruments. Unbundled instruments allow SAP to claim renewable energy attributes separately from our physical electricity use. The bundled instruments that SAP purchases are PPAs and green tariffs in selected locations, such as Germany and Australia. The percentage of these types of instruments in our strategy is set out in the table below.
| Types of Contractual Instruments | 2025 | 2024 |
| Percentage of contractual instruments of energy bundle with attributes about energy generation | 0% | 0% |
| Percentage of contractual instruments of energy unbundled with energy attributes claims | 100% | 100% |
Beyond the Value Chain: SAP’s Investments in Its Climate Finance and Removal Portfolio
As part of our transition to net-zero emissions by 2030, we are committed to making voluntary contributions to climate finance to help limit global warming and protect nature. These contributions are annual investments in climate projects outside our value chain, that reduce and remove more CO2 from the atmosphere than our own operations (including Scopes 1 and 2, and business travel GHG Emissions) cause in a year. They complement our own decarbonization efforts and help offset the emissions we cannot yet avoid. Carbon credits funded through our contribution to climate finance do not count toward our net-zero target and do not reduce SAP’s carbon footprint in line with SBTi.
In 2025, SAP met its commitment by funding a diverse portfolio of nature-based projects which in total reduce and remove more than 237,000 tons of CO2e. This portfolio includes peatland rewetting and protection, improved forest management, agroforestry, forest protection, and rural energy projects implemented in collaboration with local communities. It was financed through investments in carbon credits which SAP received from its long-term investment in the Livelihoods Carbon Funds (LCF) and procured from carbon project developers and retailers. For more information about the 2025 portfolio and due diligence, see the table below.
In addition to investments in the voluntary carbon market infrastructure, SAP continued to support non-profit organizations and their reforestation projects through donations, sponsorships, and volunteering to progress on its goal to plant 25 million trees by 2030. Between 2012 and 2025, SAP’s financial contributions and efforts helped plant more than 21 million trees worldwide, benefiting people, our climate, and biodiversity.
| 144/326 |
|
Integrated Report 2025 | ||||
| To
Our Stakeholders |
Combined Management Report |
Consolidated
Financial Statements IFRS |
Additional Information | ||
SAP’s Contribution to Climate Finance: The 2025 Carbon Credit Portfolio
| Total GHG removed or reduced through Carbon Credits | 237 kt |
| Share of reduction credits / avoidance credits | 52% |
| From forest protection projects | 37% |
| From peatland rewetting and protection projects | 13% |
| From rural energy projects | 3% |
| Share of removal credits | 48% |
| From agroforestry projects | 36% |
| From improved forest management projects | 12% |
| Share of credits certified against recognized quality standard | 100% |
| Against the Verified Carbon Standard (VCS) | 48% |
| Against the Gold Standard | 3% |
| Against the Plan Vivo Standard | 36% |
| Against MoorFutures Standard | 13% |
| Share of credits issued from projects in EU | 13% |
| Share that qualifies as a corresponding adjustment under Article. 6 of the Paris Agreement | 0% |
|
Share of credits from Livelihoods Carbon Funds SAP committed to investing about €10 million (accumulated) in LCFs 1–3 between 2013 and 2045. By the end of 2024, SAP had invested about 19.5% of its total commitment. These funds prefinance community-based carbon projects worldwide. Due diligence is ensured through recognized standards, project management by trusted partners and non-profit organizations, and through joint oversight of the strategy, project portfolio, and impact by investors. |
3% |
|
Share of credits from carbon retailers SAP collaborates with an independent third-party carbon rating agency to systematically procure carbon credits from carbon retailers which are exclusively generated by the highest-rated carbon projects on the market based on the projects’ carbon score, additionality, durability, and co-benefits such as the positive impact on people and biodiversity. This diligent procurement approach helps SAP to mitigate the risk of procuring non-genuine carbon emission reductions while reinforcing our own quality expectations. |
97% |
We are also building up our carbon credit stock to reach net-zero emissions by 2030. To this end, in 2025, we took an important step forward in building a diverse carbon removal portfolio by making initial investments in innovative technical and hybrid solutions. The resulting removal credits will be held in reserve to neutralize residual emissions, of up to 10%, by 2030, our net-zero target year, and in line with SBTi guidance.
| 145/326 |
|
Integrated Report 2025 | ||||
| To
Our Stakeholders |
Combined Management Report |
Consolidated
Financial Statements IFRS |
Additional Information | ||
Carbon Credit and Project Quality Expectations
SAP finances high-quality carbon credits and underlying projects that help mitigate climate change and meet the following criteria:
| Quality Criteria | Description |
| Additionality | The project activities must be additional and must be enabled by the revenue from the sale of carbon credits. The climate benefits should go beyond "business-as-usual" or legally required actions. The number of carbon credits issued by a project must be justified and based on a reasonable baseline scenario to address over-crediting risks. |
| Carbon Accuracy | SAP expects the project's emission reduction or removal statements to be accurate and to reflect reality as closely as possible. They must be based on a reasonable and conservative baseline and consider potential leakage. To avoid double counting, the carbon benefit resulting from SAP’s financing must be allocated to SAP only. |
| Biodiversity and environment | Projects must safeguard or improve the local environment and biodiversity. Risks of negative impacts on biodiversity, soil, water, and air quality, if any, must be identified and mitigated. The project type and intervention must be suitable to the native ecosystem. For forestry projects, a selection of diverse, non-invasive, ideally native and climate-resilient trees must be grown in mixed stands. |
| Community and benefit-sharing | Projects must be designed to protect human and land rights, enable benefit-sharing if possible, and ensure impacted stakeholders are consulted and involved prior to and during the implementation. |
| Permanence and durability | Projects must implement measures to address emission sources, and protect the project during the committed project duration, ideally permanently. In forestry projects that require harvesting to safeguard project durability, trees must be selectively and responsibly harvested, allowing for regrowth and factoring the release of stored carbon into carbon calculations. Projects that plan large-scale clear-cuts during or after the project period are excluded. |
| Competence | Partners must have a history of successfully implemented projects and the necessary expertise to implement the project. |
| External verification and due diligence | Projects must quantify carbon benefits based on a standardized and externally validated method. Carbon credits must be independently certified and validated by an external party and must pass SAP’s due diligence process, which factors in quality assessments by third-party rating agencies and advisors. |
| Transparency | Projects must be designed to protect human and land rights, enable benefit-sharing if possible, and ensure that impacted stakeholders are consulted and involved prior to and during the implementation. |
| 146/326 |
|
Integrated Report 2025 | ||||
| To
Our Stakeholders |
Combined Management Report |
Consolidated
Financial Statements IFRS |
Additional Information | ||
Resource Use and Circular Economy
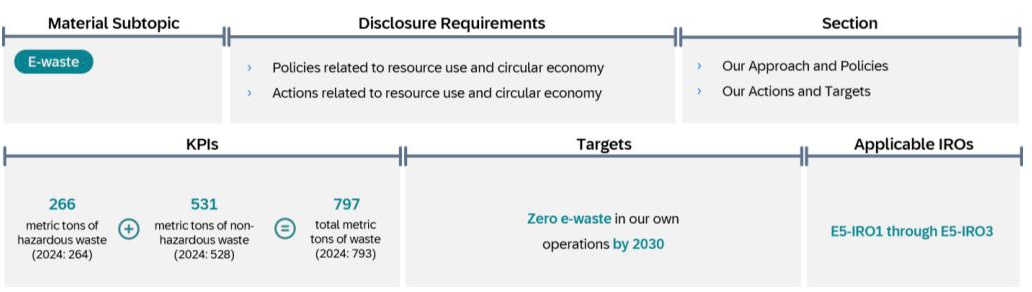
Our Approach and Policies
In alignment with the Results of the Double Materiality Assessment, this section focuses on waste electrical and electronic equipment (WEEE, or e-waste). Although general waste management is relevant in our operations, it is not material for reporting and is therefore excluded from this section. We are committed to operating free of single-use plastics, we have segregation procedures in SAP locations, and in the context of our environmental management system (EMS), there are local targets and initiatives in place to reduce general waste generation.
Policies Related to Resource Use and Circular Economy
| SAP Global Environmental Policy | |
| IRO-relevant topics covered |
The policy contains a separate section on waste which includes two objectives: – To improve SAP’s overall waste performance and separation – To strive towards zero e-waste in our own operations by 2030
In the new version released in 2026, we integrated circularity. We have defined a third objective “To include circular principles in our own operations and procurement decisions” and committed to the circular economy as a guiding principle for our business. Electronic Equipment is defined as a focus area in which we commit to implement circularity in our procurement process, internal reusage, and a proper end-of-life treatment. We also continue our commitment to operating free of single-use plastics. |
| Accountability | CEO |
| Value chain coverage | Upstream, downstream, own operations |
| Applicability | SAP, its subsidiaries, and its partners |
The Global Environmental Policy recognizes the importance of collaboration with suppliers, customers, and other stakeholders and is available on SAP’s website.
| 147/326 |
|
Integrated Report 2025 | ||||
| To
Our Stakeholders |
Combined Management Report |
Consolidated
Financial Statements IFRS |
Additional Information | ||
Our Actions and Targets
We partner with IT asset lifecycle companies to ensure a responsible end-of-life (EOL) treatment for our e-waste. In doing so, we work toward mutual sustainability targets and support the transformation of the economy into a low-carbon, circular system.
| Target | Base Year | Target Year |
Target Description |
| Zero e-waste in our own operations by 2030 | This target applies to all our e-waste on an annual basis, without reference to a base year. | 2030 |
We commit to continue diverting more than 90% of the e-waste generated by SAP-operated data centers and facilities from incineration and landfill. This global zero e-waste target, defined in our Global Environmental Policy, is a voluntary target expressed as a relative value. This target is global, and covers our own operations, including SAP-operated data centers (SAP-owned data centers and colocations) and end-user IT equipment at all SAP locations. We aim to reflect the expectations of stakeholders, particularly those of customers, investors, employees, and authorities. When setting this target, we referred to the framework and statistics for the status of e-waste management worldwide in the UN’s Global E-waste Monitor (GEM). By setting this target, we aim to constantly provide the most responsible end-of-life treatment possible. Depending on the condition a device is in, it will be reused, recycled, incinerated with or without energy recovery, or disposed of, as per the waste hierarchy. Because we operate in a non-manufacturing industry, the following topics are not material for SAP and we are not required to consider them: circular design, circular material use rate, minimization of primary raw materials, resource efficiency in the use of technical and biological materials and water, and other matters related to the circular economy (except for waste management). |
Methodology and Assumptions
Waste electrical and electronic equipment (WEEE or e-waste) is defined as all electrical and electronic devices that are discarded. It ranges from end-user IT equipment, such as laptops, peripherals, and mobile devices, to the computing, networking, and storage devices in our data centers. In alignment with ESRS (European Sustainability Reporting Standards) definitions, we have two waste streams.
Waste diverted from disposal
| - | Reuse (top priority): the refurbishment and resale of functioning devices to give them a second life |
| - | Recycling (second priority): the extraction and recovery of materials such as plastics, metals, and rare earth elements to preserve resources and enable reuse |
Waste directed to disposal
| - | Incineration with/without energy recovery: the combustion of waste as a potential source of energy |
| - | Landfill: the disposal of waste on a landfill site. We strive to avoid this treatment wherever possible. |
Waste Stream and Composition of Our E-Waste
Our e-waste includes two main substreams: workplace IT equipment, such as laptops, smartphones, tablets, and accessories (cables, power plugs, keyboards, headsets), and data center equipment, which comprises servers, network devices, storage systems, and backup units. These streams represent the primary sources of e-waste generated by SAP.
Across both substreams, the waste materials consist mainly of non-metallic components such as plastics and glass, of metallic elements such as aluminum, cobalt, lithium, magnesium, titanium, tantalum, and platinum, and, to a lesser extent, of copper, silver, gold, phosphorous, and rare earth elements. Circuit boards, ferrous metals, and non-ferrous metals are also common across both categories, reflecting the complex material composition of electronic products.
Methods Used to Calculate E-Waste Values
The e-waste data we receive from our IT asset disposition (ITAD) partners is based on weight, or on the number of devices converted into weight using the average weight per device. Their data is further differentiated by EOL treatment (reuse, recycling, incineration or landfill) as described above, and classified by material type (hazardous versus non-hazardous).
For SAP offices that are not covered by any of our partners, we extrapolate e-waste generation for end-user IT equipment based on full-time equivalents.
| 148/326 |
|
Integrated Report 2025 | ||||
| To
Our Stakeholders |
Combined Management Report |
Consolidated
Financial Statements IFRS |
Additional Information | ||
For data center equipment used in colocation data centers that are not covered by our global ITAD partners, we extrapolate the data based on SAP’s share of the electricity consumed.
The breakdown across EOL treatments for extrapolation processes is calculated using the country-specific or region-specific factors derived from Global E-waste Monitor 2024 recycling data, or based on reported data for reuse, incineration, and landfill.
Overall, we achieved a data coverage rate of 90% for our WEEE reporting. Our extrapolations represent 10% of the total e-waste reported.
Circular Economy and E-Waste Reduction in Our Own Operations
To reduce waste and foster a circular economy, we not only look at the EOL treatment of our devices; we also follow a holistic approach that focuses on how and what we procure, and on how we can operate in the most circular way possible. At SAP, we have global initiatives in place to reduce e-waste and promote the circularity of the IT equipment used in SAP offices and of the hardware components used in SAP-operated data centers.
Overall Progress
In 2025, we launched a cross-line-of-business (LoB) project under our Environmental Transformation Program to ensure that circularity principles are incorporated into our own operations. Because our materiality assessment identified it as material, the project focuses on electrical and electronic equipment associated with end users, offices, SAP-owned data centers, and colocations.
The project initiatives are listed under Actions Associated with Workplace and End-User Equipment and Offices below. For IT equipment, we also have local initiatives in the context of our environmental management system (EMS). The EMS covers 45 SAP sites worldwide, each of which has local targets that align with our global goals, including zero e-waste.
How SAP Measures Performance and Progress
We have partnered with certified local and ITAD providers at almost all SAP locations, starting with our major sites, to reuse, recycle, and properly dispose of our e-waste. These partners process 90% of SAP’s devices worldwide.
We monitor our global zero e-waste target quarterly by collecting and analyzing all ITAD providers’ data to ensure that our progress through the year aligns with that target. Progress is disclosed annually, by treatment classification and by material type , and is the basis for deriving internal actions.
Actions Associated with Workplace and End-User Equipment and Offices
| Action Name | Description | Expected Outcomes |
| Consolidation of the SAP Ariba Catalog |
SAP Ariba is a platform that includes digital catalogs of products and services from approved suppliers that facilitate the purchase of goods and services. We are continuously working to adjust and reduce the offerings based on selected sustainability criteria (repairability, durability, energy efficiency, and so on). In 2025, 91% of the devices procured had a Gold EPEAT (Electronic Product Environmental Assessment Tool) rating. |
The optimization of our catalog allows us to focus on sustainable and circular devices and on making hardware storage and delivery more efficient.
|
| Expansion of our bring-your-own device (BYOD) IT service for smartphones |
SAP offers employees the option to use their personal device for work purposes through a bring-your-own-device (BYOD) program for Android and iOS. The new BYOD program was launched on July 1, 2024. In 2025, use of the BYOD program increased 20%. |
This voluntary initiative enhances user convenience and supports SAP's circularity goals by avoiding the procurement of unnecessary extra devices and thus reducing the e-waste generated. |
| Internal reuse of end-user equipment |
SAP has developed a tool for redistributing returned end-user equipment that, based on its age and condition, is suitable for reuse. Initially available in Germany only, use of the tool was extended to China, India, and Latin America in 2025, as part of SAP’s plans to make reused devices available in all major locations. In 2025, the number of devices reused at SAP increased 52% compared to 2024. |
Promoting the internal reuse of functioning devices is an effective circularity practice that also reduces the amount of e-waste generated. |
| Office network management |
Through the Daas (Device as a Service) model, our supplier offers a holistic service that covers device provisioning, maintenance, and end-of-life treatment. This approach ensures that all hardware is managed responsibly throughout its lifecycle. The supplier also committed to integrating circular design principles into all new products and packaging by the end of 2025. |
By closing the loop with the manufacturer, we strengthen collaboration across all lifecycle stages, enabling a highly efficient and fully circular process. |
| 149/326 |
|
Integrated Report 2025 | ||||
| To
Our Stakeholders |
Combined Management Report |
Consolidated
Financial Statements IFRS |
Additional Information | ||
| SAP adopted this model in 2024 and had implemented it at 18% of its locations by the end of that year. Coverage had reached 50% of offices by the end of 2025, with full implementation targeted for the end of 2026. | ||
| Printer toners | As part of the Printing as a Service model, our service provider handles the recycling of printer cartridges. This service is offered for 98% of SAP printers worldwide. | Avoid e-waste by recycling printer cartridges and strengthen the manufacturer’s extended responsibility. |
Actions Associated with SAP-Owned Data Centers and Colocations
| Action Name | Description | Expected Outcomes |
| Collaboration with IT asset disposition (ITAD) partners to handle our hardware securely and sustainably1 |
We engage with certified ITAD companies that provide the
best possible We also collaborate with them to foster investment in advanced recycling methods to decrease incineration and landfill. |
Improved performance to support our zero-waste target.
|
| Incorporate circularity criteria into suppliers’ contracts1 |
Circularity and responsible resource management criteria are part of the Supplier Code of Conduct that is signed by all suppliers. For strategic suppliers, we specify circularity and responsible resource management criteria in the contracts we sign with them. |
Ensure supplier commitment to circular economy principles and responsible resource management. |
1 Does not include Taulia, Emarsys, WalkMe, SmartRecruiters and Volume Integration.
Metrics on Material Topics
End-of-Life Treatment of Electrical and Electronic Equipment
| 2025 | 2024 | |||||
| in metric tons | Totals | Hazardous | Non- Hazardous |
Totals | Hazardous | Non- Hazardous |
| Waste from electrical and electronic equipment (WEEE, e-waste) | 797 | 266 | 531 | 793 | 264 | 528 |
| Total amount diverted from disposal | 764 | 255 | 509 | 749 | 248 | 501 |
| Preparation of reuse | 362 | 163 | 199 | 410 | 161 | 248 |
| Recycling | 402 | 92 | 310 | 340 | 87 | 253 |
| Other recovery operations | 0 | 0 | 0 | 0 | 0 | 0 |
| Total amount directed to disposal | 33 | 11 | 22 | 43 | 16 | 27 |
| Incineration | 25 | 10 | 15 | 35 | 12 | 23 |
| Landfill | 8 | 1 | 6 | 9 | 4 | 5 |
| Other disposal operation | 0 | 0 | 0 | 0 | 0 | 0 |
| Total non-recycled waste | 33 | 11 | 22 | 43 | 16 | 27 |
| Percentage of non-recycled waste | 4% | 4% | 4% | 5% | 6% | 5% |
As outlined in the Our Approach and Policies section, this table contains only e-waste information. In 2025, we generated 797 metric tons of e-waste (an increase of 0.5% compared to 2024), of which 266 (2024: 263) metric tons are classified as hazardous.
| 150/326 |
|
Integrated Report 2025 | ||||
| To
Our Stakeholders |
Combined Management Report |
Consolidated
Financial Statements IFRS |
Additional Information | ||
Social Information
In this section, we disclose information about SAP’s human rights matters and material impacts, risks, and opportunities (IROs) related to social topics and responsibility. For more information, see the sections Human Rights, Own Workforce, Workers in the Value Chain, Security, Cloud Compliance, and Data Protection and Privacy, and Responsible AI.
Human Rights
Our Commitment
SAP is committed to respecting and advancing human rights across our operations, extended supply chain, and product lifecycle, and we expect our employees and business partners to respect human rights and to avoid complicity in human rights abuses.
SAP respects and upholds the values of the International Bill of Human Rights and the International Labour Organization (ILO) Core Labour Rights Conventions. We do this by taking guidance from the United Nations Guiding Principles on Business and Human Rights (UNGPs) and the Organisation for Economic Co-operation and Development (OECD) Guidelines for Multinational Enterprises on Responsible Business Conduct.
| Global Human Rights Commitment Statement | |
| Topics covered | SAP’s human-rights-related action areas, human rights governance and risk management system, prioritized risks, preventive and remedial measures, and expectations placed on employees and all business partners |
| Accountability | SAP Executive Board |
| Value chain coverage | Own operations, upstream, downstream |
| Applicability | All SAP operations worldwide |
The current version of SAP’s Global Human Rights Commitment Statement is available on our public website and has been rolled out globally to employees and suppliers. We updated the statement in 2024.
Our Approach to Human Rights Due Diligence
In alignment with the UNGPs and the German Supply Chain Act, we have implemented a human rights due diligence process to identify, prevent, and mitigate salient human rights risks. We continuously monitor and seek to evolve this process.25
Our due diligence process is driven collaboratively by our Human Rights Steering Committee and multiple lines of business, including People & Culture, Procurement, and Global Risk & Assurance Services, and monitored by our Human Rights Office, which reports to the SAP Executive Board at least once a year, and more often if required.
25 Due diligence efforts did not apply to Taulia, Emarsys, Walkme, SmartRecruiters, or Volume Integration.
| 151/326 |
|
Integrated Report 2025 | ||||
| To
Our Stakeholders |
Combined Management Report |
Consolidated
Financial Statements IFRS |
Additional Information | ||
Methodologies and Definitions
SAP’s assessment of potential negative human rights impacts (“risks”) is informed by the UNGPs and the German Supply Chain Act specifically. Through our Human Rights Due Diligence Program, SAP assesses and prioritizes the material matters relating to our own employees and value chain workers, such as adequate living wages, health and safety, equal treatment in employment, and the eradication of child and forced labor.
We use ESG risk management software to ensure we have a structured process for assessing potential impacts of our own operations and those of our tier 1 suppliers. For information about our suppliers, see the Workers in the Value Chain section. Our risk assessment process comprises the following steps:
Step 1: Performing an abstract risk analysis, in which we evaluate country-specific and industry-specific risks related to human rights and environmental standards by referencing quantitative indicators from the World Bank and the United Nations and qualitative data from sources such as the CSR Risk Check provided by the German Helpdesk on Business and Human Rights.
Step 2: Performing a concrete risk analysis, in which we assess risks from our own operations and from our tier 1 suppliers in more depth. For our own operations, we examine high-risk topic clusters more closely by interviewing experts, drawing on internal data from, for example, our complaints mechanisms and environmental management system, and on queries from the country-specific financial risk identification process. Through a newly introduced AI-powered analysis of the #Unfiltered survey results, we now systematically integrate employee feedback into the identification and assessment process.
Regarding our tier 1 suppliers, we conduct detailed assessments of high-risk suppliers by using questionnaires to gather information about their response to the risks that were identified.
Step 3: Prioritizing potential negative impacts related to our own operations and value chain based on criteria such as the nature of our business activities, our ability to influence suppliers, the probability and severity (scale, scope, remediability) of potential violations, and the nature of our causal contribution.
We also assess potential impacts related to our indirect (tier 2-n) upstream supply chain and downstream value chain. For example, we use impact measurement and valuation to gain an understanding of positive and negative impacts in our value chain. For more information about our impact measurement and valuation, see the Impact Valuation Approach section.
To assess select issues, we engage external human rights experts, such as those at the German Helpdesk on Business and Human Rights.
Based on our assessments, we have started to prioritize potential negative human rights impacts along the value chain:
| – | In our own operations: all salient impacts are addressed by sufficient effective mitigation measures, so the risk level is low, and we have not prioritized any risks for further action. |
| – | In our direct and indirect supply chain: adequate living wages (medium risk, prioritized for further assessment) |
| – | Related to products, services, and customers: non-discrimination and privacy |
For more information about how SAP addresses these prioritized impacts, including the resources it allocates, see the sections Own Workforce, Workers in the Value Chain, Security, Cloud Compliance, and Data Protection and Privacy, and Responsible AI.
Further Action Areas
SAP ensures its employees’ right to rest and leisure time in accordance with local labor laws and ILO conventions on labor standards regarding working hours.
We do not accept forced, bonded, or involuntary prison labor nor any form of human trafficking. Employment at SAP is voluntary. Employees are free to leave their jobs after any required notice periods, where applicable and consistent with their employment contracts. In our recruiting and hiring processes, we ensure that our employees do not have to pay recruitment fees. We also make sure that they are not required to lodge deposits, identity papers, or any other documents that might limit their legal status, their freedom to travel, or their ability to leave their job temporarily or permanently after commencing employment with SAP.
SAP does not tolerate child labor. Our recruitment and hiring processes, and our policies, prohibit it. To foster quality education and job opportunities, SAP offers various vocational training programs, which may include minors under the age of 18. These individuals receive a special employment contract, and we take extra care to protect their well-being and to ensure that their contractual working hours are not exceeded.
| 152/326 |
|
Integrated Report 2025 | ||||
| To
Our Stakeholders |
Combined Management Report |
Consolidated
Financial Statements IFRS |
Additional Information | ||
We require our suppliers and partners, pursuant to our Supplier and Partner Code of Conduct policies, to uphold human and labor rights, and to ensure a safe, healthy, and fair work environment in alignment with the international standards outlined above. Our Supplier Code of Conduct requires that suppliers must not engage in human trafficking or use forced, compulsory, or child labor; it does not include specific provisions for precarious work.
Engagement on Human Rights
As set out in our Global Human Rights Commitment Statement, SAP engages in various ways with potentially affected stakeholders. For example, in 2025, we met with employee representatives to understand their specific concerns and interests related to the rights protected by the German Supply Chain Act. We also engage works councils in designing actions to prevent and remedy identified risks. For example, employee representatives are consulted on mandatory training activities relating to antidiscrimination and AI ethics.
We regularly survey our employees to take into account their feedback on topics that matter to them. For more information about our engagement with our own workforce, see the Processes for Engaging with Our Own Workforce section; for information about our interactions with workers’ representatives, see the Social Dialogue, Involvement of Works Councils section.
For information about our engagement with value chain workers, see the Processes for Engaging with Value Chain Workers section. For information about our engagement in AI ethics and data protection and privacy, see the Responsible AI and Security, Cloud Compliance, and Data Protection and Privacy sections.
Remedy for Human Rights Violations
We are committed to working with affected people or their representatives to remedy any negative human rights impacts that SAP may have caused or contributed to. In our own business, all relevant teams and individuals work together to take immediate and long-term action to prevent human rights violations and stop them reoccurring. For more information, see the Own Workforce - Complaints Management and Investigations section.
At the time of publication of this report, we are not aware of any cases of severe human rights incidents connected to our own workforce or value chain workers that constitute a violation of the UNGPs, ILO Declaration on Fundamental Principles and Rights at Work, or the OECD Guidelines for Multinational Enterprises (no cases in 2024).
| 153/326 |
|
Integrated Report 2025 | ||||
| To
Our Stakeholders |
Combined Management Report |
Consolidated
Financial Statements IFRS |
Additional Information | ||
Own Workforce
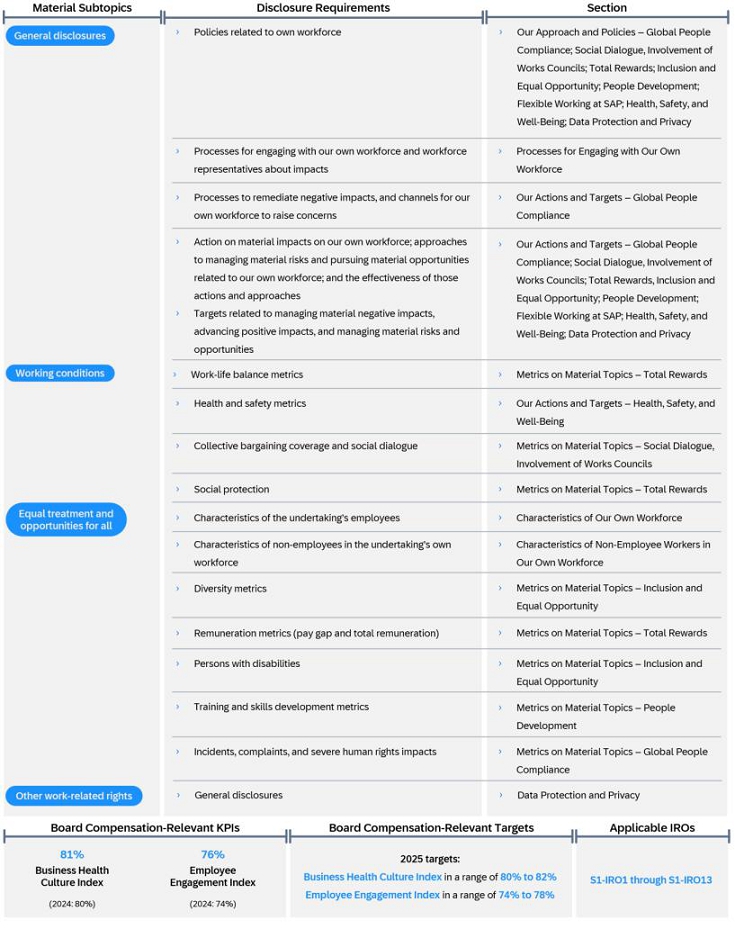
| 154/326 |
|
Integrated Report 2025 | ||||
| To
Our Stakeholders |
Combined Management Report |
Consolidated
Financial Statements IFRS |
Additional Information | ||
Based on our DMA, there are no material impacts on our own workforce that may arise from transition plans for reducing negative impacts on the environment and achieving greener and climate-neutral operations. In addition, we have not identified any operations at significant risk of incidents of child labor or forced and compulsory labor in our own workforce.
In the text below, we have outlined the targets and metrics by which we assess the effectiveness of our policies and actions. In instances where practical measurement is not possible, we have refrained from including such information. Unless otherwise stated, all numbers in this section are reported based on headcount.
Our Approach
SAP actively prioritizes the interests, views, and rights of its employees in all operations, including our business model and strategy process. At SAP, we carefully consider the possible effects of our actions on our workforce. We elaborate on these in the sections below.
We actively engage with our workforce to understand its perspectives, concerns, and aspirations. Input to the strategy from the workforce is collected at various levels and through several channels. At the employee level, the channels most frequently used for structured feedback are employee surveys and sounding boards for the most strategic corporate projects. For more information about how we engage with our workforce, see the Processes for Engaging with Our Own Workforce section. At the leadership level, selected leaders are actively involved in the yearly strategy definition process. Additionally, ongoing feedback is collected through leadership steering committees and sounding boards. For more information about our committees and boards, see the Corporate Governance Statement in the Combined Management Report. Lastly, there are frequent exchanges between SAP’s management and the works councils, who represent the rights and views of SAP employees.
Drawing on feedback from our employee engagement survey and discussions with internal sounding boards, the Board used insights from our workforce to shape the definition of our culture (which introduces four growth behaviors and three leadership promises) and our joint evolution toward establishing it. By fostering an inclusive and transparent culture, we empower employees to voice their opinions and contribute to the direction of the Company. Moreover, our People Agenda, as one of the pillars in SAP’s corporate strategy, is a key strategic priority that drives our actions.
To sum up, the interests, views, and rights of our workforce are deeply ingrained in SAP’s strategy and business model. By prioritizing our employees’ sense of well-being, inclusion, and belonging, we believe we can drive long-term value creation for all stakeholders, including our workforce, customers, partners, and shareholders.
People Agenda
Established in 2024, the People Agenda is a holistic integrated people system in which people, organizational, and technological development are interconnected. We have defined three key strategic pillars built on a strong foundation that together make up our People Agenda:
Our growth culture guides how we work internally and how we address market needs and customer relationships. It increases our capacity for change, drives efficiency, and ensures accountability, helping us deliver high-performance results for our customers and markets. To support this evolution, we are implementing an execution architecture that enables scale, speed, and adaptability. We have created leadership transformation journeys to accelerate our strategy execution and SAP’s transformation agenda. We have combined the How in the form of our growth culture (four growth behaviors and three leadership promises) with the What. We have also established a network of trained change agents that span all regions and functions. Our regular Growth Summits and growth culture activation efforts reach into the business to accelerate transformation and execution. To sustain a high-performance culture, SAP has introduced a new approach to managing performance to ensure we execute in line with our strategy. That way, we endeavor to strengthen the engagement and commitment of everyone—employees, partners, customers, and shareholders. In addition, we focus on skill-infused strategic workforce management to make the right “buy, build, borrow, or break” decisions. Strategic workforce management ensures we have the right talent in the right place and with the right volume and mix of skills. It ensures the right workforce composition to execute on our strategy and to define the hiring, reskilling, and skills access strategy through third parties and through the constant adaptation of roles which are necessary to drive the right business outcome. This includes a continuous process of transforming our workforce through reskilling and shifting our resources to areas with high demand, for example, data science and business AI. For more information about the impact of the transformation, see the Notes to the Consolidated Financial Statements, Note (B.2) and the Operating Profit and Operating Margin section in our Combined Management Report.
| 155/326 |
|
Integrated Report 2025 | ||||
| To
Our Stakeholders |
Combined Management Report |
Consolidated
Financial Statements IFRS |
Additional Information | ||
Our skills-led people ecosystem fuels growth, innovation, and opportunity—both for our people and our business. This transformation is foundational to our future and reflects a paradigm shift in how we approach hiring, learning, development, and career pathing. We have already made significant progress by building the foundation to ensure that every employee has an up-to-date skills profile that accurately reflects the work they do. This includes streamlining our skills taxonomy, aligning skills with market standards, and modernizing role profiles. In 2026, employees will be assigned to updated role profiles and, by means of the growth portfolio, we can leverage the skills taxonomy to infuse skills into every People & Culture (P&C) practice and enhance every stage of the employee experience. Our action plan includes several pilot use cases that infuse skills across the employee lifecycle, with the first use case—AI-driven, skills-based learning—launching as one of the first benefits for employees.
We invest in our people by helping employees stay relevant and build future-critical skills. We are introducing a connected, scalable system that brings together learning, talent and leadership development, assessment, succession, and performance. This holistic approach supports employees and leaders, accelerates growth for high-potential talent, and ensures our people practices are personalized across all generations and career paths.
Our game-changing people technology26 harnesses SAP’s own technological capabilities, delivering data-driven, AI-first, and personalized solutions for everyone at SAP. This will enable us to foster data-driven and transparent decision-making for leaders and allow everyone to grow and develop to their best abilities based on data insights. As the number one showcase of SAP SuccessFactors, we are actively driving the Human Capital Management (HCM) roadmap and pioneer innovations—for our customers too. This includes the acquisition of SmartRecruiters in 2025.
These pillars rest on the strong foundation of our people-centric work environment, which fosters employee well-being, safety, and health, as well as workplace diversity, and inclusion. Together, these elements are designed to establish a forward-thinking workplace.
Characteristics of Our Own Workforce
Methodologies and Definitions
Number of employees (heads): The number of employees is independent of their capacity levels.
Headcount in heads: This is the total number of employees at the Company on the last day of the reporting period. An employee working part-time counts as one employee. Only headcount-relevant employees are included in the headcount figure. In general, this includes all active employees on permanent contracts and employees on contracts of at least six months. Students, and employees on parental and long-term leave, are excluded.
Full-time equivalent (FTE): This is a key metric that indicates the staffing percentage of an employee in a position, based on the number of hours they work per week in that position compared with a full-time employee.
Headcount in FTEs: This refers to the total number of FTEs as at the last day of the reporting period. An employee working half-time counts as 0.5 FTEs. Only headcount-relevant employees are included in FTE figures. In general, this includes all active employees on permanent contracts, and employees on contracts of more than six months. Students, and employees on long-term leave, are excluded.
Headcount-relevant/non-headcount relevant: In general, employees with an FTE greater than 0 are considered headcount-relevant. Students, vocational trainees, interns, and employees on long-term leave are considered non-headcount relevant.
Breakdown by gender: This refers to the number of employees in the categories female, male, other, and not reported or not disclosed.
Gender category “other”: This ESRS category refers to gender as specified by employees themselves. At SAP, employees can select a gender other than female or male that is legally recognized in the country concerned. As at the end of 2025, this was the case for employees in Argentina, Australia, Austria, Germany, India, New Zealand, and Pakistan (in 2024: Argentina, Germany, and India).
Gender category “not reported” or “not disclosed”: This gender value is for employees who choose not to provide gender information to their local subsidiary (if they are permitted to do so by law in the country concerned).
Employees who have left SAP: This describes the total FTE of employees who have left SAP. It does not include employees who have transferred internally or from one subsidiary to another (though there may be local exceptions due to payroll system
26 “Game-changing” refers to the use of our own technology, which transforms how we operate and supports data-driven decision-making, employee development, and business impact.
| 156/326 |
|
Integrated Report 2025 | ||||
| To
Our Stakeholders |
Combined Management Report |
Consolidated
Financial Statements IFRS |
Additional Information | ||
constraints). The number includes all headcount-relevant employees whose employment contracts have been terminated and those headcount-relevant employees who have accepted a fixed-term, non-headcount relevant contract of less than six months. It is reported as a full-year number.
External hires: Total headcount in FTEs of employees who have been hired externally. This number does not include internal transfers or employees who have transferred from one SAP subsidiary to another. It is reported as a full-year number.
Employee Turnover: This describes the overall rate of terminations (that is, employees leaving SAP, not internal transfers), including fully integrated acquisitions. It applies to headcount-relevant employees only and is calculated based on FTE numbers. It is reported as a full-year number.
Employee contract type: Numbers are reported based on employment types. For more information, see the description of the different employment types below.
Temporary hourly-paid: Employees who are paid an hourly wage. Their contracts can be longer than six months (for students), depending on local practices.
All the numbers in this section are reported at the end of the reporting period unless otherwise stated.
Types of Employment
SAP offers different types of employment. Definitions may vary depending on local laws.
Employees with a permanent contract (permanent employees): Permanent employees have a direct employment relationship with an SAP entity, which does not end on a pre-determined date. Permanent employees can work either full-time or part-time and are assigned an internal SAP user ID and personnel number in our HR systems.
Employees with a fixed-term contract (temporary employees): Temporary employees have a direct employment relationship with an SAP entity, which has a predetermined end date. Temporary employees can be employed either full-time or part-time and are assigned an internal SAP user ID and a personnel number in our HR systems.
External workers (third parties): For more information, see the Characteristics of Non-Employee Workers in Our Own Workforce section.
For more information about the number of employees, see the Notes to the Consolidated Financial Statements, Note (B.1).
Number of Employees in Headcount and Full-Time Equivalents, Breakdown by Gender
| 2025 | 2024 | |||
| Gender | Number of Employees (headcount) |
Number of Employees (full- time equivalent) |
Number of Employees (headcount) |
Number of Employees (full- time equivalent) |
| Male | 71,503 | 71,340 | 71,007 | 70,823 |
| Female | 39,891 | 39,307 | 38,965 | 38,298 |
| Other | 1 | 1 | 1 | 1 |
| Not reported | 2 | 2 | 0 | 0 |
| Total employees | 111,397 | 110,650 | 109,973 | 109,121 |
In 2025, 8,993 employees (FTE) left SAP and 10,241 employees (FTE) were hired externally (2024: 8,390 left and 8,974 were hired externally). Employee Turnover was 8.2% (2024: 7.8%).
In January 2024, SAP announced a company-wide restructuring program and increased its focus on key strategic growth areas, particularly business AI. The 2024 restructuring program was set up to ensure that SAP’s skillset and resources continue to meet future business needs. The execution of the program concluded as planned at the beginning of 2025. For more information about the impact of the program, see the Notes to the Consolidated Financial Statements, Note (B.6).
Total Number of Employees by Headcount
| 2025 | 2024 | |||||||||
| Female | Male | Other | Not Disclosed |
Total | Female | Male | Other | Not Disclosed |
Total | |
| Number of employees | 39,891 | 71,503 | 1 | 2 | 111,397 | 38,965 | 71,007 | 1 | 0 | 109,973 |
| 157/326 |
|
Integrated Report 2025 | ||||
| To
Our Stakeholders |
Combined Management Report |
Consolidated
Financial Statements IFRS |
Additional Information | ||
| Number of permanent employees | 39,707 | 71,344 | 1 | 2 | 111,054 | 38,767 | 70,871 | 1 | 0 | 109,639 |
| Number of temporary employees | 184 | 159 | 0 | 0 | 343 | 198 | 136 | 0 | 0 | 334 |
At SAP, we have various non-headcount-relevant employee categories. None of these categories match the ESRS definition of “non-guaranteed hours employees.” However, at SAP, we have employees who are paid hourly (for example, working students) but who have a reliable minimum number of hours guaranteed. For 2025, the number of temporary hourly-paid employees was 1,790 (857 male, 928 female, 1 other, 4 not disclosed). In 2024, the number of temporary hourly-paid employees was 1,548 (747 male, 798 female, 2 other, 1 not disclosed).
Number of SAP Employees by Headcount, Broken Down by Country for Countries in Which SAP Has 50 or More Employees Representing at Least 10% of Its Total Number of Employees
| Country | 2025 | 2024 |
| Germany | 25,221 | 26,944 |
| United States | 17,599 | 17,712 |
| India | 17,433 | 16,164 |
Characteristics of Non-Employee Workers in Our Own Workforce
Our Global External Workforce Policy describes and governs worker classifications. Note that SAP also has country-specific policies in place to reflect local laws; these policies cover 90% of the external worker population.
The only external worker classification that would be considered part of SAP’s “own workforce” is “temporary staff.”
Temporary staff are persons deployed to act as replacement employees for a limited period of time. They can be integrated into a team and given working instructions as if they were employees. Typical circumstances in which temporary workers may be engaged to replace or fill in for an SAP employee include:
| – | Providing cover for employees who are on extended leave (for example, maternity leave or extended sick leave) |
| – | Providing cover for temporary peaks in work |
| – | Providing specialist skills on a short-term basis |
Our Temporary Staff Guidelines outline the way in which SAP employees are required to engage and behave with temporary staff to ensure transparent engagement behaviors in our daily business and compliance with this policy.
In 2025, SAP contracted 906 temporary staff by headcount (2024: 901) through undertakings primarily engaged in employment activities. This figure is an average of the number of individuals engaged in the year.
All other non-employee engagements are classified as “services.” This means that the supplier provides a service and that SAP contracts the service to be delivered, not the labor. As per the requirements of a service, the work is not under the control or supervision of SAP. For more information about workers in our value chain, see the Workers in the Value Chain section.
Processes for Engaging with Our Own Workforce
At SAP, we engage and communicate with our own workforce regularly, using a variety of formats and media as part of our comprehensive, continuous efforts to listen and to maintain a dialogue. These include dedicated follow-up actions to address employee feedback.
To ensure good communication with our employees, we have dedicated communication teams at global, Board area, regional, and local level.
We communicate with our workforce about topics that are important for all employees through a range of channels. Examples are shown below. Global communications to all employees do not usually include temporary staff, due to the dynamic nature of distribution lists for them. For local events and communication channels, local laws stipulate whether or not temporary staff should be included. Temporary staff can also access information published on SAP One, our internal employee portal.
| 158/326 |
|
Integrated Report 2025 | ||||
| To
Our Stakeholders |
Combined Management Report |
Consolidated
Financial Statements IFRS |
Additional Information | ||
| Audience | Asset/Channel | Cadence | Description |
| All employees | Global Employee Meeting (GEM) (hybrid live event) | Quarterly | The GEM is a meeting that connects members of the Executive Board with employees. Top-voted employee questions are addressed on stage and online by an expert panel. |
| Earnings Check-In (hybrid live event) |
Quarterly | This event complements the GEM by providing an additional, dedicated discussion forum with the CFO and CEO, on or immediately after earnings day. Top-voted employee questions are addressed on stage and online by an expert panel. | |
| Unplugged sessions with the CEO (hybrid live event) |
Quarterly | Unplugged sessions offer an informal forum for employees to ask the CEO questions on all topics related to SAP. | |
| Ask Me Anything sessions | As needed | Open forums at which the Extended and Executive Board address critical developments in strategy and technology, and other topics relating to SAP. These sessions reinforce transparency, provide clarity on business priorities, and foster employee trust and psychological safety. | |
| Regional/local/functional sessions | Multiple per year | Meetings attended by regional presidents, managing directors, functional leads, P&C country heads, or other leaders to share insights and provide context for country-specific topics, regional updates, and global announcements (to outline the local impact). Employees can ask questions and share feedback. | |
| Coffee Corners | Monthly | These sessions take place in a short, moderated Q&A format, in which a Board member and/or L1 executive answers questions from employees. There are two formats: Espresso Edition (hybrid live event) and Coffee Corner (onsite live event). | |
| What’s Up Work Zone (website) | Multiple per month | An internal website featuring internal global news, information, and events | |
| SAP ONE articles | As needed | Articles (with links to videos) on the Company intranet that feature topical stories and updates about new products, industry trends, and customer wins, interviews with leaders, and more | |
| Organizational announcements | As needed | Major organizational changes are followed by multi-channel communications cascades. These include e-mails, in-person events, internal online articles, FAQs, and other documentation, as required. | |
| Let’s Talk Inclusion | As needed | A dedicated platform for employees to shape SAP’s inclusion and equity agenda. Through open dialogue and feedback, employees help define future priorities and strengthen our inclusive culture. | |
| All managers | Leaders What’s Next Call | Monthly | These live calls for all leaders cover relevant and timely People & Culture and people management topics to help leaders manage their teams and organizations. |
| Executive leaders | SAP Forward call (virtual) | As needed | These meetings connect the Executive Board and SAP’s senior and global executives. They cover need-to-know, critical company topics and allow time for discussion and Q&As. |
As part of SAP’s performance management system, employees participate in “SAP Talk” conversations at which they receive feedback on their performance against defined goals. These structured, one-on-one dialogues are also designed to strengthen employee engagement. For more information, see the People Development section.
To continuously promote an inclusive culture and ensure wider accessibility to global employee events, we deploy assistive technology, including sign language interpreting (primarily American Sign Language), assistive listening devices (ALDs), closed caption screens, reserved priority seating, and post-event recordings with professional captioning.
In addition, P&C country heads (formerly known as “HR directors”) engage with employee representatives as primary points of contact on people topics, fostering a trust-based working relationship and ensuring compliance with all applicable regulations. These interactions can be initiated by either side, on an ad-hoc basis or following a prearranged schedule to ensure that these representatives are informed and consulted in a timely manner about measures that impact employees and require codetermination.
To ensure the effectiveness of its communications, our People and Transformation Communications team regularly tracks the reach, engagement, and sentiment of the channels it owns. This data is used to inform stakeholders, improve future communications, and continuously refine communication channels and approaches. The team uses a combination of email marketing tools, data analytics tools, and manual analysis. The Global Communications Team (specifically, People and Transformation Communications) also measures pre-event engagement through the volume of questions submitted, and uses in-event polling, to gather feedback from attendees. (Virtual) attendance numbers and replay views are also tracked.
At SAP, we recognize that employee engagement is a critical driver of innovation, productivity, and long-term organizational success. Our Executive Board members play an important role in fostering and maintaining employee engagement. Given SAP’s approach to employee engagement, no single role is operationally responsible for employee engagement. It falls within the responsibility of the chief human resources officer to foster engagement between SAP and its employees through various formats for interacting and
| 159/326 |
|
Integrated Report 2025 | ||||
| To
Our Stakeholders |
Combined Management Report |
Consolidated
Financial Statements IFRS |
Additional Information | ||
listening, and through our People Agenda. Further, the responsibilities of P&C country heads include supporting communication and dialogue, and implementing the People Agenda at country level in strong partnership with the P&C business partners and their teams. The chief communications officer is responsible for ensuring communication between SAP and its employees.
#Unfiltered
Methodologies and Definitions
#Unfiltered:27 Our employee engagement survey runs twice a year to measure key people metrics, engagement drivers, and employee sentiment. #Unfiltered is a demonstration of our commitment to listen regularly to our employees and act together on their feedback. In 2025, we ran surveys in April and October to gauge sentiment on employee engagement, leadership, health and well-being, and other topics. The average scores from both surveys were used to calculate the full-year Employee Engagement Index, Business Health Culture Index and Leadership Index.
Employee
Engagement Index (EEI): For more information, see the Incorporation
by Reference section of the Appendix  .
.
Business
Health Culture Index (BHCI): In 2025, we revised the BHCI definition by adding equal opportunities
as a new component of the index and replacing one of the health and well-being questions. For more information, see the Incorporation
by Reference section of the Appendix .
Leadership Index (LI): In 2025, we replaced the Leadership Trust Net Promoter Score with our new Leadership Index (LI). The LI is the percentage of favorable responses across six questions in the #Unfiltered survey. It reflects our leadership philosophy of “Develop People,” “Drive Transformation,” and “Deliver Results,” and also assesses trust in a leader’s competence, integrity, and in their care and concern for employees. By combining these components, the LI offers a nuanced view of leadership and gives leaders actionable bottom-up feedback. To ensure a reliable baseline, the six questions used to calculate the new LI were included in the November 2024 #Unfiltered survey.
Inclusion Index: The Inclusion Index from our #Unfiltered survey demonstrates the extent to which SAP successfully offers employees a working environment that promotes a culture of inclusion. This index was calculated from the responses to three questions in the #Unfiltered April 2025 survey.
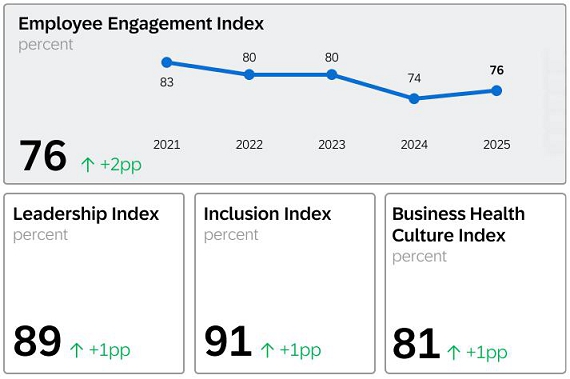
27 81,911 employees participated in the #Unfiltered survey in April (response rate: 74%); 82,362 employees participated in the #Unfiltered survey in October (response rate: 72%). All headcount-relevant employees, PhD students, and vocational trainees at SAP are eligible to take the survey unless: 1) They are employed by one of the acquired companies (SmartRecruiters, Taulia, or WalkMe); 2) they have taken the Voluntary Early Retirement Program (VERP); or 3) they are on long-term sick-leave. For Germany, non-headcount-relevant employees who have been with SAP for six months or longer are also invited to complete the survey. In 2024, 83,042 employees participated in the #Unfiltered survey in June (response rate: 76%); 77,577 employees participated in the survey in November (response rate: 70%). Simplification of Processes: In 2025, as part of broader updates to SAP’s survey landscape, the “Simplification of Processes” score was transitioned out of the #Unfiltered survey and will no longer be reported as part of the #Unfiltered metrics.
| 160/326 |
|
Integrated Report 2025 | ||||
| To
Our Stakeholders |
Combined Management Report |
Consolidated
Financial Statements IFRS |
Additional Information | ||
The EEI is part of the short-term, one-year performance-based compensation (Short-Term Incentive, STI) of the Executive Board members. Employee Engagement rose two percentage points in 2025 to 76% (2024: 74%), landing at the mid-point of the target range for 2025 of 74% to 78%.
The BHCI is part of the long-term, three-year performance-based compensation (Long-Term Incentive, LTI) of the Executive Board members. We revised the composition of this index in 2025. The BHCI score for 2025 was 81%, which is at the midpoint of the target range of 80% to 82%, and one percentage point higher than the revised 2024 score of the index (2024: revised score 80%; reported score 78%). Based on the revision of the index composition we raised the 2025 target range to 80% to 82%, ensuring the same level of ambition for this performance measure (2024: reported target range 78% to 80%). For more information about the EEI and BHCI results and outlook for 2026, see the Performance Against Our Outlook for 2025 and Outlook for 2026 sections in the Combined Management Report.
The Leadership Trust NPS was measured for the last time in 2024, scoring 68%, and has been replaced by the LI, which is based on a standard methodology. The LI currently stands at an 89% favorable rating, one percentage point higher than when it was last measured. The scores for each of the six items that make up the LI have remained largely at the same level, with no specific item showing a notable change.
We also track the Inclusion Index of our own workforce through our #Unfiltered survey, which allows us to take a deeper look at the aspects of gender, age, job level, and geography for all employee engagement scores. The Inclusion Index reached a strong 91% in 2025, up one percentage point on 2024.
We anticipated that some of the employee-relevant initiatives we implemented in 2025 would affect employee engagement. Our #Unfiltered employee engagement survey is designed to gauge employee sentiment at aggregated level and measures the cumulative effect of such initiatives. A year-over-year comparison of the index scores from #Unfiltered shows that they increased in 2025, indicating that the initiatives had no negative impact and that employee sentiment remained stable. This suggests that our communication, and the enablement and change support we provided, were at least sufficient to mitigate any potential adverse effects.
We use a number of feedback instruments within our continuous listening approach to assess how individual employees experience the various touchpoints along the employee lifecycle. This approach enables us to understand how employees perceive SAP, to enhance our processes, and to optimize the employee experience. We act on the feedback we receive from these various listening measures to improve organizational and team development. Our follow-up activities are driven by a two-fold approach: global focus areas are coordinated centrally, while team-related activities are coordinated within the respective teams.
For information about our engagement with workers’ representatives, see the Social Dialogue, Involvement of Works Councils section.
Global People Compliance
Our Approach and Policies
SAP is committed to providing a workplace that is free from discrimination and harassment. Discrimination, harassment (including sexual harassment), retaliation, and all forms of inappropriate workplace conduct are prohibited at SAP. Our Global People Compliance team supports this commitment through our Global Anti-Discrimination Policy, objective investigations, and training courses.
| SAP Global Anti-Discrimination Policy | |
| IRO-relevant topics covered |
Work-related discrimination, harassment, bullying, and retaliation in all work-related settings, including at the office, on business trips, and at business-related social events, and in all forms of communication (email, regular mail, phone) used by SAP employees, employees of other employers, contractors, vendors, customers, suppliers, visitors, and partners. The policy covers discrimination on the grounds of racial and ethnic origin, color, sex, sexual orientation, gender identity, disability, age, religion, political opinion, national extraction or social origin, and other forms of discrimination specified in European Union and national law.1 The purpose of the policy is to enforce our commitment to treating all employees with dignity and respect in a workplace that is free from discrimination and harassment. Cases of discrimination, harassment, or retaliation by any SAP employee will be treated as disciplinary matters and may constitute a justifiable cause for termination. |
| Accountability | Head of Employment & Labor Relations, People & Culture Germany |
| Value chain coverage | Own operations and value chain, where SAP employees are affected |
| 161/326 |
|
Integrated Report 2025 | ||||
| To
Our Stakeholders |
Combined Management Report |
Consolidated
Financial Statements IFRS |
Additional Information | ||
| Applicability | All employees of SAP, including the Executive Board |
1 Subject to policy-owner approval, some countries and regions (such as the United Arab Emirates (UAE) and some states in the United States) adopt local addendums to the global policy to comply with legal or other local requirements that contradict or go beyond this framework.
The policy is monitored on a regular basis and updated as necessary. It is available to all our employees on our internal employee portal and on the Global People Compliance SharePoint.
Our Actions and Targets
| IRO Identifier | Sub-Topic | Targets/Metrics |
|
Positive impact S1-IRO10 |
Measures against violence and harassment in the workplace | To achieve the objectives of our policy, we have set as a target an annual completion rate of 85% for our global anti-discrimination and anti-harassment training course. For 2025, the completion rate was 99% (2024: 97.1%).1 The course is a mandatory for all employees (except for employees of SAP Deutschland). The completion rate is determined without employees’ involvement, as it is compliance training. For more information about the course, see below. |
|
Negative impact S1-IRO11 |
1 The course and completion rate do not include employees at Taulia, Volume Integration, WalkMe, or SmartRecruiters.
All identified impacts related to discrimination and harassment are addressed by our Global Anti-Discrimination Policy. Most of the incidents investigated by our Global People Compliance team relate to psychological harassment. Incidents are spread evenly across the Company, with no indication of any systematic increase among certain employee groups or regions.
To promote awareness of the Global Anti-Discrimination Policy, we released a global anti-discrimination and anti-harassment training course (including regional legal nuances) for completion once a year. Covering all aspects of the Global Anti-Discrimination Policy, it explains how to report incidents and how the investigation process works. We track the completion rate of this training course using the same internal learning platform that is used to deliver training content to employees globally. Progress toward this target is monitored on a regular basis through centrally managed training dashboards. To meet their responsibility for overseeing the completion of compliance training by their direct reports, managers are provided with their own dashboards. Further, we offer internal information covering the various complaints channels on our Global People Compliance SharePoint and our internal portal. There are also virtual enablement sessions available specifically for internal functions such as People & Culture. You can find more information about the different complaint channels below.
In addition, our Global People Compliance team offers preventive training courses (“Is it OK?” training and “Preventing Workplace Discrimination and Harassment” training) aimed specifically at SAP managers. These courses are either offered on demand, based on the compliance situation in the different regions, or can be requested by organizations themselves.
SAP encourages all employees to report potential violations of international human rights or environmental standards.
Employees who wish to raise a concern or complaint can do so through the following channels:
| – | Our Speak Out at SAP tool, either online or through the tool’s helpline option. For more information, see the Speak Out at SAP section. |
| – | Resolver, a global case management system that allows employees to report concerns and that helps our Global People Compliance team manage concerns and investigations efficiently. The case management system gives our People Compliance function more transparency and visibility into the concerns raised across the various regions, countries, and Board areas, and into the nature of those concerns. Global People Compliance uses the data it receives to identify trends and take appropriate action to mitigate risks. Our People Compliance complaints channels are available to all our employees, including temporary staff. |
| – | An internal SAP app that all employees can use to report concerns on a mobile device. |
The Global Ombuds Office provides an additional point of contact for all employees. It operates as an informal, independent, and confidential channel (in addition to SAP’s formal complaint mechanisms) and offers a safe place to discuss any workplace concerns and to explore ways of addressing them. The Global Ombuds Office promotes constructive conflict resolution through counseling, coaching, mediation, workshops, training courses, and other measures. In the case of compliance-related topics, the Global Ombuds Office helps guide employees to the respective formal channels.
Complaints Management and Investigations
We have established a complaints management and investigations procedure that provides SAP with a globally consistent and comprehensive approach to effectively managing concerns about potential or actual violations of human rights or environmental
| 162/326 |
|
Integrated Report 2025 | ||||
| To
Our Stakeholders |
Combined Management Report |
Consolidated
Financial Statements IFRS |
Additional Information | ||
standards in accordance with the German Supply Chain Act. SAP is also guided by international frameworks such as the United Nations Guiding Principles on Business and Human Rights (UNGPs), under which companies must provide an effective grievance mechanism for all human rights topics.
We respond to concerns and complaints about behavior that is contrary to human rights or environmental standards by conducting an objective investigation. If the investigation concludes that prohibited conduct has occurred, we take action commensurate with the facts of the investigation and the severity of the violation. Reported incidents are reviewed and evaluated for investigative follow-up actions.
Global People Compliance reviews the facts collected during each investigation in detail to determine the measures required to minimize violations. In a further step, the team follows up with the affected employee within an appropriate timeframe after the investigation has ended to check whether they are experiencing any additional issues. The team also reviews data on a regular basis to identify compliance hot spots and areas in which additional training is needed.
Once a quarter, we analyze regional specifics with respect to reported concerns and investigated violations of the SAP Global Anti-Discrimination Policy and implement additional preventive training measures for specific target groups (such as manager communities) at the respective locations.
We review the effectiveness of our complaints procedure once a year, or ad hoc if required. As part of this continuous improvement process, we consider the eight effectiveness criteria defined in the Management of Complaints Assessment (MOC-A) tool from CSR Europe, namely whether the procedure is legitimate, accessible, predictable, equitable, transparent, rights-compatible, a source of continuous learning, and dialogue-compatible. We are currently focusing on enhancing stakeholder engagement to increase the effectiveness of our complaints management procedure.
SAP strictly prohibits retaliation against anyone who, in good faith, reports violations of human rights or environmental standards, or who participates in an investigation conducted by Global People Compliance, even if the investigation does not ultimately substantiate the concerns raised. Dishonest, bad faith, or otherwise abusive reports (such as false personal attacks aimed at specific individuals) are prohibited and may result in disciplinary action.
Our compliance teams conduct investigations in a professional and impartial manner in accordance with our policies and, to ensure confidentiality, are required to sign non-disclosure agreements.
Metrics on Material Topics
Identified Incidents, Complaints, and Severe Human Rights Impacts
Complaints are filed through our various complaints mechanisms. In 2025, 575 complaints were filed by email (2024: 445), 300 in our Speak Out at SAP tool (2024: 116), and 336 in Resolver (2024: 438).
We conducted a total of 130 investigations into discrimination and 402 investigations into harassment (338 into psychological harassment; 64 into sexual harassment) in 2025 (2024: 107 investigations into discrimination, 447 investigations into harassment (362 into psychological harassment, and 85 into sexual harassment)). The number of investigations that were substantiated as policy violations was significantly lower than the total number of investigations.
At the time of publication, no severe human rights incidents had been recorded, nor had any complaints been filed to National Contact Points for OECD Multinational Enterprises. For more information about human rights, see the Human Rights section.
Social Dialogue, Involvement of Works Councils
Our Approach and Policies
We respect the rights of our employees to organize and to be represented by labor unions and other bona fide employee representatives in accordance with local laws, and, as such, we engage in constructive dialogue with employee representatives (see our Human Rights Commitment Statement). Please find more information in the Human Rights section. In addition, we have an Employee Involvement Agreement (EIA), which is described below under 1. SE Works Council (Europe). Where local laws restrict the establishment of certain employee representations, we are open to other forms of employee representation that are not prohibited under local law.
| 163/326 |
|
Integrated Report 2025 | ||||
| To
Our Stakeholders |
Combined Management Report |
Consolidated
Financial Statements IFRS |
Additional Information | ||
Our Actions and Targets
| IRO Identifier | Sub-Topic | Targets/Metrics |
|
Positive impact S1-IRO1 |
Freedom of association | There are no targets related to these impacts because all matters that relate to social partners (works councils, labor unions, and other employee representation bodies) are governed in the first instance by local laws and agreements. Consultation and information topics covered by the SE Works Council (Europe) are governed by the Employee Involvement Agreement. |
|
Negative impact S1-IRO2 |
We have structures in place to ensure that the rights of employees to representation are observed. Nevertheless, individual employees or groups of employees could still be unintentionally subjected to negative impacts. Were this to happen, SAP would act within the respective legal framework and according to the facts of the case.
The two main parties in social dialogue at SAP are:
1. SAP SE Works Council (Europe)
The SAP SE Works Council (Europe) (“SE WoC (Europe)”) brings together employee representatives from the 28 EEA (European Economic Area) countries28 in which SAP SE has subsidiaries, and ensures the representation of their rights to be informed and consulted. The composition, competence, and procedures of the SE WoC (Europe) are governed by the EIA. Employees can find information about the EIA, the SE WoC (Europe), the matters that must be addressed to this body, and the relevant contact persons on our internal portal.
The EIA governs the rights of the SE WoC (Europe) to be informed about and consulted on the following:
| – | Matters that affect two or more countries in the EEA |
and
| – | Specific matters governed by the EIA, such as strategy, economic and financial situation, development of business, trend of employment, investments, reorganizations considered to be substantial, introduction of new working methods and processes, relocation of undertakings, mergers or split-ups, cutbacks or closures, collective redundancies, changes to compensation structures, diversity and demographic trends, and other topics presented by central management.29 |
The SE WoC (Europe) is the representative body for SAP employees across the EEA. When management consults it about a proposed measure, the SE WoC (Europe) submits an opinion, which, although not binding, is included in further considerations. Since all member countries have their own laws and may also have social partners and bargaining and other agreements in place, the opinion expressed by the SE WoC (Europe) cannot determine what is implemented locally, or how.
SAP’s central management is responsible for ensuring compliance with the EIA.
The SE WoC (Europe) meets every quarter at SAP headquarters in Walldorf to discuss matters covered by the EIA. Additional meetings are scheduled between the quarterly meetings as required.
2. Global Labor Relations and P&C Country Heads
Employees in many countries also have a legal right to establish representation at local level. The matters that SAP is obliged to involve social partners in, depend on national laws and the agreements that are in place at entity level. SAP enters into collective agreements with labor unions and concludes works agreements with works councils as required by law and, where appropriate, also in countries where there is no legal requirement.
We liaise closely with social partners in these countries to address matters in accordance with national laws and local needs.
Global Labor Relations (GLR), our employee and labor relations function, liaises directly with the SE WoC (Europe) and with the works councils and labor unions in France and Germany. In other countries, local P&C country heads are tasked with engaging with employee representatives. GLR works with the P&C country heads to ensure that employees’ rights to representation are respected. Further, employees have the right to address work-related issues specific to their country to their local representatives.
28 The 28 EEA countries are: Austria, Belgium, Bulgaria, Croatia, Cyprus, Czech Republic, Denmark, Estonia, Finland, France, Germany, Greece, Hungary, Ireland, Italy, Latvia, Lithuania, Luxembourg, The Netherlands, Norway, Poland, Portugal, Romania, Slovakia, Slovenia, Spain, Sweden, United Kingdom.
29 The Executive Board of SAP SE or the management level within the SAP Group that is in charge of or entrusted with a matter, and its respective representatives
| 164/326 |
|
Integrated Report 2025 | ||||
| To
Our Stakeholders |
Combined Management Report |
Consolidated
Financial Statements IFRS |
Additional Information | ||
Where violations occur because the responsible business fails to involve GLR or P&C country heads, despite being obliged to do so, SAP will make the business contact aware of the violation to prevent future occurrences. The Executive Board, P&C country heads, managing directors, and/or responsible business divisions inform all employees, including those without representation, about the content and outcome of social partner involvements and other important matters.
Employees can also raise matters directly with their representatives, P&C country heads, and other appropriate SAP contacts in their countries.
GLR has regular meetings with the chairpersons of the SE WoC (Europe) and of the local representative bodies of the respective entities in Germany and France, and with the P&C country heads in other countries, who in turn have regular meetings with the local social partners to discuss topics, strengthen collaboration, and prevent negative impacts.
Regular meetings between local social partners and Executive Board members, the Global Labor Relations team, and other roles, and between social partners and local P&C country heads, ensure that all parties have frequent opportunities to discuss the effectiveness of actions and initiatives.
Metrics on Material Topics
Collective Bargaining Agreements and Social Dialogue Coverage
Terms of employment and working conditions are determined primarily by local laws and can be regulated in more detail through bargaining agreements and other agreements that are negotiated with the social partners in certain countries.
Employees can access these agreements on the internal portal for their respective country, along with information about local contacts and a list of countries where SAP has social partners. In addition, SAP provides employee training to increase awareness of social partner rights.
Where agreements exist between an SAP entity and a social partner, the relevant group of employees at this entity (named in the respective agreement) fall under this agreement. The SAP entity concerned must therefore abide by the content of the agreement (in addition to local law) for the relevant group of employees for as long as that agreement is valid.
In 2025, 34% of SAP employees were covered by collective bargaining agreements (2024: 36%).
In the EEA, SAP had 264 collective bargaining agreements (2024: 262). Outside the EEA, 5% of our employees were covered by collective bargaining agreements (2024: 5%).
In 2025, 49% of our employees globally were covered by workers’ representatives (2024: 50%).
For a breakdown of collective bargaining coverage and workplace representation by country/region,30 see the table below, which presents consistent data for both 2024 and 2025.
| Collective Bargaining Coverage | Social Dialogue | ||
| Coverage rate | Employees – EEA | Employees – Non-EEA | Workplace representation (EEA only) |
| (for countries with >50 employees representing >10% of total employees) |
(for regions with >50 employees representing >10% of total employees) |
(for countries with >50 employees representing >10% of total employees) | |
| 0% – 19% | APJ, Americas | ||
| 20% – 39% | |||
| 40% – 59% | |||
| 60% – 79% | |||
| 80% – 100% | Germany | Germany |
30 Regions: EMEA (Europe, Middle East, and Africa), Americas (North America and Latin America), and APJ (Asia Pacific Japan)
| 165/326 |
|
Integrated Report 2025 | ||||
| To
Our Stakeholders |
Combined Management Report |
Consolidated
Financial Statements IFRS |
Additional Information | ||
Total Rewards
Our Approach and Policies
SAP is committed to providing fair pay and adequate wages. However, systemic (for example, computational errors or regulatory oversight) and individual (such as decision-making biases) incidents may occur that could have a negative impact on employees, regardless of their attributes. SAP conducts an analysis at least once a year to ensure that its employees are paid fair and adequate wages. This analysis covers all employees at SAP,31 regardless of specific personal criteria, such as gender or age. Our commitment to fair and competitive pay is fundamental to our compensation investment strategy and is formally described in our Global Policy on Compensation Management. This policy and the culture we create at SAP impact all employees and ensure there is no pay discrimination.
31 Does not include employees at Taulia, Emarsys, Volume Integration, WalkMe, or SmartRecruiters
| 166/326 |
|
Integrated Report 2025 | ||||
| To
Our Stakeholders |
Combined Management Report |
Consolidated
Financial Statements IFRS |
Additional Information | ||
| SAP Global Policy on Compensation Management | |
| IRO-relevant topics covered |
The policy details the frameworks and principles that are in place to ensure fair and adequate wages for employees, taking into consideration their role, proficiency, and local market conditions. It is connected to SAP’s global job architecture, which helps managers determine the appropriate job title, career level, and expectations for an employee. It gives guidance to managers on how to determine an appropriate wage (total target cash) for an employee during the hiring process, for internal career moves, during the Annual Compensation Review (ACR), and for any off-cycle adjustments. It also sets out the overall principles of fair pay and defines the various roles and responsibilities. Fair pay is an integral part of the Global Policy on Compensation Management. The policy establishes the following principles: – Target compensation is market-based and internally equitable. – Pay is for contribution and impact in alignment with business results. – Pay ranges and criteria for compensation decisions are transparent. The policy states explicitly that SAP leadership expects all managers to fully support SAP’s fair pay commitment and to approach any compensation decisions with this commitment in mind. |
| Accountability | Owned and overseen by the Global Head of Total Rewards. Implementation is the responsibility of all people managers, up to and including Board members, HR, and Finance. |
| Value chain coverage | Own operations |
| Applicability | All SAP employees worldwide except for executives (executives are subject to separate global executive rewards policies).1 |
1 Unless prevented by legal requirements. Local policies may be established to complement the global regulations, but in case of a conflict, the global policy prevails. The policy does not apply to employees at Taulia, Emarsys, Volume Integration, WalkMe, or SmartRecruiters.
Managers can access the full policy on SAP’s internal employee portal, where there is also a concise version available for employees. Key aspects of the policy are highlighted to managers during compensation decisions (for example, during the annual compensation review) along with in-tool enablement, guidelines, and supporting materials. Key People & Culture stakeholders who support managers are provided with relevant materials to help them interpret the policy when consulting with managers and experts on its content, and local regulations and considerations are available to managers and People & Culture stakeholders through a ticketing process.
At SAP, we strive to create a culture of mutual respect and inclusion and to ensure that our compensation practices are fair and transparent. As a foundational element of SAP’s inclusive culture, we are committed to providing equitable pay for employees in job groupings with similar market value, while remaining competitive with the external marketplace. Fair pay is an integral element of the Global Policy on Compensation Management as detailed above. Furthermore, SAP’s compensation investment strategy takes a “fair pay first” approach, meaning that the top priority for compensation investment distribution is to cover any identified need for pay adjustments to bring all employees into the correct pay ranges and ensure fair pay for work of equal value.
Many members of the People & Culture organization are responsible for aspects of fair pay and adequate wages, including the People & Culture business partners (P&C BPs) and the Total Rewards team.
Our Actions and Targets
| IRO Identifier | Sub-Topic | Targets/Metrics |
|
Negative impact S1-IRO5 |
Gender equality and equal pay for work of equal value | We want all of our people to be paid fairly and equitably. In 2022, we began making annual global pay adjustments to ensure that the compensation of at least 99% employees is within their pay ranges and equitable relative to their peers.1 We meet that target (as evidenced by the data after the annual adjustments). In addition, we have met our target of pay range transparency (99.9% of employees) and we continue to assess this.1 We are targeting a full action plan in relation to the EU Pay Transparency Directive, which comes into force in 2026. We work with social partners and employee representatives to set our payment-related targets, assess our pay practices, and identify areas for improvement. Where legally required to do so, we inform them about our performance against targets. |
1 Does not include employees at Taulia, Emarsys, Volume Integration, WalkMe, or SmartRecruiters
We take various steps to manage the impact of our fair pay initiatives. We keep our workforce informed about our approach to fair and competitive pay by means of informational materials and commitments that are publicized internally. In addition, managers have access to real-time analytics that include gender breakdowns, and are prompted to adhere to our fair pay commitments when planning compensation and career moves for employees, such as during the annual compensation review (ACR). We also actively engage with external stakeholders on industry best practices (taking part, for instance, in case studies and conferences).
| 167/326 |
|
Integrated Report 2025 | ||||
| To
Our Stakeholders |
Combined Management Report |
Consolidated
Financial Statements IFRS |
Additional Information | ||
SAP follows a total target cash (TTC) approach, meaning that employees receive a regular base salary that is paid monthly or semi-monthly (depending on the location) and a target bonus that is paid annually or quarterly and linked to individual performance. SAP maintains salary structures for every career level and country in which employees are located. Establishing TTC ranges for all jobs in SAP’s global job architecture, these pay structures are aligned with the market and are reviewed at least once a year to determine whether adjustments are required. If required, such adjustments are made and reflected in the compensation framework. SAP plans to begin implementing compensation program enhancements in 2026 as part of a multi-year effort to transform our total rewards framework holistically and allow clearer compensation structures and differentiated rewards. This evolution focuses on how compensation is allocated based on performance, career level, the external market, and internal equity to ensure we are providing the right compensation package at all career stages to support our future growth.
In our Global Policy on Compensation Management, we commit to publishing the TTC ranges (that is, base salary and target bonus) based on job/grade level internally, and to using market data benchmarks based on the relevant industry- and geographical data to review the ranges at least annually. We also commit to an annual global review of internal pay equity, including, but not limited to, any statistically relevant gender pay gaps. If significant pay gaps are identified, we implement pay adjustments to close them and ensure equal pay for substantially similar work. Furthermore, any factors we identify in our underlying compensation processes and practices that have directly contributed to those pay gaps are modified to prevent future occurrences. These actions are intended to ensure manager compliance and to verify that our established processes support an environment of equal pay for substantially similar work.
Adherence to the SAP Global Policy on Compensation Management is monitored by means of two annual analyses: 1) adherence to pay within the pay range (to ensure that all employees are paid within their designated pay range); and 2) assessment of pay equity within the ranges (to ensure that all employees are paid equitably). SAP adjusts an individual’s TTC if it falls below the recommended minimum or falls below the acceptable spread of differences in pay relative to similar peers. Employees can look up the pay range that is relevant to their role in an internal tool.
Further details of these actions are outlined below.
Annual processes:
| – | During the ACR, SAP conducts two analyses, as described above, and dedicates central budgets for making the adjustments required as per the findings of those analyses. After the ACR, SAP performs an analysis of the ACR outcomes that includes data points related to TTC, equity long-term incentives, and bonus distribution. These data points include, but are not limited to, the number of cases where fair pay adjustments were recommended and the average adjustment amount, which is further broken down by gender. We report on the post-ACR analysis to the Executive Board and all managers. Top-level managers have the option to consult with People & Culture experts on the results and next steps. If any concerns are identified in connection with the distribution, People & Culture experts can guide managers and leaders through the next steps. |
| – | We conduct an annual analysis32 to ensure that all employees are paid at least the minimum wage mandated by local laws. In regions without a legally defined minimum wage, or in the event that living wages are above the legally defined minimum wage, we adhere to the living wage standards. The data for defining a living wage is provided by the external organization “WageIndicator.” |
On a continuous basis:
| – | We remind managers of our commitments to fair and competitive pay as part of career and compensation decisions (such as internal and external hiring, and off-cycle compensation changes). They are required to stay within the pay ranges when making compensation decisions, and can use analytics to help them make fair decisions. For instance, they have aggregated information at their disposal showing how other employees in the same role and same location are paid within their pay range, as well as a dashboard that provides insights into the career and compensation information of their own team. All managers have the option of consulting with People & Culture experts when making compensation and career decisions. |
| – | We provide a dedicated, ringfenced budget for any corrections that are needed to ensure fair and competitive pay for all employees. Tools used for core activities include: BetterComp (as a resource for external competitiveness); an in-house regression analysis tool (for pay equity analysis); My Team Dashboard and Success Map reports for manager analytics related to their own teams; the Compensation Assistant tool for managers to view pay ranges and aggregated information about pay related to specific roles and locations; and the Success Map compensation planning tool and off-cycle adjustments options for making decisions (with built-in parameters to ensure compliance with pay ranges and legal requirements). |
32 Does not include employees at Taulia, Emarsys, Volume Integration, WalkMe, or SmartRecruiters
| 168/326 |
|
Integrated Report 2025 | ||||
| To
Our Stakeholders |
Combined Management Report |
Consolidated
Financial Statements IFRS |
Additional Information | ||
Metrics on Material Topics
Methodologies and Definitions
Annual total remuneration ratio: In determining the annual total remuneration ratio, we utilize the total target cash on a full-time basis, which includes both base salaries and target bonuses as of the year end. This approach ensures that the compensation of part-time employees is accurately reflected. We also include the LTI that has been granted to the individual employees during the reporting year, valued at grant date.33
To calculate the annual total remuneration ratio, we first identify the employee with the median compensation: we include Executive Board members in this calculation, but not the highest-paid employee. For a more comprehensive analysis, we also include benefits for the median employee, as well as for five employees above and below the median. These 11 data points are then averaged to calculate the remuneration of the median employee and compare it with that of the highest-paid employee.
Gender pay gap: We define the unadjusted gender pay gap as the difference in average pay levels between female and male employees, expressed as a percentage of the average pay level of male employees. Pay levels are calculated using total target cash on a full-time basis, which includes both base salaries and target bonuses as of the year end, to ensure an accurate representation. We also include the LTI, valued at grant date, that was granted to the individual employees during the reporting year.34
Family-related leave:
Parental leave applies when an employee becomes a parent, adopts a child, or becomes a child’s legal guardian. It can be taken by:
The primary caregiver: the parent who takes primary responsibility for caring for the child following its birth or adoption.
The secondary caregiver: the parent who does not have primary responsibility following the birth or adoption of a child.
Family care leave provides employees with time off to care for a family member who requires care or support for serious medical reasons.
Annual Total Remuneration Ratio
For 2025, our annual total remuneration ratio was 105 (2024: 87), which is one of the lowest among other megacap multinational technology companies (as disclosed in their latest SEC Form DEF35 14A proxy statements) with whom we compete for talent. For more information about employee compensation, see the Notes to the Consolidated Financial Statements, Note (B.2). For more information about Executive Board members compensation, see the SAP Compensation Report 2025.
Gender Pay Gap
In 2025, the unadjusted gender pay gap was 21% (2024: 20%). We attribute this largely to the effects of SAP’s demographics, including the ratio of male to female employees across seniority levels, the types of roles we offer, and the geographies our employees work in. We used established statistical methods to account for the effects of demographic attributes that are commonly used for such gender pay gap adjustments, including the distribution of employees across functional roles, seniority levels, and geographies. Applying these variables, the adjusted gender pay gap was 5% (2024: 5%). We are committed to advancing equal opportunity by identifying and removing systemic barriers across all demographics to ensure fair access at every level globally. For more information about our ongoing efforts, see the Inclusion and Equal Opportunity section.
Family-Related Leave
At SAP, we are committed to promoting a healthy work-life balance as a way of ensuring a work environment in which everyone can thrive. Beyond the standard legal requirements, our employees have access to a variety of leave options that are offered as part of SAP’s benefits package. These include, but are not limited to, parental leave and family care leave, which are available in certain countries to support a better work-life balance.
All our permanent employees are entitled to at least one of two types of family-related leave (parental leave and family care leave), and 86% (2024: 86%) are entitled to both types of leave. In 2025, 23% of employees made use of them (2024: 22%), 58% of whom were male and 42% female (2024: 58% were male and 42% were female). This breakdown is reflective of our current gender
33 This does not include employee share purchase plans and corresponding cover plans and does not include employees at SmartRecruiters.
34 This does not include employee share purchase plans and corresponding cover plans and does not include employees at SmartRecruiters.
35 Definitive Proxy Statement
| 169/326 |
|
Integrated Report 2025 | ||||
| To
Our Stakeholders |
Combined Management Report |
Consolidated
Financial Statements IFRS |
Additional Information | ||
demographics and includes only those countries where both types of leave are available. In countries where family care leave is not yet available, we are committed to addressing the gap to ensure consistent access for our employees globally.
For more information about our flex work approach, see the Flexible Working at SAP section.
For more information about our health offerings, see the Health, Safety, and Well-Being section.
Social Protection
All permanent employees are covered by social protection, through public programs and/or through benefits offered by SAP, against loss of income due to major life events including sickness, employment injury, acquired disability, parental leave, and retirement. Coverage for temporary and hourly-paid employees in some countries (including China, India, and Singapore) may differ based on local regulations.
We protect employees against the loss of income due to unemployment in accordance with applicable law. In some countries, they are protected by benefits that we provide. Eligibility for these benefits, and the benefits themselves, vary by country and by employment contract type (for example, whether employees are on permanent or temporary contracts, or are temporary, hourly-paid staff), and depend on the reason why employment was terminated. Therefore, not all our employees are protected against the loss of income due to unemployment; there is no protection in, for example, Hong Kong, India, and South Africa.
Inclusion and Equal Opportunity
Our Approach and Policies
SAP’s inclusion strategy is a core component of our corporate governance and commitment to equal opportunity. It ensures alignment with global standards, embeds inclusive and responsible people practices, and supports innovation and long-term business performance. Our diverse workforce strengthens our ability to serve global markets and reinforces SAP’s reputation as an ethical and responsible employer.
Our inclusion strategy also delivers clear business benefits, including higher employee engagement and productivity. SAP measures inclusion outcomes for all headcount-relevant employees (for a definition of headcount-relevant, see the Characteristics of Our Own Workforce section). Our initiatives and communications also address interns and other temporary staff. Our actions and communications are designed to be consistently equitable and to avoid any perception of exclusion or preferential treatment.
SAP is committed to providing equal opportunities to all employees. We are moving beyond stand-alone programs to ensure systemic, fair, and meritocratic practices that shape the employee lifecycle end to end. This approach is anticipated to create better visibility and access to the skills and abilities of our diverse talent, and to strengthen organizational capabilities across SAP. SAP adheres to applicable nondiscrimination and employment regulations in all countries where we operate, ensuring a globally consistent commitment to equality and inclusion. As an illustration of SAP’s dedication to equality and inclusion, our Equal Employment Opportunity Policy in the United States ensures compliance with legal requirements while reinforcing fair access to opportunities and equal treatment in all aspects of employment. The policy is implemented by the head of People & Culture in North America. Employees, regardless of their background, could be adversely affected if equal opportunity were not consistently upheld. While individual concerns may arise, SAP is confident that any such occurrence would reflect isolated situations rather than a systemic issue.
In November 2025, SAP established a new, joint organization, Social Responsibility, Inclusion & Communities (SRI&C), by bringing Corporate Social Responsibility (CSR) and the Global Inclusion Office (GIO) together as one unit within People & Culture. Combining these teams elevates our strategic alignment, links our people priorities to broaden our societal impact, and expands the spectrum of communities we serve.
The new structure will strengthen employee engagement and directly connect to education and skills development for wider community impact. Inclusion and equal opportunity remain top priorities, reinforced by Executive Board commitment, as we build a skills-based people ecosystem that is inclusive of everyone.
Inclusion Commitment
We express our commitment to inclusion, equality, and accessibility through our Inclusion Commitment, which is available on our internal employee portal and externally on our website. It applies to our entire workforce, including temporary staff and interns, and is overseen by the Head of SRI&C. Beginning in 2026, governance will be provided by the Inclusion & Impact Advisory Council, which brings together respect-based perspectives from across SAP to guide our strategy and execution.
| 170/326 |
|
Integrated Report 2025 | ||||
| To
Our Stakeholders |
Combined Management Report |
Consolidated
Financial Statements IFRS |
Additional Information | ||
Our inclusion commitment also informs how we design our products and services. By embedding inclusive design principles and safeguards such as the AI Ethics Steering Committee, we help ensure our solutions are developed and applied in ways that avoid discriminatory or biased outcomes. For more details, see the Responsible AI section.
We focus on systemic inclusion by embedding transparency and fairness and by mitigating bias across all people practices—from hiring and development to benefits, policies, and learning—to strengthen the employee experience and organizational impact.
Our Actions and Targets
Methodologies and Definitions
Women in Senior Executive Roles (WiSER): In 2025, for compliance with applicable German law, we continued to track the “Women in Senior Executive Roles (WiSER)” KPI (excluding employees in the United States), which we previously referred to as “Women in Executive Roles.” The KPI now measures the first two levels below the Executive Board, rather than the first three. In compliance with U.S. legal requirements, employees based in the United States will no longer be included in this metric. We define “Women in Senior Executive Roles” as the percentage of women on the first and second organizational levels below the Executive Board, that is, those who are on group executive, senior executive, or executive level.
The first management level below the Executive Board comprises L1 leaders (that is, leaders who report directly to an Executive Board member) whose jobs are at group executive, senior executive, or executive level. The second management level comprises L2 leaders (leaders who report to an L1 leader) whose job is at group executive, senior executive, or executive level. We count the number of these employees in heads.
| IRO Identifier | Sub-Topic | Targets/Metrics |
|
Negative impact S1-IRO6 |
Gender equality and equal pay for work of equal value |
To achieve the objectives of the policy, the following targets apply to the respective IROs. Our inclusion goals align with several UN Sustainable Development Goals (SDGs), specifically those on gender equality (SDG 5), reduced inequalities (SDG 10), and decent work and economic growth (SDG 8). At SAP, we are committed to advancing equal opportunities across our workforce. Our approach is guided by data, industry benchmarks, and our long-term objectives, which we pursue in alignment with applicable legal and regulatory requirements. The proportion of senior executive roles at SAP currently held by women, tracked using the Women in Senior Executive Roles (WiSER) KPI (which does not include employees in United States), is 36.4% on the first level and 25.9% on the second level below the Executive Board. Our target is to reach a 30% share on the first level and a 25% share on the second level below the Executive Board (not including employees in United States) by June 30, 2027.1 For more information about WiSER, see the Methodologies and Definitions section above. SAP discloses its inclusion targets and progress annually in its Integrated Report. In addition, quarterly internal updates are shared with the Executive Board and Board area L1 leaders to ensure transparency, drive continuous improvement, and maintain alignment with SAP’s inclusion objectives. |
|
Positive impact S1-IRO9 |
Measures against violence and harassment in the workplace | |
|
Positive impact S1-IRO12 |
Diversity | |
|
Positive impact S1-IRO8 |
Employment and inclusion of persons with disabilities | We do not have a target related to this positive impact. Usage of accommodations, feedback from employees through employee network groups, and the number of colleagues self-disclosing their disability status will continue to help measure the effectiveness of our initiatives. |
1 This target does not include employees at Taulia, Emarsys, Volume Integration, WalkMe, or SmartRecruiters. We disclose this target as required by ESRS S1-5, paragraph 44.
In 2024, SAP met its voluntary goal of having 30% of management roles held by women, reflecting years of sustained and coordinated effort. While no new numerical target has been established, our commitment to advancing gender equality remains unchanged. We continue our efforts to strengthen representation across all management levels, with particular emphasis on the two levels below the Executive Board, as described above.
In 2025, our global aspirational goal of increasing the proportion of women in the workforce to 40% was discontinued. Going forward, measurements will be taken locally to enable more relevant and actionable progress tracking. We remain fully committed to making programs and activities accessible to everyone, across demographics, and ensuring that they comply in full with the legal requirements in every country where we operate.
To assess the impact of our inclusive processes and as part of our equal-opportunity culture, we monitor gender composition across career levels and at the various stages of the employee lifecycle, such as hiring, promotion, and retention. These insights are reported regularly to leadership, and in quarterly updates to the Executive Board to ensure success is measured by real, meaningful impact.
As part of this measurement framework, SAP tracks key indicators such as the Inclusion Index (for more information, see the #Unfiltered section), which reflects employees’ perceptions of inclusion; the percentage of employees who self-identify as having a
| 171/326 |
|
Integrated Report 2025 | ||||
| To
Our Stakeholders |
Combined Management Report |
Consolidated
Financial Statements IFRS |
Additional Information | ||
disability (in countries where data collection is permitted); and the gender pay gap (for more information, see the Total Rewards section), reinforcing our commitment to equal pay for equal work. These key indicators are complemented by program-level metrics, including participation in our Autism at Work program; workforce demographic data in the United States (as required by law); engagement in training, events, and inclusion initiatives; and ongoing feedback gathered through surveys and polls. Together, these data points help guide continuous improvement across the employee experience.
Program implementation is supported by teams across regions and business areas, with assistance from regional champions and volunteers who work to activate initiatives locally. At the same time, all leaders, managers, and employees share responsibility for fostering a welcoming and respectful environment. Hiring practices focused on ensuring equal employment opportunities will continue for all positions, based on various sourcing methods and interview panels. We will also work with talent development and management processes to provide equal opportunities for career progression and learning.
Promoting respectful behaviors is a priority, particularly at critical decision-making moments. To strengthen this expectation, we continue to expand access to workshops and micro-learning opportunities for managers and employees worldwide. Our learning portfolio helps our employees recognize and address assumptions and misconceptions in their professional lives which may adversely impact team dynamics and operational effectiveness. One example from our portfolio is the micro-learning courses on our Inclusive Mindset Challenge platform, which have reached more than 16,205 unique users globally since launch in 2022 (since launch to end of 2024: 15,815), increasing awareness of the fundamental expectation that everyone should be treated with respect. To support teams in translating these principles into daily practices, we also provide an internal branding toolkit with key inclusion resources, accessibility guidance, and ready-to-use design templates and graphics that help employees communicate and reinforce respectful and inclusive behaviors across SAP.
We strive to ensure that all employees feel equally valued at SAP, including persons with disabilities. We achieve this in the following ways:
| – | We remove barriers in both physical and digital environments to promote infrastructure and digital accessibility. |
| – | We provide flexible working models: Flexibility is an integral part of our People Agenda and an approach we began practicing—by offering a hybrid working model, for example—long before the COVID-19 pandemic. For more information about our flexible work models, see the Flexible Working at SAP section. |
| – | We employ an inclusive design methodology to develop SAP products that work for the widest possible range of human diversity. In collaborating with our vast network of researchers, developers, students, partners, industry leaders, entrepreneurs, academics, and SAP customers, we work to solve accessibility and other challenges through technological innovation. |
| – | We ensure that everyone, including people with disabilities, can utilize SAP software, by making accessibility a core priority for product quality and user experience. We also make sure that our buildings and facilities are fully accessible. |
| – | For more information about how we prevent discrimination through our SAP Global Anti-Discrimination Policy, see the Global People Compliance section. |
In 2025, we set up an Accessibility Center of Excellence (CoE) (workplace accessibility and neuro-inclusion), which reflects our increased focus on the inclusion of people with disabilities and on workplace accessibility. Our vision is to help create a world in which every individual is empowered by offering a fully accessible and inclusive environment. The purposes of the Accessibility CoE include driving learning and enablement, inclusive communications and marketing, accessible hiring processes, employee and candidate support services, digital accessibility, and accessible workplace infrastructure and facilities–and encouraging self-identification.
SAP supplements its internal accessibility assessments with insights from its Employee Network Groups (ENGs),36 which help identify emerging needs and guide the provision of accommodations. These accommodations include a range of assistive devices and accessible technologies that help employees perform their tasks effectively.
SAP’s 13 ENGs represent diverse identities and interests and serve as vital grassroots communities that connect employees with leaders. Through regular engagements with Executive Board members, ENGs provide direct feedback and actionable insights, helping shape a more inclusive and equitable culture across SAP. Externally, we participate in performance ratings and benchmarking through established indices, which are published annually. We are recognized globally for our efforts in fostering an inclusive workplace. The various awards we have received attest to our progress on creating equal opportunities and are included in
36 An employee network group (ENG) is a voluntary, employee-led diversity and inclusion initiative that is formally supported by SAP.
| 172/326 |
|
Integrated Report 2025 | ||||
| To
Our Stakeholders |
Combined Management Report |
Consolidated
Financial Statements IFRS |
Additional Information | ||
the full list of Employer of Choice accolades we won in 2025. We share our achievements on our internal website and in our external Employer of Choice Awards newsletter.
As part of our ongoing efforts to strengthen inclusion, we designed several global initiatives that will launch in 2026. These programs will also incorporate social responsibility to create a unified approach that links inclusion, community impact, and responsible business practices. These initiatives, available to all employees, include:
| – | Joint ENG & Volunteer Framework: a new framework to ensure structured engagement, closer collaboration and business alignment and impact. |
| – | Inclusion & Impact Amplifier Network: a global system of inclusion ambassadors that connects Board-area and functional efforts while empowering grassroots action at location level. |
| – | Inclusion & Impact Advisory Council: a cross-functional governance body, steered by SRI&C, that brings together leaders from People & Culture and other Board areas with ENG representatives to address opportunities to build a more inclusive culture. |
Ongoing priorities include embedding inclusion into People Agenda practices, expanding accessibility projects through the Accessibility CoE, scaling neuro-inclusion globally, and amplifying the visibility and impact of employee network groups.
Metrics on Material Topics
Methodologies and Definitions
Senior executive roles: In 2025, we changed the definition of senior executive roles to align better with SAP’s organizational and reporting structures. We define senior executive roles as jobs on the two organizational levels below the Executive Board that are at group executive, senior executive, or executive level.
Employees in senior executive roles by gender1
| 2025 | 2024 | |||
| Male | 201 | 69.1% | 256 | 70.1% |
| Female | 90 | 30.9% | 109 | 29.9% |
| Other | 0 | 0.0% | 0 | 0.0% |
| Not reported | 0 | 0.0% | 0 | 0.0% |
1 Both 2025 and 2024 numbers are presented using the new definition of senior executive roles. Does not include employees at Taulia, Emarsys, Volume Integration, WalkMe, or SmartRecruiters. The numbers for 2024 also do not include employees at LeanIx.
Employees in senior executive roles by gender and organizational level (excluding the United States)1
| 2025 | ||||
| Level 1 | Level 2 | |||
| Male | 28 | 63.6% | 120 | 74.1% |
| Female | 16 | 36.4% | 42 | 25.9% |
| Other | 0 | 0.0% | 0 | 0.0% |
| Not reported | 0 | 0.0% | 0 | 0.0% |
1 Does not include employees at Taulia, Emarsys, Volume Integration, WalkMe, or SmartRecruiters.
Employees by age group
| 2025 | 2024 | |||||
| Under 30 Years | 30–50 Years | Older than 50 Years | Under 30 Years | 30–50 Years | Older than 50 Years | |
| Employees | 16,482 | 72,923 | 21,992 | 16,143 | 70,709 | 23,121 |
In countries that permit the collection of disability data, the proportion of our workforce that self-identifies as having a disability is 1.1% (2024: 1.3%). Of those, 37.4% are women and 62.6% are men (2024: 39.2% were women and 60.8% were men).
Legislation on data collection and reporting for people with disabilities varies widely. Some countries are required by law to employ a certain percentage of people with disabilities, and impose penalties if the required numbers are not met. Other countries strongly encourage data collection but do not set any legal quotas, or do not have any specific legislation in this regard. In 2024, SAP started
| 173/326 |
|
Integrated Report 2025 | ||||
| To
Our Stakeholders |
Combined Management Report |
Consolidated
Financial Statements IFRS |
Additional Information | ||
rolling out a global disability self-identification project for the countries in which it is legally permitted to do so. SAP has legal entities and employees in 74 countries (2024: 73) and the project has already been implemented in 44 of them (2024: 43).37 Please note that the European General Data Protection Regulation (GDPR) considers health-related data as sensitive personal data. It is therefore not possible to collect disability information in countries that do not have specific legislation mandating or strongly recommending such practice. The disability metrics presented in this report, including the gender breakdown, are part of this data collection project.
People Development
Our Approach and Policies
To support our People Agenda in contributing to SAP’s business strategy and value generation, we have a dedicated People Growth and Leadership Excellence organization, led by our head of People Growth and Leadership Excellence. This officer is responsible for talent and leadership development, succession management, learning, performance management, university alliances, and SAP Next Gen, and for creating a workplace that offers career growth opportunities to all SAP leaders and employees.
To further promote people development, SAP’s integrated approach combines talent development, leadership development, potential and developmental assessment, and succession management. This not only ensures the identification and growth of high-potential talent and critical successors; it also builds a sustainable leadership pipeline for the future. By nurturing critical expertise and aligning development efforts with business priorities, we continuously foster a culture of readiness, adaptability, and growth.
To unlock, accelerate, and deploy the full potential of our people, we designed a holistic system to offer learning and development for all employees, identify and develop key experts and leaders, and accelerate development for high potentials, including a holistic succession management plan. This plan incorporates the SAP Next Gen program, which is a curated suite of learning and development offerings for students and early talents that serves to connect them with people, ideas, tools, and opportunities, prepare them for specific roles and career paths at SAP, and help them become a community. In August 2025, following a redesign of our SAP Careers website, we launched the SAP Next Gen campaign on LinkedIn, Instagram, and Facebook.
Employees can access all learning content, resources, and information about our learning strategy through SAP’s internal employee portal, SAP One. This learning content is also available on the Success Map Learning site, SAP’s learning management system.
The Learning Strategy was created in 2024, implemented in 2025, and will have been rolled out in full by the end of 2026. It focuses on continuous skill development and aligns with our aim to bring out the best in our employees by being skills-based, data-driven, and learner-centric.
| – | Skills-based: We conduct external and internal research to identify and prioritize the skills needed in our workforce to meet our business objectives, to enable employees to stay relevant in their roles, to get ahead of future disruptive skills, and, ultimately, to become more agile and flexible as a company. |
| – | Data-driven: We use data in every aspect of our Learning Strategy. We enable data-driven decision-making to optimize the allocation of learning spend, and we use data and AI-supported technology to optimize learning operations and experiences. Once employees consume the training on offer, we analyze the data to see how they are adopting their learning recommendations, and the impact learning is having on skill progression and business objectives. |
| – | Learner-centric: Our Learning Strategy is learner-centric in terms of how we design, deliver, and enable discovery of our learning offerings. When it comes to discovery, particularly, we invest in technology that automates the curation and prioritization of learning offerings based on each individual employee’s skills gap. |
Our Actions and Targets
| IRO Identifier | Sub-Topic | Targets/Metrics |
|
Positive impact S1-IRO7 |
Training and skills development | There are no targets related to this positive impact as we are currently working on targets for our new strategy. Metrics showing the effectiveness of our actions to create this positive impact are listed in the Metrics on Material Topics section. |
We are committed to ensuring that the workforce we have now and in the future is equipped with the skills it needs to thrive in a rapidly changing market. That is why we provide our employees with distinct, tailored, and role-centric learning experiences that enhance their professional portfolios, foster career growth, and support continuous skill development across all levels of expertise. Every employee has access to curated and on demand learning, including classroom, virtual, and self-paced training, plus
37 Does not include employees at Taulia, Emarsys, Volume Integration, WalkMe, or SmartRecruiters.
| 174/326 |
|
Integrated Report 2025 | ||||
| To
Our Stakeholders |
Combined Management Report |
Consolidated
Financial Statements IFRS |
Additional Information | ||
experiential opportunities such as coaching, mentoring, and fellowships. From the first half of 2026, we will launch new talent and career programs, including updated high-potential and leadership offerings to strengthen leadership and professional growth across the organization. These actions include the phased launch of our four new flagship leadership programs for first-level, mid-level, executive and senior executive leaders, and the introduction of Leadership in Action, which is a set of short, practical learning experiences focused on performance management, team effectiveness, change leadership, and personal development. In addition, we will expand career development opportunities through initiatives such as reverse and multigenerational mentoring, job shadowing, and a career development speaker series. These initiatives are aligned to evolving skill needs and supported by AI-driven insights. Existing programs will also be enhanced, including rebranding fellowships as skill-based gigs, strengthening coaching and mentoring, and introducing structured career pathing enabled by AI-powered tools.
Learning offerings that employees need to perform their work are available to everyone, including temporary staff, who also have access to compliance training as part of their external workforce onboarding. Learning offerings targeting career development and progression are available to employees except temporary staff. Examples of our learning and development portfolio at SAP include:
| Audience | Offering | Purpose |
| New hires | Global Onboarding Experience | A full learning experience for all new hires at SAP, starting with access to a pre-start portal prior to joining, local and IT onboarding sessions on their first day, a week-long in-person onboarding week, and access to a self-guided learning journey and meetups over the first 12 months. New hires are also assigned a dedicated buddy to help them with function- and role-specific onboarding. |
| Selected employees | Catalyst Program | The Catalyst Program is designed to build and develop a robust talent bench that is prepared to fill critical roles across strategic business areas within two years of joining the program. Catalysts are assigned to dedicated pools that offer specialized learning opportunities, such as the AI & Data Science pool, to increase their readiness to fulfil critical roles in the future. |
| SAP Next Gen (students and early talents) | STAR, SAP iXp, getX, SAP Academies1 | SAP Next Gen is a curated suite of learning and development offerings designed to connect students and early talents to the people, ideas, tools, and opportunities that support them on their professional and personal growth – offered by various programs. |
| All employees | Career Development SharePoint | An on-demand site that provides all SAP employees with the information and resources they need to foster their career development. It includes information about self-reflection and networking, career planning and development, and the promotion and progression processes at SAP. |
| All employees | Fellowship Program | Our Fellowship Program offers employees the opportunity to experience a different role in a different team for a temporary period. Fellowships are invaluable, hands-on development opportunities open to SAP employees globally. |
| All employees | SAP Learning SharePoint | A one-stop shop for all employees’ learning needs at SAP. This site leads to comprehensive learning resources on a broad range of skills, from professional and functional to technology, AI and SAP solution skills. |
| All leaders | Leadership Experience | A dedicated site for all SAP leaders, providing access to leadership journeys by level, along with practical tools and resources. |
1 STAR: Student Training and Rotational Program; SAP iXP: SAP Internship Experience Program; getX: Global Early Talent Experience.
In 2025, our training and development programs were run by approximately 400 people at SAP. The number for 2025 incorporates training programs for students, which were previously not included. When adjusted, 2024 training and development programs were delivered by approximately 370 employees. We aim to spend between €40 million and €60 million annually on training and development, excluding personnel expense (2024: between €60 million and €80 million). The decrease in expenses results from cost-savings realized by leveraging internal resources and optimizing our external spend. Our training and development expenses are split across corporate functions and therefore can be found across different expense line items in the Consolidated Income Statements of SAP Group. For more information, see the section Consolidated Income Statements of SAP Group for the Years Ended December 31 in the Consolidated Financial Statements IFRS.
Metrics on Material Topics
Methodologies and Definitions
Average number of training hours per employee: Active headcount-relevant employees only. Calculated based on FTEs. This number includes formal training and mandatory and compliance training.
Learning participation rate: Calculated based on FTEs. This number includes formal training and mandatory and compliance training.
Percentage of completion of leadership learning assets and global senior executive development offerings: Leadership learning journeys, offered by Leadership Development, are a menu of offerings relevant to the business and SAP’s goals. The content in the modules supports leaders in improving their leadership capabilities, and they are free to select the content that best
| 175/326 |
|
Integrated Report 2025 | ||||
| To
Our Stakeholders |
Combined Management Report |
Consolidated
Financial Statements IFRS |
Additional Information | ||
fits their leadership growth. This number does not include mandatory or compliance training or other training that is not offered by Leadership Development. Global senior executives include group executives, senior executives, and Board members.
Percentage of new hires who feel a sense of belonging to their team after six months: Results are based on a survey new hires receive after six months at SAP. Scores are reported as favorable or unfavorable in response to the statement: “I feel comfortable and have a sense of belonging to my team.” The item is measured on a five-point scale, one being the lowest rating (“strongly disagree”) and five the highest (“strongly agree”).
SAP Talk: SAP Talk is our name for regular, open conversations between an employee and their manager to discuss performance and development and to ensure that the right working conditions are in place for employee success. It is also an opportunity for the manager and employee to build trust by aligning on expectations and sharing feedback, and for the employee to hear how well they are progressing on their performance and development goals. Following a change to the guidelines in 2025, SAP Talks are now held at least three times a year to set goals, check in on progress, and evaluate and agree on the impact the employee made in that year.
Employees who had at least three SAP Talks: In 2025, we revised how we determine this number. It is now based on the average percentage of employees who set goals and received a performance evaluation for both the mid-year and annual reviews.
Learning and Training Hours
For 2025, the average number of training hours per employee was 28, which can be broken down to an average of 28 hours per female employee and 29 hours per male employee (2024: 28 hours per employee, 28 hours per female and 28 hours per male employee).
We measure employee learning participation rates across our portfolio on an ongoing basis and continue to see very high participation. In 2025, the rate was 99.5%, resulting in more than 3.1 million learning hours (2024: the rate was 97%, more than three million learning hours). A total of 16,514 individuals spent more than 50 hours learning in 2025 (2024: 13,025 individuals spent more than 50 learning hours).
We measure the participation rates in our upskilling initiatives annually using the following metrics, among others:
| – | Percentage of leaders who have completed at least one relevant learning asset: 22% (2024: 36%). The decline in leadership learning participation in 2025 reflects a planned transition year in SAP’s leadership development approach. In 2025, SAP focused on designing a new integrated Leadership Development Framework and preparing a refreshed portfolio for launch from 2026. |
| – | Percentage of global senior executives who have completed relevant development offerings: 47% (2024: 90%). Completion rates measure the number of senior executives attending an available development offering compared to the total number of senior executives. The completion rate declined because we retired a senior flagship program and removed the annual Leadership Summit from the count since it did not include a specific executive development component this year. Without those large-scale events, only 47% of executives participated in the more limited, specialized sessions available in 2025, such as the newly introduced Growth Culture leadership journeys. These journeys enable senior leaders and their intact teams to apply Growth Culture behaviors and leadership practices directly to real business challenges and strategy execution. |
| – | Percentage of new hires who feel a sense of belonging to their team after six months: 96% (2024: 95%) |
| – | Percentage of cross-functional or cross-Board area fellowships (out of the total number of fellowships): 60% (2024: 72%)38 |
| – | Number of vocational training, student training, and rotational program conversions: 500 (2024: 482), which corresponds to a conversion rate of 76% (2024: 71%)39 |
Performance Management
In early 2025, we achieved another key milestone in driving a high-performing culture when we launched our globally harmonized Performance Management approach. It redefines how we manage performance and foster continuous growth, alignment with strategic priorities, and achieve clarity at every level of the organization. At SAP, we believe that people perform at their best when expectations are clear. Feedback and embracing curiosity empower individuals to stay focused, grow with purpose, and contribute meaningfully to our shared success. Our new Performance Management framework is anchored in three core principles: clear goals, meaningful dialogue, and impactful outcomes.
Through our new performance management approach, we aim to establish a high-performance focus by linking SAP’s business goals to the impacts of individuals and teams. To ensure proper enablement, we executed a multichannel change strategy that
38 Does not include employees at Taulia, Emarsys, Volume Integration, WalkMe, or SmartRecruiters.
39 Does not include employees at Taulia, Emarsys, Volume Integration, WalkMe, or SmartRecruiters.
| 176/326 |
|
Integrated Report 2025 | ||||
| To
Our Stakeholders |
Combined Management Report |
Consolidated
Financial Statements IFRS |
Additional Information | ||
touched employees as well as leaders. More than 100,000 employees globally have completed the foundational e-learning, and thousands participated in information sessions during the year. We also conducted mandatory training courses for our more than 9,000 leaders globally, both in person and virtually. It is crucial that our employees see the link between their individual contribution and SAP’s future success. At SAP, goal setting is designed to align organizational strategic priorities with individual contribution toward them. AI has been seamlessly integrated (AI Goal Writing Assistant and AI-powered suggestions) so that employees can draft and agree goals for which progress can be tracked throughout the year. Performance goals, along with clearly defined and SMART40 success indicators, establish a transparent and structured foundation for setting clear expectations, fostering ongoing development, and enabling effective performance feedback throughout the year. All employees are given the opportunity to review their goals, discuss feedback, and reflect on their own progress at least three times a year in a dedicated SAP Talk conversation with their manager. This ensures the employee knows how they are progressing at mid-year and where they stand overall for the whole year. We renewed the focus on feedback, and now incorporate upward feedback, that is, observations shared by the team members with their line managers, as crucial input when reflecting on performance at the end of the year.
In 2025,41 90% of our employees had at least three SAP Talks (89% of our female and 90% of our male employees). On average, employees attended three SAP Talks during the year (female three, male three), accounting for a total of 299,199 SAP Talks held in 2025.
Flexible Working at SAP
SAP’s holistic approach to flexible work actively addresses trends and developments—including the reshaping of today’s workforce, the skills shortage, and the AI revolution—to reimagine work at its core. We drive this transformation with state-of-the-art people practices and innovative workplace approaches to future-proof our organization in times of unprecedented change.
Our commitment to flexible work is the foundation for an engaging, inspiring, and healthy work environment at SAP. Our leading-edge framework for flexible work consists of three dimensions: flex time, flex location, and flex workspace. This framework empowers SAP employees around the world to thrive in the future of work with flexible working schedules around the requirements of our business and customers, as well as the individual needs of our people, allowing for a healthier work-life balance.
The location dimension of our flexible working model supports SAP’s transformation, strengthens our shared values, and drives innovation through networking and spontaneous interactions. Our setup generally consists of three days a week in the office or on-site with customers or partners.
Our flexible working model operates under a globally coordinated framework driven by our People & Culture Services organization, as part of the Board area People & Culture. The framework is implemented by local People & Culture teams and management within each country, taking into consideration local labor laws and regulations. The relevant local guidelines are available to our employees and managers on our internal employee portal. Managers and employees are further enabled to follow local guidelines with targeted supporting material.
Our Actions and Targets
| IRO Identifier | Sub-Topic | Targets/Metrics |
|
Positive impact S1-IRO3 |
Work-life balance | There are no targets related to this positive impact. |
SAP’s flexible working model empowers employees to define with their managers when, how, and where they work best, in accordance with the global guidance to work three days a week in the office or with customers/partners—subject to local labor law and social partner involvement.
This guidance applies to SAP employees, subject to local regulations, and excludes employees with underlying health or neurodivergent conditions, employees with disability-related needs, and employees for whom their managers have granted a temporary exception from the three-day in-office requirement. Part-time employees may adjust their in-office days proportionally to their contractual hours.
SAP’s approach allows for flexibility in line with business requirements while ensuring that employees are spending a substantial amount of time on-site with colleagues (within and outside of their own teams).
40 SMART is an acronym that stands for Specific, Measurable, Achievable, Realistic, and Timely.
41 Due to the change in guidance and methodology described above, the 2025 metrics for SAP Talk cannot be compared to the metrics reported in 2024. In 2024, 84% of our employees had at least two SAP Talks (84% female, 85% male). On average, employees attended five SAP Talks during the year (female five, male six), accounting for a total of 533,952 SAP Talks held in 2024.
| 177/326 |
|
Integrated Report 2025 | ||||
| To
Our Stakeholders |
Combined Management Report |
Consolidated
Financial Statements IFRS |
Additional Information | ||
We analyze the general office attendance trend in an anonymized way on an aggregated level (for example, per country, location, or Board area—subject to local labor law and social partner agreements and in compliance with data privacy and protection regulations).
SAP is committed to several additional flex work elements that empower our employees to bring out their best while balancing their personal needs and business requirements and without compromising our mission to succeed. Based on local labor law and social partner involvement, the following elements of flex time are applicable to most SAP locations as permanent offerings to our employees:
| – | Daily flex routine: Work start and end times may vary from established standards. |
| – | Scattered working hours: Working hours can be split into different segments of time based on individual needs. |
| – | Part-time: Employees work fewer hours than the local workplace standard. |
| – | Personal leave: Employees can take unpaid leave, depending on local business or social requirements, without loss of employment rights. |
Additionally, SAP offers employees the opportunity to work abroad for personal reasons for up to 30 working days within any 12-month period (based on an approval process that is also contingent on compliance with local legal and tax regulations and insurance coverage).42
Health, Safety, and Well-Being
Our Approach and Policies
The SAP Global Health & Safety Policy is part of our long-term commitment to sustainability. Strengthening the resilience of our workforce by enabling our people to thrive and bring out their best is vital in our highly competitive market environment.
| SAP Global Health & Safety Policy | |
| IRO-relevant topics covered |
A framework that supports business processes, healthy leadership behavior, and a culture of (self-) care by addressing, integrating, and supporting physical and mental health, physical and psychological safety, work-life balance, and overall well-being as foundations. The objective is to ensure our employees’ long-term engagement, productivity, and employability, and thereby create sustainable value for our people, our organization, and our customers. The global framework sets out SAP’s responsibilities, and those of the leaders of its legal entities and international subsidiaries, managers, and employees, to ensure a healthy workplace culture and a safe work environment. |
| Accountability | The head of Global Health, Safety & Well-Being is the owner of the policy. All employees of SAP are obliged to comply with this policy and are accountable for its implementation in their area of responsibility. |
| Value chain coverage | Own operations |
| Applicability | The policy applies to all businesses in the SAP Group and to all SAP employees and leaders. It is valid at all times when working for SAP, irrespective of the working location or setup. |
SAP’s Global Health & Safety Policy is an extension of our public commitment in the SAP Global Human Rights Commitment Statement, the Luxembourg Declaration on Workplace Health Promotion, the ILO Declaration on Fundamental Principles and Rights at Work, and the United Nations SDGs (specifically SDG 3 “Good Health” and SDG 8 “Decent Workplaces”).
We consider the interests of our stakeholders by involving them in the review process for the SAP Global Health & Safety Policy.
The SAP Global Health & Safety Policy is available to all SAP employees on SAP’s internal employee portal. Since April 2024, SAP has provided a global mandatory training course for all employees every two years. This course covers all aspects of the SAP Global Health & Safety Policy. This policy is also available externally as SAP’s Health & Safety Commitment Statement.
42 Working abroad for personal reasons is available to employees employed by an SAP entity in the following countries, which have adopted the global standard (and as far as immigration regulations in the destination country allow for it, and if their line manager agrees): Argentina, Australia, Austria, Bahrain, Belgium, Bulgaria, Brazil, Canada, Columbia, Costa Rica, Chile, China, Cyprus, Czech Republic, Denmark, Egypt, Finland, Germany, Greece, Hong Kong, Hungary, India, Indonesia, Iraq, Ireland, Israel, Italy, Japan, Kenya, Korea, Kuwait, Luxembourg, Malaysia, Mexico, Netherlands, New Zealand, Nigeria, Norway, Oman, Panama, Pakistan, Philippines, Peru, Poland, Portugal, Puerto Rico, Qatar, Romania, Saudi Arabia, Singapore, Slovakia, South Africa, Spain, Sweden, Switzerland, Taiwan, Thailand, Turkey, United Arab Emirates, United Kingdom, Unites States, Vietnam.
| 178/326 |
|
Integrated Report 2025 | ||||
| To
Our Stakeholders |
Combined Management Report |
Consolidated
Financial Statements IFRS |
Additional Information | ||
Our Actions and Targets
| IRO Identifier | Sub-Topic | Targets/Metrics |
|
Positive impact S1-IRO4 |
Health and safety |
To achieve the objectives of our policy, we have set the following targets: Business Health Culture Index (BHCI): The BHCI score for 2025 was 81% (2024 (revised): 80%; 2024 (as reported): 78%), which meets the target range of between 80% and 82%. Run Healthy Program:1 We aim to have 100% of the workforce covered by 2027. For 2025, we achieved 73% (2024: 37%). Management sets and tracks targets, taking historical data and expected developments into consideration and bearing in mind the interests of our own workforce. BHCI is measured twice a year and Run Healthy Program coverage is measured once a year. For more information about the methods used to determine the KPIs and targets, see below. |
1 Does not include employees at SmartRecruiters.
The Global Health, Safety & Well-Being team provides global frameworks and a comprehensive health, safety, and well-being portfolio to enable SAP’s business and organizations at all levels to run healthy and safe. At SAP, key health and safety management focus areas are: stress management, self-management, work-life balance support, personal resilience, a psychologically safe work environment, an ergonomically safe office setup, travel medicine, pandemic management, vaccinations, road safety, and general medical prevention. As an enterprise software company, SAP does not have the occupational health and safety issues associated with manufacturing or heavy-industry jobs. Most of our people have sedentary, intellectually demanding jobs in a constantly changing business environment that requires considerable flexibility and agility. SAP therefore has no global workplace accident prevention policy or management system in place. However, local workplace accident prevention programs are in place in several SAP locations around the world. Employees have access to services and enablement resources, and are informed about them in SAP’s internal employee portal, monthly newsletters, live information sessions, and campaigns. They can also reach out to the SAP Health team directly. In addition, SAP offers digital solutions such as our SAP generative AI copilot, Joule (for more information, see the Our Product Strategy section) and SAP Health Navigator to guide SAP’s people to relevant health content by considering their individual needs and location, and to gather their feedback to drive the highest standards of quality.
Key global health programs include:
| – | The Employee Assistance Program, which offers 24x7, around-the-clock emotional support and practical advice for all of life’s challenges for all of SAP’s employees and their immediate family members. |
| – | The Mental Health Initiative, which offers monthly global sessions (such as mental health training for employees and managers) and expert consulting. |
| – | The Mental Health First-Aider Program, which has expanded its reach to cover more countries and train more first aiders in existing countries. |
| – | Ergonomics training, consulting, and sessions with a global reach. |
| – | Activities, such as the Fit@SAP challenge platform, micro breaks with Breakthru, live sessions, and self-paced resources to foster physical activity are accessible to all employees globally. Several of our locations around the world have sports facilities and offer sports and exercise classes. |
The prevention and mitigation of occupational health and safety impacts is supported by SAP’s dedicated crisis management and business continuity frameworks, which support all SAP employees worldwide in global, regional, and local crisis situations. To safeguard our people while traveling on business, we offer medical and security assistance through our Travel Assistance Program.
SAP utilizes the enablement capabilities of global internal multiplier networks such as the Health Ambassador Network, and external training and certification, to ensure health and safety competence across the organization.
Safeguarding the mental health of all our employees is key to our ability to provide innovative solutions for our customers. SAP has a long tradition of acting against stigmatization and of applying the Employee Care Cycle, which covers prevention, early detection, case management, and re-integration. In addition, the Stress Satisfaction Index serves as an early-watch KPI, which SAP monitors to measure resilience on an individual level and to determine courses of action on individual and organizational levels. A Country Health Dashboard (available for countries with at least 50 employees) supports the identification of health risks at country level.
| 179/326 |
|
Integrated Report 2025 | ||||
| To
Our Stakeholders |
Combined Management Report |
Consolidated
Financial Statements IFRS |
Additional Information | ||
Metrics on Material Topics
Methodologies and Definitions
Business
Health Culture Index (BHCI): In 2025, we refined the BHCI definition by adding equal opportunities
as a new component of the index and replacing one of the health and well-being questions. For more information, see the Incorporation
by Reference section of the Appendix .
Run Healthy: SAP’s internal health and safety management system, which is built on ILO Occupational Health and Safety standards, and tracked in the Health Dashboard.
Stress Satisfaction Index (SSI): This index shows that the level of job satisfaction was equal to or higher than the level of stress employees perceived. The SSI was measured annually from 2020 through 2023 as a survey addressed to all employees; the 2025 survey was sent to 15% of the SAP workforce, and 3% of all employees responded. We track this index at least every two years.
SAP provides employees with a range of feedback opportunities (for example, regular employee surveys and the continuous Health Feedback Survey for all our health and well-being offerings). We encourage our people to get involved and to help shape and improve SAP’s caring culture and working conditions by speaking openly and honestly, which helps us improve where we need to. SAP conducts annual health risk assessments on a global level, with reporting at all manager levels, through regular employee surveys, the BHCI, and the SSI. As outlined in the #Unfiltered section, the BHCI reflects the extent to which SAP provides employees with a working environment that promotes health, supports their long-term employability, and fosters active engagement in achieving corporate goals. The SSI, meanwhile, reveals the relationship between job satisfaction and perceived stress. In 2025, job satisfaction was equal to or higher than perceived stress for about 40%43 of SAP’s workforce. This reflects a period of substantial transformation, during which employees experience higher stress, while the potential positive effects of ongoing improvements have not fully materialized. These measures provide SAP with continuous insights that enable us, and particularly our Global Health, Safety & Well-Being organization, together with its strong partners in Human Resources, Real Estate & Facilities, Occupational Safety, and Physical Security, to enforce and adjust our initiatives and counteract adverse developments as needed.
Run Healthy is executed locally by cross-functional councils consisting of a council lead, top management, representatives from across business functions (such as from HR, facility management, and health departments), and an employee representative. These councils meet at least once a year and conduct self-assessments, recommend measures, and drive tailored programs to ensure health and safety targets are met. The program is being expanded step by step with the goal of reaching 100% global workforce coverage by 2027, it covered 73% of the workforce as of December 2025 (37% as of December 2024).
Data Protection and Privacy
| IRO Identifier | Sub-Topic | Targets/Metrics |
|
Negative impact S1-IRO13 |
Other work-related rights | For more information about targets and metrics, see the Security, Cloud Compliance, and Data Protection and Privacy section. |
SAP is committed to data protection and respecting the rights of individuals. Data protection has therefore always been a priority for SAP. However, individual data protection incidents may occur and could potentially have a negative impact on employees. Every employee could be subject to these potential negative effects, regardless of their attributes. The introduction and continuous monitoring of compliance measures, in particular regular training courses to raise employee awareness, and the implementation of preventive measures are essential to ensuring that our employees’ rights are protected whenever their personal data is processed.
For more information about policies and actions related to this negative impact, see the Security, Cloud Compliance, and Data Protection and Privacy section.
43 The 2025 data does not include employees at Taulia, Emarsys, Volume Integration, WalkMe, or SmartRecruiters. Historical SSI data: 2023: 74%. The 2023 data does not include employees at Taulia, LeanIX, WalkMe, or SmartRecruiters. Due to the change in methodology described above, the 2025 SSI score cannot be compared to that reported in 2023.
| 180/326 |
|
Integrated Report 2025 | ||||
| To
Our Stakeholders |
Combined Management Report |
Consolidated
Financial Statements IFRS |
Additional Information | ||
Workers in the Value Chain
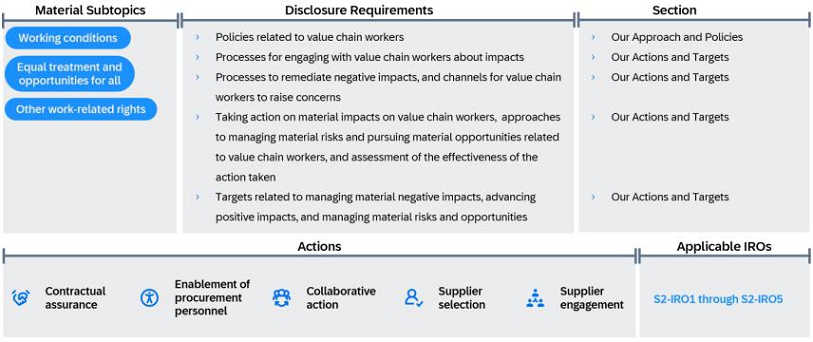
SAP prioritizes material negative impacts in line with current regulations. For more information, see the Human Rights section.
Our Approach and Policies
Our commitment to respecting and advancing human rights across our operations, extended supply chain, and product lifecycle is grounded in the United Nations Guiding Principles on Business and Human Rights (UNGPs). For more information, see the Human Rights section.
In our interactions with customers, suppliers, and partners across the entire value chain, we follow our Global Code of Ethics and Business Conduct for Employees. For more information, see the Business Conduct section.
We expect our suppliers and partners to uphold human rights. Compliance with the SAP Supplier Code of Conduct is the basis for our business with suppliers and an integral part of our supplier qualification, onboarding, and risk management process. Similarly, compliance with the SAP Partner Code of Conduct is central to our partner onboarding and due diligence process. By leveraging our systems, processes, and business network, our Global Procurement Organization (GPO) embeds ethical principles in our procurement practices.
Understanding of Potentially Affected Value Chain Workers
Our operations, supply chain, products, and business relationships may affect workers in the value chain.
SAP does not manufacture any physical products. However, for the purposes of running our daily operations in our offices and data centers, we buy products and services from across the globe. We assess the potential impacts of these purchases on the following groups of value chain workers:
| – | Upstream tier 2 to tier n, meaning any indirect suppliers that we do not have a contractual relationship with but whose goods or services are relevant for our business activities. Here we assess, for example, the impact from activities related to the manufacture of the hardware we use. |
| – | Upstream tier 1, meaning direct suppliers with whom we have a contractual relationship. Our direct business relationships include workers in the service industry, some of whom, such as IT support and facility management staff, work on SAP’s premises. |
| – | Downstream tier 1, meaning our partners who sell SAP solutions to our customers, or who service or run our solutions for them; these partners usually employ knowledge workers. |
For information about other potential downstream impacts of our solutions, see the Security, Cloud Compliance, and Data Protection and Privacy and Responsible AI sections.
| 181/326 |
|
Integrated Report 2025 | ||||
| To
Our Stakeholders |
Combined Management Report |
Consolidated
Financial Statements IFRS |
Additional Information | ||
These groups of value chain workers were identified in an internal assessment that also looked at whether there are any workers who are potentially particularly vulnerable to negative impacts. We assume that, specifically in our indirect value chain, there could be vulnerable groups, including labor unionists, migrant and seasonal workers, informal workers, women, young workers, and workers with disabilities.
While child, forced, or compulsory labor among workers in SAP’s value chain are identified as material potential impacts based on SAP’s DMA methodology, we have not identified any specific countries or commodities with significant risk of child, forced, or compulsory labor among workers in SAP’s value chain. For more information about our risk assessment methodology, see the Our Approach to Human Rights Due Diligence section.
SAP Supplier Code of Conduct and SAP Partner Code of Conduct
| SAP Supplier Code of Conduct | SAP Partner Code of Conduct | |
|
IRO-relevant topics covered |
General provisions on legal compliance and specific provisions on labor standards, human rights, and environmental standards. | Sets out what SAP expects of its partners, such as adhering to our principles of business conduct, observing human rights, meeting labor standards, protecting the environment to the relevant extent, and having compliance management systems in place. |
| Accountability | Chief Procurement Officer | Chief Partner Officer and Global Head of Third-Party Compliance |
| Value chain coverage | Workers in SAP’s upstream value chain, as described in the Applicability line item below. | Workers in SAP’s downstream value chain, as described in the Applicability line item below. |
| Applicability | Upstream tier 1 suppliers, who are encouraged to cascade the requirements of the SAP Supplier Code of Conduct down their supply chain. | Downstream: all partners who collaborate with SAP or who are members of an SAP partner program. |
The SAP Supplier Code of Conduct forms an integral part of our standard supplier contracts and our General Terms and Conditions, the latter of which are linked in all purchase orders. This approach, combined with our supplier registration process, ensures that potential suppliers are aware of the code and fosters compliance among our active suppliers. To ensure that our supplier network complies with the latest standards, we review and update the SAP Supplier Code of Conduct regularly. The most recent version was published in 2025. This practice underscores the importance SAP places on suppliers’ adherence to the code.
The SAP Partner Code of Conduct is available on our designated partner portal and was last updated in 2025. All SAP partners undergo a due diligence check upon their recruitment, and every three to five years upon their renewal. Due diligence helps us mitigate risk, comply with anti-corruption laws worldwide, comply with SAP policies, and ensure that SAP conducts business with entities that are aligned with SAP’s values. Compliance with the SAP Partner Code of Conduct is mandated by the SAP General Terms and Conditions. Additionally, the audit clause in the SAP General Terms and Conditions allows SAP to conduct periodic audits of partners to ensure their compliance.
For greater accessibility, both Codes of Conduct are also available on our website.
Our Actions and Targets
Processes for Engaging with Value Chain Workers
SAP is actively engaged in several collaborative efforts, such as the Business for Social Responsibility’s (BSR) Human Rights Working Group, the Peer Learning Group on Human Rights of the UN Global Compact Germany network, and the human rights and value chain cluster set up by econsense, the sustainability network of German business.
SAP currently does not have a process in place for directly engaging with workers in the value chain or their representatives. Once the EU Corporate Sustainability Due Diligence Directive has been transposed into national law, SAP will draft a rightsholder engagement concept, which will include individuals who may be particularly vulnerable.
Complaints Management and Investigations
SAP is committed to addressing any negative impacts it causes or contributes to with respect to workers in the value chain. As described in our Global Human Rights Commitment Statement, we are committed to working with our suppliers and business partners and, through constructive dialogue, we seek to leverage our influence to end any violations. If there is no improvement, we reserve the right to suspend our business with the party concerned or, as a last resort, to terminate it altogether.
| 182/326 |
|
Integrated Report 2025 | ||||
| To
Our Stakeholders |
Combined Management Report |
Consolidated
Financial Statements IFRS |
Additional Information | ||
SAP has established a complaints management and investigations procedure, as described in the Own Workforce – Complaints Management and Investigations section.
Workers in the value chain can raise their concerns through Speak Out at SAP. We offer this channel to any interested party through our website. We communicate its availability through the SAP Supplier Code of Conduct, the SAP Supplier Portal, the SAP Partner Code of Conduct, and the SAP Partner Portal. For more information, see the Speak Out at SAP section.
In 2025, we initiated a pilot project in India to increase awareness of and trust in our complaints mechanism among value chain workers. We selected specific target groups that potentially face an increased risk of human rights violations, and designed targeted measures to encourage their reporting of concerns.
With regard to potential human rights concerns and incidents involving our upstream and downstream value chain workers, no grievances were noted through Speak out at SAP in 2025 (of those noted in 2024, none were identified as severe).
Prevention, Mitigation, and Remediation
Under our risk assessment and prioritization process, which is described in the Human Rights section, we also prioritize actions to address negative impacts on value chain workers.
We put in place preventive measures to address potential risks and impacts. Where we are unable to eliminate a risk entirely, we plan to employ strategies to lessen its effect. Such measures include:
| Action Name | Description | Expected Outcomes |
| Contractual assurance1 | Our Supplier and Partner Codes of Conduct are usually part of our contractual arrangements with direct suppliers and partners. | The SAP Supplier Code of Conduct and SAP Partner Code of Conduct serve as a basis for all subsequent preventive and remediation measures. |
| Supplier selection2 | The GPO strengthens our supplier qualification process. | Better visibility over vendors, improved engagement, and vendor selection based on risk, environmental, and human rights performance. |
| Enablement of procurement personnel2 | In 2025, we provided training to procurement staff on due diligence in general and on the human rights issues that are most relevant to SAP. In addition, an information video is available online to all employees. | Increased awareness of our policies, procedures, and grievance mechanism, and of our human rights impacts in the GPO so that procurement practices can be improved. |
| Collaborative action | In 2025, SAP joined an industry working group led by Business for Social Responsibility (BSR) to address labor rights in the AI data supply chain. Efforts include a sector-wide human rights assessment of the AI data supply chain and the development of practical tools, supported by human rights experts and dialogue with potentially affected stakeholders. | Enhanced understanding of risk. Practical tools to help SAP and our AI suppliers implement a human-rights-based approach to labor rights issues. |
| Supplier engagement2 | In 2025, SAP piloted direct engagement with selected suppliers on the risk of withholding adequate living wages. In this context, we applied living wage thresholds, as provided by WageIndicator Foundation. | Mitigation of risk of withholding adequate living wages for upstream supply chain workers. |
| Remedial action | We recognize that, even with the prevention and mitigation measures we have in place, there might still be negative impacts on workers in our value chain. To address these impacts, we implemented the complaints mechanism (including the Speak Out at SAP confidential reporting channel) described above to encourage our value chain workers to raise their concerns. | Better identification and resolution of issues and enhanced remediation of any existing harm. |
1 Our Supplier and Partner Codes of Conduct did not apply to SmartRecruiters, WalkMe, or Volume Integration.
2 Action did not apply to Taulia, Emarsys, Walkme, SmartRecruiters, or Volume Integration.
At the beginning of 2025, we tested a new approach to assess the appropriateness and effectiveness of our due diligence approach carried out in 2024, including:
| – | Resources and expertise |
| – | Preventive measures (including policies) |
| – | Remedial action |
| – | Complaints procedure |
| – | Risk analysis and prioritization process |
| – | Documentation |
| 183/326 |
|
Integrated Report 2025 | ||||
| To
Our Stakeholders |
Combined Management Report |
Consolidated
Financial Statements IFRS |
Additional Information | ||
We used a catalog with criteria derived from various guidance documents of the German Federal Office for Economic Affairs and Export Control, from standards for management systems, and from current literature on the German Supply Chain Act. The criteria were rated on a scale of “yes,” “partial,” and “no” and then translated to a scale of 0% to 100%. This initial review enabled us to identify areas for improvement, such as targeted training and enhancing the accessibility of our complaints mechanism for value chain workers.
Resources to Manage IROs
At SAP, the management of impacts and risks relating to our value chain workers is a collective effort coordinated across multiple departments, such as GPO, Global Finance Success, Global Risk & Assurance Services, and our Human Rights Office. However, a large number of employees outside these departments also contribute indirectly to the management of value chain worker impacts and risks, through their day-to-day work and decision-making.
SAP manages actual and potential impacts in accordance with legal requirements, such as the German Supply Chain Act. We have not yet set quantitative targets to address material impacts on value chain workers. Before doing so, we plan to work on a KPI framework in 2026 as a prerequisite for setting meaningful targets.
| 184/326 |
|
Integrated Report 2025 | ||||
| To
Our Stakeholders |
Combined Management Report |
Consolidated
Financial Statements IFRS |
Additional Information | ||
Security, Cloud Compliance, and Data Protection and Privacy
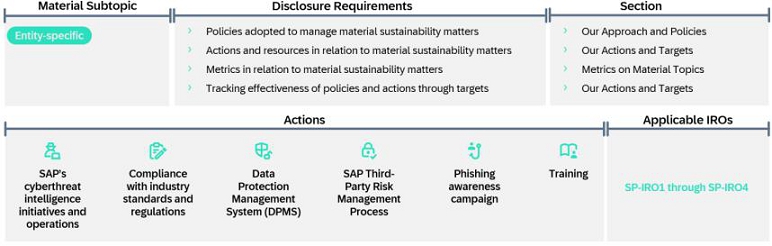
Our Approach and Policies
| SAP Global Security Policy1 | SAP Global Data Protection and Privacy Policy1 | |
| IRO-relevant topics covered | AI, Risk Management, Critical Infrastructure Protection, HR Security, Secure Development, Threat Detection and Incident Response, Training and Awareness, Physical Security, Regulatory Compliance, Operations Security, Identity and Access Management, Asset Management | Group-wide governance standard and structure for managing personal data and compliance with laws. The SAP policy is aligned with the International Bill of Human Rights and defines roles, includes AI-related data processing, and cross-references relevant policies. It reflects SAP’s commitment to privacy and ethical considerations. |
| Accountability | SAP Executive Board | SAP Executive Board |
| Value chain coverage | Upstream, downstream, own operations | Upstream, downstream, own operations |
| Applicability | All SAP employees | All SAP employees |
1 The policy does not apply to acquired companies Taulia and SmartRecruiters.
We strive to protect the rights of data subjects, safeguard information and systems, and comply with applicable local requirements across our products and services. Our integrated approach to data protection, privacy, and security is embedded in SAP’s broader business strategy and supports our objective of strengthening SAP’s reputation as a sustainable, trustworthy partner in the market. Everyone has the right to have their personal data protected. For more information about SAP’s commitment to respecting human rights, see the Human Rights section.
We address and manage the material IROs outlined in the Double Materiality Assessment section, and the risks related to data protection and privacy, as described in the Risk Factors section of our Combined Management Report, by establishing policies and frameworks, implementing them throughout the organization, monitoring compliance, and maintaining a clear chain of responsibility to promote accountability at every level.
To further enhance our commitment to security and compliance, we integrate security considerations into every stage of the software development and cloud operations lifecycle. We utilize various methodologies, guidelines, processes, and tools to address and adapt effectively to evolving cybersecurity threats.
We designed and implemented these safeguards to protect the fundamental rights of everyone whose data is processed by SAP, and of everyone who uses SAP’s products, including customers, suppliers, partners, prospects, employees, and applicants.
Management plays a central role in defining data protection, security, and regulatory-compliance requirements and in embedding them into business processes to ensure adherence to applicable laws and standards. Senior leadership delegates responsibility across management levels, establishing clear accountability, resourcing, and oversight, so that requirements are translated into operational controls.
Accordingly, each global SAP line of business (LoB) is mandated to implement these data privacy, security, and compliance requirements within its area of responsibility. LoBs align local processes with corporate policies and global standards, integrate security and privacy controls into the product and service lifecycle, perform risk and impact assessments (including Data Protection Impact Assessments where appropriate), maintain documentation and audit trails, deliver role-based training, and coordinate
| 185/326 |
|
Integrated Report 2025 | ||||
| To
Our Stakeholders |
Combined Management Report |
Consolidated
Financial Statements IFRS |
Additional Information | ||
incident reporting and remediation with SAP’s central security, privacy, legal, and compliance teams. These measures ensure consistent implementation, regulatory cooperation, and ongoing monitoring to maintain compliance and protect stakeholders.
At the local level, operational responsibility for compliance with data privacy requirements is assigned to local CFOs, who are supported by a network of local Data Protection and Privacy Coordinators (DPPCs). Unless one has already been appointed by the Data Protection and Privacy team (DPP), each CFO must designate a local DPPC. The DPPCs are responsible for conducting audits to verify the Company’s compliance with regulations. The CFO is also responsible for facilitating these audits and implementing any measures that are necessary to address compliance gaps.
The Global Security Policy is a controlled document owned by SAP’s Chief Security Officer and SAP’s Chief Security Compliance & Risk Officer, with reviews, approvals, and publishing managed by the SAP Global Policy Coordination Office in accordance with SAP’s governance and policy-management procedures. The policy is published in SAP’s central policy repository and communicated to relevant stakeholders through established governance channels and mandatory training, ensuring that those affected and those responsible for implementation have access to the policy and oversight from the leadership.
Our Actions and Targets
Addressing Material Impacts
SAP applies a layered approach to prevent, mitigate, and remediate negative impacts and risks. Preventive measures are embedded across the product lifecycle and include secure-by-design practices, role-based training and guidance on information security and data privacy, proactive publication of security information through internal and external channels, and targeted consultation and support for customers and partners.
For mitigation and remediation, SAP operates a centralized incident-management tool and follows defined response procedures to ensure timely detection, containment, investigation, and resolution of incidents in line with its policy. Post-incident root-cause analysis, remediation tracking, and stakeholder communication support accountability and continuous improvement.
The table below sets out the key actions that SAP continuously carries out to prevent, mitigate, or remediate negative impacts or risks.
| 186/326 |
|
Integrated Report 2025 | ||||
| To
Our Stakeholders |
Combined Management Report |
Consolidated
Financial Statements IFRS |
Additional Information | ||
| Action | Description | Objective | Metrics, Targets, and Performance Against Targets |
| SAP’s cyberthreat intelligence initiatives and operations1 |
An advanced initiative designed to proactively manage cybersecurity threats. It integrates various cybersecurity services, incorporates event, incident, threat, and vulnerability management, and ensures 24/7 security monitoring. Security incidents are handled through a structured incident management process aligned with ISO/IEC 27035 principles. Managing customer-reported incidents and data-subject requests entails collaboration with customers and regulatory authorities. Customers can submit security incidents through Customer Support, following which SAP engages with the data subjects or relevant regulatory bodies. SAP provides functionality for customers to correct or remove personal data from cloud services or to restrict the processing of that data in alignment with data protection law. If such functionality is not available, SAP acts on the customer’s instructions and on legal requirements. |
Promptly identify, assess, and address potential security threats and disruptions so as to minimize adverse impacts on business operations |
Metric: percentage of secure software development and operations lifecycle (SDOL) vulnerabilities mitigated within SLAs Metric: mean time to detect, respond, contain, and remediate incidents Due to the confidential nature of these metrics, the targets, KPIs, and performance against those targets cannot be disclosed. |
| Compliance with industry standards and regulations1 |
To ensure effective implementation of the SAP Cybersecurity Framework, we: - Provide our cloud and IT units with operational controls that are monitored and tested for design and operational effectiveness - Have established an independent internal audit function that reports the audit planning and audit results to the SAP Executive Board on a regular basis - Engage external internationally accredited auditors to regularly assess the design and operational effectiveness of the Framework - Offer service organization control (SOC) reports such as SOC 1 Type II/ISAE 3402 and SOC 2 Type II/ISAE 3000 for our cloud services, issued by external internationally accredited auditors - Publish certificates attesting to our compliance with international standards such as ISO 42001, ISO 9001, ISO 27001, ISO 27017, ISO 27018, ISO 22301, and BS 10012 - Offer further industry-specific and regional compliance attestations, certifications, and reports on SAP Trust Center |
Adhere to industry and international standards on information security and data protection as part of a proactive approach to managing risk and maintaining operational integrity for the benefit of everyone who uses our systems |
Metric: percentage of required certifications and SOC reports successfully renewed on schedule Target: 100% on-time issuance and renewal of all required certificates and SOC reports to be delivered on an annual basis. KPI: Due to their confidential nature, KPIs and performance against targets cannot be disclosed. Further details can be found on SAP Trust Center. |
| Data Protection Management System (DPMS)2 |
Framework that brings together activities, tools, and methodologies to help the business achieve specific data protection and privacy goals and compliance with applicable data protection and privacy requirements. We continuously enhance this framework to increase our data protection compliance level based on the annual recertification of DPMS by the British Standards Institute (BSI). SAP is audited by BSI annually and has been awarded certifications according to BS 10012 since 2011. The most recent certification is valid until the end of 2025. The certificate can be found on SAP Trust Center. |
Provide guidance to all employees with respect to meeting data protection requirements across SAP, and ensure a robust approach to data privacy compliance |
Metric: notifiable data protection incidents Target: certificate for DPMS maintained on an annual basis Details can be found on SAP Trust Center.
|
| SAP Third-Party Risk Management Process3 | Process that follows international regulations and SAP's own quality standards, both of which require the careful selection and monitoring of subprocessors who handle personal data on behalf of SAP and SAP’s customers | Ensure that all subprocessors meet the necessary data protection and security requirements for the processing of personal data, thereby safeguarding the interests of SAP, its customers, partners, employees, and end-users |
Metric: notifiable data protection incidents Target: supplier compliance maintained, risks mitigated, transparency on data processing maintained, and incident response effectively managed Details can be found on SAP Trust Center. |
| Phishing awareness campaign | SAP holds a phishing awareness campaign at least three times a year that targets all SAP employees. The campaign simulates phishing attacks, using different tactics each time, and provides targeted training to employees identified as being more susceptible to such attacks. | Minimize the risk of security breaches and data compromises by training employees to recognize and report phishing attempts effectively. This approach supports the objective of the SAP Global Security Policy Framework of protecting all SAP assets from internal and external threats, whether deliberate or accidental. |
Metric: percentage of employees who clicked on simulated phishing emails during phishing campaigns (click-through rate) Due to the confidential nature of these KPIs, targets and performance against those targets cannot be disclosed. |
1 Action does not include acquired companies Taulia and SmartRecruiters.
2 Action does not include Taulia, Emarsys, WalkMe, SmartRecruiters, or Volume Integration.
3 Action does not include SmartRecruiters and Volume Integration.
| 187/326 |
|
Integrated Report 2025 | ||||
| To
Our Stakeholders |
Combined Management Report |
Consolidated
Financial Statements IFRS |
Additional Information | ||
Training
Global data protection and privacy training is mandatory for SAP employees and is conducted every two years. New hires are required to complete the training when they join the Company. The training is validated as part of the DPMS audit carried out by BSI.
Security compliance training comprises five different sets of online courses that are delivered annually (unless otherwise indicated), with extra sessions for new hires and employees who are changing roles. Course content and completion is validated by the auditor BDO as part of an assurance process that is separate from that for the Group Sustainability Statement.
All training courses are delivered online and tracked using our online training system.
| Global Data Protection and Privacy Training3 |
Information Security Fundamentals4,5 |
Practicing Secure Software Development3 |
Supporting Secure Software Development3 |
Executive Management Security and Compliance Training4 |
Executive Support Security and Compliance Training | |||||||
| 2025 | 2024 | 2025 | 2024 | 2025 | 2024 | 2025 | 2024 | 2025 | 2024 | 2025 | 2024 | |
| Target group | All employees | All employees | Developers and developer-adjacent roles |
Developers and developer-adjacent roles |
Executive management | Executive support roles | ||||||
| Total | 106,419 | 108,597 | 112,234 | 106,420 | 32,923 | 20,993 | 7,983 | 6,812 | 664 | 612 | Not delivered in 2025 | 688 |
| Total headcount receiving training | 67,195 | 105,672 | 84,192 | 74,269 | 31,485 | 20,294 | 7,249 | 6,209 | 577 | 532 | 639 | |
| Training launch date1 | October 2025 |
October 2023 |
October 2025 |
October 2024 |
June 2025 |
February 2024 |
June 2025 |
February 2024 |
September 2025 |
July 2024 |
July 2024 | |
| Training completion date1 | January 2026 |
February 2024 |
January 2026 |
January 2025 |
December 2025 |
June 2024 |
December 2025 |
June 2024 |
December 2025 |
October 2024 |
October 2024 | |
| Target completion rate | 95% | 95% | 95% | 95% | 95% | 95% | 95% | 95% | 95% | 95% | 95% | |
| Completion rate2 | 63.14% | 97.31% | 75.01% | 69.79% | 95.63% | 96.67% | 90.81% | 91.15% | 86.90% | 86.93% | 92.88% | |
1 Training launch and completion dates may differ for new hires and acquired companies which affects the reported completion rates.
2 Completion rates include the completion rates for new hires and acquired companies. Training launch and completion dates differ for new hires and acquired companies which impacts the reported completion rates. For trainings that span calendar years, completion rates are presented as at December 31.
3 Training was not extended to Taulia, WalkMe, SmartRecruiters, or Volume Integration.
4 Training was not extended to Taulia, SmartRecruiters, or Volume Integration.
5 Training was extended also to non-HC relevant employees.
While affected stakeholders were not directly involved in setting targets, their interests were addressed through SAP’s adherence to international standards and certifications, thereby ensuring that stakeholder interests are reflected in our governance, risk management, and reporting frameworks. For more information about how we engage with our key stakeholders, see the Sustainability Strategy and Governance section.
Resources to Manage IROs
To manage associated impacts, risks, and opportunities effectively, SAP has made significant investments in dedicated resources. The SAP Global Security and Cloud Compliance organization, which focuses on security and cloud compliance, grew from 775 professionals in 2024 to over 820 professionals in 2025. The number of experts and dedicated data protection and privacy coordinators increased to more than 150. We will continue to invest in this area and expect to strengthen our teams further in 2026.
This investment in resources reflects our commitment to safeguarding sensitive data, complying with industry standards and regulatory requirements, and maintaining the trust of our customers and stakeholders.
| 188/326 |
|
Integrated Report 2025 | ||||
| To
Our Stakeholders |
Combined Management Report |
Consolidated
Financial Statements IFRS |
Additional Information | ||
Metrics on Material Topics
The policies and initiatives described above are designed to prevent and minimize negative impacts, enhance data protection, and mitigate security and compliance risks across the organization. Their effectiveness is demonstrated through the metrics outlined in the preceding section:
| – | Percentage of secure software development and operations lifecycle (SDOL) vulnerabilities mitigated within SLAs |
| – | Mean time to detect, respond, contain, and remediate incidents |
| – | Percentage of required certifications and SOC reports successfully renewed on schedule |
| – | Percentage of employees who clicked on simulated phishing emails during phishing campaigns (click-through rate) |
| – | Notifiable data protection incidents |
These metrics serve to confirm adherence to security policies, regulatory requirements, and cloud compliance standards, and reflect the maturity of SAP’s internal control framework.
In 2025, there were a total of eight notifiable data protection incidents that SAP reported to the relevant supervisory authorities as required by the applicable data protection law for data that SAP processes for its own purposes (2024: 10 notifiable data protection incidents).
Five of these notifiable data protection incidents were notified to SAP’s applicable lead supervisory authority in Germany (Der Landesbeauftragte für Datenschutz und Informationsfreiheit Baden-Württemberg (LfDI)); one incident was voluntarily notified to the supervisory authority in the United Kingdom (Information Commissioner’s Office (ICO)); one incident was notified to the supervisory authority in Hungary (National Authority for Data Protection and Freedom of Information (NAIH)); and one incident was notified to the supervisory authority in Japan (Personal Information Protection Commission (PPC)).
For the notifiable data protection incidents in the European Union (EU), the notification decision was based on the risk for the affected individuals as outlined in Article 33 (1) of the EU’s General Data Protection Regulation (GDPR), considering the relevant recitals of the GDPR and accompanying guidelines of the European Data Protection Board.
For the notifiable data protection incident in the United Kingdom (UK), the notification decision was based on the provisions of the UK General Data Protection Regulation (UK GDPR) and accompanying guidelines of the ICO.
For the notifiable data protection incident in Japan, the notification decision was based on the provisions of Japan’s Act on the Protection of Personal Information and accompanying enforcement rules.
| 189/326 |
|
Integrated Report 2025 | ||||
| To
Our Stakeholders |
Combined Management Report |
Consolidated
Financial Statements IFRS |
Additional Information | ||
Responsible AI
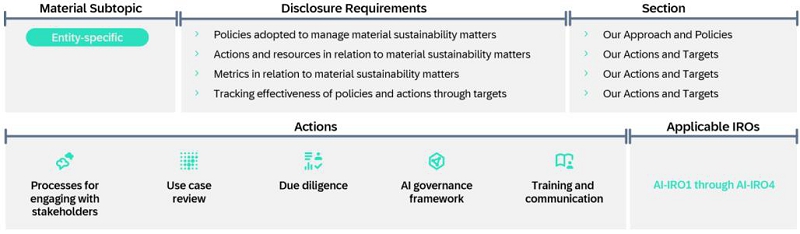
Our Approach and Policies
At SAP, we recognize AI’s potential to create opportunities for businesses, governments, societies, and for our own operations. As a technology provider, we act as an enabler for customers while also applying AI to improve our internal processes. To build trust among our customers and our employees, we must develop, deploy, use and offer AI responsibly. Our approach to responsible AI is consistent across these audiences and is anchored in the core principles of relevance, reliability, and responsibility. We apply these principles through three pillars: compliance, safety and security, and ethics, ensuring accountability throughout our AI practices.
SAP complies with the requirements of the EU Artificial Intelligence Act (Regulation (EU) 2024/1689). The provisions in the Act concerning AI literacy entered into force in February 2025; those concerning prohibited use cases in August 2025. In alignment with these regulatory milestones, SAP has established and completed a classification process to identify and assess any potentially prohibited AI systems and ensure that all AI-related activities are compliant. At present, SAP does not develop, deploy, or utilize any AI systems that fall under the prohibited categories defined by the Act. SAP promotes AI literacy across the organization through mandatory training programs on the responsible use of AI for all employees.
SAP’s AI security approach is designed to provide robust, enterprise-grade protection so that organizations can innovate confidently and uphold strict security, privacy, and compliance standards. It implements comprehensive risk evaluation, including threat modelling and specialized red teaming exercises, to proactively identify and mitigate potential vulnerabilities unique to AI systems, before public exposure. SAP collaborates with independent security researchers to conduct periodic assessment and penetration tests to verify the security posture of the external AI infrastructure. Multilayered security is embedded in our AI products through the Secure Software Development and Operations Lifecycle (SSDOL), which enables role-based access controls (RBACs), multifactor authentication (MFA), encryption of data in transit and at rest, logging, and audit trails for visibility and accountability.
Foundational to our approach to AI ethics is our commitment, set out in our Global Human Rights Commitment Statement, to uphold and support the Universal Declaration of Human Rights. This commitment includes prohibiting discrimination and harassment based on personal characteristics such as race, ethnicity, religion, age, and gender. For more information about SAP’s Global Human Rights Commitment Statement, see the Human Rights section.
Understanding of Potentially Affected Stakeholders
Responsible AI matters to everyone who uses or is affected by SAP solutions that have embedded AI systems and to any individual affected by them. Examples include our own employees and customers (including their employees), and our customers’ customers.
Our opportunity is highly dependent on our customers and other stakeholders, and is directly linked to the positive impact that SAP creates by making AI relevant, reliable, and responsible. To pursue this positive impact, we develop, deploy, use, and sell AI systems accordingly. SAP has established a robust governance framework to build AI on global ethical principles, which are adopted from UNESCO’s44 recommendation on the ethics of AI, and privacy standards. Our development and deployment follow the policies and actions described later in this section. For more information about SAP Business AI, see the Our Product Strategy section in our Combined Management Report.
44 United Nations Educational, Scientific and Cultural Organization.
| 190/326 |
|
Integrated Report 2025 | ||||
| To
Our Stakeholders |
Combined Management Report |
Consolidated
Financial Statements IFRS |
Additional Information | ||
According to market research, AI systems have an inherent potential to negatively impact the human rights of consumers, end users, and other affected individuals (for example, by perpetuating discrimination). However, this impact is associated with a minimum number of high-risk use cases.
SAP Global AI Ethics Policy
| SAP Global AI Ethics Policy1 | |
| IRO-relevant topics covered |
Ensuring that our AI systems are developed, deployed, used, and sold in line with the ethical and trustworthiness standards laid out in our guiding principles. The SAP AI Ethics Handbook provides guidance on how to implement SAP Business AI features and solutions so that they align with our AI Ethics Policy. The handbook serves as a practical and accessible resource for SAP and for its partners who are involved in the development and deployment of AI solutions at our Company. |
| Accountability | SAP Executive Board, AI Ethics Steering Committee |
| Value chain coverage | Own operations and potential guidance for customers, suppliers, and partners |
| Applicability | All SAP employees |
1 The policy does not apply to Taulia, Volume Integration, or Emarsys.
Our policy is guided by various international standards, including UNESCO’s Recommendations on the Ethics of Artificial Intelligence, and the OECD AI Principles.
The following guiding principles are set out in the SAP Global AI Ethics Policy and govern how we develop and deploy our AI solutions:
|
1) Proportionality and do not harm 2) Safety and security 3) Fairness and non-discrimination 4) Sustainability 5) Right to privacy and data protection |
6) Human oversight and determination 7) Transparency and explainability 8) Responsibility and accountability 9) Awareness and literacy 10) Multistakeholder and adoptive governance |
In upholding the rights of our customers to own and manage their own data, we may have limited knowledge of how they ultimately use our AI products and services. We endeavor to educate and advise customers and partners based on the principles in this policy. We recognize, however, that use-case responsibility lies with the customer or partner, and we rely on them to act in good faith and in accordance with applicable laws and regulations. SAP may stipulate specific terms and conditions, which are binding on customers, governing the acceptable use of AI systems.
The SAP AI Ethics Steering Committee is a key part of our commitment to respecting human rights. Under the stewardship of our global head of sustainability, the committee comprises SAP executives, from all Executive Board areas and relevant lines of business (LoBs), who guide and supervise our internal efforts to implement and enforce AI ethics in our operations, solutions, and policies.
Although the Executive Board is ultimately accountable for the impacts of our AI, the committee, acting on behalf of the Executive Board, provides long-term strategic direction on AI ethics at SAP, and advances our commitment to the ethical and responsible use of AI. It also serves as a source of expertise on AI ethics for the Executive Board.
SAP’s CEO is the executive sponsor of our Global AI Ethics Policy; the SAP AI Ethics Steering Committee is responsible for overseeing updates to that policy to guide the implementation of ethical AI in all LoBs that develop, deploy, or sell AI systems. SAP LoB management is responsible for establishing the business processes that ensure compliance with this policy.
Through the SAP Global Data Protection and Privacy Policy, SAP respects international regulations on data protection and privacy. For more information, see the Security, Cloud Compliance, and Data Protection and Privacy section.
The SAP Global AI Ethics Policy and the SAP AI Ethics Handbook are available internally on our intranet and externally on SAP’s website.
| 191/326 |
|
Integrated Report 2025 | ||||
| To
Our Stakeholders |
Combined Management Report |
Consolidated
Financial Statements IFRS |
Additional Information | ||
Our Actions and Targets45
AI Governance Framework
In 2025, we introduced a holistic AI governance framework to strengthen and expand our long-standing commitment to responsible AI. This framework brings together AI ethics, security, data protection, risk management, and regulatory compliance to create a unified governance structure that fosters accountability, transparency, and trust across all stages of the AI lifecycle, from development and deployment through use and continuous improvement.
The AI governance framework at SAP defines the structures, roles, processes, and controls through which we manage AI responsibly across the Company. It provides guidance on how to oversee and assure that all AI systems align with SAP’s core principles of relevance, reliability, and responsibility, and that they comply with applicable legal, regulatory, and ethical standards.
The framework is supported by the SAP AI Management System, which formalizes the processes, controls, and documentation necessary to govern AI effectively. The system enables SAP to continuously identify and mitigate risks, monitor compliance, and apply consistent standards to the design, deployment, and monitoring of AI systems.
In recognition of the robustness of our governance approach, the SAP AI Management System has been certified to the international standard ISO/IEC 42001 by an independent auditor. This certification confirms that the system meets globally recognized requirements for responsible AI management systems. It also establishes that SAP maintains structured governance processes for:
| – | Risk identification and mitigation across AI use cases |
| – | Defined roles and accountability for AI ethics, security, and compliance |
| – | Human oversight, transparency, and explainability of AI decisions |
| – | Ongoing performance monitoring and continuous improvement |
| – | Integration of ethical, privacy, and security considerations throughout the AI lifecycle |
The ISO/IEC 42001 certification also demonstrates SAP’s commitment to continuous learning and to the enhancement of its AI management practices. By adhering to this standard, SAP can demonstrate that all its AI-related activities are documented, measurable, and auditable, which strengthens both internal integrity and external trust.
Through AI governance, SAP reinforces its leadership in responsible technology management. The framework we have put in place aims to ensure that every AI solution—including SAP Business AI—adheres to consistent ethical, security, and compliance practices in line with SAP’s broader sustainability and trust agenda.
Resources to Manage IROs
At SAP, two main teams are responsible for driving compliance with responsible AI practices and Company policies:
Our AI Ethics team, which merged with the Human Rights Office in 2025, is overseen by the Corporate Sustainability unit. This team is responsible for establishing efficient, scalable, and compliant governance processes, for ensuring a best-in-class ethical framework for SAP Business AI, for establishing strategic external partnerships, and for addressing the sustainability impacts of AI.
Our Responsible AI team, established in March 2025 as part of the Chief Technology Office area, looks at AI ethics, AI security, and AI compliance for the SAP Business AI portfolio. Bringing these closely related functions together enables their experts to collaborate more effectively and work holistically. The team is responsible for facilitating the creation of responsible AI systems, and for ensuring the relevance of SAP’s efforts regarding AI ethics by maintaining a continuous dialogue with our external ecosystem.
Adhering to ethical AI practices is a focus across our Company, and our employees help manage responsible AI matters in their day-to-day operations and decision-making processes. Ultimately, every person involved in the development, deployment, use, and sale of AI systems bears this responsibility.
We are currently defining mature, targeted AI objectives that give us the flexibility to capture all critical aspects of responsible AI. These objectives include the achievement of ISO/IEC 42001 certification in 2025, which has since been successfully obtained. Our ambition is to bring all relevant LoBs under the umbrella of responsible AI by 2026. Additionally, we aim to ensure that all relevant AI solutions undergo an impact assessment to comply with our policy. In 2025, 860 use cases were assessed for their impacts. To keep
45 Unless otherwise stated, actions do not apply to Taulia, Volume Integration, or Emarsys.
| 192/326 |
|
Integrated Report 2025 | ||||
| To
Our Stakeholders |
Combined Management Report |
Consolidated
Financial Statements IFRS |
Additional Information | ||
our policy aligned with evolving societal trends and AI ethics, we are working on an updated version, which is scheduled for rollout in 2026. The policy was introduced in 2022, which serves as our baseline year.
Processes for Engaging with Stakeholders
We believe that cultivating a better understanding of human-centered AI will allow individuals, business, and society to benefit fully from the technology, and allay any concerns that our users may have.
Our primary internal stakeholders are our employees, the SAP Executive Board, and the AI Ethics Steering Committee. Engagement with these stakeholders is continuous and is organized through the standard AI systems development process to make sure that the relevant groups are part of the process chain. The objectives here are for all key stakeholders to contribute directly to and shape the development process, foster collective decision-making, and implement AI ethically and responsibly.
Outside the Company, our primary stakeholders are our customers, who contribute significantly to the development of our products. We work closely with them throughout the development process to understand their needs, expectations, and concerns. We also engage with our AI Ethics Advisory Panel to understand how high-risk use cases might impact individuals’ rights or society as a whole, and to gather feedback with a view to improving our internal governance structure and risk mitigation processes. For more information about our AI Ethics Advisory Panel, see the Sustainability Strategy and Governance section.
Drawing on outside expertise, we research the impact of AI on privacy and data protection to ensure that we implement AI ethically and properly address any potential human rights concerns associated with it through, among others, collaboration with BSR Human Rights Working Group.
These efforts are intended to ensure that our products meet the needs of our customers as closely as possible and avoid bias and other unintended outcomes.
Due Diligence
In the interests of transparency and adherence to AI guiding principles, any third-party systems we integrate are subject to our Supplier Code of Conduct. For more information, see the information about the SAP Supplier Code of Conduct in the Workers in the Value Chain section. Suppliers of software that has embedded AI capabilities need to comply with applicable laws on ethical and responsible AI. These AI capabilities should also meet the requirements of SAP’s guiding principles and policies. In the absence of national legislation in their respective country, suppliers need to follow global guidelines from international institutions, such as those of the Institute of Electrical and Electronics Engineers and the OECD. This requirement also extends to their own supply chain’s third-party software with embedded AI.
The due diligence process we have in place supports our commitment to upholding responsible and ethical AI. Specifically, before incorporating any third-party systems, we aim to ensure that these AI systems align with our ethical principles and continue to monitor them after integration.
Besides our suppliers, we have also onboarded our partners on our AI guiding principles and policies and, in 2024, introduced a certification program for partner applications developed on SAP Business Technology Platform (BTP) using SAP Generative AI Hub that includes checks for compliance with the principles of responsible AI. This certification program enables our relevant partners to offer trusted, compliant, and enterprise-ready applications powered by AI services. Solutions created by our partners and resold by SAP undergo additional rigorous checks to ensure that they meet the same stringent responsible AI product standards we uphold throughout our own development lifecycle.
Use Case Review
Our internal procedures follow a use-case-based approach to upholding our standards as described in the SAP Global AI Ethics Policy and the SAP AI Ethics Handbook. Each AI use case review process includes an assessment of the developed case. The use cases are classified according to their risk and reviewed. In 2025, 860 use cases were assessed. Use cases classified as high-risk are evaluated by the AI Ethics Office and selected cases are referred to the High-Risk Use Case Committee for its recommendations. Critical high-risk use-cases are referred to the AI Ethics Steering Committee for its final decision.
The SAP Executive Board reviews and adopts the AI Ethics Steering Committee’s recommendations on any issues that have wider implications for the Company. If no ethically acceptable trade-off can be identified, the development, deployment, use, or sale of the AI system, in that form, cannot proceed. The AI Ethics Steering Committee regularly reviews the appropriateness of its decisions, to identify where changes are necessary to adapt to evolving circumstances. Such activity ensures our compliance with the SAP Global AI Ethics Policy, which fosters ethical and responsible implementation of AI.
| 193/326 |
|
Integrated Report 2025 | ||||
| To
Our Stakeholders |
Combined Management Report |
Consolidated
Financial Statements IFRS |
Additional Information | ||
In 2025, 44% of all relevant use cases were recognized as high risk and reviewed (41% in 2024).
Employees can report breaches and concerns that relate to the guiding principles set out in the SAP Global AI Ethics Policy to their managers, the AI Ethics Steering Committee, the AI Ethics Office, or, anonymously, through our Speak Out at SAP tool. The matter is then referred to the AI Ethics Steering Committee. For more information about our Speak Out at SAP tool, see the Speak Out at SAP section. In 2025, no concerns were reported to the AI Ethics Office (two concerns were reported in 2024; neither was substantiated).
Training and Communication
SAP provides various training courses to its employees and customers to raise their awareness of ethical AI. In November 2024, we introduced a mandatory compliance training course on our AI ethics policy and governance, which was available for all employees until the end of December 2025. By the end of December 2025, 99.4% of SAP employees had completed the course.
In 2025, SAP worked with the Hasso Plattner Institute to produce a publicly available course on AI and sustainability to educate its ecosystem.
Through our AI Ethics Community, an internal platform that fosters discussions on responsible AI, we provide compliance resources, and organize talks by internal and external domain experts on an ongoing basis.
For more information about SAP Business AI, see the Our Product Strategy section in our Combined Management Report.
| 194/326 |
|
Integrated Report 2025 | ||||
| To
Our Stakeholders |
Combined Management Report |
Consolidated
Financial Statements IFRS |
Additional Information | ||
Governance Information
In this section, we disclose information about SAP’s material impacts, risks, and opportunities (IROs) related to governance topics and responsibilities.
Business Conduct
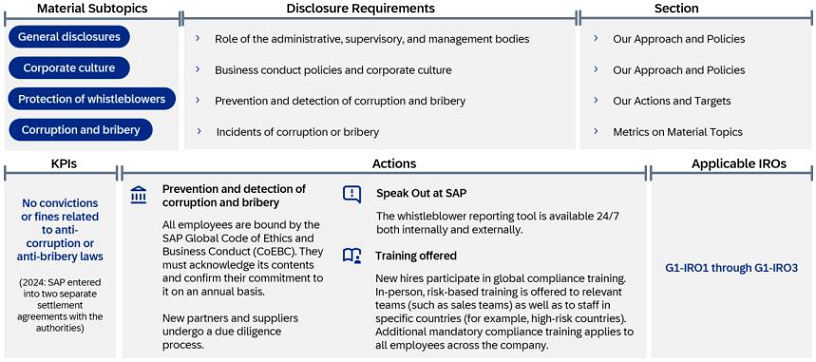
Our Approach and Policies
| SAP Global Code of Ethics and Business Conduct (CoEBC)1 | |
| IRO-relevant topics covered | Bribery and corruption, raising concerns, corporate culture and values |
| Accountability | Office of Ethics and Compliance (OEC) for OEC-related topics |
| Value chain coverage | Upstream, downstream, own operations |
| Applicability | All SAP employees |
1 The Code of Ethics and Business Conduct does not apply to SmartRecruiters.
In an increasingly complex business environment, making the right decisions and abiding by ethical choices has never been more important. As a company operating in numerous countries across the globe, SAP is required to adhere to strict international legislation that defines acceptable business conduct and practices.
At SAP, ethical behavior is one of the core cultural values that influence our daily decision-making at every level of the business and in every market. The Office of Ethics & Compliance (OEC), led by SAP’s group chief compliance officer (GCCO), develops, oversees, and implements our compliance management program, which is designed to mitigate bribery, corruption, fraud, and money laundering risks. The OEC contributes to SAP’s success by providing trusted advice to SAP managers, leaders, and employees across the entire business, thus helping SAP win the right way.
SAP’s customers expect this as well. Our reputation for doing business the right way is one of our most important assets, and the CoEBC clearly states that SAP has a zero-tolerance policy toward unethical business behavior, including all forms of bribery and corruption.
| 195/326 |
|
Integrated Report 2025 | ||||
| To
Our Stakeholders |
Combined Management Report |
Consolidated
Financial Statements IFRS |
Additional Information | ||
The following section describes our compliance management program, how we address risks, and how we promote positive impacts.
Office of Ethics & Compliance (OEC)
In 2025, the OEC team grew from 161 to 174 employees. The GCCO continues to report to the CEO. The GCCO acts with authority and autonomy within the scope and responsibilities of the team’s remit; however, the work of the OEC remains subject to SAP’s internal audit. For more information, see the Risk Management and Risks section in our Combined Management Report.
The OEC is structured to target the needs of the business. Its team of field compliance officers (FCOs) around the globe, in both high- and low-risk jurisdictions, provides the Company with business support, knowledge, and expertise. The FCOs are often the first point of contact for the business when compliance matters arise. In those high-risk countries in which the OEC is not physically represented and where local language needs might arise, the OEC operates a network of compliance stewards drawn largely from SAP’s Legal, Finance, and People & Culture departments. Compliance stewards liaise with the FCOs and provide support by offering advice on basic, specific, and straightforward compliance matters. A global network of compliance ambassadors provides further support. Drawn from all areas of the Company, compliance ambassadors amplify compliance messages, cascade information on compliance, and serve as a further point of contact for local employees to the relevant FCO.
Policies and Corporate Culture
In 2025, we continued to focus on strengthening our robust compliance program, which is based on our corporate values and voluntary commitments as well as on international standards and regulatory requirements.
After completing the second year of its self-monitorship under the settlement agreement with the Securities and Exchange Commission (SEC) and the United States Department of Justice (U.S. DOJ) in 2024, SAP continued to enhance its compliance program and related internal controls in 2025. The Strategic Compliance Improvement Office (formerly the Monitorship Compliance Office) oversees existing and newly implemented compliance measures and initiatives.
The OEC’s Compliance Culture Program Office is responsible for the global policy governance process, and works with and guides policy owners accordingly. In 2025, it rolled out the new Policy Management Tool globally, providing a single point of access for all SAP global policies, with easy search and bookmarking functions. Accountability and responsibility for policy content is managed by multiple teams across the Company. Accountability for OEC-related topics lies with the OEC.
The CoEBC continues to be the primary ethical and legal framework within which SAP conducts business and remains on course for success. Available on SAP’s internal employee portal and on SAP’s website in 23 languages, it is one of several global policies that provide clear guidance to our employees.
Compliance matters are discussed with Executive Board and Supervisory Board members at quarterly Audit and Compliance Committee meetings, and at regular touchpoints with members of the Executive Board and the Supervisory Board. Quarterly meetings of the Global Compliance Governance Committee, which are attended by members of Global Finance, Global Security, Customer Success, Global Communications, People & Culture, and Global Risk & Assurance Services (GR&AS) provide a further forum for addressing and discussing compliance matters.
Outside SAP, the OEC regularly exchanges ideas and best practices for compliance processes with relevant peers in the software industry and beyond. SAP is a corporate member of the Association of Certified Fraud Examiners (ACFE), while the GCCO is also a member of the European Chief Compliance and Integrity Officers Forum (ECCIOF), the United Nations (UN) Global Compact’s Think Lab, which focuses on transformational governance, and the World Economic Forum’s Partnering Against Corruption Initiative (PACI).
Communication
In 2025, compliance-related communication was further enhanced to strengthen employees’ confidence in operating compliantly, to reinforce the ability to speak out, and to ensure ethical and compliant business practices across all functions within the Company.
The OEC’s dedicated communications team supports messaging on compliance topics by distributing integrity-related and business-enabling communications at all levels of the Company regularly and consistently—including to senior leaders, managers, and employees. Topical content is also provided to SAP partners and suppliers.
Members of the Executive Board and senior leaders regularly address integrity-focused topics through written communications and at global and regional employee meetings, leadership team meetings, and smaller gatherings, actively demonstrating their commitment and dedication to ethical business.
| 196/326 |
|
Integrated Report 2025 | ||||
| To
Our Stakeholders |
Combined Management Report |
Consolidated
Financial Statements IFRS |
Additional Information | ||
The OEC’s quarterly newsletter informs and enables all SAP employees on compliance-related topics. A dedicated thrice-yearly leadership newsletter for managers, executives, and senior management drives strong ethical leadership across the business. The high open rates for both of these newsletters demonstrate strong employee engagement with compliance topics. In addition, ”communication toolkits” provide topic-focused resources for communicators Company-wide to further amplify compliance messages in business-owned channels.
Furthermore, all Executive Board areas have recommitted their support for the OEC’s Compliance Ambassador Program. In 2025, we introduced an eighth cohort of ambassadors. The overall number of participants—past and present—rose from over 2,300 in 2024 to over 3,000 in 2025. This program is designed to give employees a further point of contact in the business when compliance matters arise. Ambassadors participate in an extensive curriculum of monthly onboarding sessions over a 15-month period. They are expected to cascade and transfer information on the importance of compliance and ethics throughout their teams and lines of business. The Extended Compliance Ambassador Network, which convenes on a quarterly basis, provides compliance ambassadors who have completed the curriculum with a forum in which to connect on compliance topics. Participation in both programs is entirely voluntary and is open to all employees irrespective of their seniority or role at the Company.
Investigations at SAP
The OEC’s independent and autonomous investigation team is comprised of dedicated investigators who probe allegations of misconduct within the OEC’s area of responsibility. Allegations and concerns can be reported by a variety of sources, including any of the teams within the OEC. Alternatively, allegations can be submitted by individuals (internal or external) through the Speak Out at SAP whistleblower reporting tool. Regardless of the source, all allegations and concerns are subject to appropriate in-depth examination or investigation.
Where appropriate, the OEC engages the assistance of an external law firm to investigate certain allegations of non-compliance with SAP’s policies and procedures or applicable laws.
Our Actions and Targets
Prevention and Detection of Corruption and Bribery
All employees are bound by the CoEBC; they are required to acknowledge its contents and confirm their commitment to it on an annual basis. In 2025, we continued to monitor employee commitment to the CoEBC worldwide, achieving a 99.94% certification rate47 (2024: 99.99%).
The OEC also evaluates SAP’s third-party service providers to assess whether SAP’s compliance standards are being met. New suppliers and third parties seeking a partnership with SAP are scrutinized according to a risk-based compliance due diligence process, which is repeated every two to five years thereafter. Supplier and partner relationships are formally defined in contracts that outline the obligation to abide by SAP’s compliance requirements. In almost all cases, these include a “right to audit” clause. The OEC also has a dedicated team that monitors and audits the compliance of partners and suppliers, so as to assess their adherence to SAP’s requirements and to identify and address compliance risks. Significant third-party compliance risks are reported to senior management and potentially to regulators, ensuring appropriate oversight and action.
Moreover, we require all our partners and suppliers to commit to meeting our high standards of integrity. To this end, and to ensure that our suppliers and partners maintain the highest levels of integrity, SAP delivers mandatory training to its highest-risk third parties. We also have the SAP Partner Code of Conduct (PCoC) and the SAP Supplier Code of Conduct (SCoC) in place so that partners and suppliers understand what is expected of them. For more information, see the Workers in the Value Chain section.
The OEC’s Compliance Monitoring & Analysis (CMA) team monitors the effectiveness of SAP’s compliance processes and related controls through regular testing of high-risk transactions, identified using a data analytics tool and through manual sampling. The CMA team also analyzes findings from compliance investigations to identify potential enterprise-wide process deficiencies and patterns of misconduct that indicate a compliance risk. It then conducts root cause analyses on these topics and recommends remediation actions to mitigate the risks.
47 The certification rate includes all acquired companies except for SmartRecruiters. However, the schedule for confirming commitment at these companies may differ from SAP’s schedule.
| 197/326 |
|
Integrated Report 2025 | ||||
| To
Our Stakeholders |
Combined Management Report |
Consolidated
Financial Statements IFRS |
Additional Information | ||
Speak Out at SAP
Speak Out at SAP is SAP’s independently managed whistleblower reporting tool, through which any matters or concerns can be reported easily, and, if desired, anonymously. The tool is available 24 hours a day, seven days a week, both internally to SAP employees and externally to concerned parties, including customers, suppliers, and partners. It is available in multiple languages and is intuitive to use.
Individuals can submit reports either directly through the Internet-based portal or by phone, with local language support in 64 languages across the globe for maximum accessibility. In all cases, SAP maintains a strict non-retaliation policy.
Beyond Speak Out at SAP, we provide further reporting channels, including an internal ticketing system, a postal address for written submissions, and local contact persons worldwide.
SAP communicates information about its whistleblower reporting tool and other complaints channels regularly throughout the year in newsletters, internal portal articles, communication toolkits, and compliance training courses. Partners, suppliers, and external stakeholders can find detailed information about the reporting mechanisms on SAP’s website.
Cases Reported in 2025
In 2025, the number of reports submitted through Speak Out at SAP continued to rise. This is probably due to increased communication within the Company about the tool’s availability, which in turn led to better awareness of it both internally and externally.
The OEC reviews all the allegations and concerns it receives and allocates them to the appropriate teams for further action according to areas of responsibility and expertise, as required. Concerns pertaining to bribery, corruption, and fraud are examined in detail by the OEC, which then considers the next steps, including the decision to start an investigation.
When allegations or concerns are substantiated, the OEC initiates consequence management accordingly. Depending on the type and severity of the misconduct, examples of consequences might include a formal letter of warning to the employee concerned, mandatory additional training, and, in serious cases, termination of their employment. Consequence management steps could also include amending policies, creating or adapting training content, and raising employees’ awareness of specific topics.
Training Offerings
Our training programs cover topics such as anti-corruption and anti-bribery, conflicts of interest, governance for customer commitments, working with public sector customers, and compliant partner engagement.
In addition to the “Build Your Compliance Confidence” anti-bribery and anti-corruption online training course that is held every two years for all SAP employees, including Executive Board members and our employees sitting on the Supervisory Board, a new updated “Ethical Choices” workshop was delivered live in 2025 for all managers worldwide. We continue to train all new hires globally and hold “Ethical Leadership” workshops for new people managers and “Ethical Success” workshops for new colleagues in Sales and Presales. “Travel with Integrity” workshops are held for the most frequent business travelers and their managers, including Executive Board members and the employee members of the Supervisory Board, for whom sessions are typically held individually. These training programs are not offered to shareholder representatives on the Supervisory Board. Participants of the “Travel with Integrity” and “Ethical Success” workshops are selected because these colleagues either travel extensively or have a high-risk function.
Additionally, our field compliance officers hold live training courses, both in person and virtually, for the specific teams and countries they support. These courses are aimed at employees across the organization, from customer-facing personnel to colleagues in departments such as Finance, Marketing, and Legal.
| 198/326 |
|
Integrated Report 2025 | ||||
| To
Our Stakeholders |
Combined Management Report |
Consolidated
Financial Statements IFRS |
Additional Information | ||
|
Build Your Compliance (formerly: Ethical |
Ethical Choices Live Training1 (formerly: Ethical |
New Hires Introduction Live Training1 |
Travel with Integrity Live Training1 |
Ethical Success Live Training1 | ||||||
| 2025 | 2024 | 2025 | 2024 | 2025 | 2024 | 2025 | 2024 | 2025 | 2024 | |
| Training Coverage | All SAP | All managers | All new hires | All frequent travelers and their managers | All new Sales and Presales employees | |||||
| Total | 105,452 | Not delivered | 8,700 | 1,400 | 8,598 | 5,152 | 2,115 | 9,296 | 2,477 | 2,419 |
| Total headcount receiving training | 104,722 | 8,693 | 1,340 | 8,191 | 5,005 | 2,011 | 9,289 | 2,278 | 2,363 | |
| Completion rate2 | 99.31% | 99.92% | 95.71% | 95.27% | 97.15% | 95.08% | 99.92% | 91.97% | 97.68% | |
| Delivery Method and Duration | ||||||||||
| Classroom training | 1 hr | 30 mins | 1 hr | 1 hr | ||||||
| eLearning | 30 mins | |||||||||
| Frequency | ||||||||||
| How often training is required3 | Every two years | Every three years from 2022 | On joining SAP | Every three years from 2024 | Every three years from 2023 | |||||
| Topics Covered | ||||||||||
| Definition of corruption | ✔ | ✔ | ✔ | |||||||
| Conflicts of interest | ✔ | ✔ | ✔ | ✔ | ✔ | |||||
| CoEBC | ✔ | ✔ | ✔ | ✔ | ✔ | |||||
1 Of our acquired companies, 2025 numbers exclude Taulia, WalkMe, Volume Integration, and SmartRecruiters.
2 For training courses that span calendar years, completion rates are presented as at December 31.
3 Employees who are newly in scope for this training are invited to participate outside of the usual planned cycle.
While the completion rates provided above do not include all acquired companies (Taulia, WalkMe, Volume Integration, and SmartRecruiters), these acquired companies all follow comparable training requirements and goals. Assigned due dates and methods of delivery may vary, hence their exclusion from the table above.
Metrics on Material Topics
There were no convictions for the violation of anti-corruption and anti-bribery laws in 2025 (2024: SAP entered into two separate settlement agreements with the authorities).
| 199/326 |
|
Integrated Report 2025 | ||||
| To
Our Stakeholders |
Combined Management Report |
Consolidated
Financial Statements IFRS |
Additional Information | ||
Appendix
In this section, we disclose tables listing ESRS Datapoints in Cross-Cutting and Topical Standards That Derive from Other EU Legislation and our Incorporations by Reference.
ESRS Datapoints in Cross-Cutting and Topical Standards That Derive from Other EU Legislation
The following table contains references to all disclosures from other legislation or other generally accepted sustainability reporting pronouncements.
| Datapoint that Derives from Other EU Legislation |
SFDR Reference | Pillar 3 Reference | Benchmark Regulation Reference |
EU Climate Law Reference |
Reference to Group Sustainability Statements |
| ESRS 2 GOV-1 Gender diversity on the Board | Indicator number 13 of Table #1 of Annex 1 | Commission Delegated Regulation (EU) 2020/1816, Annex II | Sustainability Governance | ||
| ESRS 2 GOV-1 Percentage of Board members who are independent | Delegated Regulation (EU) 2020/1816, Annex II | Sustainability Governance | |||
| ESRS 2 GOV-4 Statement on Due Diligence | Indicator number 10 Table #3 of Annex 1 | Statement on Due Diligence | |||
| ESRS 2 SBM-1 Involvement in activities related to fossil fuel activities | Indicator number 4 Table #1 of Annex 1 | Article 449a Regulation (EU) No 575/2013; Commission Implementing Regulation (EU) 2022/2453 Table 1: Qualitative information on environmental risk and Table 2: Qualitative information on social risk | Delegated Regulation (EU) 2020/1816, Annex II | Not applicable | |
| ESRS 2 SBM-1 Involvement in activities related to chemical production | Indicator number 9 Table #2 of Annex 1 | Delegated Regulation (EU) 2020/1816, Annex II | Not applicable | ||
| ESRS 2 SBM-1 Involvement in activities related to controversial weapons | Indicator number 14 Table #1 of Annex 1 | Delegated Regulation (EU) 2020/1818, Article 12(1); Delegated Regulation (EU) 2020/1816, Annex II | Not applicable | ||
| ESRS 2 SBM-1 Involvement in activities related to cultivation and production of tobacco | Delegated Regulation (EU) 2020/1818, Article 12(1); Delegated Regulation (EU) 2020/1816, Annex II | Not applicable | |||
| E1-1 Transition plan to reach climate neutrality by 2050 | Regulation (EU) 2021/1119, Article 2(1) |
Transition Plan for Climate Change Mitigation |
| 200/326 |
|
Integrated Report 2025 | ||||
| To
Our Stakeholders |
Combined Management Report |
Consolidated
Financial Statements IFRS |
Additional Information | ||
| E1-1 Undertakings excluded from Paris-aligned benchmarks | Article 449a Regulation (EU) No 575/2013; Commission Implementing Regulation (EU) 2022/2453 Template 1: Banking book – Climate change transition risk: Credit quality of exposures by sector, emissions, and residual maturity | Delegated Regulation (EU) 2020/1818, Article 12.1 (d) to (g), and Article 12.2 | Transition Plan for Climate Change Mitigation | ||
| E1-4 GHG emission reduction targets | Indicator number 4 Table #2 of Annex 1 | Article 449a Regulation (EU) No 575/2013; Commission Implementing Regulation (EU) 2022/2453 Template 3: Banking book – Climate change transition risk: Alignment metrics | Delegated Regulation (EU) 2020/1818, Article 6 | Net-Zero Target: Expected Impact of GHG Reduction Levers | |
| E1-5 Energy consumption from fossil sources disaggregated by sources for high climate impact sectors | Indicator number 5 Table #1 and Indicator number 5 Table #2 of Annex 1 | Not material | |||
| E1-5 Energy consumption and mix | Indicator number 5 Table #1 of Annex 1 | Energy Consumption and Mix | |||
| E1-5 Energy intensity associated with activities in high climate impact sectors | Indicator number 6 Table #1 of Annex 1 | Not material | |||
| E1-6 Gross Scope 1, 2, 3, and total GHG emissions | Indicators number 1 and 2 Table #1 of Annex 1 | Article 449a; Regulation (EU) No 575/2013; Commission Implementing Regulation (EU) 2022/2453 Template 1: Banking book – Climate change transition risk: Credit quality of exposures by sector, emissions, and residual maturity | Delegated Regulation (EU) 2020/1818, Article 5(1), 6, and 8(1) | GHG Emissions Scopes 1, 2 (location- and market-based), and 3 Upstream and Downstream (location- and market-based), and Gross GHG Emissions (location- and market-based) | |
| E1-6 Gross GHG emissions intensity | Indicator number 3 Table #1 of Annex 1 | Article 449a Regulation (EU) No 575/2013; Commission Implementing Regulation (EU) 2022/2453 Template 3: Banking book – Climate change transition risk: Alignment metrics | Delegated Regulation (EU) 2020/1818, Article 8(1) | GHG Intensity per Net Revenue | |
| E1-7 GHG removals and carbon credits | Regulation (EU) 2021/1119, Article 2(1) | Carbon Credit and Project Quality Expectations | |||
| E1-9 Exposure of the benchmark portfolio to climate-related physical risks | Delegated Regulation (EU) 2020/1818, Annex II; Delegated Regulation (EU) 2020/1816, Annex II | Impact of Climate Change | |||
| E1-9 Disaggregation of monetary amounts by acute and chronic physical risks | Article 449a Regulation (EU) No 575/2013; Commission Implementing Regulation (EU) 2022/2453 paragraphs 46 and 47; Template 5: | Impact of Climate Change |
| 201/326 |
|
Integrated Report 2025 | ||||
| To
Our Stakeholders |
Combined Management Report |
Consolidated
Financial Statements IFRS |
Additional Information | ||
| E1-9 Location of significant assets at material physical risk | Banking book – Climate change physical risk: Exposures subject to physical risk | ||||
| E1-9 Breakdown of the carrying value of real estate assets by energy-efficiency classes |
Article 449a Regulation (EU) No 575/2013; Commission Implementing Regulation (EU) 2022/2453 paragraph 34;
Template 2: Banking book –Climate change transition risk: Loans collateralized by immovable property – Energy efficiency of the collateral |
Not relevant for our Integrated Report 2025 | |||
| E1-9 Degree of exposure of the portfolio to climate-related opportunities | Delegated Regulation (EU) 2020/1818, Annex II | Not relevant for our Integrated Report 2025 | |||
| E2-4 Amount of each pollutant listed in Annex II of the European Pollutant Release and Transfer Register (E-PRTR) Regulation emitted to air, water, and soil | Indicator number 8 Table #1 of Annex 1, Indicator number 2 Table #2 of Annex 1, Indicator number 1 Table #2 of Annex 1, and Indicator number 3 Table #2 of Annex 1 | Not material | |||
| E3-1 Water and marine resources | Indicator number 7 Table #2 of Annex 1 | Not material | |||
| E3-1 Dedicated policy | Indicator number 8 Table #2 of Annex 1 | Not material | |||
| E3-1 Sustainable oceans and seas | Indicator number 12 Table #2 of Annex 1 | Not material | |||
| E3-4 Total water recycled and reused | Indicator number 6.2 Table #2 of Annex 1 | Not material | |||
| E3-4 Total water consumption in m3 per net revenue on own operations | Indicator number 6.1 Table #2 of Annex 1 | Not material | |||
| E4 SBM-3 List of material sites and biodiversity-sensitive areas | Indicator number 7 Table #1 of Annex 1 | Not material | |||
| E4 SBM-3 Material negative impacts with regards to land degradation, desertification, or soil sealing | Indicator number 10 Table #2 of Annex 1 | Not material | |||
| E4 SBM-3 Operations affecting threatened species | Indicator number 14 Table #2 of Annex 1 | Not material | |||
| E4-2 Sustainable land and agriculture practices or policies | Indicator number 11 Table #2 of Annex 1 | Not material | |||
| E4-2 Sustainable ocean and sea practices or policies | Indicator number 12 Table #2 of Annex 1 | Not material | |||
| E4-2 Policies to address deforestation | Indicator number 15 Table #2 of Annex 1 | Not material | |||
| E5-5 Non-recycled waste | Indicator number 13 Table #2 of Annex 1 | End-of-Life Treatment of Electrical and Electronic Equipment |
| 202/326 |
|
Integrated Report 2025 | ||||
| To
Our Stakeholders |
Combined Management Report |
Consolidated
Financial Statements IFRS |
Additional Information | ||
| E5-5 Hazardous waste and radioactive waste | Indicator number 9 Table #1 of Annex 1 | Not material | |||
| S1 SBM-3 Risk of incidents of forced labor | Indicator number 13 Table #3 of Annex 1 | Own Workforce | |||
| S1 SBM-3 Risk of incidents of child labor | Indicator number 12 Table #3 of Annex 1 | Own Workforce | |||
| S1-1 Human rights policy commitments | Indicator number 9 Table #3 and Indicator number 11 Table #1 of Annex 1 | Human Rights | |||
| S1-1 Due diligence policies on issues addressed by the fundamental International Labour Organization Conventions 1 to 8 | Delegated Regulation (EU) 2020/1816, Annex II | Human Rights | |||
| S1-1 Processes and measures for preventing trafficking in human beings | Indicator number 11 Table #3 of Annex 1 | Human Rights | |||
| S1-1 Workplace accident prevention policy or management system | Indicator number 1 Table #3 of Annex 1 | Own Workforce: Health, Safety, and Well-Being | |||
| S1-3 Grievance and complaints handling mechanisms | Indicator number 5 Table #3 of Annex 1 | Own Workforce: Global People Compliance | |||
| S1-14 Number of fatalities and number and rate of work-related accidents | Indicator number 2 Table #3 of Annex 1 | Delegated Regulation (EU) 2020/1816, Annex II | Not material as SAP is an enterprise software company | ||
| S1-14 Number of days lost to injuries, accidents, fatalities, or illness | Indicator number 3 Table #3 of Annex 1 | Not material as SAP is an enterprise software company | |||
| S1-16 Unadjusted gender pay gap | Indicator number 12 Table #1 of Annex 1 | Own Workforce: Total Rewards | |||
| S1-16 Excessive CEO pay ratio | Indicator number 8 Table #3 of Annex 1 | Own Workforce: Total Rewards | |||
| S1-17 Incidents of discrimination | Indicator number 7 Table #3 of Annex 1 | Own Workforce: Global People Compliance | |||
| S1-17 Non-respect of U.N. Guiding Principles on Business and Human Rights, ILO principles, and/or OECD guidelines | Indicator number 10 Table #1 and Indicator number 14 Table #3 of Annex 1 | Delegated Regulation (EU) 2020/1816, Annex II; Delegated Regulation (EU) 2020/1818 Article 12(1) | Human Rights | ||
| S2 SBM-3 Significant risk of child labor or forced labor in the value chain | Indicator number 12 and number 13 Table #3 of Annex 1 | Workers in the Value Chain: Our Approach and Policies | |||
| S2-1 Human rights policy commitments | Indicator number 9 Table #3 and Indicator number 11 Table #1 of Annex 1 | Human Rights | |||
| S2-1 Policies related to value chain workers | Indicator number 11 and number 4 Table #3 of Annex 1 | Workers in the Value Chain: Our Approach and Policies | |||
| S2-1 Non-respect of U.N. Guiding Principles on Business and Human Rights, ILO principles, and/or OECD guidelines | Indicator number 10 Table #1 of Annex 1 | Delegated Regulation (EU) 2020/1816, Annex II; Delegated Regulation (EU) 2020/1818, Article 12(1) | Human Rights | ||
| S2-1 Due diligence policies on issues addressed by the fundamental International Labour Organization Conventions 1 to 8 | Delegated Regulation (EU) 2020/1816, Annex II | Human Rights |
| 203/326 |
|
Integrated Report 2025 | ||||
| To
Our Stakeholders |
Combined Management Report |
Consolidated
Financial Statements IFRS |
Additional Information | ||
| S2-4 Human rights issues and incidents connected to the upstream and downstream value chain | Indicator number 14 Table #3 of Annex 1 | Workers in the Value Chain: Our Actions and Targets | |||
| S3-1 Human rights policy commitments | Indicator number 9 Table #3 of Annex 1 and Indicator number 11 Table #1 of Annex 1 | Not material | |||
| S3-1 Non-respect of U.N. Guiding Principles on Business and Human Rights, ILO principles, and/or OECD guidelines | Indicator number 10 Table #1 Annex 1 | Delegated Regulation (EU) 2020/1816, Annex II; Delegated Regulation (EU) 2020/1818, Article 12(1) | Not material | ||
| S3-4 Human rights issues and incidents | Indicator number 14 Table #3 of Annex 1 | Not material | |||
| S4-1 Policies related to consumers and end-users | Indicator number 9 Table #3 and Indicator number 11 Table #1 of Annex 1 |
Security, Cloud Compliance, and Data Protection and Privacy;
Responsible AI: Our Approach and Policies | |||
| S4-1 Non-respect of U.N. Guiding Principles on Business and Human Rights, ILO principles, and/or OECD Guidelines | Indicator number 10 Table #1 of Annex 1 | Delegated Regulation (EU) 2020/1816, Annex II; Delegated Regulation (EU) 2020/1818, Article 12(1) | Not material as our business model is B2B | ||
| S4-4 Human rights issues and incidents | Indicator number 14 Table #3 of Annex 1 | Not material as our business model is B2B | |||
| G1-1 United Nations Convention against Corruption | Indicator number 15 Table #3 of Annex 1 | Business Conduct: Policies and Corporate Culture | |||
| G1-1 Protection of whistleblowers | Indicator number 6 Table #3 of Annex 1 | Business Conduct: Speak Out at SAP | |||
| G1-4 Fines for violation of anti-corruption and anti-bribery laws | Indicator number 17 Table #3 of Annex 1 | Delegated Regulation (EU) 2020/1816, Annex II | Business Conduct: Metrics | ||
| G1-4 Standards of anti-corruption and anti-bribery | Indicator number 16 Table #3 of Annex 1 | Business Conduct: Speak Out at SAP |
| 204/326 |
|
Integrated Report 2025 | ||||
| To
Our Stakeholders |
Combined Management Report |
Consolidated
Financial Statements IFRS |
Additional Information | ||
Incorporation by Reference
| Topic | Disclosure Requirement |
Link and Content | Text, If Applicable | |
| Sustainability Strategy | ||||
| Description of business model, inputs and outputs | ESRS 2 SBM-1 42 (a), (b) |
Combined Management Report: Strategy and Business Model – Our Business Model
Combined Management Report: Our Investments in Innovation |
NA | |
| Description of significant groups of products and/or services offered | ESRS 2 SBM-1 40 a (i) | Combined Management Report: Our Product Strategy – Products |
NA | |
| Amendments to strategy and business model | ESRS 2 SBM-2 45 c (i) | Combined Management Report: Strategy and Business Model – Our Product Strategy |
NA | |
| Description of engagement with customers | ESRS 2 SBM-2 45 (a) | Combined Management Report: Our Customers |
NA | |
| Revenue by sector, revenue by segment, and cost by segment | ESRS 2 SBM-1 40 (b), ESRS 2 AR 14. (c) | Combined Management Report: Operating Results (IFRS) |
NA | |
| Employee headcount by region and function | ESRS 2 SBM-1 40 a (iii) |
Cloud and Software: 4,714 (EMEA); 4,515 (Americas); 5,382 (APJ) Services: 8,433 (EMEA); 4,550 (Americas); 5,820 (APJ) Research and Development: 18,861 (EMEA); 5,859 (Americas); 13,534 (APJ) Sales and Marketing: 12,154 (EMEA); 9,832 (Americas); 4,966 (APJ) General and Administration: 4,175 (EMEA); 1,928 (Americas); 1,357 (APJ) Infrastructure: 3,202 (EMEA); 1,106 (Americas); 1,009 (APJ) | ||
| Sustainability Governance | ||||
| Number of executive and non-executive members | ESRS 2 GOV-1 21 (a) | Corporate Governance Statement |
Number of executive members (= Executive Board): 6 Number of non-executive members (= Supervisory Board): 18 | |
| Representation of employees | ESRS 2 GOV-1 21 (b) | Corporate Governance Statement
|
Nine out of 18 Supervisory Board members are employee representatives. | |
| Relevant experience related to sectors, products, and geographies | ESRS 2 GOV-1 21 (c) | Corporate Governance Statement |
Experience relevant to: Sectors and products: In the software industry field of expertise, SAP-specific requirements include: substantial experience in the software and IT sector; knowledge of international markets, customers and competitors; product expertise, including SAP’s sustainability products and the use of AI; experience with consumer markets; and experience and expertise in the areas of security, cloud compliance, data protection and privacy, and responsible AI. Geographic locations: To ensure an international composition of the Supervisory Board, it should comprise at least three persons who do not originate from Germany. In addition, the SAP SE Employee Involvement Agreement stipulates that the employee representatives on the Supervisory Board must come from different EU countries (currently, at least two representatives must originate from EU member states other than Germany). | |
| Percentage by gender | ESRS 2 GOV-1 21 (d) | Corporate Governance Statement |
Executive Board 5 men = 83% 1 woman = 17% |
Supervisory Board 13 men = 70% (rounded) 5 women = 30% (rounded) |
| 205/326 |
|
Integrated Report 2025 | ||||
| To
Our Stakeholders |
Combined Management Report |
Consolidated
Financial Statements IFRS |
Additional Information | ||
| Percentage of independent Supervisory Board members | ESRS 2 GOV-1 21 (e) | Corporate Governance Statement |
Furthermore, in the context of the independence assessment, the shareholder representatives found that all of the shareholders’ representatives serving on the Supervisory Board of SAP SE during the fiscal year 2025 also were independent according to the ESRS. (this equals 50% independent Supervisory Board members) |
| Incentive schemes and remuneration policies linked to sustainability matters | ESRS 2 GOV-3 29 (a) (b) (c) (d) |
Compensation Report: Compensation for Executive Board Members
Compensation Report: Compensation for Supervisory Board Members |
Executive Board: annual base salary, benefits, pension-related commitments, and performance-based compensation (short- and long-term incentive) Supervisory Board: fixed compensation only, based on role (for example, chairperson) and committee membership Non-financial key performance indicators (KPIs) are the following performance measures: the Customer Net Promoter Score (Customer NPS), measuring the satisfaction of SAP customers; the Employee Engagement Index (EEI), reflecting employees’ commitment, their pride in the Company and their loyalty; the Business Health Culture Index (BHCI), reflecting the extent to which SAP provides a working environment that promotes health, supports long-term employability, and fosters active engagement in achieving corporate goals; CO2 performance (Net Zero 2030), tracking SAP’s greenhouse gas emissions. A target is set for each non-financial (KPI). The targets are defined based on SAP’s long-term strategic planning. Based on the target value required for 100% target achievement, target achievement curves are also defined for the non-financial KPIs. The relevant period for the STI (short-term incentive) is the fiscal year for which the STI is being awarded, while for the LTI (long-term incentive), the relevant period is three years. For the STI, non-financial KPIs have a total weighting of 20% and comprise the Customer NPS and EEI. For the LTI, non-financial KPIs have a total weighting of 20% and comprise the BHCI and Net Zero 2030. The respective weightings of the individual non-financial KPIs may vary. The targets are in line with the specific targets disclosed in the topic-specific disclosures. For more information on the specific targets, see the topic sections. |
| Governance body at SAP that approves incentive plans | ESRS 2 GOV-3 29 (e) | Corporate Governance Statement |
The compensation system for the members of the Executive Board was presented to SAP SE’s Annual General Meeting of Shareholders for approval most recently on May 11, 2023, and accepted by 92.80% of the valid votes cast. |
| The expertise and skills of SAP’s Executive and Supervisory Boards on sustainability matters, and business conduct and compliance, and access to such expertise and skills |
ESRS 2 GOV-1 23 (a) (b) G1 GOV-1 5 (b) |
Corporate Governance Statement |
The Executive Board overall possesses adequate and sufficient expertise concerning the sustainability topics material for SAP mentioned in the preceding paragraph, our products for the sustainability sector, and our sustainability reporting. As far as these topics pertain to their respective areas of responsibility, the Executive Board members are supported by experts from the specialist departments and, if necessary, by external consultants. Furthermore, due to their professional experience and education, they also possess their own unique expertise on the mentioned topics. The respective information was gathered from a questionnaire completed by the Board members. The Supervisory Board members as a group possess the knowledge, ability, and expert experience required to properly perform their duties. Not only are they familiar in their entirety with the IT sector, they also have extensive knowledge in various professional areas and many years of international experience, and thus bring a broad range of skills and experience to their Supervisory Board roles. The Supervisory Board in its entirety fulfills all sustainability-related requirements that were identified as material for SAP through the double materiality analysis in accordance with the ESRS, that is, with regard to the topics of security, cloud compliance, data protection and privacy, responsible AI, business conduct, climate change, resource use and circular economy, as well as own workforce and workers in the value chain. In addition, the Supervisory Board possesses the required competencies with regard to sustainability reporting and SAP’s sustainability products. |
| 206/326 |
|
Integrated Report 2025 | ||||
| To
Our Stakeholders |
Combined Management Report |
Consolidated
Financial Statements IFRS |
Additional Information | ||
| How the Executive and Supervisory Boards are informed about sustainability matters | ESRS 2 GOV-2 26 (a) | Corporate Governance Statement |
Executive Board members with a sustainability topic in their area of responsibility are informed on these matters by their respective direct reports. For example, with regard to climate change, resource utilization, and the circular economy, Christian Klein can draw on the expertise of SAP’s Chief Sustainability and Commercial Officer and their organization, which is part of Christian Klein’s Executive Board portfolio. The Supervisory Board of SAP SE appoints, advises, and monitors the Executive Board. It seeks regular, full, and timely reports from the Executive Board on strategy (including sustainability strategy) and the status of its implementation, on business planning, profitability, and all aspects of business performance that are material for the SAP Group. |
| Sustainability and sustainability reporting risk management and internal controls framework. | ESRS 2 GOV-5 36, ESRS 2 IRO-1 53 c (iii) |
Combined Management Report: Risk Management and Risks – Our Risk Management - Internal Control and Risk Management Systems
Combined Management Report: Risk Management and Risks – Our Global Risk Management Governance Framework
Combined Management Report: Risk Management and Risks: Our Global Risk Management Organization – Internal Controls over Non-Financial and Sustainability Reporting
Combined Management Report: Risk Management and Risks – Risk Factors |
NA |
| Climate Change | |||
| Performance assessed against GHG emission reduction targets and the percentage of remuneration linked to GHG emission reduction recognized in the current period | E1 GOV-3 13 | Compensation Report: Compensation for Executive Board Members |
The final number of ESG PSUs (granted to the executive board) changes depending on SAP’s performance against the two non-financial KPI target values (BHCI and Net Zero) over the entire three-year performance period. The target values for each tranche are based on the cumulative three-year values of each KPI. The Net Zero 2030 KPI considers gross greenhouse gas emissions along the value chain in line with the Greenhouse Gas Protocol. Climate performance: Net Zero 2030 has a weight of 10% in the Executive Board’s Long Term Incentive (LTI) |
| Own Workforce | |||
| Methodologies and significant assumptions behind the metric - Employee Engagement Index (EEI) | ESRS 2 MDR-M 77 (a) | Combined Management Report: Performance Management System – Measures to Manage Our Non-Financial Performance |
NA |
| Methodologies and significant assumptions behind the metric - Business Health Culture Index (BHCI) | ESRS 2 MDR-M 77 (a) | Combined Management Report: Performance Management System – Measures to Manage Our Non-Financial Performance |
NA |
| 207/326 |
|
Integrated Report 2025 | ||||
| To
Our Stakeholders |
Combined Management Report |
Consolidated
Financial Statements IFRS |
Additional Information | ||
Responsibility Statement
To the best of our knowledge, and in accordance with the applicable reporting principles, the Consolidated Financial Statements give a true and fair view of the assets, finances, and operating results of the SAP Group, and the Combined Management Report of the Group and SAP SE includes a fair review of the development and performance of the business and the position of the Group and SAP SE, together with a description of the principal opportunities and risks associated with the expected development of the Group and SAP SE.
Walldorf, February 18, 2026
SAP SE
Walldorf, Germany
Executive Board of SAP SE
Christian Klein |
Muhammad Alam |
Dominik Asam |
Thomas Saueressig |
Sebastian Steinhaeuser |
Gina Vargiu-Breuer |
| 208/326 |
|
Integrated Report 2025 | ||||
| To
Our Stakeholders |
Combined
Management Report |
Consolidated
Financial Statements IFRS |
Additional Information | ||
Consolidated Financial Statements IFRS
 Consolidated Income Statements of SAP Group for the Years Ended December 31 Consolidated Income Statements of SAP Group for the Years Ended December 31 |
211 | ||
| Consolidated Statements of Comprehensive Income of SAP Group for the Years Ended December 31 | 212 | ||
 Consolidated Statements of Financial Position of SAP Group as at December 31 Consolidated Statements of Financial Position of SAP Group as at December 31 |
213 | ||
| Consolidated Statements of Changes in Equity of SAP Group for the Years Ended December 31 | 214 | ||
| Consolidated Statements of Cash Flows of SAP Group for the Years Ended December 31 | 215 | ||
| Notes | 216 | ||
| (IN.1) | Basis for Preparation | 216 | |
| Section A – Customers | 220 | ||
| (A.1) | Revenue | 220 | |
| (A.2) | Trade and Other Receivables | 226 | |
| (A.3) | Capitalized Cost from Contracts with Customers | 227 | |
| (A.4) | Customer-Related Provisions | 229 | |
| Section B – Employees | 230 | ||
| (B.1) | Number of Employees | 230 | |
| (B.2) | Employee Benefits Expenses | 230 | |
| (B.3) | Share-Based Payments | 231 | |
| (B.4) | Pension Plans and Similar Obligations | 237 | |
| (B.5) | Other Employee-Related Obligations | 240 | |
| (B.6) | Restructuring | 240 | |
| Section C – Financial Results | 242 | ||
| (C.1) | Results of Segments | 242 | |
| (C.2) | Reconciliation of Segment Measures to the Consolidated Income Statements | 245 | |
| (C.3) | Other Non-Operating Income/Expense, Net | 245 | |
| (C.4) | Financial Income, Net | 245 | |
| (C.5) | Income Taxes | 246 | |
| (C.6) | Earnings per Share | 250 | |
| Section D – Invested Capital | 251 | ||
| (D.1) | Business Combinations and Divestitures | 252 | |
| (D.2) | Goodwill | 256 | |
| (D.3) | Intangible Assets | 259 | |
| (D.4) | Property, Plant, and Equipment | 261 | |
| (D.5) | Leases | 262 | |
| (D.6) | Equity Investments | 263 | |
| (D.7) | Non-Current Assets by Region | 264 | |
| (D.8) | Purchase Obligations | 265 | |
| (D.9) | Income-Related Government Grants | 265 | |
| 209/326 |
|
Integrated Report 2025 | ||||
| To
Our Stakeholders |
Combined
Management Report |
Consolidated
Financial Statements IFRS |
Additional Information | ||
| Section E – Capital Structure, Financing, and Liquidity | 266 | ||
| (E.1) | Capital Structure Management | 266 | |
| (E.2) | Total Equity | 266 | |
| (E.3) | Liquidity | 268 | |
| Section F – Management of Financial Risk Factors | 273 | ||
| (F.1) | Financial Risk Factors and Risk Management | 273 | |
| (F.2) | Fair Value and Other Disclosures on Financial Instruments | 288 | |
| Section G – Other Disclosures | 295 | ||
| (G.1) | Prepaid Expenses, Advance Payments, and Other Tax Assets | 295 | |
| (G.2) | Provisions for Interest and Penalties Related to Taxes and Other Tax Liabilities | 295 | |
| (G.3) | Other Litigation, Claims, and Legal Contingencies | 296 | |
| (G.4) | Board of Directors | 298 | |
| (G.5) | Executive and Supervisory Board Compensation | 302 | |
| (G.6) | Related-Party Transactions Other Than Board Compensation | 303 | |
| (G.7) | Principal Accountant Fees | 304 | |
| (G.8) | Events After the Reporting Period | 304 | |
| (G.9) | Scope of Consolidation, Subsidiaries and Other Equity Investments | 305 | |
| (G.10) | German Code of Corporate Governance | 316 | |
| Management’s Annual Report on Internal Control over Financial Reporting in the Consolidated Financial Statements | 318 | ||
| 210/326 |
|
Integrated Report 2025 | ||||
| To
Our Stakeholders |
Combined
Management Report |
Consolidated
Financial Statements IFRS |
Additional Information | ||
 Consolidated Income Statements of SAP Group for the Years Ended December 31
| € millions, unless otherwise stated | Notes | 2025 | 2024 | 2023 |
| Cloud | 21,023 | 17,141 | 13,664 | |
| Software licenses | 990 | 1,399 | 1,764 | |
| Software support | 10,525 | 11,290 | 11,496 | |
| Software licenses and support | 11,515 | 12,689 | 13,261 | |
| Cloud and software | 32,538 | 29,830 | 26,924 | |
| Services | 4,262 | 4,346 | 4,283 | |
| Total revenue | (A.1), (C.2) |
36,800 | 34,176 | 31,207 |
| Cost of cloud | –5,480 | –4,660 | –3,884 | |
| Cost of software licenses and support | –1,313 | –1,262 | –1,383 | |
| Cost of cloud and software | –6,793 | –5,922 | –5,267 | |
| Cost of services | –3,193 | –3,321 | –3,407 | |
| Total cost of revenue | –9,986 | –9,243 | –8,674 | |
| Gross profit | 26,814 | 24,932 | 22,534 | |
| Research and development | (D.9) |
–6,633 | –6,514 | –6,324 |
| Sales and marketing | –8,879 | –9,090 | –8,828 | |
| General and administration | –1,633 | –1,435 | –1,364 | |
| Restructuring | (B.6) |
–3 | –3,144 | –215 |
| Other operating income/expense, net | –49 | –85 | –4 | |
| Total operating expenses | –27,183 | –29,511 | –25,408 | |
| Operating profit | 9,617 | 4,665 | 5,799 | |
| Other non-operating income/expense, net | (C.3) |
118 | –298 | –3 |
| Finance income | 1,911 | 1,429 | 857 | |
| Finance costs | –1,377 | –1,031 | –1,313 | |
| Financial income, net | (C.4) |
534 | 398 | –456 |
| Profit before tax from continuing operations | (C.2) |
10,270 | 4,764 | 5,341 |
| Income tax expense | (C.5) |
–2,944 | –1,614 | –1,741 |
| Profit after tax from continuing operations | 7,326 | 3,150 | 3,600 | |
| Attributable to owners of parent | 7,161 | 3,124 | 3,634 | |
| Attributable to non-controlling interests | 165 | 26 | –33 | |
| Profit (loss) after tax from discontinued operations | (D.1) |
0 | 0 | 2,363 |
| Profit after tax1 | 7,326 | 3,150 | 5,964 | |
| Attributable to owners of parent1 | 7,161 | 3,124 | 6,139 | |
| Attributable to non-controlling interests1 | 165 | 26 | –175 | |
| Earnings per share, basic (in €) from continuing operations | (C.6) |
6.14 | 2.68 | 3.11 |
| Earnings per share, basic (in €)1 | (C.6) |
6.14 | 2.68 | 5.26 |
| Earnings per share, diluted (in €) from continuing operations | (C.6) |
6.10 | 2.65 | 3.08 |
| Earnings per share, diluted (in €)1 | (C.6) |
6.10 | 2.65 | 5.20 |
The accompanying Notes are an integral part of these Consolidated Financial Statements.
1 from continuing and discontinued operations
| 211/326 |
|
Integrated Report 2025 | ||||
| To
Our Stakeholders |
Combined
Management Report |
Consolidated
Financial Statements IFRS |
Additional Information | ||
Consolidated Statements of Comprehensive Income of SAP Group for the Years Ended December 31
| € millions | Notes | 2025 | 2024 | 2023 |
 Profit after tax1 Profit after tax1 |
7,326 | 3,150 | 5,964 | |
| Items that will not be reclassified to profit or loss | ||||
| Remeasurements on defined benefit pension plans, before tax | –9 | –30 | –45 | |
| Income taxes relating to remeasurements on defined benefit pension plans | 7 | 6 | 10 | |
| Remeasurements on defined benefit pension plans, net of tax | –2 | –23 | –36 | |
| Other comprehensive income for items that will not be reclassified to profit or loss, net of tax | –2 | –23 | –36 | |
| Items that will be reclassified subsequently to profit or loss | ||||
| Gains (losses) on exchange differences on translation, before tax | –4,594 | 2,369 | –1,631 | |
| Reclassification adjustments on exchange differences on translation, before tax | –3 | 18 | 12 | |
| Exchange differences, before tax | –4,597 | 2,387 | –1,618 | |
| Income taxes relating to exchange differences on translation | 2 | –17 | 21 | |
| Exchange differences, net of tax | (E.2) |
–4,594 | 2,370 | –1,597 |
| Gains (losses) on cash flow hedges/cost of hedging, before tax | 291 | –111 | –11 | |
| Reclassification adjustments on cash flow hedges/cost of hedging, before tax | –255 | 78 | 0 | |
| Cash flow hedges/cost of hedging, before tax | (F.1) |
36 | –32 | –11 |
| Income taxes relating to cash flow hedges/cost of hedging | –10 | 9 | 3 | |
| Cash flow hedges/cost of hedging, net of tax | (E.2) |
26 | –24 | –8 |
| Other comprehensive income for items that will be reclassified to profit or loss, net of tax | –4,568 | 2,347 | –1,605 | |
| Other comprehensive income, net of tax | –4,570 | 2,323 | –1,641 | |
| Total comprehensive income | 2,756 | 5,474 | 4,323 | |
| Attributable to owners of parent | 2,649 | 5,419 | 4,670 | |
| Attributable to non-controlling interests | 107 | 54 | –347 |
The accompanying Notes are an integral part of these Consolidated Financial Statements.
1 from continuing and discontinued operations
| 212/326 |
|
Integrated Report 2025 | ||||
| To
Our Stakeholders |
Combined
Management Report |
Consolidated
Financial Statements IFRS |
Additional Information | ||
 Consolidated Statements of Financial Position of SAP Group as at December 31
| € millions | Notes | 2025 | 2024 |
| Cash and cash equivalents | (E.3) |
8,220 | 9,609 |
| Other financial assets | (D.6), (E.3) |
1,552 | 1,629 |
| Trade and other receivables | (A.2) |
6,675 | 6,774 |
| Other non-financial assets | (A.3), (G.1) |
3,212 | 2,682 |
| Tax assets | 598 | 707 | |
| Total current assets | 20,256 | 21,401 | |
| Goodwill | (D.2) |
29,014 | 31,264 |
| Intangible assets | (D.3) |
2,282 | 2,706 |
| Property, plant, and equipment | (D.4), (D.5) |
4,497 | 4,493 |
| Other financial assets | (D.6), (E.3) |
7,269 | 7,141 |
| Trade and other receivables | (A.2) |
218 | 209 |
| Other non-financial assets | (A.3), (G.1) |
4,419 | 3,990 |
| Tax assets | 244 | 359 | |
| Deferred tax assets | (C.5) |
2,163 | 2,674 |
| Total non-current assets | 50,106 | 52,836 | |
| Total assets | 70,362 | 74,237 | |
| Trade and other payables | 2,431 | 1,988 | |
| Tax liabilities | 968 | 585 | |
| Financial liabilities | (E.3), (D.5) |
2,050 | 4,277 |
| Other non-financial liabilities | (B.3), (B.5), (G.2) |
4,849 | 5,537 |
| Provisions | (A.4), (B.6), (G.2), (G.3) |
537 | 716 |
| Contract liabilities | (A.1) |
6,581 | 5,978 |
| Total current liabilities | 17,416 | 19,082 | |
| Trade and other payables | 2 | 10 | |
| Tax liabilities | 562 | 512 | |
| Financial liabilities | (E.3), (D.5) |
6,021 | 7,169 |
| Other non-financial liabilities | (B.3), (B.5), (G.2) |
524 | 749 |
| Provisions | (A.4), (B.4), (B.6), (G.2) |
550 | 494 |
| Deferred tax liabilities | (C.5) |
72 | 326 |
| Contract liabilities | (A.1) |
144 | 88 |
| Total non-current liabilities | 7,873 | 9,349 | |
| Total liabilities | 25,288 | 28,431 | |
| Issued capital | 1,229 | 1,229 | |
| Share premium | 2,778 | 2,564 | |
| Retained earnings | 47,345 | 42,907 | |
| Other components of equity | 182 | 4,692 | |
| Treasury shares | –6,948 | –5,954 | |
| Equity attributable to owners of parent | 44,586 | 45,438 | |
| Non-controlling interests | (E.2) |
488 | 368 |
| Total equity | (E.2) |
45,073 | 45,806 |
| Total equity and liabilities | 70,362 | 74,237 |
The accompanying Notes are an integral part of these Consolidated Financial Statements.
| 213/326 |
|
Integrated Report 2025 | ||||
| To
Our Stakeholders |
Combined
Management Report |
Consolidated
Financial Statements IFRS |
Additional Information | ||
Consolidated Statements of Changes in Equity of SAP Group for the Years Ended December 31
| € millions | Equity Attributable to Owners of Parent |
Non- Controlling |
Total Equity | ||||||
| Issued Capital | Share Premium |
Retained Earnings |
Other Components of Equity |
Treasury Shares |
Total | ||||
| Notes | (E.2) |
(E.2) |
(E.2) |
(E.2) |
(E.2) |
(E.2) |
|||
| 1/1/2023 | 1,229 | 3,081 | 36,418 | 3,801 | –4,341 | 40,186 | 2,662 | 42,848 | |
| Profit after
tax1 |
6,139 | 6,139 | –175 | 5,964 | |||||
| Other comprehensive income | –36 | –1,433 | –1,469 | –172 | –1,641 | ||||
| Comprehensive income | 6,103 | –1,433 | 4,670 | –347 | 4,323 | ||||
| Share-based payments | 1,032 | 1,032 | 121 | 1,153 | |||||
| Dividends | –2,395 | –2,395 | –21 | –2,417 | |||||
| Purchase of treasury shares | –968 | –968 | –968 | ||||||
| Reissuance of treasury shares under share-based payments | 568 | 568 | 568 | ||||||
| Changes in non-controlling interests | –2,268 | 2,197 | –71 | –2,164 | –2,235 | ||||
| Other changes | 135 | 135 | –1 | 134 | |||||
| 12/31/2023 | 1,229 | 1,845 | 42,457 | 2,367 | –4,741 | 43,157 | 249 | 43,406 | |
| Profit after
tax |
3,124 | 3,124 | 26 | 3,150 | |||||
| Other comprehensive income | –23 | 2,318 | 2,295 | 28 | 2,323 | ||||
| Comprehensive income | 3,101 | 2,318 | 5,419 | 54 | 5,474 | ||||
| Share-based payments, before tax | 399 | 399 | 399 | ||||||
| Income taxes relating to share-based payments | 320 | 320 | 320 | ||||||
| Dividends | –2,565 | –2,565 | –2 | –2,566 | |||||
| Purchase of treasury shares | –2,108 | –2,108 | –2,108 | ||||||
| Reissuance of treasury shares under share-based payments | 895 | 895 | 895 | ||||||
| Other changes | –86 | 7 | –79 | 66 | –13 | ||||
| 12/31/2024 | 1,229 | 2,564 | 42,907 | 4,692 | –5,954 | 45,438 | 368 | 45,806 | |
| Profit after
tax |
7,161 | 7,161 | 165 | 7,326 | |||||
| Other comprehensive income | –2 | –4,510 | –4,512 | –59 | –4,570 | ||||
| Comprehensive income | 7,159 | –4,510 | 2,649 | 107 | 2,756 | ||||
| Share-based payments, before tax | 143 | 143 | 143 | ||||||
| Income taxes relating to share-based payments | 71 | 71 | 71 | ||||||
| Dividends | –2,743 | –2,743 | –2 | –2,746 | |||||
| Purchase of treasury shares | –1,916 | –1,916 | –1,916 | ||||||
| Reissuance of treasury shares under share-based payments | 922 | 922 | 922 | ||||||
| Other changes | 22 | 0 | 22 | 15 | 38 | ||||
| 12/31/2025 | 1,229 | 2,778 | 47,345 | 182 | –6,948 | 44,586 | 488 | 45,073 | |
The accompanying Notes are an integral part of these Consolidated Financial Statements.
1 from continuing and discontinued operations
| 214/326 |
|
Integrated Report 2025 | ||||
| To
Our Stakeholders |
Combined
Management Report |
Consolidated
Financial Statements IFRS |
Additional Information | ||
Consolidated Statements of Cash Flows of SAP Group for the Years Ended December 31
| € millions | Notes | 20253 | 2024 | 2023 |
| Profit (loss) after tax1 |
7,326 | 3,150 | 5,964 | |
| Adjustments to reconcile profit (loss) after tax to net cash flows from operating activities: | ||||
| (Profit) loss after tax from discontinued operations |
0 | 0 | –2,363 | |
| Depreciation and amortization | (D.2)–(D.4) |
1,311 | 1,280 | 1,373 |
| Share-based payment expense | (B.3) |
1,695 | 2,385 | 2,220 |
| Income tax expense |
(C.5) |
2,944 | 1,614 | 1,741 |
| Financial income, net |
(C.4) |
–534 | –398 | 456 |
| Increase/decrease in allowances on trade receivables | 11 | 30 | –10 | |
| Other adjustments for non-cash items | 94 | 110 | 23 | |
| Increase/decrease in trade and other receivables | –388 | –247 | –393 | |
| Increase/decrease in other assets | –1,315 | –632 | –700 | |
| Increase/decrease in trade payables, provisions, and other liabilities | –308 | 603 | 633 | |
| Increase/decrease in contract liabilities | 1,336 | 869 | 443 | |
| Share-based payments | (B.3) |
–817 | –1,282 | –1,091 |
| Income taxes paid, net of refunds2 | –2,198 | –2,277 | –2,161 | |
| Net cash flows from operating activities – continuing operations | 9,156 | 5,207 | 6,134 | |
| Net cash flows from operating activities – discontinued operations | (D.1) |
0 | 0 | 113 |
| Net cash flows from operating activities1 | 9,156 | 5,207 | 6,246 | |
| Business combinations, net of cash and cash equivalents acquired | –702 | –1,114 | –1,168 | |
| Cash flows from derivative financial instruments related to the sale of subsidiaries or businesses | 0 | 0 | –91 | |
| Purchase of intangible assets and property, plant, and equipment | –739 | –797 | –785 | |
| Proceeds from sales of intangible assets and property, plant, and equipment | 121 | 122 | 99 | |
| Purchase of equity or debt instruments of other entities | –5,845 | –6,401 | –3,566 | |
| Proceeds from sales of equity or debt instruments of other entities | 5,779 | 7,533 | 907 | |
| Interest received | 420 | 563 | 469 | |
| Net cash flows from investing activities – continuing operations | –965 | –93 | –4,134 | |
| Net cash flows from investing activities – discontinued operations | (D.1) |
0 | 0 | 5,523 |
| Net cash flows from investing activities1 | –965 | –93 | 1,389 | |
| Dividends paid | (E.2) |
–2,743 | –2,565 | –2,395 |
| Dividends paid on non-controlling interests | –2 | –1 | –13 | |
| Purchase of treasury shares | (E.2) |
–1,937 | –2,106 | –949 |
| Proceeds from borrowings | (E.3) |
2 | 2,767 | 13 |
| Repayments of borrowings | (E.3) |
–3,191 | –1,185 | –4,081 |
| Payments of lease liabilities | –299 | –310 | –332 | |
| Transactions with non-controlling interests | (E.2) |
0 | –11 | 0 |
| Interest paid | –574 | –550 | –393 | |
| Net cash flows from financing activities – continuing operations | –8,745 | –3,961 | –8,151 | |
| Net cash flows from financing activities – discontinued operations | (D.1) |
0 | 0 | 20 |
| Net cash flows from financing activities1 | –8,745 | –3,961 | –8,131 | |
| Effect of foreign currency rates on cash and cash equivalents | –836 | 333 | –388 | |
| Net increase/decrease in cash and cash equivalents | –1,390 | 1,485 | –883 | |
 Cash and cash equivalents at the beginning of the period Cash and cash equivalents at the beginning of the period |
(E.3) |
9,609 | 8,124 | 9,008 |
| Cash and cash equivalents at the end of the period |
(E.3) |
8,220 | 9,609 | 8,124 |
The accompanying Notes are an integral part of these Consolidated Financial Statements.
1 from continuing and discontinued operations
2 Total income taxes paid, net of refunds 2023: –€2,973 million, thereof contained in the line item "Net cash flows from investing activities – discontinued operations": –€815 million.
3 As of January 2025, SAP no longer classifies interest paid and interest received as a part of cash flows from operating activities. The presentation for prior periods was amended accordingly.
| 215/326 |
|
Integrated Report 2025 | ||||
| To
Our Stakeholders |
Combined
Management Report |
Consolidated
Financial Statements IFRS |
Additional Information | ||
Notes
(IN.1) Basis for Preparation
General Information
The registered domicile of SAP SE is in Walldorf, Germany (Commercial Register of the Lower Court of Mannheim HRB 719915). The Consolidated Financial Statements for 2025 of SAP SE and its subsidiaries (collectively, “we,” “us,” “our,” “SAP,” “Group,” and “Company”) have been prepared in accordance with International Financial Reporting Standards (IFRS) and the additional requirements set forth in section 315e (1) of the German Commercial Code (HGB).
We have applied all IFRS standards and interpretations that were effective on and endorsed by the European Union (EU) as at December 31, 2025. There were no standards or interpretations as at December 31, 2025, impacting our Consolidated Financial Statements for the years ended December 31, 2025, 2024, and 2023, that were effective but not yet endorsed. Therefore, our Consolidated Financial Statements comply with both, IFRS as issued by the International Accounting Standards Board (IASB) and IFRS as endorsed by the EU.
Our Executive Board approved the Consolidated Financial Statements on February 18, 2026, for submission to our Supervisory Board which approved the Consolidated Financial Statements on the same day.
All amounts included in the Consolidated Financial Statements are reported in millions of euros (€ millions) except where otherwise stated. As figures are rounded, numbers presented throughout this document may not add up precisely to the totals we provide and percentages may not precisely reflect the absolute figures.
Amounts disclosed in the Notes that are taken directly from our Consolidated
Income Statements or our Consolidated Statements of Financial
Position are marked with the symbols and ,
respectively.
Furthermore, all financial numbers in the Consolidated Financial Statements are based on continuing operations (unless otherwise noted).
Accounting Policies, Management Judgments, and Sources of Estimation Uncertainty
How We Present Our Accounting Policies, Judgments, and Estimates
To ease the understanding of our financial statements, we present the accounting policies, management judgments, and sources of estimation uncertainty (hereafter: accounting policies, judgments, and estimates) on a given subject together with other disclosures related to the same subject in the Note that deals with this subject. Accounting policies, judgments, and estimates that do not relate to a specific subject are presented in the following section.
For easier identification of our accounting policies, judgments, and
estimates, the respective disclosures are marked with the symbol
and highlighted with a light gray box. They focus on the accounting choices made within the framework of the prevailing IFRS and refrain
from repeating the underlying promulgated IFRS guidance, unless we consider it particularly important to the understanding of a Note’s
content.
The following table provides an overview of where our accounting policies, management judgments, and estimates are disclosed:
| Note |  Accounting Policies, Judgments, and Estimates
 |
(IN.1) |
Basis for Preparation |
(A.1) |
Revenue |
(A.2) |
Trade and Other Receivables |
(A.3) |
Capitalized Cost from Contracts with Customers |
(A.4) |
Customer-Related Provisions |
| 216/326 |
|
Integrated Report 2025 | ||||
| To
Our Stakeholders |
Combined
Management Report |
Consolidated
Financial Statements IFRS |
Additional Information | ||
(B.3) |
Share-Based Payments |
(B.4) |
Pension Plans and Similar Obligations |
(B.5) |
Other Employee-Related Obligations |
(B.6) |
Restructuring |
(C.1) |
Results of Segments |
(C.5) |
Income Taxes |
(D.1) |
Business Combinations and Divestitures |
(D.2) |
Goodwill |
(D.3) |
Intangible Assets |
(D.4) |
Property, Plant, and Equipment |
(D.5) |
Leases |
(D.6) |
Equity Investments |
(D.9) |
Government Grants |
(E.2) |
Total Equity |
(E.3) |
Liquidity |
(F.1) |
Financial Risk Factors and Risk Management |
(F.2) |
Fair Value Disclosures on Financial Instruments |
(G.3) |
Other Litigation, Claims, and Legal Contingencies |
(G.5) |
Executive and Supervisory Board Compensation |
General Accounting Policies
Bases of Measurement
The Consolidated Financial Statements have been prepared on the historical cost basis except for the following:
| – | Derivative financial instruments, liabilities for cash-settled share-based payments, and financial assets with cash flows that are not solely payments of principal or interest are measured at fair value. |
| – | Post-employment benefits are measured at the present value of the defined benefit obligations less the fair value of the plan assets. |
| – | Monetary assets and liabilities denominated in foreign currencies are translated at period-end exchange rates. |
| – | Provisions are recognized at the best estimate of their fulfillment amount when they occur. |
Foreign Currencies
Income and expenses and operating cash flows of our foreign subsidiaries that use a functional currency other than the Euro are translated at average rates of foreign exchange (FX) computed on a monthly basis. Exchange differences resulting from foreign currency transactions are recognized in other non-operating income/expense, net.
The exchange rates of key currencies affecting the Company were as follows:
Exchange Rates
| Equivalent to €1 |
Middle Rate as at 12/31 |
Annual Average Exchange Rate | ||||
| 2025 | 2024 | 2025 | 2024 | 2023 | ||
| Australian dollar | AUD | 1.7581 | 1.6772 | 1.7514 | 1.6399 | 1.6285 |
| Canadian dollar | CAD | 1.6088 | 1.4948 | 1.5782 | 1.4819 | 1.4596 |
| Swiss franc | CHF | 0.9314 | 0.9412 | 0.9371 | 0.9526 | 0.9717 |
| Pound sterling | GBP | 0.8726 | 0.8292 | 0.8566 | 0.8466 | 0.8699 |
| Japanese yen | JPY | 184.0900 | 163.0600 | 168.9457 | 163.8174 | 151.9421 |
| U.S. dollar | USD | 1.1750 | 1.0389 | 1.1293 | 1.0821 | 1.0816 |
| 217/326 |
|
Integrated Report 2025 | ||||
| To
Our Stakeholders |
Combined
Management Report |
Consolidated
Financial Statements IFRS |
Additional Information | ||
Cost Classification
Cost of Cloud and Software
Cost of cloud and software includes the costs incurred in providing the services and producing the goods that generate cloud and software revenue. Consequently, this line item primarily includes employee expenses relating to these services, amortization of acquired intangibles, fees for third-party licenses, depreciation of our property, plant, and equipment (for example, of our data centers in which we host our cloud solutions), and costs for third-party hosting services. For more information about the capitalization of costs from contracts with customers, see Note (A.3).
Cost of Services
Cost of services includes the costs incurred in providing the services that generate service revenue. Consequently, this line item primarily includes employee expenses and related training, system and system administration costs, and costs for third-party resources.
Research and Development
Research and development includes the costs incurred by activities related to the development of cloud and software solutions including resource and hardware costs for the development systems. The same applies for activities related to changes in the code of SAP’s cloud and software solutions. For more information about the recognition of internally generated intangible assets from development, see Note (D.3).
Sales and Marketing
Sales and marketing includes the costs incurred for the selling activities (such as sales commissions and amortization of capitalized sales commissions) and marketing activities related to our software and cloud solutions and our service portfolio. For more information about the capitalization of costs from contracts with customers, see Note (A.3).
General and Administration
General and administration includes the costs related to finance and administrative functions, human resources, and general management as long as they are not directly attributable to one of the other operating expense line items.
Updated Accounting Policy for the Presentation of Interest Paid and Interest Received
As of 2025, SAP updated the presentation of its Consolidated Statements of Cash Flows to better reflect management’s view of the underlying business activities. Interest paid and interest received are no longer classified within net cash flows from operating activities.
Interest paid is now presented within net cash flows from financing activities, and interest received within net cash flows from investing activities, as these cash flows are not considered part of SAP’s operating activities. Prior-year amounts have been reclassified for comparability. The updated presentation is consistent with the requirements of IFRS 18.
Management Judgments and Sources of Estimation Uncertainty
The preparation of the Consolidated Financial Statements requires our management to make judgments, estimates, and assumptions that affect the application of accounting policies and the reported amounts of assets, liabilities, revenues, and expenses, as well as disclosure of contingent liabilities.
| 218/326 |
|
Integrated Report 2025 | ||||
| To
Our Stakeholders |
Combined
Management Report |
Consolidated
Financial Statements IFRS |
Additional Information | ||
We base our judgments, estimates, and assumptions on historical and forecast information, and on regional and industry economic conditions in which we or our customers operate. Changes to these conditions could adversely affect our estimates. Although we believe we have made reasonable estimates about the ultimate resolution of the underlying uncertainties, no assurance can be given that the final outcome of these matters will be consistent with what is reflected in our recognized assets, liabilities, revenues, and expenses and disclosed contingent liabilities. Actual results could differ significantly from original estimates.
The accounting policies that most frequently or significantly require us to make judgments, estimates, and assumptions, and therefore are critical to understanding our results of operations, include the following:
| Note |  Material Accounting Policies Material Accounting Policies |
(A.1) |
Revenue recognition |
(A.2) |
Valuation of trade receivables |
(A.4), (G.3) |
Accounting for legal contingencies |
(B.3) |
Accounting for share-based payments |
(C.5) |
Accounting for income taxes |
(D.1) |
Accounting for business combinations |
(D.2) |
Accounting for goodwill |
(D.3) |
Accounting for intangible assets (including recognition of internally generated intangible assets from development) |
(D.6) |
Accounting for equity investments |
Our management periodically discusses these material accounting policies with the Audit and Compliance Committee of our Supervisory Board.
New Accounting Standards
Not Yet Adopted
The IASB has issued various amendments to the IFRS standards (such as IFRS 9 and IFRS 7 (Amendments to the Classification, Measurement, and Disclosure of Financial Instruments)) that are relevant for SAP but not yet effective. We are currently assessing the impact of IFRS 9 and IFRS 7 (Amendments to the Classification, Measurement, and Disclosure of Financial Instruments) on SAP, but do not expect material effects on our financial position or profit after tax.
In April 2024, the IASB released IFRS 18 (Presentation and Disclosure in Financial Statements). The new standard will affect the presentation of our Consolidated Income Statements, introduce additional disclosure requirements, and further specify aggregation and disaggregation of information in our Notes to the Consolidated Financial Statements. IFRS 18 will become effective on January 1, 2027.
The main purpose of IFRS 18 is to increase transparency and comparability of financial performance between reporting entities. When the new standard becomes effective, the structure of SAP’s Consolidated Income Statements, as well as the definition of operating profit, will change to comply with the new requirements.
SAP has performed preliminary evaluations of its financial reporting under IFRS 18. However, mainly due to outstanding decisions and clarifications by international and national standard-setting bodies (such as the IASB’s pending decision regarding the treatment of foreign currency fluctuations arising from intercompany loans), the overall impact of IFRS 18 on operating profit cannot yet be determined. With the introduction of IFRS 18, comparison periods will be restated to conform with the new standard.
Further, changes in IFRS 18 will affect the presentation of our Consolidated Statements of Cash Flows, as defined by IAS 7. We do not expect these required changes to have a material impact on our Net cash flows from operating activities.
| 219/326 |
|
Integrated Report 2025 | ||||
| To
Our Stakeholders |
Combined
Management Report |
Consolidated
Financial Statements IFRS |
Additional Information | ||
Section A – Customers
This section discusses disclosures related to contracts with our customers. These include but are not limited to explanations of how we recognize revenue, revenue disaggregation, and information about our trade receivables and customer-related obligations.
(A.1) Revenue
Accounting for Revenue from Contracts with Customers
Classes of Revenue
We derive our revenue from fees charged to our customers for the use of our cloud offerings, for licenses to our on-premise software products, and for standardized and premium support services, consulting, customer-specific software developments, training, and other services.
Cloud and software revenue, as presented in our Consolidated Income Statements, is the sum of our cloud revenue, our software license revenue, and our software support revenue.
Cloud revenue represents fees earned from providing customers with any of the following:
Software as a service (SaaS), that is, a right to use software functionality (including standard functionalities, AI use cases, and custom cloud applications and extensions) in a cloud-based infrastructure hosted by SAP or third parties subcontracted by SAP, where the customer does not have the right to terminate the hosting contract and take possession of the software to either run it on its own IT infrastructure or to engage a third-party provider unrelated to SAP to host and manage the software; SaaS also includes transaction and agent fees for transactions that customers execute on our cloud-based transaction platforms.
Platform as a service (PaaS), that is, access to a cloud-based platform to develop, deploy, integrate, and manage applications.
Infrastructure as a service (IaaS), that is, hosting and related application management services for software hosted by SAP or third parties engaged by SAP.
Premium cloud support, that is, support beyond the regular support embedded in the underlying cloud subscription services.
Software license revenue represents fees earned from the license of perpetual or time-based software to customers for use on the premises owned or fully controlled by the customer, in other words, where the customer has the right to take possession of the software for installation on the customer’s premises or on hardware of third-party hosting providers unrelated to SAP (on-premise software).
Software support revenue represents fees earned from providing customers with standardized support services that comprise unspecified future software updates, upgrades, and enhancements as well as technical product support services for on-premise software products.
Services revenue primarily represents fees earned from professional consulting services, premium support services, and training services.
Identification of a Contract
We frequently enter into multiple contracts with the same customer. For accounting purposes, we treat these contracts as a single contract if they are entered into at or near the same time and are economically interrelated. We do not combine contracts with closing days more than three months apart because we do not consider them being entered into near the same time. Judgment is required in evaluating whether various contracts are interrelated, which includes considerations as to whether they were negotiated as a package with a single commercial objective, whether the amount of consideration on one contract is dependent on the performance of the other contract, or if some or all goods in the contracts are a single performance obligation.
New arrangements with existing customers can be either a new contract or the modification of prior contracts with the customer. Our judgment in making this determination considers whether the goods and services under the new arrangement are highly interrelated with the goods and services sold under prior contracts, how the goods and services under the new arrangement are priced, and whether there is a connection between the new arrangement and the pre-existing contracts. In determining whether a change in
| 220/326 |
|
Integrated Report 2025 | ||||
| To
Our Stakeholders |
Combined
Management Report |
Consolidated
Financial Statements IFRS |
Additional Information | ||
transaction price represents a contract modification or a change in variable consideration, we examine whether the change in price results from changing the contract or from applying unchanged existing contract provisions.
Identification of Performance Obligations
Our customer contracts often include various products and services. Typically, the products and services outlined in the Classes of Revenue section qualify as separate performance obligations and the portion of the contractual fee allocated to them is recognized separately. For distinct goods and services that are sold to customers in commercial bundles, SAP generally concludes that no significant integration or interrelation between the distinct goods and services exists, and therefore considers each individual good or service included in the commercial bundle to be distinct goods and services. Judgment is required, however, in determining whether a good or service is considered a separate performance obligation. For our professional services and implementation activities, judgment is required to evaluate whether such services significantly integrate, customize, or modify the on-premise software or cloud service to which they relate. In this context, we consider the nature of the services and their volume relative to the volume of the on-premise software or cloud service to which they relate. In general, the implementation services for our cloud services go beyond pure setup activities and qualify as separate performance obligations. Similarly, our on-premise implementation services and our custom development services typically qualify as separate performance obligations. Non-distinct goods and services are combined into one distinct bundle of goods and services (combined performance obligation).
When selling goods or services, we frequently grant customers options to acquire additional goods or services (for example, renewals of cloud or support arrangements, or additional volumes of purchased cloud solutions or software). We apply judgment in determining whether such options provide a material right to the customer that the customer would not receive without entering into that contract. In this judgment, we consider, for example, whether the options entitle the customer to a discount that exceeds the discount granted for the respective goods or services sold together with the option.
In scenarios where SAP:
- sells indirectly to end customers via partners
- sells third-party products to end customers
- provides services to end customers with the support of suppliers, or
- connects buyers and suppliers on cloud-based platforms,
SAP determines the respective nature of the performance obligation and whether SAP is providing the specified good or service itself or arranging for the good or service to be provided by the third party. SAP identifies whether it (or the partner) is acting as principal or agent in line with this performance obligation assessment. SAP exercises judgment in making this assessment, which is based on the question of whether the intermediary controls the specified good or service before it is transferred to the customer. In exercising this judgment, SAP relies in the majority of cases on bundling multiple goods or services into the specified good or service, on its legal responsibility toward the customer in providing the specified good or service, and on its pricing discretion for the same.
Determination of Transaction Price
We apply judgment in determining the amount to which we expect to be entitled in exchange for transferring promised goods or services to a customer. Generally, variable consideration is estimated based on the most likely amount and is included in the transaction price to the extent that the constraint does not apply. This includes estimates as to whether and to what extent subsequent concessions may be granted to customers and whether the customer is expected to pay the contractual fees. In this judgment, we consider our history with the respective customer or on a portfolio basis.
The recognition constraint is applied to on-premise software transactions that include usage-based or sales-based contingent fees. In contrast, our typical cloud services do not provide the customer with a software license because the customer does not have the right to terminate the hosting contract and take possession of the software. Consequently, variable cloud fees are considered in the transaction price based on estimates, rather than being accounted for as usage-based or sales-based license royalties. If SAP pays consideration to a customer in exchange for a distinct good or service—for example, when SAP acquires goods or services from a supplier, and such purchase is linked to a customer contract— the fair value of the purchase transaction must be estimated to conclude whether, and to what extent, the transaction price of the linked customer contract should be reduced or partially reduced.
| 221/326 |
|
Integrated Report 2025 | ||||
| To
Our Stakeholders |
Combined
Management Report |
Consolidated
Financial Statements IFRS |
Additional Information | ||
Only very rarely do our contracts include significant financing components. We do not account for financing components if the period between when SAP transfers the promised goods or services to the customer and when the customer pays for those goods or services is one year or less.
Allocation of Transaction Price
We have established a hierarchy to identify the standalone selling prices (SSPs) that we use to allocate the transaction price of a customer contract to the performance obligations in the contract.
| – | Where the SSPs for an offering are observable and reasonably consistent across customers (that is, not highly variable), our SSP estimates are derived from our respective pricing history. Typically, our standardized support offerings and our professional service offerings follow this approach. |
| – | Where sales prices for an offering are not directly observable or highly variable across customers, we use estimation techniques. |
The SSP for SAP’s cloud offerings considers overall pricing objectives, taking market conditions and other factors into account. We estimate the SSP using a specific pricing range that encompasses the majority of our transactions. In that context, we use judgment in determining the upper and lower end of the range. Such judgment considers price points achieved in the market as well as strategic pricing decisions.
For offerings for which we cannot justify a range and we observe highly variable pricing, and for which we lack substantial direct costs to estimate based on a cost-plus-margin approach, we allocate the transaction price by applying a residual approach. We use this technique in particular for our standard on-premise software offerings. To judge whether the historical pricing of our goods and services is highly variable, we have established thresholds of pricing variability.
As SAP’s go-to-market strategies evolve further, SAP continuously monitors its commercial models and pricing practices, which could result in changes to our SSPs in the future.
The SSPs of material right options depend on the probability of option exercise. In estimating these probabilities, we apply judgment considering historical exercise patterns.
Recognition of Revenue
Cloud revenue is recognized over time as the services are performed. For cloud business models where we grant rights to continuously access and use one or more cloud offerings for a certain term, revenue is recognized based on time elapsed and thus ratably over this term. For cloud business models provisioned on a consumption basis where a customer commits to a fixed value of spend on cloud services throughout the contract term, but with the discretion to call off cloud services during the contract term, we recognize revenue based on consumption as it best reflects our measure towards satisfaction of that performance obligation. In limited scenarios where the transaction price is entirely variable and determined by the customer’s consumption, we recognize revenue based on usage in the period in which it was earned.
Software license revenue is recognized at a point in time or over time depending on whether we deliver standard software, customer-specific software, or software subscription contracts that combine the delivery of software and the obligation to deliver, in the future, unspecified software products:
| – | Licenses for our standard on-premise software products are typically delivered by providing the customer with access to download the software. We recognize revenue for these on-premise licenses at the point in time when we grant the license rights to the customer and the customer has access to and thus control over the software. In judging whether our on-premise software offerings grant customers a right to use, rather than a right to access, our intellectual property, we have considered the usefulness of our software without subsequent updates to it. |
| – | Typically, our customer-specific on-premise software development agreements: |
| § | Represent software developed for specific needs of individual customers and therefore do not have any alternative use for us. |
| § | Provide us with an enforceable right to payment for performance completed to date. |
| For such development agreements, we recognize revenue over time as the software development progresses. Judgment is required in identifying an appropriate method to measure the progress toward complete satisfaction of such performance obligations. We typically measure progress of our development agreements based on the direct costs incurred to date in developing the software as a percentage of the total reasonably estimated direct costs to fully complete the development work (input-based percentage-of-completion method). This method of measuring progress faithfully depicts the transfer of the development services to the customer, as substantially all of these costs are cost of the staff or third parties performing the |
| 222/326 |
|
Integrated Report 2025 | ||||
| To
Our Stakeholders |
Combined
Management Report |
Consolidated
Financial Statements IFRS |
Additional Information | ||
| development work. In estimating the total cost to fully complete the development work, we consider our history with similar projects. |
| – | For agreements that combine the delivery of software and the obligation to deliver, in the future, unspecific software products, we recognize revenue at a point in time for licenses that are made immediately accessible to the customer. We recognize revenue ratably over the term of the software subscription contract for the unspecified software products, as our performance obligation is to stand ready to deliver such products on a when-and-if-available basis. |
Software support revenue is typically recognized based on time elapsed and thus ratably over the term of the support arrangement. Under our standardized support services, our performance obligation is to stand ready to provide technical product support and unspecified updates, upgrades, and enhancements on a when-and-if-available basis. Our customers simultaneously receive and consume the benefits of these support services as we perform.
Service revenue is typically recognized over time. Where we stand ready to provide the service (such as access to learning content), we recognize revenue based on time elapsed and thus ratably over the service period. Non-stand-ready services (such as separately identifiable consulting services and premium support services) are recognized over time as the services are utilized, typically following the percentage-of-completion method. We apply judgment in determining whether a service qualifies as a stand-ready service or as a non-stand-ready service.
Revenue for combined performance obligations is recognized over the longest period of all promises in the combined performance obligation.
For performance obligations satisfied over time, we need to measure progress using the method that best reflects SAP’s performance. When using cost incurred as a measure of progress for recognizing revenue over time, we apply judgment in estimating the total cost to satisfy the performance obligation.
All of the judgments and estimates mentioned above can significantly impact the timing of revenue to be recognized.
Contract Balances
We recognize trade receivables for performance obligations satisfied over time gradually as the performance obligation is satisfied and in full once the invoice is due. Judgment is required in determining whether a right to consideration is unconditional and thus qualifies as a receivable.
Contract liabilities primarily reflect invoices due or payments received in advance of revenue recognition.
Typically, we invoice fees for on-premise standard software on contract closure and software delivery. Periodic fixed fees for cloud subscription services, software support services, and other multi-period agreements are typically invoiced yearly or quarterly in advance. Such fee prepayments account for the majority of our contract liability balance. Fees based on actual transaction volumes for cloud subscriptions and fees charged for non-periodical services are invoiced as the services are delivered. While payment terms and conditions vary by contract type and region, our terms typically require payment within 30 to 60 days.
Geographic Information
The amounts for revenue by region in the following tables are based on the location of customers. The regions in the following table are EMEA (Europe, Middle East, and Africa), Americas (North America and Latin America), and APJ (Asia Pacific Japan).
| 223/326 |
|
Integrated Report 2025 | ||||
| To
Our Stakeholders |
Combined
Management Report |
Consolidated
Financial Statements IFRS |
Additional Information | ||
Total Revenue by Region
| € millions | 2025 | 2024 | 2023 |
| Germany | 5,828 | 5,359 | 4,921 |
| Rest of EMEA | 11,197 | 10,216 | 9,083 |
| EMEA | 17,025 | 15,575 | 14,004 |
| United States | 11,537 | 11,056 | 10,204 |
| Rest of Americas | 2,962 | 2,752 | 2,558 |
| Americas | 14,499 | 13,808 | 12,762 |
| Japan | 1,569 | 1,388 | 1,243 |
| Rest of APJ | 3,707 | 3,404 | 3,199 |
| APJ | 5,276 | 4,793 | 4,441 |
 SAP
Group SAP
Group |
36,800 | 34,176 | 31,207 |
Major Revenue Classes by Region
| € millions | Cloud Revenue | Cloud and Software Revenue | ||||
| 2025 | 2024 | 2023 | 2025 | 2024 | 2023 | |
| EMEA | 8,876 | 6,892 | 5,241 | 15,013 | 13,534 | 12,028 |
| Americas | 9,075 | 7,872 | 6,642 | 12,744 | 11,987 | 10,959 |
| APJ | 3,072 | 2,377 | 1,781 | 4,781 | 4,308 | 3,937 |
| SAP Group |
21,023 | 17,141 | 13,664 | 32,538 | 29,830 | 26,924 |
Remaining Performance Obligations
Amounts of a customer contract’s transaction price that are allocated to the remaining performance obligations represent contracted revenue that has not yet been recognized. They include amounts recognized as contract liabilities and amounts that are contracted but not yet due.
Contractual periods that are subject to a customer termination for convenience right without a significant early-termination fee, or that are subject to a termination right under applicable law, are excluded from our remaining performance obligations. This is because we determine that enforceable rights and obligations do not exist for the periods subject to termination.
The transaction price allocated to performance obligations that were unsatisfied or partially unsatisfied as at December 31, 2025, was €90.5 billion (December 31, 2024: €78.4 billion). The transaction price thereof allocated to cloud performance obligations that were unsatisfied or partially unsatisfied (total cloud backlog) as at December 31, 2025, was €77.3 billion (December 31, 2024: €63.3 billion). The remaining amount mostly comprises obligations to provide software support services. The vast majority of software support contracts are contracts in the renewal phase that typically have a one-year contract term, while cloud subscription contracts typically are multiple-year contracts. The portion of remaining performance obligations related to services consists of non-cancelable revenue from contracts for projects with a predefined output and from premium engagements. Overall, approximately 39% of the total remaining performance obligations is expected to be recognized over the next 12 months following December 31, 2025.
The transaction price allocated to remaining performance obligations varies between reporting periods, primarily due to the recognition of revenue for performance obligations outstanding at the end of the reporting period and the addition of new contracts within SAP’s cloud, maintenance, and services business. Other contributing factors include contract modifications, upsells, renewals, currency exchange rate fluctuations, and pricing adjustments.
| 224/326 |
|
Integrated Report 2025 | ||||
| To
Our Stakeholders |
Combined
Management Report |
Consolidated
Financial Statements IFRS |
Additional Information | ||
The revenue recognized in fiscal year 2025 for contract renewals, new contracts, and contract modifications is presented on a gross basis in the following reconciliation of outstanding performance obligations. This means that it is included as a positive entry under “Add renewals, new contracts and modifications” and as a negative entry under “Less revenue recognized in 2025.”
Reconciliation of Remaining Performance Obligations
| € billions | 2025 |
 12/31/2024 12/31/2024 |
78.4 |
| Add renewals, new contracts, and modifications: | |
| - Cloud | 35.0 |
| - Maintenance | 9.9 |
| - Services | 3.1 |
| - Others1 | –0.2 |
| Less revenue recognized in 2025: | |
| - Cloud | –21.0 |
| - Maintenance | –10.5 |
| - Services | –4.3 |
| Acquisitions and divestments2 | 0.2 |
| 12/31/2025 |
90.5 |
1 Others mainly comprises currency fluctuations for our services and maintenance contracts and changes to the remaining performance obligations for our software contracts.
2 The 2025 acquisitions and divestments figure refers to the acquisition of SmartRecruiters.
From December 31, 2023 to December 31, 2024, the remaining performance obligations increased from € 58.7 billion to €78.4 billion. The increase was mainly driven by renewals, new contracts and contract modifications of €36.2 billion for Cloud, €10.8 billion for maintenance and €5.1 billion for Services and others respectively. At the same time, revenue recognition of €17.1 billion for Cloud, €11.3 billion for Maintenance and €4.3 billion for Services reduced the remaining performance obligations per December 31, 2023 during 2024. An additional contribution factor was the acquisition of WalkMe in 2024, which contributed with an RPO increase of €0.4 billion.
Performance Obligations Satisfied in Previous Years
Revenue recognized in the reporting period for performance obligations satisfied in earlier periods was €77 million (December 31, 2024: €75 million), mainly resulting from changes in estimates of variable considerations and changes in estimates related to percentage-of-completion-based contracts.
Contract Balances
The following table presents the activities impacting contract liabilities balances during the year ended December 31, 2025:
Contract Liabilities
| € billions | 2025 |
| 1/1/2025 |
6.1 |
| Increases resulting from billing and invoices becoming due | 16.7 |
| Decreases resulting from satisfaction of performance obligations | –15.6 |
| Other1 | –0.5 |
| 12/31/2025 |
6.7 |
1 Other includes, for example, the impact of foreign currency translation and business combinations.
| 225/326 |
|
Integrated Report 2025 | ||||
| To
Our Stakeholders |
Combined
Management Report |
Consolidated
Financial Statements IFRS |
Additional Information | ||
The amount of revenue recognized in the reporting period that was included in the contract liability balance at the beginning of the reporting period was €5.3 billion (December 31, 2024: €4.7 billion).
(A.2) Trade and Other Receivables
Accounting
for Trade and Other Receivables
Depending on the business model, we measure trade receivables and contract assets from contracts with customers either at amortized cost, or at fair value through other comprehensive income (OCI) less expected credit losses. We account for expected credit losses by recording an allowance on a portfolio basis. We apply the simplified impairment approach. On initial measurement of the receivables, we consider all credit losses that are expected to occur during the lifetime of the receivables. We use a provision matrix to estimate these losses.
Additionally, we recognize allowances for individual receivables if there is objective evidence of credit impairment.
Account balances are written off either partially or in full if we judge that the likelihood of recovery is remote.
For information about how the default risk for trade receivables is analyzed and managed, how the loss rates for the provision matrix are determined, how credit impairment is determined and what our criteria for write-offs are, see the section on credit risk in Note (F.1).
In our Consolidated Income Statements, net gains/losses from expected credit loss allowances are included in Other operating income/expense, net. Gains/losses from foreign currency exchange rate fluctuations are included in Other non-operating income/expense, net.
Determining our expected credit loss allowance involves significant judgment. In this judgment, we primarily consider our historical experience with credit losses in the respective provision matrix risk class and current data on overdue receivables. We expect that our historical default rates represent a reasonable approximation for future expected customer defaults. Besides historical data, our judgment used in developing the provision matrix considers reasonable and supportable forward-looking information (for example, changes in country risk ratings, and fluctuations in credit default swaps of the countries in which our customers are located).
The assessment of whether a receivable is collectible involves the use of judgment and requires us to make assumptions about customer defaults that could change significantly.
By applying this judgment, we record an allowance for a specific customer when it is probable that a credit loss has occurred and the amount of the loss is reasonably estimable. Basing the expected credit loss allowance for the remaining receivables primarily on our historical loss experience likewise requires judgment, as history may not be indicative of future development. Also, including reasonable and supportable forward-looking information in the loss rates of the expected credit loss allowance requires judgment, as they may not provide a reliable prediction for future development.
Trade and Other Receivables
| € millions | 2025 | 2024 | ||||
| Current | Non-Current | Total | Current | Non-Current | Total | |
| Trade receivables, net | 5,790 | 0 | 5,790 | 6,231 | 0 | 6,231 |
| Other receivables | 885 | 218 | 1,103 | 543 | 209 | 752 |
|
Total |
6,675 | 218 | 6,893 | 6,774 | 209 | 6,983 |
Contract assets are included in Other receivables in our Statement of Financial Position. Contract assets as at December 31, 2025, were €803 million (December 31, 2024: €441 million).
For more information about financial risk, how we manage credit risk, and details of our trade receivables and contract assets allowances, see Note (F.1).
| 226/326 |
|
Integrated Report 2025 | ||||
| To
Our Stakeholders |
Combined
Management Report |
Consolidated
Financial Statements IFRS |
Additional Information | ||
(A.3) Capitalized Cost from Contracts with Customers
Costs of Obtaining Customer Contracts
Capitalized costs from customer contracts are classified as Other non-financial assets in our Statement of Financial Position.
The capitalized assets for the incremental costs of obtaining a customer contract consist of sales commissions earned by our sales force and partners as well as amounts paid to employees with non-sales roles when the payments meet the definition of being an incremental cost to obtain a contract with a customer. Judgment is required in determining the amounts to be capitalized, particularly where the commissions are based on cumulative targets and where commissions relate to multiple performance obligations in one customer contract. We capitalize such cumulative target commissions for all customer contracts that count towards the cumulative target but only if nothing other than obtaining customer contracts can contribute to achieving the cumulative target. Commissions for contracts with multiple performance obligations or for probable renewals thereof are allocated to these performance obligations and probable renewals relative to the respective standalone selling price.
Our sales commission payments for customer contract renewals are typically not commensurate with the commissions paid for new contracts. Thus, the commissions paid for renewable new contracts also relate to expected renewals of these contracts. Consequently, we amortize sales commissions paid for new customer contracts on a straight-line basis over the expected contract life including probable contract renewals. Judgment is required in estimating these contract lives. In exercising this judgment, we consider our expectation about future contract renewals which we evaluate periodically to confirm that the resulting amortization period properly reflects the expected contract life or if there are potential indicators of impairment. The amortization periods range from 18 months to seven years depending on the type of offering. Commensurate payments are amortized over the contract term to which they relate.
Amortization of the capitalized costs of obtaining customer contracts is classified mainly as sales and marketing expense. We expense the incremental costs of obtaining a customer contract as incurred if we expect an amortization period of one year or less.
Costs to Fulfill Customer Contracts
Capitalized costs incurred to fulfill customer contracts mainly consist of directly related costs for set-up and implementation of cloud products and custom cloud development contracts as far as these costs are not in scope of other accounting standards than IFRS 15. These costs are amortized after completion of the setup and implementation or the development, respectively, on a straight-line basis over the expected life of the cloud subscription contract including expected renewals. For the life of the contract, we consider our expectation about future contract renewals which we evaluate periodically to confirm that the resulting amortization period properly reflects the expected contract life. The amortization periods range from five to seven years depending on the type of offering. In addition, the capitalized costs include third-party license fees related to end-customer contracts, which are amortized over the term of the third-party license contract. Judgment is required in evaluating whether costs are directly related to customer contracts and in estimating contract lives.
Amortization of capitalized costs to fulfill customer contracts is included in the cost of cloud.
Capitalized Cost from Contracts with Customers
| € millions | 2025 | 2024 | ||||
| Current | Non-Current | Total | Current | Non-Current | Total | |
| Capitalized cost of obtaining customer contracts | 1,130 | 3,348 | 4,478 | 1,086 | 3,221 | 4,307 |
| Capitalized cost to fulfill customer contracts | 282 | 334 | 616 | 264 | 272 | 536 |
| Capitalized contract cost | 1,412 | 3,682 | 5,094 | 1,350 | 3,492 | 4,843 |
| Other non-financial assets |
3,212 | 4,419 | 7,631 | 2,682 | 3,990 | 6,672 |
|
Capitalized contract cost as % of |
44 | 83 | 67 | 50 | 88 | 73 |
| 227/326 |
|
Integrated Report 2025 | ||||
| To
Our Stakeholders |
Combined
Management Report |
Consolidated
Financial Statements IFRS |
Additional Information | ||
Amortization Expense
| € millions | 2025 | 2024 |
| Capitalized cost of obtaining customer contracts | 1,108 | 1,107 |
| Capitalized cost to fulfill customer contracts | 511 | 418 |
| 228/326 |
|
Integrated Report 2025 | ||||
| To
Our Stakeholders |
Combined
Management Report |
Consolidated
Financial Statements IFRS |
Additional Information | ||
(A.4) Customer-Related Provisions
Expected Contract Losses
Customer-related provisions mainly include expected contract losses. We adjust these provisions as further information becomes available and as circumstances change. Non-current provisions are measured at the present value of their expected settlement amounts as at the reporting date.
The unit of account for the identification of potential onerous customer contracts is based on the contract definition of IFRS 15 including the contract combination guidance. The economic benefits considered in the assessment comprise the future benefits we are directly entitled to under the contract as well as the anticipated future benefits that are the economic consequence of the contract if these benefits can be reliably determined.
Customer-Related Litigation and Claims
Customer-related provisions also include obligations resulting from customer-related litigation and claims. We are currently confronted with various claims and legal proceedings, including claims that relate to customers demanding indemnification for proceedings initiated against them based on their use of SAP software, and occasionally claims that relate to customers being dissatisfied with the products and services that we have delivered to them. The obligations arising from customer-related litigation and claims comprise cases in which we indemnify our customers against liabilities arising from a claim that our products infringe a third party’s patent, copyright, trade secret, or other proprietary rights.
Due to uncertainties relating to these matters, provisions are based on the best information available. Significant judgment is required in the determination of whether and when a provision is to be recorded and what the appropriate amount for such provision should be. Notably, judgment is required in the following areas:
– Determining whether an obligation exists
– Determining the probability of outflow of economic benefits
– Determining whether the amount of an obligation is reliably estimable
– Estimating the amount of the expenditure required to settle the present obligation
At the end of each reporting period, we reassess the potential obligations related to our pending claims and litigation and adjust our respective provisions to reflect the current best estimate. In addition, we monitor and evaluate new information that we receive after the end of the respective reporting period, but before the Consolidated Financial Statements are authorized for issue, to determine whether this provides additional information regarding conditions that existed at the end of the reporting period. Changes to the estimates and assumptions underlying our accounting for legal contingencies, and outcomes that differ from these estimates and assumptions, could require material adjustments to the carrying amounts of the respective provisions recorded and additional provisions. The expected timing or amounts of any outflows of economic benefits resulting from these lawsuits and claims are uncertain and not estimable, as they generally depend on the duration of the legal proceedings and settlement negotiations required to resolve the litigation and claims and the unpredictability of the outcomes of legal disputes in several jurisdictions.
Contingent liabilities exist in respect of customer-related litigation and claims for which no provision has been recognized. It is not practicable to estimate the financial impact of these contingent liabilities due to the uncertainties around these lawsuits and claims as outlined above.
| 229/326 |
|
Integrated Report 2025 | ||||
| To
Our Stakeholders |
Combined
Management Report |
Consolidated
Financial Statements IFRS |
Additional Information | ||
Section B – Employees
This section provides financial insights into our employee benefit arrangements. It should be read in conjunction with the compensation disclosures for key management personnel in Note (G.5).
(B.1) Number of Employees
The following table provides an overview of number of employees, broken down by function and by the regions EMEA (Europe, Middle East, and Africa), Americas (North America and Latin America), and APJ (Asia Pacific Japan).
Number of Employees by Region and Function
| Full-time equivalents | 12/31/2025 | 12/31/2024 | 12/31/2023 | |||||||||
| EMEA | Americas | APJ | Total | EMEA | Americas | APJ | Total | EMEA | Americas | APJ | Total | |
| Cloud and software | 4,665 | 4,511 | 5,381 | 14,557 | 4,543 | 4,339 | 4,764 | 13,646 | 4,389 | 4,266 | 4,426 | 13,080 |
| Services | 8,331 | 4,546 | 5,813 | 18,691 | 8,485 | 4,719 | 5,566 | 18,770 | 8,178 | 5,013 | 5,481 | 18,672 |
| Research and development | 18,589 | 5,845 | 13,531 | 37,965 | 18,819 | 5,677 | 13,094 | 37,590 | 18,086 | 5,884 | 12,474 | 36,444 |
|
Sales and marketing |
12,031 | 9,829 | 4,963 | 26,823 | 12,042 | 9,801 | 5,139 | 26,983 | 12,086 | 10,300 | 5,342 | 27,728 |
| General and administration | 4,057 | 1,924 | 1,356 | 7,337 | 3,836 | 1,836 | 1,300 | 6,971 | 3,619 | 1,777 | 1,307 | 6,704 |
| Infrastructure | 3,164 | 1,104 | 1,008 | 5,277 | 3,076 | 1,164 | 921 | 5,161 | 2,834 | 1,274 | 867 | 4,975 |
| SAP Group (December 31) | 50,837 | 27,760 | 32,053 | 110,650 | 50,801 | 27,536 | 30,784 | 109,121 | 49,191 | 28,515 | 29,897 | 107,602 |
|
thereof acquisitions |
288 | 74 | 13 | 375 | 413 | 414 | 86 | 912 | 421 | 138 | 0 | 558 |
| SAP Group (months’ end average) | 49,685 | 27,823 | 31,703 | 109,211 | 49,764 | 27,394 | 29,997 | 107,155 | 48,222 | 28,239 | 29,582 | 106,043 |
Most of the employees participating in the Company’s voluntary leave programs left SAP in 2024 and throughout the first half of 2025. For more information about the transformation program and its impact on employee headcount, see Note (B.6).
(B.2) Employee Benefits Expenses
| € millions | 2025 | 2024 | 2023 |
| Salaries | 12,066 | 12,244 | 12,128 |
| Social security expenses | 1,981 | 2,003 | 1,919 |
| Share-based payment expenses | 1,695 | 2,385 | 2,220 |
| Pension expenses | 495 | 435 | 438 |
| Employee-related restructuring expenses | 3 | 3,143 | 222 |
| Termination benefits outside of restructuring plans | 238 | 68 | 64 |
| Employee benefits expenses | 16,478 | 20,278 | 16,992 |
Termination benefits outside of restructuring plans increased in 2025 compared to 2024, mainly due to €191 million in expenses recognized under the workforce optimization program announced at the end of July 2025. Salaries decreased mainly due to lower bonus expenses in 2025.
| 230/326 |
|
Integrated Report 2025 | ||||
| To
Our Stakeholders |
Combined
Management Report |
Consolidated
Financial Statements IFRS |
Additional Information | ||
(B.3) Share-Based Payments
Accounting for Share-Based Payments
Classification in the Consolidated Income Statements
Share-based payments cover equity-settled and cash-settled awards issued to our employees. The respective expenses are recognized as employee benefits and classified in our Consolidated Income Statements according to the activities that the receiving employees perform. Share-based payment expenses are offset by the effective portion from the hedging of cash-settled share-based payments. Accelerated share-based payment expenses triggered by SAP’s 2024 restructuring program are classified as restructuring expenses in our Consolidated Income Statements and included in the restructuring provisions in our Statement of Financial Position.
Valuation, Judgment, and Sources of Estimation Uncertainty
We use certain assumptions in estimating the fair values for our share-based payments, including expected share price volatility and expected dividend yields. In addition, the final number of Performance Share Units (PSUs) vesting also depends on the achievement of performance indicators. Furthermore, the payout for cash-settled share units depends on our share price on the respective vesting dates. Changes to these assumptions and outcomes that differ from these assumptions could require material adjustments to the carrying amount of the liabilities we have recognized for these share-based payments. The fair value of the share units granted under the SAP Long-Term Incentive Program 2024 and 2020 (LTI 2024 and LTI 2020) is dependent on our performance against the total shareholder return (TSR) for NASDAQ-100 companies, the volatility, and the expected correlation between the TSR of the NASDAQ-100 companies and our TSR.
Regarding future payout under our cash-settled plans, the SAP share price is the most relevant factor. With respect to our LTI 2024 and LTI 2020, we believe that future payout will be significantly impacted not only by our share price but also by the relative TSR performance against the NASDAQ-100 companies. Future payouts under our LTI 2024 and LTI 2020 will also be dependent on meeting non-market-based performance conditions based on SAP’s long-term strategy. The latter, however, is not incorporated into our fair value calculation but leads to adjustments of the quantity of awards granted. Changes in these factors could significantly affect the estimated fair values as calculated by the valuation model, and the future payout.
Under the OWN SAP share purchase plan, we grant our employees discounts on share purchases. As those discounts are not dependent on future services to be provided by our employees, the discount is recognized as an expense when the discounts are granted.
Presentation in the Consolidated Statements of Cash Flows
We present the payments of our cash-settled share-based payment plans and our equity-settled share-based payment plans that are fulfilled by share purchases at the market (see Own SAP Plan in section a) of this Note (B.3)) separately in our Consolidated Statements of Cash Flows under Cash flows from operating activities. As a result, the changes in Other assets and in Other liabilities presented in the reconciliation of operating cash flow do not consider share-based payment-related assets or liabilities. Cash flows from share-based payments are offset by payments from the hedging of cash-settled share-based payments. Payments of cash-settled share-based payments triggered by SAP’s 2024 restructuring program are included in the restructuring payments.
The operating expense line items in our income statement include the following share-based payment expenses:
Share-Based Payment Expenses by Functional Area
| € millions | 2025 | 2024 | 2023 |
| Cost of cloud | 107 | 138 | 94 |
| Cost of software licenses and support | 30 | 42 | 38 |
| Cost of services | 244 | 360 | 375 |
| Research and development | 600 | 751 | 703 |
| Sales and marketing | 579 | 876 | 834 |
| General and administration | 135 | 217 | 175 |
| Share-based payment expenses | 1,695 | 2,385 | 2,220 |
| thereof equity-settled share-based payments | 1,331 | 1,591 | 1,414 |
| thereof cash-settled share-based payments | 364 | 794 | 806 |
| 231/326 |
|
Integrated Report 2025 | ||||
| To
Our Stakeholders |
Combined
Management Report |
Consolidated
Financial Statements IFRS |
Additional Information | ||
Additionally, in 2024 SAP recognized €309 million in accelerated share-based payment expenses triggered by SAP’s 2024 transformation program. These share-based payment expenses are classified as restructuring expenses in our Consolidated Income Statements. For more information about SAP’s restructuring program, see Note (B.6).
For more information about SAP’s newly implemented hedge program in 2025 related to its cash-settled share-based compensation payments, see Note (F.1).
Our major share-based payment plans are described below.
a) Equity-Settled Share-Based Payments
Equity-Settled Move SAP Plan (Move)
To retain and engage executives and certain employees, we grant share units under Move that we intend to predominantly settle in shares. For more information about the terms and conditions of the cash-settled Move plan, see section b) Cash-Settled Share-Based Payments in this Note (B.3).
Different vesting schedules apply to specific share units. Granted share units will vest in different tranches mainly as follows:
| – | Restricted Stock Units (RSUs) with service condition only |
| - | Over a three-year period on a quarterly basis after a waiting period of six months, or |
| – | Performance Share Units (PSUs) with service condition and upon achieving certain key performance indicators (KPIs) |
| - | Over a three-year period on a quarterly basis after a waiting period of 12 months. |
The number of PSUs that will vest under the different tranches is mainly contingent upon achievement of two equally weighted KPIs in the year of grant: Operating profit (non-IFRS at constant currencies) and Cloud revenue (at constant currencies). Depending on the weighted average performance, the number of PSUs vesting ranges between 0% and 200% of the number initially granted. Performance against the KPI target was 107.2% in 2025 (2024: 134.5%).
We intend to settle the share units classified as equity-settled by reissuing treasury shares upon vesting. For more information, see Note (E.2).
The valuation was based on the following parameters and assumptions:
Fair Value and Parameters Used at Grant Date in 2025
| €, unless otherwise stated |
Move (2025 tranche) |
| Weighted average fair value as at grant date | 237.67 |
| Information how fair value was measured at grant date | |
| Valuation model used | Other1 |
| Weighted average share price | 241.49 |
| Weighted average expected dividend yield (in %) | 0.98 |
| Weighted average initial life at grant date (in years) | 1.6 |
1 For these awards, the fair value is calculated by subtracting expected future dividends until maturity of the respective award from the prevailing share price as at the measurement date.
Fair Value and Parameters Used at Grant Date in 2024
| €, unless otherwise stated |
Move (2024 tranche) |
| Weighted average fair value as at grant date | 175.09 |
| Information how fair value was measured at grant date | |
| Valuation model used | Other1 |
| Weighted average share price | 170.40 |
| Weighted average expected dividend yield (in %) | 1.23 |
| Weighted average initial life at grant date (in years) | 1.7 |
1 For these awards, the fair value is calculated by subtracting expected future dividends until maturity of the respective award from the prevailing share price as at the measurement date.
| 232/326 |
|
Integrated Report 2025 | ||||
| To
Our Stakeholders |
Combined
Management Report |
Consolidated
Financial Statements IFRS |
Additional Information | ||
Changes in Outstanding Awards
| Thousands, unless otherwise stated |
Move (2023–2025 tranches) |
| 12/31/2023 | 16,830 |
| Granted2 | 6,944 |
| Adjustment based on KPI target achievement | 151 |
| Exercised | –10,193 |
| Forfeited | –392 |
| Change in settlement2 | –1,149 |
| 12/31/2024 | 12,192 |
| Granted2 | 4,934 |
| Adjustment based on KPI target achievement | –16 |
| Exercised | –8,433 |
| Forfeited | –269 |
| Change in settlement2 | –671 |
| 12/31/2025 | 7,737 |
2 We have changed the classification of some share units granted under the Move plan with the initial intention to settle in shares from equity-settled to cash-settled because a cash outflow became probable, in particular due to the restructuring program. Share units with switched classification are considered in the number of granted share units.
The weighted average share price for awards exercised in 2025 was €234.93 (2024: €197.14). The weighted average remaining life of awards outstanding as at December 31, 2025, was 0.9 years (December 31, 2024: 0.9 years).
Own SAP Plan (Own)
Under the share purchase plan Own, employees have the opportunity to purchase, on a monthly basis, SAP shares without any required holding period. The investment per each eligible employee is limited to a percentage of the respective employee’s monthly base salary. SAP matches the employee investment by 40% and adds a subsidy of €20 per month for non-executives. To recognize the employees’ contribution to SAP’s success in 2024, SAP’s contribution was temporarily increased from 40% to 100% from October to December 2024. This plan is not open to members of the Executive Board.
Numbers of Shares Purchased
| Millions | 2025 | 2024 | 2023 |
| Own | 3.8 | 4.9 | 6.5 |
As a result of Own, we have commitments to grant SAP shares to employees. We have fulfilled and intend to continue to meet these commitments through an agent who administers the equity-settled programs and purchases shares on the open market. The fair value at grant date is determined based on the average share price of €242.71 (2024: €196.90).
Recognized Expense
| € millions | 2025 | 2024 | 2023 |
| Move (2023–2025 tranches) | 1,059 | 1,240 | 1,175 |
| Own | 257 | 343 | 239 |
| 233/326 |
|
Integrated Report 2025 | ||||
| To
Our Stakeholders |
Combined
Management Report |
Consolidated
Financial Statements IFRS |
Additional Information | ||
b) Cash-Settled Share-Based Payments
Cash-Settled Move SAP Plan (Move) Including Grow SAP Plan
We also grant share units in certain circumstances under Move representing a contingent right to receive a cash payment that is determined by the SAP share price and the number of share units that ultimately vest. For more information about the terms and conditions of the equity-settled Move plan, see section a) Equity-Settled Share-Based Payments in this Note (B.3).
From 2020 to 2023, we granted share units under the Grow SAP Plan that we intend to settle in cash. This fixed term plan has broadly the same terms and conditions as Move and recognizes all employees’ commitment to SAP’s success, and deepens their participation in our future company performance.
Different vesting schedules apply to specific share units. Granted share units under the respective plans will vest in different tranches, mainly as follows:
| – | Restricted Stock Units (RSUs) with service condition only |
| - | Over a three-year period on annual basis, |
| - | Over a three-year period on a quarterly basis after a waiting period of six months, or |
| – | Performance Share Units (PSUs) with service condition and upon achieving certain key performance indicators (KPIs) |
| - | Over a three-year period on a quarterly basis after a waiting period of 12 months. |
The number of PSUs that will vest under the different tranches is mainly contingent upon achievement of two equally weighted KPIs in the year of grant. For more information, see section a) Equity-Settled Share-Based Payments in this Note (B.3).
The share units classified as cash-settled are paid out in cash upon vesting.
SAP Long-Term Incentive Program 2020 and SAP Long-Term Incentive Program 2024 (LTI 2020 and LTI 2024)
The LTI 2024 and LTI 2020 are long-term, multiyear performance-based elements of our Executive Board compensation that are granted in annual tranches. The LTI 2024 and LTI 2020 reflect SAP’s long-term strategy and thus set uniform incentives to achieve key targets from the long-term strategic plans. The LTI 2024 and LTI 2020 also serve to reward the Executive Board members for long-term SAP share price performance as compared to the market, thus ensuring that shareholders’ interests are also honored. In addition, the LTI 2024 includes ESG targets to reward the Executive Board members for their achievements in advancing SAP’s long-term sustainability goals, while the LTI 2020 includes a component to ensure long-term retention of our Executive Board members.
The LTI 2024 and LTI 2020 are virtual share programs under which annual tranches with a term of approximately four years each are granted. When the individual tranches are granted, a certain grant amount specified in the Executive Board member’s service contract is converted into virtual shares (share units). For this purpose, the grant amount is divided by the SAP share price, which corresponds for the LTI 2020 to the average of the SAP share price on the 20 trading days and for the LTI 2024 to the average of the SAP share price on the 10 trading days after scheduled publication of the preliminary results for the financial year (grant price). The share units allocated are composed for the LTI 2024 of 50% Financial Performance Share Units (Financial PSUs), 30% Market Performance Share Units (Market PSUs), and 20% ESG Performance Share Units (ESG PSUs), and for the LTI 2020 of 1/3 Financial Performance Share Units (Financial PSUs), 1/3 Market Performance Share Units (Market PSUs), and 1/3 Retention Share Units. All types of share units have a vesting period of approximately four years. In contrast to Retention Share Units, Financial PSUs, Market PSUs, and ESG PSUs are subject to changes in number. In this context, the following applies:
The number of Financial PSUs initially awarded is multiplied by a performance factor. The performance factor consists of individual performance indicators relating to non-IFRS KPIs at constant currencies, derived from SAP’s long-term strategy, which for the LTI 2024 are operating profit and total revenue (which replaced cloud revenue and software licenses and support & services revenue for the 2025 tranche). For the LTI 2020, the non-IFRS KPIs are cloud revenue, total revenue, and operating profit. The performance period throughout which the target achievement for these three KPIs is measured starts at the beginning of the financial year in which the Financial PSUs are awarded and concludes upon the end of the second year following the year in which the share units were awarded. A numerical target value equaling 100% target achievement is set for each KPI. This constitutes, in each case, a cumulative value for the three years of the performance period.
The number of Market PSUs initially awarded is multiplied by a performance factor. The performance factor depends on the amount of the TSR on SAP share, measured for an entire performance period of approximately three years, and ranked in relation to the TSR
| 234/326 |
|
Integrated Report 2025 | ||||
| To
Our Stakeholders |
Combined
Management Report |
Consolidated
Financial Statements IFRS |
Additional Information | ||
performance of the companies in the NASDAQ-100 index (Index). If the TSR for the SAP share equals the median, the performance factor will be 1.0. However, if the TSR for the SAP share over the performance period is negative, the maximum performance factor will, in deviation from the summary above, be 1.0.
The number of ESG PSUs initially awarded is multiplied by a performance factor. The performance factor consists of two individual performance indicators relating to the two non-financial KPIs, derived from SAP’s long-term strategy, which are Climate performance: Net Zero 2030, and People sustainability: Business Health Culture Index (BHCI) (which replaced the Diversity: Women in Executive Roles KPI for the 2025 tranche). The performance period throughout which the target achievement for these two KPIs is measured starts at the beginning of the financial year in which the ESG PSUs are awarded and concludes upon the end of the second year following the year in which the share units were awarded. A numerical target value equaling 100% target achievement is set for each KPI. This constitutes, in each case, a cumulative value for the three years of the performance period.
The performance of the share units is linked to the performance of the SAP share price, including dividend payments. Accordingly, an amount is paid out for each share unit that equals the then-current SAP share price plus the dividends disbursed in respect of an SAP share in the period from the beginning of the year in which the share units were awarded until the end of the third year following the year in which the share units were awarded. The average SAP share price for the LTI 2024 on the 10 trading days and for the LTI 2020 on the 20 trading days after scheduled publication of the preliminary results for the financial year determines the payout price. The payout amount per share unit, including the dividend amounts due on the share units, is capped at 200% of the grant price. The tranche is cash-settled and paid in euros after the Annual General Meeting of Shareholders of the corresponding year.
If an Executive Board member’s service contract is terminated before the end of the third year following the year in which the share units were granted, the share units are forfeited in whole or in part, depending on the circumstances in which the member resigns from office or the service contract is terminated.
The valuation was based on the following parameters and assumptions:
Fair Value and Parameters Used at Year End 2025
| €, unless otherwise stated |
LTI 2024 (2024–2025 |
LTI 2020 (2022–2023 |
Move (2022–2025 |
| Weighted average fair value as at 12/31/2025 | 209.27 | 213.21 | 206.49 |
| Information how fair value was measured at measurement date | |||
| Valuation model used | Monte Carlo | Monte Carlo | Other3 |
| Share price | 208.35 | 208.35 | 208.35 |
| Expected volatility (in %) | 24 to 25 | 19 to 28 | NA |
| Expected dividend yield (in %) | NA | NA | 1.15 |
| Weighted average remaining life of awards outstanding as at 12/31/2025 (in years) | 2.6 | 0.6 | 0.8 |
3 For these awards, the fair value is calculated by subtracting expected future dividends, if any, until maturity of the respective award from the prevailing share price as at the measurement date.
Fair Value and Parameters Used at Year End 2024
| €, unless otherwise stated |
LTI 2024 (2024 tranche) |
LTI 2020 (2021–2023 |
Move (2021–2024 |
| Weighted average fair value as at 12/31/2024 | 248.23 | 222.26 | 234.51 |
| Information how fair value was measured at measurement date | |||
| Valuation model used | Monte Carlo | Monte Carlo | Other3 |
| Share price | 236.30 | 236.30 | 236.30 |
| Expected volatility (in %) | 23 | 20 to 22 | NA |
| Expected dividend yield (in %) | NA | NA | 0.91 |
| Weighted average remaining life of awards outstanding as at 12/31/2024 (in years) | 3.2 | 1.0 | 0.8 |
3 For these awards, the fair value is calculated by subtracting expected future dividends, if any, until maturity of the respective award from the prevailing share price as at the measurement date.
| 235/326 |
|
Integrated Report 2025 | ||||
| To
Our Stakeholders |
Combined
Management Report |
Consolidated
Financial Statements IFRS |
Additional Information | ||
For the LTI 2020 valuation, the expected volatility of the NASDAQ-100 companies of 36% (2024: 31%), and the expected correlation of SAP and the NASDAQ-100 companies of 9% (2024: 16% to 21%) are based on historical TSR data for SAP and the NASDAQ-100 companies. For the LTI 2024 valuation, the expected volatility of the NASDAQ-100 companies of 32% (2024: 34%), and the expected correlation of SAP and the NASDAQ-100 companies of 12% to 18% (2024: 25%), are based on historical TSR data for SAP and the NASDAQ-100 companies. The NASDAQ-100 Total Return Index on December 31, 2025, was US$30,711.49 (2024: US$25,376.22).
The SAP dividend yield is based on expected future dividends.
Changes in Outstanding Awards
| Thousands, unless otherwise stated |
LTI 2024 (2024–2025 tranches) |
LTI 2020 (2021–2023 tranches) |
Move (2021–2025 tranches) |
| 12/31/2023 | NA | 605 | 6,672 |
| Granted4 | 126 | 0 | 823 |
| Adjustment based upon KPI target achievement | 0 | 41 | 15 |
| Exercised | 0 | –72 | –6,333 |
| Forfeited | –37 | –74 | –126 |
| Change in settlement4 | NA | NA | 1,149 |
| 12/31/2024 | 89 | 501 | 2,200 |
| Granted4 | 60 | 0 | 587 |
| Adjustment based upon KPI target achievement | 0 | 27 | 20 |
| Exercised | 0 | –217 | –2,334 |
| Forfeited | 0 | 0 | –81 |
| Change in settlement4 | NA | NA | 671 |
| 12/31/2025 | 149 | 311 | 1,063 |
| Total carrying amount (in € millions) of liabilities as at | |||
| 12/31/2024 | 7 | 98 | 343 |
| 12/31/2025 | 15 | 63 | 149 |
| Total intrinsic value of vested awards (in € millions) as at | |||
| 12/31/2024 | 2 | 57 | 0 |
| 12/31/2025 | 2 | 45 | 0 |
| Weighted average share price (in €) for awards exercised in | |||
| 2024 | NA | 172.16 | 181.68 |
| 2025 | NA | 212.81 | 255.17 |
| Total expense (in € millions) recognized in | |||
| 2023 | NA | 36 | 764 |
| 2024 | 7 | 51 | 729 |
| 2025 | 8 | 11 | 344 |
4 We have changed the classification of some share units granted under the Move plan with the initial intention to settle in shares from equity-settled to cash-settled because a cash outflow became probable, in particular due to the restructuring program.
| 236/326 |
|
Integrated Report 2025 | ||||
| To
Our Stakeholders |
Combined
Management Report |
Consolidated
Financial Statements IFRS |
Additional Information | ||
Share-Based Payment Balances
| € millions | 2025 | 2024 | ||||
| Current | Non-Current | Total | Current | Non-Current | Total | |
| Share-based payment liabilities | 162 | 74 | 235 | 303 | 151 | 453 |
| Other non-financial liabilities |
4,849 | 524 | 5,373 | 5,537 | 749 | 6,286 |
| Share-based payment liabilities as % of
Other non-financial liabilities |
3 | 14 | 4 | 5 | 20 | 7 |
(B.4) Pension Plans and Similar Obligations
Defined Contribution Plans
Amounts for domestic and foreign defined contribution plans are based on a percentage of the employees’ salaries or on the amount of contributions made by employees. In Germany and some other countries, we make contributions to public pension schemes that are operated by national or local government or similar institutions. Expenses for such local state pension plans are recognized as short-term employee benefits, that is, social security expenses.
Defined
Benefit Pension Plans
The discount rates used in measuring our post-employment benefit assets and liabilities are derived from rates available on high-quality corporate bonds and government bonds for which the timing and amounts of payments match the timing and the amounts of our projected pension payments. Net interest expense and other expenses related to defined benefit plans are recognized as employee benefits expenses and classified in our Consolidated Income Statements according to the activities that the employees owning the awards perform. Since our domestic defined benefit pension plans primarily consist of an employee-financed post-retirement plan that is fully financed with qualifying insurance policies, current service cost may become a credit as a result of adjusting the defined benefit liability’s carrying amount to the fair value of the qualifying plan assets. Such adjustments are recorded in service cost. Total expenses on defined benefit pension plans comprise related current and past service costs as well as interest income and expense.
Total Expense of Pension Plans
| € millions | 2025 | 2024 | 2023 |
| Defined contribution plans | 396 | 396 | 381 |
| Defined benefit pension plans | 99 | 39 | 57 |
| Pension expenses | 495 | 435 | 438 |
Defined Benefit Plans
Present Value of the Defined Benefit Obligations (DBO) and the Fair Value of the Plan Assets
| € millions | Domestic Plans | Foreign Plans | Other Foreign Post- Employment Plans |
Total | ||||
| 2025 | 2024 | 2025 | 2024 | 2025 | 2024 | 2025 | 2024 | |
| Present value of the DBO | 1,229 | 1,204 | 796 | 752 | 333 | 285 | 2,358 | 2,241 |
| Fair value of the plan assets | 1,238 | 1,209 | 781 | 707 | 162 | 124 | 2,181 | 2,040 |
| Net defined benefit liability (asset)¹ | 0 | 0 | 59 | 61 | 171 | 161 | 230 | 222 |
| thereof: Net defined benefit asset | 0 | 0 | –19 | –18 | 0 | –1 | –19 | –19 |
| Net defined benefit liability | 0 | 0 | 78 | 79 | 171 | 162 | 249 | 241 |
| Net defined benefit asset as % of
Non-current other financial assets |
0 | 0 | 0 | 0 | 0 | 0 | 0 | 0 |
| Net defined benefit liability as % of Non-current provisions |
0 | 0 | 14 | 16 | 31 | 33 | 45 | 49 |
¹ after the effects of the asset ceiling
| 237/326 |
|
Integrated Report 2025 | ||||
| To
Our Stakeholders |
Combined
Management Report |
Consolidated
Financial Statements IFRS |
Additional Information | ||
Of the present value of the DBO of our domestic plans, €1,179 million (2024: €1,150 million) relates to plans that provide for lump-sum payments not based on final salary; of the present value of the DBO of our foreign plans, €638 million (2024: €597 million) relates to plans that provide for annuity payments not based on final salary.
The following significant weighted average assumptions were used for the actuarial valuation of our domestic and foreign pension liabilities as well as other post-employment benefit obligations as at the respective measurement date:
Significant Actuarial Assumptions
| Percent | Domestic Plans | Foreign Plans | Other Foreign Post-Employment Plans | ||||||
| 2025 | 2024 | 2023 | 2025 | 2024 | 2023 | 2025 | 2024 | 2023 | |
| Discount rate | 3.9 | 3.4 | 3.5 | 1.9 | 1.5 | 2.0 | 5.7 | 5.3 | 5.3 |
The sensitivity analysis table below shows how the present value of all defined benefit obligations would have been influenced by reasonably possible changes to significant actuarial assumptions. The sensitivity analysis considers change in discount rate assumptions, holding all other actuarial assumptions constant.
Sensitivity Analysis
| € millions | Domestic Plans | Foreign Plans | Other Foreign Post- Employment Plans |
Total | ||||||||
| 2025 | 2024 | 2023 | 2025 | 2024 | 2023 | 2025 | 2024 | 2023 | 2025 | 2024 | 2023 | |
| Present value of all defined benefit obligations if: | ||||||||||||
| Discount rate was 50 basis points higher | 1,184 | 1,156 | 1,015 | 753 | 710 | 649 | 313 | 271 | 247 | 2,250 | 2,137 | 1,911 |
| Discount rate was 50 basis points lower | 1,278 | 1,256 | 1,108 | 843 | 798 | 727 | 338 | 292 | 266 | 2,459 | 2,346 | 2,101 |
Investments in Plan Assets
Our investment strategy on domestic benefit plans is to invest all contributions in stable insurance policies.
Our investment strategies for foreign benefit plans vary according to the conditions in the country in which the respective benefit plans are situated. We have adopted a long-term investment horizon for all major foreign benefit plans. Although our policy is to invest in a risk-diversified portfolio consisting of a mix of assets, both the defined benefit obligation and plan assets can fluctuate over time, which exposes the Group to actuarial and market (investment) risks. Depending on the statutory requirements in each country, it might be necessary to reduce any underfunding by addition of liquid assets.
| 238/326 |
|
Integrated Report 2025 | ||||
| To
Our Stakeholders |
Combined
Management Report |
Consolidated
Financial Statements IFRS |
Additional Information | ||
Plan Asset Allocation
| € millions | 2025 | 2024 | ||
|
Quoted in an Active Market |
Not Quoted in an Active Market |
Quoted in an Active Market |
Not Quoted in an Active Market | |
| Total plan assets | 781 | 1,400 | 701 | 1,338 |
| thereof: Asset category | ||||
| Equity investments | 285 | 0 | 220 | 0 |
| Corporate bonds | 199 | 0 | 240 | 0 |
| Insurance policies | 11 | 1,400 | 10 | 1,337 |
Our expected contribution in 2026 to our domestic and foreign defined benefit pension plans is immaterial. The weighted duration of our defined benefit plans amounted to nine years as at December 31, 2025, and 10 years as at December 31, 2024.
Total future benefit payments from our defined benefit plans as at December 31, 2025, are expected to be €3,059 million (2024: €2,803 million). Of this amount, 72% (2024: 73%) have maturities of over five years, and 57% (2024: 58%) relate to domestic plans.
| 239/326 |
|
Integrated Report 2025 | ||||
| To
Our Stakeholders |
Combined
Management Report |
Consolidated
Financial Statements IFRS |
Additional Information | ||
(B.5) Other Employee-Related Obligations
Accounting Policy
As far as the obligation for long-term employee benefits is secured by pledged reinsurance coverage, it is offset with the relating plan asset.
Other Employee-Related Liabilities
| € millions | 2025 | 2024 | ||||
| Current | Non-Current | Total | Current | Non-Current | Total | |
| Other employee-related liabilities | 3,753 | 450 | 4,204 | 4,208 | 598 | 4,806 |
| Other non-financial liabilities |
4,849 | 524 | 5,373 | 5,537 | 749 | 6,286 |
|
Other employee-related liabilities as % of |
77 | 86 | 78 | 76 | 80 | 76 |
Other employee-related liabilities mainly relate to obligations from bonuses and sales commissions, outstanding vacation, time credits accumulated in the working time account, employee-related social security expenses and deferred compensation liabilities. The decrease is mainly attributable to lower obligations for bonuses and for share-based payments.
(B.6) Restructuring
Recognition of Restructuring Provisions
We only recognize provisions for restructuring if and when the following occurs:
| – | SAP has designed a program that materially changes the scope of one of our businesses or the manner in which the business is conducted, and |
| – | A detailed and documented restructuring plan has been approved by our Executive Board, a member thereof, or a direct report of an Executive Board member, and |
| – | The program established is planned to start shortly after the program plan is approved and is expected to be completed in a timeframe that makes significant changes to the plan unlikely, and |
| – | The program has been announced to the parties affected or has commenced. |
We consider whether a change in business is material based on the business affected rather than for SAP as a whole. In judging whether a unit qualifies as a business for restructuring purposes, we consider if the unit has its own management team, has access to all inputs and processes necessary to provide outputs, and generates or could generate revenues. The materiality of a change to a business is assessed based on both the size and the nature of the change and therefore does not necessarily involve a material quantitative impact on our financial statements.
Restructuring Expenses
| € millions | 2025 | 2024 | 2023 |
| Employee-related restructuring expenses | –3 | –3,143 | –222 |
|
Onerous contract-related restructuring expenses and restructuring-related impairment losses |
0 | –2 | 8 |
| Restructuring expenses |
–3 | –3,144 | –215 |
The increase in restructuring costs presented in 2024 mainly relate to SAP’s Company-wide restructuring program that was announced in January 2024. SAP increased its focus on key strategic growth areas, particularly business AI. The 2024 restructuring program was set up to ensure that SAP’s skillset and resources continue to meet future business needs, and affected around 10,000 positions, a majority of which have been covered by voluntary leave programs and internal re-skilling measures. The execution of the program concluded as planned at the beginning of 2025, with most of the affected employees having left the Company in 2024 and throughout the first half of 2025.
| 240/326 |
|
Integrated Report 2025 | ||||
| To
Our Stakeholders |
Combined
Management Report |
Consolidated
Financial Statements IFRS |
Additional Information | ||
Most of the expenses related to the restructuring program were recognized in 2024. Overall expenses associated with the program were approximately €3.2 billion and mainly included employee-related benefits such as severance payments and accelerated share-based payment expenses related to the restructuring program. Restructuring payouts totaled €2.5 billion for the full year 2024 and €0.8 billion in 2025.
Termination benefits related to SAP’s 2025 workforce optimization program were not presented as restructuring expenses (for more information, see Note (B.2)).
If not presented separately in our income statement, restructuring expenses would have been classified in the different expense items in our income statement as follows:
Restructuring Expenses by Functional Area
| € millions | 2025 | 2024 | 2023 |
| Cost of cloud | 1 | –95 | 7 |
| Cost of software licenses and support | 5 | –85 | –8 |
| Cost of services | 8 | –566 | –31 |
| Research and development | 17 | –1,197 | –42 |
| Sales and marketing | –19 | –1,043 | –121 |
| General and administration | –16 | –158 | –19 |
|
Restructuring expenses |
–3 | –3,144 | –215 |
| 241/326 |
|
Integrated Report 2025 | ||||
| To
Our Stakeholders |
Combined
Management Report |
Consolidated
Financial Statements IFRS |
Additional Information | ||
Section C – Financial Results
This section provides insight into the financial results of SAP’s reportable segments and of SAP overall as far as not already covered by previous sections. This includes, but is not limited to, segment results, income taxes, and earnings per share.
(C.1) Results of Segments
General Information
In the first half of 2025, the Services Sales function was moved from the Board area Customer Success into the Board area Customer Success & Delivery, combining the sales and delivery function for services. SAP therefore revised its segment structure in the first quarter of 2025.
At year end 2025, SAP had two operating segments: the Applications, Technology & Support (ATS) segment and the Core Services segment:
| – | The ATS segment represents SAP’s cohesive product portfolio, which is holistically steered and commercialized. The segment primarily generates revenue from cloud subscriptions and support offerings, and incurs costs for operating our cloud solutions and customer support. The revenue and cost for services arise from SAP’s training business, which is highly integrated with SAP’s product portfolio. |
| – | The Core Services segment supports SAP’s product portfolio by enabling customers to accelerate the adoption of innovations. Revenues are mainly generated from professional consulting services and premium support services. Cost is incurred primarily for the delivery of those services. The Core Services segment does not reflect the full services business. |
The segment information for comparative prior periods was restated to conform with the new segment composition.
Segment Reporting Policies
Our management reporting system produces reports that present information about our business activities in a variety of ways—for example, by line of business, geography, and areas of responsibility of individual Board members. Based on these reports, the Executive Board, which is responsible for assessing the performance of our Company and for making resource allocation decisions as our Chief Operating Decision Maker (CODM), evaluates business activities.
The segment structure is derived from the organizational structure, with parts of the organization engaging in diverse activities that incur expenses across different cost classifications. For example, various teams within the organizational structure of the Core Services segment incur costs for activities that generate cloud and software support revenue. However, for the segment structure, they are allocated within the Core Services segment.
Our management reporting system produces a variety of reports that differ due to the currency exchange rates used in the accounting for foreign-currency transactions and operations, where both actual and constant currency numbers are reported to and used by our CODM. Reports based on actual currencies use the same currency rates that are used in our financial statements, whereas reports based on constant-currency use the average exchange rates from the previous year’s corresponding period. Therefore, the 2025 constant currency amounts are only comparable to 2024 actual currency amounts; similarly, the 2024 constant currency amounts are only comparable to 2023 actual currency amounts.
We use an operating profit indicator to measure the performance of our operating segments. The accounting policies applied in the measurement of operating segment expenses and profit differ as follows from the IFRS accounting principles used to determine the operating profit measure in our income statements:
The segment expense measures exclude the following:
| – | Acquisition-related charges such as amortization expense and impairment charges for intangibles acquired in business combinations, including goodwill impairment charges, and certain standalone acquisitions of intellectual property (including purchased in-process research and development) as well as settlements of pre-existing business relationships in connection with a business combination, and acquisition-related third-party expenses |
| 242/326 |
|
Integrated Report 2025 | ||||
| To
Our Stakeholders |
Combined
Management Report |
Consolidated
Financial Statements IFRS |
Additional Information | ||
| – | Restructuring expenses |
| – | Regulatory compliance matter expenses |
| – | Expenses related to the litigation with Teradata |
SAP headquarters functions that are managed
exclusively on corporate level, such as finance, accounting, legal and compliance, human resources, global strategy and business operations,
and corporate marketing, are not included in the results of our reportable segments.
Information about our assets and liabilities by segment and cashflow by segment is not regularly provided to our CODM.
Results of Segments
Applications, Technology & Support
|
€ millions (non-IFRS) |
2025 | 2024 | 2023 | ||
|
Actual Currency |
Constant Currency |
Actual Currency |
Constant Currency |
Actual Currency | |
| Cloud | 21,023 | 21,661 | 17,141 | 17,212 | 13,664 |
| Software licenses | 990 | 1,020 | 1,399 | 1,400 | 1,764 |
| Software support | 10,525 | 10,754 | 11,290 | 11,343 | 11,496 |
| Software licenses and support | 11,515 | 11,774 | 12,689 | 12,743 | 13,260 |
| Cloud and software | 32,538 | 33,435 | 29,829 | 29,955 | 26,924 |
| Services | 309 | 316 | 418 | 415 | 435 |
| Total segment revenue | 32,847 | 33,751 | 30,248 | 30,370 | 27,359 |
| Cost of cloud | –5,084 | –5,276 | –4,446 | –4,460 | –3,692 |
| Cost of software licenses and support | –1,109 | –1,143 | –1,169 | –1,174 | –1,259 |
| Cost of cloud and software | –6,193 | –6,419 | –5,615 | –5,634 | –4,951 |
| Cost of services | –349 | –357 | –385 | –380 | –405 |
| Total cost of revenue | –6,542 | –6,775 | –6,000 | –6,014 | –5,356 |
| Segment gross profit | 26,305 | 26,976 | 24,248 | 24,356 | 22,003 |
| Other segment expenses | –12,959 | –13,328 | –12,995 | –13,027 | –12,493 |
| Segment profit (loss) | 13,345 | 13,647 | 11,253 | 11,329 | 9,510 |
The expenses for depreciation and amortization decreased 6% (4% at constant currencies), from 732 million in 2024 to €689 million in 2025.
Core Services
|
€ millions (non-IFRS) |
2025 | 2024 | 2023 | ||
|
Actual Currency |
Constant Currency |
Actual Currency |
Constant Currency |
Actual Currency | |
| Services | 3,953 | 4,053 | 3,927 | 3,940 | 3,848 |
| Total segment revenue | 3,953 | 4,053 | 3,927 | 3,940 | 3,848 |
| Cost of cloud | –120 | –124 | –108 | –109 | –131 |
| Cost of software licenses and support | –39 | –40 | –49 | –49 | –49 |
| Cost of cloud and software | –159 | –164 | –158 | –159 | –180 |
| Cost of services | –2,773 | –2,843 | –2,850 | –2,864 | –2,814 |
| Total cost of revenue | –2,932 | –3,007 | –3,008 | –3,023 | –2,995 |
| Segment gross profit | 1,021 | 1,046 | 920 | 918 | 853 |
| Other segment expenses | –590 | –605 | –637 | –638 | –604 |
| Segment profit (loss) | 432 | 440 | 283 | 280 | 249 |
| 243/326 |
|
Integrated Report 2025 | ||||
| To
Our Stakeholders |
Combined
Management Report |
Consolidated
Financial Statements IFRS |
Additional Information | ||
The expenses for depreciation and amortization decreased 2% (1% at constant currencies), from €105 million in 2024 to €103 million in 2025.
Segment Revenue by Region
The amounts for revenue by region in the following tables are based on the location of customers.
Applications, Technology & Support
| 2025 | 2024 | 2023 | |||
| € millions | Actual Currency | Constant Currency |
Actual Currency | Constant Currency |
Actual Currency |
| Germany | 5,081 | 5,084 | 4,635 | 4,635 | 4,176 |
| Rest of EMEA | 10,103 | 10,178 | 9,119 | 9,054 | 8,089 |
| EMEA | 15,185 | 15,263 | 13,754 | 13,689 | 12,266 |
| United States | 10,127 | 10,556 | 9,621 | 9,620 | 8,823 |
| Rest of Americas | 2,701 | 2,867 | 2,481 | 2,539 | 2,260 |
| Americas | 12,828 | 13,423 | 12,102 | 12,160 | 11,082 |
| Japan | 1,414 | 1,459 | 1,250 | 1,337 | 1,079 |
| Rest of APJ | 3,421 | 3,606 | 3,141 | 3,184 | 2,932 |
| APJ | 4,834 | 5,066 | 4,392 | 4,521 | 4,011 |
| Segment revenue | 32,847 | 33,751 | 30,248 | 30,370 | 27,359 |
Core Services
| 2025 | 2024 | 2023 | |||
| € millions | Actual Currency | Constant Currency |
Actual Currency | Constant Currency |
Actual Currency |
| Germany | 747 | 745 | 732 | 735 | 742 |
| Rest of EMEA | 1,093 | 1,101 | 1,077 | 1,070 | 995 |
| EMEA | 1,840 | 1,845 | 1,809 | 1,805 | 1,737 |
| United States | 1,410 | 1,468 | 1,424 | 1,425 | 1,387 |
| Rest of Americas | 261 | 278 | 278 | 279 | 295 |
| Americas | 1,671 | 1,745 | 1,701 | 1,704 | 1,682 |
| Japan | 155 | 160 | 147 | 158 | 163 |
| Rest of APJ | 286 | 302 | 270 | 273 | 265 |
| APJ | 442 | 462 | 417 | 431 | 428 |
| Segment revenue | 3,953 | 4,053 | 3,927 | 3,940 | 3,848 |
| 244/326 |
|
Integrated Report 2025 | ||||
| To
Our Stakeholders |
Combined
Management Report |
Consolidated
Financial Statements IFRS |
Additional Information | ||
(C.2) Reconciliation of Segment Measures to the Consolidated Income Statements
| € millions | 2025 | 2024 | 2023 | ||
|
Actual Currency |
Constant Currency |
Actual Currency |
Constant Currency |
Actual Currency | |
| Total revenue for ATS segment | 32,847 | 33,751 | 30,248 | 30,370 | 27,359 |
| Total revenue for Core Services segment | 3,953 | 4,053 | 3,927 | 3,940 | 3,848 |
| Total segment revenue | 36,800 | 37,804 | 34,175 | 34,310 | 31,207 |
| Adjustment for currency impact | 0 | –1,004 | 0 | –135 | 0 |
|
Total revenue |
36,800 | 36,800 | 34,175 | 34,175 | 31,207 |
| Total profit for ATS segment | 13,345 | 13,647 | 11,253 | 11,329 | 9,510 |
| Total profit for Core Services segment | 432 | 440 | 283 | 280 | 249 |
| Total segment profit | 13,777 | 14,088 | 11,536 | 11,609 | 9,759 |
| Adjustment for currency impact | 0 | –242 | 0 | –78 | 0 |
| Other expenses | –3,358 | –3,427 | –3,383 | –3,378 | –3,245 |
| Adjustment for | |||||
| Acquisition-related charges | –411 | –411 | –356 | –356 | –345 |
| Restructuring |
–3 | –3 | –3,144 | –3,144 | –215 |
| Regulatory compliance matter expenses | 0 | 0 | 11 | 11 | –155 |
| Teradata litigation expenses | –387 | –387 | 0 | 0 | 0 |
| Operating profit |
9,617 | 9,617 | 4,665 | 4,665 | 5,799 |
| Other non-operating income/expense, net |
118 | 118 | –298 | –298 | –3 |
| Financial income, net | –230 | –230 | –63 | –63 | –311 |
| Adjustment for gains and losses from equity securities, net | 764 | 764 | 461 | 461 | –145 |
| Profit
before tax |
10,270 | 10,270 | 4,764 | 4,764 | 5,341 |
(C.3) Other Non-Operating Income/Expense, Net
| € millions | 2025 | 2024 | 2023 |
| Foreign currency exchange gain/loss, net | 141 | –246 | 46 |
| Miscellaneous income/expense, net | –23 | –52 | –48 |
| Other non-operating income/expense, net |
118 | –298 | –3 |
The movement in Other non-operating income/expense is mainly driven by changes in foreign exchange rates.
For more information about net gains or losses on financial instruments by IFRS 9 measurement category, see Note (F.2).
(C.4) Financial Income, Net
| € millions | 2025 | 2024 | 2023 |
| Finance income | 1,911 | 1,429 | 857 |
| thereof gains from disposals and fair value adjustments of equity securities | 1,389 | 778 | 381 |
| thereof interest income | 428 | 631 | 486 |
| thereof miscellaneous income | 93 | 20 | –10 |
| Finance costs | –1,377 | –1,031 | –1,313 |
| thereof losses from disposals and fair value adjustments of equity securities | –625 | –316 | –525 |
| thereof interest expense | –492 | –545 | –639 |
| thereof fee expense | –96 | –97 | –97 |
| thereof miscellaneous expense | –163 | –73 | –51 |
| Financial income, net |
534 | 398 | –456 |
| 245/326 |
|
Integrated Report 2025 | ||||
| To
Our Stakeholders |
Combined
Management Report |
Consolidated
Financial Statements IFRS |
Additional Information | ||
Financial income, net, increased €136 million in 2025, in comparison to 2024, mainly due to higher net gains from the fair valuation of our equity investments (€302 million), which is partially offset by a decrease in net interest by €150 million, mainly from lower interest income on investments.
For more information about net gains or losses on financial instruments by IFRS 9 measurement category, see Note (F.2).
(C.5) Income Taxes
Accounting Policies, Judgments, and Estimates
We are subject to changing tax laws in multiple jurisdictions within the countries in which we operate. Our ordinary business activities also include transactions where the ultimate tax outcome is uncertain due to different interpretations of tax laws, such as those involving transfer pricing and intercompany transactions between SAP Group entities. In addition, the amount of income taxes we pay is generally subject to ongoing audits by domestic and foreign tax authorities. In determining our worldwide income tax provisions, judgment is involved in assessing whether to consider each uncertain tax treatment separately or together with one or more other uncertain tax treatments and whether to reflect the respective effect of uncertainty based on the most likely amount or the expected value. In applying these judgments, we consider the nature and the individual facts and circumstances of each uncertain tax treatment as well as the specifics of the respective jurisdiction, including applicable tax laws and our interpretation thereof.
The assessment whether a deferred tax asset is impaired requires judgment, as we need to estimate future taxable profits to determine whether the utilization of the deferred tax asset is probable. In evaluating our ability to utilize our deferred tax assets, we consider all available positive and negative evidence, including the level of historical taxable income and projections for future taxable income over the periods in which the deferred tax assets are recoverable. Our judgment regarding future taxable income is based on assumptions about future market conditions and future profits of SAP.
Judgment is also required in evaluating whether interest or penalties related to income taxes meet the definition of income taxes, and, if not, whether it is of financial nature. In this judgment, we particularly consider applicable local tax laws and interpretations on IFRS by national standard setters in the area of group financial reporting.
Major Components of Tax Expense
| € millions | 2025 | 2024 | 2023 |
| Current tax expense | |||
| Tax expense for current year | 2,711 | 1,881 | 1,935 |
| Taxes for prior years | 287 | 53 | 17 |
| Total current tax expense | 2,998 | 1,934 | 1,952 |
| Deferred tax expense/income | |||
| Origination and reversal of temporary differences | –208 | –258 | –222 |
| Unused tax losses, research and development tax credits, and foreign tax credits | 154 | –62 | 11 |
| Total deferred tax income | –54 | –320 | –211 |
| Total income tax expense |
2,944 | 1,614 | 1,741 |
| 246/326 |
|
Integrated Report 2025 | ||||
| To
Our Stakeholders |
Combined
Management Report |
Consolidated
Financial Statements IFRS |
Additional Information | ||
Total deferred tax income includes an expense of €58 million (2024: expense of €4 million; 2023: expense of €8 million) related to changes in tax laws and tax rates, mainly due to the gradual reduction of the corporate tax rate in Germany from 15% to 10% for the 2028 to 2032 assessment period. To determine the applicable tax rates, the timing of the reversal of temporary differences was projected consistent with the expected manner of recovery or settlement of the underlying assets and liabilities.
The following table reconciles the expected income tax expense, computed by applying our combined German tax rate of 26.8% (2024: 26.7%; 2023: 26.5%), to the actual income tax expense. Our 2025 combined German tax rate includes a corporate income tax rate of 15.0% (2024: 15.0%; 2023: 15.0%), plus a solidarity surcharge of 5.5% (2024: 5.5%; 2023: 5.5%) thereon, and trade taxes of 11.0% (2024: 10.8%; 2023: 10.7%).
Relationship Between Tax Expense and Profit Before Tax
| € millions, unless otherwise stated | 2025 | 2024 | 2023 |
| Profit before tax from continuing operations |
10,270 | 4,764 | 5,341 |
|
Tax expense at applicable tax rate of 26.8% (2024: 26.7%; 2023: 26.5%) |
2,750 | 1,270 | 1,418 |
| Tax effect of: | |||
| Foreign tax rates | –242 | –220 | –210 |
| Non-deductible expenses | 309 | 325 | 241 |
| Tax-exempt income | –244 | –208 | –77 |
| Withholding taxes | 282 | 465 | 297 |
| Research and development and foreign tax credits | –96 | –91 | –89 |
| Prior-year taxes | 72 | –70 | –8 |
| Assessment of deferred tax assets, research and development tax credits, and foreign tax credits | 53 | 100 | 138 |
| Other | 60 | 43 | 31 |
| Total
income tax expense |
2,944 | 1,614 | 1,741 |
| Effective tax rate (in %) | 28.7 | 33.9 | 32.6 |
| 247/326 |
|
Integrated Report 2025 | ||||
| To
Our Stakeholders |
Combined
Management Report |
Consolidated
Financial Statements IFRS |
Additional Information | ||
Components of Recognized Deferred Tax Assets and Liabilities
| € millions | 2025 | 2024 |
| Deferred tax assets | ||
| Intangible assets | 1,081 | 1,128 |
| Property, plant, and equipment | 35 | 39 |
| Leases | 369 | 374 |
| Other financial assets | 52 | 69 |
| Trade and other receivables | 136 | 79 |
| Other non-financial assets | 72 | 48 |
| Pension provisions | 200 | 215 |
| Share-based compensation | 172 | 320 |
| Contract liabilities | 1,017 | 928 |
| Trade and other payables | 127 | 148 |
| Financial liabilities | 118 | 138 |
| Other non-financial liabilities | 785 | 844 |
| Provisions | 61 | 107 |
| Net operating loss carryforwards | 172 | 338 |
| Research and development and foreign tax credits | 85 | 80 |
| Total deferred tax assets (gross) | 4,482 | 4,855 |
| Netting | –2,319 | –2,181 |
|
Total deferred tax assets (net) |
2,163 | 2,674 |
| Deferred tax liabilities | ||
| Intangible assets | 517 | 655 |
| Property, plant, and equipment | 65 | 80 |
| Leases | 326 | 336 |
| Other financial assets | 330 | 346 |
| Trade and other receivables | 92 | 79 |
| Other non-financial assets | 790 | 739 |
| Pension provisions | 23 | 28 |
| Share-based compensation | 2 | 5 |
| Contract liabilities | 26 | 21 |
| Trade and other payables | 73 | 44 |
| Financial liabilities | 128 | 157 |
| Other non-financial liabilities | 12 | 12 |
| Provisions | 7 | 5 |
| Total deferred tax liabilities (gross) | 2,391 | 2,507 |
| Netting | –2,319 | –2,181 |
|
Total deferred tax liabilities (net) |
72 | 326 |
| 248/326 |
|
Integrated Report 2025 | ||||
| To
Our Stakeholders |
Combined
Management Report |
Consolidated
Financial Statements IFRS |
Additional Information | ||
Movement of Deferred Tax Assets and Liabilities
| € millions | 2025 | 2024 | 2023 |
| Total deferred tax assets (net) at the beginning of the period | 2,348 | 1,930 | 1,854 |
| Change in items of the Consolidated Income Statements | 54 | 320 | 211 |
| Change in items of the Consolidated Statements of Comprehensive Income | –1 | –2 | 34 |
| Change in items of the Consolidated Statements of Changes in Equity | –80 | 155 | 53 |
| Change in consolidated companies | –14 | –122 | –128 |
| Other changes (includes mainly currency translation differences) | –216 | 67 | –94 |
| Total deferred tax assets (net) at the end of the period | 2,091 | 2,348 | 1,930 |
Items Not Resulting in a Deferred Tax Asset
| € millions | 2025 | 2024 | 2023 |
| Unused tax losses | |||
| Not expiring | 628 | 291 | 151 |
| Expiring in the following year | 6 | 4 | 28 |
| Expiring after the following year | 287 | 392 | 216 |
| Total unused tax losses | 921 | 687 | 395 |
| Deductible temporary differences | 340 | 375 | 325 |
| Unused research and development and foreign tax credits | |||
| Not expiring | 31 | 41 | 59 |
| Expiring after the following year | 4 | 8 | 5 |
| Total unused tax credits | 35 | 49 | 64 |
Of the unused tax losses, €133 million (2024: €146 million; 2023: €181 million) relate to U.S. state tax loss carryforwards.
In 2025, SAP Group entities that suffered a tax loss in either the current or the preceding period recognized deferred tax assets amounting to €144 million (2024: €494 million; 2023: €90 million) in excess of deferred tax liabilities. The tax losses resulted mainly from one-time restructuring expenses in 2024, which had no negative impact on profitability or deferred tax asset recoverability.
In connection with investments in subsidiaries, there were temporary taxable differences of approximately €1.4 billion (2024: €1.8 billion) for which no deferred taxes have been recognized because SAP can control the timing of the reversal and it is not probable that the temporary differences will reverse in the foreseeable future.1
1 For a more transparent presentation in line with IAS 12, the prior-period comparative amount has been adjusted from undistributed profits to temporary taxable differences.
Global Minimum Tax
SAP falls within the scope of the global minimum taxation rules published by the Organization for Economic Co-operation and Development (OECD) and of the German Minimum Tax Law (Mindeststeuergesetz). As a result, its income tax expense increased by a single-digit million euro sum in 2025 and 2024. SAP has applied the temporary mandatory exception to recognizing and disclosing information about deferred tax assets and liabilities related to the global minimum tax.
Income Tax-Related Litigation
We are subject to ongoing tax audits by domestic and foreign tax authorities. In respect of income taxes, we are currently involved in various proceedings with foreign tax authorities mainly regarding the deductibility of intercompany royalty payments, intercompany services, and other payments. In all cases, we expect that a favorable outcome can only be achieved through litigation. For all of these matters, we have not recorded a provision as we believe that the tax authorities’ claims have no merit and that no adjustment is warranted. If, contrary to our view, the tax authorities were to prevail in their arguments before the court, we would expect to have
| 249/326 |
|
Integrated Report 2025 | ||||
| To
Our Stakeholders |
Combined
Management Report |
Consolidated
Financial Statements IFRS |
Additional Information | ||
an additional expense of approximately €1,187 million (2024: €1,250 million) in total (including related interest expenses and penalties of €773 million (2024: €726 million)).
(C.6) Earnings per Share
| € millions, unless otherwise stated | 2025 | 2024 | 2023 |
| Profit attributable to equity holders of SAP SE | 7,161 | 3,124 | 3,634 |
| Profit attributable to equity holders of SAP SE1 | 7,161 | 3,124 | 6,139 |
| Issued ordinary shares2 | 1,229 | 1,229 | 1,229 |
| Effect of treasury shares2 | –63 | –62 | –61 |
| Weighted average shares outstanding, basic2 | 1,166 | 1,166 | 1,167 |
| Dilutive effect of share-based payments2 | 9 | 13 | 12 |
| Weighted average shares outstanding, diluted2 | 1,175 | 1,180 | 1,180 |
| Earnings per share, basic, attributable to equity holders of SAP SE (in €) from continuing operations | 6.14 | 2.68 | 3.11 |
| Earnings per share, basic, attributable to equity holders of SAP SE (in €)1 | 6.14 | 2.68 | 5.26 |
| Earnings per share, diluted, attributable to equity holders of SAP SE (in €) from continuing operations | 6.10 | 2.65 | 3.08 |
| Earnings per share, diluted, attributable to equity holders of SAP SE (in €)1 | 6.10 | 2.65 | 5.20 |
1 from continuing and discontinued operations
2 Number of shares in millions
| 250/326 |
|
Integrated Report 2025 | ||||
| To
Our Stakeholders |
Combined
Management Report |
Consolidated
Financial Statements IFRS |
Additional Information | ||
Section D – Invested Capital
This section highlights our non-current assets including investments that form the basis of our operating activities. Additions to invested capital include separate asset acquisitions or business combinations. Further, we disclose information about purchase obligations and capital contributions.
(D.1) Business Combinations and Divestitures
Measuring Non-Controlling Interests and Allocation of Consideration Transferred
We decide for each business combination whether to measure the non-controlling interest in the acquiree at fair value or at the proportionate share of the acquiree’s identifiable net assets.
We classify costs related to executing business combinations as general and administration expense.
In our accounting for business combinations, judgment is required in determining whether an intangible asset is identifiable and whether it should be recorded separately from goodwill. Additionally, estimating the acquisition-date fair values of the identifiable assets acquired and liabilities assumed involves considerable judgment. The necessary measurements are based on information available on the acquisition date and are based on expectations and assumptions that have been deemed reasonable by management. These judgments, estimates, and assumptions can materially affect our financial position and profit for several reasons, including the following:
| – | Fair values assigned to assets subject to depreciation and amortization affect the amounts of depreciation and amortization to be recorded in operating profit in the periods following the acquisition. |
| – | Subsequent negative changes in the estimated fair values of assets may result in additional expense from impairment charges. |
| – | Subsequent changes in the estimated fair values of liabilities and provisions may result in additional expense (if increasing the estimated fair value) or additional income (if decreasing the estimated fair value). |
We acquire businesses in specific areas of strategic interest to us, particularly to broaden our product and service portfolio.
2025 Acquisitions
SmartRecruiters Acquisition
On August 1, 2025, SAP announced its intention to acquire 100% of SmartRecruiters, Inc. (“SmartRecruiters”), a leading provider of talent acquisition software. The transaction closed on September 11, 2025, following satisfaction of customary closing conditions and regulatory approvals.
The acquisition is expected to help SAP strengthen its suite of HR offerings. SmartRecruiters’ products are designed to improve employee hiring decision-making and reduce time to hire. Embedded analytics and AI-powered recommendations from SAP and SmartRecruiters provide valuable insights into talent pools, prevent hiring bottlenecks, and improve workforce planning.
| € millions | |
| Cash paid | 711 |
| Share-based payment awards | 39 |
| Other incurred liabilities | 3 |
| Total consideration transferred | 753 |
The consideration transferred amounted to US$878 million (€753 million) and the majority was paid in cash. The amount recognized for share-based payment awards represents both the vested and the earned portion of unvested equity-settled share-based payment awards previously held by SmartRecruiters employees as of the acquisition date. The earned portion of unvested equity-settled share-based payment awards was exchanged by SAP upon acquiring SmartRecruiters for deferred fixed-cash compensation.
| 251/326 |
|
Integrated Report 2025 | ||||
| To
Our Stakeholders |
Combined
Management Report |
Consolidated
Financial Statements IFRS |
Additional Information | ||
The following table summarizes the values of identifiable assets acquired and liabilities assumed in connection with the acquisition of SmartRecruiters, as at the acquisition date:
| € millions | |
| Intangible assets | 206 |
| Cash and cash equivalents | 50 |
| Other identifiable assets | 51 |
| Total identifiable assets | 307 |
| Other identifiable liabilities | 77 |
| Total identifiable liabilities | 77 |
| Total identifiable net assets | 230 |
| Goodwill | 523 |
| Total consideration transferred | 753 |
The initial accounting for the SmartRecruiters business combination is incomplete because we are still obtaining the information necessary to identify and measure items such as the tax-related assets and liabilities of SmartRecruiters. Accordingly, the amounts recognized in our Consolidated Financial Statements for these items are regarded as provisional as at December 31, 2025.
The goodwill arising from our acquisitions consists largely of the synergies and the know-how and skills of the acquired businesses’ workforces. SmartRecruiters goodwill was attributed to expected synergies from the acquisition, particularly in the following areas:
| – | SmartRecruiters’ Talent Acquisition (TA) suite enhances SAP’s ability to offer a more complete TA solution to customers, combining specialized capabilities with an integrated suite to support long-term success in recruiting and human capital management (HCM). |
| – | The SmartRecruiters talent acquisition platform will continue to be offered standalone and will replace an existing module within the SAP SuccessFactors HCM suite, integrating to the SAP SuccessFactors Employee Central solution, the SAP SuccessFactors Onboarding solution, and others. |
| – | The business combination facilitates new cross-selling opportunities to existing SAP customers across all regions, using SAP’s sales organization. |
The operating results and the assets and liabilities are reflected in our Consolidated Financial Statements starting September 11, 2025.
The allocation of the goodwill resulting from the SmartRecruiters acquisition to our operating segments depends on how our operating segments actually benefit from the synergies of the SmartRecruiters business combination. For more information, see Note (D.2).
Impact of Business Combinations on Our Consolidated Financial Statements
The amounts of revenue and profit or loss of the SmartRecruiters business acquired in 2025 since the acquisition date are included in the 2025 Consolidated Income Statements as follows:
| € millions |
2025 as Reported |
Contribution of SmartRecruiters |
| Revenue |
36,800 | 26 |
|
Profit after tax |
7,326 | –21 |
Had SmartRecruiters been consolidated as at January 1, 2025, our estimated pro forma revenue for the reporting period would have been €36,861 million and our estimated pro forma profit after tax would have been €7,322 million.
These pro forma numbers have been prepared for comparative purposes only. The pro forma revenue and profit numbers are not necessarily indicative of the results of operations that would have actually occurred had the acquisition been in effect at the beginning of the respective periods or of future results.
| 252/326 |
|
Integrated Report 2025 | ||||
| To
Our Stakeholders |
Combined
Management Report |
Consolidated
Financial Statements IFRS |
Additional Information | ||
2024 Acquisitions
WalkMe Acquisition
On June 5, 2024, SAP announced its intent to acquire 100% of the shares of WalkMe Ltd. (“WalkMe”), a leader in Digital Adoption Platforms (DAP). The transaction closed on September 12, 2024, following satisfaction of regulatory and other approvals. WalkMe’s shares were delisted on September 12, 2024, after meeting all relevant criteria.
The acquisition is expected to help SAP expand its business transformation portfolio. WalkMe solutions are designed to help companies navigate ongoing technological change by providing users with advanced guidance and automation capabilities.
| € millions | |
| Cash paid | 1,257 |
| Replacement share-based payment awards | 41 |
| Call option exercise liability | 31 |
| Total consideration transferred | 1,329 |
The consideration transferred amounted to US$1.4 billion (€1.3 billion) and the majority was paid in cash. SAP hedged this cash amount with respect to foreign currency risks. The amount recognized for the replacement of share-based payment awards represents the earned portion of unvested WalkMe equity-settled share-based payment awards previously held by WalkMe employees, which SAP exchanged for either deferred fixed-cash compensation or equity-settled share-based payment awards of SAP (both collectively referred to as replacement awards) upon acquiring the company.
The following table summarizes the values of identifiable assets acquired and liabilities assumed in connection with the acquisition of WalkMe, as at the acquisition date:
WalkMe Acquisition: Recognized Assets and Liabilities
| € millions | |
| Intangible assets | 502 |
| Cash and cash equivalents | 202 |
| Other identifiable assets | 276 |
| Total identifiable assets | 980 |
| Other identifiable liabilities | 416 |
| Total identifiable liabilities | 416 |
| Total identifiable net assets | 564 |
| Goodwill | 765 |
| Total consideration transferred | 1,329 |
In the third quarter of 2025, measurement of tax-related assets and liabilities for the WalkMe business combination accounting was completed and resulted in a €111 million adjustment to the Other identifiable assets/liabilities opening balance and Goodwill.
In general, the goodwill arising from our acquisitions consists largely of the synergies and the know-how and skills of the acquired businesses’ workforces.
WalkMe goodwill was attributed to expected synergies from the acquisition, particularly in the following areas:
| – | Evolution of SAP’s strategy to improve adoption, through a WalkMe solution that empowers companies to enhance the utilization of their SaaS systems, increase employee and end-user productivity, and reduce training and support costs |
| – | Cross-selling of WalkMe products to existing SAP customers across all regions, enabling seamless workflow execution across business software applications |
| – | Improved user experience and user productivity by coupling WalkMe’s AI capabilities with SAP's copilot Joule, driving adoption of existing SAP solutions |
| – | Creation of new business process intelligence offerings by combining WalkMe products and SAP products |
| – | Improved profitability in WalkMe sales and operations |
| 253/326 |
|
Integrated Report 2025 | ||||
| To
Our Stakeholders |
Combined
Management Report |
Consolidated
Financial Statements IFRS |
Additional Information | ||
The operating results and the assets and liabilities are reflected in our Consolidated Financial Statements starting September 12, 2024.
Impact of Business Combinations on Our Consolidated Financial Statements
The amounts of revenue and profit or loss of the WalkMe business acquired in 2024 since the acquisition date were included in our Consolidated Income Statements for 2024 as follows:
| € millions |
2024 as Reported |
Contribution of WalkMe |
| Revenue |
34,176 | 61 |
|
Profit after tax |
3,150 | –47 |
Had WalkMe been consolidated as at January 1, 2024, our estimated pro forma revenue for the reporting period would have been €34,328 million and our estimated pro forma profit after tax would have been €3,050 million.
These pro forma numbers have been prepared for comparative purposes only. The pro forma revenue and profit numbers are not necessarily indicative of the results of operations that would have actually occurred had the acquisition been in effect at the beginning of the respective periods or of future results.
2023 Acquisitions
LeanIX Acquisition
On September 7, 2023, SAP announced its intent to acquire 100% of the shares of LeanIX GmbH (“LeanIX”), a leader in enterprise architecture management (EAM) software.
The acquisition closed on November 7, 2023, following satisfaction of customary closing conditions and regulatory approvals; the operating results and the assets and liabilities are reflected in our Consolidated Financial Statements starting on that date.
Consideration transferred amounted to €1,231 million paid in cash. The following table summarizes the values of identifiable assets acquired and liabilities assumed in connection with the acquisition of LeanIX, as at the acquisition date:
LeanIX Acquisition: Recognized Assets and Liabilities
| € millions | |
| Intangible assets | 476 |
| Other identifiable assets | 106 |
| Total identifiable assets | 582 |
| Other identifiable liabilities | 210 |
| Total identifiable liabilities | 210 |
| Total identifiable net assets | 372 |
| Goodwill | 859 |
| Total consideration transferred | 1,231 |
In the fourth quarter of 2024, measurement of tax-related assets and liabilities for the LeanIX business combination accounting was completed and resulted in an €8 million adjustment to the Other identifiable assets/liabilities opening balance and Goodwill.
In general, the goodwill arising from our acquisitions consists largely of the synergies and the know-how and skills of the acquired businesses’ workforces.
LeanIX goodwill was attributed to expected synergies from the acquisition, particularly in the following areas:
| – | Cross-selling to existing SAP customers across all regions, using SAP’s sales organization |
| – | Creation of new offerings by combining LeanIX products and SAP products |
| – | Enhanced transformation capabilities of SAP Signavio solutions, giving SAP customers unique clarity on the IT landscapes they need to reap the full benefit of business transformation |
| 254/326 |
|
Integrated Report 2025 | ||||
| To
Our Stakeholders |
Combined
Management Report |
Consolidated
Financial Statements IFRS |
Additional Information | ||
Impact of the Business Combination on Our Consolidated Financial Statements
The amounts of revenue and profit or loss of the LeanIX business acquired in 2023 since the acquisition date were included in our Consolidated Income Statements for 2023 as follows:
| € millions |
2023 as Reported |
Contribution of LeanIX |
| Revenue |
31,207 | 10 |
|
Profit after tax |
5,964 | –8 |
Had LeanIX been consolidated as at January 1, 2023, our revenue and profit after tax for 2023 would not have been materially different.
2023 Divestitures
Qualtrics Disposal
On March 13, 2023, resulting from a process that was initiated on January 26, 2023, SAP announced it had agreed to sell all of its 423 million shares of Qualtrics International Inc. as part of the acquisition of Qualtrics by funds affiliated with Silver Lake as well as the Canada Pension Plan Investment Board. The sale closed on June 28, 2023, following satisfaction of customary closing conditions and regulatory approvals. At a purchase price of US$18.15 in cash per share, SAP’s stake was acquired for approximately US$7.7 billion. To secure the euro countervalue of the US$7.7 billion purchase price, we hedged an amount of US$7.1 billion by entering into a deal contingent forward applying net investment hedge accounting. At the time that Qualtrics was classified as a discontinued operation (following IFRS 5), there was no indication of an impairment (as the fair value less cost of disposal (calculated based on share prices) significantly exceeded the carrying amount).
SAP is a close go-to-market and technology partner for Qualtrics.
SAP’s financial results present Qualtrics as a discontinued operation as required under IFRS 5. The Qualtrics disposal group was previously included in the Qualtrics reportable segment.
The pre-tax disposal gain included in discontinued operations (€3,562 million) was calculated by adjusting the purchase price less the cost of disposal (€7,003 million) for net assets leaving the SAP Group (€5,800 million, consisting mostly of goodwill (€4,007 million) and other intangible assets (€1,294 million)), the corresponding non-controlling interests (€2,337 million), and amounts of other comprehensive income (€22 million). SAP incurred taxes amounting to €799 million in connection with the transaction.
The cash inflow resulting from the purchase price (€7,068 million) was offset by cash and cash equivalents of €713 million leaving the SAP Group.
SAP continues to provide rental guarantees for certain offices used by Qualtrics. Qualtrics is obligated to indemnify SAP with respect to the guarantees.
Additional financial information relating to Qualtrics is presented in the following tables (revenues and expenses are presented after consolidation of transactions between Qualtrics and SAP’s continuing operations):
| € millions, unless otherwise stated | 2023 | 2022 |
| Consolidated Income Statements | ||
| Cloud revenue | 621 | 1,129 |
| Total revenue | 745 | 1,351 |
| Cost of cloud | –88 | –265 |
| Total cost of revenue | –196 | –499 |
| Total operating expenses (including total cost of revenue) | –1,155 | –2,771 |
| Disposal gain before tax | 3,562 | 0 |
| Operating profit | 3,152 | –1,420 |
| Profit (loss) before tax | 3,162 | –1,423 |
| Income tax expense1 | –799 | 64 |
| Profit (loss) after tax | 2,363 | –1,359 |
| 255/326 |
|
Integrated Report 2025 | ||||
| To
Our Stakeholders |
Combined
Management Report |
Consolidated
Financial Statements IFRS |
Additional Information | ||
| Attributable to owners of parent | 2,505 | –993 |
| Earnings per share, basic (IFRS, in €)2 | 2.15 | –0.85 |
| Earnings per share, diluted (IFRS, in €)2 | 2.12 | –0.85 |
| Consolidated Statements of Cash Flow | ||
| Net operating cash flow | 113 | –33 |
| Net investing cash flow | 5,523 | –23 |
| Net financing cash flow | 20 | –268 |
1 For 2023, €799 million relates to the gain on sale of discontinued operations.
2 For 2023 and 2022, the weighted average number of shares was 1,167 million (diluted: 1,180 million) and 1,170 million (diluted: 1,175 million), respectively (treasury stock excluded).
Total operating expenses includes share-based payment expenses related to Qualtrics’ equity-settled plan of €403 million in 2023 (€1,182 million in 2022).
(D.2) Goodwill
Goodwill and Intangible Asset Impairment Testing
The annual goodwill impairment test is performed at the operating segment level, since there are no lower levels in SAP at which goodwill is monitored for internal management purposes.
In general, the test is performed at the same time (at the beginning of the fourth quarter) for each annual reporting period for all operating segments.
In making impairment assessments for our goodwill and intangible assets, the outcome of these tests is highly dependent on management’s assumptions regarding future cash flow projections and economic risks, which require significant judgment and assumptions about future developments. They can be affected by a variety of factors, including:
| – | Changes in business strategy | |
| – | Internal forecasts | |
| – | Estimation of weighted-average cost of capital | |
Changes to the assumptions underlying our goodwill and intangible assets impairment assessments could require material adjustments to the carrying amount of our recognized goodwill and intangible assets as well as the amounts of impairment charges recognized in profit or loss.
The outcome of goodwill impairment tests may also depend on the allocation of goodwill to our operating segments. This allocation involves judgment as it is based on our estimates as to which operating segments are expected to benefit from the synergies of business combinations.
Changes in our segment structure result in the reallocation of goodwill with the reallocated goodwill being calculated based on relative values (if a direct allocation is not possible).
Goodwill
| € millions | |
| Historical cost | |
| 1/1/2024 | 29,184 |
| Foreign currency exchange differences | 1,420 |
| Additions from business combinations | 765 |
| 12/31/2024 | 31,369 |
| Foreign currency exchange differences | –2,777 |
| Additions from business combinations | 523 |
| 12/31/2025 | 29,115 |
| 256/326 |
|
Integrated Report 2025 | ||||
| To
Our Stakeholders |
Combined
Management Report |
Consolidated
Financial Statements IFRS |
Additional Information | ||
| Accumulated amortization | |
| 1/1/2024 | 103 |
| Foreign currency exchange differences | 2 |
| 12/31/2024 | 105 |
| Foreign currency exchange differences | –4 |
| 12/31/2025 | 101 |
| Carrying amount | |
| 12/31/2024 | 31,264 |
| 12/31/2025 | 29,014 |
In the first half of 2025, the Company changed its segment structure. Effective January 1, 2025, the Company has two operating segments (compared to one segment at the end of 2024) and monitors its goodwill at this new level. For more information about our segments and the changes in 2025, see Note (C.1).
Our assessment in 2025, taking into account external factors such as changes in the business environment and markets and internal factors such as the change in our segment structure and reorganizations which had no adverse effect, led us to conclude that no triggering events occurred since our annual goodwill impairment test in 2024. Throughout 2025, we have—through a qualitative and quantitative analysis—been continuously monitoring whether triggering events exist. We did not identify any aspects that qualify as a triggering event that would cause the carrying amount of either operating segment to exceed the recoverable amount.
For impairment testing purposes, the carrying amount of goodwill is allocated to the operating segments expected to benefit from goodwill as follows:
Goodwill by Operating Segment
| € millions | Applications, Technology & Support1 | Core Services | Total |
| 12/31/2024 | 31,264 | NA | 31,264 |
| 12/31/2025 | 28,846 | 168 | 29,014 |
| 1 The ATS goodwill opening balance was adjusted by €111 million in 2025. For more information, see Note (D.1). | |||
Based on the expected synergies, the goodwill added through the acquisition of SmartRecruiters (€523 million) was provisionally allocated to the Applications, Technology & Support segment on December 31, 2025, as the initial accounting for the SmartRecruiters business combination is still incomplete (for more information, see Note (D.1). The goodwill impairment test for the Applications, Technology & Support segment on October 1, 2025, resulted in a headroom that is significantly higher than the portion of the goodwill that, at the end of December 2025, was allocated to the segment. Thus, there is no impairment risk resulting from the allocation of the SmartRecruiters goodwill.
Goodwill Impairment Test
The key assumptions on which management based its cash flow projections for the period covered by the underlying business plans are as follows:
| 257/326 |
|
Integrated Report 2025 | ||||
| To
Our Stakeholders |
Combined
Management Report |
Consolidated
Financial Statements IFRS |
Additional Information | ||
| Key Assumption | Basis for Determining Values Assigned to Key Assumption |
| Budgeted revenue growth | Revenue growth rate achieved in the current year, adjusted for an expected increase in SAP’s addressable cloud and database markets; expected growth in the established software applications and analytics markets. Values assigned reflect our past experience and our expectations regarding an increase in the addressable markets. |
| Budgeted operating margin | Operating margin budgeted for a given budget period equals the operating margin achieved in the current year, increased by expected efficiency gains. Values assigned reflect past experience, except for efficiency gains. |
| Discount rates | Our estimated cash flow projections are discounted to present value using discount rates (after-tax rates). Discount rates are based on the weighted average cost of capital (WACC) approach. |
| Terminal growth rate | Our estimated cash flow projections for periods beyond the business plan were extrapolated using segment-specific terminal growth rates. These growth rates do not exceed the long-term average growth rates for the markets in which our segments operate. |
Key Assumptions and Detailed Planning Period
| Percent, unless otherwise stated | Applications, Technology & Support | Core Services | ||
| 12/31/2025 | 12/31/2024 | 12/31/2025 | 12/31/2024 | |
| Budgeted revenue growth (average of the budgeted period) | 13.0 | NA | 3.5 | NA |
| After-tax discount rate | 11.7 | NA | 10.2 | NA |
| Terminal growth rate | 3.0 | NA | 3.0 | NA |
| Detailed planning period (in years) | 5 | NA | 5 | NA |
On October 1, 2025, we performed a goodwill impairment test for our operating segments:
Applications, Technology & Support Segment
The recoverable amount was determined based on a fair value less costs of disposal calculation. The fair value measurement was categorized as a Level 3 fair value based on the inputs used in the valuation. The cash flow projections were based on actual operating results and specific estimates covering a detailed planning period and the terminal growth rate thereafter. The projected results were determined based on management’s estimates and are consistent with the assumptions a market participant would make (a target operating margin of 36.3% was used in the valuation).
We believe that no reasonably possible change in any of the above key assumptions would cause the carrying amount of our Applications, Technology & Support segment to exceed the recoverable amount.
Core Services Segment
The recoverable amount was determined based on a fair value less costs of disposal calculation. The fair value measurement was categorized as a Level 3 fair value based on the inputs used in the valuation. The cash flow projections were based on actual operating results and specific estimates covering a detailed planning period and the terminal growth rate thereafter. The projected results were determined based on management’s estimates and are consistent with the assumptions a market participant would make (a target operating margin of 11.3% was used in the valuation).
The recoverable amount exceeded the carrying amount by €4,693 million.
We believe that no reasonably possible change in terminal growth rate and discount rate would cause the carrying amount of our Core Services segment to exceed the recoverable amount.
The following table shows the amounts by which the key assumptions would need to change individually (that is, without changing the other key assumptions) for the recoverable amount to be equal to the carrying amount. For budgeted revenue growth sensitivity, the cost structure was not adjusted, hence leading to a modified terminal operating margin.
| 258/326 |
|
Integrated Report 2025 | ||||
| To
Our Stakeholders |
Combined
Management Report |
Consolidated
Financial Statements IFRS |
Additional Information | ||
| Sensitivity to Change in Assumptions | |
| Core Services | |
| 12/31/2025 | |
|
Budgeted revenue growth (change in pp) |
–2.1 |
|
Target operating margin at the end of the budgeted period (change in pp) |
–10.0 |
(D.3) Intangible Assets
Recognition of Intangibles
Whereas in general, expenses for internally generated intangibles are expensed as incurred, development expenses incurred on standard-related customer development projects (for which the IAS 38 criteria are met cumulatively) are capitalized on a limited scale with those amounts being amortized over the estimated useful life for the majority of the projects of five to seven years.
Determining whether internally generated intangible assets from development qualify for recognition requires significant judgment, particularly in the following areas:
| – | Determining whether activities should be considered research activities or development activities |
| – | Determining whether the conditions for recognizing an intangible asset are met requires assumptions about future market conditions, customer demand, and other developments. |
| – | The term “technical feasibility” is not defined in IFRS, and therefore determining whether the completion of an asset is technically feasible requires judgment and a company-specific approach. |
| – | Determining the future ability to use or sell the intangible asset arising from the development and the determination of the probability of future benefits from sale or use |
| – | Determining whether a cost is directly or indirectly attributable to an intangible asset and whether a cost is necessary for completing a development |
These judgments impact the total amount of intangible assets that we present in our balance sheet as well as the timing of recognizing development expenses in profit or loss.
Measurement of Intangibles
All our purchased intangible assets other than goodwill have finite useful lives. They are initially measured at acquisition cost and subsequently amortized based on the expected consumption of economic benefits over their estimated useful lives ranging from two to 20 years.
Judgment is required in determining the following:
| – | The useful life of an intangible asset, as this is based on our estimates regarding the period over which the intangible asset is expected to generate economic benefits to us |
| – | The amortization method, as IFRS requires the straight-line method to be used unless we can reliably determine the pattern in which the asset’s future economic benefits are expected to be consumed by us |
Both the amortization period and the amortization method have an impact on the amortization expense that is recorded in each period.
Classification of Intangibles
We classify intangible assets according to their nature and use in our operations. Software and database licenses consist primarily of technology for internal use, whereas acquired technology consists primarily of purchased software to be incorporated into our product offerings. Customer relationships and other intangibles consist primarily of customer relationships and acquired trademark licenses.
| 259/326 |
|
Integrated Report 2025 | ||||
| To
Our Stakeholders |
Combined
Management Report |
Consolidated
Financial Statements IFRS |
Additional Information | ||
Amortization expenses of intangible assets are classified as Cost of cloud, Cost of services, Research and development, Sales and marketing, and General and administration, depending on the use of the respective intangible assets.
Intangible Assets
| € millions | Software and Database Licenses |
Acquired Technology |
Customer Relationships and Other Intangibles |
Total |
| Historical cost | ||||
| 1/1/2024 | 1,073 | 1,819 | 4,892 | 7,784 |
| Foreign currency exchange differences | 2 | 103 | 247 | 352 |
| Additions from business combinations | 0 | 187 | 315 | 502 |
| Other additions | 20 | 3 | 66 | 89 |
| Retirements/disposals | –84 | –326 | –174 | –584 |
| Transfers | 25 | 0 | –25 | 0 |
| 12/31/2024 | 1,036 | 1,786 | 5,321 | 8,143 |
| Foreign currency exchange differences | –3 | –198 | –468 | –669 |
| Additions from business combinations | 0 | 64 | 142 | 206 |
| Other additions | 30 | 0 | 49 | 79 |
| Retirements/disposals | –31 | 0 | –3 | –34 |
| Transfers | 56 | 0 | –56 | 0 |
| 12/31/2025 | 1,088 | 1,652 | 4,985 | 7,725 |
| Accumulated amortization | ||||
| 1/1/2024 | 594 | 1,584 | 3,101 | 5,279 |
| Foreign currency exchange differences | 2 | 89 | 151 | 242 |
| Additions amortization | 139 | 89 | 253 | 481 |
| Retirements/disposals | –68 | –326 | –171 | –565 |
| 12/31/2024 | 667 | 1,436 | 3,334 | 5,437 |
| Foreign currency exchange differences | –2 | –174 | –309 | –485 |
| Additions amortization | 114 | 106 | 300 | 520 |
| Retirements/disposals | –27 | –1 | –1 | –29 |
| 12/31/2025 | 752 | 1,367 | 3,324 | 5,443 |
| Carrying amount | ||||
| 12/31/2024 | 369 | 350 | 1,987 | 2,706 |
| 12/31/2025 | 336 | 285 | 1,661 | 2,282 |
| 260/326 |
|
Integrated Report 2025 | ||||
| To
Our Stakeholders |
Combined
Management Report |
Consolidated
Financial Statements IFRS |
Additional Information | ||
Significant Intangible Assets
| € millions, unless otherwise stated | Carrying Amount |
Remaining Useful Life (in years) | |
| 2025 | 2024 | ||
| Concur – Customer relationships | 396 | 540 | 5 to 9 |
| LeanIX – Customer relationships | 290 | 333 | 11 |
| WalkMe – Customer relationships | 226 | 246 | 13 |
| Total significant intangible assets | 912 | 1,119 | |
(D.4) Property, Plant, and Equipment
Depreciation of Property, Plant and Equipment
Property, plant, and equipment are typically depreciated using the straight-line method. Judgment is required in estimating the useful life of the assets. In this assessment we consider, among others, our history with similar assets and current and future changes in technology.
Useful Lives of Property, Plant, and Equipment
| Buildings | Predominantly 25 to 50 years |
| Leased assets and leasehold improvements | Based on the term of the lease contract |
| Information technology equipment | 2 to 6 years |
| Office furniture | 4 to 20 years |
| Automobiles | 4 to 5 years |
Property, Plant, and Equipment
| € millions | Land and Buildings | Land and Buildings Leased |
Other Property, Plant, and Equipment |
Other Property, Plant, and Equipment Leased |
Advance Payments and Construction in Progress |
Total |
| 12/31/2024 | 1,501 | 1,391 | 1,379 | 66 | 156 | 4,493 |
| 12/31/2025 | 1,497 | 1,370 | 1,328 | 107 | 195 | 4,497 |
| Additions | ||||||
| 12/31/2024 | 87 | 321 | 549 | 90 | 91 | 1,138 |
| 12/31/2025 | 89 | 301 | 480 | 120 | 141 | 1,130 |
The additions (other than from business combinations) relate primarily to the replacement and purchase of information technology equipment and the construction and leasing of buildings and data centers. For more information about leases, see Note (D.5).
| 261/326 |
|
Integrated Report 2025 | ||||
| To
Our Stakeholders |
Combined
Management Report |
Consolidated
Financial Statements IFRS |
Additional Information | ||
(D.5) Leases
Accounting Policies, Judgments, and Estimates
Under IFRS 16, a contract is or contains a lease if the contract conveys the right to control the use of an identified asset for a period of time in exchange for consideration. As a lessee, SAP recognizes a right-of-use asset representing its right to use the underlying asset and a lease liability representing its obligation to make lease payments. The right-of-use assets are depreciated on a straight-line basis and interest expense is recognized on the lease liabilities. The vast majority of our leases consist of facility and data center leases. Payments for short-term and low-value leases are expensed over the lease term. Extension options are included in the lease term if their exercise is reasonably certain.
Leases in the Balance Sheet
| € millions | 12/31/2025 | 12/31/2024 |
| Right-of-use assets | ||
| Right-of-use assets – land and buildings | 1,370 | 1,391 |
| Right-of-use assets – other property, plant, and equipment | 107 | 66 |
| Total right-of-use assets | 1,477 | 1,457 |
| Property, plant, and
equipment |
4,497 | 4,493 |
| Right-of-use assets as % of Property, plant, and equipment |
33 | 32 |
| Lease liabilities | ||
| Current lease liabilities | 254 | 295 |
| Current financial liabilities |
2,050 | 4,277 |
| Current lease liabilities as % of Current financial liabilities |
12 | 7 |
| Non-current lease liabilities | 1,430 | 1,420 |
| Non-current financial liabilities |
6,021 | 7,169 |
| Non-current lease liabilities as % of Non-current financial liabilities |
24 | 20 |
Leases in the Income Statement
| € millions | 2025 | 2024 |
| Lease expenses within operating profit | ||
| Depreciation of right-of-use assets | 275 | 280 |
For more information about right-of-use asset additions, see Note (D.4), and for a maturity analysis of lease liabilities, see Note (F.1). For more information about the cash flow related to lease liabilities, see the “Reconciliation of Liabilities Arising from Financing Activities” table within Note (E.3).
| 262/326 |
|
Integrated Report 2025 | ||||
| To
Our Stakeholders |
Combined
Management Report |
Consolidated
Financial Statements IFRS |
Additional Information | ||
(D.6) Equity Investments
Accounting Policies, Judgments, and Estimates
We generally classify financial assets into the following categories: at amortized cost (AC), at fair value through other comprehensive income (FVOCI), and at fair value through profit or loss (FVTPL), depending on the contractual cash flows of and our business model for holding the respective asset.
For equity securities, as the cash flow characteristics are other than solely principal and interest, we take an investment-by-investment decision whether to classify as FVTPL or FVOCI.
The valuation of equity securities of private companies requires judgment because it is typically based on significant unobservable inputs, as no market prices are available and there is inherent lack of liquidity.
We take the most recent qualitative and quantitative information aspects into consideration to determine the fair value estimates of these equity securities.
Considerable judgment and assumptions are involved with regard to the selection of appropriate comparable company data, the assessment of cash requirements of the business, the acceptance of the technology or products in the addressable markets, the actual and forecasted performance, the milestone achievements, the adequacy of price points from financing rounds, the transaction of similar securities of the same company, the rights and preferences of the underlying securities, the selection of adequate equity allocation parameters, the possible exit scenarios and associated weightings. Because all of these assumptions could change significantly, and because valuation is inherently uncertain, our estimated fair values may differ significantly from the values that would have been used had market prices for the investments existed and that will ultimately be realized, and those differences could be material.
Gains/losses on equity securities at FVTPL include gains/losses from fair value fluctuations, from disposals as well as dividends, while gains/losses on equity securities at FVOCI only include dividends, all of which are shown in Financial income, net. Regular way purchases and sales are recorded as at the trade date.
Equity Investments
| € millions | 2025 | 2024 | ||||
| Current | Non-Current | Total | Current | Non-Current | Total | |
| Equity securities | 0 | 6,574 | 6,574 | 0 | 6,401 | 6,401 |
| Investments in associates | 0 | 142 | 142 | 0 | 144 | 144 |
| Equity investments | 0 | 6,716 | 6,716 | 0 | 6,545 | 6,545 |
| Other financial assets | 1,552 | 7,269 | 8,821 | 1,629 | 7,141 | 8,770 |
| Equity investments as % of Other financial assets | 0 | 92 | 76 | 0 | 92 | 75 |
Investments in Associates
SAP has interests in a number of individually immaterial associates. We own more than 20% of the equity interests or have at least 20% of the voting rights in these entities. Based on these facts and the nature of the relationships, SAP has determined that it has significant influence.
The following table shows, in aggregate, the carrying amount and share of profit of these associates.
| € millions | 2025 | 2024 |
| Carrying amount of interest in associates | 142 | 144 |
| Share of profit and losses from continuing operations | 2 | 10 |
The vast majority of the carrying amount of interest in associates relates to SAP Fioneer GmbH.
For a list of the names of other equity investments, see Note (G.9).
| 263/326 |
|
Integrated Report 2025 | ||||
| To
Our Stakeholders |
Combined
Management Report |
Consolidated
Financial Statements IFRS |
Additional Information | ||
Financial Commitments in Venture Capital Funds
| € millions | 2025 | 2024 |
| Committed investments in venture capital funds | 222 | 267 |
SAP invests and holds interests in unrelated parties that manage investments in venture capital. On December 31, 2025, total commitments to make such investments amounted to €961 million (2024: €1,100 million), of which €739 million had been drawn (2024: €833 million). By investing in such venture capital funds, we are exposed to the risks inherent in the business areas in which the entities operate. Our maximum exposure to loss is the amount invested plus contractually committed future capital contributions.
Maturities
| € millions | 31/12/2025 |
| Investments in Venture Capital Funds | |
| Due 2026 | 222 |
| Total | 222 |
(D.7) Non-Current Assets by Region
The table below shows non-current assets excluding financial instruments, deferred tax assets, post-employment benefit assets, and rights arising under insurance contracts.
Non-Current Assets by Region
| € millions | 2025 | 2024 |
| Germany | 7,591 | 7,351 |
| Rest of EMEA | 6,719 | 6,864 |
| EMEA | 14,309 | 14,215 |
| United States | 24,293 | 26,845 |
| Rest of Americas | 646 | 511 |
| Americas | 24,939 | 27,356 |
| India | 430 | 405 |
| Rest of APJ | 919 | 981 |
| APJ | 1,349 | 1,385 |
| SAP Group | 40,597 | 42,956 |
The decrease in the United States is primarily due to foreign currency exchange differences for goodwill, which is partially offset by the acquisition of SmartRecruiters. For more information, see Note (D.1) and Note (D.2).
For a breakdown of our employee headcount by region, see Note (B.1), and for a breakdown of revenue by region, see Note (A.1).
| 264/326 |
|
Integrated Report 2025 | ||||
| To
Our Stakeholders |
Combined
Management Report |
Consolidated
Financial Statements IFRS |
Additional Information | ||
(D.8) Purchase Obligations
| € millions | 2025 | 2024 |
| Contractual obligations for acquisition of property, plant, and equipment and intangible assets | 344 | 270 |
| Other purchase obligations | 8,300 | 9,322 |
| Purchase obligations | 8,644 | 9,592 |
The contractual obligations for acquisition of property, plant, and equipment and intangible assets relate primarily to the purchase of hardware, software, patents, office equipment, and vehicles. The remaining obligations relate mainly to cloud services, marketing, consulting, maintenance, license agreements, and other third-party agreements. The decrease is mainly due to payments made for cloud infrastructure services. Historically, the majority of such purchase obligations have been realized.
Maturities
| € millions | 12/31/2025 |
| Purchase Obligations | |
| Due 2026 | 2,574 |
| Due 2027 to 2030 | 5,928 |
| Due thereafter | 142 |
| Total | 8,644 |
(D.9) Income-Related Government Grants
Recognition of Income-Related Government Grants
We recognize income-related government grants as a reduction of the related expense in the period in which the expense is incurred.
At the end of 2023, we received a grant from the German government to fund research and development expenditures related to cloud infrastructure. The grant will provide reimbursements of up to €245 million for qualifying expenditures through 2027. The original grant of €329 million was adjusted to reflect a reduced funding requirement compared to the initial forecast. As at December 31, 2025, the total amount recognized for reimbursement since the inception of the project was €59 million.
| 265/326 |
|
Integrated Report 2025 | ||||
| To
Our Stakeholders |
Combined
Management Report |
Consolidated
Financial Statements IFRS |
Additional Information | ||
Section E – Capital Structure, Financing, and Liquidity
This section describes how SAP manages its capital structure. Our capital management is based on a high equity ratio, modest financial leverage, a well-balanced maturity profile, and high debt capacity.
(E.1) Capital Structure Management
The primary objective of our capital structure management is to maintain a strong financial profile for investor, creditor, and customer confidence, and to support the growth of our business. We seek to maintain a capital structure that will allow us to continuously cover our funding requirements through the capital markets on reasonable terms and, in so doing, ensure a high level of independence, confidence, and financial flexibility.
SAP’s prime principle of financial risk management is to safeguard liquidity at a level to be able to meet all our financial obligations. To support this goal, SAP’s principal use of cash is focused on:
| – | Capital expenditure |
| – | Quick repayment of financial debt |
| – | Acquisitions and venture activities |
| – | Payment of dividends |
| – | Share buybacks to return excess cash to shareholders |
SAP SE’s long-term credit rating is “A1” by Moody’s (stable outlook) and “A+” by S&P Global Ratings (stable outlook).
| 12/31/2025 | 12/31/2024 | ∆ in % | |||
| € millions | % of Total equity |
€ millions |
% of Total equity | ||
| Equity |
45,073 | 64 | 45,806 | 62 | –2 |
| Current liabilities |
17,416 | 25 | 19,082 | 26 | –9 |
| Non-current liabilities |
7,873 | 11 | 9,349 | 13 | –16 |
| Liabilities |
25,288 | 36 | 28,431 | 38 | –11 |
| Thereof financial debt | 6,150 | 9 | 9,385 | 13 | –34 |
| Thereof lease liabilities | 1,684 | 2 | 1,715 | 2 | –2 |
|
Total equity and liabilities |
70,362 | 100 | 74,237 | 100 | –5 |
In September 2024, SAP drew a short-term loan of €1.25 billion to finance the acquisition of WalkMe, which was repaid in March 2025. In 2025, we also repaid €600 million in Eurobonds and US$300 million in U.S. bonds at maturity. Further, in December 2025, we repaid a total of €1 billion raised in 2024 via bilateral credit lines and early repaid US$100 million in U.S. private placements. The ratio of total nominal volume of financial debt to total equity and liabilities decreased 4pp.
(E.2) Total Equity
Accounting for Interests in Subsidiaries
Changes in SAP's interest in a subsidiary that do not result in a loss of control are accounted for as equity transactions. When SAP loses control over the subsidiary, it derecognizes the assets and liabilities of the subsidiary, and any related non-controlling interests (NCI) and other components of equity. Any resulting gain or loss is recognized in profit or loss.
| 266/326 |
|
Integrated Report 2025 | ||||
| To
Our Stakeholders |
Combined
Management Report |
Consolidated
Financial Statements IFRS |
Additional Information | ||
Issued Capital
SAP SE has issued no-par value bearer shares with a calculated nominal value of €1 per share. All of the shares issued are fully paid.
Number of Shares
| Millions | Issued Capital | Treasury Shares |
| 1/1/2023 | 1,229 | –61 |
| Purchase of treasury shares | 0 | –8 |
| Reissuance of treasury shares under share-based payments | 0 | 8 |
| 12/31/2023 | 1,229 | –61 |
| Purchase of treasury shares | 0 | –11 |
| Reissuance of treasury shares under share-based payments | 0 | 10 |
| 12/31/2024 | 1,229 | –62 |
| Purchase of treasury shares | 0 | –8 |
| Reissuance of treasury shares under share-based payments | 0 | 9 |
| 12/31/2025 | 1,229 | –61 |
For more information about the share repurchase program executed during the period from 2023 to 2025, see the Treasury Shares section below.
Authorized Shares
The Articles of Incorporation authorize the Executive Board to increase the issued capital as follows:
| – | By up to a total amount of €250 million by issuing new no-par value bearer shares against contributions in cash until May 12, 2030 (Authorized Capital I). The issuance is subject to the statutory subscription rights of existing shareholders. |
| – | By up to a total amount of €250 million by issuing new no-par value bearer shares against contributions in cash or in kind until May 12, 2030 (Authorized Capital II). Subject to the consent of the Supervisory Board, the Executive Board is authorized to exclude the shareholders’ statutory subscription rights in certain cases. |
Contingent Shares
SAP SE’s share capital is subject to a contingent capital increase, which will be implemented only insofar as the holders or creditors of convertible bonds or stock options issued or guaranteed by SAP SE or any of its directly or indirectly controlled subsidiaries under certain share-based payments exercise their conversion or subscription rights, and no other methods for servicing these rights are used. As at December 31, 2025, €100 million, representing 100 million shares, was still available for issuance (2024: €100 million).
Share Premium
The share premium is used to recognize the value of equity-settled share-based payments granted to our employees. For more information about our share-based payments, see Note (B.3).
Retained Earnings
Retained earnings mainly comprise profit after tax and dividend payments as well as transactions with non-controlling interests.
Other Components of Equity
| € millions | Exchange Differences |
Cash Flow Hedges/Cost of Hedging |
Total |
| 1/1/2023 | 4,015 | 16 | 4,031 |
| Other comprehensive income for items that will be reclassified to profit or loss, net of tax | –1,597 | –8 | –1,605 |
| 12/31/2023 | 2,418 | 9 | 2,426 |
| 267/326 |
|
Integrated Report 2025 | ||||
| To
Our Stakeholders |
Combined
Management Report |
Consolidated
Financial Statements IFRS |
Additional Information | ||
| Other comprehensive income for items that will be reclassified to profit or loss, net of tax | 2,370 | –24 | 2,347 |
| 12/31/2024 | 4,788 | –15 | 4,773 |
| Other comprehensive income for items that will be reclassified to profit or loss, net of tax | –4,594 | 26 | –4,568 |
| 12/31/2025 | 193 | 11 | 204 |
Treasury Shares
By resolution of SAP SE’s Annual General Meeting of Shareholders held on May 11, 2023, the authorization granted by the Annual General Meeting of Shareholders on May 17, 2018, regarding the acquisition of treasury shares was revoked to the extent it had not been exercised at that time, and replaced by a new authorization of the Executive Board of SAP SE to acquire, on or before May 10, 2028, shares of SAP SE representing a pro rata amount of capital stock of up to €120 million in aggregate, provided that the shares purchased under the authorization, together with any other shares in the Company previously acquired and held by, or attributable to, SAP SE do not account for more than 10% of SAP SE’s issued share capital. Although treasury shares are legally considered outstanding, there are no dividend or voting rights associated with them. We may redeem or resell shares held in treasury, or we may use treasury shares for the purpose of servicing option or conversion rights under the Company’s share-based payment plans. Also, we may use shares held in treasury as consideration in connection with mergers with, or acquisitions of, other companies.
Following the above authorization, in May 2023 we announced a share buyback program with an aggregate volume of up to €5 billion and a term until December 31, 2025, which is designed primarily to service share-based compensation awards. As part of this program, which was completed in 2025, we acquired shares with a volume of €1,916 million (without incidental acquisition costs) in 2025 (2024: €2,108 million). In January 2026, the Executive Board and the Supervisory Board authorized a new share repurchase program with a volume of up to €10 billion, which commenced as scheduled in February 2026 and is expected to be completed by the end of 2027.
Distribution Policy and Dividends
Our general intention is to remain in a position to return liquidity to our shareholders by distributing annual dividends totaling at least 40% of the SAP Group’s non-IFRS profit after tax from continuing operations and by potentially repurchasing treasury shares in future.
In 2025, we distributed €2,743 million (€2.35 per share) in dividends for 2024, compared to €2,565 million (€2.20 per share) paid in 2024 for 2023 and €2,395 million (€2.05 per share) paid in 2023 for 2022.
The total dividend available for distribution to SAP SE shareholders is based on the profits of SAP SE as reported in its statutory financial statements prepared under the accounting rules in the German Commercial Code (Handelsgesetzbuch). For the year ended December 31, 2025, the Executive Board intends to propose that a dividend of €2.50 per share (that is, an estimated total dividend of €2,919 million), be paid from the profits of SAP SE.
Non-Controlling Interests
In 2025, a profit of €165 million was attributed to non-controlling interests (2024: profit of €26 million).
(E.3) Liquidity
Accounting for Non-Derivative Financial Instruments
Classification and Measurement of Non-Derivative Financial Debt Investments
Our non-derivative financial debt investments comprise cash at banks and cash equivalents (highly liquid investments with original maturities of three months or less, such as time deposits and money-market funds), loans and other financial receivables, and acquired debt securities.
We generally classify financial assets as: at amortized cost (AC), at fair value through other comprehensive income (FVOCI), or at fair value through profit or loss (FVTPL), depending on the contractual cash flows of, and our business model for, holding the respective asset. Financial assets having cash flow characteristics other than solely principal and interest such as money market and similar
| 268/326 |
|
Integrated Report 2025 | ||||
| To
Our Stakeholders |
Combined
Management Report |
Consolidated
Financial Statements IFRS |
Additional Information | ||
funds are classified as FVTPL. Generally, other financial assets with cash flows consisting solely of principal and interest are held within a business model whose objective is “hold to collect” and are thus classified as AC. Occasionally, such other financial assets are held within a business model whose objective is “hold to collect and sell” in which case they are classified as FVOCI.
Gains/losses on non-derivative financial debt investments at FVTPL are reported in Financial income, net and show interest income/expenses separately from other gains/losses which include gains/losses from fair value fluctuations and disposals. Gains/losses on non-derivative financial debt investments at AC are reported in Financial income, net and show interest income/expenses separately from other gains/losses which include gains/losses on disposals and changes in expected and incurred credit losses. Gains/losses from foreign currency exchange rate fluctuations are included in Other non-operating income/expense, net. Regular way purchases and sales are recorded as at the trade date.
Impairment of Non-Derivative Financial Debt Investments
For these financial assets, we apply considerable judgment by employing the general impairment approach as follows:
| – | For cash at banks, time deposits, and debt securities such as acquired bonds and acquired commercial papers, we apply the low credit risk exception, as it is our policy to invest only in high-quality assets of issuers with a minimum rating of at least investment grade to minimize the risk of credit losses. Thus, these assets are always allocated to stage 1 of the three-stage credit loss model, and we record a loss allowance at an amount equal to 12-month expected credit losses. This loss allowance is calculated based on our exposure at the respective reporting date, the loss given default for this exposure, and the credit default swap spread as a measure for the probability of default. Even though we invest only in assets of at least investment-grade, we also closely observe the development of credit default swap spreads as a measure of market participants’ assessments of the creditworthiness of a debtor to evaluate probable significant increases in credit risk to timely react to changes should these manifest. Among others, we consider cash at banks, time deposits, and debt securities to be in default when the counterparty is unlikely to pay its obligations in full, when there is information about a counterparty’s financial difficulties or if there is a drastic increase in a counterparty’s credit default swap spread for a prolonged time period while the overall market environment remains generally stable. Such financial assets are written off either partially or in full if the likelihood of recovery is considered remote, which might be evidenced, for example, by the bankruptcy of a counterparty of such financial assets. | |
| – | Loans and other financial receivables are monitored based on borrower-specific internal and external information to determine whether there has been a significant increase in credit risk since initial recognition. We consider such assets to be in default if they are significantly beyond their due date or if the borrower is unlikely to pay its obligation. A write-off occurs when the likelihood of recovery is considered remote, for example when bankruptcy proceedings have been finalized or when all enforcement efforts have been exhausted. | |
Non-Derivative Financial Liabilities
Non-derivative financial liabilities include bank loans, issued bonds, private placements, and other financial liabilities. Other financial liabilities also include customer funding liabilities which are funds we draw from and make payments on behalf of our customers for customers’ employee expense reimbursements, related credit card payments, and vendor payments. We present these funds in cash and cash equivalents and record our obligation to make these expense reimbursements and payments on behalf of our customers as customer funding liabilities.
As we do not designate financial liabilities as FVTPL, we generally classify non-derivative financial liabilities as AC.
Expenses and gains or losses on financial liabilities at AC mainly consist of interest expense which is shown in Financial income, net. Gains/losses from foreign currency exchange rate fluctuations are included in Other non-operating income/expense, net.
Group Liquidity, Financial Debt, and Net Debt
Group liquidity consists of cash at banks, money market and other funds, as well as time deposits and debt securities (both with remaining maturities of less than one year). Financial debt is defined as the nominal volume of bank loans, issued commercial papers, private placements, and bonds. Net debt is group liquidity less financial debt.
Group Liquidity and Net Debt
| € millions | 2025 | 2024 | ∆ |
| Cash and cash equivalents |
8,220 | 9,609 | –1,390 |
| Current time deposits and debt securities | 1,311 | 1,471 | –160 |
| Group liquidity | 9,531 | 11,080 | –1,550 |
| 269/326 |
|
Integrated Report 2025 | ||||
| To
Our Stakeholders |
Combined
Management Report |
Consolidated
Financial Statements IFRS |
Additional Information | ||
| Current financial debt | –1,600 | –3,639 | 2,039 |
| Non-current financial debt | –4,550 | –5,746 | 1,196 |
| Financial debt | –6,150 | –9,385 | 3,235 |
| Net cash (+) / Net debt (–) | 3,381 | 1,695 | 1,685 |
While we continuously monitor the ratios presented in the capital structure table, we actively manage our liquidity and structure of our financial indebtedness based on the ratios group liquidity and net debt.
Cash and Cash Equivalents
| € millions | 2025 | 2024 | ||||
| Current | Non-Current | Total | Current | Non-Current | Total | |
| Cash at banks | 3,910 | 0 | 3,910 | 3,962 | 0 | 3,962 |
| Time deposits | 1,342 | 0 | 1,342 | 1,659 | 0 | 1,659 |
| Money market and other funds | 2,871 | 0 | 2,871 | 3,991 | 0 | 3,991 |
| Debt securities | 100 | 0 | 100 | 0 | 0 | 0 |
| Expected credit loss allowance | –3 | 0 | –3 | –3 | 0 | –3 |
|
Cash and cash equivalents |
8,220 | 0 | 8,220 | 9,609 | 0 | 9,609 |
Non-Derivative Financial Debt Investments
| € millions | 2025 | 2024 | ||||
| Current | Non-Current | Total | Current | Non-Current | Total | |
| Time deposits | 1,226 | 0 | 1,226 | 1,425 | 0 | 1,425 |
| Debt securities | 92 | 46 | 138 | 53 | 74 | 128 |
| Financial instruments related to employee benefit plans | 0 | 284 | 284 | 0 | 287 | 287 |
| Loans and other financial receivables | 174 | 218 | 392 | 98 | 231 | 329 |
| Expected credit loss allowance | –7 | 0 | –7 | –7 | 0 | –7 |
| Non-derivative financial debt investments | 1,485 | 547 | 2,032 | 1,569 | 593 | 2,161 |
| Other financial assets |
1,552 | 7,269 | 8,821 | 1,629 | 7,141 | 8,770 |
|
Non-derivative financial debt investments as % of |
96 | 8 | 23 | 96 | 8 | 25 |
Time deposits with original maturity of three months or less are presented as cash and cash equivalents, and those with original maturities of greater than three months (investments considered in group liquidity) are presented as other financial assets. Debt securities consist of acquired commercial papers and acquired bonds of mainly financial and non-financial corporations and municipalities.
For more information about financial risk and the nature of risk, see Note (F.1).
Financial Debt
| € millions | 2025 | 2024 | |||||||||
| Nominal Volume | Carrying Amount | Nominal Volume | Carrying Amount | ||||||||
| Current | Non-Current | Current | Non-Current | Total | Current | Non-Current | Current | Non-Current | Total | ||
| Bonds | 1,100 | 4,550 | 1,100 | 4,194 | 5,294 | 889 | 5,650 | 888 | 5,201 | 6,090 | |
| Private placement transactions | 0 | 0 | 0 | 0 | 0 | 0 | 96 | 0 | 99 | 99 | |
| Commercial paper | 500 | 0 | 498 | 0 | 498 | 500 | 0 | 498 | 0 | 498 | |
| 270/326 |
|
Integrated Report 2025 | ||||
| To
Our Stakeholders |
Combined
Management Report |
Consolidated
Financial Statements IFRS |
Additional Information | ||
| Bank loans | 0 | 0 | 0 | 0 | 0 | 2,250 | 0 | 2,250 | 0 | 2,250 | |
| Financial debt | 1,600 | 4,550 | 1,598 | 4,194 | 5,792 | 3,639 | 5,746 | 3,636 | 5,301 | 8,937 | |
| Financial liabilities |
2,050 | 6,021 | 8,070 | 4,277 | 7,169 | 11,446 | |||||
|
Financial debt as % of |
78 | 70 | 72 | 85 | 74 | 78 | |||||
Financial liabilities are unsecured, except for the retention of title and similar rights customary in our industry. Effective interest rates on our financial debt (including the effects from interest rate swaps) were 3.23% in 2025, 3.84% in 2024, and 3.49% in 2023.
None of our financial debt is restricted by financial covenants. Our financial debt includes covenants customarily used, such as change of control or regulatory changes that trigger an immediate repayment. Bonds are classified as non-current as at December 31, 2025, as SAP has an existing right to defer settlement for at least 12 months after the reporting period. For more information about the risk associated with our financial liabilities, see Note (F.1). For more information about fair values, see Note (F.2).
Bonds
| 2025 | 2024 | ||||||
| Maturity | Issue Price | Coupon Rate | Effective Interest Rate |
Nominal Volume (in respective currency in millions) |
Carrying Amount (in € millions) |
Carrying Amount (in € millions) | |
| Eurobond 9 – 2014 | 2027 | 99.284% | 1.750% (fix) | 1.87% | €1,000 | 972 | 947 |
| Eurobond 12 – 2015 | 2025 | 99.264% | 1.000% (fix) | 1.13% | €600 | 0 | 600 |
| Eurobond 15 – 2018 | 2026 | 99.576% | 1.000% (fix) | 1.06% | €500 | 500 | 500 |
| Eurobond 16 – 2018 | 2030 | 98.687% | 1.375% (fix) | 1.50% | €500 | 451 | 442 |
| Eurobond 20 – 2018 | 2028 | 98.871% | 1.250% (fix) | 1.38% | €1,000 | 947 | 923 |
| Eurobond 21 – 2018 | 2031 | 98.382% | 1.625% (fix) | 1.78% | €1,250 | 1,096 | 1,079 |
| Eurobond 23 – 2020 | 2026 | 99.200% | 0.125% (fix) | 0.26% | €600 | 600 | 599 |
| Eurobond 24 – 2020 | 2029 | 98.787% | 0.375% (fix) | 0.51% | €800 | 728 | 712 |
| Eurobonds | 5,294 | 5,801 | |||||
| USD bond – 2018 | 2025 | 100.000% | 4.69% (fix) | 4.74% | US$300 | 0 | 289 |
| Bonds | 5,294 | 6,090 | |||||
All of our Eurobonds are listed for trading on the Luxembourg Stock Exchange.
Private Placements
| 2025 | 2024 | |||||
| Maturity | Coupon Rate | Effective Interest Rate |
Nominal Volume (in respective currency in millions) |
Carrying Amount (in € millions) |
Carrying Amount (in € millions) | |
| U.S. private placements | ||||||
| Tranche 9 – 2012 | 2027 | 3.53% (fix) | 3.57% | US$ | 0 | 99 |
| Private placements | 0 | 99 | ||||
The U.S. private placement notes were issued by one of our subsidiaries that has the U.S. dollar as its functional currency. In the fourth quarter of 2025, SAP elected to proactively settle the remaining $100 million private placement originally scheduled to mature in 2027.
| 271/326 |
|
Integrated Report 2025 | ||||
| To
Our Stakeholders |
Combined
Management Report |
Consolidated
Financial Statements IFRS |
Additional Information | ||
Commercial Paper Program
The net proceeds from our commercial paper program (Commercial Paper, or CP) are being used for general corporate purposes. As at December 31, 2025, we had €500 million in CP outstanding with maturities generally less than 12 months and the carrying amount amounted to €498 million (December 31, 2024: €498 million). The weighted average interest rate of our CP was 2.38% as at December 31, 2025 (December 31, 2024: 3.03%).
Loans
In 2024 SAP drew short-term loans of €2,250 million for general corporate purposes, including the acquisition of WalkMe, that were flexibly repayable until December 2025. The effective interest rate on the loans was 2.91% in 2025 (2024: 3.56%). The loans contained information covenants and were fully repaid during 2025.
Reconciliation of Liabilities Arising from Financing Activities
The changes in our financial debts are reconciled to the cash flows from borrowings included in the cash flow from financing activities.
| € millions | 1/1/2025 | Cash Flows | Business Combinations |
Foreign Currency |
Fair Value Changes |
Other | 12/31/2025 |
| Current financial debt | 3,639 | –3,189 | 0 | –35 | 0 | 1,185 | 1,600 |
| Non-current financial debt | 5,746 | 0 | 0 | –11 | 0 | –1,185 | 4,550 |
| Financial debt (nominal volume) | 9,385 | –3,189 | 0 | –46 | 0 | 0 | 6,150 |
| Basis adjustment | –419 | 0 | 0 | 0 | 82 | 0 | –337 |
| Transaction costs | –29 | 0 | 0 | 0 | 0 | 8 | –21 |
| Financial debt (carrying amount) | 8,937 | –3,189 | 0 | –46 | 82 | 8 | 5,792 |
| Accrued interest and payment to banks | 230 | –151 | 0 | 0 | 0 | 57 | 136 |
| Interest rate swaps | 408 | –171 | 0 | 0 | 95 | 0 | 332 |
| Lease1 | 1,715 | –299 | 0 | 31 | 0 | 237 | 1,684 |
| Total liabilities from financing activities | 11,290 | –3,810 | 0 | –14 | 176 | 301 | 7,944 |
| 1 Other includes new lease liabilities. | |||||||
| € millions | 1/1/2024 | Cash Flows | Business Combinations |
Foreign Currency |
Fair Value Changes |
Other | 12/31/2024 |
| Current financial debt | 1,143 | 1,594 | 0 | 35 | 0 | 868 | 3,639 |
| Non-current financial debt | 6,612 | 0 | 0 | 2 | 0 | –868 | 5,746 |
| Financial debt (nominal volume) | 7,755 | 1,594 | 0 | 37 | 0 | 0 | 9,385 |
| Basis adjustment | –550 | 0 | 0 | 0 | 131 | 0 | –419 |
| Transaction costs | –35 | –3 | 0 | 0 | 0 | 10 | –29 |
| Financial debt (carrying amount) | 7,169 | 1,591 | 0 | 37 | 131 | 10 | 8,937 |
| Accrued interest and payment to banks | 94 | –182 | 0 | 0 | 0 | 318 | 230 |
| Interest rate swaps | 537 | –106 | 0 | 0 | –23 | 0 | 408 |
| Lease1 | 1,621 | –310 | 0 | 32 | 0 | 372 | 1,715 |
| Total liabilities from financing activities | 9,421 | 993 | 0 | 69 | 108 | 700 | 11,290 |
| 1 Other includes new lease liabilities. | |||||||
Certain amounts in this Note have been reclassified to conform to our 2025 presentation of interest paid and interest received in the Consolidated Statements of Cash Flows. See “Updated Accounting Policy for the Presentation of Interest Paid and Interest Received” in Note (IN.1). Comparative period amounts have been adjusted accordingly.
| 272/326 |
|
Integrated Report 2025 | ||||
| To
Our Stakeholders |
Combined
Management Report |
Consolidated
Financial Statements IFRS |
Additional Information | ||
Section F – Management of Financial Risk Factors
Based on our global activities, we are exposed to a variety of financial risks, including market risks (mainly foreign currency exchange rate risk but also interest rate risk and equity price risk), credit risk, and liquidity risk.
Financial risk management is executed on a Group-wide basis through our global treasury, global risk management, and global credit management departments. Formal risk management policies have been established to systematically identify exposures, define appropriate risk limits, and ensure continuous risk monitoring and assessment. These policies, together with our hedging strategies, are codified within internal governance frameworks—including treasury and other internal guidelines—and are subject to ongoing review, evaluation, and enhancement to reflect changes in market conditions and the SAP Group’s evolving business profile.
We use derivative financial instruments exclusively for risk mitigation purposes within the context of prudent financial risk management, and not for speculation, which is defined as entering into derivative positions without corresponding underlying exposures.
This section provides an overview of our exposure to these risk factors and describes the corresponding risk management framework. Additionally, it contains detailed information about our financial instruments.
(F.1) Financial Risk Factors and Risk Management
Accounting for Derivative Financial Instruments
We use derivatives to hedge foreign currency risk, interest rate risk, and equity price risk exposure resulting from SAP Group’s cash settled share-based compensation (SBC) programs, and designate them as cash flow, net investment, or fair value hedges if they qualify for hedge accounting under IFRS 9, which involves judgment.
Derivatives Not Designated as Hedging Instruments in Hedge Accounting Relationships
Many of our derivative transactions constitute economic hedges that effectively mitigate financial risks but do not qualify for, or are not designated in, hedge accounting relationships under IFRS 9.
To hedge currency risks inherent in foreign-currency denominated and recognized monetary assets and liabilities, we do not designate our derivative financial instruments classified as fair value through profit and loss (FVTPL) in hedge accounting, because the profits and losses from the underlying transactions are recognized in profit or loss in the same periods as the profits or losses from the derivatives, thereby achieving a natural offset.
In addition, we occasionally have contracts that contain foreign currency embedded derivatives that are required to be accounted for separately.
Fair value fluctuations in the spot component or intrinsic value of such derivatives at FVTPL are included in Other non-operating income/expense, net while the forward element or time value is shown in Financial income, net.
Derivatives Designated as Hedging Instruments
a) Cash Flow Hedge
In general, we apply cash flow hedge accounting to the foreign currency risk of highly probable forecasted transactions and to share price volatility risk of highly probable cash flows resulting from our SBC programs.
With regard to foreign currency risk, hedge accounting relates to the spot element and to the intrinsic value of the derivatives designated and qualifying as cash flow hedges. Accordingly, the effective portion of these components determined on a present value basis is recorded in Other comprehensive income. The effective portion of the forward element and time value as well as foreign currency basis spreads excluded from the hedging relationship are recorded as cost of hedging in a separate position in Other comprehensive income. As the amounts are not material, they are presented together with the effective portion of the cash flow hedges in our consolidated statements of comprehensive income and consolidated statements of changes in equity. All other components including counterparty credit risk adjustments of the derivative and the ineffective portion are immediately recognized in Financial income, net in profit or loss. Amounts accumulated in Other comprehensive income are generally reclassified to profit or
| 273/326 |
|
Integrated Report 2025 | ||||
| To
Our Stakeholders |
Combined
Management Report |
Consolidated
Financial Statements IFRS |
Additional Information | ||
loss to Other non-operating income/expense, net and Financial income, net in the same period when the hedged item affects profit or loss.
With regard to SBC hedging, we designate derivatives (normally, total return equity swaps) at full fair value. Until designation, derivatives are accounted for as FVTPL, with fair value changes recognized in Financial income, net, if material.
Upon designation, the effective portion of subsequent fair value changes is recognized in Other comprehensive income and subsequently reclassified to Operating expenses within profit or loss in the same line item and periods in which the related share-based compensation expenses are recognized. The ineffective portion of fair value changes continues to be recognized immediately in Financial income, net within profit or loss.
b) Net Investment Hedge
In general, we do not hedge the foreign currency exposure arising from net assets of subsidiaries with a functional currency different from the euro, and consequently do not apply net investment hedge accounting. Notwithstanding this general approach, net investment hedge accounting is selectively applied in specific circumstances. For more information, see the section on translation risk further below in this Note.
The designated component in hedge accounting is the spot price of the derivatives designated and qualifying as net investment hedges. Accordingly, the effective portion of this component determined on a present value basis is recorded in Other comprehensive income. All other not-designated components and ineffective portions are recognized immediately in Financial income, net in profit or loss. Amounts accumulated in Other comprehensive income are reclassified to Other non-operating income/expense, net within profit or loss in the period in which the foreign operation is partially disposed of or sold.
c) Fair Value Hedge
We apply fair value hedge accounting for certain of our fixed-rate financial liabilities and show the fair value fluctuations in Financial income, net.
d) Valuation and Testing of Effectiveness
At inception of a designated hedging relationship, we document our risk management strategy and establish the economic relationship between the hedged item and the hedging instrument.
The existence of an economic relationship is demonstrated, and its prospective effectiveness is tested, as follows:
For foreign currency hedges, the critical terms match method is applied, since currencies, maturities, and the amounts are closely aligned for the forecasted transactions and for the spot element of the forward exchange rate contract or intrinsic value of the currency options, respectively.
The same methodology is applied for SBC hedging, as the underlying variable (SAP share price), maturities, and the number of underlying shares are closely aligned between equity swaps and the hypothetical derivatives representing the SBC cash flows’ sensitivity to share price volatility.
For interest rate swaps, effectiveness is tested prospectively using statistical methods in the form of a regression analysis, by which the validity and extent of the relationship between the change in value of the hedged items as the independent variable and the fair value change of the derivatives as the dependent variable is determined.
The main sources of ineffectiveness are:
– The effect of the counterparty and our own credit risk on the fair value of the forward exchange contracts, interest rate swaps, and equity swaps, which is not reflected in the respective hedged items;
– Net cash flows from the dividend/interest component of the equity swaps, which are not part of cash flows from the hedged SBC plans; and
– Initial fair value of the equity swaps at designation date
Foreign Currency Exchange Rate Risk
Because we conduct business worldwide, our ordinary operations are subject to risks associated with fluctuations in foreign currencies that can impact our financial performance and cash flows.
| 274/326 |
|
Integrated Report 2025 | ||||
| To
Our Stakeholders |
Combined
Management Report |
Consolidated
Financial Statements IFRS |
Additional Information | ||
Translation Risk
Our reporting currency is the euro. Therefore, the consolidation of financial statements of subsidiaries with a functional currency other than the euro exposes us to foreign currency risk from the translation of the net assets of those subsidiaries. In accordance with IFRS, such translation risks are not considered in the following except where we hedge translation risk.
In general, translation risk is not hedged. However, on rare occasions we safeguard the euro countervalue of merger or disposal activities and apply net investment hedge accounting.
In 2025 and 2023, we hedged part of our net investment in subsidiaries which have the U.S. dollar as their functional currency, by entering into forwards. The hedged risk is the weakening of the U.S. dollar against the euro. The forwards are designated as a hedging instrument for the changes in the value of the net investment that is attributable to changes in the U.S. dollar/euro spot rate.
To assess hedge effectiveness, we have determined the economic relationship between the hedging instrument and the hedged item, by comparing changes in the carrying amount of the forwards that is attributable to a change in the spot rate with changes in the investment in the respective subsidiaries due to movements in the spot rate.
Transaction Risk
We continuously monitor our exposure to currency fluctuation risks based on monetary items and forecasted transactions and pursue a Group-wide strategy to manage foreign currency exchange rate risk, using derivative financial instruments, primarily foreign exchange forward contracts.
Recognized Monetary Assets and Liabilities
Generally, the Group’s entities conduct their operating business in their own functional currencies. However, occasionally the Group’s entities generate foreign currency–denominated receivables, payables, and other monetary items by transacting in a currency other than the respective functional currency. To mitigate the extent of the associated foreign currency exchange rate risk, a significant portion of these transactions is hedged as described above with the primary aim to reduce profit or loss volatility.
In rare circumstances, transacting in a currency other than the functional currency also leads to embedded foreign currency derivatives being separated and measured at FVTPL.
Generally, we are not exposed to any significant foreign currency exchange rate risk with regard to our investing and financing activities, as such activities are normally conducted in the functional currency of the investing or borrowing entity.
Forecasted Transactions
The intellectual property (IP) holders in the SAP Group are exposed to risks associated with forecasted intercompany cash flows in foreign currencies. These cash flows arise out of royalty payments from subsidiaries to the respective IP holder. The royalties are linked to the subsidiaries’ external revenue. This arrangement leads to a concentration of the foreign currency exchange rate risk with the IP holders, as the royalties are mostly denominated in the subsidiaries’ local currencies, while the functional currency of the IP holders with the highest royalty volume is the euro. The highest foreign currency exchange rate exposure of this kind relates to the currencies of subsidiaries with significant operations, for example the U.S. dollar, the pound sterling, the Japanese yen, the Swiss franc, and, in 2023, the Australian dollar.
With respect to forecasted transactions, up until December 2024 our risk management strategy was to reduce year-over-year profit or loss volatility via a rolling 12-month hedge horizon. Since December 2024, our forecasted exposure hedging strategy is aimed at reducing volatility from foreign currency fluctuations on the forecasted Free Cash Flow (FCF) of a calendar year by preserving foreign exchange rates on which the FCF guidance is based on. Notwithstanding the change in foreign currency exchange rate risk management, our hedged item remains a layer of the forecasted cash flows from royalty payments to IP holders as they correlate to our FCF. Due to the change in our foreign currency exchange rate risk management, we de-designated all existing cash flow hedge relationships and entered into new cash flow hedge relationships in December 2024.
We enter into derivative financial instruments, primarily foreign exchange forward contracts, to hedge such significant forecasted cash flows (royalties) from foreign subsidiaries denominated in foreign currencies with a hedge ratio of 1:1 and a hedge horizon of up to 18 months, which is also the maximum maturity of the foreign exchange derivatives we use.
For all years presented, no previously highly probable transaction designated as a hedged item in a foreign currency cash flow hedge relationship ceased to be probable. Therefore, we did not discontinue any of our cash flow hedge relationships except for those affected by the change in our foreign currency exchange rate risk management. Also, ineffectiveness was either not material or
| 275/326 |
|
Integrated Report 2025 | ||||
| To
Our Stakeholders |
Combined
Management Report |
Consolidated
Financial Statements IFRS |
Additional Information | ||
non-existent in all years reported. Generally, the cash flows of the hedged forecasted transactions are expected to occur and to be recognized in profit or loss monthly within the respective calendar year.
Currency Hedges Designated as Hedging Instruments (Cash Flow Hedges and Net Investment Hedges)
The amounts as at December 31 relating to items designated as hedged items were as follows:
Designated Hedged Items in Foreign Currency Exchange Rate Hedges
| Forecasted License Payments |
Net Investment | Forecasted License Payments |
Net Investment | |
| € millions | 2025 | 2024 | ||
| Change in value used for calculating hedge ineffectiveness | –32 | 1 | 19 | 0 |
| Cash flow hedge | –32 | –1 | 19 | 0 |
| Cost of hedging | 12 | 0 | 3 | 0 |
| Balances remaining in cash flow hedge reserve for which hedge accounting is no longer applied | 0 | –15 | 0 | –15 |
The amounts as at December 31 designated as hedging instruments were as follows:
Designated Hedging Instruments in Foreign Currency Exchange Rate Hedges
| Forecasted License Payments in EUR |
Net Investment in USD | Forecasted License Payments in EUR |
Net Investment in USD | |
| € millions | 2025 | 2024 | ||
| Nominal amount | 3,941 | 1,610 | 3,735 | 0 |
| Carrying amount | ||||
| Other financial assets | 27 | 1 | 12 | 0 |
| Other financial liabilities | –7 | 0 | –32 | 0 |
| Change in value recognized in OCI | 32 | 1 | –19 | 0 |
| Hedge ineffectiveness recognized in Finance income, net | –1 | 0 | 1 | 0 |
| Cost of hedging recognized in OCI | –12 | 0 | –3 | 0 |
| Amount reclassified from cash flow hedge in OCI to Other non-operating income, net | 272 | 0 | –78 | 0 |
| Amount reclassified from cost of hedging in OCI to Finance income, net | –20 | 0 | –17 | 0 |
On December 31, we held the following instruments to hedge exposures to changes in foreign currency:
Details on Hedging Instruments in Foreign Currency Exchange Rate Hedges
| Maturity | ||||
| 2025 | 2024 | |||
| Forward exchange contracts | 1–6 Months | 7–12 Months | 1–6 Months | 7–12 Months |
| Net exposure in € millions | 3,721 | 1,830 | 2,078 | 1,657 |
| Average EUR:GBP forward rate | 0.88 | 0.89 | 0.83 | 0.84 |
| Average EUR:JPY forward rate | 176.02 | 175.22 | 158.63 | 157.46 |
| Average EUR:CHF forward rate | 0.93 | 0.92 | 0.92 | 0.91 |
| Average EUR:USD forward rate | 1.18 | 1.19 | 1.06 | 1.07 |
| 276/326 |
|
Integrated Report 2025 | ||||
| To
Our Stakeholders |
Combined
Management Report |
Consolidated
Financial Statements IFRS |
Additional Information | ||
Remaining Foreign Currency Exchange Transaction Risk Exposure
Our risk exposure is based on the following assumptions:
| – | The SAP Group’s entities generally operate in their functional currencies. In exceptional cases and limited economic environments, operating transactions are denominated in currencies other than the functional currency, leading to a foreign currency exchange rate risk for the related monetary instruments. Where material, this foreign currency exchange rate risk is hedged. Therefore, fluctuations in foreign currency exchange rates only have an impact on profit and loss with regard to our unhedged non-derivative monetary financial instruments and related income or expenses. |
| – | Our free-standing derivatives designed for hedging foreign currency exchange rate risks almost completely balance the changes in the fair values of the hedged item attributable to exchange rate movements in the Consolidated Income Statements in the same period. As a consequence, the hedged items and the hedging instruments are not exposed to foreign currency exchange rate risks, and thereby have no effect on profit and loss. |
Consequently, we are only exposed to significant foreign currency exchange rate fluctuations with regard to the following:
| – | The spot component of derivatives held within a designated cash flow hedge relationship affecting other comprehensive income |
| – | Foreign currency embedded derivatives affecting other non-operating expense, net |
| – | Unhedged foreign-currency monetary assets and liabilities affecting other non-operating expense, net |
Thus, our foreign currency exposure (and our average/high/low exposure) as at December 31 was as follows:
| Foreign Currency Exposure | ||
| € billions | 2025 | 2024 |
| Year-end exposure toward all our major currencies | 6.0 | 5.6 |
| Average exposure | 5.6 | 4.5 |
| Highest exposure | 6.8 | 5.6 |
| Lowest exposure | 4.2 | 3.3 |
Foreign Currency Exchange Rate Sensitivity
If, on December 31, the foreign currency exchange rates had been higher/lower as described below, this would have had the following effects on other non-operating expense, net and other comprehensive income:
| Foreign Currency Sensitivity | ||||||
| € millions | Effects on Other Non-Operating Expense, Net | Effects on Other Comprehensive Income | ||||
| 2025 | 2024 | 2023 | 2025 | 2024 | 2023 | |
| Derivatives held within a designated cash flow hedge relationship | ||||||
| All major currencies –10% against the euro | 393 | 375 | 238 | |||
| All major currencies +10% against the euro | –393 | –375 | –238 | |||
| thereof: USD –10% against the euro | 281 | 281 | 131 | |||
| thereof: USD +10% against the euro | –281 | –281 | –131 | |||
| Embedded derivatives | ||||||
| All currencies –10% against the respective functional currency | –94 | –56 | –63 | |||
| All currencies +10% against the respective functional currency | 97 | 56 | 64 | |||
| thereof: EUR –10% against the respective functional currency | –80 | –45 | –48 | |||
| thereof: EUR +10% against the respective functional currency | 80 | 45 | 48 | |||
| Unhedged monetary assets and liabilities | ||||||
| All currencies –10% against the respective functional currency | –95 | –101 | –112 | |||
| 277/326 |
|
Integrated Report 2025 | ||||
| To
Our Stakeholders |
Combined
Management Report |
Consolidated
Financial Statements IFRS |
Additional Information | ||
| All currencies +10% against the respective functional currency | 95 | 101 | 112 | |||
| thereof: USD –10% against the respective functional currency | –45 | –39 | –46 | |||
| thereof: USD +10% against the respective functional currency | 45 | 39 | 46 |
Interest Rate Risk
We are exposed to interest rate risk as a result of our investing and financing activities mainly denominated in euros and U.S. dollars, since a significant portion of our investments is based on variable rates and/or short maturities (2025: 56%; 2024: 60%), while the majority of our financing transactions are based on fixed rates and long maturities (2025: 100%; 2024: 86%).
The objective of our interest rate risk management is to reduce profit or loss volatility and optimize our net interest result within the framework of an asset-liability matching approach. We achieve this by incorporating interest rate derivatives into our portfolio of investments and debt financing.
Derivatives Designated as Hedging Instruments (Fair Value Hedges)
To align the interest rate risk from our financing transactions with our investments, we enter into receiver interest rate swaps to convert the interest cash flows of certain fixed-rate financial liabilities to floating rates, and by this means secure the fair value of the swapped financing transactions on a 1:1 ratio. When including interest rate swaps, 28% (2024: 40%) of our total interest-bearing financial liabilities outstanding as at December 31, 2025, had fixed interest rates.
The amounts as at December 31 relating to items designated as hedged items were as follows:
Designated Hedged Items in Interest Rate Hedges
| 2025 | 2024 | |||
| € millions |
Fixed-Rate Borrowing in EUR |
Fixed-Rate Borrowing in USD |
Fixed-Rate Borrowing in EUR |
Fixed-Rate Borrowing in USD |
| Notional amount | 4,550 | 0 | 4,550 | 0 |
| Carrying amount | 4,194 | 0 | 4,103 | 0 |
| Accumulated fair value adjustments in Other financial liabilities | 337 | 0 | 423 | –3 |
| Change in fair value used for measuring ineffectiveness for the reporting period | 86 | 0 | 133 | –3 |
| Accumulated amount of fair value hedge adjustments for hedged items ceased to be adjusted for hedging gains/losses | 0 | 0 | 0 | –3 |
The amounts as at December 31 designated as hedging instruments were as follows:
Designated Hedging Instruments in Interest Rate Hedges
| 2025 | 2024 | |||
| € millions |
Interest Rate Swaps for EUR Borrowing |
Interest Rate Swaps for USD Borrowing |
Interest Rate Swaps for EUR Borrowing |
Interest Rate Swaps for USD Borrowing |
| Notional amount | 4,550 | 0 | 4,550 | 0 |
| Carrying amount | ||||
| Other financial assets | 0 | 0 | 0 | 0 |
| Other financial liabilities | –332 | 0 | –408 | 0 |
| Change in fair value used for measuring ineffectiveness for the reporting period | –76 | 0 | –127 | –1 |
As at December 31, we held the following instruments to hedge exposures to changes in interest rates:
| 278/326 |
|
Integrated Report 2025 | ||||
| To
Our Stakeholders |
Combined
Management Report |
Consolidated
Financial Statements IFRS |
Additional Information | ||
Details on Hedging Instruments in Interest Rate Hedges
| 2025 | |||||
| Maturity | |||||
| € millions | 2027 | 2028 | 2029 | 2030 | 2031 |
| EUR interest rate swaps | |||||
| Nominal amounts | 1,000 | 1,000 | 800 | 500 | 1,250 |
| Average variable interest rate1 | 4.069% | 3.503% | 2.956% | 3.672% | 3.924% |
| USD interest rate swaps | |||||
| Nominal amounts | |||||
| Average variable interest rate1 | |||||
| 2024 | |||||
| Maturity | |||||
| € millions | 2027 | 2028 | 2029 | 2030 | 2031 |
| EUR interest rate swaps | |||||
| Nominal amounts | 1,000 | 1,000 | 800 | 500 | 1,250 |
| Average variable interest rate1 | 4.535% | 3.827% | 3.056% | 3.746% | 3.912% |
| USD interest rate swaps | |||||
| Nominal amounts | |||||
| Average variable interest rate1 | |||||
| 1 Computed based on the interest rate curve as at December 31 of the respective reporting period. | |||||
Remaining Interest Rate Exposure
Our interest rate exposure (and our average/high/low exposure) as at December 31 was as follows:
Interest Rate Risk Exposure
| € billions | 2025 | 2024 | ||||||
| Year-End | Average | High | Low | Year-End | Average | High | Low | |
| Fair value interest rate risk | ||||||||
| From investments | 2.87 | 3.46 | 4.90 | 2.87 | 3.99 | 3.85 | 4.29 | 3.29 |
| Cash flow interest rate risk | ||||||||
| From investments (including interest-bearing cash) | 0.56 | 0.75 | 0.90 | 0.56 | 0.72 | 0.74 | 0.78 | 0.72 |
| From financing | 0 | 0.21 | 1.25 | 0 | 1.25 | 0.42 | 1.25 | 0 |
| From interest rate swaps | 4.55 | 4.55 | 4.55 | 4.55 | 4.55 | 4.63 | 4.64 | 4.55 |
Interest Rate Sensitivity
In compliance with IFRS 7, the following sensitivity analysis is provided to show the potential impact of interest rate fluctuations on profit or loss and equity, based on the following considerations:
| – | Non-derivative fixed-rate instruments: Changes in interest rates only affect the accounting for non-derivative fixed-rate financial instruments if they are recognized at fair value. Therefore, such interest rate changes do not change the carrying amounts of our |
| 279/326 |
|
Integrated Report 2025 | ||||
| To
Our Stakeholders |
Combined
Management Report |
Consolidated
Financial Statements IFRS |
Additional Information | ||
| non-derivative fixed-rate financial liabilities, as we account for them at amortized cost. Investments in fixed-rate financial assets classified as fair value through profit or loss were not material at each year end reported. Thus, we do not consider any fixed-rate instruments in the profit-related sensitivity calculation. |
| – | Non-derivative variable-rate instruments: Income or expenses arising from non-derivative variable interest rate financial instruments are subject to interest rate risk if they are not hedged items in an effective hedge relationship. Thus, we take into consideration interest rate changes relating to our variable-rate financing and our investments in money market instruments in the profit-related sensitivity calculation. |
| – | Derivative hedging instruments: The designation of interest rate receiver swaps in a fair value hedge relationship leads to interest rate changes affecting Financial income, net. The fair value movements related to the interest rate swaps are not reflected in the sensitivity calculation, as they offset the fixed interest rate payments for the bonds and private placements as hedged items. However, changes in market interest rates affect the amount of interest payments from the interest rate swap. As a consequence, we include those effects of market interest rates on interest payments in the profit-related sensitivity calculation. |
If, on December 31, interest rates had been higher/lower, this would have had the following effects on Financial income, net:
Interest Rate Sensitivity
| € millions | Effects on Financial Income, Net | ||
| 2025 | 2024 | 2023 | |
| Derivatives held within a designated fair value hedge relationship | |||
| Interest rates +100bps for U.S. dollar area/+100bps for euro area for all years presented | –46 | –46 | –46 |
| Interest rates –100bps for U.S. dollar area/–100bps for euro area for all years presented | 46 | 46 | 46 |
| Variable-rate financing | |||
| Interest rates +100bps for U.S. dollar area/+100bps for euro area for all years presented | 0 | –4 | 0 |
| Interest rates –100bps for U.S. dollar area/–100bps for euro area for all years presented | 0 | 4 | 0 |
| Variable-rate investments | |||
| Interest rates +100bps for U.S. dollar area/+100bps for euro area for all years presented | 34 | 47 | 32 |
| Interest rates –100bps for U.S. dollar area/–100bps for euro area for all years presented | –34 | –47 | –32 |
Equity Price Risk
Equity Price Risk Management
We are exposed to equity price risk with regard to our investments in equity securities, as well as through the cash settled components of our share based compensation (SBC) programs.
Venture Capital Activities
Our listed equity investments are monitored based on the current market value, which is affected by the fluctuations in the volatile stock markets worldwide. Unlisted equity investments are monitored based on detailed financial information provided by the investees. The fair value of our listed equity investments depends on the equity prices, while the fair value of the unlisted equity investments is influenced by various unobservable input factors.
Equity Price Exposure
On December 31, 2025, our exposure from our investments in equity securities was €6,574 million (2024: €6,401 million; 2023: €4,967 million).
Equity Price Sensitivity
Our sensitivity towards a fluctuation in equity prices is as follows:
| 280/326 |
|
Integrated Report 2025 | ||||
| To
Our Stakeholders |
Combined
Management Report |
Consolidated
Financial Statements IFRS |
Additional Information | ||
Equity Price Sensitivity
| € millions | 2025 | 2024 | 2023 |
| Investments in equity securities | |||
| Increase in equity prices and respective unobservable inputs of 8% (2024: 10%) – increase of financial income, net | 526 | 640 | 1,093 |
| Decrease in equity prices and respective unobservable inputs of 8% (2024: 10%) – decrease of financial income, net | –526 | –640 | –1,093 |
For purposes of our equity price sensitivity disclosure, we benchmarked the historical average of public market returns of the NASDAQ and S&P 500 to the average annual venture capital benchmark returns over a 12-year period, which is the assumed average holding period of venture capital funds. Overall, our analysis indicated a blended return range of +/–8% in 2025 (+/–10% in 2024, +/–22% in 2023).
Share-Based Compensation Hedging
As a result of the cash-settled components of SAP’s SBC programs, we are exposed to a Group-wide volatility in SAP’s share price, which directly impacts our SBC payment obligations (for more information about SBC payouts, see Note (B.3)). To manage this exposure on a consolidated basis, SAP started using total return equity swaps as hedging instruments in March 2025.
As at December 31, our exposure to the hedged risk represented by the number of cash-settled stock units held by employees was as follows:
Exposure to Cash-Settled RSUs
| thousands | 2025 | 2024 |
| Number of Restricted Stock Units (RSUs) | 1,049 | 2,098 |
| Number of Performance Stock Units (PSUs) | 49 | 157 |
| Total gross exposure | 1,098 | 2,255 |
| Number of hedged RSUs | 602 | 0 |
| Total net exposure | 496 | 2,255 |
SAP hedges a specific layer of cash flows from SBC programs based on grant date(s), with each forming a distinct hedge relationship. SAP hedges only RSUs, excluding PSUs, to minimize fluctuations in the hedged population, since PSU vesting quantities depend not only on employment status at time of vesting but also on performance metric achievement.
Furthermore, SAP hedges up to 80% of granted RSUs within each hedge relationship, thereby making forfeitures and potential adjustments to the Group-wide exposure immaterial to the hedged population. This approach ensures a high probability of the forecasted transactions represented by expected cash flows from hedged RSUs.
All SBC hedge relationships maintain a 1:1 hedge ratio and a hedge horizon of up to three years, which aligns with the maximum maturity of the equity swaps utilized.
Under the equity swap arrangements, a swap contract is established between SAP and the counterparty bank for each grant date (or multiple grant dates), featuring multiple settlement dates corresponding to RSU vesting dates (tranches).
At each vesting date, SAP and the bank exchange the difference between the final share price and the initial swap price for that tranche. Additionally, SAP pays interest to the bank based on floating interest rates, which are adjusted to account for dividends that would otherwise be paid by the bank to SAP.
For all periods presented, no previously highly probable transactions designated as hedged items in SBC cash flow hedge relationships ceased to be probable. Consequently, no cash flow hedge relationships were discontinued.
The amounts as at December 31 relating to items designated as hedged items were as follows:
| 281/326 |
|
Integrated Report 2025 | ||||
| To
Our Stakeholders |
Combined
Management Report |
Consolidated
Financial Statements IFRS |
Additional Information | ||
Designated Hedged Items in SBC Hedges
| € millions | 2025 | 2024 |
| Change in value used for calculating hedge ineffectiveness | 3 | 0 |
| Cash flow hedge reserve balance | 6 | 0 |
| Balances remaining in cash flow hedge reserve for which hedge accounting is no longer applied | 0 | 0 |
The amounts as at December 31 designated as hedging instruments were as follows:
Designated Hedging Instruments in SBC Hedges
| € millions, unless stated otherwise | 2025 | 2024 |
| Nominal amount in number of RSUs, thousands | 602 | 0 |
| Nominal amount in EUR | 145 | 0 |
| Carrying amount: | ||
| Other financial assets | 0 | 0 |
| Other financial liabilities | –20 | 0 |
| Change in value used for calculating hedge ineffectiveness | –3 | 0 |
| Change in value recognized in OCI | –3 | 0 |
| Hedge ineffectiveness recognized in Finance income, net | 0 | 0 |
| Amount reclassified from cash flow hedge in OCI to Operating profit | 3 | 0 |
On December 31, we held the following instruments designated in SBC hedging:
Details on Hedging Instruments in SBC Hedges
| Maturity of the Remaining Tranches | ||||||
| 2025 | 2024 | |||||
| Less
Than 12 Months |
12–24 Months | More
Than 24 Months |
Less Than 12 Months |
12–24 Months | More Than 24 Months | |
| Nominal amount in number of RSUs, thousands | 471 | 110 | 21 | 0 | 0 | 0 |
| Initial swap price, in EUR: | ||||||
| March 2025 swap | 263.32 | - | ||||
| April 2025 swap | 229.92 | - | ||||
| Nominal amount in € millions | 111 | 28 | 6 | 0 | 0 | 0 |
Sensitivity Analysis
At year end 2025, fair value changes in the equity swaps impacted Group profit or loss and equity through the Cash flow hedge reserve and amounts reclassified from the Cash flow hedge reserve to profit or loss (hedge ineffectiveness from these relationships is immaterial). The primary driver of the fair value volatility of the equity swaps is SAP share price variability. However, since the same risk factor drives volatility in hedged SBC expenses, any change in the equity swaps’ impact on profit or loss is offset by corresponding changes in SBC expenses related to the hedged RSU population. Impacts on equity (other comprehensive income) are not offset; therefore, the table below presents the increase or decrease in other comprehensive income that would have resulted had SAP’s share price at year end increased or decreased by 10%.
Equity Swaps Sensitivity
| Effects on Other Comprehensive Income | |||
| € millions | 2025 | 2024 | 2023 |
| Increase in SAP share price of 10% – increase in OCI | –4 | - | - |
| Decrease in SAP share price of 10% – decrease in OCI | 4 | - | - |
| 282/326 |
|
Integrated Report 2025 | ||||
| To
Our Stakeholders |
Combined
Management Report |
Consolidated
Financial Statements IFRS |
Additional Information | ||
Credit Risk
We are exposed to credit risk to the extent either our customers or our counterparts for financial instruments fail to meet their contractual obligations. In the absence of collateral or other significant agreements to reduce our credit risk exposure, the total nominal amounts of cash and cash equivalents, current investments, loans, other financial receivables, derivative financial assets, trade receivables, and financial guarantees represent our maximum exposure to credit risks.
Cash at Banks, Time Deposits, and Debt Securities
To mitigate the credit risk from our investing activities and derivative financial assets, we conduct all our activities only with approved financial institutions and issuers that meet stringent credit quality standards as required by our internal treasury policies. These policies mandate a minimum credit rating of “BBB” (flat) for all investments, with exceptions to this threshold permitted only in limited circumstances. Such below-threshold investments were not significant relative to total investment balances in all years presented. The weighted average credit rating of our financial assets portfolio is “A–”. Our investment approach is characterized by prudent asset allocation, emphasizing short-term maturities, conventional investment instruments, and broad portfolio diversification across multiple counterparties.
To further reduce our credit risk, we require collateral for certain investments in the full amount of the investment volume (2025: €100 million, 2024: €0 million), which we would be allowed to make use of in the case of default of the counterparty. Eligible collateral is limited to bonds with investment-grade credit ratings.
In addition, the concentration of credit risk that exists when counterparties are involved in similar activities by instrument, sector, or geographic area is mitigated through global diversification of counterparties and adherence to an internal counterparty limit framework. This framework establishes exposure limits for individual counterparties based on the lowest available long-term credit rating from major rating agencies, the counterparty’s Tier 1 capital, or participation in deposit guarantee schemes such as the German Depositors’ Guarantee Fund or equivalent protection mechanisms. Compliance with these counterparty limits is monitored on an ongoing basis. Additionally, we actively monitor credit default swap spreads as a market-based indicator of counterparty creditworthiness, enabling timely identification of emerging credit risks and prompt implementation of appropriate risk mitigation measures.
For cash at banks, time deposits, and debt securities (including bonds and commercial paper), we apply the general impairment approach. As it is our policy to only invest in high-quality assets of issuers with a minimum rating of at least investment grade to minimize the risk of credit losses, we use the low credit risk exception. Thus, these assets are always allocated to stage 1 of the three-stage credit loss model and we record a loss allowance for an amount equal to 12-month expected credit losses. This loss allowance is calculated based on our exposure as at the respective reporting date, the loss given default for this exposure, and the credit default swap spread as a measure for the probability of default. To ensure continued compliance with investment-grade criteria throughout the life of our investments, we monitor changes in credit risk by tracking published external credit ratings.
We consider cash at banks, time deposits, and debt securities to be in default when the counterparty is unlikely to pay its obligations in full, there is evidence of significant financial difficulties, or credit default swap spreads widen materially for an extended period while broader market conditions remain stable. Such financial assets are written off either partially or in full if the likelihood of recovery is considered remote, which might be evidenced by, for example, counterparty bankruptcy or insolvency proceedings.
Trade Receivables
Credit risk associated with trade receivables is managed through a dedicated assessment process that evaluates customer creditworthiness using external credit ratings and the Company’s past experience of customer payment behavior. Based on this evaluation, individual credit limits are established for each customer, with any exceptions requiring management approval.
We apply the simplified impairment approach under IFRS 9, using a provision matrix to recognize lifetime expected credit losses for all trade receivables and contract assets at initial recognition.
For the provision matrix, customers are segmented into distinct risk categories primarily based on historical credit loss experience within the respective SAP subsidiaries.
Loss rates representing lifetime expected credit losses are determined using a roll-rate methodology that considers the probability of receivables progressing through successive stages of delinquency and actual historical credit loss experience. These loss rates are adjusted for forward-looking information to reflect differences between historical economic conditions, current circumstances,
| 283/326 |
|
Integrated Report 2025 | ||||
| To
Our Stakeholders |
Combined
Management Report |
Consolidated
Financial Statements IFRS |
Additional Information | ||
and anticipated economic developments over the expected life of the receivables. Forward-looking adjustments incorporate credit default swap fluctuations for countries in which our customers operate.
Outstanding receivables are monitored continuously at the local level to identify objective evidence of credit impairment. Indicators of credit impairment include overdue payment status, information regarding significant financial difficulty of the customer, or failure to adhere to agreed payment terms. Receivables are considered to be in default when the counterparty is unlikely to fulfill its payment obligations in full. However, payment delays (such as amounts overdue beyond 90 days) in the ordinary course of business do not automatically constitute default. Receivables are written off, either partially or fully, when recovery is deemed remote, as may be evidenced by completed bankruptcy proceedings or exhaustion of collection efforts and enforcement actions.
The impact of individual customer defaults on our trade receivables portfolio is mitigated by our extensive and diversified customer base spanning multiple industries, customer sizes, and countries worldwide. For more information about trade receivables, see Note (A.2).
Credit Risk Exposure
Cash, Time Deposits, and Debt Securities
As at December 31, our exposure to credit risk from cash, time deposits, and debt securities was as follows:
Credit Risk Exposure from Cash, Time Deposits, and Debt Securities
| € millions, unless otherwise stated |
2025 | ||||
| Equivalent
to External Rating |
Weighted
Average Loss Rate |
Gross
Carrying Amount Not Credit-Impaired |
Gross
Carrying Amount Credit-Impaired |
ECL Allowance | |
| Risk class 1 – low risk | AAA to BBB– | –0.1% | 6,594 | 0 | –7 |
| Risk class 2 – high risk | BB+ to D | 0.0% | 86 | 0 | 0 |
| Risk class 3 – unrated | NA | –8.6% | 35 | 0 | –3 |
| Total | –0.1% | 6,715 | 0 | –10 | |
| € millions, unless otherwise stated |
2024 | ||||
| Equivalent to External Rating |
Weighted Average Loss Rate |
Gross Carrying Amount Not Credit-Impaired |
Gross Carrying Amount Credit-Impaired |
ECL Allowance | |
| Risk class 1 – low risk | AAA to BBB– | –0.1% | 7,004 | 0 | –7 |
| Risk class 2 – high risk | BB+ to D | 0.0% | 105 | 0 | 0 |
| Risk class 3 – unrated | NA | –4.6% | 65 | 0 | –3 |
| Total | –0.1% | 7,174 | 0 | –10 | |
Master Netting and Similar Arrangements
We enter into derivatives on the basis of the German Master Agreement on Financial Derivatives Transactions (“Deutscher Rahmenvertrag für Finanztermingeschäfte”) and similar agreements. The regulations of these agreements apply particularly in the case of insolvency and not during the normal course of business.
The following table shows the derivative instruments that are subject to such netting arrangements:
Master Netting and Similar Arrangements
| € millions | 2025 | 2024 | ||||
| Carrying Amounts | Nettable
Amounts in Case of Insolvency |
Net Amount | Carrying Amounts | Nettable amounts in Case of Insolvency |
Net Amount | |
| Financial assets | 73 | 39 | 34 | 60 | 42 | 18 |
| Financial liabilities | –437 | –39 | –398 | –525 | –42 | –483 |
| 284/326 |
|
Integrated Report 2025 | ||||
| To
Our Stakeholders |
Combined
Management Report |
Consolidated
Financial Statements IFRS |
Additional Information | ||
Trade Receivables
As at December 31, our exposure to credit risk from trade receivables was as follows:
Credit Risk Exposure from Trade Receivables
| € millions, unless otherwise stated | 2025 | |||
| Weighted Average Loss Rate | Gross
Carrying Amount |
Gross
Carrying Amount |
ECL Allowance | |
| AR not due and due | –0.3% | 3,909 | 2 | –10 |
| AR overdue 1 to 30 days | –0.5% | 704 | 79 | –4 |
| AR overdue 30 to 90 days | –1.4% | 586 | 36 | –9 |
| AR overdue more than 90 days | –29.1% | 426 | 278 | –205 |
| TOTAL | –3.8% | 5,625 | 395 | –228 |
| € millions, unless otherwise stated | 2024 | |||
| Weighted Average Loss Rate |
Gross Carrying Amount |
Gross Carrying Amount Credit-Impaired |
ECL Allowance | |
| AR not due and due | –0.2% | 4,439 | 0 | –7 |
| AR overdue 1 to 30 days | –0.9% | 619 | 64 | –6 |
| AR overdue 30 to 90 days | –1.4% | 603 | 28 | –9 |
| AR overdue more than 90 days | –29.2% | 445 | 263 | –207 |
| TOTAL | –3.5% | 6,106 | 355 | –229 |
The movement in the ECL allowance for trade receivables is as follows:
Movement in ECL Allowance for Trade Receivables
| 2025 | 2024 | |
| € millions | ECL Allowance | ECL Allowance |
| Balance as at 1/1 | –229 | –203 |
| Net credit losses recognized | –86 | –112 |
| Amounts written off | 87 | 86 |
| Balance as at 12/31 | –228 | –229 |
Liquidity Risk
We are exposed to liquidity risk from our financial obligations including obligations towards suppliers, employees, and financial institutions.
Our liquidity is managed by our global treasury department with the primary aim of maintaining liquidity at a level that is adequate to meet our financial obligations and ensuring the availability of funding through adequate levels of committed credit facilities.
Our primary source of liquidity is represented by our operating cash flows. Our global treasury department centrally manages liquidity for all subsidiaries, pooling cash surpluses where possible to optimize deployment across the Group for operational requirements, subsidiary funding needs, or short-term investment opportunities.
This centralized approach enables us to optimize returns while maintaining adequate liquid assets and marketable securities, as strategic reserve to preserve our financial flexibility and strength.
In addition to effective working capital and cash management, we have reduced our liquidity risk by arranging an adequate volume of committed credit facilities with various financial institutions.
| 285/326 |
|
Integrated Report 2025 | ||||
| To
Our Stakeholders |
Combined
Management Report |
Consolidated
Financial Statements IFRS |
Additional Information | ||
In 2023, SAP SE entered into a sustainability-linked revolving credit facility with a volume of €3.0 billion and an end date in March 2030. The use of the facility is not restricted by any financial covenants and borrowings under the facility bear interest at EURIBOR or the agreed benchmark rate for the respective currency plus a base margin which may be adjusted depending on the fulfillment of agreed sustainability performance targets. We have not drawn on the facility.
In September 2019, we initiated a commercial paper (Commercial Paper, or CP) program. As at December 31, 2025, we had €498 million of CP outstanding with maturities generally less than six months (2024: €498 million).
Additionally, as at December 31, 2025 and 2024, the Group had available lines of credit totaling €1.15 billion and €1.2 billion, respectively. In 2024, an amount of €1 billion was used via money market loans; for more information, see Note (E.3). The facility was fully repaid as at December 31, 2025.
The table below is an analysis of the remaining contractual maturities of all our financial liabilities and guarantees held as at December 31.
Financial liabilities for which repayment can be requested by the contract partner at any time are assigned to the earliest possible period. Variable interest payments were calculated using the latest relevant interest rate fixed as at December 31. As we generally settle our derivative contracts gross, we show the pay and receive legs separately for all our currency, interest rate and share-based compensation derivatives, whether or not the fair value of the derivative is negative. The cash outflows for the currency derivatives are translated using the applicable spot rate.
We continue to provide rental guarantees for certain offices used by Qualtrics. The amounts shown for the financial guarantees are the gross amounts we guarantee, however, we are entitled to indemnification payments by Qualtrics which will reduce the guarantee amounts disclosed.
| 286/326 |
|
Integrated Report 2025 | ||||
| To
Our Stakeholders |
Combined
Management Report |
Consolidated
Financial Statements IFRS |
Additional Information | ||
Contractual Maturities of Non-Derivative Financial Liabilities
| € millions | Carrying Amount |
Contractual Cash Flows | |||||
| 12/31/2025 | 2026 | 2027 | 2028 | 2029 | 2030 | Thereafter | |
| Non-derivative financial liabilities | |||||||
| Trade payables | –1,465 | –1,465 | 0 | 0 | 0 | 0 | 0 |
| Bonds | –5,294 | –1,161 | –1,045 | –1,033 | –828 | –522 | –1,254 |
| Private placements | 0 | 0 | 0 | 0 | 0 | 0 | 0 |
| Loans | 0 | 0 | 0 | 0 | 0 | 0 | 0 |
| Commercial Paper | –498 | –500 | 0 | 0 | 0 | 0 | 0 |
| Lease liabilities | –1,684 | –302 | –291 | –234 | –185 | –158 | –812 |
| Other financial liabilities1 | –157 | –207 | –21 | 0 | 0 | 0 | 0 |
| Total of non-derivative financial liabilities | –9,098 | –3,635 | –1,357 | –1,267 | –1,013 | –680 | –2,066 |
| Financial guarantees | 0 | –17 | –17 | –18 | –18 | –18 | –260 |
| € millions | Carrying Amount |
Contractual Cash Flows | |||||
| 12/31/2024 | 2025 | 2026 | 2027 | 2028 | 2029 | Thereafter | |
| Non-derivative financial liabilities | |||||||
| Trade payables | –1,178 | –1,178 | 0 | 0 | 0 | 0 | 0 |
| Bonds | –6,090 | –970 | –1,161 | –1,045 | –1,033 | –828 | –1,775 |
| Private placements | –99 | –3 | –3 | –100 | 0 | 0 | 0 |
| Loans | –2,250 | –2,300 | 0 | 0 | 0 | 0 | 0 |
| Commercial Paper | –498 | –500 | 0 | 0 | 0 | 0 | 0 |
| Lease liabilities | –1,715 | –371 | –287 | –237 | –184 | –148 | –821 |
| Other financial liabilities1 | –270 | –21 | –32 | 0 | 0 | 0 | 0 |
| Total of non-derivative financial liabilities | –12,099 | –5,343 | –1,483 | –1,382 | –1,217 | –976 | –2,596 |
| Financial guarantees | 0 | –19 | –19 | –19 | –20 | –20 | –315 |
| 1 The carrying amount of other financial liabilities includes accrued interest for our non-derivative financial debt as well as for derivatives, while the cash outflow of this accrued interest is presented together with the underlying liability in the maturity analysis. | |||||||
| 287/326 |
|
Integrated Report 2025 | ||||
| To
Our Stakeholders |
Combined
Management Report |
Consolidated
Financial Statements IFRS |
Additional Information | ||
Contractual Maturities of Derivative Financial Liabilities and Financial Assets
| € millions | Carrying Amount |
Contractual Cash Flows | Carrying Amount |
Contractual Cash Flows | ||
| 12/31/2025 | 2026 | Thereafter | 12/31/2024 | 2025 | Thereafter | |
| Derivative financial liabilities and assets | ||||||
| Derivative financial liabilities | ||||||
| Currency derivatives not designated as hedging instruments | –53 | –85 | ||||
| Cash outflows | –2,667 | 0 | –4,003 | 0 | ||
| Cash inflows | 2,626 | 0 | 3,942 | 0 | ||
| Currency derivatives designated as hedging instruments | –7 | –32 | ||||
| Cash outflows | –1,737 | –2,805 | ||||
| Cash inflows | 1,722 | 2,749 | ||||
| Interest rate derivatives without designated hedge relationship | 0 | 0 | ||||
| Cash outflows | ||||||
| Cash inflows | ||||||
| Interest rate derivatives designated as hedging instruments | –332 | –408 | ||||
| Cash outflows | –163 | –513 | –230 | –649 | ||
| Cash inflows | 60 | 181 | 60 | 241 | ||
| Equity swaps designated as hedging instruments | –20 | 0 | ||||
| Cash outflows | –3 | –18 | 0 | 0 | ||
| Cash inflows | 0 | 0 | 0 | 0 | ||
| Total of derivative financial liabilities | –412 | –162 | –350 | –525 | –287 | –408 |
| Derivative financial assets | ||||||
| Currency derivatives not designated as hedging instruments | 40 | 51 | ||||
| Cash outflows | –2,430 | –2,921 | ||||
| Cash inflows | 2,468 | 2,977 | ||||
| Currency derivatives designated as hedging instruments | 27 | 12 | ||||
| Cash outflows | –3,814 | –948 | ||||
| Cash inflows | 3,824 | 964 | ||||
| Total of derivative financial assets | 66 | 49 | 0 | 63 | 72 | 0 |
| Total of derivative financial liabilities and assets | –346 | –114 | –350 | –462 | –215 | –408 |
Other
In the fourth quarter of 2025, SAP entered into physical power purchase agreements (PPAs) with delivery start in 2026 to increase the share of renewable electricity and to achieve price stability. In this context, we early adopted the 2024 amendments to IFRS 9 and IFRS 7 ‘Contracts Referencing Nature-dependent Electricity’ in 2025, which had no material impact on our financial statements.
(F.2) Fair Value and Other Disclosures on Financial Instruments
Level Transfers
It is our policy that transfers between the different levels of the fair value hierarchy are deemed to have occurred at the beginning of the period of the event or change in circumstances that caused the transfer.
Fair Value of Financial Instruments
We use various types of financial instruments in the ordinary course of business, which are classified as either amortized cost (AC), fair value through other comprehensive income (FVOCI), or fair value through profit or loss (FVTPL). For those financial instruments measured at fair value or for which fair value must be disclosed, we have categorized the financial instruments into a three-level fair value hierarchy depending on the inputs used to determine fair value and their significance for the valuation techniques.
| 288/326 |
|
Integrated Report 2025 | ||||
| To
Our Stakeholders |
Combined
Management Report |
Consolidated
Financial Statements IFRS |
Additional Information | ||
Fair Values of Financial Instruments and Classification Within the Fair Value Hierarchy
| € millions | Category | 12/31/2025 | ||||||
| Measurement Categories | Fair Value | |||||||
| Carrying Amount |
At Amortized Cost |
At Fair Value |
Level 1 | Level 2 | Level 3 | Total | ||
| Assets | ||||||||
| Cash and cash equivalents | 8,220 | |||||||
| Cash at banks1 | AC | 3,910 | 3,910 | |||||
| Time deposits1 | AC | 1,438 | 1,438 | |||||
| Money market and similar funds | FVTPL | 2,871 | 2,871 | 2,871 | 2,871 | |||
| Trade and other receivables | 6,893 | |||||||
| Trade receivables1 | AC | 5,790 | 5,790 | |||||
| Other receivables2 | 1,103 | |||||||
| Other financial assets | 8,821 | |||||||
| Debt securities | AC | 92 | 92 | 92 | 92 | |||
| Debt securities | FVOCI | 46 | 46 | 46 | 46 | |||
| Equity securities | FVTPL | 6,574 | 6,574 | 251 | 6,324 | 6,574 | ||
| Investments in associates2 | 142 | |||||||
| Time deposits1 | AC | 1,219 | 1,219 | |||||
| Financial instruments related to employee benefit plans2 | 284 | |||||||
| Loans and other financial receivables | AC | 392 | 392 | 392 | 392 | |||
| Derivative assets | ||||||||
| Designated as hedging instrument | ||||||||
| FX forward contracts | 27 | 27 | 27 | 27 | ||||
| Not designated as hedging instrument | ||||||||
| FX forward contracts | FVTPL | 46 | 46 | 46 | 46 | |||
| Liabilities | ||||||||
| Trade and other payables | –2,433 | |||||||
| Trade payables1 | AC | –1,465 | –1,465 | |||||
| Other payables2 | –968 | |||||||
| Financial liabilities | –8,070 | |||||||
| Non-derivative financial liabilities | ||||||||
| Loans1 | AC | 0 | 0 | |||||
| Bonds | AC | –5,294 | –5,294 | –5,445 | –5,445 | |||
| Private placements | AC | 0 | 0 | 0 | 0 | |||
| Lease liabilities3 | –1,684 | –1,684 | ||||||
| Commercial paper | AC | –498 | –498 | –498 | –498 | |||
| Other non-derivative financial liabilities | AC | –157 | –157 | –157 | –157 | |||
| Derivative liabilities | ||||||||
| Designated as hedging instrument | ||||||||
| FX forward contracts | –7 | –7 | –7 | –7 | ||||
| Interest rate swaps | –332 | –332 | –332 | –332 | ||||
| Equity swaps | –20 | –20 | –20 | –20 | ||||
| Not designated as hedging instrument | ||||||||
| FX forward contracts | FVTPL | –78 | –78 | –78 | –78 | |||
| Total financial instruments, net | 13,431 | 3,744 | 9,126 | –2,185 | –628 | 6,324 | 3,510 | |
| 289/326 |
|
Integrated Report 2025 | ||||
| To
Our Stakeholders |
Combined
Management Report |
Consolidated
Financial Statements IFRS |
Additional Information | ||
Fair Values of Financial Instruments and Classification Within the Fair Value Hierarchy
| € millions | Category | 12/31/2024 | ||||||
| Measurement Categories | Fair Value | |||||||
| Carrying Amount |
At Amortized |
At Fair Value |
Level 1 | Level 2 | Level 3 | Total | ||
| Assets | ||||||||
| Cash and cash equivalents | 9,609 | |||||||
| Cash at banks1 | AC | 3,962 | 3,962 | |||||
| Time deposits1 | AC | 1,656 | 1,656 | |||||
| Money market and similar funds | FVTPL | 3,991 | 3,991 | 3,991 | 3,991 | |||
| Trade and other receivables | 6,983 | |||||||
| Trade receivables1 | AC | 6,231 | 6,231 | |||||
| Trade receivables1 | FVOCI | 0 | 0 | 0 | ||||
| Other receivables2 | – | 752 | ||||||
| Other financial assets | 8,770 | |||||||
| Debt securities | AC | 53 | 53 | 53 | 53 | |||
| Debt securities | FVOCI | 74 | 74 | 74 | 74 | |||
| Equity securities | FVTPL | 6,401 | 6,401 | 135 | 6,266 | 6,401 | ||
| Investments in associates2 | – | 144 | ||||||
| Time deposits1 | AC | 1,418 | 1,418 | |||||
| Financial instruments related to employee benefit plans2 | – | 287 | ||||||
| Loans and other financial receivables | AC | 329 | 329 | 329 | 329 | |||
| Derivative assets | ||||||||
| Designated as hedging instrument | ||||||||
| FX forward contracts | – | 12 | 12 | 12 | 12 | |||
| Interest rate swaps | – | 0 | 0 | 0 | 0 | |||
| Not designated as hedging instrument | ||||||||
| FX forward contracts | FVTPL | 51 | 51 | 51 | 51 | |||
| Call options for share-based payments | FVTPL | 0 | 0 | 0 | 0 | |||
| Call option on equity shares | FVTPL | 0 | 0 | 0 | 0 | |||
| Liabilities | ||||||||
| Trade and other payables | –2,000 | |||||||
| Trade payables1 | AC | –1,178 | –1,178 | |||||
| Other payables2 | – | –823 | ||||||
| Financial liabilities | –11,446 | |||||||
| Non-derivative financial liabilities | ||||||||
| Loans1 | AC | –2,250 | –2,250 | –2,250 | –2,250 | |||
| Bonds | AC | –6,090 | –6,090 | –6,286 | –6,286 | |||
| Private placements | AC | –99 | –99 | –99 | –99 | |||
| Lease liabilities3 | – | –1,715 | –1,715 | |||||
| –498 | –498 | –498 | –498 | |||||
| Other non-derivative financial liabilities | AC | –270 | –270 | –270 | –270 | |||
| 290/326 |
|
Integrated Report 2025 | ||||
| To
Our Stakeholders |
Combined
Management Report |
Consolidated
Financial Statements IFRS |
Additional Information | ||
| € millions | Category | 12/31/2024 | ||||||
| Measurement Categories | Fair Value | |||||||
| Carrying Amount |
At Amortized |
At Fair Value |
Level 1 | Level 2 | Level 3 | Total | ||
| Derivative liabilities | ||||||||
| Designated as hedging instrument | ||||||||
| FX forward contracts | – | –32 | –32 | –32 | –32 | |||
| Interest rate swaps | – | –408 | –408 | –408 | –408 | |||
| Not designated as hedging instrument | ||||||||
| FX forward contracts | FVTPL | –85 | –85 | –85 | –85 | |||
| Total financial instruments, net | 11,916 | 1,550 | 10,004 | –1,836 | –1,833 | 6,266 | 2,597 | |
|
1 We do not separately disclose the fair value for cash and cash equivalents, trade receivables, and accounts payable as their carrying amounts are a reasonable approximation of their fair values.
2 Since the line items Trade receivables, Trade payables, and Other financial assets contain both financial and non-financial assets or liabilities (such as other taxes or advance payments), the carrying amounts of non-financial assets or liabilities are shown to allow a reconciliation to the corresponding line items in the Consolidated Statements of Financial Position.
3 For lease liabilities, separate disclosure of fair value is not required.
| ||||||||
Fair Values of Financial Instruments by Instrument Classification
| € millions | Category | 12/31/2025 | ||
| Carrying Amount | At Amortized Cost |
At Fair Value | ||
| Financial assets | ||||
| At fair value through profit or loss | FVTPL | 9,491 | 9,491 | |
| At fair value through other comprehensive income | FVOCI | 46 | 46 | |
| At amortized cost | AC | 12,841 | 12,841 | |
| Financial liabilities | ||||
| At fair value through profit or loss | FVTPL | –78 | –78 | |
| At amortized cost | AC | –7,414 | –7,414 | |
Fair Values of Financial Instruments by Instrument Classification
| € millions | Category | 12/31/2024 | ||
| Carrying Amount |
At Amortized Cost |
At Fair Value | ||
| Financial assets | ||||
| At fair value through profit or loss | FVTPL | 10,443 | 10,443 | |
| At fair value through other comprehensive income | FVOCI | 74 | 74 | |
| At amortized cost | AC | 13,649 | 13,649 | |
| Financial liabilities | ||||
| At fair value through profit or loss | FVTPL | –85 | –85 | |
| At amortized cost | AC | –10,385 | –10,385 | |
Determination of Fair Values
A description of the valuation techniques and the inputs used in the fair value measurement is given below:
| 291/326 |
|
Integrated Report 2025 | ||||
| To
Our Stakeholders |
Combined
Management Report |
Consolidated
Financial Statements IFRS |
Additional Information | ||
Financial Instruments Measured at Fair Value on a Recurring Basis
| Type | Fair Value Hierarchy |
Determination of Fair Value/Valuation Technique |
Significant Unobservable Inputs |
Interrelationship Between Significant Unobservable Inputs and Fair Value Measurement | |
| Other financial assets | |||||
| Money-market and similar funds | Level 1 | Quoted prices in an active market | NA | NA | |
| Debt securities | Level 1 | Quoted prices in an active market | NA | NA | |
| Listed equity securities | Level 1 | Quoted prices in an active market | NA | NA | |
| Unlisted equity securities | Level 3 | Market approach. Comparable company valuation using revenue multiples derived from companies comparable to the investee. |
Peer companies used (revenue multiples range from 1.5 to 30.0) Revenues of investees Discounts for lack of marketability (0.4% to 90.9%) |
The estimated fair value would increase (decrease) if: - The revenue multiples were higher (lower) - The investees’ revenues were higher (lower) - The liquidity discounts were lower (higher) | |
| Market approach. Venture capital method evaluating a variety of quantitative and qualitative factors such as actual and forecasted results, cash position, recent or planned transactions, and market comparable companies. |
- Nature and selection of financing rounds - Weighting of financings rounds - Discounts for lack of marketability - Weighting of equity allocation method such as option pricing model and common stock equivalent model - Volatility assumptions - Estimated time to exit - Imminent exit value |
The estimated fair value would increase (decrease) if: - Different financing rounds are selected - Weighting of financing rounds changes - Weighting of the applied equity allocation methods changes - Volatility assumptions were higher(lower) - Estimated time to exit increases (decreases) - The imminent exit value increases (decreases) | |||
| Last financing round valuations | Nature and pricing indication of latest financing round |
The estimated fair value would increase (decrease) if: - Price of latest financing round would increase (decrease) - the overall company value would be higher (lower) - the respective analyzed share class would be affected by this change due to its rights and preferences | |||
| Net asset value/fair market value as reported by the respective funds | Net asset value calculations of the respective funds |
The estimated fair value would increase (decrease) if: Reported net asset value of respective fund would be higher (lower) | |||
| Call option on equity shares | Level 3 | Market approach. Venture capital method evaluating a variety of quantitative and qualitative factors such as actual and forecasted results, cash position, recent or planned transactions, and market comparable companies. | NA | NA | |
| Other financial assets/ Financial liabilities | |||||
| FX forward contracts | Level 2 | Discounted cash flow using par method. Expected future cash flows based on forward exchange rates are discounted over the respective remaining term of the contracts using the respective deposit interest rates and spot rates. | NA | NA | |
| 292/326 |
|
Integrated Report 2025 | ||||
| To
Our Stakeholders |
Combined
Management Report |
Consolidated
Financial Statements IFRS |
Additional Information | ||
| Type | Fair Value Hierarchy |
Determination of Fair Value/Valuation Technique |
Significant Unobservable Inputs |
Interrelationship Between Significant Unobservable Inputs and Fair Value Measurement | |
| Interest rate swaps | Level 2 | Discounted cash flow. Expected future cash flows are estimated based on forward interest rates from observable yield curves and contract interest rates, discounted at a rate that reflects the credit risk of the counterparty. | NA | NA | |
| Equity swaps | Level 2 | Discounted cash flow. Expected future cash flows are estimated based on projected share prices and projected interest rates. Projected share prices are calculated in a manner similar to the method applied for RSUs under IFRS 2. Projected interest rates are calculated from Euribor 3-month zero coupon yield curve, unless the rate for a particular period is already fixed with the bank. | NA | NA |
Financial Instruments Not Measured at Fair Value
| Type | Fair Value Hierarchy | Determination of Fair Value/Valuation Technique | |
| Financial liabilities | |||
| Fixed-rate bonds (financial liabilities) | Level 1 | Quoted prices in an active market | |
| Fixed-rate private placements/ loans (financial liabilities) | Level 2 |
Discounted cash flows Future cash outflows for fixed interest and principal are discounted over the term of the respective contracts using the market interest rates as at the reporting date. | |
For other non-derivative financial assets/liabilities and variable rate financial debt, it is assumed that their carrying value reasonably approximates their fair values.
Transfers Between Levels 1 and 2
Transfers of equity securities from Level 2 to Level 1, which occurred because disposal restrictions lapsed and deducting a discount for such restriction was no longer necessary, did not take place in 2025 and in 2024 (2023: none), while transfers from Level 1 to Level 2 did not occur at all.
Level 3 Fair Value Disclosures
The following table shows the reconciliation of fair values from the opening to the closing balances for our unlisted equity securities and call options on equity shares, as well as the deal contingent forward from our net investment hedge classified as Level 3 fair values:
| 293/326 |
|
Integrated Report 2025 | ||||
| To
Our Stakeholders |
Combined
Management Report |
Consolidated
Financial Statements IFRS |
Additional Information | ||
Reconciliation of Level 3 Fair Values
| € millions | 2025 | 2024 |
| Unlisted Equity Securities | Unlisted Equity Securities and Call Options on Equity Shares | |
| 1/1 | 6,269 | 4,817 |
| Transfers | ||
| Into Level 3 | 4 | 7 |
| Out of Level 3 | –180 | –2 |
| Purchases | 622 | 773 |
| Sales | –440 | –132 |
| Settlements | ||
| Gains/losses | ||
| Included in financial income, net | 772 | 481 |
| Included in exchange differences in other comprehensive income | –723 | 325 |
| 12/31 | 6,324 | 6,269 |
| Change in unrealized gains/losses in profit or loss for equity investments held at the end of the reporting period | 201 | 674 |
Transfers out of Level 3 are due to initial public offerings of the respective investees or distributions in kind in the form of listed investees. Changing the unobservable inputs to reflect reasonably possible alternative assumptions would not have a material impact on the fair values of our unlisted equity securities held as FVTPL as at the reporting date.
Net Gains or Losses from Financial Instruments by IFRS 9 Measurement Category
| € millions | 2025 | 2024 |
| Financial instruments at fair value through profit or loss | 739 | 450 |
| Financial assets measured at amortized cost | –108 | 526 |
| thereof interest income | 199 | 343 |
| Financial assets at fair value through other comprehensive income (debt securities) | –10 | –13 |
| thereof interest expenses | –10 | –13 |
| Financial liabilities measured at amortized cost | 0 | –478 |
| thereof interest expenses | –141 | –130 |
Gains and losses from the disposal of financial assets measured at amortized cost are not considered material in any of the years presented.
| 294/326 |
|
Integrated Report 2025 | ||||
| To
Our Stakeholders |
Combined
Management Report |
Consolidated
Financial Statements IFRS |
Additional Information | ||
Section G – Other Disclosures
This section provides additional disclosures on miscellaneous topics, including information pertaining to the Executive Board, the Supervisory Board, related-party transactions, and other corporate governance topics.
(G.1) Prepaid Expenses, Advance Payments, and Other Tax Assets
| € millions | 2025 | 2024 | ||||
| Current | Non-Current | Total | Current | Non-Current | Total | |
| Prepaid expenses | 1,256 | 626 | 1,882 | 988 | 430 | 1,418 |
| Advance payments | 252 | 0 | 252 | 77 | 0 | 77 |
| Other tax assets | 278 | 111 | 389 | 256 | 67 | 323 |
| Total | 1,786 | 737 | 2,523 | 1,320 | 497 | 1,817 |
| Other non-financial assets |
3,212 | 4,419 | 7,631 | 2,682 | 3,990 | 6,672 |
| Prepaid expenses, advance payments, and other tax assets as % of
Other non-financial assets |
56 | 17 | 33 | 49 | 12 | 27 |
Prepaid expenses primarily consist of prepayments for hyperscalers, support services, and software royalties. Prepaid expenses for hyperscalers relate to reserved instances for computing resources and other infrastructure prepayments, which are typically purchased and paid for a term of up to three years. These contract terms and conditions influence our prepaid expenses balance.
Advance payments relate to the investment into our supply chain by prepaying suppliers in exchange for discounts.
Other tax assets primarily consist of value-added tax (VAT).
(G.2) Provisions for Interest and Penalties Related to Taxes and Other Tax Liabilities
Provisions for Interest and Penalties Related to Taxes
| € millions | 2025 | ||
| Current | Non-Current | Total | |
| 1/1/2025 | 52 | 134 | 186 |
| Addition | 19 | 117 | 136 |
| Utilization | –6 | –24 | –30 |
| Release | –8 | –9 | –17 |
| Additions from business combinations | 1 | 0 | 1 |
| Transfer | 6 | –6 | 0 |
| Currency impact | 0 | –13 | –13 |
| 12/31/2025 | 64 | 198 | 262 |
| Total provisions | 537 | 550 | 1,087 |
|
Provision for interest and penalties related to taxes as % of |
12 | 36 | 24 |
The provisions primarily consist of interest related to income taxes.
| 295/326 |
|
Integrated Report 2025 | ||||
| To
Our Stakeholders |
Combined
Management Report |
Consolidated
Financial Statements IFRS |
Additional Information | ||
Other Tax Liabilities
| € millions | 2025 | 2024 | ||||
| Current | Non-Current | Total | Current | Non-Current | Total | |
| Other tax liabilities | 917 | 0 | 917 | 1,014 | 0 | 1,014 |
|
Other non-financial liabilities |
4,849 | 524 | 5,373 | 5,537 | 749 | 6,286 |
| Other tax liabilities as % of Other
non-financial liabilities |
19 | 0 | 17 | 18 | 0 | 16 |
Other tax liabilities primarily consist of VAT, payroll tax, and withholding tax.
(G.3) Other Litigation, Claims, and Legal Contingencies
This Note discloses information about intellectual property-related litigation and claims, competition law matters, and tax-related litigation other than income tax-related litigation (see Note (C.5)).
Uncertainty in Context of Legal Matters
The policies outlined in Note (A.4) for customer-related provisions, which include provisions for customer-related litigation cases and claims, equally apply to our other litigation, claims, and legal contingencies disclosed in this Note.
The outcome of litigation and claims is intrinsically subject to considerable uncertainty. Management’s view of these matters may also change in the future. Actual outcomes of litigation and claims may differ from the assessments made by management in prior periods, which could result in a material impact on our business, financial position, profit, cash flows, or reputation. Most of the lawsuits and claims are of a very individual nature and claims are either not quantified by the claimants or the claim amounts quantified are, based on historical evidence, not expected to be a good proxy for the expenditure that would be required to resolve the case concerned. The specifics of the jurisdictions where most of the claims are located further impair the predictability of the outcome of the cases. Therefore, it is typically not practicable to reliably estimate the financial effect that these lawsuits and claims would have if SAP were to incur expenditure for these cases.
Further, the expected timing of any resulting outflows of economic benefits from these lawsuits and claims is typically uncertain and not estimable, as it depends generally on the duration of the legal proceedings and settlement negotiations required to resolve them.
We are subject to a variety of claims and lawsuits that arise from time to time in the ordinary course of our business, including proceedings and claims that relate to companies we have acquired. We will continue to vigorously defend the Company against all claims and lawsuits against us. For the ongoing Teradata litigation, we have recorded a provision of €387 million (€0 million as at December 31, 2024) which reflects information received on the matter after December 31, 2025, as well as after the release of SAP’s preliminary financial results for the fiscal year 2025 on January 29, 2026. The provisions recorded for the other claims and lawsuits are neither individually nor in the aggregate material to SAP as at December 31, 2025, or December 31, 2024.
Among the claims and lawsuits disclosed in this Note are the following classes:
Intellectual Property-Related Litigation
Intellectual property-related litigation and claims are cases in which third parties have threatened or initiated litigation claiming that SAP violates one or more intellectual property rights that they possess. Such intellectual property rights may include patents, copyrights, and other similar rights.
Contingent liabilities exist from intellectual property-related litigation and claims for which no provision has been recognized. Generally, it is not practicable to estimate the financial impact of these contingent liabilities due to the uncertainties around the litigation and claims, as outlined above. Based on our past experience, most of the intellectual property-related litigation and claims tend to be either dismissed in court or settled out of court for amounts significantly below the originally claimed amounts. In
| 296/326 |
|
Integrated Report 2025 | ||||
| To
Our Stakeholders |
Combined
Management Report |
Consolidated
Financial Statements IFRS |
Additional Information | ||
addition to the provision which is explained in this note, we currently believe that resolving the intellectual property-related claims and lawsuits pending as at December 31, 2025, will neither individually nor in the aggregate have a material adverse effect on our business, financial position, profit, or cash flows.
Individual cases of intellectual property-related litigation and claims include the following:
The Teradata litigation claims have been pending in the U.S. federal court since 2018 when Teradata Corporation, Teradata US, Inc. and Teradata Operations, Inc. (collectively “Teradata”) filed a civil lawsuit against SAP SE, SAP America, Inc. and SAP Labs, LLC. Teradata alleges trade secret misappropriation and U.S. antitrust violations concerning the development and commercialization of the SAP HANA database. While SAP initially secured a dismissal of these claims in 2021, a 2024 appellate ruling reinstated the case, and the U.S. Supreme Court declined to review the matter in October 2025. SAP will continue to defend itself vigorously at the jury trial scheduled for March to April 2026. We have recorded a provision of €387 million as at December 31, 2025 (2024: €0 million) which to date reflects our best estimate of the outflows relating to this litigation. The outcome of the litigation remains uncertain, and the actual liability may differ from the amount provisioned. The Company will continue to monitor the situation and adjust the provision as necessary in future reporting periods.
In 2023 and 2024, Celonis SE (together with its subsidiary Celonis USA, Inc., “Celonis”) sent letters to SAP setting out various concerns and allegations. In early 2025, SAP filed a negative declaratory judgment action in Germany denying Celonis’ allegations. In March 2025, Celonis filed a lawsuit in the U.S. federal court in California, alleging that SAP had violated U.S. antitrust and competition laws relating to SAP’s sale of products from its subsidiary Signavio, and in SAP’s communications to SAP customers and the market concerning SAP’s policies for data access. Celonis requested a preliminary injunction against SAP requiring SAP to allow Celonis to continue to use its data extraction tool, and requiring SAP to retract or correct the alleged misstatements. The parties reached an agreement on June 5, 2025, whereby Celonis withdrew its request for a preliminary injunction. While the U.S. court initially dismissed the majority of Celonis’ claims in June 2025, it allowed additional claims to proceed in October 2025 after Celonis amended its complaint. SAP subsequently filed patent counterclaims against Celonis in November 2025. The trial is currently scheduled to begin on March 8, 2027. Celonis also filed a complaint against SAP in Germany (Munich), alleging unfair competition. In addition, both SAP and Celonis have initiated several patent cases in various courts in the United States and in Germany. Additionally, SAP is currently engaged in a constructive dialogue with the German Federal Cartel Office (FCO – Bundeskartellamt) regarding a complaint raised by Celonis. We are providing the FCO with comprehensive legal and factual arguments to support SAP’s position. Celonis has stated that it will seek damages from SAP based on its various claims. At present, Celonis has not made any formal monetary demands of SAP in connection with its claims in Germany or with any patent claims. In its U.S. antitrust case, Celonis is currently seeking damages of around US$70 million (around €60 million as of December 31, 2025).
Competition Law Claims
In September 2025, the European Commission (EC) started formal proceedings concerning SAP’s on-premise maintenance and support policies, which are based on long-established standards that are common across the global software sector. The investigation does not relate to or affect our cloud offerings. To address the EC’s concerns and to end the formal proceedings, SAP suggested remedies which were market tested by the EC in 2025 and are pending final EC approval in 2026. The suggested remedies have no effect on our financial results in 2025, and we do not anticipate that they will have a material impact on our future financial performance.
Tax-Related Litigation
We are subject to ongoing audits by domestic and foreign tax authorities. In respect of non-income taxes, we are involved in various proceedings with foreign tax authorities mainly regarding assessments and litigation matters on intercompany services. The potential amount in dispute related to these matters for all applicable years is approximately €192 million (2024: €274 million) in total (including related interest expenses and penalties of €127 million (2024: €150 million)). We have not recorded a provision for these matters, as we believe that we will prevail. The year-over-year decrease mainly resulted from a recent change in case law. This caused an increase of other taxes by €98 million negatively affecting SAP’s operating profit and a compensating benefit in SAP’s income tax expense in the third quarter of 2025.
For more information about our income tax–related litigation, see Note (C.5).
| 297/326 |
|
Integrated Report 2025 | ||||
| To
Our Stakeholders |
Combined
Management Report |
Consolidated
Financial Statements IFRS |
Additional Information | ||
(G.4) Board of Directors
Executive Board
Memberships on supervisory boards and other comparable governing bodies of enterprises, other than subsidiaries of SAP, on December 31, 2025:
Christian Klein
Chief Executive Officer
Corporate Development, Sustainability, Business AI, Compliance, Corporate Communications, Customer Success, Technology & Innovation
Supervisory Board, adidas AG, Herzogenaurach, Germany
Muhammad Alam
SAP Product & Engineering
Global responsibility for all SAP business software applications including product strategy, product management, design, and development
Dominik Asam
Chief Financial Officer
Global Finance & Administration including Legal, Investor Relations, Internal Audit, Data Protection & Export Control, Government Affairs
Supervisory Board, Bertelsmann Management SE and Bertelsmann SE & Co. KGaA, Guetersloh, Germany
Thomas Saueressig
Customer Services & Delivery
Global responsibility for long-term customer value in the cloud including customer services, premium engagements and customer support; cloud infrastructure, cloud operations, cloud lifecycle management, and private cloud delivery
Board of Directors, Nokia Corporation, Espoo, Finland
Sebastian Steinhaeuser (from February 1, 2025)
Chief Operating Officer
Global responsibility for the Board area Strategy & Operations, accelerating SAP’s strategy execution and simplifying operations
| 298/326 |
|
Integrated Report 2025 | ||||
| To
Our Stakeholders |
Combined
Management Report |
Consolidated
Financial Statements IFRS |
Additional Information | ||
Gina Vargiu-Breuer
Chief People Officer, Labor Director
Global responsibility for the People & Culture organization, owning SAP’s People Agenda
Supervisory Board
Memberships on supervisory boards and other comparable governing bodies of enterprises, other than subsidiaries of SAP, on December 31, 2025:
Dr. h. c. mult. Pekka Ala-Pietilä2,6,7
Chairperson
Chairperson of the Board of Directors of Sanoma Corporation, Helsinki, Finland
Chairperson of the Board of Directors of SITRA, Helsinki, Finland (from January 1, 2026)
Chairperson of the Supervisory Board of HERE Technologies B.V., Amsterdam, Netherlands
Lars Lamadé1,2,7
Deputy Chairperson
Head of Global Sponsorships, SAP SE, Walldorf, Germany
Supervisory Board, Rhein-Neckar Loewen GmbH, Kronau, Germany
Jakub Černý1,4,5
Demand Manager, SAP ČR, Prague, Czech Republic
Pascal Demat1,5,7
Solution Advisor HCM, SAP Belgium, Brussels, Belgium
SAP SE Works Council (Europe), Walldorf, Germany
Aicha Evans2,4,6
Chief Executive Officer and Member of the Board of Directors, Zoox, Inc., Foster City, CA, United States
Board of Directors, Joby Aviation LLC, Santa Cruz, CA, United States
| 299/326 |
|
Integrated Report 2025 | ||||
| To
Our Stakeholders |
Combined
Management Report |
Consolidated
Financial Statements IFRS |
Additional Information | ||
Marielle Ehrmann1,4,5 (from January 1, 2026)
Chief Security Compliance & Risk Officer, SAP SE, Walldorf, Germany
Andreas Hahn1,2,4
Product Expert, Digital Supply Chain Standards SAP SE, Walldorf, Germany
Chairperson of the SAP SE Works Council (Europe), Walldorf, Germany
Member of the SAP SE Works Council, Walldorf, Germany
Prof. Dr. Ralf Herbrich4,5
Managing Director and Professor for artificial intelligence and sustainability, Hasso Plattner Institute for Digital Engineering gGmbH, Potsdam, Germany
Margret Klein-Magar1,2,3 (until December 31, 2025)
Head of SAP Alumni Relations SAP SE, Walldorf, Germany
Chairperson of the Spokespersons’ Committee of Senior Managers of SAP SE
Jennifer Xin-Zhe Li3,5
General Partner of Changcheng Investment Partners, Beijing, China
Board of Directors, ABB Ltd., Zurich, Switzerland
Board of Directors, Full Truck Alliance Co. Ltd., Nanjing, Jiangsu, China, and Cayman Islands
Dr. Qi Lu4
CEO, MiraclePlus Ltd., Beijing, China
Board of Directors, Pinduoduo Inc., Shanghai, China
Chairperson of the Board of Directors, Pine Field Holding Limited, Cayman Islands
Chairperson of the Board of Directors, Pine Field Holding Limited, Hong Kong, China
Chairperson of the Board of Directors, Pine Field Ltd., Beijing, China
César Martin1,3,4
SAP EMEA Enterprise Architect, SAP Spain, Madrid, Spain
Chairperson of the SAP Spain Works Council, Madrid, Spain
Member of the SAP SE Works Council (Europe), Walldorf, Germany
| 300/326 |
|
Integrated Report 2025 | ||||
| To
Our Stakeholders |
Combined
Management Report |
Consolidated
Financial Statements IFRS |
Additional Information | ||
Gerhard Oswald3,4,7
Managing Director of Oswald Consulting GmbH, Walldorf, Germany
Advisory Board, TSG 1899 Hoffenheim Fußball-Spielbetriebs GmbH, Sinsheim, Germany
Advisory Board, appliedAI Initiative GmbH, Munich, Germany
Dr. Friederike Rotsch2,3,6,7
Attorney-at-law, Königstein im Taunus, Germany
Nicolas Sabatier1,2,4
Retired SAP Employee
Member of the Confédération Française de l’Encadrement – Confédération Générale des Cadres (CFE-CGC union, Paris, France)
Dr. Eberhard Schick1,3,5
Chairperson of the SAP SE Works Council, Walldorf, Germany
Nina Straßner1,2,3,7
Head of People Transformation Management BTM, SAP SE, Walldorf, Germany
Dr. Rouven Westphal2,5,6
Member of the Executive Board of the Hasso Plattner Foundation, Potsdam, Germany, and Managing Director of the General Partner of HPC Germany GmbH & Co. KG, Potsdam, Germany
Advisory Board, Sharks Sports & Entertainment LLC, San José, CA, United States
Dr. Gunnar Wiedenfels3,5
Chief Financial Officer, Warner Bros. Discovery, Inc., New York, NY, United States
Board of Directors, OWN LLC, West Hollywood, CA, United States
1 Appointed by the SAP SE Works Council (Europe)
2 Member of the Company’s Personnel and Governance Committee
3 Member of the Company’s Audit and Compliance Committee
4 Member of the Company’s Product and Technology Committee
5 Member of the Company’s Finance and Investment Committee
6 Member of the Company’s Nomination Committee
7 Member of the Company’s Government Security Committee
| 301/326 |
|
Integrated Report 2025 | ||||
| To
Our Stakeholders |
Combined
Management Report |
Consolidated
Financial Statements IFRS |
Additional Information | ||
(G.5) Executive and Supervisory Board Compensation
Accounting Policy
The short-term employee benefits disclosed below in the table “Executive Board Compensation” include a short-term, one-year performance-based compensation (“short-term incentive,” STI). The STI is granted in the Executive Board member’s home currency for a single year. Payment of part of the payout amount under the STI is deferred by one or two additional years and linked to the performance of the SAP share price (“STI deferral”). The short-term employee benefits include both the granted and the deferred amount.
The share-based payment amounts disclosed below in the table “Executive Board Compensation” are based on the grant date fair value of the share units in the respective year. In 2024 and 2025, share units were issued to the Executive Board members under the LTI 2024. In 2023, share units were issued to the Executive Board members under the LTI 2020. For more information about the terms and details of these plans, see Note (B.3).
In the table “Share-Based Payment for Executive Board Members,” the share-based payment expense is the amount recorded in profit or loss under IFRS 2 (Share-Based Payment) in the respective period.
The total compensation of the Executive Board members for each of the years 2025, 2024, and 2023 was as follows:
Executive Board Compensation
| € thousands | 2025 | 2024 | 2023 |
| Short-term employee benefits | 17,183 | 21,116 | 19,632 |
| Share-based payment | 16,215 | 22,279 | 24,469 |
| Subtotal | 33,398 | 43,395 | 44,101 |
| Post-employment benefits | 50 | –269 | 1,033 |
| thereof defined-benefit | –104 | –711 | 673 |
| thereof defined-contribution | 154 | 441 | 360 |
| Termination benefits | NA | 21,615 | NA |
| Total | 33,448 | 64,741 | 45,134 |
Share-Based Payment for Executive Board Members
| 2025 | 2024 | 2023 | |
| Number of share units granted | 60,172 | 126,244 | 214,530 |
| Total expense in € thousands | 19,367 | 52,062 | 36,127 |
The defined benefit obligation (DBO) for pensions to Executive Board members and the annual pension entitlement of the members of the Executive Board on reaching age 62 based on entitlements from performance-based and salary-linked plans were as follows:
Retirement Pension Plan for Executive Board Members
| € thousands | 2025 | 2024 | 2023 |
| DBO 12/31 | 872 | 1,187 | 2,192 |
| Annual pension entitlement | 69 | 88 | 137 |
| 302/326 |
|
Integrated Report 2025 | ||||
| To
Our Stakeholders |
Combined
Management Report |
Consolidated
Financial Statements IFRS |
Additional Information | ||
The total annual compensation of the Supervisory Board members is as follows:
Supervisory Board Compensation
| € thousands | 2025 | 2024 | 2023 |
| Total compensation | 5,131 | 5,579 | 5,427 |
| thereof fixed compensation | 3,460 | 3,507 | 3,185 |
| thereof committee remuneration | 1,671 | 2,071 | 2,242 |
The Supervisory Board compensation is a short-term benefit. The Supervisory Board members do not receive any share-based payment for their services. As far as members who are employee representatives on the Supervisory Board receive share-based payment, such compensation is for their services as employees only and is unrelated to their status as members of the Supervisory Board.
Payments to/DBO for Former Executive Board Members
| € thousands | 2025 | 2024 | 2023 |
| Payments | 2,542 | 2,444 | 2,329 |
| DBO 12/31 | 33,472 | 32,213 | 33,251 |
In 2023, SAP granted a loan within the SAP-Flex Loan program for its employees, amounting to €5,000 to an employee who later joined the Supervisory Board as an employee representative in 2024. Besides this loan, SAP did not grant any compensation advance or credit to, or enter into any commitment for the benefit of, any member of the Executive Board or Supervisory Board in 2025, 2024, or 2023.
(G.6) Related-Party Transactions Other Than Board Compensation
Certain Supervisory Board members of SAP SE currently hold, or held within the last year, positions of significant responsibility with other entities. We have relationships with certain of these entities in the ordinary course of business, whereby we buy and sell products, assets, and services on terms believed to be consistent with those negotiated at arm’s length between unrelated parties.
Occasionally, members of the Executive Board of SAP SE obtain services from SAP for which they pay a consideration consistent with those negotiated at arm’s length between unrelated parties.
All amounts related to the abovementioned transactions were immaterial to SAP in all periods presented.
SAP has relationships with joint ventures and associates in the ordinary course of business whereby SAP buys and sells a wide variety of products and services generally on arm’s length terms.
Related-Party Transactions
| Executive Board Members | Supervisory Board Members | Companies Controlled by Supervisory Board Members | Associated Entities | |||||
| € millions | 2025 | 2024 | 2025 | 2024 | 2025 | 2024 | 2025 | 2024 |
|
Products and services provided |
NA | NA | NA | NA | NA | 0 | 42 | 55 |
|
Products and services received |
NA | NA | 21 | 21 | NA | 1 | 89 | 90 |
|
Sponsoring and other financial support provided |
NA | NA | NA | NA | NA | 5 | NA | NA |
| Outstanding balances at year end (Vendors) | NA | NA | NA | NA | NA | NA | 3 | 2 |
| Outstanding balances at year end (Customers) | NA | NA | 0 | 0 | NA | NA | 3 | 20 |
|
Commitments at year end |
NA | NA | NA | NA | NA | NA | NA | NA |
1 including services from employee representatives on the Supervisory Board in their capacity as employees of SAP
All of these balances are unsecured and interest-free and settlement is expected to occur in cash.
| 303/326 |
|
Integrated Report 2025 | ||||
| To
Our Stakeholders |
Combined
Management Report |
Consolidated
Financial Statements IFRS |
Additional Information | ||
For information about the compensation of our Executive Board and Supervisory Board members, see Note (G.5).
(G.7) Principal Accountant Fees
At the Annual General Meeting of Shareholders held on May 13, 2025, our shareholders elected BDO AG Wirtschaftsprüfungsgesellschaft (BDO) as SAP’s independent auditor for 2025. BDO has been the Company’s principal auditor since the fiscal year 2023. Dr. Jens Freiberg has signed as auditor responsible for the audit of the financial reporting and the Group reporting of SAP SE since the fiscal year 2023.
BDO and other firms in the global BDO network charged the following fees to SAP for audit and other professional services related to 2025 and previous years:
| € millions | 2025 | 2024 | 2023 | ||||||
| BDO AG (Germany) |
Foreign BDO Firms |
Total | BDO AG (Germany) |
Foreign BDO Firms |
Total | BDO AG (Germany) |
Foreign BDO Firms |
Total | |
| Audit fees | 10 | 6 | 16 | 8 | 6 | 14 | 8 | 5 | 13 |
| Audit-related fees | 1 | 7 | 8 | 1 | 6 | 7 | 0 | 1 | 1 |
| Tax fees | 0 | 0 | 0 | 0 | 0 | 0 | 0 | 0 | 0 |
| All other fees | 0 | 0 | 0 | 0 | 0 | 0 | 0 | 0 | 0 |
| Total | 11 | 13 | 24 | 9 | 11 | 20 | 8 | 6 | 14 |
Audit fees are the aggregate fees charged by BDO for auditing our consolidated financial statements and the statutory financial statements of SAP SE and its subsidiaries. Audit-related fees are fees charged by BDO for assurance and related services that are reasonably related to the performance of the audit and for service organization attestation procedures. The increase in audit-related fees in 2024 was mainly related to attestation services for System and Organization Controls (SOC) reports in the United States, and for the assurance engagement on the Group Sustainability Statement.
(G.8) Events After the Reporting Period
New Share Repurchase Program
Following SAP’s strong free cash flow generation, the Executive Board and the Supervisory Board authorized a new share repurchase program with a volume of up to €10 billion. The program started in February 2026 and is expected to be completed by the end of 2027. The program was implemented based on the authorization granted by the Annual General Meeting of SAP SE on May 11, 2023, and in compliance with the restrictions set forth therein.
| 304/326 |
|
Integrated Report 2025 | ||||
| To
Our Stakeholders |
Combined
Management Report |
Consolidated
Financial Statements IFRS |
Additional Information | ||
(G.9) Scope of Consolidation, Subsidiaries and Other Equity Investments
Entities Consolidated in the Financial Statements
| Total | |
| 12/31/2023 | 235 |
| Additions | 10 |
| Disposals | –19 |
| 12/31/2024 | 226 |
| Additions | 8 |
| Disposals | –18 |
| 12/31/2025 | 216 |
The additions relate to legal entities added in connection with acquisitions and foundations. The disposals are mainly due to mergers, liquidations, and divestitures of legal entities.
| 305/326 |
|
Integrated Report 2025 | ||||
| To
Our Stakeholders |
Combined
Management Report |
Consolidated
Financial Statements IFRS |
Additional Information | ||
Subsidiaries1
| Major Subsidiaries | ||||||
| Name and Location of Company | Owner-ship | Total Revenue in 20252 |
Profit/Loss |
Total Equity as at 12/31/20252 |
Number of Employees as at 12/31/20253 |
Footnote |
| % | € thousands | € thousands | € thousands | |||
| Ariba Technologies India Private Limited, Bengaluru, India | 100 | 137,247 | 25,023 | 50,114 | 1,251 | |
| Ariba, Inc., Palo Alto, CA, United States | 100 | 1,557,926 | 806,456 | 3,989,395 | 1,284 | |
| Concur Holdings (Netherlands) B.V., 's-Hertogenbosch, the Netherlands | 100 | 541,220 | 7,936 | 386,069 | 17 | |
| Concur Technologies, Inc., Bellevue, WA, United States | 100 | 2,319,808 | 883,996 | 7,528,447 | 2,538 | |
| SAP (China) Co., Ltd., Shanghai, China | 100 | 1,294,322 | 11,633 | –97,369 | 6,199 | |
| SAP (Schweiz) AG, Biel, Switzerland | 100 | 1,590,095 | 150,714 | 357,270 | 866 | |
| SAP (UK) Limited, Feltham, United Kingdom | 100 | 1,616,658 | 77,797 | 238,541 | 1,536 | 13 |
| SAP America, Inc., Newtown Square, PA, United States | 100 | 9,892,526 | –244,393 | 14,637,281 | 8,940 | |
| SAP Argentina S.A., Buenos Aires, Argentina | 100 | 292,976 | 23,267 | 25,328 | 1,316 | 13 |
| SAP Asia Pte. Ltd., Singapore, Singapore | 100 | 813,289 | 14,349 | 57,670 | 1,134 | 13 |
| SAP Australia Pty. Ltd., Sydney, Australia | 100 | 889,659 | –6,382 | 59,446 | 1,226 | |
| SAP Belgium – Systems, Applications and Products S.A., Brussels, Belgium | 100 | 539,922 | 30,556 | 84,869 | 308 | |
| SAP Brasil Ltda., São Paulo, Brazil | 100 | 986,021 | –63,636 | 23,259 | 3,391 | 13 |
| SAP Canada Inc., Toronto, Canada | 100 | 1,285,551 | 100,619 | 701,018 | 3,076 | |
| SAP Deutschland SE & Co. KG, Walldorf, Germany | 100 | 6,641,244 | 1,095,771 | 2,170,257 | 4,935 | 9 |
| SAP España – Sistemas, Aplicaciones y Productos en la Informática, S.A., Madrid, Spain | 100 | 794,452 | 37,005 | 72,741 | 1,059 | |
| SAP France S.A., Levallois-Perret, France | 100 | 1,368,211 | 242,669 | 1,921,529 | 1,414 | |
| SAP Hungary Rendszerek, Alkalmazások és Termékek az Adatfeldolgozásban Informatikai Kft., Budapest, Hungary | 100 | 232,011 | 9,451 | 46,812 | 1,776 | |
| SAP India Private Limited, Bengaluru, India | 100 | 1,020,589 | 101,729 | 256,324 | 2,750 | |
| SAP Industries, Inc., Newtown Square, PA, United States | 100 | 629,727 | 184,152 | 1,682,091 | 192 | |
| SAP Italia Sistemi Applicazioni Prodotti in Data Processing S.p.A., Vimercate, Italy | 100 | 923,229 | 73,240 | 124,726 | 839 | |
| SAP Japan Co., Ltd., Tokyo, Japan | 100 | 1,382,651 | 137,537 | 203,818 | 1,384 | |
| SAP Labs Bulgaria EOOD, Sofia, Bulgaria | 100 | 188,520 | 7,462 | 48,241 | 1,905 | |
| SAP Labs India Private Limited, Bengaluru, India | 100 | 1,118,274 | 119,847 | 330,496 | 12,666 | |
| SAP Labs, LLC, Palo Alto, CA, United States | 100 | 563,424 | 67,838 | 916,043 | 1,408 | |
| SAP México S.A. de C.V., Mexico City, Mexico | 100 | 612,035 | 38,089 | 150,637 | 1,252 | 13 |
| SAP National Security Services, Inc., Newtown Square, PA, United States | 100 | 1,153,024 | 209,237 | 610,284 | 782 | |
| SAP Nederland B.V., 's-Hertogenbosch, the Netherlands | 100 | 980,414 | 209,483 | 308,421 | 711 | |
| SAP Österreich GmbH, Vienna, Austria | 100 | 513,797 | 45,362 | 73,728 | 525 | |
| SAP Philippines, Inc., Taguig City, Philippines | 100 | 147,067 | 5,628 | 16,218 | 1,076 | 13 |
| SAP Service and Support Centre (Ireland) Limited, Dublin, Ireland | 100 | 361,946 | 86,967 | 174,319 | 1,729 | |
| SAP Services s.r.o., Prague, Czech Republic | 100 | 175,345 | 5,371 | 30,505 | 1,845 | 13 |
| SC SAP Romania SRL, Bucharest, Romania | 100 | 148,720 | 9,766 | 31,771 | 1,078 |
| 306/326 |
|
Integrated Report 2025 | ||||
| To
Our Stakeholders |
Combined
Management Report |
Consolidated
Financial Statements IFRS |
Additional Information | ||
Other Subsidiaries4 |
||
| Name and Location of Company | Ownership | Footnote |
| % | ||
| "SAP Kazakhstan" LLP, Almaty, Kazakhstan | 100 | |
| 110405, Inc., Newtown Square, PA, United States | 100 | |
| Ambin Properties Proprietary Limited, Johannesburg, South Africa | 100 | 13 |
| Ariba Czech s.r.o., Prague, Czech Republic | 100 | 13 |
| Ariba India Private Limited, Gurugram, India | 100 | |
| Ariba International Holdings, Inc., Wilmington, DE, United States | 100 | |
| Ariba Technologies Netherlands B.V., 's-Hertogenbosch, the Netherlands | 100 | |
| Baiza Capital Designated Activity Company, Dublin, Ireland | 0 | 8 |
| Baiza Capital Italia s.r.l., Milan, Italy | 0 | 8 |
| Baiza Capital LLC, Newark, NJ, United States | 0 | 8 |
| Baiza Capital S.A., Luxembourg, Luxembourg | 0 | 8 |
| Business Objects Option, LLC, Wilmington, DE, United States | 100 | |
| Business Objects Software Limited, Dublin, Ireland | 100 | 13 |
| Callidus Software Inc., San Ramon, CA, United States | 100 | |
| CallidusCloud (India) Private Limited, Hyderabad, India | 100 | |
| CNQR Operations Mexico S. de. R.L. de. C.V., Mexico City, Mexico | 100 | |
| Concur (Canada), Inc., Toronto, Canada | 100 | |
| Concur (Czech) s.r.o., Prague, Czech Republic | 100 | 13 |
| Concur (France) S.A.S., Levallois-Perret, France | 100 | |
| Concur (Germany) GmbH, Frankfurt am Main, Germany | 100 | 10, 11 |
| Concur (Japan) Ltd., Tokyo, Japan | 100 | |
| Concur (Philippines) Inc., Makati City, Philippines | 100 | |
| Concur (Switzerland) GmbH, Zurich, Switzerland | 100 | |
| Concur Technologies (Australia) Pty. Ltd., Sydney, Australia | 100 | |
| Concur Technologies (Hong Kong) Limited, Hong Kong, China | 100 | |
| Concur Technologies (India) Private Limited, Bengaluru, India | 100 | |
| Concur Technologies (Singapore) Pte. Ltd., Singapore, Singapore | 100 | 13 |
| Concur Technologies (UK) Limited, Feltham, United Kingdom | 100 | 13 |
| ConTgo Limited, Feltham, United Kingdom | 100 | |
| Delos Cloud GmbH, Walldorf, Germany | 100 | |
| Emarsys eMarketing Systems GmbH, Vienna, Austria | 100 | 13 |
| Emarsys İletişim Sistemleri Tic. Ltd Şti., Istanbul, Turkey | 100 | |
| Emarsys Interactive Services GmbH, Berlin, Germany | 100 | |
| Emarsys Limited, Hong Kong, China | 100 | |
| Emarsys North America, Inc., Indianapolis, IN, United States | 100 | |
| Emarsys Pte. Ltd., Singapore, Singapore | 100 | |
| Emarsys Pty. Ltd., Sydney, Australia | 100 | |
| Emarsys S.A.S., Levallois-Perret, France | 100 | 13 |
| Emarsys Schweiz GmbH, Zurich, Switzerland | 100 | |
| Emarsys UK Ltd, London, United Kingdom | 100 | 13 |
| EMARSYS-Technologies Informatikai Szolgáltató Kft., Budapest, Hungary | 100 | |
| FreeMarkets Ltda., São Paulo, Brazil | 100 |
| 307/326 |
|
Integrated Report 2025 | ||||
| To
Our Stakeholders |
Combined
Management Report |
Consolidated
Financial Statements IFRS |
Additional Information | ||
Other Subsidiaries4 |
||
| Name and Location of Company | Ownership | Footnote |
| % | ||
| LeadFormix, Inc., San Ramon, CA, United States | 100 | |
| LeanIX UK Limited, London, United Kingdom | 100 | |
| LLC "SAP Labs", Moscow, Russia | 100 | |
| LLC "SAP Ukraine", Kyiv, Ukraine | 100 | 13 |
| Loyalsys Technologies Israel Ltd., Tel Aviv–Yafo, Israel | 100 | |
| LXTECH India Private Limited, Hyderabad, India | 100 | |
| Outerjoin, Inc., San Ramon, CA, United States | 100 | |
| OutlookSoft Deutschland GmbH, Walldorf, Germany | 100 | 10, 11 |
| PT SAP Indonesia, Jakarta, Indonesia | 99 | |
| Quadrem Africa Pty. Ltd., Johannesburg, South Africa | 100 | |
| Quadrem Brazil Ltda., Rio de Janeiro, Brazil | 100 | |
| Quadrem Chile Ltda., Santiago de Chile, Chile | 100 | |
| Quadrem International Ltd., Hamilton, Bermuda | 100 | |
| Quadrem Netherlands B.V., 's-Hertogenbosch, the Netherlands | 100 | |
| Quadrem Overseas Cooperatief U.A., 's-Hertogenbosch, the Netherlands | 100 | |
| Quadrem Peru S.A.C., Lima, Peru | 100 | |
| SAP (Beijing) Software System Co., Ltd., Beijing, China | 100 | |
| SAP (China) Holding Co., Ltd., Beijing, China | 100 | |
| SAP Andina y del Caribe C.A., Caracas, Venezuela | 100 | 13 |
| SAP AZ LLC, Baku, Azerbaijan | 100 | |
| SAP Beteiligungs GmbH, Walldorf, Germany | 100 | |
| SAP Bulgaria EOOD, Sofia, Bulgaria | 100 | |
| SAP Chile Limitada, Santiago de Chile, Chile | 100 | 13 |
| SAP CIS, LLC, Moscow, Russia | 100 | |
| SAP Colombia S.A.S., Bogotá, D.C., Colombia | 100 | 13 |
| SAP Costa Rica, S.A., San José, Costa Rica | 100 | 13 |
| SAP ČR, spol. s r.o., Prague, Czech Republic | 100 | |
| SAP Cyprus Limited, Strovolos, Cyprus | 100 | |
| SAP Danmark A/S, Copenhagen, Denmark | 100 | |
| SAP Dritte Beteiligungs- und Vermögensverwaltungs GmbH, Walldorf, Germany | 100 | |
| SAP društvo s ograničenom odgovornošću za digitalnu ekonomiju novog tisućljeća, Zagreb, Croatia | 100 | |
| SAP East Africa Limited, Nairobi, Kenya | 100 | 13 |
| SAP Egypt LLC, Cairo, Egypt | 100 | 13 |
| SAP EMEA Inside Sales S.L., Madrid, Spain | 100 | |
| SAP Erste Beteiligungs- und Vermögensverwaltungs GmbH, Walldorf, Germany | 100 | 10, 11 |
| SAP Estonia OÜ, Tallinn, Estonia | 100 | |
| SAP Financial, Inc., Toronto, Canada | 100 | |
| SAP Finland Oy, Espoo, Finland | 100 | |
| SAP Foreign Holdings GmbH, Walldorf, Germany | 100 | |
| SAP France Holding S.A., Levallois-Perret, France | 100 | |
| SAP Global Marketing, Inc., New York, NY, United States | 100 | |
| SAP Hellas Single Member S.A., Athens, Greece | 100 |
| 308/326 |
|
Integrated Report 2025 | ||||
| To
Our Stakeholders |
Combined
Management Report |
Consolidated
Financial Statements IFRS |
Additional Information | ||
Other Subsidiaries4 |
||
| Name and Location of Company | Ownership | Footnote |
| % | ||
| SAP Hong Kong Co., Ltd., Hong Kong, China | 100 | 13 |
| SAP Hosting Beteiligungs GmbH, St. Leon-Rot, Germany | 100 | 10, 11 |
| SAP India (Holding) Pte. Ltd., Singapore, Singapore | 100 | |
| SAP International Panama, S.A., Panama City, Panama | 100 | |
| SAP International, Inc., Miami, FL, United States | 100 | |
| SAP Investments, Inc., Wilmington, DE, United States | 100 | |
| SAP Ireland Limited, Dublin, Ireland | 100 | |
| SAP Ireland US - Financial Services Designated Activity Company, Dublin, Ireland | 100 | |
| SAP Israel Ltd., Ra'anana, Israel | 100 | 13 |
| SAP Korea Ltd., Seoul, South Korea | 100 | |
| SAP Labs France S.A.S., Mougins, France | 100 | |
| SAP Labs Israel Ltd., Ra'anana, Israel | 100 | |
| SAP Labs Korea, Inc., Seoul, South Korea | 100 | |
| SAP Latvia SIA, Riga, Latvia | 100 | |
| SAP Lietuva UAB, Vilnius, Lithuania | 100 | |
| SAP Malaysia Sdn. Bhd., Kuala Lumpur, Malaysia | 100 | |
| SAP Middle East and Africa North Regional Headquarter Company, Riyadh, Kingdom of Saudi Arabia | 100 | |
| SAP Middle East and North Africa L.L.C., Dubai, United Arab Emirates | 100 | 13 |
| SAP Middle East FZ-LLC, Dubai, United Arab Emirates | 100 | 13 |
| SAP New Zealand Limited, Auckland, New Zealand | 100 | |
| SAP Norge AS, Oslo, Norway | 100 | |
| SAP North West Africa Ltd, Casablanca, Morocco | 100 | 13 |
| SAP Perú S.A.C., Lima, Peru | 100 | 13 |
| SAP Polska Sp. z o.o., Warsaw, Poland | 100 | |
| SAP Portals Israel Ltd., Ra'anana, Israel | 100 | |
| SAP Portugal – Sistemas, Aplicações e Produtos Informáticos, Sociedade Unipessoal, Lda., Porto Salvo, Portugal | 100 | |
| SAP Projektverwaltungs- und Beteiligungs GmbH, Walldorf, Germany | 100 | |
| SAP Public Services, Inc., Washington, DC, United States | 100 | |
| SAP Puerto Rico GmbH, Walldorf, Germany | 100 | 10, 11, 13 |
| SAP Retail Solutions Beteiligungsgesellschaft GmbH, Walldorf, Germany | 100 | |
| SAP Saudi Software Services Ltd., Riyadh, Kingdom of Saudi Arabia | 100 | |
| SAP Saudi Software Trading Ltd., Riyadh, Kingdom of Saudi Arabia | 75 | 13 |
| SAP Sechste Beteiligungs- und Vermögensverwaltungs GmbH, Walldorf, Germany | 100 | 10, 11 |
| SAP Siebte Beteiligungs- und Vermögensverwaltungs GmbH, Walldorf, Germany | 100 | 10, 11 |
| SAP sistemi, aplikacije in produkti za obdelavo podatkov d.o.o., Ljubljana, Slovenia | 100 | |
| SAP Slovensko s.r.o., Bratislava, Slovakia | 100 | |
| SAP Software and Services WLL, Doha, Qatar | 49 | 6 |
| SAP Svenska Aktiebolag, Stockholm, Sweden | 100 | |
| SAP System Application and Products Asia Myanmar Limited, Yangon, Myanmar | 100 | |
| SAP Systems, Applications and Products in Data Processing (Thailand) Ltd., Bangkok, Thailand | 100 | |
| SAP Taiwan Co., Ltd., Taipei, Taiwan | 100 | |
| SAP Technologies Inc., Palo Alto, CA, United States | 100 |
| 309/326 |
|
Integrated Report 2025 | ||||
| To
Our Stakeholders |
Combined
Management Report |
Consolidated
Financial Statements IFRS |
Additional Information | ||
Other Subsidiaries4 |
||
| Name and Location of Company | Ownership | Footnote |
| % | ||
| SAP Training and Development Institute FZCO, Dubai, United Arab Emirates | 100 | |
| SAP Türkiye Yazilim Üretim ve Ticaret A.Ş., Istanbul, Turkey | 100 | |
| SAP Ventures Investment GmbH, Walldorf, Germany | 100 | 10, 11 |
| SAP Vierte Beteiligungs- und Vermögensverwaltungs GmbH, Walldorf, Germany | 100 | |
| SAP Vietnam Company Limited, Ho Chi Minh City, Vietnam | 100 | |
| SAP West Balkans d.o.o., Belgrade, Serbia | 100 | |
| SAP Zweite Beteiligungs- und Vermögensverwaltungs GmbH, Walldorf, Germany | 100 | 10, 11 |
| SAP.io Fund, L.P., Austin, TX, United States | 0 | 7 |
| Sapphire Fund Investments II Holdings, LLC, Austin, TX, United States | 100 | 7 |
| Sapphire Fund Investments II, L.P., Austin, TX, United States | 0 | 7 |
| Sapphire Fund Investments III Holdings, LLC, Austin, TX, United States | 100 | 7 |
| Sapphire Fund Investments III, L.P., Austin, TX, United States | 0 | 7 |
| Sapphire SAP HANA Fund of Funds, L.P., Austin, TX, United States | 0 | 7 |
| Sapphire Ventures Fund I, L.P., Austin, TX, United States | 0 | 7 |
| Sapphire Ventures Fund II, L.P., Austin, TX, United States | 0 | 7 |
| Sapphire Ventures Fund III, L.P., Austin, TX, United States | 0 | 7 |
| Sapphire Ventures Fund IV, L.P., Austin, TX, United States | 0 | 7 |
| Sapphire Ventures Fund V, L.P., Austin, TX, United States | 0 | 7 |
| Sapphire Ventures Fund VI Holdings, LLC, Austin, TX, United States | 100 | 5, 7 |
| Sapphire Ventures Fund VI, L.P., Austin, TX, United States | 0 | 7 |
| Sapphire Ventures Fund VII-A, L.P., Austin, TX, United States | 0 | 7 |
| Shanghai SAP Cloud Technology Company, Ltd., Shanghai, China | 100 | |
| SmartRecruiters Australia Pty Ltd, Sydney, Australia | 100 | 5 |
| SmartRecruiters GmbH, Walldorf, Germany | 100 | 5 |
| SmartRecruiters Inc., San Francisco, CA, United States | 100 | 5 |
| SmartRecruiters Ltd., London, United Kingdom | 100 | 5, 13 |
| SmartRecruiters Sarl., La Garenne Colombes, France | 100 | 5 |
| SuccessFactors (Philippines), Inc., Pasig City, Philippines | 100 | 13 |
| SuccessFactors, Inc., Newtown Square, PA, United States | 100 | |
| Sybase Angola, LDA, Luanda, Angola | 100 | |
| Sybase, Inc., San Ramon, CA, United States | 100 | |
| Systems Applications Products (Africa Region) Proprietary Limited, Johannesburg, South Africa | 100 | |
| Systems Applications Products (Africa) Proprietary Limited, Johannesburg, South Africa | 100 | |
| Systems Applications Products (South Africa) Proprietary Limited, Johannesburg, South Africa | 81 | 13 |
| Systems Applications Products Nigeria Limited, Victoria Island, Nigeria | 100 | 13 |
| Taulia (Shanghai) Smart Technology Co. Ltd., Shanghai, China | 100 | |
| Taulia Arabia LLC, Riyadh, Kingdom of Saudi Arabia | 100 | |
| Taulia Australia Pty. Ltd., Sydney, Australia | 100 | |
| Taulia Bulgaria EOOD, Sofia, Bulgaria | 100 | |
| Taulia GmbH, Düsseldorf, Germany | 100 | 12 |
| Taulia LLC, San Francisco, CA, United States | 97 | |
| Taulia Singapore Pte. Ltd., Singapore, Singapore | 100 |
| 310/326 |
|
Integrated Report 2025 | ||||
| To
Our Stakeholders |
Combined
Management Report |
Consolidated
Financial Statements IFRS |
Additional Information | ||
Other Subsidiaries4 |
||
| Name and Location of Company | Ownership | Footnote |
| % | ||
| Taulia Trade Technology GmbH, Düsseldorf, Germany | 100 | |
| Taulia UK Ltd., London, United Kingdom | 100 | 13 |
| Tereina Employee Holdings LLC, Palo Alto, CA, United States | 0 | 5, 7 |
| Tereina LLC, Palo Alto, CA, United States | 72 | 5 |
| TRX Technologies India Private Limited, Bengaluru, India | 100 | |
| TRX, Inc., Bellevue, WA, United States | 100 | |
| Volume Integration, Inc., Chantilly, VA, United States | 100 | |
| WalkMe Australia Pty. Ltd., Sydney, Australia | 100 | |
| WalkMe Canada Ltd., Toronto, Canada | 100 | |
| WalkMe Germany GmbH, Frankfurt am Main, Germany | 100 | 12 |
| WalkMe K.K., Tokyo, Japan | 100 | |
| WalkMe Ltd., Tel Aviv–Yafo, Israel | 100 | |
| WalkMe Singapore Pte. Ltd., Singapore, Singapore | 100 | |
| WalkMe UK Limited, London, United Kingdom | 100 | |
| WalkMe, Inc., San Francisco, CA, United States | 100 |
1 For the classification of the subsidiaries, the following figures are considered: revenues, profit/loss after tax, total equity, and number of employees.
2 These figures are based on our local IFRS financial statements prior to eliminations resulting from consolidation and therefore do not reflect the contribution of these companies included in the Consolidated Financial Statements. The translation of the equity into Group currency is based on period-end closing exchange rates, and on average exchange rates for revenue and net income/loss.
3 As at December 31, 2025, including managing directors, in FTE.
4 Figures for profit/loss after tax and total equity pursuant to HGB, section 285 and section 313 are not disclosed if they are of minor significance for a fair presentation of the profitability, liquidity, capital resources, and financial position of SAP SE, pursuant to HGB, section 313 (2) sentence 3 no. 4 and section 286 (3) sentence 1 no. 1.
5 Consolidated for the first time in 2025.
6 Agreements with the other shareholders provide that SAP SE fully controls the entity.
7 Structured entity belonging to SAP SE. The results of operations of these entities are included in SAP’s Consolidated Financial Statements in accordance with IFRS 10 (Consolidated Financial Statements).
8 In accordance with IFRS 10, the structured entity does not include the receivables and liabilities resulting from the supply chain financing (SCF) activities.
9 Entity whose personally liable partner is SAP SE.
10 Entity with (profit and) loss transfer agreement.
11 Pursuant to HGB, section 264 (3) or section 264b, the subsidiary is exempt from applying certain legal requirements to their statutory stand-alone financial statements including the requirement to prepare notes to the financial statements and a review of operations, the requirement of independent audit, and the requirement of public disclosure.
12 Pursuant to HGB, section 316 (1), the subsidiary is exempt from having its financial statements audited in respect of its financial year ended December 31, 2025.
13 Entity with support letter issued.
Other Equity Investments
| Name and Location of Company | Ownership |
| % | |
| Joint Arrangements and Investments in Associates | |
| China DataCom Corporation Limited, Guangzhou, China | 28 |
| Procurement Negócios Eletrônicos S/A, Rio de Janeiro, Brazil | 17 |
| SAP Fioneer GmbH, Walldorf, Germany | 20 |
| Name and Location of Company |
| Equity Investments with Ownership of at Least 5% |
| 359 Capital Parallel Fund I, L.P. (fka Sapphire Sport Parallel Fund II, L.P.), New York, NY, United States |
| 311/326 |
|
Integrated Report 2025 | ||||
| To
Our Stakeholders |
Combined
Management Report |
Consolidated
Financial Statements IFRS |
Additional Information | ||
| Name and Location of Company |
| Equity Investments with Ownership of at Least 5% |
| 359 Capital Parallel Fund Zero, L.P. (fka Sapphire Sport Parallel Fund, L.P.), New York, NY, United States |
| 359 Capital Zero, L.P. (fka Sapphire Sport I, L.P.), New York, NY, United States |
| 47th Street Partners I, L.P., Menlo Park, CA, United States |
| Adverity GmbH, Vienna, Austria |
| Alation, Inc., Redwood City, CA, United States |
| Alchemist Accelerator Fund I, LLC, San Francisco, CA, United States |
| Aleph-Bringg SPV, L.P., Grand Cayman, Cayman Islands |
| All Tax Platform – SOLUÇÕES TRIBUTÁRIAS S.A., São Paulo, Brazil |
| Amplify Bio I, L.P., Menlo Park, CA, United States |
| Amplify Partners II, L.P., Menlo Park, CA, United States |
| Amplify Partners III, L.P., Menlo Park, CA, United States |
| Amplify Partners IV, L.P., Menlo Park, CA, United States |
| Amplify Partners, L.P., Menlo Park, CA, United States |
| Anrok, Inc., San Francisco, CA, United States |
| Asylum Ventures 2024, LP (fka Filament 2024, LP), New York, NY, United States |
| BGS Holdings, Inc., Austin, TX, United States |
| BioCatch Ltd., Tel Aviv, Israel |
| Bitonic Technology Labs, Inc. (dba Yellow.ai), Bengaluru, India |
| Blue J Legal Inc., Toronto, Canada |
| Boldstart Ventures V, L.P., Miami, FL, United States |
| Boldstart Ventures VI, L.P., Miami, FL, United States |
| Brightfield Holdings, Inc., New York, NY, United States |
| Bryj Technologies, Inc. (fka Follow Analytics, Inc.), San Francisco, CA, United States |
| BY Crypto 1 GmbH & Co. KG (fka BY Capital 1 Alternative GmbH & Co. KG), Berlin, Germany |
| byFounders VC SPV III K/S, Copenhagen, Denmark |
| Castle Newco, LLC (fka Clari Inc.), Atlanta, GA, United States |
| CDQ AG, St. Gallen, Switzerland |
| Chalfen Ventures Fund I, L.P., St Heiler, Jersey, Channel Islands |
| Chalfen Ventures Fund II, L.P., St Helier, Jersey, Channel Islands |
| Chalfen Ventures Fund III, L.P., St Helier, Jersey, Channel Islands |
| Charlton House Professional Services Limited, Norwich, United Kingdom |
| CircleCI, Inc., San Francisco, CA, United States |
| Cofinity-X GmbH, Cologne, Germany |
| Collectly, Inc., Pasadena, CA, United States |
| ComponentLab, Inc., Seattle, WA, United States |
| Constructor Topco Inc., San Francisco, CA, United States |
| Contentful GmbH, Berlin, Germany |
| Costanoa Venture Capital II, L.P., Palo Alto, CA, United States |
| Costanoa Venture Capital QZ, LLC, Palo Alto, CA, United States |
| Creandum SPV TR (D) AB, Stockholm, Sweden |
| Creatio Inc., Boston, MA, United States |
| Culture Amp, Pty Ltd., Melbourne, Australia |
| Cypress.io, Inc., Atlanta, GA, United States |
| Data Collective II, L.P., Palo Alto, CA, United States |
| 312/326 |
|
Integrated Report 2025 | ||||
| To
Our Stakeholders |
Combined
Management Report |
Consolidated
Financial Statements IFRS |
Additional Information | ||
| Name and Location of Company |
| Equity Investments with Ownership of at Least 5% |
| Data Collective III, L.P., Palo Alto, CA, United States |
| Data Collective IV, L.P., Palo Alto, CA, United States |
| Data.R.X. Ltd. (dba Datricks Ltd.), Tel Aviv, Israel |
| Defense Unicorns, Inc., Colorado Springs, CO, United States |
| Digital Hub Rhein-Neckar GmbH, Ludwigshafen, Germany |
| DocEquity, Inc. (dba Supio), Seattle, WA, United States |
| Dremio Corporation, Santa Clara, CA, United States |
| Elise A.I. Technologies Corp., New York, NY, United States |
| Essence VC III, L.P., Seattle, WA, United States |
| FeedZai S.A., Coimbra, Portugal |
| Felix Capital Fund III, L.P., London, United Kingdom |
| Felix Ventures II, L.P., London, United Kingdom |
| Finco Services, Inc. (dba Current), New York, NY, United States |
| FloQast, Inc., Los Angeles, California, United States |
| Fund II, a Series of Cocoa VC, LP, Seattle, WA, United States |
| GitGuardian SAS, Paris, France |
| Gorgias Inc., San Francisco, CA, United States |
| Greenlite Inc., San Francisco, CA, United States |
| Haystack Ventures V, L.P., Mill Valley, CA, United States |
| Haystack Ventures VI, L.P., Mill Valley, CA, United States |
| Haystack Ventures VII, L.P., San Francisco, CA, United States |
| Haystack Ventures VIII, L.P., San Francisco, CA, United States |
| Huntress Labs Incorporated, Ellicott City, MD, United States |
| IDG Ventures USA III, L.P., San Francisco, CA, United States |
| IEX Group, Inc., New York, NY, United States |
| InfluxData, Inc., San Francisco, CA, United States |
| Initialized CBH SPV LLC, San Francisco, CA, United States |
| innoWerft Walldorf GmbH, Walldorf, Germany |
| Involve.ai, Inc., Santa Monica, CA, United States |
| JetLenses Inc. (dba Verse Medical), New York, NY, United States |
| JupiterOne, Inc., Morrisville, NC, United States |
| Kaltura, Inc., New York, NY, United States |
| LeanData, Inc., Sunnyvale, CA, United States |
| LGVP F I LLC, Dover, DE, United States |
| LocalGlobe Opportunity, L.P., St. Peter Port, Guernsey, Channel Islands |
| LocalGlobe VII, L.P., St. Peter Port, Guernsey, Channel Islands |
| LocalGlobe VIII, L.P., St. Peter Port, Guernsey, Channel Islands |
| LocalGlobe X, L.P., St. Peter Port, Guernsey, Channel Islands |
| LocalGlobe XI, L.P., St. Peter Port, Guernsey, Channel Islands |
| Maple Capital II, Limited Partnership, Ramat Gan, Israel |
| Matillion Ltd., Altrincham, United Kingdom |
| Medable Inc., Palo Alto, CA, United States |
| Mosaic Ventures Investors Fund I, L.P., London, United Kingdom |
| Moxxie Ventures III, L.P., Mountain View, CA, United States |
| 313/326 |
|
Integrated Report 2025 | ||||
| To
Our Stakeholders |
Combined
Management Report |
Consolidated
Financial Statements IFRS |
Additional Information | ||
| Name and Location of Company |
| Equity Investments with Ownership of at Least 5% |
| Notation Capital II CIRC, LLC, Brooklyn, NY, United States |
| Notation Capital II Circle 2024, LLC, Brooklyn, NY, United States |
| Notation Capital II, L.P., Brooklyn, NY, United States |
| Notation Capital III, L.P., Brooklyn, NY, United States |
| Notation Capital, L.P., Brooklyn, NY, United States |
| OpenX Software Limited, Pasadena, CA, United States |
| Paper Education Company Inc., Montreal, Canada |
| Pendo.io, Inc., Raleigh, NC, United States |
| PivotNorth Early Fund I, L.P., Atherton, CA, United States |
| Point Nine Annex GmbH & Co. KG, Berlin, Germany |
| Point Nine Capital Fund II GmbH & Co. KG, Berlin, Germany |
| Point Nine Capital Fund III GmbH & Co. KG, Berlin, Germany |
| Point Nine Capital Fund IV GmbH & Co. KG, Berlin, Germany |
| Point Nine Capital Fund V GmbH & Co. KG, Berlin, Germany |
| Project44, Inc., Chicago, IL, United States |
| PubNub, Inc., San Francisco, CA, United States |
| QP-Essence VC IV, LP, Seattle, WA, United States |
| Qualified.com, Inc., San Francisco, CA, United States |
| Reltio, Inc., Redwood Shores, CA, United States |
| Restream, Inc., Austin, TX, United States |
| Rewst Inc., Westchase, FL, United States |
| Ridge Ventures IV, L.P., San Francisco, CA, United States |
| Ridge Ventures V, L.P., San Francisco, CA, United States |
| SafeGraph, Inc., Denver, CO, United States |
| Side, Inc., San Francisco, CA, United States |
| Signify Holdings, Inc. (dba Rain), New York, NY, United States |
| Simpplr Inc., Redwood City, CA, United States |
| Smart City Planning, Inc., Tokyo, Japan |
| Splashtop, Inc., San Jose, CA, United States |
| Spring Mobile Solutions, Inc., Reston, VA, United States |
| StackHawk, Inc., Denver, CO, United States |
| Storm Ventures V, L.P., Menlo Park, CA, United States |
| SV Angel IV, L.P., San Francisco, CA, United States |
| Tetrate.io, Inc., Milpitas, CA, United States |
| Third Kind Venture Capital II, L.P., New York, NY, United States |
| Third Kind Venture Capital III, L.P., New York, NY, United States |
| Tractian Ltd., Atlanta, GA, United States |
| Tribe Capital LLC Series 3, Redwood City, CA, United States |
| Tribe Capital LLC Series 8, Redwood City, CA, United States |
| UJET, Inc., San Francisco, CA, United States |
| Unmind Ltd., London, United Kingdom |
| Upfront V, L.P., Santa Monica, CA, United States |
| Uptycs, Inc., Waltham, MA, United States |
| Upvest GmbH, Berlin, Germany |
| 314/326 |
|
Integrated Report 2025 | ||||
| To
Our Stakeholders |
Combined
Management Report |
Consolidated
Financial Statements IFRS |
Additional Information | ||
| Name and Location of Company |
| Equity Investments with Ownership of at Least 5% |
| VerbIT, Inc., New York, NY, United States |
| Vistex, Inc., Hoffman Estates, IL, United States |
| Walkabout Ventures Fund II, L.P., Los Angeles, CA, United States |
| Wetravel Inc., San Francisco, CA, United States |
| Yapily Ltd., London, United Kingdom |
| Zesty Tech Ltd., Ramat Gan, Israel |
| 315/326 |
|
Integrated Report 2025 | ||||
| To
Our Stakeholders |
Combined
Management Report |
Consolidated
Financial Statements IFRS |
Additional Information | ||
(G.10) German Code of Corporate Governance
The German federal government published the German Corporate Governance Code (the “Code”) in February 2002 and introduced a commission that amends the Code from time to time. The Code contains statutory requirements and a number of recommendations and suggestions. Only the legal requirements are binding for German companies. With regard to the recommendations, the German Stock Corporation Act, section 161, requires that every year, listed companies publicly state the extent to which they have implemented them. Companies can deviate from the suggestions without having to make any public statements.
In 2025 and 2024, the Executive Board and Supervisory Board of SAP SE issued the required declarations of compliance with the Code. The 2025 declaration was published in October 2025. The statements are available on our website: www.sap.com/investors/en/governance-and-sustainability.
| 316/326 |
|
Integrated Report 2025 | ||||
| To
Our Stakeholders |
Combined
Management Report |
Consolidated
Financial Statements IFRS |
Additional Information | ||
Walldorf, February 18, 2026
SAP SE
Walldorf, Germany
The Executive Board
Christian Klein |
Muhammad Alam |
Dominik Asam |
Thomas Saueressig |
Sebastian Steinhaeuser |
Gina Vargiu-Breuer |
| 317/326 |
|
Integrated Report 2025 | ||||
| To
Our Stakeholders |
Combined
Management Report |
Consolidated
Financial Statements IFRS |
Additional Information | ||
Management’s Annual Report on Internal Control over Financial Reporting in the Consolidated Financial Statements
U.S. law requires that management submit a report on the effectiveness of internal control over financial reporting in the consolidated financial statements. For 2025, that report is as follows:
The management of SAP is responsible for establishing and maintaining adequate internal control over financial reporting as such term is defined in Rules 13a–15(f) and 15d–15(f) under the U.S. Securities Exchange Act of 1934. SAP’s internal control over financial reporting is a process designed under the supervision of SAP’s CEO and CFO to provide reasonable assurance regarding the reliability of financial reporting and the preparation of financial statements for external reporting purposes in accordance with International Financial Reporting Standards as issued by the International Accounting Standards Board.
SAP’s management assessed the effectiveness of the Company’s internal control over financial reporting as at December 31, 2025. In making this assessment, it used the criteria set forth by the Committee of Sponsoring Organizations of the Treadway Commission in Internal Control – Integrated Framework (2013).
Based on the assessment under these criteria, SAP management has concluded that, as at December 31, 2025, the Company’s internal control over financial reporting was effective.
| 318/326 |
|
Integrated Report 2025 | ||||
| To
Our Stakeholders |
Combined
Management Report |
Consolidated
Financial Statements IFRS |
Additional Information | ||
Additional Information
| Five-Year Summary | 320 |
| Financial Calendar and Addresses | 323 |
| Financial and Sustainability Publications | 324 |
| Publication Details | 326 |
| 319/326 |
|
Integrated Report 2025 | ||||
| To
Our Stakeholders |
Combined
Management Report |
Consolidated
Financial Statements IFRS |
Additional Information | ||
Five-Year Summary1
| € millions, unless otherwise stated | 2025 | 2024 | 2023 | 2022 | 2021 |
| Revenues | |||||
| Cloud ERP Suite | 18,119 | 14,165 | 10,626 | 8,209 | NA |
| Cloud | 21,023 | 17,141 | 13,664 | 11,426 | 8,701 |
| Cloud and software | 32,538 | 29,830 | 26,924 | 25,391 | 23,361 |
| Services | 4,262 | 4,346 | 4,283 | 4,128 | 3,592 |
| Total revenue | 36,800 | 34,176 | 31,207 | 29,520 | 26,953 |
| Share of more predictable revenue (in %) | 86 | 83 | 81 | 79 | 75 |
| Operating Expenses | |||||
| Cost of cloud | –5,480 | –4,660 | –3,884 | –3,499 | –2,881 |
| Total cost of revenue | –9,986 | –9,243 | –8,674 | –8,038 | –7,219 |
| Total operating expenses | –27,183 | –29,511 | –25,408 | –23,606 | –20,645 |
| Profits and effective tax rate | |||||
| Cloud gross profit | 15,543 | 12,481 | 9,780 | 7,927 | 5,820 |
| Cloud gross profit (non-IFRS)2 | 15,757 | 12,559 | 9,821 | 7,981 | 5,947 |
| Gross profit | 26,814 | 24,932 | 22,534 | 21,482 | 19,734 |
| Operating profit | 9,617 | 4,665 | 5,799 | 5,914 | 6,308 |
| Operating profit (non-IFRS)2 | 10,419 | 8,153 | 6,514 | 6,447 | 8,204 |
| Profit after tax from continuing operations | 7,326 | 3,150 | 3,600 | 3,068 | 6,824 |
| Profit after tax3 | 7,326 | 3,150 | 5,964 | 1,708 | 5,376 |
| Effective tax rate (non-IFRS, in%)2 | 30.5 | 32.3 | 30.3 | 25.3 | 20.7 |
| Backlog | |||||
| Current cloud backlog | 21,052 | 18,078 | 13,745 | 11,024 | 8,674 |
| Liquidity and Cash Flow | |||||
| Net cash flows from operating activities from continuing operations | 9,156 | 5,207 | 6,134 | 5,763 | 6,324 |
| Free cash flow | 8,239 | 4,222 | 5,116 | 4,571 | 5,337 |
| Net liquidity (net debt) | 3,381 | 1,695 | 3,521 | –2,070 | –1,563 |
| Assets, Equity and Liabilities | |||||
| Total assets | 70,362 | 74,237 | 68,331 | 72,159 | 71,174 |
| Total liabilities | 25,288 | 28,431 | 24,925 | 29,311 | 29,651 |
| Total equity | 45,073 | 45,806 | 43,406 | 42,848 | 41,523 |
| Key SAP Stock Facts | |||||
| Issued shares4 (in millions) | 1,229 | 1,229 | 1,229 | 1,229 | 1,229 |
| Earnings per share, basic (in €) from continuing operations | 6.14 | 2.68 | 3.11 | 2.80 | 5.45 |
| Earnings per share, basic (non-IFRS, in €) from continuing operations2 | 6.14 | 4.53 | 3.72 | 3.94 | 6.65 |
| Earnings per share, diluted (in €) from continuing operations | 6.10 | 2.65 | 3.08 | 2.79 | 5.45 |
| Earnings per share, basic (in €)3 | 6.14 | 2.68 | 5.26 | 1.95 | 4.46 |
| Earnings per share, basic (non-IFRS, in €)2,3 | 6.14 | 4.53 | 5.51 | 3.23 | 6,73 |
| Earnings per share, diluted (in €)3 | 6.10 | 2.65 | 5.20 | 1.94 | 4.46 |
| Dividend per share4 (in €) | 2.50 | 2.35 | 2.20 | 2.05 | 2.45 |
| Total dividend distributed4 | 2,919 | 2,743 | 2,565 | 2,395 | 2,865 |
| 320/326 |
|
Integrated Report 2025 | ||||
| To
Our Stakeholders |
Combined
Management Report |
Consolidated
Financial Statements IFRS |
Additional Information | ||
| € millions, unless otherwise stated | 2025 | 2024 | 2023 | 2022 | 2021 |
| Non-financial KPI's | |||||
| Number of employees5,6 | 110,650 | 109,121 | 107,602 | 106,312 | 102,658 |
| Women working at SAP5 (in %) | 35.8 | 35.4 | 35.2 | 34.9 | 34.3 |
| Business Health Culture Index7 | 81 | 80 | 81 | 81 | 81 |
| Employee Engagement Index (in %) | 76 | 74 | 80 | 80 | 83 |
| Employee turnover (in %) | 8.2 | 7.8 | 6.0 | 8.6 | 8.7 |
| Customer Net Promoter Score8 | 9 | 12 | 9 | 7 | 10 |
|
Gross greenhouse gas emissions (scope 1, 2, 3 / market-based) (in million tons CO2 equivalents) |
6.3 | 6.9 | 6.9 | NA | NA |
1 Based on SAP Group results, according to IFRS, unless otherwise stated.
2 From 2024, we updated our non-IFRS policy to include share-based payment expenses and exclude gains and losses from equity securities, net. The years 2021 has not been retrospectively adjusted.
3 From continuing and discontinued operations.
4 2025 numbers are based on the proposed dividend and on level of treasury stock as at year end.
5 Numbers at year end.
6 Full-time equivalents
7 In 2025. SAP revised the BHCI definition. The years 2021 to 2023 have not been retrospectively restated to reflect the new definition.
8 Since 2022, we are using our updated methodology for calculating customer Net promoter score. 2021 has not been retrospectively adjusted.
| 321/326 |
|
Integrated Report 2025 | ||||
| To
Our Stakeholders |
Combined
Management Report |
Consolidated
Financial Statements IFRS |
Additional Information | ||
Financial Calendar and Addresses
Financial Calendar
| 2026 | |
| April 23 | Results for the first quarter 2026 |
| May 5 | Annual General Meeting of Shareholders |
| May 8 | Dividend payment |
| July 23 | Results for the second quarter and half-year 2026 |
| October 21 | Results for the third quarter 2026 |
Addresses
Group Headquarters
SAP SE
Dietmar-Hopp-Allee 16
69190 Walldorf
Germany
Tel. +49 6227 74 74 74
E-mail info@sap.com
Web site www.sap.com
The addresses of all our international subsidiaries and sales partners
are available on our public Web site at
https://www.sap.com/about/company/office-locations.html
For more information about the matters discussed in the report, contact:
Investor Relations
Tel. +49 6227 76 73 36
E-mail investor@sap.com
Web site www.sap.com/investor
Press
Tel. +49 6227 74 63 15
E-mail press@sap.com
Website www.sap.com/press
| 322/326 |
|
Integrated Report 2025 | ||||
| To
Our Stakeholders |
Combined
Management Report |
Consolidated
Financial Statements IFRS |
Additional Information | ||
Financial and Sustainability Publications
We present our financial, social, and environmental performance in the SAP Integrated Report 2025, which is available at www.sapintegratedreport.com. This SAP Integrated Report 2025 comprises all of the information required by accounting and disclosure standards applicable to us.
The following publications are available in English at www.sap.com/investor, or in German at www.sap.de/investor:
| – | Annual Report on Form 20-F (IFRS, available in English only) |
| – | SAP Integrated Report (PDF) |
| – | SAP SE Statutory Financial Statements and Review of Operations (HGB, available in German only) |
| – | Half-Year Reports |
| – | SAP Compensation Report |
| – | SAP Quarterly Statements |
Complete information on the governance of SAP SE is available at https://www.sap.com/investors/en/governance-and-sustainability.html. Materials include:
| – | Information about the management of SAP SE, including the current members of the Executive Board and the Supervisory Board, their CVs and memberships in boards of other companies |
| – | Information about the Supervisory Boards’ committees, including their tasks and current composition |
| – | Details of managers’ (the Executive and Supervisory Board members’) transactions in SAP securities |
| – | SAP SE’s Articles of Incorporation |
| – | Agreement on the Involvement of Employees in SAP SE |
| – | German Code of Corporate Governance |
| – | Declaration of Implementation pursuant to the German Stock Corporation Act, Section 161 |
| – | Global Code of Ethics and Business Conduct for EmployeesCorporate Governance Statement pursuant to the German Commercial Code, Sections 315d and 289f |
| – | Rules of Procedure for the SAP SE Supervisory Board |
| – | Rules of Procedure for the SAP SE Executive Board |
| – | Profile of Skills and Expertise for the SAP SE Supervisory Board |
| – | Overview of the participation of Supervisory Board members in meetings of the Supervisory Board and its committees |
Documents relating to SAP SE’s Annual General Meetings of Shareholder, including voting results are available at https://www.sap.com/agm
| 323/326 |
|
Integrated Report 2025 | ||||
| To
Our Stakeholders |
Combined
Management Report |
Consolidated
Financial Statements IFRS |
Additional Information | ||
Additional SAP policies are made public at https://www.sap.com/products/sustainability/our-approach/reporting-and-policies.html:
| – | SAP Human Rights Commitment Statement |
| – | SAP Global Health and Safety Management Policy |
| – | SAP Environmental Policy |
| – | SAP ‘s Guiding Principles for Artificial Intelligence and SAP Global Artificial Intelligence Ethics Policy |
| – | SAP Supplier Code of Conduct |
| – | SAP Partner Code of Conduct |
| – | SAP’s Global Tax Principles |
Further, the SAP Glossary is available at www.sap.com/glossary
| 324/326 |
|
Integrated Report 2025 | ||||
| To
Our Stakeholders |
Combined
Management Report |
Consolidated
Financial Statements IFRS |
Additional Information | ||
Publication Details
Publisher
SAP SE
Investor Relations
Concept and Realization
SAP Integrated Report project team with the support of SAP solutions
Printing
SAP has decided to publish the SAP Integrated Report solely as an electronic document. A hard copy of the audited consolidated financial statements can also be requested free of charge by sending an email to investor@sap.com or via phone +49 6227 7-67336.
Copyright
SAP SE
Dietmar-Hopp-Allee 16
69190 Walldorf
Germany
© 2026 SAP SE or an SAP affiliate company. All rights reserved. No part of this publication may be reproduced or transmitted in any form or for any purpose without the express permission of SAP SE or an SAP affiliate company.
SAP and other SAP products and services mentioned herein as well as their respective logos are trademarks or registered trademarks of SAP SE (or an SAP affiliate company) in Germany and other countries. All other product and service names mentioned are the trademarks of their respective companies. Please see www.sap.com/about/legal/copyright.html for additional trademark information and notices.
| 325/326 |
|
Integrated Report 2025 |
| 326/326 |