Personal Banking |
Personal Banking provides a broad suite of financial products and services to retail clients for their banking, investing and financing needs. We are focused on building deep and meaningful relationships with our clients, underscored by the delivery of exceptional client experiences, the breadth of our product suite, our depth of expertise and the features of our digital solutions.
day-to-day
~15 million |
#1 |
32,335 | ||||||
Number of Personal Banking – Canada clients |
Ranking in market share for all key retail products 1 |
Employees (FTE) 2 | ||||||
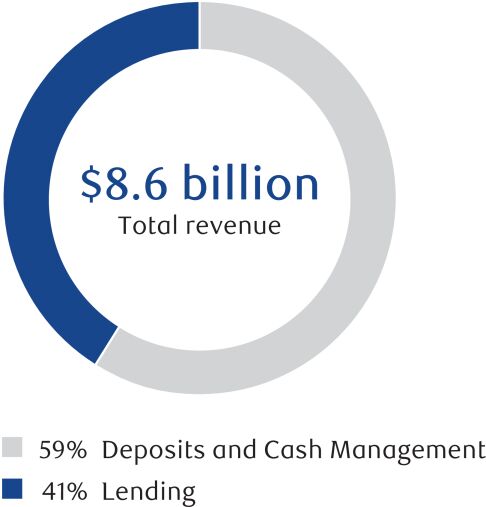
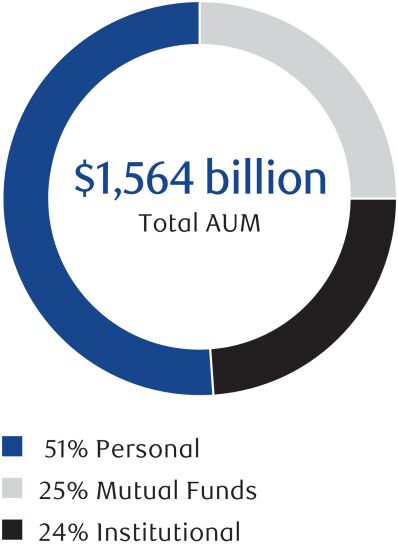
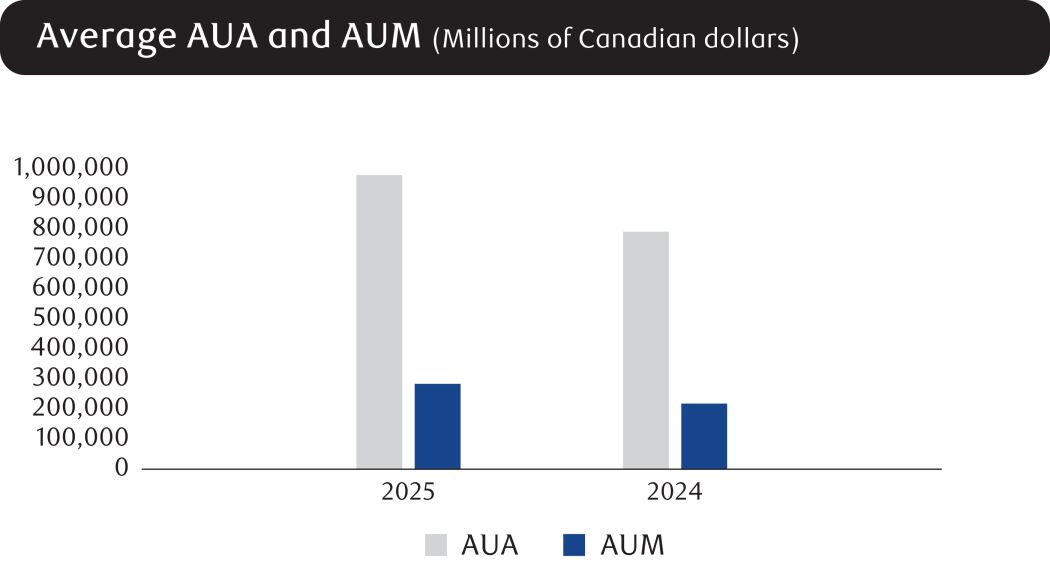
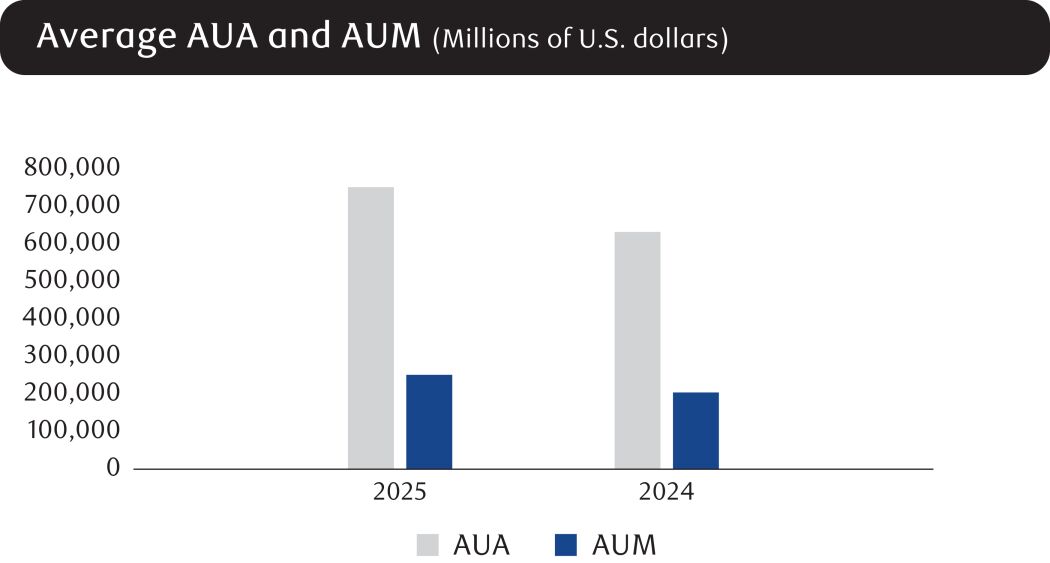
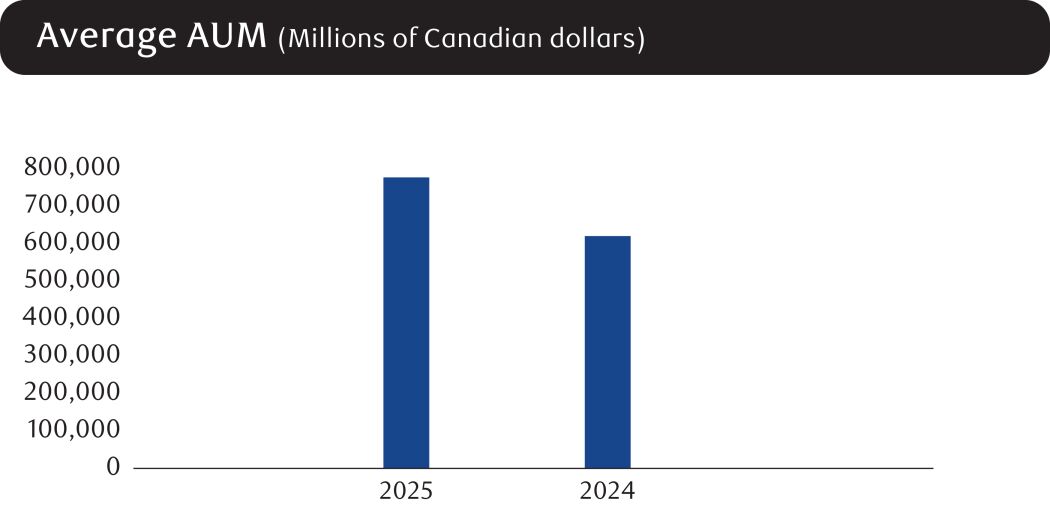
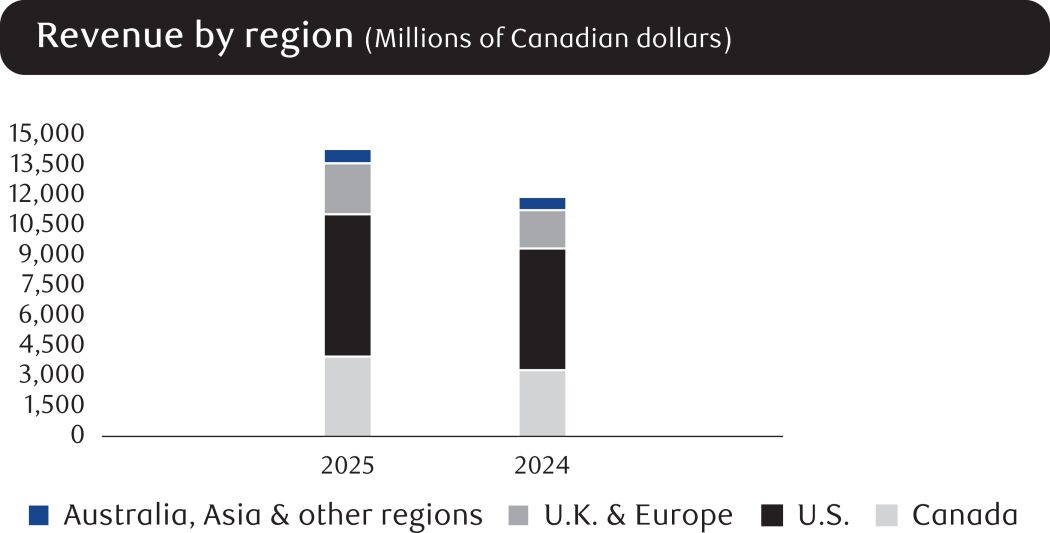
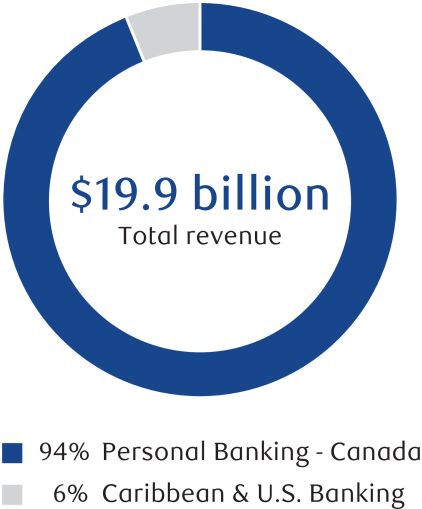
Revenue by Business Lines |
We operate through two businesses – Personal Banking – Canada and Caribbean & U.S. Banking. Personal Banking – Canada serves our home market in Canada. We have the largest branch network, the most ATMs and one of the largest mobile sales forces across Canada, along with market-leading digital capabilities. In Caribbean & U.S. Banking, we offer a broad range of financial products and services in targeted markets. In Canada, we compete with other Schedule 1 banks, independent trust companies, foreign banks, credit unions, caisses populaires and auto financing companies, as well as emerging entrants to the financial services industry. In the Caribbean, our competition includes banks, emerging digital banks, trust companies and investment management companies serving retail and corporate clients, as well as public institutions. In the U.S., we compete primarily with other Canadian banking institutions that have U.S. operations. | |||||||
 |
||||||||
2025 Operating environment
› |
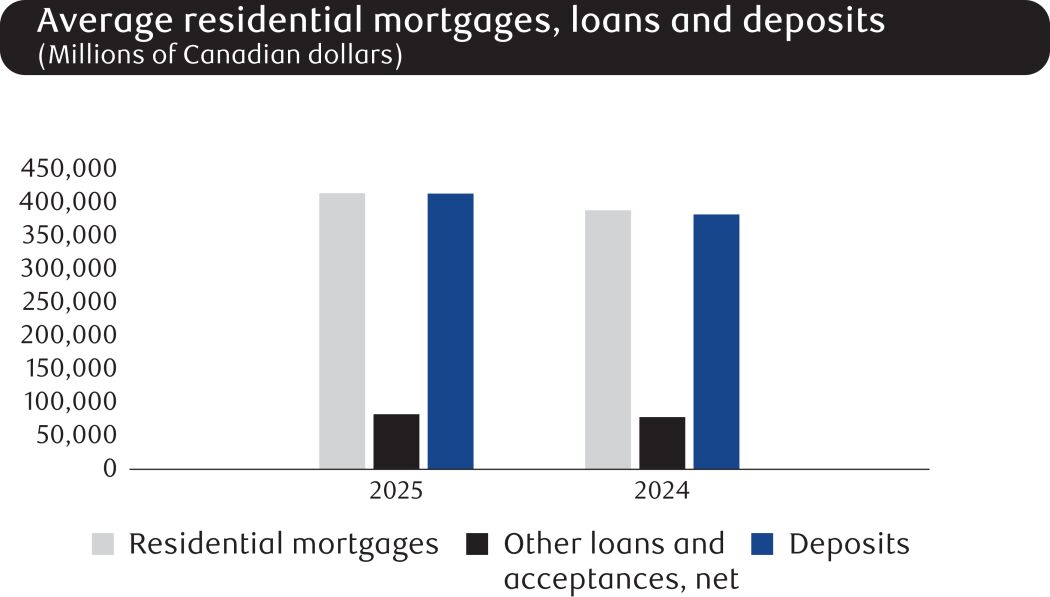
Amidst a lower inflationary environment, the BoC overnight interest rate has decreased significantly through a series of interest rate cuts since June 2024. This has been accompanied by a shift in deposit mix towards demand deposits, which has contributed to our continued increase in NIM throughout fiscal 2025. |
› |
Residential real estate markets continued to be impacted by softening demand throughout 2025, driven by the imposition of tariffs from the U.S. administration as well as general macroeconomic uncertainty. Despite slower mortgage volume growth, mortgage originations were up from the prior year. |
› |
In an environment where a higher cost of living and economic uncertainty continue to weigh on consumer spending, consumers are displaying cautious spending habits. Despite these financial pressures, overall credit card purchase volumes continued to grow from the prior year. |
› |
We recorded growth in non-term deposit products, reflecting a shift in client preference away from term deposit products, as BoC interest rates have decreased. We also maintained our number one market share position in Personal Core Deposits and Guaranteed Investments Certificates (GICs). |
› |
Favourable equity market conditions throughout the majority of fiscal 2025 and client sales activity have driven higher average mutual fund balances. |
› |
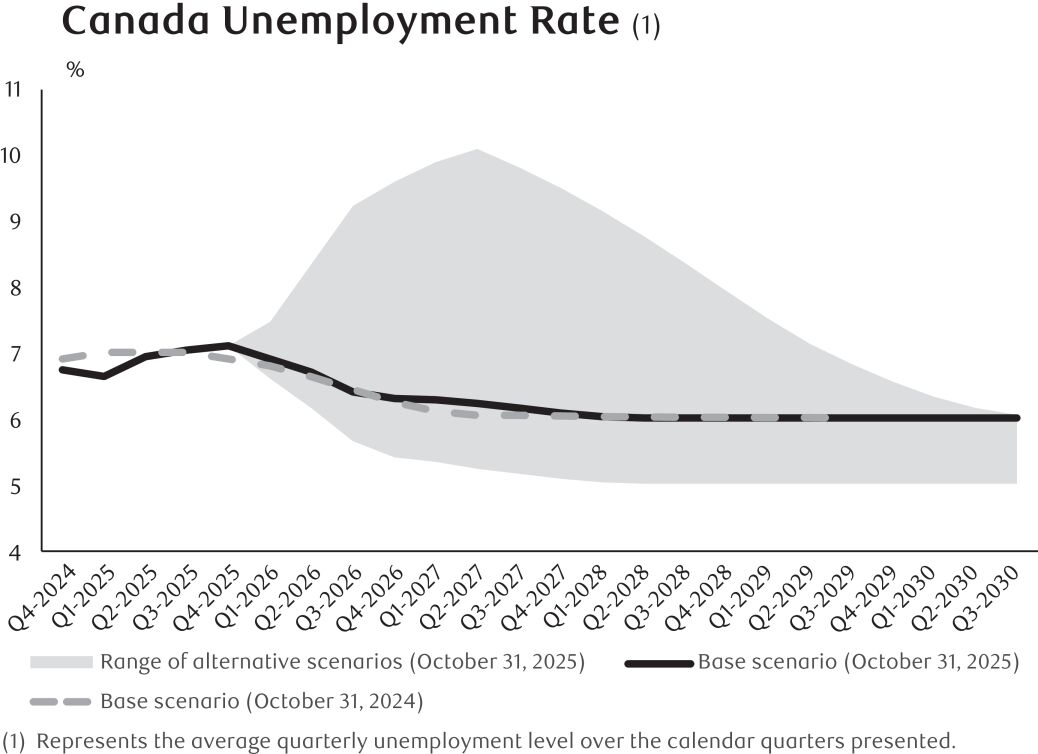
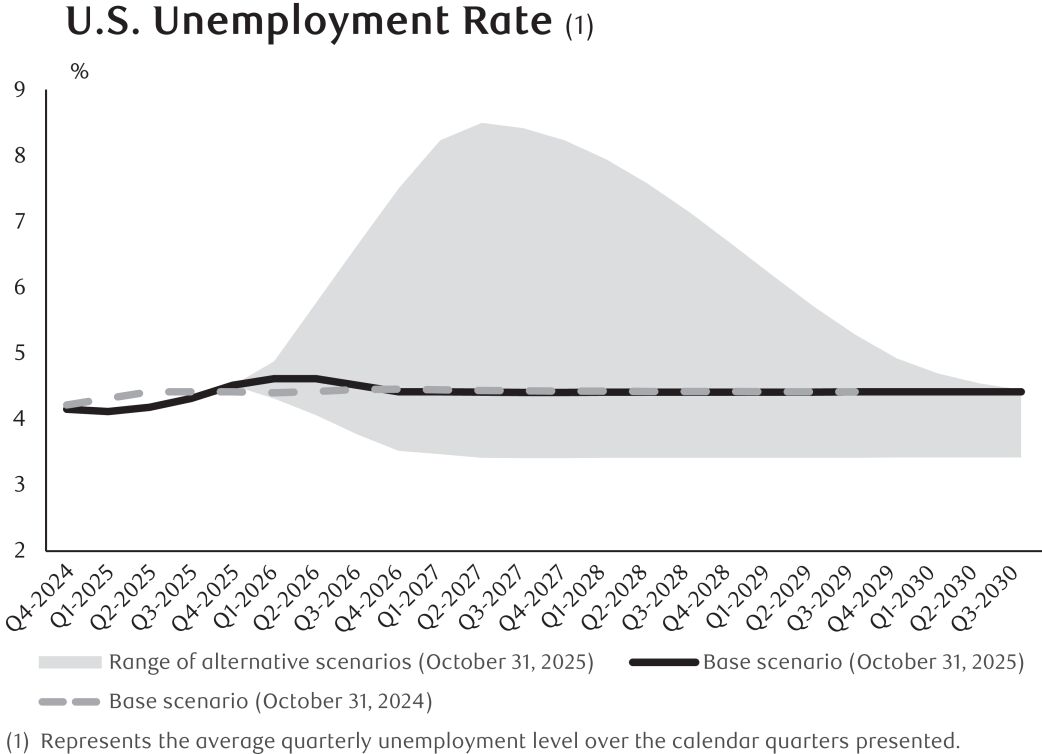
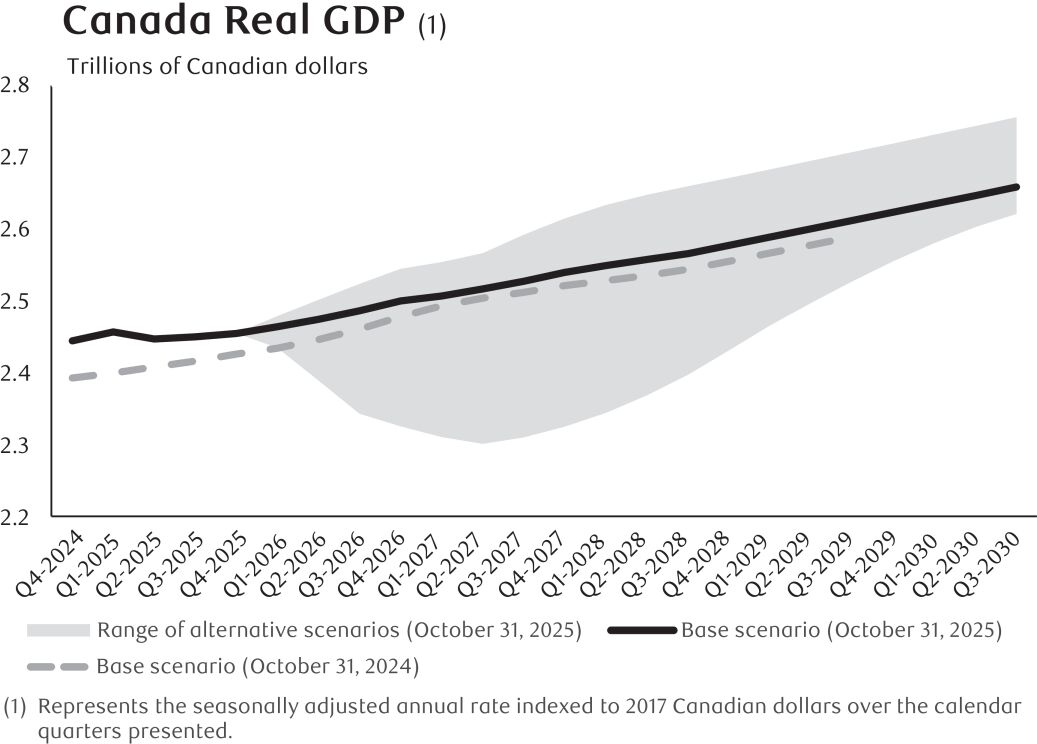
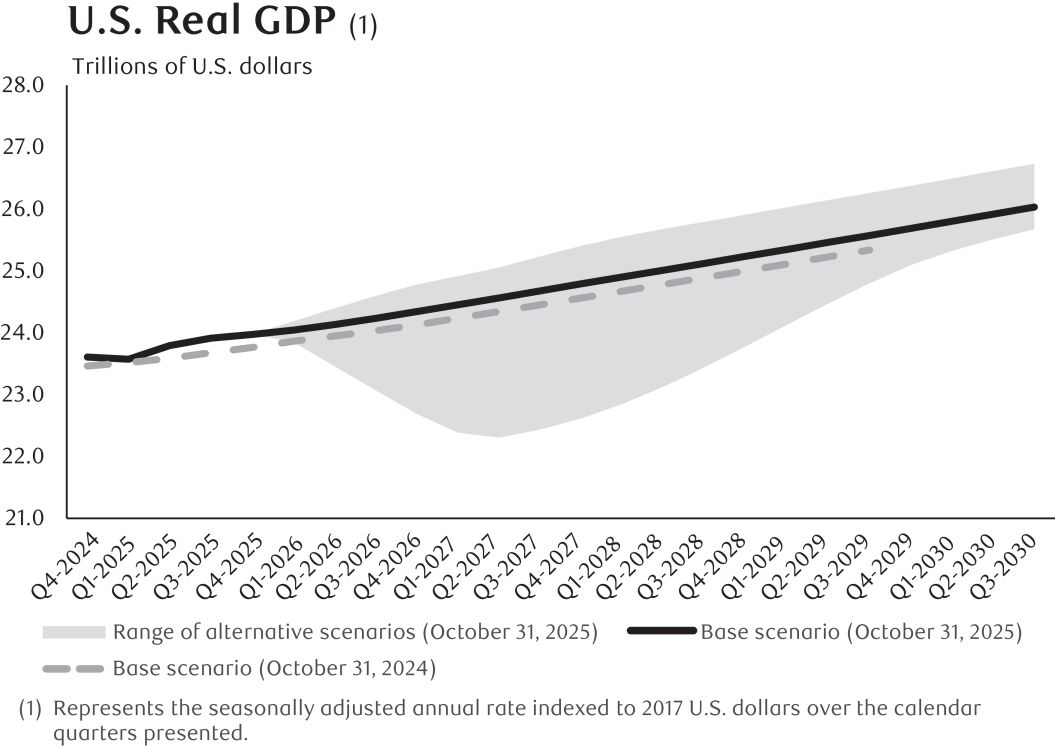
The credit environment was impacted by rising unemployment rates, slowing economic growth and the impacts of trade disruptions, resulting in higher provisions on impaired and performing loans. |
› |
We continued to focus on investments in staff along with ongoing investments in technology, including in AI and digital transformation. |
› |
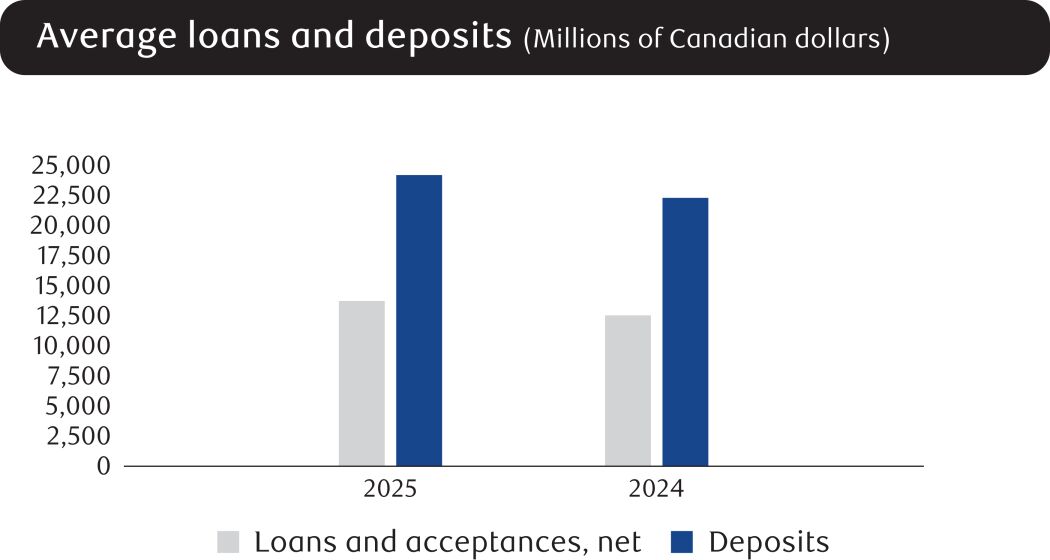
The Caribbean region’s economy continued to expand at a healthy pace in 2025, with the inflation rate in the region remaining low as the impacts of higher import costs fueled by tariffs are yet to have a downstream impact on consumers. Our Caribbean Banking business benefitted from strong volume growth in both loans and deposits as we continued to invest in growing the franchise. |
› |
The U.S. Banking business benefitted from continued loan and deposit growth and the sustained level of higher U.S. interest rates, despite uncertainty associated with U.S. trade policy and a decline in Canadian travel to the U.S. |
1 |
Market share is calculated using the most current data available from OSFI (M4), the Securities and Investment Management Association (SIMA) and the Canadian Bankers Association (CBA), and is as at August 2025 and June 2025. This is based on the following key product categories: Personal Lending (including residential mortgages), Personal Core Deposits and GICs, Credit Cards and Long-term Mutual Funds. |
2 |
Includes FTE for all shared services across Personal Banking and Commercial Banking, for which the related non-interest expenses are allocated to both Personal Banking and Commercial Banking. |
Management’s Discussion and Analysis Royal Bank of Canada: Annual Report 2025 35