 | 40 | 2023 Form 10-K | ||||||
| Re: | Insperity, Inc. | ||||
Form 10-K for the Fiscal Year Ended December 31, 2023 Form 10-Q for Fiscal Quarter Ended June 30, 2024 Item 2.02 Form 8-K Filed August 1, 2024 | |||||
| File No. 001-13998 | |||||
1. | Please disclose, present and discuss the GAAP measure that is most comparable to adjusted EBITDA per WSEE per month with equal or greater prominence. Refer to Item 10(e)(1)(i)(a) of Regulation S-K and Question 102. 10(a) of our Non-GAAP Financial Measures Compliance and Disclosure Interpretations. | ||||
2. | Adjusted EBITDA and adjusted EPS and their growth percentages are non-GAAP measures. Please disclose their most comparable GAAP measures and growth percentages with equal or greater prominence. Refer to Item 10(e)(1)(i)(a) of Regulation S-K and Question 102.10(a) of our Non-GAAP Financial Measures Compliance and Disclosure Interpretations. This comment also applies to your Forms 10-Q and the headline earnings section of your August 1, 2024 earnings release. | ||||
3. | We note that you present “% change year over year” for the non-GAAP measures you reconcile here. Please disclose their most comparable GAAP measures with equal or greater prominence. Refer to Item 10(e)(1)(i)(a) of Regulation S-K and Question 102.10(a) of our Non-GAAP Financial Measures Compliance and Disclosure Interpretations. This comment also applies to your Forms 10-Q and earnings releases. | ||||
4. | Please provide us the analysis you performed in concluding payroll tax revenues and expenses can be presented on a gross basis under ASC 606, despite your revenues being presented net for the directly-related payroll costs. Also, provide us the analysis you performed in determining that the payroll taxes can be separated from the directly-related payroll costs for ASC 606 accounting purposes. | ||||
MANAGEMENT’S DISCUSSION AND ANALYSIS OF FINANCIAL CONDITION AND RESULTS OF OPERATIONS | ||
| | 40 | 2023 Form 10-K | ||||||
MANAGEMENT’S DISCUSSION AND ANALYSIS OF FINANCIAL CONDITION AND RESULTS OF OPERATIONS | ||
| | 41 | 2023 Form 10-K | ||||||
MANAGEMENT’S DISCUSSION AND ANALYSIS OF FINANCIAL CONDITION AND RESULTS OF OPERATIONS | ||
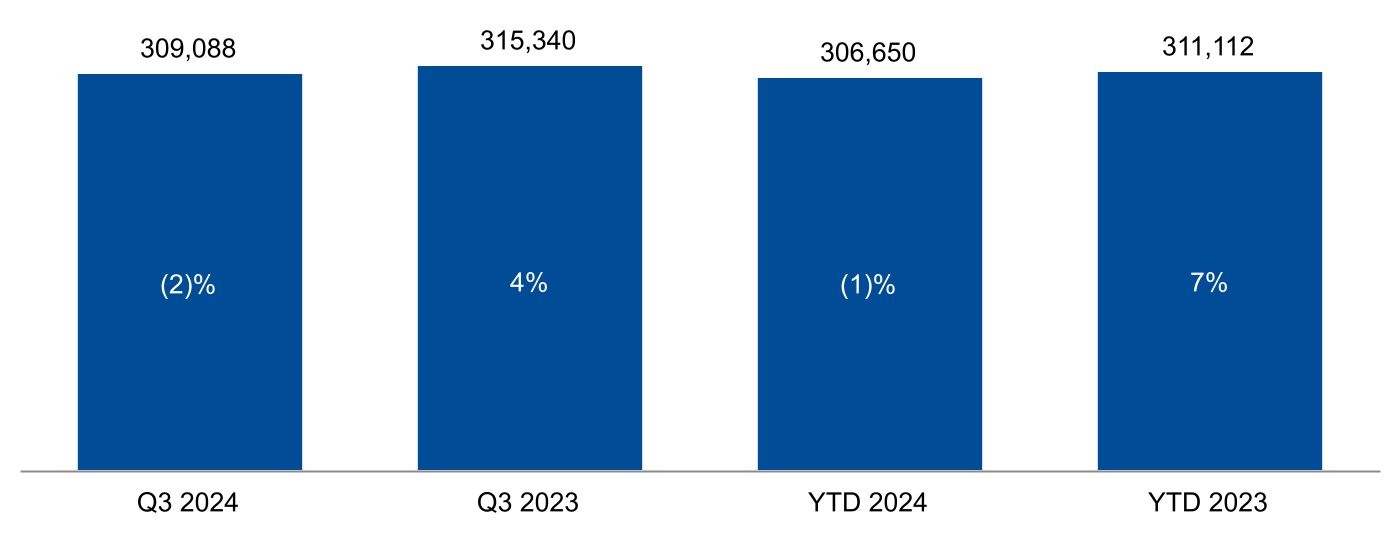
Average WSEEs Paid and Year-over-Year Growth Percentage | ||
| | 47 | 2023 Form 10-K | ||||||
MANAGEMENT’S DISCUSSION AND ANALYSIS OF FINANCIAL CONDITION AND RESULTS OF OPERATIONS | ||

| | 48 | 2023 Form 10-K | ||||||
MANAGEMENT’S DISCUSSION AND ANALYSIS OF FINANCIAL CONDITION AND RESULTS OF OPERATIONS | ||
Non-GAAP Measure | Definition | Benefit of Non-GAAP Measure | ||||||
Non-bonus payroll cost | Non-bonus payroll cost is a non-GAAP financial measure that excludes the impact of bonus payrolls paid to our WSEEs. Bonus payroll cost varies from period to period, but has no direct impact to our ultimate workers’ compensation costs under the current program. | Our management refers to non-bonus payroll cost in analyzing, reporting and forecasting our workers’ compensation costs. We include these non-GAAP financial measures because we believe they are useful to investors in allowing for greater transparency related to the costs incurred under our current workers’ compensation program. | ||||||
Adjusted cash, cash equivalents and marketable securities | Excludes funds associated with: • federal and state income tax withholdings, • employment taxes, • other payroll deductions, and • client prepayments. | We believe that the exclusion of the identified items helps us reflect the fundamentals of our underlying business model and analyze results against our expectations, against prior periods, and to plan for future periods by focusing on our underlying operations. We believe that the adjusted results provide relevant and useful information for investors because they allow investors to view performance in a manner similar to the method used by management and improves their ability to understand and assess our operating performance. Adjusted EBITDA is used by our lenders to assess our leverage and ability to make interest payments. | ||||||
EBITDA | Represents net income computed in accordance with GAAP, plus: • interest expense, • income tax expense, • depreciation and amortization expense, and • amortization of SaaS implementation costs. | |||||||
Adjusted EBITDA | Represents EBITDA plus: • non-cash stock-based compensation. | |||||||
Adjusted net income | Represents net income computed in accordance with GAAP, excluding: • non-cash stock-based compensation. | |||||||
Adjusted EPS | Represents diluted net income per share computed in accordance with GAAP, excluding: • non-cash stock-based compensation. | |||||||
(in thousands, except per WSEE per month) | Year Ended December 31, | |||||||||||||||||||||||||
2023 | 2022 | 2021 | ||||||||||||||||||||||||
Per WSEE | Per WSEE | Per WSEE | ||||||||||||||||||||||||
Payroll cost | $ | 36,655,495 | $ | 9,787 | $ | 34,188,092 | $ | 9,657 | $ | 28,345,623 | $ | 9,420 | ||||||||||||||
Less: Bonus payroll cost | 4,978,439 | 1,329 | 4,959,987 | 1,401 | 4,719,217 | 1,568 | ||||||||||||||||||||
Non-bonus payroll cost | $ | 31,677,056 | $ | 8,458 | $ | 29,228,105 | $ | 8,256 | $ | 23,626,406 | $ | 7,852 | ||||||||||||||
Payroll cost % change year over year | 7.2 | % | 1.3 | % | 20.6 | % | 2.5 | % | 18.7 | % | 10.9 | % | ||||||||||||||
Non-bonus payroll cost % cChange year over year | 8.4 | % | 2.4 | % | 23.7 | % | 5.1 | % | 14.5 | % | 6.9 | % | ||||||||||||||
| | 54 | 2023 Form 10-K | ||||||
MANAGEMENT’S DISCUSSION AND ANALYSIS OF FINANCIAL CONDITION AND RESULTS OF OPERATIONS | ||
(in thousands) | December 31, 2023 | December 31, 2022 | |||||||||
Cash, cash equivalents and marketable securities | $ 708,778 | $ 765,896 | |||||||||
Less: | |||||||||||
Amounts payable for withheld federal and state income taxes, employment taxes and other payroll deductions | 510,092 | 504,817 | |||||||||
Client prepayments | 27,592 | 36,800 | |||||||||
Adjusted cash, cash equivalents and marketable securities | $ 171,094 | $ 224,279 | |||||||||
Year Ended December 31, | ||||||||||||||||||||||||||
(in thousands, except per WSEE per month) | 2023 | 2022 | 2021 | |||||||||||||||||||||||
Per WSEE | Per WSEE | Per WSEE | ||||||||||||||||||||||||
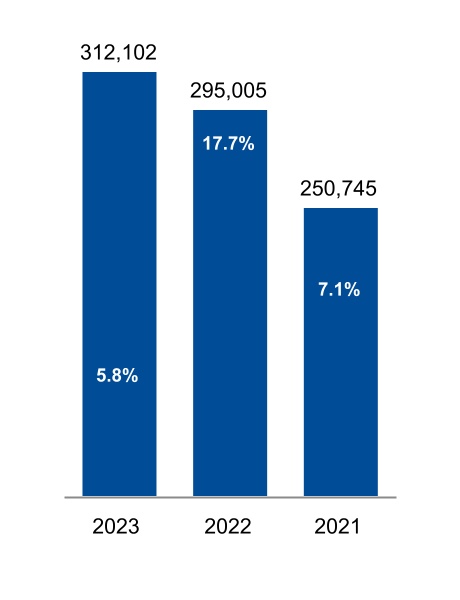
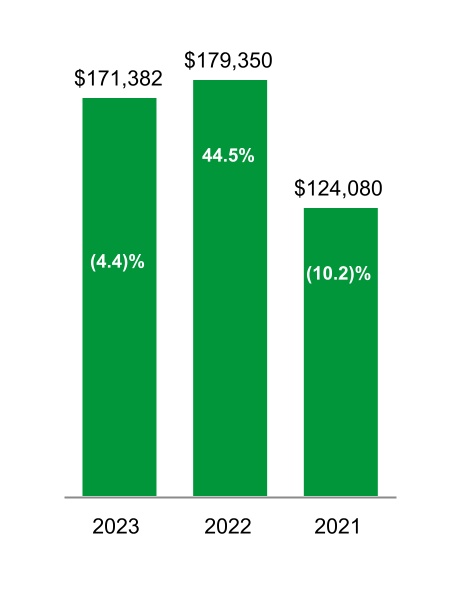
Net income | $ | 171,382 | $ | 46 | $ | 179,350 | $ | 51 | $ | 124,080 | $ | 41 | ||||||||||||||
Income tax expense | 53,696 | 14 | 66,075 | 19 | 44,238 | 15 | ||||||||||||||||||||
Interest expense | 27,137 | 7 | 14,207 | 4 | 7,458 | 2 | ||||||||||||||||||||
Amortization of SaaS implementation costs | 5,711 | 2 | 1,923 | 1 | — | — | ||||||||||||||||||||
Depreciation and amortization | 42,708 | 11 | 40,660 | 11 | 38,547 | 13 | ||||||||||||||||||||
EBITDA | 300,634 | 80 | 302,215 | 86 | 214,323 | 71 | ||||||||||||||||||||
Stock-based compensation | 52,996 | 14 | 50,080 | 14 | 40,623 | 14 | ||||||||||||||||||||
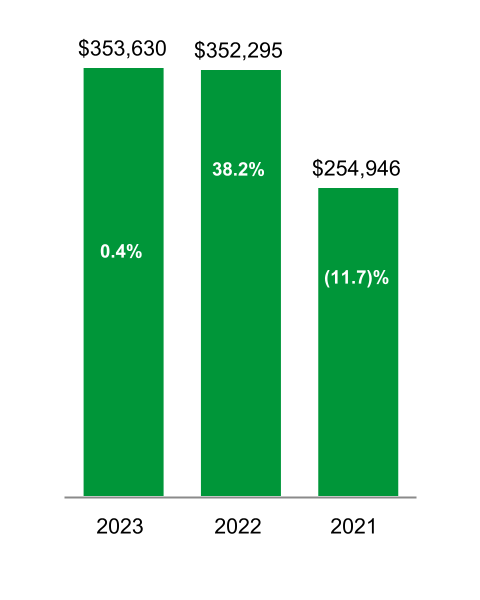
Adjusted EBITDA | $ | 353,630 | $ | 94 | $ | 352,295 | $ | 100 | $ | 254,946 | $ | 85 | ||||||||||||||
Net income % change year over year | (4.4) | % | (9.8) | % | 44.5 | % | 24.4 | % | (10.2) | % | (16.3) | % | ||||||||||||||
Adjusted EBITDA % cChange year over year | 0.4 | % | (6.0) | % | 38.2 | % | 17.6 | % | (11.7) | % | (17.5) | % | ||||||||||||||
Year Ended December 31, | |||||||||||
(in thousands) | 2023 | 2022 | 2021 | ||||||||
Net income | $ | 171,382 | $ | 179,350 | $ | 124,080 | |||||
Non-GAAP adjustments: | |||||||||||
Stock-based compensation | 52,996 | 50,080 | 40,623 | ||||||||
Tax effect | (12,643) | (13,483) | (10,677) | ||||||||
Total non-GAAP adjustments, net | 40,353 | 36,597 | 29,946 | ||||||||
Adjusted net income | $ | 211,735 | $ | 215,947 | $ | 154,026 | |||||
Net income % change year over year | (4.4) | % | 44.5 | % | (10.2) | % | |||||
Adjusted net income % cChange year over year | (2.0) | % | 40.2 | % | (15.1) | % | |||||
| | 55 | 2023 Form 10-K | ||||||
MANAGEMENT’S DISCUSSION AND ANALYSIS OF FINANCIAL CONDITION AND RESULTS OF OPERATIONS | ||
Year Ended December 31, | |||||||||||
(amounts per share) | 2023 | 2022 | 2021 | ||||||||
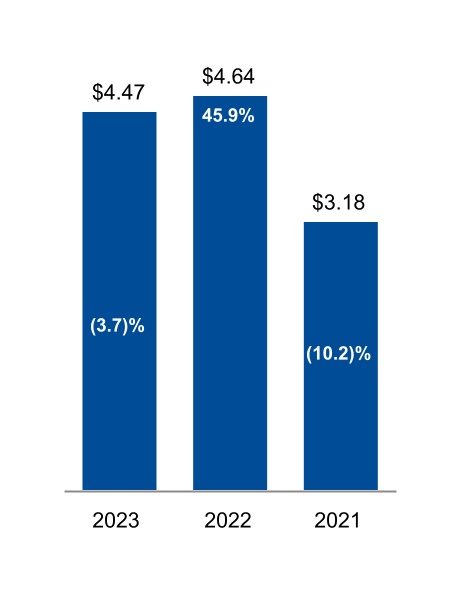
Diluted EPS | $ | 4.47 | $ | 4.64 | $ | 3.18 | |||||
Non-GAAP adjustments: | |||||||||||
Stock-based compensation | 1.38 | 1.30 | 1.04 | ||||||||
Tax effect | (0.33) | (0.35) | (0.27) | ||||||||
Total non-GAAP adjustments, net | 1.05 | 0.95 | 0.77 | ||||||||
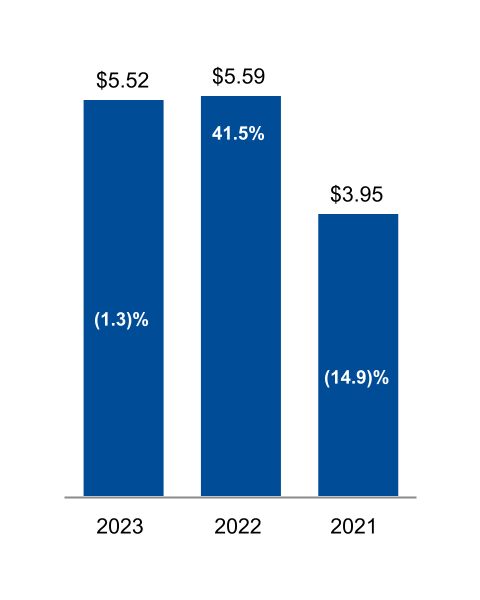
Adjusted EPS | $ | 5.52 | $ | 5.59 | $ | 3.95 | |||||
Diluted EPS % change year over year | (3.7) | % | 45.9 | % | (10.2) | % | |||||
Adjusted EPS % cChange year over year | (1.3) | % | 41.5 | % | (14.9) | % | |||||
| | 56 | 2023 Form 10-K | ||||||
MANAGEMENT’S DISCUSSION AND ANALYSIS OF FINANCIAL CONDITION AND RESULTS OF OPERATIONS | ||
Insperity | 2024 Third Quarter Form 10-Q | 21 | ||||
MANAGEMENT’S DISCUSSION AND ANALYSIS OF FINANCIAL CONDITION AND RESULTS OF OPERATIONS | ||
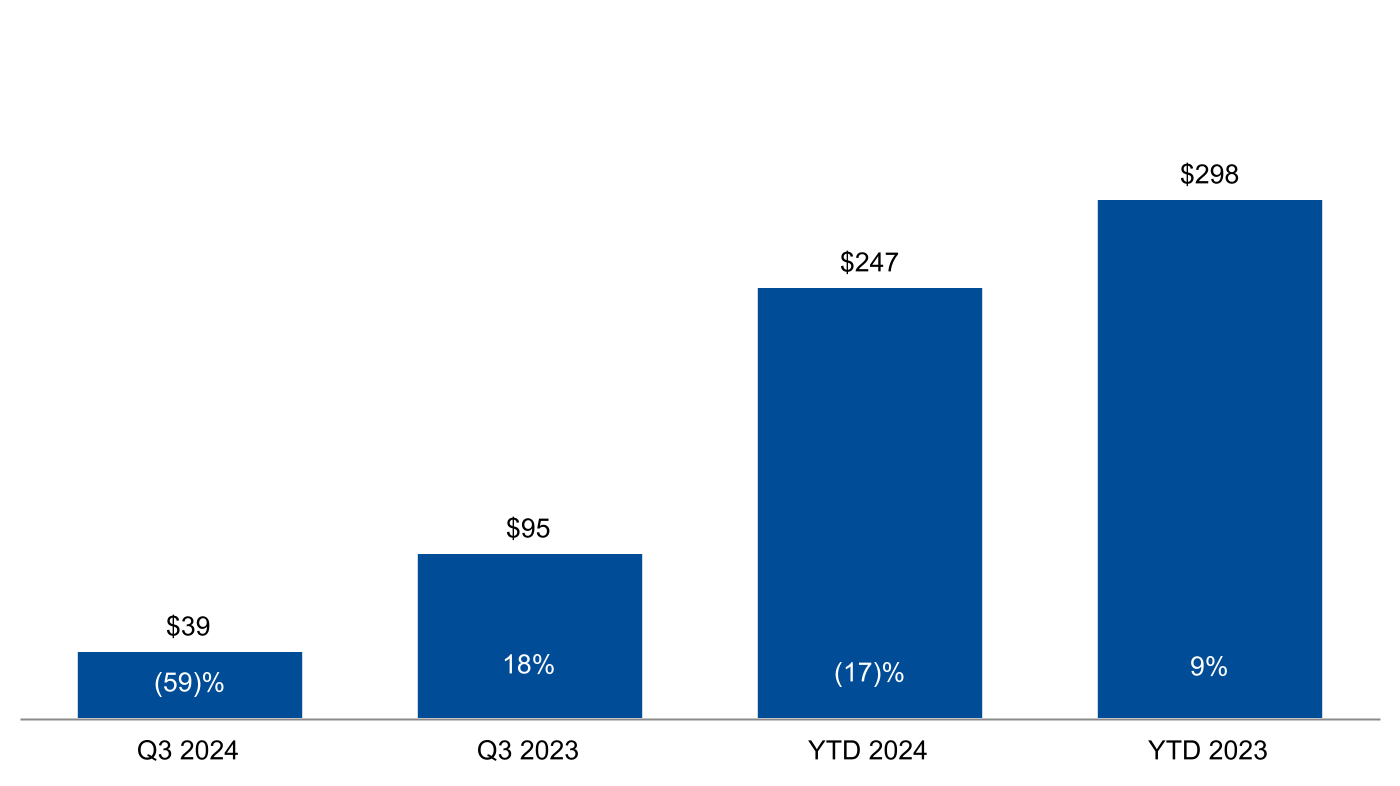
Adjusted EBITDA and Year-over-Year Growth Percentage (in millions) | ||
Insperity | 2024 Third Quarter Form 10-Q | 22 | ||||
MANAGEMENT’S DISCUSSION AND ANALYSIS OF FINANCIAL CONDITION AND RESULTS OF OPERATIONS | ||
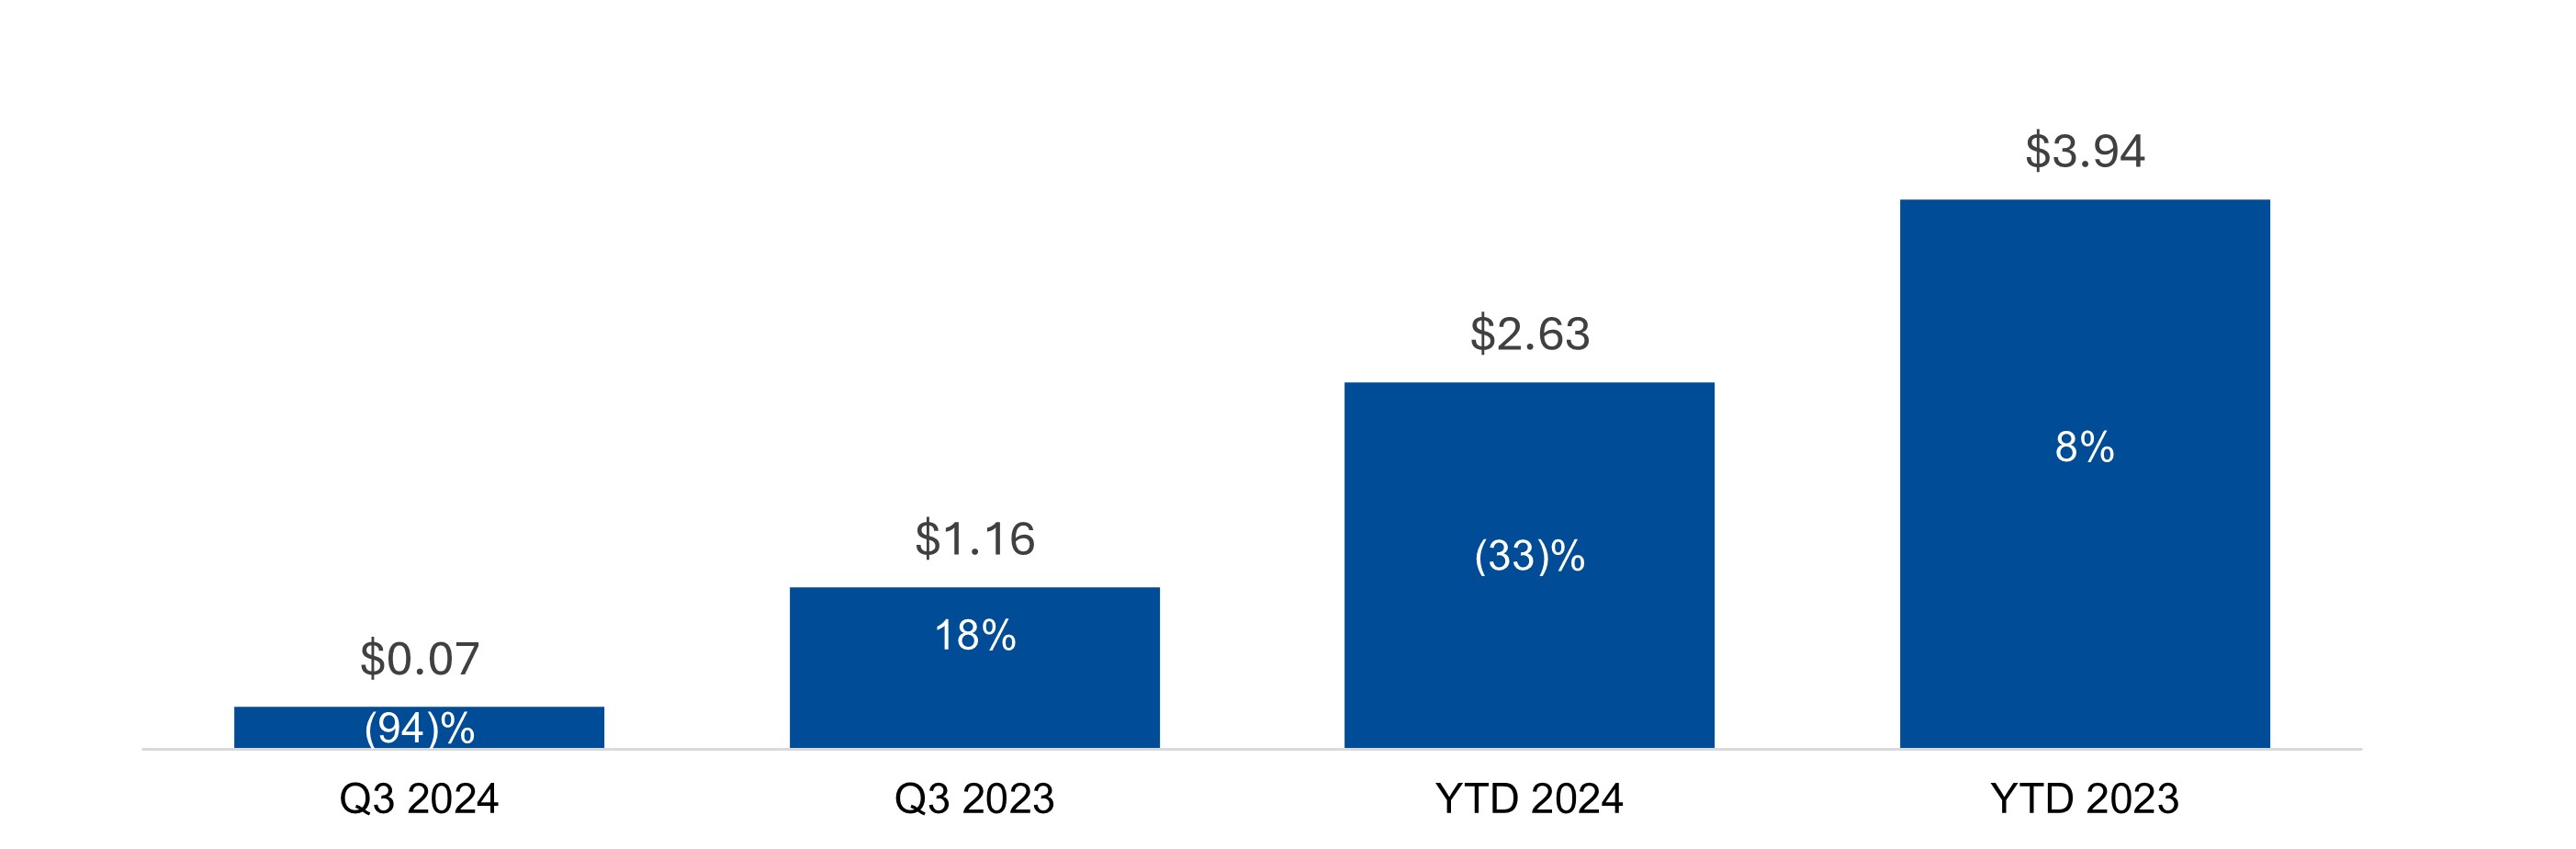
EPS and Year-over-Year Growth Percentage (amounts per share) | ||
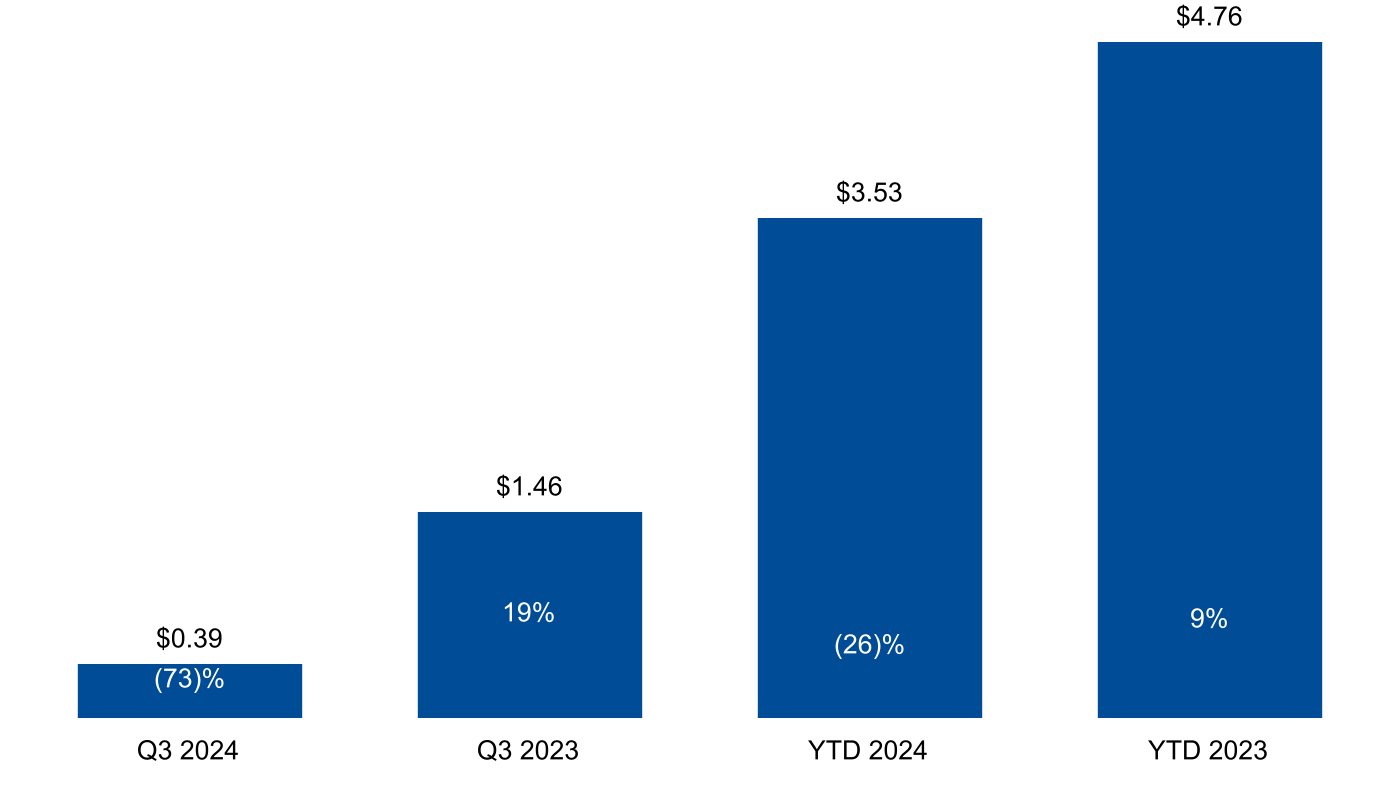
Adjusted EPS and Year-over-Year Growth Percentage (amounts per share) | ||
Insperity | 2024 Third Quarter Form 10-Q | 23 | ||||
MANAGEMENT’S DISCUSSION AND ANALYSIS OF FINANCIAL CONDITION AND RESULTS OF OPERATIONS | ||
Non-GAAP Measure | Definition | Benefit of Non-GAAP Measure | ||||||
Non-bonus payroll cost | Non-bonus payroll cost is a non-GAAP financial measure that excludes the impact of bonus payrolls paid to our WSEEs. Bonus payroll cost varies from period to period, but has no direct impact to our ultimate workers’ compensation costs under the current program. | Our management refers to non-bonus payroll cost in analyzing, reporting and forecasting our workers’ compensation costs. We include these non-GAAP financial measures because we believe they are useful to investors in allowing for greater transparency related to the costs incurred under our current workers’ compensation program. | ||||||
Adjusted cash, cash equivalents and marketable securities | Excludes funds associated with: • federal and state income tax withholdings, • employment taxes, • other payroll deductions, and • client prepayments. | We believe that the exclusion of the identified items helps us reflect the fundamentals of our underlying business model and analyze results against our expectations, against prior periods, and to plan for future periods by focusing on our underlying operations. We believe that the adjusted results provide relevant and useful information for investors because they allow investors to view performance in a manner similar to the method used by management and improves their ability to understand and assess our operating performance. Adjusted EBITDA is used by our lenders to assess our leverage and ability to make interest payments. | ||||||
EBITDA | Represents net income computed in accordance with GAAP, plus: • interest expense, • income tax expense, • depreciation and amortization expense, and • amortization of SaaS implementation costs. | |||||||
Adjusted EBITDA | Represents EBITDA plus: • non-cash stock-based compensation. | |||||||
Adjusted net income | Represents net income computed in accordance with GAAP, excluding: • non-cash stock-based compensation. | |||||||
Adjusted EPS | Represents diluted net income per share computed in accordance with GAAP, excluding: • non-cash stock-based compensation. | |||||||
Insperity | 2024 Third Quarter Form 10-Q | 32 | ||||
MANAGEMENT’S DISCUSSION AND ANALYSIS OF FINANCIAL CONDITION AND RESULTS OF OPERATIONS | ||
(in millions, except per WSEE per month) | Three Months Ended September 30, | Nine Months Ended September 30, | |||||||||||||||||||||||||||||||||
2024 | 2023 | 2024 | 2023 | ||||||||||||||||||||||||||||||||
Per WSEE | Per WSEE | Per WSEE | Per WSEE | ||||||||||||||||||||||||||||||||
Payroll cost | $ 8,730 | $ 9,415 | $ 8,516 | $ 9,003 | $ 27,167 | $ 9,844 | $ 26,857 | $ 9,592 | |||||||||||||||||||||||||||
Less: Bonus payroll cost | 704 | 759 | 529 | 560 | 3,411 | 1,236 | 3,344 | 1,195 | |||||||||||||||||||||||||||
Non-bonus payroll cost | $ 8,026 | $ 8,656 | $ 7,987 | $ 8,443 | $ 23,756 | $ 8,608 | $ 23,513 | $ 8,397 | |||||||||||||||||||||||||||
Payroll cost % change period over period | 3% | 5% | 5% | 1% | 1% | 3% | 9% | 2% | |||||||||||||||||||||||||||
Non-bonus payroll cost % change period over period | — | 3% | 6% | 2% | 1% | 3% | 10% | 3% | |||||||||||||||||||||||||||
(in millions) | September 30, 2024 | December 31, 2023 | |||||||||
Cash, cash equivalents and marketable securities | $ 486 | $ 709 | |||||||||
Less: | |||||||||||
Amounts payable for withheld federal and state income taxes, employment taxes and other payroll deductions | 255 | 510 | |||||||||
Client prepayments | 19 | 28 | |||||||||
Adjusted cash, cash equivalents and marketable securities | $ 212 | $ 171 | |||||||||
Insperity | 2024 Third Quarter Form 10-Q | 33 | ||||
MANAGEMENT’S DISCUSSION AND ANALYSIS OF FINANCIAL CONDITION AND RESULTS OF OPERATIONS | ||
Three Months Ended September 30, | Nine Months Ended September 30, | ||||||||||||||||||||||||||||||||||
(in millions, except per WSEE per month) | 2024 | 2023 | 2024 | 2023 | |||||||||||||||||||||||||||||||
Per WSEE | Per WSEE | Per WSEE | Per WSEE | ||||||||||||||||||||||||||||||||
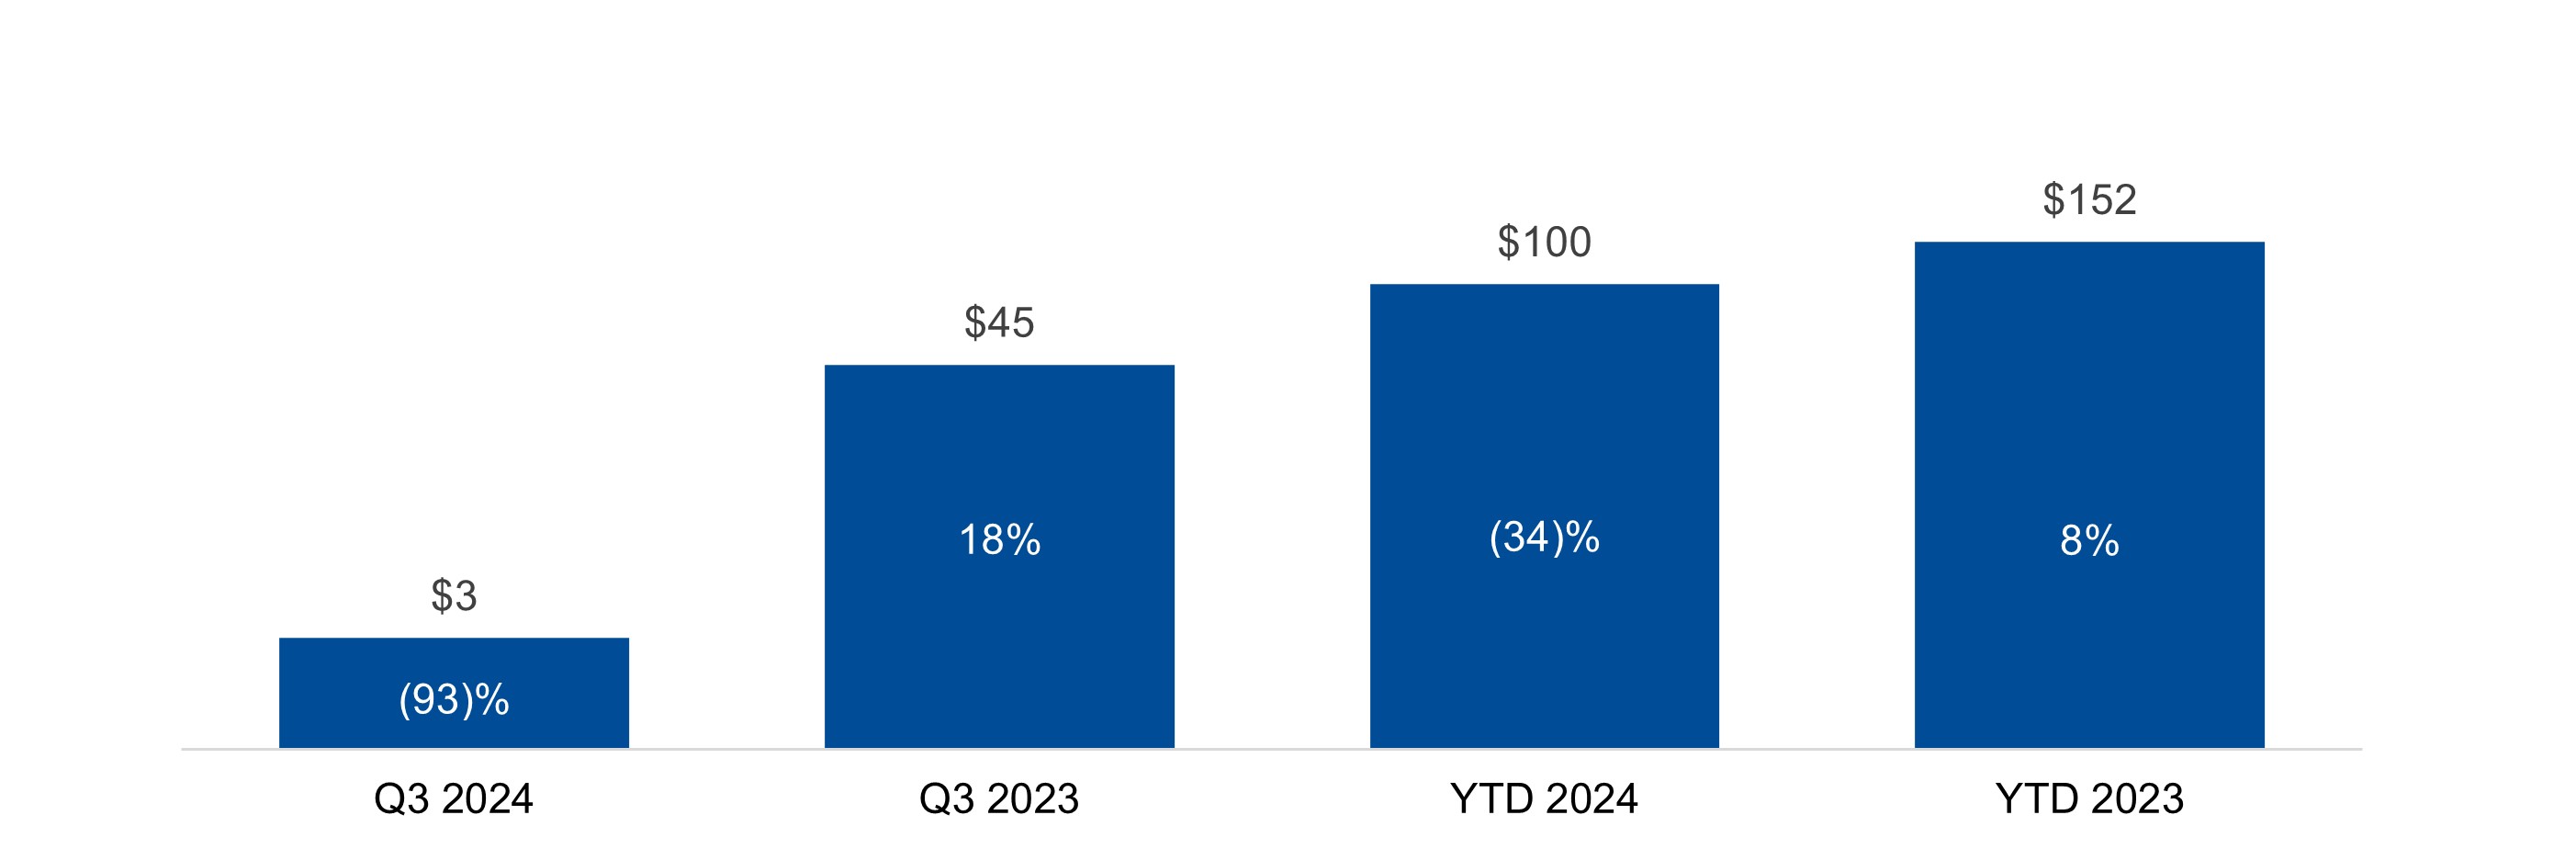
Net income | $ 3 | $ 3 | $ 45 | $ 47 | $ 100 | $ 36 | $ 152 | $ 54 | |||||||||||||||||||||||||||
Income tax expense | — | — | 16 | 19 | 39 | 13 | 49 | 18 | |||||||||||||||||||||||||||
Interest expense | 7 | 8 | 7 | 7 | 21 | 8 | 20 | 7 | |||||||||||||||||||||||||||
Amortization of SaaS implementation costs | 1 | 1 | — | — | 7 | 3 | 3 | 1 | |||||||||||||||||||||||||||
Depreciation and amortization | 11 | 12 | 11 | 11 | 33 | 12 | 32 | 11 | |||||||||||||||||||||||||||
EBITDA | 22 | 24 | 79 | 84 | 200 | 72 | 256 | 91 | |||||||||||||||||||||||||||
Stock-based compensation | 17 | 18 | 16 | 16 | 47 | 17 | 42 | 15 | |||||||||||||||||||||||||||
Adjusted EBITDA | $ 39 | $ 42 | $ 95 | $ 100 | $ 247 | $ 89 | $ 298 | $ 106 | |||||||||||||||||||||||||||
Net income % change period over period | (93)% | (94)% | 18% | 15% | (34)% | (33)% | 8% | — | |||||||||||||||||||||||||||
Adjusted EBITDA % change period over period | (59)% | (58)% | 18% | 14% | (17)% | (16)% | 9% | 2% | |||||||||||||||||||||||||||
Three Months Ended September 30, | Nine Months Ended September 30, | ||||||||||||||||
(in millions) | 2024 | 2023 | 2024 | 2023 | |||||||||||||
Net income | $ 3 | $ 45 | $ 100 | $ 152 | |||||||||||||
Non-GAAP adjustments: | |||||||||||||||||
Stock-based compensation | 17 | 16 | 47 | 42 | |||||||||||||
Tax effect | (5) | (6) | (13) | (11) | |||||||||||||
Total non-GAAP adjustments, net | 12 | 10 | 34 | 31 | |||||||||||||
Adjusted net income | $ 15 | $ 55 | $ 134 | $ 183 | |||||||||||||
Net income % change period over period | (93)% | 18% | (34)% | 8% | |||||||||||||
Adjusted net income % change period over period | (73)% | 17% | (27)% | 8% | |||||||||||||
Insperity | 2024 Third Quarter Form 10-Q | 34 | ||||
MANAGEMENT’S DISCUSSION AND ANALYSIS OF FINANCIAL CONDITION AND RESULTS OF OPERATIONS | ||
Three Months Ended September 30, | Nine Months Ended September 30, | ||||||||||||||||
(amounts per share) | 2024 | 2023 | 2024 | 2023 | |||||||||||||
Diluted EPS | $ 0.07 | $ 1.16 | $ 2.63 | $ 3.94 | |||||||||||||
Non-GAAP adjustments: | |||||||||||||||||
Stock-based compensation | 0.45 | 0.40 | 1.24 | 1.08 | |||||||||||||
Tax effect | (0.13) | (0.10) | (0.34) | (0.26) | |||||||||||||
Total non-GAAP adjustments, net | 0.32 | 0.30 | 0.90 | 0.82 | |||||||||||||
Adjusted EPS | $ 0.39 | $ 1.46 | $ 3.53 | $ 4.76 | |||||||||||||
Diluted EPS % change period over period | (94)% | 18% | (33)% | 8% | |||||||||||||
Adjusted EPS % change period over period | (73)% | 19% | (26)% | 9% | |||||||||||||
Insperity | 2024 Third Quarter Form 10-Q | 35 | ||||
SUMMARY FINANCIAL INFORMATION | ||
Non-GAAP Measure | Definition | Benefit of Non-GAAP Measure | ||||||
Non-bonus payroll cost | Non-bonus payroll cost is a non-GAAP financial measure that excludes the impact of bonus payrolls paid to our WSEEs. Bonus payroll cost varies from period to period, but has no direct impact to our ultimate workers’ compensation costs under the current program. | Our management refers to non-bonus payroll cost in analyzing, reporting and forecasting our workers’ compensation costs. We include these non-GAAP financial measures because we believe they are useful to investors in allowing for greater transparency related to the costs incurred under our current workers’ compensation program. | ||||||
Adjusted cash, cash equivalents and marketable securities | Excludes funds associated with: • federal and state income tax withholdings, • employment taxes, • other payroll deductions, and • client prepayments. | We believe that the exclusion of the identified items helps us reflect the fundamentals of our underlying business model and analyze results against our expectations, against prior periods, and to plan for future periods by focusing on our underlying operations. We believe that the adjusted results provide relevant and useful information for investors because they allow investors to view performance in a manner similar to the method used by management and improves their ability to understand and assess our operating performance. Adjusted EBITDA is used by our lenders to assess our leverage and ability to make interest payments. | ||||||
EBITDA | Represents net income computed in accordance with GAAP, plus: • interest expense, • income tax expense, • depreciation and amortization expense, and • amortization of SaaS implementation costs. | |||||||
Adjusted EBITDA | Represents EBITDA plus: • non-cash stock-based compensation. | |||||||
Adjusted net income | Represents net income computed in accordance with GAAP, excluding: • non-cash stock-based compensation. | |||||||
Adjusted EPS | Represents diluted net income per share computed in accordance with GAAP, excluding: • non-cash stock-based compensation. | |||||||
SUMMARY FINANCIAL INFORMATION | ||
Three Months Ended September 30, | Nine Months Ended September 30, | ||||||||||||||||||||||||||||||||||
(in millions, except per WSEE per month) | 2024 | 2023 | 2024 | 2023 | |||||||||||||||||||||||||||||||
Per WSEE | Per WSEE | Per WSEE | Per WSEE | ||||||||||||||||||||||||||||||||
Payroll cost | $ 8,730 | $ 9,415 | $ 8,516 | $ 9,003 | $ 27,167 | $ 9,844 | $ 26,857 | $ 9,592 | |||||||||||||||||||||||||||
Less: Bonus payroll cost | 704 | 759 | 529 | 560 | 3,411 | 1,236 | 3,344 | 1,195 | |||||||||||||||||||||||||||
Non-bonus payroll cost | $ 8,026 | $ 8,656 | $ 7,987 | $ 8,443 | $ 23,756 | $ 8,608 | $ 23,513 | $ 8,397 | |||||||||||||||||||||||||||
Payroll cost % change period over period | 3% | 5% | 5% | 1% | 1% | 3% | 9% | 2% | |||||||||||||||||||||||||||
Non-bonus payroll cost % change period over period | — | 3% | 6% | 2% | 1% | 3% | 10% | 3% | |||||||||||||||||||||||||||
(in millions) | September 30, 2024 | December 31, 2023 | |||||||||
Cash, cash equivalents and marketable securities | $ 486 | $ 709 | |||||||||
Less: | |||||||||||
Amounts payable for withheld federal and state income taxes, employment taxes and other payroll deductions | 255 | 510 | |||||||||
Client prepayments | 19 | 28 | |||||||||
Adjusted cash, cash equivalents and marketable securities | $ 212 | $ 171 | |||||||||
(in millions, except per WSEE per month) | Three Months Ended September 30, | Nine Months Ended September 30, | |||||||||||||||||||||||||||||||||
2024 | 2023 | 2024 | 2023 | ||||||||||||||||||||||||||||||||
Per WSEE | Per WSEE | Per WSEE | Per WSEE | ||||||||||||||||||||||||||||||||
Net income | $ 3 | $ 3 | $ 45 | $ 47 | $ 100 | $ 36 | $ 152 | $ 54 | |||||||||||||||||||||||||||
Income tax expense | — | — | 16 | 19 | 39 | 13 | 49 | 18 | |||||||||||||||||||||||||||
Interest expense | 7 | 8 | 7 | 7 | 21 | 8 | 20 | 7 | |||||||||||||||||||||||||||
Amortization of SaaS implementation costs | 1 | 1 | — | — | 7 | 3 | 3 | 1 | |||||||||||||||||||||||||||
Depreciation and amortization | 11 | 12 | 11 | 11 | 33 | 12 | 32 | 11 | |||||||||||||||||||||||||||
EBITDA | 22 | 24 | 79 | 84 | 200 | 72 | 256 | 91 | |||||||||||||||||||||||||||
Stock-based compensation | 17 | 18 | 16 | 16 | 47 | 17 | 42 | 15 | |||||||||||||||||||||||||||
Adjusted EBITDA | $ 39 | $ 42 | $ 95 | $ 100 | $ 247 | $ 89 | $ 298 | $ 106 | |||||||||||||||||||||||||||
Net income % change period over period | (93) % | (94) % | 18% | 15% | (34) % | (33) % | 8% | — | |||||||||||||||||||||||||||
Adjusted EBITDA % change period over period | (59) % | (58) % | 18% | 14% | (17) % | (16) % | 9% | 2% | |||||||||||||||||||||||||||
SUMMARY FINANCIAL INFORMATION | ||
Three Months Ended September 30, | Nine Months Ended September 30, | ||||||||||||||||
(in millions) | 2024 | 2023 | 2024 | 2023 | |||||||||||||
Net income | $ 3 | $ 45 | $ 100 | $ 152 | |||||||||||||
Non-GAAP adjustments: | |||||||||||||||||
Stock-based compensation | 17 | 16 | 47 | 42 | |||||||||||||
Tax effect | (5) | (6) | (13) | (11) | |||||||||||||
Total non-GAAP adjustments, net | 12 | 10 | 34 | 31 | |||||||||||||
Adjusted net income | $ 15 | $ 55 | $ 134 | $ 183 | |||||||||||||
Net income % change period over period | (93) % | 18% | (34) % | 8% | |||||||||||||
Adjusted net income % change period over period | (73) % | 17% | (27) % | 8% | |||||||||||||
Three Months Ended September 30, | Nine Months Ended September 30, | ||||||||||||||||
2024 | 2023 | 2024 | 2023 | ||||||||||||||
Diluted EPS | $ 0.07 | $ 1.16 | $ 2.63 | $ 3.94 | |||||||||||||
Non-GAAP adjustments: | |||||||||||||||||
Stock-based compensation | 0.45 | 0.40 | 1.24 | 1.08 | |||||||||||||
Tax effect | (0.13) | (0.10) | (0.34) | (0.26) | |||||||||||||
Total non-GAAP adjustments, net | 0.32 | 0.30 | 0.90 | 0.82 | |||||||||||||
Adjusted EPS | $ 0.39 | $ 1.46 | $ 3.53 | $ 4.76 | |||||||||||||
Diluted EPS % change period over period | (94) % | 18% | (33) % | 8% | |||||||||||||
Adjusted EPS % change period over period | (73) % | 19% | (26) % | 9% | |||||||||||||
SUMMARY FINANCIAL INFORMATION | ||
Q4 2024 | Full Year 2024 | ||||||||||
(in millions, except per share amounts) | Guidance | Guidance | |||||||||
Net income | $(13) - $(5) | $86 - $95 | |||||||||
Income tax expense | (6) - (2) | 33 - 36 | |||||||||
Interest expense | 7 | 28 | |||||||||
SaaS implementation amortization | 3 | 11 | |||||||||
Depreciation and amortization | 10 | 43 | |||||||||
EBITDA | 1 - 13 | 201 - 213 | |||||||||
Stock-based compensation | 14 | 61 | |||||||||
Adjusted EBITDA | $15 - $27 | $262 - $274 | |||||||||
Diluted EPS | $(0.36) - $(0.14) | $2.26 - $2.50 | |||||||||
Non-GAAP adjustments: | |||||||||||
Stock-based compensation | 0.37 | 1.61 | |||||||||
Tax effect | (0.11) | (0.45) | |||||||||
Total non-GAAP adjustments, net | 0.26 | 1.16 | |||||||||
Adjusted EPS | $(0.10) - $0.12 | $3.42 - $3.66 | |||||||||
NON-GAAP FINANCIAL MEASURES | ||
Non-GAAP Measure | Definition | Benefit of Non-GAAP Measure | ||||||
Non-bonus payroll cost | Non-bonus payroll cost is a non-GAAP financial measure that excludes the impact of bonus payrolls paid to our WSEEs. Bonus payroll cost varies from period to period, but has no direct impact to our ultimate workers’ compensation costs under the current program. | Our management refers to non-bonus payroll cost in analyzing, reporting and forecasting our workers’ compensation costs. We include these non-GAAP financial measures because we believe they are useful to investors in allowing for greater transparency related to the costs incurred under our current workers’ compensation program. | ||||||
Adjusted cash, cash equivalents and marketable securities | Excludes funds associated with: • federal and state income tax withholdings, • employment taxes, • other payroll deductions, and • client prepayments. | We believe that the exclusion of the identified items helps us reflect the fundamentals of our underlying business model and analyze results against our expectations, against prior periods, and to plan for future periods by focusing on our underlying operations. We believe that the adjusted results provide relevant and useful information for investors because they allow investors to view performance in a manner similar to the method used by management and improves their ability to understand and assess our operating performance. Adjusted EBITDA is used by our lenders to assess our leverage and ability to make interest payments. | ||||||
EBITDA | Represents net income computed in accordance with GAAP, plus: • interest expense, • income tax expense, • depreciation and amortization expense, and • amortization of SaaS implementation costs. | |||||||
Adjusted EBITDA | Represents EBITDA plus: • non-cash stock-based compensation. | |||||||
Adjusted net income | Represents net income computed in accordance with GAAP, excluding: • non-cash stock-based compensation. | |||||||
Adjusted EPS | Represents diluted net income per share computed in accordance with GAAP, excluding: • non-cash stock-based compensation. | |||||||
NON-GAAP FINANCIAL MEASURES | ||
Three Months Ended December 31, | Year Ended December 31, | ||||||||||||||||||||||||||||||||||
(in thousands, except per WSEE per month) | 2023 | 2022 | 2023 | 2022 | |||||||||||||||||||||||||||||||
Per WSEE | Per WSEE | Per WSEE | Per WSEE | ||||||||||||||||||||||||||||||||
Payroll cost | $ 9,798,217 | $ 10,366 | $ 9,525,953 | $ 10,326 | $ 36,655,495 | $ 9,787 | $ 34,188,092 | $ 9,657 | |||||||||||||||||||||||||||
Less: Bonus payroll cost | 1,633,783 | 1,728 | 1,723,928 | 1,869 | 4,978,439 | 1,329 | 4,959,987 | 1,401 | |||||||||||||||||||||||||||
Non-bonus payroll cost | $ 8,164,434 | $ 8,638 | $ 7,802,025 | $ 8,457 | $ 31,677,056 | $ 8,458 | $ 29,228,105 | $ 8,256 | |||||||||||||||||||||||||||
Payroll cost % change period over period | 2.9% | 0.4% | 14.1% | (0.2)% | 7.2% | 1.3% | 20.6% | 2.5% | |||||||||||||||||||||||||||
Non-bonus payroll cost % cChange period over period | 4.6% | 2.1% | 18.8% | 3.9% | 8.4% | 2.4% | 23.7% | 5.1% | |||||||||||||||||||||||||||
(in thousands) | December 31, 2023 | December 31, 2022 | |||||||||
Cash, cash equivalents and marketable securities | $ 708,778 | $ 765,896 | |||||||||
Less: | |||||||||||
Amounts payable for withheld federal and state income taxes, employment taxes and other payroll deductions | 510,092 | 504,817 | |||||||||
Client prepayments | 27,592 | 36,800 | |||||||||
Adjusted cash, cash equivalents and marketable securities | $ 171,094 | $ 224,279 | |||||||||
NON-GAAP FINANCIAL MEASURES | ||
(in thousands, except per WSEE per month) | Three Months Ended December 31, | Year Ended December 31, | |||||||||||||||||||||||||||||||||
2023 | 2022 | 2023 | 2022 | ||||||||||||||||||||||||||||||||
Per WSEE | Per WSEE | Per WSEE | Per WSEE | ||||||||||||||||||||||||||||||||
Net income | $ 19,561 | $ 21 | $ 38,198 | $ 41 | $ 171,382 | $ 46 | $ 179,350 | $ 51 | |||||||||||||||||||||||||||
Income tax expense | 4,485 | 4 | 12,648 | 15 | 53,696 | 14 | 66,075 | 19 | |||||||||||||||||||||||||||
Interest expense | 7,198 | 8 | 5,509 | 6 | 27,137 | 7 | 14,207 | 4 | |||||||||||||||||||||||||||
Amortization of SaaS implementation costs | 2,639 | 3 | 975 | 1 | 5,711 | 2 | 1,923 | 1 | |||||||||||||||||||||||||||
Depreciation and amortization | 10,805 | 11 | 10,293 | 11 | 42,708 | 11 | 40,660 | 11 | |||||||||||||||||||||||||||
EBITDA | 44,688 | 47 | 67,623 | 74 | 300,634 | 80 | 302,215 | 86 | |||||||||||||||||||||||||||
Stock-based compensation | 11,320 | 12 | 11,262 | 12 | 52,996 | 14 | 50,080 | 14 | |||||||||||||||||||||||||||
Adjusted EBITDA | $ 56,008 | $ 59 | $ 78,885 | $ 86 | $ 353,630 | $ 94 | $ 352,295 | $ 100 | |||||||||||||||||||||||||||
Net income % change period over period | (48.8)% | (48.8)% | 293.5% | 241.7% | (4.4)% | (9.8)% | 44.5% | 24.4% | |||||||||||||||||||||||||||
Adjusted EBITDA % cChange period over period | (29.0)% | (31.4)% | 159.6% | 126.3% | 0.4% | (6.0%) | 38.2% | 17.6% | |||||||||||||||||||||||||||
Three Months Ended December 31, | Year Ended December 31, | ||||||||||||||||
(in thousands) | 2023 | 2022 | 2023 | 2022 | |||||||||||||
Net income | $ 19,561 | $ 38,198 | $ 171,382 | $ 179,350 | |||||||||||||
Non-GAAP adjustments: | |||||||||||||||||
Stock-based compensation | 11,320 | 11,262 | 52,996 | 50,080 | |||||||||||||
Tax effect | (2,441) | (2,824) | (12,643) | (13,483) | |||||||||||||
Total non-GAAP adjustments, net | 8,879 | 8,438 | 40,353 | 36,597 | |||||||||||||
Adjusted net income | $ 28,440 | $ 46,636 | $ 211,735 | $ 215,947 | |||||||||||||
Net income % change period over period | (48.8)% | 293.5% | (4.4)% | 44.5% | |||||||||||||
Adjusted net income % cChange period over period | (39.0)% | 254.0% | (2.0%) | 40.2% | |||||||||||||
NON-GAAP FINANCIAL MEASURES | ||
Three Months Ended December 31, | Year Ended December 31, | ||||||||||||||||
2023 | 2022 | 2023 | 2022 | ||||||||||||||
Diluted EPS | $ 0.52 | $ 0.99 | $ 4.47 | $ 4.64 | |||||||||||||
Non-GAAP adjustments: | |||||||||||||||||
Stock-based compensation | 0.30 | 0.29 | 1.38 | 1.30 | |||||||||||||
Tax effect | (0.07) | (0.07) | (0.33) | (0.35) | |||||||||||||
Total non-GAAP adjustments, net | 0.23 | 0.22 | 1.05 | 0.95 | |||||||||||||
Adjusted EPS | $ 0.75 | $ 1.21 | $ 5.52 | $ 5.59 | |||||||||||||
Diluted EPS % change period over period | (47.5)% | 296.0% | (3.7)% | 45.9% | |||||||||||||
Adjusted EPS % cChange period over period | (38.0)% | 255.9% | (1.3%) | 41.5% | |||||||||||||