 |
| |
Earnings Release 3Q / 2025
|
Analysis of 3Q25 Consolidated Results
|
 |
Operating and Financial Highlights | 03 |
|
|
||
|
Senior Management Quotes
|
04 |
|
|
||
|
Third Quarter 2025 Earnings Conference Call
|
05 |
|
|
||
|
Summary of Financial Performance and Outlook
|
06 |
|
Financial Overview | 11 |
|
Credicorp’s Strategy Update | 12 |
|
Analysis of 3Q25 Consolidated Results |
|
01
|
Loan Portfolio
|
17
|
|
|
02
|
Deposits
|
20
|
|
|
03
|
Interest Earning Assets and Funding
|
23
|
|
|
04
|
Net Interest Income (NII)
|
25
|
|
|
05
|
Portfolio Quality and Provisions
|
28
|
|
|
06
|
Other Income
|
32
|
|
|
07
|
Insurance Underwriting Results and the Medical Services
|
36
|
|
|
08
|
Operating Expenses
|
39
|
|
|
09
|
Operating Efficiency
|
41
|
|
|
10
|
Regulatory Capital
|
42
|
|
|
11
|
Economic Outlook
|
44
|
|
|
12
|
Appendix
|
48
|
 |
| |
| |
Earnings Release 3Q / 2025
|
Analysis of 3Q25 Consolidated Results
|
|
|
| • |
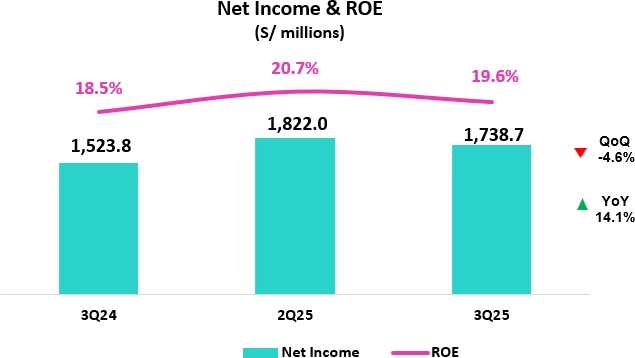
Net income attributable to Credicorp increased 14.1% YoY and declined 4.6% QoQ to S/1,738.7 million, with ROE at 19.6% driven by contributions from all lines of
business.
|
| • |
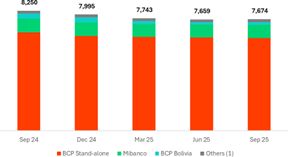
Credicorp’s total assets declined 2.1% YoY due to a non-cash FX revaluation of Bolivia’s balance sheet. Loan and deposit figures exclude this accounting adjustment.
|
| • |
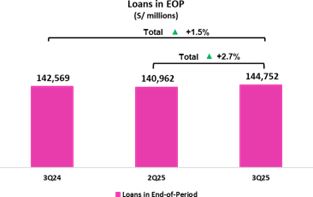
Total Loans in quarter-end balances rose 4.4% YoY and 7.0% FX Neutral, reflecting growth at BCP through Retail Banking, by Mortgages and Consumer Loans, and Wholesale
Banking. QoQ, Total Loans increased 1.6% and 2.4% FX Neutral, led by the same segments, along with SMEs at BCP and Mibanco.
|
| • |
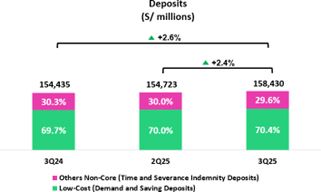
Total Deposits increased 5.9% (+10.8% FX Neutral) YoY and 1.3% (+3.8% FX Neutral) QoQ, mainly driven by growth in both Low-cost deposits and Term deposits. Low-cost
deposits accounted for 69.8% of total deposits and 58.1% of the total funding base.
|
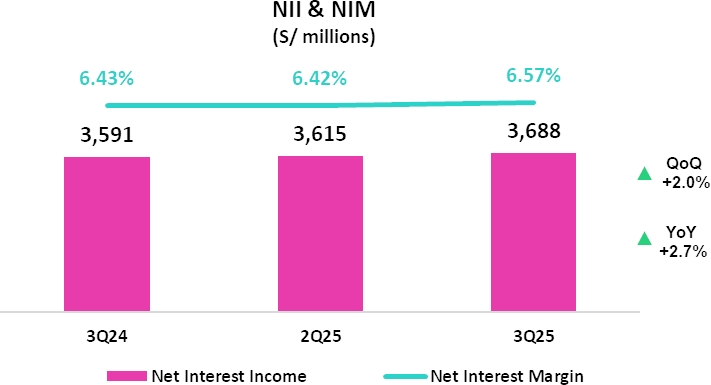
| • |
Net interest income (NII) rose 2.7% YoY, driven by a further strengthened funding mix and higher-yielding loan portfolio; and increased 2.0% QoQ. Net Interest Margin (NIM) reached 6.57%, expanding 14 bps YoY and 15 bps QoQ.
|
| • |
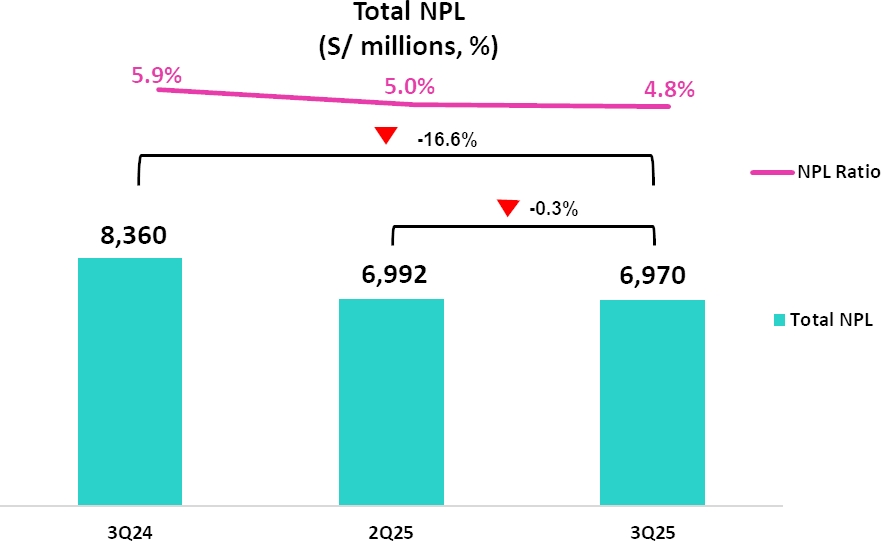
NPL Ratio improved across all segments, declining 105 bps YoY to 4.8%, principally reflecting debt repayments at BCP and a drop in overdue loans at BCP and Mibanco.
QoQ, the NPL Ratio improved by 15 bps.
|
| • |
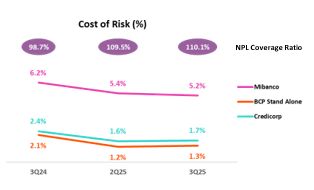
Provisions declined by 30.5% YoY, driven by BCP and Mibanco, which registered improvements in payment performance due to economic recovery and an increase in
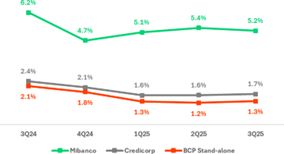
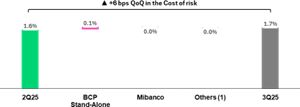
lower-risk vintages’ share of the portfolio mix. QoQ, provisions increased 4.8%. Cost of Risk declined 71 bps YoY to 1.7%, while Risk-Adjusted NIM reached
a record 5.5%.
|
| • |
Other Core Income up 11.9% YoY, supported by the strong performance of BCP core business and the dynamism of Yape, reflecting the consistent execution of our revenue
diversification and decoupling from macroeconomic factors strategy. Other Non-Core Income declined 19.0%, reflecting the base effect generated by an extraordinary income recorded last year.
|
| • |
Insurance Underwriting Results rose 33.1% YoY, principally due to a stronger Insurance Service Result in the Life business; and was up 10.7% QoQ.
|
| • |
Yape reached 15.5 million Monthly Active Users (MAU), with operating leverage continuing to expand and accounting for 6.6% of Credicorp’s total risk-adjusted revenue.
Lending reached 20% of Yape revenues, up from 7% in 3Q24.
|
| • |
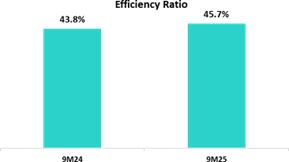
Efficiency ratio at 45.7% for 9M25, on track with full-year guidance. Operating Expenses rose 12.8% YoY in this period,
fueled mainly by BCP’s core business and innovation portfolio.
|
| • |
IFRS CET 1 Ratio at 13.17% for BCP and at 17.14% for Mibanco.
|
 |
| |
| |
Earnings Release 3Q / 2025
|
Analysis of 3Q25 Consolidated Results
|
|
|
 |
| |
| |
Earnings Release 3Q / 2025
|
Analysis of 3Q25 Consolidated Results
|
|
Third Quarter 2025 Earnings Conference Call
|
|||
 |
| |
| |
Earnings Release 3Q / 2025
|
Analysis of 3Q25 Consolidated Results
|
|
|
 |
| |
| |
Earnings Release 3Q / 2025
|
Analysis of 3Q25 Consolidated Results
|
|
|
 |
| |
| |
Earnings Release 3Q / 2025
|
Analysis of 3Q25 Consolidated Results
|

|
|
 |
|
| |
Earnings Release 3Q / 2025
|
Analysis of 3Q25 Consolidated Results
|
|
|
 |
 |
| |
Earnings Release 3Q / 2025
|
Analysis of 3Q25 Consolidated Results
|
|
Universal Banking
|
| |
|
BCP reported solid profitability this quarter, backed by increasing margins; diversified sources of income; and a cost of risk level below that seen in 2024. NIM stood at 6.1%, driven mainly
by a shift in the mix towards a higher preponderance of retail loans and by solid transactional funding. Core income remained robust, backed by a growing and diversified income base in both Yape and the core business.
The CoR stood at 1.3%, due to a greater share of lower-risk loans in the portfolio, supported by a more favorable economic environment.
|
| |
|
Insurance and Pensions
|
|
Grupo Pacífico's Net Income reflects a solid performance of the underlying business, particularly in the Life and P&C businesses, which continue to show robust
underwriting results. The consolidation o Empresas Banmedica’s operations has further strengthened results for Medical Services. These positive
dynamics were partially offset by a credit downgrade of two assets in the investment portfolio.
|
|
Microfinance
|
|
Profitability at Mibanco continued to recover, fueled primarily by a rebound in disbursements; fortified risk management; and efficient interest rate
strategies. NIM remained strong, bolstered by active loan pricing and a reduction in the funding cost.
Mibanco Colombia’s results continued to improve on the back of restructuring efforts over the past year and an improvement in the economic environment
for the microfinance sector. Growth remained stable, and risk levels controlled.
|
| |
|
Investment Management and
Advisory
|
|
Operating profitability in the Investment Management and Advisory remained at sound levels. The core business reported solid results, where good performance helped offset an increase in
operating expenses. The Asset Management and Wealth Management business reported a significant uptick in AUMs.
|
|
|
|
Outlook
|
|
We reaffirm our previously published guidance for ROE 2025 of around 19.0%. This expectation is based on (i)
accelerated loan growth, led by the retail segment, (ii) the increase of our NIM, and (iii) a cost of risk again below previous expectations.
|
 |
 |
| |
Earnings Release 3Q / 2025
|
Analysis of 3Q25 Consolidated Results
|
|
Financial Overview
|
|
Credicorp Ltd.
|
Quarter |
% change
|
Up to
|
% change
|
||||
|
S/ 000
|
3Q24
|
2Q25
|
3Q25
|
QoQ
|
YoY
|
Sep 24
|
Sep 25
|
Sep 25 / Sep 24
|
|
Net interest, similar income and expenses
|
3,590,750
|
3,615,371
|
3,687,829
|
2.0%
|
2.7%
|
10,485,337
|
10,875,212
|
3.7%
|
|
Provision for credit losses on loan portfolio, net of recoveries
|
(868,081)
|
(575,159)
|
(602,918)
|
4.8%
|
-30.5%
|
(2,776,151)
|
(1,759,970)
|
-36.6%
|
|
Net interest, similar income and expenses, after provision for credit losses on loan portfolio
|
2,722,669
|
3,040,212
|
3,084,911
|
1.5%
|
13.3%
|
7,709,186
|
9,115,242
|
18.2%
|
|
Other income
|
1,545,344
|
1,677,373
|
1,654,191
|
-1.4%
|
7.0%
|
4,529,233
|
5,021,780
|
10.9%
|
|
Insurance underwriting result
|
291,776
|
350,873
|
388,350
|
10.7%
|
33.1%
|
886,338
|
1,068,357
|
20.5%
|
|
Medical services result
|
-
|
123,319
|
123,953
|
0.5%
|
n.a.
|
-
|
289,961
|
n.a.
|
|
Total expenses
|
(2,448,229)
|
(2,630,310)
|
(2,744,642)
|
4.3%
|
12.1%
|
(7,055,916)
|
(7,907,826)
|
12.1%
|
|
Profit before income tax
|
2,111,560
|
2,561,467
|
2,506,763
|
-2.1%
|
18.7%
|
6,068,841
|
7,587,514
|
25.0%
|
|
Income tax
|
(555,117)
|
(696,969)
|
(728,308)
|
4.5%
|
31.2%
|
(1,602,927)
|
(2,129,746)
|
32.9%
|
|
Net profit
|
1,556,443
|
1,864,498
|
1,778,455
|
-4.6%
|
14.3%
|
4,465,914
|
5,457,768
|
22.2%
|
|
Non-controlling interest
|
32,655
|
42,483
|
39,800
|
-6.3%
|
21.9%
|
91,373
|
119,401
|
30.7%
|
|
Net profit attributable to Credicorp
|
1,523,788
|
1,822,015
|
1,738,655
|
-4.6%
|
14.1%
|
4,374,541
|
5,338,367
|
22.0%
|
|
Dividends paid to third parties
|
875,992
|
3,181,440
|
-
|
-100.0%
|
-100.0%
|
3,667,644
|
3,181,440
|
-13.3%
|
|
Net income / share (S/)
|
19.1
|
22.8
|
21.8
|
-4.6%
|
14.1%
|
54.8
|
66.9
|
22.0%
|
|
Dividends per Share (S/)
|
11.00
|
39.89
|
-
|
-100.0%
|
-100.0%
|
46.0
|
39.9
|
-13.3%
|
|
Loans
|
142,568,785
|
140,961,978
|
144,752,254
|
2.7%
|
1.5%
|
142,568,785
|
144,752,254
|
1.5%
|
|
Deposits and obligations
|
154,435,451
|
154,723,334
|
158,430,455
|
2.4%
|
2.6%
|
154,435,451
|
158,430,455
|
2.6%
|
|
Net equity
|
33,462,591
|
34,459,012
|
36,560,502
|
6.1%
|
9.3%
|
33,462,591
|
36,560,502
|
9.3%
|
|
Profitability
|
||||||||
|
Net interest margin(1)
|
6.4%
|
6.4%
|
6.6%
|
15 bps
|
14 bps
|
6.3%
|
6.3%
|
2 bps
|
|
Risk-adjusted Net interest margin
|
4.9%
|
5.4%
|
5.5%
|
9 bps
|
60 bps
|
4.7%
|
5.3%
|
64 bps
|
|
Funding cost(2)
|
2.7%
|
2.4%
|
2.4%
|
-1 bps
|
-25 bps
|
0.03%
|
2.4%
|
-43 bps
|
|
ROAE
|
18.5%
|
20.7%
|
19.6%
|
-110 bps
|
110 bps
|
17.7%
|
20.1%
|
240 bps
|
|
ROAA
|
2.4%
|
2.9%
|
2.8%
|
-10 bps
|
40 bps
|
2.4%
|
2.8%
|
40 bps
|
|
Loan portfolio quality
|
||||||||
|
Internal overdue ratio(3)
|
4.2%
|
3.6%
|
3.4%
|
-16 bps
|
-81 bps
|
4.2%
|
3.4%
|
-81 bps
|
|
Internal overdue ratio over 90 days
|
3.4%
|
3.0%
|
2.9%
|
-10 bps
|
-50 bps
|
3.4%
|
2.9%
|
-50 bps
|
|
NPL ratio(4)
|
5.9%
|
5.0%
|
4.8%
|
-15 bps
|
-105 bps
|
5.9%
|
4.8%
|
-105 bps
|
|
Cost of risk(5)
|
2.4%
|
1.6%
|
1.7%
|
6 bps
|
-71 bps
|
2.6%
|
1.6%
|
-95 bps
|
|
Coverage ratio of IOLs
|
136.9%
|
151.8%
|
154.9%
|
310 bps
|
1800 bps
|
136.9%
|
154.9%
|
1800 bps
|
|
Coverage ratio of NPLs
|
98.7%
|
109.5%
|
110.1%
|
60 bps
|
1140 bps
|
98.7%
|
110.1%
|
1140 bps
|
|
Operating efficiency
|
||||||||
|
Operating income(6)
|
5,211,162
|
5,529,301
|
5,670,690
|
2.6%
|
8.8%
|
15,288,024
|
16,540,190
|
8.2%
|
|
Operating expenses(7)
|
2,313,324
|
2,483,493
|
2,629,461
|
5.9%
|
13.7%
|
6,696,919
|
7,555,043
|
12.8%
|
|
Efficiency ratio(8)
|
44.4%
|
44.9%
|
46.4%
|
150 bps
|
200 bps
|
43.8%
|
45.7%
|
190 bps
|
|
Operating expenses / Total average assets
|
3.7%
|
3.9%
|
4.2%
|
27 bps
|
48 bps
|
3.7%
|
3.9%
|
20 bps
|
|
Capital adequacy - BCP Stand-alone
|
||||||||
|
Global Capital Ratio(9)
|
18.96%
|
17.33%
|
17.72%
|
42 bps
|
-126 bps
|
18.96%
|
17.72%
|
-124 bps
|
|
Ratio Tier 1(10)
|
13.25%
|
12.24%
|
12.82%
|
62 bps
|
-45 bps
|
13.25%
|
12.82%
|
-43 bps
|
|
Ratio common equity tier 1(11) (13)
|
13.42%
|
12.56%
|
13.17%
|
57 bps
|
-22 bps
|
13.42%
|
13.17%
|
-25 bps
|
|
Capital adequacy - Mibanco
|
||||||||
|
Global Capital Ratio(9)
|
20.22%
|
19.61%
|
21.13%
|
153 bps
|
88 bps
|
20.22%
|
21.13%
|
90 bps
|
|
Ratio Tier 1(10)
|
17.85%
|
16.48%
|
17.13%
|
63 bps
|
-75 bps
|
17.85%
|
17.13%
|
-80 bps
|
|
Ratio common equity tier 1(11) (13)
|
18.35%
|
16.73%
|
17.14%
|
44 bps
|
-125 bps
|
18.35%
|
17.14%
|
-130 bps
|
|
Employees(14)
|
46,555
|
48,241
|
48,878
|
1.3%
|
5.0%
|
46,555
|
48,878
|
5.0%
|
|
Share Information
|
||||||||
|
Issued Shares
|
94,382
|
94,382
|
94,382
|
0.0%
|
0.0%
|
94,382
|
94,382
|
0.0%
|
|
Treasury Shares(12)
|
14,949
|
15,016
|
15,016
|
0.0%
|
0.4%
|
14,949
|
15,016
|
0.4%
|
|
Outstanding Shares
|
79,433
|
79,366
|
79,366
|
0.0%
|
-0.1%
|
79,433
|
79,366
|
-0.1%
|
 |
|
| |
Earnings Release 3Q / 2025
|
Analysis of 3Q25 Consolidated Results
|
|
Credicorp’s Strategy Update
|
|
•
|
Scalability and monetization of the ecosystem: Credicorp accelerates financial inclusion and expansion of the formal economy, generating new income flows and deepening relationships
with more than 18 million clients.
|
|
•
|
We drive growth through business synergies: By sharing capabilities in data, artificial intelligence, and cross-functional platforms, we diversify our value proposition, unlock new
revenue streams, expand our reach to underserved segments and enhance operating efficiency.
|
|
•
|
Discipline in execution and creation of sustainable value: maintaining an eye on long-term profitability and efficient allotment of capital, backed by robust governance.
|
|
Core Businesses Transformation (1)
|
Quarter |
Up to
|
|||
|
3Q24
|
2Q25
|
3Q25
|
Sep 24
|
Sep 25
|
|
|
Credicorp
|
|||||
|
Innovation Portfolio Risk-Adjusted Revenue Share (2)
|
4.5%
|
6.2%
|
7.4%
|
3.9%
|
6.3%
|
|
BCP Stand-alone
|
|||||
|
Digital clients (3)
|
74%
|
78%
|
79%
|
74%
|
78%
|
|
Digital monetary transactions (4)
|
84%
|
88%
|
89%
|
70%
|
87%
|
|
Cashless transactions (5)
|
60%
|
65%
|
65%
|
58%
|
64%
|
|
Mibanco
|
|||||
|
Disbursements through leads (6)
|
66%
|
65%
|
68%
|
69%
|
67%
|
|
Disbursements through alternative channels (7)
|
10%
|
12%
|
10%
|
10%
|
11%
|
|
Relationship managers productivity (8)
|
23.6
|
25.9
|
29.2
|
23.4
|
26.4
|
|
Pacifico
|
|||||
|
Digital Policies (thousands) (9)
|
650.3
|
579.0
|
580.5
|
1,761.8
|
1,881.8
|
 |
|
| |
Earnings Release 3Q / 2025
|
Analysis of 3Q25 Consolidated Results
|
|
Credicorp’s Strategy Update
|
|
Management KPI's (1)
|
Quarter |
Change %
|
Up to
|
Change %
|
||||
|
3Q24
|
2Q25
|
3Q25
|
QoQ
|
YoY
|
Sep 24
|
Sep 25
|
Sep 25 / Sep 24
|
|
|
Users
|
||||||||
|
Users (millions)
|
16.6
|
18.6
|
18.7
|
0.6%
|
12.7%
|
16.6
|
18.7
|
12.7%
|
|
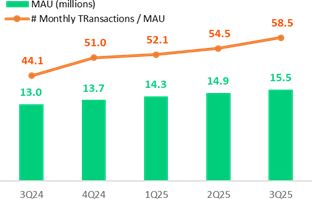
Monthly Active Users (MAU) (millions) (2)
|
13.0
|
14.9
|
15.5
|
3.6%
|
18.8%
|
13.0
|
15.5
|
18.8%
|
|
Revenue Generating MAU (millions)
|
10.4
|
12.6
|
13.2
|
5.1%
|
27.3%
|
10.4
|
13.2
|
27.3%
|
|
Engagement
|
||||||||
|
# Transactions (millions)
|
1,664.2
|
2,384.9
|
2,640.1
|
10.7%
|
58.6%
|
4,192.5
|
7,050.4
|
68.2%
|
|
# Transactions / MAU
|
44.1
|
54.5
|
58.5
|
7.4%
|
32.6%
|
44.1
|
58.5
|
32.6%
|
|
# Average Functionalities / MAU
|
2.4
|
2.7
|
2.7
|
1.5%
|
12.5%
|
2.4
|
2.7
|
12.5%
|
|
Experience
|
||||||||
|
NPS (3)
|
73.5
|
77.0
|
76.0
|
-100 bps
|
250 bps
|
73.5
|
76.0
|
250 bps
|
|
Unit Economics
|
||||||||
|
Monthly Indicators (4)
|
||||||||
|
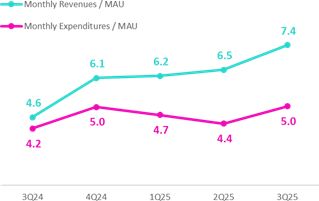
Revenues / MAU (S/)
|
4.6
|
6.5
|
7.4
|
14.9%
|
60.4%
|
4.6
|
7.4
|
60.4%
|
|
Expenses / MAU (S/)
|
-4.2
|
-4.4
|
-5.0
|
15.4%
|
20.6%
|
-4.2
|
-5.0
|
20.6%
|
|
Quarterly Indicators (5)
|
||||||||
|
Revenues / MAU (S/)
|
4.7
|
6.4
|
7.4
|
15.6%
|
58.0%
|
3.9
|
6.5
|
64.3%
|
|
Expenses / MAU (S/)
|
-4.2
|
-4.5
|
-4.8
|
6.5%
|
14.7%
|
-4.0
|
-4.5
|
13.6%
|
|
Drivers Monetization
|
||||||||
|
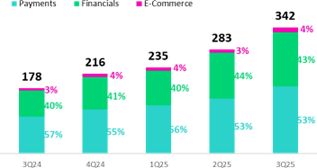
Total TPV (S/, billions) (6)
|
76.9
|
103.4
|
113.9
|
10.2%
|
48.1%
|
189.5
|
308.8
|
63.0%
|
|
Total Revenue Generating TPV (S/, billions) (7)
|
||||||||
|
Payments
|
6.3
|
10.1
|
12.0
|
18.6%
|
91.1%
|
15.0
|
30.9
|
106.6%
|
|
# Bill Payments transactions (millions)
|
35
|
50
|
56
|
12.0%
|
62.3%
|
87
|
151
|
74.7%
|
|
Financials
|
||||||||
|
# Loans Disbursements (thousands)
|
1,296
|
3,855
|
4,196
|
8.8%
|
223.8%
|
2,560
|
11,151
|
335.6%
|
|
E-Commerce
|
||||||||
|
GMV (S/, millions) (8)
|
111.8
|
129.1
|
168.6
|
30.6%
|
50.8%
|
245.8
|
422.2
|
71.7%
|
|
Financial Results (1)
|
Quarter |
|
Change %
|
Up to
|
Change %
|
|||
| S/ millions |
3Q24
|
2Q25
|
3Q25
|
QoQ
|
YoY
|
Sep 24
|
Sep 25
|
Sep 25 / Sep 24
|
|
Net Interest Income after Provisions (2)
|
70.2
|
123.9
|
146.4
|
18.1%
|
108.7%
|
106.9
|
363.3
|
239.9%
|
|
Other Income (3)
|
108.2
|
159.0
|
195.2
|
22.8%
|
80.3%
|
139.7
|
495.8
|
254.9%
|
|
Total Income
|
178.4
|
282.9
|
341.6
|
20.7%
|
91.5%
|
246.6
|
859.1
|
248.4%
|
|
Total Operating Expenses
|
-158.4
|
-197.1
|
-220.1
|
11.7%
|
39.0%
|
-426.7
|
-596.9
|
39.9%
|
 |
|
| |
Earnings Release 3Q / 2025
|
Analysis of 3Q25 Consolidated Results
|
|
Credicorp’s Strategy Update
|
|
|
|
The financial business, which has the highest potential for long-term growth, maintained solid momentum. This evolution was driven primarily by the lending business, which now exceeds 3.4 million
disbursed clients with at least one loan received. 30% of loan borrowers received their first formal loans in the financial system through Yape, which consolidates the app’s fundamental role in financial
inclusion. Credicorp aspires to include 8 million people as of 2028 by focusing on penetrating the lowest levels of the socio-economic pyramid. Currently, Yape reports more than 4 million disbursements
per quarter with average tickets that range between S/200 and S/2,500 depending on the product. To accelerate lending disbursements, Yape plans to increase its pool of pre-approved loans by 30% by 2028,
up from the current 6 million as of 3Q25. The app has begun a pilot for the SME segment, seeking to extend portfolio durations and ticket sizes, where it leverages synergies of Credicorp’s ecosystem to
bolster the value proposition. At quarter-end, the loan portfolio is primarily comprised of multi-installment loans, reflecting greater effectiveness in loan conversion. Revenue from floating continues to
grow, impacted by inflows from statutory bonus payments.
In e-commerce the monthly GMV reached S/168.5 million, driven mainly by Yape Promos, which registered a signficant rise in visits and transactions over the period. Brand Solutions and Gaming also
posted positive results on the back of an uptick in commercial campaigns.
|
 |
|
| |
Earnings Release 3Q / 2025
|
Analysis of 3Q25 Consolidated Results
|
|
Credicorp’s Strategy Update
|
 |
|
| |
Earnings Release 3Q / 2025
|
Analysis of 3Q25 Consolidated Results
|
|
Credicorp’s Strategy Update
|
|
o
|
BCP and Yape financially included 200 thousand people in 3Q25, to reach a total of 6.3 million since 2020 (+11% vs 4Q24). More than 3.4 million people have disbursed at least one
loan through Yape to date, 30% of which were first-time borrowers in the formal financial system.
|
|
o
|
At the end of 3Q25, Pacifico reported over 3.3 million clients protected by inclusive insurance products1, of which more than 2.9 million belong to mass-market
segments, distributed through BCP, Mibanco, Yape, and third-party partnerships. In August, the company launched Compra Segura (in partnership with Falabella) to cover
theft or accidental damage of purchases of S/ 50 and above; these policies also offer online medical consultations. Meanwhile, Pacífico Salud insured more than 416,000 individuals with inclusive health
insurance plans YTD.
|
|
o
|
To jump-start financial inclusion in peri-urban and rural areas, we are conducting pilots to develop innovative ways to generate trust and be closer to people. For example,
Yape’s Financial Inclusion Project in Cuzco and Mibanco’s Sobre Ruedas aim to drive banking penetration in underserved areas in Lambayeque.
|
|
o
|
We have broadened the scope our financial education programs. Thus far this year, the following initiatives have been particularly noteworthy: i) Academia del Progreso at Mibanco, which trained +372 thousand clients; ii) ABC at BCP, which improved the financial behavior of +491 thousand people; and iii) “Aprende con Yape”, which offers
financial education modules through the app, imparted 146 thousand courses.
|
|
o
|
On the front Support to Micro, Small and Medium Enterprises (MSMEs), our main initiatives achieved the following:
|
|
o
|
On the Sustainable Finances front, our subsidiaries advance as follows:
|
|
o
|
Finally, we continue to strengthen the Resilience of individuals and businesses through risk prevention training. On this front,
Pacifico has reached 315 thousand people thus far this year (including clients, non-clients and employees at businesses) through programs such as “ABC de Pacífico,” “Comunidad Segura” and “Protege365”.
|
|
o
|
On the trust front, we advanced the “OrguYO” initiative at BCP, which aims to generate civic-mindedness and integrity through personal examples. We value the ripple effect that our employees can generate
when they promote these values.
|
|
Indicator
|
Company
|
Unit
|
3Q24
|
2Q25
|
3Q25
|
|
|
Inclusion
|
||||||
|
People included financially through BCP and Yape – cumulative since 20202
|
BCP Peru and Yape
|
Millions
|
5.3
|
6.1
|
6.3
|
|
|
Clients included in inclusive insurance services
|
Pacifico
|
Millions
|
N.D.
|
2.9
|
2.9
|
|
|
Finance for the Future
|
||||||
|
Total loan disbursements for MSMEs3
|
Mibanco Peru
|
S/ Millions
|
10,059
|
7,757
|
11,812
|
|
|
Disbursements of sustainable financings - YTD
|
BCP Peru
|
$ Millions
|
1,110
|
1,517
|
2,1304
|
 |
|
| |
Earnings Release 3Q / 2025
|
Analysis of 3Q25 Consolidated Results
|
| 01 |
Loan Portfolio
|
|
This quarter, total loans were once again impacted by the asset revaluation at BCP
Bolivia. If we exclude this impact, total loans in quarter-end balances increased 1.6% QoQ and 4.4% YoY, on track to meeting our guidance by year-end.
Excluding the impact of the USD devaluation against PEN, total loans in quarter-end balances grew 2.4% QoQ in
FX neutral terms. The main dynamics that drove this evolution were (i) growth in disbursements in Small Businesses, (ii) growth in demand for loans in Mortgage and (iii) record-high disbursements in the
month of September at Mibanco.
YoY, total loans in quarter-end balances rose 7.0% in FX neutral terms. The main drivers of this
result were (i) growth in disbursements in Mortgage and an increase in the appetite for risk in Consumer (ii) an increase in the demand for short-term financing in Middle Market Banking and (iii) an
upswing in the dynamism of disbursements at Mibanco.
|
|
Total Loans
(S/ Millions)
|
As of
|
Volume change
|
USD/PEN Neutral
Volume change
|
USD/PEN Neutral
% Change
|
|||||
|
Sep 24
|
Jun 25
|
Sep 25
|
QoQ
|
YoY
|
QoQ
|
YoY
|
QoQ
|
YoY
|
|
|
BCP Stand-alone
|
117,687
|
120,999
|
123,089
|
1.7%
|
4.6%
|
2,929
|
8,186
|
2.4%
|
7.0%
|
|
Mibanco
|
12,119
|
12,785
|
13,096
|
2.4%
|
8.1%
|
311
|
977
|
2.4%
|
8.1%
|
|
Mibanco Colombia
|
1,774
|
1,976
|
2,158
|
9.2%
|
21.7%
|
227
|
533
|
11.5%
|
30.1%
|
|
BCP Bolivia
|
9,830
|
4,189
|
5,505
|
31.4%
|
-44.0%
|
n.a.
|
n.a.
|
n.a.
|
n.a.
|
|
ASB Bank Corp.
|
1,928
|
1,559
|
1,422
|
-8.8%
|
-26.3%
|
-108
|
-408
|
-6.9%
|
-21.2%
|
|
Others (1)
|
-768
|
-546
|
-519
|
-5.1%
|
-32.5%
|
28
|
251
|
-5.2%
|
-32.6%
|
|
Total Loans BAP
|
142,569
|
140,962
|
144,752
|
2.7%
|
1.5%
|
n.a.
|
n.a.
|
n.a.
|
n.a.
|
|
BCP Bolivia (Adjusted for Asset Revaluation)
|
9,830
|
9,684
|
9,554
|
-1.3%
|
-2.8%
|
68
|
382
|
0.7%
|
3.9%
|
|
Total Loans BAP (Adjusted for Asset Revaluation)
|
142,569
|
146,457
|
148,801
|
1.6%
|
4.4%
|
3,455
|
9,921
|
2.4%
|
7.0%
|
 |
|
| |
Earnings Release 3Q / 2025
|
Analysis of 3Q25 Consolidated Results
|
|
01. Loan Portfolio
|
|
Total Loans
(S/ Millions)
|
As of
|
QoQ Change
|
Balance in USD/PEN Neutral
As of
|
QoQ Change
in USD/PEN Neutral
|
||||
|
Jun 25
|
Sep 25
|
Volume
|
%
|
Jun 25
|
Sep 25
|
Volume
|
%
|
|
|
BCP Stand-alone
|
120,999
|
123,089
|
2,090
|
1.7%
|
120,999
|
123,928
|
2,929
|
2.4%
|
|
Wholesale Banking
|
53,025
|
53,340
|
315
|
0.6%
|
53,025
|
53,982
|
956
|
1.8%
|
|
Corporate
|
30,496
|
31,485
|
989
|
3.2%
|
30,496
|
31,865
|
1,369
|
4.5%
|
|
Middle - Market
|
22,529
|
21,855
|
-674
|
-3.0%
|
22,529
|
22,117
|
-413
|
-1.8%
|
|
Retail Banking
|
66,176
|
67,958
|
1,782
|
2.7%
|
66,176
|
68,130
|
1,954
|
3.0%
|
|
SME - Business
|
7,692
|
8,097
|
405
|
5.3%
|
7,692
|
8,169
|
477
|
6.2%
|
|
SME - Pyme
|
16,091
|
16,447
|
356
|
2.2%
|
16,091
|
16,449
|
359
|
2.2%
|
|
Mortgage
|
22,824
|
23,377
|
553
|
2.4%
|
22,824
|
23,411
|
587
|
2.6%
|
|
Consumer
|
13,446
|
13,781
|
335
|
2.5%
|
13,446
|
13,822
|
376
|
2.8%
|
|
Credit Card
|
6,124
|
6,257
|
133
|
2.2%
|
6,124
|
6,278
|
154
|
2.5%
|
|
Others (1)
|
1,797
|
1,791
|
-6
|
-0.3%
|
1,797
|
1,816
|
19
|
1.1%
|
 |
Larger contraction in volume
|
|
Larger expansion in volume
|
|
•
|
Small businesses, due to growth in disbursements of negotiable invoices and working capital loans in SME-Business and SME-Pyme, respectively.
|
|
•
|
Mortgage, due to an uptick in demand for loans in a more favorable economic context marked by on-going low interest rates.
|
|
•
|
Consumer, driven by growth in disbursements, mainly through BCP and Yape.
|
|
Total Loans
(S/ Millions)
|
As of
|
YoY Change
|
Balance in Neutral USDPEN
As of
|
YoY Change
in Neutral USDPEN
|
||||
|
Sep 24
|
Sep 25
|
Volume
|
%
|
Sep 24
|
Sep 25
|
Volume
|
%
|
|
|
BCP Stand-alone
|
117,687
|
123,089
|
5,402
|
4.6%
|
117,687
|
125,873
|
8,186
|
7.0%
|
|
Wholesale Banking
|
51,663
|
53,340
|
1,677
|
3.2%
|
51,663
|
55,470
|
3,807
|
7.4%
|
|
Corporate
|
31,383
|
31,485
|
102
|
0.3%
|
31,383
|
32,746
|
1,363
|
4.3%
|
|
Middle - Market
|
20,280
|
21,855
|
1,575
|
7.8%
|
20,280
|
22,724
|
2,444
|
12.1%
|
|
Retail Banking
|
64,384
|
67,958
|
3,574
|
5.6%
|
64,384
|
68,528
|
4,144
|
6.4%
|
|
SME - Business
|
7,912
|
8,097
|
184
|
2.3%
|
7,912
|
8,337
|
425
|
5.4%
|
|
SME - Pyme
|
16,268
|
16,447
|
178
|
1.1%
|
16,268
|
16,456
|
188
|
1.2%
|
|
Mortgage
|
21,614
|
23,377
|
1,764
|
8.2%
|
21,614
|
23,490
|
1,876
|
8.7%
|
|
Consumer
|
12,709
|
13,781
|
1,072
|
8.4%
|
12,709
|
13,917
|
1,208
|
9.5%
|
|
Credit Card
|
5,881
|
6,257
|
376
|
6.4%
|
5,881
|
6,329
|
447
|
7.6%
|
|
Others (1)
|
1,640
|
1,791
|
151
|
9.2%
|
1,640
|
1,875
|
234
|
14.3%
|
|
Larger contraction in volume
|
|
Larger expansion in volume
|
|
•
|
Mortgage, due to the same dynamics in play QoQ.
|
 |
|
| |
Earnings Release 3Q / 2025
|
Analysis of 3Q25 Consolidated Results
|
|
01. Loan Portfolio
|
|
•
|
Consumer, due to growth in disbursements, which rose on the back of an increase in the appetite for risk at BCP, followed by an uptick in disbursements through
Yape.
|
|
•
|
Middle Market Banking, due to growth in the demand for short-term loans, particularly in the agriculture sector.
|
|
•
|
Corporate banking, spurred by the same dynamics seen QoQ.
|
 |
 |
| |
Earnings Release 3Q / 2025
|
Analysis of 3Q25 Consolidated Results
|
| 02 |
Deposits
|
|
|
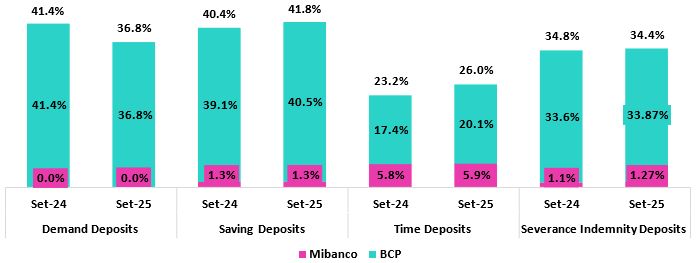
This quarter, Total Deposits were once again impacted by asset revaluation at BCP Bolivia. If we exclude this
impact, total deposits rose 1.3% QoQ and 5.9% YoY.
Excluding the impact of the USD devaluation against PEN, total deposits grew 3.8% QoQ in FX neutral terms. This
growth was primarily attributable to: (i) growth in the balance of demand deposits held by wholesale clients, (ii) expansion in the balance of Savings Deposits, which were bolstered by statutory bonus
payments in July and (iii) an increase in the balance of time deposits in LC, which rose on the back of our funding strategy’s focus on growing captures of wholesale clients.
YoY, Total Deposits rose 10.8% in FX neutral terms. This increase, which was driven by the same factors that drove
growth QoQ, was partially offset by a decline in LC Demand Deposits due the remaining impact of pension fund withdrawals.
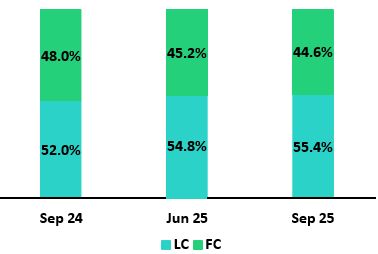
At the end of 3Q25, 69.8% of Total Deposits were low cost (Demand + Savings). Credicorp continued to lead the market
for low-cost deposits, with a market share of 39.5% at the end of September
|
|
| Deposits |
As of
|
Volume (%)
|
USD/PEN Neutral
Volume change
|
USD/PEN Neutral
% Change
|
|||||
|
S/000
|
Sep 24
|
Jun 25
|
Sep 25
|
QoQ
|
YoY
|
QoQ
|
YoY
|
QoQ
|
YoY
|
|
Demand deposits
|
53,149,144
|
49,237,039
|
50,930,173
|
3.4%
|
-4.2%
|
2,883,595
|
2,332,144
|
5.6%
|
4.4%
|
|
Saving deposits
|
54,474,960
|
59,086,275
|
60,580,840
|
2.5%
|
11.2%
|
2,419,443
|
9,581,346
|
4.0%
|
17.6%
|
|
Time deposits
|
42,514,849
|
42,361,180
|
43,115,987
|
1.8%
|
1.4%
|
1,158,309
|
4,785,244
|
2.6%
|
11.3%
|
|
Severance indemnity deposits
|
2,989,705
|
3,268,583
|
2,956,446
|
-9.5%
|
-1.1%
|
-275,884
|
34,792
|
-8.4%
|
1.2%
|
|
Interest payable
|
1,306,793
|
770,257
|
847,009
|
10.0%
|
-35.2%
|
10,367
|
-1,108
|
0.8%
|
-0.1%
|
|
Low-cost deposits (1)
|
107,624,104
|
108,323,314
|
111,511,013
|
2.9%
|
3.6%
|
||||
|
Total Deposits
|
154,435,451
|
154,723,334
|
158,430,455
|
2.4%
|
2.6%
|
||||
|
Low-cost deposits (1)
|
107,624,104
|
111,757,648
|
114,236,696
|
2.2%
|
6.1%
|
5,303,038
|
11,913,490
|
4.7%
|
11.1%
|
|
Total Deposits
|
154,435,451
|
161,439,586
|
163,607,971
|
1.3%
|
5.9%
|
6,195,830
|
16,732,417
|
3.8%
|
10.8%
|
| ● |
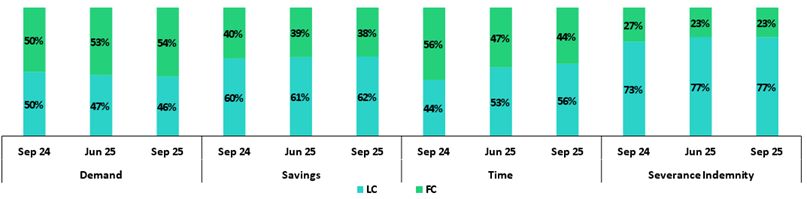
Growth of 5.6% in the balance of Demand Deposits, fueled mainly by growth in volumes of FC deposits held by wholesale clients at BCP Stand-alone. These deposits rose primarily on the back of an upswing in institutional activity and secondarily due to a drop in the exchange rate, which led
institutional clients to convert funds.
|
| ● |
An 4% increase in the balance of Savings Deposits, which was driven primarily by growth in volumes at BCP Stand-alone and in
Individuals in particular, spurred by: (i) an increase in the volume in LC, fueled by statutory bonus payments in July and (ii) an increase in the FC volume, given that clients sought to save in USD
following three consecutive quarters of declines in the USDPEN FX. Growth in the balance of Savings Deposits reflects the success of our transactional offering, which allows us to capture deposits in an
environment marked by higher liquidity.
|
| ● |
An increase of 2.6% in the balance for Time Deposits, which was driven by growth in captures of LC deposits held by wholesale clients
at BCP Stand-alone, in line with the objectives of our funding strategy.
|

|
| |
Earnings Release 3Q / 2025
|
Analysis of 3Q25 Consolidated Results
|
|
02. Deposits
|

|
| |
Earnings Release 3Q / 2025
|
Analysis of 3Q25 Consolidated Results
|
|
02. Deposits
|


|
| |
Earnings Release 3Q / 2025
|
Analysis of 3Q25 Consolidated Results
|
| 03 |
Interest-earning Assets (IEA) and Funding
|
|
|
In 3Q25, IEA rose 1.7% QoQ and 0.4% YoY. Funding, in turn, dropped 2.0% QoQ and 0.5% YoY. If we exclude the impact on
Credicorp’s balance sheet of the accounting adjustment in BCP Bolivia, the evolution of IEA and Funding was driven by the following dynamics:
QoQ, IEA rose 0.9% due to loan expansion at BCP and Mibanco. Growth in the balance for Cash and due from banks,
which reflected an increase in Deposits, also contributed to growth in IEA, albeit to a lesser extent. Funding rose 0.6%, primarily on the back of an increase in Deposits, while an uptick in the
balance for BCRP Instruments, which reflects an increase in positions to diversify funding, acted as a secondary driver.
YoY, IEA rose 2.3%, driven by loan growth, primarily at BCP. This dynamic was partially offset by a reduction in balances
for Cash and due from banks and Total investments as part of balance sheet management. Finally, Funding rose 3.1%, driven by Deposits, and low-cost deposits in particular. This growth was partially
offset by a reduction for balances for Bonds and notes issued, impacted by recent debt expirations.
|
|
| 3.1. |
IEA
|
|
Interest Earning Assets
|
As of
|
% change
|
|||
|
S/000
|
Sep 24
|
Jun 25
|
Sep 25
|
QoQ
|
YoY
|
|
Cash and due from banks
|
37,007,966
|
34,206,000
|
35,862,184
|
4.8%
|
-3.1%
|
|
Total investments
|
53,328,873
|
51,603,447
|
51,186,579
|
-0.8%
|
-4.0%
|
|
Cash collateral, reverse repurchase agreements and securities borrowing
|
1,419,305
|
4,593,501
|
3,404,639
|
-25.9%
|
139.9%
|
|
Loans
|
142,568,785
|
140,961,978
|
144,752,254
|
2.7%
|
1.5%
|
|
Total interest earning assets
|
234,324,929
|
231,364,926
|
235,205,656
|
1.7%
|
0.4%
|
|
Total interest earning assets (Adjusted for Asset Revaluation)
|
234,324,929
|
237,642,758
|
239,824,996
|
0.9%
|
2.3%
|
|
Total interest earning assets (Adjusted for Asset Revaluation, FX Neutral USDPEN)
|
1.8%
|
5.5%
|
|||

|
| |
Earnings Release 3Q / 2025
|
Analysis of 3Q25 Consolidated Results
|
|
03. Interest-earning Assets (IEA) and Funding
|
| 3.2. |
Funding
|
|
Funding
|
As of
|
% change
|
|||
|
S/ 000
|
Sep 24
|
Jun 25
|
Sep 25
|
QoQ
|
YoY
|
|
Deposits and obligations
|
154,435,451
|
154,723,334
|
158,430,455
|
2.4%
|
2.6%
|
|
Due to banks and correspondents
|
12,704,234
|
11,152,813
|
11,241,079
|
0.8%
|
-11.5%
|
|
BCRP instruments
|
4,788,939
|
5,096,459
|
6,643,892
|
30.4%
|
38.7%
|
|
Repurchase agreements with clients and third parties
|
2,594,165
|
6,168,934
|
3,537,281
|
-42.7%
|
36.4%
|
|
Bonds and notes issued
|
16,952,011
|
12,112,403
|
12,209,724
|
0.8%
|
-28.0%
|
|
Total funding
|
191,474,800
|
189,253,943
|
192,062,431
|
1.5%
|
0.3%
|
|
Total funding (Adjusted for Asset Revaluation)
|
191,474,800
|
196,368,181
|
197,503,936
|
0.6%
|
3.1%
|
|
Total funding (Adjusted for Asset Revaluation, FX Neutral USDPEN)
|
2.5%
|
1.3%
|
|||

|
| |
Earnings Release 3Q / 2025
|
Analysis of 3Q25 Consolidated Results
|
|
04
|
Net Interest Income (NII)
|
|
|
In 2Q25 Net Interest Income (NII) rose 2.0% QoQ. This evolution was driven mainly by Interest on loans, which rose
on the back of loan growth, particularly in retail segments.
YoY, NII increased 2.7% due to a reduction in Interest and similar expenses. This decline was
fueled primarily by a drop in expenses for deposits, which reflected a decrease in interest rates, and secondarily by an increase in low-cost deposits’ share of the funding structure.
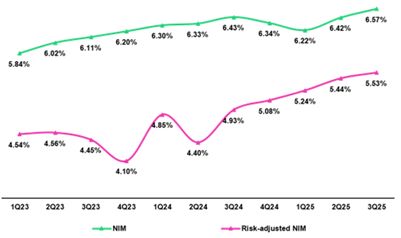
NIM expanded 14 bps YoY to stand at 6.57%, propelled by a drop in the funding cost in a context
marked by a downward trend in interest rates. It is important to note that growth in retail loans helped contain the negative impact that rates exerted on the IEA yield. Finally,
risk-adjusted NIM reached a record high1 of 5.53%.
|
|
|
Net interest income
|
Quarter
|
% change
|
Up to
|
% Change
|
||||
|
S/000
|
3Q24
|
2Q25
|
3Q25
|
QoQ
|
YoY
|
Sep 24
|
Sep 25
|
Sep 25 / Sep 24
|
|
Interest and Similar Income
|
4,995,971
|
4,922,292
|
4,987,693
|
1.3%
|
-0.2%
|
14,857,135
|
14,804,775
|
-0.4%
|
|
Interest and Similar Expenses
|
(1,405,221)
|
(1,306,921)
|
(1,299,864)
|
-0.5%
|
-7.5%
|
(4,371,798)
|
(3,929,563)
|
-10.1%
|
|
Interest Expense (excluding Net Insurance Financial Expenses)
|
(1,276,643)
|
(1,167,866)
|
(1,158,421)
|
-0.8%
|
-9.3%
|
(3,996,530)
|
(3,513,443)
|
-12.1%
|
|
Net Insurance Financial Expenses
|
(128,578)
|
(139,055)
|
(141,443)
|
1.7%
|
10.0%
|
(375,268)
|
(416,120)
|
10.9%
|
|
Net Interest, similar income and expenses
|
3,590,750
|
3,615,371
|
3,687,829
|
2.0%
|
2.7%
|
10,485,337
|
10,875,212
|
3.7%
|
|
|
||||||||
|
Balances
|
||||||||
|
Average Interest Earning Assets (IEA)
|
231,316,507
|
233,761,957
|
233,285,291
|
-0.2%
|
0.9%
|
229,452,866
|
237,958,451
|
3.7%
|
|
Average Funding
|
190,855,164
|
191,161,476
|
190,658,187
|
-0.3%
|
-0.1%
|
188,110,844
|
195,494,018
|
3.9%
|
|
|
||||||||
|
Yields
|
||||||||
|
Yield on IEAs
|
8.64%
|
8.42%
|
8.55%
|
13 bps
|
-9 bps
|
8.63%
|
8.30%
|
-33 bps
|
|
Cost of Funds(1)
|
2.68%
|
2.44%
|
2.43%
|
-1 bps
|
-25 bps
|
2.83%
|
2.40%
|
-43 bps
|
|
Net Interest Margin (NIM)(1)
|
6.43%
|
6.42%
|
6.57%
|
15 bps
|
14 bps
|
6.31%
|
6.33%
|
2 bps
|
|
Risk-Adjusted Net Interest Margin(1)
|
4.93%
|
5.44%
|
5.53%
|
9 bps
|
60 bps
|
4.70%
|
5.34%
|
64 bps
|
|
Peru's Reference Rate
|
5.25%
|
4.50%
|
4.25%
|
-25 bps
|
-100 bps
|
5.25%
|
4.25%
|
-100 bps
|
|
FED funds rate
|
5.00%
|
4.50%
|
4.25%
|
-25 bps
|
-75 bps
|
5.00%
|
4.25%
|
-75 bps
|

|
| |
Earnings Release 3Q / 2025
|
Analysis of 3Q25 Consolidated Results
|
|
04. Net Interest income (NII)
|
|
Interest Income / IEA
|
3Q24
|
2Q25
|
3Q25
|
Sep 24
|
Sep 25
|
|||||||||||
|
S/ millions
|
Average
|
Income
|
Yields
|
Average
|
Income
|
Yields
|
Average
|
Income
|
Yields
|
Average
|
Income
|
Yields
|
Average
|
Income
|
Yields
|
|
|
Balance
|
Balance
|
Balance
|
Balance
|
Balance
|
||||||||||||
|
Total (LC + FC)
|
||||||||||||||||
|
Cash and equivalents
|
32,083
|
365
|
4.6%
|
35,864
|
342
|
3.8%
|
35,034
|
316
|
3.6%
|
31,494
|
1,019
|
4.3%
|
37,991
|
1,003
|
3.5%
|
|
|
Other IEA
|
1,598
|
26
|
6.5%
|
3,215
|
69
|
8.6%
|
3,999
|
68
|
6.8%
|
1,415
|
80
|
7.5%
|
2,219
|
157
|
9.4%
|
|
|
Investments
|
52,877
|
681
|
5.2%
|
53,604
|
670
|
5.0%
|
51,396
|
643
|
5.0%
|
52,772
|
2,042
|
5.2%
|
52,506
|
1,996
|
5.1%
|
|
|
Loans
|
144,757
|
3,924
|
10.8%
|
141,079
|
3,841
|
10.9%
|
142,857
|
3,961
|
11.1%
|
143,773
|
11,715
|
10.9%
|
145,242
|
11,649
|
10.7%
|
|
|
Total IEA
|
231,315
|
4,996
|
8.6%
|
233,762
|
4,922
|
8.4%
|
233,286
|
4,988
|
8.6%
|
229,454
|
14,856
|
8.6%
|
237,958
|
14,805
|
8.3%
|
|
|
IEA (LC)
|
55.7%
|
68.8%
|
10.7%
|
56.5%
|
71.1%
|
10.6%
|
56.7%
|
71.4%
|
10.8%
|
56.3%
|
69.4%
|
10.6%
|
55.8%
|
71.0%
|
10.6%
|
|
|
IEA (FC)
|
44.3%
|
31.2%
|
6.1%
|
43.5%
|
28.9%
|
5.6%
|
43.3%
|
28.6%
|
5.7%
|
43.7%
|
30.6%
|
6.0%
|
44.2%
|
29.0%
|
5.4%
|
|
|
Interest Income / Funding
|
3Q24
|
2Q25
|
3Q25
|
Sep 24
|
Sep 25
|
|||||||||||
|
S/ millions
|
Average
|
Expense
|
Yields
|
Average
|
Expense
|
Yields
|
Average
|
Expense
|
Yields
|
Average
|
Expense
|
Yields
|
Average
|
Expense
|
Yields
|
|
|
Balance
|
Balance
|
Balance
|
Balance
|
Balance
|
||||||||||||
|
Total (LC + FC)
|
||||||||||||||||
|
Deposits
|
153,203
|
678
|
1.8%
|
156,171
|
541
|
1.4%
|
156,577
|
565
|
1.4%
|
151,070
|
2,195
|
1.9%
|
160,136
|
1,726
|
1.4%
|
|
|
BCRP + Due to Banks
|
17,828
|
262
|
5.9%
|
17,107
|
265
|
6.2%
|
17,067
|
253
|
5.9%
|
18,617
|
794
|
5.7%
|
17,643
|
785
|
5.9%
|
|
|
Bonds and Notes
|
17,453
|
201
|
4.6%
|
13,252
|
193
|
5.8%
|
12,161
|
165
|
5.4%
|
15,773
|
598
|
5.1%
|
14,739
|
525
|
4.7%
|
|
|
Others
|
2,371
|
264
|
44.5%
|
4,632
|
307
|
26.5%
|
4,853
|
317
|
26.1%
|
2,651
|
785
|
39.5%
|
2,976
|
894
|
40.1%
|
|
|
Total Funding
|
190,855
|
1,405
|
2.9%
|
191,162
|
1,306
|
2.7%
|
190,658
|
1,300
|
2.7%
|
188,111
|
4,372
|
3.1%
|
195,494
|
3,930
|
2.7%
|
|
|
Funding (LC)
|
49.3%
|
48.5%
|
2.9%
|
52.4%
|
51.9%
|
2.7%
|
52.6%
|
52.8%
|
2.7%
|
49.3%
|
50.8%
|
3.2%
|
51.9%
|
52.7%
|
2.7%
|
|
|
Funding (FC)
|
50.7%
|
51.5%
|
3.0%
|
47.6%
|
48.1%
|
2.8%
|
47.4%
|
47.2%
|
2.7%
|
50.7%
|
49.2%
|
3.0%
|
48.1%
|
47.3%
|
2.6%
|
|
|
NIM(1)
|
231,315
|
3,591
|
6.2%
|
233,762
|
3,616
|
6.2%
|
233,286
|
3,688
|
6.3%
|
229,454
|
10,484
|
6.1%
|
237,958
|
10,875
|
6.1%
|
|
|
NIM (LC)
|
55.7%
|
76.8%
|
8.6%
|
56.5%
|
78.0%
|
8.5%
|
56.7%
|
77.9%
|
8.7%
|
56.3%
|
77.1%
|
8.4%
|
55.8%
|
77.6%
|
8.5%
|
|
|
NIM (FC)
|
44.3%
|
23.2%
|
3.3%
|
43.5%
|
22.0%
|
3.1%
|
43.3%
|
22.1%
|
3.2%
|
43.7%
|
22.9%
|
3.2%
|
44.2%
|
22.4%
|
3.1%
|

|
| |
Earnings Release 3Q / 2025
|
Analysis of 3Q25 Consolidated Results
|
|
04. Net Interest income (NII)
|

|
| |
Earnings Release 3Q / 2025
|
Analysis of 3Q25 Consolidated Results
|
|
05
|
Portfolio Quality and Provisions
|
|
|
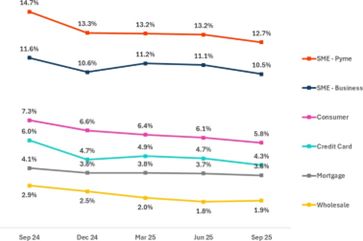
Portfolio quality indicators have continued to evolve positively over the last year, driven by
fortified risk management and backed by improvements in payment performance and in the Peruvian economy.
QoQ, the drop in the NPL balance at BCP Stand-alone was fueled mainly by ongoing improvements in origination and
debt collections management in Consumer and Credit Cards. At Mibanco, the reduction in the NPL balance was spurred primarily by a drop in overdue loans. In this context, the NPL ratio
dropped 15 bps and 105 bps QoQ and YoY, respectively, to stand at 4.8%.
Provisions rose QoQ, driven by an increase at BCP Stand-alone, reflecting both the recurring dynamics of Retail
Banking and specific impacts within Wholesale Banking, with Individuals stable, SMEs slightly higher due to a base effect, and one corporate client showing increased credit risk. This
evolution was partially offset by a drop in provisions at Mibanco, which reflects improvements in debt collections management. YoY, provisions dropped 30.5%, driven by BCP Stand-alone and
Mibanco. In this context, the cost of risk rose slightly 6 bps QoQ and fell 71 bps YoY, to stand at 1.7% at quarter-end.
|
|
| 5.1 |
Portfolio Quality
|
|
Loan Portfolio quality and Delinquency ratios
|
As of
|
% change
|
|||
|
S/000
|
Sep 24
|
Jun 25
|
Sep 25
|
QoQ
|
YoY
|
|
Total loans (Quarter-end balance)
|
142,568,785
|
140,961,978
|
144,752,254
|
2.7%
|
1.5%
|
|
Write-offs
|
923,946
|
581,373
|
713,933
|
22.8%
|
-22.7%
|
|
Internal overdue loans (IOLs)
|
6,026,341
|
5,044,212
|
4,953,303
|
-1.8%
|
-17.8%
|
|
Internal overdue loans over 90-days
|
4,851,591
|
4,171,379
|
4,142,080
|
-0.7%
|
-14.6%
|
|
Refinanced loans
|
2,333,814
|
1,947,709
|
2,016,442
|
3.5%
|
-13.6%
|
|
Non-performing loans (NPLs)
|
8,360,155
|
6,991,921
|
6,969,745
|
-0.3%
|
-16.6%
|
|
IOL ratio
|
4.2%
|
3.6%
|
3.4%
|
-16 bps
|
-81 bps
|
|
IOL over 90-days ratio
|
3.4%
|
3.0%
|
2.9%
|
-10 bps
|
-54 bps
|
|
NPL ratio
|
5.9%
|
5.0%
|
4.8%
|
-15 bps
|
-105 bps
|

|
| |
Earnings Release 3Q / 2025
|
Analysis of 3Q25 Consolidated Results
|
|
05. Portfolio Quality and Provisions
|
| ● |
Mibanco, where the NPL ratio fell 41 bps. This evolution was fueled primarily by a drop in NPL volumes and
secondarily, by loan growth.
|
| ● |
Mibanco, where the NPL ratio dropped 215 bps YoY, fueled mainly by a
reduction in NPL volumes and secondarily, by loan growth.
|

 |
| |
Earnings Release 3Q / 2025
|
Analysis of 3Q25 Consolidated Results
|
|
05. Portfolio Quality and Provisions
|
|
5.2
|
Provisions and Cost of Risk of the Total Portfolio
|
|
Loan Portfolio Provisions
|
Quarter
|
% change
|
Up to
|
% change
|
||||
|
S/000
|
3Q24
|
2Q25
|
3Q25
|
QoQ
|
YoY
|
Sep 24
|
Sep 25
|
Sep 25 / Sep 24
|
|
Gross provision for credit losses on loan portfolio
|
(981,870)
|
(683,965)
|
(720,445)
|
5.3%
|
-26.6%
|
(3,085,607)
|
(2,100,143)
|
-31.9%
|
|
Recoveries of written-off loans
|
113,789
|
108,806
|
117,527
|
8.0%
|
3.3%
|
309,456
|
340,173
|
9.9%
|
|
Provision for credit losses on loan portfolio, net of recoveries
|
(868,081)
|
(575,159)
|
(602,918)
|
4.8%
|
-30.5%
|
(2,776,151)
|
(1,759,970)
|
-36.6%
|
|
Cost of risk (1)
|
2.4%
|
1.6%
|
1.7%
|
6 bps
|
-71 bps
|
2.6%
|
1.6%
|
-95 bps
|
|
|
|
Cost of Risk by Subsidiary
|
|
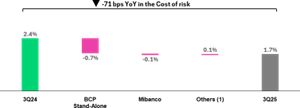
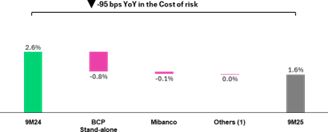
|
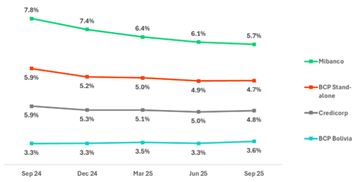
YoY, provisions dropped 30.5%, driven by BCP Stand-alone and Mibanco.
This evolution was fueled by improvements in payment performance in a context of economic recovery. At BCP Individual, the reduction in provisions was
attributable to Individuals and SME-Pyme, where the decine was mainly due to an increase in lower-risk vintages’ share
of total loans. This evolution was partially offset by Wholesale, which was impacted by the base effect generated by an uptick in reversals due to an increase in
debt repayments. At Mibanco, the decrease was led by an improvement in underlying risk as lower-risk vintages gained traction and currently represent 78% of
total loans. In this context, the CoR at Credicorp dropped 71 bps YoY to stand at 1.7%.
|
 |
|
QoQ Cost of Risk Evolution
|
|
YoY Cost of Risk Evolution
|
|
 (1) Others include BCP Bolivia, Mibanco Colombia, ASB and eliminations.
|
 (1) Others include BCP Bolivia, Mibanco Colombia, ASB and eliminations.
|
 |
|
| |
Earnings Release 3Q / 2025
|
Analysis of 3Q25 Consolidated Results
|
|
05. Portfolio Quality and Provisions
|
|
Loan Portfolio Quality and Delinquency Ratios
|
|
As of |
% change
|
||
|
S/000
|
Sep 24
|
Jun 25
|
Sep 25
|
QoQ
|
YoY
|
|
Total loans (Quarter-end balance)
|
142,568,785
|
140,961,978
|
144,752,254
|
2.7%
|
1.5%
|
|
Allowance for loan losses
|
8,250,023
|
7,658,595
|
7,674,040
|
0.2%
|
-7.0%
|
|
Non-performing loans (NPLs)
|
8,360,155
|
6,991,921
|
6,969,745
|
-0.3%
|
-16.6%
|
|
Allowance for loan losses over Total loans
|
5.8%
|
5.4%
|
5.3%
|
-13 bps
|
-49 bps
|
|
Coverage ratio of NPLs
|
98.7%
|
109.5%
|
110.1%
|
58 bps
|
1143 bps
|
|
Allowance for loan losses
(in S/ millions)
|
|
|
|
 |
QoQ, the allowance for loan losses rose slightly by 0.2%, driven mainly by BCP Bolivia and
Mibanco.
YoY, the allowance for loan losses fell 7.0%, fueled primarily by Retail Banking at BCP Stand-alone and secondarily by BCP Bolivia.
|
||
|
(1) Others include Mibanco Colombia, ASB and eliminations.
|
|||
|
NPL Coverage Ratio
|
|||
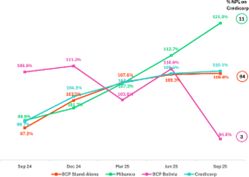 |
The NPL Coverage Ratio at Credicorp stood at 110.1% at the end of 3Q25.
QoQ
The NPL Coverage Ratio at Credicorp rose 58 bps, driven by the evolution at BCP
Stand-alone and Mibanco.
At BCP Stand-alone, the NPL Coverage Ratio increased 25 bps to stand at 109.6%. This evolution was primarily attributable to a decrease in NPLs, as
described in the QoQ analysis. At Mibanco, the NPL Coverage Ratio rose 730 bps to stand at 121.0%. This evolution
was also driven by the drop in NPLs, which is summarized in the QoQ analysis.
|
||
 |
|
| |
Earnings Release 3Q / 2025
|
Analysis of 3Q25 Consolidated Results
|
|
06
|
Other Income
|
|
|
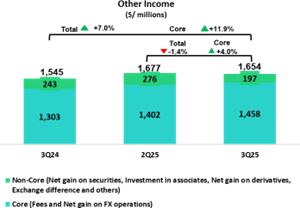
Other Income declined 1.4% QoQ but increased 7.0% YoY. The volatility in these results reflects fluctuations in Other
Non-Core Income, which included atypical items in prior quarters. Focusing on recurring components within Other Core Income:
QoQ, Other Core Income grew 4.0%, primarily driven by an uptick in Universal
Banking. Growth was supported by higher fees at Yape, fueled by increased revenue-generating transactions, and FX gains at BCP Bolivia, following the successful rollout of new foreign exchange
products.
YoY, Other Core Income rose 11.9%, mainly due to higher total fees at BCP
Stand-alone and FX gains within Universal Banking, underscoring consistent execution of our revenue diversification and decoupling strategy.
|
|
|
6.
|
Other Income1
|
|
Other Income (1)
|
Quarter
|
% Change
|
Up to
|
% change
|
||||
|
(S/ 000)
|
3Q24
|
2Q25
|
3Q25
|
QoQ
|
YoY
|
Sep 24
|
Sep 25
|
Sep 25 / Sep 24
|
|
Other Core Income
|
1,302,675
|
1,401,569
|
1,457,604
|
4.0%
|
11.9%
|
3,761,186
|
4,197,011
|
11.6%
|
|
Other Non-Core Income
|
242,670
|
275,804
|
196,587
|
-28.7%
|
-19.0%
|
768,047
|
824,769
|
7.4%
|
|
Total Other Income
|
1,545,345
|
1,677,373
|
1,654,191
|
-1.4%
|
7.0%
|
4,529,233
|
5,021,780
|
10.9%
|
|
6.1.
|
Other Core Income1
|
|
Other Core Income (1)
|
Quarter
|
% Change
|
Up to
|
% change
|
||||
|
(S/ 000)
|
3Q24
|
2Q25
|
3Q25
|
QoQ
|
YoY
|
Sep 24
|
Sep 25
|
Sep 25 / Sep 24
|
|
Fee Income
|
982,818
|
1,024,553
|
1,063,032
|
3.8%
|
8.2%
|
2,786,611
|
3,081,609
|
10.6%
|
|
Net Gain on Foreign Exchange Transactions
|
319,856
|
377,016
|
394,572
|
4.7%
|
23.4%
|
974,575
|
1,115,402
|
14.5%
|
|
Total Other Core Income
|
1,302,674
|
1,401,569
|
1,457,604
|
4.0%
|
11.9%
|
3,761,186
|
4,197,011
|
11.6%
|
|
•
|
QoQ,Other Core Income hit an all-time high, buoyed mainly by growth in Fee Income (+3.8%), which will be
discussed in the following section. The Net Gain on FX Transactions rose 4.7% after registering record-high gains once again at BCP Stand-alone and a
recovery at BCP Bolivia. The positive performance of BCP Bolivia was driven by the increased dynamism of the
Treasury Desk, which achieved higher transaction volumes thanks to sales of new products in the foreign exchange business.
|
|
•
|
YoY, growth was driven by an increase in Fee Income (+8.2%),
with the underlying drivers to be detailed in the next section. Additionally, Net Gain on FX Transactions rose by 23.4%, primarily led by BCP Stand-alone and, to a lesser extent, by BCP Bolivia, both supported by higher transaction volumes.
|
|
•
|
YTD, growth was driven mainly by an upswing in Fee Income (+10.6%);
details on the dynamics will be discussed in the next section. The Net Gain on FX transactions rose 14.5%, buoyed by on-going growth in transaction
volumes. This performance reflects two complementary strategies: (i) strengthening digital channels to capture transactional opportunities, which position us to capture transactional opportunities
through mobile banking at BCP Stand-alone, and (ii) disciplined pricing and spread management to boost volumes, where commercial management initiatives
were more active in and focused on the Retail Banking segment. Together, these initiatives position us to deliver sustainable FX revenue growth and reinforce our competitive edge.
|
 |
|
| |
Earnings Release 3Q / 2025
|
Analysis of 3Q25 Consolidated Results
|
|
06. Other Income
|
|
Fee Income by Subsidiary
|
Quarter
|
% Change
|
Up to
|
% change
|
||||
|
(S/ 000)
|
3Q24
|
2Q25
|
3Q25
|
QoQ
|
YoY
|
Sep 24
|
Sep 25
|
Sep 25 / Sep 24
|
|
BCP Stand-Alone (1)
|
804,058
|
853,720
|
873,187
|
2.3%
|
8.6%
|
2,251,040
|
2,558,334
|
13.7%
|
|
BCP Bolivia (2)
|
18,380
|
14,552
|
10,244
|
-29.6%
|
-44.3%
|
54,363
|
37,640
|
-30.8%
|
|
Mibanco
|
18,412
|
27,633
|
28,873
|
4.5%
|
56.8%
|
64,358
|
84,845
|
31.8%
|
|
Mibanco Colombia
|
12,333
|
12,395
|
14,314
|
15.5%
|
16.1%
|
34,625
|
35,835
|
3.5%
|
|
Pacífico
|
(3,218)
|
(6,287)
|
(5,123)
|
-18.5%
|
59.2%
|
(8,905)
|
(15,167)
|
70.3%
|
|
Prima
|
90,748
|
97,233
|
95,006
|
-2.3%
|
4.7%
|
284,379
|
286,311
|
0.7%
|
|
ASB
|
15,760
|
12,841
|
12,615
|
-1.8%
|
-20.0%
|
48,307
|
39,282
|
-18.7%
|
|
Credicorp Capital
|
141,657
|
134,297
|
148,115
|
10.3%
|
4.6%
|
423,287
|
418,676
|
-1.1%
|
|
Eliminations and Other (3)
|
(115,312)
|
(121,831)
|
(114,199)
|
-6.3%
|
-1.0%
|
(364,843)
|
(364,147)
|
-0.2%
|
|
Total Net Fee Income
|
982,818
|
1,024,553
|
1,063,032
|
3.8%
|
8.2%
|
2,786,611
|
3,081,609
|
10.6%
|
|
BCP Stand-alone Fees (*)
|
Quarter
|
% Change
|
Up to
|
% change
|
||||
|
(S/ 000,000)
|
3Q24
|
2Q25
|
3Q25
|
QoQ
|
YoY
|
Sep 24
|
Sep 25
|
Sep 25 / Sep 24
|
|
Payments and transactional services (1)
|
300
|
287
|
270
|
-5.7%
|
-9.9%
|
835
|
840
|
0.6%
|
|
Yape (2)
|
94
|
132
|
165
|
25.3%
|
74.6%
|
218
|
417
|
91.2%
|
|
Liability and Transactional Accounts (3)
|
198
|
201
|
204
|
1.7%
|
3.2%
|
567
|
602
|
6.1%
|
|
Loan Disbursement (4)
|
96
|
104
|
103
|
-1.1%
|
7.1%
|
287
|
305
|
6.3%
|
|
Off-balance sheet
|
57
|
53
|
54
|
1.3%
|
-5.2%
|
169
|
163
|
-3.6%
|
|
Insurances
|
34
|
40
|
35
|
-12.2%
|
2.4%
|
102
|
122
|
19.7%
|
|
Wealth Management and Corporate Finance
|
13
|
20
|
19
|
-3.1%
|
51.2%
|
40
|
54
|
35.8%
|
|
Others (5)
|
12
|
18
|
23
|
27.2%
|
87.1%
|
33
|
55
|
66.4%
|
|
Total
|
804
|
854
|
873
|
2.3%
|
8.6%
|
2,251
|
2,558
|
16.5%
|
|
•
|
Yape (+25.3%), which registered improved results in (i) QR (POS) merchant fee, driven by an upswing in
activity in July (due to growth in consumer liquidity following statutory bonus payment) and in August (due to retail campaigns). Growth over the period was also driven by (ii) bill payments,
which reflect the beginning of the educational centers registration cycle for the second half of the year, and an uptick in the use of (iii) Checkout, which experienced growth in the number of
affiliated establishments.
|
|
•
|
Other (+27.2%), reflecting growth in income from overseas branches.
|
 |
|
| |
Earnings Release 3Q / 2025
|
Analysis of 3Q25 Consolidated Results
|
|
06. Other Income
|
|
•
|
Yape (+75.0%): Growth was spurred by the same functionalities responsible for the QoQ evolution, which
represent the app’s most consolidated performers. The following businesses also contributed to growth (i) Top-ups, where Yape continues to strengthen its market share; (ii) Remittances, reflecting
the power of new strategic alliances that have bolstered our access to channels and countries for distribution; and (iii) Yape Businesses, whose TPV continues to trend gradually upward.
|
|
•
|
Others (+71.5%), related to Other Services and overseas branches.
|
|
•
|
Yape (+91.4%), as mature functionalities and new solutions advanced significantly.
|
|
•
|
Core businesses, registered positive results through (i) Liability and Transactional Accounts, which rose
on the back of Wires and Transfers and Current Accounts, (ii) Loan disbursements, associated with an uptick in the dynamism of the loan portfolio, and (iii) Payments and Transactional Services,
which reported growth due to growth in billing for debit and credit cards.
|
|
Other Non-Core Income
|
Quarter
|
% change
|
Up to
|
% change
|
||||
|
(S/ 000)
|
3Q24
|
2Q25
|
3Q25
|
QoQ
|
YoY
|
Sep 24
|
Sep 25
|
Sep 25 / Sep 24
|
|
Net Gain on Securities
|
120,033
|
179,174
|
111,977
|
-37.5%
|
-6.7%
|
274,489
|
263,002
|
-4.2%
|
|
Net Gain from Associates (1)
|
35,600
|
6,556
|
5,192
|
-20.8%
|
-85.4%
|
96,623
|
35,816
|
-62.9%
|
|
Net Gain of Derivatives Held for Trading (2)
|
(3,499)
|
21,418
|
244
|
-98.9%
|
-107.0%
|
78,233
|
40,161
|
-48.7%
|
|
Net Gain from Exchange Differences
|
(6,139)
|
10,195
|
7,518
|
-26.3%
|
-222.5%
|
(19,693)
|
33,672
|
-271.0%
|
|
Other Non-operative Income
|
96,675
|
58,461
|
71,656
|
22.6%
|
-25.9%
|
338,395
|
452,118
|
33.6%
|
|
Total Other Non-Core Income
|
242,670
|
275,804
|
196,587
|
-28.7%
|
-19.0%
|
768,047
|
824,769
|
7.4%
|
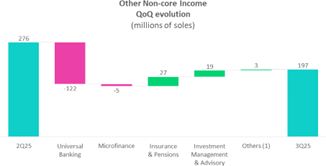 |
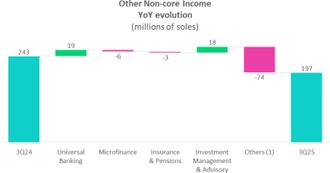 |
 |
|
| |
Earnings Release 3Q / 2025
|
Analysis of 3Q25 Consolidated Results
|
|
06. Other Income
|
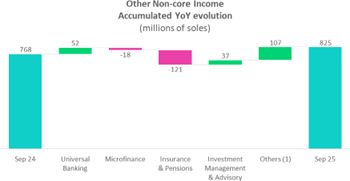
|
•
|
Net gain (loss) on securities: dropped 37.5%, spurred mainly by a base effect at BCP Stand-alone, which was associated with a sovereign bond exchange in 2Q25. This decline was partially offset by Credicorp
Capital, which reported positive results for Trading in the Capital Markets in Colombia after a strategy was executed to repurchase government papers and exchange bonds.
|
|
•
|
Net gain (loss) on derivatives held for trading: fell 98.9% due to lower results for coverage
strategies for portfolios in local currencies and for Forward contracts, mainly at Credicorp Capital.
|
|
•
|
Other non-operating income: fell 25.9%, impacted by extraordinary income in 3Q24 in Others, which registered a reversal of provisions at ASHC.
|
|
•
|
Net gain on investment in associates: decreased 85.4%, mainly attributable to Pacifico, which experienced a change in accounting after the acquisition of Banmedica; currently, the results for corporate health insurance and medical services are consolidated
in the Insurance Underwriting Result and Medical Services line rather than in the gain from associates line.
|
|
•
|
Net gain (loss) on securities: dropped 6.7%, impacted primarily by Pacífico,
which was impacted by credit downgrades on a couple of assets in the investment portfolio. The YoY decline was also driven by BCP Bolivia, which was
affected by a base effect associated with the release of anticipated losses on investments in 3Q24, and by BCP Stand-alone, which registered a base
effect related to sovereign bonds exchanges and sales in 3Q24. This contraction was partially offset by an uptick in the gain on securities at Credicorp Capital,
which was driven by the same dynamics as those seen QoQ.
|
|
•
|
Other Non-Operating Income: increased 33.6%, buoyed by an extraordinary gain following the acquisition of Banmédica.
|
|
•
|
Net Gain (Loss) on exchange differences: up mainly through ASB, due to treasury gains
to cover exposure in local currencies.
|
 |
|
| |
Earnings Release 3Q / 2025
|
Analysis of 3Q25 Consolidated Results
|
|
07
|
Results for Insurance Underwriting and Medical Services
|
|
QoQ, the Insurance Underwriting Result rose 10.7%. This evolution was driven primarily by (i) Life, attributable to a drop in
expenses for Insurance Service Expenses on the back of a decrease in claims in D&S and Group Life, (ii) EPS, which showed higher Insurance Service Income supported by a solid commercial performance
that resulted in higher premiums, and (iii) P&C, due to a more favorable reinsurance Result in Commercial Lines.
YoY and YTD, results increased 33.1% and 20.5% respectively, through (i) Life, due to a reduction in Insurance Service
Expenses in D&S and Individual Life and growth in Income in Credit Life; (ii) P & C, due to the same dynamics exposed on the QoQ analysis; and (iii) the EPS business, due to the change in
perimeter given the consolidation of Banmedica's operations.
|
|
Insurance Underwriting Results
|
|
Quarterly
|
% Change
|
Up to
|
%Change
|
||||
|
S/millions
|
3Q24
|
2Q25
|
3Q25
|
QoQ
|
YoY
|
Sep 24
|
Sep 25
|
Sep 25 / Sep 24
|
|
|
Insurance Service Income
|
940.9
|
1,185.6
|
1,212.4
|
2.3%
|
28.9%
|
2,788.0
|
3,386.0
|
21.4%
|
|
|
Total
|
Insurance Service Expenses
|
(514.7)
|
(738.8)
|
(746.6)
|
1.1%
|
45.1%
|
(1,487.1)
|
(2,057.2)
|
38.3%
|
|
Reinsurance Results
|
(134.4)
|
(96.0)
|
(77.4)
|
-19.3%
|
-42.4%
|
(414.6)
|
(260.4)
|
-37.2%
|
|
|
Insurance Underwriting Result
|
291.8
|
350.9
|
388.3
|
10.7%
|
33.1%
|
886.3
|
1,068.4
|
20.5%
|
|
|
Insurance Service Income
|
471.1
|
480.0
|
490.1
|
2.1%
|
4.0%
|
1,382.8
|
1,460.1
|
5.6%
|
|
|
P&C
|
Insurance Service Expenses
|
(278.8)
|
(298.7)
|
(319.7)
|
7.1%
|
14.7%
|
(818.7)
|
(943.7)
|
15.3%
|
|
Reinsurance Results
|
(114.0)
|
(88.7)
|
(72.9)
|
-17.8%
|
-36.1%
|
(334.2)
|
(234.0)
|
-30.0%
|
|
|
Insurance Underwriting Result
|
78.4
|
92.6
|
97.5
|
5.2%
|
24.3%
|
230.0
|
282.4
|
22.8%
|
|
|
Insurance Service Income
|
453.0
|
330.9
|
326.7
|
-1.3%
|
-27.9%
|
1,347.2
|
990.5
|
-26.5%
|
|
|
Life
|
Insurance Service Expenses
|
(233.8)
|
(79.0)
|
(38.0)
|
-52.0%
|
-83.8%
|
(671.1)
|
(229.3)
|
-65.8%
|
|
Reinsurance Results
|
(15.8)
|
(7.6)
|
(28.9)
|
281.1%
|
83.4%
|
(66.1)
|
(49.8)
|
-24.7%
|
|
|
Insurance Underwriting Result
|
203.4
|
244.3
|
259.9
|
6.4%
|
27.8%
|
610.0
|
711.4
|
16.6%
|
|
|
|
Insurance Service Income
|
23.5
|
13.3
|
14.8
|
11.7%
|
-37.0%
|
73.9
|
45.4
|
-38.5%
|
|
Crediseguros
|
Insurance Service Expenses
|
(7.1)
|
(4.2)
|
(2.2)
|
-48.3%
|
-69.6%
|
(12.7)
|
(12.2)
|
-4.3%
|
|
Reinsurance Results
|
(11.2)
|
(3.8)
|
(2.9)
|
-24.1%
|
-74.3%
|
(29.8)
|
(9.5)
|
-68.0%
|
|
|
Insurance Underwriting Result
|
5.2
|
5.3
|
9.8
|
85.5%
|
90.2%
|
31.3
|
23.7
|
-24.2%
|
|
|
|
Insurance Service Income
|
0.0
|
383.3
|
401.1
|
4.6%
|
n.a.
|
0.0
|
914.5
|
n.a.
|
| EPS |
Insurance Service Expenses
|
0.0
|
(357.3)
|
(369.5)
|
3.4%
|
n.a.
|
0.0
|
(849.7)
|
n.a.
|
|
Reinsurance Results
|
0.0
|
(1.3)
|
1.7
|
-233.9%
|
n.a.
|
0.0
|
0.0
|
n.a.
|
|
|
Insurance Underwriting Result
|
0.0
|
24.7
|
33.3
|
34.6%
|
n.a.
|
0.0
|
64.8
|
n.a.
|
|
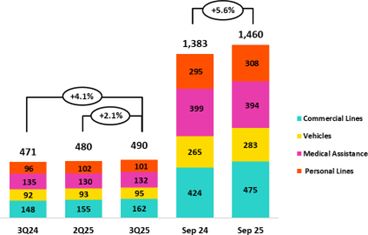
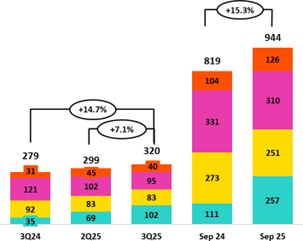
 |
|
| |
Earnings Release 3Q / 2025
|
Analysis of 3Q25 Consolidated Results
|
|
07. Results for Insurance Underwriting and Medical Services
|
| • |
Insurance Service Income rose slightly by 2.1%, driven mainly by (i) Commercial Lines and Medical Assistance, which registered an increase in premiums for seasonal renewals, and (ii) Vehicles, due to a
reduction in reserves set aside for current risks (RRC).
|
| • |
Insurance Service Expenses rose 7.1%, driven primarily by Commercial Lines, which reported an increase in claims in the Fire and Transportation lines.
|
| • |
The Reinsurance Result improved, fueled by an increase in claims recovered from the reinsurer in Commercial Lines.
|
| • |
Insurance Service Income rose 4.0%, attributable primarily to (i) Commercial lines, which reported an increase in the release of reserves for current risks, (ii) Personal Lines, where the card protection
product registered higher sales through the Bancassurance and Alliances channel, and (iii) Soat, which registered a drop in reserves set aside for current risks.
|
| • |
Insurance Service Expenses increased 14.7%, driven by the same dynamics in play QoQ.
|
| • |
The Reinsurance Result improved, fueled by the same drivers that drove the QoQ result.
|
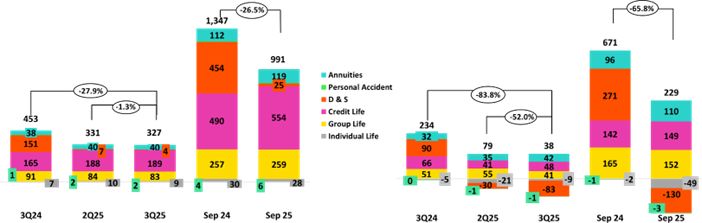
| • |
Insurance Service Income dropped 1.3%, due primarily to (i) D&S, which reported a decrease in premiums regularized under the SISCO VII contract, and (ii) Group Life, which registered a decrease in
premiums through Collective Life.
|
| • |
Insurance Service Expenses dropped 52.0%, due primarily to (i) D&S, which reported an increase in releases of reserves for claims under SISCO VII, and (ii) Group Life, which registered a decrease in D
& S claims.
|
| • |
The Reinsurance Result deteriorated due to the evolution of D&S, which reported a reserves release for claims recovered from the reinsurer.
|
| • |
Insurance Service Income dropped 27.9%; this evolution was driven primarily by D&S and reflects the fact that Company was not awarded tranches of the SISCO VIII contract (versus tranches awarded
perceived under SISCO VII). The aforementioned was partially attenuated by Credit Life, which reported growth in premiums allotted to the period through the Bancassurance and Alliance channels.
|
 |
|
| |
Earnings Release 3Q / 2025
|
Analysis of 3Q25 Consolidated Results
|
|
07. Results for Insurance Underwriting and Medical Services
|
| • |
Insurance Service Expenses fell 83.8%, fueled mainly by (i) D&S, given that no tranches of the SISCO VII were awarded to the Company, and (ii) Credit Life, due to a decrease in claims through the
Bancassurance Channel.
|
| • |
The Reinsurance Result deteriorated, driven mainly by D&S and via the same drivers that drove the QoQ result.
|
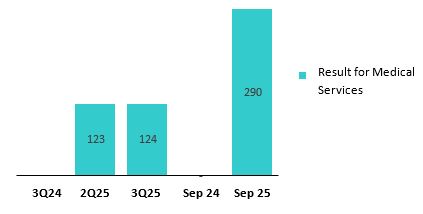
 |
|
| |
Earnings Release 3Q / 2025
|
Analysis of 3Q25 Consolidated Results
|
|
08
|
Operating Expenses
|
|
Operating expenses rose 12.8% YTD, driven mainly by core businesses at BCP Stand-alone and innovation initiatives at the Credicorp level. Core business expenses at BCP Stand-alone increased due to:
(i) an uptick in the employee salaries and benefits line, which reflects an increase in provisioning for variable compensation and an increase in headcount; and (ii) an uptick in administrative expenses, mainly through BCP
Stand-alone, which reflects an increase in cloud use among increasingly digitalized clients, and via Pacifico, which reflects the consolidation of 100% of the operations formerly held under the joint venture with Empresas
Banmedica. Expenses for initiatives in the innovation portfolio at the Credicorp level increased 16.1%.
|
|
Operating expenses
|
Quarter
|
% change
|
Up to
|
% change
|
||||
|
S/000
|
3Q24
|
2Q25
|
3Q25
|
QoQ
|
YoY
|
Sep 24
|
Sep 25
|
Sep 25 / Sep 24
|
|
Salaries and employees benefits
|
1,155,966
|
1,304,466
|
1,341,137
|
2.8%
|
16.0%
|
3,404,858
|
4,007,293
|
17.7%
|
|
Administrative and general expenses
|
971,449
|
965,994
|
1,068,459
|
10.6%
|
10.0%
|
2,740,755
|
2,904,287
|
6.0%
|
|
Depreciation and amortization
|
179,495
|
212,662
|
219,800
|
3.4%
|
22.5%
|
526,845
|
636,228
|
20.8%
|
|
Association in participation
|
6,414
|
371
|
65
|
-82.5%
|
-99.0%
|
24,461
|
7,235
|
-70.4%
|
|
Operating expenses (1)
|
2,313,324
|
2,483,493
|
2,629,461
|
5.9%
|
13.7%
|
6,696,919
|
7,555,043
|
12.8%
|
| • |
Growth in the Employee Salaries and Benefits line, which was driven mainly by (i) BCP Stand-alone, fueled primarily by an increase in provisions for variable compensation and secondarily by an increase in
headcount for new projects, and (ii) Pacifico, on the back of growth in compensation.
|
| • |
An increase in Administrative Expenses, which was fueled by BCP Stand-alone and Pacifico. At BCP Stand-alone, an increase was reported in transactions through digital channels, which triggered an upswing
in expenses for cloud use and other IT-related services. At Pacifico, growth in this line was driven primarily by the full consolidation of Empresas Banmedica operations following Credicorp’s acquisition in March 2025 of this
company’s 50% share in a joint venture with Pacífico Compañía de Seguros Reaseguros S.A.
|
|
Administrative and General Expenses
|
Quarter
|
% change
|
Up to
|
% change
|
||||
|
S/000
|
3Q24
|
2Q25
|
3Q25
|
QoQ
|
YoY
|
Sep 24
|
Sep 25
|
Sep 25 / Sep 24
|
|
IT expenses and IT third-party services
|
287,372
|
324,083
|
336,894
|
4.0%
|
17.2%
|
865,274
|
963,006
|
11.3%
|
|
Advertising
|
123,174
|
112,027
|
133,510
|
19.2%
|
8.4%
|
314,914
|
330,927
|
5.1%
|
|
Taxes and contributions
|
90,080
|
86,321
|
90,710
|
5.1%
|
0.7%
|
277,415
|
260,378
|
-6.1%
|
|
Audit Services, Consulting and professional fees
|
101,570
|
92,086
|
120,177
|
30.5%
|
18.3%
|
236,407
|
283,335
|
19.9%
|
|
Transport and communications
|
62,568
|
58,391
|
64,565
|
10.6%
|
3.2%
|
176,857
|
175,766
|
-0.6%
|
|
Repair and maintenance
|
36,316
|
37,886
|
43,719
|
15.4%
|
20.4%
|
103,552
|
113,240
|
9.4%
|
|
Agents' Fees
|
29,957
|
28,067
|
27,807
|
-0.9%
|
-7.2%
|
86,720
|
81,976
|
-5.5%
|
|
Services by third-party
|
36,689
|
26,634
|
27,766
|
4.3%
|
-24.3%
|
101,054
|
75,836
|
-25.0%
|
|
Leases of low value and short-term
|
26,378
|
34,937
|
34,858
|
-0.2%
|
32.1%
|
87,845
|
102,972
|
17.2%
|
|
Miscellaneous supplies
|
23,552
|
18,192
|
16,993
|
-6.6%
|
-27.8%
|
66,905
|
54,568
|
-18.4%
|
|
Security and protection
|
16,909
|
16,940
|
16,888
|
-0.3%
|
-0.1%
|
49,356
|
50,774
|
2.9%
|
|
Subscriptions and quotes
|
18,349
|
19,773
|
20,774
|
5.1%
|
13.2%
|
59,741
|
58,877
|
-1.4%
|
|
Electricity and water
|
11,857
|
12,513
|
11,390
|
-9.0%
|
-3.9%
|
37,207
|
34,178
|
-8.1%
|
|
Electronic processing
|
7,578
|
7,762
|
8,935
|
15.1%
|
17.9%
|
21,342
|
24,332
|
14.0%
|
|
Insurance
|
28,296
|
16,441
|
34,401
|
109.2%
|
21.6%
|
40,838
|
62,561
|
53.2%
|
|
Cleaning
|
5,761
|
7,014
|
6,474
|
-7.7%
|
12.4%
|
17,134
|
20,046
|
17.0%
|
|
Others
|
65,043
|
66,927
|
72,598
|
8.5%
|
11.6%
|
198,194
|
211,515
|
6.7%
|
|
Total
|
971,449
|
965,994
|
1,068,459
|
10.6%
|
10.0%
|
2,740,755
|
2,904,287
|
6.0%
|
 |
|
| |
Earnings Release 3Q / 2025
|
Analysis of 3Q25 Consolidated Results
|
|
08. Operating Expenses
|
|
Operating Expenses (1)
|
Quarter | % change |
Up to
|
% change
|
||||
|
S/ 000
|
3Q24
|
2Q25
|
3Q25
|
QoQ
|
YoY
|
Sep 24
|
Sep 25
|
Sep 25 / Sep 24
|
|
Operating Expenses Ex Innovation
|
2,024,870
|
2,168,180
|
2,284,842
|
5.4%
|
12.8%
|
5,868,270
|
6,593,174
|
12.4%
|
|
Innovation Portfolio (2)
|
288,454
|
315,313
|
344,619
|
9.3%
|
19.5%
|
828,649
|
961,869
|
16.1%
|
|
Total Operating Expenses
|
2,313,324
|
2,483,493
|
2,629,461
|
5.9%
|
13.7%
|
6,696,919
|
7,555,043
|
12.8%
|
(2) Includes innovation portfolio initiatives in subsidiaries and Krealo.
| • |
Core business expenses excluding IT
|
| • |
An increase in the Employee Salaries and Benefits line, due to (i) provisions for variable compensation, which rose alongside better results, and (ii) an increase in headcount.
|
| • |
Technology expenses (IT)
|
| • |
More specialized personnel with digital capacities were hired at higher-than-average salaries. This is aligned with the execution of strategic projects.
|
| • |
Growth in expenses for the use of data processing servers, in line with growth in the transaction volume via digital channels as clients become increasingly digitalized. Total monetary transactions and
transactions through digital channels rose 58.2% and 68.2%, respectively.
|
 |
|
| |
Earnings Release 3Q / 2025
|
Analysis of 3Q25 Consolidated Results
|
|
09
|
Operating Efficiency
|
|
The efficiency ratio evolved as anticipated and remains within the guidance range. YTD, it increased by 187 basis points as operating expense growth outpaced the expansion in operating income. This evolution reflects higher
expenses in core business expansion at BCP Stand-alone and innovation initiatives at the Credicorp level, which aimed to strengthen capabilities, drive future efficiency, and secure sustainable competitive advantages over the
long term.
|
|
Subsidiary
|
Quarter
|
% change
|
As of
|
% change
|
||||
|
3Q24
|
2Q25
|
3Q25
|
QoQ
|
YoY
|
Sep 24
|
Sep 25
|
Sep 25 / Sep 24
|
|
|
BCP Stand-alone
|
36.4%
|
38.3%
|
39.9%
|
160 bps
|
354 bps
|
36.2%
|
38.7%
|
249 bps
|
|
BCP Bolivia
|
80.3%
|
67.3%
|
59.0%
|
-828 bps
|
-2127 bps
|
64.3%
|
65.5%
|
121 bps
|
|
Mibanco Peru
|
54.2%
|
52.0%
|
49.4%
|
-255 bps
|
-476 bps
|
52.8%
|
51.4%
|
-144 bps
|
|
Mibanco Colombia
|
72.0%
|
65.5%
|
63.7%
|
-178 bps
|
-833 bps
|
78.6%
|
66.4%
|
-1226 bps
|
|
Pacífico
|
25.5%
|
37.5%
|
38.2%
|
70 bps
|
1269 bps
|
26.9%
|
36.1%
|
914 bps
|
|
Prima AFP
|
50.7%
|
51.4%
|
52.5%
|
111 bps
|
176 bps
|
51.1%
|
52.7%
|
163 bps
|
|
Credicorp
|
44.4%
|
44.9%
|
46.4%
|
145 bps
|
198 bps
|
43.8%
|
45.7%
|
187 bps
|
 |
|
| |
Earnings Release 3Q / 2025
|
Analysis of 3Q25 Consolidated Results
|
|
10
|
Regulatory Capital
|
|
At the end of 3Q25, the regulatory capital ratio stood at 134%, which was above the minimum required.
BCP Stand-alone’s IFRS CET1 dropped 25 bps YoY, situating at 13.17%, which was above our internal appetite of 11%. This reduction was driven by growth in RWAs for credit risk, which rose
alongside portfolio growth, and was partially offset by an increase in Retained Earnings, which ticked up alongside business growth.
The Mibanco IFRS CET1 ratio dropped 121bps YoY to stand at 17.14%. This level stood above our internal appetite of 15% and was driven by growth in RWAs, which rose hand-in-hand with loan
portfolio growth, and by a reduction in Retained Earnings following dividend payments.
|
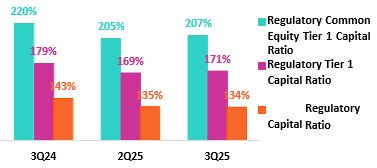
| 10.2 |
Analysis of Capital at BCP Stand-alone
|
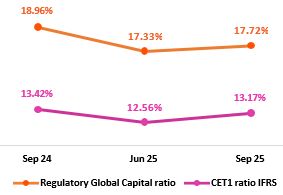
 |
|
| |
Earnings Release 3Q / 2025
|
Analysis of 3Q25 Consolidated Results
|
|
10. Regulatory Capital
|
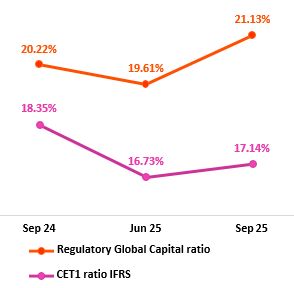
 |
|
| |
Earnings Release 3Q / 2025
|
Analysis of 3Q25 Consolidated Results
|
|
11
|
Economic Outlook
|
|
In 3Q25, GDP grew around 3.5% YoY, supported by high terms of trade, a continued recovery in formal employment, and inflation comfortably within the BCRP’s target range.
The acceleration compared to 2Q25 was mainly due to a rebound in primary sectors. Non-primary sectors grew approximately 3.4% YoY.
Inflation slowed marginally, closing the quarter at 1.4% YoY (compared to 1.7% YoY in2Q25), marking ten consecutive months below the midpoint of the target range
(1%–3%). Meanwhile, in its October meeting, the BCRP decided to keep the reference interest rate unchanged at 4.25%.
According to the BCRP, the exchange rate closed 3Q25 at USDPEN 3.47, its lowest level since 2020. Thus, the sol appreciated 1.9%
compared to the end of 2Q25 and 7.8% compared to the end of 4Q24 (USDPEN 3.77).
|
|
Peru
|
2020
|
2021
|
2022
|
2023
|
2024
|
2025 (4)
|
2026 (4)
|
|
GDP (US$ Millions)
|
210
|
230
|
248
|
272
|
295
|
337
|
365
|
|
Real GDP (% change)
|
-10.9
|
13.4
|
2.8
|
-0.4
|
3.3
|
3.4
|
3.2
|
|
GDP per capita (US$)
|
6,428
|
6,956
|
7,438
|
8,072
|
8,671
|
9,801
|
10,530
|
|
Domestic demand (% change)
|
-9.3
|
13.9
|
2.4
|
-1.1
|
3.9
|
6.0
|
3.7
|
|
Gross fixed investment (as % GDP)
|
21
|
25
|
25
|
22
|
22
|
23
|
23
|
|
Financial system loan without Reactiva (% change) (1)
|
-4.3
|
12.6
|
9.7
|
2.8
|
1.3
|
5.5
|
6.9
|
|
Inflation, end of period (2)
|
2.0
|
6.4
|
8.5
|
3.2
|
2.0
|
1.4
|
2.0
|
|
Reference Rate, end of period
|
0.25
|
2.50
|
7.50
|
6.75
|
5.00
|
4.25
|
4.00
|
|
Exchange rate, end of period
|
3.62
|
3.99
|
3.81
|
3.71
|
3.76
|
3.45
|
3.35
|
|
Exchange rate, (% change) (3)
|
-9.3%
|
-10.3%
|
4.5%
|
2.7%
|
-1.3%
|
8.2%
|
2.9%
|
|
Fiscal balance (% GDP)
|
-8.7
|
-2.5
|
-1.7
|
-2.7
|
-3.5
|
-2.3
|
-2.3
|
|
Public Debt (as % GDP)
|
34
|
35
|
33
|
32
|
32
|
32
|
32
|
|
Trade balance (US$ Millions)
|
8
|
15
|
10
|
17
|
24
|
29
|
30
|
|
(As % GDP)
|
3.9%
|
6.6%
|
4.2%
|
6.3%
|
8.2%
|
8.6%
|
8.2%
|
|
Exports
|
43
|
63
|
66
|
67
|
76
|
85
|
90
|
|
Imports
|
35
|
48
|
56
|
50
|
52
|
56
|
60
|
|
Current account balance (As % GDP)
|
0.8%
|
-2.2%
|
-4.0%
|
0.3%
|
2.2%
|
1.7%
|
1.2%
|
|
Net international reserves (US$ Millions)
|
75
|
78
|
72
|
71
|
79
|
88
|
88
|
|
(As % GDP)
|
35.6%
|
34.2%
|
28.9%
|
26.1%
|
26.8%
|
26.1%
|
24.1%
|
|
(As months of imports)
|
26
|
20
|
15
|
17
|
18
|
19
|
18
|
 |
|
| |
Earnings Release 3Q / 2025
|
Analysis of 3Q25 Consolidated Results
|
|
11. Economic Outlook
|
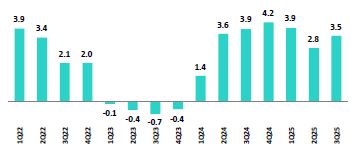
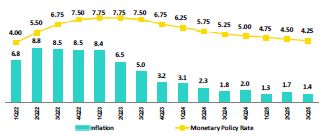
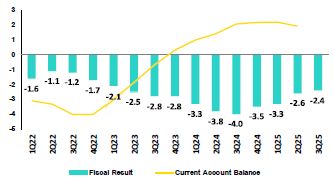
 |
|
| |
Earnings Release 3Q / 2025
|
Analysis of 3Q25 Consolidated Results
|
|
11. Economic Outlook
|
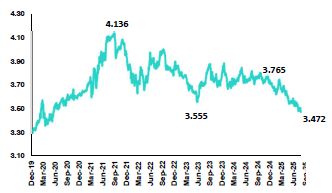
 |
|
| |
Earnings Release 3Q / 2025
|
Analysis of 3Q25 Consolidated Results
|
|
11. Economic Outlook
|
| • |
The occurrence of natural disasters or political or social instability in Peru;
|
|
•
|
The adequacy of the dividends that our subsidiaries are able to pay to us, which may affect our ability to pay dividends to shareholders and corporate
expenses;
|
| • |
Performance of, and volatility in, financial markets, including Latin-American and other markets;
|
| • |
The frequency, severity and types of insured loss events;
|
| • |
Fluctuations in interest rate levels;
|
| • |
Foreign currency exchange rates, including the Sol/US Dollar exchange rate;
|
| • |
Deterioration in the quality of our loan portfolio;
|
| • |
Increasing levels of competition in Peru and other markets in which we operate;
|
| • |
Developments and changes in laws and regulations affecting the financial sector and adoption of new international guidelines;
|
| • |
Changes in the policies of central banks and/or foreign governments;
|
| • |
Effectiveness of our risk management policies and of our operational and security systems;
|
| • |
Losses associated with counterparty exposures;
|
|
•
|
The scope of the coronavirus (“COVID-19”) outbreak, actions taken to contain the COVID-19 and related economic effects from such actions and our ability to
maintain adequate staffing; and
|
| • |
Changes in Bermuda laws and regulations applicable to so-called non-resident entities.
|
 |
|
| |
Earnings Release 3Q / 2025
|
Analysis of 3Q25 Consolidated Results
|
|
12
|
Appendix
|
|
12.1. Evolution of Loans in Average Daily Balances
|
49
|
||
|
12.2. Loan Portfolio Quality
|
49
|
||
|
12.3. Net Interest Income (NII)
|
53
|
||
|
12.4. Net Interest Margin (NIM) and Risk Adjusted NIM
|
53
|
||
|
12.5. Physical Point of Contact
|
54
|
||
|
12.6. Regulatory Capital
|
54
|
||
|
12.7. Financial Statements and Ratios by Business
|
58
|
||
|
|
12.7.1. Credicorp Consolidated
|
58
|
|
|
12.7.2. Credicorp Stand-alone
|
60
|
||
|
12.7.3. BCP Consolidated
|
61
|
||
|
12.7.4. BCP Stand-alone
|
63
|
||
|
12.7.5. BCP Bolivia
|
65
|
||
|
12.7.6. Mibanco
|
66
|
||
|
12.7.7. Prima AFP
|
67
|
||
|
12.7.8. Grupo Pacifico
|
68
|
||
|
12.7.9. Investment Management and Advisory
|
69
|
||
|
12.8. Table of Calculations
|
70
|
||
|
12.9. Glossary of terms
|
71
|
||
 |
|
| |
Earnings Release 3Q / 2025
|
Analysis of 3Q25 Consolidated Results
|
|
12. Appendix
|
| 12.1. |
Evolution of Loans in Average Daily Balances
|
|
Total Loans
(S/ millions)
|
|
As of |
Volume change
|
% change
|
% Part. in total loans
|
|||||
|
Sep 24
|
Jun 25
|
Sep 25
|
QoQ
|
YoY
|
QoQ
|
YoY
|
Sep 24
|
Jun 25
|
Sep 25
|
|
|
BCP Stand-alone
|
116,637
|
119,142
|
121,189
|
2,047
|
4,552
|
1.7%
|
3.9%
|
82.2%
|
81.8%
|
82.6%
|
|
Wholesale Banking
|
52,817
|
54,096
|
54,645
|
549
|
1,828
|
1.0%
|
3.5%
|
37.2%
|
37.1%
|
37.2%
|
|
Corporate
|
31,545
|
32,206
|
32,544
|
338
|
999
|
1.1%
|
3.2%
|
22.2%
|
22.1%
|
22.2%
|
|
Middle - Market
|
21,272
|
21,891
|
22,101
|
211
|
829
|
1.0%
|
3.9%
|
15.0%
|
15.0%
|
15.1%
|
|
Retail Banking
|
63,819
|
65,046
|
66,544
|
1,498
|
2,724
|
2.3%
|
4.3%
|
45.0%
|
44.7%
|
45.4%
|
|
SME - Business
|
7,732
|
7,521
|
7,751
|
230
|
19
|
3.1%
|
0.2%
|
5.4%
|
5.2%
|
5.3%
|
|
SME - Pyme
|
16,176
|
15,922
|
16,193
|
271
|
17
|
1.7%
|
0.1%
|
11.4%
|
10.9%
|
11.0%
|
|
Mortgage
|
21,440
|
22,439
|
22,986
|
547
|
1,546
|
2.4%
|
7.2%
|
15.1%
|
15.4%
|
15.7%
|
|
Consumer
|
12,615
|
13,207
|
13,511
|
305
|
897
|
2.3%
|
7.1%
|
8.9%
|
9.1%
|
9.2%
|
|
Credit Card
|
5,856
|
5,957
|
6,102
|
145
|
246
|
2.4%
|
4.2%
|
4.1%
|
4.1%
|
4.2%
|
|
Mibanco
|
12,199
|
12,514
|
12,734
|
220
|
534
|
1.8%
|
4.4%
|
8.6%
|
8.6%
|
8.7%
|
|
Mibanco Colombia
|
1,721
|
1,889
|
2,004
|
115
|
283
|
6.1%
|
16.5%
|
1.2%
|
1.3%
|
1.4%
|
|
Bolivia
|
9,555
|
10,542
|
9,363
|
-1,179
|
-192
|
-11.2%
|
-2.0%
|
6.7%
|
7.2%
|
6.4%
|
|
ASB Bank Corp.
|
1,867
|
1,560
|
1,431
|
-129
|
-436
|
-8.3%
|
-23.4%
|
1.3%
|
1.1%
|
1.0%
|
|
BAP's total loans
|
141,978
|
145,647
|
146,720
|
1,073
|
4,742
|
0.7%
|
3.3%
|
100.0%
|
100.0%
|
100.0%
|

| 12.2. |
Loan Portfolio Quality
|
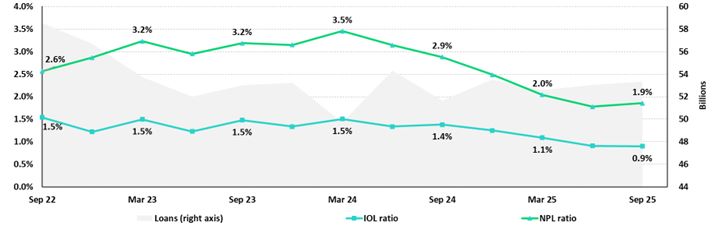
 |
|
| |
Earnings Release 3Q / 2025
|
Analysis of 3Q25 Consolidated Results
|
|
12. Appendix
|
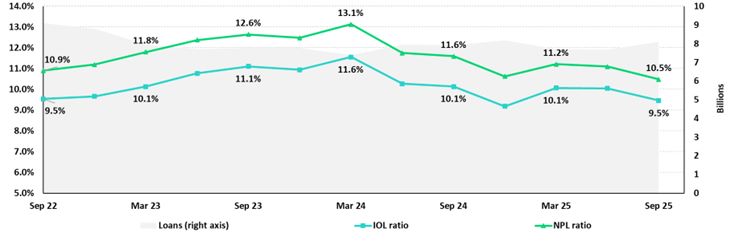
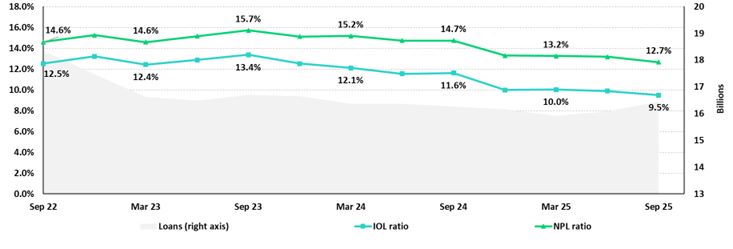
 |
|
| |
Earnings Release 3Q / 2025
|
Analysis of 3Q25 Consolidated Results
|
|
12. Appendix
|
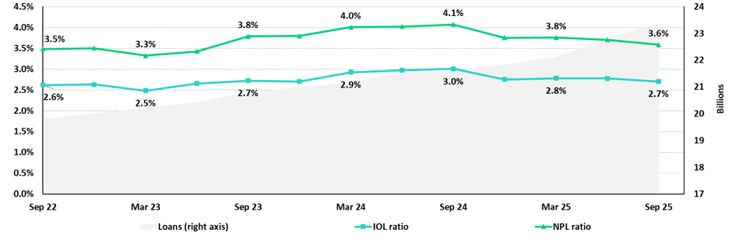
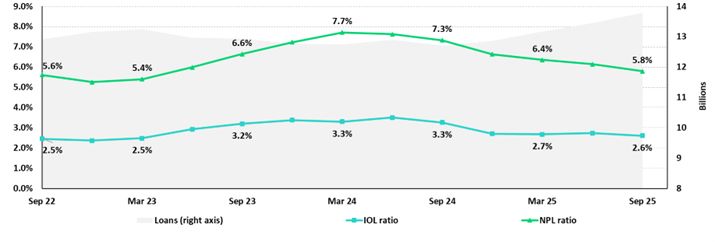
 |
|
| |
Earnings Release 3Q / 2025
|
Analysis of 3Q25 Consolidated Results
|
|
12. Appendix
|
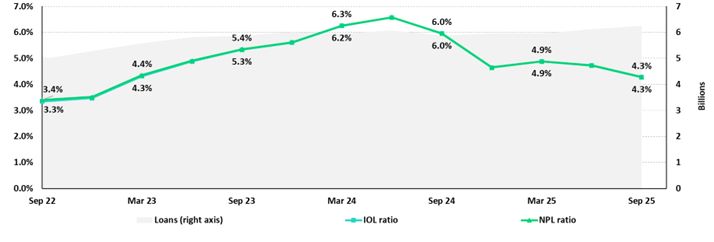
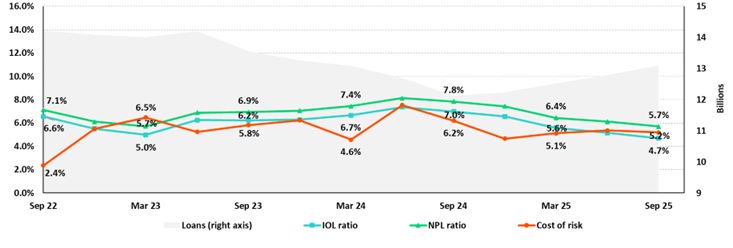
BCP Bolivia
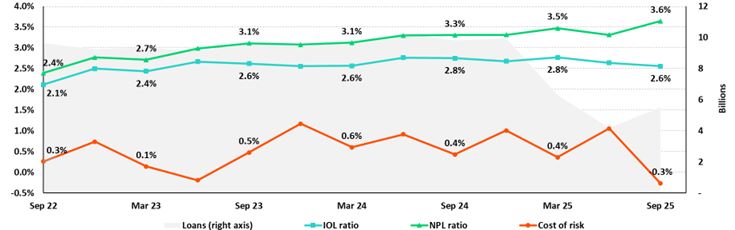
 |
|
| |
Earnings Release 3Q / 2025
|
Analysis of 3Q25 Consolidated Results
|
|
12. Appendix
|
| 12.3. |
Net Interest Income (NII)
|
|
Net interest income
|
Quarter
|
% change
|
Up to
|
% Change
|
||||
|
S/000
|
3Q24
|
2Q25
|
3Q25
|
QoQ
|
YoY
|
Sep 24
|
Sep 25
|
Sep 25 / Sep 24
|
|
Interest income
|
4,995,971
|
4,922,292
|
4,987,693
|
1.3%
|
-0.2%
|
14,857,135
|
14,804,775
|
-0.4%
|
|
Interest on loans
|
3,924,222
|
3,840,725
|
3,960,980
|
3.1%
|
0.9%
|
11,714,388
|
11,649,345
|
-0.6%
|
|
Dividends on investments
|
13,187
|
22,923
|
19,179
|
-16.3%
|
45.4%
|
34,184
|
67,211
|
96.6%
|
|
Interest on deposits with banks
|
365,361
|
342,323
|
316,420
|
-7.6%
|
-13.4%
|
1,019,649
|
1,003,365
|
-1.6%
|
|
Interest on securities
|
667,195
|
647,186
|
623,216
|
-3.7%
|
-6.6%
|
2,008,167
|
1,928,274
|
-4.0%
|
|
Other interest income
|
26,006
|
69,135
|
67,898
|
-1.8%
|
161.1%
|
80,747
|
156,580
|
93.9%
|
|
Interest expense
|
1,405,221
|
1,306,921
|
1,299,864
|
-0.5%
|
-7.5%
|
4,371,798
|
3,929,563
|
-10.1%
|
|
Interest expense (excluding Net Insurance Financial Expenses)
|
1,276,643
|
1,167,866
|
1,158,421
|
-0.8%
|
-9.3%
|
3,996,530
|
3,513,443
|
-12.1%
|
|
Interest on deposits
|
677,509
|
541,014
|
565,344
|
4.5%
|
-16.6%
|
2,195,045
|
1,725,971
|
-21.4%
|
|
Interest on borrowed funds
|
262,319
|
265,710
|
252,490
|
-5.0%
|
-3.7%
|
794,488
|
784,402
|
-1.3%
|
|
Interest on bonds and subordinated notes
|
200,801
|
193,125
|
164,653
|
-14.7%
|
-18.0%
|
598,170
|
525,802
|
-12.1%
|
|
Other interest expense
|
136,014
|
168,017
|
175,934
|
4.7%
|
29.3%
|
408,827
|
477,268
|
16.7%
|
|
Net Insurance Financial Expenses
|
128,578
|
139,055
|
141,443
|
1.7%
|
10.0%
|
375,268
|
416,120
|
10.9%
|
|
Net interest, similar income and expenses
|
3,590,750
|
3,615,371
|
3,687,829
|
2.0%
|
2.7%
|
10,485,337
|
10,875,212
|
3.7%
|
|
Provision for credit losses on loan portfolio, net of recoveries
|
868,081
|
575,159
|
602,918
|
4.8%
|
-30.5%
|
2,776,151
|
1,759,970
|
-36.6%
|
|
Net interest, similar income and expenses, after provision for credit losses on loan portfolio
|
2,722,669
|
3,040,212
|
3,084,911
|
1.5%
|
13.3%
|
7,709,186
|
9,115,242
|
18.2%
|
|
Average interest earning assets
|
231,316,507
|
233,761,957
|
233,285,291
|
-0.2%
|
0.9%
|
229,452,866
|
237,958,451
|
3.7%
|
|
Net interest margin (1)
|
6.43%
|
6.42%
|
6.57%
|
15 bps
|
14 bps
|
6.3%
|
6.3%
|
2 bps
|
|
Risk-adjusted Net interest margin (1)
|
4.93%
|
5.44%
|
5.53%
|
9 bps
|
60 bps
|
4.7%
|
5.3%
|
64 bps
|
|
Net provisions for loan losses / Net interest income (1)
|
24.18%
|
15.91%
|
16.35%
|
44 bps
|
-783 bps
|
26.5%
|
16.2%
|
-1030 bps
|
| 12.4. |
Net Interest Margin (NIM) and Risk-Adjusted NIM by Subsidiary
|
|
NIM Breakdown
|
3Q24
|
2Q25
|
3Q25
|
|
BCP
|
6.17%
|
6.00%
|
6.11%
|
|
Mibanco
|
13.86%
|
14.38%
|
15.02%
|
|
BCP Bolivia
|
2.95%
|
2.57%
|
3.21%
|
|
Credicorp
|
6.43%
|
6.42%
|
6.57%
|
|
Risk Adjusted NIM
Breakdown
|
3Q24
|
2Q25
|
3Q25
|
|
BCP
|
4.75%
|
5.22%
|
5.25%
|
|
Mibanco
|
9.12%
|
10.34%
|
11.03%
|
|
BCP Bolivia
|
2.59%
|
1.89%
|
3.45%
|
|
Credicorp
|
4.93%
|
5.44%
|
5.53%
|
 |
|
| |
Earnings Release 3Q / 2025
|
Analysis of 3Q25 Consolidated Results
|
|
12. Appendix
|
| 12.5. |
Physical Point of contact
|
|
Physical Point of Contact (1)
(Units)
|
As of
|
Change (units)
|
|||
|
Sep 24
|
Jun 25
|
Sep 25
|
QoQ
|
YoY
|
|
|
Branches (2)
|
319
|
319
|
318
|
(1)
|
(1)
|
|
ATMs
|
2,451
|
2,449
|
2,410
|
(39)
|
(41)
|
|
Agents
|
10,112
|
10,330
|
10,417
|
87
|
305
|
|
Total
|
12,882
|
13,098
|
13,145
|
47
|
263
|
|
(1)
|
Includes Physical Point of Contact of BCP Stand-Alone, Mibanco and BCP Bolivia
|
|
(2)
|
Includes Banco de la Nacion branches, which in September 24 were 36, in June were 36 and in September 25 were 36
|
| 12.6. |
Regulatory Capital
|
|
Regulatory Capital and Capital Adequacy Ratios
|
As of
|
Change %
|
|||
|
S/000
|
Sep 24
|
Jun 25
|
Sep 25
|
QoQ
|
YoY
|
|
Capital Stock
|
1,318,993
|
1,318,993
|
1,318,993
|
-
|
-
|
|
Treasury Stocks
|
(208,901)
|
(209,845)
|
(209,845)
|
0.0%
|
0.5%
|
|
Capital Surplus
|
179,027
|
133,387
|
139,527
|
4.6%
|
-22.1%
|
|
Legal and Other Capital reserves
|
27,187,346
|
29,602,851
|
29,628,427
|
0.1%
|
9.0%
|
|
Minority interest
|
479,027
|
474,990
|
475,729
|
0.2%
|
-0.7%
|
|
Current and Accumulated Earnings (1)
|
5,432,237
|
5,123,469
|
6,737,239
|
31.5%
|
24.0%
|
|
Unrealized Gains or Losses (2)
|
(227,247)
|
(246,716)
|
392,256
|
-259.0%
|
-272.6%
|
|
Goodwill
|
(734,431)
|
(1,692,823)
|
(1,290,496)
|
-23.8%
|
75.7%
|
|
Intangible Assets (3)
|
(2,050,646)
|
(2,655,440)
|
(2,864,488)
|
7.9%
|
39.7%
|
|
Deductions in Common Equity Tier 1 instruments (4)
|
(678,924)
|
(73,488)
|
(81,609)
|
11.1%
|
-88.0%
|
|
Subordinated Debt
|
7,939,610
|
7,240,645
|
7,246,406
|
0.1%
|
-8.7%
|
|
Loan loss reserves (5)
|
1,967,574
|
1,972,667
|
2,036,080
|
3.2%
|
3.5%
|
|
Deductions in Tier 2 instruments (6)
|
(1,525,608)
|
(1,289,380)
|
(1,438,739)
|
11.6%
|
-5.7%
|
|
Total Regulatory Capital (A)
|
39,078,056
|
39,699,311
|
42,089,481
|
6.0%
|
7.7%
|
|
Total Regulatory Common Equity Tier 1 Capital (B)
|
30,696,480
|
31,775,379
|
34,245,733
|
7.8%
|
11.6%
|
|
Total Regulatory Tier 1 Capital (C)
|
30,696,480
|
31,775,379
|
34,245,733
|
7.8%
|
11.6%
|
|
Total Regulatory Capital Requirement (D)
|
27,276,454
|
29,484,940
|
30,993,862
|
5.1%
|
13.6%
|
|
Total Regulatory Common Equity Tier 1 Capital Requirement (E)
|
13,968,158
|
15,535,244
|
16,281,634
|
4.8%
|
16.6%
|
|
Total Regulatory Tier 1 Capital Requirement (F)
|
17,131,013
|
18,788,044
|
19,727,355
|
5.0%
|
15.2%
|
|
Regulatory Capital Ratio (A) / (D)
|
143%
|
135%
|
136%
|
116 pp
|
-747 bps
|
|
Regulatory Common Equity Tier 1 Capital Ratio (B) / (E)
|
220%
|
205%
|
210%
|
580 pp
|
-943 bps
|
|
Regulatory Tier 1 Capital Ratio (C) / (F)
|
179%
|
169%
|
174%
|
447 pp
|
-559 bps
|
 |
|
| |
Earnings Release 3Q / 2025
|
Analysis of 3Q25 Consolidated Results
|
|
12. Appendix
|
|
Regulatory Capital
|
Quarter
|
% Change
|
|||
|
(S/ thousand)
|
Sep 24
|
Jun 25
|
Sep 25
|
QoQ
|
YoY
|
|
Capital Stock
|
12,973,175
|
12,973,175
|
12,973,175
|
0.0%
|
0.0%
|
|
Reserves
|
6,591,330
|
6,125,452
|
6,125,452
|
0.0%
|
-7.1%
|
|
Accumulated earnings
|
5,426,132
|
5,129,250
|
6,730,631
|
31.2%
|
24.0%
|
|
Loan loss reserves (1)
|
1,689,307
|
1,757,305
|
1,800,868
|
2.5%
|
6.6%
|
|
Subordinated Debt
|
-
|
-
|
-
|
n.a
|
n.a
|
|
Unrealized Profit or Losses
|
7,232,550
|
6,552,700
|
6,419,500
|
-2.0%
|
-11.2%
|
|
Investment in subsidiaries and others, net of unrealized profit and net income in subsidiaries
|
(322,210)
|
(200,969)
|
(10,363)
|
-94.8%
|
-96.8%
|
|
Intangibles
|
(2,537,005)
|
(2,380,842)
|
(2,535,672)
|
6.5%
|
-0.1%
|
|
Goodwill
|
(1,330,135)
|
(1,549,091)
|
(1,624,042)
|
4.8%
|
22.1%
|
|
Total Regulatory Capital
|
(122,083)
|
(122,083)
|
(122,083)
|
0.0%
|
0.0%
|
|
Tier 1 Common Equity (2)
|
29,601,060
|
28,284,896
|
29,757,465
|
5.2%
|
0.5%
|
|
Regulatory Tier 1 Capital (3)
|
20,679,203
|
19,974,891
|
21,537,097
|
7.8%
|
4.1%
|
|
Regulatory Tier 2 Capital (4)
|
20,679,203
|
19,974,891
|
21,537,097
|
7.8%
|
4.1%
|
|
Total risk-weighted assets
|
Quarter
|
% Change
|
|||
|
(S/ thousand)
|
Sep 24
|
Jun 25
|
Sep 25
|
QoQ
|
YoY
|
|
Market risk-weighted assets
|
4,301,156
|
4,400,226
|
5,329,045
|
21.1%
|
23.9%
|
|
Credit risk-weighted assets
|
133,937,442
|
139,386,096
|
142,895,450
|
2.5%
|
6.7%
|
|
Operational risk-weighted assets
|
17,871,737
|
19,384,021
|
19,751,032
|
1.9%
|
10.5%
|
|
Total
|
156,110,335
|
163,170,343
|
167,975,527
|
2.9%
|
7.6%
|
|
Capital requirement
|
Quarter
|
% Change
|
|||
|
(S/ thousand)
|
Sep 24
|
Jun 25
|
Sep 25
|
QoQ
|
YoY
|
|
Market risk capital requirement
|
430,116
|
440,023
|
532,904
|
21.1%
|
23.9%
|
|
Credit risk capital requirement
|
12,724,057
|
13,938,610
|
14,289,545
|
2.5%
|
12.3%
|
|
Operational risk capital requirement
|
1,787,174
|
1,938,402
|
1,975,103
|
1.9%
|
10.5%
|
|
Additional capital requirements
|
5,647,686
|
7,142,933
|
7,348,282
|
2.9%
|
30.1%
|
|
Total
|
20,589,033
|
23,459,967
|
24,145,835
|
2.9%
|
17.3%
|
|
Capital ratios under Local Regulation
|
Quarter
|
% Change
|
|||
|
Sep 24
|
Jun 25
|
Sep 25
|
QoQ
|
YoY
|
|
|
Common Equity Tier 1 ratio
|
13.25%
|
12.24%
|
12.82%
|
58 bps
|
-42 bps
|
|
Tier 1 Capital ratio
|
13.25%
|
12.24%
|
12.82%
|
58 bps
|
-42 bps
|
|
Regulatory Global Capital ratio
|
18.96%
|
17.33%
|
17.72%
|
38 bps
|
-125 bps
|
 |
|
| |
Earnings Release 3Q / 2025
|
Analysis of 3Q25 Consolidated Results
|
| 12.
Appendix |
|
Regulatory Capital
(S/ thousand)
|
Sep 24
|
As of
Jun 25
|
Sep 25
|
% Change |
|
|
QoQ
|
YoY
|
||||
|
Capital Stock
|
1,840,606
|
1,840,606
|
1,840,606
|
0.0%
|
0.0%
|
|
Reserves
|
334,650
|
365,847
|
365,847
|
0.0%
|
9.3%
|
|
Accumulated earnings
|
424,627
|
238,272
|
394,428
|
65.5%
|
-7.1%
|
|
Loan loss reserves (1)
|
143,193
|
153,732
|
158,725
|
3.2%
|
10.8%
|
|
Perpetual subordinated debt
|
-
|
-
|
-
|
n.a
|
n.a.
|
|
Subordinated debt
|
167,000
|
261,000
|
388,551
|
48.9%
|
132.7%
|
|
Unrealidez Profit or Losses
|
6,366
|
3,035
|
7,294
|
140.3%
|
14.6%
|
|
Investment in subsidiaries and others, net of unrealized profit and net income in subsidiaries
|
(293)
|
(148)
|
(164)
|
10.3%
|
-44.1%
|
|
Intangibles
|
(128,688)
|
(124,515)
|
(124,978)
|
0.4%
|
-2.9%
|
|
Goodwill
|
(139,180)
|
(139,180)
|
(139,180)
|
0.0%
|
0.0%
|
|
Total Regulatory Capital
|
2,648,281
|
2,598,649
|
2,891,129
|
11.3%
|
9.2%
|
|
Tier Common Equity (2)
|
2,338,088
|
2,183,917
|
2,343,853
|
7.3%
|
0.2%
|
|
Regulatory Tier 1 Capital (3)
|
2,338,088
|
2,183,917
|
2,343,853
|
7.3%
|
0.2%
|
|
Regulatory Tier 2 Capital (4)
|
310,193
|
414,732
|
547,276
|
32.0%
|
76.4%
|
|
Total risk-weighted assets
(S/ thousand)
|
Sep 24
|
As of
Jun 25
|
Sep 25
|
% change | |
|
QoQ
|
YoY
|
||||
|
Market risk-weighted assets
|
238,117
|
193,276
|
221,008
|
14.3%
|
-7.2%
|
|
Credit risk-weighted assets
|
11,263,844
|
12,139,570
|
12,539,729
|
3.3%
|
11.3%
|
|
Operational risk-weighted assets
|
1,594,338
|
920,354
|
922,672
|
0.3%
|
-42.1%
|
|
Total
|
13,096,299
|
13,253,200
|
13,683,410
|
3.2%
|
4.5%
|
|
Capital requirement
(S/ thousand)
|
Sep 24
|
As of
Jun 25
|
Sep 25
|
% change | |
|
QoQ
|
YoY
|
||||
|
Market risk capital requirement
|
23,812
|
19,328
|
22,101
|
14.3%
|
-7.2%
|
|
Credit risk capital requirement
|
1,070,065
|
1,213,957
|
1,253,973
|
3.3%
|
17.2%
|
|
Operational risk capital requirement
|
159,434
|
92,035
|
92,267
|
0.3%
|
-42.1%
|
|
Additional capital requirements
|
160,510
|
182,094
|
188,096
|
3.3%
|
17.2%
|
|
Total
|
1,413,821
|
1,507,414
|
1,556,437
|
3.3%
|
10.1%
|
|
Capital ratios under Local Regulation
|
Sep 24
|
As of
Jun 25
|
Sep 25
|
% change |
|
|
QoQ
|
YoY
|
||||
|
Common Equity Tier 1 Ratio
|
17.85%
|
16.48%
|
17.13%
|
65 bps
|
-72 bps
|
|
Tier 1 Capital ratio
|
17.85%
|
16.48%
|
17.13%
|
65 bps
|
-72 bps
|
|
Regulatory Global Capital Ratio
|
20.22%
|
19.61%
|
21.13%
|
152 bps
|
91 bps
|

|
| |
Earnings Release 3Q / 2025
|
Analysis of 3Q25 Consolidated Results
|
| 12.
Appendix |
|
Common Equity Tier 1 IFRS
(S/ thousand)
|
Sep 24
|
As of
Jun 25
|
Sep 25
|
% Change
|
|
|
QoQ
|
YoY
|
||||
|
Capital and reserves
|
19,052,262
|
18,586,384
|
18,586,384
|
0.0%
|
-2.4%
|
|
Retained earnings
|
6,076,551
|
5,926,516
|
7,524,062
|
27.0%
|
23.8%
|
|
Unrealized gains (losses)
|
222,730
|
282,927
|
505,339
|
78.6%
|
126.9%
|
|
Goodwill and intangibles
|
(1,599,568)
|
(1,739,625)
|
(1,806,698)
|
3.9%
|
12.9%
|
|
Investments in subsidiaries
|
(2,669,334)
|
(2,463,279)
|
(2,585,795)
|
5.0%
|
-3.1%
|
|
Total
|
21,082,641
|
20,592,923
|
22,223,292
|
7.9%
|
5.4%
|
|
Adjusted RWAs IFRS
|
157,046,547
|
163,938,888
|
168,714,799
|
2.9%
|
7.4%
|
|
Adjusted Credit RWAs IFRS
|
134,873,654
|
140,154,641
|
143,634,722
|
2.5%
|
6.5%
|
|
Others
|
22,172,893
|
23,784,246
|
25,080,077
|
5.4%
|
13.1%
|
|
CET1 ratio IFRS
|
13.42%
|
12.56%
|
13.17%
|
61 bps
|
-25 bps
|
|
Common Equity Tier 1 IFRS
(S/ thousand)
|
Sep 24
|
As of
Jun 25
|
Sep 25
|
% Change
|
|
|
QoQ
|
YoY
|
||||
|
Capital and reserves
|
2,703,385
|
2,734,582
|
2,734,582
|
0.0%
|
1.2%
|
|
Retained earnings
|
36,907
|
(202,552)
|
(80,674)
|
-60.2%
|
-318.6%
|
|
Unrealized gains (losses)
|
3,081
|
2,712
|
7,100
|
161.8%
|
130.4%
|
|
Goodwill and intangibles
|
(303,850)
|
(296,719)
|
(296,196)
|
-0.2%
|
-2.5%
|
|
Investments in subsidiaries
|
(296)
|
(152)
|
(171)
|
12.2%
|
-42.4%
|
|
Total
|
2,439,227
|
2,237,872
|
2,364,642
|
5.7%
|
-3.1%
|
|
Adjusted RWAs IFRS
|
13,291,063
|
13,378,616
|
13,792,869
|
3.1%
|
3.8%
|
|
Adjusted Credit RWAs IFRS
|
11,455,585
|
12,264,985
|
12,649,188
|
3.1%
|
10.4%
|
|
Others
|
1,835,478
|
1,113,630
|
1,143,680
|
2.7%
|
-37.7%
|
|
CET1 ratio IFRS
|
18.35%
|
16.73%
|
17.14%
|
42 bps
|
-121 bps
|

|
| |
Earnings Release 3Q / 2025
|
Analysis of 3Q25 Consolidated Results
|
| 12.
Appendix |
| 12.7. |
Financial Statements and Ratios by Business
|
| 12.7.1. |
Credicorp Consolidated
|
|
Sep 24
|
As of
Jun 25
|
Sep 25
|
% change
|
||
|
QoQ
|
YoY
|
||||
|
ASSETS
|
|
|
|
|
|
|
Cash and due from banks
|
|
|
|
|
|
|
Non-interest bearing
|
7,222,945
|
7,266,155
|
7,237,295
|
-0.4%
|
0.2%
|
|
Interest bearing
|
37,007,966
|
34,206,000
|
35,862,184
|
4.8%
|
-3.1%
|
|
Total cash and due from banks
|
44,230,911
|
41,472,155
|
43,099,479
|
3.9%
|
-2.6%
|
|
|
|
|
|
|
|
|
Cash collateral, reverse repurchase agreements and securities borrowing
|
1,419,305
|
4,593,501
|
3,404,639
|
-25.9%
|
139.9%
|
|
Fair value through profit or loss investments
|
4,642,905
|
4,819,230
|
4,356,311
|
-9.6%
|
-6.2%
|
|
Fair value through other comprehensive income investments
|
39,832,274
|
37,852,722
|
38,005,522
|
0.4%
|
-4.6%
|
|
Amortized cost investments
|
8,853,694
|
8,931,495
|
8,824,746
|
-1.2%
|
-0.3%
|
|
|
|
|
|
|
|
|
Loans
|
142,568,785
|
140,961,978
|
144,752,254
|
2.7%
|
1.5%
|
|
Current
|
136,542,444
|
135,917,766
|
139,798,951
|
2.9%
|
2.4%
|
|
Internal overdue loans
|
6,026,341
|
5,044,212
|
4,953,303
|
-1.8%
|
-17.8%
|
|
Less - allowance for loan losses
|
(8,250,023)
|
(7,658,595)
|
(7,674,040)
|
0.2%
|
-7.0%
|
|
Loans, net
|
134,318,762
|
133,303,383
|
137,078,214
|
2.8%
|
2.1%
|
|
|
|
|
|
|
|
|
Financial assets designated at fair value through profit or loss
|
900,107
|
904,621
|
956,885
|
5.8%
|
6.3%
|
|
Property, plant and equipment, net
|
1,836,732
|
2,646,168
|
2,725,302
|
3.0%
|
48.4%
|
|
Due from customers on acceptances
|
466,957
|
559,370
|
553,561
|
-1.0%
|
18.5%
|
|
Investments in associates
|
729,770
|
43,199
|
52,388
|
21.3%
|
-92.8%
|
|
Intangible assets and goodwill, net
|
3,167,296
|
4,444,424
|
4,596,373
|
3.4%
|
45.1%
|
|
Reinsurance contract assets
|
880,563
|
949,932
|
853,974
|
-10.1%
|
-3.0%
|
|
Other assets (1)
|
8,480,514
|
8,425,175
|
10,793,207
|
28.1%
|
27.3%
|
|
|
|
|
|
|
|
|
Total Assets
|
249,759,790
|
248,945,375
|
255,300,601
|
2.6%
|
2.2%
|
|
|
|
|
|
|
|
|
LIABILITIES AND EQUITY
|
|
|
|
|
|
|
Deposits and obligations
|
|
|
|
|
|
|
Non-interest bearing
|
47,436,563
|
45,734,508
|
46,588,002
|
1.9%
|
-1.8%
|
|
Interest bearing
|
106,998,888
|
108,988,826
|
111,842,453
|
2.6%
|
4.5%
|
|
Total deposits and obligations
|
154,435,451
|
154,723,334
|
158,430,455
|
2.4%
|
2.6%
|
|
|
|
|
|
|
|
|
Payables from repurchase agreements and securities lending
|
7,383,104
|
11,265,393
|
10,181,173
|
-9.6%
|
37.9%
|
|
BCRP instruments
|
4,788,939
|
5,096,459
|
6,643,892
|
30.4%
|
38.7%
|
|
Repurchase agreements with third parties
|
2,517,833
|
5,974,353
|
3,401,635
|
-43.1%
|
35.1%
|
|
Repurchase agreements with customers
|
76,332
|
194,581
|
135,646
|
-30.3%
|
77.7%
|
|
|
|
|
|
|
|
|
Due to banks and correspondents
|
12,704,234
|
11,152,813
|
11,241,079
|
0.8%
|
-11.5%
|
|
Bonds and notes issued
|
16,952,011
|
12,112,403
|
12,209,724
|
0.8%
|
-28.0%
|
|
Banker’s acceptances outstanding
|
466,957
|
559,370
|
553,561
|
-1.0%
|
18.5%
|
|
Insurance contract liability
|
13,289,394
|
13,954,799
|
14,203,439
|
1.8%
|
6.9%
|
|
Financial liabilities at fair value through profit or loss
|
698,747
|
840,022
|
928,814
|
10.6%
|
32.9%
|
|
Other liabilities
|
9,752,701
|
9,262,741
|
10,296,583
|
11.2%
|
5.6%
|
|
|
|
|
|
|
|
|
Total Liabilities
|
215,682,599
|
213,870,875
|
218,044,828
|
2.0%
|
1.1%
|
|
|
|
|
|
|
|
|
|
|
|
|
|
|
|
Net equity
|
33,462,591
|
34,459,012
|
36,560,502
|
6.1%
|
9.3%
|
|
Capital stock
|
1,318,993
|
1,318,993
|
1,318,993
|
0.0%
|
0.0%
|
|
Treasury stock
|
(208,901)
|
(209,845)
|
(209,845)
|
0.0%
|
0.5%
|
|
Capital surplus
|
179,027
|
133,388
|
139,528
|
4.6%
|
-22.1%
|
|
Reserves
|
27,187,346
|
29,602,851
|
29,628,427
|
0.1%
|
9.0%
|
|
Other reserves
|
470,550
|
19,199
|
353,144
|
1739.4%
|
-25.0%
|
|
Retained earnings
|
4,515,576
|
3,594,426
|
5,330,255
|
48.3%
|
18.0%
|
|
|
|
|
|
|
|
|
Non-controlling interest
|
614,600
|
615,488
|
695,271
|
13.0%
|
13.1%
|
|
|
|
|
|
|
|
|
Total Net Equity
|
34,077,191
|
35,074,500
|
37,255,773
|
6.2%
|
9.3%
|
|
|
|
|
|
|
|
|
Total liabilities and equity
|
249,759,790
|
248,945,375
|
255,300,601
|
2.6%
|
2.2%
|
|
|
|
|
|
|
|
|
Off-balance sheet
|
155,876,986
|
144,197,254
|
153,289,772
|
6.3%
|
-1.7%
|
|
Total performance bonds, stand-by and L/Cs.
|
20,206,333
|
21,026,042
|
21,007,568
|
-0.1%
|
4.0%
|
|
Undrawn credit lines, advised but not committed
|
88,226,431
|
75,858,566
|
78,586,547
|
3.6%
|
-10.9%
|
|
Total derivatives (notional) and others
|
47,444,222
|
47,312,646
|
53,695,657
|
13.5%
|
13.2%
|

|
| |
Earnings Release 3Q / 2025
|
Analysis of 3Q25 Consolidated Results
|
| 12.
Appendix |
|
3Q24
|
Quarter
2Q25
|
3Q25
|
% change
|
Up to
|
% change
Sep 25 / Sep 24
|
|||
|
QoQ
|
YoY
|
Sep 24
|
Sep 25
|
|||||
|
Interest income and expense
|
||||||||
|
Interest and similar income
|
4,995,971
|
4,922,292
|
4,987,693
|
1.3%
|
-0.2%
|
14,857,135
|
14,804,775
|
-0.4%
|
|
Interest and similar expenses
|
(1,405,221)
|
(1,306,921)
|
(1,299,864)
|
-0.5%
|
-7.5%
|
(4,371,798)
|
(3,929,563)
|
-10.1%
|
|
Net interest, similar income and expenses
|
3,590,750
|
3,615,371
|
3,687,829
|
2.0%
|
2.7%
|
10,485,337
|
10,875,212
|
3.7%
|
|
Provision for credit losses on loan portfolio
|
(981,870)
|
(683,965)
|
(720,445)
|
5.3%
|
-26.6%
|
(3,085,607)
|
(2,100,143)
|
-31.9%
|
|
Recoveries of written-off loans
|
113,789
|
108,806
|
117,527
|
8.0%
|
3.3%
|
309,456
|
340,173
|
9.9%
|
|
Provision for credit losses on loan portfolio, net of recoveries
|
(868,081)
|
(575,159)
|
(602,918)
|
4.8%
|
-30.5%
|
(2,776,151)
|
(1,759,970)
|
-36.6%
|
|
Net interest, similar income and expenses, after provision for credit losses on loan portfolio
|
2,722,669
|
3,040,212
|
3,084,911
|
1.5%
|
13.3%
|
7,709,186
|
9,115,242
|
18.2%
|
|
Other income
|
||||||||
|
Fee income
|
982,818
|
1,024,553
|
1,063,032
|
3.8%
|
8.2%
|
2,786,611
|
3,081,609
|
10.6%
|
|
Net gain on foreign exchange transactions
|
319,856
|
377,016
|
394,572
|
4.7%
|
23.4%
|
974,575
|
1,115,402
|
14.5%
|
|
Net loss on securities
|
120,033
|
179,174
|
111,977
|
-37.5%
|
-6.7%
|
274,489
|
263,002
|
-4.2%
|
|
Net gain from associates
|
35,600
|
6,556
|
5,192
|
-20.8%
|
-85.4%
|
96,623
|
35,816
|
-62.9%
|
|
Net gain (loss) on derivatives held for trading
|
(3,499)
|
21,418
|
244
|
-98.9%
|
-107.0%
|
78,233
|
40,161
|
-48.7%
|
|
Net gain (loss) from exchange differences
|
(6,139)
|
10,195
|
7,518
|
-26.3%
|
-222.5%
|
(19,693)
|
33,672
|
-271.0%
|
|
Others
|
96,675
|
58,461
|
71,656
|
22.6%
|
-25.9%
|
338,395
|
452,118
|
33.6%
|
|
Total other income
|
1,545,344
|
1,677,373
|
1,654,191
|
-1.4%
|
7.0%
|
4,529,233
|
5,021,780
|
10.9%
|
|
Insurance underwriting result
|
||||||||
|
Insurance Service Result
|
419,805
|
445,152
|
467,467
|
5.0%
|
11.4%
|
1,286,468
|
1,328,725
|
3.3%
|
|
Reinsurance Result
|
(128,029)
|
(94,279)
|
(79,117)
|
-16.1%
|
-38.2%
|
(400,130)
|
(260,368)
|
-34.9%
|
|
Total insurance underwriting result
|
291,776
|
350,873
|
388,350
|
10.7%
|
33.1%
|
886,338
|
1,068,357
|
20.5%
|
|
Medical services result
|
||||||||
|
Sales of medical services
|
-
|
473,746
|
421,360
|
-11.1%
|
n.a.
|
-
|
973,227
|
n.a.
|
|
Cost of sales of medical services
|
-
|
(350,427)
|
(297,407)
|
-15.1%
|
n.a.
|
-
|
(683,266)
|
n.a.
|
|
Total medical services result
|
-
|
123,319
|
123,953
|
0.5%
|
n.a.
|
-
|
289,961
|
n.a.
|
|
Total Expenses
|
||||||||
|
Salaries and employee benefits
|
(1,155,966)
|
(1,304,466)
|
(1,341,137)
|
2.8%
|
16.0%
|
(3,404,858)
|
(4,007,293)
|
17.7%
|
|
Administrative, general and tax expenses
|
(971,449)
|
(965,994)
|
(1,068,459)
|
10.6%
|
10.0%
|
(2,740,755)
|
(2,904,287)
|
6.0%
|
|
Depreciation and amortization
|
(179,495)
|
(212,662)
|
(219,800)
|
3.4%
|
22.5%
|
(526,845)
|
(636,228)
|
20.8%
|
|
Impairment loss on goodwill
|
(23,046)
|
-
|
-
|
n.a.
|
-100.0%
|
(23,046)
|
-
|
-100.0%
|
|
Association in participation
|
(6,414)
|
(371)
|
(65)
|
-82.5%
|
-99.0%
|
(24,461)
|
(7,235)
|
-70.4%
|
|
Other expenses
|
(111,859)
|
(146,817)
|
(115,181)
|
-21.5%
|
3.0%
|
(335,951)
|
(352,783)
|
5.0%
|
|
Total expenses
|
(2,448,229)
|
(2,630,310)
|
(2,744,642)
|
4.3%
|
12.1%
|
(7,055,916)
|
(7,907,826)
|
12.1%
|
|
Profit before income tax
|
2,111,560
|
2,561,467
|
2,506,763
|
-2.1%
|
18.7%
|
6,068,841
|
7,587,514
|
25.0%
|
|
Income tax
|
(555,117)
|
(696,969)
|
(728,308)
|
4.5%
|
31.2%
|
(1,602,927)
|
(2,129,746)
|
32.9%
|
|
Net profit
|
1,556,443
|
1,864,498
|
1,778,455
|
-4.6%
|
14.3%
|
4,465,914
|
5,457,768
|
22.2%
|
|
Non-controlling interest
|
32,655
|
42,483
|
39,800
|
-6.3%
|
21.9%
|
91,373
|
119,401
|
30.7%
|
|
Net profit attributable to Credicorp
|
1,523,788
|
1,822,015
|
1,738,655
|
-4.6%
|
14.1%
|
4,374,541
|
5,338,367
|
22.0%
|

|
| |
Earnings Release 3Q / 2025
|
Analysis of 3Q25 Consolidated Results
|
| 12.
Appendix |
| 12.7.2. |
Credicorp Stand-alone
|
|
Sep 24
|
As of
Jun 25
|
Sep 25
|
% change
|
||
|
QoQ
|
YoY
|
||||
|
ASSETS
|
|||||
|
Cash and cash equivalents
|
594,754
|
141,342
|
121,123
|
-14.3%
|
-79.6%
|
|
At fair value through profit or loss
|
-
|
-
|
-
|
n.a.
|
n.a.
|
|
Fair value through other comprehensive income investments
|
1,279,564
|
109,057
|
101,222
|
-7.2%
|
-92.1%
|
|
In subsidiaries and associates investments
|
37,481,263
|
38,318,421
|
40,527,583
|
5.8%
|
8.1%
|
|
Investments at amortized cost
|
629,491
|
-
|
-
|
n.a.
|
n.a.
|
|
Other assets
|
856,336
|
9,359
|
9,626
|
2.9%
|
n.a.
|
|
Total Assets
|
40,841,408
|
38,578,179
|
40,759,554
|
5.7%
|
-0.2%
|
|
LIABILITIES AND NET SHAREHOLDERS' EQUITY
|
|||||
|
Due to banks, correspondents and other entities
|
-
|
-
|
-
|
n.a.
|
n.a.
|
|
Bonds and notes issued
|
1,814,219
|
-
|
-
|
n.a.
|
n.a.
|
|
Other liabilities
|
1,294,018
|
150,294
|
211,103
|
40.5%
|
-83.7%
|
|
Total Liabilities
|
3,108,237
|
150,294
|
211,103
|
40.5%
|
-93.2%
|
|
NET EQUITY
|
|||||
|
Capital stock
|
1,318,993
|
1,318,993
|
1,318,993
|
0.0%
|
0.0%
|
|
Capital Surplus
|
384,542
|
384,542
|
384,542
|
0.0%
|
0.0%
|
|
Reserve
|
26,651,433
|
28,465,226
|
28,438,904
|
-0.1%
|
6.7%
|
|
Unrealized results
|
292,640
|
(323,985)
|
51,015
|
n.a.
|
-82.6%
|
|
Retained earnings
|
9,085,563
|
8,583,109
|
10,354,997
|
20.6%
|
14.0%
|
|
Total net equity
|
37,733,171
|
38,427,885
|
40,548,451
|
5.5%
|
7.5%
|
|
Total Liabilities And Equity
|
40,841,408
|
38,578,179
|
40,759,554
|
5.7%
|
-0.2%
|
|
3Q24
|
Quarter
2Q25 |
3Q25
|
% Change
|
Up to
|
% Change
Sep 25 / Sep 24
|
|||
|
QoQ
|
YoY
|
Sep 24
|
Sep 25
|
|||||
|
Interest income
|
||||||||
|
Net share of the income from investments in subsidiaries and associates
|
1,735,379
|
2,490,226
|
1,820,418
|
-26.9%
|
4.9%
|
5,191,851
|
5,971,110
|
15.0%
|
|
Interest and similar income
|
22,290
|
19,281
|
300
|
-98.4%
|
-98.7%
|
69,067
|
40,893
|
-40.8%
|
|
Net gain on financial assets at fair value through profit or loss
|
-
|
-
|
-
|
n.a.
|
n.a.
|
1,234
|
-
|
n.a.
|
|
Total income
|
1,757,669
|
2,509,507
|
1,820,718
|
-27.4%
|
3.6%
|
5,262,152
|
6,012,003
|
14.2%
|
|
Interest and similar expense
|
(13,527)
|
(11,388)
|
(9)
|
n.a.
|
n.a.
|
(40,600)
|
(24,525)
|
-39.6%
|
|
Administrative and general expenses
|
(4,034)
|
(5,211)
|
(4,435)
|
-14.9%
|
9.9%
|
(13,951)
|
(14,714)
|
5.5%
|
|
Total expenses
|
(17,561)
|
(16,599)
|
(4,444)
|
-73.2%
|
-74.7%
|
(54,551)
|
(39,239)
|
-28.1%
|
|
Operating income
|
1,740,108
|
2,492,908
|
1,816,274
|
-27.1%
|
4.4%
|
5,207,601
|
5,972,764
|
14.7%
|
|
Results from exchange differences
|
(119)
|
(3,468)
|
67
|
n.a.
|
n.a.
|
(2,856)
|
(3,336)
|
16.8%
|
|
Other, net
|
(367)
|
(121)
|
(7)
|
-94.2%
|
-98.1%
|
(345)
|
(313)
|
-9.3%
|
|
Profit before income tax
|
1,739,622
|
2,489,319
|
1,816,334
|
-27.0%
|
4.4%
|
5,204,400
|
5,969,115
|
14.7%
|
|
Income tax
|
(43,118)
|
(52,310)
|
(60,945)
|
16.5%
|
41.3%
|
(138,101)
|
(158,326)
|
14.6%
|
|
Net income
|
1,696,504
|
2,437,009
|
1,755,389
|
-28.0%
|
3.5%
|
5,066,299
|
5,810,789
|
14.7%
|
|
Double Leverage Ratio
|
99.3%
|
99.7%
|
99.9%
|
23 bps
|
62 bps
|
99.3%
|
99.9%
|
62 bps
|

|
| |
Earnings Release 3Q / 2025
|
Analysis of 3Q25 Consolidated Results
|
| 12.
Appendix |
|
12.7.3
|
BCP Consolidated
|
|
Sep 24
|
As of
Jun 25
|
Sep 25
|
% change
|
||
|
QoQ
|
YoY
|
||||
|
ASSETS
|
|||||
|
Cash and due from banks
|
|||||
|
Non-interest bearing
|
5,134,613
|
5,990,377
|
5,571,298
|
-7.0%
|
8.5%
|
|
Interest bearing
|
36,092,693
|
32,653,406
|
33,968,802
|
4.0%
|
-5.9%
|
|
Total cash and due from banks
|
41,227,306
|
38,643,783
|
39,540,100
|
2.3%
|
-4.1%
|
|
Cash collateral, reverse repurchase agreements and securities borrowing
|
622,399
|
574,653
|
1,211,354
|
110.8%
|
94.6%
|
|
Fair value through profit or loss investments
|
704,968
|
617,368
|
368,478
|
-40.3%
|
-47.7%
|
|
Fair value through other comprehensive income investments
|
22,888,341
|
21,881,734
|
21,868,305
|
-0.1%
|
-4.5%
|
|
Amortized cost investments
|
8,178,619
|
8,262,941
|
8,124,785
|
-1.7%
|
-0.7%
|
|
Loans
|
129,063,925
|
133,011,844
|
135,408,707
|
1.8%
|
4.9%
|
|
Current
|
123,400,733
|
128,218,187
|
130,730,717
|
2.0%
|
5.9%
|
|
Internal overdue loans
|
5,663,192
|
4,793,657
|
4,677,990
|
-2.4%
|
-17.4%
|
|
Less - allowance for loan losses
|
(7,714,711)
|
(7,310,931)
|
(7,284,860)
|
-0.4%
|
-5.6%
|
|
Loans, net
|
121,349,214
|
125,700,913
|
128,123,847
|
1.9%
|
5.6%
|
|
Property, furniture and equipment, net (1)
|
1,479,708
|
1,604,393
|
1,558,842
|
-2.8%
|
5.3%
|
|
Due from customers on acceptances
|
466,957
|
559,370
|
553,851
|
-1.0%
|
18.6%
|
|
Investments in associates
|
29,053
|
22,452
|
25,660
|
14.3%
|
-11.7%
|
|
Other assets (2)
|
7,959,779
|
7,431,802
|
8,255,103
|
11.1%
|
3.7%
|
|
Total Assets
|
204,906,344
|
205,299,409
|
209,630,325
|
2.1%
|
2.3%
|
|
Liabilities and Equity
|
|||||
|
Deposits and obligations
|
|||||
|
Non-interest bearing
|
45,310,064
|
44,615,769
|
42,835,241
|
-4.0%
|
-5.5%
|
|
Interest bearing
|
95,985,178
|
102,043,442
|
104,254,936
|
2.2%
|
8.6%
|
|
Total deposits and obligations
|
141,295,242
|
146,659,211
|
147,090,177
|
0.3%
|
4.1%
|
|
Payables from repurchase agreements and securities lending
|
5,621,745
|
5,968,190
|
7,347,033
|
23.1%
|
30.7%
|
|
BCRP instruments
|
4,788,939
|
5,096,459
|
6,642,780
|
30.3%
|
38.7%
|
|
Repurchase agreements with third parties
|
832,806
|
871,731
|
704,253
|
-19.2%
|
-15.4%
|
|
Due to banks and correspondents
|
12,210,085
|
10,402,291
|
10,529,292
|
1.2%
|
-13.8%
|
|
Bonds and notes issued
|
13,351,992
|
10,170,286
|
10,114,714
|
-0.5%
|
-24.2%
|
|
Banker’s acceptances outstanding
|
466,957
|
559,370
|
553,851
|
-1.0%
|
18.6%
|
|
Financial liabilities at fair value through profit or loss
|
354,562
|
387,867
|
455,454
|
17.4%
|
28.5%
|
|
Other liabilities (3)
|
6,110,653
|
6,224,139
|
6,785,425
|
9.0%
|
11.0%
|
|
Total Liabilities
|
179,411,236
|
180,371,354
|
182,875,946
|
1.4%
|
1.9%
|
|
Net equity
|
25,347,135
|
24,790,836
|
26,610,823
|
7.3%
|
5.0%
|
|
Capital stock
|
12,679,794
|
12,679,794
|
12,679,794
|
0.0%
|
0.0%
|
|
Reserves
|
6,372,468
|
5,906,590
|
5,906,590
|
0.0%
|
-7.3%
|
|
Unrealized gains and losses
|
223,921
|
284,780
|
507,687
|
78.3%
|
126.7%
|
|
Retained earnings
|
6,070,952
|
5,919,672
|
7,516,752
|
27.0%
|
23.8%
|
|
Non-controlling interest
|
147,973
|
137,219
|
143,556
|
4.6%
|
-3.0%
|
|
Total Net Equity
|
25,495,108
|
24,928,055
|
26,754,379
|
7.3%
|
4.9%
|
|
Total liabilities and equity
|
204,906,344
|
205,299,409
|
209,630,325
|
2.1%
|
2.3%
|
|
Off-balance sheet
|
144,241,520
|
139,056,539
|
146,718,825
|
5.5%
|
1.7%
|
|
Total performance bonds, stand-by and L/Cs.
|
19,593,247
|
20,908,399
|
20,740,429
|
-0.8%
|
5.9%
|
|
Undrawn credit lines, advised but not committed
|
77,964,739
|
71,484,467
|
72,873,063
|
1.9%
|
-6.5%
|
|
Total derivatives (notional) and others
|
46,683,534
|
46,663,673
|
53,105,333
|
13.8%
|
13.8%
|

|
| |
Earnings Release 3Q / 2025
|
Analysis of 3Q25 Consolidated Results
|
| 12.
Appendix |
|
3Q24
|
Quarter
2Q25
|
3Q25
|
% change
|
Up to
|
% Change
Sep 25 / Sep 24
|
|||
|
QoQ
|
YoY
|
Sep 24
|
Sep 25
|
|||||
|
Interest income and expense
|
||||||||
|
Interest and similar income
|
4,363,712
|
4,309,924
|
4,359,098
|
1.1%
|
-0.1%
|
12,964,152
|
12,929,405
|
-0.3%
|
|
Interest and similar expense (1)
|
(1,040,332)
|
(953,011)
|
(930,847)
|
-2.3%
|
-10.5%
|
(3,261,405)
|
(2,859,195)
|
-12.3%
|
|
Interest income and expense
|
3,323,380
|
3,356,913
|
3,428,251
|
2.1%
|
3.2%
|
9,702,747
|
10,070,210
|
3.8%
|
|
Provision for credit losses on loan portfolio
|
(935,374)
|
(633,988)
|
(675,251)
|
6.5%
|
-27.8%
|
(2,897,123)
|
(1,958,121)
|
-32.4%
|
|
Recoveries of written-off loans
|
107,848
|
105,024
|
113,472
|
8.0%
|
5.2%
|
293,820
|
327,474
|
11.5%
|
|
Provision for credit losses on loan portfolio, net of recoveries
|
(827,526)
|
(528,964)
|
(561,779)
|
6.2%
|
-32.1%
|
(2,603,303)
|
(1,630,647)
|
-37.4%
|
|
Net interest, similar income and expenses, after provision for credit losses on loan portfolio
|
2,495,854
|
2,827,949
|
2,866,472
|
1.4%
|
14.8%
|
7,099,444
|
8,439,563
|
18.9%
|
|
Other income
|
||||||||
|
Fee income
|
822,829
|
881,866
|
902,082
|
2.3%
|
9.6%
|
2,316,923
|
2,644,037
|
14.1%
|
|
Net gain on foreign exchange transactions
|
299,425
|
349,277
|
349,768
|
0.1%
|
16.8%
|
853,029
|
1,004,844
|
17.8%
|
|
Net gain (loss) on securities
|
24,114
|
121,126
|
2,683
|
-97.8%
|
-88.9%
|
47,504
|
135,170
|
184.5%
|
|
Net gain on derivatives held for trading
|
13,639
|
30,207
|
33,178
|
9.8%
|
143.3%
|
52,793
|
78,020
|
47.8%
|
|
Net loss (gain) from exchange differences
|
(10,714)
|
7,542
|
(1,064)
|
n.a.
|
n.a.
|
(3,466)
|
7,261
|
n.a.
|
|
Others
|
19,336
|
30,426
|
28,774
|
-5.4%
|
48.8%
|
150,980
|
83,173
|
-44.9%
|
|
Total other income
|
1,168,629
|
1,420,444
|
1,315,421
|
-7.4%
|
12.6%
|
3,417,763
|
3,952,505
|
15.6%
|
|
Total expenses
|
||||||||
|
Salaries and employee benefits
|
(850,918)
|
(951,711)
|
(958,832)
|
0.7%
|
12.7%
|
(2,467,693)
|
(2,890,077)
|
17.1%
|
|
Administrative expenses
|
(726,190)
|
(732,853)
|
(805,053)
|
9.9%
|
10.9%
|
(2,068,890)
|
(2,166,648)
|
4.7%
|
|
Depreciation and amortization (2)
|
(146,719)
|
(176,020)
|
(181,978)
|
3.4%
|
24.0%
|
(429,259)
|
(526,134)
|
22.6%
|
|
Other expenses
|
(62,292)
|
(57,093)
|
(55,223)
|
-3.3%
|
-11.3%
|
(178,795)
|
(165,841)
|
-7.2%
|
|
Total expenses
|
(1,786,119)
|
(1,917,677)
|
(2,001,086)
|
4.3%
|
12.0%
|
(5,144,637)
|
(5,748,700)
|
11.7%
|
|
Profit before income tax
|
1,878,364
|
2,330,716
|
2,180,807
|
-6.4%
|
16.1%
|
5,372,570
|
6,643,368
|
23.7%
|
|
Income tax
|
(472,791)
|
(576,345)
|
(577,612)
|
0.2%
|
22.2%
|
(1,335,341)
|
(1,703,419)
|
27.6%
|
|
Net profit
|
1,405,573
|
1,754,371
|
1,603,195
|
-8.6%
|
14.1%
|
4,037,229
|
4,939,949
|
22.4%
|
|
Non-controlling interest
|
(3,172)
|
(5,135)
|
(6,114)
|
19.1%
|
92.7%
|
(9,551)
|
(15,970)
|
67.2%
|
|
Net profit attributable to BCP Consolidated
|
1,402,401
|
1,749,236
|
1,597,081
|
-8.7%
|
13.9%
|
4,027,678
|
4,923,979
|
22.3%
|
|
Quarter
|
Change
|
||||
|
3Q24
|
2Q25
|
3Q25
|
QoQ
|
YoY
|
|
|
Profitability
|
|||||
|
ROAA (1)(2)
|
2.8%
|
3.4%
|
3.1%
|
-29 bps
|
32 bps
|
|
ROAE (1)(2)
|
22.9%
|
29.3%
|
24.9%
|
-449 bps
|
195 bps
|
|
Net interest margin (1)(2)
|
6.84%
|
6.73%
|
6.89%
|
16 bps
|
5 bps
|
|
Risk-adjusted Net interest margin (1)(2)
|
5.13%
|
5.67%
|
5.76%
|
9 bps
|
63 bps
|
|
Funding cost (1)(2)(3)
|
2.43%
|
2.19%
|
2.13%
|
-6 bps
|
-30 bps
|
|
Loan portfolio quality
|
|||||
|
Internal overdue ratio
|
4.4%
|
3.6%
|
3.5%
|
-15 bps
|
-93 bps
|
|
NPL ratio
|
6.1%
|
5.0%
|
4.9%
|
-15 bps
|
-128 bps
|
|
Coverage ratio of IOLs
|
136.2%
|
152.5%
|
155.7%
|
321 bps
|
1950 bps
|
|
Coverage ratio of NPLs
|
97.4%
|
109.8%
|
110.9%
|
102 bps
|
1341 bps
|
|
Cost of risk (4)
|
2.5%
|
1.6%
|
1.7%
|
7 bps
|
-85 bps
|
|
Operating efficiency
|
|||||
|
Operating expenses / Total income (5)
|
38.8%
|
40.2%
|
41.3%
|
107 bps
|
254 bps
|
|
Operating expenses / Total average assets (1)(2)(5)
|
3.4%
|
3.6%
|
3.7%
|
17 bps
|
37 bps
|

|
| |
Earnings Release 3Q / 2025
|
Analysis of 3Q25 Consolidated Results
|
| 12. Appendix |
| 12.7.4. |
BCP Stand-alone
|
|
As of
|
% change
|
||||
|
Sep 24
|
Jun 25
|
Sep 25
|
QoQ
|
YoY
|
|
|
ASSETS
|
|||||
|
Cash and due from banks
|
|||||
|
Non-interest bearing
|
4,561,696
|
5,338,286
|
4,968,923
|
-6.9%
|
8.9%
|
|
Interest bearing
|
35,307,925
|
31,838,979
|
32,541,803
|
2.2%
|
-7.8%
|
|
Total cash and due from banks
|
39,869,621
|
37,177,265
|
37,510,726
|
0.9%
|
-5.9%
|
|
Cash collateral, reverse repurchase agreements and securities borrowing
|
622,399
|
574,653
|
1,211,354
|
110.8%
|
94.6%
|
|
Fair value through profit or loss investments
|
704,968
|
617,368
|
368,478
|
-40.3%
|
-47.7%
|
|
Fair value through other comprehensive income investments
|
19,855,738
|
19,097,277
|
19,479,618
|
2.0%
|
-1.9%
|
|
Amortized cost investments
|
8,116,588
|
8,169,062
|
8,025,196
|
-1.8%
|
-1.1%
|
|
Loans
|
117,687,023
|
120,998,975
|
123,089,317
|
1.7%
|
4.6%
|
|
Current
|
112,874,488
|
116,868,257
|
119,030,125
|
1.8%
|
5.5%
|
|
Internal overdue loans
|
4,812,535
|
4,130,718
|
4,059,192
|
-1.7%
|
-15.7%
|
|
Less - allowance for loan losses
|
(6,768,497)
|
(6,418,672)
|
(6,378,494)
|
-0.6%
|
-5.8%
|
|
Loans, net
|
110,918,526
|
114,580,303
|
116,710,823
|
1.9%
|
5.2%
|
|
Property, furniture and equipment, net (1)
|
1,246,350
|
1,395,819
|
1,358,608
|
-2.7%
|
9.0%
|
|
Due from customers on acceptances
|
466,957
|
559,370
|
553,851
|
-1.0%
|
18.6%
|
|
Investments in associates
|
2,682,807
|
2,478,728
|
2,601,973
|
5.0%
|
-3.0%
|
|
Other assets (2)
|
7,227,029
|
6,772,832
|
7,675,404
|
13.3%
|
6.2%
|
|
Total Assets
|
191,710,983
|
191,422,677
|
195,496,031
|
2.1%
|
2.0%
|
|
Liabilities and Equity
|
|||||
|
Deposits and obligations
|
|||||
|
Non-interest bearing
|
45,296,819
|
44,639,208
|
42,813,340
|
-4.1%
|
-5.5%
|
|
Interest bearing
|
85,282,102
|
91,339,219
|
93,468,558
|
2.3%
|
9.6%
|
|
Total deposits and obligations
|
130,578,921
|
135,978,427
|
136,281,898
|
0.2%
|
4.4%
|
|
Payables from repurchase agreements and securities lending
|
5,122,666
|
5,227,145
|
6,850,850
|
31.1%
|
33.7%
|
|
BCRP instruments
|
4,289,860
|
4,355,414
|
6,146,597
|
41.1%
|
43.3%
|
|
Repurchase agreements with third parties
|
832,806
|
871,731
|
704,253
|
-19.2%
|
-15.4%
|
|
Due to banks and correspondents
|
11,160,491
|
8,935,346
|
8,904,033
|
-0.4%
|
-20.2%
|
|
Bonds and notes issued
|
13,045,879
|
9,772,249
|
9,508,030
|
-2.7%
|
-27.1%
|
|
Due from customers on acceptances
|
466,957
|
559,370
|
553,851
|
-1.0%
|
18.6%
|
|
Financial liabilities at fair value through profit or loss
|
354,562
|
387,867
|
455,454
|
17.4%
|
28.5%
|
|
Other liabilities (3)
|
5,629,964
|
5,766,446
|
6,326,130
|
9.7%
|
12.4%
|
|
Total Liabilities
|
166,359,440
|
166,626,850
|
168,880,246
|
1.4%
|
1.5%
|
|
Net equity
|
25,351,543
|
24,795,827
|
26,615,785
|
7.3%
|
5.0%
|
|
Capital stock
|
12,679,794
|
12,679,794
|
12,679,794
|
0.0%
|
0.0%
|
|
Reserves
|
6,372,468
|
5,906,590
|
5,906,590
|
0.0%
|
-7.3%
|
|
Unrealized gains and losses
|
222,730
|
282,927
|
505,339
|
78.6%
|
126.9%
|
|
Retained earnings
|
6,076,551
|
5,926,516
|
7,524,062
|
27.0%
|
23.8%
|
|
Total Net Equity
|
25,351,543
|
24,795,827
|
26,615,785
|
7.3%
|
5.0%
|
|
Total liabilities and equity
|
191,710,983
|
191,422,677
|
195,496,031
|
2.1%
|
2.0%
|
|
Off-balance sheet
|
140,242,082
|
135,664,961
|
143,063,117
|
5.5%
|
2.0%
|
|
Total performance bonds, stand-by and L/Cs.
|
19,593,247
|
20,908,399
|
20,740,429
|
-0.8%
|
5.9%
|
|
Undrawn credit lines, advised but not committed
|
75,257,883
|
68,251,113
|
69,365,422
|
1.6%
|
-7.8%
|
|
Total derivatives (notional) and others
|
45,390,952
|
46,505,449
|
52,957,266
|
13.9%
|
16.7%
|

|
| |
Earnings Release 3Q / 2025
|
Analysis of 3Q25 Consolidated Results
|
| 12. Appendix |
|
Quarter
|
% Change
|
Up to
|
% Change
Sep 25 / Sep 24
|
|||||
|
3Q24
|
2Q25
|
3Q25
|
QoQ
|
YoY
|
Sep 24
|
Sep 25
|
||
|
Interest income and expense
|
||||||||
|
Interest and similar income
|
3,616,878
|
3,535,213
|
3,570,917
|
1.0%
|
-1.3%
|
10,705,542
|
10,625,131
|
-0.8%
|
|
Interest and similar expenses (1)
|
(856,286)
|
(783,739)
|
(776,188)
|
-1.0%
|
-9.4%
|
(2,672,158)
|
(2,374,392)
|
-11.1%
|
|
Interest income and expense
|
2,760,592
|
2,751,474
|
2,794,729
|
1.6%
|
1.2%
|
8,033,384
|
8,250,739
|
2.7%
|
|
Provision for credit losses on loan portfolio
|
(714,464)
|
(441,020)
|
(484,000)
|
9.7%
|
-32.3%
|
(2,216,084)
|
(1,392,022)
|
-37.2%
|
|
Recoveries of written-off loans
|
79,057
|
81,258
|
89,802
|
10.5%
|
13.6%
|
199,291
|
255,899
|
28.4%
|
|
Provision for credit losses on loan portfolio, net of
recoveries
|
(635,407)
|
(359,762)
|
(394,198)
|
9.6%
|
-38.0%
|
(2,016,793)
|
(1,136,123)
|
-43.7%
|
|
|
||||||||
|
Net interest, similar income and expenses, after provision for credit losses on loan
portfolio
|
2,125,185
|
2,391,712
|
2,400,531
|
0.4%
|
13.0%
|
6,016,591
|
7,114,616
|
18.2%
|
|
|
||||||||
|
Other income
|
||||||||
|
Fee income
|
804,059
|
853,720
|
873,187
|
2.3%
|
8.6%
|
2,251,041
|
2,558,334
|
13.7%
|
|
Net gain on foreign exchange transactions
|
297,478
|
347,077
|
347,104
|
0.0%
|
16.7%
|
845,918
|
997,874
|
18.0%
|
|
Net gain on securities
|
73,084
|
215,491
|
117,414
|
-45.5%
|
60.7%
|
217,145
|
433,302
|
99.5%
|
|
Net gain (loss) from associates
|
3,078
|
1,352
|
1,137
|
-15.9%
|
-63.1%
|
5,190
|
3,998
|
-23.0%
|
|
Net gain on derivatives held for trading
|
13,899
|
35,945
|
36,289
|
1.0%
|
161.1%
|
49,775
|
85,986
|
72.7%
|
|
Net loss (gain) from exchange differences
|
(10,324)
|
1,622
|
(4,779)
|
n.a.
|
-53.7%
|
4,773
|
(1,608)
|
n.a.
|
|
Others
|
18,406
|
27,968
|
27,933
|
-0.1%
|
51.8%
|
135,047
|
79,081
|
-41.4%
|
|
Total other income
|
1,199,680
|
1,483,175
|
1,398,285
|
-5.7%
|
16.6%
|
3,508,889
|
4,156,967
|
18.5%
|
|
Total expenses
|
||||||||
|
Salaries and employee benefits
|
(640,392)
|
(721,895)
|
(728,954)
|
1.0%
|
13.8%
|
(1,852,662)
|
(2,196,784)
|
18.6%
|
|
Administrative expenses
|
(644,392)
|
(655,997)
|
(729,297)
|
11.2%
|
13.2%
|
(1,837,459)
|
(1,947,733)
|
6.0%
|
|
Depreciation and amortization (2)
|
(123,740)
|
(152,670)
|
(158,769)
|
4.0%
|
28.3%
|
(359,984)
|
(456,581)
|
26.8%
|
|
Other expenses
|
(57,047)
|
(51,591)
|
(49,126)
|
-4.8%
|
-13.9%
|
(160,644)
|
(149,070)
|
-7.2%
|
|
Total expenses
|
(1,465,571)
|
(1,582,153)
|
(1,666,146)
|
5.3%
|
13.7%
|
(4,210,749)
|
(4,750,168)
|
12.8%
|
|
Profit before income tax
|
1,859,294
|
2,292,734
|
2,132,670
|
-7.0%
|
14.7%
|
5,314,731
|
6,521,415
|
22.7%
|
|
Income tax
|
(456,956)
|
(542,848)
|
(535,124)
|
-1.4%
|
17.1%
|
(1,285,796)
|
(1,595,713)
|
24.1%
|
|
Net profit
|
1,402,338
|
1,749,886
|
1,597,546
|
-8.7%
|
13.9%
|
4,028,935
|
4,925,702
|
22.3%
|
|
Non-controlling interest
|
||||||||
|
Net profit attributable to BCP
|
1,402,338
|
1,749,886
|
1,597,546
|
-8.7%
|
13.9%
|
4,028,935
|
4,925,702
|
22.3%
|
|
Quarter
|
Change
|
||||
|
3Q24
|
2Q25
|
3Q25
|
QoQ
|
YoY
|
|
|
Profitability
|
|||||
|
ROAA (1)(2)
|
2.9%
|
3.6%
|
3.3%
|
-31 bps
|
36 bps
|
|
ROAE (1)(2)
|
22.9%
|
29.3%
|
24.9%
|
-449 bps
|
195 bps
|
|
Net interest margin (1)(2)
|
6.17%
|
6.00%
|
6.11%
|
10 bps
|
-6 bps
|
|
Risk-adjusted Net interest margin (1)(2)
|
4.75%
|
5.22%
|
5.25%
|
3 bps
|
50 bps
|
|
Funding cost (1)(2)(3)
|
2.16%
|
1.95%
|
1.93%
|
-2 bps
|
-23 bps
|
|
Loan portfolio quality
|
|||||
|
Internal overdue ratio
|
4.1%
|
3.4%
|
3.3%
|
-12 bps
|
-79 bps
|
|
NPL ratio
|
5.9%
|
4.9%
|
4.7%
|
-12 bps
|
-119 bps
|
|
Coverage ratio of IOLs
|
140.6%
|
155.4%
|
157.1%
|
175 bps
|
1649 bps
|
|
Coverage ratio of NPLs
|
97.2%
|
109.3%
|
109.6%
|
25 bps
|
1235 bps
|
|
Cost of risk (4)
|
2.1%
|
1.2%
|
1.3%
|
9 bps
|
-84 bps
|
|
Operating efficiency
|
|||||
|
Operating expenses / Total income (5)
|
36.4%
|
38.3%
|
39.9%
|
160 bps
|
354 bps
|
|
Operating expenses / Total average assets (1)(2)(5)
|
3.0%
|
3.2%
|
3.3%
|
18 bps
|
39 bps
|

|
| |
Earnings Release 3Q / 2025
|
Analysis of 3Q25 Consolidated Results
|
| 12. Appendix |
| 12.7.5. |
BCP Bolivia
|
|
As of
|
% change
|
||||
|
Sep 24
|
Jun 25
|
Sep 25
|
QoQ
|
YoY
|
|
|
ASSETS
|
|||||
|
Cash and due from banks
|
2,215,684
|
1,218,865
|
1,680,867
|
37.9%
|
-24.1%
|
|
Investments
|
1,405,967
|
685,760
|
892,962
|
30.2%
|
-36.5%
|
|
Loans
|
9,829,567
|
4,189,040
|
5,505,442
|
31.4%
|
-44.0%
|
|
Current
|
9,504,083
|
4,050,247
|
5,304,797
|
31.0%
|
-44.2%
|
|
Internal overdue loans
|
270,433
|
110,562
|
140,924
|
27.5%
|
-47.9%
|
|
Refinanced loans
|
55,051
|
28,231
|
59,721
|
111.5%
|
8.5%
|
|
Less - allowance for loan losses
|
(357,720)
|
(153,555)
|
(190,124)
|
23.8%
|
-46.9%
|
|
Loans, net
|
9,471,846
|
4,035,485
|
5,315,318
|
31.7%
|
-43.9%
|
|
Property, furniture and equipment, net
|
130,797
|
52,161
|
69,397
|
33.0%
|
-46.9%
|
|
Other assets
|
264,972
|
194,583
|
184,907
|
-5.0%
|
-30.2%
|
|
Total assets
|
13,489,266
|
6,186,854
|
8,143,451
|
31.6%
|
-39.6%
|
|
LIABILITIES AND NET SHAREHOLDERS' EQUITY
|
|||||
|
Deposits and obligations
|
11,704,551
|
5,195,468
|
6,934,203
|
33.5%
|
-40.8%
|
|
Due to banks and correspondents
|
2,032
|
-
|
-
|
n.a.
|
n.a.
|
|
Bonds and subordinated debt
|
162,042
|
64,048
|
109,107
|
70.4%
|
-32.7%
|
|
Other liabilities
|
651,779
|
374,043
|
432,084
|
15.5%
|
-33.7%
|
|
Total liabilities
|
12,520,404
|
5,633,559
|
7,475,394
|
32.7%
|
-40.3%
|
|
Net equity
|
968,862
|
553,295
|
668,057
|
20.7%
|
-31.0%
|
|
TOTAL LIABILITIES AND NET EQUITY
|
13,489,266
|
6,186,854
|
8,143,451
|
31.6%
|
-39.6%
|
|
Quarter
|
% change
|
Up to
|
% Change
|
|||||
|
3Q24
|
2Q25
|
3Q25
|
QoQ
|
YoY
|
Sep 24
|
Sep 25
|
Sep 25 / Sep 24
|
|
|
Interests income, net
|
87,688
|
41,983
|
47,796
|
13.8%
|
-45.5%
|
265,584
|
160,845
|
-39.4%
|
|
Provisions for doubtful accounts receivable, net of recoveries
|
(10,542)
|
(11,042)
|
3,686
|
-133.4%
|
-135.0%
|
(48,661)
|
(13,099)
|
-73.1%
|
|
Net interest income after provisions
|
77,146
|
30,941
|
51,482
|
66.4%
|
-33.3%
|
216,923
|
147,746
|
-31.9%
|
|
Non financial income
|
36,365
|
30,938
|
47,804
|
54.5%
|
31.5%
|
190,879
|
139,557
|
-26.9%
|
|
Total expenses
|
(77,107)
|
(44,737)
|
(72,016)
|
61.0%
|
-6.6%
|
(276,878)
|
(210,615)
|
-23.9%
|
|
Translation result
|
849
|
2,934
|
2,537
|
-13.5%
|
198.8%
|
450
|
9,239
|
1953.1%
|
|
Income tax
|
(20,638)
|
(5,846)
|
(7,147)
|
22.3%
|
-65.4%
|
(61,365)
|
(24,810)
|
-59.6%
|
|
Net profit
|
16,615
|
14,230
|
22,660
|
59.2%
|
36.4%
|
70,009
|
61,117
|
-12.7%
|
|
Quarter
|
Change
|
Up to
|
Change
|
|||||
|
3Q24
|
2Q25
|
3Q25
|
QoQ
|
YoY
|
Sep 24
|
Sep 25
|
Sep 25 / Sep 24
|
|
|
Efficiency ratio
|
80.3%
|
67.3%
|
59.0%
|
-828 bps
|
-2127 bps
|
64.3%
|
65.5%
|
121 bps
|
|
ROAE
|
6.8%
|
9.0%
|
14.8%
|
583 bps
|
803 bps
|
10.1%
|
9.7%
|
-32 bps
|
|
L/D ratio
|
84.0%
|
80.6%
|
79.4%
|
-123 bps
|
-459 bps
|
|||
|
IOL ratio
|
2.8%
|
2.6%
|
2.6%
|
-8 bps
|
-19 bps
|
|||
|
NPL ratio
|
3.3%
|
3.3%
|
3.6%
|
33 bps
|
33 bps
|
|||
|
Coverage of IOLs
|
132.3%
|
138.9%
|
134.9%
|
-397 bps
|
264 bps
|
|||
|
Coverage of NPLs
|
109.9%
|
110.6%
|
94.8%
|
-1588 bps
|
-1515 bps
|
|||
|
Branches
|
46
|
46
|
46
|
-
|
-
|
|||
|
Agentes
|
1,541
|
2,056
|
2,227
|
171
|
686
|
|||
|
ATMs
|
314
|
314
|
313
|
-1
|
-1
|
|||
|
Employees
|
1,791
|
1,897
|
1,908
|
11
|
117
|
|||

|
| |
Earnings Release 3Q / 2025
|
Analysis of 3Q25 Consolidated Results
|
| 12. Appendix |
| 12.7.6. |
Mibanco
|
|
|
As of
|
% change
|
|||
|
|
Sep 24
|
Jun 25
|
Sep 25
|
QoQ
|
YoY
|
|
ASSETS
|
|
|
|
|
|
|
Cash and due from banks
|
1,590,356
|
1,668,841
|
2,109,302
|
26.4%
|
32.6%
|
|
Investments
|
3,094,635
|
2,878,335
|
2,488,277
|
-13.6%
|
-19.6%
|
|
Total loans
|
12,118,953
|
12,785,249
|
13,095,856
|
2.4%
|
8.1%
|
|
Current
|
11,168,560
|
12,004,020
|
12,349,782
|
2.9%
|
10.6%
|
|
Internal overdue loans
|
846,455
|
659,287
|
614,819
|
-6.7%
|
-27.4%
|
|
Refinanced
|
103,938
|
121,942
|
131,255
|
7.6%
|
26.3%
|
|
Allowance for loan losses
|
(940,310)
|
(887,976)
|
(902,499)
|
1.6%
|
-4.0%
|
|
Net loans
|
11,178,643
|
11,897,273
|
12,193,357
|
2.5%
|
9.1%
|
|
Property, plant and equipment, net
|
132,430
|
126,975
|
124,994
|
-1.6%
|
-5.6%
|
|
Other assets
|
795,856
|
715,448
|
636,681
|
-11.0%
|
-20.0%
|
|
Total assets
|
16,791,920
|
17,286,872
|
17,552,611
|
1.5%
|
4.5%
|
|
|
|
|
|
|
|
|
LIABILITIES AND NET SHAREHOLDERS' EQUITY
|
|
|
|
|
|
|
Deposits and obligations
|
10,800,163
|
10,836,660
|
10,897,835
|
0.6%
|
0.9%
|
|
Due to banks and correspondents
|
1,958,657
|
2,309,869
|
2,418,667
|
4.7%
|
23.5%
|
|
Bonds and subordinated debt
|
306,113
|
398,037
|
606,683
|
52.4%
|
98.2%
|
|
Other liabilities
|
983,614
|
1,207,564
|
968,418
|
-19.8%
|
-1.5%
|
|
Total liabilities
|
14,048,547
|
14,752,130
|
14,891,603
|
0.9%
|
6.0%
|
|
|
|
|
|
|
|
|
Net equity
|
2,743,373
|
2,534,742
|
2,661,008
|
5.0%
|
-3.0%
|
|
|
|
|
|
|
|
|
TOTAL LIABILITIES AND NET SHAREHOLDERS' EQUITY
|
16,791,920
|
17,286,872
|
17,552,611
|
1.5%
|
4.5%
|
|
|
Quarter
|
% change
|
Up to
|
% change
|
||||
|
|
3Q24
|
2Q25
|
3Q25
|
QoQ
|
YoY
|
Sep 24
|
Sep 25
|
Sep 25 / Sep 24
|
|
Net interest income
|
562,421
|
604,031
|
632,469
|
4.7%
|
12.5%
|
1,665,550
|
1,816,400
|
9.1%
|
|
Provision for loan losses, net of recoveries
|
(192,435)
|
(169,741)
|
(167,975)
|
-1.0%
|
-12.7%
|
(585,934)
|
(495,928)
|
-15.4%
|
|
Net interest income after provisions
|
369,986
|
434,290
|
464,494
|
7.0%
|
25.5%
|
1,079,616
|
1,320,472
|
22.3%
|
|
Non-financial income
|
30,861
|
37,492
|
34,834
|
-7.1%
|
12.9%
|
97,947
|
105,141
|
7.3%
|
|
Total expenses
|
(320,796)
|
(335,792)
|
(335,075)
|
-0.2%
|
4.5%
|
(934,374)
|
(998,811)
|
6.9%
|
|
Translation result
|
(337)
|
(79)
|
54
|
-168.4%
|
-116.0%
|
(1,394)
|
(774)
|
-44.5%
|
|
Income taxes
|
(15,890)
|
(33,369)
|
(42,430)
|
27.2%
|
167.0%
|
(49,684)
|
(107,222)
|
115.8%
|
|
Net income
|
63,824
|
102,542
|
121,877
|
18.9%
|
91.0%
|
192,111
|
318,806
|
65.9%
|
|
|
Quarter
|
Change
|
Up to
|
Change
|
||||
|
|
3Q24
|
2Q25
|
3Q25
|
QoQ
|
YoY
|
Sep 24
|
Sep 25
|
Sep 25 / Sep 24
|
|
Efficiency ratio
|
54.2%
|
52.0%
|
49.4%
|
-255 bps
|
-476 bps
|
52.8%
|
51.4%
|
-144 bps
|
|
ROAE
|
9.4%
|
16.3%
|
18.8%
|
242 bps
|
934 bps
|
8.9%
|
16.0%
|
703 bps
|
|
ROAE incl. GoodWill
|
9.0%
|
15.5%
|
17.8%
|
232 bps
|
884 bps
|
8.5%
|
15.1%
|
664 bps
|
|
L/D ratio
|
112.2%
|
118.0%
|
120.2%
|
219 bps
|
796 bps
|
|||
|
IOL ratio
|
7.0%
|
5.2%
|
4.7%
|
-46 bps
|
-229 bps
|
|||
|
NPL ratio
|
7.8%
|
6.1%
|
5.7%
|
-41 bps
|
-215 bps
|
|||
|
Coverage of IOLs
|
111.1%
|
134.7%
|
146.8%
|
1210 bps
|
3570 bps
|
|||
|
Coverage of NPLs
|
98.9%
|
113.7%
|
121.0%
|
730 bps
|
2203 bps
|
|||
|
Branches (1)
|
285
|
283
|
284
|
1
|
-1
|
|||
|
Employees
|
10,107
|
9,679
|
9,756
|
77
|
-351
|
|||

|
| |
Earnings Release 3Q / 2025
|
Analysis of 3Q25 Consolidated Results
|
| 12. Appendix |
| 12.7.7. |
Prima AFP
|
|
|
As of
|
% change
|
|||
|
|
Sep 24
|
Jun 25
|
Sep 25
|
QoQ
|
YoY
|
|
Cash and due from banks
|
144,402
|
5,582
|
52,644
|
n.a.
|
-63.5%
|
|
Non-interest bearing
|
4,555
|
3,876
|
3,595
|
-7.2%
|
-21.1%
|
|
Interest bearing
|
139,847
|
1,706
|
49,049
|
n.a.
|
-64.9%
|
|
Fair value through profit or loss investments
|
317,682
|
361,646
|
371,402
|
2.7%
|
16.9%
|
|
Fair value through other comprehensive income investments
|
1,171
|
1,405
|
1,729
|
23.1%
|
47.7%
|
|
Property, plant and equipment, net
|
7,638
|
5,751
|
6,084
|
5.8%
|
-20.3%
|
|
Other Assets
|
260,067
|
212,969
|
214,975
|
0.9%
|
-17.3%
|
|
Total Assets
|
730,960
|
587,353
|
646,834
|
10.1%
|
-11.5%
|
|
Due to banks and correspondents
|
6
|
11
|
4
|
-63.6%
|
-33.3%
|
|
Lease payable
|
4,203
|
2,401
|
2,886
|
20.2%
|
-31.3%
|
|
Other liabilities
|
212,464
|
153,573
|
165,759
|
7.9%
|
-22.0%
|
|
Total Liabilities
|
216,673
|
155,985
|
168,649
|
8.1%
|
-22.2%
|
|
|
|
|
|
|
|
|
Capital stock
|
40,505
|
40,505
|
40,505
|
0.0%
|
0.0%
|
|
Reserves
|
20,243
|
20,243
|
20,243
|
0.0%
|
0.0%
|
|
Other reserves
|
425
|
681
|
909
|
33.5%
|
113.9%
|
|
|
|
|
|
|
|
|
Retained earnings
|
344,510
|
304,309
|
304,309
|
0.0%
|
-11.7%
|
|
Net Income for the Period
|
108,604
|
65,630
|
112,219
|
71.0%
|
3.3%
|
|
Total Liabilities and Equity
|
730,960
|
587,353
|
646,834
|
10.1%
|
-11.5%
|
|
|
Quarter
|
% change
|
Up to
|
% change
|
||||
|
|
3Q24
|
2Q25
|
3Q25
|
QoQ
|
YoY
|
Sep 24
|
Sep 25
|
Sep 25 / Sep 24
|
|
Financial income
|
1,429
|
557
|
432
|
-22.4%
|
-69.8%
|
3,892
|
2,470
|
-36.5%
|
|
Financial expenses
|
(1,055)
|
(518)
|
(910)
|
75.7%
|
-13.7%
|
(2,301)
|
(1,881)
|
-18.3%
|
|
Interest income, net
|
374
|
39
|
(478)
|
n.a.
|
-227.8%
|
1,591
|
589
|
-63.0%
|
|
Fee income
|
90,748
|
97,233
|
95,006
|
-2.3%
|
4.7%
|
284,378
|
286,311
|
0.7%
|
|
Net gain (loss) on securities
|
2,579
|
8,618
|
19,532
|
n.a.
|
n.a.
|
n.a.
|
n.a.
|
n.a.
|
|
Net gain (loss) from exchange differences
|
110
|
202
|
226
|
n.a.
|
n.a.
|
n.a.
|
n.a.
|
n.a.
|
|
Other income
|
124
|
463
|
1,110
|
139.7%
|
795.2%
|
1,509
|
1,779
|
17.9%
|
|
Salaries and employee benefits
|
(22,384)
|
(24,878)
|
(23,947)
|
-3.7%
|
7.0%
|
(68,086)
|
(72,256)
|
6.1%
|
|
Administrative expenses
|
(17,272)
|
(18,206)
|
(18,686)
|
2.6%
|
8.2%
|
(58,025)
|
(58,469)
|
0.8%
|
|
Depreciation and amortization
|
(6,603)
|
(6,970)
|
(7,078)
|
1.5%
|
7.2%
|
(19,769)
|
(20,918)
|
5.8%
|
|
Other expenses
|
(245)
|
(594)
|
(267)
|
n.a.
|
9.0%
|
(1,178)
|
(1,026)
|
-12.9%
|
|
Profit before income tax
|
47,431
|
55,907
|
65,418
|
17.0%
|
37.9%
|
152,565
|
157,458
|
3.2%
|
|
Income tax
|
(12,744)
|
(14,749)
|
(18,829)
|
27.7%
|
47.7%
|
(43,961)
|
(45,239)
|
2.9%
|
|
Net profit
|
34,687
|
41,158
|
46,589
|
13.2%
|
34.3%
|
108,604
|
112,219
|
3.3%
|
|
|
Quarter
|
Change
|
Up to
|
Change
|
||||
|
|
3Q24
|
2Q25
|
3Q25
|
QoQ
|
YoY
|
Sep 24
|
Sep 25
|
Sep 25 / Sep 24
|
|
ROE
|
27.9%
|
40.1%
|
41.0%
|
89 pbs
|
1305 pbs
|
28.6%
|
31.4%
|
283 pbs
|
|
Net Interest Margin
|
0.3%
|
0.0%
|
-0.5%
|
-53 pbs
|
-83 pbs
|
0.5%
|
0.2%
|
-29 pbs
|
|
Efficiency Ratio
|
50.7%
|
51.4%
|
52.5%
|
111 pbs
|
176 pbs
|
51.1%
|
52.7%
|
163 pbs
|
|
Operating Expenses / Total Average Assets
|
26.5%
|
32.2%
|
32.2%
|
6 pbs
|
575 pbs
|
26.4%
|
31.0%
|
456 pbs
|
|
|
Prima
|
System
|
Share %
|
Prima
|
System
|
Share %
|
|
|
2Q25
|
2Q25
|
2Q25
|
3Q25
|
3Q25
|
3Q25
|
|
AUMs (S/ Millions)
|
32,943
|
113,513
|
29%
|
35,067
|
122,262
|
29%
|
|
Affiliates (S/ Millions)
|
2,339,871
|
10,049,438
|
23%
|
2,343,615
|
10,167,243
|
23%
|
|
Collections (S/ Millions)
|
1,121
|
4,348
|
26%
|
1,092
|
4,320
|
25%
|

|
| |
Earnings Release 3Q / 2025
|
Analysis of 3Q25 Consolidated Results
|
| 12. Appendix |
| 12.7.8. |
Grupo Pacifico
|
|
As of
|
% Change
|
||||
|
Sep 24
|
Jun 25
|
Sep 25
|
QoQ
|
YoY
|
|
|
Total assets
|
17,683,826
|
19,964,153
|
20,594,428
|
3.2%
|
16.5%
|
|
Total Invesment (1)
|
13,550,847
|
14,228,488
|
14,661,176
|
3.0%
|
8.2%
|
|
Total Liabilities
|
14,442,027
|
15,922,813
|
16,308,599
|
2.4%
|
12.9%
|
|
Net equity
|
3,226,717
|
3,341,104
|
3,602,690
|
7.8%
|
11.7%
|
|
Quarter
|
% Change
|
Up to
|
% change
|
|||||
|
3Q24
|
2Q25
|
3Q25
|
QoQ
|
YoY
|
Sep 24
|
Sep 25
|
Sep 25 / Sep 24
|
|
|
Insurance Service Result
|
308,072
|
340,560
|
359,462
|
5.6%
|
16.7%
|
936,853
|
979,953
|
4.6%
|
|
Reinsurance Result
|
(151,920)
|
(105,650)
|
(108,282)
|
2.5%
|
-28.7%
|
(427,209)
|
(308,793)
|
-27.7%
|
|
Insurance underwriting result
|
156,152
|
234,910
|
251,180
|
6.9%
|
60.9%
|
509,644
|
671,160
|
31.7%
|
|
Sale of medical services
|
-
|
474,732
|
421,839
|
-11.1%
|
n.a.
|
-
|
974,838
|
n.a.
|
|
Cost of sales of medical services
|
-
|
(351,512)
|
(297,919)
|
-15.2%
|
n.a.
|
-
|
(684,824)
|
n.a.
|
|
Medical services result
|
-
|
123,220
|
123,920
|
0.6%
|
n.a.
|
-
|
290,014
|
n.a.
|
|
Interest income
|
209,425
|
234,866
|
220,584
|
-6.1%
|
5.3%
|
626,145
|
693,663
|
10.8%
|
|
Interest Expenses
|
(135,554)
|
(156,502)
|
(158,576)
|
1.3%
|
17.0%
|
(396,116)
|
(460,776)
|
16.3%
|
|
Interest expenses attributable to insurance activities
|
(128,578)
|
(139,054)
|
(141,444)
|
1.7%
|
10.0%
|
(375,268)
|
(416,120)
|
10.9%
|
|
Net Interest Income
|
73,871
|
78,364
|
62,008
|
-20.9%
|
-16.1%
|
230,029
|
232,887
|
1.2%
|
|
Fee Income and Gain in FX
|
(4,676)
|
(6,397)
|
(5,160)
|
-19.3%
|
10.4%
|
(10,200)
|
(15,708)
|
54.0%
|
|
Other Income No Core:
|
||||||||
|
Net gain (loss) from exchange differences
|
191
|
488
|
1,454
|
198.0%
|
661.3%
|
(1,808)
|
1,591
|
-188.0%
|
|
Net loss on securities and associates
|
29,761
|
(15,390)
|
(12,740)
|
-17.2%
|
-142.8%
|
77,839
|
(62,526)
|
-180.3%
|
|
Other Income not operational
|
26,029
|
34,343
|
46,175
|
34.5%
|
77.4%
|
99,988
|
106,782
|
6.8%
|
|
Other Income
|
51,305
|
13,044
|
29,729
|
127.9%
|
-42.1%
|
165,819
|
30,139
|
-81.8%
|
|
Operating expenses
|
(64,307)
|
(161,499)
|
(165,580)
|
2.5%
|
157.5%
|
(215,878)
|
(432,494)
|
100.3%
|
|
Other expenses
|
(24,098)
|
(25,822)
|
(18,325)
|
-29.0%
|
-24.0%
|
(58,428)
|
(47,984)
|
-17.9%
|
|
Total Expenses
|
(88,405)
|
(187,321)
|
(183,905)
|
-1.8%
|
108.0%
|
(274,306)
|
(480,478)
|
75.2%
|
|
Income tax
|
(3,615)
|
(37,568)
|
(49,398)
|
31.5%
|
1266.5%
|
(31,006)
|
(103,018)
|
232.3%
|
|
Net income
|
189,308
|
224,649
|
233,534
|
4.0%
|
23.4%
|
600,180
|
640,704
|
6.8%
|
| (i) |
private health insurance managed by Grupo Pacifico and included in its Financial Statements in each of the accounting lines;
|
| (ii) |
corporate health insurance (dependent workers); and
|
| (iii) |
medical services.
|

|
| |
Earnings Release 3Q / 2025
|
Analysis of 3Q25 Consolidated Results
|
| 12. Appendix |
| 12.7.9. |
Investment Management & Advisory *
|
|
Investment Management & Advisory *
|
Quarter
|
% change
|
Up to
|
% Change
|
||||
|
S/ 000
|
3Q24
|
2Q25
|
3Q25
|
QoQ
|
YoY
|
Sep 24
|
Sep 25
|
Sep 25 / Sep 24
|
|
Net interest income
|
9,934
|
13,978
|
12,434
|
-11.0%
|
25.2%
|
21,672
|
36,853
|
70.0%
|
|
Other income
|
241,628
|
232,110
|
260,937
|
12.4%
|
8.0%
|
730,832
|
757,973
|
3.7%
|
|
Fee income
|
157,828
|
147,138
|
161,004
|
9.4%
|
2.0%
|
471,750
|
458,414
|
-2.8%
|
|
Net gain on foreign exchange transactions
|
19,448
|
21,497
|
17,871
|
-16.9%
|
-8.1%
|
51,169
|
54,437
|
6.4%
|
|
Net gain on sales of securities
|
72,105
|
64,298
|
107,080
|
66.5%
|
48.5%
|
172,315
|
212,570
|
23.4%
|
|
Derivative Result
|
(17,139)
|
(8,789)
|
(32,934)
|
274.7%
|
92.2%
|
25,440
|
(37,859)
|
-248.8%
|
|
Result from exposure to the exchange rate
|
6,061
|
4,870
|
4,028
|
-17.3%
|
-33.5%
|
(11,290)
|
21,497
|
-290.4%
|
|
Other income
|
3,325
|
3,096
|
3,888
|
25.6%
|
16.9%
|
21,448
|
48,914
|
128.1%
|
|
Operating expenses (1)
|
(187,915)
|
(183,696)
|
(190,831)
|
3.9%
|
1.6%
|
(540,699)
|
(576,601)
|
6.6%
|
|
Operating income
|
63,647
|
62,392
|
82,540
|
32.3%
|
29.7%
|
211,805
|
218,225
|
3.0%
|
|
Income taxes
|
(11,053)
|
(11,686)
|
(21,056)
|
80.2%
|
90.5%
|
(45,938)
|
(43,840)
|
-4.6%
|
|
Non-controlling interest
|
86
|
167
|
142
|
-15.0%
|
65.1%
|
236
|
461
|
95.3%
|
|
Net income
|
52,508
|
50,539
|
61,342
|
21.4%
|
16.8%
|
165,631
|
173,924
|
5.0%
|

|
| |
Earnings Release 3Q / 2025
|
Analysis of 3Q25 Consolidated Results
|
| 12. Appendix |
| 12.8. |
Table of calculations
|
|
Table of calculations (1)
|
||
|
Pr
 |
Interest earning assets
|
Cash and due from banks+Total investments +Cash collateral, reverse repurchase agreements and securities borrowing+Loans |
|
Funding
|
Deposits and obligations+Due to banks and correspondents+BCRP instruments +Repurchase agreements with clients and third parties+Bonds and notes issued |
|
|
Net Interest Margin (NIM)
|
Net Interest Income (excluding Net Insurance Financial Expenses) Average Interest Earning Assets |
|
|
Risk-adjusted Net Interest Margin
(Risk-adjusted NIM)
|
Annualized Net Interest Income (excluding Net Insurance Financial Expenses)-Annualized Provisions) Average period end and period
beginning interest earning assets |
|
|
Funding cost
|
Interest Expense (Does not Include Net Insurance Financial Expenses) Average Funding |
|
|
Core income
|
Net Interest Income+Fee Income+Net Gain on Foreign exchange transactions |
|
|
Other core income
|
Fee Income+Net Gain on Foreign exchange transactions |
|
|
Other non-core income
|
Net Gain Securities+Net Gain from associates+Net Gain of derivatives held for trading +Net Gain from exchange differences+Other non operative income |
|
|
Return on average assets (ROA)
|
Annualized Net Income attributable to Credicorp Average Assets |
|
|
Return on average equity (ROE)
|
Annualized Net Income attributable to Credicorp Average Net Equity |
|
 |
Internal overdue ratio
|
(Internal overdue loans) Total Loans |
|
Non – performing loans ratio (NPL
ratio)
|
(Internal overdue loans+Refinanced loans) Total Loans |
|
|
Coverage ratio of internal overdue
loans
|
Allowance for loans losses Internal overdue loans |
|
|
Coverage ratio of non – performing
loans
|
Allowance for loans losses Non-performing loans |
|
|
Cost of risk
|
Annualized provision for credit
losses on loans portfolio, net of recoveries Average Total Loans |
|
 |
Operating expenses
|
Salaries and employees benefits+Administrtive expenses+Depreciation and amortization +Association in participation +Acquisition cost |
|
Operating Income
|
Net interest, similar income, and expenses+Fee income+Net gain on foreign exchange transactions +Net
gain from associates+Net gain on derivatives held for trading+Net gain from echange differences |
|
|
Efficiency ratio
|
Salaries and employee benefits + Administrative expenses + Depreciation and amortization + Association in participation
Net interest, similar income and expenses + Fee Income + Net gain on foreign
exchange transactions + Net gain from associates+Net gain on derivatives held for trading
+ Result on exchange differences+Insurance Underwriting Result
|
|
 |
Liquidity Coverage ratio
|
Total High Quality Liquid Assets + Min(Total Inflow 30 days; 75% * Total Outflow 30 days)
Total Outflow 30 days
|
|
Regulatory Capital ratio
|
Regulatory Capital (Risk -weighted assets) |
|
|
Tier 1 ratio
|
Tier 1(2) Risk -weighted assets |
|
|
Common Equity Tier 1 ratio (3)
|
Capital+Reserves -100% of applicable deductions (4)+ Retained Earnings+Unrealized gains or losses Risk -weighted assets |
|

|
| |
Earnings Release 3Q / 2025
|
Analysis of 3Q25 Consolidated Results
|
| 12. Appendix |
| 12.9. |
Glossary of terms
|
|
Term
|
Definition
|
|
AFP
|
Administradora de Fondo de Pensiones or Private Pension Funds Administrators
|
|
BCRP
|
Banco Central de Reserva del Perú or Peruvian Central Bank
|
|
Financially Included
|
Stock of financially included clients through BCP since 2020. New clients with BCP
savings accounts or new Yape affiliates that: (i) Do not have debt in the financial system nor other BCP products in the 12 months prior to their inclusion,
and (ii) Have performed at least 3 monthly transactions on average through any BCP channel in the last 3 months
|
|
GMV
|
Gross Merchant Volume
|
|
Government Program Loans ("GP" or "GP Loans")
|
Loan Portfolio related to Reactiva Peru, FAE-Mype and Impulso Myperu programs to respond quickly and effectively to liquidity needs and maintain
the payment chain
|
|
MAU
|
Monthly Active Users
|
|
MEF
|
Ministry of Economy and Finance of Peru
|
|
TPV
|
Total Payment Volume
|
