PERICOM SEMICONDUCTOR CORPORATION
Form 10-K for the Year Ended June 27, 2015
INDEX
| PAGE | ||||||||||
|---|---|---|---|---|---|---|---|---|---|---|
PART I |
||||||||||
Item 1: |
Business |
1 | ||||||||
Item 1A: |
Risk Factors |
14 | ||||||||
Item 1B: |
Unresolved Staff Comments |
26 | ||||||||
Item 2: |
Properties |
26 | ||||||||
Item 3: |
Legal Proceedings |
26 | ||||||||
Item 4: |
Mine Safety Disclosures |
26 | ||||||||
PART II |
||||||||||
Item 5: |
Market for Registrant’s Common Equity, Related Stockholder Matters and Issuer Purchases of Equity Securities
|
27 | ||||||||
Item 6: |
Selected Financial Data |
29 | ||||||||
Item 7: |
Management’s Discussion and Analysis of Financial Condition and Results of Operations |
30 | ||||||||
Item 7A: |
Quantitative and Qualitative Disclosures about Market Risk |
42 | ||||||||
Item 8: |
Financial Statements and Supplementary Data |
43 | ||||||||
Item 9: |
Changes in and Disagreements with Accountants on Accounting and Financial Disclosure |
44 | ||||||||
Item 9A: |
Controls and Procedures |
44 | ||||||||
Item 9B: |
Other Information |
44 | ||||||||
PART III |
||||||||||
Item 10: |
Directors, Executive Officers and Corporate Governance |
46 | ||||||||
Item 11: |
Executive Compensation |
46 | ||||||||
Item 12: |
Security Ownership of Certain Beneficial Owners and Management and Related Shareholder Matters |
46 | ||||||||
Item 13: |
Certain Relationships and Related Transactions, and Director Independence |
46 | ||||||||
Item 14: |
Principal Accountant Fees and Services |
46 | ||||||||
PART IV |
||||||||||
Item 15: |
Exhibits and Financial Statement Schedules |
47 | ||||||||
Signatures |
80 | |||||||||
i
PART I
EXPLANATORY NOTE
As used in this Form 10-K, the term “fiscal 2015”
refers to our fiscal year ended June 27, 2015, the term “fiscal 2014” refers to our fiscal year ended June 28, 2014, and the term
“fiscal 2013” refers to our fiscal year ended June 29, 2013.
ITEM 1. BUSINESS
Pericom Semiconductor Corporation (the “Company”
or “Pericom” or “we”, “us” or “our”) was incorporated in June 1990 in the state of California. We design,
develop and market high-performance integrated circuits (“ICs”) and frequency control products (“FCPs”) used in many of
today’s advanced electronic systems. Our IC products include functions that support the connectivity, timing and signal conditioning of high-speed
parallel and serial protocols that transfer data among a system’s microprocessor, memory and various peripherals, such as displays and monitors,
and between interconnected systems. Our FCPs are electronic components that provide frequency references such as crystals and oscillators for computer,
communication and consumer electronic products. Our analog, digital and mixed-signal ICs, together with our FCP products enable higher system bandwidth
and signal quality, resulting in better operating reliability, signal integrity, and lower overall system cost in applications such as notebook
computers, servers, network switches and routers, storage area networks, digital TVs, cell phones, GPS and digital media players.
We have one reportable segment, the interconnectivity
device supply market. Additional segment reporting information is included in Note 18 of Notes to Consolidated Financial Statements in this
report.
INDUSTRY BACKGROUND — OVERVIEW
Electronic systems and subsystems create the fabric that
increasingly supports everyday modern life as evidenced by the continued growth of the computer, mobile communications, networking and consumer
electronics markets. Systems characterized by ever-improving performance, flexibility, reliability and multi-functionality, as well as decreasing size,
weight and power consumption have driven the growth of these markets. IC advancements through improvements in semiconductor technology have contributed
significantly to the increased performance of, and demand for, electronic systems and to the increasing proportion of IC cost as a portion of overall
system cost. This technological progress occurs at an accelerated pace, while at the same time, the cost of electronic systems continues to
decline.
Development of high-performance computer requirements for
higher network performance and increased levels of connectivity among different types of electronic devices drive the demand for new and varying types
of high-speed, high-performance signal conditioning, connectivity and timing products to handle the conditioning, routing, bridging and timing of
digital and analog signals at high speeds with minimal loss of signal quality. High-speed signal transfer is essential to maximize the speed and
bandwidth of the microprocessor, the memory and the local or wide area network. High signal quality is equally essential for optimal balance between
high data transmission rates and reliable system operation. Without high signal quality, transmission errors occur, resulting in retransmissions and
hence lower throughput and system reliability, as bandwidth increases. The same market pressures imposed on microprocessors also drive the market
requirements for connectivity and timing products, and include higher speed, reduced power consumption, lower voltage operation, smaller size and
higher levels of integration.
Our FCPs are devices incorporating quartz crystal
resonators. Quartz crystals have the physical property such that, when stimulated electrically, they resonate at a precise and consistent frequency. A
crystal oscillator, combining a quartz crystal and a simple electronic circuit, also generates a signal at a precise and consistent frequency. All
types of crystal oscillators are clocks in the sense that they provide a frequency reference for various electronic systems.
1
The continuing increase in electronic sophistication, as
well as the penetration and proliferation of electronic products into new applications, puts new demands on frequency control devices. This creates
both technological challenges and new business opportunities for products offering faster speeds, tighter frequency tolerance, higher stability
relative to temperature, smaller surface-mountable packaging and lower unit cost.
Connectivity, switching, and timing products are used to
enable higher system bandwidth in applications such as notebook computers, servers, network switches and routers, storage area networks, wireless
base-stations, cell phones and digital TVs. We pioneer technology in each of these areas as demonstrated in the development and implementation of our
wide variety of serial protocol product families. An example is our Peripheral Component Interconnect (“PCI”) Express technology across our
interface, switching, bridging and timing product areas. PCI Express is a relatively new industry-standard serial protocol developed to offer higher
bandwidth to and from the CPU chipset and peripherals like Ethernet, Universal Serial Bus (“USB”), video, and other types of connectivity
devices. Almost every market segment and end product application is adopting PCI Express as the new serial high-speed signal path. As a serial
protocol, PCI Express can offer many times the bandwidth of PCI, the industry-standard parallel protocol that preceded PCI Express. PCI Express allows
cost-effective means to send high-speed signals across longer distances.
However, this expanded bandwidth comes at a price: signal
quality and integrity becomes difficult to maintain as data rates routinely exceed multi-gigabits per second. The problems associated with signal
quality that must be addressed by the connectivity IC’s are magnified by increased speed at which these products must transfer, route and time
electrical signals. The performance challenges presented to today’s designers are significant: signals must transfer at high speed with low
propagation delay, while signal degradation—such as ‘noise,’ ‘jitter,’ ‘skew,’ and electromagnetic interference
(“EMI”)—must be minimal. In short, high-speed signal conditioning is essential for state-of-the-art electronic systems to function
reliably and cost effectively. Our signal conditioning technology and resulting products address these critical issues, and support the major serial
high-speed protocols including Gigabit Ethernet, PCI Express, High Definition Multimedia Interface (“HDMI”), USB, Serial Advanced Technology
Architecture (“SATA”), serial attached SCSI (“SAS”) and DisplayPort (“DP”). SCSI stands for Small Computer System
Interface, referred to and pronounced “skuzzy”. Pericom refers to its signal conditioning products as ‘ReDriversTM’.
High frequency and high data transfer rates are critical in
the reliability of systems prevalent in the major market trends of today. Internet and high-performance network applications continue to push for more
data bandwidth on system buses and across system boundaries. Computer and networking system clock frequencies continue to increase at a very rapid
rate, shortening the time available to perform data transfers. While the data transfer rate has typically increased every few years, the continuing
desire for higher system reliability with minimal system downtime creates increasing pressure to achieve lower data error rates. These factors all
increase the need for high speed, high performance connectivity and switching products.
In server, networking and computing applications, we
support higher system bandwidth with our PCI Express to PCI-X/PCI bridges, and PCI Express packet switches as well as PCI Express signal switching and
re-driver products enabling optimum system partitioning and design flexibility. All major server original equipment manufacturers (“OEM”)
have adopted PCI Express. PCI Express bridges and packet switches allow the transfer and switching of high speed data in and out of the CPU chipset to
serial I/O ports such as Fiber Channel, Gigabit Ethernet and SAS.
In high-bandwidth systems, data transfer needs to be
synchronized, creating a high demand for timing products. Our clocks and FCPs provide the precise timing signals needed to ensure reliable data
transfer at high speeds in applications ranging from notebook computers to network switches. As systems continue to grow in processing power and
complexity, the demand for these products will accelerate. The demand for higher precision will also continue to increase as timing margins shrink in
higher bandwidth serial connectivity systems.
Our SATA switch and ReDriver products enable external SATA
(“eSATA”) disk drive expansion and standard compliance. They are applicable to desktop and notebook PCs, set top boxes, portable media
players and game consoles. We have expanded our SATA and SAS ReDriver product families to support the latest generation of SATA3 and SAS2 (6Gbps) and
the newest SAS3 (12Gb) for computing and storage applications.
2
Our video switch products address the need for higher video
resolution, enable the integration of horizontal and vertical synchronous signals as well as control signals, and accommodate switching of up to four
video input streams with improved cross-talk, off-isolation and electrostatic discharge (“ESD”) protection features. These products address
the HDMI, DP, and Digital Video Interface (“DVI”) switching, signal conditioning and voltage shifting requirements for PC video/graphics and
LCD monitors, as well as digital television (“DTV”) and other digital video applications.
In fiscal 2013, we introduced a new family of high
performance signal integrity products (redrivers) supporting 8Gb PCI Express GEN3, 10Gb Ethernet, and 12Gb SAS3 (Serial Attached SCSI), which are being
targeted for high speed storage applications. In addition, we launched a new family of USB3 redrivers in very small size packages targeting mobility
products.
In fiscal 2014, we introduced a total of 70 new products
across our timing, switching, connectivity, and signal integrity product families. These products are targeted to our focus market segments, such as
mobility (tablet, smart phone and ultrabook) and cloud computing (server and storage). Many of these new products are specifically targeted to address
the advancements of our customer platforms, such as lower power, faster speeds, and more highly integrated functionality. At the product level, we saw
early adoption of our new SAS3 12Gb signal integrity products, HiFlex crystal oscillator (“XO”) and clock generators, video decoders, and PCI
Express (“PCIe”) GEN2 packet switches.
In fiscal 2015, we introduced a total of 83 new products
across our timing, switching, connectivity, and signal integrity product families. We continue to focus our product development on new, high growth and
high demand applications across mobility, cloud computing, the Internet of Things, server/storage, networking, and embedded applications such as
automotive, medical and video surveillance. Examples of specific products in high demand include Type C switch for reversable USB connectors, multiple
output XO and clock generators, expanding our PCIe GEN2 packet switch family to cover larger networking and enterprise systems, AEC-Q qualified
products for automotive, and very low voltage signal integrity products for mobile (battery powered) products.
OUR STRATEGY
As a supplier of high-performance IC and FCP products, we
enable serial connectivity with solutions for the computing, communications and consumer market segments. Today’s markets feature ever-increasing
speed-and-bandwidth-demanding applications. With our analog, digital and mixed-signal ICs, along with FCPs, our complete solutions support the timing,
switching, bridging and conditioning of high-speed signals for the latest generation of products.
We define our products in collaboration with
industry-leading OEMs and industry enablers and our modular design methodology shortens our time to market and time to volume production. The key
elements of our strategy are:
Market Focus:
We are focused on high growth segments within the computer,
communications and consumer markets which allow multi-product penetration opportunities that align well with our technology focus. These growth
applications include servers, storage, enterprise networks, telecommunications and embedded applications (including automotive, video surveillance and
medical). We will continue to support applications in other segments which include notebooks and PCs, tablets, digital video and television and mobile
devices such as smart phones.
Using our development expertise, our understanding of our
customers’ product evolution, and our rapid-cycle IC development, we continue to pursue new opportunities in existing and emerging markets to
expand our market share as a solution provider.
3
Customer Focus:
Our customer strategy is to use a superior level of
responsiveness and high quality proprietary solutions to support customer needs and sell a wider range of products to our existing customers, as well
as targeted new customers. Key elements of our customer strategy include:
• |
Penetrate target accounts through joint product development. We approach prospective customers primarily by working with their system design engineers at the product specification stage with the goal that one or more Pericom ICs or FCPs will be incorporated into a new system design. Our understanding of our customers’ requirements combined with our ability to develop and deliver reliable, high-performance products within our customers’ product introduction schedules has enabled us to establish strong relationships with many leading OEMs. |
• |
Solidify customer relationships through superior responsiveness. We believe that our customer service orientation is a significant competitive advantage. We seek to maintain short product lead times and provide our customers with excellent on-schedule delivery, in part by having available adequate finished goods inventory for anticipated customer demands. We emphasize product quality for our products and we have been ISO-9001 certified since 1995. We also endeavor to be a good corporate citizen, required by many customers, with solid environmental and other processes and we received our ISO 14001 Environmental Management System certification in 2004. |
• |
Expand customer relationships through broad-based solutions. We aim to grow our business with existing customers by offering product lines that provide increasingly extensive solutions for their high-speed interfacing needs. By providing our customers with superior support in existing programs and anticipating our customers’ needs in next-generation products, we have often been able to increase our overall volume of business with those customers substantially. With larger customers, we have also initiated electronic data interchange (“EDI”) and remote warehousing programs, annual purchase and supply programs, joint development projects and other services intended to enhance our position as a key vendor. |
Technology Focus:
High bandwidth, high-speed serial protocols inherently
present challenges in system design, such as error-free signal routing, end-point integrity and timing sensitivities. We focus on three main technology
areas: serial high-speed protocol switching, advanced silicon and quartz based timing and signal conditioning solutions. These focus areas combine at
the product level to provide a complementary and complete system level solution for high-speed serial protocol implementation.
Because of this focus, we provide a broad solution in
high-speed analog switching technology. We possess a history of ‘industry first’ product introductions, such as our dual HDMI and PCI
Express signal switching solutions and our serial signal conditioning technology. Focused product families include high-frequency Signal Switches,
Packet Switches, Bridges, ReDrivers, Clock Generators/Buffers, Crystals and Oscillators.
Today, our technology encompasses all major serial
high-speed protocols including PCI Express, USB, HDMI/DVI, Display Port, SAS/SATA, 10-Gigabit Attachment Unit Interface (“XAUI”) and
Ethernet.
Our primary efforts are in the creation of additional
proprietary digital, analog and mixed-signal functionality. We work closely with our wafer suppliers to incorporate their advanced complementary metal
oxide semiconductor (“CMOS”) process technologies to improve our ability to introduce next generation products expeditiously. We continue to
expand our patent portfolio with the goal of providing increasingly proprietary product lines.
For FCPs, our strategy is to further our position in
high-frequency, superior-performance, low-jitter timing products by combining our crystal and silicon design capabilities. In addition, we address the
growing needs of very small size surface mount crystals and crystal oscillators for the growing wireless and other portable consumer markets. By
leveraging internal proprietary IC designs in digital, analog and mixed-signal functionality, we add specialized features and optimize costs to provide
advanced timing solutions for our target market segments. Working closely with historical manufacturing partners while developing new ones, we will
continue to advance proprietary process techniques and capabilities required to complement new technology products.
4
Manufacturing Focus:
We closely integrate our manufacturing strategy with our
focus on customer needs. Central to this strategy is our ability to support high-volume shipment requirements at a low cost. We design products so that
we may manufacture many different ICs from a single partially processed wafer. Accordingly, we keep inventory in the form of a wafer bank, from which
wafers can be completed to produce a variety of specific ICs in as little as five weeks. This approach has enabled us to reduce our overall
work-in-process inventory while providing increased availability to produce a variety of finished products. In addition, we keep some inventory in the
form of die bank, which can become finished product in three weeks or less. We have established relationships with four leading foundries, Magnachip
Semiconductor, Ltd. (“Magnachip”), GlobalFoundries Inc. (“GlobalFoundries”), Taiwan Semiconductor Manufacturing Company Limited
(“TSMC”), and Semiconductor Manufacturing International Corporation (“SMIC”), as well as several other suppliers. We rely on
foreign subcontractors for the assembly, testing and packaging of our finished products. Some of these subcontractors are a single source supplier for
certain packages.
For FCPs, our vertically integrated Asian design and
manufacturing subsidiaries, PSE Technology Corporation (“PSE-TW”) and PSE Technology (Shandong) Corporation (“PSE-SD”) provide a
significant competitive advantage through highly efficient design and volume crystal manufacturing processes, in combination with strict quality
standards and low-cost labor. We maintain high quality standards and all our subcontractors’ plants are ISO 9000 certified. We operate our own FCP
factories, located in Chungli (Taiwan) and Jinan, in the Shandong Province of the People’s Republic of China (“PRC”).
Strategic and Collaborative Relationships
Focus:
We pursue a strategy of entering into new relationships and
expanding existing relationships with companies that engage in the product design, manufacturing and marketing of ICs and frequency control products.
We have an active internal program focused on reference designs with key IC suppliers in the Pericom target market segments and partner programs, which
can strengthen and leverage our marketing and sales presence worldwide. We believe that these relationships enable us to access additional design and
application expertise, accelerate product introductions, reduce costs and obtain additional needed capacity. Our established collaborative
relationships with leading wafer manufacturers allow us to access high performance digital and analog core libraries for use in our future
products.
OUR PRODUCTS
We use our expertise in high-performance digital, analog,
mixed-signal silicon-based IC and quartz-based FCP designs, our reusable core cell library and our modular design methodology to achieve a rapid rate
of new product introductions. Within each of our IC product families, the product portfolio has evolved from a standard building block into both
standard products of increasing performance and application-specific standard products (“ASSP”), which are tailored to meet a specific high
volume application. Within each product family, we continue to address the common trends of decreasing supply voltage, higher integration and faster
speeds. Within our quartz based FCP product families, including crystal, crystal oscillator (“XO”), voltage controlled crystal oscillator
(“VCXO”), temperature compensated crystal oscillator (“TCXO”) and voltage controlled, temperature compensated crystal oscillator
(“VCTCXO”) we have evolved our technologies to include specialized XO and hybrid capabilities.
In fiscal 2015, IC product revenues were $82.1 million or
63.8% of the $128.8 million in total revenues, with the balance of $46.7 million attributable to FCP product revenues. In fiscal 2014, IC product
revenues were $78.3 million or 61.1% of the $128.1 million in total revenues, with the balance of $49.8 million attributable to FCP product revenues.
In fiscal 2013, IC product revenues were $77.2 million or 59.7% of the $129.3 million in total revenues, with the balance of $52.1 million attributable
to FCP product revenues.
IC PRODUCTS
Pericom has four main IC product categories: Connectivity,
Switching, Timing, and Signal Integrity. The following summarizes the various product families in each of these categories.
5
1. SiliconConnectTM Family:
Our SiliconConnect family offers the highest level of
complexity and integration among our products. It consists of our PCI and PCI-X Bridges and our PCI Express Bridges and Packet Switches, our
recently-introduced video decoder family, and our PCI Express Serial Bridges.
PCI/PCI-X:
With a comprehensive product portfolio based on performance
and value, this legacy product family consists of both existing and new applications across multiple market segments. Manufacturers continue to use PCI
and PCI-X for legacy designs, especially in long-term higher-end platforms, such as networking, storage, high-end server and embedded systems used in
military, industrial and computing applications, and PC based video surveillance products. In fiscal 2013, we continued to support legacy PCI and PCI-X
platforms in our customer base, although the shift to PCI Express continued. In fiscal 2014, we saw the continued gradual decline of PCI to PCI bridges
in favor of PCIe to PCI bridges and PCIe packet switch functionality. In fiscal 2015, we expanded our PCIe product families to accommodate the
continued transition from PCI-only bridge products to PCIe bridge and packet switch products in our customer base.
PCI Express:
PCI Express (“PCIe”) is the next generation
replacement for PCI. PCIe is a serial, high-speed technology, which offers many advantages over the parallel bus based PCI technology. All market
segment applications have adopted or are in the process of adopting PCIe, and our PCIe products actively target all major PCIe based applications,
including mainstream and industrial PCs, PC peripherals, embedded systems, high-end multifunction printers, video security monitoring, redundant arrays
of independent disks (“RAID”) and Fiber Channel cards in the Storage Area Network space, Multi-channel Ethernet Network Interface Controllers
(“Ethernet NICs”), and routers and switches. In fiscal 2013, we expanded our ‘serial bridge’ concept by introducing a family of
PCIe to video decoders, targeting the surveillance market segment. These highly integrated products process video camera surveillance data. In fiscal
2014, we continued to expand our serial bridge families with Inter-Integrated Circuit (“I2C”) and Serial Peripheral Interface
(“SPI”) to Universal Asynchronous Receiver/Transmitter (“UART”), and PCIe to local bus, targeted mainly to industrial and embedded
applications. In addition, we also continued to expand our PCIe GEN2 Packet Switch family, meeting growing demand in networking, computing, and
embedded applications. In fiscal 2015, we continued to expand our PCIe GEN2 (5Gb) packet switch family targeting networking and enterprise
applications, and introduced new UART bridge family products targeting embedded platforms.
2. SiliconSwitchTM Family
Our SiliconSwitch product family offers a broad range of
high-performance ICs for switching digital and analog signals. The ability to switch or route high-speed digital or analog signals with minimal delay
and signal distortion is a critical requirement in many high-speed computers, networking and multi-media applications. Historically, systems designers
have used mechanical relays and solid-state relays, which have significant disadvantages compared to IC switches. Mechanical relays are bulky,
dissipate significant power and have very low response times, while solid-state relays are expensive.
ASSP Switch:
We offer a line of ASSP switches for local area networks
(“LAN”), Analog Video, Digital Video such as DVI/HDMI, PCI Express and USB applications. The LAN switches address the high-performance
demands of 10/100/1000 Ethernet LANs. The video switches address the high bandwidth that enables the switching between different video sources
associated with video graphic cards and flat panel displays. Some of our newest video switches address the HDMITM Rev. 1.3 standard. We are also marketing our PCI Express signal switches with GEN1 (2.5Gbps) and GEN2 (5.0Gbps)
speeds for desktop PC, gaming stations, servers and storage applications. We continue to expand our innovations in this area to address next generation
networking, computing and media platforms. In fiscal 2013, we introduced a new family of high speed switches spanning up to 10Gb switching speed. In
fiscal 2014, we expanded our ASSP switch family with USB3 switches for computing and server applications. In fiscal 2015, using
6
our high speed switch technology, we launched a family of ‘Type C’ switches with multiple functions and features. ‘Type C’ refers to the new USB reversible connector that is being adopted by almost all products that use a USB connector.
Analog Switches:
We offer a family of analog switches for low-voltage
(1.8-volt to 7-volt) applications such as multimedia audio and video signal switching with enhanced characteristics such as low power, high bandwidth,
low crosstalk and low distortion to maintain analog signal integrity. Our analog switches have significantly lower distortion than traditional analog
switches due to our advanced CMOS switch design. To support space-constrained applications, such as wireless handsets and global positioning system
receivers, we offer 3-volt low resistance 0.4-ohm switches. To complement this low-voltage family we also offer higher voltage (17-volt) analog
switches for applications requiring higher signal range, such as instrumentation, telecommunications and industrial controls.
Microprocessor Supervisor
Family:
The fundamental application of a Microprocessor Supervisory
(“MPS”) circuit is to keep the microprocessor of a system under control. A system with good microprocessor (“uP”) supervisory
circuitry can greatly enhance the quality and reliability of the product. We focus on IC-designed uP supervisory products for the market. Currently we
provide a broad series of MPS for engineers to select for many kinds of applications including telecom, networking, hand-held devices and
television.
We also provide high accuracy voltage supervisors with
watchdog power-up reset and manual reset serial functions to improve system reliability.
Home Appliance Controller:
We offer highly integrated mixed-signal IC products for
small home appliance applications, such as single-chip temperature controller IC products for hair curlers, toaster ovens and smart electronic irons.
We also offer IC products for shaver power switches and smart battery charger applications. We provide our customers with very cost effective total
solutions utilizing leading-edge semiconductor products. Through joint efforts with our global customers, our home appliance IC products pass stringent
regulatory standards, such as Underwriters Laboratories (“UL”), Electrical Fast Transient (“EFT”), and Conformite-Europeenne
(“CE”).
Power Management:
We offer a series of power management products, including
power switches, load switches, and low dropout (“LDO”) regulators. The load switches are the latest power management family, aimed at battery
powered mobility products and providing controlled turn-on characteristics to manage battery load. Power switches integrate a current-limiting circuit
to protect the input power supply from falling out of regulation against large currents. Power switches are designed for turning power on/off and
providing fault protection. When the output loading exceeds the current-limit threshold or a short-circuit situation is present, the devices limit the
output current by switching into a constant-current mode. When switched, power dissipation increases and causes the junction temperature to rise,
whereupon a thermal protection circuit turns off the switch to prevent damage. Recovery from a thermal shutdown occurs automatically once the device
has cooled sufficiently.
We offer a series of LDO regulators, including a low
dropout voltage linear regulator featuring low noise, high ripple rejection and low current consumption specifications. We provide many extremely small
packages, such as 1mm by 1mm size LDO regulators to fulfill ultra-mobility applications. We also provide a multi-output power supply in one package to
save printed circuit board (“PCB”) space and reduce the bill of materials cost.
3. Signal Integrity Products
(ReDriver/Repeaters):
As high speed serial signals continue to increase in data
rates, systems designers are increasingly confronted with challenges associated with maintaining clean eye-pattern signal integrity at the receiver end
points. The signal attenuation loss increases is almost exponential as trace lengths increase in a signal path using high-speed
differential
7
signaling. In addition, as CPU chipsets continue to shrink to reduce power consumption, their capability to drive high speed signals decreases. Our ReDriver family of products boost signals back to required levels by combining programmable equalization and de-emphasis techniques at the transmit and receive points, respectively, on a signal path to ensure good signal integrity at the end points.
Through this line of products, we offer a broad range of
ReDrivers to manage standard protocols such as PCIe, SATA, SAS, USB3 and XAUI for applications including servers, storage, networking, notebook, tablet
and docking stations. Systems designers benefit from our ReDriver products in another way: they can now use our ReDrivers with inexpensive cables, such
as CAT6 or flexible ribbon cables instead of using very expensive passive cables to achieve good signal integrity at the end of the trace. In fiscal
2013, we introduced a family of ReDrivers covering the new SAS3 12Gb data rate as part of a new design generation with higher performance for storage
and data center applications. In fiscal 2014, we launched video protocol ReDrivers for HDMI and Display Port, as well as new generations of USB3
ReDrivers addressing low voltage mobility applications. In fiscal 2015, we successfully launched our PCIe3/SATA3 ‘combo’ redriver aimed at
new mobility chipset platforms, introduced a new family of HDMI and Display Port redrivers, and launched the first of our new ultra-linear redrivers
for high speed protocols using link training.
4. Timing Products — Quartz, FCP and
SiliconClockTM Families
In high-bandwidth systems, data transfer must be
synchronized and this creates a demand for timing products. Our timing products provide the precise timing signals needed to ensure reliable data
transfer at high speeds in applications ranging from servers to network switches to televisions. As systems continue to grow in processing power and
complexity, we expect the demand for these products to accelerate. The requirement for precision will also increase as timing margins shrink in
higher-bandwidth systems.
Our timing product line provides a broad range of
general-purpose solutions including clock generators, clock fanout buffers/converters, and zero delay buffers to meet customers’ needs for their
timing trees. In fiscal 2013, we introduced TCXO, VCXO, and VCTCXO crystal oscillator families for mobility, networking and embedded market segments.
In fiscal 2014, we continued to expand our Silicon Clock product lines with high performance clock buffers for specific applications and introduced new
Real Time Clock products for mobility applications. In fiscal 2015, we launched the ‘NX’ family of frequency selectable crystal oscillators
(XO) aimed at enterprise, networking, embedded and cloud storage applications, as well as new low-power clock generators and buffers aimed at mobile
platforms requiring longer battery life while not sacrificing performance.
HiFlexTM Clock Family:
This clock generator family includes high frequency and low
jitter clock signals generated from fundamental crystals to provide high performance and flexible timing solutions to networking and storage systems.
Performance of less than one picosecond of jitter makes these products ideal for replacing multiple XO buffer generators in a system and provides
additional cost savings to our customers. In fiscal 2013, we launched our next generation HiFlex clock generator family with even higher performance
and a broader selection of frequency options to target more applications. In fiscal 2014, we continued to expand our HiFlex multiple output XO and
clock families aimed mainly at networking and cloud computing applications. In fiscal 2015, we continued to expand the HiFlex Clock family offering to
include lower voltage options and programmable frequency outputs.
Clock Buffers and Zero-Delay Clock
Drivers:
Clock buffers receive a clock signal from a frequency
source and create multiple copies of the same frequency for distribution across system boards. We offer 1.2-volt (1.2V), 1.5V, 1.8V, 2.5V, 3.3V and 5V
clock buffers for high-speed, low-skew applications in computers and networking equipment. We offer options for integrated crystal oscillators and
provide a flexible selection of output levels for interfacing to various system components. For systems that require higher performance, we have
differential clock buffers with frequencies up to 800MHz. Zero-delay clocks virtually eliminate propagation delays by synchronizing the clock outputs
with the incoming frequency source. Our 3.3V, 2.5V and 1.8V zero-delay clock drivers offer frequencies of up to 400MHz for applications in networking
switches, routers and hubs, computer servers, and memory modules. Differential
8
zero-delay clock buffers support GEN2 PCIe as well as fully buffered dual in-line memory modules (“DIMM”). Zero-delay buffers support the 2nd generation double date rate (“DDR II”) memory technologies available today. In fiscal 2013, we continued to expand the high performance clock buffer family targeting a broader range of applications such as wired and wireless networking and enterprise and cloud computing. In fiscal 2014, we launched a number of advanced multiple output clock buffers for next generation networking and computing platforms. In fiscal 2015, we continue to improve our buffer portfolio by introducing a family of low voltage LVCMOS buffers capable of operating down to 1.5V, to support the drive towards lower power consumption.
Clock Generators:
Clock generators generate various output frequencies using
a single input frequency source and provide critical timing signals to microprocessors, memory and peripheral functions. Our products support a wide
range of microprocessor systems and their associated integrated chipsets for computing, communication and consumer applications. For computing
applications, we provide PCIe clock synthesizers for server, notebook and desktop PC applications. For high-performance networking and storage
applications, we have high-frequency clock synthesizers targeted up to 300MHz with very low jitter. For emerging networking and consumer platforms with
PCIe interface, we provide PCIe GEN2 and GEN3 compliant clock generator/buffers. For consumer applications such as digital TV and digital set-top
boxes, we have developed a line of high-performance audio and video clocks. For GPS applications, we have developed low power clock generators to
supply a clock reference for processor, real-time clock and other peripheral interface circuits. We have also developed broad-spectrum clock generators
used for reducing EMI in graphics and video applications.
Real Time Clock:
The fundamental application for a Real Time Clock
(“RTC”) circuit is to provide calendar/clock and data storage functions, such as application-specific integrated circuits for various systems
where the RTC is used as the clock signal source and parameter storage circuit. We provide high accuracy and low power consumption RTC products for
many kinds of applications such as STB, DTV, power meters and hand-held devices.
Voltage Controlled Crystal Oscillator
IC:
We offer a VCXO based jitter cleaner product to provide a
very low jitter recovered clock signal in synchronous networking systems supporting SyncE function.
Programmable Skew Clocks:
In large computing and communications systems, customers
need to provide precise timing across large PCBs. At the very high frequencies used today, these large PCB traces can result in significant timing
delays and matching these delays (or timing skew) can be a significant challenge for the system designer. We have responded to this challenge with a
family of programmable skew clock products.
FCP — Quartz based product
families
FCPs include crystals that resonate at a precise frequency,
and XOs, a circuit assembly comprising a crystal and accompanying electronic circuitry providing very stable output frequency. Crystals and XOs are
essential components used in a wide variety of electronic devices. There are three general categories of oscillator products. Clock oscillators are
oscillators without temperature compensation and voltage tuning options used primarily in networking, telecommunication, wireless and
computer/peripheral applications. VCXOs are frequency tunable crystal stabilized oscillators that are voltage controlled and generally operate below 1
GHz. Manufacturers use these oscillators primarily for synchronization in data networking and communications applications.
The ultra-miniature ceramic packaged crystal and clock
oscillators are tailored for densely populated applications such as Wireless Local Area Networking (“WLAN”), mobile phones, portable
multimedia players, personal data assistants (“PDA”s), GPS modules, networking equipment, and hard disk drives. The ultra-miniature package
allows system designers to overcome the physical space constraint of integrating more features into portable applications. The set of available
frequencies supports various industry standard protocols and applications.
9
The XP series of crystal clock oscillators is a proprietary
technology that combines our silicon ICs with our quartz crystals to improve reliability and performance for high frequency 2.5V and 3.3V, low voltage
complementary metal oxide semiconductor (“LVCMOS”) and low voltage positive emitter coupled logic (“LVPECL”) clock applications.
The product family is drop-in compatible with existing Overtone XO, surface acoustic wave (“SAW”) and PLL-based oscillator solutions in 5x7mm
and 3.2x5mm packages, yet aims to provide better cost performance benefits. These high frequency clock oscillators are used to provide a stable timing
reference in various networking and storage serial connectivity platforms such as 1/10 Gigabit Ethernet, Fiber Channel, SATA, SAS, synchronous optical
networking/synchronous digital hierarchy (“SONET/SDH”) and Passive Optical Network (“PON”). In fiscal 2013, we introduced a family
of TCXO and VCTCXO products. These products are mainly aimed at storage, networking, data center, enterprise, and consumer market segments. In fiscal
2014, we introduced new families of HiFlex XO, and added to our popular HiFlex ASSP XO family targeting specific networking, storage, enterprise, and
PCIe platforms. In fiscal 2015, we launched the ‘NX’ family of frequency selectable crystal oscillators (XO) aimed at enterprise,
networking, embedded and cloud storage applications, and continued to expand our HiFlex ASSP XO family aimed at new networking and enterprise
platforms.
OUR CUSTOMERS
The following is a list of some of our customers and
end-users:
Notebook, Desktop and Servers |
Telecommunications |
Digital Media |
||||||||
Acer |
Alcatel-Lucent |
Amtran |
||||||||
Asustek |
Avaya |
Echostar |
||||||||
Dell |
Cisco |
Hikvision |
||||||||
Gigabyte |
Dell |
LGE |
||||||||
Google |
Huawei |
Pace |
||||||||
Hewlett-Packard |
Huawei-3Com |
Primary Technology |
||||||||
IBM |
Motorola Solutions |
Proview |
||||||||
Intel |
Polycom |
Toshiba |
||||||||
Lenovo |
Tellabs |
|||||||||
Micro Star |
Zhongxing Telecom (ZTE) |
|||||||||
Samsung |
||||||||||
Wistron |
||||||||||
Networking Equipment |
Mobile Terminal |
Contract Manufacturing |
||||||||
Alpha Networks |
Even |
Celestica |
||||||||
Askey |
Garmin |
Flextronics |
||||||||
Brocade Communications |
Inventec Appliance |
Foxconn |
||||||||
Cameo Communications |
LG Electronics |
Inventec |
||||||||
Cisco |
Panasonic |
Jabil |
||||||||
Delta Networks |
Samsung |
Sanmina-SCI |
||||||||
Freebox |
Solectron |
|||||||||
H3C |
||||||||||
Huawei |
||||||||||
Inspur |
||||||||||
Juniper |
||||||||||
Nokia-Siemens |
||||||||||
TP-LINK |
||||||||||
Peripherals |
Storage |
|||||||||
EFI |
Brocade |
|||||||||
Hewlett-Packard |
Hitachi |
|||||||||
Konica-Minolta |
JMSH International Corp. |
|||||||||
Lexmark |
M&J Technologies |
|||||||||
Xerox |
USI |
|||||||||
Western Digital |
||||||||||
10
Our customers include distributors, contract manufacturers
and OEMs for computer, networking, telecommunications, embedded and consumer markets. Our direct sales include shipments to distributors, contract
manufacturers, and OEMs. We consider our end-user customer to be the OEM producing the final electronics product for sale.
In fiscal 2015, direct sales to Avnet and Techmosa
accounted for approximately 20% and 19% of net revenues, respectively, and direct sales to our top five direct customers accounted for approximately
51% of net revenues. No end-user customer accounted for greater than 10% of net revenues in the fiscal year ended June 27, 2015 and sales to the top
five end-user customers totaled approximately 29% of net revenues. End-user customer revenues include both direct purchases and purchases through
distributor or contract manufacturer channels. We rely on the end customer data provided by our direct distribution and contract manufacturing
customers for end-user customer sales data.
In fiscal 2014, direct sales to Avnet and Techmosa
accounted for approximately 26% and 10% of net revenues, respectively, and direct sales to our top five direct customers accounted for approximately
47% of net revenues. One end-user customer accounted for greater than 10% of net revenues in the fiscal year ended June 28, 2014 and sales to the top
five end-user customers totaled approximately 32% of net revenues.
In fiscal 2013, direct sales to Avnet and Techmosa
accounted for approximately 21% and 12% of net revenues, respectively, and direct sales to our top five direct customers accounted for approximately
42% of net revenues. One end-user customer accounted for greater than 10% of net revenues in the fiscal year ended June 29, 2013 and sales to the top
five end-user customers totaled approximately 29% of net revenues.
We continue to expect a small number of customers to
account for a large portion of our net revenues. See Item 1A “Risk Factors; Risks Related to our Business and Operating Results — The demand
for our products depends on the growth of our end users’ markets” and “Risk Factors; Risks Related to our Business and Operating Results
— A large portion of our revenues is derived from sales to a few key customers, and the loss of one or more of our key customers, or their key end
user customers, could significantly reduce our revenues. In addition, our sales through distributors increases the complexity of our business.” of
this Annual Report on Form 10-K.
DESIGN AND PROCESS TECHNOLOGY
Our design efforts focus on the development of
high-performance digital, analog and mixed-signal ICs. To minimize design cycle times of high-performance products, we use a modular design methodology
that has enabled us to produce many new products each year and to meet our customers’ need for fast time-to-market response. This methodology uses
state-of-the-art computer-aided design software tools such as high-level description language (“HDL”), logic synthesis, full-chip
mixed-signal simulation, and automated design layout and verification and uses our library of high-performance digital and analog core cells. We have
developed this family of core cells over several years and it contains high-performance, specialized digital and analog functions not available in
commercial application-specific integrated circuit (“ASIC”) libraries. Among these cells are our proprietary mixed-voltage input/output
(“I/O”) cells, high-speed, low-noise I/O cells, analog and digital PLLs, charge pumps and data communication transceiver circuits using low
voltage differential signaling. The United States Patent and Trademark Office has granted us 95 U.S. patents and we have five U.S. patent applications
pending. Another advantage of our modular design methodology is that it allows the application of final design options late in the wafer manufacturing
process to determine a product’s specific function. This option gives us the ability to use pre-staged wafers, which significantly reduces the
design and manufacturing cycle time and enables us to respond rapidly to a customer’s prototype needs and volume requirements.
We use advanced CMOS processes to achieve higher
performance and lower die cost. Our process and device engineers work closely with our independent wafer foundry partners to develop and evaluate new
process technologies. Our process engineers also work closely with circuit design engineers to improve the performance and reliability of our cell
library. We currently manufacture a majority of our products using 0.8, 0.6, 0.5, 0.35, 0.25, 0.18 and 0.13u micron CMOS process technologies and are
currently developing and beginning to ship new products using 0.09u (90 nanometer) technology. We are also using a high-voltage CMOS process developed
by one of our wafer suppliers in the design of higher voltage switch products.
11
For FCPs, we have a well-established design focus,
methodology and execution technique. We implement the majority of designs for oscillators and higher-functionality parts with CMOS process
technologies. However, we also pursue designs incorporating Bipolar, BiCMOS and Silicon-Germanium (“SiGe”) technologies, as well as
utilization of complex programmable logic device (“CPLD”) and field-programmable gate array (“FPGA”) components. Crystal components
developed and marketed by all suppliers are similar. However, the operating behavior of the resonator and the specific techniques employed in their
design, modeling, manufacturing & testing processes are highly specialized and distinctive. As such, manufacturing processes, equipment and test
procedures can form an important part of the design activity. The outcome of the development becomes a permanent and proprietary part of the design
specification.
SALES AND MARKETING
We market and distribute our products through a worldwide
network of independent sales representatives and distributors supported by our internal and field sales organization. Sales to domestic and
international distributors represented 67% of our net revenues in fiscal 2015, 68% of our net revenues in fiscal 2014, and 66% of our net revenues in
fiscal 2013. Our major distributors in North America and Europe include Avnet, Arrow Electronics, Future Electronics and Nu Horizons Electronics. Our
major Asian distributors include AIT (Hong Kong), Avnet (Asia), Chinatronics (Hong Kong), Desner Electronics (Singapore), Internix (Japan), MCM
(Japan), RTI Holdings (Hong Kong) and Techmosa (Taiwan).
We have two regional sales offices in the United States
(New England and Texas), as well as international sales offices in Taiwan, Korea, Singapore, Hong Kong, Japan and the United Kingdom. International
sales comprised approximately 95% of our net revenues in each of fiscal 2015, 2014 and 2013. For further information regarding our international and
domestic revenues, see the discussion under the caption “Management’s Discussion and Analysis of Financial Condition and Results of Operation
— Comparison of Fiscal 2015, 2014 and 2013 — Net Revenues” in Item 7 of this Annual Report on this Form 10-K. We also support field
sales design-in and training activities with application engineers. Marketing and product management personnel are located at our corporate
headquarters in Milpitas, California and in Taiwan.
We focus our marketing efforts on market knowledge, product
definition, new product introduction, product marketing and advertising. We use advertising both domestically and internationally to market our
products independently and in cooperation with our distributors. Our product information is available on our website, which contains overview
presentations, technical information on our products, and offers design modeling/applications support plus sample-request capabilities online. We also
publish and circulate technical briefs relating to our products and their applications.
MANUFACTURING
We have adopted a fabrication foundry non-ownership
(“fabless”) IC manufacturing strategy by subcontracting our wafer production to independent wafer foundries. We have established
collaborative relationships with selected independent foundries with which we can develop a strategic relationship to the benefit of both parties. We
believe that our fabless strategy enables us to introduce high performance products quickly at competitive cost. Currently, our principal manufacturing
relationships have been with Magnachip, GlobalFoundries, TSMC and SMIC. We have an ongoing effort to qualify new foundry vendors that offer cost or
other advantages.
We rely on foreign subcontractors for the assembly, testing
and packaging of our finished products. Some of these subcontractors are a single source supplier for certain packages.
To enhance our manufacturing capability of FCPs, which are
composed of crystals and oscillators housed in multiple sized surface mount ceramic packages, PSE-TW and PSE-SD have advanced, high volume production
lines capable of manufacturing FCPs with tight specifications to competitively support the most popular high volume target industries including
telecommunications, medical, computing and security as well as other commercial sectors. PSE-TW is ISO9001 certified and also has TS16949
certification, which allows us access to the automotive FCP market. To supplement our manufacturing capacity we are maintaining established
relationships with our manufacturing partners and we have a plan already implemented for qualifying additional factories and creating new partners. New
relationships and our expanded capacity are necessary to continue cost reduction, grow our
12
revenue and maintain our competitive position in the FCP market. We have an operations team based in Asia that pursues lower cost packaging techniques and both monitors and modifies manufacturing processes to maximize yields and improve quality. After a manufacturing partner has been qualified through a stringent process, we maintain design and process controls that include using recurring factory audits and in some cases using onsite inspectors.
In order to complement our FCP manufacturing capabilities,
we also have established relationships with selected companies for subcontracting some of the manufacturing. The primary ones are Yantai Dynamic in
Yantai, China and Zhejiang East Crystal in Zhejiang, China. We have an ongoing effort to establish relationships and qualify additional factories to
continue cost reduction and maintain our competitive position in the FCP market.
COMPETITION
The IC semiconductor and FCP industry is intensely
competitive. Significant competitive factors in the market for high-performance ICs and FCPs include the following:
• |
product features and performance; |
• |
price; |
• |
product quality; |
• |
success in developing new products; |
• |
timing of new product introductions; |
• |
general market and economic conditions; |
• |
adequate wafer fabrication, assembly and test capacity and sources of raw materials; |
• |
efficiency of production; and |
• |
ability to protect intellectual property rights and proprietary information. |
Our IC competitors include Analog Devices, Avago
Technologies, Fairchild Semiconductor International, Hitachi, Integrated Device Technology, Inc., Maxim Integrated Products, Inc., On Semiconductor
Corp., NXP, Parade Technologies, Silicon Laboratories, Inc., STMicroelectronics and Texas Instruments, Inc. Most of those competitors have
substantially greater financial, technical, marketing, distribution and other resources, broader product lines and longer-standing customer
relationships than we do. We also compete with other major or emerging companies that sell products to certain segments of our markets. Competitors
with greater financial resources or broader product lines may have a greater ability to sustain price reductions in our primary markets in order to
gain or maintain market share. We also face competition from the makers of ASICs and other system devices. These devices may include interface
functions, which may eliminate the need or sharply reduce the demand for our products in particular applications.
Our FCP competitors include Vectron International, Inc.,
Connor Winfield Ltd., Ecliptek Corporation, Mtron PTI, Epson Toyocom Corporation, Kyocera Kinseki Corporation, Daishinku Corporation, Nihon Dempa Kogyo
Company, Ltd, TXC Corporation, Siward Crystal Technology Co, Ltd, Taitien Electronics Co, Ltd and Hosonic Electronic Co, Ltd. A second group of
competitors in China primarily pursues the lower end of the FCP market with limited technical content products. However, they do have some sales to our
target customer base.
RESEARCH AND DEVELOPMENT
We believe that the continued timely development of new
interface ICs and FCPs is essential to maintaining our competitive position. Accordingly, we have assembled a team of highly skilled engineers whose
activities are focused on the development of signal transfer, routing and timing technologies and products. We have IC design centers located in
Milpitas, California, Hong Kong, Shanghai, Yangzhou and Taiwan and we develop FCP products in Milpitas, California and Taiwan. Research and development
expenses were $17.9 million in 2015, $19.8 million in 2014, and $21.0 million in 2013. Additionally, we actively seek cooperative product development
relationships.
13
INTELLECTUAL PROPERTY
In the United States, we hold 95 patents covering certain
aspects of our product designs, with various expiration dates through March 2033, and we have five additional patent applications pending. We expect to
continue to file patent applications where appropriate to protect our proprietary technologies; however, we believe that our continued success depends
primarily on factors such as the technological skills and innovation of our personnel, rather than on our patents.
EMPLOYEES
As of June 27, 2015, we had 913 full-time employees,
including 102 in sales, marketing and customer support, 503 in manufacturing, assembly and testing, 171 in research and development and 137 in finance
and administration, including information systems and quality assurance. We have never had a work stoppage and no labor organization represents any of
our employees. We consider our employee relations to be good.
AVAILABLE INFORMATION
We file electronically with the Securities and Exchange
Commission (“SEC”) our annual reports on Form 10-K, quarterly reports on Form 10-Q, current reports on Form 8-K, and amendments to those
reports pursuant to Section 13(a) or 15(d) of the Securities Exchange Act of 1934. The SEC maintains an Internet site at http://www.sec.gov that
contains these reports, proxy and information statements. We make available on our website at http://www.pericom.com, free of charge, copies of these
reports as soon as reasonably practicable after filing or furnishing the information to the SEC. Any reports or financial information presented at our
website are not to be considered part of this annual report filed on Form 10-K.
ITEM 1A. RISK FACTORS
In addition to other information contained in this Form
10-K, investors should carefully consider the following factors that could adversely affect our business, financial condition and operating results as
well as adversely affect the value of an investment in our common stock. This Annual Report on Form 10-K includes “forward-looking
statements” within the meaning of Section 27A of the Securities Act and Section 21E of the Exchange Act. All statements other than statements of
historical fact are “forward-looking statements” for purposes of these provisions, including any statements regarding: projections of
revenues, research and development expenses, selling, general and administrative expenses, other expenses, gross profit, gross margin, order backlog or
other financial items; the plans and objectives of management for future operations; the implementation of advanced process technologies; our tax rate;
the adequacy of allowances for returns, price protection and other concessions; future demand for legacy products; proposed new products or services;
the sufficiency of cash generated from operations and cash balances; our exposure to interest rate risk; future economic conditions or performance;
plans to focus on cost control; plans to seek intellectual property protection for our technologies; expectations regarding export sales and net
revenues; the expansion of sales efforts; acquisition prospects; the results of our possible future acquisitions; technological trends; and assumptions
underlying any of the foregoing. In some cases, forward-looking statements can be identified by the use of terminology such as “may,”
“will,” “expects,” “plans,” “anticipates,” “estimates,” “potential,” or
“continue,” or the negative thereof or other comparable terminology. Although we believe that the expectations reflected in the
forward-looking statements contained herein are reasonable, there can be no assurance that such expectations or any of the forward-looking statements
will prove to be correct, and actual results could differ materially from those projected or assumed in the forward-looking statements. Our future
financial condition and results of operations, as well as any forward-looking statements, are subject to risks and uncertainties, including but not
limited to the factors set forth below and elsewhere in this report. All forward-looking statements and reasons why results may differ included in this
Annual Report are made as of the date hereof, and we assume no obligation to update any such forward-looking statement or reason why actual results may
differ.
14
RISKS RELATED TO OUR BUSINESS AND OPERATING
RESULTS
In the past, our operating results have varied
significantly and are likely to fluctuate in the future, making it difficult to predict our future operating results.
We continue to face a challenging business environment and
limited visibility on end-market demands. Wide varieties of factors affect our operating results, many of which are beyond our control. These factors
and risks include, but are not limited to, the following:
• |
changes in the quantity of our products sold; |
• |
changes in the average selling price of our products; |
• |
general conditions in the semiconductor industry; |
• |
changes in our product mix; |
• |
a change in the gross margins of our products; |
• |
the operating results of the FCP product line, which normally has a lower profit margin than IC products; |
• |
expenses incurred in obtaining, enforcing, and defending intellectual property rights; |
• |
the timing of new product introductions and announcements by us and by our competitors; |
• |
customer acceptance of new products introduced by us; |
• |
delay or decline in orders received from distributors; |
• |
growth or reduction in the size of the market for interface ICs; |
• |
the availability of manufacturing capacity with our wafer suppliers, especially to support sales growth and new products; |
• |
changes in manufacturing costs; |
• |
fluctuations in manufacturing yields; |
• |
disqualification by our customers for quality or performance related issues; |
• |
the ability of customers to pay us; |
• |
increased research and development expenses associated with new product introductions or process changes; |
• |
the impairment of our intangible assets or other long-lived assets; and |
• |
fluctuations in our effective tax rate from quarter to quarter. |
All of these factors are difficult to forecast and could
seriously harm our operating results. Our expense levels are based in part on our expectations regarding future sales and are largely fixed in the
short term. Therefore, we may be unable to reduce our expenses fast enough to compensate for any unexpected shortfall in sales. Any significant decline
in demand relative to our expectations or any material delay of customer orders could harm our operating results. In addition, if our operating results
in future quarters fall below public market analysts’ and investors’ expectations, the market price of our common stock would likely
decrease.
The demand for our products depends on the growth of our
end users’ markets.
Our continued success depends in large part on the
continued growth of markets for the products into which our semiconductor and frequency control products are incorporated. These markets include the
following:
• |
computers, notebooks, tablets and connectivity to related peripherals; |
• |
data communications and telecommunications equipment including switches and routers; |
• |
servers and storage equipment including cloud computing requirements; |
• |
consumer electronics equipment; and |
• |
embedded systems including video surveillance, medical and automotive. |
Any decline in the demand for products in these markets
could seriously harm our business, financial condition and operating results. These markets have also historically experienced significant fluctuations
in demand, and over the past two years we’ve been impacted by declines in the markets for PC’s and notebook computers. We may also be
seriously harmed by slower growth in the other markets in which we sell our products.
Customer demands for the Company’s products are
volatile and difficult to predict.
Our business is characterized by short-term orders and
shipment schedules. We do not have long-term purchase agreements with any of our customers. Customers can typically cancel or reschedule their orders
without significant penalty. We typically plan production and inventory levels based on forecasts of customer demand generated with
15
input from customers and sales representatives. Our customers continuously adjust their inventories in response to changes in end market demand for their products and the availability of semiconductor components. This results in frequent changes in demand for our products. Accordingly, we must rely on multiple assumptions to forecast customer demand. Various external factors that are outside of our control can make it difficult to accurately make such forecasts, and the volatility of customer demand limits our ability to predict future levels of sales and profitability.
Further, as end customer demand can change very quickly,
the supply of semiconductors can quickly and unexpectedly match or exceed demand. Also, semiconductor suppliers can rapidly increase production output.
This can lead to a sudden oversupply situation and a subsequent reduction in order rates and revenues as customers adjust their inventories to true
demand rates. A rapid and sudden decline in customer demand for our products can result in excess quantities of certain of our products relative to
demand. Under such circumstances, we may be required to record significant provisions for excess and obsolete inventories. This could materially and
adversely affect our results of operations and financial condition.
The markets for our products are characterized by
rapidly changing technology, and our financial results could be harmed if we do not successfully develop and implement new manufacturing technologies
or develop, introduce and sell new products.
The markets for our products are characterized by rapidly
changing technology, frequent new product introductions and declining selling prices over product life cycles. We currently offer a comprehensive
portfolio of silicon and quartz based products. Our future success depends upon the timely completion and introduction of new products, across all our
product lines, at competitive price and performance levels. The success of new products depends on a variety of factors, including the
following:
• |
product performance and functionality; |
• |
customer acceptance; |
• |
competitive cost structure and pricing; |
• |
successful and timely completion of product development; |
• |
sufficient wafer fabrication capacity; and |
• |
achievement of acceptable manufacturing yields by our wafer suppliers. |
Our failure to successfully develop new products that
achieve market acceptance in a timely fashion and that can be efficiently and successfully integrated with our customers’ products could adversely
affect our ability to grow our business and improve our operating results. The development, introduction and market acceptance of new products is
critical to our ability to sustain and grow our business. Any failure to successfully develop, introduce, market and sell new products could materially
adversely affect our business and operating results.
We may also experience delays, difficulty in procuring
adequate fabrication capacity for the development and manufacture of new products, or other difficulties in achieving volume production of these
products. Even relatively minor errors may significantly affect the development and manufacture of new products. If we fail to complete and introduce
new products in a timely manner at competitive price and performance levels, our business would be significantly harmed.
If we do not develop products that our customers and
end-users design into their products, or if their products do not sell successfully, our business and operating results would be
harmed.
We have relied in the past and continue to rely upon our
relationships with our customers and end-users for insights into product development strategies for emerging system requirements. We generally
incorporate new products into a customer’s or end-user’s product or system at the design stage. Our success has been, and will continue to
be, dependent upon manufacturers designing our connectivity products into their products. To achieve design wins, which are decisions by manufacturers
to design our products into their systems, we must define and deliver cost effective and innovative connectivity solutions on a timely basis that
satisfy the manufacturers’ requirements and specifications. Our ability to achieve design wins is subject to numerous risks including competitive
pressures as well as technological risks and delays in our product development cycle. However, these design efforts, which can often require
significant expenditures by us, may precede product sales, if any, by a year or more. With the increasing complexity of new generation products the
development cost of each new product increases, making the selection
16
process ever more critical with limited staff and financial resources. Moreover, the value to us of any design win will depend in large part on the ultimate success of the customer or end-user’s product and on the extent to which the system’s design accommodates components manufactured by our competitors. If we fail to achieve design wins or if the design wins fail to result in significant future revenues, our operating results would be harmed. If we have problems developing or maintaining our relationships with our customers and end-users, our ability to develop well-accepted new products may be impaired.
Intense competition in the semiconductor industry may
reduce the demand for our products or the prices of our products, which could reduce our revenues and gross profits and limit our ability to maintain
or grow our business.
The semiconductor industry is intensely competitive, and we
expect competition in this industry to continue to increase. This competition has resulted in rapid technological change, evolving standards,
reductions in product selling prices and rapid product obsolescence leading to excess and obsolete inventory writedowns (for further detail, see Part
II, Item 7, Management’s Discussion and Analysis of Financial Condition and Results of Operations, Critical Accounting Policies —
Inventories). If we are unable to successfully meet these competitive challenges, we may be unable to maintain and grow our business. Any inability on
our part to compete successfully would also adversely affect our results of operations and impair our financial condition.
Our competitors include Analog Devices, Avago Technologies,
Cypress Semiconductor, Fairchild Semiconductor, Hitachi, Integrated Device Technology, Maxim Integrated Products, Motorola, On Semiconductor, NXP,
Parade Technologies, Silicon Laboratories, STMicroelectronics, Texas Instruments, and Toshiba. Most of those competitors have substantially greater
financial, technical, marketing, distribution and other resources, broader product lines and longer-standing customer relationships than we do. We also
compete with other major or emerging companies that sell products to certain segments of our markets. Competitors with greater financial resources or
broader product lines may have a greater ability to sustain price reductions in our primary markets in order to gain or maintain market
share.
We believe that our future success will depend on our
ability to continue to improve and develop our products and processes. Unlike us, many of our competitors maintain internal manufacturing capacity for
the fabrication and assembly of semiconductor products. This ability may provide them with more reliable manufacturing capability, shorter development
and manufacturing cycles and time-to-market advantages. In addition, competitors with their own wafer fabrication facilities that are capable of
producing products with the same design geometries as ours may be able to manufacture and sell competitive products at lower prices. Any introduction
of products by our competitors that are manufactured with improved process technology could seriously harm our business. As is typical in the
semiconductor industry, our competitors have developed and marketed products that function similarly or identically to ours. If our products do not
achieve performance, price, size or other advantages over products offered by our competitors, we might lose market share. Competitive pressures could
also reduce market acceptance of our products, reduce our prices and increase our expenses.
We also face competition from the makers of ASICs and other
system devices. These devices may include interface logic functions that may eliminate the need or sharply reduce the demand for our products in
particular applications.
Downturns in the semiconductor industry, rapidly
changing technology, accelerated selling price erosion and evolving industry standards can harm our operating results.
The semiconductor industry has historically been cyclical
and periodically subject to significant economic downturns, characterized by diminished product demand, accelerated erosion of selling prices,
overcapacity and excess and obsolete inventory as well as rapidly changing technology and evolving industry standards. In the future, we may experience
substantial period-to-period fluctuations in our business and operating results due to general semiconductor industry conditions, overall economic
conditions or other factors. Our business is also subject to the risks associated with the effects of legislation and regulations relating to the
import or export of semiconductor products.
17
Past domestic and worldwide economic conditions
adversely affected us, and future economic conditions could have adverse effects on our business, results of operations, financial condition and cash
flows.
Our revenues and earnings have fluctuated significantly in
the past and may fluctuate significantly in the future. General economic or other conditions could cause a downturn in the market for our products or
technology. In the past, financial disruptions affecting the banking system, investment banks, insurance companies and the financial markets negatively
impacted general domestic and global economic conditions. These economic conditions have resulted in our facing very challenging periods leading to
reduced sales and earnings.
Our sales have been adversely impacted due to continued
economic softness in many parts of the world and only tepid growth in others. There could be a number of effects on our business that could also
adversely affect our operating results. Disruptions may result in the insolvency of key suppliers resulting in product delays; the inability of our
customers to obtain credit to finance purchases of our products and/or customer insolvencies that cause our customers to change delivery schedules,
cancel or reduce orders; a slowdown in global economies which could result in lower end-user demand for our products; and increased impairments of our
investments. Net income could vary from expectations depending on the gains or losses realized on the sale or exchange of securities, gains or losses
from equity method investments, and impairment charges related to intangible assets, long-term assets, investments and marketable securities. Our cash
and marketable securities investments represent significant assets that may be subject to fluctuating or even negative returns depending upon interest
rate movements and financial market conditions in fixed income securities.
Volatility in the financial markets and overall economic
uncertainty increases the risk of substantial quarterly and annual fluctuations in our earnings. Given the current economic environment, we remain
cautious and we expect our customers to be cautious as well, which could affect our future results. If the economic recovery slows down or dissipates,
our business, financial condition, results of operations and cash flows could be materially and adversely affected.
The complexity of our products makes us susceptible to
manufacturing problems, which could increase our costs and delay our product shipments.
The manufacture and assembly of our products is highly
complex and sensitive to a wide variety of factors, including:
• |
the level of contaminants in the manufacturing environment; |
• |
impurities in the materials used; and |
• |
the performance of manufacturing personnel and production equipment. |
In a typical semiconductor manufacturing process, silicon
wafers produced by a foundry are cut into individual die. These die are assembled into individual packages and tested for performance. Our wafer
fabrication suppliers have from time to time experienced lower than anticipated yields of suitable die. In the event of such decreased yields, we would
incur additional costs to sort wafers, an increase in average cost per usable die and an increase in the time to market or availability of our
products. These conditions could reduce our net revenues and gross margin and harm our customer relations.
We rely on independent manufacturers who may not be able
to meet our manufacturing requirements.
We do not manufacture any of our IC products. Therefore, we
are referred to in the semiconductor industry as a “fabless” producer. We depend upon third party foundries to produce wafers and
subcontractors to manufacture IC products that meet our specifications. We currently have third party manufacturers located in China, Taiwan,
Singapore, Malaysia, India, Korea and Japan that can produce products that meet our needs. However, as the industry continues to progress to smaller
manufacturing and design geometries, the complexities of producing semiconductors will increase. Decreasing geometries may introduce new problems and
delays that may affect product development and deliveries. Due to the nature of the industry and our status as a “fabless” IC semiconductor
company, we could encounter fabrication-related problems that may affect the availability of our products, delay our shipments or increase our
costs.
18
Our contracts with our wafer suppliers do not obligate
them to a minimum supply or set prices. Any inability or unwillingness of our wafer suppliers generally, and GlobalFoundries, TSMC and MagnaChip in
particular, to meet our manufacturing requirements would delay our production and product shipments and harm our business.
In recent years, we purchased over 70% of our wafers from
MagnaChip, TSMC and GlobalFoundries, with the balance from other wafer suppliers. Our reliance on independent wafer suppliers to fabricate our wafers
at their production facilities subjects us to possible risks such as:
• |
lack of adequate capacity or assured product supply; |
• |
lack of available manufactured products; |
• |
reduced control over delivery schedules, quality assurance, manufacturing yields and production costs; |
• |
unanticipated changes in wafer prices; and |
• |
closure of production facilities. |
Any inability or unwillingness of our wafer suppliers to
provide adequate quantities of finished wafers to meet our needs in a timely manner would delay our production and product shipments and seriously harm
our business. In the past, a wafer supplier shut down one of their production facilities used to manufacture our products. We transitioned the
production of these products to different facilities. The transfer of production to other facilities subjects us to the above listed risks as well as
potential yield or other production problems, which could arise as a result of any change.
At present, we purchase wafers from our suppliers through
the issuance of purchase orders based on our rolling nine-month forecasts. The purchase orders are subject to acceptance by each wafer supplier. We do
not have long-term supply contracts that obligate our suppliers to a minimum supply or set prices. We also depend upon our wafer suppliers to
participate in process improvement efforts, such as the transition to finer geometries. If our suppliers are unable or unwilling to do so, our
development and introduction of new products could be delayed. Furthermore, sudden shortages of raw materials or production capacity constraints can
lead wafer suppliers to allocate available capacity to customers other than us or for their internal uses, interrupting our ability to meet our product
delivery obligations. Any significant interruption in our wafer supply would seriously harm our operating results and our customer relations. Our
reliance on independent wafer suppliers may also lengthen the development cycle for our products, providing time-to-market advantages to our
competitors that have in-house fabrication capacity.
In the event that our suppliers are unable or unwilling to
manufacture our key products in required volumes, we will have to identify and qualify additional wafer foundries. The qualification process can take
up to nine months or longer. Furthermore, we are unable to predict whether additional wafer foundries will become available to us or will be in a
position to satisfy any of our requirements on a timely basis, or at all.
In the quarter ended December 27, 2014, we were notified by
MagnaChip that they will close a production facility, from which we purchase wafers that support approximately 15% of our revenues, by December 2015.
We are working with MagnaChip to transfer production of these wafers to one of their alternate facilities. We have successfully conducted fab transfers
in the past, but we may suffer some disruption in supply that could reduce our future revenues.
We depend on single or limited source assembly
subcontractors with whom we do not have written contracts. Any inability or unwillingness of our assembly subcontractors to meet our assembly
requirements would delay our product shipments and harm our business.
We primarily rely on foreign subcontractors for the
assembly and packaging of our products and, to a lesser extent, for the testing of finished products. Some of these subcontractors are our single
source supplier for some of our packages. In addition, changes in our or a subcontractor’s business could cause us to become materially dependent
on a single subcontractor. We have from time to time experienced difficulties in the timeliness and quality of product deliveries from our
subcontractors and may experience similar or more severe difficulties in the future. We generally purchase these single or limited source components or
services pursuant to purchase orders and have no guaranteed arrangements with these subcontractors. These subcontractors could cease to meet our
requirements for components or services, or there could be a significant disruption in supplies from them, or degradation in the quality of components
or services supplied by them. Any circumstance that would require us to qualify alternative supply
19
sources could delay shipments, result in the loss of customers and limit or reduce our revenues. Introducing new products or transferring existing products to a new third party manufacturer or process may result in unforeseen product specification and operating problems. These problems may affect our shipments and may be costly to correct.
We may experience integration or other problems with
potential future acquisitions, which could have an adverse effect on our business or results of operations. New acquisitions could dilute the interests
of existing stockholders, and the announcement of new acquisitions could result in a decline in the price of our common stock.
Our previous and potential future acquisitions could result
in the following:
• |
large one-time write-offs; |
• |
the difficulty in integrating newly-acquired businesses and operations in an efficient and effective manner; |
• |
the challenges in achieving strategic objectives, cost savings, and other benefits from acquisitions as anticipated; |
• |
the risk of diverting the attention of senior management from other business concerns; |
• |
risks of entering geographic and business markets in which we have no or limited prior experience and potential loss of key employees of acquired organizations; |
• |
the risk that our markets do not evolve as anticipated and that the technologies and capabilities acquired do not prove to be those needed to be successful in those markets; |
• |
potentially dilutive issuances of equity securities; |
• |
excessive usages of cash; |
• |
the incurrence of debt and contingent liabilities or amortization expenses related to intangible assets; |
• |
difficulties in the assimilation of operations, personnel, technologies, products and the information systems of the acquired companies; and |
• |
difficulties in integrating or expanding information technology systems and other financial or business processes that may lead to financial reporting issues. |
As part of our business strategy, we may seek acquisition
prospects that would complement our existing product offerings, improve our market coverage or enhance our technological capabilities. In addition,
from time to time, we invest in other companies, without actually acquiring them, and such investments involve many of the same risks as are involved
with acquisitions.
Implementation of new Financial Accounting Standards
Board (“FASB”) rules and the issuance of new corporate governance regulations or other accounting regulations, or reinterpretation of
existing laws or regulations, could materially impact our business or stated results.
In general, from time to time the government, courts and
the financial accounting boards may issue new corporate governance regulations or accounting regulations, or modify or reinterpret existing ones. There
may be future changes in laws, interpretations or regulations that would affect our financial results or the way in which we present them.
Additionally, changes in the laws or regulations could have adverse effects on hiring and many other aspects of our business that would affect our
ability to compete, both nationally and internationally.
The Dodd-Frank Wall Street Reform and Consumer Protection
Act of 2010 required the SEC to establish new disclosure and reporting requirements for those companies who use “conflict” minerals mined
from the Democratic Republic of Congo and adjoining countries in their products, whether or not these products are manufactured by third parties. We
filed our latest report with the SEC in May 2015 for the calendar year ended December 31, 2014. There will be future costs associated with complying
with the disclosure requirements, including for due diligence in regard to the sources of any conflict minerals used in our products and, beginning
with the report for calendar year 2015, an audit report of our Conflict Minerals Report prepared by an independent private sector auditor. In addition,
depending on the outcome of such verification activities, there may be costs of remediation and other changes to products, processes, or sources of
supply.
20
If we are unable to maintain processes and procedures to
sustain effective internal control over our financial reporting, our ability to provide reliable and timely financial reports could be harmed and this
could have a material adverse effect on our stock price.
Under the rules promulgated under Section 404 of the
Sarbanes-Oxley Act of 2002, or Sarbanes-Oxley Act, we are required to maintain, and evaluate the effectiveness of, our internal control over financial
reporting and disclosure controls and procedures. In our annual reports on Form 10-K for the years ended July 3, 2010, June 27, 2009, June 30, 2007 and
July 2, 2005, we reported material weaknesses in our internal control over financial reporting. We have since remediated these deficiencies and
continue to spend a significant amount of time and resources to ensure compliance with Section 404 of the Sarbanes Oxley Act of 2002. As reported in
Item 9A of this Form 10-K, our management does not believe that we had any material weaknesses in our internal control over financial reporting as of
June 27, 2015, and management has determined that as of June 27, 2015, our internal control over financial reporting was effective. However, we have
and will continue to evolve our business in a changing marketplace. In addition, we are expanding our overseas operations, and as we grow in these
locations, we may have difficulty in recruiting and retaining a complement of personnel with an appropriate level of accounting knowledge, experience
and training in the application of U.S. generally accepted accounting principles commensurate with our financial reporting requirements. Due to these
factors, there can be no assurance that other material weaknesses or significant deficiencies will not arise in the future. Should we or our
independent registered public accounting firm determine in future periods that we have a material weakness in our internal control over financial
reporting, the reliability of our financial reports may be impacted, and investors could lose confidence in the accuracy and completeness of our
financial reports, which could have an adverse effect on our stock price and we could suffer other materially adverse consequences.
Changes to environmental laws and regulations applicable
to manufacturers of electrical and electronic equipment are causing us to redesign our products, and may increase our costs and expose us to
liability.
The implementation of new environmental regulatory legal
requirements, such as lead free initiatives, may affect our product designs and manufacturing processes. The impact of such regulations on our product
designs and manufacturing processes could affect the timing of compliant product introductions as well as their commercial success. Redesigning our
products to comply with new regulations may result in increased research and development and manufacturing and quality control costs. In addition, the
products we manufacture that comply with new regulatory standards may not perform as well as our current products. Moreover, if we are unable to
successfully and timely redesign existing products and introduce new products that meet new standards set by environmental regulation and our
customers, sales of our products could decline, which could materially adversely affect our business, financial condition and results of
operations.
We compete with others to attract and retain key
personnel, and any loss of or inability to attract key personnel would harm us.
To a greater degree than non-technology companies, our
future success will depend on the continued contributions of our executive officers and other key management and technical personnel. None of these
individuals has an employment agreement with us and each one would be difficult to replace. We do not maintain any key person life insurance policies
on any of these individuals. The loss of the services of one or more of our executive officers or key personnel or the inability to continue to attract
qualified personnel could delay product development cycles or otherwise harm our business, financial condition and results of
operations.
Our future success also will depend on our ability to
attract and retain qualified technical, sales, marketing, finance and management personnel, particularly highly skilled design, process and test
engineers, for whom competition can be intense. During strong business cycles, we expect to experience difficulty in filling our needs for qualified
engineers and other personnel. If we do not succeed in hiring and retaining candidates with appropriate qualifications, our revenues, operations and
product development efforts could be harmed.
21
Our limited ability to protect our intellectual property
and proprietary rights could harm our competitive position. Litigation regarding intellectual property could divert management attention, be costly to
defend and prevent us from using or selling the challenged technology.
Our success depends in part on our ability to obtain
patents and licenses and preserve other intellectual property rights covering our products and development and testing tools. In the United States, we
currently hold 95 patents covering certain aspects of our product designs and have five additional patent applications pending. Copyrights, mask work
protection, trade secrets and confidential technological know-how are also key to our business. Additional patents may not be issued to us or our
patents or other intellectual property may not provide meaningful protection. We may be subject to, or initiate, interference proceedings in the U.S.
Patent and Trademark Office. These proceedings can consume significant financial and management resources. We may become involved in litigation
relating to alleged infringement by us of others’ patents or other intellectual property rights. This type of litigation is frequently expensive
to both the winning party and the losing party and takes up significant amounts of management’s time and attention. In addition, if we lose such a
lawsuit, a court could require us to pay substantial damages and/or royalties or prohibit us from using essential technologies. For these and other
reasons, this type of litigation could seriously harm our business. Also, although we may seek to obtain a license under a third party’s
intellectual property rights in order to bring an end to certain claims or actions asserted against us, we may not be able to obtain such a license on
reasonable terms or at all.
Because it is important to our success that we are able to
prevent competitors from copying our innovations, we intend to continue to seek patent, trade secret and mask work protection for our technologies. The
process of seeking patent protection can be long and expensive, and we cannot be certain that any currently pending or future applications will
actually result in issued patents, or that, even if patents are issued, they will be of sufficient scope or strength to provide meaningful protection
or any commercial advantage to us. Furthermore, others may develop technologies that are similar or superior to our technology or design around the
patents we own.
We also rely on trade secret protection for our technology,
in part through confidentiality agreements with our employees, consultants and third parties. However, these parties may breach these agreements. In
addition, the laws of some territories in which we develop, manufacture or sell our products may not protect our intellectual property rights to the
same extent as do the laws of the United States.
Our independent foundries use a process technology that may
include technology we helped develop with them, and that may generally be used by those foundries to produce their own products or to manufacture
products for other companies, including our competitors. In addition, we may not have the right to implement key process technologies used to
manufacture some of our products with foundries other than our present foundries.
We may not provide adequate allowances for exchanges,
returns and concessions.
We recognize revenue from the sale of products when
shipped, less an allowance based on future authorized and historical patterns of returns, price protection, exchanges and other concessions. We believe
our methodology and approach are appropriate. However, if the actual amounts we incur exceed the allowances, it could decrease our revenue and
corresponding gross profit.
Our future tax rates and tax payments could be higher
than we anticipate and may harm our results of operations.
As a multinational corporation, we conduct our business in
many countries and are subject to taxation in many jurisdictions. The taxation of our business is subject to the application of multiple and sometimes
conflicting tax laws and regulations as well as multinational tax conventions. A number of factors, including unanticipated changes in the mix of
earnings in countries with differing statutory tax rates or by unexpected changes in existing tax laws or our interpretation of them, could unfavorably
affect our future effective tax rate. In the event our management determines it is no longer more likely than not that we will realize a portion of our
deferred tax assets we will be required to increase our valuation allowance which will result in an increase in our effective tax rate. Furthermore,
our tax returns are subject to examination in all the jurisdictions in which we operate which subjects us to potential increases in our tax
liabilities. The Internal Revenue Service completed their examination of the federal tax returns
22
for fiscal 2010 and 2011 during fiscal 2014, and the Company made additional tax payments of approximately $208,000 including interest charges for the two years that were examined.
In addition, in fiscal 2013 we began implementation of an
operating structure to more efficiently align the Company’s transaction flows with the Company’s geographic business operations. As a result
we formed new legal entities and realigned existing ones, completed an intercompany transfer of intellectual property rights, inventory and fixed
assets across different tax jurisdictions, and implemented intercompany intellectual property licensing agreements between our U.S. and foreign
entities. These changes may result in unanticipated changes to our tax rates and tax payments. All of these factors could have an adverse effect on our
financial condition and results of operations.
If our liability for U.S. and foreign taxes is greater
than we have anticipated and reserved for, our operating results may suffer.
We are subject to taxation in the United States and in
foreign jurisdictions in which we do business, including China. We believe that we have adequately estimated and reserved for our income tax liability.
However, our effective tax rates may not be as low as we anticipate. As of June 27, 2015, one of the Company’s subsidiaries in a foreign tax
jurisdiction is under audit for the years 2010 to 2013. Our business operations, including our transfer pricing for transactions among our various
business entities operating in different tax jurisdictions, may be audited at any time by the U.S., Chinese or other foreign tax
authorities.
A number of factors may adversely impact our future
effective tax rates, such as:
• |
changes in the tax laws of any of the countries in which we pay substantial taxes, including changes to tax rates or to transfer pricing standards, or more fundamental changes such as the various proposals that exist from time to time for U.S. international tax reform; |
• |
challenges to our transfer pricing methodologies; |
• |
changes in the valuation of our deferred tax assets and liabilities; |
• |
changes in U.S. general accepted accounting principles; and |
• |
the repatriation of non-U.S. earnings with respect to which we have not previously provided for U.S. taxes. |
A change in our effective tax rate due to any of these
factors may adversely impact our future results from operations. Also, changes in tax laws could have a material adverse effect on our ability to
utilize cash in a tax efficient manner.
A large portion of our revenues is derived from sales to
a few key customers, and the loss of one or more of our key customers, or their key end user customers, could significantly reduce our revenues. In
addition, our sales through distributor channels increases the complexity of our business.
A relatively small number of key customers have accounted
for a significant portion of our net revenues in each of the past several fiscal years. In general we expect this to continue for the foreseeable
future. We had two direct customers who accounted for more than 10% of net revenues during each of the fiscal years ended June 27, 2015, June 28, 2014
and June 29, 2013. As a percentage of net revenues, sales to our top five direct customers during the fiscal year ended June 27, 2015 totaled 51%, as
compared with 47% in the fiscal year ended June 28, 2014 and 42% in the fiscal year ended June 29, 2013.
We do not have long-term sales agreements with any of our
customers. Our customers are not subject to minimum purchase requirements, may reduce or delay orders periodically due to excess inventory and may
discontinue purchasing our products at any time. Our distributors typically offer competing products in addition to ours. For the fiscal year ended
June 27, 2015, sales to our domestic and international distributors were approximately 67% of net revenues, as compared with approximately 68% of net
revenues in the fiscal year ended June 28, 2014 and approximately 66% in the fiscal year ended June 29, 2013. Distributors therefore continue to
account for a significant portion of our sales. The loss of one or more significant customers, or the decision by a significant distributor to carry
additional product lines of our competitors could decrease our revenues.
Selling through distributor channels increases the
complexity of our business, requiring us to, among other matters:
• |
manage a more complex supply chain; |
• |
monitor and understand the drivers of inventory levels at each of our distributors; |
• |
provide for credits, return rights and price protection; |
23
• |
estimate the impact of credits, return rights, price protection and unsold inventory at distributors; and |
• |
monitor the financial condition and creditworthiness of our distributors. |
Increases in inventory could increase the complexity of one
or more of the above factors. Any failure to manage these challenges, or the occurrence of an imbalance in supply and demand, could cause us or our
distributors to inaccurately forecast sales and carry excess or insufficient inventory, thereby adversely affecting our net sales, operating results
and cash flows. For further detail on credits, return rights and price protection, see Part II, Item 7, Management’s Discussion and Analysis of
Financial Condition and Results of Operations, Critical Accounting Policies — Revenue Recognition.
Because we sell products in foreign markets and have
operations outside of the United States, we face foreign business, political, economic and currency risks that could seriously harm us. Almost all of
our wafer suppliers and assembly subcontractors are located in Southeast Asia, as are our FCP manufacturing facilities, which exposes us to the
problems associated with international operations.
Risks associated with international business operations
include the following:
• |
disruptions or delays in shipments; |
• |
changes in economic conditions in the countries where these subcontractors are located; |
• |
currency fluctuations; |
• |
changes in political conditions; |
• |
potentially reduced protection for intellectual property; |
• |
foreign governmental regulatory requirements and unexpected changes in them; |
• |
the burdens of complying with a variety of foreign laws; |
• |
import and export controls; |
• |
delays resulting from difficulty in obtaining export licenses for technology; |
• |
changes in tax laws, tariffs and other barriers, and freight rates; and |
• |
compliance with Generally Accepted Accounting Principles in the United States (“U. S. GAAP”). |
Regulatory, geopolitical and other factors could seriously
harm our business or require us to modify our current business practices. We are subject to general geopolitical risks in connection with our
international operations, such as political and economic instability and changes in diplomatic and trade relationships. Although most of our products
are sold in U.S. dollars, we incur a significant amount of certain types of expenses, such as payroll, utilities, capital equipment purchases and taxes
in local currencies. The impact of currency exchange rate movements could harm our results and financial condition. In addition, changes in tariff and
import regulations and in U.S. and non-U.S. monetary policies could harm our results and financial condition by increasing our expenses and reducing
our revenue. Varying tax rates in different jurisdictions could harm our results of operations and financial condition by increasing our overall tax
rate.
In the fiscal year ended June 27, 2015, we generated
approximately 91%, 6% and 3% of our net revenues from sales in Asia, the United States and the rest of the world, respectively. In each of the fiscal
years ended June 28, 2014 and June 29, 2013, we generated approximately 92%, 5% and 3% of our net revenues from sales in Asia, the United States and
the rest of the world, respectively. We expect that foreign sales will continue to represent by far the majority of net revenues. This will require
significant management attention and financial resources and further subject us to international operating risks.
We have subsidiaries located in Asia. We manufacture some
of our FCPs in Taiwan as well as in the Jinan Development Zone in the Shandong Province of the PRC. The development of the Jinan facility depended upon
various tax concessions, tax rebates and other support from the local governmental entity. There can be no assurance that the local governmental entity
will not change their position regarding such tax and other support and such a change might adversely affect the profitability of this facility. In
addition, there can be no assurance we will be able to assemble and maintain sufficient management resources in our Asia subsidiaries, including a
sales force knowledgeable about our target markets and an accounting staff with sufficient U. S. GAAP accounting expertise.
We are expanding our presence in China with manufacturing
and research and development activities. We will be subject to increased risks relating to foreign currency exchange rate fluctuations that could have
a material adverse effect on our business, financial condition and operating results. The value of the Chinese yuan against the
24
United States dollar and other currencies may fluctuate and is affected by, among other things, changes in China’s political and economic conditions. Significant future appreciation of the yuan could increase our component and other raw material costs as well as our labor costs, and could adversely affect our financial results. Devaluation of the yuan could lower some of our costs and make our operations more competitive, but would also reduce the value of sales made in the currency. To the extent that we need to convert United States dollars into yuan for our operations, appreciation of yuan against the United States dollar could have a material adverse effect on our business, financial condition and results of operations. Conversely, if we decide to convert our yuan into United States dollars for other business purposes and the United States dollar appreciates against the yuan, the United States dollar equivalent of the yuan we convert would be reduced. The Chinese government now measures the exchange rate of the yuan against a number of currencies, rather than just the United States dollar. Fluctuations in the yuan exchange rate could increase and could adversely affect our ability to operate our business.
In addition, there is a potential risk of conflict and
further instability in the relationship between Taiwan and the PRC. Conflict or instability could disrupt the operations of one of our principal wafer
suppliers, several of our assembly subcontractors located in Taiwan, and our FCP manufacturing operations in Taiwan and the PRC.
Our operations and financial results could be severely
harmed by natural disasters.
Our headquarters and some of our major suppliers’
manufacturing facilities are located near major earthquake faults. In particular, our Asian operations and most of our third party service providers
involved in the manufacturing of our products are located within relative close proximity. Therefore, any disaster that strikes within or close to that
geographic area could be extremely disruptive to our business and could materially and adversely affect our operating results and financial
condition.
One of the foundries we use is located in Taiwan, which has
suffered severe earthquakes in the past. Taiwan is also exposed to typhoons and tsunamis, which can affect not only foundries we rely upon but also our
PSE-TW subsidiary. In March 2011, an earthquake and tsunami occurred off the northeast coast of Japan which disrupted the global supply chain for core
materials manufactured in Japan that are incorporated in our products and manufacturing equipment. Thailand experienced floods in the quarter ended
December 31, 2011, which interrupted the industry’s supply chain for storage products and impacted our sales as well. If a major earthquake,
typhoon, tsunami or other natural disaster were to affect our operations or those of our suppliers, our product supply could be interrupted, which
would seriously harm our business. Natural disasters could also affect the operations of the distributors and contract manufacturers we sell to, as
well as the operations of our end use customers, which would adversely affect our operations and financial results. Natural disasters anywhere in the
world may potentially adversely affect us by harming or causing interruptions to our supply chain or the supply chains of our suppliers, direct
customers or end use customers.
System security risks, data protection or privacy
breaches and cyber-attacks could disrupt our internal operations and harm the reputation of the Company.
Breaches of our information technology systems caused by
computer viruses, unauthorized access, sabotage, vandalism or terrorism could compromise our information technology networks and result in unauthorized
release of our, our customers’ or our suppliers’ confidential or proprietary information, theft of our intellectual property, cause a
disruption to our manufacturing and other operations, result in release of employee personal data, or cause us to incur increased information
technology protection costs, any of which could adversely affect our financial results, stock price and reputation.
RISKS RELATED TO THE SECURITIES MARKETS AND OWNERSHIP OF
OUR COMMON STOCK
Our stock has been and will likely continue to be
subject to substantial price and volume fluctuations due to a number of factors, many of which are beyond our control.
The trading price of our common stock has been, and is
likely to continue to be, highly volatile. The securities markets have experienced significant price and volume fluctuations in the past, and the
market prices of the securities of semiconductor companies have been especially volatile. This market volatility, as well as general economic, market
or political conditions, including the current global economic situation, could reduce the market price of
25
our common stock in spite of our operating performance. Our stock price could fluctuate widely in response to factors some of which are not within our control, including:
• |
general conditions in the semiconductor and electronic systems industries; |
• |
actual or anticipated fluctuations in our operating results; |
• |
changes in expectations as to our future financial performance; |
• |
announcements of technological innovations or new products by us or our competitors; |
• |
changes in earnings estimates by analysts; and |
• |
price and volume fluctuations in the overall stock market, which have particularly affected the market prices of many high technology companies. |
ITEM 1B. UNRESOLVED STAFF COMMENTS
None.
ITEM 2. PROPERTIES
We own our corporate headquarters building of approximately
85,040 square feet located in Milpitas, California. We also own, through our PSE-TW subsidiary, a manufacturing facility near Taipei, Taiwan consisting
of approximately 74,000 square feet. Our PSE-TW subsidiary also owns a facility of approximately 8,840 square feet in Taipei and has leased
approximately 1,570 square feet of space in Hsin Chu, Taiwan for research and development as well as sales and administrative functions. In addition,
we have land use rights until July 8, 2058 from the PRC for our factory in the Jinan Development Zone in Shandong Province, China. This factory for the
development and manufacture of frequency control products is approximately 344,000 total square feet and consists of an administrative building, a
workers dormitory, and a fabrication plant. We own a 15,000 square foot office building in Shanghai, China that is occupied by our PTI subsidiary,
which also includes land use rights from the PRC. We also have leased or rented international sales offices in Japan, Korea, Singapore, India and the
United Kingdom. We believe our current facilities are adequate to support our needs through the end of fiscal 2016.
ITEM 3. LEGAL PROCEEDINGS
We are subject to various routine claims and legal
proceedings that arise in the ordinary course of business. We are presently not subject to any legal proceedings that could have a material impact on
our business or financial condition.
ITEM 4. MINE SAFETY DISCLOSURES
Not applicable.
26
PART II
ITEM 5. MARKET FOR REGISTRANT’S COMMON EQUITY,
RELATED STOCKHOLDER MATTERS AND ISSUER PURCHASES OF EQUITY SECURITIES
The information required by this item regarding equity
compensation plans is incorporated by reference to the information set forth in Item 12 of this Annual Report on Form 10-K.
COMMON STOCK PRICE RANGE
Our common stock began trading publicly on the NASDAQ
National Market on October 31, 1997 under the symbol PSEM. Prior to that date, there was no public market for the common stock. It is our policy to
reinvest our earnings to finance expansion of our operations and to repurchase shares of our common stock to help counter dilution from the
Company’s Stock Award and Employee Stock Purchase Plans. In addition, we began paying quarterly cash dividends of $0.06 per share of common stock
in the third quarter of fiscal 2015. The following table sets forth, for the periods indicated, the high and low prices of the common stock on the
NASDAQ Stock Market. As of June 27, 2015, we had 35 holders of record of our common stock. Holders of record do not include share owners whose shares
are in broker or other nominee accounts. During fiscal year 2015, we did not sell any unregistered securities.
| Common Stock Prices |
|||||||||||
|---|---|---|---|---|---|---|---|---|---|---|---|
| High |
Low |
||||||||||
Fiscal year ended June 28, 2014 |
|||||||||||
First Quarter |
$ | 7.93 | $ | 7.01 | |||||||
Second Quarter |
9.67 | 7.05 | |||||||||
Third Quarter |
9.31 | 6.16 | |||||||||
Fourth Quarter |
9.25 | 7.20 | |||||||||
Fiscal year ended June 27, 2015 |
|||||||||||
First Quarter |
$ | 10.50 | $ | 8.53 | |||||||
Second Quarter |
14.40 | 9.00 | |||||||||
Third Quarter |
16.81 | 12.51 | |||||||||
Fourth Quarter |
15.70 | 12.06 | |||||||||
27
PERFORMANCE GRAPH
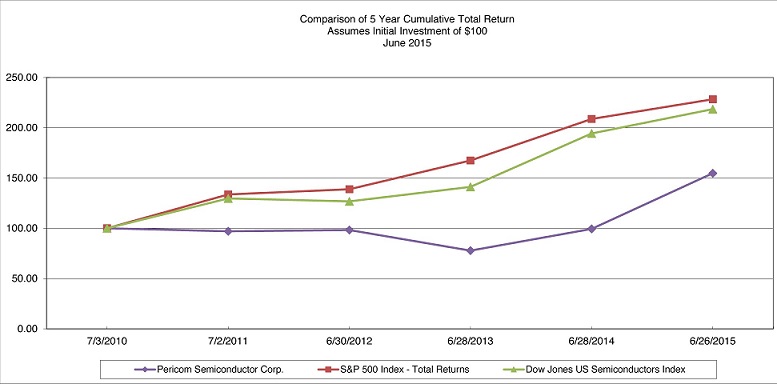
STOCK REPURCHASE PLAN
On April 26, 2012, the Board of Directors authorized a
share repurchase program for up to $25 million of shares of the Company’s common stock, and on April 24, 2014 the Board authorized an additional
$20 million for the share repurchase program. The Company was authorized to repurchase the shares from time to time in the open market or private
transactions, at the discretion of the Company’s management. During the year ended June 27, 2015, the Company repurchased 937,729 shares for an
aggregate cost of $10.9 million. Repurchases during the fourth quarter of fiscal 2015 were as follows:
| Period |
Total Number of Shares Purchased |
Average Price Paid per Share |
Total Number of Shares Purchased as Part of Publicly Announced Plans or Programs |
Maximum $ Value of Shares That May Yet be Purchased Under the Plans or Programs |
||||||||||||||
|---|---|---|---|---|---|---|---|---|---|---|---|---|---|---|---|---|---|---|
April 2015 |
175,269 | $ | 14.00 | 175,269 | $ | 19,138,579 | ||||||||||||
May 2015 |
99,396 | 12.94 | 99,396 | 17,852,759 | ||||||||||||||
June 2015 |
166,452 | 12.65 | 166,452 | 15,746,949 | ||||||||||||||
Total |
441,117 | $ | 13.25 | 441,117 | $ | 15,746,949 | ||||||||||||
During the year ended June 28, 2014, the Company
repurchased 1,354,511 shares for an aggregate cost of $11.3 million. During the year ended June 29, 2013, the Company repurchased 1,100,306 shares for
an aggregate cost of $7.8 million, of which purchases of approximately $701,000 were made under a now expired 2008 authorization.
As of June 27, 2015, the Company had $15.7 million of
purchase authority remaining under the 2014 authorization.
Current cash balances and the proceeds from stock option
exercises and purchases in the stock purchase plan have funded stock repurchases in the past, and the Company expects to fund future stock repurchases
from these same sources.
28
ITEM 6. SELECTED FINANCIAL DATA
The following selected financial data of the Company is
qualified by reference to and should be read in conjunction with the consolidated financial statements, including the Notes thereto, and
Management’s Discussion and Analysis of Financial Condition and Results of Operations included in Item 7. The consolidated statements of
operations data for each year in the three-year period ended June 27, 2015, and the consolidated balance sheets data as of June 27, 2015 and June 28,
2014, are derived from, and are qualified by reference to, the consolidated financial statements included herein. We derived the consolidated
statements of operations data for the years ended June 30, 2012 and July 2, 2011 and the consolidated balance sheets data as of June 29, 2013, June 30,
2012 and July 2, 2011 from audited financial statements not included herein. All years presented contained 52 weeks.
| Fiscal Year Ended |
|||||||||||||||||||||||
|---|---|---|---|---|---|---|---|---|---|---|---|---|---|---|---|---|---|---|---|---|---|---|---|
| June 27, 2015 |
June 28, 2014 |
June 29, 2013 |
June 30, 2012 |
July 2, 2011(1) |
|||||||||||||||||||
| (in thousands, except per share data) | |||||||||||||||||||||||
Consolidated Statements of Operations Data: |
|||||||||||||||||||||||
Net revenues |
$ | 128,835 | $ | 128,068 | $ | 129,255 | $ | 137,135 | $ | 166,343 | |||||||||||||
Cost of revenues |
71,021 | 76,983 | 81,388 | 88,484 | 110,661 | ||||||||||||||||||
Gross profit |
57,814 | 51,085 | 47,867 | 48,651 | 55,682 | ||||||||||||||||||
Operating expenses: |
|||||||||||||||||||||||
Research and development |
17,853 | 19,795 | 21,017 | 21,722 | 20,230 | ||||||||||||||||||
Selling, general and administrative |
29,998 | 30,320 | 29,581 | 29,648 | 29,447 | ||||||||||||||||||
Goodwill impairment |
— | — | 16,899 | — | — | ||||||||||||||||||
Total operating expenses |
47,851 | 50,115 | 67,497 | 51,370 | 49,677 | ||||||||||||||||||
Income (loss) from operations |
9,963 | 970 | (19,630 | ) | (2,719 | ) | 6,005 | ||||||||||||||||
Interest and other income, net |
4,452 | 2,792 | 4,043 | 3,684 | 15,142 | ||||||||||||||||||
Interest expense |
— | — | (19 | ) | (70 | ) | (765 | ) | |||||||||||||||
Income (loss) before income taxes |
14,415 | 3,762 | (15,606 | ) | 895 | 20,382 | |||||||||||||||||
Income tax expense (benefit) |
2,765 | (230 | ) | 6,223 | 3,097 | 7,619 | |||||||||||||||||
Net income (loss) from consolidated companies |
11,650 | 3,992 | (21,829 | ) | (2,202 | ) | 12,763 | ||||||||||||||||
Equity in net income of unconsolidated affiliates |
175 | 132 | 215 | 134 | 700 | ||||||||||||||||||
Net income (loss) |
$ | 11,825 | $ | 4,124 | $ | (21,614 | ) | $ | (2,068 | ) | $ | 13,463 | |||||||||||
Basic income (loss) per share |
$ | 0.53 | $ | 0.18 | $ | (0.93 | ) | $ | (0.09 | ) | $ | 0.54 | |||||||||||
Diluted income (loss) per share |
$ | 0.52 | $ | 0.18 | $ | (0.93 | ) | $ | (0.09 | ) | $ | 0.53 | |||||||||||
Shares used in computing basic income (loss) per share(2) |
22,206 | 22,594 | 23,251 | 24,094 | 24,923 | ||||||||||||||||||
Shares used in computing diluted income (loss) per share(2) |
22,716 | 22,797 | 23,251 | 24,094 | 25,254 | ||||||||||||||||||
Dividends declared and paid per share |
$ | 0.12 | $ | — | $ | — | $ | — | $ | — | |||||||||||||
| June 27, 2015 |
June 28, 2014 |
June 29, 2013 |
June 30, 2012 |
July 2, 2011(1) |
|||||||||||||||||||
|---|---|---|---|---|---|---|---|---|---|---|---|---|---|---|---|---|---|---|---|---|---|---|---|
| (in thousands) | |||||||||||||||||||||||
Consolidated Balance Sheets Data: |
|||||||||||||||||||||||
Working capital |
$ | 152,592 | $ | 142,649 | $ | 140,188 | (3) | $ | 151,265 | (3) | $ | 150,460 | (3) | ||||||||||
Total assets |
247,723 | 240,079 | 246,567 | 275,806 | 301,016 | ||||||||||||||||||
Total long-term obligations |
11,729 | 13,726 | 16,761 | 17,339 | 17,754 | ||||||||||||||||||
Total shareholders’ equity |
215,609 | 207,492 | 208,891 | 233,635 | 242,725 | ||||||||||||||||||
(1) |
On August 31, 2010, the Company completed the acquisition of PTI. |
(2) |
See Note 1 of Notes to Consolidated Financial Statements for an explanation of the method used to determine the number of shares used in computing basic and diluted earnings per share. |
(3) |
Working capital has been adjusted to conform with the current year presentation in which all available-for-sale securities are classified as short-term investments. |
29
ITEM 7. MANAGEMENT’S DISCUSSION AND ANALYSIS OF
FINANCIAL CONDITION AND RESULTS OF OPERATIONS
CRITICAL ACCOUNTING POLICIES
Our consolidated financial statements have been prepared in
accordance with accounting principles generally accepted in the United States of America. The preparation of such statements requires us to make
estimates and assumptions that affect the reported amounts of revenues and expenses during the reporting period and the reported amounts of assets and
liabilities as of the date of the financial statements. Our estimates are based on historical experience and other assumptions that we consider to be
reasonable given the circumstances. Actual results may vary from our estimates.
The methods, estimates and judgments we use in applying our
most critical accounting policies have a significant impact on the results we report in our consolidated financial statements. The Securities and
Exchange Commission has defined the most critical accounting policies as the ones that are most important to the portrayal of a company’s
financial condition and results of operations, and require the company to make its most difficult and subjective accounting judgments, often as a
result of the need to make estimates of matters that are inherently uncertain. Based on this definition, our most critical accounting policies include
revenue recognition and accounts receivable allowances, which impact the recording of revenues; valuation of inventories, which impacts costs of goods
sold and gross margins; accounting for income taxes, which impacts the income tax provision and net income; impairment of intangible assets and
investments, which impacts the intangible asset and investment accounts; and stock-based compensation, which impacts costs of goods sold and operating
expenses. These policies and the estimates and judgments involved are discussed further below. We also have other important policies that we discuss in
Note 1 to the Consolidated Financial Statements.
REVENUE RECOGNITION. We recognize revenue
from the sale of our products when:
• |
Persuasive evidence of an arrangement exists; |
• |
Delivery has occurred; |
• |
The sales price is fixed or determinable; and |
• |
Collectibility is reasonably assured. |
Generally, the Company meets these conditions upon shipment
because, in most cases, title and risk of loss passes to the customer at that time. In addition, the Company estimates and records provisions for
future returns and other charges against revenue at the time of shipment.
We sell products to both large domestic and international
distributors. We sell our products to domestic distributors at the price listed in our price book for that distributor. At the time of shipment, we
record a sales reserve for the entire amount if the customer has the right to return the product. In addition, at the time of sale we record a sales
reserve for ship from stock and debits (“SSD”s), stock rotation amounts expected to be returned, return material authorizations
(“RMA”s), authorized price protection programs, and any special programs approved by management. These sales reserves offset revenues, which
produces the net revenues amount we report in our consolidated financial statements.
The market price for our products can be significantly
different from the book price at which we sold the product to the distributor. When the market price, as compared with the book price, of a particular
sales opportunity from our distributor to their customer would result in low or negative margins to our distributor, we negotiate a ship from stock and
debit with the distributor. We analyze our SSD history and use the history to develop SSD rates that form the basis of the SSD sales reserve we record
each period. We use historical SSD rates to estimate the ultimate net sales price to the distributor.
Our distribution agreements provide for semi-annual stock
rotation privileges of typically 10% of net sales for the previous three-month period. The contractual stock rotation applies only to shipments at book
price. Asian distributors typically buy our product at less than book price and therefore are not entitled to the 10% stock rotation privilege. In
order to provide for routine inventory refreshing, for our benefit as well as theirs, we typically grant Asian distributors stock rotation privileges
between 1% and 5% even though we are not contractually obligated to do so. Each month we adjust the sales reserve for the estimated stock rotation
privilege anticipated to be utilized
30
by our distributors that month. This reserve is the sum of the product of each distributor’s net sales for the month and their stock rotation percentage, adjusted for their historical stock rotation allowance utilization rate.
From time to time, customers may request to return parts
for various reasons including the customers’ belief that the parts are not performing to specification. Many such return requests are the result
of customers incorrectly using the parts, not because the parts are defective. Our management reviews these requests and, if approved, we establish a
RMA. We are only obligated to accept returns of defective parts. For customer convenience, we may approve a particular return request, even though we
are not obligated to do so. Each month, we record a sales reserve for the approved RMAs that have not yet been returned. In the past we have not kept a
general warranty reserve because historically, valid warranty returns, which are the result of a part not meeting specifications or being
non-functional, have been immaterial and frequently we can resell parts to other customers for use in other applications. We monitor and assess RMA
activity and overall materiality to assess whether a general warranty reserve has become appropriate.
We grant price protection solely at the discretion of our
management. The purpose of price protection is to reduce our distributors’ cost of inventory as market prices fall, which reduces our SSD rates.
Our sales management team prepares price protection proposals for individual products located at individual distributors. Our general management
reviews these proposals and if a particular price protection arrangement is approved, we estimate the dollar impact based on the book price reduction
per unit for the products approved and the number of units of those products in that distributor’s inventory. We record a sales reserve in that
period for the estimated amount at the time revenue is recognized.
At the discretion of our management, we may offer rebates
on specific products sold to specific end customers. The purpose of the rebates is to allow for pricing adjustments for large programs without
affecting the pricing we charge our distributor customers. We record the customer’s rebate at the time of shipment.
Customers are typically granted payment terms of between 30
and 60 days and they generally pay within those terms. We grant relatively few customers any sales terms that include cash discounts. We invoice our
distributors for shipments at our listed book price. When our distributors pay those invoices, they may claim debits for SSDs, stock rotations, cash
discounts, RMAs and price protection when appropriate. Once claimed, we confirm these debits are in line with our management’s prior
authorizations and reduce the reserve we previously established for that customer.
The revenue we record for sales to our distributors is net
of estimated provisions for these programs. When determining this net revenue, we must make significant judgments and estimates. We base our estimates
on historical experience rates, inventory levels in the distribution channel, current trends and other related factors. However, because of the
inherent nature of estimates, there is a risk that there could be significant differences between actual amounts and our estimates. Our financial
condition and operating results depend on our ability to make reliable estimates and we believe that our estimates are reasonable.
CASH AND CASH EQUIVALENTS. Cash and cash
equivalents consist of cash on hand and in banks and all highly liquid investments with an original or remaining maturity of three months or less at
the time of purchase.
INVESTMENTS IN MARKETABLE SECURITIES. Our
policy is to invest excess funds in instruments with investment grade credit ratings. We classify our investments as “available-for-sale”. We
recognize unrealized gains and losses in our available-for sale securities as an increase or reduction in shareholders’ equity. We report our
available-for-sale securities at their fair values. We evaluate our available-for-sale securities for impairment quarterly. We recognize the credit
portion of an impairment loss as other than temporary decline in the value of investment in our consolidated statement of operations in the period in
which we discover the impairment. Any non-credit portion of an impairment loss is recorded in other comprehensive income in our consolidated balance
sheet for the period in which we discover the impairment.
We have also made other investments including loans and
bridge loans convertible to equity as well as direct equity investments. We make these loans and investments with strategic intentions and,
historically, are in privately held technology companies, which by their nature are high risk. These investments are included in other assets in the
consolidated balance sheets and we carry them at the lower of cost or market if the investment has experienced
31
an “other than temporary” decline in value. We monitor these investments quarterly and make appropriate reductions in carrying value if we deem a decline in value is other than temporary.
ALLOWANCE FOR DOUBTFUL ACCOUNTS. We evaluate
our allowance for doubtful accounts using a combination of factors. We record a specific allowance in cases where we become aware of circumstances that
may impair a specific customer’s ability to pay fully their financial obligation to us. For all other customers, we recognize an allowance based
on the length of time the receivable balances are past due, based on the current economic environment and our historical experience.
INVENTORIES. For our IC and certain FCP
products we record inventories at the lower of standard cost (which approximates actual cost on a first-in, first-out basis) or market value. We adjust
the carrying value of inventory for excess and obsolete inventory based on inventory age, shipment history and our forecast of demand over a specific
future period. The semiconductor markets that we serve are volatile and actual results may vary from our forecast or other assumptions, potentially
affecting our assessment of excess and obsolete inventory resulting in material effects on our gross margin.
We record the inventories of the remainder of our FCP
products at the lower of weighted-average cost (which approximates actual cost) or market value. Weighted average cost is comprised of average
manufacturing costs weighted by the volume produced in each production run. We define market value as the net realizable value for our finished goods
and replacement cost for raw materials and work in process.
We consider raw material inventory slow moving and fully
reserve for it if it has not moved in 365 days. For assembled devices, we disaggregate the inventory by part number. We compare the quantities on hand
in each part number category to the quantity we shipped in the previous twelve months, the quantity in backlog and to the quantity we expect to ship in
the next twelve months. We record a reserve to the extent the value of each quantity on hand is in excess of the lesser of the three comparisons. In
certain circumstances, management will determine, based on expected usage or other factors, that inventory considered excess by these guidelines should
not be reserved. The Company does occasionally determine that last twelve months’ sales levels will not continue and reserves inventory in line
with the quantity forecasted. We believe our method of evaluating our inventory fairly represents market conditions.
We consider the reserved material to be available for sale.
We do not revalue the reserved inventory should market conditions change or if a market develops for the obsolete inventory. In the past, we have sold
obsolete inventory that we have previously fully reserved. Refer to the discussion under the caption “Gross Profit” in this Management’s
Discussion and Analysis of Financial Condition and Results of Operations for further discussion of sales of our obsolete inventory.
PROPERTY, PLANT AND EQUIPMENT. We record our
property, plant and equipment at cost and depreciate the cost over the estimated useful lives of each asset classification, ranging between 3 and 40
years. Cost includes purchase cost, applicable taxes, freight, installation costs and interest incurred in the acquisition of any asset that requires a
period of time to make it ready for use. In addition, we capitalize the cost of major replacements, improvements and betterments, while we expense
normal maintenance and repair.
INVESTMENTS IN UNCONSOLIDATED AFFILIATES. We
hold and have held ownership interests in various investees. Our ownership in these affiliates has varied from 20% to approximately 49%, which we
classify as investments in unconsolidated affiliates in our consolidated balance sheets. We account for long-term investments in companies in which we
have an ownership share larger than 20% and in which we have significant influence over the activities of the investee using the equity method. We
recognize our proportionate share of each investee’s income or loss in the period in which the investee reports the income or loss. We eliminate
all intercompany transactions in accounting for our equity method investments.
LONG-LIVED ASSETS — We evaluate
long-lived assets for impairment whenever events or changes in circumstances indicate that the carrying amount of an asset may not be recoverable. When
the sum of the undiscounted future net cash flows expected to result from the use of the asset and its eventual disposition is less than its carrying
amount, we will recognize an impairment loss as the amount of the difference between carrying value and fair value as determined by discounted cash
flows.
32
SHARE-BASED COMPENSATION. The Company
recognizes employee share-based compensation through measurement at grant date based on the fair value of the award, and the fair value is recognized
as an expense over the employee’s requisite service period. See Note 14 to the Consolidated Financial Statements contained in this report on Form
10-K for further discussion of share-based compensation.
INCOME TAXES. We account for income taxes
using an asset and liability approach to recording deferred taxes. Our deferred income tax assets represent temporary differences between the financial
statement carrying amount and the tax basis of existing assets and liabilities that will result in deductible amounts in future years, including net
operating loss carry forwards. Based on estimates, the carrying value of our net deferred tax assets assumes that it is more likely than not that we
will be able to generate sufficient future taxable income in certain tax jurisdictions. Our judgments regarding future profitability may change due to
future market conditions, changes in U.S. or international tax laws and other factors. If, in the future, we experience losses for a sustained period
of time, we may not be able to conclude that it is more likely than not that we will be able to generate sufficient future taxable income to realize
our deferred tax assets. If this occurs, we may be required to increase the valuation allowance against the deferred tax assets resulting in additional
income tax expense.
Our income tax calculations are based on application of the
respective U.S. federal, state or foreign tax laws. Our tax filings, however, are subject to audit by the respective tax authorities. Accordingly, we
recognize tax liabilities based on estimates of whether, and the extent to which, additional taxes will be due when such estimates are
more-likely-than-not to be sustained. An uncertain income tax position will not be recognized if it has less than a 50% likelihood of being sustained.
To the extent the final tax liabilities are different than the amounts originally accrued, the increases or decreases are recorded as income tax
expense or benefit in the Consolidated Statements of Operations.
EXECUTIVE OVERVIEW
We design, develop and market high-performance integrated
circuits and frequency control products used in many of today’s advanced electronic systems. In fiscal 2012, we embarked on a strategy to
transform our business, as sales of our products used in personal computers and laptops declined with the transition to mobile devices such as tablets
and smart phones where we had lower market shares. Our strategy was to increase sales from those market segments offering higher gross margins and
growth potential, such as the ultramobility and embedded markets, including automotive.
During fiscal year 2015, net sales increased 0.6% as
compared with fiscal year 2014. We continued the strategic reshaping of our revenue profile by growing net IC product revenue 5% year over year, while
selectively reducing net FCP revenue by 6% year over year as we became more selective in the lower margin spectrum of our timing
business.
We increased gross profit in fiscal year 2015 to $57.8
million for an increase of $6.7 million from $51.1 million in fiscal year 2014, primarily due to IC product revenue growth, improved product mix in
both IC and FCP, and FCP cost reductions. The resulting gross margin for fiscal year 2015 was 44.9%, a 500 basis point improvement, as compared to
39.9% in fiscal year 2014. The gross margin improvement was most significant in FCP, where margins improved 840 basis points to 33.6%, due primarily to
improved crystal oscillator mix and material cost reductions, while IC gross margins improved 200 basis points to 51.3% primarily due to improved
margin mix.
Operating income was $10.0 million in fiscal year 2015, as
compared with operating income of $1.0 million in fiscal year 2014, the latter being impacted by a charge of $0.8 million related to the write-off of
an uncollected government subsidy. The improved operating income was driven by gross margin expansion as well as cost reductions in operating expenses,
which declined $2.3 million or 4.5% to $47.9 million in fiscal 2015.
Net income for fiscal year 2015 was $11.8 million, or $0.52
per diluted share as compared to net income of $4.1 million or $0.18 per diluted share for fiscal 2014.
In summary, our progress in the execution of our market
segment transition and gross margin expansion activities are evident in our financial results for fiscal year 2015.
33
RESULTS OF OPERATIONS
The following table sets forth certain statement of
operations data as a percentage of net revenues for the periods indicated:
| Fiscal Year Ended |
|||||||||||||||
|---|---|---|---|---|---|---|---|---|---|---|---|---|---|---|---|
| June 27, 2015 |
June 28, 2014 |
June 29, 2013 |
|||||||||||||
Net revenues |
100.0 | % | 100.0 | % | 100.0 | % | |||||||||
Cost of revenues |
55.1 | 60.1 | 63.0 | ||||||||||||
Gross margin |
44.9 | 39.9 | 37.0 | ||||||||||||
Operating expenses: |
|||||||||||||||
Research and development |
13.9 | 15.5 | 16.2 | ||||||||||||
Selling, general and administrative |
23.3 | 23.7 | 22.9 | ||||||||||||
Goodwill impairment |
— | — | 13.1 | ||||||||||||
Total operating expenses |
37.2 | 39.2 | 52.2 | ||||||||||||
Income (loss) from operations |
7.7 | 0.7 | (15.2 | ) | |||||||||||
Interest and other income, net |
3.5 | 2.2 | 3.1 | ||||||||||||
Income (loss) before income taxes |
11.2 | 2.9 | (12.1 | ) | |||||||||||
Income tax expense (benefit) |
2.2 | (0.2 | ) | 4.8 | |||||||||||
Net income (loss) from consolidated companies |
9.0 | 3.1 | (16.9 | ) | |||||||||||
Equity in net income of unconsolidated affiliates |
0.2 | 0.1 | 0.2 | ||||||||||||
Net income (loss) |
9.2 | % | 3.2 | % | (16.7 | )% | |||||||||
COMPARISON OF FISCAL 2015, 2014 AND
2013
NET REVENUES
The following table sets forth our revenues and the
customer concentrations with respect to such revenues for the periods indicated:
| Fiscal Year Ended |
Fiscal Year Ended |
||||||||||||||||||||||||||
|---|---|---|---|---|---|---|---|---|---|---|---|---|---|---|---|---|---|---|---|---|---|---|---|---|---|---|---|
| (in thousands) |
June 27, 2015 |
June 28, 2014 |
% Change |
June 28, 2014 |
June 29, 2013 |
% Change |
|||||||||||||||||||||
Net revenues |
$ | 128,835 | $ | 128,068 | 0.6 | % | $ | 128,068 | $ | 129,255 | –0.9 | % | |||||||||||||||
Percentage of net revenues accounted for by top 5 direct customers(1)
|
51 | % | 47 | % | 47 | % | 42 | % | |||||||||||||||||||
Number of direct customers that each account for more than 10% of net revenues |
2 | 2 | 2 | 2 | |||||||||||||||||||||||
Percentage of net revenues accounted for by top 5 end customers(2)
|
28 | % | 32 | % | 32 | % | 29 | % | |||||||||||||||||||
Number of end customers that each account for more than 10% of net revenues |
0 | 1 | 1 | 1 | |||||||||||||||||||||||
(1) |
Direct customers include distributors, contract manufacturers and OEMs. |
(2) |
End customers are OEMs and their products are manufactured using the Company’s products. End customers may purchase directly from the Company or from distributors or contract manufacturers. For end customer sales data, we rely on information provided by our direct distribution and contract manufacturing customers. |
Net revenues consist of product sales, which we generally
recognize upon shipment, less an estimate for returns and allowances.
Our order backlog stood at $14.8 million at June 27, 2015
and $18.2 million as of June 28, 2014. We expect to fulfill most of our backlogged orders as of June 27, 2015 within the first quarter of fiscal 2016.
We remain heavily reliant on orders that book and ship in the same quarter (“turns orders”). Our reliance on turns orders, the
uncertain
34
strength of our end-markets and the uncertain growth rate of the world economy make it difficult to predict near-term demand.
Net revenue increased $767,000 or 0.6% in fiscal 2015
versus 2014 primarily as the result of:
• |
An increase of $3.9 million or 5.0% in sales of our IC products to $82.1 million, partially offset by |
• |
a $3.1 million decrease in sales of FCP to $46.7 million, for a 6.3% decrease. |
The increased sales of IC products was driven by gains in
sales of PC/notebook and server products, partially offset by declines in sales of ultramobility and network products. The decreases in FCP product
revenues were primarily in networking products.
Net revenue decreased $1.2 million or 0.9% in fiscal 2014
versus 2013 primarily as the result of:
• |
An increase of $1.1 million or 1.5% in sales of our IC products to $78.3 million, which was offset by |
• |
a $2.3 million decrease in sales of FCP to $49.8 million, for a 4.4% decrease. |
The increased sales of IC products was driven by a $6.8
million gain in sales of ultramobility products, partially offset by declines in sales of PC/notebook and network products. The decreases in FCP
revenues were primarily in networking, PC/notebook, server and storage products.
For the years ended June 27, 2015 and June 28, 2014, gross
revenues were impacted by sales reserves, returns, discounts and allowances in the amount of $4.0 million and $4.9 million, respectively. In the
future, market conditions could become more difficult as other companies compete more aggressively for business. Pricing for our higher margin IC
Analog Switch, Clock and Connect products, many of which are proprietary, is more stable, and new product introductions and cost reductions generally
offset price declines.
The following table sets forth net revenues by country as a
percentage of total net revenues for the fiscal years ended June 27, 2015, June 28, 2014 and June 29, 2013:
| Fiscal Year Ended |
|||||||||||||||
|---|---|---|---|---|---|---|---|---|---|---|---|---|---|---|---|
| June 27, 2015 |
June 28, 2014 |
June 29, 2013 |
|||||||||||||
Net revenues by country: |
|||||||||||||||
China (including Hong Kong) |
45.6 | % | 47.7 | % | 47.6 | % | |||||||||
Taiwan |
35.2 | 30.8 | 33.4 | ||||||||||||
United States |
4.8 | 4.6 | 5.0 | ||||||||||||
Others (less than 10% each) |
14.4 | 16.9 | 14.0 | ||||||||||||
Total net revenues |
100.0 | % | 100.0 | % | 100.0 | % | |||||||||
Over the past three years, sales to China and Taiwan have
constituted the majority of our sales. We expect this trend will continue in the future.
GROSS PROFIT
| Fiscal Year Ended |
Fiscal Year Ended |
||||||||||||||||||||||||||
|---|---|---|---|---|---|---|---|---|---|---|---|---|---|---|---|---|---|---|---|---|---|---|---|---|---|---|---|
| (in thousands) |
June 27, 2015 |
June 28, 2014 |
% Change |
June 28, 2014 |
June 29, 2013 |
% Change |
|||||||||||||||||||||
Net revenues |
$ | 128,835 | $ | 128,068 | 0.6 | % | $ | 128,068 | $ | 129,255 | –0.9 | % | |||||||||||||||
Gross profit |
57,814 | 51,085 | 13.2 | % | 51,085 | 47,867 | 6.7 | % | |||||||||||||||||||
Gross profit percentage |
44.9 | % | 39.9 | % | 39.9 | % | 37.0 | % | |||||||||||||||||||
The $6.7 million increase in gross profit in fiscal 2015 as
compared to fiscal 2014 is primarily the result of:
• |
Higher margins at 44.9%, resulting in a $6.4 million increase in gross profit, and |
• |
A 0.6% increase in sales, resulting in $306,000 of higher gross profit. |
Gross margins improved in both IC and FCP products, from
49.3% to 51.3% for IC and from 25.2% to 33.6% for FCP from fiscal 2014 to fiscal 2015, respectively. The improvement in IC margins resulted primarily
from changes in the mix of product sales. The improvement in FCP margins resulted from improved mix between oscillator and
35
crystal products, the transfer of two production lines from Taiwan to Shandong, and reduced raw material costs due in part to favorable currency moves.
The $3.2 million increase in gross profit in fiscal 2014 as
compared to fiscal 2013 is primarily the result of:
• |
Higher margins at 39.9%, resulting in a $3.7 million increase in gross profit, partially offset by |
• |
A 0.9% decrease in sales, resulting in $439,000 of reduced gross profit. |
Gross margins improved in both IC and FCP products, from
47.9% to 49.3% for IC and from 20.9% to 25.2% for FCP from fiscal 2013 to fiscal 2014, respectively.
During fiscal years 2015, 2014 and 2013, gross profits and
gross margins benefited from the sale of inventory of $290,000, $327,000 and $306,000, respectively, that we had previously identified as excess and
reserved.
Future gross profit and gross margin are highly dependent
on the level and product mix included in net revenues. This includes the mix of sales between lower margin FCP and our higher margin IC products.
Although we have been successful at favorably improving our IC product mix and penetrating new end markets, there can be no assurance that this will
continue. Accordingly, we are not able to predict future gross profit levels or gross margins with certainty.
RESEARCH AND DEVELOPMENT
| Fiscal Year Ended |
Fiscal Year Ended |
||||||||||||||||||||||||||
|---|---|---|---|---|---|---|---|---|---|---|---|---|---|---|---|---|---|---|---|---|---|---|---|---|---|---|---|
| (in thousands) |
June 27, 2015 |
June 28, 2014 |
% Change |
June 28, 2014 |
June 29, 2013 |
% Change |
|||||||||||||||||||||
Net revenues |
$ | 128,835 | $ | 128,068 | 0.6 | % | $ | 128,068 | $ | 129,255 | –0.9 | % | |||||||||||||||
Research and development |
17,853 | 19,795 | –9.8 | % | 19,795 | 21,017 | –5.8 | % | |||||||||||||||||||
R&D as a percentage of net revenues |
13.9 | % | 15.5 | % | 15.5 | % | 16.3 | % | |||||||||||||||||||
Research and development (“R&D”) expenses
consist primarily of costs related to personnel and overhead, non-recurring engineering charges and other costs associated with the design, prototyping
and testing of new product concepts, manufacturing process support and customer applications support. The approximately $1.9 million expense decrease
for fiscal 2015 as compared with fiscal 2014 is primarily attributable to decreases of $671,000 in compensation expenses, $492,000 in facilities
charges, and reductions of $753,000 for masks, supplies, fabrication, assembly and other department operating expenses.
The approximately $1.2 million expense decrease for fiscal
2014 as compared with fiscal 2013 is primarily attributable to decreases of $684,000 in depreciation and amortization charges, and reductions of
$517,000 for outside consultants and recruiting expenses.
We believe that continued investment in research and
development to develop new products and improve manufacturing processes is critical to our success and, consequently, we expect to increase research
and development expenses in future periods over the long term.
SELLING, GENERAL AND
ADMINISTRATIVE
| Fiscal Year Ended |
Fiscal Year Ended |
||||||||||||||||||||||||||
|---|---|---|---|---|---|---|---|---|---|---|---|---|---|---|---|---|---|---|---|---|---|---|---|---|---|---|---|
| (in thousands) |
June 27, 2015 |
June 28, 2014 |
% Change |
June 28, 2014 |
June 29, 2013 |
% Change |
|||||||||||||||||||||
Net revenues |
$ | 128,835 | $ | 128,068 | 0.6 | % | $ | 128,068 | $ | 129,255 | –0.9 | % | |||||||||||||||
Selling, general and administrative |
29,998 | 30,320 | –1.1 | % | 30,320 | 29,581 | 2.5 | % | |||||||||||||||||||
SG&A as a percentage of net revenues |
23.3 | % | 23.7 | % | 23.7 | % | 22.9 | % | |||||||||||||||||||
Selling, general and administrative (“SG&A”)
expenses consist primarily of personnel and related overhead costs for sales, marketing, finance, administration, human resources and general
management. The $322,000 expense decrease for fiscal 2015 as compared with fiscal 2014 is primarily attributable to decreases of $516,000 in
facilities-related expenses and $850,000 due to an uncollectible government subsidy receivable write-off in the prior year, partially offset by
increases of $400,000 in compensation expenses, $360,000 in third party sales representative commissions and $266,000 of expenditures for outside
consultants.
36
The $739,000 expense increase for fiscal 2014 as compared
with fiscal 2013 is primarily attributable to increases of $1.5 million in compensation-related expenses and $843,000 of government subsidy receivable
write-off, partially offset by reductions of $848,000 in facilities expenses and $702,000 for outside consultants.
We anticipate that selling, general and administrative
expenses will increase in future periods as we add to our support and administrative staff, particularly in sales and marketing, and as we face
increasing commission expense to the extent we achieve higher sales levels. We intend to continue to focus on controlling selling, general and
administrative expenses.
GOODWILL IMPAIRMENT
In fiscal 2013, we recorded a goodwill impairment charge of
$16.9 million, in which we wrote-off the goodwill associated with the acquisition of PTI in 2010 and Pericom Taiwan Limited in 2009. This was based on
a combination of factors including a decline in the net present value of expected future cash flows from affected reporting units as well as a decline
in our market capitalization at the end of fiscal 2013. This write-off eliminated all goodwill on our balance sheets.
INTEREST AND OTHER INCOME,
NET
| Fiscal Year Ended |
Fiscal Year Ended |
||||||||||||||||||||||||||
|---|---|---|---|---|---|---|---|---|---|---|---|---|---|---|---|---|---|---|---|---|---|---|---|---|---|---|---|
| (in thousands) |
June 27, 2015 |
June 28, 2014 |
% Change |
June 28, 2014 |
June 29, 2013 |
% Change |
|||||||||||||||||||||
Net revenues |
$ | 128,835 | $ | 128,068 | 0.6 | % | $ | 128,068 | $ | 129,255 | –0.9 | % | |||||||||||||||
Interest income |
3,182 | 2,656 | 19.8 | % | 2,656 | 3,442 | –22.8 | % | |||||||||||||||||||
Other income |
1,270 | 136 | 833.8 | % | 136 | 601 | –77.4 | % | |||||||||||||||||||
Total interest and other income, net |
$ | 4,452 | $ | 2,792 | $ | 2,792 | $ | 4,043 | |||||||||||||||||||
The $526,000 increase in interest income including realized
gains for fiscal 2015, as compared to fiscal 2014, was primarily the result of a $410,000 increase in interest earned and a $116,000 improvement in
realized gains from the sale of investment securities. The $1.1 million increase in other income for fiscal 2015 included a $1.2 million increase in
currency exchange gains, partially offset by a $63,000 decrease in other income.
The decrease in interest income including realized gains
for fiscal 2014, as compared to fiscal 2013, was primarily the result of an $890,000 decrease in realized gains from the sale of investment securities,
partially offset by a modest increase in interest earned. The $465,000 decrease in other income for fiscal 2014 included a $573,000 decrease in
currency exchange gains and a $108,000 increase in other income.
INTEREST EXPENSE
Interest expense of less than $1,000 was recorded in each
of fiscal 2015 and 2014. There was no debt outstanding at the end of fiscal 2015.
Less than $1,000 of interest expense was recorded in fiscal
2014, as compared with $19,000 in fiscal 2013. There was no debt outstanding at the end of fiscal 2014.
PROVISION FOR INCOME TAXES
| Fiscal Year Ended |
Fiscal Year Ended |
||||||||||||||||||||||||||
|---|---|---|---|---|---|---|---|---|---|---|---|---|---|---|---|---|---|---|---|---|---|---|---|---|---|---|---|
| (in thousands) |
June 27, 2015 |
June 28, 2014 |
% Change |
June 28, 2014 |
June 29, 2013 |
% Change |
|||||||||||||||||||||
Pre-tax income (loss) |
$ | 14,415 | $ | 3,762 | 283.2 | % | $ | 3,762 | $ | (15,606 | ) | 124.1 | % | ||||||||||||||
Income tax provision (benefit) |
2,765 | (230 | ) | 1302.2 | % | (230 | ) | 6,223 | –103.7 | % | |||||||||||||||||
Effective tax rate |
19.2 | % | –6.1 | % | –6.1 | % | –39.9 | % | |||||||||||||||||||
Our effective tax rate differs from the federal statutory
rate primarily due to state income taxes, the effect of foreign income tax and foreign losses, permanent items such as stock options and subpart F
income, and changes in the deferred tax asset valuation allowance.
37
The effective tax rate of 19.2% for fiscal 2015 reflected
primarily the benefits of lower tax rates in foreign jurisdictions. A reconciliation of our tax rates for fiscal years 2015, 2014 and 2013 is detailed
in Note 16 to the Consolidated Financial Statements contained in this report on Form 10-K.
The effective tax rate for fiscal 2014 resulted in a 6.1%
tax benefit primarily due to the release of $1.8 million of tax reserves during the year.
The income tax provision for fiscal 2013 reflected our
implementation of an operating structure to more efficiently align our transaction flows with our geographic business operations, resulting in a
taxable gain in the U.S. for which we booked a $5.0 million income tax provision. Further, the pre-tax loss in fiscal 2013 is primarily the result of a
$16.9 million charge for goodwill impairment, which is not deductible for tax purposes.
EQUITY IN NET INCOME OF UNCONSOLIDATED
AFFILIATE
| Fiscal Year Ended |
Fiscal Year Ended |
||||||||||||||||||||||||||
|---|---|---|---|---|---|---|---|---|---|---|---|---|---|---|---|---|---|---|---|---|---|---|---|---|---|---|---|
| (in thousands) |
June 27, 2015 |
June 28, 2014 |
% Change |
June 28, 2014 |
June 29, 2013 |
% Change |
|||||||||||||||||||||
Equity in net income of unconsolidated affiliate |
$ | 175 | $ | 132 | 32.6 | % | $ | 132 | $ | 215 | –38.6 | % | |||||||||||||||
Equity in net income of unconsolidated affiliate consists
of the Company’s allocated portion of the net income of Jiyuan Crystal Photoelectric Frequency Technology Ltd. (“JCP”), an FCP
manufacturing company located in Science Park of Jiyuan City, Henan Province, China. JCP is a key manufacturing partner of PSE-TW, and PSE-TW has
acquired a 49% equity interest in JCP. For fiscal 2015, the Company’s allocated portion of JCP’s results was income of $175,000, as compared
with $132,000 and $215,000 for fiscal 2014 and 2013, respectively.
LIQUIDITY AND CAPITAL RESOURCES
As of June 27, 2015, our principal sources of liquidity
included continuing operations as well as cash, cash equivalents, and short-term investments of approximately $129.1 million, as compared with $119.1
million at June 28, 2014 and $117.7 million at June 29, 2013.
The Company’s investment in debt securities includes
government securities, corporate debt securities and mortgage backed and asset backed securities. Government securities include US treasury securities,
US federal agency securities, foreign government and agency securities, and US state and municipal bond obligations. Many of the municipal bonds are
insured; those that are not are nearly all AAA/Aaa rated. The corporate debt securities are all investment grade and nearly all are single A-rated or
better. The asset-backed securities are AAA/Aaa rated and are backed by auto loans, student loans, credit card balances and residential or commercial
mortgages. Most of our mortgage-backed securities are collateralized by prime residential mortgages issued by government agencies including the Federal
National Mortgage Association, the Federal Home Loan Mortgage Corporation and Federal Home Loan Banks. Those issued by commercial banks are AAA-rated.
As of June 27, 2015, unrealized gains on marketable securities, net of taxes were $23,000. When assessing marketable securities for
other-than-temporary declines in value, we consider a number of factors. Our analyses of the severity and duration of price declines, portfolio manager
reports, economic forecasts and the specific circumstances of issuers indicate that it is reasonable to expect marketable securities with unrealized
losses as of June 27, 2015 to recover in fair value up to our cost basis within a reasonable period of time. We have the ability and intent to hold
investments with unrealized losses until maturity, when the obligors are required to redeem them at full face value or par, and we believe the obligors
have the financial resources to redeem the debt securities. Accordingly, we do not consider our investments to be other than temporarily impaired as of
June 27, 2015.
As of June 27, 2015, we had cash and cash equivalents of
$38.8 million as compared to $33.0 million at June 28, 2014 and $30.8 million at June 29, 2013. The maturities of our short-term investments are
staggered throughout the year to ensure we meet our cash requirements. Because we are primarily a fabless semiconductor manufacturer, we have lower
capital equipment requirements than other semiconductor manufacturers that own fabrication foundries. During the 2015 fiscal year, we purchased $5.7
million of property and equipment as compared to $5.0 million and $13.2 million in fiscal 2014 and 2013, respectively.
38
We generated approximately $4.5 million of interest and
other income, net during the fiscal year ended June 27, 2015 compared to $2.8 million and $4.0 million in the fiscal years ended June 28, 2014 and June
29, 2013, respectively. Excluding the impact of foreign exchange gains/losses, interest and other income, net was $3.3 million, $2.8 million and $3.5
million for the years ended June 27, 2015, June 28, 2014 and June 29, 2013, respectively. In the longer term, we may generate less interest and other
income if our total invested balance decreases and the decrease is not offset by rising interest rates or realized gains on the sale of investment
securities.
In fiscal 2015, our net cash provided by operating
activities of $21.8 million was the result of net income of $11.8 million plus $14.1 million in net favorable non-cash adjustments to net income,
partially offset by unfavorable changes in assets and liabilities of $4.1 million. The favorable adjustments to net income were primarily comprised of
depreciation and amortization of $9.1 million, stock-based compensation of $4.0 million, stock transactions tax benefit of $1.8 million and $580,000 of
property and equipment write-offs, partially offset by $483,000 excess tax benefit of stock transactions, $414,000 of deferred taxes, $238,000 of
realized gain on investments and $175,000 of non-cash equity in net income of our unconsolidated affiliate. The unfavorable changes in assets and
liabilities primarily included a $1.6 million increase in net inventory, a $1.1 million increase in prepaids and other current assets, a $990,000
decrease in accounts payable, a $290,000 decrease in accrued liabilities and a $299,000 decrease in other long term liabilities.
In fiscal 2014, our net cash provided by operating
activities of $14.5 million was the result of net income of $4.1 million plus $14.4 million in net favorable non-cash adjustments to net income,
partially offset by unfavorable changes in assets and liabilities of $4.0 million. The favorable adjustments to net income were primarily comprised of
depreciation and amortization of $10.0 million, stock-based compensation of $2.8 million, $843,000 write-off of government subsidy, $343,000 of
property and equipment write-offs and stock compensation tax benefit of $700,000, partially offset by $179,000 of realized gain on investments and
$132,000 of non-cash equity in net income of our unconsolidated affiliate. The favorable changes in assets and liabilities primarily included a $2.6
million decrease in net inventory, a $245,000 decrease in prepaids and other current assets, a $338,000 decrease in other long-term assets and a
$349,000 increase in accrued liabilities, partially offset by a $2.2 million increase in accounts receivable and a $3.4 million decrease in accounts
payable.
In fiscal 2013, our net cash provided by operating
activities of $11.0 million was the result of $31.0 million in net favorable non-cash adjustments to a net loss of $21.6 million, and favorable changes
in assets and liabilities of $1.6 million. The favorable adjustments to the net loss were primarily comprised of goodwill impairment charge of $16.9
million, depreciation and amortization of $11.2 million, share-based compensation of $3.3 million, share-based compensation tax benefit of $492,000 and
$475,000 of property and equipment writeoffs, partially offset by $1.0 million of realized gain on investments and $215,000 of non-cash equity in net
income of our unconsolidated affiliates. The favorable changes in assets and liabilities primarily included a $2.5 million decrease in accounts
receivable, a $1.9 million decrease in net inventory and a $654,000 increase in long-term liabilities, partially offset by a $2.8 million decrease in
accounts payable and a $956,000 decrease in accrued liabilities.
In fiscal 2015, we used cash in our investing activities of
$10.7 million, which was the result of purchases of property and equipment of $5.7 million and purchases of available-for-sale investments exceeding
sales and maturities of investments by approximately $5.0 million.
In fiscal 2014, we used cash in our investing activities of
$3.5 million, which was primarily the result of purchases of property and equipment of $5.0 million, partially offset by net maturities of investments
of approximately $1.5 million.
In fiscal 2013, our investing activities provided cash of
$3.3 million, which was primarily comprised of maturities and sales of investments exceeding purchases by $16.5 million, partially offset by purchases
of property and equipment of $13.2 million.
In fiscal 2015, we used cash in financing activities of
$5.0 million, which consisted of $10.9 million used to repurchase common stock and $2.7 million used for payment of cash dividends, partially offset by
$8.1 million of proceeds from employee stock option exercises and purchases under the Employee Stock Purchase Plan and $483,000 excess tax benefit of
stock transactions.
39
In fiscal 2014, we used cash in financing activities of
$8.9 million, which consisted of $11.3 million used to repurchase common stock, partially offset by $2.4 million of proceeds from employee stock option
exercises and purchases under the Employee Stock Purchase Plan.
In fiscal 2013, we used cash in financing activities of
$8.4 million, which consisted of $7.8 million used to repurchase common stock and $1.4 million of net paydowns of short-term bank loans, partially
offset by $797,000 of proceeds from employee stock option exercises and purchases under the Employee Stock Purchase Plan.
We believe our existing cash and investment balances, as
well as cash expected to be generated from operating activities, will be sufficient to meet our anticipated cash needs for at least the next 12
months.
On April 26, 2012, the Board of Directors authorized a
share repurchase program for up to $25 million of shares of the Company’s common stock, and on April 24, 2014, the Board authorized an additional
$20 million for the share repurchase program. During the year ended June 27, 2015, the Company repurchased 937,729 shares for an aggregate cost of
$10.9 million. During the year ended June 28, 2014, the Company repurchased 1,354,511 shares for an aggregate cost of $11.3 million. During the year
ended June 29, 2013, the Company repurchased 1,100,306 shares for an aggregate cost of $7.8 million. As of June 27, 2015, approximately $15.7 million
may still be purchased under the 2014 authorization.
We may use a portion of our cash to acquire or invest in
complementary businesses or products or to obtain the right to use complementary technologies. From time to time, in the ordinary course of business,
we may evaluate potential acquisitions of such businesses, products or technologies.
Our long-term future capital requirements will depend on
many factors, including our level of revenues, the timing and extent of spending to support our product development efforts, the expansion of sales and
marketing activities, the timing of our introductions of new products, the costs to ensure access to adequate manufacturing capacity, and the
continuing market acceptance of our products. We could be required, or could elect, to seek additional funding through public or private equity or debt
financing and additional funds may not be available on terms acceptable to us or at all.
CONTRACTUAL OBLIGATIONS AND
COMMITMENTS
The following table depicts our contractual obligations as
of June 27, 2015:
| Payments Due by Period |
|||||||||||||||||||||||
|---|---|---|---|---|---|---|---|---|---|---|---|---|---|---|---|---|---|---|---|---|---|---|---|
| (in thousands) Contractual obligation |
Total |
Less than 1 Year |
1-3 Years |
3-5 Years |
Thereafter |
||||||||||||||||||
Operating leases and operating expense commitments |
$ | 987 | $ | 423 | $ | 542 | $ | 18 | $ | 4 | |||||||||||||
Capital equipment purchase commitments |
11 | 11 | — | — | — | ||||||||||||||||||
Facility modification commitments |
677 | 660 | 17 | — | — | ||||||||||||||||||
Total contractual obligations |
$ | 1,675 | $ | 1,094 | $ | 559 | $ | 18 | $ | 4 | |||||||||||||
The operating lease commitments are primarily facility
leases at certain of our Asian subsidiaries.
The facility modification commitments have been made by our
Shandong, China manufacturing operation for a general contractor and architecture firm to develop feasibility studies, plans and cost estimates for
potential additional development of our plant site. Building permits have been applied for, and site preparation has begun.
We have no purchase obligations other than routine purchase
orders and the facility modifications shown in the table as of June 27, 2015.
OFF-BALANCE SHEET ARRANGEMENTS
As of June 27, 2015, the Company did not have any
off-balance sheet arrangements, as defined in Item 303(a)(4) of SEC Regulation S-K.
40
RECENTLY ISSUED ACCOUNTING
STANDARDS
In July 2015, the Financial Accounting Standards Board
(“FASB”) issued Accounting Standards Update (“ASU”) 2015-11, Simplifying the Measurement of Inventory. Under this ASU,
inventory will be measured at the “lower of cost and net realizable value,” and options that currently exist for “market value”
will be eliminated. The ASU defines net realizable value as “estimated selling prices in the ordinary course of business, less reasonably
predictable costs of completion, disposal, and transportation.” No other changes were made to the current guidance on inventory measurement. ASU
2015-11 is effective for interim and annual periods beginning after December 15, 2016. Early application is permitted and should be applied
prospectively. We are evaluating the provisions of this statement, including which period to adopt, and have not determined what impact the adoption of
ASU 2015-11 will have on our financial position or results of operations.
In May 2014, the FASB issued ASU 2014-09, Revenue from
Contracts with Customers. ASU 2014-09 outlines a single comprehensive model for accounting for revenue arising from contracts with customers and
supersedes most current revenue recognition guidance. ASU 2014-09 requires an entity to recognize revenue to depict the transfer of promised goods or
services to customers in an amount that reflects the consideration to which the entity expects to be entitled in exchange for those goods or services.
ASU 2014-09 will be effective for annual and interim reporting periods beginning after December 15, 2017, although public companies may early adopt for
annual and interim reporting periods beginning after December 15, 2016. The impact on our financial condition, results of operations and cash flows as
a result of the adoption of ASU 2014-09 has not yet been determined.
41
ITEM 7A. QUANTITATIVE & QUALITATIVE DISCLOSURES
ABOUT MARKET RISK
MARKET RISK DISCLOSURE
At June 27, 2015, the Company’s investment portfolio
consisted primarily of fixed income securities, excluding those classified as cash equivalents, with fair value of $90.3 million (see Note 1 of Notes
to Financial Statements). These securities are subject to interest rate risk and will decline in value if market interest rates increase. We could
realize a loss on these securities if we were forced to sell them in a period when interest rates are higher than current rates. For example, if market
interest rates were to increase immediately and uniformly by 10% from levels as of June 27, 2015, such as from 1.8% to 2.0%, the decline in the fair
value of the portfolio would be approximately $8.2 million. On the other hand, if interest rates were to decline the effect on our portfolio would be
in the opposite direction.
When the general economy weakens significantly, as it did
in 2008 and 2009, the credit profile, financial strength and growth prospects of certain issuers of interest-bearing securities held in our investment
portfolios may deteriorate, and our interest-bearing securities may lose value either temporarily or other than temporarily. We may implement
investment strategies of different types with varying duration and risk/return trade-offs that do not perform well. As of June 27, 2015, we held a
significant portion of our corporate cash in diversified portfolios of investment-grade marketable securities, mortgage- and asset-backed securities,
and other securities that had net unrealized gains of $23,000 net of tax. Although we consider unrealized gains and losses on individual securities to
be temporary, there is a risk that we may incur other-than-temporary impairment charges if credit and equity markets are unstable and adversely impact
securities issuers.
The Company transacts business in various non-U.S.
currencies, primarily the New Taiwan Dollar, the Hong Kong Dollar and the Chinese Yuan. The Company is exposed to fluctuations in foreign currency
exchange rates on accounts receivable and accounts payable from sales and purchases in these foreign currencies and the net monetary assets and
liabilities of our foreign subsidiaries. A hypothetical 10% unfavorable change in the foreign currency exchange rates would reduce cash by
approximately $4.4 million as those monetary assets are converted to cash.
42
ITEM 8. FINANCIAL STATEMENTS AND SUPPLEMENTARY
DATA
| Page No. |
||||||||||
|---|---|---|---|---|---|---|---|---|---|---|
1. |
INDEX TO CONSOLIDATED FINANCIAL STATEMENTS |
|||||||||
The following Consolidated Financial Statements are filed as part of this report: |
||||||||||
Report of Independent Registered Public Accounting Firm |
50 | |||||||||
Consolidated Balance Sheets as of June 27, 2015 and June 28, 2014 |
51 | |||||||||
Consolidated Statements of Operations for each of the three fiscal years in the period ended June 27, 2015 |
52 | |||||||||
Consolidated Statements of Comprehensive Income (Loss) for each of the three fiscal years in the period ended June 27, 2015
|
53 | |||||||||
Consolidated Statements of Shareholders’ Equity for each of the three fiscal years in the period ended June 27, 2015
|
54 | |||||||||
Consolidated Statements of Cash Flows for each of the three fiscal years in the period ended June 27, 2015 |
55 | |||||||||
Notes to Consolidated Financial Statements |
56 | |||||||||
2. |
INDEX TO FINANCIAL STATEMENT SCHEDULE |
|||||||||
The following financial statement schedule of Pericom Semiconductor Corporation for the years ended June 27, 2015, June 28, 2014 and
June 29, 2013 is filed as part of this report and should be read in conjunction with the Consolidated Financial Statements of Pericom Semiconductor
Corporation. |
||||||||||
Schedule II — Valuation and Qualifying Accounts for each of the three fiscal years in the period ended June 27, 2015
|
Sii | |||||||||
Schedules other than those listed above have been omitted
since they are either not required, not applicable or the information is otherwise included.
43
ITEM 9. CHANGES IN AND DISAGREEMENTS WITH ACCOUNTANTS ON
ACCOUNTING AND FINANCIAL DISCLOSURE
None.
ITEM 9A. CONTROLS AND PROCEDURES
Evaluation of Disclosure Controls and
Procedures
Based on their evaluation as of June 27, 2015, our Chief
Executive Officer and Chief Financial Officer, have concluded that our disclosure controls and procedures (as defined in Rules 13a-15(e) and 15d-15(e),
under the Securities Exchange Act of 1934, as amended (the “Exchange Act”)) were effective to ensure that the information required to be
disclosed by us in this Annual Report on Form 10-K was recorded, processed, summarized and reported within the time periods specified in the SEC’s
rules and instructions for Form 10-K and that such disclosure controls and procedures were also effective to ensure that information required to be
disclosed in the reports we file or submit under the Exchange Act is accumulated and communicated to our management, including our Chief Executive
Officer and Chief Financial Officer, as appropriate to allow timely decisions regarding required disclosure.
Management’s Report on Internal Control over
Financial Reporting
Our management is responsible for establishing and
maintaining adequate internal control over financial reporting as defined in Rule 13a-15(f) of the Exchange Act. Because of its inherent limitations,
internal control over financial reporting may not prevent or detect misstatements. Also, projections of any evaluation of effectiveness to future
periods are subject to the risk that controls may become inadequate because of changes in conditions, or that the degree of compliance with the
policies or procedures may deteriorate.
Our management, with the participation of our Chief
Executive Officer and Chief Financial Officer, has assessed the effectiveness of our internal control over financial reporting as of June 27, 2015. In
making this assessment, our management used the criteria established in the 2013 framework, Internal Control—Integrated Framework, issued
by the Committee of Sponsoring Organizations of the Treadway Commission (“COSO”).Our management has concluded that, as of June 27, 2015, our
internal control over financial reporting is effective based on these criteria.
Our independent registered public accounting firm, Burr
Pilger Mayer, Inc., which audited the consolidated financial statements in this Annual Report on Form 10-K, independently assessed the effectiveness of
the Company’s internal control over financial reporting. Burr Pilger Mayer, Inc. has issued an attestation report, which appears as part of this
Annual Report on Form 10-K.
Changes in Internal Control over Financial
Reporting
There were no changes in our internal control over
financial reporting (as such term is defined in Rules 13a-15(f) and 15d-15(f) under the Exchange Act) during the year ended June 27, 2015 that have
materially affected, or are reasonably likely to materially affect, our internal control over financial reporting.
ITEM 9B. OTHER INFORMATION
None.
44
REPORT OF INDEPENDENT REGISTERED PUBLIC ACCOUNTING FIRM
ON
INTERNAL CONTROL OVER FINANCIAL REPORTING
INTERNAL CONTROL OVER FINANCIAL REPORTING
To the Board of Directors and Shareholders
of Pericom Semiconductor Corporation
of Pericom Semiconductor Corporation
We have audited the internal control over financial
reporting of Pericom Semiconductor Corporation and its subsidiaries (the “Company”) as of June 27, 2015, based on criteria established in
Internal Control — Integrated Framework (2013 Framework) issued by the Committee of Sponsoring Organizations of the Treadway Commission
(“COSO”). The Company’s management is responsible for maintaining effective internal control over financial reporting and for its
assessment of the effectiveness of internal control over financial reporting, included in the accompanying Management’s Annual Report on Internal
Control over Financial Reporting, included in Item 9A. Our responsibility is to express an opinion on the Company’s internal control over
financial reporting based on our audit.
We conducted our audit of internal control over financial
reporting in accordance with the standards of the Public Company Accounting Oversight Board (United States). Those standards require that we plan and
perform the audit to obtain reasonable assurance about whether effective internal control over financial reporting was maintained in all material
respects. Our audit included obtaining an understanding of internal control over financial reporting, assessing the risk that a material weakness
exists, testing and evaluating the design and operating effectiveness of internal control based on the assessed risk, and performing such other
procedures as we considered necessary in the circumstances. We believe that our audit provides a reasonable basis for our opinion.
A company’s internal control over financial reporting
is a process designed to provide reasonable assurance regarding the reliability of financial reporting and the preparation of financial statements for
external purposes in accordance with generally accepted accounting principles. A company’s internal control over financial reporting includes
those policies and procedures that (1) pertain to the maintenance of records that, in reasonable detail, accurately and fairly reflect the transactions
and dispositions of the assets of the company; (2) provide reasonable assurance that transactions are recorded as necessary to permit preparation of
financial statements in accordance with generally accepted accounting principles, and that receipts and expenditures of the company are being made only
in accordance with authorizations of management and directors of the company; and (3) provide reasonable assurance regarding prevention or timely
detection of unauthorized acquisition, use, or disposition of the company’s assets that could have a material effect on the financial
statements.
Because of its inherent limitations, internal control over
financial reporting may not prevent or detect misstatements. Also, projections of any evaluation of effectiveness to future periods are subject to the
risk that controls may become inadequate because of changes in conditions, or that the degree of compliance with the policies or procedures may
deteriorate.
In our opinion, the Company maintained, in all material
respects, effective internal control over financial reporting as of June 27, 2015, based on the COSO criteria.
We also have audited, in accordance with the standards of
the Public Company Accounting Oversight Board (United States), the consolidated balance sheets of Pericom Semiconductor Corporation and its
subsidiaries as of June 27, 2015 and June 28, 2014, and the related consolidated statements of operations, comprehensive income (loss),
shareholders’ equity and cash flows for each of the three years in the period ended June 27, 2015, and the related financial statement schedule
and our report dated September 1, 2015 expressed an unqualified opinion on those consolidated financial statements and the related financial statement
schedule.
/s/ Burr Pilger Mayer, Inc.
San Jose, California
September 1, 2015
September 1, 2015
45
PART III
ITEM 10. DIRECTORS, EXECUTIVE OFFICERS AND CORPORATE GOVERNANCE
The information required by this item is incorporated by
reference to the Company’s Definitive Proxy Statement related to the Annual Meeting of Shareholders to be held December 3, 2015, to be filed by
the Company with the SEC (the “Proxy Statement”).
ITEM 11. EXECUTIVE COMPENSATION
The information required by this item is incorporated by
reference to the Proxy Statement.
ITEM 12. SECURITY OWNERSHIP OF CERTAIN BENEFICIAL OWNERS
AND MANAGEMENT AND RELATED STOCKHOLDER MATTERS
The security ownership information required by this item is
incorporated by reference to the Proxy Statement.
EQUITY COMPENSATION PLANS
The following table summarizes share and exercise price
information about our equity compensation plans as of June 27, 2015.
| Plan Category |
Number of securities to be issued upon exercise of outstanding options and RSUs |
Weighted average exercise price of outstanding options, warrants and rights |
Number of securities remaining available for future issuance under plans |
|||||||||||
|---|---|---|---|---|---|---|---|---|---|---|---|---|---|---|
Equity compensation plans approved by shareholders: |
||||||||||||||
Stock incentive plans |
2,017,961 | (1) | $ | 10.92 | (2) | 3,508,938 | ||||||||
Employee stock purchase plan |
— | 1,481,175 | ||||||||||||
Total |
2,017,961 | $ | 10.92 | 4,990,113 | ||||||||||
(1) |
Represents shares of the Company’s common stock issuable upon exercise of outstanding options under the following equity compensation plans: the 2014 Stock Award and Incentive Compensation Plan, 2004 Stock Incentive Plan and 2001 Stock Incentive Plan, and 768,634 shares underlying outstanding restricted stock unit awards granted under the 2014 Stock Award and Incentive Compensation Plan and 2004 Stock Incentive Plan that may be delivered in the future upon satisfaction of vesting requirements. |
(2) |
This calculation does not take into account shares underlying restricted stock unit awards. |
ITEM 13. CERTAIN RELATIONSHIPS AND RELATED TRANSACTIONS,
AND DIRECTOR INDEPENDENCE
The information required by this item is incorporated by
reference to the Proxy Statement.
ITEM 14. PRINCIPAL ACCOUNTANT FEES AND
SERVICES
The information required by this item is incorporated by
reference to the Proxy Statement.
46
PART IV
ITEM 15. EXHIBITS AND FINANCIAL STATEMENT
SCHEDULES
(a) |
The following documents are filed as part of this report: |
(1) |
Financial Statements and Financial Statement Schedule — See Index to Financial Statements and Financial Statement Schedule at Item 8 of this annual report on Form 10-K. |
(2) |
Exhibits. The following exhibits are filed as part of, or incorporated by reference into, this Report: |
| Exhibit | Description |
|||||||||
|---|---|---|---|---|---|---|---|---|---|---|
3.1 |
Restated Articles of Incorporation of the Company, filed as Exhibit 3.1 to the Company’s Quarterly Report on Form 10-Q for the
quarter ended March 31, 2001, and incorporated herein by reference. |
|||||||||
3.2 |
Amended and Restated Bylaws of the Company (as amended by an amendment adopted on June 25, 2013), filed as Exhibit 3.1 to the
Company’s Form 8-K filed June 27, 2013, and incorporated herein by reference. |
|||||||||
3.3 |
Amended and Restated Certificate of Determination of the Series D Junior Participating Preferred Shares, filed as Exhibit 3.1 to the
Company’s Form 8-K filed March 8, 2012, and incorporated herein by reference. |
|||||||||
4.1 |
Rights Agreement between Pericom Semiconductor Corporation and Computershare Trust Company, N.A., dated as of March 6, 2012,
including Form of Right Certificate attached thereto as Exhibit B, filed as Exhibit 4.1 to the Company’s Form 8-K filed March 8, 2012, and
incorporated herein by reference. |
|||||||||
4.2 |
Amendment to the Rights Agreement, dated as of March 6, 2015, between Pericom Semiconductor Corporation and Computershare Trust
Company, N.A., filed on March 9, 2015 as Exhibit 4.2 to the Company’s Form 8-A/A and incorporated herein by reference. |
|||||||||
4.3 |
Amendment of Amended and Restated Certificate of Determination Series D Junior Participating Preferred Shares of Pericom
Semiconductor Corporation dated March 6, 2015, filed on March 9, 2015 as Exhibit 4.2 to the Company’s Form 8-K and incorporated herein by
reference. |
|||||||||
10.1* |
Form of Indemnification Agreement, filed as Exhibit 10.11 to the Company’s Registration Statement on Form S-1 filed September
10, 1997, and incorporated herein by reference. |
|||||||||
10.2* |
Amended and Restated 2001 Stock Incentive Plan including Form of Agreement thereunder, filed as Exhibit 10.2 to the Company’s
Form 8-K filed December 21, 2004, and incorporated herein by reference. |
|||||||||
10.3** |
English translation of Cooperation Agreement between Pericom Semiconductor Corporation and the Jinan Hi-Tech Industries Development
Zone Commission, dated as of January 26, 2008, filed as Exhibit 10.1 to the Company’s Form 8-K/A filed May 5, 2008, and incorporated herein by
reference. |
|||||||||
10.4* |
Forms of Restricted Stock Award Grant Notice and Restricted Stock Award Agreement under each of the Amended and Restated Pericom 2001
Stock Incentive Plan and the Amended and Restated Pericom 2004 Stock Incentive Plan, filed as Exhibit 10.2 to the Company’s Quarterly Report on
Form 10-Q for the quarter ended March 29, 2008, and incorporated herein by reference. |
|||||||||
10.5* |
Amended and Restated Change of Control Agreement, filed as Exhibit 10.1 to the Company’s Form 8-K filed November 6, 2012, and
incorporated herein by reference. |
|||||||||
47
| Exhibit | Description | |||||||||
|---|---|---|---|---|---|---|---|---|---|---|
10.6* |
Amended and Restated 2004 Stock Incentive Plan, attached as Appendix A to the Company’s Definitive Proxy Statement on Schedule
14A filed October 23, 2008, and incorporated herein by reference. |
|||||||||
10.7* |
Pericom’s 2010 Employee Stock Purchase Plan, attached as Appendix A to the Company’s Definitive Proxy Statement on Schedule
14A filed October 23, 2009, and incorporated herein by reference. |
|||||||||
10.8** |
English translation of R&D Center Investment Agreement, dated as of December 1, 2009, between Yangzhou Economic and Technological
Development Zone and Pericom Asia Limited, filed as Exhibit 10.1 to the Company’s Quarterly Report on Form 10-Q for the quarter ended December 26,
2009, and incorporated herein by reference. |
|||||||||
10.9* |
Offer letter dated February 21, 2014, by and between the Company and Kevin S. Bauer, filed as Exhibit 10.1 to the Company’s
Quarterly Report on Form 10-Q for the quarter ended March 29, 2014, and incorporated herein by reference. |
|||||||||
10.10* |
The Company’s 2014 Stock Award and Incentive Compensation Plan, filed on October 16, 2014 as Appendix A to the Company’s
proxy statement for its 2014 annual meeting, and incorporated herein by reference. |
|||||||||
10.11* |
Forms of equity award agreements under the Company’s 2014 Stock Award and Incentive Compensation Plan. |
|||||||||
14.1 |
Pericom Semiconductor Corporation Code of Business Conduct and Ethics, filed as Exhibit 14.1 to the Company’s Form 10-K for the
year ended June 26, 2004 and incorporated herein by reference. |
|||||||||
21.1 |
Subsidiaries of Pericom Semiconductor Corporation |
|||||||||
23.1 |
Consent of Burr Pilger Mayer, Inc. Independent Registered Public Accounting Firm |
|||||||||
24.1 |
Power of Attorney (see signature page) |
|||||||||
31.1 |
Certification of Alex C. Hui, Chief Executive Officer, pursuant to Section 302 of the Sarbanes-Oxley Act of
2002 |
|||||||||
31.2 |
Certification of Kevin S. Bauer, Chief Financial Officer, pursuant to Section 302 of the Sarbanes-Oxley Act of
2002 |
|||||||||
32.1 |
Certification of Alex C. Hui, Chief Executive Officer, pursuant to Section 906 of the Sarbanes-Oxley Act of
2002 |
|||||||||
32.2 |
Certification of Kevin S. Bauer, Chief Financial Officer, pursuant to Section 906 of the Sarbanes-Oxley Act of
2002 |
|||||||||
101.INS |
XBRL Instance Document |
|||||||||
101.SCH |
XBRL Taxonomy Extension Schema Document |
|||||||||
101.CAL |
XBRL Taxonomy Extension Calculation Linkbase Document |
|||||||||
101.DEF |
XBRL Taxonomy Extension Definition Linkbase Document |
|||||||||
101.LAB |
XBRL Taxonomy Extension Label Linkbase Document |
|||||||||
101.PRE |
XBRL Taxonomy Extension Presentation Linkbase Document |
|||||||||
* |
Management contract or compensatory plan or arrangement. |
48
** |
Portions of this exhibit have been omitted pursuant to a confidential treatment request that was granted by the Securities and Exchange Commission pursuant to Rule 24b-2 of the Securities Exchange Act of 1934, as amended. |
(b) |
Exhibits: See list of exhibits under (a)(2) above. |
(c) |
Financial Statement Schedules: See list of schedules under (a)(1) above. |
49
REPORT OF INDEPENDENT REGISTERED PUBLIC ACCOUNTING
FIRM
To the Board of Directors and Shareholders of
Pericom Semiconductor Corporation
Pericom Semiconductor Corporation
We have audited the accompanying consolidated balance
sheets of Pericom Semiconductor Corporation and its subsidiaries (the “Company”) as of June 27, 2015 and June 28, 2014, and the related
consolidated statements of operations, comprehensive income (loss), shareholders’ equity and cash flows for each of the three years in the period
ended June 27, 2015. Our audits also included the financial statement schedule listed in the Index to this Annual Report on Form 10-K at Part IV Item
15(a)(1). These consolidated financial statements and the financial statement schedule are the responsibility of the Company’s management. Our
responsibility is to express an opinion on these consolidated financial statements and the financial statement schedule based on our
audits.
We conducted our audits in accordance with the standards of
the Public Company Accounting Oversight Board (United States). Those standards require that we plan and perform the audit to obtain reasonable
assurance about whether the financial statements are free of material misstatement. An audit includes examining, on a test basis, evidence supporting
the amounts and disclosures in the financial statements. An audit also includes assessing the accounting principles used and significant estimates made
by management, as well as evaluating the overall financial statement presentation. We believe that our audits provide a reasonable basis for our
opinion.
In our opinion, the consolidated financial statements
referred to above present fairly, in all material respects, the financial position of Pericom Semiconductor Corporation and its subsidiaries as of June
27, 2015 and June 28, 2014, and the results of their operations and their cash flows for each of the three years in the period ended June 27, 2015, in
conformity with accounting principles generally accepted in the United States of America. Also, in our opinion, the related financial statement
schedule, when considered in relation to the consolidated financial statements taken as a whole, presents fairly, in all material respects, the
information set forth therein.
We have also audited, in accordance with the standards of
the Public Company Accounting Oversight Board (United States), the Company’s internal control over financial reporting as of June 27, 2015, based
on the criteria established in Internal Control—Integrated Framework (2013 Framework) issued by the Committee of Sponsoring
Organizations of the Treadway Commission (“COSO”) and our report dated September 1, 2015 expressed an unqualified opinion
thereon.
/s/ Burr Pilger Mayer, Inc.
San Jose, California
September 1, 2015
September 1, 2015
50
PERICOM SEMICONDUCTOR CORPORATION
CONSOLIDATED BALANCE SHEETS
(in thousands, except share data)
CONSOLIDATED BALANCE SHEETS
(in thousands, except share data)
| June 27, 2015 |
June 28, 2014 |
|||||||||
|---|---|---|---|---|---|---|---|---|---|---|
ASSETS |
||||||||||
Current assets: |
||||||||||
Cash and cash equivalents |
$ | 38,773 | $ | 33,020 | ||||||
Investments in marketable securities |
90,304 | 86,104 | ||||||||
Accounts receivable: |
||||||||||
Trade (net of reserves and allowances of $1,830 and $2,461) |
23,962 | 24,036 | ||||||||
Other receivables |
2,377 | 2,878 | ||||||||
Inventories |
13,613 | 12,288 | ||||||||
Prepaid expenses and other current assets |
3,510 | 2,458 | ||||||||
Deferred income taxes |
438 | 726 | ||||||||
Total current assets |
172,977 | 161,510 | ||||||||
Property, plant and equipment — net |
57,746 | 58,537 | ||||||||
Investments in unconsolidated affiliates |
2,311 | 2,445 | ||||||||
Deferred income taxes — non current |
2,601 | 2,460 | ||||||||
Intangible assets (net of accumulated amortization of $15,588 and $12,849) |
4,057 | 7,009 | ||||||||
Other assets |
8,031 | 8,118 | ||||||||
Total assets |
$ | 247,723 | $ | 240,079 | ||||||
LIABILITIES AND SHAREHOLDERS’ EQUITY |
||||||||||
Current liabilities: |
||||||||||
Accounts payable |
$ | 8,960 | $ | 8,927 | ||||||
Accrued liabilities |
11,425 | 9,934 | ||||||||
Total current liabilities |
20,385 | 18,861 | ||||||||
Industrial development subsidy |
5,377 | 6,354 | ||||||||
Deferred tax liabilities |
4,705 | 5,460 | ||||||||
Noncurrent tax liabilities |
1,411 | 1,041 | ||||||||
Other long-term liabilities |
236 | 871 | ||||||||
Total liabilities |
32,114 | 32,587 | ||||||||
Commitments and contingencies (Note 11) |
||||||||||
Shareholders’ equity: |
||||||||||
Common stock and paid in capital—no par value, 60,000,000 shares authorized; shares issued and outstanding: at June 27, 2015, 22,177,000;
at June 28, 2014, 21,974,000 |
114,248 | 113,118 | ||||||||
Retained earnings |
92,346 | 83,204 | ||||||||
Accumulated other comprehensive income, net of tax |
9,015 | 11,170 | ||||||||
Total shareholders’ equity |
215,609 | 207,492 | ||||||||
Total liabilities and shareholders’ equity |
$ | 247,723 | $ | 240,079 | ||||||
See notes to consolidated financial
statements.
51
PERICOM SEMICONDUCTOR CORPORATION
CONSOLIDATED STATEMENTS OF OPERATIONS
CONSOLIDATED STATEMENTS OF OPERATIONS
(in thousands, except per share data)
| Year Ended |
|||||||||||||||
|---|---|---|---|---|---|---|---|---|---|---|---|---|---|---|---|
| June 27, 2015 |
June 28, 2014 |
June 29, 2013 |
|||||||||||||
Net revenues |
$ | 128,835 | $ | 128,068 | $ | 129,255 | |||||||||
Cost of revenues |
71,021 | 76,983 | 81,388 | ||||||||||||
Gross profit |
57,814 | 51,085 | 47,867 | ||||||||||||
Operating expenses: |
|||||||||||||||
Research and development |
17,853 | 19,795 | 21,017 | ||||||||||||
Selling, general and administrative |
29,998 | 30,320 | 29,581 | ||||||||||||
Goodwill impairment |
— | — | 16,899 | ||||||||||||
Total operating expenses |
47,851 | 50,115 | 67,497 | ||||||||||||
Income (loss) from operations |
9,963 | 970 | (19,630 | ) | |||||||||||
Interest and other income, net |
4,452 | 2,792 | 4,043 | ||||||||||||
Interest expense |
— | — | (19 | ) | |||||||||||
Income (loss) before income taxes |
14,415 | 3,762 | (15,606 | ) | |||||||||||
Income tax expense (benefit) |
2,765 | (230 | ) | 6,223 | |||||||||||
Net income (loss) from consolidated companies |
11,650 | 3,992 | (21,829 | ) | |||||||||||
Equity in net income of unconsolidated affiliates |
175 | 132 | 215 | ||||||||||||
Net income (loss) |
$ | 11,825 | $ | 4,124 | $ | (21,614 | ) | ||||||||
Basic income (loss) per share |
$ | 0.53 | $ | 0.18 | $ | (0.93 | ) | ||||||||
Diluted income (loss) per share |
$ | 0.52 | $ | 0.18 | $ | (0.93 | ) | ||||||||
Shares used in computing basic earnings (loss) per share |
22,206 | 22,594 | 23,251 | ||||||||||||
Shares used in computing diluted earnings (loss) per share |
22,716 | 22,797 | 23,251 | ||||||||||||
Dividends declared and paid per share |
$ | 0.12 | $ | — | $ | — | |||||||||
See notes to consolidated financial
statements.
52
PERICOM SEMICONDUCTOR CORPORATION
CONSOLIDATED STATEMENTS OF COMPREHENSIVE INCOME (LOSS)
CONSOLIDATED STATEMENTS OF COMPREHENSIVE INCOME (LOSS)
(in thousands)
| Year Ended |
|||||||||||||||
|---|---|---|---|---|---|---|---|---|---|---|---|---|---|---|---|
| June 27, 2015 |
June 28, 2014 |
June 29, 2013 |
|||||||||||||
Net income (loss) |
$ | 11,825 | $ | 4,124 | $ | (21,614 | ) | ||||||||
Other comprehensive income: |
|||||||||||||||
Change in unrealized gain (loss) on securities available-for-sale, net |
(279 | ) | 925 | (1,005 | ) | ||||||||||
Foreign currency translation adjustment |
(2,046 | ) | 394 | 1,260 | |||||||||||
Tax benefit (provision) related to other comprehensive income |
170 | (369 | ) | 386 | |||||||||||
Other comprehensive income, net of tax |
(2,155 | ) | 950 | 641 | |||||||||||
Comprehensive income (loss) |
$ | 9,670 | $ | 5,074 | $ | (20,973 | ) | ||||||||
See notes to consolidated financial
statements.
53
PERICOM SEMICONDUCTOR CORPORATION
CONSOLIDATED STATEMENTS OF SHAREHOLDERS’ EQUITY
CONSOLIDATED STATEMENTS OF SHAREHOLDERS’ EQUITY
(in thousands)
| Common Stock |
||||||||||||||||||||||
|---|---|---|---|---|---|---|---|---|---|---|---|---|---|---|---|---|---|---|---|---|---|---|
| Shares |
Amount |
Retained Earnings |
Accumulated Other Comprehensive Income (Loss), Net |
Total Shareholders’ Equity |
||||||||||||||||||
BALANCES, June 30, 2012 |
23,565 | $ | 123,362 | $ | 100,694 | $ | 9,579 | $ | 233,635 | |||||||||||||
Net loss |
— | — | (21,614 | ) | — | (21,614 | ) | |||||||||||||||
Change in unrealized gain loss on investments, net |
— | — | — | (619 | ) | (619 | ) | |||||||||||||||
Currency translation adjustment |
— | — | — | 1,260 | 1,260 | |||||||||||||||||
Issuance of common stock under employee stock plans |
348 | 797 | — | — | 797 | |||||||||||||||||
Share-based compensation expense |
— | 3,339 | — | — | 3,339 | |||||||||||||||||
Tax expense resulting from share-based transactions |
— | (134 | ) | — | — | (134 | ) | |||||||||||||||
Repurchase and retirement of common stock |
(1,100 | ) | (7,773 | ) | — | — | (7,773 | ) | ||||||||||||||
BALANCES, June 29, 2013 |
22,813 | $ | 119,591 | $ | 79,080 | $ | 10,220 | $ | 208,891 | |||||||||||||
Net income |
— | — | 4,124 | — | 4,124 | |||||||||||||||||
Change in unrealized gain on investments, net |
— | — | — | 556 | 556 | |||||||||||||||||
Currency translation adjustment |
— | — | — | 394 | 394 | |||||||||||||||||
Issuance of common stock under employee stock plans |
515 | 2,344 | — | — | 2,344 | |||||||||||||||||
Share-based compensation expense |
— | 2,777 | — | — | 2,777 | |||||||||||||||||
Tax expense resulting from share-based transactions |
— | (278 | ) | — | — | (278 | ) | |||||||||||||||
Repurchase and retirement of common stock |
(1,354 | ) | (11,316 | ) | — | — | (11,316 | ) | ||||||||||||||
BALANCES, June 28, 2014 |
21,974 | $ | 113,118 | $ | 83,204 | $ | 11,170 | $ | 207,492 | |||||||||||||
Net income |
— | — | 11,825 | — | 11,825 | |||||||||||||||||
Change in unrealized gain on investments, net |
— | — | — | (109 | ) | (109 | ) | |||||||||||||||
Currency translation adjustment |
— | — | — | (2,046 | ) | (2,046 | ) | |||||||||||||||
Dividends declared and paid |
— | — | (2,683 | ) | — | (2,683 | ) | |||||||||||||||
Issuance of common stock under employee stock plans |
1,141 | 8,107 | — | — | 8,107 | |||||||||||||||||
Share-based compensation expense |
— | 3,994 | — | — | 3,994 | |||||||||||||||||
Tax expense resulting from share-based transactions |
— | (107 | ) | — | — | (107 | ) | |||||||||||||||
Repurchase and retirement of common stock |
(938 | ) | (10,864 | ) | — | — | (10,864 | ) | ||||||||||||||
BALANCES, June 27, 2015 |
22,177 | $ | 114,248 | $ | 92,346 | $ | 9,015 | $ | 215,609 | |||||||||||||
See notes to consolidated financial
statements.
54
PERICOM SEMICONDUCTOR CORPORATION
CONSOLIDATED STATEMENTS OF CASH FLOWS
CONSOLIDATED STATEMENTS OF CASH FLOWS
(in thousands)
| Year Ended |
|||||||||||||||
|---|---|---|---|---|---|---|---|---|---|---|---|---|---|---|---|
| June 27, 2015 |
June 28, 2014 |
June 29, 2013 |
|||||||||||||
CASH FLOWS FROM OPERATING ACTIVITIES: |
|||||||||||||||
Net income (loss) |
$ | 11,825 | $ | 4,124 | $ | (21,614 | ) | ||||||||
Adjustments to reconcile net income (loss) to net cash provided by operating activities: |
|||||||||||||||
Depreciation and amortization |
9,084 | 10,023 | 11,208 | ||||||||||||
Share-based compensation |
3,971 | 2,792 | 3,340 | ||||||||||||
Tax benefit resulting from share-based transactions |
1,786 | 700 | 492 | ||||||||||||
Excess tax benefit resulting from share-based transactions |
(483 | ) | (41 | ) | (4 | ) | |||||||||
Write-off of government subsidy receivable |
— | 843 | — | ||||||||||||
Gain on sale of investments |
(238 | ) | (179 | ) | (1,013 | ) | |||||||||
Write-off of property and equipment |
580 | 343 | 475 | ||||||||||||
Goodwill impairment |
— | — | 16,899 | ||||||||||||
Equity in net income of unconsolidated affiliates |
(175 | ) | (132 | ) | (215 | ) | |||||||||
Deferred taxes |
(414 | ) | 90 | (182 | ) | ||||||||||
Changes in assets and liabilities net of effects of entities acquired: |
|||||||||||||||
Accounts receivable |
51 | (2,229 | ) | 2,475 | |||||||||||
Inventories |
(1,553 | ) | 2,602 | 1,884 | |||||||||||
Prepaid expenses and other current assets |
(1,075 | ) | 245 | 188 | |||||||||||
Other assets |
43 | 338 | 151 | ||||||||||||
Accounts payable |
(990 | ) | (3,404 | ) | (2,768 | ) | |||||||||
Accrued liabilities |
(290 | ) | 349 | (956 | ) | ||||||||||
Other long-term liabilities |
(299 | ) | (1,917 | ) | 654 | ||||||||||
Net cash provided by operating activities |
21,823 | 14,547 | 11,014 | ||||||||||||
CASH FLOWS FROM INVESTING ACTIVITIES: |
|||||||||||||||
Purchases of property plant and equipment |
(5,700 | ) | (4,950 | ) | (13,231 | ) | |||||||||
Purchase of available-for-sale investments |
(88,517 | ) | (58,359 | ) | (92,993 | ) | |||||||||
Maturities and sales of available-for-sale investments |
83,559 | 59,799 | 109,525 | ||||||||||||
Net cash provided by (used in) investing activities |
(10,658 | ) | (3,510 | ) | 3,301 | ||||||||||
CASH FLOWS FROM FINANCING ACTIVITIES: |
|||||||||||||||
Proceeds from common stock issuance under stock plans |
8,107 | 2,344 | 797 | ||||||||||||
Excess tax benefit resulting from share-based transactions |
483 | 41 | 4 | ||||||||||||
Cash dividends paid |
(2,683 | ) | — | — | |||||||||||
Proceeds from short-term debt |
— | 514 | 3,992 | ||||||||||||
Payments on short-term debt |
— | (514 | ) | (5,398 | ) | ||||||||||
Repurchase of common stock |
(10,864 | ) | (11,316 | ) | (7,773 | ) | |||||||||
Net cash used in financing activities |
(4,957 | ) | (8,931 | ) | (8,378 | ) | |||||||||
EFFECT OF EXCHANGE RATE CHANGES ON CASH AND CASH EQUIVALENTS |
(455 | ) | 70 | 624 | |||||||||||
NET INCREASE IN CASH AND CASH EQUIVALENTS |
5,753 | 2,176 | 6,561 | ||||||||||||
CASH AND CASH EQUIVALENTS: |
|||||||||||||||
Beginning of year |
33,020 | 30,844 | 24,283 | ||||||||||||
End of year |
$ | 38,773 | $ | 33,020 | $ | 30,844 | |||||||||
SUPPLEMENTAL DISCLOSURE OF CASH FLOW INFORMATION: |
|||||||||||||||
Cash paid during the period for income taxes |
$ | 2,233 | $ | 1,378 | $ | 4,467 | |||||||||
Cash paid during the period for interest |
$ | — | $ | — | $ | 21 | |||||||||
See notes to consolidated financial
statements.
55
PERICOM SEMICONDUCTOR CORPORATION
NOTES TO CONSOLIDATED FINANCIAL STATEMENTS
NOTES TO CONSOLIDATED FINANCIAL STATEMENTS
1. BUSINESS AND SIGNIFICANT ACCOUNTING
POLICIES
Pericom Semiconductor Corporation (the “Company”
or “Pericom”) was incorporated in June 1990 in the state of California. The Company designs, manufactures and markets high performance
digital, analog and mixed-signal integrated circuits (“ICs”) and frequency control products (“FCPs”) used for the transfer,
routing, and timing of digital and analog signals within and between computer, networking, datacom and telecom systems.
USE OF ESTIMATES — The preparation of
financial statements in conformity with accounting principles generally accepted in the United States of America requires management to make estimates
and assumptions that affect the reported amounts of assets, liabilities, revenues and expenses during the reporting period. Actual results could differ
from those estimates.
BASIS OF PRESENTATION — These
consolidated financial statements include the accounts of Pericom Semiconductor Corporation and its wholly owned subsidiaries, Pericom Global Limited
(“PGL”), PSE Technology Corporation (“PSE-TW”), and Pericom Asia Limited (“PAL”). PGL has two wholly-owned subsidiaries,
Pericom International Limited (“PIL”) and Pericom Semiconductor (HK) Limited (“PHK”). In addition, PAL has three subsidiaries, PSE
Technology (Shandong) Corporation (“PSE-SD”), Pericom Technology Yangzhou Corporation (“PSC-YZ”) for the Jinan, China and Yangzhou,
China operations, respectively, and Pericom Technology Inc. (“PTI”). All significant intercompany balances and transactions have been
eliminated in consolidation.
FISCAL PERIOD — For purposes of
reporting the financial results, the Company’s fiscal years end on the Saturday closest to the end of June. All fiscal years presented herein
include 52 weeks.
CASH EQUIVALENTS — The Company considers
all highly liquid investments purchased with an original or remaining maturity of three months or less when purchased to be cash equivalents. The
recorded carrying amounts of the Company’s cash and cash equivalents approximate their fair value.
INVESTMENTS IN MARKETABLE SECURITIES —
The Company’s policy is to invest in instruments with investment grade credit ratings. The Company classifies its investments as
“available-for-sale” securities and the Company bases the cost of securities sold using the specific identification method. The Company
accounts for unrealized gains and losses on its available-for-sale securities as a separate component of shareholders’ equity in the consolidated
balance sheets in the period in which the gain or loss occurs. All available-for-sale securities are classified as short-term investments, as we
consider the entire investment portfolio to be saleable if cash is needed or if better investment opportunities arise.
As of June 27, 2015 and June 28, 2014, investments, and any
difference between the fair market value and the underlying amortized cost of such investments, consisted of the following:
56
PERICOM SEMICONDUCTOR CORPORATION
NOTES TO CONSOLIDATED FINANCIAL STATEMENTS
NOTES TO CONSOLIDATED FINANCIAL STATEMENTS
1. BUSINESS AND SIGNIFICANT ACCOUNTING POLICIES
(Continued)
Available-for-Sale Securities:
| As of June 27, 2015 |
|||||||||||||||||||||||
|---|---|---|---|---|---|---|---|---|---|---|---|---|---|---|---|---|---|---|---|---|---|---|---|
| (in thousands) |
Amortized Cost |
Unrealized Gains |
Unrealized Losses |
Net Unrealized Gains (Losses) |
Fair Value |
||||||||||||||||||
Available-for-Sale Securities |
|||||||||||||||||||||||
Time deposits |
$ | 22,157 | $ | — | $ | — | $ | — | $ | 22,157 | |||||||||||||
National government and agency securities |
4,612 | 64 | (3 | ) | 61 | 4,673 | |||||||||||||||||
State and municipal bond obligations |
4,488 | 13 | (11 | ) | 2 | 4,490 | |||||||||||||||||
Corporate bonds and notes |
46,889 | 168 | (200 | ) | (32 | ) | 46,857 | ||||||||||||||||
Asset backed securities |
6,994 | 12 | (20 | ) | (8 | ) | 6,986 | ||||||||||||||||
Mortgage backed securities |
5,143 | 11 | (13 | ) | (2 | ) | 5,141 | ||||||||||||||||
Total |
$ | 90,283 | $ | 268 | $ | (247 | ) | $ | 21 | $ | 90,304 | ||||||||||||
| As of June 28, 2014 |
|||||||||||||||||||||||
|---|---|---|---|---|---|---|---|---|---|---|---|---|---|---|---|---|---|---|---|---|---|---|---|
| (in thousands) |
Amortized Cost |
Unrealized Gains |
Unrealized Losses |
Net Unrealized Gains (Losses) |
Fair Value |
||||||||||||||||||
Available-for-Sale Securities |
|||||||||||||||||||||||
Time deposits |
$ | 17,693 | $ | — | $ | — | $ | — | $ | 17,693 | |||||||||||||
Repurchase agreements |
500 | — | — | — | 500 | ||||||||||||||||||
US Treasury securities |
526 | 1 | — | 1 | 527 | ||||||||||||||||||
National government and agency securities |
4,962 | 95 | (2 | ) | 93 | 5,055 | |||||||||||||||||
State and municipal bond obligations |
7,090 | 63 | (4 | ) | 59 | 7,149 | |||||||||||||||||
Corporate bonds and notes |
42,675 | 249 | (143 | ) | 106 | 42,781 | |||||||||||||||||
Asset backed securities |
7,592 | 28 | (6 | ) | 22 | 7,614 | |||||||||||||||||
Mortgage backed securities |
4,766 | 26 | (7 | ) | 19 | 4,785 | |||||||||||||||||
Total |
$ | 85,804 | $ | 462 | $ | (162 | ) | $ | 300 | $ | 86,104 | ||||||||||||
The following tables show the gross unrealized losses and
fair values of the Company’s investments that have unrealized losses, aggregated by investment category and length of time that individual
securities have been in a continuous unrealized loss position, as of June 27, 2015 and June 28, 2014:
| Continuous Unrealized Losses at June 27, 2015 |
|||||||||||||||||||||||||||
|---|---|---|---|---|---|---|---|---|---|---|---|---|---|---|---|---|---|---|---|---|---|---|---|---|---|---|---|
| Less Than 12 Months |
12 Months or Longer |
Total |
|||||||||||||||||||||||||
| (in thousands) |
Fair Value |
Unrealized Losses |
Fair Value |
Unrealized Losses |
Fair Value |
Unrealized Losses |
|||||||||||||||||||||
National government and agency securities |
$ | 1,411 | $ | 3 | $ | 190 | $ | — | $ | 1,601 | $ | 3 | |||||||||||||||
State and municipal bond obligations |
928 | 4 | 1,077 | 7 | 2,005 | 11 | |||||||||||||||||||||
Corporate bonds and notes |
20,621 | 188 | 2,893 | 12 | 23,514 | 200 | |||||||||||||||||||||
Asset backed securities |
1,961 | 16 | 1,061 | 4 | 3,022 | 20 | |||||||||||||||||||||
Mortgage backed securities |
2,023 | 12 | 336 | 1 | 2,359 | 13 | |||||||||||||||||||||
| $ | 26,944 | $ | 223 | $ | 5,557 | $ | 24 | $ | 32,501 | $ | 247 | ||||||||||||||||
57
PERICOM SEMICONDUCTOR CORPORATION
NOTES TO CONSOLIDATED FINANCIAL STATEMENTS
NOTES TO CONSOLIDATED FINANCIAL STATEMENTS
1. BUSINESS AND SIGNIFICANT ACCOUNTING POLICIES
(Continued)
| Continuous Unrealized Losses at June 28, 2014 |
|||||||||||||||||||||||||||
|---|---|---|---|---|---|---|---|---|---|---|---|---|---|---|---|---|---|---|---|---|---|---|---|---|---|---|---|
| Less Than 12 Months |
12 Months or Longer |
Total |
|||||||||||||||||||||||||
| (in thousands) |
Fair Value |
Unrealized Losses |
Fair Value |
Unrealized Losses |
Fair Value |
Unrealized Losses |
|||||||||||||||||||||
National government and agency securities |
$ | 282 | $ | 1 | $ | 91 | $ | 1 | $ | 373 | $ | 2 | |||||||||||||||
State and municipal bond obligations |
— | — | 695 | 4 | 695 | 4 | |||||||||||||||||||||
Corporate bonds and notes |
3,901 | 11 | 5,801 | 132 | 9,702 | 143 | |||||||||||||||||||||
Asset backed securities |
895 | 1 | 1,195 | 5 | 2,090 | 6 | |||||||||||||||||||||
Mortgage backed securities |
1,083 | 3 | 504 | 4 | 1,587 | 7 | |||||||||||||||||||||
| $ | 6,161 | $ | 16 | $ | 8,286 | $ | 146 | $ | 14,447 | $ | 162 | ||||||||||||||||
The unrealized losses are of a temporary nature due to the
Company’s intent and ability to hold the investments until maturity or until the cost is recoverable. The unrealized losses are primarily due to
fluctuations in market interest rates. The Company reports unrealized gains and losses on its “available-for-sale” securities in accumulated
other comprehensive income, net of tax, in shareholders’ equity.
The Company records gains or losses realized on sales of
available-for-sale securities in interest and other income, net on its consolidated statements of operations. The cost of securities sold is based on
the specific identification of the security and its amortized cost. In fiscal 2015, 2014 and 2013, realized gains on available-for-sale securities were
$238,000, $179,000 and $1.0 million, respectively.
The following table lists the fair value of the
Company’s short-term investments by length of time to maturity as of June 27, 2015 and June 28, 2014:
| (in thousands) |
June 27, 2015 |
June 28, 2014 |
||||||||
|---|---|---|---|---|---|---|---|---|---|---|
One year or less |
$ | 23,751 | $ | 24,963 | ||||||
Between one and three years |
40,357 | 24,242 | ||||||||
Greater than three years |
20,678 | 30,449 | ||||||||
Multiple dates |
5,518 | 6,450 | ||||||||
| $ | 90,304 | $ | 86,104 | |||||||
Securities with maturities over multiple dates are
mortgage-backed securities (“MBS”) or asset-backed securities (“ABS”) featuring periodic principle paydowns through
2041.
FAIR VALUE OF FINANCIAL INSTRUMENTS —
The Company has determined that the amounts reported for cash and cash equivalents, accounts receivable, accounts payable and accrued liabilities
approximate fair value because of their short maturities. Available-for-sale investments are reported at their fair value based on quoted market
prices. A further discussion of the fair value of financial instruments is detailed in Note 15.
ALLOWANCE FOR DOUBTFUL ACCOUNTS — The
Company computes its allowance for doubtful accounts using a combination of factors. In cases where the Company is aware of circumstances that may
impair a specific customer’s ability to meet its financial obligations to the Company, the Company records a specific allowance against amounts
due to the Company, reducing the net recognized receivable to the amount the Company reasonably believes it will collect. For all other customers, the
Company recognizes allowances for doubtful accounts based on the length of time the receivables are past due, the current business environment and its
historical experience.
INVENTORIES — For IC and certain FCP
products, the Company records inventories at the lower of standard cost (which generally approximates actual cost on a first-in, first-out basis) or
market value. The carrying value of inventory is adjusted for excess and obsolete inventory based on inventory age, shipment history and the forecast
of demand over a specific future period. The semiconductor markets that the Company serves are volatile and actual
58
PERICOM SEMICONDUCTOR CORPORATION
NOTES TO CONSOLIDATED FINANCIAL STATEMENTS
NOTES TO CONSOLIDATED FINANCIAL STATEMENTS
1. BUSINESS AND SIGNIFICANT ACCOUNTING POLICIES
(Continued)
results may vary from forecast or other assumptions, potentially affecting the Company’s assessment of excess and obsolete inventory, resulting in material effects on gross margin.
The inventories of the remainder of the FCP products are
recorded at the lower of weighted-average cost, which approximates actual cost, or market value. Weighted average cost is comprised of average
manufacturing costs weighted by the volume produced in each production run. Market value is defined as the net realizable value for finished goods, and
replacement cost for raw materials and work in process.
Raw material inventory is considered slow moving and is
fully reserved if it has not moved in 365 days. For assembled devices, the inventory is disaggregated by part number. The quantities on hand in each
part number category are compared to the quantity that was shipped in the previous twelve months, the quantity in backlog and to the quantity expected
to ship in the next twelve months. A reserve is recorded to the extent the value of each quantity on hand is in excess of the lesser of the three
comparisons. The Company also periodically reviews inventory for obsolescence beyond the established formulaic tests. The Company believes this method
of evaluating inventory fairly represents market conditions.
The Company considers the reserved material to be
available-for-sale. The reserved inventory is not revalued should market conditions change or if a market develops for the obsolete inventory. In the
past, the Company has sold obsolete inventory that was previously fully reserved.
PROPERTY, PLANT AND EQUIPMENT — The
Company states its property, plant and equipment at cost. Cost includes purchase cost, applicable taxes, freight, installation costs and interest
incurred in the acquisition of any asset that requires a period of time to make it ready for use. We compute depreciation and amortization using the
straight-line method over estimated useful lives of three to eight years except for buildings, which we depreciate using the straight-line method over
estimated useful lives of twenty to forty years. We depreciate leasehold improvements over the shorter of the lease term or the improvement’s
estimated useful life. In addition, we capitalize the cost of major replacements, improvements and betterments, while we expense normal maintenance and
repair.
INVESTMENTS IN UNCONSOLIDATED AFFILIATES
— The Company holds or has held ownership interests in various investees. Our ownership in these affiliates has varied from 20% to approximately
49%. We classify these investments as investments in unconsolidated affiliates in our consolidated balance sheets. The Company accounts for long-term
investments in companies in which it has an ownership share larger than 20% and in which it has significant influence over the activities of the
investee using the equity method. We recognize our proportionate share of each investee’s income or loss in the period in which the investee
reports the income or loss. We eliminate all intercompany transactions in accounting for our equity method investments.
OTHER ASSETS — The Company’s other
assets classification includes investments in privately held companies in which we have less than a 20% interest, land use rights and deposits. The
Company reports its investments in privately held companies at the lower of cost or market. The Company’s management reviews the investment in
these companies for losses that may be other than temporary on a quarterly basis. Should management determine that such an impairment exists, the
Company will reduce the value of the Company’s investment in the period in which management discovers the impairment and charge the impairment to
the consolidated statement of operations. The Company’s management performed such an evaluation as of June 27, 2015 and determined that no
impairment existed. Two of the Company’s subsidiaries, PSE-SD and PTI, hold land use rights that were acquired from the local Chinese government
which entitle the Company to use the land for 15 to 50 years. The cost of the land use rights is recorded as a component of other assets and is being
depreciated over 15 to 50 years, the useful life of the rights.
LONG-LIVED ASSETS — We Company evaluates
long-lived assets for impairment whenever events or changes in circumstances indicate that the carrying amount of an asset may not be recoverable. When
the sum of the undiscounted future net cash flows expected to result from the use of the asset and its eventual disposition is less
59
PERICOM SEMICONDUCTOR CORPORATION
NOTES TO CONSOLIDATED FINANCIAL STATEMENTS
NOTES TO CONSOLIDATED FINANCIAL STATEMENTS
1. BUSINESS AND SIGNIFICANT ACCOUNTING POLICIES
(Continued)
than its carrying amount, the Company will recognize an impairment loss as the amount of the difference between carrying value and fair value as determined by discounted cash flows.
INCOME TAXES — The Company accounts for
income taxes following the Financial Accounting Standards Board’s (“FASB”) statements and related interpretations, which require an
asset and liability approach to recording deferred taxes. We record a valuation allowance to reduce deferred tax assets when it is more likely than not
that a tax benefit will not be realized. The Company’s income tax calculations are based on application of the respective U.S. federal, state or
foreign tax laws. The Company’s tax filings, however, are subject to audit by the respective tax authorities. Accordingly, the Company recognizes
tax liabilities based on its estimates of whether, and the extent to which, additional taxes will be due when such estimates are more-likely-than-not
to be sustained. An uncertain income tax position will not be recognized if it has less than a 50% likelihood of being sustained. To the extent the
final tax liabilities are different than the amounts originally accrued, the increases or decreases are recorded as income tax expense or benefit in
the consolidated statements of operations.
The Internal Revenue Service completed their examination of
the Company’s federal tax returns for fiscal 2010 and 2011 during fiscal 2014, and additional tax payments of approximately $208,000 were made in
fiscal 2014, including interest charges for the two years that were examined. The Company had previously accrued for this exposure.
FOREIGN CURRENCY TRANSLATION — The
functional currency of the Company’s foreign subsidiaries is the local currency. In consolidation, the Company translates assets and liabilities
at exchange rates in effect at the balance sheet date. The Company translates revenue and expense accounts at average exchange rates during the period
in which the transaction takes place. Net gains or (losses) from foreign currency translation of assets and liabilities of $(2.0 million) and $394,000
in fiscal 2015 and 2014, respectively, are included in the cumulative translation adjustment component of accumulated other comprehensive income, net
of tax, which is a component of shareholders’ equity. Net gains or (losses) arising from transactions denominated in currencies other than the
functional currency were $1.2 million, $(11,000) and $562,000 in fiscal 2015, 2014 and 2013 respectively, and are included in interest and other
income, net.
SHARE-BASED COMPENSATION — The Company
recognizes employee share-based compensation through measurement at grant date based on the fair value of the award, and the fair value is recognized
as an expense over the employee’s requisite service period. See Note 14 for further discussion of share-based compensation.
REVENUE RECOGNITION — The Company
recognizes revenue from the sale of its products when:
• |
Persuasive evidence of an arrangement exists; |
• |
Delivery has occurred; |
• |
The sales price is fixed or determinable; and |
• |
Collectibility is reasonably assured. |
Generally, the Company meets these conditions upon shipment
because, in most cases, title and risk of loss passes to the customer at that time. In addition, the Company estimates and records provisions for
future returns and other charges against revenue at the time of shipment consistent with the terms of sale.
The Company sells products to large, domestic distributors
at the price listed in its price book for that distributor. At the time of sale, the Company records a sales reserve for ship from stock and debits
(“SSD”s), stock rotations, return material authorizations (“RMA”s), authorized price protection programs, and any special programs
approved by management. The Company offsets the sales reserve against revenues, producing the net revenue amount reported in the consolidated
statements of operations.
The market price for the Company’s products can be
significantly different from the book price at which the Company sold the product to the distributor. When the market price, as compared to the
Company’s original book
60
PERICOM SEMICONDUCTOR CORPORATION
NOTES TO CONSOLIDATED FINANCIAL STATEMENTS
NOTES TO CONSOLIDATED FINANCIAL STATEMENTS
1. BUSINESS AND SIGNIFICANT ACCOUNTING POLICIES
(Continued)
price, of a particular distributor’s sales opportunity to their own customer would result in low or negative margins for our distributor, the Company negotiates a ship from stock and debit with the distributor. Management analyzes the Company’s SSD history to develop current SSD rates that form the basis of the SSD sales reserve recorded each period. The Company obtains the historical SSD rates from its internal records.
The Company’s distribution agreements provide for
semi-annual stock rotation privileges of typically 10% of net sales for the previous six-month period. The contractual stock rotation applies only to
shipments at the Company’s listed book price. Asian distributors typically buy the Company’s product at less than standard price and
therefore are not entitled to the 10% stock rotation privilege. In order to provide for routine inventory refreshing, for the Company’s benefit as
well as theirs, the Company grants Asian distributors stock rotation privileges between 1% and 10% even though the Company is not contractually
obligated to do so. Each month the Company adjusts the sales reserve for the estimated stock rotation privilege anticipated to be utilized by the
distributors.
From time to time, customers may request to return parts
for various reasons including the customers’ belief that the parts are not performing to specification. Many such return requests are the result
of customers incorrectly using the parts, not because the parts are defective. Management reviews these requests and, if approved, the Company prepares
a RMA. The Company is only obligated to accept defective parts returns. To accommodate the Company’s customers, the Company may approve particular
return requests, even though it is not obligated to do so. Each month the Company records a sales reserve for approved RMAs covering products that have
not yet been returned. The Company does not maintain a general warranty reserve because, historically, valid warranty returns, which are the result of
a part not meeting specifications or being non-functional, have been immaterial and the Company can frequently resell returned parts to other customers
for use in other applications. The Company monitors and assesses RMA activity and overall materiality to assess whether a general warranty reserve has
become appropriate.
The Company grants price protection solely at the
discretion of Pericom management. The purpose of price protection is to reduce the distributor’s cost of inventory as market prices fall thus
reducing SSD rates. Pericom sales management prepares price protection proposals for individual products located at individual distributors. Pericom
management reviews and approves or disapproves these proposals. If a particular price protection arrangement is approved, the Company estimates the
dollar impact based on the sales price reduction per unit for the products approved and the number of units of those products in that
distributor’s inventory. The Company records a sales reserve in that period for the estimated amount at the time revenue is
recognized.
At the discretion of Pericom management, the Company may
offer rebates on specific products sold to specific end customers. The purpose of the rebates is to allow for pricing adjustments for large programs
without affecting the pricing the Company charges its distributor customers. The Company records the rebate at the time of shipment.
Pericom typically grants payment terms of between 30 and 60
days to its customers. The Company’s customers generally pay within those terms. The Company grants relatively few customers sales terms that
include cash discounts. Distributors are invoiced for shipments at listed book price. When the distributors pay the Company’s invoices, they may
claim debits for SSDs, stock rotations, cash discounts, RMAs and price protection when appropriate. Once claimed, the Company processes the requests
against the prior authorizations and reduces the reserve previously established for that customer.
The revenue the Company records for sales to its
distributors is net of estimated provisions for these programs. When determining this net revenue, the Company must make significant judgments and
estimates. The Company bases its estimates on historical experience rates, inventory levels in the distribution channel, current trends and other
related factors. However, because of the inherent nature of estimates, there is a risk that there could be significant differences between actual
amounts and the Company’s estimates. The Company’s financial condition and operating results depend on its ability to make reliable estimates
and Pericom believes that such estimates are reasonable.
61
PERICOM SEMICONDUCTOR CORPORATION
NOTES TO CONSOLIDATED FINANCIAL STATEMENTS
NOTES TO CONSOLIDATED FINANCIAL STATEMENTS
1. BUSINESS AND SIGNIFICANT ACCOUNTING POLICIES
(Continued)
PRODUCT WARRANTY — The Company offers a
standard one-year product replacement warranty. In the past, the Company has not had to accrue for a general warranty reserve, but assesses the level
and materiality of RMAs and determines whether it is appropriate to accrue for estimated returns of defective products at the time revenue is
recognized. On occasion, management may determine to accept product returns beyond the standard one-year warranty period. In those instances, the
Company accrues for the estimated cost at the time management decides to accept the return. Because of the Company’s standardized manufacturing
processes and product testing procedures, returns of defective product are infrequent and the quantities have not been significant. Accordingly,
historical warranty costs have not been material.
SHIPPING COSTS — We charge shipping
costs to cost of revenues as incurred.
CONCENTRATION OF CREDIT RISK — The
Company primarily sells its products to a relatively small number of companies and generally does not require its customers to provide collateral or
other security to support accounts receivable. The Company maintains allowances for estimated bad debt losses. The Company also purchases substantially
all of its wafers from three suppliers and purchases other manufacturing services from a relatively small number of suppliers.
The following table indicates the percentage of our net
revenues and accounts receivable in excess of 10% with any single customer:
| Percentage of |
|||||||||||||||
|---|---|---|---|---|---|---|---|---|---|---|---|---|---|---|---|
| Fiscal Year Ended: |
Net Revenues |
Trade Accounts Receivable |
|||||||||||||
June 27, 2015 |
Customer A |
20 | % | 16 | % | ||||||||||
Customer B |
19 | 23 | |||||||||||||
All others |
61 | 61 | |||||||||||||
| 100 | % | 100 | % | ||||||||||||
June 28, 2014 |
Customer A |
26 | % | 29 | % | ||||||||||
Customer B |
10 | 8 | |||||||||||||
All others |
64 | 63 | |||||||||||||
| 100 | % | 100 | % | ||||||||||||
June 29, 2013 |
Customer A |
21 | % | 28 | % | ||||||||||
Customer B |
12 | 7 | |||||||||||||
All others |
67 | 65 | |||||||||||||
| 100 | % | 100 | % | ||||||||||||
The Company maintains cash, cash equivalents and short-term
investments with various high credit quality financial institutions. The Company has designed its investment policy to limit exposure to any one
institution. The Company performs periodic evaluations of the relative credit standing of those financial institutions that manage its investments. The
Company is exposed to credit risk in the event of default by the financial institutions or issuers of securities to the extent of the amounts reported
in the consolidated balance sheets.
RECENTLY ISSUED ACCOUNTING STANDARDS —
In July 2015, the Financial Accounting Standards Board (“FASB”) issued Accounting Standards Update (“ASU”) 2015-11, Simplifying
the Measurement of Inventory. Under this ASU, inventory will be measured at the “lower of cost and net realizable value,” and options
that currently exist for “market value” will be eliminated. The ASU defines net realizable value as “estimated selling prices in the
ordinary course of business, less reasonably predictable costs of completion, disposal, and transportation.” No other changes were made to the
current guidance on inventory measurement. ASU 2015-11 is effective for interim and annual periods beginning after December 15, 2016. Early application
is permitted and should be applied
62
PERICOM SEMICONDUCTOR CORPORATION
NOTES TO CONSOLIDATED FINANCIAL STATEMENTS
NOTES TO CONSOLIDATED FINANCIAL STATEMENTS
1. BUSINESS AND SIGNIFICANT ACCOUNTING POLICIES
(Continued)
prospectively. Management is evaluating the provisions of this statement, including which period to adopt, and has not determined what impact the adoption of ASU 2015-11 will have on the Company’s financial position or results of operations.
In May 2014, the FASB issued ASU 2014-09, Revenue from
Contracts with Customers. ASU 2014-09 outlines a single comprehensive model for accounting for revenue arising from contracts with customers and
supersedes most current revenue recognition guidance. ASU 2014-09 requires an entity to recognize revenue to depict the transfer of promised goods or
services to customers in an amount that reflects the consideration to which the entity expects to be entitled in exchange for those goods or services.
ASU 2014-09 will be effective for annual and interim reporting periods beginning after December 15, 2017, although public companies may early adopt for
annual and interim reporting periods beginning after December 15, 2016. The impact on the Company’s financial condition, results of operations and
cash flows as a result of the adoption of ASU 2014-09 has not yet been determined.
EARNINGS (LOSS) PER SHARE — The Company
bases its basic earnings (loss) per share upon the weighted-average number of common shares outstanding during the period. Diluted earnings (loss) per
share reflect the potential dilution that could occur if securities or other contracts to issue common stock were exercised or converted into common
stock.
Basic and diluted earnings (loss) per share for each of the
three years in the period ended June 27, 2015 is as follows:
| Fiscal Year Ended |
|||||||||||||||
|---|---|---|---|---|---|---|---|---|---|---|---|---|---|---|---|
| (in thousands, except for per share
data) |
June 27, 2015 |
June 28, 2014 |
June 29, 2013 |
||||||||||||
Net income (loss) |
$ | 11,825 | $ | 4,124 | $ | (21,614 | ) | ||||||||
Computation of common shares outstanding — basic earnings (loss) per share: |
|||||||||||||||
Weighted average shares of common stock |
22,206 | 22,594 | 23,251 | ||||||||||||
Basic earnings (loss) per share |
$ | 0.53 | $ | 0.18 | $ | (0.93 | ) | ||||||||
Computation of common shares outstanding — diluted earnings (loss) per share: |
|||||||||||||||
Weighted average shares of common stock |
22,206 | 22,594 | 23,251 | ||||||||||||
Dilutive shares using the treasury stock method |
510 | 203 | — | ||||||||||||
Shares used in computing diluted earnings (loss) per share |
22,716 | 22,797 | 23,251 | ||||||||||||
Diluted earnings (loss) per share |
$ | 0.52 | $ | 0.18 | $ | (0.93 | ) | ||||||||
As the Company incurred a loss for the year ended June 29,
2013, diluted loss per share is the same as basic loss per share since the addition of any contingently issuable share would be anti-dilutive. Options
to purchase 616,000 shares of common stock were outstanding during the year ended June 27, 2015 and were excluded from the computation of diluted net
earnings per share because such options and restricted stock units were anti-dilutive. Options to purchase 1.9 million shares of common stock, and
restricted stock units of 1,138 shares were outstanding during the year ended June 28, 2014 and were excluded from the computation of diluted net
earnings per share because such options and units were anti-dilutive. Options to purchase 2.4 million shares of common stock, and restricted stock
units of 525,000 shares were outstanding during the year ended June 29, 2013 and were excluded from the computation of diluted net loss per share
because such options and units were anti-dilutive.
63
PERICOM SEMICONDUCTOR CORPORATION
NOTES TO CONSOLIDATED FINANCIAL STATEMENTS
NOTES TO CONSOLIDATED FINANCIAL STATEMENTS
2. OTHER RECEIVABLES
Other receivables consist of:
| As of the year ended |
|||||||||||
|---|---|---|---|---|---|---|---|---|---|---|---|
| (in thousands) |
June 27, 2015 |
June 28, 2014 |
|||||||||
Interest receivable |
$ | 1,267 | $ | 1,516 | |||||||
VAT and other tax receivables |
471 | 1,031 | |||||||||
Other accounts receivable |
639 | 331 | |||||||||
| $ | 2,377 | $ | 2,878 | ||||||||
3. INVENTORIES
Inventories consist of:
| As of the year ended |
|||||||||||
|---|---|---|---|---|---|---|---|---|---|---|---|
| (in thousands) |
June 27, 2015 |
June 28, 2014 |
|||||||||
Finished goods |
$ | 4,552 | $ | 3,991 | |||||||
Work-in-process |
2,812 | 2,468 | |||||||||
Raw materials |
6,249 | 5,829 | |||||||||
| $ | 13,613 | $ | 12,288 | ||||||||
As of June 27, 2015, the Company had reserved for $2.8
million of inventory as compared to $3.2 million at June 28, 2014.
4. PROPERTY, PLANT AND EQUIPMENT —
NET
| As of the year ended |
|||||||||||
|---|---|---|---|---|---|---|---|---|---|---|---|
| (in thousands) |
June 27, 2015 |
June 28, 2014 |
|||||||||
Machinery and equipment |
$ | 56,595 | $ | 55,408 | |||||||
Buildings |
36,594 | 36,196 | |||||||||
Computer equipment and software |
14,858 | 13,742 | |||||||||
Land |
9,622 | 9,473 | |||||||||
Furniture and fixtures |
1,250 | 1,218 | |||||||||
Leasehold improvements |
499 | 595 | |||||||||
Vehicles |
116 | 151 | |||||||||
Total |
119,534 | 116,783 | |||||||||
Accumulated depreciation and amortization |
(63,594 | ) | (59,500 | ) | |||||||
Construction-in-progress |
1,806 | 1,254 | |||||||||
Property, plant and equipment — net |
$ | 57,746 | $ | 58,537 | |||||||
Depreciation expense for the years ended June 27, 2015,
June 28, 2014 and June 29, 2013 was $5.7 million, $6.4 million and $7.4 million, respectively.
64
PERICOM SEMICONDUCTOR CORPORATION
NOTES TO CONSOLIDATED FINANCIAL STATEMENTS
NOTES TO CONSOLIDATED FINANCIAL STATEMENTS
5. OTHER ASSETS
| As of the year ended |
|||||||||||
|---|---|---|---|---|---|---|---|---|---|---|---|
| (in thousands) |
June 27, 2015 |
June 28, 2014 |
|||||||||
Land use rights |
$ | 6,365 | $ | 6,631 | |||||||
Investments in privately held companies |
1,224 | 1,243 | |||||||||
Deposits |
109 | 118 | |||||||||
Other |
333 | 126 | |||||||||
Total |
$ | 8,031 | $ | 8,118 | |||||||
The Company purchased land use rights from the PRC in 2008
for the construction of its Jinan facility and its operation for a period of 50 years. In addition, the PTI acquisition in 2011 included land use
rights for PTI’s properties in Shanghai.
The Company has investments in certain privately held
companies which it accounts for under the cost method. The Company reviews these investments for impairment on a periodic basis. No impairment charges
relating to investments in privately held companies were recorded during fiscal 2015, 2014 or 2013.
6. INVESTMENT IN UNCONSOLIDATED AFFILIATE
The Company’s investment in unconsolidated affiliate
is comprised of the following:
| As of the year ended |
|||||||||||
|---|---|---|---|---|---|---|---|---|---|---|---|
| (in thousands) |
June 27, 2015 |
June 28, 2014 |
|||||||||
Jiyuan Crystal Photoelectric Frequency Technology Ltd. |
$ | 2,311 | $ | 2,445 | |||||||
PSE-TW has a 49% equity interest in Jiyuan Crystal
Photoelectric Frequency Technology Ltd. (“JCP”), an FCP manufacturing company located in Science Park of Jiyuan City, Henan Province, China.
JCP is a key manufacturing partner of PSE-TW. For fiscal 2015, the Company’s investment in JCP increased by the $175,000 allocated portion of
JCP’s income and decreased by a JCP declared dividend ($117,000) as well as the impact of currency exchange rates over the year. For fiscal 2014,
the Company’s investment in JCP increased by the $132,000 allocated portion of JCP’s income, and decreased by a $212,000 JCP declared
dividend.
The Company holds or has held ownership interests in
various other privately held companies. The ownership in these affiliates varied from 20% to approximately 49%. For those companies in which the
ownership interest is more than 20% and in which the Company has the ability to exercise significant influence on the affiliate’s operations, the
investment is valued using the equity method of accounting. As of June 27, 2015, the amount of consolidated retained earnings of the Company
represented by undistributed earnings of 50% or less entities accounted for by the equity method was approximately $4.1 million.
65
PERICOM SEMICONDUCTOR CORPORATION
NOTES TO CONSOLIDATED FINANCIAL STATEMENTS
NOTES TO CONSOLIDATED FINANCIAL STATEMENTS
7. INTANGIBLE ASSETS
The Company’s acquired intangible assets associated
with completed acquisitions for each of the following fiscal years are composed of:
| As of the year ended |
|||||||||||||||||||||||||||
|---|---|---|---|---|---|---|---|---|---|---|---|---|---|---|---|---|---|---|---|---|---|---|---|---|---|---|---|
| June 27, 2015 |
June 28, 2014 |
||||||||||||||||||||||||||
| (in thousands) |
Gross |
Accumulated Amortization |
Net |
Gross |
Accumulated Amortization |
Net |
|||||||||||||||||||||
Customer relationships |
$ | 6,008 | $ | (4,862 | ) | $ | 1,146 | $ | 6,056 | $ | (3,913 | ) | $ | 2,143 | |||||||||||||
In process research and development |
3,539 | (2,543 | ) | 996 | 3,564 | (1,959 | ) | 1,605 | |||||||||||||||||||
Core developed technology |
9,712 | (8,183 | ) | 1,529 | 9,838 | (6,977 | ) | 2,861 | |||||||||||||||||||
Total amortizable purchased intangible assets |
19,259 | (15,588 | ) | 3,671 | 19,458 | (12,849 | ) | 6,609 | |||||||||||||||||||
SaRonix trade name |
386 | — | 386 | 400 | — | 400 | |||||||||||||||||||||
Total purchased intangible assets |
$ | 19,645 | $ | (15,588 | ) | $ | 4,057 | $ | 19,858 | $ | (12,849 | ) | $ | 7,009 | |||||||||||||
Amortization expense related to finite-lived purchased
intangible assets was approximately $2.9 million in fiscal 2015, $3.0 million in fiscal 2014 and $3.1 million in fiscal 2013.
The Company performs an annual impairment review of its
long-lived assets, including its intangible assets. Based on the results of its most recent annual impairment tests, the Company determined that no
impairment of the intangible assets existed as of June 27, 2015 or June 28, 2014. However, future impairment tests could result in a charge to
earnings.
The finite-lived purchased intangible assets consist of
customer relationships, capitalized in-process research and development and core developed technology, which have remaining useful lives of
approximately two years. We expect our future amortization expense over the next five years associated with these assets to be:
| (in thousands) |
2016 |
2017 |
2018 and beyond |
Total |
||||||||||||||||||
|---|---|---|---|---|---|---|---|---|---|---|---|---|---|---|---|---|---|---|---|---|---|---|
Expected Amortization |
||||||||||||||||||||||
Customer relationships |
$ | 982 | $ | 164 | $ | — | $ | 1,146 | ||||||||||||||
In process research and development |
590 | 406 | — | 996 | ||||||||||||||||||
Core developed technology |
1,311 | 218 | — | 1,529 | ||||||||||||||||||
| $ | 2,883 | $ | 788 | $ | — | $ | 3,671 | |||||||||||||||
8. ACCRUED LIABILITIES
Accrued liabilities consist of:
| As of the year ended |
|||||||||||
|---|---|---|---|---|---|---|---|---|---|---|---|
| (in thousands) |
June 27, 2015 |
June 28, 2014 |
|||||||||
Accrued compensation |
$ | 6,489 | $ | 6,892 | |||||||
Income taxes payable |
2,280 | 1,140 | |||||||||
Sales commissions |
347 | 307 | |||||||||
Other accrued expenses |
2,309 | 1,595 | |||||||||
| $ | 11,425 | $ | 9,934 | ||||||||
66
PERICOM SEMICONDUCTOR CORPORATION
NOTES TO CONSOLIDATED FINANCIAL STATEMENTS
NOTES TO CONSOLIDATED FINANCIAL STATEMENTS
9. DEBT
As of June 27, 2015 and June 28, 2014, the Company had no
outstanding debt. However, the Company’s subsidiary PSE-TW has three loan and credit facilities in place for equipment purchases or inventory
financing via short term loans, letters of credit, and trade financing. The first is an unsecured facility for $100 million New Taiwan Dollars
(“NTD”), or approximately U.S. $3.2 million. Loans under this facility are limited to $70 million NTD (U.S. $2.3 million), are for up to 180
days, and are based on the Taiwan Interbank Offered Rate (“TAIBOR”) plus 1.25% and may be in NTD, USD, Japanese yen (“JPY”) or
other currencies. The second is an unsecured facility for $80 million NTD (U.S. $2.6 million). Loans under this facility are limited to $60 million NTD
(U.S. $1.9 million), are for up to 180 days, with the interest rate determined on a case by case basis, and may be in NTD, USD, or JPY. The third is a
secured facility for up to either $200 million NTD or $6.0 million USD. The loans are for up to 180 days, and may be in NTD, USD, JPY or other
currencies, with the interest rate based on a spread over various benchmark rates depending upon the currency.
10. RESTRICTED ASSETS
As of June 27, 2015 and June 28, 2014, the Company had
pledged and restricted assets of $4.0 million and $4.2 million, respectively, consisting of land and buildings PSE-TW has pledged for its $200 million
NTD loan and credit facility, as noted above.
11. COMMITMENTS AND CONTINGENCIES
The future minimum commitments at June 27, 2015 are as
follows:
| Fiscal Year |
|||||||||||||||||||||||||||||||
|---|---|---|---|---|---|---|---|---|---|---|---|---|---|---|---|---|---|---|---|---|---|---|---|---|---|---|---|---|---|---|---|
| (in thousands) |
2016 |
2017 |
2018 |
2019 |
2020 |
Thereafter |
Total |
||||||||||||||||||||||||
Operating lease payments |
$ | 423 | $ | 290 | $ | 252 | $ | 9 | $ | 9 | $ | 4 | $ | 987 | |||||||||||||||||
Capital equipment purchase commitments |
11 | — | — | — | — | — | 11 | ||||||||||||||||||||||||
Facility modification commitments |
660 | 17 | — | — | — | — | 677 | ||||||||||||||||||||||||
Total |
$ | 1,094 | $ | 307 | $ | 252 | $ | 9 | $ | 9 | $ | 4 | $ | 1,675 | |||||||||||||||||
The operating lease commitments are primarily facility
leases at certain of the Company’s Asian subsidiaries.
The facility modification commitments have been made at the
Company’s Shandong, China manufacturing operation for a general contractor and architecture firm to develop feasibility studies, plans and cost
estimates for potential additional development of the plant site. Building permits have been applied for, and site preparation has
begun.
The Company has no purchase obligations other than routine
purchase orders and the facility modifications shown in the table as of June 27, 2015.
Rent expense during the fiscal years ended June 27, 2015,
June 28, 2014 and June 29, 2013 was $588,000, $801,000 and $2.0 million, respectively.
12. INDUSTRIAL DEVELOPMENT SUBSIDY
As of June 27, 2015, industrial development subsidies in
the amount of $11.9 million have been earned and applied for by PSE-SD from the Jinan Hi-Tech Industries Development Zone Commission based on meeting
certain pre-defined criteria. The subsidies may be used for the acquisition of assets or to cover business expenses. When a subsidy is used to acquire
assets, the subsidy will be amortized over the useful life of the asset. When a subsidy is used for expenses incurred, the subsidy is regarded as
earned upon the incurrence of the expenditure. The remaining balance of the subsidies at June 27, 2015 was $5.4 million, which is expected to be
recognized over the next five to seven years. The remaining balance of the subsidies at June 28, 2014 was $6.4 million.
67
PERICOM SEMICONDUCTOR CORPORATION
NOTES TO CONSOLIDATED FINANCIAL STATEMENTS
NOTES TO CONSOLIDATED FINANCIAL STATEMENTS
12. INDUSTRIAL DEVELOPMENT SUBSIDY
(Continued)
A portion of the industrial development subsidies had been
recorded as a receivable. As of June 28, 2014, the Company concluded that the remaining $843,000 of receivables will not be paid and accordingly the
balance was written off.
The Company recognized $747,000, $755,000 and $1.3 million
of industrial development subsidy as a reduction of cost of goods sold and $185,000, $187,000 and $183,000 of industrial development subsidy as a
reduction of operating expenses in the consolidated statements of operations for the years ended June 27, 2015, June 28, 2014 and June 29, 2013,
respectively.
13. EQUITY AND COMPREHENSIVE INCOME
Comprehensive income (loss) consists of net income (loss),
changes in net unrealized gains (losses) on available-for-sale investments and changes in cumulative currency translation adjustments at consolidated
subsidiaries.
As of June 29, 2015, accumulated other comprehensive income
of $9.0 million consists of $9.0 million of accumulated currency translation gains and $21,000 of net unrealized gains on available-for-sale
investments, which was recorded net of a $2,000 tax benefit. As of June 28, 2014, accumulated other comprehensive income of $11.2 million consists of
$11.0 million of accumulated currency translation gains and $300,000 of net unrealized gains on available-for-sale investments, which was recorded net
of a $168,000 tax provision.
14. SHAREHOLDERS’ EQUITY AND SHARE-BASED
COMPENSATION
PREFERRED STOCK
The Company’s shareholders have authorized the Board
of Directors to issue 5,000,000 shares of currently undesignated preferred stock from time to time in one or more series and to fix the rights,
privileges and restrictions of each series. As of June 27, 2015, the Company has issued no shares of preferred stock.
STOCK INCENTIVE PLANS
At June 27, 2015, the Company had three stock incentive
plans and one employee stock purchase plan, including the 2001 Stock Option Plan, 2004 Stock Incentive Plan, 2014 Stock Award and Incentive
Compensation Plan (collectively, the “Plans”) and the 2010 Employee Stock Purchase Plan (“ESPP”). The Company’s aggregate
compensation cost due to option and restricted and performance stock unit grants and the ESPP for the twelve months ended June 27, 2015 totaled $4.0
million, as compared with $2.8 million and $3.3 million for fiscal 2014 and 2013, respectively. The Company recognized $1.3 million, $910,000 and $1.1
million in income tax benefit in the consolidated statements of operations for fiscal 2015, 2014 and 2013, respectively, related to the Company’s
share-based compensation arrangements. The net impact of share-based compensation for the fiscal years ended June 27, 2015, June 28, 2014 and June 29,
2013 was a charge to net income (loss) of $2.7 million, $1.9 million and $2.2 million, respectively, or a charge of $0.12, $0.08 and $0.10 per diluted
share, respectively.
Under the Plans, the Company has reserved 6.4 million
shares of common stock as of June 27, 2015 for issuance to employees, officers, directors, independent contractors and consultants of the Company in
the form of incentive and nonqualified stock options and restricted and performance stock units.
The Company may grant options at the fair value on grant
date for incentive stock options and nonqualified stock options. Options vest over periods of generally 48 months as determined by the Board of
Directors. Options granted under the Plans expire 10 years from the grant date.
The Company estimates the fair value of each employee
option on the date of grant using the Black-Scholes option valuation model and expenses that value as compensation using a straight-line method over
the option’s vesting period, which corresponds to the requisite employee service period. The Company estimates expected stock
price
68
PERICOM SEMICONDUCTOR CORPORATION
NOTES TO CONSOLIDATED FINANCIAL STATEMENTS
NOTES TO CONSOLIDATED FINANCIAL STATEMENTS
14. SHAREHOLDERS’ EQUITY AND SHARE-BASED COMPENSATION
(Continued)
volatility based on actual historical volatility for periods that the Company believes represent predictors of future volatility. The Company uses historical data to estimate option exercises, expected option holding periods and option forfeitures. The Company bases the risk-free interest rate on the U.S. Treasury note yield for periods equal to the expected term of the option.
The following table lists the weighted-average assumptions
the Company used to value stock options:
| Fiscal Year Ended |
|||||||||||||||
|---|---|---|---|---|---|---|---|---|---|---|---|---|---|---|---|
| June 27, 2015 |
June 28, 2014 |
June 29, 2013 |
|||||||||||||
Expected life |
5.9 years |
5.9 years |
5.9 years |
||||||||||||
Risk-free interest rate |
1.74% |
1.47% |
1.05% |
||||||||||||
Volatility |
49% |
52% |
54% |
||||||||||||
Dividend yield |
0.00% |
0.00% |
0.00% |
||||||||||||
The following table summarizes the Company’s stock
option plans as of July 1, 2012 and changes during the three fiscal periods ended June 27, 2015:
| Outstanding Options |
||||||||||||||||||
|---|---|---|---|---|---|---|---|---|---|---|---|---|---|---|---|---|---|---|
| Options |
Shares |
Weighted Average Exercise Price |
Weighted Average Remaining Contractual Term |
Aggregate Intrinsic Value |
||||||||||||||
| (in thousands) | (years) | (in thousands) | ||||||||||||||||
Options outstanding at June 30, 2012 |
2,453 | $ | 10.34 | 5.12 | $ | 912 | ||||||||||||
Options granted (weighted average grant date fair value of $4.06) |
233 | 8.07 | ||||||||||||||||
Options exercised |
(6 | ) | 7.87 | |||||||||||||||
Options forfeited or expired |
(249 | ) | 9.17 | |||||||||||||||
Options outstanding at June 29, 2013 |
2,431 | $ | 10.25 | 4.86 | $ | 52 | ||||||||||||
Options granted (weighted average grant date fair value of $4.06) |
236 | 8.16 | ||||||||||||||||
Options exercised |
(190 | ) | 8.25 | |||||||||||||||
Options forfeited or expired |
(392 | ) | 9.96 | |||||||||||||||
Options outstanding at June 28, 2014 |
2,085 | $ | 10.25 | 4.54 | $ | 1,077 | ||||||||||||
Options granted (weighted average grant date fair value of $4.80) |
84 | 10.12 | ||||||||||||||||
Options exercised |
(816 | ) | 9.02 | |||||||||||||||
Options forfeited or expired |
(104 | ) | 11.77 | |||||||||||||||
Options outstanding at June 27, 2015 |
1,249 | $ | 10.92 | 4.67 | $ | 4,501 | ||||||||||||
Options vested and expected to vest at June 27, 2015 |
1,236 | $ | 10.95 | 4.62 | $ | 4,427 | ||||||||||||
Options exercisable at June 27, 2015 |
1,039 | $ | 11.37 | 3.90 | $ | 3,383 | ||||||||||||
At June 27, 2015, 3.5 million shares were available for
future grants under the option plans. The aggregate intrinsic value of options exercised during the fiscal years ended June 27, 2015, June 28, 2014 and
June 29, 2013 was $2.7 million, $177,000 and $2,000, respectively.
The Company has unamortized share-based compensation
expense related to options of $756,000, which will be amortized to expense over a weighted average period of 2.2 years.
69
PERICOM SEMICONDUCTOR CORPORATION
NOTES TO CONSOLIDATED FINANCIAL STATEMENTS
NOTES TO CONSOLIDATED FINANCIAL STATEMENTS
14. SHAREHOLDERS’ EQUITY AND SHARE-BASED COMPENSATION
(Continued)
Additional information regarding options outstanding as of
June 27, 2015 is as follows:
| Options Outstanding |
Options Exercisable |
||||||||||||||||||||||
|---|---|---|---|---|---|---|---|---|---|---|---|---|---|---|---|---|---|---|---|---|---|---|---|
| Range of Exercise Prices |
Number Outstanding as of June 27, 2015 |
Weighted Average Remaining Contractual Term (Years) |
Weighted Average Exercise Price |
Number Exercisable as of June 27, 2015 |
Weighted Average Exercise Price |
||||||||||||||||||
$ 5.48 $ 8.10 |
252,997 | 6.94 | $ | 7.65 | 147,338 | $ | 7.62 | ||||||||||||||||
$ 8.11 $ 8.85 |
261,537 | 4.76 | $ | 8.56 | 224,771 | $ | 8.54 | ||||||||||||||||
$ 8.86 $10.25 |
254,617 | 5.09 | $ | 9.83 | 207,785 | $ | 9.98 | ||||||||||||||||
$10.26 $15.45 |
314,676 | 3.62 | $ | 13.53 | 293,345 | $ | 13.58 | ||||||||||||||||
$15.46 $18.10 |
165,500 | 2.39 | $ | 16.36 | 165,500 | $ | 16.36 | ||||||||||||||||
$ 5.48 $18.10 |
1,249,327 | 4.67 | $ | 10.92 | 1,038,739 | $ | 11.37 | ||||||||||||||||
Restricted Stock Units
Restricted stock units (“RSUs”) and performance
stock units (“PSUs”) are converted into shares of the Company’s common stock upon vesting on a one-for-one basis. Typically, vesting of
RSUs and PSUs is subject to the employee’s continuing service to the Company. RSUs generally vest over a period of 4 years and are expensed
ratably on a straight-line basis over their respective vesting period net of estimated forfeitures. PSUs are granted to executives of the Company and
will vest in approximately 12 months subject to certain financial metrics of the Company and the achievement of each participant’s performance
goals established at the beginning of the fiscal year. The fair value of RSUs and PSUs granted pursuant to the Company’s stock incentive plans is
the product of the number of shares granted and the grant date fair value of the common stock. The following table summarizes the RSUs and PSUs as of
July 1, 2012 and changes during the three fiscal years ended June 27, 2015:
| Shares |
Weighted Average Grant Date Fair Value |
Weighted Average Remaining Vesting Term |
Aggregate Intrinsic Value |
|||||||||||||||
|---|---|---|---|---|---|---|---|---|---|---|---|---|---|---|---|---|---|---|
| (in thousands) | (years) | (in thousands) | ||||||||||||||||
RSUs outstanding at June 30, 2012 |
504 | $ | 9.06 | 1.42 | $ | 4,535 | ||||||||||||
Awarded |
301 | 7.74 | ||||||||||||||||
Released |
(217 | ) | 9.55 | |||||||||||||||
Forfeited |
(63 | ) | 8.24 | |||||||||||||||
RSUs outstanding at June 29, 2013 |
525 | $ | 8.20 | 1.48 | $ | 3,735 | ||||||||||||
Awarded |
416 | 8.46 | ||||||||||||||||
Released |
(196 | ) | 8.61 | |||||||||||||||
Forfeited |
(96 | ) | 8.26 | |||||||||||||||
RSUs outstanding at June 28, 2014 |
649 | $ | 8.23 | 1.58 | $ | 5,901 | ||||||||||||
Awarded |
433 | 11.12 | ||||||||||||||||
Released |
(228 | ) | 8.27 | |||||||||||||||
Forfeited |
(85 | ) | 8.98 | |||||||||||||||
RSUs and PSUs outstanding at June 27, 2015 |
769 | $ | 9.76 | 1.33 | $ | 10,792 | ||||||||||||
RSUs and PSUs expected to vest after June 27, 2015 |
695 | $ | 9.73 | 1.25 | $ | 9,755 | ||||||||||||
70
PERICOM SEMICONDUCTOR CORPORATION
NOTES TO CONSOLIDATED FINANCIAL STATEMENTS
NOTES TO CONSOLIDATED FINANCIAL STATEMENTS
14. SHAREHOLDERS’ EQUITY AND SHARE-BASED COMPENSATION
(Continued)
Of the 433,000 shares awarded during the fiscal year ended
June 27, 2015, 320,000 shares were RSUs and 113,000 shares were PSUs. Of the 85,000 shares forfeited during the fiscal year ended June 27, 2015, 67,000
shares were RSUs and 18,000 shares were PSUs.
The Company has unamortized share-based compensation
expense related to RSUs of $4.5 million, which will be amortized to expense over a weighted average remaining recognition period of 2.3 years. The PSUs
awarded in fiscal 2015 were fully expensed during the year to the extent they were earned and not forfeited.
2010 EMPLOYEE STOCK PURCHASE
PLAN
The Company’s ESPP allows eligible employees of the
Company to purchase shares of common stock through payroll deductions. The Company reserved 2.0 million shares of the Company’s common stock for
issuance under the ESPP, of which 1.5 million remain available at June 27, 2015. The ESPP permits eligible employees to purchase common stock at a
discount through payroll deductions during six-month purchase periods. The six-month periods come to an end on or about May 1 and November 1 and the
purchases are then made. Participants in the ESPP may purchase stock at 85% of the lower of the stock’s fair market value on the first day and
last day of the purchase period. The maximum number of shares of common stock that any employee may purchase under the ESPP during any offering period
is 1,500 shares, and an employee may not accrue more than $15,000 for share purchases in any offering period. During fiscal year 2015, 2014 and 2013,
the Company issued 100,000, 129,000 and 125,000 shares of common stock at weighted average prices of $7.87, $6.02 and $5.98, respectively. The weighted
average grant date fair value of the fiscal 2015, 2014 and 2013 stock purchase awards were $2.80, $1.75 and $1.65 per share,
respectively.
The Company estimates the fair value of stock purchase
rights granted under the Company’s ESPP on the date of grant using the Black-Scholes option valuation model. Accounting Standards Codification
(“ASC”) Topic 718, Stock-Based Compensation, states that a “lookback” pricing provision with a share limit should be considered a
combination of stock and a call option. The valuation results for these elements have been combined to value the specific features of the stock
purchase rights. The Company bases volatility on the expected volatility of the Company’s stock during the accrual period. The expected term is
determined as the time from enrollment until purchase. The Company uses historical data to determine expected forfeitures and the U.S. Treasury yield
for the risk-free interest rate for the expected term.
The following table lists the values of the assumptions the
Company used to value share-based compensation in the ESPP:
| Fiscal Year Ended |
|||||||||||||||
|---|---|---|---|---|---|---|---|---|---|---|---|---|---|---|---|
| June 27, 2015 |
June 28, 2014 |
June 29, 2013 |
|||||||||||||
Expected life |
6 months |
6 months |
6 months |
||||||||||||
Risk-free interest rate |
0.05% |
0.07% |
0.12% |
||||||||||||
Volatility range |
34%–37% |
26%–34% |
35%–37% |
||||||||||||
Dividend yield |
0.00% |
0.00% |
0.00% |
||||||||||||
The following table summarizes activity in the
Company’s employee ESPP during the fiscal year ended June 27, 2015:
| Shares |
Weighted- Average Purchase Price |
|||||||||
|---|---|---|---|---|---|---|---|---|---|---|
Beginning Available |
1,581,556 | |||||||||
Purchases |
(100,381 | ) | $ | 7.87 | ||||||
Ending Available |
1,481,175 | |||||||||
71
PERICOM SEMICONDUCTOR CORPORATION
NOTES TO CONSOLIDATED FINANCIAL STATEMENTS
NOTES TO CONSOLIDATED FINANCIAL STATEMENTS
14. SHAREHOLDERS’ EQUITY AND SHARE-BASED COMPENSATION
(Continued)
At June 27, 2015, the Company has $68,000 in unamortized
share-based compensation related to its employee ESPP. We estimate this expense will be amortized and recognized in the consolidated statements of
operations over the next four months.
REPORTING SHARE-BASED
COMPENSATION
The following table shows total share-based compensation
expense classified by consolidated statement of operations reporting caption generated from the plans mentioned above:
| Fiscal Year Ended |
|||||||||||||||
|---|---|---|---|---|---|---|---|---|---|---|---|---|---|---|---|
| (in thousands) |
June 27, 2015 |
June 28, 2014 |
June 29, 2013 |
||||||||||||
Cost of revenues |
$ | 242 | $ | 163 | $ | 187 | |||||||||
Research and development |
1,201 | 1,096 | 1,282 | ||||||||||||
Selling, general and administrative |
2,528 | 1,533 | 1,871 | ||||||||||||
Pre-tax stock-based compensation expense |
3,971 | 2,792 | 3,340 | ||||||||||||
Income tax effect |
(1,322 | ) | (910 | ) | (1,101 | ) | |||||||||
Net stock-based compensation expense |
$ | 2,649 | $ | 1,882 | $ | 2,239 | |||||||||
The amount of share-based compensation expense in inventory
at June 27, 2015, June 28, 2014 and June 29, 2013 is immaterial.
STOCK REPURCHASE PLAN
On April 26, 2012, the Board of Directors authorized a
share repurchase program for up to $25 million of shares of the Company’s common stock, and on April 24, 2014 the Board authorized an additional
$20 million for the share repurchase program. The Company was authorized to repurchase the shares from time to time in the open market or private
transactions, at the discretion of the Company’s management. During the year ended June 27, 2015, the Company repurchased 937,729 shares for an
aggregate cost of $10.9 million. During the year ended June 28, 2014, the Company repurchased 1,354,511 shares for an aggregate cost of $11.3 million.
During the year ended June 29, 2013, the Company repurchased 1,100,306 shares for an aggregate cost of $7.8 million. As of June 27, 2015, approximately
$15.7 million may yet be purchased under the 2014 purchase authority.
Current cash balances and the proceeds from stock option
exercises and purchases in the stock purchase plan have funded stock repurchases in the past, and the Company expects to fund future stock repurchases
from these same sources.
15. FAIR VALUE MEASUREMENTS
The Company defines fair value as the exchange price that
would be received for an asset or paid to transfer a liability (an exit price) in the principal or most advantageous market for the asset or liability
in an orderly transaction between market participants on the measurement date. Valuation techniques used to measure fair value must maximize the use of
observable inputs and minimize the use of unobservable inputs. The fair value hierarchy is based on three levels of inputs that may be used to measure
fair value, of which the first two are considered observable and the last is considered unobservable:
• |
Level 1 — Quoted prices in active markets for identical assets or liabilities. |
• |
Level 2 — Inputs other than Level 1 that are observable, either directly or indirectly, such as quoted prices for similar assets or liabilities; quoted prices in markets that are not active; or other inputs that are observable or can be corroborated by observable market data for substantially the full term of the assets or liabilities. |
• |
Level 3 — Unobservable inputs that are supported by little or no market activity and that are significant to the fair value of the assets or liabilities. |
72
PERICOM SEMICONDUCTOR CORPORATION
NOTES TO CONSOLIDATED FINANCIAL STATEMENTS
NOTES TO CONSOLIDATED FINANCIAL STATEMENTS
15. FAIR VALUE MEASUREMENTS
(Continued)
The following table represents our fair value hierarchy for
financial assets (cash equivalents and investments) measured at fair value on a recurring basis. Level 1 available-for-sale investments are primarily
comprised of investments in U.S. Treasury securities, valued using market prices in active markets. Most of the investments are classified as Level 2.
Level 2 pricing is provided by third party sources of market information obtained through the Company’s investment advisors. The Company does not
adjust for or apply any additional assumptions or estimates to the pricing information it receives from advisors. The Company’s investment
advisors obtain pricing data from independent sources, such as Standard & Poor’s, Bloomberg and Interactive Data Corporation, and rely on
comparable pricing of other securities because the Level 2 securities it holds are not actively traded and have fewer observable transactions. The
Company considers this the most reliable information available for the valuation of the securities.
The Company’s Level 2 securities include time
deposits, government securities, corporate debt securities and mortgage backed and asset backed securities. The securities must meet a required rating
level by at least one of the rating agencies (Moody’s, Standard & Poors, Fitch.) Government securities include US federal agency securities,
foreign government and agency securities, and US state and municipal bond obligations. Many of the municipal bonds are insured; those that are not are
nearly all AAA/Aaa rated. The corporate debt securities are all investment grade and most are single A-rated or better. The asset-backed securities are
AAA/Aaa rated and are backed by auto loans, student loans, credit card balances and residential or commercial mortgages.
Assets measured at fair value are summarized as
follows:
| As of June 27, 2015 |
|||||||||||||||||||
|---|---|---|---|---|---|---|---|---|---|---|---|---|---|---|---|---|---|---|---|
| (in thousands) |
Fair Value |
Level 1 |
Level 2 |
Level 3 |
|||||||||||||||
Investments(1) |
|||||||||||||||||||
US Treasury securities |
$ | — | $ | — | $ | — | $ | — | |||||||||||
Repurchase agreements |
463 | — | 463 | — | |||||||||||||||
Time deposits |
42,277 | — | 42,277 | — | |||||||||||||||
National government and agency securities |
4,673 | — | 4,673 | — | |||||||||||||||
State and municipal bond obligations |
4,490 | — | 4,490 | — | |||||||||||||||
Corporate bonds and notes |
46,857 | — | 46,857 | — | |||||||||||||||
Asset backed securities |
6,986 | — | 6,986 | — | |||||||||||||||
Mortgage backed securities |
5,141 | — | 5,141 | — | |||||||||||||||
Total |
$ | 110,887 | $ | — | $ | 110,887 | $ | — | |||||||||||
| As of June 28, 2014 |
|||||||||||||||||||
|---|---|---|---|---|---|---|---|---|---|---|---|---|---|---|---|---|---|---|---|
| (in thousands) |
Fair Value |
Level 1 |
Level 2 |
Level 3 |
|||||||||||||||
Investments(1) |
|||||||||||||||||||
US Treasury securities |
$ | 527 | $ | 527 | $ | — | $ | — | |||||||||||
Repurchase agreements |
4,547 | — | 4,547 | — | |||||||||||||||
Time deposits |
17,693 | — | 17,693 | — | |||||||||||||||
National government and agency securities |
5,055 | — | 5,055 | — | |||||||||||||||
State and municipal bond obligations |
7,149 | — | 7,149 | — | |||||||||||||||
Corporate bonds and notes |
42,781 | — | 42,781 | — | |||||||||||||||
Asset backed securities |
7,614 | — | 7,614 | — | |||||||||||||||
Mortgage backed securities |
4,785 | — | 4,785 | — | |||||||||||||||
Total |
$ | 90,151 | $ | 527 | $ | 89,624 | $ | — | |||||||||||
(1) |
At June 27, 2015, $20.1 million of the time deposits and all of the repurchase agreements are included in cash and cash equivalents. At June 28, 2014, $4.0 million of the repurchase agreements are included in cash and cash equivalents. The balance of the investments at June 27, 2015 and June 28, 2014 are included in short-term investments in marketable securities in the consolidated balance sheets. |
73
PERICOM SEMICONDUCTOR CORPORATION
NOTES TO CONSOLIDATED FINANCIAL STATEMENTS
NOTES TO CONSOLIDATED FINANCIAL STATEMENTS
15. FAIR VALUE MEASUREMENTS
(Continued)
The Company had no transfers between Level 1 and Level 2
during the years ended June 27, 2015 and June 28, 2014.
When assessing marketable securities for
other-than-temporary declines in value, a number of factors are considered. Analyses of the severity and duration of price declines, remaining years to
maturity, portfolio manager reports, economic forecasts, and the specific circumstances of issuers indicate that it is reasonable to expect marketable
securities with unrealized losses at June 27, 2015 to recover in fair value up to the Company’s cost bases within a reasonable period of time. The
Company does not intend to sell investments with unrealized losses before maturity, when the obligors are required to redeem them at full face value or
par. The Company believes the obligors have the financial resources to redeem the debt securities. Accordingly, the Company does not consider the
investments to be other-than-temporarily impaired at June 27, 2015.
The Company has determined that the amounts reported for
cash and cash equivalents, accounts receivable, deposits, accounts payable and accrued liabilities approximate fair value because of their short
maturities and/or variable interest rates.
16. INCOME TAXES
Income tax expense consists of federal, state and foreign
current and deferred income taxes as follows:
| Fiscal Year Ended |
|||||||||||||||
|---|---|---|---|---|---|---|---|---|---|---|---|---|---|---|---|
| (in thousands) |
June 27, 2015 |
June 28, 2014 |
June 29, 2013 |
||||||||||||
Income (loss) before income taxes |
|||||||||||||||
U.S. |
$ | 446 | $ | (1,282 | ) | $ | 12,176 | ||||||||
Foreign |
13,969 | 5,044 | (27,782 | ) | |||||||||||
| 14,415 | 3,762 | (15,606 | ) | ||||||||||||
Federal: |
|||||||||||||||
Current |
(51 | ) | (1,366 | ) | 5,424 | ||||||||||
Deferred |
310 | 95 | 141 | ||||||||||||
| 259 | (1,271 | ) | 5,565 | ||||||||||||
State: |
|||||||||||||||
Current |
3 | — | 7 | ||||||||||||
Deferred |
29 | (12 | ) | (172 | ) | ||||||||||
| 32 | (12 | ) | (165 | ) | |||||||||||
Foreign: |
|||||||||||||||
Current |
2,801 | 953 | 672 | ||||||||||||
Deferred |
(327 | ) | 100 | 151 | |||||||||||
| 2,474 | 1,053 | 823 | |||||||||||||
Total current |
2,753 | (413 | ) | 6,103 | |||||||||||
Total deferred |
12 | 183 | 120 | ||||||||||||
Total income tax expense (benefit) |
$ | 2,765 | $ | (230 | ) | $ | 6,223 | ||||||||
74
PERICOM SEMICONDUCTOR CORPORATION
NOTES TO CONSOLIDATED FINANCIAL STATEMENTS
NOTES TO CONSOLIDATED FINANCIAL STATEMENTS
16. INCOME TAXES (Continued)
The reconciliation between the Company’s effective tax
rate and the U.S. statutory rate is as follows:
| Fiscal Year Ended |
|||||||||||||||
|---|---|---|---|---|---|---|---|---|---|---|---|---|---|---|---|
| June 27, 2015 |
June 28, 2014 |
June 29, 2013 |
|||||||||||||
Tax provision at federal statutory rate |
34.0 | % | 34.0 | % | 33.8 | % | |||||||||
State income taxes, net of federal benefit |
(0.4 | ) | (1.3 | ) | 2.1 | ||||||||||
Foreign income and withholding taxes |
(13.2 | ) | 1.7 | (67.9 | ) | ||||||||||
Benefits from resolution of certain tax audits and expiration of statute of limitations |
— | (21.8 | ) | 0.8 | |||||||||||
Intercompany licensing of intellectual property |
— | (27.1 | ) | (6.5 | ) | ||||||||||
Share-based compensation |
0.8 | 3.4 | (1.1 | ) | |||||||||||
Research and development tax credits |
— | (2.3 | ) | — | |||||||||||
Change in valuation allowance |
(0.2 | ) | 0.5 | (1.8 | ) | ||||||||||
Other |
(1.8 | ) | 6.8 | 0.7 | |||||||||||
Income tax expense |
19.2 | % | (6.1 | )% | (39.9 | )% | |||||||||
The components of the net deferred tax assets were as
follows (in thousands):
| As of the year ended |
|||||||||||
|---|---|---|---|---|---|---|---|---|---|---|---|
| (in thousands) |
June 27, 2015 |
June 28, 2014 |
|||||||||
Deferred tax assets: |
|||||||||||
Credit carryforwards |
$ | 3,395 | $ | 2,778 | |||||||
Accruals and reserves |
576 | 843 | |||||||||
Cumulative loss on investment |
406 | 400 | |||||||||
Depreciation and amortization |
(871 | ) | (933 | ) | |||||||
Net operating loss carryforward |
664 | 1,418 | |||||||||
Share-based compensation |
2,941 | 3,013 | |||||||||
Other |
301 | 781 | |||||||||
Total |
7,412 | 8,300 | |||||||||
Valuation allowance |
(4,373 | ) | (5,114 | ) | |||||||
Deferred tax assets |
$ | 3,039 | $ | 3,186 | |||||||
Deferred tax liabilities: |
|||||||||||
Gain on previously held shares in unconsolidated affiliate |
$ | (3,838 | ) | $ | (3,793 | ) | |||||
Acquired PTI intangibles and other |
(867 | ) | (1,667 | ) | |||||||
Deferred tax liabilities |
$ | (4,705 | ) | $ | (5,460 | ) | |||||
As of June 27, 2015, the Company has net operating loss
carryforwards of approximately $2.0 million and $2.2 million for PSE-SD in China and PTI in Hong Kong, respectively, which will begin to expire in
fiscal 2016 and no expiration, respectively. In addition, the Company has research and development tax credit carryforwards of approximately $350,000
and $5.6 million to offset future federal and state taxable income. The federal research and development tax credit carryforward will begin to expire
in 2034 and the state research and development tax credit can be carried forward indefinitely.
The Company provides a valuation allowance for deferred tax
assets when it is more likely than not, based upon currently available evidence and other factors, that some portion or all of the deferred tax asset
will not be realized. The change in valuation allowance for the year ended June 27, 2015 and June 28, 2014 was a decrease of $741,000
75
PERICOM SEMICONDUCTOR CORPORATION
NOTES TO CONSOLIDATED FINANCIAL STATEMENTS
NOTES TO CONSOLIDATED FINANCIAL STATEMENTS
16. INCOME TAXES (Continued)
and an increase of $50,000, respectively, which resulted primarily from a decrease in the foreign tax credit and the foreign net operating losses.
Consolidated income before income taxes includes non-U.S.
income (loss) of approximately $14.0 million, $5.0 million and $(27.8) million for the fiscal years ended June 27, 2015, June 28, 2014 and June 29,
2013, respectively. Pericom has not provided for U.S. income taxes on a cumulative total of approximately $53.3 million of undistributed earnings
reported by certain foreign subsidiaries. The Company intends to reinvest these earnings indefinitely in its foreign subsidiaries. If these earnings
were distributed to the United States in the form of dividends or otherwise, or if the shares of the relevant foreign subsidiaries were sold or
otherwise transferred, the Company would be subject to additional U.S. income taxes (subject to an adjustment for foreign tax credits) and foreign
withholding taxes. It is not practical to determine the unrecognized deferred U.S. income tax liability that might be payable on the possible
remittance of earnings that are intended to be reinvested indefinitely due to the complexities associated with its hypothetical
calculation.
The Company recorded $2.2 million for unrecognized tax
benefits as of June 27, 2015. A reconciliation of the beginning and ending amount of unrecognized tax benefit for the three fiscal years from July 1,
2012 through June 27, 2015 is as follows:
| (in thousands) |
||||||
|---|---|---|---|---|---|---|
Balance as of June 30, 2012 |
$ | (1,607 | ) | |||
Gross increases — prior period tax positions |
(135 | ) | ||||
Gross increases — current period tax positions |
(1,423 | ) | ||||
Reductions as a result of a lapse of statute of limitations |
132 | |||||
Balance as of June 29, 2013 |
$ | (3,033 | ) | |||
Gross increases — prior period tax positions |
(411 | ) | ||||
Gross increases — current period tax positions |
(194 | ) | ||||
Reductions — prior period tax positions |
1,020 | |||||
Reductions as a result of a lapse of statute of limitations |
887 | |||||
Balance as of June 28, 2014 |
$ | (1,731 | ) | |||
Gross increases — prior period tax positions |
(53 | ) | ||||
Gross increases — current period tax positions |
(495 | ) | ||||
Reductions — prior period tax positions |
21 | |||||
Reductions as a result of a lapse of statute of limitations |
65 | |||||
Balance as of June 27, 2015 |
$ | (2,193 | ) | |||
As of June 27, 2015, $1.2 million of the balance would
affect the Company’s effective tax rate if recognized. The Company is subject to examination by federal, foreign, and various state jurisdictions
for the years 2009 through 2015.
As of June 27, 2015, the Company has accrued $227,000 for
interest and penalties related to the unrecognized tax benefits. The balance of unrecognized tax benefits and the related interest and penalties is
recorded as a noncurrent liability on our consolidated balance sheet.
Within the next 12 months, we do not anticipate a material
increase in the unrecognized tax benefit or any other significant changes to our tax reserves during that period.
76
PERICOM SEMICONDUCTOR CORPORATION
NOTES TO CONSOLIDATED FINANCIAL STATEMENTS
NOTES TO CONSOLIDATED FINANCIAL STATEMENTS
17. EMPLOYEE BENEFIT PLAN
The Company has a 401(k) tax-deferred savings plan under
which eligible employees may elect to have a portion of their salary deferred and contributed to the plan. The Board of Directors determines the
employer matching contributions at their discretion. There were no employer-matching contributions in fiscal 2015, 2014 or 2013.
18. INDUSTRY AND GEOGRAPHICAL SEGMENT
INFORMATION
The Company has two operating segments which aggregate into
one reportable segment, the interconnectivity device supply market. The Company designs, develops, manufactures and markets high performance integrated
circuits and frequency control products. The Chief Executive Officer has been identified as the Chief Operating Decision Maker as defined by ASC No.
280, Disclosures about Segments Reporting (“ASC 280”).
For geographical reporting, the Company attributes net
sales to the country where customers are located (the “bill to” location). The Company neither conducts business in, nor sells to persons in,
Iran, Syria, or Sudan, countries located in the referenced regions that are identified as state sponsors of terrorism by the U.S. Department of State,
and are subject to U.S. economic sanctions and export controls. Long-lived assets consist of all non-monetary assets, excluding non-current deferred
tax assets, goodwill and intangible assets. The Company attributes long-lived assets to the country where they are located. The following presents net
sales for each of the three years ended June 27, 2015; and the net book value of long-lived assets as of June 27, 2015, June 28, 2014 and June 29, 2013
by geographical segment:
| Fiscal year ended |
|||||||||||||||
|---|---|---|---|---|---|---|---|---|---|---|---|---|---|---|---|
| (in thousands) |
June 27, 2015 |
June 28, 2014 |
June 29, 2013 |
||||||||||||
Net sales to countries: |
|||||||||||||||
China (including Hong Kong) |
$ | 58,722 | $ | 61,054 | $ | 61,486 | |||||||||
Taiwan |
45,353 | 39,463 | 43,144 | ||||||||||||
United States |
6,177 | 5,927 | 6,517 | ||||||||||||
Others (less than 10% each) |
18,583 | 21,624 | 18,108 | ||||||||||||
Total net sales |
$ | 128,835 | $ | 128,068 | $ | 129,255 | |||||||||
| (in thousands) |
|||||||||||||||
Long-lived assets: |
|||||||||||||||
China (including Hong Kong) |
$ | 31,211 | $ | 32,234 | $ | 35,180 | |||||||||
United States |
14,392 | 12,154 | 10,779 | ||||||||||||
Taiwan |
10,974 | 12,914 | 14,120 | ||||||||||||
Korea |
1,024 | 1,067 | 659 | ||||||||||||
Others (less than 10% each) |
145 | 168 | 221 | ||||||||||||
Total long-lived assets |
$ | 57,746 | $ | 58,537 | $ | 60,959 | |||||||||
77
PERICOM SEMICONDUCTOR CORPORATION
NOTES TO CONSOLIDATED FINANCIAL STATEMENTS
NOTES TO CONSOLIDATED FINANCIAL STATEMENTS
19. QUARTERLY FINANCIAL DATA (Unaudited)
Following is a summary of quarterly operating results and
share data for the years ended June 27, 2015 and June 28, 2014:
PERICOM SEMICONDUCTOR CORPORATION
QUARTERLY FINANCIAL DATA
(in thousands, except per share data)
(Unaudited)
QUARTERLY FINANCIAL DATA
(in thousands, except per share data)
(Unaudited)
| For the Quarter Ended |
|||||||||||||||||||
|---|---|---|---|---|---|---|---|---|---|---|---|---|---|---|---|---|---|---|---|
| June 27, 2015 |
March 28, 2015 |
Dec 27, 2014 |
Sept 27, 2014 |
||||||||||||||||
Net revenues |
$ | 30,564 | $ | 31,757 | $ | 33,255 | $ | 33,259 | |||||||||||
Cost of revenues |
16,360 | 17,054 | 18,427 | 19,179 | |||||||||||||||
Gross profit |
14,204 | 14,703 | 14,828 | 14,080 | |||||||||||||||
Operating expenses: |
|||||||||||||||||||
Research and development |
4,261 | 4,614 | 4,390 | 4,588 | |||||||||||||||
Selling, general and administrative |
7,444 | 7,573 | 7,682 | 7,300 | |||||||||||||||
Total operating expenses |
11,705 | 12,187 | 12,072 | 11,888 | |||||||||||||||
Income from operations |
2,499 | 2,516 | 2,756 | 2,192 | |||||||||||||||
Interest and other income, net |
695 | 548 | 1,935 | 1,274 | |||||||||||||||
Income before income tax expense |
3,194 | 3,064 | 4,691 | 3,466 | |||||||||||||||
Income tax expense |
7 | 635 | 1,113 | 1,010 | |||||||||||||||
Net income from consolidated companies |
3,187 | 2,429 | 3,578 | 2,456 | |||||||||||||||
Equity in net income of unconsolidated affiliates |
27 | 35 | 74 | 39 | |||||||||||||||
Net income |
$ | 3,214 | $ | 2,464 | $ | 3,652 | $ | 2,495 | |||||||||||
Basic income per share |
$ | 0.14 | $ | 0.11 | $ | 0.17 | $ | 0.11 | |||||||||||
Diluted income per share |
$ | 0.14 | $ | 0.11 | $ | 0.16 | $ | 0.11 | |||||||||||
Shares used in computing basic income per share |
22,344 | 22,436 | 22,110 | 21,936 | |||||||||||||||
Shares used in computing diluted income per share |
22,928 | 23,049 | 22,624 | 22,262 | |||||||||||||||
Dividends declared and paid per share |
$ | 0.06 | $ | 0.06 | $ | — | $ | — | |||||||||||
78
PERICOM SEMICONDUCTOR CORPORATION
NOTES TO CONSOLIDATED FINANCIAL STATEMENTS
NOTES TO CONSOLIDATED FINANCIAL STATEMENTS
19. QUARTERLY FINANCIAL DATA (Unaudited)
(Continued)
| For the Quarter Ended |
|||||||||||||||||||
|---|---|---|---|---|---|---|---|---|---|---|---|---|---|---|---|---|---|---|---|
| June 28, 2014 |
March 29, 2014 |
Dec 28, 2013 |
Sept 28, 2013 |
||||||||||||||||
Net revenues |
$ | 32,739 | $ | 30,681 | $ | 32,040 | $ | 32,608 | |||||||||||
Cost of revenues |
19,188 | 18,175 | 19,820 | 19,800 | |||||||||||||||
Gross profit |
13,551 | 12,506 | 12,220 | 12,808 | |||||||||||||||
Operating expenses: |
|||||||||||||||||||
Research and development |
4,782 | 4,694 | 5,274 | 5,045 | |||||||||||||||
Selling, general and administrative |
8,100 | 7,407 | 7,126 | 7,687 | |||||||||||||||
Total operating expenses |
12,882 | 12,101 | 12,400 | 12,732 | |||||||||||||||
Income from operations |
669 | 405 | (180 | ) | 76 | ||||||||||||||
Interest and other income, net |
456 | 802 | 1,047 | 486 | |||||||||||||||
Income before income tax expense |
1,125 | 1,207 | 867 | 562 | |||||||||||||||
Income tax expense (benefit) |
291 | (421 | ) | (331 | ) | 231 | |||||||||||||
Net income from consolidated companies |
834 | 1,628 | 1,198 | 331 | |||||||||||||||
Equity in net income of unconsolidated affiliates |
50 | 13 | 27 | 43 | |||||||||||||||
Net income |
$ | 884 | $ | 1,641 | $ | 1,225 | $ | 374 | |||||||||||
Basic income per share |
$ | 0.04 | $ | 0.07 | $ | 0.05 | $ | 0.02 | |||||||||||
Diluted income per share |
$ | 0.04 | $ | 0.07 | $ | 0.05 | $ | 0.02 | |||||||||||
Shares used in computing basic income per share |
22,123 | 22,659 | 22,800 | 22,794 | |||||||||||||||
Shares used in computing diluted income per share |
22,338 | 22,880 | 23,019 | 22,951 | |||||||||||||||
79
SIGNATURES
Pursuant to the requirements of Section 13 or 15(d) of the
Securities Exchange Act of 1934, the Registrant has duly caused this report to be signed on its behalf by the undersigned, thereunto duly
authorized.
PERICOM
SEMICONDUCTOR CORPORATION |
||||||||||
By: |
/s/ ALEX C. HUI |
|||||||||
Alex C. Hui Chief Executive Officer, President and Chairman of the Board of Directors |
||||||||||
Date: |
September 1, 2015 |
|||||||||
80
POWER OF ATTORNEY
KNOWN ALL PERSONS BY THESE PRESENTS, that each person whose signature appears below constitutes and appoints Alex C. Hui and Kevin S. Bauer
and each of them, his attorney-in-fact, each with the power of substitution, for him in any and all capacities, to sign any amendments to this Report
on Form 10-K and file the same, with exhibits thereto and other documents in connection therewith, with the Securities and Exchange Commission, and
hereby ratifying and confirming all that each of said attorney-in-fact, or his substitute or substitutes, may do or cause to be done by virtue
hereof.
Pursuant to the requirements of the Securities Exchange Act
of 1934, this report has been signed below by the following persons on behalf of the registrant and in the capacities and on the dates
indicated.
| Signature |
Title |
Date |
||||||||
|---|---|---|---|---|---|---|---|---|---|---|
/s/ ALEX C. HUI Alex C. Hui |
Chief Executive Officer, President and Chairman of the Board of Directors (Principal Executive Officer) |
September 1, 2015 |
||||||||
/s/ KEVIN S. BAUER Kevin S. Bauer |
Chief Financial Officer (Principal Financial Officer and Accounting Officer) |
September 1, 2015 |
||||||||
/s/ JOHN CHI-HUNG HUI John Chi-Hung Hui |
Senior Vice President, R&D and Director |
September 1, 2015 |
||||||||
/s/ JOHN C. EAST John C. East |
Director |
September 1, 2015 |
||||||||
/s/ HAU L. LEE Hau L. Lee |
Director |
September 1, 2015 |
||||||||
/s/ MICHAEL SOPHIE Michael Sophie |
Director |
September 1, 2015 |
||||||||
/s/ SIMON WONG Simon Wong |
Director |
September 1, 2015 |
||||||||
81
Schedule II
PERICOM SEMICONDUCTOR CORPORATION
VALUATION AND QUALIFYING ACCOUNTS
(in thousands)
VALUATION AND QUALIFYING ACCOUNTS
(in thousands)
| Balance at Beginning of Period |
Charged to Revenues |
Deductions |
Balance at End of Period |
|||||||||||||||
|---|---|---|---|---|---|---|---|---|---|---|---|---|---|---|---|---|---|---|
Reserves for returns and pricing adjustments |
||||||||||||||||||
Fiscal year ended June 27, 2015 |
$ | 2,436 | $ | 3,970 | $ | (4,598 | ) | $ | 1,808 | |||||||||
Fiscal year ended June 28, 2014 |
2,435 | 4,880 | (4,879 | ) | 2,436 | |||||||||||||
Fiscal year ended June 29, 2013 |
2,522 | 4,493 | (4,580 | ) | 2,435 | |||||||||||||
| Balance at Beginning of Period |
Charged to Expense |
Deductions/ Write-offs |
Balance at End of Period |
|||||||||||||||
Allowance for doubtful accounts |
||||||||||||||||||
Fiscal year ended June 27, 2015 |
$ | 25 | $ | 16 | $ | (19 | ) | $ | 22 | |||||||||
Fiscal year ended June 28, 2014 |
76 | 1 | (52 | ) | 25 | |||||||||||||
Fiscal year ended June 29, 2013 |
44 | 49 | (17 | ) | 76 | |||||||||||||
| Balance at Beginning of Period |
Charged to Expense |
Deductions/ Write-offs |
Balance at End of Period |
|||||||||||||||
Deferred tax valuation allowance |
||||||||||||||||||
Fiscal year ended June 27, 2015 |
$ | 5,114 | $ | — | $ | (741 | ) | $ | 4,373 | |||||||||
Fiscal year ended June 28, 2014 |
5,064 | 50 | — | 5,114 | ||||||||||||||
Fiscal year ended June 29, 2013 |
4,305 | 759 | — | 5,064 | ||||||||||||||
Sii