Please wait
.2
On February 6, 2014, Dassault Systèmes issued the following presentation slides in connection with its announcement of results for the fourth quarter and year ended December 31, 2013.
3D Experience Analysts Meeting Q4 & FY 2013 Bernard Charlès, President and CEO Thibault de Tersant, Senior EVP, CFO
Important Information The tender offer described in this presentation has not yet commenced, and this material is neither an offer to purchase nor a solicitation of an offer to sell shares of Accelrys’ common stock. At the time the tender offer is commenced, Dassault Systèmes will file a tender offer statement with the United States Securities and Exchange Commission (the “SEC”). Accelrys’ stockholders are strongly advised to read these documents that will be filed with the SEC, because they will contain important information that Accelrys’ stockholders should consider before tendering their shares. These documents will be available for free at the SEC’s website (http://www.sec.gov) or by directing a request to Dassault Systèmes, 10 rue Marcel Dassault, CS 40501, 78946 Vélizy-Villacoublay, Cedex, France.
Forward Looking Information Statements herein that are not historical facts but express expectations or objectives for the future, including but not limited to statements regarding the Company’s non-IFRS financial performance objectives, are forward-looking statements. Such forward-looking statements are based on Dassault Systèmes management’s current views and assumptions and involve known and unknown risks and uncertainties. Actual results or performances may differ materially from those in such statements due to a range of factors. If global economic and business conditions continue to be volatile or deteriorate, the Company’s business results may not develop as currently anticipated and may decline below their earlier levels for an extended period of time. Furthermore, due to factors affecting sales of the Company’s products and services, there may be a substantial time lag between any change in global economic and business conditions and its impact on the Company’s business results. In preparing such forward-looking statements, the Company has in particular assumed an average Japanese yen to euro exchange rate of JPY140 to €1.00 for the 2014 first quarter and full year and an average US dollar to euro exchange rate of US$1.40 per €1.00 for the 2014 first quarter and US$1.35 per €1.00 for the remaining three quarters; however, currency values fluctuate, and the Company’s results of operations may be significantly affected by changes in exchange rates. The Company’s actual results or performance may also be materially negatively affected by numerous risks and uncertainties as described in the “Risk Factors” section of the 2012 Document de Référence, filed with the AMF on April 3, 2013, and also available on the Company’s website www.3ds.com.
Non-IFRS Information Readers are cautioned that the supplemental non-IFRS information presented in this document is subject to inherent limitations. It is not based on any comprehensive set of accounting rules or principles and should not be considered as a substitute for IFRS measurements. Also, the Company’s supplemental non-IFRS financial information may not be comparable to similarly titled non-IFRS measures used by other companies. Further specific limitations for individual non-IFRS measures, and the reasons for presenting non-IFRS financial information, are set forth in the Company’s annual report for the year ended December 31, 2012 included in the Company’s 2012 Document de Référence filed with the AMF on April 3, 2013. In the tables accompanying this document the Company sets forth its supplemental non-IFRS figures for revenue, operating income, operating margin, net income and diluted earnings per share, which exclude the effect of adjusting the carrying value of acquired companies’ deferred revenue, share-based compensation expense, the amortization of acquired intangible assets, other operating income and expense, net, certain one-time items included in financial revenue and other, net, and the income tax effect of the non-IFRS adjustments and certain one-time tax effects in 2013 and 2012. The tables also set forth the most comparable IFRS financial measure and reconciliations of this information with non-IFRS information. When the Company believes it would be helpful for understanding trends in its business, the Company provides percentage increases or decreases in its revenue (in both IFRS as well as non-IFRS) to eliminate the effect of changes in currency values, particularly the U.S. dollar and the Japanese yen, relative to the euro. When trend information is expressed herein “in constant currencies”, the results of the “prior” period have first been recalculated using the average exchange rates of the comparable period in the current year, and then compared with the results of the comparable period in the current year.
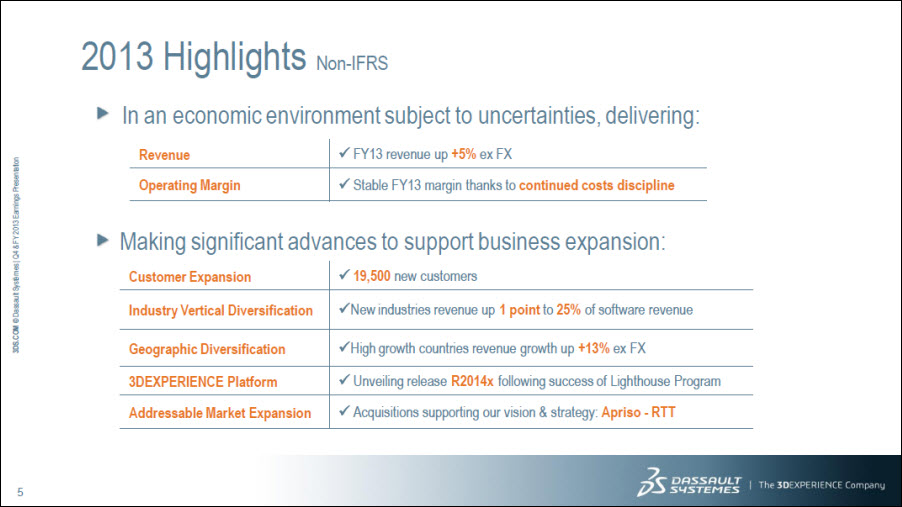
2013 Highlights Non-IFRS In an economic environment subject to uncertainties, delivering: Revenue FY13 revenue up +5% ex FX Operating Margin Stable FY13 margin thanks to continued costs discipline Making significant advances to support business expansion: Customer Expansion 19,500 new customers Industry Vertical Diversification New industries revenue up 1 point to 25% of software revenue Geographic Diversification High growth countries revenue growth up +13% ex FX 3DEXPERIENCE Platform Unveiling release R2014x following success of Lighthouse Program Addressable Market Expansion Acquisitions supporting our vision & strategy: Apriso – RTT
Agenda 1 Q4&FY13 Business Review & Strategy Update 2 Q4&FY13 Financial Highlights 3 Q1&FY14 Financial Objectives 4 Financial Information Appendix
Business Review & Strategy Update 1. Business Review Customer Expansion Geographic Diversification Industry Vertical Diversification 2. Strategy Update Strategy RTT Acquisition 3DEXPERIENCE R2014x Proposed Accelrys Acquisition
19,500 New Customers in 2013 Including customers who adopted “Industry Solution Experiences” such as:
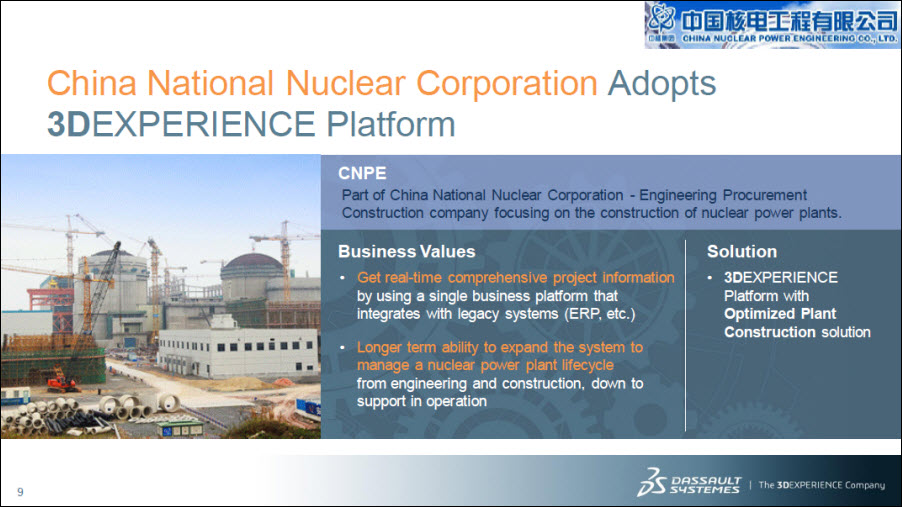
China National Nuclear Corporation Adopts 3DEXPERIENCE Platform CNPE Part of China National Nuclear Corporation - Engineering Procurement Construction company focusing on the construction of nuclear power plants. Business Values Get real-time comprehensive project information by using a single business platform that integrates with legacy systems (ERP, etc.) Longer term ability to expand the system to manage a nuclear power plant lifecycle from engineering and construction, down to support in operation Solution 3DEXPERIENCE Platform with Optimized Plant Construction solution
Business Review & Strategy Update 1. Business Review Customer Expansion Geographic Diversification Industry Vertical Diversification 2. Strategy Update Strategy RTT Acquisition 3DEXPERIENCE R2014x Proposed Accelrys Acquisition
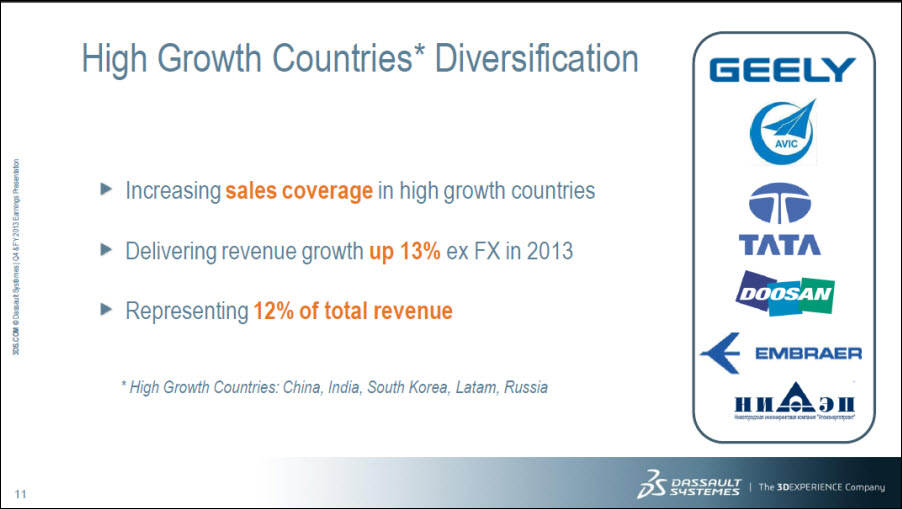
High Growth Countries* Diversification Increasing sales coverage in high growth countries Delivering revenue growth up 13% ex FX in 2013 Representing 12% of total revenue * High Growth Countries: China, India, South Korea, Latam, Russia
GEELY Adopts 3DEXPERIENCE Platform GEELY Zhejiang Geely Holding Group is one of the top ten automobile manufacturers in China Business Values Manage increasing product complexity with an integrated collaborative environment for designing and managing electrical and electronics architecture Accelerate product development by reusing and enhancing an existing electronics and electrical vehicle architecture for new car programs Solution 3DEXPERIENCE Platform with Smart, Safe & Connected Industry Solution Experience
Business Review & Strategy Update 1. Business Review Customer Expansion Geographic Diversification Industry Vertical Diversification 2. Strategy Update Strategy RTT Acquisition 3DEXPERIENCE R2014x Proposed Accelrys Acquisition
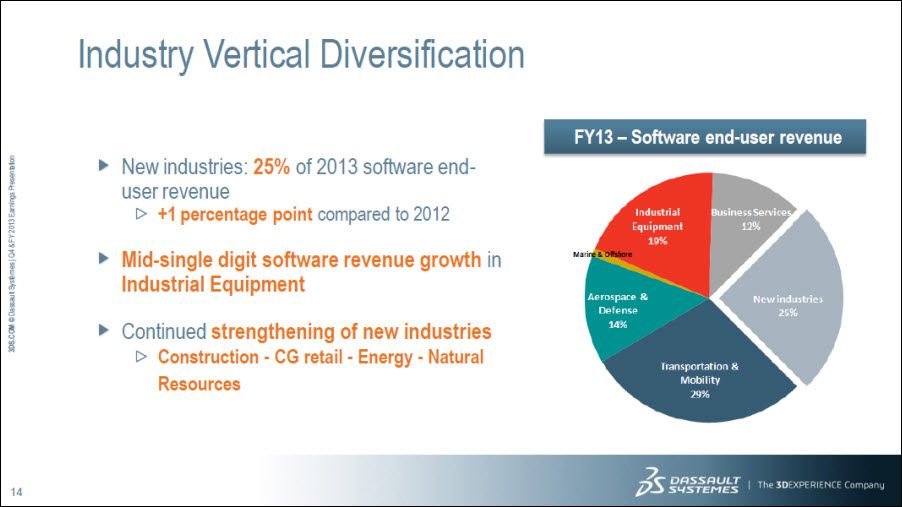
Industry Vertical Diversification New industries: 25% of 2013 software end-user revenue +1 percentage point compared to 2012 Mid-single digit software revenue growth in Industrial Equipment Continued strengthening of new industries Construction - CG retail - Energy - Natural Resources FY13 – Software end-user revenue Industrial Equipment 19% Marine & Offshore Aerospace & Defense 14% Transportation & Mobility 29% New Industries 25% Business Services 12%
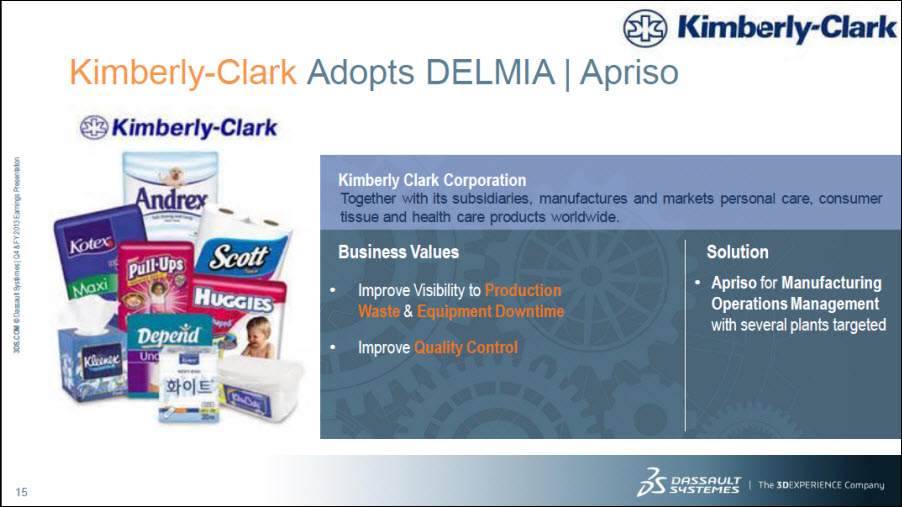
Kimberly-Clark Adopts DELMIA | Apriso Kimberly-Clark Corporation Together with its subsidiaries, manufactures and markets personal care, consumer tissue and health care products worldwide. Business Values Improve Visibility to Production Waste & Equipment Downtime Improve Quality Control Solution Apriso for Manufacturing Operations Management with several plants targeted
Business Review & Strategy Update 1. Business Review Customer Expansion Geographic Diversification Industry Vertical Diversification 2. Strategy Update Strategy RTT Acquisition 3DEXPERIENCE R2014x Proposed Accelrys Acquisition
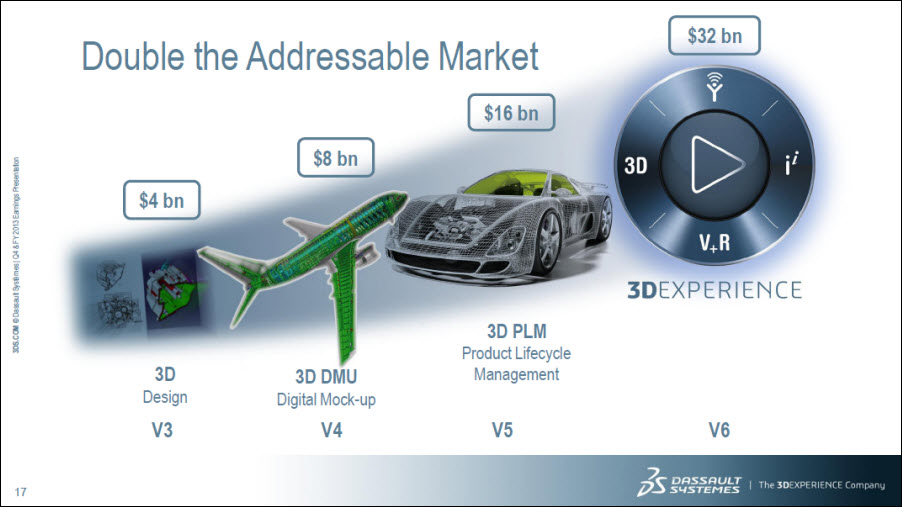
Double the Addressable Market $4 bn 3D Design V3 $8 bn 3D DMU Digital Mock-up V4 $16 bn 3D PLM Product Lifecycle Management V5 $32 bn 3DEXPERIENCE V6
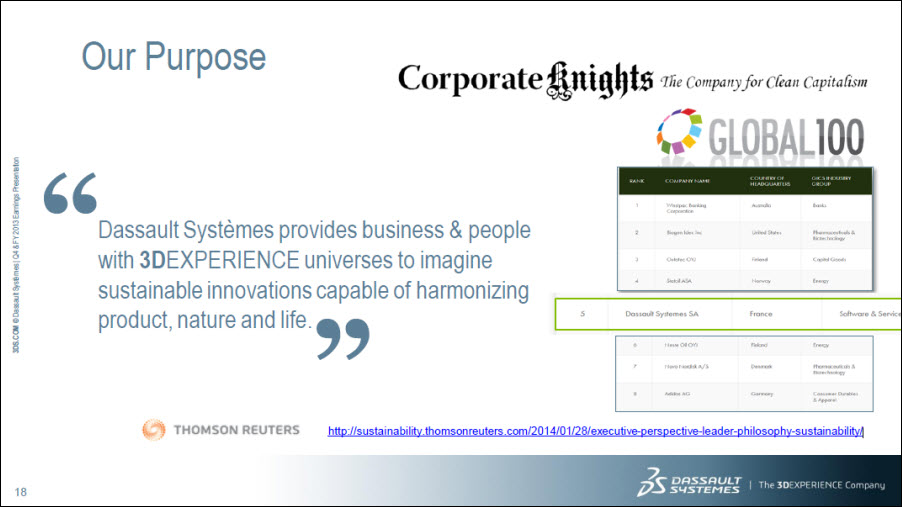
Our Purpose Corporate Knights The Company for Clean Capitalism “Dassault Systèmes provides business & people with 3DEXPERIENCE universes to imagine sustainable innovations capable of harmonizing product, nature and life.” http://sustainability.thomsonreuters.com/2014/01/28/executive-perspective-leader-philosophy-sustainability/
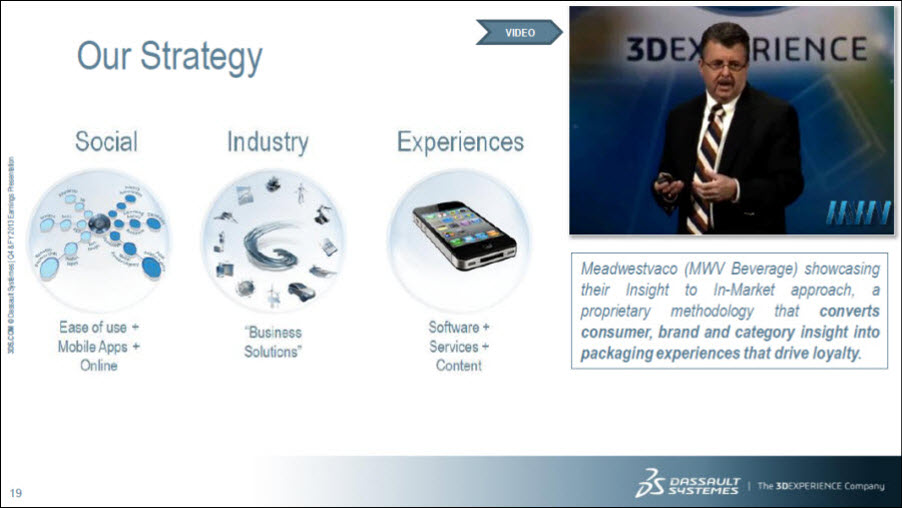
Our Strategy Social Ease of use + Mobile Apps + Online Industry “Business Solutions” Experiences Software + Services + Content Video Meadwestvaco (MWV Beverage) showcasing their Insight to In-Market approach, a proprietary methodology that converts consumer, brand and category insight into packaging experiences that drive loyalty.
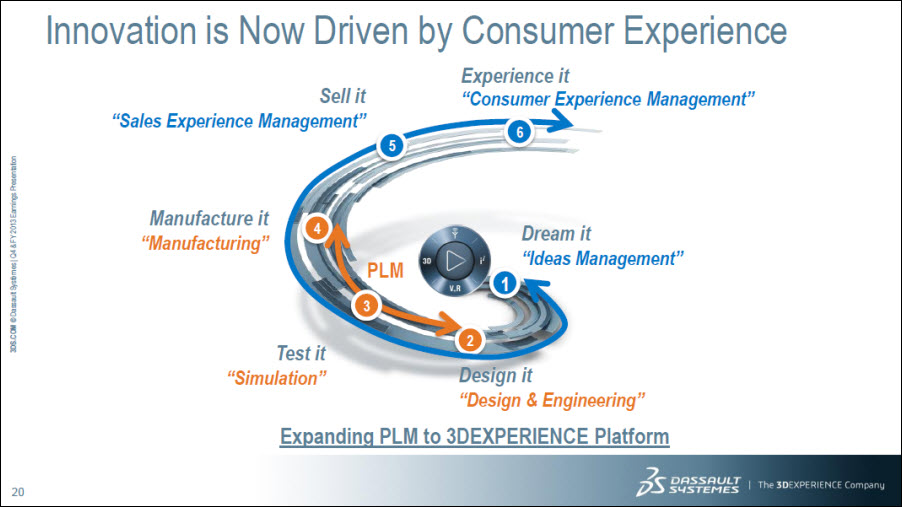
Innovation is Now Driven by Consumer Experience Sell it “Sales Experience Management” 5 Experience it “Consumer Experience Management” 6 Manufacture it “Manufacturing” 4 PLM 3 Test it “Simulation” Design it “Design & Engineering” 2 Dream it “Ideas Management” 1 Expanding PLM to 3DEXPERIENCE Platform
Business Review & Strategy Update 1. Business Review Customer Expansion Geographic Diversification Industry Vertical Diversification 2. Strategy Update Strategy RTT Acquisition 3DEXPERIENCE R2014x Proposed Accelrys Acquisition
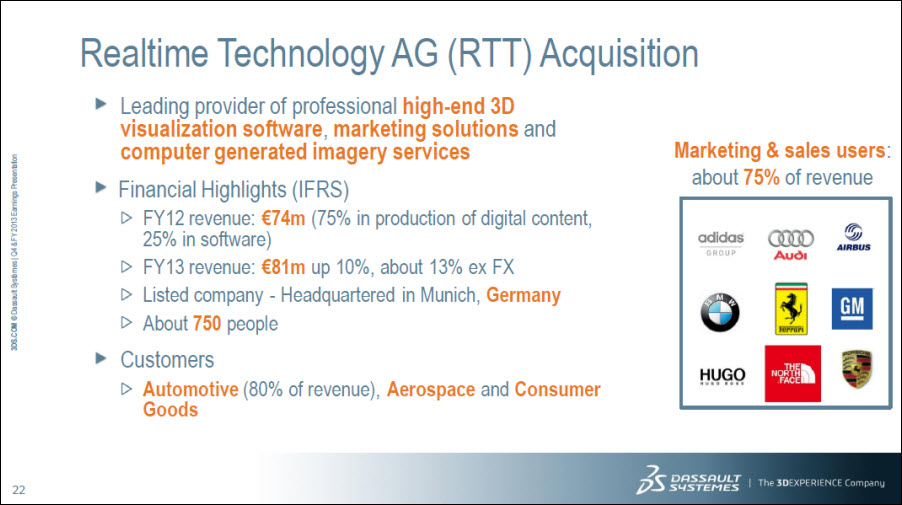
Realtime Technology AG (RTT) Acquisition Leading provider of professional high-end 3D visualization software, marketing solutions and computer generated imagery services Financial Highlights (IFRS) FY12 revenue: €74m (75% in production of digital content, 25% in software) FY13 revenue: €81m up 10%, about 13% ex FX Listed company - Headquartered in Munich, Germany About 750 people Customers Automotive (80% of revenue), Aerospace and Consumer Goods Marketing & sales users: about 75% of revenue
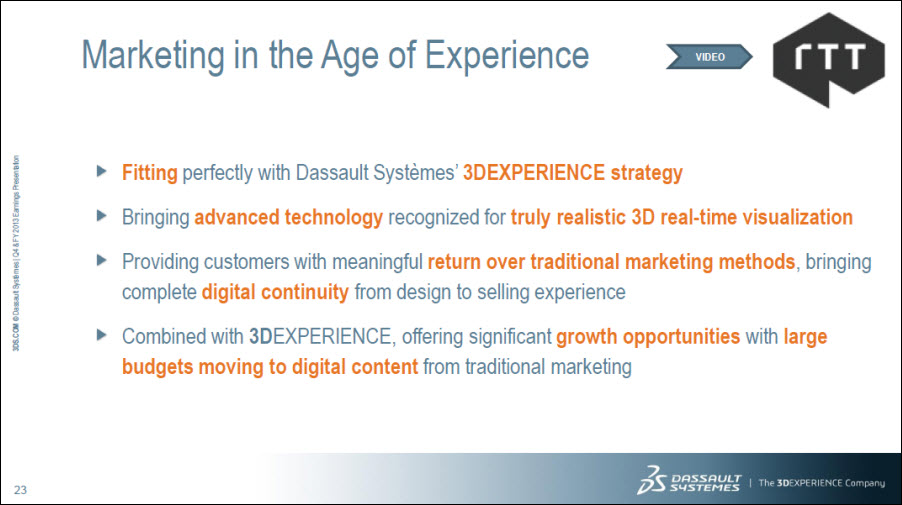
Marketing in the Age of Experience Fitting perfectly with Dassault Systèmes’ 3DEXPERIENCE strategy Bringing advanced technology recognized for truly realistic 3D real-time visualization Providing customers with meaningful return over traditional marketing methods, bringing complete digital continuity from design to selling experience Combined with 3DEXPERIENCE, offering significant growth opportunities with large budgets moving to digital content from traditional marketing
Business Review & Strategy Update 1. Business Review Customer Expansion Geographic Diversification Industry Vertical Diversification 2. Strategy Update Strategy RTT Acquisition 3DEXPERIENCE R2014x Proposed Accelrys Acquisition
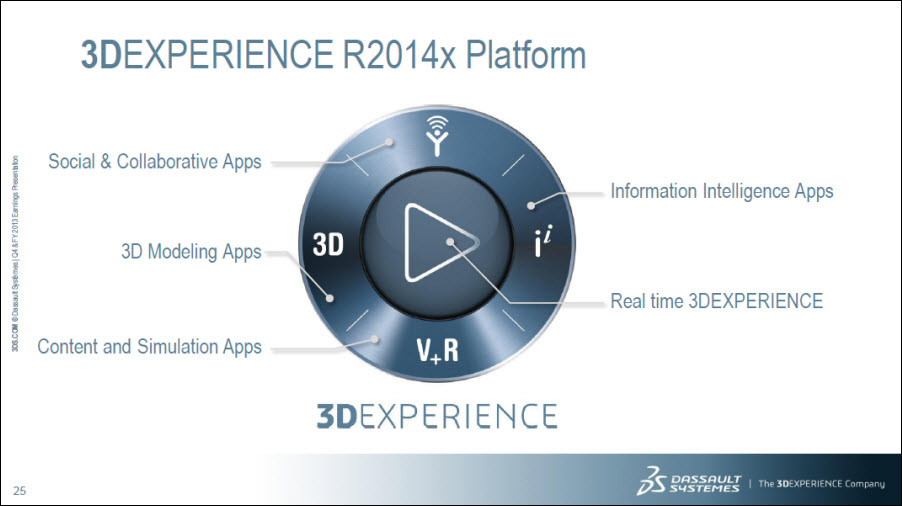
3DEXPERIENCE R2014x Platform Social & Collaborative Apps 3D Modeling Apps Content and Simulation Apps Information Intelligence Apps Real time 3DEXPERIENCE 3DEXPERIENCE
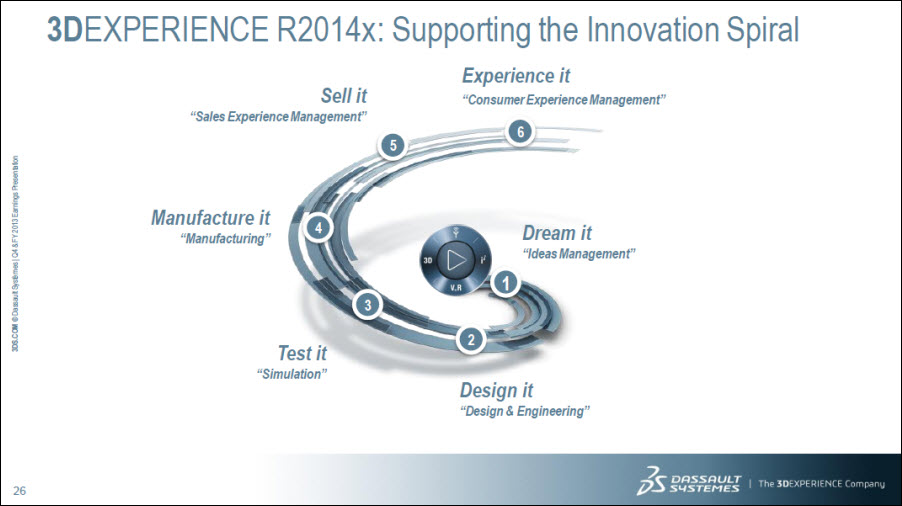
3DEXPERIENCE R2014x: Supporting the Innovation Spiral 6 Experience it “Consumer Experience Management” 1 Dream it “Ideas Management” 2 Design it “Design & Engineering” 3 Test it “Simulation” 4 Manufacture it “Manufacturing” 5 Sell it “Sales Experience Management”
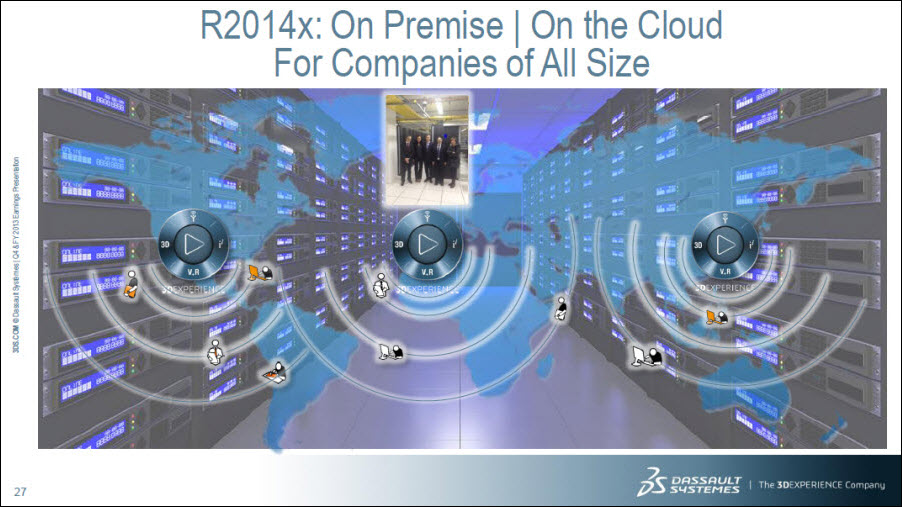
R2014x: On Premise | On the Cloud For Companies of All Size
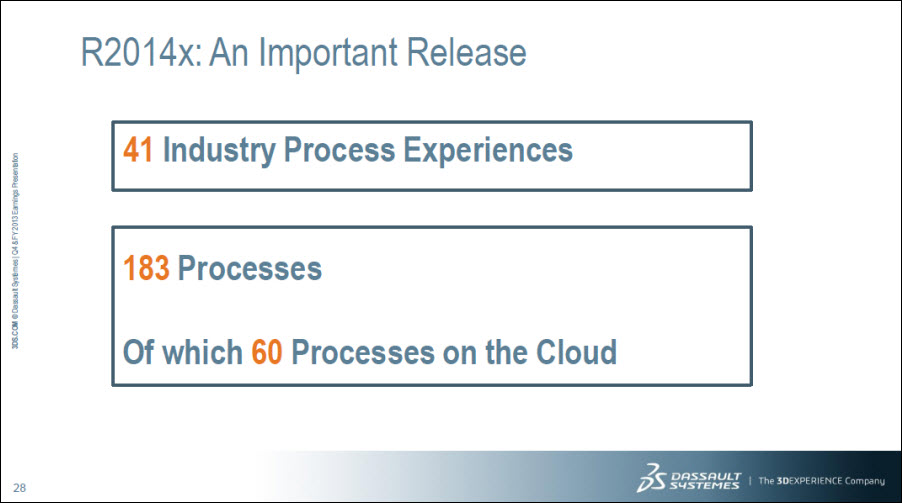
R2014x: An Important Release 41 Industry Process Experiences 183 Processes Of which 60 Processes on the Cloud
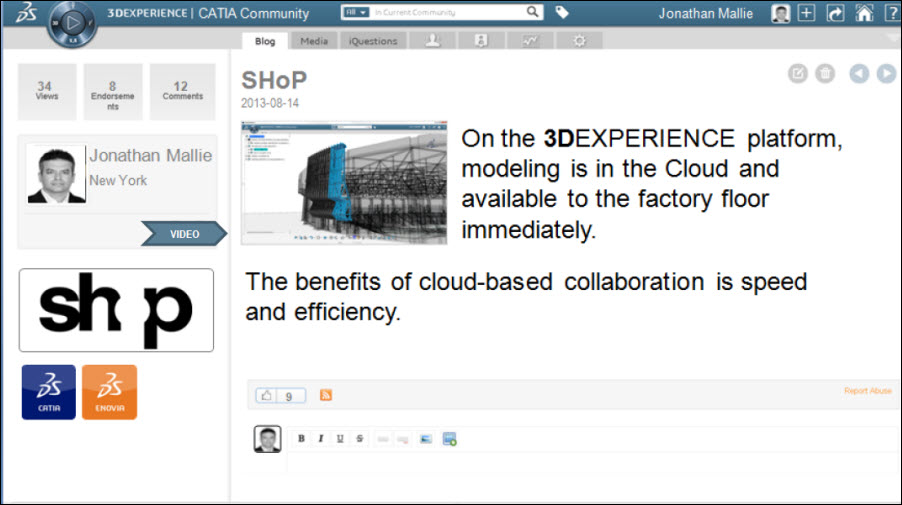
On the 3DEXPERIENCE platform, modeling is in the Cloud and available to the factory floor immediately. The benefits of cloud-based collaboration is speed and efficiency.
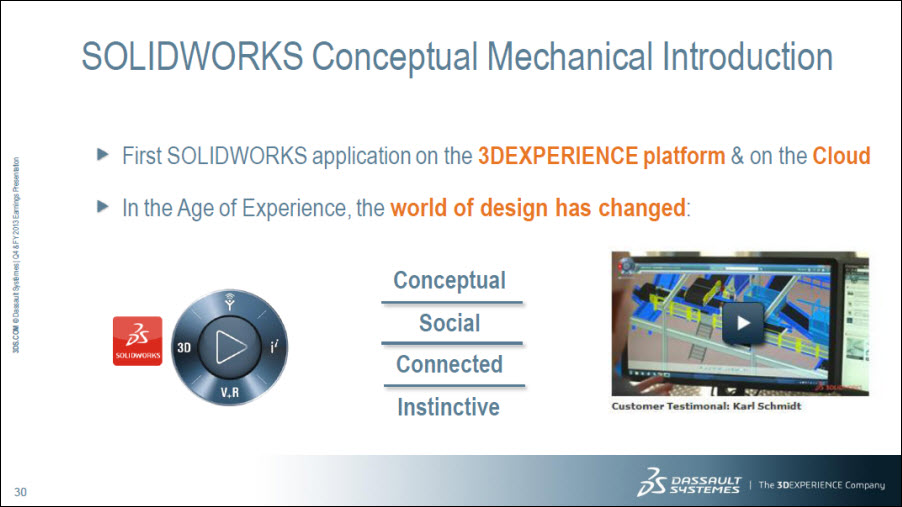
SOLIDWORKS Conceptual Mechanical Introduction First SOLIDWORKS application on the 3DEXPERIENCE platform & on the Cloud In the Age of Experience, the world of design has changed: Conceptual Social Connected Instinctive
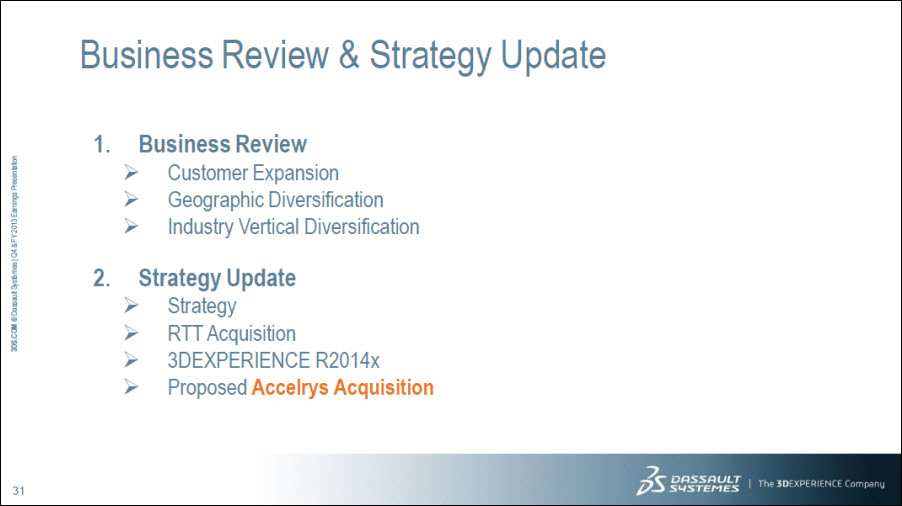
Business Review & Strategy Update 1. Business Review Customer Expansion Geographic Diversification Industry Vertical Diversification 2. Strategy Update Strategy RTT Acquisition 3DEXPERIENCE R2014x Proposed Accelrys Acquisition
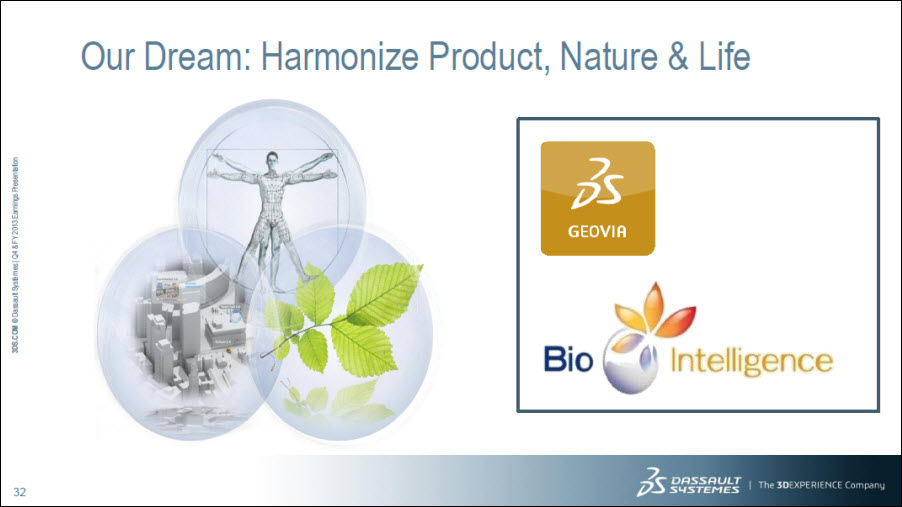
Our Dream: Harmonize Product, Nature & Life Geovia Bio Intelligence
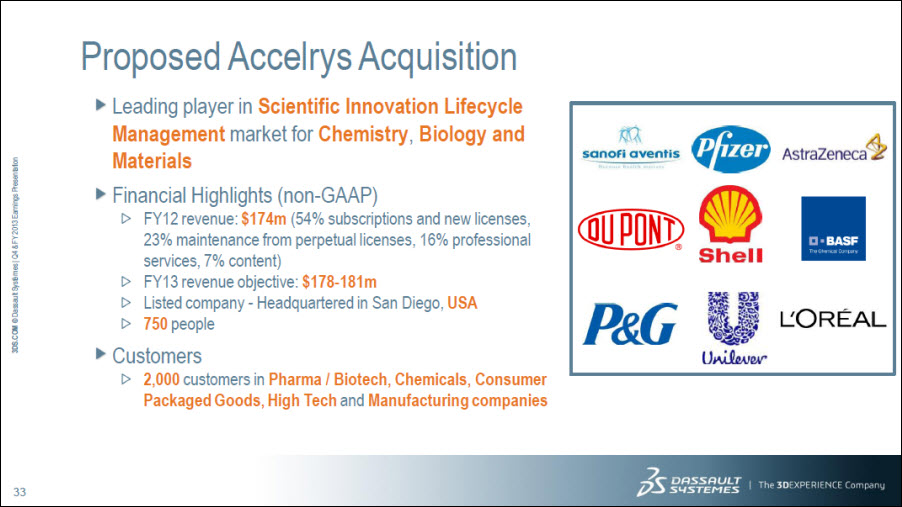
Proposed Accelrys Acquisition Leading player in Scientific Innovation Lifecycle Management market for Chemistry, Biology and Materials Financial Highlights (non-GAAP) FY12 revenue: $174m (54% subscriptions and new licenses, 23% maintenance from perpetual licenses, 16% professional services, 7% content) FY13 revenue objective: $178-181m Listed company - Headquartered in San Diego, USA 750 people Customers 2,000 customers in Pharma / Biotech, Chemicals, Consumer Packaged Goods, High Tech and Manufacturing companies
Key Events To Accelrys Timeline Merger agreement signed on January 30, 2014 Tender offer to be launched for all outstanding shares at $12.50 per share (equity value of about $750m) Completion of the transaction subject to Accelrys’ stockholders tendering a majority of Accelrys’ outstanding shares, receipt of certain regulatory approvals and other customary closing conditions Impact on non-IFRS FY14 objectives to be included after the closing expected in Q2 2014
Agenda 1 Q4&FY13 Business Review & Strategy Update 2 Q4&FY13 Business Highlights 3 Q1&FY14 Financial Objectives 4 Financial Information Appendix
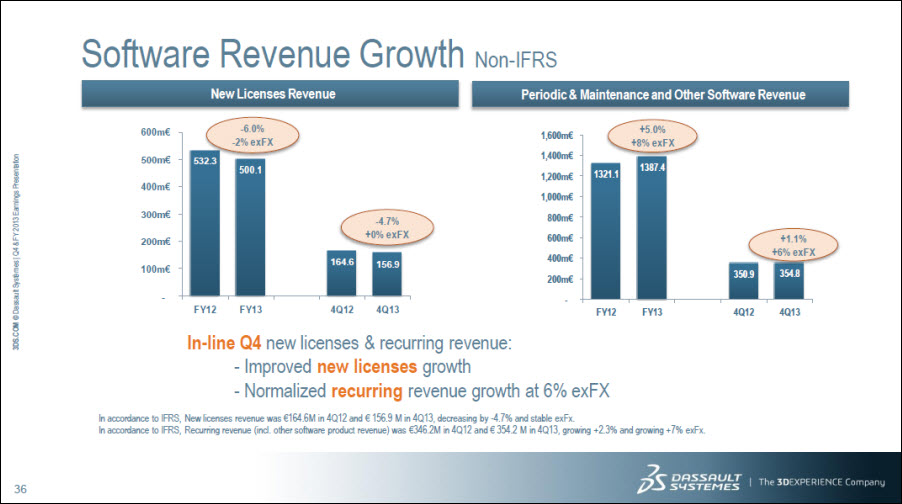
Software Revenue Growth New Licenses Revenue 100m€ 200m€ 300m€ 400m€ 500m€ 600m€ -6.0% -2% exFX 532.3 FY12 500.1 FY13 -4.7% +0% exFX 164.6 4Q12 156.9 4Q13 Non-IFRS Periodic & Maintenance and Other Software Revenue 1,600m€ 1,400m€ 1,200m€ 1,000m€ 800m€ 600m€ 400m€ 200m€ 1321.1 FY12 +5.0% +8% exFX 1387.4 FY13 350.9 4Q12 354.8 4Q13 +1.1% +6% exFX In-line Q4 new licenses & recurring revenue: - Improved new licenses growth - Normalized recurring revenue growth at 6% exFX In accordance to IFRS, New licenses revenue was €164.6M in 4Q12 and € 156.9 M in 4Q13, decreasing by -4.7% and stable exFx. In accordance to IFRS, Recurring revenue (incl. other software product revenue) was €346.2M in 4Q12 and €354.2 M in 4Q13, growing +2.3% and growing +7% exFx.
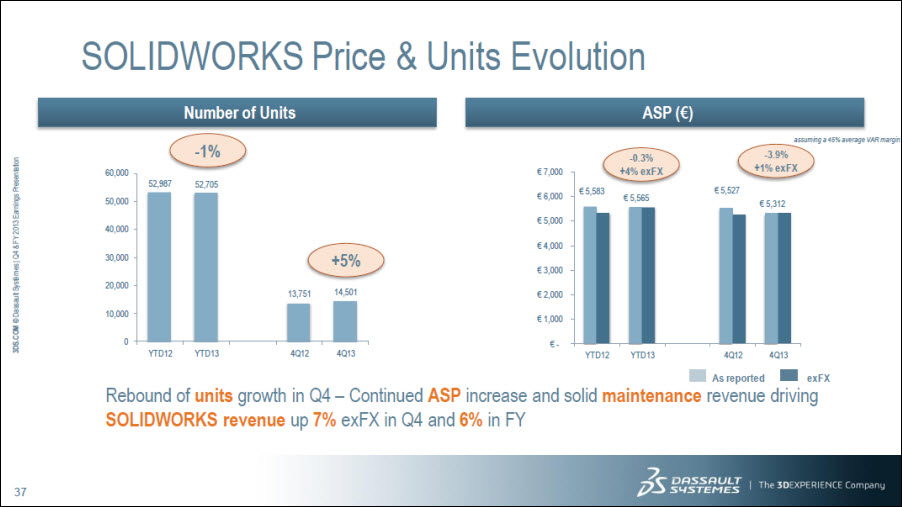
SOLIDWORKS Price & Units Evolution Number of Units 0 10,000 20,000 30,000 40,000 50,000 60,000 -1% +5% 52,987 52,705 13,751 14,501 YTD12 YTD13 4Q12 4Q13 ASP (€) 7,000 € 6,000 € 5,000 € 4,000 € 3,000 € 2,000 € 1,000 € - YTD12 YTD13 4Q12 4Q13 -0.3% +4% exFX -3.9% +1% exFX € 5,583 € 5,565 € 5,527 € 5,312 As reported exFX Rebound of units growth in Q4 – Continued ASP increase and solid maintenance revenue driving SOLIDWORKS revenue up 7% exFX in Q4 and 6% in FY
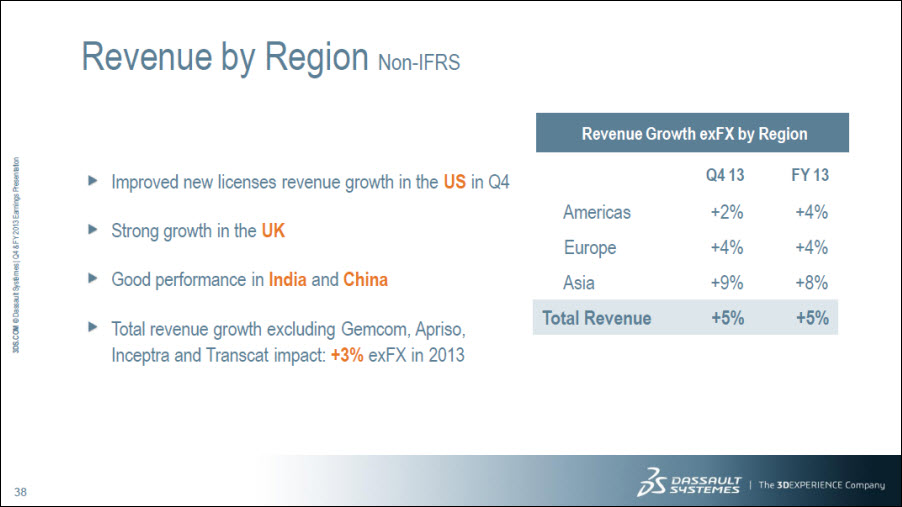
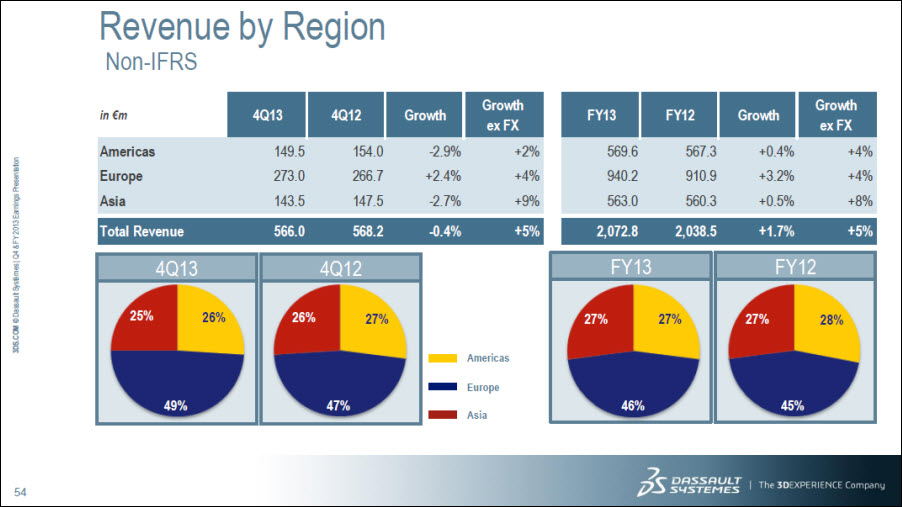
Revenue by Region Non-IFRS Improved new licenses revenue growth in the US in Q4 Strong growth in the UK Good performance in India and China Total revenue growth excluding Gemcom, Apriso, Inceptra and Transcat impact: +3% exFX in 2013 Revenue Growth exFX by Region Q4 13 FY 13 Americas +2% +4% Europe +4% +4% Asia +9% +8% Total Revenue +5% +5%
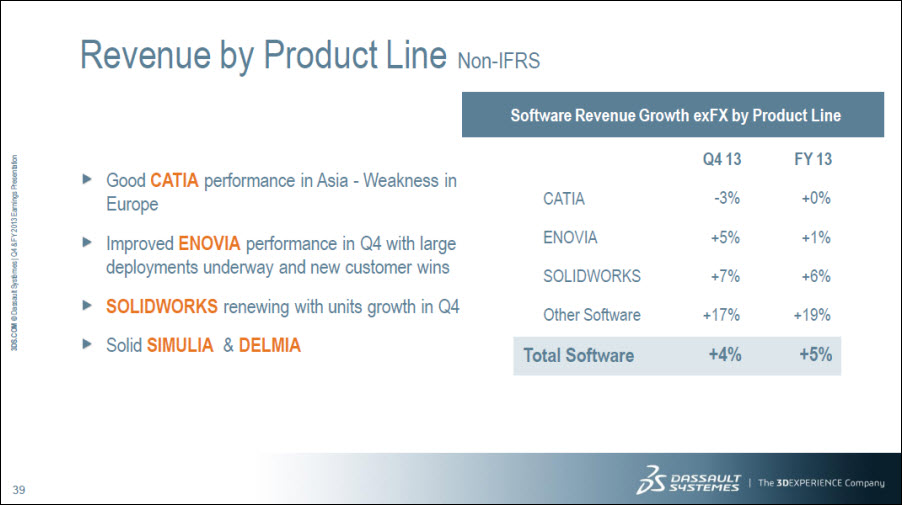
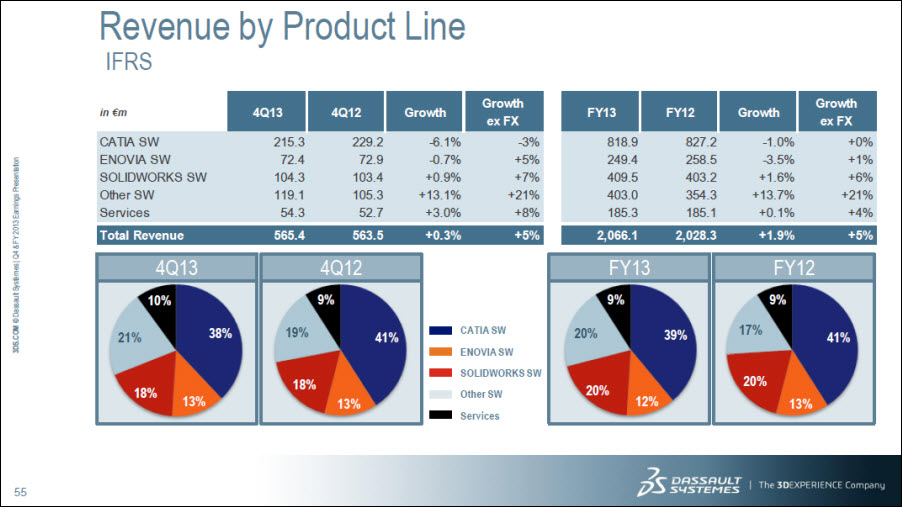
Revenue by Product Line Non-IFRS Good CATIA performance in Asia - Weakness in Europe Improved ENOVIA performance in Q4 with large deployments underway and new customer wins SOLIDWORKS renewing with units growth in Q4 Solid SIMULIA & DELMIA Q4 13 FY 13 CATIA -3% +0% ENOVIA +5% +1% SOLIDWORKS +7% +6% Other Software +17% +19% Total Software +4% +5%
V6 Architecture | 3DEXPERIENCE Platform Performance V6 momentum in Q4, representing about 27% of PLM new licenses revenue More than 60% of ENOVIA new licenses revenue comes from V6 in 2013 Half of top 20 customers are engaged in large V6 deployments New V6 customers to drive business going forward
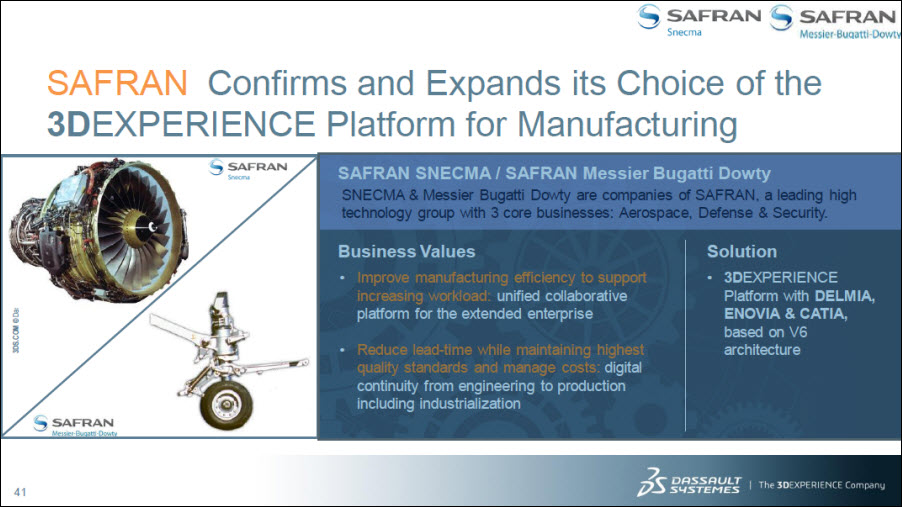
SAFRAN Confirms and Expands its Choice of the 3DEXPERIENCE Platform for Manufacturing SAFRAN SNECMA / SAFRAN Messier Bugatti Dowty SNECMA & Messier Bugatti Dowty are companies of SAFRAN, a leading high technology group with 3 core businesses: Aerospace, Defense & Security. Business Values Improve manufacturing efficiency to support increasing workload: unified collaborative platform for the extended enterprise Reduce lead-time while maintaining highest quality standards and manage costs: digital continuity from engineering to production including industrialization Solution 3DEXPERIENCE Platform with DELMIA, ENOVIA & CATIA, based on V6 architecture
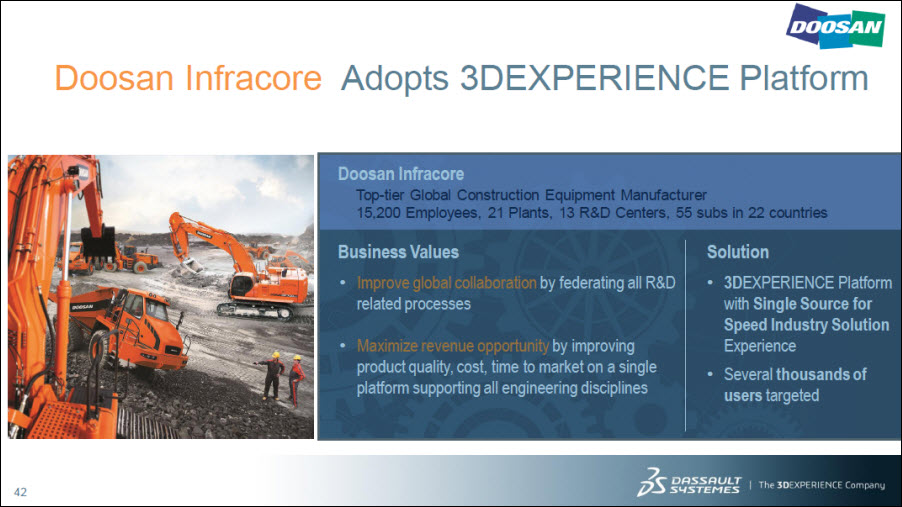
Doosan Infracore Adopts 3DEXPERIENCE Platform Doosan Infracore Top-tier Global Construction Equipment Manufacturer 15,200 Employees, 21 Plants, 13 R&D Centers, 55 subs in 22 countries Business Values Improve global collaboration by federating all R&D related processes Maximize revenue opportunity by improving product quality, cost, time to market on a single platform supporting all engineering disciplines Solution 3DEXPERIENCE Platform with Single Source for Speed Industry Solution Experience Several thousands of users targeted
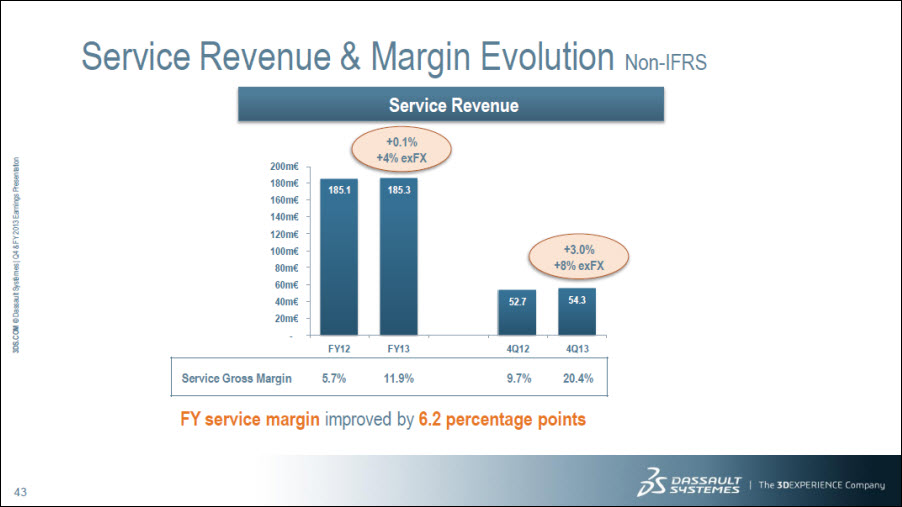
Service Revenue & Margin Evolution Non-IFRS Service Revenue - 20m€ 40m€ 60m€ 80m€ 100m€ 120m€ 140m€ 160m€ 180m€ 200m€ +0.1% +4% exFX 185.1 185.3 +3.0% +8% exFX 52.7 54.3 FY12 FY13 4Q12 4Q13 Service Gross Margin 5.7% 11.9% 9.7% 20.4% FY service margin improved by 6.2 percentage points
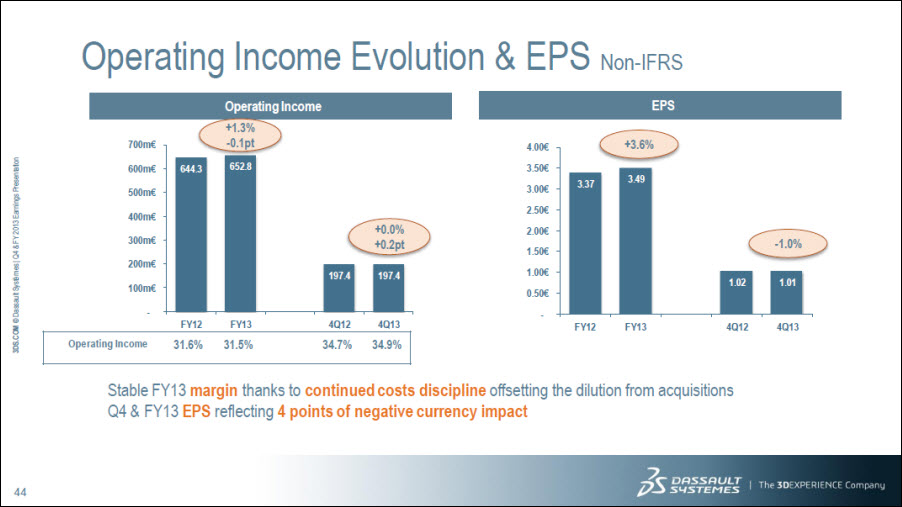
Operating Income Evolution & EPS Non-IFRS Operating Income - 100m€ 200m€ 300m€ 400m€ 500m€ 600m€ 700m€ +1.3% -0.1pt 644.3 652.8 +0.0% +0.2pt 197.4 197.4 FY12 FY13 4Q12 4Q13 Operating Income 31.6% 31.5% 34.7% 34.9% EPS 4.00€ 3.50€ 3.00€ 2.50€ 2.00€ 1.50€ 1.00€ 0.50€ +3.6% 3.37 3.49 -1.0% 1.02 1.01 FY12 FY13 4Q12 4Q13 Stable FY13 margin thanks to continued costs discipline offsetting the dilution from acquisitions Q4 & FY13 EPS reflecting 4 points of negative currency impact
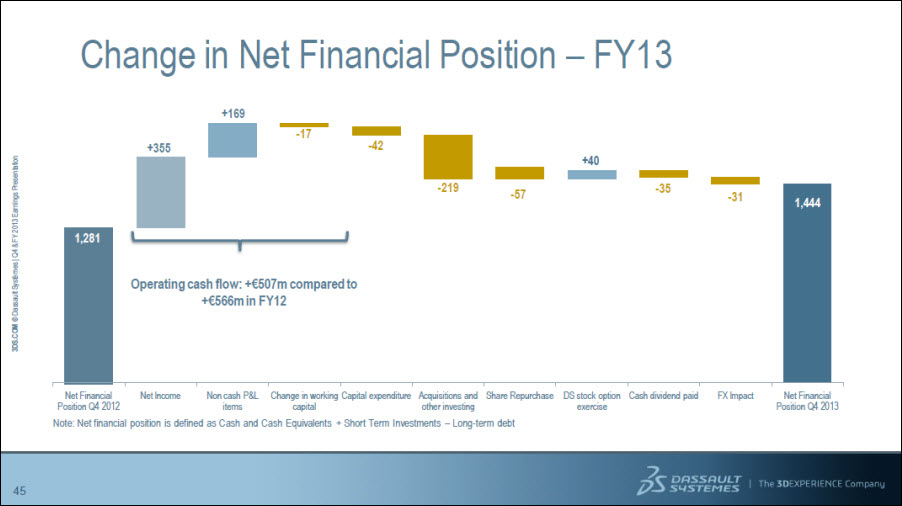
Change in Net Financial Position – FY13 1,281 +355 +169 -17 -42 -219 -57 +40 -35 -31 1,444 Operating cash flow: +€507m compared to +€566m in FY12 Net Financial Position Q4 2012 Net Income Non cash P&L items Change in working capital Capital expenditure Acquisitions and other investing Share Repurchase DS stock option exercise Cash dividend paid FX Impact Net Financial Position Q4 2013 Note: Net financial position is defined as Cash and Cash Equivalents + Short Term Investments – Long-term debt
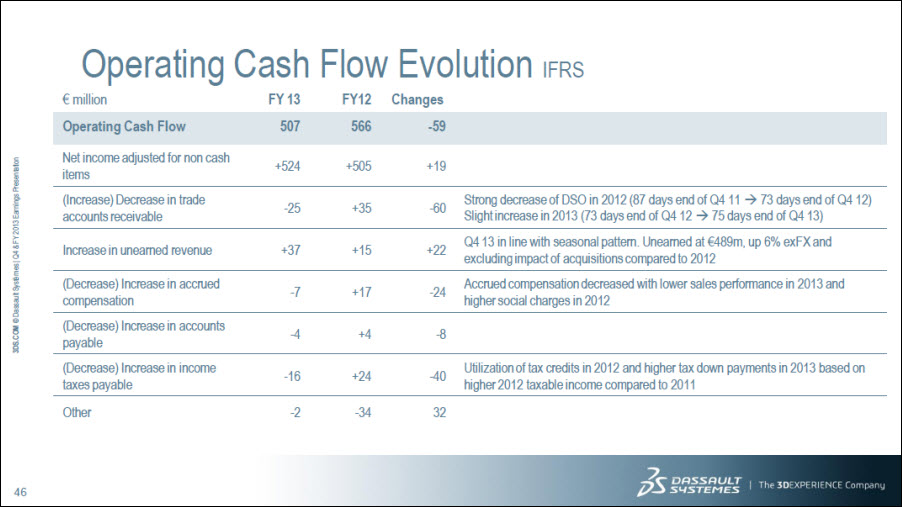
Operating Cash Flow Evolution IFRS € million FY 13 FY12 Changes Operating Cash Flow 507 566 -59 Net income adjusted for non cash items +524 +505 +19 (Increase) Decrease in trade accounts receivable -25 +35 -60 Strong decrease of DSO in 2012 (87 days end of Q4 11 73 days end of Q4 12) Slight increase in 2013 (73 days end of Q4 12 75 days end of Q4 13) Increase in unearned revenue +37 +15 +22 Q4 13 in line with seasonal pattern. Unearned at €489m, up 6% exFX and excluding impact of acquisitions compared to 2012 (Decrease) Increase in accrued compensation -7 +17 -24 Accrued compensation decreased with lower sales performance in 2013 and higher social charges in 2012 (Decrease) Increase in accounts payable -4 +4 -8 (Decrease) Increase in income taxes payable -16 +24 -40 Utilization of tax credits in 2012 and higher tax down payments in 2013 based on higher 2012 taxable income compared to 2011 Other -2 -34 32
Agenda 1 Q4&FY13 Business Review & Strategy Update 2 Q4&FY13 Business Highlights 3 Q1&FY14 Financial Objectives 4 Financial Information Appendix
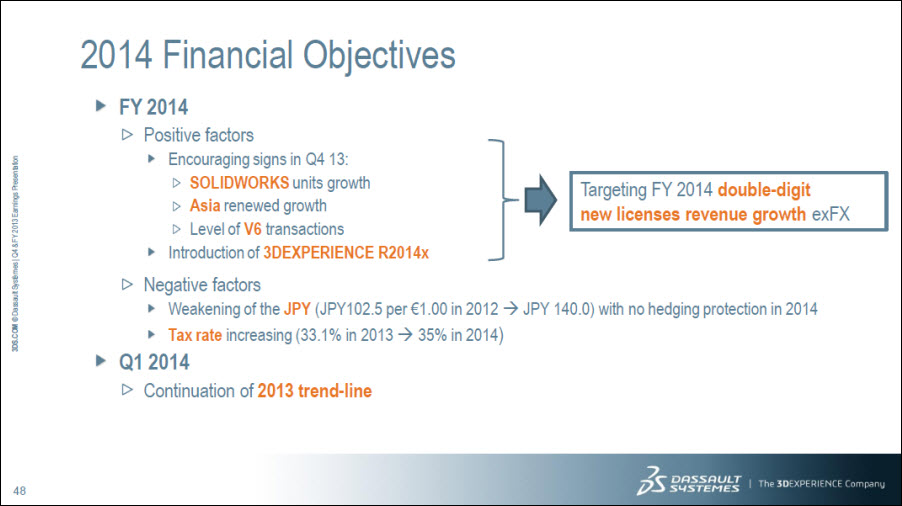
2014 Financial Objectives FY 2014 Positive factors Encouraging signs in Q4 13: SOLIDWORKS units growth Asia renewed growth Level of V6 transactions Introduction of 3DEXPERIENCE R2014x Negative factors Weakening of the JPY (JPY102.5 per €1.00 in 2012 JPY 140.0) with no hedging protection in 2014 Tax rate increasing (33.1% in 2013 35% in 2014) Q1 2014 Continuation of 2013 trend-line Targeting FY 2014 double-digit new licenses revenue growth exFX
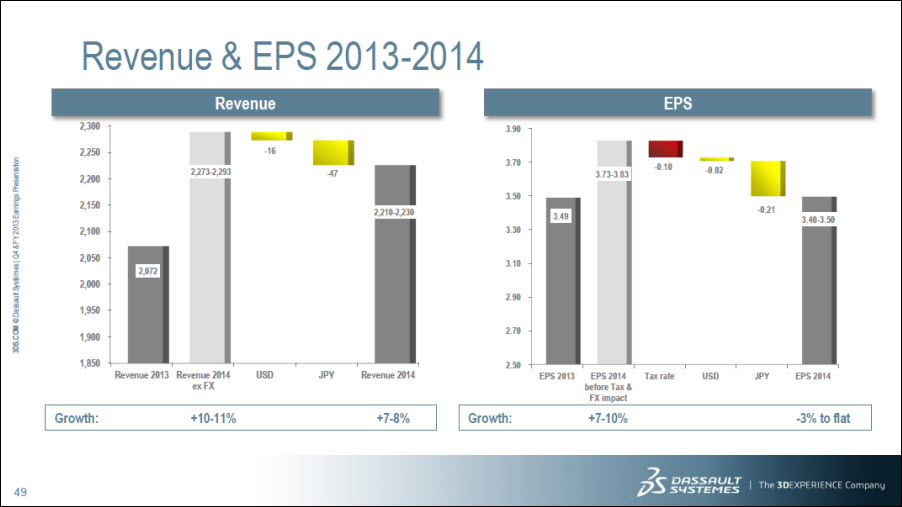
Revenue & EPS 2013-2014 Revenue 2,300 2,250 2,200 2,150 2,100 2,050 2,000 1,950 1,900 1,850 2,072 2,273-2,293 -16 -47 2,210-2,230 Revenue 2013 Revenue 2014 ex FX USD JPY Revenue 2014 Growth: +10-11% +7-8% EPS 3.90 3.70 3.50 3.30 3.10 2.90 2.70 2.50 3.49 3.73-3.83 -0.10 -0.02 -0.21 3-40-3.50 EPS 2013 EPS 2014 before Tax & FX impact Tax rate USD JPY EPS 2014 Growth: +7-10% -3% to flat
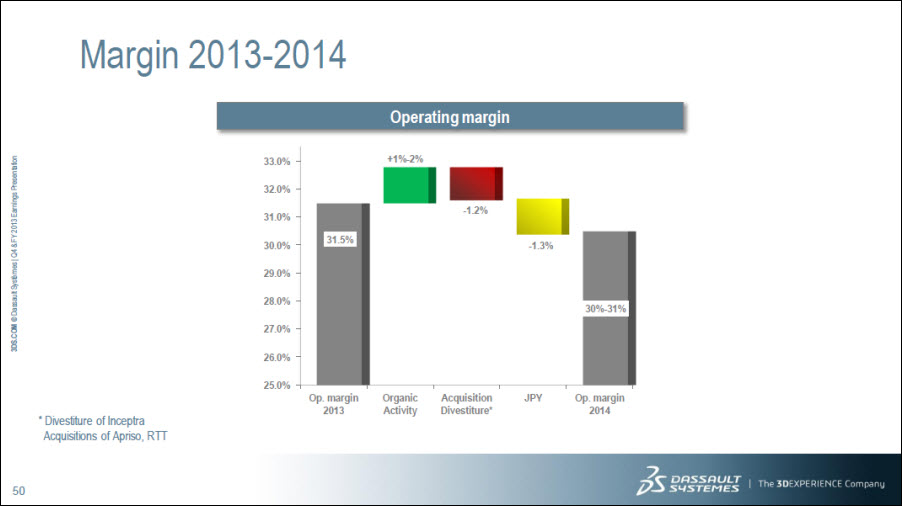
Margin 2013-2014 25.0% 26.0% 27.0% 28.0% 29.0% 30.0% 31.0% 32.0% 33.0% Op. margin 2013 Organic Activity Acquisition Divestiture* JPY Op. margin 2014 31.5% +1%-2% -1.2% -1.3% 30%-31% Operating margin * Divestiture of Inceptra Acquisitions of Apriso, RTT
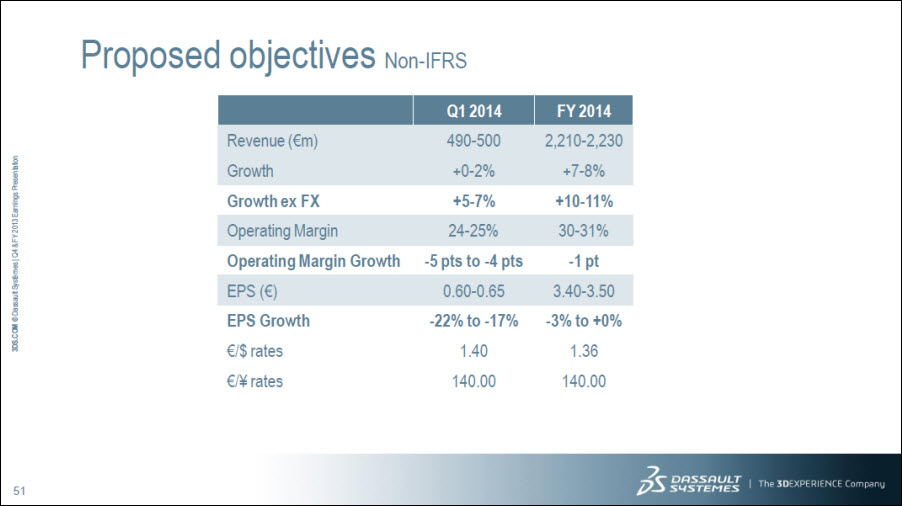
Proposed objectives Non-IFRS Q1 2014 FY 2014 Revenue (€m) 490-500 2,210-2,230 Growth +0-2% +7-8% Growth ex FX +5-7% +10-11% Operating Margin 24-25% 30-31% Operating Margin Growth -5 pts to -4 pts -1 pt EPS (€) 0.60-0.65 3.40-3.50 EPS Growth -22% to -17% -3% to +0% €/$ rates 1.40 1.36 €/¥ rates 140.00 140.00
Agenda 1 Q4&FY13 Business Review & Strategy Update 2 Q4&FY13 Business Highlights 3 Q1&FY14 Financial Objectives 4 Financial Information Appendix
Revenue by Region IFRS in €m 4Q13 4Q12 Growth Growth ex FX FY13 FY12 Growth Growth ex FX Americas 149.6 152.6 -2.0% +3% 567.2 564.3 +0.5% +4% Europe 272.3 265.8 +2.4% +4% 937.8 908.9 +3.2% +4% Asia 143.5 145.1 -1.1% +10% 561.1 555.1 +1.1% +9% Total Revenue 565.4 563.5 +0.3% +5% 2,066.1 2,028.3 +1.9% +5% 4Q13 4Q12 FY13 FY12 25% 26% 49% 26% 27% 47% 27% 27% 46% 27% 28% 45% Americas Europe Asia
Revenue by Region Non-IFRS in €m 4Q13 4Q12 Growth Growth ex FX FY13 FY12 Growth Growth ex FX Americas 149.5 154.0 -2.9% +2% 569.6 567.3 +0.4% +4% Europe 273.0 266.7 +2.4% +4% 940.2 910.9 +3.2% +4% Asia 143.5 147.5 -2.7% +9% 563.0 560.3 +0.5% +8% Total Revenue 566.0 568.2 -0.4% +5% 2,072.8 2,038.5 +1.7% +5% 4Q13 4Q12 FY13 FY12 25% 26% 49% 26% 27% 47% 27% 27% 46% 27% 28% 45% Americas Europe Asia
Revenue by Product Line IFRS in €m 4Q13 4Q12 Growth Growth ex FX FY13 FY12 Growth Growth ex FX CATIA SW 215.3 229.2 -6.1% -3% 818.9 827.2 -1.0% +0% ENOVIA SW 72.4 72.9 -0.7% +5% 249.4 258.5 -3.5% +1% SOLIDWORKS SW 104.3 103.4 +0.9% +7% 409.5 403.2 +1.6% +6% Other SW 119.1 105.3 +13.1% +21% 403.0 354.3 +13.7% +21% Services 54.3 52.7 +3.0% +8% 185.3 185.1 +0.1% +4% Total Revenue 565.4 563.5 +0.3% +5% 2,066.1 2,028.3 +1.9% +5% 4Q13 4Q12 FY13 FY12 10% 38% 13% 18% 21% 9% 41% 13% 18% 19% 9% 39% 12% 20% 20% 9% 41% 13% 20% 17% CATIA SW ENOVIA SW SOIDWORKS SW Other SW Services
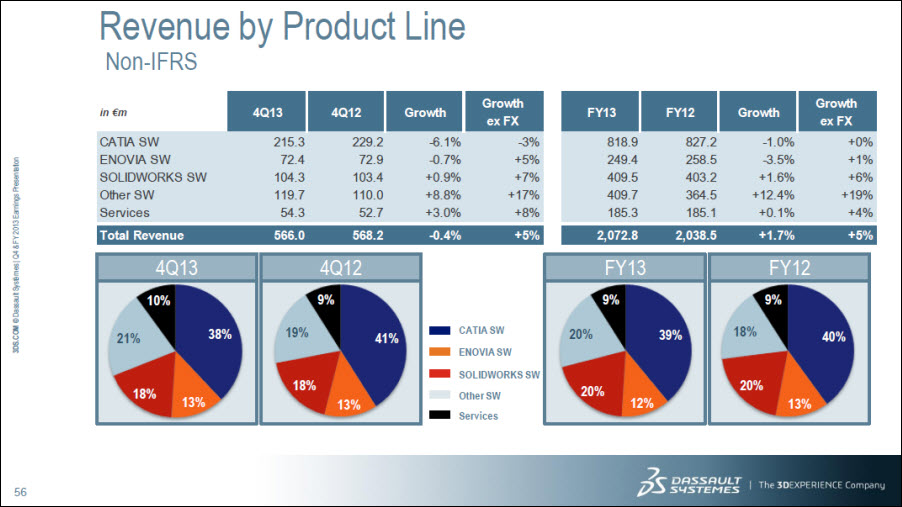
Revenue by Product Line Non-IFRS in €m 4Q13 4Q12 Growth Growth ex FX FY13 FY12 Growth Growth ex FX CATIA SW 215.3 229.2 -6.1% -3% 818.9 827.2 -1.0% +0% ENOVIA SW 72.4 72.9 -0.7% +5% 249.4 258.5 -3.5% +1% SOLIDWORKS SW 104.3 103.4 +0.9% +7% 409.5 403.2 +1.6% +6% Other SW 119.7 110.0 +8.8% +17% 409.7 364.5 +12.4% +19% Services 54.3 52.7 +3.0% +8% 185.3 185.1 +0.1% +4% Total Revenue 566.0 568.2 -0.4% +5% 2,072.8 2,038.5 +1.7% +5% 4Q13 4Q12 FY13 FY12 10% 38% 13% 18% 21% 9% 41% 13% 18% 19% 9% 39% 12% 20% 20% 9% 40% 13% 20% 18% CATIA SW ENOVIA SW SOLIDWORKS SW Other SW Services
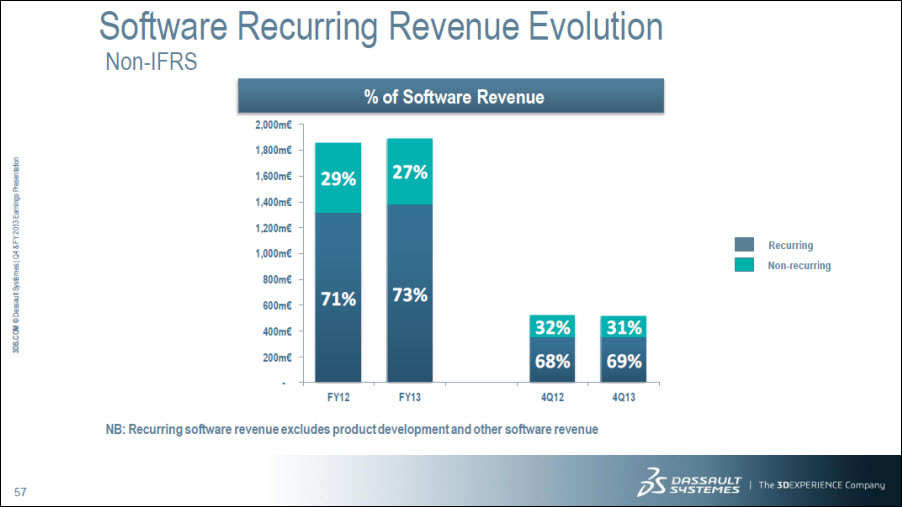
Software Recurring Revenue Evolution Non-IFRS % of Software Revenue 2,000m€ 1,800m€ 1,600m€ 1,400m€ 1,200m€ 1,000m€ 800m€ 600m€ 400m€ 200m€ - 29% 27% 71% 73% 32% 31% 68% 69% FY12 FY13 4Q12 4Q13 NB: Recurring software revenue excludes product development and other software revenue Recurring Non-recurring
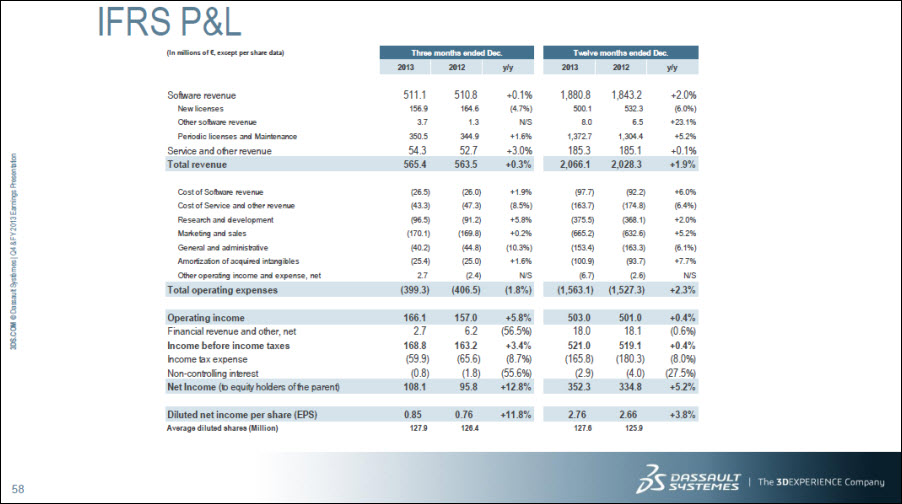
IFRS P&L (In millions of €, except per share data) Three months ended Dec.Twelve months ended Dec. 2013 2012 y/y 2013 2012 y/y Software revenue 511.1 510.8 +0.1% 1,880.8 1,843.2 +2.0% New licenses 156.9 164.6 (4.7%) 500.1 532.3 (6.0%) Other software revenue 3.7 1.3 N/S 8.0 6.5 +23.1% Periodic licenses and Maintenance 350.5 344.9 +1.6% 1,372.7 1,304.4 +5.2% Service and other revenue 54.3 52.7 +3.0% 185.3 185.1 +0.1% Total revenue 565.4 563.5 +0.3% 2,066.1 2,028.3 +1.9% Cost of Software revenue (26.5) (26.0) +1.9% (97.7) (92.2) +6.0% Cost of Service and other revenue (43.3) (47.3) (8.5%) (163.7) (174.8) (6.4%) Research and development (96.5) (91.2) +5.8% (375.5) (368.1) +2.0% Marketing and sales (170.1) (169.8) +0.2% (665.2) (632.6) +5.2% General and administrative (40.2) (44.8) (10.3%) (153.4) (163.3) (6.1%) Amortization of acquired intangibles (25.4) (25.0) +1.6% (100.9) (93.7) +7.7% Other operating income and expense, net 2.7 (2.4) N/S (6.7) (2.6 )N/S Total operating expenses (399.3) (406.5) (1.8%) (1,563.1) (1,527.3) +2.3% Operating income 166.1 157.0 +5.8% 503.0 501.0 +0.4% Financial revenue and other, net 2.7 6.2 (56.5%) 18.0 18.1 (0.6%) Income before income taxes 168.8 163.2 +3.4% 521.0 519.1 +0.4% Income tax expense (59.9) (65.6) (8.7%) (165.8) (180.3) (8.0%) Non-controlling interest (0.8) (1.8) (55.6%) (2.9) (4.0) (27.5%) Net Income (to equity holders of the parent) 108.1 95.8 +12.8% 352.3 334.8 +5.2% Diluted net income per share (EPS) 0.85 0.76 +11.8% 2.76 2.66 +3.8% Average diluted shares (Million) 127.9 126.4 127.6 125.9
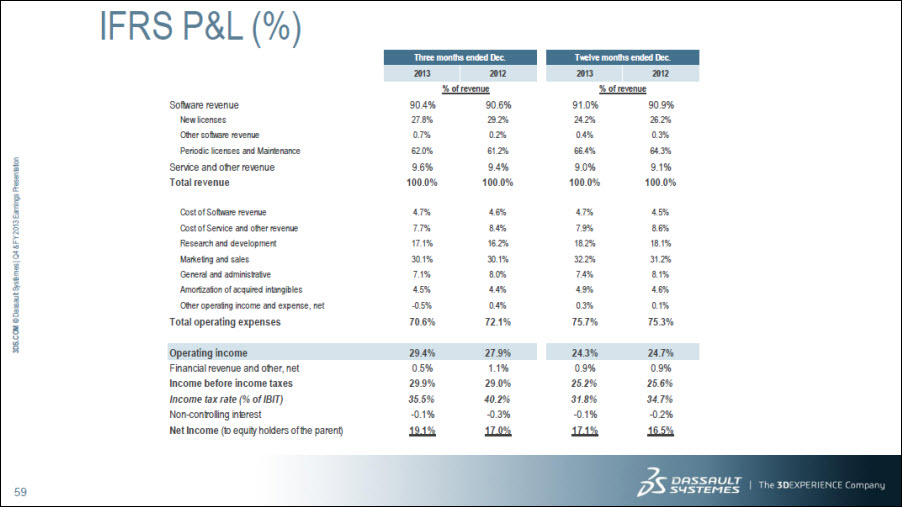
IFRS P&L (%) Three months ended Dec. Twelve months ended Dec. 2013 2012 2013 2012 % of revenue % of revenue Software revenue 90.4% 90.6% 91.0% 90.9% New licenses 27.8% 29.2% 24.2% 26.2% Other software revenue 0.7% 0.2% 0.4% 0.3% Periodic licenses and Maintenance 62.0% 61.2% 66.4% 64.3% Service and other revenue 9.6% 9.4% 9.0% 9.1% Total revenue 100.0% 100.0% 100.0% 100.0% Cost of Software revenue 4.7% 4.6% 4.7% 4.5% Cost of Service and other revenue 7.7% 8.4% 7.9% 8.6% Research and development 17.1% 16.2% 18.2% 18.1% Marketing and sales 30.1% 30.1% 32.2% 31.2% General and administrative 7.1% 8.0% 7.4% 8.1% Amortization of acquired intangibles 4.5% 4.4% 4.9% 4.6% Other operating income and expense, net -0.5% 0.4% 0.3% 0.1% Total operating expenses 70.6% 72.1% 75.7% 75.3% Operating income 29.4% 27.9% 24.3% 24.7% Financial revenue and other, net 0.5% 1.1% 0.9% 0.9% Income before income taxes 29.9% 29.0% 25.2% 25.6% Income tax rate (% of IBIT) 35.5% 40.2% 31.8% 34.7% Non-controlling interest -0.1% -0.3% -0.1% -0.2% Net Income (to equity holders of the parent) 19.1% 17.0% 17.1% 16.5%
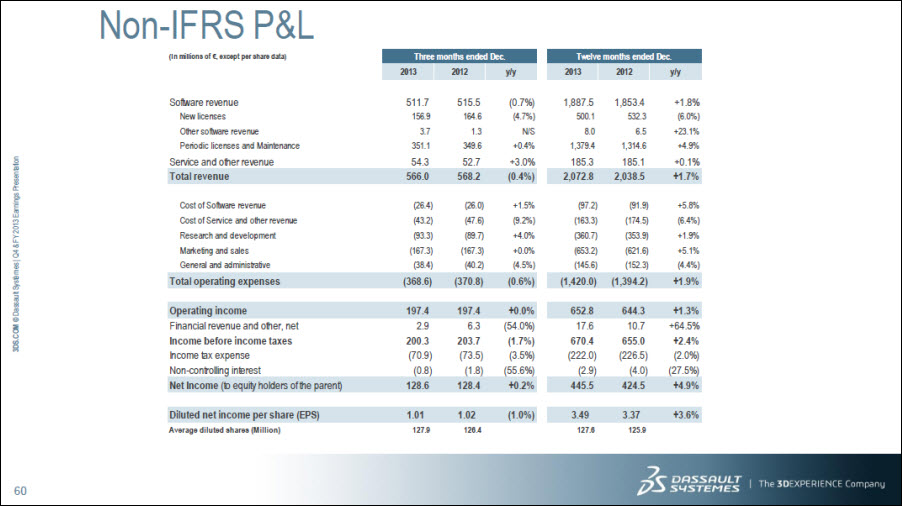
Non-IFRS P&L (In millions of €, except per share data) Three months ended Dec. Twelve months ended Dec. 2013 2012 y/y 2013 2012 y/y Software revenue 511.7 515.5 (0.7%) 1,887.5 1,853.4 +1.8% New licenses 156.9 164.6 (4.7%) 500.1 532.3 (6.0%) Other software revenue 3.7 1.3 N/S 8.0 6.5 +23.1% Periodic licenses and Maintenance 351.1 349.6 +0.4% 1,379.4 1,314.6 +4.9% Service and other revenue 54.3 52.7 +3.0% 185.3 185.1 +0.1% Total revenue 566.0 568.2 (0.4%) 2,072.8 2,038.5 +1.7% Cost of Software revenue (26.4) (26.0) +1.5% (97.2) (91.9) +5.8% Cost of Service and other revenue (43.2) (47.6) (9.2%) (163.3) (174.5) (6.4%) Research and development (93.3) (89.7) +4.0% (360.7) (353.9) +1.9% Marketing and sales (167.3) (167.3) +0.0% (653.2) (621.6) +5.1% General and administrative (38.4) (40.2) (4.5%) (145.6) (152.3) (4.4%) Total operating expenses (368.6) (370.8) (0.6%) (1,420.0) (1,394.2) +1.9% Operating income 197.4 197.4 +0.0% 652.8 644.3 +1.3% Financial revenue and other, net 2.9 6.3 (54.0%) 17.6 10.7 +64.5% Income before income taxes 200.3 203.7 (1.7%) 670.4 655.0 +2.4% Income tax expense (70.9) (73.5) (3.5%) (222.0) (226.5) (2.0%) Non-controlling interest (0.8) (1.8) (55.6%) (2.9) (4.0) (27.5%) Net Income (to equity holders of the parent) 128.6 128.4 +0.2% 445.5 424.5 +4.9% Diluted net income per share (EPS) 1.01 1.02 (1.0%) 3.49 3.37 +3.6% Average diluted shares (Million) 127.9 126.4 127.6 125.9
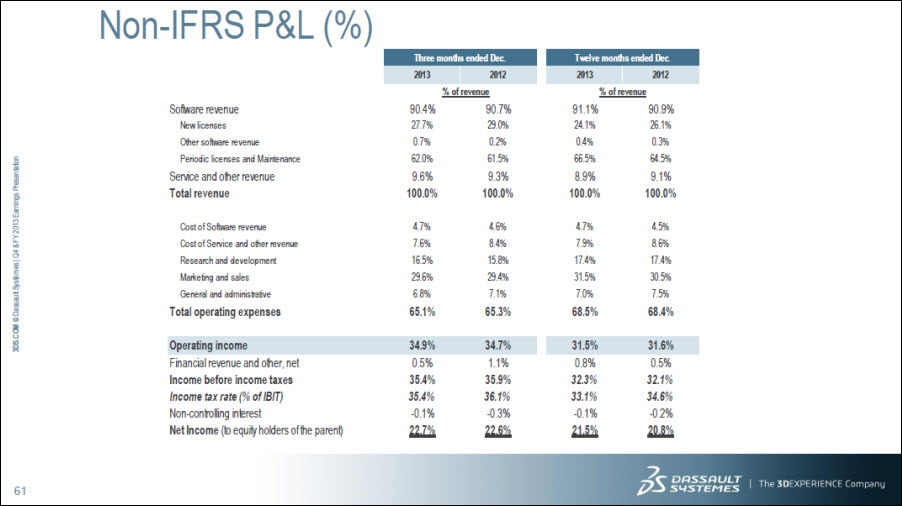
Non-IFRS P&L (%) Three months ended Dec.Twelve months ended Dec. 2013 2012 2013 2012 % of revenue % of revenue Software revenue 90.4% 90.7% 91.1% 90.9% New licenses 27.7% 29.0% 24.1% 26.1% Other software revenue 0.7% 0.2% 0.4% 0.3% Periodic licenses and Maintenance 62.0% 61.5% 66.5% 64.5% Service and other revenue 9.6% 9.3% 8.9% 9.1% Total revenue 100.0% 100.0% 100.0% 100.0% Cost of Software revenue 4.7% 4.6% 4.7% 4.5% Cost of Service and other revenue 7.6% 8.4% 7.9% 8.6% Research and development 16.5% 15.8% 17.4% 17.4% Marketing and sales 29.6% 29.4% 31.5% 30.5% General and administrative 6.8% 7.1% 7.0% 7.5% Total operating expenses 65.1% 65.3% 68.5% 68.4% Operating income 34.9% 34.7% 31.5% 31.6% Financial revenue and other, net 0.5% 1.1% 0.8% 0.5% Income before income taxes 35.4% 35.9% 32.3% 32.1% Income tax rate (% of IBIT) 35.4% 36.1% 33.1% 34.6% Non-controlling interest -0.1% -0.3% -0.1% -0.2% Net Income (to equity holders of the parent) 22.7% 22.6% 21.5% 20.8%
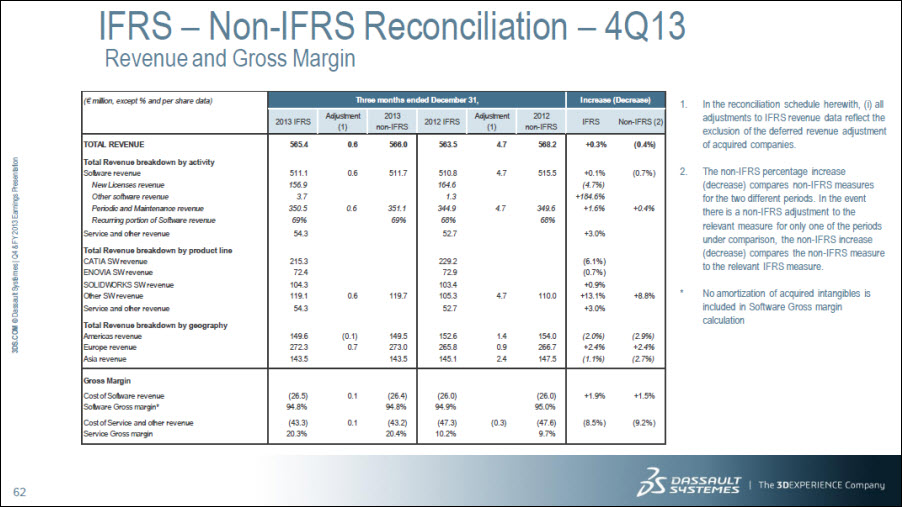
IFRS – Non-IFRS Reconciliation – 4Q13 Revenue and Gross Margin (€ million, except % and per share data) Three months ended December 31, Increase (Decrease) 2013 IFRS Adjustment(1) 2013 non-IFRS 2012 IFRS Adjustment(1) 2012 non-IFRS IFRS Non-IFRS (2) TOTAL REVENUE 565.4 0.6 566.0 563.5 4.7 568.2 +0.3% (0.4%) Total Revenue breakdown by activity Software revenue 511.1 0.6 511.7 510.8 4.7 515.5 +0.1% (0.7%) New Licenses revenue 156.9 164.6 (4.7%) Other software revenue 3.7 1.3 +184.6% Periodic and Maintenance revenue 350.5 0.6 351.1 344.9 4.7 349.6 +1.6% +0.4% Recurring portion of Software revenue 69% 69% 68% 68% Service and other revenue 54.3 52.7 +3.0% Total Revenue breakdown by product line CATIA SW revenue 215.3 229.2 (6.1%) ENOVIA SW revenue 72.4 72.9 (0.7%) SOLIDWORKS SW revenue 104.3 103.4 +0.9% Other SW revenue 119.1 0.6 119.7 105.3 4.7 110.0 +13.1% +8.8% Service and other revenue 54.3 52.7 +3.0% Total Revenue breakdown by geography Americas revenue 149.6 (0.1) 149.5 152.6 1.4 154.0 (2.0%) (2.9%) Europe revenue 272.3 0.7 273.0 265.8 0.9 266.7 +2.4% +2.4% Asia revenue 143.5 143.5 145.1 2.4 147.5 (1.1%) (2.7%) Gross Margin Cost of Software revenue (26.5) 0.1 (26.4) (26.0) (26.0) +1.9% +1.5% Software Gross margin* 94.8% 94.8% 94.9% 95.0% Cost of Service and other revenue (43.3) 0.1 (43.2) (47.3) (0.3) (47.6) (8.5%) (9.2%) Service Gross margin 20.3% 20.4% 10.2% 9.7% 1. In the reconciliation schedule herewith, (i) all adjustments to IFRS revenue data reflect the exclusion of the deferred revenue adjustment of acquired companies. 2. The non-IFRS percentage increase (decrease) compares non-IFRS measures for the two different periods. In the event there is a non-IFRS adjustment to the relevant measure for only one of the periods under comparison, the non-IFRS increase (decrease) compares the non-IFRS measure to the relevant IFRS measure. * No amortization of acquired intangibles is included in Software Gross margin calculation
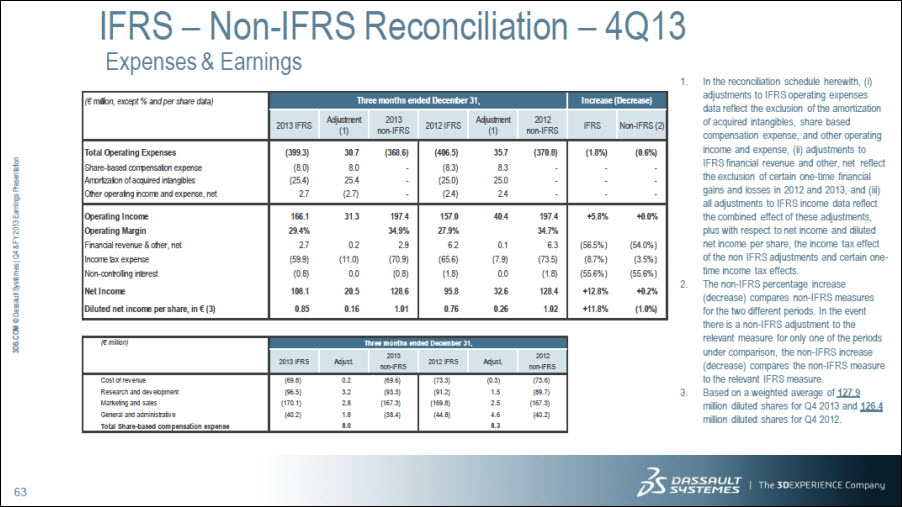
IFRS – Non-IFRS Reconciliation – 4Q13 Expenses & Earnings Three months ended December 31, Increase (Decrease) (€ million, except % and per share data) 2013 IFRS Adjustment(1) 2013 non-IFRS 2012 IFRS Adjustment(1) 2012 non-IFRS IFRS Non-IFRS (2) Total Operating Expenses (399.3) 30.7 (368.6) (406.5) 35.7 (370.8) (1.8%) (0.6%) Share-based compensation expense (8.0) 8.0 - (8.3) 8.3 - - - Amortization of acquired intangibles (25.4) 25.4 - (25.0) 25.0 - - - Other operating income and expense, net 2.7 (2.7) - (2.4) 2.4 - - - Operating Income 166.1 31.3 197.4 157.0 40.4 197.4 +5.8% +0.0% Operating Margin 29.4% 34.9% 27.9% 34.7% Financial revenue & other, net 2.7 0.2 2.9 6.2 0.1 6.3 (56.5%) (54.0%) Income tax expense (59.9) (11.0) (70.9) (65.6) (7.9) (73.5) (8.7%) (3.5%) Non-controlling interest (0.8) 0.0 (0.8) (1.8) 0.0 (1.8) (55.6%) (55.6%) Net Income 108.1 20.5 128.6 95.8 32.6 128.4 +12.8% +0.2% Diluted net income per share, in € (3) 0.85 0.16 1.01 0.76 0.26 1.02 +11.8% (1.0%) (€ million) Three months ended December 31, 2013 IFRS Adjust 2013 non-IFRS 2012 IFRS Adjust 2012 non-IFRS Cost of revenue (69.8) 0.2 (69.6) (73.3) (0.3) (73.6) Research and development (96.5) 3.2 (93.3) (91.2) 1.5 (89.7) Marketing and sales (170.1) 2.8 (167.3) (169.8) 2.5 (167.3) General and administrative (40.2) 1.8 (38.4) (44.8) 4.6 (40.2) Total Share-based compensation expense 8.0 8.3 1. In the reconciliation schedule herewith, (i) adjustments to IFRS operating expenses data reflect the exclusion of the amortization of acquired intangibles, share based compensation expense, and other operating income and expense, (ii) adjustments to IFRS financial revenue and other, net reflect the exclusion of certain one-time financial gains and losses in 2012 and 2013, and (iii) all adjustments to IFRS income data reflect the combined effect of these adjustments, plus with respect to net income and diluted net income per share, the income tax effect of the non IFRS adjustments and certain one-time income tax effects. 2. The non-IFRS percentage increase (decrease) compares non-IFRS measures for the two different periods. In the event there is a non-IFRS adjustment to the relevant measure for only one of the periods under comparison, the non-IFRS increase (decrease) compares the non-IFRS measure to the relevant IFRS measure. 3. Based on a weighted average of 127.9 million diluted shares for Q4 2013 and 126.4 million diluted shares for Q4 2012.

IFRS – Non-IFRS Reconciliation – FY13 Revenue and Gross Margin (€ million, except % and per share data) Twelve months ended December 31, Increase (Decrease) 2013 IFRS Adjustment(1) 2013 non-IFRS 2012 IFRS Adjustment(1) 2012 non-IFRS IFRS Non-IFRS (2) TOTAL REVENUE 2,066.1 6.7 2,072.8 2,028.3 10.2 2,038.5 +1.9% +1.7% Total Revenue breakdown by activity Software revenue 1,880.8 6.7 1,887.5 1,843.2 10.2 1,853.4 +2.0% +1.8% New Licenses revenue 500.1 532.3 (6.0%) Other software revenue 8.0 6.5 +23.1% Periodic and Maintenance revenue 1,372.7 6.7 1,379.4 1,304.4 10.2 1,314.6 +5.2% +4.9% Recurring portion of Software revenue 73% 73% 71% 71% Service and other revenue 185.3 185.1 +0.1% Total Revenue breakdown by product line CATIA SW revenue 818.9 827.2 (1.0%) ENOVIA SW revenue 249.4 258.5 (3.5%) SOLIDWORKS SW revenue 409.5 403.2 +1.6% Other SW revenue 403.0 6.7 409.7 354.3 10.2 364.5 +13.7% +12.4% Service and other revenue 185.3 185.1 +0.1% Total Revenue breakdown by geography Americas revenue 567.2 2.4 569.6 564.3 3.0 567.3 +0.5% +0.4% Europe revenue 937.8 2.4 940.2 908.9 2.0 910.9 +3.2% +3.2% Asia revenue 561.1 1.9 563.0 555.1 5.2 560.3 +1.1% +0.5% Gross Margin Cost of Software revenue (97.7) 0.5 (97.2) (92.2) 0.3 (91.9) +6.0% +5.8% Software Gross margin* 94.8% 94.9% 95.0% 95.0% Cost of Service and other revenue (163.7) 0.4 (163.3) (174.8) 0.3 (174.5) (6.4%) (6.4%) Service Gross margin 11.7% 11.9% 5.6% 5.7% 1. In the reconciliation schedule herewith, (i) all adjustments to IFRS revenue data reflect the exclusion of the deferred revenue adjustment of acquired companies. 2. The non-IFRS percentage increase (decrease) compares non-IFRS measures for the two different periods. In the event there is a non-IFRS adjustment to the relevant measure for only one of the periods under comparison, the non-IFRS increase (decrease) compares the non-IFRS measure to the relevant IFRS measure. * No amortization of acquired intangibles is included in Software Gross margin calculation
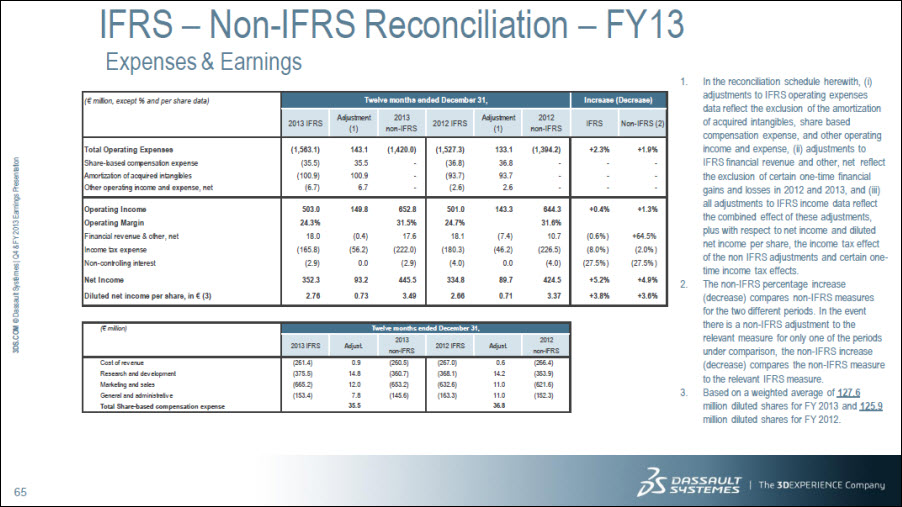
IFRS – Non-IFRS Reconciliation – FY13 Expenses & Earnings Twelve months ended December 31, Increase (Decrease) (€ million, except % and per share data) 2013 IFRS Adjustment(1) 2013 non-IFRS 2012 IFRS Adjustment(1) 2012 non-IFRS IFRS Non-IFRS (2) Total Operating Expenses (1,563.1) 143.1 (1,420.0) (1,527.3) 133.1 (1,394.2) +2.3% +1.9% Share-based compensation expense (35.5) 35.5 - (36.8) 36.8 - - - Amortization of acquired intangibles (100.9) 100.9 - (93.7) 93.7 - - - Other operating income and expense, net (6.7) 6.7 - (2.6) 2.6 - - - Operating Income 503.0 149.8 652.8 501.0 143.3 644.3 +0.4% +1.3% Operating Margin 24.3% 31.5% 24.7% 31.6% Financial revenue & other, net 18.0 (0.4) 17.6 18.1 (7.4) 10.7 (0.6%) +64.5% Income tax expense (165.8) (56.2) (222.0) (180.3) (46.2) (226.5) (8.0%) (2.0%) Non-controlling interest (2.9) 0.0 (2.9) (4.0) 0.0 (4.0) (27.5%) (27.5%) Net Income 352.3 93.2 445.5 334.8 89.7 424.5 +5.2% +4.9% Diluted net income per share, in € (3) 2.76 0.73 3.49 2.66 0.71 3.37 +3.8% +3.6% (€ million) Twelve months ended December 31, 2013 IFRS Adjust 2013 non-IFRS 2012 IFRS Adjust 2012 non-IFRS Cost of revenue (261.4) 0.9 (260.5) (267.0) 0.6 (266.4) Research and development (375.5) 14.8 (360.7) (368.1) 14.2 (353.9) Marketing and sales (665.2) 12.0 (653.2) (632.6) 11.0 (621.6) General and administrative (153.4) 7.8 (145.6) (163.3) 11.0 (152.3) Total Share-based compensation expense 35.5 36.8 1. In the reconciliation schedule herewith, (i) adjustments to IFRS operating expenses data reflect the exclusion of the amortization of acquired intangibles, share based compensation expense, and other operating income and expense, (ii) adjustments to IFRS financial revenue and other, net reflect the exclusion of certain one-time financial gains and losses in 2012 and 2013, and (iii) all adjustments to IFRS income data reflect the combined effect of these adjustments, plus with respect to net income and diluted net income per share, the income tax effect of the non IFRS adjustments and certain one-time income tax effects. 2. The non-IFRS percentage increase (decrease) compares non-IFRS measures for the two different periods. In the event there is a non-IFRS adjustment to the relevant measure for only one of the periods under comparison, the non-IFRS increase (decrease) compares the non-IFRS measure to the relevant IFRS measure. 3. Based on a weighted average of 127.6 million diluted shares for FY 2013 and 125.9 million diluted shares for FY 2012.
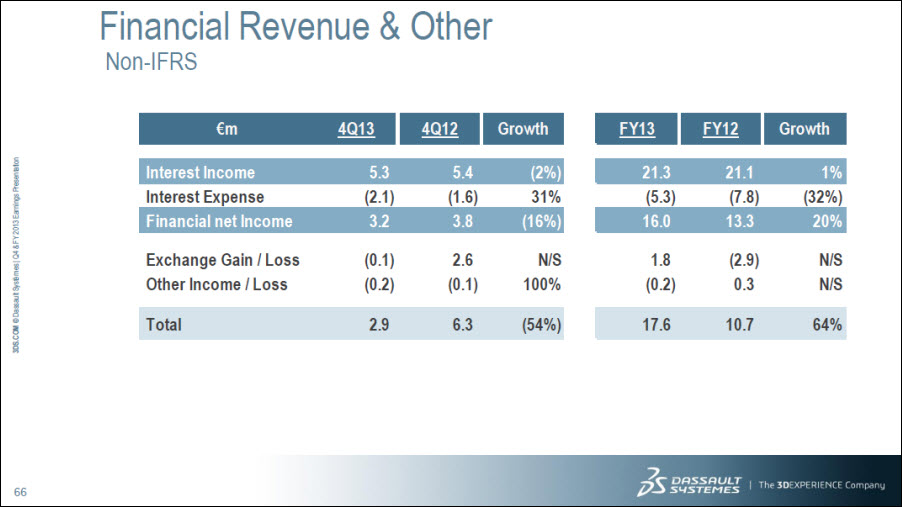
Financial Revenue & Other Non-IFRS €m 4Q13 4Q12 Growth FY13 FY12 Growth Interest Income 5.3 5.4 (2%) 21.3 21.1 1% Interest Expense (2.1) (1.6) 31% (5.3) (7.8) (32%) Financial net Income 3.2 3.8 (16%) 16.0 13.3 20% Exchange Gain / Loss (0.1) 2.6 N/S 1.8 (2.9) N/S Other Income / Loss (0.2) (0.1) 100% (0.2) 0.3 N/S Total 2.9 6.3 (54%) 17.6 10.7 64%
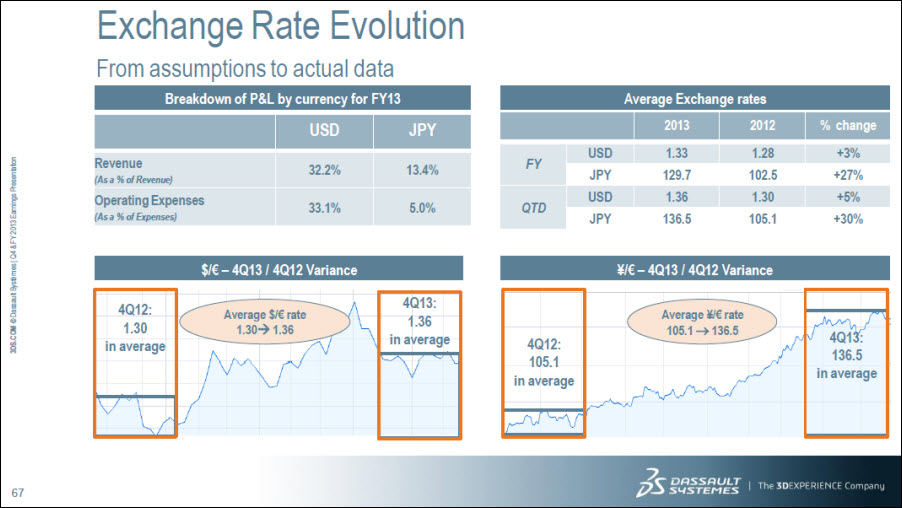
Exchange Rate Evolution From assumptions to actual data Breakdown of P&L by currency for FY13 USD JPY Revenue (As a % of Revenue) 32.2% 13.4% Operating Expenses (As a % of Expenses) 33.1% 5.0% Average Exchange rates 2013 2012 % change FY USD 1.33 1.28 +3% JPY 129.7 102.5 +27% QTD USD 1.36 1.30 +5% JPY 136.5 105.1 +30% $/€ – 4Q13 / 4Q12 Variance 4Q12: 1.30 in average Average $/€ rate 1.30 1.36 4Q13: 1.36 in average ¥/€ – 4Q13 / 4Q12 Variance 4Q12: 105.1 in average Average ¥/€ rate 105.1 136.5 4Q13: 136.5 in average
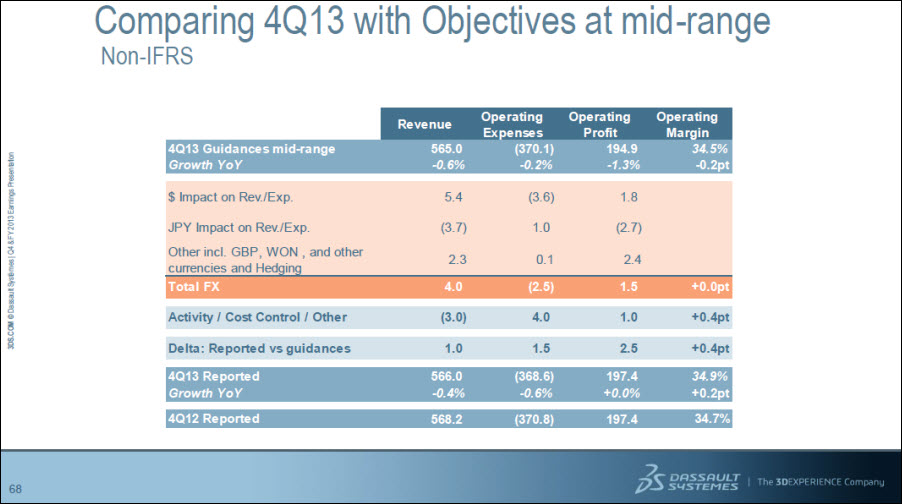
Comparing 4Q13 with Objectives at mid-range Non-IFRS Revenue Operating Expenses Operating Profit Operating Margin 4Q13 Guidances mid-range 565.0 (370.1) 194.9 34.5% Growth YoY -0.6% -0.2% -1.3% -0.2pt $ Impact on Rev./Exp .5.4 (3.6) 1.8 JPY Impact on Rev./Exp. (3.7) 1.0 (2.7) Other incl. GBP, WON , and other currencies and Hedging 2.3 0.1 2.4 Total FX 4.0 (2.5) 1.5 +0.0pt Activity / Cost Control / Other (3.0) 4.0 1.0 +0.4pt Delta: Reported vs guidances 1.0 1.5 2.5 +0.4 pt 4Q13 Reported 566.0 (368.6) 197.4 34.9% Growth YoY -0.4% -0.6% +0.0% +0.2pt 4Q12 Reported 568.2 (370.8) 197.4 34.7%
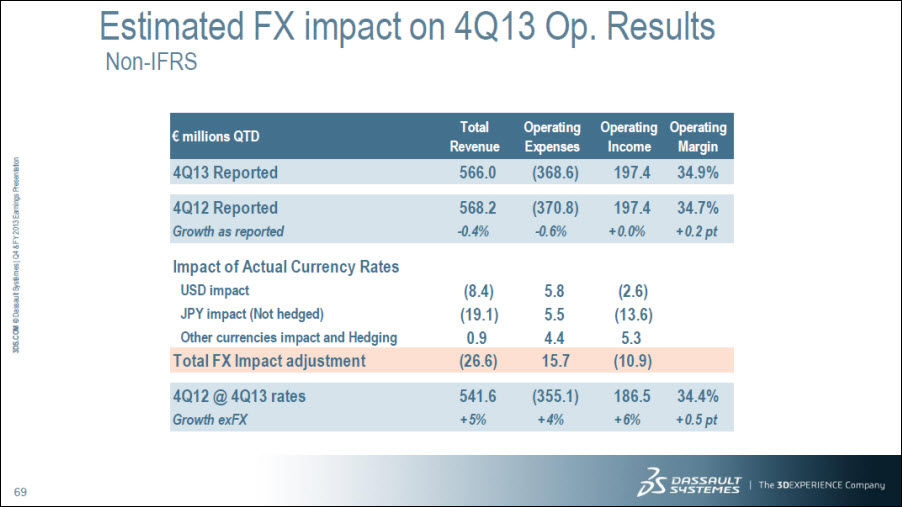
Estimated FX impact on 4Q13 Op. Results Non-IFRS € millions QTD Total Revenue Operating Expenses Operating Income Operating Margin 4Q13 Reported 566.0 (368.6) 197.4 34.9% 4Q12 Reported 568.2 (370.8) 197.4 34.7% Growth as reported -0.4% -0.6% +0.0% +0.2 pt Impact of Actual Currency Rates USD impact (8.4) 5.8 (2.6) JPY impact (Not hedged) (19.1) 5.5 (13.6) Other currencies impact and Hedging 0.9 4.4 5.3 Total FX Impact adjustment (26.6) 15.7 (10.9) 4Q12 @ 4Q13 rates 541.6 (355.1) 186.5 34.4% Growth exFX +5% +4% +6% +0.5 pt
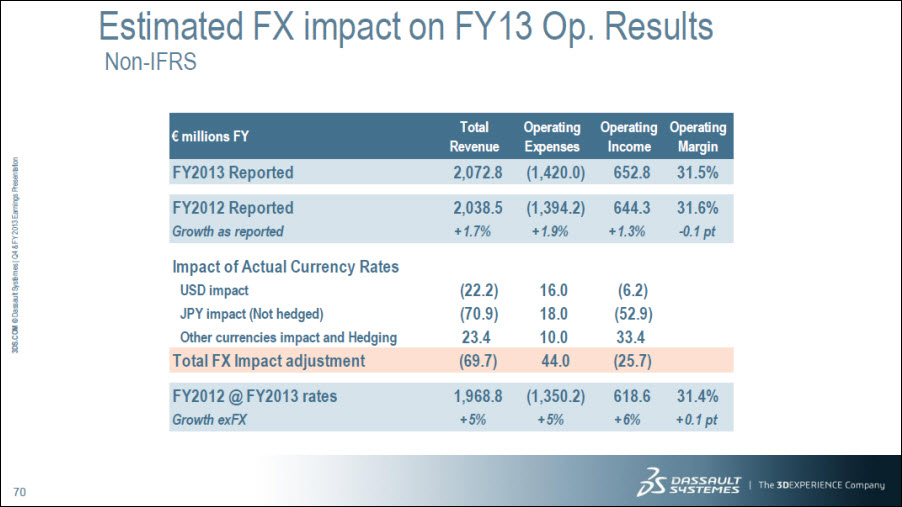
Estimated FX impact on FY13 Op. Results Non-IFRS € millions FY Total Revenue Operating Expenses Operating Income Operating Margin FY2013 Reported 2,072.8 (1,420.0) 652.8 31.5% FY2012 Reported 2,038.5 (1,394.2) 644.3 31.6% Growth as reported +1.7% +1.9% +1.3% -0.1 pt Impact of Actual Currency Rates USD impact (22.2) 16.0 (6.2) JPY impact (Not hedged) (70.9) 18.0 (52.9) Other currencies impact and Hedging 23.4 10.0 33.4 Total FX Impact adjustment (69.7) 44.0 (25.7) FY2012 @ FY2013 rates 1,968.8 (1,350.2) 618.6 31.4% Growth exFX +5% +5% +6% +0.1 pt
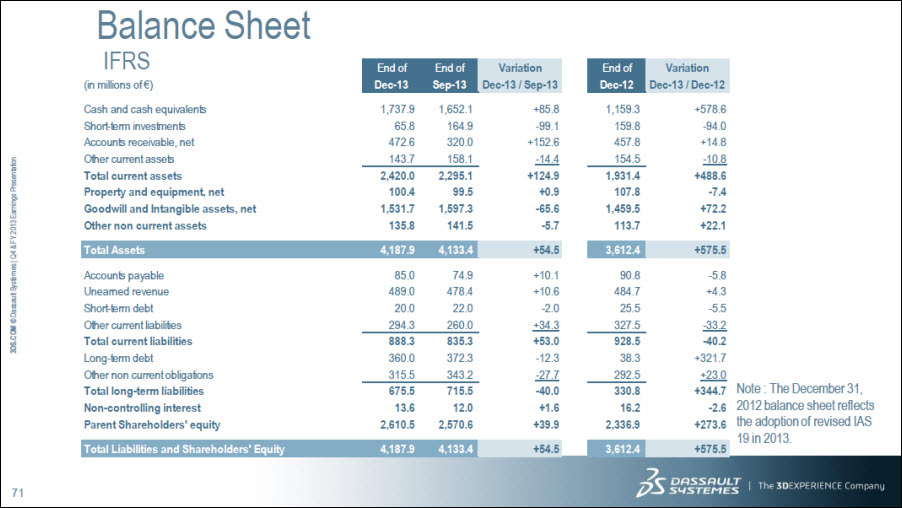
Balance Sheet IFRS (in millions of €) End of Dec-13 End of Sep-13 Variation Dec-13/Sep-13 End of Dec-12 Variation Dec-13/ Dec-12 Cash and cash equivalents 1,737.9 1,652.1 +85.8 1,159.3 +578.6 Short-term investments 65.8 164.9 -99.1 159.8 -9.40 Accounts receivable, net 472.6 320.0 +152.6 457.8 +14.8 Other current assets 143.7 158.1 -14.4 154.5 -10.8 Total current assets 2,420.0 2,295.1 +124.9 1,931.4 +488.6 Property and equipment, net 100.4 99.5 +0.9 107.8 -7.4 Goodwill and Intangible assets, net 1,531.7 1,597.3 -65.6 1,459.5 +72.2 Other non current assets 135.8 141.5 -5.7 113.7 +22.1 Total Assets 4,187.9 4,133.4 +54.5 3,612.4 +575.5 Accounts payable 85.0 74.9 +10.1 90.8 -5.8 Unearned revenue 489.0 478.4 +10.6 484.7 +4.3 Short-term debt 20.0 22.0 -2.0 25.5 -5.5 Other current liabilities 294.3 260.0 +34.3 327.5 -33.2 Total current liabilities 888.3 835.3 +53.0 928.5 -40.2 Long-term debt 360.0 372.3 -12.3 38.3 +321.7 Other non current obligations 315.5 343.2 -27.7 292.5 +23.0 Total long-term liabilities 675.5 715.5 -40.0 330.8 +344.7 Non-controlling interest 13.6 12.0 +1.6 16.2 -2.6 Parent Shareholders’ equity 2,610.5 2,570.6 +39.9 2,336.9 +273.6 Total Liabilities and Shareholders’ Equity 4,187.9 4,133.4 +54.5 3,612.4 +575.5 Note : The December 31, 2012 balance sheet reflects the adoption of revised IAS 19 in 2013.
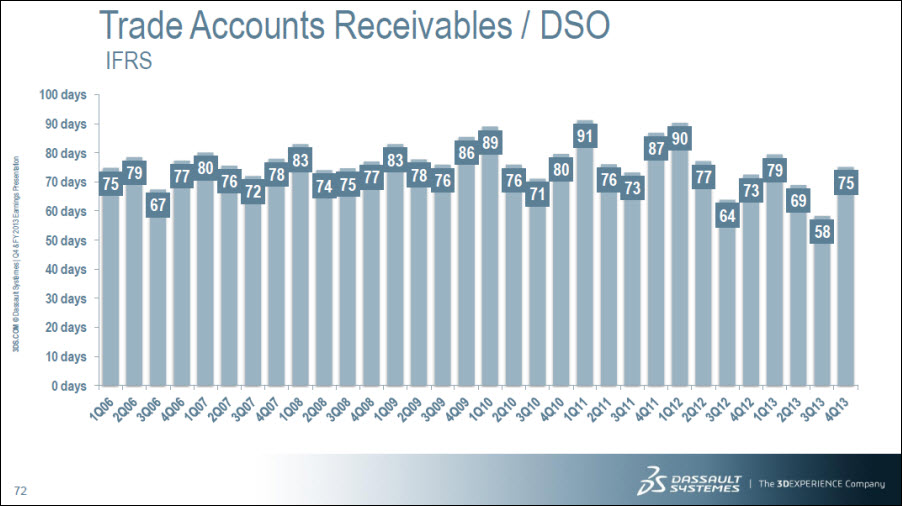
Trade Accounts Receivables/DSO IFRS 100 days 90 days 80 days 70 days 60 days 50 days 40 days 30 days 20 days 10 days 0 days 75 79 67 77 80 76 72 78 83 74 75 77 83 78 76 86 89 76 71 80 91 76 73 87 90 77 64 73 79 69 58 75 1Q06 2Q06 3Q06 4Q06 1Q07 2Q07 3Q07 4Q07 1Q08 2Q08 3Q08 4Q08 1Q09 2Q09 3Q09 4Q09 1Q10 2Q10 3Q10 4Q10 1Q11 2Q11 3Q11 4Q11 1Q12 2Q12 3Q12 4Q12 1Q13 2Q13 3Q13 4Q13
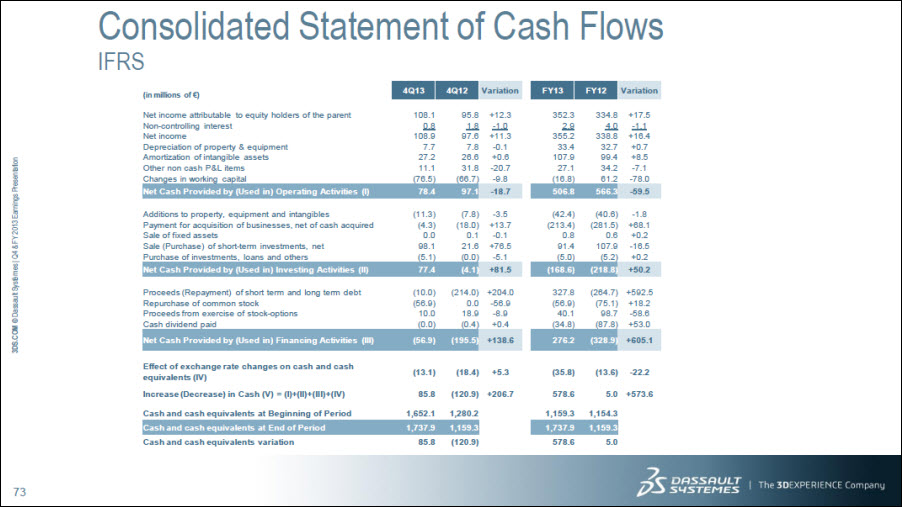
Consolidated Statement of Cash Flows IFRS (in millions of €) 4Q13 4Q12 Variation FY13 FY12 Variation Net income attributable to equity holders of the parent 108.1 95.8 +12.3 352.3 334.8 +17.5 Non-controlling interest 0.8 1.8 -1.0 2.9 4.0 -1.1 Net income 108.9 97.6 +11.3 355.2 338.8 +16.4 Depreciation of property & equipment 7.7 7.8 -0.1 33.4 32.7 +0.7 Amortization of intangible assets 27.2 26.6 +0.6 107.9 99.4 +8.5 Other non cash P&L items 11.1 31.8 -20.7 27.1 34.2 -7.1 Changes in working capital (76.5) (66.7) -9.8 (16.8) 61.2 -78.0 Net Cash Provided by (Used in) Operating Activities (I) 78.4 97.1 -18.7 506.8 566.3 -59.5 Additions to property, equipment and intangibles (11.3) (7.8) -3.5 (42.4) (40.6) -1.8 Payment for acquisition of businesses, net of cash acquired (4.3) (18.0) +13.7 (213.4) (281.5) +68.1 Sale of fixed assets 0.0 0.1 -0.1 0.8 0.6 +0.2 Sale (Purchase) of short-term investments, net 98.1 21.6 +76.5 91.4 107.9 -16.5 Purchase of investments, loans and others (5.1) (0.0) -5.1 (5.0) (5.2) +0.2 Net Cash Provided by (Used in) Investing Activities (II) 77.4 (4.1) +81.5 (168.6) (218.8) +50.2 Proceeds (Repayment) of short term and long term debt (10.0) (214.0) +204.0 327.8 (264.7) +592.5 Repurchase of common stock (56.9) 0.0 -56.9 (56.9) (75.1) +18.2 Proceeds from exercise of stock-options 10.0 18.9 -8.9 40.1 98.7 -58.6 Cash dividend paid (0.0) (0.4) +0.4 (34.8) (87.8) +53.0 Net Cash Provided by (Used in) Financing Activities (III) (56.9) (195.5) +138.6 276.2 (328.9) +605.1 Effect of exchange rate changes on cash and cash equivalents (IV) (13.1) (18.4) +5.3 (35.8) (13.6) -22.2 Increase (Decrease) in Cash (V) = (I)+(II)+(III)+(IV) 85.8 (120.9) +206.7 578.6 5.0 +573.6 Cash and cash equivalents at Beginning of Period 1,652.1 1,280.2 1,159.3 1,154.3 Cash and cash equivalents at End of Period 1,737.9 1,159.3 1,737.9 1,159.3 Cash and cash equivalents variation 85.8 (120.9) 578.6 5.0
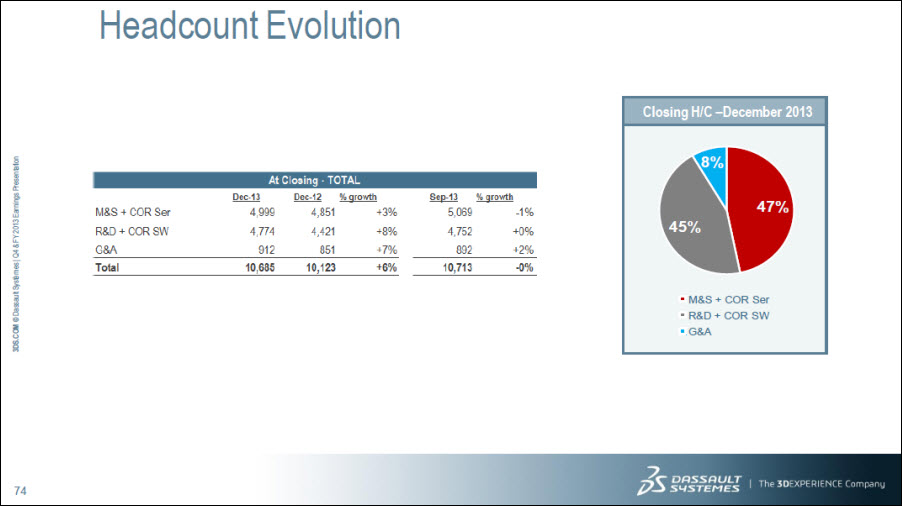
Headcount Evolution At Closing – TOTAL Dec-13 Dec-12 % growth Sep-13 % growth M&S + COR Ser 4,999 4,851 +3% 5,069 -1% R&D + COR SW 4,774 4,421 +8% 4,752 +0% G&A 912 851 +7% 892 +2% Total 10,685 10,123 +6% 10,713 -0% Closing H/C – December 2013 45% 8% 47% M&S + COR Ser R&D + COR SW G&A
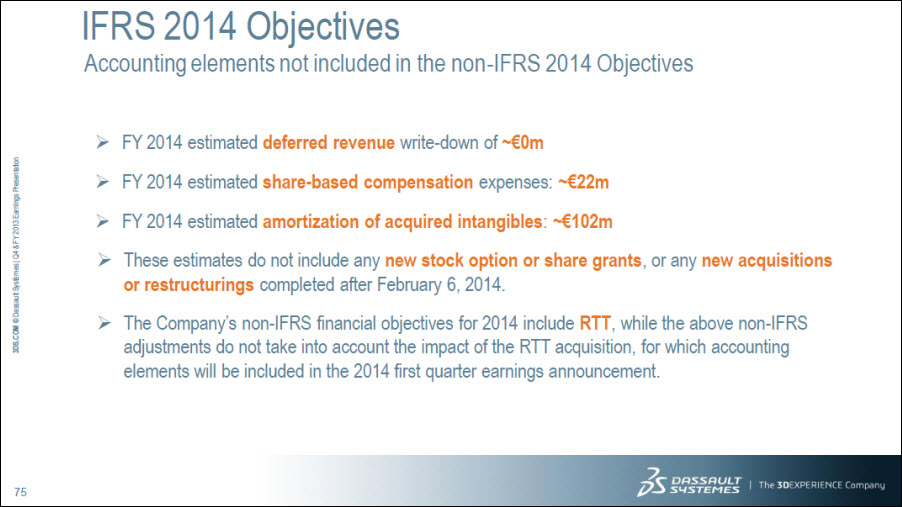
IFRS 2014 Objectives Accounting elements not included in the non-IFRS 2014 Objectives FY 2014 estimated deferred revenue write-down of ~€0m FY 2014 estimated share-based compensation expenses: ~€22m FY 2014 estimated amortization of acquired intangibles: ~€102m These estimates do not include any new stock option or share grants, or any new acquisitions or restructurings completed after February 6, 2014. The Company’s non-IFRS financial objectives for 2014 include RTT, while the above non-IFRS adjustments do not take into account the impact of the RTT acquisition, for which accounting elements will be included in the 2014 first quarter earnings announcement.