
Q2 Fiscal 2026 Financial Results Conference Call October 30, 2025 Kristine MoserGregory RustowiczDavid Wilson President & Chief Executive Officer Executive Vice President Finance & Chief Financial Officer Vice President, Investor Relations & Treasurer
Safe Harbor Statement 2 This presentation and the accompanying oral discussion contains “forward-looking statements” within the meaning of the Section 27A of the Securities Act of 1933, as amended, and Section 21E of the Securities Exchange Act of 1934, as amended. Such forward looking statements are generally identified by the use of forward-looking terminology, including the terms "anticipate," “believe,” “continue,” “could,” “estimate,” “expect,” “illustrative,” “intend,” “likely,” “may,” “opportunity,” “plan,” “possible,” “potential,” “predict,” “project,” “shall,” “should,” “target,” “will,” “would” and, in each case, their negative or other various or comparable terminology. Such forward-looking statements include, among others, statements regarding: (1) our strategy, outlook and growth prospects, including our fiscal year 2026 guidance as well as the associated assumed inputs for our fiscal 2026 guidance regarding interest expense, amortization, effective tax rate and diluted average shares outstanding and our ability to achieve tariff cost neutrality in fiscal 2026, margin neutrality in fiscal 2027 and the expected amount of tariff- related impact to fiscal 2026 results; (2) our operational and financial targets and capital allocation priorities; (3) general economic trends, global policy, including tariff policy, trends in our industry and markets and their expected impacts on the Company; (4) the expected benefits of the Kito Crosby acquisition; (5) the expected future financial results of the combined companies and (6) the expected timing for the closing of the Kito Crosby acquisition. Forward-looking statements are not based on historical facts, but instead represent our current expectations and assumptions regarding our business, the economy and other future conditions, and involve known and unknown risks, uncertainties and other factors that could cause the actual results, performance or achievements of the Company to differ materially from any future results, performance or achievements expressed or implied by the forward-looking statements. It is not possible to predict or identify all such risks. These risks include, but are not limited to, (1) risks relating to the competitive environment in which we operate; (2) the risk that the integration of Kito Crosby's business and operations into the Company will be materially delayed or will be more costly or difficult than expected, or that the Company is otherwise unable to successfully integrate Kito Crosby's business into its own, including as a result of unexpected factors or events; (3) risks regarding the ability of the Company and Kito Crosby to obtain required governmental approvals of the transaction on the timeline expected, or at all, and the risk that such approvals may result in the imposition of conditions that could adversely affect the Company after the closing of the transaction or adversely affect the expected benefits of the transaction; (4) the failure of the closing conditions in the purchase agreement for the acquisition of Kito Crosby to be satisfied, or any unexpected delay in closing the transaction or the occurrence of any event, change or other circumstances that could give rise to the termination of the purchase agreement; (5) risks related to the general competitive, economic, political and market conditions and other factors that may affect future results of the Company; and (7) the other risk factors that are described under the section titled “Risk Factors” in our Annual Report on Form 10-K for the fiscal year ended March 31, 2025 as well as in our other filings with the Securities and Exchange Commission, which are available on its website at www.sec.gov. Given these uncertainties, you should not place undue reliance on these forward-looking statements. Forward looking statements speak only as of the date they are made. Columbus McKinnon undertakes no duty to update publicly any such forward-looking statement, whether as a result of new information, future events or otherwise, except as may be required by applicable law, regulation or other competent legal authority. Non-GAAP Financial Measures and Forward-looking Non-GAAP Financial Measures This presentation will discuss some non-GAAP (“adjusted”) financial measures which we believe are useful in evaluating Columbus McKinnon and Kito Crosby’s performance. You should not consider the presentation of this additional information in isolation or as a substitute for results prepared in accordance with GAAP. The non-GAAP financial measures are noted and reconciliations of comparable historical GAAP measures with historical non-GAAP financial measures can be found in tables either included in the Supplemental Information portion of this presentation or our filings with the Securities and Exchange Commission.
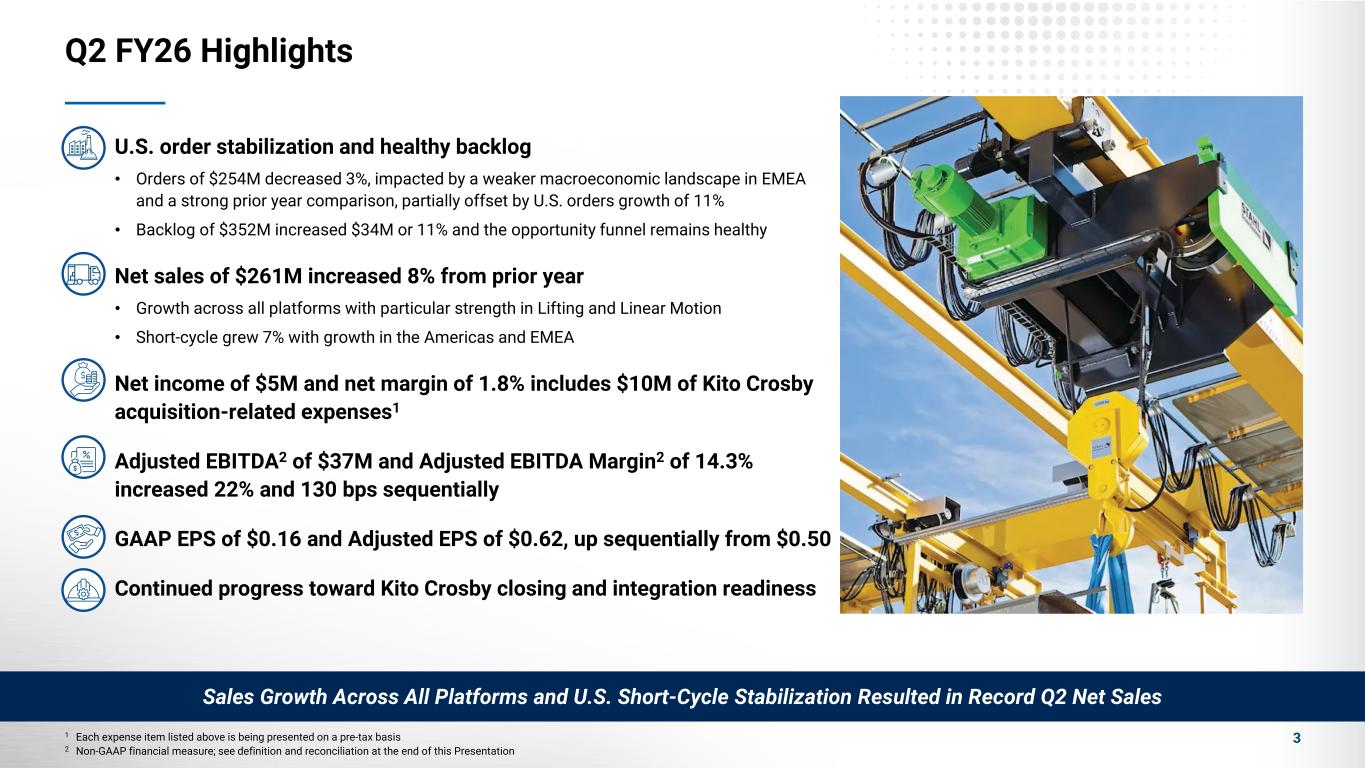
Q2 FY26 Highlights 31 Each expense item listed above is being presented on a pre-tax basis 2 Non-GAAP financial measure; see definition and reconciliation at the end of this Presentation U.S. order stabilization and healthy backlog • Orders of $254M decreased 3%, impacted by a weaker macroeconomic landscape in EMEA and a strong prior year comparison, partially offset by U.S. orders growth of 11% • Backlog of $352M increased $34M or 11% and the opportunity funnel remains healthy Net sales of $261M increased 8% from prior year • Growth across all platforms with particular strength in Lifting and Linear Motion • Short-cycle grew 7% with growth in the Americas and EMEA Net income of $5M and net margin of 1.8% includes $10M of Kito Crosby acquisition-related expenses1 Adjusted EBITDA2 of $37M and Adjusted EBITDA Margin2 of 14.3% increased 22% and 130 bps sequentially GAAP EPS of $0.16 and Adjusted EPS of $0.62, up sequentially from $0.50 Continued progress toward Kito Crosby closing and integration readiness Sales Growth Across All Platforms and U.S. Short-Cycle Stabilization Resulted in Record Q2 Net Sales
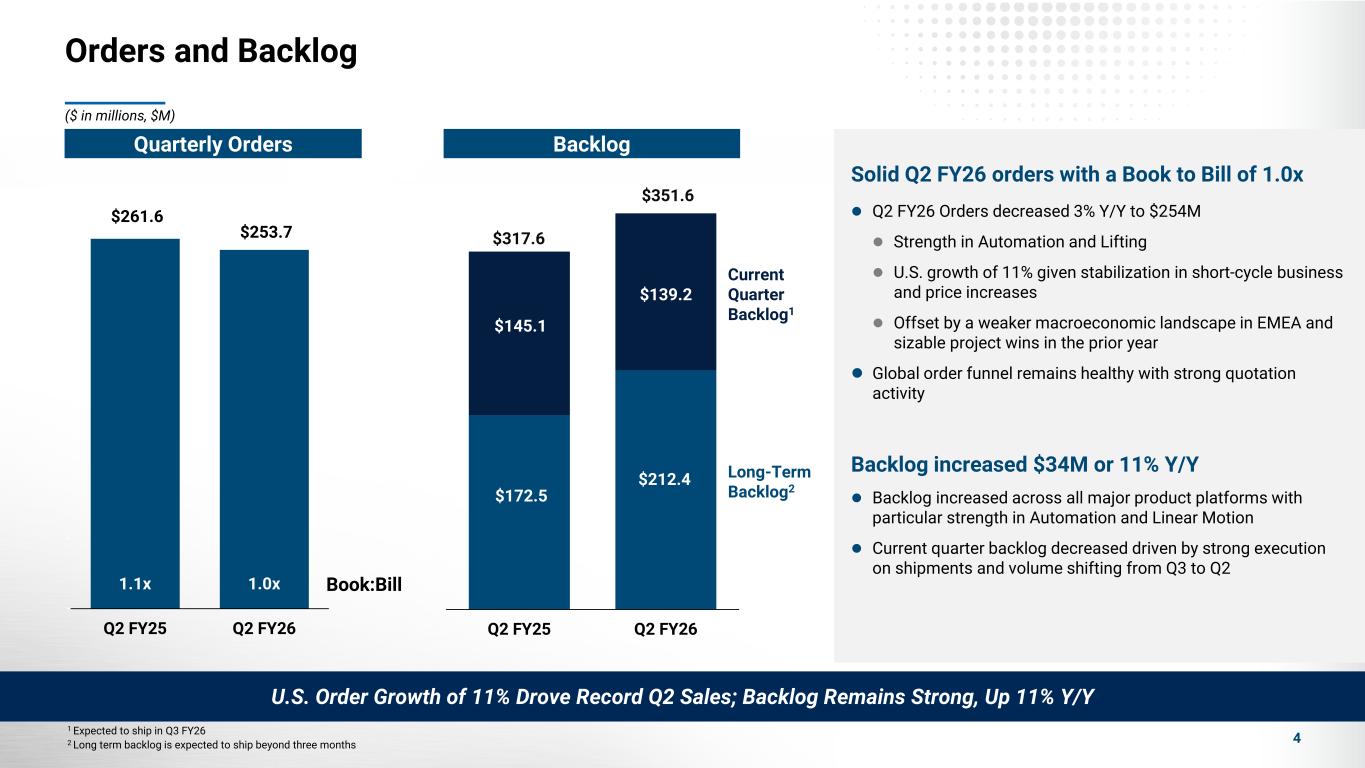
Orders and Backlog 4 $172.5 $212.4 $145.1 $139.2 $317.6 $351.6 Q2 FY25 Q2 FY26 Book:Bill $261.6 $253.7 1.1x 1.0x 0.0x 0.2x 0.4x 0.6x 0.8x 1.0x 1.2x 1.4x 1.6x 1.8x 2.0x $- $50.0 $100.0 $150.0 $200.0 $250.0 $300.0 Q2 FY25 Q2 FY26 Current Quarter Backlog1 Long-Term Backlog2 1 Expected to ship in Q3 FY26 2 Long term backlog is expected to ship beyond three months U.S. Order Growth of 11% Drove Record Q2 Sales; Backlog Remains Strong, Up 11% Y/Y Solid Q2 FY26 orders with a Book to Bill of 1.0x Q2 FY26 Orders decreased 3% Y/Y to $254M Strength in Automation and Lifting U.S. growth of 11% given stabilization in short-cycle business and price increases Offset by a weaker macroeconomic landscape in EMEA and sizable project wins in the prior year Global order funnel remains healthy with strong quotation activity Backlog increased $34M or 11% Y/Y Backlog increased across all major product platforms with particular strength in Automation and Linear Motion Current quarter backlog decreased driven by strong execution on shipments and volume shifting from Q3 to Q2 ($ in millions, $M) BacklogQuarterly Orders
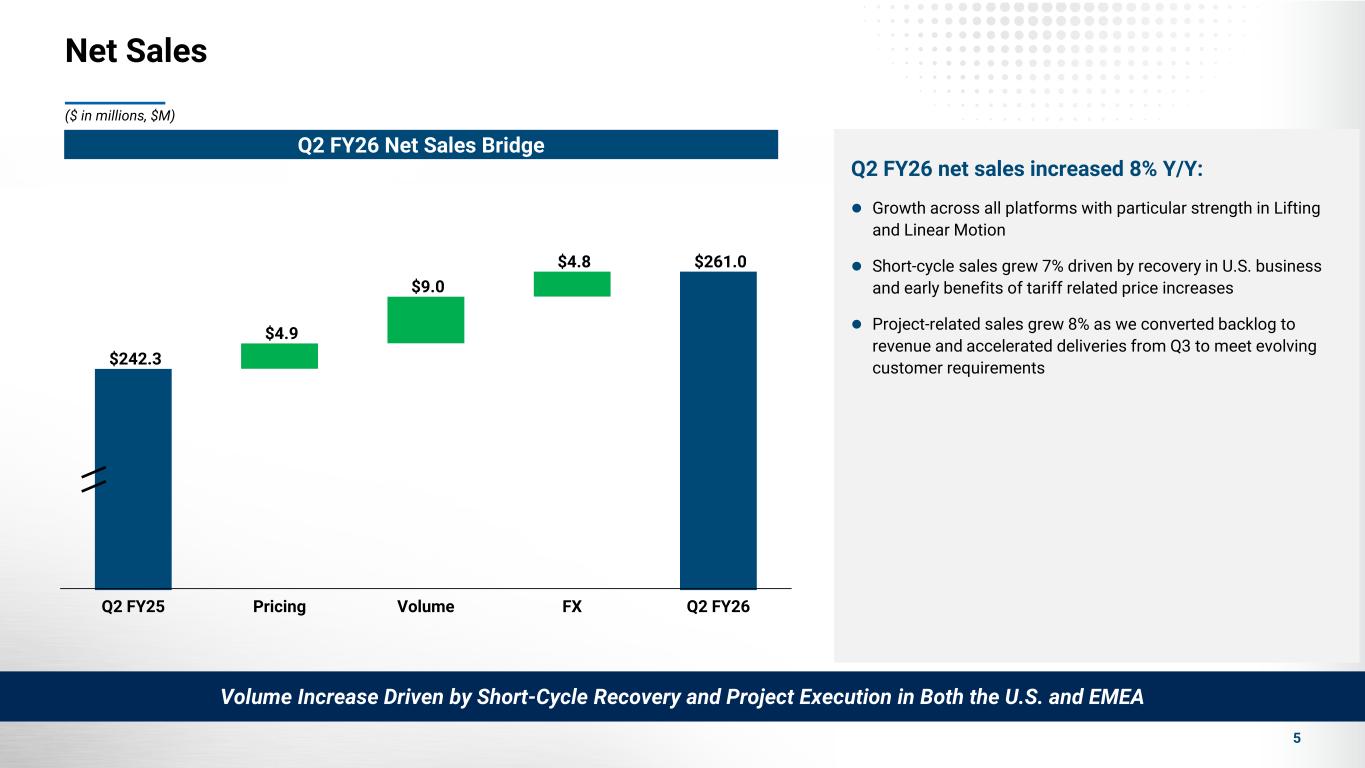
$242.3 $4.9 $9.0 $4.8 $261.0 Q2 FY25 Pricing Volume FX Q2 FY26 Q2 FY26 Net Sales Bridge Net Sales 5 Q2 FY26 net sales increased 8% Y/Y: Growth across all platforms with particular strength in Lifting and Linear Motion Short-cycle sales grew 7% driven by recovery in U.S. business and early benefits of tariff related price increases Project-related sales grew 8% as we converted backlog to revenue and accelerated deliveries from Q3 to meet evolving customer requirements Volume Increase Driven by Short-Cycle Recovery and Project Execution in Both the U.S. and EMEA ($ in millions, $M)
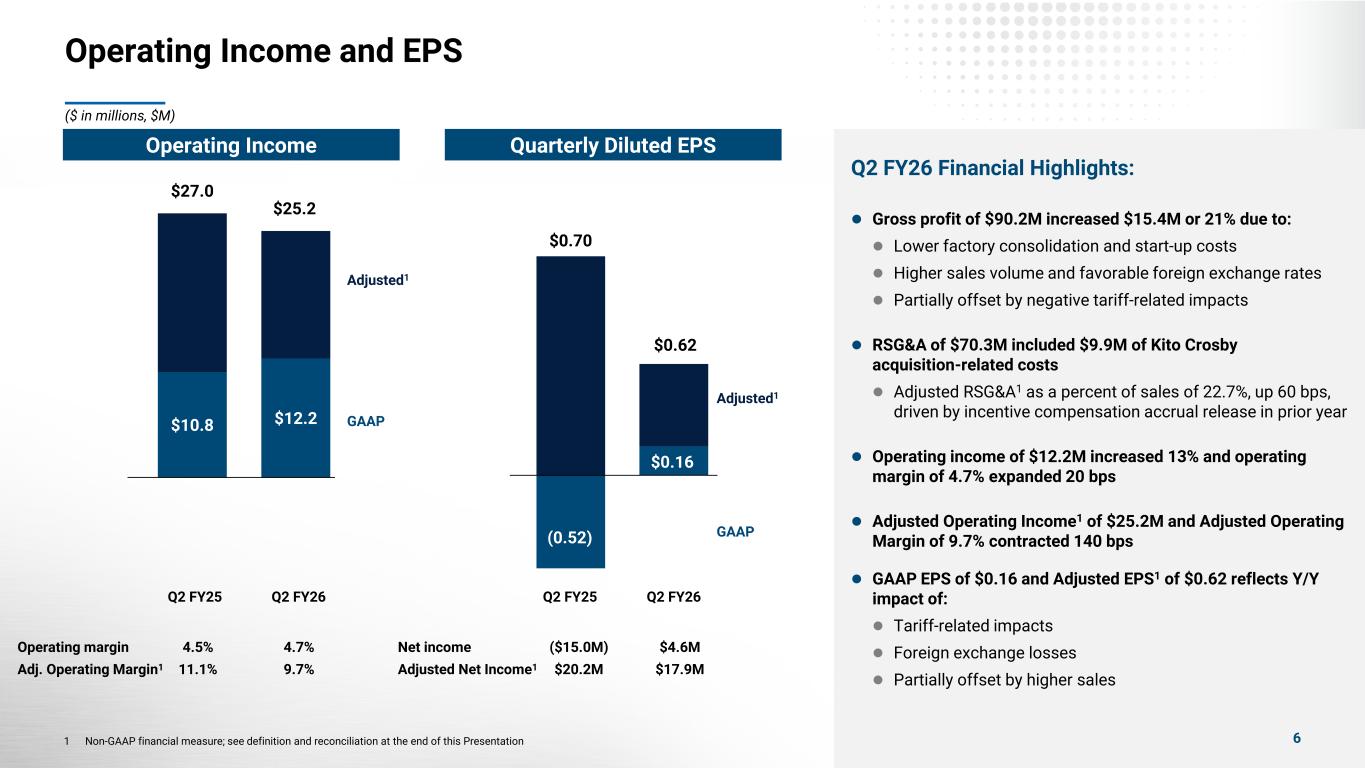
Operating Income and EPS 1 Non-GAAP financial measure; see definition and reconciliation at the end of this Presentation ($ in millions, $M) Quarterly Diluted EPSOperating Income Net income ($15.0M) $4.6M Adjusted Net Income1 $20.2M $17.9M (0.52) $0.16 $0.70 $0.62 Adjusted1 GAAP $10.8 $12.2 $27.0 $25.2 Adjusted1 GAAP Operating margin 4.5% 4.7% Adj. Operating Margin1 11.1% 9.7% Q2 FY25 Q2 FY26 Q2 FY26 Financial Highlights: Gross profit of $90.2M increased $15.4M or 21% due to: Lower factory consolidation and start-up costs Higher sales volume and favorable foreign exchange rates Partially offset by negative tariff-related impacts RSG&A of $70.3M included $9.9M of Kito Crosby acquisition-related costs Adjusted RSG&A1 as a percent of sales of 22.7%, up 60 bps, driven by incentive compensation accrual release in prior year Operating income of $12.2M increased 13% and operating margin of 4.7% expanded 20 bps Adjusted Operating Income1 of $25.2M and Adjusted Operating Margin of 9.7% contracted 140 bps GAAP EPS of $0.16 and Adjusted EPS1 of $0.62 reflects Y/Y impact of: Tariff-related impacts Foreign exchange losses Partially offset by higher sales Q2 FY25 Q2 FY26 6
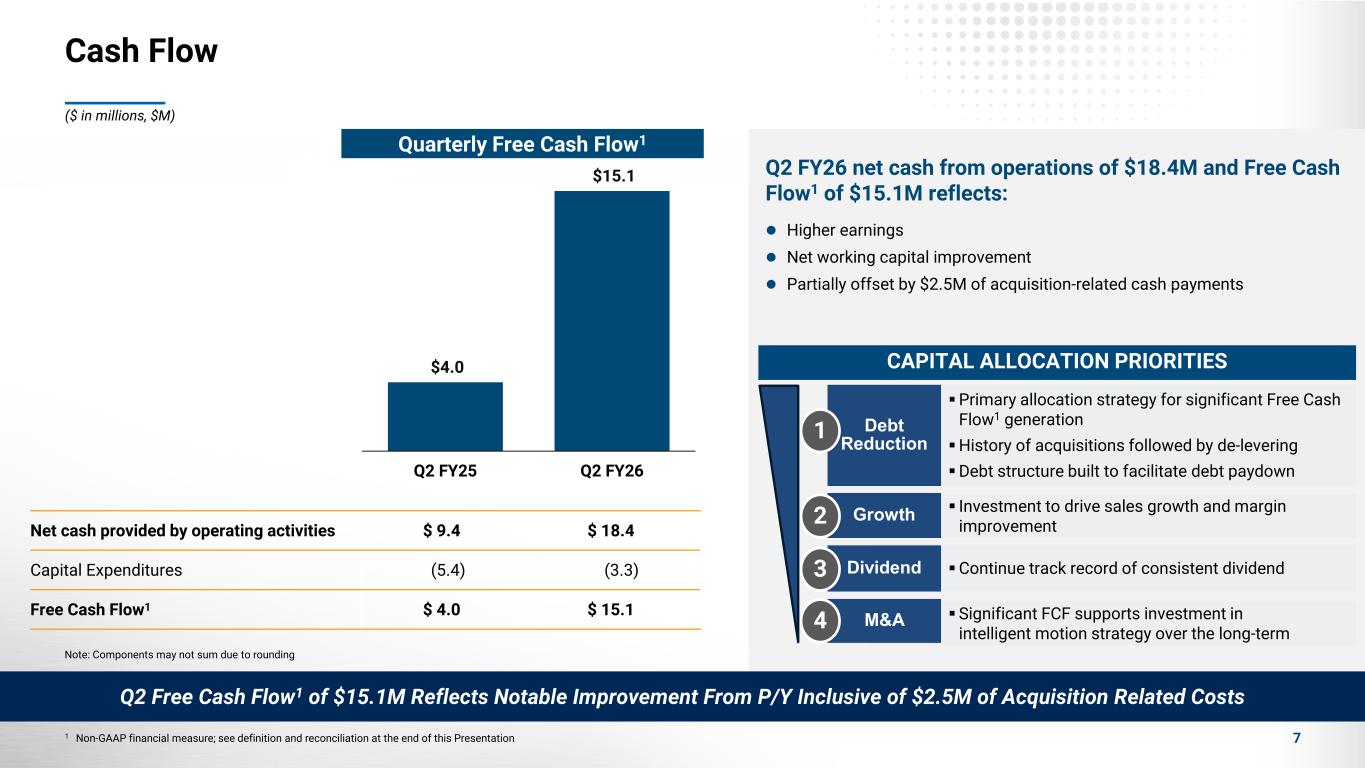
Cash Flow 7 Net cash provided by operating activities $ 9.4 $ 18.4 Capital Expenditures (5.4) (3.3) Free Cash Flow1 $ 4.0 $ 15.1 Note: Components may not sum due to rounding Q2 FY26 net cash from operations of $18.4M and Free Cash Flow1 of $15.1M reflects: Higher earnings Net working capital improvement Partially offset by $2.5M of acquisition-related cash payments Primary allocation strategy for significant Free Cash Flow1 generation History of acquisitions followed by de-levering Debt structure built to facilitate debt paydown CAPITAL ALLOCATION PRIORITIES Debt Reduction Investment to drive sales growth and margin improvement Growth Continue track record of consistent dividend Significant FCF supports investment in intelligent motion strategy over the long-term Dividend M&A 1 2 3 4 Q2 Free Cash Flow1 of $15.1M Reflects Notable Improvement From P/Y Inclusive of $2.5M of Acquisition Related Costs 1 Non-GAAP financial measure; see definition and reconciliation at the end of this Presentation ($ in millions, $M) Quarterly Free Cash Flow1 $4.0 $15.1 Q2 FY25 Q2 FY26
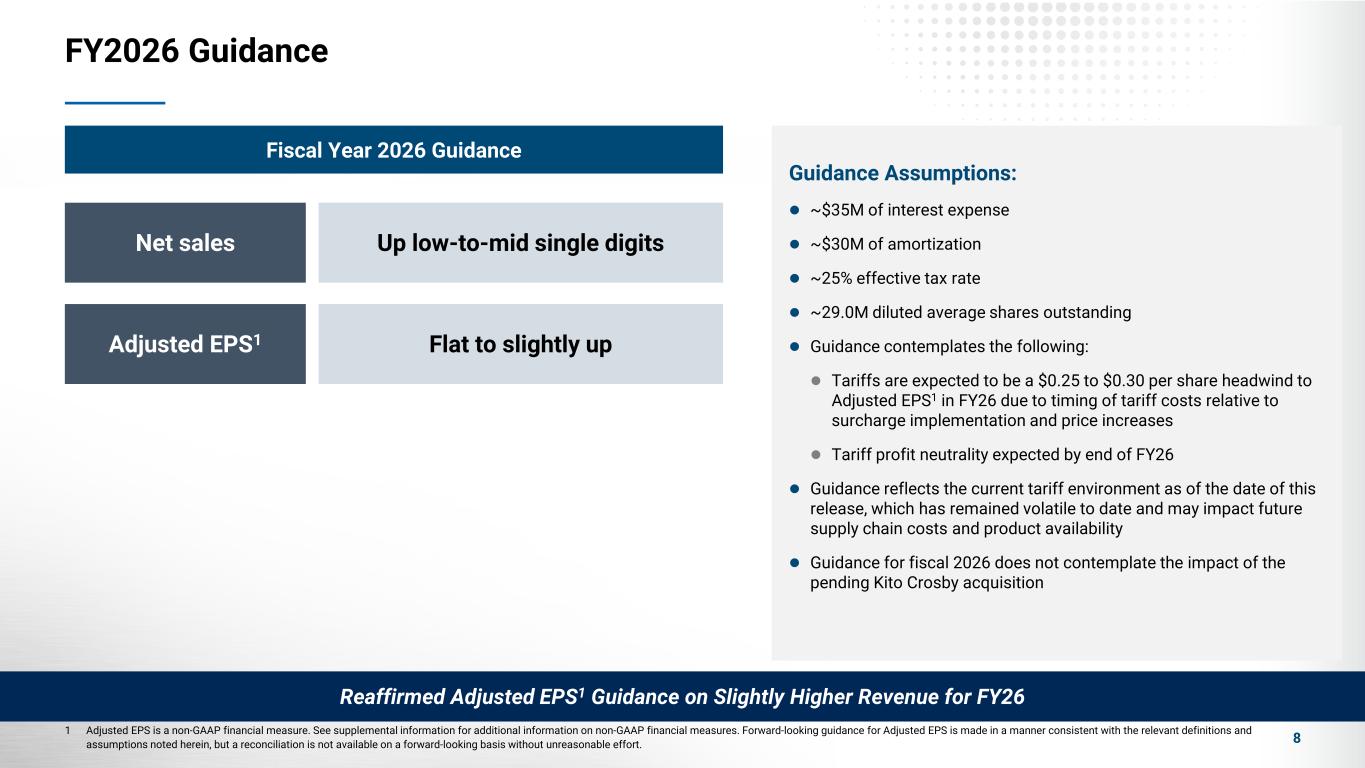
FY2026 Guidance 8 Net sales Up low-to-mid single digits Adjusted EPS1 Flat to slightly up Fiscal Year 2026 Guidance Guidance Assumptions: ~$35M of interest expense ~$30M of amortization ~25% effective tax rate ~29.0M diluted average shares outstanding Guidance contemplates the following: Tariffs are expected to be a $0.25 to $0.30 per share headwind to Adjusted EPS1 in FY26 due to timing of tariff costs relative to surcharge implementation and price increases Tariff profit neutrality expected by end of FY26 Guidance reflects the current tariff environment as of the date of this release, which has remained volatile to date and may impact future supply chain costs and product availability Guidance for fiscal 2026 does not contemplate the impact of the pending Kito Crosby acquisition 1 Adjusted EPS is a non-GAAP financial measure. See supplemental information for additional information on non-GAAP financial measures. Forward-looking guidance for Adjusted EPS is made in a manner consistent with the relevant definitions and assumptions noted herein, but a reconciliation is not available on a forward-looking basis without unreasonable effort. Reaffirmed Adjusted EPS1 Guidance on Slightly Higher Revenue for FY26
Supplement
Non-GAAP Measures 10 The following information provides definitions and reconciliations of the non-GAAP financial measures presented in this presentation to the most directly comparable financial measures calculated and presented in accordance with generally accepted accounting principles (GAAP). The Company has provided this non-GAAP financial information, which is not calculated or presented in accordance with GAAP, as information supplemental and in addition to the financial measures presented in this presentation that are calculated and presented in accordance with GAAP. Such non-GAAP financial measures should not be considered superior to, as a substitute for or alternative to, and should be considered in conjunction with, the GAAP financial measures presented in this presentation. The non-GAAP financial measures in this presentation may differ from similarly titled measures used by other companies. Adjusted Gross Profit and Adjusted Gross Margin Adjusted RSG&A and Adjusted RSG&A as a Percentage of Sales Adjusted Operating Income and Adjusted Operating Margin Adjusted Net Income and Adjusted EPS Adjusted EBITDA and Adjusted EBITDA Margin Free Cash Flow Forward-Looking: The Company has not reconciled the Adjusted EPS guidance to the most comparable GAAP financial measure because it is not possible to do so without unreasonable efforts due to the uncertainty and potential variability of reconciling items, which are dependent on future events and often outside of management’s control and which could be significant. Because such items cannot be reasonably predicted with the level of precision required, we are unable to provide guidance for the comparable GAAP financial measure. Forward-looking guidance regarding Adjusted EPS for fiscal 2026 is made in a manner consistent with the relevant definitions and assumptions noted herein. Forward looking guidance regarding Adjusted EBITDA Margin for the proforma combination of Columbus McKinnon and the Kito Crosby acquisition is made in a manner consistent with the relevant definitions and assumptions noted herein.
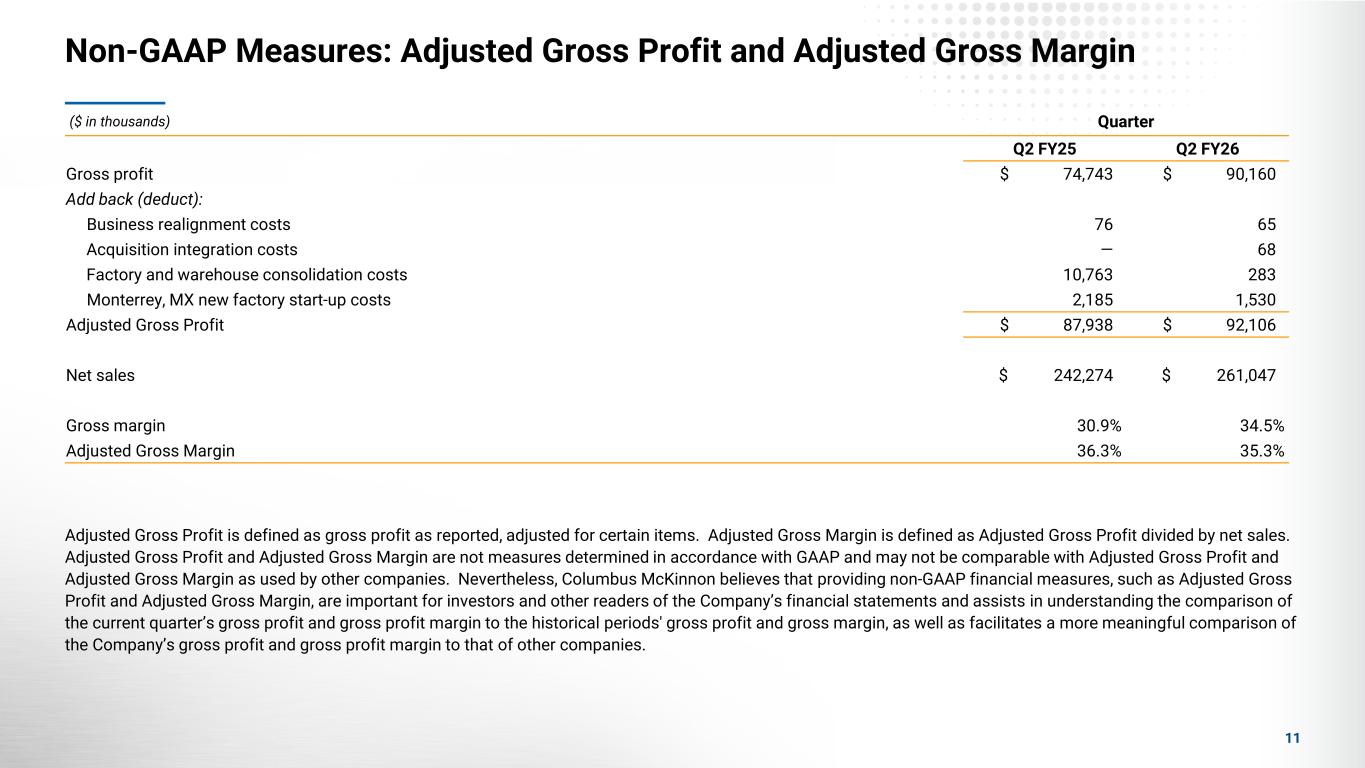
Non-GAAP Measures: Adjusted Gross Profit and Adjusted Gross Margin 11 Adjusted Gross Profit is defined as gross profit as reported, adjusted for certain items. Adjusted Gross Margin is defined as Adjusted Gross Profit divided by net sales. Adjusted Gross Profit and Adjusted Gross Margin are not measures determined in accordance with GAAP and may not be comparable with Adjusted Gross Profit and Adjusted Gross Margin as used by other companies. Nevertheless, Columbus McKinnon believes that providing non-GAAP financial measures, such as Adjusted Gross Profit and Adjusted Gross Margin, are important for investors and other readers of the Company’s financial statements and assists in understanding the comparison of the current quarter’s gross profit and gross profit margin to the historical periods' gross profit and gross margin, as well as facilitates a more meaningful comparison of the Company’s gross profit and gross profit margin to that of other companies. ($ in thousands) Quarter Q2 FY25 Q2 FY26 Gross profit $ 74,743 $ 90,160 Add back (deduct): Business realignment costs 76 65 Acquisition integration costs — 68 Factory and warehouse consolidation costs 10,763 283 Monterrey, MX new factory start-up costs 2,185 1,530 Adjusted Gross Profit $ 87,938 $ 92,106 Net sales $ 242,274 $ 261,047 Gross margin 30.9% 34.5% Adjusted Gross Margin 36.3% 35.3%
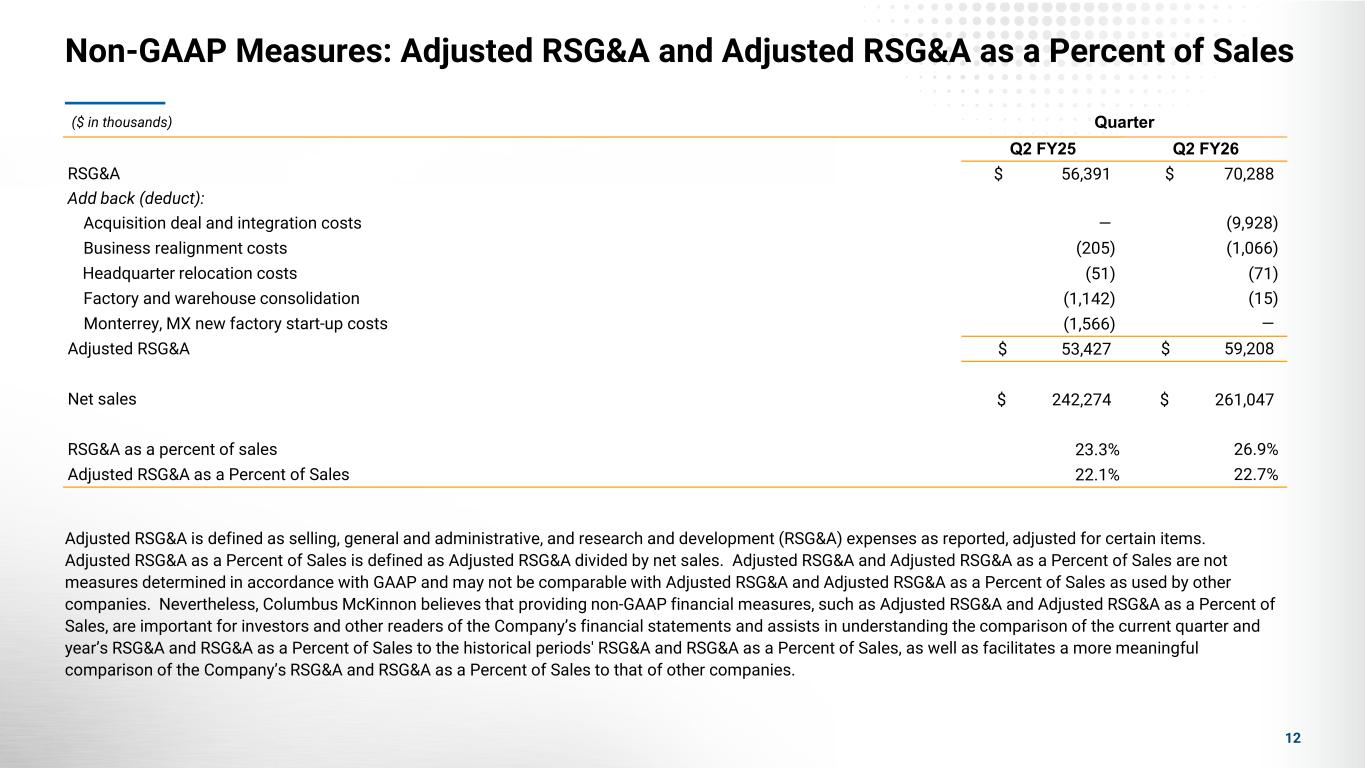
Non-GAAP Measures: Adjusted RSG&A and Adjusted RSG&A as a Percent of Sales 12 ($ in thousands) Quarter Q2 FY25 Q2 FY26 RSG&A $ 56,391 $ 70,288 Add back (deduct): Acquisition deal and integration costs — (9,928) Business realignment costs (205) (1,066) Headquarter relocation costs (51) (71) Factory and warehouse consolidation (1,142) (15) Monterrey, MX new factory start-up costs (1,566) — Adjusted RSG&A $ 53,427 $ 59,208 Net sales $ 242,274 $ 261,047 RSG&A as a percent of sales 23.3% 26.9% Adjusted RSG&A as a Percent of Sales 22.1% 22.7% Adjusted RSG&A is defined as selling, general and administrative, and research and development (RSG&A) expenses as reported, adjusted for certain items. Adjusted RSG&A as a Percent of Sales is defined as Adjusted RSG&A divided by net sales. Adjusted RSG&A and Adjusted RSG&A as a Percent of Sales are not measures determined in accordance with GAAP and may not be comparable with Adjusted RSG&A and Adjusted RSG&A as a Percent of Sales as used by other companies. Nevertheless, Columbus McKinnon believes that providing non-GAAP financial measures, such as Adjusted RSG&A and Adjusted RSG&A as a Percent of Sales, are important for investors and other readers of the Company’s financial statements and assists in understanding the comparison of the current quarter and year’s RSG&A and RSG&A as a Percent of Sales to the historical periods' RSG&A and RSG&A as a Percent of Sales, as well as facilitates a more meaningful comparison of the Company’s RSG&A and RSG&A as a Percent of Sales to that of other companies.
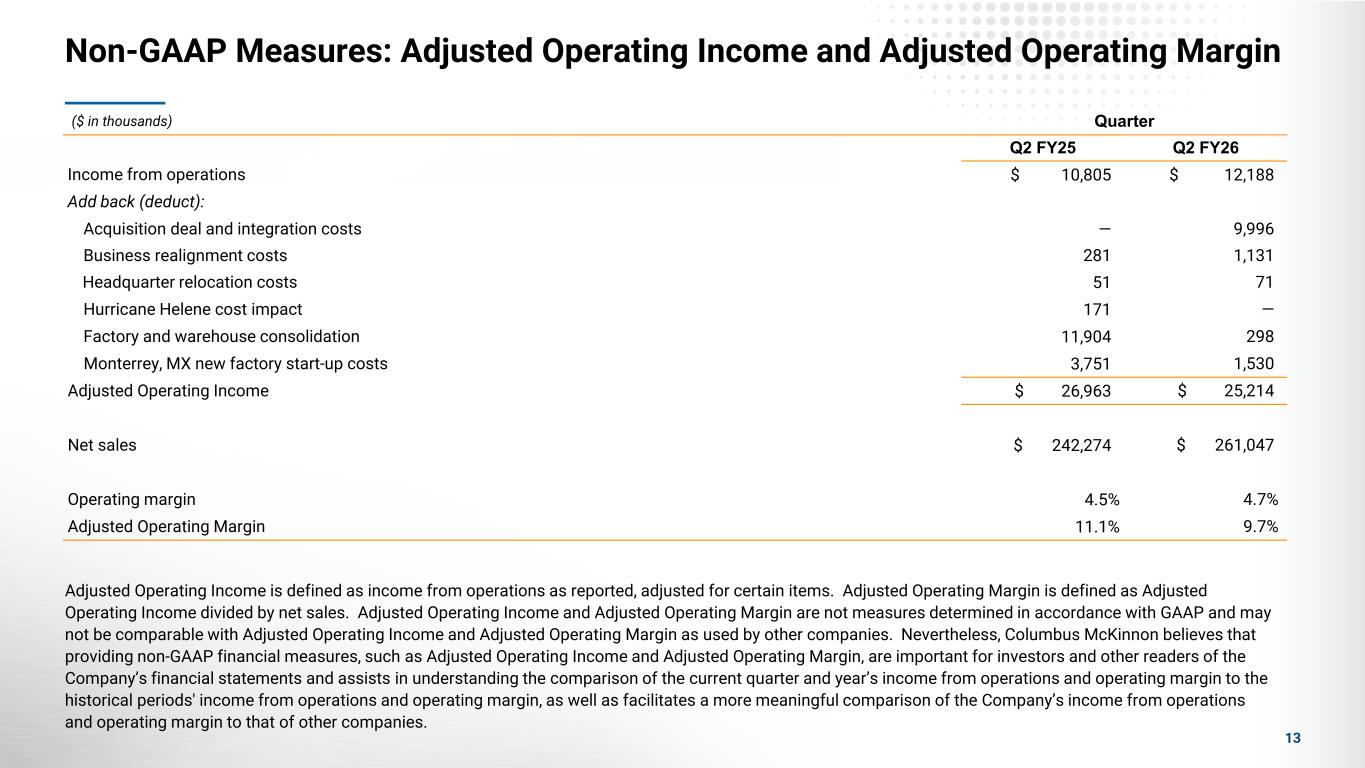
Non-GAAP Measures: Adjusted Operating Income and Adjusted Operating Margin 13 ($ in thousands) Quarter Q2 FY25 Q2 FY26 Income from operations $ 10,805 $ 12,188 Add back (deduct): Acquisition deal and integration costs — 9,996 Business realignment costs 281 1,131 Headquarter relocation costs 51 71 Hurricane Helene cost impact 171 — Factory and warehouse consolidation 11,904 298 Monterrey, MX new factory start-up costs 3,751 1,530 Adjusted Operating Income $ 26,963 $ 25,214 Net sales $ 242,274 $ 261,047 Operating margin 4.5% 4.7% Adjusted Operating Margin 11.1% 9.7% Adjusted Operating Income is defined as income from operations as reported, adjusted for certain items. Adjusted Operating Margin is defined as Adjusted Operating Income divided by net sales. Adjusted Operating Income and Adjusted Operating Margin are not measures determined in accordance with GAAP and may not be comparable with Adjusted Operating Income and Adjusted Operating Margin as used by other companies. Nevertheless, Columbus McKinnon believes that providing non-GAAP financial measures, such as Adjusted Operating Income and Adjusted Operating Margin, are important for investors and other readers of the Company’s financial statements and assists in understanding the comparison of the current quarter and year’s income from operations and operating margin to the historical periods' income from operations and operating margin, as well as facilitates a more meaningful comparison of the Company’s income from operations and operating margin to that of other companies.
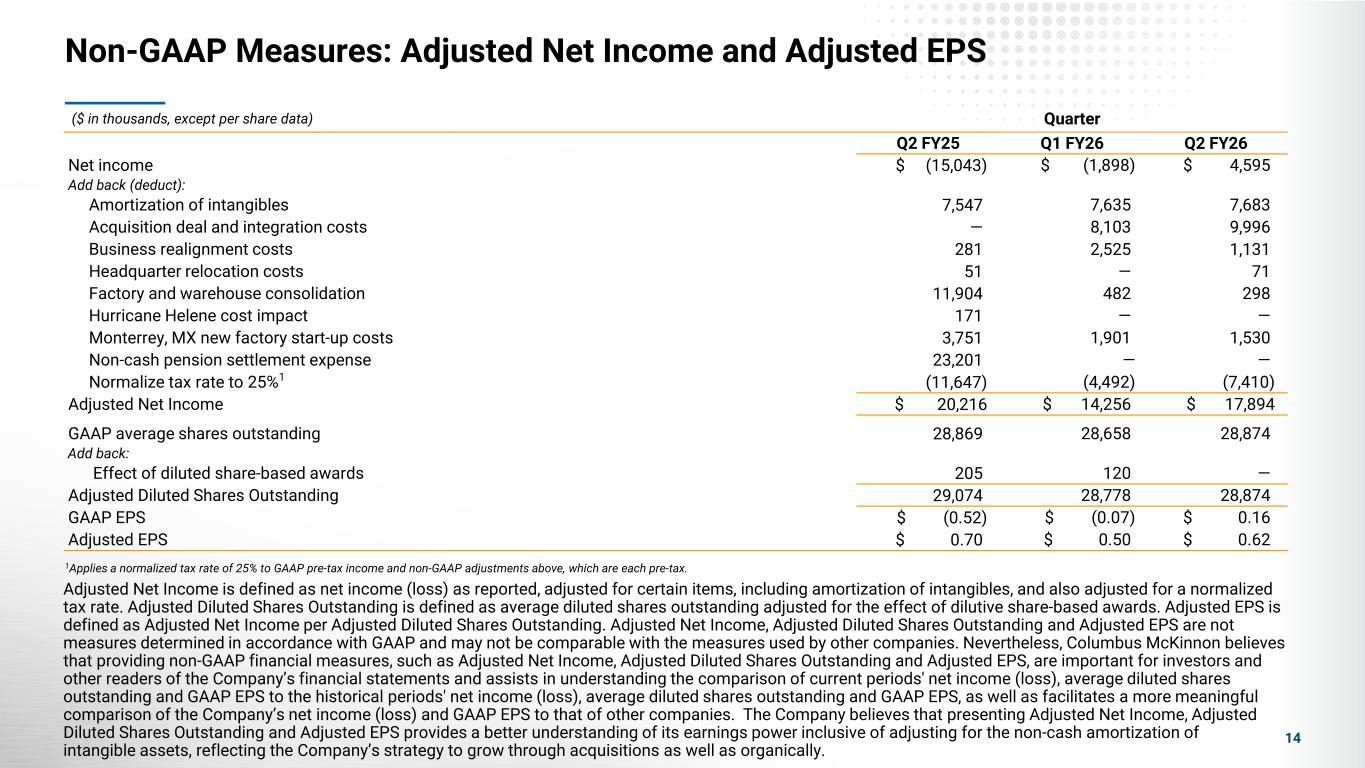
Adjusted Net Income is defined as net income (loss) as reported, adjusted for certain items, including amortization of intangibles, and also adjusted for a normalized tax rate. Adjusted Diluted Shares Outstanding is defined as average diluted shares outstanding adjusted for the effect of dilutive share-based awards. Adjusted EPS is defined as Adjusted Net Income per Adjusted Diluted Shares Outstanding. Adjusted Net Income, Adjusted Diluted Shares Outstanding and Adjusted EPS are not measures determined in accordance with GAAP and may not be comparable with the measures used by other companies. Nevertheless, Columbus McKinnon believes that providing non-GAAP financial measures, such as Adjusted Net Income, Adjusted Diluted Shares Outstanding and Adjusted EPS, are important for investors and other readers of the Company’s financial statements and assists in understanding the comparison of current periods' net income (loss), average diluted shares outstanding and GAAP EPS to the historical periods' net income (loss), average diluted shares outstanding and GAAP EPS, as well as facilitates a more meaningful comparison of the Company’s net income (loss) and GAAP EPS to that of other companies. The Company believes that presenting Adjusted Net Income, Adjusted Diluted Shares Outstanding and Adjusted EPS provides a better understanding of its earnings power inclusive of adjusting for the non-cash amortization of intangible assets, reflecting the Company’s strategy to grow through acquisitions as well as organically. Non-GAAP Measures: Adjusted Net Income and Adjusted EPS ($ in thousands, except per share data) Quarter Q2 FY25 Q1 FY26 Q2 FY26 Net income $ (15,043) $ (1,898) $ 4,595 Add back (deduct): Amortization of intangibles 7,547 7,635 7,683 Acquisition deal and integration costs — 8,103 9,996 Business realignment costs 281 2,525 1,131 Headquarter relocation costs 51 — 71 Factory and warehouse consolidation 11,904 482 298 Hurricane Helene cost impact 171 — — Monterrey, MX new factory start-up costs 3,751 1,901 1,530 Non-cash pension settlement expense 23,201 — — Normalize tax rate to 25%1 (11,647) (4,492) (7,410) Adjusted Net Income $ 20,216 $ 14,256 $ 17,894 GAAP average shares outstanding 28,869 28,658 28,874 Add back: Effect of diluted share-based awards 205 120 — Adjusted Diluted Shares Outstanding 29,074 28,778 28,874 GAAP EPS $ (0.52) $ (0.07) $ 0.16 Adjusted EPS $ 0.70 $ 0.50 $ 0.62 1Applies a normalized tax rate of 25% to GAAP pre-tax income and non-GAAP adjustments above, which are each pre-tax. 14
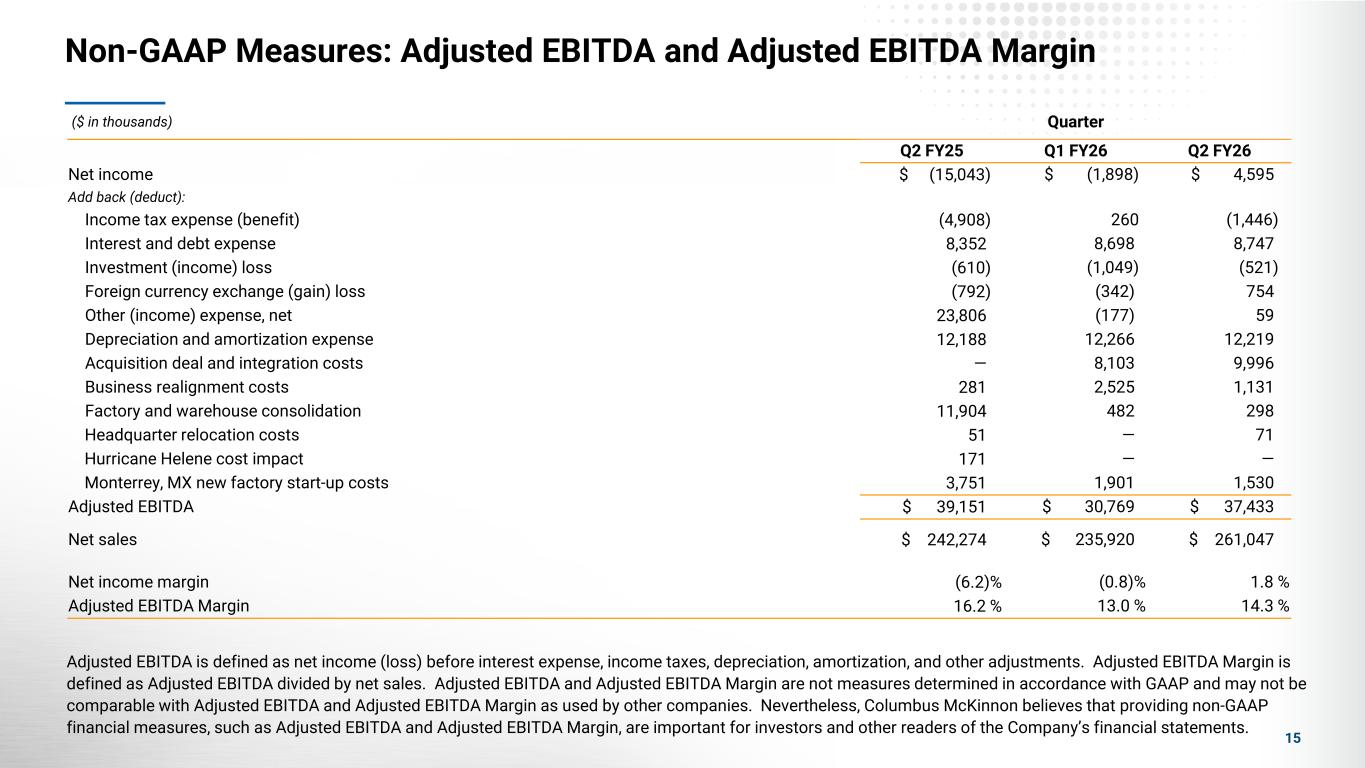
Non-GAAP Measures: Adjusted EBITDA and Adjusted EBITDA Margin 15 Adjusted EBITDA is defined as net income (loss) before interest expense, income taxes, depreciation, amortization, and other adjustments. Adjusted EBITDA Margin is defined as Adjusted EBITDA divided by net sales. Adjusted EBITDA and Adjusted EBITDA Margin are not measures determined in accordance with GAAP and may not be comparable with Adjusted EBITDA and Adjusted EBITDA Margin as used by other companies. Nevertheless, Columbus McKinnon believes that providing non-GAAP financial measures, such as Adjusted EBITDA and Adjusted EBITDA Margin, are important for investors and other readers of the Company’s financial statements. ($ in thousands) Quarter Q2 FY25 Q1 FY26 Q2 FY26 Net income $ (15,043) $ (1,898) $ 4,595 Add back (deduct): Income tax expense (benefit) (4,908) 260 (1,446) Interest and debt expense 8,352 8,698 8,747 Investment (income) loss (610) (1,049) (521) Foreign currency exchange (gain) loss (792) (342) 754 Other (income) expense, net 23,806 (177) 59 Depreciation and amortization expense 12,188 12,266 12,219 Acquisition deal and integration costs — 8,103 9,996 Business realignment costs 281 2,525 1,131 Factory and warehouse consolidation 11,904 482 298 Headquarter relocation costs 51 — 71 Hurricane Helene cost impact 171 — — Monterrey, MX new factory start-up costs 3,751 1,901 1,530 Adjusted EBITDA $ 39,151 $ 30,769 $ 37,433 Net sales $ 242,274 $ 235,920 $ 261,047 Net income margin (6.2)% (0.8)% 1.8 % Adjusted EBITDA Margin 16.2 % 13.0 % 14.3 %
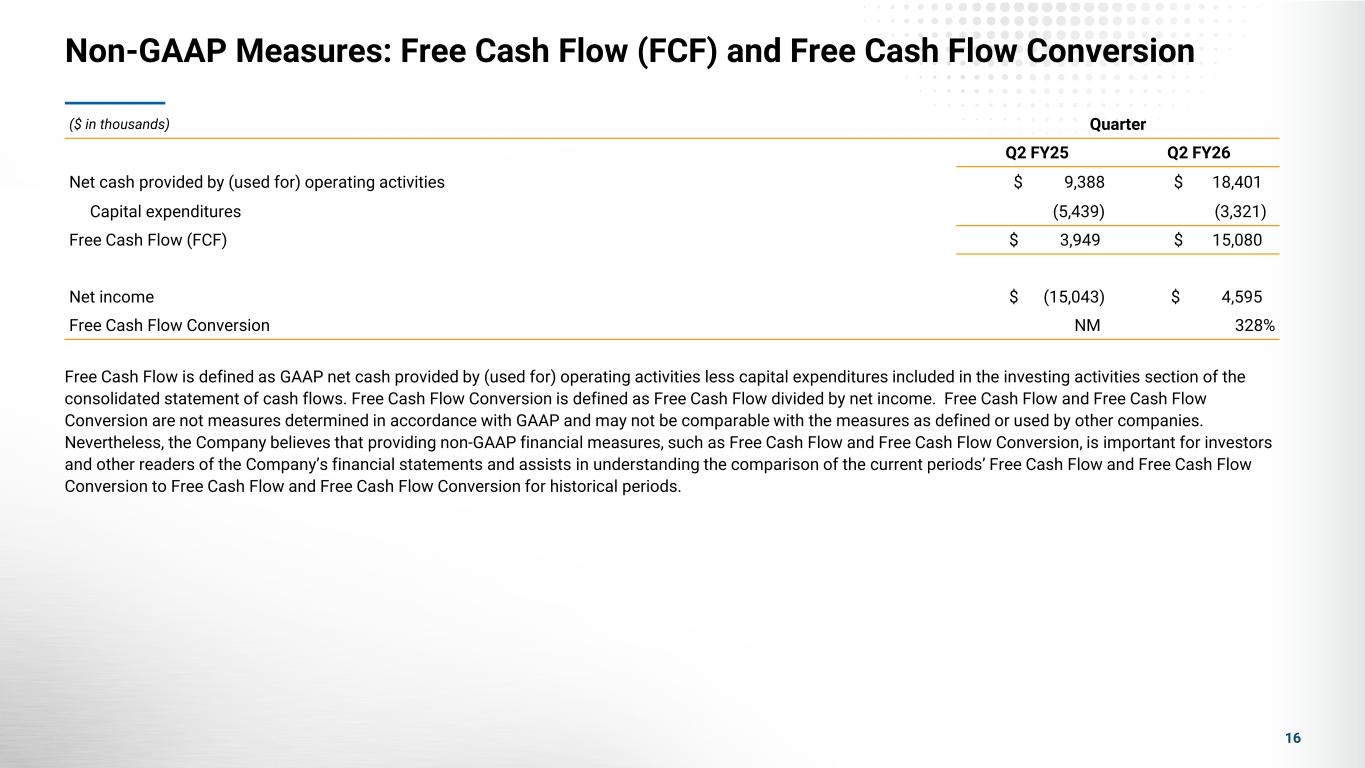
Non-GAAP Measures: Free Cash Flow (FCF) and Free Cash Flow Conversion 16 Free Cash Flow is defined as GAAP net cash provided by (used for) operating activities less capital expenditures included in the investing activities section of the consolidated statement of cash flows. Free Cash Flow Conversion is defined as Free Cash Flow divided by net income. Free Cash Flow and Free Cash Flow Conversion are not measures determined in accordance with GAAP and may not be comparable with the measures as defined or used by other companies. Nevertheless, the Company believes that providing non-GAAP financial measures, such as Free Cash Flow and Free Cash Flow Conversion, is important for investors and other readers of the Company’s financial statements and assists in understanding the comparison of the current periods’ Free Cash Flow and Free Cash Flow Conversion to Free Cash Flow and Free Cash Flow Conversion for historical periods. ($ in thousands) Quarter Q2 FY25 Q2 FY26 Net cash provided by (used for) operating activities $ 9,388 $ 18,401 Capital expenditures (5,439) (3,321) Free Cash Flow (FCF) $ 3,949 $ 15,080 Net income $ (15,043) $ 4,595 Free Cash Flow Conversion NM 328%