2025 Proxy ReviewAugust, 2025
Disclaimers and Safe Harbor Statement 2 This presentation and the accompanying
oral discussion contains “forward-looking statements” within the meaning of the Section 27A of the Securities Act of 1933, as amended, and Section 21E of the Securities Exchange Act of 1934, as amended. Such forward looking statements are
generally identified by the use of forward-looking terminology, including the terms "anticipate," “believe,” “continue,” “could,” “estimate,” “expect,” “illustrative,” “intend,” “likely,” “may,” “opportunity,” “plan,” “possible,” “potential,”
“predict,” “project,” “shall,” “should,” “target,” “will,” “would” and, in each case, their negative or other various or comparable terminology. Such forward-looking statements include, among others, statements regarding: (1) our strategy,
outlook and growth prospects; (2) our operational and financial targets and capital allocation policy; (3) general economic trends, global policy, including tariff policy, trends in our industry and markets and their expected impacts on the
Company; (4) the amount of debt to be paid down by the Company following the closing of the Kito Crosby acquisition and the amount of cost and revenue synergies expected to be achieved after the completion of the Kito Crosby acquisition; (5)
the expected benefits of the Kito Crosby acquisition; (6) the expected future financial results of the combined companies and (7) the expected timing for the closing of the Kito Crosby acquisition. Forward-looking statements are not based on
historical facts, but instead represent our current expectations and assumptions regarding our business, the economy and other future conditions, and involve known and unknown risks, uncertainties and other factors that could cause the actual
results, performance or achievements of the Company to differ materially from any future results, performance or achievements expressed or implied by the forward-looking statements. It is not possible to predict or identify all such risks.
These risks include, but are not limited to, (1) risks relating to the competitive environment in which we operate; (2) the risk that the cost synergies and any revenue synergies from the Kito Crosby transaction may not be fully realized or may
take longer than anticipated to be realized; (3) the risk that the integration of Kito Crosby's business and operations into the Company will be materially delayed or will be more costly or difficult than expected, or that the Company is
otherwise unable to successfully integrate Kito Crosby's business into its own, including as a result of unexpected factors or events; (4) risks regarding the ability of the Company and Kito Crosby to obtain required governmental approvals of
the transaction on the timeline expected, or at all, and the risk that such approvals may result in the imposition of conditions that could adversely affect the Company after the closing of the transaction or adversely affect the expected
benefits of the transaction; (5) the failure of the closing conditions in the purchase agreement for the acquisition of Kito Crosby to be satisfied, or any unexpected delay in closing the transaction or the occurrence of any event, change or
other circumstances that could give rise to the termination of the purchase agreement; (6) the possibility that the Kito Crosby acquisition transaction may be more expensive to complete than anticipated, including as a result of unexpected
factors or events; (7) risks related to the general competitive, economic, political and market conditions and other factors that may affect future results of the Company and Kito Crosby; and (8) the other risk factors that are described under
the section titled “Risk Factors” in our Annual Report on Form 10-K for the fiscal year ended March 31, 2025 as well as in our other filings with the Securities and Exchange Commission, which are available on its website at www.sec.gov. Given
these uncertainties, you should not place undue reliance on these forward-looking statements. Forward looking statements speak only as of the date they are made. Columbus McKinnon undertakes no duty to update publicly any such forward-looking
statement, whether as a result of new information, future events or otherwise, except as may be required by applicable law, regulation or other competent legal authority. Non-GAAP Financial Measures and Forward-looking Non-GAAP Financial
MeasuresThis presentation will discuss some non-GAAP (“adjusted”) financial measures which we believe are useful in evaluating Columbus McKinnon and Kito Crosby’s performance. You should not consider the presentation of this additional
information in isolation or as a substitute for results prepared in accordance with GAAP. The non-GAAP financial measures are noted and reconciliations of comparable historical GAAP measures with historical non-GAAP financial measures can be
found in tables included in the appendix portion of this presentation. Additional Information Regarding the 2025 Annual Meeting and Where to Find It Columbus McKinnon has filed its definitive proxy statement with the SEC with respect to its
solicitation of proxies for the 2025 Annual Meeting. INVESTORS AND SHAREHOLDERS ARE STRONGLY URGED TO READ CAREFULLY AND IN THEIR ENTIRETY THE PROXY STATEMENT (INCLUDING ANY AMENDMENTS OR SUPPLEMENTS THERETO) AND ACCOMPANYING PROXY CARD
FILED BY COLUMBUS McKINNON AND ANY OTHER RELEVANT DOCUMENTS TO BE FILED WITH THE SEC WHEN THEY BECOME AVAILABLE AS THEY CONTAIN IMPORTANT INFORMATION ABOUT ANY SOLICITATION. Investors and shareholders may obtain copies of these documents
and other documents filed with the SEC by Columbus McKinnon free of charge through the website maintained by the SEC at www.sec.gov. Copies of the documents filed by Columbus McKinnon are also available free of charge by accessing Columbus
McKinnon’s website at investors.cmco.com.
Explanatory Note regarding the Proxy Statement 3 On June 30, 2025, the Company
filed the definitive proxy statement (the “Proxy Statement”) with the Securities and Exchange Commission in connection with the 2025 Annual Meeting. The Proxy Statement contained a typographical error on page 76 in the section titled
“Background of the Kito Crosby Acquisition” that inadvertently named Mr. Michael Dastoor as being a member of the Sub-Committee of the Company’s Board of Directors tasked with evaluating the Kito Crosby acquisition, but should have instead
listed Mr. Chad R. Abraham, who was a member of the Sub-Committee. The Sub-Committee consisted of Messrs. Colella, Abraham and Stephens. Mr. Dastoor was not a member of the Sub-Committee.
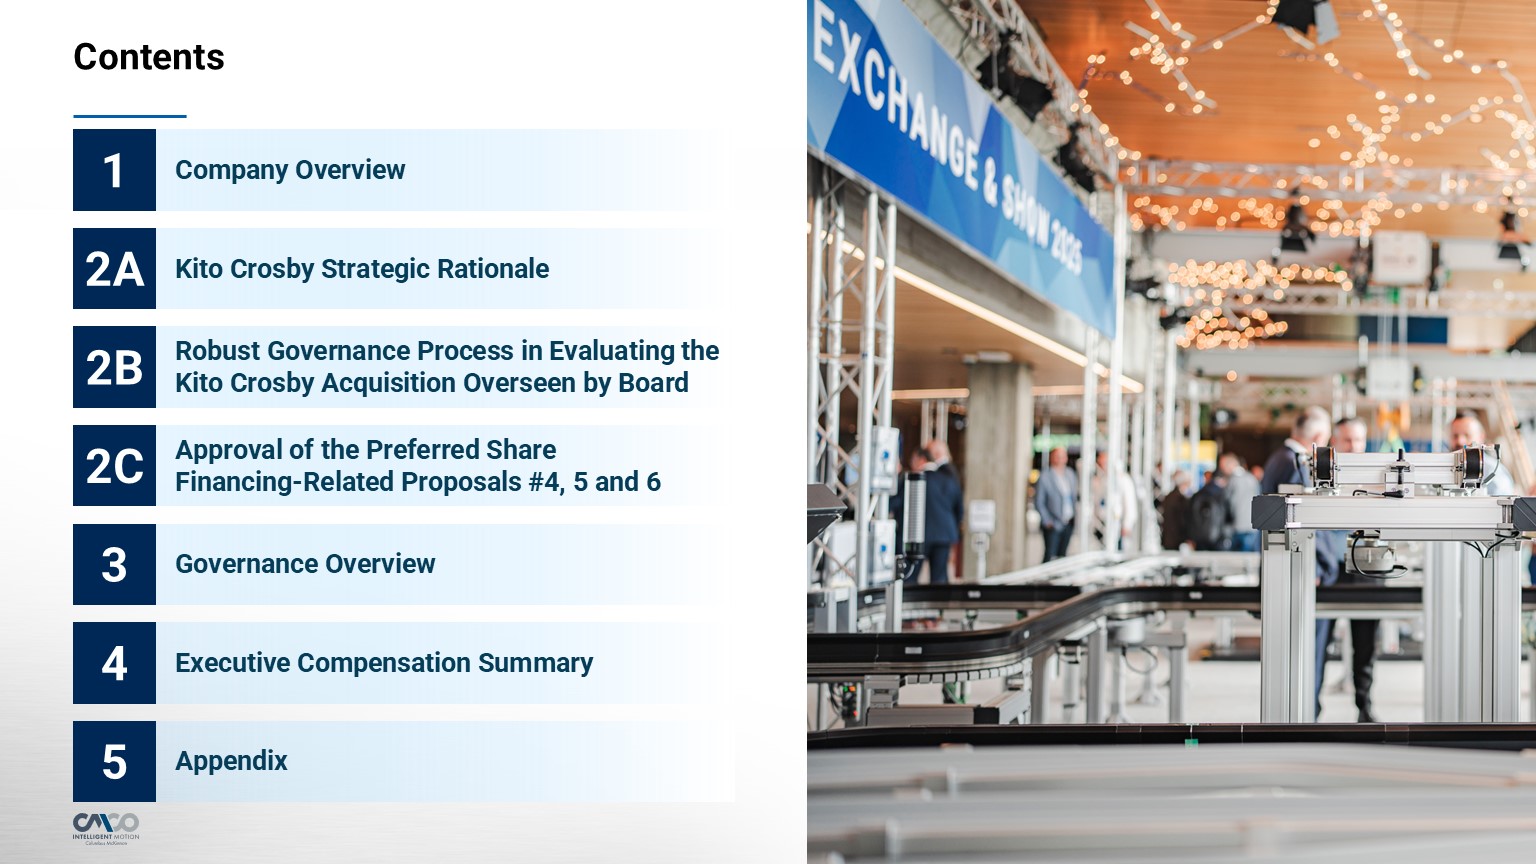
Contents Company Overview 1 Kito Crosby Strategic Rationale 2A Robust
Governance Process in Evaluating the Kito Crosby Acquisition Overseen by Board 2B Approval of the Preferred Share Financing-Related Proposals #4, 5 and 6 2C Governance Overview 3 Executive Compensation Summary 4 Appendix 5 4
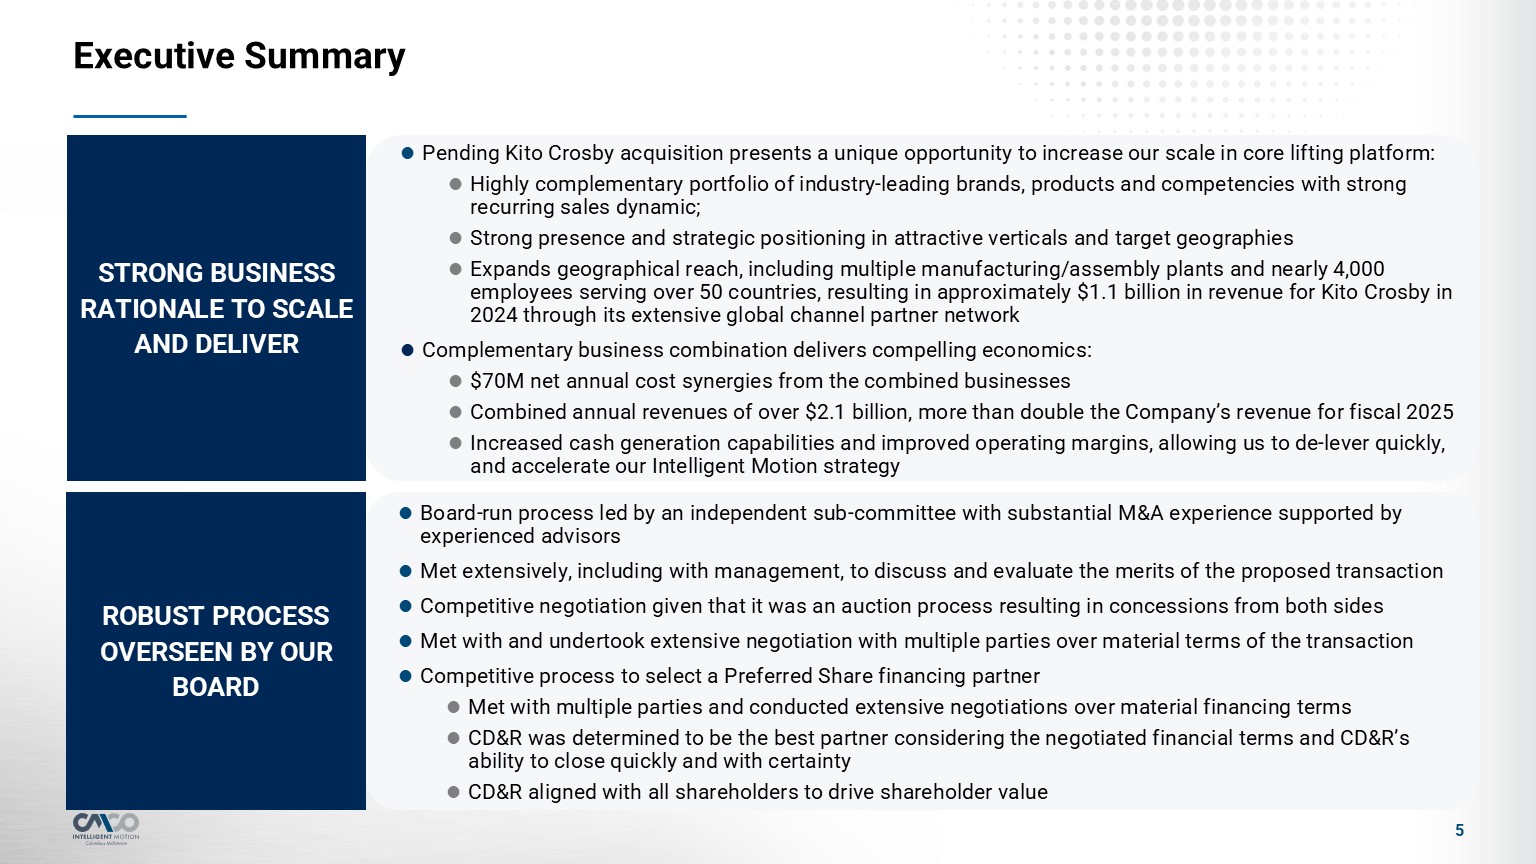
Executive Summary 5 Pending Kito Crosby acquisition presents a unique
opportunity to increase our scale in core lifting platform: Highly complementary portfolio of industry-leading brands, products and competencies with strong recurring sales dynamic; Strong presence and strategic positioning in attractive
verticals and target geographies Expands geographical reach, including multiple manufacturing/assembly plants and nearly 4,000 employees serving over 50 countries, resulting in approximately $1.1 billion in revenue for Kito Crosby in 2024
through its extensive global channel partner network Complementary business combination delivers compelling economics: $70M net annual cost synergies from the combined businesses Combined annual revenues of over $2.1 billion, more than
double the Company’s revenue for fiscal 2025 Increased cash generation capabilities and improved operating margins, allowing us to de-lever quickly, and accelerate our Intelligent Motion strategy STRONG BUSINESS RATIONALE TO SCALE AND
DELIVER OWNERSHIP & GOVERNANCE Board-run process led by an independent sub-committee with substantial M&A experience supported by experienced advisors Met extensively, including with management, to discuss and evaluate the merits of
the proposed transaction Competitive negotiation given that it was an auction process resulting in concessions from both sides Met with and undertook extensive negotiation with multiple parties over material terms of the
transaction Competitive process to select a Preferred Share financing partner Met with multiple parties and conducted extensive negotiations over material financing terms CD&R was determined to be the best partner considering the
negotiated financial terms and CD&R’s ability to close quickly and with certainty CD&R aligned with all shareholders to drive shareholder value ROBUST PROCESS OVERSEEN BY OUR BOARD
Executive Summary 6 OWNERSHIP & GOVERNANCE We believe materially beneficial
to shareholders to avoid higher cost of capital Without approval for each of Proposals 4, 5 and 6, the dividend rate payable on the Preferred Shares will increase from 7.00% per annum to 10.00% per annum Heighted interest rate will continue
until we are able to obtain approval of each of these Proposals If not approved, in the first full year after the closing of the issuance, this will result in $24 million of additional dividend payments to CD&R In future years, if not
approved, the amount of additional dividend payments payable to CD&R may increase further as a result of compounding in paid in kind Given that the Preferred Shares will not be convertible until Proposals 4, 5 and 6 are approved, failure
to approve may adversely impact the Company’s credit rating and cost of permanent financed debt APPROVAL OF THE PREFERRED SHARE FINANCING-RELATED PROPOSALS (#4, 5 AND 6)

Company Overview 1
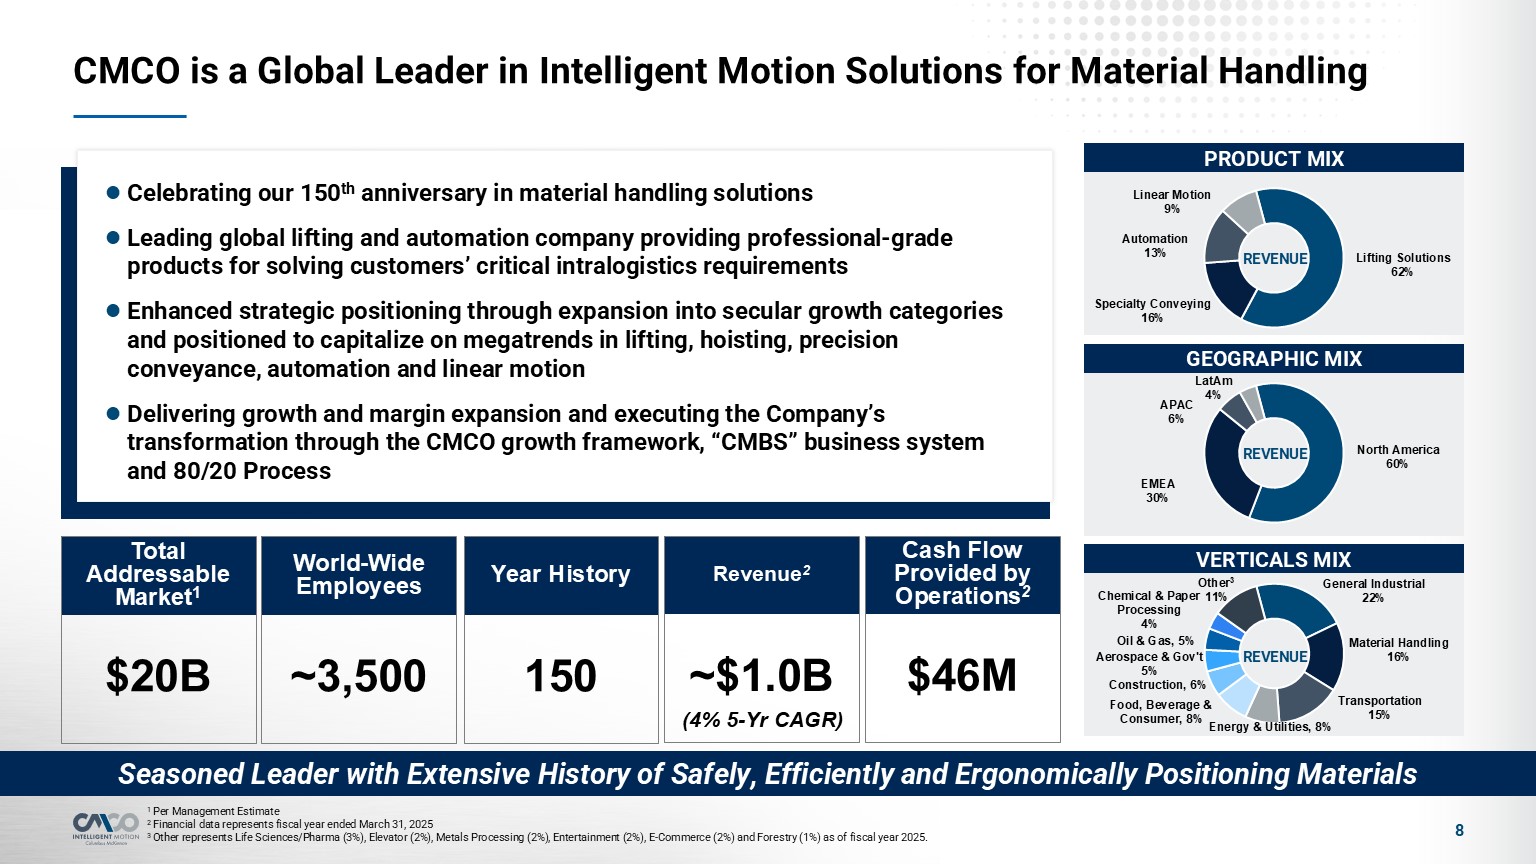
CMCO is a Global Leader in Intelligent Motion Solutions for Material
Handling 8 1 Per Management Estimate 2 Financial data represents fiscal year ended March 31, 2025 3 Other represents Life Sciences/Pharma (3%), Elevator (2%), Metals Processing (2%), Entertainment (2%), E-Commerce (2%) and Forestry (1%) as
of fiscal year 2025. Seasoned Leader with Extensive History of Safely, Efficiently and Ergonomically Positioning Materials PRODUCT MIX Celebrating our 150th anniversary in material handling solutions Leading global lifting and automation
company providing professional-grade products for solving customers’ critical intralogistics requirements Enhanced strategic positioning through expansion into secular growth categories and positioned to capitalize on megatrends in lifting,
hoisting, precision conveyance, automation and linear motion Delivering growth and margin expansion and executing the Company’s transformation through the CMCO growth framework, “CMBS” business system and 80/20 Process GEOGRAPHIC
MIX VERTICALS MIX REVENUE REVENUE REVENUE (4% 5-Yr CAGR) Year History 150 World-Wide Employees ~3,500 Total Addressable Market1 $20B Revenue2 ~$1.0B Cash Flow Provided by Operations2 $46M
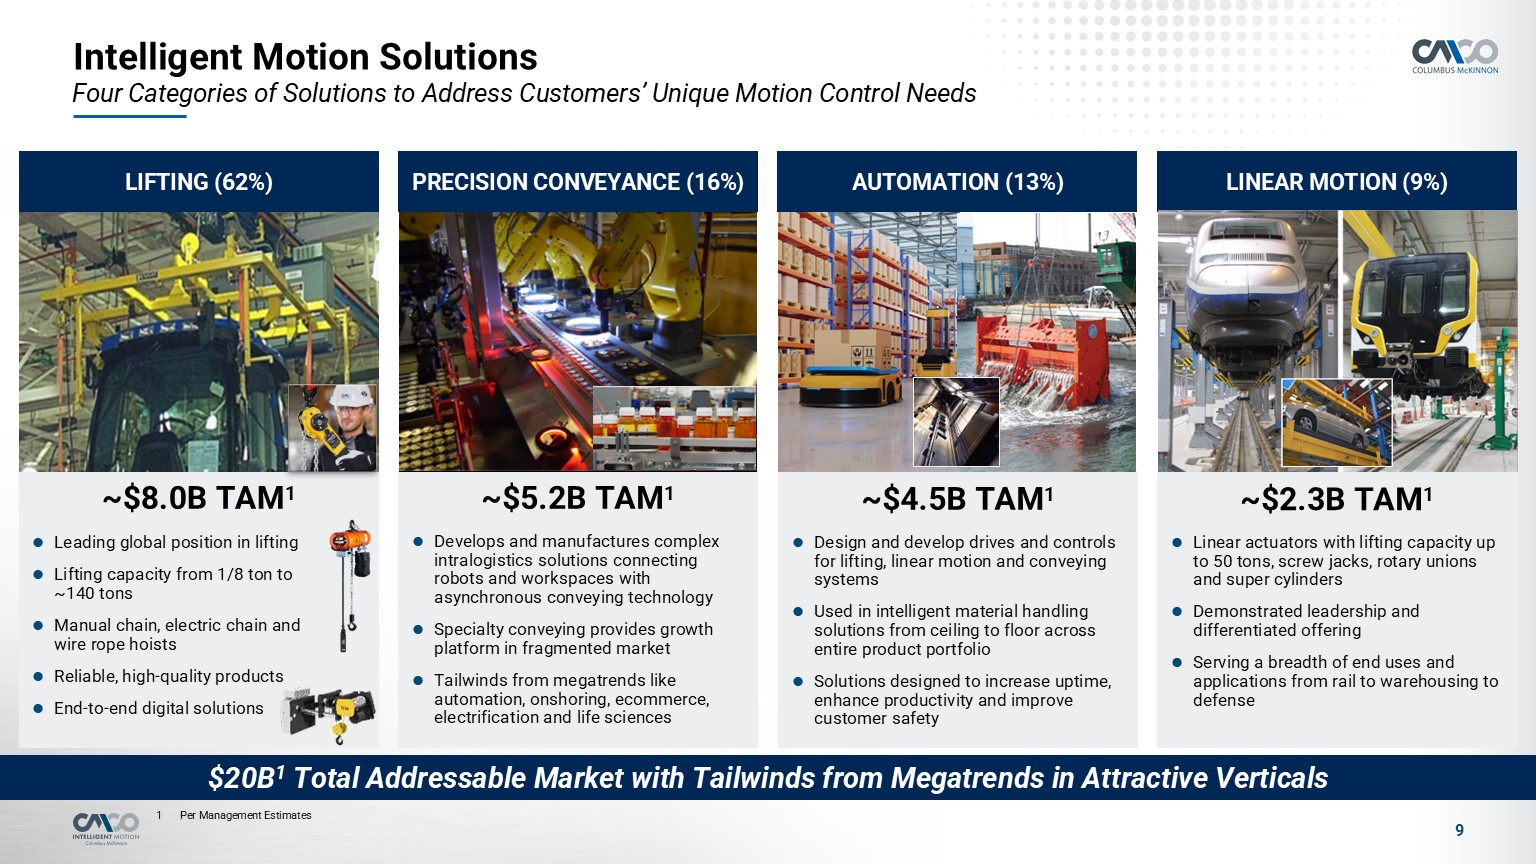
9 ~$8.0B TAM1 Leading global position in lifting Lifting capacity from 1/8 ton
to ~140 tons Manual chain, electric chain and wire rope hoists Reliable, high-quality products End-to-end digital solutions ~$5.2B TAM1 Develops and manufactures complex intralogistics solutions connecting robots and workspaces with
asynchronous conveying technology Specialty conveying provides growth platform in fragmented market Tailwinds from megatrends like automation, onshoring, ecommerce, electrification and life sciences ~$4.5B TAM1 Design and develop drives
and controls for lifting, linear motion and conveying systems Used in intelligent material handling solutions from ceiling to floor across entire product portfolio Solutions designed to increase uptime, enhance productivity and improve
customer safety ~$2.3B TAM1 Linear actuators with lifting capacity up to 50 tons, screw jacks, rotary unions and super cylinders Demonstrated leadership and differentiated offering Serving a breadth of end uses and applications from rail to
warehousing to defense LINEAR MOTION (9%) LIFTING (62%) Four Categories of Solutions to Address Customers’ Unique Motion Control Needs $20B1 Total Addressable Market with Tailwinds from Megatrends in Attractive Verticals Intelligent Motion
Solutions AUTOMATION (13%) PRECISION CONVEYANCE (16%) Per Management Estimates
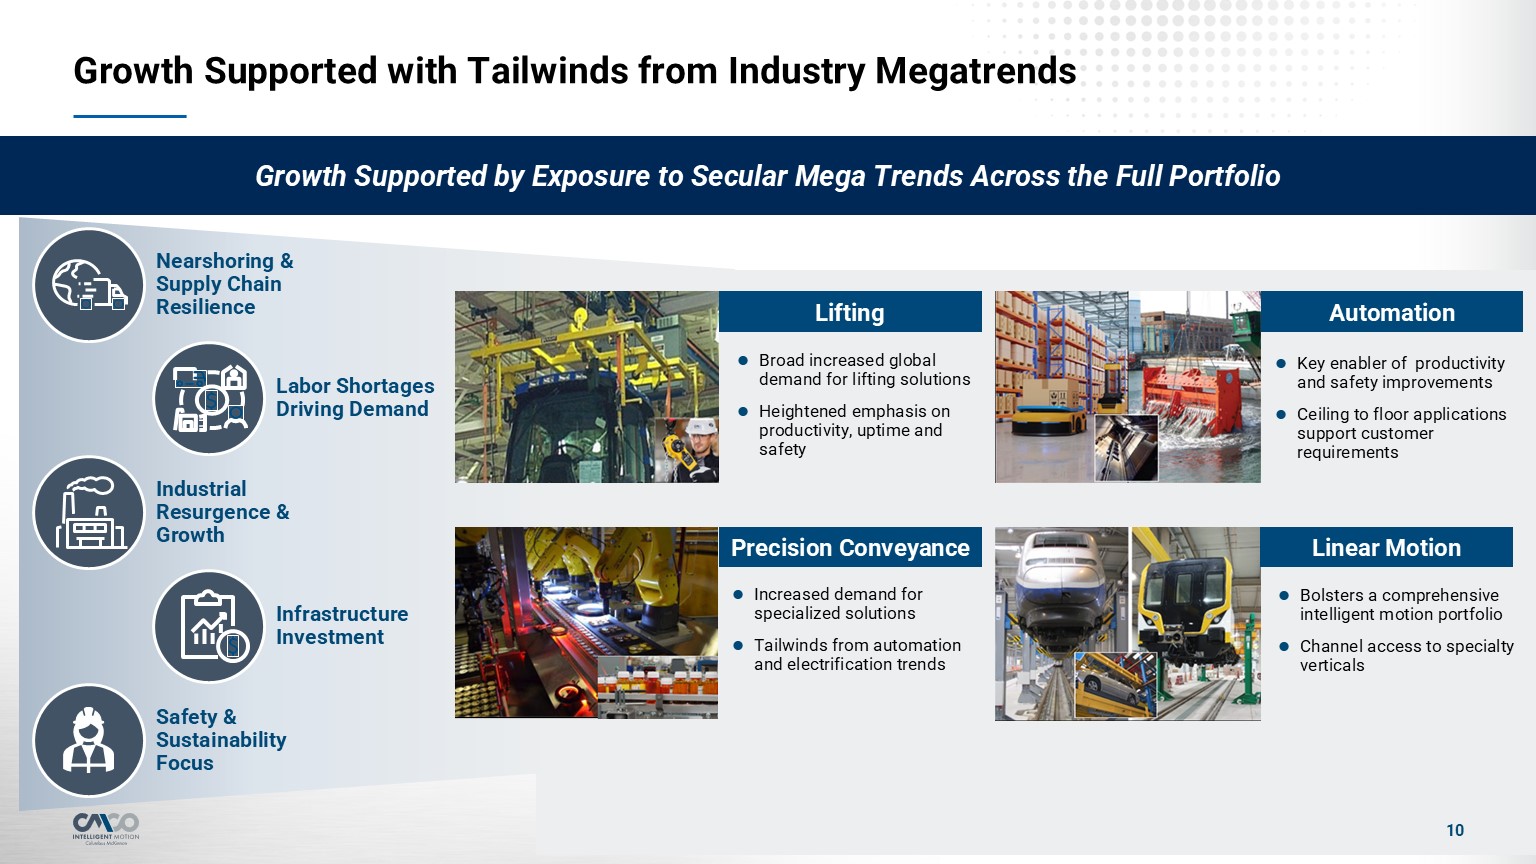
Growth Supported by Exposure to Secular Mega Trends Across the Full
Portfolio Growth Supported with Tailwinds from Industry Megatrends Nearshoring & Supply Chain Resilience 10 Labor Shortages Driving Demand Industrial Resurgence & Growth Infrastructure Investment Safety & Sustainability
Focus Lifting Broad increased global demand for lifting solutions Heightened emphasis on productivity, uptime and safety Precision Conveyance Increased demand for specialized solutions Tailwinds from automation and electrification
trends Automation Key enabler of productivity and safety improvements Ceiling to floor applications support customer requirements Linear Motion Bolsters a comprehensive intelligent motion portfolio Channel access to specialty verticals
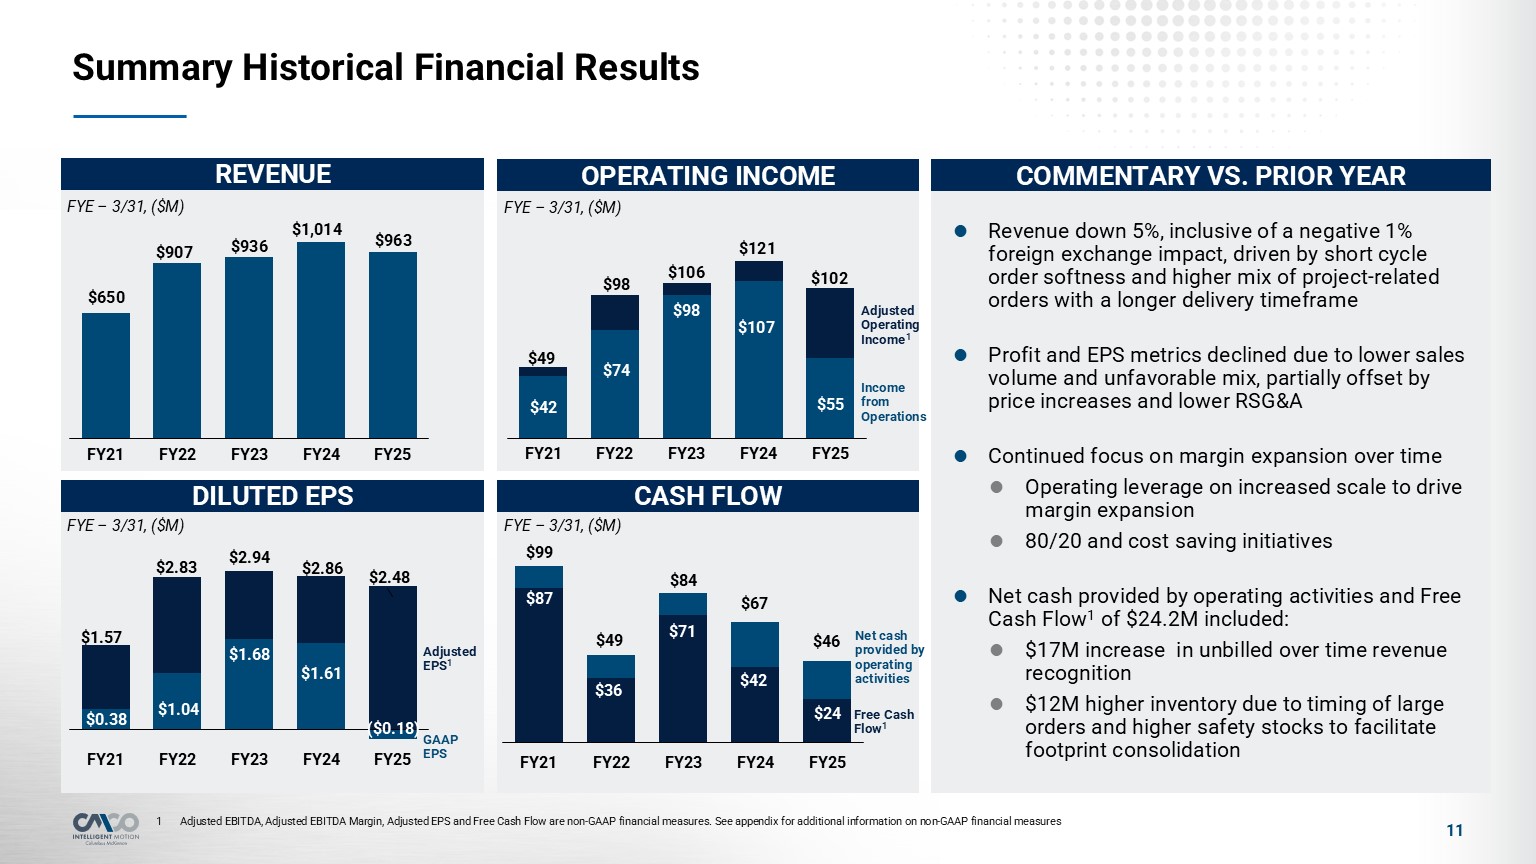
Summary Historical Financial Results FYE – 3/31, ($M) FYE – 3/31, ($M) FYE –
3/31, ($M) FYE – 3/31, ($M) COMMENTARY VS. PRIOR YEAR Revenue down 5%, inclusive of a negative 1% foreign exchange impact, driven by short cycle order softness and higher mix of project-related orders with a longer delivery timeframe
Profit and EPS metrics declined due to lower sales volume and unfavorable mix, partially offset by price increases and lower RSG&A Continued focus on margin expansion over time Operating leverage on increased scale to drive margin
expansion 80/20 and cost saving initiatives Net cash provided by operating activities and Free Cash Flow1 of $24.2M included: $17M increase in unbilled over time revenue recognition $12M higher inventory due to timing of large orders and
higher safety stocks to facilitate footprint consolidation REVENUE OPERATING INCOME DILUTED EPS CASH FLOW 11 Adjusted EBITDA, Adjusted EBITDA Margin, Adjusted EPS and Free Cash Flow are non-GAAP financial measures. See appendix for
additional information on non-GAAP financial measures Net cash provided by operating activities Free Cash Flow1 Adjusted EPS1 GAAP EPS Adjusted Operating Income1 Income from Operations
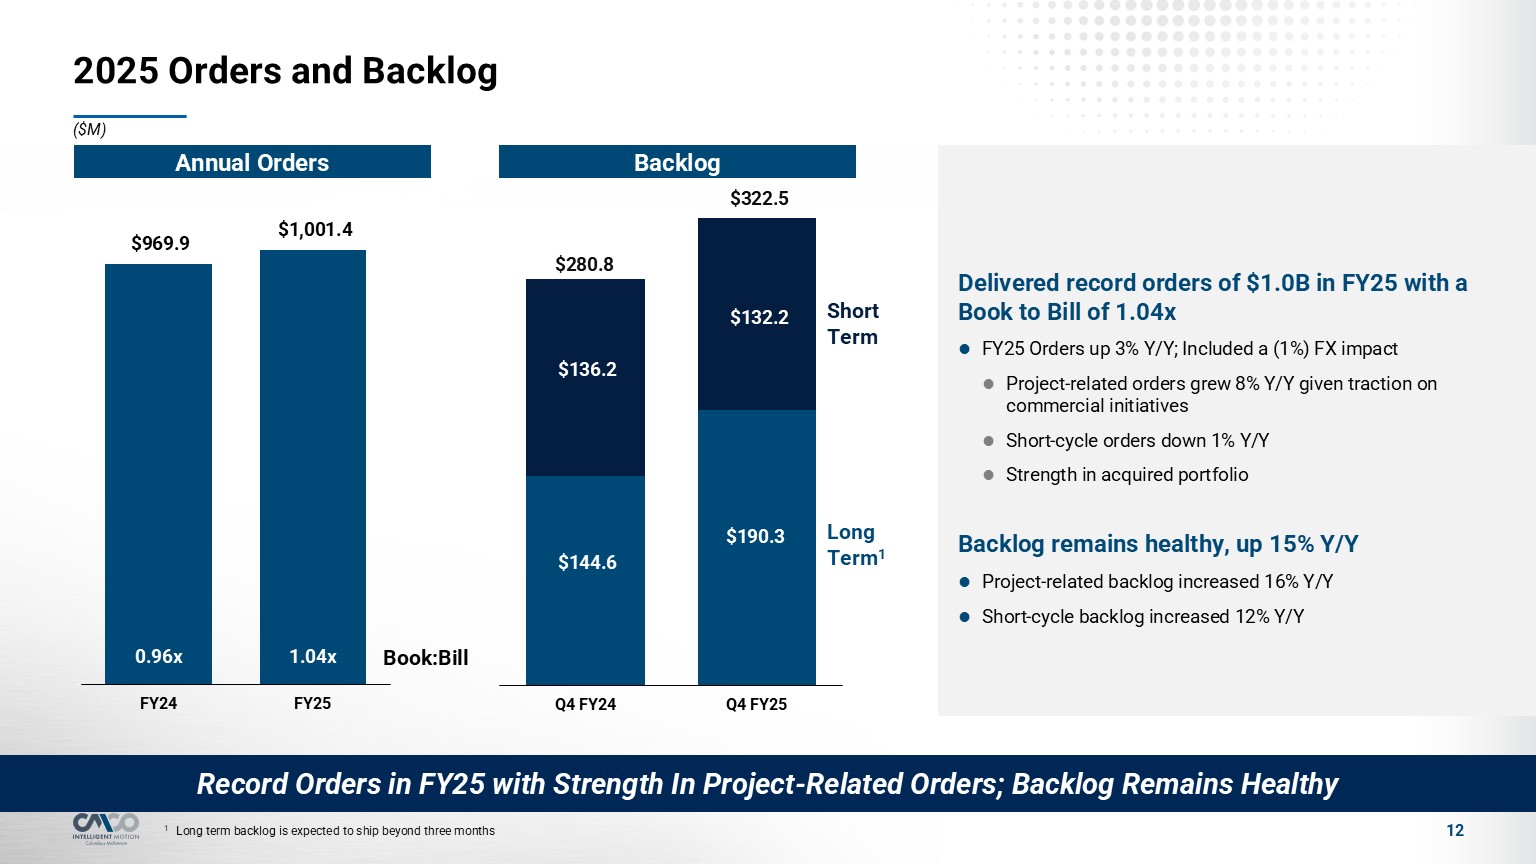
2025 Orders and Backlog 12 Book:Bill Short Term Long Term1 1 Long term
backlog is expected to ship beyond three months Record Orders in FY25 with Strength In Project-Related Orders; Backlog Remains Healthy Delivered record orders of $1.0B in FY25 with a Book to Bill of 1.04x FY25 Orders up 3% Y/Y; Included a
(1%) FX impact Project-related orders grew 8% Y/Y given traction on commercial initiatives Short-cycle orders down 1% Y/Y Strength in acquired portfolio Backlog remains healthy, up 15% Y/Y Project-related backlog increased 16% Y/Y
Short-cycle backlog increased 12% Y/Y ($M) Backlog Annual Orders
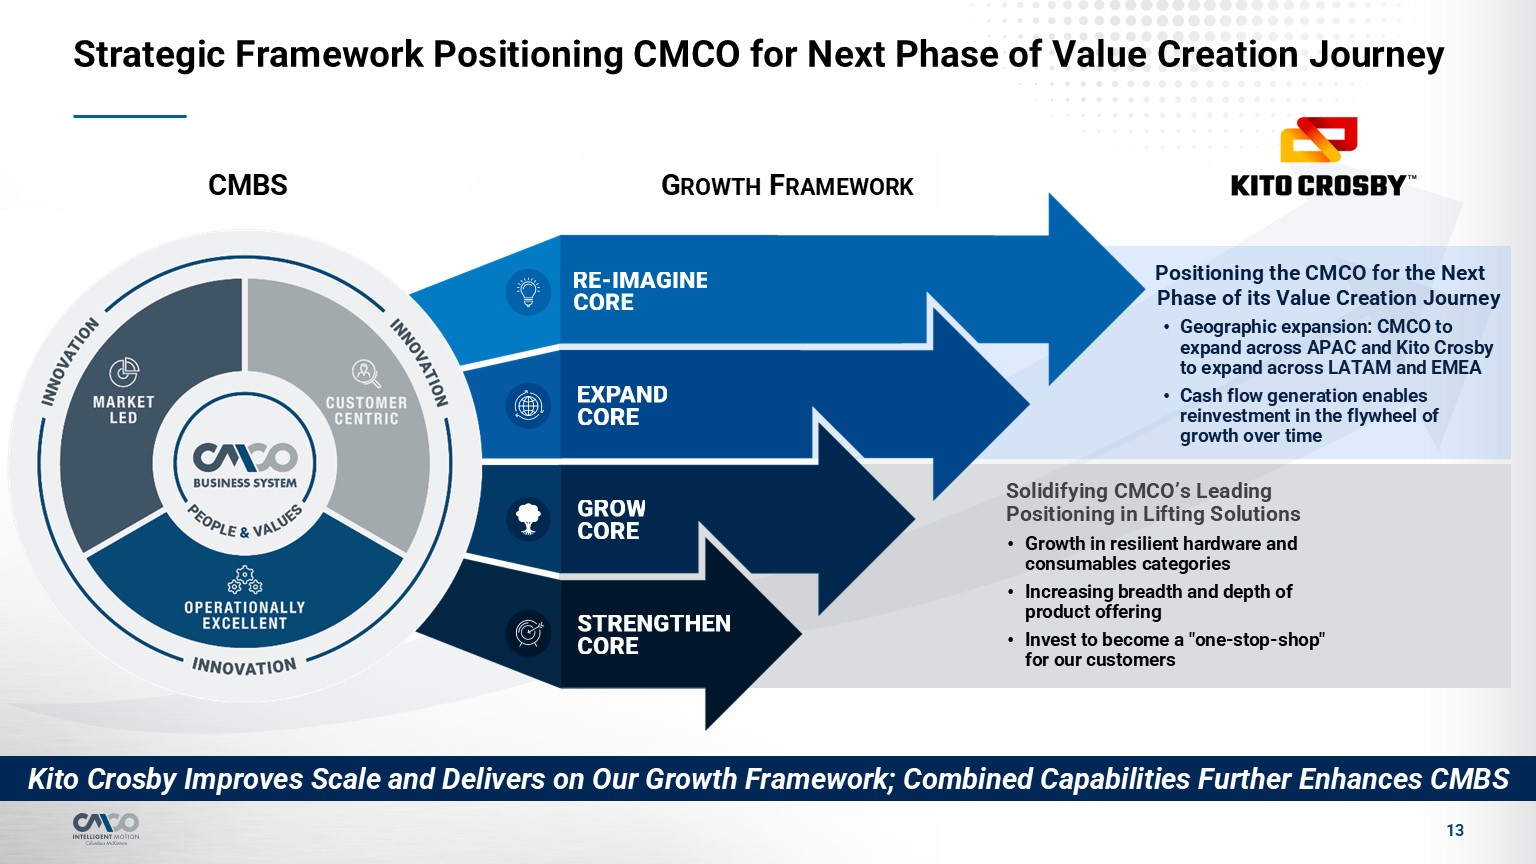
Strategic Framework Positioning CMCO for Next Phase of Value Creation
Journey 13 Solidifying CMCO’s Leading Positioning in Lifting Solutions Growth in resilient hardware and consumables categories Increasing breadth and depth of product offering Invest to become a "one-stop-shop" for our customers
Positioning the CMCO for the Next Phase of its Value Creation Journey Geographic expansion: CMCO to expand across APAC and Kito Crosby to expand across LATAM and EMEA Cash flow generation enables reinvestment in the flywheel of growth over
time Growth Framework CMBS Kito Crosby Improves Scale and Delivers on Our Growth Framework; Combined Capabilities Further Enhances CMBS
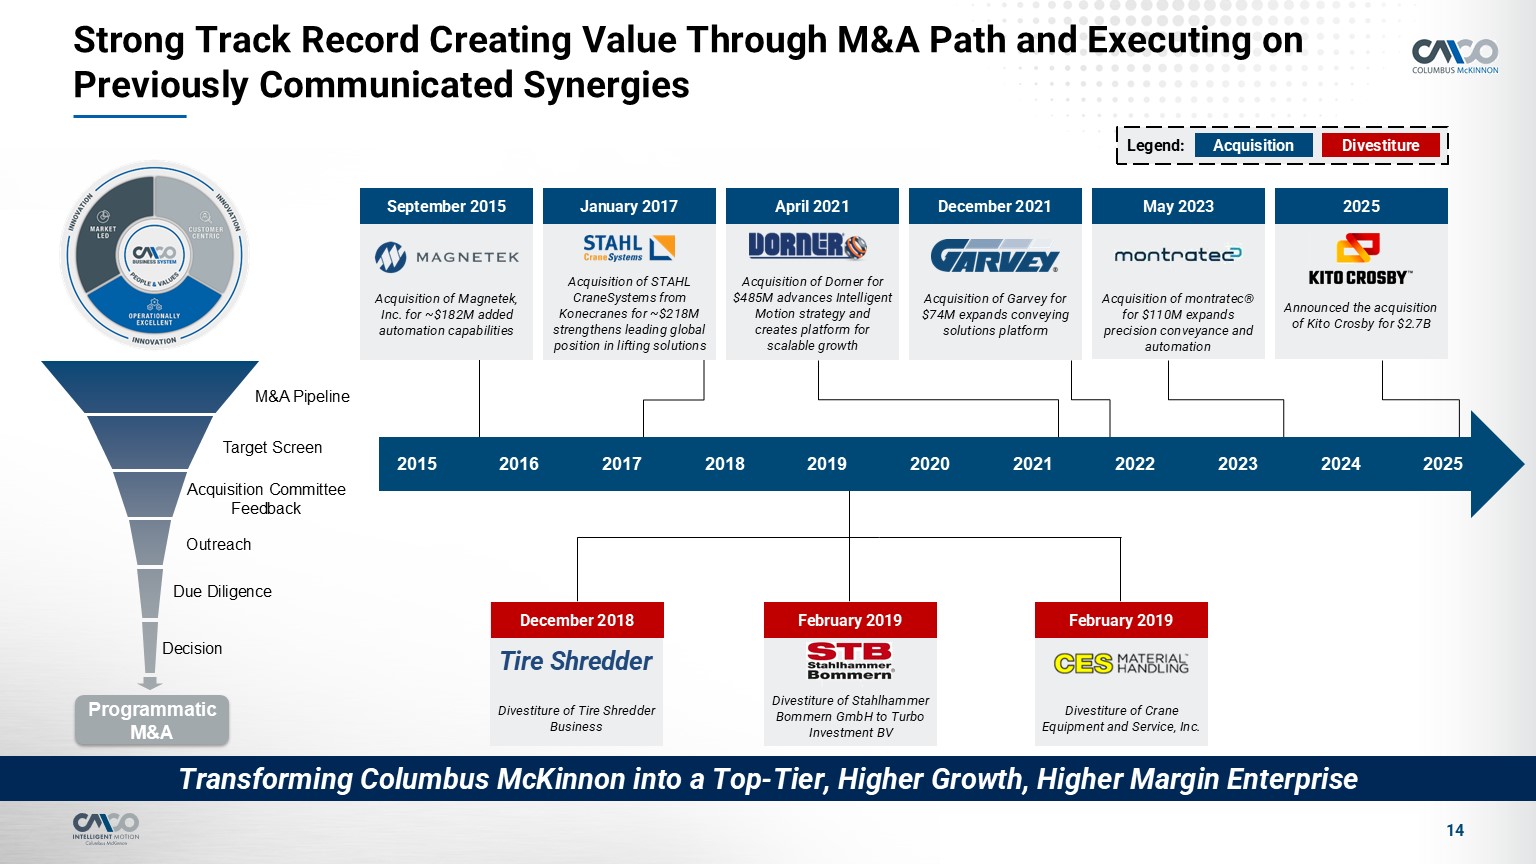
Transforming Columbus McKinnon into a Top-Tier, Higher Growth, Higher Margin
Enterprise Strong Track Record Creating Value Through M&A Path and Executing on Previously Communicated Synergies 14 January 2017 Acquisition of STAHL CraneSystems from Konecranes for ~$218M strengthens leading global position in
lifting solutions Programmatic M&A M&A Pipeline Target Screen Acquisition CommitteeFeedback Outreach Due Diligence Decision Acquisition of Magnetek, Inc. for ~$182M added automation capabilities Divestiture of Stahlhammer
Bommern GmbH to Turbo Investment BV April 2021 Acquisition of Dorner for $485M advances Intelligent Motion strategy and creates platform for scalable growth Divestiture of Crane Equipment and Service, Inc. Divestiture of Tire Shredder
Business Tire Shredder December 2021 Acquisition of Garvey for $74M expands conveying solutions platform May 2023 Acquisition of montratec® for $110M expands precision conveyance and automation September 2015 January 2017 April
2021 December 2021 May 2023 December 2018 February 2019 February 2019 2016 2017 2018 2019 2020 2021 2015 2022 2023 2025 2024 Announced the acquisition of Kito Crosby for $2.7B 2025 Legend: Divestiture Acquisition
Kito Crosby Acquisition provides Strong Business Rationale to Scale with Top Tier
Margins 2A
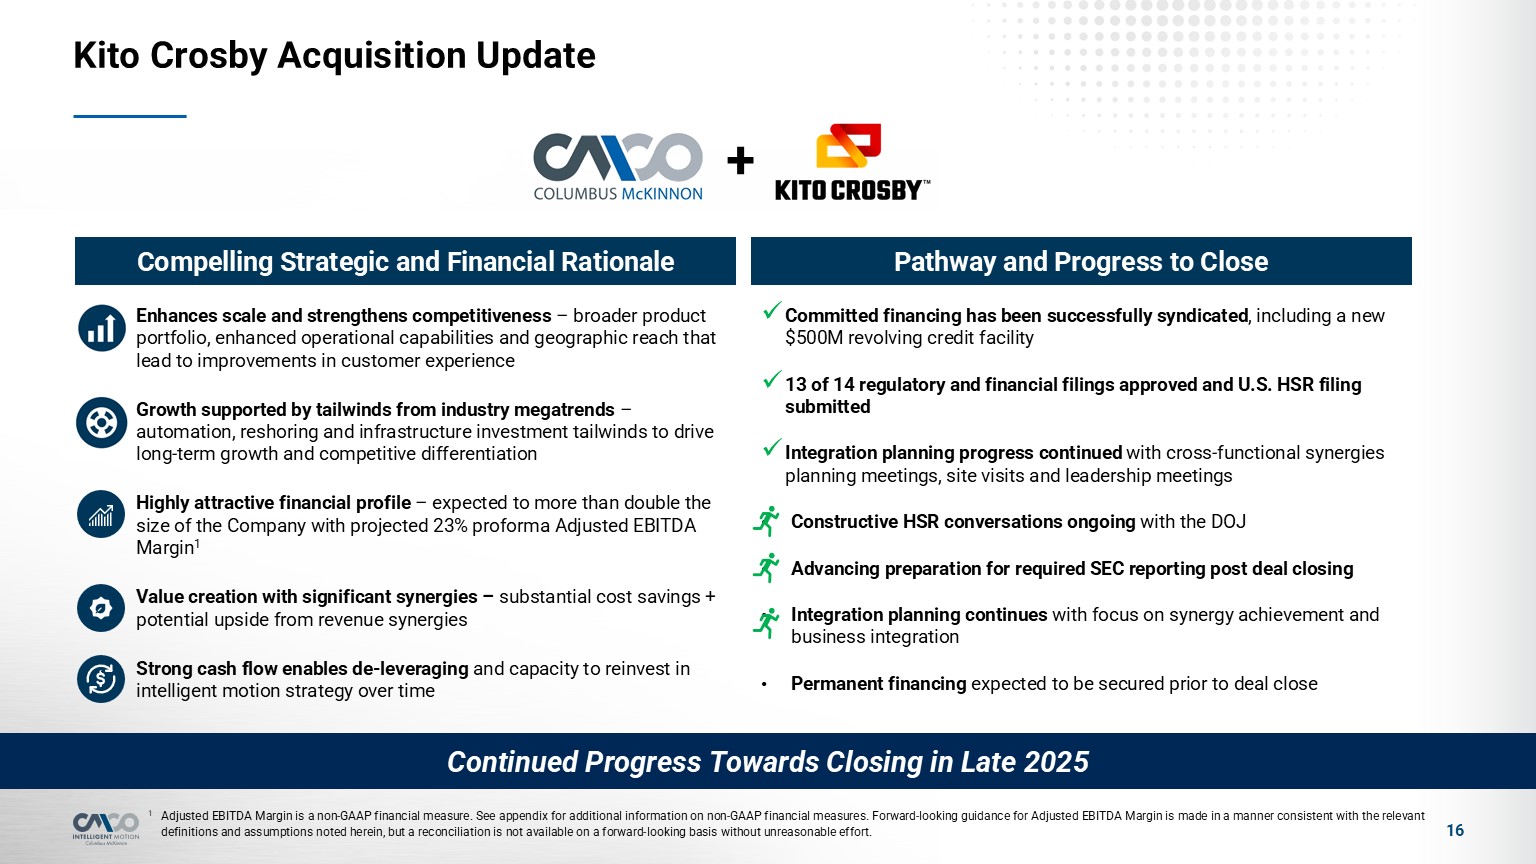
16 Compelling Strategic and Financial Rationale Pathway and Progress to
Close Committed financing has been successfully syndicated, including a new $500M revolving credit facility 13 of 14 regulatory and financial filings approved and U.S. HSR filing submitted Integration planning progress continued with
cross-functional synergies planning meetings, site visits and leadership meetings Constructive HSR conversations ongoing with the DOJ Advancing preparation for required SEC reporting post deal closing Integration planning continues with
focus on synergy achievement and business integration Permanent financing expected to be secured prior to deal close Continued Progress Towards Closing in Late 2025 Enhances scale and strengthens competitiveness – broader product portfolio,
enhanced operational capabilities and geographic reach that lead to improvements in customer experience Growth supported by tailwinds from industry megatrends – automation, reshoring and infrastructure investment tailwinds to drive long-term
growth and competitive differentiation Highly attractive financial profile – expected to more than double the size of the Company with projected 23% proforma Adjusted EBITDA Margin1 Value creation with significant synergies – substantial
cost savings + potential upside from revenue synergies Strong cash flow enables de-leveraging and capacity to reinvest in intelligent motion strategy over time + Kito Crosby Acquisition Update 1 Adjusted EBITDA Margin is a non-GAAP
financial measure. See appendix for additional information on non-GAAP financial measures. Forward-looking guidance for Adjusted EBITDA Margin is made in a manner consistent with the relevant definitions and assumptions noted herein, but a
reconciliation is not available on a forward-looking basis without unreasonable effort.
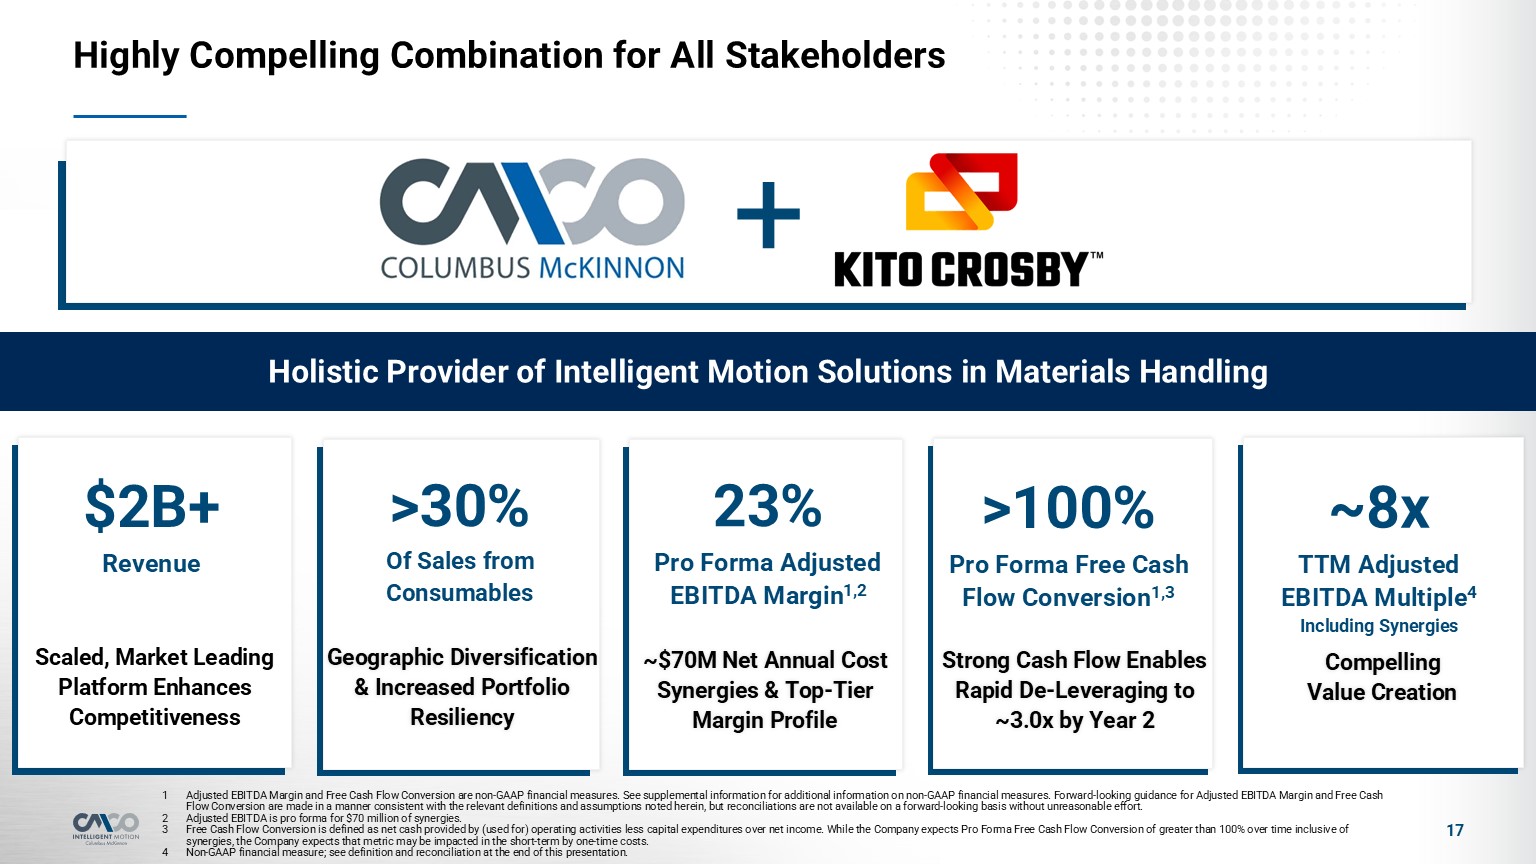
Highly Compelling Combination for All Stakeholders 17 Holistic Provider of
Intelligent Motion Solutions in Materials Handling + Adjusted EBITDA Margin and Free Cash Flow Conversion are non-GAAP financial measures. See supplemental information for additional information on non-GAAP financial measures. Forward-looking
guidance for Adjusted EBITDA Margin and Free Cash Flow Conversion are made in a manner consistent with the relevant definitions and assumptions noted herein, but reconciliations are not available on a forward-looking basis without unreasonable
effort. Adjusted EBITDA is pro forma for $70 million of synergies. Free Cash Flow Conversion is defined as net cash provided by (used for) operating activities less capital expenditures over net income. While the Company expects Pro Forma
Free Cash Flow Conversion of greater than 100% over time inclusive of synergies, the Company expects that metric may be impacted in the short-term by one-time costs. Non-GAAP financial measure; see definition and reconciliation at the end of
this presentation. Scaled, Market Leading Platform Enhances Competitiveness $2B+ Revenue 23% Pro Forma Adjusted EBITDA Margin1,2 >100% Pro Forma Free Cash Flow Conversion1,3 Strong Cash Flow Enables Rapid De-Leveraging to ~3.0x by
Year 2 ~8x TTM Adjusted EBITDA Multiple4 Including Synergies Compelling Value Creation ~$70M Net Annual Cost Synergies & Top-Tier Margin Profile >30% Of Sales from Consumables Geographic Diversification & Increased
Portfolio Resiliency
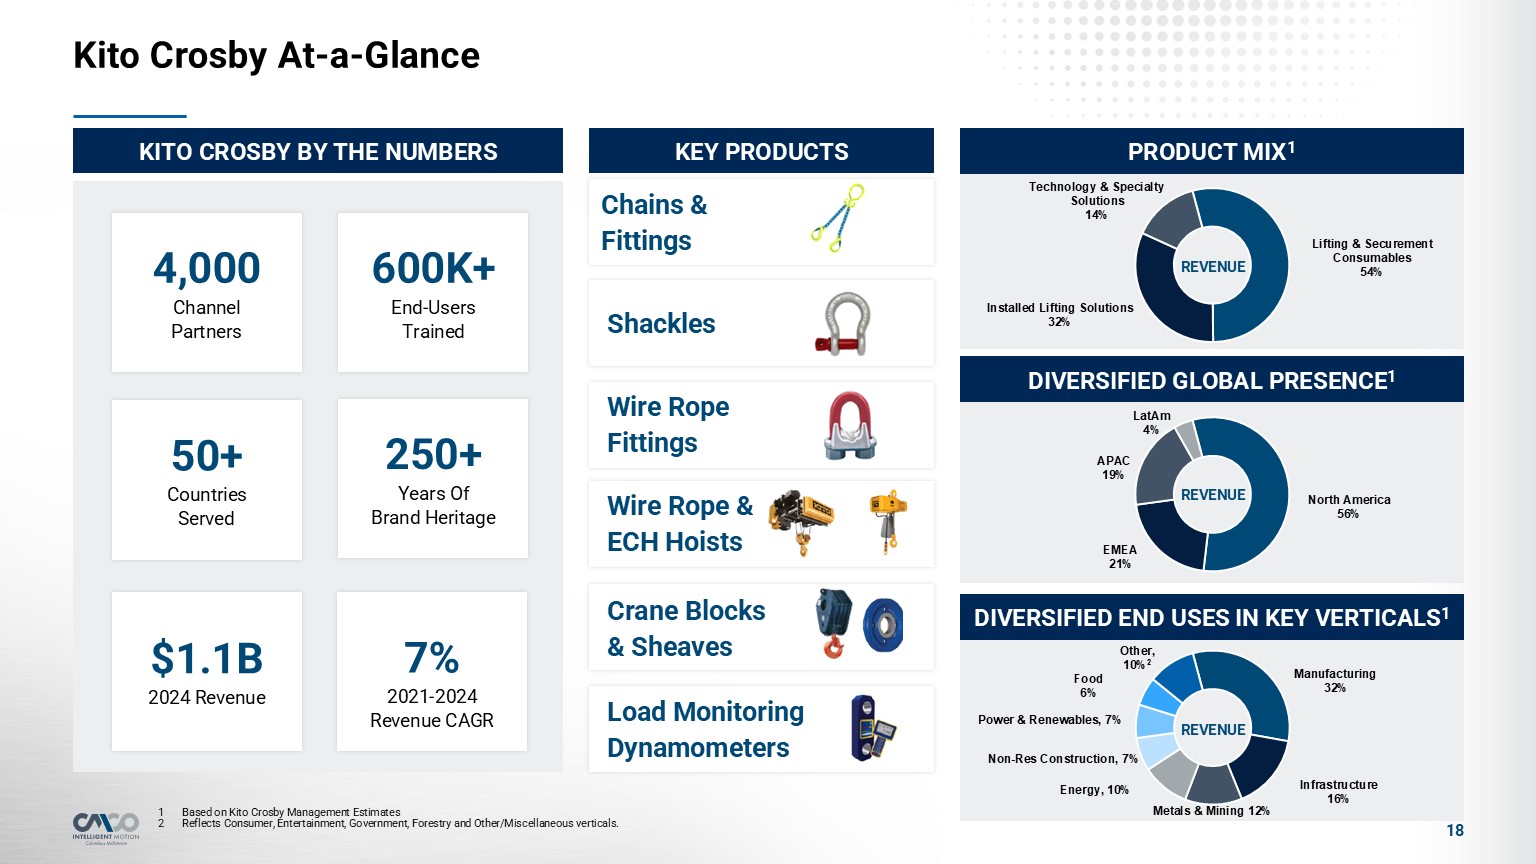
Kito Crosby At-a-Glance 18 4,000Channel
Partners 600K+End-UsersTrained 250+Years OfBrand Heritage 50+CountriesServed $1.1B2024 Revenue 7%2021-2024Revenue CAGR KITO CROSBY BY THE NUMBERS Key Industry Brands KEY PRODUCTS Chains & Fittings Shackles Wire Rope
Fittings Wire Rope & ECH Hoists Crane Blocks & Sheaves Load Monitoring Dynamometers PRODUCT MIX1 REVENUE DIVERSIFIED GLOBAL PRESENCE1 REVENUE DIVERSIFIED END USES IN KEY VERTICALS1 REVENUE Based on Kito Crosby Management
Estimates Reflects Consumer, Entertainment, Government, Forestry and Other/Miscellaneous verticals.
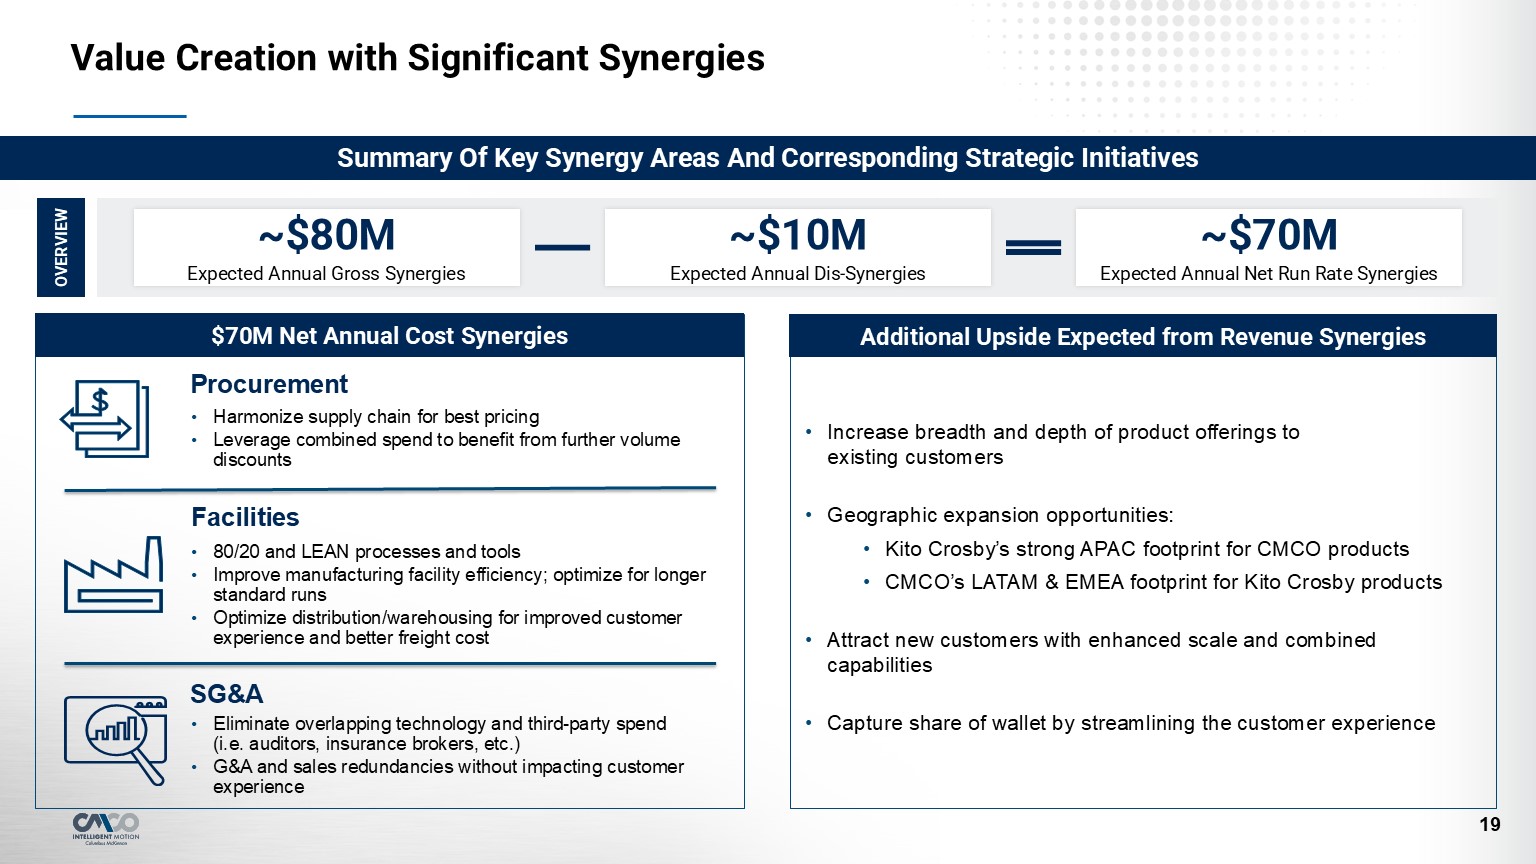
Value Creation with Significant Synergies 19 Additional Upside Expected from
Revenue Synergies $70M Net Annual Cost Synergies Increase breadth and depth of product offerings to existing customers Geographic expansion opportunities: Kito Crosby’s strong APAC footprint for CMCO products CMCO’s LATAM & EMEA
footprint for Kito Crosby products Attract new customers with enhanced scale and combined capabilities Capture share of wallet by streamlining the customer experience Harmonize supply chain for best pricing Leverage combined spend to
benefit from further volume discounts 80/20 and LEAN processes and tools Improve manufacturing facility efficiency; optimize for longer standard runs Optimize distribution/warehousing for improved customer experience and better freight
cost Eliminate overlapping technology and third-party spend (i.e. auditors, insurance brokers, etc.) G&A and sales redundancies without impacting customer experience Procurement Facilities SG&A ~$80MExpected Annual Gross
Synergies ~$10MExpected Annual Dis-Synergies ~$70MExpected Annual Net Run Rate Synergies OVERVIEW Summary Of Key Synergy Areas And Corresponding Strategic Initiatives
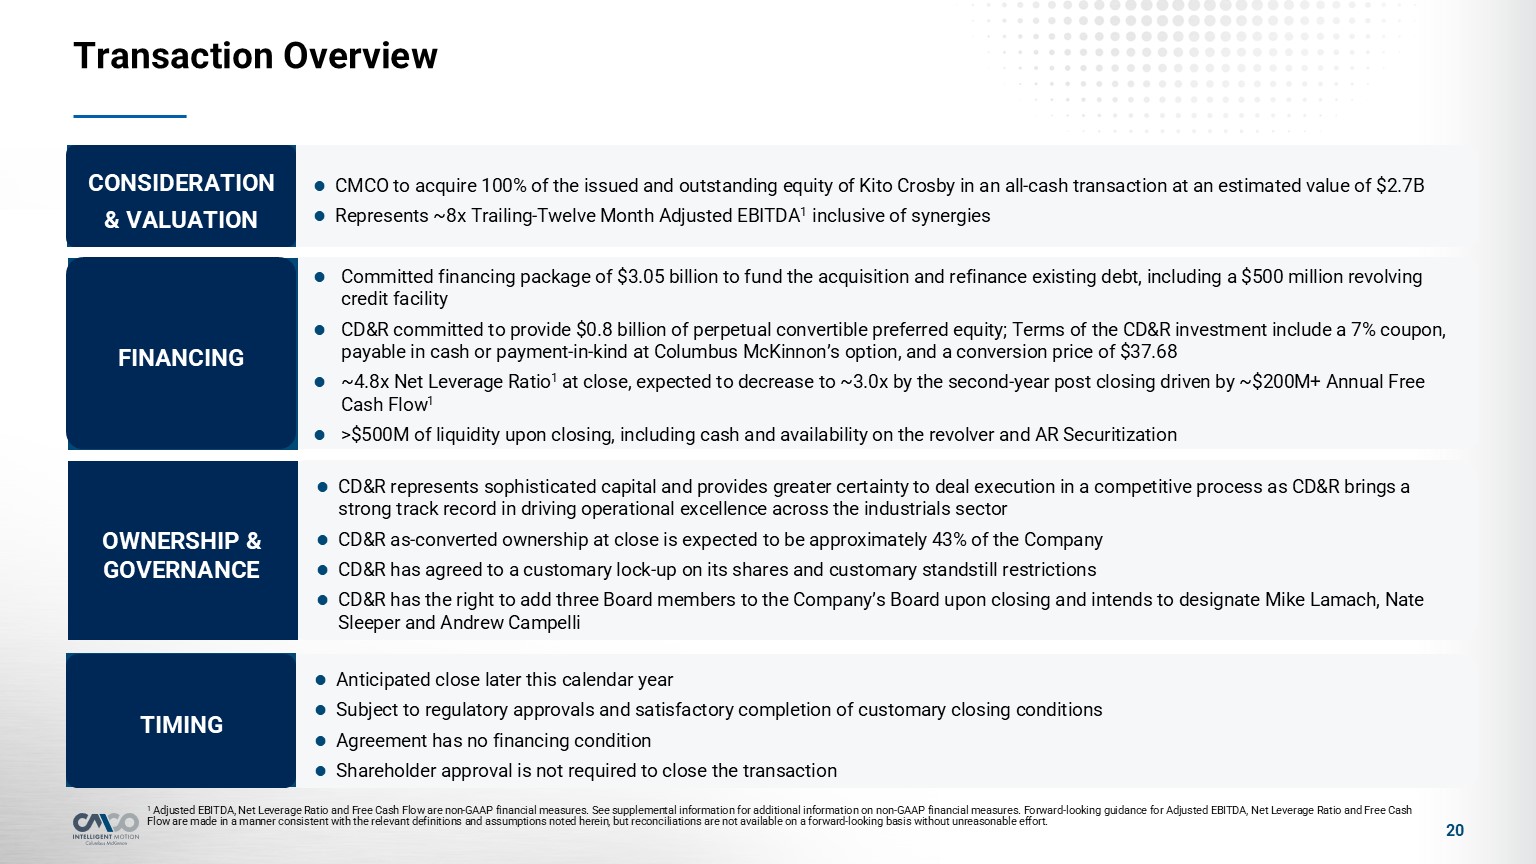
Transaction Overview 20 CD&R represents sophisticated capital and provides
greater certainty to deal execution in a competitive process as CD&R brings a strong track record in driving operational excellence across the industrials sector CD&R as-converted ownership at close is expected to be approximately 43%
of the Company CD&R has agreed to a customary lock-up on its shares and customary standstill restrictions CD&R has the right to add three Board members to the Company’s Board upon closing and intends to designate Mike Lamach, Nate
Sleeper and Andrew Campelli Anticipated close later this calendar year Subject to regulatory approvals and satisfactory completion of customary closing conditions Agreement has no financing condition Shareholder approval is not required to
close the transaction CMCO to acquire 100% of the issued and outstanding equity of Kito Crosby in an all-cash transaction at an estimated value of $2.7B Represents ~8x Trailing-Twelve Month Adjusted EBITDA1 inclusive of
synergies CONSIDERATION & VALUATION Committed financing package of $3.05 billion to fund the acquisition and refinance existing debt, including a $500 million revolving credit facility CD&R committed to provide $0.8 billion of
perpetual convertible preferred equity; Terms of the CD&R investment include a 7% coupon, payable in cash or payment-in-kind at Columbus McKinnon’s option, and a conversion price of $37.68 ~4.8x Net Leverage Ratio1 at close, expected to
decrease to ~3.0x by the second-year post closing driven by ~$200M+ Annual Free Cash Flow1 >$500M of liquidity upon closing, including cash and availability on the revolver and AR Securitization FINANCING OWNERSHIP &
GOVERNANCE TIMING 1 Adjusted EBITDA, Net Leverage Ratio and Free Cash Flow are non-GAAP financial measures. See supplemental information for additional information on non-GAAP financial measures. Forward-looking guidance for Adjusted EBITDA,
Net Leverage Ratio and Free Cash Flow are made in a manner consistent with the relevant definitions and assumptions noted herein, but reconciliations are not available on a forward-looking basis without unreasonable effort.
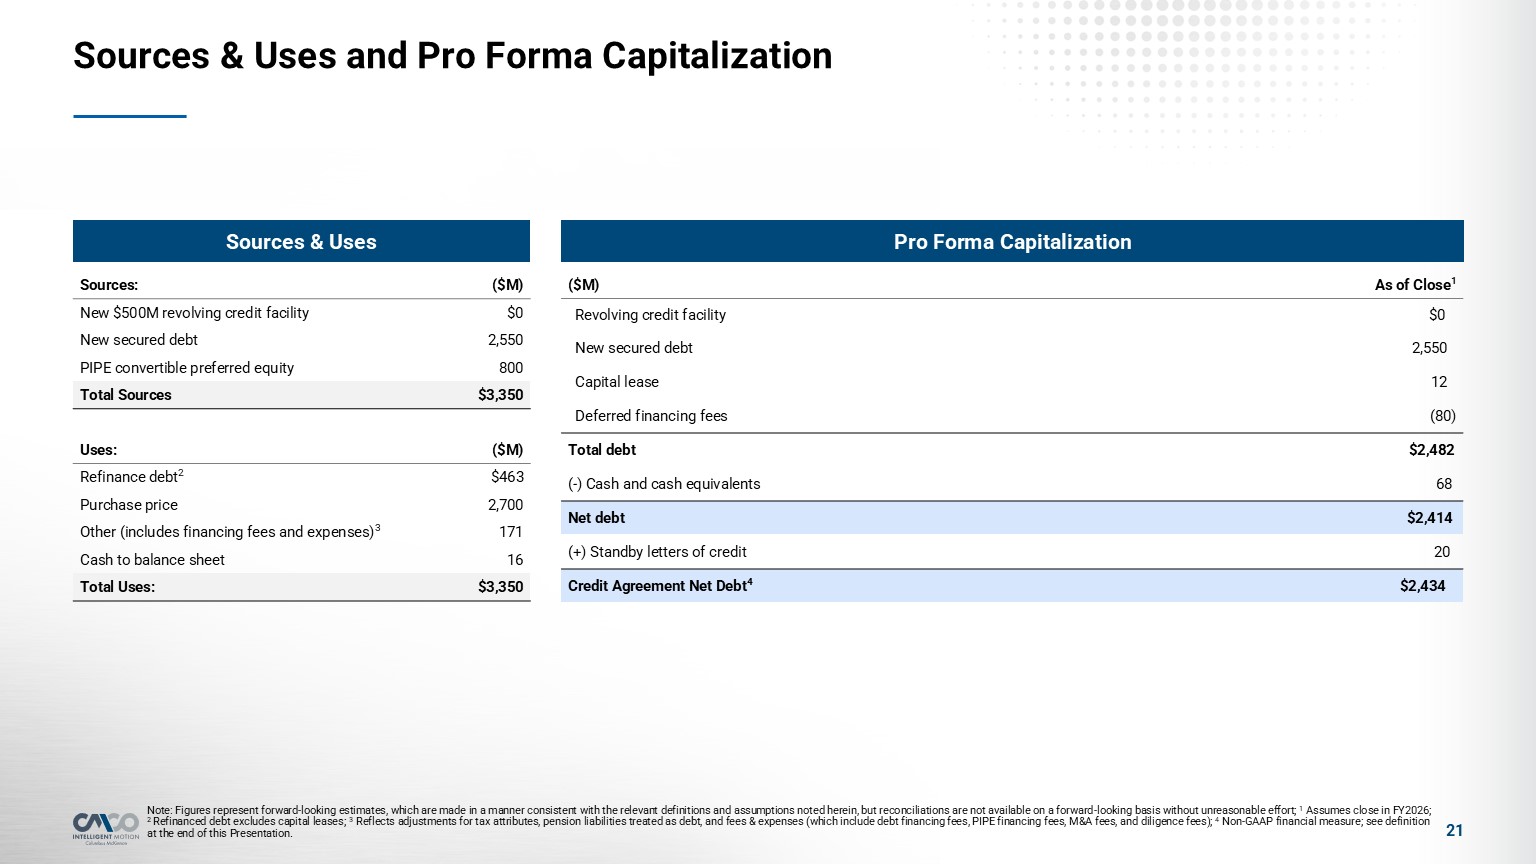
Sources & Uses and Pro Forma Capitalization 21 Sources: ($M) New $500M
revolving credit facility $0 New secured debt 2,550 PIPE convertible preferred equity 800 Total Sources $3,350 Uses: ($M) Refinance debt2 $463 Purchase price 2,700 Other (includes financing fees and expenses)3 171 Cash
to balance sheet 16 Total Uses: $3,350 Sources & Uses Pro Forma Capitalization Note: Figures represent forward-looking estimates, which are made in a manner consistent with the relevant definitions and assumptions noted herein, but
reconciliations are not available on a forward-looking basis without unreasonable effort; 1 Assumes close in FY2026; 2 Refinanced debt excludes capital leases; 3 Reflects adjustments for tax attributes, pension liabilities treated as debt, and
fees & expenses (which include debt financing fees, PIPE financing fees, M&A fees, and diligence fees); 4 Non-GAAP financial measure; see definition at the end of this Presentation. ($M) As of Close1 Revolving credit facility $0
New secured debt 2,550 Capital lease 12 Deferred financing fees (80) Total debt $2,482 (-) Cash and cash equivalents 68 Net debt $2,414 (+) Standby letters of credit 20 Credit Agreement Net Debt4 $2,434
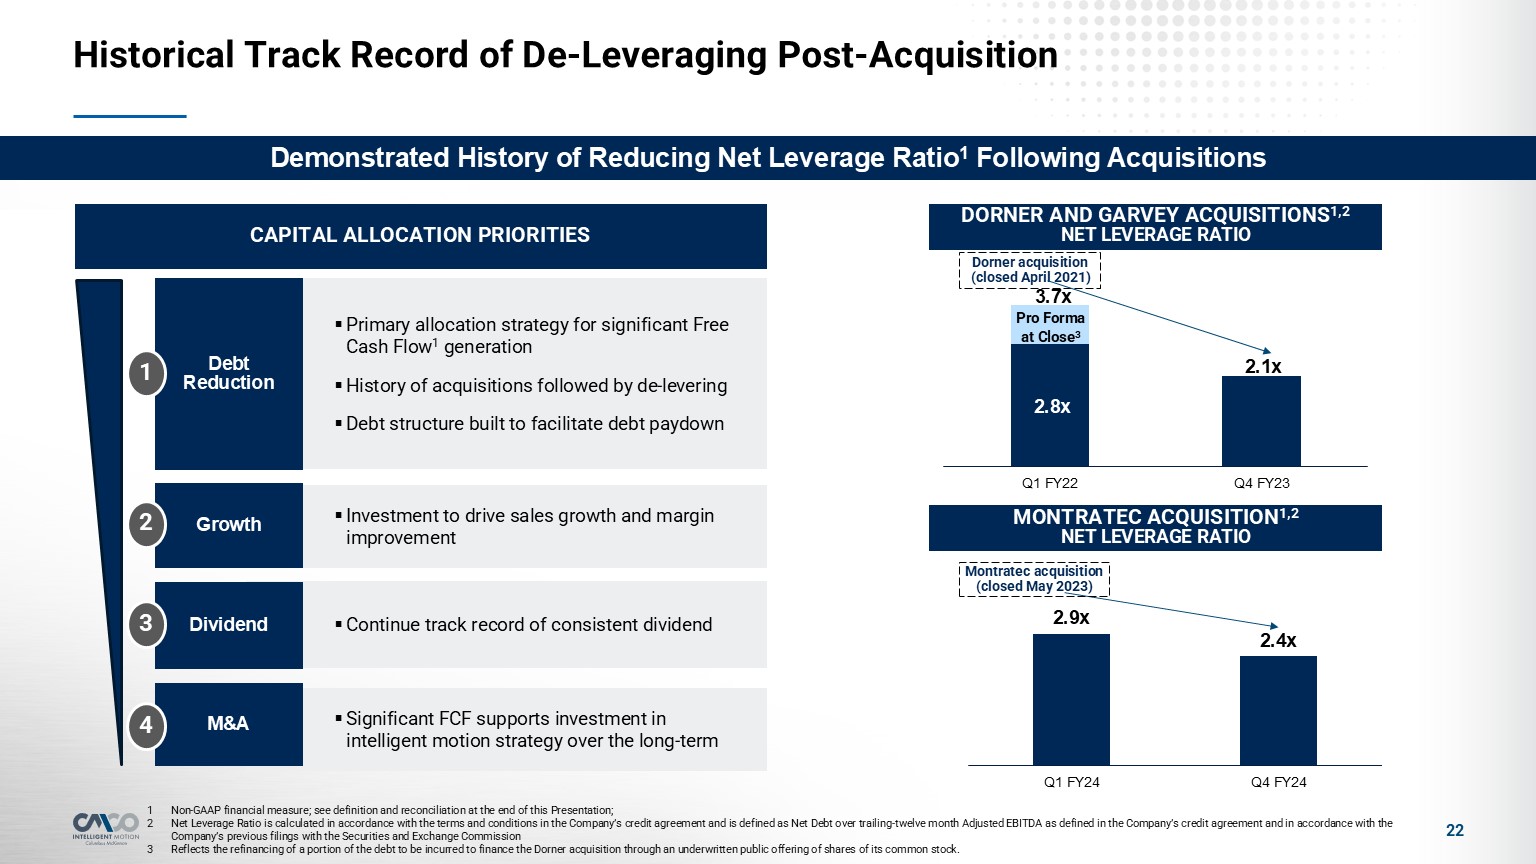
22 Historical Track Record of De-Leveraging Post-Acquisition Non-GAAP financial
measure; see definition and reconciliation at the end of this Presentation; Net Leverage Ratio is calculated in accordance with the terms and conditions in the Company’s credit agreement and is defined as Net Debt over trailing-twelve month
Adjusted EBITDA as defined in the Company’s credit agreement and in accordance with the Company’s previous filings with the Securities and Exchange Commission Reflects the refinancing of a portion of the debt to be incurred to finance the
Dorner acquisition through an underwritten public offering of shares of its common stock. DORNER AND GARVEY ACQUISITIONS1,2 NET LEVERAGE RATIO MONTRATEC ACQUISITION1,2 NET LEVERAGE RATIO Dorner acquisition (closed April 2021) Montratec
acquisition (closed May 2023) Pro Forma at Close3 Primary allocation strategy for significant Free Cash Flow1 generation History of acquisitions followed by de-levering Debt structure built to facilitate debt paydown CAPITAL ALLOCATION
PRIORITIES Debt Reduction Investment to drive sales growth and margin improvement Growth Continue track record of consistent dividend Significant FCF supports investment in intelligent motion strategy over the
long-term Dividend M&A 1 2 3 4 Demonstrated History of Reducing Net Leverage Ratio1 Following Acquisitions
Robust Governance Process in Evaluating the Kito Crosby Acquisition Overseen by
Board 2B
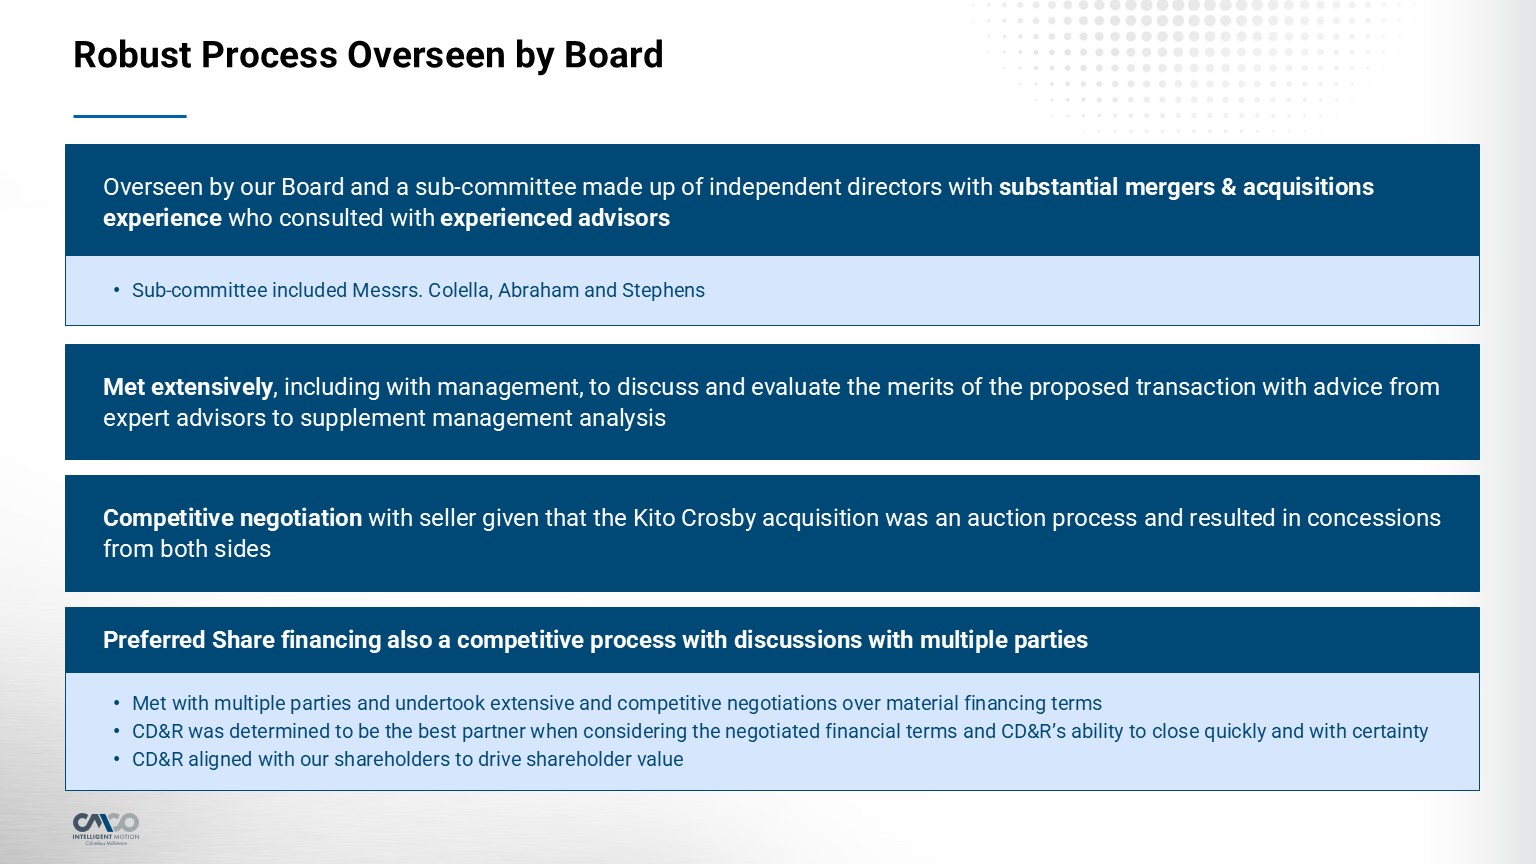
Overseen by our Board and a sub-committee made up of independent directors with
substantial mergers & acquisitions experience who consulted with experienced advisors Met extensively, including with management, to discuss and evaluate the merits of the proposed transaction with advice from expert advisors to supplement
management analysis Competitive negotiation with seller given that the Kito Crosby acquisition was an auction process and resulted in concessions from both sides Preferred Share financing also a competitive process with discussions with
multiple parties Met with multiple parties and undertook extensive and competitive negotiations over material financing terms CD&R was determined to be the best partner when considering the negotiated financial terms and CD&R’s
ability to close quickly and with certainty CD&R aligned with our shareholders to drive shareholder value Robust Process Overseen by Board Sub-committee included Messrs. Colella, Abraham and Stephens
Approval of the Preferred Share Financing-Related Proposals #4, 5 and 6 2C
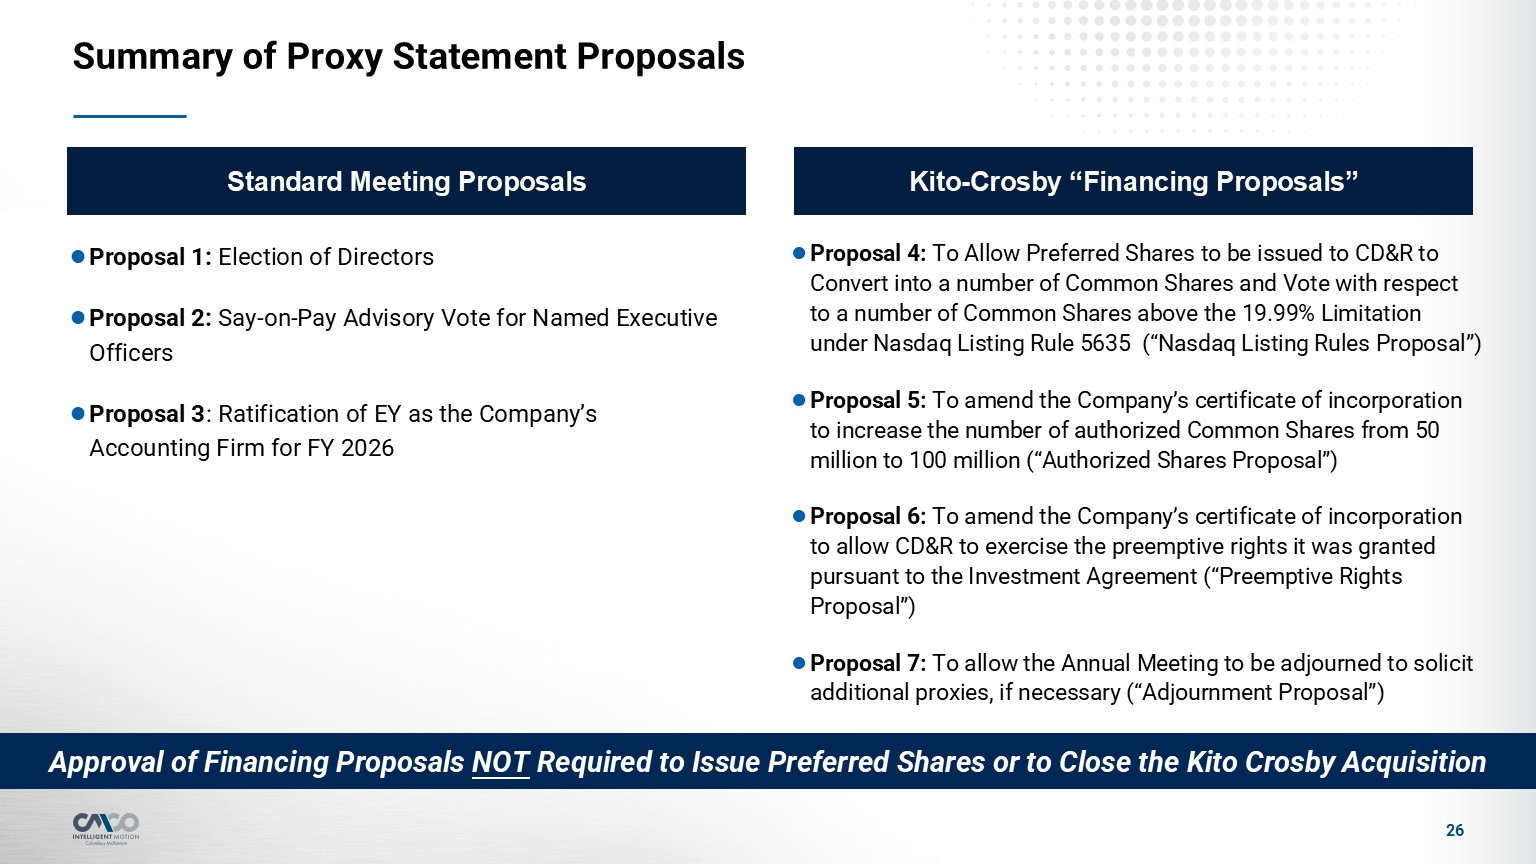
Summary of Proxy Statement Proposals Proposal 1: Election of Directors Proposal
2: Say-on-Pay Advisory Vote for Named Executive Officers Proposal 3: Ratification of EY as the Company’s Accounting Firm for FY 2026 Standard Meeting Proposals Kito-Crosby “Financing Proposals” Proposal 4: To Allow Preferred Shares to be
issued to CD&R to Convert into a number of Common Shares and Vote with respect to a number of Common Shares above the 19.99% Limitation under Nasdaq Listing Rule 5635 (“Nasdaq Listing Rules Proposal”) Proposal 5: To amend the Company’s
certificate of incorporation to increase the number of authorized Common Shares from 50 million to 100 million (“Authorized Shares Proposal”) Proposal 6: To amend the Company’s certificate of incorporation to allow CD&R to exercise the
preemptive rights it was granted pursuant to the Investment Agreement (“Preemptive Rights Proposal”) Proposal 7: To allow the Annual Meeting to be adjourned to solicit additional proxies, if necessary (“Adjournment Proposal”) 26 Approval of
Financing Proposals NOT Required to Issue Preferred Shares or to Close the Kito Crosby Acquisition
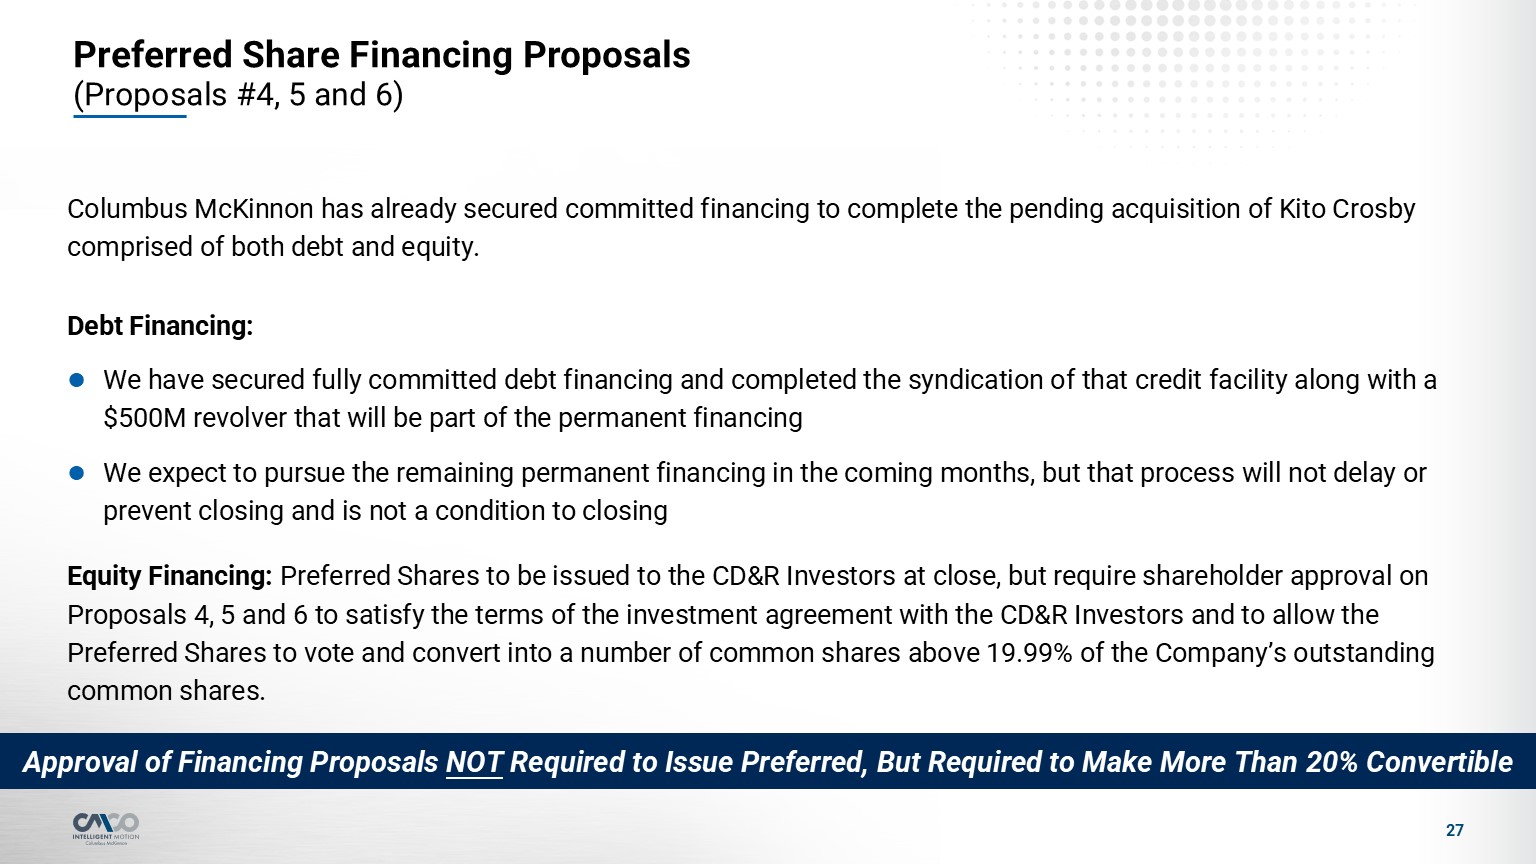
27 Columbus McKinnon has already secured committed financing to complete the
pending acquisition of Kito Crosby comprised of both debt and equity. Debt Financing: We have secured fully committed debt financing and completed the syndication of that credit facility along with a $500M revolver that will be part of the
permanent financing We expect to pursue the remaining permanent financing in the coming months, but that process will not delay or prevent closing and is not a condition to closing Equity Financing: Preferred Shares to be issued to the
CD&R Investors at close, but require shareholder approval on Proposals 4, 5 and 6 to satisfy the terms of the investment agreement with the CD&R Investors and to allow the Preferred Shares to vote and convert into a number of common
shares above 19.99% of the Company’s outstanding common shares. Preferred Share Financing Proposals (Proposals #4, 5 and 6) Approval of Financing Proposals NOT Required to Issue Preferred, But Required to Make More Than 20% Convertible
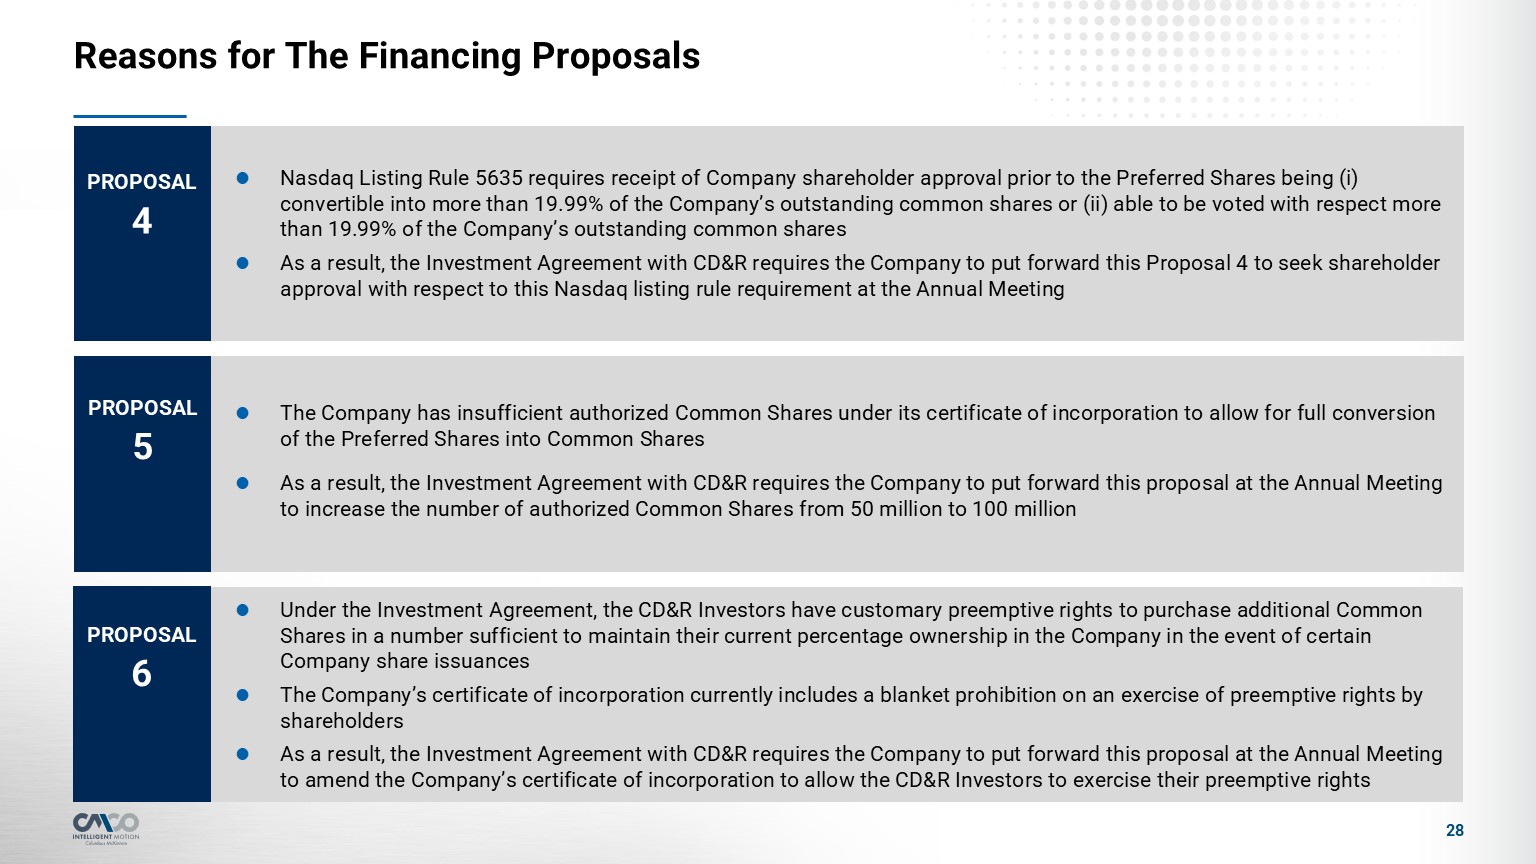
Reasons for The Financing Proposals Nasdaq Listing Rule 5635 requires receipt of
Company shareholder approval prior to the Preferred Shares being (i) convertible into more than 19.99% of the Company’s outstanding common shares or (ii) able to be voted with respect more than 19.99% of the Company’s outstanding common
shares As a result, the Investment Agreement with CD&R requires the Company to put forward this Proposal 4 to seek shareholder approval with respect to this Nasdaq listing rule requirement at the Annual Meeting 28 The Company has
insufficient authorized Common Shares under its certificate of incorporation to allow for full conversion of the Preferred Shares into Common Shares As a result, the Investment Agreement with CD&R requires the Company to put forward this
proposal at the Annual Meeting to increase the number of authorized Common Shares from 50 million to 100 million Under the Investment Agreement, the CD&R Investors have customary preemptive rights to purchase additional Common Shares in a
number sufficient to maintain their current percentage ownership in the Company in the event of certain Company share issuances The Company’s certificate of incorporation currently includes a blanket prohibition on an exercise of preemptive
rights by shareholders As a result, the Investment Agreement with CD&R requires the Company to put forward this proposal at the Annual Meeting to amend the Company’s certificate of incorporation to allow the CD&R Investors to exercise
their preemptive rights PROPOSAL 4 PROPOSAL 5 PROPOSAL 6
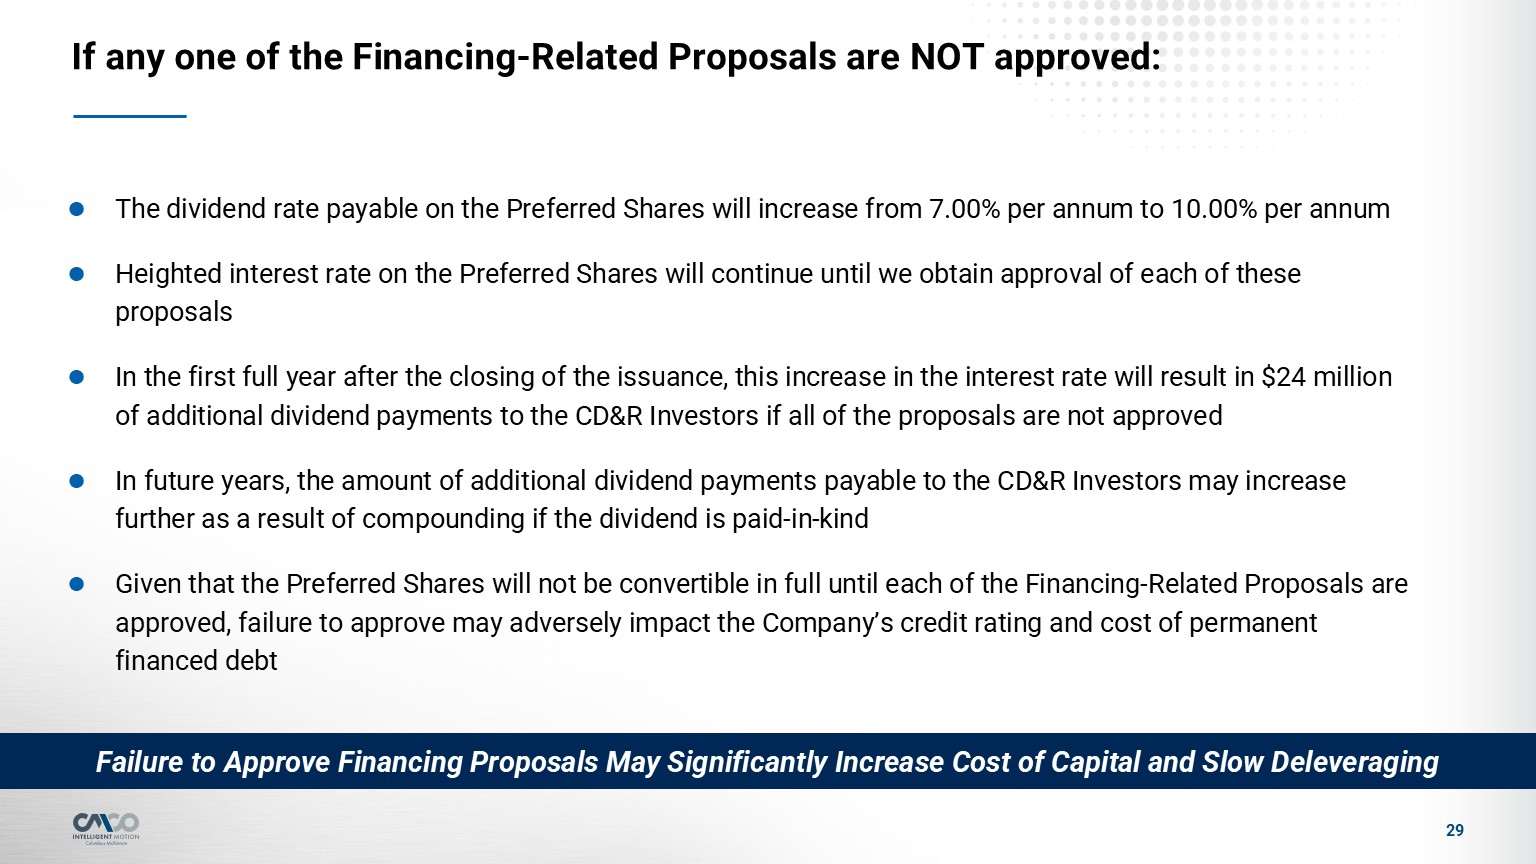
If any one of the Financing-Related Proposals are NOT approved: 29 The dividend
rate payable on the Preferred Shares will increase from 7.00% per annum to 10.00% per annum Heighted interest rate on the Preferred Shares will continue until we obtain approval of each of these proposals In the first full year after the
closing of the issuance, this increase in the interest rate will result in $24 million of additional dividend payments to the CD&R Investors if all of the proposals are not approved In future years, the amount of additional dividend
payments payable to the CD&R Investors may increase further as a result of compounding if the dividend is paid-in-kind Given that the Preferred Shares will not be convertible in full until each of the Financing-Related Proposals are
approved, failure to approve may adversely impact the Company’s credit rating and cost of permanent financed debt Failure to Approve Financing Proposals May Significantly Increase Cost of Capital and Slow Deleveraging
Brief Description of Terms of Preferred Shares to be Issued to the CD&R
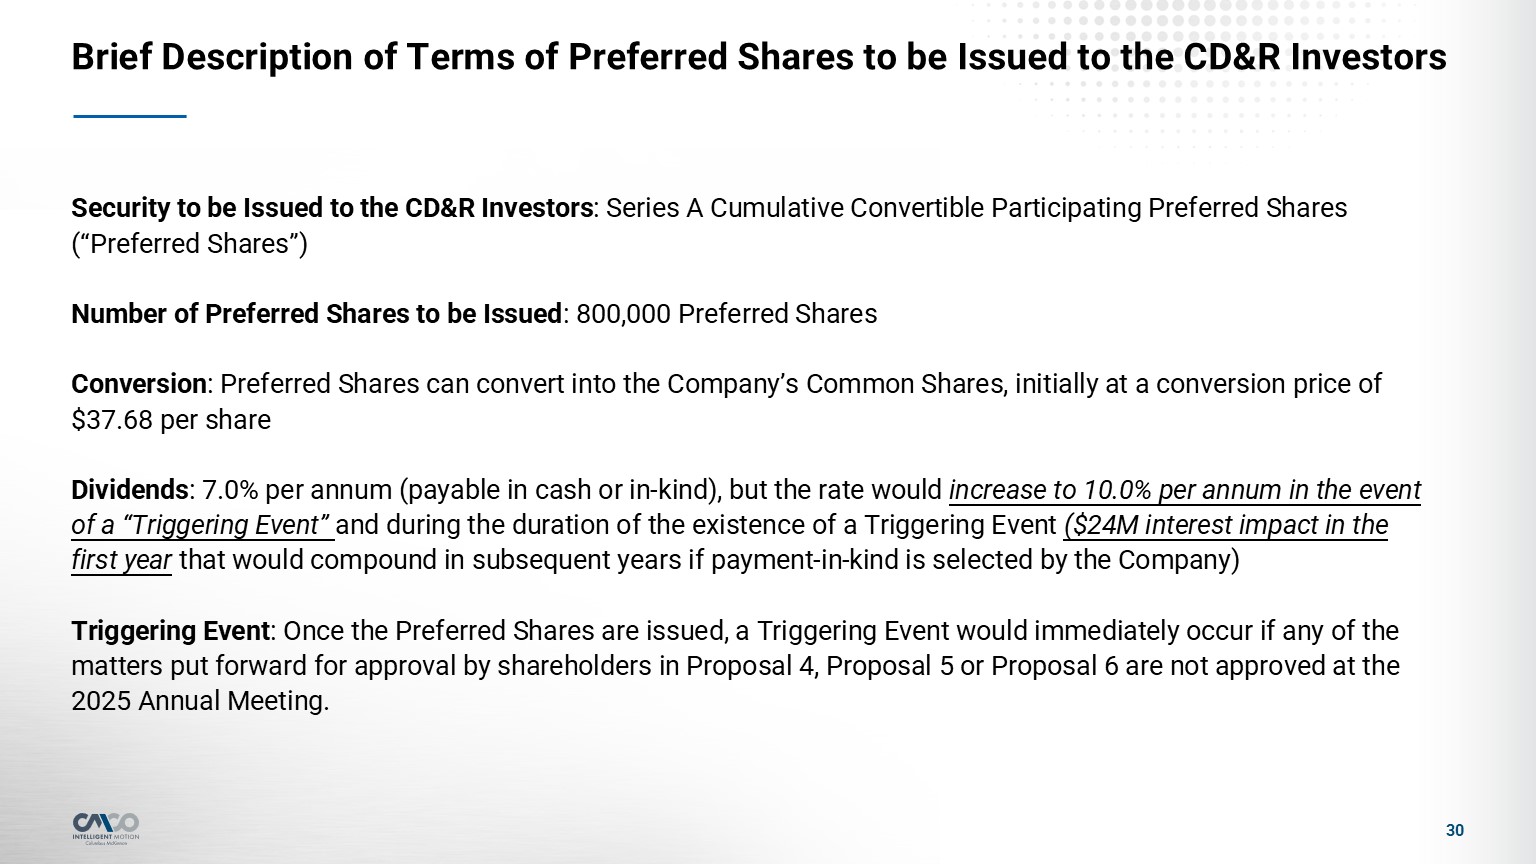
Investors Security to be Issued to the CD&R Investors: Series A Cumulative Convertible Participating Preferred Shares (“Preferred Shares”) Number of Preferred Shares to be Issued: 800,000 Preferred Shares Conversion: Preferred Shares can
convert into the Company’s Common Shares, initially at a conversion price of $37.68 per share Dividends: 7.0% per annum (payable in cash or in-kind), but the rate would increase to 10.0% per annum in the event of a “Triggering Event” and
during the duration of the existence of a Triggering Event ($24M interest impact in the first year that would compound in subsequent years if payment-in-kind is selected by the Company) Triggering Event: Once the Preferred Shares are issued, a
Triggering Event would immediately occur if any of the matters put forward for approval by shareholders in Proposal 4, Proposal 5 or Proposal 6 are not approved at the 2025 Annual Meeting. 30

CMCO Governance Highlights 3
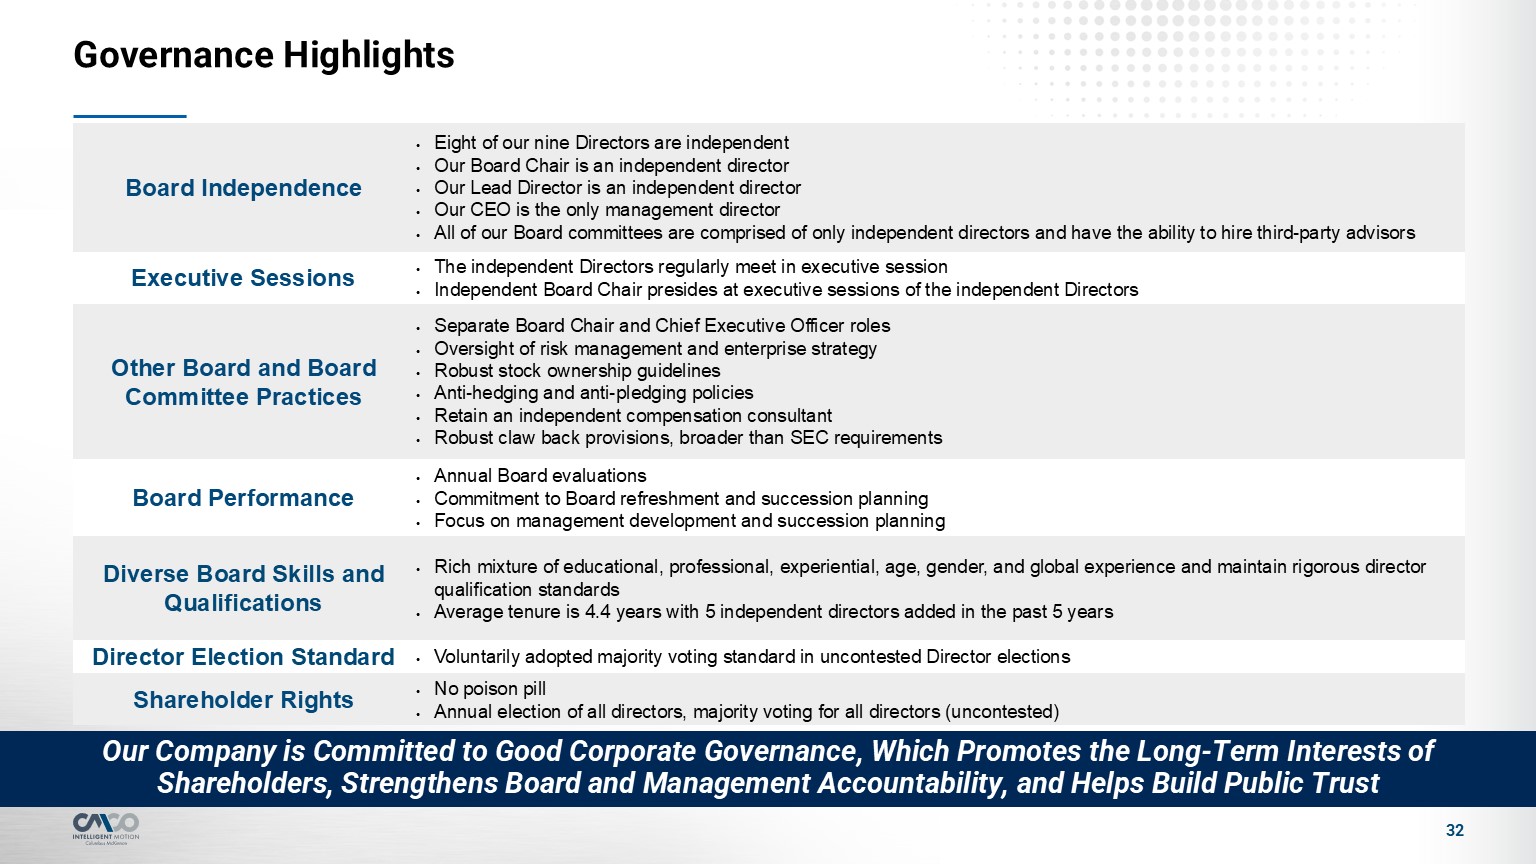
Governance Highlights 32 Our Company is Committed to Good Corporate Governance,
Which Promotes the Long-Term Interests of Shareholders, Strengthens Board and Management Accountability, and Helps Build Public Trust Board Independence Eight of our nine Directors are independent Our Board Chair is an independent
director Our Lead Director is an independent director Our CEO is the only management director All of our Board committees are comprised of only independent directors and have the ability to hire third-party advisors Executive Sessions The
independent Directors regularly meet in executive session Independent Board Chair presides at executive sessions of the independent Directors Other Board and Board Committee Practices Separate Board Chair and Chief Executive Officer
roles Oversight of risk management and enterprise strategy Robust stock ownership guidelines Anti-hedging and anti-pledging policies Retain an independent compensation consultant Robust claw back provisions, broader than SEC
requirements Board Performance Annual Board evaluations Commitment to Board refreshment and succession planning Focus on management development and succession planning Diverse Board Skills and Qualifications Rich mixture of educational,
professional, experiential, age, gender, and global experience and maintain rigorous director qualification standards Average tenure is 4.4 years with 5 independent directors added in the past 5 years Director Election Standard Voluntarily
adopted majority voting standard in uncontested Director elections Shareholder Rights No poison pill Annual election of all directors, majority voting for all directors (uncontested)
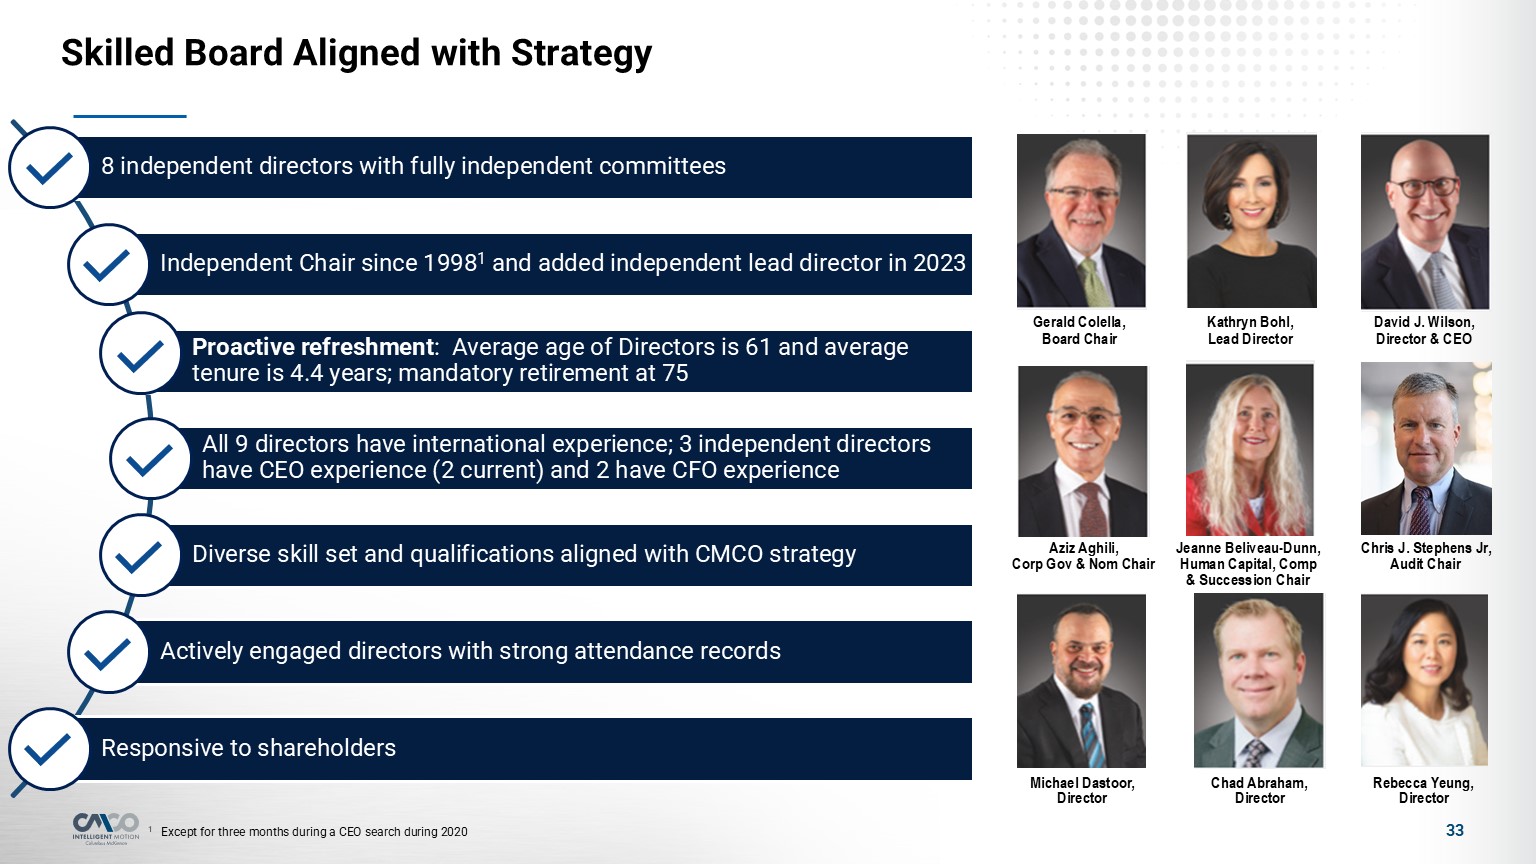
33 Skilled Board Aligned with Strategy Gerald Colella, Board Chair Kathryn
Bohl, Lead Director David J. Wilson, Director & CEO Aziz Aghili, Corp Gov & Nom Chair Jeanne Beliveau-Dunn, Human Capital, Comp & Succession Chair Michael Dastoor, Director Chad Abraham, Director Rebecca Yeung, Director Chris
J. Stephens Jr, Audit Chair 1 Except for three months during a CEO search during 2020
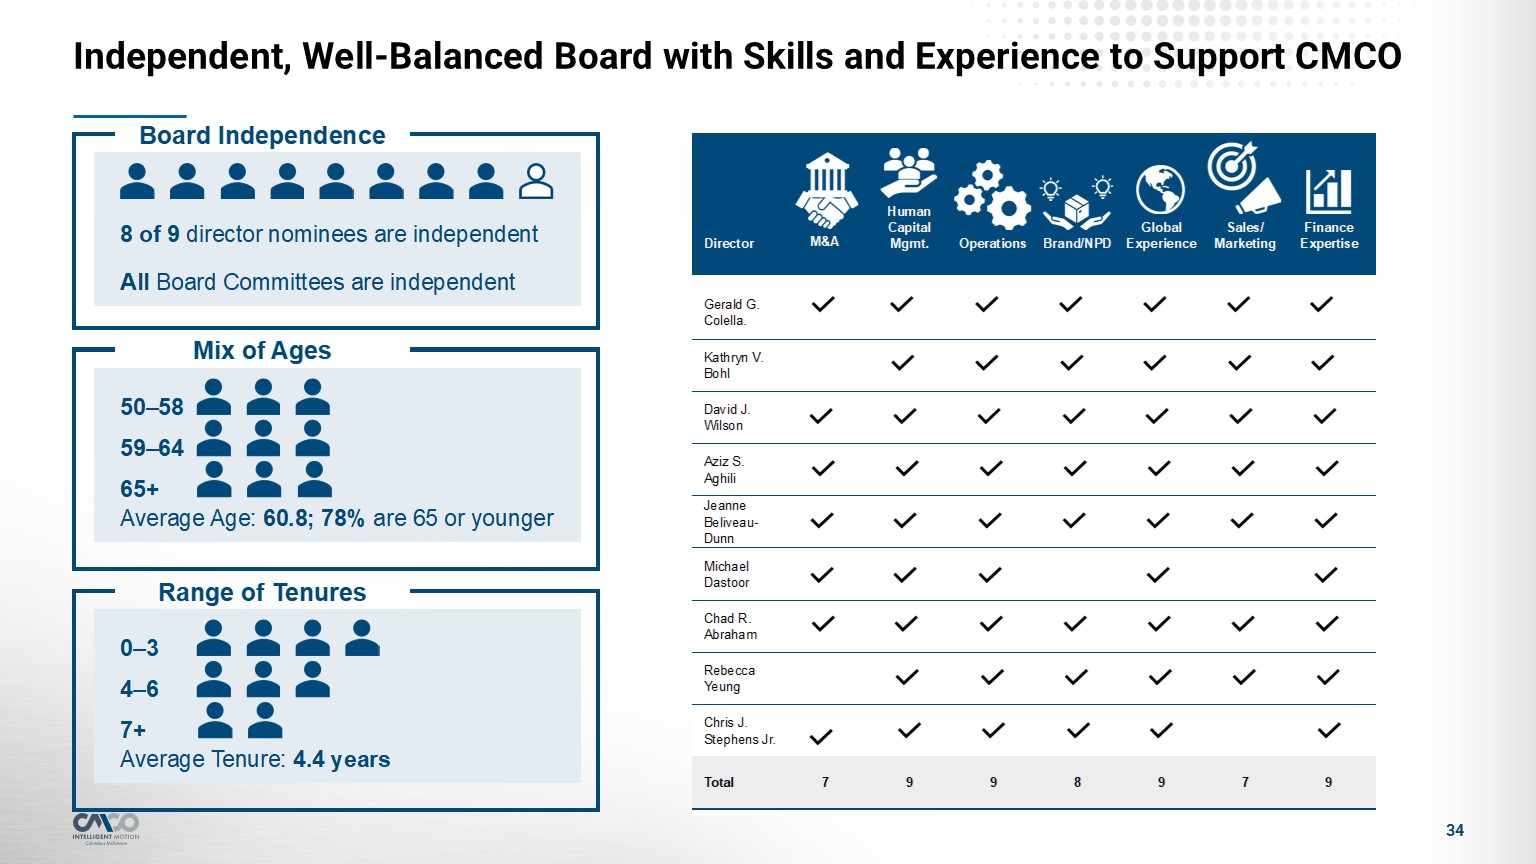
Independent, Well-Balanced Board with Skills and Experience to Support CMCO 34
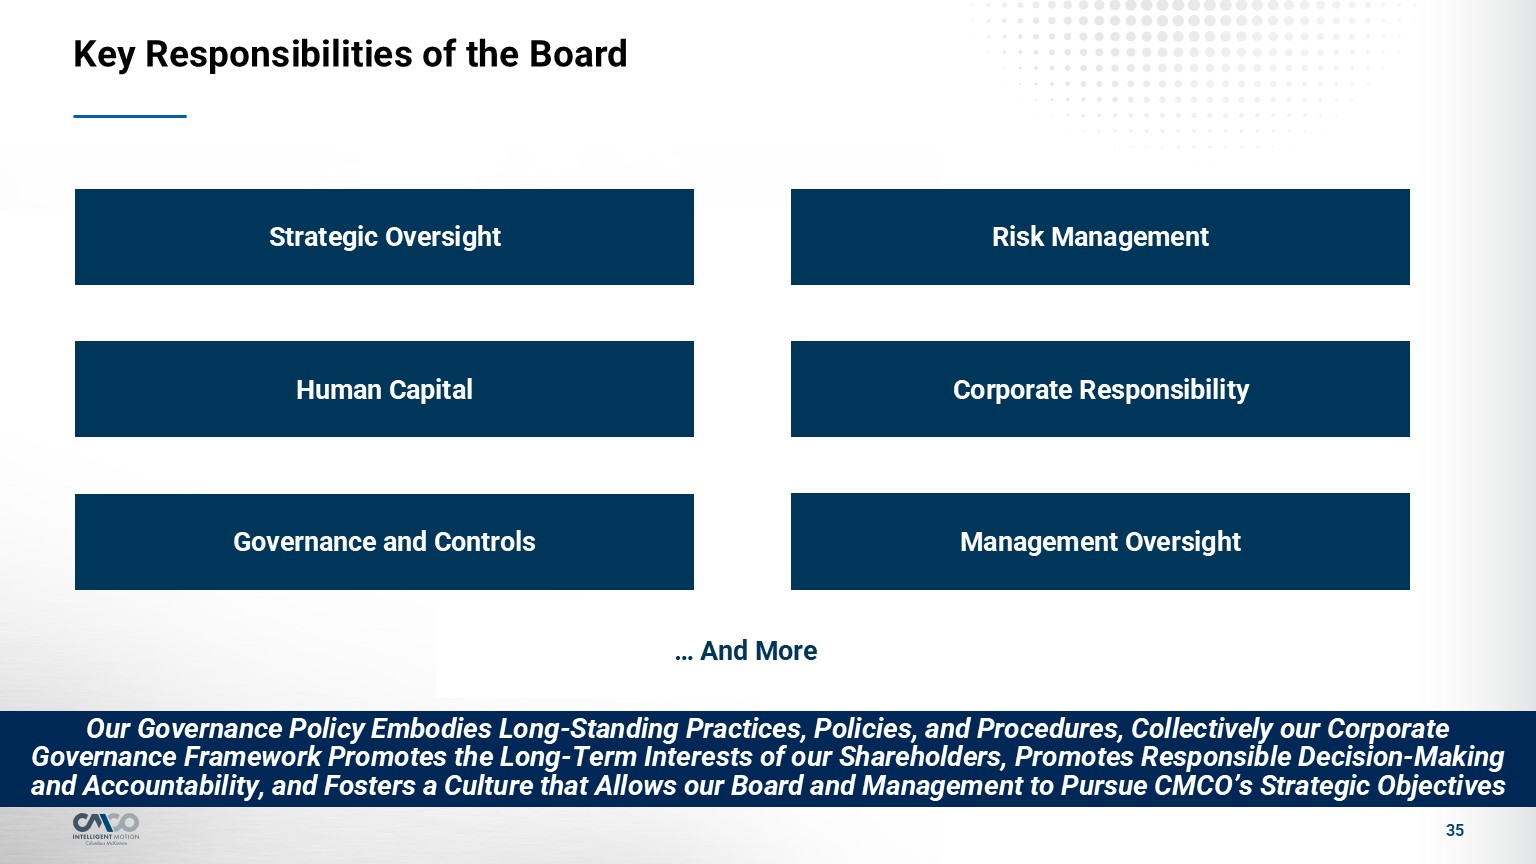
Key Responsibilities of the Board 35 Our Governance Policy Embodies
Long-Standing Practices, Policies, and Procedures, Collectively our Corporate Governance Framework Promotes the Long-Term Interests of our Shareholders, Promotes Responsible Decision-Making and Accountability, and Fosters a Culture that Allows
our Board and Management to Pursue CMCO’s Strategic Objectives Strategic Oversight Risk Management Governance and Controls Management Oversight Human Capital Corporate Responsibility … And More
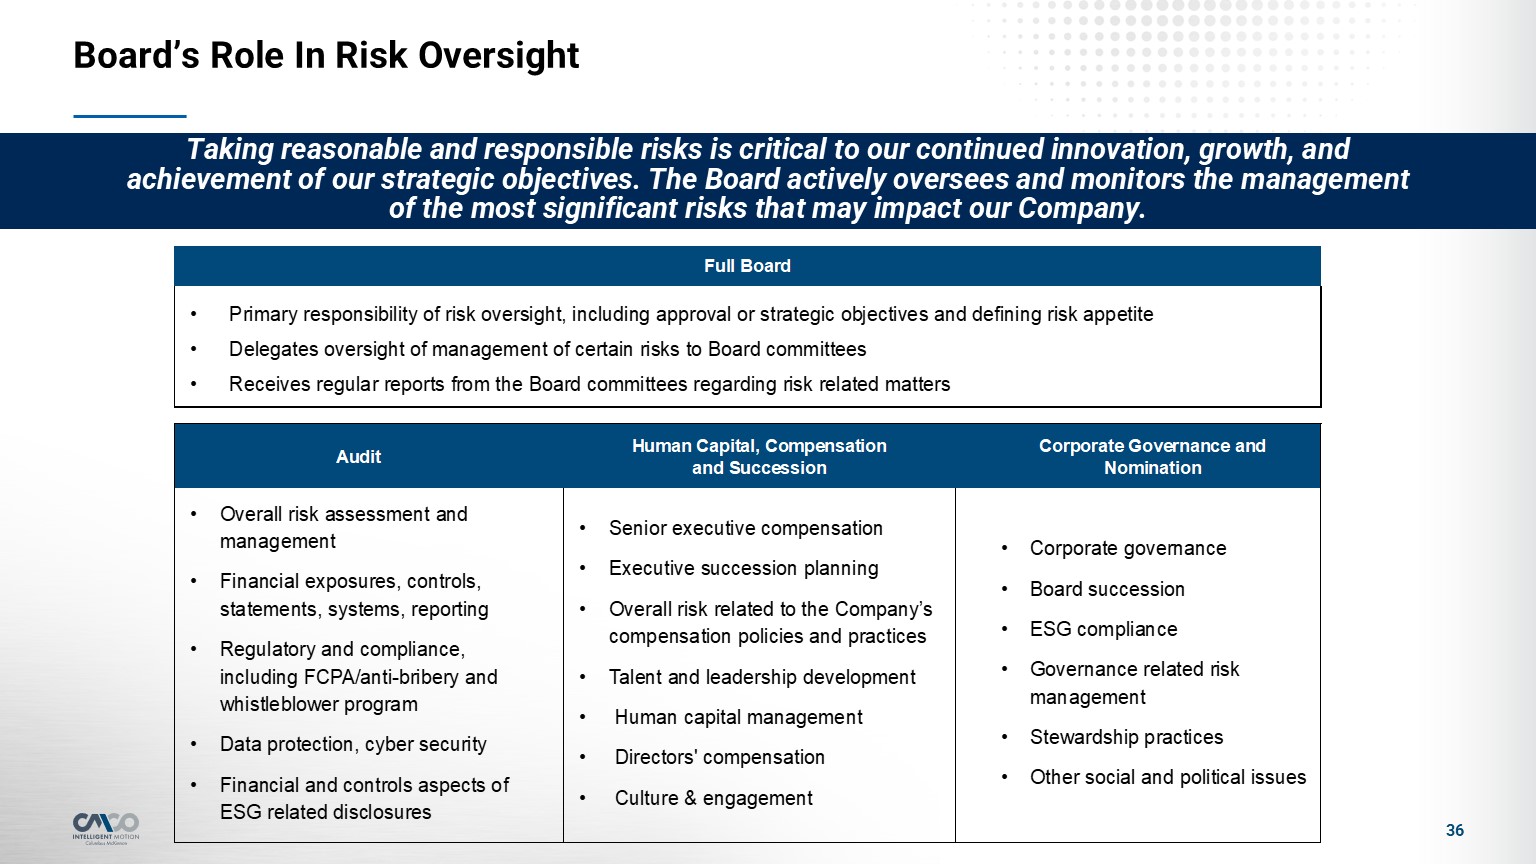
Board’s Role In Risk Oversight 36 Taking reasonable and responsible risks is
critical to our continued innovation, growth, and achievement of our strategic objectives. The Board actively oversees and monitors the management of the most significant risks that may impact our Company.
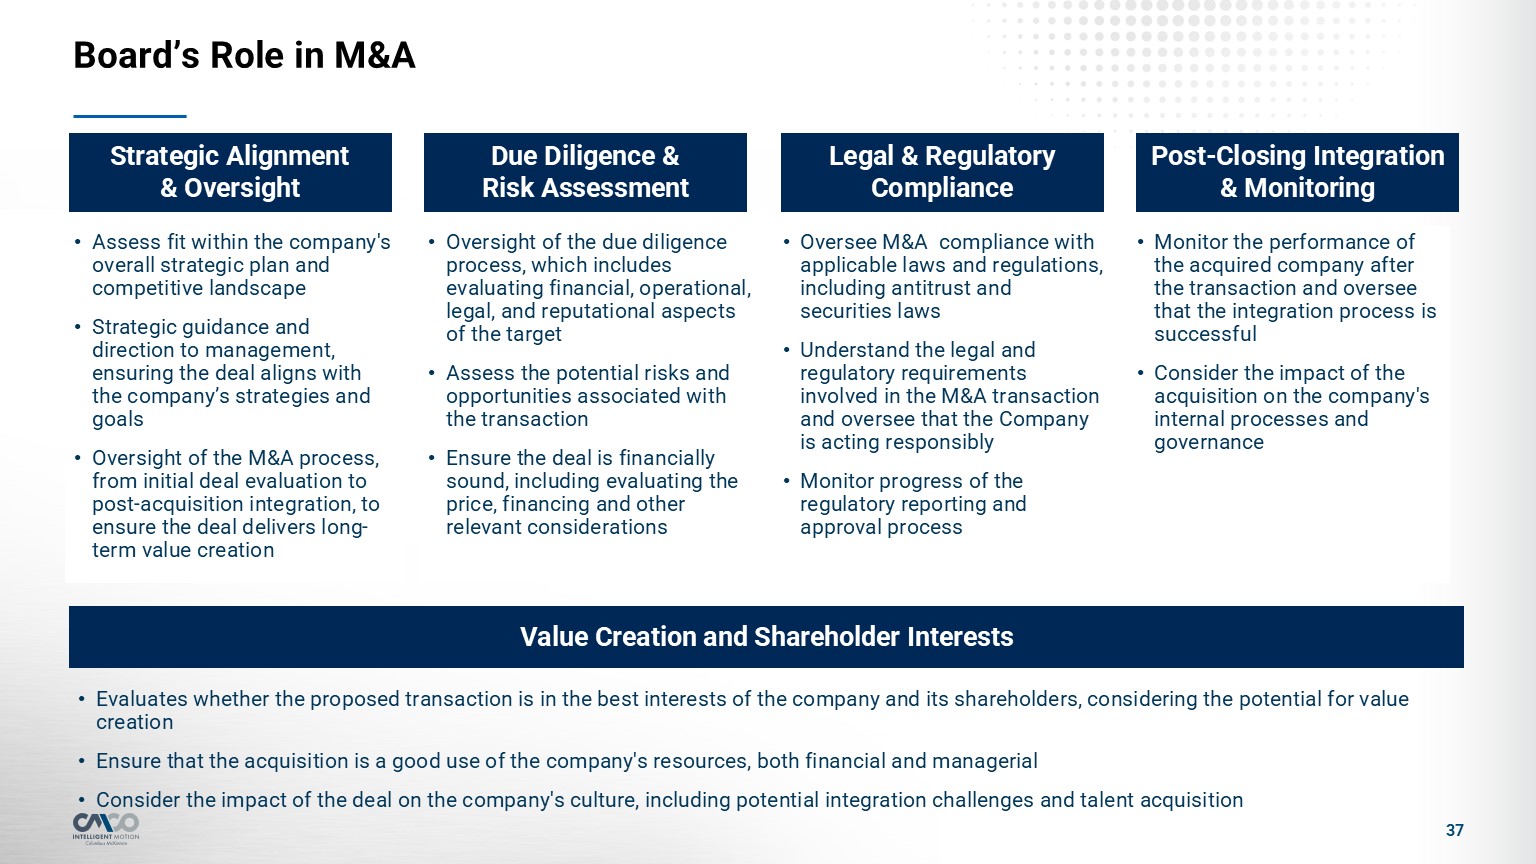
Board’s Role in M&A 37 Strategic Alignment & Oversight Legal &
Regulatory Compliance Value Creation and Shareholder Interests Due Diligence & Risk Assessment Post-Closing Integration & Monitoring Assess fit within the company's overall strategic plan and competitive landscape Strategic
guidance and direction to management, ensuring the deal aligns with the company’s strategies and goals Oversight of the M&A process, from initial deal evaluation to post-acquisition integration, to ensure the deal delivers long-term value
creation Oversight of the due diligence process, which includes evaluating financial, operational, legal, and reputational aspects of the target Assess the potential risks and opportunities associated with the transaction Ensure the deal is
financially sound, including evaluating the price, financing and other relevant considerations Oversee M&A compliance with applicable laws and regulations, including antitrust and securities laws Understand the legal and regulatory
requirements involved in the M&A transaction and oversee that the Company is acting responsibly Monitor progress of the regulatory reporting and approval process Monitor the performance of the acquired company after the transaction and
oversee that the integration process is successful Consider the impact of the acquisition on the company's internal processes and governance Evaluates whether the proposed transaction is in the best interests of the company and its
shareholders, considering the potential for value creation Ensure that the acquisition is a good use of the company's resources, both financial and managerial Consider the impact of the deal on the company's culture, including potential
integration challenges and talent acquisition

Executive Compensation Summary 4
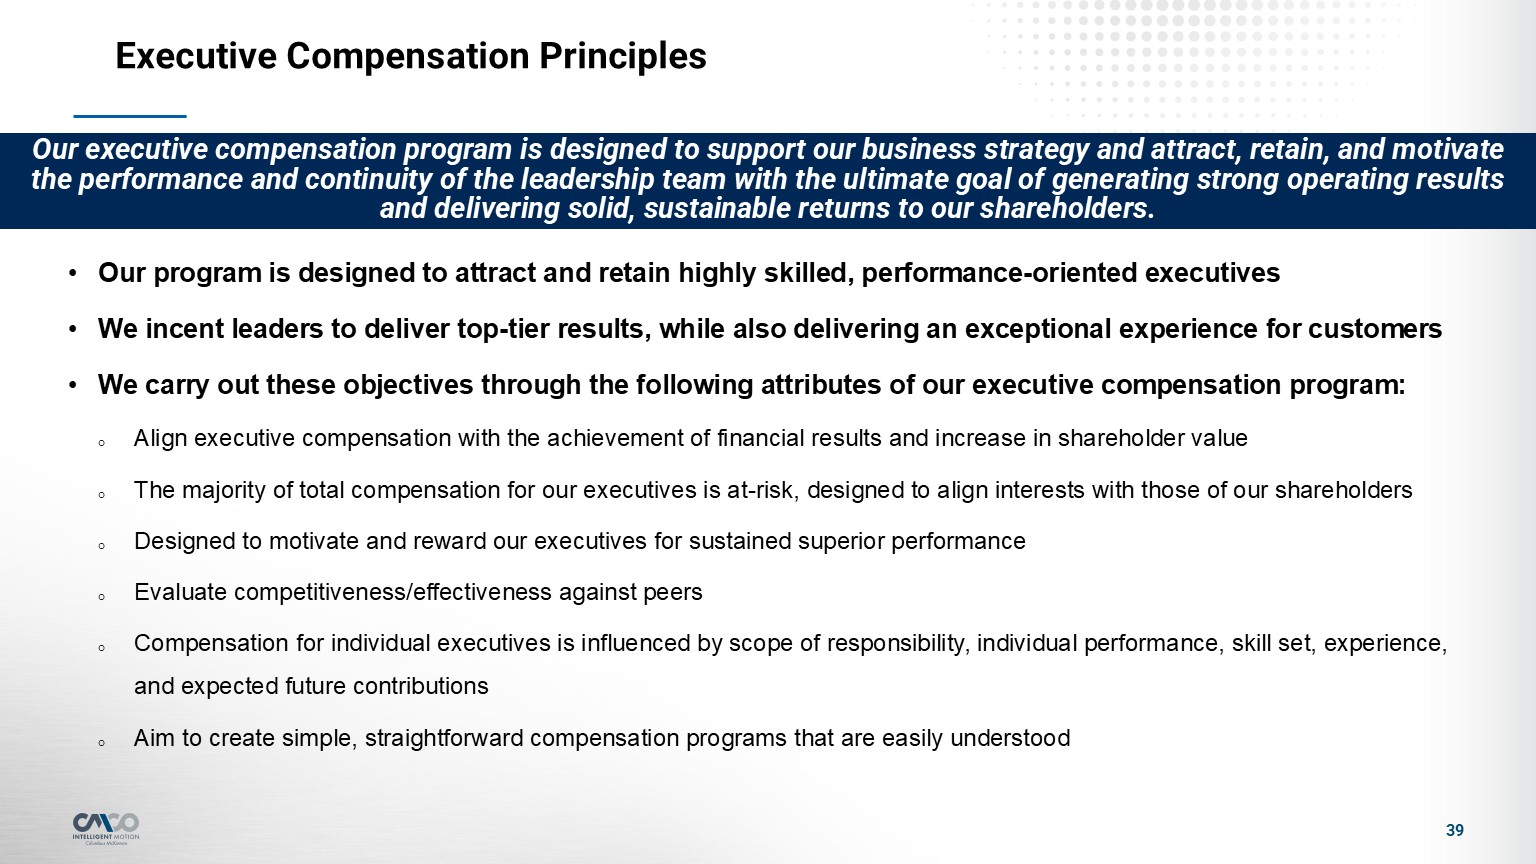
Executive Compensation Principles Our program is designed to attract and retain
highly skilled, performance-oriented executives We incent leaders to deliver top-tier results, while also delivering an exceptional experience for customers We carry out these objectives through the following attributes of our executive
compensation program: Align executive compensation with the achievement of financial results and increase in shareholder value The majority of total compensation for our executives is at-risk, designed to align interests with those of our
shareholders Designed to motivate and reward our executives for sustained superior performance Evaluate competitiveness/effectiveness against peers Compensation for individual executives is influenced by scope of responsibility, individual
performance, skill set, experience, and expected future contributions Aim to create simple, straightforward compensation programs that are easily understood Our executive compensation program is designed to support our business strategy and
attract, retain, and motivate the performance and continuity of the leadership team with the ultimate goal of generating strong operating results and delivering solid, sustainable returns to our shareholders. 39
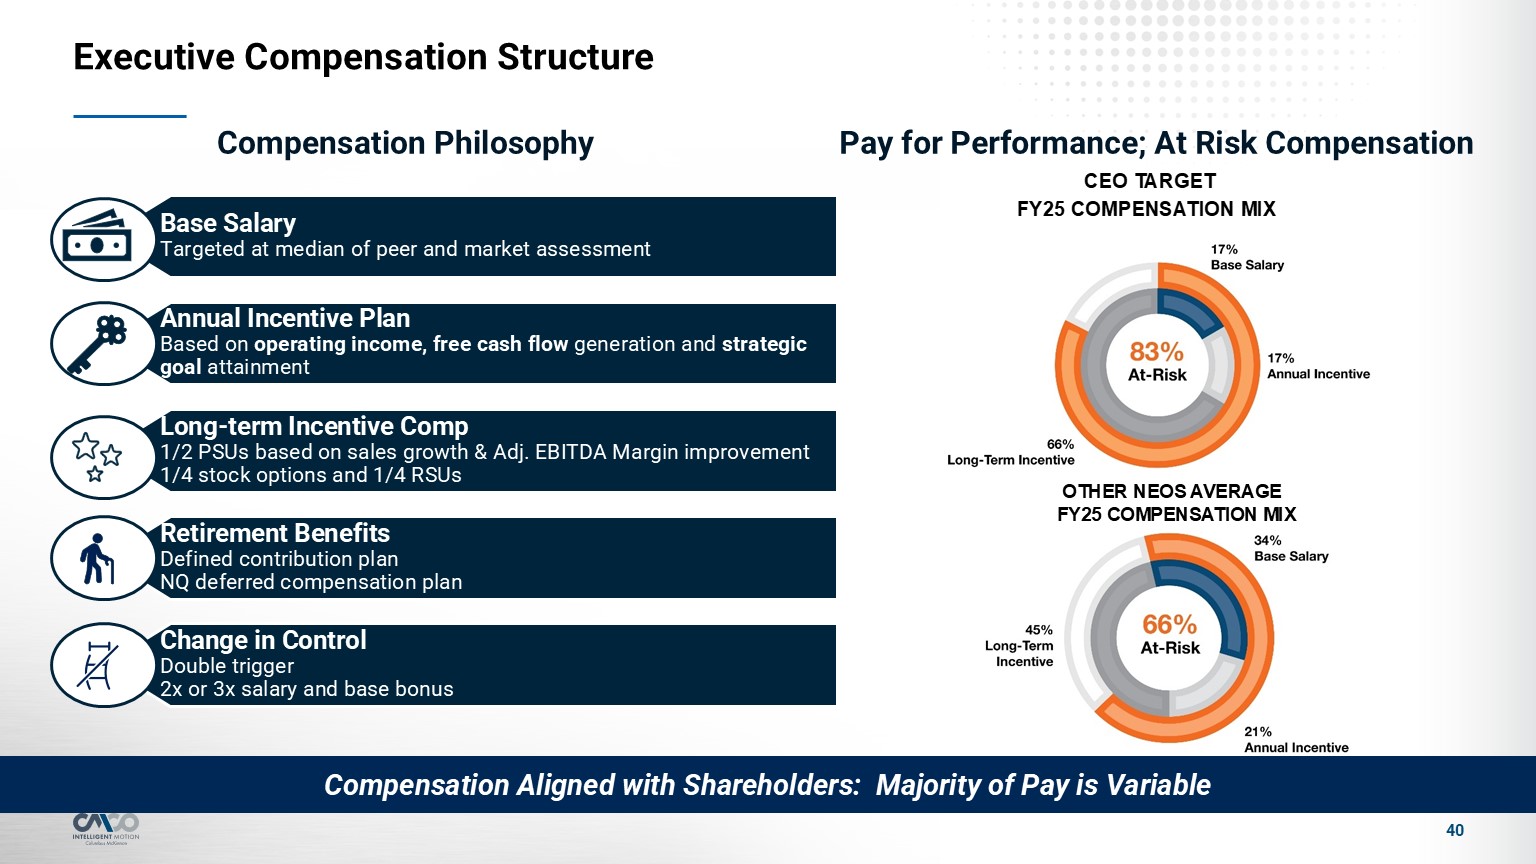
40 Compensation Philosophy Executive Compensation Structure Base
Salary Targeted at median of peer and market assessment Annual Incentive Plan Based on operating income, free cash flow generation and strategic goal attainment Long-term Incentive Comp 1/2 PSUs based on sales growth & Adj. EBITDA
Margin improvement 1/4 stock options and 1/4 RSUs Retirement Benefits Defined contribution planNQ deferred compensation plan Change in Control Double trigger2x or 3x salary and base bonus Pay for Performance; At Risk Compensation OTHER
NEOS AVERAGE FY25 COMPENSATION MIX Compensation Aligned with Shareholders: Majority of Pay is Variable
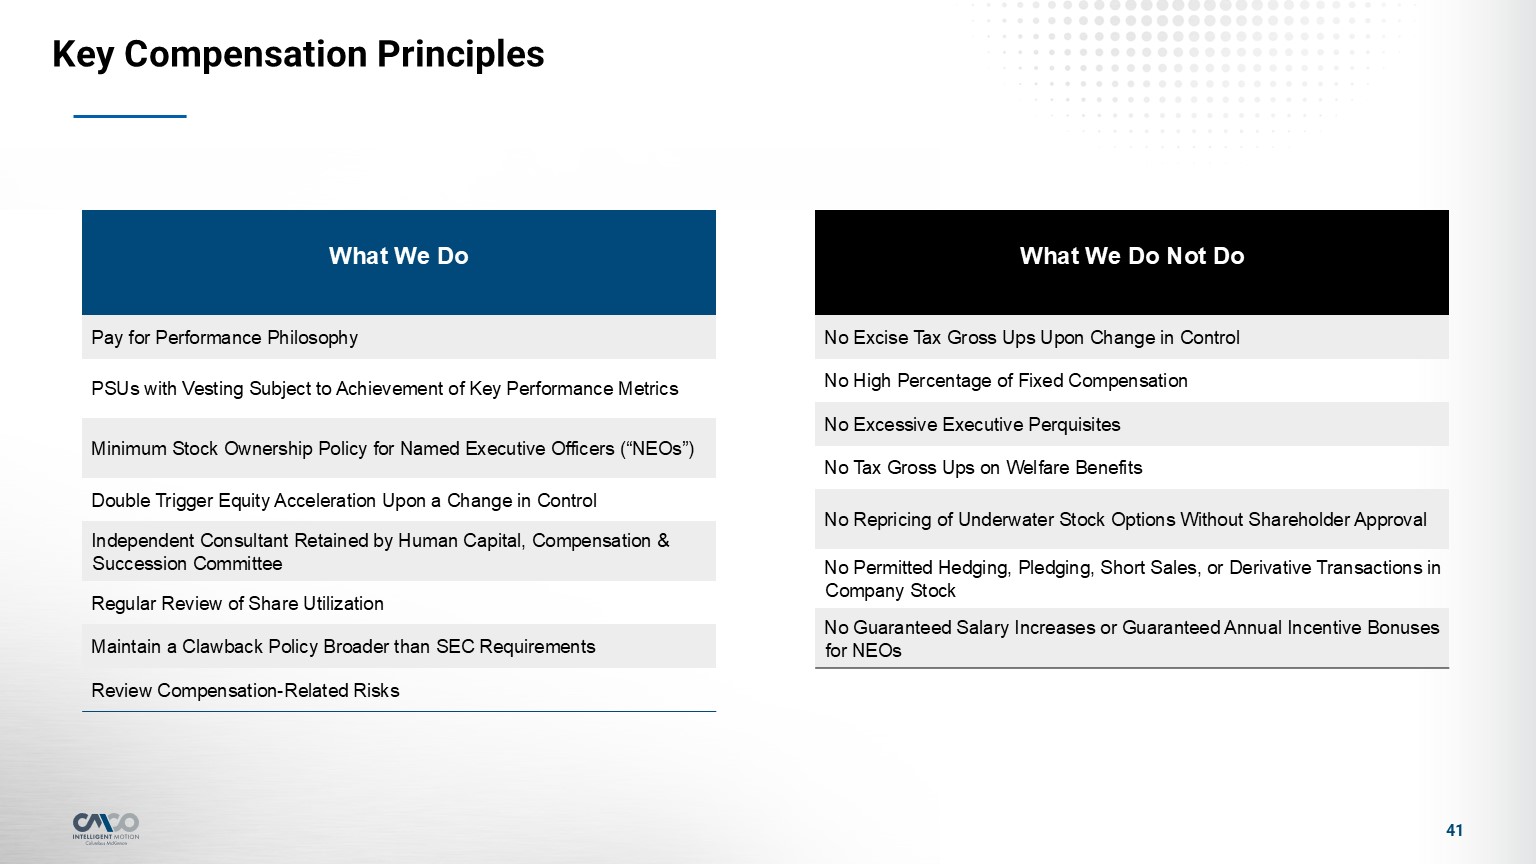
Key Compensation Principles What We Do Pay for Performance
Philosophy PSUs with Vesting Subject to Achievement of Key Performance Metrics Minimum Stock Ownership Policy for Named Executive Officers (“NEOs”) Double Trigger Equity Acceleration Upon a Change in Control Independent Consultant Retained
by Human Capital, Compensation & Succession Committee Regular Review of Share Utilization Maintain a Clawback Policy Broader than SEC Requirements Review Compensation-Related Risks What We Do Not Do No Excise Tax Gross Ups Upon
Change in Control No High Percentage of Fixed Compensation No Excessive Executive Perquisites No Tax Gross Ups on Welfare Benefits No Repricing of Underwater Stock Options Without Shareholder Approval No Permitted Hedging, Pledging, Short
Sales, or Derivative Transactions in Company Stock No Guaranteed Salary Increases or Guaranteed Annual Incentive Bonuses for NEOs 41

Appendix 5
Non-GAAP Measures 43 The following information provides definitions and
reconciliations of the non-GAAP financial measures presented in this presentation to the most directly comparable financial measures calculated and presented in accordance with generally accepted accounting principles (GAAP). The Company has
provided this non-GAAP financial information, which is not calculated or presented in accordance with GAAP, as information supplemental and in addition to the financial measures presented in this presentation that are calculated and presented
in accordance with GAAP. Such non-GAAP financial measures should not be considered superior to, as a substitute for or alternative to, and should be considered in conjunction with, the GAAP financial measures presented in this presentation. The
non-GAAP financial measures in this presentation may differ from similarly titled measures used by other companies. Adjusted Operating Income and Adjusted Operating Margin Adjusted Net Income and Adjusted EPS Adjusted EBITDA and Adjusted
EBITDA Margin Free Cash Flow Net Debt and Net Leverage Ratio Forward-Looking: The Company has not reconciled the guidance to the most comparable GAAP financial measure because it is not possible to do so without unreasonable efforts due to
the uncertainty and potential variability of reconciling items, which are dependent on future events and often outside of management’s control and which could be significant. Because such items cannot be reasonably predicted with the level of
precision required, we are unable to provide guidance for the comparable GAAP financial measure. Forward-looking guidance regarding is made in a manner consistent with the relevant definitions and assumptions noted herein. Forward looking
guidance regarding the proforma combination of Columbus McKinnon and the Kito Crosby acquisition is made in a manner consistent with the relevant definitions and assumptions noted herein.
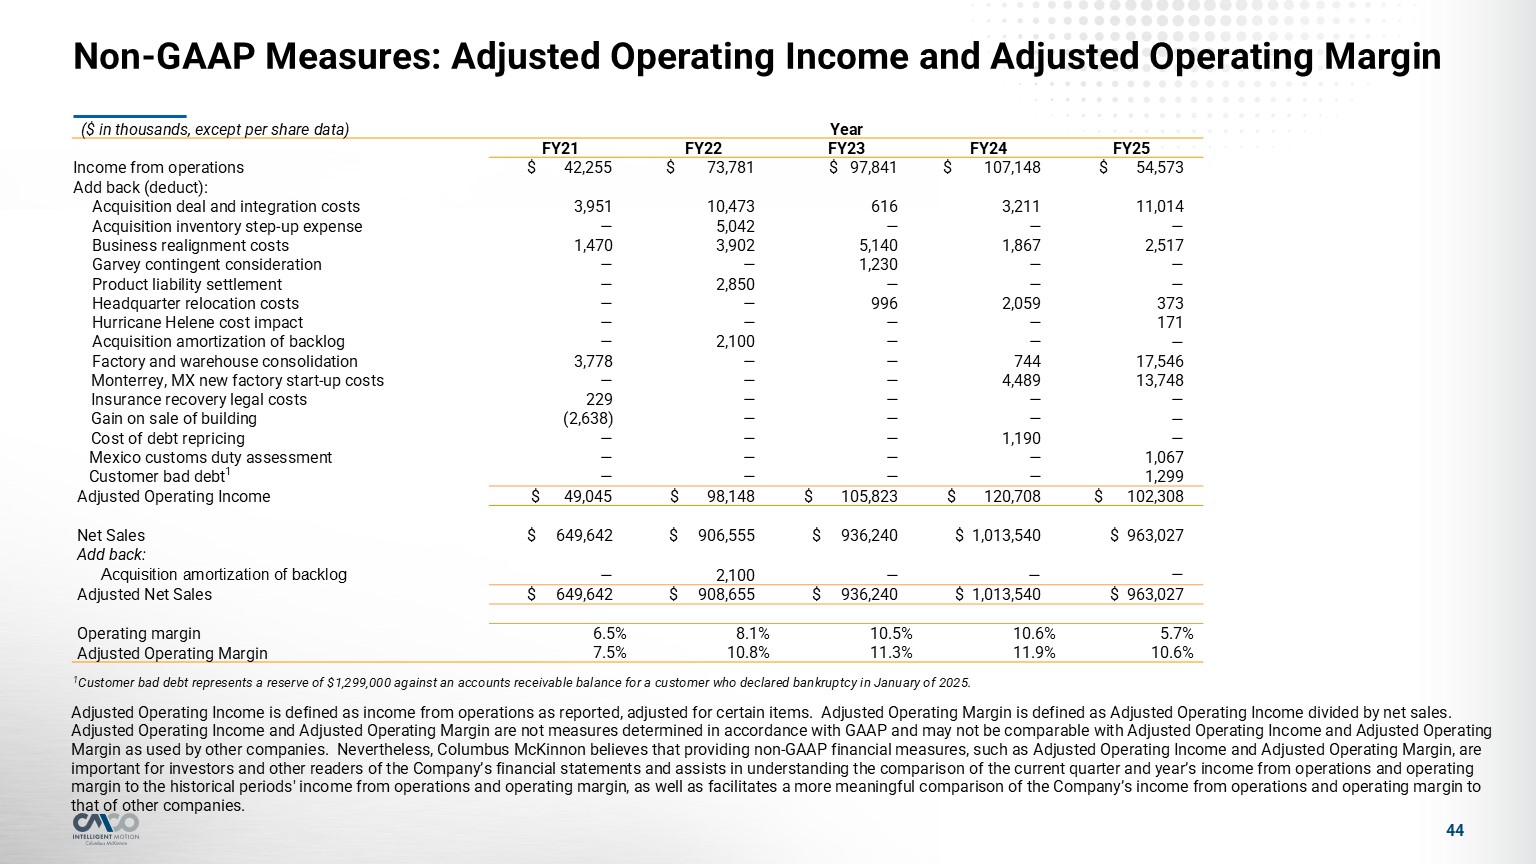
Adjusted Operating Income is defined as income from operations as reported,
adjusted for certain items. Adjusted Operating Margin is defined as Adjusted Operating Income divided by net sales. Adjusted Operating Income and Adjusted Operating Margin are not measures determined in accordance with GAAP and may not be
comparable with Adjusted Operating Income and Adjusted Operating Margin as used by other companies. Nevertheless, Columbus McKinnon believes that providing non-GAAP financial measures, such as Adjusted Operating Income and Adjusted Operating
Margin, are important for investors and other readers of the Company’s financial statements and assists in understanding the comparison of the current quarter and year’s income from operations and operating margin to the historical periods'
income from operations and operating margin, as well as facilitates a more meaningful comparison of the Company’s income from operations and operating margin to that of other companies. Non-GAAP Measures: Adjusted Operating Income and Adjusted
Operating Margin ($ in thousands, except per share data) Year FY21 FY22 FY23 FY24 FY25 Income from operations $ 42,255 $ 73,781 $ 97,841 $ 107,148 $ 54,573 Add back (deduct): Acquisition deal and
integration costs 3,951 10,473 616 3,211 11,014 Acquisition inventory step-up expense — 5,042 — — — Business realignment costs 1,470 3,902 5,140 1,867 2,517 Garvey contingent consideration — —
1,230 — — Product liability settlement — 2,850 — — — Headquarter relocation costs — — 996 2,059 373 Hurricane Helene cost impact — — — — 171 Acquisition amortization of backlog — 2,100 —
— — Factory and warehouse consolidation 3,778 — — 744 17,546 Monterrey, MX new factory start-up costs — — — 4,489 13,748 Insurance recovery legal costs 229 — — — — Gain on sale of building
(2,638) — — — — Cost of debt repricing — — — 1,190 — Mexico customs duty assessment — — — — 1,067 Customer bad debt1 — — — — 1,299 Adjusted Operating Income $ 49,045 $ 98,148 $
105,823 $ 120,708 $ 102,308 Net Sales $ 649,642 $ 906,555 $ 936,240 $ 1,013,540 $ 963,027 Add back: Acquisition amortization of backlog — 2,100 — — — Adjusted Net Sales $ 649,642 $
908,655 $ 936,240 $ 1,013,540 $ 963,027 Operating margin 6.5% 8.1% 10.5% 10.6% 5.7% Adjusted Operating Margin 7.5% 10.8% 11.3% 11.9% 10.6% 1Customer bad debt represents a reserve of $1,299,000 against an accounts receivable
balance for a customer who declared bankruptcy in January of 2025. 44
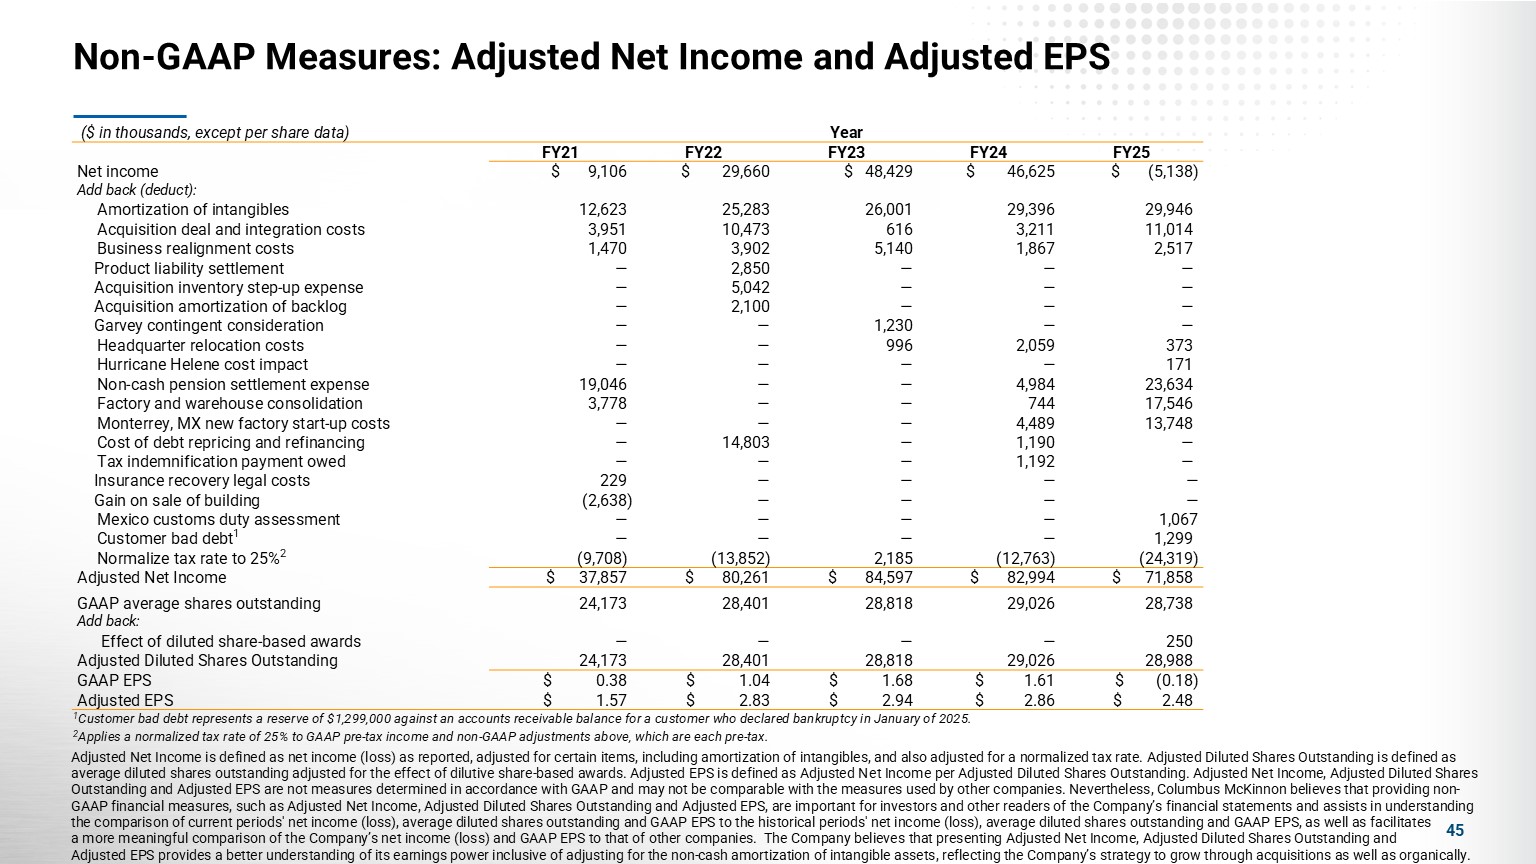
Adjusted Net Income is defined as net income (loss) as reported, adjusted for
certain items, including amortization of intangibles, and also adjusted for a normalized tax rate. Adjusted Diluted Shares Outstanding is defined as average diluted shares outstanding adjusted for the effect of dilutive share-based awards.
Adjusted EPS is defined as Adjusted Net Income per Adjusted Diluted Shares Outstanding. Adjusted Net Income, Adjusted Diluted Shares Outstanding and Adjusted EPS are not measures determined in accordance with GAAP and may not be comparable with
the measures used by other companies. Nevertheless, Columbus McKinnon believes that providing non-GAAP financial measures, such as Adjusted Net Income, Adjusted Diluted Shares Outstanding and Adjusted EPS, are important for investors and other
readers of the Company’s financial statements and assists in understanding the comparison of current periods' net income (loss), average diluted shares outstanding and GAAP EPS to the historical periods' net income (loss), average diluted
shares outstanding and GAAP EPS, as well as facilitates a more meaningful comparison of the Company’s net income (loss) and GAAP EPS to that of other companies. The Company believes that presenting Adjusted Net Income, Adjusted Diluted Shares
Outstanding and Adjusted EPS provides a better understanding of its earnings power inclusive of adjusting for the non-cash amortization of intangible assets, reflecting the Company’s strategy to grow through acquisitions as well as organically.
Non-GAAP Measures: Adjusted Net Income and Adjusted EPS ($ in thousands, except per share data) Year FY21 FY22 FY23 FY24 FY25 Net income $ 9,106 $ 29,660 $ 48,429 $ 46,625 $ (5,138) Add back
(deduct): Amortization of intangibles 12,623 25,283 26,001 29,396 29,946 Acquisition deal and integration costs 3,951 10,473 616 3,211 11,014 Business realignment costs 1,470 3,902
5,140 1,867 2,517 Product liability settlement — 2,850 — — — Acquisition inventory step-up expense — 5,042 — — — Acquisition amortization of backlog — 2,100 — — — Garvey contingent
consideration — — 1,230 — — Headquarter relocation costs — — 996 2,059 373 Hurricane Helene cost impact — — — — 171 Non-cash pension settlement expense 19,046 — — 4,984 23,634 Factory
and warehouse consolidation 3,778 — — 744 17,546 Monterrey, MX new factory start-up costs — — — 4,489 13,748 Cost of debt repricing and refinancing — 14,803 — 1,190 — Tax indemnification payment
owed — — — 1,192 — Insurance recovery legal costs 229 — — — — Gain on sale of building (2,638) — — — — Mexico customs duty assessment — — — — 1,067 Customer bad debt1 — — —
— 1,299 Normalize tax rate to 25%2 (9,708) (13,852) 2,185 (12,763) (24,319) Adjusted Net Income $ 37,857 $ 80,261 $ 84,597 $ 82,994 $ 71,858 GAAP average shares outstanding 24,173 28,401
28,818 29,026 28,738 Add back: Effect of diluted share-based awards — — — — 250 Adjusted Diluted Shares Outstanding 24,173 28,401 28,818 29,026 28,988 GAAP EPS $ 0.38 $ 1.04 $ 1.68 $ 1.61 $
(0.18) Adjusted EPS $ 1.57 $ 2.83 $ 2.94 $ 2.86 $ 2.48 1Customer bad debt represents a reserve of $1,299,000 against an accounts receivable balance for a customer who declared bankruptcy in January of 2025. 2Applies a
normalized tax rate of 25% to GAAP pre-tax income and non-GAAP adjustments above, which are each pre-tax. 45
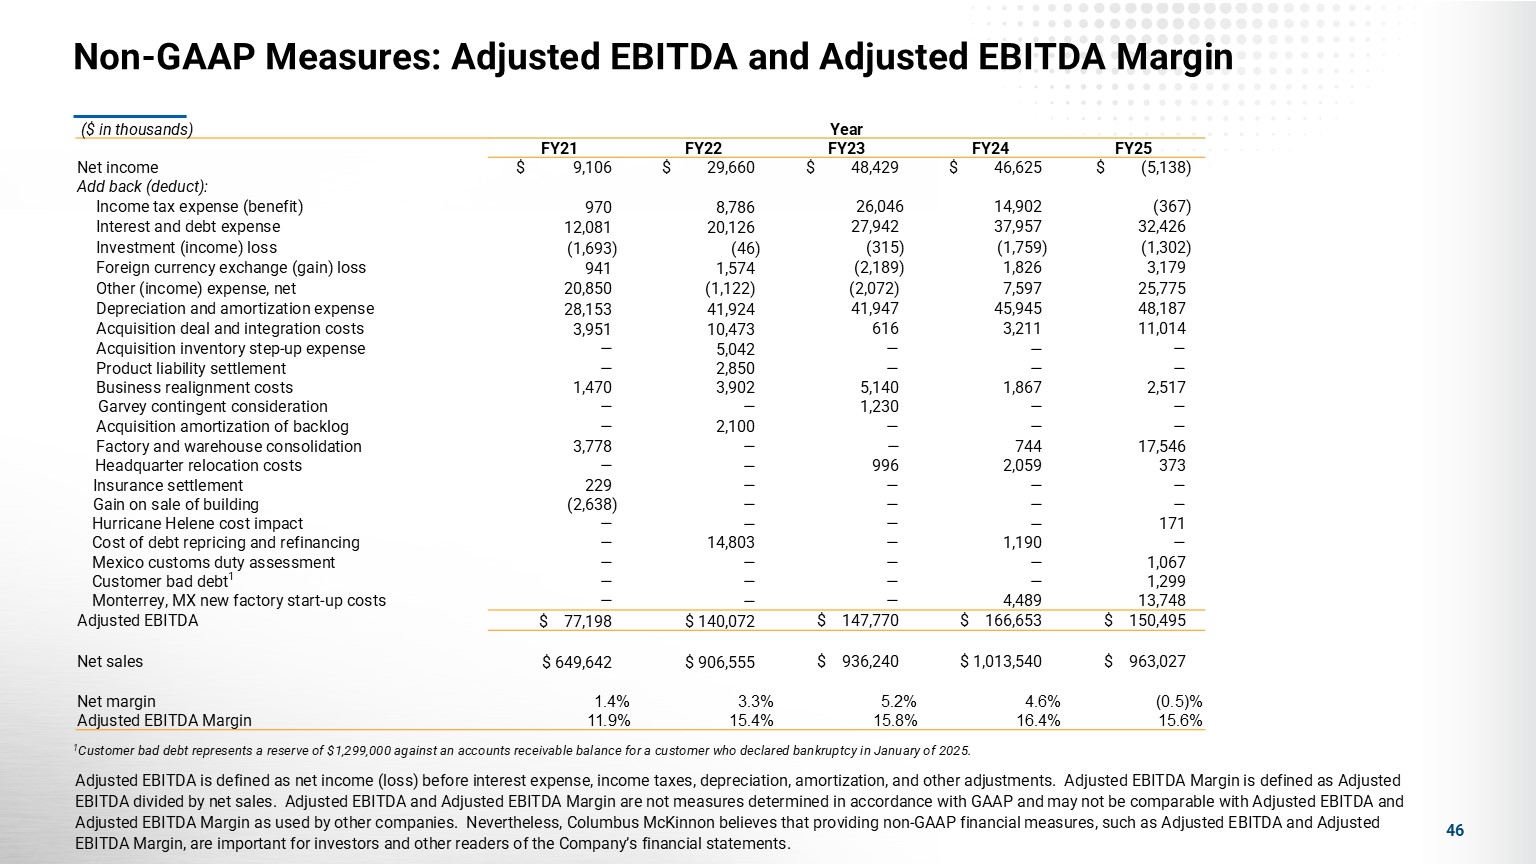
Non-GAAP Measures: Adjusted EBITDA and Adjusted EBITDA Margin 46 Adjusted EBITDA
is defined as net income (loss) before interest expense, income taxes, depreciation, amortization, and other adjustments. Adjusted EBITDA Margin is defined as Adjusted EBITDA divided by net sales. Adjusted EBITDA and Adjusted EBITDA Margin are
not measures determined in accordance with GAAP and may not be comparable with Adjusted EBITDA and Adjusted EBITDA Margin as used by other companies. Nevertheless, Columbus McKinnon believes that providing non-GAAP financial measures, such as
Adjusted EBITDA and Adjusted EBITDA Margin, are important for investors and other readers of the Company’s financial statements. ($ in thousands) Year FY21 FY22 FY23 FY24 FY25 Net income $ 9,106 $ 29,660 $ 48,429 $
46,625 $ (5,138) Add back (deduct): Income tax expense (benefit) 970 8,786 26,046 14,902 (367) Interest and debt expense 12,081 20,126 27,942 37,957 32,426 Investment (income) loss (1,693) (46)
(315) (1,759) (1,302) Foreign currency exchange (gain) loss 941 1,574 (2,189) 1,826 3,179 Other (income) expense, net 20,850 (1,122) (2,072) 7,597 25,775 Depreciation and amortization expense 28,153 41,924
41,947 45,945 48,187 Acquisition deal and integration costs 3,951 10,473 616 3,211 11,014 Acquisition inventory step-up expense — 5,042 — — — Product liability settlement — 2,850 — — — Business
realignment costs 1,470 3,902 5,140 1,867 2,517 Garvey contingent consideration — — 1,230 — — Acquisition amortization of backlog — 2,100 — — — Factory and warehouse consolidation 3,778 — —
744 17,546 Headquarter relocation costs — — 996 2,059 373 Insurance settlement 229 — — — — Gain on sale of building (2,638) — — — — Hurricane Helene cost impact — — — — 171 Cost of
debt repricing and refinancing — 14,803 — 1,190 — Mexico customs duty assessment — — — — 1,067 Customer bad debt1 — — — — 1,299 Monterrey, MX new factory start-up costs — — —
4,489 13,748 Adjusted EBITDA $ 77,198 $ 140,072 $ 147,770 $ 166,653 $ 150,495 Net sales $ 649,642 $ 906,555 $ 936,240 $ 1,013,540 $ 963,027 Net margin 1.4% 3.3% 5.2% 4.6% (0.5)% Adjusted
EBITDA Margin 11.9% 15.4% 15.8% 16.4% 15.6% 1Customer bad debt represents a reserve of $1,299,000 against an accounts receivable balance for a customer who declared bankruptcy in January of 2025.
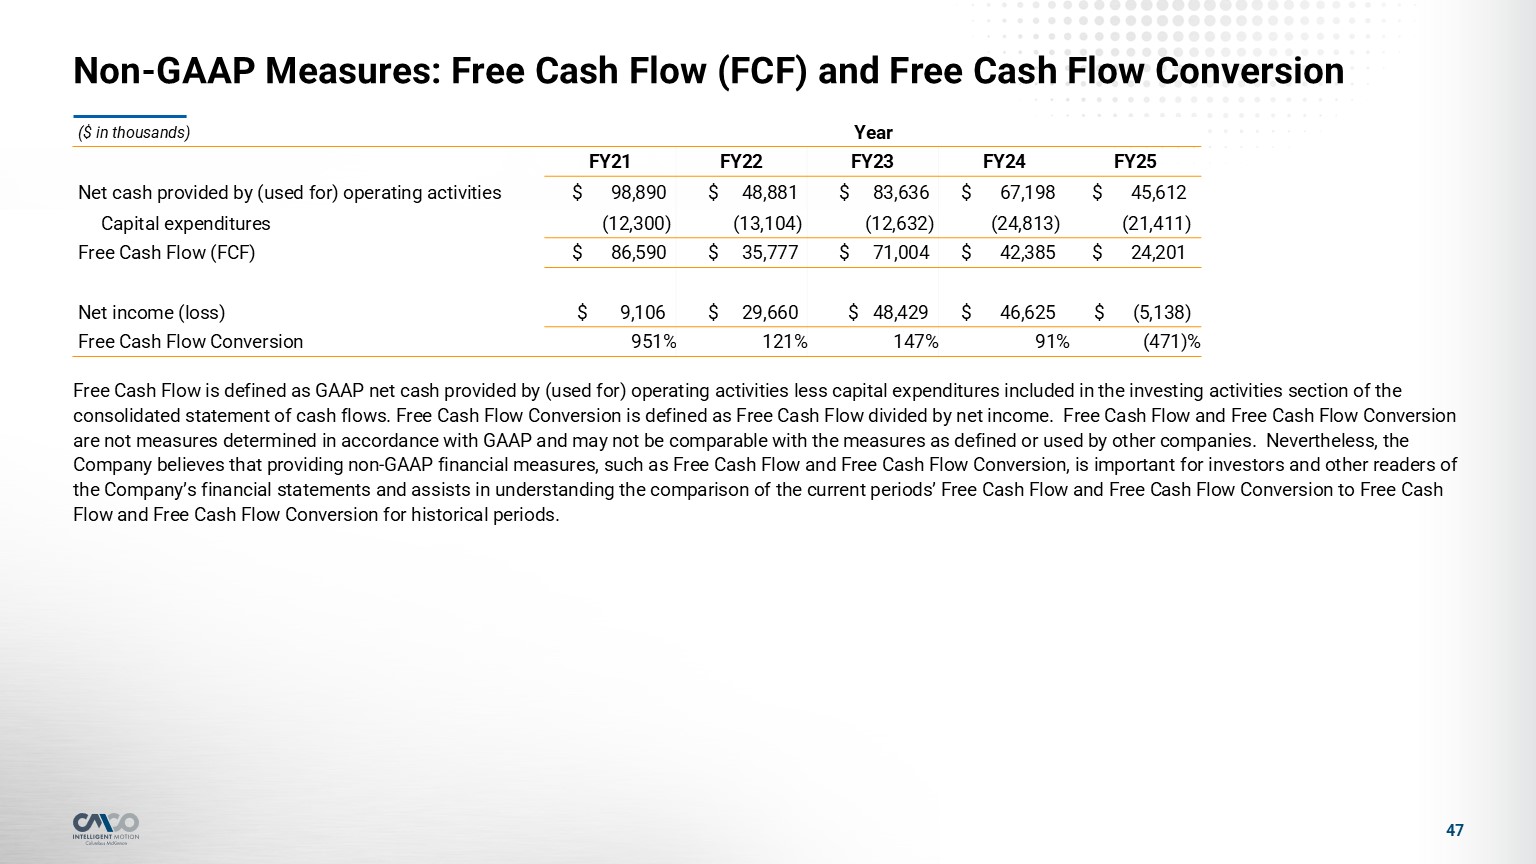
Non-GAAP Measures: Free Cash Flow (FCF) and Free Cash Flow Conversion 47 Free
Cash Flow is defined as GAAP net cash provided by (used for) operating activities less capital expenditures included in the investing activities section of the consolidated statement of cash flows. Free Cash Flow Conversion is defined as Free
Cash Flow divided by net income. Free Cash Flow and Free Cash Flow Conversion are not measures determined in accordance with GAAP and may not be comparable with the measures as defined or used by other companies. Nevertheless, the Company
believes that providing non-GAAP financial measures, such as Free Cash Flow and Free Cash Flow Conversion, is important for investors and other readers of the Company’s financial statements and assists in understanding the comparison of the
current periods’ Free Cash Flow and Free Cash Flow Conversion to Free Cash Flow and Free Cash Flow Conversion for historical periods. ($ in thousands) Year FY21 FY22 FY23 FY24 FY25 Net cash provided by (used for) operating
activities $ 98,890 $ 48,881 $ 83,636 $ 67,198 $ 45,612 Capital expenditures (12,300) (13,104) (12,632) (24,813) (21,411) Free Cash Flow (FCF) $ 86,590 $ 35,777 $ 71,004 $ 42,385 $ 24,201 Net
income (loss) $ 9,106 $ 29,660 $ 48,429 $ 46,625 $ (5,138) Free Cash Flow Conversion 951% 121% 147% 91% (471)%
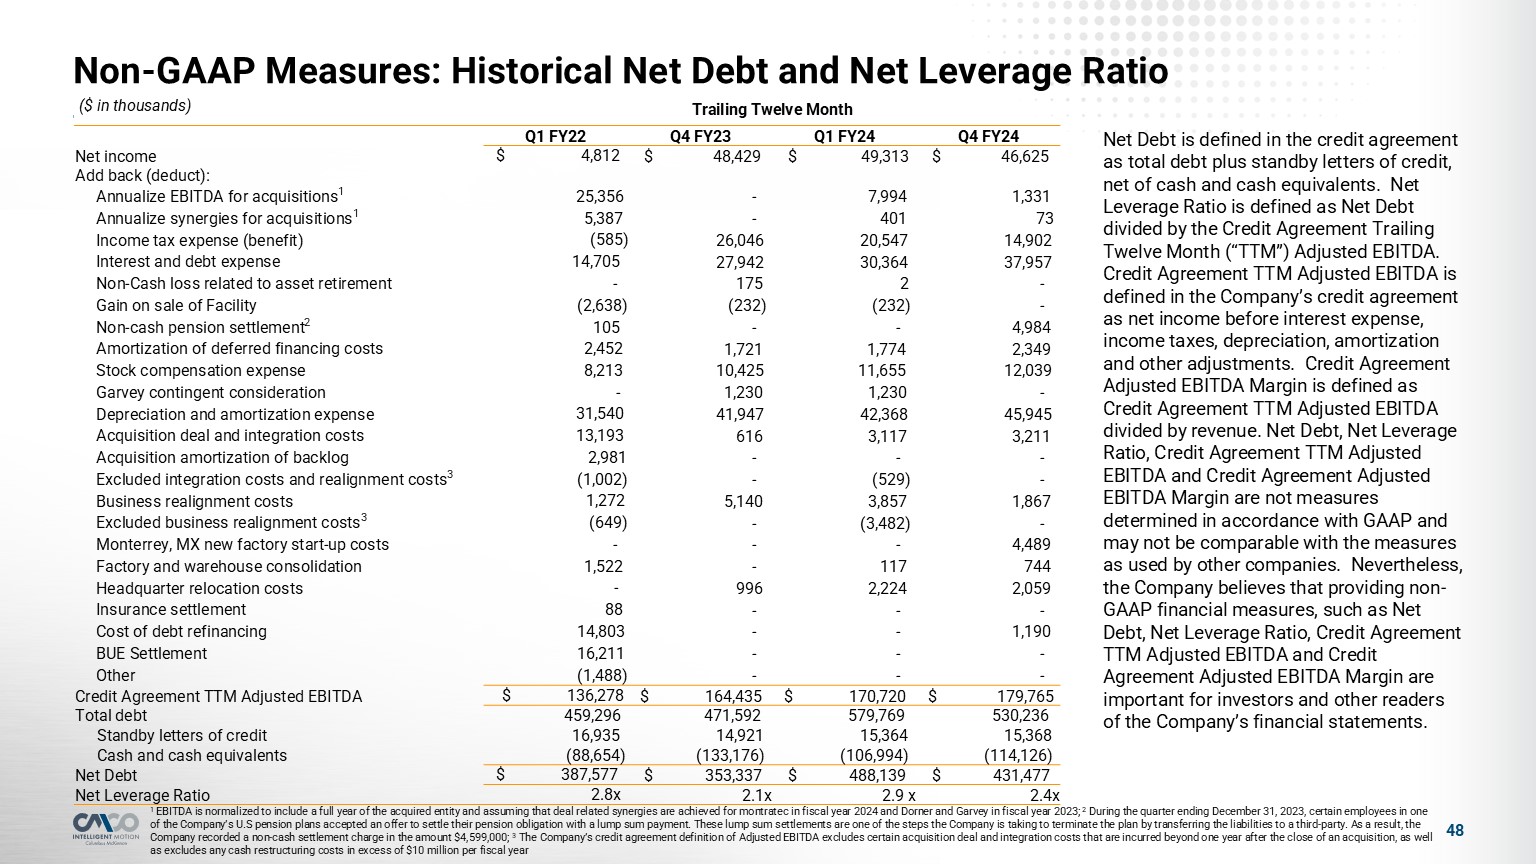
Non-GAAP Measures: Historical Net Debt and Net Leverage Ratio 48 1 EBITDA is
normalized to include a full year of the acquired entity and assuming that deal related synergies are achieved for montratec in fiscal year 2024 and Dorner and Garvey in fiscal year 2023; 2 During the quarter ending December 31, 2023, certain
employees in one of the Company’s U.S pension plans accepted an offer to settle their pension obligation with a lump sum payment. These lump sum settlements are one of the steps the Company is taking to terminate the plan by transferring the
liabilities to a third-party. As a result, the Company recorded a non-cash settlement charge in the amount $4,599,000; 3 The Company’s credit agreement definition of Adjusted EBITDA excludes certain acquisition deal and integration costs that
are incurred beyond one year after the close of an acquisition, as well as excludes any cash restructuring costs in excess of $10 million per fiscal year ($ in thousands) Trailing Twelve Month Q1 FY22 Q4 FY23 Q1 FY24 Q4 FY24 Net
income $ 4,812 $ 48,429 $ 49,313 $ 46,625 Add back (deduct): Annualize EBITDA for acquisitions1 25,356 - 7,994 1,331 Annualize synergies for acquisitions1 5,387 - 401 73 Income tax expense
(benefit) (585) 26,046 20,547 14,902 Interest and debt expense 14,705 27,942 30,364 37,957 Non-Cash loss related to asset retirement - 175 2 - Gain on sale of Facility (2,638) (232) (232) - Non-cash
pension settlement2 105 - - 4,984 Amortization of deferred financing costs 2,452 1,721 1,774 2,349 Stock compensation expense 8,213 10,425 11,655 12,039 Garvey contingent consideration - 1,230 1,230
- Depreciation and amortization expense 31,540 41,947 42,368 45,945 Acquisition deal and integration costs 13,193 616 3,117 3,211 Acquisition amortization of backlog 2,981 - - - Excluded integration costs and
realignment costs3 (1,002) - (529) - Business realignment costs 1,272 5,140 3,857 1,867 Excluded business realignment costs3 (649) - (3,482) - Monterrey, MX new factory start-up costs - - - 4,489
Factory and warehouse consolidation 1,522 - 117 744 Headquarter relocation costs - 996 2,224 2,059 Insurance settlement 88 - - - Cost of debt refinancing 14,803 - - 1,190 BUE Settlement
16,211 - - - Other (1,488) - - - Credit Agreement TTM Adjusted EBITDA $ 136,278 $ 164,435 $ 170,720 $ 179,765 Total debt 459,296 471,592 579,769 530,236 Standby letters of credit 16,935 14,921
15,364 15,368 Cash and cash equivalents (88,654) (133,176) (106,994) (114,126) Net Debt $ 387,577 $ 353,337 $ 488,139 $ 431,477 Net Leverage Ratio 2.8x 2.1x 2.9 x 2.4x Net Debt is defined in the credit agreement
as total debt plus standby letters of credit, net of cash and cash equivalents. Net Leverage Ratio is defined as Net Debt divided by the Credit Agreement Trailing Twelve Month (“TTM”) Adjusted EBITDA. Credit Agreement TTM Adjusted EBITDA is
defined in the Company’s credit agreement as net income before interest expense, income taxes, depreciation, amortization and other adjustments. Credit Agreement Adjusted EBITDA Margin is defined as Credit Agreement TTM Adjusted EBITDA divided
by revenue. Net Debt, Net Leverage Ratio, Credit Agreement TTM Adjusted EBITDA and Credit Agreement Adjusted EBITDA Margin are not measures determined in accordance with GAAP and may not be comparable with the measures as used by other
companies. Nevertheless, the Company believes that providing non-GAAP financial measures, such as Net Debt, Net Leverage Ratio, Credit Agreement TTM Adjusted EBITDA and Credit Agreement Adjusted EBITDA Margin are important for investors and
other readers of the Company’s financial statements.