.3 Lender Presentation January 2026
Disclaimer Safe Harbor Statement This presentation and the accompanying oral discussion contain “forward-looking statements” within the meaning of Section 27A of the Securities Act of 1933, as amended, and Section 21E of the Securities Exchange Act of 1934, as amended. Such forward looking statements are generally identified by the use of forward-looking terminology, including the terms anticipate, “believe,” “continue,” “could,” “estimate,” “expect,” “illustrative,” “intend,” “likely,” “may,” “opportunity,” “plan,” “possible,” “potential,” “predict,” “project,” “shall,” “should,” “target,” “will,” “would” and, in each case, their negative or other various or comparable terminology. Such forward-looking statements include, among others, statements regarding: (1) our strategy, outlook and growth prospects; (2) our operational and financial targets and capital allocation policy; (3) general economic trends, global policy, including tariff policy, trends in our industry and markets and their expected impacts on Columbus McKinnon; (4) the amount of debt to be paid down by Columbus McKinnon during the 2026 fiscal year and the amount of cost and revenue synergies expected to be achieved after the completion of the Kito Crosby acquisition; (5) the expected benefits of the Kito Crosby acquisition; (6) the expected future financial results of the combined companies and (7) the expected timing for the closing of the Kito Crosby acquisition and the Divestiture. Forward-looking statements are not based on historical facts, but instead represent our current expectations and assumptions regarding our business, the economy and other future conditions, and involve known and unknown risks, uncertainties and other factors that could cause the actual results, performance or achievements of Columbus McKinnon to differ materially from any future results, performance or achievements expressed or implied by the forward-looking statements. It is not possible to predict or identify all such risks. These risks include, but are not limited to, (1) risks relating to the competitive environment in which we operate; (2) the risk that the cost synergies and any revenue synergies from the Kito Crosby transaction may not be fully realized or may take longer than anticipated to be realized; (3) the risk that the integration of Kito Crosby's business and operations into Columbus McKinnon will be materially delayed or will be more costly or difficult than expected, or that Columbus McKinnon is otherwise unable to successfully integrate Kito Crosby's business into its own, including as a result of unexpected factors or events; (4) risks regarding the ability of Columbus McKinnon and Kito Crosby to obtain required governmental approvals of the transaction on the timeline expected, or at all, and the risk that such approvals may result in the imposition of conditions that could adversely affect Columbus McKinnon after the closing of the transaction or adversely affect the expected benefits of the transaction; (5) the failure of the closing conditions in the purchase agreement for each of the acquisition of Kito Crosby and the Divestiture to be satisfied, or any unexpected delay in closing such transactions or the occurrence of any event, change or other circumstances that could give rise to the termination of the purchase agreement relating to each of the acquisition of Kito Crosby and the Divestiture; (6) the possibility that the Kito Crosby acquisition or the Divestiture may be more expensive to complete than anticipated, including as a result of unexpected factors or events; (7) risks related to the general competitive, economic, political and market conditions and other factors that may affect future results of Columbus McKinnon and Kito Crosby; and (8) the other risk factors that are described under the section titled “Risk Factors” in our Annual Report on Form 10-K for the fiscal year ended March 31, 2025 and our Quarterly Report on Form 10-Q for the quarterly period ended September 30, 2025 as well as in our other filings with the Securities and Exchange Commission, which are available on its website at www.sec.gov. Given these uncertainties, you should not place undue reliance on these forward-looking statements. Forward looking statements speak only as of the date they are made. Columbus McKinnon undertakes no duty to update publicly any such forward-looking statement, whether as a result of new information, future events or otherwise, except as may be required by applicable law, regulation or other competent legal authority. Non-GAAP Financial Measures and Forward-looking Non-GAAP Measures This presentation will discuss some non-GAAP (“adjusted”) financial measures which we believe are useful in evaluating our performance. Kito Crosby’s Credit Agreement Adjusted EBITDA represents Adjusted EBITDA as adjusted for CMCO’s Credit Agreement. You should not consider the presentation of this additional information in isolation or as a substitute for results prepared in accordance with GAAP. The non-GAAP financial measures are noted and reconciliations of comparable GAAP measures with non-GAAP financial measures can be found in tables included in the Supplemental Information portion of this presentation. 2
1 Executive Summary
Executive Summary l Columbus McKinnon Corporation (“Columbus McKinnon,” “CMCO” or the “Company” and, after the Transaction described herein, the “combined Company”) is a global market leader in material handling and a leading global hoist manufacturer 1,2 l For the TTM period ended 9/30/2025, the Company generated Net Sales and Credit Agreement Adjusted EBITDA of $978M and $146M, respectively l On February 10, 2025, the Company entered into a definitive agreement to acquire Kito Crosby Limited (“Kito Crosby”) for an aggregate purchase price of $2.7B (the “Transaction”), subject to customary adjustments l The Transaction is expected to be funded via a combination of up to $2,550M in new debt financing and $800M in a perpetual convertible preferred equity investment from CD&R l The debt financing is expected to consist of a new 7-year $1,325M Term Loan B as well as up to a new $1,225M Senior Secured Debt raise, with a $500M Revolving 3 Credit Facility at close l Shortly after the closing of the Transaction, the Company’s pending divestiture of its U.S. power chain hoist manufacturing facility in Damascus, Virginia, its chain manufacturing facility in Lexington, Tennessee and certain other assets (the “Divestiture”) is anticipated to close with gross proceeds of approximately $210M of cash plus a potential earn out of $25M l Net proceeds are expected to be approximately $160M, after approximately $50M of expected taxes and transaction related costs l Net proceeds are anticipated to be used to pay down the Term Loan B l The Company believes the Transaction presents a compelling strategic rationale and sets the Company up for its next stage of growth and is expected to: l Increase scale substantially and extend leadership in the core lifting market l Strengthen financial profile, expanding Adjusted EBITDA Margin and bolstering cash flow generation l Create significant opportunities for synergies through procurement, facility optimization and SG&A savings, with revenue synergies as an upside l Long-term target remains 2.0x Net Leverage Ratio 1,4 l For the TTM period ended 9/30/2025, the pro forma combined Company generated ~$2.0B in annual net sales at a ~22% Pro Forma Adjusted EBITDA Margin l CD&R as-converted ownership at close is expected to be approximately 42.5% of the combined Company 1 2 Note: Credit Agreement Adjusted EBITDA, Pro Forma Adjusted EBITDA, Credit Agreement Adjusted EBITDA Margin and Pro Forma Adjusted EBITDA Margin are non-GAAP financial measures. See definitions and reconciliations at the end of this Presentation; Reflects 3 standalone TTM 9/30/2025 Credit Agreement Adjusted EBITDA, not pro forma for the Divestiture or the Transaction; A portion of the RCF, up to $75M, may be drawn at the Transaction closing due to cash and net working capital held by Kito Crosby pursuant to the 4 4 Transaction; Reflects TTM 9/30/2025 Pro Forma Adjusted EBITDA Margin, adjusted for the Divestiture and the Transaction, with ~$70M of estimated annual net run rate cost synergies included (the Annual Net Run Rate Cost Synergies ); Credit Agreement Adjusted EBITDA for TTM 9/30/2025, adjusted for the Transaction and the Divestiture, is referred to as “Pro Forma Adj EBITDA” throughout the presentation
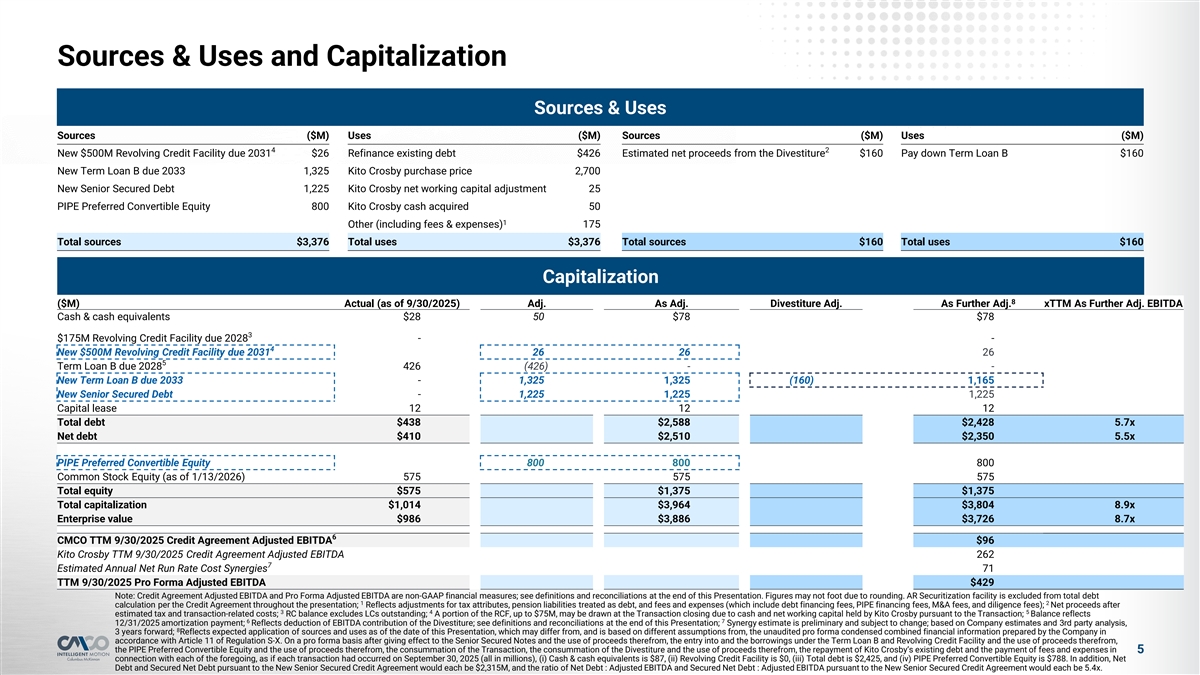
Sources & Uses and Capitalization Sources & Uses Sources ($M) Uses ($M) Sources ($M) Uses ($M) 4 2 New $500M Revolving Credit Facility due 2031 $26 Refinance existing debt $426 Estimated net proceeds from the Divestiture $160 Pay down Term Loan B $160 New Term Loan B due 2033 1,325 Kito Crosby purchase price 2,700 New Senior Secured Debt 1,225 Kito Crosby net working capital adjustment 25 PIPE Preferred Convertible Equity 800 Kito Crosby cash acquired 50 1 Other (including fees & expenses) 175 Total sources $3,376 Total uses $3,376 Total sources $160 Total uses $160 Capitalization 8 ($M) Actual (as of 9/30/2025) Adj. As Adj. Divestiture Adj. As Further Adj. xTTM As Further Adj. EBITDA Cash & cash equivalents $28 50 $78 $78 3 $175M Revolving Credit Facility due 2028 - - 4 New $500M Revolving Credit Facility due 2031 26 26 26 5 Term Loan B due 2028 426 (426) - - New Term Loan B due 2033 - 1,325 1,325 (160) 1,165 New Senior Secured Debt - 1,225 1,225 1,225 Capital lease 12 12 12 Total debt $438 $2,588 $2,428 5.7x Net debt $410 $2,510 $2,350 5.5x PIPE Preferred Convertible Equity 800 800 800 Common Stock Equity (as of 1/13/2026) 575 575 575 Total equity $575 $1,375 $1,375 Total capitalization $1,014 $3,964 $3,804 8.9x Enterprise value $986 $3,886 $3,726 8.7x 6 CMCO TTM 9/30/2025 Credit Agreement Adjusted EBITDA $96 Kito Crosby TTM 9/30/2025 Credit Agreement Adjusted EBITDA 262 7 Estimated Annual Net Run Rate Cost Synergies 71 TTM 9/30/2025 Pro Forma Adjusted EBITDA $429 Note: Credit Agreement Adjusted EBITDA and Pro Forma Adjusted EBITDA are non-GAAP financial measures; see definitions and reconciliations at the end of this Presentation. Figures may not foot due to rounding. AR Securitization facility is excluded from total debt 1 2 calculation per the Credit Agreement throughout the presentation; Reflects adjustments for tax attributes, pension liabilities treated as debt, and fees and expenses (which include debt financing fees, PIPE financing fees, M&A fees, and diligence fees); Net proceeds after 3 4 5 estimated tax and transaction-related costs; RC balance excludes LCs outstanding; A portion of the RCF, up to $75M, may be drawn at the Transaction closing due to cash and net working capital held by Kito Crosby pursuant to the Transaction; Balance reflects 6 7 12/31/2025 amortization payment; Reflects deduction of EBITDA contribution of the Divestiture; see definitions and reconciliations at the end of this Presentation; Synergy estimate is preliminary and subject to change; based on Company estimates and 3rd party analysis, 8 3 years forward; Reflects expected application of sources and uses as of the date of this Presentation, which may differ from, and is based on different assumptions from, the unaudited pro forma condensed combined financial information prepared by the Company in accordance with Article 11 of Regulation S-X. On a pro forma basis after giving effect to the Senior Secured Notes and the use of proceeds therefrom, the entry into and the borrowings under the Term Loan B and Revolving Credit Facility and the use of proceeds therefrom, the PIPE Preferred Convertible Equity and the use of proceeds therefrom, the consummation of the Transaction, the consummation of the Divestiture and the use of proceeds therefrom, the repayment of Kito Crosby’s existing debt and the payment of fees and expenses in 5 connection with each of the foregoing, as if each transaction had occurred on September 30, 2025 (all in millions), (i) Cash & cash equivalents is $87, (ii) Revolving Credit Facility is $0, (iii) Total debt is $2,425, and (iv) PIPE Preferred Convertible Equity is $788. In addition, Net Debt and Secured Net Debt pursuant to the New Senior Secured Credit Agreement would each be $2,315M, and the ratio of Net Debt : Adjusted EBITDA and Secured Net Debt : Adjusted EBITDA pursuant to the New Senior Secured Credit Agreement would each be 5.4x.

2 Company Overview
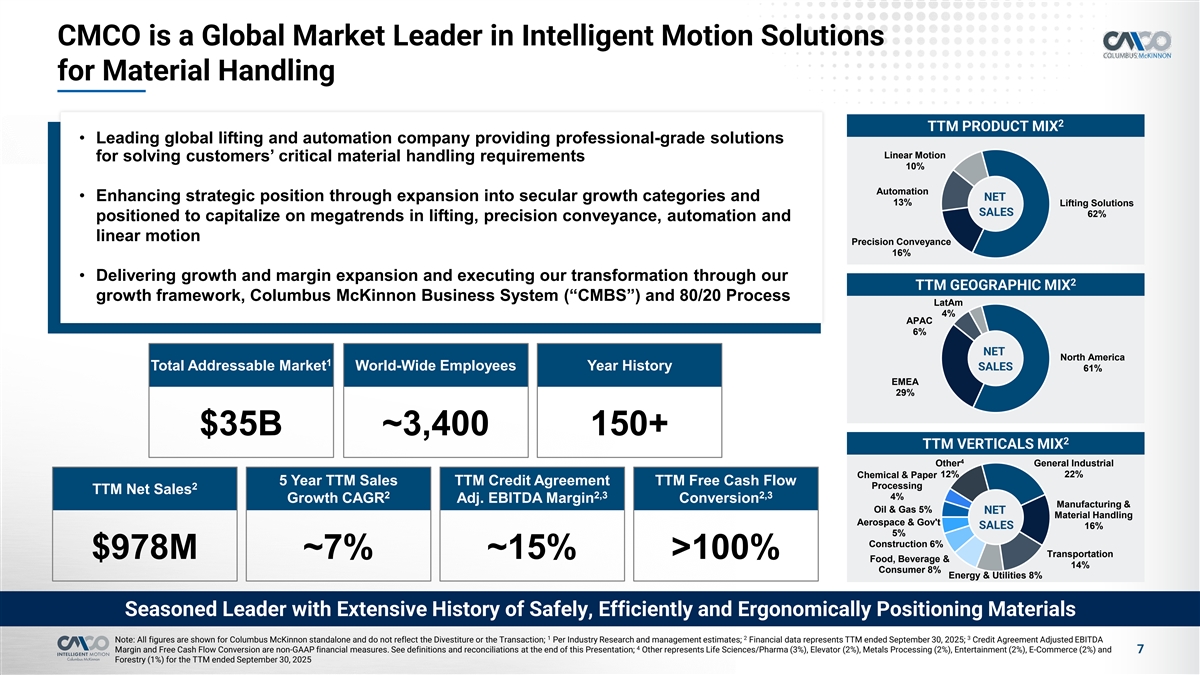
CMCO is a Global Market Leader in Intelligent Motion Solutions for Material Handling 2 TTM PRODUCT MIX • Leading global lifting and automation company providing professional-grade solutions Linear Motion for solving customers’ critical material handling requirements 10% Automation • Enhancing strategic position through expansion into secular growth categories and NET 13% Lifting Solutions SALES 62% positioned to capitalize on megatrends in lifting, precision conveyance, automation and linear motion Precision Conveyance 16% • Delivering growth and margin expansion and executing our transformation through our 2 TTM GEOGRAPHIC MIX growth framework, Columbus McKinnon Business System (“CMBS”) and 80/20 Process LatAm 4% APAC 6% NET 1 North America 1 Total Addressable Market Total Addressable Market World-Wide Employees Year History SALES 61% EMEA 29% $35B ~3,400 150+ 2 TTM VERTICALS MIX 4 Other General Industrial 12% 22% Chemical & Paper 5 Year TTM Sales TTM Credit Agreement TTM Free Cash Flow Processing 2 TTM Net Sales 2 2,3 2,3 4% Growth CAGR Adj. EBITDA Margin Conversion Manufacturing & Oil & Gas 5% NET Material Handling Aerospace & Gov't SALES 16% 5% Construction 6% Transportation $978M ~7% ~15% >100% Food, Beverage & 14% Consumer 8% Energy & Utilities 8% Seasoned Leader with Extensive History of Safely, Efficiently and Ergonomically Positioning Materials 1 2 3 Note: All figures are shown for Columbus McKinnon standalone and do not reflect the Divestiture or the Transaction; Per Industry Research and management estimates; Financial data represents TTM ended September 30, 2025; Credit Agreement Adjusted EBITDA 4 Margin and Free Cash Flow Conversion are non-GAAP financial measures. See definitions and reconciliations at the end of this Presentation; Other represents Life Sciences/Pharma (3%), Elevator (2%), Metals Processing (2%), Entertainment (2%), E-Commerce (2%) and 7 Forestry (1%) for the TTM ended September 30, 2025
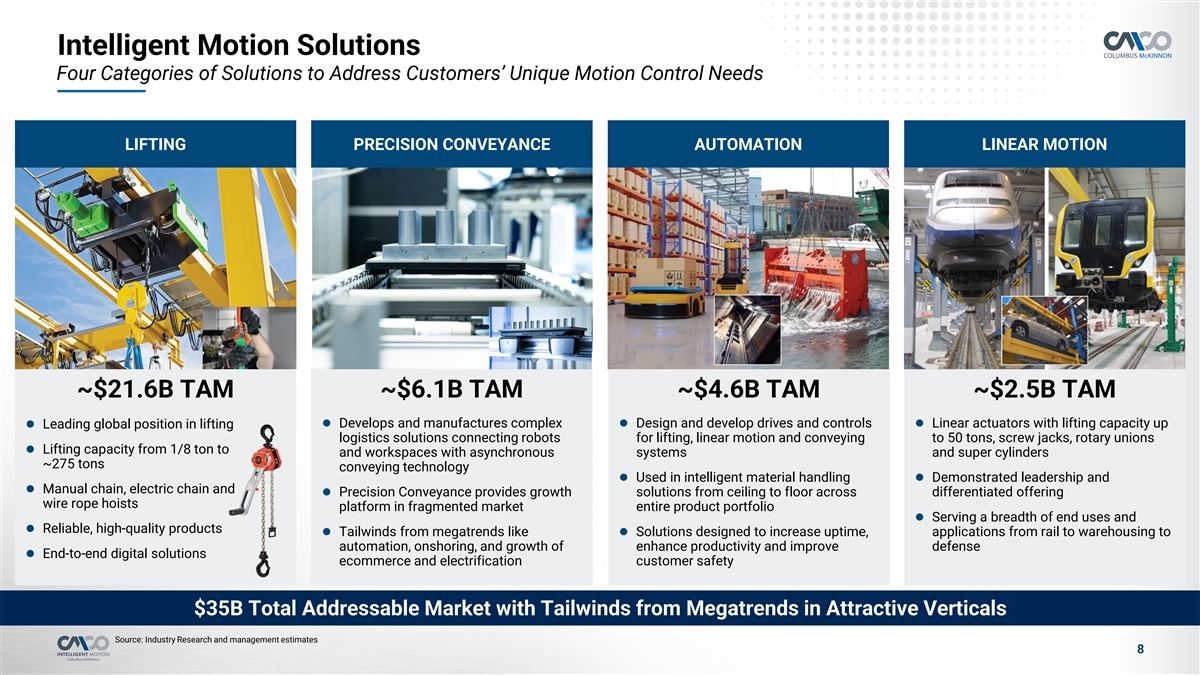
Intelligent Motion Solutions Four Categories of Solutions to Address Customers’ Unique Motion Control Needs LIFTING PRECISION CONVEYANCE AUTOMATION LINEAR MOTION ~$21.6B TAM ~$6.1B TAM ~$4.6B TAM ~$2.5B TAM l Leading global position in lifting l Develops and manufactures complex l Design and develop drives and controls l Linear actuators with lifting capacity up logistics solutions connecting robots for lifting, linear motion and conveying to 50 tons, screw jacks, rotary unions l Lifting capacity from 1/8 ton to and workspaces with asynchronous systems and super cylinders ~275 tons conveying technology l Used in intelligent material handling l Demonstrated leadership and l Manual chain, electric chain and l Precision Conveyance provides growth solutions from ceiling to floor across differentiated offering wire rope hoists platform in fragmented market entire product portfolio l Serving a breadth of end uses and l Reliable, high-quality products l Tailwinds from megatrends like l Solutions designed to increase uptime, applications from rail to warehousing to automation, onshoring, and growth of enhance productivity and improve defense l End-to-end digital solutions ecommerce and electrification customer safety $35B Total Addressable Market with Tailwinds from Megatrends in Attractive Verticals Source: Industry Research and management estimates 8
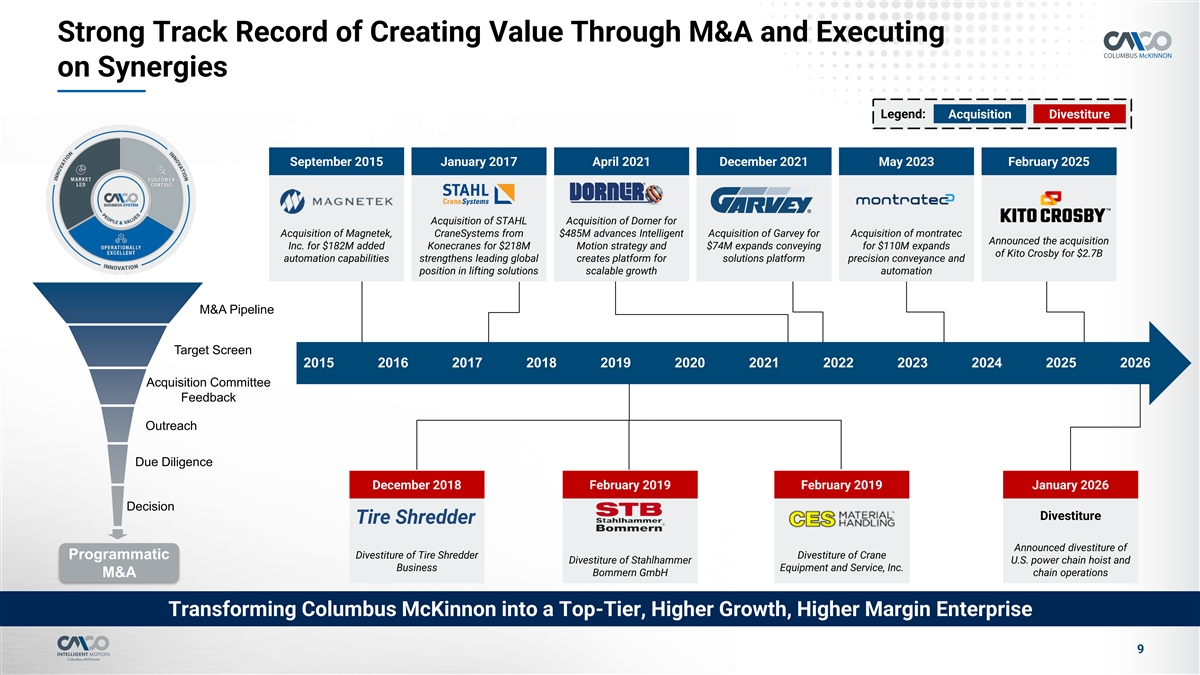
Strong Track Record of Creating Value Through M&A and Executing on Synergies Legend: Acquisition Divestiture December 2021 September 2015 January 2017 April 2021 December 2021 M Ma ay y 2023 2023 February 2025 January 2017 April 2021 Acquisition of STAHL Acquisition of Dorner for Acquisition of Magnetek, CraneSystems from $485M advances Intelligent Acquisition of Garvey for Acquisition of montratec Announced the acquisition Inc. for $182M added Konecranes for $218M Motion strategy and $74M expands conveying for $110M expands of Kito Crosby for $2.7B automation capabilities strengthens leading global creates platform for solutions platform precision conveyance and position in lifting solutions scalable growth automation M&A Pipeline Target Screen 2015 2016 2017 2018 2019 2020 2021 2022 2023 2024 2025 2026 Acquisition Committee Feedback Outreach Due Diligence December 2018 February 2019 February 2019 January 2026 Decision Divestiture Tire Shredder Announced divestiture of Divestiture of Tire Shredder Divestiture of Crane Programmatic Divestiture of Stahlhammer U.S. power chain hoist and Business Equipment and Service, Inc. Bommern GmbH chain operations M&A Transforming Columbus McKinnon into a Top-Tier, Higher Growth, Higher Margin Enterprise 9
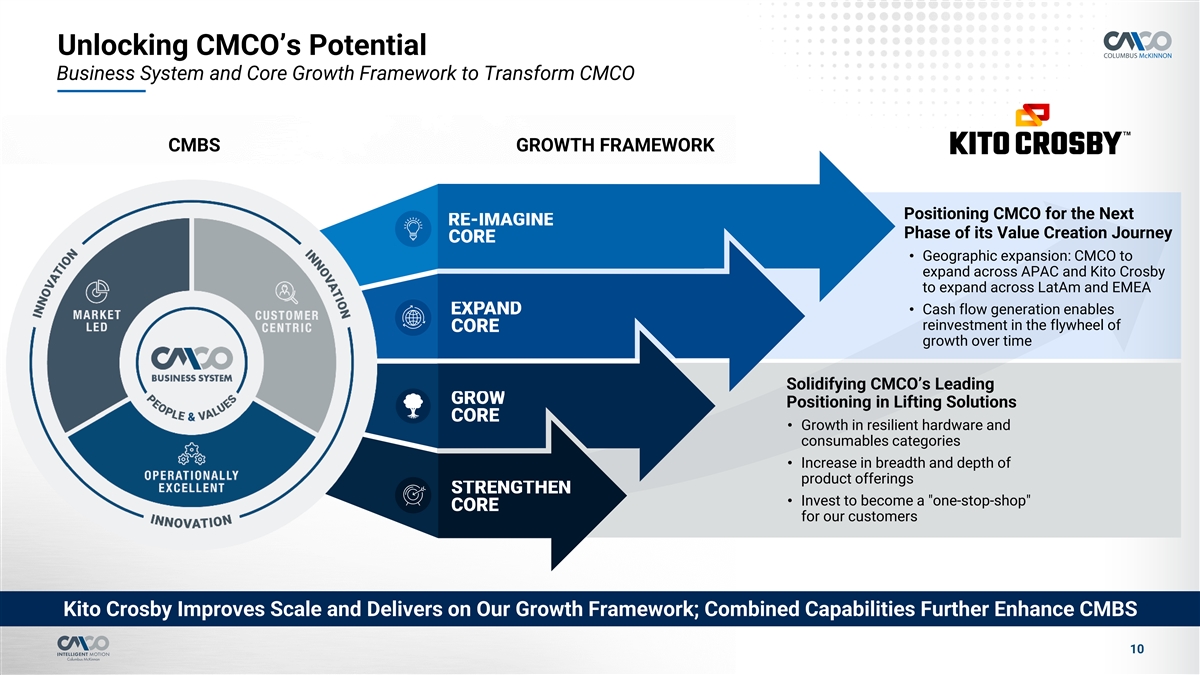
Unlocking CMCO’s Potential Business System and Core Growth Framework to Transform CMCO CMBS GROWTH FRAMEWORK Positioning CMCO for the Next Phase of its Value Creation Journey • Geographic expansion: CMCO to expand across APAC and Kito Crosby to expand across LatAm and EMEA • Cash flow generation enables reinvestment in the flywheel of growth over time Solidifying CMCO’s Leading Positioning in Lifting Solutions • Growth in resilient hardware and consumables categories • Increase in breadth and depth of product offerings • Invest to become a one-stop-shop for our customers Kito Crosby Improves Scale and Delivers on Our Growth Framework; Combined Capabilities Further Enhance CMBS 10
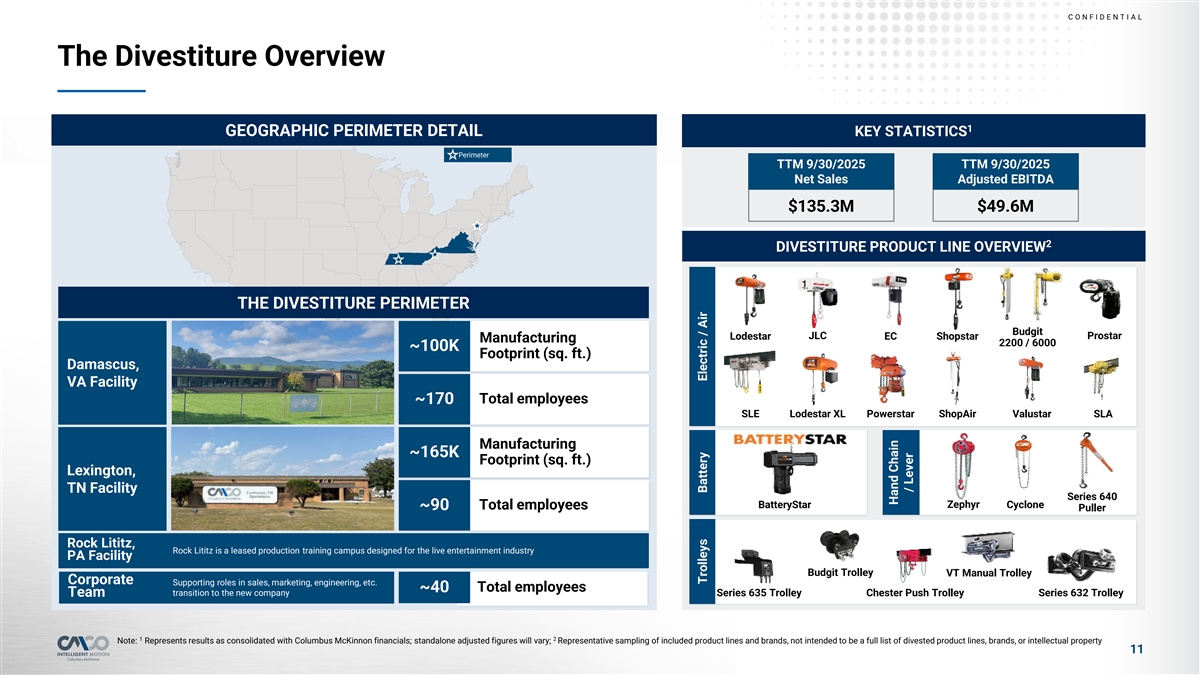
C O NF I D E NT I A L The Divestiture Overview 1 GEOGRAPHIC PERIMETER DETAIL KEY STATISTICS Perimeter TTM 9/30/2025 TTM 9/30/2025 Net Sales Adjusted EBITDA $135.3M $49.6M 2 DIVESTITURE PRODUCT LINE OVERVIEW THE DIVESTITURE PERIMETER Budgit Lodestar JLC EC Shopstar Prostar Manufacturing 2200 / 6000 ~100K Footprint (sq. ft.) Damascus, VA Facility Total employees ~170 SLE Lodestar XL Powerstar ShopAir Valustar SLA Manufacturing ~165K Footprint (sq. ft.) Lexington, TN Facility Series 640 BatteryStar Zephyr Cyclone Total employees ~90 Puller Rock Lititz, Rock Lititz is a leased production training campus designed for the live entertainment industry PA Facility Budgit Trolley VT Manual Trolley Corporate Supporting roles in sales, marketing, engineering, etc. Total employees ~40 transition to the new company Team Series 635 Trolley Chester Push Trolley Series 632 Trolley 1 2 Note: Represents results as consolidated with Columbus McKinnon financials; standalone adjusted figures will vary; Representative sampling of included product lines and brands, not intended to be a full list of divested product lines, brands, or intellectual property 11 Trolleys Battery Electric / Air Hand Chain / Lever
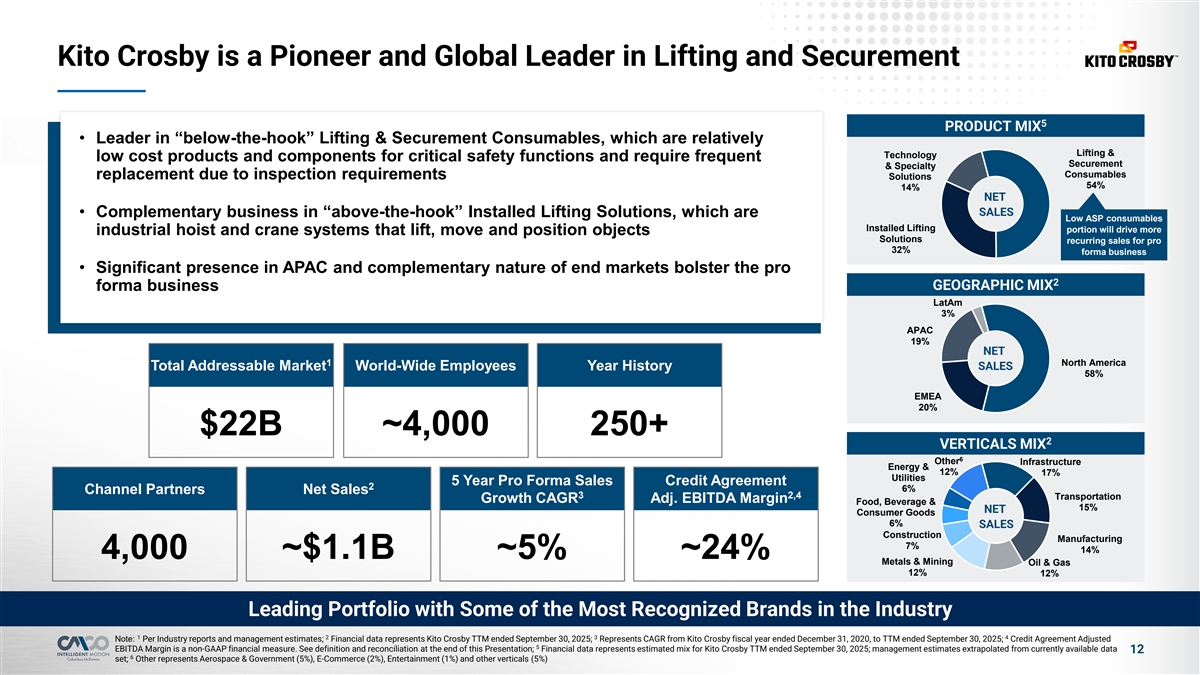
Kito Crosby is a Pioneer and Global Leader in Lifting and Securement 5 PRODUCT MIX • Leader in “below-the-hook” Lifting & Securement Consumables, which are relatively Lifting & Technology low cost products and components for critical safety functions and require frequent Securement & Specialty Consumables replacement due to inspection requirements Solutions 54% 14% NET SALES • Complementary business in “above-the-hook” Installed Lifting Solutions, which are Low ASP consumables Installed Lifting portion will drive more industrial hoist and crane systems that lift, move and position objects Solutions recurring sales for pro 32% forma business • Significant presence in APAC and complementary nature of end markets bolster the pro 2 GEOGRAPHIC MIX forma business LatAm 3% APAC 19% NET 1 North America 1 Total Addressable Market SALES Total Addressable Market World-Wide Employees Year History 58% EMEA 20% $22B ~4,000 250+ 2 VERTICALS MIX 6 Other Infrastructure Energy & 12% 17% Utilities 5 Year Pro Forma Sales Credit Agreement 2 6% Channel Partners Net Sales 3 2,4 Transportation Growth CAGR Adj. EBITDA Margin Food, Beverage & 15% NET Consumer Goods 6% SALES Construction Manufacturing 7% 14% 4,000 ~$1.1B ~5% ~24% Metals & Mining Oil & Gas 12% 12% Leading Portfolio with Some of the Most Recognized Brands in the Industry 1 2 3 4 Note: Per Industry reports and management estimates; Financial data represents Kito Crosby TTM ended September 30, 2025; Represents CAGR from Kito Crosby fiscal year ended December 31, 2020, to TTM ended September 30, 2025; Credit Agreement Adjusted 5 EBITDA Margin is a non-GAAP financial measure. See definition and reconciliation at the end of this Presentation; Financial data represents estimated mix for Kito Crosby TTM ended September 30, 2025; management estimates extrapolated from currently available data 12 6 set; Other represents Aerospace & Government (5%), E-Commerce (2%), Entertainment (1%) and other verticals (5%)
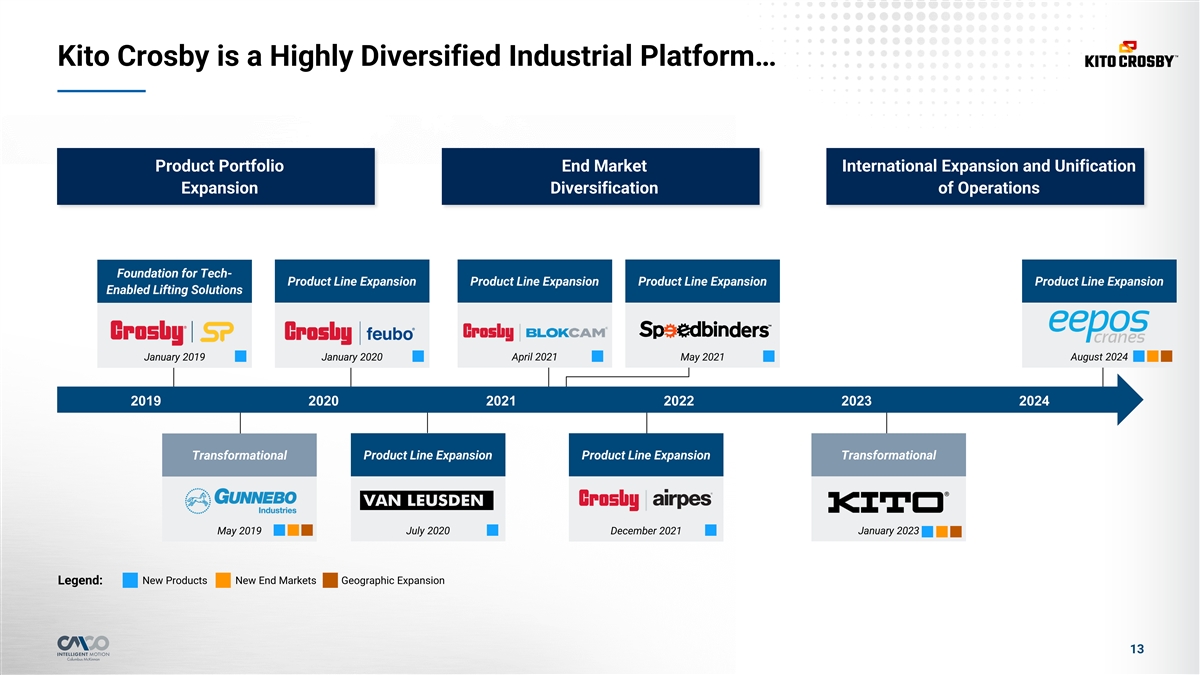
Kito Crosby is a Highly Diversified Industrial Platform… Product Portfolio End Market International Expansion and Unification Expansion Diversification of Operations Foundation for Tech- Product Line Expansion Product Line Expansion Product Line Expansion Product Line Expansion Enabled Lifting Solutions January 2019 January 2020 April 2021 May 2021 August 2024 2019 2020 2021 2022 2023 2024 Transformational Product Line Expansion Product Line Expansion Transformational May 2019 July 2020 December 2021 January 2023 Legend: New Products New End Markets Geographic Expansion 13
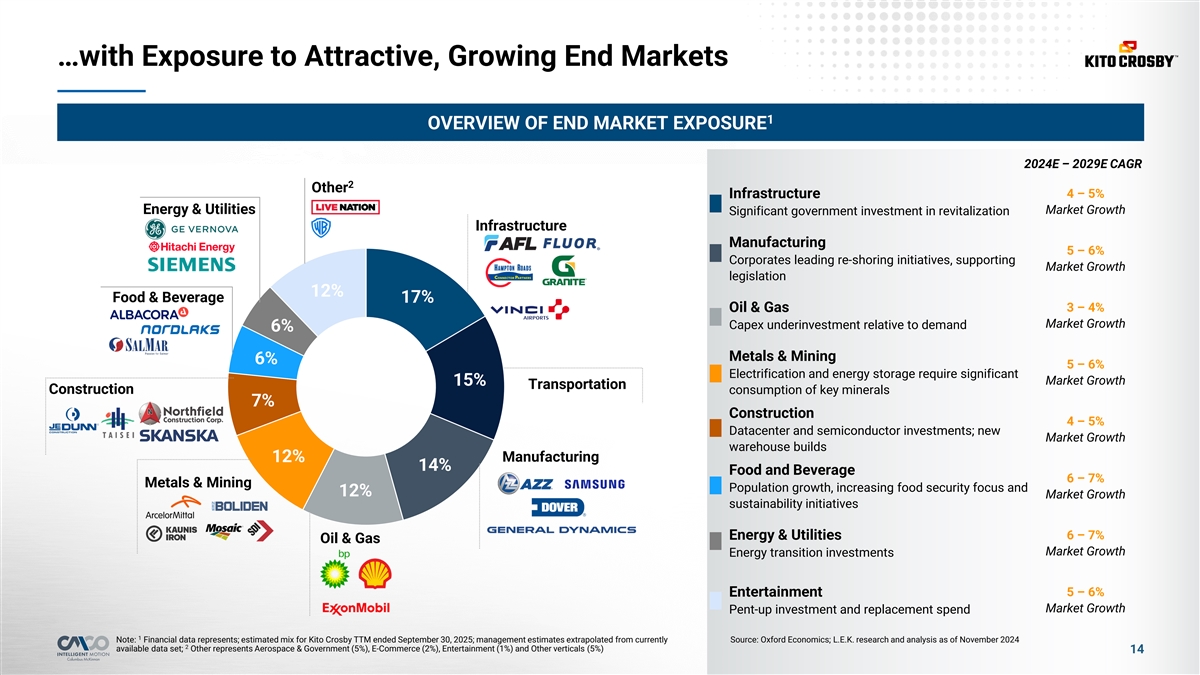
…with Exposure to Attractive, Growing End Markets 1 OVERVIEW OF END MARKET EXPOSURE 2024E – 2029E CAGR 2 Other Infrastructure 4 – 5% Market Growth Energy & Utilities Significant government investment in revitalization Infrastructure Manufacturing 5 – 6% Corporates leading re-shoring initiatives, supporting Market Growth legislation 12% Food & Beverage 17% 3 – 4% Oil & Gas Market Growth Capex underinvestment relative to demand 6% Metals & Mining 6% 5 – 6% Electrification and energy storage require significant Market Growth 15% Transportation Construction consumption of key minerals 7% Construction 4 – 5% Datacenter and semiconductor investments; new Market Growth warehouse builds Manufacturing 12% 14% Food and Beverage 6 – 7% Metals & Mining Population growth, increasing food security focus and 12% Market Growth sustainability initiatives Energy & Utilities 6 – 7% Oil & Gas Market Growth Energy transition investments 5 – 6% Entertainment Market Growth Pent-up investment and replacement spend 1 Note: Financial data represents; estimated mix for Kito Crosby TTM ended September 30, 2025; management estimates extrapolated from currently Source: Oxford Economics; L.E.K. research and analysis as of November 2024 2 available data set; Other represents Aerospace & Government (5%), E-Commerce (2%), Entertainment (1%) and Other verticals (5%) 14
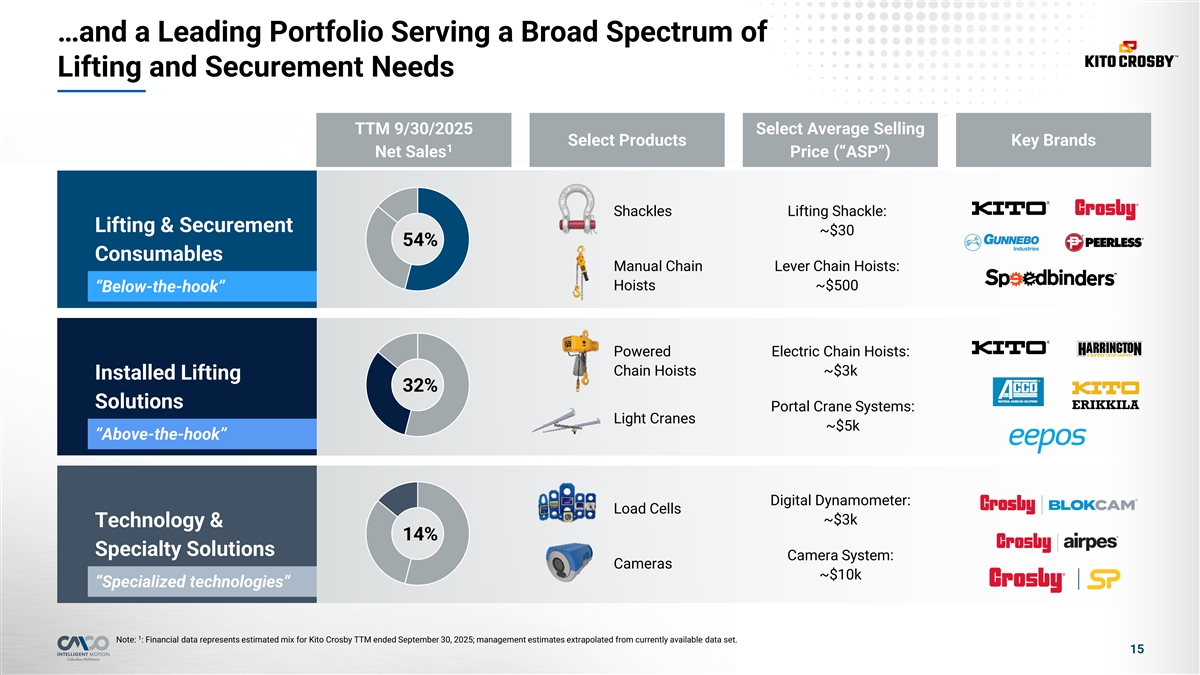
…and a Leading Portfolio Serving a Broad Spectrum of Lifting and Securement Needs TTM 9/30/2025 Select Average Selling Select Products Key Brands 1 Net Sales Price (“ASP”) Shackles Lifting Shackle: Lifting & Securement ~$30 54% Consumables Manual Chain Lever Chain Hoists: Hoists ~$500 “Below-the-hook” Powered Electric Chain Hoists: Chain Hoists ~$3k Installed Lifting 32% Solutions Portal Crane Systems: Light Cranes ~$5k “Above-the-hook” Digital Dynamometer: Load Cells ~$3k Technology & 14% Specialty Solutions Camera System: Cameras ~$10k “Specialized technologies” 1 Note: : Financial data represents estimated mix for Kito Crosby TTM ended September 30, 2025; management estimates extrapolated from currently available data set. 15
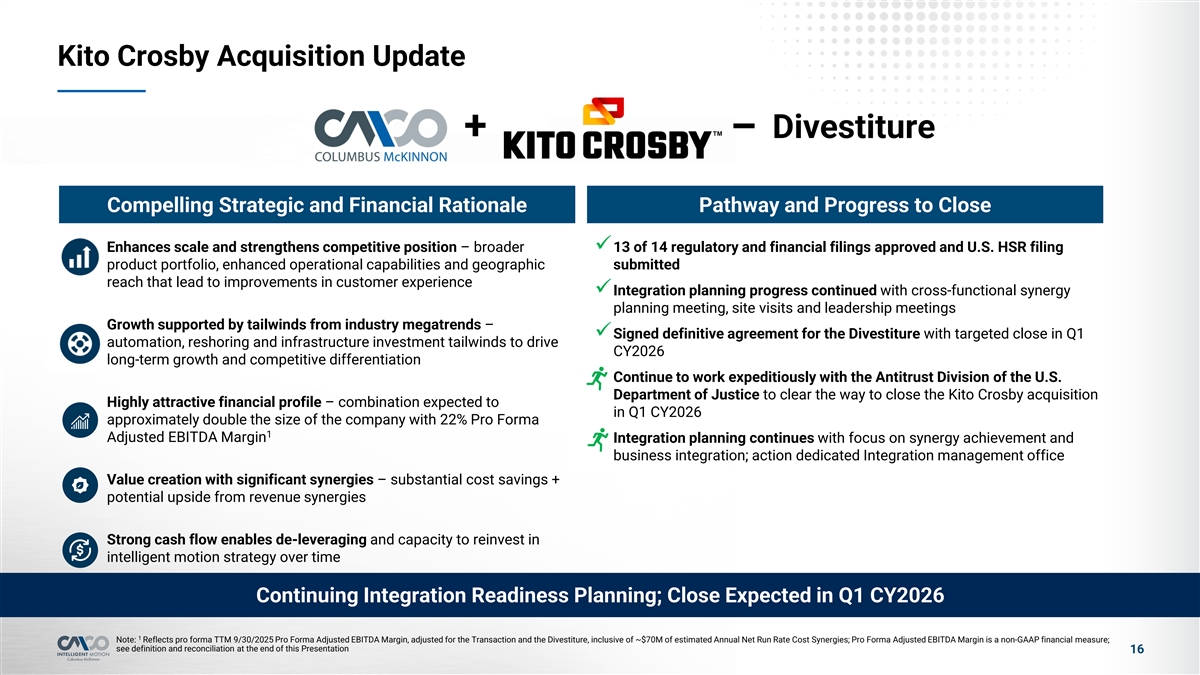
Kito Crosby Acquisition Update Divestiture + – Compelling Strategic and Financial Rationale Pathway and Progress to Close Enhances scale and strengthens competitive position – broader ü13 of 14 regulatory and financial filings approved and U.S. HSR filing product portfolio, enhanced operational capabilities and geographic submitted reach that lead to improvements in customer experience üIntegration planning progress continued with cross-functional synergy planning meeting, site visits and leadership meetings Growth supported by tailwinds from industry megatrends – üSigned definitive agreement for the Divestiture with targeted close in Q1 automation, reshoring and infrastructure investment tailwinds to drive CY2026 long-term growth and competitive differentiation üContinue to work expeditiously with the Antitrust Division of the U.S. Department of Justice to clear the way to close the Kito Crosby acquisition Highly attractive financial profile – combination expected to in Q1 CY2026 approximately double the size of the company with 22% Pro Forma 1 Adjusted EBITDA Margin üIntegration planning continues with focus on synergy achievement and business integration; action dedicated Integration management office Value creation with significant synergies – substantial cost savings + potential upside from revenue synergies Strong cash flow enables de-leveraging and capacity to reinvest in intelligent motion strategy over time Continuing Integration Readiness Planning; Close Expected in Q1 CY2026 1 Note: Reflects pro forma TTM 9/30/2025 Pro Forma Adjusted EBITDA Margin, adjusted for the Transaction and the Divestiture, inclusive of ~$70M of estimated Annual Net Run Rate Cost Synergies; Pro Forma Adjusted EBITDA Margin is a non-GAAP financial measure; see definition and reconciliation at the end of this Presentation 16
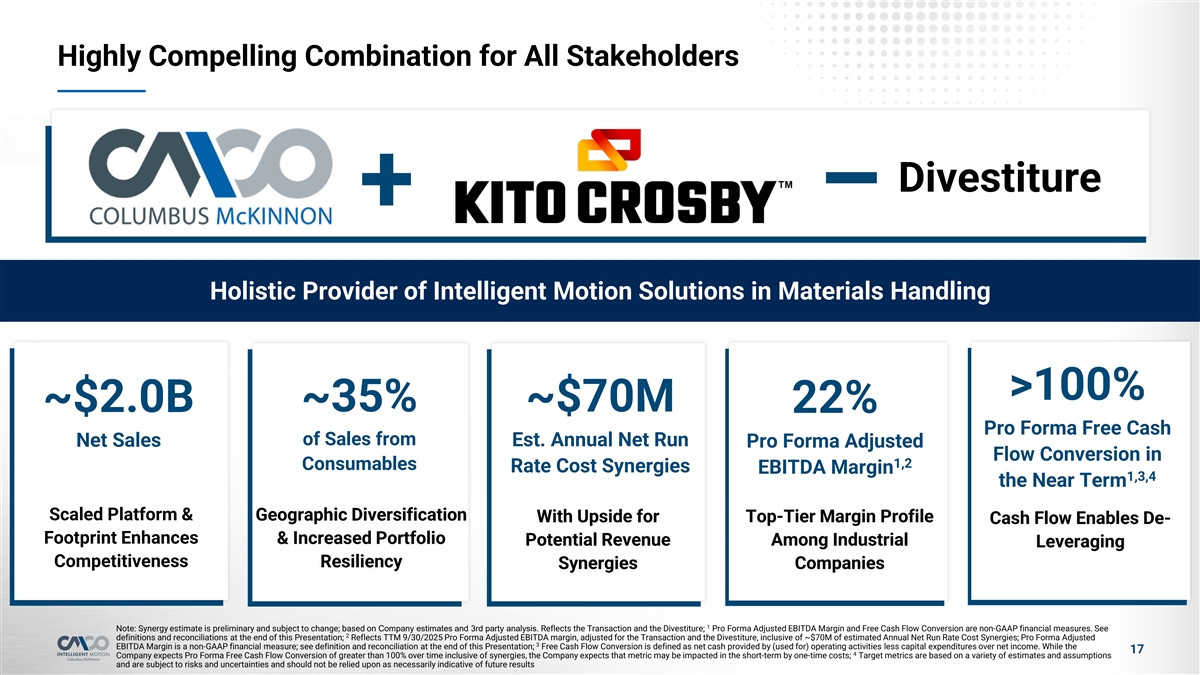
Highly Compelling Combination for All Stakeholders Divestiture + – Holistic Provider of Intelligent Motion Solutions in Materials Handling >100% ~35% ~$70M ~$2.0B 22% Pro Forma Free Cash of Sales from Net Sales Est. Annual Net Run Pro Forma Adjusted Flow Conversion in 1,2 Consumables Rate Cost Synergies EBITDA Margin 1,3,4 the Near Term Scaled Platform & Geographic Diversification Top-Tier Margin Profile With Upside for Cash Flow Enables De- Footprint Enhances & Increased Portfolio Potential Revenue Among Industrial Leveraging Competitiveness Resiliency Synergies Companies 1 Note: Synergy estimate is preliminary and subject to change; based on Company estimates and 3rd party analysis. Reflects the Transaction and the Divestiture; Pro Forma Adjusted EBITDA Margin and Free Cash Flow Conversion are non-GAAP financial measures. See 2 definitions and reconciliations at the end of this Presentation; Reflects TTM 9/30/2025 Pro Forma Adjusted EBITDA margin, adjusted for the Transaction and the Divestiture, inclusive of ~$70M of estimated Annual Net Run Rate Cost Synergies; Pro Forma Adjusted 3 EBITDA Margin is a non-GAAP financial measure; see definition and reconciliation at the end of this Presentation; Free Cash Flow Conversion is defined as net cash provided by (used for) operating activities less capital expenditures over net income. While the 17 4 Company expects Pro Forma Free Cash Flow Conversion of greater than 100% over time inclusive of synergies, the Company expects that metric may be impacted in the short-term by one-time costs; Target metrics are based on a variety of estimates and assumptions and are subject to risks and uncertainties and should not be relied upon as necessarily indicative of future results

3 Key Credit Highlights
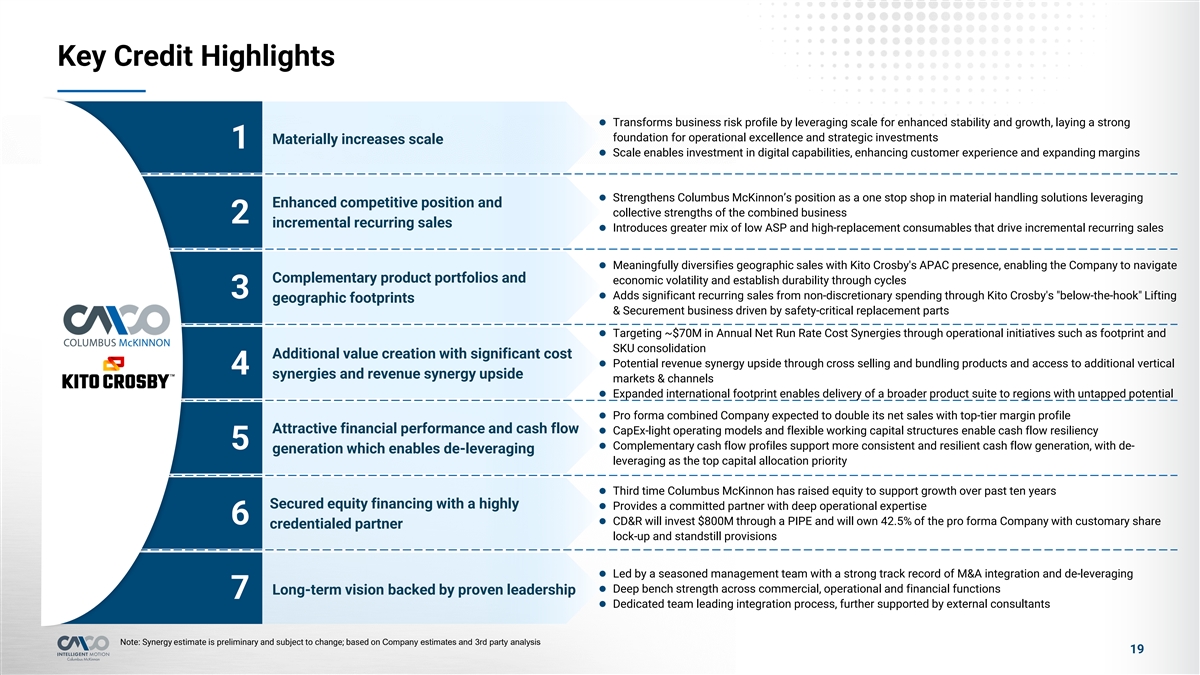
Key Credit Highlights l Transforms business risk profile by leveraging scale for enhanced stability and growth, laying a strong foundation for operational excellence and strategic investments Materially increases scale 1 l Scale enables investment in digital capabilities, enhancing customer experience and expanding margins l Strengthens Columbus McKinnon’s position as a one stop shop in material handling solutions leveraging Enhanced competitive position and collective strengths of the combined business 2 incremental recurring sales l Introduces greater mix of low ASP and high-replacement consumables that drive incremental recurring sales l Meaningfully diversifies geographic sales with Kito Crosby's APAC presence, enabling the Company to navigate Complementary product portfolios and economic volatility and establish durability through cycles 3l Adds significant recurring sales from non-discretionary spending through Kito Crosby's below-the-hook Lifting geographic footprints & Securement business driven by safety-critical replacement parts l Targeting ~$70M in Annual Net Run Rate Cost Synergies through operational initiatives such as footprint and SKU consolidation Additional value creation with significant cost l Potential revenue synergy upside through cross selling and bundling products and access to additional vertical 4 synergies and revenue synergy upside markets & channels l Expanded international footprint enables delivery of a broader product suite to regions with untapped potential l Pro forma combined Company expected to double its net sales with top-tier margin profile Attractive financial performance and cash flow l CapEx-light operating models and flexible working capital structures enable cash flow resiliency 5l Complementary cash flow profiles support more consistent and resilient cash flow generation, with de- generation which enables de-leveraging leveraging as the top capital allocation priority l Third time Columbus McKinnon has raised equity to support growth over past ten years Secured equity financing with a highly l Provides a committed partner with deep operational expertise 6l CD&R will invest $800M through a PIPE and will own 42.5% of the pro forma Company with customary share credentialed partner lock-up and standstill provisions l Led by a seasoned management team with a strong track record of M&A integration and de-leveraging l Deep bench strength across commercial, operational and financial functions Long-term vision backed by proven leadership 7 l Dedicated team leading integration process, further supported by external consultants Note: Synergy estimate is preliminary and subject to change; based on Company estimates and 3rd party analysis 19
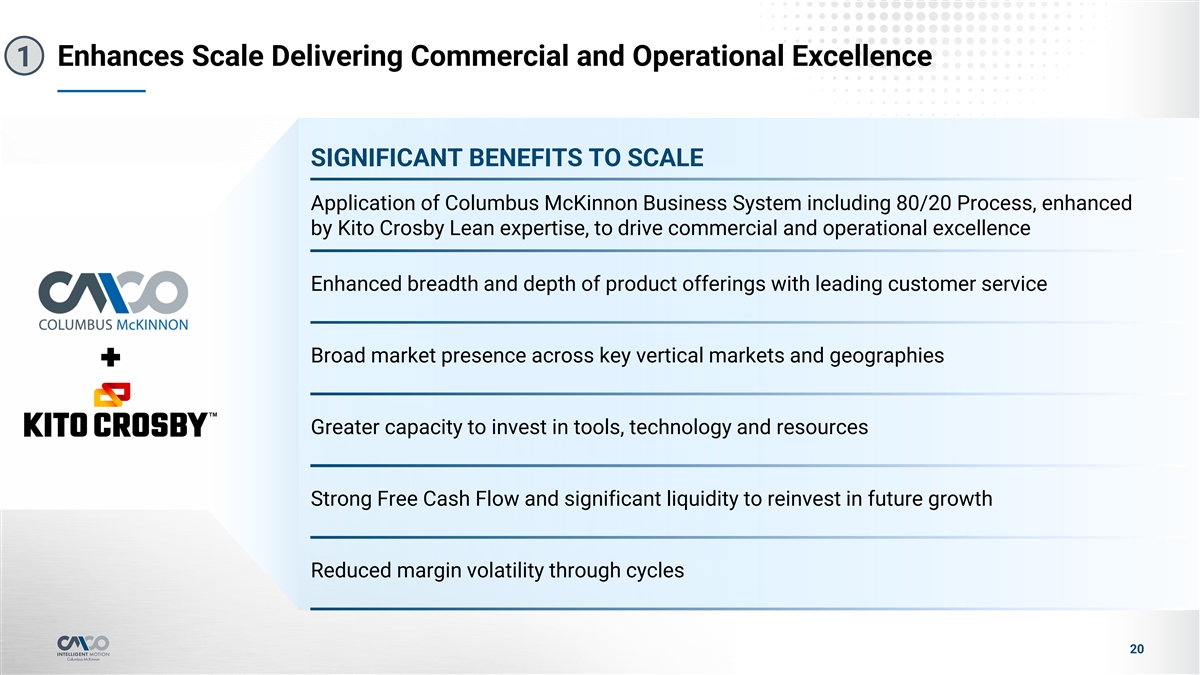
Enhances Scale Delivering Commercial and Operational Excellence 1 SIGNIFICANT BENEFITS TO SCALE Application of Columbus McKinnon Business System including 80/20 Process, enhanced by Kito Crosby Lean expertise, to drive commercial and operational excellence Enhanced breadth and depth of product offerings with leading customer service Broad market presence across key vertical markets and geographies Greater capacity to invest in tools, technology and resources Strong Free Cash Flow and significant liquidity to reinvest in future growth Reduced margin volatility through cycles 20
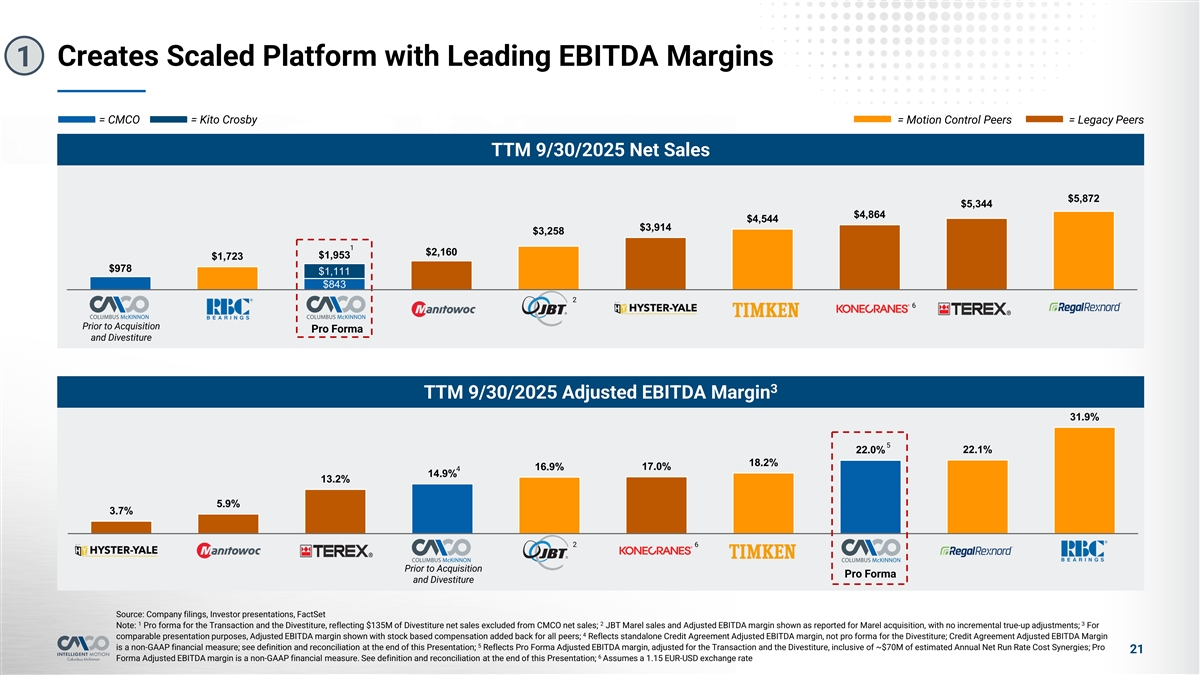
Creates Scaled Platform with Leading EBITDA Margins 1 = CMCO = Kito Crosby = Motion Control Peers = Legacy Peers TTM 9/30/2025 Net Sales $5,872 $5,344 $4,864 $4,544 $3,914 $3,258 1 $2,160 $1,953 $1,723 $978 $1,111 $843 2 6 Prior to Acquisition Pro Forma and Divestiture 3 TTM 9/30/2025 Adjusted EBITDA Margin 31.9% 5 22.0% 22.1% 18.2% 16.9% 17.0% 4 14.9% 13.2% 5.9% 3.7% 2 6 Prior to Acquisition Pro Forma and Divestiture Source: Company filings, Investor presentations, FactSet 1 2 3 Note: Pro forma for the Transaction and the Divestiture, reflecting $135M of Divestiture net sales excluded from CMCO net sales; JBT Marel sales and Adjusted EBITDA margin shown as reported for Marel acquisition, with no incremental true-up adjustments; For 4 comparable presentation purposes, Adjusted EBITDA margin shown with stock based compensation added back for all peers; Reflects standalone Credit Agreement Adjusted EBITDA margin, not pro forma for the Divestiture; Credit Agreement Adjusted EBITDA Margin 5 is a non-GAAP financial measure; see definition and reconciliation at the end of this Presentation; Reflects Pro Forma Adjusted EBITDA margin, adjusted for the Transaction and the Divestiture, inclusive of ~$70M of estimated Annual Net Run Rate Cost Synergies; Pro 21 6 Forma Adjusted EBITDA margin is a non-GAAP financial measure. See definition and reconciliation at the end of this Presentation; Assumes a 1.15 EUR-USD exchange rate
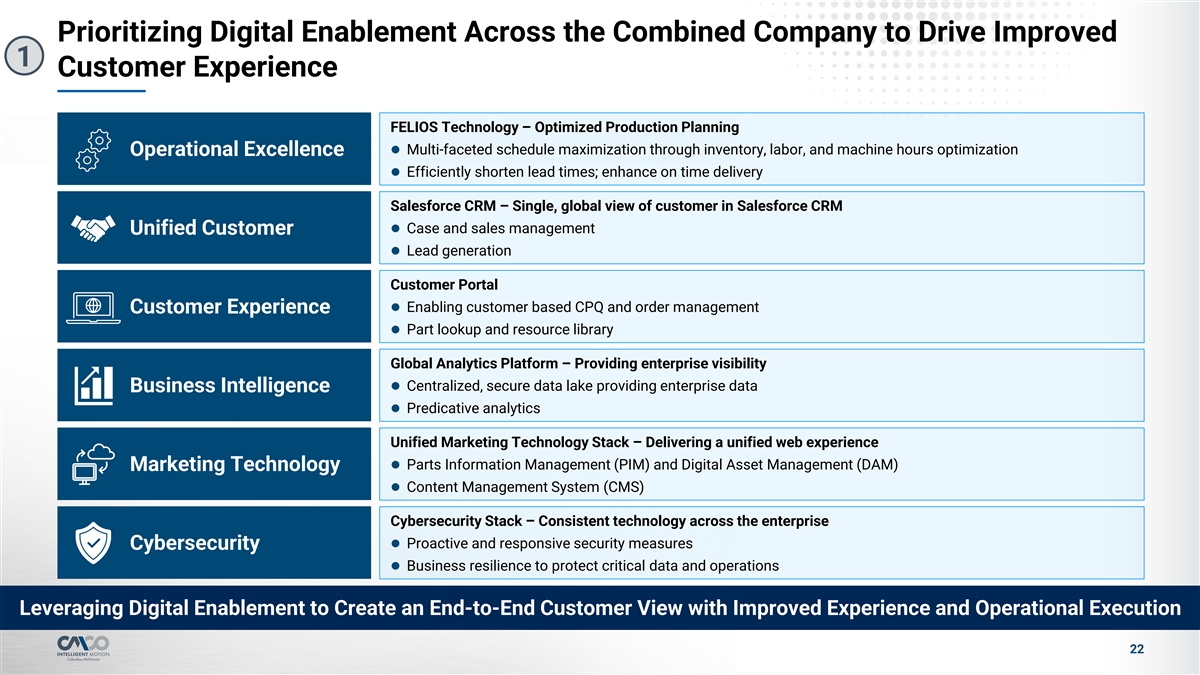
Prioritizing Digital Enablement Across the Combined Company to Drive Improved 1 Customer Experience FELIOS Technology – Optimized Production Planning l Multi-faceted schedule maximization through inventory, labor, and machine hours optimization Operational Excellence l Efficiently shorten lead times; enhance on time delivery Salesforce CRM – Single, global view of customer in Salesforce CRM l Case and sales management Unified Customer l Lead generation Customer Portal l Enabling customer based CPQ and order management Customer Experience l Part lookup and resource library Global Analytics Platform – Providing enterprise visibility l Centralized, secure data lake providing enterprise data Business Intelligence l Predicative analytics Unified Marketing Technology Stack – Delivering a unified web experience l Parts Information Management (PIM) and Digital Asset Management (DAM) Marketing Technology l Content Management System (CMS) Cybersecurity Stack – Consistent technology across the enterprise l Proactive and responsive security measures Cybersecurity l Business resilience to protect critical data and operations Leveraging Digital Enablement to Create an End-to-End Customer View with Improved Experience and Operational Execution 22
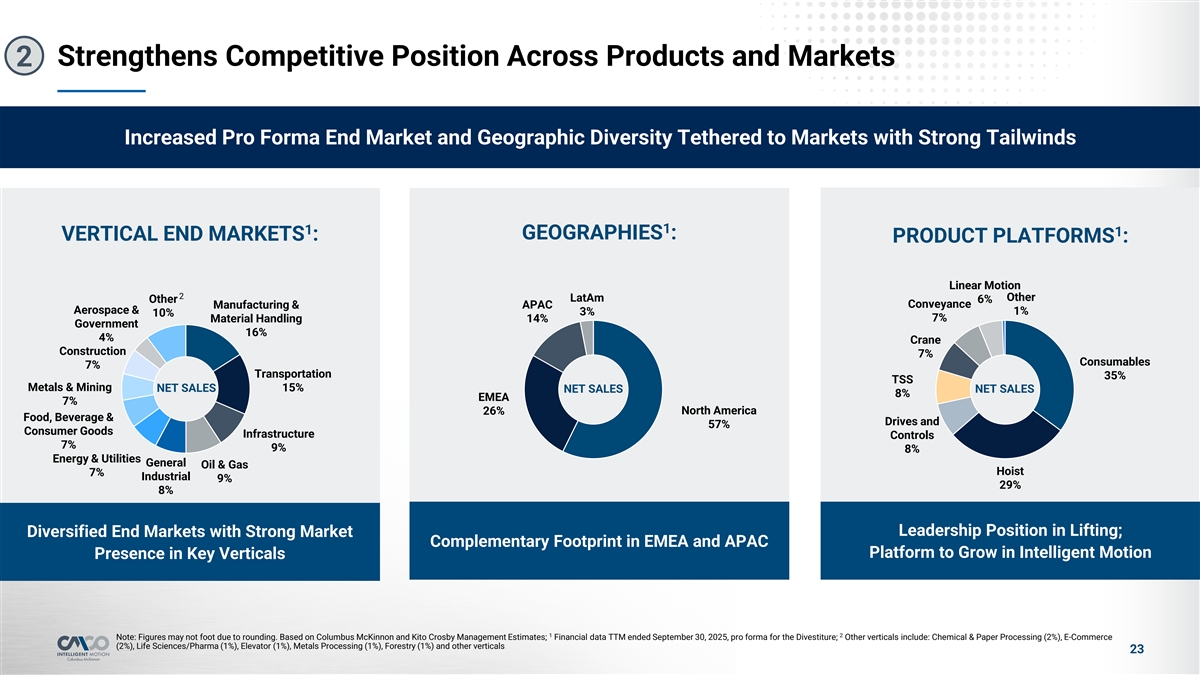
Strengthens Competitive Position Across Products and Markets 2 Increased Pro Forma End Market and Geographic Diversity Tethered to Markets with Strong Tailwinds 1 1 1 GEOGRAPHIES : VERTICAL END MARKETS : PRODUCT PLATFORMS : Linear Motion 2 Other LatAm Other 6% Manufacturing & APAC Conveyance Aerospace & 1% 3% 10% 7% Material Handling 14% Government 16% 4% Crane Construction 7% Consumables 7% Transportation 35% TSS Metals & Mining NET SALES 15% NET SALES NET SALES 8% EMEA 7% 26% North America Food, Beverage & Drives and 57% Consumer Goods Infrastructure Controls 7% 9% 8% Energy & Utilities General Oil & Gas Hoist 7% Industrial 9% 29% 8% Leadership Position in Lifting; Diversified End Markets with Strong Market Complementary Footprint in EMEA and APAC Platform to Grow in Intelligent Motion Presence in Key Verticals 1 2 Note: Figures may not foot due to rounding. Based on Columbus McKinnon and Kito Crosby Management Estimates; Financial data TTM ended September 30, 2025, pro forma for the Divestiture; Other verticals include: Chemical & Paper Processing (2%), E-Commerce (2%), Life Sciences/Pharma (1%), Elevator (1%), Metals Processing (1%), Forestry (1%) and other verticals 23
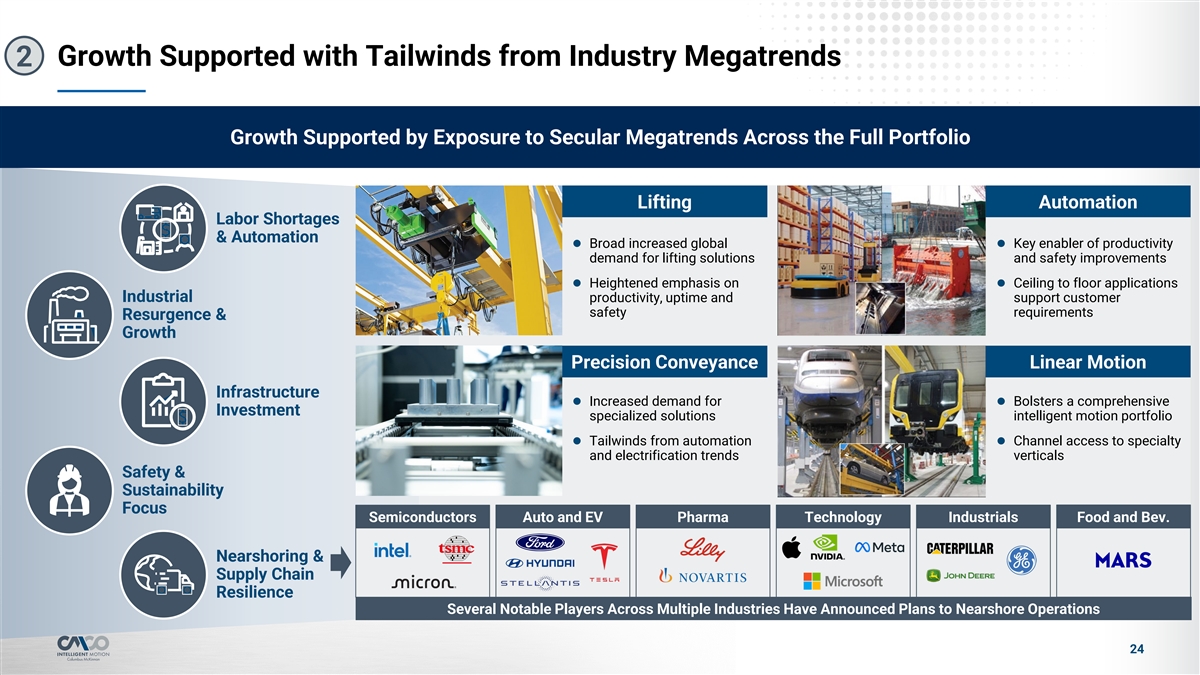
Growth Supported with Tailwinds from Industry Megatrends 2 Growth Supported by Exposure to Secular Megatrends Across the Full Portfolio Lifting Automation Labor Shortages & Automation l Broad increased global l Key enabler of productivity demand for lifting solutions and safety improvements l Heightened emphasis on l Ceiling to floor applications Industrial productivity, uptime and support customer safety requirements Resurgence & Growth Precision Conveyance Linear Motion Infrastructure l Increased demand for l Bolsters a comprehensive Investment specialized solutions intelligent motion portfolio l Tailwinds from automation l Channel access to specialty and electrification trends verticals Safety & Sustainability Focus Semiconductors Auto and EV Pharma Technology Industrials Food and Bev. Nearshoring & Supply Chain Resilience Several Notable Players Across Multiple Industries Have Announced Plans to Nearshore Operations 24
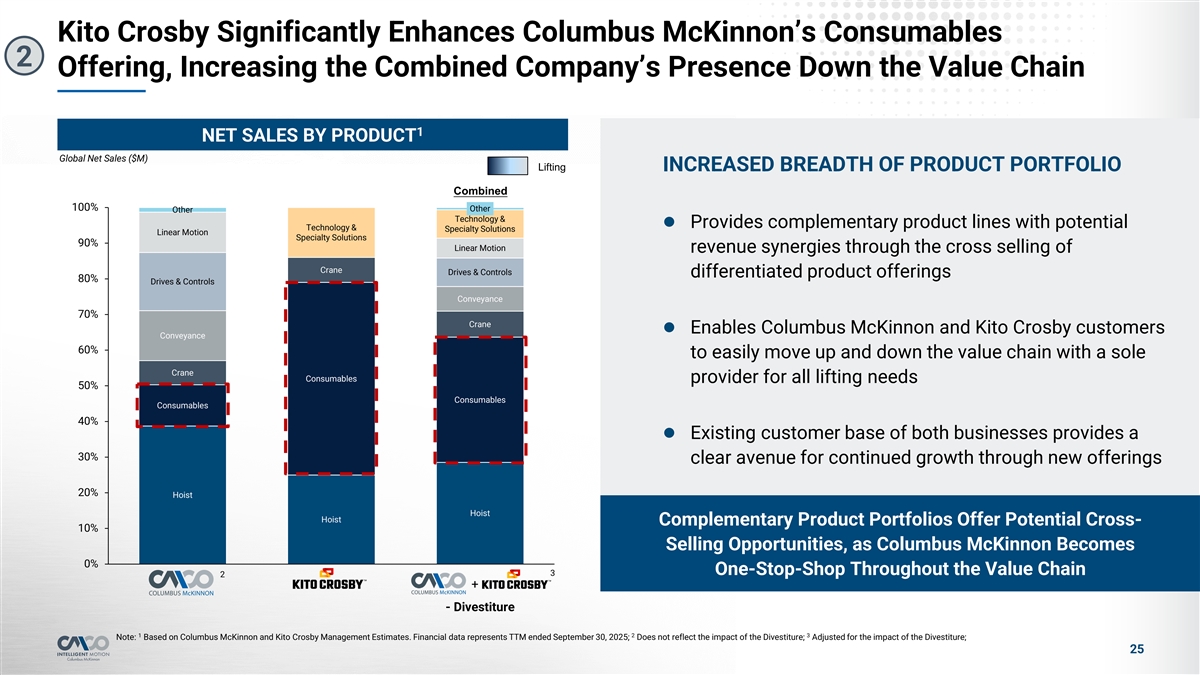
Kito Crosby Significantly Enhances Columbus McKinnon’s Consumables 2 Offering, Increasing the Combined Company’s Presence Down the Value Chain 1 NET SALES BY PRODUCT Global Net Sales ($M) Lifting INCREASED BREADTH OF PRODUCT PORTFOLIO Combined 100% Other Other Technology & l Provides complementary product lines with potential Technology & Specialty Solutions Linear Motion Specialty Solutions 90% Linear Motion revenue synergies through the cross selling of Crane Drives & Controls differentiated product offerings 80% Drives & Controls Conveyance 70% Crane l Enables Columbus McKinnon and Kito Crosby customers Conveyance 60% to easily move up and down the value chain with a sole Crane Consumables provider for all lifting needs 50% Consumables Consumables 40% l Existing customer base of both businesses provides a 30% clear avenue for continued growth through new offerings 20% Hoist Hoist Hoist Complementary Product Portfolios Offer Potential Cross- 10% Selling Opportunities, as Columbus McKinnon Becomes 0% One-Stop-Shop Throughout the Value Chain 3 2 + - Divestiture 1 2 3 Note: Based on Columbus McKinnon and Kito Crosby Management Estimates. Financial data represents TTM ended September 30, 2025; Does not reflect the impact of the Divestiture; Adjusted for the impact of the Divestiture; 25
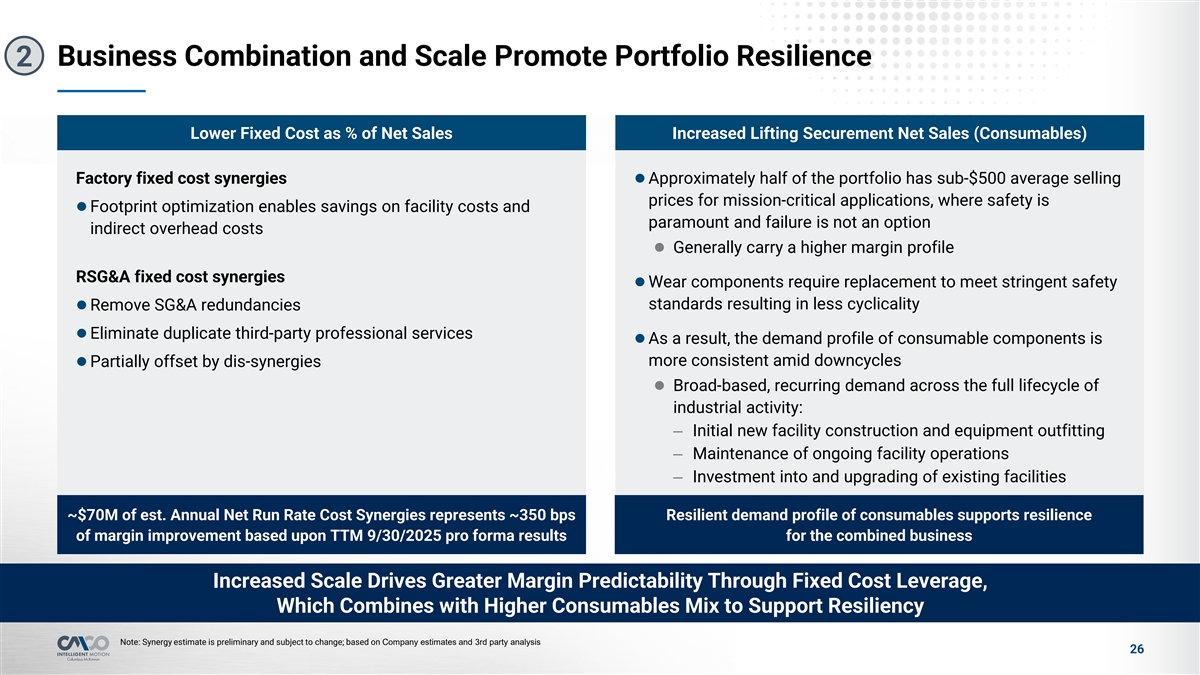
Business Combination and Scale Promote Portfolio Resilience 2 Lower Fixed Cost as % of Net Sales Increased Lifting Securement Net Sales (Consumables) Factory fixed cost synergiesl Approximately half of the portfolio has sub-$500 average selling prices for mission-critical applications, where safety is l Footprint optimization enables savings on facility costs and paramount and failure is not an option indirect overhead costs l Generally carry a higher margin profile RSG&A fixed cost synergies l Wear components require replacement to meet stringent safety standards resulting in less cyclicality l Remove SG&A redundancies l Eliminate duplicate third-party professional services l As a result, the demand profile of consumable components is more consistent amid downcycles l Partially offset by dis-synergies l Broad-based, recurring demand across the full lifecycle of industrial activity: – Initial new facility construction and equipment outfitting – Maintenance of ongoing facility operations – Investment into and upgrading of existing facilities ~$70M of est. Annual Net Run Rate Cost Synergies represents ~350 bps Resilient demand profile of consumables supports resilience of margin improvement based upon TTM 9/30/2025 pro forma results for the combined business Increased Scale Drives Greater Margin Predictability Through Fixed Cost Leverage, Which Combines with Higher Consumables Mix to Support Resiliency Note: Synergy estimate is preliminary and subject to change; based on Company estimates and 3rd party analysis 26
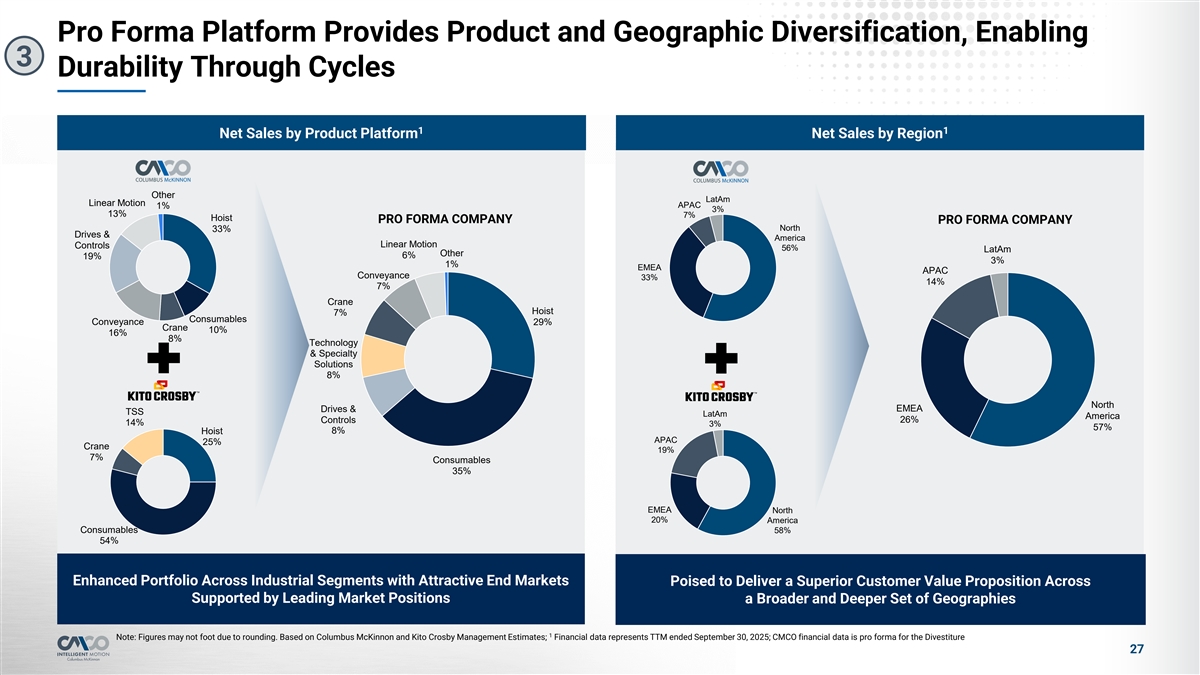
Pro Forma Platform Provides Product and Geographic Diversification, Enabling 3 Durability Through Cycles 1 1 Net Sales by Product Platform Net Sales by Region Other LatAm Linear Motion APAC 1% 3% 13% 7% Hoist PRO FORMA COMPANY PRO FORMA COMPANY North 33% Drives & America Linear Motion Controls 56% LatAm Other 6% 19% 3% 1% EMEA APAC Conveyance 33% 14% 7% Crane Hoist 7% Consumables Conveyance 29% Crane 10% 16% 8% Technology & Specialty Solutions 8% North EMEA Drives & TSS LatAm America Controls 26% 14% 3% 57% Hoist 8% APAC 25% Crane 19% 7% Consumables 35% EMEA North 20% America Consumables 58% 54% Enhanced Portfolio Across Industrial Segments with Attractive End Markets Poised to Deliver a Superior Customer Value Proposition Across Supported by Leading Market Positions a Broader and Deeper Set of Geographies 1 Note: Figures may not foot due to rounding. Based on Columbus McKinnon and Kito Crosby Management Estimates; Financial data represents TTM ended September 30, 2025; CMCO financial data is pro forma for the Divestiture 27
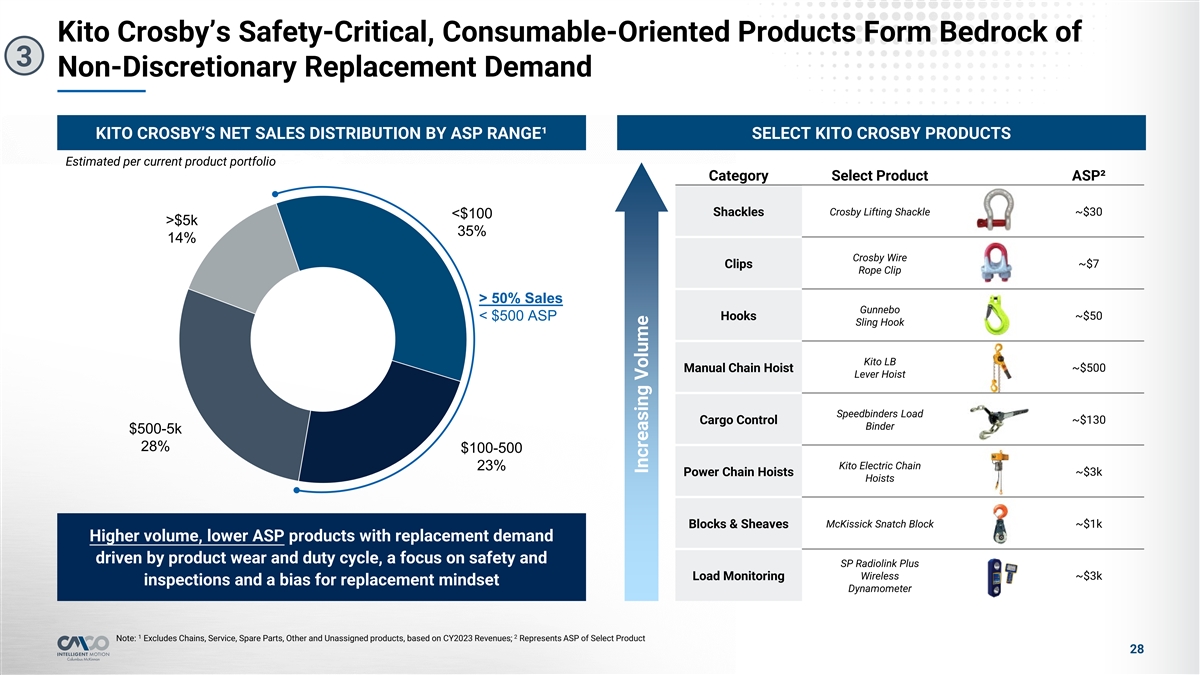
Kito Crosby’s Safety-Critical, Consumable-Oriented Products Form Bedrock of 3 Non-Discretionary Replacement Demand KITO CROSBY’S NET SALES DISTRIBUTION BY ASP RANGE¹ SELECT KITO CROSBY PRODUCTS Estimated per current product portfolio Category Select Product ASP² Crosby Lifting Shackle ~$30 Shackles <$100 >$5k 35% 14% Crosby Wire Clips ~$7 Rope Clip > 50% Sales Gunnebo Hooks ~$50 < $500 ASP Sling Hook Kito LB Manual Chain Hoist ~$500 Lever Hoist Speedbinders Load Cargo Control ~$130 Binder $500-5k 28% $100-500 Kito Electric Chain 23% Power Chain Hoists ~$3k Hoists Blocks & Sheaves McKissick Snatch Block ~$1k Higher volume, lower ASP products with replacement demand driven by product wear and duty cycle, a focus on safety and SP Radiolink Plus Wireless Load Monitoring ~$3k inspections and a bias for replacement mindset Dynamometer 1 2 Note: Excludes Chains, Service, Spare Parts, Other and Unassigned products, based on CY2023 Revenues; Represents ASP of Select Product 28 Increasing Volume
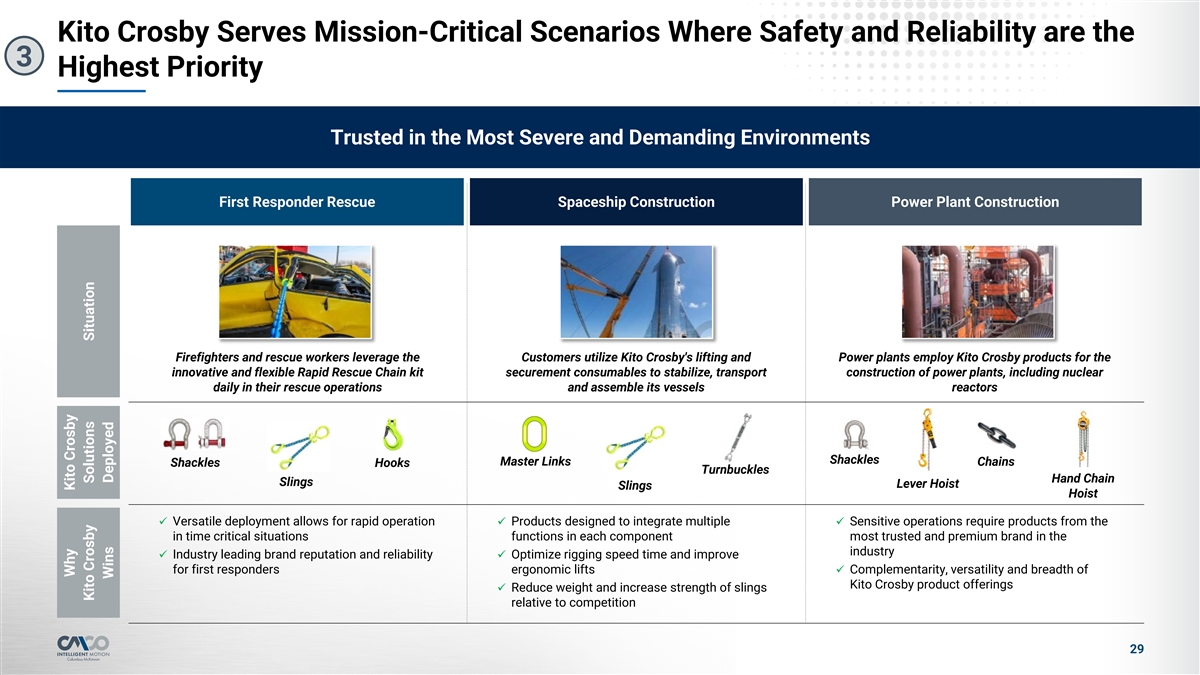
Kito Crosby Serves Mission-Critical Scenarios Where Safety and Reliability are the 3 Highest Priority Trusted in the Most Severe and Demanding Environments First Responder Rescue Spaceship Construction Power Plant Construction Firefighters and rescue workers leverage the Customers utilize Kito Crosby's lifting and Power plants employ Kito Crosby products for the innovative and flexible Rapid Rescue Chain kit securement consumables to stabilize, transport construction of power plants, including nuclear daily in their rescue operations and assemble its vessels reactors Shackles Master Links Chains Shackles Hooks Turnbuckles Hand Chain Slings Lever Hoist Slings Hoist ü Versatile deployment allows for rapid operation ü Products designed to integrate multiple ü Sensitive operations require products from the in time critical situations functions in each component most trusted and premium brand in the industry Industry leading brand reputation and reliability Optimize rigging speed time and improve üü for first responders ergonomic liftsü Complementarity, versatility and breadth of Kito Crosby product offerings ü Reduce weight and increase strength of slings relative to competition 29 Why Kito Crosby Kito Crosby Solutions Situation Wins Deployed
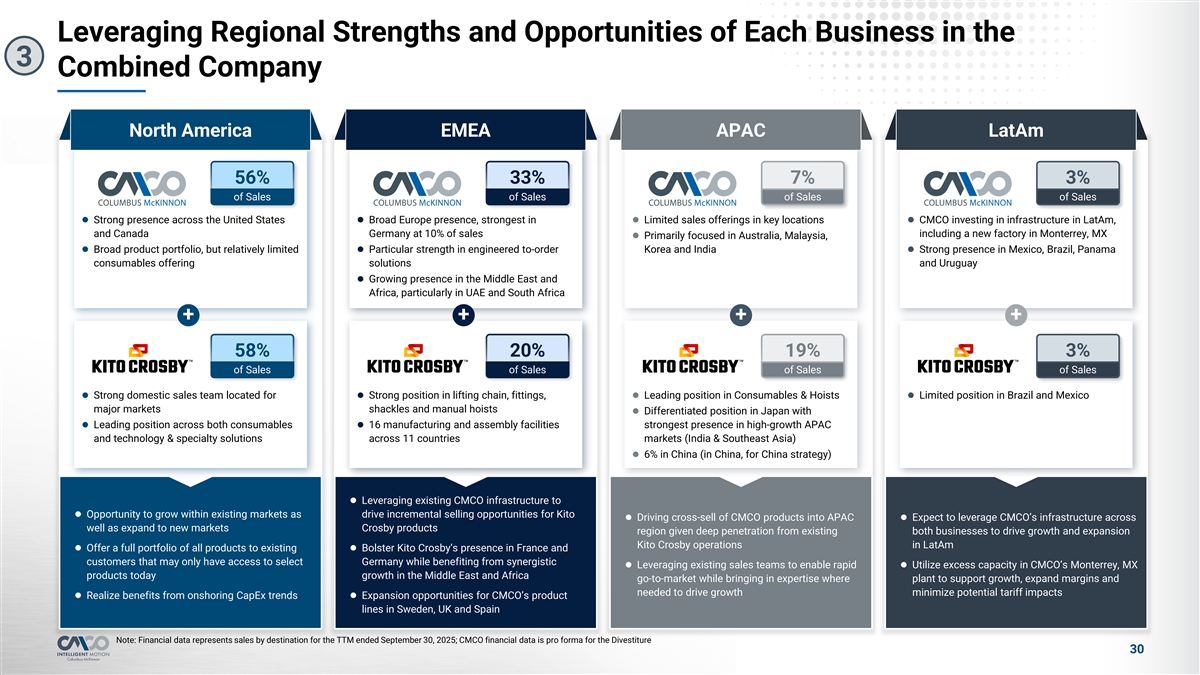
Leveraging Regional Strengths and Opportunities of Each Business in the 3 Combined Company North America EMEA APAC LatAm 56% 33% 7% 3% of Sales of Sales of Sales of Sales l Strong presence across the United States l Broad Europe presence, strongest in l Limited sales offerings in key locations l CMCO investing in infrastructure in LatAm, and Canada Germany at 10% of sales including a new factory in Monterrey, MX l Primarily focused in Australia, Malaysia, l Broad product portfolio, but relatively limited l Particular strength in engineered to-order Korea and India l Strong presence in Mexico, Brazil, Panama consumables offering solutions and Uruguay l Growing presence in the Middle East and Africa, particularly in UAE and South Africa + + + + 58% 20% 19% 3% of Sales of Sales of Sales of Sales l Strong domestic sales team located for l Strong position in lifting chain, fittings, l Leading position in Consumables & Hoistsl Limited position in Brazil and Mexico major markets shackles and manual hoists l Differentiated position in Japan with l Leading position across both consumables l 16 manufacturing and assembly facilities strongest presence in high-growth APAC and technology & specialty solutions across 11 countries markets (India & Southeast Asia) l 6% in China (in China, for China strategy) l Leveraging existing CMCO infrastructure to l Opportunity to grow within existing markets as drive incremental selling opportunities for Kito l Driving cross-sell of CMCO products into APAC l Expect to leverage CMCO’s infrastructure across well as expand to new markets Crosby products region given deep penetration from existing both businesses to drive growth and expansion Kito Crosby operations in LatAm l Offer a full portfolio of all products to existing l Bolster Kito Crosby’s presence in France and customers that may only have access to select Germany while benefiting from synergistic l Leveraging existing sales teams to enable rapid l Utilize excess capacity in CMCO’s Monterrey, MX products today growth in the Middle East and Africa go-to-market while bringing in expertise where plant to support growth, expand margins and needed to drive growth minimize potential tariff impacts l Realize benefits from onshoring CapEx trendsl Expansion opportunities for CMCO’s product lines in Sweden, UK and Spain Note: Financial data represents sales by destination for the TTM ended September 30, 2025; CMCO financial data is pro forma for the Divestiture 30
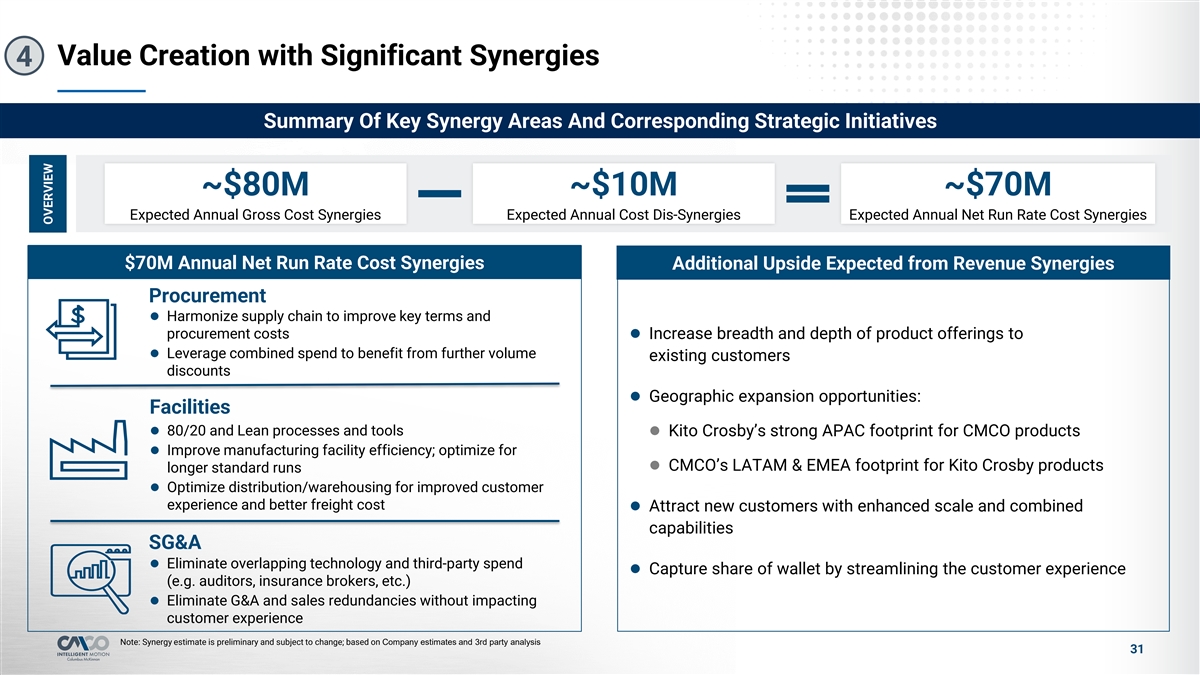
Value Creation with Significant Synergies 4 Summary Of Key Synergy Areas And Corresponding Strategic Initiatives ~$80M ~$10M ~$70M Expected Annual Gross Cost Synergies Expected Annual Cost Dis-Synergies Expected Annual Net Run Rate Cost Synergies $70M Annual Net Run Rate Cost Synergies Additional Upside Expected from Revenue Synergies Procurement l Harmonize supply chain to improve key terms and procurement costs l Increase breadth and depth of product offerings to l Leverage combined spend to benefit from further volume existing customers discounts l Geographic expansion opportunities: Facilities l 80/20 and Lean processes and tools l Kito Crosby’s strong APAC footprint for CMCO products l Improve manufacturing facility efficiency; optimize for l CMCO’s LATAM & EMEA footprint for Kito Crosby products longer standard runs l Optimize distribution/warehousing for improved customer experience and better freight cost l Attract new customers with enhanced scale and combined capabilities SG&A l Eliminate overlapping technology and third-party spend l Capture share of wallet by streamlining the customer experience (e.g. auditors, insurance brokers, etc.) l Eliminate G&A and sales redundancies without impacting customer experience Note: Synergy estimate is preliminary and subject to change; based on Company estimates and 3rd party analysis 31 OVERVIEW
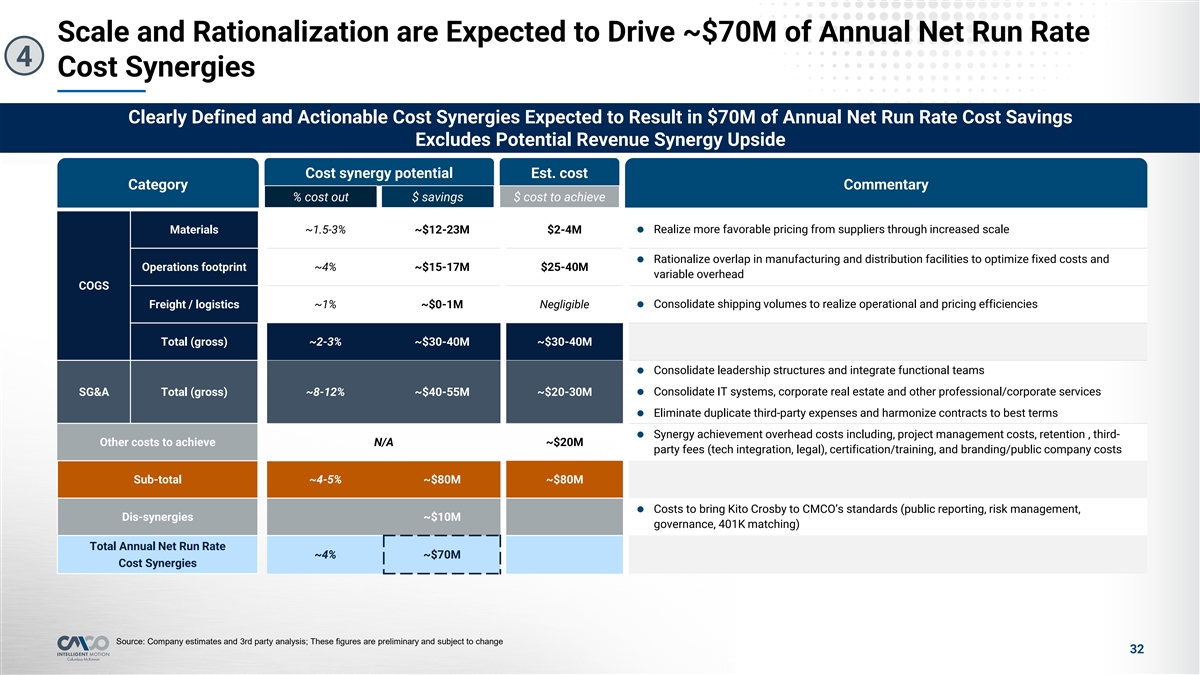
Scale and Rationalization are Expected to Drive ~$70M of Annual Net Run Rate 4 Cost Synergies Clearly Defined and Actionable Cost Synergies Expected to Result in $70M of Annual Net Run Rate Cost Savings Excludes Potential Revenue Synergy Upside Cost synergy potential Est. cost Category Commentary % cost out $ savings $ cost to achieve Materials ~1.5-3% ~$12-23M $2-4Ml Realize more favorable pricing from suppliers through increased scale l Rationalize overlap in manufacturing and distribution facilities to optimize fixed costs and Operations footprint ~4% ~$15-17M $25-40M variable overhead COGS Freight / logistics ~1% ~$0-1M Negligiblel Consolidate shipping volumes to realize operational and pricing efficiencies Total (gross) ~2-3% ~$30-40M ~$30-40M l Consolidate leadership structures and integrate functional teams SG&A Total (gross) ~8-12% ~$40-55M ~$20-30Ml Consolidate IT systems, corporate real estate and other professional/corporate services Eliminate duplicate third-party expenses and harmonize contracts to best terms l l Synergy achievement overhead costs including, project management costs, retention , third- Other costs to achieve N/A ~$20M party fees (tech integration, legal), certification/training, and branding/public company costs Sub-total ~4-5% ~$80M ~$80M Costs to bring Kito Crosby to CMCO’s standards (public reporting, risk management, l Dis-synergies ~$10M governance, 401K matching) Total Annual Net Run Rate ~4% ~$70M Cost Synergies Source: Company estimates and 3rd party analysis; These figures are preliminary and subject to change 32
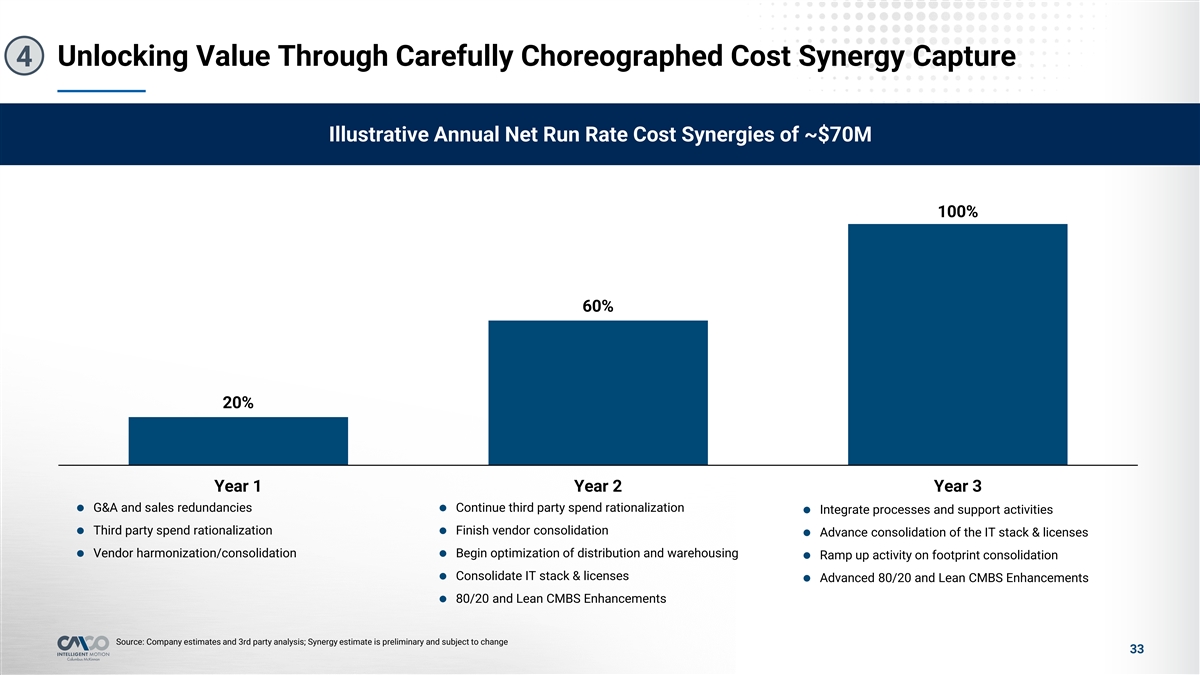
Unlocking Value Through Carefully Choreographed Cost Synergy Capture 4 Illustrative Annual Net Run Rate Cost Synergies of ~$70M 100% 60% 20% Year 1 Year 2 Year 3 G&A and sales redundancies Continue third party spend rationalization ll Integrate processes and support activities l Third party spend rationalization Finish vendor consolidation ll Advance consolidation of the IT stack & licenses l l Vendor harmonization/consolidationl Begin optimization of distribution and warehousing l Ramp up activity on footprint consolidation l Consolidate IT stack & licenses l Advanced 80/20 and Lean CMBS Enhancements l 80/20 and Lean CMBS Enhancements Source: Company estimates and 3rd party analysis; Synergy estimate is preliminary and subject to change 33
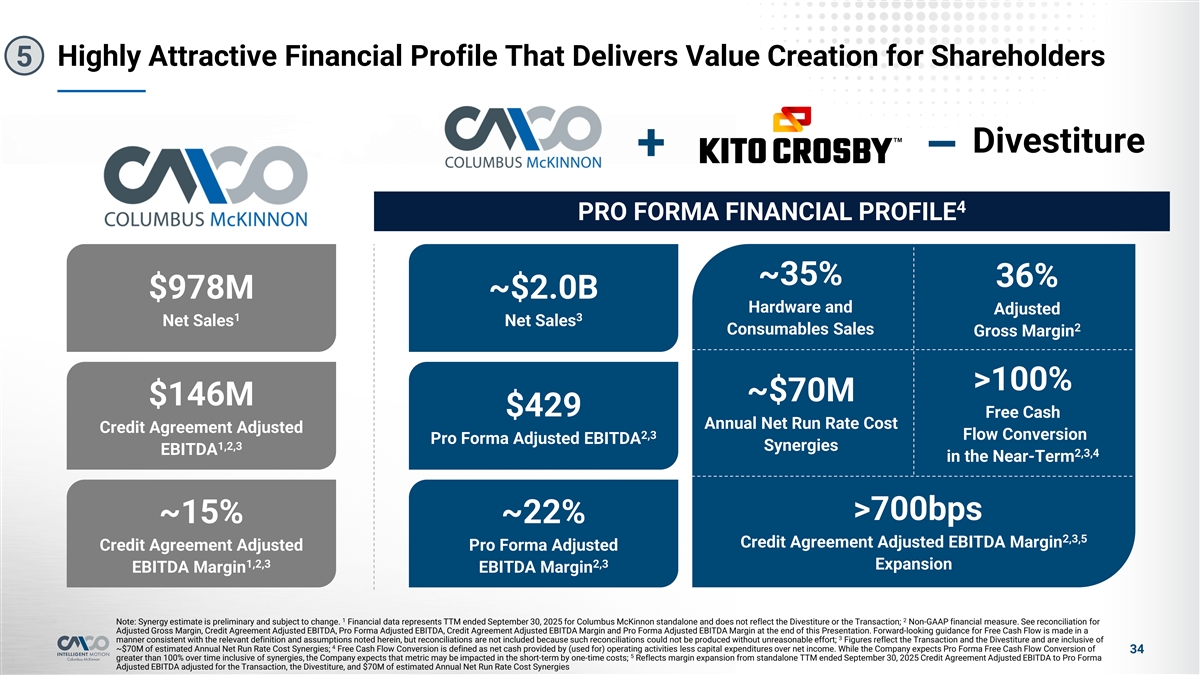
Highly Attractive Financial Profile That Delivers Value Creation for Shareholders 5 Divestiture + – 4 PRO FORMA FINANCIAL PROFILE ~35% 36% $978M ~$2.0B Hardware and Adjusted 1 3 Net Sales Net Sales 2 Consumables Sales Gross Margin >100% ~$70M $146M $429 Free Cash Annual Net Run Rate Cost Credit Agreement Adjusted 2,3 Flow Conversion Pro Forma Adjusted EBITDA 1,2,3 Synergies EBITDA 2,3,4 in the Near-Term >700bps ~15% ~22% 2,3,5 Credit Agreement Adjusted EBITDA Margin Credit Agreement Adjusted Pro Forma Adjusted 1,2,3 2,3 Expansion EBITDA Margin EBITDA Margin 1 2 Note: Synergy estimate is preliminary and subject to change. Financial data represents TTM ended September 30, 2025 for Columbus McKinnon standalone and does not reflect the Divestiture or the Transaction; Non-GAAP financial measure. See reconciliation for Adjusted Gross Margin, Credit Agreement Adjusted EBITDA, Pro Forma Adjusted EBITDA, Credit Agreement Adjusted EBITDA Margin and Pro Forma Adjusted EBITDA Margin at the end of this Presentation. Forward-looking guidance for Free Cash Flow is made in a 3 manner consistent with the relevant definition and assumptions noted herein, but reconciliations are not included because such reconciliations could not be produced without unreasonable effort; Figures reflect the Transaction and the Divestiture and are inclusive of 4 ~$70M of estimated Annual Net Run Rate Cost Synergies; Free Cash Flow Conversion is defined as net cash provided by (used for) operating activities less capital expenditures over net income. While the Company expects Pro Forma Free Cash Flow Conversion of 34 5 greater than 100% over time inclusive of synergies, the Company expects that metric may be impacted in the short-term by one-time costs; Reflects margin expansion from standalone TTM ended September 30, 2025 Credit Agreement Adjusted EBITDA to Pro Forma Adjusted EBITDA adjusted for the Transaction, the Divestiture, and $70M of estimated Annual Net Run Rate Cost Synergies
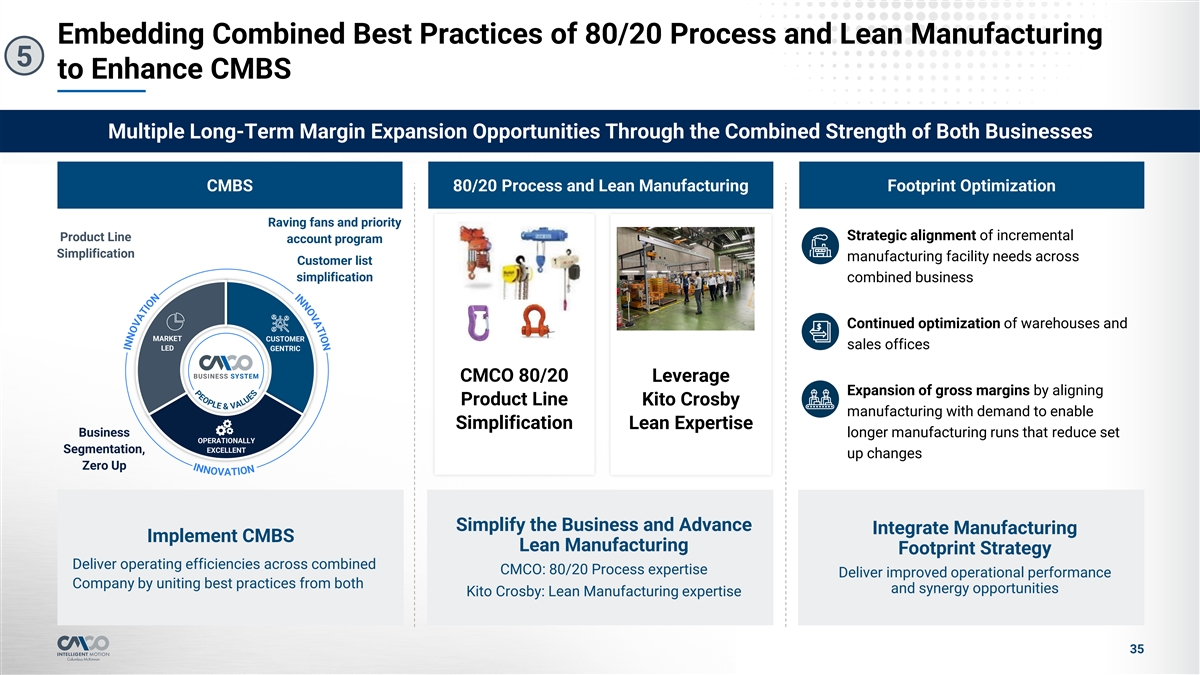
Embedding Combined Best Practices of 80/20 Process and Lean Manufacturing 5 to Enhance CMBS Multiple Long-Term Margin Expansion Opportunities Through the Combined Strength of Both Businesses CMBS 80/20 Process and Lean Manufacturing Footprint Optimization Raving fans and priority Strategic alignment of incremental Product Line account program Simplification manufacturing facility needs across Customer list simplification combined business Continued optimization of warehouses and MARKET CUSTOMER sales offices LED GENTRIC BUSINESS SYSTEM CMCO 80/20 Leverage Expansion of gross margins by aligning Product Line Kito Crosby manufacturing with demand to enable Simplification Lean Expertise Business longer manufacturing runs that reduce set OPERATIONALLY Segmentation, EXCELLENT up changes Zero Up Simplify the Business and Advance Integrate Manufacturing Implement CMBS Lean Manufacturing Footprint Strategy Deliver operating efficiencies across combined CMCO: 80/20 Process expertise Deliver improved operational performance Company by uniting best practices from both and synergy opportunities Kito Crosby: Lean Manufacturing expertise 35
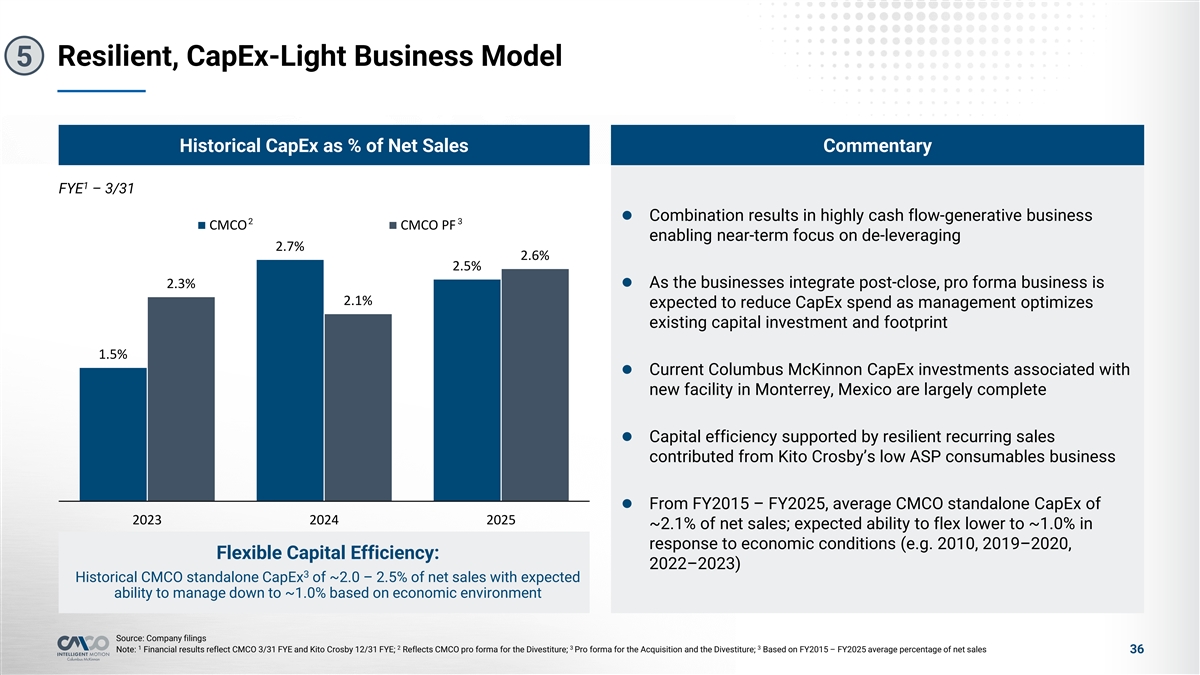
Resilient, CapEx-Light Business Model 5 Historical CapEx as % of Net Sales Commentary 1 FYE – 3/31 l Combination results in highly cash flow-generative business 2 3 CMCO CMCO PF enabling near-term focus on de-leveraging 2.7% 2.6% 2.5% l As the businesses integrate post-close, pro forma business is 2.3% 2.1% expected to reduce CapEx spend as management optimizes existing capital investment and footprint 1.5% l Current Columbus McKinnon CapEx investments associated with new facility in Monterrey, Mexico are largely complete l Capital efficiency supported by resilient recurring sales contributed from Kito Crosby’s low ASP consumables business l From FY2015 – FY2025, average CMCO standalone CapEx of 2023 2024 2025 ~2.1% of net sales; expected ability to flex lower to ~1.0% in response to economic conditions (e.g. 2010, 2019–2020, Flexible Capital Efficiency: 2022–2023) 3 Historical CMCO standalone CapEx of ~2.0 – 2.5% of net sales with expected ability to manage down to ~1.0% based on economic environment Source: Company filings 1 2 3 3 Note: Financial results reflect CMCO 3/31 FYE and Kito Crosby 12/31 FYE; Reflects CMCO pro forma for the Divestiture; Pro forma for the Acquisition and the Divestiture; Based on FY2015 – FY2025 average percentage of net sales 36
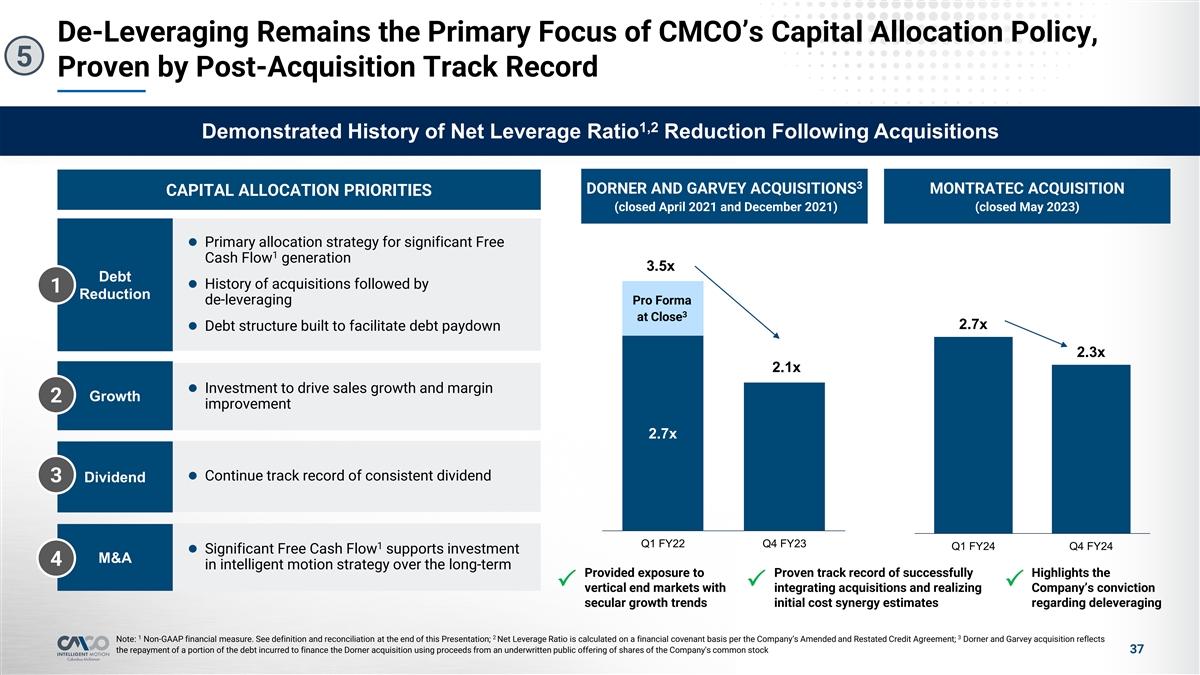
De-Leveraging Remains the Primary Focus of CMCO’s Capital Allocation Policy, 5 Proven by Post-Acquisition Track Record 1,2 Demonstrated History of Net Leverage Ratio Reduction Following Acquisitions 3 DORNER AND GARVEY ACQUISITIONS MONTRATEC ACQUISITION CAPITAL ALLOCATION PRIORITIES (closed April 2021 and December 2021) (closed May 2023) 4.5 l Primary allocation strategy for significant Free 4 1 Cash Flow generation 3.5x Debt 3.5 l History of acquisitions followed by 1 Reduction de-leveraging Pro Forma 3 at Close 3 2.7x l Debt structure built to facilitate debt paydown 2.5 2.3x 2.1x l Investment to drive sales growth and margin 2 Growth 2 improvement 1.5 2.7x 1 l Continue track record of consistent dividend 3 Dividend 0.5 0 Q1 FY22 Q4 FY23 1 Q1 FY24 Q4 FY24 l Significant Free Cash Flow supports investment M&A 4 in intelligent motion strategy over the long-term Provided exposure to Proven track record of successfully Highlights the PPP vertical end markets with integrating acquisitions and realizing Company’s conviction secular growth trends initial cost synergy estimates regarding deleveraging 1 2 3 Note: Non-GAAP financial measure. See definition and reconciliation at the end of this Presentation; Net Leverage Ratio is calculated on a financial covenant basis per the Company’s Amended and Restated Credit Agreement; Dorner and Garvey acquisition reflects the repayment of a portion of the debt incurred to finance the Dorner acquisition using proceeds from an underwritten public offering of shares of the Company's common stock 37
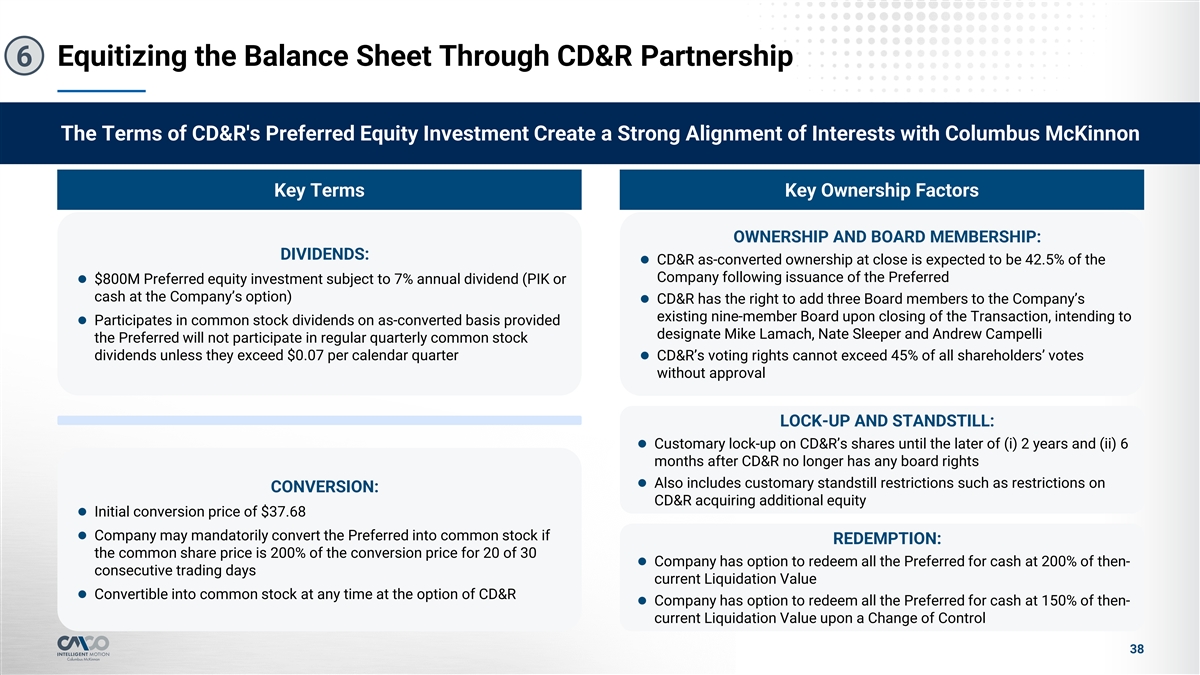
Equitizing the Balance Sheet Through CD&R Partnership 6 The Terms of CD&R's Preferred Equity Investment Create a Strong Alignment of Interests with Columbus McKinnon Key Terms Key Ownership Factors OWNERSHIP AND BOARD MEMBERSHIP: DIVIDENDS: l CD&R as-converted ownership at close is expected to be 42.5% of the Company following issuance of the Preferred l $800M Preferred equity investment subject to 7% annual dividend (PIK or cash at the Company’s option) l CD&R has the right to add three Board members to the Company’s existing nine-member Board upon closing of the Transaction, intending to l Participates in common stock dividends on as-converted basis provided designate Mike Lamach, Nate Sleeper and Andrew Campelli the Preferred will not participate in regular quarterly common stock dividends unless they exceed $0.07 per calendar quarterl CD&R’s voting rights cannot exceed 45% of all shareholders’ votes without approval LOCK-UP AND STANDSTILL: l Customary lock-up on CD&R’s shares until the later of (i) 2 years and (ii) 6 months after CD&R no longer has any board rights l Also includes customary standstill restrictions such as restrictions on CONVERSION: CD&R acquiring additional equity l Initial conversion price of $37.68 l Company may mandatorily convert the Preferred into common stock if REDEMPTION: the common share price is 200% of the conversion price for 20 of 30 l Company has option to redeem all the Preferred for cash at 200% of then- consecutive trading days current Liquidation Value l Convertible into common stock at any time at the option of CD&R l Company has option to redeem all the Preferred for cash at 150% of then- current Liquidation Value upon a Change of Control 38
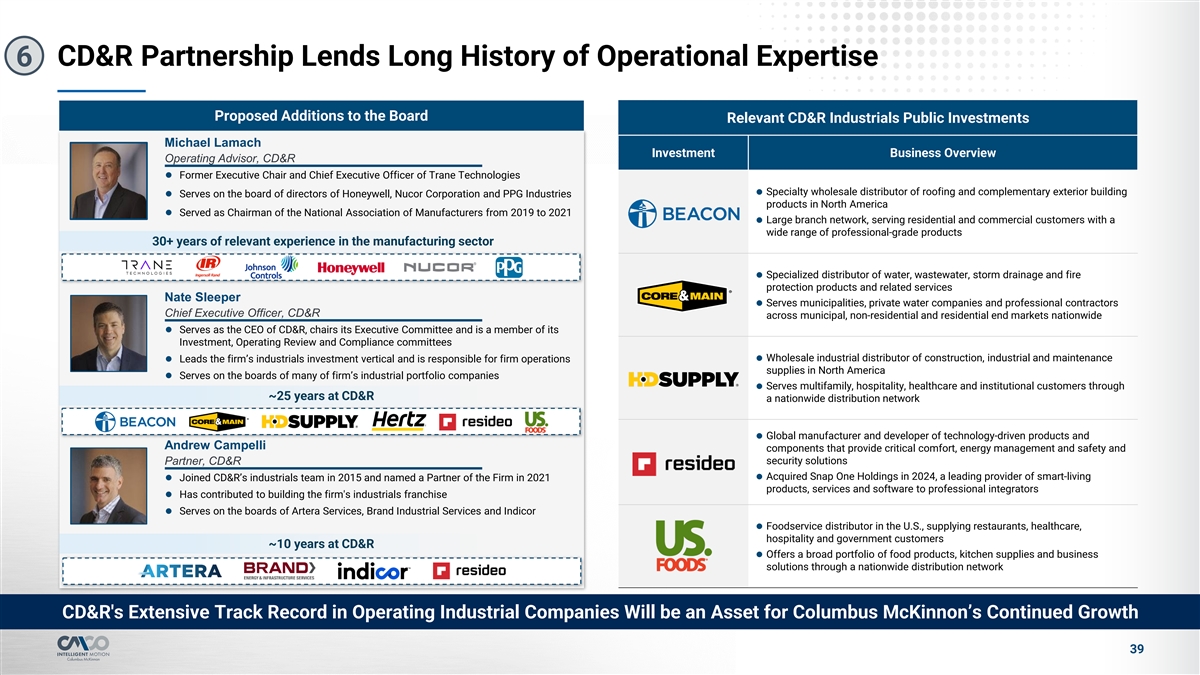
CD&R Partnership Lends Long History of Operational Expertise 6 Proposed Additions to the Board Relevant CD&R Industrials Public Investments Michael Lamach Investment Business Overview Operating Advisor, CD&R l Former Executive Chair and Chief Executive Officer of Trane Technologies Specialty wholesale distributor of roofing and complementary exterior building l l Serves on the board of directors of Honeywell, Nucor Corporation and PPG Industries products in North America l Served as Chairman of the National Association of Manufacturers from 2019 to 2021 Large branch network, serving residential and commercial customers with a l wide range of professional-grade products 30+ years of relevant experience in the manufacturing sector l Specialized distributor of water, wastewater, storm drainage and fire protection products and related services Nate Sleeper l Serves municipalities, private water companies and professional contractors Chief Executive Officer, CD&R across municipal, non-residential and residential end markets nationwide l Serves as the CEO of CD&R, chairs its Executive Committee and is a member of its Investment, Operating Review and Compliance committees l Wholesale industrial distributor of construction, industrial and maintenance l Leads the firm’s industrials investment vertical and is responsible for firm operations supplies in North America l Serves on the boards of many of firm’s industrial portfolio companies l Serves multifamily, hospitality, healthcare and institutional customers through ~25 years at CD&R a nationwide distribution network l Global manufacturer and developer of technology-driven products and Andrew Campelli components that provide critical comfort, energy management and safety and Partner, CD&R security solutions l Acquired Snap One Holdings in 2024, a leading provider of smart-living l Joined CD&R’s industrials team in 2015 and named a Partner of the Firm in 2021 products, services and software to professional integrators l Has contributed to building the firm's industrials franchise l Serves on the boards of Artera Services, Brand Industrial Services and Indicor l Foodservice distributor in the U.S., supplying restaurants, healthcare, hospitality and government customers ~10 years at CD&R l Offers a broad portfolio of food products, kitchen supplies and business solutions through a nationwide distribution network CD&R's Extensive Track Record in Operating Industrial Companies Will be an Asset for Columbus McKinnon’s Continued Growth 39
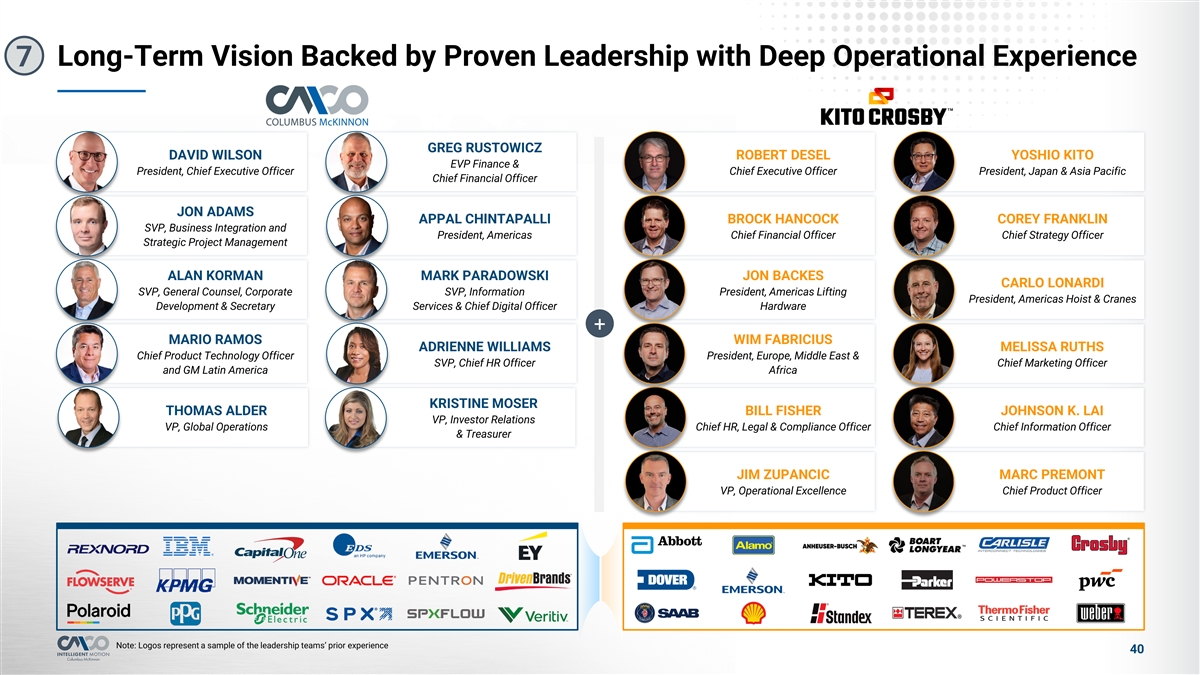
Long-Term Vision Backed by Proven Leadership with Deep Operational Experience 7 GREG RUSTOWICZ DAVID WILSON ROBERT DESEL YOSHIO KITO EVP Finance & President, Chief Executive Officer Chief Executive Officer President, Japan & Asia Pacific Chief Financial Officer JON ADAMS APPAL CHINTAPALLI BROCK HANCOCK COREY FRANKLIN SVP, Business Integration and President, Americas Chief Financial Officer Chief Strategy Officer Strategic Project Management ALAN KORMAN MARK PARADOWSKI JON BACKES CARLO LONARDI SVP, General Counsel, Corporate SVP, Information President, Americas Lifting President, Americas Hoist & Cranes Development & Secretary Services & Chief Digital Officer Hardware + MARIO RAMOS WIM FABRICIUS ADRIENNE WILLIAMS MELISSA RUTHS Chief Product Technology Officer President, Europe, Middle East & SVP, Chief HR Officer Chief Marketing Officer and GM Latin America Africa KRISTINE MOSER THOMAS ALDER BILL FISHER JOHNSON K. LAI VP, Investor Relations VP, Global Operations Chief HR, Legal & Compliance Officer Chief Information Officer & Treasurer JIM ZUPANCIC MARC PREMONT VP, Operational Excellence Chief Product Officer Note: Logos represent a sample of the leadership teams’ prior experience 40
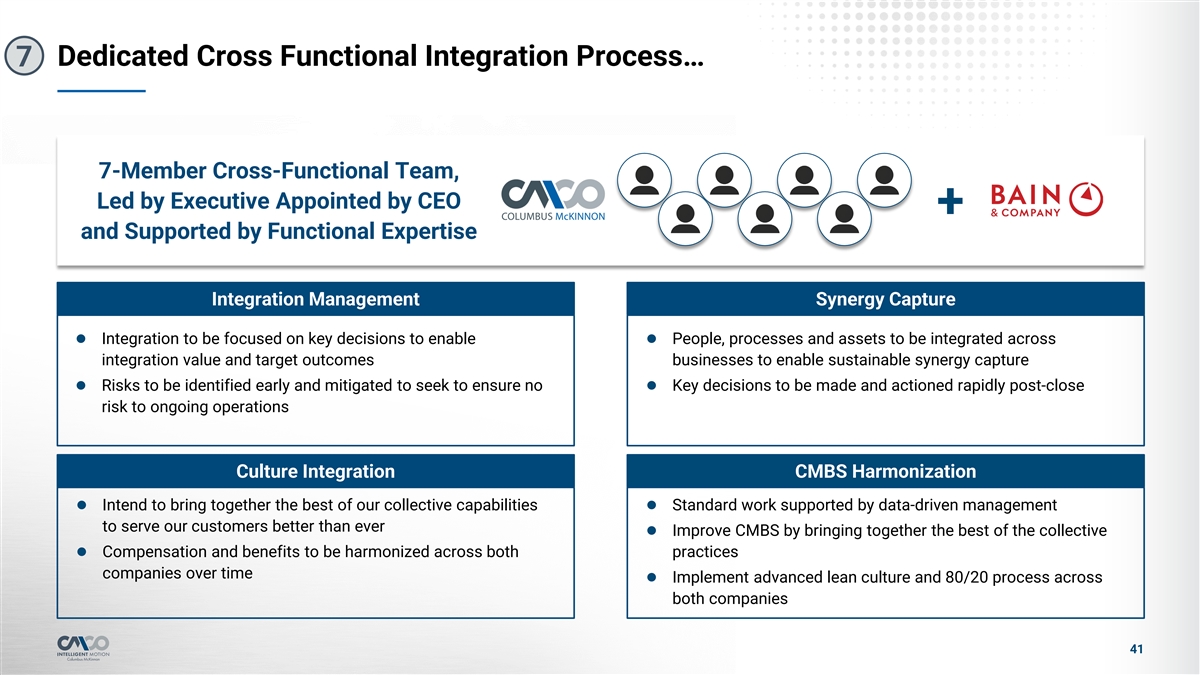
Dedicated Cross Functional Integration Process… 7 7-Member Cross-Functional Team, Led by Executive Appointed by CEO + and Supported by Functional Expertise Integration Management Synergy Capture l Integration to be focused on key decisions to enable l People, processes and assets to be integrated across integration value and target outcomes businesses to enable sustainable synergy capture l Risks to be identified early and mitigated to seek to ensure no l Key decisions to be made and actioned rapidly post-close risk to ongoing operations Culture Integration CMBS Harmonization l Intend to bring together the best of our collective capabilities l Standard work supported by data-driven management to serve our customers better than ever l Improve CMBS by bringing together the best of the collective l Compensation and benefits to be harmonized across both practices companies over time l Implement advanced lean culture and 80/20 process across both companies 41
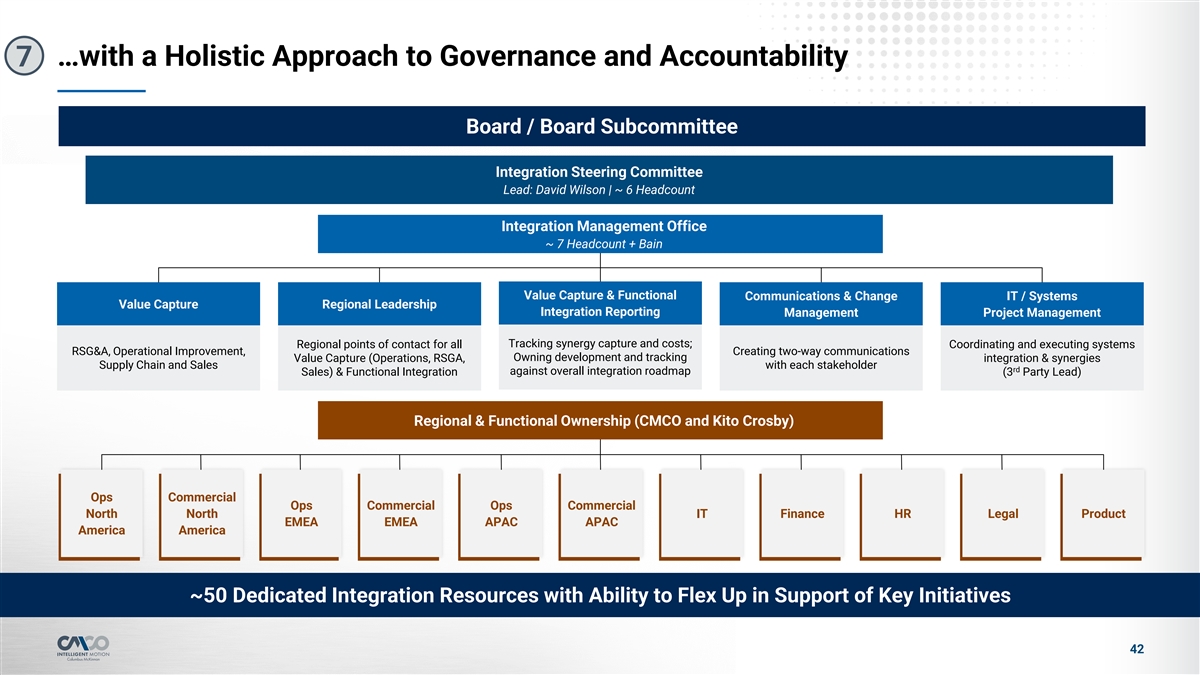
…with a Holistic Approach to Governance and Accountability 7 Board / Board Subcommittee Integration Steering Committee Lead: David Wilson | ~ 6 Headcount Integration Management Office ~ 7 Headcount + Bain Value Capture & Functional Communications & Change IT / Systems Value Capture Regional Leadership Integration Reporting Management Project Management Tracking synergy capture and costs; Regional points of contact for all Coordinating and executing systems RSG&A, Operational Improvement, Creating two-way communications Owning development and tracking Value Capture (Operations, RSGA, integration & synergies Supply Chain and Sales with each stakeholder rd against overall integration roadmap Sales) & Functional Integration (3 Party Lead) Regional & Functional Ownership (CMCO and Kito Crosby) Ops Commercial Ops Commercial Ops Commercial North North IT Finance HR Legal Product EMEA EMEA APAC APAC America America ~50 Dedicated Integration Resources with Ability to Flex Up in Support of Key Initiatives 42

4 Historical Financial Overview
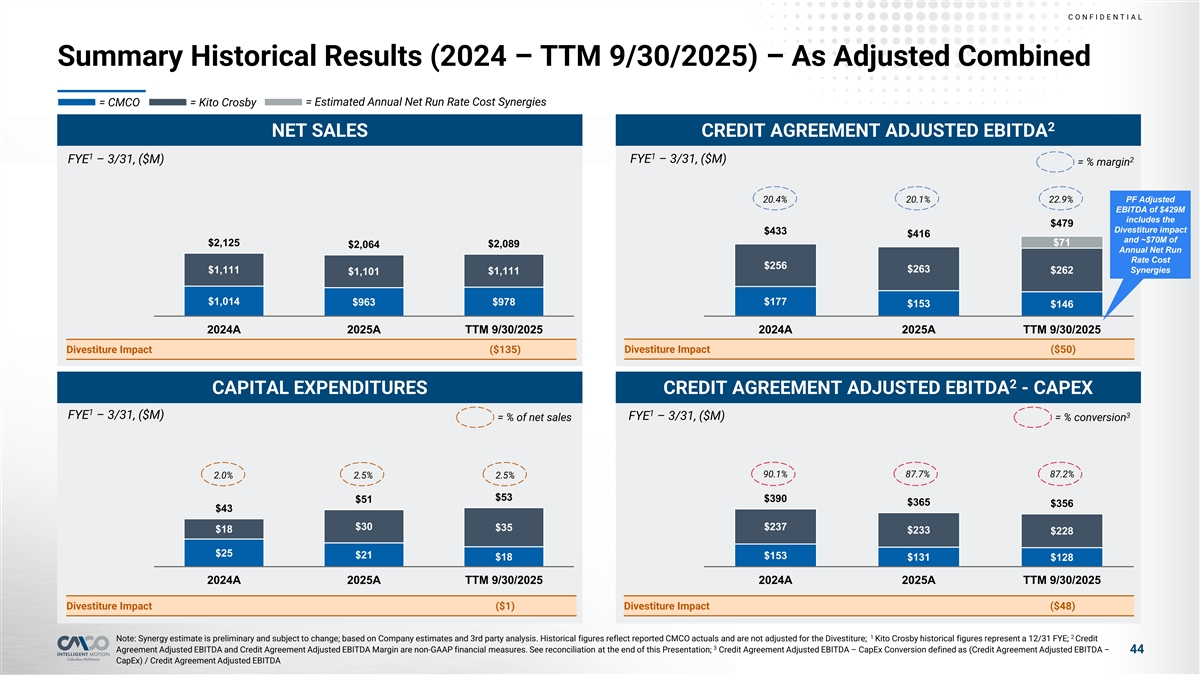
C O NF I D E NT I A L Summary Historical Results (2024 – TTM 9/30/2025) – As Adjusted Combined = CMCO = Kito Crosby = Estimated Annual Net Run Rate Cost Synergies 2 NET SALES CREDIT AGREEMENT ADJUSTED EBITDA 1 1 FYE – 3/31, ($M) 2 FYE – 3/31, ($M) = % margin PF Adjusted 20.4% 20.1% 22.9% EBITDA of $429M includes the $479 Divestiture impact $433 $416 and ~$70M of $2,125 $71 $2,064 $2,089 Annual Net Run Rate Cost $256 $263 Synergies $1,111 $262 $1,101 $1,111 $1,014 $978 $177 $963 $153 $146 2024A 2025A TTM 9/30/2025 2024A 2025A TTM 9/30/2025 Divestiture Impact ($135) Divestiture Impact ($50) 2 CAPITAL EXPENDITURES CREDIT AGREEMENT ADJUSTED EBITDA - CAPEX 1 1 3 FYE – 3/31, ($M) FYE – 3/31, ($M) = % of net sales = % conversion 90.1% 87.7% 87.2% 2.0% 2.5% 2.5% $53 $390 $51 $365 $356 $43 $30 $237 $35 $18 $233 $228 $25 $21 $153 $18 $131 $128 2024A 2025A TTM 9/30/2025 2024A 2025A TTM 9/30/2025 Divestiture Impact ($1) Divestiture Impact ($48) 1 2 Note: Synergy estimate is preliminary and subject to change; based on Company estimates and 3rd party analysis. Historical figures reflect reported CMCO actuals and are not adjusted for the Divestiture; Kito Crosby historical figures represent a 12/31 FYE; Credit 3 Agreement Adjusted EBITDA and Credit Agreement Adjusted EBITDA Margin are non-GAAP financial measures. See reconciliation at the end of this Presentation; Credit Agreement Adjusted EBITDA – CapEx Conversion defined as (Credit Agreement Adjusted EBITDA – 44 CapEx) / Credit Agreement Adjusted EBITDA
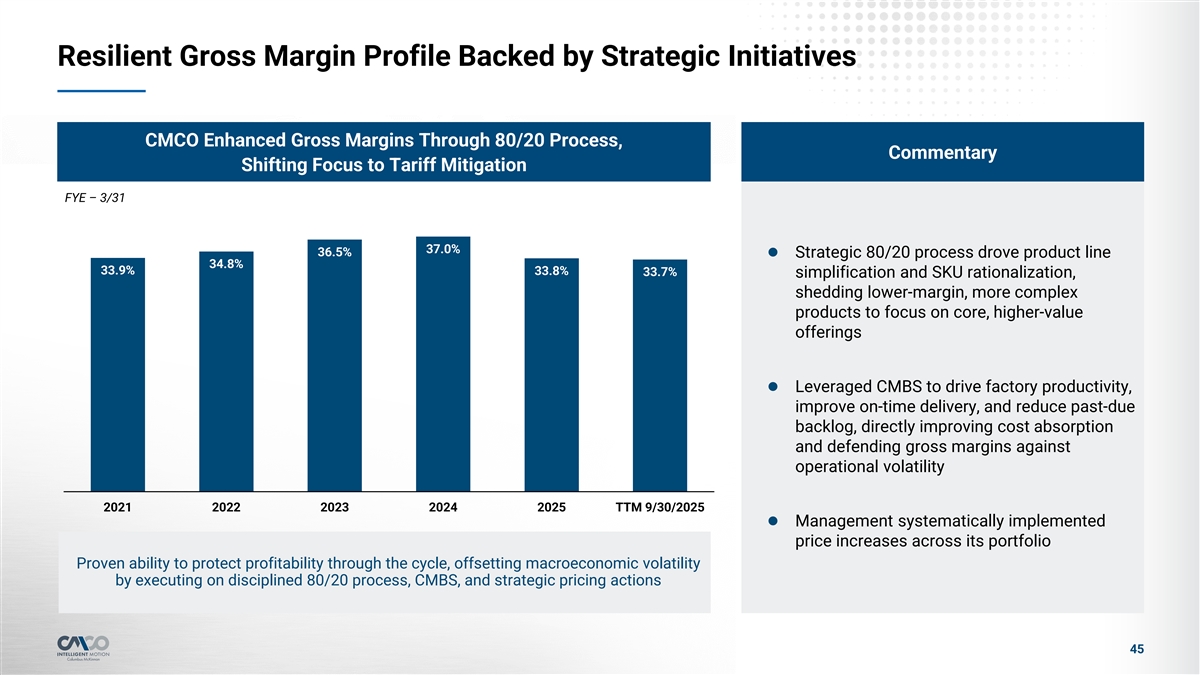
Resilient Gross Margin Profile Backed by Strategic Initiatives CMCO Enhanced Gross Margins Through 80/20 Process, Commentary Shifting Focus to Tariff Mitigation FYE – 3/31 37.0% 36.5% l Strategic 80/20 process drove product line 34.8% 33.9% 33.8% 33.7% simplification and SKU rationalization, shedding lower-margin, more complex products to focus on core, higher-value offerings l Leveraged CMBS to drive factory productivity, improve on-time delivery, and reduce past-due backlog, directly improving cost absorption and defending gross margins against operational volatility 2021 2022 2023 2024 2025 TTM 9/30/2025 l Management systematically implemented price increases across its portfolio Proven ability to protect profitability through the cycle, offsetting macroeconomic volatility by executing on disciplined 80/20 process, CMBS, and strategic pricing actions 45
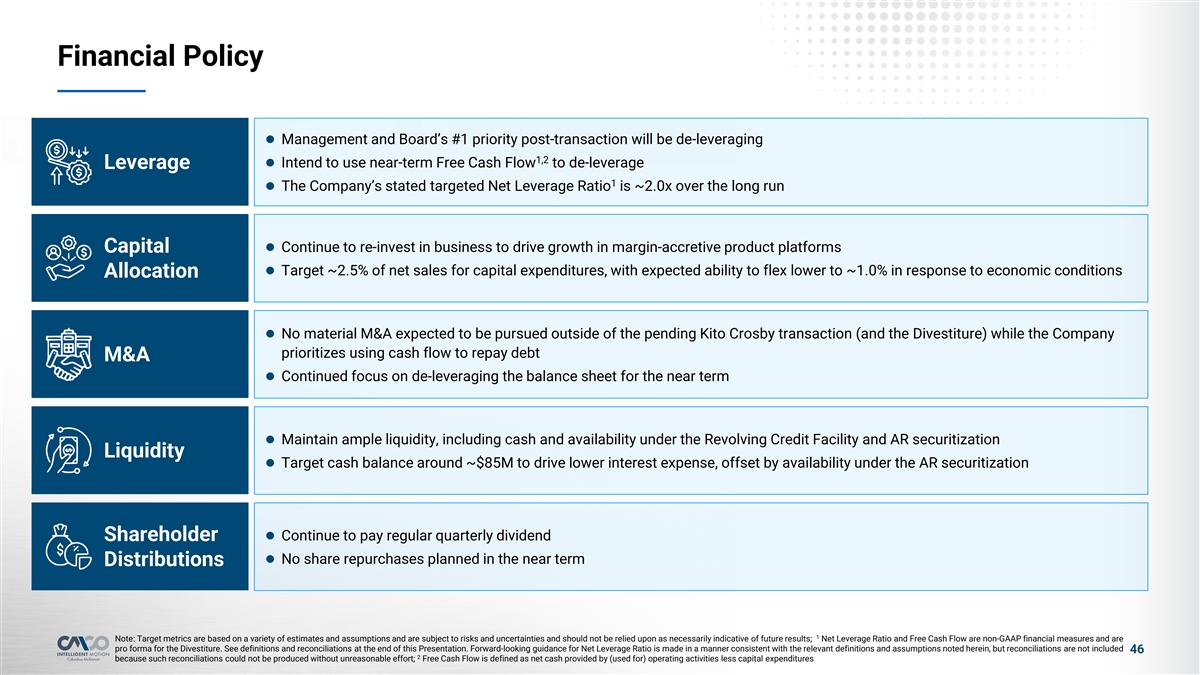
Financial Policy l Management and Board’s #1 priority post-transaction will be de-leveraging 1,2 l Intend to use near-term Free Cash Flow to de-leverage Leverage 1 l The Company’s stated targeted Net Leverage Ratio is ~2.0x over the long run l Continue to re-invest in business to drive growth in margin-accretive product platforms Capital l Target ~2.5% of net sales for capital expenditures, with expected ability to flex lower to ~1.0% in response to economic conditions Allocation l No material M&A expected to be pursued outside of the pending Kito Crosby transaction (and the Divestiture) while the Company prioritizes using cash flow to repay debt M&A l Continued focus on de-leveraging the balance sheet for the near term l Maintain ample liquidity, including cash and availability under the Revolving Credit Facility and AR securitization Liquidity l Target cash balance around ~$85M to drive lower interest expense, offset by availability under the AR securitization l Continue to pay regular quarterly dividend Shareholder l No share repurchases planned in the near term Distributions 1 Note: Target metrics are based on a variety of estimates and assumptions and are subject to risks and uncertainties and should not be relied upon as necessarily indicative of future results; Net Leverage Ratio and Free Cash Flow are non-GAAP financial measures and are pro forma for the Divestiture. See definitions and reconciliations at the end of this Presentation. Forward-looking guidance for Net Leverage Ratio is made in a manner consistent with the relevant definitions and assumptions noted herein, but reconciliations are not included 46 2 because such reconciliations could not be produced without unreasonable effort; Free Cash Flow is defined as net cash provided by (used for) operating activities less capital expenditures
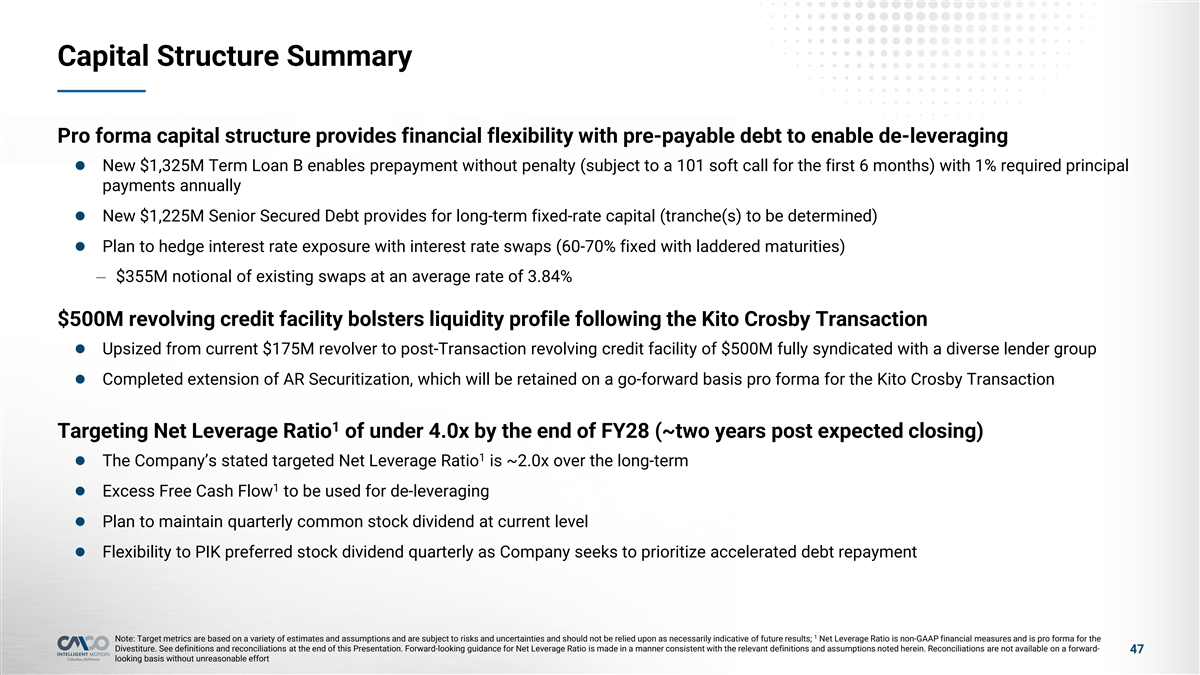
Capital Structure Summary Pro forma capital structure provides financial flexibility with pre-payable debt to enable de-leveraging l New $1,325M Term Loan B enables prepayment without penalty (subject to a 101 soft call for the first 6 months) with 1% required principal payments annually l New $1,225M Senior Secured Debt provides for long-term fixed-rate capital (tranche(s) to be determined) l Plan to hedge interest rate exposure with interest rate swaps (60-70% fixed with laddered maturities) – $355M notional of existing swaps at an average rate of 3.84% $500M revolving credit facility bolsters liquidity profile following the Kito Crosby Transaction l Upsized from current $175M revolver to post-Transaction revolving credit facility of $500M fully syndicated with a diverse lender group l Completed extension of AR Securitization, which will be retained on a go-forward basis pro forma for the Kito Crosby Transaction 1 Targeting Net Leverage Ratio of under 4.0x by the end of FY28 (~two years post expected closing) 1 l The Company’s stated targeted Net Leverage Ratio is ~2.0x over the long-term 1 l Excess Free Cash Flow to be used for de-leveraging l Plan to maintain quarterly common stock dividend at current level l Flexibility to PIK preferred stock dividend quarterly as Company seeks to prioritize accelerated debt repayment 1 Note: Target metrics are based on a variety of estimates and assumptions and are subject to risks and uncertainties and should not be relied upon as necessarily indicative of future results; Net Leverage Ratio is non-GAAP financial measures and is pro forma for the Divestiture. See definitions and reconciliations at the end of this Presentation. Forward-looking guidance for Net Leverage Ratio is made in a manner consistent with the relevant definitions and assumptions noted herein. Reconciliations are not available on a forward- 47 looking basis without unreasonable effort
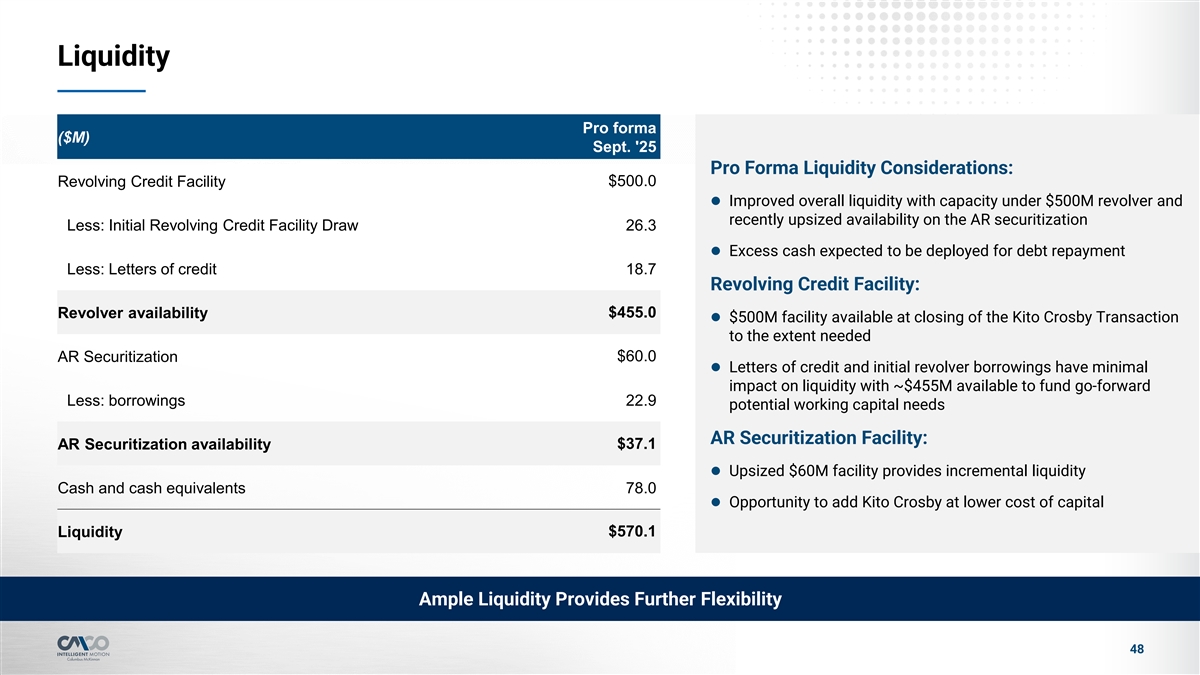
Liquidity Pro forma ($M) Sept. '25 Pro Forma Liquidity Considerations: Revolving Credit Facility $500.0 l Improved overall liquidity with capacity under $500M revolver and recently upsized availability on the AR securitization Less: Initial Revolving Credit Facility Draw 26.3 l Excess cash expected to be deployed for debt repayment Less: Letters of credit 18.7 Revolving Credit Facility: $455.0 Revolver availability l $500M facility available at closing of the Kito Crosby Transaction to the extent needed $60.0 AR Securitization l Letters of credit and initial revolver borrowings have minimal impact on liquidity with ~$455M available to fund go-forward Less: borrowings 22.9 potential working capital needs AR Securitization Facility: $37.1 AR Securitization availability l Upsized $60M facility provides incremental liquidity Cash and cash equivalents 78.0 l Opportunity to add Kito Crosby at lower cost of capital $570.1 Liquidity Ample Liquidity Provides Further Flexibility 48

5 Appendix
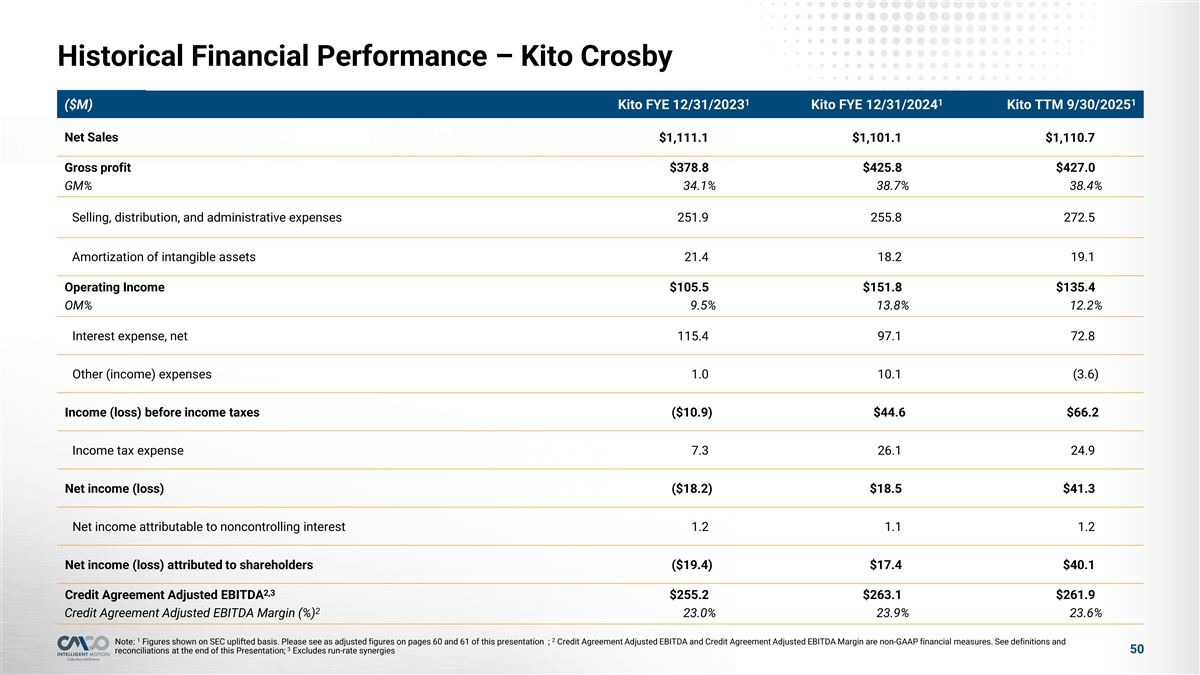
Historical Financial Performance – Kito Crosby 1 1 1 ($M) Kito FYE 12/31/2023 Kito FYE 12/31/2024 Kito TTM 9/30/2025 Net Sales $1,111.1 $1,101.1 $1,110.7 Gross profit $378.8.. $425.8.. $427.0.. GM% 34.1% 38.7% 38.4% Selling, distribution, and administrative expenses 251.9 255.8 272.5 Amortization of intangible assets 21.4 18.2 19.1 Operating Income $105.5.. $151.8.. $135.4.. OM% 9.5% 13.8% 12.2% Interest expense, net 115.4 97.1 72.8 Other (income) expenses 1.0 10.1 (3.6) Income (loss) before income taxes ($10.9) $44.6 $66.2 Income tax expense 7.3 26.1 24.9 Net income (loss) ($18.2) $18.5 $41.3 Net income attributable to noncontrolling interest 1.2 1.1 1.2 Net income (loss) attributed to shareholders ($19.4) $17.4 $40.1 2,3 Credit Agreement Adjusted EBITDA $255.2.. ..$263.1.. $261.9.. 2 Credit Agreement Adjusted EBITDA Margin (%) 23.0% 23.9% 23.6% 1 2 Note: Figures shown on SEC uplifted basis. Please see as adjusted figures on pages 60 and 61 of this presentation ; Credit Agreement Adjusted EBITDA and Credit Agreement Adjusted EBITDA Margin are non-GAAP financial measures. See definitions and 3 50 reconciliations at the end of this Presentation; Excludes run-rate synergies
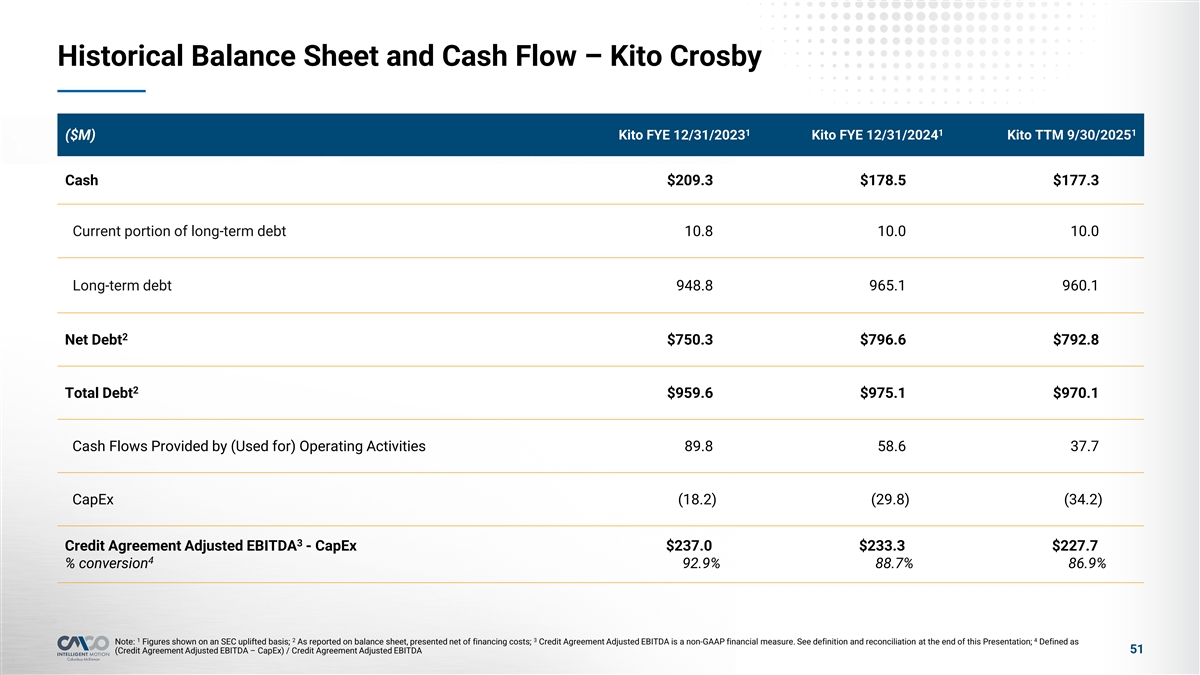
Historical Balance Sheet and Cash Flow – Kito Crosby 1 1 1 ($M) Kito FYE 12/31/2023 Kito FYE 12/31/2024 Kito TTM 9/30/2025 Cash $209.3 $178.5 $177.3 Current portion of long-term debt 10.8 10.0 10.0 Long-term debt 948.8 965.1 960.1 2 Net Debt $750.3 $796.6 $792.8 2 Total Debt $959.6 $975.1 $970.1 Cash Flows Provided by (Used for) Operating Activities 89.8 58.6 37.7 CapEx (18.2) (29.8) (34.2) 3 Credit Agreement Adjusted EBITDA - CapEx $237.0.. $233.3.. $227.7.. 4 % conversion 92.9% 88.7% 86.9% 1 2 3 4 Note: Figures shown on an SEC uplifted basis; As reported on balance sheet, presented net of financing costs; Credit Agreement Adjusted EBITDA is a non-GAAP financial measure. See definition and reconciliation at the end of this Presentation; Defined as 51 (Credit Agreement Adjusted EBITDA – CapEx) / Credit Agreement Adjusted EBITDA
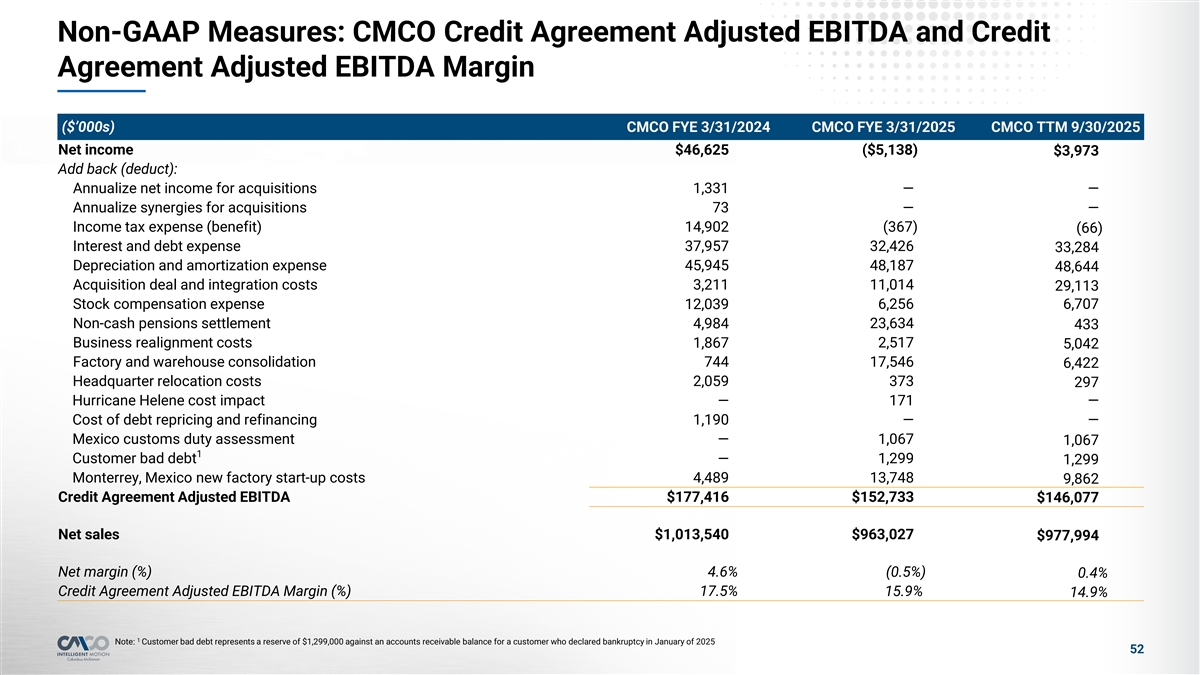
Non-GAAP Measures: CMCO Credit Agreement Adjusted EBITDA and Credit Agreement Adjusted EBITDA Margin ($’000s) CMCO FYE 3/31/2024 CMCO FYE 3/31/2025 CMCO TTM 9/30/2025 Net income $46,625 ($5,138) $3,973 Add back (deduct): Annualize net income for acquisitions 1,331 — — Annualize synergies for acquisitions 73 — — Income tax expense (benefit) 14,902 (367) (66) Interest and debt expense 37,957 32,426 33,284 Depreciation and amortization expense 45,945 48,187 48,644 Acquisition deal and integration costs 3,211 11,014 29,113 Stock compensation expense 12,039 6,256 6,707 Non-cash pensions settlement 4,984 23,634 433 Business realignment costs 1,867 2,517 5,042 Factory and warehouse consolidation 744 17,546 6,422 Headquarter relocation costs 2,059 373 297 Hurricane Helene cost impact — 171 — Cost of debt repricing and refinancing 1,190 — — Mexico customs duty assessment — 1,067 1,067 1 Customer bad debt — 1,299 1,299 Monterrey, Mexico new factory start-up costs 4,489 13,748 9,862 Credit Agreement Adjusted EBITDA $177,416 $152,733 $146,077 Net sales $1,013,540 $963,027 $977,994 Net margin (%) 4.6% (0.5%) 0.4% Credit Agreement Adjusted EBITDA Margin (%) 17.5% 15.9% 14.9% 1 Note: Customer bad debt represents a reserve of $1,299,000 against an accounts receivable balance for a customer who declared bankruptcy in January of 2025 52
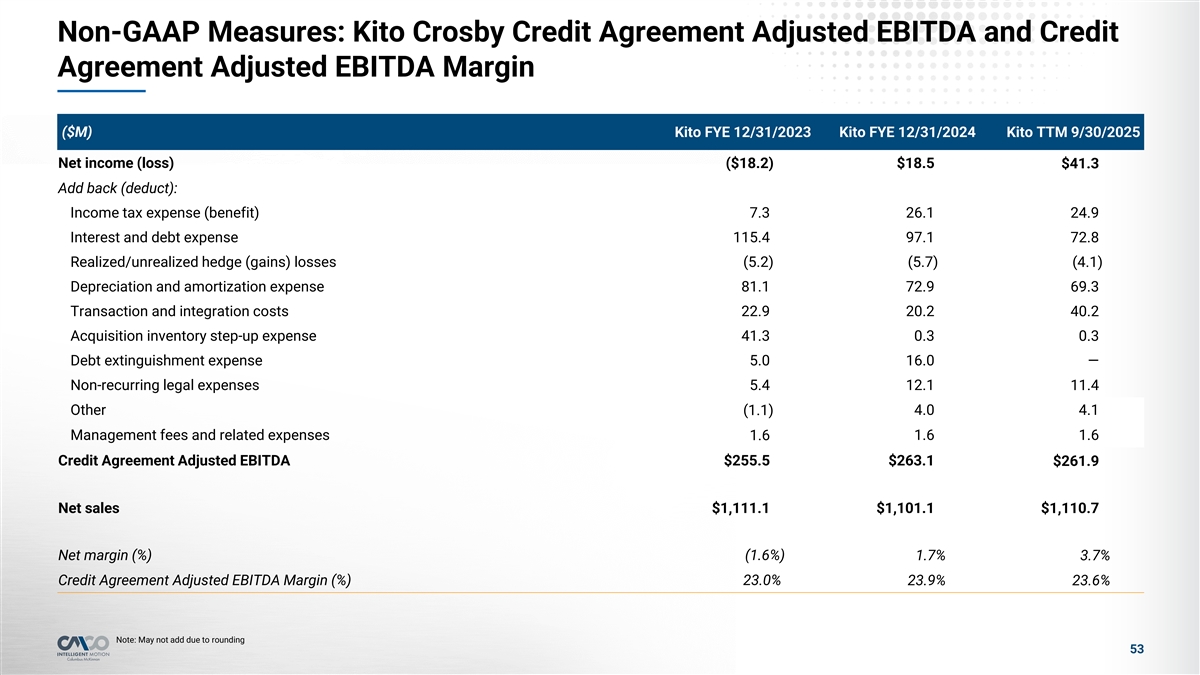
Non-GAAP Measures: Kito Crosby Credit Agreement Adjusted EBITDA and Credit Agreement Adjusted EBITDA Margin ($M) Kito FYE 12/31/2023 Kito FYE 12/31/2024 Kito TTM 9/30/2025 Net income (loss) ($18.2) $18.5 $41.3 Add back (deduct): Income tax expense (benefit) 7.3 26.1 24.9 Interest and debt expense 115.4 97.1 72.8 Realized/unrealized hedge (gains) losses (5.2) (5.7) (4.1) Depreciation and amortization expense 81.1 72.9 69.3 Transaction and integration costs 22.9 20.2 40.2 Acquisition inventory step-up expense 41.3 0.3 0.3 Debt extinguishment expense 5.0 16.0 — Non-recurring legal expenses 5.4 12.1 11.4 Other 4.0 4.1 (1.1) Management fees and related expenses 1.6 1.6 1.6 Credit Agreement Adjusted EBITDA $255.5 $263.1 $261.9 Net sales $1,111.1 $1,101.1 $1,110.7 Net margin (%) (1.6%) 1.7% 3.7% Credit Agreement Adjusted EBITDA Margin (%) 23.0% 23.9% 23.6% Note: May not add due to rounding 53
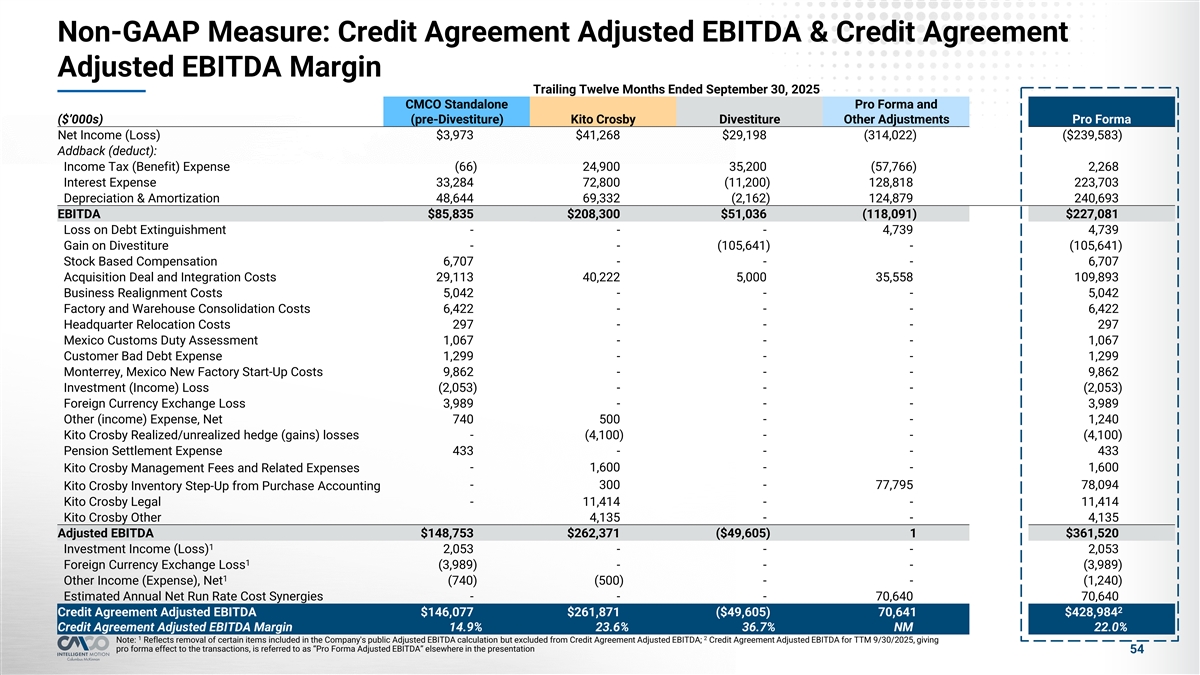
Non-GAAP Measure: Credit Agreement Adjusted EBITDA & Credit Agreement Adjusted EBITDA Margin Trailing Twelve Months Ended September 30, 2025 CMCO Standalone Pro Forma and ($’000s) (pre-Divestiture) Kito Crosby Divestiture Other Adjustments Pro Forma Net Income (Loss) $3,973 $41,268 $29,198 (314,022) ($239,583) Addback (deduct): Income Tax (Benefit) Expense (66) 24,900 35,200 (57,766) 2,268 Interest Expense 33,284 72,800 (11,200) 128,818 223,703 Depreciation & Amortization 48,644 69,332 (2,162) 124,879 240,693 EBITDA $85,835 $208,300 $51,036 (118,091) $227,081 Loss on Debt Extinguishment - - - 4,739 4,739 Gain on Divestiture - - (105,641) - (105,641) Stock Based Compensation 6,707 - - - 6,707 Acquisition Deal and Integration Costs 29,113 40,222 5,000 35,558 109,893 Business Realignment Costs 5,042 - - - 5,042 Factory and Warehouse Consolidation Costs 6,422 - - - 6,422 Headquarter Relocation Costs 297 - - - 297 Mexico Customs Duty Assessment 1,067 - - - 1,067 Customer Bad Debt Expense 1,299 - - - 1,299 Monterrey, Mexico New Factory Start-Up Costs 9,862 - - - 9,862 Investment (Income) Loss (2,053) - - - (2,053) Foreign Currency Exchange Loss 3,989 - - - 3,989 Other (income) Expense, Net 740 500 - - 1,240 Kito Crosby Realized/unrealized hedge (gains) losses - (4,100) - - (4,100) Pension Settlement Expense 433 - - - 433 Kito Crosby Management Fees and Related Expenses - 1,600 - - 1,600 - 300 - 77,795 78,094 Kito Crosby Inventory Step-Up from Purchase Accounting Kito Crosby Legal - 11,414 - - 11,414 Kito Crosby Other 4,135 - - 4,135 Adjusted EBITDA $148,753 $262,371 ($49,605) 1 $361,520 1 Investment Income (Loss) 2,053 - - - 2,053 1 Foreign Currency Exchange Loss (3,989) - - - (3,989) 1 Other Income (Expense), Net (740) (500) - - (1,240) Estimated Annual Net Run Rate Cost Synergies - - - 70,640 70,640 2 Credit Agreement Adjusted EBITDA $146,077 $261,871 ($49,605) 70,641 $428,984 Credit Agreement Adjusted EBITDA Margin 14.9% 23.6% 36.7% NM 22.0% 1 2 Note: Reflects removal of certain items included in the Company's public Adjusted EBITDA calculation but excluded from Credit Agreement Adjusted EBITDA; Credit Agreement Adjusted EBITDA for TTM 9/30/2025, giving pro forma effect to the transactions, is referred to as “Pro Forma Adjusted EBITDA” elsewhere in the presentation 54
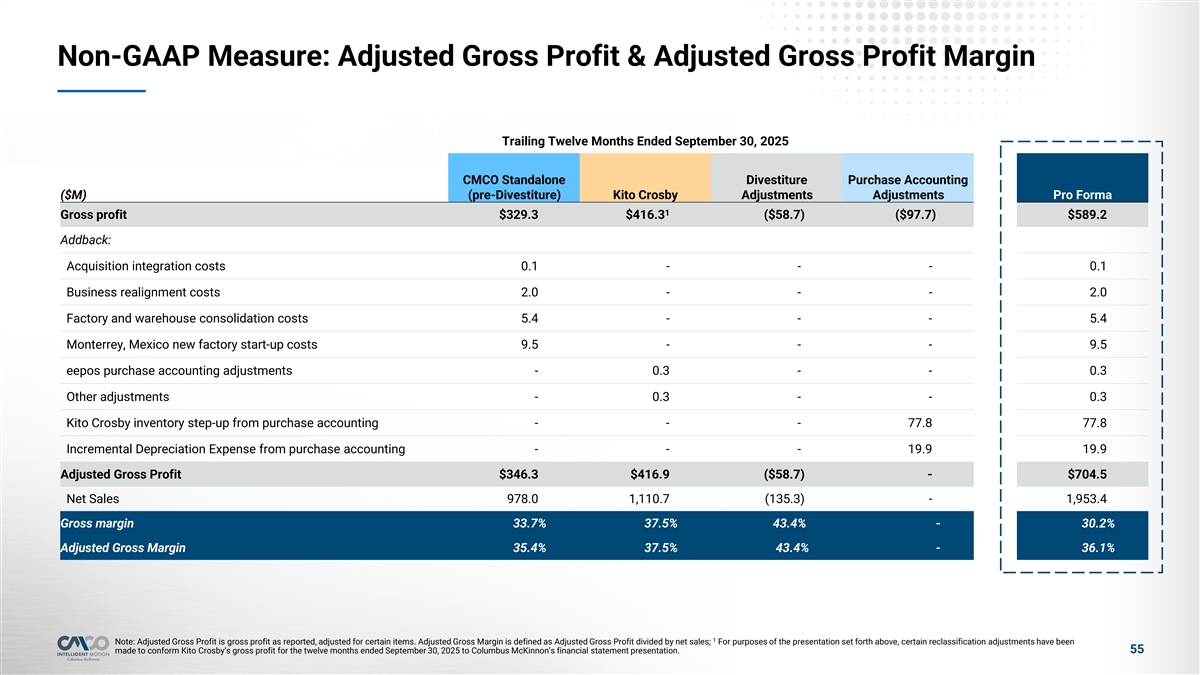
Non-GAAP Measure: Adjusted Gross Profit & Adjusted Gross Profit Margin Trailing Twelve Months Ended September 30, 2025 CMCO Standalone Divestiture Purchase Accounting ($M) (pre-Divestiture) Kito Crosby Adjustments Adjustments Pro Forma 1 Gross profit $329.3 $416.3 ($58.7) ($97.7) $589.2 Addback: Acquisition integration costs 0.1 - - - 0.1 Business realignment costs 2.0 - - - 2.0 Factory and warehouse consolidation costs 5.4 - - - 5.4 Monterrey, Mexico new factory start-up costs 9.5 - - - 9.5 eepos purchase accounting adjustments - 0.3 - - 0.3 Other adjustments - 0.3 - - 0.3 Kito Crosby inventory step-up from purchase accounting - - - 77.8 77.8 Incremental Depreciation Expense from purchase accounting - - - 19.9 19.9 Adjusted Gross Profit $346.3 $416.9 ($58.7) - $704.5 Net Sales 978.0 1,110.7 (135.3) - 1,953.4 Gross margin 33.7% 37.5% 43.4% - 30.2% Adjusted Gross Margin 35.4% 37.5% 43.4% - 36.1% 1 Note: Adjusted Gross Profit is gross profit as reported, adjusted for certain items. Adjusted Gross Margin is defined as Adjusted Gross Profit divided by net sales; For purposes of the presentation set forth above, certain reclassification adjustments have been 55 made to conform Kito Crosby’s gross profit for the twelve months ended September 30, 2025 to Columbus McKinnon’s financial statement presentation.
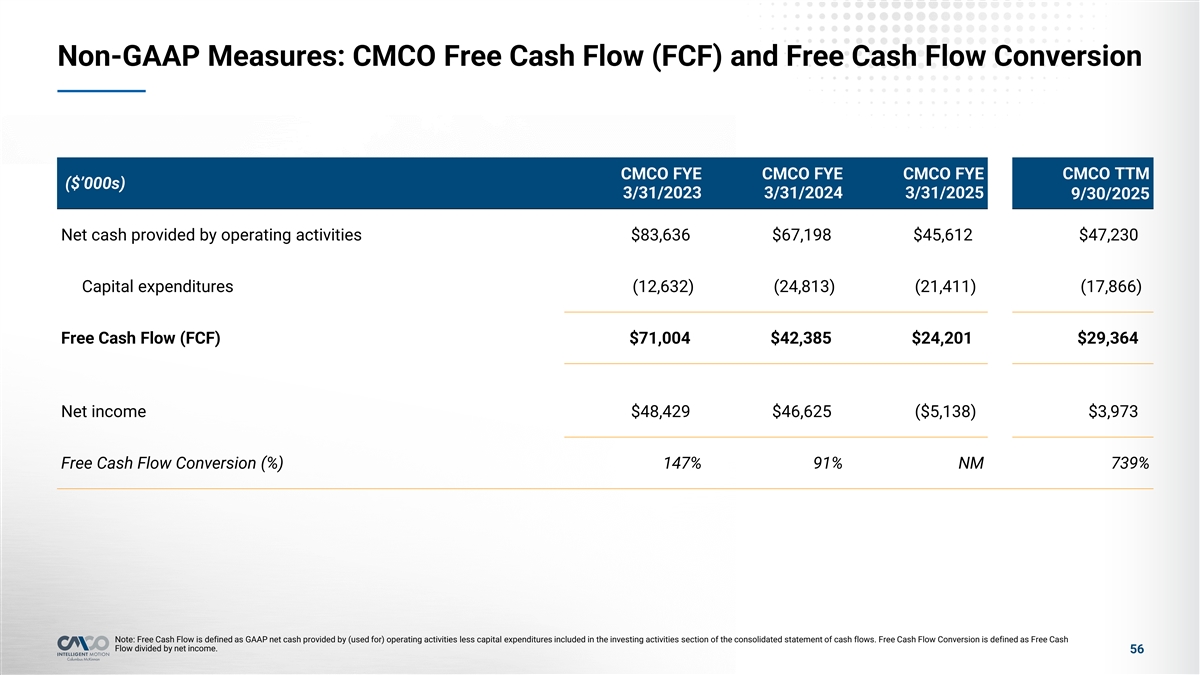
Non-GAAP Measures: CMCO Free Cash Flow (FCF) and Free Cash Flow Conversion CMCO FYE CMCO FYE CMCO FYE CMCO TTM ($’000s) 3/31/2023 3/31/2024 3/31/2025 9/30/2025 Net cash provided by operating activities $83,636 $67,198 $45,612 $47,230 Capital expenditures (12,632) (24,813) (21,411) (17,866) Free Cash Flow (FCF) $71,004 $42,385 $24,201 $29,364 Net income $48,429 $46,625 ($5,138) $3,973 Free Cash Flow Conversion (%) 147% 91% NM 739% Note: Free Cash Flow is defined as GAAP net cash provided by (used for) operating activities less capital expenditures included in the investing activities section of the consolidated statement of cash flows. Free Cash Flow Conversion is defined as Free Cash Flow divided by net income. 56
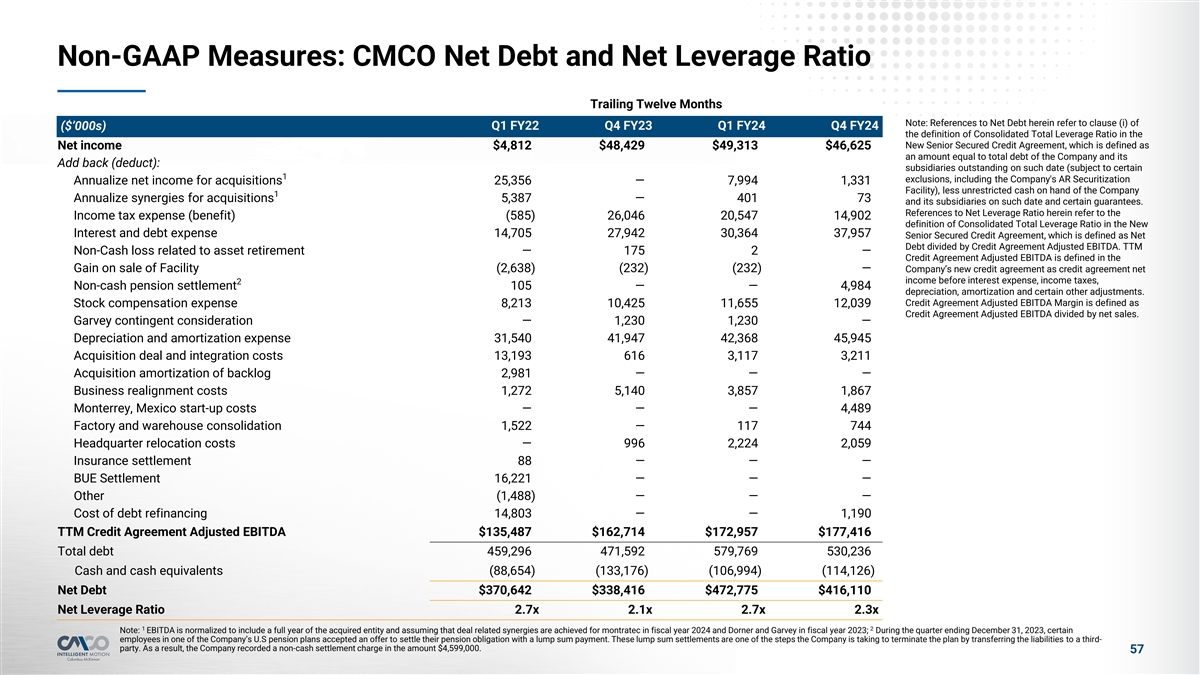
Non-GAAP Measures: CMCO Net Debt and Net Leverage Ratio Trailing Twelve Months Note: References to Net Debt herein refer to clause (i) of ($’000s) Q1 FY22 Q4 FY23 Q1 FY24 Q4 FY24 the definition of Consolidated Total Leverage Ratio in the New Senior Secured Credit Agreement, which is defined as Net income $4,812 $48,429 $49,313 $46,625 an amount equal to total debt of the Company and its Add back (deduct): subsidiaries outstanding on such date (subject to certain 1 exclusions, including the Company's AR Securitization Annualize net income for acquisitions 25,356 — 7,994 1,331 Facility), less unrestricted cash on hand of the Company 1 Annualize synergies for acquisitions 5,387 — 401 73 and its subsidiaries on such date and certain guarantees. References to Net Leverage Ratio herein refer to the Income tax expense (benefit) (585) 26,046 20,547 14,902 definition of Consolidated Total Leverage Ratio in the New Interest and debt expense 14,705 27,942 30,364 37,957 Senior Secured Credit Agreement, which is defined as Net Debt divided by Credit Agreement Adjusted EBITDA. TTM Non-Cash loss related to asset retirement — 175 2 — Credit Agreement Adjusted EBITDA is defined in the Gain on sale of Facility (2,638) (232) (232) — Company’s new credit agreement as credit agreement net income before interest expense, income taxes, 2 Non-cash pension settlement 105 — — 4,984 depreciation, amortization and certain other adjustments. Credit Agreement Adjusted EBITDA Margin is defined as Stock compensation expense 8,213 10,425 11,655 12,039 Credit Agreement Adjusted EBITDA divided by net sales. Garvey contingent consideration — 1,230 1,230 — Depreciation and amortization expense 31,540 41,947 42,368 45,945 Acquisition deal and integration costs 13,193 616 3,117 3,211 Acquisition amortization of backlog 2,981 — — — Business realignment costs 1,272 5,140 3,857 1,867 Monterrey, Mexico start-up costs — — — 4,489 Factory and warehouse consolidation 1,522 — 117 744 Headquarter relocation costs — 996 2,224 2,059 Insurance settlement 88 — — — BUE Settlement 16,221 — — — Other (1,488) — — — Cost of debt refinancing 14,803 — — 1,190 TTM Credit Agreement Adjusted EBITDA $135,487 $162,714 $172,957 $177,416 Total debt 459,296 471,592 579,769 530,236 Cash and cash equivalents (88,654) (133,176) (106,994) (114,126) Net Debt $370,642 $338,416 $472,775 $416,110 Net Leverage Ratio 2.7x 2.1x 2.7x 2.3x 1 2 Note: EBITDA is normalized to include a full year of the acquired entity and assuming that deal related synergies are achieved for montratec in fiscal year 2024 and Dorner and Garvey in fiscal year 2023; During the quarter ending December 31, 2023, certain employees in one of the Company’s U.S pension plans accepted an offer to settle their pension obligation with a lump sum payment. These lump sum settlements are one of the steps the Company is taking to terminate the plan by transferring the liabilities to a third- party. As a result, the Company recorded a non-cash settlement charge in the amount $4,599,000. 57