| May 2026 | Investor Presentation Distributed Energy. Delivered. On site. On demand. Always On. OTCQX: CGEH |
| Disclaimer This presentation has been prepared by Capstone Energy+, Inc. (the "Company”) solely for informational purposes. This presentation is not intended to constitute investment advice or a recommendation to buy, sell, or hold any securities of the Company. The information contained in this presentation has been prepared solely to provide information regarding the Company, its business, financial condition, results of operations, strategy, market opportunity, and prospects. Each reader and each prospective investor is strongly encouraged to conduct their own independent investigation and verification of the information, opinions, and financial projections contained herein. This presentation does not constitute an offer to sell or the solicitation of an offer to buy or acquire securities of the Company in any jurisdiction or an inducement to enter into any investment activity, nor may it or any part of it form the basis of or be relied upon in connection with any contract or commitment whatsoever. Specifically, this presentation does not constitute a “prospectus” within the meaning of the U.S. Securities Act of 1933, as amended (the “Securities Act”). This presentation does not contain all relevant information relating to the Company or its securities, particularly with respect to the risks and special considerations involved with an investment in securities of the Company. Investors should review the Company's filings with the Securities and Exchange Commission, including the risk factors and other disclosures contained therein, before making any investment decision. No securities of the Company may be offered or sold in the United States without registration under the Securities Act or an exemption from such registration. This document has been prepared based on information available at the time of presentation. No representation or warranty, express or implied, is made as to the fairness, accuracy, or completeness of the information, opinions, and conclusions contained in this presentation. While reasonable care has been taken to ensure that facts stated in this presentation are accurate and/or that the opinions expressed are fair and reasonable, no reliance can be placed for any purpose whatsoever on the information contained in this document or its completeness. Certain industry, market, and competitive-position information contained in this presentation is based on third-party sources, management estimates, and assumptions that the Company believes to be reasonable as of the date hereof. Such information has not been independently verified by the Company, may be subject to change, and should not be viewed as guarantees of future performance, market share, revenue, or profitability 2 |
| Safe Harbor This presentation contains “forward-looking statements” within the meaning of the safe harbor provisions of the Private Securities Litigation Reform Act of 1995. Forward-looking statements include, without limitation, statements regarding the financial outlook, business strategy, plans, objectives, market trends, opportunities and positioning of Capstone Energy+, Inc. (the “Company,” “Capstone,” “we,” “our,” “CGEH” or “us”), including statements regarding the potential impact of the Company’s expansion in the data center market, the integration and expected benefits of acquisitions and other strategic transactions, total addressable market, illustrative revenue opportunities, potential market share capture, timing and success of product development initiatives, technology roadmap timing, emissions performance and compliance, expected system performance, cost-of-ownership comparisons, management estimates and assumptions, and other statements that are not historical facts. Statements regarding total addressable market, market opportunity, illustrative revenue opportunities, potential market share capture, data-center demand, expected customer adoption, product roadmap timing, emissions performance, deployment timing and management estimates are forward-looking statements and are not guarantees of future results, revenue, contracts, customer demand or market penetration. Words such as “expect,” “anticipate,” “believe,” “project,” “target,” “estimate,” “intend,” “plan,” “seek,” “may,” “will,” “would,” “could,” “should,” “potential,” “continue,” “likely” and similar expressions, or the negative of those terms, may identify forward-looking statements, although not all forward-looking statements contain these words. Forward-looking statements are based on current expectations, estimates, assumptions and projections and are subject to risks, uncertainties and other factors, many of which are beyond our control, that could cause actual results to differ materially from those expressed or implied. These factors include, but are not limited to: the Company’s liquidity position and ability to access capital; the Company’s ability to continue as a going concern; the Company’s ability to enter, compete in and grow within the data center market; the timing, cost and success of the Company's product development roadmap, including higher-output systems, 800 VDC architecture, emissions-related improvements and other technology initiatives; the Company's ability to validate, commercialize and scale new products and integrated solutions; the availability, cost and performance of third-party components, including batteries, chillers, dry coolers and balance-of-plant equipment; customer adoption of on-site power solutions; the Company’s ability to remediate material weaknesses in internal control over financial reporting; the Company’s ability to realize anticipated benefits from its financial restructuring, acquisitions and other strategic transactions; the Company’s ability to comply with covenants in its financing arrangements and operating subsidiary governance documents; tariffs, trade barriers and changes in trade policy; employee attrition and the Company’s ability to attract and retain senior management and other key personnel; risks relating to acquisitions, including the Cal Microturbine acquisition, integration risks, performance of acquired businesses and assumed liabilities; the Company’s ability to develop new products and enhance existing products; product quality issues, warranty claims and the adequacy of related reserves; intense competition; conditions in the oil and natural gas, artificial intelligence, data center and other markets the Company serves; general economic, industry, supply chain and geopolitical conditions; and litigation and regulatory proceedings. Additional risks and uncertainties are described in the Company’s Annual Report on Form 10-K, Quarterly Reports on Form 10-Q and other reports filed with the Securities and Exchange Commission. Because of these risks and uncertainties, Capstone cautions you not to place undue reliance on forward-looking statements, which speak only as of the date of this presentation. Actual results may differ materially from management estimates, illustrative scenarios, modeled cost-of-ownership comparisons, market-size estimates, product-performance assumptions, and potential revenue opportunities presented herein. if this presentation. The Company may not achieve the plans, intentions, expectations or results disclosed in its forward-looking statements. Except as required by federal securities laws, the Company undertakes no obligation, and specifically disclaims any obligation, to update or revise any forward-looking statement, whether as a result of new information, future events or otherwise. 3 |
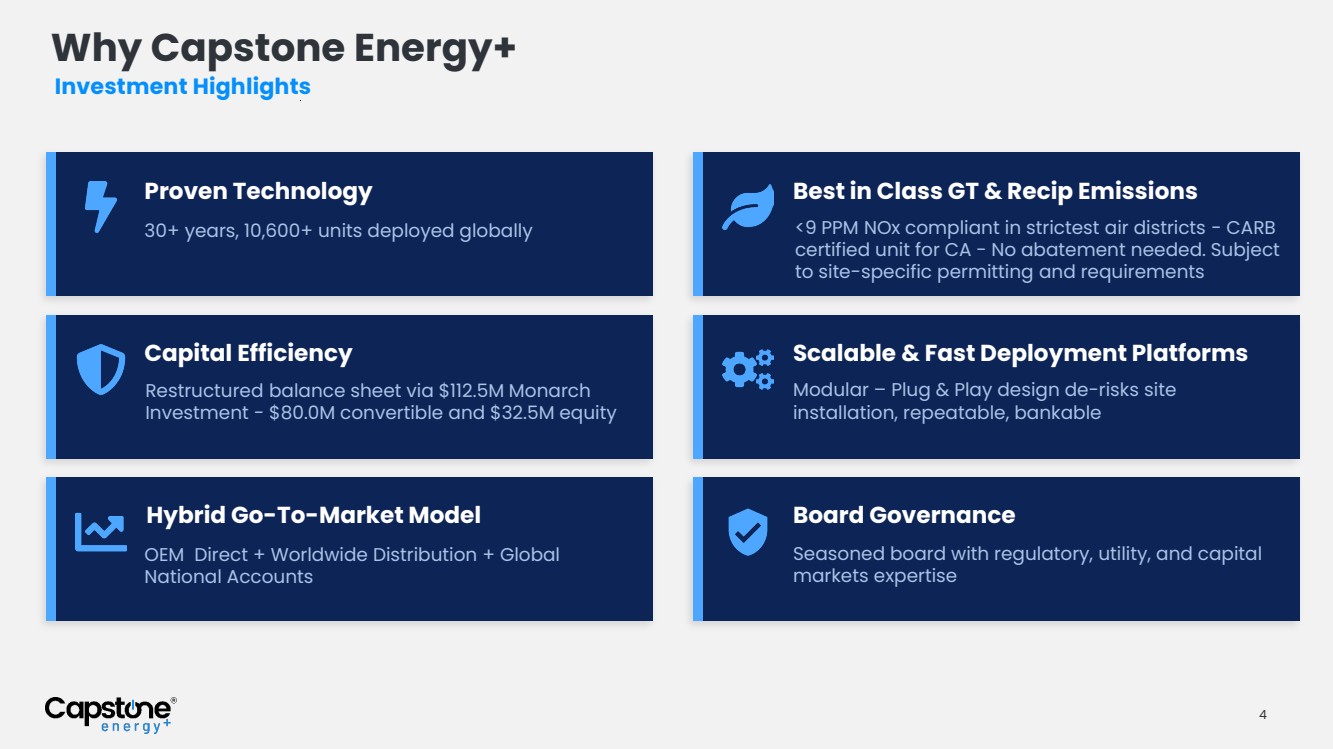
| Proven Technology 30+ years, 10,600+ units deployed globally Best in Class GT & Recip Emissions <9 PPM NOx compliant in strictest air districts - CARB certified unit for CA - No abatement needed. Subject to site-specific permitting and requirements Capital Efficiency Restructured balance sheet via $112.5M Monarch Investment - $80.0M convertible and $32.5M equity Scalable & Fast Deployment Platforms Modular – Plug & Play design de-risks site installation, repeatable, bankable Hybrid Go-To-Market Model OEM Direct + Worldwide Distribution + Global National Accounts Board Governance Seasoned board with regulatory, utility, and capital markets expertise Investment Highlights Why Capstone Energy+ 4 |
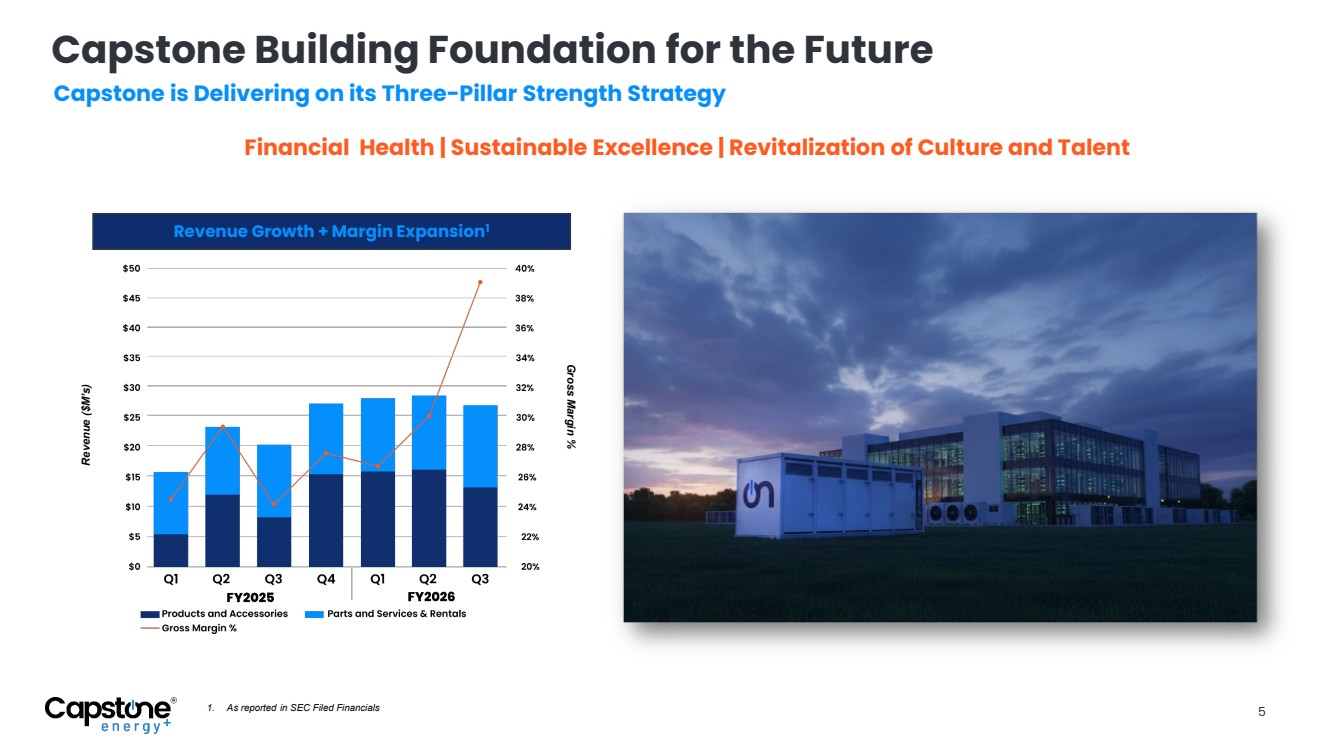
| Capstone Building Foundation for the Future Revenue Growth + Margin Expansion1 Revenue ($M’s) Gross Margin % 1. As reported in SEC Filed Financials 5 Capstone is Delivering on its Three-Pillar Strength Strategy Financial Health | Sustainable Excellence | Revitalization of Culture and Talent |
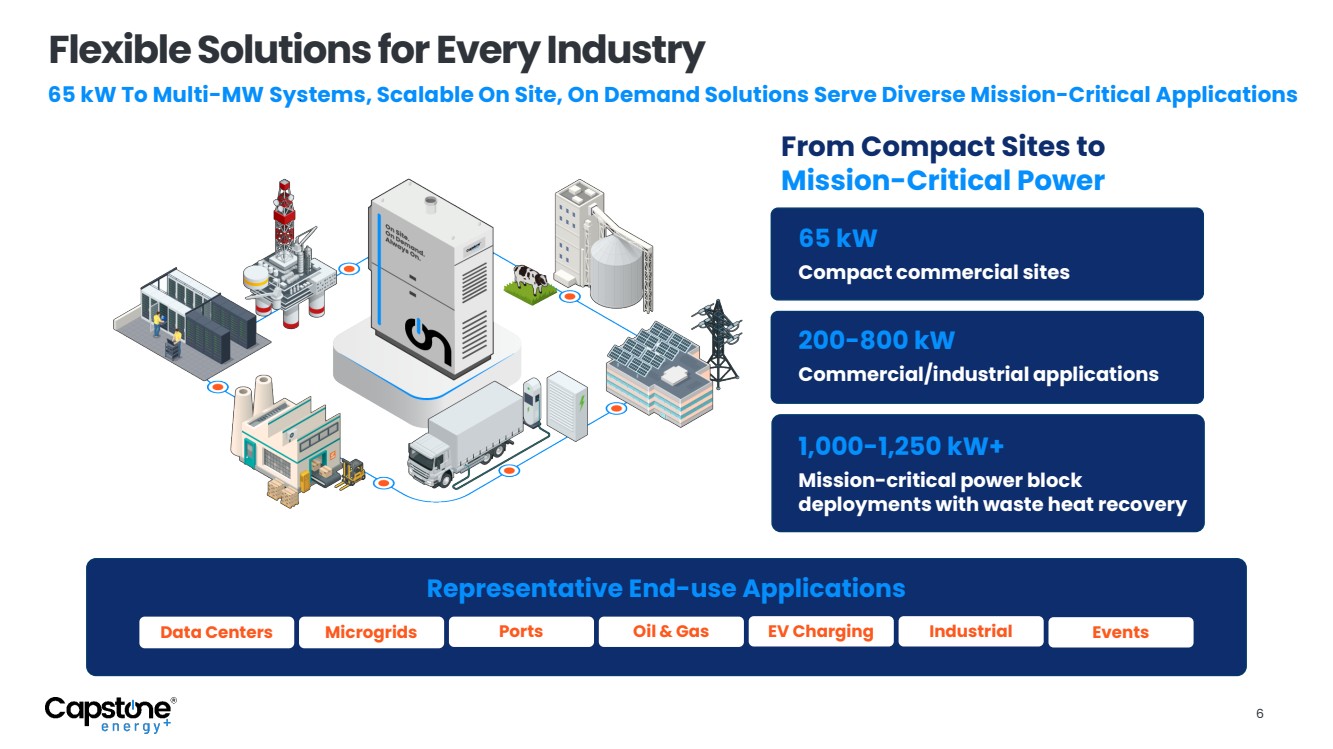
| 6 Flexible Solutions for Every Industry 65 kW To Multi-MW Systems, Scalable On Site, On Demand Solutions Serve Diverse Mission-Critical Applications From Compact Sites to Mission-Critical Power Data Centers Microgrids Ports Oil & Gas EV Charging Industrial Events Representative End-use Applications Mission-critical power block deployments with waste heat recovery 1,000-1,250 kW+ Commercial/industrial applications 200-800 kW Compact commercial sites 65 kW |
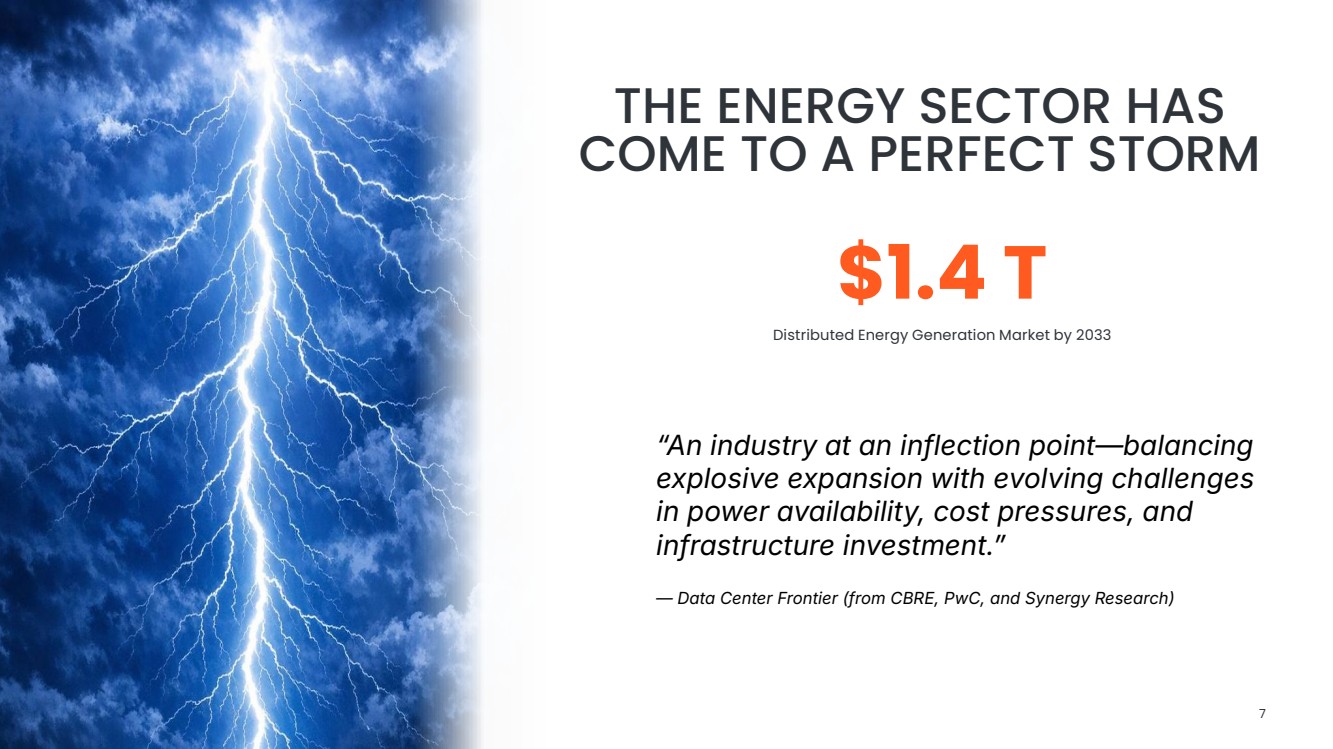
| $1.4 T Distributed Energy Generation Market by 2033 “An industry at an inflection point—balancing explosive expansion with evolving challenges in power availability, cost pressures, and infrastructure investment.ˮ — Data Center Frontier (from CBRE, PwC, and Synergy Research) Source: Allied Market Research: Distributed Energy Generation Market (2024 - 2033) THE ENERGY SECTOR HAS COME TO A PERFECT STORM 7 |
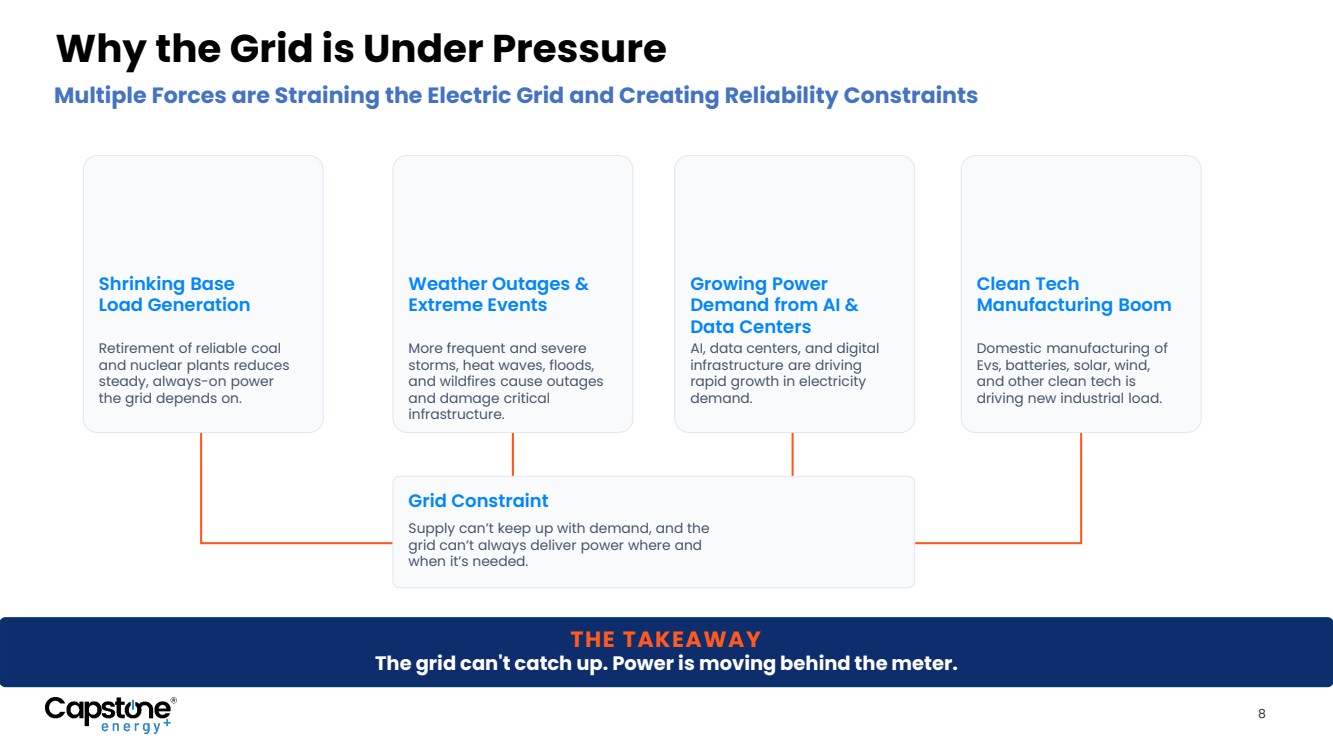
| 8 THE TAKEAWAY The grid can't catch up. Power is moving behind the meter. Why the Grid is Under Pressure Multiple Forces are Straining the Electric Grid and Creating Reliability Constraints Shrinking Base Load Generation Retirement of reliable coal and nuclear plants reduces steady, always-on power the grid depends on. Weather Outages & Extreme Events More frequent and severe storms, heat waves, floods, and wildfires cause outages and damage critical infrastructure. Growing Power Demand from AI & Data Centers AI, data centers, and digital infrastructure are driving rapid growth in electricity demand. Clean Tech Manufacturing Boom Domestic manufacturing of Evs, batteries, solar, wind, and other clean tech is driving new industrial load. Grid Constraint Supply can’t keep up with demand, and the grid can’t always deliver power where and when it’s needed. |
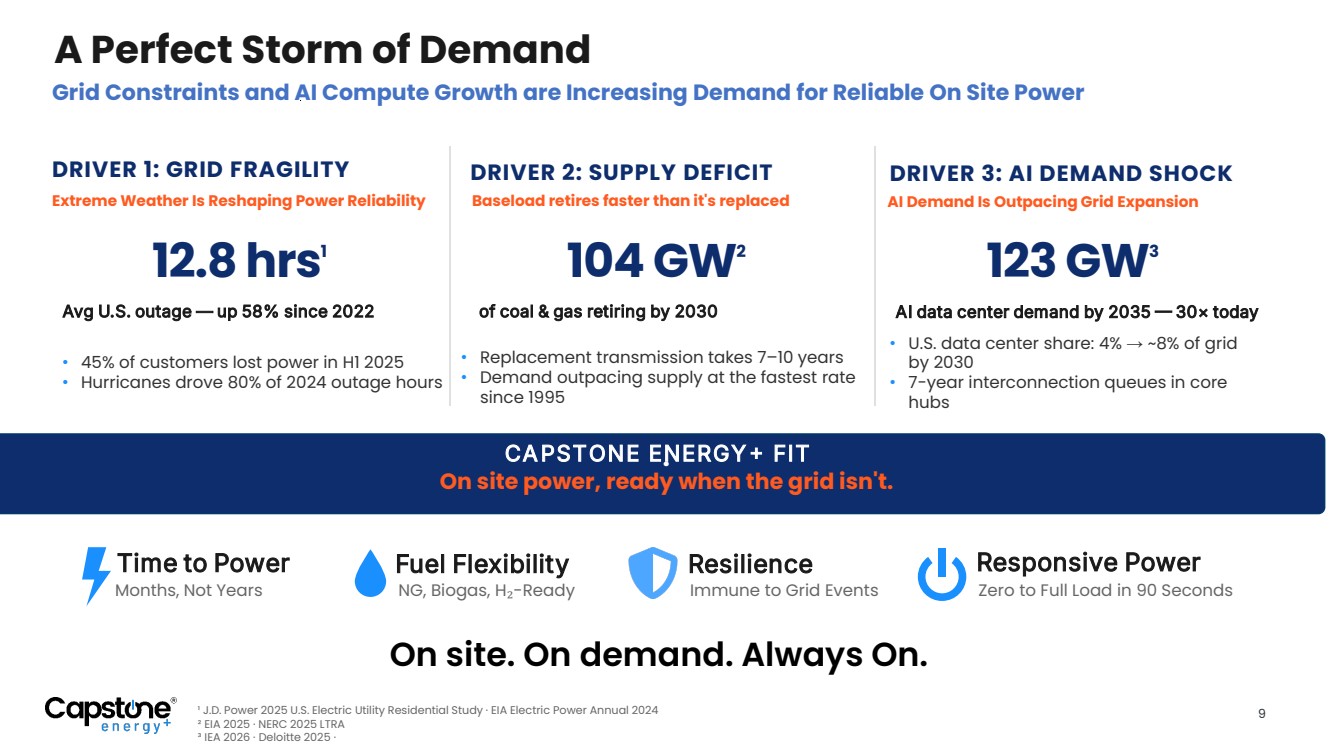
| Grid Constraints and AI Compute Growth are Increasing Demand for Reliable On Site Power DRIVER 1: GRID FRAGILITY Extreme Weather Is Reshaping Power Reliability 12.8 hrs1 Avg U.S. outage — up 58% since 2022 • 45% of customers lost power in H1 2025 • Hurricanes drove 80% of 2024 outage hours DRIVER 2: SUPPLY DEFICIT Baseload retires faster than it's replaced 104 GW2 of coal & gas retiring by 2030 • Replacement transmission takes 7–10 years • Demand outpacing supply at the fastest rate since 1995 DRIVER 3: AI DEMAND SHOCK AI Demand Is Outpacing Grid Expansion 123 GW3 AI data center demand by 2035 30× today • U.S. data center share: 4% → ~8% of grid by 2030 • 7-year interconnection queues in core hubs CAPSTONE ENERGY FIT . On site power, ready when the grid isn't. Time to Power Months, Not Years Fuel Flexibility NG, Biogas, H₂-Ready Resilience Immune to Grid Events ¹ J.D. Power 2025 U.S. Electric Utility Residential Study · EIA Electric Power Annual 2024 ² EIA 2025 · NERC 2025 LTRA ³ IEA 2026 · Deloitte 2025 · A Perfect Storm of Demand 9 On site. On demand. Always On. Responsive Power Zero to Full Load in 90 Seconds |
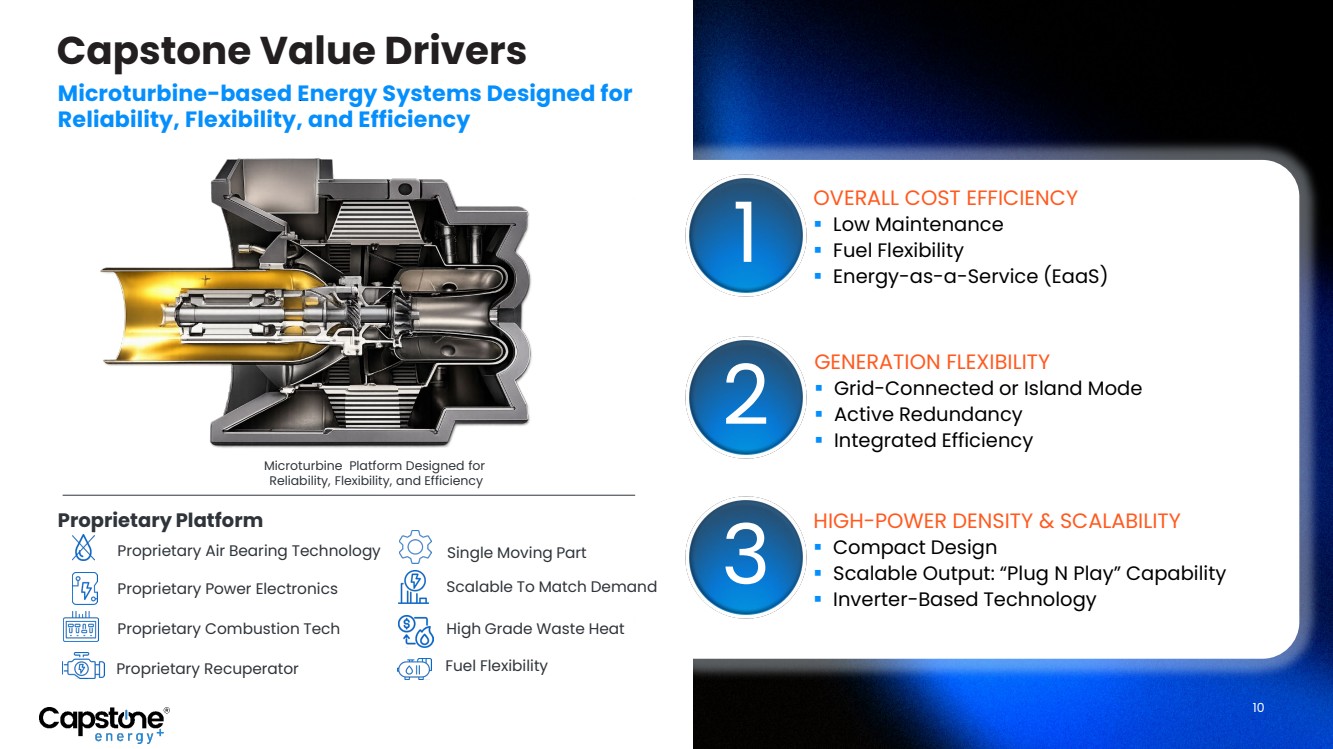
| Capstone Value Drivers Proprietary Air Bearing Technology Proprietary Power Electronics Proprietary Combustion Tech Proprietary Recuperator Fuel Flexibility High Grade Waste Heat Single Moving Part Scalable To Match Demand 1 2 3 OVERALL COST EFFICIENCY Low Maintenance Fuel Flexibility Energy-as-a-Service (EaaS) GENERATION FLEXIBILITY Grid-Connected or Island Mode Active Redundancy Integrated Efficiency HIGH-POWER DENSITY & SCALABILITY Compact Design Scalable Output: “Plug N Play” Capability Inverter-Based Technology Microturbine-based Energy Systems Designed for Reliability, Flexibility, and Efficiency Proprietary Platform Microturbine Platform Designed for Reliability, Flexibility, and Efficiency 10 |
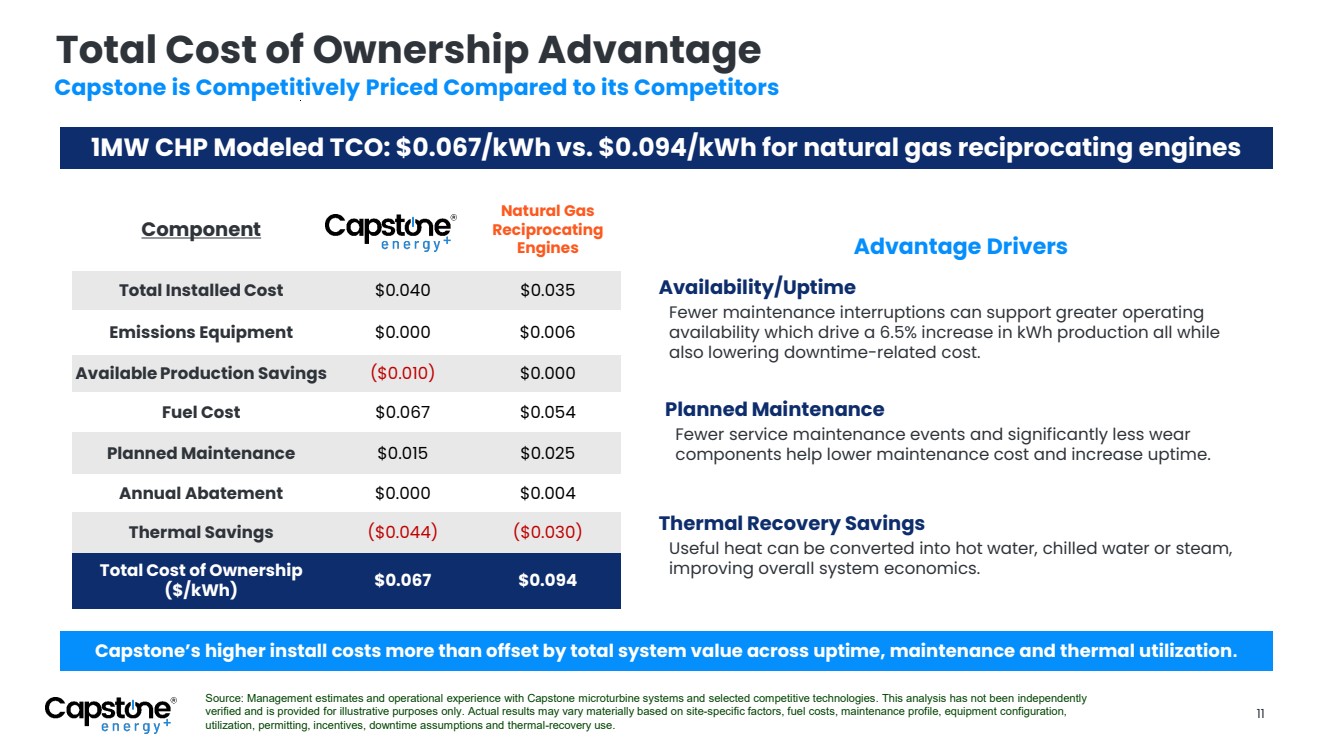
| 11 Total Cost of Ownership Advantage Capstone is Competitively Priced Compared to its Competitors 1MW CHP Modeled TCO: $0.067/kWh vs. $0.094/kWh for natural gas reciprocating engines Source: Management estimates and operational experience with Capstone microturbine systems and selected competitive technologies. This analysis has not been independently verified and is provided for illustrative purposes only. Actual results may vary materially based on site-specific factors, fuel costs, maintenance profile, equipment configuration, utilization, permitting, incentives, downtime assumptions and thermal-recovery use. Advantage Drivers Capstone’s higher install costs more than offset by total system value across uptime, maintenance and thermal utilization. Availability/Uptime Fewer maintenance interruptions can support greater operating availability which drive a 6.5% increase in kWh production all while also lowering downtime-related cost. Planned Maintenance Fewer service maintenance events and significantly less wear components help lower maintenance cost and increase uptime. Thermal Recovery Savings Useful heat can be converted into hot water, chilled water or steam, improving overall system economics. Component Natural Gas Reciprocating Engines Total Installed Cost $0.040 $0.035 Emissions Equipment $0.000 $0.006 Available Production Savings ($0.010) $0.000 Fuel Cost $0.067 $0.054 Planned Maintenance $0.015 $0.025 Annual Abatement $0.000 $0.004 Thermal Savings ($0.044) ($0.030) Total Cost of Ownership ($/kWh) $0.067 $0.094 |
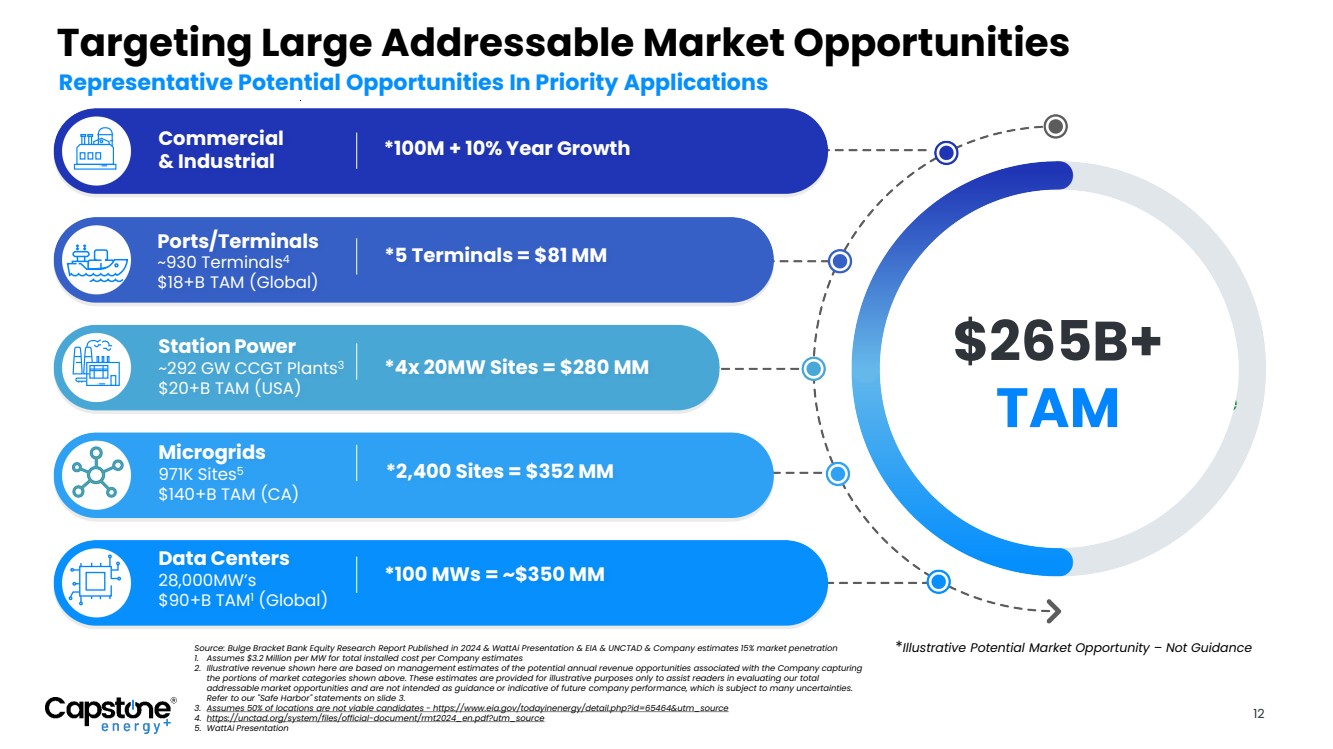
| Source: Bulge Bracket Bank Equity Research Report Published in 2024 & WattAi Presentation & EIA & UNCTAD & Company estimates 15% market penetration 1. Assumes $3.2 Million per MW for total installed cost per Company estimates 2. Illustrative revenue shown here are based on management estimates of the potential annual revenue opportunities associated with the Company capturing the portions of market categories shown above. These estimates are provided for illustrative purposes only to assist readers in evaluating our total addressable market opportunities and are not intended as guidance or indicative of future company performance, which is subject to many uncertainties. Refer to our "Safe Harbor" statements on slide 3. 3. Assumes 50% of locations are not viable candidates - https://www.eia.gov/todayinenergy/detail.php?id=65464&utm_source 4. https://unctad.org/system/files/official-document/rmt2024_en.pdf?utm_source 5. WattAi Presentation Targeting Large Addressable Market Opportunities Station Power ~292 GW CCGT Plants3 $20+B TAM (USA) Ports/Terminals ~930 Terminals4 $18+B TAM (Global) Microgrids 971K Sites5 $140+B TAM (CA) Data Centers 28,000MW’s $90+B TAM1 (Global) Commercial & Industrial *4x 20MW Sites = $280 MM *5 Terminals = $81 MM *2,400 Sites = $352 MM *100 MWs = ~$350 MM *100M + 10% Year Growth Illustrative Revenue Opportunity2 $265B+ TAM Representative Potential Opportunities In Priority Applications 12 *Illustrative Potential Market Opportunity – Not Guidance |
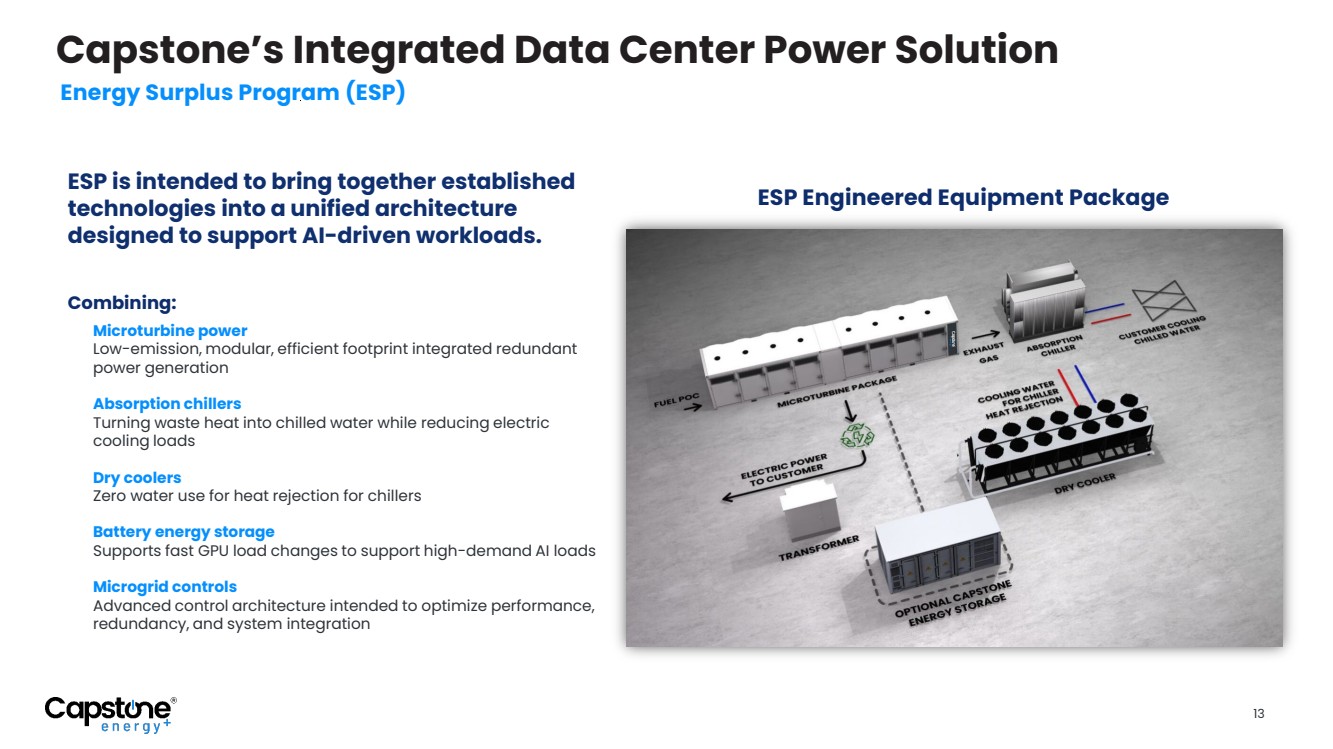
| Capstone’s Integrated Data Center Power Solution Energy Surplus Program (ESP) ESP is intended to bring together established technologies into a unified architecture designed to support AI-driven workloads. Combining: Microturbine power Low-emission, modular, efficient footprint integrated redundant power generation Absorption chillers Turning waste heat into chilled water while reducing electric cooling loads Dry coolers Zero water use for heat rejection for chillers Battery energy storage Supports fast GPU load changes to support high-demand AI loads Microgrid controls Advanced control architecture intended to optimize performance, redundancy, and system integration ESP Engineered Equipment Package 13 |
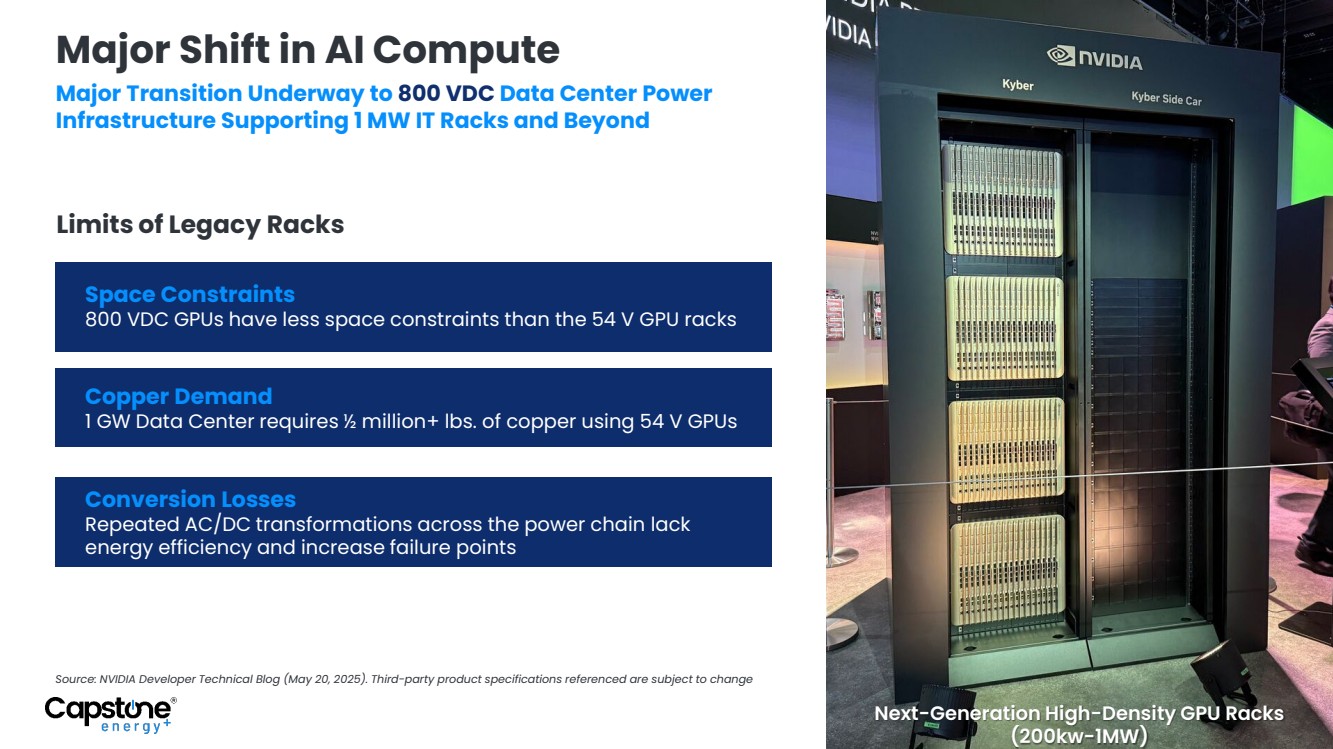
| Major Shift in AI Compute Space Constraints 800 VDC GPUs have less space constraints than the 54 V GPU racks Limits of Legacy Racks Major Transition Underway to 800 VDC Data Center Power Infrastructure Supporting 1 MW IT Racks and Beyond Source: NVIDIA Developer Technical Blog (May 20, 2025). Third-party product specifications referenced are subject to change Copper Demand 1 GW Data Center requires ½ million+ lbs. of copper using 54 V GPUs Conversion Losses Repeated AC/DC transformations across the power chain lack energy efficiency and increase failure points Next-Generation High-Density GPU Racks (200kw-1MW) |
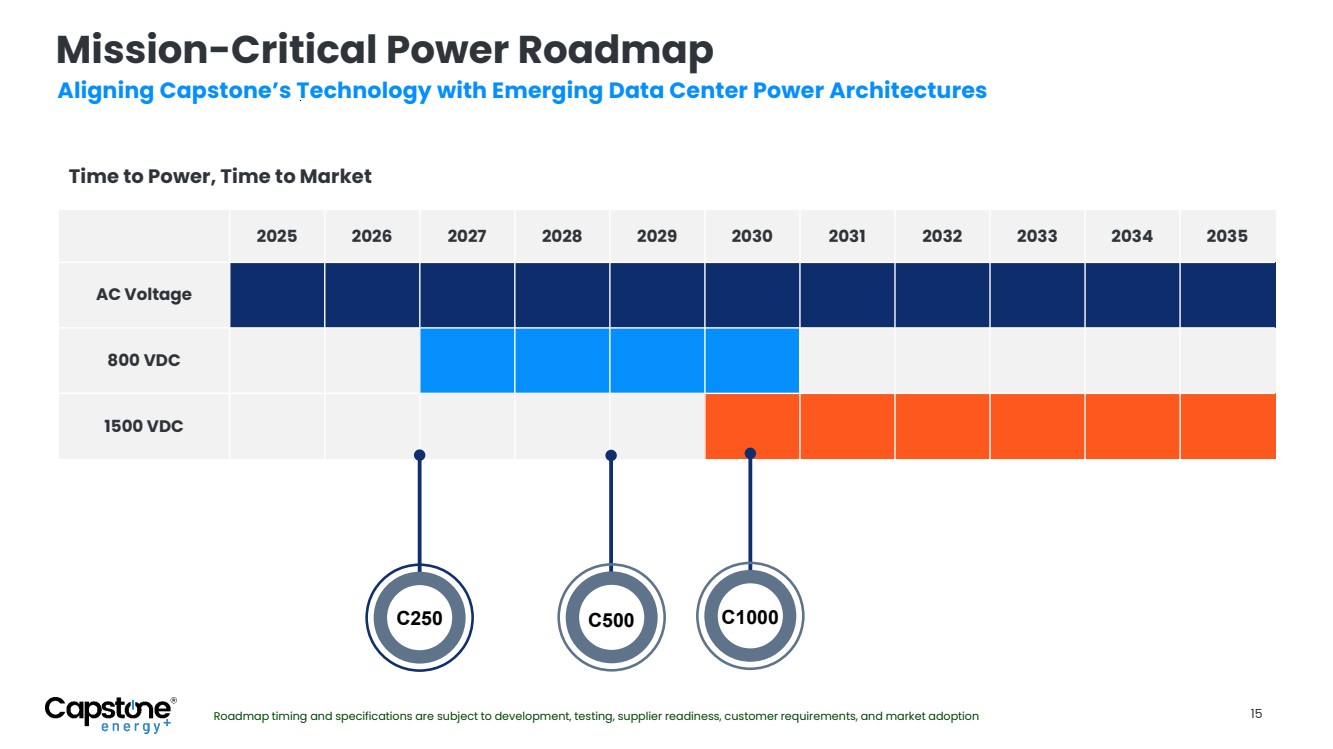
| Mission-Critical Power Roadmap Aligning Capstone’s Technology with Emerging Data Center Power Architectures Time to Power, Time to Market C250 C500 C1000 2025 2026 2027 2028 2029 2030 2031 2032 2033 2034 2035 AC Voltage 800 VDC 1500 VDC C250 Roadmap timing and specifications are subject to development, testing, supplier readiness, customer requirements, and market adoption 15 |
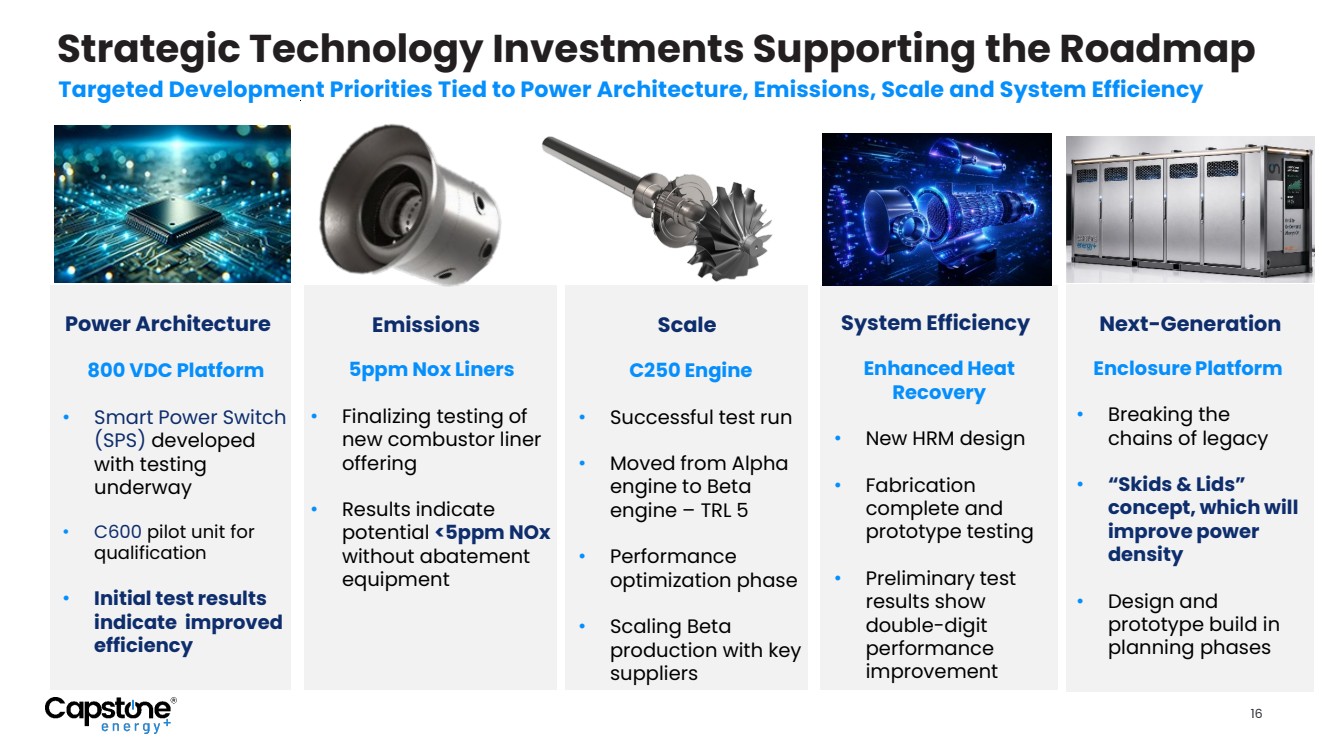
| System Efficiency Strategic Technology Investments Supporting the Roadmap Targeted Development Priorities Tied to Power Architecture, Emissions, Scale and System Efficiency Power Architecture 800 VDC Platform • Smart Power Switch (SPS) developed with testing underway • C600 pilot unit for qualification • Initial test results indicate improved efficiency Emissions 5ppm Nox Liners • Finalizing testing of new combustor liner offering • Results indicate potential <5ppm NOx without abatement equipment Scale C250 Engine • Successful test run • Moved from Alpha engine to Beta engine – TRL 5 • Performance optimization phase • Scaling Beta production with key suppliers Enhanced Heat Recovery • New HRM design • Fabrication complete and prototype testing • Preliminary test results show double-digit performance improvement Next-Generation Enclosure Platform • Breaking the chains of legacy • “Skids & Lids” concept, which will improve power density • Design and prototype build in planning phases 16 |
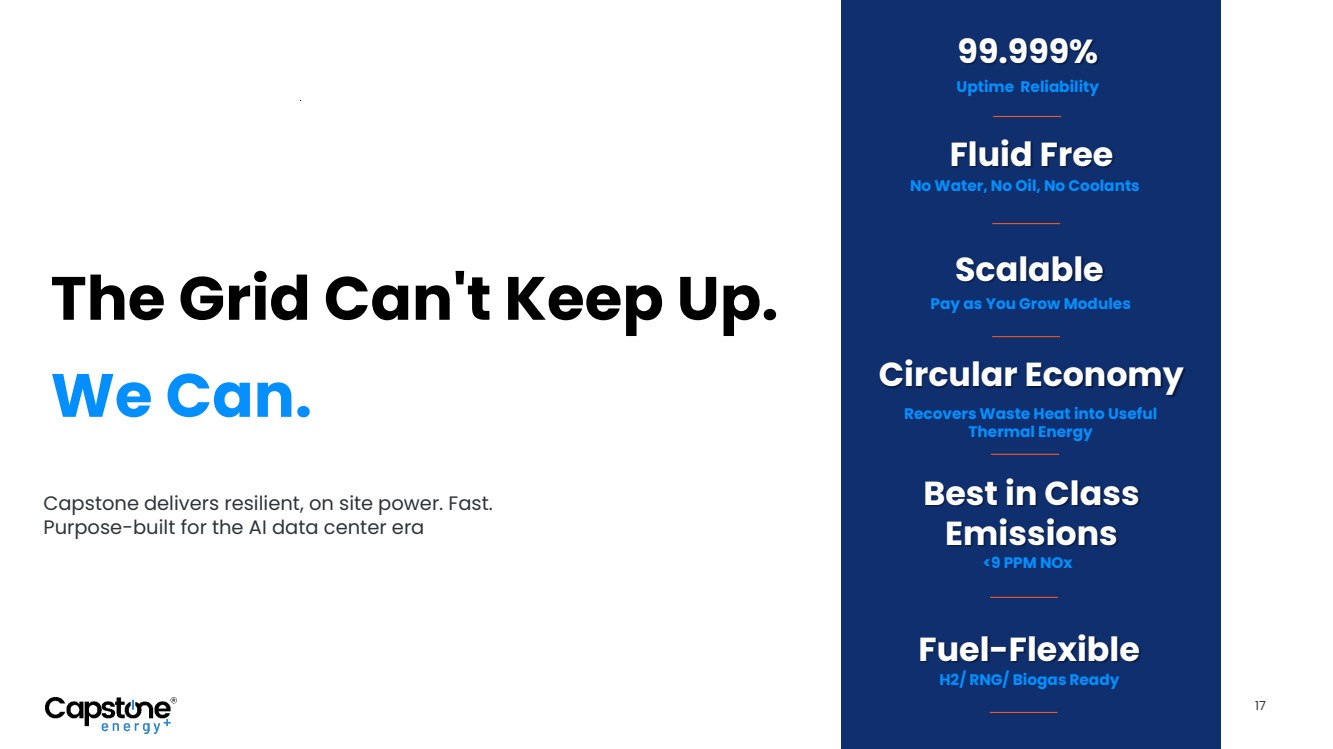
| 99.999% Uptime Reliability <9 PPM NOx Best in Class Emissions Recovers Waste Heat into Useful Thermal Energy Circular Economy Scalable Pay as You Grow Modules Fuel-Flexible H2/ RNG/ Biogas Ready Capstone delivers resilient, on site power. Fast. Purpose-built for the AI data center era The Grid Can't Keep Up. We Can. 17 Fluid Free No Water, No Oil, No Coolants |
| Questions? |

| OTCQX: CGEH 16640 Stagg Street | Van Nuys, CA 91406 T: +1 818.734.5300 | M: +1 818.960.9780 CapstoneEnergyPlus.com On Site. On Demand. Always On. Thank you. |
| Appendix |

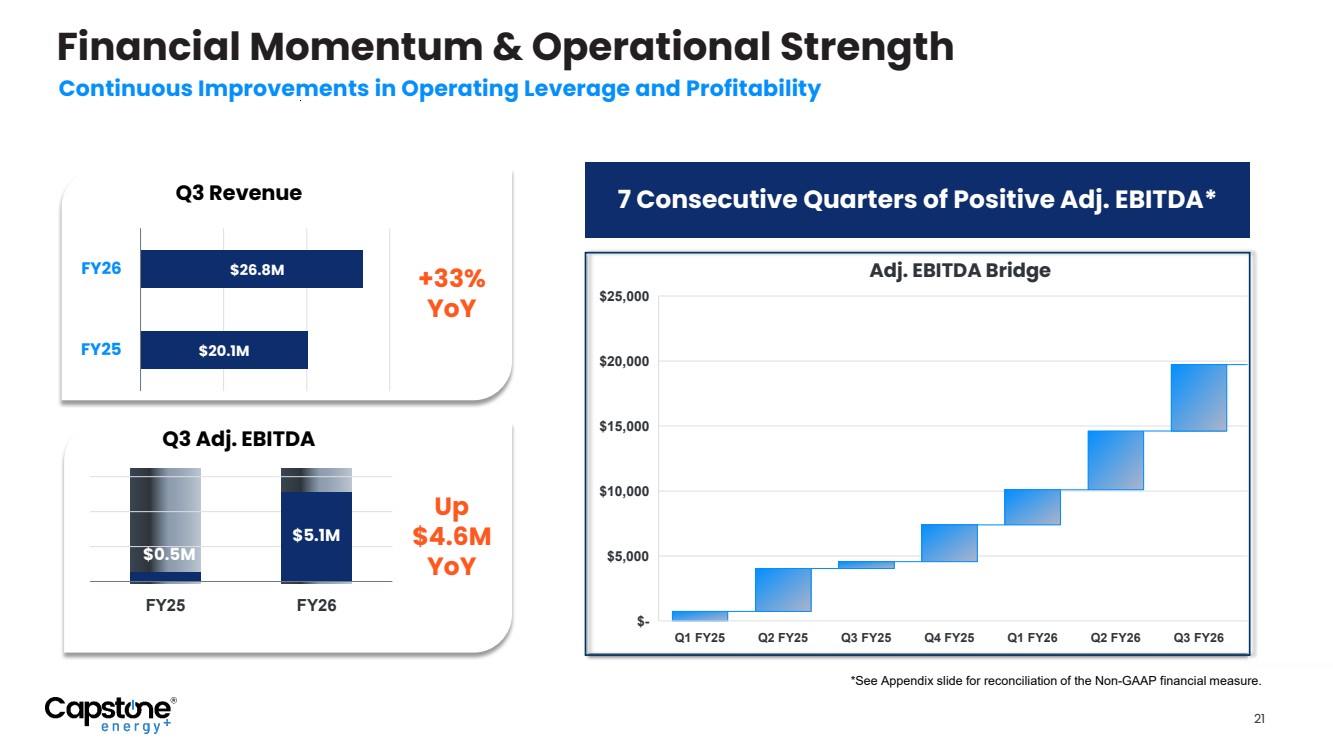
| Financial Momentum & Operational Strength Continuous Improvements in Operating Leverage and Profitability Q3 Revenue Q3 Adj. EBITDA 7 Consecutive Quarters of Positive Adj. EBITDA* FY25 FY26 $5.1M $0.5M Q1 FY25 Q2 FY25 Q3 FY25 Q4 FY25 Q1 FY26 Q2 FY26 Q3 FY26 Total $- $5,000 $10,000 $15,000 $20,000 $25,000 $26.8M Adj. EBITDA Bridge $20.1M FY26 FY25 +33% YoY Up $4.6M YoY 21 *See Appendix slide for reconciliation of the Non-GAAP financial measure. |
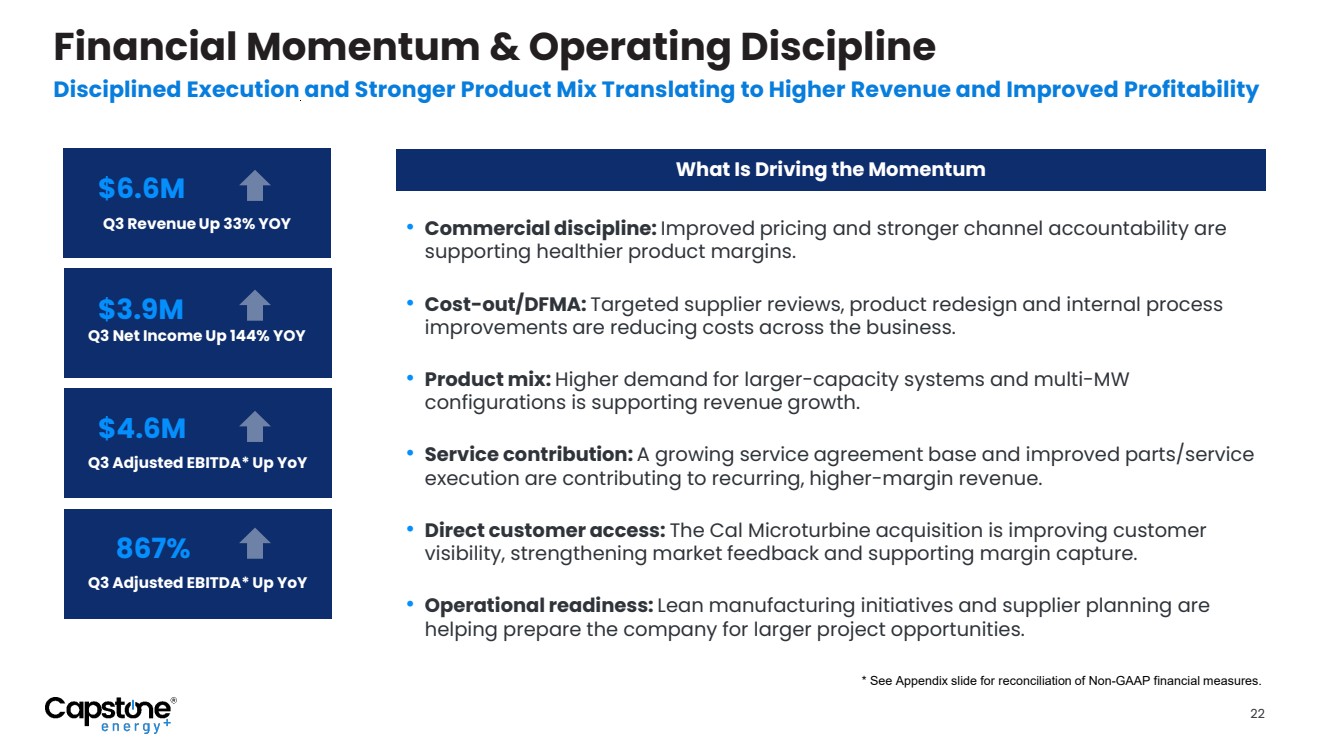
| 22 Financial Momentum & Operating Discipline Disciplined Execution and Stronger Product Mix Translating to Higher Revenue and Improved Profitability $5,114 $529 $6.6M Q3 Revenue Up 33% YOY 867% Q3 Adjusted EBITDA* Up YoY $4.6M Q3 Adjusted EBITDA* Up YoY $3.9M Q3 Net Income Up 144% YOY • Commercial discipline: Improved pricing and stronger channel accountability are supporting healthier product margins. • Cost-out/DFMA: Targeted supplier reviews, product redesign and internal process improvements are reducing costs across the business. • Product mix: Higher demand for larger-capacity systems and multi-MW configurations is supporting revenue growth. • Service contribution: A growing service agreement base and improved parts/service execution are contributing to recurring, higher-margin revenue. • Direct customer access: The Cal Microturbine acquisition is improving customer visibility, strengthening market feedback and supporting margin capture. • Operational readiness: Lean manufacturing initiatives and supplier planning are helping prepare the company for larger project opportunities. What Is Driving the Momentum * See Appendix slide for reconciliation of Non-GAAP financial measures. |
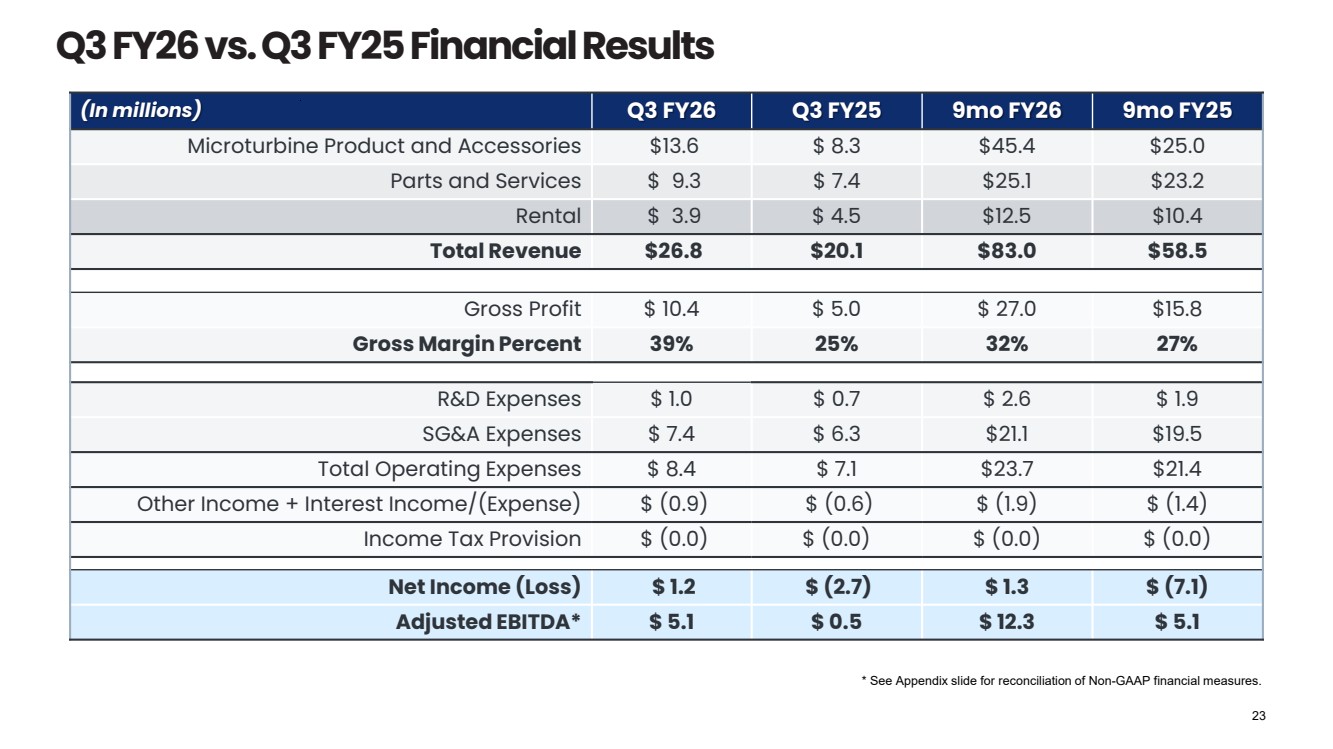
| (In millions) Q3 FY26 Q3 FY25 9mo FY26 9mo FY25 Microturbine Product and Accessories $13.6 $ 8.3 $45.4 $25.0 Parts and Services $ 9.3 $ 7.4 $25.1 $23.2 Rental $ 3.9 $ 4.5 $12.5 $10.4 Total Revenue $26.8 $20.1 $83.0 $58.5 Gross Profit $ 10.4 $ 5.0 $ 27.0 $15.8 Gross Margin Percent 39% 25% 32% 27% R&D Expenses $ 1.0 $ 0.7 $ 2.6 $ 1.9 SG&A Expenses $ 7.4 $ 6.3 $21.1 $19.5 Total Operating Expenses $ 8.4 $ 7.1 $23.7 $21.4 Other Income + Interest Income/(Expense) $ (0.9) $ (0.6) $ (1.9) $ (1.4) Income Tax Provision $ (0.0) $ (0.0) $ (0.0) $ (0.0) Net Income (Loss) $ 1.2 $ (2.7) $ 1.3 $ (7.1) Adjusted EBITDA* $ 5.1 $ 0.5 $ 12.3 $ 5.1 Q3 FY26 vs. Q3 FY25 Financial Results * See Appendix slide for reconciliation of Non-GAAP financial measures. 23 |
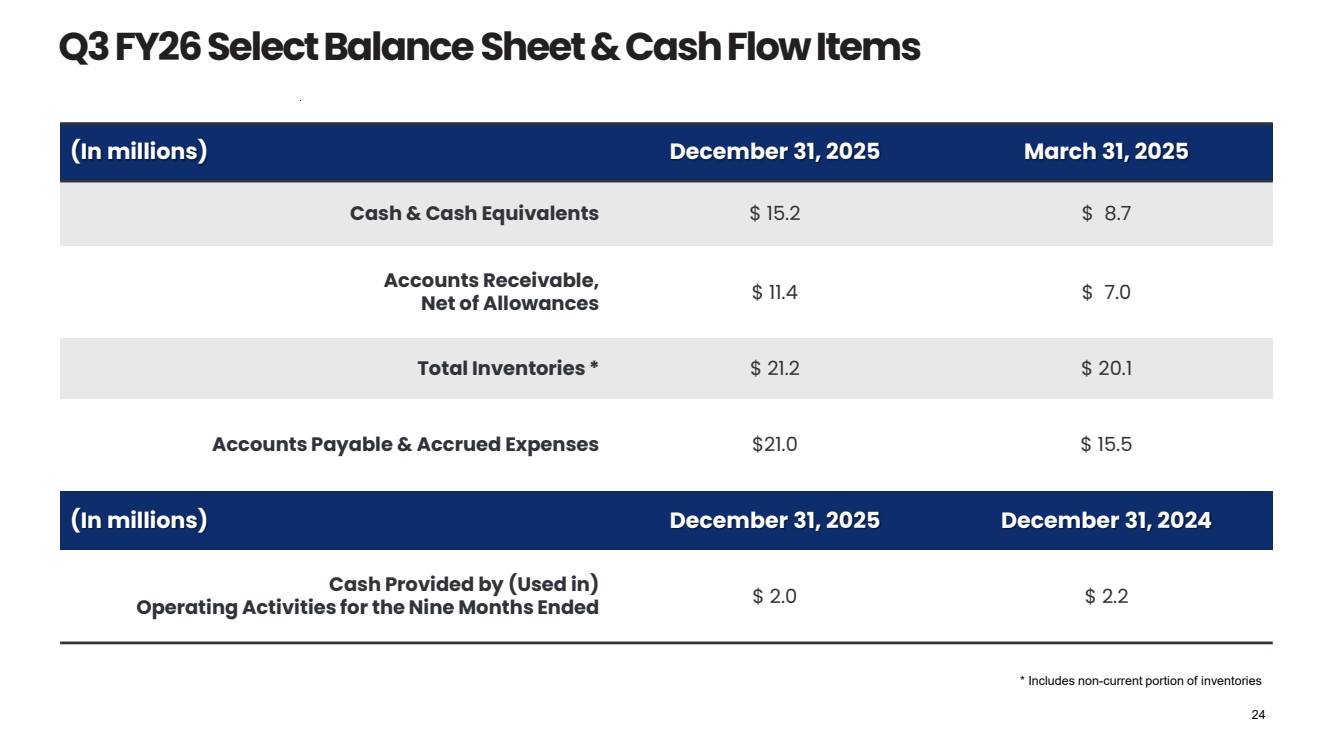
| (In millions) December 31, 2025 March 31, 2025 Cash & Cash Equivalents $ 15.2 $ 8.7 Accounts Receivable, Net of Allowances $ 11.4 $ 7.0 Total Inventories * $ 21.2 $ 20.1 Accounts Payable & Accrued Expenses $21.0 $ 15.5 (In millions) December 31, 2025 December 31, 2024 Cash Provided by (Used in) Operating Activities for the Nine Months Ended $ 2.0 $ 2.2 Q3 FY26 Select BalanceSheet & Cash Flow Items 24 * Includes non-current portion of inventories |
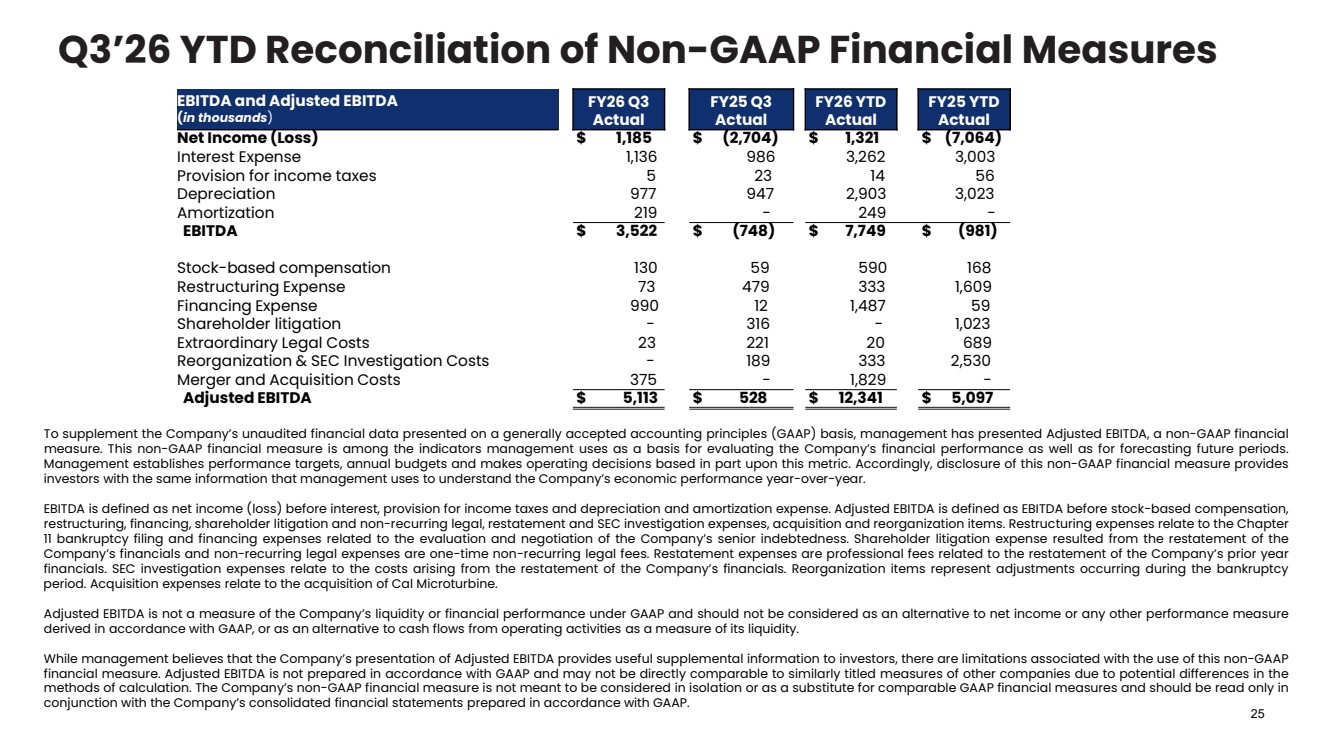
| Q3’26 YTD Reconciliation of Non-GAAP Financial Measures 25 EBITDA and Adjusted EBITDA (in thousands) FY26 Q3 Actual FY25 Q3 Actual FY26 YTD Actual FY25 YTD Actual Net Income (Loss) $ 1,185 $ (2,704) $ 1,321 $ (7,064) Interest Expense 1,136 986 3,262 3,003 Provision for income taxes 5 23 14 56 Depreciation 977 947 2,903 3,023 Amortization 219 - 249 - EBITDA $ 3,522 $ (748) $ 7,749 $ (981) Stock-based compensation 130 59 590 168 Restructuring Expense 73 479 333 1,609 Financing Expense 990 12 1,487 59 Shareholder litigation - 316 - 1,023 Extraordinary Legal Costs 23 221 20 689 Reorganization & SEC Investigation Costs - 189 333 2,530 Merger and Acquisition Costs 375 - 1,829 - Adjusted EBITDA $ 5,113 $ 528 $ 12,341 $ 5,097 To supplement the Company’s unaudited financial data presented on a generally accepted accounting principles (GAAP) basis, management has presented Adjusted EBITDA, a non-GAAP financial measure. This non-GAAP financial measure is among the indicators management uses as a basis for evaluating the Company’s financial performance as well as for forecasting future periods. Management establishes performance targets, annual budgets and makes operating decisions based in part upon this metric. Accordingly, disclosure of this non-GAAP financial measure provides investors with the same information that management uses to understand the Company’s economic performance year-over-year. EBITDA is defined as net income (loss) before interest, provision for income taxes and depreciation and amortization expense. Adjusted EBITDA is defined as EBITDA before stock-based compensation, restructuring, financing, shareholder litigation and non-recurring legal, restatement and SEC investigation expenses, acquisition and reorganization items. Restructuring expenses relate to the Chapter 11 bankruptcy filing and financing expenses related to the evaluation and negotiation of the Company’s senior indebtedness. Shareholder litigation expense resulted from the restatement of the Company’s financials and non-recurring legal expenses are one-time non-recurring legal fees. Restatement expenses are professional fees related to the restatement of the Company’s prior year financials. SEC investigation expenses relate to the costs arising from the restatement of the Company’s financials. Reorganization items represent adjustments occurring during the bankruptcy period. Acquisition expenses relate to the acquisition of Cal Microturbine. Adjusted EBITDA is not a measure of the Company’s liquidity or financial performance under GAAP and should not be considered as an alternative to net income or any other performance measure derived in accordance with GAAP, or as an alternative to cash flows from operating activities as a measure of its liquidity. While management believes that the Company’s presentation of Adjusted EBITDA provides useful supplemental information to investors, there are limitations associated with the use of this non-GAAP financial measure. Adjusted EBITDA is not prepared in accordance with GAAP and may not be directly comparable to similarly titled measures of other companies due to potential differences in the methods of calculation. The Company’s non-GAAP financial measure is not meant to be considered in isolation or as a substitute for comparable GAAP financial measures and should be read only in conjunction with the Company’s consolidated financial statements prepared in accordance with GAAP. |
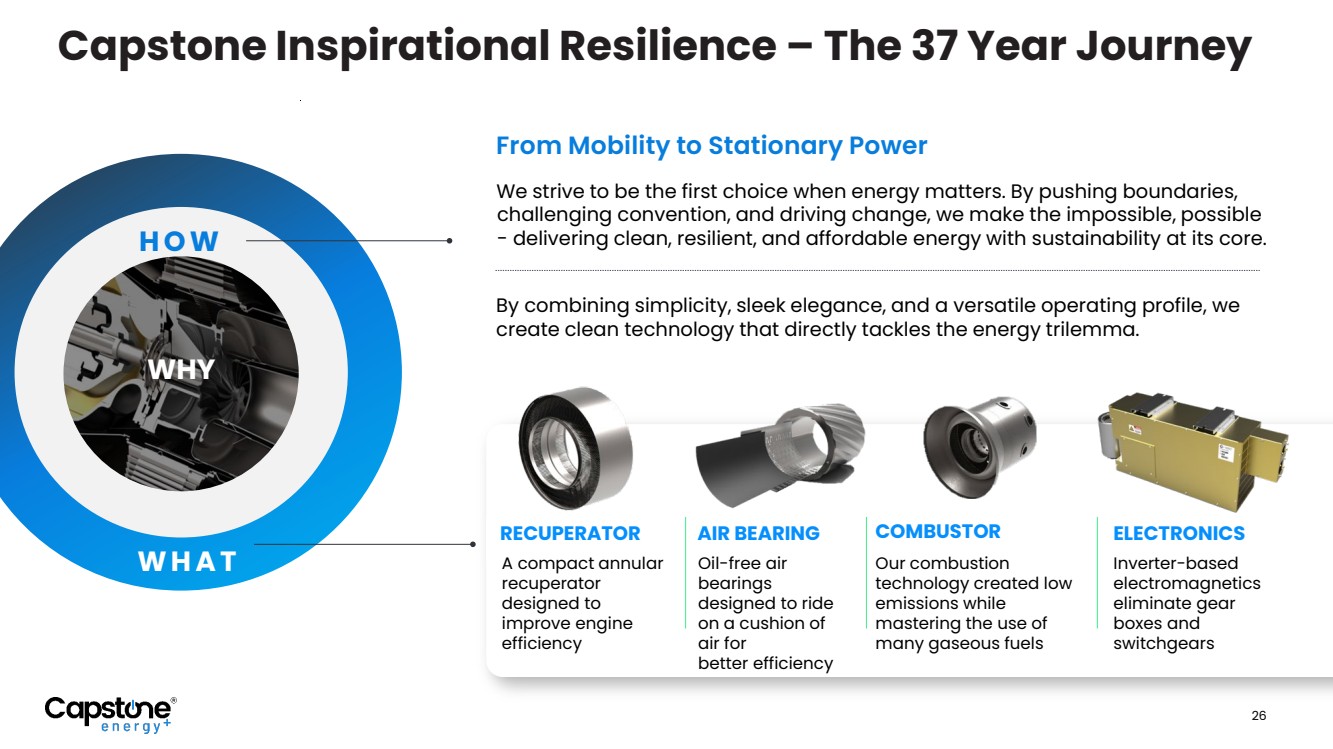
| 26 Capstone Inspirational Resilience – The 37 Year Journey From Mobility to Stationary Power why every detail matters. HOW We strive to be the first choice when energy matters. By pushing boundaries, challenging convention, and driving change, we make the impossible, possible - delivering clean, resilient, and affordable energy with sustainability at its core. Oil-free air bearings designed to ride on a cushion of air for better efficiency AIR BEARING A compact annular recuperator designed to improve engine efficiency RECUPERATOR Inverter-based electromagnetics eliminate gear boxes and switchgears ELECTRONICS Our combustion technology created low emissions while mastering the use of many gaseous fuels COMBUSTOR By combining simplicity, sleek elegance, and a versatile operating profile, we create clean technology that directly tackles the energy trilemma. WHAT WHY |
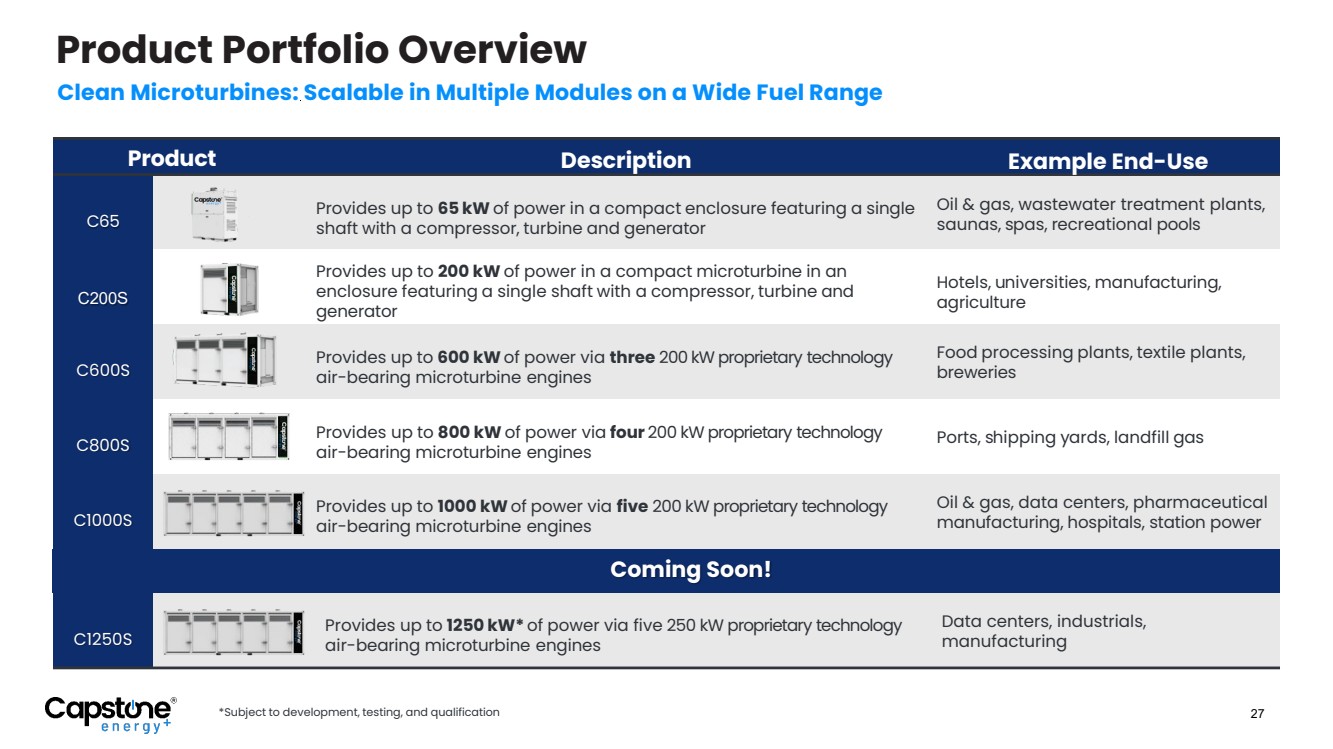
| Product Description Example End-Use C65 Provides up to 65 kW of power in a compact enclosure featuring a single shaft with a compressor, turbine and generator Oil & gas, wastewater treatment plants, saunas, spas, recreational pools C200S Provides up to 200 kW of power in a compact microturbine in an enclosure featuring a single shaft with a compressor, turbine and generator Hotels, universities, manufacturing, agriculture C600S Provides up to 600 kWof power via three 200 kW proprietary technology air-bearing microturbine engines Food processing plants, textile plants, breweries C800S Provides up to 800 kW of power via four 200 kW proprietary technology air-bearing microturbine engines Ports, shipping yards, landfill gas C1000S Provides up to 1000 kWof power via five 200 kW proprietary technology air-bearing microturbine engines Oil & gas, data centers, pharmaceutical manufacturing, hospitals, station power C1250S Provides up to 1250 kW* of power via five 250 kW proprietary technology air-bearing microturbine engines Data centers, industrials, manufacturing Coming Soon! 27 Product Portfolio Overview Clean Microturbines: Scalable in Multiple Modules on a Wide Fuel Range *Subject to development, testing, and qualification |
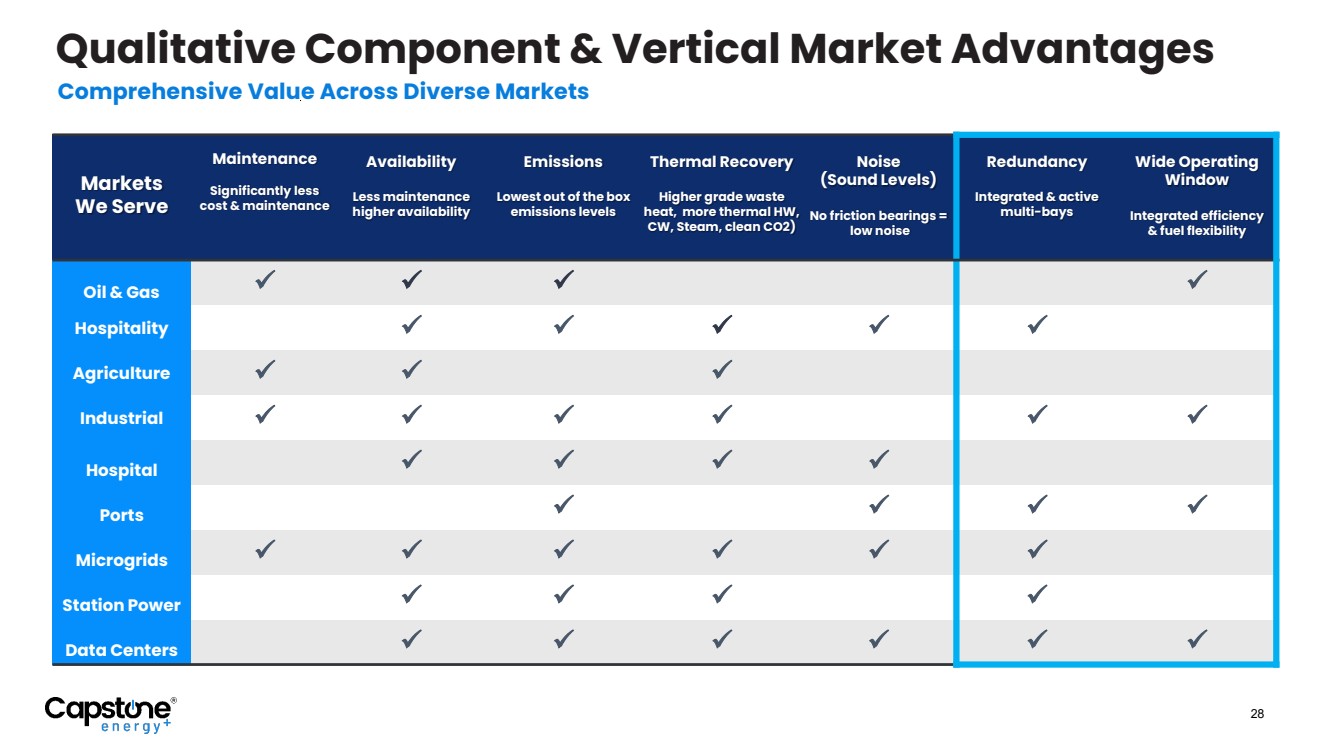
| Markets We Serve Maintenance Significantly less cost & maintenance Availability Less maintenance higher availability Emissions Lowest out of the box emissions levels Thermal Recovery Higher grade waste heat, more thermal HW, CW, Steam, clean CO2) Noise (Sound Levels) No friction bearings = low noise Redundancy Integrated & active multi-bays Wide Operating Window Integrated efficiency & fuel flexibility Oil & Gas Hospitality Agriculture Industrial Hospital Ports Microgrids Station Power Data Centers 28 Qualitative Component & Vertical Market Advantages Comprehensive Value Across Diverse Markets |
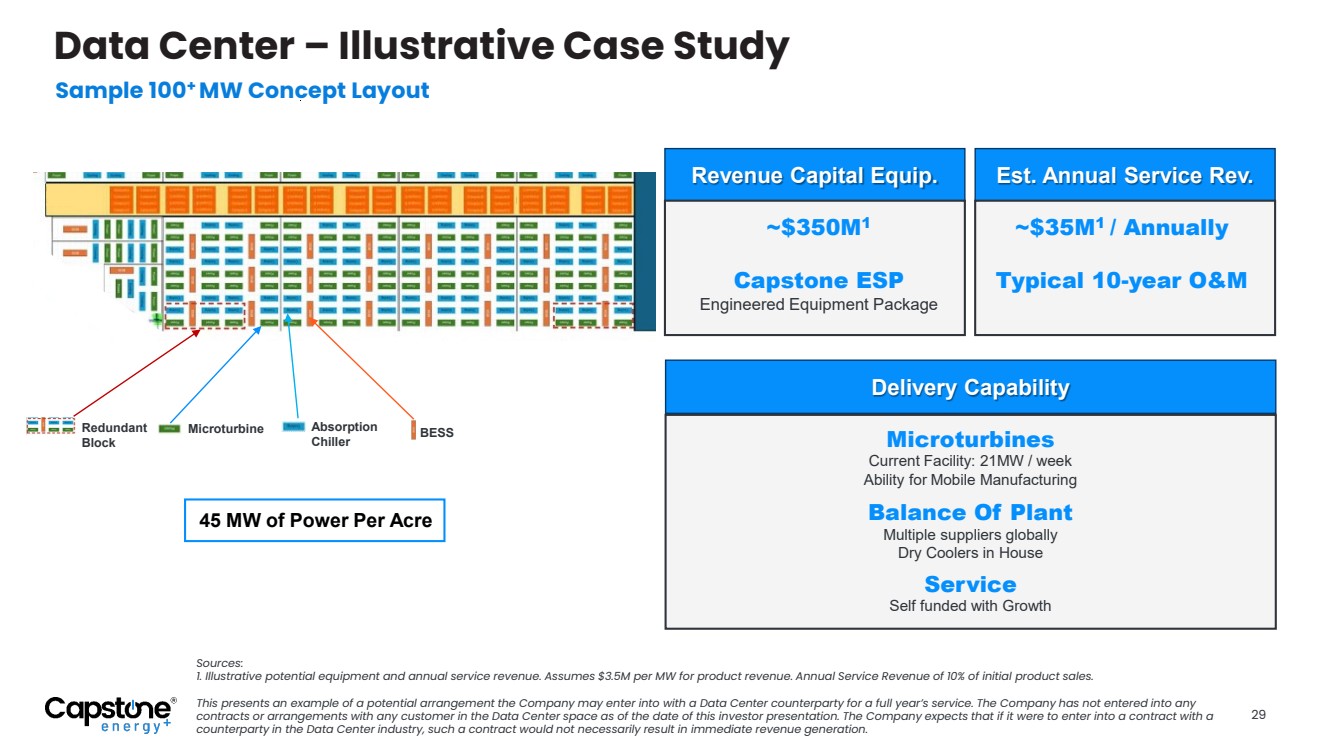
| 29 Data Center – Illustrative Case Study Sample 100+ MW Concept Layout Revenue Capital Equip. Est. Annual Service Rev. Delivery Capability Service Self funded with Growth Balance Of Plant Multiple suppliers globally Dry Coolers in House Microturbines Current Facility: 21MW / week Ability for Mobile Manufacturing ~$350M1 Capstone ESP Engineered Equipment Package ~$35M1 / Annually Typical 10-year O&M 45 MW of Power Per Acre Redundant Block Microturbine Absorption Chiller BESS Sources: 1. Illustrative potential equipment and annual service revenue. Assumes $3.5M per MW for product revenue. Annual Service Revenue of 10% of initial product sales. This presents an example of a potential arrangement the Company may enter into with a Data Center counterparty for a full year’s service. The Company has not entered into any contracts or arrangements with any customer in the Data Center space as of the date of this investor presentation. The Company expects that if it were to enter into a contract with a counterparty in the Data Center industry, such a contract would not necessarily result in immediate revenue generation. |
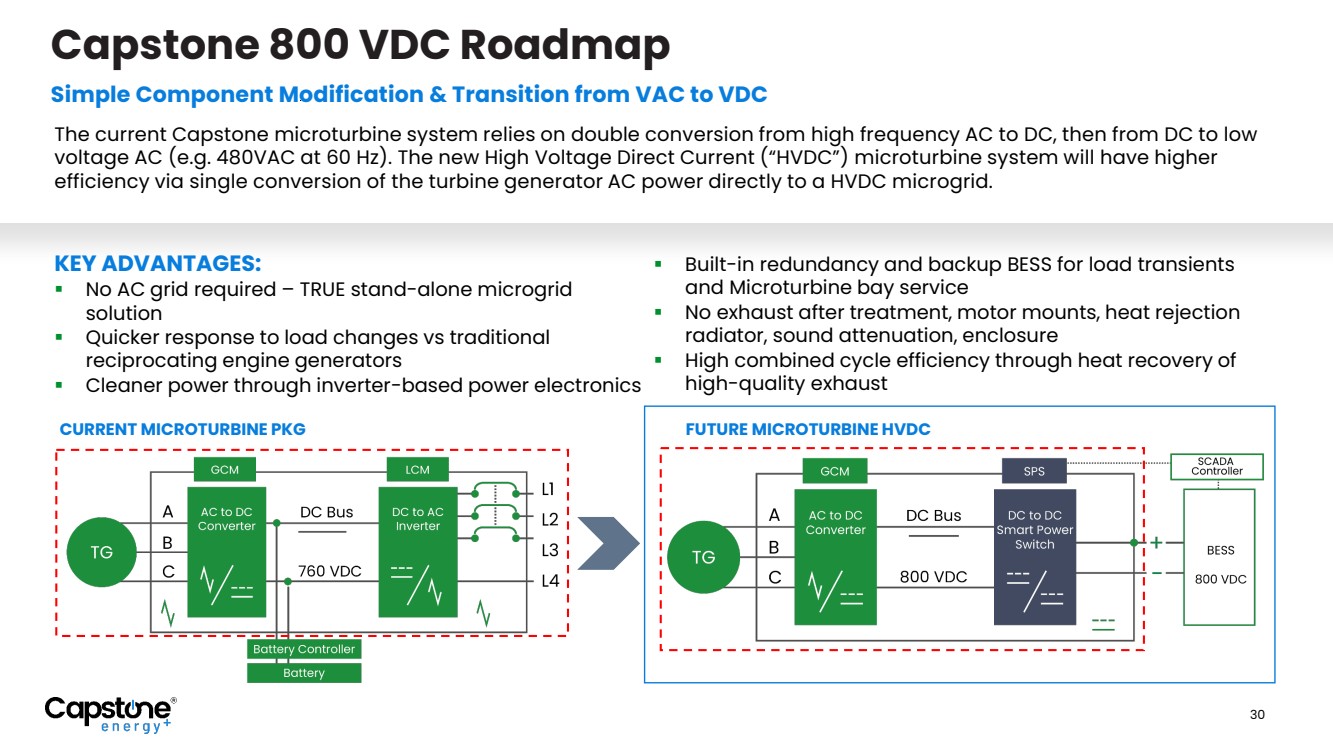
| Capstone 800 VDC Roadmap Simple Component Modification & Transition from VAC to VDC The current Capstone microturbine system relies on double conversion from high frequency AC to DC, then from DC to low voltage AC (e.g. 480VAC at 60 Hz). The new High Voltage Direct Current (“HVDC”) microturbine system will have higher efficiency via single conversion of the turbine generator AC power directly to a HVDC microgrid. KEY ADVANTAGES: No AC grid required – TRUE stand-alone microgrid solution Quicker response to load changes vs traditional reciprocating engine generators Cleaner power through inverter-based power electronics Built-in redundancy and backup BESS for load transients and Microturbine bay service No exhaust after treatment, motor mounts, heat rejection radiator, sound attenuation, enclosure High combined cycle efficiency through heat recovery of high-quality exhaust CURRENT MICROTURBINE PKG FUTURE MICROTURBINE HVDC 30 |
| OTCQX: CGEH 16640 Stagg Street | Van Nuys, CA 91406 T: +1 818.734.5300 | M: +1 818.960.9780 CapstoneEnergyPlus.com On Site. On Demand. Always On. |