Exhibit (c)(12)
|
Presentation to Farm Bureau Property & Casualty Insurance Company Discussion Materials Goldman, Sachs & Co. September 3, 2020 PRIVAT E AND CONFIDENT IAL. T hi s document i s bei ng sent to you for your i nformation only as an i nvestment banki ng cl ient of Gol dman Sachs and shoul d not be fo rwarded outsi de of your organi zation. T his document has been prepared by the Investment Banki ng Di visi on and i s not a product of Gol dman Sach s Gl obal Investment Research. T his document shoul d not be used as a basi s for tradi ng i n the securi ti es or l oans of the compani es named herein or for any other i nvestmen t decisi on. T his document does not consti tute an offer to sel l the securi ti es or l oans of the compani es named herein or a sol i ci tation of proxi es or votes and shoul d not be construed as consi sti ng of i nvestment advice. Goldman Sachs does not provi de accounting, tax, or l egal advice. Private & Confidential |
 |
Disclaimer These materials have been prepared and are provided by Goldman Sachs on a conf idential basis solely f or the inf ormation and a ssistance of the board of directors and senior management of Farm Bureau Property & Casualty Insurance Company (the "Company") in connection w ith its consideration of the matters ref erred to herein. These materials and Goldman Sachs’ presentation relating to these materials (the “Conf idential Inf ormation”) may not be disclosed to any thir d party or circulated or ref erred to publicly or used f or or relied upon f or any other purpose w ithout the prior w ritten consent of Goldman Sachs. The Conf idential Inf ormation w as not prepared w ith a view to public disclosure or to conf orm to any disclosure standards under any state, f ederal or international securities law s or other law s, rules or regulat ions, and Goldman Sachs does not take any responsibility f or the use of the Conf idential Inf ormation by persons other than those set f orth above. Notw ithstanding anyth ing in this Conf idential Inf ormation to the contrary, the Company may disclose to any person the US f ederal income and state income tax treatment and tax structure of any transaction described herein and all materials of any kind (including tax opinions and other tax analyses) that are provided to the Company relating to such tax treatment and tax struc ture, w ithout Goldman Sachs imposing any limitation of any kind. The Conf idential Inf ormation has been prepared by the Investment Banking Division of Goldman Sachs and is not a product of its research department. Goldman Sachs and its af f iliates are engaged in advisory, underw riting and f inancing, principal investing, sales and trading, research, investment management and other f inancial and non-f inancial activities and services f or various persons and entities. Goldman Sachs and its af f iliates and employees, and f unds or other entities they manage or in w hich they invest or have other economic interest or w ith w hich they co-invest, may at any time purchase, sell, hold or vote long or short positions and investments in securities, derivatives, loans, commodities, currencies, credit def ault sw aps and other f inancial instruments of the Company, any other p arty to any transaction and any of their respective af f iliates or any currency or commodity that may be involved in any transaction. Goldman Sachs’ investment banking division maintains regular, ordinary course client service dialogues w ith clients and potential clients to review events, opportunities, and conditions in particular sectors and indust ries and, in that connection, Goldman Sachs may make ref erence to the Company, but Goldman Sachs w ill not disclose any conf idential inf ormation received f rom the Company. The Conf idential Inf ormation has been prepared based on historical f inancial inf ormation, f orecasts and other inf ormation obt ained by Goldman Sachs f rom publicly available sources, the management of the Company or other sources (approved f or our use by the Company in the case of inf ormation f rom management and non-public inf ormation). In preparing the Conf idential Inf ormation, Goldman Sachs has relied upon and assumed, w ithout assuming any responsibility f or in dependent verif ication, the accuracy and completeness of all of the f inancial, legal, regulatory, tax, accounting and other inf ormation provided to, discussed w ith or review ed by us, and Goldman Sachs does not assume any liability f or any such inf ormation. Goldman Sachs does not provide accounting, tax, legal or regulatory advice. Goldman Sachs has not made an independent evaluation or appraisal of the assets and liabilities (including any contingent, de rivative or of f -balance sheet assets and liabilities) of the Company or any other party to any transaction or any of their respective af f iliates and has no obligation to evaluate the solvency of the Company or any other party to any transaction under any state or f ederal law s relating to bankruptcy, insolvency or similar matters. The analyses contained in the Conf idential Inf ormation do not purport to be appraisals nor do they necessarily ref lect the prices at w hich businesses or securities actually may be sold or purchased. Go ldman Sachs’ role in any due diligence review is limited solely to perf orming such a review as it shall deem necessary to support its ow n advice and analysis and shall not be on behalf of the Company. Analyses based upon f orecasts of f uture results are not necessarily indicative of actual f uture results, w hich may be signif icantly more or less f avorable than suggested by these analyses, and Goldman Sachs does not assume responsibility if f uture results are materially dif f erent f rom those f orecast. The Conf idential Inf ormation does not address the underlying business decision of the Company to engage in any transaction, o r the relative merits of any transaction or strategic alternative ref erred to herein as compared to any other transaction or alternative that may be available to the Company. The Conf idential Inf ormation is necessarily based on economic, monetary, market and other conditions as in ef f ect on, and the inf ormation made available to Goldman Sachs as of , t he date of such Conf idential Inf ormation and Goldman Sachs assumes no responsibility f or updating or revising the Conf idential Inf ormation based on circumstances, develop ments or events occurring af ter such date. The Conf idential Inf ormation does not constitute any opinion, nor does the Conf idential Inf ormation constitute a recommendation to any security holder of the Company or any other person as to how to vote or act w ith respect to any transaction or any other matter. The Conf idential Inf ormation, including this disclaimer, are subject to, and governed by, any w ritten agreement betw een the Company, on the one hand, and Goldman Sachs, on the other hand. 2 |
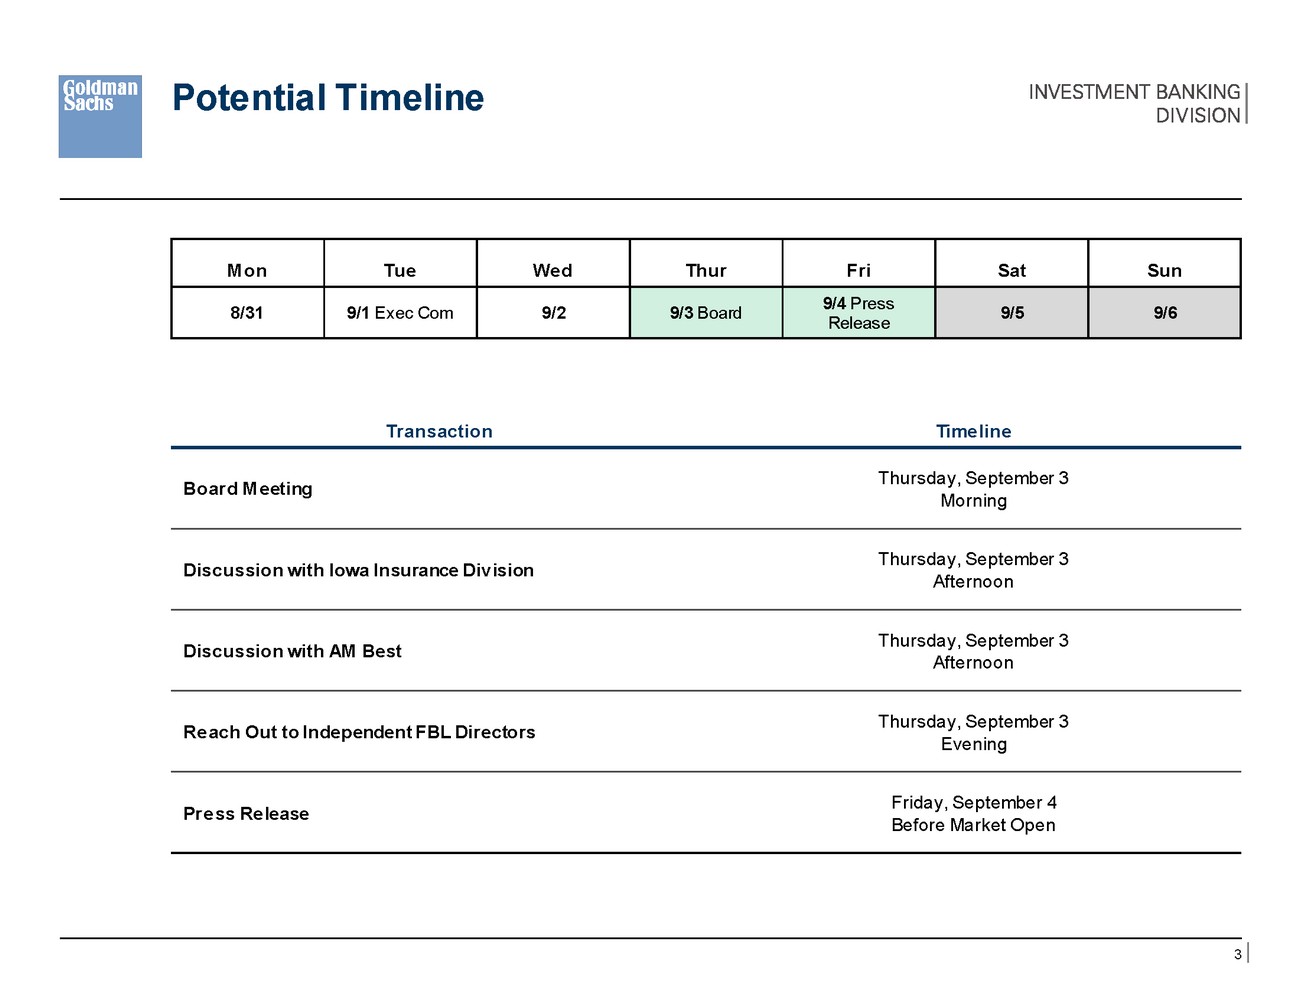 |
Potential Timeline Transaction Time line Thursday, September 3 Morning Board M eeting Thursday, September 3 Afternoon Discussion with Iowa Insurance Div ision Thursday, September 3 Afternoon Discussion with AM Best Thursday, September 3 Evening Re ach Out to Independent FBL Directors Friday, September 4 Before Market Open Pre ss Re lease 3 M on Tue We d Thur Fri Sat Sun 8/31 9/1 Exec Com 9/2 9/3 Board 9/4 Press Release 9/5 9/6 |
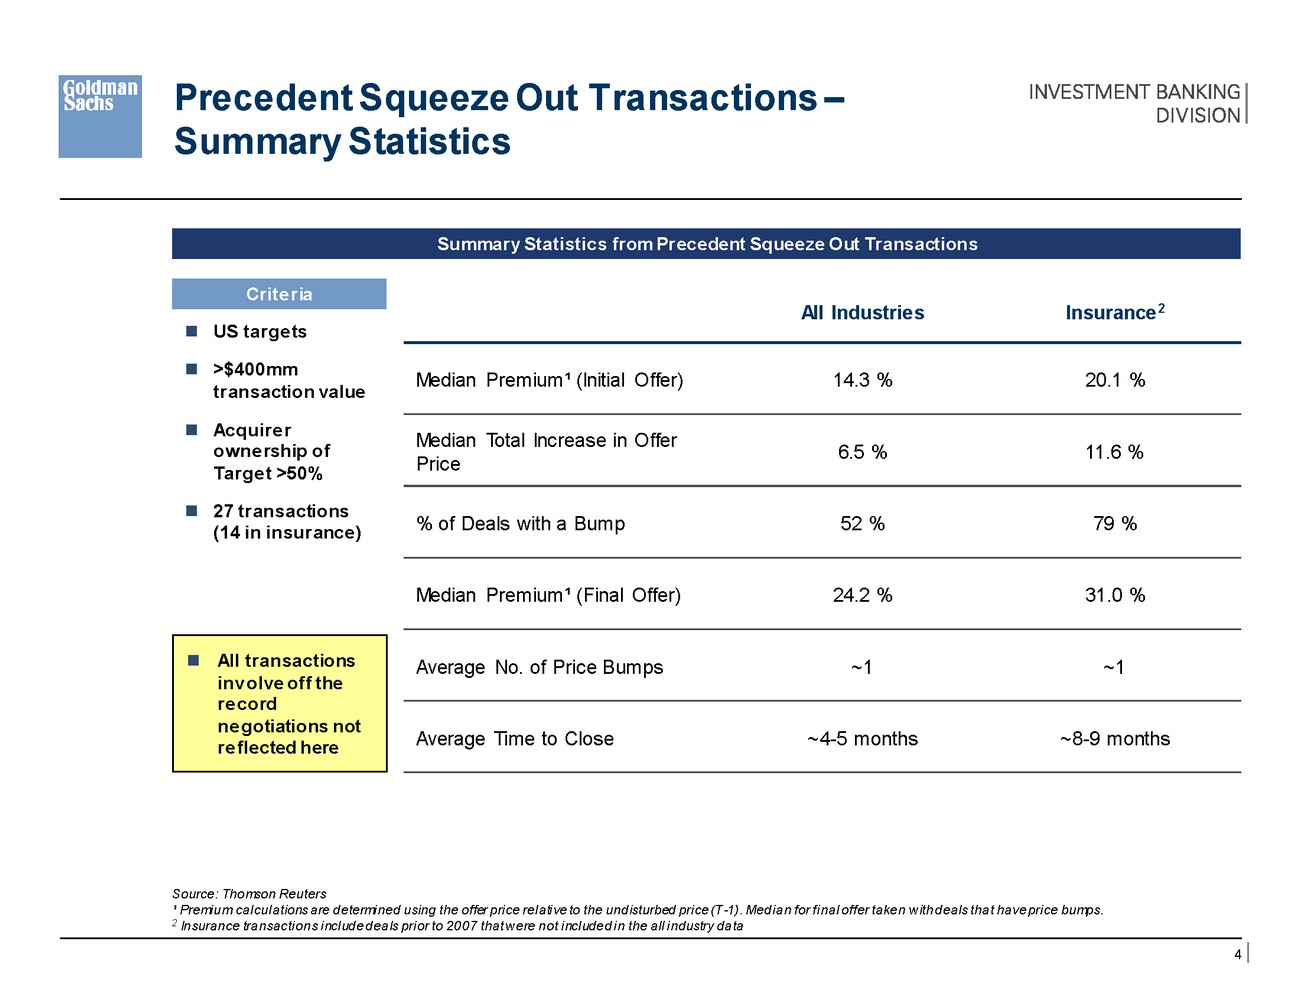 |
Precedent Squeeze Out Transactions – Summary Statistics Insurance2 All Industries US targe ts >$400mm transaction value Acquire r owne rship of Targe t >50% Median Premium¹ (Initial Offer) 14.3 % 20.1 % Median Total Increase in Offer Price 6.5 % 11.6 % 27 transactions (14 in insurance) % of Deals with a Bump 52 % 79 % Median Premium¹ (Final Offer) 24.2 % 31.0 % Average No. of Price Bumps ~1 ~1 Average Time to Close ~4-5 months ~8-9 months Source: Thomson Reuters ¹ Premi um cal cul ations are determi ned using the offer pri ce rel ati ve to the undisturbed pri ce (T -1). Medi an for fi nal offer take n w ith deals that have pri ce bumps. 2 Insurance transacti ons i ncl ude deals pri or to 2007 that w ere not i ncl uded i n the all i ndustry data 4 All transactions inv olve off the re cord ne gotiations not re flected here Crite ria Summary Statistics from Precedent Squeeze Out Transactions |
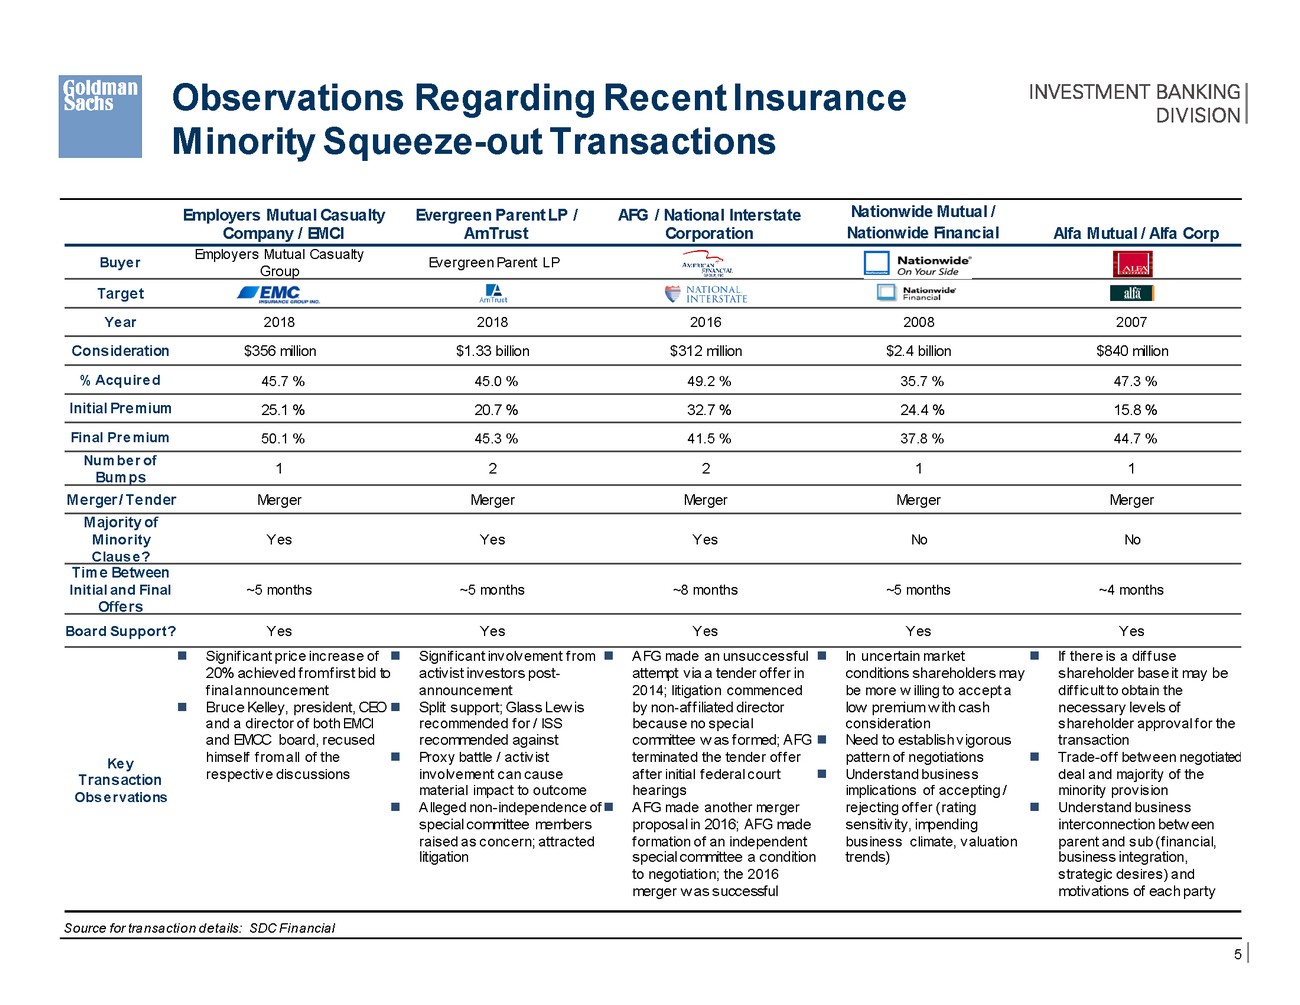 |
Observations Regarding Recent Insurance Minority Squeeze-out Transactions Nationwide Mutual / Nationwide Financial Employers Mutual Casualty Company / EMCI Evergreen Parent LP / AmTrust AFG / National Interstate Corporation Alfa Mutual / Alfa Corp Employers Mutual Casualty Group Buye r Evergreen Parent LP Targe t Ye ar 2018 2018 2016 2008 2007 Cons ideration $356 million $1.33 billion $312 million $2.4 billion $840 million % Acquire d 45.7 % 45.0 % 49.2 % 35.7 % 47.3 % Initial Pre mium 25.1 % 20.7 % 32.7 % 24.4 % 15.8 % Final Pre mium 50.1 % 45.3 % 41.5 % 37.8 % 44.7 % Num be r of Bum ps 1 2 2 1 1 M e rger / Te nder Merger Merger Merger Merger Merger M ajority of M inority Yes Yes Yes No No Claus e ? Tim e Be tween Initial and Final ~5 months ~5 months ~8 months ~5 months ~4 months Offe r s Board Support? Yes Yes Yes Yes Yes Signif icant price increase of 20% achieved f rom f irst bid to f inal announcement Bruce Kelley, president, CEO and a director of both EMCI and EMCC board, recused Signif icant involvement f rom activist investors post-announcement Split support; Glass Lew is recommended f or / ISS recommended against Proxy battle / activist involvement can cause material impact to outcome Alleged non-independence of special committee members raised as concern; attracted litigation AFG made an unsuccessful attempt via a tender of f er in 2014; litigation commenced by non-af f iliated director because no special committee w as f ormed; AFG terminated the tender of f er In uncertain market conditions shareholders may be more w illing to accept a low premium w ith cash consideration Need to establish vigorous pattern of negotiations Understand business implications of accepting / rejecting of f er (rating sensitivity, impending business climate, valuation trends) If there is a dif f use shareholder base it may be dif f icult to obtain the necessary levels of shareholder approval f or the transaction Trade-of f betw een negotiated deal and majority of the minority provision Understand business interconnection betw een parent and sub (f inancial, business integration, strategic desires) and motivations of each party himself f rom all of the respective discussions Ke y Trans action Obs e rvations af ter initial f ederal court hearings AFG made another merger proposal in 2016; AFG made f ormation of an independent special committee a condition to negotiation; the 2016 merger w as successful Source for transacti on details: SDC Fi nancial 5 |
 |
Review of FBL’s Stock 10-Year History Price Performance 10 Year Price History 10 Year Total Return Performance vs. Peers Since COVID¹ Performance (%) YTD 1Y 3Y 5Y 10Y FBL Financial Protection Peers² (31.2)% (32.4)% (25.3)% (35.4)% (11.7)% 141.9 % Statistic Value $120 400 600% (17.9) (14.5) (1.7) 1.5 53.1 242.6 92.9 272.9 301.6 $110 350 $100 500% $90 300 301.6 % 272.9 % 242.6 % $80 400% 250 $70 300% $60 200 $50 141.9 % 150 92.9 % $40 200% $ 37.29 100 $30 $20 100% 50 $10 0% $0 0 Sep-2010 Sep-2015 Sep-2020 Sep-2010 Sep-2015 Sep-2020 Cap Light Peers4 FBL Financial Protection Peers² Cap Intensive Peers³ S&P 500 Source: Bl oomberg as of 01-Sep-2020 1 COVID date as of 19-Feb-2020. 2 Protection Peers i nclude: CNO Fi nancial, Aflac, Pri meri ca, Globe Li fe, Unum. 3 Cap Intensi ve Peers i ncl ude: Athene, Metli fe, Prudential, Equitable, Ameri can Equi ty Li fe, Li ncoln Fi nancial , Bri ghthouse Fi nancial. 4 Cap Li ght Peers i nclude: Voya, Pri ncipal, Ameri pri se. 6 Volume (000) Closing Price (USD) Indexed Price 1M Average $ 37.17 3M Average 36.19 Average Since COVID¹ 37.66 6M Average 36.85 1Y Average 45.62 3Y Average 59.27 5Y Average 58.52 10Y Average 45.34 Cap Intensive Peers³ (27.7) (22.8) (6.8) (24.4) 1.0 Cap Light Peers4 (15.7) (12.1) 6.3 11.1 33.2 S&P 500 Index 5.2 10.6 22.9 51.0 104.0 Total s hare - holde r re turn has unde r - pe rforme d pe e rs , e s pe cially ove r las t 2-3 ye ars |
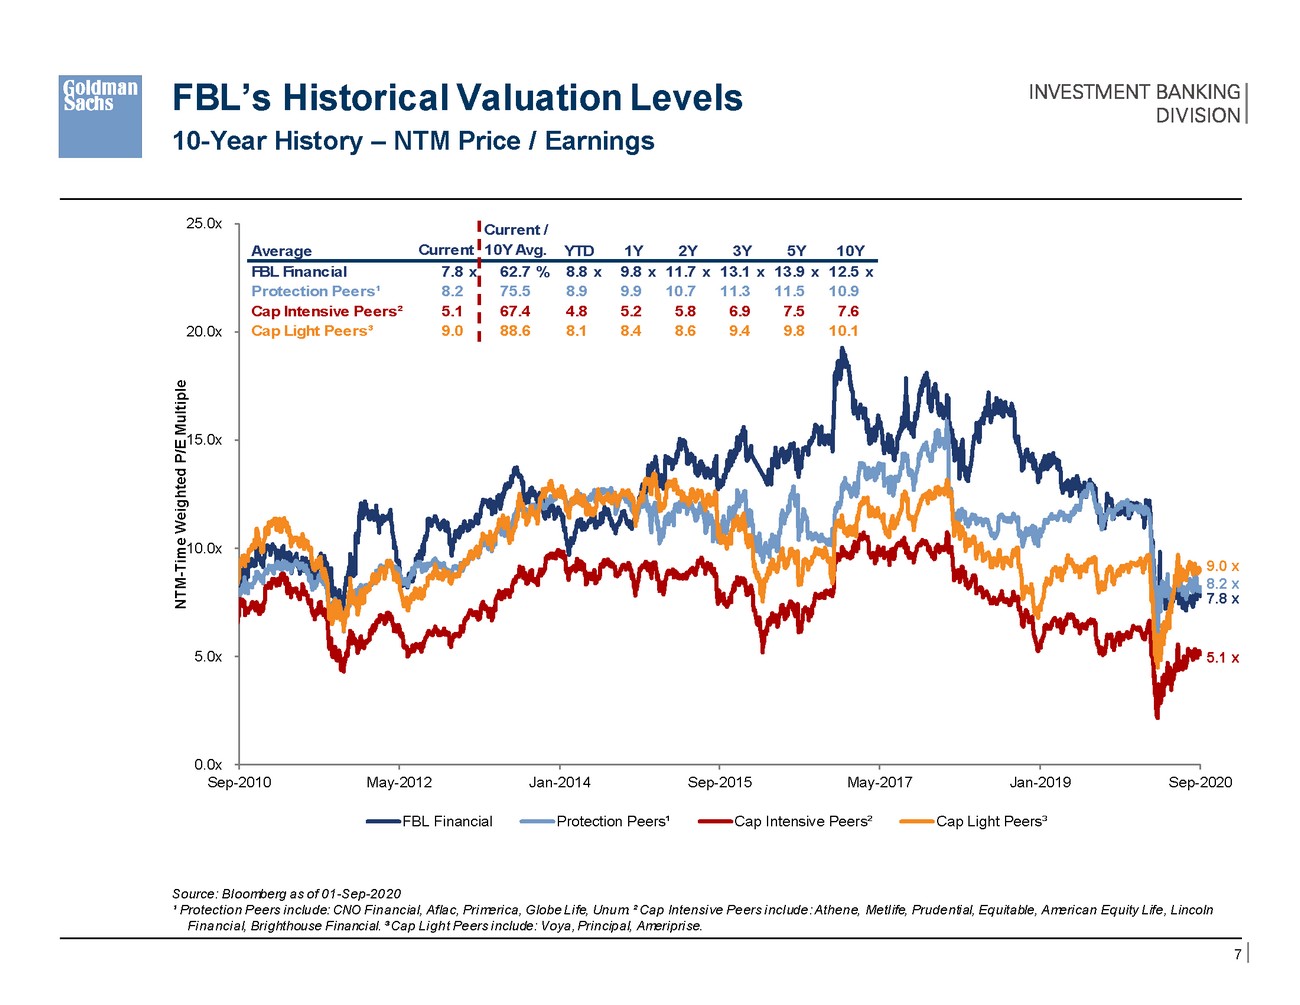 |
FBL’s Historical Valuation Levels 10-Year History – NTM Price / Earnings 25.0x 20.0x 15.0x 10.0x 9.0 x 8.2 x 7.8 x 5.0x 5.1 x 0.0x Sep-2010 May-2012 Jan-2014 Sep-2015 May-2017 Jan-2019 Sep-2020 FBL Financial Protection Peers¹ Cap Intensive Peers² Cap Light Peers³ Source: Bl oomberg as of 01-Sep-2020 ¹ Protecti on Peers i nclude: CNO Fi nancial, Aflac, Pri meri ca, Globe Li fe, Unum. ² Cap Intensi ve Peers i ncl ude: Athene, Metl ife, Prudenti al, Equitable, Ameri can Equity Life, Lincoln Fi nanci al, Bri ghthouse Fi nanci al. ³ Cap Li ght Peers i nclude: Voya, Pri ncipal, Ameri pri se. 7 NTM-Time Weighted P/E Multiple Current / Average Current 10Y Avg. YTD 1Y 2Y 3Y 5Y 10Y FBL Financial 7.8 x 62.7 % 8.8 x 9.8 x 11.7 x 13.1 x 13.9 x 12.5 x Protection Peers¹ 8.2 75.5 8.9 9.9 10.7 11.3 11.5 10.9 Cap Intensive Peers² 5.1 67.4 4.8 5.2 5.8 6.9 7.5 7.6 Cap Light Peers³ 9.0 88.6 8.1 8.4 8.6 9.4 9.8 10.1 |
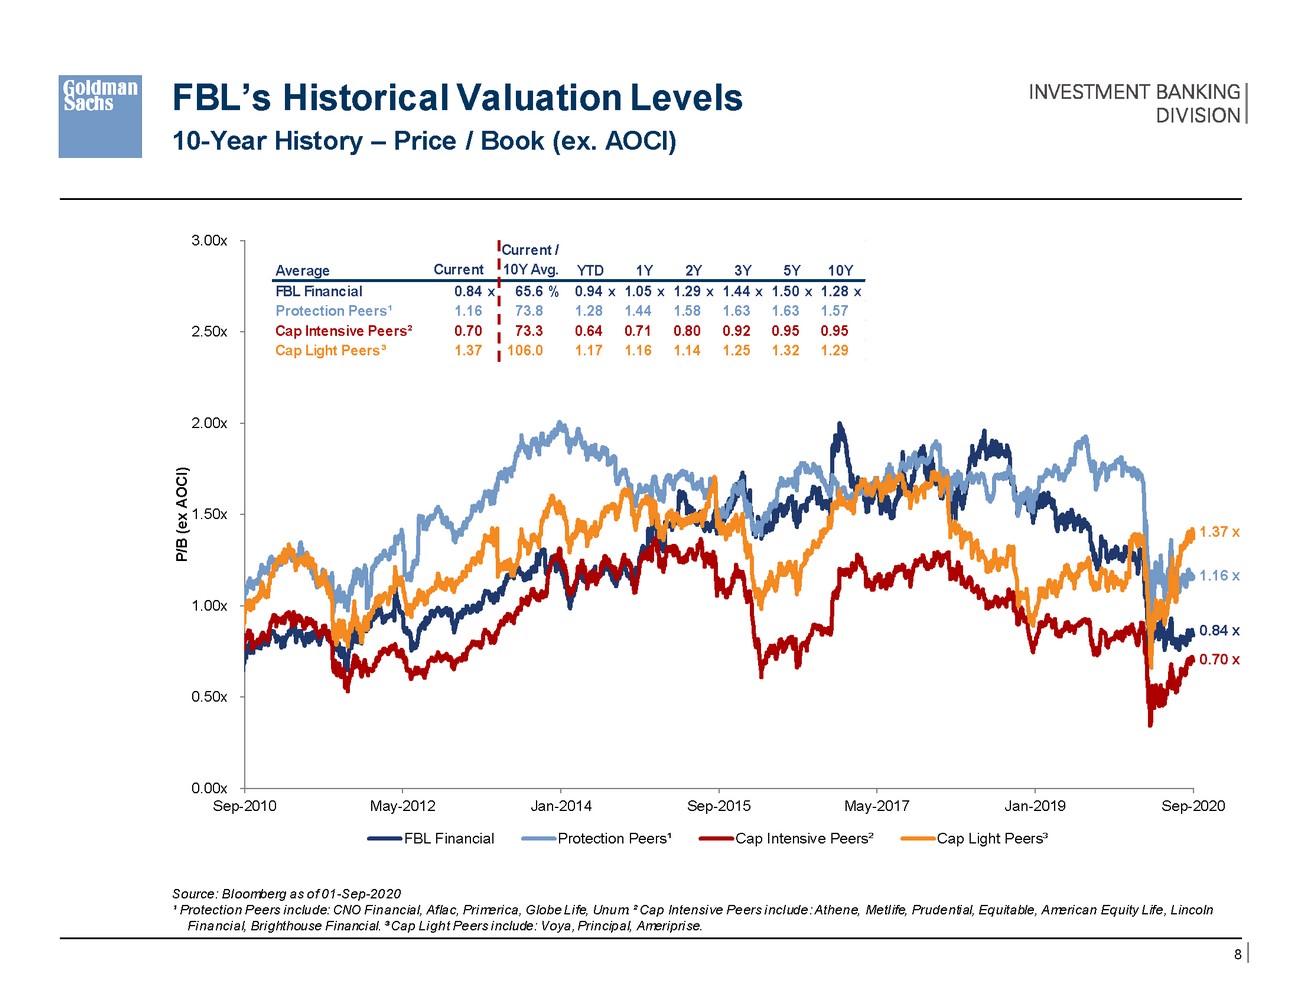 |
FBL’s Historical Valuation Levels 10-Year History – Price / Book (ex. AOCI) 3.00x 2.50x 2.00x 1.50x 1.37 x 1.16 x 1.00x 0.84 x 0.70 x 0.50x 0.00x Sep-2010 May-2012 Jan-2014 Sep-2015 May-2017 Jan-2019 Sep-2020 FBL Financial Protection Peers¹ Cap Intensive Peers² Cap Light Peers³ Source: Bl oomberg as of 01-Sep-2020 ¹ Protecti on Peers i nclude: CNO Fi nancial, Aflac, Pri meri ca, Globe Li fe, Unum. ² Cap Intensi ve Peers i ncl ude: Athene, Metl ife, Prudenti al, Equitable, Ameri can Equity Life, Lincoln Fi nanci al, Bri ghthouse Fi nanci al. ³ Cap Li ght Peers i nclude: Voya, Pri ncipal, Ameri pri se. 8 P/B (ex AOCI) Current / AverageCurrent10Y Avg. YTD 1Y 2Y 3Y 5Y 10Y FBL Financial0.84 x65.6 % 0.94 x 1.05 x 1.29 x 1.44 x 1.50 x 1.28 x Protection Peers¹1.1673.81.281.441.581.631.631.57 Cap Intensive Peers²0.7073.30.640.710.800.920.950.95 Cap Light Peers³1.37106.01.171.161.141.251.321.29 |
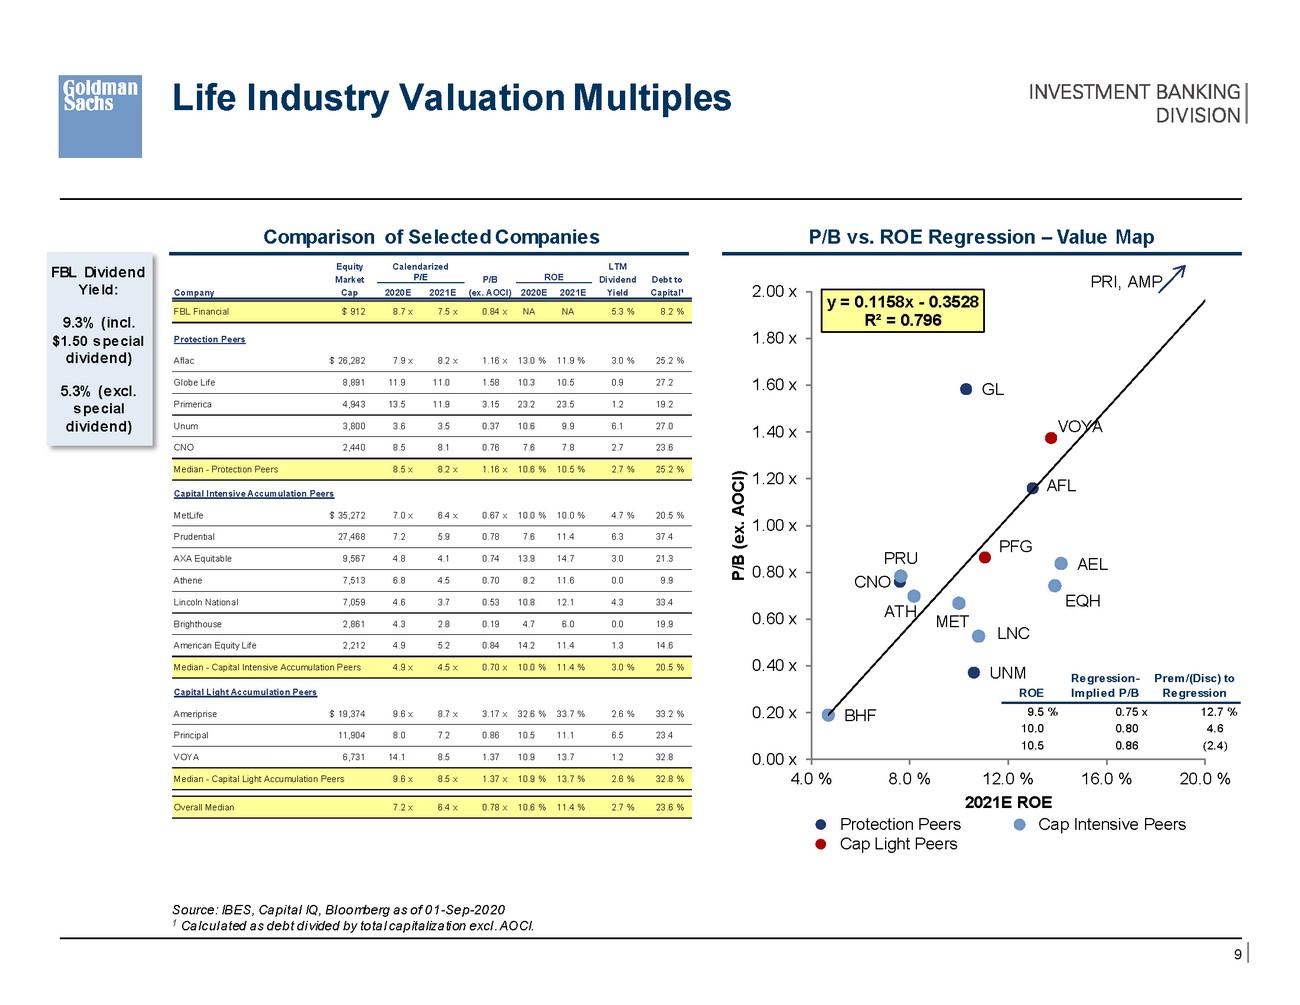 |
Life Industry Valuation Multiples Comparison of Selected Companies P/B vs. ROE Regression – Value Map EquityCalendarized LTM P/B ROE Dividend Debt to P/E PRI, AMP Market 2.00 x Company Cap 2020E 2021E (ex. AOCI) 2020E 2021E Yield Capital¹ 1.80 x Protection Peers Aflac $ 26,282 7.9 x 8.2 x 1.16 x 13.0 % 11.9 % 3.0 % 25.2 % Globe Life 8,891 11.9 11.0 1.58 10.3 10.5 0.9 27.2 1.60 x Primerica 4,943 13.5 11.9 3.15 23.2 23.5 1.2 19.2 Unum 3,800 3.6 3.5 0.37 10.6 9.9 6.1 27.0 1.40 x CNO 2,440 8.5 8.1 0.76 7.6 7.8 2.7 23.6 1.20 x Capital Intensive Accumulation Peers MetLife $ 35,272 7.0 x 6.4 x 0.67 x 10.0 % 10.0 % 4.7 % 20.5 % 1.00 x Prudential 27,468 7.2 5.9 0.78 7.6 11.4 6.3 37.4 AXA Equitable 9,567 4.8 4.1 0.74 13.9 14.7 3.0 21.3 0.80 x Athene 7,513 6.8 4.5 0.70 8.2 11.6 0.0 9.9 Lincoln National 7,059 4.6 3.7 0.53 10.8 12.1 4.3 33.4 0.60 x Brighthouse 2,861 4.3 2.8 0.19 4.7 6.0 0.0 19.9 LNC American Equity Life 2,212 4.9 5.2 0.84 14.2 11.4 1.3 14.6 0.40 x Regression-Prem/(Disc) to sion Capital Light Accumulation Peers 0.20 x 2.7 % 4.6 2.4) Ameriprise $ 19,374 9.6 x 8.7 x 3.17 x 32.6 % 33.7 % 2.6 % 33.2 % Principal 11,904 8.0 7.2 0.86 10.5 11.1 6.5 23.4 0.00 x VOYA 6,731 14.1 8.5 1.37 10.9 13.7 1.2 32.8 4.0 % 8.0 % 12.0 % 2021E ROE 16.0 % 20.0 % Protection Peers Cap Light Peers Cap Intensive Peers Source: IBES, Capi tal IQ, Bl oomberg as of 01-Sep-2020 1 Cal cul ated as debt di vided by total capitalizati on excl . AOCI. 9 P/B (ex. AOCI) Overall Median7.2 x6.4 x0.78 x 10.6 % 11.4 %2.7 %23.6 % Median - Capital Light Accumulation Peers9.6 x8.5 x1.37 x 10.9 % 13.7 %2.6 %32.8 % Median - Capital Intensive Accumulation Peers4.9 x4.5 x0.70 x 10.0 % 11.4 %3.0 %20.5 % Median - Protection Peers8.5 x8.2 x1.16 x 10.6 % 10.5 %2.7 %25.2 % FBL Financial$ 9128.7 x7.5 x0.84 x NANA5.3 %8.2 % y = 0.1158x - 0.3528 R² = 0.796 GL VOYA AFL PFG PRUAEL CNO EQH ATHMET UNM ROE Implied P/B Regres BHF9.5 % 0.75 x 1 10.0 0.80 10.5 0.86 ( FBL Divide nd Yie ld: 9.3% (incl. $1.50 s pe cial divide nd) 5.3% (e xcl. s pe cial divide nd) |
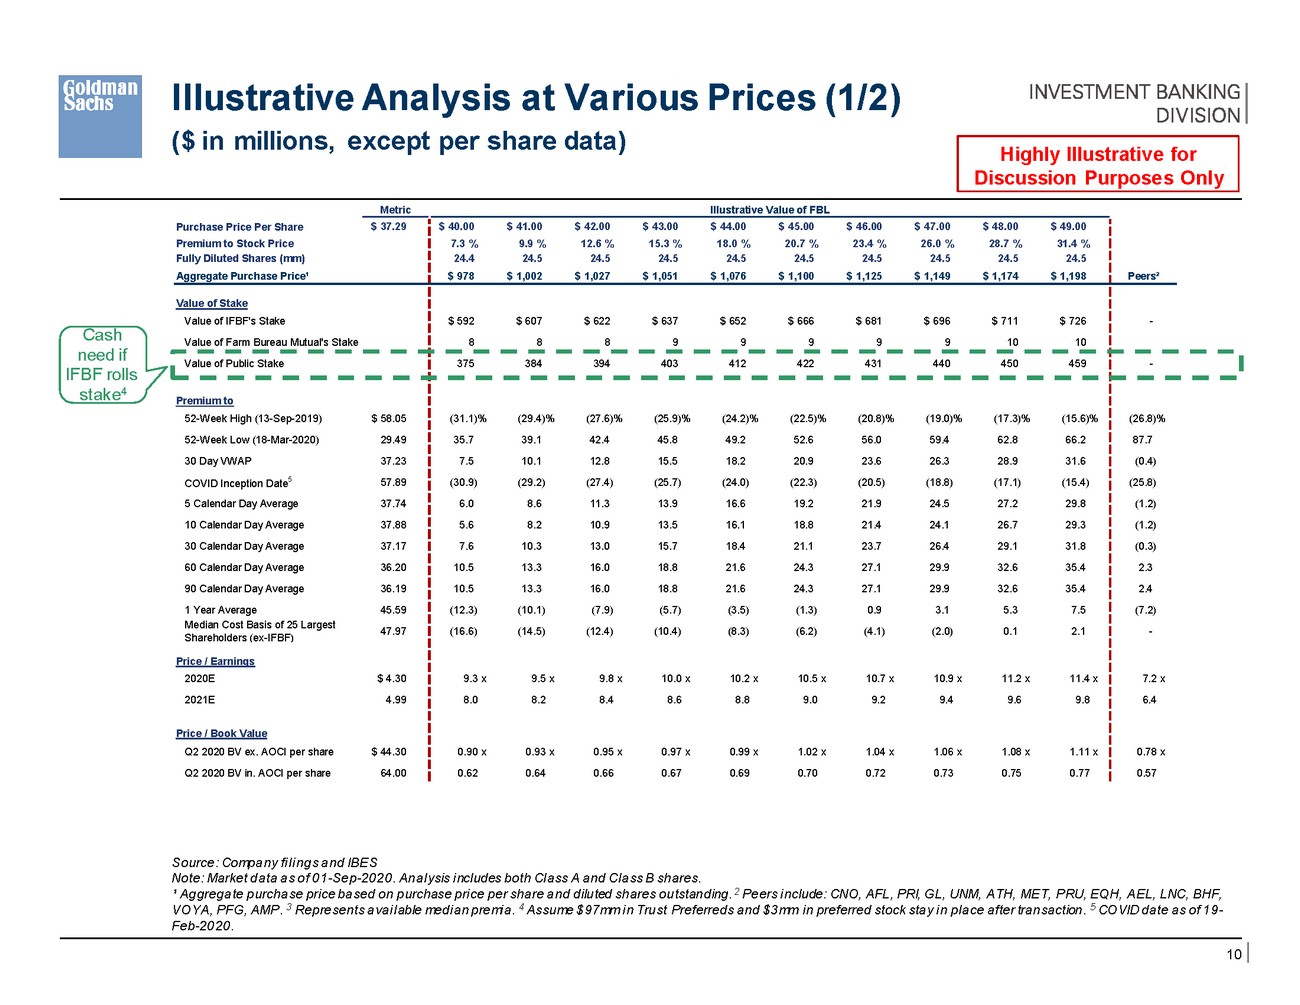 |
Illustrative Analysis at Various Prices (1/2) ($ in millions, except per share data) Metric Illustrative Value of FBL Cash need if IFBF rolls stake4 Shareholders (ex-IFBF) Source: Company fi l i ngs and IBES Note: Market data as of 01-Sep-2020. Anal ysis i ncl udes both Cl ass A and Cl ass B shares. ¹ Aggregate purchase pri ce based on purchase pri ce per share and diluted shares outstanding. 2 Peers i nclude: CNO, AFL, PRI, GL, UNM, ATH, MET, PRU, EQH, AEL, LNC, BHF, VOYA, PFG, AMP. 3 Represents avai l able medi an premi a. 4 Assume $97mm i n Trust Preferreds and $3mm i n preferred stock stay i n pl ace after transaction. 5 COVID date as of 19-Feb-2020. 10 Purchase Price Per Share Premium to Stock Price Fully Diluted Shares (mm) Aggregate Purchase Price¹ $ 37.29 $ 40.00 $ 41.00 $ 42.00 $ 43.00 $ 44.00 $ 45.00 $ 46.00 $ 47.00 $ 48.00 $ 49.00 7.3 % 9.9 % 12.6 % 15.3 % 18.0 % 20.7 % 23.4 % 26.0 % 28.7 % 31.4 % 24.4 24.5 24.5 24.5 24.5 24.5 24.5 24.5 24.5 24.5 $ 978 $ 1,002 $ 1,027 $ 1,051 $ 1,076 $ 1,100 $ 1,125 $ 1,149 $ 1,174 $ 1,198 Peers² Value of Stake Value of IFBF's Stake Value of Farm Bureau Mutual's Stake $ 592 $ 607 $ 622 $ 637 $ 652 $ 666 $ 681 $ 696 $ 711 $ 726 8 8 8 9 9 9 9 9 10 10 - Value of Public Stake 375 384 394 403 412 422 431 440 450 459 - Premium to 52-Week High (13-Sep-2019) $ 58.05 52-Week Low (18-Mar-2020)29.49 30 Day VWAP 37.23 COVID Inception Date5 57.89 5 Calendar Day Average 37.74 10 Calendar Day Average 37.88 30 Calendar Day Average 37.17 60 Calendar Day Average 36.20 90 Calendar Day Average 36.19 1 Year Average 45.59 Median Cost Basis of 25 Largest 47.97 Price / Earnings 2020E $ 4.30 2021E 4.99 Price / Book Value Q2 2020 BV ex. AOCI per share $ 44.30 Q2 2020 BV in. AOCI per share 64.00 (31.1)% (29.4)% (27.6)% (25.9)% (24.2)% (22.5)% (20.8)% (19.0)% (17.3)% (15.6)% 35.7 39.1 42.4 45.8 49.2 52.6 56.0 59.4 62.8 66.2 7.5 10.1 12.8 15.5 18.2 20.9 23.6 26.3 28.9 31.6 (30.9) (29.2) (27.4) (25.7) (24.0) (22.3) (20.5) (18.8) (17.1) (15.4) 6.0 8.6 11.3 13.9 16.6 19.2 21.9 24.5 27.2 29.8 5.6 8.2 10.9 13.5 16.1 18.8 21.4 24.1 26.7 29.3 7.6 10.3 13.0 15.7 18.4 21.1 23.7 26.4 29.1 31.8 10.5 13.3 16.0 18.8 21.6 24.3 27.1 29.9 32.6 35.4 10.5 13.3 16.0 18.8 21.6 24.3 27.1 29.9 32.6 35.4 (12.3) (10.1) (7.9) (5.7) (3.5) (1.3) 0.9 3.1 5.3 7.5 (16.6) (14.5) (12.4) (10.4) (8.3) (6.2) (4.1) (2.0) 0.1 2.1 9.3 x 9.5 x 9.8 x 10.0 x 10.2 x 10.5 x 10.7 x 10.9 x 11.2 x 11.4 x 8.0 8.2 8.4 8.6 8.8 9.0 9.2 9.4 9.6 9.8 0.90 x 0.93 x 0.95 x 0.97 x 0.99 x 1.02 x 1.04 x 1.06 x 1.08 x 1.11 x 0.62 0.64 0.66 0.67 0.69 0.70 0.72 0.73 0.75 0.77 (26.8)% 87.7 (0.4) (25.8) (1.2) (1.2) (0.3) 2.3 2.4 (7.2) - 7.2 x 6.4 0.78 x 0.57 Highly Illustrative for Discussion Purposes Only |
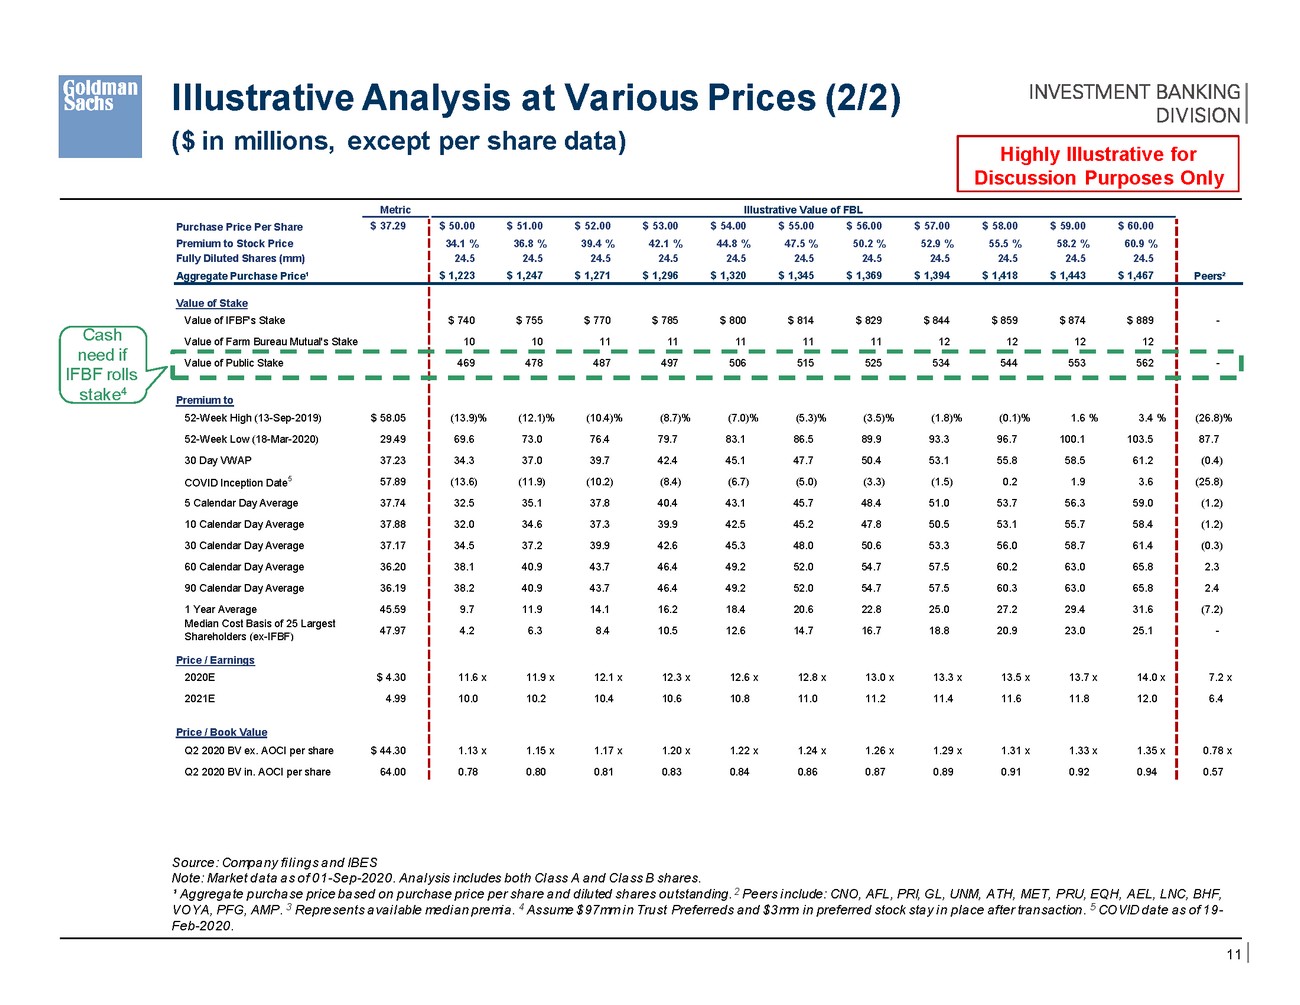 |
Illustrative Analysis at Various Prices (2/2) ($ in millions, except per share data) Metric Illustrative Value of FBL Cash need if IFBF rolls stake4 Shareholders (ex-IFBF) Source: Company fi l i ngs and IBES Note: Market data as of 01-Sep-2020. Anal ysis i ncl udes both Cl ass A and Cl ass B shares. ¹ Aggregate purchase pri ce based on purchase pri ce per share and diluted shares outstanding. 2 Peers i nclude: CNO, AFL, PRI, GL, UNM, ATH, MET, PRU, EQH, AEL, LNC, BHF, VOYA, PFG, AMP. 3 Represents avai l able medi an premi a. 4 Assume $97mm i n Trust Preferreds and $3mm i n preferred stock stay i n pl ace after transaction. 5 COVID date as of 19-Feb-2020. 11 Purchase Price Per Share Premium to Stock Price Fully Diluted Shares (mm) Aggregate Purchase Price¹ $ 37.29 $ 50.00 $ 51.00 $ 52.00 $ 53.00 $ 54.00 $ 55.00 $ 56.00 $ 57.00 $ 58.00 $ 59.00 $ 60.00 34.1 % 36.8 % 39.4 % 42.1 % 44.8 % 47.5 % 50.2 % 52.9 % 55.5 % 58.2 % 60.9 % 24.5 24.5 24.5 24.5 24.5 24.5 24.5 24.5 24.5 24.5 24.5 $ 1,223 $ 1,247 $ 1,271 $ 1,296 $ 1,320 $ 1,345 $ 1,369 $ 1,394 $ 1,418 $ 1,443 $ 1,467 Peers² Value of Stake Value of IFBF's Stake Value of Farm Bureau Mutual's Stake $ 740 $ 755 $ 770 $ 785 $ 800 $ 814 $ 829 $ 844 $ 859 $ 874 $ 889 10 10 11 11 11 11 11 12 12 12 12 - Value of Public Stake 469 478 487 497 506 515 525 534 544 553 562 - Premium to 52-Week High (13-Sep-2019) $ 58.05 52-Week Low (18-Mar-2020)29.49 30 Day VWAP 37.23 COVID Inception Date5 57.89 5 Calendar Day Average 37.74 10 Calendar Day Average 37.88 30 Calendar Day Average 37.17 60 Calendar Day Average 36.20 90 Calendar Day Average 36.19 1 Year Average 45.59 Median Cost Basis of 25 Largest 47.97 Price / Earnings 2020E $ 4.30 2021E 4.99 Price / Book Value Q2 2020 BV ex. AOCI per share $ 44.30 Q2 2020 BV in. AOCI per share 64.00 (13.9)% (12.1)% (10.4)% (8.7)% (7.0)% (5.3)% (3.5)% (1.8)% (0.1)% 1.6 % 3.4 % 69.6 73.0 76.4 79.7 83.1 86.5 89.9 93.3 96.7 100.1 103.5 34.3 37.0 39.7 42.4 45.1 47.7 50.4 53.1 55.8 58.5 61.2 (13.6) (11.9) (10.2) (8.4) (6.7) (5.0) (3.3) (1.5) 0.2 1.9 3.6 32.5 35.1 37.8 40.4 43.1 45.7 48.4 51.0 53.7 56.3 59.0 32.0 34.6 37.3 39.9 42.5 45.2 47.8 50.5 53.1 55.7 58.4 34.5 37.2 39.9 42.6 45.3 48.0 50.6 53.3 56.0 58.7 61.4 38.1 40.9 43.7 46.4 49.2 52.0 54.7 57.5 60.2 63.0 65.8 38.2 40.9 43.7 46.4 49.2 52.0 54.7 57.5 60.3 63.0 65.8 9.7 11.9 14.1 16.2 18.4 20.6 22.8 25.0 27.2 29.4 31.6 4.2 6.3 8.4 10.5 12.6 14.7 16.7 18.8 20.9 23.0 25.1 11.6 x 11.9 x 12.1 x 12.3 x 12.6 x 12.8 x 13.0 x 13.3 x 13.5 x 13.7 x 14.0 x 10.0 10.2 10.4 10.6 10.8 11.0 11.2 11.4 11.6 11.8 12.0 1.13 x 1.15 x 1.17 x 1.20 x 1.22 x 1.24 x 1.26 x 1.29 x 1.31 x 1.33 x 1.35 x 0.78 0.80 0.81 0.83 0.84 0.86 0.87 0.89 0.91 0.92 0.94 (26.8)% 87.7 (0.4) (25.8) (1.2) (1.2) (0.3) 2.3 2.4 (7.2) - 7.2 x 6.4 0.78 x 0.57 Highly Illustrative for Discussion Purposes Only |
 |
Appendix A: Selected Minority Squeeze-outs |
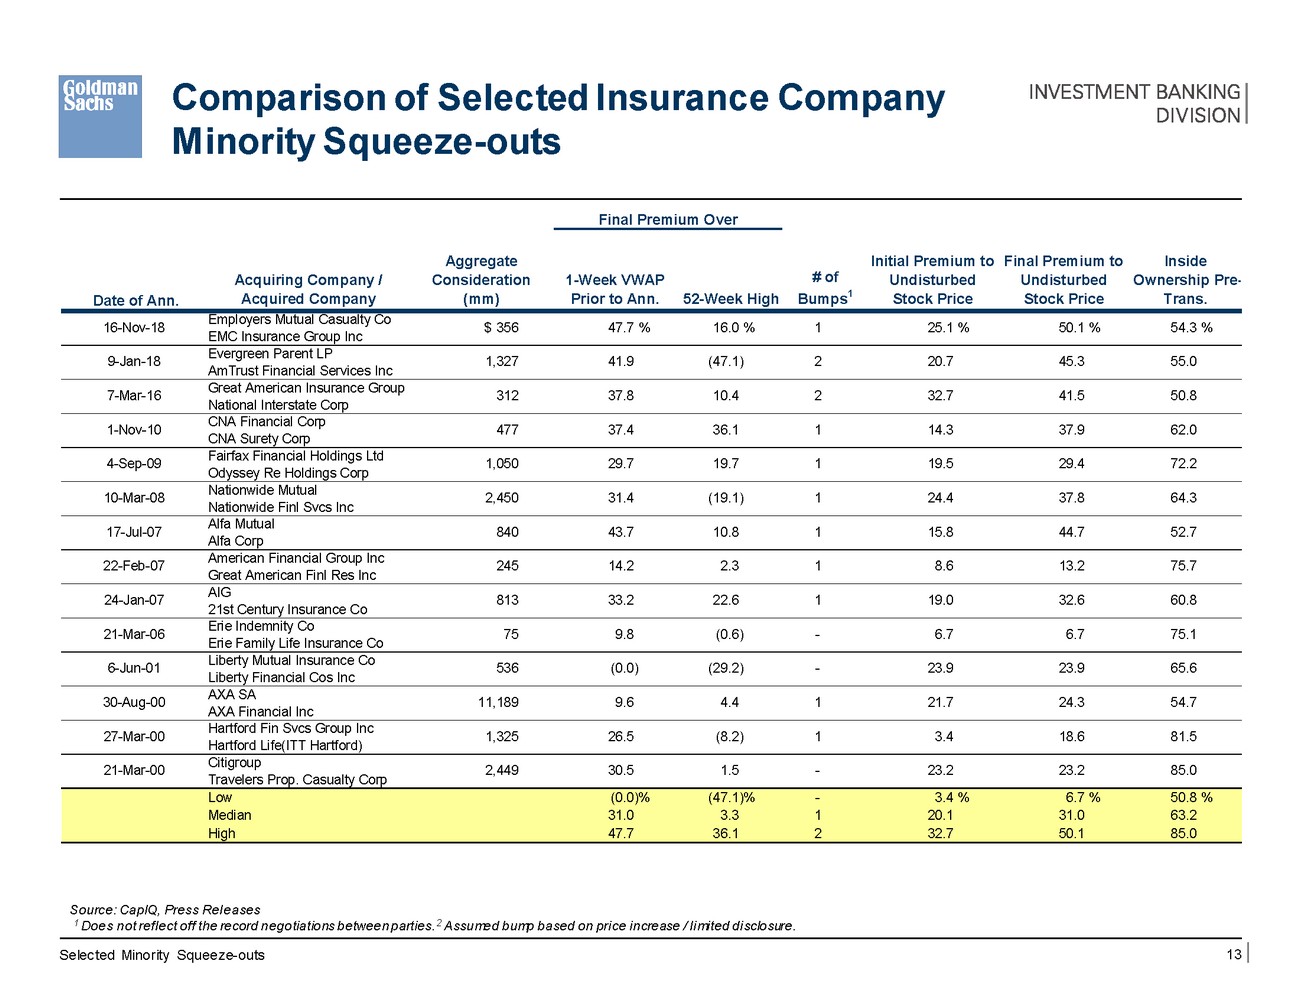 |
Comparison of Selected Insurance Company Minority Squeeze-outs Final Premium Over Aggregate Consideration (mm) Initial Premium to Undisturbed Stock Price Final Premium to Undisturbed Stock Price Inside Ownership Pre-Trans. # of Bumps1 Acquiring Company / Acquired Company 1-Week VWAP Prior to Ann. 52-Week High Date of Ann. Employers Mutual Casualty Co EMC Insurance Group Inc 16-Nov-18 $ 356 47.7 % 16.0 % 1 25.1 % 50.1 % 54.3 % Evergreen Parent LP AmTrust Financial Services Inc 9-Jan-18 1,327 41.9 (47.1) 2 20.7 45.3 55.0 Great American Insurance Group National Interstate Corp 7-Mar-16 312 37.8 10.4 2 32.7 41.5 50.8 CNA Financial Corp CNA Surety Corp 1-Nov-10 477 37.4 36.1 1 14.3 37.9 62.0 Fairfax Financial Holdings Ltd Odyssey Re Holdings Corp 4-Sep-09 1,050 29.7 19.7 1 19.5 29.4 72.2 Nationwide Mutual Nationwide Finl Svcs Inc 10-Mar-08 2,450 31.4 (19.1) 1 24.4 37.8 64.3 Alfa Mutual Alfa Corp 17-Jul-07 840 43.7 10.8 1 15.8 44.7 52.7 American Financial Group Inc Great American Finl Res Inc 22-Feb-07 245 14.2 2.3 1 8.6 13.2 75.7 AIG 21st Century Insurance Co 24-Jan-07 813 33.2 22.6 1 19.0 32.6 60.8 Erie Indemnity Co Erie Family Life Insurance Co 21-Mar-06 75 9.8 (0.6) - 6.7 6.7 75.1 Liberty Mutual Insurance Co Liberty Financial Cos Inc 6-Jun-01 536 (0.0) (29.2) - 23.9 23.9 65.6 AXA SA AXA Financial Inc 30-Aug-00 11,189 9.6 4.4 1 21.7 24.3 54.7 Hartford Fin Svcs Group Inc Hartford Life(ITT Hartford) 27-Mar-00 1,325 26.5 (8.2) 1 3.4 18.6 81.5 Citigroup Travelers Prop. Casualty Corp 21-Mar-00 2,449 30.5 1.5 - 23.2 23.2 85.0 Source: CapIQ, Press Rel eases 1 Does not refl ect off the record negotiations between parties. 2 Assumed bump based on pri ce i ncrease / l i mi ted di sclosure. Selected Minority Squeeze-outs 13 Low (0.0)% (47.1)% - 3.4 % 6.7 % 50.8 % Median 31.0 3.3 1 20.1 31.0 63.2 High 47.7 36.1 2 32.7 50.1 85.0 |
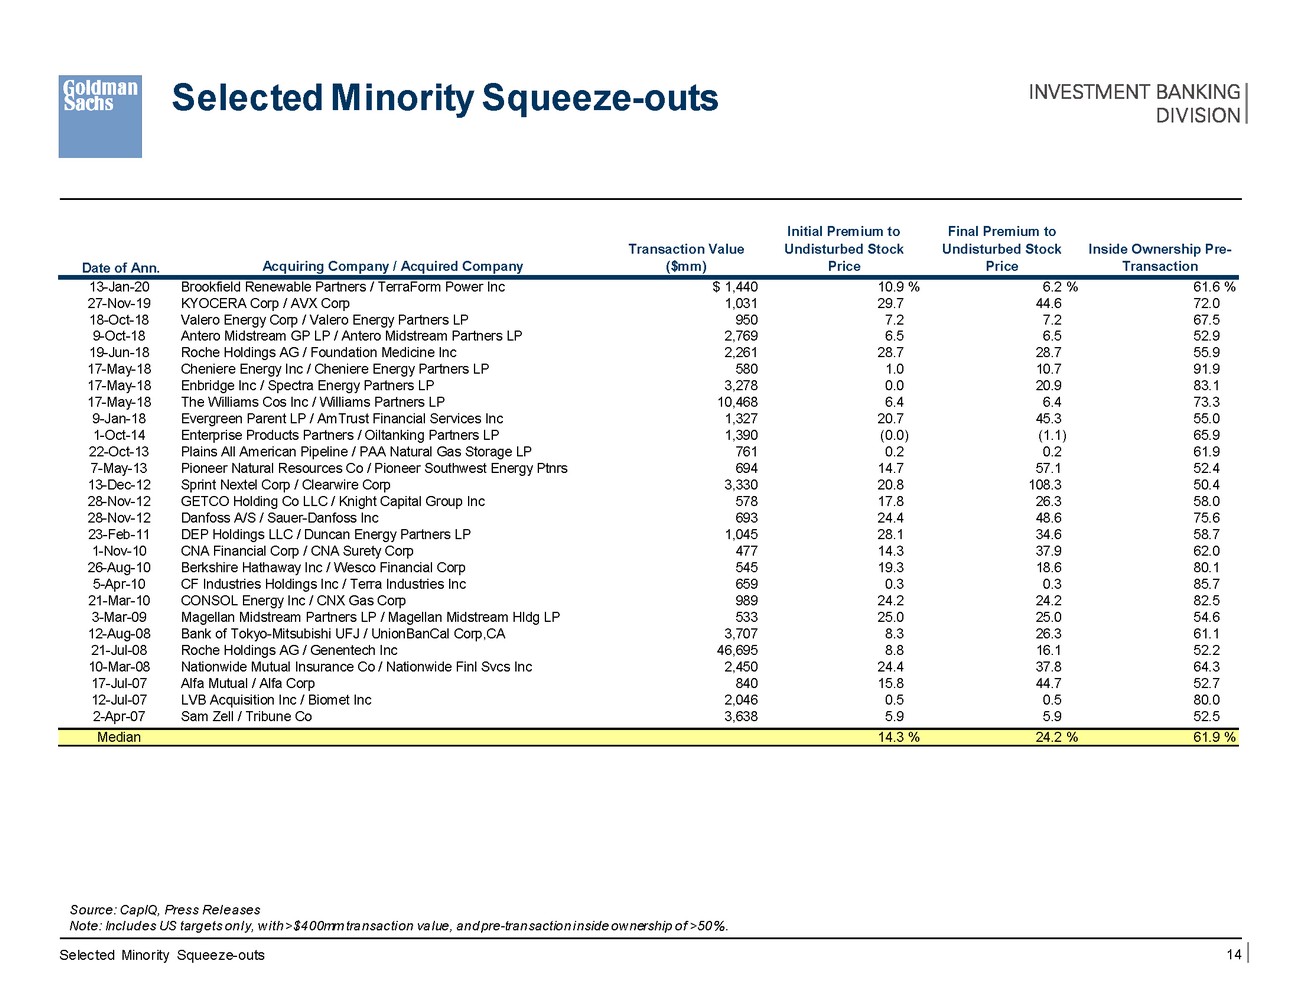 |
Selected Minority Squeeze-outs Initial Premium to Undisturbed Stock Price Final Premium to Undisturbed Stock Price Transaction Value ($mm) Inside Ownership Pre-Transaction Acquiring Company / Acquired Company Date of Ann. 13-Jan-20 27-Nov-19 18-Oct-18 9-Oct-18 19-Jun-18 17-May-18 17-May-18 17-May-18 9-Jan-18 1-Oct-14 22-Oct-13 7-May-13 13-Dec-12 28-Nov-12 28-Nov-12 23-Feb-11 1-Nov-10 26-Aug-10 5-Apr-10 21-Mar-10 3-Mar-09 12-Aug-08 21-Jul-08 10-Mar-08 17-Jul-07 12-Jul-07 2-Apr-07 Brookfield Renewable Partners / TerraForm Power Inc KYOCERA Corp / AVX Corp Valero Energy Corp / Valero Energy Partners LP Antero Midstream GP LP / Antero Midstream Partners LP Roche Holdings AG / Foundation Medicine Inc Cheniere Energy Inc / Cheniere Energy Partners LP Enbridge Inc / Spectra Energy Partners LP The Williams Cos Inc / Williams Partners LP Evergreen Parent LP / AmTrust Financial Services Inc Enterprise Products Partners / Oiltanking Partners LP Plains All American Pipeline / PAA Natural Gas Storage LP Pioneer Natural Resources Co / Pioneer Southwest Energy Ptnrs Sprint Nextel Corp / Clearwire Corp GETCO Holding Co LLC / Knight Capital Group Inc Danfoss A/S / Sauer-Danfoss Inc DEP Holdings LLC / Duncan Energy Partners LP CNA Financial Corp / CNA Surety Corp Berkshire Hathaway Inc / Wesco Financial Corp CF Industries Holdings Inc / Terra Industries Inc CONSOL Energy Inc / CNX Gas Corp Magellan Midstream Partners LP / Magellan Midstream Hldg LP Bank of Tokyo-Mitsubishi UFJ / UnionBanCal Corp,CA Roche Holdings AG / Genentech Inc Nationwide Mutual Insurance Co / Nationwide Finl Svcs Inc Alfa Mutual / Alfa Corp LVB Acquisition Inc / Biomet Inc Sam Zell / Tribune Co $ 1,440 1,031 950 2,769 2,261 580 3,278 10,468 1,327 1,390 761 694 3,330 578 693 1,045 477 545 659 989 533 3,707 46,695 2,450 840 2,046 3,638 10.9 % 29.7 7.2 6.5 28.7 1.0 0.0 6.4 20.7 (0.0) 0.2 14.7 20.8 17.8 24.4 28.1 14.3 19.3 0.3 24.2 25.0 8.3 8.8 24.4 15.8 0.5 5.9 6.2 % 44.6 7.2 6.5 28.7 10.7 20.9 6.4 45.3 (1.1) 0.2 57.1 108.3 26.3 48.6 34.6 37.9 18.6 0.3 24.2 25.0 26.3 16.1 37.8 44.7 0.5 5.9 61.6 % 72.0 67.5 52.9 55.9 91.9 83.1 73.3 55.0 65.9 61.9 52.4 50.4 58.0 75.6 58.7 62.0 80.1 85.7 82.5 54.6 61.1 52.2 64.3 52.7 80.0 52.5 Source: CapIQ, Press Rel eases Note: Incl udes US targets onl y, w i th >$400mm transacti on val ue, and pre-transaction i nside ow nership of >50%. Selected Minority Squeeze-outs 14 Median 14.3 % 24.2 % 61.9 % |