Exhibit (c)(15)
|
Presentation to Farm Bureau Property & Casualty Insurance Company Discussion Materials Goldman, Sachs & Co. December 9, 2020 PRIVAT E AND CONFIDENT IAL. T hi s document i s bei ng sent to you for your i nformation only as an i nvestment banki ng cl ient of Gol dman Sachs and shoul d not be fo rwarded outsi de of your organi zation. T his document has been prepared by the Investment Banki ng Di visi on and i s not a product of Gol dman Sach s Gl obal Investment Research. T his document shoul d not be used as a basi s for tradi ng i n the securi ti es or l oans of the compani es named herein or for any other i nvestmen t decisi on. T his document does not consti tute an offer to sel l the securi ti es or l oans of the compani es named herein or a sol i ci tation of proxi es or votes and shoul d not be construed as consi sti ng of i nvestment advice. Goldman Sachs does not provi de accounting, tax, or l egal advice. Private & Confidential |
 |
Disclaimer These materials have been prepared and are provided by Goldman Sachs on a conf idential basis solely f or the inf ormation and a ssistance of the board of directors and senior management of Farm Bureau Property & Casualty Insurance Company (the "Company") in connection w ith its consideration of the matters ref erred to herein. These materials and Goldman Sachs’ presentation relating to these materials (the “Conf idential Inf ormation”) may not be disclosed to any thir d party or circulated or ref erred to publicly or used f or or relied upon f or any other purpose w ithout the prior w ritten consent of Goldman Sachs. The Conf idential Inf ormation w as not prepared w ith a view to public disclosure or to conf orm to any disclosure standards under any state, f ederal or international securities law s or other law s, rules or regulat ions, and Goldman Sachs does not take any responsibility f or the use of the Conf idential Inf ormation by persons other than those set f orth above. Notw ithstanding anyth ing in this Conf idential Inf ormation to the contrary, the Company may disclose to any person the US f ederal income and state income tax treatment and tax structure of any transaction described herein and all materials of any kind (including tax opinions and other tax analyses) that are provided to the Company relating to such tax treatment and tax struc ture, w ithout Goldman Sachs imposing any limitation of any kind. The Conf idential Inf ormation has been prepared by the Investment Banking Division of Goldman Sachs and is not a product of its research department. Goldman Sachs and its af f iliates are engaged in advisory, underw riting and f inancing, principal investing, sales and trading, research, investment management and other f inancial and non-f inancial activities and services f or various persons and entities. Goldman Sachs and its af f iliates and employees, and f unds or other entities they manage or in w hich they invest or have other economic interest or w ith w hich they co-invest, may at any time purchase, sell, hold or vote long or short positions and investments in securities, derivatives, loans, commodities, currencies, credit def ault sw aps and other f inancial instruments of the Company, any other p arty to any transaction and any of their respective af f iliates or any currency or commodity that may be involved in any transaction. Goldman Sachs’ investment banking division maintains regular, ordinary course client service dialogues w ith clients and potential clients to review events, opportunities, and conditions in particular sectors and indust ries and, in that connection, Goldman Sachs may make ref erence to the Company, but Goldman Sachs w ill not disclose any conf idential inf ormation received f rom the Company. The Conf idential Inf ormation has been prepared based on historical f inancial inf ormation, f orecasts and other inf ormation obt ained by Goldman Sachs f rom publicly available sources, the management of the Company or other sources (approved f or our use by the Company in the case of inf ormation f rom management and non-public inf ormation). In preparing the Conf idential Inf ormation, Goldman Sachs has relied upon and assumed, w ithout assuming any responsibility f or in dependent verif ication, the accuracy and completeness of all of the f inancial, legal, regulatory, tax, accounting and other inf ormation provided to, discussed w ith or review ed by us, and Goldman Sachs does not assume any liability f or any such inf ormation. Goldman Sachs does not provide accounting, tax, legal or regulatory advice. Goldman Sachs has not made an independent evaluation or appraisal of the assets and liabilities (including any contingent, de rivative or of f -balance sheet assets and liabilities) of the Company or any other party to any transaction or any of their respective af f iliates and has no obligation to evaluate the solvency of the Company or any other party to any transaction under any state or f ederal law s relating to bankruptcy, insolvency or similar matters. The analyses contained in the Conf idential Inf ormation do not purport to be appraisals nor do they necessarily ref lect the prices at w hich businesses or securities actually may be sold or purchased. Go ldman Sachs’ role in any due diligence review is limited solely to perf orming such a review as it shall deem necessary to support its ow n advice and analysis and shall not be on behalf of the Company. Analyses based upon f orecasts of f uture results are not necessarily indicative of actual f uture results, w hich may be signif icantly more or less f avorable than suggested by these analyses, and Goldman Sachs does not assume responsibility if f uture results are materially dif f erent f rom those f orecast. The Conf idential Inf ormation does not address the underlying business decision of the Company to engage in any transaction, o r the relative merits of any transaction or strategic alternative ref erred to herein as compared to any other transaction or alternative that may be available to the Company. The Conf idential Inf ormation is necessarily based on economic, monetary, market and other conditions as in ef f ect on, and the inf ormation made available to Goldman Sachs as of , t he date of such Conf idential Inf ormation and Goldman Sachs assumes no responsibility f or updating or revising the Conf idential Inf ormation based on circumstances, develop ments or events occurring af ter such date. The Conf idential Inf ormation does not constitute any opinion, nor does the Conf idential Inf ormation constitute a recommendation to any security holder of the Company or any other person as to how to vote or act w ith respect to any transaction or any other matter. The Conf idential Inf ormation, including this disclaimer, are subject to, and governed by, any w ritten agreement betw een the Company, on the one hand, and Goldman Sachs, on the other hand. 2 |
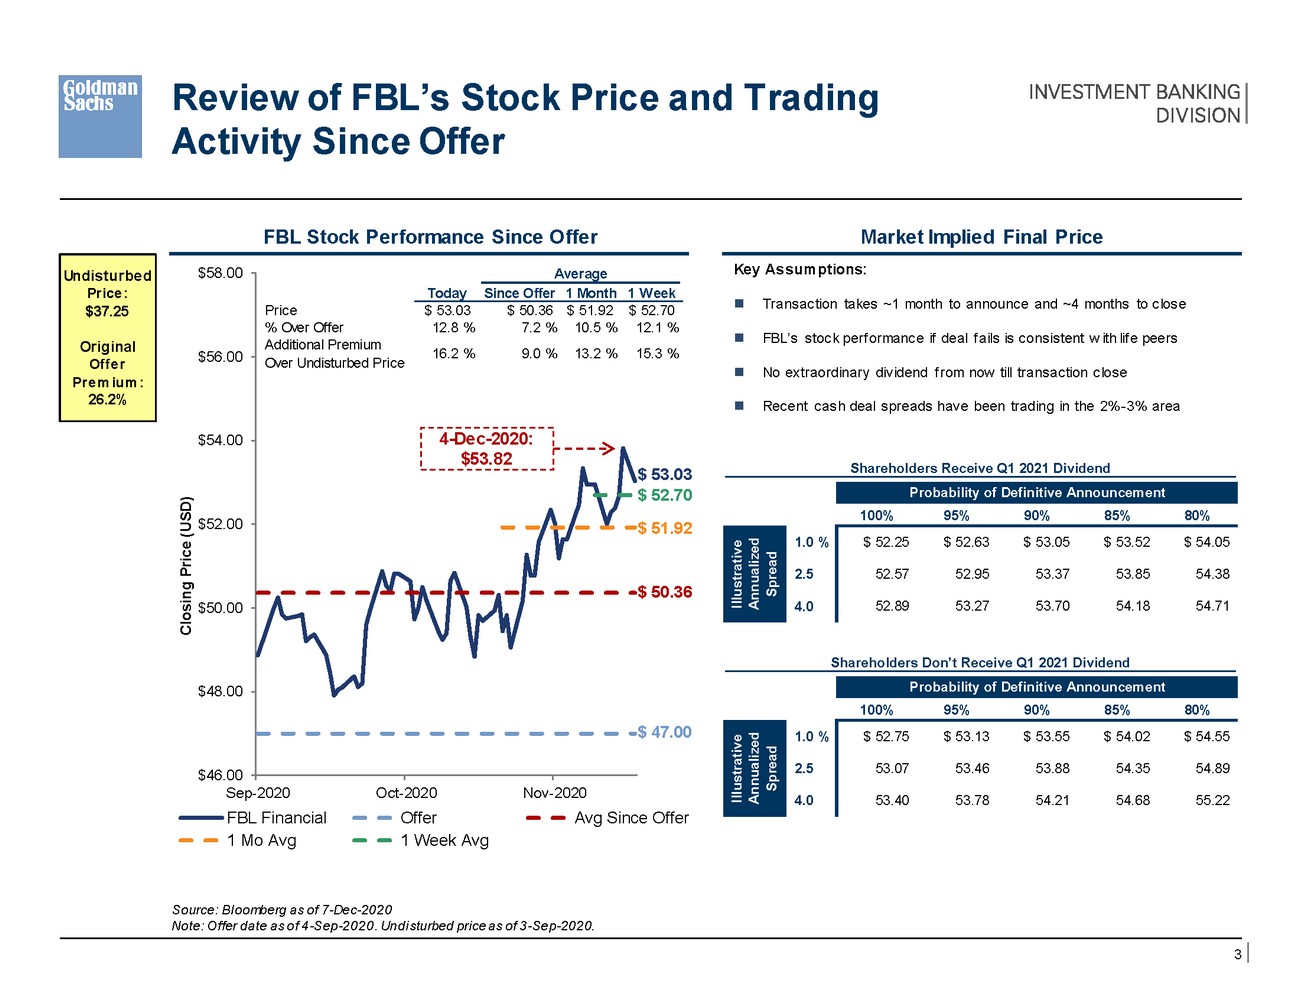 |
Review of FBL’s Stock Price and Trading Activity Since Offer FBL Stock Performance Since Offer Market Implied Final Price Ke y As s um ptions: $58.00 Average Week Transaction takes ~1 month to announce and ~4 months to close 52.70 12.1 % 15.3 % FBL’s stock perf ormance if deal f ails is consistent w ith lif e peers $56.00 No extraordinary dividend f rom now till transaction close Recent cash deal spreads have been trading in the 2% -3% area $54.00 Shareholders Receive Q1 2021 Dividend $ 53.03 $ 52.70 $ 51.92 100% 95% 90% 85% 80% $52.00 1.0 % 2.5 $ 50.36 4.0 $50.00 Sh areho lders Do n ’t Receiv e Q 1 2021 Dividend $48.00 100% 95% 90% 85% 80% $ 47.00 1.0 % 2.5 $46.00 Sep-2020 FBL Financial 1 Mo Avg Oct-2020 Nov-2020 4.0 Offer 1 Week Avg Avg Since Offer Source: Bl oomberg as of 7-Dec-2020 Note: Offer date as of 4-Sep-2020. Undi sturbed pri ce as of 3-Sep-2020. 3 Closing Price (USD) Illustrative Annualized Spread Illustrative Annualized Spread $ 52.75 $ 53.13 $ 53.55 $ 54.02 $ 54.55 53.07 53.46 53.88 54.35 54.89 53.40 53.78 54.21 54.68 55.22 Probability of Definitive Announcement $ 52.25 $ 52.63 $ 53.05 $ 53.52 $ 54.05 52.57 52.95 53.37 53.85 54.38 52.89 53.27 53.70 54.18 54.71 Probability of Definitive Announcement Today Since Offer 1 Month 1 Price$ 53.03$ 50.36 $ 51.92 $ % Over Offer12.8 %7.2 % 10.5 % Additional Premium 16.2 %9.0 % 13.2 % Over Undisturbed Price 4-Dec-2020: $53.82 Undis turbe d Price : $37.25 Original Offe r Pre m ium : 26.2% |
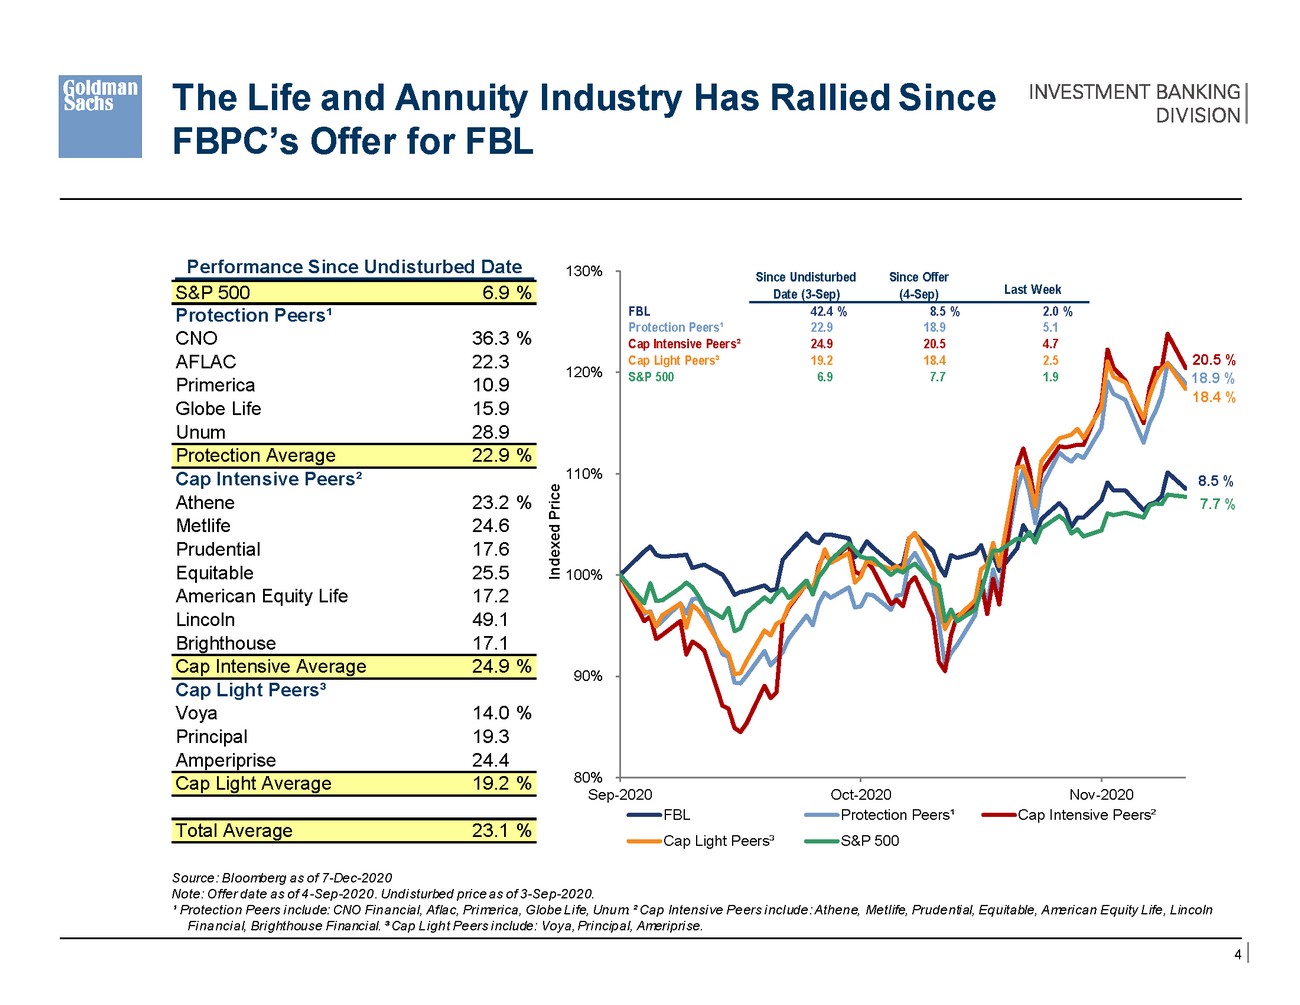 |
The Life and Annuity Industry FBPC’s Offer for FBL Has Rallied Since Performance Since Undisturbed Date 130% Protection Peers¹ CNO AFLAC Primerica Globe Life Unum 36.3 % 22.3 10.9 15.9 28.9 20.5 % 18.9 % 18.4 % 120% 110% Cap Intensive Peers² Athene Metlife Prudential Equitable American Equity Life Lincoln Brighthouse 8.5 % 7.7 % 23.2 % 24.6 17.6 25.5 17.2 49.1 17.1 100% 90% Cap Light Peers³ Voya Principal Amperiprise 14.0 % 19.3 24.4 80% Sep-2020 Oct-2020 Nov-2020 Cap Intensive Peers² FBL Cap Light Peers³ Protection Peers¹ S&P 500 Source: Bl oomberg as of 7-Dec-2020 Note: Offer date as of 4 -Sep-2020. Undi sturbed pri ce as of 3-Sep-2020. ¹ Protecti on Peers i nclude: CNO Fi nancial, Aflac, Pri meri ca, Globe Li fe, Unum. ² Cap Intensi ve Peers i ncl ude: Athene, Metl ife, Prudenti al, Equitable, Ameri can Equity Life, Lincoln Fi nanci al, Bri ghthouse Fi nanci al. ³ Cap Li ght Peers i nclude: Voya, Pri ncipal, Ameri pri se. 4 Indexed Price Total Average23.1 % Cap Light Average19.2 % Cap Intensive Average24.9 % Protection Average22.9 % S&P 5006.9 % Since UndisturbedSince Offer Date (3-Sep) (4-Sep) Last Week FBL42.4 %8.5 %2.0 % Protection Peers¹22.918.95.1 Cap Intensive Peers²24.920.54.7 Cap Light Peers³19.218.42.5 S&P 5006.97.71.9 |
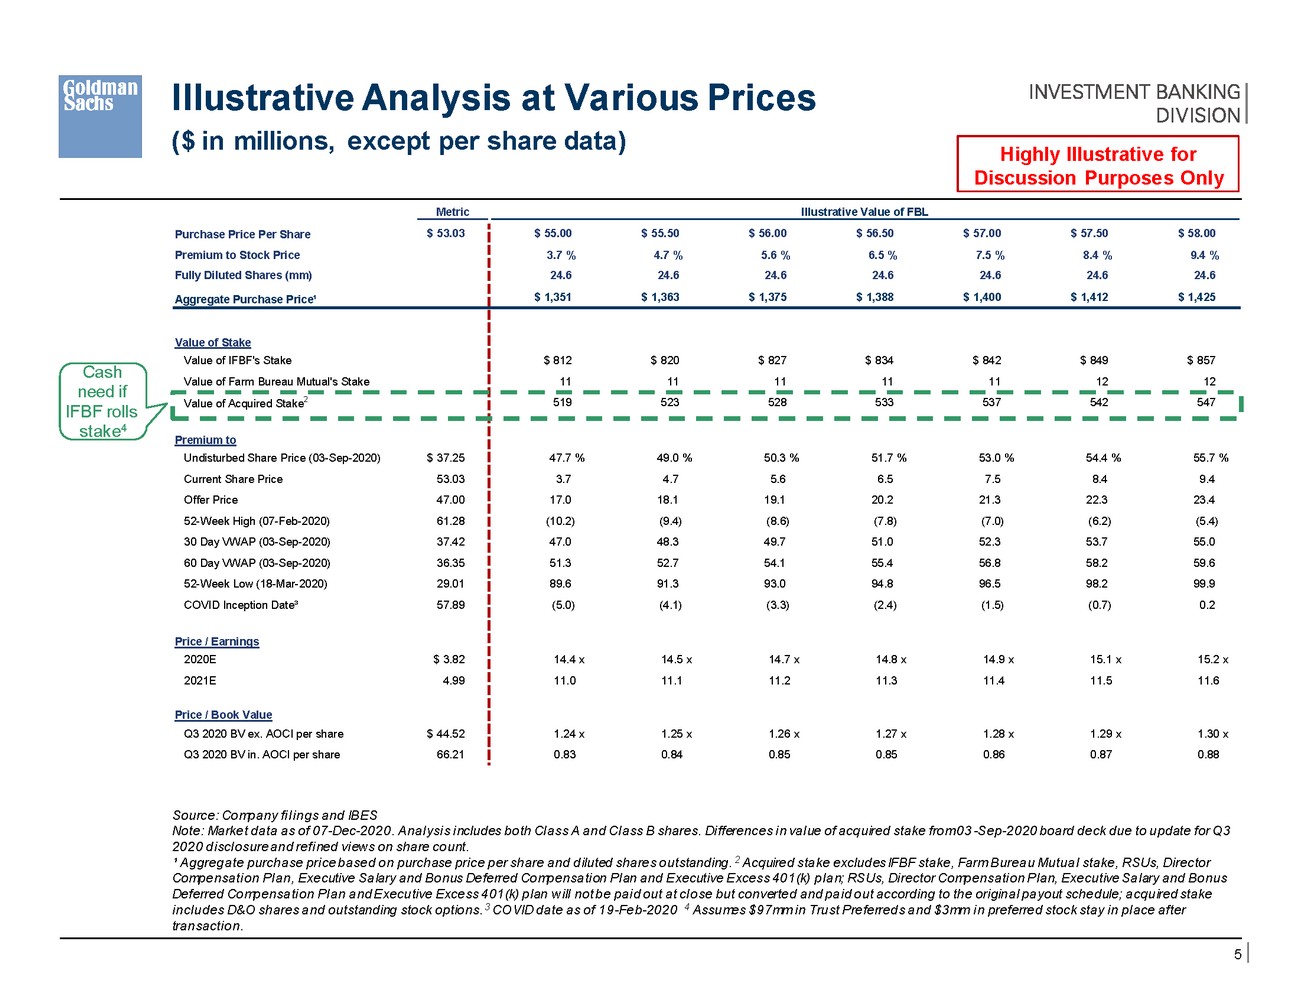 |
Illustrative Analysis at Various Prices ($ in millions, except per share data) Metric Illustrative Value of FBL Cash need if IFBF rolls stake4 Source: Company fi l i ngs and IBES Note: Market data as of 07-Dec-2020. Anal ysi s i ncludes both Cl ass A and Cl ass B shares. Di fferences i n val ue of acquired stake from03 -Sep-2020 board deck due to update for Q3 2020 di scl osure and refi ned vi ew s on share count. ¹ Aggregate purchase pri ce based on purchase pri ce per share and diluted shares outstanding. 2 Acquired stake excludes IFBF stake, Farm Bureau Mutual stake, RSUs, Di rector Compensati on Pl an, Executive Salary and Bonus Deferred Compensati on Pl an and Executive Excess 401(k) pl an; RSUs, Di rector Compensati on Pl an, Executive Sal ary and Bonus Deferred Compensati on Pl an and Executive Excess 401(k) pl an w ill not be pai d out at cl ose but converted and pai d out according to the ori ginal payout schedule; acquired stake i ncl udes D&O shares and outstanding stock options. 3 COVID date as of 19-Feb-2020 4 Assumes $97mm i n Trust Preferreds and $3mm i n preferred stock stay i n pl ace after transacti on. 5 Purchase Price Per Share Premium to Stock Price Fully Diluted Shares (mm) Aggregate Purchase Price¹ $ 53.03 $ 55.00 $ 55.50 $ 56.00 $ 56.50 $ 57.00 $ 57.50 $ 58.00 3.7 % 4.7 % 5.6 % 6.5 % 7.5 % 8.4 % 9.4 % 24.6 24.6 24.6 24.6 24.6 24.6 24.6 $ 1,351 $ 1,363 $ 1,375 $ 1,388 $ 1,400 $ 1,412 $ 1,425 Value of Stake Value of IFBF's Stake Value of Farm Bureau Mutual's Stake $ 812 $ 820 $ 827 $ 834 $ 842 $ 849 $ 857 11 11 11 11 11 12 12 Value of Acquired Stake2 519 523 528 533 537 542 547 Premium to Undisturbed Share Price (03-Sep-2020) $ 37.25 Current Share Price 53.03 Offer Price 47.00 52-Week High (07-Feb-2020) 61.28 30 Day VWAP (03-Sep-2020) 37.42 60 Day VWAP (03-Sep-2020) 36.35 52-Week Low (18-Mar-2020) 29.01 COVID Inception Date³ 57.89 Price / Earnings 2020E $ 3.82 2021E 4.99 Price / Book Value Q3 2020 BV ex. AOCI per share $ 44.52 Q3 2020 BV in. AOCI per share 66.21 47.7 % 49.0 % 50.3 % 51.7 % 53.0 % 54.4 % 55.7 % 3.7 4.7 5.6 6.5 7.5 8.4 9.4 17.0 18.1 19.1 20.2 21.3 22.3 23.4 (10.2) (9.4) (8.6) (7.8) (7.0) (6.2) (5.4) 47.0 48.3 49.7 51.0 52.3 53.7 55.0 51.3 52.7 54.1 55.4 56.8 58.2 59.6 89.6 91.3 93.0 94.8 96.5 98.2 99.9 (5.0) (4.1) (3.3) (2.4) (1.5) (0.7) 0.2 14.4 x 14.5 x 14.7 x 14.8 x 14.9 x 15.1 x 15.2 x 11.0 11.1 11.2 11.3 11.4 11.5 11.6 1.24 x 1.25 x 1.26 x 1.27 x 1.28 x 1.29 x 1.30 x 0.83 0.84 0.85 0.85 0.86 0.87 0.88 Highly Illustrative for Discussion Purposes Only |
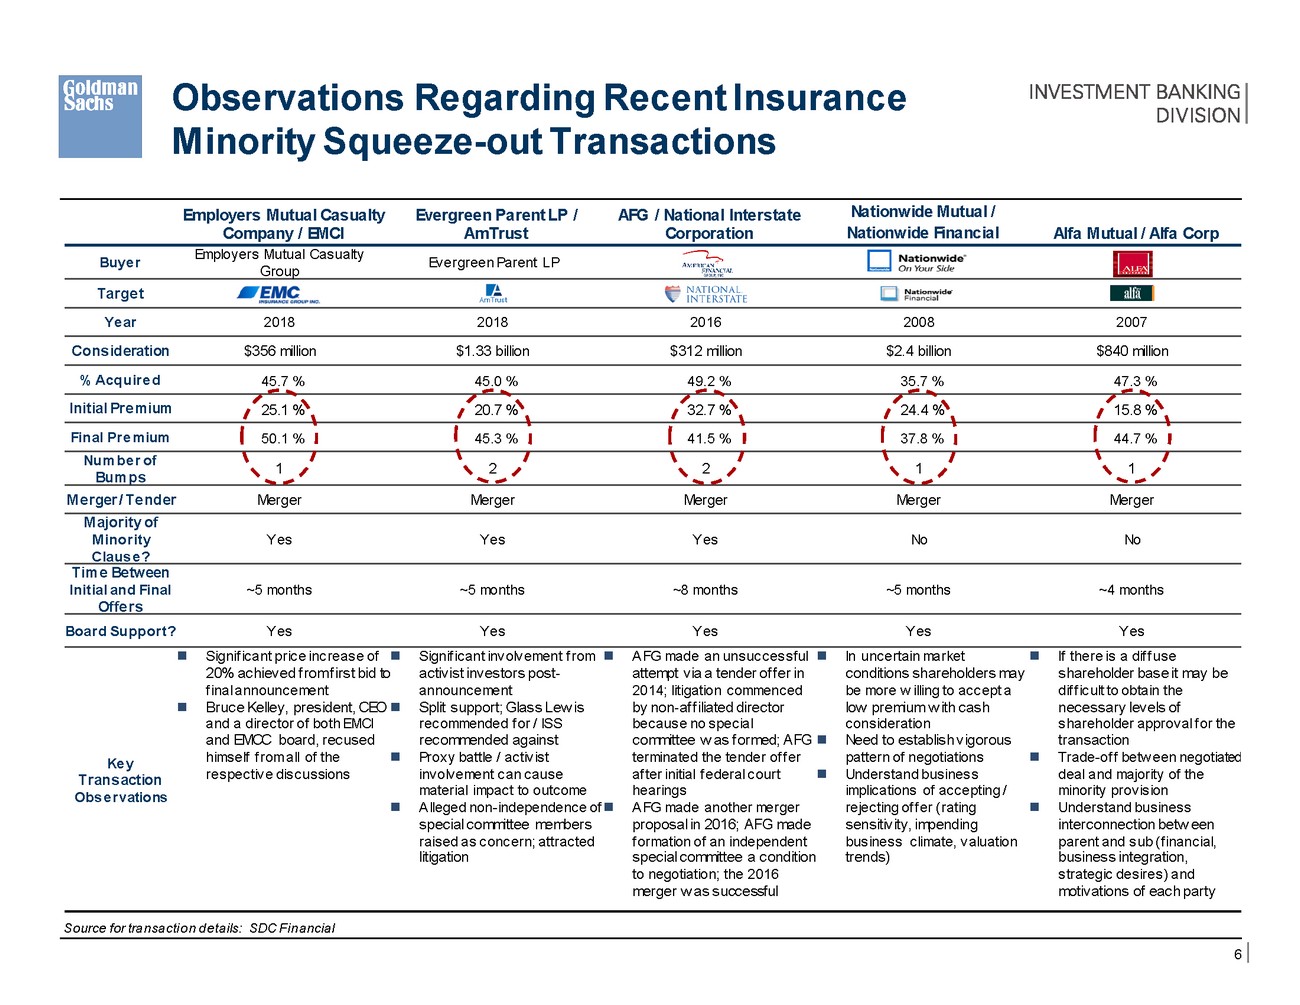 |
Observations Regarding Recent Insurance Minority Squeeze-out Transactions Nationwide Mutual / Nationwide Financial Employers Mutual Casualty Company / EMCI Evergreen Parent LP / AmTrust AFG / National Interstate Corporation Alfa Mutual / Alfa Corp Employers Mutual Casualty Group Evergreen Parent LP Buye r Targe t Ye ar 2018 2018 2016 2008 2007 Cons ideration $356 million $1.33 billion $312 million $2.4 billion $840 million % Acquire d 45.7 % 45.0 % 49.2 % 35.7 % 47.3 % Initial Pre mium 25.1 % 20.7 % 32.7 % 24.4 % 15.8 % Final Pre mium 50.1 % 45.3 % 41.5 % 37.8 % 44.7 % Num be r of Bum ps 1 2 2 1 1 M e rger / Te nder Merger Merger Merger Merger Merger M ajority of M inority Yes Yes Yes No No Claus e ? Tim e Be tween Initial and Final ~5 months ~5 months ~8 months ~5 months ~4 months Offe r s Board Support? Yes Yes Yes Yes Yes Signif icant price increase of 20% achieved f rom f irst bid to f inal announcement Bruce Kelley, president, CEO and a director of both EMCI and EMCC board, recused Signif icant involvement f rom activist investors post-announcement Split support; Glass Lew is recommended f or / ISS recommended against Proxy battle / activist involvement can cause material impact to outcome Alleged non-independence of special committee members raised as concern; attracted litigation AFG made an unsuccessful attempt via a tender of f er in 2014; litigation commenced by non-af f iliated director because no special committee w as f ormed; AFG terminated the tender of f er In uncertain market conditions shareholders may be more w illing to accept a low premium w ith cash consideration Need to establish vigorous pattern of negotiations Understand business implications of accepting / rejecting of f er (rating sensitivity, impending business climate, valuation trends) If there is a dif f use shareholder base it may be dif f icult to obtain the necessary levels of shareholder approval f or the transaction Trade-of f betw een negotiated deal and majority of the minority provision Understand business interconnection betw een parent and sub (f inancial, business integration, strategic desires) and motivations of each party himself f rom all of the respective discussions Ke y Trans action Obs e rvations af ter initial f ederal court hearings AFG made another merger proposal in 2016; AFG made f ormation of an independent special committee a condition to negotiation; the 2016 merger w as successful Source for transacti on details: SDC Fi nancial 6 |
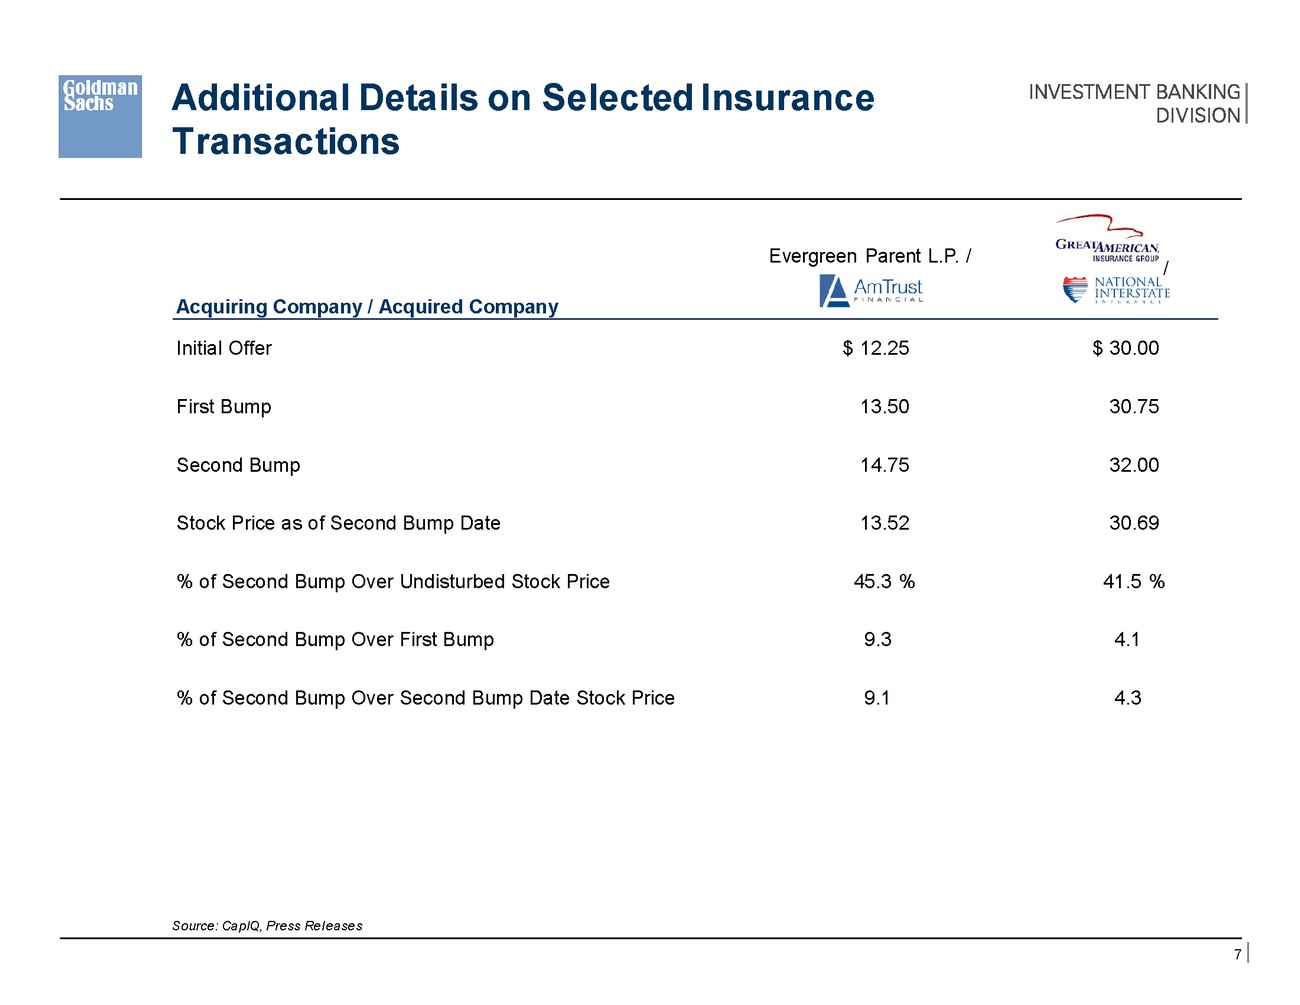 |
Additional Details on Selected Insurance Transactions Evergreen Parent L.P. / / Acquiring Company / Acquired Company Initial Offer $ 12.25 $ 30.00 First Bump 13.50 30.75 Second Bump 14.75 32.00 Stock Price as of Second Bump Date 13.52 30.69 % of Second Bump Over Undisturbed Stock Price 45.3 % 41.5 % % of Second Bump Over First Bump 9.3 4.1 % of Second Bump Over Second Bump Date Stock Price 9.1 4.3 Source: CapIQ, Press Rel eases 7 |
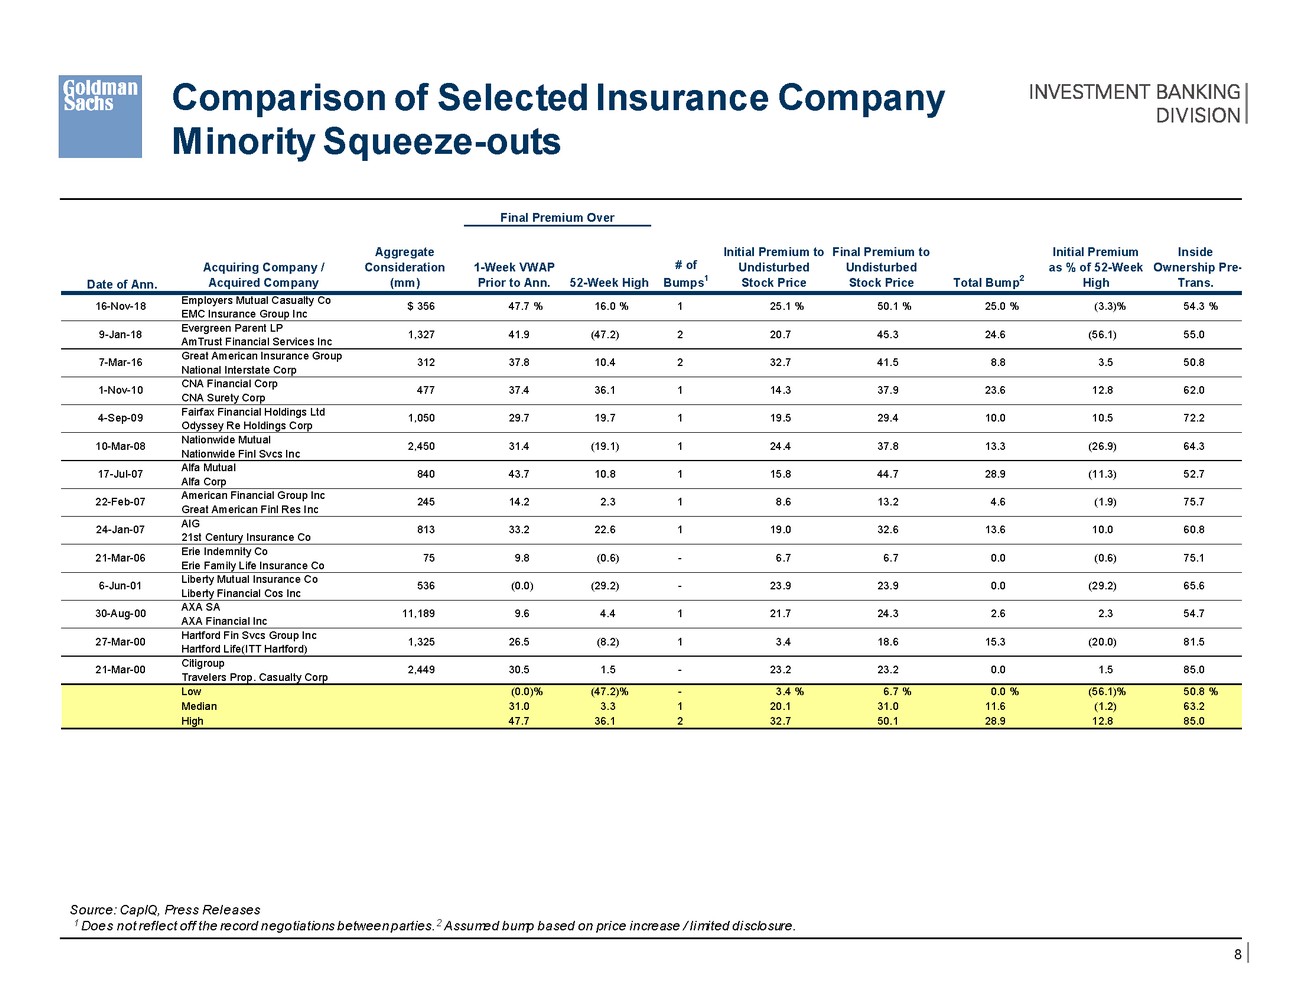 |
Comparison of Selected Insurance Company Minority Squeeze-outs Final Premium Over Aggregate Consideration (mm) Initial Premium to Final Premium to Initial Premium as % of 52-Week High Inside Ownership Pre-Trans. # of Bumps1 Acquiring Company / Acquired Company 1-Week VWAP Prior to Ann. Undisturbed Stock Price Undisturbed Stock Price Total Bump2 52-Week High Date of Ann. Employers Mutual Casualty Co EMC Insurance Group Inc 16-Nov-18 $ 356 47.7 % 16.0 % 1 25.1 % 50.1 % 25.0 % (3.3)% 54.3 % Evergreen Parent LP AmTrust Financial Services Inc 9-Jan-18 1,327 41.9 (47.2) 2 20.7 45.3 24.6 (56.1) 55.0 Great American Insurance Group National Interstate Corp 7-Mar-16 312 37.8 10.4 2 32.7 41.5 8.8 3.5 50.8 CNA Financial Corp CNA Surety Corp 1-Nov-10 477 37.4 36.1 1 14.3 37.9 23.6 12.8 62.0 Fairfax Financial Holdings Ltd Odyssey Re Holdings Corp 4-Sep-09 1,050 29.7 19.7 1 19.5 29.4 10.0 10.5 72.2 Nationwide Mutual Nationwide Finl Svcs Inc 10-Mar-08 2,450 31.4 (19.1) 1 24.4 37.8 13.3 (26.9) 64.3 Alfa Mutual Alfa Corp 17-Jul-07 840 43.7 10.8 1 15.8 44.7 28.9 (11.3) 52.7 American Financial Group Inc Great American Finl Res Inc 22-Feb-07 245 14.2 2.3 1 8.6 13.2 4.6 (1.9) 75.7 AIG 21st Century Insurance Co 24-Jan-07 813 33.2 22.6 1 19.0 32.6 13.6 10.0 60.8 Erie Indemnity Co Erie Family Life Insurance Co 21-Mar-06 75 9.8 (0.6) - 6.7 6.7 0.0 (0.6) 75.1 Liberty Mutual Insurance Co Liberty Financial Cos Inc 6-Jun-01 536 (0.0) (29.2) - 23.9 23.9 0.0 (29.2) 65.6 AXA SA AXA Financial Inc 30-Aug-00 11,189 9.6 4.4 1 21.7 24.3 2.6 2.3 54.7 Hartford Fin Svcs Group Inc Hartford Life(ITT Hartford) 27-Mar-00 1,325 26.5 (8.2) 1 3.4 18.6 15.3 (20.0) 81.5 Citigroup Travelers Prop. Casualty Corp 21-Mar-00 2,449 30.5 1.5 - 23.2 23.2 0.0 1.5 85.0 Source: CapIQ, Press Rel eases 1 Does not refl ect off the record negotiations between parties. 2 Assumed bump based on pri ce i ncrease / l i mi ted di sclosure. 8 Low (0.0)% (47.2)% - 3.4 % 6.7 % 0.0 % (56.1)% 50.8 % Median 31.0 3.3 1 20.1 31.0 11.6 (1.2) 63.2 High 47.7 36.1 2 32.7 50.1 28.9 12.8 85.0 |
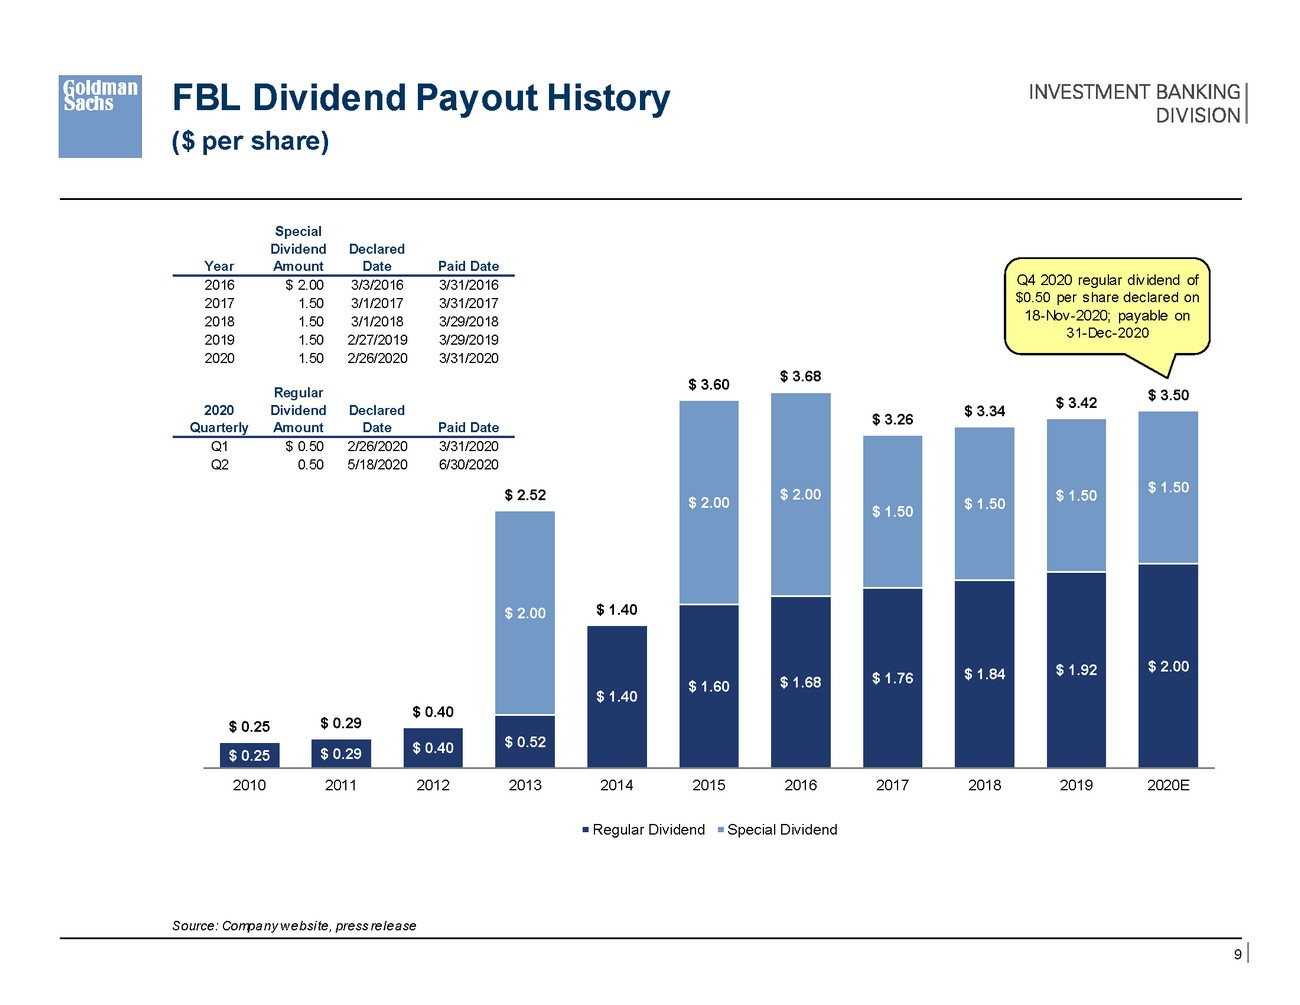 |
FBL Dividend Payout ($ per share) History Special Dividend Declared te 6 7 8 9 0 0 per sha yable on c-2020 2020 Dividend Declared te 0 0 2010 2011 2012 2013 2014 2015 2016 2017 2018 2019 2020E Regular Dividend Special Dividend Source: Company w ebsi te, press rel ease 9 Year Amount Date Paid Da 2.52 $ 3.60 $ 3.68 $ 3.26 $ 3.34 Q4 2 $0.5 18-020 regu Nov-2020 31-De $ 3.42 lar di re de ; pa vidend of clared on $ 3.50 2016 $ 2.00 3/3/2016 3/31/201 2017 1.50 3/1/2017 3/31/201 2018 1.50 3/1/2018 3/29/201 2019 1.50 2/27/2019 3/29/201 2020 1.50 2/26/2020 3/31/202 Regular Quarterly Amount Date Paid Da $ 2.00 $ 2.00 $ 1.50 $ 1.50 $ 1.50 Q1 $ 0.50 2/26/2020 3/31/202 Q2 0.50 5/18/2020 6/30/202 $ $ 1.50 $ 1.40 $ 2.00 $ 2.00 $ 1.92 $ 1.84 $ 1.76 $ 1.68 $ 1.60 $ 1.40 $ 0.40 $ 0.29 $ 0.52 $ 0.25 $ 0.40 $ 0.29 $ 0.25 |