Exhibit (c)(6)
CONFIDENTIAL – Draft for Discussion Purposes Only Working Draft as of Nov 23, 2020 Project Kinnick Special Committee Valuation Materials November 23, 2020 Note that this is a working draft subject to further revision in its entirety from ongoing discussion / negotiation / refinement
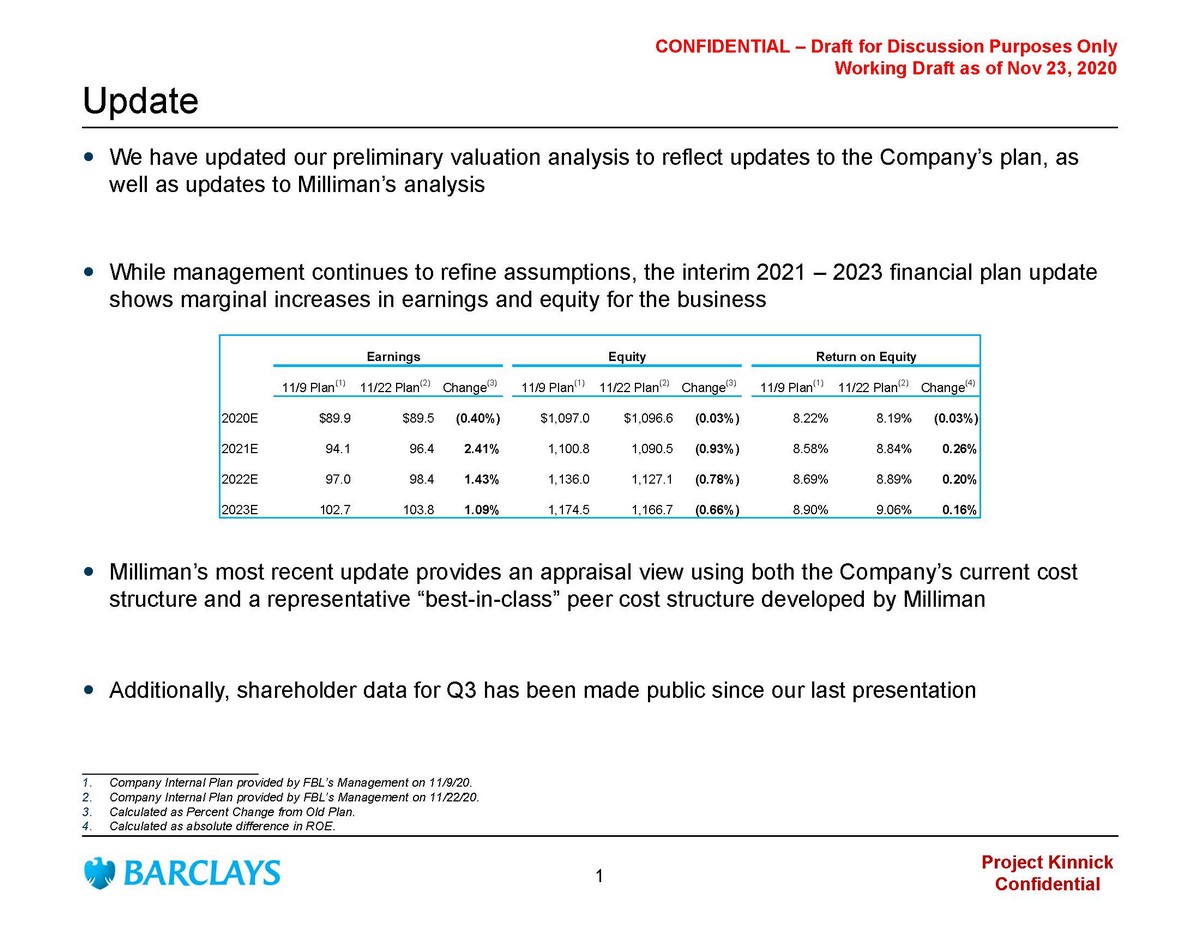
Project Kinnick Confidential CONFIDENTIAL – Draft for Discussion Purposes Only Working Draft as of Nov 23, 2020 We have updated our preliminary valuation analysis to reflect updates to the Company’s plan, as well as updates to Milliman’s analysis While management continues to refine assumptions, the interim 2021 – 2023 financial plan update shows marginal increases in earnings and equity for the business Milliman’s most recent update provides an appraisal view using both the Company’s current cost structure and a representative “best - in - class” peer cost structure developed by Milliman Additionally, shareholder data for Q3 has been made public since our last presentation Update __________________________ 1. Company Internal Plan provided by FBL’s Management on 11/9/20. 2. Company Internal Plan provided by FBL’s Management on 11/22/20. 3. Calculated as Percent Change from Old Plan. 4. Calculated as absolute difference in ROE. Earnings Equity Return on Equity 11/9 Plan (1) 11/22 Plan (2) Change (3) 11/9 Plan (1) 11/22 Plan (2) Change (3) 11/9 Plan (1) 11/22 Plan (2) Change (4) 2020E $89.9 $89.5 (0.40%) $1,097.0 $1,096.6 (0.03%) 8.22% 8.19% (0.03%) 2021E 94.1 96.4 2.41% 1,100.8 1,090.5 (0.93%) 8.58% 8.84% 0.26% 2022E 97.0 98.4 1.43% 1,136.0 1,127.1 (0.78%) 8.69% 8.89% 0.20% 2023E 102.7 103.8 1.09% 1,174.5 1,166.7 (0.66%) 8.90% 9.06% 0.16% 1
Updated Valuation
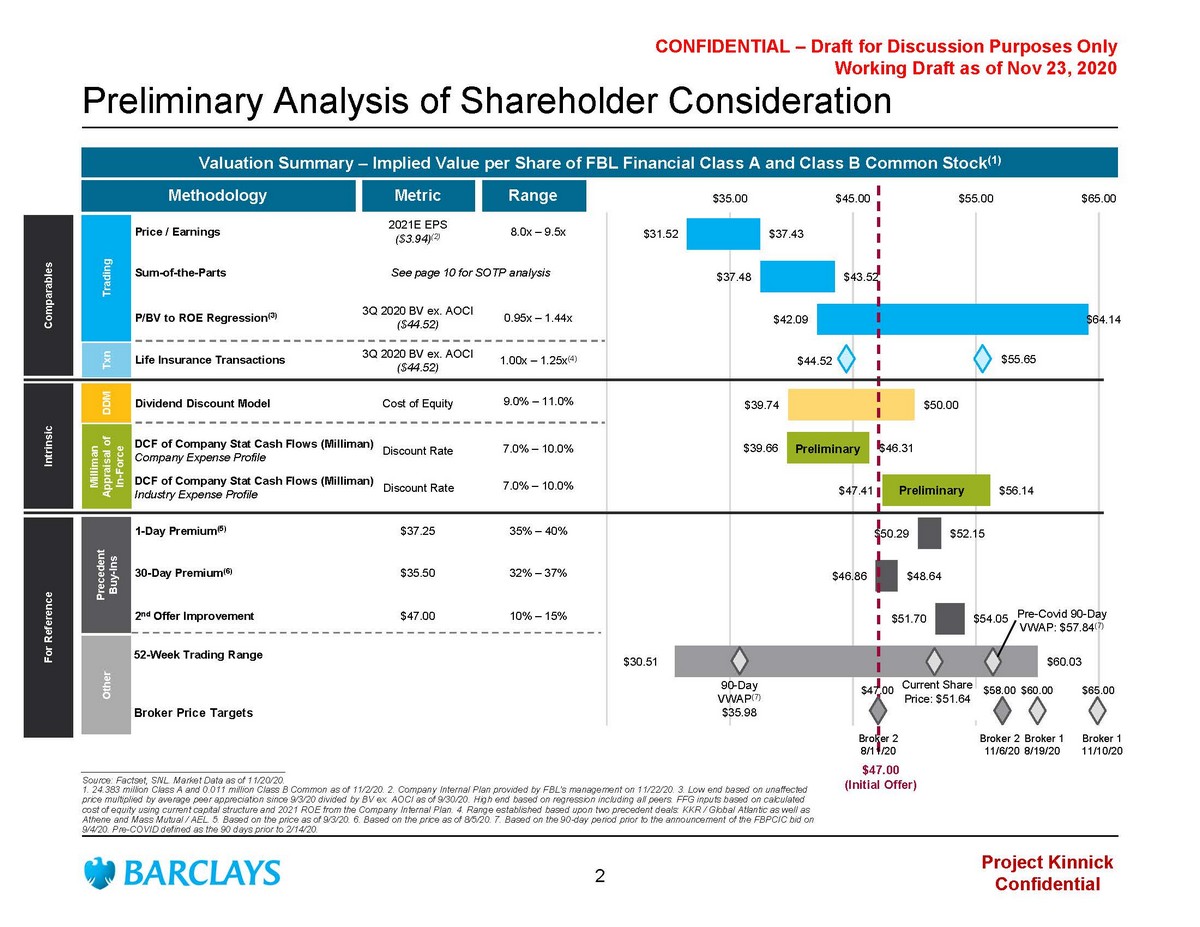
Project Kinnick Confidential CONFIDENTIAL – Draft for Discussion Purposes Only Working Draft as of Nov 23, 2020 $31.52 $37.48 $42.09 $44.52 $39.74 $39.66 $47.41 $50.29 $46.86 $51.70 $30.51 $37.43 $43.52 $64.14 $55.65 $50.00 $46.31 $56.14 $52.15 $48.64 $54.05 $60.03 $25.00 $35.00 $45.00 $55.00 $65.00 Preliminary Analysis of Shareholder Consideration ________________________________________ Source: Factset , SNL. Market Data as of 11/20/20. 1. 24.383 million Class A and 0.011 million Class B Common as of 11/2/20. 2. Company Internal Plan provided by FBL’s management on 11/22/20. 3. Low end based on unaffected price multiplied by average peer appreciation since 9/3/20 divided by BV ex. AOCI as of 9/30/20. High end based on regression including all peers. FFG inputs based on calculated cost of equity using current capital structure and 2021 ROE from the Company Internal Plan. 4. Range established based upon t wo precedent deals: KKR / Global Atlantic as well as Athene and Mass Mutual / AEL. 5. Based on the price as of 9/3/20. 6. Based on the price as of 8/5/20. 7. Based on the 90 - day period prior to the announcement of the FBPCIC bid on 9/4/20. Pre - COVID defined as the 90 days prior to 2/14/20 . Valuation Summary – Implied Value per Share of FBL Financial Class A and Class B Common Stock (1) 7.0% – 10.0% DDM Methodology Metric Range Discount Rate Dividend Discount Model 9.0% – 11.0% Cost of Equity Trading Price / Earnings 8.0x – 9.5x 2021E EPS ($3.94) (2) Precedent Buy - Ins 1 - Day Premium (5) 35% – 40 % 2 nd Offer Improvement 10% – 1 5% 30 - Day Premium (6) 32% – 37% Other 52 - Week Trading Range Broker Price Targets Txn Life Insurance Transactions 1.00x – 1.25x (4) $37.25 Broker 2 8/11/20 Broker 1 8/19/20 Broker 1 11/10/20 $35.50 $47.00 $47.00 $60.00 $65.00 3 Q 2020 BV ex. AOCI ($44.52) Milliman Appraisal of In - Force For Reference P/BV to ROE Regression (3) 0.95x – 1.44x Sum - of - the - Parts See page 10 for SOTP analysis 3 Q 2020 BV ex. AOCI ($44.52) Intrinsic Comparables $58.00 Broker 2 11/6/20 90 - Day VWAP (7) $35.98 Pre - Covid 90 - Day VWAP: $57.84 (7) Preliminary 7.0% – 10.0% Discount Rate DCF of Company Stat Cash Flows ( Milliman ) Company Expense Profile DCF of Company Stat Cash Flows ( Milliman ) Industry Expense Profile Preliminary $47.00 (Initial Offer) Current Share Price: $51.64 2
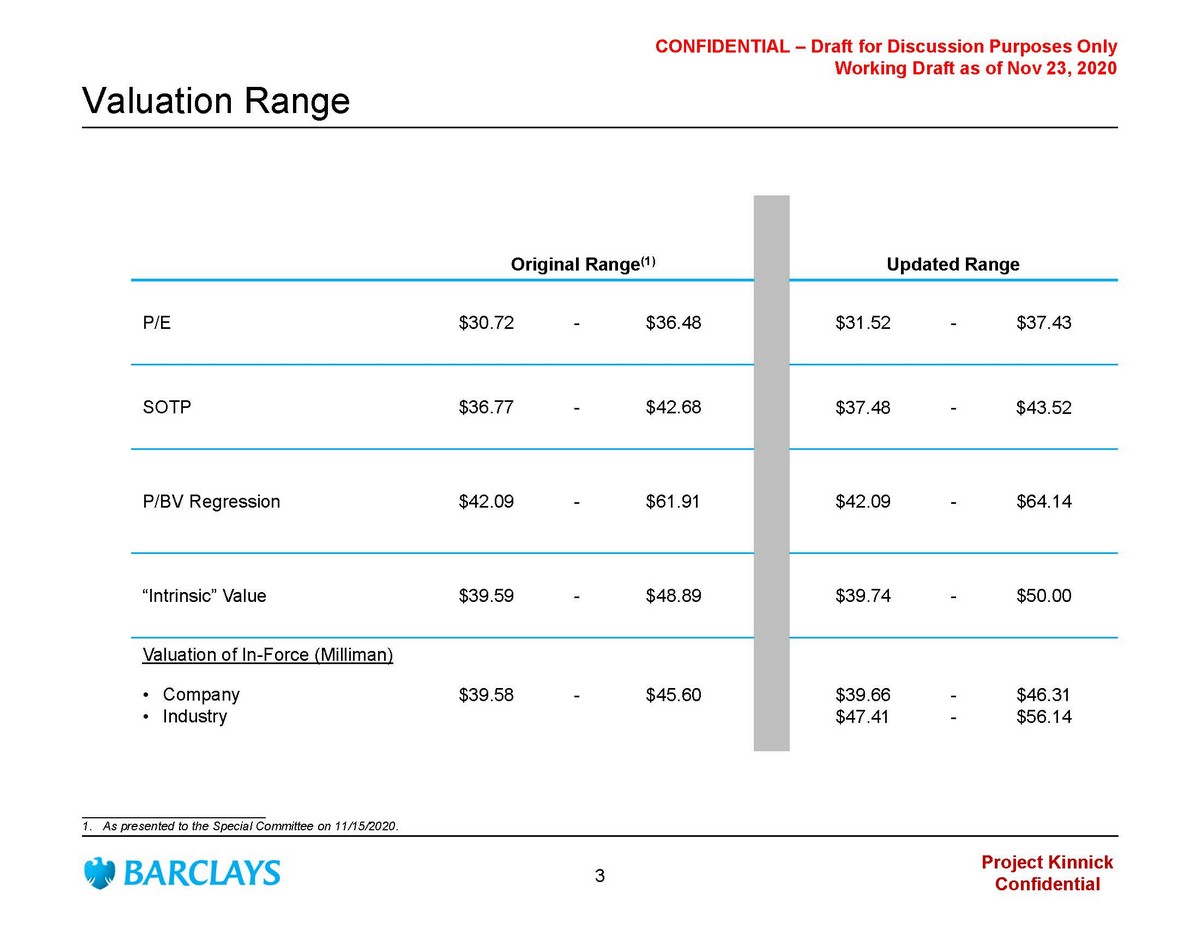
Project Kinnick Confidential CONFIDENTIAL – Draft for Discussion Purposes Only Working Draft as of Nov 23, 2020 Valuation Range Original Range (1) Updated Range P/E $30.72 - $36.48 $31.52 - $37.43 SOTP $36.77 - $42.68 $ 37.48 - $ 43.52 P/BV Regression $42.09 - $61.91 $42.09 - $64.14 “Intrinsic” Value $39.59 - $48.89 $39.74 - $50.00 Valuation of In - Force (Milliman) • Company • Industry $39.58 - $45.60 $39.66 $47.41 - - $46.31 $56.14 ___________________________ 1. As presented to the Special Committee on 11/15/2020. 3
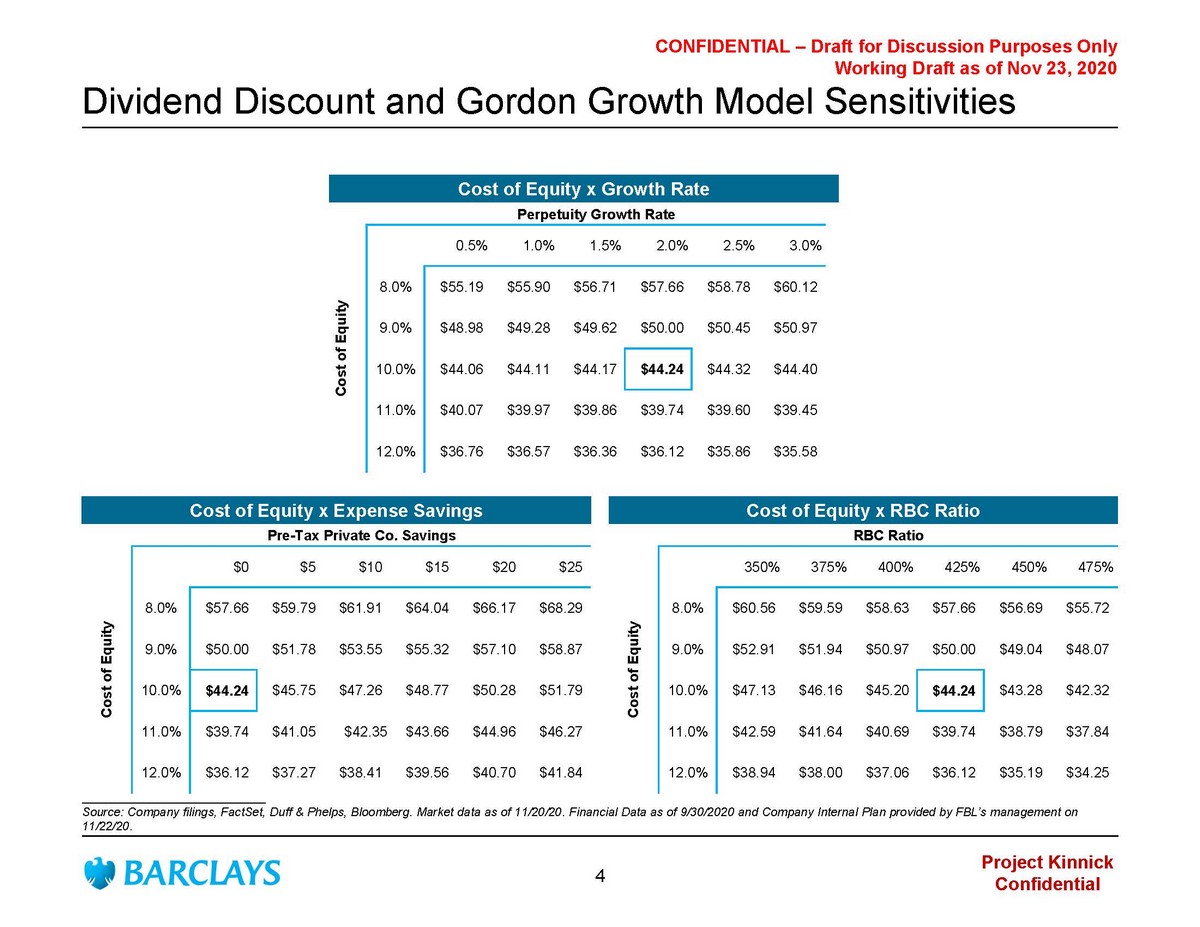
Project Kinnick Confidential CONFIDENTIAL – Draft for Discussion Purposes Only Working Draft as of Nov 23, 2020 Dividend Discount and Gordon Growth Model Sensitivities Cost of Equity x Expense Savings Pre-Tax Private Co. Savings $44.24 $0 $5 $10 $15 $20 $25 8.0% $57.66 $59.79 $61.91 $64.04 $66.17 $68.29 9.0% $50.00 $51.78 $53.55 $55.32 $57.10 $58.87 10.0% $44.24 $45.75 $47.26 $48.77 $50.28 $51.79 11.0% $39.74 $41.05 $42.35 $43.66 $44.96 $46.27 12.0% $36.12 $37.27 $38.41 $39.56 $40.70 $41.84 Cost of Equity Cost of Equity x Growth Rate Perpetuity Growth Rate $44.24 0.5% 1.0% 1.5% 2.0% 2.5% 3.0% 8.0% $55.19 $55.90 $56.71 $57.66 $58.78 $60.12 9.0% $48.98 $49.28 $49.62 $50.00 $50.45 $50.97 10.0% $44.06 $44.11 $44.17 $44.24 $44.32 $44.40 11.0% $40.07 $39.97 $39.86 $39.74 $39.60 $39.45 12.0% $36.76 $36.57 $36.36 $36.12 $35.86 $35.58 Cost of Equity Cost of Equity x RBC Ratio RBC Ratio $44.24 350% 375% 400% 425% 450% 475% 8.0% $60.56 $59.59 $58.63 $57.66 $56.69 $55.72 9.0% $52.91 $51.94 $50.97 $50.00 $49.04 $48.07 10.0% $47.13 $46.16 $45.20 $44.24 $43.28 $42.32 11.0% $42.59 $41.64 $40.69 $39.74 $38.79 $37.84 12.0% $38.94 $38.00 $37.06 $36.12 $35.19 $34.25 Cost of Equity ___________________________ Source: Company filings, FactSet , Duff & Phelps, Bloomberg. Market data as of 11/20/20 . Financial Data as of 9/30/2020 and Company Internal Plan provided by FBL’s management on 11/22/20. 4
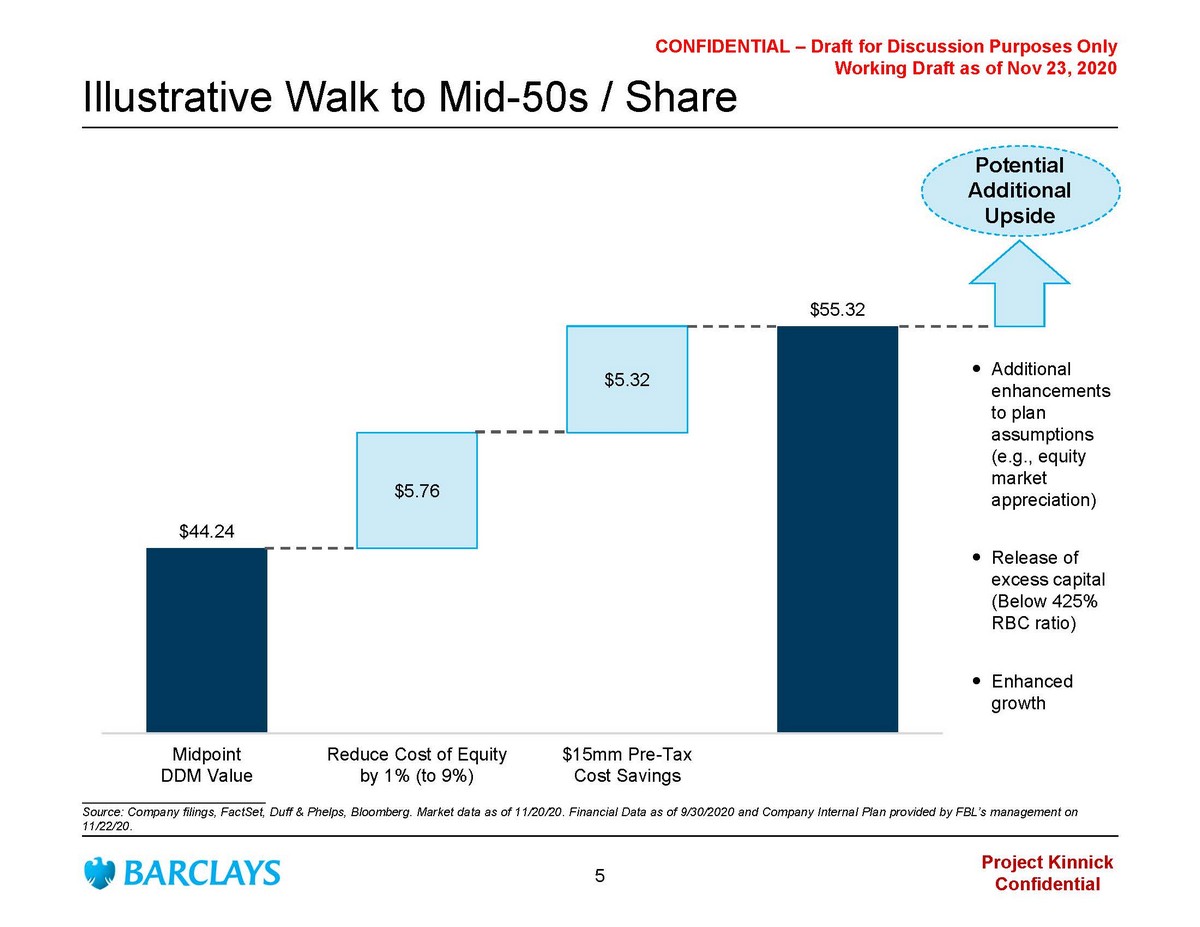
Project Kinnick Confidential CONFIDENTIAL – Draft for Discussion Purposes Only Working Draft as of Nov 23, 2020 Illustrative Walk to Mid - 50s / Share $5.76 $5.32 $44.24 $55.32 Midpoint DDM Value Reduce Cost of Equity by 1% (to 9%) $15mm Pre-Tax Cost Savings Additional enhancements to plan assumptions (e.g., equity market appreciation) Release of excess c apital (Below 425% RBC ratio) Enhanced growth Potential Additional Upside ___________________________ Source: Company filings, FactSet , Duff & Phelps, Bloomberg. Market data as of 11/20/20 . Financial Data as of 9/30/2020 and Company Internal Plan provided by FBL’s management on 11/22/20. 5
Shareholder Analysis
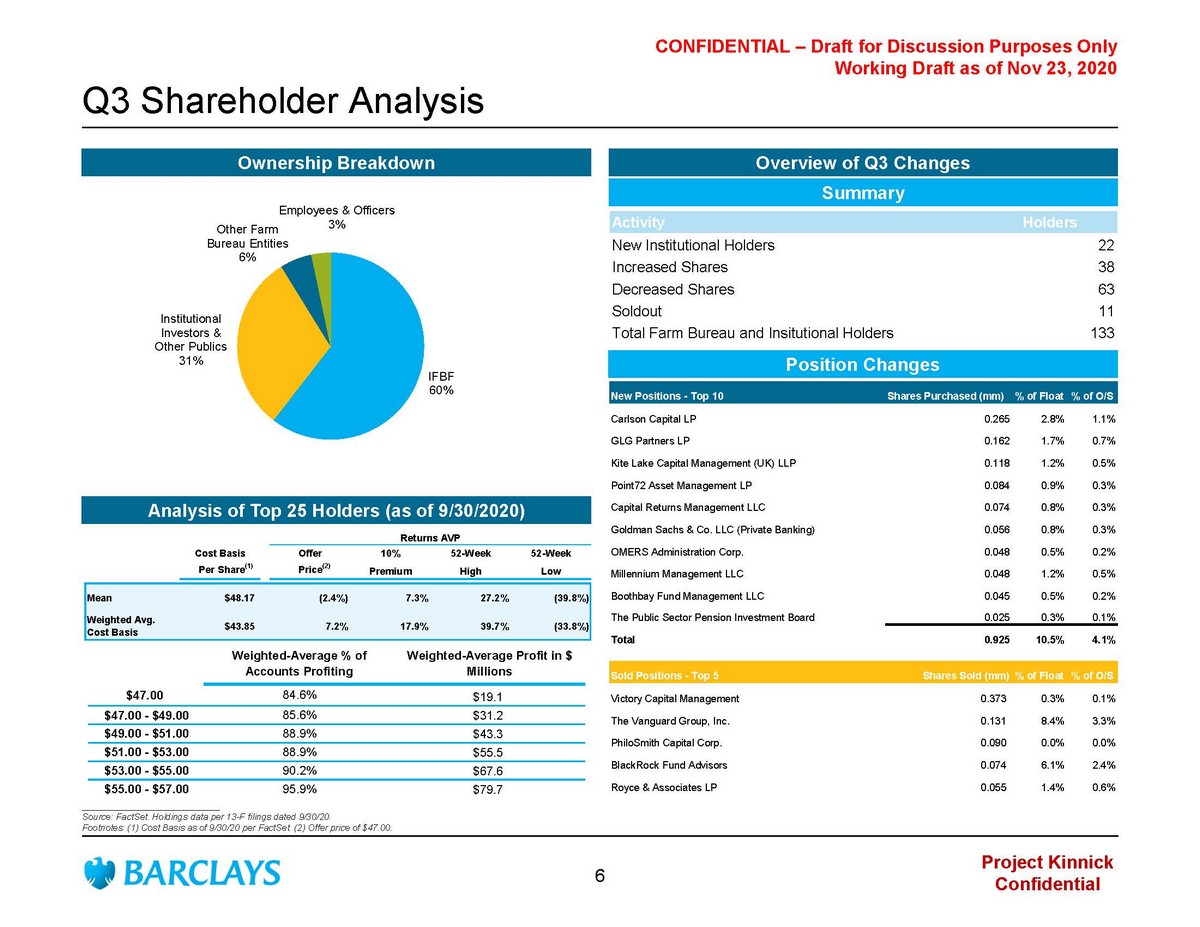
Project Kinnick Confidential CONFIDENTIAL – Draft for Discussion Purposes Only Working Draft as of Nov 23, 2020 Ownership Breakdown Analysis of Top 25 Holders (as of 9/30/2020) IFBF 60% Institutional Investors & Other Publics 31% Other Farm Bureau Entities 6% Employees & Officers 3% Q3 Shareholder Analysis Overview of Q3 Changes Activity Holders New Institutional Holders 22 Increased Shares 38 Decreased Shares 63 Soldout 11 Total Farm Bureau and Insitutional Holders 133 New Positions - Top 10 Shares Purchased (mm) % of Float % of O/S Carlson Capital LP 0.265 2.8% 1.1% GLG Partners LP 0.162 1.7% 0.7% Kite Lake Capital Management (UK) LLP 0.118 1.2% 0.5% Point72 Asset Management LP 0.084 0.9% 0.3% Capital Returns Management LLC 0.074 0.8% 0.3% Goldman Sachs & Co. LLC (Private Banking) 0.056 0.8% 0.3% OMERS Administration Corp. 0.048 0.5% 0.2% Millennium Management LLC 0.048 1.2% 0.5% Boothbay Fund Management LLC 0.045 0.5% 0.2% The Public Sector Pension Investment Board 0.025 0.3% 0.1% Total 0.925 10.5% 4.1% Sold Positions - Top 5 Shares Sold (mm) % of Float % of O/S Victory Capital Management 0.373 0.3% 0.1% The Vanguard Group, Inc. 0.131 8.4% 3.3% PhiloSmith Capital Corp. 0.090 0.0% 0.0% BlackRock Fund Advisors 0.074 6.1% 2.4% Royce & Associates LP 0.055 1.4% 0.6% Returns AVP Position Cost Basis Offer 10% 52-Week 52-Week Per Share (1) Price (2) Premium High Low Mean $48.17 (2.4%) 7.3% 27.2% (39.8%) Weighted Avg. Cost Basis $43.85 7.2% 17.9% 39.7% (33.8%) Weighted-Average % of Accounts Profiting Weighted-Average Profit in $ Millions $47.00 84.6% $19.1 $47.00 - $49.00 85.6% $31.2 $49.00 - $51.00 88.9% $43.3 $51.00 - $53.00 88.9% $55.5 $53.00 - $55.00 90.2% $67.6 $55.00 - $57.00 95.9% $79.7 Position Changes Summary ___________________________ Source : FactSet . Holdings data per 13 - F filings dated 9/30/20. Footnotes: (1) Cost Basis as of 9 /30/20 per FactSet . (2) Offer price of $47.00. 6
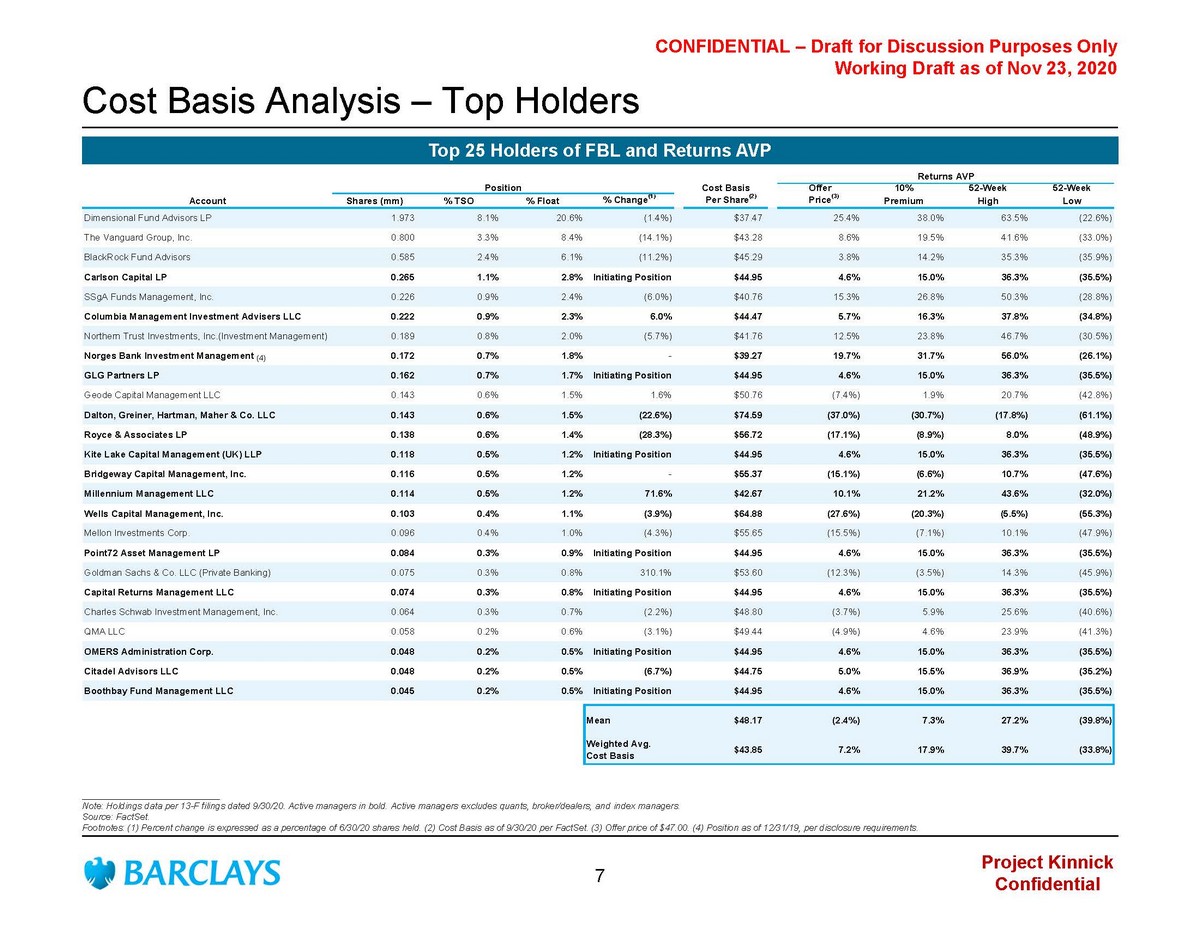
Project Kinnick Confidential CONFIDENTIAL – Draft for Discussion Purposes Only Working Draft as of Nov 23, 2020 Returns AVP Position Cost Basis Offer 10% 52-Week 52-Week Account Shares (mm) % TSO % Float % Change (1) Per Share (2) Price (3) Premium High Low Dimensional Fund Advisors LP 1.973 8.1% 20.6% (1.4%) $37.47 25.4% 38.0% 63.5% (22.6%) The Vanguard Group, Inc. 0.800 3.3% 8.4% (14.1%) $43.28 8.6% 19.5% 41.6% (33.0%) BlackRock Fund Advisors 0.585 2.4% 6.1% (11.2%) $45.29 3.8% 14.2% 35.3% (35.9%) Carlson Capital LP 0.265 1.1% 2.8% Initiating Position $44.95 4.6% 15.0% 36.3% (35.5%) SSgA Funds Management, Inc. 0.226 0.9% 2.4% (6.0%) $40.76 15.3% 26.8% 50.3% (28.8%) Columbia Management Investment Advisers LLC 0.222 0.9% 2.3% 6.0% $44.47 5.7% 16.3% 37.8% (34.8%) Northern Trust Investments, Inc.(Investment Management) 0.189 0.8% 2.0% (5.7%) $41.76 12.5% 23.8% 46.7% (30.5%) Norges Bank Investment Management 0.172 0.7% 1.8% - $39.27 19.7% 31.7% 56.0% (26.1%) GLG Partners LP 0.162 0.7% 1.7% Initiating Position $44.95 4.6% 15.0% 36.3% (35.5%) Geode Capital Management LLC 0.143 0.6% 1.5% 1.6% $50.76 (7.4%) 1.9% 20.7% (42.8%) Dalton, Greiner, Hartman, Maher & Co. LLC 0.143 0.6% 1.5% (22.6%) $74.59 (37.0%) (30.7%) (17.8%) (61.1%) Royce & Associates LP 0.138 0.6% 1.4% (28.3%) $56.72 (17.1%) (8.9%) 8.0% (48.9%) Kite Lake Capital Management (UK) LLP 0.118 0.5% 1.2% Initiating Position $44.95 4.6% 15.0% 36.3% (35.5%) Bridgeway Capital Management, Inc. 0.116 0.5% 1.2% - $55.37 (15.1%) (6.6%) 10.7% (47.6%) Millennium Management LLC 0.114 0.5% 1.2% 71.6% $42.67 10.1% 21.2% 43.6% (32.0%) Wells Capital Management, Inc. 0.103 0.4% 1.1% (3.9%) $64.88 (27.6%) (20.3%) (5.5%) (55.3%) Mellon Investments Corp. 0.096 0.4% 1.0% (4.3%) $55.65 (15.5%) (7.1%) 10.1% (47.9%) Point72 Asset Management LP 0.084 0.3% 0.9% Initiating Position $44.95 4.6% 15.0% 36.3% (35.5%) Goldman Sachs & Co. LLC (Private Banking) 0.075 0.3% 0.8% 310.1% $53.60 (12.3%) (3.5%) 14.3% (45.9%) Capital Returns Management LLC 0.074 0.3% 0.8% Initiating Position $44.95 4.6% 15.0% 36.3% (35.5%) Charles Schwab Investment Management, Inc. 0.064 0.3% 0.7% (2.2%) $48.80 (3.7%) 5.9% 25.6% (40.6%) QMA LLC 0.058 0.2% 0.6% (3.1%) $49.44 (4.9%) 4.6% 23.9% (41.3%) OMERS Administration Corp. 0.048 0.2% 0.5% Initiating Position $44.95 4.6% 15.0% 36.3% (35.5%) Citadel Advisors LLC 0.048 0.2% 0.5% (6.7%) $44.75 5.0% 15.5% 36.9% (35.2%) Boothbay Fund Management LLC 0.045 0.2% 0.5% Initiating Position $44.95 4.6% 15.0% 36.3% (35.5%) Mean $48.17 (2.4%) 7.3% 27.2% (39.8%) Weighted Avg. Cost Basis $43.85 7.2% 17.9% 39.7% (33.8%) Cost Basis Analysis – Top Holders ___________________________ Note: Holdings data per 13 - F filings dated 9/30/20. Active managers in bold. Active managers excludes quants, broker/dealers, an d index managers. Source: FactSet . Footnotes: (1) Percent change is expressed as a percentage of 6/30/20 shares held. (2) Cost Basis as of 9 /30/20 per FactSet . (3) Offer price of $47.00. (4) Position as of 12/31/19, per disclosure requirements. (4) Top 25 Holders of FBL and Returns AVP 7
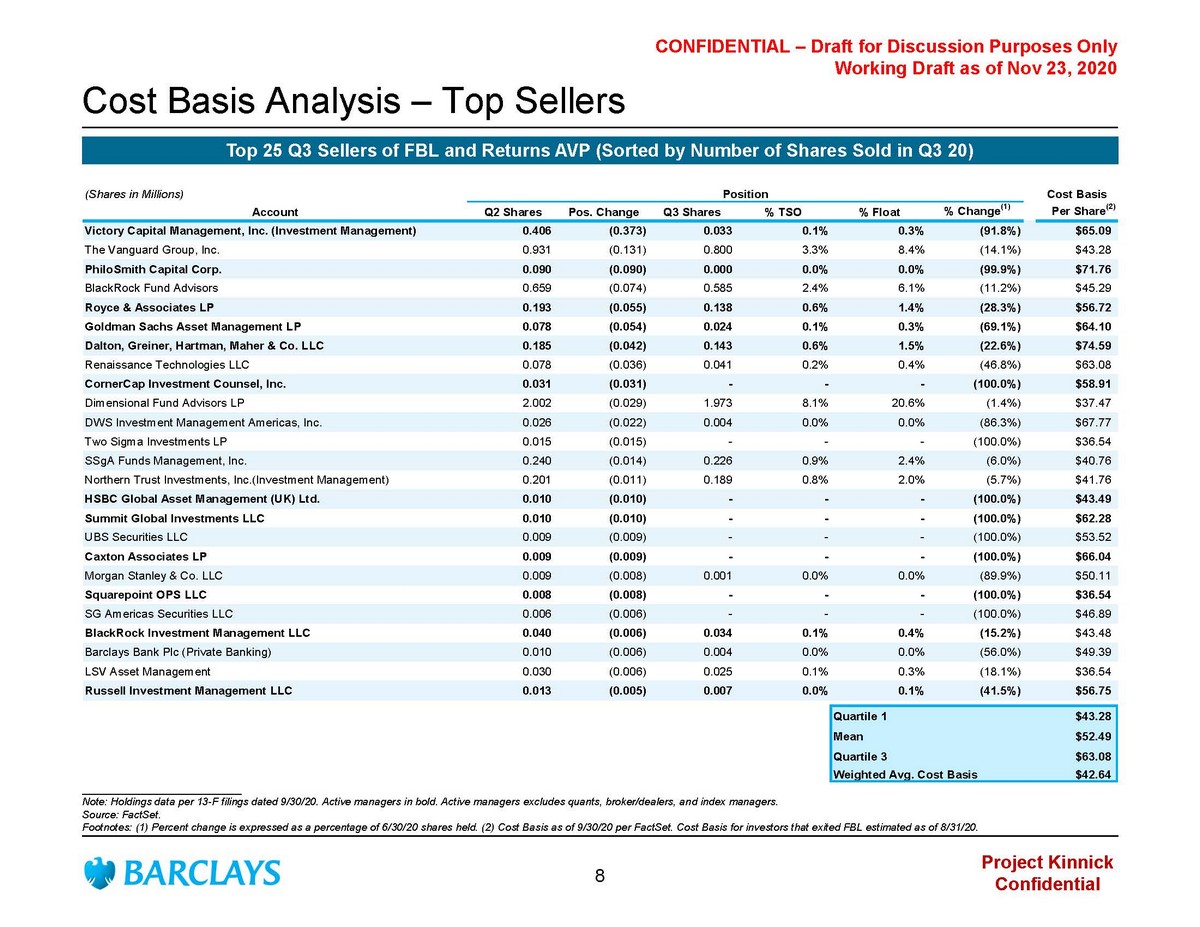
Project Kinnick Confidential CONFIDENTIAL – Draft for Discussion Purposes Only Working Draft as of Nov 23, 2020 Cost Basis Analysis – Top Sellers ___________________________ Note: Holdings data per 13 - F filings dated 9/30/20. Active managers in bold. Active managers excludes quants, broker/dealers, an d index managers. Source: FactSet . Footnotes: (1) Percent change is expressed as a percentage of 6/30/20 shares held. (2) Cost Basis as of 9 /30/20 per FactSet . Cost Basis for investors that exited FBL estimated as of 8/31/20. Return AVP (Shares in Millions) Position Cost Basis Account Q2 Shares Pos. Change Q3 Shares % TSO % Float % Change (1) Per Share (2) Victory Capital Management, Inc. (Investment Management) 0.406 (0.373) 0.033 0.1% 0.3% (91.8%) $65.09 The Vanguard Group, Inc. 0.931 (0.131) 0.800 3.3% 8.4% (14.1%) $43.28 PhiloSmith Capital Corp. 0.090 (0.090) 0.000 0.0% 0.0% (99.9%) $71.76 BlackRock Fund Advisors 0.659 (0.074) 0.585 2.4% 6.1% (11.2%) $45.29 Royce & Associates LP 0.193 (0.055) 0.138 0.6% 1.4% (28.3%) $56.72 Goldman Sachs Asset Management LP 0.078 (0.054) 0.024 0.1% 0.3% (69.1%) $64.10 Dalton, Greiner, Hartman, Maher & Co. LLC 0.185 (0.042) 0.143 0.6% 1.5% (22.6%) $74.59 Renaissance Technologies LLC 0.078 (0.036) 0.041 0.2% 0.4% (46.8%) $63.08 CornerCap Investment Counsel, Inc. 0.031 (0.031) - - - (100.0%) $58.91 Dimensional Fund Advisors LP 2.002 (0.029) 1.973 8.1% 20.6% (1.4%) $37.47 DWS Investment Management Americas, Inc. 0.026 (0.022) 0.004 0.0% 0.0% (86.3%) $67.77 Two Sigma Investments LP 0.015 (0.015) - - - (100.0%) $36.54 SSgA Funds Management, Inc. 0.240 (0.014) 0.226 0.9% 2.4% (6.0%) $40.76 Northern Trust Investments, Inc.(Investment Management) 0.201 (0.011) 0.189 0.8% 2.0% (5.7%) $41.76 HSBC Global Asset Management (UK) Ltd. 0.010 (0.010) - - - (100.0%) $43.49 Summit Global Investments LLC 0.010 (0.010) - - - (100.0%) $62.28 UBS Securities LLC 0.009 (0.009) - - - (100.0%) $53.52 Caxton Associates LP 0.009 (0.009) - - - (100.0%) $66.04 Morgan Stanley & Co. LLC 0.009 (0.008) 0.001 0.0% 0.0% (89.9%) $50.11 Squarepoint OPS LLC 0.008 (0.008) - - - (100.0%) $36.54 SG Americas Securities LLC 0.006 (0.006) - - - (100.0%) $46.89 BlackRock Investment Management LLC 0.040 (0.006) 0.034 0.1% 0.4% (15.2%) $43.48 Barclays Bank Plc (Private Banking) 0.010 (0.006) 0.004 0.0% 0.0% (56.0%) $49.39 LSV Asset Management 0.030 (0.006) 0.025 0.1% 0.3% (18.1%) $36.54 Russell Investment Management LLC 0.013 (0.005) 0.007 0.0% 0.1% (41.5%) $56.75 Quartile 1 $43.28 Mean $52.49 Quartile 3 $63.08 Weighted Avg. Cost Basis $42.64 Top 25 Q3 Sellers of FBL and Returns AVP (Sorted by Number of Shares S old in Q3 20) 8

Valuation Reference Materials
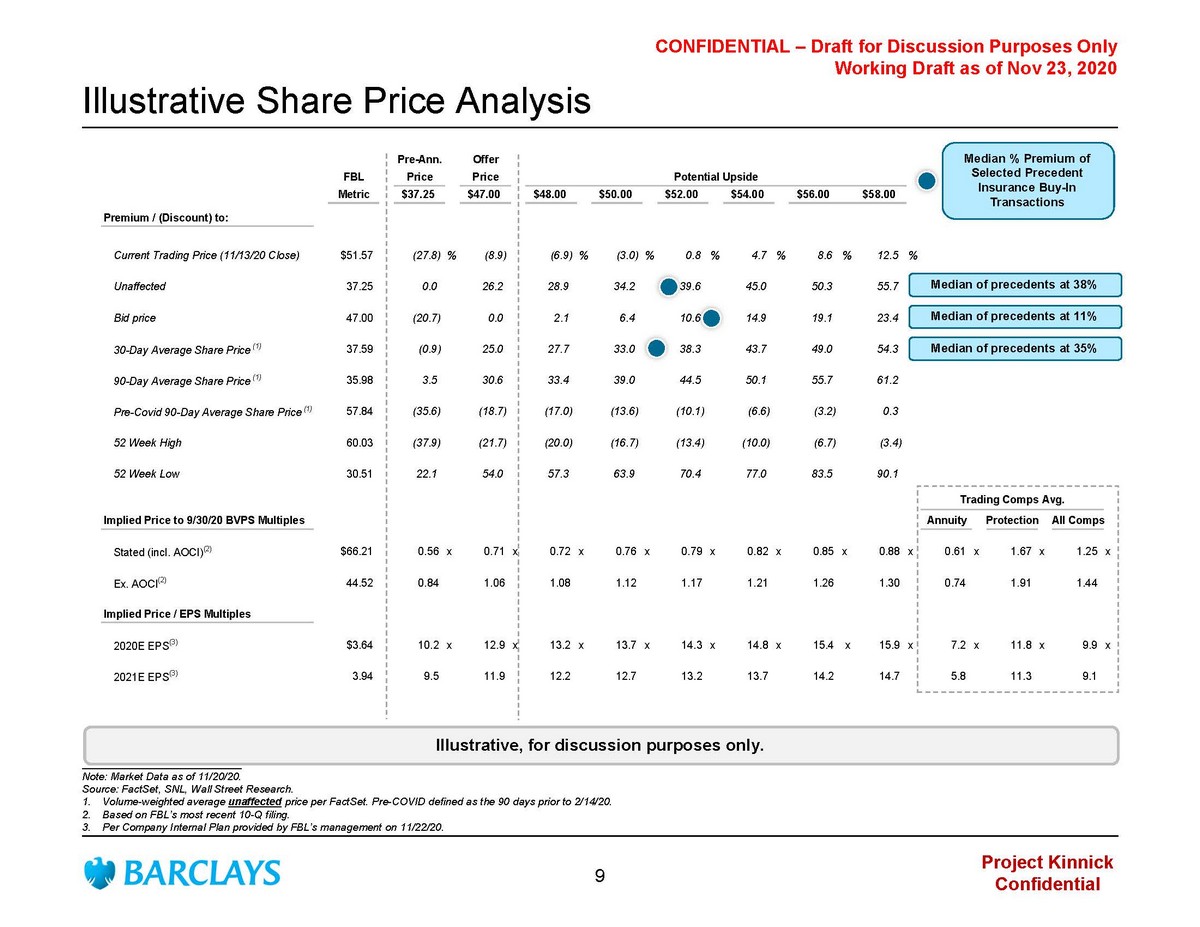
Project Kinnick Confidential CONFIDENTIAL – Draft for Discussion Purposes Only Working Draft as of Nov 23, 2020 Pre-Ann. Offer FBL Price Price Potential Upside Metric $37.25 $47.00 $48.00 $50.00 $52.00 $54.00 $56.00 $58.00 Premium / (Discount) to: Current Trading Price (11/13/20 Close) $51.57 (27.8) % (8.9) (6.9) % (3.0) % 0.8 % 4.7 % 8.6 % 12.5 % Unaffected 37.25 0.0 26.2 28.9 34.2 39.6 45.0 50.3 55.7 Bid price 47.00 (20.7) 0.0 2.1 6.4 10.6 14.9 19.1 23.4 30-Day Average Share Price (1) 37.59 (0.9) 25.0 27.7 33.0 38.3 43.7 49.0 54.3 90-Day Average Share Price (1) 35.98 3.5 30.6 33.4 39.0 44.5 50.1 55.7 61.2 Pre-Covid 90-Day Average Share Price (1) 57.84 (35.6) (18.7) (17.0) (13.6) (10.1) (6.6) (3.2) 0.3 52 Week High 60.03 (37.9) (21.7) (20.0) (16.7) (13.4) (10.0) (6.7) (3.4) 52 Week Low 30.51 22.1 54.0 57.3 63.9 70.4 77.0 83.5 90.1 Trading Comps Avg. Implied Price to 9/30/20 BVPS Multiples Annuity Protection All Comps Stated (incl. AOCI) (2) $66.21 0.56 x 0.71 x 0.72 x 0.76 x 0.79 x 0.82 x 0.85 x 0.88 x 0.61 x 1.67 x 1.25 x Ex. AOCI (2) 44.52 0.84 1.06 1.08 1.12 1.17 1.21 1.26 1.30 0.74 1.91 1.44 Implied Price / EPS Multiples 2020E EPS (3) $3.64 10.2 x 12.9 x 13.2 x 13.7 x 14.3 x 14.8 x 15.4 x 15.9 x 7.2 x 11.8 x 9.9 x 2021E EPS (3) 3.94 9.5 11.9 12.2 12.7 13.2 13.7 14.2 14.7 5.8 11.3 9.1 Illustrative Share Price Analysis ___________________________ Note: Market Data as of 11/20/20. Source: FactSet, SNL, Wall Street Research. 1. Volume - weighted average unaffected price per FactSet . Pre - COVID defined as the 90 days prior to 2/14/20. 2. Based on FBL’s most recent 10 - Q filing. 3. Per Company Internal Plan provided by FBL’s management on 11/22/20. Illustrative, for discussion purposes only. Median % Premium of Selected P recedent I nsurance B uy - In T ransactions Median of precedents at 38% Median of precedents at 35% Median of precedents at 11% 9
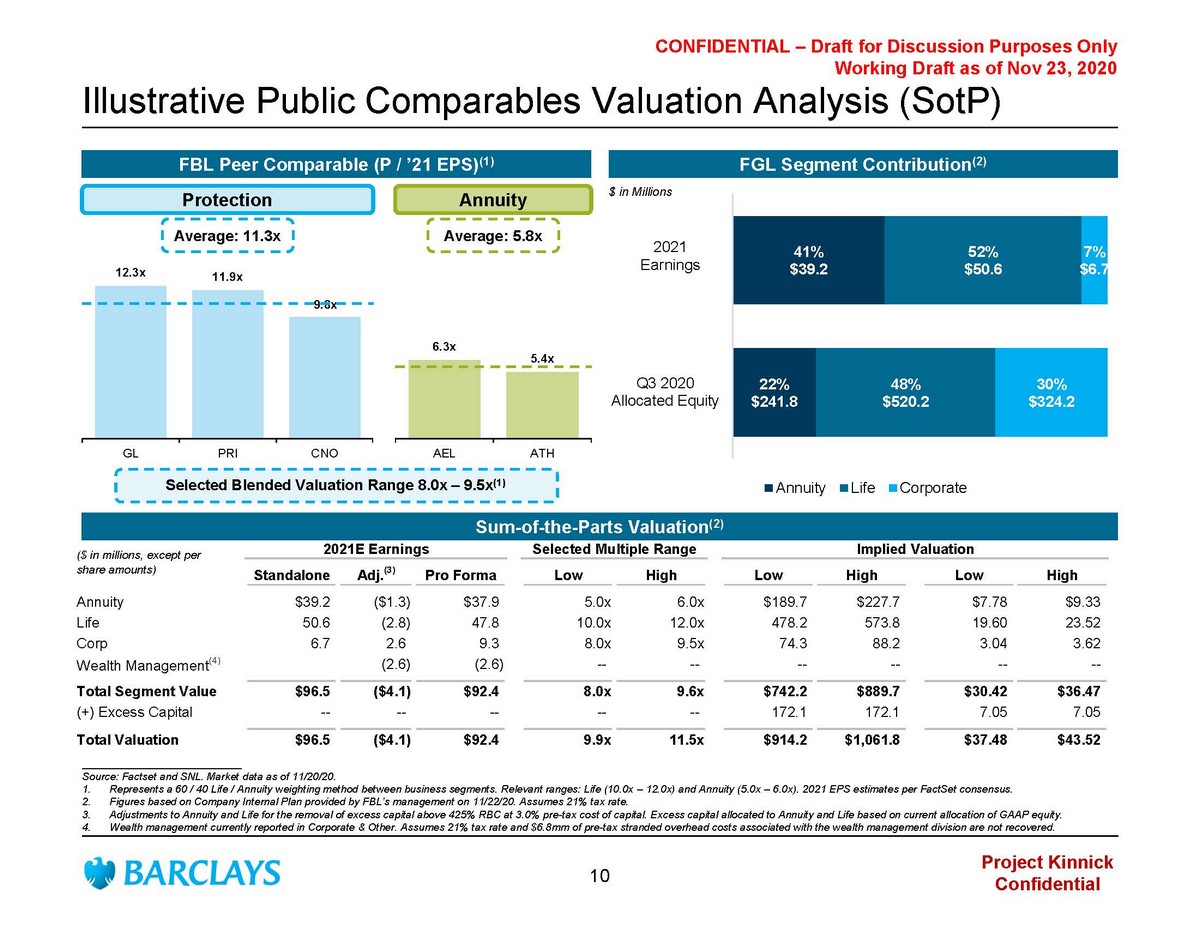
Project Kinnick Confidential CONFIDENTIAL – Draft for Discussion Purposes Only Working Draft as of Nov 23, 2020 22% $241.8 41% $39.2 48% $520.2 52% $50.6 30% $324.2 7% $6.7 Q3 2020 Allocated Equity 2021 Earnings Annuity Life Corporate Illustrative Public Comparables Valuation Analysis ( SotP ) FBL Peer Comparable (P / ’21 EPS) (1) ___________________________ Source: Factset and SNL. Market data as of 11/20/20. 1. Represents a 60 / 40 Life / Annuity weighting method between business segments. Relevant ranges: Life (10.0x – 12.0x) and Annuit y (5.0x – 6.0x). 2021 EPS estimates per FactSet consensus. 2. Figures based on Company Internal Plan provided by FBL’s management on 11/22/20. Assumes 21% tax rate. 3. Adjustments to Annuity and Life for the removal of excess capital above 425% RBC at 3.0% pre - tax cost of capital. Excess capital allocated to Annuity and Life based on current allocation of GAAP equity. 4. Wealth management currently reported in Corporate & Other. A ssumes 21% tax rate and $6.8mm of pre - tax stranded overhead costs associated with the wealth management division are not recover ed. FGL Segment Contribution (2) Sum - of - the - Parts Valuation (2) Selected Blended Valuation Range 8.0x – 9.5x (1) 2021E Earnings Selected Multiple Range Implied Valuation Standalone Adj. (3) Pro Forma Low High Low High Low High Annuity $39.2 ($1.3) $37.9 5.0x 6.0x $189.7 $227.7 $7.78 $9.33 Life 50.6 (2.8) 47.8 10.0x 12.0x 478.2 573.8 19.60 23.52 Corp 6.7 2.6 9.3 8.0x 9.5x 74.3 88.2 3.04 3.62 Wealth Management (4) (2.6) (2.6) -- -- -- -- -- -- Total Segment Value $96.5 ($4.1) $92.4 8.0x 9.6x $742.2 $889.7 $30.42 $36.47 (+) Excess Capital -- -- -- -- -- 172.1 172.1 7.05 7.05 Total Valuation $96.5 ($4.1) $92.4 9.9x 11.5x $914.2 $1,061.8 $37.48 $43.52 ($ in millions, except per share amounts) $ in Millions 12.3x 11.9x 9.8x GL PRI CNO Annuity Average: 11.3x Average: 5.8x Protection 6.3x 5.4x AEL ATH 2021 Earnings 10
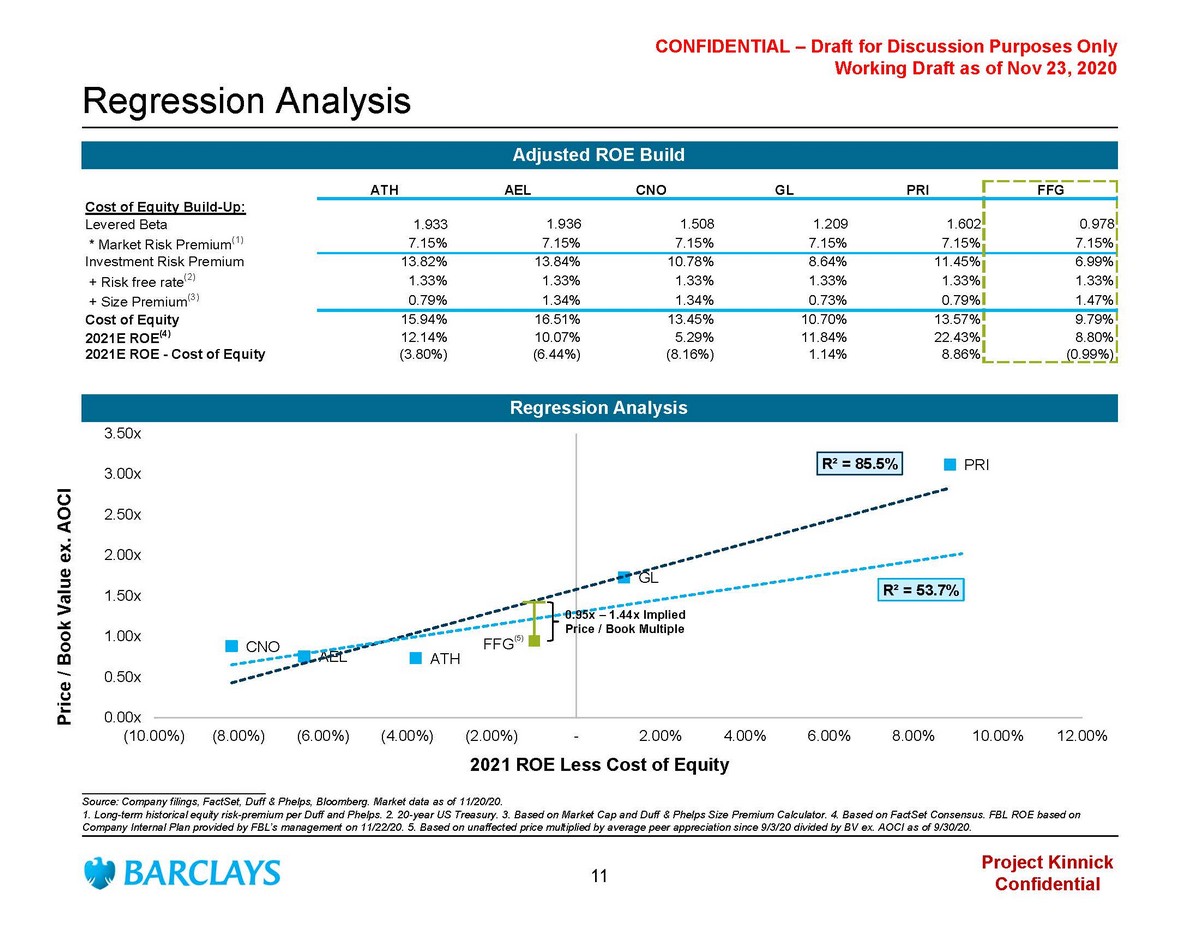
Project Kinnick Confidential CONFIDENTIAL – Draft for Discussion Purposes Only Working Draft as of Nov 23, 2020 ATH AEL CNO GL PRI FFG R² = 85.5% R² = 53.7% 0.00x 0.50x 1.00x 1.50x 2.00x 2.50x 3.00x 3.50x (10.00%) (8.00%) (6.00%) (4.00%) (2.00%) - 2.00% 4.00% 6.00% 8.00% 10.00% 12.00% ___________________________ Source: Company filings, FactSet, Duff & Phelps, Bloomberg. Market data as of 11/20/20. 1. Long - term historical equity risk - premium per Duff and Phelps. 2. 20 - year US Treasury. 3. Based on Market Cap and Duff & Phelp s Size Premium Calculator. 4. Based on FactSet Consensus. FBL ROE based on Company Internal Plan provided by FBL’s management on 11/22/20 . 5. Based on unaffected price multiplied by average peer appreciation since 9/3/20 divided by BV ex. AOCI as of 9/30/20. Regression Analysis Regression Analysis Price / Book Value ex. AOCI 2021 ROE Less Cost of Equity Adjusted ROE Build ATH AEL CNO GL PRI FFG Cost of Equity Build-Up: Levered Beta 1.933 1.936 1.508 1.209 1.602 0.978 * Market Risk Premium (1) 7.15% 7.15% 7.15% 7.15% 7.15% 7.15% Investment Risk Premium 13.82% 13.84% 10.78% 8.64% 11.45% 6.99% + Risk free rate (2) 1.33% 1.33% 1.33% 1.33% 1.33% 1.33% + Size Premium (3) 0.79% 1.34% 1.34% 0.73% 0.79% 1.47% Cost of Equity 15.94% 16.51% 13.45% 10.70% 13.57% 9.79% 2021E ROE (4) 12.14% 10.07% 5.29% 11.84% 22.43% 8.80% 2021E ROE - Cost of Equity (3.80%) (6.44%) (8.16%) 1.14% 8.86% (0.99%) (5) 0.95x – 1.44x Implied Price / Book Multiple 11
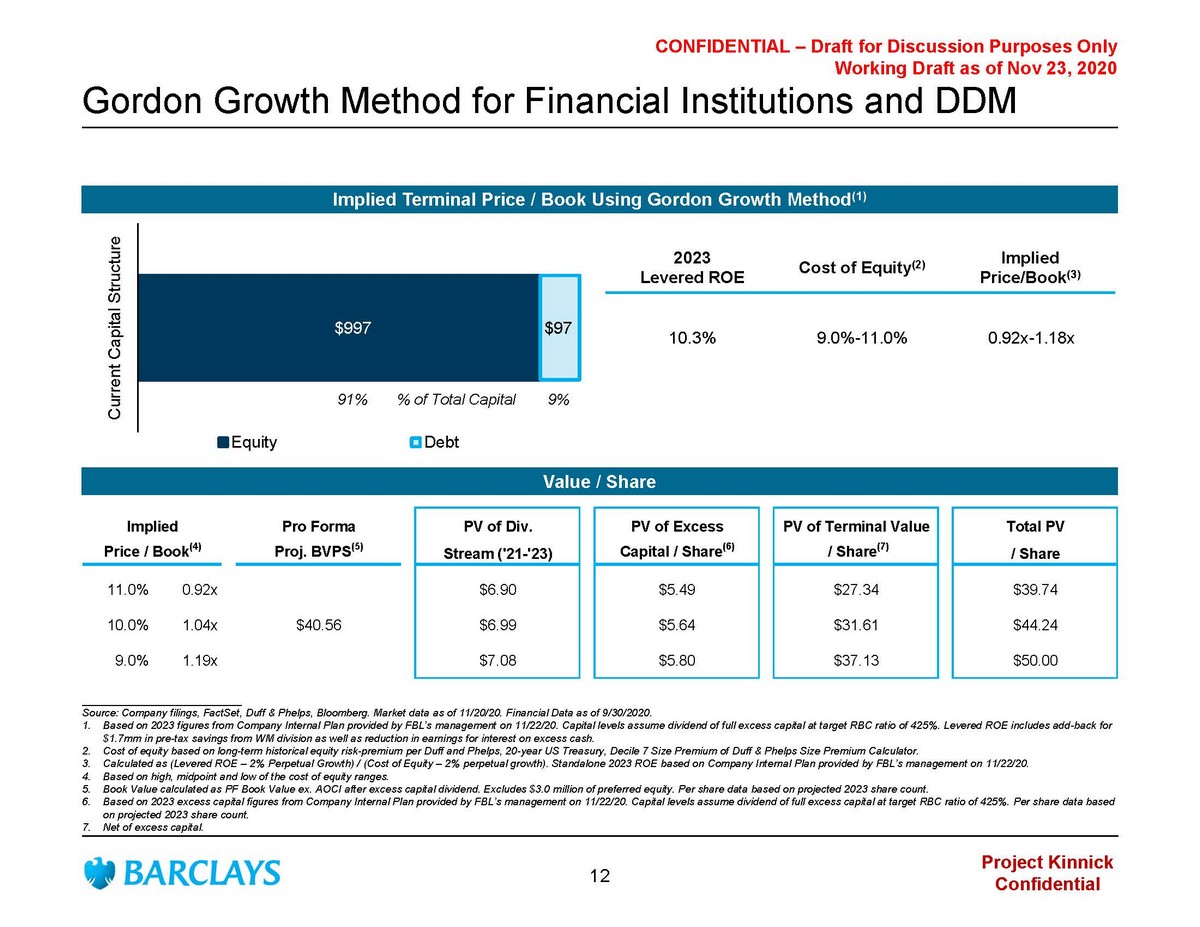
Project Kinnick Confidential CONFIDENTIAL – Draft for Discussion Purposes Only Working Draft as of Nov 23, 2020 $997 $97 Current Capital Structure Equity Debt 2023 Levered ROE Cost of Equity (2) Implied Price/Book (3) 10.3% 9.0% - 11.0% 0.92 x - 1.18x Gordon Growth Method for Financial Institutions and DDM Implied Terminal Price / Book Using Gordon Growth Method (1) Value / Share ___________________________ Source: Company filings, FactSet , Duff & Phelps, Bloomberg. Market data as of 11/20/20. Financial Data as of 9/30/2020. 1. B ased on 2023 figures from Company Internal Plan provided by FBL’s management on 11/22/20. Capital levels assume dividend of full excess capital at target RBC ratio of 425%. Levered ROE includes add - back for $1.7mm in pre - tax savings from WM division as well as reduction in earnings for interest on excess cash. 2. Cost of equity based on long - term historical equity risk - premium per Duff and Phelps, 20 - year US Treasury, Decile 7 Size Premium of D uff & Phelps Size Premium Calculator. 3. Calculated as (Levered ROE – 2% Perpetual Growth) / (Cost of Equity – 2% perpetual growth). Standalone 2023 ROE based on Company Internal Plan provided by FBL’s management on 11/22/20. 4. Based on high, midpoint and low of the cost of equity ranges. 5. Book Value calculated as PF Book Value ex . AOCI after excess capital dividend. Excludes $3.0 million of preferred equity. Per share data b ased on projected 2023 share count. 6. Based on 2023 excess capital figures from Company Internal Plan provided by FBL’s management on 11/22/20 . Capital levels assume dividend of full excess capital at target RBC ratio of 425%. Per share data based on projected 2023 share count. 7. Net of excess capital. 91% 9 % % of Total Capital Implied Pro Forma PV of Div. PV of Excess PV of Terminal Value Total PV Price / Book (4) Proj. BVPS (5) Stream ('21-'23) Capital / Share (6) / Share (7) / Share 11.0% 0.92x $6.90 $5.49 $27.34 $39.74 10.0% 1.04x $40.56 $6.99 $5.64 $31.61 $44.24 9.0% 1.19x $7.08 $5.80 $37.13 $50.00 12
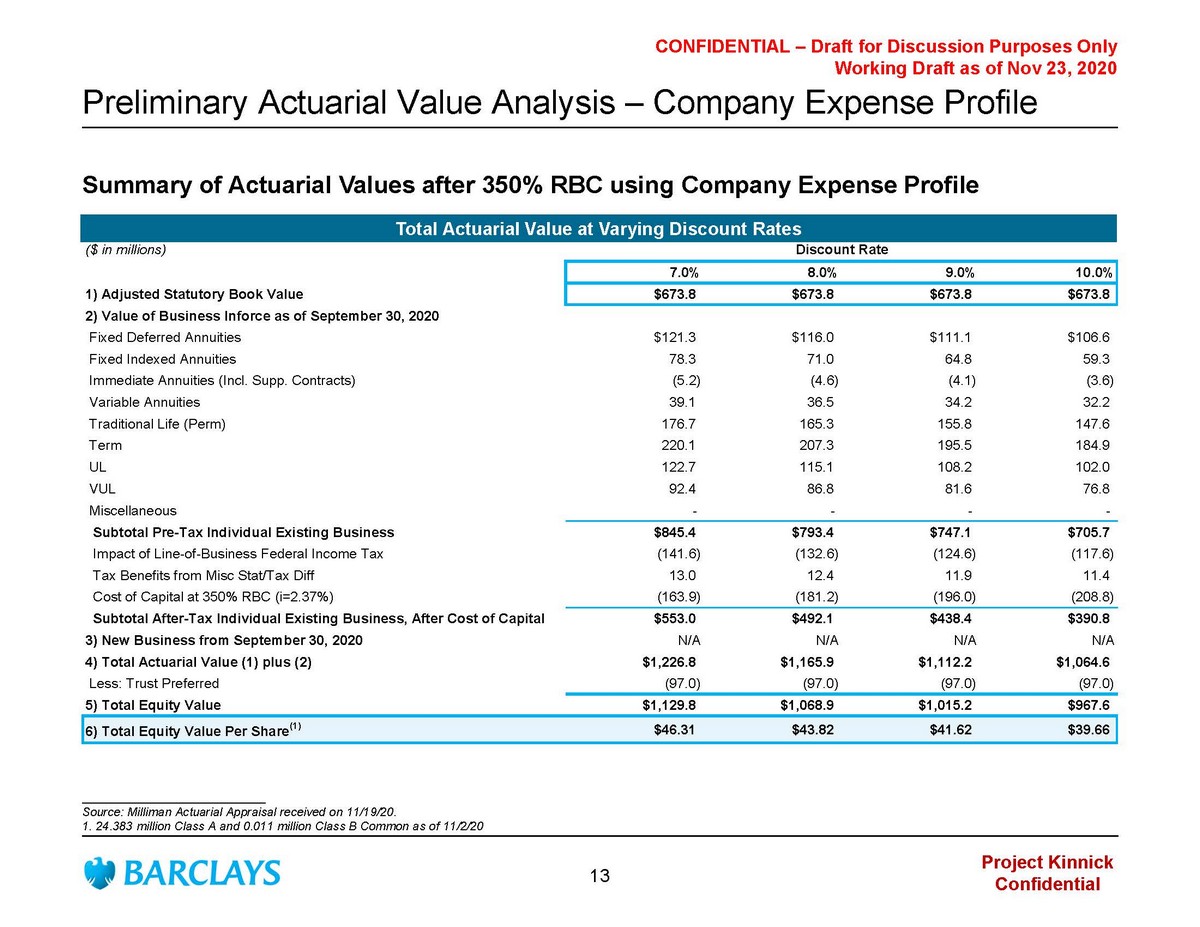
Project Kinnick Confidential CONFIDENTIAL – Draft for Discussion Purposes Only Working Draft as of Nov 23, 2020 Preliminary Actuarial Value Analysis – Company Expense Profile Summary of Actuarial Values after 350% RBC using Company Expense Profile Total Actuarial Value at Varying Discount Rates ___________________________ Source: Milliman Actuarial Appraisal received on 11/19/20. 1. 24.383 million Class A and 0.011 million Class B Common as of 11/2/20 ($ in millions) Discount Rate 7.0% 8.0% 9.0% 10.0% 1) Adjusted Statutory Book Value $673.8 $673.8 $673.8 $673.8 2) Value of Business Inforce as of September 30, 2020 Fixed Deferred Annuities $121.3 $116.0 $111.1 $106.6 Fixed Indexed Annuities 78.3 71.0 64.8 59.3 Immediate Annuities (Incl. Supp. Contracts) (5.2) (4.6) (4.1) (3.6) Variable Annuities 39.1 36.5 34.2 32.2 Traditional Life (Perm) 176.7 165.3 155.8 147.6 Term 220.1 207.3 195.5 184.9 UL 122.7 115.1 108.2 102.0 VUL 92.4 86.8 81.6 76.8 Miscellaneous - - - - Subtotal Pre-Tax Individual Existing Business $845.4 $793.4 $747.1 $705.7 Impact of Line-of-Business Federal Income Tax (141.6) (132.6) (124.6) (117.6) Tax Benefits from Misc Stat/Tax Diff 13.0 12.4 11.9 11.4 Cost of Capital at 350% RBC (i=2.37%) (163.9) (181.2) (196.0) (208.8) Subtotal After-Tax Individual Existing Business, After Cost of Capital $553.0 $492.1 $438.4 $390.8 3) New Business from September 30, 2020 N/A N/A N/A N/A 4) Total Actuarial Value (1) plus (2) $1,226.8 $1,165.9 $1,112.2 $1,064.6 Less: Trust Preferred (97.0) (97.0) (97.0) (97.0) 5) Total Equity Value $1,129.8 $1,068.9 $1,015.2 $967.6 6) Total Equity Value Per Share (1) $46.31 $43.82 $41.62 $39.66 13
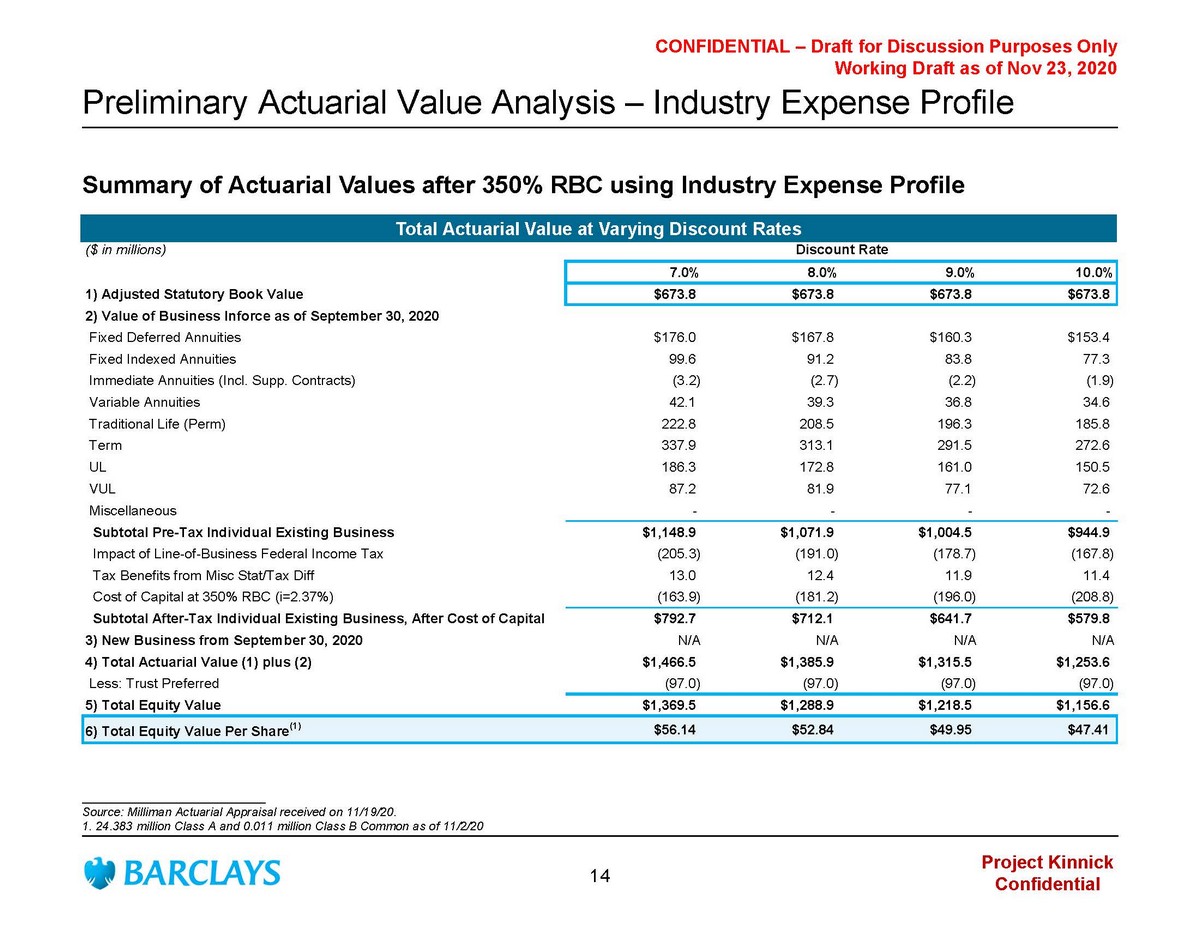
Project Kinnick Confidential CONFIDENTIAL – Draft for Discussion Purposes Only Working Draft as of Nov 23, 2020 Preliminary Actuarial Value Analysis – Industry Expense Profile ___________________________ Source: Milliman Actuarial Appraisal received on 11/19/20. 1. 24.383 million Class A and 0.011 million Class B Common as of 11/2/20 ($ in millions) Discount Rate 7.0% 8.0% 9.0% 10.0% 1) Adjusted Statutory Book Value $673.8 $673.8 $673.8 $673.8 2) Value of Business Inforce as of September 30, 2020 Fixed Deferred Annuities $176.0 $167.8 $160.3 $153.4 Fixed Indexed Annuities 99.6 91.2 83.8 77.3 Immediate Annuities (Incl. Supp. Contracts) (3.2) (2.7) (2.2) (1.9) Variable Annuities 42.1 39.3 36.8 34.6 Traditional Life (Perm) 222.8 208.5 196.3 185.8 Term 337.9 313.1 291.5 272.6 UL 186.3 172.8 161.0 150.5 VUL 87.2 81.9 77.1 72.6 Miscellaneous - - - - Subtotal Pre-Tax Individual Existing Business $1,148.9 $1,071.9 $1,004.5 $944.9 Impact of Line-of-Business Federal Income Tax (205.3) (191.0) (178.7) (167.8) Tax Benefits from Misc Stat/Tax Diff 13.0 12.4 11.9 11.4 Cost of Capital at 350% RBC (i=2.37%) (163.9) (181.2) (196.0) (208.8) Subtotal After-Tax Individual Existing Business, After Cost of Capital $792.7 $712.1 $641.7 $579.8 3) New Business from September 30, 2020 N/A N/A N/A N/A 4) Total Actuarial Value (1) plus (2) $1,466.5 $1,385.9 $1,315.5 $1,253.6 Less: Trust Preferred (97.0) (97.0) (97.0) (97.0) 5) Total Equity Value $1,369.5 $1,288.9 $1,218.5 $1,156.6 6) Total Equity Value Per Share (1) $56.14 $52.84 $49.95 $47.41 Total Actuarial Value at Varying Discount Rates Summary of Actuarial Values after 350% RBC using Industry Expense Profile 14

Appendices
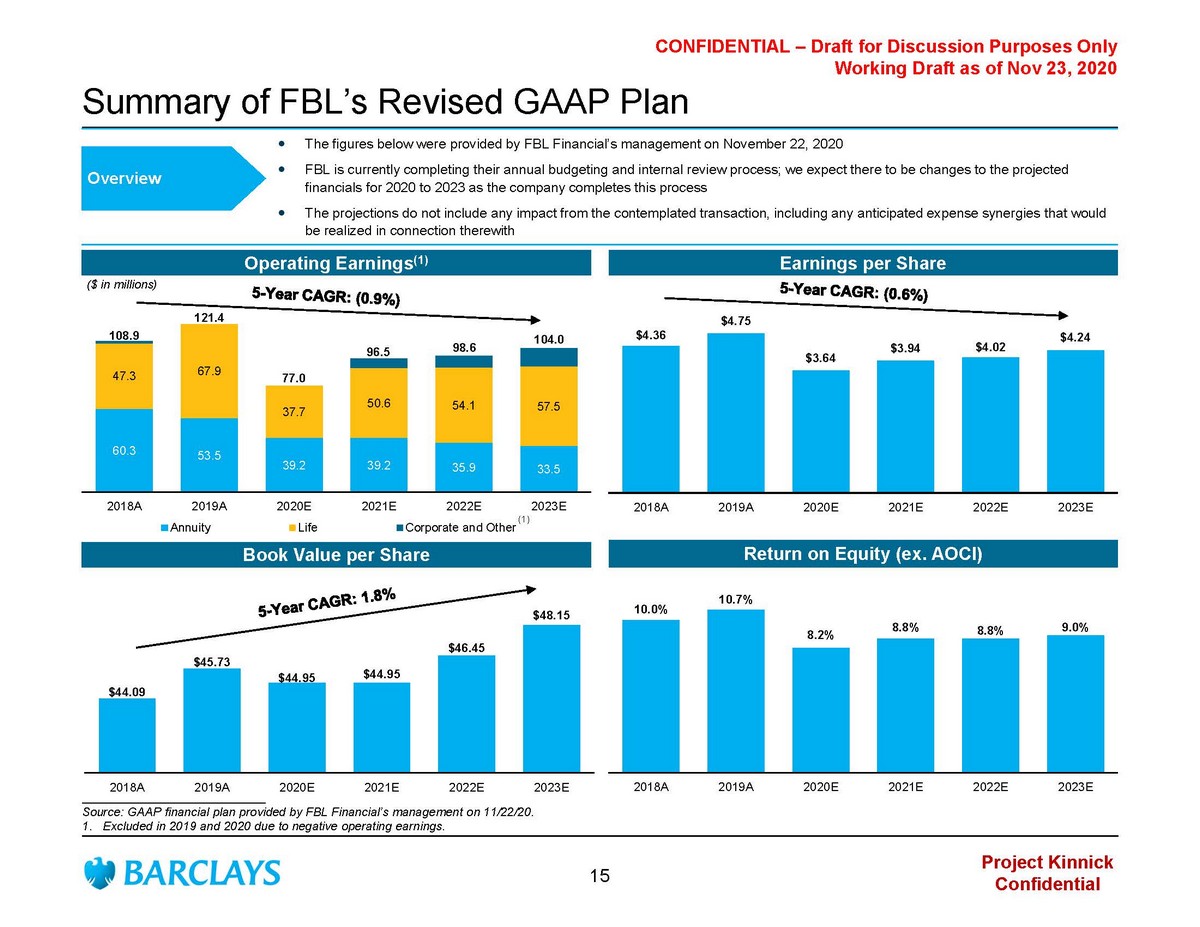
Project Kinnick Confidential CONFIDENTIAL – Draft for Discussion Purposes Only Working Draft as of Nov 23, 2020 Summary of FBL’s Revised GAAP Plan The figures below were provided by FBL Financial’s management on November 22, 2020 FBL is currently completing their annual budgeting and internal review process; we expect there to be changes to the projecte d financials for 2020 to 2023 as the company completes this process The projections do not include any impact from the contemplated transaction, including any anticipated expense synergies that wo uld be realized in connection therewith Overview Operating Earnings (1) Earnings per Share Book Value per Share Return on Equity (ex. AOCI) 60.3 53.5 39.2 39.2 35.9 33.5 47.3 67.9 37.7 50.6 54.1 57.5 2018A 2019A 2020E 2021E 2022E 2023E ($ in millions) Annuity Life Corporate and Other $4.36 $4.75 $3.64 $3.94 $4.02 $4.24 2018A 2019A 2020E 2021E 2022E 2023E 108.9 121.4 77.0 96.5 98.6 104.0 $44.09 $45.73 $44.95 $44.95 $46.45 $48.15 2018A 2019A 2020E 2021E 2022E 2023E 10.0% 10.7% 8.2% 8.8% 8.8% 9.0% 2018A 2019A 2020E 2021E 2022E 2023E ___________________________ Source: GAAP financial plan provided by FBL Financial’s management on 11/22/20. 1. Excluded in 2019 and 2020 due to negative operating earnings. (1) 15
Project Kinnick Confidential CONFIDENTIAL – Draft for Discussion Purposes Only Working Draft as of Nov 23, 2020 Disclaimer The prior pages contain material that was provided to the Special Committee of the Board of Directors (the “Special Committee ”) of FBL Financial Group, Inc. (the “Company”) by Barclays Capital Inc. (“Barclays”). The accompanying material and any Barclays presentation related to the material was compiled or pr epa red on a confidential basis solely for consideration by the Special Committee and no part of it may be reproduced, distributed or transmitted without the prior written consent of Barcla ys. The information contained in this material was obtained from the Company, and/or publicly available sources, and Barclays has relied upon such information without independent verification th ere of and does not assume any liability for any such information. These materials are being provided in connection with an actual corporate engagement and may not be used or relied upon for a ny purpose other than as specifically contemplated by a written agreement with Barclays. Moreover, any information provided herein was not prepared for or intended for use by any individual fo r personal, family or household purposes. Any estimates, historical financial information, projections and other information contained herein have been prepared by man age ment of the Company and Milliman , Inc. or were obtained from publicly available sources (approved for Barclays’ use by the Company) or are based upon such estimates and projections. Wi th respect to such estimates and projections, Barclays has assumed that they have been reasonably prepared on a basis reflecting the best currently available estimates, projections and ju dgment of the management of the Company or Milliman , Inc. The projections contained herein may or may not be achieved and differences between projected results and those actually achi eve d may be material. No representation or warranty, expressed or implied, is made as to the accuracy or completeness of such information and nothing contained herein is, or shal l b e relied upon as, a promise or representation, whether as to the past or the future. The analysis contained herein is based on current market conditions which are subject to change and B arc lays assumes no obligation to update or otherwise revise these materials. Nothing in these materials shall be deemed to constitute a recommendation or investment, legal, tax, financi al, accounting or other advice. Because these materials were prepared for use in the context of a presentation to the Special Committee, these materials are inc omplete without reference to, and should be assessed solely in conjunction with, the oral briefing provided by Barclays to the Special Committee (in their capacity as directors and not in any individual capacity and is not for the benefit of any individual, including any individual officer, director, shareholder or any other person). These materials were not prepared for or intend ed for use by any individual for personal, family or household purposes nor were they prepared to comply with the disclosure standards under state and federal securities laws or any other app licable laws and, to the extent the material may be considered by readers not as familiar with the business and affairs of the Company as the Special Committee, none of the Company, Barcla ys, their respective affiliates or any of their respective legal or financial advisors or accountants takes any responsibility for the accuracy or completeness of any of the material if used by pe rsons other than the Special Committee. These materials are not intended to provide the sole basis for evaluation of the proposed corporate transaction and do not purport to contain all inf orm ation that may be required and should not be considered a recommendation with respect to the proposed corporate transaction. Barclays has not made or obtained any evaluations or appraisals of the assets or liabilities of the Company or any other part y t o any corporate transaction or any of their respective affiliates and has no obligation to evaluate the solvency of the Company or any other party to any transaction under any state or federa l l aws relating to bankruptcy, insolvency or similar matters. The analyses contained herein do not purport to be appraisals nor do they necessarily reflect the prices at which businesses or s ecu rities actually may be sold or purchased. Barclays’ role in any due diligence review is limited solely to performing such a review as it shall deem necessary to support its own advice and a nal ysis and shall not be on behalf of the Company, the Special Committee or any individual officer, director, shareholder or any other person. Barclays, its subsidiaries and affiliates engage in a wide range of businesses from investment and commercial banking, lendin g, asset management and other financial and non - financial services. In the ordinary course of its business, Barclays and its affiliates may actively trade and effect transactions in t he equity, debt and/or other securities (and any derivatives thereof) and financial instruments (including loans and other obligations) of the Company for its own account and for the accounts of its cus tomers and, accordingly, may at any time hold long or short positions and investments in such securities and financial instruments or in other financial products and instruments. Unless ot herwise expressly agreed or provided for in other applicable Barclays disclosures governing such corporate transactions or required by law or regulation, Barclays conducts these activiti es as principal and executes its principal transactions as an arm’s length counterparty. Barclays does not act as a fiduciary in relation to these corporate transactions. These materials do not constitute investment advice nor do they form part of an offer to sell or purchase, or the solicitatio n o f an offer to sell or purchase, any securities or any of the businesses or assets described herein or an offer of financing or an offer or recommendation to enter into any corporate tran sac tion described herein. Barclays Capital Inc. is the United States investment bank of Barclays Bank PLC. Barclays Bank PLC is authorised by the Prudential Regulation Authority and regulated by the Financial Conduct Authority and the Prudential Regulation Authority (Financial Services Register No. 122702). Registered in England. Re gis tered No. 1026167. Registered office: 1 Churchill Place, London E14 5HP. Copyright Barclays Bank PLC, 2020 (all rights reserved). 16