.2 Q4 2025 Earnings Presentation J a n u a r y 2 2 , 2 0 2 6
Forward-looking Statements and Additional Information This presentation contains forward-looking statements within the meaning of the federal securities laws that are made by Norwood Financial Corp (“Norwood”). All statements other than statements of historical fact are statements that could be deemed forward-looking statements, including all statements regarding the intent, belief or current expectations of Norwood and members of its board of directors and senior management teams. Investors and security holders are cautioned that such statements are predictions, and are not guarantees of future performance. Actual events or results may differ materially. Expected financial results or other plans are subject to a number of known and unknown risks, uncertainties and assumptions that are difficult to assess and are subject to change based on factors which are, in many instances, beyond Norwood’s control. Additional risks and uncertainties may include, but are not limited to, the risk that expected cost savings, revenue synergies and other financial benefits from the recently completed merger with PB Bankshares, Inc. (“PB Bankshares”) may not be realized or take longer than expected to realize; the merger may be more expensive to complete than anticipated, including as a result of unexpected factors or events; the integration of PB Bankshares’ business and operations with those of Norwood may take longer than anticipated, may be more costly than anticipated and may have unanticipated adverse results relating to Norwood’s existing businesses; the anticipated cost savings and other synergies of the merger may take longer to be realized or may not be achieved in their entirety, and attrition in key client, partner and other relationships relating to the merger may be greater than expected; the ability to achieve anticipated merger-related operational efficiencies; the ability to enhance revenue through increased market penetration, expanded lending capacity and product offerings; changes in monetary and fiscal policies of the Federal Reserve Board and the U. S. Government, particularly related to changes in interest rates; changes in general economic conditions, especially the effects of current fluctuations in tariff policies, impacts of workforce deportations, the proliferation of legal actions challenging government policies, and substantial reductions in force of government and non-government organization employees, all of which may put pressure on supply chains and exacerbate market volatility; occurrence of natural or man-made disasters or calamities, including health emergencies, the spread of infectious diseases, pandemics or outbreaks of hostilities, or the effects of climate change, and the ability of Norwood and its customers to deal effectively with disruptions caused by the foregoing; legislative or regulatory changes; downturn in demand for loan, deposit and other financial services in our market area; increased competition from other banks and non-bank providers of financial services; technological changes and increased technology-related costs; and changes in accounting principles, or the application of generally accepted accounting principles. For further information regarding these risks and uncertainties and additional factors that could cause results to differ materially from those contained in the forward-looking statements, see the forward-looking statement disclosure contained in the Quarterly Report on Form 10-Q for the quarter ended September 30, 2025, as well as the other documents subsequently filed by Norwood with the Securities and Exchange Commission (www.sec.gov). Due to these and other possible uncertainties and risks, Norwood can give no assurance that the results contemplated in the forward-looking statements will be realized, and readers are cautioned not to place undue reliance on the forward-looking statements contained in this presentation. Forward-looking statements are based on information currently available to Norwood, and Norwood assumes no obligation and disclaim any intent to update any such forward-looking statements. All forward-looking statements, express or implied, included in the presentation are qualified in their entirety by this cautionary statement. NON-GAAP FINANCIAL MEASURES In addition to results presented in accordance with GAAP, this presentation includes certain non-GAAP financial measures. Norwood believes these non-GAAP financial measures provide additional information that is useful to investors in helping to understand underlying financial performance and condition and trends of Norwood. Non-GAAP financial measures have inherent limitations. Readers should be aware of these limitations and should be cautious with respect to the use of such measures. To compensate for these limitations, non-GAAP measures are used as comparative tools, together with GAAP measures, to assist in the evaluation of operating performance or financial condition. These measures are also calculated using the appropriate GAAP or regulatory components in their entirety and are computed in a manner intended to facilitate consistent period-to-period comparisons. Norwood’s method of calculating these non-GAAP measures may differ from methods used by other companies. These non-GAAP measures should not be considered in isolation or as a substitute or an alternative for those financial measures prepared in accordance with GAAP or in-effect regulatory requirements. Numbers in this presentation may not sum due to rounding. Where non-GAAP financial measures are used, the most directly comparable GAAP or regulatory financial measure, as well as the reconciliation to the most directly comparable GAAP or regulatory financial measure, can be found in this presentation. 2
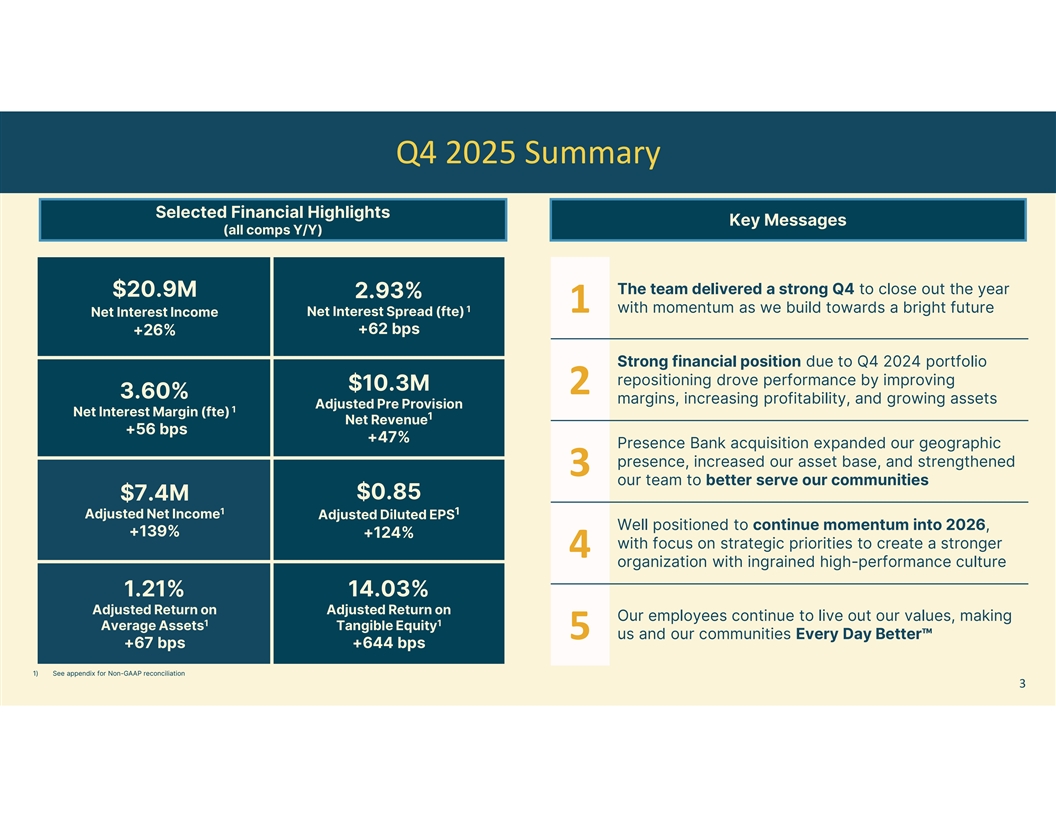
Q4 2025 Summary Selected Financial Highlights Key Messages (all comps Y/Y) The team delivered a strong Q4 to close out the year $20.9M 2.93% 1 1 with momentum as we build towards a bright future Net Interest Spread (fte) Net Interest Income +62 bps +26% Strong financial position due to Q4 2024 portfolio repositioning drove performance by improving $10.3M 2 3.60% margins, increasing profitability, and growing assets Adjusted Pre Provision 1 Net Interest Margin (fte) 1 Net Revenue +56 bps +47% Presence Bank acquisition expanded our geographic presence, increased our asset base, and strengthened 3 our team to better serve our communities $0.85 $7.4M 1 1 Adjusted Net Income Adjusted Diluted EPS Well positioned to continue momentum into 2026, +139% +124% with focus on strategic priorities to create a stronger 4 organization with ingrained high-performance culture 1.21% 14.03% Adjusted Return on Adjusted Return on Our employees continue to live out our values, making 1 1 Average Assets Tangible Equity 5 us and our communities Every Day Better +67 bps +644 bps 1) See appendix for Non-GAAP reconciliation 3
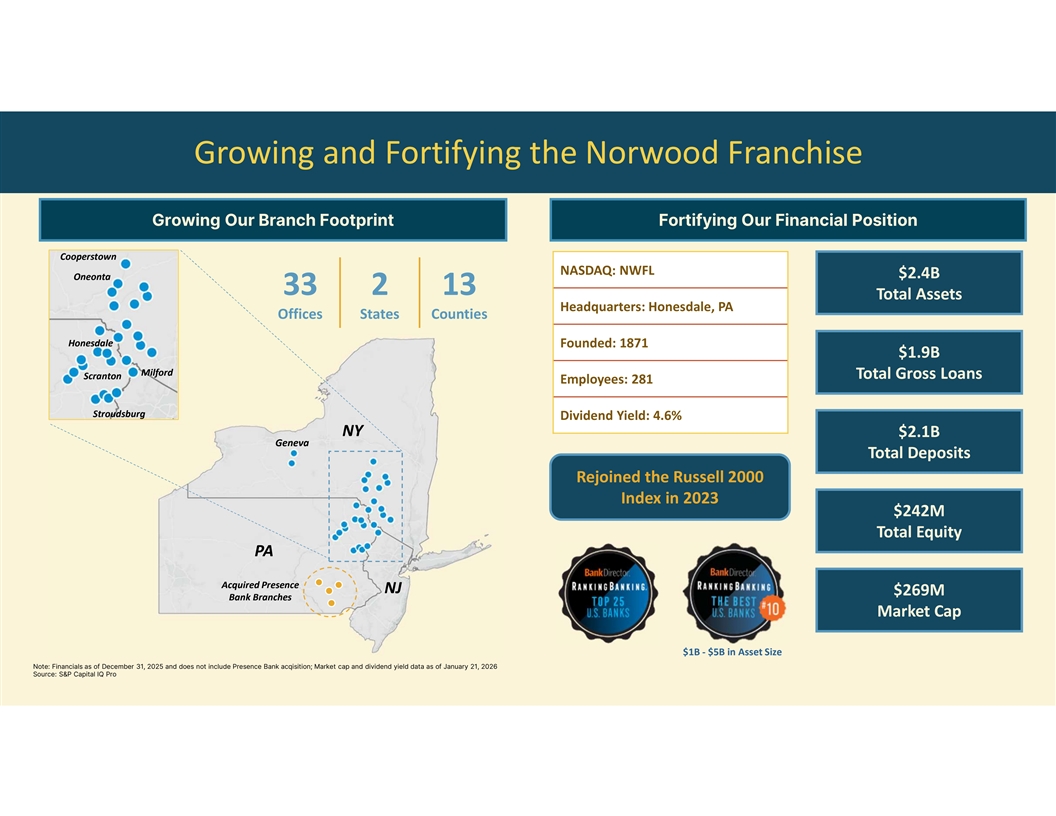
Growing and Fortifying the Norwood Franchise Growing Our Branch Footprint Fortifying Our Financial Position Cooperstown NASDAQ: NWFL $2.4B Oneonta 33 2 13 Total Assets Headquarters: Honesdale, PA Offices States Counties Honesdale Founded: 1871 $1.9B Milford Total Gross Loans Scranton Employees: 281 Stroudsburg Dividend Yield: 4.6% NY $2.1B Geneva Total Deposits Rejoined the Russell 2000 Index in 2023 $242M Total Equity PA Acquired Presence NJ $269M Bank Branches Market Cap $1B - $5B in Asset Size Note: Financials as of December 31, 2025 and does not include Presence Bank acqisition; Market cap and dividend yield data as of January 21, 2026 Source: S&P Capital IQ Pro
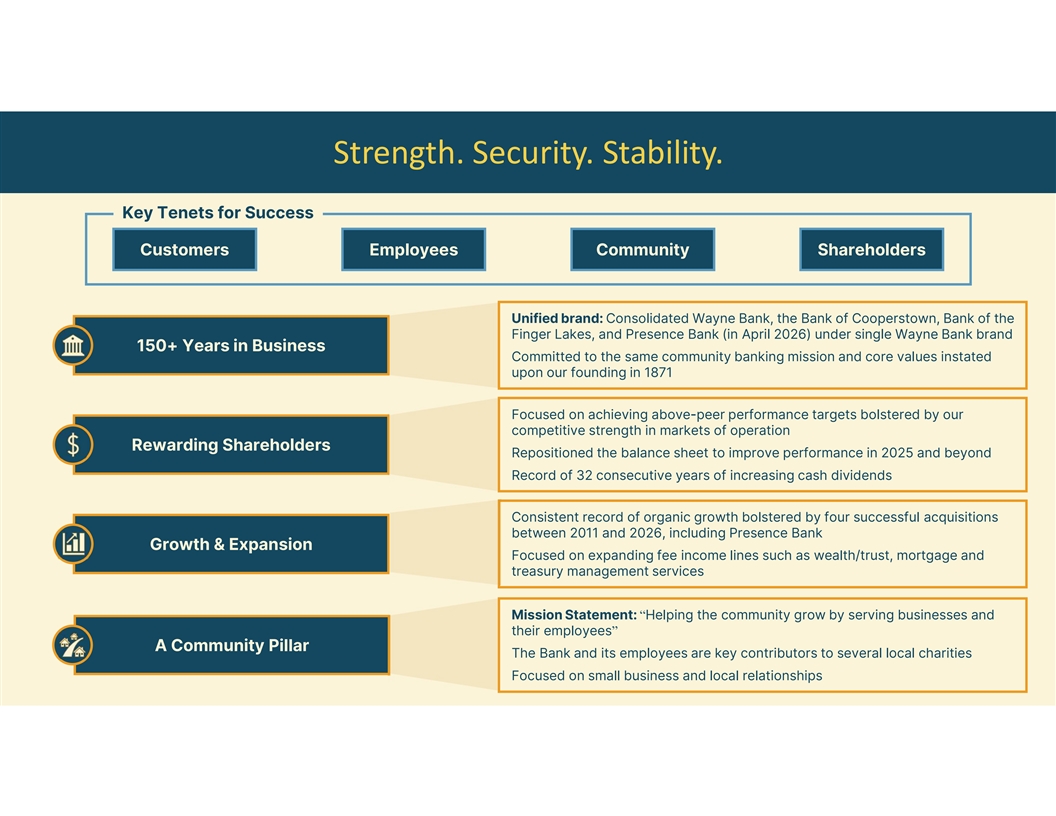
Strength. Security. Stability. Key Tenets for Success Customers Employees Community Shareholders Unified brand: Consolidated Wayne Bank, the Bank of Cooperstown, Bank of the Finger Lakes, and Presence Bank (in April 2026) under single Wayne Bank brand 150+ Years in Business Committed to the same community banking mission and core values instated upon our founding in 1871 Focused on achieving above-peer performance targets bolstered by our competitive strength in markets of operation Rewarding Shareholders Repositioned the balance sheet to improve performance in 2025 and beyond Record of 32 consecutive years of increasing cash dividends Consistent record of organic growth bolstered by four successful acquisitions between 2011 and 2026, including Presence Bank Growth & Expansion Focused on expanding fee income lines such as wealth/trust, mortgage and treasury management services Mission Statement: “Helping the community grow by serving businesses and their employees” A Community Pillar The Bank and its employees are key contributors to several local charities Focused on small business and local relationships
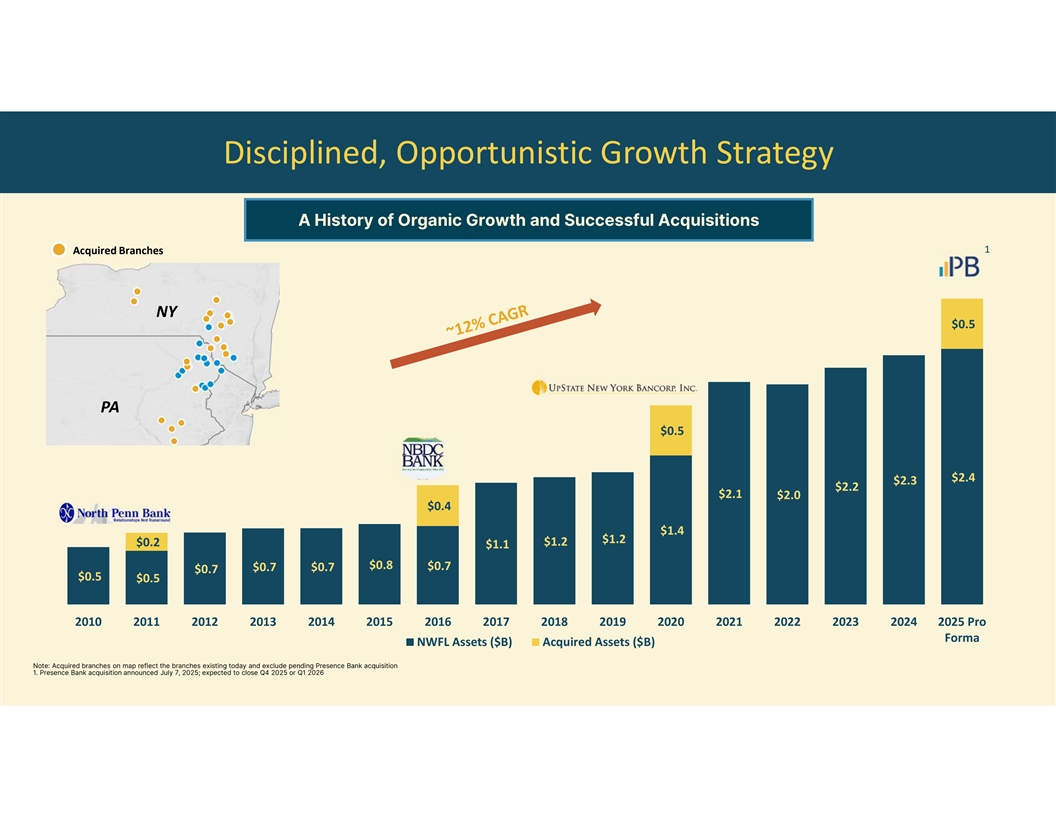
Disciplined, Opportunistic Growth Strategy A History of Organic Growth and Successful Acquisitions 1 Acquired Branches NY $0.5 PA $0.5 $2.4 $2.3 $2.2 $2.1 $2.0 $0.4 $1.4 $1.2 $1.2 $0.2 $1.1 $0.8 $0.7 $0.7 $0.7 $0.7 $0.5 $0.5 2010 2011 2012 2013 2014 2015 2016 2017 2018 2019 2020 2021 2022 2023 2024 2025 Pro Forma NWFL Assets ($B) Acquired Assets ($B) Note: Acquired branches on map reflect the branches existing today and exclude pending Presence Bank acquisition 1. Presence Bank acquisition announced July 7, 2025; expected to close Q4 2025 or Q1 2026
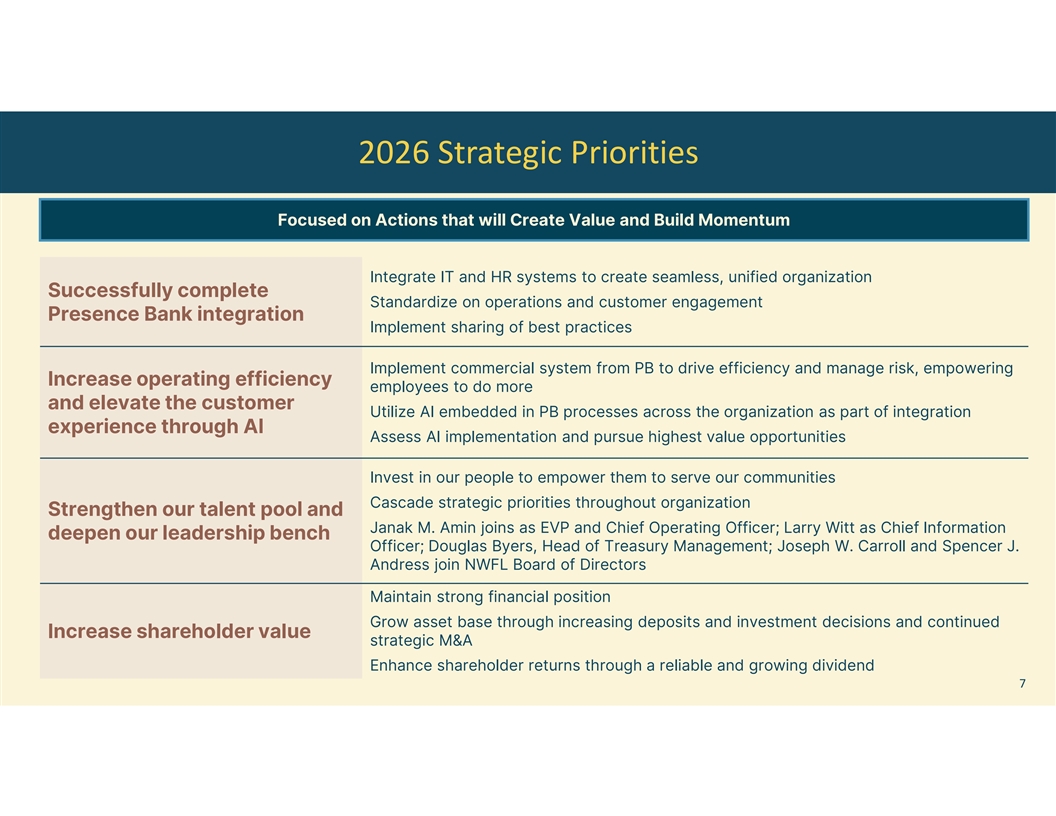
2026 Strategic Priorities Focused on Actions that will Create Value and Build Momentum Integrate IT and HR systems to create seamless, unified organization Successfully complete Standardize on operations and customer engagement Presence Bank integration Implement sharing of best practices Implement commercial system from PB to drive efficiency and manage risk, empowering Increase operating efficiency employees to do more and elevate the customer Utilize AI embedded in PB processes across the organization as part of integration experience through AI Assess AI implementation and pursue highest value opportunities Invest in our people to empower them to serve our communities Cascade strategic priorities throughout organization Strengthen our talent pool and Janak M. Amin joins as EVP and Chief Operating Officer; Larry Witt as Chief Information deepen our leadership bench Officer; Douglas Byers, Head of Treasury Management; Joseph W. Carroll and Spencer J. Andress join NWFL Board of Directors Maintain strong financial position Grow asset base through increasing deposits and investment decisions and continued Increase shareholder value strategic M&A Enhance shareholder returns through a reliable and growing dividend 7
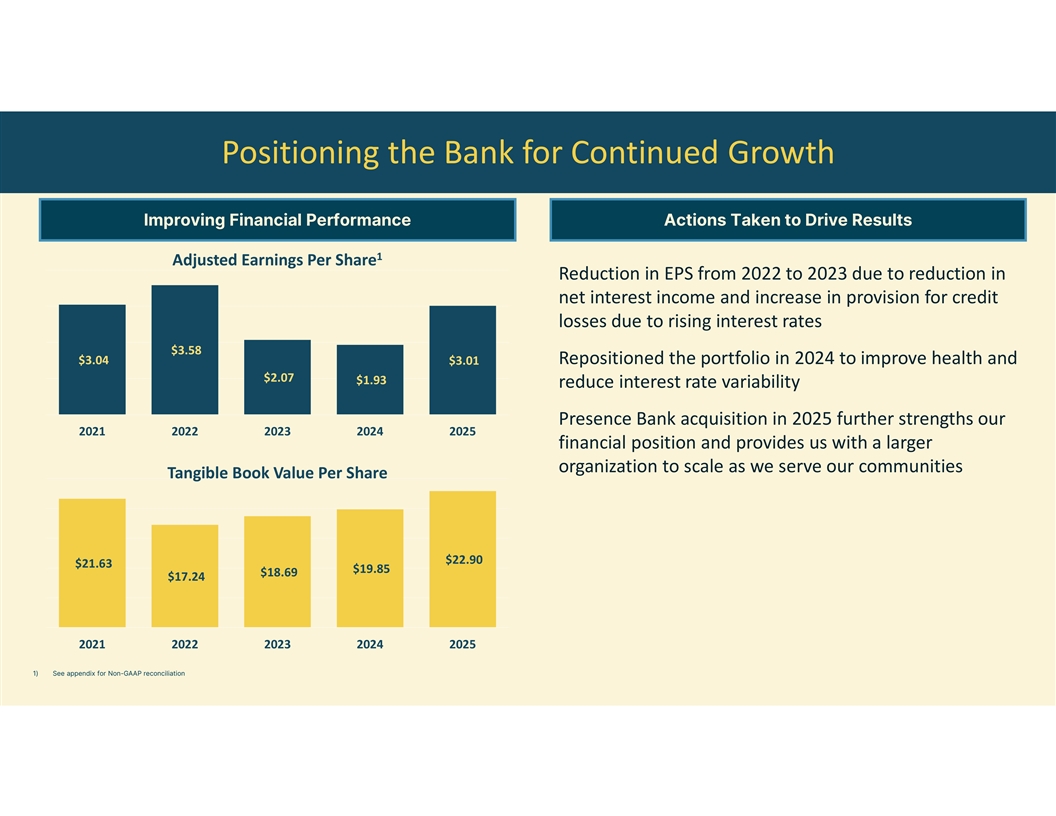
Positioning the Bank for Continued Growth Improving Financial Performance Actions Taken to Drive Results 1 Adjusted Earnings Per Share Reduction in EPS from 2022 to 2023 due to reduction in net interest income and increase in provision for credit losses due to rising interest rates $3.58 $3.04 Repositioned the portfolio in 2024 to improve health and $3.01 $2.07 $1.93 reduce interest rate variability Presence Bank acquisition in 2025 further strengths our 2021 2022 2023 2024 2025 financial position and provides us with a larger organization to scale as we serve our communities Tangible Book Value Per Share $22.90 $21.63 $19.85 $18.69 $17.24 2021 2022 2023 2024 2025 1) See appendix for Non-GAAP reconciliation
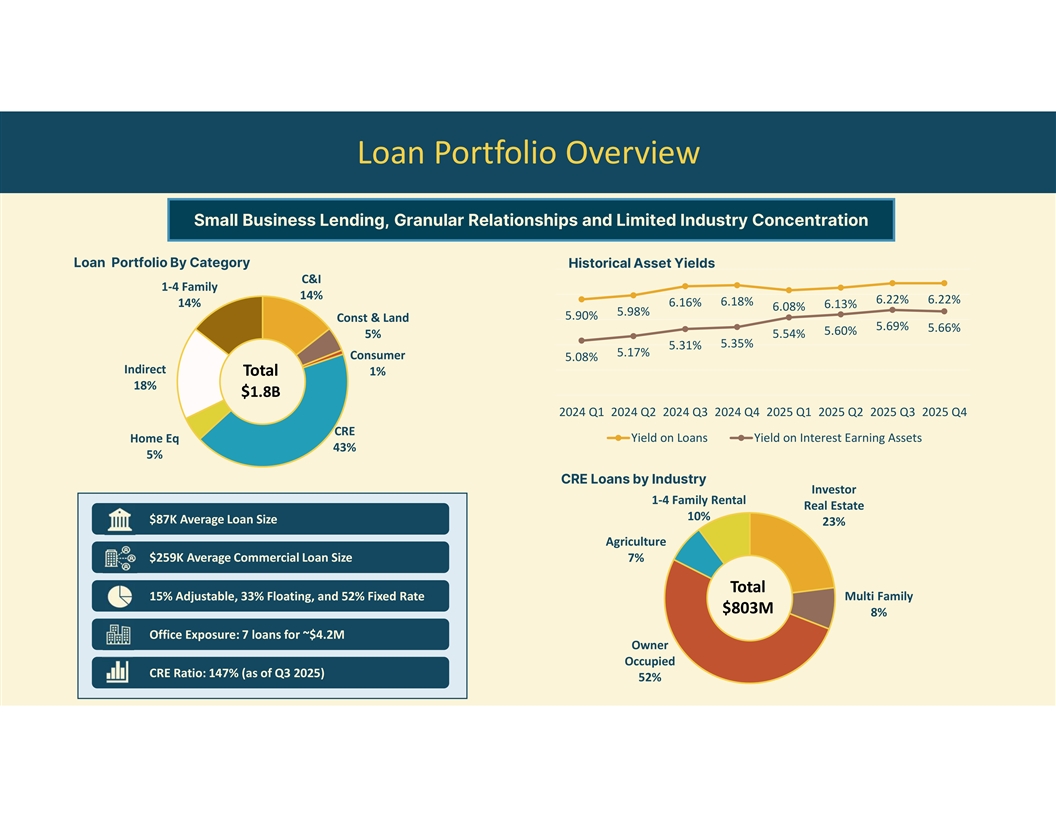
Loan Portfolio Overview Small Business Lending, Granular Relationships and Limited Industry Concentration Loan Portfolio By Category Historical Asset Yields C&I 1-4 Family 14% 6.22% 6.22% 6.18% 14% 6.16% 6.13% 6.08% 5.98% 5.90% Const & Land 5.69% 5.66% 5.60% 5% 5.54% 5.35% 5.31% 5.17% Consumer 5.08% Indirect Total 1% 18% $1.8B 2024 Q1 2024 Q2 2024 Q3 2024 Q4 2025 Q1 2025 Q2 2025 Q3 2025 Q4 CRE Home Eq Yield on Loans Yield on Interest Earning Assets 43% 5% CRE Loans by Industry Investor 1-4 Family Rental Real Estate 10% $87K Average Loan Size 23% Agriculture $259K Average Commercial Loan Size 7% Total 15% Adjustable, 33% Floating, and 52% Fixed Rate Multi Family $803M 8% Office Exposure: 7 loans for ~$4.2M Owner Occupied CRE Ratio: 147% (as of Q3 2025) 52%
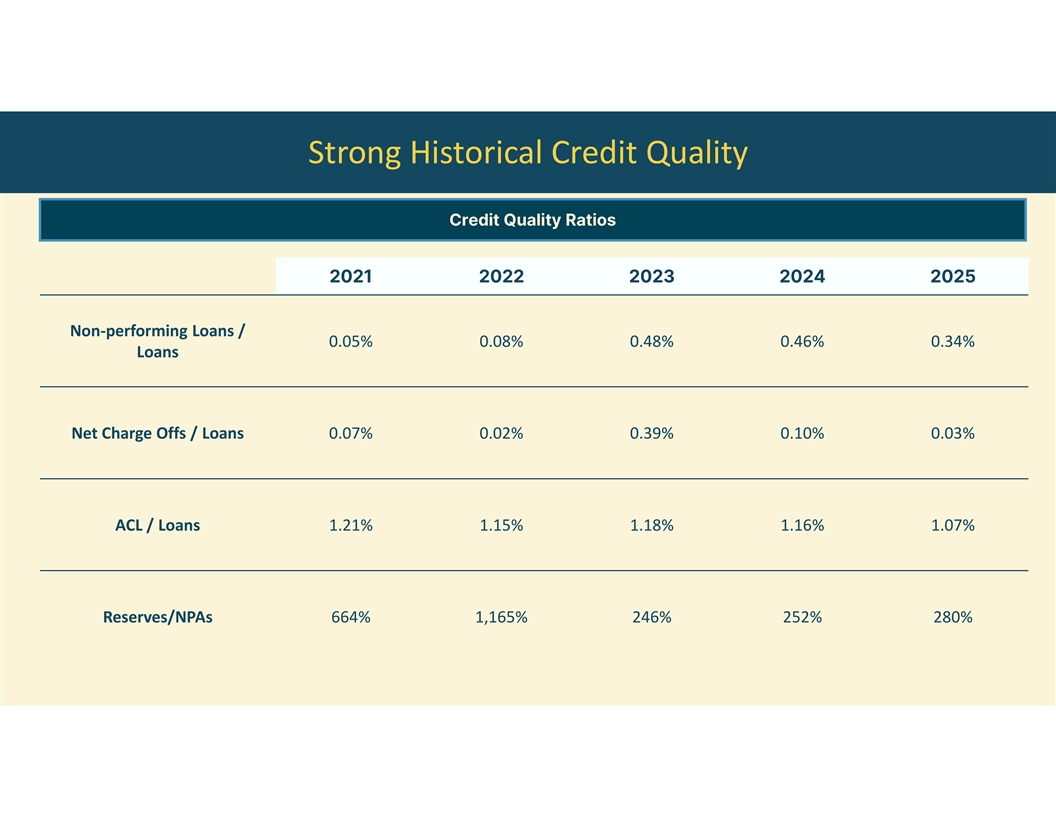
Strong Historical Credit Quality Credit Quality Ratios 2021 2022 2023 2024 2025 Non-performing Loans / 0.05% 0.08% 0.48% 0.46% 0.34% Loans Net Charge Offs / Loans 0.07% 0.02% 0.39% 0.10% 0.03% ACL / Loans 1.21% 1.15% 1.18% 1.16% 1.07% Reserves/NPAs 664% 1,165% 246% 252% 280%
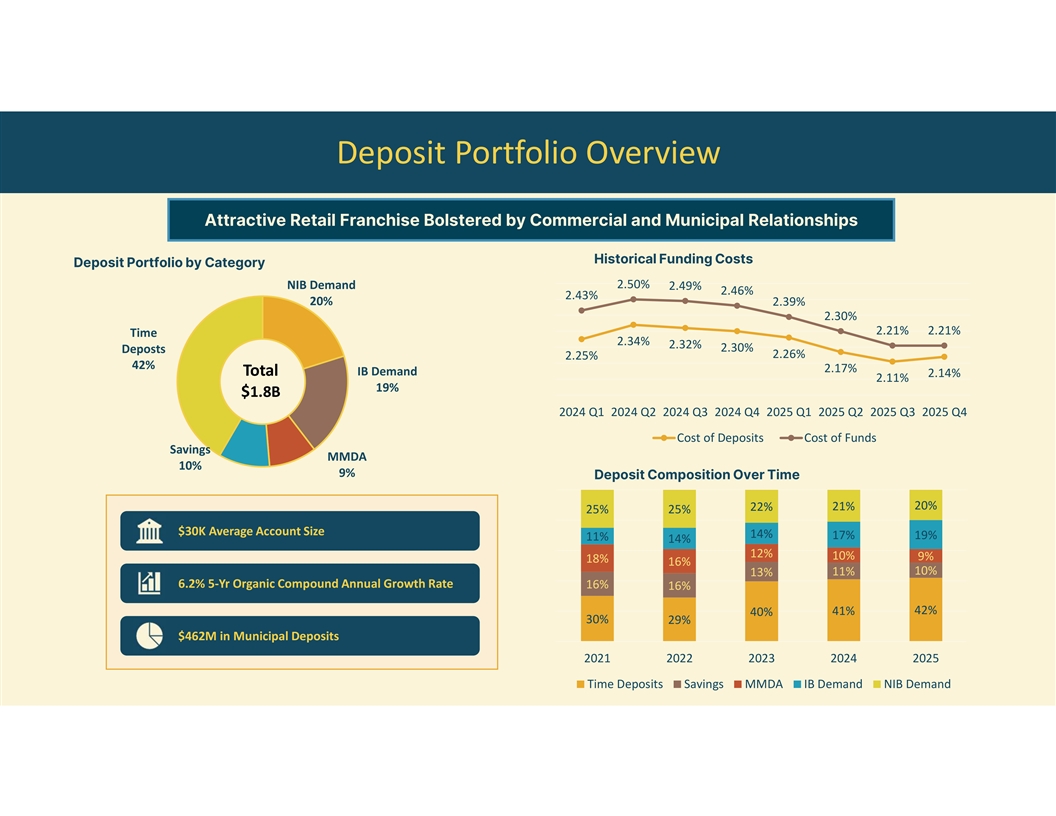
Deposit Portfolio Overview Attractive Retail Franchise Bolstered by Commercial and Municipal Relationships Historical Funding Costs Deposit Portfolio by Category 2.50% NIB Demand 2.49% 2.46% 2.43% 20% 2.39% 2.30% 2.21% 2.21% Time 2.34% 2.32% 2.30% Deposts 2.26% 2.25% 42% 2.17% Total IB Demand 2.14% 2.11% 19% $1.8B 2024 Q1 2024 Q2 2024 Q3 2024 Q4 2025 Q1 2025 Q2 2025 Q3 2025 Q4 Cost of Deposits Cost of Funds Savings MMDA 10% 9% Deposit Composition Over Time 20% 22% 21% 25% 25% $30K Average Account Size 14% 17% 19% 11% 14% 12% 10% 9% 18% 16% 10% 13% 11% 6.2% 5-Yr Organic Compound Annual Growth Rate 16% 16% 41% 42% 40% 30% 29% $462M in Municipal Deposits 2021 2022 2023 2024 2025 Time Deposits Savings MMDA IB Demand NIB Demand
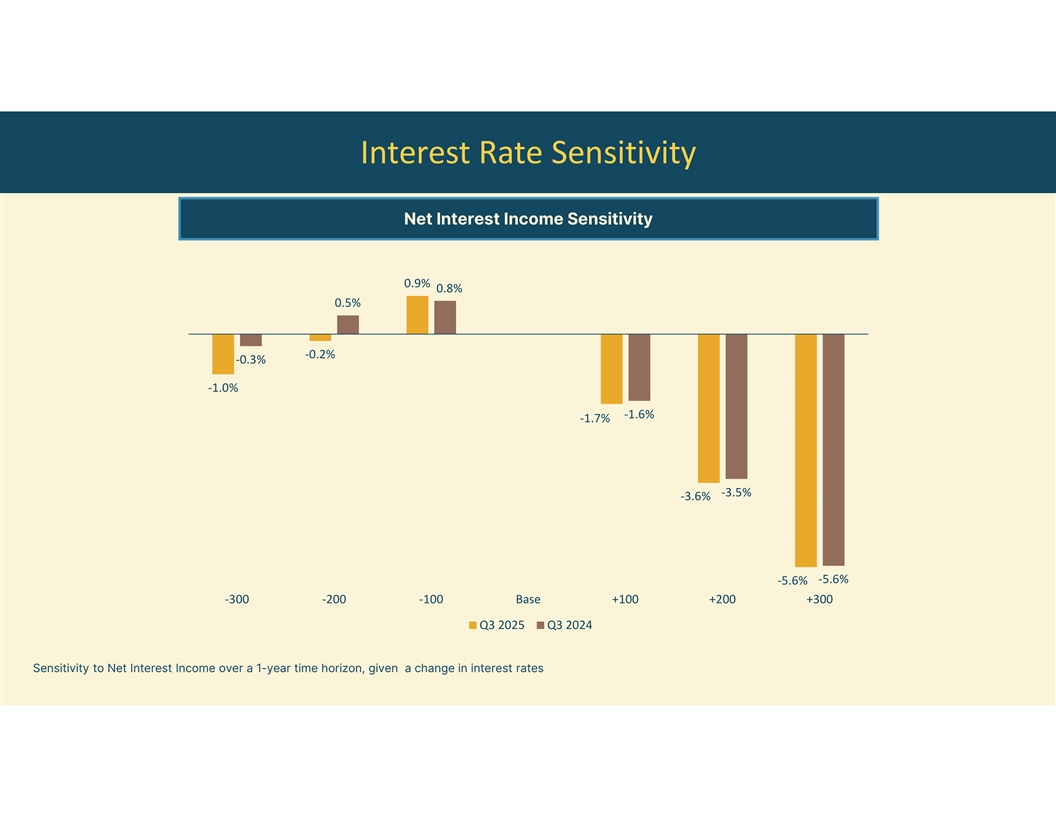
Interest Rate Sensitivity Net Interest Income Sensitivity 0.9% 0.8% 0.5% -0.2% -0.3% -1.0% -1.6% -1.7% -3.5% -3.6% -5.6% -5.6% -300 -200 -100 Base +100 +200 +300 Q3 2025 Q3 2024 Sensitivity to Net Interest Income over a 1-year time horizon, given a change in interest rates
Investment Proposition Strong local ties providing consistent Disciplined underwriting culture and sound growth opportunities Experienced Executive Team, aligned Granular loan and deposit with Board of Directors, focused on portfolio tied to our community delivering shareholder return Well-positioned to take Attractive financial profile advantage of market dislocation enhanced by recent repositioning and M&A opportunities Strength. Security. Stability.

APPENDIX
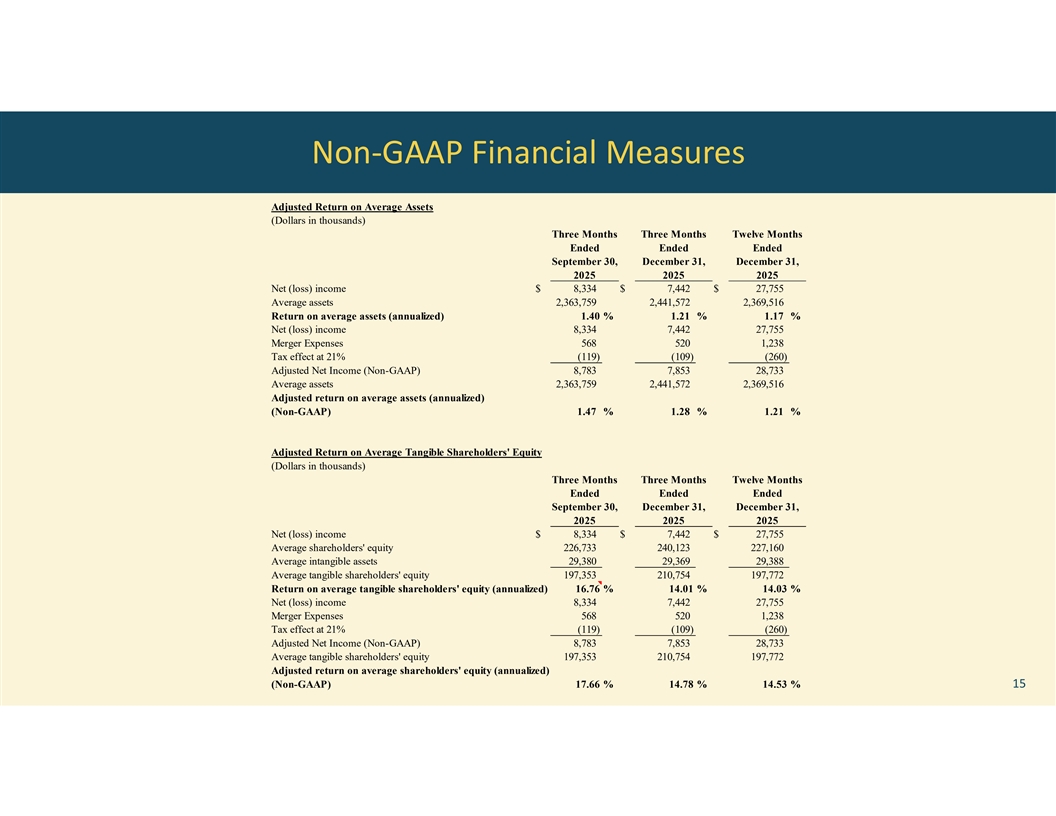
Non-GAAP Financial Measures Adjusted Return on Average Assets (Dollars in thousands) Three Months Three Months Twelve Months Ended Ended Ended September 30, December 31, December 31, 2025 2025 2025 Net (loss) income $ 8,334 $ 7,442 $ 27,755 Average assets 2,363,759 2,441,572 2,369,516 Return on average assets (annualized) 1.40 % 1.21 % 1.17 % Net (loss) income 8,334 7,442 27,755 Merger Expenses 568 520 1,238 Tax effect at 21% (119) (109) (260) Adjusted Net Income (Non-GAAP) 8,783 7,853 28,733 Average assets 2,363,759 2,441,572 2,369,516 Adjusted return on average assets (annualized) (Non-GAAP) 1.47 % 1.28 % 1.21 % Adjusted Return on Average Tangible Shareholders' Equity (Dollars in thousands) Three Months Three Months Twelve Months Ended Ended Ended September 30, December 31, December 31, 2025 2025 2025 Net (loss) income $ 8,334 $ 7,442 $ 27,755 Average shareholders' equity 226,733 240,123 227,160 Average intangible assets 29,380 29,369 29,388 Average tangible shareholders' equity 197,353 210,754 197,772 Return on average tangible shareholders' equity (annualized) 16.76 % 14.01 % 14.03 % Net (loss) income 8,334 7,442 27,755 Merger Expenses 568 520 1,238 Tax effect at 21% (119) (109) (260) Adjusted Net Income (Non-GAAP) 8,783 7,853 28,733 Average tangible shareholders' equity 197,353 210,754 197,772 Adjusted return on average shareholders' equity (annualized) (Non-GAAP) 17.66 % 14.78 % 14.53 % 15
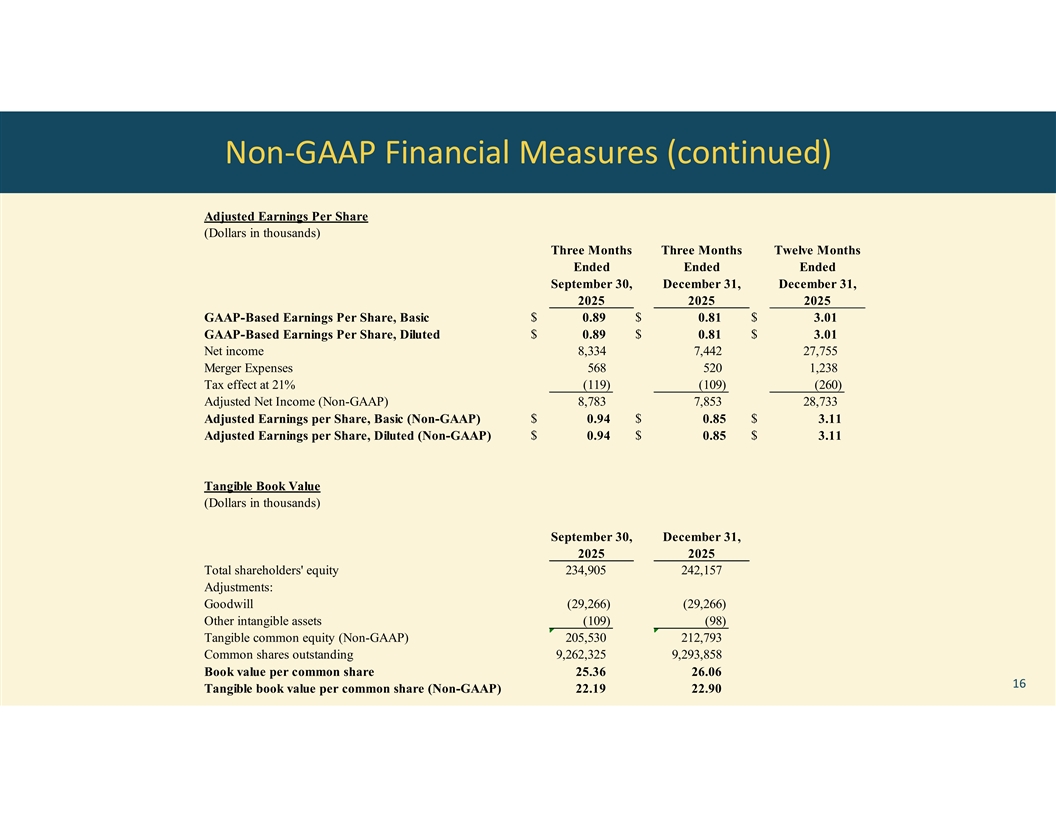
Non-GAAP Financial Measures (continued) Adjusted Earnings Per Share (Dollars in thousands) Three Months Three Months Twelve Months Ended Ended Ended September 30, December 31, December 31, 2025 2025 2025 GAAP-Based Earnings Per Share, Basic $ 0.89 $ 0.81 $ 3.01 GAAP-Based Earnings Per Share, Diluted $ 0.89 $ 0.81 $ 3.01 Net income 8,334 7,442 27,755 Merger Expenses 568 520 1,238 Tax effect at 21% (119) (109) (260) Adjusted Net Income (Non-GAAP) 8,783 7,853 28,733 Adjusted Earnings per Share, Basic (Non-GAAP) $ 0.94 $ 0.85 $ 3.11 Adjusted Earnings per Share, Diluted (Non-GAAP) $ 0.94 $ 0.85 $ 3.11 Tangible Book Value (Dollars in thousands) September 30, December 31, 2025 2025 Total shareholders' equity 234,905 242,157 Adjustments: Goodwill (29,266) (29,266) Other intangible assets (109) (98) Tangible common equity (Non-GAAP) 205,530 212,793 Common shares outstanding 9,262,325 9,293,858 Book value per common share 25.36 26.06 16 Tangible book value per common share (Non-GAAP) 22.19 22.90
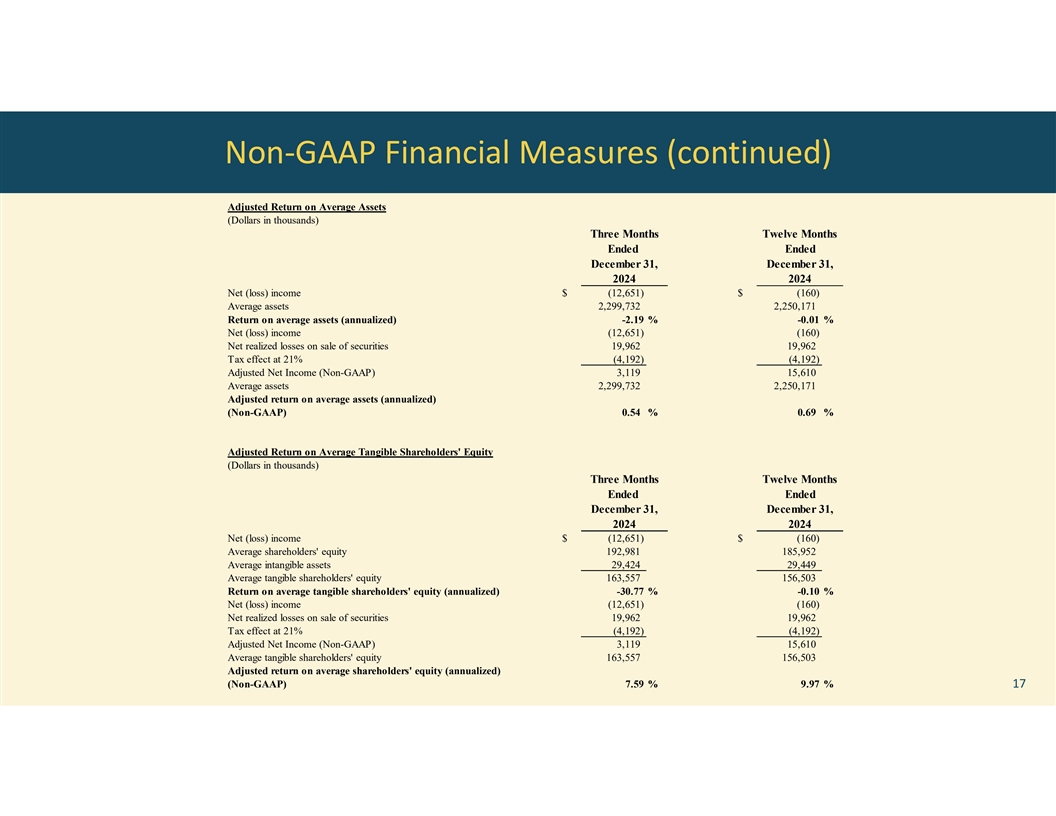
Non-GAAP Financial Measures (continued) Adjusted Return on Average Assets (Dollars in thousands) Three Months Twelve Months Ended Ended December 31, December 31, 2024 2024 Net (loss) income $ (12,651) $ (160) Average assets 2,299,732 2,250,171 Return on average assets (annualized) -2.19 % -0.01 % Net (loss) income (12,651) (160) Net realized losses on sale of securities 19,962 19,962 Tax effect at 21% (4,192) (4,192) Adjusted Net Income (Non-GAAP) 3,119 15,610 Average assets 2,299,732 2,250,171 Adjusted return on average assets (annualized) (Non-GAAP) 0.54 % 0.69 % Adjusted Return on Average Tangible Shareholders' Equity (Dollars in thousands) Three Months Twelve Months Ended Ended December 31, December 31, 2024 2024 Net (loss) income $ (12,651) $ (160) Average shareholders' equity 192,981 185,952 Average intangible assets 29,424 29,449 Average tangible shareholders' equity 163,557 156,503 Return on average tangible shareholders' equity (annualized) -30.77 % -0.10 % Net (loss) income (12,651) (160) Net realized losses on sale of securities 19,962 19,962 Tax effect at 21% (4,192) (4,192) Adjusted Net Income (Non-GAAP) 3,119 15,610 Average tangible shareholders' equity 163,557 156,503 Adjusted return on average shareholders' equity (annualized) (Non-GAAP) 7.59 % 9.97 % 17
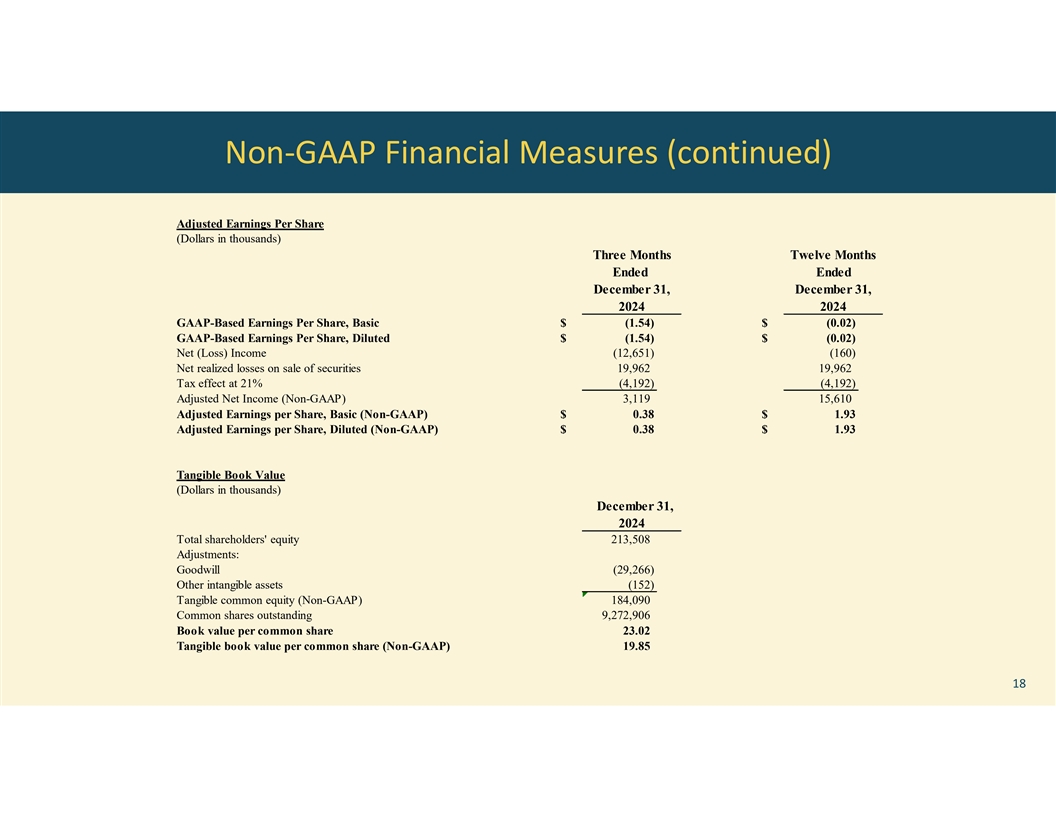
Non-GAAP Financial Measures (continued) Adjusted Earnings Per Share (Dollars in thousands) Three Months Twelve Months Ended Ended December 31, December 31, 2024 2024 GAAP-Based Earnings Per Share, Basic $ (1.54) $ (0.02) GAAP-Based Earnings Per Share, Diluted $ (1.54) $ (0.02) Net (Loss) Income (12,651) (160) Net realized losses on sale of securities 19,962 19,962 Tax effect at 21% (4,192) (4,192) Adjusted Net Income (Non-GAAP) 3,119 15,610 Adjusted Earnings per Share, Basic (Non-GAAP) $ 0.38 $ 1.93 Adjusted Earnings per Share, Diluted (Non-GAAP) $ 0.38 $ 1.93 Tangible Book Value (Dollars in thousands) December 31, 2024 Total shareholders' equity 213,508 Adjustments: Goodwill (29,266) Other intangible assets (152) Tangible common equity (Non-GAAP) 184,090 Common shares outstanding 9,272,906 Book value per common share 23.02 Tangible book value per common share (Non-GAAP) 19.85 18
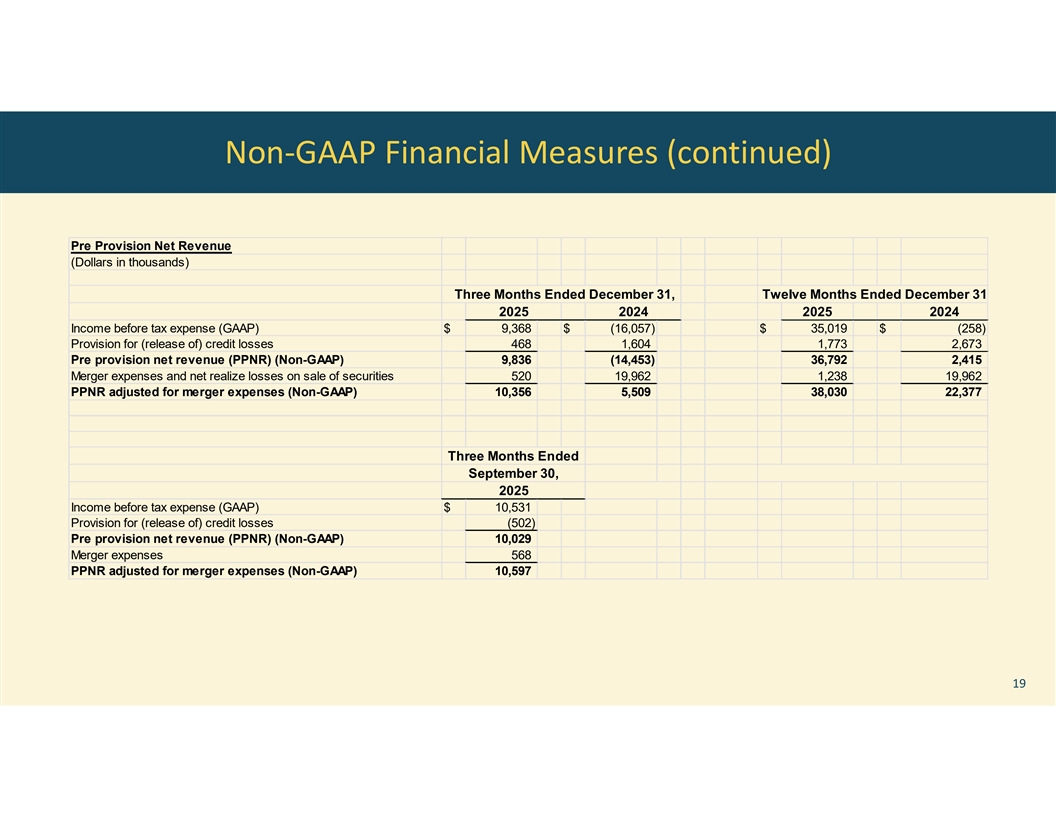
Non-GAAP Financial Measures (continued) Pre Provision Net Revenue (Dollars in thousands) Three Months Ended December 31, Twelve Months Ended December 31, 2025 2024 2025 2024 Income before tax expense (GAAP) $ 9,368 $ (16,057) $ 35,019 $ (258) Provision for (release of) credit losses 468 1,604 1,773 2,673 Pre provision net revenue (PPNR) (Non-GAAP) 9,836 (14,453) 36,792 2,415 Merger expenses and net realize losses on sale of securities 520 19,962 1,238 19,962 PPNR adjusted for merger expenses (Non-GAAP) 10,356 5,509 38,030 22,377 Three Months Ended September 30, 2025 Income before tax expense (GAAP) $ 10,531 Provision for (release of) credit losses (502) Pre provision net revenue (PPNR) (Non-GAAP) 10,029 Merger expenses 568 PPNR adjusted for merger expenses (Non-GAAP) 10,597 19

Thank You