Please wait

.2

ABOUT PRECISION


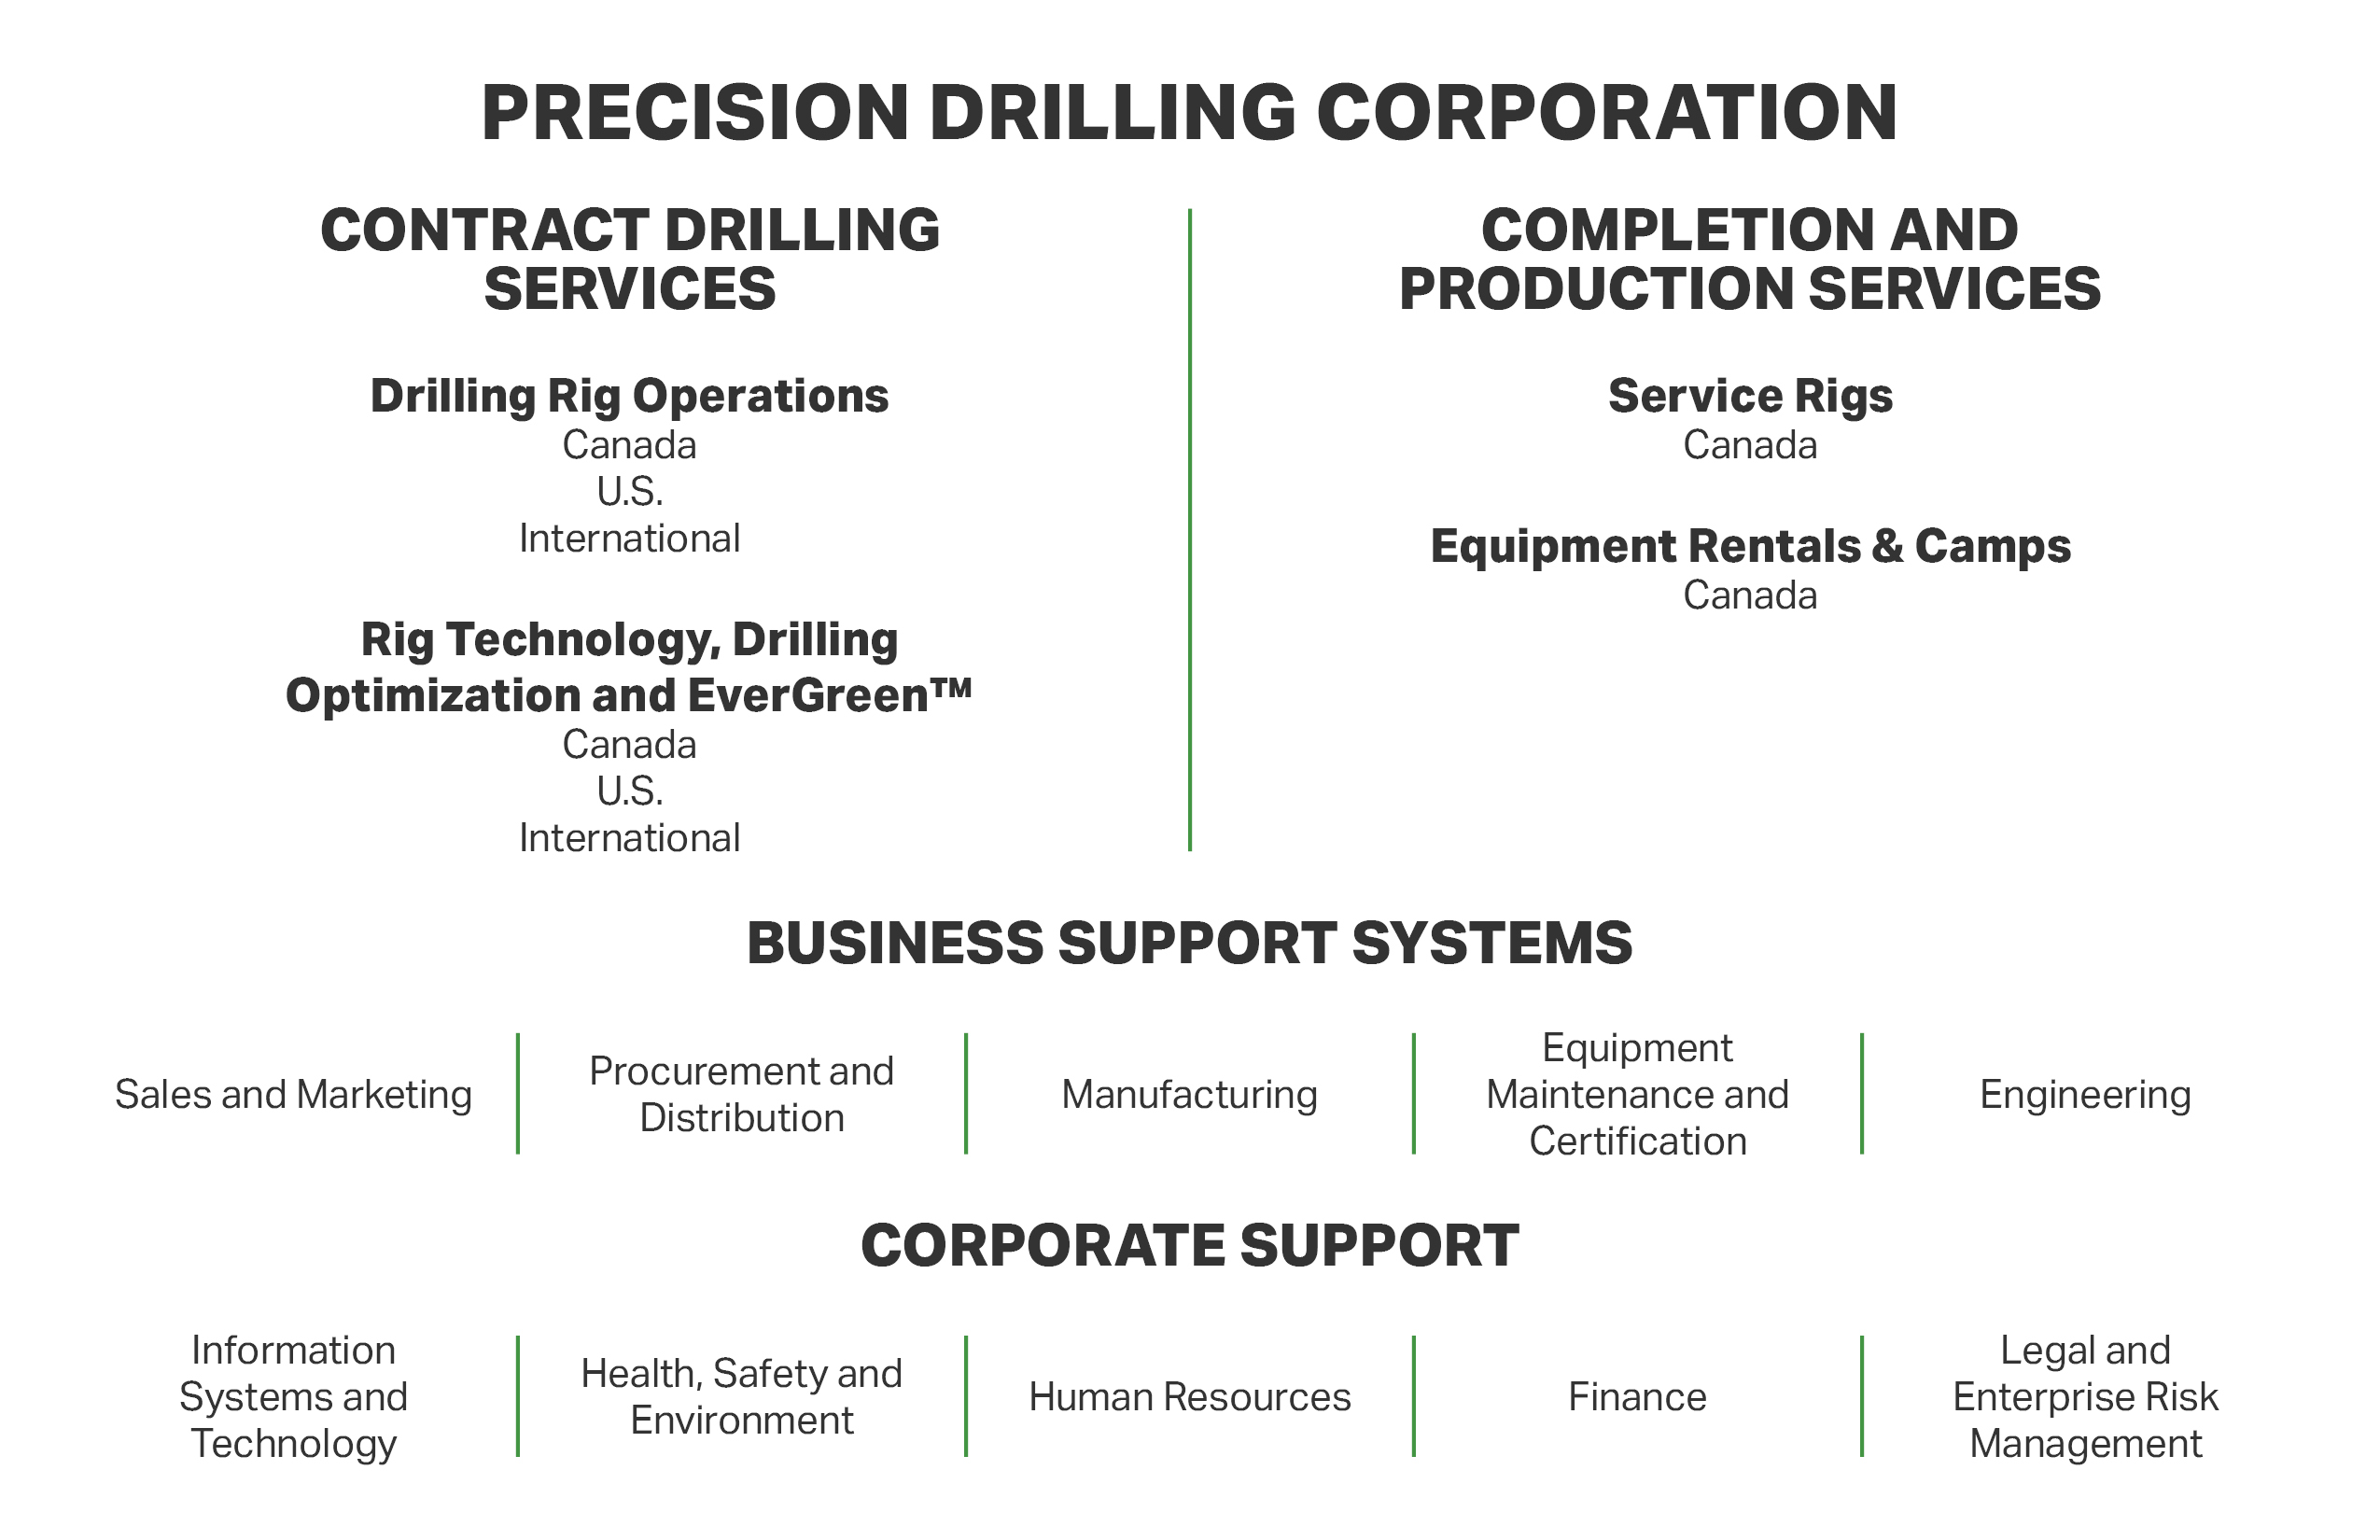
Precision is a leading provider of safe, efficient, and environmentally responsible High Performance, High Value services to the energy industry, offering customers access to an extensive fleet of Super Series drilling rigs. As we mark our 75th anniversary in 2026, Precision continues to build on a legacy of operational excellence, innovation, and disciplined execution. Precision offers an industry-leading digital technology portfolio known as AlphaTM technologies that leverages advanced automation software and analytics to generate more efficient, predictable, and repeatable results for our customers. Our drilling services are further enhanced by our EverGreenTM suite of environmental solutions, which bolsters our commitment to reducing the environmental impact of our operations. Additionally, Precision's services include a broad range of well service rigs, camps, and rental equipment all backed by a comprehensive mix of technical support services and skilled, experienced personnel.

From our founding as a private drilling contractor in 1951, Precision has spent 75 years evolving alongside our customers and the energy industry, growing to become one of the most active drillers in North America. Our vision is to be globally recognized as the High Performance, High Value provider of land drilling services. Our mission is to deliver leading High Performance through passionate people supported by quality business systems, superior equipment and technologies designed to optimize results and reduce environmental, human and operational risks. We create High Value by operating sustainably, lowering our customers' risks and costs while improving efficiency, developing our people, and generating long-term financial returns for our investors.

Our High Performance, High Value competitive advantage is underpinned by five distinguishing features:

a high-quality, Super Series land drilling fleet with AlphaTM technologies, and EverGreenTM environmental solutions designed to deliver consistent, repeatable, high-quality wellbores while improving safety, performance, capital and operational efficiency, and reducing environmental impact;
size and scale of our vertically integrated operations that provide better service capabilities and higher margins;
a performance-driven culture that prioritizes safety and operational excellence;
a capital structure that provides long-term financial resilience, flexibility and liquidity, allowing us to take advantage of business cycle opportunities and support sustainable value creation for our stakeholders; and
an inclusive and responsible corporate culture.

CORPORATE RESPONSIBILITY

Corporate Responsibility is a fundamental element of Precision’s High Performance, High Value strategy and critical to our long-term success. Our foundation was shaped by a commitment to operate with the highest ethical standards, prioritize the health and safety of our workforce, minimize our environmental impact, and better the communities where we operate. Our employees, investors and customers reward our commitment to Corporate Responsibility and recognize that it provides us the ability to attract talent and capital, while earning a premium for our services.

To learn more about Precision’s commitment to Corporate Responsibility, we invite you to explore our website showcasing our progress in Environmental, Social and Governance (ESG) initiatives. The site offers annual updates on our ESG initiatives and performance data.

OUR VISION AND 2025 STRATEGIC PRIORITY ACHIEVEMENTS

Precision’s vision is to be globally recognized as the High Performance, High Value provider of land drilling services. We work toward this vision by defining and measuring our results against strategic priorities established at the beginning of each year.

In 2025, Precision focused on three strategic priorities:

Maximize free cash flow through disciplined capital deployment and strict cost management.
Enhance shareholder returns through debt reduction and share repurchases.
Reduce debt by at least $100 million in 2025 and reduce debt by $700 million between 2022 and 2027, while remaining committed to achieving a sustained Net Debt to Adjusted EBITDA ratio(1) of below 1.0 times.
Allocate 35% to 45% of free cash flow, before debt repayments, directly to shareholders and continue moving direct shareholder returns toward 50% of free cash flow thereafter.
Grow revenue in existing service lines through contracted upgrades, optimized pricing and utilization, and opportunistic consolidating tuck-in acquisitions.

We successfully delivered on each of these priorities in 2025, a milestone year as we continue to demonstrate the execution discipline that has defined the company for 75 years. We generated cash from operations of $413 million, allowing us to fund major rig upgrades, meet our debt reduction and share purchase goals while increasing our cash balance by $12 million year over year. We delivered resilient operating margins in Canada and the U.S. even though average industry activity declined versus 2024. With a strict focus on cost management, we proactively reduced our fixed costs and expect to achieve $10 million in annual savings. We also wound down our U.S. well service operations, while sustaining Completion and Production Services Adjusted EBITDA and free cash flow generation year over year.

Precision Drilling Corporation 2025 Annual Report 1


We enhanced shareholder returns by reducing debt by $101 million and ended the year with a Net Debt to Adjusted EBITDA ratio of 1.2 times. Over the past four years, Precision has reduced debt by $535 million and is well on track to meet its long-term debt repayment target of $700 million between 2022 and 2027 and achieve a Net Debt to Adjusted EBITDA ratio of below 1.0 times. We also returned $76 million to shareholders through share repurchases, achieving the mid point of our target range, and reduced our outstanding shares by 6%.

To grow revenue in existing service lines, we invested $107 million in expansion and upgrade capital(2), which provided for 27 major customer-funded rig upgrades and included two AC Super Triple rigs moved from the U.S. to Canada under long-term contracts. In Canada, we grew our drilling rig market share year over year and maintained strong pricing with revenue per utilization day improving 2%. In the U.S., even with declining industry activity, we improved our rig utilization from a low of 27 active rigs in February to a peak of 40 active rigs in October and exited the year with 36 active rigs. During the year, we continued to expand our EverGreenTM product offering across our Super Series fleet and increased our EverGreenTM revenue by 22% year over year.

Demand for our services remains robust, as our High Performance, High Value strategy, underpinned by our Super Series rigs, AlphaTM technologies, EverGreenTM suite of environmental solutions, and people, continues to differentiate our services and support sustainable value creation for customers and shareholders alike.

With a robust cash flow outlook, we plan to reduce debt by another $100 million in 2026 while allocating up to 50% of our free cash flow, before debt principal payments, directly to shareholders.

(1) See Financial Measures and Ratios on page 44 of this report.

(2) See Supplementary Financial Measures on page 45 of this report.

MANAGEMENT'S DISCUSSION AND ANALYSIS


This Management’s Discussion and Analysis (MD&A) contains information to help you understand our business and financial performance. Information is as of March 6, 2026, unless otherwise stated. This MD&A focuses on our Consolidated Financial Statements and Notes and includes a discussion of known risks and uncertainties relating to our business and the oilfield services sector.

You should read this MD&A with the accompanying audited Consolidated Financial Statements and Notes, which have been prepared in accordance with International Financial Reporting Standards (IFRS) as issued by the International Accounting Standards Board (IASB) and with information contained in the Cautionary Statement About Forward-Looking Information and Statements on page 43. In this MD&A, we reference certain Non-Generally Accepted Accounting Principles (Non-GAAP) financial measures and ratios that are not defined terms under IFRS to assess our performance as we believe they provide useful supplemental information to investors. Non-GAAP financial measures and ratios do not have a standardized meaning under IFRS and might not be comparable to similar financial measures disclosed by other issuers. Our Non-GAAP financial measures and ratios are defined on page 44.

The terms we, us, our, Corporation, Company, Precision and Precision Drilling mean Precision Drilling Corporation and our subsidiaries and include any partnerships of which we are a part.

All amounts are in Canadian dollars unless otherwise stated.


2 Management's Discussion and Analysis


BUSINESS SEGMENTS

We have two business segments, Contract Drilling Services and Completion and Production Services, which share business support systems and corporate and administrative services.

img194954887_0.jpg


Precision Drilling Corporation Contract Drilling Services Drilling Rig Operations Canada U.S. International Directional Drilling Operations Canada Completion and Production Services Canada and U.S. Service Rigs Canada Camps and ing Equipment Rentals Business Support Systems Sales and Marketing Procurement and Distribution Manufacturing Equipment Maintenance and Certification Engineering Corporate Support Information Systems Health, Safety and Environment Human Resources Finance Legal and Enterprise Risk Management

img194954887_1.jpg img194954887_2.jpg

Precision Drilling Corporation 2025 Annual Report 3


Contract Drilling Services

We provide onshore drilling services to exploration and production companies in the oil and natural gas and geothermal industries, operating in Canada, the U.S., and internationally. In 2025, we were one of the most active drillers in North America, driven by our leading market share in Canada and owning the fourth largest fleet of marketable rigs in the U.S. We also have an international presence with operations in the Middle East. At December 31, 2025, our Contract Drilling Services segment consisted of 184 land drilling rigs, including 95 in Canada, 80 in the U.S., six in Kuwait and three in the Kingdom of Saudi Arabia.

We offer customers access to an extensive fleet of Super Series drilling rigs ideally suited for industrialized development drilling. Our rigs are strategically deployed across the most active drilling regions in North America, including all major unconventional oil and natural gas basins.

Our Super Series drilling rigs are enhanced by our AlphaTM technologies and EverGreenTM suite of environmental solutions. Our AlphaTM technologies drive performance by integrating data insights, human ingenuity, automation consistency and intelligent algorithms, increasing drilling performance and cost efficiencies for our customers. At December 31, 2025, over 90% of our active AC Super Triple and Super Single rigs based in North America were equipped with AlphaTM. Our EverGreenTM suite of environmental solutions bolsters our commitment to reducing the environmental impact of oilfield operations and offers customers products and applications to measure and reduce their Greenhouse Gas (GHG) emissions during drilling operations. We have multiple commercial agreements in place for our EverGreenTM products as over 90% of our active AC Super Triple rigs were equipped with at least one EverGreenTM product at December 31, 2025.

Completion and Production Services

We provide well completion, workover, abandonment, and re-entry preparation services to oil and natural gas exploration and production companies in Canada, along with equipment rentals and camp services. Our well service fleet is strategically located across western Canada and in 2025, we held the industry‑leading Canadian market share with 145 registered rigs, including four held within a partnership with two Indigenous groups. Workovers and abandonments represented approximately 88% of activity, while completions accounted for roughly 12%. During the year, we wound down our U.S. well service operations, selling select assets and mobilizing others into the Canadian fleet.

We also support customers through our rentals and camp services, with more than 2,100 pieces of equipment, including surface equipment, wellsite accommodations, power generation units, and solids control equipment, all supported by a central technical service center. Our camp services provide food and accommodation for workers in remote locations, operating eight drill camps and four dormitory facilities at year‑end 2025. These services play an essential role in supporting drilling and completions activity as operators continue to explore and develop resources in remote areas.

Production Ad


4 Management's Discussion and Analysis


strategic priorities

Our 2025 strategic priorities focused on generating free cash flow, continuing to strengthen our financial position with debt repayments, increasing our direct capital returns to shareholders, and delivering operational excellence with our High Performance, High Value services to strengthen our competitive position and extend market penetration of our AlphaTM and EverGreenTM products. We successfully delivered on each of these priorities in 2025 and our results are summarized in the table below.

2025 Strategic Priorities

2025 Results

Maximize free cash flow through disciplined capital deployment and strict cost management.


Generated cash from operations of $413 million, allowing us to fund 27 major rig upgrades, meet our debt reduction and share purchase goals, and increase our cash balance by $12 million year over year.
Realized approximately $10 million in annual savings by proactively reducing fixed costs in the first quarter of 2025 to address market uncertainty.
Delivered resilient operating margins(1) in Canada and the U.S. even though average industry activity declined(2).
Sustained Completion and Production Services Adjusted EBITDA and free cash flow generation even though we wound down our U.S. well service operation in the second quarter.

Enhance shareholder returns through debt reduction and share repurchases.

Reduce debt by at least $100 million in 2025 and reduce debt by $700 million between 2022 and 2027, while remaining committed to achieving a sustained Net Debt to Adjusted EBITDA ratio of below 1.0 times

Allocate 35% to 45% of free cash flow, before debt repayments, directly to shareholders and continue moving direct shareholder returns toward 50% of free cash flow thereafter.

Reduced debt by $101 million and ended the year with a Net Debt to Adjusted EBITDA ratio of 1.2 times. Continue to target a sustained Net Debt to Adjusted EBITDA ratio of below 1.0 times.
Well positioned to meet our long-term debt reduction target of $700 million between 2022 and 2027. As of December 31, 2025, we have reduced debt by $535 million since the beginning of 2022.
Returned $76 million to shareholders through share repurchases, achieving the midpoint of our target range, and reducing our outstanding shares by 6%.
Renewed our Normal Course Issuer Bid (NCIB) in September, allowing share repurchases of up to 10% of the public float.

Grow revenue in existing service lines through contracted upgrades, optimized pricing and utilization, and opportunistic consolidating tuck-in acquisitions.


Invested $107 million in expansion and upgrade capital, including 27 major customer-funded rig upgrades in Canada and the U.S.
Relocated two AC Super Triple rigs from the U.S. to Canada under long-term contracts.
Grew our leading Canadian drilling rig market share year over year(2) and maintained strong pricing with revenue per utilization day improving 2%.
Grew U.S. rig utilization in 2025 from a low of 27 active rigs in February to a peak of 40 active rigs in October and exited the year with 36 active rigs.
Continued to expand our EverGreenTM product offering across our Super Series fleet, increasing revenue 22% year over year.


(1)
Revenue per utilization day less operating costs per utilization day.
(2)
See Segmented Results – Contract Drilling Services on page 14.

We have established the following strategic priorities for 2026:

2026 Strategic Priorities


Drive revenue growth and deepen customer relationships through contracted upgrades, continuous operational excellence, and by leveraging our performance-driven technology as a key competitive differentiator.
Maximize free cash flow through strategic capital deployment and sustained cost discipline.
Enhance shareholder returns by reducing debt by $100 million in 2026 and allocating up to 50% of free cash flow, before debt repayments, directly to shareholders.


Precision Drilling Corporation 2025 Annual Report 5


UNDERSTANDING OUR BUSINESS DRIVERS


ENERGY INDUSTRY OVERVIEW

Precision operates in the energy services business. Our primary customers are oil and natural gas exploration and production companies, who contract our services as part of their exploration and development activities. The economics of their upstream businesses are largely dictated by the current and expected future margin between their finding and development costs and the eventual market price for the commodities they produce: crude oil, natural gas, and Natural Gas Liquids (NGLs).

Commodity Prices

Our customers’ capital expenditures for exploration and development are largely dependent on current and expected future prices of crude oil and natural gas. Crude oil is generally priced in a global market that is influenced by an array of economic and political factors. Natural gas is generally priced more regionally and, in North America, largely depends on the weather. Colder winter temperatures, and to a lesser extent, warmer summer temperatures, result in greater natural gas demand. Beyond heating and cooling, natural gas demand has become increasingly sensitive to Liquefied Natural Gas (LNG) production and domestic natural gas-fired power generation. Both commodities have historically been, and we expect them to continue to be cyclical and highly volatile.

Historically, there has been a strong correlation between crude oil and natural gas prices and the demand for drilling rigs with the rig count increasing and decreasing with movements in commodity prices. However, beginning in 2021, rig activity has not moved in tandem with crude oil prices to the same extent it has historically, as a large portion of our customers instituted and adhered to a more disciplined approach to their operations and capital spending in order to enhance their own financial returns.

Average Oil and Natural Gas Prices


2025


2024


2023


Oil


West Texas Intermediate (per barrel) (US$)


64.81


75.73


77.62


Western Canadian Select (per barrel) (US$)


53.88


61.24


58.96


Natural gas


U.S.


Henry Hub (per MMBtu) (US$)


3.63


2.41


2.67


Canada


AECO (per MMBtu) (Cdn$)


1.69


1.39


2.64


Source: Sproule Escalated Price Forecast as of December 31, 2025.


Drilling Activity

In 2025, global energy demand growth was tempered by several geopolitical events including OPEC+ easing of curtailments, trade and tariff uncertainty, international conflicts, and concerns over excess supply. In the U.S., West Texas Intermediate (WTI) fell 14%, averaging US$64.81 per barrel compared to US$75.73 in 2024. In contrast, Henry Hub natural gas prices increased 51% and averaged US$3.63 per MMBtu as demand is expected to increase with the build out of LNG projects and AI data centers. Canadian and U.S. producers remained focused on capital discipline and shareholder returns versus production growth and as a result, average drilling activity decreased in both Canada and the U.S. in 2025.

According to Baker Hughes, the onshore Canadian average active rig count in 2025 decreased approximately 5% year over year. The Canadian Association of Energy Contractors (CAOEC) reported on December 1, 2025, that approximately 5,500 wells were expected to be drilled in 2025, compared with 5,800 in 2024 and 5,400 in 2023. In the U.S., Baker Hughes reported the onshore Lower 48 rig count average for 2025 was 6% lower than 2024. In early 2026, Enverus reported that approximately 13,400 wells were started onshore in the U.S. in 2025, compared with approximately 14,800 in 2024 and 16,100 in 2023. In Canada, drilling activity is supported by strong fundamentals from pipeline capacity including the Trans Mountain expansion pipeline which was completed in 2024 providing additional take away capacity and improved Western Canadian Select (WCS) pricing for oil, and the start-up of LNG Canada in mid-2025 providing additional natural gas takeaway capacity. While Canadian drilling fundamentals supported additional activity in 2025, tariff and commodity price uncertainty tempered producers' drilling plans. In the U.S. drilling activity continued to weaken throughout 2025 due to oil and natural gas price volatility, exacerbated by drilling and completion efficiencies. In both Canada and the U.S., producers continue to prioritize capital discipline and returns to shareholders over production growth.

The following graphs show oil and natural gas drilling activity since 2021, in both the U.S. and Canada. The Canadian drilling rig activity graph also shows the seasonality of the Canadian drilling activity which fluctuates with spring breakup, a market dynamic that generally is not present in the U.S.


6 Management's Discussion and Analysis


img194954887_3.jpg

img194954887_4.jpg

Precision Drilling Corporation 2025 Annual Report 7


Competition

The land drilling industry is highly competitive, with technology increasingly differentiating the market as customers have transitioned to increasingly complex directional and horizontal drilling programs. These wells require higher capacity rigs, which typically include AC power, digital control systems, integrated top drives, pad walking systems, highly mechanized pipe handling equipment, and high capacity mud pumps. These rigs are referred to as Super Specification (Super-Spec). Consequently, the rig market has been shedding older, low-technology rigs in favour of these Super-Spec rigs.

In Canada, the top four land drillers own virtually all of these Super-Spec rigs, while in the U.S., the top five land drillers own the majority of these rigs.

Drilling Contracts

We market our drilling rigs mainly on a regional basis through sales and marketing personnel. We secure contracts to drill wells either through competitive bidding or as a result of business development efforts and negotiations with customers. Our drilling contracts provide for payment on a daywork basis, pursuant to which we provide the drilling rig and crew to the customer. The customer provides the drilling program and is responsible for managing the downhole operation. Our compensation is based on a contracted rate per day (day rate) during the period the drilling rig is utilized, and several of our contracts also include performance-based compensation clauses. Generally, we do not bear any of the costs arising from downhole risks or loss of oil and natural gas reserves.

Products and services provided by our Alpha™ technologies and EverGreen™ suite of environmental solutions earn revenue that is incremental to the contracted day rate.

Seasonality

Drilling and well servicing activity is affected by seasonal weather patterns and ground conditions. In Canada and the northern U.S., wet weather and the spring thaw make the ground unstable resulting in road restrictions that may limit the movement of heavy oilfield equipment and reduce the level of drilling and well servicing activity primarily during the second quarter of the year. In Canada, some drilling sites can only be accessed in the winter once the terrain is frozen, which usually begins late in the fourth quarter. Our business activity depends, in part, on the severity and duration of the winter drilling season. In recent years, however, many of our customers have shifted to working through the seasonal low depending on their specific drilling program. This has been enabled in part by our highly mobile fleet, namely our Super Triples and Super Singles, upgraded to allow for optimized pad drilling. Our customers historically drilled approximately 250 days per year in Canada, however with advancements in rig design and technology many of our rigs now drill more than 300 days per year.

COMPETITIVE OPERATING MODEL

The core of our competitive strategy lies in our commitment to provide High Performance, High Value services to our customers. We deliver High Performance through the dedication of our passionate people bolstered by our robust business systems, cutting-edge drilling technology, quality equipment and infrastructure designed to optimize results and mitigate risks. We create High Value by prioritizing safety and sustainability, thereby reducing risks and costs to our customers while enhancing efficiency, developing our people and striving to generate superior financial returns for our investors.

Employees

Our people strategies focus on initiatives that provide a safe and productive work environment, opportunities for advancement, and strong wage security. In 2025, we employed an average of 5,007 people, with a peak workforce of 5,245. Even with a competitive labor market, our safety performance, training programs, and industry reputation help us attract and retain experienced talent during periods of high activity.

Talent Management

We are committed to recruiting and developing high-performing employees across both field and corporate roles. We maintain competitive compensation, strong recruitment practices, and robust talent management systems to build a capable, well‑trained workforce through all market cycles. Our Talent Management and Field Training & Development teams leverage innovative technology platforms and in‑house expertise to deliver comprehensive learning opportunities and maintain a strong leadership pipeline.

Employee Safety and Training

Safety is embedded in every aspect of our operations, supporting our commitment to deliver High Performance, High Value services without compromising employee well‑being. In 2025, 1,760 field employees completed nearly 50,000 hours of development, supplemented by over 16,100 hours of on‑site coaching. Our Short Service Employee program supported 624 new workers with mentorship and 17,000 hours of instruction, while corporate and field leaders participated in 125 hours of leadership training. Employees also completed more than 3,500 hours of online learning through our Learning Management Systems (LMS) and external platforms.

8 Management's Discussion and Analysis


Technology and Innovation

Precision's long-standing commitment to technology and innovation leadership has shaped the evolution of our Super Series rig designs. Beginning with our Super Single rig in the early 1990s, purpose-built for long-term conventional heavy oil development in the oil sands and other heavy oil plays, we expanded the portfolio in 2010 with the Super Triple rig, now the preferred rig in Canada's Montney and well suited for large pad horizontal drilling in the U.S. Our Super Series fleet meets or exceeds the industry term Super-Spec and as of December 31, 2025, our global fleet of 184 rigs included 48 Super Single rigs and 105 AC Super Triple rigs.

Precision’s Alpha™ platform further modernizes drilling by integrating digital automation and real‑time analytics, now active on 78 rigs across North America. Through AlphaAutomation™, AlphaApps™, and AlphaAnalytics™, we reduce human error, improve consistency, and enhance operational efficiency across multiple basins. In 2024, we expanded these capabilities with the first Super Triple rig equipped with AlphaArms™ robotics, automating more than 95% of rig floor activities to improve safety and productivity while supporting crews with advanced, human‑complementary technology.

Complementing our automation initiatives, is our EverGreen™ suite of environmental solutions that include a diverse range of technologies specifically designed to quantify and reduce GHG emissions during rig operations. In 2022, we commissioned our Battery Energy Storage Systems (BESS) and fuel monitoring system for our AC Super Triple rigs, and in 2024 we extended our EverGreenTM product offerings to our Super Single rigs with LED mast lighting and hydrogen enabled power generation systems. EverGreen™ products were installed on approximately 80% of our AC Super Triple rigs by year‑end 2025. These advancements reaffirm Precision’s commitment to innovation, operational excellence, and responsible energy development.

Diversity and Respect

Delivering strong operational and financial results in today’s environment requires the expertise and positive contributions of every Precision employee. We are committed to developing a diverse range of thoughts, experiences, and points of view to complement our strategy and decision-making processes. Precision is an inclusive workplace that strives to be free of discrimination, harassment, workplace violence, and retaliation. Our policies prohibit discrimination of any kind and promote diversity and respect among our employees, management, and Board of Directors (Board).

OUTLOOK


Contracts

Term customer contracts provide a base level of activity and revenue. In 2025, we had an average of 43 drilling rigs working under term contracts: 17 in the U.S., 19 in Canada and seven internationally. Utilization days from these contracts represented approximately 40% of our total contract drilling utilization days for the year. As of March 6, 2026, we had term contracts in place for an average of 34 rigs: nine in the U.S., 18 in Canada and seven internationally for 2026. In most regions in the U.S. and internationally, term contracts normally generate 365 utilization days per rig year. In Canada, term contracted rigs normally generate 250-300 utilization days per rig year because of the seasonal nature of wellsite access.

Pricing, Demand and Utilization

Near-term expectations for global energy demand growth remain tempered by persistent geopolitical and economic uncertainties. However, this narrative has started to soften as demand indicators stabilize, particularly in natural gas markets, where accelerating LNG supply growth and strengthening consumption in key regions, including Asia and Europe, are expected to support a more constructive demand outlook in 2026.

Looking further ahead, we believe the long‑term fundamentals for energy remain favorable, underpinned by economic expansion, rising energy needs from emerging economies, and sustained global appetite for LNG, driven by the continued build‑out of LNG infrastructure and trade flows. Additionally, natural gas‑fired power generation is poised for multi-year structural growth as data centers scale rapidly to meet AI driven electricity demand.

In Canada, constructive commodity prices for heavy oil and condensate, plus additional takeaway capacity for both oil and natural gas continue to support Canadian activity. LNG Canada made its first shipment at the beginning of July and as customers take a long-term view of this business, demand for our Super Triple rigs is near full capacity. The Trans Mountain pipeline expansion continues to support improved pricing and heavy oil production, driving our Super Single rig utilization toward full capacity. We expect our winter drilling season activity to exceed last year's levels.

In the U.S., while volatile WTI oil prices and drilling efficiencies continue to suppress oil-targeted rig activity, the natural gas rig count increased approximately 20% in 2025 as customers became more constructive on LNG off-take and AI demand. We capitalized on these emerging opportunities in natural gas basins such as the Haynesville and Marcellus and increased our U.S. drilling rig utilization days 25% over the last nine months of 2025. We continue to have encouraging customer conversations that could result in additional activity increases in 2026.

Internationally, we currently have seven active rigs, including four in Kuwait and three in the Kingdom of Saudi Arabia, supported by contracts that extend into 2027 and 2028. In early 2026, one Kuwait rig was demobilized and activity was backfilled by reactivating our rig in Saudi Arabia that had been temporarily suspended in 2025. While our Saudi Arabia rig generates a lower

Precision Drilling Corporation 2025 Annual Report 9


operating margin, this transition maintains overall utilization levels in 2026. We continue to seek opportunities to increase our international utilization by pursuing long‑term, contract‑backed investments.

As the premier well service provider in Canada, the long-term outlook for this business is positive, driven by increased takeaway capacity from the Trans Mountain pipeline expansion and LNG Canada, and our High Performance, High Value service offering. We expect customer demand and pricing to remain strong into the foreseeable future, assuming no significant change in market conditions.

High Performance Rig Fleet

The industry trend toward more complex drilling programs has accelerated the retirement of older generation, less capable drilling rigs. Over the past several years, we have been upgrading our drilling rig fleets primarily through the upgrade of existing rigs and the decommissioning of lower capacity rigs. Expansion and upgrade capital includes the cost of long-lead items purchased for our capital inventory, such as integrated top drives, drill pipe, control systems, engines, and other items used to complete new-build projects or upgrade our rigs in North America and internationally. In more recent years, drilling rigs have been equipped with automation systems and emission reduction technologies to further drive time and cost efficiencies and improve environmental performance in the well construction process. We believe this retooling of the industry-wide fleet has made legacy rigs virtually obsolete in North America. In 2025, as part of our regular review of our drilling rig fleet to ensure they continued to meet our advanced technology and performance standards, we decommissioned 31 marketable drilling rigs that no longer aligned with those requirements.

Capital Spending and Free Cash Flow Allocation

Capital spending in 2026 is expected to be $245 million and capital spending by spend category(1) includes $182 million for maintenance, infrastructure, and intangibles and $63 million for expansion and upgrades. We expect to spend $221 million in the Contract Drilling Services segment, $21 million in the Completion and Production Services segment and $3 million in the Corporate and Other segment. The 2026 capital plan may fluctuate with activity levels and customer contract upgrade opportunities. At December 31, 2025, we had capital commitments of $153 million with payments expected through 2027.

We remain committed to our debt reduction plans in 2026 and expect to reduce debt by $100 million, positioning us one step closer to our long-term target of reducing debt by $700 million between 2022 and 2027 and achieving a sustained Net Debt to Adjusted EBITDA ratio of below 1.0 times. In 2026, we intend to allocate up to 50% of free cash flow before debt repayments to share repurchases.

(1) See Financial Measures and Ratios on page 44 of this report.

10 Management's Discussion and Analysis


2025 RESULTS


Financial Highlights


Year ended December 31
(in thousands of dollars, except where noted)


2025


% increase/
(decrease)


2024


% increase/
(decrease)


2023


% increase/
(decrease)


Revenue


1,843,704


(3.1

)


1,902,328


(1.8

)


1,937,854


19.8


Adjusted EBITDA(1)


489,615


(6.1

)


521,221


(14.7

)


611,118


96.1


Adjusted EBITDA % of revenue(1)


26.6

%


27.4

%


31.5

%


Net earnings


3,094


(97.2

)


111,330


(61.5

)


289,244


(943.4

)


Net earnings attributable to shareholders


1,842


(98.3

)


111,195


(61.6

)


289,244


(943.4

)


Cash provided by operations


412,897


(14.4

)


482,083


(3.7

)


500,571


111.1


Funds provided by operations(1)


435,423


(6.0

)


463,372


(13.1

)


533,409


88.5


Cash used in investing activities


208,324


2.6


202,986


(5.5

)


214,784


48.7


Capital spending by spend category(1)


Expansion and upgrade


106,908


105.3


52,066


(18.5

)


63,898


0.9


Maintenance, infrastructure and intangibles


156,590


(4.9

)


164,632


1.1


162,851


34.6


Proceeds on sale of property, plant and equipment


(39,038

)


28.4


(30,395

)


27.5


(23,841

)


(35.9

)


Net capital spending(1)


224,460


20.5


186,303


(8.2

)


202,908


38.0


Net earnings attributable to shareholders
   per share ($)


Basic


0.14


(98.2

)


7.81


(62.9

)


21.03


(931.2

)


Diluted


0.14


(98.2

)


7.81


(60.0

)


19.53


(871.9

)


(1) See Financial Measures and Ratios on page 44 of this report.

Operating Highlights


Year ended December 31


2025


% increase/
(decrease)


2024


% increase/
(decrease)


2023


% increase/
(decrease)


Contract drilling rig fleet


184


(14.0

)


214


214


(4.9

)

Drilling rig utilization days


Canada


23,121


(2.4

)


23,685


12.0


21,156


3.1


U.S.


12,427


(4.2

)


12,969


(27.8

)


17,961


(11.9

)

International


2,698


(7.9

)


2,928


37.3


2,132


(2.6

)

Revenue per utilization day


Canada (Cdn$)


35,576


2.2


34,797


5.0


33,151


22.6


U.S. (US$)


31,480


(3.2

)


32,531


(7.2

)


35,040


28.3


International (US$)


52,195


1.9


51,227


0.8


50,840


(0.8

)

Operating cost per utilization day


Canada (Cdn$)


21,305


4.3


20,424


6.2


19,225


13.0


U.S. (US$)


22,489


2.2


22,009


7.9


20,401


9.5


Service rig fleet(1)


145


(9.4

)


160


(7.5

)


173


38.4


Service rig operating hours(1)


234,166


(3.4

)


242,479


28.1


189,362


24.0


(1) The service rig fleet and service rig operating hours exclude our U.S. operations that we wound down in second quarter of 2025.

Financial Position and Ratios


(in thousands of dollars, except ratios)


December 31,
2025


December 31,
2024


December 31,
2023


Working capital(1)


186,815


162,592


136,872


Working capital ratio(1)


1.6


1.5


1.4


Long-term debt(2)


679,291


812,469


914,830


Total long-term financial liabilities(1)


746,944


888,173


995,849


Total assets


2,726,690


2,956,315


3,019,035


Enterprise Value(1)(3)


1,867,222


1,950,192


1,892,305


Long-term debt to long-term debt plus equity(1)


0.3


0.3


0.4


Long-term debt to cash provided by operations(1)


1.6


1.7


1.8


Net Debt to Adjusted EBITDA(1)


1.2


1.4


1.4


(1) See Financial Measures and Ratios on page 44 of this report.

(2) Net of unamortized debt issue costs.

(3) See page 23 for more information.

Precision Drilling Corporation 2025 Annual Report 11


Consolidated Statements of Net Earnings Summary

Year ended December 31 (in thousands of dollars)


2025


2024


2023


Revenue


Contract Drilling Services


1,576,036


1,617,735


1,704,265


Completion and Production Services


278,818


294,817


240,716


Inter-segment elimination


(11,150

)


(10,224

)


(7,127

)


1,843,704


1,902,328


1,937,854


Adjusted EBITDA(1)


Contract Drilling Services


488,796


532,345


630,761


Completion and Production Services


63,980


66,681


51,224


Corporate and Other


(63,161

)


(77,805

)


(70,867

)


489,615


521,221


611,118


Depreciation and amortization


317,904


309,314


297,557


Gain on asset disposals


(8,623

)


(16,148

)


(24,469

)

Loss on asset decommissioning


67,080


9,592


Foreign exchange


(1,208

)


2,259


(1,667

)

Finance charges


57,197


69,753


83,414


Loss on investments and other assets


1,344


1,484


6,810


Gain on acquisition


(25,761

)

Gain on redemption and repurchase of unsecured senior notes


(137

)

Earnings before income taxes


55,921


154,559


265,779


Income taxes


52,827


43,229


(23,465

)

Net earnings


3,094


111,330


289,244


Non-controlling interest


1,252


135


Net earnings attributable to shareholders


1,842


111,195


289,244


(1) See Financial Measures and Ratios on page 44 of this report.

Results by Geographic Segment


Year ended December 31 (in thousands of dollars)


2025


2024


2023


Revenue


Canada


1,099,184


1,106,163


929,639


U.S.


547,728


590,641


861,915


International


196,792


205,524


146,300


1,843,704


1,902,328


1,937,854


Total assets


Canada


1,202,650


1,206,868


1,246,069


U.S.


1,154,872


1,292,983


1,226,256


International


369,168


456,464


546,710


2,726,690


2,956,315


3,019,035


2025 COMPARED WITH 2024

In the U.S., WTI oil prices averaged US$64.81 per barrel and Henry Hub natural gas prices averaged US$3.63 per MMBtu, representing a 14% decrease and a 51% increase from 2024, respectively. In Canada, WCS oil and AECO natural gas prices averaged US$53.88 per barrel and $1.69 per MMBtu in 2025. AECO pricing increased by 22% year over year, while WCS declined by 12%. Despite this commodity price volatility, Precision's operating performance has become less correlated with price movements than in the past, reflecting customers' increasingly disciplined approach to operations and capital allocation, focused on enhancing returns and cash flow durability.

Revenue for the year was $1,844 million, representing a 3% decrease from $1,902 million in 2024. Our 2025 revenue was negatively impacted by lower U.S. drilling activity and day rates and lower U.S. completions activity as we wound down our U.S. well service operations in the second quarter of 2025.

We recognized Adjusted EBITDA in 2025 of $490 million versus $521 million in 2024. The decrease was primarily driven by lower U.S. drilling activity, which was partially offset by lower share-based compensation expense of $24 million compared to $47 million in 2024. Our Net Debt to Adjusted EBITDA ratio was 1.2 times, slightly above our target of 1.0 times set at the end of 2022, due to foreign exchange impacts, as the weakened Canadian dollar increased the translated value of our U.S. dollar denominated debt.

Net earnings attributable to shareholders was $3 million or $0.14 per share compared to $111 million or $7.81 per share in 2024. The decrease was due to lower Adjusted EBITDA, decommissioning charges of $67 million, change in useful life estimates resulting in additional depreciation expense of $17 million, and higher deferred income taxes related to our U.S. operations, partially offset by lower finance charges.

12 Management's Discussion and Analysis


Debt Repayments and Shareholder Returns

In 2025, we reduced debt by $101 million, redeeming $222 million (US$160 million) of 2026 unsecured senior notes, while drawing $122 million on our Senior Credit Facility, compared to a reduction of debt in 2024 of $176 million.

Pursuant to our NCIB in 2025, we repurchased and cancelled 1,024,002 common shares for $76 million and in 2024, we repurchased and cancelled 833,614 common shares for $75 million.

Finance Charges

Finance charges were $57 million and decreased $13 million as a result of our lower outstanding debt, partially offset by the impact of the weakening Canadian dollar on our U.S. dollar-denominated interest expense.

Capital Spending and Long-Lived Assets

Capital expenditures for the purchase of property, plant and equipment were $263 million and included $157 million for maintenance, infrastructure, and intangible assets, and $107 million for upgrades, including 27 major rig upgrades. By comparison, in 2024 capital expenditures were $217 million and included $165 million for maintenance, infrastructure, and intangible assets, and $52 million for upgrades. The overall $47 million increase was driven by strong demand for customer-funded upgrades, offset in part by reduced maintenance expenditures due to lower U.S. and international activity.

Through the completion of normal course business operations, we sold non-core assets for proceeds of $39 million resulting in a gain on asset disposal of $9 million.

In accordance with IFRS, we review the carrying value of our long-lived assets for indications of impairment at the end of each reporting period. At December 31, 2025, we reviewed each of our Cash-Generating Units (CGU) and did not identify indications of impairment and, therefore, did not test our CGUs for impairment.

Drill Pipe Depreciation

In 2025, we completed a detailed review of our drilling rig equipment and revised the estimated useful life of drill pipe as more complex drilling programs have reduced the useful life of this asset class. This revision resulted in additional depreciation expense of $17 million (2024 - nil).

Loss on Asset Decommissioning

In 2025, we decommissioned 31 of our 215 marketable drilling rigs that were no longer aligned with Precision's advanced technology and performance standards, resulting in a loss on asset decommissioning of $67 million (2024 - nil).

Income Taxes

In 2025, we recognized an income tax expense of $53 million, an increase of $10 million from 2024. A significant portion was related to a higher deferred income tax expense related to our U.S. operations as we waived certain U.S. tax deductions to mitigate minimum taxes that the Corporation became subject to as a result of stronger operating results. We continue to not recognize deferred income tax assets for certain international locations.

Partnership

Precision holds a controlling interest in our well servicing partnership with two Indigenous groups. The share of net earnings and equity not attributable to Precision's controlling interest are shown separately as Non-Controlling Interests (NCI) in the Consolidated Statements of Net Earnings and Consolidated Statements of Financial Position. In 2025, net earnings attributable to NCI was $1 million (2024 - nil).

2024 COMPARED WITH 2023

In the U.S., 2024 WTI oil prices averaged US$75.73 per barrel and Henry Hub natural gas prices averaged US$2.41 per MMBtu, representing decreases of 2% and 10% from 2023, respectively. In Canada, WCS and AECO natural gas prices averaged US$61.24 and $1.39 in 2024, respectively. Average WCS pricing was 4% higher than 2023 while AECO decreased by 47%.

As compared with 2023, our revenue decreased by 2% to $1,902 million. Our lower revenue in 2024 was primarily the result of decreased drilling activity and lower revenue per utilization day rates in the U.S., partially offset by stronger Canadian drilling and well service and international activity.

We recognized Adjusted EBITDA in 2024 of $521 million, 15% lower than 2023. Our lower Adjusted EBITDA in 2024 was primarily due to decreased U.S drilling results and higher share-based compensation charges, partially offset by stronger Canadian and international activity.

As compared with 2023, our U.S. drilling activity decreased 28%, Canadian activity increased 12% and international activity increased 37%. Our service rig operating hours in 2024 increased 28% as compared with 2023.

Net earnings attributable to shareholders was $111 million or $7.81 per share compared to $289 million or $21.03 per share in the prior year. Our lower net earnings in 2024 was due to the impact of decreased U.S. drilling results, higher income tax expense of $67 million and the gain on acquisition of $26 million recognized in 2023.

Precision Drilling Corporation 2025 Annual Report 13


Debt Repayments and Shareholder Returns

In 2024, we reduced debt by $176 million, comprised of US$113 million of 2026 unsecured senior note redemptions and the repayment and termination of our Canadian and U.S. Real Estate Credit Facilities for $38 million, partially offset by US$12 million of drawings on our Senior Credit Facility.

Pursuant to our NCIB in 2024, we repurchased and cancelled 833,614 common shares for $75 million.

Finance Charges

Finance charges were $70 million as compared with $83 million in 2023. Our decreased finance charges in 2024 were the result of our lower interest expense on our outstanding debt balance.

Capital Spending and Long-Lived Assets

Our 2024 capital expenditures for the purchase of property, plant and equipment were $217 million, a decrease of $10 million from 2023. Capital spending by spend category included $52 million for expansion and upgrades and $165 million for the maintenance of existing assets, infrastructure and intangibles. Capital expenditures were $7 million higher than guidance due to the timing of the strategic purchase of drill pipe before new import tariffs took effect and additional customer-backed upgrades.

Through the completion of normal course business operations, we sold non-core assets for proceeds of $30 million resulting in a gain on asset disposal of $16 million for the year ended December 31, 2024.

At December 31, 2024, we reviewed each of our CGUs and did not identify indications of impairment and, therefore, did not test our CGUs for impairment.

Income Taxes

In 2024, we recognized an income tax expense of $43 million as compared with an income tax recovery of $23 million in 2023. During the fourth quarter of 2023, we recorded a deferred income tax asset of $73 million for the expected future use of certain Canadian operating losses. We continue to not recognize deferred income tax assets for certain international locations.

Partnership

In 2024, Precision formed a partnership with two Indigenous partners to provide well servicing operations in northeast British Columbia. Precision contributed $4 million in assets to the partnership. Net earnings attributable to NCI was nil in 2024.

SEGMENTED RESULTS

Contract Drilling Services

Financial Results

Year ended December 31
(in thousands of dollars, except where noted)


2025


% of
revenue


2024


% of
revenue


2023


% of
revenue


Revenue


1,576,036


1,617,735


1,704,265


Expenses


Operating


1,045,884


66.4


1,041,068


64.4


1,030,053


60.4


General and administrative


41,356


2.6


44,322


2.7


43,451


2.5


Adjusted EBITDA(1)


488,796


31.0


532,345


32.9


630,761


37.0


(1) See Financial Measures and Ratios on page 44 of this report.

Operating Statistics


Year ended December 31


2025


% increase/
(decrease)


2024


% increase/
(decrease)


2023


% increase/
(decrease)


Number of drilling rigs (year-end)


184


(14.0

)


214


214


(4.9

)

Drilling utilization days (operating and moving)


Canada


23,121


(2.4

)


23,685


12.0


21,156


3.1


U.S.


12,427


(4.2

)


12,969


(27.8

)


17,961


(11.9

)

International


2,698


(7.9

)


2,928


37.3


2,132


(2.6

)

Drilling revenue per utilization day


Canada


35,576


2.2


34,797


5.0


33,151


22.6


U.S.


31,480


(3.2

)


32,531


(7.2

)


35,040


28.3


International


52,195


1.9


51,227


0.8


50,840


(0.8

)

2025 Compared with 2024

Revenue from Contract Drilling Services was $1,576 million compared to $1,618 million in 2024 due to lower North American and international drilling activity. Commodity price volatility, trade and tariff uncertainty, and a focus on customer capital discipline resulted in lower industry activity in both Canada and the U.S. in 2025. Internationally, in May 2025, one drilling rig was temporarily suspended in the Kingdom of Saudi Arabia, reducing our active rig count to seven for the remainder of the year. During the fourth quarter of 2025, we incurred costs to reactivate this rig, which began operating in early February 2026.

14 Management's Discussion and Analysis


Operating expenses in 2025 were 66% of segment revenue compared to 64% in the prior year as we reactivated 17 drilling rigs in the U.S. during the year.

General and administrative expenses for 2025 were largely consistent with 2024 and included share-based compensation of $3 million in 2025 compared with $4 million in 2024.

Our Adjusted EBITDA was $489 million in 2025 as compared with $532 million in 2024, primarily due to lower drilling activity.

Canadian Drilling

Revenue from Canadian drilling was $823 million and similar to 2024 as drilling rig activity and revenue per utilization day remained largely consistent. Demand for our AC Super Triple and Super Single rigs was robust in 2025 and we increased our drilling rig market share even though average industry activity declined 5%.

Adjusted EBITDA in 2025 was consistent with the prior year.

Drilling Statistics – Canada

We ended the year with a Canadian rig count of 95. Our average active rig count decreased to 63 rigs in 2025, down from 65 rigs in 2024, and was consistent with decreased industry activity as the average active land rigs decreased from 186 to 176.


2025


2024


2023


Precision


Industry (1)


Precision


Industry (1)


Precision


Industry (1)


Average number of active land rigs
 for quarters ended:


March 31


74


214


73


208


69


221


June 30


50


127


49


134


42


117


September 30


63


176


72


207


57


188


December 31


66


185


65


194


64


181


Annual average


63


176


65


186


58


177


(1) Source: Baker Hughes.

U.S. Drilling

Revenue from U.S. drilling was US$391 million compared to US$422 million in 2024 due to lower drilling rig utilization and revenue per utilization day. Drilling rig utilization fell by 4% compared to the U.S. average industry activity which decreased by 6% year over year. With declining activity, revenue per utilization day compressed.

Adjusted EBITDA was 22% lower than 2024 as a result of lower drilling activity and day rates and additional rig reactivations in 2025. Even with declining industry activity, we improved our rig utilization from a low of 27 in February, reactivating several rigs to reach a peak of 40 in October and exited 2025 with 36 active rigs.

Drilling Statistics – U.S.

We ended the year with a U.S. rig count of 80. We averaged 34 rigs working in 2025, down from 36 rigs in 2024 and consistent with decreased industry activity as the average active land rigs decreased from 580 to 545.


2025


2024


2023


Precision


Industry (1)


Precision


Industry (1)


Precision


Industry (1)


Average number of active land rigs
 for quarters ended:


March 31


30


572


38


602


60


744


June 30


33


556


36


583


51


700


September 30


36


525


35


565


41


631


December 31


37


527


34


569


45


603


Annual average


34


545


36


580


49


670


(1) Source: Baker Hughes.

International Drilling

Revenue from international drilling was US$141 million compared to US$150 million in 2024, primarily due to the temporary suspension of one rig in the second quarter of 2025.

Precision Drilling Corporation 2025 Annual Report 15


COMPLETION AND PRODUCTION SERVICES

Financial Results


Year ended December 31
(in thousands of dollars, except where noted)


2025


% of
revenue


2024


% of
revenue


2023


% of
revenue


Revenue


278,818


294,817


240,716


Expenses


Operating


204,915


73.5


217,842


73.9


181,622


75.5


General and administrative


9,923


3.6


10,294


3.5


7,870


3.3


Adjusted EBITDA(1)


63,980


22.9


66,681


22.6


51,224


21.3


(1) See Financial Measures and Ratios on page 44 of this report.

Operating Statistics


Year ended December 31


2025


% increase/
(decrease)


2024


% increase/
(decrease)


2023


% increase/
(decrease)


Number of service rigs (end of year)(1)


145


(9.4

)


160


(7.5

)


173


38.4


Service rig operating hours(1)


234,166


(3.4

)


242,479


28.1


189,362


24.0


(1) The service rig fleet and service rig operating hours exclude our U.S. operations that we wound down in the second quarter of 2025.

2025 Compared with 2024

Revenue from Completion and Production Services was $279 million, 5% lower than 2024 as we wound down our U.S. well service operations, selling certain assets and mobilizing others to Canada in the second quarter of 2025.

Operating expenses were 74% of segment revenue, largely consistent with 2024. General and administrative expenses decreased 4% due to lower share-based compensation in 2025.

Adjusted EBITDA decreased slightly from 2024, even though we wound down our U.S. operations during the year.

CORPORATE AND OTHER

Financial Results


Year ended December 31
(in thousands of dollars, except where noted)


2025


2024


2023


Expenses


General and administrative


63,161


77,805


70,867


Adjusted EBITDA(1)


(63,161

)


(77,805

)


(70,867

)

(1) See Financial Measures and Ratios on page 44 of this report.

2025 Compared with 2024

Our Corporate and Other segment contains support functions that provide assistance to our business segments. It includes costs incurred in corporate groups in both Canada and the U.S.

Corporate general and administrative expenses were $63 million, $15 million lower than 2024. The decrease was primarily due to lower share-based compensation of $12 million in 2025 compared to $28 million last year, as our share price appreciation was less in 2025 compared to 2024. In 2025, we recognized approximately $10 million in annualized fixed cost savings through our focus on cost management. Corporate general and administrative costs were 3% of consolidated revenue, largely consistent with 2024.

QUARTERLY FINANCIAL RESULTS


2025 – Quarters Ended
(in thousands of dollars, except per share amounts)


March 31


June 30


September 30


December 31


Revenue


496,331


406,615


462,250


478,508


Adjusted EBITDA(1)


137,497


108,100


117,632


126,386


Net earnings (loss) attributable to shareholders


34,511


16,267


(6,761

)


(42,175

)

per basic share


2.52


1.21


(0.51

)


(3.23

)

per diluted share


2.20


1.07


(0.51

)


(3.23

)

Funds provided by operations(1)


109,842


104,290


96,541


124,750


Cash provided by (used in) operations


63,419


147,495


75,869


126,114


(1) See Financial Measures and Ratios on page 44 of this report.


16 Management's Discussion and Analysis


2024 – Quarters Ended
(in thousands of dollars, except per share amounts)


March 31


June 30


September 30


December 31


Revenue


527,788


429,214


477,155


468,171


Adjusted EBITDA(1)


143,149


115,121


142,425


120,526


Net earnings attributable to shareholders


36,516


20,701


39,183


14,795


per basic share


2.53


1.44


2.77


1.06


per diluted share


2.53


1.44


2.31


1.06


Funds provided by operations(1)


117,765


111,750


113,322


120,535


Cash provided by operations


65,543


174,075


79,674


162,791


(1) See Financial Measures and Ratios on page 44 of this report.

Fourth Quarter 2025 Compared with Fourth Quarter 2024

Revenue in the fourth quarter was $479 million, $10 million higher than the same period last year primarily due to higher drilling activity in the U.S., offset in part by lower international drilling activity. Revenue from our Canadian drilling and Completion and Production operations were comparable with the fourth quarter of 2024.

Adjusted EBITDA was $126 million compared to $121 million in the fourth quarter of 2024 as our stronger U.S. drilling activity and lower share-based compensation were partially offset by lower international drilling activity and higher rig reactivation costs.

Net loss attributable to shareholders was $42 million or a loss of $3.23 per share compared to net earnings of $15 million or $1.06 per share for the same period last year. During the quarter, we recorded a non-cash asset charge of $67 million related to decommissioning 31 of our 215 marketable drilling rigs that no longer aligned with Precision's technology standards. We also recorded a non-cash charge of $17 million related to drill pipe as more complex drilling programs have reduced the useful life of this asset class.

Quarterly Segment Financial Results


2025


2024


Three months ended December 31
(in thousands of dollars, except where noted)


Contract Drilling
Services


Completion &
Production Services


Corporate &
Other


Contract Drilling
Services


Completion &
Production Services


Corporate &
Other


Revenue


410,284


70,940


402,610


68,830


Expenses


Operating


274,724


51,001


264,858


50,714


General and administrative


11,062


2,652


15,399


12,069


2,221


21,052


Adjusted EBITDA(1)


124,498


17,287


(15,399

)


125,683


15,895


(21,052

)

(1) See Financial Measures and Ratios on page 44 of this report.

Quarterly Segment Operating Results


Three months ended December 31

2025


2024


% Change


Contract drilling rig fleet


184


214


(14.0

)

Drilling rig utilization days:


Canada


6,095


6,018


1.3


U.S.


3,362


3,084


9.0


International


644


736


(12.5

)

Revenue per utilization day:


Canada (Cdn$)


35,241


35,675


(1.2

)

U.S. (US$)


30,904


30,991


(0.3

)

International (US$)


53,505


49,636


7.8


Operating costs per utilization day:


Canada (Cdn$)


21,109


21,116


(0.0

)

U.S. (US$)


22,150


21,698


2.1


Service rig fleet(1)


145


160


(9.4

)

Service rig operating hours(1)


61,231


57,932


5.7


(1) The service rig fleet and service rig operating hours exclude our U.S. operations that we wound down in second quarter of 2025.

Contract Drilling Services

Revenue from Contract Drilling Services was $410 million as compared to $403 million in the fourth quarter of 2024. While drilling activity in North America improved over the same period last year, international activity was lower due to one rig being temporarily suspended earlier in the year.

In Canada, our revenue per utilization day less operating costs per utilization day was $14,132 and comparable to $14,559 in the fourth quarter of 2024. Quarterly operating costs per utilization day remained in line with 2024.

Precision Drilling Corporation 2025 Annual Report 17


In the U.S., our revenue per utilization day less operating costs per utilization day was US$8,754 compared to US$9,293 in the same period last year, due to additional rig reactivation costs totaling US$713 per day in the fourth quarter of 2025 compared to US$338 per day in 2024.

Internationally, the higher revenue per utilization day was more than offset by costs incurred in the fourth quarter to reactivate the suspended rig, which began operating in early February 2026.

Our general and administrative expenses of $11 million were largely consistent with 2024.

Adjusted EBITDA was $124 million in 2025 compared to $126 million in 2024.

Completion and Production Services

Completion and Production Services Revenue was $71 million versus $69 million generated in the fourth quarter of 2024 even though we wound down our U.S. well service operations in the second quarter of 2025.

Adjusted EBITDA was $17 million compared to $16 million in the fourth quarter of 2024 as robust demand and pricing for our Canadian completion and production services more than offset our shutdown of U.S. operations.

Corporate and Other

The Corporate and Other segment had negative Adjusted EBITDA of $15 million as compared with negative Adjusted EBITDA of $21 million in 2024. Adjusted EBITDA improved in the fourth quarter of 2025 as a result of lower share-based compensation.


18 Management's Discussion and Analysis


FINANCIAL CONDITION


The oilfield services business is inherently cyclical. To manage this variability, we focus on maintaining a strong financial position to have the financial flexibility necessary to manage our capital expenditures and cash flows, no matter where we are in the business cycle.

We apply a disciplined approach to managing and tracking the results of our operations to keep costs down. We maintain a variable cost structure so we can respond to changing market demand. We also invest in our fleet to make sure we remain competitive. Our maintenance capital expenditures are tightly governed and highly responsive to activity levels with additional cost savings generated through the operating leverage provided by our internal manufacturing and supply divisions. Term contracts on expansion capital for new-build rig programs help provide more certainty of future revenues and return on our growth capital investments.

LIQUIDITY

During 2025, we maintained our strong liquidity position, exiting the year with a cash balance of $86 million and more than $445 million of available liquidity. We expect cash provided by operations and our sources of financing, including our Senior Credit Facility, to be sufficient to meet our unsecured senior note obligations and to fund future capital expenditures.

At December 31, 2025, excluding letters of credit, we had approximately $687 million (2024 – $822 million) outstanding under our secured and unsecured credit facilities and senior note indenture and $8 million (2024 – $10 million) in unamortized debt issue costs. Our Senior Credit Facility includes financial ratio covenants that are tested quarterly.

The current blended cash interest cost of our debt is approximately 6.6%.

Key Financial Indicators and Ratios

We evaluate the relative strength of our financial position by monitoring our working capital, debt ratios and liquidity. We also monitor returns on capital and link our executives’ incentive compensation to certain long-term strategic targets as well as the returns of our shareholders relative to the shareholder returns of our peers. Please refer to page 11 for our summary of Financial Position and Ratios.

Credit Rating

Credit ratings affect our ability to obtain short and long-term financing, the cost of this financing, and our ability to engage in certain business activities cost-effectively.


At March 6, 2026


Moody’s


S&P


Fitch

Corporate credit rating


Ba2


BB-


BB-

Senior Credit Facility rating


Not rated


Not rated


BB+

Unsecured senior notes credit rating


Ba3


BB-


BB-


CAPITAL MANAGEMENT

To maintain and grow our business, we invest in growth, upgrade and sustaining capital. We base expansion and upgrade capital decisions on returns on capital employed and payback. We mitigate the risk that we may not be able to fully recover our capital, by requiring term contracts for new-build rigs.

We base our maintenance capital decisions on actual activity levels, using key financial indicators that we express as per operating day or a per operating hour basis. Sourcing internally (through our manufacturing and supply divisions) helps keep our maintenance capital costs as low as possible.

Foreign Exchange Risk

Our U.S. and international operations have revenue, expenses, assets, and liabilities denominated in currencies other than the Canadian dollar (mostly in U.S. dollars and currencies that are pegged to the U.S. dollar). Accordingly, changes in currency exchange rates can materially affect our income statement, statement of financial position and statement of cash flow. We manage this risk by matching the currency of our debt obligations with the currency of cash flows generated by the operations that the debt supports.

Hedge of Investments in Foreign Operations

We utilize foreign currency long-term debt to hedge our exposure to changes in the carrying values of our net investment in certain foreign operations as a result of changes in foreign exchange rates. During 2025, we continued to designate our U.S. dollar Senior Credit Facility and unsecured senior notes as a net investment hedge in our U.S. dollar denominated foreign operations. To be accounted for as a hedge, the foreign currency denominated long-term debt must be designated and documented as such and must be effective at inception and on an ongoing basis. We recognize the effective amount of this hedge (net of tax) in other comprehensive income, while we recognize ineffective amounts in earnings.

Precision Drilling Corporation 2025 Annual Report 19


SOURCES AND USES OF CASH


At December 31 (in thousands of dollars)


2025


2024


2023


Cash provided by operations


412,897


482,083


500,571


Cash used in investing activities


(208,324

)


(202,986

)


(214,784

)

Surplus


204,573


279,097


285,787


Cash used in financing activities


(192,279

)


(261,385

)


(251,966

)

Effect of exchange rate changes on cash


(284

)


1,877


(1,226

)

Net cash movement


12,010


19,589


32,595


Cash Provided by Operations

In 2025, cash provided by operations was $413 million compared with $482 million in 2024. The decrease was driven by the impact of our lower U.S. and international drilling activity, partially offset by lower share-based compensation.

Cash Used in Investing Activities

Our 2025 capital spending of $263 million by spend category was comprised of:

$107 million on expansion and upgrade capital, and
$157 million on maintenance and infrastructure capital.

The $263 million in capital expenditures in 2025 was split between our segments as follows:

$249 million in Contract Drilling Services,
$13 million in Completion and Production Services, and
$1 million in Corporate and Other.

We sold underutilized capital assets for proceeds of $39 million in 2025 compared with $30 million in 2024.

Cash Used in Financing Activities

In 2025, cash used in financing activities was $192 million as compared with $261 million in 2024. Our 2025 financing activities were comprised of:

$101 million of long-term debt repayments,
$76 million of NCIB share repurchases, and
$15 million of lease payments.

CAPITAL STRUCTURE

Material Debt


Amount


Availability


Used for


Maturity

Senior Credit Facility (secured)


US$375 million (extendible, revolving
term credit facility with US$375 million
accordion feature)


US$80 million and $28 million drawn and US$51 million in outstanding letters of credit


General corporate purposes


October 31, 2028(1)

Operating facilities (secured)


$40 million


Undrawn, except $6 million in
outstanding letters of credit


Letters of credit and general
corporate purposes


US$15 million


Undrawn


Short term working capital
requirements


Demand letter of credit facility (secured)


US$40 million


Undrawn, except US$31 million in
outstanding letters of credit


Letters of credit


Unsecured senior notes (unsecured)


US$400 million – 6.875%


Fully drawn


Debt redemption and repurchases


January 15, 2029

(1)
US$43 million will expire on June 28, 2027.

20 Management's Discussion and Analysis


Covenants

At December 31, 2025, we were in compliance with the covenants of our Senior Credit Facility and unsecured senior notes.


Covenant


At December 31, 2025


Senior Credit Facility


Consolidated senior debt to consolidated covenant EBITDA(1)


≤ 2.50


0.29


Consolidated covenant EBITDA to consolidated interest expense


≥ 2.50


8.95


(1) For purposes of calculating the leverage ratio consolidated senior debt only includes secured indebtedness.

Senior Credit Facility

The senior secured revolving credit facility (Senior Credit Facility) provides financing for general corporate purposes, including for acquisitions, of up to US$375 million with a provision to increase the facility up to an additional US$375 million. The Senior Credit Facility is secured by charges on substantially all of the present and future assets of Precision, its material U.S. and Canadian subsidiaries and, if necessary, to adhere to covenants under the Senior Credit Facility, certain subsidiaries organized in jurisdictions outside of Canada and the U.S.

The Senior Credit Facility requires Precision to comply with certain restrictive and financial covenants, including a leverage ratio of consolidated senior debt to consolidated Covenant EBITDA (as defined in the debt agreement) of less than 2.5:1. For purposes of calculating the leverage ratio, consolidated senior debt only includes secured indebtedness. It also requires the Corporation to maintain a ratio of consolidated Covenant EBITDA to consolidated interest expense for the most recent four consecutive quarters of greater than 2.5:1.

Distributions under the Senior Credit Facility are subject to a pro-forma senior net leverage covenant of less than or equal to 1.75:1. The Senior Credit Facility also limits the redemption and repurchase of junior debt subject to a pro-forma senior net leverage covenant test of less than or equal to 1.75:1.

In 2025, Precision extended its Senior Credit Facility's maturity date and amended certain terms of the facility. The maturity date was extended from June 28, 2027 to October 31, 2028, with the exception of US$43 million, which will mature on June 28, 2027.

Under the Senior Credit Facility, amounts can be drawn in U.S. dollars and/or Canadian dollars. At December 31, 2025, US$80 million and $28 million were drawn under this facility (2024 – US$12 million). Up to US$200 million of the Senior Credit Facility is available for letters of credit denominated in U.S. and/or Canadian dollars and other currencies acceptable to the fronting lender. As of December 31, 2025, outstanding letters of credit amounted to US$51 million (2024 – US$51 million).

The interest rate on loans that are denominated in U.S. dollars is, at the option of Precision, either a margin over a U.S. base rate or a margin over the Secured Overnight Financing Rate (SOFR). The interest rate on loans denominated in Canadian dollars is, at the option of Precision, either a margin over the Canadian prime rate or a margin over the Canadian Overnight Repo Rate Average (CORRA); such margins will be based on the then applicable ratio of consolidated total debt to EBITDA.

In connection with the Senior Credit Facility borrowings, Precision entered into a floating-to-fixed interest rate swap agreement with a notional amount of US$50 million and a maturity date of December 2026. Under the agreement, Precision pays a fixed rate of 3.7% in place of the variable SOFR-based rate. The fair value of the interest rate swap arrangement is the difference between the forward interest rates and the discounted contract rate and is classified as Level II on the fair value hierarchy. As of December 31, 2025, the mark-to-market value of the interest rate swap was not material and was included within accounts receivable in the consolidated statements of financial position.

Unsecured Senior Notes

The unsecured senior notes require us to comply with an incurrence based consolidated interest coverage ratio test of consolidated cash flow, as defined in the senior note indenture, to consolidated interest expense of greater than 2.0:1 for the most recent four consecutive fiscal quarters. In the event our consolidated interest coverage ratio is less than 2.0:1 for the most recent four consecutive fiscal quarters, the senior notes restrict our ability to incur additional indebtedness.

The unsecured senior notes contain a restricted payment covenant that limits our ability to pay dividends, make distributions or repurchase shares from shareholders. This restricted payment basket grows from a starting point of July 1, 2021 by, among other things, 50% of consolidated cumulative net earnings and decreases by 100% of consolidated cumulative net losses, as defined in the senior note agreements, and payments made to shareholders. At December 31, 2025, the governing net restricted payments basket was $41 million (2024 - negative $4 million). During 2024, pursuant to the indentures governing the unsecured senior notes, Precision used the available general restricted payments basket to facilitate the repurchase and cancellation of its common shares.

In addition, the unsecured senior notes contain certain covenants that limit our ability, and the ability of certain subsidiaries, to incur additional indebtedness and issue preferred shares; create liens; create or permit to exist restrictions on our ability or certain subsidiaries to make certain payments and distributions; engage in amalgamations, mergers or consolidations; make certain dispositions and engage in transactions with affiliates.

During 2025, Precision fully redeemed the 2026 unsecured senior notes. The redemption was executed at par value, comprising US$160 million in principal and US$3 million in accrued interest. The transaction was financed through a combination of cash on hand and proceeds drawn from the Senior Credit Facility.

Precision Drilling Corporation 2025 Annual Report 21


For further information, please see the unsecured senior note indentures which are available on SEDAR+ (www.sedarplus.ca) and EDGAR Next.

Long-Term Debt Guarantors

Precision Drilling Corporation (Parent) issued registered unsecured senior notes in 2021 which are fully and unconditionally guaranteed by certain U.S. and Canadian subsidiaries (Guarantor Subsidiaries) that also guaranteed the Senior Credit Facility. These Guarantor Subsidiaries are directly or indirectly wholly owned by the Parent. The following is a description of the terms and conditions of the guarantees with respect to the unsecured senior notes for which Precision is the Parent issuer and Guarantor Subsidiaries (Obligor Group) and provides a full and unconditional guarantee.

As of December 31, 2025, Precision had $549 million principal amount of unsecured senior notes outstanding due in 2029, all of which is guaranteed by the Guarantor Subsidiaries.

The Guarantor Subsidiaries jointly and severally, fully, unconditionally, and irrevocably guarantee the payment of the principal and interest on the unsecured senior notes when they become due, whether at maturity or otherwise. The guarantee is unsecured and ranks senior with all of the Guarantor Subsidiaries' other unsecured obligations.

The Guarantor Subsidiaries will be released and relieved of their obligations under the guarantees after the obligations to the holders are satisfied in accordance with the applicable indentures.

Summarized Financial Information

The following tables include summarized financial information for the Obligor Group on a combined basis after the elimination of (i) intercompany transactions and balances within the Obligor Group; (ii) equity in earnings from investments in the non-guarantor subsidiaries; and (iii) intercompany dividend income.

Statements of Net Earnings


Parent and Guarantor Subsidiaries


2025


2024

Revenue


$1,644,891


$1,703,796

Expenses


1,204,763


1,236,952

Adjusted EBITDA


440,128


466,844

Net earnings


9,527


107,997

Statements of Financial Position


Parent and Guarantor Subsidiaries


2025


2024

Assets


Current assets


$384,251


$374,188

Property, plant and equipment


1,860,703


2,002,663

Other non-current assets


73,673


91,240


Parent and Guarantor Subsidiaries


2025


2024

Liabilities


Current liabilities


$238,353


$262,899

Long-term debt


679,291


812,469

Other non-current liabilities


151,931


116,880

Excluded from the statements of net earnings and statements of financial position above are the following intercompany transactions and balances that the Obligor Group had with the non-guarantor subsidiaries:


Parent and Guarantor Subsidiaries


2025


2024

Assets


Accounts receivable, intercompany


$62,677


$60,059

Short-term advances to affiliates


1,029


1,687


Parent and Guarantor Subsidiaries


2025


2024

Liabilities


Accounts payable, intercompany


$37,106


$29,593

Short-term advances from affiliates


18

Long-term advances from affiliates


237,617


215,595


22 Management's Discussion and Analysis


Parent and Guarantor Subsidiaries


2025


2024

Cash transactions with non-guarantor subsidiaries


Capital contributions to non-guarantor subsidiaries


$1,380


$4,409

Return of capital from non-guarantor subsidiaries


200


-

Contractual Obligations

Our contractual obligations include both financial obligations (long-term debt and interest) and non-financial obligations (new-build rig commitments, leases, and equity-based compensation for key executives and officers). The table below shows the amounts of these obligations and when payments are due for each.


Payments due (by period)


At December 31, 2025
(in thousands of dollars)


Less than
1 year


1-3 years


4-5 years


More than
5 years


Total


Long-term debt


137,809


549,044


686,853


Interest on long-term debt


45,058


88,962


1,573


135,593


Purchase of property, plant and equipment(1)


130,702


22,680


153,382


Leases


21,256


30,229


13,254


28,753


93,492


Contractual incentive plans(2)


18,855


36,476


55,331


Total


215,871


316,156


563,871


28,753


1,124,651


(1) Balance primarily relates to cost of rig equipment with flexible delivery schedule wherein we can take delivery through 2027.

(2) Includes amounts not yet accrued but are likely to be paid at the end of the contract term. Our long-term incentive plans compensate officers and key employees through cash payments when their awards vest. Equity-based compensation amounts are shown based on the closing share price on the TSX of $98.49 at December 31, 2025.

Shareholders Capital


March 6,
2026


December 31,
2025


December 31,
2024


December 31,
2023


Shares outstanding


12,945,419


12,932,399


13,779,502


14,336,539


Deferred shares outstanding


8,813


8,813


4,223


1,470


Share options outstanding


2,725


72,012


151,453


Subsequent to December 31, 2025, we settled certain vesting Executive RSUs through the issuance of 42,833 common shares and, pursuant to our NCIB, repurchased and cancelled 32,538 common shares for $3 million. In addition, the U.S. share options that were outstanding at year-end were exercised on February 17, 2026.

More information about our capital structure can be found on our AIF, available on our website and on SEDAR+ (www.sedarplus.ca).

Enterprise Value


(in thousands of dollars, except shares outstanding and per share amounts)


December 31,
2025


December 31,
2024


December 31,
2023


Shares outstanding


12,932,399


13,779,502


14,336,539


Year-end share price on the TSX


98.49


87.92


71.96


Shares at market


1,273,712


1,211,494


1,031,657


Long-term debt


679,291


812,469


914,830


Less cash


(85,781

)


(73,771

)


(54,182

)

Enterprise Value(1)


1,867,222


1,950,192


1,892,305


(1) See Financial Measures and Ratios on page 44 of this report.

ACCOUNTING POLICIES, ESTIMATES, AND ARRANGEMENTS


CRITICAL ACCOUNTING ESTIMATES AND JUDGEMENTS

Because of the nature of our business, we are required to make estimates about the future that affect the reported amounts of assets, liabilities, revenues and expenses, and the disclosure of contingent liabilities. Estimates are based on our past experience, our best judgement and assumptions we think are reasonable.

Our material accounting policies are described in Note 3 to the Consolidated Financial Statements. We believe the following are the most difficult, subjective or complex judgements, and are the most critical to how we report our financial position and results of operations:

impairment of long-lived assets
income taxes

Precision Drilling Corporation 2025 Annual Report 23


Climate-related risks and opportunities may have a future impact on the Corporation and its estimates and judgements, including but not limited to the useful life and residual value of its property, plant and equipment and the measurement of projected cash flows when identifying impairment triggers, performing tests for impairment or impairment recoveries of non-financial assets.

The Corporation evaluated the remaining useful lives and residual values of its property, plant and equipment, concluding they are reasonable given the current estimate of the demand period for oil and natural gas extractive services well exceeds their remaining useful lives. In addition, the Corporation’s property, plant and equipment, including drill rig equipment, adapts to numerous low-carbon projects, including but not limited to geothermal drilling, carbon capture and storage and the extraction of helium and hydrogen gas.

In future periods, if indications of impairment of non-financial assets exist, the Corporation’s measurement of projected cash flows may be exposed to higher estimation uncertainty, including but not limited to the Corporation’s continued capital investment required to lower the carbon intensity of its property, plant and equipment, period and growth expectations used to calculate terminal values and the Corporation’s weighted average cost of capital.

Impairment of Long-Lived Assets

Long-lived assets, which include property, plant and equipment and intangibles, comprise the majority of our assets. The carrying value of these assets is reviewed for impairment periodically or whenever events or changes in circumstances indicate that their carrying amounts may not be recoverable. The Corporation’s analysis is based on relevant internal and external factors that indicate a CGU may be impaired such as the obsolescence or planned disposal of significant assets, the financial performance of the CGU compared to forecasts and past impairment tests, with a focus on Adjusted EBITDA, and consideration of the Corporation’s market capitalization.

The recoverability of long-lived assets requires a calculation of the recoverable amount of the Cash-Generating Unit or groups of CGUs to which assets have been allocated. A CGU is the smallest identifiable group of assets that generates cash inflows that are largely independent of the cash inflows from other assets or groups of assets. Judgement is required in the aggregation of assets into CGUs. The recoverability calculation requires an estimation of the future cash flows from the CGU or group of CGUs, and judgement is required in projecting cash flows and selecting the appropriate discount rate. We use observable market data inputs to develop a discount rate that we believe approximates the discount rate from market participants. For property, plant and equipment, this requires us to forecast future cash flows to be derived from the utilization of our assets based on assumptions about future business conditions and technological developments. Significant, unanticipated changes to these assumptions could require a provision for impairment in the future.

In deriving the underlying projected cash flows, assumptions must also be made about future drilling activity, margins and market conditions over the long-term life of the assets or CGUs. We cannot predict if an event that triggers impairment will occur, when it will occur or how it will occur, or how it will affect reported asset amounts. Although we believe the estimates are reasonable and consistent with current conditions, internal planning, and expected future operations, such estimates are subject to significant uncertainty and judgement.

Income Taxes

Uncertainties exist with respect to the interpretation of complex tax regulations, changes in tax laws, and the amount and timing of future taxable income. Differences arising between the actual results and the assumptions made, or future changes to such assumptions, could necessitate future adjustments to taxable income and expenses already recorded. We establish provisions, based on reasonable estimates, for possible consequences of audits by the tax authorities of the respective countries in which we operate. The amount of such provisions is based on various factors, such as our experience with previous tax audits and differing interpretations of tax regulations by the taxable entity and the responsible tax authority.

CHANGE IN ACCOUNTING ESTIMATE

During 2025, we completed our normal course review of expected life of property, plant and equipment, including a detailed review of drilling rig equipment.

In connection with this review, we revised the estimated useful lives of tubulars to better reflect the period over which the related future economic benefits are expected to be realized. Effective December 31, 2025, the estimated useful life was changed to an average of four years (previously five to eight years, depending on geographical location).

The change in accounting estimate has been applied prospectively. For the year ended December 31, 2025, this revision resulted in additional depreciation expense of $17 million. Based on the existing asset base, we expect this change to increase annual depreciation expense by approximately $38 million in 2026.

No other major category of property, plant and equipment was affected by this change.

24 Management's Discussion and Analysis


ACCOUNTING STANDARDS AND AMENDMENTS NOT YET EFFECTIVE

The IASB has issued several new standards and amendments to existing standards that will become effective for periods subsequent to December 31, 2025. Accordingly, these new standards and amendments were not applied when preparing our 2025 consolidated financial statements. For each standard, we remain in the process of assessing the impact these new standards and amendments will have on our consolidated financial statements.

Standards and Amendments


Effective for periods beginning on or after


Impact to Precision Drilling Corporation

Classification and Measurement of Financial Instruments
   (Amendments to IFRS 9 and IFRS 7)


January 1, 2026


Review in-progress

Contracts Referencing Nature-dependent Electricity
   (Amendments to IFRS 9 and IFRS 7)


January 1, 2026


Review in-progress

Annual Improvements to IFRS Accounting Standards
   (Volume 11)


January 1, 2026


Review in-progress

IFRS 18 Presentation and Disclosure in Financial Statements


January 1, 2027


Review in-progress

IFRS 19 Subsidiaries without Public Accountability: Disclosures


January 1, 2027


Review in-progress

Sale or Contribution of Assets between an Investor and its
   Associate or Joint Venture (Amendments to IFRS 10
   and IAS 28)


To be determined


Review in-progress

IFRS 18 Presentation and Disclosure in Financial Statements

IFRS 18 will replace IAS 1 Presentation of Financial Statements and applies for annual reporting periods beginning on or after January 1, 2027. The new standard introduces the following key new requirements.

Entities are required to classify all income and expenses into five categories in the statement of profit or loss, namely the operating, investing, financing, discontinued operations and income tax categories. Entities are also required to present a newly-defined operating subtotal. Entities' net profit will not change.
Management-defined Performance Measures (MPMs) are to be disclosed in a single note within the financial statements.
Enhanced guidance is provided on how to group information within the financial statements.


In addition, all entities are required to use the operating profit subtotal as the starting point in the statement of cash flows when presenting operating cash flows under the indirect method.

We expect IFRS 18 to significantly impact our financial statements and are still in the process of assessing the full impact of the standard, particularly with respect to the structure of our statement of net earnings, statement of cash flows and additional note disclosures required for MPMs.

Off-Balance Sheet Arrangements

Precision has not entered into any arrangements that involve off-balance sheet transactions.


Precision Drilling Corporation 2025 Annual Report 25


RISKS IN OUR BUSINESS


Investing in Precision Drilling Corporation involves inherent risks. We encourage you to carefully review the risks outlined in this section, along with other information provided in this Annual Report and our additional disclosure documents, including our Management Disclosure and Analysis and other continuous disclosure filings, before making an investment decision. The risks included in this section and our other disclosure documents, individually and in aggregate, could materially and adversely impact our business, financial position, operational results, cash flows, liquidity and long-term strategy. We also recommend consulting with professional advisors to ensure an informed decision.

Our enterprise risk management framework is an integral part of our strategic and operational approach. Operating at both business and functional levels, it is designed to systematically identify, evaluate, and mitigate risks across the categories outlined below. It incorporates ongoing monitoring, escalation, and oversight mechanisms and integrates Precision’s policies, guidelines, and internal controls to address risks proactively and effectively. Notwithstanding these processes, we are exposed to risks inherent to the oilfield services industry and to operating in a dynamic global environment, including risks that are difficult to predict. As part of our daily operations, we encounter and manage various risks, some of which may lead to outcomes materially different from our current expectations or forward looking statements. In this section, we provide an analysis of key strategic, operational, financial, legal, and compliance risks. The manner in which we respond to these risks and other emerging challenges will play a critical role in shaping our future performance, resilience and long-term value creation.

Our operations depend on the prices of oil and natural gas, which are subject to volatility and on the exploration and development activities of oil and natural gas exploration and production companies

We primarily sell our services to oil and natural gas exploration and production companies. Macroeconomic and geopolitical factors associated with oil and natural gas supply and demand are the primary factors driving pricing and profitability in the oilfield services industry. Generally, we experience higher demand for our services when commodity prices are relatively high, and the opposite is true when commodity prices are relatively low. The volatility of crude oil and natural gas prices accounts for much of the cyclical nature of the oilfield services business. Increased volatility and other factors beyond our control have led to greater uncertainty in the demand for our services in recent years.

The markets for oil and natural gas are separate and distinct. Oil is a global commodity with a vast distribution network, although the differential between benchmarks such as West Texas Intermediate, Western Canadian Select, and European Brent crude oil can fluctuate. As in all markets, when supply, demand, inability to access domestic or export markets, transportation constraints and other factors change, so can the spreads between benchmarks. The use of natural gas is growing worldwide, with the three most developed demand centers residing in North America, Western Europe and North Asia. These regions have dense pipeline networks and a high demand for natural gas. The world’s largest producers of natural gas are currently the U.S., Russia, Iran, Qatar, Canada, China, Norway and Australia. The most economical way to transport natural gas is in its gaseous state by pipeline, and the natural gas market depends on pipeline infrastructure and regional supply and demand. However, developments in the transportation of LNG in ocean-going tanker introduced an element of globalization to the natural gas market by linking major production centers with the world’s primary demand centers.

Global military and political conditions, along with economic factors such as expectations for growth, inflation, and trade disputes, as well as events like global pandemics, ongoing conflicts in Ukraine and the Middle East, or production decisions by OPEC+, can all affect supply and demand for oil and natural gas. Weather conditions, governmental regulation (in the countries in which we operate), levels of consumer demand, the availability and pricing of alternate sources of energy (including renewable energy initiatives), the availability of pipeline capacity and other transportation for oil and natural gas, global oil and natural gas storage and production levels, and other factors beyond our control can also affect the supply of and demand for oil and natural gas and lead to future price volatility.

According to Baker Hughes, the onshore Canadian average active rig count in 2025 decreased approximately 5% year-over-year. The Canadian Association of Energy Contractors (CAOEC) reported on December 1, 2025, that approximately 5,500 wells were expected to be drilled in 2025, compared with 5,800 in 2024 and 5,400 in 2023. In the U.S., Baker Hughes reports the onshore Lower 48 rig count average for 2025 was 6% lower than the average in 2024. In early 2026, Enverus reported approximately 13,400 wells were started onshore in the U.S. in 2025, compared with approximately 14,800 in 2024 and 16,100 in 2023. In Canada, drilling activity is supported by strong fundamentals from additional take away capacity including the Trans Mountain expansion pipeline in 2024 providing additional take away capacity and improved pricing for oil, and the start up of LNG Canada in mid-2025 providing additional natural gas takeaway capacity. While Canadian drilling fundamentals supported additional activity in 2025, tariff and commodity price uncertainty tempered producers' drilling plans. In the U.S. drilling activity continued to weaken throughout 2025 due to oil and natural gas price volatility, exacerbated by drilling and completion efficiencies. In both Canada and the U.S, producers continue to prioritize capital discipline and returns to shareholders over production growth.

Recently, commodity prices have been negatively affected by a combination of factors, including increased production, the decisions of OPEC+, concerns in respect of a recession and a strengthening in the U.S. dollar relative to most other currencies. Although OPEC+ agreed in December 2025 to extend oil production cuts into 2026, there is no assurance that the most recent OPEC+ agreement will be observed by its parties and OPEC+ may change its agreement depending upon market conditions.

26 Management's Discussion and Analysis


Oil and natural gas prices are expected to continue to be volatile as a result of tariffs and trade disputes, conflict in Ukraine, concerns around expansion of conflict in the Middle East, including Iran, potential increased production in Venezuela, changes in oil and natural gas inventories, sanctions on Russian oil and natural gas exports and prices, global and national economic performance, the actions of OPEC+, and any coordinated releases of oil from or additions to strategic reserves by the U.S. (or any other country). Certain of these events and conditions may contribute to decreased exploration and drilling activities and a decrease in confidence in the oil and natural gas industry. These difficulties have been exacerbated in Canada and the U.S. by political and other actions resulting in uncertainty surrounding regulatory, tax, royalty and environmental regulation. Each of these factors have adversely affected, and could continue to adversely affect, the price of oil and natural gas and drilling activities by our customers, which would adversely affect the level of capital spending by our customers and in turn could have a material adverse effect on our business, financial condition, results of operations and cash flow.

The current U.S. administration and its policy priorities have introduced, and may continue to introduce, additional volatility into oil and natural gas markets. Historically, the Trump administration pursued policies favoring increased domestic energy production, including rolling back certain environmental regulations and expanding access to federal lands for drilling. The continuation or expansion of such policy priorities could lead to increased U.S. oil and natural gas production, which, depending on global supply and demand conditions, could place downward pressure on commodity prices and adversely affect drilling activity. At the same time, changes in U.S. trade, foreign policy, and international energy relations, including the use of tariffs, sanctions, and engagement with OPEC+, could increase market uncertainty and price volatility. In particular, potential changes in U.S. policy toward Venezuela, including the easing or tightening of sanctions or support for increased Venezuelan oil production, could add incremental global supply and further pressure oil prices. Such developments could have indirect adverse effects on Canadian oil and gas markets, including by widening price differentials, affecting export economics, and influencing capital allocation decisions by producers operating in Canada. Additionally, the regulatory landscape could shift dramatically, with a possible relaxation of environmental restrictions and permitting processes affecting infrastructure development, pipelines, and drilling projects. These policy changes could have both positive and negative effects on the industry, depending on the balance between increased production, global market reactions, and investor confidence in long-term stability.

As a result of the continued volatility in oil and natural gas prices, regulatory uncertainty, and strategies of certain of our customers to focus on debt reductions, returning cash to shareholders or other capital discipline rather than incurring expenditures on exploration and drilling activities, demand for our services may be lower compared to historical periods when commodity prices were at similar levels. Reductions in commodity prices or factors that impact the supply and demand for oil and natural gas and lead to price volatility may result in reductions in capital budgets by our customers in the future, which could result in cancelled, delayed or reduced drilling programs by our customers and a corresponding decline in demand for our services. Additionally, the availability and pricing of alternative sources of energy, a transition to lower carbon intensive energy sources or a shift to a lower carbon economy, and technological advances may also depress the overall level of oil and natural gas exploration and production activity, similarly impacting the demand for our services.

If a reduction in exploration and development activities, whether resulting from changes in oil and natural gas prices or reductions in capital expenditures and capital budgets as described above or otherwise, continues or worsens, it could materially and adversely affect us by:

negatively impacting our revenue, cash flow, profitability and financial condition
restricting our ability to make capital expenditures and our ability to meet future contracted deliveries of new-build rigs
affecting the existing fair market value of our rig fleet, which in turn could trigger a write-down for accounting purposes
our customers negotiating, terminating, or failing to honour their drilling contracts with us
making our Senior Credit Facility financial covenants more difficult to maintain, and
negatively impacting our ability to maintain or increase our borrowing capacity, our ability to obtain additional capital to finance our business and our ability to achieve our debt reduction targets.

There is no assurance that demand for our services or conditions in the oil and natural gas and oilfield services sector will remain stable in the future. A significant decline in demand could have a material adverse effect on our business, financial condition, results of operations and cash flow.

Additionally, we have accounts receivable with customers in the oil and natural gas industry and their revenues may be affected by fluctuations in commodity prices. Our ability to collect receivables may be adversely affected by any prolonged weakness in oil and natural gas prices.

Intense price competition and the cyclical nature of the contract drilling industry could have an adverse effect on revenue and profitability

The contract drilling business is highly competitive with many industry participants. In an environment characterized by fierce competition, companies often face pressure to lower prices to secure contracts, potentially eroding profit margins. We compete for drilling contracts that are usually awarded based on competitive bids. We believe pricing, rig availability and technology are the primary factors potential customers consider when selecting a drilling contractor. We believe other factors are also important, such as the drilling capabilities and condition of drilling rigs, the quality of service and experience of rig crews, the safety record of the contractor, the offering of ancillary services, the ability to provide drilling equipment that is adaptable, having personnel familiar with new technologies and drilling techniques, and rig mobility and efficiency.

Precision Drilling Corporation 2025 Annual Report 27


Historically, contract drilling has been cyclical with periods of low demand, excess rig supply and low day rates, followed by periods of high demand, short rig supply and increasing day rates. Periods of excess drilling rig supply intensify the competition and often result in rigs being idle. There are numerous drilling companies in the markets where we operate, and an oversupply of drilling rigs can cause greater price competition. Contract drilling companies compete primarily on a regional basis, and the intensity of competition can vary significantly from region to region at any particular time. However, if demand for contract drilling and drilling services is better in a region where we operate, our competitors might respond by moving suitable drilling rigs in from other regions with lower demand, reactivating previously stacked rigs or purchasing new drilling rigs. An influx of drilling rigs into a market from any source could rapidly intensify competition and make any improvement in the demand for our drilling rigs short-lived, which could in turn have a material adverse effect on our business, financial condition, results of operations and cash flow. In addition, the development of new drilling technology by competitors has increased in recent years, which could negatively affect our ability to differentiate our services.

Our business results and the strength of our financial position are affected by our ability to strategically manage our costs and capital expenditure program in a manner consistent with industry cycles and fluctuations in the demand for contract drilling services. If we do not effectively manage our costs and capital expenditures or respond to market signals relating to the supply or demand for contract drilling and oilfield services, it could have a material adverse effect on our business, financial condition, results of operations and cash flow.

Lower activity in the contract drilling industry exposes us to the risk of oversupply of equipment

Periods of low demand often lead to low utilization. The number of drilling rigs competing for work in markets where we operate has remained the same as the industry has seen a decrease in drilling activity relative to periods prior to 2015. The industry supply of drilling rigs may exceed actual demand because of the relatively long-life span of oilfield services equipment as well as the typically long time from when a decision is made to upgrade or build new equipment to when the equipment is built and placed into service. Excess supply resulting from industry decline could lead to lower demand for term drilling contracts and for our equipment and services. The additional supply of drilling rigs allows competitors to potentially reallocate rigs to higher demand areas and has intensified price competition in the past and could continue to do so. This could lead to lower day rates in the oilfield services industry generally and lower utilization of existing rigs. If any of these factors materialize, it could have a material adverse effect on our business, financial condition, results of operations and cash flow.

Pipeline constraints and other regulatory uncertainty in Western Canada could have an adverse effect on the demand for our services in Canada

In western Canada, delays and/or the inability to obtain necessary regulatory approvals for pipeline projects that would provide additional transportation capacity and access to refinery capacity for our customers have led to downward price pressure on oil and natural gas produced in western Canada, which has depressed, and may continue to depress, the overall exploration and production activity of our customers. Canada generally has lagged behind other natural gas producing countries in taking advantage of rising global demand and prices for natural gas primarily as a result of Canada’s lack of liquified natural gas facilities and, by extension, export capacity owing to regulatory delay and uncertainty. While LNG Canada, a liquefaction facility and export terminal at Kitimat, is operational which enables Western Canada produced natural gas natural gas to reach global markets, other proposed LNG facilities in Canada are at earlier stages of development, including Woodfibre LNG and Ksi Lisims LNG (completions currently anticipated between 2027 and 2029). There is no assurance that LNG projects in Canada will be completed on their expected timelines, or at all.

The regulatory uncertainty in Canada has impacted some of our customers’ ability to obtain financing as well as their ability to market their oil and natural gas, which has also depressed overall exploration and production activity. These factors could result in a corresponding decline in the demand for our services that could have a material adverse effect on our business, financial condition, results of operations and cash flow.

Given the ongoing challenges in obtaining timely regulatory approvals and securing necessary infrastructure, there is concern that Canada’s oil and natural gas industry may continue to face competitive disadvantages compared to other energy-producing nations. Without further clarity on government policies and expedited project approvals, Canada risks missing out on the growing global demand for LNG and other energy exports, potentially leading to further reductions in drilling activity and capital investment in the region.

Risks and uncertainties associated with operating internationally can negatively affect our business

Operating in multiple international regions exposes us to various geopolitical risks that could adversely affect our operations and financial performance. Political instability, such as government upheavals, civil unrest, or regime changes, can disrupt our activities by leading to expropriation of assets, nationalization of industry, or nullification of existing contracts. Regulatory changes, including shifts in environmental policies, taxation, or labor laws, may increase operational costs or impose limitations on our drilling activities. International sanctions, whether imposed by the United States, Canada or other countries, can restrict our ability to conduct business in certain regions, limit access to necessary equipment or technology, and impede financial transactions. Sanctions and other related geopolitical conflicts can lead to significant negative impacts on economies and the markets for certain commodities, such as oil and natural gas. These factors could result in operational disruptions, increased costs, and reduced profitability, thereby materially affecting our business and financial condition. Although we monitor

28 Management's Discussion and Analysis


geopolitical developments and strive to implement strategies to mitigate these risks, the unpredictable nature of global politics and economic conditions means we cannot eliminate their potential impact.

Our international operations are subject to risks normally associated with conducting business in foreign countries, including, but not limited to, the following:

an uncertain political and economic environment
the loss of revenue, property and equipment as a result of expropriation, confiscation, nationalization, contract deprivation and force majeure
war, terrorist acts or threats, civil insurrection and geopolitical and other political risks
fluctuations in foreign currency and exchange controls
restrictions on the repatriation of income or capital
increases in duties, taxes and governmental royalties
renegotiation of contracts with governmental entities
changes in laws and policies governing operations of companies
compliance and regulatory challenges, including compliance with anti-corruption and anti-bribery legislation in Canada, the U.S. and other countries
trade restrictions, increased tariffs or embargoes imposed by the U.S. or other countries where we operate
tariffs or retaliatory trade policies, and trade disputes particularly between major oil and gas-producing nations, which may increase costs and create uncertainty in global energy markets
heightened international tensions and geopolitical instability, including disputes between major economies, which could disrupt global supply chains and impact oil and gas markets
increasing global scrutiny on environmental practices and the evolving landscape of climate change regulations, and
differences in cultural norms and social expectations

If a dispute arises in connection with our international operations, we may be subject to the exclusive jurisdiction of foreign courts. In addition, we may not be able to file suits against foreign persons or subject them to the jurisdiction of a court in Canada or the U.S. or be able to enforce judgments or arbitrated awards against state-owned customers.

Government-owned petroleum companies located in some of the countries where we operate now or in the future may have policies, or may be subject to governmental policies, that give preference to the purchase of goods and services from companies that are majority-owned by local nationals. As such, we may rely on joint ventures, license arrangements and other business combinations with local nationals in these countries, which may expose us to certain counterparty risks, including the failure of such partners or local nationals to meet contractual obligations or comply with local or international laws potentially exposing us to legal, financial or reputational harm.

In the international markets where we operate, we are subject to various laws and regulations that govern the operation and taxation of our businesses and the import and export of our equipment from country to country. There may be uncertainty about how these laws and regulations are imposed, applied or interpreted, and they could be subject to change. Since we derive a portion of our revenues from subsidiaries outside of Canada and the U.S., the subsidiaries paying dividends or making other cash payments or advances may be restricted from transferring funds in or out of the respective countries, or face exchange controls or taxes on any payments or advances. We have organized our foreign operations partly based on certain assumptions about various tax laws (including capital gains and withholding taxes), foreign currency exchange, and capital repatriation laws and other relevant laws of a variety of foreign jurisdictions. While we believe these assumptions are reasonable; there is no assurance that foreign taxing or other authorities will reach the same conclusion. If these foreign jurisdictions change or modify the laws, we could suffer adverse tax and financial consequences.

Diverse regulatory frameworks across countries pose challenges in compliance, with variations in environmental standards, safety regulations, and permitting processes. Adapting to different regulatory environments may result in increased compliance costs, potential legal issues, and delays in project execution.

We are subject to compliance with the United States Foreign Corrupt Practices Act (FCPA) and the Corruption of Foreign Public Official Act (Canada) (CFPOA), which generally prohibit companies from making improper payments to foreign government officials for the purpose of obtaining business. While we have developed policies and procedures designed to achieve compliance with the FCPA, CFPOA and other applicable international laws, we could be exposed to potential civil and criminal claims, economic sanctions or other restrictions for alleged or actual violations of international laws related to our international operations, including anti-corruption and anti-bribery legislation, trade laws and trade sanctions. The Canadian government, the U.S. Department of Justice, the Securities and Exchange Commission (SEC), the U.S. Office of Foreign Assets Control and similar agencies have a broad range of civil and criminal penalties they may seek to impose against corporations and individuals for such violations, including injunctive relief, disgorgement, fines, penalties and modifications to business practices and compliance programs, among other things. We could also face penalties or other sanctions from authorities in other relevant foreign jurisdictions, including prohibition of our participation in or curtailment of business operations in those jurisdictions and the seizure of drilling rigs or other assets. While we cannot accurately predict the impact of any of these factors, if any of those risks materialize, it could have a material adverse effect on our reputation, business, financial condition, results of operations and cash flow.

Precision Drilling Corporation 2025 Annual Report 29


Differences in cultural norms and social expectations can influence community relations, workforce dynamics, and stakeholder engagement. Failure to effectively manage or navigate differences could result in reputational damage, community opposition, or challenges in attracting and retaining skilled personnel.

Uncertainty as to the position of the United States in respect of world affairs and events

As a result of the new Trump administration and its shift in political priorities and foreign posture there is increased uncertainty regarding the position the U.S. will take with respect to world affairs and geopolitical events. This uncertainty may include issues such as U.S. support for existing treaty and trade relationships with other countries, including Canada, position on territorial and sovereign matters and diplomatic or economic relations with key energy producing regions.

Recent public statements and policy positions regarding strategic regions and countries, including Iran, Greenland and Venezuela, underscore the potential for shifts in U.S. foreign policy that could affect global energy supply, trade flows, sanctions regimes, and geopolitical stability. Ongoing U.S. military operations involving Iran could increase volatility in global energy markets, including oil prices, energy operations, and trading activities. Changes in U.S. policy toward Venezuela, including the easing, tightening, or selective enforcement of sanctions, could increase global oil supply and contribute to additional volatility in oil prices, with potential downstream effects on North American producers and service providers, including in Canada.

Additionally, the Canada-United States-Mexico Agreement (CUSMA) is set for review in 2026 and there is uncertainty whether the parties will seek to renegotiate its terms.

Implementation by the U.S. of new legislative or regulatory regimes, tariffs or revisions to CUSMA could impose additional costs on us, decrease Canadian or U.S. demand for our services or otherwise negatively impact us or our customers, which may have a material adverse effect on our business, financial condition and operations. The potential for, and continuation of, tariffs imposed by the U.S. government and counter-tariffs imposed by the Canadian and other governments have created economic uncertainty, which could have a material adverse effect on our business, including impacts to commodity prices and potential impacts on cross-border supply chain. The impact of U.S. tariffs and retaliatory measures from other countries remains uncertain. There is a possibility that trade disputes could escalate, which could have a material adverse impact on our operations and cash flows.

Any difficulty in retaining, replacing, or adding personnel could adversely affect our business

Our ability to provide reliable services depends on the availability of well-trained, experienced crews to operate our field equipment. We must also balance our need to maintain a skilled workforce with cost structures that fluctuate with activity levels. We retain the most experienced employees during periods of low utilization by having them fill lower-level positions on field crews. Many of our businesses experience manpower shortages in peak operating periods, and we may experience more severe shortages if the industry adds more rigs, oilfield services companies expand, and new companies enter the business.

We may not be able to find enough skilled labour to meet our needs, and this could limit growth. We may also have difficulty finding enough skilled and unskilled labour in the future if demand for our services increases. Shortages of qualified personnel have occurred in the past during periods of high demand. The demand for qualified rig personnel generally increases with stronger demand for land drilling services and as new and refurbished rigs are brought into service. Increased demand typically leads to higher wages, which may or may not be reflected in service rate increases.

Other factors can also affect our ability to find enough workers to meet our needs. Our business requires skilled workers who can perform physically demanding work. Volatility in oil and natural gas activity and the demanding nature of the work, however, may prompt workers to pursue other kinds of jobs that offer a more desirable work environment and wages competitive to ours. Our success depends on our ability to continue to employ and retain skilled technical personnel and qualified rig personnel. If we are unable to, it could have a material adverse effect on our business, financial condition, results of operations and cash flow.

Internationally, our operations rely on expat crews working in the host country where we operate. Any restriction, delays or embargo on issuance or renewal of work visas by host governments, or regulatory changes, can have a material impact on our ability to conduct operations.

We require sufficient cash flows to service and repay our debt

We will need sufficient cash flows in the future to service and repay our debt. Our ability to generate cash in the future is affected to some extent by general economic, geopolitical, financial, competitive and other factors that may be beyond our control. If we need to borrow funds in the future to service our debt, our ability will depend on covenants in our Senior Credit Facility, in our unsecured Senior Notes Indenture, other debt agreements we may have in the future, and on our credit ratings. We may not be able to access sufficient amounts under the Senior Credit Facility or from the capital markets in the future to pay our obligations as they mature, or to fund other liquidity requirements. If we are not able to generate enough cash flow from operations or borrow a sufficient amount to service and repay our debt, we will need to refinance our debt or we will be in default, and we could be forced to reduce or delay investments and capital expenditures or dispose of material assets or issue equity. We may not be able to refinance or arrange alternative measures on favourable terms or at all. If we are unable to service, repay or refinance our debt, it could have a negative impact on our business, financial condition, results of operations and cash flow.

30 Management's Discussion and Analysis


Repaying our debt depends on our ability to generate cash flow and our guarantor subsidiaries generating cash flow and making it available to us by dividend, debt repayment or otherwise. Our guarantor subsidiaries may not be able to, or may not be permitted to, make distributions to allow us to make payments on our debt. Each guarantor subsidiary is a distinct legal entity, and, under certain circumstances, legal and contractual restrictions may limit our ability to obtain cash from the subsidiaries. While the agreements governing certain existing debt limit the ability of our subsidiaries to incur consensual restrictions on their ability to pay dividends or make other intercompany payments to us, these limitations are subject to qualifications and exceptions.

A substantial portion of our operations is carried out through subsidiaries, and some of them are not guarantors of our debt. The assets of the non-guarantor subsidiaries represent approximately 15% of Precision’s consolidated assets. These subsidiaries do not have any obligation to pay amounts due on the debt or to make funds available for that purpose.

If we do not receive funds from our guarantor subsidiaries, we may be unable to make the required principal and interest payments, which could have a material adverse effect on our business, financial condition, results of operations and cash flow.

Customers’ inability to obtain credit/financing could lead to lower demand for our services

Many of our customers require reasonable access to credit facilities and debt capital markets to finance their oil and natural gas drilling activities. If the availability of credit to our customers is reduced or the terms of such credit become less favourable to them, they may reduce their drilling and production expenditures, thereby decreasing demand for our products and services. Relatively higher interest rates resulting from actions by central banks in response to inflation may reduce the amount of borrowing by our customers, which would decrease demand for our services. Additionally, certain investors and lenders may discourage investments or lending into the hydrocarbon industry. To the extent that certain institutions implement policies that discourage investments or lending into the hydrocarbon industry, it could have an adverse effect on the cost and terms of capital or availability of capital for our customers, which may result in reduced spending by our customers. A reduction in spending by our customers could have a material adverse effect on our business, financial condition, results of operations and cash flow as described further under – “Our operations depend on the prices of oil and natural gas, which are subject to volatility, and on the exploration and development activities of oil and natural gas exploration and production companies” on page 26.

Our debt facilities contain restrictive covenants

Our Senior Credit Facility and the 2029 Senior Notes Indenture contain a number of covenants which, among other things, restrict us and some of our subsidiaries from conducting certain activities (see Capital Structure – Material Debt – Unsecured Senior Notes on page 21). In the event our Consolidated Interest Coverage Ratio (as defined in our 2029 Senior Notes Indenture) is less than 2.0:1 for the most recent four consecutive fiscal quarters, the 2029 Senior Notes Indenture restricts our ability to incur additional indebtedness. As of December 31, 2025, our Consolidated Interest Coverage Ratio, as calculated per our 2029 Senior Notes Indenture, was 8.7.

In addition, we must satisfy and maintain certain financial ratio tests under the Senior Credit Facility (see Capital Structure – Material Debt on page 20). Events beyond our control could affect our ability to meet these tests in the future. If we breach any covenants, it could result in a default under the Senior Credit Facility or the Senior Notes Indenture. If there is a default under our Senior Credit Facility, the applicable lenders could decide to declare all amounts outstanding under the Senior Credit Facility to be due and payable immediately and terminate any commitments to extend further credit under the Senior Credit Facility. If there is an acceleration by the lenders under the Senior Credit Facility and the accelerated amounts exceed a specific threshold, the applicable noteholders under the 2029 Senior Notes Indenture could decide to declare all amounts outstanding under the Senior Notes Indenture to be due and payable immediately. Additionally, subject to the terms of the 2029 Senior Notes Indenture, certain defaults could result in an acceleration of amounts owing under the senior notes.

As of December 31, 2025, we were in compliance with the covenants of our Senior Credit Facility.

New technology could reduce demand for certain rigs or put us at a competitive disadvantage

Advancements in drilling technologies are essential to meet the demands of complex exploration and development programs for both conventional and unconventional oil and natural gas reserves. Continuous improvements in areas such as drive systems, control systems, automation, mud systems, and top drives are crucial for enhancing drilling efficiency. Our success depends on our ability to deliver equipment and services that align with customer expectations. However, we cannot guarantee that our rig technology will consistently meet these evolving needs, especially as rigs age and technology advances. Competitors may develop technological improvements that are more advantageous, timely, or cost-effective, potentially placing us at a competitive disadvantage. Failure to adopt or invest in emerging technologies could lead to a decline in market share and profitability. Additionally, new technologies, services, or standards could render some of our services, drilling rigs, or equipment obsolete, adversely affecting our competitiveness and having a material negative impact on our business, financial condition, and results of operations.

Moreover, the increasing integration of digital technologies, such as Artificial Intelligence (AI) and the Internet of Things (IoT), into drilling and other operations and modernizing our enterprise systems presents both opportunities and challenges. While these technologies can enhance operational efficiency and decision-making, they also introduce risks related to cybersecurity threats, including data breaches and operational disruptions.

Precision Drilling Corporation 2025 Annual Report 31


Furthermore, the industry's shift towards electrification, including the adoption of electric drilling rigs and hydraulic fracturing, aims to reduce emissions and improve environmental performance. However, challenges such as grid infrastructure limitations and the high costs associated with electrification may impede widespread implementation.

Entering new lines of business or technical enhancements to our existing operating capabilities can be subject to risks, including a potential lack of acceptance by consumers and increased capital expenditures

Our AlphaTM technologies and EverGreenTM suite of environmental solutions use new technologies and are relatively new lines of business for us. There can be no assurance that new lines of business will be able to generate significant revenue or be profitable. We may not realize benefits from investments into new business lines or technical enhancements for several years or may not realize benefits from such investments at all. Failure to realize the intended benefits from such investments could negatively affect our ability to attract new customers or expand our offerings to existing customers and may adversely affect our results from operations.

The timing and amount of capital expenditures we incur, including those related to our AlphaTM technologies, EverGreenTM suite of environmental solutions and implementation of artificial intelligence and robotics technologies, will directly affect the amount of cash available to us. The cost of equipment generally escalates as a result of high input costs during periods of high demand for our drilling rigs and oilfield services equipment and other factors. There is no assurance that we will be able to recover higher capital costs through rate increases to our customers.

Artificial Intelligence may impact our business

The integration of AI and robotics into our operations presents both opportunities and challenges. While these technologies have the potential to enhance efficiency, safety, and decision-making, their development, implementation, deployment and use may involve significant operational, financial, legal and reputational risks. There is no certainty that our investments in AI and robotics will yield materially better results, higher outputs, or increased productivity. Failure to adopt or invest adequately in these technologies could place us at a competitive disadvantage, leading to a decline in market share and profitability. Additionally, the use of AI throughout our organization is subject to risks related to data privacy and security, inaccuracy, or failure to integrate with our existing systems, which could deter current and potential customers, affect our performance and damage customer relationships.

Moreover, the rapid pace of technological advancement may result in shorter lifecycles for AI and robotic systems, necessitating continuous investment to stay current. This could strain financial resources and divert capital from other critical areas. Conversely, accelerated or premature adoption of AI technology could expose us to execution risk, cost overruns or operational disruptions. The complexity of integrating AI into existing workflows may also lead to operational disruptions during the transition period. Furthermore, increased reliance on AI systems introduces vulnerabilities to cyber threats, potentially compromising sensitive data and operational integrity.

Our business is subject to cybersecurity risks

We rely heavily on information technology systems and other digital systems for operating our business. Threats to information technology systems associated with cybersecurity risks and cyber incidents or attacks continue to grow and are increased by the growing complexity of our information technology systems. Cybersecurity attacks could include, but are not limited to, malicious software, attempts to gain unauthorized access to data and the unauthorized release, corruption or loss of data and personal information, account takeovers, and other electronic security breaches that could lead to disruptions in our critical systems. Other cyber incidents may occur as a result of natural disasters, telecommunication failures, utility outages, human error, design defects, and unexpected complications with technology upgrades. Risks associated with these attacks and other incidents include, among other things, loss of intellectual property, reputational harm, leaked information, improper use of our assets, disruption of our and our customers’ business operations and safety procedures, loss or damage to our data delivery systems, unauthorized disclosure of personal information which could result in administrative penalties and increased costs to prevent, respond to or mitigate cybersecurity events. Our increased use of technology, artificial intelligence and robotics in our service offerings could increase the potential impact that a cybersecurity incident or attack could have on our operations. Although we use various procedures and controls to mitigate our exposure to such risk, including cybersecurity risk assessments that are reviewed by our CGNRC, cybersecurity awareness programs for our employees, continuous monitoring of our information technology systems for threats, and insurance that may cover losses incurred as a result of certain cybersecurity attacks or incidents, cybersecurity attacks and other incidents are evolving and unpredictable, and these procedures and controls may not be effective. The occurrence of such an attack or incident could go unnoticed for a period of time. Any such attack or incident could have a material adverse effect on our business, financial condition, results of operations and cash flow.


Our and our customers’ operations are subject to numerous environmental laws, regulations and guidelines

In addition to expanded regulations and guidelines related specifically to climate change, our customers and us are subject to numerous environmental laws and regulations, including regulations relating to spills, releases and discharges of hazardous substances or other waste materials into the environment, requiring removal or remediation of pollutants or contaminants, and imposing civil and criminal penalties for violations. Some of these regulations apply directly to our operations and authorize the recovery of damages by the government, injunctive relief, and the imposition of stop, control, remediation and abandonment

32 Management's Discussion and Analysis


orders. For instance, our land drilling operations may be conducted in or near ecologically sensitive areas, such as wetlands that are subject to special protective measures, which may expose us to additional operating costs and liabilities for noncompliance with certain laws. Some environmental laws and regulations may impose strict and, in certain cases joint and several, liability. This means that in some situations we could be exposed to liability as a result of conduct that was lawful at the time it occurred, or conditions caused by prior operators or other third parties, including any liability related to offsite treatment or disposal facilities. The costs arising from compliance with these laws, regulations and guidelines may be material. The total costs of complying with environmental protection requirements are unknown, but we may experience increased insurance and compliance costs as further environmental laws and regulations are introduced.

We maintain liability insurance, including insurance for certain environmental claims, but coverage is limited and some of our policies exclude coverage for damages resulting from environmental contamination. We cannot assure that insurance will continue to be available to us on commercially reasonable terms, that the possible types of liabilities that we may incur will be covered by insurance, or that the dollar amount of the liabilities will not exceed our policy limits. Even a partially uninsured claim, if successful and of sufficient magnitude, could have a material adverse effect on our business, financial condition, results of operations and cash flow.

Governments in Canada and the U.S. may also consider more stringent regulations or restrictions of hydraulic fracturing, a technology used by most of our customers that involves the injection of water, sand and chemicals under pressure into rock formations to stimulate oil and natural gas production. Increasing regulatory restrictions could have a negative impact on the exploration of unconventional energy resources, which are only commercially viable with the use of hydraulic fracturing. Laws relating to hydraulic fracturing are in various stages of development at levels of governments in markets where we operate and the outcome of these developments and their effect on the regulatory landscape and the contract drilling industry is uncertain. Hydraulic fracturing laws or regulations that cause a decrease in the completion of new oil and natural gas wells and an associated decrease in demand for our services could have a material adverse effect on our business, financial condition, results of operations and cash flow.

Any regulatory changes that impose additional environmental restrictions or requirements on us, or our customers, could increase our operating costs and potentially lead to lower demand for our services and have an adverse effect. There can also be no guarantee that other laws and other government programs relating to the oil and natural gas industry and the transportation industry will not be changed in a manner that directly and adversely impacts the demand for oil and natural gas which could affect our business, nor can there be any assurances that the laws, regulations or rules governing our customers will not be changed in a manner that adversely affects our customers and, therefore, our business. The potential for increased regulation and oversight may make it more difficult or costly for us to operate.

Major projects that would benefit our customers, such as new pipelines and other facilities, including liquified natural gas export facilities in Canada, may be inhibited, delayed or stopped by a variety of factors, including inability to obtain regulatory or governmental approvals or public opposition. Canada's carbon tax policies and environmental review requirements may increase our compliance costs.

Recent executive orders and political plans of the Trump Administration include a strong focus on expanding U.S. domestic oil and gas production, rolling back environmental protections and opening federal lands to drilling. While these policies may create opportunities, future administrations' legal rulings, or local challenges may reverse these policies.

Relying on third-party suppliers has risks and shortages in supply of equipment could adversely impact our business

We source certain key rig components, raw materials, equipment and component parts from a variety of suppliers in Canada, the U.S. and internationally. We also outsource some or all construction services for drilling and service rigs, including new-build rigs, as part of our capital expenditure programs. We maintain relationships with several key suppliers and contractors and an inventory of key components, materials, equipment and parts. We also place advance orders for components that have long lead times. We may, however, experience cost increases, delays in delivery due to strong activity or financial hardship of suppliers or contractors, or other unforeseen circumstances relating to third parties. Increased inflation may also result in cost increases for the key components, materials, equipment and parts we use in our business. In times of increased demand for drilling services, there may be shortages of components, materials, equipment, parts and services required for our business. If our current or alternate suppliers are unable to deliver the necessary components, materials, equipment, parts and services we require for our businesses, including the construction of new-build drilling rigs, it can delay service to our customers and have a material adverse effect on our business, financial condition, results of operations and cash flow.

Supply chain disruptions can significantly impact our operations by affecting the availability and cost of essential drilling equipment and materials. Tariffs, trade disputes, revisions to trade agreements (such as the CUSMA), and geopolitical events such as sanctions can impact our opportunities and supply chain efficiency in North America by causing sudden shortages or increased costs for critical components. Natural disasters may damage infrastructure or halt production at key manufacturing hubs, causing delays in equipment delivery. Pandemics and epidemics can disrupt global supply chains through factory shutdowns, transportation restrictions, and labor shortages. These disruptions could lead to increased operational costs, project delays, and challenges in meeting customer commitments, thereby adversely affecting our business, financial condition, and results of operations. To mitigate these risks, we are committed to diversifying our supplier base, maintaining strategic inventories, and developing contingency plans to ensure operational resilience in the face of supply chain uncertainties.

Precision Drilling Corporation 2025 Annual Report 33


Additionally, new laws regarding forced labour and other human rights issues throughout the supply chain may result in increased compliance costs for us or a potential need to make changes to our supply chain.

Effects of climate change, including physical and regulatory impacts, could have a negative impact on our business

The views on climate change are evolving at a regional, national and international level. As a result, political and economic events may significantly affect the scope and timing of climate change measures and regulations that are ultimately put in place, which may challenge the oil and gas industry in a number of ways or result in changes to how companies in the industry operate or spend capital. Additionally, the risks of natural disasters that could impact our business may increase in the future as a result of climate change. Furthermore, consumer demand for alternative fuel sources may continue to rise and incentives to conserve energy may be developed. Our business may be adversely impacted as a result of climate change and its associated impacts, including, without limitation, our financial condition, results of operations, cash flow, reputation, access to capital, access to insurance, cost of borrowing, access to liquidity, and/or business plans.

Physical Impact

As discussed under “Business in our industry is seasonal and highly variable” on page 38, weather patterns in Canada and the northern U.S. affect activity in the oilfield services industry. Global climate change could impact the timing and length of the spring thaw and the period in which the muskeg freezes and thaws and could impact the severity of winter, which could have a material adverse effect on our business and operating results. Furthermore, extreme and evolving climate conditions could result in increased risks of, or more frequent, natural disasters such as flooding or forest fires and may result in delays or cancellation of some of our customers' operations or could increase our operating costs (such as insurance costs), which could have a material adverse effect on our business and operating results. Extreme weather conditions could also impact the production and drilling of new wells. We cannot estimate the extent to which climate change and extreme climate conditions could impact our business and operating results; however, our insurance costs have increased, partially as a result of recent natural disasters.

Regulatory Impact

In response to climate change and increased focus on environmental protection, environmental laws, regulations and guidelines relating to the protection of the environment, including regulations and treaties concerning climate change or greenhouse gas and other emissions, continue to expand in scope. There has been an increasing focus on the reduction of greenhouse gas and other emissions and a potential shift to lower carbon intensive energy sources or a shift to a lower carbon economy. Laws, regulations or treaties concerning climate change or GHG and other emissions, including incentives to conserve energy or use alternative sources of energy, can have an adverse impact on the demand for oil and natural gas, which could have a material adverse effect on us. Such laws, regulations or treaties are evolving, and it is difficult to estimate with certainty the impact they will have on our business.

Canada and the U.S. were signatories to the Paris Agreement drafted at the United Nations Framework Convention on Climate Change (UNFCCC) in December 2015. On January 20, 2025, President Trump issued an Executive Order withdrawing the U.S. as a signatory to the Paris Agreement. The goals of the Paris Agreement are to prevent global temperature rise from exceeding 2 degrees Celsius above pre-industrial levels and to pursue efforts to limit the temperature increase to 1.5 degrees Celsius above pre-industrial levels. The Paris Agreement may provide for climate targets that could result in reduced global demand for oil and natural gas. In Canada, in connection with its commitments under the Paris Agreement, the federal government developed the Pan-Canadian Framework on Clean Growth and Climate Change in 2016 (the PCF). To implement the principles of the PCF, the federal government enacted the Greenhouse Gas Pollution Pricing Act (the GGPPA), which required all provinces and territories to have a carbon price of $30 per ton in 2020 and rising by $10 per year to $50 per ton in 2022. If a province or territory does not do so, the federal government can enforce its own carbon pricing regime in the province or territory called the Output-Based Pricing System (the OPBS). In December 2020, the Canadian Government announced proposed $15 per year increases to the carbon price commencing in 2023, to reach a total of $170 per ton by 2030. Provinces and territories can implement either an explicit price-based system (such as the systems implemented in British Columbia and Alberta) or a cap-and-trade system. Certain Canadian provinces, including Alberta and Saskatchewan, had previously launched constitutional challenges related to the GGPPA; however, on March 25, 2021, the Supreme Court of Canada released its judgment confirming the constitutionality of Canada’s national carbon pricing regime. The Canadian federal government and the Alberta provincial government recently signed a Memorandum of Understanding (the MOU) on November 27, 2025. In the MOU, the two governments commit to agreeing on or before April 1, 2026 to an amendment to Alberta’s carbon pricing system (the Technology Innovation and Emissions Reduction system or TIER) that will increase the minimum effective carbon credit price to $130/ton. In contrast, Saskatchewan previously announced it was pausing its carbon pollution pricing system for industry effective April 1, 2025, and the federal government has yet to impose the OPBS in the province.

In November 2021, to conclude the 26th Conference of the Parties to the UNFCCC, nearly 200 countries including Canada signed the Glasgow Climate Pact, which reaffirmed the commitments to limiting global temperature rise set out in the Paris Agreement. The Glasgow Climate Pact called for nations to submit new targets to the UNFCCC by the end of 2022 to align with the Paris Agreement’s goals, requests that nations take accelerated actions to reduce emissions by 2030 and asks nations to accelerate the development and adoption of policies to transition towards low-emission energy systems. It also includes the party nations’ agreement on rules under the Paris Agreement to create a global carbon credit market.

34 Management's Discussion and Analysis


In December 2024, the Canadian federal government finalized Clean Electricity Regulations, which are aimed at achieving net-zero emissions from Canada’s electricity grid by 2050. The regulations implement measures to limit carbon emissions produced by electricity generated using fossil fuels, which may include natural gas. Certain provinces in Canada have indicated opposition to the Clean Electricity Regulations, which may decrease domestic demand for natural gas in Canada, and have an adverse effect on the demand for our services. Pursuant to the MOU, Canada has suspended the Clean Electricity Regulations in Alberta pending the TIER carbon pricing agreement. Upon completion of the TIER carbon pricing agreement and other matters, Canada will place the Clean Electricity Regulations in Alberta in abeyance.

As of the date hereof, it is not possible to predict the effect of the Paris Agreement, the Glasgow Climate Pact, Clean Electricity Regulations, and climate change-related legislation in Canada, the U.S. and globally on our business or whether additional climate-change legislation, regulations or other measures will be adopted at the federal, state, provincial or local levels in Canada, the U.S. or globally. While some of these regulations are in effect, others remain in various phases of review, discussion or implementation, leading to uncertainties regarding the timing and effects of these emerging regulations, making it difficult to accurately determine the cost impacts and effects on our operations. Further efforts by governments and non-governmental organizations to reduce greenhouse gas emissions appear likely, which, together with existing efforts, may reduce demand for oil and natural gas and potentially lead to lower demand for our services.

Transition Impact

In addition to the physical and regulatory effects of climate change on our business, an increasing focus on the reduction of greenhouse gas emissions and a potential shift to lower carbon intensive energy sources or a shift to a lower carbon economy may result in lower oil and natural gas prices and depress the overall level of oil and natural gas exploration and production activity, impacting the demand for our services from the oil and natural gas industry. Additionally, if our reputation is diminished as a result of the industry we operate in or services we provide, it could result in increased operating or regulatory costs, reduce access to capital, lower shareholder confidence or loss of public support for our business. It may also encourage exploration and production companies to diversify and limit drilling to find less carbon intensive energy alternatives.

Poor safety performance could lead to lower demand for our services

Standards for accident prevention in the oil and natural gas industry are governed by service company safety policies and procedures, accepted industry safety practices, customer-specific safety requirements, and health and safety legislation. Safety is a key factor that customers consider when selecting an oilfield services company. A decline in our safety performance could result in lower demand for services, which could have a material adverse effect on our business, financial condition, results of operations and cash flow. A public safety performance issue could also result in reputational damage to us or increased costs of operating and insuring assets.

We are subject to various health and safety laws, rules, legislation and guidelines which can impose material liability, increase our costs or lead to lower demand for our services.

Our business could be negatively affected as a result of actions of activist shareholders and some institutional investors may be discouraged from investing in the industry in which we operate

Activist shareholders could advocate for changes to our corporate governance, operational practices and strategic direction, which could have an adverse effect on our reputation, business and future operations. In recent years, publicly traded companies have been increasingly subject to demands from activist shareholders advocating for changes to corporate governance practices, such as executive compensation practices, capital allocation, board composition, social issues, or certain corporate actions or reorganizations. These campaigns are increasingly conducted through coordinated proxy solicitation, public letters, media engagement and engagement with proxy advisory firms. There can be no assurances that activist shareholders will not publicly advocate for us to make certain corporate governance changes or engage in certain corporate actions. The appointment of a new CEO may increase our visibility to shareholders, as leadership transition can be viewed as an opportunity to influence strategy, management structure or board oversight. Responding to challenges from activist shareholders, such as proxy contests, media campaigns or other activities, could be costly and time consuming and could have an adverse effect on our reputation and divert the attention and resources of management and our Board, which could have an adverse effect on our business and operational results. Additionally, shareholder activism could create uncertainty about future strategic direction, resulting in loss of future business opportunities, which could adversely affect our business, future operations, profitability and our ability to attract and retain qualified personnel.

In addition to risks associated with activist shareholders, some institutional investors are placing an increased emphasis on ESG factors when allocating their capital. These investors may be seeking enhanced ESG disclosures or may implement policies that discourage investment in the hydrocarbon industry. Other investors may discourage investments in new lines of business which may be related to ESG matters. To the extent that certain institutions implement policies that discourage investments in our industry or new lines of business, it could have an adverse effect on our financing costs, terms or access to liquidity and capital. Additionally, if our reputation is diminished as a result of the industry we operate in or service, or we face litigation related to ESG matters, it could result in increased operational or regulatory costs, lower shareholder confidence or loss of public support for our business.

Precision Drilling Corporation 2025 Annual Report 35


The loss of one or more of our larger customers or consolidation among our customers could have a material adverse effect on our business and our current backlog of contract drilling revenue may decline

In 2025, approximately 49% of our revenue was received from our ten largest drilling customers and approximately 23% of our revenue was received from our three largest drilling customers. The loss of one or more of our larger customers could have a material adverse effect on our business, financial condition, results of operations and cash flow. In addition, financial difficulties experienced by customers could adversely impact their demand for our services and cause them to request amendments to our contracts with them.

Our fixed-term drilling contracts generally provide our customers with the ability to terminate the contracts at their election, with an early termination payment to us if the contract is terminated before the expiration of the fixed term. During depressed market conditions or otherwise, customers may be unable to satisfy their contractual obligations or may seek to terminate or renegotiate or otherwise fail to honor their contractual obligations. In addition, we may not be able to perform under these contracts due to events beyond our control, and our customers may seek to terminate or renegotiate our contracts for various reasons, without paying an early termination payment. As a result, we may not realize all of our contract drilling backlog. In addition, the termination or renegotiation of fixed-term contracts without receiving early termination payments could have a material adverse effect on our business, financial condition, results of operations and cash flows. Our contract drilling backlog may decline, as fixed-term drilling contract coverage over time may not be offset by new or renegotiated contracts or may be reduced by price adjustments to existing contracts, including as a result of the decline in the price of oil and natural gas, capital spending reductions by our customers or other factors.

Further, consolidation among oil and natural gas exploration and production companies may reduce the number of available customers or could increase customer leverage. As exploration and production entities merge, they often seek operational synergies and cost efficiencies. This can reduce the number of drilling services required. Also, integrated entities may opt for in-house drilling capabilities or favor established contracts with other service providers. This may result in increased competition for available contracts or contractual termination, potentially impacting pricing dynamics and profitability.

We have exposure to fluctuations in foreign currency exchange rates

Our U.S. and international operations have revenue, expenses, assets and liabilities denominated in currencies other than the Canadian dollar and are mostly in U.S. dollars and currencies that are pegged to the U.S. dollar. This means that currency exchange rates can affect our financial results.

We have long-term debt denominated in U.S. dollars. We have designated our U.S. dollar denominated unsecured senior notes as a hedge against the net asset position of our U.S. and foreign operations. This debt is converted at the exchange rate in effect at the period end dates with the resulting gains or losses included in the statement of comprehensive income. If the Canadian dollar strengthens against the U.S. dollar, we will incur a foreign exchange gain from the translation of this debt. Similarly, if the Canadian dollar weakens against the U.S. dollar, we will incur a foreign exchange loss from the translation of this debt. The vast majority of our international operations are transacted in U.S. dollars or U.S. dollar-pegged currencies. Transactions for our Canadian operations are primarily transacted in Canadian dollars. We occasionally purchase goods and supplies in U.S. dollars for our Canadian operations, and we maintain U.S. dollar cash in our Canadian operations.

Translation into Canadian Dollars

When preparing our consolidated financial statements, we translate the financial statements of foreign operations that do not have a Canadian dollar functional currency into Canadian dollars. We translate assets and liabilities at exchange rates in effect at the period end date. We translate revenues and expenses using average exchange rates for the month of the transaction. We initially recognize gains or losses from these translation adjustments in other comprehensive income and reclassify them from equity to net earnings on disposal or partial disposal of the foreign operation. Changes in currency exchange rates could materially increase or decrease our foreign currency-denominated net assets, which would increase or decrease shareholders’ equity. Changes in currency exchange rates will affect the amount of revenues and expenses we record for our U.S. and international operations, which will increase or decrease our net earnings. If the Canadian dollar strengthens against the U.S. dollar, the net earnings we record in Canadian dollars from our U.S. and international operations will be lower.

We may be unable to access additional financing

We may need to obtain additional debt or equity financing in the future to support ongoing operations, undertake capital expenditures, repay existing or future debt including the Senior Credit Facility and the 2029 Senior Notes Indenture, or pursue acquisitions or other business combination transactions. Volatility or uncertainty in the credit markets and inflationary pressure may increase costs associated with issuing debt or equity, and there is no assurance that we will be able to access additional financing when we need it, or on terms we find acceptable or favourable. Such volatility and uncertainty may be adversely impacted by potential negative perception of investing in the hydrocarbon industry. If we are unable to obtain financing to support ongoing operations or to fund capital expenditures, acquisitions, debt repayments, or other business combination transactions, it could limit growth and may have a material adverse effect on our business, financial condition, results of operations, and cash flow. See “Our business could be negatively affected as a result of actions of activist shareholders and some institutional investors may be discouraged from investing in the industry in which we operate” on page 35.

36 Management's Discussion and Analysis


Increasing interest rates may increase our cost of borrowing

Increases to the Canadian or United States benchmark interest rates may affect our cost of borrowing under our Senior Credit Facility and any debt financing we may negotiate. Actions by central banks to increase benchmark interest rates may increase our cost of borrowing and make the terms of borrowing less favourable to us.

Risks associated with turnkey drilling operations could adversely affect our business

We earn some of our revenue from turnkey drilling contracts. We expect turnkey drilling to remain part of our service offering; however, turnkey contracts pose substantially more risk than wells drilled on a daywork basis. Under a typical turnkey drilling contract, we agree to drill a well for a customer to a specified depth and under specified conditions for a fixed price. We typically provide technical expertise and engineering services, as well as most of the equipment required for the drilling of turnkey wells and use subcontractors for related services. We typically do not receive progress payments and are entitled to payment by the customer only after we have met the full terms of the drilling contract. We sometimes encounter difficulties on wells and incur unanticipated costs, and not all the costs are covered by insurance. As a result, under turnkey contracts, we assume most of the risks associated with drilling operations that are generally assumed by customers under a daywork contract. Operating cost overruns or operational difficulties and higher contractual liabilities on turnkey jobs could have a material adverse effect on our business, financial condition, results of operations and cash flow.

Mergers and acquisitions entail numerous risks and may disrupt our business or distract management and we may be impacted by industry consolidations or unsolicited acquisition proposals

We consider and evaluate mergers and acquisitions of, or significant investments in, complementary businesses and assets as part of our business strategy. The drilling and oilfield services industry has experienced, and may continue to experience, increased consolidation as market participants seek scale, efficiencies, capital discipline and better returns. Mergers and acquisitions involve numerous risks, including unanticipated costs and liabilities, difficulty in integrating the operations and assets of the merged or acquired business, the ability to properly access and maintain an effective internal control environment over a merged or acquired company to comply with public reporting requirements, potential loss of key employees and customers of the merged or acquired companies, and an increase in our expenses and working capital requirements. Any merger or acquisition could have a material adverse effect on our business, financial condition, results of operations and cash flow.

We may incur substantial debt to finance future mergers and acquisitions and also may issue equity securities or convertible securities for mergers and acquisitions. Debt service requirements could be a burden on our results of operations and financial condition. We would also be required to meet certain conditions to borrow money to fund future mergers and acquisitions. Mergers and acquisitions could also divert the attention of management and other employees from our day-to-day operations and the development of new business opportunities. Even if we are successful in integrating future mergers and acquisitions into our operations, we may not derive the benefits such as operational, financial, or administrative synergies we expect from mergers and acquisitions, which may result in us committing capital resources and not receiving the expected returns. Additionally, failing to pursue appropriate mergers when opportune may also pose a risk to our competitive positioning and growth potential. We may not be able to continue to identify attractive acquisition opportunities or successfully acquire identified targets.

As a result of ongoing industry consolidation, our size, asset base, market position or valuation may make us a potential target for strategic transactions, including friendly or unsolicited acquisition proposals. Any such proposal could create uncertainty among employees, customers, suppliers and other stakeholders, divert management and Board attention, result in increased costs, or lead to volatility in the market price of our securities. There can be no assurance that any transaction proposal would be completed on terms favorable to the Company or at all, or that responding to such proposals would not have an adverse effect on our business, results of operations or strategic objectives. In addition, consolidation among our competitors could result in larger, better-capitalized competitors with increased operational scale, geographic reach, pricing power or bargaining leverage with customers and suppliers. Such consolidation could intensify competitive pressures, limit our ability to win or retain contracts, compress margins, or require increased capital investment to remain competitive, any of which could adversely affect our business, financial condition, and operations.

Our operations face risks of interruption and casualty losses

Our operations face many hazards inherent in the drilling and well servicing industries, including blowouts, cratering, explosions, fires, loss of well control, loss of hole, reservoir damage, loss of directional control, damaged or lost equipment, and damage or loss from inclement weather or natural disasters. Any of these hazards could result in personal injury or death, damage to or destruction of equipment and facilities, suspension of operations, environmental damage, damage to the property of others, and damage to producing or potentially productive oil and natural gas formations that we drill through, which could have a material adverse effect on our business, financial condition, results of operations and cash flow. Additionally, unexpected events such as unplanned power outages, natural disasters, supply disruptions, pandemic illness or other unforeseeable circumstances could have a material adverse effect on our business, financial condition, results of operations and cash flow.

Our worldwide operations could be disrupted by terrorism, acts of war, political sanctions, earthquakes, telecommunications failures, power or water shortages, tsunamis, floods, hurricanes, typhoons, fires, extreme weather conditions (whether as a result of climate change or otherwise), medical epidemics or pandemics and other natural or manmade disasters or catastrophic

Precision Drilling Corporation 2025 Annual Report 37


events, some of which may be self insured or may not be fully insurable, or may be subject to policy exclusions or significant deductions. The occurrence of any of these business disruptions could result in difficulties in transporting our crews, hiring or managing personnel as well as other significant losses, that may adversely affect our business, financial conditions, results of operations and cash flow, and require substantial expenditures and recovery time in order to fully resume operations.

Generally, drilling and service rig contracts separate the responsibilities of a drilling or service rig company and the customer. We try to obtain indemnification from our customers by contract for some of these risks even though we also have insurance coverage to protect us. We cannot assure; however, that any insurance or indemnification agreements will adequately protect us against liability from all the consequences described above. Certain state, province or foreign law may limit, invalidate or render unenforceable contractual indemnity provisions regardless of the intent of the parties. If there is an event that is not fully insured or indemnified against, or a customer or insurer does not meet its indemnification or insurance obligations, it could result in substantial losses. In addition, we may not be able to get insurance to cover any or all these risks, or the coverage may not be adequate. Insurance premiums or other costs may rise significantly in the future, making the insurance prohibitively expensive or uneconomic. Significant events, including terrorist attacks in the U.S., wildfires, flooding, severe hurricane damage and well blowout damage in the U.S. Gulf Coast region, have resulted in significantly higher insurance costs, deductibles and coverage restrictions. When we renew our insurance, we may decide to self-insure at higher levels and assume increased risk to reduce costs associated with higher insurance premiums. Insurance carriers may also deny or dispute coverage, which could result in litigation with insurers. This could be costly, time-consuming and uncertain and may require us to fund losses or defense cost prior to resolution.

Business in our industry is seasonal and highly variable

Seasonal weather patterns in Canada and the northern U.S. affect activity in the oilfield services industry. During the spring months, wet weather and the spring thaw make the ground unstable, so municipalities, counties, provincial and state transportation departments enforce road bans that restrict the movement of rigs and other heavy equipment. This reduces activity and highlights the importance of the location of our equipment before the imposition of the road bans. The timing and length of road bans depend on weather conditions leading to the spring thaw and during the thawing period.

Additionally, certain oil and natural gas producing areas are located in parts of western Canada that are only accessible during the winter months because the ground surrounding or containing the drilling sites in these areas consists of terrain known as muskeg. Rigs and other necessary equipment cannot cross this terrain to reach the drilling site until the muskeg freezes. Moreover, once the rigs and other equipment have been moved to a drilling site, they may become stranded or be unable to move to another site if the muskeg thaws unexpectedly. Our business activity depends, at least in part, on the severity and duration of the winter season.

Litigation and legal claims could have an adverse impact on our business

We may be subject to legal proceedings and governmental investigations from time to time related to our business and operations. Lawsuits or claims against us could have a material adverse effect on our business, financial condition, results of operations and cash flow. While we maintain insurance that may cover the cost of certain litigation or have indemnity provisions in our favor, we cannot assure that any insurance or indemnification agreement will cover the cost of these liabilities, thus litigation or claims could negatively impact our business, reputation, financial condition and cash flow.

Certain of our offerings use proprietary technology and equipment which can involve potential infringement of a third party’s rights or a third party’s infringement of our rights, including rights to intellectual property. From time to time, our customers or we may become involved in disputes over infringement of intellectual property rights relating to equipment or technology owned or used by us. As a result, we may lose access to important equipment or technology, be required to cease use of some equipment or technology, be forced to modify our drilling rigs or technology, or be required to pay license fees or royalties for the use of equipment or technology. In addition, we may lose a competitive advantage in the event we are unsuccessful in enforcing our rights against third parties, or third parties are successful in enforcing their rights against us. As a result, any technology disputes involving us or our customers or supplying vendors could have a material adverse impact on our business, financial condition, results of operations and cash flow.

Indigenous rights and relationships may adversely impact our operations

Our operations are subject to risks related to Indigenous rights, interests, and relationships in Canada. Many of our activities are conducted on or near lands subject to asserted or established Aboriginal or treaty rights. Canadian law recognizes and protects these rights, and governments have a duty to consult and, where appropriate, accommodate Indigenous communities in connection with decisions that may adversely affect such rights.

The company has established and continues to develop constructive relationships with Indigenous communities and recognizes the importance of respectful engagement, collaboration, and long-term partnership. As our business expands and our operating footprint evolves, our ability to maintain and further grow these relationships will remain an important factor in supporting operational continuity and future growth.

The views of Indigenous communities may affect the timing, cost, scope, or feasibility of projects. If consultation processes are delayed, challenged, or result in additional conditions, or if Indigenous communities oppose or raise concerns regarding

38 Management's Discussion and Analysis


development activities, our customers' operations may be subject to permitting delays, increased costs, project modifications, or, in certain circumstances, suspensions or cancellations, which could have a material adverse impact on our business.

Public health crises, such as pandemics and epidemics, may impact our business

Local, regional, national or international public health crises, such as pandemics and epidemics, could have an adverse effect on local economies and potentially the global economy, which may adversely impact the price of and demand for oil and natural gas (and correspondingly, decrease the demand for our services, which could have a material adverse effect on our business, financial condition, results of operations and cash flows). Such public health crises, pandemics, epidemics and disease outbreaks are continuously evolving and the extent to which our business operations and financial results continue to be affected depends on various factors, such as the duration, severity and geographic spread of any outbreak; the impact and effectiveness of governmental action to reduce the spread and treat such outbreak, including government policies and restrictions; vaccine hesitancy and voluntary or mandatory quarantines; and the global response surrounding any such uncertainty.

The economic climate resulting from the impact of public health crises, pandemics and epidemics and any corresponding emergency measures that may be implemented from time to time by various governments may have significant adverse impacts on Precision including, but not exclusively:

potential interruptions of our business or operations
material declines in revenue and cash flows, as our customers are concentrated in the oil and natural gas industry
future impairment charges to our property, plant and equipment and intangible assets
risk of non-payment of accounts receivable and customer defaults, and
additional restructuring charges as we align our structure and personnel to the dynamic environment.

Additionally, such public health crises, if uncontrolled, may result in temporary shortages of staff to the extent our workforce is impacted and may result in temporary interruptions to our business or operations, which may have an adverse effect on our financial condition, results of operations and cash flow.

A successful challenge by the tax authorities of expense deductions could negatively affect the value of our common shares

Taxation authorities may not agree with the classification of expenses we or our subsidiaries have claimed, or they may challenge the amount of interest expense deducted. In addition, tax authorities in the jurisdictions in which we operate may challenge our transfer pricing arrangements, the allocation of income and expenses among jurisdictions, the characterization of intercompany transactions, the availability of tax losses or credits, or the application of tax treaties. Tax authorities may also assert that we have created a permanent establishment in a jurisdiction where we did not previously file or pay taxes, which could subject us to additional income, payroll, withholding or indirect taxes.

Tax audits, reassessments or investigations may cover multiple years and may result in material additional taxes, interest and penalties, including retroactive assessments. If the taxation authorities successfully challenge our classifications or deductions, or otherwise successfully reassess our tax positions, it could have a material adverse effect on our business, financial condition, results of operations and cash flow. Such outcomes could also reduce earnings, increase our effective tax rate, require significant cash payments and adversely affect our liquidity.

Tax laws, regulations and interpretations are subject to change, including as a result of legislative action, administrative practice, judicial decisions or international initiatives aimed at base erosion and profit shifting. Changes in tax laws or their interpretation, including changes implemented on a retroactive basis, could adversely affect our tax position and increase our tax liabilities.

In addition, disputes with tax authorities can be costly, time-consuming and uncertain, and may divert management attention and resources. Adverse outcomes in such disputes, or the perception of increased tax risk, could negatively impact investor confidence and the market price of our common shares.

Unionization efforts and labor regulations could materially increase our costs or limit our flexibility

Efforts may be made from time to time to unionize portions of our workforce. We may be subject to strikes or work stoppages and other labor disruptions in connection with unionization efforts or renegotiation of existing contracts with unions. Unionization efforts, if successful, new collective bargaining agreements or work stoppages could materially increase our labor costs, reduce our revenues and adversely impact our operations and cash flow.

Losing key management could reduce our competitiveness and prospects for future success

Our future success and growth depend partly on the expertise and experience of our key management. There is no assurance that we will be able to retain key management. Losing these individuals could have a material adverse effect on our business, financial condition, results of operations and cash flow.

Our assessment of capital assets for impairment may result in a non-cash charge against our consolidated net income

We are required to assess our capital asset balance for impairment when certain internal and external factors indicate the need for further analysis. When assessing impairment triggers and calculating impairment, it is based on management’s estimates and assumptions. We may consider several factors, including any declines in our share price and market capitalization, lower future cash flow and earnings estimates, significantly reduced or depressed markets in our industry, and general economic

Precision Drilling Corporation 2025 Annual Report 39


conditions, among others. Any impairment, write-down to capital assets would result in a non-cash charge against net earnings, which could be material.

Our credit ratings may change

Credit ratings affect our financing costs, liquidity and operations over the long term and are intended as an independent measure of the credit quality of long-term debt. Credit ratings affect our ability to obtain short and long-term financing and the cost of this financing, and our ability to engage in certain business activities cost-effectively.

If a rating agency downgrades our current corporate credit rating or rating of debt, or changes our credit outlook to negative, it could have an adverse effect on our financing costs and access to liquidity and capital.

The price of our common shares can fluctuate

Several factors can cause volatility in our share price, including increases or decreases in revenue or earnings, changes in revenue or earnings estimates by the investment community, plans in respect of returns of capital to shareholders, failure to meet analysts’ expectations, changes in credit ratings, and speculation in the media or investment community about our financial condition or results of operations. General market conditions, the perception of the industry we operate in and service and Canadian, U.S. or international economic and social factors and political events unrelated to our performance may also affect the price of our shares. Investors should therefore not rely on past performance of our shares to predict the future performance of our shares or financial results. When our share price is relatively low, we may be subject to opportunistic takeover attempts by certain companies or institutions.

While there is currently an active trading market for our shares in the United States and Canada, we cannot guarantee that an active trading market will be sustained in either country. There could cease to be an active trading market due to, among other factors, minimum listing requirements of stock exchanges. If an active trading market in our shares is not sustained, the trading liquidity of our shares will be limited and the market value of our shares may be reduced.

Selling additional shares could affect share value

While we have a normal course issuer bid in place under which we may acquire our own shares, in the future, we may issue additional shares to fund our needs or those of other entities owned directly or indirectly by us, as authorized by the Board. We do not need shareholder approval to issue additional shares, except as may be required by applicable stock exchange rules, and shareholders do not have any pre-emptive rights related to share issues. See Capital Structure on page 15 of our Annual Information Form (AIF).

As a foreign private issuer in the U.S., we may file less information with the SEC than a company incorporated in the U.S.

As a foreign private issuer, we are exempt from certain rules under the United States Exchange Act of 1934 (the Exchange Act) that impose disclosure and procedural requirements, for proxy solicitations under Section 14 of the Exchange Act. Our directors, officers and principal shareholders are also exempt from the short-swing profit recovery provisions of Section 16 of the Exchange Act. We are not required to file periodic reports and financial statements with the SEC as frequently or as promptly as U.S. companies whose securities are registered under the Exchange Act, nor are we generally required to comply with Regulation FD, which restricts the selective disclosure of material non-public information. As a result, there may be less publicly available information about us than U.S. public companies and this information may not be provided as promptly. In addition, we are permitted, under a multi-jurisdictional disclosure system adopted by the U.S. and Canada, to prepare our disclosure documents in accordance with Canadian disclosure requirements, including preparing our financial statements in accordance with International Financial Reporting Standards (IFRS), which differ in some respects from U.S. GAAP. We are required to assess our foreign private issuer status under U.S. securities laws annually at the end of the second quarter. If we were to lose our status as a foreign private issuer under U.S. securities laws, we would be required to comply with U.S. securities and accounting requirements.

We have retained liabilities from prior reorganizations

We have retained all liabilities of our predecessor companies, including liabilities relating to corporate and income tax matters.


We may become a passive foreign investment company, which could result in adverse U.S. tax consequences to U.S. investors

Management does not believe we are or will be treated as a passive foreign investment company (PFIC) for U.S. tax purposes. However, because PFIC status is determined annually and will depend on the composition of our income and assets from time to time, it is possible that we could be considered a PFIC in the future. This could result in adverse U.S. tax consequences for a U.S. investor. In particular, a U.S. investor would be subject to U.S. federal income tax at ordinary income rates, plus a possible interest charge, for any gain derived from a disposition of common shares, as well as certain distributions by us. In addition, a step-up in the tax basis of our common shares would not be available to an individual holder upon death.

An investor who acquires 10% or more of our common shares may be subject to taxation under the controlled foreign corporation (CFC) rules.

40 Management's Discussion and Analysis


Under certain circumstances, a U.S. person who directly or indirectly owns 10% or more of the voting power of a foreign corporation that is a CFC (generally, a foreign corporation where 10% or more U.S. shareholders own more than 50% of the voting power or value of the stock of the foreign corporation) for 30 straight days or more during a taxable year and who holds any shares of the foreign corporation on the last day of the corporation’s tax year must include in gross income for U.S. federal income tax purposes its pro rata share of certain income of the CFC even if the income is not distributed to the person. We are not currently a CFC, but this could change in the future.

Precision Drilling Corporation 2025 Annual Report 41


EVALUATION OF CONTROLS AND PROCEDURES


Internal Control over Financial Reporting

We maintain internal control over financial reporting that is designed to provide reasonable assurance regarding the reliability of financial reporting and the preparation of financial statements for external purposes in accordance with IFRS.

Management is responsible for establishing and maintaining adequate internal control over financial reporting, as defined in Rules 13a – 15(f) and 15d – 15(f) under the United States Securities Exchange Act of 1934, as amended (the Exchange Act) and under National Instrument 52-109 Certification of Disclosure in Issuer’s Annual and Interim Filings (NI 52-109).

Management, including the Chief Executive Officer (CEO) and the Chief Financial Officer (CFO), has conducted an evaluation of our internal control over financial reporting based on criteria established in Internal Control – Integrated Framework (2013) issued by the Committee of Sponsoring Organizations of the Treadway Commission (COSO 2013).

There were no changes in our internal control over financial reporting in 2025 that have materially affected or are reasonably likely to materially affect our internal control over financial reporting. Based on management’s assessment as of December 31, 2025, management has concluded that our internal control over financial reporting is effective.

The effectiveness of internal control over financial reporting as of December 31, 2025 was audited by KPMG LLP, an independent registered public accounting firm, as stated in their Report of Independent Registered Public Accounting Firm, which is included in this annual report.

Due to its inherent limitations, internal control over financial reporting is not intended to provide absolute assurance that a misstatement of our financial statements would be prevented or detected. Further, the evaluation of the effectiveness of internal control over financial reporting was made as of a specific date, and continued effectiveness in future periods is subject to the risk that controls may become inadequate.

Disclosure Controls and Procedures

We maintain disclosure controls and procedures designed to provide reasonable assurance that information required to be disclosed in our interim and annual filings is reviewed, recognized and disclosed accurately and in the appropriate time period.

Management, including the CEO and CFO, carried out an evaluation, as of December 31, 2025, of the effectiveness of the design and operation of Precision’s disclosure controls and procedures, as defined in Rule 13a – 15(e) and 15d – 15(e) under the Exchange Act and NI 52-109. Based on that evaluation, the CEO and CFO have concluded that the design and operation of Precision’s disclosure controls and procedures were effective to ensure that information required to be disclosed in the reports we file or submit under the Exchange Act or Canadian securities legislation is recorded, processed, summarized and reported within the time periods specified in the rules and forms therein.

It should be noted that while the CEO and CFO believe that our disclosure controls and procedures provide a reasonable level of assurance that they are effective, they do not expect that these disclosure controls and procedures will prevent all errors and fraud. A control system, no matter how well conceived or operated, can provide only reasonable, not absolute, assurance that the objectives of the control system are met.


42 Management's Discussion and Analysis


ADVISORIES


CAUTIONARY STATEMENT ABOUT FORWARD-LOOKING INFORMATION AND STATEMENTS

We disclose forward-looking information to help current and prospective investors understand our future prospects.

Certain statements contained in this MD&A, including statements that contain words such as could, should, can, anticipate, estimate, intend, plan, expect, believe, will, may, continue, project, potential and similar expressions and statements relating to matters that are not historical facts constitute forward-looking information within the meaning of applicable Canadian securities legislation and forward-looking statements within the meaning of the safe harbor provisions of the United States Private Securities Litigation Reform Act of 1995 (collectively, forward-looking information and statements).

Our forward-looking information and statements in this MD&A include, but are not limited to, the following:

our strategic priorities for 2026
our capital expenditures, free cash flow allocation and debt reduction plan for 2026 and beyond
anticipated activity levels in 2026
anticipated demand for our drilling rigs
plans for returns of capital to shareholders
the average number of term contracts in place for 2026
customer adoption of Alpha technologies and EverGreen suite of environmental solutions
potential commercial opportunities and rig contract renewals
our customer's ability to pay or honor their contractual obligations
our future debt reduction plans
our expectations regarding global energy demand
our outlook on oil and natural gas prices
target Net Debt to Adjusted EBITDA ratio
the potential impact liquefied natural gas export development could have on North American drilling activity
our expectations that new or newer rigs will enter the markets we currently operate in, and
our ability to remain compliant with our Senior Credit Facility financial debt covenants.

The forward-looking information and statements are based on certain assumptions and analysis made by Precision in light of our experience and our perception of historical trends, current conditions and expected future developments as well as other factors we believe are appropriate in the circumstances. These include, among other things:

the fluctuation in oil and natural gas prices may pressure customers into reducing or limiting their drilling budgets
the status of current negotiations with our customers and vendors
customer focus on safety performance
existing term contracts are neither renewed or terminated prematurely
continued market demand for our drilling rigs
our ability to deliver rigs to customers on a timely basis
the impact of climate change on our business
the general stability of the economic and political environment in the jurisdictions in which we operate, and
the impact of an increase/decrease in capital spending.

Undue reliance should not be placed on forward-looking information and statements. Whether actual results, performance or achievements will conform to our expectations and predictions is subject to a number of known and unknown risks and uncertainties which could cause actual results to differ materially from our expectations. Such risks and uncertainties include, but are not limited to:

volatility in the price and demand for oil and natural gas
fluctuations in the level of oil and natural gas exploration and development activities
fluctuations in the demand for contract drilling, well servicing and ancillary oilfield services
our customers’ inability to obtain adequate credit or financing to support their drilling and production activity
changes in drilling and well servicing technology, which could reduce demand for certain rigs or put us at a competitive advantage
shortages, delays and interruptions in the delivery of equipment supplies and other key inputs
liquidity of the capital markets to fund customer drilling programs
availability of cash flow, debt and equity sources to fund our capital and operating requirements, as needed
the physical, regulatory and transition impacts of climate change
the impact of weather and seasonal conditions on operations and facilities
the impact of tariffs and trade disputes
competitive operating risks inherent in contract drilling, well servicing and ancillary oilfield services
ability to improve our rig technology to improve drilling efficiency
disease outbreaks which could impact demand for our services or impact our operations
public health crises that impact demand for our services and our business
general political, economic, market or business conditions
the availability of qualified personnel and management
a decline in our safety performance which could result in lower demand for our services

Precision Drilling Corporation 2025 Annual Report 43


the impact of inflation and supply chain disruptions
business interruptions related to cybersecurity risks
changes to, and new laws or regulations, including changes in environmental laws and regulations such as increased regulation of hydraulic fracturing or restrictions on the burning of fossil fuels and greenhouse gas emissions, which could have an adverse impact on the demand for oil and natural gas
terrorism, acts of war, and social, civil and political unrest globally or in the foreign jurisdictions where we operate
fluctuations in foreign exchange, interest rates and tax rates, and
other unforeseen conditions which could impact the use of services supplied by Precision and Precision’s ability to respond to such conditions.

Readers are cautioned that the foregoing list of risk factors is not exhaustive. You can find more information about these and other factors that could affect our business, operations or financial results in this MD&A under the section titled “Risks in our Business” and in reports on file with securities regulatory authorities from time to time, including but not limited to our Annual Information Form (AIF) for the year ended December 31, 2025, which you can find in our profile on SEDAR+ (www.sedarplus.ca) or in our profile on EDGAR Next ( www.sec.gov).

All of the forward-looking information and statements made in this MD&A are expressly qualified by these cautionary statements. There can be no assurance that actual results or developments that we anticipate will be realized. We caution you not to place undue reliance on forward-looking information and statements. The forward-looking information and statements made in this MD&A are made as of the date hereof. We will not necessarily update or revise this forward-looking information as a result of new information, future events or otherwise, unless we are required to by securities law.

Forward-looking information and statements in this MD&A may also address our sustainability plans and progress. The inclusion of these statements is not an indication that these contents are necessarily material to investors and certain standards for measuring progress for sustainability are still developing (including for emissions disclosures).

FINANCIAL MEASURES AND RATIOS

NON-GAAP FINANCIAL MEASURES

We reference certain additional Non-GAAP measures that are not defined terms under IFRS to assess performance because we believe they provide useful supplemental information to investors. Non-GAAP financial measures are not standardized financial measures under IFRS and might not be comparable to similar financial measures disclosed by other issuers.

Adjusted EBITDA

We believe Adjusted EBITDA (earnings before income taxes, gain on repurchase of unsecured senior notes, gain on acquisition, loss on investments and other assets, finance charges, foreign exchange, loss on asset decommissioning, gain on asset disposals, and depreciation and amortization), as reported in our Consolidated Statements of Net Earnings, is a useful measure, because it gives an indication of the results from our principal business activities prior to consideration of how our activities are financed and the impact of foreign exchange, taxation and depreciation and amortization charges.

The most directly comparable financial measure is net earnings.


Year ended December 31 (in thousands of dollars)


2025


2024


2023


Adjusted EBITDA by segment


Contract Drilling Services


488,796


532,345


630,761


Completion and Production Services


63,980


66,681


51,224


Corporate and Other


(63,161

)


(77,805

)


(70,867

)


489,615


521,221


611,118


Depreciation and amortization


317,904


309,314


297,557


Gain on asset disposals


(8,623

)


(16,148

)


(24,469

)

Loss on asset decommissioning


67,080


9,592


Foreign exchange


(1,208

)


2,259


(1,667

)

Finance charges


57,197


69,753


83,414


Loss on investments and other assets


1,344


1,484


6,810


Gain on acquisition


(25,761

)

Gain on redemption and repurchase of unsecured senior notes


(137

)

Income taxes


52,827


43,229


(23,465

)

Net earnings


3,094


111,330


289,244


Non-controlling interest


1,252


135


Net earnings attributable to shareholders


1,842


111,195


289,244


Funds provided by (used in) operations

We believe funds provided by (used in) operations, as reported in our Consolidated Statements of Cash Flows, is a useful measure because it provides an indication of the funds our principal business activities generate prior to consideration of working capital changes, which is primarily made up of highly liquid balances.

The most directly comparable financial measure is cash provided by (used in) operations.


44 Management's Discussion and Analysis


Net capital spending

We believe net capital spending is a useful measure as it provides an indication of our primary investment activities.

The most directly comparable financial measure is cash provided by (used in) investing activities.

Net capital spending is calculated as follows:


Year ended December 31 (in thousands of dollars)


2025


2024


2023


Capital spending by spend category


Expansion and upgrade


106,908


52,066


63,898


Maintenance and infrastructure


156,590


164,632


162,851


263,498


216,698


226,749


Proceeds on sale of property, plant and equipment


(39,038

)


(30,395

)


(23,841

)

Net capital spending


224,460


186,303


202,908


Business acquisitions


28,646


Proceeds from sale of investments and other assets


(3,623

)


(10,013

)

Purchase of investments and other assets


21


725


5,343


Receipt of finance lease payments


(851

)


(799

)


(255

)

Changes in non-cash working capital balances


(15,306

)


20,380


(11,845

)

Cash used in investing activities


208,324


202,986


214,784


Working capital

We define working capital as current assets less current liabilities, as reported in our Consolidated Statements of Financial Position.

Working capital is calculated as follows:


Year ended December 31 (in thousands of dollars)


2025


2024


2023


Current assets


486,915


501,284


510,881


Current liabilities


(300,100

)


(338,692

)


(374,009

)

Working capital


186,815


162,592


136,872


Total Long-term Financial Liabilities

We define total long-term financial liabilities as total non-current liabilities less deferred tax liabilities, as reported in our Consolidated Statements of Financial Position.

Total long-term financial liabilities is calculated as follows:


Year ended December 31 (in thousands of dollars)


2025


2024


2023


Total non-current liabilities


837,707


935,624


1,069,364


Deferred tax liabilities


(90,763

)


(47,451

)


(73,515

)

Total long-term financial liabilities


746,944


888,173


995,849


NON-GAAP RATIOS

We reference certain additional non-GAAP ratios that are not defined terms under IFRS to assess performance because we believe they provide useful supplemental information to investors. Non-GAAP ratios are not standardized financial measures under IFRS and might not be comparable to similar financial measures disclosed by other issuers.

Adjusted EBITDA % of Revenue

We believe Adjusted EBITDA as a percentage of consolidated revenue, as reported in our Consolidated Statements of Net Earnings, provides an indication of our profitability from our principal business activities prior to consideration of how our activities are financed and the impact of foreign exchange, taxation and depreciation and amortization charges.

Long-term debt to long-term debt plus equity

We believe that long-term debt (as reported in our Consolidated Statements of Financial Position) to long-term debt plus equity (total shareholders’ equity as reported in our Consolidated Statements of Financial Position) provides an indication of our debt leverage.

Net Debt to Adjusted EBITDA

We believe the Net Debt (long-term debt less cash, as reported in our Consolidated Statements of Financial Position) to Adjusted EBITDA ratio provides an indication of the number of years it would take for us to repay our debt obligations.

SUPPLEMENTARY FINANCIAL MEASURES

We reference certain supplementary financial measures that are not defined terms under IFRS to assess performance because we believe they provide useful supplemental information to investors.

Capital spending by spend category

We provide additional disclosure to better depict the nature of our capital spending. Our capital spending is categorized as expansion and upgrade, maintenance and infrastructure, or intangibles.

Precision Drilling Corporation 2025 Annual Report 45


Enterprise Value

We calculate our Enterprise Value as our market capitalization (outstanding common shares multiplied by our share price at the reporting date) plus our long-term debt less cash, as reported in our Consolidated Statements of Financial Position.

Long-term debt to cash provided by (used in) operations

We calculate our long-term debt, as reported in our Consolidated Statements of Financial Position, to cash provided by (used in) operations, as reported in our Consolidated Statements of Cash Flows.

Working capital ratio

We define our working capital ratio as current assets divided by current liabilities, as reported in our Consolidated Statements of Financial Position.

46 Management's Discussion and Analysis