| Extraordinary Care That Changes Lives © 2026 OPTION CARE HEALTH, INC. ALL RIGHTS RESERVED Option Care Health, Inc. 44th Annual J.P. Morgan Healthcare Conference January 13, 2026 1 |

| © 2026 OPTION CARE HEALTH, INC. ALL RIGHTS RESERVED Disclaimers Forward-Looking Statements This presentation may contain “forward-looking statements” within the meaning of the safe harbor provisions of the U.S. Private Securities Litigation Reform Act of 1995. Forward-looking statements can be identified by words such as: “anticipate,” “intend,” “plan,” “believe,” “project,” “estimate,” “expect,” “may,” “should,” “will” and similar references to future periods. Examples of forward-looking statements include, among others, statements we may make regarding future revenues, future earnings, other future financial results, regulatory developments, market developments, new products and growth strategies, and the effects of any of the foregoing on our future results of operations or financial conditions. Forward-looking statements are neither historical facts nor assurances of future performance. Instead, they are based only on our current beliefs, expectations and assumptions regarding the future of our business, future plans and strategies, projections, anticipated events and trends, the economy and other future conditions. Because forward-looking statements relate to the future, they are subject to inherent uncertainties, risks and changes in circumstances that are difficult to predict and many of which are outside of our control. Our actual results and financial condition may differ materially from those indicated in the forward-looking statements. Important factors that could cause our actual results and financial condition to differ materially from those indicated in the forward-looking statements include, among others, the following: changes in laws, regulations or trade policies applicable to our business model; loss of relationships with managed care organizations and other non-governmental third party payers; changes in the pharmaceutical industry, including limiting or discontinuing research, development, production and marketing of pharmaceuticals compatible with our services; changes in market conditions and receptivity to our services and offerings; and pending and future litigation or potential liability for claims not covered by insurance. For a detailed discussion of the risk factors that could affect our actual results, please refer to the risk factors identified in our reports as filed with the SEC. Any forward-looking statement made by us in this presentation is based only on information currently available to us and speaks only as of the date on which it is made. We undertake no obligation to publicly update any forward-looking statement, whether written or oral, that may be made from time to time, whether as a result of new information, future developments or otherwise. Non-GAAP Measures In addition to reporting financial information in accordance with generally accepted accounting principles (“GAAP”), we are also reporting Adjusted net income, Adjusted EBITDA, Adjusted EBITDA margin, Adjusted earnings per share ("Adjusted EPS"), and Net Debt Leverage Ratio, each of which are non-GAAP financial measures. These adjusted measures are not measurements of financial performance under GAAP and should not be used in isolation or as a substitute or alternative to net income, net profit margin, earnings per share or any other performance measure derived in accordance with GAAP, or as a substitute or alternative to cash flow from operating activities or a measure of our liquidity. In addition, our definitions of Adjusted net income, Adjusted EBITDA, Adjusted EBITDA margin, Adjusted EPS, and Net Debt Leverage Ratio may not be comparable to similarly titled non-GAAP financial measures reported by other companies. As defined by us: (i) Adjusted net income represents net income before intangible asset amortization expense, stock-based compensation expense, loss on extinguishment of debt, and restructuring, acquisition, integration and other expenses, net of tax adjustments, (ii) Adjusted EBITDA represents net income before net interest expense, income tax expense, depreciation and amortization, stock-based compensation expense, loss on extinguishment of debt, and restructuring, acquisition, integration and other expenses; (iii) Adjusted EBITDA margin represents Adjusted EBITDA divided by net revenue, (iv) Adjusted EPS represents Adjusted net income divided by weighted average common shares outstanding, diluted, and (v) Net Debt Leverage Ratio represents gross debt less cash and cash equivalents on the balance sheet divided by the trailing twelve months Adjusted EBITDA. Gross debt is defined as the current portion of long-term debt and long-term debt excluding discounts and unamortized debt issuance costs. As part of restructuring, acquisition, integration and other expenses, we may incur significant charges such as the write down of certain long-lived assets, temporary redundant expenses, professional fees, certain litigation expenses and reserves related to acquired businesses, potential retention and severance costs and potential accelerated payments or termination costs for certain of its contractual obligations. Management believes that these adjusted measures provide useful supplemental information regarding the performance of our business operations and facilitate comparisons to our historical operating results. We have not reconciled Adjusted EBITDA and Adjusted EPS guidance to net income as management believes creation of this reconciliation would not be practicable due to the uncertainty regarding, and potential variability of, material reconciling items. Full reconciliations of each historical adjusted measure to the most comparable GAAP financial measure are set forth at the end of this presentation. 44 2 th Annual J.P. Morgan Healthcare Conference | January 2026 |
| © 2026 OPTION CARE HEALTH, INC. ALL RIGHTS RESERVED Disclaimers Preliminary Unaudited Financial Data The preliminary financial information included in this presentation is subject to completion of our year-end close procedures and further financial review. We have provided ranges, rather than specific amounts, because these results are preliminary and subject to change. Actual results may differ from these estimates as a result of the completion of our year-end closing procedures, review adjustments and other developments that may arise between now and the time such financial information for the period is finalized. As a result, these estimates are preliminary, may change and constitute forward-looking information and, as a result, are subject to risks and uncertainties. These preliminary estimates should not be viewed as a substitute for full financial statements prepared in accordance with GAAP, and they should not be viewed as indicative of our results for any future period. Our independent registered public accounting firm has not audited, reviewed, compiled, or performed any procedures with respect to these estimated financial results and, accordingly, does not express an opinion or any other form of assurance with respect to these preliminary estimates. 44 3 th Annual J.P. Morgan Healthcare Conference | January 2026 |
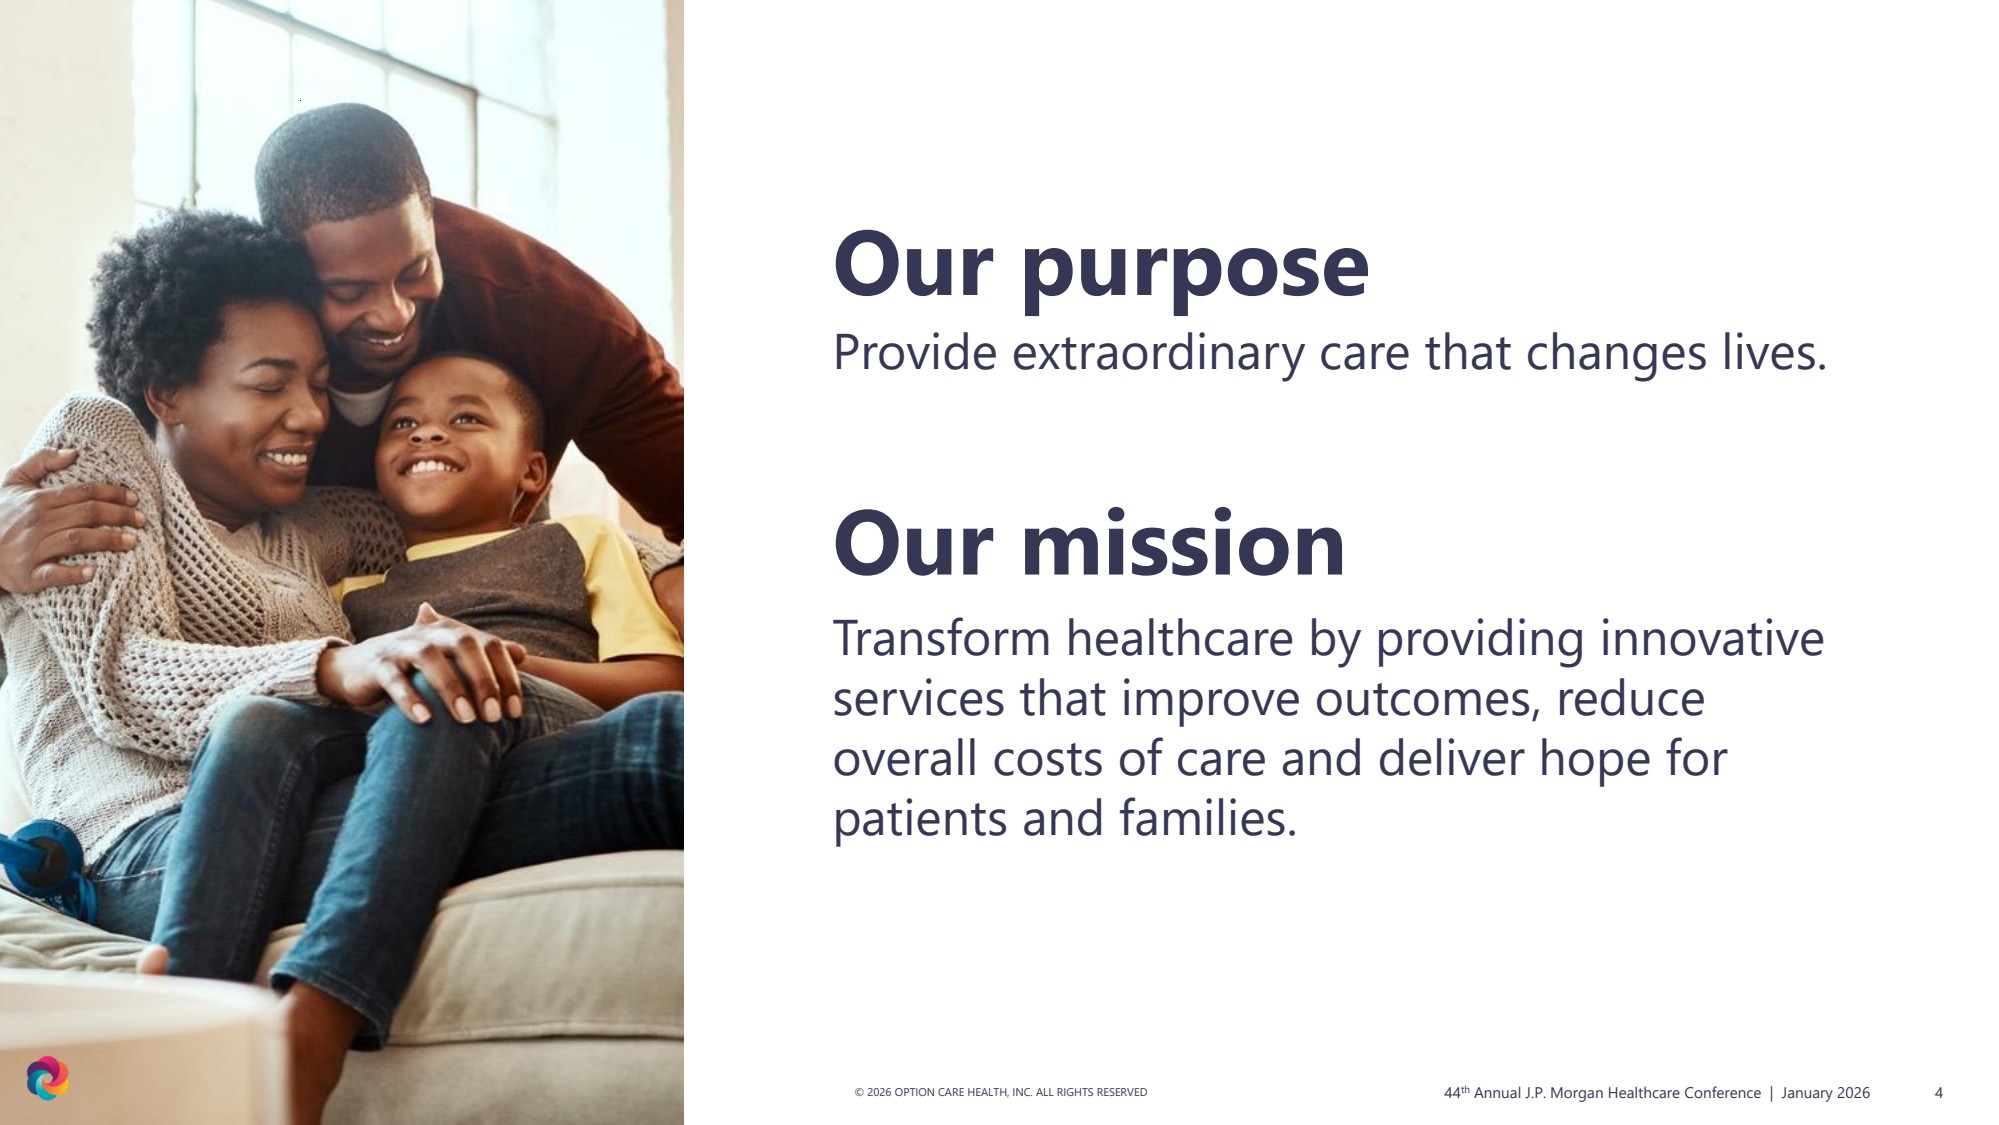
| © 2026 OPTION CARE HEALTH, INC. ALL RIGHTS RESERVED 4 Our purpose Provide extraordinary care that changes lives. Our mission Transform healthcare by providing innovative services that improve outcomes, reduce overall costs of care and deliver hope for patients and families. 44 th Annual J.P. Morgan Healthcare Conference | January 2026 |
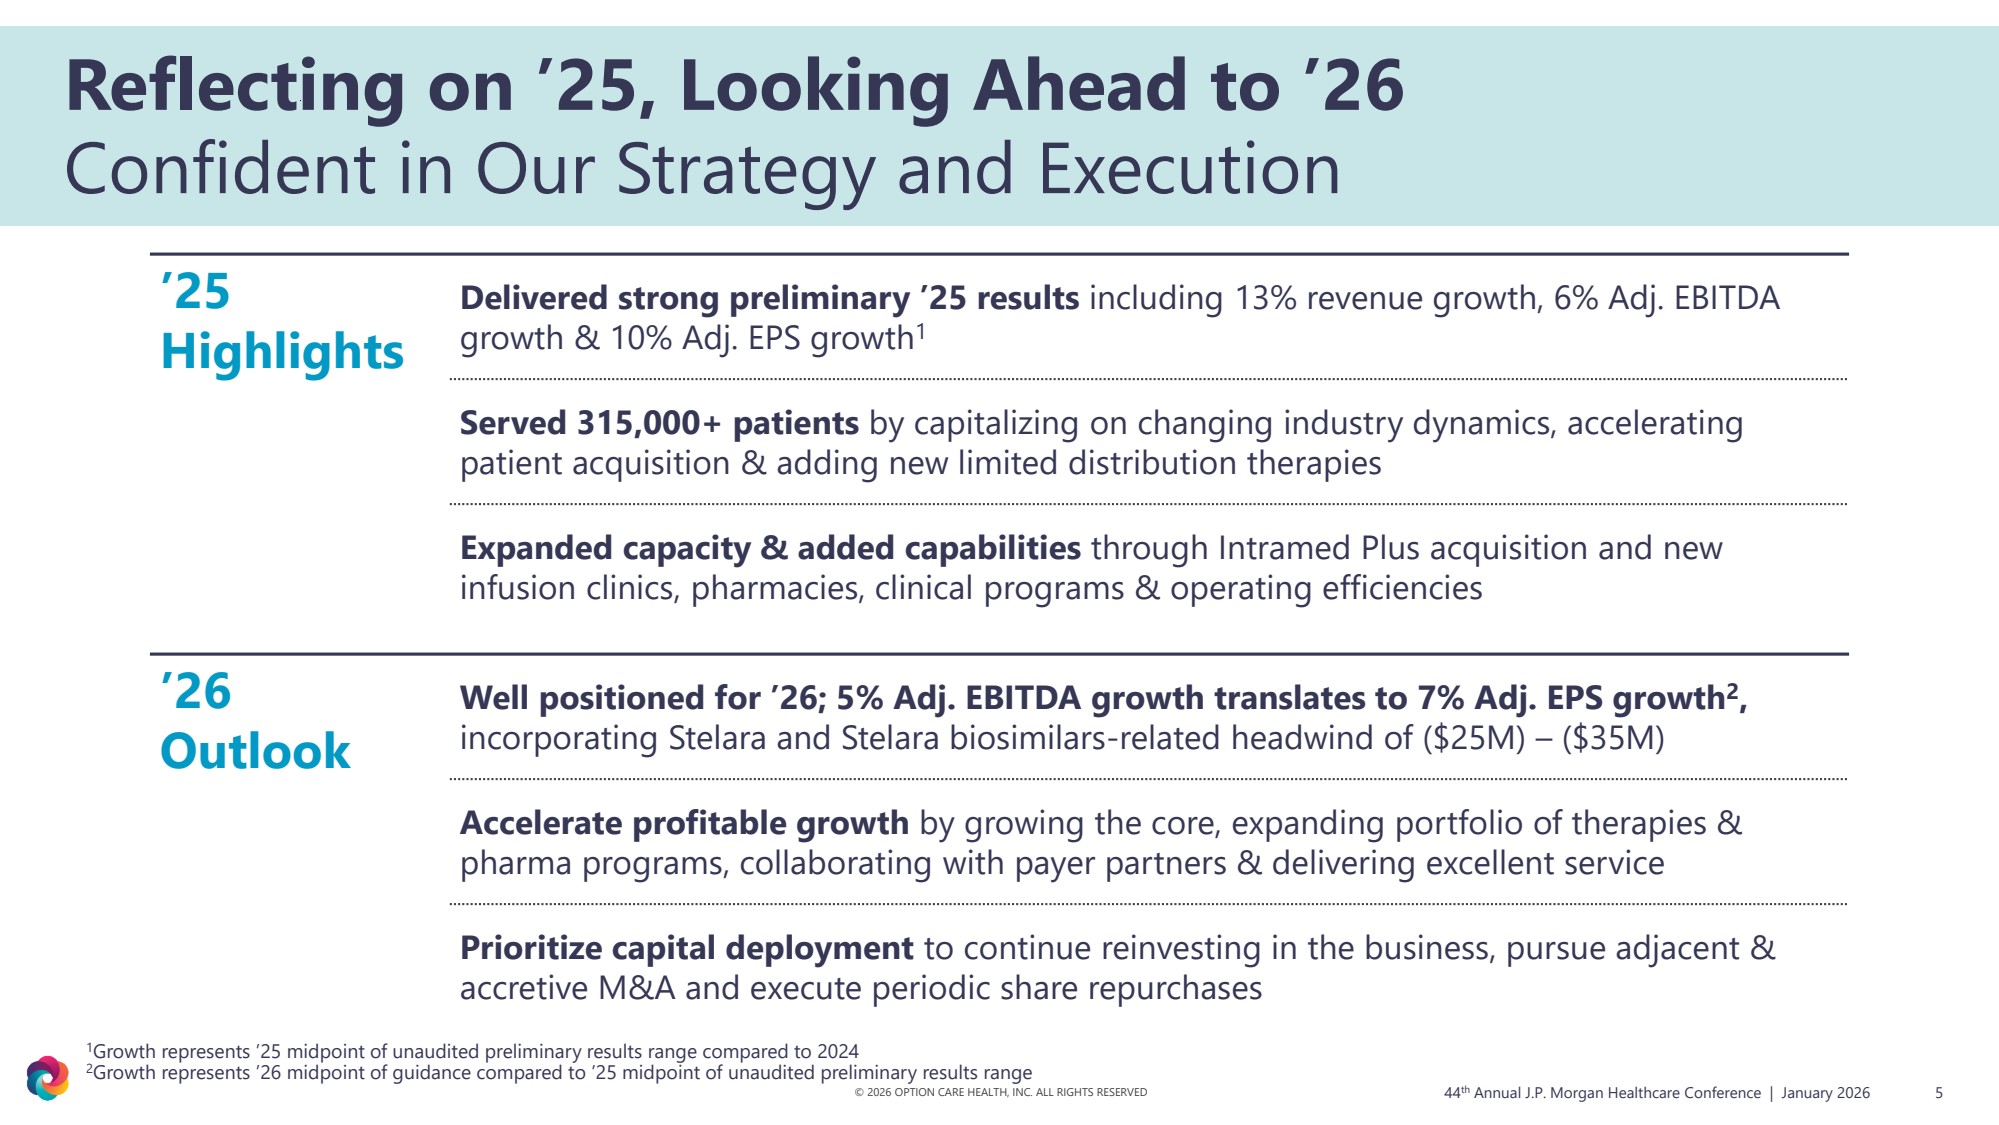
| © 2026 OPTION CARE HEALTH, INC. ALL RIGHTS RESERVED 5 Reflecting on ’25, Looking Ahead to ’26 Confident in Our Strategy and Execution 44 th Annual J.P. Morgan Healthcare Conference | January 2026 ’25 Highlights Delivered strong preliminary ’25 results including 13% revenue growth, 6% Adj. EBITDA growth & 10% Adj. EPS growth1 Served 315,000+ patients by capitalizing on changing industry dynamics, accelerating patient acquisition & adding new limited distribution therapies Expanded capacity & added capabilities through Intramed Plus acquisition and new infusion clinics, pharmacies, clinical programs & operating efficiencies ’26 Outlook Well positioned for ’26; 5% Adj. EBITDA growth translates to 7% Adj. EPS growth2 , incorporating Stelara and Stelara biosimilars-related headwind of ($25M) – ($35M) Accelerate profitable growth by growing the core, expanding portfolio of therapies & pharma programs, collaborating with payer partners & delivering excellent service Prioritize capital deployment to continue reinvesting in the business, pursue adjacent & accretive M&A and execute periodic share repurchases 1Growth represents ’25 midpoint of unaudited preliminary results range compared to 2024 2Growth represents ’26 midpoint of guidance compared to ’25 midpoint of unaudited preliminary results range |
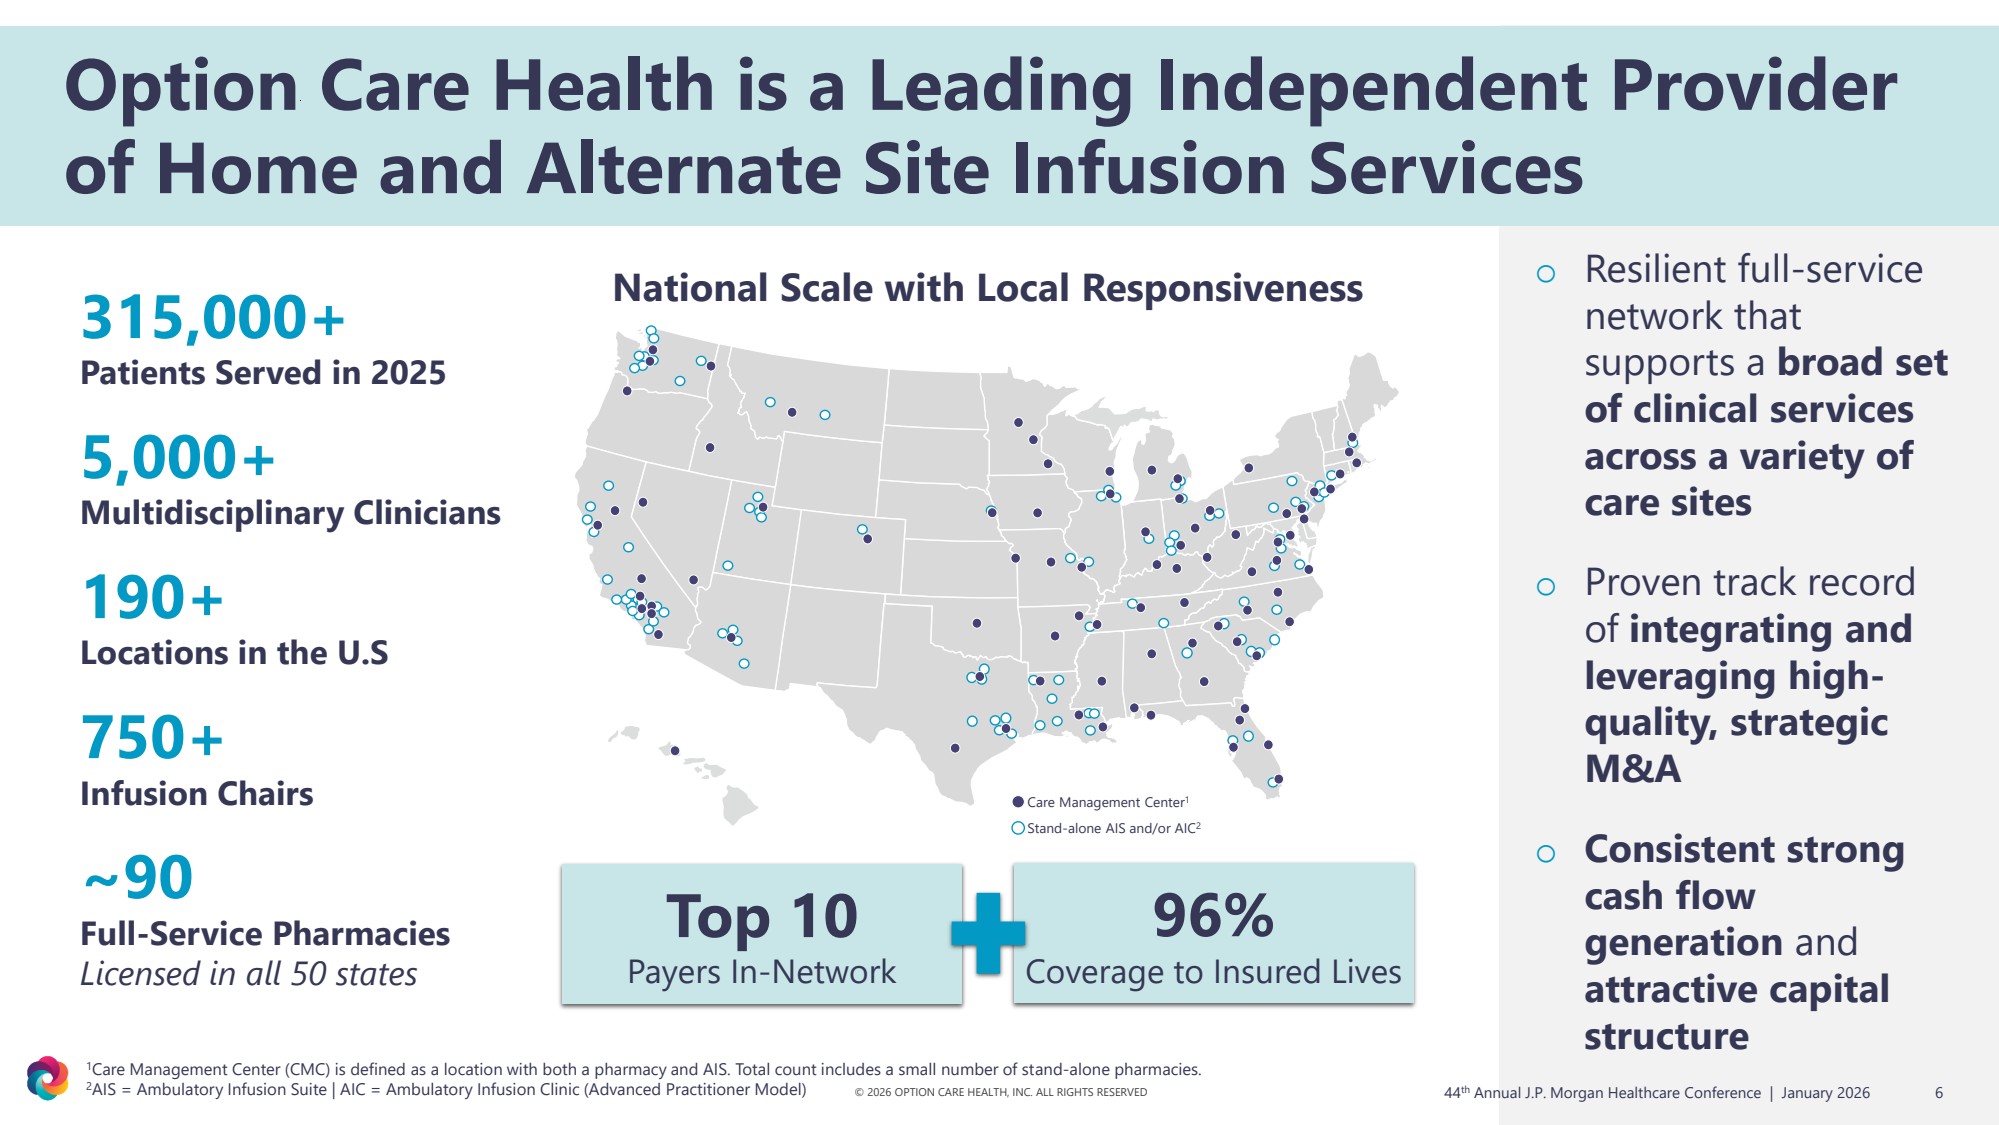
| © 2026 OPTION CARE HEALTH, INC. ALL RIGHTS RESERVED Option Care Health is a Leading Independent Provider of Home and Alternate Site Infusion Services Stand-alone AIS and/or AIC2 Care Management Center1 National Scale with Local Responsiveness o Resilient full-service network that supports a broad set of clinical services across a variety of care sites o Proven track record of integrating and leveraging high-quality, strategic M&A o Consistent strong cash flow generation and attractive capital structure 315,000+ Patients Served in 2025 5,000+ Multidisciplinary Clinicians 190+ Locations in the U.S 750+ Infusion Chairs 6 ~90 Full-Service Pharmacies Licensed in all 50 states Top 10 Payers In-Network 96% Coverage to Insured Lives 44 th Annual J.P. Morgan Healthcare Conference | January 2026 1Care Management Center (CMC) is defined as a location with both a pharmacy and AIS. Total count includes a small number of stand-alone pharmacies. 2AIS = Ambulatory Infusion Suite | AIC = Ambulatory Infusion Clinic (Advanced Practitioner Model) |
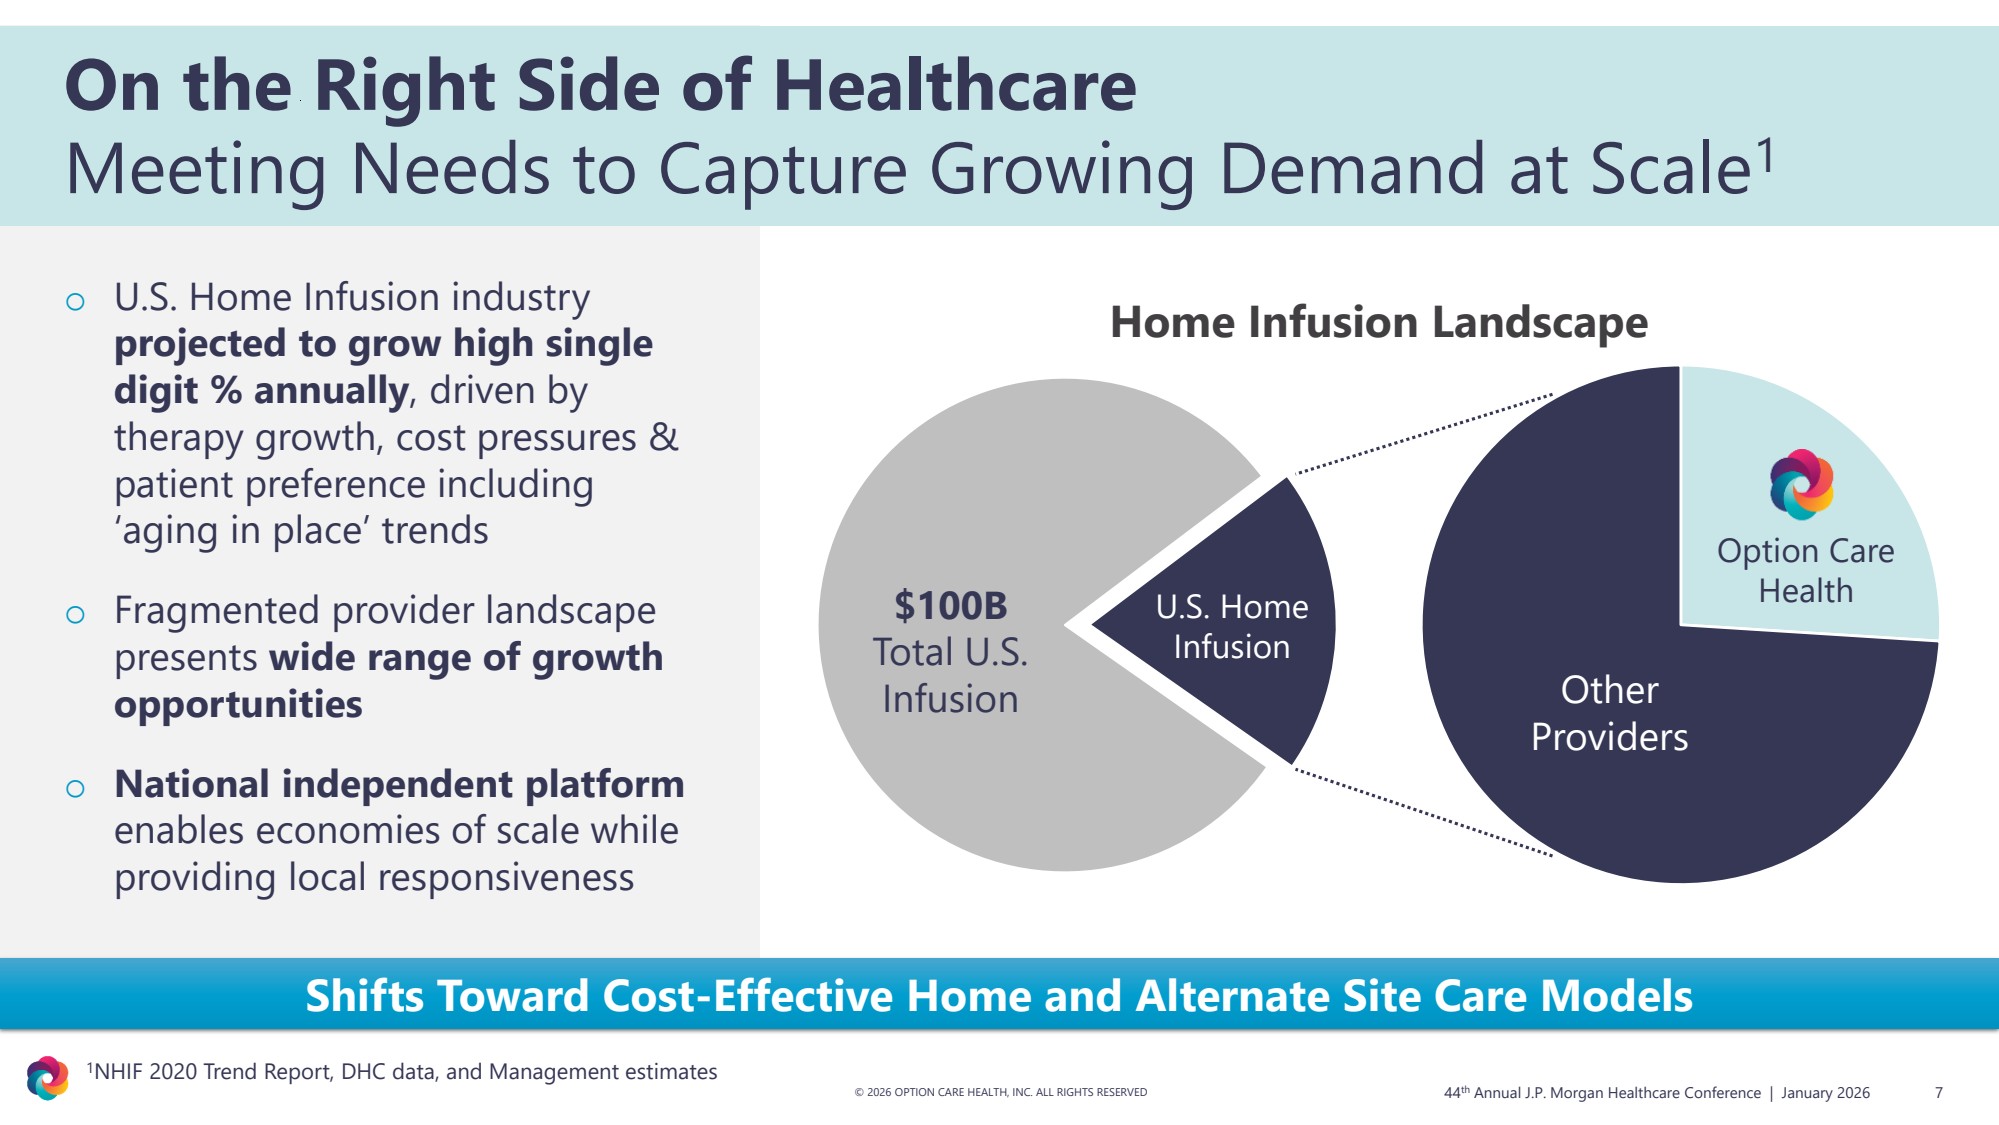
| Shifts Toward Cost-Effective Home and Alternate Site Care Models o U.S. Home Infusion industry projected to grow high single digit % annually, driven by therapy growth, cost pressures & patient preference including ‘aging in place’ trends o Fragmented provider landscape presents wide range of growth opportunities o National independent platform enables economies of scale while providing local responsiveness U.S. Home Infusion $100B Total U.S. Infusion Other Providers Option Care Health Home Infusion Landscape © 2026 OPTION CARE HEALTH, INC. ALL RIGHTS RESERVED 44 7 th Annual J.P. Morgan Healthcare Conference | January 2026 On the Right Side of Healthcare Meeting Needs to Capture Growing Demand at Scale 1 1NHIF 2020 Trend Report, DHC data, and Management estimates |
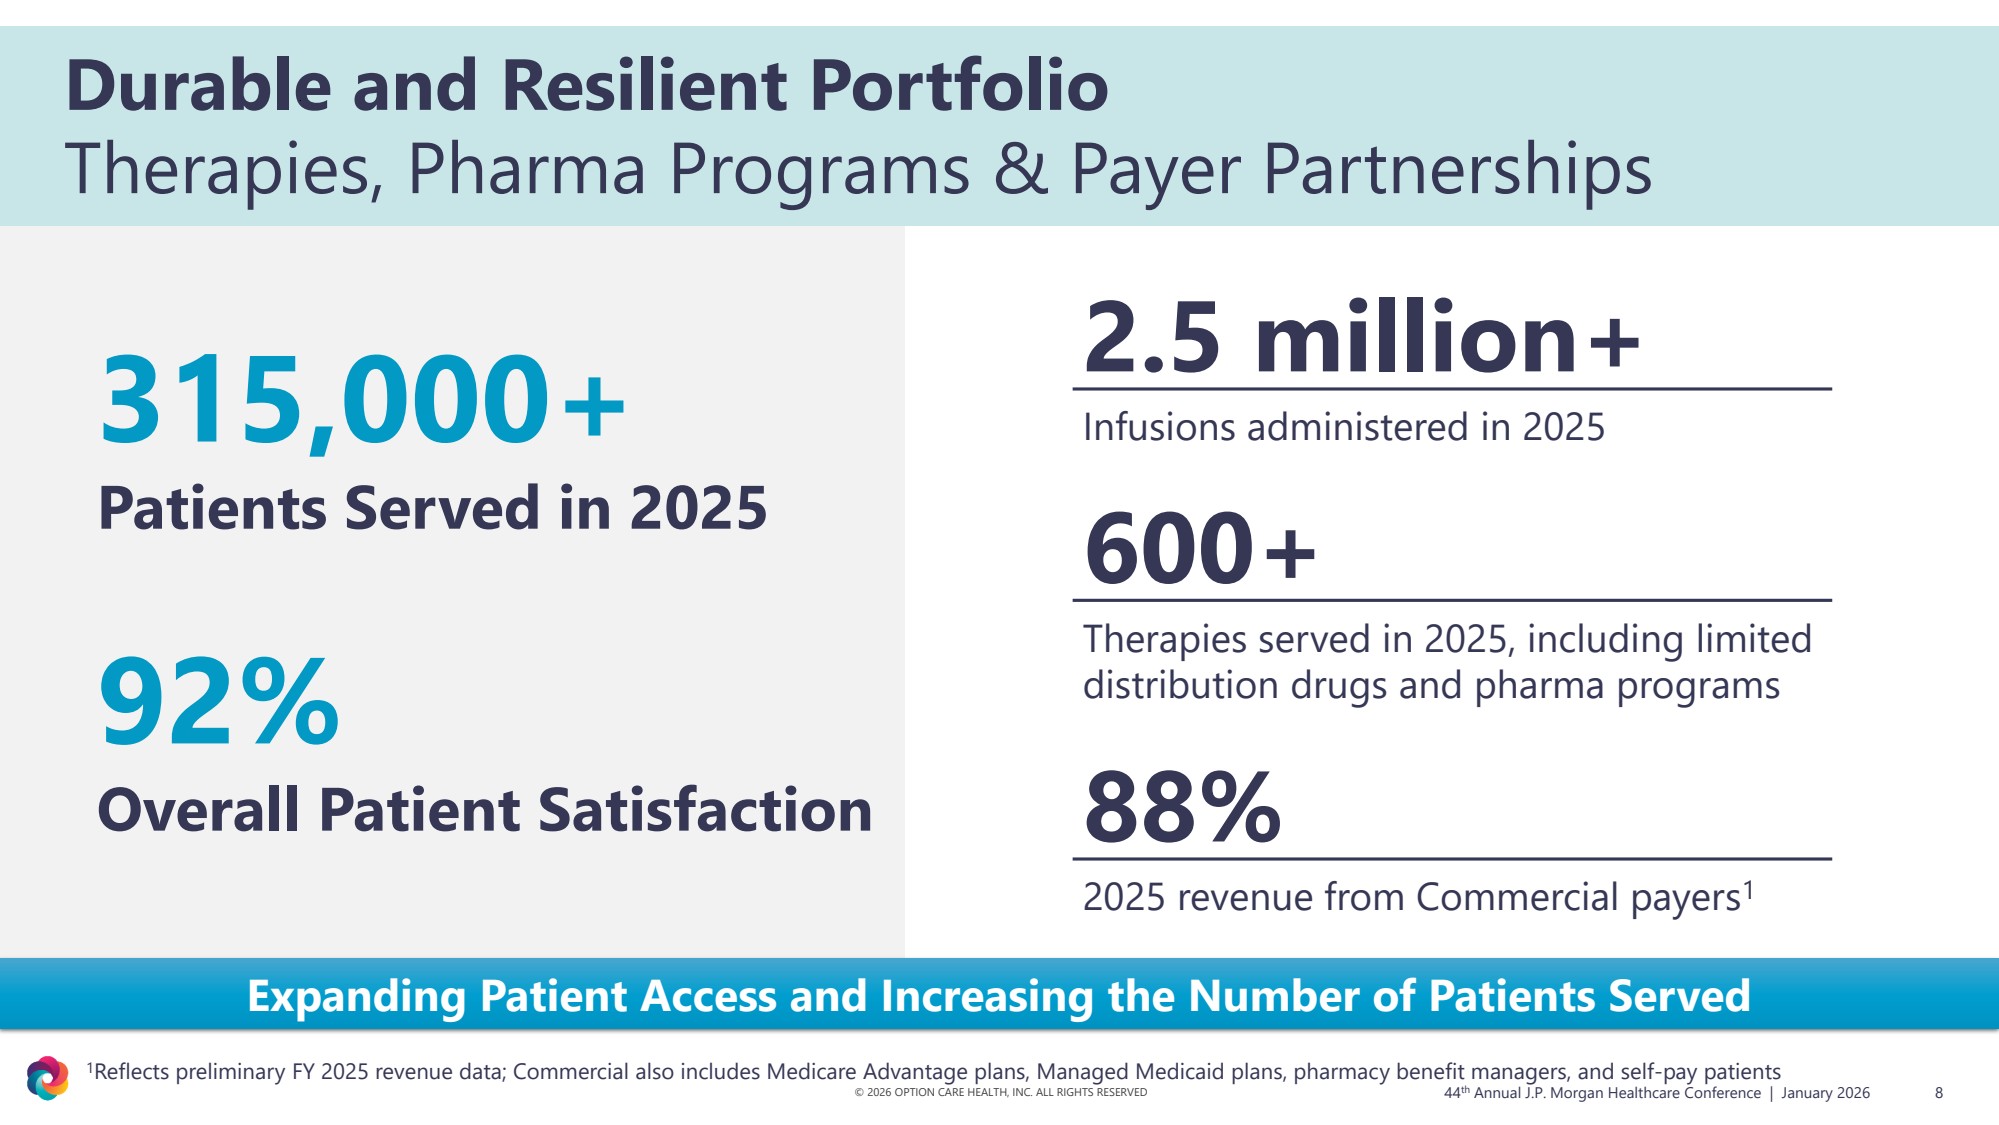
| © 2026 OPTION CARE HEALTH, INC. ALL RIGHTS RESERVED 8 315,000+ Patients Served in 2025 2.5 million+ Infusions administered in 2025 600+ Therapies served in 2025, including limited distribution drugs and pharma programs 88% 2025 revenue from Commercial payers 1 92% Overall Patient Satisfaction Durable and Resilient Portfolio Therapies, Pharma Programs & Payer Partnerships 44 th Annual J.P. Morgan Healthcare Conference | January 2026 Expanding Patient Access and Increasing the Number of Patients Served 1Reflects preliminary FY 2025 revenue data; Commercial also includes Medicare Advantage plans, Managed Medicaid plans, pharmacy benefit managers, and self-pay patients |
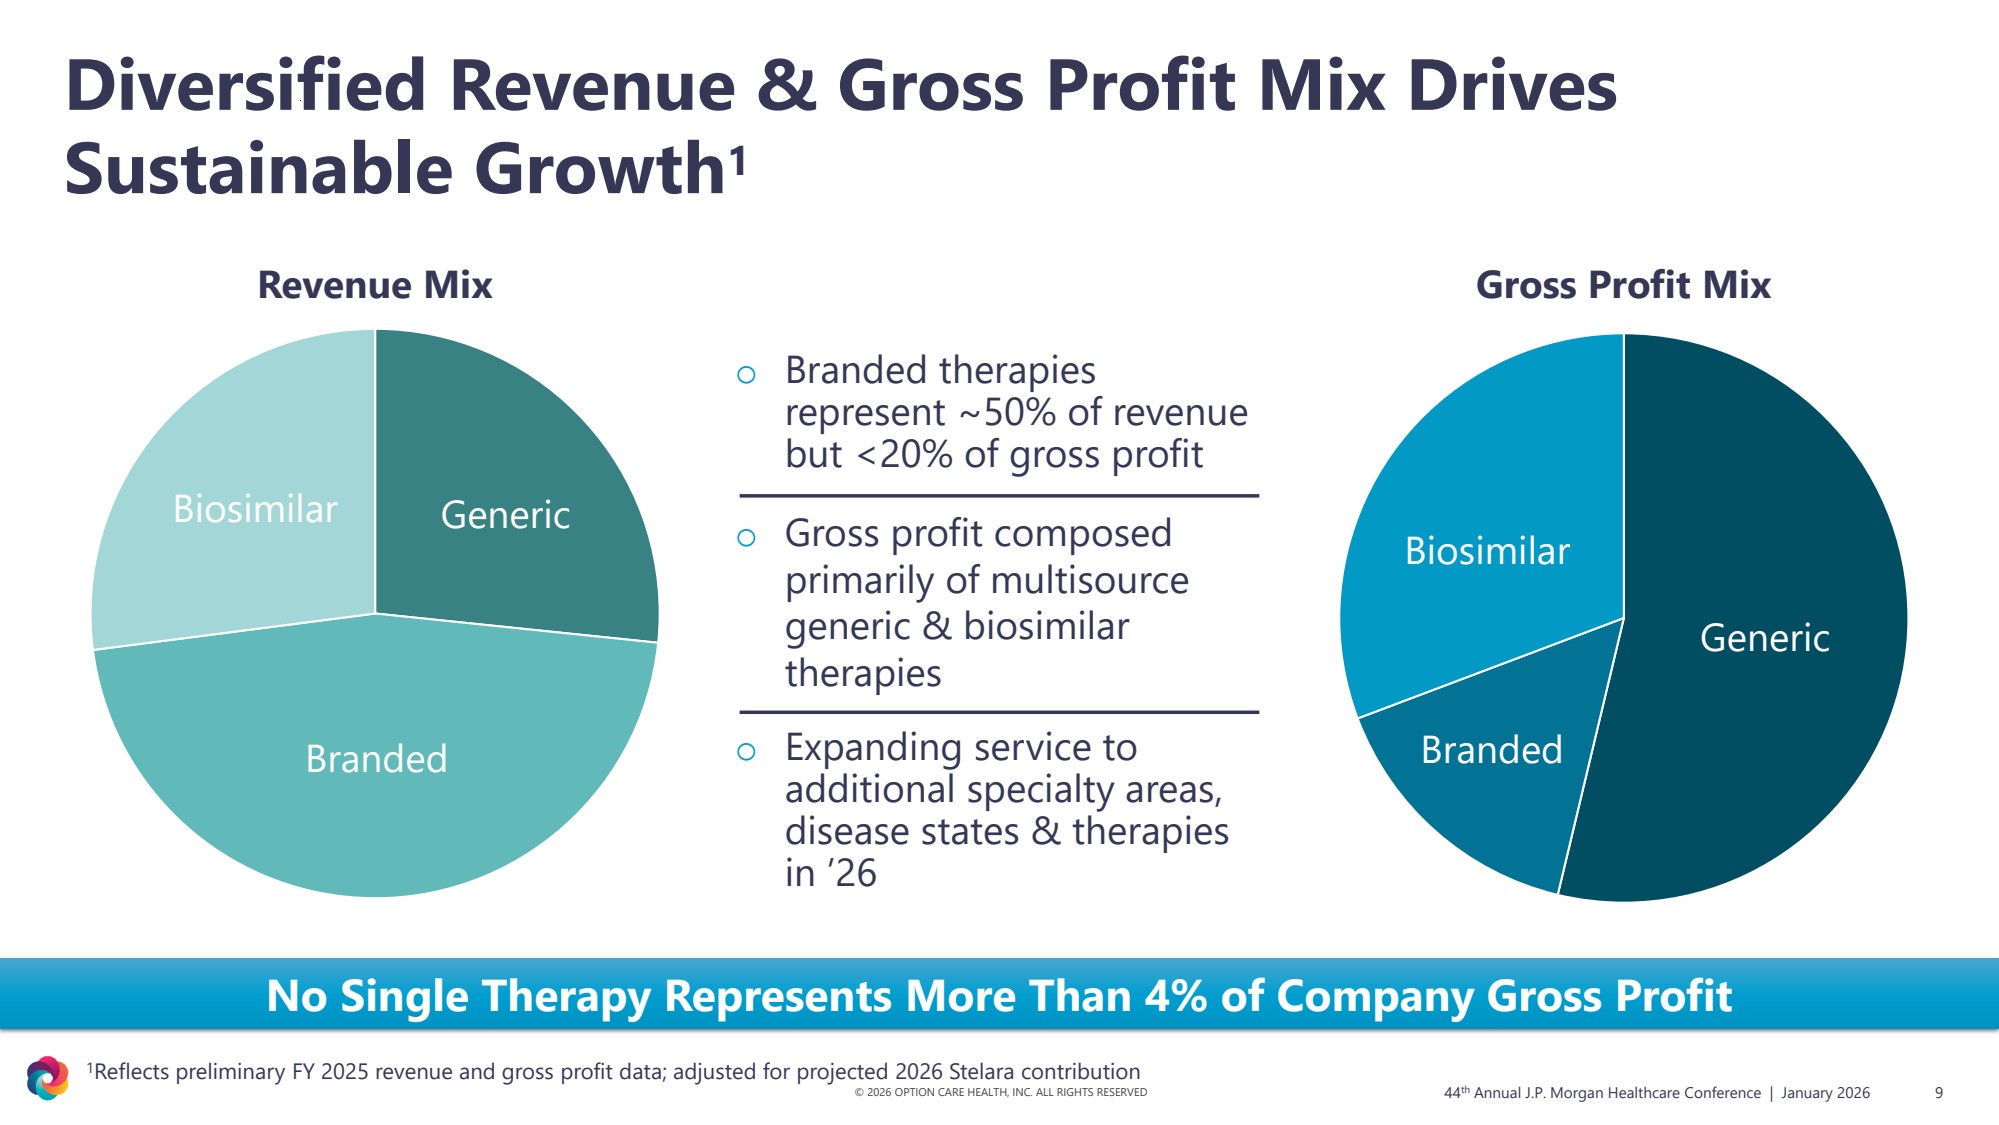
| Generic Branded Biosimilar Generic Branded Biosimilar © 2026 OPTION CARE HEALTH, INC. ALL RIGHTS RESERVED Gross Profit Mix 9 Revenue Mix o Gross profit composed primarily of multisource generic & biosimilar therapies o Branded therapies represent ~50% of revenue but <20% of gross profit o Expanding service to additional specialty areas, disease states & therapies in ’26 No Single Therapy Represents More Than 4% of Company Gross Profit 44 th Annual J.P. Morgan Healthcare Conference | January 2026 1Reflects preliminary FY 2025 revenue and gross profit data; adjusted for projected 2026 Stelara contribution Diversified Revenue & Gross Profit Mix Drives Sustainable Growth1 |
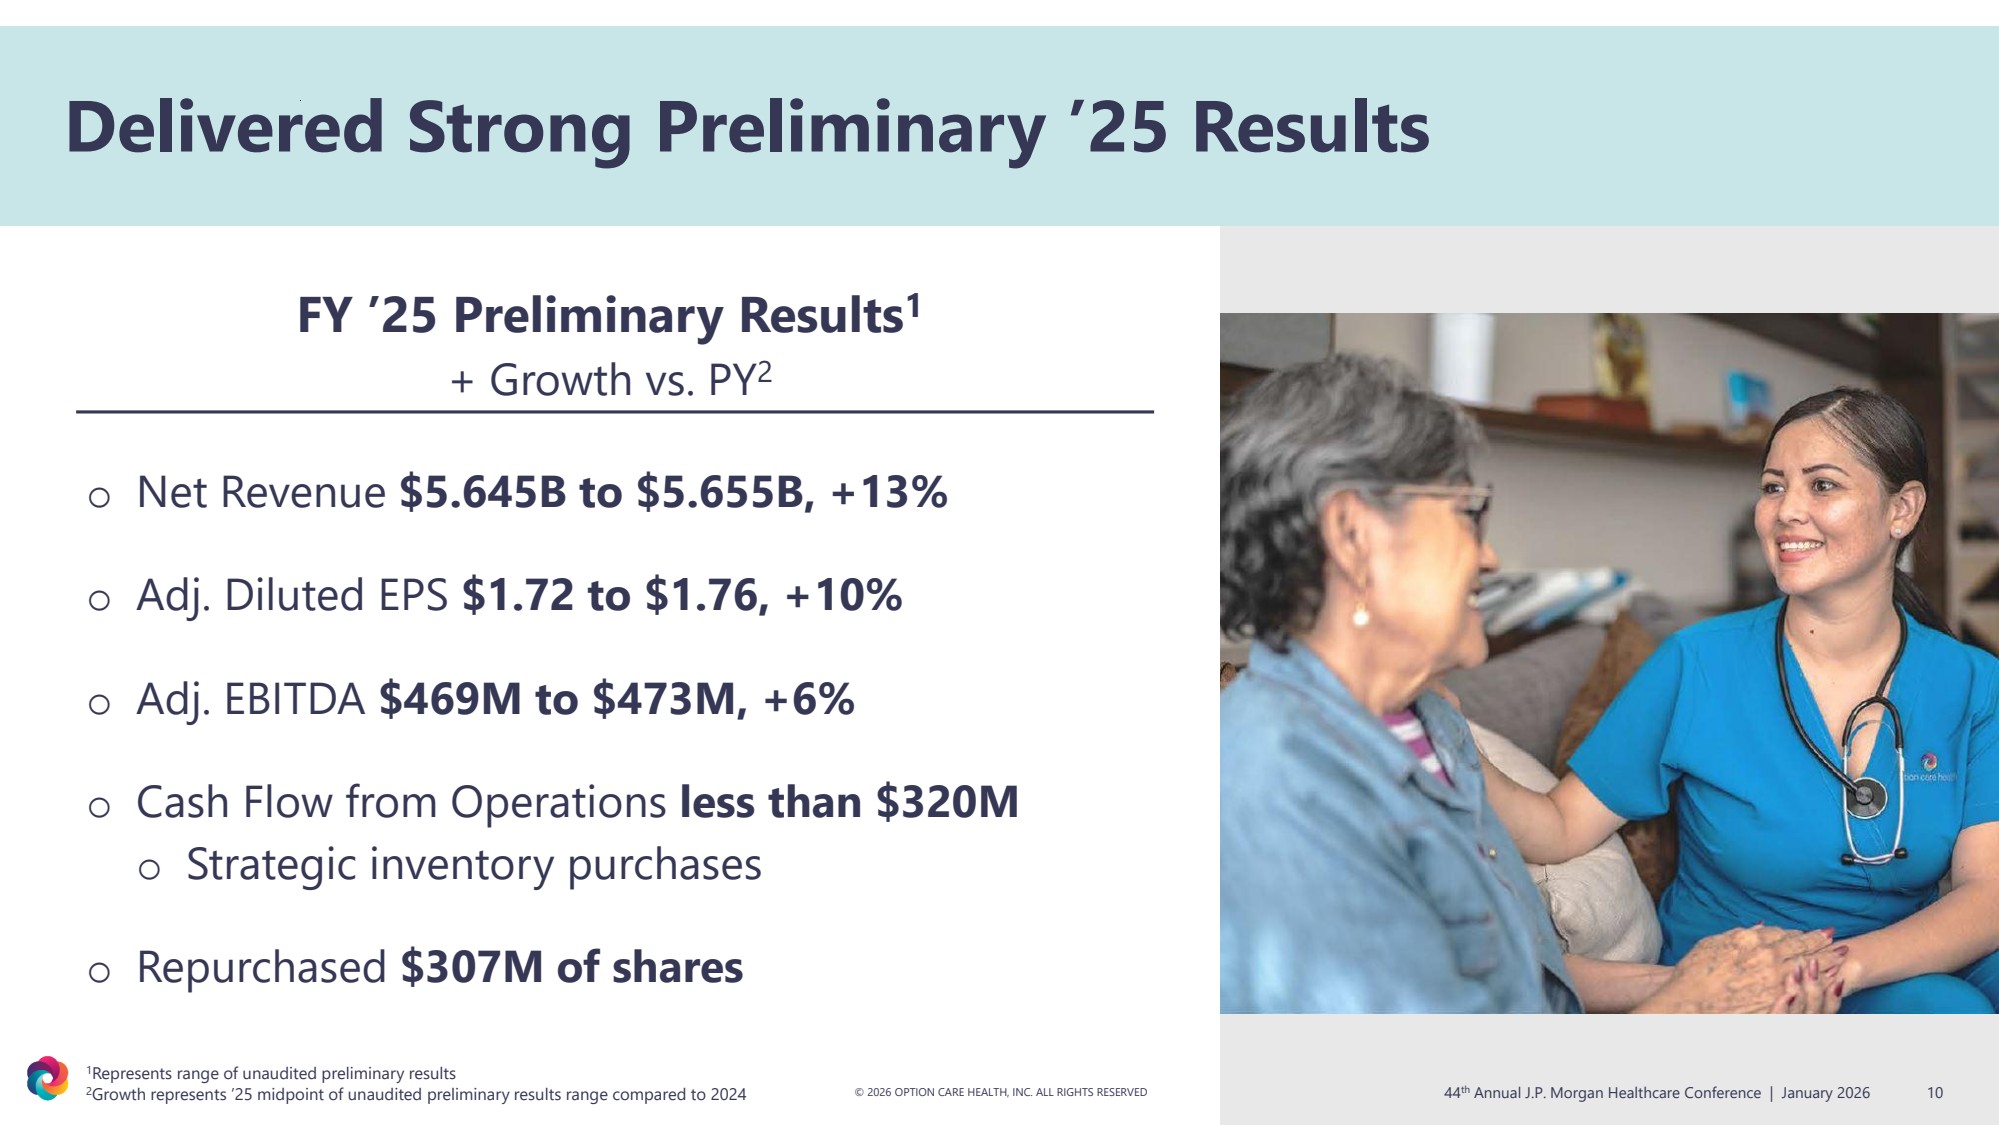
| © 2026 OPTION CARE HEALTH, INC. ALL RIGHTS RESERVED 44 10 th Annual J.P. Morgan Healthcare Conference | January 2026 FY ’25 Preliminary Results1 + Growth vs. PY2 o Net Revenue $5.645B to $5.655B, +13% o Adj. Diluted EPS $1.72 to $1.76, +10% o Adj. EBITDA $469M to $473M, +6% o Cash Flow from Operations less than $320M o Strategic inventory purchases o Repurchased $307M of shares Delivered Strong Preliminary ’25 Results 1Represents range of unaudited preliminary results 2Growth represents ’25 midpoint of unaudited preliminary results range compared to 2024 |
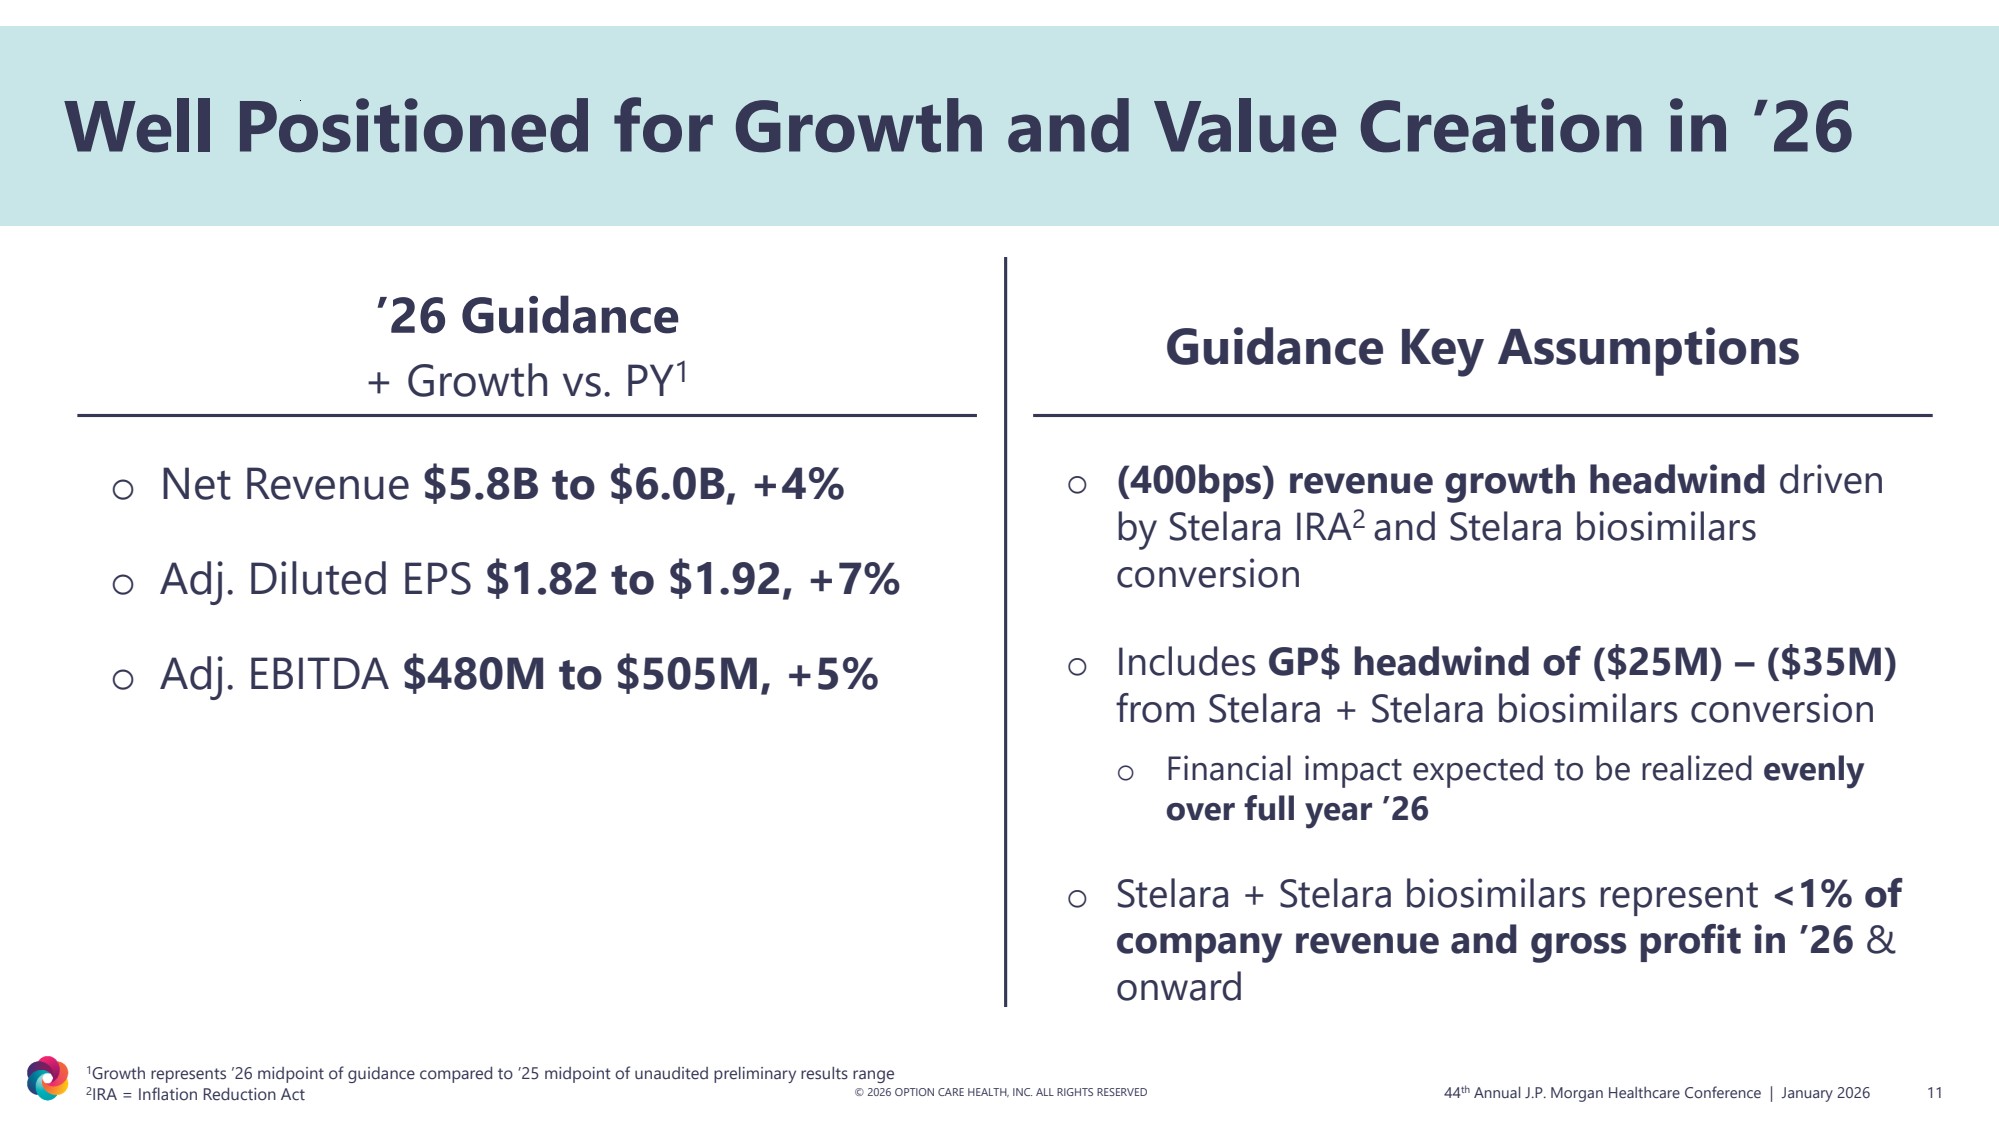
| ’26 Guidance + Growth vs. PY1 © 2026 OPTION CARE HEALTH, INC. ALL RIGHTS RESERVED 44 11 th Annual J.P. Morgan Healthcare Conference | January 2026 Guidance Key Assumptions Well Positioned for Growth and Value Creation in ’26 1Growth represents ’26 midpoint of guidance compared to ’25 midpoint of unaudited preliminary results range 2 IRA = Inflation Reduction Act o (400bps) revenue growth headwind driven by Stelara IRA2 and Stelara biosimilars conversion o Includes GP$ headwind of ($25M) – ($35M) from Stelara + Stelara biosimilars conversion o Financial impact expected to be realized evenly over full year ’26 o Stelara + Stelara biosimilars represent <1% of company revenue and gross profit in ’26 & onward o Net Revenue $5.8B to $6.0B, +4% o Adj. Diluted EPS $1.82 to $1.92, +7% o Adj. EBITDA $480M to $505M, +5% |
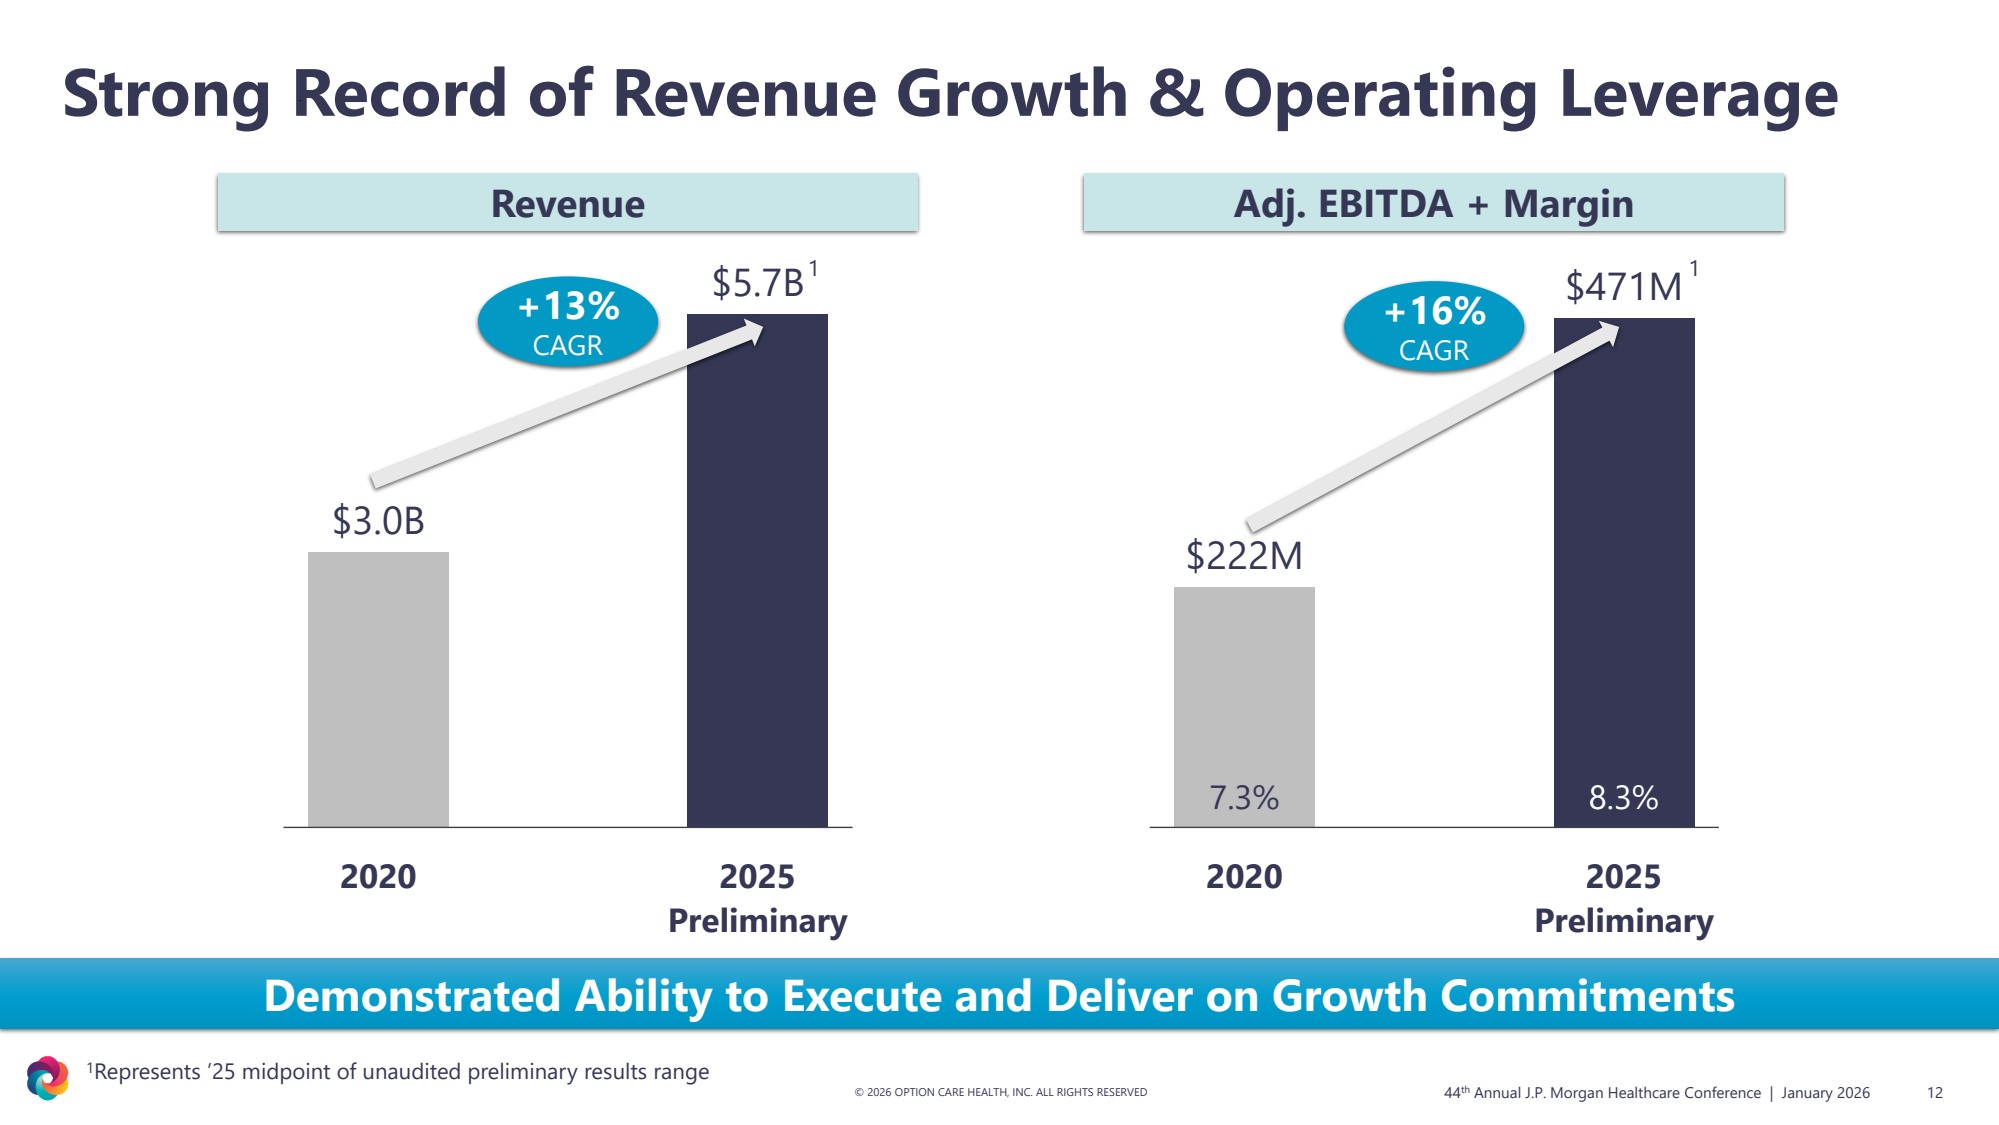
| 1Represents ’25 midpoint of unaudited preliminary results range Strong Record of Revenue Growth & Operating Leverage Demonstrated Ability to Execute and Deliver on Growth Commitments $3.0B $5.7B 2020 2025 Preliminary $222M $471M 7.3% 8.3% 2020 2025 Preliminary Revenue Adj. EBITDA + Margin © 2026 OPTION CARE HEALTH, INC. ALL RIGHTS RESERVED 12 +13% CAGR +16% CAGR 1 44 th Annual J.P. Morgan Healthcare Conference | January 2026 1 |
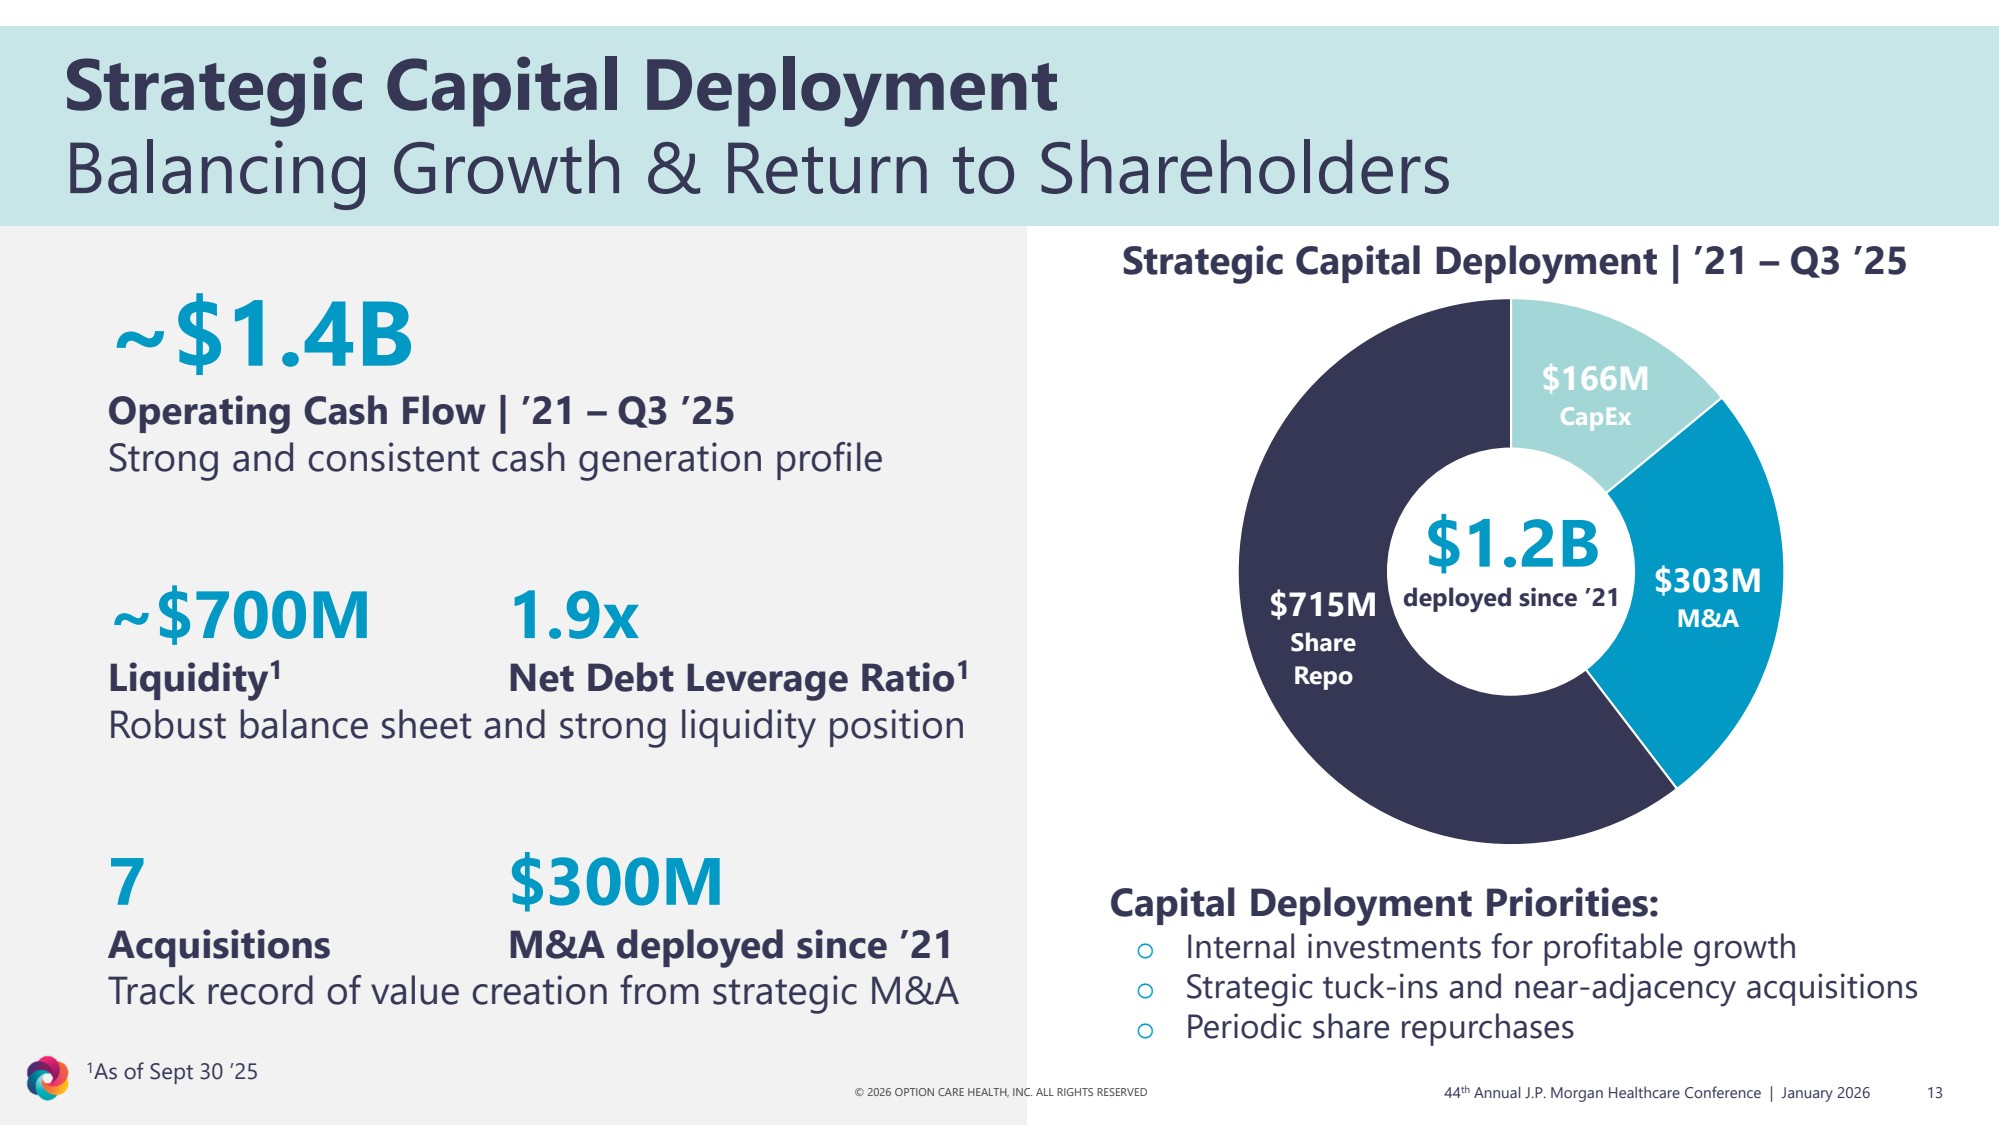
| $166M CapEx $303M M&A $715M Share Repo $1.2B deployed since ’21 © 2026 OPTION CARE HEALTH, INC. ALL RIGHTS RESERVED ~$1.4B Operating Cash Flow | ’21 – Q3 ’25 Strong and consistent cash generation profile ~$700M 1.9x Liquidity1 Net Debt Leverage Ratio1 Robust balance sheet and strong liquidity position 7 $300M Acquisitions M&A deployed since ’21 Track record of value creation from strategic M&A Strategic Capital Deployment | ’21 – Q3 ’25 44 13 th Annual J.P. Morgan Healthcare Conference | January 2026 Strategic Capital Deployment Balancing Growth & Return to Shareholders Capital Deployment Priorities: o Internal investments for profitable growth o Strategic tuck-ins and near-adjacency acquisitions o Periodic share repurchases 1As of Sept 30 ’25 |
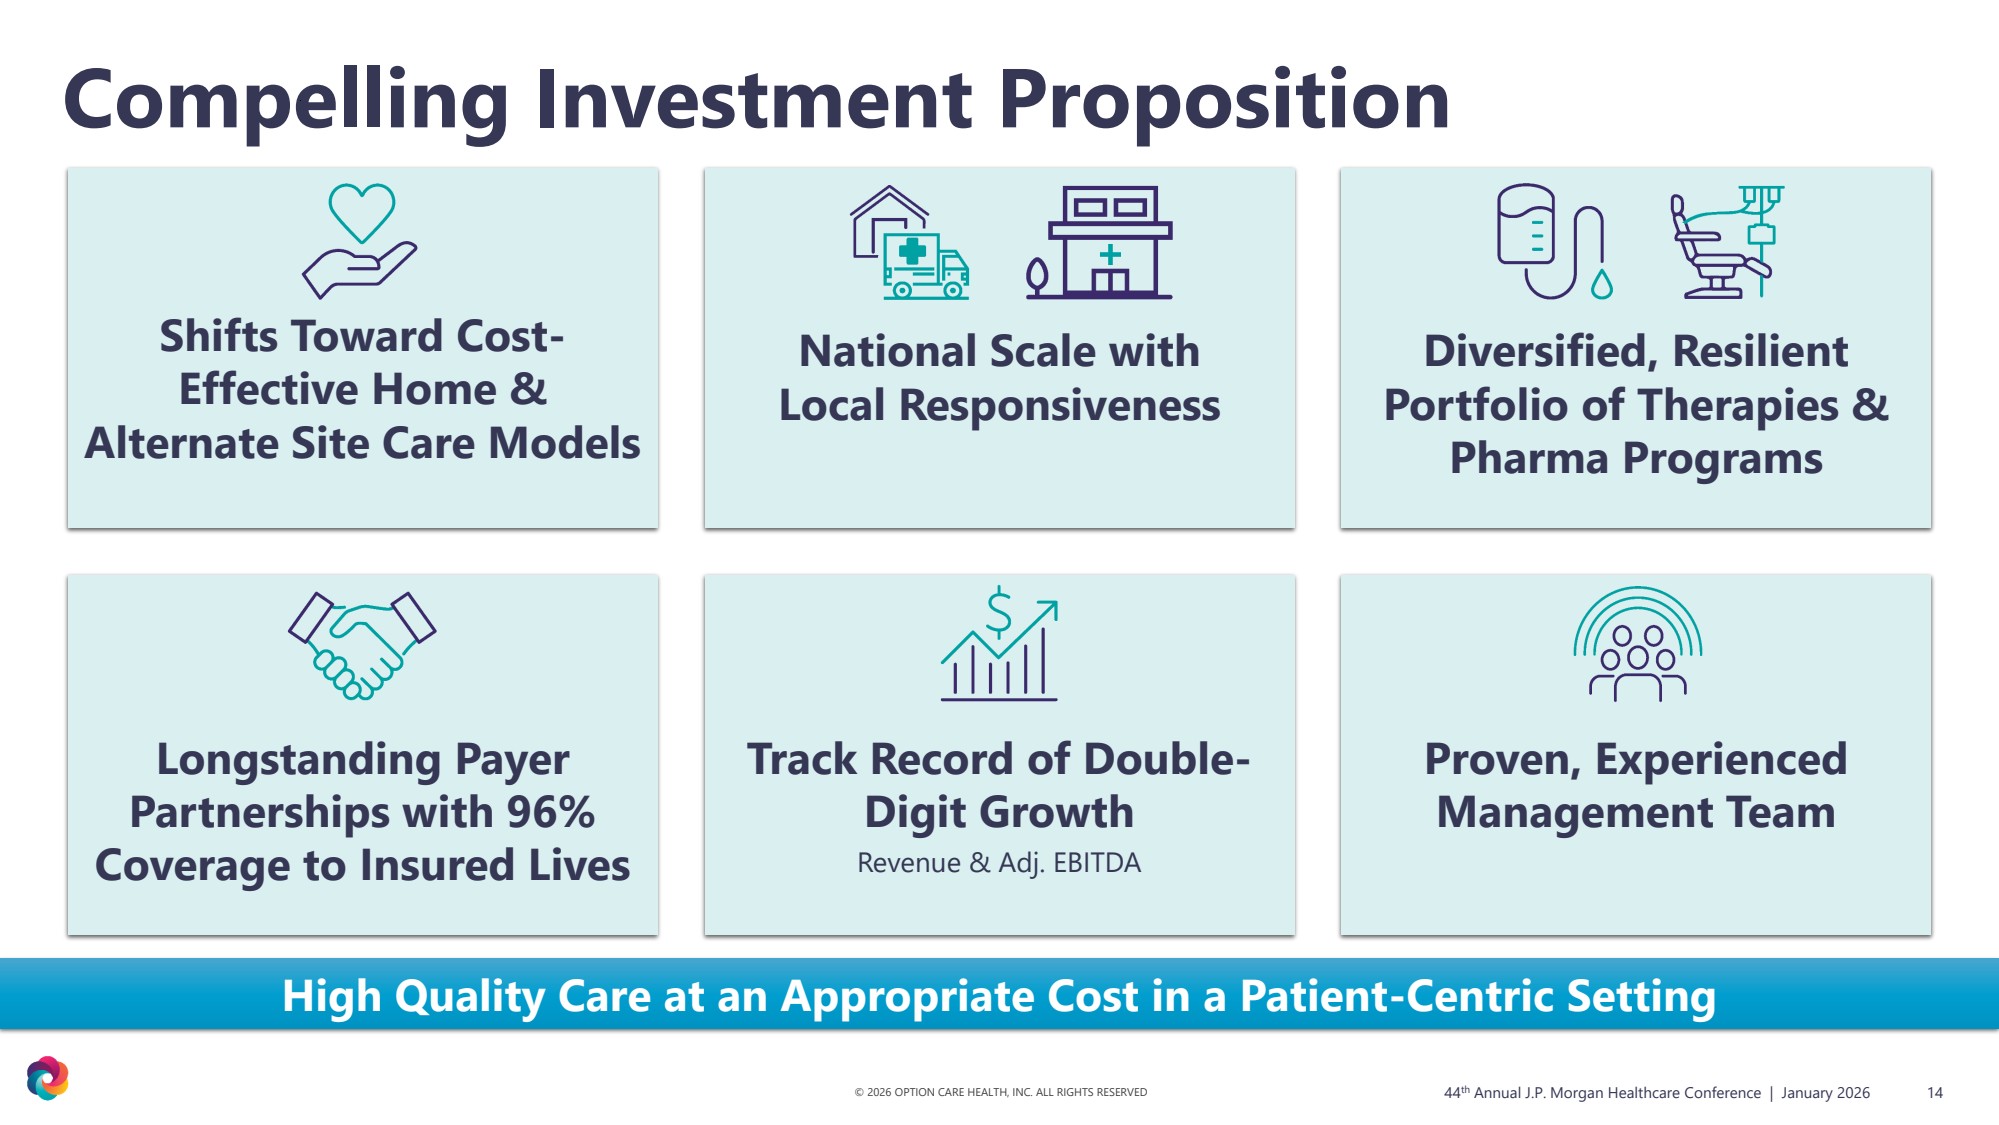
| Shifts Toward Cost-Effective Home & Alternate Site Care Models National Scale with Local Responsiveness Diversified, Resilient Portfolio of Therapies & Pharma Programs Longstanding Payer Partnerships with 96% Coverage to Insured Lives Track Record of Double-Digit Growth Revenue & Adj. EBITDA Proven, Experienced Management Team © 2026 OPTION CARE HEALTH, INC. ALL RIGHTS RESERVED 14 High Quality Care at an Appropriate Cost in a Patient-Centric Setting Compelling Investment Proposition 44 th Annual J.P. Morgan Healthcare Conference | January 2026 |
| Contact Us Our Website © 2026 OPTION CARE HEALTH, INC. ALL RIGHTS RESERVED investors@optioncarehealth.com optioncarehealth.com 44 15 th Annual J.P. Morgan Healthcare Conference | January 2026 |

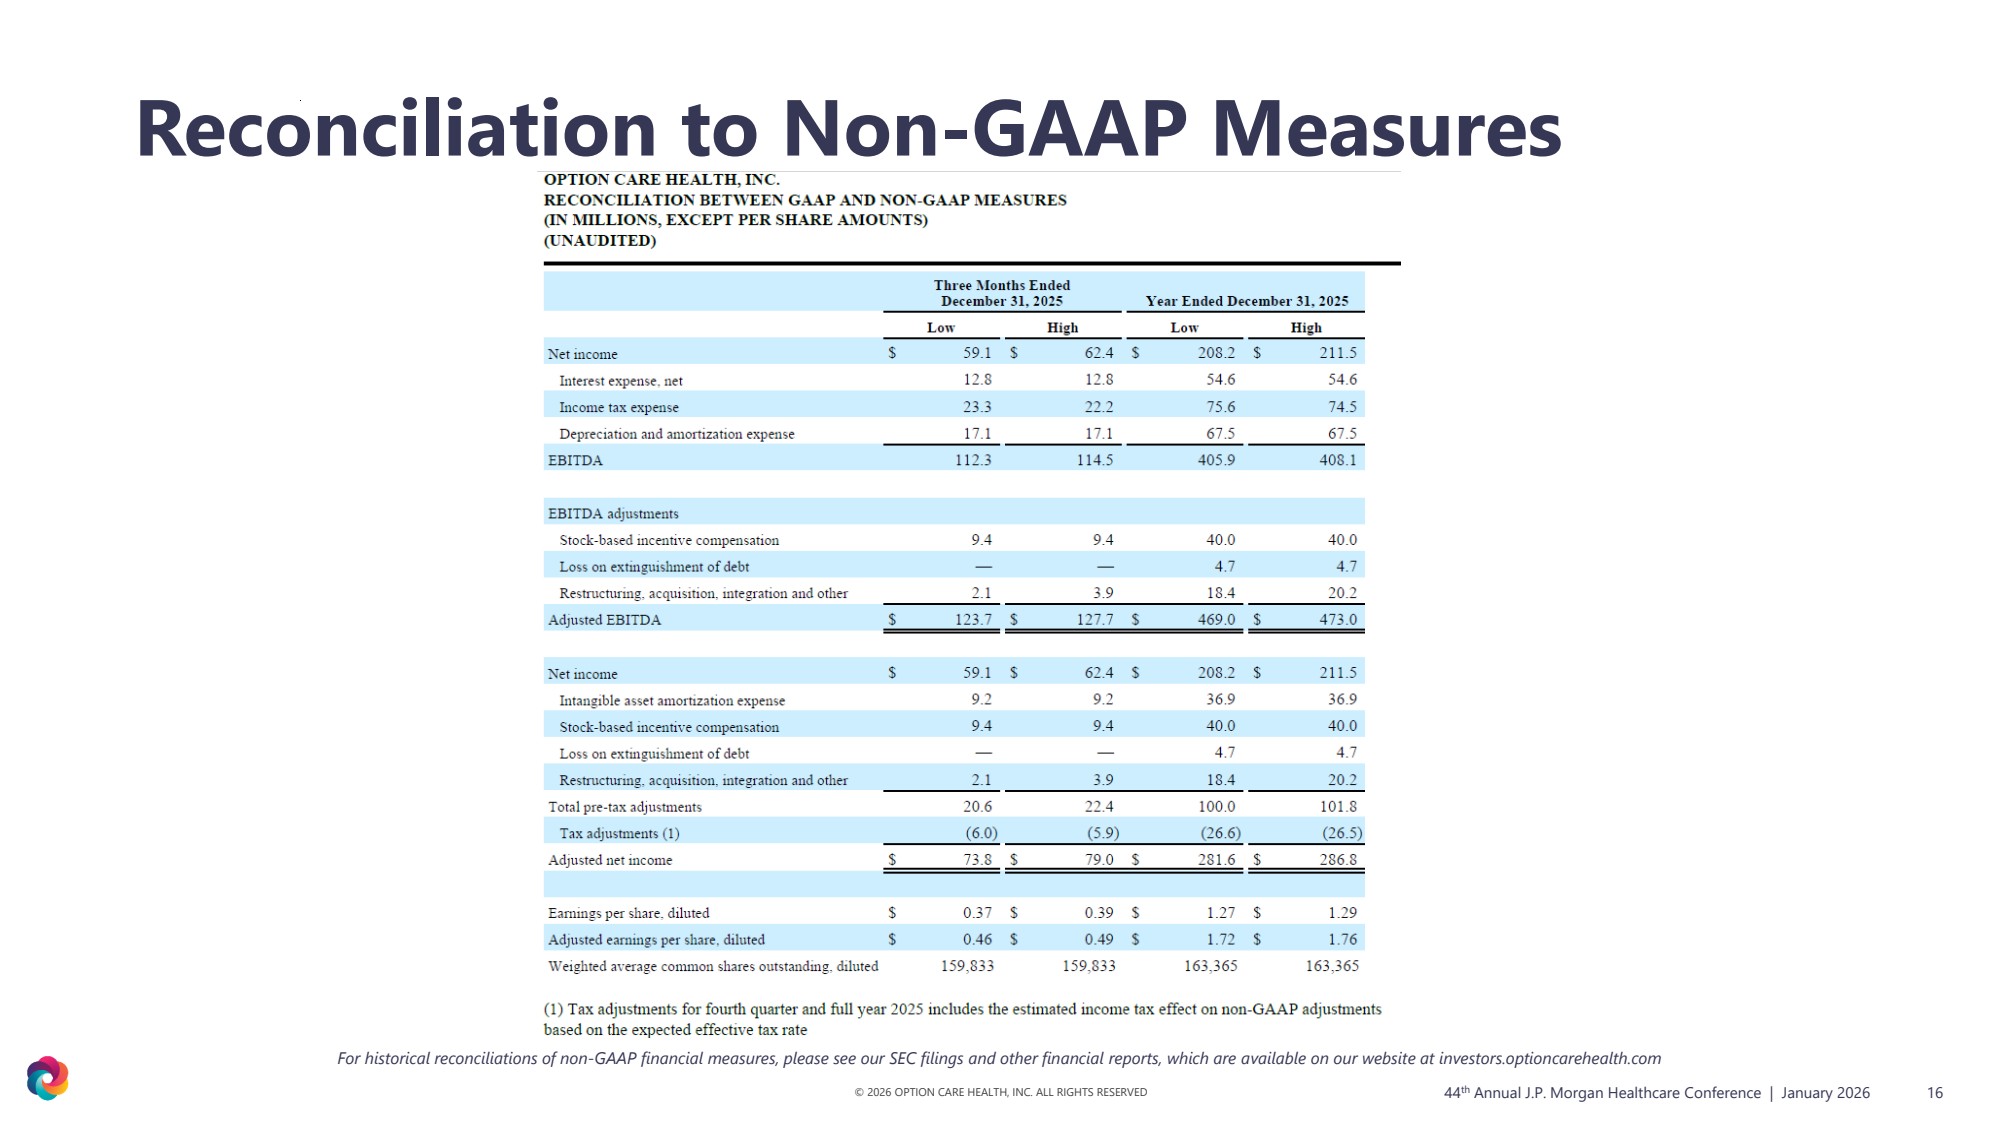
| © 2026 OPTION CARE HEALTH, INC. ALL RIGHTS RESERVED Reconciliation to Non-GAAP Measures For historical reconciliations of non-GAAP financial measures, please see our SEC filings and other financial reports, which are available on our website at investors.optioncarehealth.com 44 16 th Annual J.P. Morgan Healthcare Conference | January 2026 |
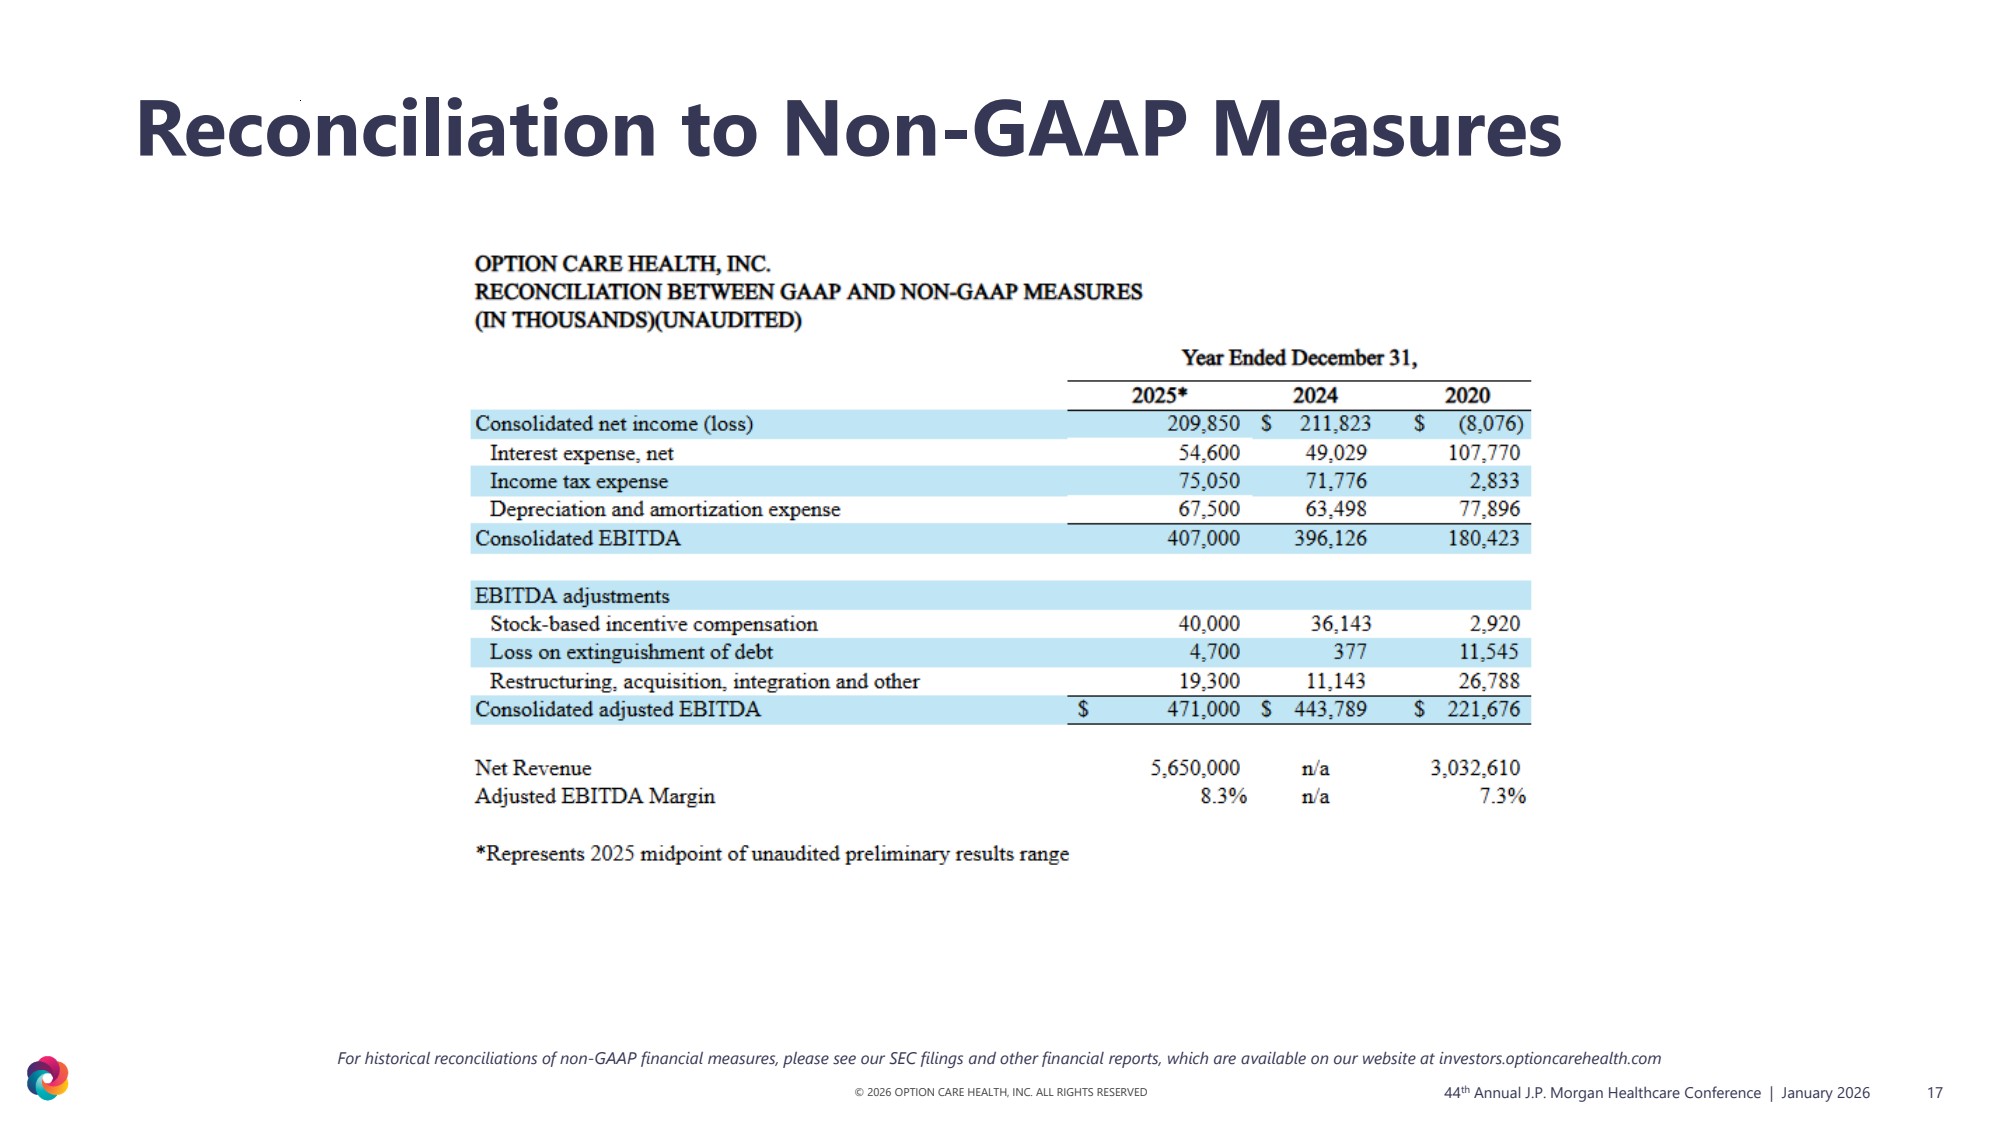
| © 2026 OPTION CARE HEALTH, INC. ALL RIGHTS RESERVED Reconciliation to Non-GAAP Measures For historical reconciliations of non-GAAP financial measures, please see our SEC filings and other financial reports, which are available on our website at investors.optioncarehealth.com 44 17 th Annual J.P. Morgan Healthcare Conference | January 2026 |
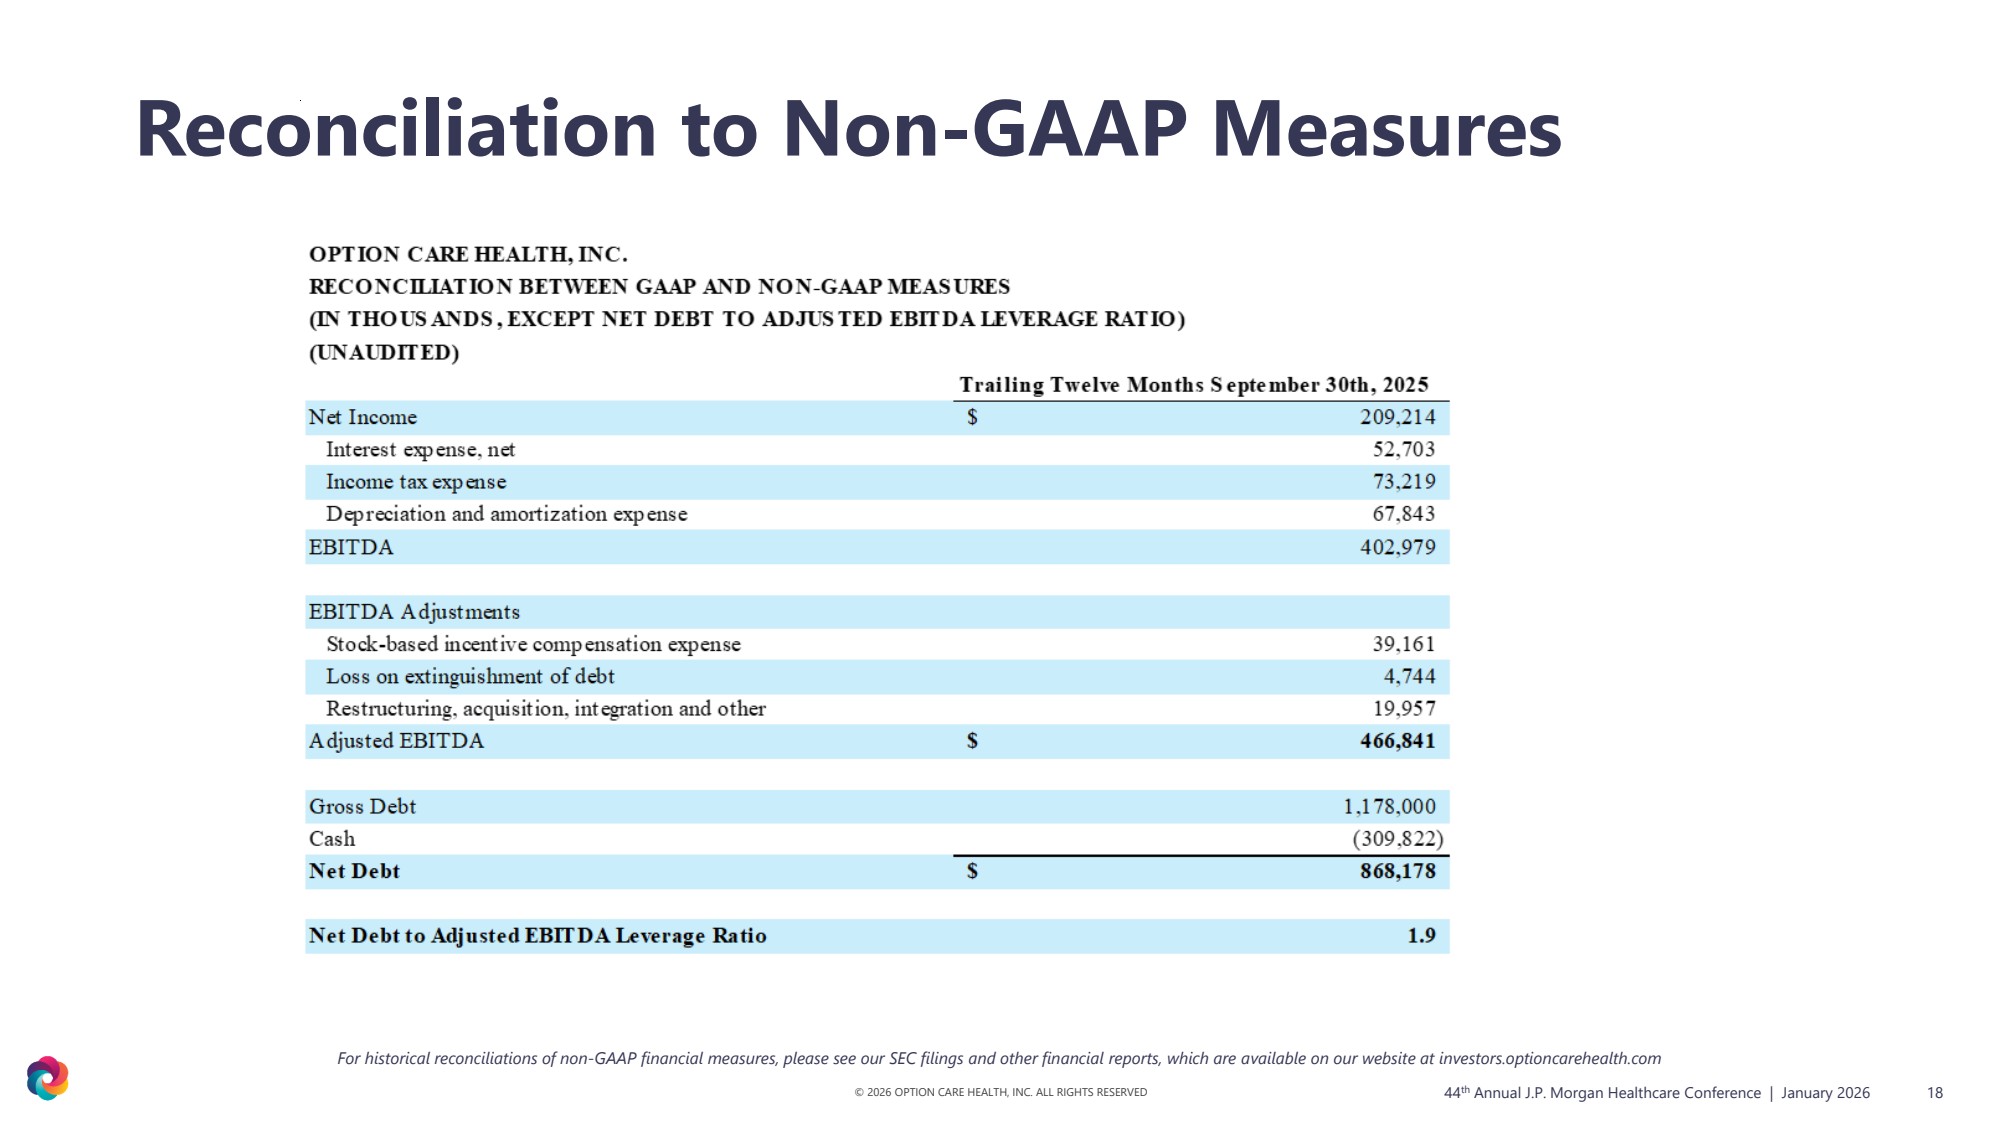
| © 2026 OPTION CARE HEALTH, INC. ALL RIGHTS RESERVED Reconciliation to Non-GAAP Measures For historical reconciliations of non-GAAP financial measures, please see our SEC filings and other financial reports, which are available on our website at investors.optioncarehealth.com 44 18 th Annual J.P. Morgan Healthcare Conference | January 2026 |