| FOR IMMEDIATE RELEASE | July 21, 2025 | |||||||
% or (1) basis point (bp) change from 1st Quarter 2025 | % or basis point (bp) change from 2nd Quarter 2024 | ||||||||||||||||||||||||||||||||||
| Three Months Ended | |||||||||||||||||||||||||||||||||||
| (Dollars in thousands, except per share data) | Jun 30, 2025 | Mar 31, 2025 | Jun 30, 2024 | ||||||||||||||||||||||||||||||||
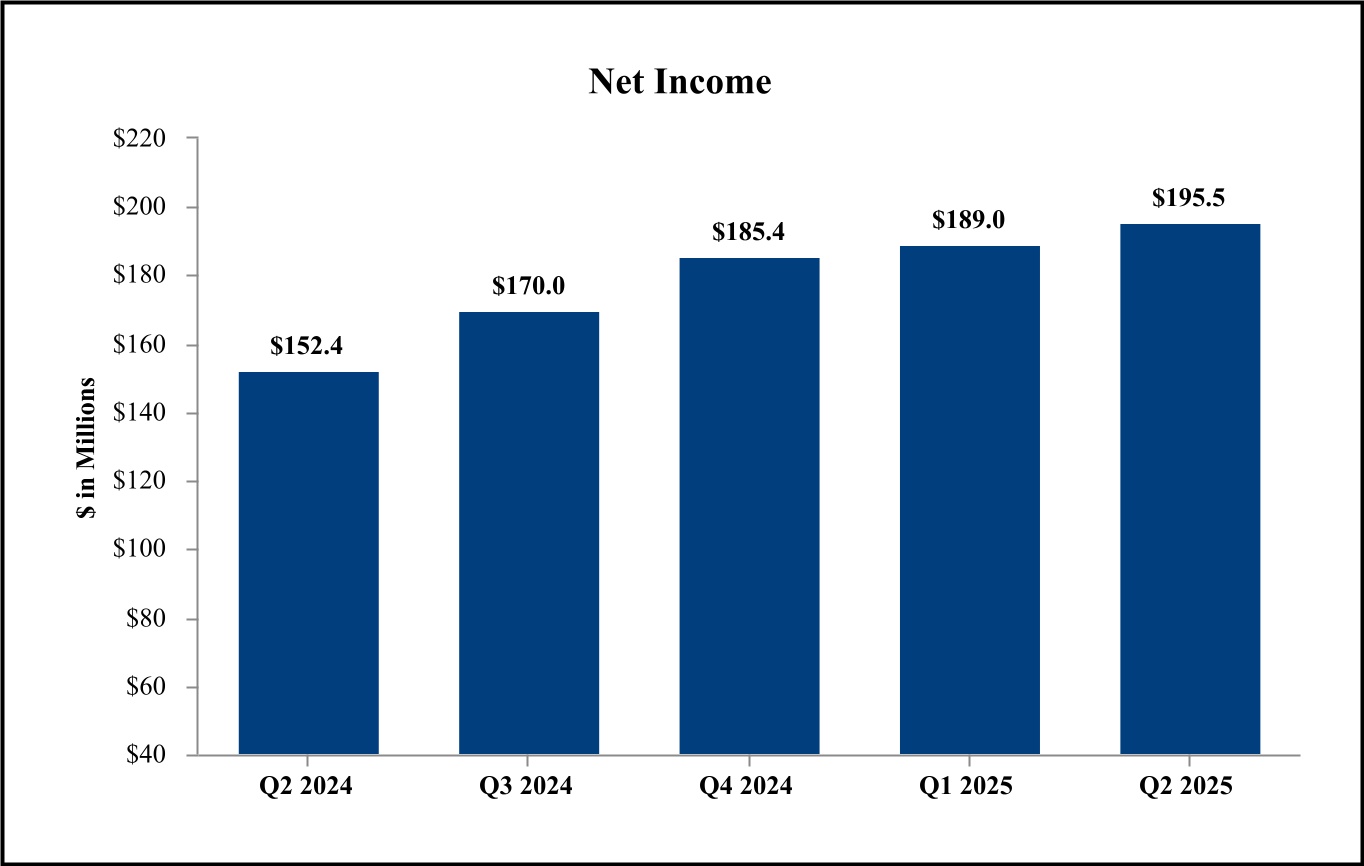
| Net income | $ | 195,527 | $ | 189,039 | $ | 152,388 | 3 | % | 28 | % | |||||||||||||||||||||||||
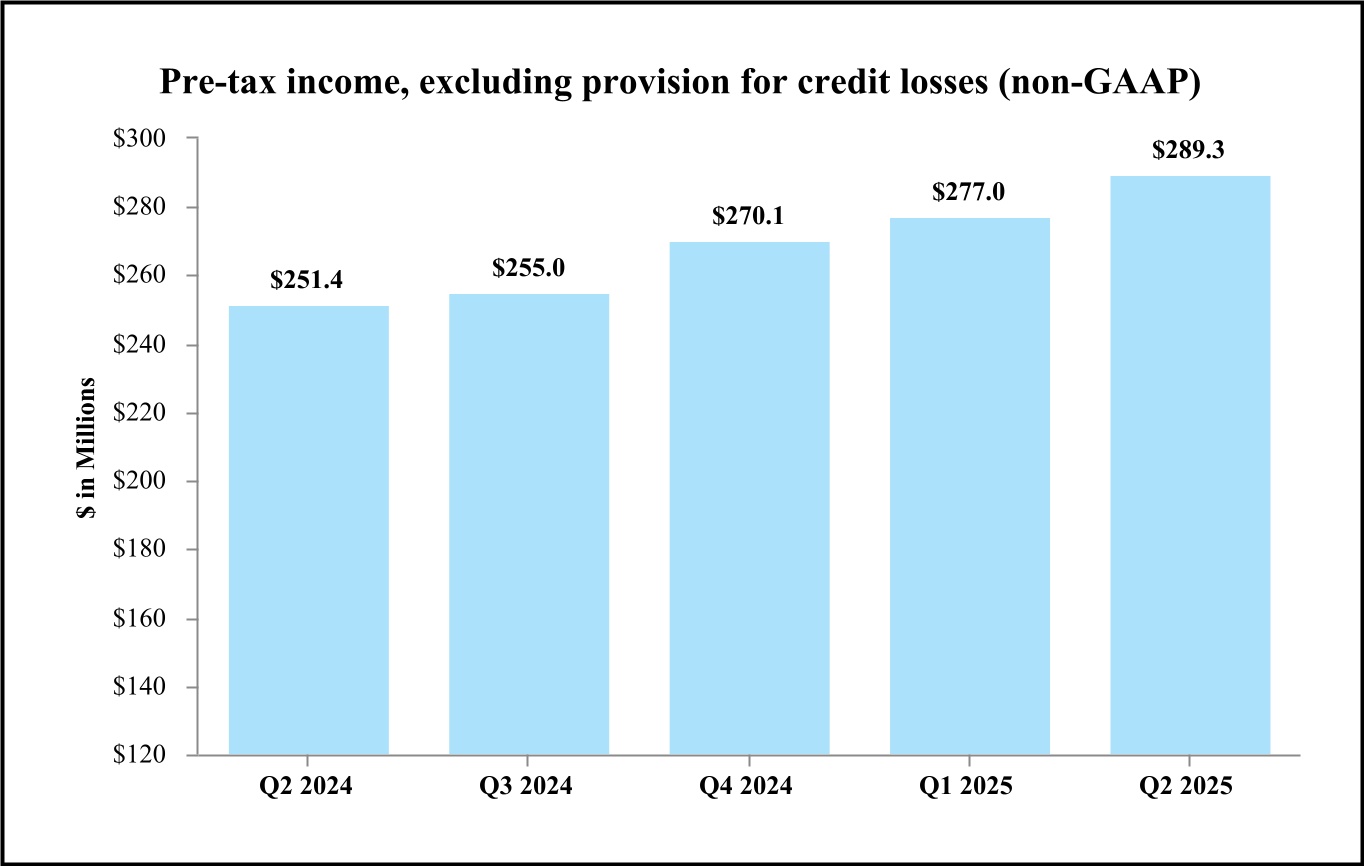
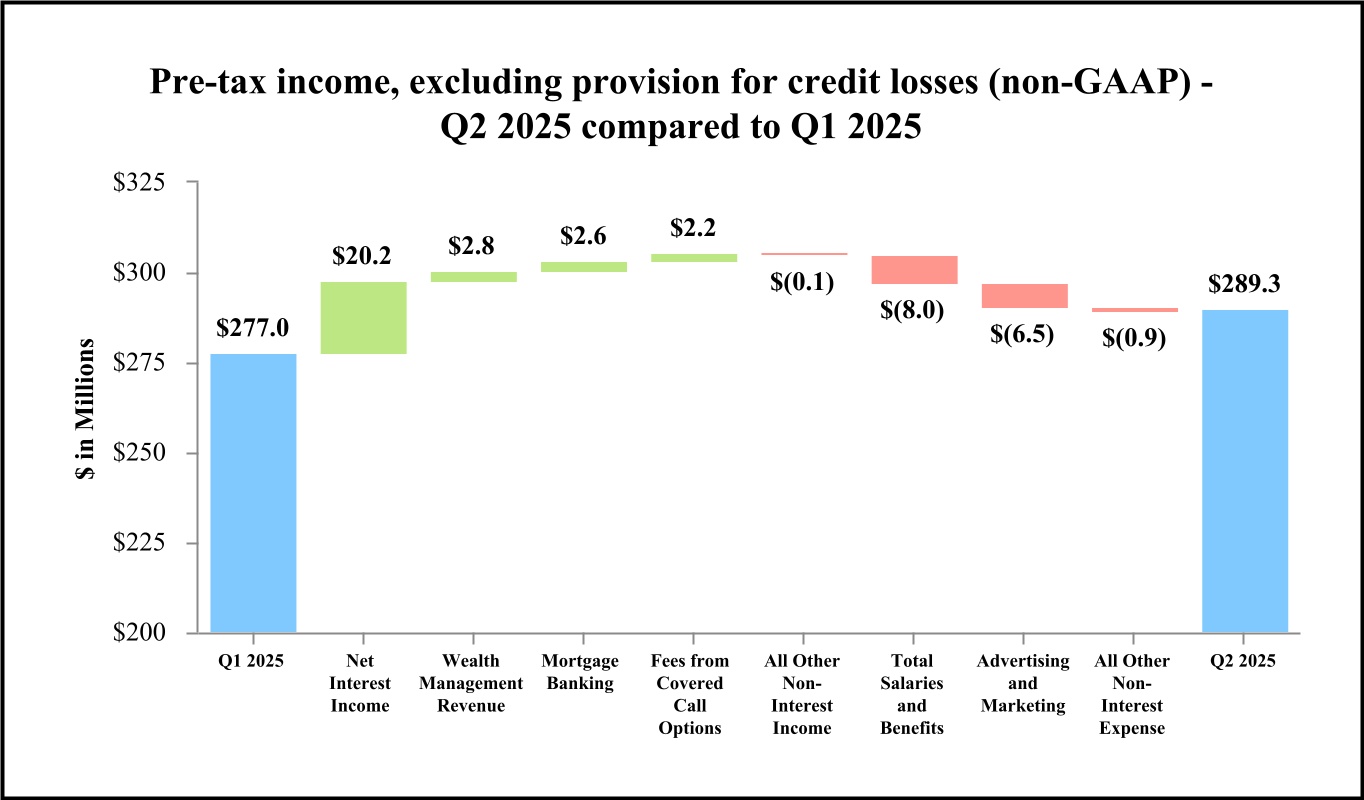
Pre-tax income, excluding provision for credit losses (non-GAAP) (2) | 289,322 | 277,018 | 251,404 | 4 | 15 | ||||||||||||||||||||||||||||||
| Net income per common share – Diluted | 2.78 | 2.69 | 2.32 | 3 | 20 | ||||||||||||||||||||||||||||||
| Cash dividends declared per common share | 0.50 | 0.50 | 0.45 | — | 11 | ||||||||||||||||||||||||||||||
Net revenue (3) | 670,783 | 643,108 | 591,757 | 4 | 13 | ||||||||||||||||||||||||||||||
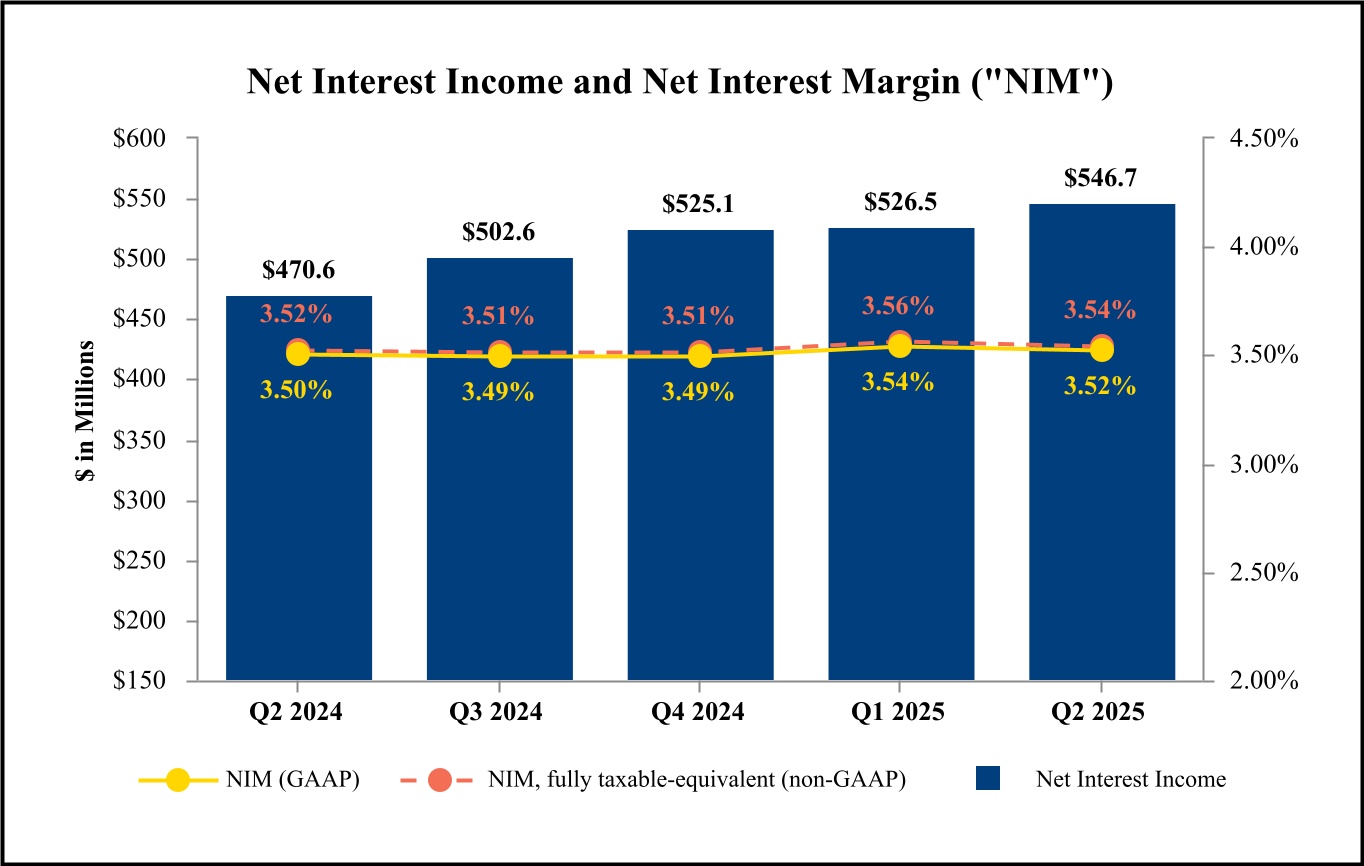
| Net interest income | 546,694 | 526,474 | 470,610 | 4 | 16 | ||||||||||||||||||||||||||||||
| Net interest margin | 3.52 | % | 3.54 | % | 3.50 | % | (2) | bps | 2 | bps | |||||||||||||||||||||||||
Net interest margin – fully taxable-equivalent (non-GAAP) (2) | 3.54 | 3.56 | 3.52 | (2) | 2 | ||||||||||||||||||||||||||||||
Net overhead ratio (4) | 1.57 | 1.58 | 1.53 | (1) | 4 | ||||||||||||||||||||||||||||||
| Return on average assets | 1.19 | 1.20 | 1.07 | (1) | 12 | ||||||||||||||||||||||||||||||
| Return on average common equity | 12.07 | 12.21 | 11.61 | (14) | 46 | ||||||||||||||||||||||||||||||
Return on average tangible common equity (non-GAAP) (2) | 14.44 | 14.72 | 13.49 | (28) | 95 | ||||||||||||||||||||||||||||||
| At end of period | |||||||||||||||||||||||||||||||||||
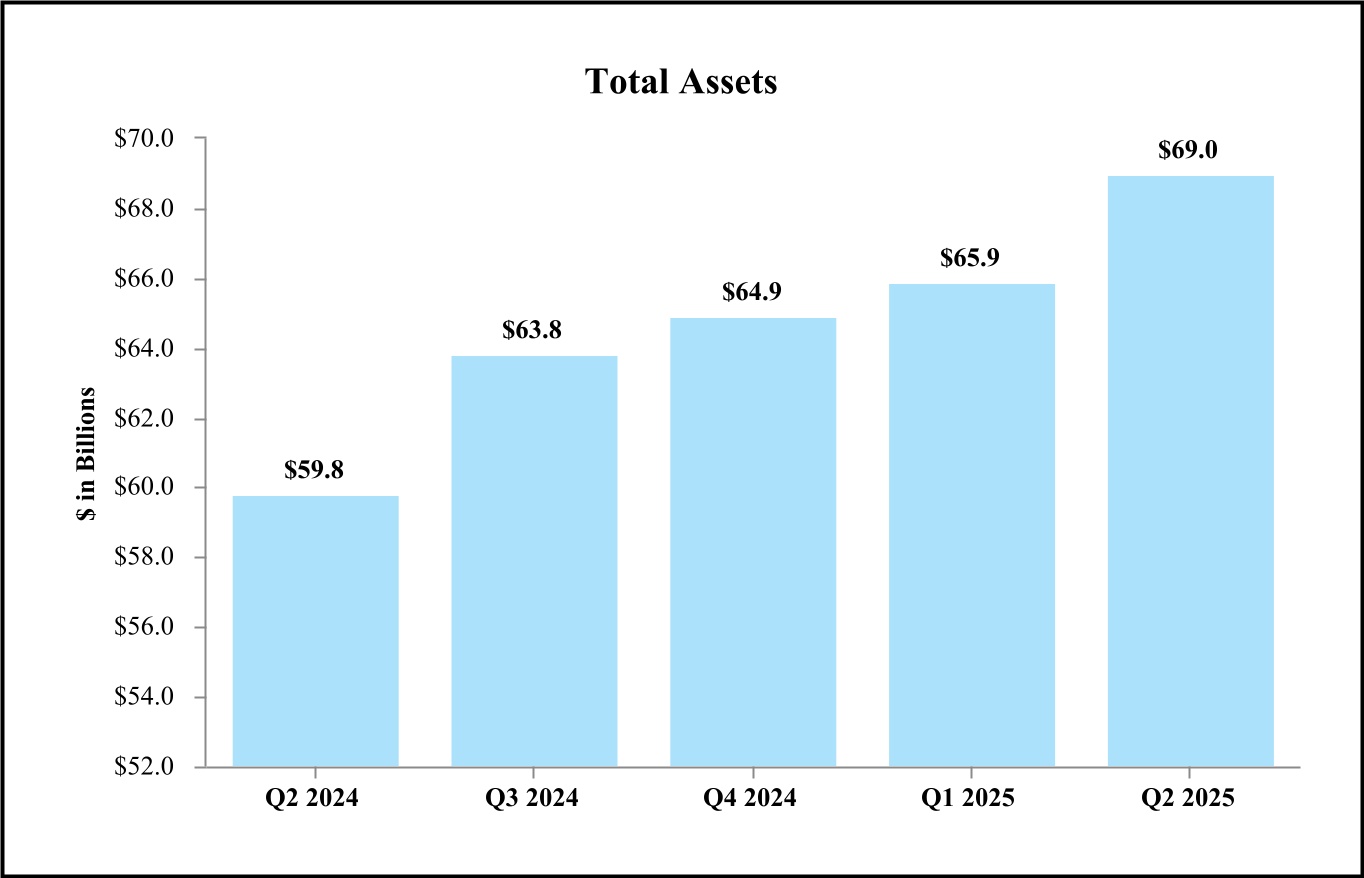
| Total assets | $ | 68,983,318 | $ | 65,870,066 | $ | 59,781,516 | 19 | % | 15 | % | |||||||||||||||||||||||||
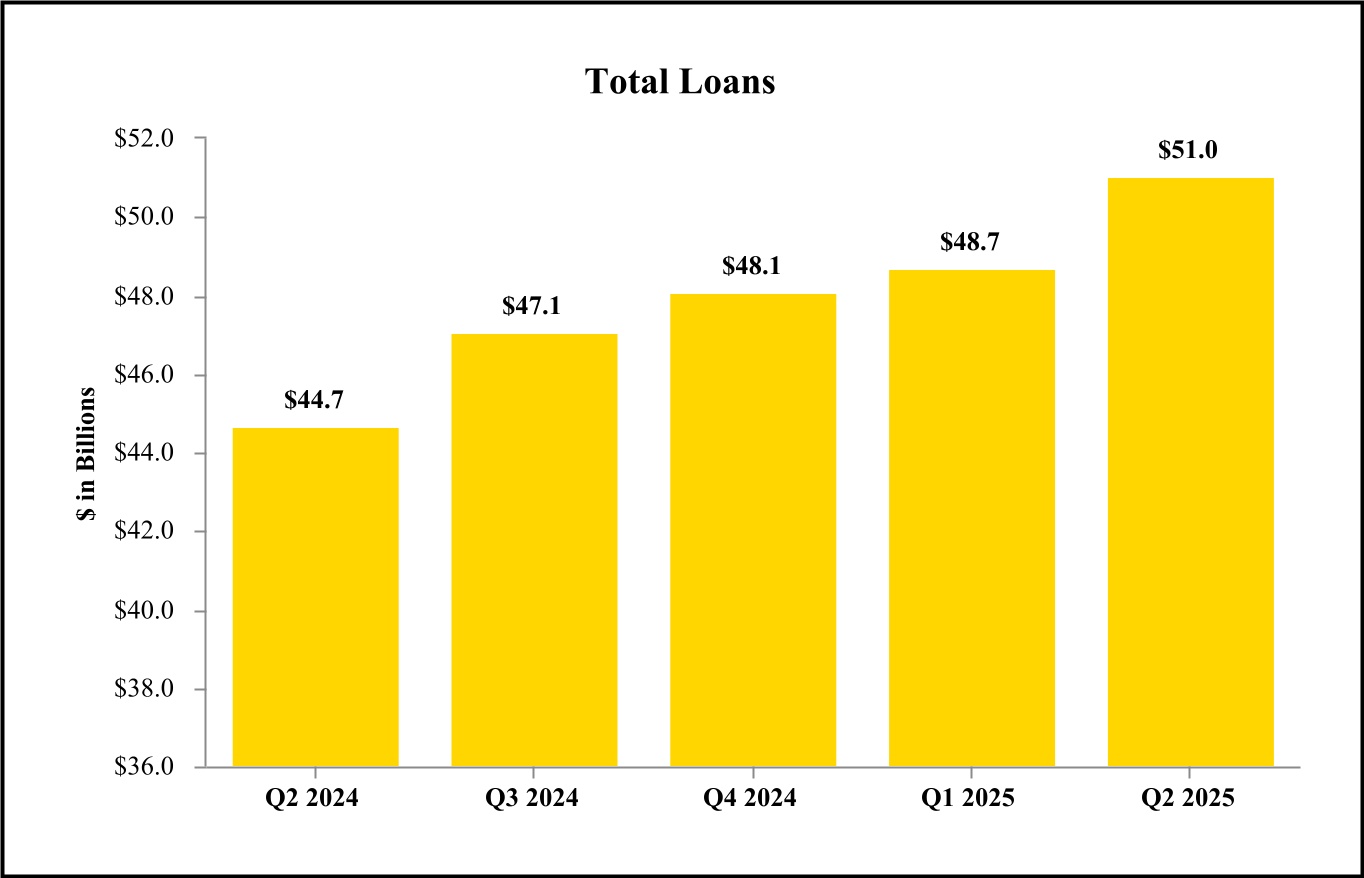
Total loans (5) | 51,041,679 | 48,708,390 | 44,675,531 | 19 | 14 | ||||||||||||||||||||||||||||||
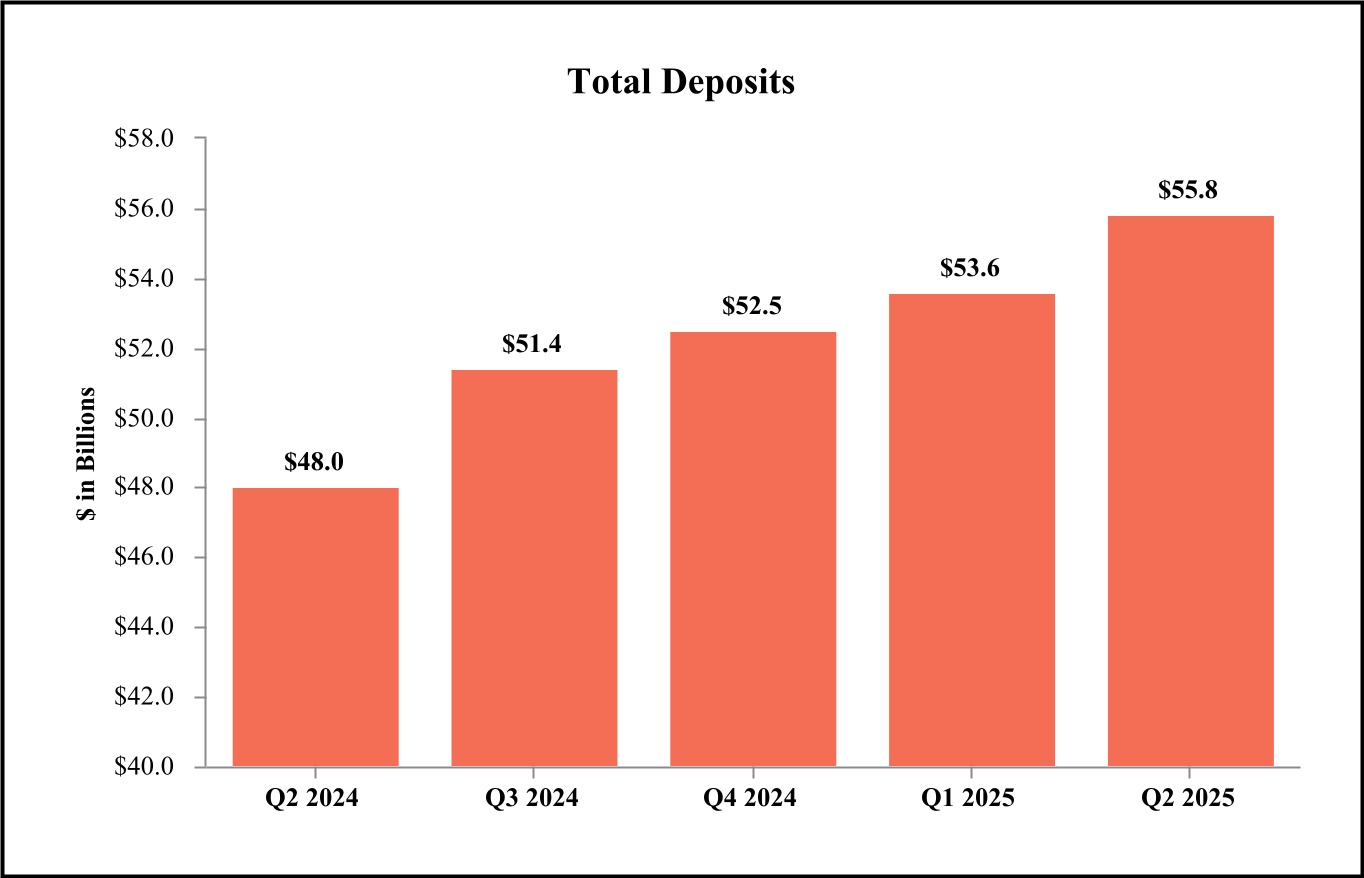
| Total deposits | 55,816,811 | 53,570,038 | 48,049,026 | 17 | 16 | ||||||||||||||||||||||||||||||
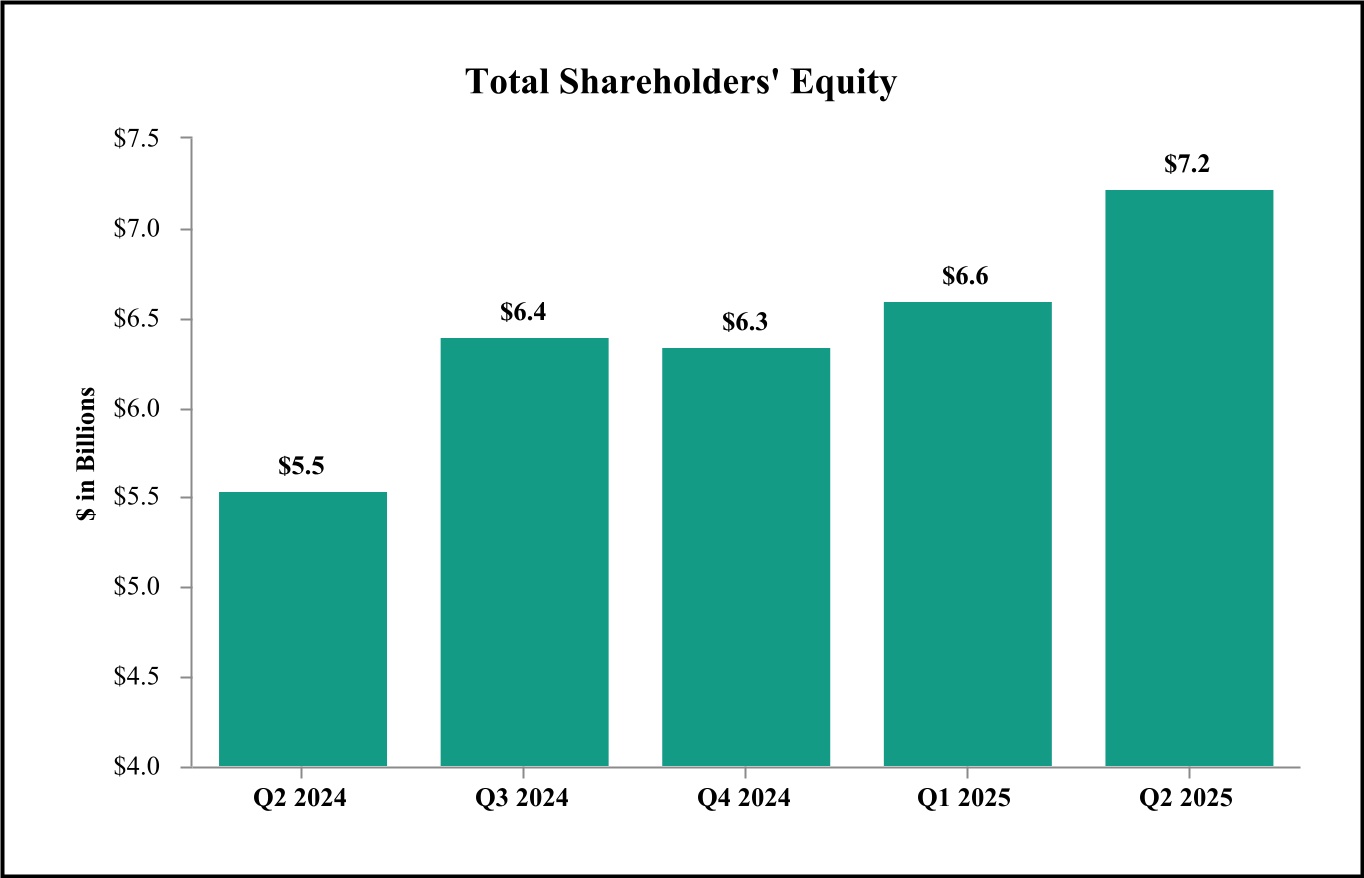
| Total shareholders’ equity | 7,225,696 | 6,600,537 | 5,536,628 | 38 | 31 | ||||||||||||||||||||||||||||||
| Three Months Ended | Six Months Ended | ||||||||||||||||||||||||||||||||||||||||
| (Dollars in thousands, except per share data) | Jun 30, 2025 | Mar 31, 2025 | Dec 31, 2024 | Sep 30, 2024 | Jun 30, 2024 | Jun 30, 2025 | Jun 30, 2024 | ||||||||||||||||||||||||||||||||||
| Selected Financial Condition Data (at end of period): | |||||||||||||||||||||||||||||||||||||||||
| Total assets | $ | 68,983,318 | $ | 65,870,066 | $ | 64,879,668 | $ | 63,788,424 | $ | 59,781,516 | |||||||||||||||||||||||||||||||
Total loans (1) | 51,041,679 | 48,708,390 | 48,055,037 | 47,067,447 | 44,675,531 | ||||||||||||||||||||||||||||||||||||
| Total deposits | 55,816,811 | 53,570,038 | 52,512,349 | 51,404,966 | 48,049,026 | ||||||||||||||||||||||||||||||||||||
| Total shareholders’ equity | 7,225,696 | 6,600,537 | 6,344,297 | 6,399,714 | 5,536,628 | ||||||||||||||||||||||||||||||||||||
| Selected Statements of Income Data: | |||||||||||||||||||||||||||||||||||||||||
| Net interest income | $ | 546,694 | $ | 526,474 | $ | 525,148 | $ | 502,583 | $ | 470,610 | $ | 1,073,168 | $ | 934,804 | |||||||||||||||||||||||||||
Net revenue (2) | 670,783 | 643,108 | 638,599 | 615,730 | 591,757 | 1,313,891 | 1,196,531 | ||||||||||||||||||||||||||||||||||
| Net income | 195,527 | 189,039 | 185,362 | 170,001 | 152,388 | 384,566 | 339,682 | ||||||||||||||||||||||||||||||||||
Pre-tax income, excluding provision for credit losses (non-GAAP) (3) | 289,322 | 277,018 | 270,060 | 255,043 | 251,404 | 566,340 | 523,033 | ||||||||||||||||||||||||||||||||||
| Net income per common share – Basic | 2.82 | 2.73 | 2.68 | 2.51 | 2.35 | 5.55 | 5.28 | ||||||||||||||||||||||||||||||||||
| Net income per common share – Diluted | 2.78 | 2.69 | 2.63 | 2.47 | 2.32 | 5.47 | 5.21 | ||||||||||||||||||||||||||||||||||
| Cash dividends declared per common share | 0.50 | 0.50 | 0.45 | 0.45 | 0.45 | 1.00 | 0.90 | ||||||||||||||||||||||||||||||||||
| Selected Financial Ratios and Other Data: | |||||||||||||||||||||||||||||||||||||||||
| Performance Ratios: | |||||||||||||||||||||||||||||||||||||||||
| Net interest margin | 3.52 | % | 3.54 | % | 3.49 | % | 3.49 | % | 3.50 | % | 3.53 | % | 3.53 | % | |||||||||||||||||||||||||||
Net interest margin – fully taxable-equivalent (non-GAAP) (3) | 3.54 | 3.56 | 3.51 | 3.51 | 3.52 | 3.55 | 3.56 | ||||||||||||||||||||||||||||||||||
| Non-interest income to average assets | 0.76 | 0.74 | 0.71 | 0.74 | 0.85 | 0.75 | 0.93 | ||||||||||||||||||||||||||||||||||
| Non-interest expense to average assets | 2.32 | 2.32 | 2.31 | 2.36 | 2.38 | 2.32 | 2.40 | ||||||||||||||||||||||||||||||||||
Net overhead ratio (4) | 1.57 | 1.58 | 1.60 | 1.62 | 1.53 | 1.57 | 1.46 | ||||||||||||||||||||||||||||||||||
| Return on average assets | 1.19 | 1.20 | 1.16 | 1.11 | 1.07 | 1.19 | 1.21 | ||||||||||||||||||||||||||||||||||
| Return on average common equity | 12.07 | 12.21 | 11.82 | 11.63 | 11.61 | 12.14 | 13.01 | ||||||||||||||||||||||||||||||||||
Return on average tangible common equity (non-GAAP) (3) | 14.44 | 14.72 | 14.29 | 13.92 | 13.49 | 14.57 | 15.12 | ||||||||||||||||||||||||||||||||||
| Average total assets | $ | 65,840,345 | $ | 64,107,042 | $ | 63,594,105 | $ | 60,915,283 | $ | 57,493,184 | $ | 64,978,481 | $ | 56,547,939 | |||||||||||||||||||||||||||
| Average total shareholders’ equity | 6,862,040 | 6,460,941 | 6,418,403 | 5,990,429 | 5,450,173 | 6,662,598 | 5,445,315 | ||||||||||||||||||||||||||||||||||
| Average loans to average deposits ratio | 93.0 | % | 92.3 | % | 91.9 | % | 93.8 | % | 95.1 | % | 92.7 | % | 94.8 | % | |||||||||||||||||||||||||||
| Period-end loans to deposits ratio | 91.4 | 90.9 | 91.5 | 91.6 | 93.0 | ||||||||||||||||||||||||||||||||||||
| Common Share Data at end of period: | |||||||||||||||||||||||||||||||||||||||||
| Market price per common share | $ | 123.98 | $ | 112.46 | $ | 124.71 | $ | 108.53 | $ | 98.56 | |||||||||||||||||||||||||||||||
| Book value per common share | 95.43 | 92.47 | 89.21 | 90.06 | 82.97 | ||||||||||||||||||||||||||||||||||||
Tangible book value per common share (non-GAAP) (3) | 81.86 | 78.83 | 75.39 | 76.15 | 72.01 | ||||||||||||||||||||||||||||||||||||
| Common shares outstanding | 66,937,732 | 66,919,325 | 66,495,227 | 66,481,543 | 61,760,139 | ||||||||||||||||||||||||||||||||||||
| Other Data at end of period: | |||||||||||||||||||||||||||||||||||||||||
| Common equity to assets ratio | 9.3 | % | 9.4 | % | 9.1 | % | 9.4 | % | 8.6 | % | |||||||||||||||||||||||||||||||
Tangible common equity ratio (non-GAAP) (3) | 8.0 | 8.1 | 7.8 | 8.1 | 7.5 | ||||||||||||||||||||||||||||||||||||
Tier 1 leverage ratio (5) | 10.2 | 9.6 | 9.4 | 9.6 | 9.3 | ||||||||||||||||||||||||||||||||||||
| Risk-based capital ratios: | |||||||||||||||||||||||||||||||||||||||||
Tier 1 capital ratio (5) | 11.4 | 10.8 | 10.7 | 10.6 | 10.3 | ||||||||||||||||||||||||||||||||||||
Common equity tier 1 capital ratio (5) | 10.0 | 10.1 | 9.9 | 9.8 | 9.5 | ||||||||||||||||||||||||||||||||||||
Total capital ratio (5) | 12.9 | 12.5 | 12.3 | 12.2 | 12.1 | ||||||||||||||||||||||||||||||||||||
Allowance for credit losses (6) | $ | 457,461 | $ | 448,387 | $ | 437,060 | $ | 436,193 | $ | 437,560 | |||||||||||||||||||||||||||||||
| Allowance for loan and unfunded lending-related commitment losses to total loans | 0.90 | % | 0.92 | % | 0.91 | % | 0.93 | % | 0.98 | % | |||||||||||||||||||||||||||||||
| Number of: | |||||||||||||||||||||||||||||||||||||||||
| Bank subsidiaries | 16 | 16 | 16 | 16 | 15 | ||||||||||||||||||||||||||||||||||||
| Banking offices | 208 | 208 | 205 | 203 | 177 | ||||||||||||||||||||||||||||||||||||
| (Unaudited) | (Unaudited) | (Unaudited) | (Unaudited) | |||||||||||||||||||||||||||||
| Jun 30, | Mar 31, | Dec 31, | Sep 30, | Jun 30, | ||||||||||||||||||||||||||||
| (In thousands) | 2025 | 2025 | 2024 | 2024 | 2024 | |||||||||||||||||||||||||||
| Assets | ||||||||||||||||||||||||||||||||
| Cash and due from banks | $ | 695,501 | $ | 616,216 | $ | 452,017 | $ | 725,465 | $ | 415,462 | ||||||||||||||||||||||
| Federal funds sold and securities purchased under resale agreements | 63 | 63 | 6,519 | 5,663 | 62 | |||||||||||||||||||||||||||
| Interest-bearing deposits with banks | 4,569,618 | 4,238,237 | 4,409,753 | 3,648,117 | 2,824,314 | |||||||||||||||||||||||||||
| Available-for-sale securities, at fair value | 4,885,715 | 4,220,305 | 4,141,482 | 3,912,232 | 4,329,957 | |||||||||||||||||||||||||||
| Held-to-maturity securities, at amortized cost | 3,502,186 | 3,564,490 | 3,613,263 | 3,677,420 | 3,755,924 | |||||||||||||||||||||||||||
| Trading account securities | — | — | 4,072 | 3,472 | 4,134 | |||||||||||||||||||||||||||
| Equity securities with readily determinable fair value | 273,722 | 270,442 | 215,412 | 125,310 | 112,173 | |||||||||||||||||||||||||||
| Federal Home Loan Bank and Federal Reserve Bank stock | 282,087 | 281,893 | 281,407 | 266,908 | 256,495 | |||||||||||||||||||||||||||
| Brokerage customer receivables | — | — | 18,102 | 16,662 | 13,682 | |||||||||||||||||||||||||||
| Mortgage loans held-for-sale, at fair value | 299,606 | 316,804 | 331,261 | 461,067 | 411,851 | |||||||||||||||||||||||||||
| Loans, net of unearned income | 51,041,679 | 48,708,390 | 48,055,037 | 47,067,447 | 44,675,531 | |||||||||||||||||||||||||||
| Allowance for loan losses | (391,654) | (378,207) | (364,017) | (360,279) | (363,719) | |||||||||||||||||||||||||||
| Net loans | 50,650,025 | 48,330,183 | 47,691,020 | 46,707,168 | 44,311,812 | |||||||||||||||||||||||||||
| Premises, software and equipment, net | 776,324 | 776,679 | 779,130 | 772,002 | 722,295 | |||||||||||||||||||||||||||
| Lease investments, net | 289,768 | 280,472 | 278,264 | 270,171 | 275,459 | |||||||||||||||||||||||||||
| Accrued interest receivable and other assets | 1,610,025 | 1,598,255 | 1,739,334 | 1,721,090 | 1,671,334 | |||||||||||||||||||||||||||
| Receivable on unsettled securities sales | 240,039 | 463,023 | — | 551,031 | — | |||||||||||||||||||||||||||
| Goodwill | 798,144 | 796,932 | 796,942 | 800,780 | 655,955 | |||||||||||||||||||||||||||
| Other acquisition-related intangible assets | 110,495 | 116,072 | 121,690 | 123,866 | 20,607 | |||||||||||||||||||||||||||
| Total assets | $ | 68,983,318 | $ | 65,870,066 | $ | 64,879,668 | $ | 63,788,424 | $ | 59,781,516 | ||||||||||||||||||||||
| Liabilities and Shareholders’ Equity | ||||||||||||||||||||||||||||||||
| Deposits: | ||||||||||||||||||||||||||||||||
| Non-interest-bearing | $ | 10,877,166 | $ | 11,201,859 | $ | 11,410,018 | $ | 10,739,132 | $ | 10,031,440 | ||||||||||||||||||||||
| Interest-bearing | 44,939,645 | 42,368,179 | 41,102,331 | 40,665,834 | 38,017,586 | |||||||||||||||||||||||||||
| Total deposits | 55,816,811 | 53,570,038 | 52,512,349 | 51,404,966 | 48,049,026 | |||||||||||||||||||||||||||
| Federal Home Loan Bank advances | 3,151,309 | 3,151,309 | 3,151,309 | 3,171,309 | 3,176,309 | |||||||||||||||||||||||||||
| Other borrowings | 625,392 | 529,269 | 534,803 | 647,043 | 606,579 | |||||||||||||||||||||||||||
| Subordinated notes | 298,458 | 298,360 | 298,283 | 298,188 | 298,113 | |||||||||||||||||||||||||||
| Junior subordinated debentures | 253,566 | 253,566 | 253,566 | 253,566 | 253,566 | |||||||||||||||||||||||||||
| Payable on unsettled securities sales | 39,105 | — | — | — | — | |||||||||||||||||||||||||||
| Accrued interest payable and other liabilities | 1,572,981 | 1,466,987 | 1,785,061 | 1,613,638 | 1,861,295 | |||||||||||||||||||||||||||
| Total liabilities | 61,757,622 | 59,269,529 | 58,535,371 | 57,388,710 | 54,244,888 | |||||||||||||||||||||||||||
| Shareholders’ Equity: | ||||||||||||||||||||||||||||||||
| Preferred stock | 837,500 | 412,500 | 412,500 | 412,500 | 412,500 | |||||||||||||||||||||||||||
| Common stock | 67,025 | 67,007 | 66,560 | 66,546 | 61,825 | |||||||||||||||||||||||||||
| Surplus | 2,495,637 | 2,494,347 | 2,482,561 | 2,470,228 | 1,964,645 | |||||||||||||||||||||||||||
| Treasury stock | (9,156) | (9,156) | (6,153) | (6,098) | (5,760) | |||||||||||||||||||||||||||
| Retained earnings | 4,200,923 | 4,045,854 | 3,897,164 | 3,748,715 | 3,615,616 | |||||||||||||||||||||||||||
| Accumulated other comprehensive loss | (366,233) | (410,015) | (508,335) | (292,177) | (512,198) | |||||||||||||||||||||||||||
| Total shareholders’ equity | 7,225,696 | 6,600,537 | 6,344,297 | 6,399,714 | 5,536,628 | |||||||||||||||||||||||||||
| Total liabilities and shareholders’ equity | $ | 68,983,318 | $ | 65,870,066 | $ | 64,879,668 | $ | 63,788,424 | $ | 59,781,516 | ||||||||||||||||||||||
| Three Months Ended | Six Months Ended | |||||||||||||||||||||||||||||||||||||
| (Dollars in thousands, except per share data) | Jun 30, 2025 | Mar 31, 2025 | Dec 31, 2024 | Sep 30, 2024 | Jun 30, 2024 | Jun 30, 2025 | Jun 30, 2024 | |||||||||||||||||||||||||||||||
| Interest income | ||||||||||||||||||||||||||||||||||||||
| Interest and fees on loans | $ | 797,997 | $ | 768,362 | $ | 789,038 | $ | 794,163 | $ | 749,812 | $ | 1,566,359 | $ | 1,460,153 | ||||||||||||||||||||||||
| Mortgage loans held-for-sale | 4,872 | 4,246 | 5,623 | 6,233 | 5,434 | 9,118 | 9,580 | |||||||||||||||||||||||||||||||
| Interest-bearing deposits with banks | 34,317 | 36,766 | 46,256 | 32,608 | 19,731 | 71,083 | 36,389 | |||||||||||||||||||||||||||||||
| Federal funds sold and securities purchased under resale agreements | 276 | 179 | 53 | 277 | 17 | 455 | 36 | |||||||||||||||||||||||||||||||
| Investment securities | 78,053 | 72,016 | 67,066 | 69,592 | 69,779 | 150,069 | 139,457 | |||||||||||||||||||||||||||||||
| Trading account securities | — | 11 | 6 | 11 | 13 | 11 | 31 | |||||||||||||||||||||||||||||||
| Federal Home Loan Bank and Federal Reserve Bank stock | 5,393 | 5,307 | 5,157 | 5,451 | 4,974 | 10,700 | 9,452 | |||||||||||||||||||||||||||||||
| Brokerage customer receivables | — | 78 | 302 | 269 | 219 | 78 | 394 | |||||||||||||||||||||||||||||||
| Total interest income | 920,908 | 886,965 | 913,501 | 908,604 | 849,979 | 1,807,873 | 1,655,492 | |||||||||||||||||||||||||||||||
| Interest expense | ||||||||||||||||||||||||||||||||||||||
| Interest on deposits | 333,470 | 320,233 | 346,388 | 362,019 | 335,703 | 653,703 | 635,235 | |||||||||||||||||||||||||||||||
| Interest on Federal Home Loan Bank advances | 25,724 | 25,441 | 26,050 | 26,254 | 24,797 | 51,165 | 46,845 | |||||||||||||||||||||||||||||||
| Interest on other borrowings | 6,957 | 6,792 | 7,519 | 9,013 | 8,700 | 13,749 | 17,948 | |||||||||||||||||||||||||||||||
| Interest on subordinated notes | 3,735 | 3,714 | 3,733 | 3,712 | 5,185 | 7,449 | 10,672 | |||||||||||||||||||||||||||||||
| Interest on junior subordinated debentures | 4,328 | 4,311 | 4,663 | 5,023 | 4,984 | 8,639 | 9,988 | |||||||||||||||||||||||||||||||
| Total interest expense | 374,214 | 360,491 | 388,353 | 406,021 | 379,369 | 734,705 | 720,688 | |||||||||||||||||||||||||||||||
| Net interest income | 546,694 | 526,474 | 525,148 | 502,583 | 470,610 | 1,073,168 | 934,804 | |||||||||||||||||||||||||||||||
| Provision for credit losses | 22,234 | 23,963 | 16,979 | 22,334 | 40,061 | 46,197 | 61,734 | |||||||||||||||||||||||||||||||
| Net interest income after provision for credit losses | 524,460 | 502,511 | 508,169 | 480,249 | 430,549 | 1,026,971 | 873,070 | |||||||||||||||||||||||||||||||
| Non-interest income | ||||||||||||||||||||||||||||||||||||||
| Wealth management | 36,821 | 34,042 | 38,775 | 37,224 | 35,413 | 70,863 | 70,228 | |||||||||||||||||||||||||||||||
| Mortgage banking | 23,170 | 20,529 | 20,452 | 15,974 | 29,124 | 43,699 | 56,787 | |||||||||||||||||||||||||||||||
| Service charges on deposit accounts | 19,502 | 19,362 | 18,864 | 16,430 | 15,546 | 38,864 | 30,357 | |||||||||||||||||||||||||||||||
| Gains (losses) on investment securities, net | 650 | 3,196 | (2,835) | 3,189 | (4,282) | 3,846 | (2,956) | |||||||||||||||||||||||||||||||
| Fees from covered call options | 5,624 | 3,446 | 2,305 | 988 | 2,056 | 9,070 | 6,903 | |||||||||||||||||||||||||||||||
| Trading gains (losses), net | 151 | (64) | (113) | (130) | 70 | 87 | 747 | |||||||||||||||||||||||||||||||
| Operating lease income, net | 15,166 | 15,287 | 15,327 | 15,335 | 13,938 | 30,453 | 28,048 | |||||||||||||||||||||||||||||||
| Other | 23,005 | 20,836 | 20,676 | 24,137 | 29,282 | 43,841 | 71,613 | |||||||||||||||||||||||||||||||
| Total non-interest income | 124,089 | 116,634 | 113,451 | 113,147 | 121,147 | 240,723 | 261,727 | |||||||||||||||||||||||||||||||
| Non-interest expense | ||||||||||||||||||||||||||||||||||||||
| Salaries and employee benefits | 219,541 | 211,526 | 212,133 | 211,261 | 198,541 | 431,067 | 393,714 | |||||||||||||||||||||||||||||||
| Software and equipment | 36,522 | 34,717 | 34,258 | 31,574 | 29,231 | 71,239 | 56,962 | |||||||||||||||||||||||||||||||
| Operating lease equipment | 10,757 | 10,471 | 10,263 | 10,518 | 10,834 | 21,228 | 21,517 | |||||||||||||||||||||||||||||||
| Occupancy, net | 20,228 | 20,778 | 20,597 | 19,945 | 19,585 | 41,006 | 38,671 | |||||||||||||||||||||||||||||||
| Data processing | 12,110 | 11,274 | 10,957 | 9,984 | 9,503 | 23,384 | 18,795 | |||||||||||||||||||||||||||||||
| Advertising and marketing | 18,761 | 12,272 | 13,097 | 18,239 | 17,436 | 31,033 | 30,476 | |||||||||||||||||||||||||||||||
| Professional fees | 9,243 | 9,044 | 11,334 | 9,783 | 9,967 | 18,287 | 19,520 | |||||||||||||||||||||||||||||||
| Amortization of other acquisition-related intangible assets | 5,580 | 5,618 | 5,773 | 4,042 | 1,122 | 11,198 | 2,280 | |||||||||||||||||||||||||||||||
| FDIC insurance | 10,971 | 10,926 | 10,640 | 10,512 | 10,429 | 21,897 | 24,966 | |||||||||||||||||||||||||||||||
| Other real estate owned (“OREO”) expenses, net | 505 | 643 | 397 | (938) | (259) | 1,148 | 133 | |||||||||||||||||||||||||||||||
| Other | 37,243 | 38,821 | 39,090 | 35,767 | 33,964 | 76,064 | 66,464 | |||||||||||||||||||||||||||||||
| Total non-interest expense | 381,461 | 366,090 | 368,539 | 360,687 | 340,353 | 747,551 | 673,498 | |||||||||||||||||||||||||||||||
| Income before taxes | 267,088 | 253,055 | 253,081 | 232,709 | 211,343 | 520,143 | 461,299 | |||||||||||||||||||||||||||||||
| Income tax expense | 71,561 | 64,016 | 67,719 | 62,708 | 58,955 | 135,577 | 121,617 | |||||||||||||||||||||||||||||||
| Net income | $ | 195,527 | $ | 189,039 | $ | 185,362 | $ | 170,001 | $ | 152,388 | $ | 384,566 | $ | 339,682 | ||||||||||||||||||||||||
| Preferred stock dividends | 6,991 | 6,991 | 6,991 | 6,991 | 6,991 | 13,982 | 13,982 | |||||||||||||||||||||||||||||||
| Net income applicable to common shares | $ | 188,536 | $ | 182,048 | $ | 178,371 | $ | 163,010 | $ | 145,397 | $ | 370,584 | $ | 325,700 | ||||||||||||||||||||||||
| Net income per common share - Basic | $ | 2.82 | $ | 2.73 | $ | 2.68 | $ | 2.51 | $ | 2.35 | $ | 5.55 | $ | 5.28 | ||||||||||||||||||||||||
| Net income per common share - Diluted | $ | 2.78 | $ | 2.69 | $ | 2.63 | $ | 2.47 | $ | 2.32 | $ | 5.47 | $ | 5.21 | ||||||||||||||||||||||||
| Cash dividends declared per common share | $ | 0.50 | $ | 0.50 | $ | 0.45 | $ | 0.45 | $ | 0.45 | $ | 1.00 | $ | 0.90 | ||||||||||||||||||||||||
| Weighted average common shares outstanding | 66,931 | 66,726 | 66,491 | 64,888 | 61,839 | 66,829 | 61,660 | |||||||||||||||||||||||||||||||
| Dilutive potential common shares | 888 | 923 | 1,233 | 1,053 | 926 | 903 | 901 | |||||||||||||||||||||||||||||||
| Average common shares and dilutive common shares | 67,819 | 67,649 | 67,724 | 65,941 | 62,765 | 67,732 | 62,561 | |||||||||||||||||||||||||||||||
% Growth From (1) | |||||||||||||||||||||||||||||||||||
| (Dollars in thousands) | Jun 30, 2025 | Mar 31, 2025 | Dec 31, 2024 | Sep 30, 2024 | Jun 30, 2024 | Mar 31, 2025 (2) | Jun 30, 2024 | ||||||||||||||||||||||||||||
| Balance: | |||||||||||||||||||||||||||||||||||
| Mortgage loans held-for-sale, excluding early buy-out exercised loans guaranteed by U.S. government agencies | $ | 192,633 | $ | 181,580 | $ | 189,774 | $ | 314,693 | $ | 281,103 | 24 | % | (31) | % | |||||||||||||||||||||
| Mortgage loans held-for-sale, early buy-out exercised loans guaranteed by U.S. government agencies | 106,973 | 135,224 | 141,487 | 146,374 | 130,748 | (84) | (18) | ||||||||||||||||||||||||||||
| Total mortgage loans held-for-sale | $ | 299,606 | $ | 316,804 | $ | 331,261 | $ | 461,067 | $ | 411,851 | (22) | % | (27) | % | |||||||||||||||||||||
| Core loans: | |||||||||||||||||||||||||||||||||||
| Commercial | |||||||||||||||||||||||||||||||||||
| Commercial and industrial | $ | 7,028,247 | $ | 6,871,206 | $ | 6,867,422 | $ | 6,774,683 | $ | 6,236,290 | 9 | % | 13 | % | |||||||||||||||||||||
| Asset-based lending | 1,663,693 | 1,701,962 | 1,611,001 | 1,709,685 | 1,465,867 | (9) | 13 | ||||||||||||||||||||||||||||
| Municipal | 771,785 | 798,646 | 826,653 | 827,125 | 747,357 | (13) | 3 | ||||||||||||||||||||||||||||
| Leases | 2,757,331 | 2,680,943 | 2,537,325 | 2,443,721 | 2,439,128 | 11 | 13 | ||||||||||||||||||||||||||||
| Commercial real estate | |||||||||||||||||||||||||||||||||||
| Residential construction | 59,027 | 55,849 | 48,617 | 73,088 | 55,019 | 23 | 7 | ||||||||||||||||||||||||||||
| Commercial construction | 2,165,263 | 2,086,797 | 2,065,775 | 1,984,240 | 1,866,701 | 15 | 16 | ||||||||||||||||||||||||||||
| Land | 304,827 | 306,235 | 319,689 | 346,362 | 338,831 | (2) | (10) | ||||||||||||||||||||||||||||
| Office | 1,601,208 | 1,641,555 | 1,656,109 | 1,675,286 | 1,585,312 | (10) | 1 | ||||||||||||||||||||||||||||
| Industrial | 2,824,889 | 2,677,555 | 2,628,576 | 2,527,932 | 2,307,455 | 22 | 22 | ||||||||||||||||||||||||||||
| Retail | 1,452,351 | 1,402,837 | 1,374,655 | 1,404,586 | 1,365,753 | 14 | 6 | ||||||||||||||||||||||||||||
| Multi-family | 3,200,578 | 3,091,314 | 3,125,505 | 3,193,339 | 2,988,940 | 14 | 7 | ||||||||||||||||||||||||||||
| Mixed use and other | 1,683,867 | 1,652,759 | 1,685,018 | 1,588,584 | 1,439,186 | 8 | 17 | ||||||||||||||||||||||||||||
| Home equity | 466,815 | 455,683 | 445,028 | 427,043 | 356,313 | 10 | 31 | ||||||||||||||||||||||||||||
| Residential real estate | |||||||||||||||||||||||||||||||||||
| Residential real estate loans for investment | 3,814,715 | 3,561,417 | 3,456,009 | 3,252,649 | 2,933,157 | 29 | 30 | ||||||||||||||||||||||||||||
| Residential mortgage loans, early buy-out eligible loans guaranteed by U.S. government agencies | 80,800 | 86,952 | 114,985 | 92,355 | 88,503 | (28) | (9) | ||||||||||||||||||||||||||||
| Residential mortgage loans, early buy-out exercised loans guaranteed by U.S. government agencies | 53,267 | 36,790 | 41,771 | 43,034 | 45,675 | NM | 17 | ||||||||||||||||||||||||||||
| Total core loans | $ | 29,928,663 | $ | 29,108,500 | $ | 28,804,138 | $ | 28,363,712 | $ | 26,259,487 | 11 | % | 14 | % | |||||||||||||||||||||
| Niche loans: | |||||||||||||||||||||||||||||||||||
| Commercial | |||||||||||||||||||||||||||||||||||
| Franchise | $ | 1,286,265 | $ | 1,262,555 | $ | 1,268,521 | $ | 1,191,686 | $ | 1,150,460 | 8 | % | 12 | % | |||||||||||||||||||||
| Mortgage warehouse lines of credit | 1,232,530 | 1,019,543 | 893,854 | 750,462 | 593,519 | 84 | NM | ||||||||||||||||||||||||||||
| Community Advantage - homeowners association | 526,595 | 525,492 | 525,446 | 501,645 | 491,722 | 1 | 7 | ||||||||||||||||||||||||||||
| Insurance agency lending | 1,120,985 | 1,070,979 | 1,044,329 | 1,048,686 | 1,030,119 | 19 | 9 | ||||||||||||||||||||||||||||
| Premium Finance receivables | |||||||||||||||||||||||||||||||||||
| U.S. property & casualty insurance | 7,378,340 | 6,486,663 | 6,447,625 | 6,253,271 | 6,142,654 | 55 | 20 | ||||||||||||||||||||||||||||
| Canada property & casualty insurance | 944,836 | 753,199 | 824,417 | 878,410 | 958,099 | NM | (1) | ||||||||||||||||||||||||||||
| Life insurance | 8,506,960 | 8,365,140 | 8,147,145 | 7,996,899 | 7,962,115 | 7 | 7 | ||||||||||||||||||||||||||||
| Consumer and other | 116,505 | 116,319 | 99,562 | 82,676 | 87,356 | 1 | 33 | ||||||||||||||||||||||||||||
| Total niche loans | $ | 21,113,016 | $ | 19,599,890 | $ | 19,250,899 | $ | 18,703,735 | $ | 18,416,044 | 31 | % | 15 | % | |||||||||||||||||||||
| Total loans, net of unearned income | $ | 51,041,679 | $ | 48,708,390 | $ | 48,055,037 | $ | 47,067,447 | $ | 44,675,531 | 19 | % | 14 | % | |||||||||||||||||||||
| % Growth From | ||||||||||||||||||||||||||||||||||||||
| (Dollars in thousands) | Jun 30, 2025 | Mar 31, 2025 | Dec 31, 2024 | Sep 30, 2024 | Jun 30, 2024 | Mar 31, 2025 (1) | Jun 30, 2024 | |||||||||||||||||||||||||||||||
| Balance: | ||||||||||||||||||||||||||||||||||||||
| Non-interest-bearing | $ | 10,877,166 | $ | 11,201,859 | $ | 11,410,018 | $ | 10,739,132 | $ | 10,031,440 | (12) | % | 8 | % | ||||||||||||||||||||||||
| NOW and interest-bearing demand deposits | 6,795,725 | 6,340,168 | 5,865,546 | 5,466,932 | 5,053,909 | 29 | 34 | |||||||||||||||||||||||||||||||
Wealth management deposits (2) | 1,595,764 | 1,408,790 | 1,469,064 | 1,303,354 | 1,490,711 | 53 | 7 | |||||||||||||||||||||||||||||||
| Money market | 19,556,041 | 18,074,733 | 17,975,191 | 17,713,726 | 16,320,017 | 33 | 20 | |||||||||||||||||||||||||||||||
| Savings | 6,659,419 | 6,576,251 | 6,372,499 | 6,183,249 | 5,882,179 | 5 | 13 | |||||||||||||||||||||||||||||||
| Time certificates of deposit | 10,332,696 | 9,968,237 | 9,420,031 | 9,998,573 | 9,270,770 | 15 | 11 | |||||||||||||||||||||||||||||||
| Total deposits | $ | 55,816,811 | $ | 53,570,038 | $ | 52,512,349 | $ | 51,404,966 | $ | 48,049,026 | 17 | % | 16 | % | ||||||||||||||||||||||||
| Mix: | ||||||||||||||||||||||||||||||||||||||
| Non-interest-bearing | 19 | % | 21 | % | 22 | % | 21 | % | 21 | % | ||||||||||||||||||||||||||||
| NOW and interest-bearing demand deposits | 12 | 12 | 11 | 11 | 11 | |||||||||||||||||||||||||||||||||
Wealth management deposits (2) | 3 | 3 | 3 | 3 | 3 | |||||||||||||||||||||||||||||||||
| Money market | 35 | 34 | 34 | 34 | 34 | |||||||||||||||||||||||||||||||||
| Savings | 12 | 12 | 12 | 12 | 12 | |||||||||||||||||||||||||||||||||
| Time certificates of deposit | 19 | 18 | 18 | 19 | 19 | |||||||||||||||||||||||||||||||||
| Total deposits | 100 | % | 100 | % | 100 | % | 100 | % | 100 | % | ||||||||||||||||||||||||||||
| (Dollars in thousands) | Total Time Certificates of Deposit | Weighted-Average Rate of Maturing Time Certificates of Deposit | ||||||||||||
| 1-3 months | $ | 2,486,694 | 3.92 | % | ||||||||||
| 4-6 months | 4,464,126 | 3.80 | ||||||||||||
| 7-9 months | 2,187,365 | 3.74 | ||||||||||||
| 10-12 months | 771,114 | 3.64 | ||||||||||||
| 13-18 months | 262,094 | 3.41 | ||||||||||||
| 19-24 months | 99,689 | 2.92 | ||||||||||||
| 24+ months | 61,614 | 2.36 | ||||||||||||
| Total | $ | 10,332,696 | 3.78 | % | ||||||||||
| Average Balance for three months ended, | ||||||||||||||||||||||||||||||||
| Jun 30, | Mar 31, | Dec 31, | Sep 30, | Jun 30, | ||||||||||||||||||||||||||||
| (In thousands) | 2025 | 2025 | 2024 | 2024 | 2024 | |||||||||||||||||||||||||||
Interest-bearing deposits with banks, securities purchased under resale agreements and cash equivalents (1) | $ | 3,308,199 | $ | 3,520,048 | $ | 3,934,016 | $ | 2,413,728 | $ | 1,485,481 | ||||||||||||||||||||||
Investment securities (2) | 8,801,560 | 8,409,735 | 8,090,271 | 8,276,576 | 8,203,764 | |||||||||||||||||||||||||||
FHLB and FRB stock (3) | 282,001 | 281,702 | 271,825 | 263,707 | 253,614 | |||||||||||||||||||||||||||
Liquidity management assets (4) | $ | 12,391,760 | $ | 12,211,485 | $ | 12,296,112 | $ | 10,954,011 | $ | 9,942,859 | ||||||||||||||||||||||
Other earning assets (4) (5) | — | 13,140 | 20,528 | 17,542 | 15,257 | |||||||||||||||||||||||||||
| Mortgage loans held-for-sale | 310,534 | 286,710 | 378,707 | 376,251 | 347,236 | |||||||||||||||||||||||||||
Loans, net of unearned income (4) (6) | 49,517,635 | 47,833,380 | 47,153,014 | 45,920,586 | 43,819,354 | |||||||||||||||||||||||||||
Total earning assets (4) | $ | 62,219,929 | $ | 60,344,715 | $ | 59,848,361 | $ | 57,268,390 | $ | 54,124,706 | ||||||||||||||||||||||
| Allowance for loan and investment security losses | (398,685) | (375,371) | (367,238) | (383,736) | (360,504) | |||||||||||||||||||||||||||
| Cash and due from banks | 478,707 | 476,423 | 470,033 | 467,333 | 434,916 | |||||||||||||||||||||||||||
| Other assets | 3,540,394 | 3,661,275 | 3,642,949 | 3,563,296 | 3,294,066 | |||||||||||||||||||||||||||
Total assets | $ | 65,840,345 | $ | 64,107,042 | $ | 63,594,105 | $ | 60,915,283 | $ | 57,493,184 | ||||||||||||||||||||||
| NOW and interest-bearing demand deposits | $ | 6,423,050 | $ | 6,046,189 | $ | 5,601,672 | $ | 5,174,673 | $ | 4,985,306 | ||||||||||||||||||||||
| Wealth management deposits | 1,552,989 | 1,574,480 | 1,430,163 | 1,362,747 | 1,531,865 | |||||||||||||||||||||||||||
| Money market accounts | 18,184,754 | 17,581,141 | 17,579,395 | 16,436,111 | 15,272,126 | |||||||||||||||||||||||||||
| Savings accounts | 6,578,698 | 6,479,444 | 6,288,727 | 6,096,746 | 5,878,844 | |||||||||||||||||||||||||||
| Time deposits | 9,841,702 | 9,406,126 | 9,702,948 | 9,598,109 | 8,546,172 | |||||||||||||||||||||||||||
| Interest-bearing deposits | $ | 42,581,193 | $ | 41,087,380 | $ | 40,602,905 | $ | 38,668,386 | $ | 36,214,313 | ||||||||||||||||||||||
FHLB advances (3) | 3,151,310 | 3,151,309 | 3,160,658 | 3,178,973 | 3,096,920 | |||||||||||||||||||||||||||
| Other borrowings | 593,657 | 582,139 | 577,786 | 622,792 | 587,262 | |||||||||||||||||||||||||||
| Subordinated notes | 298,398 | 298,306 | 298,225 | 298,135 | 410,331 | |||||||||||||||||||||||||||
| Junior subordinated debentures | 253,566 | 253,566 | 253,566 | 253,566 | 253,566 | |||||||||||||||||||||||||||
Total interest-bearing liabilities | $ | 46,878,124 | $ | 45,372,700 | $ | 44,893,140 | $ | 43,021,852 | $ | 40,562,392 | ||||||||||||||||||||||
| Non-interest-bearing deposits | 10,643,798 | 10,732,156 | 10,718,738 | 10,271,613 | 9,879,134 | |||||||||||||||||||||||||||
| Other liabilities | 1,456,383 | 1,541,245 | 1,563,824 | 1,631,389 | 1,601,485 | |||||||||||||||||||||||||||
| Equity | 6,862,040 | 6,460,941 | 6,418,403 | 5,990,429 | 5,450,173 | |||||||||||||||||||||||||||
Total liabilities and shareholders’ equity | $ | 65,840,345 | $ | 64,107,042 | $ | 63,594,105 | $ | 60,915,283 | $ | 57,493,184 | ||||||||||||||||||||||
Net free funds/contribution (6) | $ | 15,341,805 | $ | 14,972,015 | $ | 14,955,221 | $ | 14,246,538 | $ | 13,562,314 | ||||||||||||||||||||||
| Net Interest Income for three months ended, | ||||||||||||||||||||||||||||||||
| Jun 30, | Mar 31, | Dec 31, | Sep 30, | Jun 30, | ||||||||||||||||||||||||||||
| (In thousands) | 2025 | 2025 | 2024 | 2024 | 2024 | |||||||||||||||||||||||||||
| Interest income: | ||||||||||||||||||||||||||||||||
| Interest-bearing deposits with banks, securities purchased under resale agreements and cash equivalents | $ | 34,593 | $ | 36,945 | $ | 46,308 | $ | 32,885 | $ | 19,748 | ||||||||||||||||||||||
| Investment securities | 78,733 | 72,706 | 67,783 | 70,260 | 70,346 | |||||||||||||||||||||||||||
FHLB and FRB stock (1) | 5,393 | 5,307 | 5,157 | 5,451 | 4,974 | |||||||||||||||||||||||||||
Liquidity management assets (2) | $ | 118,719 | $ | 114,958 | $ | 119,248 | $ | 108,596 | $ | 95,068 | ||||||||||||||||||||||
Other earning assets (2) | — | 92 | 310 | 282 | 235 | |||||||||||||||||||||||||||
| Mortgage loans held-for-sale | 4,872 | 4,246 | 5,623 | 6,233 | 5,434 | |||||||||||||||||||||||||||
Loans, net of unearned income (2) | 800,197 | 770,568 | 791,390 | 796,637 | 752,117 | |||||||||||||||||||||||||||
| Total interest income | $ | 923,788 | $ | 889,864 | $ | 916,571 | $ | 911,748 | $ | 852,854 | ||||||||||||||||||||||
| Interest expense: | ||||||||||||||||||||||||||||||||
| NOW and interest-bearing demand deposits | $ | 37,517 | $ | 33,600 | $ | 31,695 | $ | 30,971 | $ | 32,719 | ||||||||||||||||||||||
| Wealth management deposits | 8,182 | 8,606 | 9,412 | 10,158 | 10,294 | |||||||||||||||||||||||||||
| Money market accounts | 155,890 | 146,374 | 159,945 | 167,382 | 155,100 | |||||||||||||||||||||||||||
| Savings accounts | 37,637 | 35,923 | 38,402 | 42,892 | 41,063 | |||||||||||||||||||||||||||
| Time deposits | 94,244 | 95,730 | 106,934 | 110,616 | 96,527 | |||||||||||||||||||||||||||
| Interest-bearing deposits | $ | 333,470 | $ | 320,233 | $ | 346,388 | $ | 362,019 | $ | 335,703 | ||||||||||||||||||||||
FHLB advances (1) | 25,724 | 25,441 | 26,050 | 26,254 | 24,797 | |||||||||||||||||||||||||||
| Other borrowings | 6,957 | 6,792 | 7,519 | 9,013 | 8,700 | |||||||||||||||||||||||||||
| Subordinated notes | 3,735 | 3,714 | 3,733 | 3,712 | 5,185 | |||||||||||||||||||||||||||
| Junior subordinated debentures | 4,328 | 4,311 | 4,663 | 5,023 | 4,984 | |||||||||||||||||||||||||||
| Total interest expense | $ | 374,214 | $ | 360,491 | $ | 388,353 | $ | 406,021 | $ | 379,369 | ||||||||||||||||||||||
| Less: Fully taxable-equivalent adjustment | (2,880) | (2,899) | (3,070) | (3,144) | (2,875) | |||||||||||||||||||||||||||
Net interest income (GAAP) (3) | 546,694 | 526,474 | 525,148 | 502,583 | 470,610 | |||||||||||||||||||||||||||
| Fully taxable-equivalent adjustment | 2,880 | 2,899 | 3,070 | 3,144 | 2,875 | |||||||||||||||||||||||||||
Net interest income, fully taxable-equivalent (non-GAAP) (3) | $ | 549,574 | $ | 529,373 | $ | 528,218 | $ | 505,727 | $ | 473,485 | ||||||||||||||||||||||
| Net Interest Margin for three months ended, | ||||||||||||||||||||||||||||||||
| Jun 30, 2025 | Mar 31, 2025 | Dec 31, 2024 | Sep 30, 2024 | Jun 30, 2024 | ||||||||||||||||||||||||||||
| Yield earned on: | ||||||||||||||||||||||||||||||||
| Interest-bearing deposits with banks, securities purchased under resale agreements and cash equivalents | 4.19 | % | 4.26 | % | 4.68 | % | 5.42 | % | 5.35 | % | ||||||||||||||||||||||
| Investment securities | 3.59 | 3.51 | 3.33 | 3.38 | 3.45 | |||||||||||||||||||||||||||
FHLB and FRB stock (1) | 7.67 | 7.64 | 7.55 | 8.22 | 7.89 | |||||||||||||||||||||||||||
| Liquidity management assets | 3.84 | % | 3.82 | % | 3.86 | % | 3.94 | % | 3.85 | % | ||||||||||||||||||||||
| Other earning assets | — | 2.84 | 6.01 | 6.38 | 6.23 | |||||||||||||||||||||||||||
| Mortgage loans held-for-sale | 6.29 | 6.01 | 5.91 | 6.59 | 6.29 | |||||||||||||||||||||||||||
| Loans, net of unearned income | 6.48 | 6.53 | 6.68 | 6.90 | 6.90 | |||||||||||||||||||||||||||
| Total earning assets | 5.96 | % | 5.98 | % | 6.09 | % | 6.33 | % | 6.34 | % | ||||||||||||||||||||||
| Rate paid on: | ||||||||||||||||||||||||||||||||
| NOW and interest-bearing demand deposits | 2.34 | % | 2.25 | % | 2.25 | % | 2.38 | % | 2.64 | % | ||||||||||||||||||||||
| Wealth management deposits | 2.11 | 2.22 | 2.62 | 2.97 | 2.70 | |||||||||||||||||||||||||||
| Money market accounts | 3.44 | 3.38 | 3.62 | 4.05 | 4.08 | |||||||||||||||||||||||||||
| Savings accounts | 2.29 | 2.25 | 2.43 | 2.80 | 2.81 | |||||||||||||||||||||||||||
| Time deposits | 3.84 | 4.13 | 4.38 | 4.58 | 4.54 | |||||||||||||||||||||||||||
| Interest-bearing deposits | 3.14 | % | 3.16 | % | 3.39 | % | 3.72 | % | 3.73 | % | ||||||||||||||||||||||
| FHLB advances | 3.27 | 3.27 | 3.28 | 3.29 | 3.22 | |||||||||||||||||||||||||||
| Other borrowings | 4.70 | 4.73 | 5.18 | 5.76 | 5.96 | |||||||||||||||||||||||||||
| Subordinated notes | 5.02 | 5.05 | 4.98 | 4.95 | 5.08 | |||||||||||||||||||||||||||
| Junior subordinated debentures | 6.85 | 6.90 | 7.32 | 7.88 | 7.91 | |||||||||||||||||||||||||||
| Total interest-bearing liabilities | 3.20 | % | 3.22 | % | 3.44 | % | 3.75 | % | 3.76 | % | ||||||||||||||||||||||
Interest rate spread (2) (3) | 2.76 | % | 2.76 | % | 2.65 | % | 2.58 | % | 2.58 | % | ||||||||||||||||||||||
| Less: Fully taxable-equivalent adjustment | (0.02) | (0.02) | (0.02) | (0.02) | (0.02) | |||||||||||||||||||||||||||
Net free funds/contribution (4) | 0.78 | 0.80 | 0.86 | 0.93 | 0.94 | |||||||||||||||||||||||||||
Net interest margin (GAAP) (3) | 3.52 | % | 3.54 | % | 3.49 | % | 3.49 | % | 3.50 | % | ||||||||||||||||||||||
| Fully taxable-equivalent adjustment | 0.02 | 0.02 | 0.02 | 0.02 | 0.02 | |||||||||||||||||||||||||||
Net interest margin, fully taxable-equivalent (non-GAAP) (3) | 3.54 | % | 3.56 | % | 3.51 | % | 3.51 | % | 3.52 | % | ||||||||||||||||||||||
Average Balance for six months ended, | Interest for six months ended, | Yield/Rate for six months ended, | |||||||||||||||||||||||||||
| (Dollars in thousands) | Jun 30, 2025 | Jun 30, 2024 | Jun 30, 2025 | Jun 30, 2024 | Jun 30, 2025 | Jun 30, 2024 | |||||||||||||||||||||||
Interest-bearing deposits with banks, securities purchased under resale agreements and cash equivalents (1) | $ | 3,413,538 | $ | 1,369,906 | $ | 71,538 | $ | 36,425 | 4.23 | % | 5.35 | % | |||||||||||||||||
Investment securities (2) | 8,606,730 | 8,276,780 | 151,439 | 140,574 | 3.55 | 3.42 | |||||||||||||||||||||||
FHLB and FRB stock (3) | 281,853 | 242,131 | 10,700 | 9,452 | 7.66 | 7.85 | |||||||||||||||||||||||
Liquidity management assets (4) (5) | $ | 12,302,121 | $ | 9,888,817 | $ | 233,677 | $ | 186,451 | 3.83 | % | 3.79 | % | |||||||||||||||||
Other earning assets (4) (5) (6) | 6,533 | 15,169 | 92 | 433 | 2.84 | 5.74 | |||||||||||||||||||||||
| Mortgage loans held-for-sale | 298,688 | 318,756 | 9,118 | 9,580 | 6.16 | 6.04 | |||||||||||||||||||||||
Loans, net of unearned income (4) (5) (7) | 48,680,160 | 42,974,623 | 1,570,765 | 1,464,704 | 6.51 | 6.85 | |||||||||||||||||||||||
Total earning assets (5) | $ | 61,287,502 | $ | 53,197,365 | $ | 1,813,652 | $ | 1,661,168 | 5.97 | % | 6.28 | % | |||||||||||||||||
| Allowance for loan and investment security losses | (387,092) | (361,119) | |||||||||||||||||||||||||||
| Cash and due from banks | 477,571 | 442,591 | |||||||||||||||||||||||||||
| Other assets | 3,600,500 | 3,269,102 | |||||||||||||||||||||||||||
Total assets | $ | 64,978,481 | $ | 56,547,939 | |||||||||||||||||||||||||
| NOW and interest-bearing demand deposits | $ | 6,235,661 | $ | 5,332,786 | $ | 71,117 | $ | 67,615 | 2.30 | % | 2.55 | % | |||||||||||||||||
| Wealth management deposits | 1,563,675 | 1,521,034 | 16,788 | 20,755 | 2.17 | 2.74 | |||||||||||||||||||||||
| Money market accounts | 17,884,615 | 14,873,309 | 302,264 | 293,084 | 3.41 | 3.96 | |||||||||||||||||||||||
| Savings accounts | 6,529,345 | 5,835,481 | 73,560 | 80,134 | 2.27 | 2.76 | |||||||||||||||||||||||
| Time deposits | 9,625,117 | 7,847,314 | 189,974 | 173,647 | 3.98 | 4.45 | |||||||||||||||||||||||
| Interest-bearing deposits | $ | 41,838,413 | $ | 35,409,924 | $ | 653,703 | $ | 635,235 | 3.15 | % | 3.61 | % | |||||||||||||||||
| Federal Home Loan Bank advances | 3,151,310 | 2,912,884 | 51,165 | 46,845 | 3.27 | 3.23 | |||||||||||||||||||||||
| Other borrowings | 587,930 | 607,487 | 13,749 | 17,948 | 4.72 | 5.94 | |||||||||||||||||||||||
| Subordinated notes | 298,353 | 424,112 | 7,449 | 10,672 | 5.04 | 5.06 | |||||||||||||||||||||||
| Junior subordinated debentures | 253,566 | 253,566 | 8,639 | 9,988 | 6.87 | 7.92 | |||||||||||||||||||||||
Total interest-bearing liabilities | $ | 46,129,572 | $ | 39,607,973 | $ | 734,705 | $ | 720,688 | 3.21 | % | 3.66 | % | |||||||||||||||||
| Non-interest-bearing deposits | 10,687,733 | 9,925,890 | |||||||||||||||||||||||||||
| Other liabilities | 1,498,578 | 1,568,761 | |||||||||||||||||||||||||||
| Equity | 6,662,598 | 5,445,315 | |||||||||||||||||||||||||||
Total liabilities and shareholders’ equity | $ | 64,978,481 | $ | 56,547,939 | |||||||||||||||||||||||||
Interest rate spread (5) (8) | 2.76 | % | 2.62 | % | |||||||||||||||||||||||||
| Less: Fully taxable-equivalent adjustment | (5,779) | (5,676) | (0.02) | (0.03) | |||||||||||||||||||||||||
Net free funds/contribution (9) | $ | 15,157,930 | $ | 13,589,392 | 0.79 | 0.94 | |||||||||||||||||||||||
Net interest income/margin (GAAP) (5) | $ | 1,073,168 | $ | 934,804 | 3.53 | % | 3.53 | % | |||||||||||||||||||||
| Fully taxable-equivalent adjustment | 5,779 | 5,676 | 0.02 | 0.03 | |||||||||||||||||||||||||
Net interest income/margin, fully taxable-equivalent (non-GAAP) (4) | $ | 1,078,947 | $ | 940,480 | 3.55 | % | 3.56 | % | |||||||||||||||||||||
| Static Shock Scenario | +200 Basis Points | +100 Basis Points | -100 Basis Points | -200 Basis Points | ||||||||||||||||||||||
| Jun 30, 2025 | (1.5) | % | (0.4) | % | (0.2) | % | (1.2) | % | ||||||||||||||||||
| Mar 31, 2025 | (1.8) | (0.6) | (0.2) | (1.2) | ||||||||||||||||||||||
| Dec 31, 2024 | (1.6) | (0.6) | (0.3) | (1.5) | ||||||||||||||||||||||
| Sep 30, 2024 | 1.2 | 1.1 | 0.4 | (0.9) | ||||||||||||||||||||||
| Jun 30, 2024 | 1.5 | 1.0 | 0.6 | (0.0) | ||||||||||||||||||||||
| Ramp Scenario | +200 Basis Points | +100 Basis Points | -100 Basis Points | -200 Basis Points | |||||||||||||||||||
| Jun 30, 2025 | 0.0 | % | 0.0 | % | (0.1) | % | (0.4) | % | |||||||||||||||
| Mar 31, 2025 | 0.2 | 0.2 | (0.1) | (0.5) | |||||||||||||||||||
| Dec 31, 2024 | (0.2) | (0.0) | 0.0 | (0.3) | |||||||||||||||||||
| Sep 30, 2024 | 1.6 | 1.2 | 0.7 | 0.5 | |||||||||||||||||||
| Jun 30, 2024 | 1.2 | 1.0 | 0.9 | 1.0 | |||||||||||||||||||
| Loans repricing or contractual maturity period | |||||||||||||||||||||||||||||
| As of June 30, 2025 | One year or less | From one to five years | From five to fifteen years | After fifteen years | Total | ||||||||||||||||||||||||
| (In thousands) | |||||||||||||||||||||||||||||
| Commercial | |||||||||||||||||||||||||||||
| Fixed rate | $ | 429,173 | $ | 3,756,650 | $ | 2,117,493 | $ | 14,925 | $ | 6,318,241 | |||||||||||||||||||
| Variable rate | 10,068,079 | 1,111 | — | — | 10,069,190 | ||||||||||||||||||||||||
| Total commercial | $ | 10,497,252 | $ | 3,757,761 | $ | 2,117,493 | $ | 14,925 | $ | 16,387,431 | |||||||||||||||||||
| Commercial real estate | |||||||||||||||||||||||||||||
| Fixed rate | $ | 712,348 | $ | 2,732,428 | $ | 369,615 | $ | 70,471 | $ | 3,884,862 | |||||||||||||||||||
| Variable rate | 9,396,306 | 10,775 | 67 | — | 9,407,148 | ||||||||||||||||||||||||
| Total commercial real estate | $ | 10,108,654 | $ | 2,743,203 | $ | 369,682 | $ | 70,471 | $ | 13,292,010 | |||||||||||||||||||
| Home equity | |||||||||||||||||||||||||||||
| Fixed rate | $ | 9,626 | $ | 773 | $ | — | $ | 15 | $ | 10,414 | |||||||||||||||||||
| Variable rate | 456,401 | — | — | — | 456,401 | ||||||||||||||||||||||||
| Total home equity | $ | 466,027 | $ | 773 | $ | — | $ | 15 | $ | 466,815 | |||||||||||||||||||
| Residential real estate | |||||||||||||||||||||||||||||
| Fixed rate | $ | 15,271 | $ | 4,318 | $ | 72,630 | $ | 1,056,508 | $ | 1,148,727 | |||||||||||||||||||
| Variable rate | 108,431 | 699,875 | 1,991,749 | — | 2,800,055 | ||||||||||||||||||||||||
| Total residential real estate | $ | 123,702 | $ | 704,193 | $ | 2,064,379 | $ | 1,056,508 | $ | 3,948,782 | |||||||||||||||||||
| Premium finance receivables - property & casualty | |||||||||||||||||||||||||||||
| Fixed rate | $ | 8,220,850 | $ | 102,326 | $ | — | $ | — | $ | 8,323,176 | |||||||||||||||||||
| Variable rate | — | — | — | — | — | ||||||||||||||||||||||||
| Total premium finance receivables - property & casualty | $ | 8,220,850 | $ | 102,326 | $ | — | $ | — | $ | 8,323,176 | |||||||||||||||||||
| Premium finance receivables - life insurance | |||||||||||||||||||||||||||||
| Fixed rate | $ | 319,732 | $ | 169,958 | $ | 4,000 | $ | — | $ | 493,690 | |||||||||||||||||||
| Variable rate | 8,013,270 | — | — | — | 8,013,270 | ||||||||||||||||||||||||
| Total premium finance receivables - life insurance | $ | 8,333,002 | $ | 169,958 | $ | 4,000 | $ | — | $ | 8,506,960 | |||||||||||||||||||
| Consumer and other | |||||||||||||||||||||||||||||
| Fixed rate | $ | 36,771 | $ | 8,483 | $ | 1,070 | $ | 859 | $ | 47,183 | |||||||||||||||||||
| Variable rate | 69,322 | — | — | — | 69,322 | ||||||||||||||||||||||||
| Total consumer and other | $ | 106,093 | $ | 8,483 | $ | 1,070 | $ | 859 | $ | 116,505 | |||||||||||||||||||
| Total per category | |||||||||||||||||||||||||||||
| Fixed rate | $ | 9,743,771 | $ | 6,774,936 | $ | 2,564,808 | $ | 1,142,778 | $ | 20,226,293 | |||||||||||||||||||
| Variable rate | 28,111,809 | 711,761 | 1,991,816 | — | 30,815,386 | ||||||||||||||||||||||||
| Total loans, net of unearned income | $ | 37,855,580 | $ | 7,486,697 | $ | 4,556,624 | $ | 1,142,778 | $ | 51,041,679 | |||||||||||||||||||
Less: Existing cash flow hedging derivatives (1) | (6,700,000) | ||||||||||||||||||||||||||||
| Total loans repricing or maturing in one year or less, adjusted for cash flow hedging activity | $ | 31,155,580 | |||||||||||||||||||||||||||
| Variable Rate Loan Pricing by Index: | |||||||||||||||||||||||||||||
SOFR tenors (2) | $ | 19,459,501 | |||||||||||||||||||||||||||
12- month CMT (3) | 6,906,397 | ||||||||||||||||||||||||||||
| Prime | 3,243,035 | ||||||||||||||||||||||||||||
| Fed Funds | 786,924 | ||||||||||||||||||||||||||||
| Other U.S. Treasury tenors | 187,736 | ||||||||||||||||||||||||||||
| Other | 231,793 | ||||||||||||||||||||||||||||
| Total variable rate | $ | 30,815,386 | |||||||||||||||||||||||||||
| Basis Point (bp) Change in | |||||||||||||||||||||||
| 1-month SOFR | 12- month CMT | Prime | |||||||||||||||||||||
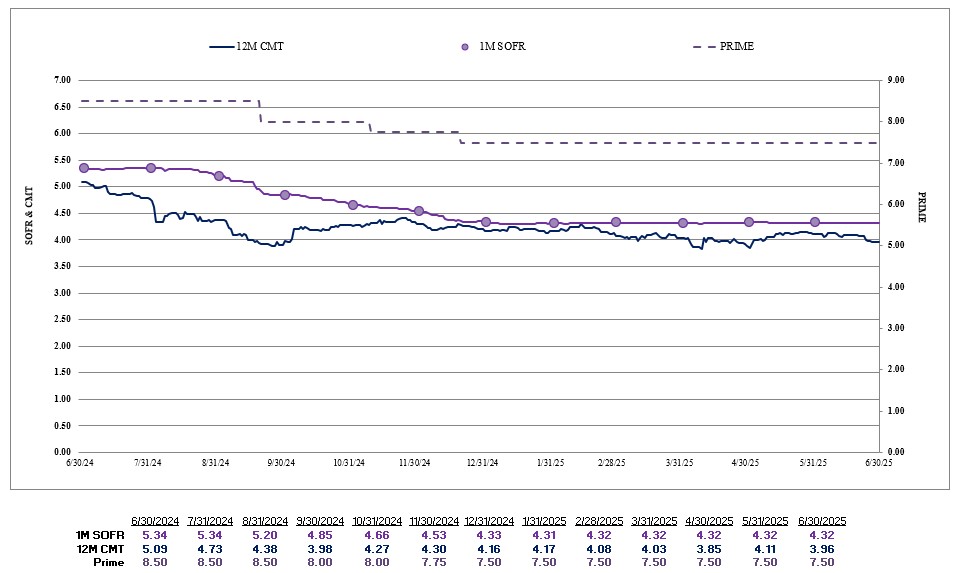
| Second Quarter 2025 | — | bps | (7) | bps | — | bps | |||||||||||||||||
| First Quarter 2025 | (1) | (13) | — | ||||||||||||||||||||
| Fourth Quarter 2024 | (52) | 18 | (50) | ||||||||||||||||||||
| third quarter 2024 | (49) | (111) | (50) | ||||||||||||||||||||
| Second Quarter 2024 | 1 | 6 | — | ||||||||||||||||||||
| Three Months Ended | Six Months Ended | ||||||||||||||||||||||||||||||||||||||||
| Jun 30, | Mar 31, | Dec 31, | Sep 30, | Jun 30, | Jun 30, | Jun 30, | |||||||||||||||||||||||||||||||||||
| (Dollars in thousands) | 2025 | 2025 | 2024 | 2024 | 2024 | 2025 | 2024 | ||||||||||||||||||||||||||||||||||
| Allowance for credit losses at beginning of period | $ | 448,387 | $ | 437,060 | $ | 436,193 | $ | 437,560 | $ | 427,504 | $ | 437,060 | $ | 427,612 | |||||||||||||||||||||||||||
| Provision for credit losses - Other | 22,234 | 23,963 | 16,979 | 6,787 | 40,061 | 46,197 | 61,734 | ||||||||||||||||||||||||||||||||||
| Provision for credit losses - Day 1 on non-PCD assets acquired during the period | — | — | — | 15,547 | — | — | — | ||||||||||||||||||||||||||||||||||
| Initial allowance for credit losses recognized on PCD assets acquired during the period | — | — | — | 3,004 | — | — | — | ||||||||||||||||||||||||||||||||||
| Other adjustments | 180 | 4 | (187) | 30 | (19) | 184 | (50) | ||||||||||||||||||||||||||||||||||
| Charge-offs: | |||||||||||||||||||||||||||||||||||||||||
| Commercial | 6,148 | 9,722 | 5,090 | 22,975 | 9,584 | 15,870 | 20,799 | ||||||||||||||||||||||||||||||||||
| Commercial real estate | 5,711 | 454 | 1,037 | 95 | 15,526 | 6,165 | 20,995 | ||||||||||||||||||||||||||||||||||
| Home equity | 111 | — | — | — | — | 111 | 74 | ||||||||||||||||||||||||||||||||||
| Residential real estate | — | — | 114 | — | 23 | — | 61 | ||||||||||||||||||||||||||||||||||
| Premium finance receivables - property & casualty | 6,346 | 7,114 | 13,301 | 7,790 | 9,486 | 13,460 | 16,424 | ||||||||||||||||||||||||||||||||||
| Premium finance receivables - life insurance | — | 12 | — | 4 | — | 12 | — | ||||||||||||||||||||||||||||||||||
| Consumer and other | 179 | 147 | 189 | 154 | 137 | 326 | 244 | ||||||||||||||||||||||||||||||||||
| Total charge-offs | 18,495 | 17,449 | 19,731 | 31,018 | 34,756 | 35,944 | 58,597 | ||||||||||||||||||||||||||||||||||
| Recoveries: | |||||||||||||||||||||||||||||||||||||||||
| Commercial | 1,746 | 929 | 775 | 649 | 950 | 2,675 | 1,429 | ||||||||||||||||||||||||||||||||||
| Commercial real estate | 10 | 12 | 172 | 30 | 90 | 22 | 121 | ||||||||||||||||||||||||||||||||||
| Home equity | 30 | 216 | 194 | 101 | 35 | 246 | 64 | ||||||||||||||||||||||||||||||||||
| Residential real estate | 2 | 136 | 0 | 5 | 8 | 138 | 10 | ||||||||||||||||||||||||||||||||||
| Premium finance receivables - property & casualty | 3,335 | 3,487 | 2,646 | 3,436 | 3,658 | 6,822 | 5,177 | ||||||||||||||||||||||||||||||||||
| Premium finance receivables - life insurance | — | — | — | 41 | 5 | — | 13 | ||||||||||||||||||||||||||||||||||
| Consumer and other | 32 | 29 | 19 | 21 | 24 | 61 | 47 | ||||||||||||||||||||||||||||||||||
| Total recoveries | 5,155 | 4,809 | 3,806 | 4,283 | 4,770 | 9,964 | 6,861 | ||||||||||||||||||||||||||||||||||
| Net charge-offs | (13,340) | (12,640) | (15,925) | (26,735) | (29,986) | (25,980) | (51,736) | ||||||||||||||||||||||||||||||||||
| Allowance for credit losses at period end | $ | 457,461 | $ | 448,387 | $ | 437,060 | $ | 436,193 | $ | 437,560 | $ | 457,461 | $ | 437,560 | |||||||||||||||||||||||||||
| Annualized net charge-offs (recoveries) by category as a percentage of its own respective category’s average: | |||||||||||||||||||||||||||||||||||||||||
| Commercial | 0.11 | % | 0.23 | % | 0.11 | % | 0.61 | % | 0.25 | % | 0.17 | % | 0.29 | % | |||||||||||||||||||||||||||
| Commercial real estate | 0.17 | 0.01 | 0.03 | 0.00 | 0.53 | 0.10 | 0.36 | ||||||||||||||||||||||||||||||||||
| Home equity | 0.07 | (0.20) | (0.18) | (0.10) | (0.04) | (0.06) | 0.01 | ||||||||||||||||||||||||||||||||||
| Residential real estate | (0.00) | (0.02) | 0.01 | 0.00 | 0.00 | (0.01) | 0.00 | ||||||||||||||||||||||||||||||||||
| Premium finance receivables - property & casualty | 0.16 | 0.20 | 0.59 | 0.24 | 0.33 | 0.18 | 0.33 | ||||||||||||||||||||||||||||||||||
| Premium finance receivables - life insurance | — | 0.00 | — | (0.00) | (0.00) | 0.00 | (0.00) | ||||||||||||||||||||||||||||||||||
| Consumer and other | 0.44 | 0.45 | 0.63 | 0.63 | 0.56 | 0.44 | 0.49 | ||||||||||||||||||||||||||||||||||
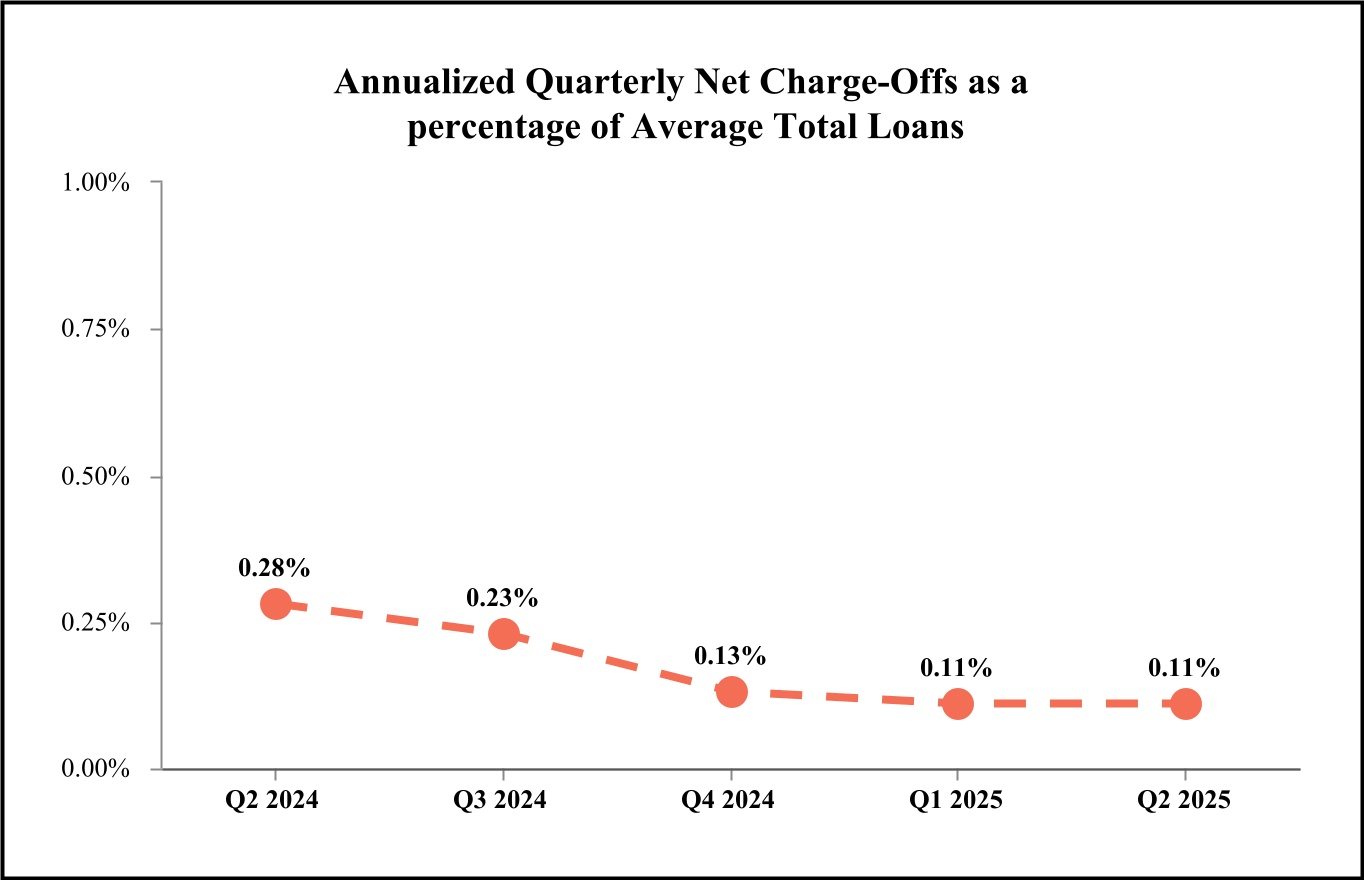
| Total loans, net of unearned income | 0.11 | % | 0.11 | % | 0.13 | % | 0.23 | % | 0.28 | % | 0.11 | 0.24 | % | ||||||||||||||||||||||||||||
| Loans at period end | $ | 51,041,679 | $ | 48,708,390 | $ | 48,055,037 | $ | 47,067,447 | $ | 44,675,531 | |||||||||||||||||||||||||||||||
| Allowance for loan losses as a percentage of loans at period end | 0.77 | % | 0.78 | % | 0.76 | % | 0.77 | % | 0.81 | % | |||||||||||||||||||||||||||||||
| Allowance for loan and unfunded lending-related commitment losses as a percentage of loans at period end | 0.90 | 0.92 | 0.91 | 0.93 | 0.98 | ||||||||||||||||||||||||||||||||||||
| Three Months Ended | Six Months Ended | ||||||||||||||||||||||||||||||||||||||||
| Jun 30, | Mar 31, | Dec 31, | Sep 30, | Jun 30, | Jun 30, | Jun 30, | |||||||||||||||||||||||||||||||||||
| (In thousands) | 2025 | 2025 | 2024 | 2024 | 2024 | 2025 | 2024 | ||||||||||||||||||||||||||||||||||
| Provision for loan losses - Other | $ | 26,607 | $ | 26,826 | $ | 19,852 | $ | 6,782 | $ | 45,111 | $ | 53,433 | $ | 71,270 | |||||||||||||||||||||||||||
| Provision for credit losses - Day 1 on non-PCD assets acquired during the period | — | — | — | 15,547 | — | — | — | ||||||||||||||||||||||||||||||||||
| Provision for unfunded lending-related commitments losses - Other | (4,325) | (2,852) | (2,851) | 17 | (5,212) | (7,177) | (9,680) | ||||||||||||||||||||||||||||||||||
| Provision for held-to-maturity securities losses | (48) | (11) | (22) | (12) | 162 | (59) | 144 | ||||||||||||||||||||||||||||||||||
| Provision for credit losses | $ | 22,234 | $ | 23,963 | $ | 16,979 | $ | 22,334 | $ | 40,061 | $ | 46,197 | $ | 61,734 | |||||||||||||||||||||||||||
| Allowance for loan losses | $ | 391,654 | $ | 378,207 | $ | 364,017 | $ | 360,279 | $ | 363,719 | |||||||||||||||||||||||||||||||
| Allowance for unfunded lending-related commitments losses | 65,409 | 69,734 | 72,586 | 75,435 | 73,350 | ||||||||||||||||||||||||||||||||||||
| Allowance for loan losses and unfunded lending-related commitments losses | 457,063 | 447,941 | 436,603 | 435,714 | 437,069 | ||||||||||||||||||||||||||||||||||||
| Allowance for held-to-maturity securities losses | 398 | 446 | 457 | 479 | 491 | ||||||||||||||||||||||||||||||||||||
| Allowance for credit losses | $ | 457,461 | $ | 448,387 | $ | 437,060 | $ | 436,193 | $ | 437,560 | |||||||||||||||||||||||||||||||
| As of Jun 30, 2025 | As of Mar 31, 2025 | As of Dec 31, 2024 | |||||||||||||||||||||||||||||||||||||||||||||
| (Dollars in thousands) | Recorded Investment | Calculated Allowance | % of its category’s balance | Recorded Investment | Calculated Allowance | % of its category’s balance | Recorded Investment | Calculated Allowance | % of its category’s balance | ||||||||||||||||||||||||||||||||||||||
| Commercial | $ | 16,387,431 | $ | 194,568 | 1.19 | % | $ | 15,931,326 | $ | 201,183 | 1.26 | % | $ | 15,574,551 | $ | 175,837 | 1.13 | % | |||||||||||||||||||||||||||||
| Commercial real estate: | |||||||||||||||||||||||||||||||||||||||||||||||
| Construction and development | 2,529,117 | 75,936 | 3.00 | 2,448,881 | 71,388 | 2.92 | 2,434,081 | 87,236 | 3.58 | ||||||||||||||||||||||||||||||||||||||
| Non-construction | 10,762,893 | 148,422 | 1.38 | 10,466,020 | 138,622 | 1.32 | 10,469,863 | 135,620 | 1.30 | ||||||||||||||||||||||||||||||||||||||
| Total commercial real estate | $ | 13,292,010 | $ | 224,358 | 1.69 | % | $ | 12,914,901 | $ | 210,010 | 1.63 | % | $ | 12,903,944 | $ | 222,856 | 1.73 | % | |||||||||||||||||||||||||||||
| Total commercial and commercial real estate | $ | 29,679,441 | $ | 418,926 | 1.41 | % | $ | 28,846,227 | $ | 411,193 | 1.43 | % | $ | 28,478,495 | $ | 398,693 | 1.40 | % | |||||||||||||||||||||||||||||
| Home equity | 466,815 | 9,221 | 1.98 | 455,683 | 9,139 | 2.01 | 445,028 | 8,943 | 2.01 | ||||||||||||||||||||||||||||||||||||||
| Residential real estate | 3,948,782 | 11,455 | 0.29 | 3,685,159 | 10,652 | 0.29 | 3,612,765 | 10,335 | 0.29 | ||||||||||||||||||||||||||||||||||||||
| Premium finance receivables | |||||||||||||||||||||||||||||||||||||||||||||||
| Property and casualty insurance | 8,323,176 | 15,872 | 0.19 | 7,239,862 | 15,310 | 0.21 | 7,272,042 | 17,111 | 0.24 | ||||||||||||||||||||||||||||||||||||||
| Life insurance | 8,506,960 | 740 | 0.01 | 8,365,140 | 729 | 0.01 | 8,147,145 | 709 | 0.01 | ||||||||||||||||||||||||||||||||||||||
| Consumer and other | 116,505 | 849 | 0.73 | 116,319 | 918 | 0.79 | 99,562 | 812 | 0.82 | ||||||||||||||||||||||||||||||||||||||
| Total loans, net of unearned income | $ | 51,041,679 | $ | 457,063 | 0.90 | % | $ | 48,708,390 | $ | 447,941 | 0.92 | % | $ | 48,055,037 | $ | 436,603 | 0.91 | % | |||||||||||||||||||||||||||||
Total core loans (1) | $ | 29,928,663 | $ | 409,826 | 1.37 | % | $ | 29,108,500 | $ | 397,664 | 1.37 | % | $ | 28,804,138 | $ | 392,319 | 1.36 | % | |||||||||||||||||||||||||||||
Total niche loans (1) | 21,113,016 | 47,237 | 0.22 | 19,599,890 | 50,277 | 0.26 | 19,250,899 | 44,284 | 0.23 | ||||||||||||||||||||||||||||||||||||||
| (In thousands) | Jun 30, 2025 | Mar 31, 2025 | Dec 31, 2024 | Sep 30, 2024 | Jun 30, 2024 | |||||||||||||||||||||||||||
| Loan Balances: | ||||||||||||||||||||||||||||||||
| Commercial | ||||||||||||||||||||||||||||||||
| Nonaccrual | $ | 80,877 | $ | 70,560 | $ | 73,490 | $ | 63,826 | $ | 51,087 | ||||||||||||||||||||||
| 90+ days and still accruing | — | 46 | 104 | 20 | 304 | |||||||||||||||||||||||||||
| 60-89 days past due | 34,855 | 15,243 | 54,844 | 32,560 | 16,485 | |||||||||||||||||||||||||||
| 30-59 days past due | 45,103 | 97,397 | 92,551 | 46,057 | 36,358 | |||||||||||||||||||||||||||
| Current | 16,226,596 | 15,748,080 | 15,353,562 | 15,105,230 | 14,050,228 | |||||||||||||||||||||||||||
| Total commercial | $ | 16,387,431 | $ | 15,931,326 | $ | 15,574,551 | $ | 15,247,693 | $ | 14,154,462 | ||||||||||||||||||||||
| Commercial real estate | ||||||||||||||||||||||||||||||||
| Nonaccrual | $ | 32,828 | $ | 26,187 | $ | 21,042 | $ | 42,071 | $ | 48,289 | ||||||||||||||||||||||
| 90+ days and still accruing | — | — | — | 225 | — | |||||||||||||||||||||||||||
| 60-89 days past due | 11,257 | 6,995 | 10,521 | 13,439 | 6,555 | |||||||||||||||||||||||||||
| 30-59 days past due | 51,173 | 83,653 | 30,766 | 48,346 | 38,065 | |||||||||||||||||||||||||||
| Current | 13,196,752 | 12,798,066 | 12,841,615 | 12,689,336 | 11,854,288 | |||||||||||||||||||||||||||
| Total commercial real estate | $ | 13,292,010 | $ | 12,914,901 | $ | 12,903,944 | $ | 12,793,417 | $ | 11,947,197 | ||||||||||||||||||||||
| Home equity | ||||||||||||||||||||||||||||||||
| Nonaccrual | $ | 1,780 | $ | 2,070 | $ | 1,117 | $ | 1,122 | $ | 1,100 | ||||||||||||||||||||||
| 90+ days and still accruing | — | — | — | — | — | |||||||||||||||||||||||||||
| 60-89 days past due | 138 | 984 | 1,233 | 1,035 | 275 | |||||||||||||||||||||||||||
| 30-59 days past due | 2,971 | 3,403 | 2,148 | 2,580 | 1,229 | |||||||||||||||||||||||||||
| Current | 461,926 | 449,226 | 440,530 | 422,306 | 353,709 | |||||||||||||||||||||||||||
| Total home equity | $ | 466,815 | $ | 455,683 | $ | 445,028 | $ | 427,043 | $ | 356,313 | ||||||||||||||||||||||
| Residential real estate | ||||||||||||||||||||||||||||||||
Early buy-out loans guaranteed by U.S. government agencies (1) | $ | 134,067 | $ | 123,742 | $ | 156,756 | $ | 135,389 | $ | 134,178 | ||||||||||||||||||||||
| Nonaccrual | 28,047 | 22,522 | 23,762 | 17,959 | 18,198 | |||||||||||||||||||||||||||
| 90+ days and still accruing | — | — | — | — | — | |||||||||||||||||||||||||||
| 60-89 days past due | 8,954 | 1,351 | 5,708 | 6,364 | 1,977 | |||||||||||||||||||||||||||
| 30-59 days past due | 38 | 38,943 | 18,917 | 2,160 | 130 | |||||||||||||||||||||||||||
| Current | 3,777,676 | 3,498,601 | 3,407,622 | 3,226,166 | 2,912,852 | |||||||||||||||||||||||||||
| Total residential real estate | $ | 3,948,782 | $ | 3,685,159 | $ | 3,612,765 | $ | 3,388,038 | $ | 3,067,335 | ||||||||||||||||||||||
| Premium finance receivables - property & casualty | ||||||||||||||||||||||||||||||||
| Nonaccrual | $ | 30,404 | $ | 29,846 | $ | 28,797 | $ | 36,079 | $ | 32,722 | ||||||||||||||||||||||
| 90+ days and still accruing | 14,350 | 18,081 | 16,031 | 18,235 | 22,427 | |||||||||||||||||||||||||||
| 60-89 days past due | 25,641 | 19,717 | 19,042 | 18,740 | 29,925 | |||||||||||||||||||||||||||
| 30-59 days past due | 29,460 | 39,459 | 68,219 | 30,204 | 45,927 | |||||||||||||||||||||||||||
| Current | 8,223,321 | 7,132,759 | 7,139,953 | 7,028,423 | 6,969,752 | |||||||||||||||||||||||||||
| Total Premium finance receivables - property & casualty | $ | 8,323,176 | $ | 7,239,862 | $ | 7,272,042 | $ | 7,131,681 | $ | 7,100,753 | ||||||||||||||||||||||
| Premium finance receivables - life insurance | ||||||||||||||||||||||||||||||||
| Nonaccrual | $ | — | $ | — | $ | 6,431 | $ | — | $ | — | ||||||||||||||||||||||
| 90+ days and still accruing | 327 | 2,962 | — | — | — | |||||||||||||||||||||||||||
| 60-89 days past due | 11,202 | 10,587 | 72,963 | 10,902 | 4,118 | |||||||||||||||||||||||||||
| 30-59 days past due | 34,403 | 29,924 | 36,405 | 74,432 | 17,693 | |||||||||||||||||||||||||||
| Current | 8,461,028 | 8,321,667 | 8,031,346 | 7,911,565 | 7,940,304 | |||||||||||||||||||||||||||
| Total Premium finance receivables - life insurance | $ | 8,506,960 | $ | 8,365,140 | $ | 8,147,145 | $ | 7,996,899 | $ | 7,962,115 | ||||||||||||||||||||||
| Consumer and other | ||||||||||||||||||||||||||||||||
| Nonaccrual | $ | 41 | $ | 18 | $ | 2 | $ | 2 | $ | 3 | ||||||||||||||||||||||
| 90+ days and still accruing | 184 | 98 | 47 | 148 | 121 | |||||||||||||||||||||||||||
| 60-89 days past due | 61 | 162 | 59 | 22 | 81 | |||||||||||||||||||||||||||
| 30-59 days past due | 175 | 542 | 882 | 264 | 366 | |||||||||||||||||||||||||||
| Current | 116,044 | 115,499 | 98,572 | 82,240 | 86,785 | |||||||||||||||||||||||||||
| Total consumer and other | $ | 116,505 | $ | 116,319 | $ | 99,562 | $ | 82,676 | $ | 87,356 | ||||||||||||||||||||||
| Total loans, net of unearned income | ||||||||||||||||||||||||||||||||
Early buy-out loans guaranteed by U.S. government agencies (1) | $ | 134,067 | $ | 123,742 | $ | 156,756 | $ | 135,389 | $ | 134,178 | ||||||||||||||||||||||
| Nonaccrual | 173,977 | 151,203 | 154,641 | 161,059 | 151,399 | |||||||||||||||||||||||||||
| 90+ days and still accruing | 14,861 | 21,187 | 16,182 | 18,628 | 22,852 | |||||||||||||||||||||||||||
| 60-89 days past due | 92,108 | 55,039 | 164,370 | 83,062 | 59,416 | |||||||||||||||||||||||||||
| 30-59 days past due | 163,323 | 293,321 | 249,888 | 204,043 | 139,768 | |||||||||||||||||||||||||||
| Current | 50,463,343 | 48,063,898 | 47,313,200 | 46,465,266 | 44,167,918 | |||||||||||||||||||||||||||
| Total loans, net of unearned income | $ | 51,041,679 | $ | 48,708,390 | $ | 48,055,037 | $ | 47,067,447 | $ | 44,675,531 | ||||||||||||||||||||||
| Jun 30, | Mar 31, | Dec 31, | Sep 30, | Jun 30, | |||||||||||||||||||||||||
| (Dollars in thousands) | 2025 | 2025 | 2024 | 2024 | 2024 | ||||||||||||||||||||||||
| Loans past due greater than 90 days and still accruing: | |||||||||||||||||||||||||||||
| Commercial | $ | — | $ | 46 | $ | 104 | $ | 20 | $ | 304 | |||||||||||||||||||
| Commercial real estate | — | — | — | 225 | — | ||||||||||||||||||||||||
| Home equity | — | — | — | — | — | ||||||||||||||||||||||||
| Residential real estate | — | — | — | — | — | ||||||||||||||||||||||||
| Premium finance receivables - property & casualty | 14,350 | 18,081 | 16,031 | 18,235 | 22,427 | ||||||||||||||||||||||||
| Premium finance receivables - life insurance | 327 | 2,962 | — | — | — | ||||||||||||||||||||||||
| Consumer and other | 184 | 98 | 47 | 148 | 121 | ||||||||||||||||||||||||
| Total loans past due greater than 90 days and still accruing | 14,861 | 21,187 | 16,182 | 18,628 | 22,852 | ||||||||||||||||||||||||
| Non-accrual loans: | |||||||||||||||||||||||||||||
| Commercial | 80,877 | 70,560 | 73,490 | 63,826 | 51,087 | ||||||||||||||||||||||||
| Commercial real estate | 32,828 | 26,187 | 21,042 | 42,071 | 48,289 | ||||||||||||||||||||||||
| Home equity | 1,780 | 2,070 | 1,117 | 1,122 | 1,100 | ||||||||||||||||||||||||
| Residential real estate | 28,047 | 22,522 | 23,762 | 17,959 | 18,198 | ||||||||||||||||||||||||
| Premium finance receivables - property & casualty | 30,404 | 29,846 | 28,797 | 36,079 | 32,722 | ||||||||||||||||||||||||
| Premium finance receivables - life insurance | — | — | 6,431 | — | — | ||||||||||||||||||||||||
| Consumer and other | 41 | 18 | 2 | 2 | 3 | ||||||||||||||||||||||||
| Total non-accrual loans | 173,977 | 151,203 | 154,641 | 161,059 | 151,399 | ||||||||||||||||||||||||
| Total non-performing loans: | |||||||||||||||||||||||||||||
| Commercial | 80,877 | 70,606 | 73,594 | 63,846 | 51,391 | ||||||||||||||||||||||||
| Commercial real estate | 32,828 | 26,187 | 21,042 | 42,296 | 48,289 | ||||||||||||||||||||||||
| Home equity | 1,780 | 2,070 | 1,117 | 1,122 | 1,100 | ||||||||||||||||||||||||
| Residential real estate | 28,047 | 22,522 | 23,762 | 17,959 | 18,198 | ||||||||||||||||||||||||
| Premium finance receivables - property & casualty | 44,754 | 47,927 | 44,828 | 54,314 | 55,149 | ||||||||||||||||||||||||
| Premium finance receivables - life insurance | 327 | 2,962 | 6,431 | — | — | ||||||||||||||||||||||||
| Consumer and other | 225 | 116 | 49 | 150 | 124 | ||||||||||||||||||||||||
| Total non-performing loans | $ | 188,838 | $ | 172,390 | $ | 170,823 | $ | 179,687 | $ | 174,251 | |||||||||||||||||||
| Other real estate owned | 23,615 | 22,625 | 23,116 | 13,682 | 19,731 | ||||||||||||||||||||||||
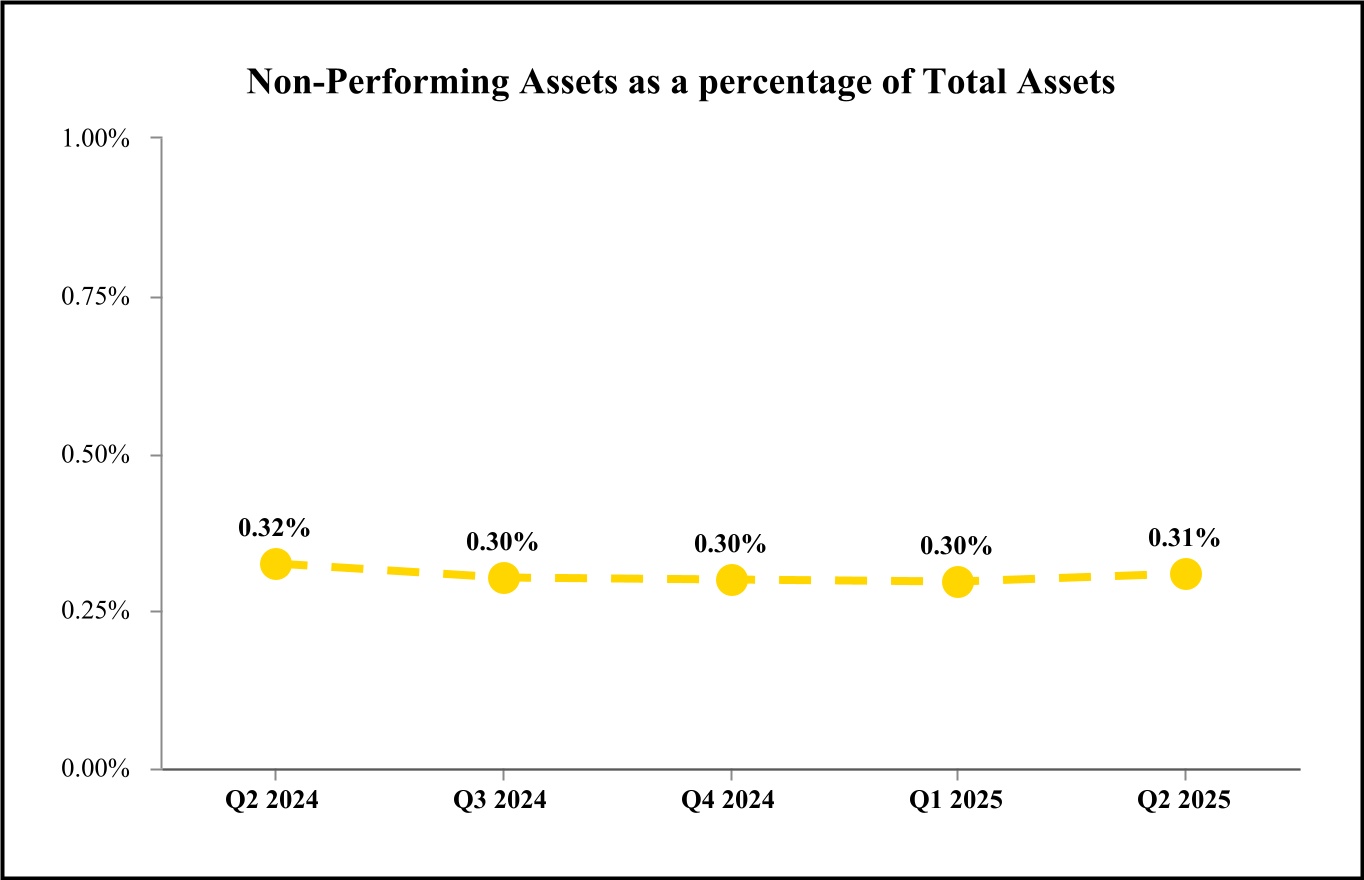
| Total non-performing assets | $ | 212,453 | $ | 195,015 | $ | 193,939 | $ | 193,369 | $ | 193,982 | |||||||||||||||||||
| Total non-performing loans by category as a percent of its own respective category’s period-end balance: | |||||||||||||||||||||||||||||
| Commercial | 0.49 | % | 0.44 | % | 0.47 | % | 0.42 | % | 0.36 | % | |||||||||||||||||||
| Commercial real estate | 0.25 | 0.20 | 0.16 | 0.33 | 0.40 | ||||||||||||||||||||||||
| Home equity | 0.38 | 0.45 | 0.25 | 0.26 | 0.31 | ||||||||||||||||||||||||
| Residential real estate | 0.71 | 0.61 | 0.66 | 0.53 | 0.59 | ||||||||||||||||||||||||
| Premium finance receivables - property & casualty | 0.54 | 0.66 | 0.62 | 0.76 | 0.78 | ||||||||||||||||||||||||
| Premium finance receivables - life insurance | 0.00 | 0.04 | 0.08 | — | — | ||||||||||||||||||||||||
| Consumer and other | 0.19 | 0.10 | 0.05 | 0.18 | 0.14 | ||||||||||||||||||||||||
| Total loans, net of unearned income | 0.37 | % | 0.35 | % | 0.36 | % | 0.38 | % | 0.39 | % | |||||||||||||||||||
| Total non-performing assets as a percentage of total assets | 0.31 | % | 0.30 | % | 0.30 | % | 0.30 | % | 0.32 | % | |||||||||||||||||||
| Allowance for loan losses and unfunded lending-related commitments losses as a percentage of non-accrual loans | 262.71 | % | 296.25 | % | 282.33 | % | 270.53 | % | 288.69 | % | |||||||||||||||||||
| Three Months Ended | Six Months Ended | |||||||||||||||||||||||||||||||||||||
| Jun 30, | Mar 31, | Dec 31, | Sep 30, | Jun 30, | Jun 30, | Jun 30, | ||||||||||||||||||||||||||||||||
| (In thousands) | 2025 | 2025 | 2024 | 2024 | 2024 | 2025 | 2024 | |||||||||||||||||||||||||||||||
| Balance at beginning of period | $ | 172,390 | $ | 170,823 | $ | 179,687 | $ | 174,251 | $ | 148,359 | $ | 170,823 | $ | 139,030 | ||||||||||||||||||||||||
| Additions from becoming non-performing in the respective period | 48,651 | 27,721 | 30,931 | 42,335 | 54,376 | 76,372 | 77,518 | |||||||||||||||||||||||||||||||
| Additions from assets acquired in the respective period | — | — | — | 189 | — | — | — | |||||||||||||||||||||||||||||||
| Return to performing status | (6,896) | (1,207) | (1,108) | (362) | (912) | (8,103) | (1,402) | |||||||||||||||||||||||||||||||
| Payments received | (5,602) | (15,965) | (12,219) | (10,894) | (9,611) | (21,567) | (17,947) | |||||||||||||||||||||||||||||||
| Transfer to OREO and other repossessed assets | (1,315) | — | (17,897) | (3,680) | (6,945) | (1,315) | (8,326) | |||||||||||||||||||||||||||||||
| Charge-offs, net | (11,734) | (8,600) | (5,612) | (21,211) | (7,673) | (20,334) | (22,483) | |||||||||||||||||||||||||||||||
| Net change for premium finance receivables | (6,656) | (382) | (2,959) | (941) | (3,343) | (7,038) | 7,861 | |||||||||||||||||||||||||||||||
| Balance at end of period | $ | 188,838 | $ | 172,390 | $ | 170,823 | $ | 179,687 | $ | 174,251 | $ | 188,838 | $ | 174,251 | ||||||||||||||||||||||||
| Three Months Ended | |||||||||||||||||||||||||||||
| Jun 30, | Mar 31, | Dec 31, | Sep 30, | Jun 30, | |||||||||||||||||||||||||
| (In thousands) | 2025 | 2025 | 2024 | 2024 | 2024 | ||||||||||||||||||||||||
| Balance at beginning of period | $ | 22,625 | $ | 23,116 | $ | 13,682 | $ | 19,731 | $ | 14,538 | |||||||||||||||||||
| Disposals/resolved | — | — | (8,545) | (9,729) | (1,752) | ||||||||||||||||||||||||
| Transfers in at fair value, less costs to sell | 1,315 | — | 17,979 | 3,680 | 6,945 | ||||||||||||||||||||||||
| Fair value adjustments | (325) | (491) | — | — | — | ||||||||||||||||||||||||
| Balance at end of period | $ | 23,615 | $ | 22,625 | $ | 23,116 | $ | 13,682 | $ | 19,731 | |||||||||||||||||||
| Period End | |||||||||||||||||||||||||||||
| (In thousands) | Jun 30, | Mar 31, | Dec 31, | Sep 30, | Jun 30, | ||||||||||||||||||||||||
| Balance by Property Type: | 2025 | 2025 | 2024 | 2024 | 2024 | ||||||||||||||||||||||||
| Residential real estate | $ | — | $ | — | $ | — | $ | — | $ | 161 | |||||||||||||||||||
| Commercial real estate | 23,615 | 22,625 | 23,116 | 13,682 | 19,570 | ||||||||||||||||||||||||
| Total | $ | 23,615 | $ | 22,625 | $ | 23,116 | $ | 13,682 | $ | 19,731 | |||||||||||||||||||
| Three Months Ended | Q2 2025 compared to Q1 2025 | Q2 2025 compared to Q2 2024 | |||||||||||||||||||||||||||||||||||||||||||||
| Jun 30, | Mar 31, | Dec 31, | Sep 30, | Jun 30, | |||||||||||||||||||||||||||||||||||||||||||
| (Dollars in thousands) | 2025 | 2025 | 2024 | 2024 | 2024 | $ Change | % Change | $ Change | % Change | ||||||||||||||||||||||||||||||||||||||
| Brokerage | $ | 4,212 | $ | 4,757 | $ | 5,328 | $ | 6,139 | $ | 5,588 | $ | (545) | (11) | % | $ | (1,376) | (25) | % | |||||||||||||||||||||||||||||
| Trust and asset management | 32,609 | 29,285 | 33,447 | 31,085 | 29,825 | 3,324 | 11 | 2,784 | 9 | ||||||||||||||||||||||||||||||||||||||
| Total wealth management | 36,821 | 34,042 | 38,775 | 37,224 | 35,413 | 2,779 | 8 | 1,408 | 4 | ||||||||||||||||||||||||||||||||||||||
| Mortgage banking | 23,170 | 20,529 | 20,452 | 15,974 | 29,124 | 2,641 | 13 | (5,954) | (20) | ||||||||||||||||||||||||||||||||||||||
| Service charges on deposit accounts | 19,502 | 19,362 | 18,864 | 16,430 | 15,546 | 140 | 1 | 3,956 | 25 | ||||||||||||||||||||||||||||||||||||||
| Gains (losses) on investment securities, net | 650 | 3,196 | (2,835) | 3,189 | (4,282) | (2,546) | (80) | 4,932 | NM | ||||||||||||||||||||||||||||||||||||||
| Fees from covered call options | 5,624 | 3,446 | 2,305 | 988 | 2,056 | 2,178 | 63 | 3,568 | NM | ||||||||||||||||||||||||||||||||||||||
| Trading gains (losses), net | 151 | (64) | (113) | (130) | 70 | 215 | NM | 81 | NM | ||||||||||||||||||||||||||||||||||||||
| Operating lease income, net | 15,166 | 15,287 | 15,327 | 15,335 | 13,938 | (121) | (1) | 1,228 | 9 | ||||||||||||||||||||||||||||||||||||||
| Other: | |||||||||||||||||||||||||||||||||||||||||||||||
| Interest rate swap fees | 3,010 | 2,269 | 3,360 | 2,914 | 3,392 | 741 | 33 | (382) | (11) | ||||||||||||||||||||||||||||||||||||||
| BOLI | 2,257 | 796 | 1,236 | 1,517 | 1,351 | 1,461 | NM | 906 | 67 | ||||||||||||||||||||||||||||||||||||||
| Administrative services | 1,315 | 1,393 | 1,347 | 1,450 | 1,322 | (78) | (6) | (7) | (1) | ||||||||||||||||||||||||||||||||||||||
| Foreign currency remeasurement gains (losses) | 658 | (183) | (682) | 696 | (145) | 841 | NM | 803 | NM | ||||||||||||||||||||||||||||||||||||||
| Changes in fair value on EBOs and loans held-for-investment | 172 | 383 | 129 | 518 | 604 | (211) | (55) | (432) | (72) | ||||||||||||||||||||||||||||||||||||||
| Early pay-offs of capital leases | 400 | 768 | 514 | 532 | 393 | (368) | (48) | 7 | 2 | ||||||||||||||||||||||||||||||||||||||
| Miscellaneous | 15,193 | 15,410 | 14,772 | 16,510 | 22,365 | (217) | (1) | (7,172) | (32) | ||||||||||||||||||||||||||||||||||||||
| Total Other | 23,005 | 20,836 | 20,676 | 24,137 | 29,282 | 2,169 | 10 | (6,277) | (21) | ||||||||||||||||||||||||||||||||||||||
| Total Non-Interest Income | $ | 124,089 | $ | 116,634 | $ | 113,451 | $ | 113,147 | $ | 121,147 | $ | 7,455 | 6 | % | $ | 2,942 | 2 | % | |||||||||||||||||||||||||||||
| Six Months Ended | Q2 2025 compared to Q2 2024 | |||||||||||||||||||
| Jun 30, | Jun 30, | |||||||||||||||||||
| (Dollars in thousands) | 2025 | 2024 | $ Change | % Change | ||||||||||||||||
| Brokerage | $ | 8,969 | $ | 11,144 | $ | (2,175) | (20) | % | ||||||||||||
| Trust and asset management | 61,894 | 59,084 | 2,810 | 5 | ||||||||||||||||
| Total wealth management | 70,863 | 70,228 | 635 | 1 | ||||||||||||||||
| Mortgage banking | 43,699 | 56,787 | (13,088) | (23) | ||||||||||||||||
| Service charges on deposit accounts | 38,864 | 30,357 | 8,507 | 28 | ||||||||||||||||
| Gains (losses) on investment securities, net | 3,846 | (2,956) | 6,802 | NM | ||||||||||||||||
| Fees from covered call options | 9,070 | 6,903 | 2,167 | 31 | ||||||||||||||||
| Trading gains, net | 87 | 747 | (660) | (88) | ||||||||||||||||
| Operating lease income, net | 30,453 | 28,048 | 2,405 | 9 | ||||||||||||||||
| Other: | ||||||||||||||||||||
| Interest rate swap fees | 5,279 | 6,220 | (941) | (15) | ||||||||||||||||
| BOLI | 3,053 | 3,002 | 51 | 2 | ||||||||||||||||
| Administrative services | 2,708 | 2,539 | 169 | 7 | ||||||||||||||||
| Foreign currency remeasurement gains (losses) | 475 | (1,316) | 1,791 | NM | ||||||||||||||||
| Changes in fair value on EBOs and loans held-for-investment | 555 | 165 | 390 | NM | ||||||||||||||||
| Early pay-offs of capital leases | 1,168 | 823 | 345 | 42 | ||||||||||||||||
| Miscellaneous | 30,603 | 60,180 | (29,577) | (49) | ||||||||||||||||
| Total Other | 43,841 | 71,613 | (27,772) | (39) | ||||||||||||||||
| Total Non-Interest Income | $ | 240,723 | $ | 261,727 | $ | (21,004) | (8) | % | ||||||||||||
| Three Months Ended | |||||||||||||||||||||||||||||
| (Dollars in thousands) | Jun 30, 2025 | Mar 31, 2025 | Dec 31, 2024 | Sep 30, 2024 | Jun 30, 2024 | ||||||||||||||||||||||||
| Originations: | |||||||||||||||||||||||||||||
| Retail originations | $ | 523,759 | $ | 348,468 | $ | 483,424 | $ | 527,408 | $ | 544,394 | |||||||||||||||||||
| Veterans First originations | 157,787 | 111,985 | 176,914 | 239,369 | 177,792 | ||||||||||||||||||||||||
| Total originations for sale (A) | $ | 681,546 | $ | 460,453 | $ | 660,338 | $ | 766,777 | $ | 722,186 | |||||||||||||||||||
| Originations for investment | 422,926 | 217,177 | 355,119 | 218,984 | 275,331 | ||||||||||||||||||||||||
| Total originations | $ | 1,104,472 | $ | 677,630 | $ | 1,015,457 | $ | 985,761 | $ | 997,517 | |||||||||||||||||||
| As a percentage of originations for sale: | |||||||||||||||||||||||||||||
| Retail originations | 77 | % | 76 | % | 73 | % | 69 | % | 75 | % | |||||||||||||||||||
| Veterans First originations | 23 | 24 | 27 | 31 | 25 | ||||||||||||||||||||||||
| Purchases | 74 | % | 77 | % | 65 | % | 72 | % | 83 | % | |||||||||||||||||||
| Refinances | 26 | 23 | 35 | 28 | 17 | ||||||||||||||||||||||||
| Production Margin: | |||||||||||||||||||||||||||||
Production revenue (B) (1) | $ | 13,380 | $ | 9,941 | $ | 6,993 | $ | 13,113 | $ | 14,990 | |||||||||||||||||||
| Total originations for sale (A) | $ | 681,546 | $ | 460,453 | $ | 660,338 | $ | 766,777 | $ | 722,186 | |||||||||||||||||||
Add: Current period end mandatory interest rate lock commitments to fund originations for sale (2) | 163,664 | 197,297 | 103,946 | 272,072 | 222,738 | ||||||||||||||||||||||||
Less: Prior period end mandatory interest rate lock commitments to fund originations for sale (2) | 197,297 | 103,946 | 272,072 | 222,738 | 207,775 | ||||||||||||||||||||||||
| Total mortgage production volume (C) | $ | 647,913 | $ | 553,804 | $ | 492,212 | $ | 816,111 | $ | 737,149 | |||||||||||||||||||
| Production margin (B / C) | 2.07 | % | 1.80 | % | 1.42 | % | 1.61 | % | 2.03 | % | |||||||||||||||||||
| Mortgage Servicing: | |||||||||||||||||||||||||||||
| Loans serviced for others (D) | $ | 12,470,924 | $ | 12,402,352 | $ | 12,400,913 | $ | 12,253,361 | $ | 12,211,027 | |||||||||||||||||||
| Mortgage Servicing Rights (“MSR”), at fair value (E) | 193,061 | 196,307 | 203,788 | 186,308 | 204,610 | ||||||||||||||||||||||||
| Percentage of MSRs to loans serviced for others (E / D) | 1.55 | % | 1.58 | % | 1.64 | % | 1.52 | % | 1.68 | % | |||||||||||||||||||
| Servicing income | $ | 10,520 | $ | 10,611 | $ | 10,731 | $ | 10,809 | $ | 10,586 | |||||||||||||||||||
| MSR Fair Value Asset Activity | |||||||||||||||||||||||||||||
| MSR - FV at Beginning of Period | $ | 196,307 | $ | 203,788 | $ | 186,308 | $ | 204,610 | $ | 201,044 | |||||||||||||||||||
| MSR - current period capitalization | 6,336 | 4,669 | 10,010 | 6,357 | 8,223 | ||||||||||||||||||||||||
| MSR - collection of expected cash flows - paydowns | (1,516) | (1,590) | (1,463) | (1,598) | (1,504) | ||||||||||||||||||||||||
| MSR - collection of expected cash flows - payoffs and repurchases | (4,100) | (3,046) | (4,315) | (5,730) | (4,030) | ||||||||||||||||||||||||
| MSR - changes in fair value model assumptions | (3,966) | (7,514) | 13,248 | (17,331) | 877 | ||||||||||||||||||||||||
| MSR Fair Value at end of period | $ | 193,061 | $ | 196,307 | $ | 203,788 | $ | 186,308 | $ | 204,610 | |||||||||||||||||||
| Summary of Mortgage Banking Revenue: | |||||||||||||||||||||||||||||
| Operational: | |||||||||||||||||||||||||||||
Production revenue (1) | $ | 13,380 | $ | 9,941 | $ | 6,993 | $ | 13,113 | $ | 14,990 | |||||||||||||||||||
| MSR - Current period capitalization | 6,336 | 4,669 | 10,010 | 6,357 | 8,223 | ||||||||||||||||||||||||
| MSR - Collection of expected cash flows - paydowns | (1,516) | (1,590) | (1,463) | (1,598) | (1,504) | ||||||||||||||||||||||||
| MSR - Collection of expected cash flows - pay offs | (4,100) | (3,046) | (4,315) | (5,730) | (4,030) | ||||||||||||||||||||||||
| Servicing Income | 10,520 | 10,611 | 10,731 | 10,809 | 10,586 | ||||||||||||||||||||||||
| Other Revenue | (79) | (172) | (51) | (67) | 112 | ||||||||||||||||||||||||
| Total operational mortgage banking revenue | $ | 24,541 | $ | 20,413 | $ | 21,905 | $ | 22,884 | $ | 28,377 | |||||||||||||||||||
| Fair Value: | |||||||||||||||||||||||||||||
| MSR - changes in fair value model assumptions | $ | (3,966) | $ | (7,514) | $ | 13,248 | $ | (17,331) | $ | 877 | |||||||||||||||||||
| Gain (loss) on derivative contract held as an economic hedge, net | 2,535 | 4,897 | (11,452) | 6,892 | (772) | ||||||||||||||||||||||||
| Changes in FV on early buy-out loans guaranteed by US Govt (HFS) | 60 | 2,733 | (3,249) | 3,529 | 642 | ||||||||||||||||||||||||
| Total fair value mortgage banking revenue | $ | (1,371) | $ | 116 | $ | (1,453) | $ | (6,910) | $ | 747 | |||||||||||||||||||
| Total mortgage banking revenue | $ | 23,170 | $ | 20,529 | $ | 20,452 | $ | 15,974 | $ | 29,124 | |||||||||||||||||||
| Six Months Ended | |||||||||||
| (Dollars in thousands) | Jun 30, 2025 | Jun 30, 2024 | |||||||||
| Originations: | |||||||||||
| Retail originations | $ | 872,227 | $ | 875,898 | |||||||
| Veterans First originations | 269,772 | 321,901 | |||||||||
| Total originations for sale (A) | $ | 1,141,999 | $ | 1,197,799 | |||||||
| Originations for investment | 640,103 | 444,577 | |||||||||
| Total originations | $ | 1,782,102 | $ | 1,642,376 | |||||||
| As a percentage of originations for sale: | |||||||||||
| Retail originations | 76 | % | 73 | % | |||||||
| Veterans First originations | 24 | 27 | |||||||||
| Purchases | 75 | % | 80 | % | |||||||
| Refinances | 25 | 20 | |||||||||
| Production Margin: | |||||||||||
Production revenue (B) (1) | $ | 23,321 | $ | 28,425 | |||||||
| Total originations for sale (A) | $ | 1,141,999 | $ | 1,197,799 | |||||||
Add: Current period end mandatory interest rate lock commitments to fund originations for sale (2) | 163,664 | 222,738 | |||||||||
Less: Prior period end mandatory interest rate lock commitments to fund originations for sale (2) | 103,946 | 119,624 | |||||||||
| Total mortgage production volume (C) | $ | 1,201,717 | $ | 1,300,913 | |||||||
| Production margin (B / C) | 1.94 | % | 2.19 | % | |||||||
| Mortgage Servicing: | |||||||||||
| Loans serviced for others (D) | $ | 12,470,924 | $ | 12,211,027 | |||||||
| MSRs, at fair value (E) | 193,061 | 204,610 | |||||||||
| Percentage of MSRs to loans serviced for others (E / D) | 1.55 | % | 1.68 | % | |||||||
| Servicing income | $ | 21,131 | $ | 21,084 | |||||||
| MSR Fair Value Asset Activity | |||||||||||
| MSR - FV at Beginning of Period | $ | 203,788 | $ | 192,456 | |||||||
| MSR - current period capitalization | 11,005 | 13,602 | |||||||||
| MSR - collection of expected cash flows - paydowns | (3,106) | (2,948) | |||||||||
| MSR - collection of expected cash flows - payoffs and repurchases | (7,146) | (6,972) | |||||||||
| MSR - changes in fair value model assumptions | (11,480) | 8,472 | |||||||||
| MSR Fair Value at end of period | $ | 193,061 | $ | 204,610 | |||||||
| Summary of Mortgage Banking Revenue: | |||||||||||
| Operational: | |||||||||||
Production revenue (1) | $ | 23,321 | $ | 28,425 | |||||||
| MSR - Current period capitalization | 11,005 | 13,602 | |||||||||
| MSR - Collection of expected cash flows - paydowns | (3,106) | (2,948) | |||||||||
| MSR - Collection of expected cash flows - pay offs | (7,146) | (6,972) | |||||||||
| Servicing Income | 21,131 | 21,084 | |||||||||
| Other Revenue | (251) | 21 | |||||||||
| Total operational mortgage banking revenue | $ | 44,954 | $ | 53,212 | |||||||
| Fair Value: | |||||||||||
| MSR - changes in fair value model assumptions | $ | (11,480) | $ | 8,472 | |||||||
| Gain (loss) on derivative contract held as an economic hedge, net | 7,432 | (3,349) | |||||||||
| Changes in FV on early buy-out loans guaranteed by US Govt (HFS) | 2,793 | (1,548) | |||||||||
| Total fair value mortgage banking revenue | $ | (1,255) | $ | 3,575 | |||||||
| Total mortgage banking revenue | $ | 43,699 | $ | 56,787 | |||||||
| Three Months Ended | Q2 2025 compared to Q1 2025 | Q2 2025 compared to Q2 2024 | |||||||||||||||||||||||||||||||||||||||||||||
| Jun 30, | Mar 31, | Dec 31, | Sep 30, | Jun 30, | |||||||||||||||||||||||||||||||||||||||||||
| (Dollars in thousands) | 2025 | 2025 | 2024 | 2024 | 2024 | $ Change | % Change | $ Change | % Change | ||||||||||||||||||||||||||||||||||||||
| Salaries and employee benefits: | |||||||||||||||||||||||||||||||||||||||||||||||
| Salaries | $ | 123,174 | $ | 123,917 | $ | 120,969 | $ | 118,971 | $ | 113,860 | $ | (743) | (1) | % | $ | 9,314 | 8 | % | |||||||||||||||||||||||||||||
| Commissions and incentive compensation | 55,871 | 52,536 | 54,792 | 57,575 | 52,151 | 3,335 | 6 | 3,720 | 7 | ||||||||||||||||||||||||||||||||||||||
| Benefits | 40,496 | 35,073 | 36,372 | 34,715 | 32,530 | 5,423 | 15 | 7,966 | 24 | ||||||||||||||||||||||||||||||||||||||
| Total salaries and employee benefits | 219,541 | 211,526 | 212,133 | 211,261 | 198,541 | 8,015 | 4 | 21,000 | 11 | ||||||||||||||||||||||||||||||||||||||
| Software and equipment | 36,522 | 34,717 | 34,258 | 31,574 | 29,231 | 1,805 | 5 | 7,291 | 25 | ||||||||||||||||||||||||||||||||||||||
| Operating lease equipment | 10,757 | 10,471 | 10,263 | 10,518 | 10,834 | 286 | 3 | (77) | (1) | ||||||||||||||||||||||||||||||||||||||
| Occupancy, net | 20,228 | 20,778 | 20,597 | 19,945 | 19,585 | (550) | (3) | 643 | 3 | ||||||||||||||||||||||||||||||||||||||
| Data processing | 12,110 | 11,274 | 10,957 | 9,984 | 9,503 | 836 | 7 | 2,607 | 27 | ||||||||||||||||||||||||||||||||||||||
| Advertising and marketing | 18,761 | 12,272 | 13,097 | 18,239 | 17,436 | 6,489 | 53 | 1,325 | 8 | ||||||||||||||||||||||||||||||||||||||
| Professional fees | 9,243 | 9,044 | 11,334 | 9,783 | 9,967 | 199 | 2 | (724) | (7) | ||||||||||||||||||||||||||||||||||||||
| Amortization of other acquisition-related intangible assets | 5,580 | 5,618 | 5,773 | 4,042 | 1,122 | (38) | (1) | 4,458 | NM | ||||||||||||||||||||||||||||||||||||||
| FDIC insurance | 10,971 | 10,926 | 10,640 | 10,512 | 10,429 | 45 | 0 | 542 | 5 | ||||||||||||||||||||||||||||||||||||||
| OREO expense, net | 505 | 643 | 397 | (938) | (259) | (138) | (21) | 764 | NM | ||||||||||||||||||||||||||||||||||||||
| Other: | |||||||||||||||||||||||||||||||||||||||||||||||
| Lending expenses, net of deferred origination costs | 4,869 | 5,866 | 6,448 | 4,995 | 5,335 | (997) | (17) | (466) | (9) | ||||||||||||||||||||||||||||||||||||||
| Travel and entertainment | 6,026 | 5,270 | 8,140 | 5,364 | 5,340 | 756 | 14 | 686 | 13 | ||||||||||||||||||||||||||||||||||||||
| Miscellaneous | 26,348 | 27,685 | 24,502 | 25,408 | 23,289 | (1,337) | (5) | 3,059 | 13 | ||||||||||||||||||||||||||||||||||||||
| Total other | 37,243 | 38,821 | 39,090 | 35,767 | 33,964 | (1,578) | (4) | 3,279 | 10 | ||||||||||||||||||||||||||||||||||||||
| Total Non-Interest Expense | $ | 381,461 | $ | 366,090 | $ | 368,539 | $ | 360,687 | $ | 340,353 | $ | 15,371 | 4 | % | $ | 41,108 | 12 | % | |||||||||||||||||||||||||||||
| Six Months Ended | Q2 2025 compared to Q2 2024 | |||||||||||||||||||
| Jun 30, | Jun 30, | |||||||||||||||||||
| (Dollars in thousands) | 2025 | 2024 | $ Change | % Change | ||||||||||||||||
| Salaries and employee benefits: | ||||||||||||||||||||
| Salaries | $ | 247,091 | $ | 226,032 | $ | 21,059 | 9 | % | ||||||||||||
| Commissions and incentive compensation | 108,407 | 103,152 | 5,255 | 5 | ||||||||||||||||
| Benefits | 75,569 | 64,530 | 11,039 | 17 | ||||||||||||||||
| Total salaries and employee benefits | 431,067 | 393,714 | 37,353 | 9 | ||||||||||||||||
| Software and equipment | 71,239 | 56,962 | 14,277 | 25 | ||||||||||||||||
| Operating lease equipment | 21,228 | 21,517 | (289) | (1) | ||||||||||||||||
| Occupancy, net | 41,006 | 38,671 | 2,335 | 6 | ||||||||||||||||
| Data processing | 23,384 | 18,795 | 4,589 | 24 | ||||||||||||||||
| Advertising and marketing | 31,033 | 30,476 | 557 | 2 | ||||||||||||||||
| Professional fees | 18,287 | 19,520 | (1,233) | (6) | ||||||||||||||||
| Amortization of other acquisition-related intangible assets | 11,198 | 2,280 | 8,918 | NM | ||||||||||||||||
| FDIC insurance | 21,897 | 19,810 | 2,087 | 11 | ||||||||||||||||
| FDIC insurance - special assessment | — | 5,156 | (5,156) | (100) | ||||||||||||||||
| OREO expense, net | 1,148 | 133 | 1,015 | NM | ||||||||||||||||
| Other: | ||||||||||||||||||||
| Lending expenses, net of deferred origination costs | 10,735 | 10,413 | 322 | 3 | ||||||||||||||||
| Travel and entertainment | 11,296 | 9,937 | 1,359 | 14 | ||||||||||||||||
| Miscellaneous | 54,033 | 46,114 | 7,919 | 17 | ||||||||||||||||
| Total other | 76,064 | 66,464 | 9,600 | 14 | ||||||||||||||||
| Total Non-Interest Expense | $ | 747,551 | $ | 673,498 | $ | 74,053 | 11 | % | ||||||||||||
| Three Months Ended | Six Months Ended | |||||||||||||||||||||||||||||||||||||
| Jun 30, | Mar 31, | Dec 31, | Sep 30, | Jun 30, | Jun 30, | Jun 30, | ||||||||||||||||||||||||||||||||
| (Dollars and shares in thousands) | 2025 | 2025 | 2024 | 2024 | 2024 | 2025 | 2024 | |||||||||||||||||||||||||||||||
| Reconciliation of Non-GAAP Net Interest Margin and Efficiency Ratio: | ||||||||||||||||||||||||||||||||||||||
| (A) Interest Income (GAAP) | $ | 920,908 | $ | 886,965 | $ | 913,501 | $ | 908,604 | $ | 849,979 | $ | 1,807,873 | $ | 1,655,492 | ||||||||||||||||||||||||
| Taxable-equivalent adjustment: | ||||||||||||||||||||||||||||||||||||||
- Loans | 2,200 | 2,206 | 2,352 | 2,474 | 2,305 | 4,406 | 4,551 | |||||||||||||||||||||||||||||||
| - Liquidity Management Assets | 680 | 690 | 716 | 668 | 567 | 1,370 | 1,117 | |||||||||||||||||||||||||||||||
| - Other Earning Assets | — | 3 | 2 | 2 | 3 | 3 | 8 | |||||||||||||||||||||||||||||||
| (B) Interest Income (non-GAAP) | $ | 923,788 | $ | 889,864 | $ | 916,571 | $ | 911,748 | $ | 852,854 | $ | 1,813,652 | $ | 1,661,168 | ||||||||||||||||||||||||
| (C) Interest Expense (GAAP) | 374,214 | 360,491 | 388,353 | 406,021 | 379,369 | 734,705 | 720,688 | |||||||||||||||||||||||||||||||
| (D) Net Interest Income (GAAP) (A minus C) | 546,694 | 526,474 | 525,148 | 502,583 | 470,610 | 1,073,168 | 934,804 | |||||||||||||||||||||||||||||||
| (E) Net Interest Income (non-GAAP) (B minus C) | 549,574 | 529,373 | 528,218 | 505,727 | 473,485 | 1,078,947 | 940,480 | |||||||||||||||||||||||||||||||
| Net interest margin (GAAP) | 3.52 | % | 3.54 | % | 3.49 | % | 3.49 | % | 3.50 | % | 3.53 | % | 3.53 | % | ||||||||||||||||||||||||
| Net interest margin, fully taxable-equivalent (non-GAAP) | 3.54 | 3.56 | 3.51 | 3.51 | 3.52 | 3.55 | 3.56 | |||||||||||||||||||||||||||||||
| (F) Non-interest income | $ | 124,089 | $ | 116,634 | $ | 113,451 | $ | 113,147 | $ | 121,147 | $ | 240,723 | $ | 261,727 | ||||||||||||||||||||||||
| (G) Gains (losses) on investment securities, net | 650 | 3,196 | (2,835) | 3,189 | (4,282) | 3,846 | (2,956) | |||||||||||||||||||||||||||||||
| (H) Non-interest expense | 381,461 | 366,090 | 368,539 | 360,687 | 340,353 | 747,551 | 673,498 | |||||||||||||||||||||||||||||||
| Efficiency ratio (H/(D+F-G)) | 56.92 | % | 57.21 | % | 57.46 | % | 58.88 | % | 57.10 | % | 57.06 | % | 56.15 | % | ||||||||||||||||||||||||
| Efficiency ratio (non-GAAP) (H/(E+F-G)) | 56.68 | 56.95 | 57.18 | 58.58 | 56.83 | 56.81 | 55.88 | |||||||||||||||||||||||||||||||
| Three Months Ended | Six Months Ended | |||||||||||||||||||||||||||||||||||||
| Jun 30, | Mar 31, | Dec 31, | Sep 30, | Jun 30, | Jun 30, | Jun 30, | ||||||||||||||||||||||||||||||||
| (Dollars and shares in thousands) | 2025 | 2025 | 2024 | 2024 | 2024 | 2025 | 2024 | |||||||||||||||||||||||||||||||
| Reconciliation of Non-GAAP Tangible Common Equity Ratio: | ||||||||||||||||||||||||||||||||||||||
| Total shareholders’ equity (GAAP) | $ | 7,225,696 | $ | 6,600,537 | $ | 6,344,297 | $ | 6,399,714 | $ | 5,536,628 | ||||||||||||||||||||||||||||
| Less: Non-convertible preferred stock (GAAP) | (837,500) | (412,500) | (412,500) | (412,500) | (412,500) | |||||||||||||||||||||||||||||||||
| Less: Acquisition-related intangible assets (GAAP) | (908,639) | (913,004) | (918,632) | (924,646) | (676,562) | |||||||||||||||||||||||||||||||||
| (I) Total tangible common shareholders’ equity (non-GAAP) | $ | 5,479,557 | $ | 5,275,033 | $ | 5,013,165 | $ | 5,062,568 | $ | 4,447,566 | ||||||||||||||||||||||||||||
| (J) Total assets (GAAP) | $ | 68,983,318 | $ | 65,870,066 | $ | 64,879,668 | $ | 63,788,424 | $ | 59,781,516 | ||||||||||||||||||||||||||||
| Less: Intangible assets (GAAP) | (908,639) | (913,004) | (918,632) | (924,646) | (676,562) | |||||||||||||||||||||||||||||||||
| (K) Total tangible assets (non-GAAP) | $ | 68,074,679 | $ | 64,957,062 | $ | 63,961,036 | $ | 62,863,778 | $ | 59,104,954 | ||||||||||||||||||||||||||||
| Common equity to assets ratio (GAAP) (L/J) | 9.3 | % | 9.4 | % | 9.1 | % | 9.4 | % | 8.6 | % | ||||||||||||||||||||||||||||
| Tangible common equity ratio (non-GAAP) (I/K) | 8.0 | 8.1 | 7.8 | 8.1 | 7.5 | |||||||||||||||||||||||||||||||||
| Reconciliation of Non-GAAP Tangible Book Value per Common Share: | ||||||||||||||||||||||||||||||||||||||
| Total shareholders’ equity | $ | 7,225,696 | $ | 6,600,537 | $ | 6,344,297 | $ | 6,399,714 | $ | 5,536,628 | ||||||||||||||||||||||||||||
| Less: Preferred stock | (837,500) | (412,500) | (412,500) | (412,500) | (412,500) | |||||||||||||||||||||||||||||||||
| (L) Total common equity | $ | 6,388,196 | $ | 6,188,037 | $ | 5,931,797 | $ | 5,987,214 | $ | 5,124,128 | ||||||||||||||||||||||||||||
| (M) Actual common shares outstanding | 66,938 | 66,919 | 66,495 | 66,482 | 61,760 | |||||||||||||||||||||||||||||||||
| Book value per common share (L/M) | $ | 95.43 | $ | 92.47 | $ | 89.21 | $ | 90.06 | $ | 82.97 | ||||||||||||||||||||||||||||
| Tangible book value per common share (non-GAAP) (I/M) | 81.86 | 78.83 | 75.39 | 76.15 | 72.01 | |||||||||||||||||||||||||||||||||
| Reconciliation of Non-GAAP Return on Average Tangible Common Equity: | ||||||||||||||||||||||||||||||||||||||
| (N) Net income applicable to common shares | $ | 188,536 | $ | 182,048 | $ | 178,371 | $ | 163,010 | $ | 145,397 | $ | 370,584 | $ | 325,700 | ||||||||||||||||||||||||
| Add: Acquisition-related intangible asset amortization | 5,580 | 5,618 | 5,773 | 4,042 | 1,122 | 11,198 | 2,280 | |||||||||||||||||||||||||||||||
| Less: Tax effect of acquisition-related intangible asset amortization | (1,495) | (1,421) | (1,547) | (1,087) | (311) | (2,923) | (602) | |||||||||||||||||||||||||||||||
| After-tax Acquisition-related intangible asset amortization | $ | 4,085 | $ | 4,197 | $ | 4,226 | $ | 2,955 | $ | 811 | $ | 8,275 | $ | 1,678 | ||||||||||||||||||||||||
| (O) Tangible net income applicable to common shares (non-GAAP) | $ | 192,621 | $ | 186,245 | $ | 182,597 | $ | 165,965 | $ | 146,208 | $ | 378,859 | $ | 327,378 | ||||||||||||||||||||||||
| Total average shareholders’ equity | $ | 6,862,040 | $ | 6,460,941 | $ | 6,418,403 | $ | 5,990,429 | $ | 5,450,173 | $ | 6,662,598 | $ | 5,445,315 | ||||||||||||||||||||||||
| Less: Average preferred stock | (599,313) | (412,500) | (412,500) | (412,500) | (412,500) | (506,423) | (412,500) | |||||||||||||||||||||||||||||||
| (P) Total average common shareholders’ equity | $ | 6,262,727 | $ | 6,048,441 | $ | 6,005,903 | $ | 5,577,929 | $ | 5,037,673 | $ | 6,156,175 | $ | 5,032,815 | ||||||||||||||||||||||||
| Less: Average acquisition-related intangible assets | (910,924) | (916,069) | (921,438) | (833,574) | (677,207) | (913,483) | (677,969) | |||||||||||||||||||||||||||||||
| (Q) Total average tangible common shareholders’ equity (non-GAAP) | $ | 5,351,803 | $ | 5,132,372 | $ | 5,084,465 | $ | 4,744,355 | $ | 4,360,466 | $ | 5,242,692 | $ | 4,354,846 | ||||||||||||||||||||||||
| Return on average common equity, annualized (N/P) | 12.07 | % | 12.21 | % | 11.82 | % | 11.63 | % | 11.61 | % | 12.14 | % | 13.01 | % | ||||||||||||||||||||||||
| Return on average tangible common equity, annualized (non-GAAP) (O/Q) | 14.44 | 14.72 | 14.29 | 13.92 | 13.49 | 14.57 | 15.12 | |||||||||||||||||||||||||||||||
| Reconciliation of Non-GAAP Pre-Tax, Pre-Provision Income: | ||||||||||||||||||||||||||||||||||||||
| Income before taxes | $ | 267,088 | $ | 253,055 | $ | 253,081 | $ | 232,709 | $ | 211,343 | $ | 520,143 | $ | 461,299 | ||||||||||||||||||||||||
| Add: Provision for credit losses | 22,234 | 23,963 | 16,979 | 22,334 | 40,061 | 46,197 | 61,734 | |||||||||||||||||||||||||||||||
| Pre-tax income, excluding provision for credit losses (non-GAAP) | $ | 289,322 | $ | 277,018 | $ | 270,060 | $ | 255,043 | $ | 251,404 | $ | 566,340 | $ | 523,033 | ||||||||||||||||||||||||