(Exact name of Registrant as Specified in Its Charter)
Delaware
(State or other jurisdiction of incorporation)
85 New Hampshire Avenue, Suite 150
Portsmouth, New Hampshire
(Address of principal executive offices)
23-2588479
(I.R.S. Employer Identification No.)
03801
(Zip Code)
617-535-4766
(Registrant’s telephone number, including area code)
Securities registered pursuant to Section 12(b) of the Act:
Title of Each Class
Trading Symbols(s)
Name of Exchange on Which Registered
Common Stock, $.01 par value per share
IRM
New York Stock Exchange
Securities registered pursuant to Section 12(g) of the Act: None
Indicate by check mark if the registrant is a well-known seasoned issuer, as defined in Rule 405 of the Securities Act. Yes ☒ No ☐
Indicate by check mark if the registrant is not required to file reports pursuant to Section 13 or Section 15(d) of the Act. Yes ☐ No ☒
Indicate by check mark whether the registrant: (1) has filed all reports required to be filed by Section 13 or 15(d) of the Securities Exchange Act of 1934 during the preceding 12 months (or for such shorter period that the registrant was required to file such reports), and (2) has been subject to such filing requirements for the past 90 days. Yes ☒ No ☐
Indicate by check mark whether the registrant has submitted electronically, every Interactive Data File required to be submitted pursuant to Rule 405 of Regulation S-T during the preceding 12 months (or for such shorter period that the registrant was required to submit such files). Yes ☒ No ☐
Indicate by check mark whether the registrant is a large accelerated filer, an accelerated filer, a non-accelerated filer, smaller reporting company, or an emerging growth company. See the definitions of "large accelerated filer", "accelerated filer", "smaller reporting company" and "emerging growth company" in Rule 12b-2 of the Exchange Act. (Check one):
Large accelerated filer
☒
Accelerated filer
☐
Non-accelerated filer
☐
Smaller reporting company
☐
Emerging growth company
☐
Indicate by check mark whether the registrant has filed a report on and attestation to its management’s assessment of the effectiveness of its internal control over financial reporting under Section 404(b) of the Sarbanes-Oxley Act (15 U.S.C. 7262(b)) by the registered public accounting firm that prepared or issued its audit report. Yes ☒ No ☐
If securities are registered pursuant to Section 12(b) of the Act, indicate by check mark whether the financial statements of the registrant included in the filing reflect the correction of an error to previously issued financial statements. ☐
Indicate by check mark whether any of those error corrections are restatements that required a recovery analysis of incentive-based compensation received by any of the registrant’s executive officers during the relevant recovery period pursuant to § 240.10D-1(b). ☐
Indicate by check mark whether the registrant is a shell company (as defined in Rule 12b-2 of the Exchange Act). Yes ☐ No ☒
As of June 30, 2025, the last business day of the registrant's most recently completed second fiscal quarter, the aggregate market value of the Common Stock of the registrant held by non-affiliates of the registrant was approximately $29.8 billion based on the closing price on the New York Stock Exchange on such date.
Number of shares of the registrant’s Common Stock at February 6, 2026: 295,835,206
DOCUMENTS INCORPORATED BY REFERENCE
Certain information required in Items 10, 11, 12, 13 and 14 of Part III of this Annual Report on Form 10-K (the "Annual Report") is incorporated by reference from our definitive Proxy Statement for our 2026 Annual Meeting of Stockholders (our "Proxy Statement") to be filed with the Securities and Exchange Commission (the "SEC") within 120 days after the close of the fiscal year ended December 31, 2025.
References in this Annual Report on Form 10-K for the year ended December 31, 2025 (this "Annual Report") to "the Company", "Iron Mountain", "we", "us" or "our" include Iron Mountain Incorporated, a Delaware corporation, and its predecessor, as applicable, and its consolidated subsidiaries, unless the context indicates otherwise.
We have made statements in this Annual Report that constitute "forward-looking statements" as that term is defined in the Private Securities Litigation Reform Act of 1995 and other securities laws. These forward-looking statements concern our current expectations regarding our future results from operations, economic performance, financial condition, goals, strategies, investment objectives, plans and achievements. These forward-looking statements are subject to various known and unknown risks, uncertainties and other factors, and you should not rely upon them except as statements of our present intentions and of our present expectations, which may or may not occur. When we use words such as "believes", "expects", "anticipates", "estimates", "plans", "intends", "pursue", "commits", "will" or similar expressions, we are making forward-looking statements. Although we believe that our forward-looking statements are based on reasonable assumptions, our expected results may not be achieved, and actual results may differ materially from our expectations. In addition, important factors that could cause actual results to differ from expectations include, among others:
•our ability or inability to execute our strategic growth plan, including our ability to invest according to plan, grow our businesses (including through joint ventures or other co-investment vehicles), incorporate alternative technologies (including artificial intelligence ("AI") ) into our business, achieve satisfactory returns on new product offerings, continue our revenue management, expand and manage our global operations, complete acquisitions on satisfactory terms, integrate acquired companies efficiently and transition to more sustainable sources of energy;
•changes in customer preferences and demand for our storage and information management services, including as a result of the shift from paper and tape storage to alternative technologies that require less physical space or services activity;
•the costs of complying with and our ability to comply with laws, regulations and customer requirements, including those relating to data privacy and cybersecurity issues, as well as fire and safety and environmental standards, and regulatory and contractual requirements under government contracts;
•the impact of attacks on our internal information technology ("IT") systems, including the impact of such incidents on our reputation and ability to compete and any litigation or disputes that may arise in connection with such incidents;
•our ability to fund capital expenditures;
•the impact of our distribution requirements on our ability to execute our business plan;
•our ability to remain qualified for taxation as a real estate investment trust for United States federal income tax purposes ("REIT");
•changes in the political and economic environments in the countries in which we operate and changes in the global political climate;
•our ability to raise debt or equity capital and changes in the cost of our debt;
•our ability to comply with our existing debt obligations and restrictions in our debt instruments;
•the impact of service interruptions or equipment damage and the cost of power on our data center operations;
•the cost or potential liabilities associated with real estate necessary for our business;
•unexpected events, including those resulting from climate change or geopolitical events, could disrupt our operations and adversely affect our reputation and results of operations;
•fluctuations in commodity prices;
•competition for customers;
•our ability to attract, develop, and retain key personnel;
•deficiencies in our disclosure controls and procedures or internal control over financial reporting;
•other trends in competitive or economic conditions affecting our financial condition or results of operations not presently contemplated; and
•the other risks described in our periodic reports filed with the SEC, including under the caption "Risk Factors" in Part I, Item 1A of this Annual Report.
Except as required by law, we undertake no obligation to update any forward-looking statements appearing in this report.
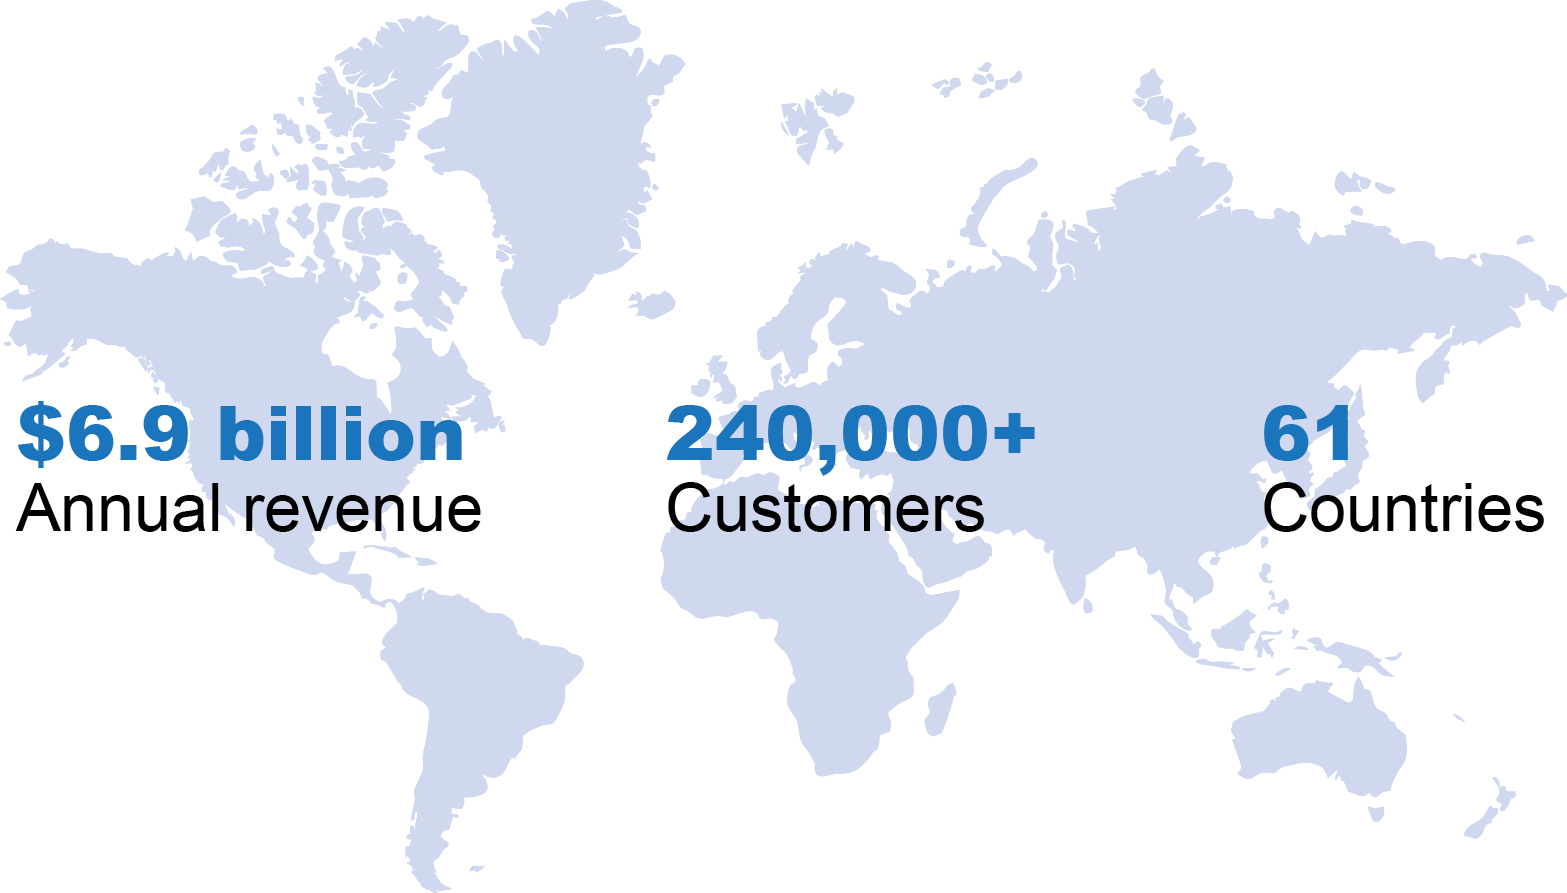
Iron Mountain Incorporated, a Delaware corporation ("IMI"), was founded in an underground facility near Hudson, New York in 1951 where it stored business records. Today, we are a global leader in information management services, and we are trusted by more than 240,000 customers in 61 countries, including approximately 95% of the Fortune 1000, to help unlock value and intelligence from their assets through services that transcend the physical and digital worlds. Our broad range of solutions address their information management, digital transformation, information security, data center and asset lifecycle management (“ALM”) needs. Our longstanding commitment to safety, security, sustainability and innovation in support of our customers underpins everything we do. We currently serve customers across an array of market verticals — commercial, legal, financial, healthcare, technology, insurance, life sciences, energy, business services, entertainment and government organizations.
We are listed on the New York Stock Exchange (the "NYSE") and are a constituent of the Standard & Poor’s 500 Index, the Morgan Stanley Capital International ("MSCI") REIT index and the FTSE EPRA Nareit Global Real Estate Index. As of December 31, 2025, we were number 567 on the Fortune 1000. We have been organized and have operated as a REIT beginning with our taxable year ended December 31, 2014.
BUSINESS STRATEGY
OVERVIEW
Our strategy is to be the leading partner to our more than 240,000 customers by providing a broad range of end-to-end solutions leveraging our strong reputation for security and chain of custody, decades-long relationships built on trust, and global footprint and operational scale. With leadership positions in physical records management, digital solutions, data center, and asset lifecycle management, Iron Mountain serves as a key global partner for enterprises.
Our key strategic priorities are outlined below.
Records Management: Driving continued revenue growth in our physical storage Records Management business (as defined below)
•We are focused on driving volume growth, while also capitalizing on revenue management opportunities as we enhance the value we are providing customers through our expanded suite of global and integrated services.
•We are a leading global provider of physical records management services and will seek to enhance our position in higher-growth markets such as Central and Eastern Europe, Latin America, Asia, the Middle East and Africa.
Digital Solutions: Delivering differentiated digital solutions which give transformative results to our customers in terms of revenue, security and cost
•We are focused on supporting our customers' digital transformation needs as they navigate a complex regulatory environment and seek to gain access to their dark data. Our strategy is underpinned by our persistent focus on best-in-class customer experience as we continue to deliver innovative solutions, such as Insight Digital Experience Platform (“DXP”), to help our customers better leverage data and drive improved efficiency.
•We provide our digital solutions offering globally to customers across an array of market verticals.
Data Center: Supplying differentiated data center offerings through our global scale and customer trust
•We are focused on growing our data center operating portfolio by leasing unsold capacity to hyperscale customers across various global markets. We are also focused on completing construction and commencing data center leases entered into in prior periods.
•As of December 31, 2025, we operated 31 data centers across 21 global markets, either directly or through unconsolidated joint ventures. In addition, we had leased approximately 97% of the existing 488 megawatt ("MW") capacity of our data centers. With a total potential capacity of 1,340 MW in land and buildings currently owned or operated by us, we are among the largest global data center operators.
ALM: Providing asset lifecycle management capabilities, which are both economic and environmentally sustainable
•We are a global ALM provider and are focused on broadening our customer base and increasing our penetration with existing customers through cross-selling initiatives, expanded capabilities and select tuck-in acquisitions.
•As of December 31, 2025, we operated 34 facilities across 8 global markets.
PROJECT MATTERHORN
In 2025, we completed our investments in Project Matterhorn, a global program designed to accelerate the growth of our business ("Project Matterhorn"), which we announced in September 2022. Project Matterhorn investments focused on transforming our operating model to a global operating model. Project Matterhorn enabled the development of a solution-based sales approach that allowed us to optimize our shared services and best practices to better serve our customers' needs. As part of this, we invested to accelerate growth and to capture a greater share of the large, global addressable markets in which we operate. We incurred approximately $574.4 million in Restructuring and other transformation costs related to Project Matterhorn since its inception. Costs were comprised of (1) restructuring costs, which included (i) site consolidation and other related exit costs, (ii) employee severance costs and (iii) certain professional fees associated with these activities, and (2) other transformation costs, which included professional fees such as project management costs and costs for third party consultants who assisted in the enablement of our growth initiatives. Total costs related to Project Matterhorn during the years ended December 31, 2025, 2024 and 2023 were approximately $195.9 million, $161.4 million, and $175.2 million, respectively.
BUSINESS SEGMENTS
The amount of revenues derived from our business segments and other relevant data, including financial information about geographic areas and product and service lines, for the years ended December 31, 2025, 2024 and 2023, are set forth in Note 10 to Notes to Consolidated Financial Statements included in this Annual Report.
GLOBAL RIM BUSINESS
The Global Records and Information Management ("Global RIM") Business segment includes several distinct offerings.
Records Management, stores physical records and provides information services, vital records services, courier operations, and the collection, handling and disposal of sensitive documents ("Records Management") for customers in 61 countries around the globe.
Data Management, provides storage and rotation of backup computer media as part of corporate disaster recovery plans, including service and courier operations, server and computer backup services and related services offerings ("Data Management").
Global Digital Solutions, develops, implements and supports comprehensive storage and information management solutions for the complete lifecycle of our customers’ information, including the management of physical records, conversion of documents to digital formats and digital storage of information ("Global Digital Solutions"). In October 2025, we launched version 2.0 of DXP, which offers enhanced content management and smart document processing, an easy-to-use secure platform with workflow tools and AI agents, allowing customers to make faster and more insightful decisions as well as eliminate obsolete and duplicative data to save costs.
Secure Shredding, includes the scheduled pick-up of office records that customers accumulate in specially designed secure containers we provide and is a natural extension of our hardcopy records management operations, completing the lifecycle of a record. Through a combination of shredding facilities and mobile shredding units consisting of custom built trucks, we are able to offer secure shredding services to our customers.
Media and Archive Services, includes entertainment and media services, which help industry clients store, safeguard and deliver physical media of all types, and provides digital content repository systems that house, distribute and archive key media assets.
Consumer Storage, provides on-demand, valet storage for consumers ("Consumer Storage") utilizing data analytics and machine learning to provide effective customer acquisition and a convenient and seamless consumer storage experience.
The Global Data Center Business segment provides enterprise-class data center facilities and hyperscale-ready capacity to protect mission-critical assets and ensure the continued operation of our customers’ IT infrastructure with secure, reliable and flexible data center options. The world’s most heavily regulated organizations have trusted us as a data center operator for over 20 years, with five of the largest global hyperscalers among our customers.
CORPORATE AND OTHER
Corporate and Other consists primarily of our ALM and Fine Arts businesses and other corporate items ("Corporate and Other").
ALM, provides hyperscale and corporate IT infrastructure managers with services and solutions that enable the decommissioning, data erasure, processing and disposition, and recycling or sale of IT hardware and component assets. ALM services are enabled by: secure logistics, chain of custody and complete asset traceability practices, environmentally-responsible asset processing and recycling, and data sanitization and asset refurbishment services that enable value recovery through asset remarketing. In addition, ALM also offers workplace IT asset management services including storage, configuration, deployment, device support, end-of-life disposition and recycling or sale of employee IT devices. Our ALM services focus on protecting and eradicating customer data while maintaining strong, auditable and transparent chain of custody practices.
Fine Arts, provides technical expertise in the handling, installation and storing of art ("Fine Arts").
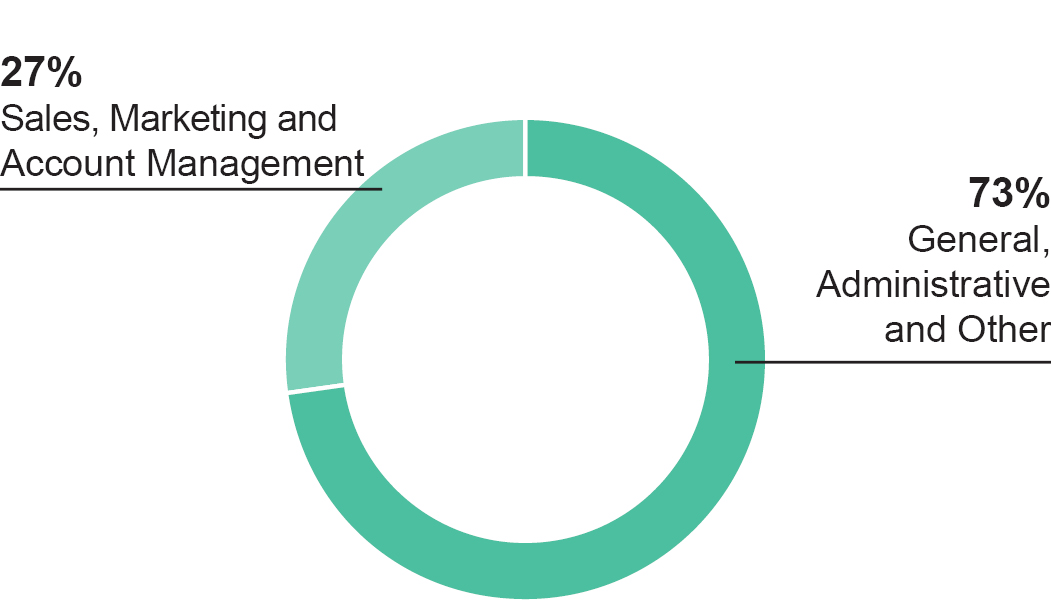
Corporate and Other also includes costs related to executive and staff functions, including finance, human resources and IT, which benefit the enterprise as a whole.
The world’s most heavily regulated organizations trust us with their information management, digital transformation, information security, data center and ALM needs. As an S&P 500 REIT with approximately 1,340 locations globally, our mission-critical solutions generated approximately $6.9 billion in annual revenue in 2025. Our business has a highly diverse customer base of more than 240,000 customers - with no single customer accounting for more than approximately 3% of revenue during the year ended December 31, 2025 - and operates in 61 countries globally. Approximately 5% of our customers currently buy from more than one of our business units, which presents a significant cross-sell opportunity for our expanding solutions, including digital, data center and ALM.
Strong Positions in Large and Growing Markets
We have strong global market positions in each of our businesses, including records management, data center, ALM, digital solutions and fine arts storage. The markets for our solutions are large and growing. We see continued opportunity for growth as our focus on providing innovative solutions unlocks greater value for our customers.
Synergistic Business Model
We operate a synergistic business model, where we leverage cross-selling opportunities against our end-to-end solutions across our 240,000 customers. Our reputation for security, longstanding relationships, and our proven track record of reliability and trust, along with our comprehensive solutions offering and global scale, enables our customers to partner with a single vendor to increase their operational efficiency.
Recurring, Durable
Revenue Stream
A majority of our revenue is recurring in nature. Our contracted storage rental agreements in our Records Management business generally range from one to five years in length. As of December 31, 2025, we stored more than 740 million cubic feet of physical volume and we have consistently experienced strong customer retention levels. In our Global Data Center Business, our lease durations vary by customer, with a weighted average lease expiration of 10.3 years as of December 31, 2025.
Limited Revenue Cyclicality
Historically, economic downturns have not significantly affected our storage rental business. We anticipate continued growth in organic storage rental revenue, supported by the longevity of our total global physical volumes, successful revenue management initiatives and the expansion of our Global Data Center business.
Significant Owner and Operator
of Real Estate
We operate over 98 million square feet of real estate worldwide. Our owned real estate footprint spans to over 24 million square feet. We will continue to seek ways to optimize the efficiency of our real estate portfolio.
Large Data Center Platform with Differentiated Compliance and Security and Sustainability Focus
As of December 31, 2025, we had 488 MW of leasable capacity with an additional 852 MW under construction or held for development.
We offer comprehensive compliance support as well as physical security and cybersecurity. Our “Security-in-Depth” strategy integrates both technical and human security measures, with oversight from senior security leaders with military and public sector backgrounds. As of December 31, 2025, our data center portfolio has achieved numerous certifications and received third party assurance reports, making it one of the most comprehensive compliance programs in the industry. These certifications and reports on compliance include the global ISO 27001, ISO 22301, ISO 9001, SOC 2 and PCI-DSS standards, as well as HIPAA, NIST 800-53 and FISMA HIGH in the United States. The program also includes enterprise-wide certified ISO 14001 and 50001 environmental and energy management systems and complies with ISO 14064 for greenhouse gas emissions, supporting our commitment to sustainability.
We have matched 100% of the energy consumption in our data centers with clean energy annually since 2017. This approach enables our Green Power Pass offering, which allows customers to report the power they consume at any Iron Mountain Data Center as clean power in their public reporting, making Iron Mountain a key part of their decarbonization roadmaps and goals. Our data center business is a founding signatory to the UN Compact on 24/7 Carbon-Free Energy (“CFE”), which seeks hour-by-hour matching of site consumption with local CFE by 2040.
COMPETITION
We face competition from numerous storage and information management services providers globally, as well as storage and information management services that are managed and operated internally by organizations. Competition for records and information customers is driven by factors such as pricing, reputation and reliability, the quality and security of storage solutions and the scope and scale of technology. While the majority of our competitors operate in only one market or region, we believe we provide a differentiated global offering that competes effectively in these areas.
We also compete with numerous data center developers, owners and operators, many of whom own properties comparable to ours in several of the same metropolitan areas where our facilities are located. We believe that competition for data center customers is based on availability of power, security measures, location, connectivity and rental rates, and we are confident in our ability to compete effectively in each of these areas. Additionally, we believe our strong brand, global footprint and excellent commercial relationships empower us to compete successfully and provide significant cross-selling opportunities with our existing customer base.
In our ALM business, we compete with both hyperscalers and individual corporate clients who manage their own asset recycling, disposition and management, in addition to external competitors.
HUMAN CAPITAL MANAGEMENT
EMPLOYEES
As of December 31, 2025, we employed approximately 11,700 employees in the United States and approximately 17,700 employees outside of the United States. As of December 31, 2025, approximately 400 employees were represented by unions in North America and approximately 1,100 employees were represented by unions in Latin America. All union employees are currently under renewed labor agreements or operating under an extension agreement.
BENEFIT PROGRAMS
We provide our employees with benefits that are designed to support their overall physical, financial, emotional and social well-being. These benefits vary by location but generally include health and welfare benefits, paid time off and programs to support financial security. Additionally, employees are able to access emotional well-being resources through global employee assistance programs and new global mental health training. Certain unionized employees receive benefits through unions and are not eligible to participate in our benefit programs. In addition to base compensation and other usual benefits, a significant portion of full-time employees participate in some form of incentive-based compensation program that provides payments based on revenues, profits or attainment of specific objectives for the unit in which they work.
We are committed to making a meaningful impact on our customers, our people and our business by cultivating a culture that is firmly grounded in our values: Acting with Integrity, Owning Safety and Security, Building Customer Value, Taking Ownership and Promoting Inclusion and Teamwork.
We foster an environment of learning, collaboration and wellbeing. Our culture encourages open communication and innovation while building trust, driving engagement and delivering exceptional performance. We evaluate this through our annual global employee engagement survey (the "IM Listening Survey") and use data driven insights to deepen our understanding of our global workforce. These insights collectively enable us to boost employee engagement, measure effectiveness and refine our approach for sustained success.
Led by our President and CEO, William Meaney, our Executive Leadership Team plays a pivotal role in advancing our culture and driving growth. The team reviews and supports key initiatives, monitors progress toward enterprise goals, ensures accountability through measurable targets and communicates achievements to stakeholders. They also actively review the results of our IM Listening Survey, aligning on enterprise-wide actions and focus areas that continue to reinforce our culture. Several members of our Executive Leadership Team are also active sponsors of our employee resource groups, acting as allies and champions of inclusivity and belonging across the enterprise, ensuring that our working environment is a place where all Mountaineers feel that they belong and can contribute at their best.
COMMUNITY INVOLVEMENT
We are committed to integrating responsible and sustainable practices throughout our organization to help our operations have a positive impact on the environment and the communities in which we operate. We aim to give back to the communities where we live and work and believe that this commitment helps in our efforts to attract and retain employees. We offer philanthropic support to our global community through our Living Legacy Initiative, which is our commitment to help preserve and make accessible cultural and historical information and artifacts. We encourage volunteerism in the communities in which we live and work through our Moving Mountains volunteer program, offering paid time off for employees to help community-based and civic-minded organizations.
INSURANCE
For strategic risk transfer purposes, we maintain a comprehensive insurance program with insurers that we believe to be reputable and which have adequate capitalization in amounts that we believe to be appropriate. Property insurance is purchased on a comprehensive basis, including flood and earthquake (including excess coverage), subject to certain policy conditions, sublimits and deductibles. Property is insured based upon the replacement cost of real and personal property, including leasehold improvements, business income loss and extra expense. Other types of insurance that we carry, which are also subject to certain policy conditions, sublimits and deductibles, include medical, workers’ compensation, general liability, umbrella, automobile, professional, cyber, warehouse legal liability and directors’ and officers’ liability policies.
GOVERNMENT REGULATION
We are required to comply with numerous laws and regulations covering a wide variety of subject matters which may have a material effect on our capital expenditures, earnings and competitive position.
For example, some of our currently and formerly owned or leased properties were previously used by entities other than us for industrial or other purposes, or were affected by waste generated from nearby properties, that involved the use, storage, generation and/or disposal of hazardous substances and wastes, including petroleum products. In some instances, this prior use involved the operation of underground storage tanks or the presence of asbestos-containing materials. Where we are aware of environmental conditions that require remediation, we undertake appropriate activity, in accordance with all legal requirements. Although we have from time to time conducted limited environmental investigations and remedial activities at some of our former and current facilities, we have not undertaken environmental reviews of all of our properties. We therefore may be potentially liable for environmental costs and may be unable to sell, rent, mortgage or use contaminated real estate owned or leased by us. Under various federal, state and local environmental laws, we may be liable for environmental compliance and remediation costs to address contamination, if any, located at owned and leased properties as well as damages arising from such contamination, whether or not we know of, or were responsible for, the contamination, or the contamination occurred while we owned or leased the property. Environmental conditions for which we might be liable may also exist at properties that we may acquire in the future. In addition, future regulatory action and environmental laws may impose costs for environmental compliance that do not exist today.
We transfer a portion of our risk of financial loss due to currently undetected environmental matters by purchasing an environmental impairment liability insurance policy, which covers all owned and leased locations. Coverage is provided for both liability and remediation costs.
In addition, we are subject to numerous laws and regulations relating to data privacy and cybersecurity, which are complex, change frequently and have tended to become more stringent over time. We have an established global privacy compliance framework and devote substantial resources, and may in the future have to devote significant additional resources, to facilitate compliance with these laws and regulations, and to investigate, defend or remedy actual or alleged violations or breaches. Any failure by us to comply with, or remedy any violations or breaches of, these laws and regulations could negatively impact our operations, result in the imposition of fines and penalties, liability and litigation, significant costs and expenses and reputational harm.
For more information about laws and regulations that could affect our business, see "Item 1A. Risk Factors" included in this Annual Report.
SUSTAINABILITY
As a global leader in innovative solutions, data center infrastructure and asset lifecycle and information management services, we strive to take responsibility for a sustainable future by unlocking opportunities in our operations and beyond.
We have embedded sustainability across our organizational processes to optimize performance and meet stakeholder needs. Our collaborative approach enables customers to make better decisions about how they manage their most valuable information and assets, prioritizes our employee well-being and development, and supports our local communities.
We transparently report on our sustainability efforts and the advancement of our objectives by using widely adopted reporting frameworks such as the Global Reporting Initiative, CDP and EcoVadis. In addition, we continue to further align our reporting with the recommendations of the Financial Stability Board’s Task Force on Climate-related Financial Disclosures.
Our work continues to receive recognition. Our emissions reduction targets, which align with the Paris Climate Agreement aspiration to limit the global temperature increase to 1.5 degrees Celsius, have been validated by the Science Based Targets initiative ("SBTi"). Our ALM business received the ITAD Company of the Year award at the ITAD Summit in July 2025. This recognition reflects our continued commitment to delivering sustainable, secure and value-driven IT asset disposition solutions.
As of June 30, 2025, we are a constituent of multiple indexes that focus on corporate sustainability standards, including several MSCI All Country World Indexes (ACWI), such as the ACWI Low Carbon Target and World Low Carbon SRI Selection, ACWI Climate Paris Aligned, ACWI USA Extended ESG Leaders and ACWI KLD 400 Social Index. We have also been a constituent of the FTSE4Good Index for more than ten years. A copy of our sustainability report is available on the "Who we are" section of our website, www.ironmountain.com, under the heading "Sustainability". We are not including the information contained on or available through our website as part of, or incorporating such information by reference into, this Annual Report.
STRONG ENVIRONMENTAL FOCUS
•Iron Mountain provides a Green Power Pass solution in the data center market to help customers manage their carbon footprint.
•Founding signatory of the UN Compact on 24/7 Carbon Free Energy. As of 2025, Iron Mountain has over 200 locations globally with the ability to track and match renewable energy usage on an hourly basis.
•91% of our global electricity use was covered by renewable sources in 2024.
•Iron Mountain has near and long-term science-based emissions reduction targets that have been validated by SBTi.
•Reduced Scope 1 and 2 greenhouse gas (GHG) emissions by 16% from 2022 to 2024.
•Achieved a landfill diversion rate of 82% in 2024, reducing waste to landfill and lowering emissions associated with waste processing.
INTERNET WEBSITE
Our internet address is www.ironmountain.com. Under the "Investors" section on our website, we make available, free of charge, our Annual Reports on Form 10-K, our Quarterly Reports on Form 10-Q, our Current Reports on Form 8-K and amendments to those reports filed or furnished pursuant to Section 13(a) or 15(d) of the Securities Exchange Act of 1934 (the "Exchange Act") as soon as reasonably practicable after such forms are filed with or furnished to the SEC. We are not including the information contained on or available through our website as a part of, or incorporating such information by reference into, this Annual Report. Copies of our corporate governance guidelines, code of ethics and the charters of our audit, compensation, finance, nominating and governance and risk and safety committees are available on the "Investors" section of our website, www.ironmountain.com, under the heading "Corporate Governance".
We face many risks. If any of the events or circumstances described below actually occur, we and our businesses, financial condition or results of operations could suffer, and the trading price of our debt or equity securities could decline. Our current and potential investors should consider the following risks and the information contained under the heading "Cautionary Note Regarding Forward-Looking Statements" before deciding to invest in our securities.
BUSINESS RISKS
Failure to execute our strategic growth plan may adversely impact our financial condition and results of operations.
As part of our strategic growth plan, we expect to invest in our existing businesses, including records and information management storage and services businesses in our higher-growth markets, data centers, digital solutions, ALM business and other complementary businesses, and in new businesses, business strategies, products, services, technologies and geographies. These initiatives may involve significant risks and uncertainties, including:
•our inability to maintain relationships with key customers and suppliers or to execute on our plan to incorporate the digitization of our customers’ records and new digital information technologies into our offerings;
•failure to achieve satisfactory returns on new product offerings, acquired companies, joint ventures, growth initiatives or other investments, particularly in markets where we do not currently operate or have a substantial presence;
•our inability to identify suitable companies to acquire, invest in or partner with;
•our inability to complete acquisitions or investments on satisfactory terms;
•our inability to structure acquisitions or investments in a manner that complies with our debt covenants or is consistent with our leverage ratio goals;
•challenges in managing costs to offset the impact of inflationary pressure;
•increased demands on our management, operating systems, internal controls and financial and physical resources and, if necessary, our inability to successfully expand our infrastructure;
•incurring additional debt necessary to acquire suitable companies or make other growth investments if we are unable to pay the purchase price or make the investment out of working capital or the issuance of our common stock or other equity securities;
•our inability to manage the budgeting, forecasting and other process control issues presented by future growth, particularly with respect to new lines of business;
•insufficient revenues to offset expenses and liabilities associated with new investments; and
•our inability to attract, develop and retain skilled employees to lead and support our strategic growth plan, particularly in new businesses, technologies, products or offerings outside our core competencies.
Our new ventures are inherently risky and we can provide no assurance that such strategies and offerings will be successful in achieving the desired returns within a reasonable timeframe, if at all, and that they will not adversely affect our business, reputation, financial condition and operating results.
As stored records and tapes become less active, our service revenue growth and profits from related services may decline.
Our Records Management and Data Management service revenue growth is being negatively impacted by declining activity rates as stored records and tapes are becoming less active and more archival. The amount of information available to customers digitally or in their own information systems has been steadily increasing in recent years, and we believe this trend will continue. As a result, our customers are less likely than they have been in the past to retrieve records and rotate tapes, thereby reducing their activity levels. At the same time, many of our costs related to records and tape related services remain relatively fixed. In addition, our reputation for providing secure information storage is critical to our success, and actions to manage cost structure, such as outsourcing certain transportation, security or other functions, could negatively impact our reputation and adversely affect our business, and, if we are unable to appropriately align our cost structure with decreased levels of service activity, our operating results could be adversely affected.
Our customers continue to evolve the way they store records, which could impact our storage revenue.
We derive substantial revenues from rental fees for the storage of physical records and computer backup media and from storage related services. Volume in and demand for our traditional storage related services has evolved as our customers adopt alternative storage technologies or as retention requirements change, which may require significantly less space than traditional physical records and tape storage; however, volumes in our Global RIM Business segment were relatively steady in 2025 and we expect them to remain relatively consistent in the near term. We can provide no assurance that our customers will continue to store most or a portion of their records as paper documents or as tapes, or that the paper documents or tapes they do store with us will require our storage related services at the same levels as they have in the past. A significant shift by our customers to storage of data through non-paper or non-tape-based technologies, whether now existing or developed in the future, could adversely affect our businesses. In addition, the digitization of records may shift our revenue mix from the more predictable storage revenue to service revenue, which is inherently more volatile.
We and our customers are subject to laws and governmental regulations, including laws relating to data privacy and cybersecurity, and our customers’ demands in this area are increasing. This may cause us to incur significant expenses and non-compliance with such regulations and demands could harm our business.
Our business is subject to regulation under a wide variety of laws and regulations in the jurisdictions which we operate. Although we have policies and procedures designed to comply with applicable laws and regulations, failure to comply with the various laws and regulations may result in civil and criminal liability, fines and penalties and increased costs of compliance.
We and our customers are subject to numerous laws and regulations relating to data privacy and cybersecurity. These regulations are complex, change frequently and have tended to become more stringent over time. In addition, a growing number of regulatory bodies have adopted data breach notification requirements and increased enforcement of regulations regarding the use, access, accuracy and security of personal information. Finally, as a result of the continued emphasis on information security and instances in which personal information has been compromised, our customers are requesting that we take increasingly sophisticated measures to enhance security and comply with cybersecurity and data privacy regulations and that we assume higher liability under our contracts.
We have an established global privacy compliance program and devote substantial resources, and may in the future have to devote significant additional resources, to facilitate compliance with global laws and regulations, our customers’ data privacy, data residency and security demands, and to investigate, defend or remedy actual or alleged violations or breaches. Any failure by us to comply with, or remedy any violations or breaches of, laws and regulations or customer requirements could negatively impact our operations, result in the imposition of fines and penalties, contractual liability and litigation, significant costs and expenses and reputational harm.
Expansion into Global Digital Solutions and ALM services means that our data privacy and security risk profile is increasing. In particular, we are hosting increasing volumes of customer digital data, including sensitive and confidential data, and disposing of customer data-bearing devices. This may result in increased regulatory exposure, contractual liability and security expectations from customers. Finally, emerging AI technology, such as AI and generative AI systems, have become subject to regulation under new laws and new applications of prior existing laws which require additional resources and increase compliance risks as we integrate AI into our services.
Attacks on our internal IT systems could damage our reputation, cause us to lose revenues and adversely affect our business, financial condition and results of operations.
Our reputation for providing secure information storage to customers is critical to the success of our business. Our reputation or brand, and specifically, the trust our customers place in us, could be negatively impacted in the event of perceived or actual failures by us to store information securely. Although we seek to prevent and detect attempts by unauthorized users to gain access to our IT systems, and incur significant costs to do so, our IT and network infrastructure has in the past been and may in the future be vulnerable to cyberattacks and security incidents, including by state-sponsored organizations with significant financial and technological resources, breaches due to employee or contractor error, fraud or malice or other disruptions (including, but not limited to, computer viruses and other malware, denial of service and ransomware), which may involve a breach requiring us to notify regulators, clients or employees and enlist identity theft protection. Recent developments in the cybersecurity threat landscape include the use of AI and machine learning, as well as an increased number of cyber extortion and ransomware attacks. As techniques used to breach security change frequently and are generally not recognized until launched against a target, we may not be able to promptly detect that a cyber breach has occurred, or implement security measures in a timely manner or, if and when implemented, we may not be able to determine the extent to which these measures could be circumvented. Moreover, until we have migrated businesses we acquire onto our IT systems or ensured compliance with our information technology security standards, we have in the past and may in the future face additional risks because of the continued use of predecessor IT systems. We utilize remote work arrangements and outsource certain support services, including cloud storage systems and cloud computing services, to third parties, which has in the past and may in the future subject our IT and other sensitive information to additional risk. A successful breach of the security of our IT systems could lead to theft or misuse of our customers’ proprietary or confidential information or our employees’ personal information and result in third party claims against us, regulatory penalties and reputational harm. Although we maintain insurance coverage for various cybersecurity risks, there is no guarantee that all costs or losses incurred will be fully insured. Damage to our reputation could make us less competitive, which could negatively impact our business, financial condition and results of operations.
The development and use of AI in our business and operations presents risks and challenges that may adversely impact our business and operating results.
Our ability to attract and retain customers, particularly in our Global Digital Solutions business, depends on our ability to offer innovative products and services, including through developing or deploying emerging technologies such as AI. Some of our products, services and processes leverage AI, including both machine learning and generative AI, and we continue to make investments in initiatives focused on the further development and deployment of these technologies. However, there is no assurance that our use or development of AI will enhance our products or services or their marketability, improve operating results, or deliver anticipated benefits, and our product development initiatives involving AI may be unsuccessful. While implementation of these technologies offers the potential for innovation and competitive differentiation, it also poses significant risks and uncertainties, especially given its early stage of commercial adoption.
The use of AI in our product initiatives and offerings or services, or in our internal business operations, may give rise to risks related to accuracy, bias, discrimination, intellectual property infringement, misappropriation or leakage of proprietary, confidential and personal information, defamation, data privacy, and cybersecurity. Any error, defect, or vulnerability in our AI-powered products or business processes could undermine the quality of our products and services, adversely impact our clients’ businesses, subject us or our clients to regulatory scrutiny, fines or litigation and cause reputational harm. We are exposed to similar risks in connection with the use of AI technology by our third-party vendors and clients.
These technologies are subject to an evolving and fragmented legal and regulatory landscape. The absence of a unified regulatory framework, and the risk of divergent or conflicting regulations across jurisdictions applicable to our business, could increase the complexity and costs of compliance for us and our clients. New or changing legal requirements may limit or restrict our use of AI, impose burdensome obligations, or require us to modify or discontinue certain offerings. Any of these factors, alone or in combination, could adversely affect our business, reputation, or results of operations.
Failure to successfully integrate acquired businesses could negatively impact our balance sheet and results of operations.
Strategic acquisitions are an important element of our growth strategy and the success of any acquisition we make depends in part on our ability to integrate the acquired business and realize anticipated synergies. The process of integrating acquired businesses, particularly in new markets or for new offerings, may involve difficulties and may require a disproportionate amount of our management’s attention and our financial and other resources.
For example, the success of our significant acquisitions depends, in large part, on our ability to realize the anticipated benefits, including cost savings or revenue acceleration from combining the acquired businesses with ours. To realize these anticipated benefits, we must be able to successfully integrate our business and the acquired businesses, and this integration is complex and time-consuming. We may encounter challenges in the integration process including the following:
•challenges and difficulties associated with managing our larger, more complex, company;
•conforming standards, controls, procedures and policies, business cultures and compensation and benefits structures between the two businesses;
•consolidating corporate and administrative infrastructures;
•potential unknown liabilities and unforeseen expenses or delays associated with an acquisition; and
•our ability to deliver on our strategy going forward.
Further, our acquisitions subject us to liabilities (including tax liabilities) that may exist at an acquired company, some of which may be unknown. Although we and our advisors conduct due diligence on the businesses we acquire, there can be no guarantee that we are aware of all liabilities of an acquired company. These liabilities, and any additional risks and uncertainties related to an acquired company not known to us or that we may deem immaterial or unlikely to occur at the time of the acquisition, could negatively impact our future business, financial condition and results of operations.
We can give no assurance that we will ultimately be able to effectively integrate and manage the operations of any acquired business or realize anticipated synergies. The failure to successfully integrate the cultures, operating systems, procedures and information technologies of an acquired business could have a material adverse effect on our financial condition and results of operations.
Our future growth depends in part upon our ability to continue to effectively manage and execute on revenue management.
Our organic revenue growth has been positively impacted by our ability to effectively introduce, expand and monitor revenue management. If we are not able to continue and effectively manage pricing, our results of operations could be adversely affected and we may not be able to execute on our strategic growth plan.
Our customer contracts do not always limit our liability and sometimes contain terms that could subject us to significant liability or lead to disputes in contract interpretation.
Our customer contracts typically contain standardized provisions limiting our liability regarding the services we perform and the loss or destruction of, or damage to, records, information or other items stored with us; however, some of our contracts with large customers and governmental entities and some of the contracts assumed in our acquisitions contain no such limits or contain non-standard limits. We can provide no assurance that our limitation of liability provisions will be enforceable in all instances or, if enforceable, that they would otherwise protect us from liability. In the past, we have had relatively few disputes with our customers regarding the terms of their customer contracts, and most disputes to date have not been material, but we can provide no assurance that we will not have material disputes in the future. Moreover, as we expand our operations into new businesses, including Global Digital Solutions, ALM, and the storage of valuable items, and respond to customer demands for higher limitation of liability, our exposure to contracts with higher or no limitations of liability and disputes with customers over contract interpretation may increase. Although we maintain a comprehensive insurance program, we can provide no assurance that we will be able to maintain insurance policies on acceptable terms or with high enough coverage amounts to cover losses to us in connection with customer contract disputes.
As a global company, we are subject to the unique risks of operating in many countries.
As of December 31, 2025, we operated in 61 countries. The global nature of our business and our growth strategy, which includes continued acquisitions and investments in countries where we do not currently operate or have limited operations, is subject to numerous risks, including:
•fluctuations of currency exchange rates in the markets in which we operate;
•the impact of laws and regulations that apply to us in countries in which we operate or have made investments; in particular, we are subject to sanctions and anti-corruption laws, such as the Foreign Corrupt Practices Act and the United Kingdom Bribery Act, and, although we have implemented internal controls, policies and procedures and training to deter prohibited practices, our employees, partners, contractors or agents may violate or circumvent such policies and the law;
•costs and difficulties associated with managing global operations, including cross-border sales;
•the volatility of certain economies in which we operate;
•political uncertainties and changes in the global political climate or other global events, such as war or other military conflict, tariffs or trade restrictions, trade wars, global pandemics or supply chain challenges, which may create additional risk in relation to our global operations, which may become more pronounced as we consolidate operations across countries and need to move data across borders;
•the risk that business partners upon whom we depend for technical assistance or management and acquisition expertise in some markets will not perform as expected;
•difficulties attracting and retaining local management and key employees to operate our business in certain countries; and
•cultural differences and differences in business practices and operating standards, as well as risks and challenges in expanding into countries where we have no prior operational experience.
If we fail to transition to more sustainable sources of energy, it may negatively impact our ability to attract and retain certain of our customers, employees and investors. Furthermore, changes to environmental laws and standards may increase the cost to operate some of our businesses. This could impact our results of operations, our competitiveness and the trading value of our stock.
We have made progress towards reducing our carbon footprint, but if we are not successful in continuing this reduction or if our customers, employees and investors are not satisfied with our sustainability efforts, it may negatively impact our ability to attract and retain customers, employees and investors who focus on this commitment. This could negatively impact our results of operations and the trading of our stock.
Furthermore, changes in environmental laws in any jurisdiction in which we operate could increase compliance costs or impose limitations on our operations. For example, our emergency generators at our data centers are subject to regulations and permit requirements governing air pollutants, and the heating, ventilation and air conditioning and fire suppression systems at some of our data centers and data management locations may include ozone-depleting substances that are subject to regulation. While environmental regulations do not normally impose material costs upon operations at our facilities, unexpected events, equipment malfunctions, human error and changes in law or regulations, among other factors, could result in unexpected costs, which could be material.
Our use of joint ventures or other co-investment vehicles could expose us to additional risks and liabilities, including our lack of sole decision-making authority and our reliance on joint venture or other co-investment vehicle partners who may have economic and business interests that are inconsistent with our business interests.
As part of our growth strategy, particularly in connection with our international and data center expansion, we currently, and may in the future, co-invest with third parties using joint ventures or other co-investment vehicles. These ventures can result in our holding non-controlling interests in, or not having sole control over managing the affairs of, a property or portfolio of properties, business, partnership, joint venture or other entity. In connection with our pursuit or entrance into any such venture, we may be subject to additional risks, including:
•our ability to sell our interests in the venture may be limited by the venture agreement;
•we may not have the right to exercise sole decision-making authority regarding the properties, business, partnership, venture or other entity;
•we may be liable for the venture's failure to comply with applicable law despite only having a non-controlling interest in the venture;
•if our partners become bankrupt or fail to fund their share of required capital contributions, we may choose or be required to contribute unplanned capital;
•our partners may have economic, tax or other interests or goals that are inconsistent with our interests or goals, which could affect our ability to negotiate satisfactory venture terms, to operate the property or business or to maintain our qualification for taxation as a REIT; and
•disputes may arise between us and our partners that result in litigation or arbitration that would increase our expenses and divert the attention of our officers and directors.
Each of these factors may result in returns on these investments being less than we expect or in losses, and our financial and operating results may be adversely affected.
Significant costs or disruptions at our data centers could adversely affect our business, financial condition and results of operations.
Our Global Data Center Business depends on providing customers with highly reliable facilities, power infrastructure and operations solutions, and we will need to retain and hire qualified personnel to manage our data centers. Service interruptions or significant equipment damage could result in difficulty maintaining service-level commitment obligations that we owe to certain of our customers. Service interruptions or equipment damage may occur at one or more of our data centers because of numerous factors, including: human error; equipment failure; physical, electronic and cybersecurity breaches; fire, hurricane, flood, earthquake and other natural disasters; water damage; fiber cuts; extreme temperatures; power loss or telecommunications failure; war, terrorism and any related conflicts or similar events worldwide; and sabotage and vandalism.
We purchase significant amounts of electricity and water for cooling from suppliers that are subject to environmental laws, regulations and permit requirements. These environmental requirements are subject to material change, which could result in increases in our suppliers’ compliance costs that may be passed through to us or otherwise constrain the availability of such resources. In addition, climate change may increase the likelihood that our data centers are affected by some of these factors.
While these risks could impact our overall business, they could have a more significant impact on our Global Data Center Business, where we have service-level commitment obligations to certain of our customers. As a result, service interruptions or significant equipment damage at our data centers could result in difficulty maintaining service-level commitments to these customers and potential claims related to such failures. Because our data centers are critical to many of our customers’ businesses, service interruptions or significant equipment damage at our data centers could also result in lost profits or other indirect or consequential damages to our customers, which could in turn result in contractual liability to our customers or impair our ability to obtain and retain customers, which would adversely affect both our ability to generate revenue and our results of operations.
We also rely on third party telecommunications carriers to provide internet connectivity to our customers. These carriers may elect not to offer or to restrict their services within our data centers or may elect to discontinue such services. Furthermore, carriers may face business difficulties, which could affect their ability to provide telecommunications services or the quality of such services. If connectivity is interrupted or terminated, our financial condition and results of operations may be adversely affected. Events such as these may also impact our reputation as a data center provider which could adversely affect our results of operations.
Our Global Data Center Business is susceptible to regional and local costs of power, power shortages, planned or unplanned power outages and limitations on the availability of adequate power resources. We rely on third parties to provide power to our data centers. We are therefore subject to an inherent risk that such third parties may fail to deliver such power in adequate quantities or on a consistent basis. If the power delivered to our data centers is insufficient or interrupted, we would be required to provide power through the operation of our on-site generators, generally at a significantly higher operating cost. Additionally, global fluctuations in the price of power can increase the cost of energy, and we may be limited in our ability to, or may not always choose to, pass these increased costs on to our customers.
We face additional risks in expanding our Global Data Center Business, including the significant amount of capital required.
Expanding our Global Data Center Business requires significant capital. In addition, we may be required to commit significant operational and financial resources in connection with the organic growth of our Global Data Center Business substantially in advance of such newly developed data centers generating revenue.
We continue to experience rising construction costs which reflect the increase in cost of labor and raw materials, as well as supply chain and logistical challenges. Unexpected disruptions to our supply chain, continued inflationary pressures or high interest rates, tariffs, delays in construction, limited financing availability, constrained supplies of new power, or changes in customer requirements could significantly affect the cost or timing of our planned expansion projects, have consequences under our project financing and partnership agreements, and interfere with our ability to meet commitments to customers who have contracted for space in new data centers under construction.
All construction-related data center projects require us to carefully select, manage, and rely on the experience of one or more design firms, general contractors, and associated subcontractors during the design and construction process, and to obtain critical government permits and authorizations. Should a design firm, general contractor, significant subcontractor, or key supplier experience financial or operational problems during the design or construction process or fail to perform properly, or should we be unable to obtain, or experience delays in obtaining, all necessary zoning, land-use, building, occupancy and other governmental permits and authorizations, we could experience significant delays, increased costs to complete the project, penalties under customer preleases and other negative impacts to the expected return on our committed capital.
There can be no assurance we will have sufficient customer demand to support the data centers we have acquired or built, or that we will not be adversely affected by the risks noted above under "Significant costs or disruptions at our data centers could adversely affect our business, financial condition and results of operations", which could make it difficult for us to realize expected returns on our investments, if any.
Our ALM business may be subject to additional risks, including those related to its client and geographic concentration, government trade policies, and macroeconomic conditions.
A significant portion of the revenue from our ALM business is derived from a limited number of clients and tied to cyclical projects involving the decommissioning and destruction of IT assets and the disposition of components of such assets to purchasers in concentrated geographies. Though we generally enter into long-term contracts with such clients, the volume of work we perform for specific clients may vary over the life of each contract due to various factors including changes in client behavior or macroeconomic conditions impacting the availability of new IT assets in the marketplace. There can be no assurance that we will be able to retain our current volumes, existing clients or that, if we were to lose one or more of our significant clients, we would be able to replace such clients with clients that generate a comparable amount of revenue. Further, many of the purchasers of the decommissioned IT asset components are geographically concentrated, particularly in China. If governments enact trade policies or environmental regulations that restrict or increase the cost of exporting IT assets into China or the other markets in which we sell decommissioned IT asset components or recyclable materials, or increase the enforcement of such policies, then the revenue from the sale of these assets may be negatively impacted. Additionally, uncertain macroeconomic conditions, particularly within China, may reduce our purchasers’ demand for the IT asset components that we sell, thereby reducing our revenues and earnings.
Failure to comply with certain regulatory and contractual requirements under our government contracts could adversely affect our revenues, operating results and financial position and reputation.
Having the government entities as customers subjects us to certain regulatory and contractual requirements. Failure to comply with these requirements could subject us to investigations, price reductions, up to treble damages, and civil penalties. Noncompliance with certain regulatory and contractual requirements could also result in us being suspended or debarred from future contracting with such government entities. We may also face private derivative securities claims because of adverse government actions. Any of these outcomes could have a material adverse effect on our revenues, operating results, financial position and reputation.
We may be subject to certain costs and potential liabilities associated with the real estate required for our business.
As of December 31, 2025, we operated approximately 1,340 facilities worldwide, including approximately 530 in the United States, and face special risks attributable to the real estate we own or lease, which could have a material adverse effect on our revenues, operating results and financial position. Such risks include:
•acquisition and occupancy costs that make it difficult to meet anticipated margins and difficulty locating suitable facilities due to a relatively small number of available buildings having the desired characteristics in some real estate markets;
•increases in rent expense and property taxes as a result of the increasing demand for industrial real estate;
•uninsured losses or damage to our facilities due to an inability to obtain full coverage on a cost-effective basis for some casualties, such as fires, severe weather events, earthquakes and other natural disasters, or any coverage for certain losses, such as losses from riots or terrorist activities;
•inability to use our real estate holdings effectively and costs associated with vacating or consolidating facilities if the demand for physical storage were to diminish;
•liability under environmental laws for the costs of investigation and cleanup of contaminated real estate owned or leased by us, whether or not (i) we know of, or were responsible for, the contamination, or (ii) the contamination occurred while we owned or leased the property; and
•costs of complying with fire protection and safety standards.
Some of our current and formerly owned or leased properties were previously used by entities other than us for industrial or other purposes, or were affected by waste generated from nearby properties, that involved the use, storage, generation and/or disposal of hazardous substances and wastes, including petroleum products. In some instances, this prior use involved the operation of underground storage tanks or the presence of asbestos-containing materials. Where we are aware of environmental conditions that require remediation, we undertake appropriate activity, in accordance with all legal requirements. Although we have from time to time conducted limited environmental investigations and remedial activities at some of our former and current facilities, we have not undertaken an environmental review of all of our properties, including those we have acquired. We therefore may be potentially liable for environmental costs like those discussed above and may be unable to sell, rent, mortgage or use contaminated real estate owned or leased by us. Environmental conditions for which we might be liable may also exist at properties that we may acquire in the future. In addition, future regulatory action and environmental laws may impose costs for environmental compliance that do not exist today.
Unexpected events, including those resulting from climate change or geopolitical events, could disrupt our operations and adversely affect our reputation and results of operations.
Unexpected events, including fires or explosions at our facilities, war or other military conflict, terrorist activities, natural disasters such as earthquakes and wildfires, unplanned power outages, supply disruptions, failure of equipment or systems, and severe weather events, such as droughts, heat waves, wind events, hurricanes, and flooding, could adversely affect our reputation and results of operations through physical damage to our facilities, equipment and customers' inventory and through physical damage to, or disruption of, local infrastructure. During the past several years, we have seen an increase in the frequency and intensity of severe weather events and we expect this trend to continue due to climate change. Some of our key facilities worldwide are vulnerable to severe weather events, and global weather pattern changes may also pose long-term risks of physical impacts to our business. Our customers rely on us to securely store and timely retrieve their critical information, and, while we maintain disaster recovery and business continuity plans that would be implemented in these situations, these unexpected events could result in customer service disruption, physical damage to one or more key operating facilities and the information stored in those facilities, the closure of one or more key operating facilities or the disruption of information systems, each of which could negatively impact our reputation and results of operations. In addition, these unexpected events could negatively impact our reputation if such events result in adverse publicity, governmental investigations or litigation or if customers do not otherwise perceive our response to be adequate.
Fluctuations in commodity prices may affect our operating revenues and results of operations.
Our operating revenues and results of operations are impacted by significant changes in commodity prices. In particular, our secure shredding operations generate revenue from the sale of shredded paper for recycling. Additionally, our ALM business may be affected by the prices of scrap metals. Significant declines in the cost of paper or scrap metals may negatively impact our revenues and results of operations, and increases in other commodity prices, including steel, may negatively impact our results of operations.
Failure to manage and adequately implement our new IT systems could negatively affect our business.
We rely on IT infrastructure, including hardware, networks, software, people and processes, to provide information to support assessments and conclusions about our operating performance. We are in the process of upgrading a number of our IT systems, including consolidating our existing finance operations platforms, and we face risks relating to these transitions. For example, we may incur greater costs than we anticipate training our personnel on the new systems, we may experience service disruptions or errors in accurately capturing data or retaining our records, and we may be delayed in meeting our various reporting obligations. There can be no assurance that we will manage our IT systems and implement these new systems as planned or that we will do so without disruptions to our operations, which could have an adverse effect on our business, financial condition, results of operations and cash flows.
Our indebtedness could adversely affect our financial health and prevent us from fulfilling our obligations under our various debt instruments.
As of December 31, 2025, our total long-term debt was approximately $16,544.5 million, stockholders' deficit was approximately $981.0 million and we had cash and cash equivalents of approximately $158.5 million. Our indebtedness could have important consequences to our current and potential investors. These risks include:
•inability to satisfy our obligations with respect to our various debt instruments;
•inability to make borrowings to fund future working capital, capital expenditures and strategic growth opportunities, including acquisitions, further organic development of, and investment into, our Global Data Center, ALM and Global Digital Solutions businesses and other service offerings, and other general corporate requirements, including possible required repurchases, redemptions or prepayments of our various indebtedness;
•limits on our distributions to stockholders; in this regard if these limits prevented us from satisfying our REIT distribution requirements, we could fail to remain qualified for taxation as a REIT or, if these limits do not jeopardize our qualification for taxation as a REIT but do nevertheless prevent us from distributing 100% of our REIT taxable income, we will be subject to federal corporate income tax, and potentially a nondeductible excise tax, on the retained amounts;
•limits on future borrowings under our existing or future credit arrangements, which could affect our ability to pay our indebtedness or to fund our other liquidity needs;
•inability to generate sufficient funds to cover required interest payments;
•restrictions on our ability to refinance our indebtedness on commercially reasonable terms;
•limits on our flexibility in planning for, or reacting to, changes in our business and the information management services industry; and
•inability to adjust to adverse economic conditions that could place us at a disadvantage to our competitors with less debt and who, therefore, may be able to take advantage of opportunities that our indebtedness prevents us from pursuing.
Certain of our indebtedness, including indebtedness under our Credit Agreement (as defined below), is paid at floating interest rates, and as a result, our interest expense or the cost of our debt may increase due to rising interest rates or changes to benchmark rates.
Restrictive debt covenants may limit our ability to pursue our growth strategy.
Our Credit Agreement and our indentures contain covenants restricting or limiting our ability to, among other things:
•incur additional indebtedness;
•pay dividends or make other restricted payments;
•make asset dispositions;
•create or permit liens;
•sell, transfer or exchange assets;
•guarantee certain indebtedness;
•make acquisitions and other investments; and
•enter into partnerships, joint ventures and co-investment vehicles.
These restrictions and our long-term commitment to maintain our leverage ratio may adversely affect our ability to pursue acquisitions and other growth strategies, including our strategic growth plan.
We may not have the ability to raise the funds necessary to finance the repurchase of outstanding senior notes upon a change of control event as required by our indentures.
Upon the occurrence of a "change of control", as defined in our indentures, we will be required to offer to repurchase all of our outstanding senior notes. However, it is possible that we will not have sufficient funds at the time of a change of control to make the required repurchase of any outstanding notes or that restrictions in our Credit Agreement will not allow such repurchases. Failure to make the required repurchases could result in cross defaults or payment acceleration events under our other debt instruments. Certain important corporate events, however, such as leveraged recapitalizations that would increase the level of our indebtedness, would not constitute a "change of control" under our indentures.
IMI is a holding company, and, therefore, its ability to make payments on its various debt obligations depends in large part on the operations of its subsidiaries.
IMI is a holding company; substantially all of its assets consist of the equity in its subsidiaries, and substantially all of its operations are conducted by its direct and indirect consolidated subsidiaries. As a result, its ability to make payments on its debt obligations will be dependent upon the receipt of sufficient funds from its subsidiaries, whose ability to distribute funds may be limited by local capital requirements, joint venture and co-investment vehicle structures and other applicable restrictions. However, our various debt obligations are guaranteed, on a joint and several and full and unconditional basis, by IMI’s U.S. subsidiaries that represent the substantial majority of its U.S. operations.
RISKS RELATED TO OUR TAXATION AS A REIT
If we fail to remain qualified for taxation as a REIT, we will be subject to tax at corporate income tax rates and will not be able to deduct distributions to stockholders when computing our taxable income.
We have elected to be taxed as a REIT for federal income tax purposes beginning with our 2014 taxable year. We believe that our organization and method of operation comply with the rules and regulations promulgated under the Internal Revenue Code of 1986, as amended (the "Code"), such that we will continue to qualify for taxation as a REIT. However, we can provide no assurance that we will remain qualified for taxation as a REIT. We also have invested in subsidiaries that have elected or that we expect will elect to be taxed as REITs and therefore must independently satisfy all REIT qualification requirements. We may in the future invest in other such subsidiary REITs. If such a subsidiary REIT were to fail to qualify as a REIT, it may cause us to fail to remain qualified for taxation as a REIT. If we fail to remain qualified for taxation as a REIT, including as a result of a cascading failure of any subsidiary REIT to remain qualified as a REIT, we will be subject to federal income taxation at corporate income tax rates unless certain relief provisions apply.
Qualification for taxation as a REIT involves the application of highly technical and complex provisions of the Code to our operations, as well as various factual determinations concerning matters and circumstances not entirely within our control. There are limited judicial or administrative interpretations of applicable REIT provisions of the Code.
If, in any taxable year, we fail to remain qualified for taxation as a REIT and are not entitled to relief under the Code:
•we will not be allowed a deduction for distributions to stockholders in computing our taxable income;
•we will be subject to federal and state income tax on our taxable income at regular corporate income tax rates; and
•we would not be eligible to elect REIT status again until the fifth taxable year that begins after the first year for which we failed to qualify for taxation as a REIT.
Any such corporate tax liability could be substantial and would reduce the amount of cash available for other purposes. If we fail to remain qualified for taxation as a REIT, we may need to borrow additional funds or liquidate some investments to pay any additional tax liability. Accordingly, funds available for investment and distributions to stockholders could be reduced.
As a REIT, failure to make required distributions would subject us to federal corporate income tax.
We expect to continue paying regular quarterly distributions; however, the amount, timing and form of our regular quarterly distributions will be determined, and will be subject to adjustment, by our board of directors. To remain qualified for taxation as a REIT, we are generally required to distribute at least 90% of our REIT taxable income (determined without regard to the dividends paid deduction and excluding net capital gain) each year, or in limited circumstances, the following year, to our stockholders. Generally, we expect to distribute all or substantially all of our REIT taxable income. If our cash available for distribution falls short of our estimates, we may be unable to maintain distributions that approximate our REIT taxable income and may fail to remain qualified for taxation as a REIT. In addition, our cash flows from operations may be insufficient to fund required distributions as a result of nondeductible expenditures or as a result of differences in timing between the actual receipt of income and the payment of expenses and the recognition of income and expenses for federal income tax purposes.
To the extent that we satisfy the 90% distribution requirement but distribute less than 100% of our REIT taxable income, we will be subject to federal corporate income tax on our undistributed taxable income. In addition, we will be subject to a 4% nondeductible excise tax on our undistributed taxable income if the actual amount that we distribute to our stockholders for a calendar year is less than the minimum amount specified under the Code.
We may be required to borrow funds, sell assets or raise equity to satisfy our REIT distribution requirements, to comply with asset ownership tests or to fund capital expenditures, future growth and expansion initiatives.
In order to satisfy our REIT distribution requirements and maintain our qualification and taxation as a REIT, or to fund capital expenditures, future growth and expansion initiatives, we may need to borrow funds, sell assets or raise equity, even if our financial condition or the then-prevailing market conditions are not favorable for these borrowings, sales or offerings. Furthermore, the REIT distribution requirements and our commitment to investors on dividend growth may result in increasing our financing needs to fund capital expenditures, future growth and expansion initiatives, which would increase our indebtedness. An increase in our outstanding debt could lead to a downgrade of our credit ratings, which could negatively impact our ability to access credit markets. Further, certain of our current debt instruments limit the amount of indebtedness we and our subsidiaries may incur. Additional financing, therefore, may be unavailable, more expensive or restricted by the terms of our outstanding indebtedness. For a discussion of risks related to our substantial level of indebtedness, see "Risks Related to Our Indebtedness".
Complying with REIT requirements may limit our flexibility, cause us to forgo otherwise attractive opportunities that we would otherwise pursue to execute our strategic growth plan, or otherwise reduce our income and amounts available for distribution to our stockholders.
To remain qualified for taxation as a REIT, we must satisfy tests concerning, among other things, the sources of our income, the nature and diversification of our assets and the amounts we distribute to our stockholders. Thus, compliance with these tests may require us to refrain from certain activities and may hinder our ability to make certain attractive investments, including the purchase of non-REIT qualifying operations or assets, the expansion of non-real estate activities, and investments in the businesses to be conducted by our taxable REIT subsidiaries ("TRSs"), and, to that extent, limit our opportunities and our flexibility to change our business strategy and execute on our strategic growth plan. This may restrict our ability to acquire certain businesses, enter into joint ventures or co-investment vehicles, or acquire minority interests of companies. Furthermore, acquisition opportunities in domestic and international markets may be adversely affected if we need or require the target company to comply with some REIT requirements prior to closing.
We conduct a significant portion of our business activities, including our information management services businesses and several of our international operations, through domestic and foreign TRSs. Under the Code, no more than 25% of the value of the assets of a REIT may be represented by securities of one or more TRSs. Similar rules apply to other nonqualifying assets. These limitations may affect our ability to make additional investments in non-REIT qualifying operations or assets or in international operations through TRSs.
If we fail to comply with specified asset ownership tests applicable to REITs as measured at the end of any calendar quarter, we generally must correct such failure within 30 days after the end of the applicable calendar quarter or qualify for statutory relief provisions to avoid losing our qualification for taxation as a REIT. As a result, we may be required to liquidate assets or to forgo our pursuit of otherwise attractive investments or executing on portions of our strategic growth plan. These actions may reduce our income and amounts available for distribution to our stockholders.
As a REIT, we are limited in our ability to fund distribution payments using cash generated through our TRSs.
Our ability to receive distributions from our TRSs is limited by the rules with which we must comply to maintain our qualification for taxation as a REIT. In particular, at least 75% of our gross income for each taxable year as a REIT must be derived from real estate, which generally includes gross income from providing customers with secure storage space or colocation or wholesale data center space. Consequently, no more than 25% of our gross income may consist of dividend income from our TRSs and other nonqualifying types of income. Thus, our ability to receive distributions from our TRSs may be limited, which may impact our ability to fund distributions to our stockholders using cash flows from our TRSs. Specifically, if our TRSs become highly profitable, we might become limited in our ability to receive net income from our TRSs in an amount required to fund distributions to our stockholders commensurate with that profitability.
In addition, a significant amount of our income and cash flows from our TRSs is generated from our international operations. In many cases, there are local withholding taxes and currency controls that may impact our ability or willingness to repatriate funds to the United States to help satisfy REIT distribution requirements.
Our extensive use of TRSs, including for certain of our international operations, may cause us to fail to remain qualified for taxation as a REIT.
Our operations include an extensive use of TRSs. The net income of our TRSs is not required to be distributed to us, and income that is not distributed to us generally is not subject to the REIT income distribution requirement. However, there may be limitations on our ability to accumulate earnings in our TRSs and the accumulation or reinvestment of significant earnings in our TRSs could result in adverse tax treatment. In particular, if the accumulation of cash in our TRSs causes (i) the fair market value of our securities in our TRSs to exceed 25% of the fair market value of our assets or (ii) the fair market value of our securities in our TRSs and other nonqualifying assets to exceed 25% of the fair market value of our assets, then we will fail to remain qualified for taxation as a REIT. Further, a substantial portion of our operations are conducted overseas, and a material change in foreign currency rates could also affect the value of our foreign holdings in our TRSs, negatively impacting our ability to remain qualified for taxation as a REIT.
Even if we remain qualified for taxation as a REIT, some of our business activities are subject to corporate level income tax and foreign taxes, which will continue to reduce our cash flows, and we will have potential deferred and contingent tax liabilities.
Even if we remain qualified for taxation as a REIT, we may be subject to some federal, state, local and foreign taxes, including taxes on any undistributed income, and state, local or foreign income, franchise, property and transfer taxes. In addition, we could in certain circumstances be required to pay an excise or penalty tax, which could be significant in amount, in order to utilize one or more relief provisions under the Code to maintain our qualification for taxation as a REIT.
A portion of our business is conducted through TRSs because certain of our business activities could generate nonqualifying REIT income as currently structured and operated. The income of our domestic TRSs will continue to be subject to federal and state corporate income taxes. In addition, our international assets and operations will continue to be subject to taxation in the foreign jurisdictions where those assets are held or those operations are conducted. Any of these taxes would decrease our earnings and our available cash.
We will also be subject to a federal corporate level income tax at the highest regular corporate income tax rate on gain recognized from a sale of a REIT asset where our basis in the asset is determined by reference to the basis of the asset in the hands of a C corporation (such as an asset that we hold in one of our qualified REIT subsidiaries ("QRSs") following the liquidation or other conversion of a former TRS). This tax is generally applicable to any disposition of such an asset during the five-year period after the date we first owned the asset as a REIT asset, to the extent of the built-in-gain based on the fair market value of such asset on the date we first held the asset as a REIT asset. In addition, any depreciation recapture income that we recognize because of accounting method changes that we make in connection with our acquisition activities will be fully subject to this tax.
Complying with REIT requirements may limit our ability to hedge effectively and increase the cost of our hedging and may cause us to incur tax liabilities.
The REIT provisions of the Code limit our ability to hedge assets, liabilities, revenues and expenses. Generally, income from hedging transactions that we enter into to manage risk of interest rate changes with respect to borrowings made or to be made by us to acquire or carry real estate assets and income from certain currency hedging transactions related to our non-United States operations, as well as income from qualifying counteracting hedges, do not constitute "gross income" for purposes of the REIT gross income tests. To the extent that we enter into other types of hedging transactions, the income from those transactions is likely to be treated as nonqualifying income for purposes of the REIT gross income tests. As a result of these rules, we may need to limit our use of advantageous hedging techniques or implement those hedges through our TRSs. This could increase the cost of our hedging activities because our TRSs would be subject to tax on income or gains resulting from hedges entered into by them and may expose us to greater risks associated with changes in interest rates or exchange rates than we would otherwise want to bear. In addition, hedging losses in any of our TRSs generally will not provide any tax benefit, except for being carried forward for possible use against future income or gain in the TRSs.
Distributions payable by REITs generally do not qualify for preferential tax rates, which could reduce the demand for and market price of our common stock.
Dividends payable by United States corporations to noncorporate stockholders, such as individuals, trusts and estates, are generally eligible for reduced United States federal income tax rates applicable to "qualified dividends". Distributions paid by REITs generally are not treated as "qualified dividends" under the Code, and the reduced rates applicable to such dividends do not generally apply. However, REIT dividends paid to noncorporate stockholders that meet specified holding period requirements are generally taxed at an effective tax rate lower than applicable ordinary income tax rates due to the availability of a deduction under the Code for specified forms of income from passthrough entities. More favorable rates will nevertheless continue to apply to regular corporate "qualified" dividends, which may cause some investors to perceive that an investment in a REIT is less attractive than an investment in a non-REIT entity that pays dividends, thereby reducing the demand and market price of our common stock.
The ownership and transfer restrictions contained in our certificate of incorporation may not protect our qualification for taxation as a REIT, could have unintended antitakeover effects and may prevent our stockholders from receiving a takeover premium.
In order for us to remain qualified for taxation as a REIT, no more than 50% of the value of outstanding shares of our capital stock may be owned, beneficially or constructively, by five or fewer individuals at any time during the last half of each taxable year. In addition, rents from "affiliated tenants" will not qualify as qualifying REIT income if we own 10% or more by vote or value of the customer, whether directly or after application of attribution rules under the Code. Subject to certain exceptions, our certificate of incorporation prohibits any stockholder from owning, beneficially or constructively, more than (i) 9.8% in value of the outstanding shares of all classes or series of our capital stock or (ii) 9.8% in value or number, whichever is more restrictive, of the outstanding shares of any class or series of our capital stock. We refer to these restrictions collectively as the "ownership limits" and we included them in our certificate of incorporation to facilitate our compliance with REIT tax rules. The constructive ownership rules under the Code are complex and may cause the outstanding stock owned by a group of related individuals or entities to be deemed to be constructively owned by one individual or entity. As a result, the acquisition of less than 9.8% of our outstanding common stock (or the outstanding shares of any class or series of our capital stock) by an individual or entity could cause that individual or entity or another individual or entity to own constructively in excess of the relevant ownership limits. Any attempt to own or transfer shares of our common stock or of any of our other capital stock in violation of these restrictions may result in the shares being automatically transferred to a charitable trust or may be void. Even though our certificate of incorporation contains the ownership limits, there can be no assurance that these provisions will be effective to prevent our qualification for taxation as a REIT from being jeopardized, including under the affiliated tenant rule. Furthermore, there can be no assurance that we will be able to monitor and enforce the ownership limits. If the restrictions in our certificate of incorporation are not effective and, as a result, we fail to satisfy the REIT tax rules described above, then, absent an applicable relief provision, we will fail to remain qualified for taxation as a REIT.
In addition, the ownership and transfer restrictions could delay, defer or prevent a transaction or a change in control that might involve a premium price for our stock or otherwise be in the best interest of our stockholders. As a result, the overall effect of the ownership and transfer restrictions may be to render more difficult or discourage any attempt to acquire us, even if such acquisition may be favorable to the interests of our stockholders.
Legislative or other actions affecting REITs could have a negative effect on us or our stockholders.
At any time, the federal or state income tax laws governing REITs, the administrative interpretations of those laws, or local laws impacting our REIT structure for our international operations may be amended. Federal, state and local tax laws are constantly under review by persons involved in the legislative process, the United States Internal Revenue Service, the United States Department of the Treasury and state and local taxing authorities. Changes to the tax laws, regulations and administrative interpretations or local laws governing our international operations, which may have retroactive application, could adversely affect us. In addition, some of these changes could have a more significant impact on us as compared to other REITs due to the nature of our business and our substantial use of TRSs, particularly non-United States TRSs, or how we have structured our operations outside the United States to comply with REIT qualification requirements. We cannot predict with certainty whether, when, in what forms, or with what effective dates, the tax laws, regulations, administrative interpretations or local laws applicable to us may be changed or if such laws would impact our ability to remain qualified for taxation as a REIT or the costs of doing so.
GENERAL RISK FACTORS
Our cash distributions are not guaranteed and may fluctuate.
As a REIT, we are generally required to distribute at least 90% of our REIT taxable income to our stockholders. Furthermore, we are committed to growing our dividends, and have stated this publicly.
Our board of directors, in its sole discretion, will determine, on a quarterly basis, the amount of cash to be distributed to our stockholders based on a number of factors including, but not limited to, our results of operations, cash flow and capital requirements, economic conditions, tax considerations, borrowing capacity and other factors, including debt covenant restrictions that may impose limitations on cash payments, future acquisitions and divestitures, any stock repurchase program and general market demand for our space and related services. Consequently, our distribution levels may fluctuate and we may not be able to meet our public commitments with respect to dividend growth.
Our business could be adversely impacted if there are deficiencies in our disclosure controls and procedures or internal control over financial reporting.
The design and effectiveness of our disclosure controls and procedures and internal control over financial reporting may not prevent all errors, misstatements or misrepresentations. While management will continue to review the effectiveness of our disclosure controls and procedures and internal control over financial reporting, there can be no guarantee that our internal control over financial reporting will be effective in accomplishing all control objectives all of the time. Furthermore, our disclosure controls and procedures and internal control over financial reporting with respect to entities that we do not control or manage may be substantially more limited than those we maintain with respect to the subsidiaries that we have controlled or managed over the course of time. Deficiencies, including any material weakness, in our internal control over financial reporting which may occur in the future could result in misstatements of our results of operations, restatements of our financial statements, a decline in our stock price, or otherwise materially adversely affect our business, reputation, results of operations, financial condition or liquidity.
We compete with multiple businesses in all geographic areas where we operate; our current or potential customers may choose to use those competitors instead of us. In addition, if we are successful in winning record storage customers from competitors, the process of moving their stored records into our facilities is often costly and time consuming. We also compete, in some of our business lines, with our current and potential customers’ internal storage and information management services capabilities and their cloud-based alternatives. These organizations may not begin or continue to use us for their future storage and information management service needs.
The performance of our businesses relies on our ability to attract, develop, and retain talented personnel, while controlling our labor costs.
We are highly dependent on skilled and qualified personnel to operate our businesses. Furthermore, our contracts with the United States Government require us to use personnel with security clearances, and we may not be successful or may experience delays in attracting, training or retaining qualified personnel with the requisite skills or security clearances. The failure to attract and retain qualified employees or to effectively control our labor costs could negatively affect our competitive position and operating results. Our ability to control labor costs and attract qualified personnel is subject to numerous external factors, including prevailing wages, labor shortages, the impact of legislation or regulations governing wages and hours, labor relations, immigration, healthcare and other benefits, other employment-related costs and the hiring practices of our competitors.
ITEM 1B. UNRESOLVED STAFF COMMENTS.
None.
ITEM 1C. CYBERSECURITY.
RISK MANAGEMENT AND STRATEGY
We maintain a robust information security program that is designed to protect our information and the information of our customers. Our information security program is based on a recognized cybersecurity framework established by the National Institute of Standards and Technology ("NIST") and establishes controls to mitigate critical areas of cybersecurity risk. Our information security program has adopted all elements of the NIST cybersecurity framework, including the six functions of identify, protect, detect, respond, recover and governance. We use the NIST framework as a guide to ensure our information security program is designed to manage cybersecurity risks relevant to our business. Among other things, the cybersecurity controls in our information security program address information access rights, incident monitoring response processes, information technology system configuration, network security, security architecture planning, mobile device security and compliance with information security policy requirements and protocols. These cybersecurity controls are designed to oversee, identify and mitigate risks from cybersecurity threats, including those arising from our use of third-party service providers. Our cybersecurity controls are evaluated regularly by our internal information security team, and we engage a third party examiner to assess the maturity of our information security program against the NIST cybersecurity framework no less frequently than bi-annually. Additionally, our information security program is assessed periodically by a federal regulator in the United States as part of its routine audit of the Company.In addition to our internal assessments, we also assess our third-party service providers on a regular basis using a risk-based approach that assigns a risk calculation to each such service provider. The results of our assessments are tracked and evaluated to ensure these third parties comply with our cybersecurity standards. We require all employees to undertake data protection and cybersecurity training and compliance programs annually.
Our reputation for providing secure information storage to customers is critical to the success of our business, and protecting against material cybersecurity risks is an integral part of maintaining that reputation. A successful cybersecurity breach could lead to theft or misuse of our or our customers’ proprietary or confidential information or our employees’ personal information and result in third-party claims against us, regulatory penalties and reputational harm. As part of our information security program, we also actively monitor emerging cyberattack patterns to develop custom detection capabilities and mitigation techniques to protect against material risk of cybersecurity threats. Upon encountering a cybersecurity incident, our information security team responds using our detailed cybersecurity incident response plan ("CSIRP"), which is based on industry best practices, relevant legal requirements and our contractual commitments. Among other things, the CSIRP sets forth the specific criteria used to assess a cybersecurity incident, mitigate risks of adverse consequences associated with any such incident, protocols to escalate the management of the incident and the process to inform our executive management team and any impacted functions of our business. All cybersecurity incidents are assessed to determine whether disclosure is required pursuant to any contractual or regulatory requirements and any material cybersecurity incident is also reported to our board of directors (our "Board").
To date, our information security program has been successful in protecting against risks from cybersecurity threats, and we have not had any cybersecurity incidents that have materially affected or are reasonably likely to materially affect our business strategy, results of operations or financial condition. Additional information about cybersecurity risks we face is discussed in Item 1A of Part I, “Risk Factors,” under the heading “Attacks on our internal IT systems could damage our reputation, cause us to lose revenues, and adversely affect our business, financial condition and results of operations”, which should be read in conjunction with the information above.
GOVERNANCE
Our Board reviews and discusses significant risks with executive management, including cybersecurity risk, that affect us. Although our executive management team and our Board work together on risk matters, our Board has the ultimate oversight authority over all enterprise risks, including cybersecurity risk. Our Board reserves the right to, and periodically does, consult with third-party advisors and experts to assist our Board in understanding and anticipating future cybersecurity threats and trends. The Risk and Safety Committee of our Board (the "RSC") is specifically tasked with reviewing and monitoring cybersecurity and information security risk, as well as the risk management strategies, systems and policies, and processes implemented, established and reported on by our executive management team. The RSC is also primarily responsible for assisting our Board with oversight of our enterprise risk management program.
Our executive management team, with oversight from our Board, is responsible for our enterprise risk management process and the day-to-day supervision and mitigation of enterprise risks, including cybersecurity risk. Our enterprise risk management program includes our executive management team receiving regular reports from our operations personnel. As part of our enterprise risk program, our executive management team has established an enterprise risk committee (the "ERC"), which is chaired by our Chief Risk Officer and is otherwise composed of each of our other executive vice presidents. The ERC oversees our risk and compliance activities to ensure that management has appropriate policies and management plans in place for managing risks of the business, including cybersecurity risk, as well as reviewing and prioritizing significant risks and allocating resources for risk mitigation.
Our Chief Risk Officer provides reports at each meeting of the RSC on areas of potential risks to us, including cybersecurity risk, and our Chief Information Security Officer provides quarterly reports to the RSC on the key performance indicators of our information security program to facilitate the RSC’s oversight of the program through objective measurements, including metrics regarding software patching, IT asset management, cyber incident management and cybersecurity training. Reports by our Chief Information Security Officer also include detailed information on the activities of our cyber incident response team to allow for analysis of trends and the identification of any control gaps that require remediation.
We also maintain a business information security committee (the "ISC") with employee representation across geographies, business lines and business functions. The ISC includes a cross functional group of our employees with expertise and responsibilities in areas such as operations, digital product solutions, information technology, compliance, security, finance, privacy, internal audit and legal risk mitigation. The ISC is managed by our Chief Information Security Officer and meets regularly to receive updates on our cybersecurity posture, emerging risks and new cybersecurity capabilities. Members of the ISC act as points of contact during incident response activities to provide oversight and logistical support to the information security team.
The information security team is made primarily of full-time employees; however, we routinely engage consultants to provide supplemental labor and additional expertise in specific areas on an as-needed basis. Our information security team is organized based on industry best practices in alignment with NIST recommendations.All of the leaders in our information security team have over 10 years of cybersecurity experience and most of our information security staff maintain cybersecurity program certifications such as CMU Cybersecurity Executive Certification, ISACA Certifications (CISSP & CISM) and other relevant vendor certifications. Our information security team also regularly undergoes continuing education to ensure our implementation of best-in-class techniques.
As of December 31, 2025, we conducted operations through 1,111 leased facilities and 232 owned facilities. Our facilities are divided among our reportable segments and Corporate and Other as follows: Global RIM Business (1,214), Global Data Center Business (36) and Corporate and Other (93). These facilities contain a total of approximately 98.6 million square feet of space. A breakdown of owned and leased facilities by country (and by state within the United States) is listed below:
The leased facilities typically have initial lease terms of five to 10 years with one or more renewal options. In addition, some of the leases contain either a purchase option or a right of first refusal upon the sale of the property. We believe that the space available in our facilities is adequate to meet our current needs, although future growth may require that we lease or purchase additional real property.
Our total building utilization and total racking utilization as of December 31, 2025 in Records Management and Data Management are as follows:
RECORDS MANAGEMENT(1)
DATA MANAGEMENT
BUILDING UTILIZATION
RACKING UTILIZATION
BUILDING UTILIZATION
RACKING UTILIZATION
81%
88%
38%
62%
(1)Total building utilization and total racking utilization for Records Management includes the utilization for Global Digital Solutions and Consumer Storage.
See Note 2.j. to Notes to Consolidated Financial Statements included in this Annual Report for information regarding our minimum annual lease commitments as a lessee.
See Schedule III—Schedule of Real Estate and Accumulated Depreciation in this Annual Report for information regarding the cost, accumulated depreciation and encumbrances associated with our owned real estate.
The following table sets forth a summary of the lease expirations for leases in place related to our Global Data Center Business, for which we are the lessor, as of December 31, 2025. The information set forth in the table assumes that tenants will exercise any early termination rights that do not have significant penalties and will not exercise any renewal options.
YEAR
NUMBER OF LEASES EXPIRING
TOTAL MEGAWATTS EXPIRING
PERCENTAGE OF TOTAL MEGAWATTS EXPIRING
ANNUALIZED TOTAL CONTRACT RENT EXPIRING (IN THOUSANDS)
PERCENTAGE OF TOTAL CONTRACT VALUE ANNUALIZED RENT
We are involved in litigation from time to time in the ordinary course of business. A portion of the defense and/or settlement costs associated with such litigation is covered by various commercial liability insurance policies purchased by us and, in limited cases, indemnification from third parties. In the opinion of management, no material legal proceedings are pending to which we, or any of our properties, are subject.
ITEM 5. MARKET FOR REGISTRANT'S COMMON EQUITY, RELATED STOCKHOLDER MATTERS AND ISSUER PURCHASES OF EQUITY SECURITIES.
Our common stock is traded on the NYSE under the symbol "IRM". The closing price of our common stock on the NYSE on February 6, 2026 was $95.78. As of February 6, 2026, there were 2,840 holders of record of our common stock. See Note 8 to Notes to Consolidated Financial Statements included in this Annual Report for additional information on dividends declared on our common stock.
UNREGISTERED SALES OF EQUITY SECURITIES AND USE OF PROCEEDS
We did not sell any unregistered equity securities during the three months ended December 31, 2025, nor did we repurchase any shares of our common stock during the three months ended December 31, 2025.
ITEM 6. [RESERVED.]
ITEM 7. MANAGEMENT'S DISCUSSION AND ANALYSIS OF FINANCIAL CONDITION AND RESULTS OF OPERATIONS.
The following discussion should be read in conjunction with the Consolidated Financial Statements and Notes thereto and the other financial and operating information included elsewhere in this Annual Report.
This discussion contains "forward-looking statements" as that term is defined in the Private Securities Litigation Reform Act of 1995 and in other securities laws. See "Cautionary Note Regarding Forward-Looking Statements" on page iii of this Annual Report and "Item 1A. Risk Factors" beginning on page 8 of this Annual Report.
In 2025, we completed our investments in Project Matterhorn, a global program designed to accelerate the growth of our business, which we announced in September 2022. Project Matterhorn investments focused on transforming our operating model to a global operating model. Project Matterhorn enabled the development of a solution-based sales approach that allowed us to optimize our shared services and best practices to better serve our customers' needs. As part of this, we invested to accelerate growth and to capture a greater share of the large, global addressable markets in which we operate. We incurred approximately $574.4 million in Restructuring and other transformation costs related to Project Matterhorn since its inception. During the years ended December 31, 2025 and 2024, we incurred approximately $195.9 million and $161.4 million, respectively, in Restructuring and other transformation costs related to Project Matterhorn. Costs were comprised of (1) restructuring costs, which included (i) site consolidation and other related exit costs, (ii) employee severance costs and (iii) certain professional fees associated with these activities, and (2) other transformation costs, which included professional fees such as project management costs and costs for third party consultants who assisted in the enablement of our growth initiatives.
GENERAL
RESULTS OF OPERATIONS - KEY TRENDS
•Our organic storage rental revenue growth is primarily driven by revenue management in our Global RIM Business segment, where we expect volume to be relatively stable in the near term, as well as by growth in our Global Data Center Business segment, primarily driven by lease commencements.
•Our organic service revenue growth is primarily driven by new and existing digital offerings, traditional records management services and services in our asset lifecycle management ("ALM") business, all of which we expect to grow in the near term and benefit our organic service revenue growth in 2026.
•We expect continued total revenue and Adjusted earnings before interest, taxes, depreciation and amortization ("EBITDA") growth in 2026 as a result of our focus on new product and service offerings, cross-selling opportunities, innovation, customer solutions and market expansion in line with our growth strategies.
Our revenues consist of storage rental revenues and service revenues and are reflected net of sales and value-added taxes. Storage rental revenues, which are considered a key driver of financial performance for the storage and information management services industry, consist primarily of recurring periodic rental charges related to the storage of materials or data (generally on a per unit basis) that are typically retained by customers for many years and of revenues associated with our data center operations. Service revenues include charges for related service activities, the most significant of which include: (1) the handling of records, including the addition of new records, temporary removal of records from storage, refiling of removed records, customer termination and permanent withdrawal fees, project revenues and courier operations, consisting primarily of the pickup and delivery of records upon customer request; (2) secure shredding of sensitive documents and the subsequent sale of shredded paper for recycling, the price of which can fluctuate from period to period; (3) the decommissioning, data erasure, processing and disposition, and recycling or sale of IT hardware and component assets; and (4) digital solutions, including the scanning, imaging and document conversion services of active and inactive records, consulting services and the sale of software as a service, including our Digital Experience Platform.
Cost of sales (excluding depreciation and amortization) consists primarily of labor, including wages and benefits for field personnel, facility occupancy costs (including rent and utilities), data center pass-through power costs, transportation expenses (including vehicle leases and fuel), other product cost of sales and other equipment costs and supplies. Of these, labor and facility occupancy costs are the most significant. Selling, general and administrative expenses consist primarily of wages and benefits for management, administrative, IT, sales, account management and marketing personnel, as well as expenses related to communications, travel, professional fees, bad debts, training, office equipment and supplies.
Cost of sales (excluding depreciation and amortization) and Selling, general and administrative expenses for the year ended December 31, 2025 consists of the following:
COST OF SALES
SELLING, GENERAL AND ADMINISTRATIVE EXPENSES
Trends in facility occupancy costs are impacted by:
•the total number of facilities we occupy;
•the mix of properties we own versus properties we lease;
•fluctuations in per square foot occupancy costs;
•the levels of utilization of these properties; and
•data center power costs.
Trends in total wages and benefits in dollars and as a percentage of total revenue are influenced by:
•changes in headcount and compensation levels;
•achievement of incentive compensation targets;
•workforce productivity; and
•variability in costs associated with medical insurance and workers’ compensation.
Our depreciation charges result primarily from depreciation related to storage systems, which include buildings, building and leasehold improvements, data center infrastructure, racking structures and computer systems hardware and software. Our amortization charges relate primarily to customer and supplier relationship intangible assets, Contract Costs (as defined below in Critical Accounting Estimates) and data center lease-based intangible assets. Both depreciation and amortization are impacted by the timing of acquisitions.
Our consolidated revenues and expenses are subject to the net effect of foreign currency translation related to our operations outside the United States. It is difficult to predict the future fluctuations of foreign currency exchange rates and how those fluctuations will impact our Consolidated Statements of Operations. As a result of the relative size of our international operations, these fluctuations may be material on individual balances. Our revenues and expenses from our international operations are generally denominated in the local currency of the country in which they are derived or incurred. Therefore, the impact of currency fluctuations on our operating income and operating margin is partially mitigated. In order to provide a framework for assessing how our underlying businesses performed excluding the effect of foreign currency fluctuations, we compare the percentage change in the results from one period to another period in this report using constant currency presentation. The constant currency growth rates are calculated by translating the 2024 results at the 2025 average exchange rates. Constant currency growth rates are a non-GAAP measure.
The following table is a comparison of underlying average exchange rates of the foreign currencies that had the most significant impact on our United States dollar-reported revenues and expenses:
PERCENTAGE OF UNITED STATES DOLLAR- REPORTED REVENUE FOR THE YEAR ENDED DECEMBER 31,
AVERAGE EXCHANGE RATES FOR THE YEAR ENDED DECEMBER 31,
PERCENTAGE (WEAKENING) / STRENGTHENING OF FOREIGN CURRENCY
2025
2024
2025
2024
Australian dollar
2.7
%
2.6
%
$
0.645
$
0.660
(2.3)
%
British pound sterling
6.8
%
6.9
%
$
1.318
$
1.278
3.1
%
Canadian dollar
4.4
%
4.9
%
$
0.716
$
0.730
(1.9)
%
Euro
6.8
%
6.8
%
$
1.130
$
1.082
4.4
%
The percentage of United States dollar-reported revenues for all other foreign currencies was 13.0% and 13.6% for the years ended December 31, 2025 and 2024, respectively.
We define Adjusted EBITDA as net income (loss) before interest expense, net, provision (benefit) for income taxes, depreciation and amortization (inclusive of our share of Adjusted EBITDA from our unconsolidated joint ventures), and excluding certain items we do not believe to be indicative of our core operating results, specifically:
EXCLUDED
•Acquisition and Integration Costs (as defined below)
•Restructuring and other transformation
•Loss (gain) on disposal/write-down of property, plant and equipment, net (including real estate)
•Other expense (income), net
•Stock-based compensation expense
•Intangible impairments
Adjusted EBITDA Margin is calculated by dividing Adjusted EBITDA by total revenues. We also show Adjusted EBITDA and Adjusted EBITDA Margin for each of our reportable segments under "Results of Operations – Segment Analysis" below.
Adjusted EBITDA excludes both interest expense, net and the provision (benefit) for income taxes. These expenses are associated with our capitalization and tax structures, which we do not consider when evaluating the operating profitability of our core operations. Adjusted EBITDA does not include depreciation and amortization expenses, in order to eliminate the impact of capital investments, which we evaluate by comparing capital expenditures to incremental revenue generated and as a percentage of total revenues. Adjusted EBITDA and Adjusted EBITDA Margin should be considered in addition to, but not as a substitute for, other measures of financial performance reported in accordance with accounting principles generally accepted in the United States of America ("GAAP"), such as operating income, net income (loss) or cash flows from operating activities.
RECONCILIATION OF NET INCOME (LOSS) TO ADJUSTED EBITDA (IN THOUSANDS):
YEAR ENDED DECEMBER 31,
2025
2024
Net Income (Loss)
$
152,254
$
183,666
Add/(Deduct):
Interest expense, net
829,335
721,559
Provision (benefit) for income taxes
58,934
60,872
Depreciation and amortization
1,024,435
900,905
Acquisition and Integration Costs(1)
19,545
35,842
Restructuring and other transformation
195,912
161,359
Loss (gain) on disposal/write-down of property, plant and equipment, net (including real estate)
24,641
6,196
Other expense (income), net, excluding our share of losses (gains) from our unconsolidated joint ventures(2)
118,473
39,159
Stock-based compensation expense
140,280
118,138
Our share of Adjusted EBITDA reconciling items from our unconsolidated joint ventures
10,141
8,684
Adjusted EBITDA
$
2,573,950
$
2,236,380
(1)Represent operating expenditures directly associated with the closing and integration activities of our business acquisitions that have closed, or are highly probable of closing, and include (i) advisory, legal and professional fees to complete business acquisitions and (ii) costs to integrate acquired businesses into our existing operations, including move, severance and system integration costs (collectively, "Acquisition and Integration Costs").
(2)Includes foreign currency transaction losses (gains), net, debt extinguishment expense and other, net. See Note 2.v. to Notes to Consolidated Financial Statements included in this Annual Report for additional information regarding the components of Other expense (income), net.
We define Adjusted EPS as reported earnings per share fully diluted from net income (loss) attributable to Iron Mountain Incorporated (inclusive of our share of adjusted losses (gains) from our unconsolidated joint ventures) and excluding certain items, specifically:
EXCLUDED
•Acquisition and Integration Costs
•Restructuring and other transformation
•Loss (gain) on disposal/write-down of property, plant and equipment, net (including real estate)
•Other expense (income), net
•Stock-based compensation expense
•Non-cash amortization related to derivative instruments
•Tax impact of reconciling items and discrete tax items
•Amortization related to the write-off of certain customer relationship intangible assets
We do not believe these excluded items to be indicative of our ongoing operating results, and they are not considered when we are forecasting our future results. We believe Adjusted EPS is of value to our current and potential investors when comparing our results from past, present and future periods.
RECONCILIATION OF REPORTED EPS—FULLY DILUTED FROM NET INCOME (LOSS) ATTRIBUTABLE TO IRON MOUNTAIN INCORPORATED TO ADJUSTED EPS—FULLY DILUTED FROM NET INCOME (LOSS) ATTRIBUTABLE TO IRON MOUNTAIN INCORPORATED:
YEAR ENDED DECEMBER 31,
2025
2024
Reported EPS—Fully Diluted from Net Income (Loss) Attributable to Iron Mountain Incorporated
$
0.49
$
0.61
Add/(Deduct):
Acquisition and Integration Costs
0.07
0.12
Restructuring and other transformation
0.66
0.54
Loss (gain) on disposal/write-down of property, plant and equipment, net (including real estate)
0.08
0.02
Other expense (income), net, excluding our share of losses (gains) from our unconsolidated joint ventures
0.40
0.13
Stock-based compensation expense
0.47
0.40
Non-cash amortization related to derivative instruments(1)
0.06
0.06
Tax impact of reconciling items and discrete tax items(2)
(0.12)
(0.12)
Income (Loss) Attributable to Noncontrolling Interests
0.03
0.01
Adjusted EPS—Fully Diluted from Net Income (Loss) Attributable to Iron Mountain Incorporated(3)
$
2.12
$
1.77
(1)Relates to the amortization of the excluded component of our cross-currency swap agreements, which is recognized on a straight-line basis as a component of Interest expense, net in our Consolidated Statements of Operations.
(2)The differences between our effective tax rates and our structural tax rate (or adjusted effective tax rates) for the years ended December 31, 2025 and 2024 are primarily due to (i) the reconciling items above, which impact our reported Net Income (Loss) Before Provision (Benefit) for Income Taxes but have an insignificant impact on our reported Provision (Benefit) for Income Taxes and (ii) other discrete tax items. Our structural tax rate for purposes of the calculation of Adjusted EPS for the years ended December 31, 2025 and 2024 was 13.1% and 15.6%, respectively.
Funds from operations ("FFO") is defined by the National Association of Real Estate Investment Trusts as net income (loss) excluding depreciation on real estate assets, losses and gains on sale of real estate, net of tax, and amortization of data center leased-based intangibles ("FFO (Nareit)"). We calculate our FFO measures, including FFO (Nareit), adjusting for our share of reconciling items from our unconsolidated joint ventures. FFO (Nareit) does not give effect to real estate depreciation because these amounts are computed, under GAAP, to allocate the cost of a property over its useful life. Because values for well-maintained real estate assets have historically increased or decreased based upon prevailing market conditions, we believe that FFO (Nareit) provides investors with a clearer view of our operating performance. Our most directly comparable GAAP measure to FFO (Nareit) is net income (loss).
We modify FFO (Nareit), as is common among REITs seeking to provide financial measures that most meaningfully reflect their particular business ("FFO (Normalized)"). Our definition of FFO (Normalized) excludes certain items included in FFO (Nareit) that we believe are not indicative of our core operating results, specifically:
EXCLUDED
•Acquisition and Integration Costs
•Restructuring and other transformation
•Loss (gain) on disposal/write-down of property, plant and equipment, net (excluding real estate)
•Other expense (income), net
•Stock-based compensation expense
•Non-cash amortization related to derivative instruments
•Real estate financing lease depreciation
•Tax impact of reconciling items and discrete tax items
•Intangible impairments
•(Income) loss from discontinued operations, net of tax
RECONCILIATION OF NET INCOME (LOSS) TO FFO (NAREIT) AND FFO (NORMALIZED) (IN THOUSANDS):
YEAR ENDED DECEMBER 31,
2025
2024
Net Income (Loss)
$
152,254
$
183,666
Add/(Deduct):
Real estate depreciation(1)
421,561
367,362
(Gain) loss on sale of real estate, net of tax(2)
(3,299)
(6,698)
Data center lease-based intangible assets amortization(3)
7,395
22,304
Our share of FFO (Nareit) reconciling items from our unconsolidated joint ventures
6,264
4,830
FFO (Nareit)
584,175
571,464
Add/(Deduct):
Acquisition and Integration Costs
19,545
35,842
Restructuring and other transformation
195,912
161,359
Loss (gain) on disposal/write-down of property, plant and equipment, net (excluding real estate)
27,759
14,025
Other expense (income), net, excluding our share of losses (gains) from our unconsolidated joint ventures
118,473
39,159
Stock-based compensation expense
140,280
118,138
Non-cash amortization related to derivative instruments
16,705
16,705
Real estate financing lease depreciation
13,124
13,135
Tax impact of reconciling items and discrete tax items(4)
(35,757)
(37,248)
Our share of FFO (Normalized) reconciling items from our unconsolidated joint ventures
(296)
(17)
FFO (Normalized)
$
1,079,920
$
932,562
(1)Includes depreciation expense related to owned real estate assets (land improvements, buildings, building and leasehold improvements, data center infrastructure and racking structures), excluding depreciation related to real estate financing leases.
(2)Tax (benefit) expense associated with the gain on sale of real estate for the years ended December 31, 2025 and 2024 was approximately $(0.2) million and $1.1 million, respectively.
(3)Includes amortization expense for Data Center In-Place Leases and Data Center Tenant Relationships as defined in Note 2.m. to Notes to Consolidated Financial Statements included in this Annual Report.
(4)Represents the tax impact of (i) the reconciling items above, which impact our reported Net Income (Loss) Before Provision (Benefit) for Income Taxes but has an insignificant impact on our reported Provision (Benefit) for Income Taxes and (ii) other discrete tax items. Discrete tax items resulted in a provision (benefit) for income taxes of $2.0 million and $(6.2) million for the years ended December 31, 2025 and 2024, respectively.
Our discussion and analysis of our financial condition and results of operations are based upon our Consolidated Financial Statements, which have been prepared in accordance with GAAP. The preparation of these financial statements requires us to make estimates, judgments and assumptions that affect the reported amounts of assets, liabilities, revenues and expenses, and related disclosure of contingent assets and liabilities at the date of the financial statements and for the period then ended. On an ongoing basis, we evaluate the estimates used. We base our estimates on historical experience, actuarial estimates, current conditions and various other assumptions that we believe to be reasonable under the circumstances. These estimates form the basis for making judgments about the carrying values of assets and liabilities and are not readily apparent from other sources. Actual results may differ from these estimates. The following should be read in conjunction with Note 2 to Notes to Consolidated Financial Statements included in this Annual Report, which provides a summary of our significant accounting policies. Our critical accounting estimates include the following, which are listed in no particular order:
REVENUE RECOGNITION
Revenue is recognized when or as control of promised goods or services is transferred to the customer, in an amount that reflects the consideration we expect to be entitled to in exchange for those goods or services. See Note 2.s. to Notes to Consolidated Financial Statements included in this Annual Report for additional details on our revenue recognition policies. The majority of our revenue is recognized in accordance with Accounting Standards Codification ("ASC") Topic 606, Revenue from Contracts with Customers ("ASC 606"), the application of which requires that we make significant judgments related to performance obligations and the transfer of control to the customer. Storage revenue for our Global Data Center Business is recognized in accordance with ASC Topic 842, Leases.
We have determined that the majority of our contracts contain series performance obligations which qualify to be recognized under a practical expedient available in ASC 606 known as the "right to invoice". This determination allows variable consideration in such contracts to be allocated to and recognized in the period to which the consideration relates, which is typically the period in which it is billed, rather than requiring estimation of variable consideration at the inception of the contract.
Certain costs to fulfill or obtain customer contracts and certain initial direct costs of obtaining leases, including the costs associated with the initial movement of customer records into physical storage and certain commission expenses, are collectively referred to as "Contract Costs". Contract Costs are capitalized and amortized as a component of depreciation and amortization in our Consolidated Statements of Operations, generally over a three year term, which we have determined is consistent with the transfer of the underlying performance obligations to which the assets relate or the lease term. Different determinations on term length would result in differences in the amount and timing of amortization expense recognized.
ACCOUNTING FOR ACQUISITIONS
Part of our growth strategy has been to acquire businesses. The purchase price of each acquisition is determined after due diligence of the target business, market research, strategic planning and the forecasting of expected future results and synergies. Estimated future results and expected synergies are subject to revisions as we integrate each acquisition and attempt to leverage resources.
Accounting for acquisitions of a business has resulted in the capitalization of the cost in excess of the estimated fair value of the net assets acquired in each of these acquisitions as goodwill. We estimate the fair values of the assets acquired in each acquisition as of the date of acquisition and these estimates are subject to adjustment based on the final assessments of the fair value of intangible assets (primarily customer and supplier relationship and data center lease-based intangible assets), property, plant and equipment (primarily buildings, building and leasehold improvements, data center infrastructure and racking structures), operating leases, contingencies and income taxes (primarily deferred income taxes). See Note 3 to Notes to Consolidated Financial Statements included in this Annual Report for a description of recent acquisitions.
Determining the fair values of the net assets acquired requires management’s judgment and often involves the use of assumptions with respect to future cash inflows and outflows, discount rates and market data, among other items. As it relates to our data center acquisitions, the fair values of the net assets acquired requires management’s judgment and often involves the use of assumptions with respect to (i) certain economic costs (as described more fully in Note 2.m. to Notes to Consolidated Financial Statements included in this Annual Report) avoided by acquiring a data center operation with active tenants that would have otherwise been incurred if the data center operation was purchased vacant, (ii) market rental rates and (iii) expectations of lease renewals and extensions. Due to the inherent uncertainty of future events, actual values of net assets acquired could be different from our estimated fair values and could have a material impact on our financial statements.
Of the net assets acquired in our acquisitions, the fair value of owned buildings, including data center infrastructure and building improvements, customer and supplier relationship and data center lease-based intangible assets, racking structures and operating leases are generally the most common and most significant. For significant acquisitions or acquisitions involving new markets or new products, we generally use third parties to assist us in estimating the fair value of owned buildings, including data center infrastructure and building improvements, customer and supplier relationship and lease-based intangible assets and market rental rates for acquired operating leases. For acquisitions that are not significant or do not involve new markets or new products, we generally use third parties to assist us in estimating the fair value of owned buildings, including data center infrastructure and building improvements, and market rental rates for acquired operating leases. When not using third party appraisals of the fair value of acquired net assets, the fair value of acquired customer and supplier relationship intangible assets, above and below market in-place operating leases, and racking structures is determined internally. When estimating fair values internally, we use discounted cash flow models to determine the fair value of customer and supplier relationship intangible assets, which requires a significant amount of judgment by management, including estimating expected lives of the relationships, expected future cash flows and discount rates. The fair value of above and below market in-place operating leases is determined internally using a discounted cash flow model, utilizing the difference in cash flows between the contractual lease payments over the remaining lease term and estimated market rental rates on comparable assets at the time of the acquisition. The fair value of acquired racking structures is determined internally by taking current estimated replacement cost at the date of acquisition for the quantity of racking structures acquired, discounted to take into account the quality (e.g. age, material and type) of the racking structures. We determine the fair value of tangible data center assets using an estimated replacement cost at the date of acquisition, then discounting for age, economic and functional obsolescence.
The fair value of the deferred purchase obligation associated with the Regency Transaction (as defined in Note 3 to Notes to Consolidated Financial Statements included in this Annual Report) was initially established utilizing a Monte-Carlo simulation model and takes into account our forecasted projections as it relates to the underlying performance of the business. The Monte-Carlo simulation model incorporates assumptions as to expected revenue over the achievement period, including adjustments for volatility and timing, as well as discount rates that account for the risk of the arrangement and overall market risks.
Our estimates of fair value are based upon assumptions believed to be reasonable at that time but which are inherently uncertain and unpredictable. Assumptions may be incomplete or inaccurate, and unanticipated events and circumstances may occur, which may affect the accuracy of such assumptions. There were no material acquisitions in 2025.
IMPAIRMENT OF TANGIBLE AND INTANGIBLE ASSETS
ASSETS SUBJECT TO DEPRECIATION OR AMORTIZATION
We review long-lived assets, including finite-lived intangible assets, for impairment whenever events or changes in circumstances indicate the carrying amount of such assets may not be recoverable. Examples of events or circumstances that may be indicative of impairment include, but are not limited to:
•A significant decrease in the market price of an asset;
•A significant change in the extent or manner in which a long-lived asset is being used or in its physical condition;
•A significant adverse change in legal factors or in the business climate that could affect the value of the asset;
•An accumulation of costs significantly greater than the amount originally expected for the acquisition or construction of an asset;
•A current-period operating or cash flow loss combined with a history of operating or cash flow losses or a projection or forecast that demonstrates continuing losses associated with the use of a long-lived asset; and
•A current expectation that, more likely than not, an asset will be sold or otherwise disposed of significantly before the end of its previously estimated useful life.
If events indicate the carrying value of such assets may not be recoverable, recoverability of these assets is determined by comparing the sum of the forecasted undiscounted net cash flows of the operation to which the assets relate to their carrying amount. The operations are generally distinguished by the business segment and geographic region in which they operate. If it is determined that we are unable to recover the carrying amount of the assets, the long-lived assets are written down, on a pro rata basis, to fair value. Fair value is determined based on discounted cash flows or appraised values, depending upon the nature of the assets.
We did not record impairment charges for any of our long-lived assets or finite-lived intangibles during the years ended December 31, 2025 and 2024.
GOODWILL AND OTHER INDEFINITE-LIVED INTANGIBLE ASSETS NOT SUBJECT TO AMORTIZATION
Goodwill and intangible assets with indefinite lives are not amortized but are reviewed annually for impairment, or more frequently if impairment indicators arise. Other than goodwill, we currently have no intangible assets that have indefinite lives and which are not amortized. See Note 2.l. to Notes to Consolidated Financial Statements included in this Annual Report for additional details on our goodwill and other indefinite-lived intangible assets policies.
We have selected October 1 as our annual goodwill impairment review date. We have performed our annual goodwill impairment review as of October 1, 2025 and 2024. We concluded that as of October 1, 2025 and 2024, goodwill was not impaired.
Our reporting units at which level we performed our goodwill impairment analysis as of October 1, 2025 were as follows:
•North American Records and Information Management reporting unit ("North America RIM")
•Europe Records and Information Management reporting unit ("Europe RIM")
•Latin America Records and Information Management reporting unit ("Latin America RIM")
•Asia, Australia and New Zealand Records and Information Management reporting unit ("APAC RIM")
•Media and Archive Services
•Global Data Center
•Fine Arts
•ALM
See Note 2.l. to Notes to Consolidated Financial Statements included in this Annual Report for a description of our reporting units.
Based on our goodwill impairment analysis as of October 1, 2025, all of our reporting units had estimated fair values exceeding their carrying values. The ALM reporting unit represented approximately $780.3 million, or 14.8%, of our consolidated goodwill balance at December 31, 2025, and its fair value is sensitive to changes in our assumptions. The following is a summary of the ALM reporting unit including the goodwill balance (in thousands), the percentage by which the fair value of the reporting unit exceeded its carrying value and certain key assumptions used by us in determining the fair value of the reporting unit as of October 1, 2025:
REPORTING UNIT
GOODWILL
BALANCE AT
OCTOBER 1,
2025
PERCENTAGE BY
WHICH THE FAIR VALUE
OF THE REPORTING
UNIT EXCEEDED THE
REPORTING UNIT
CARRYING VALUE AS OF
OCTOBER 1, 2025
KEY ASSUMPTIONS IN THE FAIR VALUE OF REPORTING UNIT
MEASUREMENT AS OF OCTOBER 1, 2025
DISCOUNT RATE
AVERAGE ANNUAL ADJUSTED EBITDA MARGIN USED IN DISCOUNTED CASH FLOW
AVERAGE
ANNUAL CAPITAL
EXPENDITURES AS
PERCENTAGE OF
REVENUE(1)
TERMINAL
GROWTH
RATE(2)
ALM
$781,128
93.7%
15.0%
18.6%
1.7%
3.5%
(1)For purposes of our goodwill impairment analysis, the term "capital expenditures" includes both growth investment and recurring capital expenditures.
(2)Terminal growth rates are applied after year 10 of our discounted cash flow analysis.
The following includes supplemental information to the table above for the ALM reporting unit where the estimated fair value exceeded its carrying value by approximately 93.7% as of October 1, 2025. The fair value of our ALM reporting unit was determined using a Discounted Cash Flow Model approach. We do not use a Market Approach when determining the fair value of our ALM reporting unit given a lack of directly comparable publicly traded guideline companies to ALM. The success of these businesses and the achievement of certain key assumptions developed by management and used in the Discounted Cash Flow Model are contingent upon various factors including, but not limited to, (i) achieving growth from existing customers, (ii) sales to new customers, (iii) increased market penetration and (iv) market pricing trends of IT hardware and component assets.
ALM
Our ALM business provides hyperscale and corporate IT infrastructure managers with services and solutions that enable the decommissioning, data erasure, processing and disposition, and recycling or sale of IT hardware and component assets. ALM services are enabled by: (i) secure logistics, chain of custody and complete asset traceability practices; (ii) environmentally-responsible asset processing and recycling; and (iii) data sanitization and asset refurbishment services that enable value recovery through asset remarketing. The assumptions we used in determining fair value reflect the ongoing and anticipated expansion of these services, the maintenance and further development of the supplier relationships required to expand this business and meet customer demand and decommissioning schedules of our supplier's IT hardware and component assets, as well as demand for such assets at that time. The assumptions used also reflect market pricing for IT hardware and component assets that is consistent with the normalized pricing we observed in the current year.
The fair values of our reporting units are generally determined using a combined approach based on the present value of future cash flows (the "Discounted Cash Flow Model") and market multiples (the "Market Approach"). There are inherent uncertainties and judgments involved when determining the fair value of the reporting units for purposes of our annual goodwill impairment testing. Key factors that could reasonably be expected to have a negative impact on the estimated fair value of these reporting units and potentially result in impairment charges include, but are not limited to: (i) a deterioration in general economic conditions, (ii) significant adverse changes in regulatory factors or in the business climate, (iii) adverse actions or assessment by regulators and (iv) changes in market trends due to the evolution of technology, all of which could result in adverse changes to the key assumptions used in valuing the reporting units. The inability to meet the assumptions used in the Discounted Cash Flow Model and Market Approach for each of the reporting units, or future adverse market conditions not currently known, could lead to a fair value that is less than the carrying value in any one of our reporting units.
The Discounted Cash Flow Model incorporates significant assumptions including future revenue growth rates, operating margins, discount rates and capital expenditures. The Market Approach requires us to make assumptions related to EBITDA multiples. Changes in economic and operating conditions impacting these assumptions or changes in multiples could result in goodwill impairments in future periods. In conjunction with our annual goodwill impairment reviews, we reconcile the sum of the valuations of all of our reporting units to our market capitalization as of such dates.
Although we believe we have sufficient historical and projected information available to us to test for goodwill impairment, it is possible that actual results could differ from the estimates used in our impairment tests. Of the key assumptions that impact the goodwill impairment test, the expected future cash flows and discount rate are among the most sensitive and are considered to be critical assumptions, as changes to these estimates could have an effect on the estimated fair value of each of our reporting units. We have assessed the sensitivity of these assumptions on each of our reporting units as of October 1, 2025.
We noted that, based on the estimated fair value of our reporting units determined as of October 1, 2025:
•a hypothetical decrease of 10% in the expected annual future cash flows of these reporting units, with all other assumptions unchanged, would have decreased the estimated fair value of our reporting units as of October 1, 2025 by a range of approximately 9.4% to 10.6% but would not, however, have resulted in the carrying value of any of our reporting units exceeding their estimated fair value; and
•a hypothetical increase of 100 basis points in the discount rate, with all other assumptions unchanged, would have decreased the estimated fair value of our reporting units as of October 1, 2025 by a range of approximately 3.3% to 10.9% but would not, however, have resulted in the carrying value of any of our reporting units exceeding their estimated fair value.
At December 31, 2025, no factors were identified that would alter the conclusions of our October 1, 2025 goodwill impairment analysis. In making this assessment, we considered a number of factors including operating results, business plans, anticipated future cash flows, transactions and marketplace data. There are inherent uncertainties related to these factors and our judgment in applying them to the analysis of goodwill impairment.
INCOME TAXES
Accounting for income taxes requires the recognition of deferred tax assets and liabilities for the expected future tax consequences of temporary differences between the tax and financial reporting bases of assets and liabilities and for loss and credit carryforwards. We measure deferred tax assets and liabilities using enacted tax rates expected to be applied to taxable income in the years in which those temporary differences and carryforwards are expected to be recovered or settled. The effect on deferred tax assets and liabilities as a result of a change in tax rates is recognized in income in the period that the change is enacted. Valuation allowances are provided when recovery of deferred tax assets does not meet the more likely than not standard as defined in GAAP. Valuation allowances would be reversed as a reduction to the provision for income taxes if related deferred tax assets are deemed realizable based on changes in facts and circumstances relevant to the recoverability of the asset.
At December 31, 2025, we have federal net operating loss carryforwards of $116.2 million and disallowed interest expense carryforwards of $185.9 million, both of which can be carried forward indefinitely, and of which $109.9 million and $64.6 million, respectively, are expected to be realized to reduce future federal taxable income. We have assets for foreign net operating losses of $146.3 million and foreign disallowed interest expense carryforwards of $46.6 million, with various expiration dates (and in some cases no expiration date), subject to valuation allowances of approximately 77.5% and 26.8%, respectively. If actual results differ unfavorably from certain of our estimates used, we may not be able to realize all or part of our net deferred income tax assets and additional valuation allowances may be required. Although we believe our estimates are reasonable, no assurance can be given that our estimates reflected in the tax provisions and accruals will equal our actual results. These differences could have a material impact on our income tax provision and operating results in the period in which such determination is made.
We provide for foreign withholding taxes on the undistributed earnings of our foreign TRSs because it is not our intention to reinvest the undistributed earnings of our foreign TRSs indefinitely outside the United States. As a REIT, future repatriation of incremental undistributed earnings of our foreign subsidiaries will not be subject to federal or state income tax.
The following information summarizes our results of operations for the year ended December 31, 2025 compared to the year ended December 31, 2024. For a discussion of our results for the year ended December 31, 2024 compared to the year ended December 31, 2023, see "Item 7. Management's Discussion and Analysis of Financial Condition and Results of Operations" included in our Annual Report on Form 10-K filed with the SEC on February 14, 2025.
COMPARISON OF YEAR ENDED DECEMBER 31, 2025 TO YEAR ENDED DECEMBER 31, 2024
(IN THOUSANDS):
YEAR ENDED DECEMBER 31,
DOLLAR CHANGE
PERCENTAGE CHANGE
2025
2024
Revenues
$
6,901,737
$
6,149,909
$
751,828
12.2
%
Operating Expenses
5,737,915
5,140,390
597,525
11.6
%
Operating Income
1,163,822
1,009,519
154,303
15.3
%
Other Expenses, Net
1,011,568
825,853
185,715
22.5
%
Net Income (Loss)
152,254
183,666
(31,412)
(17.1)
%
Net Income (Loss) Attributable to Noncontrolling Interests
7,663
3,510
4,153
118.3
%
Net Income (Loss) Attributable to Iron Mountain Incorporated
$
144,591
$
180,156
$
(35,565)
(19.7)
%
Adjusted EBITDA(1)
$
2,573,950
$
2,236,380
$
337,570
15.1
%
Adjusted EBITDA Margin(1)
37.3
%
36.4
%
(1)See "Non-GAAP Measures—Adjusted EBITDA" in this Annual Report for the definitions of Adjusted EBITDA and Adjusted EBITDA Margin, reconciliation of Net Income (Loss) to Adjusted EBITDA and a discussion of why we believe these non-GAAP measures provide relevant and useful information to our current and potential investors.
Total revenues consist of the following (in thousands):
YEAR ENDED DECEMBER 31,
PERCENTAGE CHANGE
2025
2024
DOLLAR CHANGE
ACTUAL
CONSTANT
CURRENCY(1)
IMPACT OF ACQUISITIONS
ORGANIC
GROWTH(2)
Storage Rental
$
4,052,510
$
3,682,259
$
370,251
10.1
%
9.7
%
0.1
%
9.6
%
Service
2,849,227
2,467,650
381,577
15.5
%
15.1
%
3.9
%
11.2
%
Total Revenues
$
6,901,737
$
6,149,909
$
751,828
12.2
%
11.9
%
1.7
%
10.2
%
(1)Constant currency growth rate, which is a non-GAAP measure, is calculated by translating the 2024 results at the 2025 average exchange rates.
(2)Our organic revenue growth rate, which is a non-GAAP measure, represents the year-over-year growth rate of our revenues excluding the impact of business acquisitions, divestitures and foreign currency exchange rate fluctuations. Our organic revenue growth rate includes the impact of acquisitions of customer relationships.
TOTAL REVENUES
For the year ended December 31, 2025, the increase in reported revenue was primarily driven by reported storage rental revenue growth and reported service revenue growth.
STORAGE RENTAL REVENUE AND SERVICE REVENUE
Primary factors influencing the change in reported storage rental revenue and reported service revenue for the year ended December 31, 2025 compared to the year ended December 31, 2024 include the following:
STORAGE RENTAL REVENUE
•organic storage rental revenue growth driven by revenue management in our Global RIM Business segment and lease commencements and improved pricing in our Global Data Center Business segment.
SERVICE REVENUE
•organic service revenue growth driven by increases in Global Digital Solutions and traditional service activity levels in our Global RIM Business segment and growth from new and existing customers in our ALM business; and
•an increase of $87.5 million due to acquisitions in our ALM business.
Cost of sales (excluding depreciation and amortization) consists of the following expenses (in thousands):
YEAR ENDED DECEMBER 31,
PERCENTAGE CHANGE
% OF CONSOLIDATED REVENUES
PERCENTAGE CHANGE (FAVORABLE)/ UNFAVORABLE
2025
2024
DOLLAR CHANGE
ACTUAL
CONSTANT CURRENCY
2025
2024
Labor
$
1,176,560
$
1,052,568
$
123,992
11.8
%
11.2
%
17.0
%
17.1
%
(0.1)
%
Facilities
1,193,214
1,114,316
78,898
7.1
%
6.5
%
17.3
%
18.1
%
(0.8)
%
Transportation
173,809
179,166
(5,357)
(3.0)
%
(3.4)
%
2.5
%
2.9
%
(0.4)
%
Product Cost of Sales and Other
535,897
350,499
185,398
52.9
%
52.4
%
7.8
%
5.7
%
2.1
%
Total Cost of sales
$
3,079,480
$
2,696,549
$
382,931
14.2
%
13.6
%
44.6
%
43.8
%
0.8
%
Primary factors influencing the change in reported Cost of sales for the year ended December 31, 2025 compared to the year ended December 31, 2024 include the following:
•an increase in labor costs driven by an increase in service activity, primarily within our Global RIM Business segment and ALM business, including the impact of recent acquisitions;
•an increase in facilities expenses, primarily driven by higher real estate taxes in our Global Data Center Business segment, and increases in utilities and rent expense; and
•an increase in product cost of sales and other in our ALM business in line with product sales increases from new and existing customers.
Selling, general and administrative expenses consists of the following expenses (in thousands):
YEAR ENDED DECEMBER 31,
PERCENTAGE CHANGE
% OF CONSOLIDATED REVENUES
PERCENTAGE CHANGE (FAVORABLE)/ UNFAVORABLE
DOLLAR CHANGE
2025
2024
ACTUAL
CONSTANT CURRENCY
2025
2024
General, Administrative and Other
$
1,015,578
$
977,345
$
38,233
3.9
%
3.9
%
14.7
%
15.9
%
(1.2)
%
Sales, Marketing and Account Management
378,324
362,194
16,130
4.5
%
3.9
%
5.5
%
5.9
%
(0.4)
%
Total Selling, general and administrative expenses
$
1,393,902
$
1,339,539
$
54,363
4.1
%
3.9
%
20.2
%
21.8
%
(1.6)
%
Primary factors influencing the change in reported Selling, general and administrative expenses for the year ended December 31, 2025 compared to the year ended December 31, 2024 include the following:
•an increase in general, administrative and other expenses, primarily driven by higher compensation expense; and
•an increase in sales, marketing and account management expenses, primarily driven by higher compensation expense, and increased marketing costs.
DEPRECIATION AND AMORTIZATION
Our depreciation and amortization charges result primarily from depreciation related to storage systems, which include buildings, building and leasehold improvements, data center infrastructure, racking structures and computer systems hardware and software. Amortization relates primarily to customer and supplier relationship intangible assets, Contract Costs and data center lease-based intangible assets. Both depreciation and amortization are impacted by the timing of acquisitions.
Depreciation expense increased $101.6 million, or 16.1%, on a reported dollar basis for the year ended December 31, 2025 compared to the year ended December 31, 2024. See Note 2.i. to Notes to Consolidated Financial Statements included in this Annual Report for additional information regarding the useful lives over which our property, plant and equipment is depreciated.
Amortization expense increased $21.9 million, or 8.1%, on a reported dollar basis for the year ended December 31, 2025 compared to the year ended December 31, 2024.
ACQUISITION AND INTEGRATION COSTS
Acquisition and Integration Costs for the years ended December 31, 2025 and 2024 were approximately $19.5 million and $35.8 million, respectively.
RESTRUCTURING AND OTHER TRANSFORMATION
Restructuring and other transformation costs for the years ended December 31, 2025 and 2024 were approximately $195.9 million and $161.4 million, respectively, and related to operating expenses associated with the implementation of Project Matterhorn.
LOSS (GAIN) ON DISPOSAL/WRITE-DOWN OF PROPERTY, PLANT AND EQUIPMENT, NET
Loss (gain) on disposal/write-down of property, plant and equipment, net for the years ended December 31, 2025 and 2024 was approximately $24.6 million and $6.2 million, respectively.
OTHER EXPENSES, NET
INTEREST EXPENSE, NET
Interest expense, net increased $107.8 million to $829.3 million in the year ended December 31, 2025 from $721.6 million in the year ended December 31, 2024. The increase is primarily due to higher average debt outstanding during the year ended December 31, 2025 compared to the prior year period. Our weighted average interest rate, inclusive of the fees associated with our outstanding letters of credit, was 5.6% and 5.7% at December 31, 2025 and 2024, respectively. See Note 6 to Notes to Consolidated Financial Statements included in this Annual Report for additional information regarding our indebtedness.
(1)We recorded net foreign currency transaction losses of $105.6 million in the year ended December 31, 2025, based on period-end exchange rates. These losses resulted primarily from the impact of changes in the exchange rate of the British pound sterling and the Euro against the United States dollar compared to December 31, 2024 on our intercompany balances with and between certain of our subsidiaries.
PROVISION (BENEFIT) FOR INCOME TAXES
We have been organized and have operated as a REIT beginning with our taxable year ended December 31, 2014.
Our effective tax rates for the years ended December 31, 2025 and 2024 were 27.9% and 24.9%, respectively. Our effective tax rate is subject to variability in the future due to, among other items: (i) changes in the mix of income between our QRSs and our TRSs, as well as among the jurisdictions in which we operate, (ii) tax law changes, (iii) volatility in foreign exchange gains and losses, (iv) the timing of the establishment and reversal of tax reserves, (v) our ability to utilize net operating losses and interest expenses that we generate and (vi) the taxability or deductibility of significant transactions.
The primary reconciling items between the federal statutory tax rate of 21.0% and our overall effective tax rate were:
YEAR ENDED DECEMBER 31,
2025
2024
The lack of tax benefits recognized for the foreign exchange losses of $26.9 million and ordinary losses and disallowed interest expenses of certain entities of $16.7 million, as well as withholding tax expenses of $15.2 million, partially offset by the net benefits derived from the dividends paid deduction of $52.6 million.
The lack of tax benefits recognized for the ordinary losses and disallowed interest expenses of certain entities of $37.0 million and differences in the tax rates to which our foreign earnings are subject of $13.3 million, partially offset by the benefits derived from the dividends paid deduction of $33.9 million. In addition, we recorded gains and losses in Other expense (income), net during the period, for which there was no tax impact.
As a REIT, we are entitled to a deduction for dividends paid, resulting in a substantial reduction of federal income tax expense. As a REIT, substantially all of our income tax expense will be incurred based on the earnings generated by our foreign subsidiaries and our domestic TRSs.
We are subject to income taxes in the United States and numerous foreign jurisdictions. We are subject to examination by various tax authorities in jurisdictions in which we have business operations or a taxable presence. We regularly assess the likelihood of additional assessments by tax authorities and provide for these matters as appropriate. Although we believe our tax estimates are appropriate, the final determination of tax audits and any related litigation could result in changes in our estimates.
The OECD has issued proposals that change long-standing tax principles, including a global minimum tax rate of 15% ("Pillar Two"). While the United States has not enacted legislation to effectuate Pillar Two, Iron Mountain operates in many foreign jurisdictions that have enacted legislation to implement Pillar Two. Pillar Two became applicable for Iron Mountain beginning in 2024. Recent G7 Country (Canada, France, Germany, Italy, Japan and the UK) statements released a side-by-side ("SbS") safe harbor that exempts certain U.S.-parented groups from these rules. The side-by-side Safe Harbor provides that Multinational Enterprise G Groups with an Ultimate Parent Entity in a jurisdiction with qualified SbS regime will not be subject to the Income Inclusion Rule and Undertaxed Profits Rule if they elect the SbS Safe Harbor, applicable as of the beginning of 2026. Since we do not have material operations in jurisdictions with tax rates lower than the Pillar Two minimum, we are not expecting a material impact on our effective tax rate, corporate tax liabilities or cash tax liabilities. We continue to monitor United States and global legislative actions as well as administrative guidance related to Pillar Two for potential impacts.
On July 4, 2025, President Trump signed into law the reconciliation bill, commonly referred to as the One Big Beautiful Bill Act ("OBBBA"). The OBBBA introduces several changes to U.S. federal income tax law, such as suspending the capitalization and amortization of domestic research and development expenditures and reinstating bonus depreciation. It also modifies the deductions available for net controlled foreign corporation tested income (formerly referred to as "global intangible low-taxed income") from non-U.S. subsidiaries and changes the limitations on deductible interest. Under the prior law, not more than 20% of the value of a REIT’s total assets at the end of any quarter could be represented by securities of one or more taxable REIT subsidiaries; the OBBBA increased this threshold to 25% effective January 1, 2026. The effective dates of the OBBBA provisions range from 2025 through 2027. We do not expect the OBBBA provisions to have a material impact on our consolidated financial statements.
The following table reflects the effect of the foregoing factors on our net income (loss) and Adjusted EBITDA (in thousands):
YEAR ENDED DECEMBER 31,
DOLLAR CHANGE
PERCENTAGE CHANGE
2025
2024
Net Income (Loss)
$
152,254
$
183,666
$
(31,412)
(17.1)
%
Net Income (Loss) as a percentage of Revenue
2.2
%
3.0
%
Adjusted EBITDA
$
2,573,950
$
2,236,380
$
337,570
15.1
%
Adjusted EBITDA Margin
37.3
%
36.4
%
Adjusted EBITDA Margin for the year ended December 31, 2025 increased 90 basis points from the prior year driven by favorable overhead management, offset by changes in our revenue mix.
See the discussion of Business Segments under Item I and Note 10 to Notes to Consolidated Financial Statements, both included in this Annual Report, for a description of our reportable segments.
GLOBAL RIM BUSINESS (IN THOUSANDS)
YEAR ENDED DECEMBER 31,
PERCENTAGE CHANGE
2025
2024
DOLLAR CHANGE
ACTUAL
CONSTANT CURRENCY
IMPACT OF ACQUISITIONS
ORGANIC GROWTH
Storage Rental
$
3,183,735
$
3,009,094
$
174,641
5.8
%
5.5
%
0.1
%
5.4
%
Service
2,107,746
1,970,344
137,402
7.0
%
6.6
%
0.4
%
6.2
%
Segment Revenue
$
5,291,481
$
4,979,438
$
312,043
6.3
%
6.0
%
0.3
%
5.7
%
Segment Adjusted EBITDA
$
2,363,498
$
2,223,117
$
140,381
Segment Adjusted EBITDA Margin
44.7
%
44.6
%
SEGMENT ANALYSIS: GLOBAL RIM BUSINESS (IN MILLIONS)
Storage Rental Revenue
Service Revenue
Segment Revenue
Segment Adjusted EBITDA
Primary factors influencing the change in revenue and Adjusted EBITDA Margin in our Global RIM Business segment for the year ended December 31, 2025 compared to the year ended December 31, 2024 include the following:
•organic storage rental revenue growth driven by revenue management;
•organic service revenue growth primarily driven by increases in our Global Digital Solutions and growth in our traditional service activity levels; and
•a 10 basis point increase in Adjusted EBITDA Margin primarily driven by ongoing cost containment measures and revenue management.
SEGMENT ANALYSIS: GLOBAL DATA CENTER BUSINESS (IN MILLIONS)
Storage Rental Revenue
Service Revenue
Segment Revenue
Segment Adjusted EBITDA
Primary factors influencing the change in revenue and Adjusted EBITDA Margin in our Global Data Center Business segment for the year ended December 31, 2025 compared to the year ended December 31, 2024 include the following:
•organic storage rental revenue growth from leases that commenced during 2025 and in prior periods, improved pricing and increased usage of pass-through power;
•an increase in Adjusted EBITDA primarily driven by organic storage rental revenue growth; and
•a 620 basis point increase in Adjusted EBITDA Margin reflecting recent lease commencements, improved pricing and cost containment.
Primary factors influencing the change in revenue and Adjusted EBITDA in Corporate and Other for the year ended December 31, 2025 compared to the year ended December 31, 2024 include the following:
•an increase in service revenue of $87.5 million due to acquisitions in our ALM business;
•organic service revenue growth in our ALM business driven by growth from new and existing customers and improved component pricing trends; and
•an improvement in Adjusted EBITDA driven by service revenue improvement in our ALM business.
We expect to meet our short-term and long-term cash flow requirements through cash generated from operations, cash on hand, borrowings under our Credit Agreement (as defined below), as well as other potential financings (such as the issuance of debt). Our cash flow requirements, both in the near and long term, include, but are not limited to, capital expenditures, the repayment of outstanding debt, shareholder dividends, potential business acquisitions and normal business operation needs.
PROJECT MATTERHORN
As disclosed above, as of December 31, 2025, we completed our investments in Project Matterhorn. We incurred approximately $574.4 million in Restructuring and other transformation costs related to Project Matterhorn since its inception. During the years ended December 31, 2025 and 2024, we incurred approximately $195.9 million and $161.4 million, respectively, in Restructuring and other transformation costs related to Project Matterhorn, which were comprised of (1) restructuring costs, which included (i) site consolidation and other related exit costs, (ii) employee severance costs and (iii) certain professional fees associated with these activities, and (2) other transformation costs, which included professional fees such as project management costs and costs for third party consultants who assisted in the enablement of our growth initiatives.
CASH FLOWS
The following is a summary of our cash balances and cash flows (in thousands) as of and for the years ended December 31,
2025
2024
Cash Flows from Operating Activities
$
1,339,999
$
1,196,708
Cash Flows from Investing Activities
(2,574,206)
(2,136,761)
Cash Flows from Financing Activities
1,267,914
876,745
Cash and Cash Equivalents, End of Year
158,535
155,716
A. CASH FLOWS FROM OPERATING ACTIVITIES
For the year ended December 31, 2025, net cash flows provided by operating activities increased by $143.3 million compared to the prior year period primarily due to an increase in net income (loss) (excluding non-cash charges) of $131.4 million and an increase in cash from working capital of $11.9 million.
B. CASH FLOWS FROM INVESTING ACTIVITIES
Our significant investing activities during the year ended December 31, 2025 included:
•Cash paid for capital expenditures of $2,271.6 million. Additional details of our capital spending are included in the "Capital Expenditures" section below.
•Cash paid for acquisitions, net of cash acquired, of $101.6 million, primarily funded by borrowings under the Revolving Credit Facility (as defined below).
C. CASH FLOWS FROM FINANCING ACTIVITIES
Our significant financing activities during the year ended December 31, 2025 included:
•Net proceeds of approximately $1,390.7 million associated with the issuance of the Euro Notes (as defined below).
•Net proceeds of approximately $1,006.4 million, primarily associated with borrowings under our Credit Agreement (as defined below) and our data center credit facilities, which were used to partially finance the construction of our data centers, offset by the repayment of the 3.875% GBP Senior Notes due 2025 (the "GBP Notes").
•Payment of dividends in the amount of $919.4 million on our common stock.
•Payments of deferred purchase obligations and other deferred payments of $240.7 million.
We present two categories of capital expenditures: (1) Growth Investment Capital Expenditures and (2) Recurring Capital Expenditures with the following sub-categories: (i) Data Center; (ii) Real Estate; (iii) Innovation and Other (for Growth Investment Capital Expenditures only); and (iv) Non-Real Estate (for Recurring Capital Expenditures only).
GROWTH INVESTMENT CAPITAL EXPENDITURES:
•Data Center: Expenditures primarily related to investments in the construction of data center facilities (including the acquisition of land), as well as investments to drive revenue growth, expand capacity or achieve operational or cost efficiencies.
•Real Estate: Expenditures primarily related to investments in land, buildings, building and leasehold improvements and racking structures to grow our revenues, extend the useful life of an asset or achieve operational or cost efficiencies.
•Innovation and Other: Discretionary capital expenditures for new products and services as well as computer hardware and software to drive revenue growth, expand capacity or to achieve operational cost efficiencies in businesses other than our data center business. Integration costs of acquisitions are also included.
RECURRING CAPITAL EXPENDITURES:
•Data Center: Expenditures related to the replacement of equivalent components and overall maintenance of existing data center assets.
•Real Estate: Expenditures primarily related to the replacement of components of real estate assets such as buildings, building and leasehold improvements and racking structures.
•Non-Real Estate: Expenditures primarily related to the replacement of containers and shred bins, warehouse equipment, fixtures, computer hardware, or third-party or internally-developed software assets that support the maintenance of existing revenues or avoidance of an increase in costs.
The following table presents our capital spend for 2025 and 2024 organized by the type of the spending as described above:
NATURE OF CAPITAL SPEND (IN THOUSANDS)
2025
2024
Growth Investment Capital Expenditures:
Data Center
$
1,746,981
$
1,422,118
Real Estate
180,944
204,248
Innovation and Other
140,050
131,195
Total Growth Investment Capital Expenditures
2,067,975
1,757,561
Recurring Capital Expenditures:
Data Center
20,564
19,728
Real Estate
59,572
56,781
Non-Real Estate
67,218
66,558
Total Recurring Capital Expenditures
147,354
143,067
Total Capital Spend (on accrual basis)
2,215,329
1,900,628
Net (decrease) increase in prepaid capital expenditures
(4,278)
(1,627)
Net (increase) decrease in accrued capital expenditures
60,577
(107,437)
Total Capital Spend (on cash basis)
$
2,271,628
$
1,791,564
Excluding capital expenditures associated with potential future acquisitions, we expect total capital expenditures of approximately $2,200.0 million for the year ending December 31, 2026. Of this, we expect capital expenditures for growth investment of approximately $2,050.0 million and recurring capital expenditures of approximately $150.0 million.
DIVIDENDS
See Note 8 to Notes to Consolidated Financial Statements included in this Annual Report for information on dividends.
NONCONTROLLING INTERESTS
In December 2025, we entered into an agreement with a partner to form our Iron Mountain Data Centers Arizona 3 JV, LP joint venture, which resulted in an initial Noncontrolling interest of approximately $74.8 million recorded in our Consolidated Balance Sheet at December 31, 2025.
Financial instruments that potentially subject us to credit risk consist principally of cash and cash equivalents (including money market funds and time deposits) and accounts receivable. We had no significant concentrations of liquid investments as of December 31, 2025.
Long-term debt as of December 31, 2025 is as follows (in thousands):
DECEMBER 31, 2025
DEBT (INCLUSIVE
OF DISCOUNT)
UNAMORTIZED
DEFERRED
FINANCING COSTS
CARRYING
AMOUNT
Revolving Credit Facility
$
751,500
$
(8,207)
$
743,293
Term Loan A
487,500
—
487,500
Term Loan B
2,020,957
(12,465)
2,008,492
Virginia 3 Term Loans
271,079
(1,189)
269,890
Virginia 6 Term Loans
210,000
(2,633)
207,367
Virginia 7 Term Loans
275,314
(4,351)
270,963
Virginia 4/5 Term Loans due 2030
208,224
(3,529)
204,695
Australian Dollar Term Loan (the "AUD Term Loan")
262,192
(1,965)
260,227
UK Revolving Credit Facility
188,385
(2,002)
186,383
47/8% Senior Notes due 2027 (the "47/8% Notes due 2027")
1,000,000
(2,488)
997,512
51/4% Senior Notes due 2028 (the "51/4% Notes due 2028")
825,000
(2,657)
822,343
5% Senior Notes due 2028 (the "5% Notes due 2028")
500,000
(1,869)
498,131
7% Senior Notes due 2029 (the "7% Notes")
1,000,000
(6,559)
993,441
47/8% Senior Notes due 2029 (the "47/8% Notes due 2029")
1,000,000
(5,425)
994,575
51/4% Senior Notes due 2030 (the "51/4% Notes due 2030")
1,300,000
(6,894)
1,293,106
41/2% Senior Notes due 2031 (the "41/2% Notes")
1,100,000
(6,430)
1,093,570
5% Senior Notes due 2032 (the "5% Notes due 2032")
750,000
(8,595)
741,405
55/8% Senior Notes due 2032 (the "55/8% Notes")
600,000
(3,823)
596,177
61/4% Senior Notes due 2033 (the "61/4% Notes")
1,200,000
(12,752)
1,187,248
43/4% Euro Senior Notes due 2034 (the "Euro Notes")
1,408,825
(16,765)
1,392,060
Real Estate Mortgages, Financing Lease Liabilities and Other
785,497
(1,512)
783,985
Accounts Receivable Securitization Program
400,000
(404)
399,596
Total Long-term Debt
16,544,473
(112,514)
16,431,959
Less Current Portion
(216,074)
—
(216,074)
Long-term Debt, Net of Current Portion
$
16,328,399
$
(112,514)
$
16,215,885
See Note 6 to Notes to Consolidated Financial Statements included in this Annual Report for additional information regarding our long-term debt.
CREDIT AGREEMENT
Our credit agreement (the "Credit Agreement") consists of a revolving credit facility (the "Revolving Credit Facility"), a term loan A facility (the "Term Loan A") and a term loan B facility (the "Term Loan B").
During the year ended December 31, 2025, we took the following actions regarding our Credit Agreement:
•On June 18, 2025, we amended the Credit Agreement, which resulted in:
◦an increase in the principal amount of the Term Loan A from approximately $218.8 million to $500.0 million.
•On November 13, 2025, we amended the Credit Agreement, which resulted in:
◦an increase in the principal amount of the Term Loan B from approximately $1,836.7 million to $2,036.7 million.
In connection with the November 13, 2025 amendment, we paid original issue discount fees of approximately $1.8 million.
The Revolving Credit Facility and the Term Loan A are scheduled to mature on March 18, 2030, at which point all obligations become due. The Term Loan B is scheduled to mature on January 31, 2031, at which point all obligations become due. As of December 31, 2025, we had $751.5 million, $487.5 million and $2,031.5 million outstanding under the Revolving Credit Facility, the Term Loan A and the Term Loan B, respectively. As of December 31, 2025, we had various outstanding letters of credit totaling $12.4 million under the Revolving Credit Facility. The remaining amount available for borrowing under the Revolving Credit Facility as of December 31, 2025, which is based on IMI’s leverage ratio, the last 12 months' earnings before interest, taxes, depreciation and amortization and rent expense ("EBITDAR"), other adjustments as defined in the Credit Agreement and current external debt, was $1,986.1 million (which amount represents the maximum availability as of such date). Available borrowings under the Revolving Credit Facility are subject to compliance with our indenture covenants as discussed below. The weighted average interest rate in effect under the Revolving Credit Facility as of December 31, 2025 was 5.7%. The interest rates in effect under the Term Loan A and the Term Loan B as of December 31, 2025 were 5.5% and 5.8%, respectively.
DATA CENTER DEBT AGREEMENTS
As our Global Data Center Business continues to expand, we have entered into debt agreements in order to partially finance the construction of various data centers. These agreements primarily consist of term loan facilities with the following terms (in thousands):
AGREEMENT
MAXIMUM BORROWING AMOUNT
OUTSTANDING BORROWINGS AS OF DECEMBER 31, 2025
DIRECT OBLIGOR
CONTRACTUAL INTEREST RATE
UNUSED COMMITMENT FEE
MATURITY DATE(2)
Virginia 3 Term Loans(1)(2)
$
275,000
271,079
Iron Mountain Data Centers Virginia 3, LLC
SOFR plus 2.50%
0.75
%
August 31, 2026
Virginia 7 Term Loans(1)(2)
300,000
275,314
Iron Mountain Data Centers Virginia 7, LLC
SOFR plus 2.50%
0.75
%
April 12, 2027
Virginia 6 Term Loans(1)(2)
210,000
210,000
Iron Mountain Data Centers Virginia 6, LLC
SOFR plus 2.75%
0.75
%
May 3, 2027
Virginia 4/5 Term Loans due 2030(2)
208,224
208,224
Iron Mountain Data Centers Virginia 4/5 Subsidiary, LLC
5.60%
N/A
November 1, 2030
(1)The term loans are indexed to the one-month Secured Overnight Financing Rate ("SOFR") benchmark rate.
(2)All obligations will become due on the specified maturity dates. Each agreement, with the exception of the Virginia 4/5 Term Loans due 2030, includes two one-year options that allow us to extend the initial maturity date, subject to the conditions specified in the agreements.
See Note 6 to Notes to Consolidated Financial Statements included in this Annual Report for additional information regarding these agreements.
AUSTRALIAN DOLLAR TERM LOAN
On June 25, 2025, Iron Mountain Australia Group Pty, Ltd., a wholly-owned subsidiary of IMI, amended its AUD Term Loan, which resulted in:
•an extension of the maturity date from September 30, 2026 to September 30, 2030, at which point all obligations become due,
•an increase in the original principal amount from 350.0 million Australian dollars to 400.0 million Australian dollars and
•a decrease in the interest rate from BBSY (an Australian benchmark variable interest rate) plus 3.625% to BBSY plus 3.500%.
The amended loan was issued at 99.5% of par. Principal payments on the AUD Term Loan are to be paid in quarterly installments in an aggregate amount of 10.0 million Australian dollars per year, with the remaining balance due September 2030. As of December 31, 2025, we had 395.0 million Australian dollars (or $263.9 million, based upon the exchange rate between the United States dollar and the Australian dollar as of December 31, 2025) outstanding on the AUD Term Loan and the interest rate in effect under the AUD Term Loan was 7.3%.
See Note 6 to Notes to Consolidated Financial Statements included in this Annual Report for additional information regarding this agreement.
SEPTEMBER 2025 OFFERING
On September 10, 2025, IMI completed a private offering of (in thousands):
SERIES OF NOTES
AGGREGATE PRINCIPAL AMOUNT
MATURITY DATE
INTEREST PAYMENT DUE
PAR CALL DATE(1)
Euro Notes
€
1,200,000
January 15, 2034
January 15 and July 15
September 10, 2030
(1)We may redeem the Euro Notes at any time, at our option, in whole or in part. Prior to the par call date, we may redeem the Euro Notes at the redemption price or make-whole premium specified in the indenture governing the Euro Notes, together with accrued and unpaid interest to, but excluding, the redemption date. On or after the par call date, we may redeem the Euro Notes at a price equal to 100% of the principal amount being redeemed, together with accrued and unpaid interest to, but excluding, the redemption date.
The Euro Notes were issued at par and have a contractual interest rate of 4.75%. The total net proceeds from the issuance, after deducting the initial purchasers' commissions, of approximately 1,188.0 million Euros (or $1,390.7 million, based upon the exchange rate between the Euro and the United States dollar on September 10, 2025 (the settlement date for the Euro Notes)), were used to repay the GBP Notes and a portion of the outstanding borrowings under the Revolving Credit Facility. As of December 31, 2025, we had 1,200.0 million Euros (or $1,408.8 million, based upon the exchange rate between the United States dollar and the Euro as of December 31, 2025) outstanding on the Euro Notes.
DEBT COVENANTS
The Credit Agreement, our bond indentures and other agreements governing our indebtedness contain certain restrictive financial and operating covenants, including covenants that restrict our ability to complete acquisitions, pay cash dividends, incur indebtedness, make investments, sell assets and take other specified corporate actions. The covenants do not contain a rating trigger. Therefore, a change in our debt rating would not trigger a default under the Credit Agreement, our bond indentures or other agreements governing our indebtedness. The Credit Agreement requires that we satisfy a net total lease adjusted leverage ratio and a fixed charge coverage ratio on a quarterly basis, and our bond indentures require that, among other things, we satisfy a leverage ratio (not lease adjusted) or a fixed charge coverage ratio (not lease adjusted), as a condition to taking actions such as paying dividends and incurring indebtedness.
The Credit Agreement uses EBITDAR-based calculations and the bond indentures use EBITDA based calculations as the primary measures of financial performance for purposes of calculating leverage and fixed charge coverage ratios. The EBITDAR- and EBITDA-based leverage calculations include our consolidated subsidiaries, other than those we have designated as "Unrestricted Subsidiaries" as defined in the Credit Agreement and bond indentures. Generally, the Credit Agreement and the bond indentures use a trailing four fiscal quarter basis for purposes of the relevant calculations and require certain adjustments and exclusions for purposes of those calculations, which make the calculation of financial performance under the Credit Agreement and bond indentures not directly comparable to Adjusted EBITDA as presented herein. These adjustments can be significant. For example, the calculation of financial performance under the Credit Agreement and certain of our bond indentures includes (subject to specified exceptions and caps) adjustments for non-cash charges and for expected benefits associated with (i) completed acquisitions, (ii) certain executed lease agreements associated with our data center business that have yet to commence and (iii) restructuring and other strategic initiatives. The calculation of financial performance under our other bond indentures includes, for example, adjustments for non-cash charges and for expected benefits associated with (i) completed acquisitions and (ii) events that are extraordinary, unusual or non-recurring.
Our leverage and fixed charge coverage ratios under the Credit Agreement as of December 31, 2025 are as follows:
DECEMBER 31, 2025
MAXIMUM/MINIMUM ALLOWABLE
Net total lease adjusted leverage ratio
4.9
Maximum allowable of 7.0
Fixed charge coverage ratio
2.5
Minimum allowable of 1.5
We are in compliance with our leverage and fixed charge coverage ratios under the Credit Agreement, our bond indentures and other agreements governing our indebtedness as of December 31, 2025. Noncompliance with these leverage and fixed charge coverage ratios would have a material adverse effect on our financial condition and liquidity.
Our ability to pay interest on or to refinance our indebtedness depends on our future performance, working capital levels and capital structure, which are subject to general economic, financial, competitive, legislative, regulatory and other factors which may be beyond our control. There can be no assurance that we will generate sufficient cash flow from our operations or that future financings will be available on acceptable terms or in amounts sufficient to enable us to service or refinance our indebtedness or to make necessary capital expenditures.
DERIVATIVE INSTRUMENTS
INTEREST RATE SWAP AGREEMENTS
We utilize interest rate swap agreements designated as cash flow hedges to limit our exposure to changes in interest rates on a portion of our floating rate indebtedness. Certain of our interest rate swap agreements have notional amounts that will increase with the underlying hedged transaction. Under our interest rate swap agreements, we receive variable rate interest payments associated with the notional amount of each interest rate swap, based upon the one-month SOFR, in exchange for the payment of fixed interest rates as specified in the interest rate swap agreements. Our interest rate swap agreements are marked to market at the end of each reporting period, representing the fair values of the interest rate swap agreements, and any changes in fair value are recognized as a component of Accumulated other comprehensive items, net. Unrealized gains are recognized as assets, while unrealized losses are recognized as liabilities.
As of December 31, 2025 and 2024, we have approximately $1,349.0 million and $1,482.0 million, respectively, in notional value outstanding on our interest rate swap agreements. As of December 31, 2025, our interest rate swap agreements have maturity dates ranging from February 2026 through May 2027.
We utilize cross-currency interest rate swaps to hedge the variability of exchange rate impacts between the United States dollar and certain of our foreign functional currencies, including the Euro and the Canadian dollar. As of December 31, 2025, our cross-currency interest rate swap agreements have maturity dates ranging from February 2026 through November 2026.
The notional values of our cross-currency interest rate swaps, by currency, as of December 31, 2025 and 2024 are as follows (in thousands):
YEAR ENDED DECEMBER 31,
2025
2024
Euro
$
509,187
$
509,187
Canadian dollar
350,000
350,000
$
859,187
$
859,187
We have designated these cross-currency swap agreements as hedges of net investments in our Euro and Canadian dollar denominated subsidiaries and they require an exchange of the notional amounts at maturity. These cross-currency swap agreements are marked to market at the end of each reporting period, representing the fair values of the cross-currency swap agreements, and any changes in fair value are recognized as a component of Accumulated other comprehensive items, net. Unrealized gains are recognized as assets while unrealized losses are recognized as liabilities. The excluded component of our cross-currency swap agreements is recorded in Accumulated other comprehensive items, net and amortized to interest expense on a straight-line basis.
See Note 5 to Notes to Consolidated Financial Statements included in this Annual Report for additional information on our derivative instruments.
ACQUISITIONS
See Note 3 to Notes to Consolidated Financial Statements included in this Annual Report for information regarding our acquisitions.
INVESTMENTS
The following joint venture is accounted for as an equity method investment and is presented as a component of Other within Other assets, net in our Consolidated Balance Sheets. The carrying value and equity interest in our unconsolidated joint venture at December 31, 2025 is as follows (in thousands):
DECEMBER 31, 2025
CARRYING VALUE
EQUITY INTEREST
Joint venture with AGC Equity Partners
$
85,156
20.00
%
NET OPERATING LOSSES
At December 31, 2025, we have federal net operating loss carryforwards of $116.2 million and disallowed interest expense carryforwards of $185.9 million, both of which can be carried forward indefinitely, and of which $109.9 million and $64.6 million, respectively, are expected to be realized to reduce future federal taxable income. We have assets for foreign net operating losses of $146.3 million and foreign disallowed interest expense carryforwards of $46.6 million, with various expiration dates (and in some cases no expiration date), subject to valuation allowances of approximately 77.5% and 26.8%, respectively.
ITEM 7A. QUANTITATIVE AND QUALITATIVE DISCLOSURES ABOUT MARKET RISK.
CREDIT RISK
Financial instruments that potentially subject us to credit risk consist principally of cash and cash equivalents (including money market funds and time deposits) and accounts receivable. We had no significant concentrations of liquid investments as of December 31, 2025. As per our risk management investment policy, we limit exposure to concentration of credit risk by limiting the amount invested in any one mutual fund to a maximum of 1% of the fund's total assets or in any one financial institution to a maximum of $75.0 million. As of December 31, 2025, our cash and cash equivalents balance was $158.5 million.
INTEREST RATE RISK
Given the recurring nature of our revenues and the long-term nature of our asset base, we have the ability and the preference to use long-term, fixed interest rate debt to finance our business at attractive rates, thereby helping to preserve our long-term returns on invested capital. Occasionally, we may use interest rate swaps as a tool to maintain our targeted level of fixed rate debt.
As of December 31, 2025, approximately 22.0%, or $3,640.4 million, of our total long-term debt outstanding was subject to variable interest rates. If the weighted average variable interest rate on our average variable rate debt outstanding during the year had increased by 1%, our net income for the year ended December 31, 2025 would have been reduced by approximately $41.9 million.
See Note 5 to Notes to Consolidated Financial Statements included in this Annual Report for a discussion on our interest rate swaps and Note 6 to Notes to Consolidated Financial Statements included in this Annual Report for a discussion of our long-term indebtedness, including the fair values of such indebtedness as of December 31, 2025.
CURRENCY RISK
Our international investments may be subject to risks and uncertainties related to fluctuations in currency valuation. Our reporting currency is the United States dollar. However, our international revenues and expenses are generated in the currencies of the countries in which we operate, primarily the British pound sterling, Euro, Canadian dollar and Australian dollar. Declines in the value of the local currencies in which we are paid relative to the United States dollar will cause revenues in United States dollar terms to decrease and dollar-denominated liabilities to increase in local currency. The impact of currency fluctuations on our earnings is mitigated by the fact that most operating and other expenses are also incurred and paid in the local currency. We also have several intercompany obligations with and between certain of our subsidiaries of differing functional currencies, resulting in foreign transaction gains or losses based on period-end exchange rates.
We have adopted and implemented a number of strategies to mitigate the risks associated with fluctuations in foreign currency exchange rates. One strategy is to finance certain of our international subsidiaries with debt that is denominated in local currencies, thereby providing a natural hedge. In determining the amount of any such financing, we take into account local tax considerations, among other factors. Another strategy we utilize is for IMI or IMIM to borrow in foreign currencies to hedge our intercompany financing activities. IM UK has financed a portion of its capital needs through the issuance of the UK Revolving Credit Facility, which is denominated in British pounds sterling. Our Australian business has financed a portion of its capital needs through direct borrowings in Australian dollars under the AUD Term Loan. These create a tax efficient natural currency hedge. In addition, IMI has financed a portion of its capital needs through the issuance of the Euro Notes, which are a natural hedge against our net investments in our Euro denominated subsidiaries.
We have entered into cross-currency swap agreements to hedge the variability of exchange rate impacts between the United States dollar and certain of our functional foreign currencies, including the Euro and the Canadian dollar. These cross-currency swap agreements are designated as a hedge of net investment against certain of our Euro and Canadian dollar denominated subsidiaries and require an exchange of the notional amounts at maturity. These cross-currency swap agreements are marked to market at the end of each reporting period, representing the fair values of the cross-currency swap agreements, and any changes in fair value are recognized as a component of Accumulated other comprehensive items, net. Unrealized gains are recognized as assets, which are recorded as either a component of (i) Prepaid expenses and other or (ii) Other within Other assets, net, while unrecognized losses are recognized as liabilities, which are recorded as either a component of (i) Accrued expenses and other current liabilities or (ii) Other long-term liabilities in our Consolidated Balance Sheets.
See Note 5 to Notes to Consolidated Financial Statements included in this Annual Report for a discussion on our cross-currency swap agreements.
The impact of devaluation or depreciating currency on an entity depends on the residual effect on the local economy and the ability of an entity to raise prices and/or reduce expenses. Due to our constantly changing currency exposure and the potential substantial volatility of currency exchange rates, we cannot predict the effect of exchange fluctuations on our business. The effect of a change in foreign currency exchange rates on our net investment in foreign subsidiaries is reflected in the "Accumulated Other Comprehensive Items, net" component of equity. A 10% depreciation in year-end 2025 functional currencies, relative to the United States dollar, would result in a reduction in our equity of $374.7 million.
ITEM 8. FINANCIAL STATEMENTS AND SUPPLEMENTARY DATA.
The information required by this item is included in Item 15(a) of this Annual Report.
ITEM 9. CHANGES IN AND DISAGREEMENTS WITH ACCOUNTANTS ON ACCOUNTING AND FINANCIAL DISCLOSURE.
The term "disclosure controls and procedures" is defined in Rules 13a-15(e) and 15d-15(e) of the Exchange Act. These rules refer to the controls and other procedures of a company that are designed to ensure that information is recorded, processed, accumulated, summarized, communicated and reported to management, including its principal executive and principal financial officers, as appropriate to allow timely decisions regarding what is required to be disclosed by a company in the reports that it files under the Exchange Act. As of December 31, 2025 (the "Evaluation Date"), we carried out an evaluation, under the supervision and with the participation of our management, including our chief executive officer and chief financial officer, of the effectiveness of our disclosure controls and procedures. Based upon that evaluation, our chief executive officer and chief financial officer concluded that, as of the Evaluation Date, our disclosure controls and procedures are effective.
MANAGEMENT’S REPORT ON INTERNAL CONTROL OVER FINANCIAL REPORTING
Our management, with the participation of our principal executive officer and principal financial officer, is responsible for establishing and maintaining adequate internal control over financial reporting as defined in Rules 13a-15(f) and 15d-15(f) of the Exchange Act. Our internal control system is designed to provide reasonable assurance to our management and board of directors regarding the preparation and fair presentation of published financial statements. Due to their inherent limitations, internal control over financial reporting may not prevent or detect misstatements. Projections of any evaluation of effectiveness to future periods are subject to the risks that controls may become inadequate because of changes in conditions or that the degree of compliance with policies or procedures may deteriorate. Under the supervision and with the participation of our management, including our chief executive officer and chief financial officer, we conducted an evaluation of the effectiveness of our internal control over financial reporting based on the framework in Internal Control—Integrated Framework (2013) issued by the Committee of Sponsoring Organizations of the Treadway Commission. Based on this evaluation, our management concluded that our internal control over financial reporting was effective as of December 31, 2025.
The effectiveness of our internal control over financial reporting has been audited by Deloitte & Touche LLP, an independent registered public accounting firm, as stated in their report which is included in this Annual Report.
REPORT OF INDEPENDENT REGISTERED PUBLIC ACCOUNTING FIRM
To the shareholders and the Board of Directors of Iron Mountain Incorporated
OPINION ON INTERNAL CONTROL OVER FINANCIAL REPORTING
We have audited the internal control over financial reporting of Iron Mountain Incorporated and subsidiaries (the "Company") as of December 31, 2025, based on criteria established in Internal Control — Integrated Framework (2013) issued by the Committee of Sponsoring Organizations of the Treadway Commission (COSO). In our opinion, the Company maintained, in all material respects, effective internal control over financial reporting as of December 31, 2025, based on criteria established in Internal Control — Integrated Framework (2013) issued by COSO.
We have also audited, in accordance with the standards of the Public Company Accounting Oversight Board (United States) (PCAOB), the consolidated financial statements as of and for the year ended December 31, 2025, of the Company and our report dated February 12, 2026, expressed an unqualified opinion on those financial statements.
BASIS FOR OPINION
The Company’s management is responsible for maintaining effective internal control over financial reporting and for its assessment of the effectiveness of internal control over financial reporting, included in the accompanying Management's Report on Internal Control over Financial Reporting. Our responsibility is to express an opinion on the Company’s internal control over financial reporting based on our audit. We are a public accounting firm registered with the PCAOB and are required to be independent with respect to the Company in accordance with the U.S. federal securities laws and the applicable rules and regulations of the Securities and Exchange Commission and the PCAOB.
We conducted our audit in accordance with the standards of the PCAOB. Those standards require that we plan and perform the audit to obtain reasonable assurance about whether effective internal control over financial reporting was maintained in all material respects. Our audit included obtaining an understanding of internal control over financial reporting, assessing the risk that a material weakness exists, testing and evaluating the design and operating effectiveness of internal control based on the assessed risk, and performing such other procedures as we considered necessary in the circumstances. We believe that our audit provides a reasonable basis for our opinion.
DEFINITION AND LIMITATIONS OF INTERNAL CONTROL OVER FINANCIAL REPORTING
A company’s internal control over financial reporting is a process designed to provide reasonable assurance regarding the reliability of financial reporting and the preparation of financial statements for external purposes in accordance with generally accepted accounting principles. A company’s internal control over financial reporting includes those policies and procedures that (1) pertain to the maintenance of records that, in reasonable detail, accurately and fairly reflect the transactions and dispositions of the assets of the company; (2) provide reasonable assurance that transactions are recorded as necessary to permit preparation of financial statements in accordance with generally accepted accounting principles, and that receipts and expenditures of the company are being made only in accordance with authorizations of management and directors of the company; and (3) provide reasonable assurance regarding prevention or timely detection of unauthorized acquisition, use, or disposition of the company’s assets that could have a material effect on the financial statements.
Because of its inherent limitations, internal control over financial reporting may not prevent or detect misstatements. Also, projections of any evaluation of effectiveness to future periods are subject to the risk that controls may become inadequate because of changes in conditions, or that the degree of compliance with the policies or procedures may deteriorate.
CHANGES IN INTERNAL CONTROL OVER FINANCIAL REPORTING
Our management, with the participation of our principal executive officer and principal financial officer, is responsible for establishing and maintaining adequate internal control over financial reporting as defined in Rules 13a-15(f) and 15d-15(f) of the Exchange Act. Our internal control system is designed to provide reasonable assurance to our management and board of directors regarding the preparation and fair presentation of published financial statements.
There were no changes in our internal control over financial reporting (as defined in Rule 13a-15(f) of the Exchange Act) during the quarter ended December 31, 2025 that have materially affected, or are reasonably likely to materially affect, our internal control over financial reporting.
ITEM 9B. OTHER INFORMATION.
On December 19, 2025, Ms. Mithu Bhargava, our Executive Vice President and General Manager, Digital Business Unit, adopted a 10b5-1 trading plan to sell 100% of the net shares to be acquired upon vesting of 32,295 gross performance units ("PUs"), as adjusted based on the actual performance results of such PUs, between March 19, 2026 and December 31, 2026. Ms. Bhargava´s plan will terminate on the earlier of December 31, 2026 and the date that all trades under the plan are completed.
This arrangement was entered into during an open trading window and is intended to satisfy the affirmative defense of Rule 10b5-1(c) under the Exchange Act of 1934.
ITEM 9C. DISCLOSURE REGARDING FOREIGN JURISDICTIONS THAT PREVENT INSPECTIONS.
ITEM 10. DIRECTORS, EXECUTIVE OFFICERS AND CORPORATE GOVERNANCE.
The information required by Item 10 is incorporated by reference to our Proxy Statement.
The Company has adopted its Insider Trading Policy containing insider trading policies and procedures governing the purchase, sale, and/or other dispositions of the Company’s securities by its directors, officers and employees that we believe are reasonably designed to promote compliance with insider trading laws, rules and regulations, and any listing standards applicable to the Company. While the Company has not adopted a formal policy governing insider trading restrictions on the Company itself, the Company will observe similar procedures and restrictions, including those relating to the possession of material non-public information, with respect to transactions by the Company in its securities, including repurchases of common stock. A copy of the Insider Trading Policy is incorporated by reference to our 2024 Annual Report on Form 10-K, filed with the SEC on February 14, 2025.
ITEM 11. EXECUTIVE COMPENSATION.
The information required by Item 11 is incorporated by reference to our Proxy Statement.
ITEM 12. SECURITY OWNERSHIP OF CERTAIN BENEFICIAL OWNERS AND MANAGEMENT AND RELATED STOCKHOLDER MATTERS.
The information required by Item 12 is incorporated by reference to our Proxy Statement.
ITEM 13. CERTAIN RELATIONSHIPS AND RELATED TRANSACTIONS, AND DIRECTOR INDEPENDENCE.
The information required by Item 13 is incorporated by reference to our Proxy Statement.
ITEM 14. PRINCIPAL ACCOUNTANT FEES AND SERVICES.
The information required by Item 14 is incorporated by reference to our Proxy Statement.
(b)Exhibits filed as part of this report: As listed in the Exhibit Index following the Financial Statement Schedule III-Schedule of Real Estate and Accumulated Depreciation.
REPORT OF INDEPENDENT REGISTERED PUBLIC ACCOUNTING FIRM
To the shareholders and the Board of Directors of Iron Mountain Incorporated
OPINION ON THE FINANCIAL STATEMENTS
We have audited the accompanying consolidated balance sheets of Iron Mountain Incorporated and subsidiaries (the "Company") as of December 31, 2025 and 2024, the related consolidated statements of operations, comprehensive income (loss), (deficit) equity, and cash flows, for each of the three years in the period ended December 31, 2025, and the related notes and the schedule listed in the Index at Item 15 (collectively referred to as the "financial statements"). In our opinion, the financial statements present fairly, in all material respects, the financial position of the Company as of December 31, 2025 and 2024, and the results of its operations and its cash flows for each of the three years in the period ended December 31, 2025, in conformity with accounting principles generally accepted in the United States of America.
We have also audited, in accordance with the standards of the Public Company Accounting Oversight Board (United States) (PCAOB), the Company's internal control over financial reporting as of December 31, 2025, based on criteria established in Internal Control — Integrated Framework (2013) issued by the Committee of Sponsoring Organizations of the Treadway Commission and our report dated February 12, 2026, expressed an unqualified opinion on the Company's internal control over financial reporting.
BASIS FOR OPINION
These financial statements are the responsibility of the Company's management. Our responsibility is to express an opinion on the Company's financial statements based on our audits. We are a public accounting firm registered with the PCAOB and are required to be independent with respect to the Company in accordance with the U.S. federal securities laws and the applicable rules and regulations of the Securities and Exchange Commission and the PCAOB.
We conducted our audits in accordance with the standards of the PCAOB. Those standards require that we plan and perform the audit to obtain reasonable assurance about whether the financial statements are free of material misstatement, whether due to error or fraud. Our audits included performing procedures to assess the risks of material misstatement of the financial statements, whether due to error or fraud, and performing procedures that respond to those risks. Such procedures included examining, on a test basis, evidence regarding the amounts and disclosures in the financial statements. Our audits also included evaluating the accounting principles used and significant estimates made by management, as well as evaluating the overall presentation of the financial statements. We believe that our audits provide a reasonable basis for our opinion.
CRITICAL AUDIT MATTER
The critical audit matter communicated below is a matter arising from the current-period audit of the financial statements that was communicated or required to be communicated to the audit committee and that (1) relates to accounts or disclosures that are material to the financial statements and (2) involved our especially challenging, subjective, or complex judgments. The communication of critical audit matters does not alter in any way our opinion on the financial statements, taken as a whole, and we are not, by communicating the critical audit matter below, providing a separate opinion on the critical audit matter or on the accounts or disclosures to which it relates.
GOODWILL - ASSET LIFECYCLE MANAGEMENT REPORTING UNIT - REFER TO NOTE 2.L. TO THE FINANCIAL STATEMENTS
CRITICAL AUDIT MATTER DESCRIPTION
The Company’s evaluation of goodwill for impairment involves the comparison of the fair value of the reporting unit to its carrying value. The Company determined the fair value of the Asset Lifecycle Management reporting unit based on the present value of future cash flows (the "Discounted Cash Flow Model"). The determination of the fair value using the Discounted Cash Flow Model requires management to make significant assumptions related to future revenue growth rates and discount rates. Changes in economic and operating conditions impacting these assumptions could result in goodwill impairment in future periods. The goodwill balance allocated to the Asset Lifecycle Management reporting unit was $781.1 million as of October 1, 2025 (goodwill impairment measurement date). The fair value of the Asset Lifecycle Management reporting unit exceeded its carrying value as of the measurement date and, therefore, no impairment was recognized.
We identified the evaluation of goodwill for the Asset Lifecycle Management reporting unit for impairment as a critical audit matter because of the significant judgments made by management to estimate the fair value of the Asset Lifecycle Management reporting unit. Performing audit procedures to evaluate the reasonableness of management’s estimates and assumptions related to selection of the discount rate and forecasts of future revenue of the Asset Lifecycle Management reporting unit required a high degree of auditor judgment and an increased extent of effort, including the need to involve our fair value specialists.
HOW THE CRITICAL AUDIT MATTER WAS ADDRESSED IN THE AUDIT
Our audit procedures related to testing the reasonableness of key assumptions within the Discounted Cash Flow Model of the Asset Lifecycle Management reporting unit. The key assumptions include future revenue growth rates and the selection of the discount rate. We performed the following procedures as part of the audit:
•We tested the effectiveness of controls over the evaluation of goodwill for impairment, including those over the Discounted Cash Flow Model and discount rate.
•We evaluated management’s ability to accurately forecast by comparing actual results to management’s historical forecasts.
•We evaluated the reasonableness of the revenue growth rates presented within management’s Discounted Cash Flow Model by comparing it to (1) historical results, (2) internal communications to management and the Board of Directors, and (3) forecasted information included in Company press releases and industry reports in which Asset Lifecycle Management operates.
•With the assistance of our fair value specialists, we evaluated the discount rate, including testing the underlying source information and the mathematical accuracy of the calculation, and developing a range of independent estimates and comparing that to the discount rate selected by management.
/s/ Deloitte & Touche LLP
Boston, Massachusetts
February 12, 2026
We have served as the Company’s auditor since 2002.
Accounts receivable (less allowances of $107,838 and $86,712 as of December 31, 2025 and 2024, respectively)
1,443,669
1,291,379
Prepaid expenses and other
332,779
244,127
Total Current Assets
1,934,983
1,691,222
Property, Plant and Equipment:
Property, plant and equipment
14,457,335
11,985,997
Less—Accumulated depreciation
(4,911,010)
(4,354,398)
Property, Plant and Equipment, Net
9,546,325
7,631,599
Other Assets, Net:
Goodwill
5,285,801
5,083,817
Customer and supplier relationships and other intangible assets
1,269,607
1,274,731
Operating lease right-of-use assets
2,465,196
2,489,893
Other
623,107
545,853
Total Other Assets, Net
9,643,711
9,394,294
Total Assets
$
21,125,019
$
18,717,115
LIABILITIES AND EQUITY
Current Liabilities:
Current portion of long-term debt
$
216,074
$
715,109
Accounts payable
710,662
678,716
Accrued expenses and other current liabilities (includes current portion of operating lease liabilities)
1,290,669
1,366,568
Deferred revenue
402,091
326,882
Total Current Liabilities
2,619,496
3,087,275
Long-term Debt, net of current portion
16,215,885
13,003,977
Long-term Operating Lease Liabilities, net of current portion
2,300,448
2,334,826
Other Long-term Liabilities
450,083
312,199
Deferred Income Taxes
184,015
205,341
Commitments and Contingencies
Redeemable Noncontrolling Interests
64,423
78,171
(Deficit) Equity:
Iron Mountain Incorporated Stockholders’ (Deficit) Equity:
Preferred stock (par value $0.01; authorized 10,000,000 shares; none issued and outstanding)
—
—
Common stock (par value $0.01; authorized 400,000,000 shares; issued and outstanding 295,788,645 shares and 293,592,637 shares as of December 31, 2025 and 2024, respectively)
2,958
2,936
Additional paid-in capital
4,790,190
4,647,330
(Distributions in excess of earnings) Earnings in excess of distributions
(5,405,147)
(4,583,436)
Accumulated other comprehensive items, Net
(369,008)
(569,952)
Total Iron Mountain Incorporated Stockholders’ (Deficit) Equity
(981,007)
(503,122)
Noncontrolling Interests
271,676
198,448
Total (Deficit) Equity
(709,331)
(304,674)
Total Liabilities and (Deficit) Equity
$
21,125,019
$
18,717,115
The accompanying notes are an integral part of these consolidated financial statements.
The accompanying financial statements represent the consolidated accounts of Iron Mountain Incorporated, a Delaware corporation ("IMI"), and its subsidiaries ("we" or "us").
IMI was founded in an underground facility near Hudson, New York in 1951 where it stored business records. Today, we are a global leader in information management services, and we are trusted by more than 240,000 customers in 61 countries, including approximately 95% of the Fortune 1000, to help unlock value and intelligence from their assets through services that transcend the physical and digital worlds. Our broad range of solutions address their information management, digital transformation, information security, data center and asset lifecycle management (“ALM”) needs. Our longstanding commitment to safety, security, sustainability and innovation in support of our customers underpins everything we do. We currently serve customers across an array of market verticals — commercial, legal, financial, healthcare, technology, insurance, life sciences, energy, business services, entertainment and government organizations.
We have been organized and have operated as a real estate investment trust for United States federal income tax purposes ("REIT") beginning with our taxable year ended December 31, 2014.
2. SUMMARY OF SIGNIFICANT ACCOUNTING POLICIES
A. PRINCIPLES OF CONSOLIDATION
The accompanying financial statements reflect our financial position, results of operations, comprehensive income (loss), (deficit) equity and cash flows on a consolidated basis. The accompanying financial statements include the results of those entities over which we have a controlling financial interest or of which we are deemed to be the primary beneficiary. All intercompany transactions and account balances have been eliminated.
B. USE OF ESTIMATES
The preparation of financial statements in conformity with accounting principles generally accepted in the United States of America ("GAAP") requires us to make estimates, judgments and assumptions that affect the reported amounts of assets, liabilities, revenues and expenses, and the related disclosure of contingent assets and liabilities at the date of the financial statements and for the period then ended. On an ongoing basis, we evaluate the estimates used. We base our estimates on historical experience, actuarial estimates, current conditions and various other assumptions that we believe to be reasonable under the circumstances. These estimates form the basis for making judgments about the carrying values of assets and liabilities and are not readily apparent from other sources. Actual results may differ from these estimates.
C. CHANGES IN PRESENTATION
Certain items previously reported under specific captions within Note 2.i. and Note 9 have been reclassified to conform to the current year presentation.
D. FOREIGN CURRENCY
Local currencies are the functional currencies for our operations outside the United States, with the exception of certain foreign holding companies, whose functional currency is the United States dollar. In those instances where the local currency is the functional currency, assets and liabilities are translated at period-end exchange rates, and revenues and expenses are translated at average exchange rates for the applicable period. See Note 2.r.
NOTES TO CONSOLIDATED FINANCIAL STATEMENTS (CONTINUED)
DECEMBER 31, 2025
(In thousands, except share and per share data)
2. SUMMARY OF SIGNIFICANT ACCOUNTING POLICIES (CONTINUED)
E. CASH AND CASH EQUIVALENTS
Cash and cash equivalents include cash on hand and cash invested in highly liquid short-term securities, which have remaining maturities at the date of purchase of less than 90 days. Cash and cash equivalents are carried at cost, which approximates fair value.
F. ALLOWANCE FOR DOUBTFUL ACCOUNTS AND CREDIT MEMO RESERVES
We maintain an allowance for doubtful accounts and a credit memo reserve for estimated losses resulting from the potential inability of our customers to make required payments and potential disputes regarding billing and service issues. We evaluate and monitor the collectability of accounts receivable based on a combination of factors, including historical loss experience, assessments of trends in our aged receivables and credit memo activity, the location of our businesses, the composition of our customer base, our product and service lines, potential future macroeconomic factors, including natural disasters, and reasonable and supportable forecasts for expected future collectability of our outstanding receivables. Continued adjustments will be made, as it becomes evident, should there be any material change to reasonable and supportable forecasts that may impact our likelihood of collection. Our highly diverse global customer base, with no single customer accounting for more than approximately 3% of revenue during the years ended December 31, 2025, 2024 and 2023, limits our exposure to concentration of credit risk. Additionally, we write off uncollectible balances as circumstances warrant, generally no later than one year past due.
The rollforward of the allowance for doubtful accounts and credit memo reserves is as follows:
YEAR ENDED DECEMBER 31,
BALANCE AT
BEGINNING OF
THE YEAR
CREDIT MEMOS
CHARGED TO
REVENUE
ALLOWANCE FOR
BAD DEBTS CHARGED
TO EXPENSE
DEDUCTIONS
AND OTHER(1)
BALANCE AT END OF THE YEAR
2025
$
86,712
$
98,594
$
56,675
$
(134,143)
$
107,838
2024
74,762
104,130
45,123
(137,303)
86,712
2023
54,143
92,881
32,692
(104,954)
74,762
(1)Primarily consists of the issuance of credit memos, the write-off of accounts receivable and the impact associated with currency translation adjustments.
G. CONCENTRATIONS OF CREDIT RISK
Financial instruments that potentially subject us to credit risk consist principally of cash and cash equivalents (including money market funds and time deposits) and accounts receivable. We had no significant concentrations of liquid investments as of December 31, 2025 and 2024. As per our risk management investment policy, we limit exposure to concentration of credit risk by limiting the amount invested in any one mutual fund to a maximum of 1% of the fund's total assets or in any one financial institution to a maximum of $75,000. See Note 2.p.
NOTES TO CONSOLIDATED FINANCIAL STATEMENTS (CONTINUED)
DECEMBER 31, 2025
(In thousands, except share and per share data)
2. SUMMARY OF SIGNIFICANT ACCOUNTING POLICIES (CONTINUED)
H. PREPAID EXPENSES AND ACCRUED EXPENSES
Prepaid expenses totaled $145,257 and $131,615 as of December 31, 2025 and 2024, respectively and taxes receivable totaled $97,289 and $46,523 as of December 31, 2025 and 2024, respectively. There were no other items greater than 5% of Total Current Assets included within Prepaid expenses and other as of December 31, 2025 and 2024.
Accrued expenses and other current liabilities with items greater than 5% of total current liabilities are shown separately and consist of the following:
DECEMBER 31,
DESCRIPTION
2025
2024
Current portion of operating lease liabilities
$
319,129
$
315,400
Accrued compensation and benefits
253,443
244,499
Dividends
269,563
222,649
Interest
216,717
164,336
Deferred purchase obligations, purchase price holdbacks and other
23,621
137,207
Other
208,196
282,477
Accrued expenses and other current liabilities
$
1,290,669
$
1,366,568
I. PROPERTY, PLANT AND EQUIPMENT
Property, plant and equipment are stated at cost and depreciated using the straight-line method with the following useful lives (in years):
DESCRIPTION
RANGE
Buildings, building improvements and data center infrastructure
5 to 40
Leasehold improvements
5 to 20 or life of the lease (whichever is shorter)
Racking structures
1 to 20 or life of the lease (whichever is shorter)
Warehouse equipment/vehicles
1 to 10
Furniture and fixtures and computer hardware
1 to 10
Software
1 to 7
Property, plant and equipment (including financing leases in the respective categories), at cost, consist of the following:
DECEMBER 31,
DESCRIPTION
2025
2024
Land
$
724,386
$
670,529
Buildings, building improvements and data center infrastructure
NOTES TO CONSOLIDATED FINANCIAL STATEMENTS (CONTINUED)
DECEMBER 31, 2025
(In thousands, except share and per share data)
2. SUMMARY OF SIGNIFICANT ACCOUNTING POLICIES (CONTINUED)
Minor maintenance costs are expensed as incurred. Major improvements which (i) extend the life, (ii) increase the capacity or functionality or (iii) improve the safety or the efficiency of property owned are capitalized and depreciated. Major improvements to buildings under operating leases are capitalized as leasehold improvements and depreciated. Major improvements to buildings under financing leases are capitalized as building improvements and depreciated.
CAPITALIZED INTEREST
We capitalize interest expense during the active construction period of major capital projects. Capitalized interest is added to the cost of the underlying assets and is amortized over the useful lives of the assets.During the years ended December 31, 2025, 2024 and 2023, capitalized interest is as follows:
YEAR ENDED DECEMBER 31,
2025
2024
2023
Capitalized interest
$
78,367
$
63,333
$
44,845
INTERNAL USE SOFTWARE
We develop various software applications for internal use. Computer software costs associated with internal use software are expensed as incurred until certain capitalization criteria are met. Third party consulting costs, as well as payroll and related costs for employees directly associated with, and devoting time to, the development of internal use computer software projects (to the extent time is spent directly on the project) are capitalized. Capitalization of costs, including costs incurred for upgrades and enhancements that provide additional functionality to our existing software, generally begins during the application development stage of the project, which occurs after it is probable that the project will be completed and used to perform the function intended. Capitalization ends when the asset is ready for its intended use. Capitalized internal use software costs are depreciated on a straight-line basis over the expected useful life of the software, commencing when the software is ready for its intended use. Computer software costs that are capitalized are periodically evaluated for impairment.
During the years ended December 31, 2025, 2024 and 2023, capitalized costs associated with the development of internal use computer software projects are as follows:
YEAR ENDED DECEMBER 31,
2025
2024
2023
Capitalized costs associated with the development of internal use computer software projects
$
76,104
$
69,055
$
64,488
ASSET RETIREMENT OBLIGATIONS
Entities are required to record the fair value of a liability for an asset retirement obligation in the period in which it is incurred. Asset retirement obligations represent the costs to replace or remove tangible long-lived assets required by law, regulatory rule or contractual agreement. Our asset retirement obligations are primarily the result of requirements under our facility lease agreements which generally have "return to original condition" clauses which would require us to remove or restore items such as shred pits, vaults, demising walls and office build-outs, among others. The significant assumptions used in estimating our aggregate asset retirement obligations are the timing of removals, the probability of a requirement to perform, estimated cost and associated expected inflation rates that are consistent with historical rates and credit-adjusted risk-free rates that approximate our incremental borrowing rate. Our asset retirement obligations at December 31, 2025 and 2024 were $62,972 and $43,844, respectively, and are included in Other Long-term Liabilities in our Consolidated Balance Sheets.
NOTES TO CONSOLIDATED FINANCIAL STATEMENTS (CONTINUED)
DECEMBER 31, 2025
(In thousands, except share and per share data)
2. SUMMARY OF SIGNIFICANT ACCOUNTING POLICIES (CONTINUED)
J. LEASES
We lease facilities for certain warehouses, data centers and office spaces. We also have land leases, including those on which certain facilities are located. The majority of our leased facilities are classified as operating leases that, on average, have initial lease terms of five to 10 years, with one or more lease renewal options to extend the lease term. Our lease renewal option terms generally range from one to five years. The exercise of the lease renewal option is generally at our sole discretion and may contain fixed rent, fair market value based rent or Consumer Price Index rent escalation clauses. We include option periods in the lease term when our failure to renew the lease would result in an economic disincentive, thereby making it reasonably certain that we will renew the lease. We recognize straight line rental expense over the life of the lease and any fair market value or Consumer Price Index rent escalations are recognized as variable lease expense in the period in which the obligation is incurred. In addition, we lease certain vehicles and equipment. Vehicle and equipment leases typically have lease terms ranging from one to seven years.
We account for all leases, both operating and financing, in accordance with Accounting Standards Codification ("ASC") Topic 842, Leases ("ASC 842"). Our accounting policy provides that leases with an initial term of 12 months or less will not be included within the lease right-of-use assets and lease liabilities recognized on our Consolidated Balance Sheets. We recognize the lease payments for those leases with an initial term of 12 months or less in our Consolidated Statements of Operations on a straight-line basis over the lease term.
The lease right-of-use assets and related lease liabilities are classified as either operating or financing. Lease right-of-use assets are calculated as the net present value of future payments plus any capitalized initial direct costs less any tenant improvements or lease incentives. Lease liabilities are calculated as the net present value of future payments. In calculating the present value of the lease payments, we utilize the rate stated in the lease (in the limited circumstances when such rate is explicitly stated) or, if no rate is explicitly stated, we utilize a rate that reflects our securitized incremental borrowing rate by geography for the lease term. We account for nonlease components (which include common area maintenance, taxes, and insurance) with the related lease component. Any variable nonlease components are not included within the lease right-of-use asset and lease liability on our Consolidated Balance Sheets, and instead, are reflected as an expense in the period incurred.
Operating and financing lease right-of-use assets and lease liabilities as of December 31, 2025 and 2024 are as follows:
DECEMBER 31,
DESCRIPTION
2025
2024
Assets:
Operating lease right-of-use assets(1)
$
2,465,196
$
2,489,893
Financing lease right-of-use assets, net of accumulated depreciation(2)(3)
470,803
359,265
Liabilities:
Current
Operating lease liabilities
$
319,129
$
315,400
Financing lease liabilities(3)
56,287
128,397
Long-term
Operating lease liabilities
$
2,300,448
$
2,334,826
Financing lease liabilities(3)
470,912
278,444
(1)At December 31, 2025 and 2024, these assets are comprised of approximately 98% real estate related assets (which include land, buildings, data center infrastructure and racking structures) and 2% non-real estate related assets (which include warehouse equipment, vehicles, furniture and fixtures and computer hardware and software).
(2)At December 31, 2025, these assets are comprised of approximately 56% real estate related assets and 44% non-real estate related assets. At December 31, 2024, these assets are comprised of approximately 58% real estate related assets and 42% non-real estate related assets.
(3)Financing lease right-of-use assets, current financing lease liabilities and long-term financing lease liabilities are included within Property, Plant and Equipment, Net, Current portion of long-term debt and Long-term Debt, net of current portion, respectively, within our Consolidated Balance Sheets.
NOTES TO CONSOLIDATED FINANCIAL STATEMENTS (CONTINUED)
DECEMBER 31, 2025
(In thousands, except share and per share data)
2. SUMMARY OF SIGNIFICANT ACCOUNTING POLICIES (CONTINUED)
The components of the lease expense for the years ended December 31, 2025, 2024 and 2023 are as follows:
YEAR ENDED DECEMBER 31,
DESCRIPTION
2025
2024
2023
Operating lease cost(1)
$
708,220
$
682,960
$
660,889
Financing lease cost:
Depreciation of financing lease right-of-use assets
$
63,234
$
50,548
$
42,089
Interest expense for financing lease liabilities
27,602
21,949
18,638
(1)Operating lease cost, the majority of which is included in Cost of sales, includes variable lease costs of $186,110, $163,916 and $142,154 for the years ended December 31, 2025, 2024 and 2023, respectively.
Weighted average remaining lease terms and discount rates as of December 31, 2025 and 2024 are as follows:
DECEMBER 31, 2025
DECEMBER 31, 2024
OPERATING LEASES
FINANCING LEASES
OPERATING LEASES
FINANCING LEASES
Remaining Lease Term
9.7 years
9.7 years
9.9 years
7.8 years
Discount Rate
6.9
%
6.4
%
6.8
%
6.3
%
The estimated minimum future lease payments (receipts) as of December 31, 2025 are as follows:
YEAR
OPERATING LEASES(1)
SUBLEASE INCOME
FINANCING LEASES(1)
2026
$
506,526
$
(3,929)
$
84,725
2027
473,605
(3,481)
74,103
2028
419,147
(2,586)
109,804
2029
371,756
(1,663)
60,671
2030
320,583
(840)
134,421
Thereafter
1,602,141
(240)
204,290
Total minimum lease payments (receipts)
3,693,758
$
(12,739)
668,014
Less amounts representing interest or imputed interest
1,074,181
140,815
Present value of lease obligations
$
2,619,577
$
527,199
(1)Estimated minimum future lease payments exclude variable common area maintenance charges, insurance and taxes.
Other information:Supplemental cash flow information relating to our leases for the years ended December 31, 2025, 2024 and 2023 is as follows:
YEAR ENDED DECEMBER 31,
CASH PAID FOR AMOUNTS INCLUDED IN MEASUREMENT OF LEASE LIABILITIES:
2025
2024
2023
Operating cash flows used in operating leases
$
500,216
$
473,474
$
450,412
Operating cash flows used in financing leases (interest)
27,602
21,949
18,638
Financing cash flows used in financing leases
57,078
54,366
52,284
NON-CASH ITEMS:
Operating lease modifications and reassessments
$
7,983
$
29,345
$
86,948
New operating leases (including acquisitions and sale-leaseback transactions)
NOTES TO CONSOLIDATED FINANCIAL STATEMENTS (CONTINUED)
DECEMBER 31, 2025
(In thousands, except share and per share data)
2. SUMMARY OF SIGNIFICANT ACCOUNTING POLICIES (CONTINUED)
K. LONG-LIVED ASSETS
We review long-lived assets for impairment whenever events or changes in circumstances indicate the carrying amount of such assets may not be recoverable. Recoverability of these assets is determined by comparing the sum of the forecasted undiscounted net cash flows of the operation to which the assets relate to their carrying amount. The operations are generally distinguished by the business segment and geographic region in which they operate. If it is determined that we are unable to recover the carrying amount of the assets, the long-lived assets are written down, on a pro rata basis, to fair value. Fair value is determined based on discounted cash flows or appraised values, depending upon the nature of the assets. Long-lived assets, including finite-lived intangible assets, are amortized over their useful lives. Annually, or more frequently if events or circumstances warrant, we assess whether a change in the lives over which long-lived assets, including finite-lived intangible assets, are amortized is necessary.
Loss (gain) on disposal/write-down of property, plant and equipment, net for the years ended December 31, 2025, 2024 and 2023 is as follows:
YEAR ENDED DECEMBER 31,
2025
2024
2023
Loss (gain) on disposal/write-down of property, plant and equipment, net
$
24,641
$
6,196
$
(12,825)
Primarily consists of(1):
•Losses related to the disposal of assets associated with facility consolidations.
•Losses related to the disposal of assets associated with facility consolidations.
•Gains associated with sale and sale-leaseback transactions of approximately $19,500, of which approximately $18,500 relates to a sale-leaseback transaction of a facility in Singapore during the first quarter of 2023. These gains are partially offset by losses related to the disposal of assets associated with facility consolidations.
(1) The gain recognized during the year ended December 31, 2023 is the result of our program to monetize a small portion of our industrial assets through sale and sale-leaseback transactions. The terms for these leases are consistent with the terms of our lease portfolio, which are disclosed in Note 2.j.
L. GOODWILL AND OTHER INDEFINITE-LIVED INTANGIBLE ASSETS
Goodwill and intangible assets with indefinite lives are not amortized but are reviewed annually for impairment, or more frequently if impairment indicators arise. Other than goodwill, we currently have no intangible assets that have indefinite lives and which are not amortized.
We test goodwill annually on October 1, and more frequently if impairment indicators arise that would require an interim test. We have performed our annual goodwill impairment review as of October 1, 2025, 2024 and 2023. We concluded that as of October 1, 2025, 2024 and 2023, goodwill was not impaired.
NOTES TO CONSOLIDATED FINANCIAL STATEMENTS (CONTINUED)
DECEMBER 31, 2025
(In thousands, except share and per share data)
2. SUMMARY OF SIGNIFICANT ACCOUNTING POLICIES (CONTINUED)
REPORTING UNITS AS OF OCTOBER 1, 2025 and 2024
Our reporting units at which level we performed our goodwill impairment analysis as of October 1, 2025and2024 were as follows:
•North America Records and Information Management ("North America RIM")
•Europe Records and Information Management ("Europe RIM")
•Latin America Records and Information Management ("Latin America RIM")
•Asia Pacific Records and Information Management ("APAC RIM")
•Media and Archive Services
•Global Data Center
•Fine Arts
•ALM
There were no changes to the composition of our reporting units between October 1, 2024 and December 31, 2024 and October 1, 2025 and December 31, 2025.
GOODWILL BY REPORTING UNIT AS OF DECEMBER 31, 2025 and 2024
The carrying value of goodwill, net for each of our reporting units described above as of December 31, 2025 and 2024 is as follows:
SEGMENT
REPORTING UNIT
CARRYING VALUE AS OF DECEMBER 31,
2025
2024
Global RIM Business
North America RIM
$
2,686,929
$
2,675,999
Europe RIM
600,897
542,521
Latin America RIM
112,870
99,599
APAC RIM
539,522
467,059
Media and Archive Services
33,188
31,696
Global Data Center Business
Global Data Center
482,864
469,461
Corporate and Other
Fine Arts
49,197
47,925
ALM
780,334
749,557
Total
$
5,285,801
$
5,083,817
The fair value of our reporting units has generally been determined using a combined approach based on the present value of future cash flows (the "Discounted Cash Flow Model") and market multiples (the "Market Approach").
The Discounted Cash Flow Model incorporates significant assumptions including future revenue growth rates, operating margins, discount rates and capital expenditures.
The Market Approach requires us to make assumptions related to Adjusted EBITDA (as defined in Note 10) multiples.
Changes in economic and operating conditions impacting these assumptions or changes in multiples could result in goodwill impairments in future periods. In conjunction with our annual goodwill impairment reviews, we reconcile the sum of the valuations of all of our reporting units to our market capitalization as of such dates.
NOTES TO CONSOLIDATED FINANCIAL STATEMENTS (CONTINUED)
DECEMBER 31, 2025
(In thousands, except share and per share data)
2. SUMMARY OF SIGNIFICANT ACCOUNTING POLICIES (CONTINUED)
The changes in the carrying value of goodwill attributable to each reportable segment for the years ended December 31, 2025 and 2024 are as follows:
GLOBAL RIM BUSINESS
GLOBAL DATA CENTER BUSINESS
CORPORATE AND OTHER
TOTAL CONSOLIDATED
Goodwill balance, net of accumulated amortization, as of December 31, 2023
$
3,911,945
$
478,930
$
627,037
$
5,017,912
Tax deductible goodwill acquired during the year
—
—
132,891
132,891
Non-tax deductible goodwill acquired during the year
—
—
39,646
39,646
Fair value and other adjustments
372
(186)
(186)
—
Currency effects
(95,443)
(9,283)
(1,906)
(106,632)
Goodwill balance, net of accumulated amortization, as of December 31, 2024
3,816,874
469,461
797,482
5,083,817
Tax deductible goodwill acquired during the year
—
—
17,620
17,620
Non-tax deductible goodwill acquired during the year
46,752
—
12,177
58,929
Fair value and other adjustments
1,100
—
(1,464)
(364)
Currency effects
108,680
13,403
3,716
125,799
Goodwill balance, net of accumulated amortization, as of December 31, 2025
$
3,973,406
$
482,864
$
829,531
$
5,285,801
Accumulated Goodwill Impairment Balance as of December 31, 2024
$
132,409
$
—
$
26,011
$
158,420
Accumulated Goodwill Impairment Balance as of December 31, 2025
$
132,409
$
—
$
26,011
$
158,420
M. FINITE-LIVED INTANGIBLE ASSETS AND LIABILITIES
I. CUSTOMER AND SUPPLIER RELATIONSHIP INTANGIBLE ASSETS
Customer and supplier relationship intangible assets, which are acquired through either business combinations or acquisitions of customer relationships, are generally amortized over periods ranging from 10 to 30 years. Customer and supplier relationship intangible assets are recorded based upon estimates of their fair value.
II. CUSTOMER INDUCEMENTS
Payments that are made to a customer in order to terminate the customer’s storage of records with its current records management vendor ("Permanent Withdrawal Fees"), or direct payments to a customer for which no distinct benefit is received in return, are collectively referred to as "Customer Inducements". Customer Inducements are treated as a reduction of the transaction price over the associated contract terms, which range from one to 10 years, and are included in storage and service revenue in the accompanying Consolidated Statements of Operations. If the customer terminates its relationship with us, the unamortized carrying value of the Customer Inducement intangible asset is charged to revenue. However, in the event of such termination, we generally collect, and record as revenue, Permanent Withdrawal Fees that generally equal or exceed the amount of the unamortized Customer Inducement intangible asset.
NOTES TO CONSOLIDATED FINANCIAL STATEMENTS (CONTINUED)
DECEMBER 31, 2025
(In thousands, except share and per share data)
2. SUMMARY OF SIGNIFICANT ACCOUNTING POLICIES (CONTINUED)
III. DATA CENTER INTANGIBLE ASSETS AND LIABILITIES
Finite-lived intangible assets associated with our Global Data Center Business consist of the following:
DATA CENTER IN-PLACE LEASE INTANGIBLE ASSETS AND DATA CENTER TENANT RELATIONSHIP INTANGIBLE ASSETS
Data center in-place lease intangible assets ("Data Center In-Place Leases") and data center tenant relationship intangible assets ("Data Center Tenant Relationships") reflect the value associated with acquiring a data center operation with active tenants as of the date of acquisition. The value of Data Center In-Place Leases is determined based upon an estimate of the economic costs (such as lost revenues, tenant improvement costs, commissions, legal expenses and other costs to acquire new data center leases) avoided by acquiring a data center operation with active tenants. Data Center In-Place Leases are amortized over the weighted average remaining term of the acquired data center leases determined at the time of acquisition and range from five to 10 years. The value of Data Center Tenant Relationships is determined based upon an estimate of the economic costs avoided upon lease renewal of the acquired tenants, based upon expectations of lease renewal. Data Center Tenant Relationships are amortized over the weighted average remaining anticipated life of the relationship with the acquired tenant determined at the time of acquisition and range from six to 13 years.
DATA CENTER ABOVE-MARKET AND BELOW-MARKET IN-PLACE LEASE INTANGIBLE ASSETS
Data center above-market in-place lease intangible assets ("Data Center Above-Market Leases") and data center below-market in-place lease intangible assets ("Data Center Below-Market Leases") are recorded at the net present value of the difference between (i) the contractual amounts to be paid pursuant to each in-place lease and (ii) management’s estimate of the fair market lease rates for each corresponding in-place lease. Data Center Above-Market Leases and Data Center Below-Market Leases are amortized over the remaining non-cancellable term of the acquired in-place lease to storage revenue and range from 10 to 11 years.
The gross carrying amount and accumulated amortization of our finite-lived intangible assets as of December 31, 2025 and 2024, respectively, are as follows:
DECEMBER 31, 2025
DECEMBER 31, 2024
DESCRIPTION
GROSS CARRYING AMOUNT
ACCUMULATED AMORTIZATION
NET CARRYING AMOUNT
GROSS CARRYING AMOUNT
ACCUMULATED AMORTIZATION
NET CARRYING AMOUNT
Assets:
Customer and supplier relationship intangible assets(1)
$
2,429,156
$
(1,194,940)
$
1,234,216
$
2,268,949
$
(1,035,846)
$
1,233,103
Customer inducements(1)
40,457
(22,330)
18,127
38,782
(19,706)
19,076
Data center lease-based intangible assets(1)(2)
67,513
(50,249)
17,264
138,714
(116,162)
22,552
Third-party commissions asset and other(3)
93,174
(66,735)
26,439
86,314
(51,508)
34,806
Liabilities:
Data center below-market leases(4)
$
10,774
$
(8,380)
$
2,394
$
10,819
$
(7,275)
$
3,544
(1)Included in Customer and supplier relationship and other intangible assets in the accompanying Consolidated Balance Sheets.
(2)Data center lease-based intangible assets includes Data Center In-Place Leases, Data Center Tenant Relationships and Data Center Above-Market Leases.
(3)Included in Other (within Other Assets, Net) in the accompanying Consolidated Balance Sheets.
(4)Included in Other long-term liabilities in the accompanying Consolidated Balance Sheets.
NOTES TO CONSOLIDATED FINANCIAL STATEMENTS (CONTINUED)
DECEMBER 31, 2025
(In thousands, except share and per share data)
2. SUMMARY OF SIGNIFICANT ACCOUNTING POLICIES (CONTINUED)
Amortization expense associated with finite-lived intangible assets, revenue reduction associated with the amortization of Customer Inducements and net revenue reduction associated with the amortization of Data Center Above-Market Leases and Data Center Below-Market Leases for the years ended December 31, 2025, 2024 and 2023 is as follows:
YEAR ENDED DECEMBER 31,
2025
2024
2023
Amortization expense included in depreciation and amortization associated with:
Customer and supplier relationship intangible assets
$
163,550
$
155,872
$
153,128
Data center in-place leases and tenant relationships
7,395
22,304
22,322
Third-party commissions asset and other
16,671
16,478
12,541
Revenue reduction associated with amortization of:
Customer inducements and data center above-market and below-market leases
$
6,151
$
5,347
$
7,036
Estimated amortization expense for existing finite-lived intangible assets (excluding Contract Costs, as defined in Note 2.s.) is as follows:
ESTIMATED AMORTIZATION
YEAR
INCLUDED IN DEPRECIATION AND AMORTIZATION
REVENUE REDUCTION ASSOCIATED WITH CUSTOMER INDUCEMENTS AND DATA CENTER ABOVE-MARKET AND BELOW-MARKET LEASES
2026
$
177,956
$
5,614
2027
153,087
3,510
2028
140,905
1,990
2029
123,727
1,716
2030
113,809
1,100
Thereafter
568,365
1,873
N. DEFERRED FINANCING COSTS
Deferred financing costs are amortized over the life of the related debt. If debt is retired early, the related unamortized deferred financing costs are written off in the period the debt is retired and included as a component of Other expense (income), net. See Note 6.
O. DERIVATIVE INSTRUMENTS AND HEDGING ACTIVITIES
Derivative instruments are measured at fair value and are recorded as either assets or liabilities in our Consolidated Balance Sheets. Periodically, we acquire derivative instruments that are intended to hedge either cash flows or values that are subject to foreign exchange or other market price risk and not for trading purposes. We have formally documented our hedging relationships, including identification of the hedging instruments and the hedged items, as well as our risk management objectives and strategies for undertaking each hedge transaction concurrently with the execution of the derivative instrument. Given the recurring nature of our revenues and the long-term nature of our asset base, we have the ability and the preference to use long-term, fixed interest rate debt to finance our business, thereby preserving our long-term returns on invested capital. We may use interest rate swaps as a tool to maintain our targeted level of fixed rate debt. In addition, we may enter into cross-currency swaps to hedge the variability of exchange rates between the United States dollar and the currencies of our foreign subsidiaries, as well as interest rates. We may also use borrowings in foreign currencies, either obtained in the United States or by our foreign subsidiaries, to hedge foreign currency risk associated with our international investments. Gains and losses realized as a result of the maturing or termination of our interest rate swaps and cross-currency swaps are reflected as operating cash flows within our Consolidated Statements of Cash Flows. As of December 31, 2025 and 2024, none of our derivative instruments contained credit-risk related contingent features. See Note 5.
NOTES TO CONSOLIDATED FINANCIAL STATEMENTS (CONTINUED)
DECEMBER 31, 2025
(In thousands, except share and per share data)
2. SUMMARY OF SIGNIFICANT ACCOUNTING POLICIES (CONTINUED)
P. FAIR VALUE MEASUREMENTS
Entities are permitted under GAAP to elect to measure certain financial instruments and certain other items at either fair value or cost. We have elected the cost measurement option in all circumstances where we had an option.
Our financial assets or liabilities that are carried at fair value are required to be measured using inputs from the three levels of the fair value hierarchy. A financial asset or liability’s classification within the hierarchy is determined based on the lowest level input that is significant to the fair value measurement. The three levels of the fair value hierarchy are as follows:
Level 1—Inputs are unadjusted quoted prices in active markets for identical assets or liabilities that we have the ability to access at the measurement date.
Level 2—Inputs include quoted prices for similar assets and liabilities in active markets, quoted prices for identical or similar assets or liabilities in markets that are not active, inputs other than quoted prices that are observable for the asset or liability (i.e., interest rates, yield curves, etc.), and inputs that are derived principally from or corroborated by observable market data by correlation or other means (market corroborated inputs).
Level 3—Unobservable inputs that reflect our assumptions about the assumptions that market participants would use in pricing the asset or liability.
NOTES TO CONSOLIDATED FINANCIAL STATEMENTS (CONTINUED)
DECEMBER 31, 2025
(In thousands, except share and per share data)
2. SUMMARY OF SIGNIFICANT ACCOUNTING POLICIES (CONTINUED)
The assets and liabilities carried at fair value and measured on a recurring basis as of December 31, 2025 and 2024, respectively, are as follows:
FAIR VALUE MEASUREMENTS AT DECEMBER 31, 2025 USING
DESCRIPTION
TOTAL CARRYING
VALUE AT
DECEMBER 31, 2025
QUOTED PRICES IN ACTIVE MARKETS (LEVEL 1)
SIGNIFICANT OTHER OBSERVABLE INPUTS (LEVEL 2)
SIGNIFICANT
UNOBSERVABLE INPUTS
(LEVEL 3)(6)
Money Market Funds(1)
$
7,149
$
—
$
7,149
$
—
Time Deposits(1)
3,430
—
3,430
—
Trading Securities
8,220
6,400
(2)
1,820
(3)
—
Derivative Liabilities(4)
71,869
—
71,869
—
Deferred Purchase Obligations(5)
134,142
—
—
134,142
FAIR VALUE MEASUREMENTS AT DECEMBER 31, 2024 USING
DESCRIPTION
TOTAL CARRYING
VALUE AT
DECEMBER 31, 2024
QUOTED PRICES IN ACTIVE MARKETS (LEVEL 1)
SIGNIFICANT OTHER OBSERVABLE INPUTS (LEVEL 2)
SIGNIFICANT
UNOBSERVABLE INPUTS
(LEVEL 3)(6)
Money Market Funds(1)
$
2,488
$
—
$
2,488
$
—
Time Deposits(1)
9,612
—
9,612
—
Trading Securities
8,144
6,390
(2)
1,754
(3)
—
Derivative Assets(4)
28,092
—
28,092
—
Derivative Liabilities(4)
5,326
—
5,326
—
Deferred Purchase Obligations(5)
147,055
—
—
147,055
(1)Money market funds and time deposits are measured based on quoted prices for similar assets and/or subsequent transactions.
(2)Certain trading securities are measured at fair value using quoted market prices.
(3)Certain trading securities are measured based on inputs other than quoted market prices that are observable.
(4)Derivative assets and liabilities include (i) interest rate swap agreements, and (ii) cross-currency swap agreements to hedge the variability of exchange rate impacts between the United States dollar and certain of our foreign functional currencies, including the Euro and the Canadian dollar. Our derivative financial instruments are measured using industry standard valuation models using market-based observable inputs, including interest rate curves, forward and spot prices for currencies and implied volatilities. See Note 5 for additional information on our derivative financial instruments.
(5)The balance as of December 31, 2025 primarily relates to the fair value of the deferred purchase obligation associated with the Regency Transaction (as defined in Note 3). The balance as of December 31, 2024 primarily relates to the fair values of the deferred purchase obligations associated with the Regency Transaction and the ITRenew Transaction (as defined below).
(6)The following is a rollforward of the Level 3 liabilities presented above for December 31, 2023 through December 31, 2025:
NOTES TO CONSOLIDATED FINANCIAL STATEMENTS (CONTINUED)
DECEMBER 31, 2025
(In thousands, except share and per share data)
2. SUMMARY OF SIGNIFICANT ACCOUNTING POLICIES (CONTINUED)
The level 3 valuations of the deferred purchase obligations were determined utilizing either a Monte-Carlo simulation model or a discounted cash flow model and take into account our forecasted projections as they relate to the underlying performance of the respective businesses. On January 25, 2022, in order to expand our ALM operations, we acquired an approximately 80% interest in ITRenew (the "ITRenew Transaction"). The Monte-Carlo simulation model applied in assessing the fair value of the deferred purchase obligation associated with the ITRenew Transaction incorporates assumptions as to expected gross profits over the achievement period, including adjustments for the volatility of timing and amount of the associated revenue and costs, as well as discount rates that account for the risk of the arrangement and overall market risks. The discounted cash flow model applied in assessing the fair value of the deferred purchase obligation associated with the Regency Transaction incorporates assumptions as to expected revenue over the achievement period, including adjustments for volatility and timing, as well as discount rates that account for the risk of the arrangement and overall market risks. Any material change to these assumptions may result in a significantly higher or lower fair value of the related deferred purchase obligation.
There were no material items that were measured at fair value on a non-recurring basis for the years ended December 31, 2025 and 2024 other than (i) the reporting units as presented in our goodwill impairment analysis (as disclosed in Note 2.l.); (ii) assets acquired and liabilities assumed through our acquisitions; (iii) the redemption value of recently acquired noncontrolling interests; and (iv) contributions to our equity method investments, all of which are based on Level 3 inputs.
The fair value of our long-term debt, which was determined based on Level 2 and Level 3 inputs, is disclosed in Note 6. Long-term debt is measured at cost in our Consolidated Balance Sheets as of December 31, 2025 and 2024.
Q. NONCONTROLLING INTERESTS
Unaffiliated third parties own noncontrolling interests in certain of our consolidated subsidiaries. The classification of these ownership interests are evaluated under ASC 810, Consolidation and ASC 480, Distinguishing Liabilities from Equity. Ownership interests are classified as equity unless the underlying agreements contain provisions requiring classification as a liability or temporary equity. Noncontrolling interests are presented as a separate component of Iron Mountain Incorporated Stockholders’ (Deficit) Equity in the accompanying Consolidated Balance Sheets and Consolidated Statements of (Deficit) Equity.
Certain agreements with our noncontrolling interest shareholders contain put options which allow the noncontrolling interest shareholders to require us to purchase their respective interests in such subsidiaries at certain times and at purchase prices as stipulated in the underlying agreements (generally at fair value). These ownership interests, otherwise known as redeemable noncontrolling interests, are classified as temporary equity in our Consolidated Balance Sheets and Consolidated Statements of (Deficit) Equity. Redeemable noncontrolling interests are reported as temporary equity at the greater of their redemption value or the noncontrolling interest holders’ proportionate share of the underlying subsidiary’s net carrying value. Increases or decreases in the redemption value are offset against Additional Paid-in Capital. Changes in ownership interests that do not result in a loss of control are accounted for as equity transactions. If control is lost, the subsidiary’s assets, liabilities and noncontrolling interests are derecognized, and any resulting gain or loss is recorded in earnings.
The amount of consolidated net income attributable to noncontrolling interests, including redeemable noncontrolling interests, are presented in the accompanying Consolidated Statements of Operations and Consolidated Statements of Comprehensive Income (Loss).
When ownership interests are determined to be mandatorily redeemable, they are classified as liabilities and included as a component of Accrued expenses and other current liabilities or Other long-term liabilities on our Consolidated Balance Sheets, depending on the timing of the obligation.
NOTES TO CONSOLIDATED FINANCIAL STATEMENTS (CONTINUED)
DECEMBER 31, 2025
(In thousands, except share and per share data)
2. SUMMARY OF SIGNIFICANT ACCOUNTING POLICIES (CONTINUED)
S. REVENUES
Our revenues consist of storage rental revenues and service revenues and are reflected net of sales and value-added taxes. Storage rental revenues, which are considered a key driver of financial performance for the storage and information management services industry, consist primarily of recurring periodic rental charges related to the storage of materials or data (generally on a per unit basis) that are typically retained by customers for many years and of revenues associated with our data center operations. Service revenues include charges for related service activities, the most significant of which include: (1) the handling of records, including the addition of new records, temporary removal of records from storage, refiling of removed records, customer termination and permanent withdrawal fees, project revenues and courier operations consisting primarily of the pickup and delivery of records upon customer request; (2) secure shredding of sensitive documents and the subsequent sale of shredded paper for recycling, the price of which can fluctuate from period to period; (3) the decommissioning, data erasure, processing and disposition, and recycling or sale of information technology ("IT") hardware and component assets; and (4) digital solutions, including the scanning, imaging and document conversion services of active and inactive records, consulting services and the sale of software as a service, including our Digital Experience Platform.
The majority of our revenue is recognized in accordance with Accounting Standards Codification ("ASC") 606, Revenue from Contracts with Customers ("ASC 606"). Storage revenue for our Global Data Center Business is recognized in accordance with ASC Topic 842, Leases. For revenue recognized in accordance with ASC 606, customers are generally billed monthly based on contractually agreed-upon terms, and storage rental and service revenues are recognized in the month the respective storage rental or service is provided, in line with the transfer of control to the customer. When storage rental fees or services are billed in advance, amounts related to future storage rental or prepaid service contracts are accounted for as deferred revenue and recognized upon the transfer of control to the customer. Customer contracts generally include promises to provide monthly recurring storage and related services that are essentially the same over time and have the same pattern of transfer of control to the customer; therefore, most performance obligations represent a promise to deliver a series of distinct services over time (as determined for purposes of ASC 606, a "series"). For those contracts that qualify as a series, we apply the "right to invoice" practical expedient as we have a right to consideration from the customer in an amount that corresponds directly with the value of the underlying performance obligation transferred to the customer to date. Additionally, each purchasing decision is fully in the control of the customer; therefore, consideration beyond the current reporting period is variable and allocated to the specific period to which the consideration relates, which is consistent with the practical expedient. Revenue from product sales, the majority of which is IT asset sales, is recognized at the point in time at which control transfers to the customer, which is generally upon shipment.
Our Global Data Center Business features storage rental provided to the customer at contractually specified rates over a fixed contractual period. The revenue related to the storage component of our Global Data Center Business is recognized on a straight-line basis over the contract term in accordance with ASC 842. The revenue related to the service component of our Global Data Center Business that is not part of the combined single lease component is recognized in the period the related services are provided.
From time to time, we make payments to entities that are also customers under a revenue contract. These payments are primarily comprised of (i) Customer Inducements and (ii) payments to customers of our ALM business under revenue sharing arrangements for the remarketing of the customer's disposed IT assets. Customer Inducements do not represent payments for a distinct service, and, as such, are treated as a reduction of the transaction price and are amortized over the term of the contracts, which range from one to 10 years. Payments for disposed IT assets are for a distinct good and, as such, are expensed as cost of sales in the period when the asset is sold and the corresponding revenue is recognized.
Certain costs to fulfill or obtain customer contracts and certain initial direct costs of obtaining leases, including the costs associated with the initial movement of customer records into physical storage and certain commission expenses, are collectively referred to as "Contract Costs". The following describes our significant Contract Costs:
NOTES TO CONSOLIDATED FINANCIAL STATEMENTS (CONTINUED)
DECEMBER 31, 2025
(In thousands, except share and per share data)
2. SUMMARY OF SIGNIFICANT ACCOUNTING POLICIES (CONTINUED)
INTAKE COSTS (AND ASSOCIATED DEFERRED REVENUE)
The costs of the initial intake of customer records into physical storage ("Intake Costs"), are deferred and amortized as a component of depreciation and amortization in our Consolidated Statements of Operations generally over three years, consistent with the transfer of the performance obligation to the customer to which the asset relates. In instances where such Intake Costs are billed to the customer, the associated revenue is deferred and recognized over the same three-year period.
COMMISSIONS
Certain commission payments that are directly associated with obtaining long-term contracts are capitalized and amortized as a component of depreciation and amortization in our Consolidated Statements of Operations generally over three years, consistent with the transfer of the performance obligation to the customer to which the asset relates or the lease term. We also apply the practical expedient to expense certain commission payments as incurred when the amortization period for those commission payments is one year or less.
Contract Costs, which are included as a component of Other within Other Assets, Net as of December 31, 2025 and 2024 are as follows:
DECEMBER 31, 2025
DECEMBER 31, 2024
DESCRIPTION
GROSS CARRYING AMOUNT
ACCUMULATED AMORTIZATION
NET CARRYING AMOUNT
GROSS CARRYING AMOUNT
ACCUMULATED AMORTIZATION
NET CARRYING AMOUNT
Intake Costs and other fulfillment costs asset
$
111,923
$
(60,999)
$
50,924
$
89,057
$
(43,783)
$
45,274
Commissions asset
243,966
(110,365)
133,601
200,149
(78,955)
121,194
Amortization expense associated with the Intake Costs and other fulfillment costs asset and Commissions assets for the years ended December 31, 2025, 2024 and 2023 are as follows:
YEAR ENDED DECEMBER 31,
DESCRIPTION
2025
2024
2023
Intake Costs and other fulfillment costs asset
$
33,474
$
22,114
$
18,904
Commissions asset
72,460
54,841
43,413
Estimated amortization expense for Contract Costs is as follows:
NOTES TO CONSOLIDATED FINANCIAL STATEMENTS (CONTINUED)
DECEMBER 31, 2025
(In thousands, except share and per share data)
2. SUMMARY OF SIGNIFICANT ACCOUNTING POLICIES (CONTINUED)
Deferred revenue liabilities, which also includes deferred revenue accounted for under ASC 842 (as described below), are reflected as follows in our Consolidated Balance Sheets:
DECEMBER 31,
DESCRIPTION
LOCATION IN BALANCE SHEET
2025
2024(1)
Deferred revenue - Current(2)
Deferred revenue
$
402,091
$
326,882
Deferred revenue - Long-term(3)
Other Long-term Liabilities
165,804
110,601
(1)The beginning balance of current and long-term deferred revenue for the year ended December 31, 2024 was $325,665 and $100,770, respectively.
(2)The current deferred revenue accounted for under ASC 842 is approximately $41,600 and $25,500 as of December 31, 2025 and 2024, respectively. Approximately half of this revenue is expected to be recognized over the next month, with the remainder expected to be recognized over the next two to 12 months.
(3)The long-term deferred revenue accounted for under ASC 842 is approximately $141,100 and $95,000 as of December 31, 2025 and 2024, respectively.
In addition to our deferred revenue, we have remaining performance obligations related to certain customer contracts that have annual or monthly fixed fees with noncancelable terms. As of December 31, 2025, approximately $269,000 of remaining performance obligations are expected to be recognized as revenue over periods generally ranging from one to five years, with approximately 25% expected to be recognized within the next 12 months. As permitted under ASC 606, we do not disclose the value of remaining performance obligations for contracts as we have applied the "right to invoice" practical expedient, as described above.
DATA CENTER LESSOR CONSIDERATIONS
Our Global Data Center Business features storage rental provided to customers at contractually specified rates over a fixed contractual period. Our data center revenue contracts are accounted for in accordance with ASC 842. ASC 842 provides a practical expedient which allows lessors to account for nonlease components with the related lease component if both the timing and pattern of transfer are the same for nonlease components and the lease component, and the lease component, if accounted for separately, would be classified as an operating lease. The single combined component is accounted for under ASC 842 if the lease component is the predominant component. We have elected to take this practical expedient. The single combined component is presented as part of our storage rental revenue.
Storage rental revenue associated with our Global Data Center Business for the years ended December 31, 2025, 2024 and 2023 are as follows:
YEAR ENDED DECEMBER 31,
2025
2024
2023
Storage rental revenue(1)
$
797,017
$
606,294
$
474,066
(1)Revenue associated with variable lease payments, primarily related to power and connectivity, included within storage rental revenue was approximately $172,000, $131,000 and $111,000 for the years ended December 31, 2025, 2024 and 2023, respectively.
The future minimum lease payments we expect to receive under non-cancellable data center operating leases for which we are the lessor, excluding month to month leases, for the next five years and thereafter are as follows:
YEAR
FUTURE MINIMUM LEASE PAYMENTS(1)
2026
$
628,775
2027
627,803
2028
585,750
2029
570,311
2030
541,514
Thereafter
3,398,163
(1)Future minimum lease payments we expect to receive exclude payments for contingent and variable costs such as taxes, insurance, common area maintenance and power and connectivity, which are included in our total storage revenue. These amounts also exclude approximately $3,317,000 in total expected future minimum lease payments for non-cancellable leases that have not yet commenced, which we expect to receive over a weighted average period of 16 years.
NOTES TO CONSOLIDATED FINANCIAL STATEMENTS (CONTINUED)
DECEMBER 31, 2025
(In thousands, except share and per share data)
2. SUMMARY OF SIGNIFICANT ACCOUNTING POLICIES (CONTINUED)
T. STOCK-BASED COMPENSATION
We record stock-based compensation expense, utilizing the straight-line method, for the cost of stock options, restricted stock units ("RSUs"), and performance units ("PUs") (together, "Employee Stock-Based Awards"). Forfeitures are recorded in the period during which they occur. Our non-employee directors are considered employees for purposes of our Employee Stock-Based Awards and the associated reporting of these awards.
Our equity compensation plans generally provide that, upon a vesting change in control (as defined in each plan), any unvested options and other awards granted thereunder shall vest immediately if an employee is terminated as a result of the change in control or terminates their own employment for good reason (as defined in each plan). Other than in specified circumstances, no equity-based award will vest before the first anniversary of the date of grant.
On January 20, 2015, our stockholders approved the adoption of the Iron Mountain Incorporated 2014 Stock and Cash Incentive Plan, as amended (the "2014 Plan"). On May 29, 2025, our stockholders approved an amendment to the 2014 Plan, which (i) increases the number of shares of common stock authorized for issuance under the 2014 Plan by 4,600,000, from 20,750,000 to 25,350,000, and (ii) extends the termination date of the 2014 Plan from May 12, 2031 to May 29, 2035.
A total of 25,350,000 shares of common stock have been reserved for grants of options and other rights under our various stock incentive plans, including the 2014 Plan. The number of shares available for grant under our various stock incentive plans at December 31, 2025 was 7,617,011.
RETIREMENT ELIGIBLE CRITERIA
Our Employee Stock-Based Awards include the following retirement provision:
•Upon an employee’s retirement on or after attaining age 55 with at least five years of service, if the sum of (i) the award recipient’s age at retirement and (ii) the award recipient’s years of service with us totals at least 65, the award recipient is entitled to continued vesting of any outstanding Employee Stock-Based Awards, provided that their retirement occurs on or after a minimum of six months from the grant date (the "Retirement Criteria").
•Accordingly, (i) grants of Employee Stock-Based Awards to an employee who has met the Retirement Criteria on or before the date of grant, or will meet the Retirement Criteria before the six month anniversary in the year of the grant, will be expensed over six months from the date of grant and (ii) grants of Employee Stock-Based Awards to employees who will meet the Retirement Criteria during the award’s normal vesting period will be expensed between the date of grant and the date upon which the award recipient meets the Retirement Criteria.
•Stock options and RSUs granted to award recipients who meet the Retirement Criteria will be delivered to the award recipient based upon the original vesting schedule. If an award recipient retires and has met the Retirement Criteria, stock options will remain exercisable until the original expiration date of the stock options. PUs granted to award recipients who meet the Retirement Criteria will be delivered in accordance with the original vesting schedule of the applicable PU award and remain subject to the same performance conditions.
Stock-based compensation expense for Employee Stock-Based Awards included in Selling, general and administrative expenses in the accompanying Consolidated Statements of Operations for the years ended December 31, 2025, 2024 and 2023 is as follows:
YEAR ENDED DECEMBER 31,
2025
2024
2023
Stock-based compensation expense
$
140,280
$
118,138
$
73,799
Stock-based compensation expense, after tax
132,537
109,252
68,309
As of December 31, 2025, unrecognized compensation cost related to the unvested portion of our Employee Stock-Based Awards, inclusive of our estimated achievement of the performance metrics, was $86,285 and is expected to be recognized over a weighted-average period of 1.9 years.
We issue shares of our common stock for the exercises of stock options, and the vesting of RSUs, PUs and shares of our common stock under our ESPP from unissued reserved shares.
NOTES TO CONSOLIDATED FINANCIAL STATEMENTS (CONTINUED)
DECEMBER 31, 2025
(In thousands, except share and per share data)
2. SUMMARY OF SIGNIFICANT ACCOUNTING POLICIES (CONTINUED)
STOCK OPTIONS
Options are generally granted with exercise prices equal to the market price of the stock on the date of grant; however, in certain instances, options are granted at exercise prices greater than the market price of the stock on the date of grant. We issue options that become exercisable ratably over a period of three years from the date of grant and have a contractual life of 10 years from the date of grant, unless the holder’s employment is terminated sooner. Dividends and dividend equivalents are not paid with respect to stock options.
The fair value of stock options granted in 2025, 2024 and 2023 was $25.18, $22.58 and $10.98 per share, respectively. These values were estimated on the date of grant using the Black-Scholes option pricing model. The assumptions used for stock option grants in the years ended December 31, 2025, 2024 and 2023 are as follows:
YEAR ENDED DECEMBER 31,
STOCK OPTION GRANT ASSUMPTIONS
2025
2024
2023
Expected volatility(1)
28.6
%
28.6
%
29.1
%
Risk-free interest rate(2)
4.24
%
4.25
%
3.92
%
Expected dividend yield(3)
3.4
%
3.2
%
4.7
%
Expected life(4)
10.0 years
10.0 years
10.0 years
(1)Expected volatility is calculated utilizing daily historical volatility over a period that equates to the expected life of the option.
(2)Risk-free interest rate is based on the United States Treasury interest rates whose term is consistent with the expected life (estimated period of time outstanding) of the stock options.
(3)Expected dividend yield is considered in the option pricing model and represents our annualized expected per share dividends over the trade price of our common stock at the date of grant.
(4)Expected life of the stock options granted is estimated using the historical exercise behavior of employees.
A summary of stock option activity for the year ended December 31, 2025 is as follows:
OPTIONS
WEIGHTED AVERAGE EXERCISE PRICE
WEIGHTED AVERAGE REMAINING CONTRACTUAL TERM (YEARS)
NOTES TO CONSOLIDATED FINANCIAL STATEMENTS (CONTINUED)
DECEMBER 31, 2025
(In thousands, except share and per share data)
2. SUMMARY OF SIGNIFICANT ACCOUNTING POLICIES (CONTINUED)
RESTRICTED STOCK UNITS
Our RSUs generally have a vesting period of three years from the date of grant. However, RSUs granted to our non-employee directors vest immediately upon grant. All RSUs accrue dividend equivalents associated with the underlying stock as we declare dividends. Dividends will generally be paid to holders of RSUs in cash upon the vesting date of the associated RSU and will be forfeited if the RSU does not vest. The fair value of RSUs is the excess of the market price of our common stock at the date of grant over the holder's purchase price (which is typically zero).
The fair value of RSUs vested during the years ended December 31, 2025, 2024 and 2023 are as follows:
YEAR ENDED DECEMBER 31,
2025
2024
2023
Fair value of RSUs vested
$
42,277
$
29,852
$
32,664
A summary of RSU activity for the year ended December 31, 2025 is as follows:
RSUs
WEIGHTED-AVERAGE GRANT-DATE FAIR VALUE
Non-vested at December 31, 2024
1,194,375
$
70.06
Granted
596,134
91.27
Vested
(632,233)
66.87
Forfeited
(121,835)
85.98
Non-vested at December 31, 2025
1,036,441
$
82.33
PERFORMANCE UNITS
The PUs we issue vest based on our performance against predefined operational performance and relative total shareholder return based targets over a three-year performance period. The vesting is subject to a minimum level of return on invested capital in the third year of the performance period, and the number of PUs earned is based on certain metrics determined at the outset of the performance period.
The number of PUs earned is based on:
•either (i) the revenue performance for each year averaged at the end of the three-year performance period, or (ii) if (a) absolute Company total shareholder return is positive at the end of the three-year performance period and (b) a predetermined revenue hurdle is achieved in the third year of the performance period, then the revenue performance achieved in the third year of the performance period; and
•the total return at the end of the three-year performance period on our common stock relative to the companies comprising the Morgan Stanley Capital International ("MSCI") United States REIT Index.
The number of PUs earned will range from 0% to approximately 350% of the initial award.
NOTES TO CONSOLIDATED FINANCIAL STATEMENTS (CONTINUED)
DECEMBER 31, 2025
(In thousands, except share and per share data)
2. SUMMARY OF SIGNIFICANT ACCOUNTING POLICIES (CONTINUED)
All of our PUs will be settled in shares of our common stock and are subject to cliff vesting three years from the date of the original PU grant. As detailed above, PUs granted are subject to the Retirement Criteria. PUs are generally expensed over the three-year performance period, unless they are granted to a recipient who meets the Retirement Criteria, for which expense will be recognized as described above. PUs granted to recipients who meet the Retirement Criteria will continue to vest and be delivered in accordance with the original vesting schedule of the applicable PU award and remain subject to the same performance conditions.
All PUs accrue dividend equivalents associated with the underlying stock as we declare dividends. Dividends will generally be paid to holders of PUs in cash upon the settlement date of the associated PU and will be forfeited if the PU does not vest.
During the years ended December 31, 2025, 2024 and 2023, we issued 512,905, 462,501 and 641,412 PUs, respectively. We forecast the likelihood of achieving the predefined targets for our PUs in order to calculate the expected PUs to be earned. We record a compensation charge based on either the forecasted PUs to be earned (during the performance period) or the actual PUs earned (at the three-year anniversary of the grant date) over the vesting period for each of the awards. The fair value of PUs based on our performance against predefined targets is the excess of the market price of our common stock at the date of grant over the purchase price (which is typically zero). For PUs earned based on a market condition, we utilize a Monte Carlo simulation to estimate the fair value of these awards at the date of grant.
The fair value of earned PUs that vested during the years ended December 31, 2025, 2024 and 2023 is as follows:
YEAR ENDED DECEMBER 31,
2025
2024
2023
Fair value of earned PUs that vested
$
52,091
$
24,617
$
34,896
A summary of PU activity for the year ended December 31, 2025 is as follows:
PUs
WEIGHTED-AVERAGE GRANT-DATE FAIR VALUE
Non-vested at December 31, 2024
562,028
$
83.33
Granted
512,905
83.69
Prior year grant adjustments for performance(1)
1,845,118
37.47
Vested
(1,390,205)
37.47
Forfeited
(34,473)
84.56
Non-vested at December 31, 2025
1,495,373
$
69.47
(1)Represents an increase or decrease in the number of original PUs awarded based on either the final performance criteria or market condition achievement at the end of the performance period of such PUs.
EMPLOYEE STOCK PURCHASE PLAN
We offer an Employee Stock Purchase Plan ("ESPP") in which participation is available to substantially all United States and Canadian employees who meet certain service eligibility requirements. Shares of our common stock may be purchased by eligible employees at six-month intervals at 95% of the fair market price at the end of each six-month period, without a look-back feature, up to a maximum of 15% of their gross compensation during the offering period. We do not recognize compensation expense for the ESPP shares purchased. The number of shares of Common Stock authorized for issuance under our ESPP is 2,000,000. For the years ended December 31, 2025, 2024 and 2023, there were 80,068, 82,244 and 120,647 shares, respectively, purchased under the ESPP. As of December 31, 2025, we have 708,545 shares available under the ESPP.
NOTES TO CONSOLIDATED FINANCIAL STATEMENTS (CONTINUED)
DECEMBER 31, 2025
(In thousands, except share and per share data)
2. SUMMARY OF SIGNIFICANT ACCOUNTING POLICIES (CONTINUED)
U. ACQUISITION AND INTEGRATION COSTS
Acquisition and integration costs represent operating expenditures directly associated with the closing and integration activities of our business acquisitions that have closed, or are highly probable of closing, and include (i) advisory, legal and professional fees to complete business acquisitions and (ii) costs to integrate acquired businesses into our existing operations, including move, severance and system integration costs (collectively, "Acquisition and Integration Costs"). Acquisition and integration costs for the years ended December 31, 2025, 2024 and 2023 were $19,545, $35,842 and $25,875, respectively.
V. OTHER EXPENSE (INCOME), NET
Other expense (income), net for the years ended December 31, 2025, 2024 and 2023 consists of the following:
(1)The gain or loss on foreign currency transactions, calculated as the difference between the historical exchange rate and the exchange rate at the applicable measurement date, includes gains or losses primarily related to British pound sterling and Euro denominated intercompany obligations of our foreign subsidiaries to us and between our foreign subsidiaries, which are not considered permanently invested.
(2)Other, net for the year ended December 31, 2025 primarily consists of (i) a loss of approximately $13,800 due to the change in value of our deferred purchase obligations and other deferred payments and (ii) losses on our equity method investment.
(3)Other, net for the year ended December 31, 2024 primarily consists of (i) a loss of approximately $41,000 due to the change in value of our deferred purchase obligations and other deferred payments, (ii) approximately $29,200 in charges associated with the agreement to purchase the remaining interest in a joint venture and (iii) losses on our equity method investments.
(4)Other, net for the year ended December 31, 2023 consists primarily of a loss of approximately $38,000 associated with the remeasurement to fair value of our previously held equity interest in the joint venture we had formed with Clutter Intermediate, Inc. (the "Clutter JV"), as well as losses on our equity method investments and the change in value of our deferred purchase obligations.
W. INCOME TAXES
Accounting for income taxes requires the recognition of deferred tax assets and liabilities for the expected future tax consequences of temporary differences between the tax and financial reporting bases of assets and liabilities and for loss and credit carryforwards. Valuation allowances are provided when recovery of deferred tax assets does not meet the more likely than not standard as defined in GAAP. We have elected to recognize interest and penalties associated with uncertain tax positions as a component of the Provision (Benefit) for Income Taxes in the accompanying Consolidated Statements of Operations.
X. INCOME (LOSS) PER SHARE—BASIC AND DILUTED
Basic income (loss) per common share is calculated by dividing income (loss) by the weighted average number of common shares outstanding. The calculation of diluted income (loss) per share is consistent with that of basic income (loss) per share but gives effect to all potential common shares (that is, securities such as stock options, RSUs or PUs) that were outstanding during the period, unless the effect is antidilutive.
NOTES TO CONSOLIDATED FINANCIAL STATEMENTS (CONTINUED)
DECEMBER 31, 2025
(In thousands, except share and per share data)
2. SUMMARY OF SIGNIFICANT ACCOUNTING POLICIES (CONTINUED)
The calculation of basic and diluted income (loss) per share for the years ended December 31, 2025, 2024 and 2023 is as follows:
YEAR ENDED DECEMBER 31,
2025
2024
2023
Net Income (Loss)
$
152,254
$
183,666
$
187,263
Less: Net Income (Loss) Attributable to Noncontrolling Interests
7,663
3,510
3,029
Net Income (Loss) Attributable to Iron Mountain Incorporated (utilized in numerator of Earnings Per Share calculation)
$
144,591
$
180,156
$
184,234
Weighted-average shares—basic
295,403,000
293,365,000
291,936,000
Effect of dilutive potential stock options
1,946,000
2,241,000
1,435,000
Effect of dilutive potential RSUs and PUs
467,000
628,000
594,000
Weighted-average shares—diluted
297,816,000
296,234,000
293,965,000
Net Income (Loss) Per Share Attributable to Iron Mountain Incorporated:
Basic
$
0.49
$
0.61
$
0.63
Diluted
$
0.49
$
0.61
$
0.63
Antidilutive stock options, RSUs and PUs, excluded from the calculation
113,130
225,847
81,817
Y. NEW ACCOUNTING PRONOUNCEMENTS
RECENTLY ADOPTED ACCOUNTING PRONOUNCEMENTS
In December 2023, the FASB issued ASU No. 2023-09, Income Taxes (Topic 740), Improvements to Income Tax Disclosures ("ASU 2023-09") to provide disaggregated income tax disclosures on the rate reconciliation and income taxes paid. Further, certain requirements related to uncertain tax positions and unrecognized deferred tax liabilities are eliminated. We adopted ASU 2023-09 on January 1, 2025 on a prospective basis, and there was no material impact on our consolidated financial statements.
OTHER AS YET ADOPTED ACCOUNTING PRONOUNCEMENTS
In November 2024, the FASB issued ASU No. 2024-03, Income Statement - Reporting Comprehensive Income - Expense Disaggregation Disclosures (Subtopic 220-40), Disaggregation of Income Statement Expenses ("ASU 2024-03"), which requires disclosure of additional information about specific expense categories in the notes to financial statements on an annual and interim basis. The amendments in this update should be applied on a prospective basis, with retrospective application permitted. The amendments in this update are effective for annual reporting periods beginning after December 15, 2026, and interim reporting periods within fiscal years beginning after December 15, 2027, with early adoption permitted. We do not expect ASU 2024-03 to have a material impact on our consolidated financial statements.
In September 2025, the FASB issued ASU No. 2025-06, Intangibles – Goodwill and Other – Internal-Use Software (Subtopic 350-40): Targeted Improvements to the Accounting for Internal-Use Software (“ASU 2025-06”). The ASU primarily updates the accounting for internal-use software by replacing former stage-based rules with a principles-based framework. Costs associated with internal-use software will be capitalized only when management has authorized and committed funding and it is probable that the project will be completed and the software will be used to perform the function intended. The amendments in this update are effective for annual reporting periods beginning after December 15, 2027 and interim reporting periods therein, with early adoption permitted, and can be applied either prospectively, retrospectively or on a modified prospective basis. We are currently evaluating the impact of ASU 2025-06 on our consolidated financial statements, but we do not expect it to be material.
NOTES TO CONSOLIDATED FINANCIAL STATEMENTS (CONTINUED)
DECEMBER 31, 2025
(In thousands, except share and per share data)
2. SUMMARY OF SIGNIFICANT ACCOUNTING POLICIES (CONTINUED)
In December 2025, the FASB issued ASU No. 2025-11, Interim Reporting (Topic 270): Narrow-Scope Improvements ("ASU 2025-11"), which is intended to update the guidance in Topic 270 by improving navigability of the required interim disclosures, clarifying when that guidance is applicable and adding a principle that requires entities to disclose events since the end of the last annual reporting period that have a material impact on the entity. The amendments in this update are effective for the interim reporting periods within annual reporting periods beginning after December 15, 2027, with early adoption permitted, and can be applied either prospectively or retrospectively to any or all prior periods presented in the financial statements. We do not expect ASU 2025-11 to have a material impact on our quarterly condensed consolidated financial statements.
3. ACQUISITIONS
We account for acquisitions using the acquisition method of accounting, and, accordingly, the assets and liabilities acquired are recorded at their estimated fair values and the results of operations for each acquisition have been included in our consolidated results from their respective acquisition dates.
Allocations of the purchase price for acquisitions are based on estimates of the fair value of the net assets acquired and are subject to adjustment upon the finalization of the purchase price allocations. The accounting for business combinations requires estimates and judgments regarding expectations for future cash flows of the acquired business, and the allocations of those cash flows to identifiable tangible and intangible assets, in determining the assets acquired and liabilities assumed. The fair values assigned to tangible and intangible assets acquired and liabilities assumed, including contingent consideration, are based on management’s best estimates and assumptions, as well as other information compiled by management, including valuations that utilize customary valuation procedures and techniques. The estimates and assumptions underlying the initial valuations are subject to the collection of information necessary to complete the valuations within the measurement periods, which are up to one year from the respective acquisition dates.
As the valuation of certain assets and liabilities for purposes of purchase price allocations are preliminary in nature, they are subject to adjustment as additional information is obtained about the facts and circumstances regarding these assets and liabilities that existed at the acquisition date. Any adjustments to our estimates of purchase price allocation will be made in the periods in which the adjustments are determined and the cumulative effect of such adjustments will be calculated as if the adjustments had been completed as of the acquisition dates. Purchase price allocation adjustments recorded during the fourth quarter of 2025 and year ended December 31, 2025 were not material to our balance sheet or results from operations.
REGENCY TECHNOLOGIES
On January 3, 2024, in order to expand our ALM business, we acquired 100% of RSR Partners, LLC (doing business as Regency Technologies), an IT asset disposition services provider with operations throughout the United States, for an initial purchase price of approximately $200,000, subject to certain working capital adjustments at, and subsequent to, the closing, with $125,000 paid at closing, funded by borrowings under the Revolving Credit Facility, and the remaining $75,000 (the "January 2025 Payment"), paid in January 2025 (the "Regency Transaction"). The present value of the January 2025 Payment was included as a component of Accrued expenses and other current liabilities in our Consolidated Balance Sheet at December 31, 2024. The agreement for the Regency Transaction also includes a performance-based contingent consideration with a potential earnout range from zero to $200,000 based upon achievement of certain three-year cumulative revenue targets, which would be payable in 2027, if earned. The preliminary fair value estimate of this deferred purchase obligation as of the acquisition date was approximately $78,400. See Note 2.p. for details on the methodology used to establish the fair value. The fair value of the deferred purchase obligation is included as a component of Other long-term liabilities in our Consolidated Balance Sheets at December 31, 2025 and 2024. Subsequent increases or decreases in the fair value estimate of the deferred purchase obligation, as well as the accretion of the discount to present value, is included as a component of Other expense (income), net in our Consolidated Statements of Operations until the deferred purchase obligation is settled or paid. Subsequent to the acquisition, the results of Regency Technologies are included as a component of Corporate and Other (as defined in Note 10).
NOTES TO CONSOLIDATED FINANCIAL STATEMENTS (CONTINUED)
DECEMBER 31, 2025
(In thousands, except share and per share data)
4. INVESTMENTS
The following joint venture is accounted for as an equity method investment and is presented as a component of Other within Other assets, net in our Consolidated Balance Sheets. The carrying value and equity interest in our unconsolidated joint venture at December 31, 2025 and 2024 is as follows:
DECEMBER 31, 2025
DECEMBER 31, 2024
CARRYING VALUE
EQUITY INTEREST
CARRYING VALUE
EQUITY INTEREST
Joint venture with AGC Equity Partners (the "Frankfurt JV")
$
85,156
20.00
%
$
61,075
20.00
%
5. DERIVATIVE INSTRUMENTS AND HEDGING ACTIVITIES
Derivative instruments we are party to include: (i) interest rate swap agreements (which are designated as cash flow hedges) and (ii) cross-currency swap agreements (which are designated as net investment hedges).
INTEREST RATE SWAP AGREEMENTS DESIGNATED AS CASH FLOW HEDGES
We utilize interest rate swap agreements designated as cash flow hedges to limit our exposure to changes in interest rates on a portion of our floating rate indebtedness. Certain of our interest rate swap agreements have notional amounts that will increase with the underlying hedged transaction. Under our interest rate swap agreements, we receive variable rate interest payments associated with the notional amount of each interest rate swap, based upon the one-month Secured Overnight Financing Rate ("SOFR"), in exchange for the payment of fixed interest rates as specified in the interest rate swap agreements. Our interest rate swap agreements are marked to market at the end of each reporting period, representing the fair values of the interest rate swap agreements, and any changes in fair value are recognized as a component of Accumulated other comprehensive items, net. Unrealized gains are recognized as assets, while unrealized losses are recognized as liabilities.
As of December 31, 2025 and 2024, we have approximately $1,349,000 and $1,482,000, respectively, in notional value outstanding on our interest rate swap agreements. As of December 31, 2025, our interest rate swap agreements have maturity dates ranging from February 2026 through May 2027.
CROSS-CURRENCY SWAP AGREEMENTS DESIGNATED AS A HEDGE OF NET INVESTMENT
We utilize cross-currency interest rate swaps to hedge the variability of exchange rate impacts between the United States dollar and certain of our foreign functional currencies, including the Euro and the Canadian dollar. As of December 31, 2025, our cross-currency interest rate swap agreements have maturity dates ranging from February 2026 through November 2026.
The notional values of our cross-currency interest rate swaps, by currency, as of December 31, 2025 and 2024 are as follows:
NOTES TO CONSOLIDATED FINANCIAL STATEMENTS (CONTINUED)
DECEMBER 31, 2025
(In thousands, except share and per share data)
5. DERIVATIVE INSTRUMENTS AND HEDGING ACTIVITIES (CONTINUED)
We have designated these cross-currency swap agreements as hedges of net investments in our Euro and Canadian dollar denominated subsidiaries and they require an exchange of the notional amounts at maturity. These cross-currency swap agreements are marked to market at the end of each reporting period, representing the fair values of the cross-currency swap agreements, and any changes in fair value are recognized as a component of Accumulated other comprehensive items, net. Unrealized gains are recognized as assets while unrealized losses are recognized as liabilities. The excluded component of our cross-currency swap agreements is recorded in Accumulated other comprehensive items, net and amortized to interest expense on a straight-line basis.
The fair value of derivative instruments recognized in our Consolidated Balance Sheets as of December 31, 2025 and 2024, by derivative instrument, are as follows:
DERIVATIVE INSTRUMENTS(1)
DECEMBER 31, 2025
DECEMBER 31, 2024
Assets
Liabilities
Assets
Liabilities
Cash Flow Hedges(2)
Interest rate swap agreements
$
—
$
(9,752)
$
1,887
$
(5,326)
Net Investment Hedges(3)
Cross-currency swap agreements
—
(62,117)
26,205
—
(1)Our derivative assets are included as a component of (i) Prepaid expenses and other or (ii) Other within Other assets, net and our derivative liabilities are included as a component of (i) Accrued expenses and other current liabilities or (ii) Other long-term liabilities in our Consolidated Balance Sheets. As of December 31, 2025, $63,634 is included within Accrued expenses and other current liabilities and $8,235 is included within Other long-term liabilities. As of December 31, 2024, $8,891 is included within Prepaid expenses and other, $19,201 is included within Other assets and $5,326 is included within Other long-term liabilities.
(2)As of December 31, 2025, cumulative net losses recorded within Accumulated other comprehensive items, net associated with our interest rate swap agreements are $10,959.
(3)As of December 31, 2025, cumulative net losses recorded within Accumulated other comprehensive items, net associated with our cross-currency swap agreements are $1,490, which include $63,607 related to the excluded component of our cross-currency swap agreements.
Unrealized (losses) gains recognized in Accumulated other comprehensive items, net during the years ending December 31, 2025, 2024 and 2023, by derivative instrument, are as follows:
NOTES TO CONSOLIDATED FINANCIAL STATEMENTS (CONTINUED)
DECEMBER 31, 2025
(In thousands, except share and per share data)
6. DEBT (CONTINUED)
(1)The capital stock or other equity interests of our United States subsidiaries representing the substantial majority of our United States operations, and up to 66% of the capital stock or other equity interests of most of our first-tier foreign subsidiaries, are pledged to secure these debt instruments, together with all intercompany obligations (including promissory notes) of subsidiaries owed to us or to one of our United States subsidiary guarantors. In addition, Iron Mountain Canada Operations ULC has pledged 66% of the capital stock of its subsidiaries, and all intercompany obligations (including promissory notes) owed to or held by it, to secure the Revolving Credit Facility. The fair value (Level 2 and Level 3 of fair value hierarchy described at Note 2.p.) of these debt instruments approximates the carrying value, as borrowings under these debt instruments are based on current variable market interest rates (plus a margin that is subject to change based on our consolidated leverage ratio), as of December 31, 2025 and 2024 (collectively, the "Credit Agreement Collateral").
(2)The amount of debt for the Term Loan B (as defined below) reflects an unamortized original issue discount of $10,538and $10,517 as of December 31, 2025 and 2024, respectively.
(3)The fair value (Level 2 of fair value hierarchy described at Note 2.p.) of this debt instrument approximates the carrying value as borrowings under this debt instrument are based on a current variable market interest rate.
(4)The amount of debt for the AUD Term Loan (as defined below) reflects an unamortized original issue discount of $1,756 and $842 as of December 31, 2025 and 2024, respectively.
(5)The fair values (Level 2 of fair value hierarchy described at Note 2.p.) of these debt instruments are based on quoted market prices for comparable notes on December 31, 2025 and 2024, respectively.
(6)Collectively, the "Unregistered Notes". The Unregistered Notes have not been registered under the Securities Act of 1933, as amended (the "Securities Act"), or under the securities laws of any other jurisdiction. Unless they are registered, the Unregistered Notes may be offered only in transactions that are exempt from registration under the Securities Act or the securities laws of any other jurisdiction.
(7)Iron Mountain (UK) PLC ("IM UK") is the direct obligor on the GBP Notes, which are fully and unconditionally guaranteed, on a senior basis, by IMI and IMI’s United States subsidiaries that represent the substantial majority of our United States operations (the "Note Guarantors"). These guarantees are joint and several obligations of IMI and the Note Guarantors. The remainder of our subsidiaries do not guarantee the GBP Notes. The full amount of the GBP Notes is classified within the current portion of long-term debt in our Consolidated Balance Sheet at December 31, 2024.
(8)Collectively, the "Parent Notes". IMI is the direct obligor on the Parent Notes, which are fully and unconditionally guaranteed, on a senior basis, by the Note Guarantors. These guarantees are joint and several obligations of the Note Guarantors. The remainder of our subsidiaries do not guarantee the Parent Notes.
(9)Iron Mountain Information Management Services, Inc. ("IMIM Services") is the direct obligor on the 5% Notes due 2032, which are fully and unconditionally guaranteed, on a senior basis, by IMI and the Note Guarantors. These guarantees are joint and several obligations of IMI and the Note Guarantors. The remainder of our subsidiaries do not guarantee the 5% Notes due 2032.
(10)We believe the fair value (Level 2 of fair value hierarchy described at Note 2.p.) of this debt approximates its carrying value as these borrowings are based on current market interest rates. This debt includes the following:
DECEMBER 31, 2025
DECEMBER 31, 2024
Real estate mortgages(1)
$
73,250
$
74,250
Financing lease liabilities(2)
527,199
406,841
Other notes and other obligations(3)
185,048
133,140
$
785,497
$
614,231
(1)Bear interest at approximately 4.2% and 4.4% at December 31, 2025 and 2024, respectively, and includes $50,000 outstanding under our Mortgage Securitization Program at both December 31, 2025 and 2024.
(2)Bear a weighted average interest rate of 5.6% and 5.2% at December 31, 2025 and 2024, respectively.
(3)These notes and other obligations, which were assumed by us as a result of certain acquisitions, bear a weighted average interest rate of 6.5% and 7.2% at December 31, 2025 and 2024, respectively.
(11) The Accounts Receivable Securitization Special Purpose Subsidiaries (as defined below) are the obligors under this program.
A. CREDIT AGREEMENT
Our credit agreement (the "Credit Agreement") consists of a revolving credit facility (the "Revolving Credit Facility"), a term loan A facility (the "Term Loan A") and a term loan B facility (the "Term Loan B").
During the year ended December 31, 2025, we took the following actions regarding our Credit Agreement:
•On June 18, 2025, we amended the Credit Agreement, which resulted in:
◦an increase in the principal amount of the Term Loan A from $218,750 to $500,000.
•On November 13, 2025, we amended the Credit Agreement, which resulted in:
◦an increase in the principal amount of the Term Loan B from approximately $1,836,700 to $2,036,700.
NOTES TO CONSOLIDATED FINANCIAL STATEMENTS (CONTINUED)
DECEMBER 31, 2025
(In thousands, except share and per share data)
6. DEBT (CONTINUED)
In connection with the November 13, 2025 amendment, we paid original issue discount fees of approximately $1,750.
The Revolving Credit Facility enables IMI and certain of its subsidiaries to borrow an aggregate outstanding amount not to exceed $2,750,000 in United States dollars and (subject to sublimits) Canadian dollars. Additionally, the Credit Agreement permits us to incur incremental indebtedness thereunder by adding new term loans or revolving loans or by increasing the principal amount of any existing loans thereunder. The Revolving Credit Facility and the Term Loan A are scheduled to mature on March 18, 2030, at which point all obligations become due. The Term Loan A, which was fully drawn as of December 31, 2025, is to be paid in quarterly installments in an amount equal to approximately $6,250 per quarter. The Term Loan B is scheduled to mature on January 31, 2031, at which point all obligations become due. The Term Loan B, which was fully drawn as of December 31, 2025, is to be paid in quarterly installments in an amount equal to approximately $5,182 per quarter.
IMI and certain subsidiaries of IMI that represent the substantial majority of our operations in the United States, Canada and the United Kingdom guarantee all obligations under the Credit Agreement. The interest rate on borrowings under the Revolving Credit Facility varies depending on our choice of interest rate benchmark and currency options, plus an applicable margin, which varies based on our consolidated leverage ratio. The Term Loan A and the Term Loan B bear interest at the SOFR plus 1.75% and the SOFR plus 2.00%, respectively. Additionally, the Credit Agreement requires the payment of a commitment fee on the unused portion of the Revolving Credit Facility, which fee ranges from 0.2% to 0.3% based on our consolidated leverage ratio.
As of December 31, 2025, we had $751,500, $487,500 and $2,031,495 outstanding under the Revolving Credit Facility, the Term Loan A and the Term Loan B, respectively. As of December 31, 2025, we had various outstanding letters of credit totaling $12,398 under the Revolving Credit Facility. The remaining amount available for borrowing under the Revolving Credit Facility as of December 31, 2025, which is based on IMI’s leverage ratio, the last 12 months' earnings before interest, taxes, depreciation and amortization and rent expense ("EBITDAR"), other adjustments as defined in the Credit Agreement and current external debt, was $1,986,102 (which amount represents the maximum availability as of such date). Available borrowings under the Revolving Credit Facility are subject to compliance with our indenture covenants as discussed below. The weighted average interest rates in effect under the Revolving Credit Facility as of December 31, 2025 and 2024 were 5.7% and 6.3%, respectively. The interest rates in effect under the Term Loan A as of December 31, 2025 and 2024 were 5.5% and 6.1%, respectively. The interest rates in effect under the Term Loan B as of December 31, 2025 and 2024 were 5.8% and 6.4%, respectively.
NOTES TO CONSOLIDATED FINANCIAL STATEMENTS (CONTINUED)
DECEMBER 31, 2025
(In thousands, except share and per share data)
6. DEBT (CONTINUED)
B. DATA CENTER DEBT AGREEMENTS
As our Global Data Center Business continues to expand, we have entered into debt agreements in order to partially finance the construction of various data centers. These agreements primarily consist of term loan facilities with the following terms:
AGREEMENT
MAXIMUM BORROWING AMOUNT
OUTSTANDING BORROWINGS AS OF DECEMBER 31, 2025
DIRECT OBLIGOR
CONTRACTUAL INTEREST RATE
UNUSED COMMITMENT FEE
MATURITY DATE(1)
Virginia 3 Term Loans(2)
$
275,000
$
271,079
Iron Mountain Data Centers Virginia 3, LLC
SOFR plus 2.50%
0.75
%
August 31, 2026
Virginia 7 Term Loans(3)
300,000
275,314
Iron Mountain Data Centers Virginia 7, LLC
SOFR plus 2.50%
0.75
%
April 12, 2027
Virginia 6 Term Loans(4)
210,000
210,000
Iron Mountain Data Centers Virginia 6, LLC
SOFR plus 2.75%
0.75
%
May 3, 2027
Virginia 4/5 Term Loans due 2030(5)
208,224
208,224
Iron Mountain Data Centers Virginia 4/5 Subsidiary, LLC
5.60%
N/A
November 1, 2030
(1)All obligations will become due on the specified maturity dates. Each agreement, with the exception of the Virginia 4/5 Term Loans due 2030, includes twoone-year options that allow us to extend the initial maturity date, subject to the conditions specified in the agreements.
(2)Iron Mountain Data Centers Virginia 3, LLC, a wholly-owned subsidiary of IMI, has a credit agreement that includes a term loan facility (the "Virginia 3 Term Loans") and a letter of credit facility (collectively, the "Virginia 3 Credit Agreement"). The Virginia 3 Credit Agreement is secured by the equity interests and assets of Iron Mountain Data Centers Virginia 3, LLC. As of December 31, 2025 and 2024, the Virginia 3 Term Loans have a weighted average interest rate of 6.2% and 6.7%, respectively.
(3)Iron Mountain Data Centers Virginia 7, LLC, a wholly-owned subsidiary of Iron Mountain Data Centers Virginia 6/7 JV, LLC, has a credit agreement that includes a term loan facility (the "Virginia 7 Term Loans") and a letter of credit facility (collectively, the "Virginia 7 Credit Agreement"). The Virginia 7 Credit Agreement is secured by the equity interests and assets of Iron Mountain Data Centers Virginia 7, LLC. As of December 31, 2025 and 2024, the interest rate in effect under the Virginia 7 Credit Agreement was 7.1% and 7.0%, respectively.
(4)Iron Mountain Data Centers Virginia 6, LLC, a wholly-owned subsidiary of Iron Mountain Data Centers Virginia 6/7 JV, LLC, has a creditagreement that includes a term loan facility (the "Virginia 6 Term Loans") and a letter of credit facility (collectively, the "Virginia 6 Credit Agreement"). The Virginia 6 Credit Agreement is secured by the equity interests and assets of Iron Mountain Data Centers Virginia 6, LLC. As of December 31, 2025 and 2024, the interest rate in effect under the Virginia 6 Credit Agreement was 7.1% and 7.1%, respectively.
(5)At December 31, 2024, Iron Mountain Data Centers Virginia 4/5 Subsidiary, LLC, a wholly-owned subsidiary of Iron Mountain Data Centers Virginia 4/5 JV, LP, had a credit agreement that included a term loan facility (the "Virginia 4/5 Term Loans due 2025") and a letter of credit facility (collectively, the "Virginia 4/5 Credit Agreement"). On November 3, 2025, Iron Mountain Data Centers Virginia 4/5 Subsidiary, LLC entered into a term loan agreement (the "Virginia 4/5 Term Loans due 2030"). Total net proceeds from the Virginia 4/5 Term Loans due 2030 were used to repay the Virginia 4/5 Term Loans due 2025. The Virginia 4/5 Term Loans due 2030 is secured by the property of Iron Mountain Data Centers Virginia 4/5 Subsidiary, LLC. The Virginia 4/5 Term Loans due 2025 bore interest at SOFR plus a credit spread adjustment of 0.1% plus 1.625% until its extinguishment in November 2025. The interest rate in effect under the Virginia 4/5 Term Loans due 2025 as of December 31, 2024 was 5.1%.
NOTES TO CONSOLIDATED FINANCIAL STATEMENTS (CONTINUED)
DECEMBER 31, 2025
(In thousands, except share and per share data)
6. DEBT (CONTINUED)
C. NOTES ISSUED UNDER INDENTURES
Each series of notes shown below (i) is effectively subordinated to all of our secured indebtedness, including under the Credit Agreement, to the extent of the value of the collateral securing such indebtedness, (ii) ranks pari passu in right of payment with each other and with debt outstanding under the Credit Agreement, the senior notes shown below and other "senior debt" we incur from time to time and (iii) is structurally subordinated to all liabilities of our subsidiaries that do not guarantee such series of notes.
The key terms of our indentures are as follows:
SENIOR NOTES
AGGREGATE PRINCIPAL AMOUNT
DIRECT OBLIGOR
MATURITY DATE
CONTRACTUAL INTEREST RATE
INTEREST PAYMENTS DUE
PAR CALL DATE(1)
47/8% Notes due 2027
$
1,000,000
IMI
September 15, 2027
47/8%
March 15 and September 15
September 15, 2025
51/4% Notes due 2028
$
825,000
IMI
March 15, 2028
51/4%
March 15 and September 15
March 15, 2025
5% Notes due 2028
$
500,000
IMI
July 15, 2028
5%
January 15 and July 15
July 15, 2025
7% Notes
$
1,000,000
IMI
February 15, 2029
7%
February 15 and August 15
August 15, 2025
47/8% Notes due 2029
$
1,000,000
IMI
September 15, 2029
47/8%
March 15 and September 15
September 15, 2027
51/4% Notes due 2030
$
1,300,000
IMI
July 15, 2030
51/4%
January 15 and July 15
July 15, 2028
41/2% Notes
$
1,100,000
IMI
February 15, 2031
41/2%
February 15 and August 15
February 15, 2029
5% Notes due 2032
$
750,000
IMIM Services
July 15, 2032
5%
May 15 and November 15
July 15, 2027
55/8% Notes
$
600,000
IMI
July 15, 2032
55/8%
January 15 and July 15
July 15, 2029
61/4% Notes
$
1,200,000
IMI
January 15, 2033
61/4%
January 15 and July 15
December 6, 2029
Euro Notes
€
1,200,000
IMI
January 15, 2034
43/4%
January 15 and July 15
September 10, 2030
(1)We may redeem the notes at any time, at our option, in whole or in part. Prior to the par call date, we may redeem the notes at the redemption price or make-whole premium specified in the applicable indenture, together with accrued and unpaid interest to, but excluding, the redemption date. On or after the par call date, we may redeem the notes at a price equal to 100% of the principal amount being redeemed, together with accrued and unpaid interest to, but excluding, the redemption date.
Each of the indentures for the notes provides that we must repurchase, at the option of the holders, the notes at 101% of their principal amount, plus accrued and unpaid interest, upon the occurrence of a "Change of Control", which is defined in each respective indenture. Except for required repurchases upon the occurrence of a Change of Control or in the event of certain asset sales, each as described in the respective indenture, we are not required to make sinking fund or redemption payments with respect to any of the notes.
SEPTEMBER 2025 OFFERING
On September 10, 2025, IMI completed a private offering of:
SERIES OF NOTES
AGGREGATE PRINCIPAL AMOUNT
Euro Notes
€
1,200,000
The Euro Notes were issued at par and have a contractual interest rate of 4.75%. The total net proceeds from the issuance, after deducting the initial purchasers' commissions, of approximately 1,188,000 Euros (or $1,390,651, based upon the exchange rate between the Euro and the United States dollar on September 10, 2025 (the settlement date for the Euro Notes)), were used to repay the GBP Notes and a portion of the outstanding borrowings under the Revolving Credit Facility. As of December 31, 2025, we had 1,200,000 Euros (or $1,408,825, based upon the exchange rate between the United States dollar and the Euro as of December 31, 2025) outstanding on the Euro Notes.
NOTES TO CONSOLIDATED FINANCIAL STATEMENTS (CONTINUED)
DECEMBER 31, 2025
(In thousands, except share and per share data)
6. DEBT (CONTINUED)
D. AUSTRALIAN DOLLAR TERM LOAN
Iron Mountain Australia Group Pty, Ltd., a wholly-owned subsidiary of IMI, has an AUD term loan (the "AUD Term Loan"). On June 25, 2025, we amended the AUD Term Loan, which resulted in:
•an extension of the maturity date from September 30, 2026 to September 30, 2030,
•an increase in the original principal amount from 350,000 Australian dollars to 400,000 Australian dollars and
•a decrease in the interest rate from BBSY (an Australian benchmark variable interest rate) plus 3.625% to BBSY plus 3.500%.
The amended loan was issued at 99.5% of par. Principal payments on the AUD Term Loan are to be paid in quarterly installments in an aggregate amount of 10,000 Australian dollars per year, with the remaining balance due September 2030. The AUD Term Loan is guaranteed by Iron Mountain Australia Group Pty, Ltd. and certain other Australian subsidiaries (the "Australia Group Guarantors") and by the guarantors of the Credit Agreement. The AUD Term Loan is secured by the capital stock and assets of the Australia Group Guarantors and by the Credit Agreement Collateral.
As of December 31, 2025, we had 395,000 Australian dollars (or $263,948, based upon the exchange rate between the United States dollar and the Australian dollar as of December 31, 2025) outstanding on the AUD Term Loan. As of December 31, 2024, we had 284,727 Australian dollars (or $176,655, based upon the exchange rate between the United States dollar and the Australian dollar as of December 31, 2024) outstanding on the AUD Term Loan. The interest rate in effect under the AUD Term Loan was 7.3% and 8.1% as of December 31, 2025 and 2024, respectively.
OUTSTANDING BORROWINGS
AU$395,000
7.3%
Interest rate
As of December 31, 2025
E. UK REVOLVING CREDIT FACILITY
IM UK and Iron Mountain (UK) Data Centre Limited, wholly-owned subsidiaries of IMI (collectively, the "UK Borrowers"), have a British pounds sterling Revolving Credit Facility (the "UK Revolving Credit Facility"). The maximum amount permitted to be borrowed under the UK Revolving Credit Facility is 140,000 British pounds sterling. We have the option to request additional commitments of up to 125,000 British pounds sterling, subject to conditions specified in the UK Revolving Credit Facility. IMI and subsidiaries of IMI that represent the substantial majority of our operations in the United States and the United Kingdom guarantee all obligations under the UK Revolving Credit Facility. The UK Revolving Credit Facility is secured by certain properties in the United Kingdom. The UK Revolving Credit Facility bears interest at the Sterling Overnight Index Average plus 2.0%.
On July 11, 2025, the UK Borrowers amended the UK Revolving Credit Facility to extend the maturity date from September 24, 2026 to September 24, 2028.
The UK Revolving Credit Facility was fully drawn as of December 31, 2025. The interest rate in effect under the UK Revolving Credit Facility was 5.8% and 7.0% as of December 31, 2025 and 2024, respectively.
NOTES TO CONSOLIDATED FINANCIAL STATEMENTS (CONTINUED)
DECEMBER 31, 2025
(In thousands, except share and per share data)
6. DEBT (CONTINUED)
F. ACCOUNTS RECEIVABLE SECURITIZATION PROGRAM
We participate in an accounts receivable securitization program (the "Accounts Receivable Securitization Program") involving several of our wholly-owned subsidiaries and certain financial institutions. Under the Accounts Receivable Securitization Program, certain of our subsidiaries sell substantially all of their United States accounts receivable balances to our wholly-owned special purpose entities, Iron Mountain Receivables QRS, LLC and Iron Mountain Receivables TRS, LLC (the "Accounts Receivable Securitization Special Purpose Subsidiaries"). The Accounts Receivable Securitization Special Purpose Subsidiaries use the accounts receivable balances to collateralize loans obtained from certain financial institutions. The Accounts Receivable Securitization Special Purpose Subsidiaries are consolidated subsidiaries of IMI. The Accounts Receivable Securitization Program is accounted for as a collateralized financing activity, rather than a sale of assets, and therefore: (i) accounts receivable balances pledged as collateral are presented as assets and borrowings are presented as liabilities on our Consolidated Balance Sheets, (ii) our Consolidated Statements of Operations reflect the associated charges for bad debt expense related to pledged accounts receivable (a component of selling, general and administrative expenses) and reductions to revenue due to billing and service related credit memos issued to customers and related reserves, as well as interest expense associated with the collateralized borrowings and (iii) receipts from customers related to the underlying accounts receivable are reflected as operating cash flows and borrowings and repayments under the collateralized loans are reflected as financing cash flows within our Consolidated Statements of Cash Flows. Iron Mountain Information Management, LLC retains the responsibility of servicing the accounts receivable balances pledged as collateral for the Accounts Receivable Securitization Program and IMI provides a performance guaranty. The maximum availability allowed is limited by eligible accounts receivable, as defined under the terms of the Accounts Receivable Securitization Program. The Accounts Receivable Securitization Program is secured by a substantial majority of our net receivables in the United States.
The maximum amount permitted to be borrowed under the Accounts Receivable Securitization Program is $400,000 and the maturity date is July 1, 2027, at which point all obligations become due.
As of December 31, 2025 and 2024, the amount outstanding under the Accounts Receivable Securitization Program was $400,000 and $400,000, respectively. The interest rate in effect under the Accounts Receivable Securitization Program was 4.7% and 5.6% as of December 31, 2025 and 2024, respectively. We have the option to increase the borrowing capacity by $75,000. Commitment fees at a rate of 35
basis points are charged on amounts made available but not borrowed under the Accounts Receivable Securitization Program.
MAXIMUM AMOUNT
$400,000
OUTSTANDING BORROWINGS
$400,000
4.7%
Interest rate
As of December 31, 2025
G. CASH POOLING
Certain of our subsidiaries participate in cash pooling arrangements (the "Cash Pools") to help manage global liquidity requirements. We utilize the following Cash Pools: (i) two Cash Pools with ING Bank NV (doing business as Bank Mendes Gans), one of which we use to manage global liquidity requirements for our qualified REIT subsidiaries ("QRSs") and the other for our taxable REIT subsidiaries ("TRSs"), (ii) two Cash Pools with JP Morgan Chase Bank, N.A. ("JPM"), one of which we use to manage liquidity requirements for our QRSs in the Asia Pacific region and the other for our TRSs in the Asia Pacific region and (iii) two Cash Pools with JPM, one of which we use to manage liquidity requirements for our QRSs in the Europe, Middle East, and Africa regions and the other for our TRSs in the Europe, Middle East, and Africa regions.
Under each of the Cash Pools, cash deposited by participating subsidiaries with certain financial institutions is pledged as security against the debit balances of other participating subsidiaries with legal rights of offset provided to the financial institutions. Therefore, such amounts are presented in our Consolidated Balance Sheets on a net basis. Each subsidiary receives interest on the cash balances held on deposit or pays interest on its debit balances based on an applicable rate as defined in the Cash Pools.
The net cash position balances as of December 31, 2025 and 2024 are reflected as Cash and cash equivalents in our Consolidated Balance Sheets.
NOTES TO CONSOLIDATED FINANCIAL STATEMENTS (CONTINUED)
DECEMBER 31, 2025
(In thousands, except share and per share data)
6. DEBT (CONTINUED)
H. LETTERS OF CREDIT
As of December 31, 2025, we had outstanding letters of credit totaling $80,751, of which $12,398 reduce our borrowing capacity under the Revolving Credit Facility (as described above). The letters of credit expire at various dates between February 2026 and May 2027.
I. DEBT COVENANTS
The Credit Agreement, our bond indentures and other agreements governing our indebtedness contain certain restrictive financial and operating covenants, including covenants that restrict our ability to complete acquisitions, pay cash dividends, incur indebtedness, make investments, sell assets and take other specified corporate actions. The covenants do not contain a rating trigger. Therefore, a change in our debt rating would not trigger a default under the Credit Agreement, our bond indentures or other agreements governing our indebtedness. The Credit Agreement requires that we satisfy a net total lease adjusted leverage ratio and a fixed charge coverage ratio on a quarterly basis, and our bond indentures require that, among other things, we satisfy a leverage ratio (not lease adjusted) or a fixed charge coverage ratio (not lease adjusted), as a condition to taking actions such as paying dividends and incurring indebtedness.
The Credit Agreement uses EBITDAR-based calculations and the bond indentures use earnings before income, taxes, depreciation and amortization ("EBITDA") based calculations as the primary measures of financial performance for purposes of calculating leverage and fixed charge coverage ratios. The EBITDAR- and EBITDA-based leverage calculations include our consolidated subsidiaries, other than those we have designated as "Unrestricted Subsidiaries" as defined in the Credit Agreement and bond indentures. Generally, the Credit Agreement and the bond indentures use a trailing four fiscal quarter basis for purposes of the relevant calculations and require certain adjustments and exclusions for purposes of those calculations, which make the calculation of financial performance under the Credit Agreement and bond indentures not directly comparable to Adjusted EBITDA as presented herein. We are in compliance with our leverage and fixed charge coverage ratios under the Credit Agreement, our bond indentures and other agreements governing our indebtedness as of December 31, 2025. Noncompliance with these leverage and fixed charge coverage ratios would have a material adverse effect on our financial condition and liquidity.
J. MATURITIES OF LONG-TERM DEBT (GROSS OF DISCOUNTS) ARE AS FOLLOWS:
NOTES TO CONSOLIDATED FINANCIAL STATEMENTS (CONTINUED)
DECEMBER 31, 2025
(In thousands, except share and per share data)
7. COMMITMENTS AND CONTINGENCIES
A. PURCHASE COMMITMENTS
We have certain contractual obligations related to purchase commitments which require minimum payments as follows:
YEAR
PURCHASE COMMITMENTS(1)
2026
$
80,208
2027
94,778
2028
37,333
2029
9,141
2030
6,382
Thereafter
6,185
$
234,027
(1)Purchase commitments (i) include obligations related principally to software maintenance and support services and (ii) exclude our operating and financing lease obligations (see Note 2.j.) and our deferred purchase obligations (see Note 2.p.).
In addition to the above, as of December 31, 2025, we have contractual commitments of approximately $1,085,725 for future construction costs associated with the expansion of our Global Data Center Business that are expected to be incurred over the next one to two years.
B. SELF-INSURED LIABILITIES
We are self-insured up to certain limits for costs associated with workers’ compensation claims, vehicle accidents, property and general business liabilities and benefits paid under employee healthcare and short-term disability programs. At December 31, 2025 and 2024, there were approximately $44,300 and $45,200, respectively, of self-insurance accruals reflected in Accrued expenses on our Consolidated Balance Sheets. The measurement of these costs requires the consideration of historical cost experience and judgments about the present and expected levels of cost per claim. We account for these costs primarily through actuarial methods, which develop estimates of the undiscounted liability for claims incurred, including those claims incurred but not reported. These methods provide estimates of future claim costs based on claims incurred as of the balance sheet date.
C. LITIGATION—GENERAL
We are involved in litigation from time to time in the ordinary course of business, including litigation arising from damage to customer assets in our facilities caused by fires and other natural disasters. A portion of the defense and/or settlement costs associated with such litigation is covered by various commercial liability insurance policies purchased by us and, in limited cases, indemnification from third parties. Our policy is to establish reserves for loss contingencies when the losses are both probable and reasonably estimable. We record legal costs associated with loss contingencies as expenses in the period in which they are incurred. While the outcome of litigation is inherently uncertain, we do not believe any current litigation will have a material adverse effect on our consolidated financial condition, results of operations or cash flows.
NOTES TO CONSOLIDATED FINANCIAL STATEMENTS (CONTINUED)
DECEMBER 31, 2025
(In thousands, except share and per share data)
8. STOCKHOLDERS' EQUITY MATTERS
DIVIDENDS
Our board of directors has adopted a dividend policy under which we have paid, and in the future intend to pay, quarterly cash dividends on our common stock. The amount and timing of future dividends will continue to be subject to the approval of our board of directors, in its sole discretion, and to applicable legal requirements.
In 2023, 2024 and 2025, our board of directors declared the following dividends:
DECLARATION DATE
DIVIDEND PER SHARE
RECORD DATE
TOTAL AMOUNT
PAYMENT DATE
February 23, 2023
$
0.6185
March 15, 2023
$
180,339
April 5, 2023
May 4, 2023
0.6185
June 15, 2023
180,493
July 6, 2023
August 3, 2023
0.6500
September 15, 2023
189,730
October 5, 2023
November 2, 2023
0.6500
December 15, 2023
189,886
January 4, 2024
February 22, 2024
0.6500
March 15, 2024
190,506
April 4, 2024
May 2, 2024
0.6500
June 17, 2024
190,643
July 5, 2024
August 1, 2024
0.7150
September 16, 2024
209,776
October 3, 2024
November 6, 2024
0.7150
December 16, 2024
209,913
January 7, 2025
February 13, 2025
0.7850
March 17, 2025
231,549
April 4, 2025
May 1, 2025
0.7850
June 16, 2025
231,789
July 3, 2025
August 6, 2025
0.7850
September 15, 2025
231,972
October 3, 2025
November 5, 2025
0.8640
December 15, 2025
255,560
January 6, 2026
On February 12, 2026, we declared a dividend to our stockholders of record as of March 16, 2026 of $0.8640 per share, payable on April 3, 2026.
During the years ended December 31, 2025, 2024 and 2023, we declared dividends in an aggregate and per share amount, based on the weighted average number of common shares outstanding during each respective year, as follows:
YEAR ENDED DECEMBER 31,
2025
2024
2023
Declared distributions
$
950,870
$
800,838
$
740,448
Amount per share each distribution represents based on weighted average number of common shares outstanding
NOTES TO CONSOLIDATED FINANCIAL STATEMENTS (CONTINUED)
DECEMBER 31, 2025
(In thousands, except share and per share data)
8. STOCKHOLDERS’ EQUITY MATTERS (CONTINUED)
For federal income tax purposes, distributions to our stockholders are generally treated as nonqualified ordinary dividends (potentially eligible for the lower effective tax rates available for "qualified REIT dividends"), qualified ordinary dividends or return of capital. The United States Internal Revenue Service requires historical C corporation earnings and profits to be distributed prior to any REIT distributions, which may affect the character of each distribution to our stockholders, including whether and to what extent each distribution is characterized as a qualified or nonqualified ordinary dividend. In addition, certain of our distributions qualify as capital gain distributions. For the years ended December 31, 2025, 2024 and 2023, the dividends we paid on our common shares were classified as follows:
YEAR ENDED DECEMBER 31,
2025
2024
2023
Nonqualified ordinary dividends
61.1
%
82.6
%
98.2
%
Qualified ordinary dividends(1)
—
%
—
%
0.8
%
Return of capital
38.9
%
17.4
%
1.0
%
100.0
%
100.0
%
100.0
%
(1)During the year ended December 31, 2023, the percentage of our dividends that was classified as qualified ordinary dividends for federal income tax purposes primarily related to the distribution of historical C corporation earnings and profits during the year ended December 31, 2023.
NONCONTROLLING INTERESTS
In December 2025, we entered into an agreement with a partner to form our Iron Mountain Data Centers Arizona 3 JV, LP joint venture, which resulted in an initial Noncontrolling interest of approximately $74,800 recorded in our Consolidated Balance Sheet at December 31, 2025.
During the quarter ended September 30, 2024, a put option available to our partner in our Iron Mountain Data Centers Virginia 4/5 JV, LP joint venture expired, triggering a change in the presentation of the related noncontrolling interest. Prior to September 30, 2024, the noncontrolling interest of approximately $53,400 was presented as Redeemable noncontrolling interests in our Consolidated Balance Sheets. Our partner's interest is now presented as Noncontrolling interests in our Consolidated Balance Sheets at December 31, 2025 and 2024.
In August 2024, we entered into an agreement with a partner to form our Iron Mountain Data Centers Virginia 6/7 JV, LLC joint venture, which resulted in an initial Noncontrolling interest of approximately $103,100 recorded in our Consolidated Balance Sheet at September 30, 2024.
9. INCOME TAXES
We have been organized and have operated as a REIT effective beginning with our taxable year that ended on December 31, 2014. As a REIT, we are generally permitted to deduct from our federal taxable income the dividends we pay to our stockholders. The income represented by such dividends is not subject to federal taxation at the entity level but is taxed, if at all, at the stockholder level. The income of our domestic TRSs, which hold our domestic operations that may not be REIT-compliant as currently operated and structured, is subject, as applicable, to federal and state corporate income tax. In addition, we and our subsidiaries continue to be subject to foreign income taxes in other jurisdictions in which we have business operations or a taxable presence, regardless of whether assets are held or operations are conducted through subsidiaries disregarded for federal income tax purposes or TRSs. We will also be subject to a separate corporate income tax on any gains recognized on the sale or disposition of any asset previously owned by a C corporation during a five-year period after the date we first owned the asset as a REIT asset that are attributable to "built-in gains" with respect to that asset on that date. We will also be subject to a built-in gains tax on our depreciation recapture recognized into income as a result of accounting method changes in connection with our acquisition activities. If we fail to remain qualified for taxation as a REIT, we will be subject to federal income tax at regular corporate income tax rates. Even if we remain qualified for taxation as a REIT, we may be subject to some federal, state, local and foreign taxes on our income and property in addition to taxes owed with respect to our TRS operations. In particular, while state income tax regimes often parallel the federal income tax regime for REITs, many states do not completely follow federal rules and some do not follow them at all.
NOTES TO CONSOLIDATED FINANCIAL STATEMENTS (CONTINUED)
DECEMBER 31, 2025
(In thousands, except share and per share data)
9. INCOME TAXES (CONTINUED)
The significant components of our deferred tax assets and deferred tax liabilities as of December 31, 2025 and 2024 are presented below:
DECEMBER 31,
2025
2024
Deferred Tax Assets:
Accrued liabilities and other adjustments
$
158,987
$
156,349
Net operating loss carryforwards
173,024
168,773
Valuation allowance
(152,605)
(132,714)
179,406
192,408
Deferred Tax Liabilities:
Other assets, principally due to differences in amortization
(177,675)
(185,301)
Property, plant and equipment, principally due to differences in depreciation
(37,915)
(63,192)
Other
(116,082)
(122,844)
(331,672)
(371,337)
Net deferred tax (liability) asset
$
(152,266)
$
(178,929)
The deferred tax assets and deferred tax liabilities as of December 31, 2025 and 2024 are presented below:
DECEMBER 31,
2025
2024
Deferred tax assets (Included in Other, a component of Other assets, net)
$
31,749
$
26,412
Deferred tax liabilities
(184,015)
(205,341)
At December 31, 2025, we have federal net operating loss carryforwards of $116,233 and disallowed interest expense carryforwards of $185,852 both of which can be carried forward indefinitely, and of which $109,868 and $64,556, respectively, are expected to be realized to reduce future federal taxable income. We have assets for foreign net operating losses of $146,255 and foreign disallowed interest expense carryforwards of $46,625, with various expiration dates (and in some cases no expiration date), subject to valuation allowances of approximately 77.5% and 26.8%, respectively. If actual results differ unfavorably from certain of our estimates used, we may not be able to realize all or part of our net deferred income tax assets and additional valuation allowances may be required. Although we believe our estimates are reasonable, no assurance can be given that our estimates reflected in the tax provisions and accruals will equal our actual results. These differences could have a material impact on our income tax provision and operating results in the period in which such determination is made.
A rollforward of the valuation allowance is as follows:
YEAR ENDED DECEMBER 31,
BALANCE AT BEGINNING OF THE YEAR
CHARGED (CREDITED) TO EXPENSE
OTHER INCREASES/(DECREASES)(1)(2)
BALANCE AT END OF THE YEAR
2025
$
132,714
$
16,740
$
3,151
$
152,605
2024
103,897
37,018
(8,201)
132,714
2023
47,514
4,855
51,528
103,897
(1)Other decreases and increases in valuation allowances are primarily related to changes in foreign currency exchange rates and prior year acquisitions.
(2)In connection with the implementation of the Organization for Economic Co-operation and Development (the "OECD") global minimum tax initiative known as Pillar Two, any existing deferred taxes not disclosed in our 2023 financial statements will not be available in the future to reduce tax otherwise due under Pillar Two. Accordingly, in 2023, the above table includes the tax effects of these non-United States tax loss carryforwards, which were not previously disclosed in the prior years due to the remote possibility of realization, offset with a full valuation allowance.
NOTES TO CONSOLIDATED FINANCIAL STATEMENTS (CONTINUED)
DECEMBER 31, 2025
(In thousands, except share and per share data)
9. INCOME TAXES (CONTINUED)
Pursuant to the disclosure requirements of ASU 2023-09, a reconciliation of Provision (Benefit) for Income Taxes and the "expected" tax provision computed by applying the current federal statutory tax rate of 21.0% to Net Income (Loss) Before Provision (Benefit) for Income Taxes for the year ended December 31, 2025 is as follows:
YEAR ENDED DECEMBER 31, 2025
Amount
Percentage of Net Income (Loss) Before Provision (Benefit) for Income Taxes
NOTES TO CONSOLIDATED FINANCIAL STATEMENTS (CONTINUED)
DECEMBER 31, 2025
(In thousands, except share and per share data)
9. INCOME TAXES (CONTINUED)
YEAR ENDED DECEMBER 31, 2025
Amount
Percentage of Net Income (Loss) Before Provision (Benefit) for Income Taxes
Germany
Other
$
2,586
1.2
%
India
Changes in valuation allowance
3,869
1.8
%
Other
1,012
0.5
%
Other foreign jurisdictions
10,996
5.2
%
Changes in unrecognized tax benefits
2,323
1.1
%
Provision (Benefit) for Income Taxes
$
58,934
27.9
%
(1)In 2025, state and local taxes in Tennessee, Pennsylvania and Texas made up the majority (greater than 50%) of the tax effect in this category.
A reconciliation of Provision (Benefit) for Income Taxes and the "expected" tax provision computed by applying the current federal statutory tax rate of 21.0% to Net Income (Loss) Before Provision (Benefit) for Income Taxes for the years ended December 31, 2024 and 2023, respectively, is as follows:
YEAR ENDED DECEMBER 31,
2024
2023
Computed "expected" tax provision
$
51,353
$
47,713
Changes in income taxes resulting from:
Tax adjustment relating to REIT
(33,926)
(39,299)
State taxes, net of federal tax benefit
(2,919)
(3,147)
Increase (decrease) in valuation allowance
37,018
4,855
Withholding taxes
11,359
11,658
(Reversal) reserve accrual and audit settlements, net of federal tax benefit
(2,052)
(4,946)
Change in valuation of acquisition contingencies
643
3,242
Foreign tax rate differential
13,322
6,876
Adjustments relating to foreign taxes
(10,346)
14,405
Excess tax benefits on equity compensation
(5,047)
(1,905)
Other, net
1,467
491
Provision (Benefit) for Income Taxes
$
60,872
$
39,943
Our effective tax rates for the years ended December 31, 2025, 2024 and 2023 were 27.9%, 24.9% and 17.6%, respectively. Our effective tax rate is subject to variability in the future due to, among other items: (i) changes in the mix of income between our QRSs and our TRSs, as well as among the jurisdictions in which we operate, (ii) tax law changes, (iii) volatility in foreign exchange gains and losses, (iv) the timing of the establishment and reversal of tax reserves, (v) our ability to utilize net operating losses and interest expenses that we generate and (vi) the taxability or deductibility of significant transactions.
NOTES TO CONSOLIDATED FINANCIAL STATEMENTS (CONTINUED)
DECEMBER 31, 2025
(In thousands, except share and per share data)
9. INCOME TAXES (CONTINUED)
The primary reconciling items between the federal statutory tax rate of 21.0% and our overall effective tax rate were:
YEAR ENDED DECEMBER 31,
2025
2024
2023
The lack of tax benefits recognized for the foreign exchange losses of $26,948 and ordinary losses and disallowed interest expenses of certain entities of $16,740, as well as withholding tax expenses of $15,203, partially offset by the net benefits derived from the dividends paid deduction of $52,601.
The lack of tax benefits recognized for the ordinary losses and disallowed interest expenses of certain entities of $37,018 and differences in the tax rates to which our foreign earnings are subject of $13,322, partially offset by the benefits derived from the dividends paid deduction of $33,926. In addition, we recorded gains and losses in Other expense (income), net during the period, for which there was no tax impact.
The benefits derived from the dividends paid deduction of $39,299 and the differences in the tax rates to which our foreign earnings are subject of $6,876. In addition, there were gains and losses recorded in Other expense (income), net for which there was no tax impact.
As a REIT, we are entitled to a deduction for dividends paid, resulting in a substantial reduction of federal income tax expense. As a REIT, substantially all of our income tax expense will be incurred based on the earnings generated by our foreign subsidiaries and our domestic TRSs.
We provide for foreign withholding taxes on the undistributed earnings of our foreign TRSs because it is not our intention to reinvest the undistributed earnings of our foreign TRSs indefinitely outside the United States. As a REIT, future repatriation of incremental undistributed earnings of our foreign subsidiaries will not be subject to federal or state income tax.
The OECD has issued proposals that change long-standing tax principles, including a global minimum tax rate of 15% ("Pillar Two"). While the United States has not enacted legislation to effectuate Pillar Two, Iron Mountain operates in many foreign jurisdictions that have enacted legislation to implement Pillar Two. Pillar Two became applicable for Iron Mountain beginning in 2024. Recent G7 Country (Canada, France, Germany, Italy, Japan and the UK) statements released a side-by-side ("SbS") safe harbor that exempts certain U.S.-parented groups from these rules. The side-by-side Safe Harbor provides that Multinational Enterprise G Groups with an Ultimate Parent Entity in a jurisdiction with qualified SbS regime will not be subject to the Income Inclusion Rule and Undertaxed Profits Rule if they elect the SbS Safe Harbor, applicable as of the beginning of 2026. Since we do not have material operations in jurisdictions with tax rates lower than the Pillar Two minimum, we are not expecting a material impact on our effective tax rate, corporate tax liabilities or cash tax liabilities. We continue to monitor United States and global legislative actions as well as administrative guidance related to Pillar Two for potential impacts.
On July 4, 2025, President Trump signed into law the reconciliation bill, commonly referred to as the One Big Beautiful Bill Act ("OBBBA"). The OBBBA introduces several changes to U.S. federal income tax law, such as suspending the capitalization and amortization of domestic research and development expenditures and reinstating bonus depreciation. It also modifies the deductions available for net controlled foreign corporation tested income (formerly referred to as "global intangible low-taxed income") from non-U.S. subsidiaries and changes the limitations on deductible interest. Under the prior law, not more than 20% of the value of a REIT’s total assets at the end of any quarter could be represented by securities of one or more taxable REIT subsidiaries; the OBBBA increased this threshold to 25% effective January 1, 2026. The effective dates of the OBBBA provisions range from 2025 through 2027. We do not expect the OBBBA provisions to have a material impact on our consolidated financial statements.
NOTES TO CONSOLIDATED FINANCIAL STATEMENTS (CONTINUED)
DECEMBER 31, 2025
(In thousands, except share and per share data)
9. INCOME TAXES (CONTINUED)
The evaluation of an uncertain tax position is a two-step process. The first step is a recognition process whereby we determine whether it is more likely than not that a tax position will be sustained upon examination, including resolution of any related appeals or litigation processes, based on the technical merits of the position. The second step is a measurement process whereby a tax position that meets the more likely than not recognition threshold is calculated to determine the amount of benefit to recognize in the financial statements. The tax position is measured as the largest amount of benefit that is greater than 50% likely of being realized upon ultimate settlement.
We have elected to recognize interest and penalties associated with uncertain tax positions as a component of the Provision (Benefit) for Income Taxes in the accompanying Consolidated Statements of Operations. We recorded decreases of $326, $375 and $2,557 for gross interest and penalties for the years ended December 31, 2025, 2024 and 2023, respectively. We had $4,071 and $3,558 accrued for the payment of interest and penalties as of December 31, 2025 and 2024, respectively.
A summary of tax years that remain subject to examination by major tax jurisdictions is as follows:
TAX YEARS
TAX JURISDICTION
See Below
United States—Federal and State
2022 to present
United Kingdom
2016 and 2018 to present
Canada
The normal statute of limitations for United States federal tax purposes is three years from the date the tax return is filed; however, the statute of limitations may remain open for periods longer than three years in instances where a federal tax examination is in progress. The 2025, 2024 and 2023 tax years and net operating loss carryforwards utilized in these years remain subject to examination for United States federal tax purposes. The normal statute of limitations for state purposes is between three to five years. However, certain of our state statute of limitations remain open for periods longer than this when audits are in progress.
We are subject to income taxes in the United States and numerous foreign jurisdictions. We are subject to examination by various tax authorities in jurisdictions in which we have business operations or a taxable presence. We regularly assess the likelihood of additional assessments by tax authorities and provide for these matters as appropriate. As of December 31, 2025, we had $28,478 of reserves related to uncertain tax positions, of which $25,020 and $3,458 is included in Other Long-term Liabilities and Deferred Income Taxes, respectively, in the accompanying Consolidated Balance Sheet. As of December 31, 2024, we had $25,876 of reserves related to uncertain tax positions, of which $19,740 and $6,136 is included in Other Long-term Liabilities and Deferred Income Taxes, respectively, in the accompanying Consolidated Balance Sheet. Although we believe our tax estimates are appropriate, the final determination of tax audits and any related litigation could result in changes to our estimates.
NOTES TO CONSOLIDATED FINANCIAL STATEMENTS (CONTINUED)
DECEMBER 31, 2025
(In thousands, except share and per share data)
9. INCOME TAXES (CONTINUED)
A rollforward of unrecognized tax benefits is as follows:
Gross tax contingencies—January 1, 2023
$
27,753
Gross additions based on tax positions related to the current year
3,511
Gross additions for tax positions of prior years
634
Gross reductions for tax positions of prior years
(5,454)
Lapses of statutes
(2,874)
Gross tax contingencies—December 31, 2023
23,570
Gross additions based on tax positions related to the current year
3,091
Gross reductions for tax positions of prior years
(1,698)
Acquired unrecognized tax benefits
5,717
Lapses of statutes
(4,804)
Gross tax contingencies—December 31, 2024
25,876
Gross additions based on tax positions related to the current year
4,449
Gross additions for tax positions of prior years
1,791
Lapses of statutes
(3,598)
Settlements
(40)
Gross tax contingencies—December 31, 2025
$
28,478
INCOME TAX PAYMENTS
Pursuant to the disclosure requirements of ASU 2023-09, the following is a summary of income taxes paid by jurisdiction for the year ended December 31, 2025:
NOTES TO CONSOLIDATED FINANCIAL STATEMENTS (CONTINUED)
DECEMBER 31, 2025
(In thousands, except share and per share data)
10. SEGMENT INFORMATION
Our Chief Operating Decision Maker (“CODM”), our President and CEO, uses Adjusted EBITDA as the basis for evaluating the performance of, and allocating resources to, our operating segments. The CODM uses Adjusted EBITDA to ensure that resources, including capital, are allocated strategically to support our strategy.
As of December 31, 2025, our two reportable segments are described as follows:
(1)Global Records and Information Management ("Global RIM") Business includes several distinct offerings:
(i)Records Management, which stores physical records and provides information services, vital records services, courier operations, and the collection, handling and disposal of sensitive documents ("Records Management") for customers in 61 countries around the globe.
(ii)Data Management, which provides storage and rotation of backup computer media as part of corporate disaster recovery plans, including service and courier operations, server and computer backup services and related services offerings ("Data Management").
(iii)Global Digital Solutions, which develops, implements and supports comprehensive storage and information management solutions for the complete lifecycle of our customers’ information, including the management of physical records, conversion of documents to digital formats and digital storage of information. In October 2025, we launched version 2.0 of our Digital Experience Platform (also referred to as DXP), which offers enhanced content management and smart document processing, an easy-to-use secure platform with workflow tools and Artificial Intelligence agents, allowing customers to make faster and more insightful decisions as well as eliminate obsolete and duplicative data to save costs.
(iv)Secure Shredding, which includes the scheduled pick-up of office records that customers accumulate in specially designed secure containers we provide and is a natural extension of our hardcopy records management operations, completing the lifecycle of a record. Through a combination of shredding facilities and mobile shredding units consisting of custom built trucks, we are able to offer secure shredding services to our customers.
(v)Media and Archive Services, which includes entertainment and media services, which help industry clients store, safeguard and deliver physical media of all types, and provides digital content repository systems that house, distribute and archive key media assets.
(vi)Consumer Storage, which provides on-demand, valet storage for consumers utilizing data analytics and machine learning to provide effective customer acquisition and a convenient and seamless consumer storage experience.
(2)Global Data Center Business, which provides enterprise-class data center facilities and hyperscale-ready capacity to protect mission-critical assets and ensure the continued operation of our customers’ IT infrastructure, with secure, reliable and flexible data center options.
The remaining activities of our business consist primarily of our ALM and Fine Arts businesses and Corporate and Other.
(i)ALM provides hyperscale and corporate IT infrastructure managers with services and solutions that enable the decommissioning, data erasure, processing and disposition, and recycling or sale of IT hardware and component assets. ALM services are enabled by: secure logistics, chain of custody and complete asset traceability practices, environmentally-responsible asset processing and recycling, and data sanitization and asset refurbishment services that enable value recovery through asset remarketing. In addition, ALM also offers workplace IT asset management services including storage, configuration, deployment, device support, end-of-life disposition and recycling or sale of employee IT devices. Our ALM services focus on protecting and eradicating customer data while maintaining strong, auditable and transparent chain of custody practices.
(ii)Fine Arts provides technical expertise in the handling, installation and storing of art.
(iii)Corporate and Other also includes costs related to executive and staff functions, including finance, human resources and IT, which benefit the enterprise as a whole.
NOTES TO CONSOLIDATED FINANCIAL STATEMENTS (CONTINUED)
DECEMBER 31, 2025
(In thousands, except share and per share data)
10. SEGMENT INFORMATION (CONTINUED)
The accounting policies of our reportable segments are the same as those described in Note 2.
The operations associated with acquisitions completed during 2025 have been incorporated into our Global RIM Business and Corporate and Other.
An analysis of our business segment information and reconciliation to the accompanying Consolidated Financial Statements is as follows:
GLOBAL RIM BUSINESS
GLOBAL DATA CENTER BUSINESS
TOTAL REPORTABLE SEGMENTS
CORPORATE AND OTHER
TOTAL CONSOLIDATED
As of and for the Year Ended December 31, 2025
Total Revenues
$
5,291,481
$
803,429
$
6,094,910
$
806,827
$
6,901,737
Storage Rental
3,183,735
797,017
3,980,752
71,758
4,052,510
Service
2,107,746
6,412
2,114,158
735,069
2,849,227
Other Segment Items(1)
2,927,983
387,103
3,315,086
Adjusted EBITDA
2,363,498
416,326
2,779,824
Total Assets(2)
10,891,324
7,968,990
18,860,314
2,264,705
21,125,019
As of and for the Year Ended December 31, 2024
Total Revenues
$
4,979,438
$
620,028
$
5,599,466
$
550,443
$
6,149,909
Storage Rental
3,009,094
606,294
3,615,388
66,871
3,682,259
Service
1,970,344
13,734
1,984,078
483,572
2,467,650
Other Segment Items(1)
2,756,321
337,515
3,093,836
Adjusted EBITDA
2,223,117
282,513
2,505,630
Total Assets(2)
10,408,885
6,060,608
16,469,493
2,247,622
18,717,115
As of and for the Year Ended December 31, 2023
Total Revenues
$
4,661,776
$
495,026
$
5,156,802
$
323,487
$
5,480,289
Storage Rental
2,834,352
474,066
3,308,418
62,227
3,370,645
Service
1,827,424
20,960
1,848,384
261,260
2,109,644
Other Segment Items(1)
2,634,739
279,081
2,913,820
Adjusted EBITDA
2,027,037
215,945
2,242,982
Total Assets(2)
10,876,225
4,788,600
15,664,825
1,808,977
17,473,802
(1)Relates to Cost of sales (excluding depreciation and amortization) and Selling, general and administrative expenses for the respective reportable segment. The CODM does not regularly review disaggregated expense information included within “Other Segment Items” for any individual segments but may review consolidated Cost of sales (excluding depreciation and amortization) and consolidated Selling, general and administrative expense information to manage the business.
(2)Excludes all intercompany receivables or payables and investment in subsidiary balances.
NOTES TO CONSOLIDATED FINANCIAL STATEMENTS (CONTINUED)
DECEMBER 31, 2025
(In thousands, except share and per share data)
10. SEGMENT INFORMATION (CONTINUED)
A reconciliation of Adjusted EBITDA for our reportable segments to total Net Income (Loss) Before Provision (Benefit) for Income Taxes for the years ended December 31, 2025, 2024 and 2023 is as follows:
YEAR ENDED DECEMBER 31,
2025
2024
2023
Total Adjusted EBITDA for Reportable Segments
$
2,779,824
$
2,505,630
$
2,242,982
Add/(Deduct):
Corporate and other
(205,874)
(269,250)
(281,305)
Interest expense, net
(829,335)
(721,559)
(585,932)
Depreciation and amortization
(1,024,435)
(900,905)
(776,159)
Acquisition and Integration Costs
(19,545)
(35,842)
(25,875)
Restructuring and other transformation
(195,912)
(161,359)
(175,215)
(Loss) gain on disposal/write-down of property, plant and equipment, net (including real estate)
(24,641)
(6,196)
12,825
Other (expense) income, net,excluding our share of (losses) gains from our unconsolidated joint ventures
(118,473)
(39,159)
(98,891)
Stock-based compensation expense
(140,280)
(118,138)
(73,799)
Our share of Adjusted EBITDA reconciling items from our unconsolidated joint ventures
(10,141)
(8,684)
(11,425)
Total Net Income (Loss) Before Provision (Benefit) for Income Taxes
NOTES TO CONSOLIDATED FINANCIAL STATEMENTS (CONTINUED)
DECEMBER 31, 2025
(In thousands, except share and per share data)
10. SEGMENT INFORMATION (CONTINUED)
Information as to our operations in different geographical areas for the years ended December 31, 2025, 2024 and 2023 is as follows:
YEAR ENDED DECEMBER 31,
2025
2024
2023
Revenues:
United States
$
4,573,462
$
4,008,402
$
3,507,134
United Kingdom
472,611
426,462
393,917
Canada
302,421
303,184
279,325
Remaining Countries
1,553,243
1,411,861
1,299,913
Long-lived Assets:
United States
$
12,284,125
$
11,399,912
$
9,492,911
United Kingdom
1,913,326
1,419,582
1,315,715
Canada
639,904
612,581
498,511
Remaining Countries
4,352,681
3,593,818
4,431,120
Information as to our revenues by product and service lines by segment for the years ended December 31, 2025, 2024 and 2023 is as follows:
GLOBAL RIM BUSINESS
GLOBAL DATA CENTER BUSINESS
CORPORATE AND OTHER
TOTAL CONSOLIDATED
For the Year Ended December 31, 2025
Records Management(1)
$
4,208,905
$
—
$
174,290
$
4,383,195
Data Management(1)
504,662
—
—
504,662
Information Destruction(1)(2)(3)
577,914
—
632,537
1,210,451
Data Center(1)
—
803,429
—
803,429
For the Year Ended December 31, 2024
Records Management(1)
$
3,899,109
$
—
$
162,366
$
4,061,475
Data Management(1)
515,306
—
—
515,306
Information Destruction(1)(2)(3)
565,023
—
388,077
953,100
Data Center(1)
—
620,028
—
620,028
For the Year Ended December 31, 2023
Records Management(1)
$
3,625,264
$
—
$
146,389
$
3,771,653
Data Management(1)
520,194
—
—
520,194
Information Destruction(1)(2)(3)
516,318
—
177,098
693,416
Data Center(1)
—
495,026
—
495,026
(1)Each of these offerings has a component of revenue that is storage rental related and a component that is service related, except for information destruction, which does not have a storage rental component.
(2)Information destruction revenue for our Global RIM Business includes secure shredding services.
(3)Information destruction revenue for Corporate and Other includes product revenue from our ALM business.
NOTES TO CONSOLIDATED FINANCIAL STATEMENTS (CONTINUED)
DECEMBER 31, 2025
(In thousands, except share and per share data)
11. RELATED PARTY TRANSACTIONS
In October 2020, in connection with the formation of the Frankfurt JV, we entered into agreements whereby we earn various fees, including (i) special project revenue and (ii) property management and construction and development fees for services we are providing to the Frankfurt JV (the "Frankfurt JV Agreements").
Revenue recognized in the accompanying Consolidated Statements of Operations under these agreements for the years ended December 31, 2025, 2024 and 2023 is as follows (approximately):
YEAR ENDED DECEMBER 31,
2025
2024
2023
Frankfurt JV Agreements(1)
$
19
$
3,000
$
1,800
Clutter Agreement(2)
—
—
13,000
(1)Revenue associated with the Frankfurt JV Agreements is presented as a component of our Global Data Center Business segment.
(2)Relates to revenue associated with certain storage and related services provided to the Clutter JV (the "Clutter Agreement"), which were presented as a component of our Global RIM Business segment through June 2023. In June 2023, we acquired a controlling interest in the Clutter JV and terminated the Clutter Agreement.
12. RESTRUCTURING AND OTHER TRANSFORMATION
PROJECT MATTERHORN
In 2025, we completed our investments in Project Matterhorn, a global program designed to accelerate the growth of our business, which we announced in September 2022. Project Matterhorn investments focused on transforming our operating model to a global operating model. Project Matterhorn enabled the development of a solution-based sales approach that allowed us to optimize our shared services and best practices to better serve our customers' needs. As part of this, we invested to accelerate growth and to capture a greater share of the large, global addressable markets in which we operate. We incurred approximately $574,400 in Restructuring and other transformation costs related to Project Matterhorn since its inception. Costs were comprised of (1) restructuring costs, which included (i) site consolidation and other related exit costs, (ii) employee severance costs and (iii) certain professional fees associated with these activities, and (2) other transformation costs, which included professional fees such as project management costs and costs for third party consultants who assisted in the enablement of our growth initiatives.
Restructuring and other transformation related to Project Matterhorn included in the accompanying Consolidated Statements of Operations for the years ended December 31, 2025, 2024 and 2023 and from the inception of Project Matterhorn through December 31, 2025 is as follows:
NOTES TO CONSOLIDATED FINANCIAL STATEMENTS (CONTINUED)
DECEMBER 31, 2025
(In thousands, except share and per share data)
12. RESTRUCTURING AND OTHER TRANSFORMATION (CONTINUED)
Restructuring costs for Project Matterhorn, included as a component of Restructuring and other transformation in the accompanying Consolidated Statements of Operations, by segment, for the years ended December 31, 2025, 2024 and 2023 and from the inception of Project Matterhorn through December 31, 2025 are as follows:
YEAR ENDED
DECEMBER 31, 2025
YEAR ENDED
DECEMBER 31, 2024
YEAR ENDED
DECEMBER 31, 2023
FROM INCEPTION
THROUGH DECEMBER 31, 2025
Global RIM Business
$
78,638
$
42,130
$
46,722
$
180,573
Global Data Center Business
415
3,056
520
3,991
Corporate and Other
7,234
5,896
10,077
23,416
Total restructuring costs
$
86,287
$
51,082
$
57,319
$
207,980
Other transformation costs for Project Matterhorn, included as a component of Restructuring and other transformation in the accompanying Consolidated Statements of Operations, by segment, for the years ended December 31, 2025, 2024 and 2023 and from the inception of Project Matterhorn through December 31, 2025 are as follows:
YEAR ENDED
DECEMBER 31, 2025
YEAR ENDED
DECEMBER 31, 2024
YEAR ENDED
DECEMBER 31, 2023
FROM INCEPTION
THROUGH DECEMBER 31, 2025
Global RIM Business
$
46,453
$
38,337
$
28,369
$
117,060
Global Data Center Business
4,190
4,798
4,964
14,010
Corporate and Other
58,982
67,142
84,563
235,369
Total other transformation costs
$
109,625
$
110,277
$
117,896
$
366,439
A rollforward of the accrued restructuring costs and accrued other transformation costs, which are included as components of Accrued expenses and other current liabilities in our Consolidated Balance Sheets for December 31, 2023 through December 31, 2025 is as follows:
SCHEDULE III—SCHEDULE OF REAL ESTATE AND ACCUMULATED DEPRECIATION
DECEMBER 31, 2025
(Dollars in thousands)
Schedule III - Schedule of Real Estate and Accumulated Depreciation ("Schedule III") reflects the cost and associated accumulated depreciation for the real estate facilities that are owned. The gross cost included in Schedule III includes the cost for land, land improvements, buildings, building improvements, data center infrastructure and racking structures. Schedule III does not reflect the 1,111 leased facilities in our real estate portfolio. In addition, Schedule III does not include any value for financing leases for property that is classified as land, buildings, data center infrastructure and building improvements in our consolidated financial statements.
The following table presents a reconciliation of the gross amount of real estate assets, as presented in Schedule III below, to the sum of the historical book value of land, buildings and building improvements, data center infrastructure, racking structures and construction in progress as disclosed in Note 2.i. to Notes to Consolidated Financial Statements as of December 31, 2025:
Gross Amount of Real Estate Assets, As Reported on Schedule III
$
7,923,550
Add (Deduct) Reconciling Items:
Book value of racking structures included in leased facilities(1)
1,515,395
Book value of financing leases(2)
462,121
Book value of construction in progress(3)
1,137,968
Book value of other
34,715
Total Reconciling Items
3,150,199
Gross Amount of Real Estate Assets, As Disclosed in Note 2.i.
$
11,073,749
(1)Represents the gross book value of racking structures installed in our 1,111 leased facilities, which are included in the historical book value of racking structures in Note 2.i., but excluded from Schedule III.
(2)Represents the gross book value of buildings, building improvements and data center infrastructure that are subject to financing leases, which are included in the historical book value of buildings, building improvements and data center infrastructure in Note 2.i., but excluded from Schedule III.
(3)Represents the gross book value of non-real estate assets, which are included in the historical book value of construction in progress assets in Note 2.i., but excluded from Schedule III. The historical book value of real estate assets associated with owned buildings that are related to construction in progress as of December 31, 2025 are included in Schedule III.
The following table presents a reconciliation of the accumulated depreciation of real estate assets, as presented in Schedule III below, to the total accumulated depreciation for all property, plant and equipment presented on our Consolidated Balance Sheet as of December 31, 2025:
Accumulated Depreciation of Real Estate Assets, As Reported on Schedule III
Accumulated Depreciation - racking structures in leased facilities(2)
1,176,364
Accumulated Depreciation - financing leases(3)
185,363
Accumulated Depreciation - other
14,933
Total Reconciling Items
3,235,462
Accumulated Depreciation, As Reported on Consolidated Balance Sheet
$
4,911,010
(1)Represents the accumulated depreciation of non-real estate assets that is included in the total accumulated depreciation of property, plant and equipment on our Consolidated Balance Sheet, but excluded from Schedule III as the assets to which this accumulated depreciation relates are not considered real estate assets associated with owned buildings.
(2)Represents the accumulated depreciation of racking structures as of December 31, 2025 installed in our 1,111 leased facilities, which is included in total accumulated depreciation of property, plant and equipment on our Consolidated Balance Sheet, but excluded from Schedule III, as disclosed in Footnote 1 to Schedule III.
(3)Represents the accumulated depreciation of buildings, building improvements and data center infrastructure as of December 31, 2025 that are subject to financing leases, which is included in the total accumulated depreciation of property, plant and equipment on our Consolidated Balance Sheet, but excluded from Schedule III, as disclosed in Footnote 1 to Schedule III.
SCHEDULE III—SCHEDULE OF REAL ESTATE AND ACCUMULATED DEPRECIATION (CONTINUED)
DECEMBER 31, 2025
(Dollars in thousands)
(A)
(B)
(C)
(D)
(E)
(F)
REGION/COUNTRY/ STATE/CAMPUS ADDRESS
FACILITIES(1)
ENCUMBRANCES
INITIAL COST
TO COMPANY(1)
COST
CAPITALIZED
SUBSEQUENT TO
ACQUISITION(1)(2)
GROSS AMOUNT
CARRIED AT
CLOSE OF
CURRENT
PERIOD(1)(11)
ACCUMULATED
DEPRECIATION
AT CLOSE OF
CURRENT
PERIOD(1)(2)(11)
DATE OF CONSTRUCTION OR ACQUIRED(3)
LIFE ON WHICH DEPRECIATION IN LATEST INCOME STATEMENT IS COMPUTED
Asia Pacific
12 Whitestone Drive, Austins Ferry, Australia
1
$
—
$
681
$
2,376
$
3,057
$
765
2012
(4)
Up to 40 years
No.464, Pattandur Agrahara Village, Vertex Tech Park, India
5
—
113,767
120,792
234,559
5,305
2023
(10)
Up to 40 years
Jalan Karanggan Muda Raya No 59, Bogor, Indonesia
1
—
7,897
3,615
11,512
3,800
2017
Up to 40 years
Jl. Amd Projakal KM 5.5 Rt 46, Kel. Graha Indah, Kec. Balikpapan Utara, Indonesia
1
—
125
70
195
16
2021
Up to 40 years
1 Serangoon North Avenue 6, Singapore
1
—
58,637
70,484
129,121
34,396
2018
(6)
Up to 40 years
2 Yung Ho Road, Singapore
1
—
10,395
2,608
13,003
6,493
2016
(4)
Up to 40 years
IC1 69 Moo 2, Soi Wat Namdaeng, Bangkok, Thailand
2
—
13,226
4,670
17,896
8,736
2016
(4)
Up to 40 years
Total Asia Pacific
12
$
—
$
204,728
$
204,615
$
409,343
$
59,511
Total
232
$
—
$
2,422,703
$
5,500,847
$
7,923,550
$
1,675,548
(1)The above information only includes the real estate facilities that are owned. The gross cost includes the cost for land, land improvements, buildings, building improvements, data center infrastructure and racking structures. The listing does not reflect the 1,111 leased facilities in our real estate portfolio. In addition, the above information does not include any value for financing leases for property that is classified as land, buildings, building improvements and data center infrastructure in our consolidated financial statements.
(2)Amount includes cumulative impact of foreign currency translation fluctuations.
(3)Date of construction or acquired represents the date we constructed the facility or acquired the facility through purchase or acquisition.
(4)Property was acquired in connection with our acquisition of Recall Holdings Limited.
(5)Property was acquired in connection with our acquisition of IO Data Centers, LLC.
(6)Property was acquired in connection with our acquisition of Credit Suisse International and Credit Suisse AG.
(7)Property was acquired in connection with our acquisition of Information Fort, LLC.
(8)Property was acquired in connection with the Frankfurt data center acquisition.
(9)Property was acquired in connection with our acquisition of XData Properties, S.L.U.
(10)Property was acquired in connection with our acquisition of the Web Werks JV.
(11)This date represents the date the categorization of the property was changed from a leased facility to an owned facility.
SCHEDULE III—SCHEDULE OF REAL ESTATE AND ACCUMULATED DEPRECIATION (CONTINUED)
DECEMBER 31, 2025
(Dollars in thousands)
(12)The following tables present the changes in gross carrying amount of real estate owned and accumulated depreciation for the years ended December 31, 2025 and 2024:
YEAR ENDED DECEMBER 31,
GROSS CARRYING AMOUNT OF REAL ESTATE
2025
2024
Gross amount at beginning of period
$
6,714,601
$
4,964,366
Additions during period:
Discretionary capital projects
1,107,166
1,836,648
Foreign currency translation fluctuations
108,733
(73,945)
1,215,899
1,762,703
Deductions during period:
Cost of real estate sold, disposed or written-down
(13,061)
(14,872)
Other adjustments
6,111
2,404
(6,950)
(12,468)
Gross amount at end of period
$
7,923,550
$
6,714,601
YEAR ENDED DECEMBER 31,
ACCUMULATED DEPRECIATION
2025
2024
Gross amount of accumulated depreciation at beginning of period
$
1,453,058
$
1,305,461
Additions during period:
Depreciation
198,994
183,138
Foreign currency translation fluctuations
31,971
(28,488)
230,965
154,650
Deductions during period:
Amount of accumulated depreciation for real estate assets sold, disposed or written-down
(6,300)
(10,619)
Other adjustments
(2,175)
3,566
(8,475)
(7,053)
Gross amount of end of period
$
1,675,548
$
1,453,058
The aggregate cost of our real estate assets for federal tax purposes at December 31, 2025 was approximately $7,881,000.
Certain exhibits indicated below are incorporated by reference to documents we have filed with the SEC. Each exhibit marked by a pound sign (#) is a management contract or compensatory plan.
Description of Securities. (Incorporated by reference to Exhibit 4.16 to the Company's Form 10-K for the year ended December 31, 2019, filed with the SEC on February 13, 2020.)
Insider Trading Policy.(Incorporated by reference to Exhibit 19.1 to the Company's Form 10-K for the year ended December 31, 2024, filed with the SEC on February 14, 2025.)
Clawback Policy. (Incorporated by reference to Exhibit 97.1 to the Company's Form 10-K for the year ended December 31, 2023, filed with the SEC on February 22, 2024.)
101.INS
XBRL Instance Document - the instance document does not appear in the Interactive Data File because its XBRL tags are embedded within the Inline XBRL document.
Pursuant to the requirements of Section 13 or 15(d) of the Securities Exchange Act of 1934, the registrant has duly caused this report to be signed on its behalf by the undersigned, thereunto duly authorized.
IRON MOUNTAIN INCORPORATED
By:
/s/ DANIEL BORGES
Daniel Borges
Senior Vice President, Chief Accounting Officer
(Principal Accounting Officer)
Dated: February 12, 2026
Pursuant to the requirements of the Securities Exchange Act of 1934, this report has been signed below by the following persons on behalf of the registrant and in the capacities and on the dates indicated.
NAME
TITLE
DATE
/s/ WILLIAM L. MEANEY
President and Chief Executive Officer and Director (Principal Executive Officer)
February 12, 2026
William L. Meaney
/s/ BARRY A. HYTINEN
Executive Vice President and Chief Financial Officer (Principal Financial Officer)