QUARTERLY REPORT PURSUANT TO SECTION 13 OR 15(d) OF THE SECURITIES EXCHANGE ACT OF 1934
For the Quarterly Period Ended June 30, 2026
OR
☐
TRANSITION REPORT PURSUANT TO SECTION 13 OR 15(d) OF THE SECURITIES EXCHANGE ACT OF 1934
For the Transition Period from to
Commission file number 1-13045
IRON MOUNTAIN INCORPORATED
(Exact Name of Registrant as Specified in Its Charter)
Delaware
23-2588479
(State or other Jurisdiction of Incorporation or Organization)
(I.R.S. Employer Identification No.)
85 New Hampshire Avenue, Suite 150, Portsmouth, New Hampshire03801
(Address of Principal Executive Offices, Including Zip Code)
(617) 535-4766
(Registrant's Telephone Number, Including Area Code)
Securities registered pursuant to Section 12(b) of the Exchange Act:
Title of each class
Trading Symbol(s)
Name of each exchange on which registered
Common Stock, $.01 par value
IRM
NYSE
Indicate by check mark whether the registrant: (1) has filed all reports required to be filed by Section 13 or 15(d) of the Securities Exchange Act of 1934 during the preceding 12 months (or for such shorter period that the registrant was required to file such reports), and (2) has been subject to such filing requirements for the past 90 days. Yes ☒ No ☐
Indicate by check mark whether the registrant has submitted electronically every Interactive Data File required to be submitted pursuant to Rule 405 of Regulation S-T during the preceding 12 months (or for such shorter period that the registrant was required to submit such files). Yes ☒ No ☐
Indicate by check mark whether the registrant is a large accelerated filer, an accelerated filer, a non-accelerated filer, a smaller reporting company or an emerging growth company. See the definitions of “large accelerated filer,” “accelerated filer”, “smaller reporting company” and “emerging growth company” in Rule 12b-2 of the Exchange Act. (Check one):
Large accelerated filer
☒
Accelerated filer
☐
Non-accelerated filer
☐
Smaller reporting company
☐
Emerging growth company
☐
If an emerging growth company, indicate by check mark if the registrant has elected not to use the extended transition period for complying with any new or revised financial accounting standards provided pursuant to Section 13(a) of the Exchange Act. ☐
Indicate by check mark whether the registrant is a shell company (as defined in Rule 12b-2 of the Exchange Act). Yes ☐ No ☒
As of July 24, 2026, the registrant had 297,702,812 outstanding shares of common stock, $.01 par value.
(IN THOUSANDS, EXCEPT SHARE AND PER SHARE DATA) (UNAUDITED)
JUNE 30, 2026
DECEMBER 31, 2025
ASSETS
Current Assets:
Cash and cash equivalents
$
204,793
$
158,535
Accounts receivable (less allowances of $105,218 and $107,838 as of June 30, 2026 and December 31, 2025, respectively)
1,487,128
1,443,669
Prepaid expenses and other
411,820
332,779
Total Current Assets
2,103,741
1,934,983
Property, Plant and Equipment:
Property, plant and equipment
15,426,928
14,457,335
Less—Accumulated depreciation
(5,157,107)
(4,911,010)
Property, Plant and Equipment, Net
10,269,821
9,546,325
Other Assets, Net:
Goodwill
5,267,192
5,285,801
Customer and supplier relationships and other intangible assets
1,235,492
1,269,607
Operating lease right-of-use assets
2,437,199
2,465,196
Other
641,997
623,107
Total Other Assets, Net
9,581,880
9,643,711
Total Assets
$
21,955,442
$
21,125,019
LIABILITIES AND EQUITY
Current Liabilities:
Current portion of long-term debt
$
220,809
$
216,074
Accounts payable
857,182
710,662
Accrued expenses and other current liabilities (includes current portion of operating lease liabilities)
1,421,561
1,290,669
Deferred revenue
397,974
402,091
Total Current Liabilities
2,897,526
2,619,496
Long-term Debt, net of current portion
17,128,840
16,215,885
Long-term Operating Lease Liabilities, net of current portion
2,265,294
2,300,448
Other Long-term Liabilities
373,987
450,083
Deferred Income Taxes
181,564
184,015
Commitments and Contingencies
Redeemable Noncontrolling Interests
63,236
64,423
(Deficit) Equity:
Iron Mountain Incorporated Stockholders' (Deficit) Equity:
Preferred stock (par value $0.01; authorized 10,000,000 shares; none issued and outstanding)
—
—
Common stock (par value $0.01; authorized 400,000,000 shares; issued and outstanding 297,662,013 and 295,788,645 shares as of June 30, 2026 and December 31, 2025, respectively)
2,977
2,958
Additional paid-in capital
4,821,527
4,790,190
(Distributions in excess of earnings) Earnings in excess of distributions
(5,690,140)
(5,405,147)
Accumulated other comprehensive items, net
(415,284)
(369,008)
Total Iron Mountain Incorporated Stockholders' (Deficit) Equity
(1,280,920)
(981,007)
Noncontrolling Interests
325,915
271,676
Total (Deficit) Equity
(955,005)
(709,331)
Total Liabilities and (Deficit) Equity
$
21,955,442
$
21,125,019
The accompanying notes are an integral part of these condensed consolidated financial statements.
Adjustments to reconcile net income (loss) to cash flows from operating activities:
Depreciation
394,971
343,013
Amortization (includes amortization of deferred financing costs and discounts of $16,110 and $15,659 for the six months ended June 30, 2026 and 2025, respectively)
170,373
157,366
Revenue reduction associated with amortization of customer inducements and above- and below-market leases
2,964
2,976
Stock-based compensation expense
85,044
86,448
Provision (benefit) for deferred income taxes
3,468
2,472
Loss (gain) on disposal/write-down of property, plant and equipment, net
19,099
4,609
Loss (gain) associated with the remeasurements of deferred purchase obligations
59,773
—
Foreign currency transactions and other, net
(20,940)
46,238
(Increase) decrease in assets
(196,314)
(135,299)
Increase (decrease) in liabilities
114,274
91,709
Cash Flows from Operating Activities
887,813
572,425
Cash Flows from Investing Activities:
Capital expenditures
(1,106,206)
(1,231,523)
Cash paid for acquisitions, net of cash acquired
—
(34,362)
Acquisition of customer intangibles
(40,176)
(9,905)
Contract costs
(30,310)
(41,534)
Investments in joint ventures and other investments, net
2,157
(43,585)
Proceeds from sales of property and equipment and other, net
8,170
10,099
Cash Flows from Investing Activities
(1,166,365)
(1,350,810)
Cash Flows from Financing Activities:
Repayment of revolving credit facility, term loan facilities and other debt
(10,667,709)
(7,353,497)
Proceeds from revolving credit facility, term loan facilities and other debt
10,046,549
8,991,334
Net proceeds from sale of senior note
1,485,000
—
Equity contribution from noncontrolling interests
95,168
—
Equity distribution to noncontrolling interests
(11,424)
(3,481)
Parent cash dividends
(532,742)
(455,236)
Payment of deferred purchase obligations and other deferred payments
(6,914)
(240,217)
Net (payments) proceeds associated with employee stock-based awards
(93,815)
(53,120)
Other, net
(10,128)
(2,915)
Cash Flows from Financing Activities
303,985
882,868
Effect of Exchange Rates on Cash and Cash Equivalents
20,825
(42,207)
Increase (Decrease) in Cash and Cash Equivalents
46,258
62,276
Cash and Cash Equivalents, Beginning of Period
158,535
155,716
Cash and Cash Equivalents, End of Period
$
204,793
$
217,992
Supplemental Information:
Cash Paid for Interest
$
461,459
$
386,391
Cash Paid for Income Taxes, Net
$
60,679
$
60,099
Non-Cash Investing and Financing Activities:
Financing Leases and Other
$
90,464
$
141,811
Accrued Capital Expenditures
$
298,947
$
242,272
Deferred Purchase Obligations and Other Deferred Payments
$
7,880
$
3,600
Dividends Payable
$
266,909
$
242,395
The accompanying notes are an integral part of these condensed consolidated financial statements.
NOTES TO CONDENSED CONSOLIDATED FINANCIAL STATEMENTS
(In thousands, except share and per share data) (Unaudited)
1. GENERAL
The unaudited condensed consolidated financial statements of Iron Mountain Incorporated, a Delaware corporation, and its subsidiaries ("we" or "us"), have been prepared pursuant to the rules and regulations of the United States Securities and Exchange Commission (the "SEC"). Certain information and footnote disclosures normally included in the annual financial statements prepared in accordance with accounting principles generally accepted in the United States of America ("GAAP") have been omitted pursuant to those rules and regulations, but we believe that the disclosures included herein are adequate to make the information presented not misleading. The interim condensed consolidated financial statements are presented herein and, in the opinion of management, reflect all adjustments of a normal recurring nature necessary for a fair presentation. Interim results are not necessarily indicative of results for a full year.
The Condensed Consolidated Financial Statements and Notes thereto, which are included herein, should be read in conjunction with the Consolidated Financial Statements and Notes thereto for the year ended December 31, 2025 included in our Annual Report on Form 10-K filed with the SEC on February 12, 2026 (our "Annual Report").
We have been organized and have operated as a real estate investment trust ("REIT") for United States federal income tax purposes beginning with our taxable year ended December 31, 2014.
2. SUMMARY OF SIGNIFICANT ACCOUNTING POLICIES
A. ACCOUNTS RECEIVABLE
We maintain an allowance for doubtful accounts and a credit memo reserve for estimated losses resulting from the potential inability of our customers to make required payments and potential disputes regarding billing and service issues.The rollforward of the allowance for doubtful accounts and credit memo reserves for the six months ended June 30, 2026 is as follows:
Balance as of December 31, 2025
$
107,838
Credit memos charged to revenue
52,676
Allowance for bad debts charged to expense
31,863
Deductions and other(1)
(87,159)
Balance as of June 30, 2026
$
105,218
(1)Primarily consists of the issuance of credit memos, the write-off of accounts receivable and the impact associated with currency translation adjustments.
NOTES TO CONDENSED CONSOLIDATED FINANCIAL STATEMENTS (CONTINUED)
(In thousands, except share and per share data) (Unaudited)
2. SUMMARY OF SIGNIFICANT ACCOUNTING POLICIES (CONTINUED)
B. LEASES
We lease facilities for certain warehouses, data centers and office spaces. We also have land leases, including those on which certain facilities are located.
Operating and financing lease right-of-use assets and lease liabilities as of June 30, 2026 and December 31, 2025 are as follows:
DESCRIPTION
JUNE 30, 2026
DECEMBER 31, 2025
Assets:
Operating lease right-of-use assets
$
2,437,199
$
2,465,196
Financing lease right-of-use assets, net of accumulated depreciation(1)
502,784
470,803
Liabilities:
Current
Operating lease liabilities
$
332,177
$
319,129
Financing lease liabilities(1)
63,245
56,287
Long-term
Operating lease liabilities
$
2,265,294
$
2,300,448
Financing lease liabilities(1)
490,672
470,912
(1)Financing lease right-of-use assets, current financing lease liabilities and long-term financing lease liabilities are included within Property, Plant and Equipment, Net, Current portion of long-term debt and Long-term Debt, net of current portion, respectively, within our Condensed Consolidated Balance Sheets.
The components of lease expense for the three and six months ended June 30, 2026 and 2025 are as follows:
THREE MONTHS ENDED JUNE 30,
SIX MONTHS ENDED JUNE 30,
DESCRIPTION
2026
2025
2026
2025
Operating lease cost(1)
$
183,433
$
179,831
$
367,802
$
353,139
Financing lease cost:
Depreciation of financing lease right-of-use assets
$
19,582
$
15,246
$
36,951
$
28,978
Interest expense for financing lease liabilities
9,032
7,325
16,398
13,454
(1)Operating lease cost, the majority of which is included in Cost of sales, includes variable lease costs of $48,675 and $97,134 for the three and six months ended June 30, 2026, respectively, and $47,261 and $93,666 for the three and six months ended June 30, 2025, respectively.
Other information:Supplemental cash flow information relating to our leases for the six months ended June 30, 2026 and 2025 is as follows:
SIX MONTHS ENDED JUNE 30,
CASH PAID FOR AMOUNTS INCLUDED IN MEASUREMENT OF LEASE LIABILITIES:
2026
2025
Operating cash flows used in operating leases
$
258,236
$
244,840
Operating cash flows used in financing leases (interest)
16,398
13,454
Financing cash flows used in financing leases
34,265
27,242
NON-CASH ITEMS:
Operating lease modifications and reassessments
$
51,537
$
(21,629)
New operating leases (including acquisitions)
98,356
58,717
In February 2026, we entered into a finance lease that is expected to commence in the fourth quarter of 2026, with an initial lease term of 31 years. The total undiscounted minimum lease payments for this lease are approximately $223,400.
NOTES TO CONDENSED CONSOLIDATED FINANCIAL STATEMENTS (CONTINUED)
(In thousands, except share and per share data) (Unaudited)
2. SUMMARY OF SIGNIFICANT ACCOUNTING POLICIES (CONTINUED)
C. GOODWILL
Our reporting units as of December 31, 2025 are described in detail in Note 2.l. to Notes to Consolidated Financial Statements included in our Annual Report.
The changes in the carrying value of goodwill attributable to each reportable segment and Corporate and Other (as defined in Note 8) for the six months ended June 30, 2026 are as follows:
GLOBAL RIM BUSINESS
GLOBAL DATA CENTER BUSINESS
CORPORATE AND OTHER
TOTAL CONSOLIDATED
Goodwill balance, net of accumulated amortization, as of December 31, 2025
$
3,973,406
$
482,864
$
829,531
$
5,285,801
Fair value and other adjustments
550
—
(321)
229
Currency effects
(12,042)
(6,557)
(239)
(18,838)
Goodwill balance, net of accumulated amortization, as of June 30, 2026
$
3,961,914
$
476,307
$
828,971
$
5,267,192
Accumulated goodwill impairment balance as of June 30, 2026
NOTES TO CONDENSED CONSOLIDATED FINANCIAL STATEMENTS (CONTINUED)
(In thousands, except share and per share data) (Unaudited)
2. SUMMARY OF SIGNIFICANT ACCOUNTING POLICIES (CONTINUED)
D. FAIR VALUE MEASUREMENTS
The assets and liabilities carried at fair value and measured on a recurring basis as of June 30, 2026 and December 31, 2025 are as follows:
FAIR VALUE MEASUREMENTS AS OF JUNE 30, 2026 USING
DESCRIPTION
TOTAL CARRYING
VALUE AS OF
JUNE 30, 2026
QUOTED PRICES IN ACTIVE MARKETS (LEVEL 1)
SIGNIFICANT OTHER OBSERVABLE INPUTS (LEVEL 2)
SIGNIFICANT
UNOBSERVABLE
INPUTS (LEVEL 3)(2)
Money Market Funds
$
19,590
$
—
$
19,590
$
—
Time Deposits
3,004
—
3,004
—
Trading Securities
9,346
7,493
1,853
—
Derivative Assets
3,380
—
3,380
—
Derivative Liabilities
54,717
—
54,717
—
Deferred Purchase Obligations(1)
194,310
—
—
194,310
FAIR VALUE MEASUREMENTS AS OF DECEMBER 31, 2025 USING
DESCRIPTION
TOTAL CARRYING
VALUE AS OF
DECEMBER 31, 2025
QUOTED PRICES IN ACTIVE MARKETS (LEVEL 1)
SIGNIFICANT OTHER OBSERVABLE INPUTS (LEVEL 2)
SIGNIFICANT
UNOBSERVABLE
INPUTS (LEVEL 3)(2)
Money Market Funds
$
7,149
$
—
$
7,149
$
—
Time Deposits
3,430
—
3,430
—
Trading Securities
8,220
6,400
1,820
—
Derivative Liabilities
71,869
—
71,869
—
Deferred Purchase Obligations(1)
134,142
—
—
134,142
(1)The balance as of June 30, 2026 and December 31, 2025 primarily relates to the fair value of the deferred purchase obligation associated with the Regency Transaction (as defined in Note 3 to Notes to Consolidated Financial Statements included in our Annual Report).
(2)The following is a rollforward of the Level 3 liabilities presented above for December 31, 2025 through June 30, 2026:
Balance as of December 31, 2025
$
134,142
Additions
—
Payments
—
Other changes, including accretion
60,168
Balance as of June 30, 2026
$
194,310
The level 3 valuations of the deferred purchase obligations were determined utilizing a discounted cash flow model and take into account our forecasted projections as they relate to the underlying performance of the business. The discounted cash flow model incorporates assumptions as to expected results over the achievement period, including adjustments for volatility and timing, as well as discount rates that account for the risk of the arrangement and overall market risks. Any material change to these assumptions may result in a significantly higher or lower fair value of the deferred purchase obligations.
There were no material items that were measured at fair value on a non-recurring basis as of June 30, 2026 and December 31, 2025 other than those disclosed in Note 2.p. to Notes to Consolidated Financial Statements included in our Annual Report.
NOTES TO CONDENSED CONSOLIDATED FINANCIAL STATEMENTS (CONTINUED)
(In thousands, except share and per share data) (Unaudited)
2. SUMMARY OF SIGNIFICANT ACCOUNTING POLICIES (CONTINUED)
F. REVENUES
Certain costs to fulfill or obtain customer contracts and certain initial direct costs of obtaining leases, including the costs associated with the initial movement of customer records into physical storage and certain commission expenses, are collectively referred to as "Contract Costs".Contract Costs are primarily made up of Intake Costs and Commissions (each as defined in Note 2.s. to Notes to Consolidated Financial Statements included in our Annual Report). Contract Costs as of June 30, 2026 and December 31, 2025 are as follows:
JUNE 30, 2026
DECEMBER 31, 2025
DESCRIPTION
GROSS CARRYING AMOUNT
ACCUMULATED AMORTIZATION
NET CARRYING AMOUNT
GROSS CARRYING AMOUNT
ACCUMULATED AMORTIZATION
NET CARRYING AMOUNT
Intake Costs and other fulfillment costs asset
$
106,103
$
(59,739)
$
46,364
$
111,923
$
(60,999)
$
50,924
Commissions asset
249,604
(119,248)
130,356
243,966
(110,365)
133,601
Deferred revenue liabilities are reflected in our Condensed Consolidated Balance Sheets as follows:
DESCRIPTION
LOCATION IN BALANCE SHEET
JUNE 30, 2026
DECEMBER 31, 2025(1)
Deferred revenue—Current(2)
Deferred revenue
$
397,974
$
402,091
Deferred revenue—Long-term(3)
Other Long-term Liabilities
170,278
165,804
(1) The beginning balance of current and long-term deferred revenue for the year ended December 31, 2025 was $326,882 and $110,601, respectively.
(2) Approximately half of this revenue is expected to be recognized over the next month, with the remainder expected to be recognized over the next two to 12 months. The current deferred revenue accounted for under Accounting Standards Codification 842, Leases ("ASC 842") is approximately $75,000 and $41,600 as of June 30, 2026 and December 31, 2025, respectively.
(3) The long-term deferred revenue accounted for under ASC 842 is approximately $152,800 and $141,100 as of June 30, 2026 and December 31, 2025, respectively.
In addition to our deferred revenue, we have remaining performance obligations related to certain customer contracts that have annual or monthly fixed fees with noncancelable terms. As of June 30, 2026, approximately $252,000 of remaining performance obligations are expected to be recognized as revenue over periods generally ranging from one to five years, with approximately 25% expected to be recognized within the next 12 months. As permitted under ASC 606, we do not disclose the value of remaining performance obligations for contracts to which we have applied the "right to invoice" practical expedient (as described in Note 2.s. to Notes to Consolidated Financial Statements included in our Annual Report).
DATA CENTER LESSOR CONSIDERATIONS
Our Global Data Center Business features storage rental provided to customers at contractually specified rates over a fixed contractual period. Our data center revenue contracts are accounted for in accordance with ASC 842.Storage rental revenue associated with our Global Data Center Business for the three and six months ended June 30, 2026 and 2025 is as follows:
THREE MONTHS ENDED JUNE 30,
SIX MONTHS ENDED JUNE 30,
2026
2025
2026
2025
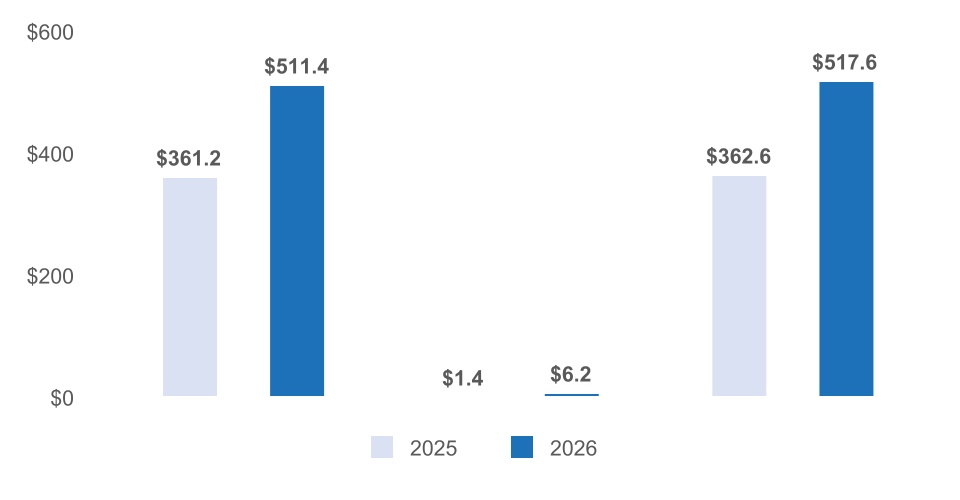
Storage rental revenue(1)
$
258,892
$
188,279
$
511,397
$
361,224
(1) Revenue associated with variable lease payments, primarily related to power and connectivity, included within storage rental revenue was approximately $56,900 and $116,800for the three and six months ended June 30, 2026, respectively, and $39,100 and $73,500 for the three and six months ended June 30, 2025, respectively.
NOTES TO CONDENSED CONSOLIDATED FINANCIAL STATEMENTS (CONTINUED)
(In thousands, except share and per share data) (Unaudited)
2. SUMMARY OF SIGNIFICANT ACCOUNTING POLICIES (CONTINUED)
G. STOCK-BASED COMPENSATION
Our stock-based compensation expense includes the cost of stock options, restricted stock units ("RSUs") and performance units ("PUs") (together, "Employee Stock-Based Awards").
STOCK-BASED COMPENSATION EXPENSE
Stock-based compensation expense for Employee Stock-Based Awards for the three and six months ended June 30, 2026 and 2025 is as follows:
THREE MONTHS ENDED JUNE 30,
SIX MONTHS ENDED JUNE 30,
2026
2025
2026
2025
Stock-based compensation expense
$
56,787
$
60,354
$
85,044
$
86,448
On March 1, 2026, we granted approximately 74,000 stock options, 552,000 RSUs and 441,000 PUs under the 2014 Plan (as defined in Note 2.t. to Notes to Consolidated Financial Statements included in our Annual Report).
As of June 30, 2026, unrecognized compensation cost related to the unvested portion of our Employee Stock-Based Awards, inclusive of our estimated achievement of the performance metrics, is $152,371.
H. OTHER EXPENSE (INCOME), NET
Other expense (income), net for the three and six months ended June 30, 2026 and 2025 consists of the following:
(1)The gains for the three and six months ended June 30, 2026 primarily consist of the impact of changes in the exchange rate of the Euro against the United States dollar on our intercompany balances with and between certain of our subsidiaries.
(2)Other, net for the three and six months ended June 30, 2026 primarily consists of a loss of approximately $41,900 and $59,700, respectively, due to the change in value of our deferred purchase obligations and other deferred payments.
NOTES TO CONDENSED CONSOLIDATED FINANCIAL STATEMENTS (CONTINUED)
(In thousands, except share and per share data) (Unaudited)
2. SUMMARY OF SIGNIFICANT ACCOUNTING POLICIES (CONTINUED)
I. INCOME TAXES
We provide for income taxes during interim periods based on our estimate of the effective tax rate for the year.Our effective tax rates for the three and six months ended June 30, 2026 and 2025 are as follows:
THREE MONTHS ENDED JUNE 30,
SIX MONTHS ENDED JUNE 30,
2026(1)
2025(2)
2026(1)
2025(2)
Effective Tax Rate
12.2
%
60.3
%
14.1
%
773.6
%
(1)The primary reconciling items between the federal statutory tax rate of 21.0% and our overall effective tax rate for the three and six months ended June 30, 2026 were the (i) benefits derived from the dividends paid deduction, (ii) non-taxable income we recorded in Other expense (income), net during the period, as well as the differences in the tax rates to which our foreign earnings are subject, partially offset by (iii) disallowed interest expenses of certain entities.
(2)The primary reconciling items between the federal statutory tax rate of 21.0% and our overall effective tax rate for the three and six months ended June 30, 2025 were the (i) lack of tax benefits recognized for the foreign exchange losses we recorded in Other expense (income), net, during the period, (ii) disallowed interest expenses of certain entities and (iii) the differences in the tax rates to which our foreign earnings are subject, partially offset by (iv) benefits derived from the dividends paid deduction.
Effective on January 1, 2026, the One Big Beautiful Bill Act increased the maximum allowable value of a REIT’s total assets held in one or more taxable REIT subsidiaries at the end of any quarter from 20% to 25%.
J. INCOME (LOSS) PER SHARE—BASIC AND DILUTED
The calculations of basic and diluted income (loss) per share for the three and six months ended June 30, 2026 and 2025 are as follows:
THREE MONTHS ENDED JUNE 30,
SIX MONTHS ENDED JUNE 30,
2026
2025
2026
2025
Net Income (Loss)
$
106,102
$
(43,340)
$
255,101
$
(27,107)
Less: Net Income (Loss) Attributable to Noncontrolling Interests
4,672
1,581
10,006
1,862
Net Income (Loss) Attributable to Iron Mountain Incorporated
$
101,430
$
(44,921)
$
245,095
$
(28,969)
Weighted-average shares—basic
297,741,000
295,364,000
297,295,000
294,935,000
Effect of potentially dilutive stock options
1,828,000
—
1,766,000
—
Effect of potentially dilutive RSUs and PUs
280,000
—
281,000
—
Weighted-average shares—diluted
299,849,000
295,364,000
299,342,000
294,935,000
Net Income (Loss) Per Share Attributable to Iron Mountain Incorporated:
Basic
$
0.34
$
(0.15)
$
0.82
$
(0.10)
Diluted
$
0.34
$
(0.15)
$
0.82
$
(0.10)
Antidilutive stock options, RSUs and PUs excluded from the calculation
NOTES TO CONDENSED CONSOLIDATED FINANCIAL STATEMENTS (CONTINUED)
(In thousands, except share and per share data) (Unaudited)
3. INVESTMENTS
Our joint venture with AGC Equity Partners (the "Frankfurt JV") is accounted for as an equity method investment and is presented as a component of Other within Other assets, net in our Condensed Consolidated Balance Sheets. The carrying value and equity interest in the unconsolidated Frankfurt JV as of June 30, 2026 and December 31, 2025 is as follows:
JUNE 30, 2026
DECEMBER 31, 2025
CARRYING VALUE
EQUITY INTEREST
CARRYING VALUE
EQUITY INTEREST
Frankfurt JV
$
78,209
20
%
$
85,156
20
%
4. DERIVATIVE INSTRUMENTS AND HEDGING ACTIVITIES
Derivative instruments we are party to include: (i) interest rate swap agreements (which are designated as cash flow hedges) and (ii) cross-currency swap agreements (which are designated as net investment hedges).
INTEREST RATE SWAP AGREEMENTS DESIGNATED AS CASH FLOW HEDGES
We utilize interest rate swap agreements designated as cash flow hedges to limit our exposure to changes in interest rates on a portion of our floating rate indebtedness. Certain of our interest rate swap agreements have notional amounts that will increase with the underlying hedged transaction. Under our interest rate swap agreements, we receive variable rate interest payments associated with the notional amount of each interest rate swap, based upon the one-month Secured Overnight Financing Rate ("SOFR"), in exchange for the payment of fixed interest rates as specified in the interest rate swap agreements. Our interest rate swap agreements are marked to market at the end of each reporting period, representing the fair values of the interest rate swap agreements, and any changes in fair value are recognized as a component of Accumulated other comprehensive items, net. Unrealized gains are recognized as assets, while unrealized losses are recognized as liabilities.
As of June 30, 2026 and December 31, 2025, we have approximately $1,032,000 and $1,349,000, respectively, in notional value outstanding on our interest rate swap agreements. As of June 30, 2026, our interest rate swap agreements have maturity dates ranging from August 2026 through June 2029.
CROSS-CURRENCY SWAP AGREEMENTS DESIGNATED AS NET INVESTMENT HEDGES
We utilize cross-currency swaps to hedge the variability of exchange rate impacts between the United States dollar and certain of our foreign functional currencies, including the Euro and the Canadian dollar. As of June 30, 2026, our cross-currency swap agreements have maturity dates ranging from November 2026 through February 2029.
The notional values of our cross-currency swaps, by hedged currency, as of June 30, 2026 and December 31, 2025, are as follows:
JUNE 30, 2026
DECEMBER 31, 2025
Euro
$
504,559
$
509,187
Canadian dollar
350,000
350,000
$
854,559
$
859,187
We have designated these cross-currency swap agreements as hedges of net investments in our Euro and Canadian dollar denominated subsidiaries and they require an exchange of the notional amounts at maturity. These cross-currency swap agreements are marked to market at the end of each reporting period, representing the fair values of the cross-currency swap agreements, and any changes in fair value are recognized as a component of Accumulated other comprehensive items, net. Unrealized gains are recognized as assets, while unrealized losses are recognized as liabilities. The excluded component of our cross-currency swap agreements is recorded in Accumulated other comprehensive items, net and amortized to interest expense on a straight-line basis.
NOTES TO CONDENSED CONSOLIDATED FINANCIAL STATEMENTS (CONTINUED)
(In thousands, except share and per share data) (Unaudited)
4. DERIVATIVE INSTRUMENTS AND HEDGING ACTIVITIES (CONTINUED)
The fair values of derivative instruments recognized in our Condensed Consolidated Balance Sheets as of June 30, 2026 and December 31, 2025, by derivative instrument, are as follows:
JUNE 30, 2026
DECEMBER 31, 2025
DERIVATIVE INSTRUMENTS(1)
ASSETS
LIABILITIES
ASSETS
LIABILITIES
Cash Flow Hedges(2)
Interest rate swap agreements
$
—
$
(2,945)
$
—
$
(9,752)
Net Investment Hedges(3)
Cross-currency swap agreements
3,380
(51,772)
—
(62,117)
(1)Our derivative assets are included as a component of (i) Prepaid expenses and other or (ii) Other within Other assets, net and our derivative liabilities are included as a component of (i) Accrued expenses and other current liabilities or (ii) Other long-term liabilities in our Condensed Consolidated Balance Sheets. As of June 30, 2026, $3,380 is included within Prepaid expenses and other, $2,416 is included within Accrued expenses and other current liabilities and $52,301 is included within Other long-term liabilities. As of December 31, 2025, $63,634 is included within Accrued expenses and other current liabilities and $8,235 is included within Other long-term liabilities.
(2)As of June 30, 2026, cumulative net losses recorded within Accumulated other comprehensive items, net associated with our interest rate swap agreements are $2,945.
(3)As of June 30, 2026, cumulative net losses recorded within Accumulated other comprehensive items, net associated with our cross-currency swap agreements are $48,392. In addition, we have cumulative net gains of $56,800 related to the excluded component of our cross-currency swap agreements recorded within Accumulated other comprehensive items, net.
Unrealized gains (losses) recognized in Accumulated other comprehensive items, net during the three and six months ended June 30, 2026 and 2025, by derivative instrument, are as follows:
NOTES TO CONDENSED CONSOLIDATED FINANCIAL STATEMENTS (CONTINUED)
(In thousands, except share and per share data) (Unaudited)
5. DEBT
Long-term debt is as follows:
JUNE 30, 2026
DECEMBER 31, 2025
DEBT
(INCLUSIVE OF
DISCOUNT)
UNAMORTIZED
DEFERRED
FINANCING
COSTS
CARRYING
AMOUNT
FAIR
VALUE
DEBT
(INCLUSIVE OF
DISCOUNT)
UNAMORTIZED
DEFERRED
FINANCING
COSTS
CARRYING
AMOUNT
FAIR
VALUE
Revolving Credit Facility(1)
$
30,000
$
(7,241)
$
22,759
$
30,000
$
751,500
$
(8,207)
$
743,293
$
751,500
Term Loan A(1)
475,000
—
475,000
475,000
487,500
—
487,500
487,500
Term Loan B(1)
2,011,653
(11,426)
2,000,227
2,021,130
2,020,957
(12,465)
2,008,492
2,031,495
Virginia 3 Term Loans due 2026
—
—
—
—
271,079
(1,189)
269,890
271,079
Virginia 6 Term Loans(2)
210,000
(1,645)
208,355
210,000
210,000
(2,633)
207,367
210,000
Virginia 7 Term Loans(2)
293,455
(2,719)
290,736
293,455
275,314
(4,351)
270,963
275,314
Virginia 9 Term Loans(3)
29,595
(7,038)
22,557
29,595
—
—
—
—
Virginia 4/5 Term Loans due 2030(2)
208,224
(3,167)
205,057
208,224
208,224
(3,529)
204,695
208,224
Virginia 3 Term Loans due 2031(3)
433,000
(8,137)
424,863
433,000
—
—
—
—
Australian Dollar Term Loan(2)
267,257
(1,814)
265,443
268,877
262,192
(1,965)
260,227
263,948
UK Revolving Credit Facility(2)
185,405
(1,405)
184,000
185,405
188,385
(2,002)
186,383
188,385
47/8% Notes due 2027(2)(4)
1,000,000
(1,777)
998,223
998,750
1,000,000
(2,488)
997,512
995,000
51/4% Notes due 2028(2)(4)
825,000
(2,067)
822,933
822,938
825,000
(2,657)
822,343
823,969
5% Notes due 2028(2)(4)
500,000
(1,507)
498,493
496,250
500,000
(1,869)
498,131
497,500
7% Notes(2)(4)
1,000,000
(5,495)
994,505
1,016,250
1,000,000
(6,559)
993,441
1,025,000
47/8% Notes due 2029(2)(4)
1,000,000
(4,701)
995,299
976,250
1,000,000
(5,425)
994,575
983,750
51/4% Notes due 2030(2)(4)
1,300,000
(6,142)
1,293,858
1,275,625
1,300,000
(6,894)
1,293,106
1,280,500
41/2% Notes(2)(4)
1,100,000
(5,809)
1,094,191
1,047,750
1,100,000
(6,430)
1,093,570
1,042,250
5% Notes due 2032(2)
750,000
(7,942)
742,058
718,125
750,000
(8,595)
741,405
710,625
55/8% Notes(2)(4)
600,000
(3,533)
596,467
591,750
600,000
(3,823)
596,177
586,500
61/4% Notes(2)(4)
1,200,000
(11,852)
1,188,148
1,210,500
1,200,000
(12,752)
1,187,248
1,206,000
Euro Notes(2)(4)
1,368,929
(15,728)
1,353,201
1,358,662
1,408,825
(16,765)
1,392,060
1,370,082
61/4% Senior Notes due 2035 (the "61/4% Notes due 2035")(4)(5)
1,500,000
(18,220)
1,481,780
1,503,750
—
—
—
—
Real Estate Mortgages, Financing Lease Liabilities and Other
794,087
(1,277)
792,810
794,087
785,497
(1,512)
783,985
785,497
Accounts Receivable Securitization Program
400,500
(1,814)
398,686
400,500
400,000
(404)
399,596
400,000
Total Long-term Debt
17,482,105
(132,456)
17,349,649
16,544,473
(112,514)
16,431,959
Less Current Portion
(220,809)
—
(220,809)
(216,074)
—
(216,074)
Long-term Debt, Net of Current Portion
$
17,261,296
$
(132,456)
$
17,128,840
$
16,328,399
$
(112,514)
$
16,215,885
(1)Collectively, the “Credit Agreement”. The Credit Agreement consists of a revolving credit facility (the “Revolving Credit Facility”), a term loan A facility (the “Term Loan A”) and a term loan B facility (the "Term Loan B"). The remaining amount available for borrowing under the Revolving Credit Facility as of June 30, 2026 was $2,707,574 (which represents the maximum availability as of such date). The weighted average interest rate in effect under the Revolving Credit Facility was 5.4% as of June 30, 2026.
(2)Each as defined in Note 6 to Notes to Consolidated Financial Statements included in our Annual Report.
(3)We believe the fair value (Level 2 of the fair value hierarchy described in Note 2.p. to Notes to Consolidated Financial Statements included in our Annual Report) of this debt instrument approximates its carrying value as these borrowings are based on current market interest rates.
NOTES TO CONDENSED CONSOLIDATED FINANCIAL STATEMENTS (CONTINUED)
(In thousands, except share and per share data) (Unaudited)
5. DEBT (CONTINUED)
(4)Collectively, the "Parent Notes". Iron Mountain Incorporated ("IMI") is the direct obligor on the Parent Notes, which are fully and unconditionally guaranteed, on a senior basis, by the Note Guarantors. These guarantees are joint and several obligations of the Note Guarantors. The remainder of our subsidiaries do not guarantee the Parent Notes.
(5)The fair value (Level 2 of the fair value hierarchy described in Note 2.p. to Notes to Consolidated Financial Statements included in our Annual Report) of this debt instrument is based on a quoted market price for comparable notes on June 30, 2026.
See Note 6 to Notes to Consolidated Financial Statements included in our Annual Report for additional information regarding our long-term debt, including the direct obligors of each of our debt instruments as well as information regarding the fair value of our debt instruments (including the levels of the fair value hierarchy used to determine the fair value of our debt instruments, which are consistent with the levels of the fair value hierarchy used to determine the fair value of our debt as of June 30, 2026).
DATA CENTER DEBT AGREEMENTS
On January 9, 2026, Iron Mountain Data Centers Virginia 3, LLC and Iron Mountain Data Centers Virginia 3 Intermediate II, LLC, both wholly-owned subsidiaries of IMI, entered into a mortgage loan agreement and a mezzanine loan agreement with a total original principal balance of $433,000 (the "Virginia 3 Term Loans due 2031"). The Virginia 3 Term Loans due 2031 are secured by the property of Iron Mountain Data Centers Virginia 3, LLC and are scheduled to mature on January 9, 2031, at which point all obligations will become due. The Virginia 3 Term Loans due 2031 bear interest at a weighted average rate of 6.3%. Total net proceeds from the Virginia 3 Term Loans due 2031 were used to repay the Virginia 3 Term Loans due 2026 (defined as the Virginia 3 Term Loans in Note 6 to Notes to Consolidated Financial Statements included in our Annual Report) and a portion of the outstanding borrowings under the Revolving Credit Facility.
On June 9, 2026, Iron Mountain Data Centers Virginia 9, LLC, an indirect subsidiary of IMI, entered into a credit agreement that includes a term loan facility (the "Virginia 9 Term Loans") and a letter of credit facility (collectively, the "Virginia 9 Credit Agreement"), under which we have the option to borrow, in the form of term loans, an aggregate outstanding amount not to exceed $298,000. The Virginia 9 Term Loans bear interest at SOFR plus 3.00%. The Virginia 9 Credit Agreement requires the payment of a commitment fee on any unused commitments at a rate of 0.90%. The Virginia 9 Credit Agreement is secured by the equity interests and assets of Iron Mountain Data Centers Virginia 9, LLC and is scheduled to mature on June 9, 2029, at which point all obligations will become due. We have twoone-year options that allow us to extend the maturity date, subject to the conditions specified in the Virginia 9 Credit Agreement. As of June 30, 2026, we had $29,595 outstanding on the Virginia 9 Term Loans and the interest rate in effect under the Virginia 9 Credit Agreement was 6.9%.
ACCOUNTS RECEIVABLE SECURITIZATION PROGRAM
On May 28, 2026, we amended the Accounts Receivable Securitization Program (as defined in Note 6 to Notes to Consolidated Financial Statements included in our Annual Report) to (i) include the sale of accounts receivable from certain of our wholly-owned Canadian entities, (ii) increase the maximum borrowing capacity from $400,000 to $450,000 and (iii) extend the maturity date from July 1, 2027 to July 1, 2029, at which point all obligations become due. All other material terms of the Accounts Receivable Securitization Program remain the same as disclosed in Note 6 to Notes to Consolidated Financial Statements included in our Annual Report.
NOTES TO CONDENSED CONSOLIDATED FINANCIAL STATEMENTS (CONTINUED)
(In thousands, except share and per share data) (Unaudited)
5. DEBT (CONTINUED)
JUNE 2026 OFFERING
On June 26, 2026, IMI completed a private offering of:
SERIES OF NOTES
AGGREGATE PRINCIPAL AMOUNT
MATURITY DATE
INTEREST PAYMENT DUE
PAR CALL DATE(1)
61/4% Notes due 2035
$
1,500,000
January 15, 2035
January 15 and July 15
July 15, 2031
(1)We may redeem the 61/4% Notes due 2035 at any time, at our option, in whole or in part. Prior to the par call date, we may redeem the 61/4% Notes due 2035 at the redemption price or make-whole premium specified in the indenture governing the 61/4% Notes due 2035, together with accrued and unpaid interest to, but excluding, the redemption date. On or after the par call date, we may redeem the 61/4% Notes due 2035 at a price equal to 100% of the principal amount being redeemed, together with accrued and unpaid interest to, but excluding, the redemption date.
The 61/4% Notes due 2035 were issued at par and have a contractual interest rate of 6.25%. The total net proceeds from the issuance, after deducting the initial purchasers' commissions and third-party fees, of approximately $1,481,800 were used to repay a portion of the outstanding borrowings under the Revolving Credit Facility and for general corporate purposes. As of June 30, 2026, we had $1,500,000outstanding on the 61/4% Notes due 2035.
LETTERS OF CREDIT
As of June 30, 2026, we have outstanding letters of credit totaling $51,395, of which $12,426 reduces our borrowing capacity under the Revolving Credit Facility. The letters of credit expire at various dates between October 2026 and July 2027.
DEBT COVENANTS
The Credit Agreement, certain of our bond indentures and other agreements governing our indebtedness contain certain restrictive financial and operating covenants, including covenants that restrict our ability to complete acquisitions, pay cash dividends, incur indebtedness, make investments, sell assets and take other specified corporate actions. The covenants do not contain a rating trigger. Therefore, a change in our debt rating would not trigger a default under the Credit Agreement, our bond indentures or other agreements governing our indebtedness. The Credit Agreement requires that we satisfy a net total lease adjusted leverage ratio and a fixed charge coverage ratio on a quarterly basis, and certain of our bond indentures require that, among other things, we satisfy a leverage ratio (not lease adjusted) or a fixed charge coverage ratio (not lease adjusted) as a condition to taking actions such as paying dividends and incurring indebtedness.
The Credit Agreement uses earnings before interest, taxes, depreciation and amortization and rent expense ("EBITDAR")-based calculations and the bond indentures use earnings before interest, taxes, depreciation and amortization ("EBITDA")-based calculations as the primary measures of financial performance for purposes of calculating leverage and fixed charge coverage ratios. The EBITDAR- and EBITDA-based leverage calculations include our consolidated subsidiaries, other than those we have designated as "Unrestricted Subsidiaries" as defined in the Credit Agreement and bond indentures. Generally, the Credit Agreement and the bond indentures use a trailing four fiscal quarter basis for purposes of the relevant calculations and require certain adjustments and exclusions for purposes of those calculations, which make the calculation of financial performance under the Credit Agreement and bond indentures not directly comparable to Adjusted EBITDA as presented herein. We are in compliance with our leverage and fixed charge coverage ratios under the Credit Agreement, our bond indentures and other agreements governing our indebtedness as of June 30, 2026. Noncompliance with these leverage and fixed charge coverage ratios would have a material adverse effect on our financial condition and liquidity.
6. COMMITMENTS AND CONTINGENCIES
We are involved in litigation from time to time in the ordinary course of business, including litigation arising from damage to customer assets in our facilities caused by fires and other natural disasters. While the outcome of litigation is inherently uncertain, we do not believe any current litigation will have a material adverse effect on our consolidated financial condition, results of operations or cash flows.
NOTES TO CONDENSED CONSOLIDATED FINANCIAL STATEMENTS (CONTINUED)
(In thousands, except share and per share data) (Unaudited)
7. STOCKHOLDERS' EQUITY MATTERS
DIVIDENDS
In fiscal year 2025 and the six months ended June 30, 2026, our board of directors declared the following dividends:
DECLARATION DATE
DIVIDEND PER SHARE
RECORD DATE
TOTAL AMOUNT
PAYMENT DATE
February 13, 2025
$
0.785
March 17, 2025
$
231,549
April 4, 2025
May 1, 2025
0.785
June 16, 2025
231,789
July 3, 2025
August 6, 2025
0.785
September 15, 2025
231,972
October 3, 2025
November 5, 2025
0.864
December 15, 2025
255,560
January 6, 2026
February 12, 2026
0.864
March 16, 2026
257,022
April 3, 2026
April 30, 2026
0.864
June 15, 2026
257,178
July 6, 2026
On August 5, 2026, we declared a dividend to our stockholders of record as of September 15, 2026 of $0.864 per share, payable on October 2, 2026.
NONCONTROLLING INTERESTS
During the quarter ended June 30, 2026, we entered into an agreement with a partner to form our Iron Mountain Data Centers Virginia 9 JV, LP joint venture, which resulted in Noncontrolling interests of approximately $49,900 in our Condensed Consolidated Balance Sheet as of June 30, 2026.
NOTES TO CONDENSED CONSOLIDATED FINANCIAL STATEMENTS (CONTINUED)
(In thousands, except share and per share data) (Unaudited)
8. SEGMENT INFORMATION
Our Chief Operating Decision Maker (“CODM”), our President and CEO, uses Adjusted EBITDA as the basis for evaluating the performance of, and allocating resources to, our operating segments. The CODM uses Adjusted EBITDA to ensure that resources, including capital, are allocated strategically to support our strategy.
Our reportable segments as of December 31, 2025 are described in Note 10 to Notes to Consolidated Financial Statements included in our Annual Report. Our reportable segments are as follows:
•Global RIM Business
•Global Data Center Business
The remaining activities of our business consist primarily of our asset lifecycle management ("ALM") and Fine Arts businesses and other corporate items ("Corporate and Other").
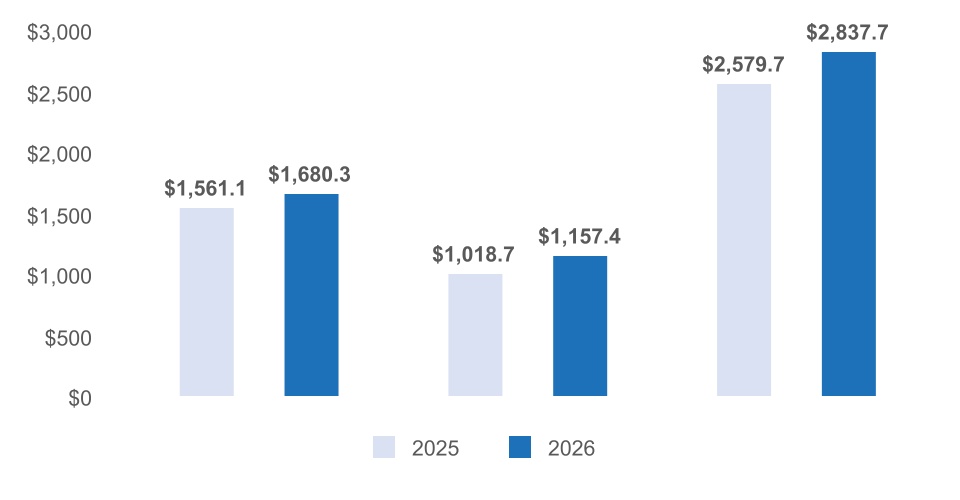
An analysis of our business segment information and reconciliation to the accompanying Condensed Consolidated Financial Statements for the three and six months ended June 30, 2026 and 2025 is as follows:
GLOBAL RIM BUSINESS
GLOBAL DATA CENTER BUSINESS
TOTAL REPORTABLE SEGMENTS
CORPORATE AND OTHER
TOTAL CONSOLIDATED
For the Three Months Ended June 30, 2026
Total Revenues
$
1,433,562
$
262,871
$
1,696,433
$
332,629
$
2,029,062
Storage Rental
856,751
258,892
1,115,643
18,968
1,134,611
Service
576,811
3,979
580,790
313,661
894,451
Other Segment Items(1)
812,811
125,528
938,339
Adjusted EBITDA
620,751
137,343
758,094
For the Three Months Ended June 30, 2025
Total Revenues
$
1,323,798
$
189,401
$
1,513,199
$
198,749
$
1,711,948
Storage Rental
803,580
188,279
991,859
18,130
1,009,989
Service
520,218
1,122
521,340
180,619
701,959
Other Segment Items(1)
737,495
93,135
830,630
Adjusted EBITDA
586,303
96,266
682,569
As of and for the Six Months Ended June 30, 2026
Total Revenues
$
2,837,648
$
517,596
$
3,355,244
$
609,967
$
3,965,211
Storage Rental
1,680,268
511,397
2,191,665
37,711
2,229,376
Service
1,157,380
6,199
1,163,579
572,256
1,735,835
Other Segments Items(1)
1,599,218
247,490
1,846,708
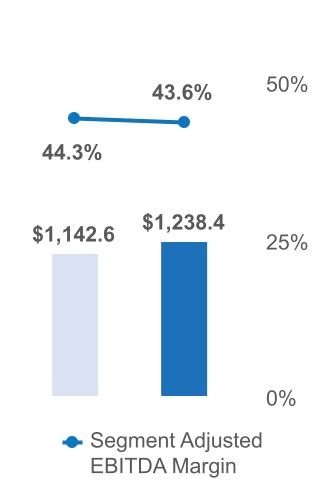
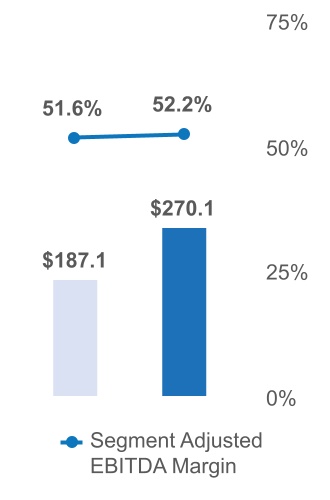
Adjusted EBITDA
1,238,430
270,106
1,508,536
Total Assets(2)
10,898,848
8,782,891
19,681,739
2,273,703
21,955,442
As of and for the Six Months Ended June 30, 2025
Total Revenues
$
2,579,740
$
362,598
$
2,942,338
$
362,139
$
3,304,477
Storage Rental
1,561,088
361,224
1,922,312
36,053
1,958,365
Service
1,018,652
1,374
1,020,026
326,086
1,346,112
Other Segment Items(1)
1,437,123
175,516
1,612,639
Adjusted EBITDA
1,142,617
187,082
1,329,699
Total Assets(2)
10,706,096
7,156,801
17,862,897
2,313,892
20,176,789
(1)Relates to Cost of sales (excluding depreciation and amortization) and Selling, general and administrative expenses for the respective reportable segment. The CODM does not regularly review disaggregated expense information included within “Other Segment Items” for any individual segments but may review consolidated Cost of sales (excluding depreciation and amortization) and consolidated Selling, general and administrative expense information to manage the business.
(2)Excludes all intercompany receivables or payables and investment in subsidiary balances.
NOTES TO CONDENSED CONSOLIDATED FINANCIAL STATEMENTS (CONTINUED)
(In thousands, except share and per share data) (Unaudited)
8. SEGMENT INFORMATION (CONTINUED)
A reconciliation of Adjusted EBITDA for our reportable segments to total Net Income (Loss) Before Provision (Benefit) for Income Taxes for the three and six months ended June 30, 2026 and 2025 is as follows:
THREE MONTHS ENDED JUNE 30,
SIX MONTHS ENDED JUNE 30,
2026
2025
2026
2025
Total Adjusted EBITDA for Reportable Segments
$
758,094
$
682,569
$
1,508,536
$
1,329,699
Add/(Deduct):
Corporate and other
(31,076)
(54,181)
(73,579)
(121,405)
Interest expense, net
(223,446)
(205,063)
(447,267)
(399,801)
Depreciation and amortization
(281,395)
(252,566)
(549,234)
(484,720)
Acquisition and Integration Costs(1)
(1,684)
(4,815)
(4,605)
(10,638)
Restructuring and other transformation
—
(50,340)
—
(105,086)
(Loss) gain on disposal/write-down of property, plant and equipment, net (including real estate)
(11,507)
962
(19,099)
(4,609)
Other (expense) income, net, excluding our share of (losses) gains from our unconsolidated joint ventures
(28,857)
(80,698)
(27,661)
(108,080)
Stock-based compensation expense
(56,787)
(60,354)
(85,044)
(86,448)
Our share of Adjusted EBITDA reconciling items from our unconsolidated joint ventures
(2,438)
(2,558)
(5,026)
(4,888)
Total Net Income (Loss) Before Provision (Benefit) for Income Taxes
$
120,904
$
(27,044)
$
297,021
$
4,024
(1)Represents operating expenditures directly associated with the closing and integration activities of our business acquisitions that have closed, or are highly probable of closing, and include (i) advisory, legal and professional fees to complete business acquisitions and (ii) costs to integrate acquired businesses into our existing operations, including move, severance and system integration costs (collectively, "Acquisition and Integration Costs").
NOTES TO CONDENSED CONSOLIDATED FINANCIAL STATEMENTS (CONTINUED)
(In thousands, except share and per share data) (Unaudited)
8. SEGMENT INFORMATION (CONTINUED)
Segment revenue by product and service lines for the three and six months ended June 30, 2026 and 2025 is as follows:
THREE MONTHS ENDED JUNE 30,
SIX MONTHS ENDED JUNE 30,
2026
2025
2026
2025
Global RIM Business
Records Management(1)
$
1,153,385
$
1,055,495
$
2,283,486
$
2,047,322
Data Management(1)
123,148
123,946
246,105
246,033
Information Destruction(1)(2)
157,029
144,357
308,057
286,385
Data Center(1)
—
—
—
—
Global Data Center Business
Records Management(1)
$
—
$
—
$
—
$
—
Data Management(1)
—
—
—
—
Information Destruction(1)
—
—
—
—
Data Center(1)
262,871
189,401
517,596
362,598
Corporate and Other
Records Management(1)
$
44,642
$
45,686
$
90,131
$
88,473
Data Management(1)
—
—
—
—
Information Destruction(1)(3)
287,987
153,063
519,836
273,666
Data Center(1)
—
—
—
—
Total Consolidated
Records Management(1)
$
1,198,027
$
1,101,181
$
2,373,617
$
2,135,795
Data Management(1)
123,148
123,946
246,105
246,033
Information Destruction(1)(2)(3)
445,016
297,420
827,893
560,051
Data Center(1)
262,871
189,401
517,596
362,598
(1)Each of these offerings has a component of revenue that is storage rental related and a component that is service related, except for information destruction, which does not have a storage rental component.
(2)Information destruction revenue for our Global RIM Business includes secure shredding services.
(3)Information destruction revenue for Corporate and Other includes product revenue from our ALM business.
9. RELATED PARTIES
We have agreements with the Frankfurt JV whereby we earn various fees, including (i) special project revenue and (ii) property management and construction and development fees for services we are providing to the Frankfurt JV (the "Frankfurt JV Agreements").
Revenue recognized in the accompanying Condensed Consolidated Statements of Operations under these agreements for the three and six months ended June 30, 2026 and 2025 is as follows (approximately):
THREE MONTHS ENDED JUNE 30,
SIX MONTHS ENDED JUNE 30,
2026
2025
2026
2025
Frankfurt JV Agreements(1)
$
—
$
—
$
436
$
—
(1)Revenue associated with the Frankfurt JV Agreements is presented as a component of our Global Data Center Business segment.
NOTES TO CONDENSED CONSOLIDATED FINANCIAL STATEMENTS (CONTINUED)
(In thousands, except share and per share data) (Unaudited)
10. RESTRUCTURING AND OTHER TRANSFORMATION
PROJECT MATTERHORN
In 2025, we completed our investments in Project Matterhorn, a global program designed to accelerate the growth of our business ("Project Matterhorn"), which we announced in September 2022. The implementation of Project Matterhorn resulted in Restructuring and other transformation costs which were comprised of: (1) restructuring costs, which included (i) site consolidation and other related exit costs, (ii) employee severance costs and (iii) certain professional fees associated with these activities, and (2) other transformation costs, which included professional fees such as project management costs and costs for third party consultants who assisted in the enablement of our growth initiatives.
As Project Matterhorn was completed as of December 31, 2025, there were no Restructuring and other transformation costs for the three and six months ended June 30, 2026. Total Restructuring and other transformation costs for the three and six months ended June 30, 2025 were $50,340 and $105,086, respectively, and consisted of (i) restructuring costs of $18,246 and $40,102, respectively, and (ii) other transformation costs of $32,094 and $64,984, respectively.
ITEM 2. MANAGEMENT'S DISCUSSION AND ANALYSIS OF FINANCIAL CONDITION AND RESULTS OF OPERATIONS
The following discussion and analysis of our financial condition and results of operations for the three and six months ended June 30, 2026 should be read in conjunction with our Condensed Consolidated Financial Statements and Notes thereto for the three and six months ended June 30, 2026, included herein, and our Consolidated Financial Statements and Notes thereto for the year ended December 31, 2025, included in our Annual Report on Form 10-K filed with the United States Securities and Exchange Commission ("SEC") on February 12, 2026 (our "Annual Report").
FORWARD-LOOKING STATEMENTS
We have made statements in this Quarterly Report that constitute "forward-looking statements" as that term is defined in the Private Securities Litigation Reform Act of 1995 and other securities laws. These forward-looking statements concern our current expectations regarding our future results from operations, economic performance, financial condition, goals, strategies, investment objectives, plans and achievements. These forward-looking statements are subject to various known and unknown risks, uncertainties and other factors, and you should not rely upon them except as statements of our present intentions and of our present expectations, which may or may not occur. When we use words such as "believes", "expects", "anticipates", "estimates", "plans", "intends", "pursue", "commits", "will" or similar expressions, we are making forward-looking statements. Although we believe that our forward-looking statements are based on reasonable assumptions, our expected results may not be achieved, and actual results may differ materially from our expectations. In addition, important factors that could cause actual results to differ from expectations include, among others:
•our ability or inability to execute our strategic growth plan, including our ability to invest according to plan, grow our businesses (including through joint ventures or other co-investment vehicles), incorporate alternative technologies (including artificial intelligence) into our business, achieve satisfactory returns on new product offerings, continue our revenue management, expand and manage our global operations, complete acquisitions on satisfactory terms, integrate acquired companies efficiently and transition to more sustainable sources of energy;
•changes in customer preferences and demand for our storage and information management services, including as a result of the shift from paper and tape storage to alternative technologies that require less physical space or services activity;
•the costs of complying with and our ability to comply with laws, regulations and customer requirements, including those relating to data privacy and cybersecurity issues, as well as fire and safety and environmental standards, and regulatory and contractual requirements under government contracts;
•the impact of attacks on our internal information technology ("IT") systems, including the impact of such incidents on our reputation and ability to compete and any litigation or disputes that may arise in connection with such incidents;
•our ability to fund capital expenditures;
•the impact of our distribution requirements on our ability to execute our business plan;
•our ability to remain qualified for taxation as a real estate investment trust for United States federal income tax purposes ("REIT");
•changes in the political and economic environments in the countries in which we operate and changes in the global political climate;
•our ability to raise debt or equity capital and changes in the cost of our debt;
•our ability to comply with our existing debt obligations and restrictions in our debt instruments;
•the impact of service interruptions or equipment damage and the cost of power on our data center operations;
•the cost or potential liabilities associated with real estate necessary for our business;
•unexpected events, including those resulting from climate change or geopolitical events, could disrupt our operations and adversely affect our reputation and results of operations;
•fluctuations in commodity prices;
•competition for customers;
•our ability to attract, develop, and retain key personnel;
•deficiencies in our disclosure controls and procedures or internal control over financial reporting;
•other trends in competitive or economic conditions affecting our financial condition or results of operations not presently contemplated; and
•the other risks described in our periodic reports filed with the SEC, including under the caption "Risk Factors" in Part I, Item 1A of our Annual Report.
Except as required by law, we undertake no obligation to update any forward-looking statements appearing in this report.
The following discussions set forth, for the periods indicated, management's discussion and analysis of financial condition and results of operations. Significant trends and changes are discussed for the three and six months ended June 30, 2026 within each section. Trends and changes that are consistent for both the three and six month periods are not repeated and are discussed on a year to date basis only.
GENERAL
RESULTS OF OPERATIONS—KEY TRENDS
•Our organic storage rental revenue growth is primarily driven by revenue management in our Global RIM Business segment, where we expect volume to be relatively stable in the near term, as well as by growth in our Global Data Center Business segment, primarily driven by lease commencements.
•Our organic service revenue growth is primarily driven by new and existing digital offerings, traditional records management services and services in our asset lifecycle management ("ALM") business, all of which we expect to grow in the near term and benefit our organic service revenue growth in 2026.
•We expect continued total revenue and Adjusted earnings before interest, taxes, depreciation and amortization ("EBITDA") growth in 2026 as a result of our focus on new product and service offerings, cross-selling opportunities, innovation, customer solutions and market expansion in line with our growth strategies.
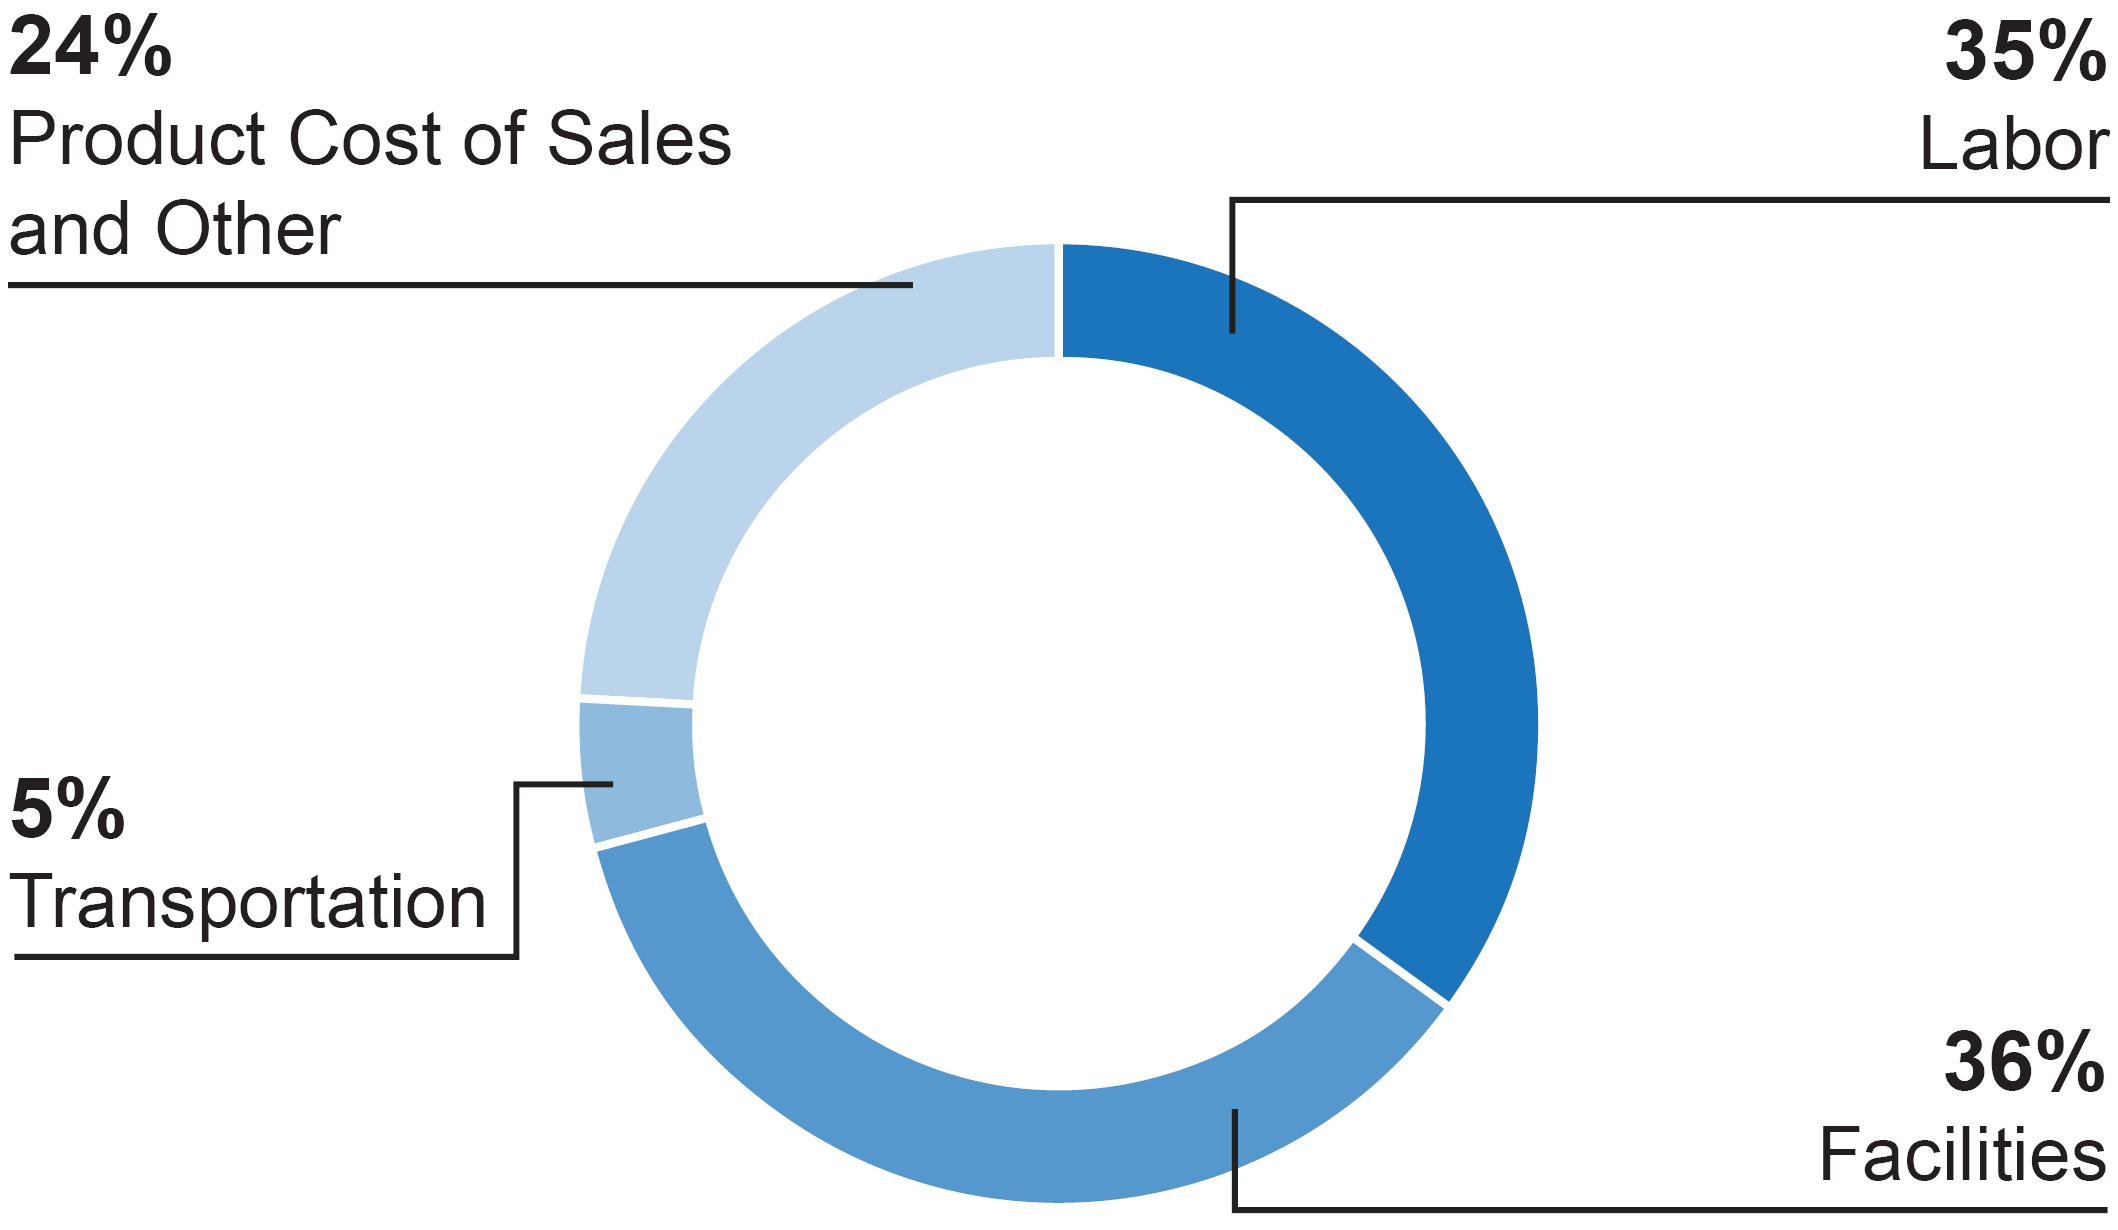
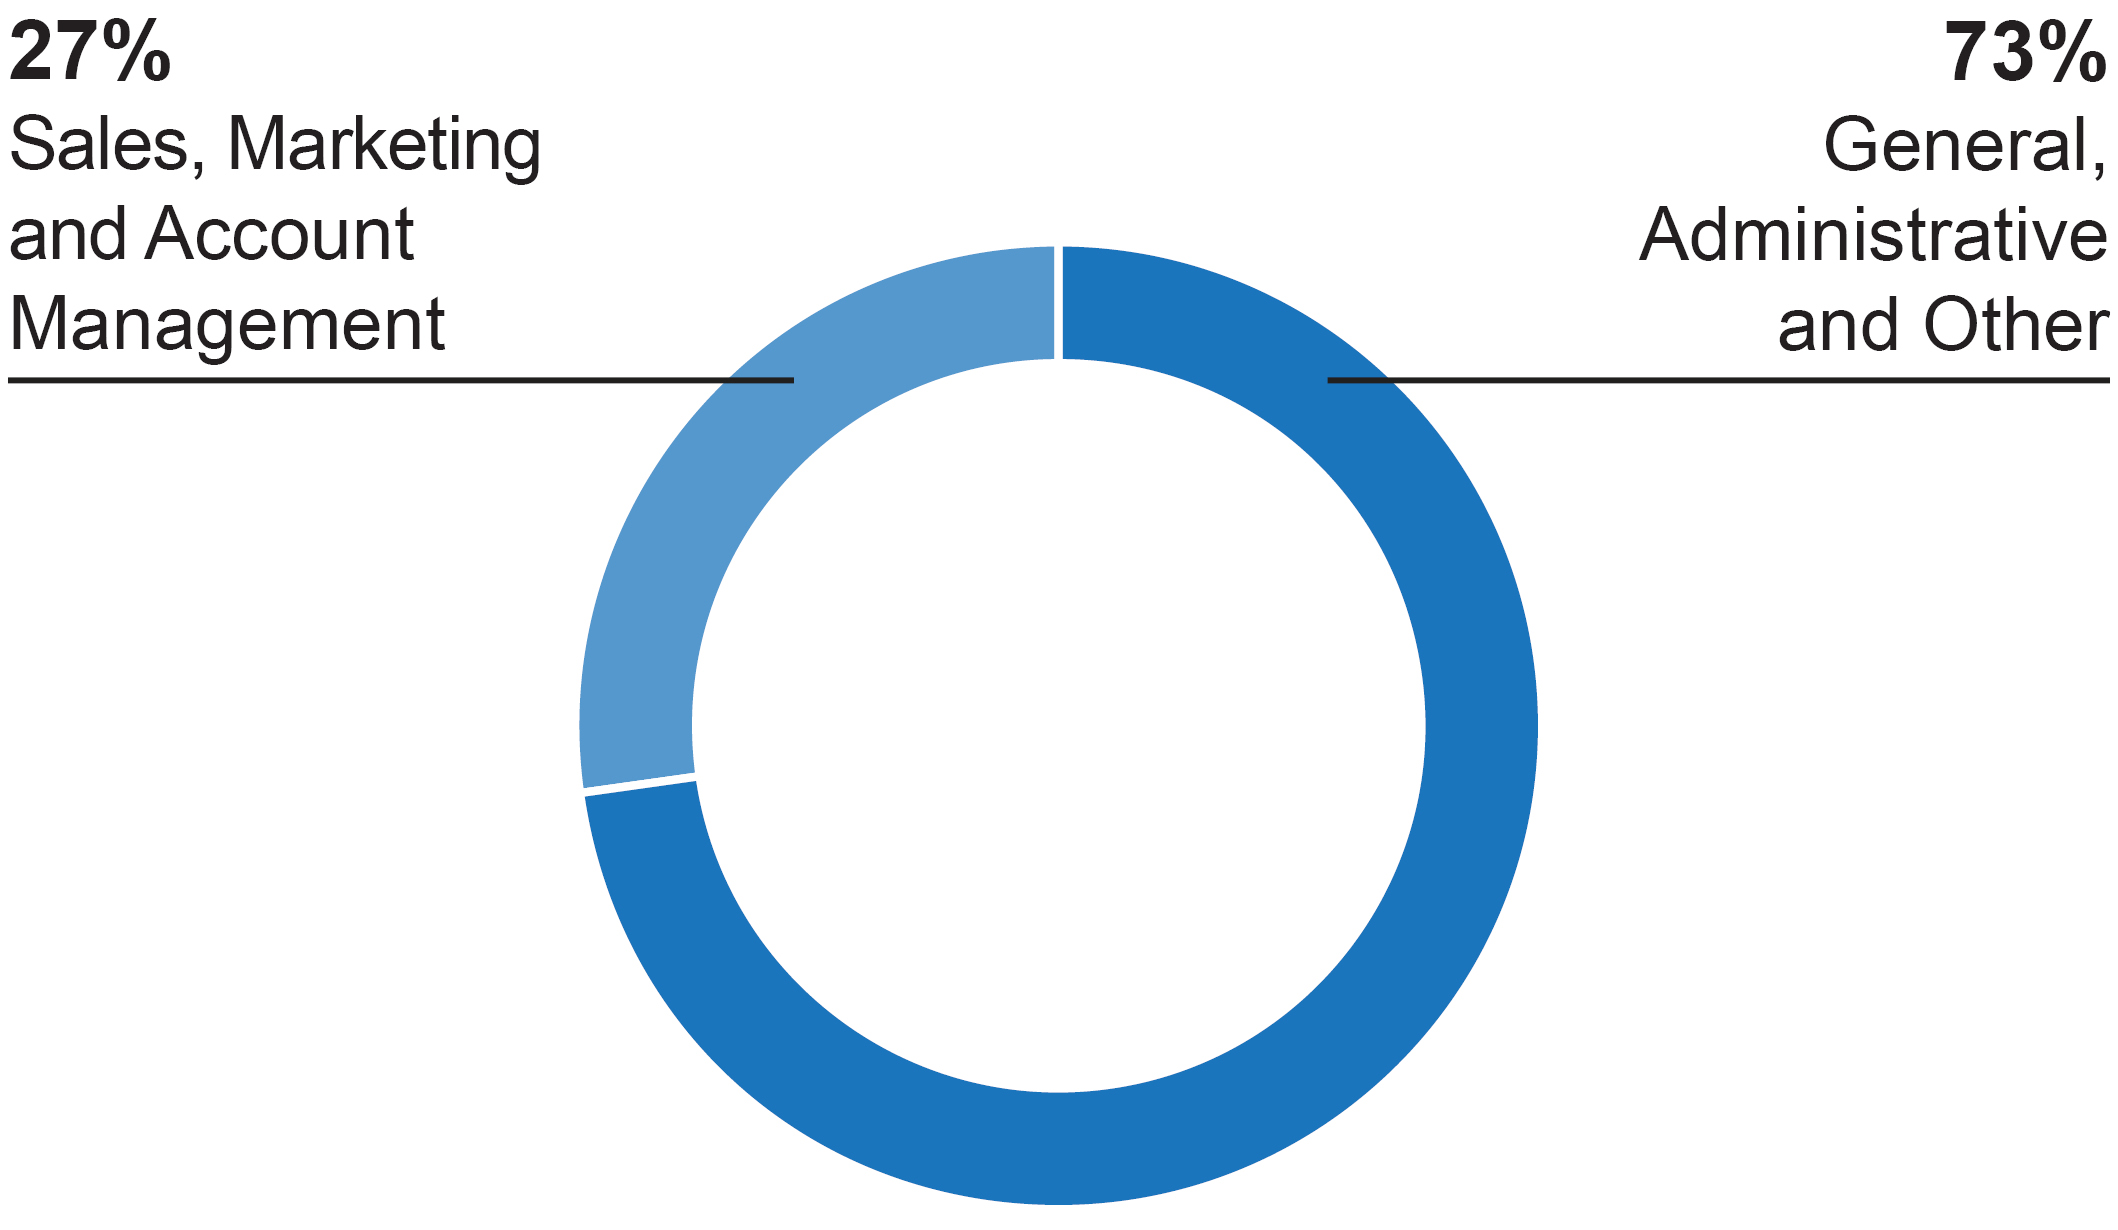
Cost of sales (excluding depreciation and amortization) and Selling, general and administrative expenses for the six months ended June 30, 2026 consists of the following:
We define Adjusted EBITDA as net income (loss) before interest expense, net, provision (benefit) for income taxes, depreciation and amortization (inclusive of our share of Adjusted EBITDA from our unconsolidated joint ventures), and excluding certain items we do not believe to be indicative of our core operating results, specifically:
EXCLUDED
•Acquisition and Integration Costs (as defined below)
•Restructuring and other transformation
•Loss (gain) on disposal/write-down of property, plant and equipment, net (including real estate)
•Other expense (income), net
•Stock-based compensation expense
•Intangible impairments
Adjusted EBITDA Margin is calculated by dividing Adjusted EBITDA by total revenues. We also show Adjusted EBITDA and Adjusted EBITDA Margin for each of our reportable segments under "Results of Operations – Segment Analysis" below.
Adjusted EBITDA excludes both interest expense, net and the provision (benefit) for income taxes. These expenses are associated with our capitalization and tax structures, which we do not consider when evaluating the operating profitability of our core operations. Adjusted EBITDA does not include depreciation and amortization expenses, in order to eliminate the impact of capital investments, which we evaluate by comparing capital expenditures to incremental revenue generated and as a percentage of total revenues. Adjusted EBITDA and Adjusted EBITDA Margin should be considered in addition to, but not as a substitute for, other measures of financial performance reported in accordance with accounting principles generally accepted in the United States of America ("GAAP"), such as operating income (loss), net income (loss) or cash flows from operating activities.
RECONCILIATION OF NET INCOME (LOSS) TO ADJUSTED EBITDA (IN THOUSANDS):
THREE MONTHS ENDED JUNE 30,
SIX MONTHS ENDED JUNE 30,
2026
2025
2026
2025
Net Income (Loss)
$
106,102
$
(43,340)
$
255,101
$
(27,107)
Add/(Deduct):
Interest expense, net
223,446
205,063
447,267
399,801
Provision (benefit) for income taxes
14,802
16,296
41,920
31,131
Depreciation and amortization
281,395
252,566
549,234
484,720
Acquisition and Integration Costs(1)
1,684
4,815
4,605
10,638
Restructuring and other transformation
—
50,340
—
105,086
Loss (gain) on disposal/write-down of property, plant and equipment, net (including real estate)
11,507
(962)
19,099
4,609
Other expense (income), net, excluding our share of losses (gains) from our unconsolidated joint ventures
28,857
80,698
27,661
108,080
Stock-based compensation expense
56,787
60,354
85,044
86,448
Our share of Adjusted EBITDA reconciling items from our unconsolidated joint ventures
2,438
2,558
5,026
4,888
Adjusted EBITDA
$
727,018
$
628,388
$
1,434,957
$
1,208,294
(1)Represents operating expenditures directly associated with the closing and integration activities of our business acquisitions that have closed, or are highly probable of closing, and include (i) advisory, legal and professional fees to complete business acquisitions and (ii) costs to integrate acquired businesses into our existing operations, including move, severance and system integration costs (collectively, "Acquisition and Integration Costs").
We define Adjusted EPS as reported earnings per share fully diluted from net income (loss) attributable to Iron Mountain Incorporated (inclusive of our share of adjusted losses (gains) from our unconsolidated joint ventures) and excluding certain items, specifically:
EXCLUDED
•Acquisition and Integration Costs
•Restructuring and other transformation
•Loss (gain) on disposal/write-down of property, plant and equipment, net (including real estate)
•Other expense (income), net
•Stock-based compensation expense
•Non-cash amortization related to derivative instruments
•Tax impact of reconciling items and discrete tax items
•Amortization related to the write-off of certain customer relationship intangible assets
We do not believe these excluded items to be indicative of our ongoing operating results, and they are not considered when we are forecasting our future results. We believe Adjusted EPS is of value to our current and potential investors when comparing our results from past, present and future periods.
RECONCILIATION OF REPORTED EPS—FULLY DILUTED FROM NET INCOME (LOSS) ATTRIBUTABLE TO IRON MOUNTAIN INCORPORATED TO ADJUSTED EPS—FULLY DILUTED FROM NET INCOME (LOSS) ATTRIBUTABLE TO IRON MOUNTAIN INCORPORATED:
THREE MONTHS ENDED JUNE 30,
SIX MONTHS ENDED JUNE 30,
2026
2025
2026
2025
Reported EPS—Fully Diluted from Net Income (Loss) Attributable to Iron Mountain Incorporated
$
0.34
$
(0.15)
$
0.82
$
(0.10)
Add/(Deduct):
Acquisition and Integration Costs
0.01
0.02
0.02
0.04
Restructuring and other transformation
—
0.17
—
0.36
Loss (gain) on disposal/write-down of property, plant and equipment, net (including real estate)
0.04
—
0.06
0.02
Other expense (income), net, excluding our share of losses (gains) from our unconsolidated joint ventures
0.10
0.27
0.09
0.37
Stock-based compensation expense
0.19
0.20
0.28
0.29
Non-cash amortization related to derivative instruments
(0.02)
0.01
(0.02)
0.03
Tax impact of reconciling items and discrete tax items(1)
(0.07)
(0.04)
(0.09)
(0.08)
Income (Loss) Attributable to Noncontrolling Interests
0.02
0.01
0.03
0.01
Impact of weighted average dilutive shares(2)
—
—
—
(0.01)
Adjusted EPS—Fully Diluted from Net Income (Loss) Attributable to Iron Mountain Incorporated(3)
$
0.60
$
0.48
$
1.20
$
0.92
(1)The differences between our effective tax rates and our structural tax rate (or adjusted effective tax rates) for the three and six months ended June 30, 2026 and 2025 are primarily due to (i) the reconciling items above, which impact our reported Net Income (Loss) Before Provision (Benefit) for Income Taxes but have an insignificant impact on our reported Provision (Benefit) for Income Taxes and (ii) other discrete tax items. Our structural tax rate for purposes of the calculation of Adjusted EPS for the three and six months ended June 30, 2026 and 2025 was 16.1% and 16.7%, respectively. The Tax impact of reconciling items and discrete tax items is calculated using the current quarter's estimate of the annual structural tax rate. This may result in the current period adjustment plus prior period reported quarterly adjustments not summing to the full year adjustment.
(2)Reflects the impact of dilutive shares of 2,278 and 2,516 for the three and six months ended June 30, 2025, respectively, not included in Reported EPS-Fully Diluted due to our net loss position during the periods.
Funds from operations ("FFO") is defined by the National Association of Real Estate Investment Trusts as net income (loss) excluding depreciation on real estate assets, losses and gains on sale of real estate, net of tax, and amortization of data center leased-based intangibles ("FFO (Nareit)"). We calculate our FFO measures, including FFO (Nareit), adjusting for our share of reconciling items from our unconsolidated joint ventures. FFO (Nareit) does not give effect to real estate depreciation because these amounts are computed, under GAAP, to allocate the cost of a property over its useful life. Because values for well-maintained real estate assets have historically increased or decreased based upon prevailing market conditions, we believe that FFO (Nareit) provides investors with a clearer view of our operating performance. Our most directly comparable GAAP measure to FFO (Nareit) is net income (loss).
We modify FFO (Nareit), as is common among REITs seeking to provide financial measures that most meaningfully reflect their particular business ("FFO (Normalized)"). Our definition of FFO (Normalized) excludes certain items included in FFO (Nareit) that we believe are not indicative of our core operating results, specifically:
EXCLUDED
•Acquisition and Integration Costs
•Restructuring and other transformation
•Loss (gain) on disposal/write-down of property, plant and equipment, net (excluding real estate)
•Other expense (income), net
•Stock-based compensation expense
•Non-cash amortization related to derivative instruments
•Real estate financing lease depreciation
•Tax impact of reconciling items and discrete tax items
•Intangible impairments
•(Income) loss from discontinued operations, net of tax
RECONCILIATION OF NET INCOME (LOSS) TO FFO (NAREIT) AND FFO (NORMALIZED) (IN THOUSANDS):
THREE MONTHS ENDED JUNE 30,
SIX MONTHS ENDED JUNE 30,
2026
2025
2026
2025
Net Income (Loss)
$
106,102
$
(43,340)
$
255,101
$
(27,107)
Add/(Deduct):
Real estate depreciation
116,734
107,186
228,193
201,333
Loss (gain) on sale of real estate, net of tax
531
(4,981)
1,248
(4,669)
Data center lease-based intangible assets amortization
1,825
1,683
3,667
3,702
Our share of FFO (Nareit) reconciling items from our unconsolidated joint ventures
1,484
1,567
3,082
3,063
FFO (Nareit)
226,676
62,115
491,291
176,322
Add/(Deduct):
Acquisition and Integration Costs
1,684
4,815
4,605
10,638
Restructuring and other transformation
—
50,340
—
105,086
Loss (gain) on disposal/write-down of property, plant and equipment, net (excluding real estate)
10,976
3,809
17,851
9,101
Other expense (income), net, excluding our share of losses (gains) from our unconsolidated joint ventures(1)
28,857
80,698
27,661
108,080
Stock-based compensation expense
56,787
60,354
85,044
86,448
Non-cash amortization related to derivative instruments
(5,911)
4,177
(6,807)
8,353
Real estate financing lease depreciation
3,996
3,426
7,920
6,574
Tax impact of reconciling items and discrete tax items(2)
(19,279)
(11,671)
(31,025)
(23,344)
Our share of FFO (Normalized) reconciling items from our unconsolidated joint ventures
(54)
(58)
(111)
(183)
FFO (Normalized)
$
303,732
$
258,005
$
596,429
$
487,075
(1)Includes foreign currency transaction (gains) losses, net and other, net. See Note 2.h. to Notes to Condensed Consolidated Financial Statements included in this Quarterly Report for additional information regarding the components of Other expense (income), net.
(2)Represents the tax impact of (i) the reconciling items above, which impact our reported Net Income (Loss) Before Provision (Benefit) for Income Taxes but have an insignificant impact on our reported Provision (Benefit) for Income Taxes and (ii) other discrete tax items. Discrete tax items resulted in a (benefit) provision for income taxes of $(7.8) million and $(8.0) million for the three and six months ended June 30, 2026, respectively, and $2.3 million and $2.6 million for the three and six months ended June 30, 2025, respectively.
Our discussion and analysis of our financial condition and results of operations are based upon our Condensed Consolidated Financial Statements, which have been prepared in accordance with GAAP. The preparation of these financial statements requires us to make estimates, judgments and assumptions that affect the reported amounts of assets, liabilities, revenues and expenses, and related disclosure of contingent assets and liabilities at the date of the financial statements and for the period then ended. On an ongoing basis, we evaluate the estimates used. We base our estimates on historical experience, actuarial estimates, current conditions and various other assumptions that we believe to be reasonable under the circumstances. These estimates form the basis for making judgments about the carrying values of assets and liabilities and are not readily apparent from other sources. Actual results may differ from these estimates. Our critical accounting estimates include the following, which are listed in no particular order:
•Revenue Recognition
•Accounting for Acquisitions
•Impairment of Tangible and Intangible Assets
•Income Taxes
Further detail regarding our critical accounting estimates can be found in "Item 7. Management's Discussion and Analysis of Financial Condition and Results of Operations" in our Annual Report, and the Consolidated Financial Statements and the Notes included therein. We have determined that no material changes concerning our critical accounting estimates have occurred since December 31, 2025.
RESULTS OF OPERATIONS
COMPARISON OF THE THREE AND SIX MONTHS ENDED JUNE 30, 2026 TO THE THREE AND SIX MONTHS ENDED JUNE 30, 2025 (IN THOUSANDS):
THREE MONTHS ENDED JUNE 30,
DOLLAR CHANGE
PERCENTAGE CHANGE
2026
2025
Revenues
$
2,029,062
$
1,711,948
$
317,114
18.5
%
Operating Expenses
1,655,534
1,452,052
203,482
14.0
%
Operating Income
373,528
259,896
113,632
43.7
%
Other Expenses, Net
267,426
303,236
(35,810)
(11.8)
%
Net Income (Loss)
106,102
(43,340)
149,442
344.8
%
Net Income (Loss) Attributable to Noncontrolling Interests
4,672
1,581
3,091
195.5
%
Net Income (Loss) Attributable to Iron Mountain Incorporated
$
101,430
$
(44,921)
$
146,351
325.8
%
Adjusted EBITDA(1)
$
727,018
$
628,388
$
98,630
15.7
%
Adjusted EBITDA Margin(1)
35.8
%
36.7
%
SIX MONTHS ENDED JUNE 30,
DOLLAR CHANGE
PERCENTAGE CHANGE
2026
2025
Revenues
$
3,965,211
$
3,304,477
$
660,734
20.0
%
Operating Expenses
3,196,453
2,790,287
406,166
14.6
%
Operating Income
768,758
514,190
254,568
49.5
%
Other Expenses, Net
513,657
541,297
(27,640)
(5.1)
%
Net Income (Loss)
255,101
(27,107)
282,208
1,041.1
%
Net Income (Loss) Attributable to Noncontrolling Interests
10,006
1,862
8,144
437.4
%
Net Income (Loss) Attributable to Iron Mountain Incorporated
$
245,095
$
(28,969)
$
274,064
946.1
%
Adjusted EBITDA(1)
$
1,434,957
$
1,208,294
$
226,663
18.8
%
Adjusted EBITDA Margin(1)
36.2
%
36.6
%
(1)See "Non-GAAP Measures—Adjusted EBITDA" in this Quarterly Report for the definitions of Adjusted EBITDA and Adjusted EBITDA Margin, reconciliation of Net Income (Loss) to Adjusted EBITDA and a discussion of why we believe these non-GAAP measures provide relevant and useful information to our current and potential investors.
Total revenues consist of the following (in thousands):
THREE MONTHS ENDED JUNE 30,
PERCENTAGE CHANGE
2026
2025
DOLLAR CHANGE
ACTUAL
CONSTANT
CURRENCY(1)
ORGANIC
GROWTH(2)
IMPACT OF ACQUISITIONS
Storage Rental
$
1,134,611
$
1,009,989
$
124,622
12.3
%
11.5
%
11.3
%
0.2
%
Service
894,451
701,959
192,492
27.4
%
26.3
%
24.8
%
1.5
%
Total Revenues
$
2,029,062
$
1,711,948
$
317,114
18.5
%
17.6
%
16.8
%
0.8
%
SIX MONTHS ENDED JUNE 30,
PERCENTAGE CHANGE
2026
2025
DOLLAR CHANGE
ACTUAL
CONSTANT
CURRENCY(1)
ORGANIC
GROWTH(2)
IMPACT OF ACQUISITIONS
Storage Rental
$
2,229,376
$
1,958,365
$
271,011
13.8
%
12.0
%
11.8
%
0.2
%
Service
1,735,835
1,346,112
389,723
29.0
%
27.0
%
24.6
%
2.4
%
Total Revenues
$
3,965,211
$
3,304,477
$
660,734
20.0
%
18.1
%
17.0
%
1.1
%
(1)Constant currency growth rate, which is a non-GAAP measure, is calculated by translating the 2025 results at the 2026 average exchange rates.
(2)Our organic revenue growth rate, which is a non-GAAP measure, represents the year-over-year growth rate of our revenues excluding the impact of business acquisitions, divestitures and foreign currency exchange rate fluctuations. Our organic revenue growth rate includes the impact of acquisitions of customer relationships.
TOTAL REVENUES
Primary factors influencing the change in reported storage rental revenue and reported service revenue for the six months ended June 30, 2026 compared to the six months ended June 30, 2025 include the following:
STORAGE RENTAL REVENUE
•organic storage rental revenue growth driven by revenue management in our Global RIM Business segment and lease commencements and improved pricing in our Global Data Center Business segment.
SERVICE REVENUE
•organic service revenue growth driven by increases in Global Digital Solutions and traditional service activity levels in our Global RIM Business segment and growth from new and existing customers in our ALM business; and
•an increase of $24.4 million due to recent acquisitions in our ALM business.
Cost of sales (excluding depreciation and amortization) consists of the following expenses (in thousands):
THREE MONTHS ENDED JUNE 30,
PERCENTAGE CHANGE
% OF TOTAL REVENUES
PERCENTAGE CHANGE (FAVORABLE)/ UNFAVORABLE
2026
2025
DOLLAR CHANGE
ACTUAL
CONSTANT CURRENCY
2026
2025
Labor
$
328,071
$
292,344
$
35,727
12.2
%
10.9
%
16.2
%
17.1
%
(0.9)
%
Facilities
327,860
293,534
34,326
11.7
%
10.8
%
16.2
%
17.1
%
(0.9)
%
Transportation
51,817
45,942
5,875
12.8
%
11.7
%
2.6
%
2.7
%
(0.1)
%
Product Cost of Sales and Other
250,861
123,017
127,844
103.9
%
102.8
%
12.4
%
7.2
%
5.2
%
Total Cost of sales
$
958,609
$
754,837
$
203,772
27.0
%
25.8
%
47.2
%
44.1
%
3.1
%
SIX MONTHS ENDED JUNE 30,
PERCENTAGE CHANGE
% OF TOTAL REVENUES
PERCENTAGE CHANGE (FAVORABLE)/ UNFAVORABLE
2026
2025
DOLLAR CHANGE
ACTUAL
CONSTANT CURRENCY
2026
2025
Labor
$
644,102
$
566,325
$
77,777
13.7
%
11.4
%
16.2
%
17.1
%
(0.9)
%
Facilities
658,507
580,940
77,567
13.4
%
11.3
%
16.6
%
17.6
%
(1.0)
%
Transportation
95,964
89,075
6,889
7.7
%
5.9
%
2.4
%
2.7
%
(0.3)
%
Product Cost of Sales and Other
449,839
228,701
221,138
96.7
%
94.8
%
11.3
%
6.9
%
4.4
%
Total Cost of sales
$
1,848,412
$
1,465,041
$
383,371
26.2
%
23.9
%
46.6
%
44.3
%
2.3
%
Primary factors influencing the change in reported Cost of sales for the six months ended June 30, 2026 compared to the six months ended June 30, 2025 include the following:
•an increase in labor costs driven by an increase in service activity, primarily within our Global RIM Business segment;
•an increase in facilities expenses, primarily driven by higher utilities cost in our Global Data Center Business segment, and increases in rent and real estate tax expense; and
•an increase in product cost of sales and other in our ALM business in line with product sales increases from new and existing customers.
Selling, general and administrative expenses consists of the following expenses (in thousands):
THREE MONTHS ENDED JUNE 30,
PERCENTAGE CHANGE
% OF TOTAL REVENUES
PERCENTAGE CHANGE (FAVORABLE)/ UNFAVORABLE
2026
2025
DOLLAR CHANGE
ACTUAL
CONSTANT CURRENCY
2026
2025
General, Administrative and Other
$
290,053
$
287,051
$
3,002
1.0
%
0.7
%
14.3
%
16.8
%
(2.5)
%
Sales, Marketing and Account Management
112,286
103,405
8,881
8.6
%
7.4
%
5.5
%
6.0
%
(0.5)
%
Total Selling, general and administrative expenses
$
402,339
$
390,456
$
11,883
3.0
%
2.5
%
19.8
%
22.8
%
(3.0)
%
SIX MONTHS ENDED JUNE 30,
PERCENTAGE CHANGE
% OF TOTAL REVENUES
PERCENTAGE CHANGE (FAVORABLE)/ UNFAVORABLE
2026
2025
DOLLAR CHANGE
ACTUAL
CONSTANT CURRENCY
2026
2025
General, Administrative and Other
$
564,568
$
529,925
$
34,643
6.5
%
5.5
%
14.2
%
16.0
%
(1.8)
%
Sales, Marketing and Account Management
210,535
190,268
20,267
10.7
%
8.4
%
5.3
%
5.8
%
(0.5)
%
Total Selling, general and administrative expenses
$
775,103
$
720,193
$
54,910
7.6
%
6.3
%
19.5
%
21.8
%
(2.3)
%
Primary factors influencing the change in reported Selling, general and administrative expenses for the six months ended June 30, 2026 compared to the six months ended June 30, 2025 include the following:
•an increase in general, administrative and other expenses, primarily driven by higher compensation expense and professional fees, and
•an increase in sales, marketing and account management expenses, primarily driven by higher compensation expense and increased marketing costs.
DEPRECIATION AND AMORTIZATION
Depreciation expense increased $52.0 million, or 15.1%, for the six months ended June 30, 2026 compared to the prior year period. See Note 2.i. to Notes to Consolidated Financial Statements included in our Annual Report for additional information regarding the useful lives over which our property, plant and equipment is depreciated.
Amortization expense increased $12.6 million, or 8.9%, for the six months ended June 30, 2026 compared to the prior year period.
ACQUISITION AND INTEGRATION COSTS
Acquisition and Integration Costs for the six months ended June 30, 2026 and 2025 were approximately $4.6 million and $10.6 million, respectively.
LOSS (GAIN) ON DISPOSAL/WRITE-DOWN OF PROPERTY, PLANT AND EQUIPMENT, NET
Loss (gain) on disposal/write-down of property, plant and equipment, net for the six months ended June 30, 2026 and 2025 was approximately $19.1 million and $4.6 million, respectively.
Interest expense, net increased $47.5 million to $447.3 million in the six months ended June 30, 2026 from $399.8 million in the prior year period. The increase is primarily due to higher average debt outstanding during the six months ended June 30, 2026 compared to the prior year period. Our weighted average interest rate, inclusive of the fees associated with our outstanding letters of credit, was 5.6% and 5.7% as of June 30, 2026 and 2025, respectively. See Note 5 to Notes to Condensed Consolidated Financial Statements included in this Quarterly Report for additional information regarding our indebtedness.
OTHER EXPENSE (INCOME), NET
Other expense (income), net for the three and six months ended June 30, 2026 and 2025 consists of the following (in thousands):
(1)The gains for the three and six months ended June 30, 2026 primarily consist of the impact of changes in the exchange rate of the Euro against the United States dollar on our intercompany balances with and between certain of our subsidiaries.
(2)Other, net for the three and six months ended June 30, 2026 primarily consists of a loss of approximately $41.9 million and $59.7 million, respectively, due to the change in value of our deferred purchase obligations and other deferred payments.
PROVISION (BENEFIT) FOR INCOME TAXES
We provide for income taxes during interim periods based on our estimate of the effective tax rate for the year. Our effective tax rates for the three and six months ended June 30, 2026 and 2025 are as follows:
THREE MONTHS ENDED JUNE 30,
SIX MONTHS ENDED JUNE 30,
2026
2025
2026
2025
Effective Tax Rate
12.2
%
60.3
%
14.1
%
773.6
%
The primary reconciling items between the federal statutory tax rate of 21.0% and our overall effective tax rate for the three and six months ended June 30, 2026 were the (i) benefits derived from the dividends paid deduction, (ii) non-taxable income we recorded in Other expense (income), net during the period, as well as the differences in the tax rates to which our foreign earnings are subject, partially offset by (iii) disallowed interest expenses of certain entities.
Effective on January 1, 2026, the One Big Beautiful Bill Act increased the maximum allowable value of a REIT’s total assets held in one or more taxable REIT subsidiaries at the end of any quarter from 20% to 25%.
Beginning in 2024, we became subject to the Organization for Economic Cooperation and Development (the “OECD”) Global Anti-Base Erosion Model Rules (“Pillar Two”). Pillar Two may impose additional taxes (“Top-Up Taxes”) if the effective tax rate (as defined by the OECD) in a jurisdiction is below 15%. Pillar Two does not apply to “Excluded Entities” and certain subsidiaries of Excluded Entities. We continue to believe that we qualify as an Excluded Entity as a “Real Estate Investment Vehicle.” In the event certain subsidiaries do not qualify as Excluded Entities, available safe harbor rules could apply that would exempt the entities from any Top-Up Taxes. Substantially all of our non-excluded, non-U.S. jurisdictions qualify for one or more of the safe harbor rules.
On January 5, 2026, the OECD announced a comprehensive Side-by-Side safe harbor package (the “SbS Safe Harbor”) that, if enacted, would exempt U.S.-parented multinational companies from certain Top-Up Taxes under Pillar Two beginning January 1, 2026. While the SbS Safe Harbor is not yet enacted in any foreign jurisdiction where we operate, we expect that the SbS Safe Harbor may be adopted prior to the year ended December 31, 2026.
We do not expect the Top-Up Taxes of the remaining non-U.S. jurisdictions that may not qualify for the safe harbor rules, or the Top-Up Taxes from our U.S. income that may be subject to Pillar Two, to have a material impact on our consolidated financial statements.
The following table reflects the effect of the foregoing factors on our net income (loss) and Adjusted EBITDA (in thousands):
THREE MONTHS ENDED JUNE 30,
DOLLAR CHANGE
PERCENTAGE CHANGE
2026
2025
Net Income (Loss)
$
106,102
$
(43,340)
$
149,442
344.8
%
Net Income (Loss) as a percentage of Revenue
5.2
%
(2.5)
%
Adjusted EBITDA
$
727,018
$
628,388
$
98,630
15.7
%
Adjusted EBITDA Margin
35.8
%
36.7
%
SIX MONTHS ENDED JUNE 30,
DOLLAR CHANGE
PERCENTAGE CHANGE
2026
2025
Net Income (Loss)
$
255,101
$
(27,107)
$
282,208
1,041.1
%
Net Income (Loss) as a percentage of Revenue
6.4
%
(0.8)
%
Adjusted EBITDA
$
1,434,957
$
1,208,294
$
226,663
18.8
%
Adjusted EBITDA Margin
36.2
%
36.6
%
Adjusted EBITDA Margin for the six months ended June 30, 2026 decreased 40 basis points from the same prior year period driven by changes in our revenue mix, offset by favorable overhead management.
See Note 8 to Notes to Condensed Consolidated Financial Statements included in this Quarterly Report for a description of our reportable segments.
GLOBAL RIM BUSINESS (IN THOUSANDS)
THREE MONTHS ENDED JUNE 30,
PERCENTAGE CHANGE
DOLLAR CHANGE
ACTUAL
CONSTANT CURRENCY
ORGANIC GROWTH
IMPACT OF ACQUISITIONS
2026
2025
Storage Rental
$
856,751
$
803,580
$
53,171
6.6
%
5.6
%
5.4
%
0.2
%
Service
576,811
520,218
56,593
10.9
%
9.8
%
9.1
%
0.7
%
Segment Revenue
$
1,433,562
$
1,323,798
$
109,764
8.3
%
7.3
%
6.8
%
0.5
%
Segment Adjusted EBITDA
$
620,751
$
586,303
$
34,448
Segment Adjusted EBITDA Margin
43.3
%
44.3
%
SIX MONTHS ENDED JUNE 30,
PERCENTAGE CHANGE
DOLLAR CHANGE
ACTUAL
CONSTANT CURRENCY
ORGANIC GROWTH
IMPACT OF ACQUISITIONS
2026
2025
Storage Rental
$
1,680,268
$
1,561,088
$
119,180
7.6
%
5.8
%
5.5
%
0.3
%
Service
1,157,380
1,018,652
138,728
13.6
%
11.6
%
10.7
%
0.9
%
Segment Revenue
$
2,837,648
$
2,579,740
$
257,908
10.0
%
8.0
%
7.6
%
0.4
%
Segment Adjusted EBITDA
$
1,238,430
$
1,142,617
$
95,813
Segment Adjusted EBITDA Margin
43.6
%
44.3
%
SIX MONTHS ENDED YEAR OVER YEAR SEGMENT ANALYSIS: GLOBAL RIM BUSINESS (IN MILLIONS)
Storage Rental Revenue
Service Revenue
Segment Revenue
Segment Adjusted EBITDA
Primary factors influencing the change in revenue and Adjusted EBITDA Margin in our Global RIM Business segment for the six months ended June 30, 2026 compared to the prior year period include the following:
•organic storage rental revenue growth driven by revenue management;
•organic service revenue growth primarily driven by increases in our Global Digital Solutions business and growth in our traditional service activity levels; and
•a 70 basis point decrease in Adjusted EBITDA Margin primarily driven by changes in revenue mix, partially offset by favorable overhead management.
SIX MONTHS ENDED YEAR OVER YEAR SEGMENT ANALYSIS: GLOBAL DATA CENTER BUSINESS (IN MILLIONS)
Storage Rental Revenue
Service Revenue
Segment Revenue
Segment Adjusted EBITDA
Primary factors influencing the change in revenue and Adjusted EBITDA Margin in our Global Data Center Business segment for the six months ended June 30, 2026 compared to the prior year period include the following:
•organic storage rental revenue growth from leases that commenced during the first six months of 2026 and in prior periods, improved pricing and increased customer usage of power;
•an increase in Adjusted EBITDA primarily driven by organic storage rental revenue growth; and
•a 60 basis point increase in Adjusted EBITDA Margin reflecting lease commencements, improved pricing and cost containment, partially offset by higher pass-through power costs.
Primary factors influencing the change in revenue and Adjusted EBITDA in Corporate and Other (as defined in Note 8 to Notes to Condensed Consolidated Financial Statements included in this Quarterly Report) for the six months ended June 30, 2026 compared to the prior year period include the following:
•an increase in service revenue of $24.4 million due to acquisitions in our ALM business;
•organic service revenue growth in our ALM business driven by growth from new and existing customers and improved component pricing trends; and
•an improvement in Adjusted EBITDA driven by service revenue improvement in our ALM business.
We expect to meet our short-term and long-term cash flow requirements through cash generated from operations, cash on hand, borrowings under the Credit Agreement (as defined below), as well as other potential financings (such as the issuance of debt). Our cash flow requirements, both in the near and long term, include, but are not limited to, capital expenditures, the repayment of outstanding debt, shareholder dividends, potential business acquisitions and normal business operation needs.
CASH FLOWS
The following is a summary of our cash balances and cash flows (in thousands) as of and for the six months ended June 30,
2026
2025
Cash Flows from Operating Activities
$
887,813
$
572,425
Cash Flows from Investing Activities
(1,166,365)
(1,350,810)
Cash Flows from Financing Activities
303,985
882,868
Cash and Cash Equivalents, End of Period
204,793
217,992
A. CASH FLOWS FROM OPERATING ACTIVITIES
For the six months ended June 30, 2026, net cash flows provided by operating activities increased by $315.4 million compared to the prior year period, primarily due to an increase in net income (loss) (excluding non-cash charges) of $353.8 million, partially offset by a decrease in cash from working capital of $38.4 million.
B. CASH FLOWS FROM INVESTING ACTIVITIES
Our significant investing activity during the six months ended June 30, 2026 included cash paid for capital expenditures of $1,106.2 million. Additional details of our capital spending are included in the "Capital Expenditures" section below.
C. CASH FLOWS FROM FINANCING ACTIVITIES
Our significant financing activities during the six months ended June 30, 2026 included:
•Net proceeds of approximately $1,485.0 million associated with the issuance of the 61/4% Notes due 2035 (as defined below).
•Net payments of approximately $621.2 million primarily associated with repayments under the Revolving Credit Facility, partially offset by borrowings under our data center credit facilities, which were used to partially finance the construction of our data centers.
•Payment of dividends in the amount of $532.7 million on our common stock.
The following table presents our capital spend for the six months ended June 30, 2026 and 2025, organized by the type of the spending as described in our Annual Report (in thousands):
SIX MONTHS ENDED JUNE 30,
NATURE OF CAPITAL SPEND
2026
2025
Growth Investment Capital Expenditures:
Data Center
$
880,086
$
952,982
Real Estate
96,485
67,980
Innovation and Other
68,283
49,605
Total Growth Investment Capital Expenditures
1,044,854
1,070,567
Recurring Capital Expenditures:
Data Center
$
8,333
$
8,243
Real Estate
22,375
20,281
Non-Real Estate
42,560
34,353
Total Recurring Capital Expenditures
73,268
62,877
Total Capital Spend (on accrual basis)
$
1,118,122
$
1,133,444
Net increase (decrease) in prepaid capital expenditures
5,856
(1,401)
Net (increase) decrease in accrued capital expenditures
(17,772)
99,480
Total Capital Spend (on cash basis)
$
1,106,206
$
1,231,523
Excluding capital expenditures associated with potential future acquisitions, we expect total capital expenditures of approximately $2,200.0 million for the year ending December 31, 2026. Of this, we expect capital expenditures for growth investment of approximately $2,050.0 million and recurring capital expenditures of approximately $150.0 million.
DIVIDENDS
See Note 7 to Notes to Condensed Consolidated Financial Statements included in this Quarterly Report for a listing of dividends that we declared during the first six months of 2026 and fiscal year 2025.
On August 5, 2026, we declared a dividend to our stockholders of record as of September 15, 2026 of $0.864 per share, payable on October 2, 2026.
NONCONTROLLING INTERESTS
During the quarter ended June 30, 2026, we entered into an agreement with a partner to form our Iron Mountain Data Centers Virginia 9 JV, LP joint venture, which resulted in Noncontrolling interests of approximately $49.9 million in our Condensed Consolidated Balance Sheet as of June 30, 2026.
Financial instruments that potentially subject us to credit risk consist principally of cash and cash equivalents (including money market funds and time deposits) and accounts receivable. The only significant concentrations of liquid investments as of June 30, 2026 are related to cash and cash equivalents held in money market funds. See Note 2.d. to Notes to Condensed Consolidated Financial Statements included in this Quarterly Report for information on our money market funds and time deposits.
Long-term debt as of June 30, 2026 is as follows (in thousands):
JUNE 30, 2026
DEBT (INCLUSIVE OF DISCOUNT)
UNAMORTIZED DEFERRED FINANCING COSTS
CARRYING AMOUNT
Revolving Credit Facility(1)
$
30,000
$
(7,241)
$
22,759
Term Loan A(1)
475,000
—
475,000
Term Loan B(1)
2,011,653
(11,426)
2,000,227
Virginia 6 Term Loans(2)
210,000
(1,645)
208,355
Virginia 7 Term Loans(2)
293,455
(2,719)
290,736
Virginia 9 Term Loans
29,595
(7,038)
22,557
Virginia 4/5 Term Loans due 2030(2)
208,224
(3,167)
205,057
Virginia 3 Term Loans due 2031
433,000
(8,137)
424,863
AUD Term Loan(2)
267,257
(1,814)
265,443
UK Revolving Credit Facility(2)
185,405
(1,405)
184,000
47/8% Notes due 2027(2)(3)
1,000,000
(1,777)
998,223
51/4% Notes due 2028(2)(3)
825,000
(2,067)
822,933
5% Notes due 2028(2)(3)
500,000
(1,507)
498,493
7% Notes(2)(3)
1,000,000
(5,495)
994,505
47/8% Notes due 2029(2)(3)
1,000,000
(4,701)
995,299
51/4% Notes due 2030(2)(3)
1,300,000
(6,142)
1,293,858
41/2% Notes(2)(3)
1,100,000
(5,809)
1,094,191
5% Notes due 2032(2)
750,000
(7,942)
742,058
55/8% Notes(2)(3)
600,000
(3,533)
596,467
61/4% Notes(2)(3)
1,200,000
(11,852)
1,188,148
Euro Notes(2)(3)
1,368,929
(15,728)
1,353,201
61/4% Senior Notes due 2035 (the "61/4% Notes due 2035")(3)
1,500,000
(18,220)
1,481,780
Real Estate Mortgages, Financing Lease Liabilities and Other
794,087
(1,277)
792,810
Accounts Receivable Securitization Program
400,500
(1,814)
398,686
Total Long-term Debt
17,482,105
(132,456)
17,349,649
Less Current Portion
(220,809)
—
(220,809)
Long-term Debt, Net of Current Portion
$
17,261,296
$
(132,456)
$
17,128,840
(1)Collectively, the “Credit Agreement”. The Credit Agreement consists of a revolving credit facility (the “Revolving Credit Facility”), a term loan A facility (the “Term Loan A”) and a term loan B facility (the "Term Loan B").
(2)Each as defined in Note 6 to Notes to Consolidated Financial Statements included in our Annual Report.
(3)Collectively, the "Parent Notes".
See Note 6 to Notes to Consolidated Financial Statements included in our Annual Report and Note 5 to Notes to Condensed Consolidated Financial Statements included in this Quarterly Report for additional information regarding our long-term debt.
On January 9, 2026, Iron Mountain Data Centers Virginia 3, LLC and Iron Mountain Data Centers Virginia 3 Intermediate II, LLC, both wholly-owned subsidiaries of Iron Mountain Incorporated ("IMI"), entered into a mortgage loan agreement and a mezzanine loan agreement with a total original principal balance of $433.0 million (the "Virginia 3 Term Loans due 2031"). The Virginia 3 Term Loans due 2031 are secured by the property of Iron Mountain Data Centers Virginia 3, LLC and are scheduled to mature on January 9, 2031, at which point all obligations will become due. The Virginia 3 Term Loans due 2031 bear interest at a weighted average rate of 6.3%. Total net proceeds from the Virginia 3 Term Loans due 2031 were used to repay the Virginia 3 Term Loans due 2026 (defined as the Virginia 3 Term Loans in Note 6 to Notes to Consolidated Financial Statements included in our Annual Report) and a portion of the outstanding borrowings under the Revolving Credit Facility.
On June 9, 2026, Iron Mountain Data Centers Virginia 9, LLC, an indirect subsidiary of IMI, entered into a credit agreement that includes a term loan facility (the "Virginia 9 Term Loans") and a letter of credit facility (collectively, the "Virginia 9 Credit Agreement"), under which we have the option to borrow, in the form of term loans, an aggregate outstanding amount not to exceed $298.0 million. The Virginia 9 Term Loans bear interest at SOFR plus 3.00%. The Virginia 9 Credit Agreement requires the payment of a commitment fee on any unused commitments at a rate of 0.90%. The Virginia 9 Credit Agreement is secured by the equity interests and assets of Iron Mountain Data Centers Virginia 9, LLC and is scheduled to mature on June 9, 2029, at which point all obligations will become due. We have two one-year options that allow us to extend the maturity date, subject to the conditions specified in the Virginia 9 Credit Agreement. As of June 30, 2026, we had $29.6 million outstanding on the Virginia 9 Term Loans and the interest rate in effect under the Virginia 9 Credit Agreement was 6.9%.
ACCOUNTS RECEIVABLE SECURITIZATION PROGRAM
On May 28, 2026, we amended the Accounts Receivable Securitization Program (as defined in Note 6 to Notes to Consolidated Financial Statements included in our Annual Report) to (i) include the sale of accounts receivable from certain of our wholly-owned Canadian entities, (ii) increase the maximum borrowing capacity from $400.0 million to $450.0 million and (iii) extend the maturity date from July 1, 2027 to July 1, 2029, at which point all obligations become due. All other material terms of the Accounts Receivable Securitization Program remain the same as disclosed in Note 6 to Notes to Consolidated Financial Statements included in our Annual Report.
JUNE 2026 OFFERING
On June 26, 2026, IMI completed a private offering of (in thousands):
SERIES OF NOTES
AGGREGATE PRINCIPAL AMOUNT
MATURITY DATE
INTEREST PAYMENT DUE
PAR CALL DATE(1)
61/4% Notes due 2035
$
1,500,000
January 15, 2035
January 15 and July 15
July 15, 2029
(1)We may redeem the 61/4% Notes due 2035 at any time, at our option, in whole or in part. Prior to the par call date, we may redeem the 61/4% Notes due 2035 at the redemption price or make-whole premium specified in the indenture governing the 61/4% Notes due 2035, together with accrued and unpaid interest to, but excluding, the redemption date. On or after the par call date, we may redeem the 61/4% Notes due 2035 at a price equal to 100% of the principal amount being redeemed, together with accrued and unpaid interest to, but excluding, the redemption date.
The 61/4% Notes due 2035 were issued at par and have a contractual interest rate of 6.25%. The total net proceeds from the issuance, after deducting the initial purchasers' commissions and third-party fees, of approximately $1,481.8 million, were used to repay a portion of the outstanding borrowings under the Revolving Credit Facility and to pay related fees and expenses, and for general corporate purposes. As of June 30, 2026, we had $1,500.0 millionoutstanding on the 61/4% Notes due 2035.
DEBT COVENANTS
The Credit Agreement, certain of our bond indentures and other agreements governing our indebtedness contain certain restrictive financial and operating covenants, including covenants that restrict our ability to complete acquisitions, pay cash dividends, incur indebtedness, make investments, sell assets and take other specified corporate actions. The covenants do not contain a rating trigger. Therefore, a change in our debt rating would not trigger a default under the Credit Agreement, our bond indentures or other agreements governing our indebtedness. The Credit Agreement requires that we satisfy a net total lease adjusted leverage ratio and a fixed charge coverage ratio on a quarterly basis, and certain of our bond indentures require that, among other things, we satisfy a leverage ratio (not lease adjusted) or a fixed charge coverage ratio (not lease adjusted) as a condition to taking actions such as paying dividends and incurring indebtedness.
The Credit Agreement uses earnings before interest, taxes, depreciation and amortization and rent expense ("EBITDAR")-based calculations and the bond indentures use EBITDA-based calculations as the primary measures of financial performance for purposes of calculating leverage and fixed charge coverage ratios. The EBITDAR- and EBITDA-based leverage calculations include our consolidated subsidiaries, other than those we have designated as "Unrestricted Subsidiaries" as defined in the Credit Agreement and bond indentures. Generally, the Credit Agreement and the bond indentures use a trailing four fiscal quarter basis for purposes of the relevant calculations and require certain adjustments and exclusions for purposes of those calculations, which make the calculation of financial performance under the Credit Agreement and bond indentures not directly comparable to Adjusted EBITDA as presented herein. These adjustments can be significant. For example, the calculation of financial performance under the Credit Agreement and certain of our bond indentures includes (subject to specified exceptions and caps) adjustments for non-cash charges and for expected benefits associated with (i) completed acquisitions, (ii) certain executed lease agreements associated with our data center business that have yet to commence and (iii) restructuring and other strategic initiatives. The calculation of financial performance under our other bond indentures includes, for example, adjustments for non-cash charges and for expected benefits associated with (i) completed acquisitions and (ii) events that are extraordinary, unusual or non-recurring.
Our leverage and fixed charge coverage ratios under the Credit Agreement as of June 30, 2026 are as follows:
JUNE 30, 2026
MAXIMUM/MINIMUM ALLOWABLE
Net total lease adjusted leverage ratio
4.8
Maximum allowable of 7.0
Fixed charge coverage ratio
2.5
Minimum allowable of 1.5
We are in compliance with our leverage and fixed charge coverage ratios under the Credit Agreement, our bond indentures and other agreements governing our indebtedness as of June 30, 2026. Noncompliance with these leverage and fixed charge coverage ratios would have a material adverse effect on our financial condition and liquidity.
Our ability to pay interest on or to refinance our indebtedness depends on our future performance, working capital levels and capital structure, which are subject to general economic, financial, competitive, legislative, regulatory and other factors which may be beyond our control. There can be no assurance that we will generate sufficient cash flow from our operations or that future financings will be available on acceptable terms or in amounts sufficient to enable us to service or refinance our indebtedness or to make necessary capital expenditures.
DERIVATIVE INSTRUMENTS
INTEREST RATE SWAP AGREEMENTS
We utilize interest rate swap agreements designated as cash flow hedges to limit our exposure to changes in interest rates on a portion of our floating rate indebtedness. Certain of our interest rate swap agreements have notional amounts that will increase with the underlying hedged transaction. Under our interest rate swap agreements, we receive variable rate interest payments associated with the notional amount of each interest rate swap, based upon the one-month Secured Overnight Financing Rate ("SOFR"), in exchange for the payment of fixed interest rates as specified in the interest rate swap agreements. Our interest rate swap agreements are marked to market at the end of each reporting period, representing the fair values of the interest rate swap agreements, and any changes in fair value are recognized as a component of Accumulated other comprehensive items, net. Unrealized gains are recognized as assets, while unrealized losses are recognized as liabilities.
As of June 30, 2026 and December 31, 2025, we have approximately $1,032.0 million and $1,349.0 million, respectively, in notional value outstanding on our interest rate swap agreements. As of June 30, 2026, our interest rate swap agreements have maturity dates ranging from August 2026 through June 2029.
We utilize cross-currency swaps to hedge the variability of exchange rate impacts between the United States dollar and certain of our foreign functional currencies, including the Euro and the Canadian dollar. As of June 30, 2026, our cross-currency swap agreements have maturity dates ranging from November 2026 through February 2029.
The notional values of our cross-currency swaps, by hedged currency, as of June 30, 2026 and December 31, 2025, are as follows (in thousands):
JUNE 30, 2026
DECEMBER 31, 2025
Euro
$
504,559
$
509,187
Canadian dollar
350,000
350,000
$
854,559
$
859,187
We have designated these cross-currency swap agreements as hedges of net investments in our Euro and Canadian dollar denominated subsidiaries and they require an exchange of the notional amounts at maturity. These cross-currency swap agreements are marked to market at the end of each reporting period, representing the fair values of the cross-currency swap agreements, and any changes in fair value are recognized as a component of Accumulated other comprehensive items, net. Unrealized gains are recognized as assets, while unrealized losses are recognized as liabilities. The excluded component of our cross-currency swap agreements is recorded in Accumulated other comprehensive items, net and amortized to interest expense on a straight-line basis.
INVESTMENTS
Our joint venture with AGC Equity Partners (the "Frankfurt JV") is accounted for as an equity method investment and is presented as a component of Other within Other assets, net in our Condensed Consolidated Balance Sheets. The carrying value and equity interest in the unconsolidated Frankfurt JV as of June 30, 2026 is as follows (in thousands):
The term "disclosure controls and procedures" is defined in Rules 13a-15(e) and 15d-15(e) of the Securities Exchange Act of 1934, as amended (the "Exchange Act"). These rules refer to the controls and other procedures of a company that are designed to ensure that information is recorded, processed, accumulated, summarized, communicated and reported to management, including its principal executive and principal financial officers, as appropriate to allow timely decisions regarding what is required to be disclosed by a company in the reports that it files under the Exchange Act.
As of June 30, 2026 (the "Evaluation Date"), we carried out an evaluation, under the supervision and with the participation of our management, including our chief executive officer and chief financial officer, of the effectiveness of our disclosure controls and procedures. Based upon that evaluation, our chief executive officer and chief financial officer concluded that, as of the Evaluation Date, our disclosure controls and procedures are effective.
CHANGES IN INTERNAL CONTROL OVER FINANCIAL REPORTING
Our management, with the participation of our principal executive officer and principal financial officer, is responsible for establishing and maintaining adequate internal control over financial reporting as defined in Rules 13a-15(f) and 15d-15(f) of the Exchange Act. Our internal control system is designed to provide reasonable assurance to our management and board of directors regarding the preparation and fair presentation of published financial statements.
There were no changes in our internal control over financial reporting that occurred during the quarter ended June 30, 2026 that have materially affected, or are reasonably likely to materially affect, our internal control over financial reporting.
ITEM 2. UNREGISTERED SALES OF EQUITY SECURITIES AND USE OF PROCEEDS
We did not sell any unregistered equity securities during the three months ended June 30, 2026, nor did we repurchase any shares of our common stock during the three months ended June 30, 2026.
ITEM 5. OTHER INFORMATION
On May 8, 2026, Mr. Greg McIntosh, our Executive Vice President and Chief Commercial Officer, adopted a Rule 10b5-1 trading plan to exercise options to purchase up to 6,839 shares of our common stock and sell up to 66,839 shares of our common stock between August 6, 2026 and July 1, 2027. Mr. McIntosh’s plan will terminate on the earlier of August 31, 2027 and the date that all trades under the plan are completed.
This arrangement was entered into during an open trading window and is intended to satisfy the affirmative defense of Rule 10b5-1(c) under the Securities Exchange Act of 1934.
ITEM 6. EXHIBITS
Certain exhibits indicated below are incorporated by reference to documents we have filed with the SEC. Each exhibit marked by a pound sign (#) is a management contract or compensatory plan.
XBRL Instance Document - the instance document does not appear in the Interactive Data File because its XBRL tags are embedded within the Inline XBRL document.
Pursuant to the requirements of the Securities Exchange Act of 1934, the registrant has duly caused this report to be signed on its behalf by the undersigned thereunto duly authorized.