
NOV Inc. Third Quarter 2025 Earnings Presentation October 28, 2025 .2
2025 Earnings Presentation – 10/28/2025 © 2025 NOV Inc. All rights reserved. This document contains, or has incorporated by reference, statements that are not historical facts, including estimates, projections, and statements relating to our business plans, objectives, and expected operating results that are “forward-looking statements” within the meaning of the Private Securities Litigation Reform Act of 1995. Such statements often contain words such as “may,” “can,” “likely,” “believe,” “plan,” “predict,” “potential,” “will,” “intend,” “think,” “should,” “expect,” “anticipate,” “estimate,” “forecast,” “expectation,” “goal,” “outlook,” “projected,” “projections,” “target,” and other similar words, although some such statements are expressed differently. Other oral or written statements we release to the public may also contain forward-looking statements. Forward-looking statements involve risk and uncertainties and reflect our best judgment based on current information. You should be aware that our actual results could differ materially from results anticipated in such forward-looking statements due to a number of factors, including but not limited to changes in oil and gas prices, customer demand for our products, potential catastrophic events related to our operations, protection of intellectual property rights, compliance with laws, and worldwide economic activity, including matters related to recent Russian sanctions and changes in U.S. trade policies, including the imposition of tariffs and retaliatory tariffs and their related impacts on the economy. Given these uncertainties, current or prospective investors are cautioned not to place undue reliance on any such forward-looking statements. We undertake no obligation to update any such factors or forward-looking statements to reflect future events or developments. You should also consider carefully the statements under “Risk Factors,” as disclosed in our most recent Annual Report on Form 10-K, as updated in Part II, Item 1A of our most recent Quarterly Report on Form 10-Q, and “Management’s Discussion and Analysis of Financial Condition and Results of Operations” of our most recent Annual Report on Form 10-K, which address additional factors that could cause our actual results to differ from those set forth in the forward-looking statements, as well as additional disclosures we make in our press releases and other securities filings. We also suggest that you listen to our quarterly earnings release conference calls with financial analysts. This presentation contains certain forward-looking non-GAAP financial measures, including Adjusted EBITDA. The Company has not provided a reconciliation of projected Adjusted EBITDA. Management cannot predict with a reasonable degree of accuracy certain of the necessary components of net income, such as other income (expense), which includes fluctuations in foreign currencies. As such, a reconciliation of projected Adjusted EBITDA to projected net income is not available without unreasonable effort. The actual amount of other income (expense), provision (benefit) for income taxes, equity income (loss) in unconsolidated affiliates, depreciation and amortization, and other amounts excluded from Adjusted EBITDA could have a significant impact on net income. Safe Harbor / Forward Looking Statements / Non-GAAP Financial Measures
2025 Earnings Presentation – 10/28/2025 © 2025 NOV Inc. All rights reserved. NOV delivers technology-driven solutions to empower the global energy industry. For more than 150 years, NOV has pioneered innovations that enable its customers to safely produce abundant energy while minimizing environmental impact. The energy industry depends on NOV’s deep expertise and technology to continually improve oilfield operations and assist in efforts to advance the energy transition towards a more sustainable future. NOV powers the industry that powers the world.
1 Working capital intensity defined as working capital less cash, debt, and lease liabilities as a percentage of annualized revenue. 2 Free Cash Flow and Adjusted EBITDA are non-GAAP financial measures. See appendix for a reconciliation to the nearest GAAP measures. $951MM Bookings Book-to-Bill of 141% Working Capital Intensity1 360 basis point improvement YOY Free Cash Flow2 ~95% conversion of Adjusted EBITDA 27.9% $245MM Third Quarter 2025 Highlights 2025 Earnings Presentation – 10/28/2025 © 2025 NOV Inc. All rights reserved.
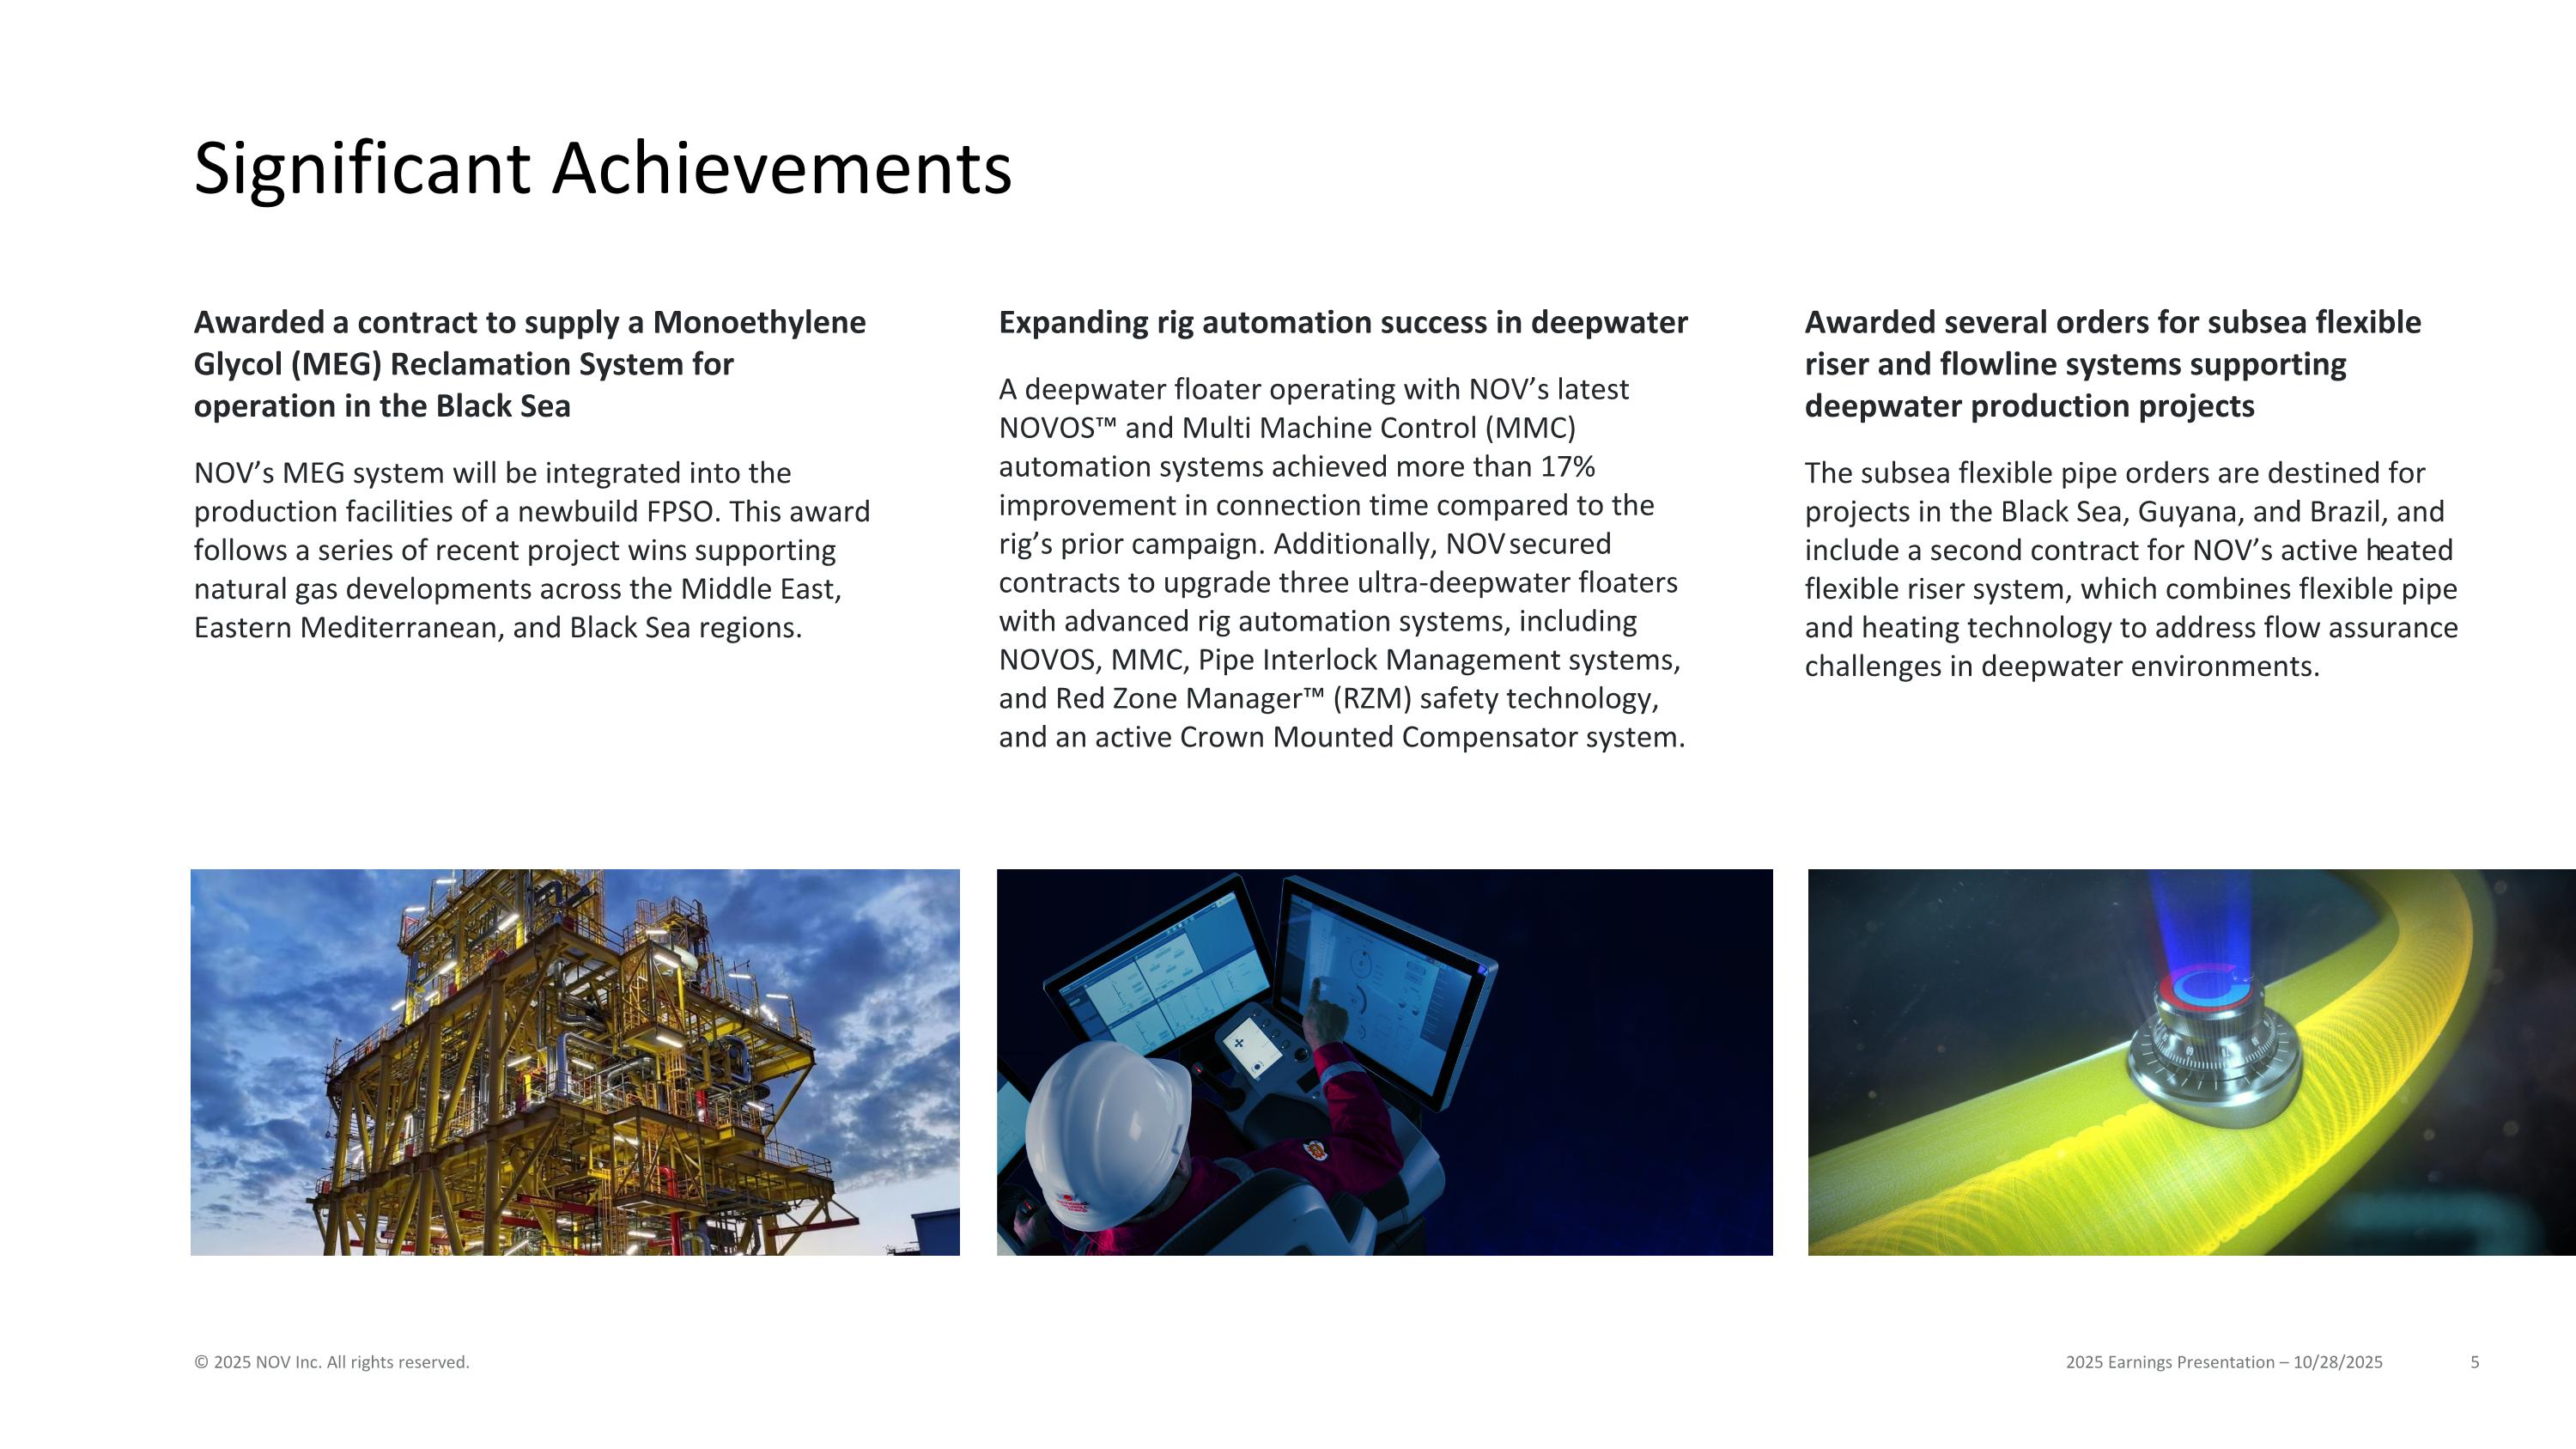
Significant Achievements 2025 Earnings Presentation – 10/28/2025 © 2025 NOV Inc. All rights reserved. Awarded a contract to supply a Monoethylene Glycol (MEG) Reclamation System for operation in the Black Sea NOV’s MEG system will be integrated into the production facilities of a newbuild FPSO. This award follows a series of recent project wins supporting natural gas developments across the Middle East, Eastern Mediterranean, and Black Sea regions. Expanding rig automation success in deepwater A deepwater floater operating with NOV’s latest NOVOS™ and Multi Machine Control (MMC) automation systems achieved more than 17% improvement in connection time compared to the rig’s prior campaign. Additionally, NOV secured contracts to upgrade three ultra-deepwater floaters with advanced rig automation systems, including NOVOS, MMC, Pipe Interlock Management systems, and Red Zone Manager™ (RZM) safety technology, and an active Crown Mounted Compensator system. Awarded several orders for subsea flexible riser and flowline systems supporting deepwater production projects The subsea flexible pipe orders are destined for projects in the Black Sea, Guyana, and Brazil, and include a second contract for NOV’s active heated flexible riser system, which combines flexible pipe and heating technology to address flow assurance challenges in deepwater environments.
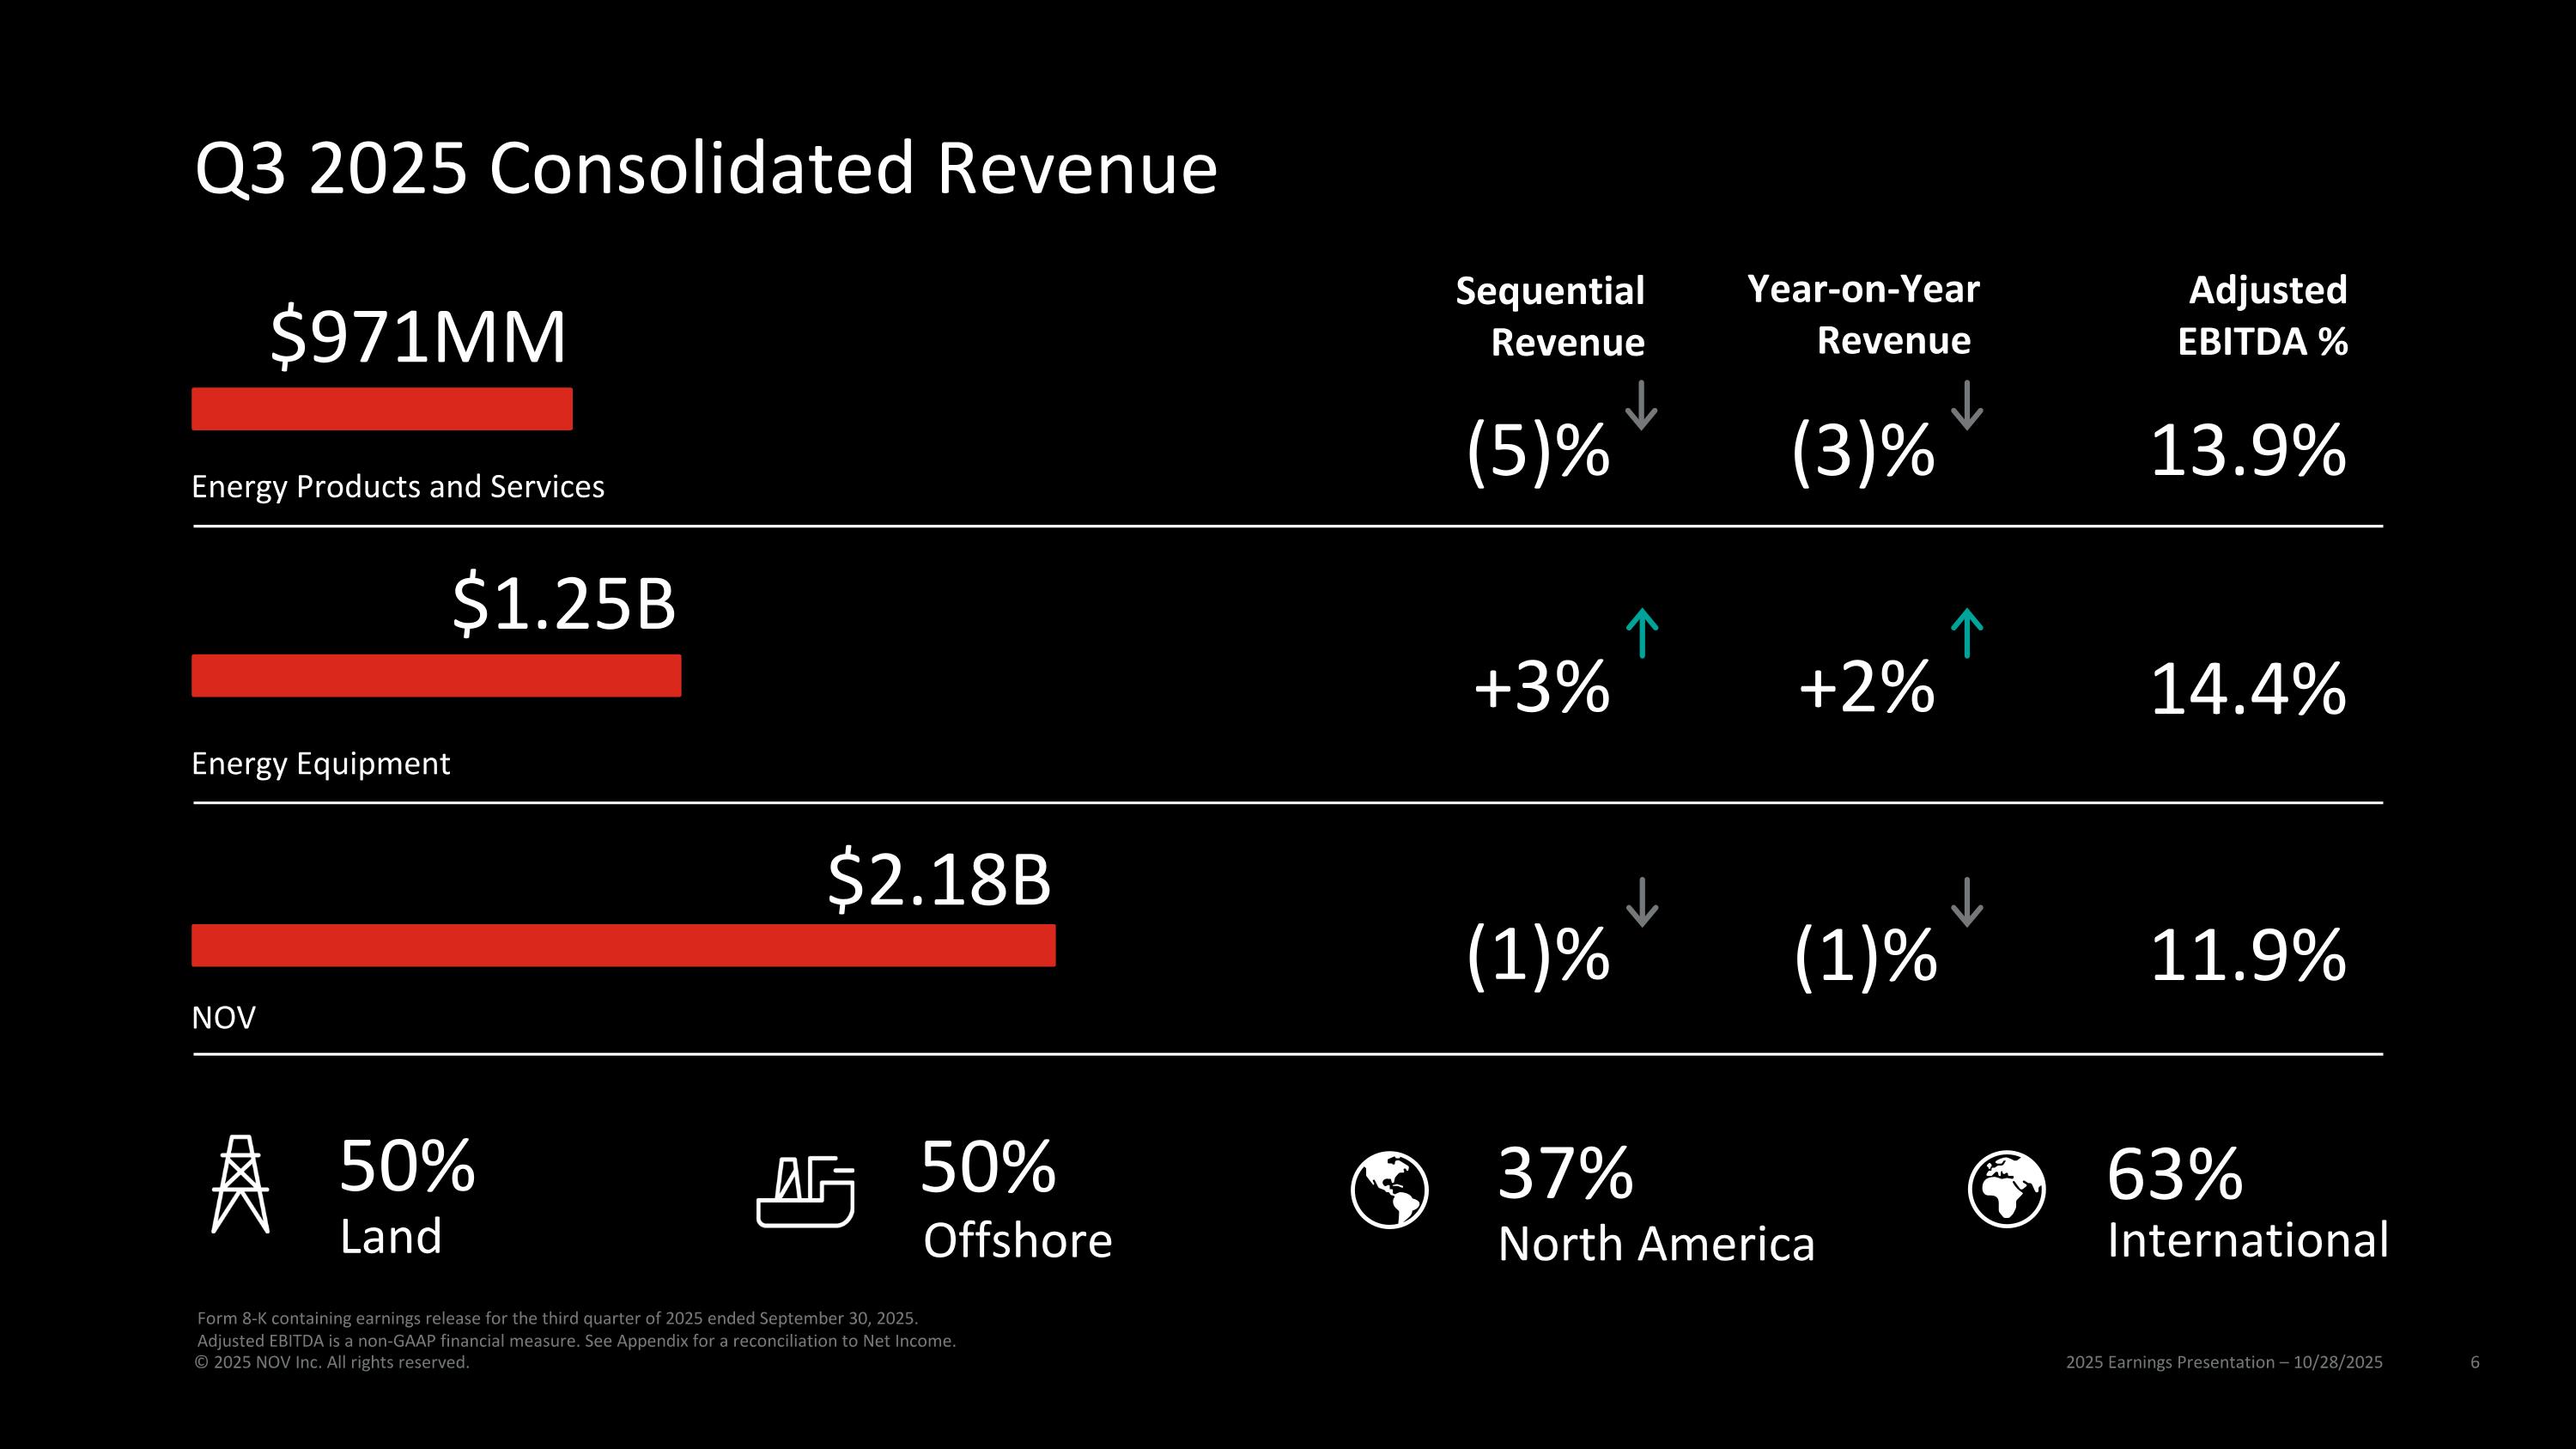
Q3 2025 Consolidated Revenue 2025 Earnings Presentation – 10/28/2025 © 2025 NOV Inc. All rights reserved. $1.25B $971MM Energy Products and Services Energy Equipment (3)% 13.9% +2% 14.4% 37% North America 63% International 50% Land 50% Offshore $2.18B NOV 11.9% (1)% Form 8-K containing earnings release for the third quarter of 2025 ended September 30, 2025. Adjusted EBITDA is a non-GAAP financial measure. See Appendix for a reconciliation to Net Income. (5)% +3% (1)% Year-on-Year Revenue Adjusted EBITDA % Sequential Revenue
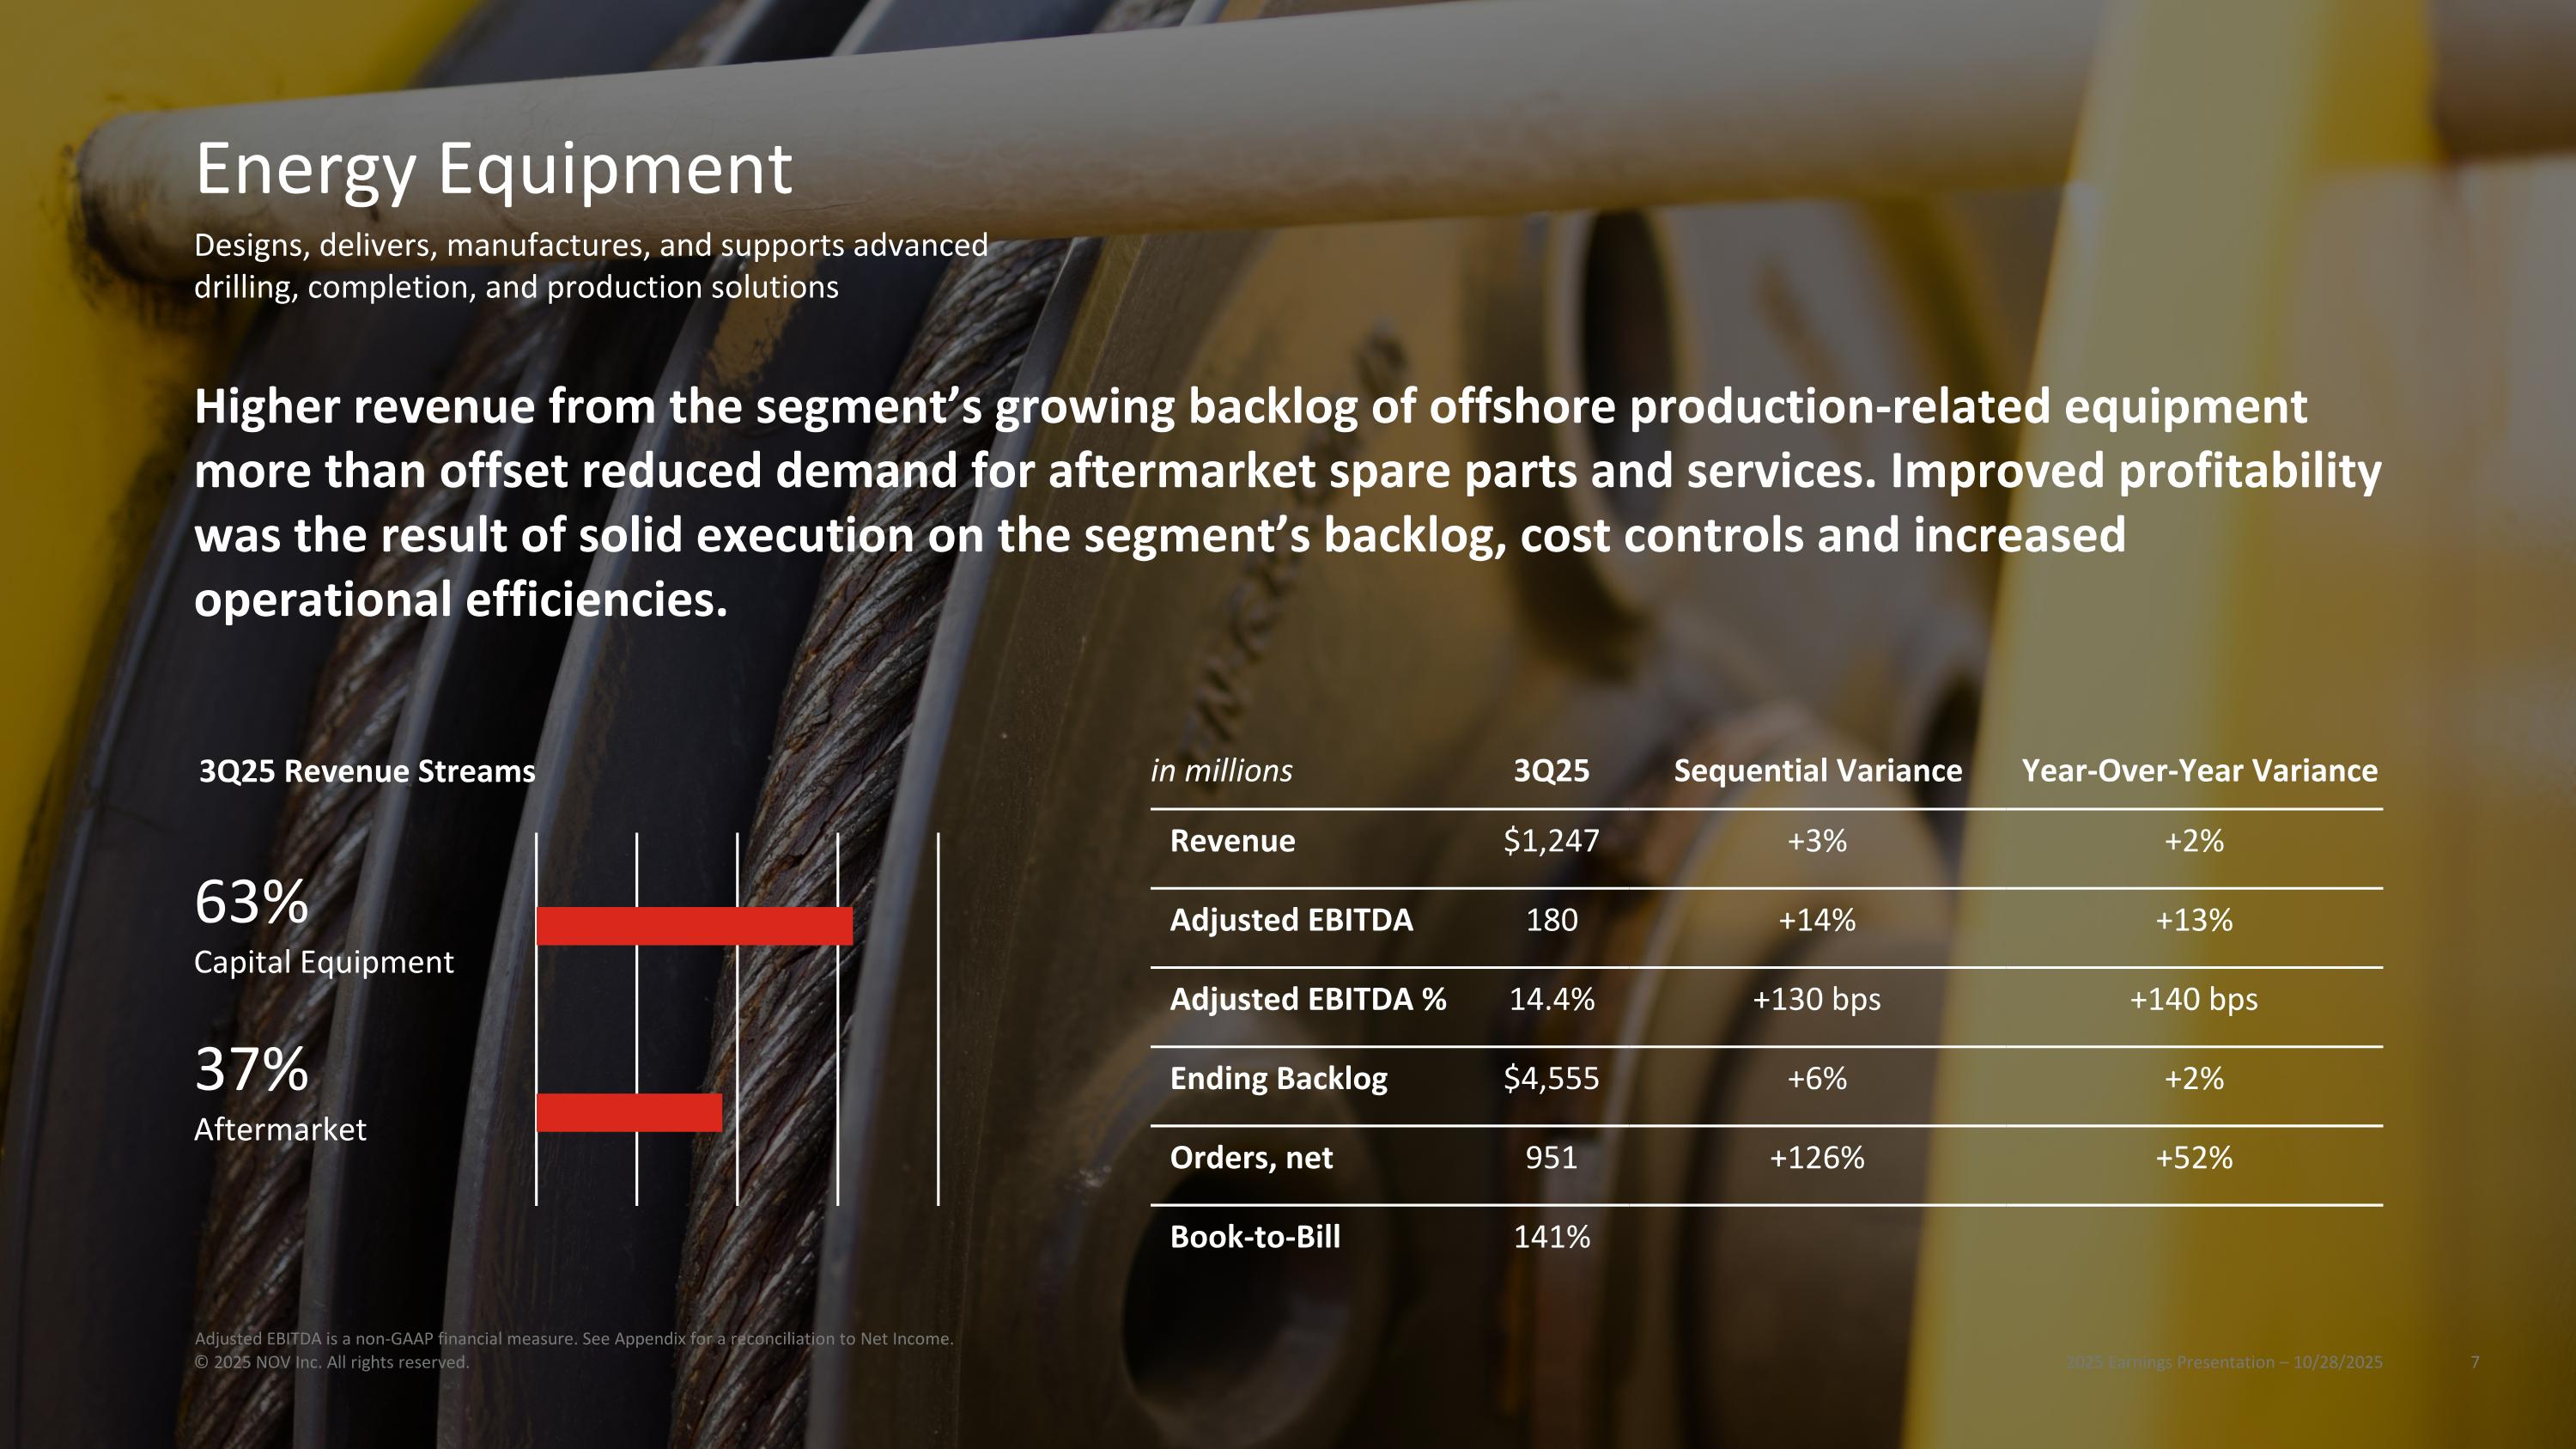
in millions 3Q25 Sequential Variance Year-Over-Year Variance Revenue $1,247 +3% +2% Adjusted EBITDA 180 +14% +13% Adjusted EBITDA % 14.4% +130 bps +140 bps Ending Backlog $4,555 +6% +2% Orders, net 951 +126% +52% Book-to-Bill 141% Higher revenue from the segment’s growing backlog of offshore production-related equipment more than offset reduced demand for aftermarket spare parts and services. Improved profitability was the result of solid execution on the segment’s backlog, cost controls and increased operational efficiencies. 3Q25 Revenue Streams 37% Aftermarket 63% Capital Equipment Energy Equipment 2025 Earnings Presentation – 10/28/2025 © 2025 NOV Inc. All rights reserved. Designs, delivers, manufactures, and supports advanced drilling, completion, and production solutions Adjusted EBITDA is a non-GAAP financial measure. See Appendix for a reconciliation to Net Income.
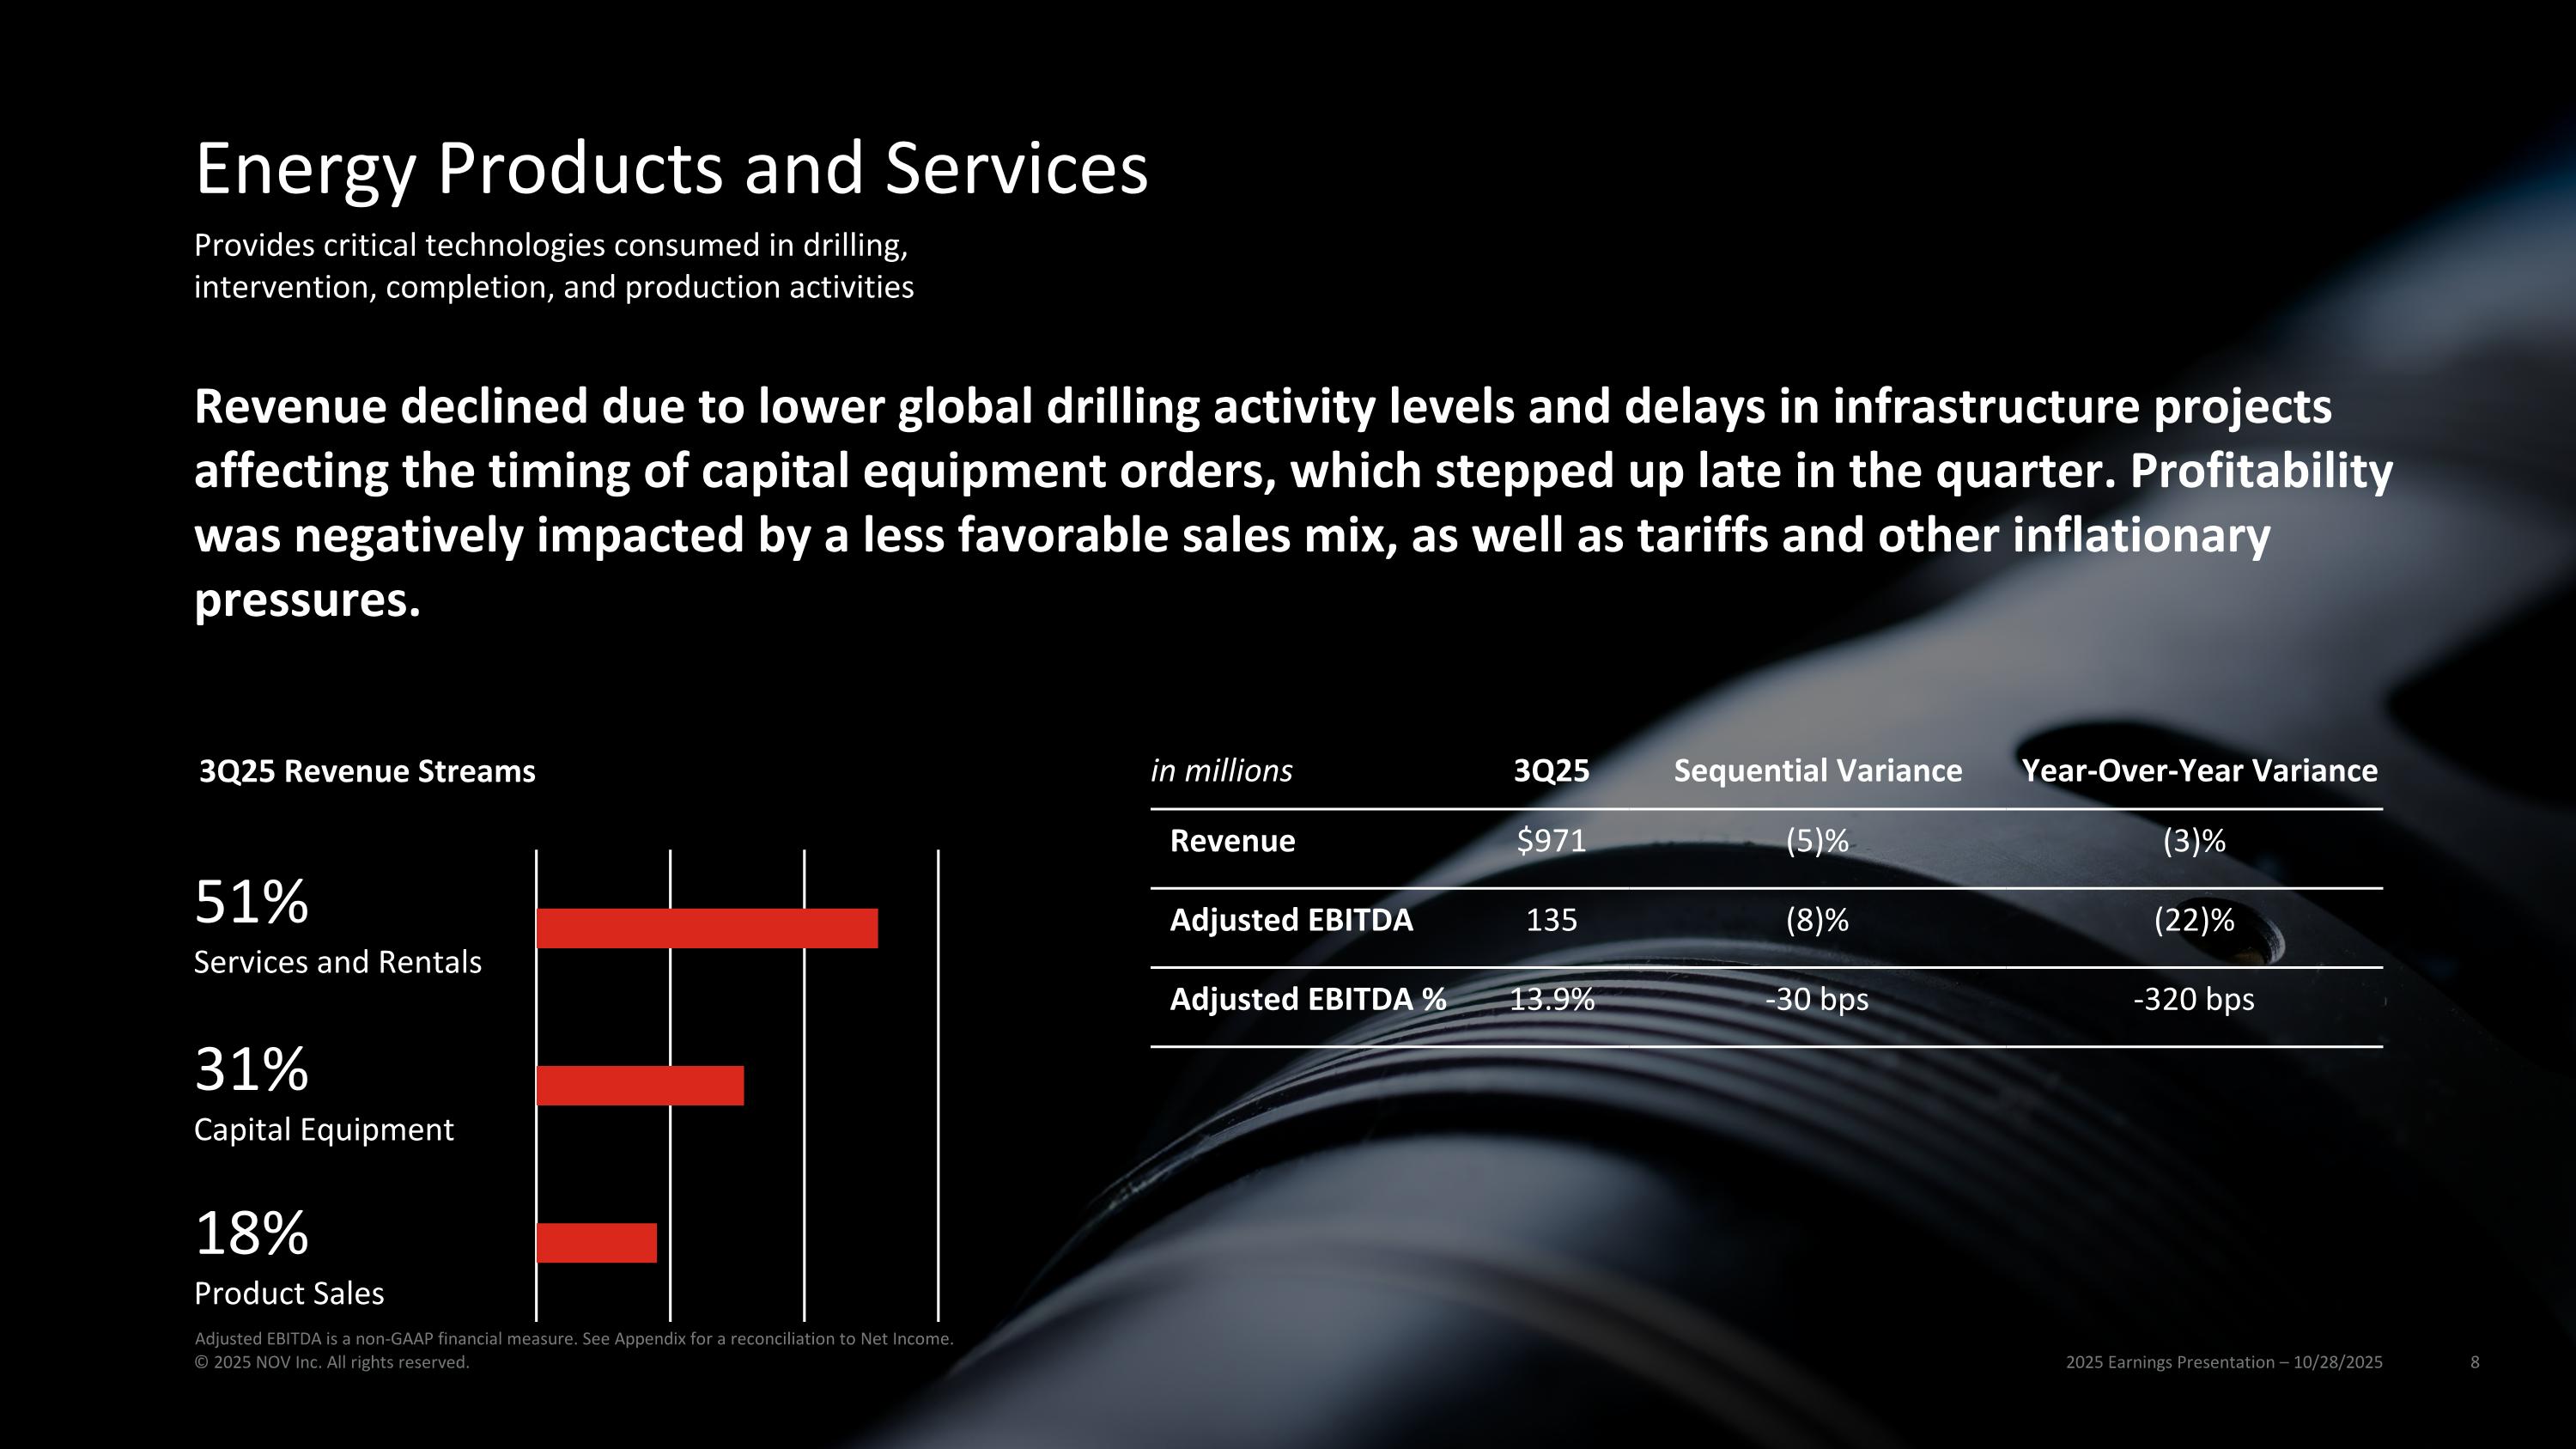
in millions 3Q25 Sequential Variance Year-Over-Year Variance Revenue $971 (5)% (3)% Adjusted EBITDA 135 (8)% (22)% Adjusted EBITDA % 13.9% -30 bps -320 bps Revenue declined due to lower global drilling activity levels and delays in infrastructure projects affecting the timing of capital equipment orders, which stepped up late in the quarter. Profitability was negatively impacted by a less favorable sales mix, as well as tariffs and other inflationary pressures. 3Q25 Revenue Streams 31% Capital Equipment 51% Services and Rentals 18% Product Sales Energy Products and Services 2025 Earnings Presentation – 10/28/2025 © 2025 NOV Inc. All rights reserved. Provides critical technologies consumed in drilling, intervention, completion, and production activities Adjusted EBITDA is a non-GAAP financial measure. See Appendix for a reconciliation to Net Income.
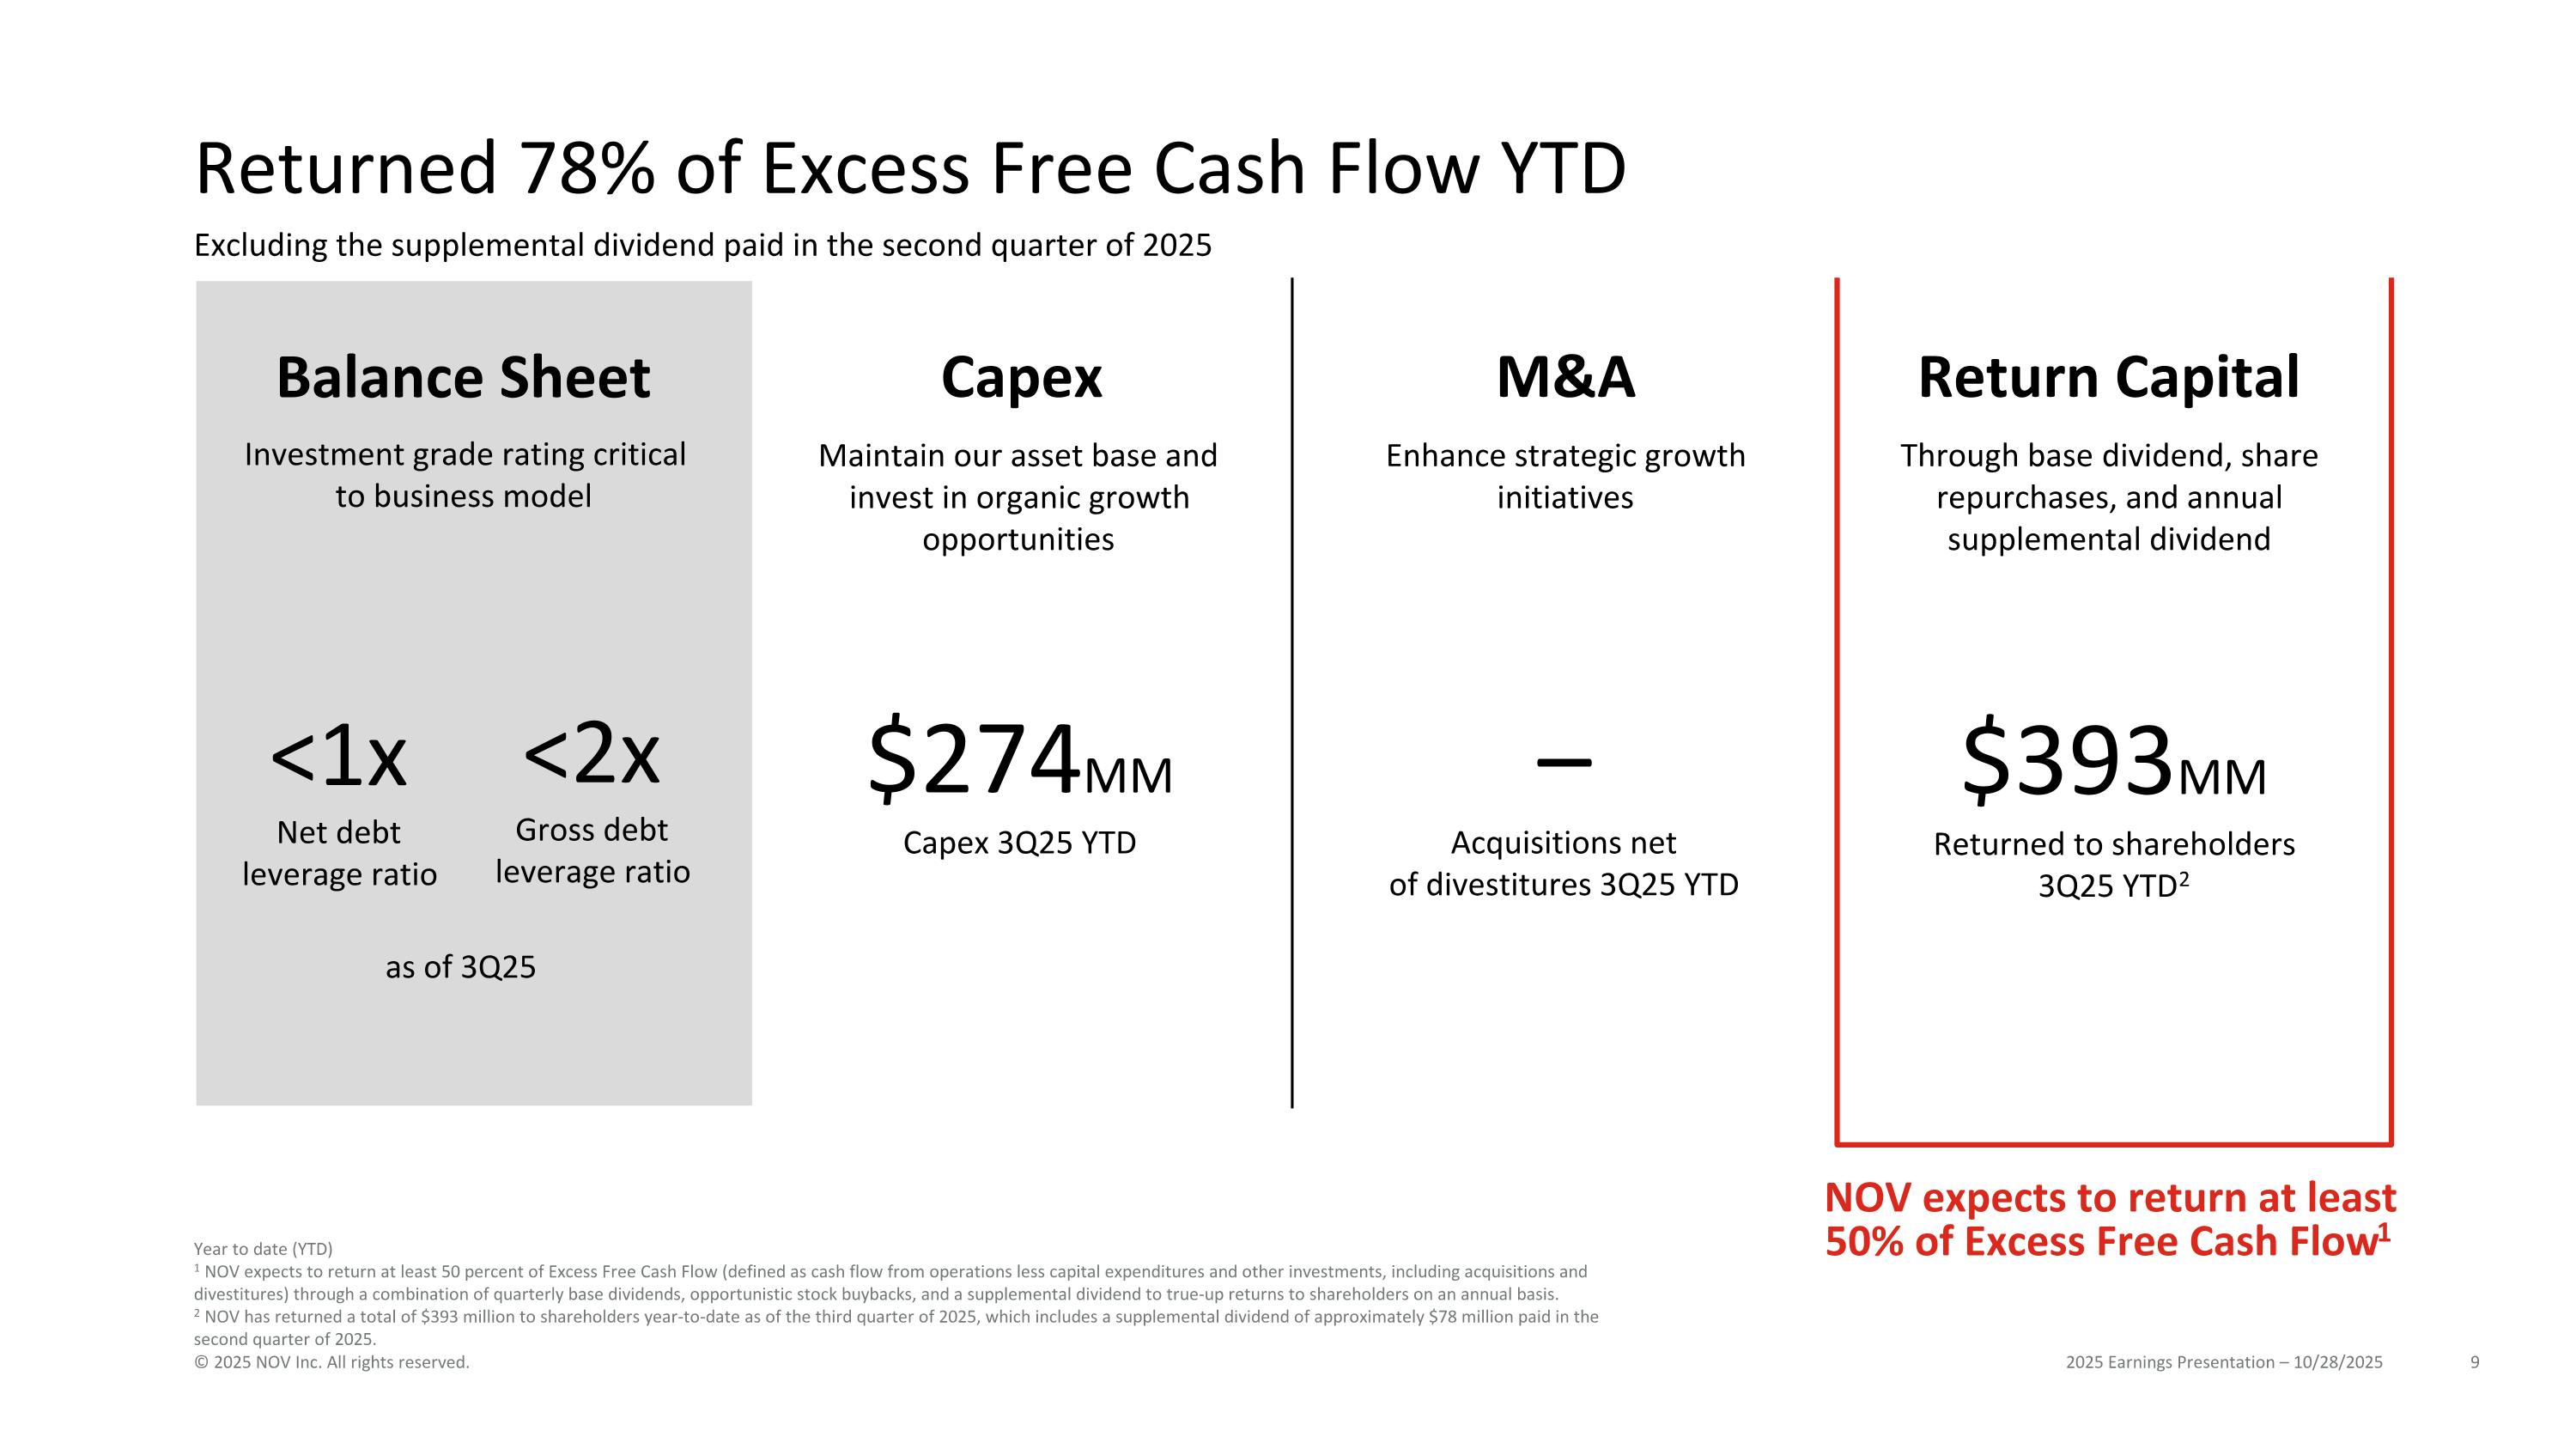
Returned 78% of Excess Free Cash Flow YTD 2025 Earnings Presentation – 10/28/2025 © 2025 NOV Inc. All rights reserved. NOV expects to return at least 50% of Excess Free Cash Flow1 Year to date (YTD) 1 NOV expects to return at least 50 percent of Excess Free Cash Flow (defined as cash flow from operations less capital expenditures and other investments, including acquisitions and divestitures) through a combination of quarterly base dividends, opportunistic stock buybacks, and a supplemental dividend to true-up returns to shareholders on an annual basis. 2 NOV has returned a total of $393 million to shareholders year-to-date as of the third quarter of 2025, which includes a supplemental dividend of approximately $78 million paid in the second quarter of 2025. Maintain our asset base and invest in organic growth opportunities Enhance strategic growth initiatives Through base dividend, share repurchases, and annual supplemental dividend Balance Sheet Capex M&A Return Capital Investment grade rating critical to business model $274MM Capex 3Q25 YTD – Acquisitions net of divestitures 3Q25 YTD <1x Net debt leverage ratio <2x Gross debt leverage ratio as of 3Q25 $393MM Returned to shareholders 3Q25 YTD2 Excluding the supplemental dividend paid in the second quarter of 2025
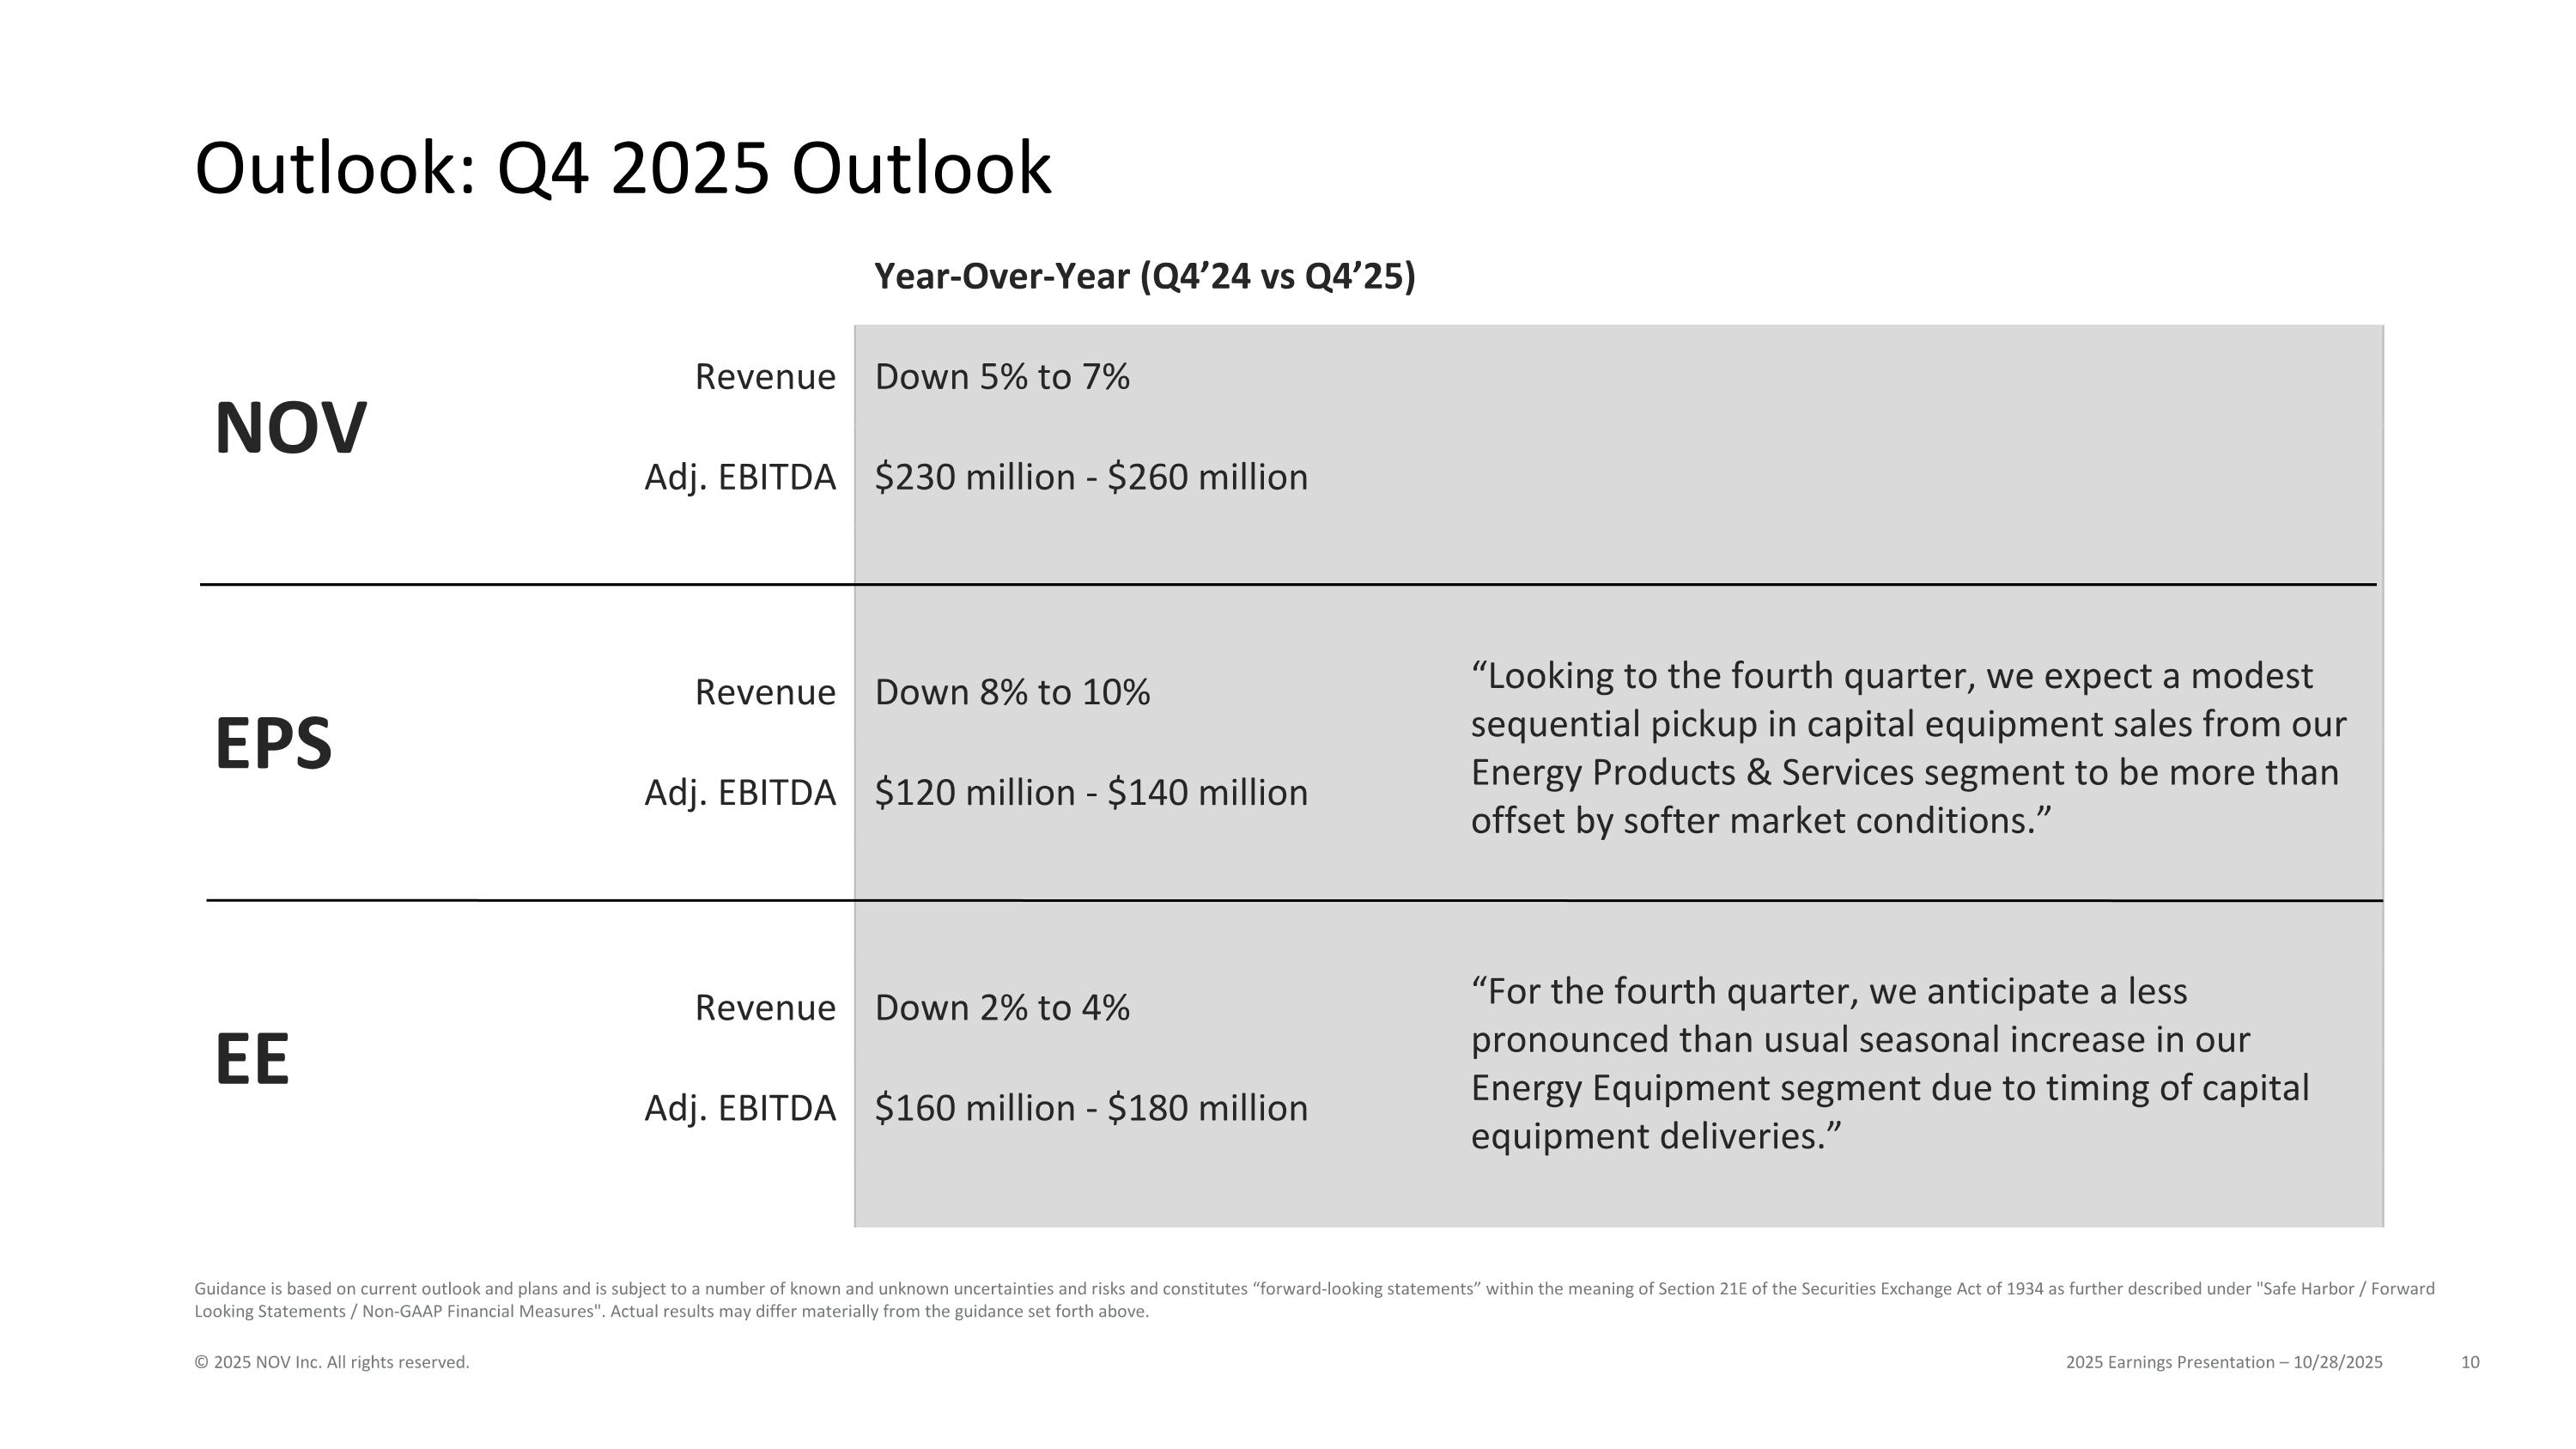
Outlook: Q4 2025 Outlook 2025 Earnings Presentation – 10/28/2025 © 2025 NOV Inc. All rights reserved. Year-Over-Year (Q4’24 vs Q4’25) NOV Revenue Down 5% to 7% Adj. EBITDA $230 million - $260 million EPS Revenue Down 8% to 10% “Looking to the fourth quarter, we expect a modest sequential pickup in capital equipment sales from our Energy Products & Services segment to be more than offset by softer market conditions.” Adj. EBITDA $120 million - $140 million EE Revenue Down 2% to 4% “For the fourth quarter, we anticipate a less pronounced than usual seasonal increase in our Energy Equipment segment due to timing of capital equipment deliveries.” Adj. EBITDA $160 million - $180 million Guidance is based on current outlook and plans and is subject to a number of known and unknown uncertainties and risks and constitutes “forward-looking statements” within the meaning of Section 21E of the Securities Exchange Act of 1934 as further described under "Safe Harbor / Forward Looking Statements / Non-GAAP Financial Measures". Actual results may differ materially from the guidance set forth above.
Appendix 2025 Earnings Presentation – 10/28/2025 © 2025 NOV Inc. All rights reserved.

Reconciliation of Net Income to Adjusted EBITDA (Unaudited) 2025 Earnings Presentation – 10/28/2025 © 2025 NOV Inc. All rights reserved. In millions Three Months Ended Nine Months Ended September 30, June 30, September 30, 2025 2024 2025 2025 2024 Revenue: Energy Products and Services $ 971 $ 1,003 $ 1,025 $ 2,988 $ 3,070 Energy Equipment 1,247 1,219 1,207 3,600 3,601 Eliminations (42 ) (31 ) (44 ) (121 ) (109 ) Total revenue 2,176 2,191 2,188 6,467 6,562 Adjusted EBITDA: Energy Products and Services $ 135 $ 172 $ 146 $ 426 $ 530 Energy Equipment 180 159 158 503 420 Eliminations and corporate costs (57 ) (45 ) (52 ) (167 ) (142 ) Total Adjusted EBITDA $ 258 $ 286 $ 252 $ 762 $ 808 Adjusted EBITDA %: Energy Products and Services 13.9 % 17.1 % 14.2 % 14.3 % 17.3 % Energy Equipment 14.4 % 13.0 % 13.1 % 14.0 % 11.7 % Eliminations and corporate costs — — — — — Total Adjusted EBITDA % 11.9 % 13.1 % 11.5 % 11.8 % 12.3 % Reconciliation of Adjusted EBITDA: GAAP net income attributable to Company $ 42 $ 130 $ 108 $ 223 $ 475 Noncontrolling interests 2 — 6 9 (1 ) Provision for income taxes 29 44 1 77 158 Interest and financial costs 22 21 22 66 67 Interest income (11 ) (11 ) (10 ) (32 ) (27 ) Equity (income) loss in unconsolidated affiliates 11 — (1 ) 10 (37 ) Other expense, net 12 10 17 49 34 (Gain) loss on sales of fixed assets (3 ) 1 3 (2 ) — Depreciation and amortization 89 86 87 265 255 Other items, net 65 5 19 97 (116 ) Total Adjusted EBITDA $ 258 $ 286 $ 252 $ 762 $ 808
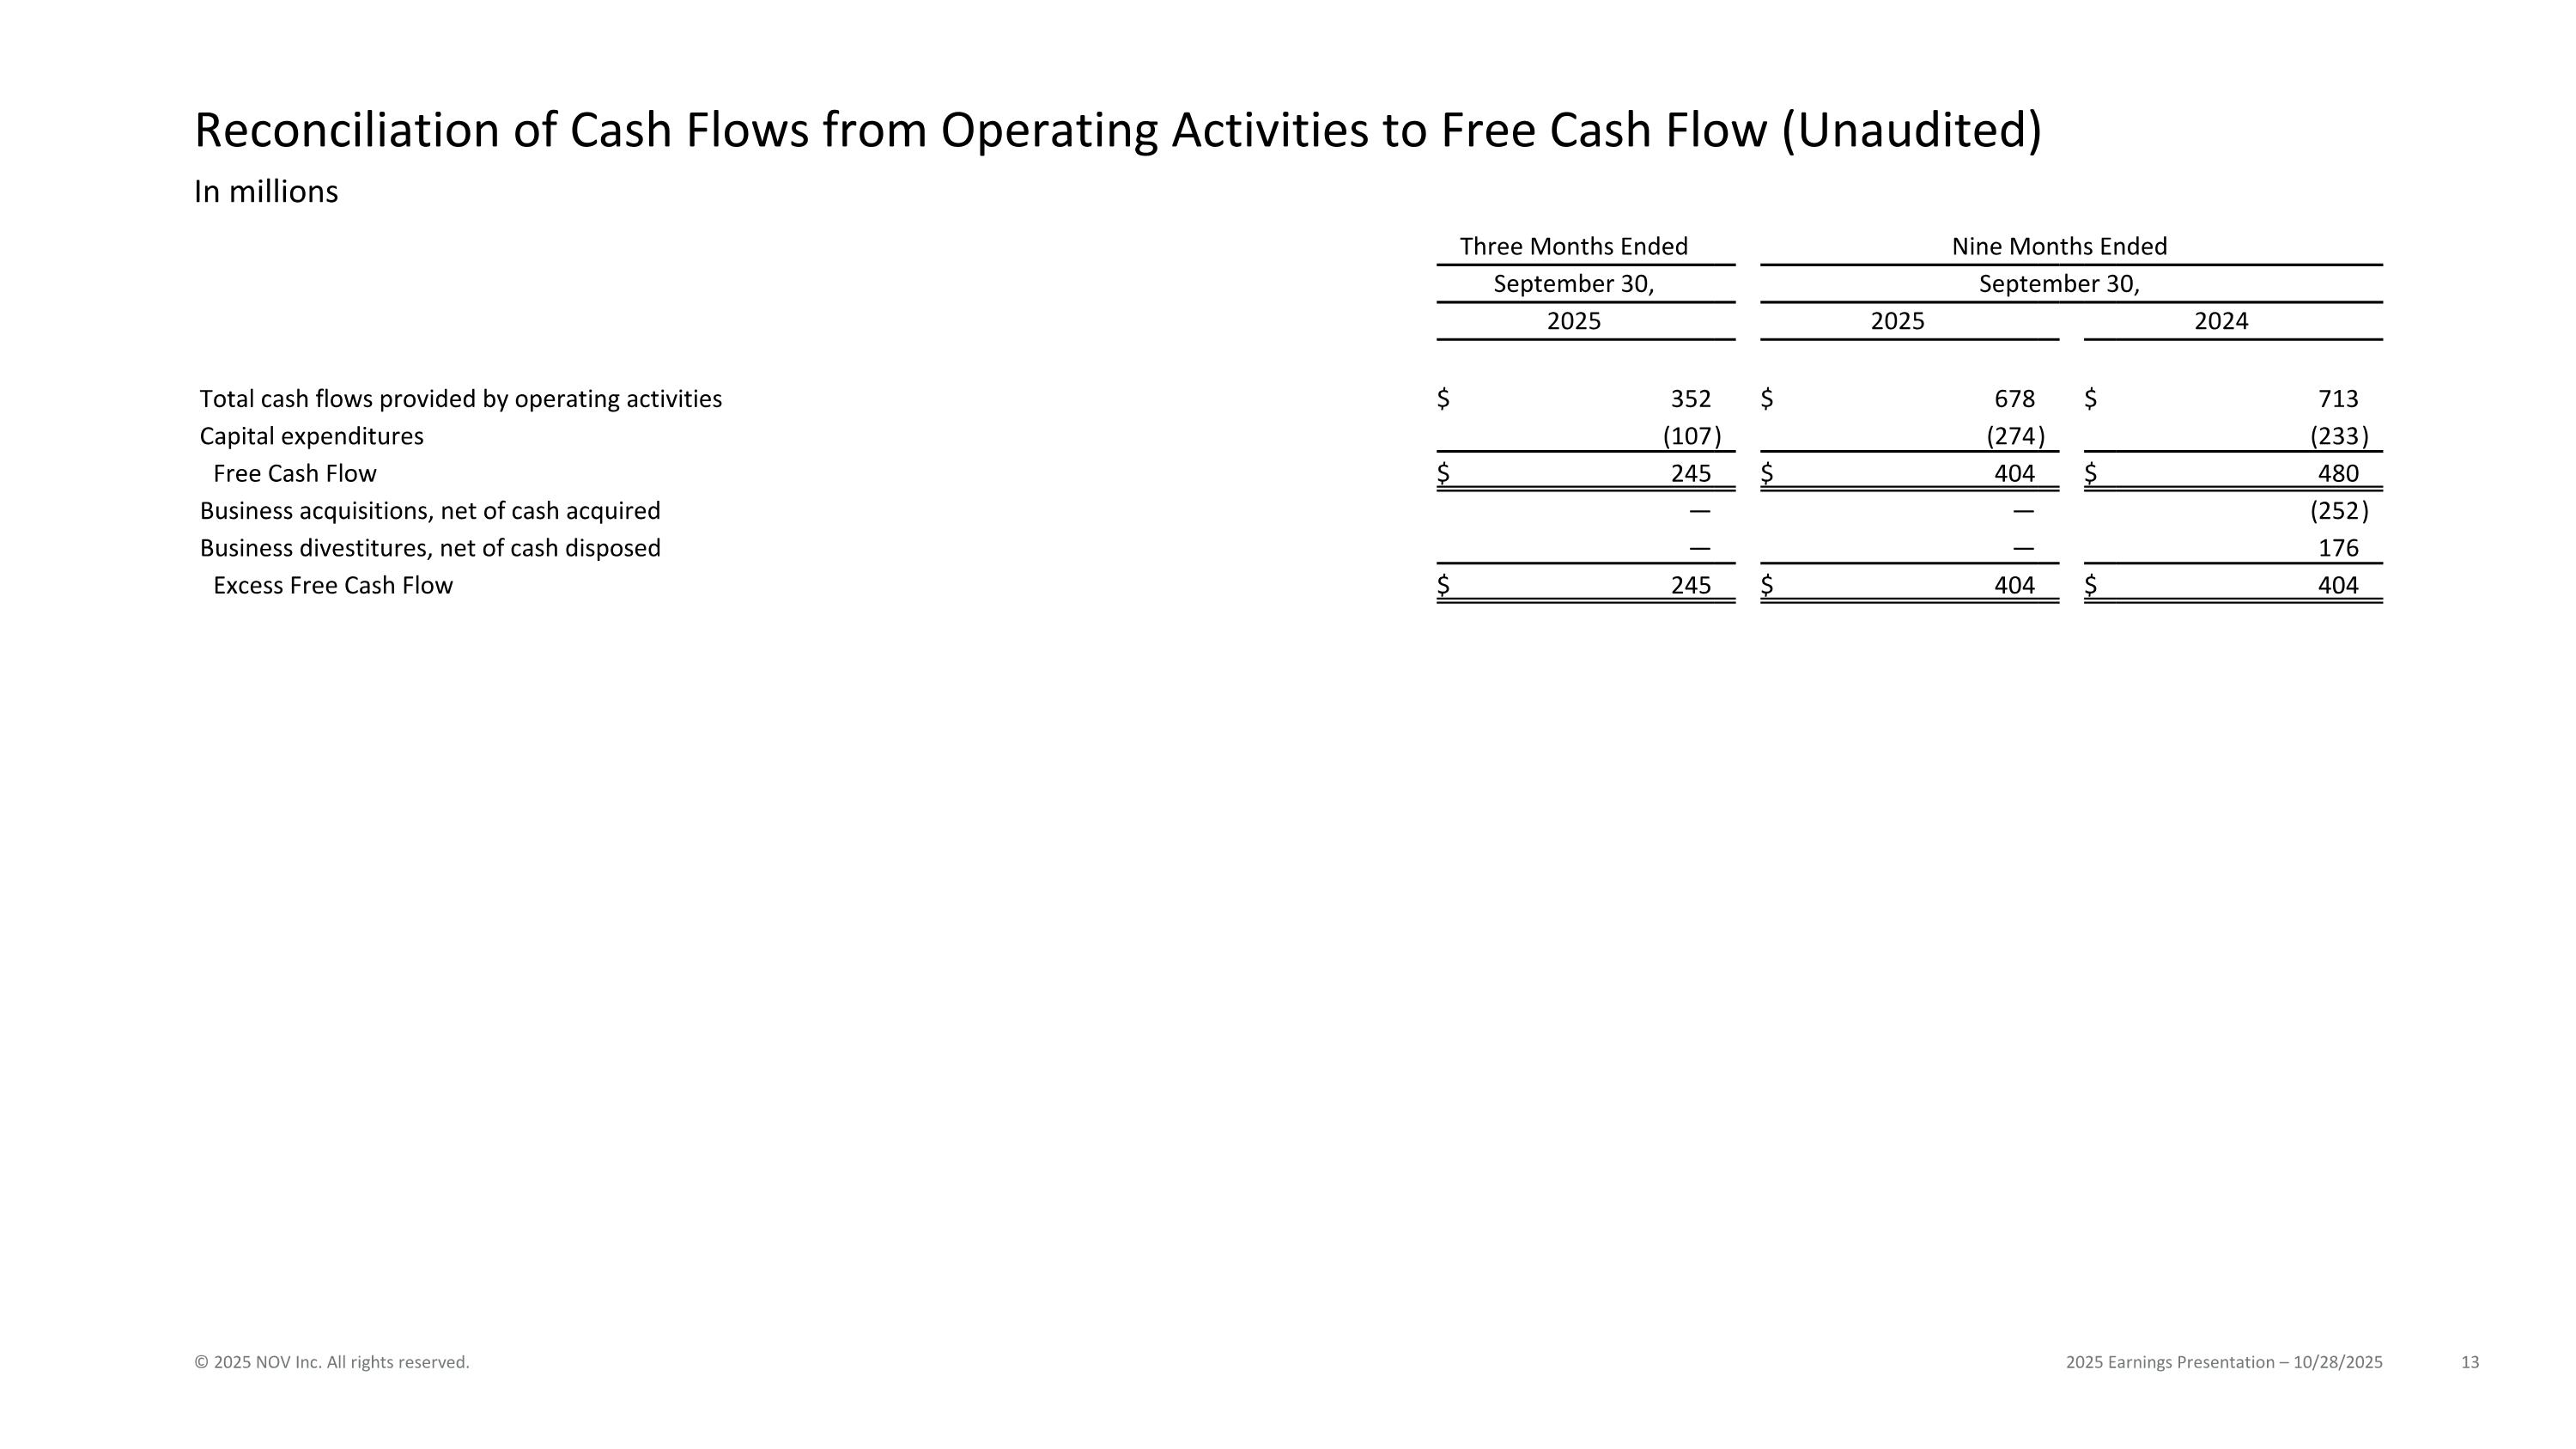
Reconciliation of Cash Flows from Operating Activities to Free Cash Flow (Unaudited) 2025 Earnings Presentation – 10/28/2025 © 2025 NOV Inc. All rights reserved. In millions Three Months Ended Nine Months Ended September 30, September 30, 2025 2025 2024 Total cash flows provided by operating activities $ 352 $ 678 $ 713 Capital expenditures (107 ) (274 ) (233 ) Free Cash Flow $ 245 $ 404 $ 480 Business acquisitions, net of cash acquired — — (252 ) Business divestitures, net of cash disposed — — 176 Excess Free Cash Flow $ 245 $ 404 $ 404

2025 Earnings Presentation – 10/28/2025 © 2025 NOV Inc. All rights reserved.