QUARTERLY REPORT PURSUANT TO SECTION 13 OR 15(d) OF THE SECURITIES EXCHANGE ACT OF 1934
FOR THE QUARTERLY PERIOD ENDED SEPTEMBER 30, 2025
OR
☐
TRANSITION REPORT PURSUANT TO SECTION 13 OR 15(d) OF THE SECURITIES EXCHANGE ACT OF 1934
Commission File Number 1-12317
NOV INC.
(Exact name of registrant as specified in its charter)
Delaware
76-0475815
(State or other jurisdiction
of incorporation or organization)
(IRS Employer
Identification No.)
10353 Richmond Avenue Houston, Texas
77042-4103
(Address of principal executive offices)
(346) 223-3000
(Registrant’s telephone number, including area code)
Securities registered pursuant to Section 12(b) of the Act:
Title of each class
Trading Symbol(s)
Name of each exchange on which registered
Common Stock, par value $.01 per share
NOV
New York Stock Exchange
Indicate by check mark whether the registrant (1) has filed all reports required to be filed by Section 13 or 15(d) of the Securities Exchange Act of 1934 during the preceding 12 months (or for such shorter period that the registrant was required to file such reports), and (2) has been subject to such filing requirements for the past 90 days. Yes ☒ No ☐
Indicate by check mark whether the registrant has submitted electronically, every Interactive Data File required to be submitted pursuant to Rule 405 of Regulation S-T (§232.405 of this chapter) during the preceding 12 months (or for such shorter period that the registrant was required to submit such files). Yes ☒ No ☐
Indicate by check mark whether the registrant is a large accelerated filer, an accelerated filer, a non-accelerated filer, smaller reporting company, or an emerging growth company. See the definitions of “large accelerated filer”, “accelerated filer”, “smaller reporting company” and “emerging growth company” in Rule 12b-2 of the Exchange Act.
Large accelerated filer
☑
Accelerated filer
☐
Non-accelerated filer
☐
Smaller reporting company
☐
Emerging growth company
☐
If an emerging growth company, indicate by check mark if the registrant has elected not to use the extended transition period for complying with any new or revised financial accounting standards provided pursuant to Section 13(a) of the Exchange Act. ☐
Indicate by check mark whether the registrant is a shell company (as defined in Rule 12b-2 of the Exchange Act). Yes ☐ No ☑
As of October 24, 2025 the registrant had 364,752,877 shares of common stock, par value $0.01 per share, outstanding.
PART I - FINANCIAL INFORMATION
Item 1. Financial Statements
NOV INC.
CONSOLIDATED BALANCE SHEETS
(In millions, except share data)
September 30,
December 31,
2025
2024
ASSETS
(Unaudited)
Current assets:
Cash and cash equivalents
$
1,207
$
1,230
Receivables, net
1,871
1,819
Inventories, net
1,886
1,932
Contract assets
576
577
Prepaid and other current assets
222
212
Total current assets
5,762
5,770
Property, plant and equipment, net
2,025
1,922
Lease right-of-use assets, operating
340
353
Lease right-of-use assets, financing
192
196
Deferred income taxes
389
413
Goodwill
1,623
1,630
Intangibles, net
466
508
Investment in unconsolidated affiliates
173
163
Other assets
368
406
Total assets
$
11,338
$
11,361
LIABILITIES AND STOCKHOLDERS’ EQUITY
Current liabilities:
Accounts payable
$
798
$
837
Accrued liabilities
760
861
Contract liabilities
564
492
Current portion of lease liabilities
101
102
Current portion of long-term debt
34
37
Accrued income taxes
7
18
Total current liabilities
2,264
2,347
Long-term debt
1,692
1,703
Lease liabilities
528
544
Deferred income taxes
74
56
Other liabilities
268
283
Total liabilities
4,826
4,933
Commitments and contingencies
Stockholders’ equity:
Common stock - par value $.01; 1 billion shares authorized; 366,505,774 and 381,549,541 shares issued and outstanding at September 30, 2025 and December 31, 2024
4
4
Additional paid-in capital
8,429
8,625
Accumulated other comprehensive loss
(1,410
)
(1,625
)
Retained deficit
(568
)
(628
)
Total Company stockholders’ equity
6,455
6,376
Noncontrolling interests
57
52
Total stockholders’ equity
6,512
6,428
Total liabilities and stockholders’ equity
$
11,338
$
11,361
See notes to unaudited consolidated financial statements.
2
NOV INC.
CONSOLIDATED STATEMENTS OF INCOME (UNAUDITED)
(In millions, except per share data)
Three Months Ended
Nine Months Ended
September 30,
September 30,
2025
2024
2025
2024
Revenue
$
2,176
$
2,191
$
6,467
$
6,562
Cost of revenue
1,764
1,722
5,162
5,045
Gross profit
412
469
1,305
1,517
Selling, general and administrative
305
275
903
848
Operating profit
107
194
402
669
Interest and financial costs
(22
)
(21
)
(66
)
(67
)
Interest income
11
11
32
27
Equity income (loss) in unconsolidated affiliates
(11
)
—
(10
)
37
Other expense, net
(12
)
(10
)
(49
)
(34
)
Net income before income taxes
73
174
309
632
Provision for income taxes
29
44
77
158
Net income
44
130
232
474
Net income (loss) attributable to noncontrolling interests
2
—
9
(1
)
Net income attributable to Company
$
42
$
130
$
223
$
475
Net income attributable to Company per share:
Basic
$
0.11
$
0.33
$
0.59
$
1.21
Diluted
$
0.11
$
0.33
$
0.59
$
1.20
Cash dividends per share
$
0.075
$
0.075
$
0.435
$
0.20
Weighted average shares outstanding:
Basic
370
392
375
394
Diluted
371
395
377
397
See notes to unaudited consolidated financial statements.
3
NOV INC.
CONSOLIDATED STATEMENTS OF COMPREHENSIVE INCOME (UNAUDITED)
(In millions)
Three Months Ended
Nine Months Ended
September 30,
September 30,
2025
2024
2025
2024
Net income
$
44
$
130
$
232
$
474
Currency translation adjustments
—
49
193
(8
)
Changes in derivative financial instruments, net of tax
—
2
20
4
Changes in defined benefit plans, net of tax
1
(4
)
2
(5
)
Comprehensive income
45
177
447
465
Comprehensive income (loss) attributable to noncontrolling interests
2
—
9
(1
)
Comprehensive income attributable to Company
$
43
$
177
$
438
$
466
See notes to unaudited consolidated financial statements.
4
NOV INC.
CONSOLIDATED STATEMENTS OF CASH FLOWS (UNAUDITED)
(In millions)
Nine Months Ended
September 30,
2025
2024
Cash flows from operating activities:
Net income
$
232
$
474
Adjustments to reconcile net income to net cash provided by operating activities:
Depreciation and amortization
265
255
Deferred income taxes
39
53
Equity (income) loss in unconsolidated affiliates
10
(37
)
Dividend from unconsolidated affiliate
1
84
Stock-based compensation
50
53
Gain on business divestiture
—
(131
)
Other, net
88
51
Change in operating assets and liabilities, net of acquisitions:
Receivables
54
12
Inventories
23
81
Contract assets
1
55
Prepaid and other current assets
(9
)
(2
)
Accounts payable
(39
)
(87
)
Accrued liabilities
(108
)
(72
)
Contract liabilities
73
(38
)
Income taxes payable
(10
)
(1
)
Other assets/liabilities, net
8
(37
)
Net cash provided by operating activities
$
678
$
713
Cash flows from investing activities:
Purchases of property, plant and equipment
(274
)
(233
)
Business acquisitions, net of cash acquired
—
(252
)
Business divestitures, net of cash disposed
—
176
Other
8
1
Net cash used in investing activities
$
(266
)
$
(308
)
Cash flows from financing activities:
Borrowings against lines of credit and other debt
2
419
Payments against lines of credit and other debt
(17
)
(422
)
Cash dividends paid
(163
)
(79
)
Share repurchases
(230
)
(117
)
Financing leases
(20
)
(19
)
Other
(23
)
(17
)
Net cash used in financing activities
(451
)
(235
)
Effect of exchange rates on cash
16
(1
)
Increase (decrease) in cash and cash equivalents
(23
)
169
Cash and cash equivalents, beginning of period
1,230
816
Cash and cash equivalents, end of period
$
1,207
$
985
Supplemental disclosures of cash flow information:
Cash payments during the period for:
Interest
$
47
$
48
Income taxes
$
179
$
124
See notes to unaudited consolidated financial statements.
5
NOV INC.
CONSOLIDATED STATEMENTS OF STOCKHOLDERS’ EQUITY (UNAUDITED)
(In millions)
Shares Issued and Outstanding
Common Stock
Additional Paid-in Capital
Accumulated Other Comprehensive Loss
Retained Deficit
Total Company Stockholders’ Equity
Noncontrolling Interests
Total Stockholders’ Equity
Balance at December 31, 2024
382
$
4
$
8,625
$
(1,625
)
$
(628
)
$
6,376
$
52
$
6,428
Net income
—
—
—
—
73
73
1
74
Other comprehensive income
—
—
—
98
—
98
—
98
Cash dividends, $0.075 per common share
—
—
—
—
(28
)
(28
)
—
(28
)
Stock-based compensation
—
—
16
—
—
16
—
16
Common stock issued
3
—
—
—
—
—
—
—
Withholding taxes
(1
)
—
(13
)
—
—
(13
)
—
(13
)
Share repurchases
(5
)
—
(81
)
—
—
(81
)
—
(81
)
Other
(1
)
—
(1
)
—
—
(1
)
1
—
Balance at March 31, 2025
378
$
4
$
8,546
$
(1,527
)
$
(583
)
$
6,440
$
54
$
6,494
Net income
—
—
—
—
108
108
6
114
Other comprehensive income
—
—
—
116
—
116
—
116
Cash dividends, $0.285 per common share
—
—
—
—
(107
)
(107
)
—
(107
)
Transactions with non-controlling interests
—
—
—
—
—
—
(5
)
(5
)
Stock-based compensation
—
—
17
—
—
17
—
17
Share repurchases
(6
)
—
(69
)
—
—
(69
)
—
(69
)
Other
1
—
(1
)
—
—
(1
)
(1
)
(2
)
Balance at June 30, 2025
373
$
4
$
8,493
$
(1,411
)
$
(582
)
$
6,504
$
54
$
6,558
Net income
—
—
—
—
42
42
2
44
Other comprehensive income
—
—
—
1
—
1
—
1
Cash dividends, $0.075 per common share
—
—
—
—
(28
)
(28
)
—
(28
)
Stock-based compensation
—
—
17
—
—
17
—
17
Share repurchases
(6
)
—
(80
)
—
—
(80
)
—
(80
)
Other
—
—
(1
)
—
—
(1
)
1
—
Balance at September 30, 2025
367
$
4
$
8,429
$
(1,410
)
$
(568
)
$
6,455
$
57
$
6,512
6
Shares Issued and Outstanding
Common Stock
Additional Paid-in Capital
Accumulated Other Comprehensive Loss
Retained Deficit
Total Company Stockholders’ Equity
Noncontrolling Interests
Total Stockholders’ Equity
Balance at December 31, 2023
394
$
4
$
8,812
$
(1,493
)
$
(1,155
)
$
6,168
$
74
$
6,242
Net income
—
—
—
—
119
119
2
121
Other comprehensive loss
—
—
—
(27
)
—
(27
)
—
(27
)
Cash dividends, $0.05 per common share
—
—
—
—
(20
)
(20
)
—
(20
)
Transactions with non-controlling interests
—
—
1
—
—
1
(1
)
—
Stock-based compensation
—
—
19
—
—
19
—
19
Common stock issued
3
—
—
—
—
—
—
—
Withholding taxes
(1
)
—
(15
)
—
—
(15
)
—
(15
)
Other
—
—
1
—
—
1
—
1
Balance at March 31, 2024
396
$
4
$
8,818
$
(1,520
)
$
(1,056
)
$
6,246
$
75
$
6,321
Net income
—
—
—
—
226
226
(3
)
223
Other comprehensive loss
—
—
—
(29
)
—
(29
)
—
(29
)
Cash dividends, $0.075 per common share
—
—
—
—
(30
)
(30
)
—
(30
)
Transactions with non-controlling interests
—
—
(17
)
—
—
(17
)
(19
)
(36
)
Stock-based compensation
—
—
17
—
—
17
—
17
Share repurchases
(2
)
—
(37
)
—
—
(37
)
—
(37
)
Other
—
—
3
—
—
3
—
3
Balance at June 30, 2024
394
$
4
$
8,784
$
(1,549
)
$
(860
)
$
6,379
$
53
$
6,432
Net income
—
—
—
—
130
130
—
130
Other comprehensive income
—
—
—
47
—
47
—
47
Cash dividends, $0.075 per common share
—
—
—
—
(29
)
(29
)
—
(29
)
Transactions with non-controlling interests
—
—
—
—
—
—
(1
)
(1
)
Stock-based compensation
—
—
17
—
—
17
—
17
Share repurchases
(5
)
—
(80
)
—
—
(80
)
—
(80
)
Balance at September 30, 2024
389
$
4
$
8,721
$
(1,502
)
$
(759
)
$
6,464
$
52
$
6,516
See notes to unaudited consolidated financial statements.
7
NOV INC.
Notes to Consolidated Financial Statements (Unaudited)
1. Basis of Presentation
The accompanying unaudited consolidated financial statements of NOV Inc. (“NOV” or the “Company”) present information in accordance with generally accepted accounting principles in the United States (“GAAP”) for interim financial information and the instructions to Form 10-Q and applicable rules of Regulation S-X. They do not include all information or footnotes required by GAAP for complete consolidated financial statements and should be read in conjunction with the audited consolidated financial statements and footnotes included in the Company’s 2024 Annual Report on Form 10-K. Certain reclassifications have been made to prior period financial information in order to conform with current period presentation.
In our opinion, the consolidated financial statements include all adjustments, which are of a normal recurring nature unless otherwise disclosed, necessary for a fair presentation of the results for the interim periods. The results of operations for the three and nine months ended September 30, 2025 are not necessarily indicative of the results to be expected for the full year.
The preparation of financial statements in conformity with GAAP requires management to make estimates and assumptions that affect reported and contingent amounts of assets and liabilities as of the date of the financial statements and reported amounts of revenues and expenses during the reporting period. Actual results could differ from those estimates.
The fair values of cash and cash equivalents, receivables and payables were approximately the same as their presented carrying values because of the short maturities of these instruments. The fair value of long-term debt is provided in Note 8, and the fair values of derivative financial instruments are provided in Note 11.
2. Inventories, net
Inventories consist of (in millions):
September 30,
December 31,
2025
2024
Raw materials and supplies
$
466
$
394
Work in process
218
181
Finished goods and purchased products
1,466
1,643
2,150
2,218
Less: Inventory reserve
(264
)
(286
)
Total
$
1,886
$
1,932
3. Accrued Liabilities
Accrued liabilities consist of (in millions):
September 30,
December 31,
2025
2024
Compensation
$
232
$
268
Vendor costs
129
141
Taxes (non-income)
107
119
Warranties
68
68
Insurance
47
43
Interest
26
11
Commissions
18
16
Fair value of derivatives
6
24
Other
127
171
Total
$
760
$
861
8
4. Accumulated Other Comprehensive Loss
The components of accumulated other comprehensive loss are as follows (in millions):
Derivative
Employee
Currency
Financial
Benefit
Translation
Instruments,
Plans,
Adjustments
Net of Tax
Net of Tax
Total
Balance at December 31, 2024
$
(1,569
)
$
(10
)
$
(46
)
$
(1,625
)
Accumulated other comprehensive income before reclassifications
185
21
—
206
Amounts reclassified from accumulated other comprehensive loss
8
(1
)
2
9
Balance at September 30, 2025
$
(1,376
)
$
10
$
(44
)
$
(1,410
)
The components of amounts reclassified from accumulated other comprehensive loss are as follows (in millions):
Three Months Ended
September 30,
2025
2024
Currency
Derivative
Employee
Currency
Derivative
Employee
Translation
Financial
Benefit
Translation
Financial
Benefit
Adjustments
Instruments
Plans
Total
Adjustments
Instruments
Plans
Total
Revenue
$
—
$
(3
)
$
—
$
(3
)
$
—
$
—
$
—
$
—
Cost of revenue
—
(3
)
—
(3
)
—
1
—
1
Selling, general and administrative
3
—
1
4
—
—
—
—
Tax effect
—
1
—
1
1
—
(1
)
—
$
3
$
(5
)
$
1
$
(1
)
$
1
$
1
$
(1
)
$
1
Nine Months Ended
September 30,
2025
2024
Currency
Derivative
Employee
Currency
Derivative
Employee
Translation
Financial
Benefit
Translation
Financial
Benefit
Adjustments
Instruments
Plans
Total
Adjustments
Instruments
Plans
Total
Revenue
$
—
$
(1
)
$
—
$
(1
)
$
—
$
1
$
—
$
1
Cost of revenue
—
—
—
—
—
2
—
2
Selling, general and administrative
8
—
2
10
—
—
—
—
Tax effect
—
—
—
—
1
—
(1
)
—
$
8
$
(1
)
$
2
$
9
$
1
$
3
$
(1
)
$
3
The Company’s reporting currency is the U.S. dollar. A majority of the Company’s international entities in which there is a substantial investment have the local currency as their functional currency. As a result, currency translation adjustments resulting from the process of translating the entities’ financial statements into the reporting currency are reported in other comprehensive income (loss).
The effect of changes in the fair values of derivatives designated as cash flow hedges are accumulated in other comprehensive loss, net of tax, until the underlying transactions are realized. The movement in other comprehensive loss from period to period will be the combination of: 1) changes in fair value of open derivatives of $5 million and $21 million during the three and nine months ended September 30, 2025; and, 2) the outflow of other comprehensive loss related to cumulative changes in the fair value of derivatives that have settled in the current period, which were $(5) million and $(1) million for the three and nine months ended September 30, 2025.
5. Segments
The Company has two reportable segments, Energy Products and Services, and Energy Equipment, based on the products and services provided, customer base, and operating environment. These reportable segments are determined as those businesses for which results are reviewed regularly by our Chief Executive Officer, who is identified as the Chief Operating Decision Maker, in allocating resources and assessing performance.
9
The following table presents financial data by business segment (in millions):
Three Months Ended
September 30,
2025
2024
Energy Products and Services
Energy Equipment
Eliminations and corporate costs (1)
Total
Energy Products and Services
Energy Equipment
Eliminations and corporate costs (1)
Total
Revenue from external customers
$
946
$
1,230
$
—
$
2,176
$
985
$
1,206
$
—
$
2,191
Intersegment revenue
25
17
(42
)
—
18
13
(31
)
—
Total revenue
971
1,247
(42
)
2,176
1,003
1,219
(31
)
2,191
Less:
Cost of revenue (2)
750
953
(19
)
1,684
713
939
(10
)
1,642
Selling, general, and administrative (2)
127
135
37
299
121
122
25
268
Depreciation and amortization
58
30
1
89
54
29
3
86
(Gain) loss on sales of fixed assets
(2
)
(1
)
—
(3
)
1
—
—
1
Operating profit
$
38
$
130
$
(61
)
$
107
$
114
$
129
$
(49
)
$
194
Reconciliation to income before income taxes:
Interest and financial costs
—
—
(22
)
(22
)
—
—
(21
)
(21
)
Interest income
—
—
11
11
—
—
11
11
Equity income (loss) in unconsolidated affiliates
(10
)
(1
)
—
(11
)
1
(1
)
—
—
Other expenses, net
—
—
(12
)
(12
)
—
—
(10
)
(10
)
Income before income taxes
$
28
$
129
$
(84
)
$
73
$
115
$
128
$
(69
)
$
174
Other segment information:
Capital expenditures
$
66
$
37
$
4
$
107
$
58
$
21
$
3
$
82
Nine Months Ended
September 30,
2025
2024
Energy Products and Services
Energy Equipment
Eliminations and corporate costs (1)
Total
Energy Products and Services
Energy Equipment
Eliminations and corporate costs (1)
Total
Revenue from external customers
$
2,915
$
3,552
$
—
$
6,467
$
3,005
$
3,557
$
—
$
6,562
Intersegment revenue
73
48
(121
)
—
65
44
(109
)
—
Total revenue
2,988
3,600
(121
)
6,467
3,070
3,601
(109
)
6,562
Less:
Cost of revenue (2)
2,235
2,744
(55
)
4,924
2,165
2,686
(41
)
4,810
Selling, general, and administrative (2)
379
386
113
878
379
373
76
828
Depreciation and amortization
174
86
5
265
163
86
6
255
(Gain) loss on sales of fixed assets
(4
)
(2
)
4
(2
)
-
—
—
—
Operating profit
$
204
$
386
$
(188
)
$
402
$
363
$
456
$
(150
)
$
669
Reconciliation to income before income taxes:
Interest and financial costs
—
—
(66
)
(66
)
—
—
(67
)
(67
)
Interest income
—
—
32
32
—
—
27
27
Equity income (loss) in unconsolidated affiliates
(12
)
2
—
(10
)
36
1
—
37
Other expenses, net
—
—
(49
)
(49
)
—
—
(34
)
(34
)
Income before income taxes
$
192
$
388
$
(271
)
$
309
$
399
$
457
$
(224
)
$
632
Other segment information:
Capital expenditures
$
163
$
103
$
8
$
274
$
182
$
42
$
9
$
233
Investment in unconsolidated affiliates
$
167
$
6
$
—
$
173
$
164
$
6
$
—
$
170
Goodwill
$
805
$
818
$
—
$
1,623
$
796
$
816
$
—
$
1,612
Intangibles, net
$
327
$
139
$
—
$
466
$
353
$
140
$
—
$
493
Total assets
$
4,883
$
5,082
$
1,373
$
11,338
$
5,006
$
5,234
$
1,182
$
11,422
10
(1)
Sales from one segment to another generally are priced at estimated equivalent commercial selling prices; however, segments originating an external sale are credited with the full profit to the Company. Eliminations and corporate costs include intercompany transactions conducted between the two reporting segments that are eliminated in consolidation, as well as corporate costs not allocated to the segments. Intercompany transactions within each reporting segment are eliminated within each reporting segment. Also included in the eliminations and corporate costs column are capital expenditures and total assets related to corporate. Corporate assets consist primarily of cash and fixed assets.
(2)
Operating profit for the three and nine months ended September 30, 2025, included charges of $62 million and $85 million, respectively, reported in “Cost of Revenue,” primarily related to a discount charge to reflect delayed timing of the expected cash collection of royalty receivables currently in litigation as discussed in Note 6, the write-down of certain long-lived assets and inventory, and severance charges associated with facility consolidations and other restructuring activities during the third quarter of 2025, and charges related to severance and other restructuring costs during the first nine months of 2025. Operating profit included charges of $3 million and $12 million for the three and nine months ended September 30, 2025, respectively, reported in “Selling, General, and Administrative.” These charges were primarily related to the release of cumulative translation adjustment (“CTA”) balances to earnings upon the liquidation of a foreign subsidiary during the third quarter of 2025, streamlining our business processes during the second quarter of 2025, and the deconsolidation of the Company’s Russian subsidiaries in the first quarter of 2025. Operating profit for the three months ended September 30, 2024, included charges of $5 million reported in “Cost of Revenue,” primarily attributed to severance pay. For the nine months ended September 30, 2024, operating profit included a credit of $116 million reported in “Cost of Revenue,” primarily attributed to a pre-tax gain on the sale of a business during the second quarter of 2024.
Three Months Ended
September 30,
2025
2024
Energy Products and Services
Energy Equipment
Corporate
Total
Energy Products and Services
Energy Equipment
Corporate
Total
Other Items included in:
Cost of revenue
$
41
$
21
$
-
$
62
$
3
$
1
$
1
$
5
Selling, general, and administrative
—
—
3
3
—
—
—
—
Total
$
41
$
21
$
3
$
65
$
3
$
1
$
1
$
5
Nine Months Ended
September 30,
2025
2024
Energy Products and Services
Energy Equipment
Corporate
Total
Energy Products and Services
Energy Equipment
Corporate
Total
Other Items included in:
Cost of revenue
$
51
$
33
$
1
$
85
$
4
$
(122
)
$
2
$
(116
)
Selling, general, and administrative
1
—
11
12
—
—
—
—
Total
$
52
$
33
$
12
$
97
$
4
$
(122
)
$
2
$
(116
)
6. Revenue
Disaggregation of Revenue
The following tables disaggregate our revenue by destinations and revenue streams, as we believe it best depicts how the nature, amount, timing and uncertainty of our revenue and cash flows are affected by economic factors (in millions).
In the table below, North America includes only the U.S. and Canada:
Three Months Ended
September 30,
2025
2024
Energy
Energy
Products
Energy
Products
Energy
and Services
Equipment
Eliminations
Total
and Services
Equipment
Eliminations
Total
North America
$
537
$
275
$
—
$
812
$
502
$
319
$
—
$
821
International
409
955
—
1,364
483
887
—
1,370
Intersegment revenue
25
17
(42
)
—
18
13
(31
)
—
$
971
$
1,247
$
(42
)
$
2,176
$
1,003
$
1,219
$
(31
)
$
2,191
Land
$
700
$
379
$
—
$
1,079
$
761
$
436
$
—
$
1,197
Offshore
246
851
—
1,097
224
770
—
994
Intersegment revenue
25
17
(42
)
—
18
13
(31
)
—
$
971
$
1,247
$
(42
)
$
2,176
$
1,003
$
1,219
$
(31
)
$
2,191
11
Nine Months Ended
September 30,
2025
2024
Energy
Energy
Products
Energy
Products
Energy
and Services
Equipment
Elims.
Total
and Services
Equipment
Elims.
Total
North America
$
1,658
$
807
$
—
$
2,465
$
1,573
$
916
$
—
$
2,489
International
1,257
2,745
—
4,002
1,432
2,641
—
4,073
Intersegment revenue
73
48
(121
)
—
65
44
(109
)
—
$
2,988
$
3,600
$
(121
)
$
6,467
$
3,070
$
3,601
$
(109
)
$
6,562
Land
$
2,192
$
1,198
$
—
$
3,390
$
2,310
$
1,323
$
—
$
3,633
Offshore
723
2,354
—
3,077
695
2,234
—
2,929
Intersegment revenue
73
48
(121
)
—
65
44
(109
)
—
$
2,988
$
3,600
$
(121
)
$
6,467
$
3,070
$
3,601
$
(109
)
$
6,562
In the table below, the revenue streams of the Energy Products and Services segment are categorized as services and rentals, sales of shorter-lived capital equipment, and sales of consumable products. The revenue streams of Energy Equipment are categorized as long-lived capital equipment sales and aftermarket sales and services.
Three Months Ended
September 30,
2025
2024
Energy Products and Services:
Services & rental
$
485
$
507
Capital equipment
293
280
Product sales
168
198
Intersegment revenue
25
18
Total
971
1,003
Energy Equipment:
Capital equipment
777
648
Aftermarket
453
558
Intersegment revenue
17
13
Total
1,247
1,219
Eliminations
(42
)
(31
)
Total consolidated
$
2,176
$
2,191
Nine Months Ended
September 30,
2025
2024
Energy Products and Services:
Services & rental
$
1,493
$
1,491
Capital equipment
916
910
Product sales
506
604
Intersegment revenue
73
65
Total
2,988
3,070
Energy Equipment:
Capital equipment
2,151
1,898
Aftermarket
1,401
1,659
Intersegment revenue
48
44
Total
3,600
3,601
Eliminations
(121
)
(109
)
Total consolidated
$
6,467
$
6,562
12
Performance Obligations
Net revenue recognized from performance obligations satisfied in previous periods was not material for the nine months ended September 30, 2025.
Remaining performance obligations represent the transaction price of firm orders for all revenue streams for which work has not been performed on contracts with original expected duration of one year or more. We do not disclose the remaining performance obligations of royalty contracts, service contracts for which there is a right to invoice, and short-term contracts that are expected to have a duration of one year or less. As of September 30, 2025, the aggregate amount of the transaction price allocated to remaining performance obligations was $5,037 million. Although numerous factors can affect timing of revenue recognized on performance obligations, such as customer change orders and supplier accelerations or delays, the Company expects to recognize approximately $544 million in revenue for the remaining performance obligations in the remainder of 2025, $1,796 million in 2026, $1,109 million in 2027, and $1,588 million thereafter.
Contract Assets and Liabilities
Contract assets include unbilled amounts when revenue recognized exceeds the amount billed to the customer under contracts where revenue is recognized over-time. Contract liabilities consist of customer billings in excess of revenue recognized under over-time contracts, customer advance payments and deferred revenue.
The changes in the carrying amount of contract assets and contract liabilities are as follows (in millions):
Contract Assets
Contract Liabilities
Balance at December 31, 2024
$
577
$
492
Billings
(1,360
)
1,212
Revenue recognized
1,335
(1,152
)
Currency translation adjustments and other
24
12
Balance at September 30, 2025
$
576
$
564
Royalty Revenue
The Company recognizes royalty revenue due under various licenses for the Company’s intellectual property, including for technology related to drill bits. The Company recognized revenue for drill bit licenses of approximately $19 million and $57 million for the three and nine months ended September 30, 2025, and $17 million and $50 million for the three and nine months ended September 30, 2024, respectively. As previously disclosed, the Company is currently pursuing litigation against certain non-paying licensees, which will impact our ability to collect the receivables timely. During the third quarter of 2025, the Company recognized a non-cash discount charge of approximately $24 million to reflect the delayed timing of expected cash collection. As of September 30, 2025, royalty receivables of $129 million, net of related reserves of $78 million and the remaining timing related discount of $51 million, are included in Other assets on the Consolidated Balance Sheets. The reserves and discounts do not impact the amount the Company is entitled to recover on its claims from the licensees in litigation. While we continue to believe it is probable the Company will collect all or substantially all of the consideration to which it is entitled pursuant to the terms of the licensing agreements, the Company will also continue to evaluate the collectibility of the receivables. Also see Note 15 to the Consolidated Financial Statements for discussion of the ongoing litigation.
Allowance for Credit Losses
The Company estimates its allowance for credit losses using information about past events, current conditions and risk characteristics of each customer, and reasonable and supportable forecasts relevant to assessing risk associated with the collectability of receivables and contract assets. The Company’s customer base, mostly in the oil and gas industry, have generally similar collectability risk characteristics, although larger and state-owned customers may have lower risk than smaller independent customers. As of September 30, 2025, the allowance for credit losses on accounts receivable and contract assets totaled $68 million.
The changes in the carrying amount of the allowance for credit losses are as follows (in millions):
Balance at December 31, 2024
$
67
Provision for expected credit losses
68
Recoveries collected
(13
)
Reclass for long-term receivables
(47
)
Write-offs
(5
)
Other
(2
)
Balance at September 30, 2025
$
68
13
7. Leases
The Company leases certain facilities and equipment to support its operations around the world. These leases generally require the Company to pay maintenance, insurance, taxes and other operating costs in addition to rent. Renewal options are common in longer term leases; however, it is rare that the Company intends to exercise a lease option at inception due to the cyclical nature of the Company’s business. Residual value guarantees are not typically part of the Company’s leases. Occasionally, the Company sub-leases excess facility space, generally at terms similar to the source lease. The Company reviews new agreements to determine if they include a lease and, when they do, uses its incremental borrowing rate to determine the present value of the future lease payments as most do not include implicit interest rates.
Components of leases are as follows (in millions):
September 30,
December 31,
2025
2024
Current portion of lease liabilities:
Operating
$
70
$
72
Financing
31
30
Total
$
101
$
102
September 30,
December 31,
2025
2024
Long-term portion of lease liabilities:
Operating
$
288
$
301
Financing
240
243
Total
$
528
$
544
8. Debt
Debt consists of (in millions):
September 30,
December 31,
2025
2024
$1.1 billion in Senior Notes, interest at 3.95% payable semiannually, principal due on December 1, 2042
$
1,091
$
1,091
$0.5 billion in Senior Notes, interest at 3.60% payable semiannually, principal due on December 1, 2029
497
496
Other debt
138
153
Total debt
1,726
1,740
Less current portion
34
37
Long-term debt
$
1,692
$
1,703
14
The Company has a revolving credit facility with a borrowing capacity of $1.5 billion through September 12, 2029. The Company has the right to increase the aggregate commitments under this agreement to an aggregate amount of up to $2.5 billion upon the consent of only those lenders holding any such increase. Interest under the multicurrency facility is based upon Secured Overnight Financing Rate (SOFR), Euro Interbank Offered Rate (EURIBOR), Sterling Overnight Index Average (SONIA), Canadian Overnight Repo Rate Average (CORRA), or Norwegian Interbank Offered Rate (NIBOR), plus 1.25% subject to a ratings-based grid or the U.S. prime rate. The credit facility contains a financial covenant establishing a maximum debt-to-capitalization ratio of 60%. As of September 30, 2025, the Company was in compliance with a debt-to-capitalization ratio of 23.5% and had no outstanding borrowings or letters of credits issued under the facility, resulting in $1.5 billion of available funds.
A consolidated joint venture of the Company borrowed $120 million against a $150 million bank line of credit, payable by June 2032, for the construction of a facility in Saudi Arabia. Interest under the bank line of credit is based upon SOFR plus 1.40%. The bank line of credit contains a financial covenant regarding maximum debt-to-equity ratio of 75%. As of September 30, 2025, the joint venture was in compliance and will not have future borrowings on the line of credit. As of September 30, 2025, the Company had $89 million in borrowings related to this line of credit. The carrying value of debt under the Company’s consolidated joint venture approximates fair value because the interest rates are variable and reflective of current market rates. The Company has $11 million in payments related to this line of credit due in the next twelve months. The Company can repay the entire outstanding facility balance without penalty at its sole discretion.
Other debt at September 30, 2025 included $48 million of amounts owed to current and former minority interest partners of NOV consolidated joint ventures, of which $23 million is due in the next twelve months.
The Company had $889 million of outstanding letters of credit at September 30, 2025, primarily in Norway and the United States, that are under various bilateral letter of credit facilities. Letters of credit are issued as bid bonds, advanced payment bonds and performance bonds.
At September 30, 2025 and December 31, 2024, the fair value of the Company’s unsecured Senior Notes approximated $1,344 million and $1,285 million, respectively. The fair value of the Company’s debt is estimated using Level 2 inputs in the GAAP fair value hierarchy and is based on quoted prices for those of similar instruments. At September 30, 2025 and December 31, 2024, the carrying value of the Company’s unsecured Senior Notes approximated $1,588 million and $1,587 million, respectively.
9. Income Taxes
The effective tax rate for the three and nine months ended September 30, 2025 was 39.7% and 24.9%, respectively, compared to 25.3% and 25.0% for the same period in 2024. The U.S. statutory tax rate was 21% for all periods presented. The effective tax rate for the three months ended September 30, 2025 was negatively impacted by a mix of earnings in higher tax rate jurisdictions, pre-tax charges discrete to the quarter in lower tax rate jurisdictions, and losses in certain jurisdictions with no tax benefit, partially offset by interest income related to payments made in connection with tax disputes of $11 million. The effective tax rate for the nine months ended September 30, 2025 was negatively impacted by a mix of earnings in higher tax rate jurisdictions and losses in certain jurisdictions with no benefit, an increase to reserves for uncertain tax positions of $23 million, unfavorable adjustments related to the carrying value of deferred tax assets of $15 million, and unfavorable adjustments related to changes in certain foreign currency exchange rates of $6 million, partially offset by the release of previously recorded reserves for uncertain tax positions of $59 million as well as interest income related to payments made in connection with tax disputes of $11 million. The effective tax rate for the three and nine months ended September 30, 2024 was negatively impacted by a mix of earnings in higher tax rate jurisdictions, losses in certain jurisdictions with no tax benefit, and adjustments to the carrying value of deferred tax assets, partially offset by the reduction of valuation allowances related to U.S. and state deferred tax assets.
10. Stock-Based Compensation
The Company’s stock-based compensation plan, known as the NOV Inc. Long-Term Incentive Plan (the “NOV Plan”), was approved by shareholders on May 11, 2018 and was amended and restated on May 24, 2022 and May 20, 2025. The NOV Plan provides for the granting of stock options, restricted stock, restricted stock units, performance awards, phantom shares, stock appreciation rights, stock payments and substitute awards. The number of shares authorized under the NOV Plan is 70.9 million. At September 30, 2025, approximately 17.1 million shares remained available for future grants under the NOV Plan. The Company also has outstanding awards under its former stock-based compensation plan known as the National Oilwell Varco, Inc. Long-Term Incentive Plan (the “Former Plan”); however, the Company is no longer granting new awards under the Former Plan.
Total expense for all stock-based compensation arrangements was $17 million and $50 million for the three and nine months ended September 30, 2025, respectively, and $17 million and $53 million for the three and nine months ended September 30, 2024, respectively.
The total income tax expense (benefit) recognized in the Consolidated Statements of Income for stock-based compensation arrangements was $(1) million and $5 million for the three and nine months ended September 30, 2025, respectively, and $(2) million and $1 million for the three and nine months ended September 30, 2024, respectively.
15
11. Derivative Financial Instruments
The Company uses forward currency contracts to manage the foreign currency exchange rate risk on forecasted revenues and expenses denominated in currencies other than the functional currency of the operating unit (cash flow hedge). The Company also executes forward currency contracts to manage the foreign currency exchange rate risk on recognized nonfunctional currency monetary accounts (non-designated hedge).
The fair values of these derivative financial instruments are determined using Level 2 inputs (inputs other than quoted prices in active markets for identical assets and liabilities that are observable either directly or indirectly for substantially the full term of the asset or liability) in the fair value hierarchy as the fair value is based on publicly available foreign exchange and interest rates at each financial reporting date.
Forward currency contracts consist of (in millions):
Currency Denomination
September 30,
December 31,
Currency
2025
2024
Colombian Peso
COP
50,194
COP
60,970
South Korean Won
KRW
26,071
KRW
45,130
Norwegian Krone
NOK
2,579
NOK
2,850
Japanese Yen
JPY
1,249
JPY
1,039
U.S. Dollar
USD
891
USD
1,031
Mexican Peso
MXN
177
MXN
405
Euro
EUR
124
EUR
95
Singapore Dollar
SGD
18
SGD
12
British Pound Sterling
GBP
5
GBP
—
Danish Krone
DKK
3
DKK
3
South African Rand
ZAR
—
ZAR
25
Canadian Dollar
CAD
—
CAD
1
Cash Flow Hedging Strategy
To protect against the volatility of forecasted foreign currency cash flows resulting from forecasted revenues and expenses, the Company maintains a cash flow hedging program. For derivative instruments that are designated and qualify as a cash flow hedge, the gain or loss on the derivative instrument is recorded in accumulated other comprehensive loss and reclassified into earnings in the same line item associated with the forecasted transaction and in the same period or periods during which the hedged transaction affects earnings (e.g., in “revenues” when the hedged transactions are cash flows associated with forecasted revenues). The Company includes time value in hedge relationships.
The Company expects accumulated other comprehensive income of $8 million will be reclassified into earnings within the next twelve months.
Non-designated Hedging Strategy
The Company enters into forward exchange contracts to hedge certain nonfunctional currency monetary accounts. The gain or loss on the derivative instrument is recognized in earnings in other income (expense), together with the changes in the hedged nonfunctional monetary accounts.
The amount of gain (loss) recognized in Other Expense, net was $(13) million and $3 million for the three and nine months ended September 30, 2025, respectively, and $19 million and $29 million for the three and nine months ended September 30, 2024, respectively.
16
The Company has the following fair values of its derivative instruments and their balance sheet classifications (in millions):
Asset Derivatives
Liability Derivatives
Fair Value
Fair Value
Balance Sheet
September 30,
December 31,
Balance Sheet
September 30,
December 31,
Location
2025
2024
Location
2025
2024
Derivatives designated as hedging instruments under ASC Topic 815
Foreign exchange contracts
Prepaid and other current assets
$
10
$
1
Accrued liabilities
$
2
$
13
Foreign exchange contracts
Other assets
—
—
Other liabilities
—
1
Designated total
$
10
$
1
$
2
$
14
Derivatives not designated as hedging instruments under ASC Topic 815
Foreign exchange contracts
Prepaid and other current assets
$
4
$
4
Accrued liabilities
$
4
$
11
Foreign exchange contracts
Other assets
—
—
Other liabilities
1
1
Non-designated total
$
4
$
4
$
5
$
12
Total
$
14
$
5
$
7
$
26
12. Net Income Attributable to Company Per Share
The following table sets forth the computation of weighted average basic and diluted shares outstanding (in millions, except per share data):
Three Months Ended
Nine Months Ended
September 30,
September 30,
2025
2024
2025
2024
Numerator:
Net income attributable to Company
$
42
$
130
$
223
$
475
Denominator:
Basic—weighted average common shares outstanding
370
392
375
394
Dilutive effect of employee stock options and other unvested stock awards
1
3
2
3
Diluted—weighted average common shares outstanding
371
395
377
397
Net income attributable to Company per share:
Basic
$
0.11
$
0.33
$
0.59
$
1.21
Diluted
$
0.11
$
0.33
$
0.59
$
1.20
Cash dividends per share
$
0.075
$
0.075
$
0.435
$
0.20
Companies with unvested participating securities are required to utilize a two-class method for the computation of net income attributable to Company per share. The two-class method requires a portion of net income attributable to Company to be allocated to participating securities, which are unvested awards of share-based payments with non-forfeitable rights to receive dividends or dividend equivalents if declared. Net income attributable to the Company allocated to these participating securities was immaterial for each of the three and nine months ended September 30, 2025 and 2024, respectively.
The Company had stock options outstanding that were anti-dilutive totaling 19 million and 16 million shares for the three and nine months ended September 30, 2025, respectively, compared to 17 million and 16 million shares for the three and nine months ended September 30, 2024, respectively.
13. Cash Dividends
Cash dividends were $28 million and $163 million for the three and nine months ended September 30, 2025, compared to $29 million and $79 million for the three and nine months ended September 30, 2024. The declaration and payment of future dividends is at the discretion of the Company’s Board of Directors and will be dependent upon the Company’s results of operations, financial condition, capital requirements and other factors deemed relevant by the Company’s Board of Directors.
17
14. Share Repurchase Program
On April 25, 2024, the Company established a share repurchase program for up to $1 billion of the currently outstanding shares of the Company’s common stock over a period of 36 months. Under the share repurchase program, the Company may repurchase shares from time to time through open market purchases, in privately negotiated transactions or by other means, including through the use of trading plans intended to qualify under Rule 10b5-1 under the Securities Exchange Act of 1934 (the “Exchange Act”), as amended, in accordance with applicable securities laws and other restrictions, including Rule 10b-18. The timing and total amount of any stock repurchases will depend upon business, economic and market conditions, corporate and regulatory requirements, prevailing stock prices and other considerations.
The Company intends to fund the repurchases using its available U.S. cash balances, which may involve the repatriation of foreign earnings not indefinitely reinvested. However, depending on U.S. cash balances, the Company may choose to borrow against its revolving credit facility or issue new debt to finance the repurchases. As shares are repurchased, they are constructively retired and returned to an unissued state. During the three months ended September 30, 2025, the Company repurchased approximately 6.2 million shares of common stock under the program for an aggregate amount of $80 million. During the nine months ended September 30, 2025, the Company repurchased 17.1 million shares of common stock under the program for an aggregate amount of $230 million.
15. Commitments and Contingencies
From time to time, the Company is involved in various claims, regulatory agency audits, investigations and legal actions involving a variety of matters. As of September 30, 2025, in the ordinary course of business, the Company recorded reserves in an amount believed to be sufficient, given the estimated range of potential outcomes, for contingent liabilities believed to be probable. These estimated liabilities are based on the Company’s assessment of the nature of these matters, their progress toward resolution, the advice of legal counsel and outside experts as well as management’s experience. The litigation process and the outcome of regulatory oversight is inherently uncertain, and our best judgment concerning the probable outcome of litigation or regulatory enforcement matters may prove to be incorrect. No assurance can be given as to the outcome of these matters. The total potential loss on these matters cannot be determined; however, in our opinion, any ultimate liability, to the extent not otherwise provided for, should not materially affect our financial position, cash flows or results of operations.
The Company is currently pursuing litigation against several companies involving royalties due under licenses for technology related to drill bits. This technology resulted in a portfolio of patents related to leaching technology, a revolutionary technology owned by the Company that improves the performance of drill bits and other products utilizing certain synthetic diamond parts. The Company previously sued several drill bit manufacturers for patent infringement and those lawsuits were resolved by a series of licensing agreements with various drill bit manufacturers. To settle and end litigation or to avoid litigation, the licensees were provided access to the portfolio of leaching patents owned by the Company in exchange for a royalty payment, as defined in each license agreement. The companies agreed to pay the royalties for the right to use the portfolio of patents, whether they used some, all or none of the specific patented claims in any particular patent. The license agreements provide that they terminate on the date of the last to expire of the patents in the licensed portfolio. Having obtained the benefit of these licenses for more than a decade, all of the drill bit manufacturer licensees unilaterally stopped making royalty payments even though all of the patents in the portfolio have not expired. These companies have asserted, among other reasons, that they are entitled to stop making these payments because they claim to not manufacture products covered by the unexpired patents. Some of these companies stopped making payments after the expiration of what are allegedly the patents in the portfolio that they elected to use. Others paid for some period of time after that date but have since stopped making payments. The Company has sued asserting that failure to pay the royalties is a breach of the license agreements at issue. The Company is in litigation with most of the licensees seeking a judicial determination that it is entitled to be paid royalties pursuant to the terms of the licenses. The licensees have responded with a number of alleged defenses and requests for declaratory judgment all focused on avoiding the payments called for under the licenses. The parties’ legal filings to date can be found in the following cases: Grant Prideco, Inc., et al. v. Schlumberger Technology Corp., et al., No. 4:23-cv-00730; Halliburton Energy Services, Inc. v. Grant Prideco, Inc., et al., No. 4:23-cv-01789; and Grant Prideco, Inc., et al. v. Baker Hughes Oilfield Operations Inc., et al., No. 4:25-cv-03459, all in the United States District Court for the Southern District of Texas. We have also recently initiated litigation against Taurex Drill Bits. The legal filings to date can be found in the case Grant Prideco, Inc., et al. v. Taurex Drill Bits, L.L.C., No. 25-BC11B-0065, in the Eleventh Business Court Division for Harris County, Texas. On September 29, 2025, and October 7, 2025, in the lawsuits against Halliburton, Ulterra and Varel, the Court issued two rulings, the effect of which is that NOV cannot collect royalties under the License Agreements, after the date each Licensee stopped making royalty payments. NOV believes the Court’s ruling is incorrect, and once the Court has entered an appealable order in each case, NOV intends to appeal the Court’s rulings. While the Company continues to strongly believe that the royalties for which it has sued are due and owing pursuant to the terms of the licensing agreements, there is inherent risk with the related litigation and the Company makes no assurances as to the outcome of such litigation. See Note 6 to the Consolidated Financial Statements for discussion of the financial impact of royalties.
18
Item 2. Management’s Discussion and Analysis of Financial Condition and Results of Operations
Introduction
NOV is a leading independent equipment and technology provider to the global energy industry. NOV and its predecessor companies have spent over 160 years helping transform oil and gas development and improving its cost-effectiveness, efficiency, safety, and environmental impact. Over the past few decades, the Company has pioneered and refined key technologies to improve the economic viability of frontier resources, including unconventional and deepwater oil and gas. More recently, by applying its deep expertise and technology, the Company has developed solutions to improve the economics of alternate energy sources.
NOV’s extensive proprietary technology portfolio supports the industry’s drilling, completion, and production needs. With unmatched cross-segment capabilities, scope, and scale, NOV continues to develop and introduce technologies that further enhance the economics and efficiencies of energy production, with a focus on digital solutions, including automation, predictive analytics, and condition-based maintenance.
NOV serves major-diversified, national, and independent service companies, contractors, and energy producers in 57 countries. NOV operates under two segments, Energy Products and Services and Energy Equipment.
Results of operations are presented in accordance with GAAP. Certain reclassifications have been made to prior period financial information in order to conform with current period presentation. The Company discloses Adjusted EBITDA (defined as operating profit excluding depreciation, amortization, gains and losses on sales of fixed assets and, when applicable, Other Items) in its periodic earnings press releases and other public disclosures to provide investors additional information about the results of ongoing operations. See “Non-GAAP Financial Measures and Reconciliations in Results of Operations” for an explanation of our use of non-GAAP financial measures and reconciliations to their corresponding measures calculated in accordance with GAAP.
Energy Products and Services
The Company’s Energy Products and Services segment primarily designs, manufactures, rents, and sells products and equipment used in drilling, intervention, completion, and production activities. Products include drill bits, downhole tools, premium drill pipe, drilling fluids, integral and weld-on connectors for conductor strings and surface casing, completion tools, and artificial lift systems. The segment also designs, manufactures, and delivers high-end composite pipe, tanks, and structures engineered to solve both corrosion and weight challenges in a wide variety of applications, including oil and gas, chemical, industrial, wastewater, fuel handling, marine and offshore, and rare earth mineral extraction.
In addition to product and equipment sales, the segment provides services, software, and digital solutions to improve drilling and completion operational performance. Services include tubular inspection and coating, solids control, and waste management. Software and digital solutions offered include drilling and completion optimization and remote monitoring (via downhole and surface instrumentation), wired drill pipe services, software controls and applications, and data management and analytics services at the edge and in the cloud.
Energy Products and Services serves oil and gas companies, drilling contractors, oilfield service companies, oilfield equipment rental companies and developers of geothermal energy. Demand for the segment’s products and services primarily depends on the level of oilfield drilling activity by oil and gas companies, drilling contractors, and oilfield service companies. Demand for the segment’s composite solutions serving applications outside of oil and gas are driven by industrial activity, infrastructure spend, and population growth.
Energy Equipment
The Company’s Energy Equipment segment manufactures and supports the capital equipment and integrated systems needed for oil and gas exploration and production, both onshore and offshore, as well as for other marine-based, industrial and renewable energy markets.
The segment designs, manufactures, and integrates technologies for drilling and producing oil and gas wells. This includes equipment and technologies needed for drilling, including land rigs, offshore drilling equipment packages, drilling rig components, managed pressure drilling, and software control systems that mechanize and automate the drilling process and rig functionality; hydraulic fracture stimulation; well intervention, including coiled tubing units, coiled tubing, and wireline units and tools; cementing products; onshore production, including fluid processing, and surface transfer as well as progressive cavity pumps; offshore production, including integrated production systems and subsea production technologies; and aftermarket support of these technologies, providing spare parts, service, and repair.
Energy Equipment primarily serves contract drillers, oilfield service companies, and oil and gas companies. Demand for the segment’s products primarily depends on capital spending plans by drilling contractors, service companies, and oil and gas companies, and secondarily on the overall level of oilfield drilling, completions, and workover activity which drives demand for equipment, spare parts, service, and repair for the segment’s large installed base of equipment.
The segment also serves marine and offshore markets, where it designs and builds equipment for wind turbine installation and cable lay vessels, and offers heavy lift cranes and jacking systems; industrial markets, where the segment provides pumps and mixers for a wide breadth of industrial end markets; and other energy transition markets, where it is applying its gas processing expertise to provide solutions that aid in wind power development, hydrogen production and carbon sequestration.
19
Critical Accounting Policies and Estimates
In our annual report on Form 10-K for the year ended December 31, 2024, we identified our most critical accounting policies. In preparing the financial statements, we make assumptions, estimates and judgments that affect the amounts reported. We periodically evaluate our estimates and judgments that are most critical in nature which are related to revenue recognition under long-term construction contracts, impairment of goodwill and other indefinite-lived intangible assets, and income taxes. Our estimates are based on historical experience and on our future expectations that we believe are reasonable. The combination of these factors forms the basis for making judgments about the carrying values of assets and liabilities that are not readily apparent from other sources. Actual results are likely to differ from our current estimates and those differences may be material.
EXECUTIVE SUMMARY
For the third quarter ended September 30, 2025, the Company generated revenues of $2.18 billion, a decrease of one percent compared to the third quarter of 2024. Net income decreased 68 percent to $42 million, or $0.11 per share, and operating profit decreased 45 percent to $107 million, or 4.9 percent of sales. The Company recorded $65 million within Other Items during the third quarter of 2025, primarily related to a discount charge to reflect delayed timing of the expected cash collection of royalty receivables currently in litigation as discussed in Note 6, the write-down of certain long-lived assets and inventory, and severance charges associated with facility consolidations and other restructuring activities. Adjusted EBITDA (operating profit excluding depreciation, amortization, gains and losses on sales of fixed assets and, when applicable, Other Items) decreased 10 percent year-over-year to $258 million, or 11.9 percent of sales. Sequentially, revenue declined less than one percent, net income declined 61 percent, and Adjusted EBITDA increased two percent.
Segment Performance
Energy Products and Services
Energy Products and Services generated revenues of $971 million in the third quarter of 2025, a decrease of three percent from the third quarter of 2024. Operating profit decreased $76 million from the prior year to $38 million, or 3.9 percent of sales, and included $41 million in Other Items. Adjusted EBITDA decreased $37 million from the prior year to $135 million, or 13.9 percent of sales. Revenue declined due to lower global drilling activity levels and delays in infrastructure projects affecting the timing of capital equipment orders. Profitability was negatively impacted by a less favorable sales mix, as well as tariffs and other inflationary pressures.
Energy Equipment
Energy Equipment generated revenues of $1,247 million in the third quarter of 2025, an increase of two percent when compared to the third quarter of 2024. Operating profit increased $1 million from the prior year to $130 million, or 10.4 percent of sales, and included $21 million in Other Items. Adjusted EBITDA increased $21 million from the prior year to $180 million, or 14.4 percent of sales, representing thirteen consecutive quarters of year-over-year Adjusted EBITDA margin growth. Higher revenue from the segment’s growing backlog of offshore production-related equipment more than offset reduced demand for aftermarket spare parts and services. Improved profitability was the result of solid execution on the segment’s backlog, cost controls and increased operational efficiencies.
New orders booked during the quarter totaled $951 million, representing a book-to-bill of 141 percent when compared to $674 million orders shipped from backlog. As of September 30, 2025, backlog for capital equipment orders for Energy Equipment totaled $4.56 billion, an increase of $77 million from the third quarter of 2024.
20
Oil & Gas Equipment and Services Market and Outlook
Macroeconomic uncertainties remain elevated due to geopolitical conflicts, changes to trade policies, and the decision by OPEC+ to return larger than anticipated quantities of oil to the market. These factors are raising concerns for both supply and demand related challenges to global commodity markets, resulting in lower oil prices, significant market volatility, and greater uncertainty.
Current market conditions present a difficult environment for making capital investment decisions, and the short-term outlook remains uncertain, with clearer downside risk than upside. However, management does not expect near-term volatility to affect broader industry trends including: (1) offshore and international resources becoming the primary source for future incremental supplies of oil to meet global demand; (2) growing focus on natural gas from deepwater and unconventional resources to meet growing global demand for power; and (3) the application of emerging technologies to drive efficiencies and productivity in energy operations.
NOV remains focused on the development and commercialization of innovative products and services that lower the marginal cost and environmental footprint of energy production. We believe this strategy along with continued efforts to improve organizational efficiencies will further advance the Company’s competitive position in any market environment.
Operating Environment Overview
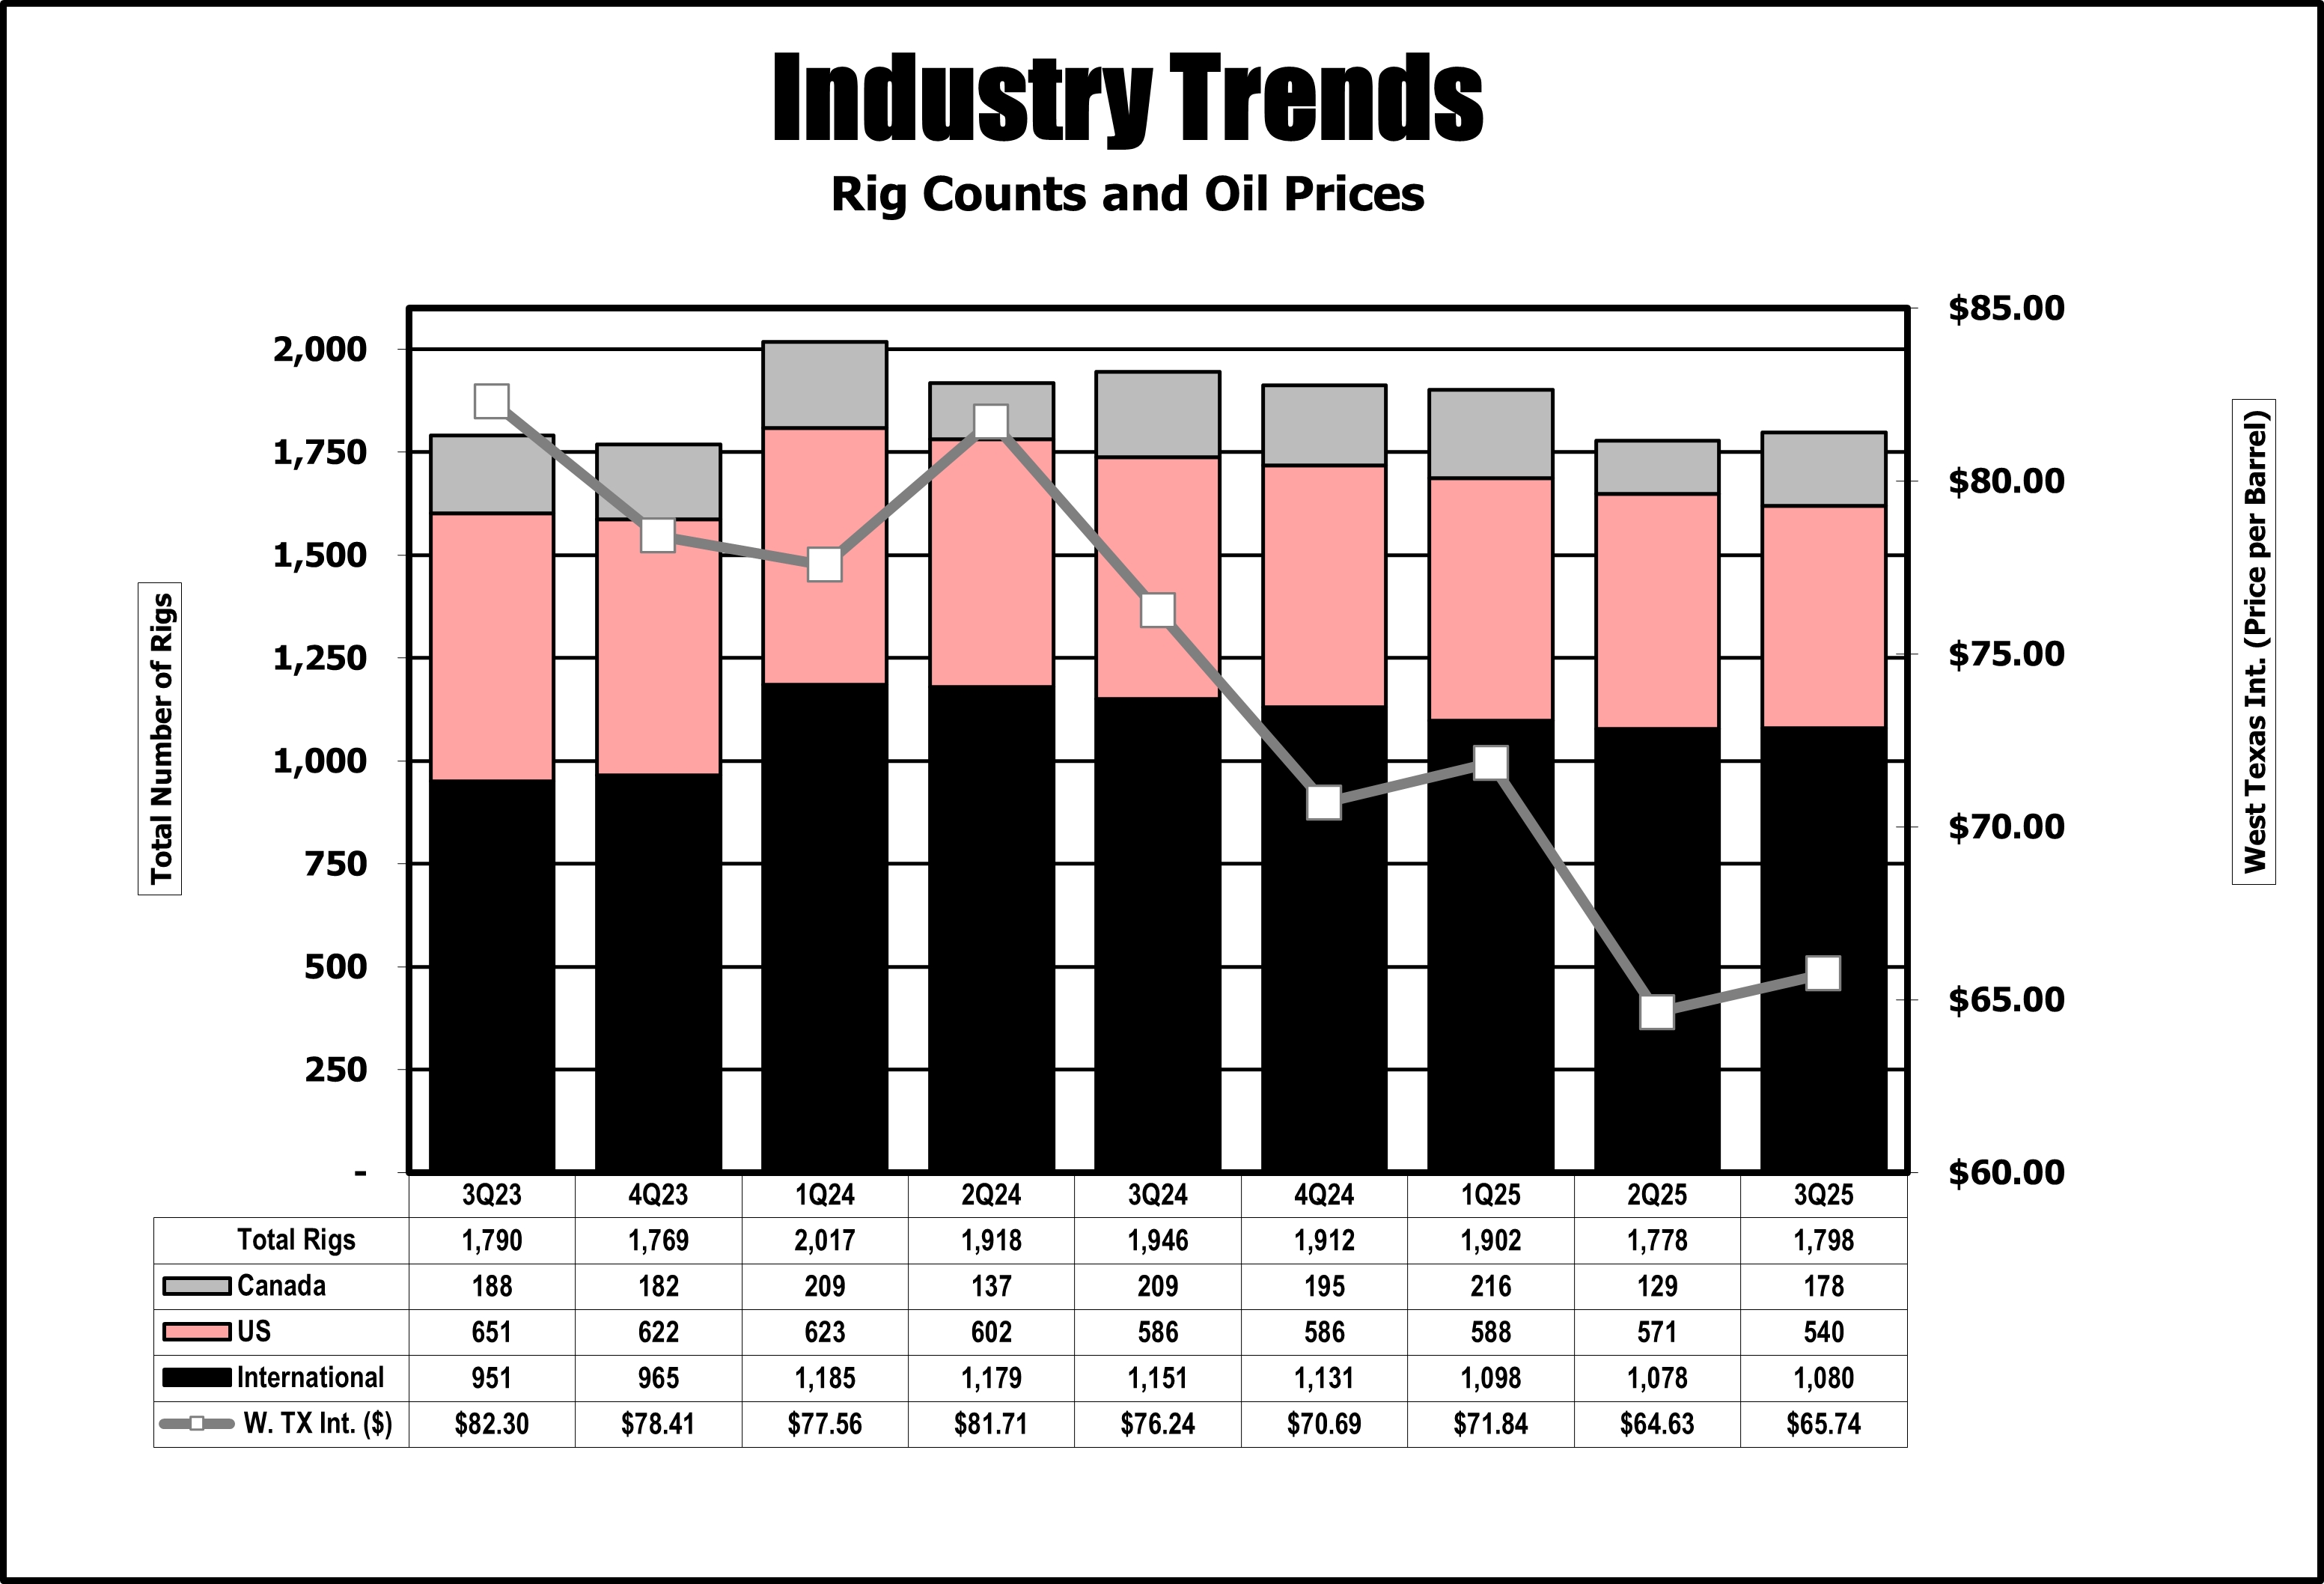
The Company’s results are dependent on, among other things, the level of worldwide oil and gas drilling, well remediation activity, the prices of crude oil and natural gas, capital spending by exploration and production companies and drilling contractors, worldwide oil and gas inventory levels and, to a lesser degree, the level of investment in wind and geothermal energy projects. Key industry indicators for the third quarter of 2025 and 2024, and the second quarter of 2025 include the following:
% increase (decrease)
3Q25 v
3Q25 v
3Q25*
3Q24*
2Q25*
3Q24
2Q25
Active Drilling Rigs:
U.S.
540
586
571
(7.8
)%
(5.4
)%
Canada
178
209
129
(14.8
)%
38.0
%
International
1,080
1,151
1,078
(6.2
)%
0.2
%
Worldwide
1,798
1,946
1,778
(7.6
)%
1.1
%
West Texas Intermediate Crude Prices (per barrel)
$
65.74
$
76.24
$
64.63
(13.8
)%
1.7
%
Natural Gas Prices ($/mmbtu)
$
3.03
$
2.11
$
3.19
43.6
%
(5.0
)%
* Averages for the quarters indicated. See sources below.
The Company is engaged with a variety of energy projects, including wind, geothermal, and carbon capture and sequestration. Management expects to see continued growth in these areas.
21
The following table details the U.S., Canadian, and international rig activity and West Texas Intermediate Crude Oil prices for the past nine quarters ended September 30, 2025, on a quarterly basis. During the quarter, Baker Hughes updated its methodology for calculating rig counts in the Kingdom of Saudi Arabia effective for periods beginning January 2024. Prior-period international rig count data has been restated to reflect this change.
Source: Rig count: Baker Hughes, Inc. (www.bakerhughes.com); West Texas Intermediate Crude Oil and Natural Gas Prices: US Department of Energy, Energy Information Administration (www.eia.doe.gov).
The worldwide quarterly average rig count increased 1 percent (from 1,778 to 1,798) in the third quarter of 2025 when compared to the second quarter of 2025. The average per barrel price of West Texas Intermediate Crude Oil increased 2 percent (from $64.63 per barrel to $65.74 per barrel) and natural gas prices decreased 5 percent (from $3.19 per mmbtu to $3.03 per mmbtu) in the third quarter of 2025 compared to the second quarter of 2025.
On October 24, 2025, there were 749 rigs actively drilling in North America, comprised of U.S. and Canada, which increased 4 percent from the third quarter average of 718 rigs. The price for West Texas Intermediate Crude Oil was $61.50 per barrel at October 24, 2025, a decrease of 6 percent from the third quarter of 2025 average. The price for natural gas was $3.30 per mmbtu at October 24, 2025, an increase of 9 percent from the third quarter of 2025 average.
22
Results of Operations
Financial results by operating segment are as follows (in millions):
Three Months Ended
Nine Months Ended
September 30,
September 30,
2025
2024
2025
2024
Revenue:
Energy Products and Services
$
971
$
1,003
$
2,988
$
3,070
Energy Equipment
1,247
1,219
3,600
3,601
Eliminations
(42
)
(31
)
(121
)
(109
)
Total revenue
$
2,176
$
2,191
$
6,467
$
6,562
Operating profit:
Energy Products and Services
$
38
$
114
$
204
$
363
Energy Equipment
130
129
386
456
Eliminations and corporate costs
(61
)
(49
)
(188
)
(150
)
Total operating profit
$
107
$
194
$
402
$
669
Energy Products and Services
three and nine months ended September 30, 2025 and 2024. Revenue from Energy Products and Services was $971 million for the three months ended September 30, 2025, compared to $1,003 million for the three months ended September 30, 2024, a decrease of $32 million or 3 percent. For the nine months ended September 30, 2025, revenue from Energy Products and Services was $2,988 million compared to $3,070 million for the nine months ended September 30, 2024, a decrease of $82 million or 3 percent. The decline in revenue was primarily driven by lower levels of global drilling activity on a 8 percent year-over-year decrease in the worldwide rig count, which impacted demand for the segment’s shorter-cycle consumable products and led to a decline in sales by 15 percent on a quarter-to-date basis and 16 percent year-to-date. The decrease in the quarter-to-date period was partially offset by higher sales in the segment’s capital equipment offerings, which saw a 5 percent quarter-to-date increase in sales.
Operating profit from Energy Products and Services was $38 million for the three months ended September 30, 2025, compared to an operating profit of $114 million for the three months ended September 30, 2024, a decrease of $76 million. For the nine months ended September 30, 2025, operating profit from Energy Products and Services was $204 million compared to operating profit of $363 million for the nine months ended September 30, 2024, a decrease of $159 million. The decrease in profitability was impacted by a less favorable sales mix, tariffs and other inflationary pressures experienced throughout the year, the impact of discounts on royalty receivables currently in litigation, charges incurred primarily during the third quarter for the write-down of certain inventory, and severance charges associated with facility consolidations.
Energy Equipment
three and nine months ended September 30, 2025 and 2024. Revenue from Energy Equipment was $1,247 million for the three months ended September 30, 2025, compared to $1,219 million for the three months ended September 30, 2024, an increase of $28 million or 2 percent. For the nine months ending September 30, 2025, revenue from Energy Equipment was $3,600 million compared to $3,601 million for the nine months ending September 30, 2024, a decrease of $1 million. Revenue increased slightly in the third quarter of 2025 compared to prior year. The improvement was primarily driven by a 20 percent increase in revenue out of backlog, which offset a 19 percent decline in sales of aftermarket parts and services. On a year-to-date basis, revenue out of backlog increased 13 percent, offset by a 16 percent decline in aftermarket parts and services sales.
Operating profit from Energy Equipment was $130 million for the three months ended September 30, 2025, compared to an operating profit of $129 million for the three months ended September 30, 2024, an increase of $1 million. For the nine months ended September 30, 2025, operating profit from Energy Equipment was $386 million compared to operating profit of $456 million for the nine months ended September 30, 2024, a decrease of $70 million. Lower profitability on a year-to-date basis is attributed to a pre-tax gain of approximately $130 million on the sale of a business during the second quarter of 2024. Excluding this gain, the segment experienced improved profitability, which was driven by strong execution on higher-margin backlog, cost controls, and increased operational efficiencies despite $33 million of write-downs of certain long-lived assets, and severance charges associated with facility consolidations.
23
The Energy Equipment segment monitors its capital equipment backlog to plan its business. New orders are added to backlog only when the Company receives a firm written order for major completion and production components or a contract related to a construction project. The capital equipment backlog was $4,555 million at September 30, 2025, an increase of $77 million from backlog of $4,478 million at September 30, 2024. Although numerous factors can affect the timing of revenue out of backlog (including, but not limited to, customer change orders and supplier accelerations or delays), the Company reasonably expects approximately 14 percent of backlog to become revenue during the rest of 2025 and the remainder thereafter. At September 30, 2025, approximately 58 percent of the capital equipment backlog was for offshore products and approximately 94 percent of the capital equipment backlog was destined for international markets.
Eliminations and corporate costs
Eliminations and corporate costs were $61 million and $188 million for the three and nine months ended September 30, 2025, compared to $49 million and $150 million for the three and nine months ended September 30, 2024.
Sales from one segment to another generally are priced at estimated equivalent commercial selling prices; however, segments originating an external sale are credited with the full profit to the company. Eliminations include intercompany transactions conducted between the two reporting segments that are eliminated in consolidation. Intrasegment transactions are eliminated within each segment. Eliminations increased 30 percent when compared to the third quarter of 2024 and 8 percent year-to-date due to higher intrasegment activity.
Corporate costs increased 23 percent from the third quarter of 2024 primarily due to higher legal costs, self-insured property losses, and corporate reserves. For the nine months ended September 30, 2025, corporate costs increased 37 percent year-over-year due to the non-recurring charge of $5 million related to the deconsolidation of our Russian subsidiaries in the first quarter of 2025, higher legal costs, self-insured property losses, and corporate reserves.
Interest and financial costs and Interest income
Interest and financial costs were $22 million and $66 million for the three and nine months ended September 30, 2025, compared to $21 million and $67 million for the three and nine months ended September 30, 2024, remaining relatively consistent year-over-year.
Interest income was $11 million and $32 million for the three and nine months ended September 30, 2025, compared to $11 million and $27 million for the three and nine months ended September 30, 2024. The year-to-date increase was primarily related to interest earned on larger cash balances in the current year compared to prior year.
Equity income (loss) in unconsolidated affiliates
Equity income (loss) in unconsolidated affiliates was $(11) million and $(10) million for the three and nine months ended September 30, 2025, compared to zero and $37 million for the three and nine months ended September 30, 2024. Sales for our largest investment in unconsolidated affiliates declined 7 percent for the third quarter of 2025 when compared to the third quarter of 2024. For the nine months ended September 30, 2025, sales declined 31 percent year-over-year. The decline in sales is primarily due to pricing pressures and lower volume for oil country tubular goods, as well as higher cost for labor and materials, which led to lower profitability year-over-year.
Other expense, net
Other expense, net was $12 million and $49 million for the three and nine months ended September 30, 2025, compared to $10 million and $34 million for the three and nine months ended September 30, 2024, respectively. The year-to-date change in expense was primarily due to larger foreign currency fluctuations in the current year, particularly with the devaluation of the U.S. Dollar.
24
Provision for income taxes
The effective tax rate for the three and nine months ended September 30, 2025 was 39.7% and 24.9%, respectively, compared to 25.3% and 25.0% for the same period in 2024. The U.S. statutory tax rate was 21% for all periods presented. The effective tax rate for the three months ended September 30, 2025 was negatively impacted by a mix of earnings in higher tax rate jurisdictions, pre-tax charges discrete to the quarter in lower tax rate jurisdictions, and losses in certain jurisdictions with no tax benefit, partially offset by interest income related to payments made in connection with tax disputes of $11 million. The effective tax rate for the nine months ended September 30, 2025 was negatively impacted by a mix of earnings in higher tax rate jurisdictions and losses in certain jurisdictions with no benefit, an increase to reserves for uncertain tax positions of $23 million, unfavorable adjustments related to the carrying value of deferred tax assets of $15 million, and unfavorable adjustments related to changes in certain foreign currency exchange rates of $6 million, partially offset by the release of previously recorded reserves for uncertain tax positions of $59 million as well as interest income related to payments made in connection with tax disputes of $11 million. The effective tax rate for the three and nine months ended September 30, 2024 was negatively impacted by a mix of earnings in higher tax rate jurisdictions, losses in certain jurisdictions with no tax benefit, and adjustments to the carrying value of deferred tax assets, partially offset by the reduction of valuation allowances related to U.S. and state deferred tax assets.
On July 4, 2025, the One Big Beautiful Bill Act (“OBBBA”) was enacted in the U.S. The OBBBA includes significant provisions, such as the permanent extension of certain expiring provisions of the Tax Cuts and Jobs Act, modifications to the international tax framework and the restoration of favorable tax treatment for certain business provisions. OBBBA has multiple effective dates, with certain provisions effective in 2025 and others implemented through 2027. The Company incorporated these provisions effective during the quarter, and they had no material impact on operational results for the three and nine months ended September 30, 2025.
Non-GAAP Financial Measures and Reconciliations
This Form 10-Q contains certain non-GAAP financial measures that management believes are useful tools for internal use and the investment community in evaluating NOV’s overall financial performance. These non-GAAP financial measures are broadly used to value and compare companies in the oilfield services and equipment industry. Not all companies define these measures in the same way. In addition, these non-GAAP financial measures are not a substitute for financial measures prepared in accordance with GAAP and should therefore be considered only as supplemental to such GAAP financial measures.
The Company defines Adjusted EBITDA as operating profit excluding depreciation, amortization, gains and losses on sales of fixed assets and, when applicable, Other Items. Adjusted EBITDA % is a ratio showing Adjusted EBITDA as a percentage of sales. Management believes this is important information to provide because it is used by management to evaluate the Company’s operational performance and trends between periods and manage the business. Management also believes this information may be useful to investors and analysts to gain a better understanding of the Company’s results of ongoing operations. Adjusted EBITDA and Adjusted EBITDA % are not intended to replace GAAP financial measures, such as Net Income and Operating Profit %.
Additionally, Excess Free Cash Flow is defined as cash flows from operations less capital expenditures and other investments, including acquisitions and divestitures. Excess Free Cash Flow does not represent the Company’s residual cash flow available for discretionary expenditures, as the calculation of these measures does not account for certain debt service requirements or other non-discretionary expenditures.
25
The following tables set forth the reconciliation of Adjusted EBITDA to its most comparable GAAP financial measure (in millions):
Three Months Ended
Nine Months Ended
September 30,
June 30,
September 30,
2025
2024
2025
2025
2024
Operating profit:
Energy Products and Services
$
38
$
114
$
83
$
204
$
363
Energy Equipment
130
129
122
386
456
Eliminations and corporate costs
(61
)
(49
)
(62
)
(188
)
(150
)
Total operating profit
$
107
$
194
$
143
$
402
$
669
Operating profit %:
Energy Products and Services
3.9
%
11.4
%
8.1
%
6.8
%
11.8
%
Energy Equipment
10.4
%
10.6
%
10.1
%
10.7
%
12.7
%
Eliminations and corporate costs
—
—
—
—
—
Total operating profit %
4.9
%
8.9
%
6.5
%
6.2
%
10.2
%
Other items, net:
Energy Products and Services
$
41
$
3
$
6
$
52
$
4
Energy Equipment
21
1
9
33
(122
)
Corporate
3
1
4
12
2
Total other items
$
65
$
5
$
19
$
97
$
(116
)
(Gain) loss on sales of fixed assets:
Energy Products and Services
$
(2
)
$
1
$
—
$
(4
)
$
—
Energy Equipment
(1
)
—
(1
)
(2
)
—
Corporate
—
—
4
4
—
Total (gain) loss on sales of fixed assets
$
(3
)
$
1
$
3
$
(2
)
$
—
Depreciation & amortization:
Energy Products and Services
$
58
$
54
$
57
$
174
$
163
Energy Equipment
30
29
28
86
86
Corporate
1
3
2
5
6
Total depreciation & amortization
$
89
$
86
$
87
$
265
$
255
Adjusted EBITDA:
Energy Products and Services
$
135
$
172
$
146
$
426
$
530
Energy Equipment
180
159
158
503
420
Eliminations and corporate costs
(57
)
(45
)
(52
)
(167
)
(142
)
Total Adjusted EBITDA
$
258
$
286
$
252
$
762
$
808
Adjusted EBITDA %:
Energy Products and Services
13.9
%
17.1
%
14.2
%
14.3
%
17.3
%
Energy Equipment
14.4
%
13.0
%
13.1
%
14.0
%
11.7
%
Eliminations and corporate costs
—
—
—
—
—
Total Adjusted EBITDA %
11.9
%
13.1
%
11.5
%
11.8
%
12.3
%
Reconciliation of Adjusted EBITDA:
GAAP net income attributable to Company
$
42
$
130
$
108
$
223
$
475
Noncontrolling interests
2
—
6
9
(1
)
Provision for income taxes
29
44
1
77
158
Interest and financial costs
22
21
22
66
67
Interest income
(11
)
(11
)
(10
)
(32
)
(27
)
Equity (income) loss in unconsolidated affiliates
11
—
(1
)
10
(37
)
Other expense, net
12
10
17
49
34
(Gain) loss on sales of fixed assets
(3
)
1
3
(2
)
—
Depreciation and amortization
89
86
87
265
255
Other items, net
65
5
19
97
(116
)
Total Adjusted EBITDA
$
258
$
286
$
252
$
762
$
808
26
Liquidity and Capital Resources
Overview
At September 30, 2025, the Company had cash and cash equivalents of $1,207 million and total debt of $1,726 million. At December 31, 2024, cash and cash equivalents were $1,230 million and total debt was $1,740 million. As of September 30, 2025, approximately $842 million of the $1,207 million of cash and cash equivalents was held by our foreign subsidiaries and the earnings associated with this cash could be subject to foreign withholding taxes and incremental U.S. taxation if transferred among countries or repatriated to the U.S. If opportunities to invest in the U.S. are greater than available cash balances that are not subject to income tax, rather than repatriating cash, the Company may choose to borrow against its revolving credit facility.
The Company has a revolving credit facility with a borrowing capacity of $1.5 billion through September 12, 2029. The Company has the right to increase the aggregate commitments under this agreement to an aggregate amount of up to $2.5 billion upon the consent of only those lenders holding any such increase. Interest under the multicurrency facility is based upon Secured Overnight Financing Rate (SOFR), Euro Interbank Offered Rate (EURIBOR), Sterling Overnight Index Average (SONIA), Canadian Overnight Repo Rate Average (CORRA), or Norwegian Interbank Offered Rate (NIBOR), plus 1.25% subject to a ratings-based grid or the U.S. prime rate. The credit facility contains a financial covenant establishing a maximum debt-to-capitalization ratio of 60%. As of September 30, 2025, the Company was in compliance with a debt-to-capitalization ratio of 23.5% and had no borrowings or letters of credits issued under the facility, resulting in $1.5 billion of available funds.
A consolidated joint venture of the Company borrowed $120 million against a $150 million bank line of credit, payable by June 2032, for the construction of a facility in Saudi Arabia. Interest under the bank line of credit is based upon SOFR plus 1.40%. The bank line of credit contains a financial covenant regarding maximum debt-to-equity ratio of 75%. As of September 30, 2025, the joint venture was in compliance and will not have future borrowings on the line of credit. As of September 30, 2025, the Company had $89 million in borrowings related to this line of credit. The Company has $11 million in payments related to this line of credit due in the next twelve months. The Company can repay the entire outstanding facility balance without penalty at its sole discretion.
Other debt at September 30, 2025 included $48 million of amounts owed to current and former minority interest partners of NOV consolidated joint ventures, of which $23 million is due in the next twelve months.
The Company’s outstanding debt at September 30, 2025 also consisted of $1,091 million in 3.95% Senior Notes, maturing on December 1, 2042, and $497 million in 3.60% Senior Notes, maturing on December 31, 2029. The Company was in compliance with all covenants at September 30, 2025. Long-term lease liabilities totaled $528 million at September 30, 2025.
The Company had $889 million of outstanding letters of credit at September 30, 2025, primarily in Norway and the United States, that are under various bilateral letter of credit facilities. Letters of credit are issued as bid bonds, advanced payment bonds and performance bonds.
The following table summarizes our net cash provided by (used in) continuing operating activities, continuing investing activities and continuing financing activities for the periods presented (in millions):
Nine Months Ended
September 30,
2025
2024
Net cash provided by operating activities
$
678
$
713
Net cash used in investing activities
(266
)
(308
)
Net cash used in financing activities
(451
)
(235
)
Significant uses and sources of cash during the first nine months of 2025
•
Cash flows provided by operating activities were $678 million, primarily driven by net income before depreciation and amortization and changes in the primary components of our working capital (receivables, inventories, accounts payable, and accrued liabilities).
•
Capital expenditures were $274 million.
•
Dividend payments to our shareholders were $163 million.
•
Share repurchases were $230 million.
27
Other
The effect of the change in exchange rates on cash flows was an increase of $16 million for the first nine months of 2025, and a decrease of $1 million for the first nine months of 2024.
We believe that cash on hand, cash generated from operations and amounts available under our credit facilities and from other sources of debt will be sufficient to fund operations, lease payments, working capital needs, capital expenditure requirements, dividends and financing obligations.
During the three months ended September 30, 2025, the Company repurchased approximately 6.2 million shares of common stock under its share repurchase program for an aggregate amount of $80 million. During the nine months ended September 30, 2025, the Company repurchased 17.1 million shares of common stock under the program for an aggregate amount of $230 million. The Company expects to return at least 50% of Excess Free Cash Flow (defined as cash flow from operations less capital expenditures and other investments, including acquisitions and divestitures), through a combination of quarterly base dividends, opportunistic stock buybacks, and an annual supplemental dividend to true-up returns to shareholders on an annual basis.
We may pursue additional acquisition candidates, but the timing, size or success of any acquisition effort and the related potential capital commitments cannot be predicted. We continue to expect to fund future cash acquisitions primarily with cash flow from operations and borrowings, including the unborrowed portion of the revolving credit facility or new debt issuances, but may also issue additional equity either directly or in connection with acquisitions. There can be no assurance that additional financing for acquisitions will be available at terms acceptable to us.
This document contains, or has incorporated by reference, statements that are not historical facts, including estimates, projections, and statements relating to our business plans, objectives, and expected operating results that are “forward-looking statements” within the meaning of the Private Securities Litigation Reform Act of 1995. Such statements often contain words such as “may,” “can,” “likely,” “believe,” “plan,” “predict,” “potential,” “will,” “intend,” “think,” “should,” “expect,” “anticipate,” “estimate,” “forecast,” “expectation,” “goal,” “outlook,” “projected,” “projections,” “target,” and other similar words, although some such statements are expressed differently. Other oral or written statements we release to the public may also contain forward-looking statements. Forward-looking statements involve risk and uncertainties and reflect our best judgment based on current information. You should be aware that our actual results could differ materially from results anticipated in such forward-looking statements due to a number of factors, including but not limited to changes in oil and gas prices, customer demand for our products, potential catastrophic events related to our operations, protection of intellectual property rights, compliance with laws, and worldwide economic activity, including matters related to recent Russian sanctions and changes in U.S. trade policies, including the imposition of tariffs and retaliatory tariffs and their related impacts on the economy. Given these uncertainties, current or prospective investors are cautioned not to place undue reliance on any such forward-looking statements. We undertake no obligation to update any such factors or forward-looking statements to reflect future events or developments. You should also consider carefully the statements under “Risk Factors,” as disclosed in our most recent Annual Report on Form 10-K, as updated in Part II, Item 1A of our most recent Quarterly Report on Form 10-Q, and “Management’s Discussion and Analysis of Financial Condition and Results of Operations” of our most recent Annual Report on Form 10-K, which address additional factors that could cause our actual results to differ from those set forth in such forward-looking statements, as well as additional disclosures we make in our press releases and other securities filings. We also suggest that you listen to our quarterly earnings release conference calls with financial analysts.
28
Item 3. Quantitative and Qualitative Disclosures About Market Risk
We are exposed to changes in foreign currency exchange rates and interest rates. Additional information concerning each of these matters follows:
Foreign Currency Exchange Rates
We have extensive operations in foreign countries. The net assets and liabilities of these operations are exposed to changes in foreign currency exchange rates, although such fluctuations have a muted effect on net income since the functional currency for the majority of them is the local currency. These operations also have net assets and liabilities not denominated in the functional currency, which exposes us to changes in foreign currency exchange rates that impact income. We recorded a foreign exchange loss in our income statement of $42 million in the first nine months of 2025, compared to a $27 million foreign exchange loss in the same period of the prior year. Gains and losses are primarily due to exchange rate fluctuations related to monetary asset balances denominated in currencies other than the functional currency and adjustments to our hedged positions as a result of changes in foreign currency exchange rates. Currency exchange rate fluctuations may create losses in future periods to the extent we maintain net monetary assets and liabilities not denominated in the functional currency of the NOV operation.
Some of our revenues in foreign countries are denominated in U.S. dollars, and therefore, changes in foreign currency exchange rates impact our earnings to the extent that costs associated with those U.S. dollar revenues are denominated in the local currency. Similarly, some of our revenues are denominated in foreign currencies, but have associated U.S. dollar costs, which also give rise to foreign currency exchange rate exposure. In order to mitigate that risk, we may utilize foreign currency forward contracts to better match the currency of our revenues and associated costs. We do not use foreign currency forward contracts for trading or speculative purposes.
The Company had other financial market risk sensitive instruments (cash balances, overdraft facilities, accounts receivable and accounts payable) denominated in foreign currencies with transactional exposures totaling $571 million and translation exposures totaling $443 million as of September 30, 2025. The Company estimates that a hypothetical 10% movement of all applicable foreign currency exchange rates on the transactional exposures could affect net income by $45 million and the translational exposures could affect Other Comprehensive Income by $44 million.
The counterparties to forward contracts are major financial institutions. The credit ratings and concentration of risk of these financial institutions are monitored on a continuing basis. Because these contracts are net-settled the Company’s credit risk with the counterparties is limited to the foreign currency rate differential at the end of the contract.
Interest Rate Risk
At September 30, 2025, borrowings consisted of $1,091 million in 3.95% Senior Notes, $497 million in 3.60% Senior Notes, and other debt of $138 million. At September 30, 2025, there were no outstanding letters of credit issued under the Company’s revolving credit facility, resulting in $1.5 billion of available funds. Additionally, the Company’s joint venture has outstanding borrowings of $89 million under a $150 million bank line of credit for the construction of a facility in Saudi Arabia. Interest under the bank line of credit is based upon SOFR plus 1.40%. Occasionally a portion of borrowings under our credit facility could be denominated in multiple currencies which could expose us to market risk with exchange rate movements. These instruments carry interest at a pre-agreed upon percentage point spread from either SOFR, EURIBOR, SONIA, CORRA, or NIBOR, or at the U.S. prime rate. Under our credit facility, we may, at our option, fix the interest rate for certain borrowings based on a spread over SOFR, EURIBOR, SONIA, CORRA or NIBOR for one month to six months. Our objective is to maintain a portion of our debt in variable rate borrowings for the flexibility obtained regarding early repayment without penalties and lower overall cost as compared with fixed-rate borrowings.
Item 4. Controls and Procedures
As of the end of the period covered by this report, we carried out an evaluation, under the supervision and with the participation of the Company’s management, including the Company’s Chief Executive Officer and Chief Financial Officer, of the effectiveness of the design and operation of the Company’s disclosure controls and procedures. The Company’s disclosure controls and procedures are designed to provide reasonable assurance that the information required to be disclosed by the Company in the reports it files under the Exchange Act is accumulated and communicated to the Company’s management, including the Company’s Chief Executive Officer and Chief Financial Officer, as appropriate, to allow timely decisions regarding required disclosures and is recorded, processed, summarized and reported within the time period specified in the rules and forms of the Securities and Exchange Commission. Based upon that evaluation, the Company’s Chief Executive Officer and Chief Financial Officer concluded that the Company’s disclosure controls and procedures are effective as of the end of the period covered by this report at a reasonable assurance level.
There has been no change in our internal control over financial reporting (as defined in Rule 13a-15(f) under the Exchange Act) that occurred during our last fiscal quarter that has materially affected, or is reasonably likely to materially affect, our internal control over financial reporting.
29
PART II - OTHER INFORMATION
Item 1A. Risk Factors
As of the date of this filing, the Company and its operations continue to be subject to the risk factors previously disclosed in Part I, Item 1A “Risk Factors” in our 2024 Annual Report on Form 10-K for the fiscal year ended December 31, 2024.
Item 2. Purchases of Equity Securities by the Issuer and Affiliated Purchasers
Period
Total number of shares purchased
Average price paid per share
Total number of shares purchased as part of publicly announced plans or programs(1)
Approximate dollar value of shares that may yet be purchased under the plans or programs
July 1 through July 31, 2025
1,371,322
$
13.10
1,371,322
$
602,734,395
August 1 through August 31, 2025
2,375,054
12.40
2,375,054
573,284,746
September 1 through September 30, 2025
2,483,909
13.10
2,483,909
540,756,073
Total
6,230,285
$
12.83
6,230,285
(1) On April 25, 2024, the Company established a share repurchase program for up to $1 billion of the currently outstanding shares of the Company’s common stock over a period of 36 months.
Item 4. Mine Safety Disclosures
Information regarding mine safety and other regulatory actions at our mines is included in Exhibit 95 to this Form 10-Q.
Item 6. Exhibits
Reference is hereby made to the Exhibit Index commencing on page 31.
Inline XBRL Instance Document – the instance document does not appear in the Interactive Data File because its XBRL tags are embedded within the Inline XBRL document.
Cover Page Interactive Data File (formatted as inline XBRL and contained in Exhibit 101)
* Compensatory plan or arrangement for management or others.
(1)
Filed as Exhibit 3.1 to our Current Report on Form 8-K filed on May 18, 2023
(2)
Filed as Exhibit 3.1 to our Current Report on Form 8-K filed on February 28, 2023.
(3)
Filed herewith.
We hereby undertake, pursuant to Regulation S-K, Item 601(b), paragraph (4) (iii), to furnish to the U.S. Securities and Exchange Commission, upon request, all constituent instruments defining the rights of holders of our long-term debt not filed herewith.
31
SIGNATURE
Pursuant to the requirements of the Securities Exchange Act of 1934, the registrant has duly caused this report to be signed on its behalf by the undersigned thereunto duly authorized.