Please wait
Driving Sustainable Growth, Delivering Long-term Value
Jim Davis
Chairman, CEO, and President
J.P. Morgan Healthcare Conference
January 12, 2026
Quest Diagnostics
Safe harbor disclosure
The statements in this presentation that are not historical facts may be forward-looking statements. Readers and listeners are cautioned not to place undue reliance on forward-looking statements, which speak only as of the date that they are made and which reflect management's current estimates, projections, expectations, or beliefs and which involve risks and uncertainties that could cause actual results and outcomes to be materially different. Risks and uncertainties that may affect the future results of the company include, but are not limited to, uncertain and volatile economic conditions, adverse results from pending or future government investigations, lawsuits or private actions, the competitive environment, the complexity of billing, reimbursement and revenue recognition for clinical laboratory testing, changes in government policies, including related to trade, and regulations, changing relationships with customers, payers, suppliers, or strategic partners, acquisitions, and other factors discussed in the company's most recently filed Annual Report on Form 10-K and in any of the company's subsequently filed Quarterly Reports on Form 10-Q and Current Reports on Form 8-K, including those discussed in the "Business," "Risk Factors," "Cautionary Factors that May Affect Future Results," and "Management's Discussion and Analysis of Financial Condition and Results of Operations" sections of those reports.
In the following presentation, references to adjusted EPS refer to adjusted diluted EPS. Any references to operating margin(s) refer to adjusted operating income as a percentage of net revenues. Any references to free cash flow refer to cash flow from operations less capital expenditures.
WHY WE EXIST
PURPOSE
The Quest Way
STRATEGY
HOW WE GROW
CULTURE
HOW WE WORK
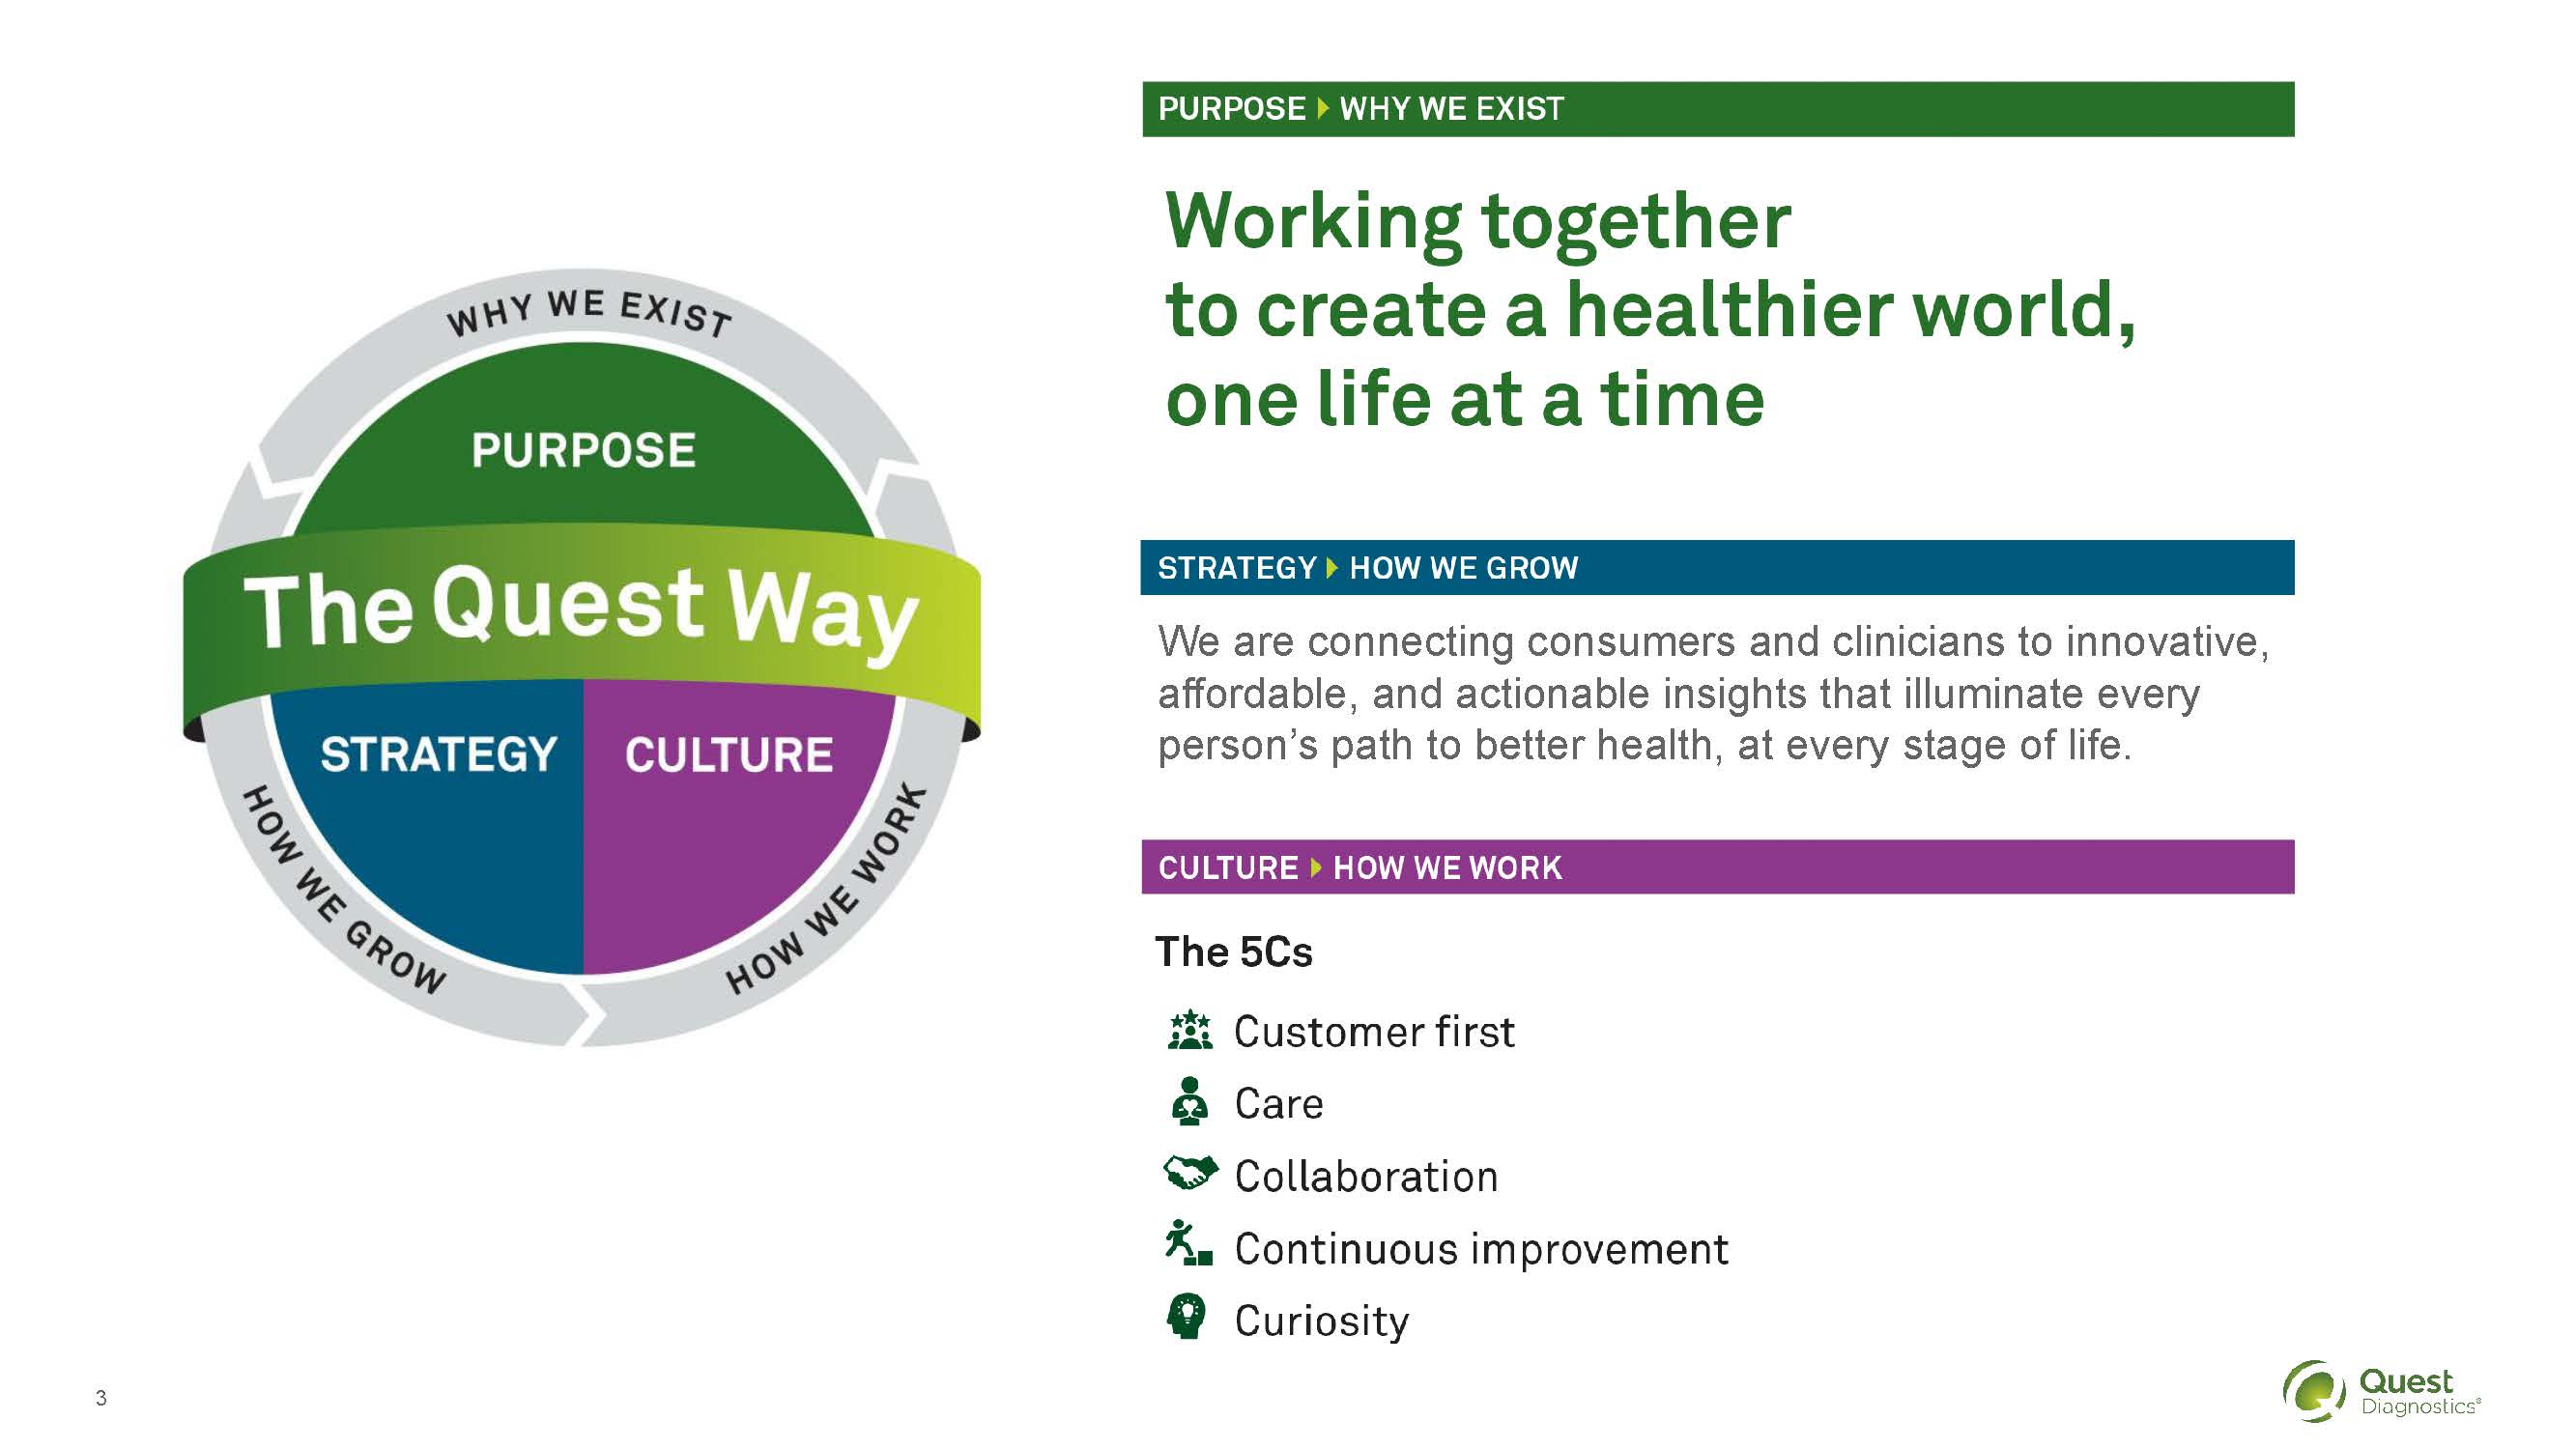
PURPOSE WHY WE EXIST
Working together to create a healthier world, one life at a time
STRATEGY HOW WE GROW
We are connecting consumers and clinicians to innovative, affordable, and actionable insights that illuminate every person's path to better health, at every stage of life.
CULTURE HOW WE WORK
The 5Cs
Customer first
Care
Collaboration
Continuous improvement
Curiosity
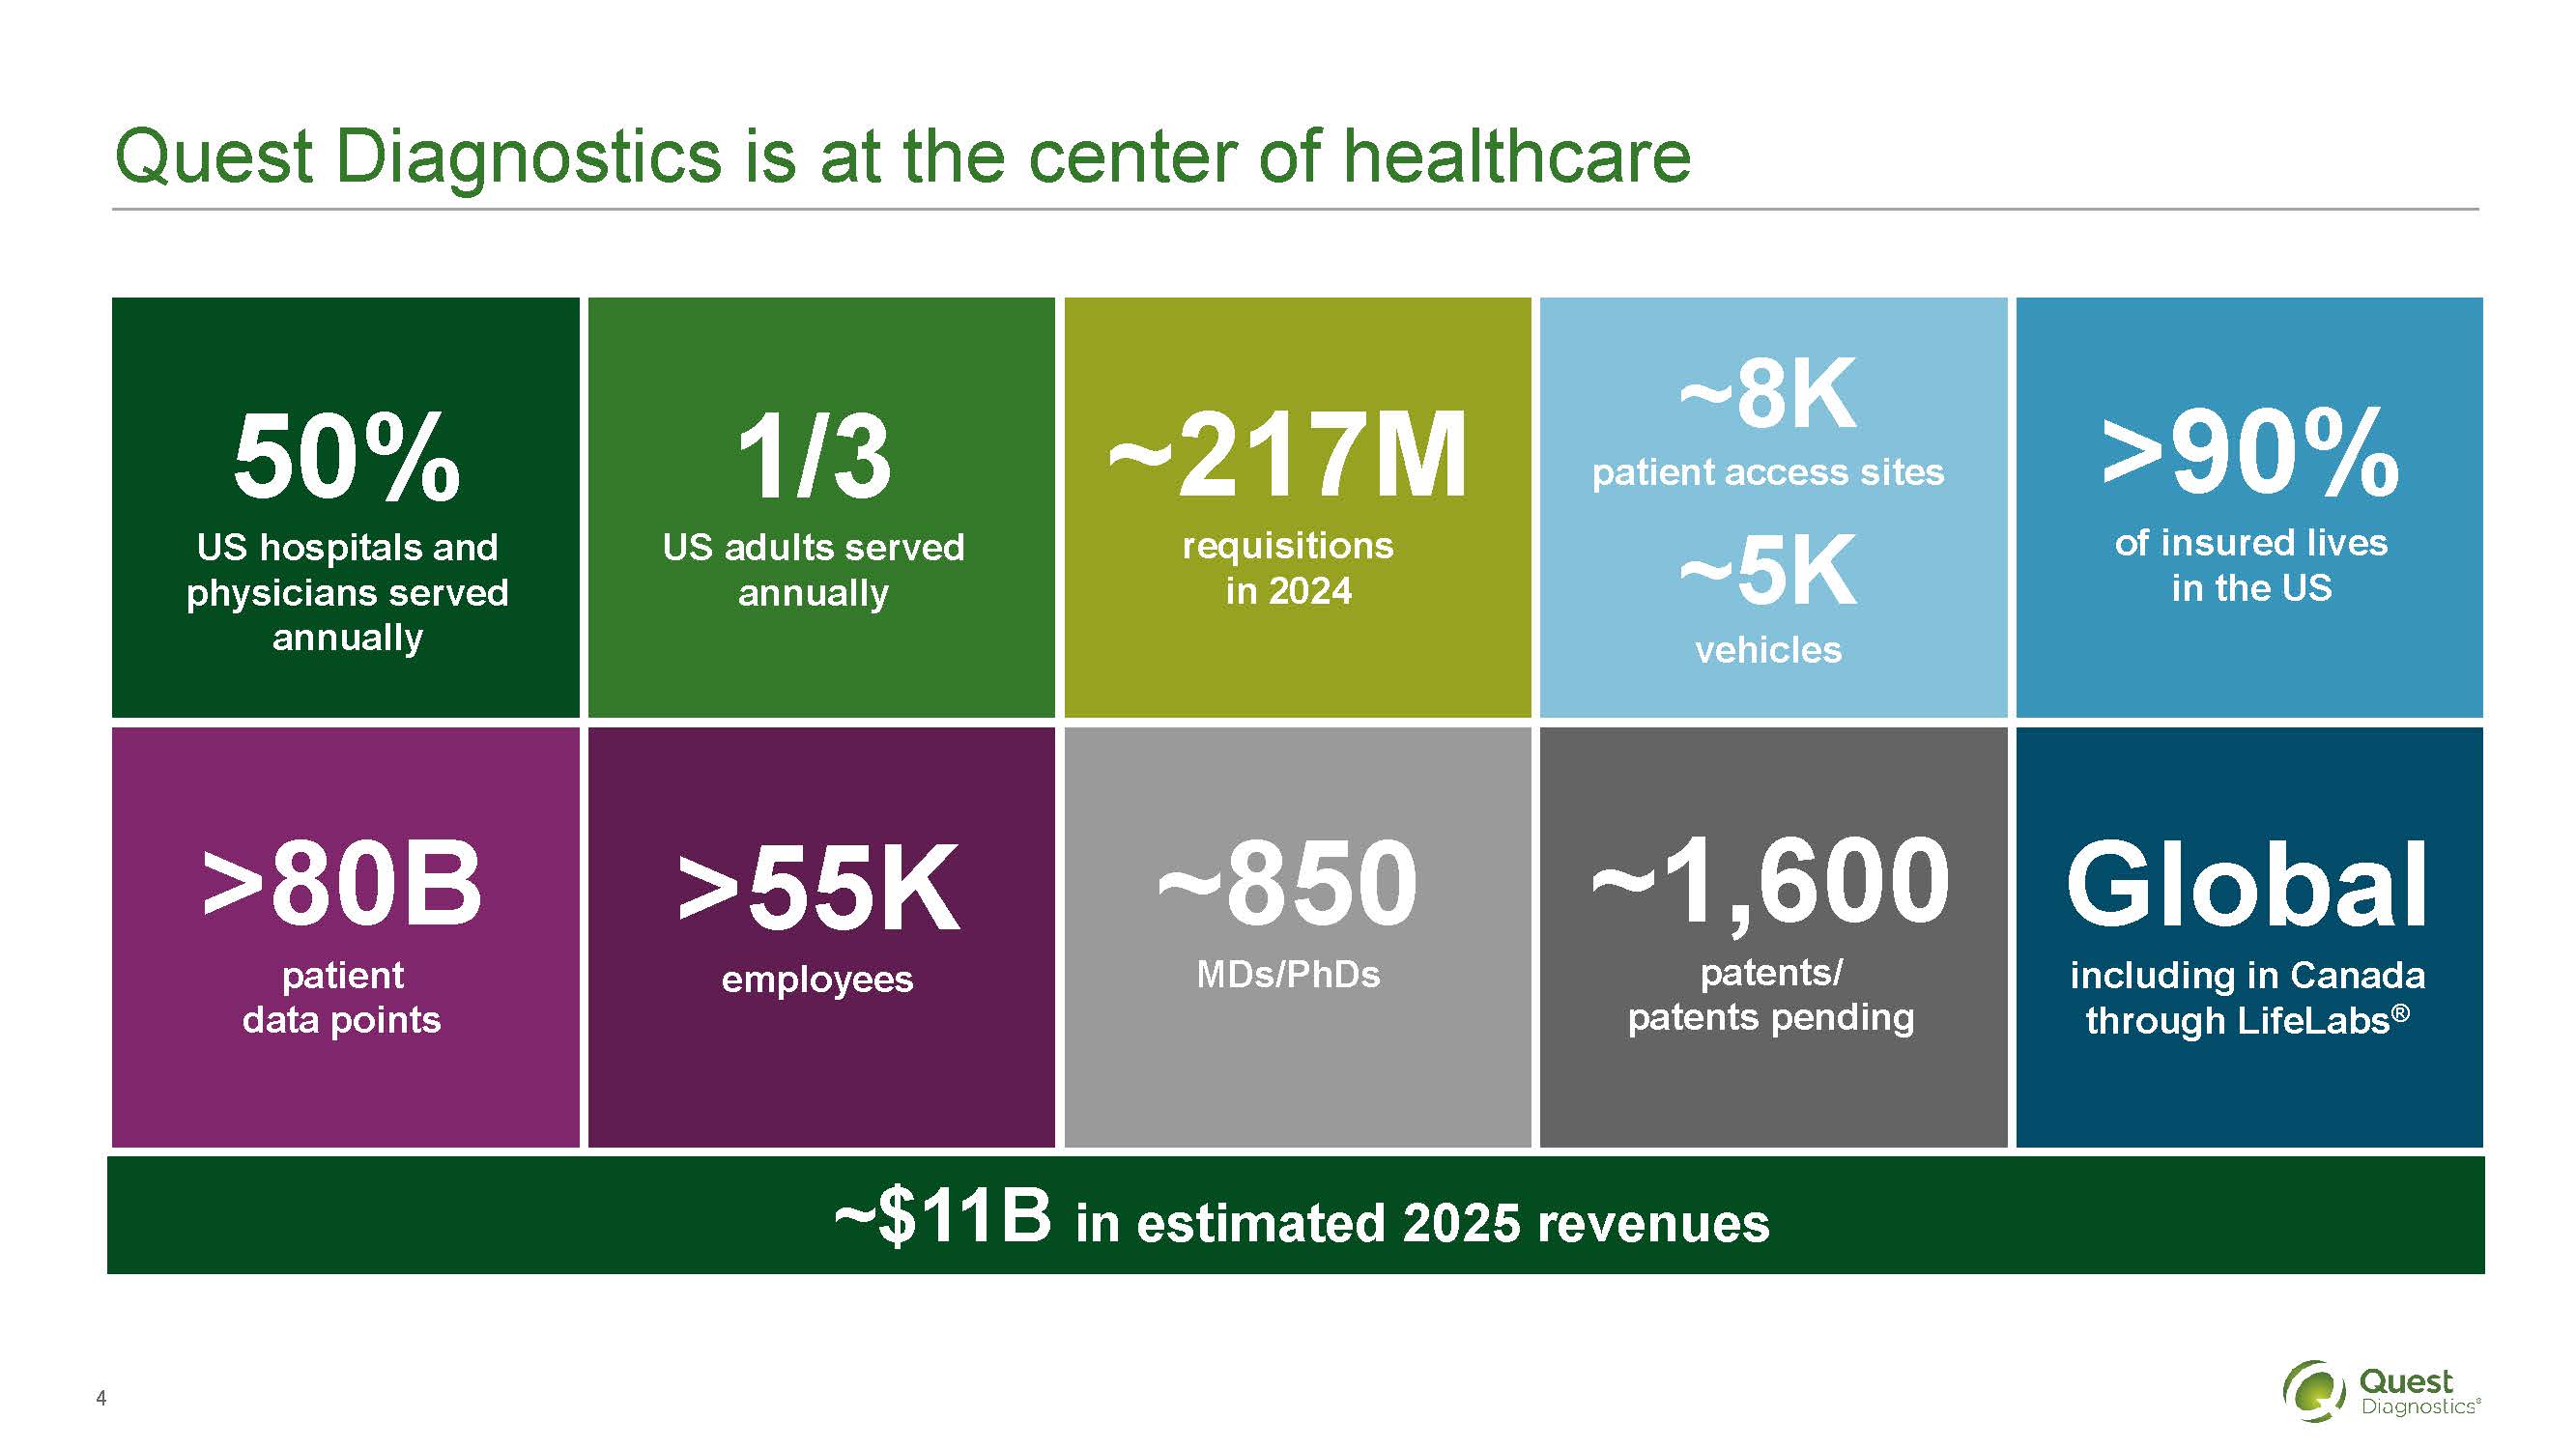
Quest Diagnostics is at the center of healthcare
50% US hospitals and physicians served annually
1/3 US adults served annually
~217M requisitions in 2024
~8K patient access sites
~5K vehicles
>90% of insured lives in the US
>>80B patient data points
>55K employees
~850 MDs/PhDs
~1,600 patents/patents pending
Global including in Canada through LifeLabs
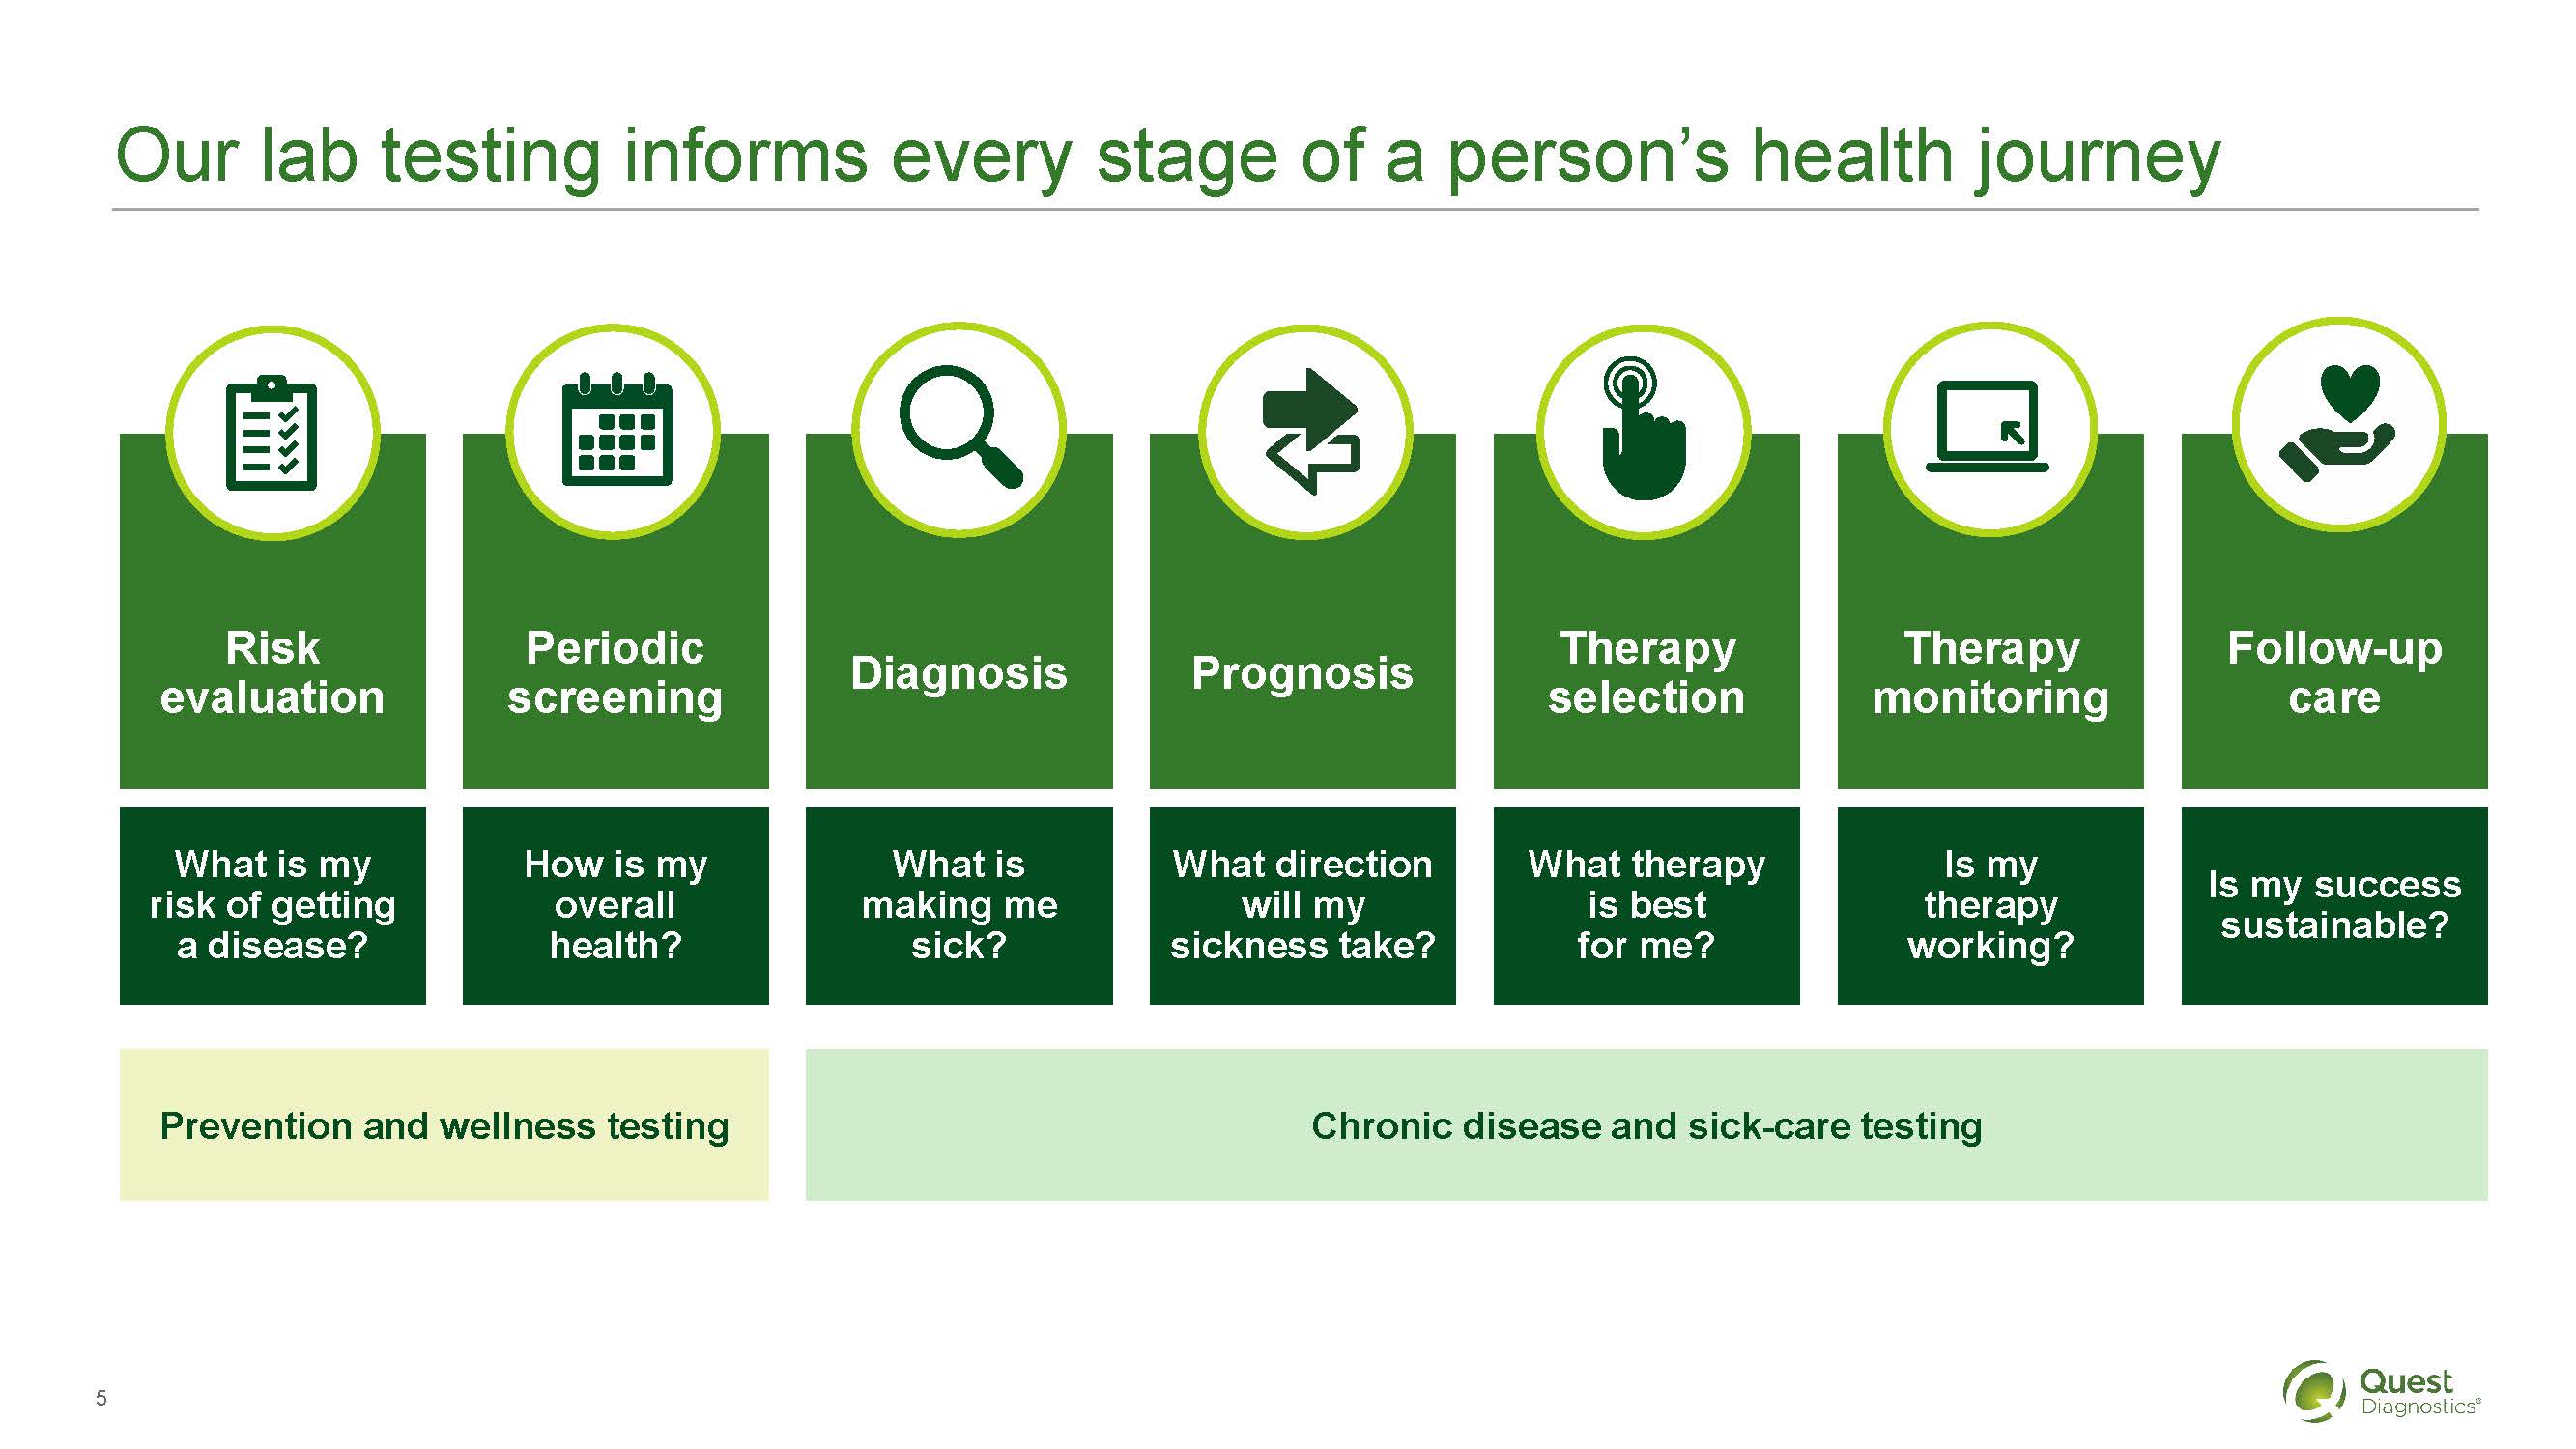
Our lab testing informs every stage of a person's health journey
Risk evaluation
What is my risk of getting a disease?
Periodic screening
How is my overall health?
Diagnosis
What is making me sick?
Prognosis
What direction wil my sickness take?
Therapy selection
What therapy is best for me?
Therapy monitoring
Is my therapy working?
Follow-up care
Is my success sustainable?
Prevention and wellness testing
Chronic disease and sick-care testing
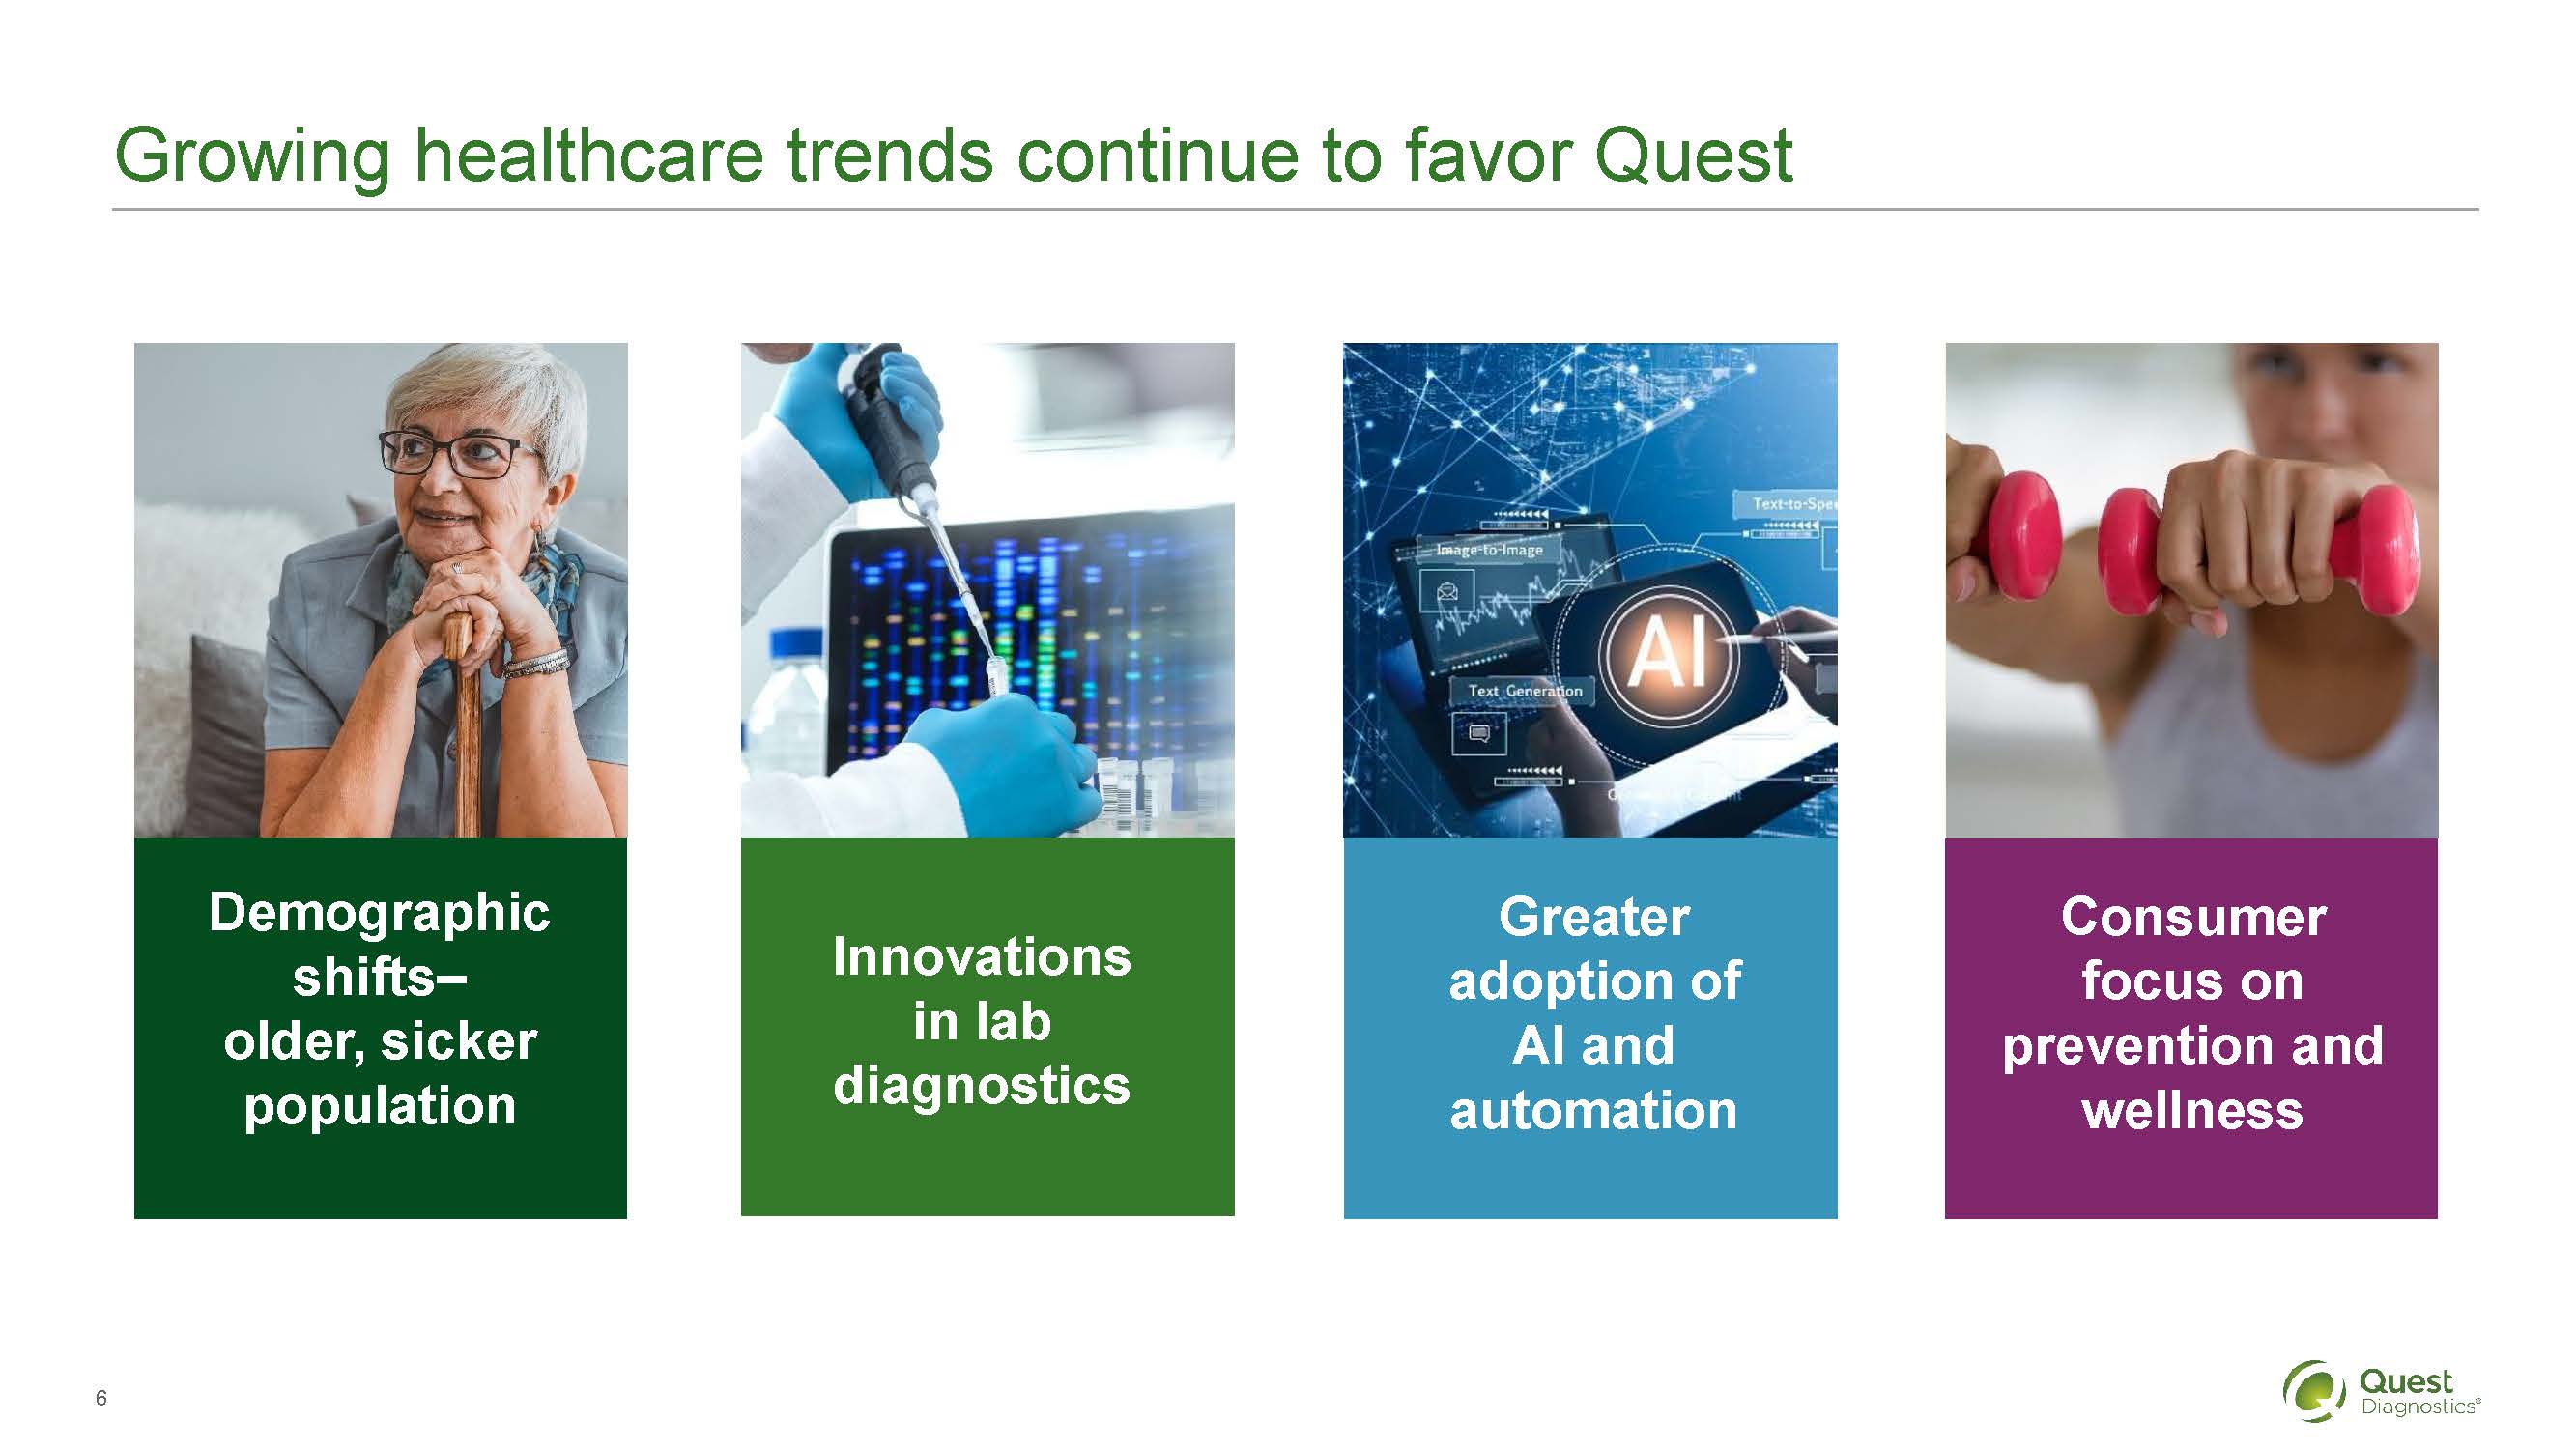
Growing healthcare trends continue to favor Quest
Demographic shifts- older, sicker population
Innovations in lab diagnostics
Greater adoption of AI and automation
Consumer focus on prevention and wellness
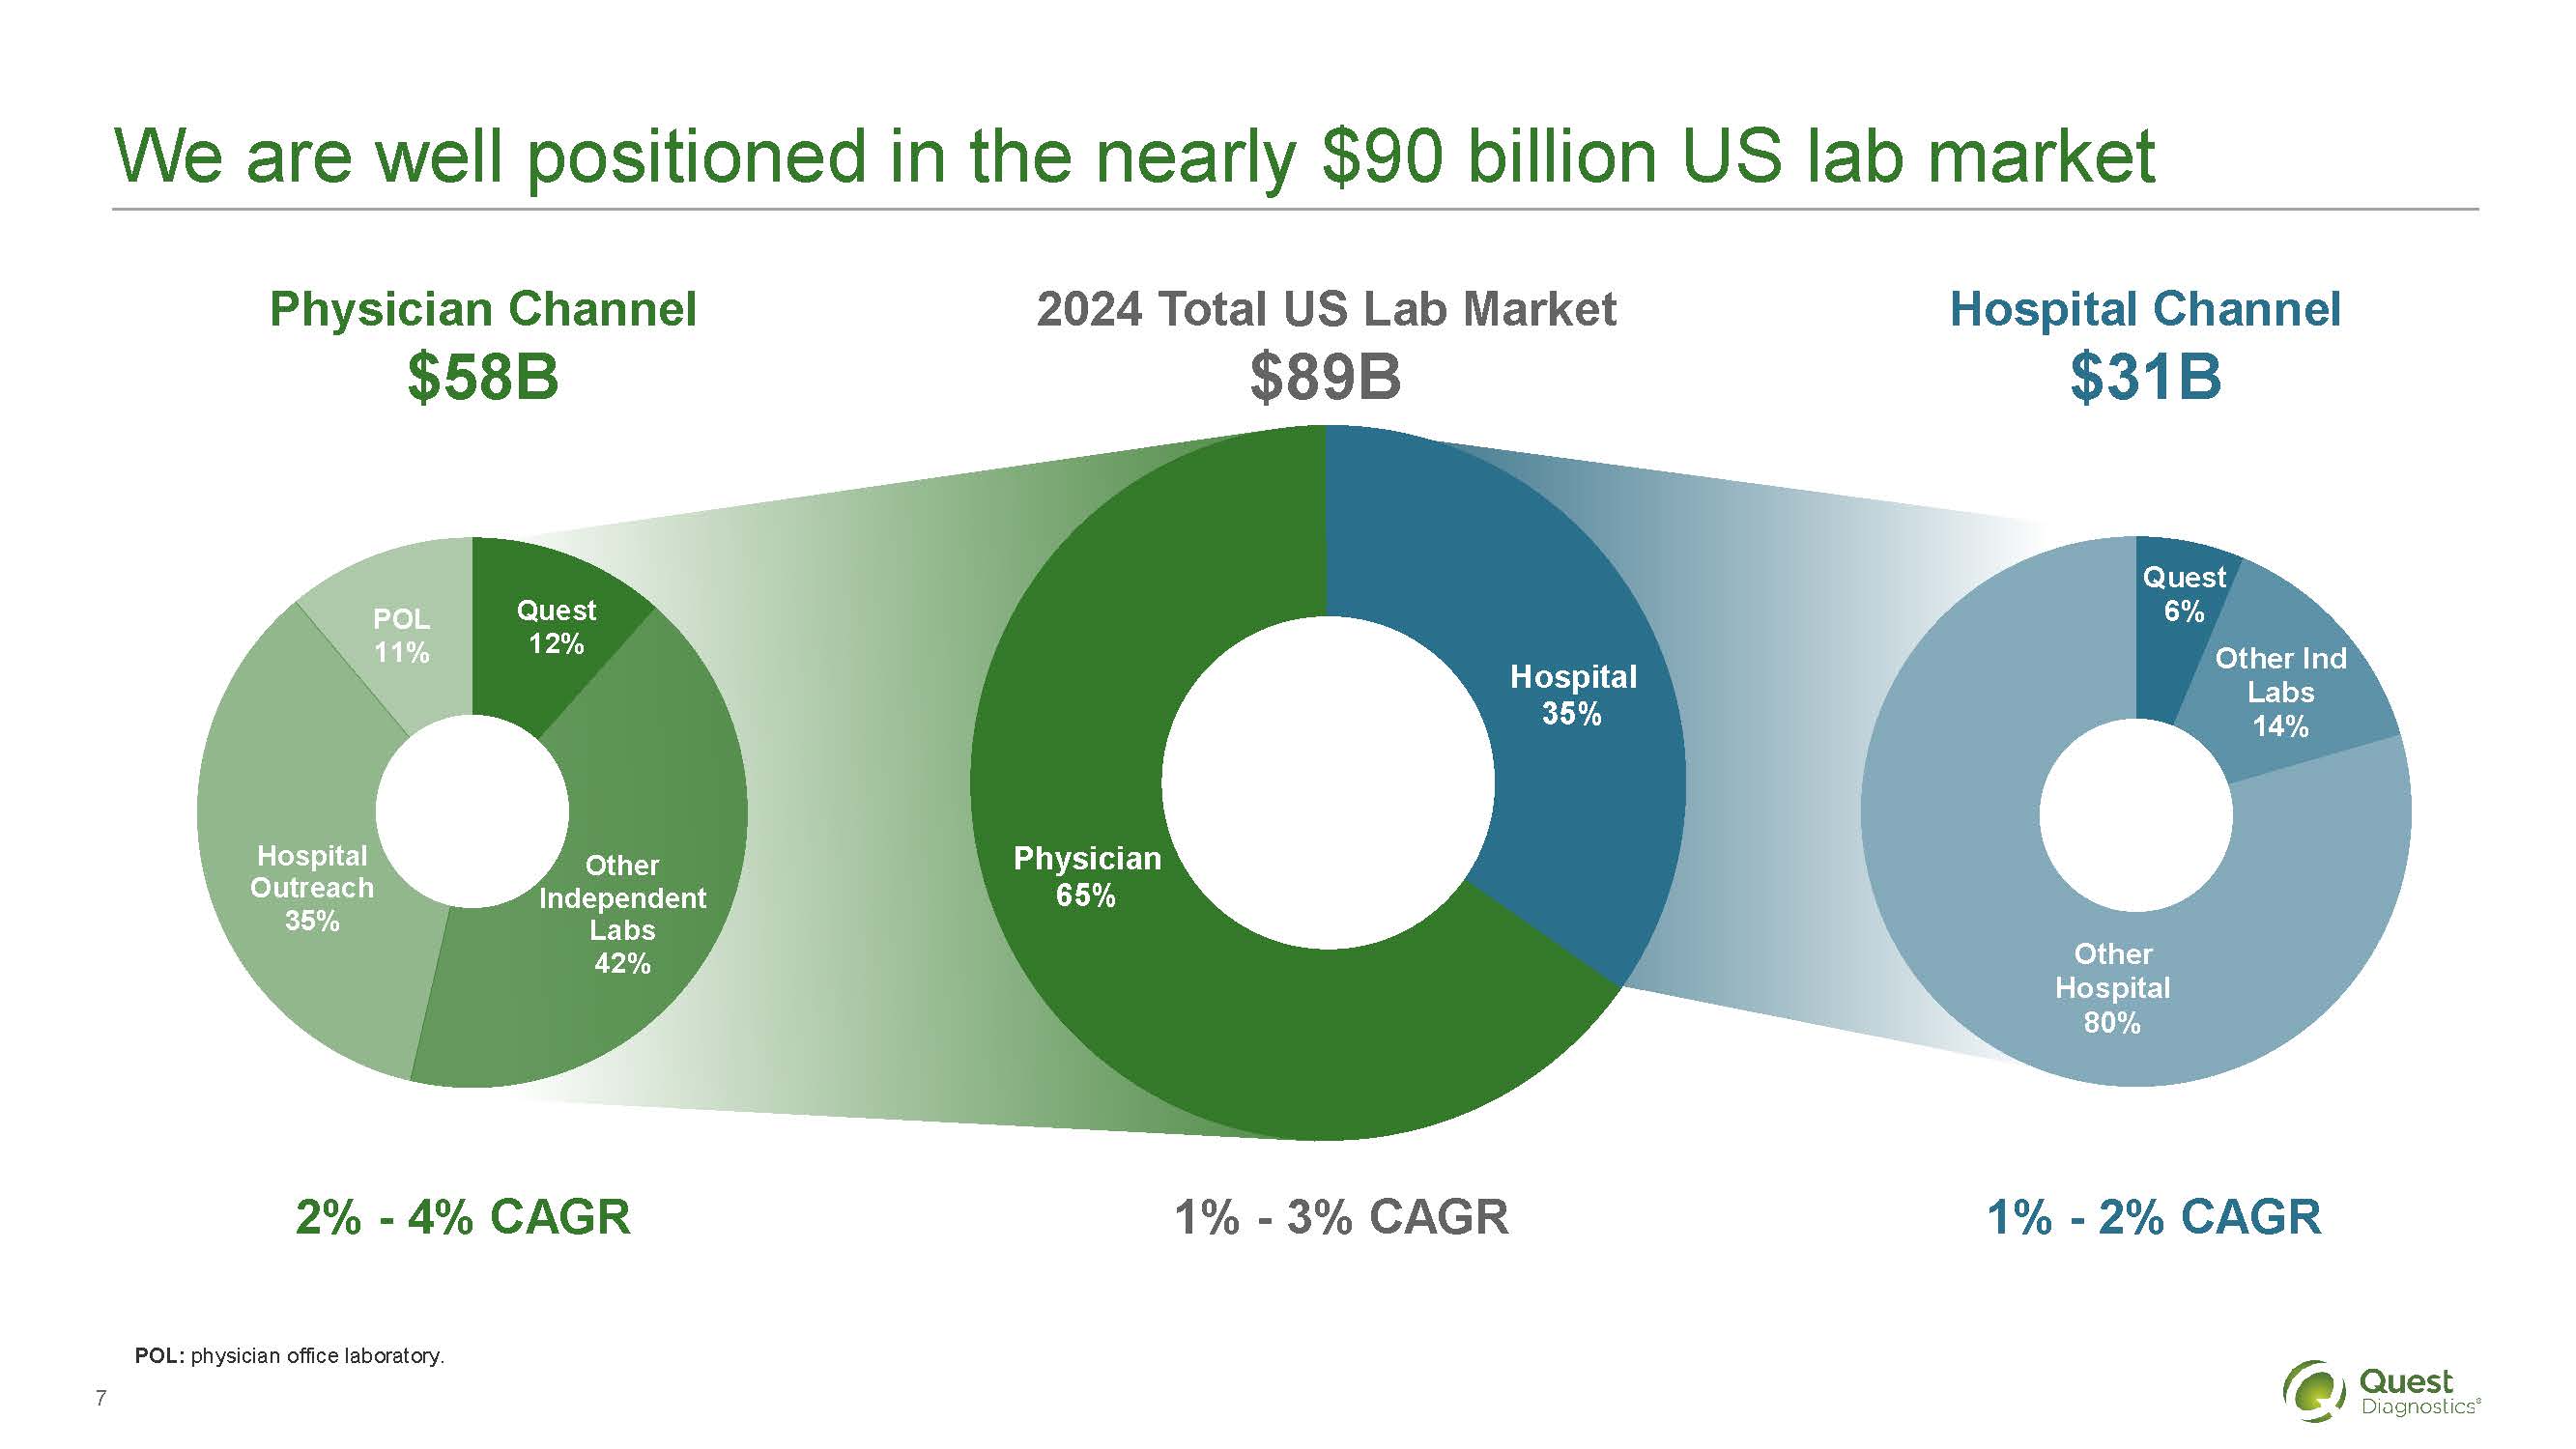
We are well positioned in the nearly $90 billion US lab market
Physician Channel $58B
POL 11%
Quest 12%
Hospital Outreach 35%
Other independent Labs 42%
2% - 4% CAGR
2024 Total US Lab Market $89B
Physician 65%
Hospital 35%
1% - 3% CAGR
Hospital Channel $31B
Quest 6%
Other Ind Labs 14%
Other Hospital 80%
1% - 2% CAGR
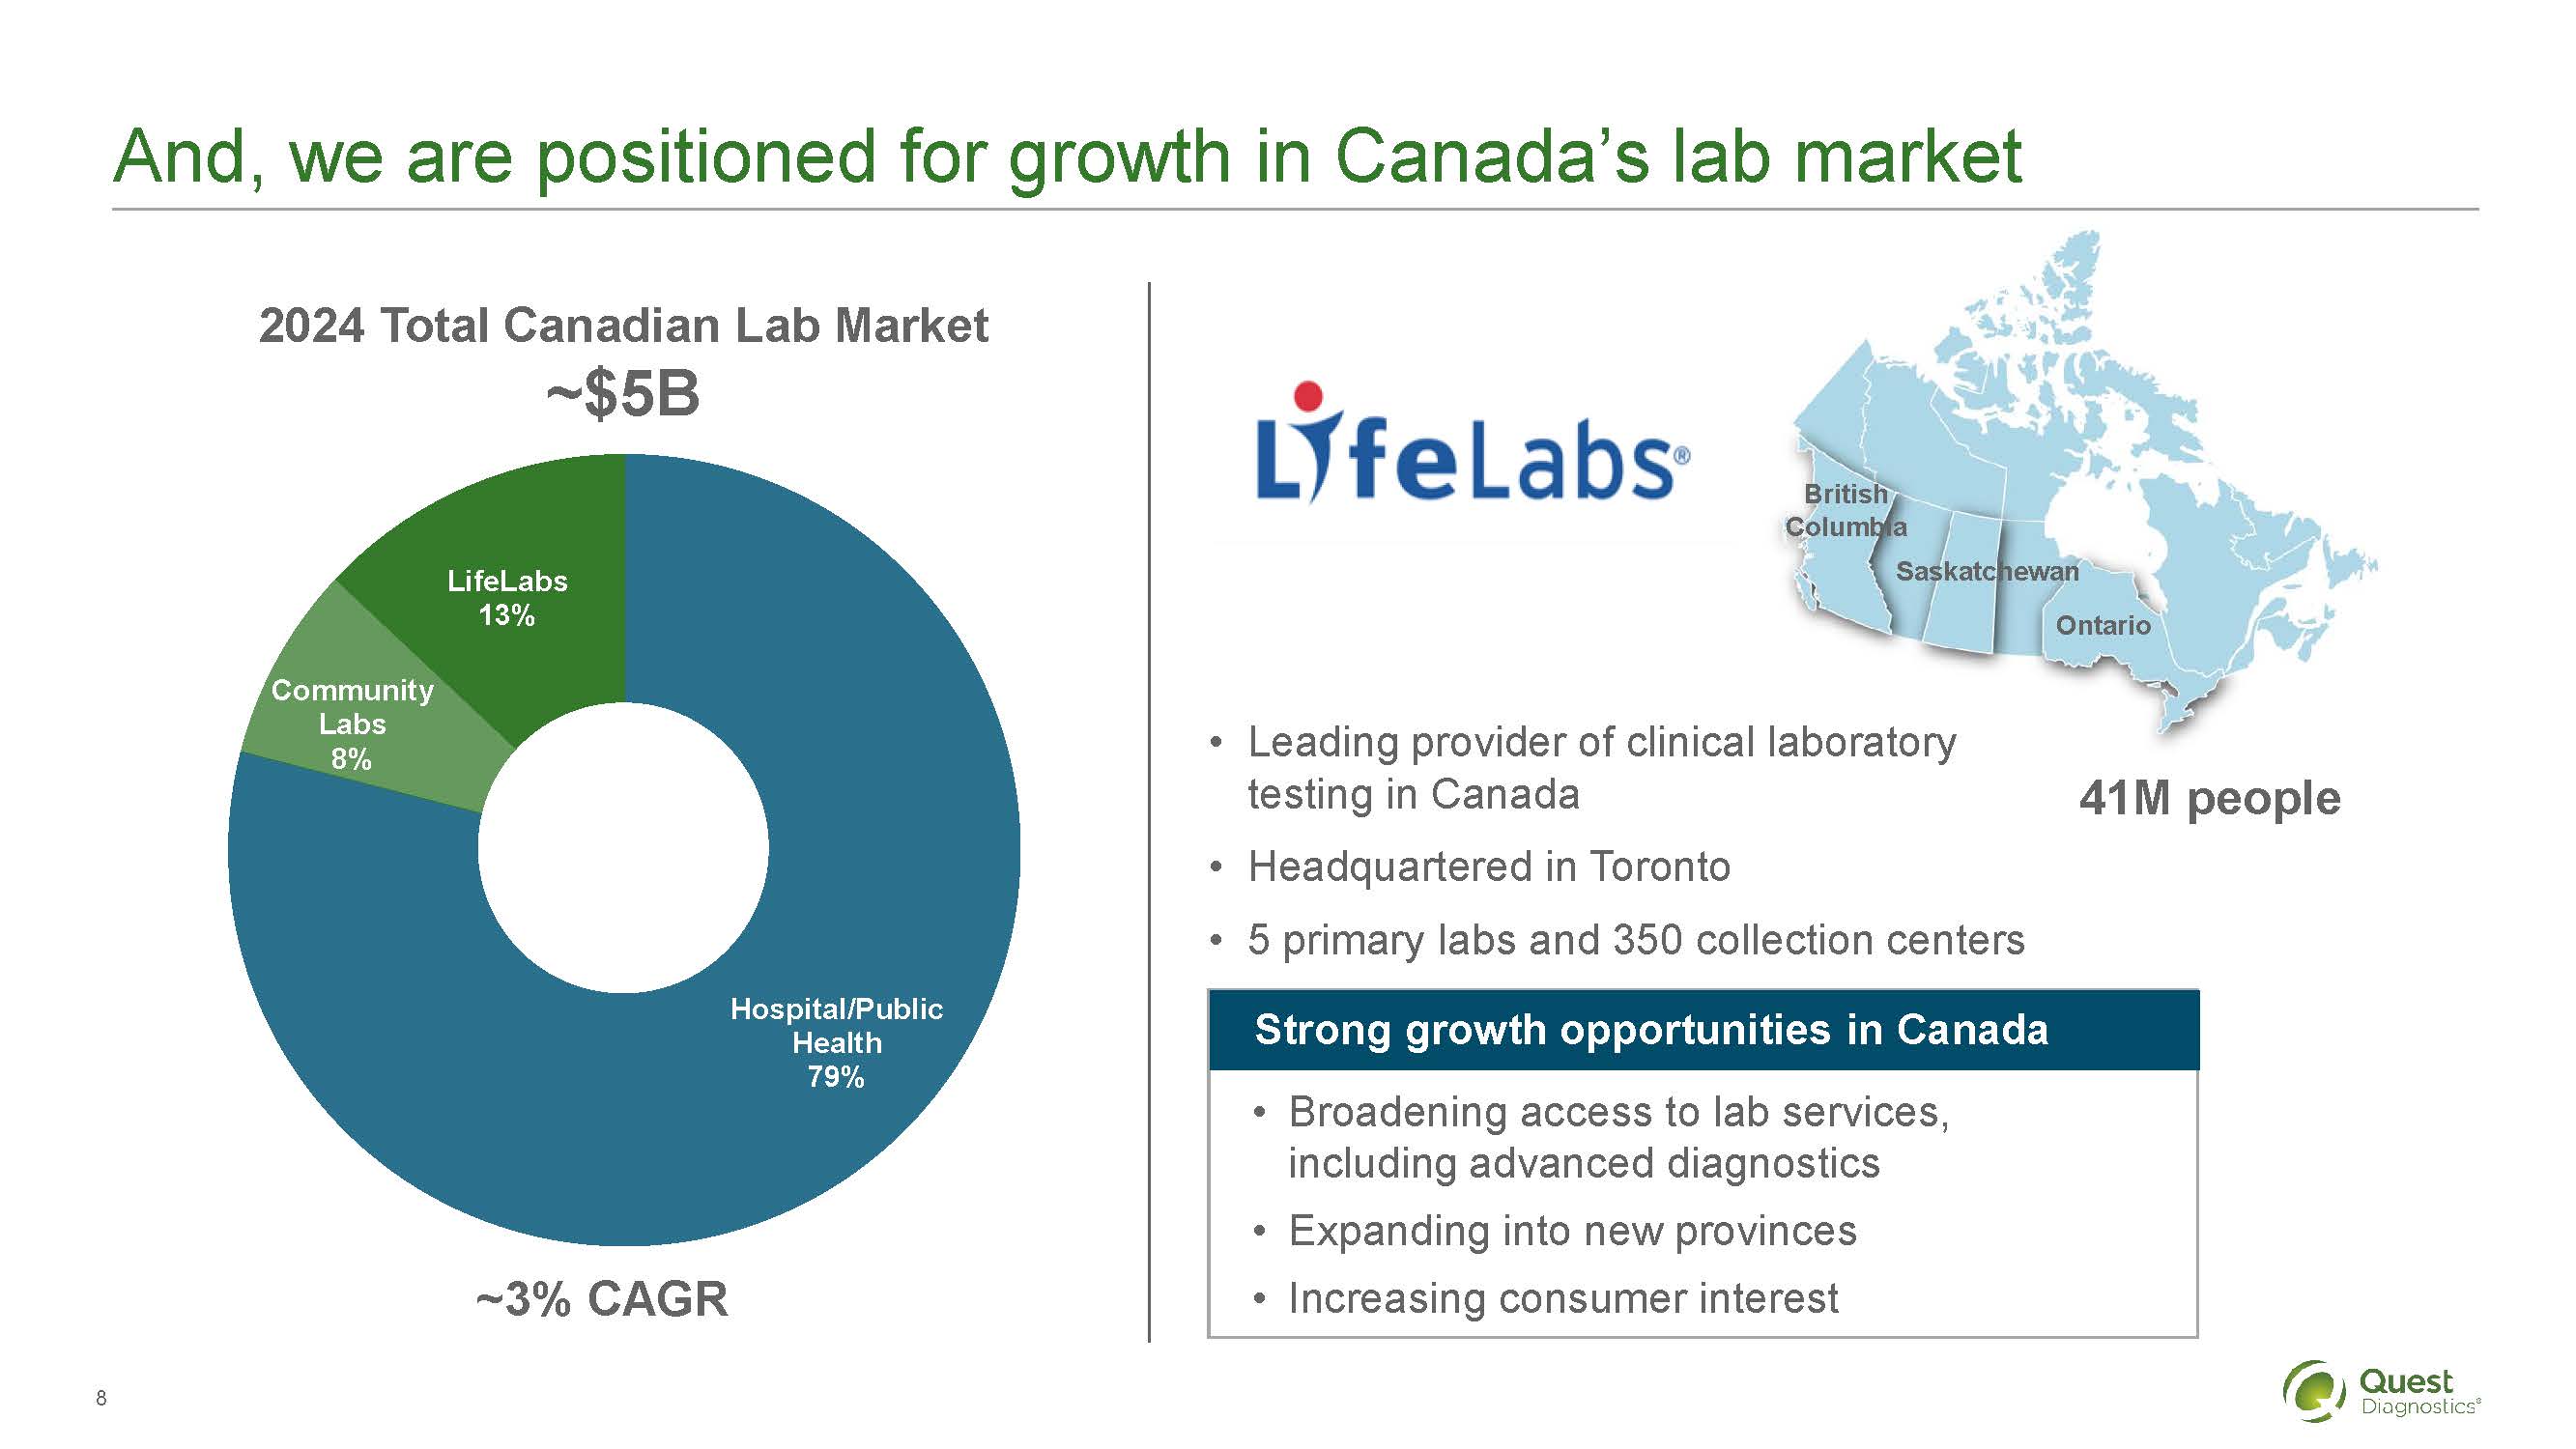
2024 Total Canadian Lab Market ~$5B
LifeLabs 13%
Community Labs 8%
Hospital/Public Health 79%
~3%CAGR
LifeLabs
British Columbia
Saskatchewan
Ontario
41M people
Leading provider of clinical laboratory testing in Canada
Headquartered in Toronto
5 primary labs and 350 collection centers
Strong growth opportunities in Canada
Broadening access to lab services, including advanced diagnostics
Expanding into new provinces
Increasing consumer interest
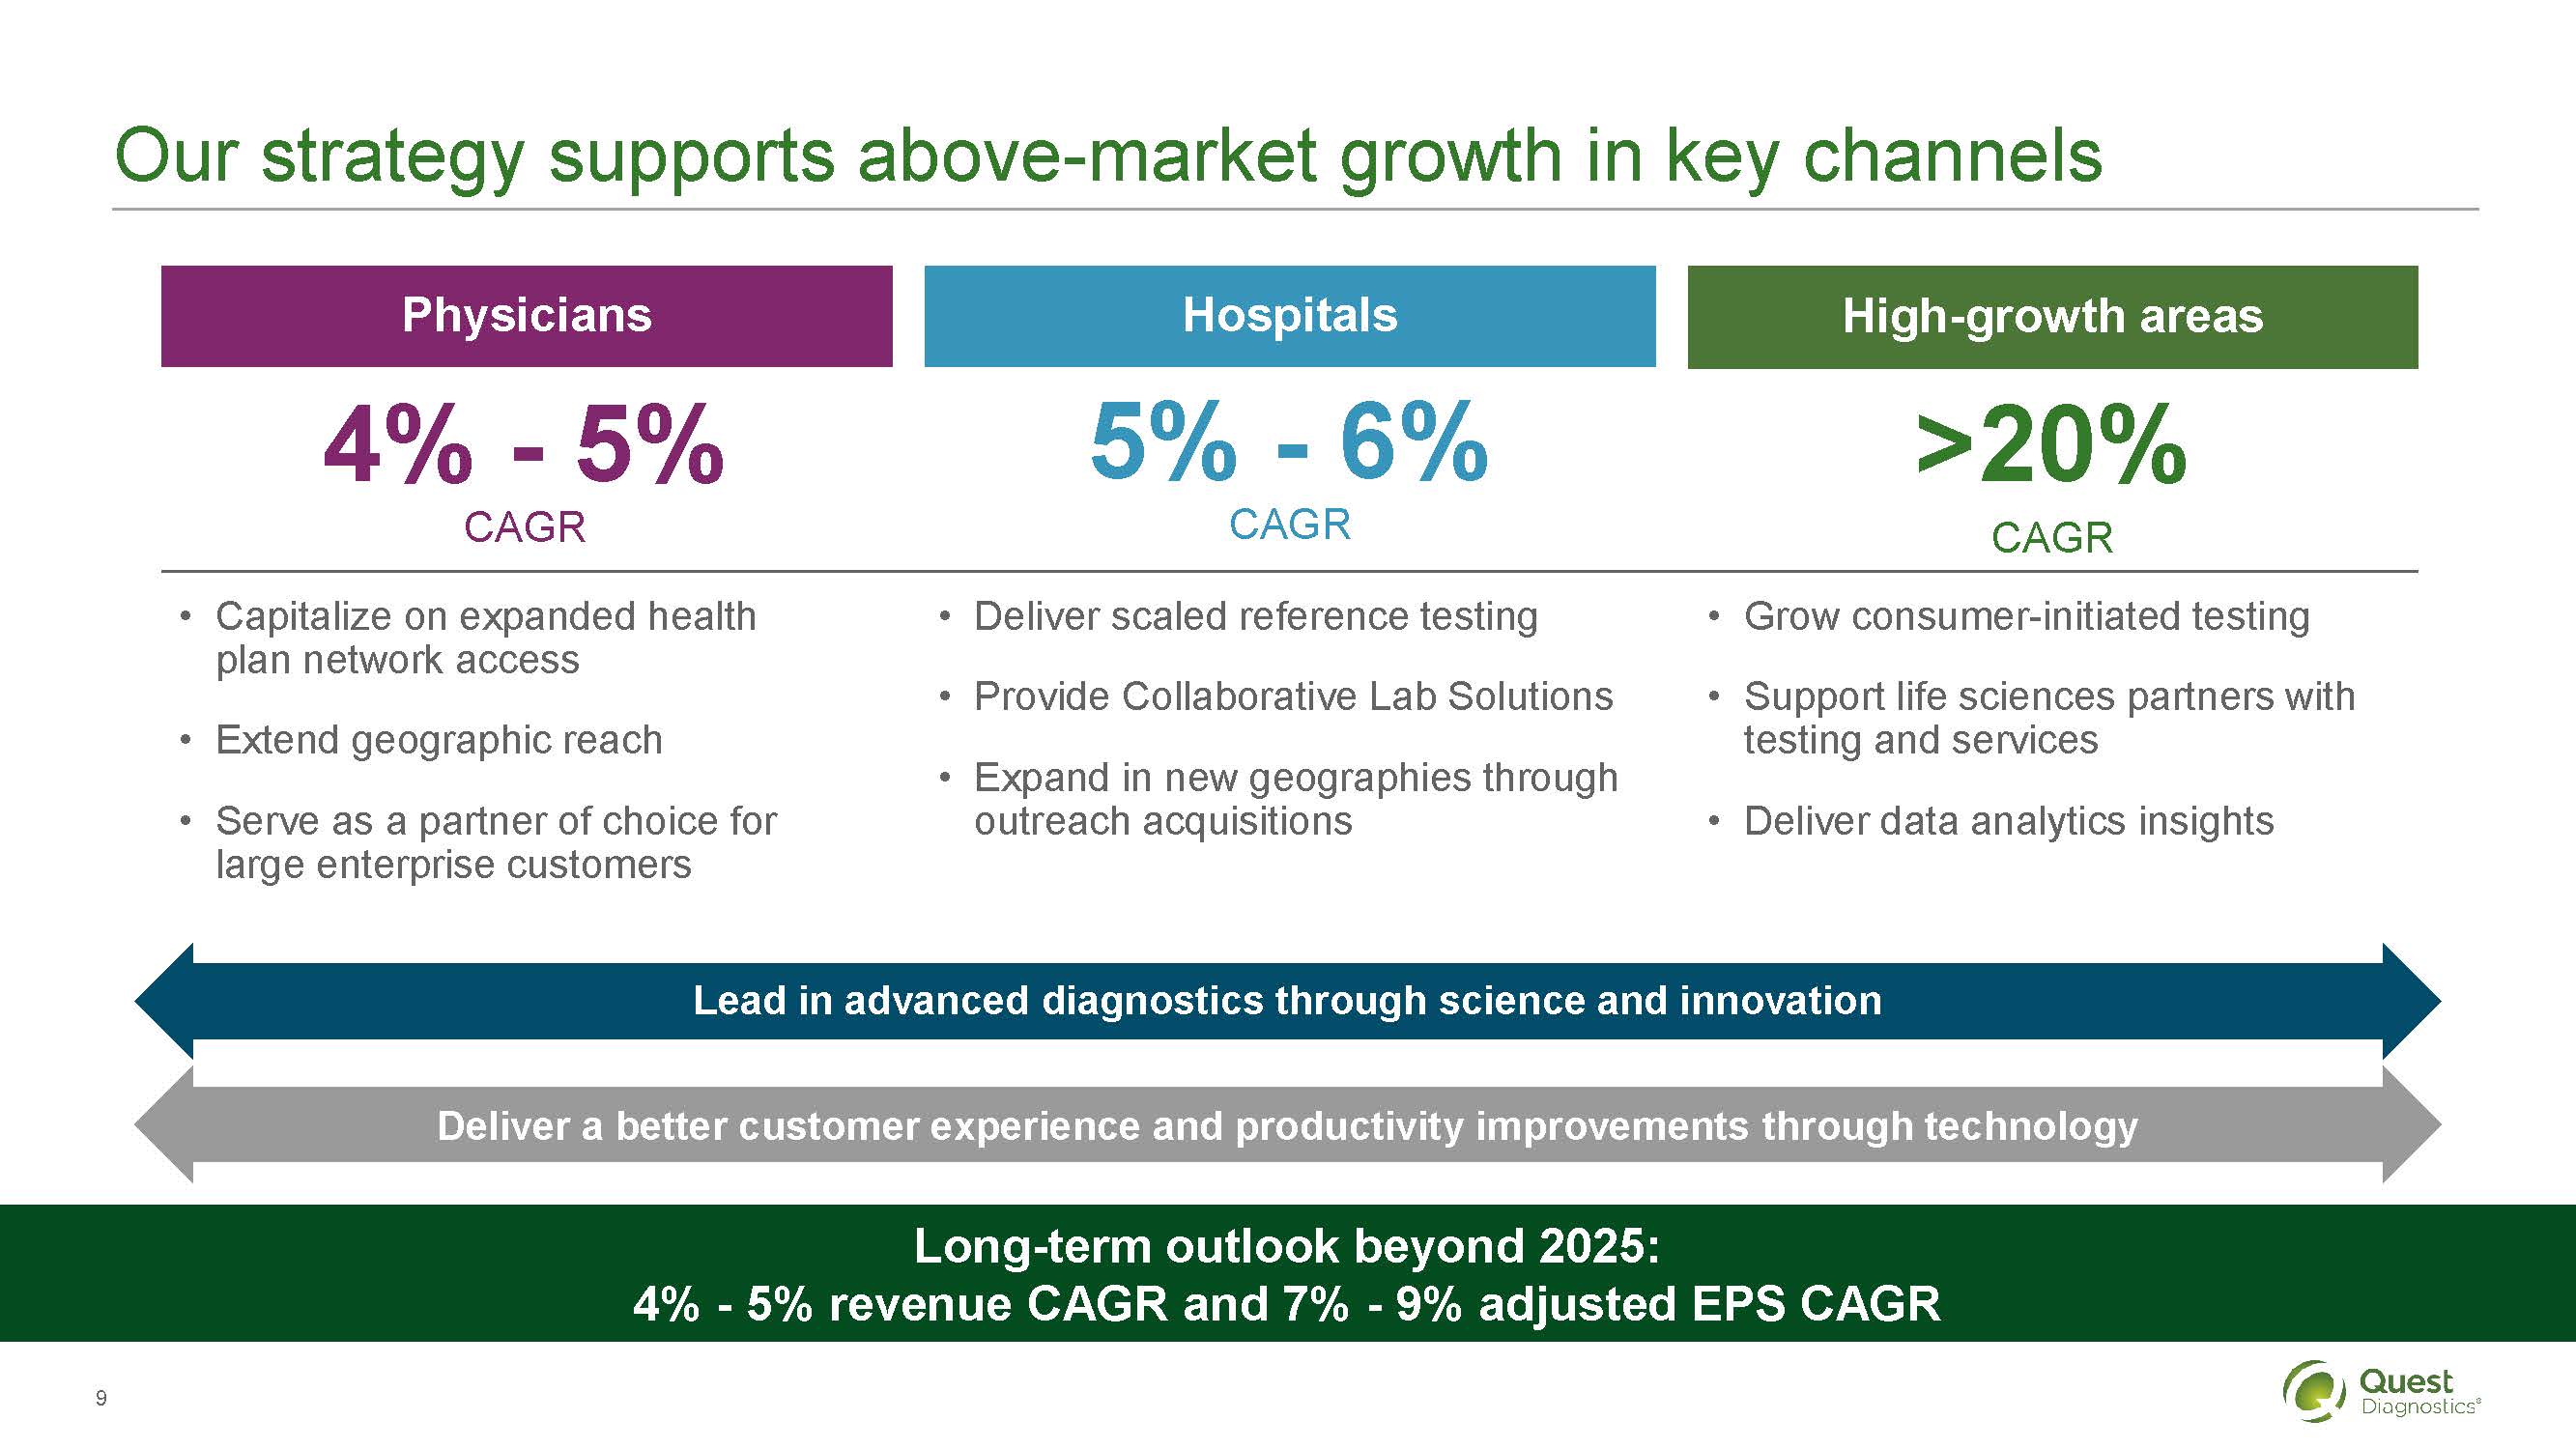
Our strategy supports above-market growth in key channels
Physicians
4% - 5% CAGR
Capitalize on expanded health
plan network access
Extend geographic reach
Serve as a partner of choice for large enterprise customers
Hospitals
5% - 6% CAGR
Deliver scaled reference testing
Provide Collaborative Lab Solutions
Expand in new geographies through outreach acquisitions
High-growth areas
>20% CAGR
Grow consumer-initiated testing
Support life sciences partners with testing and services
Deliver data analytics insights
Lead in advanced diagnostics through science and innovationDeliver a better customer experience and productivity improvements through technology
Long-term outlook beyond 2025: 4% - 5% revenue CAGR and 7% - 9% adjusted EPS CAGR
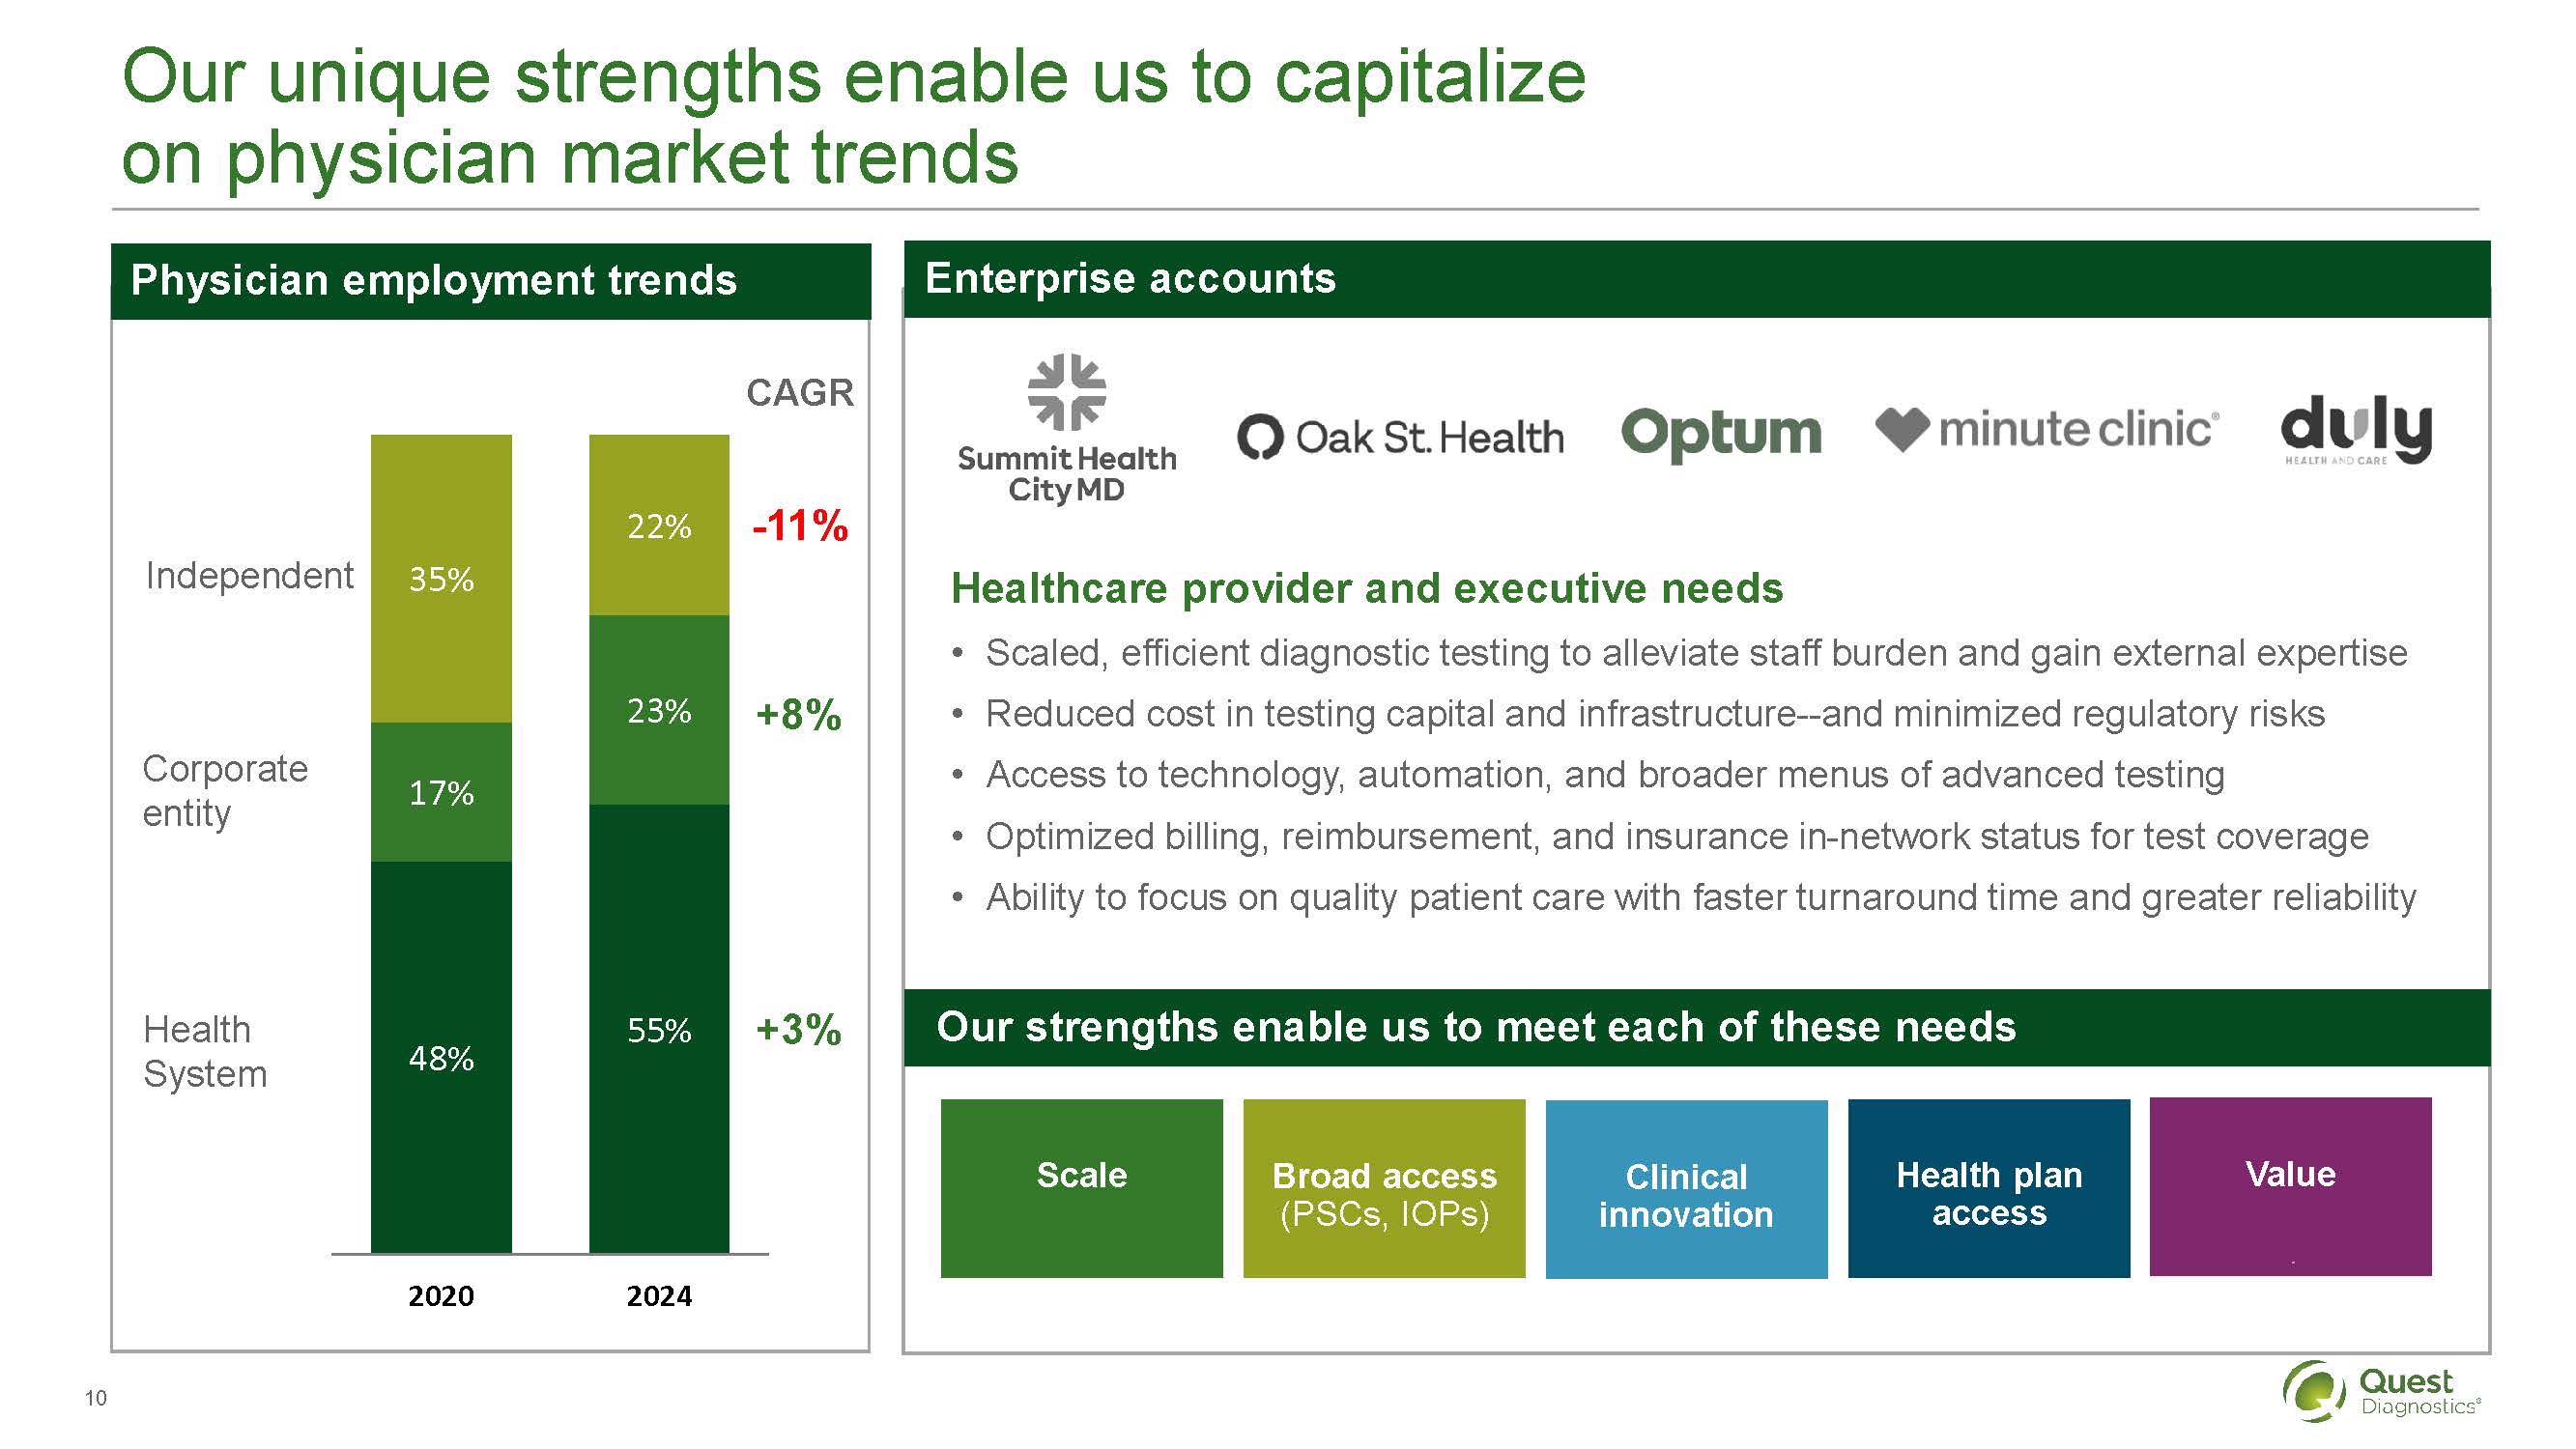
Our unique strengths enable us to capitalize on physician market trends
Physician employment trends
CAGR
Independent
35%
22%
-11%
Corporate entity
17%
23%
+8%
Health System
48%
55%
+3%
2020
2024
Enterprise accounts
Summit Health City MD
Oak St. Health
Optum
Minute clinic
duly
Healthcare provider and executive needs
Scaled, efficient diagnostic testing to alleviate staff burden and gain external expertise
Reduced cost in testing capital and infrastructure--and minimized regulatory risks
Access to technology, automation, and broader menus of advanced testing
Optimized billing, reimbursement, and insurance in-network status for test coverage
Ability to focus on quality patient care with faster turnaround time and greater reliability
Our strengths enable us to meet each of these needs
Scale
Board access (PSCs, IOPs)
Clinical Innovation
Health plan access
Value
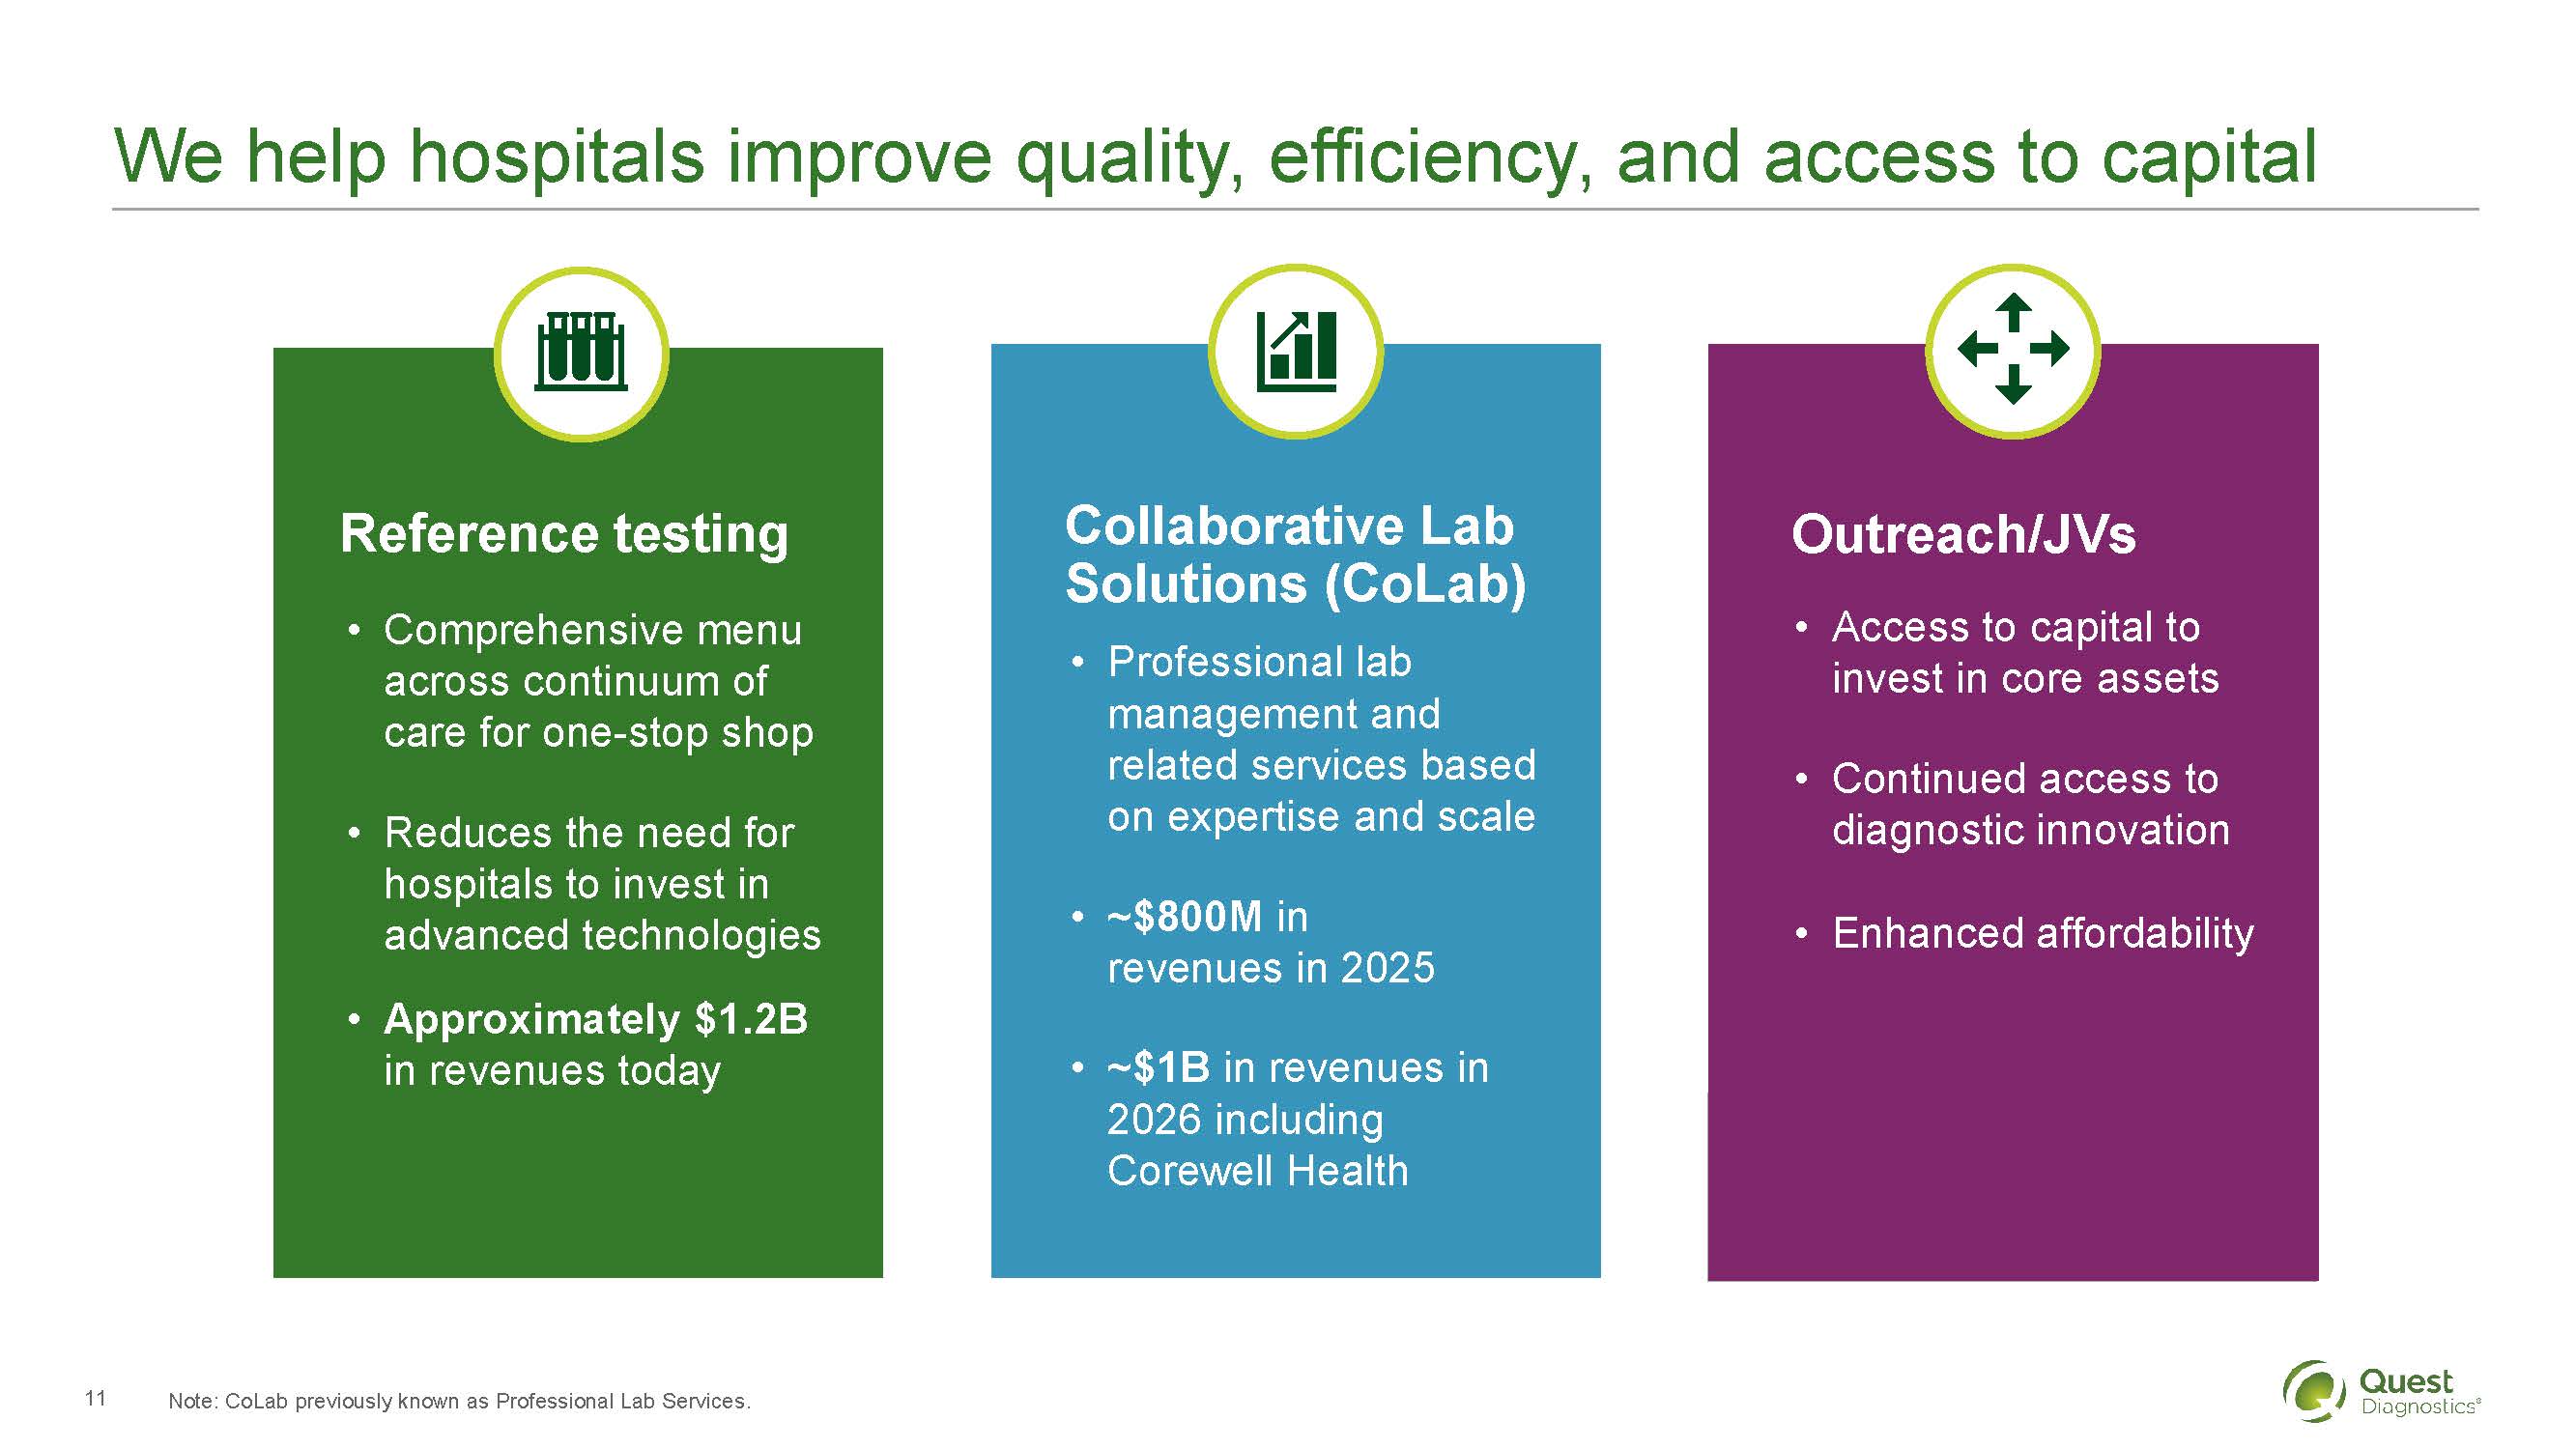
We help hospitals improve quality, efficiency, and access to capital
Reference testing
Comprehensive menu across continuum of care for one-stop shop
Reduces the need for hospitals to invest in advanced technologies
Approximately $1.2B in revenues today
Collaborative Lab Solutions (CoLab)
Professional lab management and related services based on expertise and scale
~$800M in revenues in 2025
~$1B in revenues in 2026 including Corewell Health
Outreach / JVs
Access to capital to invest in core assets
Continued access to diagnostic innovation
Enhanced affordability
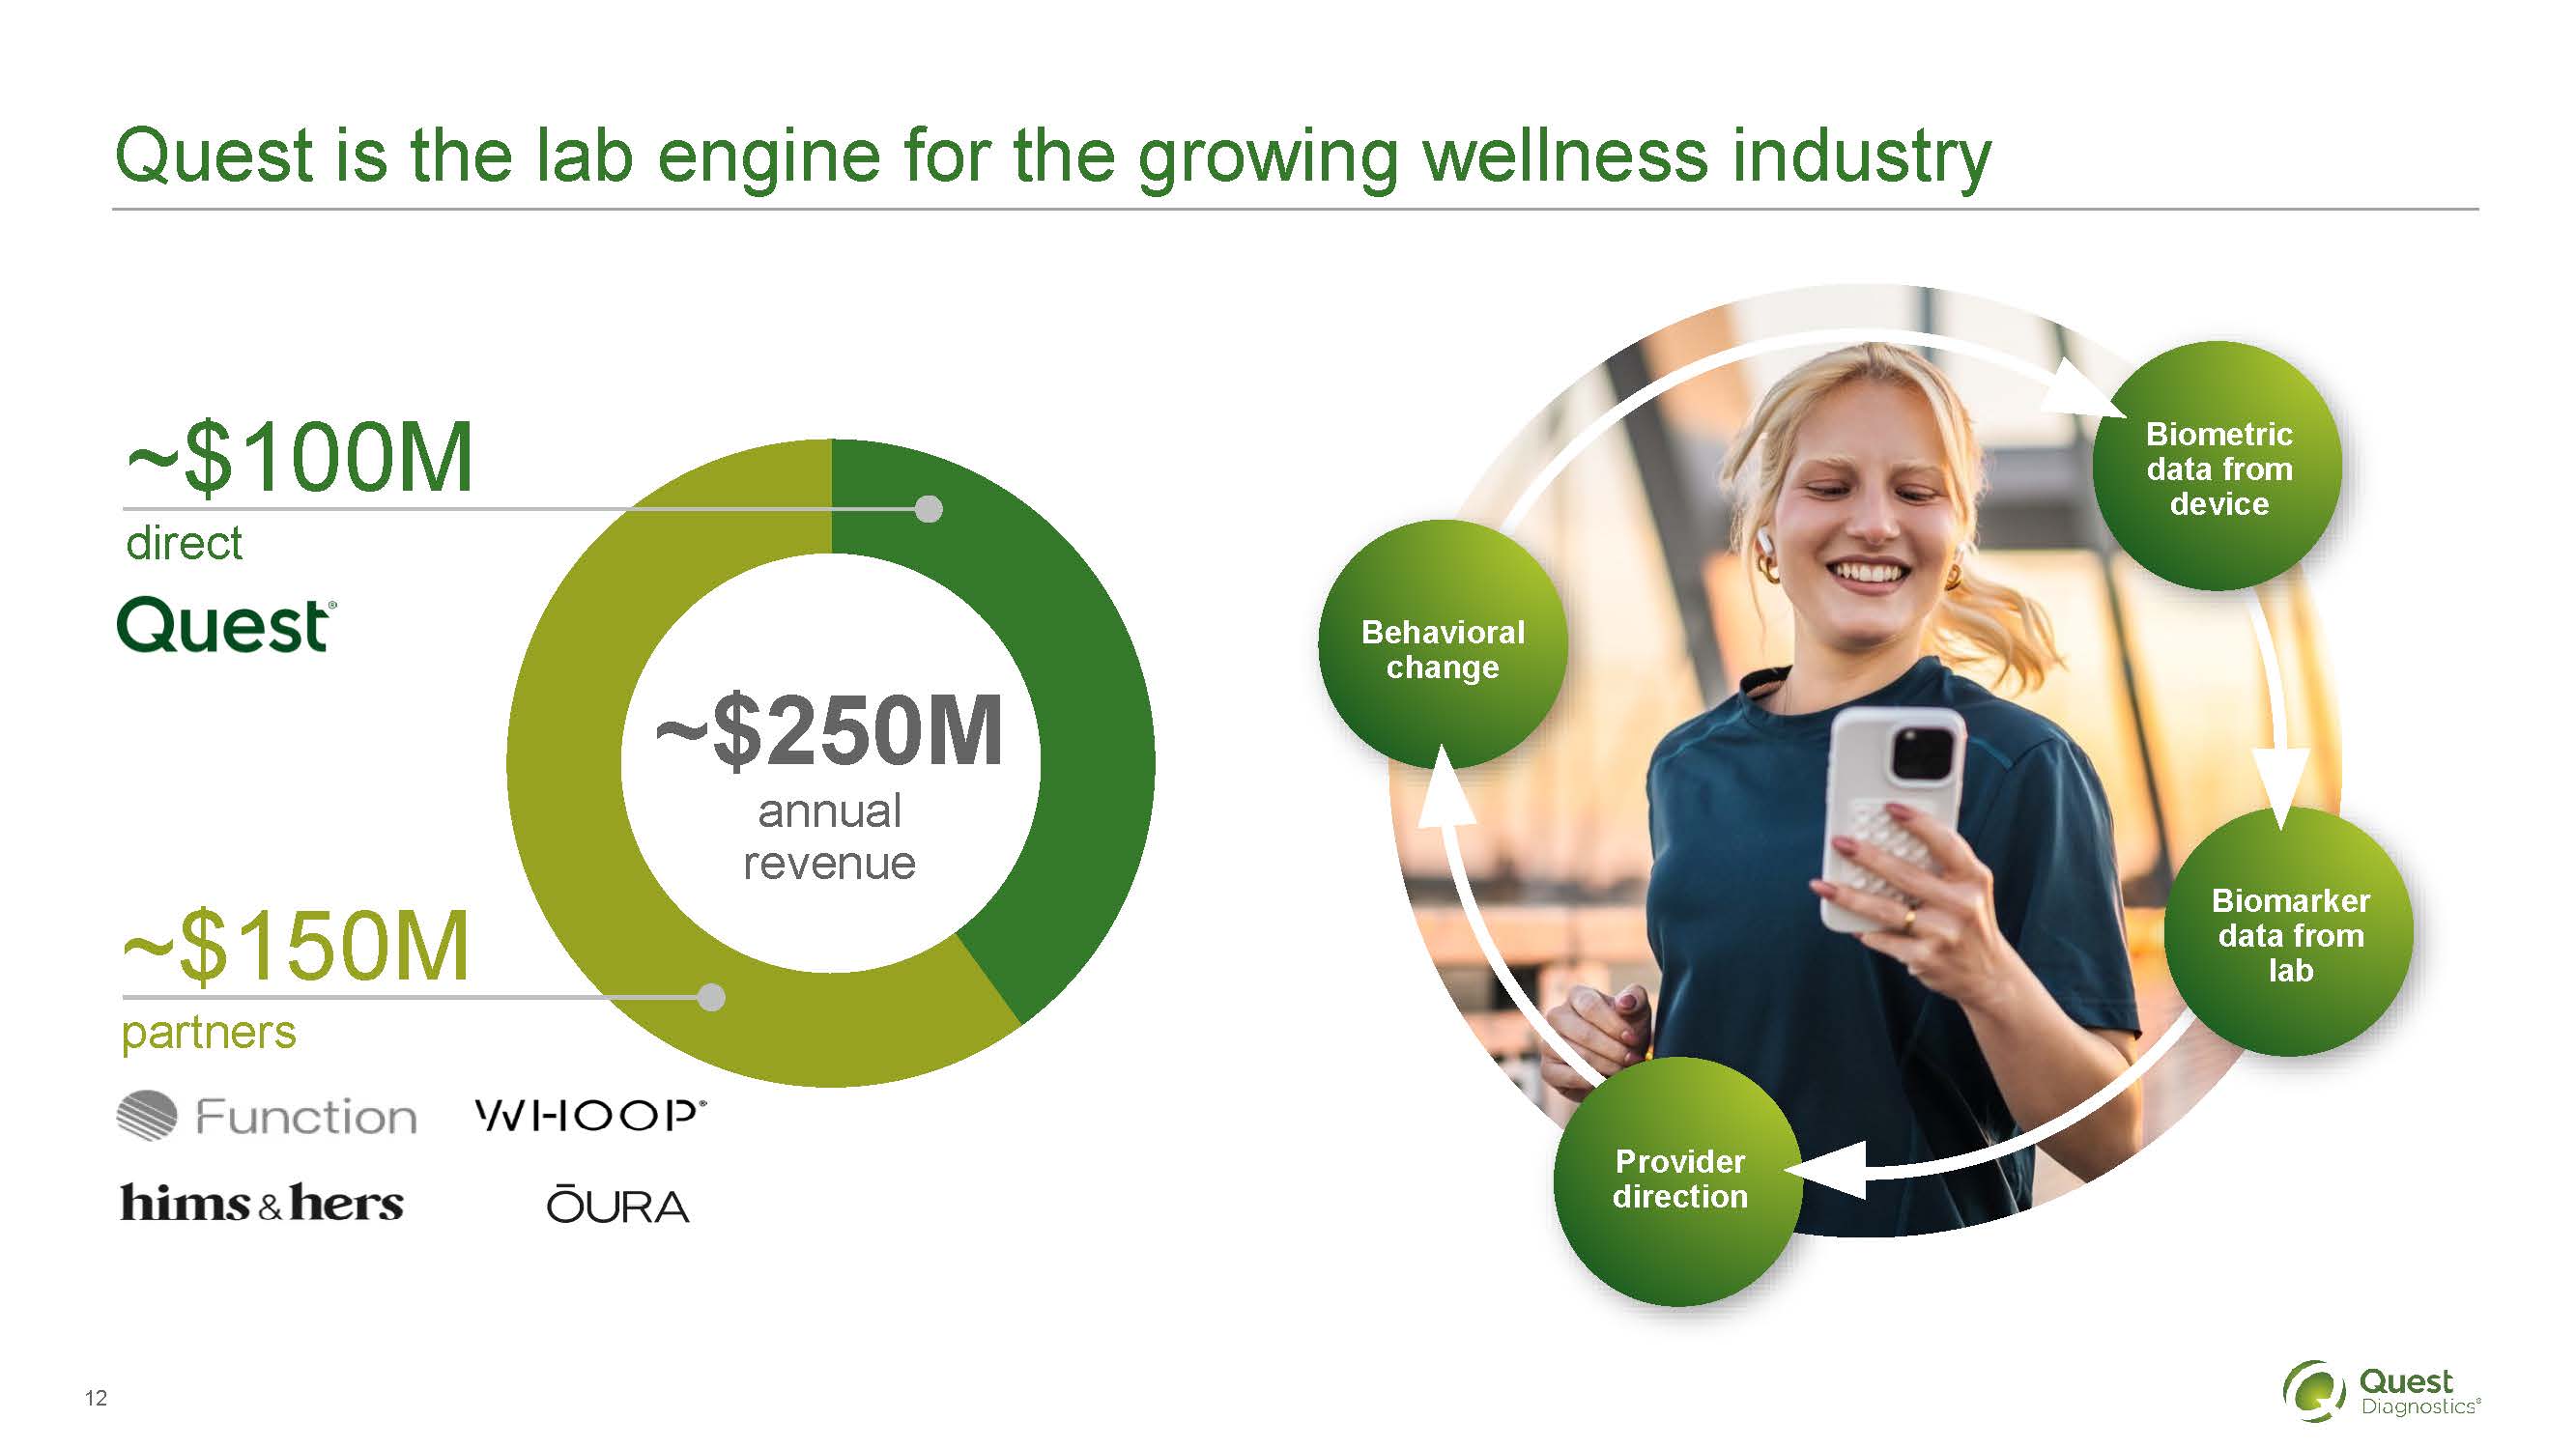
Quest is the lab engine for the growing wellness industry
~$100M direct
Quest
~250M annual revenue
~150M partners
Function
WHOOP
Hims&hers
OURA
Behavioral Change
Biometric data from device
Biomarker data from lab
Provider direction
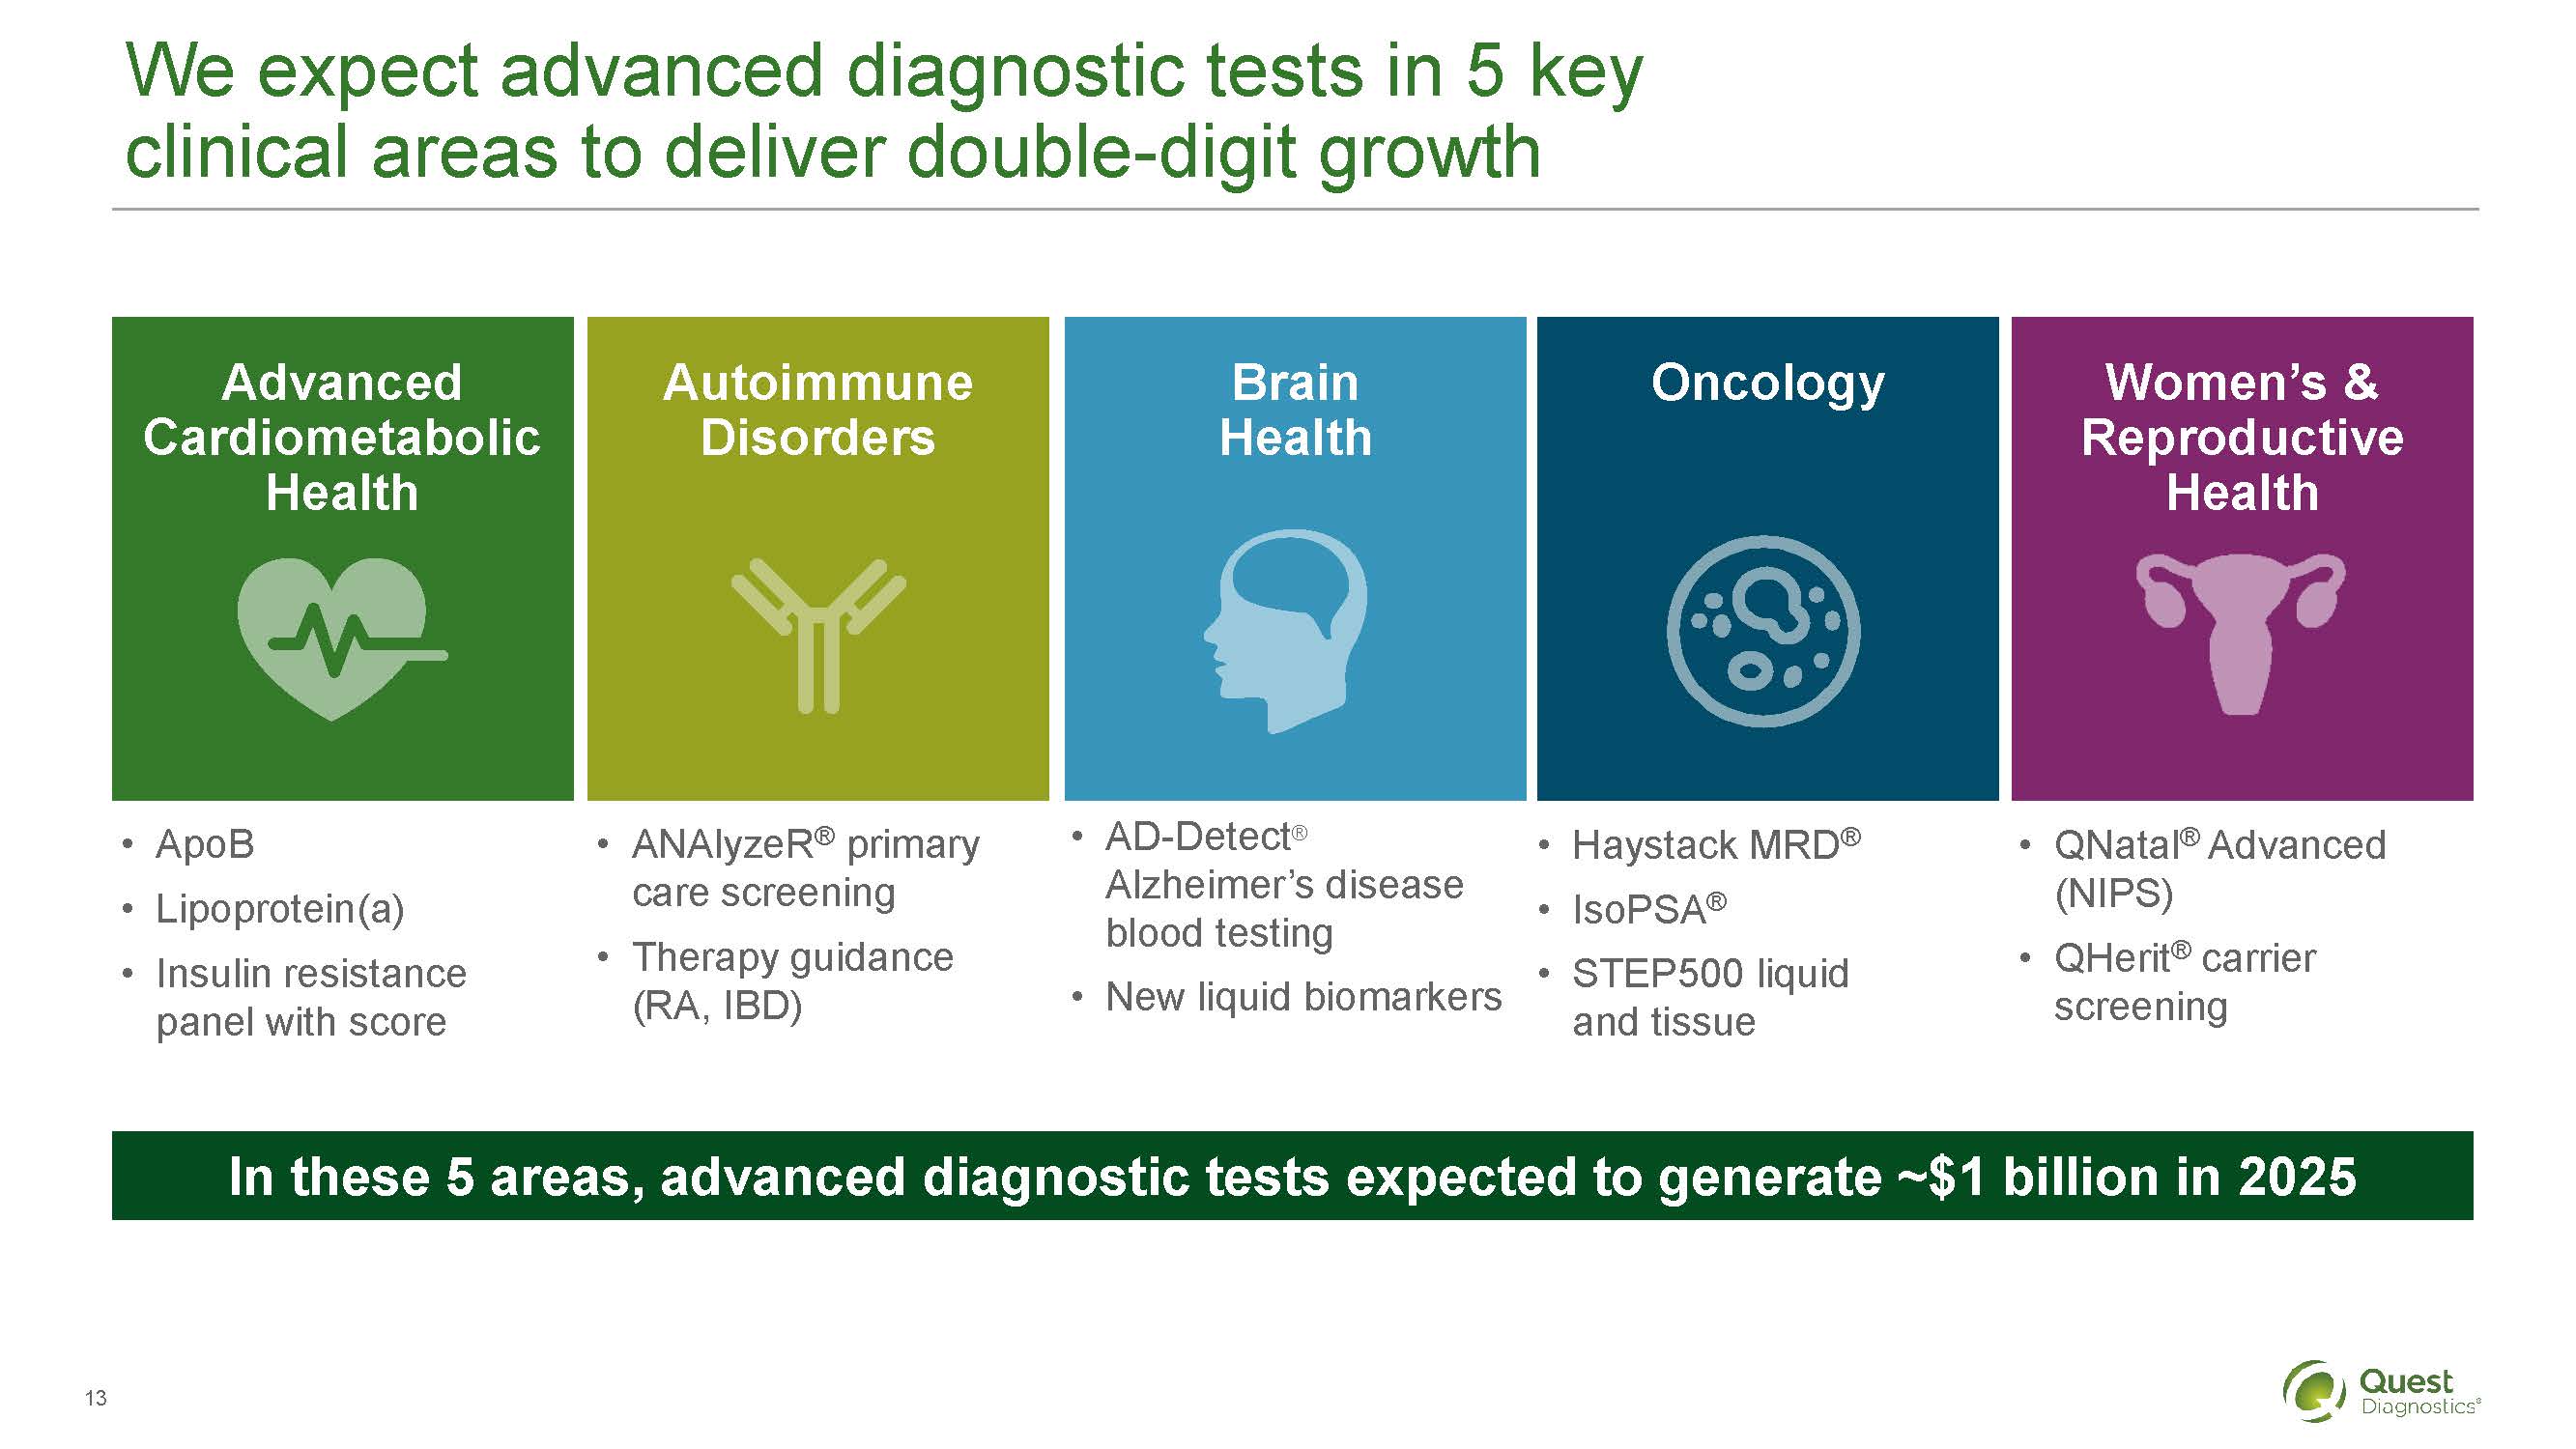
We expect advanced diagnostic tests in 5 key clinical areas to deliver double-digit growth
Advanced Cardiometabolic Health
ApoB
Lipoprotein(a)
Insulin resistance panel with score
Autoimmune Disorders
ANAlyzeR® primary care screening
Therapy guidance
(RA, IBD)
Brain Health
AD-Detect® Alzheimer's disease blood testing
New liquid biomarkers
Oncology
Haystack MRD®
IsoPSA®
STEP500 liquid and tissue
Women's & Reproductive Health
QNatal® Advanced (NIPS)
QHerit® carrier screening
In these 5 areas, advanced diagnostic tests expected to generate ~$1 billion in 2025
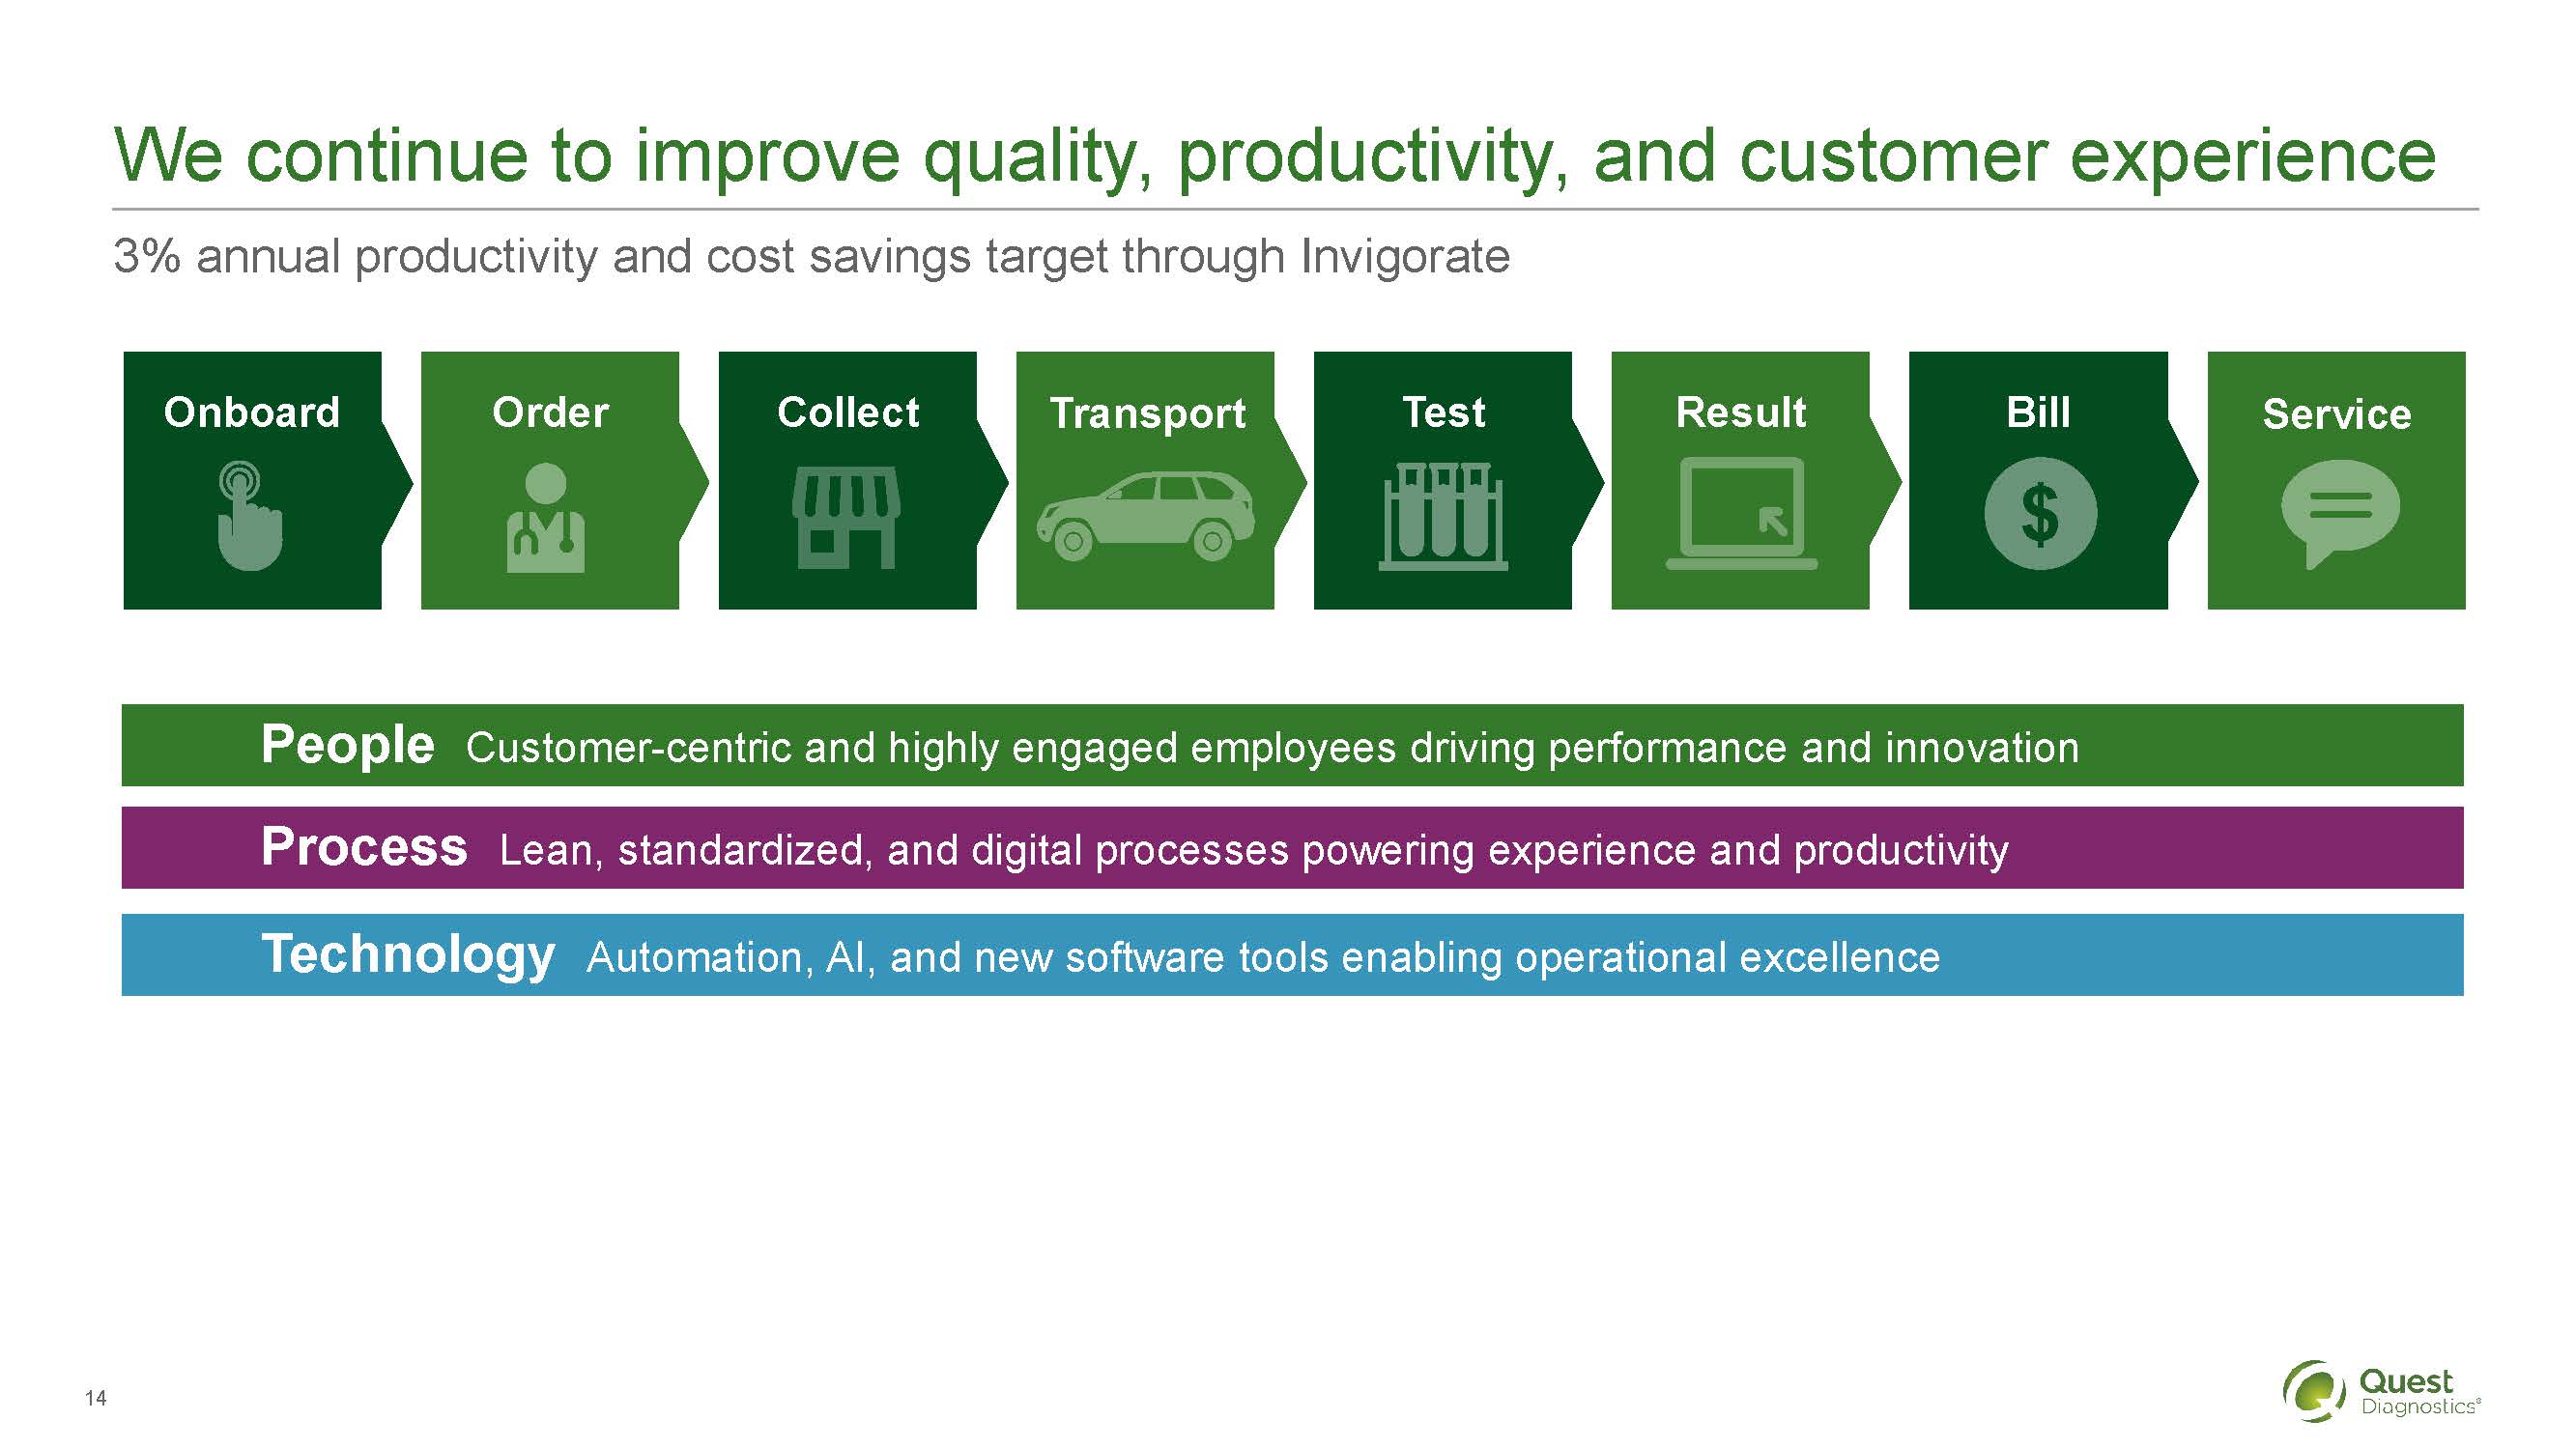
We continue to improve quality, productivity, and customer experience
3% annual productivity and cost savings target through Invigorate
Onboard
Order
Collect
Transport
Test
Result
Bill
Service
People Customer-centric and highly engaged employees driving performance and innovation
Process Lean, standardized, and digital processes powering experience and productivity
Technology Automation, AI, and new software tools enabling operational excellence
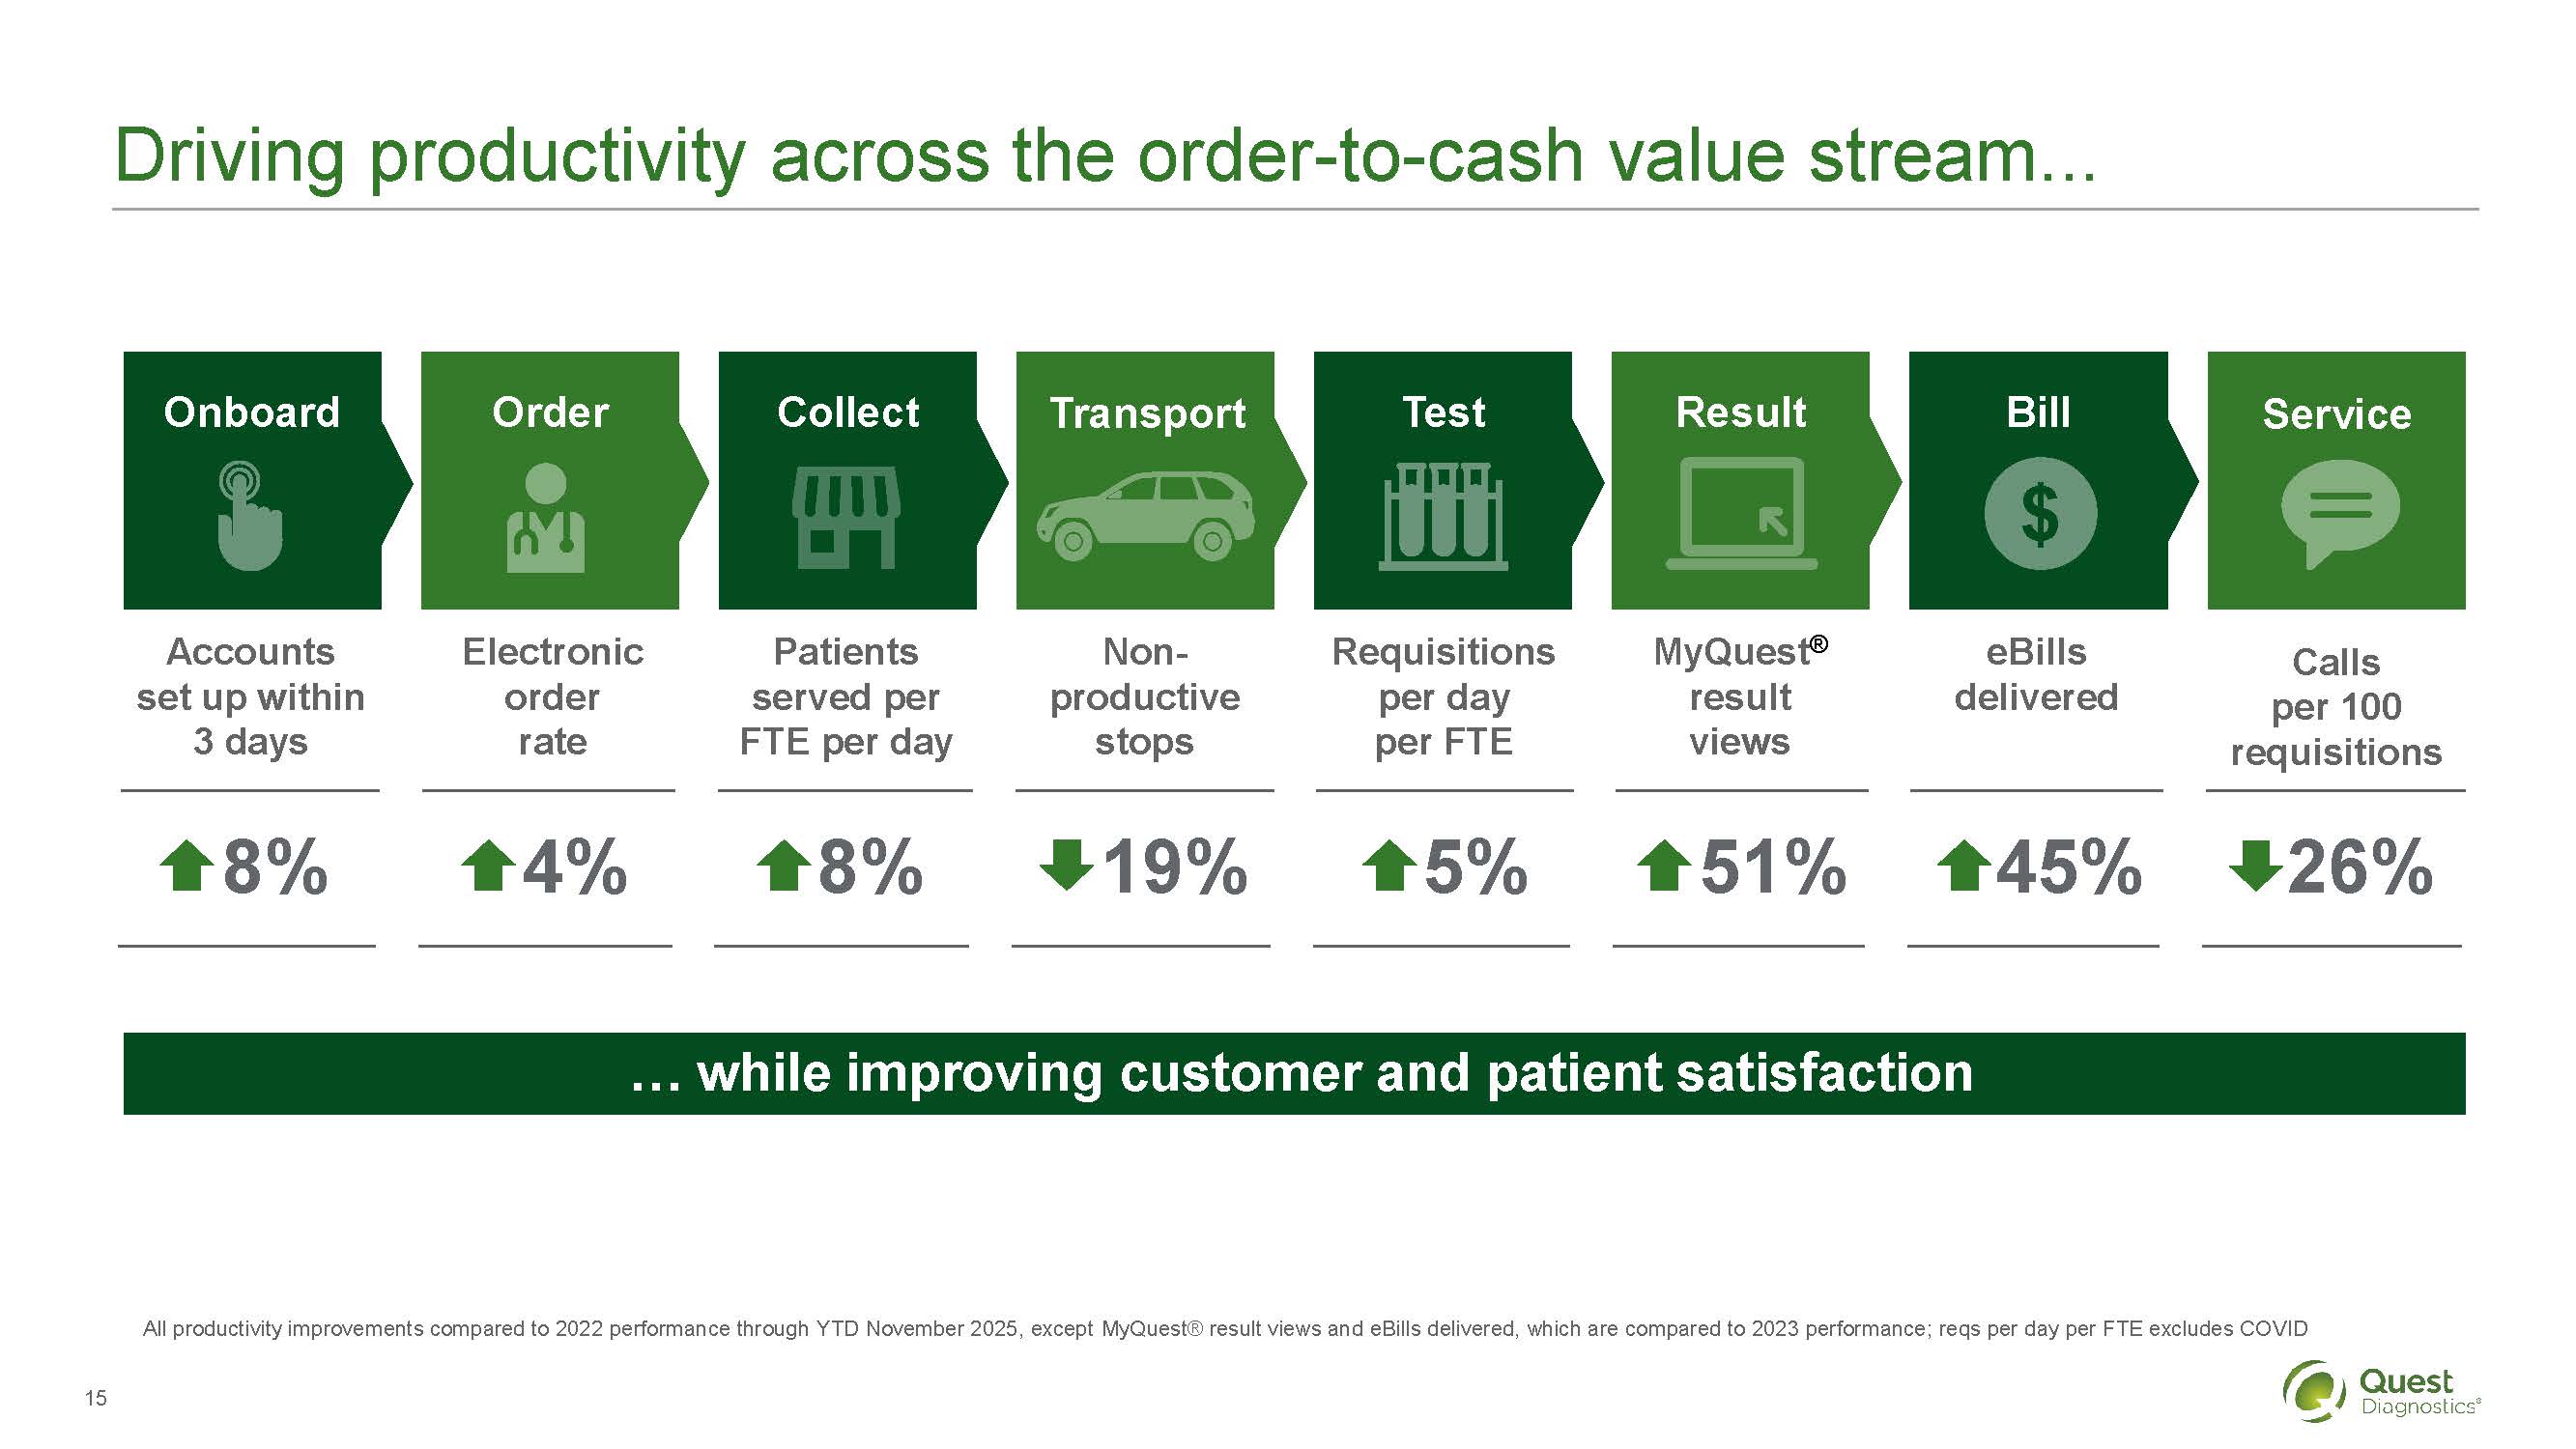
Driving productivity across the order-to-cash value stream...
Onboard
Order
Collect
Transport
Test
Result
Bill
Service
Accounts set up within 3 days
Electronic order rate
Patients served per FTE per day
Non-productive stops
Requisitions per day per FTE
MyQuest® result views
eBills delivered
Calls per 100 requisitions
8%
4%
8%
19%
5%
51%
45%
26%
… while improving customer and patient satisfaction
All productivity improvements compared to 2022 performance through YTD November 2025, except MyQuest®result views and eBills delivered, which are compared to 2023 performance; reqs per day per FTE excludes COVID
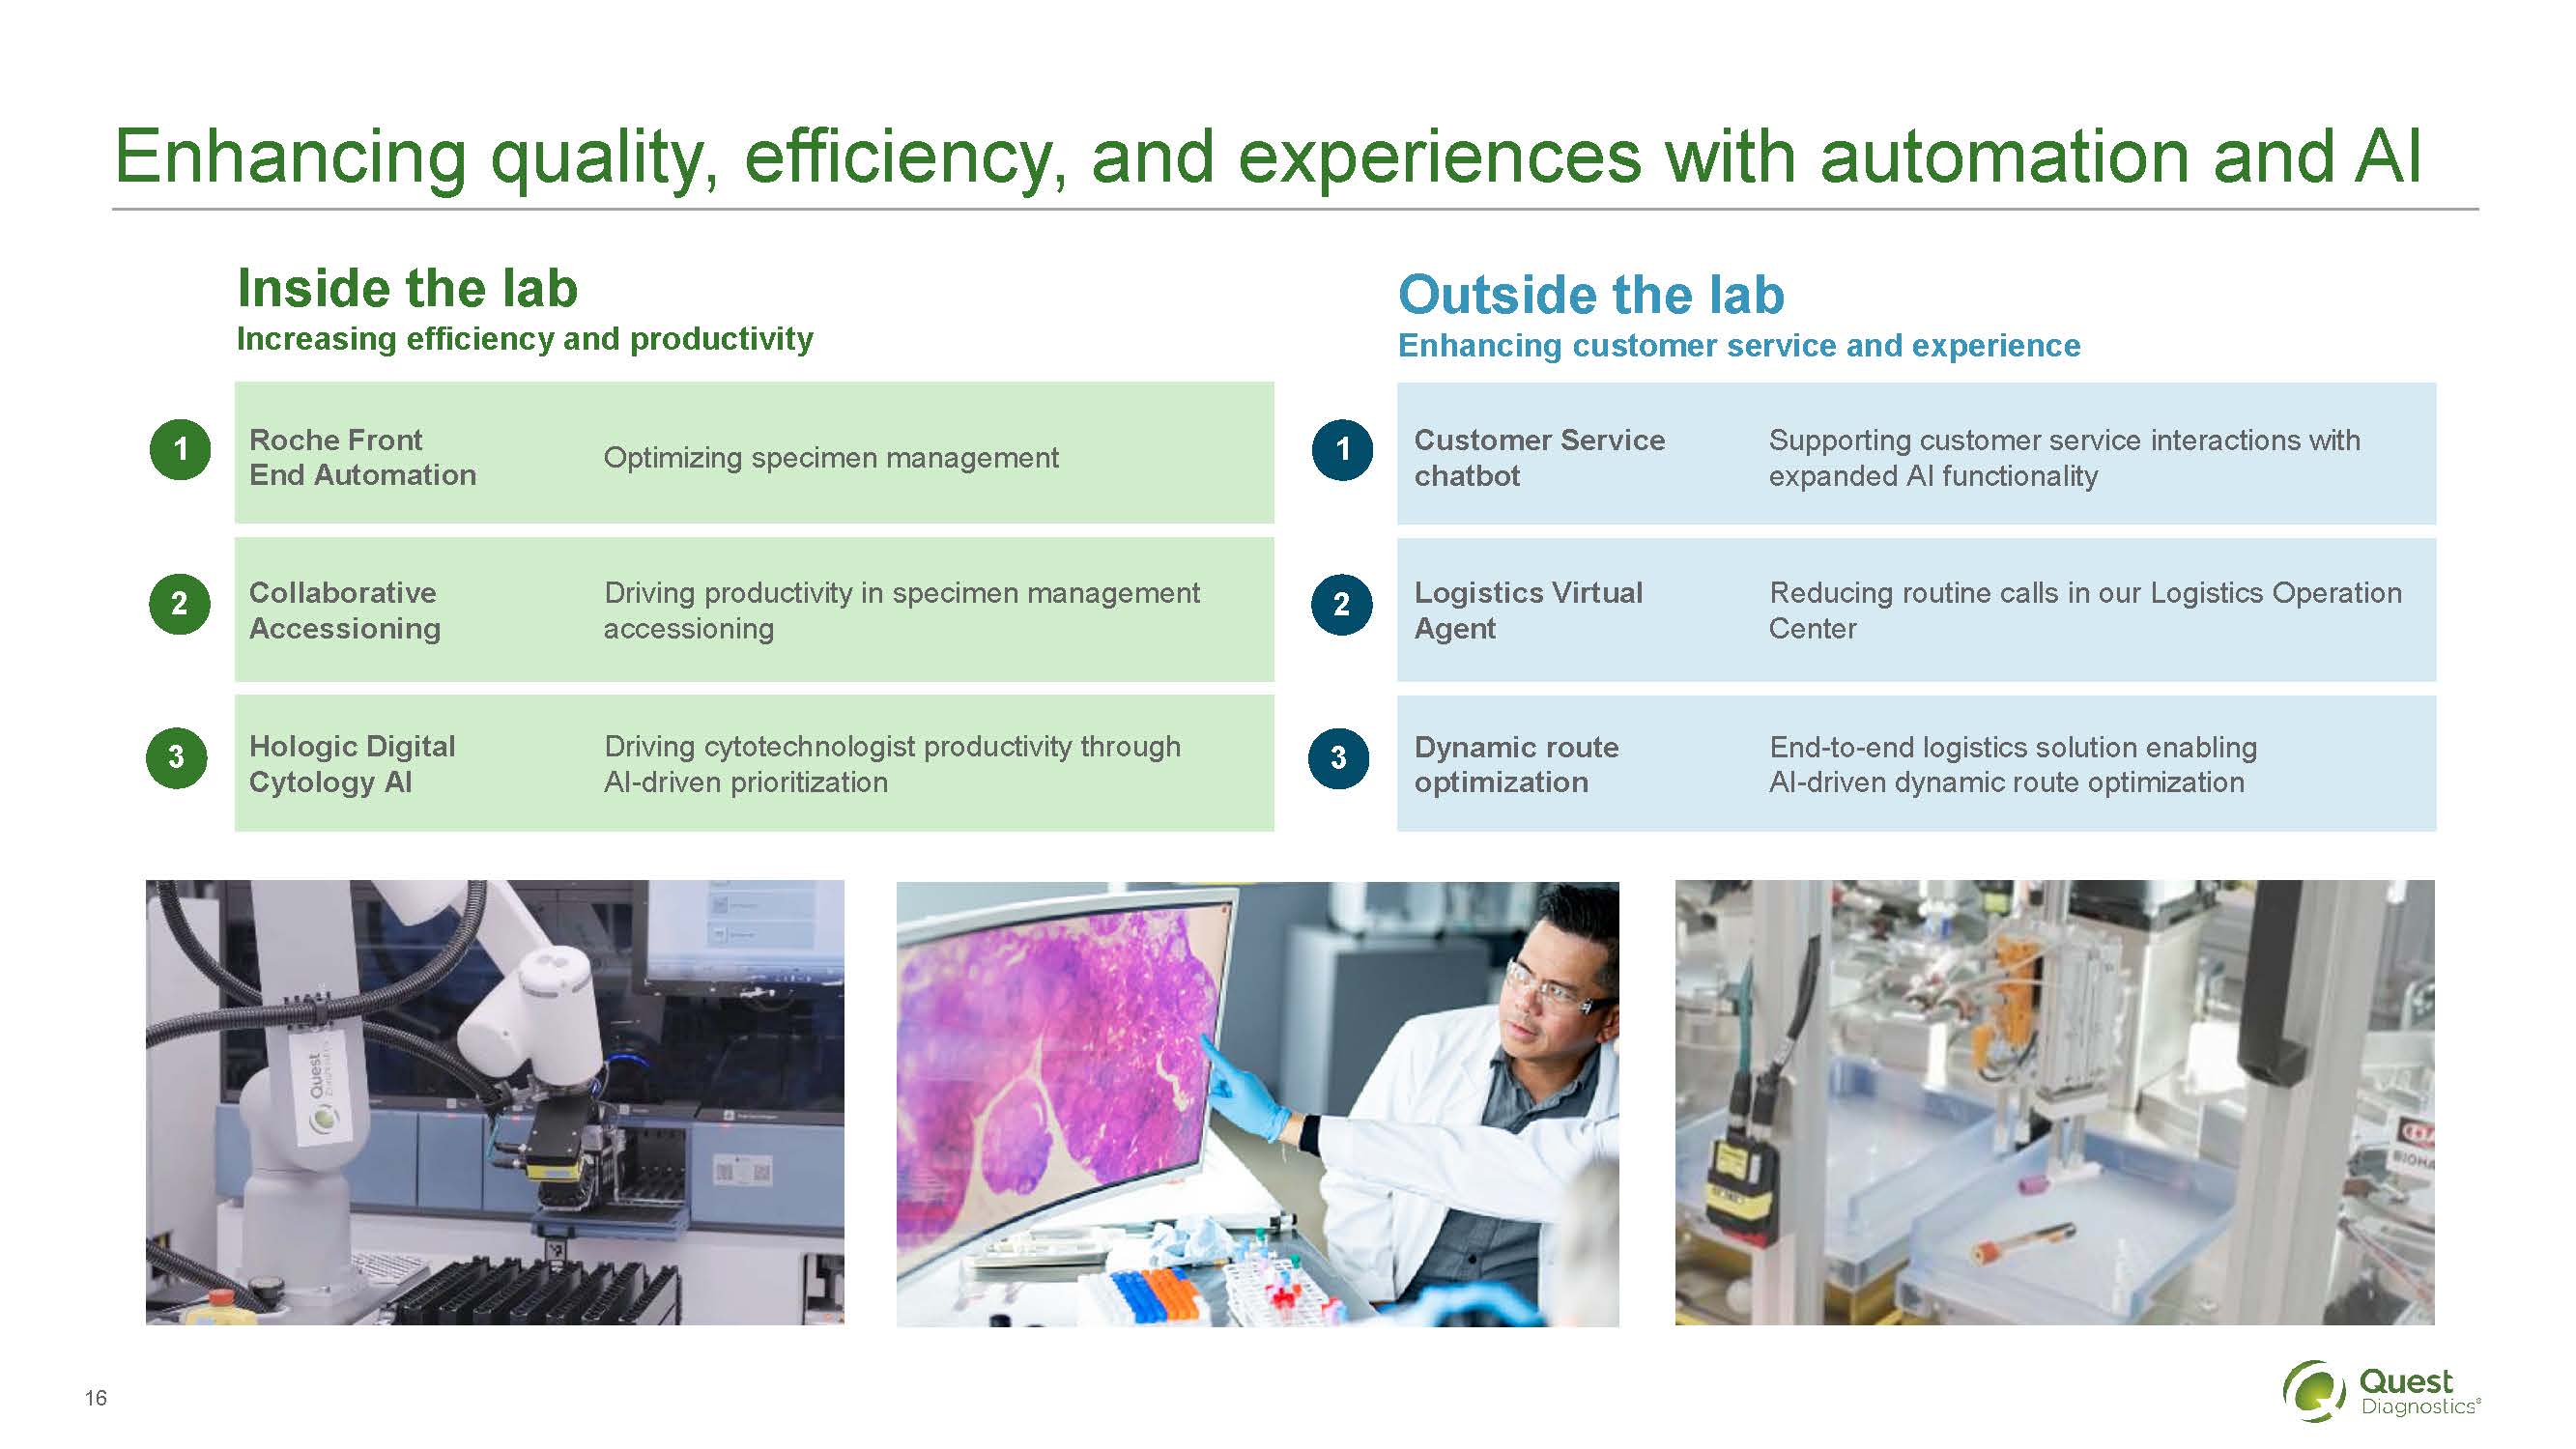
Enhancing quality, efficiency, and experiences with automation and AI
Inside the lab
Increasing efficiency and productivity
1 Roche Front End Automation
Optimizing specimen management
2 Driving productivity in specimen management accessioning
Driving productivity in specimen management accessioning
3 Hologic Digital Cytology AI
Driving cytotechnologist productivity through AI-driven prioritization
Outside the lab
Enhancing customer service and experience
1 Customer Service chatbot
Supporting customer service interactions with expanded AI functionality
2 Logistics Virtual Agent
Reducing routine calls in our Logistics Operation Center
3 Dynamic route optimization
End-to-end logistics solution enabling AI-driven dynamic route optimization
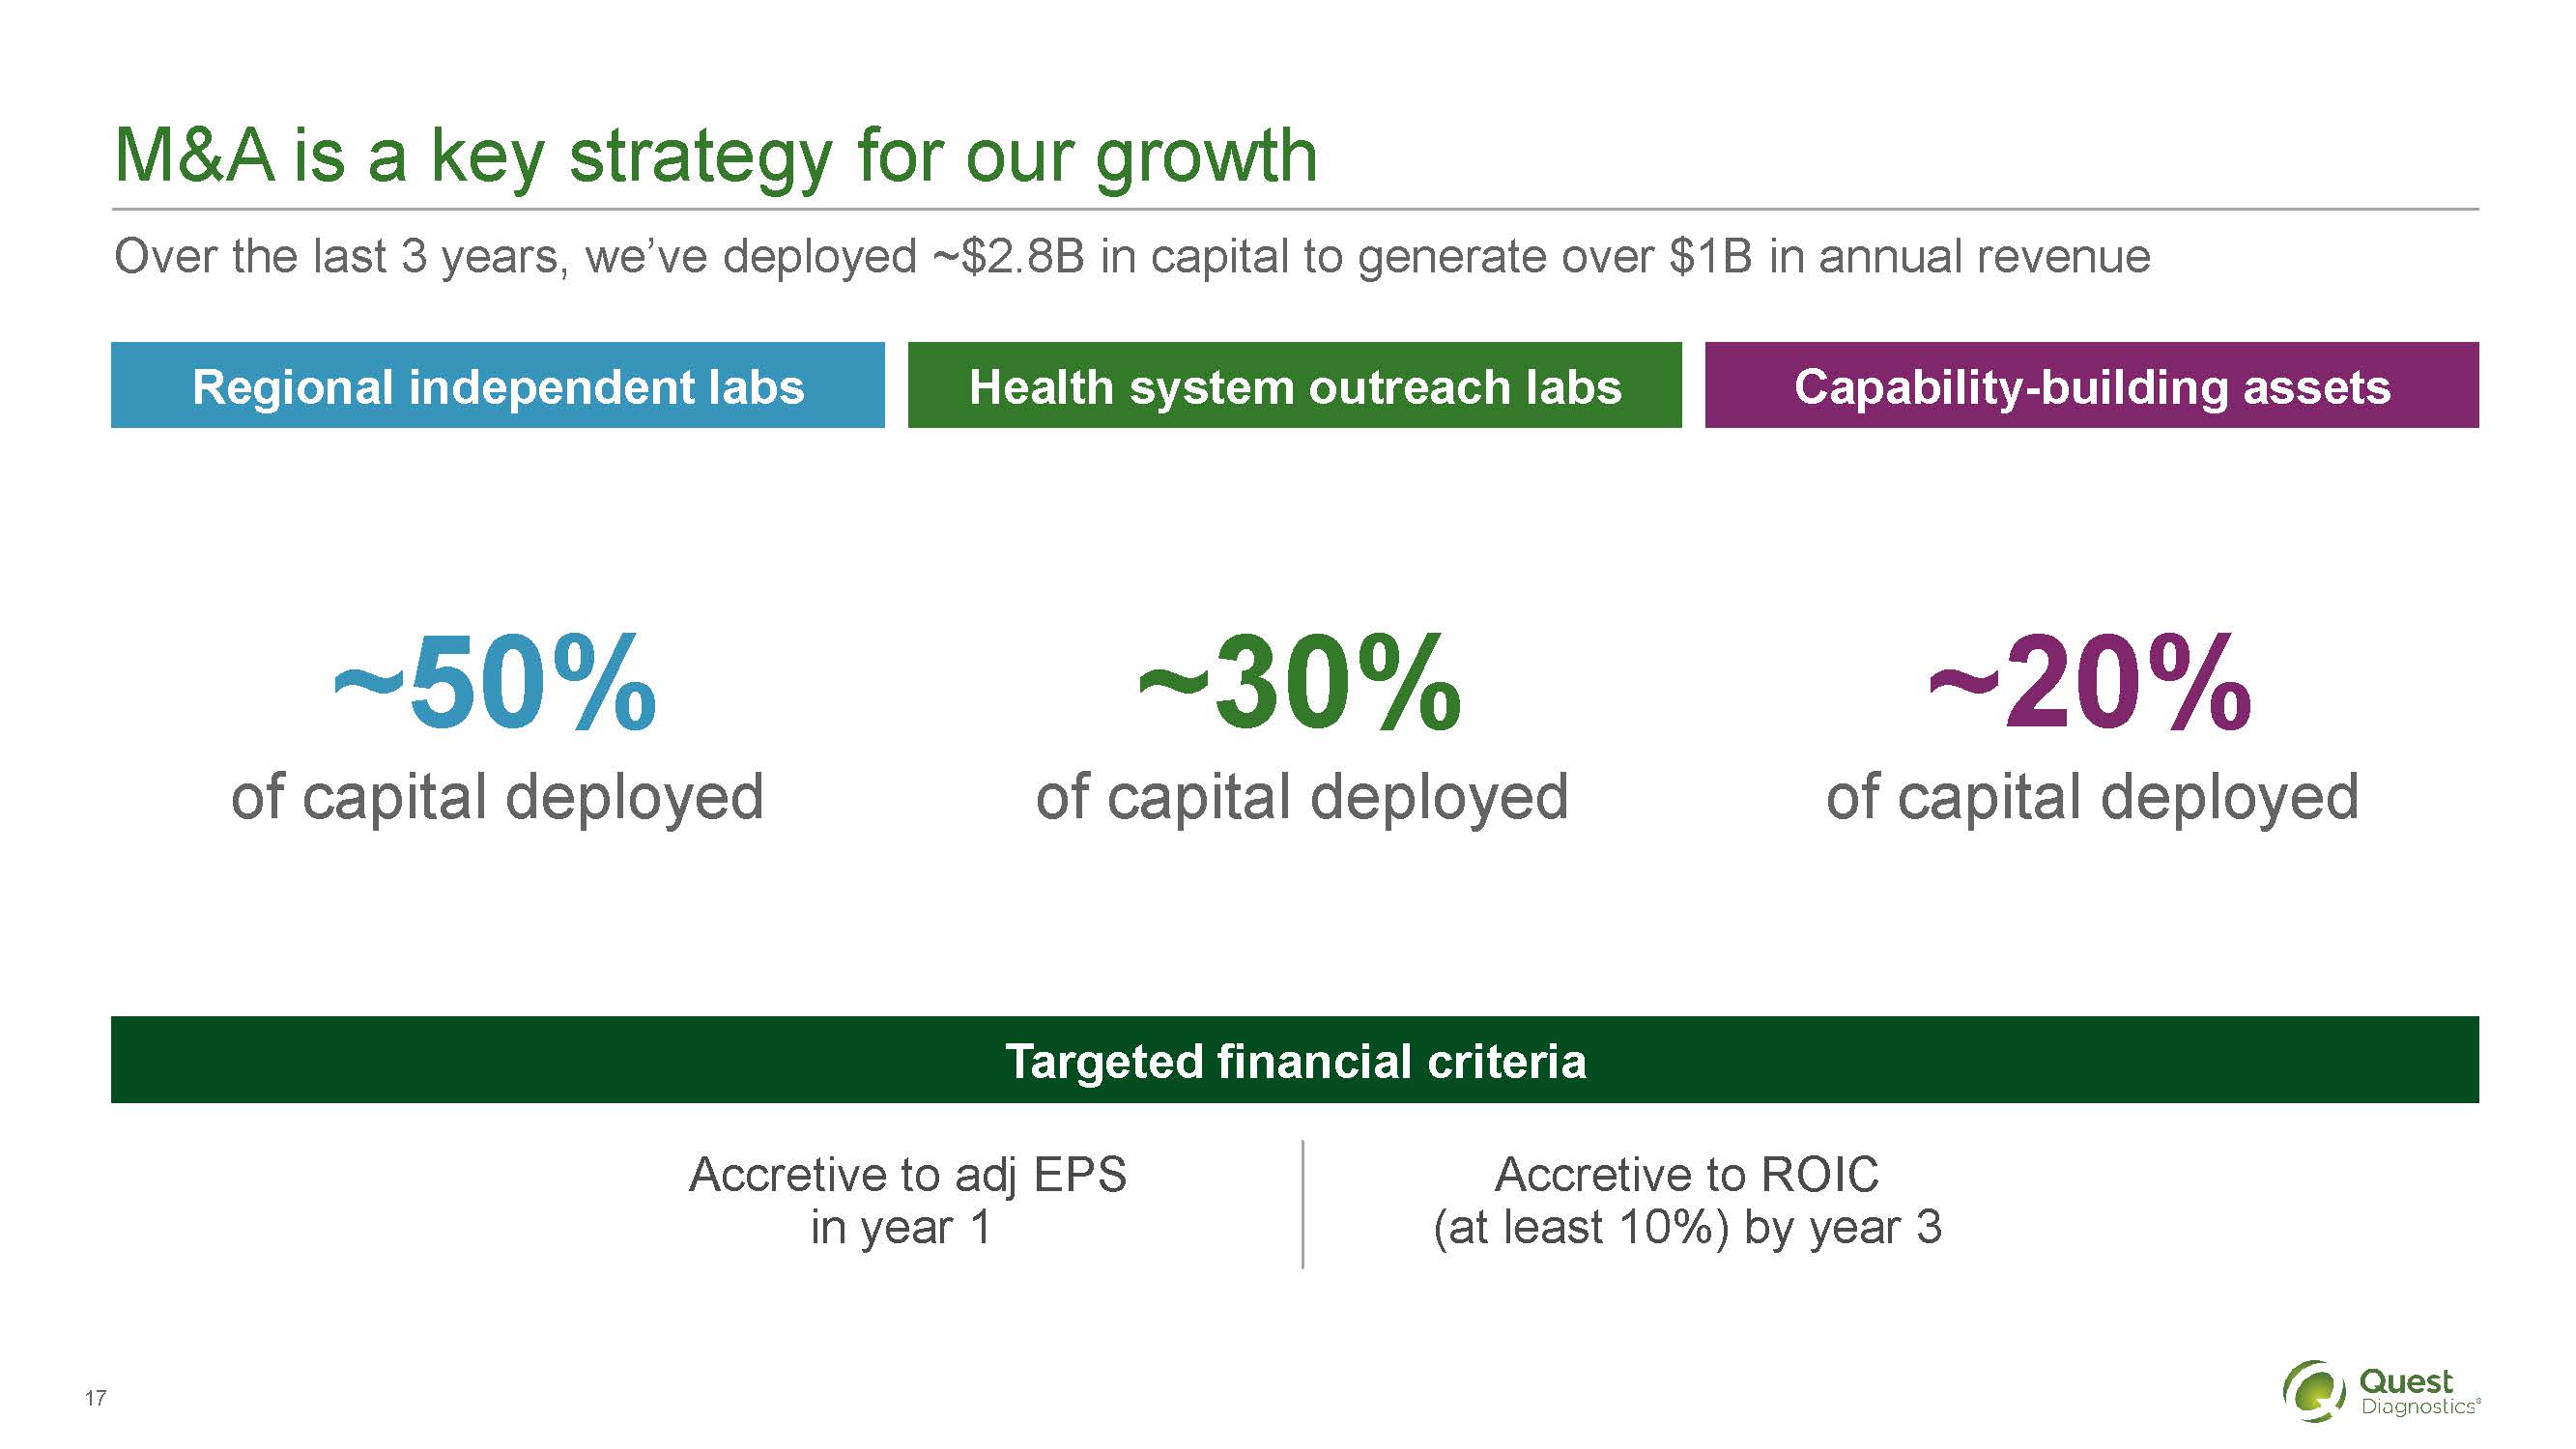
M&A is a key strategy for our growth
Over the last 3 years, we've deployed ~$2.8B in capital to generate over $1B in annual revenue
Regional independent labs
Health system outreach labs
Capability-building assets
~50% of capital deployed
~30% of capital deployed
~20% of capital deployed
Targeted financial criteria
Accretive to adj EPS in year 1
Accretive to ROIC (at least 10%) by year 3
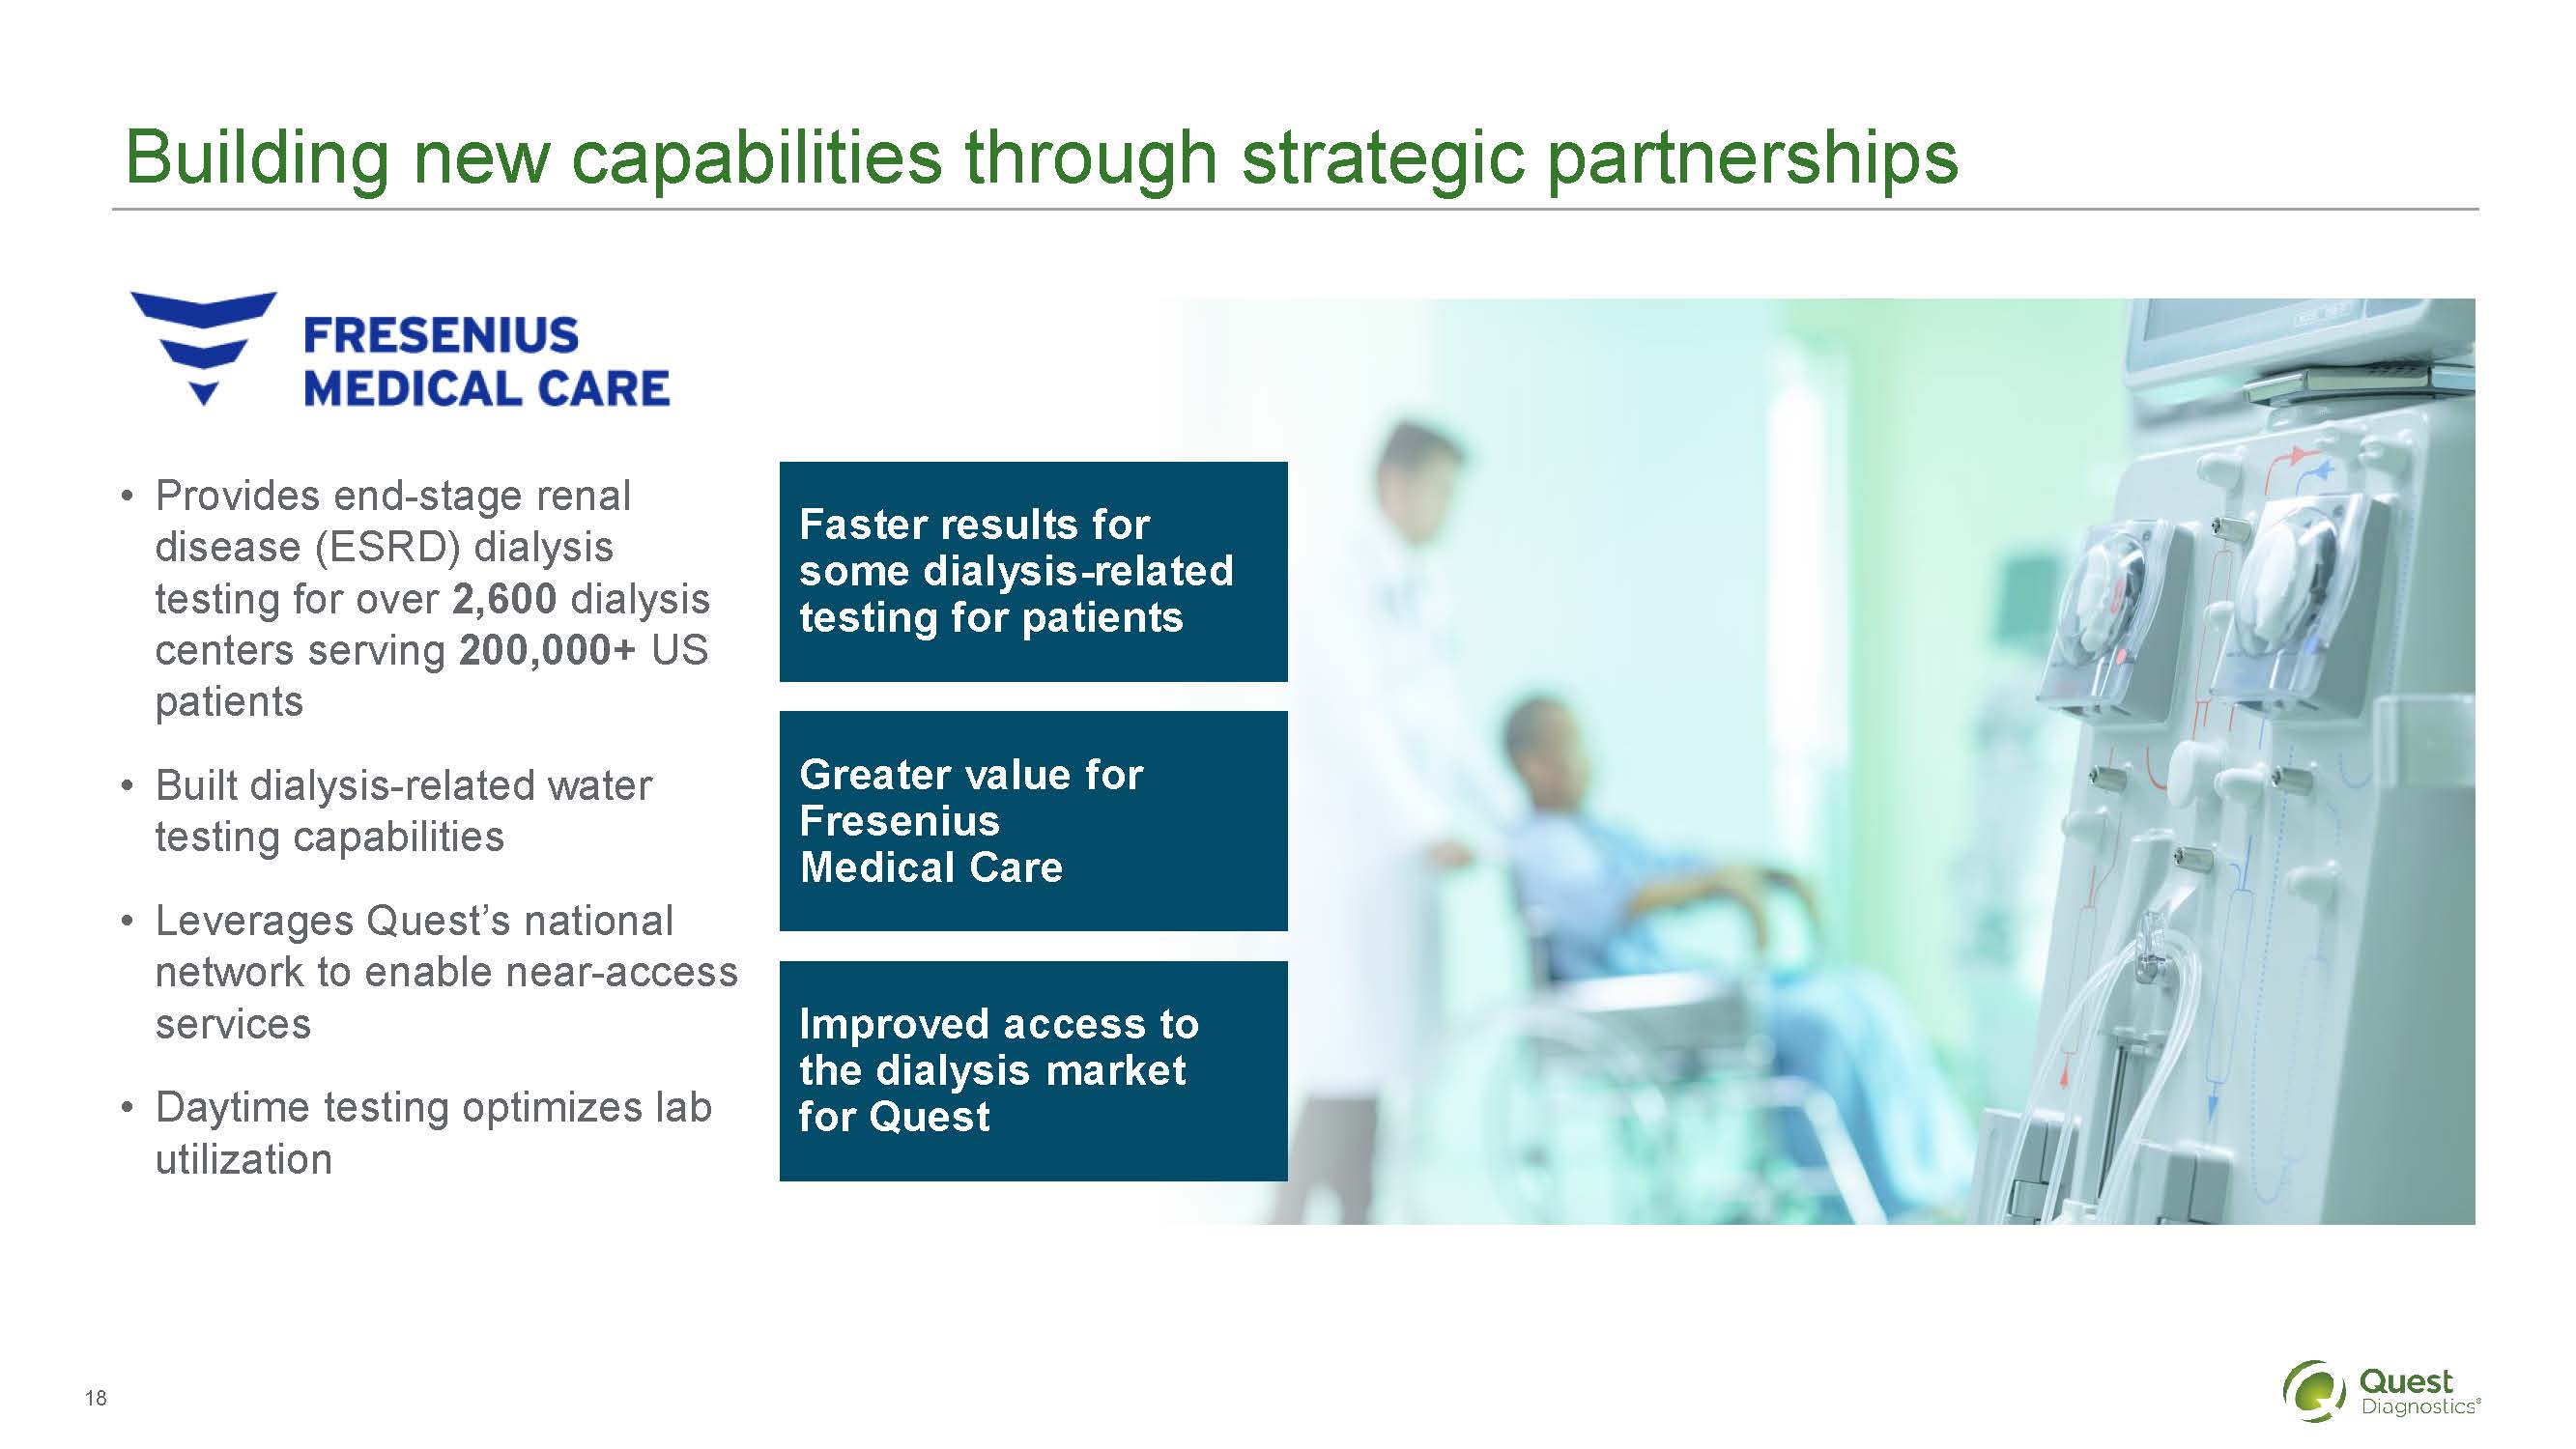
Building new capabilities through strategic partnerships
FRESENIUS MEDICAL CARE
Provides end-stage renal disease (ESRD) dialysis testing for over 2,600 dialysis centers serving 200,000+ US patients
Built dialysis-related water testing capabilities
Leverages Quest's national network to enable near-access services
Daytime testing optimizes lab utilization
Faster results for some dialysis-related testing for patients
Greater value for Fresenius
Medical Care
Improved access to the dialysis market
for Quest
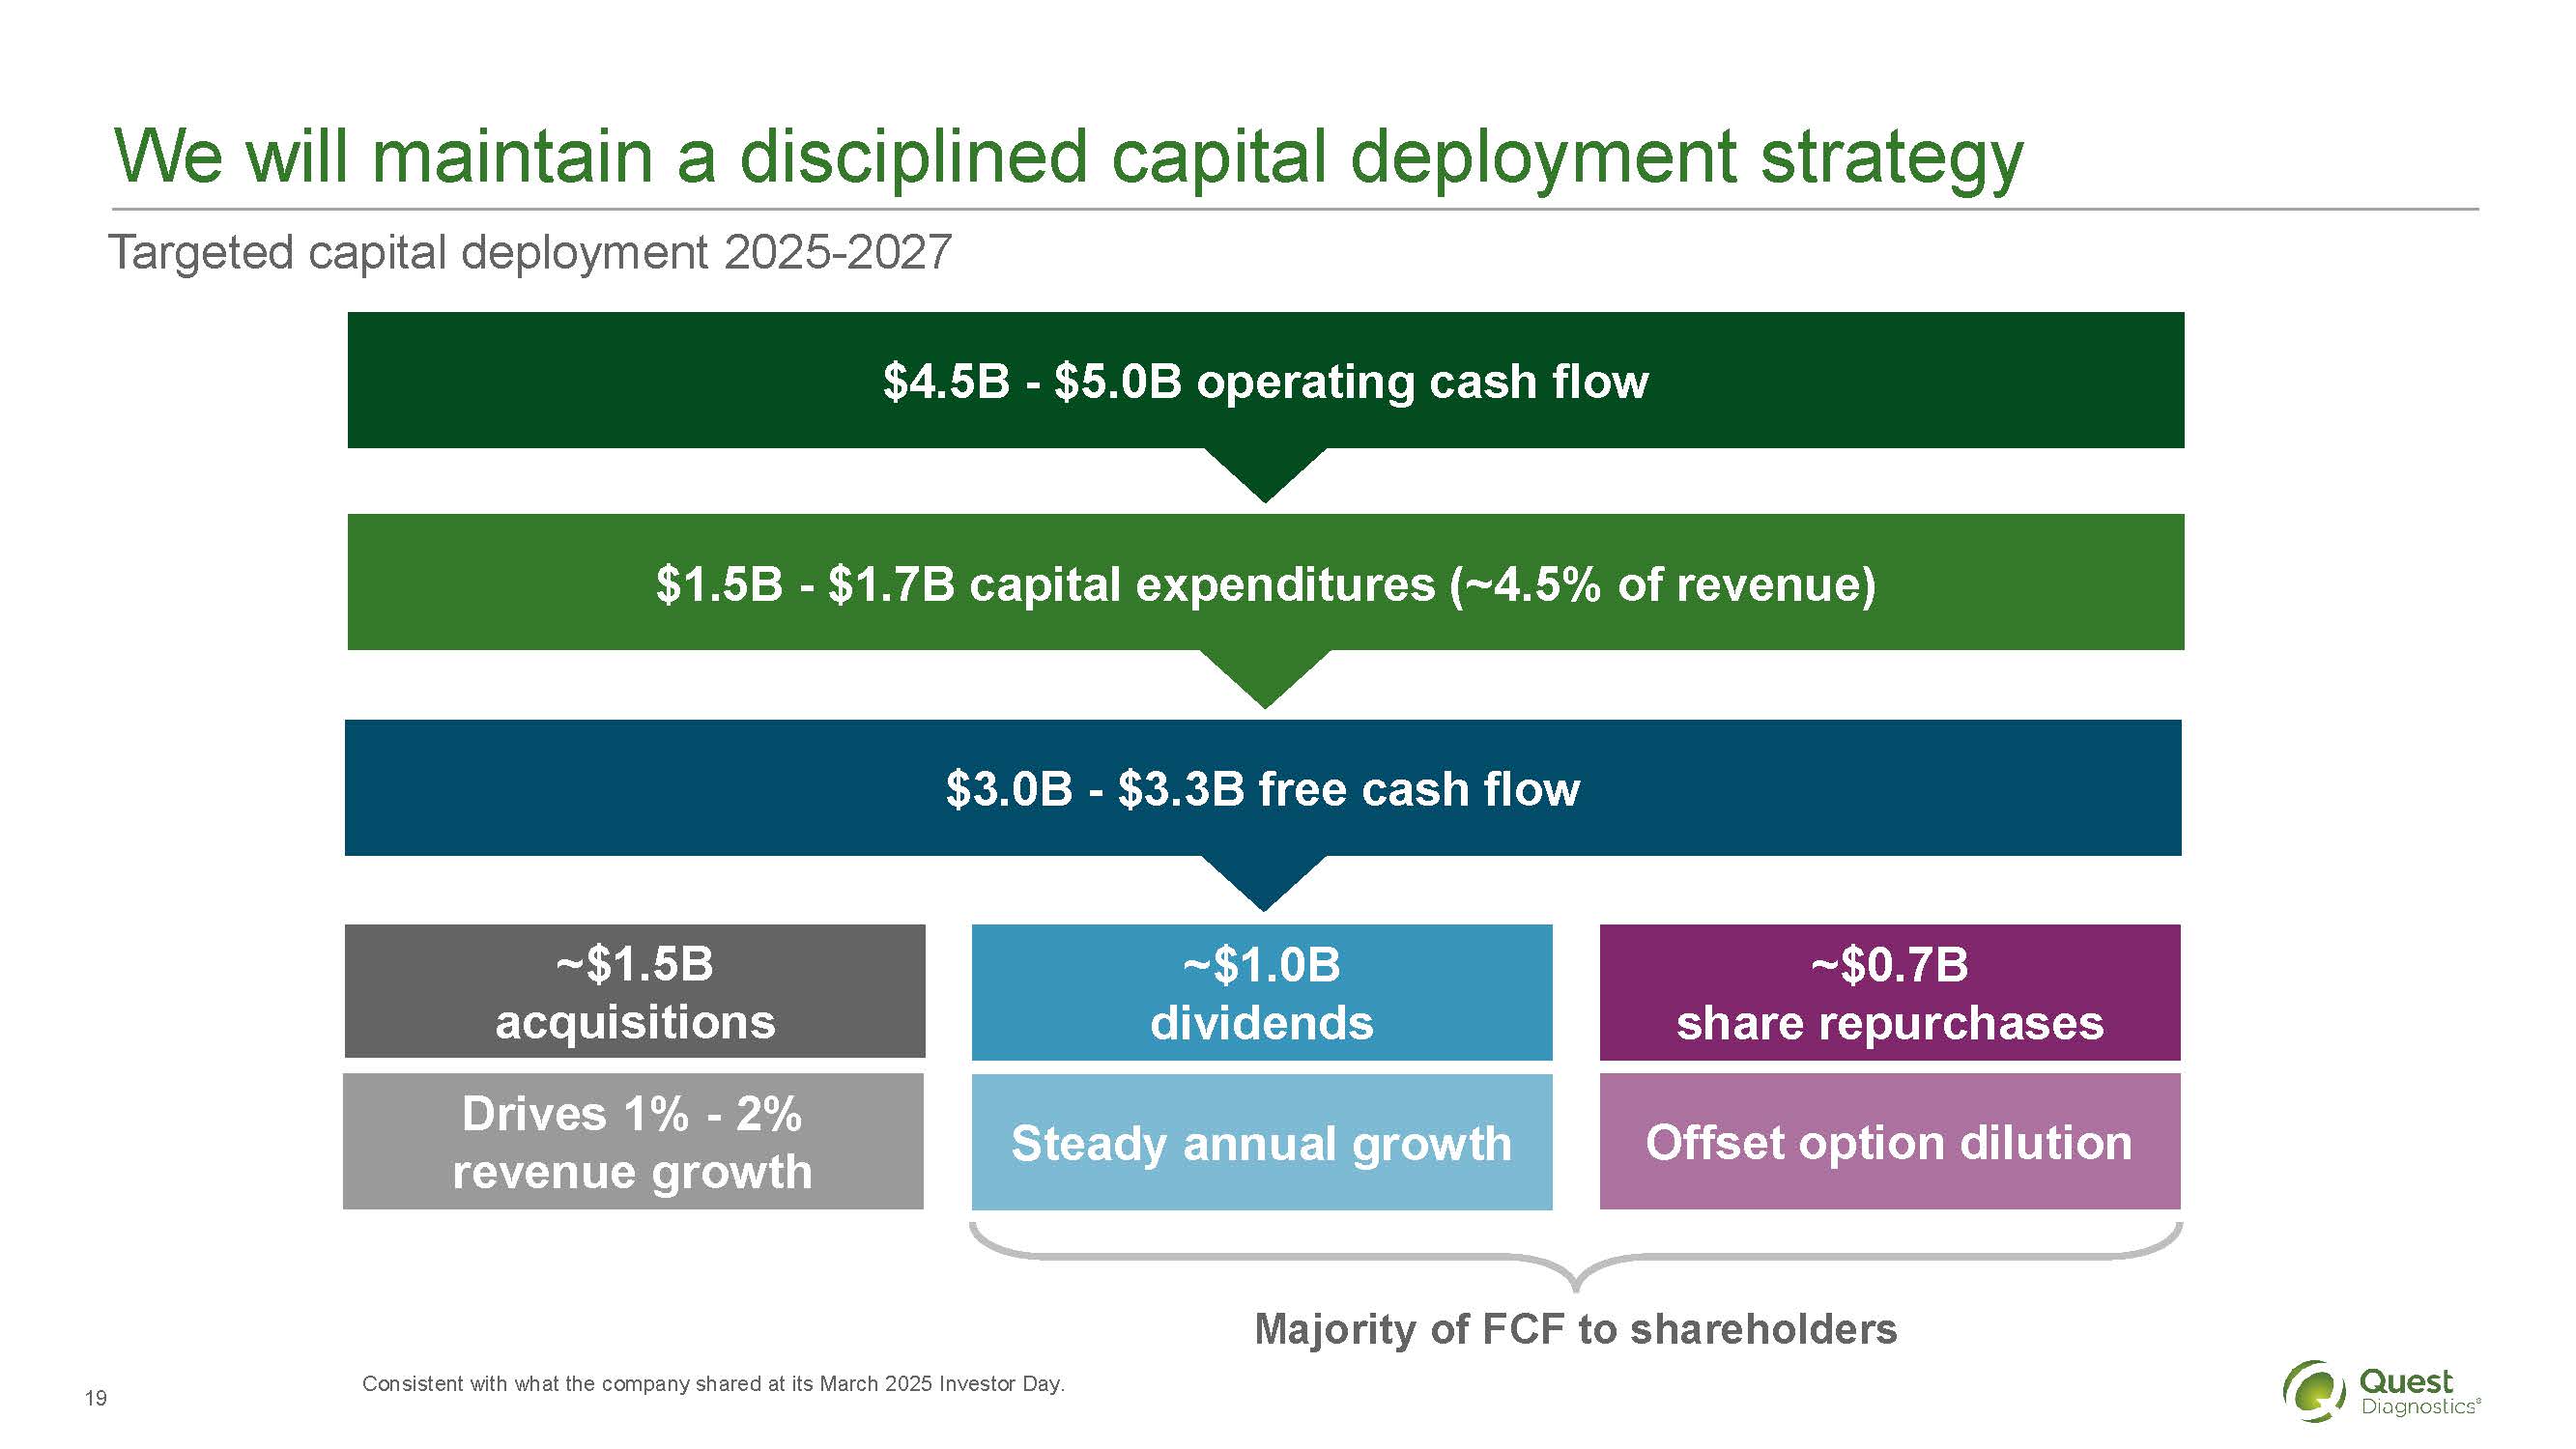
We will maintain a disciplined capital deployment strategy
Targeted capital deployment 2025-2027
$4.5B - $5.0B operating cash flow
$1.5B - $1.7B capital expenditures (~4.5% of revenue)
$3.0B - $3.3B free cash flow
~$1.5B
acquisitions
Drives 1% - 2%
revenue growth
~$1.0B
dividends
Steady annual growth
~$0.7B
share repurchases
Offset option dilution
Majority of FCF to shareholders
Consistent with what the company shared at its March 2025 Investor Day.
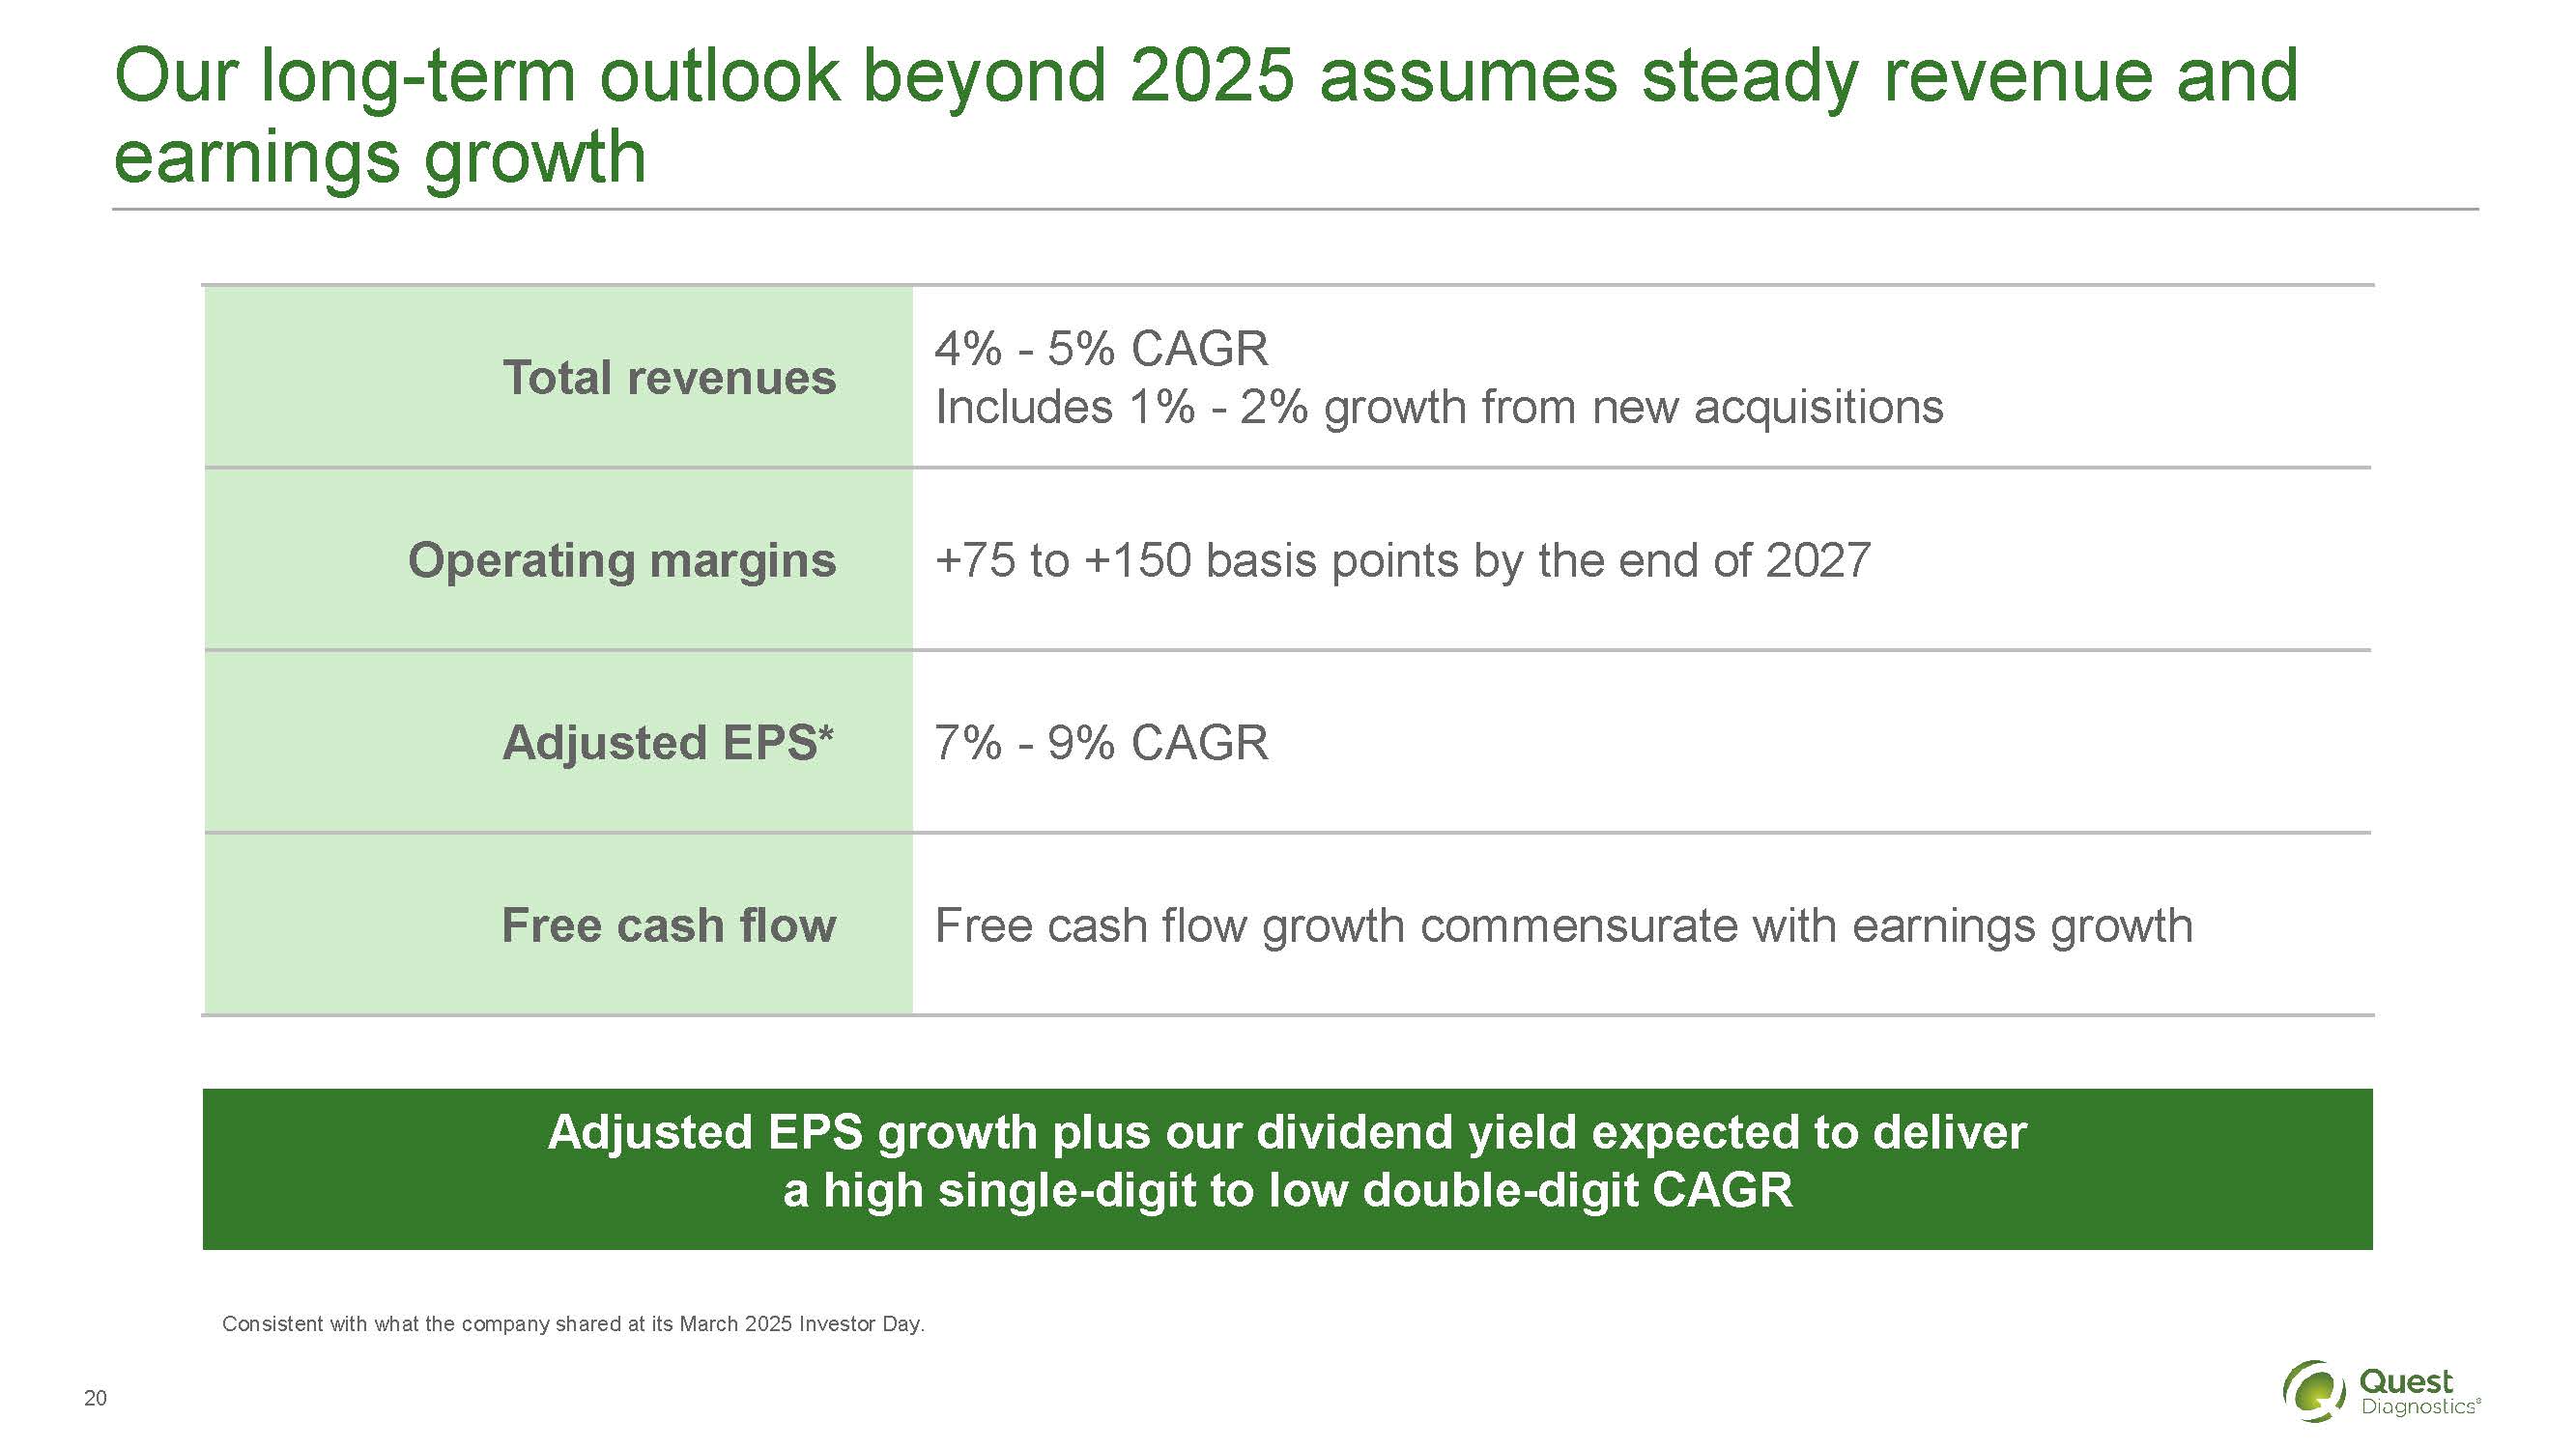
Our long-term outlook beyond 2025 assumes steady revenue and earnings growth
Total revenues
4% - 5% CAGR
Includes 1% - 2% growth from new acquisitions
Operating margins
+75 to +150 basis points by the end of 2027
Adjusted EPS*
7% - 9% CAGR
Free cash flow
Free cash flow growth commensurate with earnings growth
Adjusted EPS growth plus our dividend yield expected to deliver a high single-digit to low double-digit CAGR
The lab market is expected to remain strong driven by health trends and diagnostic innovation
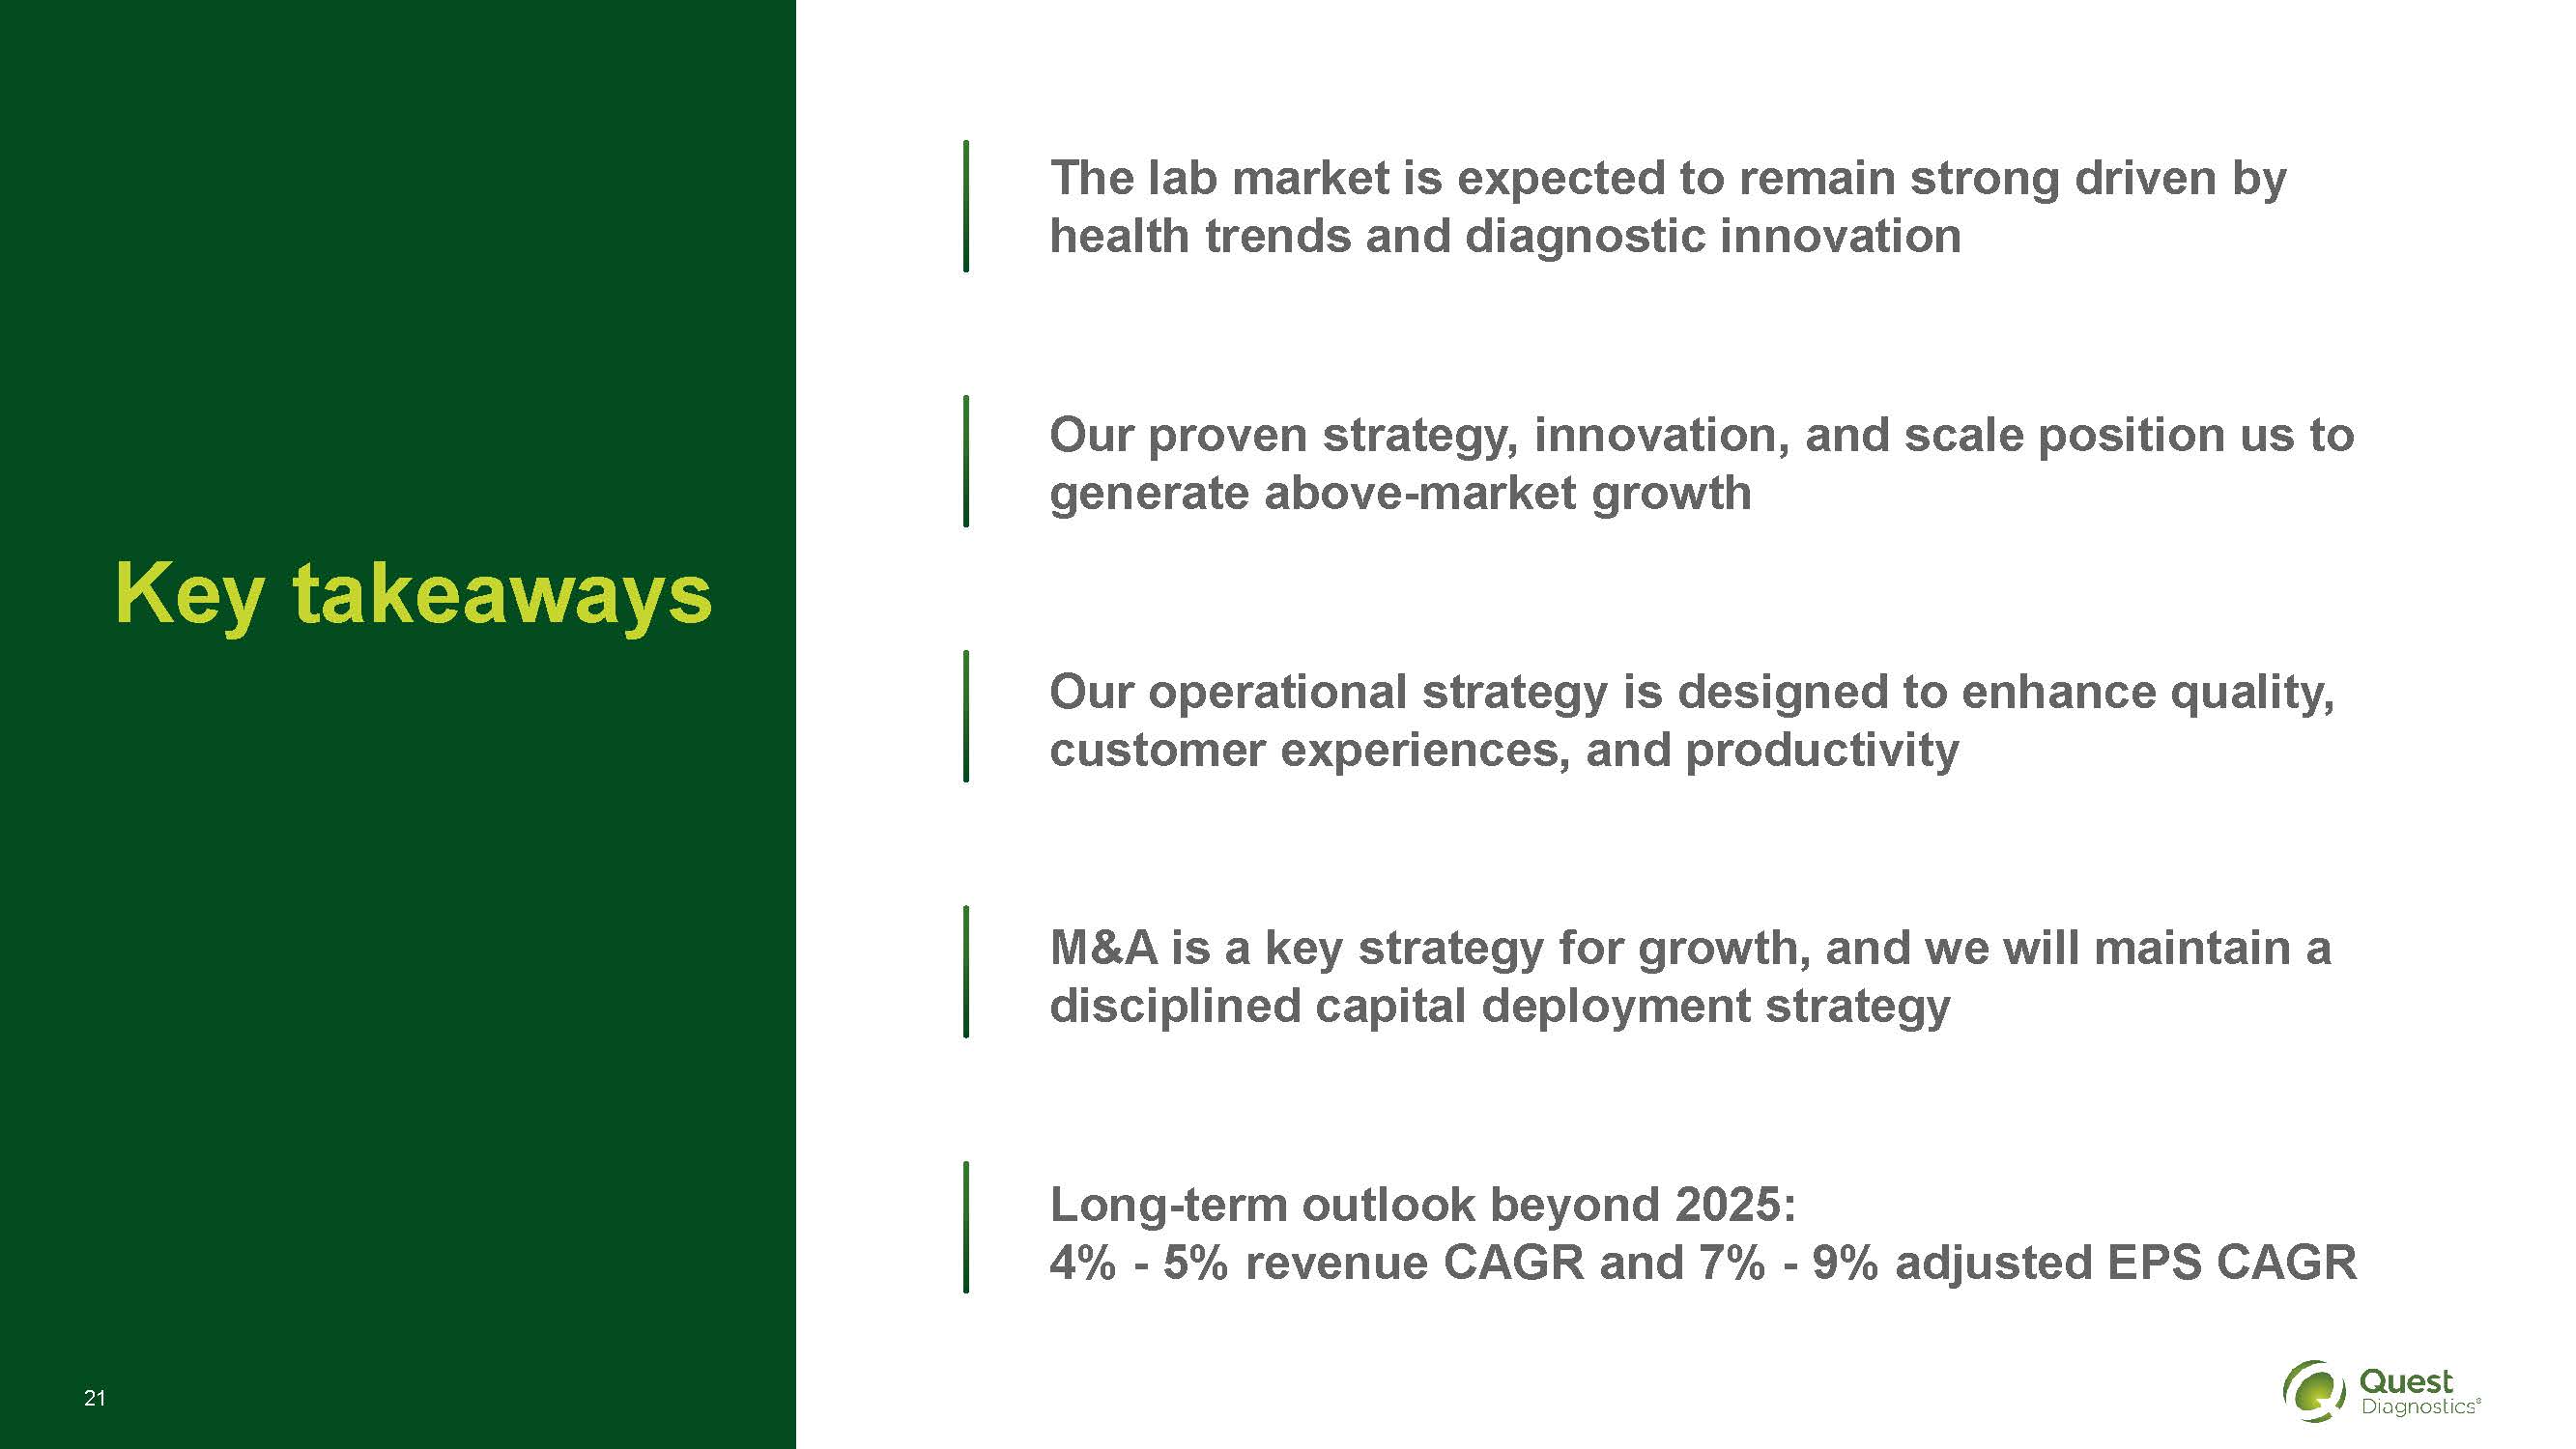
Key takeaways
The lab market is expected to remain strong driven by health trends and diagnostic innovation
Our proven strategy, innovation, and scale position us to generate above-market growth
Our operational strategy is designed to enhance quality, customer experiences, and productivity
M&A is a key strategy for growth, and we will maintain a disciplined capital deployment strategy
Long-term outlook beyond 2025: 4% - 5% revenue CAGR and 7% - 9% adjusted EPS CAGR
Note on Non-GAAP Financial Measures
As used in this presentation, the term "reported" refers to measures under accounting principles generally accepted in the United States ("GAAP"). The term "adjusted" refers to non-GAAP operating performance measures that exclude special items such as restructuring and integration charges, amortization expense, gains and losses on investments, and excess tax benefits ("ETB") associated with stock-based compensation.
The company has provided discussion of projected operating margin, which is adjusted operating income as a percentage of net revenues, and a compound annual growth rate projection beyond 2025 of 7% - 9% for adjusted diluted earnings per share ("EPS"), which are non-GAAP measures. The company is unable to present a reconciliation of adjusted operating income as a percentage of net revenues to operating income as a percentage of net revenues and adjusted diluted EPS to reported diluted EPS, the most comparable GAAP measure, due to the inherent uncertainty and variability in the nature and amount of special items referenced above, and the amount of these items could be significant in any of the associated periods.
Non-GAAP measures are presented because management believes those measures are useful adjuncts to GAAP results. Non-GAAP adjusted measures should not be considered as an alternative to the corresponding measures determined under GAAP. Management may use these non-GAAP measures to evaluate our performance period over period and relative to competitors, to analyze the underlying trends in our business, to establish operational budgets and forecasts, and for incentive compensation purposes. We believe that these non-GAAP measures are useful to investors and analysts to evaluate our performance period over period and relative to competitors as well as to analyze the underlying trends in our business and to assess our performance.