false2025FYGENESIS ENERGY LP0001022321122,424,32139,997P1YP1YP1YP1YP1YP1YP1YP1YP1YP1YP1YP1Yhttp://fasb.org/us-gaap/2025#AccruedLiabilitiesCurrenthttp://fasb.org/us-gaap/2025#AccruedLiabilitiesCurrenthttp://fasb.org/us-gaap/2025#OtherLiabilitiesNoncurrenthttp://fasb.org/us-gaap/2025#OtherLiabilitiesNoncurrenthttp://fasb.org/us-gaap/2025#AssetImpairmentChargesP1Y6.5iso4217:USDxbrli:sharesxbrli:pureiso4217:USDxbrli:sharesgel:segmentgel:extensiongel:metricgel:buyergel:quartersgel:directorutr:bbliso4217:USDutr:bblutr:MMBTUiso4217:USDutr:MMBTU00010223212025-01-012025-12-3100010223212025-06-300001022321us-gaap:CommonClassAMember2026-02-180001022321us-gaap:CommonClassBMember2026-02-180001022321gel:AlkaliBusinessMember2025-02-280001022321gel:AlkaliBusinessMember2025-02-282025-02-280001022321gel:FivePointEightSevenFivePercentageSeniorSecuredNoteMemberus-gaap:SeniorNotesMember2025-02-280001022321us-gaap:ConvertiblePreferredStockMember2025-03-062025-03-060001022321gel:EightPercentageSeniorUnsecuredNotesMemberus-gaap:SeniorNotesMember2025-04-032025-04-030001022321gel:PoseidonOilPipelineCompanyMembergel:OffshorePipelineTransportationMember2025-12-310001022321gel:OdysseyPipelineLLCMembergel:OffshorePipelineTransportationMember2025-12-310001022321gel:NeptunePipelineCompanyLLCMembergel:OffshorePipelineTransportationMember2025-12-3100010223212025-10-012025-12-3100010223212025-12-3100010223212024-12-310001022321us-gaap:ConvertiblePreferredStockMember2025-12-310001022321us-gaap:ConvertiblePreferredStockMember2024-12-310001022321gel:OffshorePipelineTransportationRevenueMembergel:OffshorePipelineTransportationSegmentMember2025-01-012025-12-310001022321gel:OffshorePipelineTransportationRevenueMembergel:OffshorePipelineTransportationSegmentMember2024-01-012024-12-310001022321gel:OffshorePipelineTransportationRevenueMembergel:OffshorePipelineTransportationSegmentMember2023-01-012023-12-310001022321gel:MarineTransportationRevenueMembergel:MarineTransportationSegmentMember2025-01-012025-12-310001022321gel:MarineTransportationRevenueMembergel:MarineTransportationSegmentMember2024-01-012024-12-310001022321gel:MarineTransportationRevenueMembergel:MarineTransportationSegmentMember2023-01-012023-12-310001022321gel:OnshoreFacilitiesAndTransportationRevenueMembergel:OnshoreTransportationAndServicesSegmentMember2025-01-012025-12-310001022321gel:OnshoreFacilitiesAndTransportationRevenueMembergel:OnshoreTransportationAndServicesSegmentMember2024-01-012024-12-310001022321gel:OnshoreFacilitiesAndTransportationRevenueMembergel:OnshoreTransportationAndServicesSegmentMember2023-01-012023-12-3100010223212024-01-012024-12-3100010223212023-01-012023-12-310001022321gel:OffshorePipelineTransportationRevenueMember2025-01-012025-12-310001022321gel:OffshorePipelineTransportationRevenueMember2024-01-012024-12-310001022321gel:OffshorePipelineTransportationRevenueMember2023-01-012023-12-310001022321gel:MarineTransportationRevenueMember2025-01-012025-12-310001022321gel:MarineTransportationRevenueMember2024-01-012024-12-310001022321gel:MarineTransportationRevenueMember2023-01-012023-12-310001022321gel:OnshoreFacilitiesAndTransportationProductMember2025-01-012025-12-310001022321gel:OnshoreFacilitiesAndTransportationProductMember2024-01-012024-12-310001022321gel:OnshoreFacilitiesAndTransportationProductMember2023-01-012023-12-310001022321gel:OnshoreTransportationAndServicesMember2025-01-012025-12-310001022321gel:OnshoreTransportationAndServicesMember2024-01-012024-12-310001022321gel:OnshoreTransportationAndServicesMember2023-01-012023-12-310001022321gel:PartnersCapitalDeficitMember2022-12-310001022321us-gaap:NoncontrollingInterestMember2022-12-310001022321us-gaap:AccumulatedOtherComprehensiveIncomeMember2022-12-3100010223212022-12-310001022321gel:PartnersCapitalDeficitMember2023-01-012023-12-310001022321us-gaap:NoncontrollingInterestMember2023-01-012023-12-310001022321us-gaap:AccumulatedOtherComprehensiveIncomeMember2023-01-012023-12-310001022321gel:PartnersCapitalDeficitMember2023-12-310001022321us-gaap:NoncontrollingInterestMember2023-12-310001022321us-gaap:AccumulatedOtherComprehensiveIncomeMember2023-12-3100010223212023-12-310001022321gel:PartnersCapitalDeficitMember2024-01-012024-12-310001022321us-gaap:NoncontrollingInterestMember2024-01-012024-12-310001022321us-gaap:AccumulatedOtherComprehensiveIncomeMember2024-01-012024-12-310001022321gel:PartnersCapitalDeficitMember2024-12-310001022321us-gaap:NoncontrollingInterestMember2024-12-310001022321us-gaap:AccumulatedOtherComprehensiveIncomeMember2024-12-310001022321gel:PartnersCapitalDeficitMember2025-01-012025-12-310001022321us-gaap:NoncontrollingInterestMember2025-01-012025-12-310001022321us-gaap:AccumulatedOtherComprehensiveIncomeMember2025-01-012025-12-310001022321gel:PartnersCapitalDeficitMember2025-12-310001022321us-gaap:NoncontrollingInterestMember2025-12-310001022321us-gaap:AccumulatedOtherComprehensiveIncomeMember2025-12-310001022321gel:GenesisEnergyLLCMember2025-01-012025-12-310001022321gel:NeptunePipelineCompanyLLCMembergel:PalomaPipelineCompanyMember2025-12-310001022321srt:MinimumMemberus-gaap:PipelinesMember2025-12-310001022321srt:MaximumMemberus-gaap:PipelinesMember2025-12-310001022321srt:MinimumMembergel:MarineVesselsMember2025-12-310001022321srt:MaximumMembergel:MarineVesselsMember2025-12-310001022321srt:MinimumMemberus-gaap:MachineryAndEquipmentMember2025-12-310001022321srt:MaximumMemberus-gaap:MachineryAndEquipmentMember2025-12-310001022321srt:MinimumMemberus-gaap:TransportationEquipmentMember2025-12-310001022321srt:MaximumMemberus-gaap:TransportationEquipmentMember2025-12-310001022321srt:MinimumMemberus-gaap:BuildingAndBuildingImprovementsMember2025-12-310001022321srt:MaximumMemberus-gaap:BuildingAndBuildingImprovementsMember2025-12-310001022321gel:FeebasedRevenuesMembergel:OffshorePipelineTransportationSegmentMember2025-01-012025-12-310001022321gel:FeebasedRevenuesMembergel:MarineTransportationSegmentMember2025-01-012025-12-310001022321gel:FeebasedRevenuesMembergel:OnshoreTransportationAndServicesSegmentMember2025-01-012025-12-310001022321gel:FeebasedRevenuesMember2025-01-012025-12-310001022321gel:ProductSalesMembergel:OffshorePipelineTransportationSegmentMember2025-01-012025-12-310001022321gel:ProductSalesMembergel:MarineTransportationSegmentMember2025-01-012025-12-310001022321gel:ProductSalesMembergel:OnshoreTransportationAndServicesSegmentMember2025-01-012025-12-310001022321gel:ProductSalesMember2025-01-012025-12-310001022321gel:RefineryServicesMembergel:OffshorePipelineTransportationSegmentMember2025-01-012025-12-310001022321gel:RefineryServicesMembergel:MarineTransportationSegmentMember2025-01-012025-12-310001022321gel:RefineryServicesMembergel:OnshoreTransportationAndServicesSegmentMember2025-01-012025-12-310001022321gel:RefineryServicesMember2025-01-012025-12-310001022321gel:OffshorePipelineTransportationSegmentMember2025-01-012025-12-310001022321gel:MarineTransportationSegmentMember2025-01-012025-12-310001022321gel:OnshoreTransportationAndServicesSegmentMember2025-01-012025-12-310001022321gel:FeebasedRevenuesMembergel:OffshorePipelineTransportationSegmentMember2024-01-012024-12-310001022321gel:FeebasedRevenuesMembergel:MarineTransportationSegmentMember2024-01-012024-12-310001022321gel:FeebasedRevenuesMembergel:OnshoreTransportationAndServicesSegmentMember2024-01-012024-12-310001022321gel:FeebasedRevenuesMember2024-01-012024-12-310001022321gel:ProductSalesMembergel:OffshorePipelineTransportationSegmentMember2024-01-012024-12-310001022321gel:ProductSalesMembergel:MarineTransportationSegmentMember2024-01-012024-12-310001022321gel:ProductSalesMembergel:OnshoreTransportationAndServicesSegmentMember2024-01-012024-12-310001022321gel:ProductSalesMember2024-01-012024-12-310001022321gel:RefineryServicesMembergel:OffshorePipelineTransportationSegmentMember2024-01-012024-12-310001022321gel:RefineryServicesMembergel:MarineTransportationSegmentMember2024-01-012024-12-310001022321gel:RefineryServicesMembergel:OnshoreTransportationAndServicesSegmentMember2024-01-012024-12-310001022321gel:RefineryServicesMember2024-01-012024-12-310001022321gel:OffshorePipelineTransportationSegmentMember2024-01-012024-12-310001022321gel:MarineTransportationSegmentMember2024-01-012024-12-310001022321gel:OnshoreTransportationAndServicesSegmentMember2024-01-012024-12-310001022321gel:FeebasedRevenuesMembergel:OffshorePipelineTransportationSegmentMember2023-01-012023-12-310001022321gel:FeebasedRevenuesMembergel:MarineTransportationSegmentMember2023-01-012023-12-310001022321gel:FeebasedRevenuesMembergel:OnshoreTransportationAndServicesSegmentMember2023-01-012023-12-310001022321gel:FeebasedRevenuesMember2023-01-012023-12-310001022321gel:ProductSalesMembergel:OffshorePipelineTransportationSegmentMember2023-01-012023-12-310001022321gel:ProductSalesMembergel:MarineTransportationSegmentMember2023-01-012023-12-310001022321gel:ProductSalesMembergel:OnshoreTransportationAndServicesSegmentMember2023-01-012023-12-310001022321gel:ProductSalesMember2023-01-012023-12-310001022321gel:RefineryServicesMembergel:OffshorePipelineTransportationSegmentMember2023-01-012023-12-310001022321gel:RefineryServicesMembergel:MarineTransportationSegmentMember2023-01-012023-12-310001022321gel:RefineryServicesMembergel:OnshoreTransportationAndServicesSegmentMember2023-01-012023-12-310001022321gel:RefineryServicesMember2023-01-012023-12-310001022321gel:OffshorePipelineTransportationSegmentMember2023-01-012023-12-310001022321gel:MarineTransportationSegmentMember2023-01-012023-12-310001022321gel:OnshoreTransportationAndServicesSegmentMember2023-01-012023-12-310001022321gel:OffshorePipelineTransportationMember2025-01-012025-12-310001022321gel:OnshoreFacilitiesandTransportationMember2025-01-012025-12-310001022321gel:OffshorePipelineTransportationMember2026-01-012025-12-310001022321gel:OnshoreFacilitiesandTransportationMember2026-01-012025-12-310001022321gel:OffshorePipelineTransportationMember2027-01-012025-12-310001022321gel:OnshoreFacilitiesandTransportationMember2027-01-012025-12-310001022321gel:OffshorePipelineTransportationMember2028-01-012025-12-310001022321gel:OnshoreFacilitiesandTransportationMember2028-01-012025-12-310001022321gel:OffshorePipelineTransportationMember2029-01-012025-12-310001022321gel:OnshoreFacilitiesandTransportationMember2029-01-012025-12-310001022321gel:OffshorePipelineTransportationMember2030-01-012025-12-310001022321gel:OnshoreFacilitiesandTransportationMember2030-01-012025-12-310001022321gel:OffshorePipelineTransportationMember2025-12-310001022321gel:OnshoreFacilitiesandTransportationMember2025-12-310001022321us-gaap:DisposalGroupHeldforsaleNotDiscontinuedOperationsMember2025-01-012025-12-310001022321us-gaap:DisposalGroupHeldforsaleNotDiscontinuedOperationsMember2024-01-012024-12-310001022321us-gaap:DisposalGroupHeldforsaleNotDiscontinuedOperationsMember2023-01-012023-12-310001022321us-gaap:DiscontinuedOperationsDisposedOfBySaleMember2025-01-012025-12-310001022321us-gaap:DiscontinuedOperationsDisposedOfBySaleMember2024-01-012024-12-310001022321us-gaap:DiscontinuedOperationsDisposedOfBySaleMember2023-01-012023-12-310001022321us-gaap:TransportationEquipmentMember2025-12-310001022321us-gaap:TransportationEquipmentMember2024-12-310001022321gel:OfficeSpaceandEquipmentMember2025-12-310001022321gel:OfficeSpaceandEquipmentMember2024-12-310001022321gel:FacilitiesandEquipmentMember2025-12-310001022321gel:FacilitiesandEquipmentMember2024-12-310001022321gel:MarineTransportationMember2025-01-012025-12-310001022321gel:MarineTransportationMember2024-01-012024-12-310001022321gel:MarineTransportationMember2023-01-012023-12-310001022321gel:MarineTransportationMember2025-12-310001022321us-gaap:PipelinesMember2025-12-310001022321us-gaap:PipelinesMember2024-12-310001022321us-gaap:MachineryAndEquipmentMember2025-12-310001022321us-gaap:MachineryAndEquipmentMember2024-12-310001022321us-gaap:MaritimeEquipmentMember2025-12-310001022321us-gaap:MaritimeEquipmentMember2024-12-310001022321us-gaap:LandBuildingsAndImprovementsMember2025-12-310001022321us-gaap:LandBuildingsAndImprovementsMember2024-12-310001022321us-gaap:FurnitureAndFixturesMember2025-12-310001022321us-gaap:FurnitureAndFixturesMember2024-12-310001022321us-gaap:ConstructionInProgressMember2025-12-310001022321us-gaap:ConstructionInProgressMember2024-12-310001022321us-gaap:PropertyPlantAndEquipmentOtherTypesMember2025-12-310001022321us-gaap:PropertyPlantAndEquipmentOtherTypesMember2024-12-310001022321us-gaap:AccruedLiabilitiesMember2025-12-310001022321us-gaap:AccruedLiabilitiesMember2024-12-310001022321us-gaap:ContractualRightsMembergel:OffshorePipelineTransportationMember2025-12-310001022321us-gaap:ContractualRightsMembergel:OffshorePipelineTransportationMember2024-12-310001022321us-gaap:OtherIntangibleAssetsMember2025-12-310001022321us-gaap:OtherIntangibleAssetsMember2024-12-310001022321us-gaap:ContractualRightsMember2025-12-310001022321gel:SodiumMineralsAndSulfurServicesSegmentMember2024-12-310001022321gel:SodiumMineralsAndSulfurServicesSegmentMember2025-12-310001022321us-gaap:RevolvingCreditFacilityMembergel:SeniorSecuredCreditFacilityMemberus-gaap:LineOfCreditMember2025-12-310001022321us-gaap:RevolvingCreditFacilityMembergel:SeniorSecuredCreditFacilityMemberus-gaap:LineOfCreditMember2024-12-310001022321gel:EightPercentageSeniorUnsecuredNotesMemberus-gaap:SeniorNotesMember2025-12-310001022321gel:EightPercentageSeniorUnsecuredNotesMemberus-gaap:SeniorNotesMember2024-12-310001022321gel:SevenPointSevenFivePercentageSeniorUnsecuredNoteMemberus-gaap:SeniorNotesMember2025-12-310001022321gel:SevenPointSevenFivePercentageSeniorUnsecuredNoteMemberus-gaap:SeniorNotesMember2024-12-310001022321gel:A8.250SeniorUnsecuredNotesDue2029Memberus-gaap:SeniorNotesMember2025-12-310001022321gel:A8.250SeniorUnsecuredNotesDue2029Memberus-gaap:SeniorNotesMember2024-12-310001022321gel:A8.875SeniorUnsecuredNotesDue2030Memberus-gaap:SeniorNotesMember2025-12-310001022321gel:A8.875SeniorUnsecuredNotesDue2030Memberus-gaap:SeniorNotesMember2024-12-310001022321gel:A7.875SeniorUnsecuredNotesDue2032Memberus-gaap:SeniorNotesMember2025-12-310001022321gel:A7.875SeniorUnsecuredNotesDue2032Memberus-gaap:SeniorNotesMember2024-12-310001022321gel:A8.000SeniorUnsecuredNotesDue2033Memberus-gaap:SeniorNotesMember2025-12-310001022321gel:A8.000SeniorUnsecuredNotesDue2033Memberus-gaap:SeniorNotesMember2024-12-310001022321us-gaap:RevolvingCreditFacilityMembergel:SeniorSecuredCreditFacilityRevolvingMemberus-gaap:LineOfCreditMember2025-12-310001022321us-gaap:RevolvingCreditFacilityMembergel:SeniorSecuredCreditFacilityRevolvingMemberus-gaap:LineOfCreditMember2024-12-310001022321us-gaap:RevolvingCreditFacilityMembergel:SeniorSecuredCreditFacilityRevolvingMemberus-gaap:LineOfCreditMember2024-07-190001022321gel:SeniorSecuredCreditFacilityMemberus-gaap:LineOfCreditMember2024-07-192024-07-190001022321gel:SevenPointSevenFivePercentageSeniorUnsecuredNoteMemberus-gaap:SeniorNotesMember2024-07-190001022321us-gaap:RevolvingCreditFacilityMembergel:SeniorSecuredCreditFacilityRevolvingMemberus-gaap:LineOfCreditMember2025-02-270001022321gel:SeniorSecuredCreditFacilityMemberus-gaap:LineOfCreditMember2025-02-270001022321us-gaap:RevolvingCreditFacilityMembergel:FederalFundsEffectiveRateMembergel:SeniorSecuredCreditFacilityRevolvingMemberus-gaap:LineOfCreditMember2025-01-012025-12-310001022321us-gaap:RevolvingCreditFacilityMembergel:LiborRateMembergel:SeniorSecuredCreditFacilityRevolvingMembersrt:MaximumMemberus-gaap:LineOfCreditMember2025-01-012025-12-310001022321gel:TermSOFRAdjustmentMemberus-gaap:RevolvingCreditFacilityMemberus-gaap:SecuredOvernightFinancingRateSofrOvernightIndexSwapRateMembergel:SeniorSecuredCreditFacilityRevolvingMembersrt:MaximumMemberus-gaap:LineOfCreditMember2025-01-012025-12-310001022321us-gaap:RevolvingCreditFacilityMembergel:AlternateBaseRateMembergel:SeniorSecuredCreditFacilityRevolvingMembersrt:MinimumMemberus-gaap:LineOfCreditMember2025-01-012025-12-310001022321us-gaap:RevolvingCreditFacilityMembergel:AlternateBaseRateMembergel:SeniorSecuredCreditFacilityRevolvingMembersrt:MaximumMemberus-gaap:LineOfCreditMember2025-01-012025-12-310001022321us-gaap:RevolvingCreditFacilityMembergel:EurodollarRateMembergel:SeniorSecuredCreditFacilityRevolvingMembersrt:MinimumMemberus-gaap:LineOfCreditMember2025-01-012025-12-310001022321us-gaap:RevolvingCreditFacilityMembergel:EurodollarRateMembergel:SeniorSecuredCreditFacilityRevolvingMembersrt:MaximumMemberus-gaap:LineOfCreditMember2025-01-012025-12-310001022321us-gaap:RevolvingCreditFacilityMembergel:AlternateBaseRateMembergel:SeniorSecuredCreditFacilityRevolvingMemberus-gaap:LineOfCreditMember2025-12-312025-12-310001022321us-gaap:RevolvingCreditFacilityMemberus-gaap:SecuredOvernightFinancingRateSofrOvernightIndexSwapRateMembergel:SeniorSecuredCreditFacilityRevolvingMemberus-gaap:LineOfCreditMember2025-12-312025-12-310001022321us-gaap:RevolvingCreditFacilityMembergel:SeniorSecuredCreditFacilityMembersrt:MinimumMemberus-gaap:LineOfCreditMember2025-01-012025-12-310001022321us-gaap:RevolvingCreditFacilityMembergel:SeniorSecuredCreditFacilityMembersrt:MaximumMemberus-gaap:LineOfCreditMember2025-01-012025-12-310001022321us-gaap:RevolvingCreditFacilityMembergel:SeniorSecuredCreditFacilityMemberus-gaap:LineOfCreditMember2025-12-312025-12-310001022321us-gaap:RevolvingCreditFacilityMembergel:SeniorSecuredCreditFacilityRevolvingMembersrt:MinimumMemberus-gaap:LineOfCreditMember2025-01-012025-12-310001022321us-gaap:RevolvingCreditFacilityMembergel:SeniorSecuredCreditFacilityRevolvingMembersrt:MaximumMemberus-gaap:LineOfCreditMember2025-01-012025-12-310001022321us-gaap:RevolvingCreditFacilityMembergel:SeniorSecuredCreditFacilityRevolvingMemberus-gaap:LineOfCreditMember2025-12-312025-12-310001022321us-gaap:RevolvingCreditFacilityMembergel:SeniorSecuredCreditFacilityRevolvingMemberus-gaap:LineOfCreditMemberus-gaap:PublicUtilitiesInventoryPetroleumProductsMember2025-12-310001022321us-gaap:BridgeLoanMembergel:SeniorSecuredCreditFacilityRevolvingMemberus-gaap:LineOfCreditMemberus-gaap:PublicUtilitiesInventoryPetroleumProductsMember2025-12-310001022321us-gaap:RevolvingCreditFacilityMembergel:SeniorSecuredCreditFacilityRevolvingMembersrt:MaximumMemberus-gaap:LineOfCreditMember2025-12-310001022321gel:SevenPointSevenFivePercentageSeniorUnsecuredNoteMemberus-gaap:SeniorNotesMember2020-01-160001022321gel:SevenPointSevenFivePercentageSeniorUnsecuredNoteMemberus-gaap:SeniorNotesMember2020-01-162020-01-160001022321gel:SixPointSevenFivePercentageSeniorUnsecuredNotesMemberus-gaap:SeniorNotesMember2020-01-160001022321gel:EightPercentageSeniorUnsecuredNotesMemberus-gaap:SeniorNotesMember2020-12-170001022321gel:EightPercentageSeniorUnsecuredNotesMemberus-gaap:SeniorNotesMember2021-04-220001022321gel:EightPercentageSeniorUnsecuredNotesMemberus-gaap:SeniorNotesMember2024-12-202024-12-200001022321gel:A2029NotesMemberus-gaap:SeniorNotesMember2024-12-190001022321gel:A2030NotesMemberus-gaap:SeniorNotesMember2023-01-250001022321gel:A2030NotesMemberus-gaap:SeniorNotesMember2023-01-252023-01-250001022321us-gaap:SeniorNotesMembergel:FivePointSixTwoFivePercentageSeniorUnsecuredNotesMember2023-01-252023-01-250001022321gel:FivePointSixTwoFivePercentageSeniorUnsecuredNotesMemberus-gaap:SeniorNotesMember2023-01-250001022321us-gaap:SeniorNotesMembergel:FivePointSixTwoFivePercentageSeniorUnsecuredNotesMember2023-01-250001022321gel:A2029NotesMemberus-gaap:SeniorNotesMember2023-12-070001022321gel:A2029NotesMemberus-gaap:SeniorNotesMember2023-12-072023-12-070001022321us-gaap:SeniorNotesMembergel:SixPointfivepercentageSeniorUnsecuredNotesDue2025Member2023-12-072023-12-070001022321us-gaap:SeniorNotesMembergel:SixPointfivepercentageSeniorUnsecuredNotesDue2025Member2023-12-070001022321us-gaap:SeniorNotesMembergel:A2032NotesMember2024-05-090001022321gel:FivePointEightSevenFivePercentageSeniorSecuredNoteMemberus-gaap:SeniorNotesMember2024-05-092024-05-090001022321gel:SixpointtwofivepercentageseniorunsecurednotesMemberus-gaap:SeniorNotesMember2017-12-110001022321gel:SixpointtwofivepercentageseniorunsecurednotesMemberus-gaap:SeniorNotesMember2024-05-092024-05-090001022321gel:SixpointtwofivepercentageseniorunsecurednotesMemberus-gaap:SeniorNotesMember2024-01-012024-12-310001022321gel:A2029NotesMemberus-gaap:SeniorNotesMember2024-12-192024-12-190001022321us-gaap:SeniorNotesMembergel:SixPointfivepercentageSeniorUnsecuredNotesDue2025Member2024-12-192024-12-190001022321us-gaap:SeniorNotesMembergel:FivePointSixTwoFivePercentageSeniorUnsecuredNotesMember2024-12-192024-12-190001022321us-gaap:SeniorNotesMember2025-01-012025-12-310001022321gel:FivePointSixTwoFivePercentageSeniorUnsecuredNotesMemberus-gaap:SeniorNotesMember2025-01-012025-12-310001022321gel:SixpointtwofivepercentageseniorunsecurednotesMemberus-gaap:SeniorNotesMember2025-01-012025-12-310001022321gel:SixPointfivepercentageSeniorUnsecuredNotesDue2025Memberus-gaap:SeniorNotesMember2025-01-012025-12-310001022321gel:EightPercentageSeniorUnsecuredNotesMemberus-gaap:SeniorNotesMember2025-01-012025-12-310001022321us-gaap:SeniorNotesMember2025-12-310001022321gel:GenesisEnergyLLCMembersrt:GuarantorSubsidiariesMembergel:GenesisFinanceCorporationMemberus-gaap:SeniorNotesMember2025-01-012025-12-310001022321gel:SeniorSecuredCreditFacilityMemberus-gaap:LineOfCreditMember2025-12-310001022321gel:DebtCovenantPeriodTwoMembergel:SeniorSecuredCreditFacilityMemberus-gaap:LineOfCreditMember2025-12-310001022321gel:DebtCovenantPeriodOneMembergel:SeniorSecuredCreditFacilityMemberus-gaap:LineOfCreditMember2025-12-310001022321gel:DebtCovenantPeriodThreeMembergel:SeniorSecuredCreditFacilityMemberus-gaap:LineOfCreditMember2025-12-310001022321us-gaap:LimitedPartnerMemberus-gaap:CommonClassAMember2025-12-310001022321us-gaap:LimitedPartnerMemberus-gaap:CommonClassBMember2025-12-310001022321us-gaap:LimitedPartnerMemberus-gaap:PreferredClassAMember2025-12-310001022321gel:A2023RepurchaseProgramMemberus-gaap:CommonClassAMember2023-08-080001022321gel:A2023RepurchaseProgramMemberus-gaap:CommonClassAMember2023-01-012023-12-310001022321gel:CommonUnitholdersMember2023-05-152023-05-150001022321gel:CommonUnitholdersMember2023-05-150001022321gel:CommonUnitholdersMember2023-08-142023-08-140001022321gel:CommonUnitholdersMember2023-08-140001022321gel:CommonUnitholdersMember2023-11-142023-11-140001022321gel:CommonUnitholdersMember2023-11-140001022321gel:CommonUnitholdersMember2024-02-142024-02-140001022321gel:CommonUnitholdersMember2024-02-140001022321gel:CommonUnitholdersMember2024-05-152024-05-150001022321gel:CommonUnitholdersMember2024-05-150001022321gel:CommonUnitholdersMember2024-08-142024-08-140001022321gel:CommonUnitholdersMember2024-08-140001022321gel:CommonUnitholdersMember2024-11-142024-11-140001022321gel:CommonUnitholdersMember2024-11-140001022321gel:CommonUnitholdersMember2025-02-142025-02-140001022321gel:CommonUnitholdersMember2025-02-140001022321gel:CommonUnitholdersMember2025-05-152025-05-150001022321gel:CommonUnitholdersMember2025-05-150001022321gel:CommonUnitholdersMember2025-08-142025-08-140001022321gel:CommonUnitholdersMember2025-08-140001022321gel:CommonUnitholdersMember2025-11-142025-11-140001022321gel:CommonUnitholdersMember2025-11-140001022321gel:CommonUnitholdersMemberus-gaap:SubsequentEventMember2026-02-142026-02-140001022321gel:CommonUnitholdersMemberus-gaap:SubsequentEventMember2026-02-140001022321us-gaap:ConvertiblePreferredStockMemberus-gaap:PrivatePlacementMember2017-09-012017-09-010001022321us-gaap:ConvertiblePreferredStockMemberus-gaap:PrivatePlacementMember2017-09-010001022321us-gaap:ConvertiblePreferredStockMember2017-09-010001022321us-gaap:ConvertiblePreferredStockMember2017-09-012017-09-010001022321srt:MinimumMemberus-gaap:ConvertiblePreferredStockMember2017-09-012017-09-010001022321srt:MaximumMemberus-gaap:ConvertiblePreferredStockMember2017-09-012017-09-010001022321us-gaap:ConvertiblePreferredStockMembergel:InArrearsAtAnnualRateMember2017-09-012017-09-010001022321us-gaap:ConvertiblePreferredStockMembergel:QuarterlyRateMember2017-09-012017-09-010001022321us-gaap:ConvertiblePreferredStockMember2022-09-290001022321us-gaap:ConvertiblePreferredStockMembergel:PreferredUnitholdersMember2025-12-310001022321us-gaap:ConvertiblePreferredStockMember2019-09-012019-09-010001022321us-gaap:ConvertiblePreferredStockMember2019-09-010001022321us-gaap:ConvertiblePreferredStockMember2019-03-012019-03-010001022321us-gaap:ConvertiblePreferredStockMember2019-03-010001022321us-gaap:ConvertiblePreferredStockMembergel:PreferredUnitholdersMember2023-05-150001022321us-gaap:ConvertiblePreferredStockMembergel:PreferredUnitholdersMember2023-05-152023-05-150001022321us-gaap:ConvertiblePreferredStockMembergel:PreferredUnitholdersMember2023-08-140001022321us-gaap:ConvertiblePreferredStockMembergel:PreferredUnitholdersMember2023-08-142023-08-140001022321us-gaap:ConvertiblePreferredStockMembergel:PreferredUnitholdersMember2023-11-140001022321us-gaap:ConvertiblePreferredStockMembergel:PreferredUnitholdersMember2023-11-142023-11-140001022321us-gaap:ConvertiblePreferredStockMembergel:PreferredUnitholdersMember2024-02-140001022321us-gaap:ConvertiblePreferredStockMembergel:PreferredUnitholdersMember2024-02-142024-02-140001022321us-gaap:ConvertiblePreferredStockMembergel:PreferredUnitholdersMember2024-05-150001022321us-gaap:ConvertiblePreferredStockMembergel:PreferredUnitholdersMember2024-05-152024-05-150001022321us-gaap:ConvertiblePreferredStockMembergel:PreferredUnitholdersMember2024-08-140001022321us-gaap:ConvertiblePreferredStockMembergel:PreferredUnitholdersMember2024-08-142024-08-140001022321us-gaap:ConvertiblePreferredStockMembergel:PreferredUnitholdersMember2024-11-140001022321us-gaap:ConvertiblePreferredStockMembergel:PreferredUnitholdersMember2024-11-142024-11-140001022321us-gaap:ConvertiblePreferredStockMembergel:PreferredUnitholdersMember2025-02-140001022321us-gaap:ConvertiblePreferredStockMembergel:PreferredUnitholdersMember2025-02-142025-02-140001022321us-gaap:ConvertiblePreferredStockMembergel:PreferredUnitholdersMember2025-05-150001022321us-gaap:ConvertiblePreferredStockMembergel:PreferredUnitholdersMember2025-05-152025-05-150001022321us-gaap:ConvertiblePreferredStockMembergel:PreferredUnitholdersMember2025-08-140001022321us-gaap:ConvertiblePreferredStockMembergel:PreferredUnitholdersMember2025-08-142025-08-140001022321us-gaap:ConvertiblePreferredStockMembergel:PreferredUnitholdersMember2025-11-140001022321us-gaap:ConvertiblePreferredStockMembergel:PreferredUnitholdersMember2025-11-142025-11-140001022321us-gaap:ConvertiblePreferredStockMembergel:PreferredUnitholdersMemberus-gaap:SubsequentEventMember2026-02-140001022321us-gaap:ConvertiblePreferredStockMembergel:PreferredUnitholdersMemberus-gaap:SubsequentEventMember2026-02-142026-02-140001022321us-gaap:ConvertiblePreferredStockMember2023-10-032023-10-030001022321us-gaap:ConvertiblePreferredStockMember2023-07-032023-07-030001022321us-gaap:ConvertiblePreferredStockMember2023-04-032023-04-030001022321us-gaap:ConvertiblePreferredStockMember2023-04-030001022321us-gaap:ConvertiblePreferredStockMember2025-03-060001022321us-gaap:ConvertiblePreferredStockMembergel:PreferredUnitholdersMember2025-03-062025-03-060001022321us-gaap:ConvertiblePreferredStockMembergel:PreferredUnitholdersMember2025-03-060001022321us-gaap:ConvertiblePreferredStockMember2025-01-012025-12-310001022321us-gaap:ConvertiblePreferredStockMember2024-01-012024-12-310001022321us-gaap:ConvertiblePreferredStockMember2023-01-012023-12-310001022321gel:CameronHighwayOilPipelineMembersrt:AffiliatedEntityMember2021-11-162021-11-160001022321gel:CameronHighwayOilPipelineMembersrt:AffiliatedEntityMember2021-11-172021-11-170001022321gel:CameronHighwayOilPipelineMembersrt:AffiliatedEntityMember2021-11-172021-12-310001022321gel:GenesisEnergyLLCMembersrt:AffiliatedEntityMembergel:IndependenceHubLLCMember2025-12-310001022321gel:GenesisAlkaliHoldingsCompanyLLCMembersrt:SubsidiariesMember2019-09-232019-09-230001022321us-gaap:OperatingSegmentsMembergel:OffshorePipelineTransportationSegmentMember2025-01-012025-12-310001022321us-gaap:OperatingSegmentsMembergel:MarineTransportationSegmentMember2025-01-012025-12-310001022321us-gaap:OperatingSegmentsMembergel:OnshoreFacilitiesAndTransportationSegmentMember2025-01-012025-12-310001022321us-gaap:OperatingSegmentsMember2025-01-012025-12-310001022321us-gaap:IntersegmentEliminationMembergel:OffshorePipelineTransportationSegmentMember2025-01-012025-12-310001022321us-gaap:IntersegmentEliminationMembergel:MarineTransportationSegmentMember2025-01-012025-12-310001022321us-gaap:IntersegmentEliminationMembergel:OnshoreFacilitiesAndTransportationSegmentMember2025-01-012025-12-310001022321us-gaap:IntersegmentEliminationMember2025-01-012025-12-310001022321gel:OnshoreFacilitiesAndTransportationSegmentMember2025-01-012025-12-310001022321gel:OnshoreFacilitiesAndTransportationSegmentMember2024-01-012024-12-310001022321us-gaap:OperatingSegmentsMember2024-01-012024-12-310001022321us-gaap:OperatingSegmentsMembergel:OffshorePipelineTransportationSegmentMember2024-01-012024-12-310001022321us-gaap:OperatingSegmentsMembergel:MarineTransportationSegmentMember2024-01-012024-12-310001022321us-gaap:OperatingSegmentsMembergel:OnshoreFacilitiesAndTransportationSegmentMember2024-01-012024-12-310001022321us-gaap:OperatingSegmentsMembergel:OffshorePipelineTransportationSegmentMember2023-01-012023-12-310001022321us-gaap:OperatingSegmentsMembergel:MarineTransportationSegmentMember2023-01-012023-12-310001022321us-gaap:OperatingSegmentsMembergel:OnshoreFacilitiesAndTransportationSegmentMember2023-01-012023-12-310001022321us-gaap:OperatingSegmentsMember2023-01-012023-12-310001022321us-gaap:IntersegmentEliminationMembergel:OffshorePipelineTransportationSegmentMember2023-01-012023-12-310001022321us-gaap:IntersegmentEliminationMembergel:MarineTransportationSegmentMember2023-01-012023-12-310001022321us-gaap:IntersegmentEliminationMembergel:OnshoreFacilitiesAndTransportationSegmentMember2023-01-012023-12-310001022321us-gaap:IntersegmentEliminationMember2023-01-012023-12-310001022321gel:OnshoreFacilitiesAndTransportationSegmentMember2023-01-012023-12-310001022321us-gaap:OperatingSegmentsMembergel:OffshorePipelineTransportationSegmentMember2025-12-310001022321us-gaap:OperatingSegmentsMembergel:OffshorePipelineTransportationSegmentMember2024-12-310001022321us-gaap:OperatingSegmentsMembergel:MarineTransportationSegmentMember2025-12-310001022321us-gaap:OperatingSegmentsMembergel:MarineTransportationSegmentMember2024-12-310001022321us-gaap:OperatingSegmentsMembergel:OnshoreFacilitiesAndTransportationSegmentMember2025-12-310001022321us-gaap:OperatingSegmentsMembergel:OnshoreFacilitiesAndTransportationSegmentMember2024-12-310001022321us-gaap:OperatingSegmentsMember2025-12-310001022321us-gaap:OperatingSegmentsMember2024-12-310001022321us-gaap:CorporateNonSegmentMember2025-12-310001022321us-gaap:CorporateNonSegmentMember2024-12-310001022321us-gaap:MaterialReconcilingItemsMember2025-01-012025-12-310001022321us-gaap:MaterialReconcilingItemsMember2024-01-012024-12-310001022321gel:PoseidonOilPipelineCompanyMemberus-gaap:EquityMethodInvesteeMember2025-01-012025-12-310001022321gel:PoseidonOilPipelineCompanyMemberus-gaap:EquityMethodInvesteeMember2024-01-012024-12-310001022321gel:PoseidonOilPipelineCompanyMemberus-gaap:EquityMethodInvesteeMember2023-01-012023-12-310001022321srt:ChiefExecutiveOfficerMember2025-01-012025-12-310001022321srt:ChiefExecutiveOfficerMember2024-01-012024-12-310001022321srt:ChiefExecutiveOfficerMember2023-01-012023-12-310001022321gel:PoseidonOilPipelineCompanyMember2025-12-310001022321gel:FeesMemberus-gaap:EquityMethodInvesteeMember2025-01-012025-12-310001022321gel:FeesMemberus-gaap:EquityMethodInvesteeMember2024-01-012024-12-310001022321gel:FeesMemberus-gaap:EquityMethodInvesteeMember2023-01-012023-12-310001022321us-gaap:EquityMethodInvesteeMember2025-12-310001022321us-gaap:EquityMethodInvesteeMember2024-12-310001022321gel:TwoThousandAndTenLongTermIncentivePlanMemberus-gaap:PhantomShareUnitsPSUsMember2025-01-012025-12-310001022321gel:TwoThousandAndTenLongTermIncentivePlanMemberus-gaap:PhantomShareUnitsPSUsMember2024-01-012024-12-310001022321gel:TwoThousandAndTenLongTermIncentivePlanMemberus-gaap:PhantomShareUnitsPSUsMember2023-01-012023-12-310001022321gel:ServiceBasedPhantomShareUnitsPSUsMember2022-12-310001022321gel:ServiceBasedPhantomShareUnitsPSUsMember2023-01-012023-12-310001022321gel:ServiceBasedPhantomShareUnitsPSUsMember2023-12-310001022321gel:ServiceBasedPhantomShareUnitsPSUsMember2024-01-012024-12-310001022321gel:ServiceBasedPhantomShareUnitsPSUsMember2024-12-310001022321gel:ServiceBasedPhantomShareUnitsPSUsMember2025-01-012025-12-310001022321gel:ServiceBasedPhantomShareUnitsPSUsMember2025-12-310001022321gel:TwoThousandAndTenLongTermIncentivePlanMemberus-gaap:PhantomShareUnitsPSUsMember2025-12-310001022321gel:TwoThousandAndTenLongTermIncentivePlanMemberus-gaap:PhantomShareUnitsPSUsMember2024-12-310001022321gel:ShellMemberus-gaap:CustomerConcentrationRiskMemberus-gaap:RevenueFromContractWithCustomerMember2024-01-012024-12-310001022321gel:ShellMemberus-gaap:CustomerConcentrationRiskMemberus-gaap:RevenueFromContractWithCustomerMember2023-01-012023-12-310001022321us-gaap:FutureMemberus-gaap:DesignatedAsHedgingInstrumentMembersrt:CrudeOilMemberus-gaap:ShortMember2025-01-012025-12-310001022321us-gaap:FutureMemberus-gaap:DesignatedAsHedgingInstrumentMembersrt:CrudeOilMemberus-gaap:LongMember2025-01-012025-12-310001022321us-gaap:SwapMemberus-gaap:NondesignatedMembersrt:NaturalGasReservesMemberus-gaap:ShortMember2025-01-012025-12-310001022321us-gaap:SwapMemberus-gaap:NondesignatedMembersrt:NaturalGasReservesMemberus-gaap:LongMember2025-01-012025-12-310001022321us-gaap:OptionMemberus-gaap:NondesignatedMembersrt:CrudeOilMemberus-gaap:ShortMember2025-01-012025-12-310001022321us-gaap:OptionMemberus-gaap:NondesignatedMembersrt:CrudeOilMemberus-gaap:LongMember2025-01-012025-12-310001022321us-gaap:CommodityContractMemberus-gaap:NondesignatedMember2025-12-310001022321us-gaap:CommodityContractMemberus-gaap:NondesignatedMember2024-12-310001022321us-gaap:CommodityContractMemberus-gaap:DesignatedAsHedgingInstrumentMember2025-12-310001022321us-gaap:CommodityContractMemberus-gaap:DesignatedAsHedgingInstrumentMember2024-12-310001022321us-gaap:CommodityContractMemberus-gaap:OtherCurrentAssetsMemberus-gaap:NondesignatedMember2025-12-310001022321us-gaap:CommodityContractMemberus-gaap:OtherCurrentAssetsMemberus-gaap:NondesignatedMember2024-12-310001022321us-gaap:CommodityContractMemberus-gaap:OtherCurrentAssetsMemberus-gaap:DesignatedAsHedgingInstrumentMember2025-12-310001022321us-gaap:CommodityContractMemberus-gaap:OtherCurrentAssetsMemberus-gaap:DesignatedAsHedgingInstrumentMember2024-12-310001022321gel:OnshoreFacilitiesandTransportationProductCostsMemberus-gaap:CommodityContractMemberus-gaap:DesignatedAsHedgingInstrumentMember2025-01-012025-12-310001022321gel:OnshoreFacilitiesandTransportationProductCostsMemberus-gaap:CommodityContractMemberus-gaap:DesignatedAsHedgingInstrumentMember2024-01-012024-12-310001022321gel:OnshoreFacilitiesandTransportationProductCostsMemberus-gaap:CommodityContractMemberus-gaap:DesignatedAsHedgingInstrumentMember2023-01-012023-12-310001022321gel:OnshoreFacilitiesandTransportationProductCostsSodiumMineralsandSulfurServicesOperatingcostsMemberus-gaap:CommodityContractMemberus-gaap:NondesignatedMember2025-01-012025-12-310001022321gel:OnshoreFacilitiesandTransportationProductCostsSodiumMineralsandSulfurServicesOperatingcostsMemberus-gaap:CommodityContractMemberus-gaap:NondesignatedMember2024-01-012024-12-310001022321gel:OnshoreFacilitiesandTransportationProductCostsSodiumMineralsandSulfurServicesOperatingcostsMemberus-gaap:CommodityContractMemberus-gaap:NondesignatedMember2023-01-012023-12-310001022321us-gaap:CommodityContractMember2025-01-012025-12-310001022321us-gaap:CommodityContractMember2024-01-012024-12-310001022321us-gaap:CommodityContractMember2023-01-012023-12-310001022321us-gaap:CommodityContractMemberus-gaap:FairValueMeasurementsRecurringMemberus-gaap:FairValueInputsLevel1Member2025-12-310001022321us-gaap:CommodityContractMemberus-gaap:FairValueMeasurementsRecurringMemberus-gaap:FairValueInputsLevel2Member2025-12-310001022321us-gaap:CommodityContractMemberus-gaap:FairValueMeasurementsRecurringMemberus-gaap:FairValueInputsLevel3Member2025-12-310001022321us-gaap:CommodityContractMemberus-gaap:FairValueMeasurementsRecurringMemberus-gaap:FairValueInputsLevel1Member2024-12-310001022321us-gaap:CommodityContractMemberus-gaap:FairValueMeasurementsRecurringMemberus-gaap:FairValueInputsLevel2Member2024-12-310001022321us-gaap:CommodityContractMemberus-gaap:FairValueMeasurementsRecurringMemberus-gaap:FairValueInputsLevel3Member2024-12-310001022321gel:SeniorUnsecuredNotesMember2025-12-310001022321gel:SeniorUnsecuredNotesMember2024-12-310001022321country:US2025-12-310001022321country:US2024-12-310001022321us-gaap:StateAndLocalJurisdictionMember2025-12-310001022321us-gaap:StateAndLocalJurisdictionMember2024-12-310001022321us-gaap:SubsequentEventMember2026-02-030001022321us-gaap:SubsequentEventMember2026-02-032026-02-03
☒ANNUAL REPORT PURSUANT TO SECTION 13 OR 15(d) OF THE SECURITIES EXCHANGE ACT OF 1934
For the fiscal year ended December 31, 2025
OR
☐TRANSITION REPORT PURSUANT TO SECTION 13 OR 15(d) OF THE SECURITIES EXCHANGE ACT OF 1934
Commission file number 1-12295
GENESIS ENERGY, L.P.
(Exact name of registrant as specified in its charter)
Delaware
76-0513049
(State or other jurisdiction of incorporation or organization)
(I.R.S. Employer Identification No.)
811 Louisiana, Suite 1200,
Houston
,
TX
77002
(Address of principal executive offices)
(Zip code)
Registrant’s telephone number, including area code:
(713)
860-2500
Securities registered pursuant to Section 12(b) of the Act:
Title of Each Class
Trading Symbol(s)
Name of Each Exchange on Which Registered
Common Units
GEL
NYSE
Securities registered pursuant to Section 12(g) of the Act:
NONE
Indicate by check mark if the registrant is a well-known seasoned issuer, as defined in Rule 405 of the Securities Act. Yesx No o
Indicate by check mark if the registrant is not required to file reports pursuant to Section 13 or Section 15(d) of the Act. Yes oNox
Indicate by check mark whether the registrant (1) has filed all reports required to be filed by Section 13 or 15(d) of the Securities Exchange Act of 1934 during the preceding 12 months (or for such shorter period that the registrant was required to file such reports), and (2) has been subject to such filing requirements for the past 90 days. Yesx No o
Indicate by check mark whether the registrant has submitted electronically every Interactive Data File required to be submitted and posted pursuant to Rule 405 of Regulation S-T(§232.405 of this chapter) during the preceding 12 months (or for such shorter period that the registrant was required to submit and post such files). Yesx No o
Indicate by check mark whether the registrant is a large accelerated filer, an accelerated filer, a non-accelerated filer, a smaller reporting company, or an emerging growth company. See the definitions of “large accelerated filer,” “accelerated filer,” “smaller reporting company,” and “emerging growth company” in Rule 12b-2 of the Exchange Act.
Large accelerated filer
x
Accelerated filer
☐
Non-accelerated filer
☐
Smaller reporting company
☐
Emerging growth company
☐
If an emerging growth company, indicate by check mark if the registrant has elected not to use the extended transition period for complying with any new or revised financial accounting standards provided pursuant to Section 13(a) of the Exchange Act. o
Indicate by check mark whether the registrant has filed a report on and attestation to its management’s assessment of the effectiveness of its internal control over financial reporting under Section 404(b) of the Sarbanes-Oxley Act (15 U.S.C. 7262(b)) by the registered public accounting firm that prepared or issued its audit report. ☒
If securities are registered pursuant to Section 12(b) of the Act, indicate by check mark whether the financial statements of the registrant included in the filing reflect the correction of an error to previously issued financial statements. ☐
Indicate by check mark whether any of those error corrections are restatements that required a recovery analysis of incentive-based compensation received by any of the registrant’s executive officers during the relevant recovery period pursuant to §240.10D-1(b). ☐
Indicate by check mark whether the registrant is a shell company (as defined in Rule 12b-2) of the Act). Yes ☐ No x
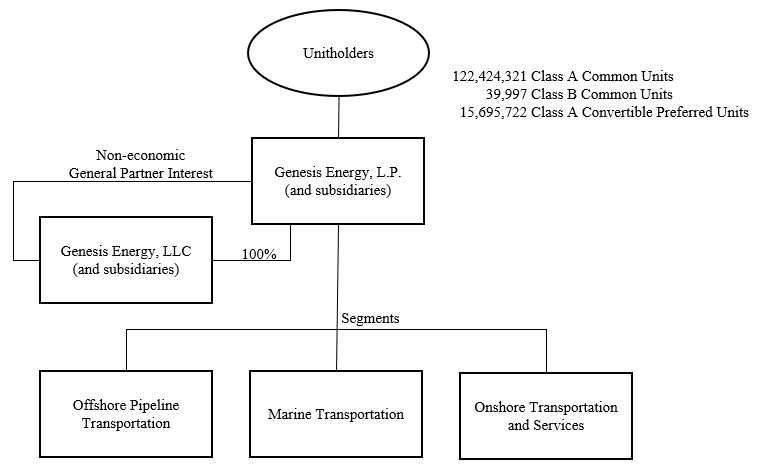
The aggregate market value of the Class A common units held by non-affiliates of the Registrant on June 30, 2025 (the last business day of Registrant’s most recently completed second fiscal quarter) was approximately $1,855.0 million based on $17.23 per unit, the closing price of the common units as reported on the NYSE. For purposes of this computation, all executive officers and directors are deemed to be affiliates. Such a determination should not be deemed an admission that such executive officers and directors are affiliates. On February 18, 2026, the Registrant had 122,424,321 Class A Common Units and 39,997 Class B Common Units outstanding.
Unless the context otherwise requires, references in this annual report to “Genesis Energy, L.P.,” “Genesis,” “we,” “our,” “us,” “the Company” or like terms refer to Genesis Energy, L.P. and its operating subsidiaries. Unless the context otherwise requires, references made in this annual report to the“Alkali Business” as defined below in Item 1. “Business” relate specifically to the period of our ownership of such business prior to the date of sale, February 28, 2025. As generally used within the energy industry and in this annual report, the identified terms have the following meanings:
Bbl or Barrel: One stock tank barrel, or 42 U.S. gallons liquid volume, used in reference to crude oil or other liquid hydrocarbons.
Bbls/day: Barrels per day.
DST: Dry short tons (2,000 pounds), a unit of weight measurement.
FERC: Federal Energy Regulatory Commission.
MBbls: Thousand Bbls.
MBbls/day: Thousand Bbls per day.
Mcf: Thousand cubic feet of gas.
MMBtu: One million British thermal units, an energy measurement.
MMcf: Thousand Mcf.
MMcf/day: Thousand Mcf per day.
NaHS: (commonly pronounced as “nash”) Sodium hydrosulfide.
NaOH or Caustic Soda: Sodium hydroxide.
Natural gas liquid(s) or NGL(s): The combination of ethane, propane, normal butane, isobutane and natural gasolines that, when removed from natural gas, become liquid under various levels of higher pressure and lower temperature.
Sour gas: Natural gas containing more than four parts per million of hydrogen sulfide.
Wellhead: The point at which the hydrocarbons and water exit the ground.
FORWARD-LOOKING INFORMATION
The statements in this Annual Report on Form 10-K that are not historical information may be “forward looking statements” as defined under federal law. All statements, other than historical facts, included in this document that address activities, events or developments that we expect or anticipate will or may occur in the future, including things such as plans for growth of the business, future capital expenditures, competitive strengths, goals, references to future goals or intentions, estimated or projected future financial performance, and other such references are forward-looking statements, and historical performance is not necessarily indicative of future performance. These forward-looking statements are identified as any statement that does not relate strictly to historical or current facts. They use words such as “anticipate,” “believe,” “continue,” “estimate,” “expect,” “forecast,” “goal,” “intend,” “may,” “could,” “plan,” “position,” “projection,” “strategy,” “should” or “will,” or the negative of those terms or other variations of them or by comparable terminology. In particular, statements, expressed or implied, concerning future actions, conditions or events (including production rates and other conditions and events), future operating results, the ability to generate sales, income or cash flow, the timing and anticipated benefits of our development projects and the expected performance of our offshore assets and other projects and business segments, the ability to simplify our capital structure and lower our cost of capital, and the availability of borrowing capacity to fund our growth capital expenditures are forward-looking statements. Forward-looking statements are not guarantees of performance. They involve risks, uncertainties and assumptions. Future actions, conditions or events and future results of operations may differ materially from those expressed in these forward-looking statements. Many of the factors that will determine these results are beyond our ability or the ability of our affiliates to control or predict. Specific factors that could cause actual results to differ from those in the forward-looking statements include, among others:
•demand for, the supply of, our assumptions about, changes in forecast data for, and price trends related to crude oil, liquid petroleum, natural gas, NaHS, and caustic soda, all of which may be affected by economic activity, capital expenditures and operational and technical issues experienced by energy producers, weather, alternative energy sources, international conflicts and international events (including the war in Ukraine, the Israel and Hamas war and broader geopolitical tensions in South America, the Caribbean, the Middle East and Europe), global pandemics, inflation, the actions of OPEC and other oil exporting nations, conservation and technological advances;
•our ability to successfully execute our business and financial strategies;
•our ability to continue to realize cost savings from our cost saving measures;
•throughput levels and rates;
•changes in, or challenges to, our tariff rates;
•our ability to successfully identify and close strategic acquisitions on acceptable terms (including obtaining third-party consents and waivers of preferential rights), develop or construct infrastructure assets, make cost saving changes in operations and integrate acquired assets or businesses into our existing operations;
•service interruptions in our pipeline transportation systems, or processing operations, including due to adverse weather events;
•shutdowns or cutbacks at refineries, petrochemical plants, utilities, individual plants or other businesses for which we transport crude oil, petroleum, natural gas or other products or to whom we sell petroleum or other products;
•risks inherent in marine transportation and vessel operation, including accidents and discharge of pollutants;
•changes in laws and regulations to which we are subject, including tax withholding issues, regulations regarding qualifying income, accounting pronouncements, and safety, environmental and employment laws and regulations;
•the effects of production declines resulting from a suspension of drilling in the Gulf of America or otherwise;
•the effects of future laws and regulations, including increased tariffs and proposed tariffs, taxes, duties and similar matters affecting international trade;
•planned capital expenditures and availability of capital resources to fund capital expenditures, and our ability to access the credit and capital markets to obtain financing on terms we deem acceptable;
•our inability to borrow or otherwise access funds needed for operations, expansions or capital expenditures as a result of our credit agreement and the indentures governing our notes, which contain various affirmative and negative covenants;
•loss of key personnel;
•cash from operations that we generate could decrease or fail to meet expectations, either of which could reduce our ability to pay quarterly cash distributions (common and preferred) at the current level or to increase quarterly cash distributions in the future;
•an increase in the competition that our operations encounter;
•cost and availability of insurance;
•hazards and operating risks that may not be covered fully by insurance;
•our financial and commodity hedging arrangements, which may reduce our earnings, profitability and cash flow;
•changes in global economic conditions, including capital and credit markets conditions, inflation and interest rates, including the result of any economic recession or depression that has occurred or may occur in the future;
•the impact of natural disasters, international military conflicts (such as the war in Ukraine, the Israel and Hamas war and broader geopolitical tensions in South America, the Caribbean, the Middle East and Europe), global pandemics, epidemics, accidents or terrorism, and actions taken by governmental authorities and other third parties in response thereto, on our business financial condition and results of operations;
•reduction in demand for our services resulting in impairments of our assets;
•changes in the financial condition of customers or counterparties;
•adverse rulings, judgments, or settlements in litigation or other legal or tax matters;
•the treatment of us as a corporation for federal income tax purposes or if we become subject to entity-level taxation for state tax purposes;
•the potential that our internal controls may not be adequate, weaknesses may be discovered or remediation of any identified weaknesses may not be successful and the impact these could have on our unit price; and
•a cyberattack involving our information systems and related infrastructure, or that of our business associates.
You should not put undue reliance on any forward-looking statements. When considering forward-looking statements, please review the risk factors described under “Risk Factors” discussed in Item 1A. These risks may also be specifically described in our Quarterly Reports on Form 10-Q, Current Reports on Form 8-K (or any amendments to those reports) and other documents that we may file from time to time with the SEC. New factors that could cause actual results to differ materially from those described in forward-looking statements emerge from time to time, and it is not possible for us to predict all such factors, or the extent to which any such factor or combination of factors may cause actual results to differ from those contained in any forward-looking statement. Except as required by applicable securities laws, we do not intend to update these forward-looking statements and information.
We are a growth-oriented master limited partnership (“MLP”) formed in Delaware in 1996 focused on the midstream segment of the crude oil and natural gas industry. Our common units are traded on the New York Stock Exchange (“NYSE”), under the ticker symbol “GEL.” We provide an integrated suite of services (including transportation, storage, sulfur removal, blending, terminaling and processing) to crude oil and natural gas producers, refiners, and industrial and commercial enterprises. Our operations are primarily located in the Gulf of America and in the Gulf Coast region of the United States. We have a diverse portfolio of assets, including pipelines, offshore hub and junction platforms, refinery-related plants, storage tanks, terminals, railcars, rail unloading facilities, barges and other vessels, and trucks. Prior to February 28, 2025, our business also included the trona and trona-based exploring, mining, processing, producing, marketing, logistics and selling business based in Wyoming (the “Alkali Business”).
In the first quarter of 2025, we sold the Alkali Business and, as a result, re-organized our operating segments to represent how our chief operating decision maker, who is our Chief Executive Officer (our “CODM”), evaluates the performance of operations, develops strategy and allocates resources, including capital. Our sulfur services business, formerly reported under our soda and sulfur services reporting segment along with our Alkali Business, is now reported under our onshore transportation and services reporting segment along with those businesses that were included within our previously reported onshore facilities and transportation segment. As a result of this change, we now manage our businesses through the following three divisions that constitute our reportable segments:
•Offshore pipeline transportation, which includes the transportation and processing of crude oil and natural gas in the Gulf of America;
•Marine transportation, which provides waterborne transportation of petroleum products (primarily fuel oil, asphalt and other heavy refined products) and crude oil throughout North America; and
•Onshore transportation and services, which includes terminaling, blending, storing, and marketing crude oil, and transporting crude oil and refined products, as well as the processing of high sulfur (or “sour”) gas streams for refineries to remove the sulfur, and selling the related by-product, NaHS.
For additional information regarding our reportable segments, see discussion below entitled “Description of Segments and Related Assets.”
We conduct our operations and own our operating assets through our subsidiaries and joint ventures. Our general partner, Genesis Energy, LLC, a wholly-owned subsidiary that owns a non-economic general partner interest in us, has sole responsibility for conducting our business and managing our operations. Our outstanding common units (including our Class B Common Units), and our outstanding Class A convertible preferred units (our “Class A Convertible Preferred Units”), representing limited partner interests, constitute all of the economic equity interests in us.
The following chart depicts our organizational structure at December 31, 2025.
Our Objectives and Strategies
Our primary objectives and strategies are to generate and grow stable free cash flows from operations and continue to deleverage our balance sheet, while never wavering from our commitment to safe and responsible operations. We believe the following have been and are critical to meet our objectives:
•The completion of our major growth capital spending program during 2025, which included the construction and connection of our SYNC Pipeline (as defined and discussed further below under “Recent Developments”) and the expansion of our existing Cameron Highway oil pipeline system (“CHOPS Pipeline”) (as discussed further below under “Recent Developments”).
•An increase in volumes from long-term contracted offshore commercial opportunities in the Gulf of America, including volumes from the Shenandoah development, which saw first production in the third quarter of 2025 and ties into our SYNC Pipeline and further downstream to our CHOPS Pipeline, and volumes from the Salamanca Floating Production System (“FPS”), which also saw first production in the third quarter of 2025 and ties into our existing Southeast Keathley Canyon pipeline system (“SEKCO Pipeline”) for further transportation downstream to our Poseidon oil pipeline system (“Poseidon Pipeline”).
•New and incremental volumes from continued in-field and sub-sea tieback opportunities as a result of the continued investment by the offshore producing community. These opportunities require minimal to no additional investment from us as a result of the current production handling capacity on our offshore pipeline transportation assets in the Gulf of America.
•The creation of financial flexibility from the combination of a significant amount of available borrowing capacity under our senior secured credit facility, subject to compliance with covenants, and our increasing cash flows from operations as discussed above, which will allow us to maximize our cash flow and focus on returning value to our capital structure with an emphasis on reducing debt in absolute terms, opportunistically redeeming our Class A Convertible Preferred Units and thoughtfully evaluating increases in our quarterly distributions to common unitholders.
Our primary business strategy is to provide an integrated suite of services to crude oil and natural gas producers and refiners and provide NaHS and caustic soda to industrial and commercial enterprises. Successfully executing this strategy should enable us to generate and grow stable cash flows from operations. We intend to execute this strategy by:
•Identifying and exploiting incremental profit opportunities, including cost synergies, across an increasingly integrated footprint;
•Economically expanding our pipeline and terminal operations by utilizing capacity currently available on our existing assets that requires minimal to no additional investment;
•Optimizing our existing assets and creating synergies through additional commercial and operating advancement;
•Leveraging customer relationships across business segments;
•Attracting new customers and expanding our scope of services offered to existing customers;
•Expanding the geographic reach of our businesses;
•Evaluating internal and third party growth opportunities (including asset and business acquisitions) that leverage our core competencies and strengths and further integrate our businesses; and
•Focusing on health, safety and environmental stewardship, and advancement of our sustainability program.
Financial Strategy
We believe that preserving financial flexibility is an important factor in our overall strategy and success. Over the long-term, we intend to:
•Increase the relative contribution of recurring and throughput-based revenues, emphasizing longer-term contractual arrangements;
•Maintain a sound, disciplined capital structure, including our current and forward path to deleveraging;
•Preserve a significant amount of available borrowing capacity under our senior secured credit facility;
•Reduce our overall cost of capital through a combination of reducing debt in absolute terms and opportunistically redeeming our high-cost Class A Convertible Preferred Units;
•Create strategic arrangements and share capital costs and risks through joint ventures and strategic alliances;
•Prudently manage our limited direct commodity price risks; and
•Pursue divestitures that support our deleveraging objective.
Competitive Strengths
We believe we are well positioned to execute our strategies and ultimately achieve our objectives due primarily to the following competitive strengths:
•Certain of our businesses are among the leaders in each of their respective markets, have long commercial lives, and have significant barriers to entry. We operate, among others, diversified businesses, each of which is one of the leaders in its market, has a long commercial life, and has significant barriers to entry. We operate one of the largest pipeline networks (based on throughput capacity) in the Deepwater area of the Gulf of America, an area that produced approximately 14% of the oil produced in the U.S. during 2025. We are one of the largest producers and marketers (based on tons produced) of NaHS in North and South America. We are one of the leading providers of crude oil and petroleum product transportation, storage and other handling services for two large, complex refineries in Baton Rouge, Louisiana and Baytown, Texas, both of which have been operational for over 100 years.
•Our businesses encompass a balanced, diversified portfolio of customers, operations and assets. We operate three business segments composed of a diversified suite of assets that enable us to provide a number of services primarily to crude oil and natural gas producers and refiners, and provide NaHS and caustic soda to industrial and commercial enterprises. Our businesses complement each other by allowing us to offer an integrated suite of services to common customers across our segments.
•We are financially flexible and have significant liquidity. As of December 31, 2025, we had $788.6 million of availability under our $800.0 million senior secured credit facility, subject to compliance with our covenants, including up to $171.9 million available under the $200.0 million petroleum products inventory loan sublimit and $45.0 million available for letters of credit. Our inventory borrowing base was $28.1 million at December 31, 2025.
•Our businesses provide relatively consistent consolidated financial performance. Our historically consistent financial performance, combined with our goal of a conservative capital structure over the long term, has allowed us to generate relatively stable cash flows from operations.
•We have limited direct commodity price risk exposure in our crude oil marketing business and limited cost exposure in our NaHS business. The volumes of crude oil, refined products or intermediate feedstocks we purchase are either subject to back-to-back sales contracts or are hedged with exchange-traded derivatives to limit our direct exposure to movements in the price of the commodity; however, we cannot completely eliminate commodity price exposure. We have a risk management policy that requires us to monitor the effectiveness of the hedges as well as other limitations on the maximum levels of inventory we may hold that is not hedged. In addition, our service contracts with refiners allow us to adjust the rates we charge for processing to maintain a balance between NaHS supply and demand.
•Our offshore Gulf of America crude oil and natural gas pipeline transportation and handling operations are located in a significant producing region with large-reservoir, long-lived crude oil and natural gas properties. We provide a suite of services, primarily to integrated and large independent energy companies who make intensive capital investments to develop numerous large-reservoir, long-lived crude oil and natural gas properties in one of the largest producing regions in the U.S., the deepwater Gulf of America.
•Our expertise and reputation for high performance standards and quality enable us to provide refiners with economic and proven services. Our extensive understanding of the sulfur removal process and crude oil refining can provide us with an advantage when evaluating new opportunities and/or markets.
•Some of our pipeline transportation and related assets are strategically located. Our pipelines are critical to the ongoing operations of our refiner and producer customers. In addition, a majority of our terminals are located in areas that can be accessed by pipeline, truck, rail or barge.
•Some of our onshore transportation and services assets are operationally flexible. Our portfolio of trucks, barges, pipelines, rail unloading facilities, tanks and terminals affords us flexibility within our existing regional footprint and provides us the capability to enter new markets and expand our customer relationships.
•Our marine transportation assets provide waterborne transportation throughout North America. We own and operate a fleet of barges and boats used to provide transportation services to both inland and offshore customers within a large North American geographic footprint. All of our vessels operate under the U.S. flag and are qualified for U.S. coastwise trade under the Jones Act.
•We have an experienced, knowledgeable and motivated executive management team with a proven track record. Our executive management team has a significant level of experience in the midstream sector. Certain of our executive management team members have worked in leadership roles at a number of large, successful public companies, including other publicly-traded partnerships. Through their equity interest in us and compensation package (including long term incentive awards based on available cash before reserves, leverage, sustainability and safety metrics), our executive management team is incentivized to create value.
Recent Developments
The following is a brief listing of developments since December 31, 2024. Additional information regarding most of these items may be found elsewhere in this report.
Sale of the Alkali Business and Related Transactions
On February 28, 2025, we completed the sale of the Alkali Business to an indirect affiliate of WE Soda Ltd for a gross purchase price of $1.425 billion. The sale generated proceeds of approximately $1.0 billion, which reflects the net proceeds after the assumption of $413.4 million of our then outstanding 5.875% senior secured notes due 2042 (the “Alkali senior secured notes”) by an indirect affiliate of WE Soda Ltd, and other purchase price adjustments. We used the proceeds to pay down the outstanding balance on our senior secured credit facility on February 28, 2025, purchase 7,416,196 Class A Convertible Preferred Units on March 6, 2025 at a purchase price of $35.40, and redeem the remaining $406.2 million of principal outstanding on the 8.000% senior unsecured notes due January 15, 2027 (the “2027 Notes”) on April 3, 2025.
On February 27, 2025, in connection with the sale of the Alkali Business discussed above, we entered into the Second Amendment to the Seventh Amended and Restated Credit Agreement. This amendment primarily provides for: (i) a reduction from $900 million to $800 million of total borrowing capacity under our senior secured credit facility; (ii) unlimited cash netting against our outstanding debt for purposes of our leverage ratio calculation if our credit facility is undrawn at the end of a reporting period, otherwise a maximum netting of $25 million is allowed; and (iii) an increased permitted investment basket under certain circumstances that will allow us to opportunistically purchase existing private or public securities across our capital structure. Our senior secured credit facility matures on September 1, 2028, subject to extension at our request for one additional year on up to two occasions and subject to certain conditions, provided that if more than $150 million of our 7.750%
senior unsecured notes due February 1, 2028 (the “2028 Notes”) remain outstanding as of November 2, 2027, the senior secured credit facility matures on such date.
Offshore Growth Capital Projects Completion
We previously entered into definitive agreements to provide transportation services for 100% of the crude oil production associated with two separate standalone deepwater developments (Shenandoah and Salamanca). In conjunction with these agreements, we committed to two offshore growth capital projects, which included expanding the current capacity of our 64% owned CHOPS Pipeline (the “CHOPS expansion”) and constructing a new 100% owned, approximately 105-mile, 20” diameter crude oil pipeline (the “SYNC Pipeline”) to connect the Shenandoah deepwater development to our existing asset footprint in the Gulf of America.
The CHOPS expansion included a complete overhaul of the Garden Banks 72 platform (“GB-72”) topside facilities, reconnection of the CHOPS Pipeline to the GB-72 platform, and the addition of pumps at both the High Island A5 (“HI-A5”) and GB-72 platforms to upgrade processing capabilities and increase throughput on the CHOPS Pipeline.
During 2025, we successfully finished the CHOPS expansion and SYNC Pipeline, which completed our major growth capital spending program. During the third quarter of 2025, we saw first production from the Shenandoah and Salamanca deepwater developments, and during the fourth quarter of 2025, Shenandoah throughput was well above the minimum volume commitments (“MVCs”) and volumes from Salamanca continued to ramp toward targeted production levels.
Market Update
Over the past several years, we have seen a heightened level of volatility in global markets and commodity prices driven by various events or circumstances outside of our control including, but not limited to, global pandemics, international military conflicts, geopolitical events and significant changes in economic policies. This volatility could negatively impact future prices for crude oil, natural gas, petroleum products and industrial products.
Management’s estimates are based on numerous assumptions about future operations and market conditions, which we believe to be reasonable, but are inherently uncertain. The uncertainties underlying our assumptions could cause our estimates to differ significantly from actual results, including with respect to the duration and severity of the lasting impacts of international conflicts and the result of any economic recession or depression that has occurred or may occur in the future as a result of or as it relates to changes in governmental policies (including with respect to tariffs or proposed tariffs, taxes, duties and similar matters affecting international trade) aimed at addressing inflation or other conditions or events, which could cause fluctuations in global economic conditions, including capital and credit markets. We will continue to monitor the current market environment and to the extent conditions deteriorate, we may identify triggering events that may require future evaluations of the recoverability of the carrying value of our long-lived assets, intangible assets and goodwill, which could result in impairment charges that could be material to our results of operations.
Although the ultimate impacts of these international conflicts, changes in governmental policies (including with respect to tariffs or proposed tariffs, taxes, duties and similar matters) and fluctuations in global economic conditions, including capital and credit markets, are still unknown at this time, we believe the fundamentals of our core businesses continue to remain strong and, considering the current industry environment and capital market behavior, we have continued our focus on deleveraging our balance sheet as further explained in “Liquidity and Capital Resources.”
Description of Segments and Related Assets
We conduct our businesses through three operating segments: offshore pipeline transportation, marine transportation and onshore transportation and services. These segments are strategic business units that provide a variety of midstream energy-related services. Financial information with respect to each of our operating segments can be found in Note 14 to our Consolidated Financial Statements in Item 8. Below is a more detailed description of our operating segments and their related assets.
We conduct our offshore crude oil and natural gas pipeline transportation and handling operations in the Gulf of America through our offshore pipeline transportation segment, which focuses on providing a suite of services to integrated and large independent energy companies who make intensive capital investments (often in excess of a billion dollars) to develop large-reservoir, long-lived crude oil and natural gas properties located primarily in offshore Texas, Louisiana and Mississippi. The Gulf of America is one of the most active drilling and development regions in the U.S. representing approximately 14% of the crude oil production in the U.S. during 2025. Because the related pipelines and other infrastructure needed to develop the large-reservoir properties are capital intensive, we believe they are generally much less sensitive to short-term commodity price volatility, particularly once a project has been sanctioned or brought on-line.
We own interests in various offshore crude oil and natural gas pipeline systems, platforms and related infrastructure. Our interests in offshore crude oil pipeline systems that are currently operating (a number of which pipeline systems are substantial and/or strategically located) include approximately 1,536 miles of pipe with an aggregate design capacity of approximately 2,094 MMbls/day. For example, we own a 64% interest in the CHOPS Pipeline and a 64% interest in the Poseidon Pipeline, which are two of the largest crude oil pipelines (in terms of both length and design capacity) located in the Gulf of America. We also own 100% of the SEKCO Pipeline, which is a deepwater pipeline currently servicing the Lucius, Buckskin and Hadrian North fields as well as the Leon and Castille fields (through the Salamanca FPS), in the southern Keathley Canyon area of the Gulf of America and 100% of the SYNC Pipeline, which is a deepwater pipeline currently servicing the Shenandoah production field in the Walker Ridge area of the Gulf of America.
Our interests in operating offshore natural gas pipeline systems and related infrastructure include approximately 759 miles of pipe with an aggregate design capacity of approximately 2,200 MMcf/day. We also own an interest in two offshore hub platforms with an aggregate processing capacity of approximately 495 MMcf/day of natural gas and 123 MBbls/day of crude oil. Additionally, we own an interest in a number of junction and service platforms in the Gulf of America, which are used to (i) interconnect the offshore pipeline network; (ii) provide an efficient means to perform pipeline maintenance; and (iii) increase or direct the flow on our pipelines via pumps and measurement equipment.
We generate cash flows from our offshore pipelines from fees charged to customers or substantially similar arrangements that otherwise limit our direct exposure to changes in commodity prices.
We believe our offshore pipeline transportation segment is well positioned to participate in both the energy transition and lower carbon world as barrels produced from the Gulf of America are some of the least emission intensive barrels, from reservoir to refinery, of any barrel refined by Gulf Coast refineries (including shipping).
The table below reflects our interests in our operating offshore crude oil pipelines:
Offshore crude oil pipelines
Operator
System Miles
Design Capacity (Bbls/day)(1)
Interest Owned
Throughput (Bbls/day) 100% basis(1)
Throughput (Bbls/day) net to ownership interest
Main Lines
CHOPS Pipeline
Genesis
380
550,000
64
%
357,207
228,612
Poseidon Pipeline
Genesis
367
350,000
64
%
256,777
164,337
Odyssey Pipeline
Shell Pipeline
120
200,000
29
%
66,906
19,403
Eugene Island Pipeline System
Genesis/Shell Pipeline
184
39,000
29
%
1,629
1,629
Total
1,051
1,139,000
682,519
413,981
Lateral Lines(2)
SEKCO Pipeline
Genesis
149
115,000
100
%
SYNC Pipeline
Genesis
105
240,000
100
%
Shenzi Crude Oil Pipeline
Genesis
83
230,000
100
%
Allegheny Crude Oil Pipeline
Genesis
40
140,000
100
%
Marco Polo Crude Oil Pipeline
Genesis
37
120,000
100
%
Constitution Crude Oil Pipeline
Genesis
67
80,000
100
%
Tarantula
Genesis
4
30,000
100
%
(1)Capacity figures presented represent 100% of the design capacity as of December 31, 2025 and throughput figures represent 100% of the volumes in the period; except for Eugene Island, which represents our net capacity and volumes in the undivided interest (29%) in that system. Ultimate capacities can vary primarily as a result of crude oil quality, pressure requirements, installed pumps, related facilities, utilization of drag reducing agents and the viscosity of the crude oil actually moved.
(2)Represents 100% owned lateral crude oil pipelines which ultimately flow into our other offshore crude oil pipelines (including the CHOPS Pipeline and Poseidon Pipeline) and thus are excluded from main lines above.
•CHOPS Pipeline. CHOPS Pipeline is comprised of 24- to 30-inch diameter pipelines designed to deliver crude oil from fields in the Gulf of America to refining markets along the Texas Gulf Coast via interconnections with refineries and terminals located in Port Arthur and Texas City, Texas. Cameron Highway Oil Pipeline Company, LLC (“CHOPS”) also owns three strategically located multi-purpose offshore platforms. A financial party owns the remaining 36% interest in CHOPS.
•Poseidon Pipeline. The Poseidon Pipeline is comprised of 16- to 24-inch diameter pipelines to deliver crude oil from developments in the central and western offshore Gulf of America to other pipelines and terminals located in onshore and offshore Louisiana. An affiliate of Shell owns the remaining 36% interest in Poseidon Oil Pipeline Company, LLC (“Poseidon”).
•Odyssey Pipeline. The Odyssey pipeline is comprised of 12- to 20-inch diameter pipelines to deliver crude oil from developments in the eastern Gulf of America to other pipelines and terminals onshore in Louisiana. An affiliate of Shell owns the remaining 71% interest in Odyssey Pipeline, LLC (“Odyssey”).
•Eugene Island. The Eugene Island system is comprised of a network of crude oil pipelines, the main pipeline of which is 20 inches in diameter, to deliver crude oil from developments in the central Gulf of America to other pipelines and onshore terminals in Louisiana. Other owners in Eugene Island include affiliates of Exxon Mobil and Shell Oil Company.
•SEKCO Pipeline. The SEKCO Pipeline is a deepwater pipeline that connects the Lucius platform, which supports the Lucius, Hadrian, and Buckskin production fields, and the Salamanca FPS, which supports the Leon and Castille production fields, located in the southern Keathley Canyon area of the Gulf of America, to our CHOPS Pipeline and Poseidon Pipeline.
•SYNC Pipeline. The SYNC pipeline is a newly constructed 20-inch diameter crude oil pipeline that connects the Shenandoah FPS, supporting the Shenandoah production field located in the Walker Ridge area of the Gulf of America, to our CHOPS Pipeline and Poseidon Pipeline.
•Shenzi Pipeline. The Shenzi Pipeline connects the Shenzi platform, supporting the Shenzi production field, and the King’s Quay FPS, which supports the Khaleesi, Mormont and Samurai production fields, located in the Green Canyon area of the Gulf of America, to our CHOPS Pipeline and Poseidon Pipeline.
•Allegheny Pipeline. The Allegheny Pipeline connects the Allegheny platform, which supports the Allegheny and Pegasus production fields, and the South Timbalier 316 platform, which supports the South Timbalier 316 production field, in the Green Canyon area of the Gulf of America, to our CHOPS Pipeline and Poseidon Pipeline.
•Marco Polo Pipeline. The Marco Polo Pipeline connects the Marco Polo platform, which supports the Shenzi K, K2 and Warrior production fields, to an interconnect with the Allegheny Crude Oil Pipeline in Green Canyon Block 164.
•Constitution Pipeline. The Constitution Pipeline connects the Constitution platform, which supports the Constitution, Constellation and Caesar Tonga production fields located in the Green Canyon area of the Gulf of America, to our CHOPS Pipeline and Poseidon Pipeline.
None of our offshore crude oil pipelines are rate regulated with the exception of Eugene Island, which is regulated by the FERC.
The table below reflects our interests in our operating offshore natural gas pipelines:
Offshore natural gas pipelines
Operator
System Miles
Design Capacity (MMcf/day)(1)
Interest Owned
High Island Offshore System
Genesis
238
500
100
%
Anaconda Gathering System
Genesis
183
300
100
%
Manta Ray Offshore Gathering System
Enbridge
237
800
25.7
%
Nautilus System
Enbridge
101
600
25.7
%
Total
759
2,200
(1)Capacity figures presented represent 100% of the design capacity.
•High Island. The High Island Offshore System (“HIOS”) transports natural gas from producing fields located in the Galveston, Garden Banks, West Cameron, High Island and East Breaks areas of the Gulf of America to the Kinetica Energy Express. HIOS includes 152 miles of pipeline and eight pipeline junction and service platforms that are regulated by the FERC. In addition, this system includes the 86-mile East Breaks Gathering System, which connects HIOS to the Hoover-Diana deepwater platform located in Alaminos Canyon Block 25.
•Anaconda. The Anaconda Gathering System gathers natural gas from producing fields located in the Green Canyon area in the Gulf of America, as well as the King’s Quay FPS, which supports the Khaleesi, Mormont and Samurai production fields, for delivery to the Nautilus System.
•Manta Ray. The Manta Ray Offshore Gathering System gathers natural gas from producing fields located in the Green Canyon, Southern Green Canyon, Ship Shoal, South Timbalier and Ewing Bank areas of the Gulf of America for delivery to numerous downstream pipelines, including the Nautilus System. This system includes three pipeline junction platforms.
•Nautilus. The Nautilus System connects the Anaconda Gathering system and Manta Ray Offshore Gathering System to the Neptune natural gas processing plant located in south Louisiana.
Offshore Hub Platforms
Offshore Hub platforms are typically used to: (i) interconnect the offshore pipeline network; (ii) provide an efficient means to perform pipeline maintenance; (iii) locate compression, separation and production handling equipment and similar assets; and (iv) conduct drilling operations during the initial development phase of a crude oil and natural gas property. The results of operations from offshore platform services are primarily dependent upon the level of commodity charges and/or demand-type fees billable to customers. Revenue from commodity charges is based on a fee per unit of volume delivered to the platform (typically per MMcf of natural gas or per barrel of crude oil) multiplied by the total volume of each product delivered.
Demand-type fees are similar to firm capacity reservation agreements for a pipeline in that they are charged to a customer regardless of the volume the customer actually delivers to the platform. Contracts for platform services often include both demand-type fees and commodity charges, but demand-type fees generally expire after a contractually fixed period of time and in some instances may be subject to cancellation by customers.
The table below reflects our interests in our operating offshore hub platforms:
Offshore hub platform
Operator
Water Depth (Feet)
Natural Gas Capacity (MMcf/day)(1)
Crude Oil Capacity (Bbls/day)(1)
Interest Owned
Marco Polo
Occidental
4,300
300
120,000
100
%
East Cameron 373
Genesis
441
195
3,000
100
%
Total
495
123,000
(1)Capacity figures presented represent 100% of the design capacity.
•Marco Polo. The Marco Polo platform, which is located in Green Canyon Block 608, processes crude oil and natural gas from production fields located in the South Green Canyon area of the Gulf of America.
•East Cameron. The East Cameron 373 platform has the ability to process production from the Garden Banks and East Cameron areas of the Gulf of America.
Customers
Due to the intensive capital requirements of exploring for and developing crude oil properties in the deepwater regions of the Gulf of America, most of our offshore pipeline transportation customers are integrated energy companies and other large independent producers, who desire to have longer-term arrangements ensuring that their production can access the markets.
Usually, our offshore crude oil pipeline customers enter into buy-sell or other transportation arrangements, pursuant to which the pipeline acquires possession (and, sometimes, title) from its customer of the relevant production at a specified location (often a producer’s platform or at another interconnection) and redelivers possession (and title, if applicable) to such customer of an equivalent volume at one or more specified downstream locations (such as a refinery or an interconnection with another pipeline). Most of the production handled by our offshore pipelines is pursuant to life-of-lease commitments that include both firm and interruptible capacity arrangements.
Competition
Our principal competition in our offshore pipeline transportation business includes other crude oil and natural gas pipeline systems as well as producers who may elect to build or utilize their own production handling facilities. We compete for new production on the basis of geographic proximity to the source, cost of connection, available capacity, transportation rates and access to onshore markets. In addition, our access to future reserves will depend on our ability, or the producers’ ability, to fund the significant capital expenditures required to connect to the new sources of oil and natural gas production. In general, most of our offshore pipelines are not subject to regulatory rate-making authority, and the rates we charge for services are dependent on the quality of the service required by the customer and the amount and term of the reserve commitment by that customer.
Our marine transportation segment consists of (i) our inland marine fleet, which transports intermediate refined petroleum products, including asphalt, principally serving refineries and storage terminals along the Gulf Coast, Intracoastal Canal and western river systems of the U.S., principally along the Mississippi River and its tributaries; (ii) our offshore marine fleet, which transports crude oil and refined petroleum products, principally serving refineries and storage terminals along the Gulf Coast, Eastern Seaboard, Great Lakes and Caribbean; and (iii) our modern, double-hulled tanker, M/T American Phoenix. All of our vessels operate under the U.S. flag and are qualified for domestic trade under the Jones Act. The below table includes operational information relating to our marine transportation fleet:
Inland
Offshore
American Phoenix
Aggregate Fleet Design Capacity (MBbls)
2,165
884
330
Individual Vessel Capacity Range (MBbls)(1)
23-39
65-135
330
Number of:
Push/Tug Boats
33
10
—
Barges
78
9
—
Product Tankers
—
—
1
(1)Represents capacity per barge ranges on our inland and offshore barge, as well as the capacity of our M/T American Phoenix.
Customers
Our marine customers are primarily refiners as well as large energy companies. In 2025, approximately80% of the revenue we generated stemmed from contracts with refiners. Our M/T American Phoenix is currently operating under a charter with a refining customer along the Gulf Coast and Eastern Seaboard. We are a provider of transportation services for our customers and do not assume ownership of the products we transport. Marine transportation services are conducted under term contracts, some of which have renewal options for customers with whom we have traditionally had long-standing relationships, as well as spot contracts. Most of our customers have been our customers for many years and we generally anticipate continued relationships; however, there is no assurance that any individual contract will be renewed.
Our marine contracts for our inland and offshore fleets are agreements to transport cargo for a specific customer at a set rate (affreightment) or at a daily rate (time charter). The rate may or may not escalate during the term of the contract; however, the base rate generally remains constant and contracts often include escalation provisions to recover changes in specific costs such as fuel. Time charters, which insulate us from revenue fluctuations caused by weather and navigational delays and temporary market declines, represented over 95%of our marine transportation revenues under contracts during 2025. A term contract is an agreement with a customer to move cargo for a specific period of time, and may involve multiple trips to various destinations. A spot contract is an agreement with a customer to move cargo from a specific origin to a designated destination for a rate negotiated at the time the cargo movement takes place. Spot contract rates are at the current “market” rate and are subject to market volatility. During 2025, approximately 77% of our marine transportation revenues were from term contracts and 23% were from spot contracts.
Competition
Our competitors for the marine transportation of crude oil and heavy refined petroleum products are midstream MLPs with marine transportation divisions, refineries and other companies that are in the business of solely marine transportation operations. Competition among common marine carriers is based on a number of factors including proximity to production, refineries and connecting infrastructures, customer service, and transportation pricing.
Our marine transportation segment also competes with other modes of transporting crude oil and heavy refined petroleum products, including pipeline, rail and trucking operations. Each mode of transportation has different advantages and disadvantages, which often are fact and circumstance dependent. For example, without requiring longer-term economic commitments from shippers, marine and truck transportation can offer shippers much more flexibility to access numerous markets in multiple directions (i.e., pipelines tend to flow in a single direction and are geographically limited by their receipt and delivery points with other pipelines and facilities), and our marine transportation offers shippers certain economies of scale as compared to truck transportation. In addition, due to construction costs and timing considerations, marine and truck transportation can provide cost effective and immediate services to a nascent producing region, whereas new pipelines can be very expensive and time consuming to construct and may require shippers to make longer-term economic commitments, such as take-or-pay commitments. On the other hand, in mature developed areas serviced by extensive, multi-directional pipelines, with extensive connections to various markets, pipeline transportation may be preferred by shippers, especially if shippers are
willing to make longer-term economic commitments, such as take-or-pay commitments. Lastly, all of our inland marine transportation barges are asphalt capable and heated. This allows us to transport intermediate refined products that require heat, which other modes of transportation are not necessarily equipped to handle.
Onshore Transportation and Services
Through our onshore transportation and services segment, we provide various transportation and facilities services for crude oil and refined products as well as sulfur removal services (our sulfur services business).
We provide transportation and facilities services to Gulf Coast crude oil refiners and producers through a combination of purchasing, transporting, storing, blending and marketing of crude oil and refined products. In connection with these services, we utilize our increasingly integrated portfolio of logistical assets consisting of pipelines, trucks, tanks and terminals, barges and rail unloading facilities. The integrated nature of our onshore transportation and services assets is particularly evident in areas such as Louisiana and Texas.
Our crude oil onshore transportation and services operations are concentrated in Texas, Louisiana, Alabama, Florida and Mississippi. We provide services which include the gathering of crude oil from producers at the wellhead, transporting crude oil by gathering line, truck and barge to pipeline injection points, transporting crude oil for our gathering and marketing operations and for other shippers on our pipelines and marketing crude oil to refiners. We also have the ability to transport refined products via pipeline. For certain of these services, we generate fee-based income related to the transportation services provided. In some cases, we also realize a profit equal to the difference between the price at which we sell the crude oil and the price at which we purchase the crude oil, less the associated costs of aggregation and transportation. The most substantial components of the costs we incur while aggregating crude oil and petroleum products are transportation related costs.
These operations help to ensure (among other things) a base supply source for our crude oil pipeline systems, refinery customers and other shippers while providing our producer customers with a market outlet for their production. By utilizing our network of pipelines, trucks, rail unloading facilities, barges, and tanks and terminals, we are able to provide transportation related services to, and in many cases back-to-back gathering and marketing arrangements with, crude oil refiners and producers. Additionally, our crude oil and petroleum product gathering and marketing expertise and knowledge base provide us with the ability to capitalize on opportunities that arise from time to time in our market areas. We gather and market approximately 18,785 Bbls/day (as of December 31, 2025) of crude oil, most of which is produced from large resource basins throughout Texas and the Gulf Coast. Our crude oil pipelines transport many of these barrels, as well as barrels for third party producers and refiners to which we charge fees for our transportation services. Given our network of terminals, we also have the ability to store crude oil during periods of contango (crude oil prices for future deliveries are higher than for current deliveries) for delivery in future months. When we purchase and store crude oil during periods of contango, we attempt to limit direct commodity price risk by simultaneously entering into a contract to sell the inventory in a future period, either with a counterparty or in the crude oil futures market. Unsold volumes are hedged with commodity derivatives to offset the remaining price risk.
Onshore Crude Oil Pipelines
Through our onshore pipeline systems and related assets we own and operate, we transport crude oil for our gathering and marketing operations and for other shippers pursuant to tariff rates regulated by the FERC, Louisiana Public Service Commission (“LPSC”) or the Railroad Commission of Texas (“TXRRC”). Accordingly, we offer transportation services to any shipper of crude oil, if the products tendered for transportation satisfy the conditions and specifications contained in the applicable tariff. Pipeline revenues are a function of the level of throughput and the particular point where the crude oil is injected into the pipeline and the delivery point. We also may earn revenue from pipeline loss allowance volumes. In exchange for bearing the risk of pipeline volumetric losses, we deduct volumetric pipeline loss allowances and crude oil quality deductions. Such allowances and deductions are offset by measurement gains and losses. When our actual volume losses are less than the related allowances and deductions, we recognize the difference as income and inventory available for sale valued at the market price for the crude oil.
The margins from our onshore crude oil pipeline operations are equal to the revenues we generate from regulated published tariffs and pipeline loss allowances less the fixed and variable costs of operating and maintaining our pipelines. Each of our onshore pipeline systems has available capacity to accommodate potential growth in volumes.
The four onshore common carrier crude oil pipeline systems we own and operate are the Texas System, the Louisiana System, the Jay System, and the Mississippi System.
Hastings Junction, TX to Webster, TX Texas City, TX to Webster, TX
Port Hudson, LA to Baton Rouge, LA Baton Rouge, LA to Port Allen, LA
Southern AL/FL to Mobile, AL
Soso, MS to Liberty, MS
Rate Regulated
FERC/TXRRC
FERC/LPSC
FERC
FERC
•Texas System. Our Texas System takes delivery of crude oil volumes at various receipt points around Texas City (which includes the capability of receiving various Gulf of America pipeline volumes) for delivery to Webster, Texas, which ultimately connects to other crude oil pipelines. Our Texas System also transports crude oil from Hastings Junction (south of Houston, Texas) to several delivery points near Houston, Texas (including our Webster, Texas facility). We earn a tariff for our transportation services, with the tariff rate per barrel of crude oil varying with the distance from injection point to delivery point.
•Louisiana System. Our Louisiana System connects the Anchorage Tank Farm to our Port of Baton Rouge Terminal (which was built to service Exxon Mobil Corporation’s Baton Rouge refinery, which is one of the largest refinery complexes in North America, with more than 500,000 Bbls/day of refining capacity), allowing bidirectional flow of crude oil, intermediates and refined products between the Anchorage Tank Farm and this terminal via a dedicated crude oil pipeline and a dedicated intermediates pipeline. Our Louisiana system also transports crude oil bidirectionally between Port Hudson, our Baton Rouge Scenic Station rail unloading facility and the Anchorage Tank Farm. This pipeline system serves as a key asset in our integrated Baton Rouge area midstream infrastructure.
•Jay System. Our Jay System provides crude oil shippers access to refineries, pipelines and storage near Mobile, Alabama. That system also includes gathering connections, additional crude oil storage capacity of approximately 20,000 barrels in the field, an interconnect with our Walnut Hill rail facility and a delivery connection to a refinery in Alabama.
•Mississippi System. Our Mississippi System provides shippers of crude oil in Mississippi indirect access to refineries, pipelines, storage, terminals and other crude oil infrastructure located in the Eastern Gulf Coast.
Other Onshore Transportation and Services Operations
We own four operational crude oil rail unloading facilities located in Baton Rouge, Louisiana; Raceland, Louisiana; Walnut Hill, Florida; and Natchez, Mississippi which provide synergies to our existing asset footprint. We generally earn a fee for unloading railcars at these facilities. Three of these facilities, our Baton Rouge, Louisiana, Raceland, Louisiana, and Walnut Hill, Florida facilities are directly connected to our existing integrated crude oil pipeline and terminal infrastructure.
Within our onshore transportation and services business segment, we employ many types of logistically flexible assets. These assets include a suite of trucks and trailers, as well as terminals and other tankage with approximately 4.2 million barrels of leased and owned storage capacity in multiple locations along the Gulf Coast, accessible by pipeline, truck, rail or barge, in addition to tankage related to our crude oil pipelines, previously mentioned.
Our sulfur services business primarily (i) provides sulfur removal services whereby it processes high sulfur (or “sour”) gas streams generated from crude oil processing operations to remove sulfur at 11 refining or petrochemical processing facilities located mainly in Texas, Louisiana, Arkansas, Oklahoma, Montana and Utah; (ii) operates storage and transportation assets in relation to those services; and (iii) sells NaHS and NaOH (also known as caustic soda) to large industrial and commercial companies. To provide sulfur removal services, we apply our proprietary technology, which uses large quantities of caustic soda (the primary raw material used in our process) to act as a scrubbing agent under prescribed temperature and pressure to remove sulfur. Sulfur removal in a refinery is a key factor in optimizing the production of refined products such as gasoline, diesel and aviation fuel. Our sulfur removal technology returns a clean (sulfur-free) hydrocarbon stream to the refinery for further processing into refined products, and simultaneously produces NaHS. The resultant, NaHS, constitutes the sole consideration we receive for our sulfur removal services. A majority of the NaHS we receive is sourced from refineries owned and operated by large companies, including Phillips 66, CITGO, HF Sinclair, Calumet and Ergon.
Our 11 sulfur removal services contracts have an average remaining term of approximately two years. The timing upon which these contracts renew vary based upon location and terms specified within each specific contract.
Our sulfur services footprint includes NaHS and caustic soda terminals in the Gulf Coast, the Southwest, Montana, Utah and British Columbia. We sell and deliver (via railcars, ships, barges and trucks) NaHS and caustic soda to over 100 customers. We are one of the largest marketers of NaHS in North and South America. By minimizing our costs through utilization of our own logistical assets and leased storage sites, we believe we have a competitive advantage over other suppliers of NaHS. NaHS is used in the specialty chemicals business (plastic additives, dyes and personal care products), in the pulp and paper business, and in connection with mining operations (separating copper from molybdenum and in the mining of nickel and gold) as well as bauxite refining (aluminum). NaHS has also gained acceptance in environmental applications, including waste treatment programs requiring stabilization and reduction of heavy and toxic metals and flue gas scrubbing. Additionally, NaHS can be used for removing hair from hides at the beginning of the tannery process.
Caustic soda is used in many of the same industries as NaHS. Many applications require both chemicals for use in the same process. For example, caustic soda can increase the yields in bauxite refining, pulp manufacturing and in the recovery of copper, gold and nickel. Caustic soda is also used as a cleaning agent (when combined with water and heated) for process equipment and storage tanks at refineries.
Customers
We provide transportation and facilities services for, as well as gather from and market crude oil and refined products to, numerous refiners and producers.
As part of our sulfur services business, we sell NaHS to customers in a variety of industries, with the largest customers involved in mining of base metals, primarily copper and molybdenum, and the production of pulp and paper. We sell to customers in the copper mining industry in the western U.S., Canada and Mexico. We also export NaHS to South America for sale to mining customers in Peru and Chile. Many of the industries that our NaHS customers are in (such as copper mining and the pulp and paper industry) participate in global markets for their products. As a result, this creates an indirect exposure for NaHS to global demand for the end products of our customers.
We sell caustic soda to many of the same customers who purchase NaHS from us as well as to some of the refineries in which we operate.
Our onshore transportation and services segment is not dependent on any single or small group of customers. The loss of any one customer would not have a material, adverse effect on us.
Competition
Our competitors for the provision of transportation and facilities services include other regional and local midstream service providers and companies who may have significant market share in the respective areas in which they operate. Competition among common carrier pipelines is based primarily on posted tariffs, quality of customer service and proximity to refineries, production and connecting pipelines. We believe that high capital costs, tariff regulation and the cost of acquiring rights-of-way make it unlikely that other competing pipeline systems, comparable in size and scope to our onshore pipelines, will be built in the same geographic areas in the near future. In addition, as the majority of our onshore pipelines directly serve refineries, we believe that these pipelines are not subject to the same competitive pressures as those tied directly to crude oil production.
Our competitors for the supply of NaHS consist primarily of parties who produce NaHS as a by-product of or an alternative to other sulfur derivative products, including fertilizers, pesticides, other agricultural products, plastic additives and lubricants. Typically our competitors for the supply of NaHS have only one location and they do not have the logistical infrastructure that we have to supply customers. These competitors often reduce NaHS production when demand for their alternative sulfur derivatives is high and increase NaHS production when demand for these alternatives is low. Also, they tend to supply less when prices and demand for elemental sulfur are higher and supply more NaHS when the price of elemental sulfur falls.
Demand for NaHS faces competition from alternative sulfidity management mediums such as sulfidic caustic, emulsified sulfur, salt cake and flake NaHS. Changes in the value, supply and/or demand of these alternative products can impact the volume and/or value of our NaHS sold.
Typically, our competitors for sulfur removal services include refineries themselves through the use of their sulfur removal processes.
Our competitors for sales of caustic soda include manufacturers of caustic soda. These competitors supply caustic soda to our sulfur services operations and support us in our third-party caustic soda sales. By utilizing our storage capabilities and having access to transportation assets, we sell caustic soda to third parties who gain efficiencies from acquiring both NaHS and caustic soda from one source.
Credit Exposure
Our portfolio of accounts receivable is generally comprised in large part of obligations of refiners, integrated and large independent oil and natural gas producers, and mining and other industrial companies that purchase NaHS, most of which have stable payment histories. We believe that any credit risk posed by a concentration of customers in a specific industry is offset by the creditworthiness of our specific customer base in the context of our specific transactions as well as other factors, including the strategic nature of certain of our assets and relationships and our credit procedures. The credit risk related to exchange-traded contracts is limited due to the daily cash settlement procedures and other exchange related requirements.
When we market crude oil, petroleum products, and NaHS and provide transportation and other services, we must determine the amount, if any, of the line of credit we will extend to any given customer. We have established procedures to manage our credit exposure, including initial credit approvals, credit limits, collateral requirements and rights of offset. Letters of credit, prepayments and guarantees are also utilized to limit credit risk to ensure that our established credit criteria are met. We use similar procedures to manage our exposure to our customers in the offshore pipeline transportation and marine transportation segments.
Some of our largest customers include Exxon Mobil Corporation, MV Purchasing, BP, Shell, and Phillips 66.
Human Capital
We believe our employees are our most important asset and the cornerstone of our organization. We take steps to attract and retain talented people to safely operate our assets, foster customer relationships, and achieve our long-term goals. We are committed to employee retention and we encourage our employees to maintain long-term careers with us. Human capital measures and objectives which we focus on in managing our business include safety, employee compensation and benefits, diversity and inclusion, and employee development.
Employees
To carry out our business activities, we employed 1,061 employees at December 31, 2025. We consider our relationship with our employees to be in good standing.
Safety
Safety is one of our guiding principles and it is our intention to create and sustain a workplace free from recognized safety and health hazards. We have implemented safety programs and management practices to promote a culture of safety, which include policies, training, procedures, audits, inspections, incident evaluations, data analysis, reporting and communications. We also established annual safety and health targets for total recordable injury and illness rates, and tied a portion of our management compensation to safety related goals to emphasize the importance of safety at the Company.
Our compensation programs are integrated with our overall business strategies and management processes to incentivize performance, maximize returns and build shareholder value. We participate in market surveys as well as work with consultants to benchmark our compensation and benefits programs to help us offer competitive remuneration packages to attract and retain high-performing employees.
Furthermore, to attract and meet the needs of our workforce, we offer a comprehensive and affordable benefits program that includes medical, dental, vision, life insurance, and disability protection, along with a generous retirement savings plan, including up to six percent matching. Our benefits package options may vary depending on the type of employee and date of hire. Additionally, we continuously look for ways to improve employee work-life balance and the well-being of our employees and their families.
Employee Development
Our success as a company is measured by the successful performance of our employees in their respective roles. Thus, it is our policy to properly train and equip each employee to perform his or her job functions safely and in compliance with all laws, regulations and internal procedures.
We develop our employees through performance management processes, regular coaching and supervisory and leadership training while also offering a tuition reimbursement program. Our annual performance management cycle enables managers and employees to collaborate to set performance goals and development objectives that align to business objectives. We also provide in-house health and safety training and emergency response training. Employee attendance at external workshops, conferences and other training events is also encouraged.
Regulation
Pipeline Rate and Access Regulation
The rates and the terms and conditions of service of our interstate common carrier pipeline operations are subject to regulation by FERC under the Interstate Commerce Act, or ICA. Under the ICA, rates must be “just and reasonable,” and must not be unduly discriminatory or confer any undue preference on any shipper. FERC regulations require that oil pipeline rates and terms and conditions of service for regulated pipelines be filed with FERC and posted publicly.
Effective January 1, 1995, FERC promulgated rules simplifying and streamlining the ratemaking process. Previously established rates were “grandfathered,” limiting the challenges that could be made to existing tariff rates. Increases from grandfathered rates of interstate oil pipelines are currently regulated by FERC primarily through an index methodology, whereby a pipeline is allowed to change its rates based on the year-to-year change in an index. Under FERC regulations, we are able to change our rates within prescribed ceiling levels that are tied to the Producer Price Index for Finished Goods (“PPI-FG”). Rate increases made pursuant to the index are presumed to be just and reasonable. They will be subject to protest, but such protests must show that the rate increase resulting from application of the index is substantially in excess of the applicable pipeline’s increase in costs. We may be required to lower our rates if the ceiling level decreases below our existing rates in a given year. The FERC indexing is subject to review and revision every five years.
On December 17, 2020, the FERC issued a final rule setting the index for the five-year period beginning July 1, 2021, and ending on June 30, 2026, at PPI-FG plus 0.78%. On January 20, 2022, the FERC granted a rehearing of certain aspects of the final rule and revised the index level to PPI-FG minus 0.21% effective March 1, 2022 through June 30, 2026. The FERC ordered pipelines with filed rates that exceed their index ceiling levels based on PPI-FG minus 0.21% to file rate reductions effective March 1, 2022. On review, the U.S. Court of Appeals for the D.C. Circuit, in Liquid Energy Pipeline Association v. FERC, 109 F.4th 543 (D.C. Cir. 2024), vacated FERC’s rehearing order that adopted the PPI-FG minus 0.21% and ordered FERC to reinstate its prior order with a PPI-FG plus 0.78%. In September 2024, FERC reinstated the PPI-FG plus 0.78% and subsequently initiated a rulemaking in Docket No. RM25-2, proposing to amend the PPI-FG for the five-year period that began on July 1, 2021, and adopt a revised index level of PPI-FG minus 0.21%. On November 20, 2025, the FERC issued an order terminating the rulemaking proceeding in Docket No. RM25-2 without amending the index level, with the result that the PPI-FG plus 0.78% remains in place for the remainder of the five-year review period ending on June 30, 2026. A petition for review of this FERC order has been filed with the U.S. Court of Appeals for the D.C. Circuit.
FERC also issued a separate order on November 20, 2025, in Docket Nos. RM93-11-003, RM20-14-003 and RM20-24-004, in which it granted pipeline remedial relief for the period from March 1, 2022, the effective date of the PPI-FG minus 0.21%, to September 17, 2024, the date on which FERC reinstated the PPI-FG plus 0.78%. FERC allowed pipelines that charged the maximum rates permitted for shipments made during the period of March 1, 2022 to September 17, 2024 to apply the PP-FG plus 0.78% to those shipments and recover amounts directly from shippers. Requests for rehearing of the FERC’s order have been filed with FERC, and a petition for review of the FERC’s order has been filed with the U.S. Court of Appeals for the D.C. Circuit. A motion for stay of the FERC’s order has also been filed with FERC.
In addition to the index methodology, FERC allows for rate changes under three other methods—cost-of-service, competitive market showings and agreements between shippers and the oil pipeline company that the rate is acceptable, or Settlement Rates. The pipeline tariff rates on our Mississippi, Jay, Texas and Louisiana systems are either rates that are subject to change under the index methodology or Settlement Rates. None of our tariffs have been subjected to a protest or complaint by any shipper or other interested party.
Our offshore pipelines, with the exception of our Eugene Island pipeline and HIOS, are neither interstate nor common carrier pipelines. However, these pipelines are subject to federal regulation under the Outer Continental Shelf Lands Act, which requires all pipelines operating on or across the outer continental shelf to provide nondiscriminatory transportation service.
Our intrastate common carrier pipeline operations in Texas are subject to regulation by the TXRRC. The applicable Texas statutes require that pipeline rates and practices be reasonable and non-discriminatory and that pipeline rates provide a fair return on the aggregate value of the property of a common carrier, after providing reasonable allowance for depreciation and other factors and for reasonable operating expenses. Although no assurance can be given that the tariffs we charge would ultimately be upheld if challenged, we believe that the tariffs now in effect can be sustained.
Marine Regulations
The operation of towboats, tugboats, barges, vessels and marine equipment create maritime obligations involving property, personnel and cargo and are subject to regulation by the U.S. Coast Guard, or USCG, the Environmental Protection Agency, or EPA, the Department of Homeland Security, or DHS, federal laws, state laws and certain international conventions under General Maritime Law. These obligations can create risks which are varied and include, among other things, the risk of collision and allision, which may precipitate claims for personal injury, cargo, contract, pollution, third-party claims and property damages to vessels and facilities. Routine towage operations can also create risk of personal injury under the Jones Act and General Maritime Law, cargo claims involving the quality of a product and delivery, terminal claims, contractual claims and regulatory issues. Federal regulations also require that all tank barges engaged in the transportation of oil and petroleum in the U.S. be double hulled. All of our barges are double-hulled.
All of our barges are inspected by the USCG and carry certificates of inspection. All of our towboats and tugboats are certificated by the USCG. Most of our vessels are built to American Bureau of Shipping, or ABS, classification standards and in some instances are inspected periodically by ABS to maintain the vessels in class standards. The crews we employ aboard vessels, including captains, pilots, engineers, tankermen and ordinary seamen, are documented by the USCG.
We are required by various governmental agencies to obtain licenses, certificates and permits for our vessels depending upon such factors as the cargo transported, the waters in which the vessels operate and other factors. We are of the opinion that our vessels have obtained and can maintain all required licenses, certificates and permits required by such governmental agencies for the foreseeable future.
Jones Act: The Jones Act is a federal law that restricts maritime transportation between locations in the U.S. to vessels built and registered in the U.S. and owned and manned by U.S. citizens. We are responsible for monitoring the ownership of our subsidiary that engages in maritime transportation and for taking any remedial action necessary to ensure that no violation of the Jones Act ownership restrictions occurs. Jones Act requirements significantly increase operating costs of U.S.-flag vessel operations compared to foreign-flag vessel operations. Further, the USCG and ABS maintain the most stringent regime of vessel inspection in the world, which tends to result in higher regulatory compliance costs for U.S.-flag operators than for owners of vessels registered under foreign flags or flags of convenience. The Jones Act and General Maritime Law also provide damage remedies for crew members injured in the service of the vessel arising from employer negligence or vessel unseaworthiness.
Merchant Marine Act of 1936: The Merchant Marine Act of 1936 is a federal law providing that, upon proclamation by the President of the U.S. of a national emergency or a threat to the national security, the U.S. Secretary of Transportation may requisition or purchase any vessel or other watercraft owned by U.S. citizens (including us, provided that we are considered a U.S. citizen for this purpose). If one of our tow boats or barges were purchased or requisitioned by the U.S. government under this law, we would be entitled to be paid the fair market value of the vessel in the case of a purchase or, in the case of a requisition, the fair market value of charter hire. However, if one of our tow boats is requisitioned or purchased and its associated barge or barges are left idle, we would not be entitled to receive any compensation for the lost revenues resulting from the idled barges. We also would not be entitled to be compensated for any consequential damages we suffer as a result of the requisition or purchase of any of our tow boats or barges.
Security Requirements: The Maritime Transportation Security Act of 2002 requires, among other things, submission to and approval by the USCG of vessel and waterfront facility security plans, or VSP. Our VSP’s have been approved and we are operating in compliance with the plans for all of its vessels and that are subject to the requirements, whether engaged in domestic or foreign trade.
We operate a number of railcar unloading facilities and lease a significant number of railcars. Our railcar operations are subject to the regulatory jurisdiction of the Federal Railroad Administration of the DOT, the Occupational Safety and Health Administration, or OSHA, as well as other federal and state regulatory agencies. We believe that our railcar operations are in substantial compliance with all existing federal, state and local regulations.
DOT and OSHA have jurisdiction under several federal statutes over a number of safety and health aspects of rail operations, including the transportation of hazardous materials. State agencies regulate some aspects of rail operations with respect to health and safety in areas not otherwise preempted by federal law.
Environmental Regulations
General - We are subject to stringent federal, state and local laws and regulations governing the discharge of materials into the environment or otherwise relating to environmental protection. These laws and regulations may (i) require the acquisition of and compliance with permits for regulated activities, (ii) limit or prohibit operations on environmentally sensitive lands such as wetlands or wilderness area, seismically sensitive areas, or areas inhabited by endangered or threatened species, (iii) result in capital expenditures to limit or prevent emissions or discharges, and (iv) place burdensome restrictions on our operations, including the management and disposal of wastes. Failure to comply with these laws and regulations may result in the assessment of administrative, civil and criminal penalties, including the assessment of monetary penalties, the imposition of investigatory and remedial obligations, the suspension or revocation of necessary permits, licenses and authorizations, the requirement that additional pollution controls be installed and the issuance of orders enjoining future operations or imposing additional compliance requirements. Changes in environmental laws and regulations occur frequently, typically increasing in stringency through time, and any changes that result in more stringent and costly operating restrictions, emission control, waste handling, disposal, cleanup and other environmental requirements have the potential to have a material adverse effect on our operations. While we believe that we are in substantial compliance with current environmental laws and regulations and that continued compliance with existing requirements will not materially affect us, there is no assurance that this trend will continue in the future. Revised or new additional regulations that result in increased compliance costs or additional operating restrictions, particularly if those costs are not fully recoverable from our customers, could have a material adverse effect on our business, financial position, results of operations and cash flows.
Hazardous Substances and Waste Handling - The Comprehensive Environmental Response, Compensation, and Liability Act, as amended, or CERCLA, also known as the “Superfund” law, and analogous state laws impose liability, without regard to fault or the legality of the original conduct, on certain classes of persons. These persons include current owners and operators of the site where a release of hazardous substances occurred, prior owners or operators that owned or operated the site at the time of the release of hazardous substances, and companies that disposed or arranged for the disposal of the hazardous substances found at the site. We currently own or lease, and have in the past owned, operated or leased, properties that have been in use for many years with the gathering and transportation of hydrocarbons including crude oil and other activities that could cause an environmental impact. Persons deemed “responsible persons” under CERCLA may be subject to strict and joint and several liability for the costs of removing or remediating previously disposed wastes (including wastes disposed of or released by prior owners or operators) or property contamination (including groundwater contamination), for damages to the environment, and for the costs of certain health studies. CERCLA also authorizes the EPA and, in some instances, third parties to act in response to threats to the public health or the environment and to seek to recover the costs they incur from the responsible classes of persons. It is not uncommon for neighboring landowners and other third parties to file claims for personal injury and property damage allegedly caused by hazardous substances or other pollutants released into the environment.
We also may incur liability under the Resource Conservation and Recovery Act, as amended, or RCRA, and analogous state laws which impose requirements and also liability relating to the management and disposal of solid and hazardous wastes. While RCRA regulates both solid and hazardous wastes, it imposes strict requirements on the generation, storage, treatment, transportation and disposal of hazardous wastes. Certain petroleum production wastes are excluded from RCRA’s hazardous waste regulations. However, it is possible that these wastes, which could include wastes currently generated during our operations, will in the future be designated as “hazardous wastes” and, therefore, be subject to more rigorous and costly disposal requirements. Indeed, legislation has been proposed from time to time in Congress to re-categorize certain crude oil and natural gas exploration and production wastes as “hazardous wastes.” Also, in December 2016, the EPA agreed in a consent decree to review its regulation of oil and gas waste. However, in April 2019, the EPA concluded that revisions to the federal regulations for the management of oil and gas waste are not necessary at this time. Any such changes in the laws and regulations could have a material adverse effect on our capital expenditures and operating expenses.
We believe that we are in substantial compliance with the requirements of CERCLA, RCRA and related state and local laws and regulations, and that we hold all necessary and up-to-date permits, registrations and other authorizations required under such laws and regulations. Although we believe that the current costs of managing our wastes as they are presently
classified are reflected in our budget, any legislative or regulatory reclassification of oil and natural gas exploration and production wastes could increase our costs to manage and dispose of such wastes.
Water Discharges - The Federal Water Pollution Control Act, as amended, also known as the “Clean Water Act,” and analogous state laws impose restrictions and strict controls regarding the unauthorized discharge of pollutants, including crude oil, into navigable waters of the U.S., as well as state waters. Permits must be obtained to discharge pollutants into these waters. Spill prevention, control and countermeasure plan requirements under federal law require appropriate containment berms and similar structures to help prevent the contamination of navigable waters in the event of a petroleum hydrocarbon tank spill, rupture or leak. The Clean Water Act and regulations implemented thereunder also prohibit the discharge of dredge and fill material into regulated waters, including jurisdictional wetlands, unless authorized by an appropriately issued permit.
The scope of waters regulated under the Clean Water Act has fluctuated in recent years. On June 29, 2015, the EPA and the U.S. Army Corps of Engineers, or Corps, jointly promulgated final rules expanding the scope of waters protected under the Clean Water Act. However, on October 22, 2019, the agencies repealed the 2015 rules, and then, on April 21, 2020, the EPA and the Corps published a final rule replacing the 2015 rules, and significantly reducing the waters subject to federal regulation under the Clean Water Act. On August 30, 2021, a federal court struck down the replacement rule and, on January 18, 2023, the EPA and the Corps published a final rule that would restore water protections that were in place prior to 2015. However, on May 25, 2023, the Supreme Court issued an opinion substantially narrowing the scope of “waters of the United States” protected by the Clean Water Act. On September 8, 2023, the EPA and the Corps published a final conforming rule. On November 20, 2025, the U.S. Department of the Army and EPA jointly proposed a revision to the “waters of the United States” definition, following the Supreme Court’s 2023 Sackett v. EPA decision, which would further narrow the scope of activities subject to federal regulation under the Clean Water Act. However, to the extent the EPA and the Corps broadly interpret their jurisdiction and expand the range of properties subject to the Clean Water Act's jurisdiction, including under future administrations, we could face increased costs and delays with respect to obtaining permits for dredge and fill activities in wetland areas.
Also, on June 28, 2016, the EPA published a final rule prohibiting the discharge of wastewater from onshore unconventional oil and natural gas extraction facilities to publicly owned wastewater treatment plants. In addition, the Clean Water Act and analogous state laws require individual permits or coverage under general permits for discharges of storm water runoff from certain types of facilities. These permits may require us to monitor and sample the storm water runoff from certain of our facilities. Some states also maintain groundwater protection programs that require permits for discharges or operations that may impact groundwater conditions.
The Oil Pollution Act is the primary federal law for oil spill liability. The Oil Pollution Act contains numerous requirements relating to the prevention of and response to petroleum releases into waters of the United States, including the requirement that operators of offshore facilities and certain onshore facilities near or crossing waterways must develop and maintain facility response contingency plans and maintain certain significant levels of financial assurance to cover potential environmental cleanup and restoration costs. The Oil Pollution Act subjects owners of facilities to strict liability that, in some circumstances, may be joint and several for all containment and cleanup costs and certain other damages arising from a release, including, but not limited to, the costs of responding to a release of oil to surface waters.
Noncompliance with the Clean Water Act or the Oil Pollution Act may result in substantial administrative, civil and criminal penalties, as well as injunctive obligations. We believe we are in material compliance with each of these requirements.
Air Emissions - The Federal Clean Air Act, or CAA, as amended, and analogous state and local laws and regulations restrict the emission of air pollutants, and impose permit requirements and other obligations. Regulated emissions occur as a result of our operations, including the handling or storage of crude oil and other petroleum products. Both federal and state laws impose substantial penalties for violation of these applicable requirements. Accordingly, our failure to comply with these requirements could subject us to monetary penalties, injunctions, conditions or restrictions on operations, revocation or suspension of necessary permits and, potentially, criminal enforcement actions.
On August 16, 2012, the EPA published final regulations under the CAA that establish new air emission controls for oil and natural gas production and natural gas processing operations. Specifically, the EPA’s rule package includes New Source Performance standards to address emissions of sulfur dioxide and volatile organic compounds and a separate set of emission standards to address hazardous air pollutants frequently associated with oil and natural gas production and processing activities. The final rules seek to achieve a 95% reduction in volatile organic compounds emitted by requiring the use of reduced emission completions or “green completions” on all hydraulically-fractured wells constructed or refractured after January 1, 2015. The rules also establish specific new requirements regarding emissions from compressors, controllers, dehydrators, storage tanks and other production equipment. The EPA received numerous requests for reconsideration of these rules from both industry and the environmental community, and court challenges to the rules were also filed. In response, the EPA has issued, and will likely continue to issue, revised rules responsive to some of the requests for reconsideration. In particular, on May 12, 2016, the EPA amended its regulations to impose new standards for methane and volatile organic compounds emissions for certain new,
modified, and reconstructed equipment, processes, and activities across the oil and natural gas sector. However, on August 13, 2020, in response to an executive order by President Trump during his first term to review and revise unduly burdensome regulations, the EPA amended the 2012 and 2016 New Source Performance standards to ease regulatory burdens, including rescinding standards applicable to transmission or storage segments and eliminating methane requirements altogether. On June 30, 2021, former President Biden signed into law a joint resolution of Congress disapproving the 2020 amendments (with the exception of some technical changes) thereby reinstating the 2012 and 2016 New Source Performance standards. The EPA expects owners and operators of regulated sources to take “immediate steps” to comply with these standards. Additionally, on December 2, 2023, the EPA announced a final rule that would expand and strengthen emission reduction requirements for both new and existing sources in the oil and natural gas industry by requiring increased monitoring of fugitive emissions, imposing new requirements for pneumatic controllers and tank batteries, and prohibiting venting of natural gas in certain situations. On April 17, 2023, the EPA agreed in a consent decree to issue a proposed rule by December 10, 2024 that either revises its emission standards for hazardous air pollutants from oil and natural gas production activities or determines that no revision is necessary. These laws and regulations, as well as any future laws and their implementing regulations, may require us to obtain pre-approval for the expansion or modification of existing facilities or the construction of new facilities expected to produce air emissions, impose stringent air permit requirements, or mandate the use of specific equipment or technologies to control emissions. On March 8, 2024, the EPA published a final rule revising the New Source Performance standards regulating GHG and volatile organic compound (VOC) emissions from oil and gas sources.
National Environmental Policy Act - Under the National Environmental Policy Act, or NEPA, a federal agency, commonly in conjunction with a current permittee or applicant, may be required to prepare an environmental assessment or a detailed environmental impact statement before taking any major action, including issuing a permit for a pipeline extension or addition that would affect the quality of the environment. Should an environmental impact statement or environmental assessment be required for any proposed pipeline extensions or additions, NEPA may prevent or delay construction or alter the proposed location, design or method of construction.
Endangered Species Act - The federal Endangered Species Act and analogous state statutes restrict activities that may adversely affect endangered and threatened species or their habitat. Similar protections are offered to migratory birds under the Migratory Bird Treaty Act. The designation of previously unidentified endangered or threatened species in areas and/or the designation of critical habitats or other protected lands where we operate could cause us to incur additional costs or become subject to operating delays, restrictions or bans.
Climate Change - In December 2009, the EPA published its findings that emissions of carbon dioxide, methane and other greenhouse gases (“GHGs”) present an endangerment to human health and the environment because emissions of such gases are, according to the EPA, contributing to the warming of the earth’s atmosphere and other climatic changes. Accordingly, in recent years, federal, state, and local governments have taken steps to reduce emissions of GHGs. On August 16, 2022, President Biden signed into law the Inflation Reduction Act (“IRA”), which, along with the Investment in Infrastructure and Jobs Act, provides billions of dollars in incentives for the development of renewable energy, clean hydrogen, clean fuels, electric vehicles, investments in advanced biofuels and supporting infrastructure and carbon capture and sequestration. These incentives could accelerate the transition of the economy away from the use of fossil fuels towards lower or zero-carbon emissions alternatives, which could decrease demand for, and in turn the prices of, the oil and natural gas that we store, transport and sell and adversely impact our business. However, certain provisions of the IRA, including clean energy tax credits, were repealed by the One Big Beautiful Bill Act, which was signed into law on July 4, 2025. In August 2025, the EPA published a proposed rule to rescind its “endangerment” finding regarding GHGs.
The EPA has also finalized a series of GHG monitoring, reporting and emission control rules for the oil and natural gas industry, and almost half of the states, either individually or through multi-state regional initiatives, have taken legal measures to reduce GHG emissions, primarily through the planned development of GHG emission inventories and/or GHG cap-and-trade programs. In addition, states have imposed increasingly stringent requirements related to the venting or flaring of gas during oil and gas operations. The net effect of this regulatory regime is to impose increasing costs on the combustion of carbon-based fuels such as crude oil, refined petroleum products and natural gas. Our compliance with any future legislation or regulation of GHGs, if adopted, may result in materially increased compliance and operating costs.
In addition, in December 2015, the United States participated in the 21st Conference of the Parties (COP-21) of the United Nations Framework Convention on Climate Change in Paris, France. The resulting Paris Agreement calls for the parties to undertake “ambitious efforts” to limit the average global temperature, and to conserve and enhance sinks and reservoirs of GHGs. The Agreement went into effect on November 4, 2016. On April 21, 2021, the United States announced that it was setting an economy-wide target of reducing its GHG emissions by 50-52 percent below 2005 levels in 2030. In November 2021, in connection with the 26th Conference of the Parties (COP-26) in Glasgow, Scotland, the United States and other world leaders made further commitments to reduce GHG emissions, including reducing global methane emissions by at least 30% by 2030 from 2020 levels. More than 150 countries have now signed on to this pledge. The urgency to reduce GHG emissions was
further emphasized in the 27th Conference of the Parties (COP-27) in Sharm El-Sheikh, Egypt. At the 28th Conference of the Parties (COP-28) in the United Arab Emirates, world leaders agreed to transition away from fossil fuels in a just, orderly and equitable manner and to triple renewables and double energy efficiency globally by 2030. Also at COP-28, 50 companies accounting for 40 percent of global oil production committed to eliminating their methane emissions by 2050 under the Oil and Gas Decarbonization Charter. These companies also committed to ending flaring by 2030. Furthermore, many state and local leaders have stated their intent to intensify efforts to support the international climate commitments. The United States withdrew from the Paris Agreement and any similar commitments under the United Nations Framework Convention on Climate Change on January 20, 2025.
Legislative efforts or related implementation regulations that regulate or restrict emissions of GHGs in areas that we conduct business could adversely affect the demand for the products that we transport, store and distribute and, depending on the particular program adopted, could increase our costs to operate and maintain our facilities by requiring that we, among other things, measure and report our emissions, install new emission controls on our facilities, acquire allowances to authorize our GHG emissions, pay any fees or taxes related to our GHG emissions and administer and manage a GHG emissions program. We may be unable to include some or all of such increased costs in the rates charged by our pipelines or other facilities, and any such recovery may depend on events beyond our control, including the outcome of future rate proceedings before the FERC or state regulatory agencies and the provisions of any final legislation or implementing regulations. Any GHG emissions legislation or regulatory programs applicable to power plants or refineries could also increase the cost of consuming, and thereby adversely affect demand for the crude oil and natural gas that we produce. Consequently, legislation and regulatory programs to reduce GHG emissions could have an adverse effect on our business, financial condition and results of operations. It is not possible at this time to predict with any accuracy the structure or outcome of any future legislative or regulatory efforts to address such emissions or the eventual costs to us of compliance.
Furthermore, there have been efforts in recent years to influence the investment community, including investment advisors and certain sovereign wealth, pension and endowment funds promoting divestment of fossil fuel equities and pressuring lenders to limit funding to companies engaged in the extraction of fossil fuel reserves. Such environmental activism and initiatives aimed at limiting climate change and reducing air pollution could interfere with our business activities, operations and ability to access capital. In addition, claims have been made against certain energy companies alleging that GHG emissions from crude oil and natural gas operations constitute a public nuisance under federal and/or state common law. As a result, private individuals or public entities may seek to enforce environmental laws and regulations against us and could allege personal injury, property damages, or other liabilities. While our business is not a party to any such litigation, we could be named in actions making similar allegations. An unfavorable ruling in any such case could adversely impact our business, financial condition and results of operations.
Moreover, climate change may be associated with extreme weather conditions such as more intense hurricanes, thunderstorms, tornadoes and snow or ice storms, as well as rising sea levels. Another possible consequence of climate change is increased volatility in seasonal temperatures. Some studies indicate that climate change could cause some areas to experience temperatures substantially hotter or colder than their historical averages. Extreme weather conditions can interfere with our production and increase our costs and damage resulting from extreme weather may not be fully insured. However, at this time, we are unable to determine the extent to which climate change may lead to increased storm or weather hazards affecting our operations.
Safety and Security Regulations
Our crude oil pipelines are subject to construction, installation, operation and safety regulation by the U.S. Department of Transportation (“DOT”) Pipeline and Hazardous Materials Safety Administration, or PHMSA, and various other federal, state and local agencies under various provisions of Title 49 of the United States Code and comparable state statutes. Congress has enacted several pipeline safety acts over the years. The Pipeline Safety, Regulatory Certainty, and Job Creation Act of 2011 (the “Pipeline Safety Act”) provides for regulation of the nation’s pipelines, penalties for violations of pipeline safety rules, and other DOT matters. The Pipeline Safety Act currently provides for significant financial penalties involving non-compliance with DOT regulations. In addition, the Pipeline Safety Act includes additional safety requirements for newly constructed pipelines. In June 2016, Congress approved new pipeline safety legislation, the “Protecting Our Infrastructure of Pipelines and Enhancing Safety Act of 2016,” or the 2016 PIPES Act, which provides the PHMSA with additional authority to address imminent hazards by imposing emergency restrictions, prohibitions, and safety measures on owners and operators of gas or hazardous liquids pipeline facilities. In December 2020, the “Protecting Our Infrastructure of Pipelines and Enhancing Safety Act of 2020,” or the 2020 PIPES Act, was signed into law. The 2020 PIPES Act extends the PHMSA’s statutory mandate through 2023. It continues the legislative mandates that were established in the 2016 PIPES Act and creates new regulatory mandates, including, among other things: (i) requiring regulations prescribing the applicability of pipeline safety requirements to idled natural gas transmission and hazardous liquids pipelines; (ii) the creation of new leak detection and repair programs that impact certain natural gas gathering, transmission, and distribution lines; and (iii) necessitating updates to gas pipeline and hazardous liquid pipeline facility inspection and maintenance plans.
The PHMSA administers pipeline safety requirements for natural gas and hazardous liquid pipelines pursuant to detailed regulations set forth in 49 C.F.R. Parts 190 to 199. These regulations, among other things, address pipeline integrity management and pipeline operator qualification rules and specify how companies should assess, evaluate, validate and maintain the integrity of pipeline segments that, in the event of a release, could impact High Consequence Areas, or HCAs, which include populated areas, unusually sensitive areas and commercially navigable waterways. We are subject to the PHMSA Integrity Management, or IM, regulations, which require that we perform baseline assessments of all pipelines that could affect an HCA, and to continually assess all pipelines at specified intervals to periodically evaluate the integrity of each pipeline segment that could affect an HCA. The integrity of these pipelines must be assessed by internal inspection, pressure test, or equivalent alternative new technology. We must also abide by an Integrity Management Plan, or IMP, that details the risk assessment factors, the overall risk rating for each segment of pipe, a schedule for completing the integrity assessment, the methods to assess pipeline integrity, and an explanation of the assessment methods selected. No assurance can be given that the cost of testing and the required rehabilitation identified will not be material costs to us that may not be fully recoverable by tariff increases.
The PHMSA has issued a number of rulemakings in response to the Pipeline Safety Act, the 2016 PIPES Act, and the 2020 PIPES Act, as well as prior statutes, concerning pipeline safety that impact our pipeline facilities. Over the past several years, the PHMSA adopted additional regulations for natural gas and hazardous liquid pipeline safety. In particular, on October 1, 2019, the PHMSA published final rules to expand its IM requirements and impose new pressure testing requirements on regulated pipelines, including certain segments outside HCAs that became effective on July 1, 2020. Among other things, the rules require all hazardous liquid pipelines in or affecting an HCA to be capable of accommodating in-line inspection tools within the next 20 years. In addition, the final rule imposes inspection requirements on pipelines in areas affected by extreme weather events and natural disasters, such as hurricanes, landslides, floods, earthquakes, or other similar events that are likely to damage infrastructure. The rules also extend reporting requirements to certain previously unregulated hazardous liquid gravity and rural gathering lines. Many of the requirements will be phased in over an extended compliance schedule. Also, on November 15, 2021, the PHMSA published a final rule extending reporting requirements to all onshore gas gathering operators and establishing a set of minimum safety requirements for certain gas gathering pipelines with large diameters and high operating pressures. On December 27, 2021, the PHMSA published an Interim Final Rule that designates the Great Lakes, coastal beaches, and marine coastal waters as “Unusually Sensitive Areas,” extending more stringent IMP requirements to hazardous liquid pipelines near such areas. Additional final rules were announced in 2022, including a final rule regarding the installation of rupture-mitigation valves, published on April 8, 2022. Further, on August 24, 2022, the PHMSA published a final rule strengthening integrity management requirements for onshore gas transmission lines, bolstering corrosion control standards and repair criteria, and imposing new requirements for inspections after extreme weather events. On January 17, 2025, PHMSA issued a final rule, to be effective 180 days after the date of publication in the Federal Register, to improve public safety and reduce methane and other flammable toxic or corrosive gases emissions from new and existing offshore gas gathering pipelines, regulated onshore gas pipelines, underground natural gas storage facilities, and liquefied natural gas facilities by modifying the leak detection performance standard to accommodate commercially available advanced technology used for detecting leaks, improving specificity for grading leaks and changing the leak repair timelines and leak survey intervals inside buildings.
Significant expenses could be incurred in the future if additional safety measures are required or if safety standards are raised and exceed the current pipeline control system capabilities.
We have developed a Risk Management Plan required by the PHMSA as part of our IMP. This plan is intended to minimize the offsite consequences of catastrophic spills. As part of this program, we have developed a mapping program. This mapping program identified HCAs and unusually sensitive areas along the pipeline right-of-ways in addition to mapping of shorelines to characterize the potential impact of a spill of crude oil on waterways.
Our crude oil, refined products and soda and sulfur services operations are also subject to the requirements of OSHA and comparable state statutes. Various other federal and state regulations require that we train all operations employees in Hazardous Communication (“HAZCOM”) and disclose information about the hazardous materials used in our operations. Certain information must be reported to employees, government agencies and local citizens upon request.
In most cases, states are responsible for enforcing the federal regulations and more stringent state pipeline regulations and inspection with respect to intrastate hazardous liquids pipelines, including crude oil and natural gas pipelines. In practice, states vary considerably in their authority and capacity to address pipeline safety. The Railroad Commission recently updated its pipeline safety regulations consistent with PHMSA requirements, effective September 13, 2021. We do not anticipate any significant problems in complying with applicable state laws and regulations in those states in which we operate.
Our trucking operations are licensed to perform both intrastate and interstate motor carrier services. As a motor carrier, we are subject to certain safety regulations issued by the DOT. The trucking regulations cover, among other things, driver operations, log book maintenance, truck manifest preparations, safety placard placement on the trucks and trailer vehicles, drug and alcohol testing, operation and equipment safety and many other aspects of truck operations. We are also subject to OSHA with respect to our trucking operations.
The USCG regulates occupational health standards related to our marine operations. Shore-side operations are subject to the regulations of OSHA and comparable state statutes. The Maritime Transportation Security Act requires, among other things, submission to and approval of the USCG of vessel security plans.
Since the terrorist attacks of September 11, 2001, the U.S. Government has issued numerous warnings that energy assets could be the subject of future terrorist attacks. We have instituted security measures and procedures in conformity with federal guidance. We will institute, as appropriate, additional security measures or procedures indicated by the federal government. None of these measures or procedures should be construed as a guarantee that our assets are protected in the event of a terrorist attack.
On May 27, 2021, the Department of Homeland Security’s Transportation Security Administration (“TSA”) announced Security Directive Pipeline-2021-01 that requires us, as a critical pipeline owner, to report confirmed and potential cybersecurity incidents to the DHS Cybersecurity and Infrastructure Security Agency (“CISA”) and to designate a Cybersecurity Coordinator. It also requires us and the third-party operators of our assets to review current practices as well as to identify any gaps and related remediation measures to address cyber-related risks and report the results to TSA and CISA within 30 days. We designated a Cybersecurity Coordinator, developed a plan to comply with mandatory reporting timeframes and completed the vulnerability assessment required under this directive in 2021. On July 20, 2021, the TSA issued a second Security Directive. Then, on July 27, 2022, a third TSA-issued Security Directive took effect. We have evaluated the impacts of the TSA security directives, including as these directives continue to be updated and renewed, on our pipeline business and have made significant progress in compliance. See “Compliance with and changes in cybersecurity requirements has a cost impact on our business, and failure to comply with such laws and regulations could have an impact on our assets, costs, revenue generation and growth opportunities.”
Available Information
We make available free of charge on our internet website (www.genesisenergy.com) our Annual Report on Form 10-K, quarterly reports on Form 10-Q, current reports on Form 8-K and amendments to those reports filed or furnished pursuant to Section 13(a) or 15(d) of the Securities Exchange Act of 1934 as soon as reasonably practicable after we electronically file the material with, or furnish it to, the SEC. These documents are also available at the SEC’s website (www.sec.gov). Additionally, on our internet website we make available our Corporate Governance Guidelines, Code of Business Conduct and Ethics, Audit Committee Charter and Governance, Compensation and Business Development Committee Charter. Information on our website is not incorporated into this Form 10-K or our other securities filings and is not a part of this Form 10-K or our other securities filings.
Item 1A. Risk Factors
The following risk factors and other information included in this Annual Report on Form 10-K should be carefully considered. The occurrence of any of the following risks or of unknown risks and uncertainties may adversely affect our business, operating results and financial condition.
Risk Factors Summary
Risks Related to the Operations of Our Business
•We may not be able to fully execute our growth strategy due to various factors, such as unreceptive capital markets and/or excessive competition for acquisitions.
•We may not have sufficient cash from operations after the establishment of cash reserves and payment of fees and expenses to pay the current level of quarterly distributions.
•Our profitability and cash flow are dependent on our ability to increase or, at a minimum, maintain our current commodity (crude oil, natural gas, refined products, NaHS and caustic soda) volumes, which often depend on actions and commitments by parties beyond our control.
•Many of our crude oil and natural gas transportation customers are producers whose drilling activity levels and spending for transportation have historically been, and may continue to be, impacted by volatility in the commodity markets.
•Fluctuations in prices for crude oil, natural gas, refined petroleum products, NaHS and caustic soda could adversely affect our business.
Risks Related to Liquidity and Financing
•Our indebtedness could adversely restrict our ability to operate, affect our financial condition, prevent us from complying with requirements under our debt instruments and prevent us from paying cash distributions to our unitholders.
•We may not be able to access adequate capital (debt and/or equity) on economically viable terms, or any terms.
•The IRA could accelerate the transition to a low carbon economy away from oil and natural gas.
•Inflationary pressures and associated changes in monetary policy have increased and may further increase our operating costs, which in turn have caused and may continue to cause our capital expenditures and operating costs to rise.
•Non-traditional investment criteria used by many investors may diminish investor interest in us and reduce the value of our common units and our access to capital.
Risks Related to Legal and Regulatory Compliance
•Our operations are subject to federal and state rate regulation and federal, state, and local environmental protection and safety laws and regulations.
•Climate change legislation and regulatory initiatives may decrease demand for the products we store, transport and sell and increase our operating costs.
•Changes in environmental laws could increase costs and harm our business, financial condition and results of operations.
•Compliance with and changes in cybersecurity requirements have a cost impact on our business.
Risks Related to Our Partnership Structure
•Individual members of the Davison family can exert significant influence over us and may have conflicts of interest with us and may be permitted to favor their interests to the detriment of our other unitholders.
•Our Class B Common Units may be transferred to a third party without unitholder consent, which could affect our strategic direction.
•The interruption of distributions to us from our subsidiaries and joint ventures could affect our ability to make payments on indebtedness or cash distributions to our unitholders.
•We do not have the same flexibility as other types of organizations to accumulate cash and equity to protect against illiquidity in the future.
Tax Risks to Our Unitholders
•Our tax treatment depends on our status as a partnership for federal income tax purposes, as well as us not being subject to a material amount of entity-level taxation by individual states. If the Internal Revenue Service, or IRS, were to treat us as a corporation (for U.S. federal income tax purposes) or if we were to become subject to a material amount of entity-level taxation for state tax purposes, then our cash available for distribution to our unitholders could be substantially reduced.
•Our unitholders will be required to pay taxes on income (as well as deemed distributions, if any) from us even if they do not receive any cash distributions from us.
•Our unitholders will likely be subject to state and local taxes in states where they do not live as a result of an investment in our units.
General Risks
•We are exposed to the credit risk of our customers in the ordinary course of our business activities.
•A natural disaster, pandemic, epidemic, accident, terrorist attack or other interruption event could result in an economic slowdown, severe personal injury, property damage and/or environmental damage, which could curtail our operations or otherwise adversely affect our assets and cash flow.
•We cannot predict the impact of international military conflicts and the related humanitarian crisis or other geopolitical tensions on the global economy, energy markets, geopolitical stability and our business.
•Our business could be negatively impacted by security threats, including cybersecurity threats, and related disruptions.
•Artificial intelligence presents risks and challenges that can impact our business, including by posing security risks to our confidential information, proprietary information and personal data.
•Our significant unitholders may sell units or other limited partner interests in the trading market, which could reduce the market price of our common units.
•We may issue additional common units without unitholders’ approval, which would dilute their ownership interests.
Risks Related to the Operations of Our Business
We may not be able to fully execute our growth strategy due to various factors, such as unreceptive capital markets and/or excessive competition for acquisitions.
Our strategy contemplates growth through the development and acquisition of a wide range of midstream and other infrastructure while maintaining a strong balance sheet. This strategy includes constructing and acquiring additional assets and businesses to enhance our ability to compete effectively, diversify our asset portfolio and, thereby, provide more stable cash flow. We regularly consider and enter into discussions regarding additional potential joint ventures, stand-alone projects and other transactions that we believe will present opportunities to realize synergies, increase our market position and, ultimately, increase distributions to our unitholders. A number of factors could adversely affect our ability to execute our growth strategy,
including an inability to raise adequate capital on acceptable terms, competition from competitors and/or an inability to successfully integrate one or more acquired businesses into our operations.
We will need new capital to finance the future development and acquisition of assets and businesses. Limitations on our access to capital will impair our ability to execute this strategy. Expensive capital will limit our ability to develop or acquire accretive assets. Although we intend to continue to expand our business, this strategy may require substantial capital, and we may not be able to raise the necessary funds on satisfactory terms, if at all.
In addition, we experience competition for the assets we purchase or contemplate purchasing. Increased competition for a limited pool of assets could result in our not being the successful bidder more often or our acquiring assets at a higher relative price than that which we have paid historically. Either occurrence would limit our ability to fully execute our growth strategy. Our ability to execute our growth strategy may impact the market price of our securities.
We may be unable to integrate successfully businesses we acquire. We may incur substantial expenses, delays or other problems in connection with our growth strategy that could negatively impact our results of operations. Moreover, acquisitions and business expansions involve numerous risks, including: difficulties in the assimilation of the operations, technologies, services and products of the acquired companies or business segments; inefficiencies and complexities that can arise because of unfamiliarity with new assets and the businesses associated with them, including unfamiliarity with their markets; and diversion of the attention of management and other personnel from day-to-day business to the development or acquisition of new businesses and other business opportunities.
We may not have sufficient cash from operations after the establishment of cash reserves and payment of fees and expenses to pay the current level of quarterly distributions.
The amount of cash we distribute to our common unitholders principally depends upon margins we generate from our businesses, which fluctuate from quarter to quarter based on, among other things: the volumes and prices at which we purchase and sell crude oil, natural gas, refined products and caustic soda; the volumes of NaHS, that we produce and the prices at which we sell NaHS; the demand for our services; the level of competition; the level of our operating costs; the effect of worldwide energy conservation measures; governmental regulations and taxes; the level of our general and administrative costs; and prevailing economic conditions.
In addition, the actual amount of cash we will have available for distribution to our common unitholders will depend on other factors that include: our debt service requirements; distributions we pay to our Class A Convertible Preferred unitholders; the level of capital expenditures and costs associated with asset retirement obligations we may incur, including the cost of acquisitions (if any); fluctuations in our working capital; restrictions on distributions contained in our debt instruments or organizational documents governing our joint ventures and unrestricted subsidiaries; our ability to borrow under our senior secured credit facility to pay distributions, and the amount of cash reserves required in the conduct of our business.
Our ability to pay distributions each quarter depends primarily on our cash flow, including cash flow from operations and our cash requirements, which includes capital expenditures amongst other items, and is not solely a function of profitability, which will be affected by non-cash items. As a result, we may make cash distributions during periods when we record losses and we may not make distributions during periods when we record net income.
Our profitability and cash flow are dependent on our ability to increase or, at a minimum, maintain our current commodity (crude oil, natural gas, refined products, NaHS and caustic soda) volumes, which often depend on actions and commitments by parties beyond our control.
We access commodity volumes through various sources, such as our producers, service providers (including gatherers, shippers, marketers and other aggregators) and refiners. Depending on the needs of each customer and the market in which it operates, we can provide a service for a fee (as in the case of our pipeline, terminal, marine vessel transportation and railcar unloading operations) or we can acquire the commodity from our customer and resell it to another party.
Our source of volumes depends on successful exploration and development of additional crude oil and natural gas reserves by others; continued demand for refining and our related sulfur removal and other services, for which we are paid in NaHS; the breadth and depth of our logistics operations; the extent that third parties provide NaHS for resale; and other matters beyond our control.
The crude oil, natural gas and refined products available to us and our refinery customers are derived from reserves produced from existing wells, and these reserves naturally decline over time. In order to offset this natural decline, our energy infrastructure assets must access additional reserves. Additionally, some of the projects we have recently completed are dependent on reserves that we expect to be produced from newly discovered properties that producers are currently developing.
Finding and developing new reserves is very expensive, requiring large capital expenditures by producers for exploration and development drilling, installing production facilities and constructing pipeline extensions to reach new wells. Many economic and business factors out of our control can adversely affect the decision by any producer to explore for and
develop new reserves. These factors include the prevailing market price of the commodity, the capital budgets of producers, the depletion rate of existing reservoirs, the success of new wells drilled, environmental concerns, regulatory initiatives, cost and availability of equipment, capital budget limitations or the lack of available capital and other matters beyond our control. Additional reserves, if discovered, may not be developed in the near future or at all. The volatility in crude oil and natural gas prices has forced some producers to significantly defer or curtail their planned capital expenditures. Thus, crude oil and natural gas production in our market areas could decline, which could have a material negative impact on our revenues and prospects.
Demand for our midstream services is dependent on the demand for crude oil and natural gas. Any decrease in demand for crude oil or natural gas, including by those refineries or connecting carriers to which we deliver could adversely affect our cash flows. The demand for crude oil also is dependent on the competition from refineries, the impact of future economic conditions, fuel conservation measures, alternative fuel requirements or alternative fuel sources such as electricity, coal, fuel oils or nuclear energy, government regulation or technological advances in fuel economy and energy generation devices, all of which could reduce demand for our services. A reduction in demand for our services in the markets we serve could result in impairments of our assets and have a material adverse effect on our business, financial condition and results of operations.
Our ability to access NaHS depends primarily on the demand for our proprietary sulfur removal process. Demand for our sulfur services could be adversely affected by many factors, including lower refinery utilization rates, U.S. refineries accessing more “sweet” (instead of “sour”) crude and the development of alternative sulfur removal processes. We are dependent on third parties for caustic soda for use in our sulfur removal process as well as volumes to market to third parties. Should regulatory requirements or operational difficulties disrupt the manufacture of caustic soda by these producers, we could be affected. Caustic soda is a major component of the proprietary sulfur removal process we provide to our refinery customers. Because we are a large consumer of caustic soda, we can leverage our economies of scale and logistics capabilities to effectively market caustic soda to third parties. NaHS, the resulting by-product from our sulfur removal operations, is a vital ingredient in a number of industrial and consumer products and processes. Any decrease in the supply of caustic soda could affect our ability to provide sulfur removal services to refiners and any decrease in the demand for NaHS by the parties to whom we sell the NaHS could adversely affect our business.
We face intense competition to obtain crude oil, natural gas and refined products volumes.
Our competitors, gatherers, transporters, marketers, brokers and other aggregators, include integrated, large and small independent energy companies, as well as their marketing affiliates, who vary widely in size, financial resources and experience. Some of these competitors have capital resources many times greater than ours and control substantially greater supplies of crude oil, natural gas and refined products.
Even if reserves exist or refined products are produced in the areas accessed by our facilities, we may not be chosen by the refiners or producers to gather, refine, market, transport, store or otherwise handle any of these crude oil and natural gas reserves, NaHS, caustic soda or other refined products. We compete with others for any such volumes on the basis of many factors, including: geographic proximity to the production and/or refineries; costs of connection; available capacity; rates; logistical efficiency in all of our operations; operational efficiency in our sulfur removal business; customer relationships; and access to markets.
Additionally, on our onshore pipelines, most of our third-party shippers do not have long-term contractual commitments to ship crude oil on our pipelines. A decision by a shipper to substantially reduce or cease to ship volumes of crude oil on our pipelines could cause a significant decline in our revenues. In many of our onshore pipeline locations, we are dependent on interconnections with other pipelines to provide shippers with a market for their crude oil. Any reduction of throughput available to our shippers on these interconnecting pipelines as a result of testing, pipeline repair, reduced operating pressures or other causes could result in reduced throughput on our pipelines that would adversely affect our cash flows and results of operations.
Fluctuations in demand for crude oil or natural gas or availability of refined products or NaHS, such as those caused by refinery downtime or shutdowns, can negatively affect our operating results. Reduced demand in areas we service with our pipelines, marine vessels, rail facilities and trucks can result in less demand for our transportation services.
Many of our crude oil and natural gas transportation customers are producers whose drilling activity levels and spending for transportation have historically been, and may continue to be, impacted by volatility in the commodity markets.
Many of our customers finance their drilling activities through cash flow from operations, the incurrence of debt or the issuance of equity. Extreme volatility in commodity prices has caused many of our customers’ equity value to substantially decline. New credit facilities and other debt financing from institutional sources have generally become more difficult and expensive to obtain, and there may be a general reduction in the amount of credit available in the markets in which we conduct business. Over the last three years, prices for crude oil ranged from a high of over $90 per barrel to a low of less than $60 per barrel, and such volatility, or even more extreme volatility, may continue going forward. Adverse price changes put downward pressure on drilling budgets for crude oil and natural gas producers, which have resulted, and could continue to result, in lower
volumes than we otherwise would have seen being transported on our pipeline and transportation systems, which could have a material negative impact on our revenues and prospects.
Fluctuations in prices for crude oil, natural gas, refined petroleum products, NaHS and caustic soda could adversely affect our business.
Because we purchase (or otherwise acquire) and sell crude oil, natural gas, refined petroleum products, NaHS, and caustic soda we are exposed to some direct commodity price risks. Prices for those commodities can fluctuate in response to changes in supply, market uncertainty and a variety of additional factors that are beyond our control, which could have an adverse effect on our cash flows, profit and/or Segment Margin. We attempt to limit those commodity price risks through back-to-back purchases and sales, hedges and other contractual arrangements; however, we cannot completely eliminate our commodity price risk exposure.
Our use of derivative financial instruments could result in financial losses.
We use derivative financial instruments and other hedging mechanisms from time to time to limit a portion of the effects resulting from changes in commodity prices. To the extent we hedge our commodity price exposure, we forego the benefits we would otherwise experience if commodity prices were to increase. In addition, we could experience losses resulting from our hedging and other derivative positions. Such losses could occur under various circumstances, including if our counterparty does not perform its obligations under the hedge arrangement, our hedge is imperfect or our hedging policies and procedures are not followed.
Non-utilization of certain assets could significantly reduce our profitability due to the fixed costs incurred with respect to such assets.
From time to time in connection with our business, we may lease or otherwise secure the right to use certain third party assets (such as railcars, trucks, barges, pipeline capacity, storage capacity and other similar assets) with the expectation that the revenues we generate through the use of such assets will be greater than the fixed costs we incur pursuant to the applicable leases or other arrangements. However, when such assets are not utilized or are under-utilized, our profitability is negatively affected because the revenues we earn are either reduced (in the event of under-utilization) or non-existent, but we remain obligated to continue paying any applicable fixed charges, in addition to incurring any other costs attributable to the non-utilization of such assets. For example, in connection with our operations, we lease all of our railcars which requires us to pay the applicable lease rate without regard to utilization. In addition, during the period of time that we are not utilizing such assets, we will incur incremental costs associated with the cost of storing such assets, and we will continue to incur costs for maintenance and upkeep. Our failure to utilize a significant portion of our leased assets and other similar assets could have a significant negative impact on our profitability and cash flows.
In addition, certain of our field and pipeline operating costs and expenses are fixed and do not vary with the volumes we gather and transport. These costs and expenses may not decrease ratably or at all should we experience a reduction in our volumes transported by truck, marine vessel, rail or our pipelines. As a result, we may experience declines in our profitability and margin if our volumes decrease.
We cannot cause our joint ventures and certain of our unrestricted subsidiaries to take or not to take certain actions unless some or all of the joint venture or third party participants agree.
Due to the nature of joint ventures, each participant (including us) in our material joint ventures has made substantial investments (including contributions and other commitments) in that joint venture and, accordingly, has required that the relevant charter documents contain certain features designed to provide each participant with the opportunity to participate in the management of the joint venture and to protect its investment in that joint venture, as well as any other assets which may be substantially dependent on or otherwise affected by the activities of that joint venture. These participation and protective features often include a governance structure that consists of a management committee or other governing body composed of members or member-designees, only some of which are appointed by us. In addition, certain of our joint ventures are operated by our “partners” or have “stand-alone” credit agreements that limit their freedom to take certain actions. Thus, without the concurrence of the other joint venture participants and/or the lenders of our joint venture participants, we cannot cause our joint ventures to take or not to take certain actions, even though those actions may be in the best interest of the joint ventures or us.
The insolvency of an operator of our joint ventures, the failure of an operator of our joint ventures to adequately perform operations or an operator’s breach of applicable agreements could reduce our earnings and cash flow and result in our liability to governmental authorities for compliance with environmental, safety and other regulatory requirements and to the operator’s suppliers and vendors. As a result, the success and timing of development activities of our joint ventures operated by others and the economic results derived therefrom depends upon a number of factors outside our control, including the operator’s timing and amount of capital expenditures, expertise and financial resources, and the inclusion of other participants.
In addition, joint venture participants may have obligations that are important to the success of the joint venture, such as the obligation to pay their share of capital and other costs of the joint venture. The performance and ability of third parties to satisfy their obligations under joint venture arrangements is outside our control. If these third parties do not satisfy their obligations under these arrangements, our business may be adversely affected.
We may not be able to renew our marine transportation term charters and contracts when they expire at favorable rates, for extended periods, or at all, which may increase our exposure to the spot market and lead to lower revenues and increased expenses.
During the year ended December 31, 2025, our marine transportation segment received approximately 77% of its revenue from term charters and other fixed contracts, which help to insulate us from revenue fluctuations caused by weather, navigational delays and short-term market declines. We earned approximately 23% of our marine transportation revenues from spot contracts, where competition is high and rates are typically volatile and subject to short-term market fluctuations, and where we could bear the risk of vessel downtime due to weather and navigational delays. If we deploy a greater percentage of our vessels in the spot market, we may experience a lower overall utilization of our fleet through waiting time or ballast voyages, leading to a decline in our operating revenue and gross profit. There can be no assurance that we will be able to enter into future time charters or other fixed contracts on terms favorable to us. For further discussion of our marine transportation contracts, see “Marine Transportation - Customers”.
A decrease in the cost of importing refined petroleum products could cause demand for U.S. flag product carrier and barge capacity and charter rates to decline, which would decrease our revenues and cash flows from operations.
The demand for U.S. flag product carriers and barges is influenced by the cost of importing refined petroleum products. Historically, charter rates for vessels qualified to participate in the U.S. coastwise trade under the Jones Act have been higher than charter rates for foreign flag vessels. This is due to the higher construction and operating costs of U.S. flag vessels under the Jones Act requirements that such vessels be built in the U.S. and manned by U.S. crews. This has made it less expensive for certain areas of the U.S. that are underserved by pipelines or which lack local refining capacity, such as in the Northeast, to import refined petroleum products carried aboard foreign flag vessels than to obtain them from U.S. refineries. If the cost of importing refined petroleum products decreases to the extent that it becomes less expensive to import refined petroleum products to other regions of the East Coast and the West Coast than producing such products in the U.S. and transporting them on U.S. flag vessels, demand for our vessels and the charter rates for them could decrease.
We face periodic dry-docking costs for our vessels, which can be substantial.
Vessels must be dry-docked periodically for regulatory compliance and for maintenance and repair. Our dry-docking requirements are subject to associated risks, including delay, cost overruns, lack of necessary equipment, unforeseen engineering problems, employee strikes or other work stoppages, unanticipated cost increases, inability to obtain necessary certifications and approvals and shortages of materials or skilled labor. A significant delay in dry-dockings could have an adverse effect on our marine transportation contract commitments. The cost of repairs and renewals required at each dry-dock are difficult to predict with certainty and can be substantial.
The U.S. inland waterway infrastructure is aging and may result in increased costs and disruptions to our marine transportation segment.
Maintenance of the U.S. inland waterway system is vital to our marine transportation operations. The complete inland waterway system is composed of 25,000 miles of commercially navigable waterways and channels, supported by approximately 240 lock chambers and approximately 1,000 coastal, Great Lakes, and inland harbors. The U.S. inland waterway infrastructure is aging as approximately 80% of the lock and dam infrastructure exceeds its 50-year design life, which may cause more frequently scheduled and unscheduled maintenance outages and result in our marine transportation segment experiencing delays and incurring additional operating expenses. Failure of the federal government to adequately fund infrastructure maintenance and improvements in the future would have a negative impact on our ability to deliver products for our marine transportation customers on a timely basis. For example, when the Mississippi river floods significantly or if water levels are significantly reduced by severe drought conditions, barges may be unable to traverse the river system and we may be prevented from timely completing our voyages.
Failure to obtain or renew surety bonds on acceptable terms could affect our ability to satisfy long-term obligations.
We are required to obtain surety bonds or post other financial security to secure performance or payment of certain long-term obligations. The amount of security required to be obtained can change as the result of new laws, as well as changes to the factors used to calculate the bonding or security amounts. We may have difficulty procuring or maintaining our surety bonds. Our bond issuers may demand higher fees or additional collateral, including letters of credit or other terms less favorable to us upon those renewals.
Our indebtedness could adversely restrict our ability to operate, affect our financial condition, prevent us from complying with requirements under our debt instruments and prevent us from paying cash distributions to our unitholders.
We have outstanding debt and the potential to incur additional indebtedness. As of December 31, 2025, we had approximately $6.4 million outstanding under our senior secured credit facility and approximately $3.1 billion aggregate principal amount of senior unsecured notes outstanding. We must comply with various affirmative and negative covenants contained in our credit agreement and the indentures or purchase agreement governing our notes, some of which may restrict the way in which we would like to conduct our business. Among other things, these covenants limit or will limit our ability to incur additional indebtedness or liens, make payments in respect of or redeem or acquire any debt or equity issued by us, sell assets, make loans or investments, make guarantees, enter into any hedging agreement for speculative purposes, acquire or be acquired by other companies, and amend some of our contracts.
The restrictions under our indebtedness may prevent us from engaging in certain transactions which might otherwise be considered beneficial to us and could have other important consequences to unitholders. For example, they could increase our vulnerability to general adverse economic and industry conditions, limit our ability to; make distributions, to fund future working capital, capital expenditures and other general partnership requirements, to engage in future acquisitions, construction or development activities, to access capital markets (debt and equity), or to otherwise fully realize the value of our assets and opportunities, limit our flexibility in planning for, or reacting to, changes in our businesses and the industries in which we operate, and place us at a competitive disadvantage as compared to our competitors that have less debt. Moreover, the need to dedicate a substantial portion of our cash flows from operations to payments on our indebtedness may similarly prevent us from engaging in certain transactions which might otherwise be considered beneficial to us and could have other important consequences to unitholders.
We may incur additional indebtedness (public or private) in the future under our existing credit agreement, by issuing debt instruments, under new credit agreements, under joint venture credit agreements, under new credit agreements of our unrestricted subsidiaries, under finance leases or synthetic leases, on a project-finance or other basis or a combination of any of these. If we incur additional indebtedness in the future, it likely would be under our existing or a replacement credit agreement or under arrangements that may have terms and conditions at least as or even more restrictive as those contained in our existing credit agreement and the indentures or purchase agreement governing our existing notes. Failure to comply with the terms and conditions of any existing or future indebtedness would constitute an event of default. If an event of default occurs, the lenders or noteholders will have the right to accelerate the maturity of such indebtedness and foreclose upon the collateral, if any, securing that indebtedness. In addition, if there is a change of control as described in our senior secured credit facility, that would be an event of default, unless our creditors agreed otherwise, and, under our senior secured credit facility, any such event could limit our ability to fulfill our obligations under our debt instruments and to make cash distributions to unitholders which could adversely affect the market price of our securities.
In addition, from time to time, some of our joint ventures or unrestricted subsidiaries may have substantial indebtedness, which will include affirmative and negative covenants and other provisions that limit their ability to conduct certain operations, events of default, prepayment and other customary terms.
We may not be able to access adequate capital (debt and/or equity) on economically viable terms or any terms.
The capital markets (debt and equity) have previously been disrupted and volatile as a result of adverse conditions, including inflationary pressures, bubble-effects and volatility in commodity prices. These circumstances and events, which can last for extended periods of time, have led to reduced capital availability, tighter lending standards and higher interest rates on loans for companies in the energy industry, especially non-investment grade companies. Although we cannot predict the future condition of the capital markets, future turmoil in capital markets and the related higher cost of capital could have a material adverse effect on our business, liquidity, financial condition and cash flows, particularly if our ability to borrow money from lenders or access the capital markets to finance our operations were to be limited.
If we are unable to access the amounts and types of capital we seek at a cost and/or on terms that have been available to us historically, we could be materially and adversely affected. Such an inability to access capital, including renewing and extending the terms at the relevant time on our existing debt, including the debt at our unrestricted subsidiaries, could limit or prohibit our ability to execute significant portions of our business plan, such as executing our growth strategy and/or optimizing our capital structure.
Our actual construction, development and acquisition costs could exceed our forecast, and our cash flow from construction and development projects may not be immediate.
Our forecast contemplates expenditures for the development, construction or other acquisition of onshore and offshore infrastructure, including some construction and development projects with technological challenges. We (or our joint ventures)
may not be able to complete our projects at the costs or within the timeframes currently estimated. If we (or our joint ventures) experience material cost overruns, we will have to finance these overruns using one or more of the following methods: using cash from operations; delaying other planned projects; incurring additional borrowings from our senior secured credit facility; or issuing additional debt or equity.
Any or all of these methods may not be available when needed, may be prohibited or restricted by our or our joint venture’s debt agreements or other contractual arrangements or may adversely affect our future results of operations.
In addition, some construction projects require substantial investments over a long period of time before they begin generating any meaningful cash flow.
The IRA could accelerate the transition to a low carbon economy away from oil and natural gas.
On August 16, 2022, President Biden signed into law the IRA which, among other provisions, imposes a fee on methane emissions from sources required to report their greenhouse gas emissions to the U.S. Environmental Protection Agency, including those sources in the onshore petroleum and natural gas production and gathering and boosting source categories. Beginning in 2024, the IRA’s methane emissions charge imposes a fee on excess methane emissions from certain oil and gas facilities, starting at $900 per metric ton of leaked methane in 2024 and rising to $1,200 in 2025, and $1,500 for 2026 and thereafter. The imposition of this fee and other provisions contained within the IRA could accelerate the transition away from oil and natural gas, which could decrease demand for, and in turn the prices of, the oil and natural gas that we store, transport and sell and adversely impact our business.
Fluctuations in interest rates could adversely affect our business.
We have exposure to movements in interest rates. The interest rates on our senior secured credit facility ($6.4 million outstanding at December 31, 2025) and the debt at certain of our unrestricted subsidiaries is variable. Our results of operations and our cash flows, as well as our access to future capital and our ability to fund our growth strategy, could be adversely affected by significant increases in interest rates. Obligations under our senior secured credit facility bear interest at a rate based on the Secured Overnight Financing Rate (“SOFR”) or an alternate base rate at our option, plus the applicable margin in accordance with our credit agreement. We have not historically hedged our interest rates. Adverse effects to interest rates could have a negative effect on our financial condition, operating results and cash flow.
An increase in interest rates may also cause a corresponding decline in demand for equity investments, in general, and in particular, for yield-based equity investments such as our common units. Any such reduction in demand for our common units resulting from other more attractive investment opportunities may cause the trading price of our common units to decline.
Inflationary pressures and associated changes in monetary policy have historically increased and may further increase our operating costs, which in turn have caused and may continue to cause our capital expenditures and operating costs to rise.
Inflationary pressures have increased in recent years and could occur in the future. These inflationary pressures have historically increased and may further increase our operating costs, which in turn have caused and may continue to cause our capital expenditures and operating costs to rise. Sustained levels of high inflation have historically caused the Federal Reserve and other central banks to increase interest rates, which raises the cost of capital, including the cost of borrowings under our senior secured credit facility, and depresses economic growth, which could adversely affect the financial and operating results of our business.
Non-traditional investment criteria used by many investors may diminish investor interest in us and reduce the value of our common units and our access to capital.
Recently, investor advocacy groups, certain institutional investors and many investment funds have increased their focus on non-traditional investment criteria, such as environmental, social and governance (ESG) and sustainability goals. In particular, numerous investment firms, banks, insurance companies and other financial institutions have made pledges to reduce their carbon emissions, which in many cases may involve reducing or eliminating their investments in organizations involved in the production, transport and use of fossil fuels. In connection with this trend, investor demand for and valuation of our common units may decline, and our access to the debt and equity capital necessary to finance our growth projects and to refinance our existing debt obligations when due may be reduced, either of which could adversely impact our businesses.
Risks Related to Legal and Regulatory Compliance
Our operations are subject to federal and state rate regulation and federal, state and local environmental protection and safety laws and regulations.
Our operations are subject to stringent federal, state and local environmental protection and safety laws and regulations. See “Regulation-Environmental Regulations.” Failure to comply with these laws and regulations may result in the
assessment of administrative, civil and criminal penalties, including the assessment of monetary penalties, the imposition of investigatory and remedial obligations, the suspension or revocation of necessary permits, licenses and authorizations, the requirement that additional pollution controls be installed and the issuance of orders enjoining future operations or imposing additional compliance requirements. While we believe that we are in substantial compliance with current environmental laws and regulations and that continued compliance with existing requirements would not materially affect us, there is no assurance that this trend will continue in the future. Revised or new additional regulations that result in increased compliance costs or additional operating restrictions, particularly if those costs are not fully recoverable from our customers, could have a material adverse effect on our business, financial position, results of operations and cash flows. Moreover, our operations, including the transportation and storage of crude oil, natural gas and other commodities, involves a risk that crude oil, natural gas and related hydrocarbons or other substances may be released into the environment, which may result in substantial expenditures for a response action, significant government penalties, liability to government agencies for natural resources damages, liability to private parties for personal injury or property damages and significant business interruption. These costs and liabilities could rise under increasingly strict environmental and safety laws, including regulations and enforcement policies, or claims for damages to property or persons resulting from our operations. If we are unable to recover such resulting costs through increased rates or insurance reimbursements, our cash flows and distributions to our unitholders could be materially affected.
Climate change legislation and regulatory initiatives may decrease demand for the products we store, transport and sell and increase our operating costs.
In recent years, federal, state, and local governments have taken steps to reduce emissions of GHGs. For example, the IRA and the Investment in Infrastructure and Jobs Act include billions of dollars in incentives for the development of renewable energy, clean hydrogen, clean fuels, electric vehicles, investments in advanced biofuels and supporting infrastructure and carbon capture and sequestration. On July 4, 2025, the One Big Beautiful Bill Act was signed into law, which revises and expands certain renewable energy tax credits that were previously available under the IRA. Also, the EPA has proposed ambitious rules to reduce harmful air pollutant emissions, including GHGs, from light-, medium-, and heavy-duty vehicles beginning in model year 2027. These incentives and regulations could accelerate the transition of the economy away from the use of fossil fuels towards lower or zero-carbon emissions alternatives, which could decrease demand for, and in turn the prices of, the oil and natural gas that we store, transport and sell and adversely impact our business.
Efforts to regulate or restrict emissions of GHGs in areas that we conduct business could adversely affect the demand for the products that we transport, store and distribute and, depending on the particular program adopted, could increase our costs to operate and maintain our facilities by requiring that we, among other things, measure and report our emissions, install new emission controls on our facilities, acquire allowances to authorize our GHG emissions, pay any fees or taxes related to our GHG emissions and administer and manage a GHG emissions program. We may be unable to include some or all of such increased costs in the rates charged by our pipelines or other facilities, and any such recovery may depend on events beyond our control, including the outcome of future rate proceedings before the FERC or state regulatory agencies and the provisions of any final legislation or implementing regulations. Any GHG emissions legislation or regulatory programs applicable to power plants or refineries could also increase the cost of consuming, and thereby adversely affect demand for the crude oil and natural gas that we produce. Consequently, legislation and regulatory programs to reduce GHG emissions could have an adverse effect on our business, financial condition and results of operations. It is not possible at this time to predict with any accuracy the structure or outcome of any future legislative or regulatory efforts to address such emissions or the eventual costs to us of compliance.
Moreover, climate change may be associated with extreme weather conditions such as more intense hurricanes, thunderstorms, tornadoes and snow or ice storms, as well as rising sea levels. Another possible consequence of climate change is increased volatility in seasonal temperatures. Some studies indicate that climate change could cause some areas to experience temperatures substantially hotter or colder than their historical averages. Extreme weather conditions can interfere with our production and increase our costs and damage resulting from extreme weather may not be fully insured. However, at this time, we are unable to determine the extent to which climate change may lead to increased storm or weather hazards affecting our operations.
Regulation of the rates, terms and conditions of services and a changing regulatory environment could affect our financial position, results of operations or cash flow.
FERC regulates certain of our energy infrastructure assets engaged in interstate operations. Our intrastate pipeline operations are regulated by state agencies. Our railcar operations are subject to the regulatory jurisdiction of the Federal Railroad Administration of the DOT, the Occupational Safety and Health Administration, as well as other federal and state regulatory agencies. This regulation extends to such matters as: rate structures; rates of return on equity; recovery of costs; the services that our regulated assets are permitted to perform; the acquisition, construction and disposition of assets; and to an extent, the level of competition in that regulated industry.
In addition, some of our pipelines and other infrastructure are subject to laws providing for open and/or non-discriminatory access.
Given the extent of this regulation, the evolving nature of federal and state regulation and the possibility for additional changes, the current regulatory regime may change and affect our financial position, results of operations or cash flow.
Our business would be adversely affected if we failed to comply with the Jones Act foreign ownership provisions.
We are subject to the Jones Act and other federal laws that restrict maritime cargo transportation between points in the U.S. only to vessels operating under the U.S. flag, built in the U.S., at least 75% owned and operated by U.S. citizens (or owned and operated by other entities meeting U.S. citizenship requirements to own vessels operating in the U.S. coastwise trade and, in the case of limited partnerships, where the general partner meets U.S. citizenship requirements) and manned by U.S. crews. To ensure compliance with the Jones Act, we must be U.S. citizens qualified to document vessels for coastwise trade. We could cease being a U.S. citizen if certain events were to occur, including if non-U.S. citizens were to own 25% or more of our equity interest or were otherwise deemed to control us or our general partner. We are responsible for monitoring ownership to ensure compliance with the Jones Act. The consequences of our failure to comply with the Jones Act provisions on coastwise trade, including failing to qualify as a U.S. citizen, would have an adverse effect on us as we may be prohibited from operating our vessels in the U.S. coastwise trade or, under certain circumstances, permanently lose U.S. coastwise trading rights or be subject to fines or forfeiture of our vessels.
Our business would be adversely affected if the Jones Act provisions on coastwise trade or international trade agreements were modified or repealed or as a result of modifications to existing legislation or regulations governing the crude oil and natural gas industry.
If the restrictions contained in the Jones Act were repealed or altered or certain international trade agreements were changed, the maritime transportation of cargo between U.S. ports could be opened to foreign flag or foreign-built vessels. The Secretary of the Department of Homeland Security, or the Secretary, is vested with the authority and discretion to waive the coastwise laws if the Secretary deems that such action is necessary in the interest of national defense. Any waiver of the coastwise laws, whether in response to natural disasters or otherwise, could result in increased competition from foreign product carrier and barge operators, which could reduce our revenues and cash available for distribution.
Foreign-flag vessels generally have lower construction costs and generally operate at significantly lower costs than we do in U.S. markets, which would likely result in reduced charter rates. We believe that continued efforts will be made to modify or repeal the Jones Act. If these efforts are successful, foreign-flag vessels could be permitted to trade in the U.S. coastwise trade and significantly increase competition with our fleet, which could have an adverse effect on our business.
Compliance with and changes in cybersecurity requirements have a cost impact on our business, and failure to comply with such laws and regulations could have an impact on our assets, costs, revenue generation and growth opportunities.
The Department of Homeland Security’s Transportation Security Administration (“TSA”) announced in October 2025 the revision and re-issuance of one of its security directives originally issued in the second quarter of 2021. Together, these directives, including the newly amended directive, require critical pipeline owners to comply with mandatory reporting measures and provide vulnerability assessments, and changes in the requirements may require us to expend significant additional resources to modify or enhance our protective measures, or our procedures for assessing, investigating, and remediating any critical infrastructure security vulnerabilities and for responding to cyberattacks. Furthermore, the U.S. Coast Guard’s Cybersecurity in the Marine Transportation System Rule introduces additional training and reporting obligations and requires taking various measures to maintain cybersecurity within the marine transportation system. Any failure to remain in compliance with these government regulations may result in enforcement actions which may have a material adverse effect on our business and operations.
We are subject to regulatory and economic risks associated with doing business outside of the United States.
Doing business with entities located outside of the United States has risks that are inherent in conducting business internationally, including compliance with both United States and foreign laws and regulations that apply to our international operations. These laws and regulations could include tax laws, anti-competition regulations, import and export requirements, data privacy requirements, labor relations laws, environmental, health and safety laws, and anti-bribery laws such as the U.S. Foreign Corrupt Practices Act and similar anti-bribery laws in other jurisdictions. Given the high level of complexity of these laws, there is a risk that some provisions may be violated inadvertently or through fraudulent or negligent behavior of individual employees, our failure to comply with certain formal documentation requirements or otherwise. In addition, these laws are subject to changes, which may require additional resources or make it more difficult for us to comply with these laws. Violations of the laws and regulations governing our international operations could result in fines against us, our officers or our employees. In addition to the foregoing, engaging in international business involves a number of other risks, including cost and availability of international shipping channels, longer payment cycles in certain countries, and the potential of political or
economic instability. These potential risks and difficulties, individually or in the aggregate, could have a material adverse effect on our business, results of operations, financial condition and cash flows.
Risks Related to Our Partnership Structure
Individual members of the Davison family can exert significant influence over us and may have conflicts of interest with us and may be permitted to favor their interests to the detriment of our other unitholders.
James E. Davison and James E. Davison, Jr., each of whom is a director of our general partner, each own a significant portion of our common units, including our Class B Common Units, the holders of which elect our directors. Other members of the Davison family also own a significant portion of our common units. Collectively, members of the Davison family and their affiliates own approximately 9% of our Class A Common Units and 77% of our Class B Common Units and are able to exert significant influence over us, including the ability to elect at least a majority of the members of our board of directors and the ability to control most matters requiring board approval, such as material business strategies, mergers, business combinations, acquisitions or dispositions of assets, issuances of additional partnership securities, incurrences of debt or other financings and payments of distributions. In addition, the existence of a controlling group (if one were to form) may have the effect of making it difficult for, or may discourage or delay, a third party from seeking to acquire us, which may adversely affect the market price of our common units. Further, conflicts of interest may arise between us and other entities for which members of the Davison family serve as officers or directors. In resolving any conflicts that may arise, such members of the Davison family may favor the interests of another entity over our interests.
Members of the Davison family own, control and have interests in diverse companies, some of which may (or could in the future) compete directly or indirectly with us. As a result, the interests of the members of the Davison family may not always be consistent with our interests or the interests of our other unitholders. Members of the Davison family could also pursue acquisitions or business opportunities that may be complementary to our business. Our organizational documents allow the holders of our units (including affiliates, like the Davisons’) to take advantage of such corporate opportunities without first presenting such opportunities to us. As a result, corporate opportunities that may benefit us may not be available to us in a timely manner, or at all. To the extent that conflicts of interest may arise among us and any member of the Davison family, those conflicts may be resolved in a manner adverse to us or you. Other potential conflicts may involve, among others, the following situations: our general partner is allowed to take into account the interest of parties other than us, such as one or more of its affiliates, in resolving conflicts of interest; our general partner may limit its liability and reduce its fiduciary duties, while also restricting the remedies available to our unitholders for actions that, without such limitations, might constitute breaches of fiduciary duty; our general partner determines the amount and timing of asset purchases and sales, capital expenditures, borrowings, issuance of additional partnership securities, reimbursements and enforcement of obligations to the general partner and its affiliates, retention of counsel, accountants and service providers and cash reserves, each of which can also affect the amount of cash that is distributed to our unitholders; and our general partner determines which costs incurred by it and its affiliates are reimbursable by us and the reimbursement of these costs and of any services provided by our general partner could adversely affect our ability to pay cash distributions to our unitholders.
Our Class B Common Units may be transferred to a third party without unitholder consent, which could affect our strategic direction.
Unlike the holders of common stock in a corporation, our unitholders have only limited voting rights on matters affecting our business and, therefore, limited ability to influence management’s decisions regarding our business. Only holders of our Class B Common Units have the right to elect our board of directors. Holders of our Class B Common Units may transfer such units to a third party without the consent of the unitholders. The new holders of our Class B Common Units may then be in a position to replace our board of directors and officers of our general partner with its own choices and to control the strategic decisions made by our board of directors and officers.
Our general partner has a limited call right that may require common unitholders to sell their units at an undesirable time or price.
If at any time our general partner, the partnership, and our subsidiaries collectively own 80% or more of the Class A Common Units or Class B Common Units, our general partner will have the right, but not the obligation, which it may assign to us, to acquire all, but not less than all, of the remaining common units of such class held by persons other than our general partner, the partnership or our subsidiaries at a price not less than their then-current market price. As a result, common unitholders may be required to sell their common units at an undesirable time or price. Such unitholders may also incur a tax liability upon such sale of their units.
The interruption of distributions to us from our subsidiaries and joint ventures could affect our ability to make payments on indebtedness or cash distributions to our unitholders.
We are a holding company. As such, our primary assets are the equity interests in our subsidiaries and joint ventures. Consequently, our ability to fund our commitments (including payments on our indebtedness) and to make cash distributions depends upon the earnings and cash flow of our subsidiaries and joint ventures and the distribution of that cash to us. While some of our joint ventures and our unrestricted subsidiaries may generally be required to make cash distributions to us on a quarterly or other periodic basis, distributions from our joint ventures and our unrestricted subsidiaries are subject to the discretion of their respective management committee or similar governing body in one or more respects even if such distributions are generally required, such as with respect to the establishment of cash reserves. Further, the charter documents of certain of our joint ventures and unrestricted subsidiaries may vest in the management committees or similar governing body’s certain discretion or contain certain limitations regarding cash distributions even if such distributions are generally required. Accordingly, our joint ventures and our unrestricted subsidiaries may not continue to make distributions to us at current levels or at all.
We do not have the same flexibility as other types of organizations to accumulate cash and equity to protect against illiquidity in the future.
Unlike a corporation, our partnership agreement requires us to make quarterly distributions to our unitholders of all available cash reduced by any amounts reserved for commitments and contingencies, including capital and operating costs and debt service requirements. The value of our units and other limited partner interests may decrease in direct correlation with decreases in the amount we distribute per unit. Accordingly, if we experience a liquidity problem in the future, we may not be able to issue more equity to recapitalize.
Unitholders may have liability to repay distributions that were wrongfully distributed to them.
Under certain circumstances, unitholders may have to repay amounts wrongfully returned or distributed to them. Under Section 17-607 of the Delaware Revised Uniform Limited Partnership Act, we may not make a distribution to you if the distribution would cause our liabilities to exceed the fair value of our assets. Delaware law provides that for a period of three years from the date of an impermissible distribution, limited partners who received the distribution and who knew at the time of the distribution that it violated Delaware law will be liable to the limited partnership for the distribution amount. Substituted limited partners are liable both for the obligations of the assignor to make contributions to the partnership that were known to the substituted limited partner at the time it became a limited partner and for those obligations that were unknown if the liabilities could have been determined from the partnership agreement. Neither liabilities to partners on account of their partnership interest nor liabilities that are non-recourse to the partnership are counted for purposes of determining whether a distribution is permitted.
Unitholder liability may not be limited if a court finds that unitholder action constitutes control of our business.
A general partner of a partnership generally has unlimited liability for the obligations of the partnership, except for those contractual obligations of the partnership that are expressly made without recourse to the general partner. Our partnership is organized under Delaware law, and we conduct business in other states. The limitations on the liability of holders of limited partner interests for the obligations of a limited partnership have not been clearly established in some states in which we do business or may do business in from time to time in the future. Unitholders could be liable for any and all of our obligations as if unitholders were a general partner if a court or government agency were to determine that: we were conducting business in a state but had not complied with that particular state’s partnership statute; or unitholders right to act with other unitholders to remove or replace our general partner, to approve some amendments to our partnership agreement or to take other actions under our partnership agreement constitutes “control” of our business.
Tax Risks to Our Unitholders
Our tax treatment depends on our status as a partnership for federal income tax purposes, as well as us not being subject to a material amount of entity-level taxation by individual states. If the IRS were to treat us as a corporation (for U.S. federal income tax purposes) or if we were to become subject to a material amount of entity-level taxation for state tax purposes, then our cash available for distribution to our unitholders would be substantially reduced.
The anticipated after-tax economic benefit of an investment in our units depends largely on our being treated as a partnership for federal income tax purposes. Section 7704 of the Internal Revenue Code provides that publicly traded partnerships will, as a general rule, be taxed as corporations. However, an exception exists with respect to publicly traded partnerships, 90% or more of the gross income of which for each taxable year consists of “qualifying income.”
If less than 90% of our gross income for any taxable year is “qualifying income” from transportation, processing or marketing of natural resources (including minerals, crude oil, natural gas or products thereof), interest or dividends income, we
will be taxable as a corporation under Section 7704 of the Internal Revenue Code for federal income tax purposes for that taxable year and all subsequent years. We have not requested a ruling from the IRS with respect to our treatment as a partnership for federal income tax purposes.
The decision of the U.S. Court of Appeals for the Fifth Circuit in Tidewater Inc. v. U.S., 565 F.3d 299 (5th Cir. April 13, 2009) held that the marine time charter being analyzed in that case was a “lease” that generated rental income rather than income from transportation services for purposes of a foreign sales corporation provision of the Internal Revenue Code. Even though (i) the Tidewater case did not involve a publicly traded partnership and it was not decided under Section 7704 of the Internal Revenue Code relating to “qualifying income,” (ii) some experienced practitioners believe the decision was not well reasoned, (iii) the IRS stated in an Action on Decision (AOD 2010-01) that it disagrees with and will not acquiesce to the Fifth Circuit’s marine time charter analysis contained in the Tidewater case and (iv) the IRS has issued several favorable private letter rulings (which can be relied upon and cited as precedent by only the taxpayers that obtained them) relating to time charters since the Tidewater decision was issued, the Tidewater decision creates some uncertainty regarding the status of income from certain of our marine time charters as “qualifying income” under Section 7704 of the Internal Revenue Code. Notwithstanding the foregoing, the Tidewater case is relevant authority because it is the only case of which we and our outside tax counsel are aware directly analyzing whether a particular time charter would constitute a lease or service agreement for certain U.S. federal tax purposes. Due to the uncertainty created by the Tidewater decision, our outside tax counsel at the time was required to change the standard in its opinion relating to our status as a partnership for federal income tax purposes to “should” from “will.”
Although we do not believe based upon our current operations that we are treated as a corporation for federal income tax purposes, a change in our business (or a change in current law) could cause us to be treated as a corporation for federal income tax purposes or otherwise subject us to taxation as an entity. If we were treated as a corporation for federal income tax purposes, we would pay federal income tax on our taxable income at the corporate tax rate and would pay state income tax at varying rates. Distributions to our unitholders would generally be taxable to them again as corporate distributions and no income, gains, losses, or deductions would flow through to them. Because a tax would be imposed upon us as a corporation, our cash available for distribution to our unitholders would be substantially reduced. Therefore, treatment of us as a corporation would result in a material reduction in the anticipated cash flow and after-tax return to our unitholders, likely causing a substantial reduction in the value of our units.
At the state level, because of widespread state budget deficits and other reasons, several states are evaluating ways to subject partnerships to entity-level taxation through the imposition of state income, franchise and other forms of taxation. For example, we are required to pay Texas franchise tax on our gross income apportioned to Texas. Imposition of any such taxes on us by any other state would reduce our cash available for distribution to our unitholders.
The tax treatment of publicly traded partnerships or an investment in our units could be subject to potential legislative, judicial or administrative changes and differing interpretations, possibly on a retroactive basis.
The present U.S. federal income tax treatment of publicly traded partnerships, including us, or an investment in our units may be modified by administrative, legislative or judicial interpretation at any time. From time to time, members of Congress propose and consider substantive changes to the existing U.S. federal income tax laws that affect publicly traded partnerships, including the elimination of partnership tax treatment for certain publicly traded partnerships.
Any modifications to the U.S. federal income tax laws may be applied retroactively and could make it more difficult or impossible for us to meet the exception for certain publicly traded partnerships to be treated as partnerships for U.S. federal income tax purposes. We are unable to predict whether any of these changes, or other proposals, will ultimately be enacted. Any such changes could cause a material reduction in our anticipated cash flows and could cause us to be treated as an association taxable as a corporation for U.S. federal income tax purposes subjecting us to the entity-level tax and adversely affecting the value of our units.
A successful IRS contest of the federal income tax positions we take may adversely affect the market for our units, and the costs of any IRS contest would reduce our cash available for distribution to our unitholders and our general partner.
The IRS may adopt positions that differ from the positions we take. It may be necessary to resort to administrative or court proceedings to sustain some or all of the positions we take. A court may not agree with some or all of the positions we take. Any contest with the IRS may materially and adversely impact the market for our units and the price at which they trade. In addition, our costs of any contest with the IRS will be borne indirectly by our unitholders and our general partner because these costs will reduce our cash available for distribution.
If the IRS makes adjustments to our income tax returns, it (and some states) may assess and collect any taxes (including any applicable penalties and interest) resulting from such audit adjustments directly from us. To the extent possible under the rules, our general partner may elect to either cause us to pay the taxes (including any applicable penalties and interest) directly to the IRS or, if we are eligible, issue a revised information statement to each unitholder and former unitholder with respect to an audited and adjusted return. Although our general partner may elect to have our unitholders and former unitholders take such audit adjustments into account and pay any resulting taxes (including applicable penalties or interest) in accordance with their interests in us during the tax year under audit, there can be no assurance that such election will be practical, permissible or effective in all circumstances. If we make payments of taxes and any penalties and interest directly to the IRS in the year in which the audit is completed, our cash available for distribution to our unitholders might be substantially reduced, in which case our current unitholders may bear some or all of the tax liability resulting from such audit adjustments, even if such unitholders did not own units in us during the tax year under audit.
Our unitholders will be required to pay taxes on income (as well as deemed distributions, if any) from us even if they do not receive any cash distributions from us.
Our unitholders will be required to pay any federal income taxes and, in some cases, state and local income taxes on their share of our taxable income (as well as deemed distributions and gains on the sale of assets or businesses, if any) even if unitholders receive no cash distributions from us. Our unitholders may not receive cash distributions from us equal to their share of our taxable income (or deemed distributions and gains on the sale of assets or businesses, if any) or even the tax liability that results from that income (or deemed distribution).
Tax gain or loss on the disposition of our units could be more or less than expected.
If our unitholders sell their units, they will recognize a gain or loss equal to the difference between the amount realized and their tax basis in those units. Because distributions in excess of their allocable share of our net taxable income decrease their tax basis in their units, the amount, if any, of such prior excess distributions with respect to the units a unitholder sells will, in effect, become taxable income to the unitholder if it sells such units at a price greater than its tax basis in those units, even if the price received is less than its original cost. A substantial portion of the amount realized, whether or not representing gain, may be ordinary income due to potential recapture items, including depreciation recapture. In addition, because the amount realized includes a unitholder’s share of our non-recourse liabilities, if our unitholders sell their units, they may incur a tax liability in excess of the amount of cash they receive from the sale.
Unitholders may be subject to limitations on their ability to deduct interest expense by us.
Our ability to deduct interest paid or accrued on indebtedness properly allocable to our trade or business during our taxable year may be limited in certain circumstances. If this limitation were to apply with respect to a taxable year, it could result in an increase in the taxable income allocable to a unitholder for such taxable year without any corresponding increase in the cash available for distribution to such unitholder. However, in certain circumstances, a unitholder may be able to utilize a portion of a business interest deduction subject to this limitation in future taxable years. Unitholders should consult their tax advisors regarding the impact of this business interest deduction limitation on an investment in our units.
Tax-exempt entities and non-U.S. persons face unique tax issues from owning our units that may result in adverse tax consequences to them.
Investment in our units by tax-exempt entities, such as individual retirement accounts (known as IRAs), other retirement plans and non-U.S. persons, raises issues unique to them. For example, virtually all of our income allocated to organizations that are exempt from federal income tax, including IRAs and other retirement plans, will be unrelated business taxable income and will be taxable to them. Subject to the aggregation rules for certain similarly situated businesses or activities, a tax-exempt entity with more than one unrelated trade or business (including by attribution from investment in a partnership such as ours) is required to compute the unrelated business taxable income of such tax-exempt entity separately with respect to each trade or business (including for purposes of determining any net operating loss deduction). As a result, it may not be possible for tax exempt entities to utilize losses from an investment in our partnership to offset unrelated business taxable income from another unrelated trade or business and vice versa. Tax-exempt entities should consult a tax advisor before investing in our units.
Non-U.S. unitholders are generally taxed and subject to income tax filing requirements by the United States on income effectively connected with a U.S. trade or business (“effectively connected income”). Income allocated to our unitholders and any gain from the sale of our units will generally be considered to be “effectively connected” with a U.S. trade or business. As a result, distributions to a non-U.S. unitholder will be subject to withholding at the highest applicable effective tax rate and a non-U.S. unitholder who sells or otherwise disposes of a unit will also be subject to U.S. federal income tax on the gain realized from the sale or disposition of that unit. Moreover, the transferee of an interest in a partnership that is engaged in a U.S. trade or business is generally required to withhold 10% of the “amount realized” by the transferor unless the transferor certifies that it is not a foreign person. While the determination of a partner’s “amount realized” generally includes any decrease of a partner’s share of the partnership’s liabilities, Treasury regulations provide that the “amount realized” on a transfer of an interest in a publicly traded partnership, such as our common units, will generally be the amount of gross proceeds paid to the broker effecting the applicable transfer on behalf of the transferor, and thus will be determined without regard to any decrease in that partner’s share of a publicly traded partnership’s liabilities. The Treasury regulations further provide that for any transfer of an interest in a publicly traded partnership that is effected through a broker, the obligation to withhold is imposed on the transfer’s broker. Non-U.S. unitholders should consult a tax advisor before investing in our units.
We will treat each purchaser of our common units as having the same tax benefits without regard to the common units actually purchased. The IRS may challenge this treatment, which could adversely affect the value of our common units.
Because we cannot match transferors and transferees of our common units, we adopt depreciation and amortization conventions that may not conform to all aspects of existing Treasury Regulations and may result in audit adjustments to our unitholders’ tax returns without the benefit of additional deductions. A successful IRS challenge to those conventions could adversely affect the amount of tax benefits available to a common unitholder. It also could affect the timing of these tax benefits or the amount of gain from a sale of common units and could have a negative impact on the value of our common units or result in audit adjustments to the common unitholder’s tax returns.
Our unitholders will likely be subject to state and local taxes in states where they do not live as a result of an investment in our units.
In addition to federal income taxes, our unitholders will likely be subject to other taxes, including foreign, state and local taxes, unincorporated business taxes and estate inheritance or intangible taxes that are imposed by the various jurisdictions in which we do business or own property, even if our unitholders do not live in any of those jurisdictions. Our unitholders will likely be required to file foreign, state, and local income tax returns and pay state and local income taxes in some or all of these jurisdictions. Further, our unitholders may be subject to penalties for failure to comply with those requirements. We currently own assets and do business in several states including Texas, Louisiana, Mississippi, Alabama, Florida, Arkansas and Oklahoma. Many of the states we currently do business in impose a personal income tax. It is our unitholders’ responsibility to file all applicable U.S. federal, foreign, state and local tax returns. Unitholders should consult with their own tax advisors regarding the filing of such tax returns, the payment of such taxes, and the deductibility of any taxes paid.
We have subsidiaries that are treated as corporations for federal income tax purposes and subject to corporate-level income taxes.
We conduct a portion of our operations through subsidiaries that are, or are treated as, corporations for federal income tax purposes. We may elect to conduct additional operations in corporate form in the future. These corporate subsidiaries will be subject to corporate-level tax, currently at a maximum 21% federal rate, and will likely pay state (and possibly local) income tax at varying rates, on their taxable income. Any such entity level taxes will reduce the cash available for distribution to us and, in turn, to our unitholders. If the IRS were to successfully assert that these corporate subsidiaries have more tax liability than we anticipate or legislation was enacted that increased the corporate tax rate, our cash available for distribution to our unitholders would be further reduced.
We generally prorate our items of income, gain, loss and deduction between transferors and transferees of our units each month based upon the ownership of our units on the first day of each month, instead of on the basis of the date a particular unit is transferred. The IRS may challenge this treatment, which could change the allocation of items of income, gain, loss and deduction among our unitholders.
We generally prorate our items of income, gain, loss, and deduction between transferors and transferees of our units each month based upon the ownership of our units on the first day of each month (the “Allocation Date”), instead of on the basis of the date a particular unit is transferred. Similarly, we generally allocate (i) certain deductions for depreciation of capital additions, (ii) gain or loss realized on a sale or other disposition of our assets and (iii) in the discretion of the general partner, any other extraordinary item of income, gain, loss or deduction based upon ownership on the Allocation Date. Treasury Regulations allow a similar monthly simplifying convention, but such regulations do not specifically authorize all aspects of our proration method. If the IRS were to challenge our proration method, we may be required to change the allocation of items of income, gain, loss and deduction among our unitholders.
A unitholder whose units are loaned to a “short seller” to cover a short sale of units may be considered as having disposed of those units. If so, such unitholder would no longer be treated for tax purposes as a partner with respect to those units during the period of the loan and may recognize gain or loss from the disposition.
Because a unitholder whose units are loaned to a “short seller” to cover a short sale of units may be considered as having disposed of the loaned units, such unitholder may no longer be treated for tax purposes as a partner with respect to those units during the period of the loan to the short seller and the unitholder may recognize gain or loss from such disposition. Moreover, during the period of the loan to the short seller, any of our income, gain, loss or deduction with respect to those units may not be reportable by the unitholder and any cash distributions received by the unitholder as to those units could be fully taxable as ordinary income. Unitholders desiring to assure their status as partners and avoid the risk of gain recognition from a loan to a short seller are urged to modify any applicable brokerage account agreements to prohibit their brokers from borrowing their units.
The IRS could challenge our treatment of the holders of Class A Convertible Preferred Units as partners for tax purposes, and if such challenge were sustained, certain holders of Class A Convertible Preferred Units could be adversely impacted.
The IRS may disagree with our treatment of the Class A Convertible Preferred Units as equity for U.S. federal income tax purposes, and no assurance can be given that our treatment will be sustained. If the IRS were to successfully characterize the Class A Convertible Preferred Units as indebtedness for tax purposes, certain holders of Class A Convertible Preferred Units may be subject to additional withholding and reporting requirements. Further, if the Class A Convertible Preferred Units were treated as indebtedness for U.S. federal tax purposes, rather than equity, distributions likely would be treated as payments of interest by us to the holders of Class A Convertible Preferred Units. Holders of Class A Convertible Preferred Units are encouraged to consult their tax advisors regarding the tax consequences applicable to the re-characterization of the Class A Convertible Preferred Units as indebtedness for tax purposes.
The amount that a Class A Convertible Preferred unitholder would receive upon liquidation may be less than the liquidation value of the Class A Convertible Preferred Units.
In general, we intend to specially allocate to the Class A Convertible Preferred Units items of our gross income in an amount equal to the distributions paid in respect of the Class A Convertible Preferred Units during the taxable year. If the distributions paid in respect of the Class A Convertible Preferred Units during a taxable year exceed the amount of our gross income allocated to the Class A Convertible Preferred Units for such taxable year (as in the case of prior distributions during the PIK period), the per unit capital account balance of the Class A Convertible Preferred unitholders would be reduced by the amount of such excess. If we were to dissolve or liquidate, after satisfying all of our liabilities, our unitholders (including the Class A Convertible Preferred unitholders) would be entitled to receive liquidating distributions in accordance with their capital account balances. In such event, Class A Convertible Preferred unitholders would be specially allocated items of gross income and gain in a manner designed to cause the capital account balance of a preferred unit to equal the liquidation value of a preferred unit. If we were to have insufficient gross income and gain to cause the capital account balance to equal the liquidation value of a preferred unit, then the amount that a Class A Convertible Preferred unitholder would receive upon liquidation would be less than the liquidation value of the Class A Convertible Preferred Units, even though there may be cash available for distribution to the holders of common units or any other junior securities with respect to their capital accounts.
General Risks
We are exposed to the credit risk of our customers in the ordinary course of our business activities.
When we (or our joint ventures) market our products or services, we (or our joint ventures) must determine the amount, if any, of the line of credit to extend to our customers. Since certain transactions can involve very large payments, the risk of nonpayment and nonperformance by customers, industry participants and others is an important consideration in our business.
For example, in those cases where we provide division order services for crude oil and natural gas purchased at the wellhead, we may be responsible for distribution of proceeds to all of the interest owners. In other cases, we pay all of or a portion of the production proceeds to an operator who distributes these proceeds to the various interest owners. These arrangements expose us to operator credit risk. As a result, we must determine that operators have sufficient financial resources to make such payments and distributions and to indemnify and defend us in case of a protest, action or complaint.
Additionally, we sell NaHS and caustic soda to customers in a variety of industries. Some of these customers are in industries that have been or could be impacted by a decline in demand for their products and services. Even if our credit review and analytical procedures work properly, we have experienced, and we could continue to experience losses in dealings with other parties.
Further, many of our customers could be impacted by weakened economic conditions, and volatility in commodity prices, such as crude oil, natural gas, copper, molybdenum, and aluminum in a manner that could influence the need for our products and services and their ability to pay us for those products and services. It is uncertain to what extent commodity prices will experience increased volatility in the future.
A natural disaster, pandemic, epidemic, accident, terrorist attack or other interruption event could result in an economic slowdown, severe personal injury, property damage and/or environmental damage, which could curtail our operations or otherwise adversely affect our assets and cash flow.
Some of our operations involve significant risks of severe personal injury, property damage and environmental damage, any of which could curtail our operations or otherwise expose us to liability and adversely affect our cash flow. Virtually all of our operations are exposed to the elements, including hurricanes, tornadoes, storms, floods, earthquakes and extended periods of below freezing weather. A significant portion of our operations are located along the U.S. Gulf Coast, and our offshore pipelines are located in the Gulf of America, which can be heavily subjected to these types of disasters or storms throughout a given year.
If one or more facilities that are owned by us or that connect to us or our customers is damaged or otherwise affected by severe weather or any other disaster, pandemic, epidemic, accident, catastrophe or event, our operations could be significantly interrupted. Similar interruptions could result from damage to production or other facilities that supply our facilities or other stoppages arising from factors beyond our control. These interruptions might involve significant damage to people, property or the environment, and repairs or recovery might take several months or even longer. Any event that interrupts the fees generated by our energy infrastructure assets, or which causes us to make significant expenditures not covered by insurance, could adversely affect our cash flows available for paying our interest obligations as well as unitholder distributions and, accordingly, adversely impact the market price of our securities. Additionally, the proceeds of any property insurance maintained by us may not be paid in a timely manner or be in an amount sufficient to meet our needs if such an event were to occur, and we may not be able to renew it or obtain other desirable insurance on commercially reasonable terms, if at all.
Any terrorist attack at our facilities, those of our customers and, in some cases, those of other pipelines, could have a material adverse effect on our business.
In addition, a natural disaster, pandemic, epidemic, accident, terrorist attack or other interruption event may cause significant volatility in global financial markets, disruptions to commerce and reduced economic activity. The degree to which a pandemic or any other public health crisis adversely impacts our results will depend on future developments, which are highly uncertain and cannot be predicted. These developments include, but are not limited to, the duration and spread of the outbreak, its severity, the actions to contain the virus or treat its impact, its impact on the economy and market conditions and how quickly and to what extent normal economic and operating conditions can resume. In addition, vaccine mandates or health prerequisites may be announced in jurisdictions in which our businesses operate. Our implementation of any such requirements if and when they are deemed to be enforceable may result in attrition, including attrition of critically skilled labor, and difficulty securing future labor needs. These potential impacts, while uncertain, could adversely affect our operating results. The resulting macroeconomic conditions could adversely affect our cash flows, as well as the market price of our securities.
We cannot predict the impact of the ongoing international military conflicts and any related humanitarian crisis or any other geopolitical tensions on the global economy, energy markets, geopolitical stability and our business.
The ultimate consequences of the war in Ukraine, the Israel and Hamas war and broader geopolitical tensions in South America, the Caribbean, the Middle East and Europe may lead to further sanctions or tariffs, embargoes, supply chain disruptions, regional instability and geopolitical shifts, may have adverse effects on global macroeconomic conditions or our South American export sales, increase volatility in the price of and demand for oil and natural gas, increase exposure to cyberattacks, cause disruptions in global supply chains, increase foreign currency fluctuations, cause constraints or disruption in the capital markets and limit sources of liquidity. We cannot predict the extent of these conflicts’ effect on our business and results of operations, as well as on the global economy and energy industry.
Our business could be negatively impacted by security threats, including cybersecurity threats, and related disruptions.
We rely on our information technology (“IT”) and operational technology (“OT”) infrastructure to process, transmit and store electronic information, including information we use to conduct our operations, and to safely operate our assets. While we believe that we maintain appropriate security policies and protocols, we face cybersecurity and other security threats to our IT and OT infrastructure, which could include threats to our operational and safety systems that operate our pipelines, facilities and other assets. We could face unlawful attempts to gain access to our IT and OT systems, including coordinated attacks from hackers, whether state-sponsored groups, “hacktivists” or private individuals. The age, operating systems or condition of our current IT and OT system infrastructure and software assets and our ability to maintain and upgrade such assets could affect our ability to resist cybersecurity threats.
Our IT and OT infrastructure is critical to the efficient operation of our business and essential to our ability to perform day-to-day operations. Breaches in our infrastructure, networks or physical facilities, or other disruptions, could result in damage to our assets, loss of intellectual property, impairment of our ability to conduct our operations, disruption of our customers’ operations, loss or damage to our customer data delivery systems, safety incidents, damage to the environment, compromise of personal data, and could have a material adverse effect on our operations, financial position and results of operations. It is also possible that, despite our use of security monitoring and alerting tools, breaches to our systems could go unnoticed for some period of time.
We and our third-party service providers may therefore be vulnerable to security events that are beyond our control, and we may be the target of cyberattacks, as well as physical attacks, which could result in cybersecurity breaches and significant disruption to our business. Such data breaches and cyberattacks could compromise our operational or other capabilities and cause significant damage to our business and our reputation. Our information systems have experienced threats to the security of our digital infrastructure, but none of these have had a significant impact on our business, operations or reputation. We maintain a 24/7 dedicated security operations center to anticipate, detect and prevent cyberattacks; however, there is no assurance that we will not suffer such losses or breaches in the future. As cyberattacks continue to evolve, we may be required to expend significant additional resources to respond to cyberattacks, to continue to modify or enhance our protective measures or to investigate and remediate any security vulnerabilities in our systems and infrastructure. We may also be subject to regulatory investigations or litigation relating from cybersecurity issues.
Artificial intelligence presents risks and challenges that can impact our business, including by posing security risks to our confidential information, proprietary information and personal data.
Issues in the development and use of artificial intelligence, combined with an uncertain regulatory environment, may result in reputational harm, liability, or other adverse consequences to our business operations. As with many technological innovations, artificial intelligence presents risks and challenges that could impact our business. We may adopt and integrate generative artificial intelligence tools into our systems for specific use cases reviewed by legal and information security. Our vendors may incorporate generative artificial intelligence tools into their offerings without disclosing this use to us, and the providers of these generative artificial intelligence tools may not meet existing or rapidly evolving regulatory or industry standards with respect to privacy and data protection and may inhibit our or our vendors’ ability to maintain an adequate level of service and experience. If we, our vendors, or our third-party partners experience an actual or perceived breach of privacy or security incident because of the use of generative artificial intelligence, we may lose valuable intellectual property and confidential information, and our reputation and the public perception of the effectiveness of our security measures could be harmed. Further, bad actors around the world use increasingly sophisticated methods, including the use of artificial intelligence, to engage in illegal activities involving the theft and misuse of personal information, confidential information, and intellectual property. Any of these outcomes could damage our reputation, result in the loss of valuable property and information, and have a material adverse effect on our business, financial condition and results of operations.
Our significant unitholders may sell units or other limited partner interests in the trading market, which could reduce the market price of our common units.
As of December 31, 2025, we have a number of significant unitholders. For example, certain members of the Davison family (including their affiliates) and management owned approximately 14.0 million, or approximately 11%, of our common units. From time to time, we also may have other unitholders that have large positions in our common units. In the future, any such parties may acquire additional interest or dispose of some or all of their interest. If they dispose of a substantial portion of their interest in the trading markets, such sales could reduce the market price of common units. In connection with certain transactions, we have put in place resale shelf registration statements, which allow unit holders thereunder to sell their common units at any time (subject to certain restrictions) and to include those securities in any equity offering we consummate for our own account.
We may issue additional common units without common unitholders’ approval, which would dilute their ownership interests.
We may issue an unlimited number of limited partner interests of any type without the approval of our common unitholders. The issuance of additional common units or other equity securities of equal or senior rank will have the following effects: our unitholders’ proportionate ownership interest in us will decrease; the amount of cash available for distribution on each unit may decrease; the relative voting strength of each previously outstanding unit may be diminished; and the market price of our common units may decline.
If we are unable to attract and retain senior management and key technical professionals with elite skills, we may not be able to execute our business strategy effectively and, our operations could be adversely affected.
The success of our business and ability to meet our strategic objectives depends upon our ability to attract, develop, retain and replace key qualified technical and management professionals. The market for these professionals is competitive in
the sectors in which we operate, and we rely heavily upon the expertise and leadership of our professionals. If we are unable to attract and retain a sufficient number of elite skilled professionals, our ability to pursue our business objectives may be adversely affected thus reducing our revenue, increasing our cost, or damaging our reputation.
Item 1B. Unresolved Staff Comments
None.
Item 1C. Cybersecurity
We maintain a cybersecurity program designed to identify, assess, manage, mitigate and respond to cybersecurity risks, and we partner with leading cybersecurity experts to continually enhance the security of our operating environments. Our program spans both IT and OT assets, including systems supporting TSA pipeline operations and operations regulated under the Marine Transport Security Act (“MTSA”). As an organization, we have devoted significant resources to cybersecurity processes aimed at addressing the known risks, as well as adapting to the changing cybersecurity landscape and responding to emerging threats in a timely and effective manner. We utilize threat intelligence relevant to the energy sector to monitor and assess evolving adversary activity. Some of the key risks identified include unauthorized access to our systems, credential compromise, ransomware and other financial motivated attacks. We maintain formal processes for identifying, assessing and escalating cybersecurity incidents, including a structured materiality determination consistent with SEC rules. We assess the materiality of cybersecurity risks and incidents based on factors such as financial impact, regulatory implications, operational disruption and reputational harm. Our comprehensive cybersecurity program is implemented and maintained using information security tools, policies, training and a team of IT professionals. We have a Cybersecurity Incident Response Plan and a Business Continuity and Disaster Recovery Program, in addition to other company policies and procedures that directly or indirectly relate to cybersecurity, such as policies related to vulnerability management, encryption standards, endpoint protection, remote access, multifactor authentication, confidential information, and the use of the internet, social media, email and wireless devices. These policies go through an internal review process, are approved by the appropriate members of management, and are a required part of our annual employee training.
Our cybersecurity program leverages the National Institute of Standards and Technology (“NIST”) framework, which consists of five core functions: identify, protect, detect, respond and recover. We engage third-party experts to assess our alignment with the NIST framework. Additionally, as further described in Item 1. Business – Regulation – Safety and Security Regulations, the TSA has issued a series of security directives applicable to pipeline owners and operators that require cyber planning, testing and incident reporting. Our OT environments supporting pipeline operations are designed with network segmentation, access controls and monitoring appropriate for industrial control systems. We continue to comply with mandatory TSA security directives applicable to pipeline owners and operators, including requirements related to assessments, testing, reporting, architecture hardening, and vulnerability management, and successor directives or regulatory updates as they are issued. We also comply with U.S. Coast Guard cybersecurity requirements under the Maritime Transportation Security Act applicable to MTSA-regulated facilities. We have made investments to enhance cybersecurity, including additional end-user training, using layered defenses, identifying and protecting critical assets, and strengthening our security monitoring and alerting capabilities. In support of these efforts, we conduct regular cybersecurity performance assessments, technical simulations, and tabletop exercises. We periodically test and update our Cybersecurity Incident Response Plan to incorporate lessons learned and evolving threat scenarios. These tests and assessments are useful tools for maintaining a mature cybersecurity program to protect our stakeholders, including investors, customers, employees and vendors.
In addition to assessing our own cybersecurity preparedness, we evaluate cybersecurity risks associated with third-party vendors and supply-chain dependencies as part of our broader enterprise risk management process. This risk evaluation considers the potential impact of a disruption to critical services and the sensitivity of data shared with such vendors and assesses the cybersecurity preparedness of third-party vendors. The internal business owners of our hosted applications are required to document user access reviews at least annually and obtain and review System and Organization Controls (SOC 1 or SOC 2) reports from the vendor. If a third-party vendor is unable to provide a SOC 1 or SOC 2 report, we take additional steps to assess their cybersecurity preparedness and evaluate the associated risks. If a provided SOC report identifies significant deficiencies or control weaknesses, we conduct a detailed risk assessment, request remediation plans, implement additional monitoring measures, or, if necessary, reevaluate the vendor relationship. Our assessment of third-party provider risks is an integral part of our overall cybersecurity program and our efforts to ensure that appropriate safeguards are in place to protect our data and operations.
The Audit Committee of the Board of Directors oversees our enterprise-wide risk management program, including cybersecurity, the assessment of cybersecurity risks, and the actions we take to monitor and mitigate cybersecurity risks. Cybersecurity risk management involves coordination among IT, Operations, Legal, Compliance, and executive leadership. Working directly with executive management, our cybersecurity program is overseen and implemented by our Chief Information Officer (“CIO”), who has over 20 years of experience building and maintaining cybersecurity programs, and a
team of skilled individuals, including a Director of Enterprise Security, and a Cyber-Resilience Team, who, together, are responsible for monitoring our networks, providing training to our employees, analyzing the evolution of new threats and strategies for mitigating such threats and seeking to continually harden our cybersecurity program. The Cyber-Resilience Team is dedicated to recovery efforts and business continuity plans and is knowledgeable across our information technology and operational applications. The Audit Committee reviews, with the CIO and executive management, the company’s technology and cybersecurity program, including company plans, programs, policies, assessments and opportunities at its regularly scheduled meetings. Our CIO is responsible for providing regular updates, at least quarterly at regularly scheduled meetings, to the Audit Committee regarding cybersecurity-related situations, intelligence pointing to increased adversary activity, regulatory changes and improvements or impediments to our cybersecurity posture. The Audit Committee reports on cybersecurity-related matters to the Board of Directors on an annual basis, or more frequently if there are any required matters to report. Based on these updates, the Audit Committee and the Board of Directors may request follow-up data and presentations to address any specific concerns and recommendations. In addition to this regular reporting, significant cybersecurity risks and threats may also be escalated to the Audit Committee by the CIO and executive management on an as necessary basis.
As of the date of this Annual Report on Form 10-K, we have not identified any cybersecurity incidents that have materially affected, or are reasonably likely to materially affect, our business strategy, results of operations, or financial condition. We are not aware of any cybersecurity risks that have materially affected or are reasonably likely to materially affect our business strategy, results of operations or financial condition. We have periodically encountered threats and security breaches affecting our information and systems, including malware and cyberattacks. We recognize that cybersecurity risks are constantly evolving, and while we implement and continue to refine our security measures, the potential for future incidents remains. Despite the implementation of our cybersecurity processes, our security measures cannot guarantee that a significant cybersecurity attack will not occur. While we devote resources to our security measures designed to protect our systems and information, no security measure is infallible. See Item 1A. “Risk Factors” for additional information about the risks to our business associated with a breach or other compromise to our IT and OT systems.
Item 2. Properties
We have various operating leases for rental of office space, facilities and field equipment and transportation equipment. See Management’s Discussion and Analysis of Financial Condition and Results of Operations, and Note 5 to our Consolidated Financial Statements in Item 8 for details on our right of use assets and related lease liabilities. Such information is incorporated herein by reference.
Item 3. Legal Proceedings
We are involved from time to time in various claims, lawsuits and administrative proceedings incidental to our business. In our opinion, the ultimate outcome, if any, of such proceedings is not expected to have a material adverse effect on our financial condition, results of operations or cash flows. See Note 21 to our Consolidated Financial Statements in Item 8.
Item 103 of SEC Regulation S-K requires disclosure of certain environmental matters when a governmental authority is a party to the proceedings and such proceedings involve potential monetary sanctions that we reasonably believe will exceed a specified threshold. Pursuant to recent SEC amendments to this item, we will be using a threshold of $1 million for such proceedings. We believe that such threshold is reasonably designed to result in disclosure of environmental proceedings that are material to our business or financial condition. Applying this threshold, there are no environmental matters to disclose for this period.
Item 4. Mine Safety Disclosures
We sold our mine in Green River, Wyoming on February 28, 2025, and therefore are no longer required to provide information required by Section 1503(a) of the Dodd-Frank Wall Street Reform and Consumer Protection Act and Item 104 of Regulation S-K (17 CFR 229.104).
Item 5. Market for Registrant’s Common Equity, Related Unitholder Matters and Issuer Purchases of Equity Securities
Our Class A Common Units are listed on the New York Stock Exchange, or NYSE, under the symbol “GEL.”
As of February 18, 2026, we have 122,424,321 Class A Common Units outstanding. As of December 31, 2025, the closing price of our common units was $15.60 and we had approximately 25,000 record holders of our Class A Common Units, which include holders who own units through their brokers “in street name.” Additionally, as of February 18, 2026, we have 14,954,102 Class A Convertible Preferred Units outstanding for which there is no established public trading market.
Available cash generally means, for each fiscal quarter, all cash on hand at the end of the quarter:
•less the amount of cash reserves that our general partner determines in its reasonable discretion is necessary or appropriate to:
•provide for the proper conduct of our business;
•comply with applicable law, any of our debt instruments, or other agreements; or
•provide funds for distributions to our unitholders for any one or more of the next four quarters;
•plus all cash on hand on the date of determination of available cash for the quarter resulting from working capital borrowings. Working capital borrowings are generally borrowings that are made under our senior secured credit facility and in all cases are used solely for working capital purposes or to pay distributions to partners.
The full definition of available cash is set forth in our partnership agreement and amendments thereto, which are incorporated by reference as an exhibit to this Form 10-K.
See Item 7. “Management’s Discussion and Analysis of Financial Condition and Results of Operations – Liquidity and Capital Resources – Capital Expenditures and Distributions Paid to our Unitholders” and Note 12 to our Consolidated Financial Statements in Item 8 for further information regarding restrictions on our distributions.
Item 7. Management’s Discussion and Analysis of Financial Condition and Results of Operations
Introduction
We are a growth-oriented MLP formed in Delaware in 1996. Our common units are traded on the NYSE, under the ticker symbol “GEL.” We are a provider of an integrated suite of midstream services (primarily transportation, storage, sulfur removal, blending, terminaling and processing) for a large area of the Gulf of America and the Gulf Coast region of the crude oil and natural gas industry. We provide an integrated suite of services to crude oil and natural gas producers, refiners, and industrial and commercial enterprises and have a diverse portfolio of assets, including pipelines, offshore hub and junction platforms, refinery-related plants, storage tanks, terminals, railcars, rail unloading facilities, barges and other vessels, and trucks.
Prior to February 28, 2025, our operations also included the Alkali Business. We determined that the exit of the Alkali Business and its operations in Wyoming represented a strategic and geographic shift that met the criteria for discontinued operations. Accordingly, we have separately reported the operations from the Alkali Business in the Consolidated Statements of Operations and the related assets and liabilities of the Alkali Business in the Consolidated Balance Sheets as discontinued operations. These changes have been applied retrospectively to all periods presented.
Included in Management’s Discussion and Analysis are the following sections:
•Overview of 2025 Results
•Recent Developments and Initiatives
•Results of Operations
•Other Consolidated Results
•Financial Measures
•Liquidity and Capital Resources
•Guarantor Summarized Financial Information
•Critical Accounting Estimates
Overview of 2025 Results
We reported Net Income from Continuing Operations of $30.5 million in 2025 compared to Net Loss from Continuing Operations of $50.8 million in 2024.
Net Income from Continuing Operations in 2025 was primarily impacted by an increase in operating income associated with our reportable segments, primarily related to our offshore pipeline transportation segment (see “Results of Operations” below for additional details). In addition, an impairment expense of $43.0 million was reported during 2024, whereas no impairment expense was reported in 2025 (see “Results of Operations” below for additional details). These impacts were partially offset by: (i) an increase in general and administrative expenses of $28.0 million primarily related to an increase in third-party transaction costs incurred associated with the sale of the Alkali Business on February 28, 2025; (see “Results of Operations” below for additional details); (ii) an increase in depreciation and amortization expense of $25.4 million (see “Results of Operations” below for additional details); and (iii) a decrease in equity in earnings of equity investees of $10.7 million.
We reported Net Loss from Discontinued Operations, net of tax of $423.7 million in 2025 and Net Income from Discontinued Operations, net of tax of $17.8 million in 2024 associated with the Alkali Business that was sold on February 28, 2025. Net Loss from Discontinued Operations, net of tax in 2025 was impacted by a loss of $432.2 million associated with the sale of the Alkali Business.
Cash flows from operating activities, which is inclusive of both our continuing and discontinued operations, were $252.8 million for 2025 compared to $391.9 million for 2024. This decrease was primarily attributable to negative changes in our working capital requirements during 2025 compared to 2024. In addition, cash flows provided by operating activities for 2025 only included two months of activity from the Alkali Business, as it was sold on February 28, 2025, whereas 2024 included a full year of activity from the Alkali Business.
Available Cash before Reserves (as defined below in “Non-GAAP Financial Measures”) to our common unitholders was $149.1 million for 2025, a decrease of $10.3 million, or 6%, from 2024 primarily as a result of 2025 only including two months of activity from the Alkali Business, as it was sold on February 28, 2025, whereas 2024 included a full year of activity from the Alkali Business. Partially offsetting this decrease were primarily the following: (i) an increase in Segment Margin of $48.7 million in 2025 compared to 2024 from our continuing operations (which is further discussed below in “Results from Operations”); and (ii) a decrease in accumulated distributions to our Class A Convertible Preferred unitholders of $23.0 million. See “Financial Measures” below for additional information on Available Cash before Reserves.
Segment Margin was $577.9 million in 2025, an increase of $48.7 million, or 9%, as compared to 2024. We currently manage our businesses through three divisions that constitute our reportable segments - offshore pipeline transportation, marine transportation and onshore transportation and services. A more detailed discussion of our segment results and other costs is included below in “Results of Operations.”
Distributions to Unitholders
On February 13, 2026, we paid a distribution of $0.18 per common unit related to the fourth quarter of 2025. This represents a 9% increase in the quarterly distribution to common unitholders from the previous quarter.
With respect to our Class A Convertible Preferred Units, we declared a quarterly cash distribution of $0.9473 per unit (or $3.7892 on an annualized basis). These distributions were paid on February 13, 2026 to unitholders holders of record at the close of business January 30, 2026.
Recent Developments and Initiatives
Our primary objectives and strategies are to generate and grow stable free cash flows from operations and continue to deleverage our balance sheet, while never wavering from our commitment to safe and responsible operations. We believe the following have been and are important to meet our objectives:
•The completion of our major growth capital spending program during 2025, which included the construction and connection of our SYNC Pipeline and the expansion of our existing CHOPS Pipeline.
•An increase in volumes from long-term contracted offshore commercial opportunities in the Gulf of America, including volumes from the Shenandoah development, which saw first production in the third quarter of 2025 and ties into our SYNC Pipeline and further downstream to our CHOPS Pipeline, and volumes from the Salamanca FPS, which also saw first production in the third quarter of 2025 and ties into our existing SEKCO Pipeline for further transportation downstream on our Poseidon Pipeline.
•New and incremental volumes from continued in-field and sub-sea tieback opportunities as a result of the continued investment by the offshore producing community. These opportunities require minimal to no additional investment from us as a result of the current production handling capacity on our offshore pipeline transportation assets in the Gulf of America.
•The creation of financial flexibility from a combination of a significant amount of available borrowing capacity under our senior secured credit facility, subject to compliance with covenants, and our increasing cash flows from operations as discussed above, which will allow us to maximize our cash flow and focus on returning value to our capital structure with an emphasis on reducing debt in absolute terms, opportunistically redeeming our Class A Convertible Preferred Units and thoughtfully evaluating increases in our quarterly distributions to common unitholders.
Offshore Growth Capital Projects Completion
We previously entered into definitive agreements to provide transportation services for 100% of the crude oil production associated with two separate standalone deepwater developments (Shenandoah and Salamanca). In conjunction with these agreements, we committed to two offshore growth capital projects, which included expanding the current capacity of our 64% owned CHOPS Pipeline and constructing the SYNC Pipeline, a new 100% owned, approximately 105-mile, 20” diameter crude oil pipeline to connect the Shenandoah deepwater development to our existing asset footprint in the Gulf of America.
The CHOPS expansion included a complete overhaul of the GB-72 platform topside facilities, reconnection of the CHOPS Pipeline to the GB-72 platform, and the addition of pumps at both the HI-A5 and GB-72 platforms to upgrade processing capabilities and increase throughput on the CHOPS Pipeline.
During 2025, we successfully finished the CHOPS expansion and SYNC Pipeline, which completed our major growth capital spending program. During the third quarter of 2025, we saw first production from the Shenandoah and Salamanca deepwater developments. During the fourth quarter of 2025, we saw ramp up in volumes from Shenandoah to over 90 MBbls/day, which is in excess of the MVCs, while volumes from Salamanca reached over 30 MBbls/day during the fourth quarter of 2025 and continued to ramp up toward targeted production levels.
These two new developments represent a significant step change for the future financial performance of our offshore pipeline transportation segment. Longer term, in addition to the production expected from these fields, we are well positioned to benefit from a growing inventory of future opportunities around these production facilities as well as around the remaining excess capacity available on our now expanded pipeline infrastructure. Combined with minimal future growth capital requirements, these new developments will serve as the cornerstone of our ability to generate increasing levels of free cash flow in the future.
Sale of the Alkali Business and Related Transactions
On February 28, 2025, we completed the sale of the Alkali Business to an indirect affiliate of WE Soda Ltd for a gross purchase price of $1.425 billion. The sale generated proceeds of approximately $1.0 billion, which reflects the net proceeds after the assumption of $413.4 million of our then outstanding Alkali senior secured notes by an indirect affiliate of WE Soda Ltd, and other purchase price adjustments. We used the proceeds to pay down the outstanding balance on our senior secured credit facility on February 28, 2025, purchase 7,416,196 Class A Convertible Preferred Units on March 6, 2025 at a purchase price of $35.40, and redeem the remaining $406.2 million of principal outstanding on the 8.000% senior unsecured notes due January 15, 2027 (the “2027 Notes”) on April 3, 2025. The sale of the Alkali Business has allowed us to deleverage our balance sheet, and provide additional financial flexibility for us to focus on returning value to our capital structure.
In the discussions that follow, we will focus on our revenues, costs and expenses, as well as two measures that we use to manage the business and to review the results of our operations - Segment Margin and Available Cash before Reserves. Segment Margin and Available Cash before Reserves are defined in the “Financial Measures” section below.
Revenues, Costs and Expenses
Our revenues for the year ended December 31, 2025 decreased $30.4 million, or 2%, from the year ended December 31, 2024, and our costs and expenses (excluding the impairment expense in 2024) decreased $75.7 million, or 5%, between the two periods, with a net increase to operating income (excluding the impairment expense in 2024) of $45.3 million. The increase in our operating income during 2025 is primarily due to: (i) our offshore pipeline transportation segment as a result of the contractual MVCs on our 100% owned SYNC Pipeline and 64% owned CHOPS Pipeline associated with the Shenandoah deepwater development that began in June 2025; (ii) a subsequent ramp-up in production from the Shenandoah development in excess of the MVCs during the fourth quarter 2025; and (iii) an overall increase in volumes across our offshore pipeline transportation network (see further discussion below). These were partially offset by: (i) an increase in depreciation and amortization of $25.4 million during 2025 (see further discussion below); and (ii) an increase in general and administrative expenses of $28.0 million during 2025 (see further discussion below). See further discussion below under “Segment Margin” regarding the activity in our individual operating segments.
A substantial portion of our revenues and costs are derived from our onshore transportation and services segment, which includes the purchase and sale of crude oil in our crude oil marketing business as well as our other refinery-centric onshore operations. Additionally, our revenues and costs are derived from the operations within our offshore pipeline transportation segment and our marine transportation segment. We describe the impact on revenues and costs for each of our businesses in more detail below.
As it relates to our crude oil marketing business, the average closing prices for West Texas Intermediate crude oil on the New York Mercantile Exchange (“NYMEX”) decreased approximately 15% to $65.39 per barrel in 2025 as compared to $76.63 per barrel in 2024. We expect changes in crude oil prices to continue to proportionately affect our revenues and costs attributable to our purchase and sale of crude oil, resulting in a minimal direct impact on Net income (loss), Segment Margin and Available Cash before Reserves. We have limited our direct commodity price exposure in our crude oil operations through the broad use of fee-based service contracts, back-to-back purchase and sale arrangements and hedges. As a result, changes in the price of crude oil would proportionately impact both our revenues and our costs, with a disproportionately smaller impact on Net income (loss), Segment Margin and Available Cash before Reserves. However, we do have some indirect exposure to certain changes in prices for crude oil, particularly if they are significant and extended. We tend to experience more demand for certain of our services when prices increase significantly over extended periods of time, and we tend to experience less demand for certain of our services when prices decrease significantly over extended periods of time. For additional information regarding certain of our indirect exposure to commodity prices, see our segment-by-segment analysis below and the section of our Annual Report entitled “ Risks Related to Our Business.”
We also have revenues and costs associated with our other refinery-centric operations including our sulfur services business, which we believe is one of the largest producers and marketers of NaHS in North and South America, and from our other logistical assets including pipelines, trucks, terminals, and rail unloading facilities.
We conduct our offshore crude oil and natural gas pipeline transportation and handling operations in the Gulf of America through our offshore pipeline transportation segment, which focuses on providing a suite of services to integrated and large independent energy companies who make intensive capital investments (often in excess of a billion dollars) to develop large-reservoir, long-lived crude oil and natural gas properties located primarily in offshore Texas, Louisiana and Mississippi. We own interests in various offshore crude oil and natural gas pipeline systems, platforms and related infrastructure and generate cash flows from fees to customers to utilize our assets. Our costs are primarily related to expenses incurred for the maintenance of our assets, employee compensation, and other operating costs.
Our marine transportation segment consists of (i) our inland marine fleet, which transports intermediate refined petroleum products, including asphalt, principally serving refineries and storage terminals along the Gulf Coast, Intracoastal Canal and western river systems of the U.S., primarily along the Mississippi River and its tributaries; (ii) our offshore marine fleet, which transports crude oil and refined petroleum products, principally serving refineries and storage terminals along the Gulf Coast, Eastern Seaboard, Great Lakes and Caribbean; and (iii) our modern, double-hulled tanker, M/T American Phoenix. Our revenues are driven by the demand for our barge services and associated utilization of our fleets, as well as the day rates we charge, which can be dependent upon market conditions (including supply and demand in the market), amongst other factors. Our costs are principally related to the costs required to maintain our fleets, employee compensation, and other operating costs.
Refiners are the shippers of a majority of the volumes transported on our onshore crude oil pipelines. Additionally, refiners contracted for the majority of the revenues from our marine transportation segment during 2025, which are used primarily to transport intermediate refined products (not crude oil) between refining complexes. Given these facts, we do not
expect changes in commodity prices to impact our Net income (loss), Segment Margin or Available Cash before Reserves derived from our offshore crude oil and natural gas pipeline transportation and handling operations in the same manner in which they impact our revenues and costs derived from the purchase and sale of crude oil.
Additionally, changes in certain of our operating costs between the respective periods, such as those associated with our offshore pipeline transportation and marine transportation segments, are not directly correlated with crude oil prices. We discuss certain of those costs in further detail below in our segment-by-segment analysis.
Included below is additional detailed discussion of the results of our operations focusing on Segment Margin and other costs including general and administrative expenses, depreciation and amortization, impairment expense, interest expense, net, and income taxes.
Segment Margin
We define Segment Margin as revenues less product costs, operating expenses and segment general and administrative expenses (all of which are net of the effects of our noncontrolling interest holders), plus or minus applicable Select Items (defined below in “Non-GAAP Financial Measures”) from continuing operations. Although we do not necessarily consider all of our Select Items to be non-recurring, infrequent or unusual, we believe that an understanding of these Select Items is important to the evaluation of our core operating results. See “Non-GAAP Financial Measures” for further discussion surrounding total Segment Margin.
The contribution of each of our segments to total Segment Margin in each of the last three years was as follows:
(1)The increase in operating costs are primarily related to an increase in costs associated with accommodating our higher level of volumes in 2025, such as fuel and drag reducing agent costs, which are often rebilled to the associated producers and do not have a significant impact to our Segment Margin.
(2)Offshore pipeline transportation Segment Margin includes distributions received from our offshore pipeline joint ventures accounted for under the equity method of accounting in 2025 and 2024, respectively.
(3)One of our wholly-owned subsidiaries (GEL Offshore Pipeline, LLC, or “GOPL”) owns our undivided interest in the Eugene Island pipeline system.
(4)Volumes are the product of our effective ownership interest throughout the year multiplied by the relevant throughput over the given year.
Offshore pipeline transportation Segment Margin for 2025 increased $52.9 million, or 16%, from 2024, primarily due to: (i) the contractual MVCs on our 100% owned SYNC Pipeline and 64% owned CHOPS Pipeline associated with the deepwater Shenandoah development that began in June 2025 and a subsequent ramp-up in production from the Shenandoah development in excess of the MVCs during the fourth quarter 2025, and (ii) an increase to other MVCs on our 64% owned CHOPS Pipeline during 2025, including those related to the Warrior and Winterfell developments. Production volumes from the Shenandoah FPS are life-of-lease dedicated to our 100% owned SYNC Pipeline and further downstream to our 64% owned CHOPS Pipeline. The Shenandoah FPS achieved first oil production in late July 2025 and we have seen a ramp-up in volumes from the Shenandoah FPS to over 90 MBbls/day during the fourth quarter of 2025. Additionally, production from the Salamanca FPS, which ties into our existing SEKCO Pipeline for further transportation downstream on our Poseidon Pipeline, came on-line at the end of September. Production from the initial three wells has since ramped up to over 30 MBbls/day in December 2025. A fourth well is planned to be drilled and completed in the second quarter of 2026, with the potential for a fifth well to be drilled and completed as early as the fourth quarter of 2026, at which point Salamanca production levels are anticipated to approach 50 to 60 MBbls/day.
Partially offsetting these increases to Segment Margin were decreases primarily due to: (i) an economic step-down in the rate on a certain existing life-of-lease transportation dedication beginning in the third quarter of 2024 as we reached the 10-year anniversary of a certain existing life-of-lease dedication, which resulted in the contractual economic step-down of the associated transportation rate; and (ii) an increase in producer downtime in 2025 compared to 2024 as a result of several wells being shut in due to certain sub-sea operational and technical challenges that began in the second quarter of 2024 and continued to impact our production results for a majority of 2025. As of December 31, 2025, most of these mechanical issues were resolved by our producer customers.
Marine Transportation Segment
Within our marine transportation segment, we own a fleet of 87 barges (78 inland and 9 offshore) with a combined transportation capacity of 3.0 million barrels, 43 push/tow boats (33 inland and 10 offshore), and a 330,000 barrel capacity ocean going tanker, the M/T American Phoenix. Operating results for our marine transportation segment were as follows:
Year Ended December 31,
2025
2024
Revenues (in thousands):
Inland freight revenues
$
131,415
$
146,237
Offshore freight revenues
124,710
107,935
Other rebill revenues(1)
63,373
67,444
Total segment revenues
$
319,498
$
321,616
Operating costs, excluding non-cash charges for long-term incentive compensation and other non-cash expenses(1)
(203,808)
(196,613)
Segment Margin (in thousands)
$
115,690
$
125,003
Fleet Utilization:(2)
Inland Barge Utilization
95.2
%
98.8
%
Offshore Barge Utilization
95.4
%
97.7
%
(1) Under certain of our marine contracts, we “rebill” our customers for a portion of our operating costs.
(2) Utilization rates are based on a 365 day year, as adjusted for planned downtime and drydocking.
Marine Transportation Segment Margin for 2025 decreased $9.3 million, or 7%, from 2024. We experienced slightly lower utilization rates during 2025 in our inland business primarily due to a temporary decline in refinery utilization during the first quarter of 2025 and a decline in Midwest refinery demand for black oil equipment as a result of changing crude slates in the third quarter of 2025. This decrease in Segment Margin from our inland marine business was partially offset by an increase in Segment Margin from our offshore marine business primarily as a result of fewer dry-docking days in our offshore fleet. In addition, the M/T American Phoenix, which is under contract through mid-2027, benefited from a contractual rate increase during 2025 compared to 2024.
Our onshore transportation and services segment includes terminaling, blending, storing, and marketing of crude oil, and transporting of crude oil and refined products, as well as the processing of high sulfur (or “sour”) gas streams for refineries to remove the sulfur, and selling the related by-product, NaHS. Our onshore transportation and services segment utilizes an integrated set of pipelines, storage tanks, terminals, facilities, trucks and barges to facilitate the movement of crude oil and refined products on behalf of producers, refiners and other customers. This segment includes crude oil and refined products pipelines, terminals, rail unloading facilities, and refinery processing locations operating primarily within the U.S. Gulf Coast market. In addition, we utilize our trucking fleet that supports the purchase and sale of gathered and bulk-purchased crude oil as well as the sale and delivery of NaHS and NaOH (also known as caustic soda) to customers. Through these assets we offer our customers a full suite of services, including the following as of December 31, 2025:
•facilitating the transportation of crude oil and refined products from producers and from our terminals, as well as those owned by third parties, to refineries via pipelines and trucks;
•purchasing/selling and/or transporting, storing, and blending crude oil from the wellhead to markets for ultimate use in refining;
•purchasing products from refiners, transporting those products to one of our terminals and blending those products to a quality that meets the requirements of our customers, storing, and selling those products (primarily fuel oil, asphalt and other heavy refined products) to wholesale markets;
•unloading railcars at our crude-by-rail terminals;
•providing sulfur removal services from crude oil processing operations at refining or petrochemical processing facilities;
•operating storage and transportation assets in relation to our sulfur removal services; and
•selling NaHS and caustic soda to large industrial and commercial companies.
We also may use our terminal facilities to take advantage of contango market conditions for crude oil gathering and marketing and to capitalize on regional opportunities which arise from time to time for crude oil.
Despite crude oil being considered a somewhat homogeneous commodity, many refiners are very particular about the quality of crude oil feedstock they process. Many U.S. refineries have distinct configurations and product slates that require crude oil with specific characteristics, such as gravity, sulfur content and metals content. The refineries evaluate the costs to obtain, transport and process their preferred feedstocks. That particularity provides us with opportunities to help the refineries in our areas of operation identify crude oil sources and transport crude oil meeting their requirements. The imbalances and inefficiencies relative to meeting the refiners’ requirements may also provide opportunities for us to utilize our purchasing and logistical skills to meet their demands. The pricing in the majority of our crude oil purchase contracts contains a market price component and a deduction to cover the cost of transportation and to provide us with a margin. Contracts sometimes contain a grade differential which considers the chemical composition of the crude oil and its appeal to different customers. Typically, the pricing in a contract to sell crude oil will consist of the market price components and the grade differentials. The margin on individual transactions is then dependent on our ability to manage our transportation costs and to capitalize on grade differentials.
Crude oil and products costs, excluding unrealized gains and losses from derivative transactions
(452,079)
(599,845)
Operating costs, excluding non-cash expenses
(175,327)
(186,762)
Other
3,975
7,385
Segment Margin
$
76,469
$
71,353
Volumetric Data (average Bbls/day unless otherwise noted):
Onshore crude oil pipelines:
Texas
99,322
65,059
Jay
5,847
5,189
Mississippi
1,099
2,390
Louisiana(1)
49,851
55,687
Onshore crude oil pipelines total
156,119
128,325
Crude oil product sales
18,785
21,591
Rail unload volumes
23,747
13,500
NaHS volumes (Dry short tons “DST”)
91,523
104,322
NaOH (caustic soda) volumes (DST sold)
36,226
40,108
(1)Total daily volumes for the years ended December 31, 2025 and 2024 include 21,348 and 19,298 Bbls/day, respectively, of intermediate refined products and 27,753 and 36,046 Bbls/day, respectively, of crude oil associated with our Port of Baton Rouge Terminal pipelines.
Segment Margin for our onshore transportation and services segment increased $5.1 million, or 7%, in 2025 as compared to 2024. The increase is primarily due to an increase in the rail unload volumes at our Scenic Station facility and an overall increase in volumes on our onshore crude oil pipeline systems principally driven by an increase in volumes on our Texas pipeline system, which is a key destination point for various grades of crude oil produced in the Gulf of America including those transported on our 64% owned CHOPS Pipeline.
In our sulfur services business we experienced a decline in NaHS and NaOH sales volumes in 2025 as compared to 2024. Despite the decrease in sales volumes, we saw a slight increase in Segment Margin in 2025 primarily due to operational and logistical cost improvements as well as an improvement to our NaHS sales mix.
General and administrative expenses not separately identified below:
Corporate
$
43,729
$
52,700
Segment
2,678
2,712
Long-term incentive based compensation plan expense
12,975
2,857
Third-party costs related to business development activities and growth projects
26,957
60
Total general and administrative expenses
$
86,339
$
58,329
Total general and administrative expenses increased $28.0 million between 2025 and 2024. This increase is primarily due to: (i) the increase in third party costs related to business development activities and growth projects as a result of the transaction costs incurred associated with the sale of the Alkali Business on February 28, 2025; and (ii) how we valued the outstanding long-term incentive compensation awards in each period. This increase was partially offset by a reduction in corporate general and administrative expenses as a result of 2024 experiencing higher costs as a result of us conforming our short-term cash incentive programs to industry standards at that time.
Depreciation and amortization expense
Year Ended December 31,
2025
2024
(in thousands)
Depreciation expense
$
221,803
$
196,245
Amortization expense
10,269
10,441
Total depreciation and amortization expense
$
232,072
$
206,686
Total depreciation and amortization expense increased $25.4 million between 2025 and 2024. This increase is primarily attributable to our continued growth and maintenance capital expenditures and placing new assets into service, including assets associated with our CHOPS expansion project and SYNC Pipeline, subsequent to the period ended December 31, 2024.
Impairment expense
In the fourth quarter of 2024, we terminated an on-going project related to the integration of certain of our corporate enterprise resource planning systems and we impaired the costs incurred to date. As a result, we recognized an impairment charge of $43.0 million. We did not record any impairment expense for the year ended December 31, 2025.
Interest expense, net
Year Ended December 31,
2025
2024
(in thousands)
Interest expense, senior secured credit facility (including commitment fees), net
$
12,354
$
28,150
Interest expense, senior unsecured notes
259,315
269,841
Amortization of debt issuance costs, premium and discount
9,758
11,067
Capitalized interest
(16,698)
(47,183)
Interest expense, net
$
264,729
$
261,875
Interest expense, net increased $2.9 million between 2025 and 2024 primarily due to a decrease in capitalized interest in 2025, which is primarily attributable to the completion of the CHOPS expansion project and the SYNC Pipeline subsequent to 2024. This increase in interest expense, net was partially offset by a decrease in interest expense associated with our senior unsecured notes and a decrease in interest expense associated with our senior secured credit facility. The decrease in interest expense associated with our senior unsecured notes was primarily related to the redemption of our 2027 Notes on April 3, 2025. The decrease in interest expense, net associated with our senior secured credit facility during 2025 was primarily a result of a reduction in the average borrowings outstanding during the period compared to 2024.
A portion of our operations are owned by wholly-owned corporate subsidiaries that are taxable as corporations. As a result, a substantial portion of the income tax expense we record relates to the operations of those corporations, and will vary from period to period as a percentage of our income before taxes based on the percentage of our income or loss that is derived from those corporations. The balance of the income tax expense we record relates to state taxes imposed on our operations that are treated as income taxes under generally accepted accounting principles and foreign income taxes.
Other Consolidated Results
Net Income from Continuing Operations for the year ended December 31, 2025 included a loss of $9.8 million associated with the following: (i) a net loss of $8.9 million associated with the redemption premium and the write-off of the related unamortized debt issuance costs and premium on the remaining $406.2 million of 2027 Notes that were redeemed in the year; and (ii) a net loss of $0.8 million associated with the write-off of unamortized credit facility issuance costs as a result of the Second Amendment to our credit agreement. These amounts are included within “Other expense” on the Consolidated Statement of Operations.
Net Loss from Continuing Operations for the year ended December 31, 2024 included a net loss of $15.4 million associated with the following: (i) a net loss of $14.0 million associated with the tender fee and write-off of the related unamortized debt issuance costs and premium on the initial $575.0 million of our 2027 Notes that were tendered and redeemed in the year; and (ii) a loss of $1.4 million from the write-off of the unamortized issuance costs associated with the redemption of our 6.250% senior unsecured notes due May 15, 2026 (the “2026 Notes”). These amounts are included within “Other expense” on the Consolidated Statement of Operations.
(1)Offshore pipeline transportation Segment Margin includes distributions received from our offshore pipeline joint ventures accounted for under the equity method of accounting in 2024 and 2023, respectively.
(2)One of our wholly-owned subsidiaries, GOPL, owns our undivided interest in the Eugene Island pipeline system.
(3)Volumes are the product of our effective ownership interest throughout the year multiplied by the relevant throughput over the given year.
Offshore pipeline transportation Segment Margin for 2024 decreased $73.9 million, or 18%, from 2023, primarily due to: (i) an economic step-down in the rate on a certain existing life-of-lease transportation dedication; (ii) producer underperformance at several of our major host platforms; and (iii) an increase in operating costs. At the beginning of the third quarter of 2024, we reached the 10-year anniversary of a certain existing life-of-lease dedication, which resulted in the contractual economic step-down of the associated transportation rate. Additionally, during the second half of 2024, there was an increase in producer downtime as a result of several wells being shut in due to certain sub-sea operational and technical challenges. The production from these wells impacted our results as they are molecules that we touch multiple times throughout our oil and natural gas pipeline infrastructure.
Operating results for our marine transportation segment were as follows:
Year Ended December 31,
2024
2023
Revenues (in thousands):
Inland freight revenues
$
146,237
$
129,023
Offshore freight revenues
107,935
113,990
Other rebill revenues(1)
67,444
84,451
Total segment revenues
$
321,616
$
327,464
Operating costs, excluding non-cash charges for long-term incentive compensation and other non-cash expenses(1)
(196,613)
(217,041)
Segment Margin (in thousands)
$
125,003
$
110,423
Fleet Utilization:(2)
Inland Barge Utilization
98.8
%
100.0
%
Offshore Barge Utilization
97.7
%
98.1
%
(1) Under certain of our marine contracts, we “rebill” our customers for a portion of our operating costs.
(2) Utilization rates are based on a 365 day year, as adjusted for planned downtime and drydocking.
Marine Transportation Segment Margin for 2024 increased $14.6 million, or 13%, from 2023. This increase is primarily attributable to an increase in our overall day rates in our inland and offshore business, including the M/T American Phoenix, during 2024. The increase in day rates more than offset the impact to Segment Margin from the increased number of planned regulatory dry-docking days in our offshore fleet during 2024 as compared to 2023. In addition, we saw strong demand from our barge services to move intermediate and refined products keeping utilization rates high across both
periods. This strong demand from our customers as well as the lack of new supply of similar type vessels and the continued
retirement of older vessels in the market have contributed to the increase in day rates. The M/T American Phoenix started a new three-and-a-half year contract at the beginning of 2024 with a credit-worthy counterparty at the highest day rate we have received since we first purchased the vessel in 2014.
Crude oil and products costs, excluding unrealized gains and losses from derivative transactions
(599,845)
(637,092)
Operating costs, excluding non-cash expenses
(186,762)
(207,556)
Other
7,385
8,173
Segment Margin
$
71,353
$
73,183
Volumetric Data (average Bbls/day unless otherwise noted):
Onshore crude oil pipelines:
Texas
65,059
70,032
Jay
5,189
5,793
Mississippi
2,390
4,635
Louisiana(1)
55,687
65,895
Onshore crude oil pipelines total
128,325
146,355
Crude oil product sales
21,591
23,170
Rail unload volumes
13,500
—
NaHS volumes (Dry short tons “DST”)
104,322
106,857
NaOH (caustic soda) volumes (DST sold)
40,108
41,855
(1) Total daily volumes for the years ended December 31, 2024 and 2023 include 19,298 and 32,458 Bbls/day, respectively, of intermediate refined products and 36,046 and 33,019 Bbls/day, respectively, of crude oil associated with our Port of Baton Rouge Terminal pipelines.
Segment Margin for our onshore transportation and facilities segment decreased $1.8 million, or 3%, in 2024 as compared to 2023. The decrease is primarily due to lower NaHS sales volumes and pricing and an overall decrease in volumes on our onshore crude oil pipeline systems. In our sulfur services business, we faced challenges on the production side at our largest host refinery as well as continued pressures on demand in South America, including competitive pressures from Chinese flake, which had a negative impact on pricing during 2024. This decrease in Segment Margin was partially offset by an increase in the rail unload volumes at our Scenic Station facility.
General and administrative expenses not separately identified below:
Corporate
$
52,700
$
48,291
Segment
2,712
2,751
Long-term incentive based compensation plan expense
2,857
13,405
Third-party costs related to business development activities and growth projects
60
105
Total general and administrative expenses
$
58,329
$
64,552
Total general and administrative expenses decreased $6.2 million, or 10%, between 2024 and 2023. The decrease is primarily due to the assumptions used to value the outstanding awards under our long-term incentive compensation plan during 2024 as compared to 2023. This decrease was partially offset by higher corporate general and administrative expenses as a result of us conforming our short-term cash incentive programs to industry standards during 2024.
Depreciation and amortization expense
Year Ended December 31,
2024
2023
(in thousands)
Depreciation expense
$
196,245
$
189,008
Amortization expense
10,441
10,108
Total depreciation and amortization expense
$
206,686
$
199,116
Total depreciation and amortization expense increased $7.6 million, or 4%, between 2024 and 2023. This increase is primarily attributable to our continued growth and maintenance capital expenditures and placing new assets into service. This increase was partially offset by an acceleration of depreciation on our asset retirement obligation assets as a result of updates to the estimated timing and costs associated with certain of our non-core offshore gas assets in 2023.
Impairment expense
In the fourth quarter of 2024, we terminated an on-going project related to the integration of certain of our corporate enterprise resource planning systems and we impaired the costs incurred to date. As a result, we recognized an impairment charge of $43.0 million. We did not record any impairment expense for the year ended December 31, 2023.
Interest expense, net
Year Ended December 31,
2024
2023
(in thousands)
Interest expense, senior secured credit facility (including commitment fees), net
$
28,150
$
22,528
Interest expense, senior unsecured notes
269,841
231,006
Amortization of debt issuance costs, premium and discount
Interest expense, net increased $42.8 million, or 20%, between 2024 and 2023 primarily due to an increase in interest associated with our senior unsecured notes and senior secured credit facility. The increase in interest expense associated with our senior unsecured notes was primarily related to: (i) the issuance of our 8.250% senior unsecured notes due January 15, 2029, issued on December 7, 2023 in aggregate principal amount of $600.0 million (the “2029 Notes”), which have a higher principal and interest rate as compared to our 6.500% senior unsecured notes due October 1, 2025 (the “2025 Notes”) that were partially tendered in December 2023 and ultimately redeemed in January 2024; and (ii) the issuance of $700.0 million in aggregate principal amount of 7.875% senior unsecured notes due May 15, 2032 (the “2032 Notes”) in May 2024, which have a higher principal and interest rate as compared to our 2026 Notes that were redeemed in June 2024. The increase in interest expense associated with our senior secured credit facility is primarily due to higher average outstanding indebtedness during 2024 and an increase in the SOFR rate, which is one of the main components of our interest rate, compared to 2023.
This increase was partially offset by higher capitalized interest during 2024 as a result of our increased capital expenditures associated with our offshore growth capital construction projects during the year.
Other Consolidated Results
Net Loss from Continuing Operations for the year ended December 31, 2024 included a net loss of $15.4 million associated with the following: (i) a net loss of $14.0 million associated with the tender fee and write-off of the related unamortized debt issuance costs and premium on the initial $575.0 million of our 2027 Notes that were tendered and redeemed in the year; and (ii) a loss of $1.4 million from the write-off of the unamortized issuance costs associated with the redemption of our 6.250% senior unsecured notes due May 15, 2026 (the “2026 Notes”). These amounts are included within “Other expense” on the Consolidated Statement of Operations.
Net Income Continuing Operations for the year ended December 31, 2023 included a loss of $4.6 million associated with the tender and write-off of the unamortized issuance costs associated with the 2024 Notes and 2025 Notes, which is included within “Other expense” on the Consolidated Statement of Operations.
Non- GAAP Financial Measures
General
To help evaluate our business, this Annual Report on Form 10-K includes the non-generally accepted accounting principles (“non-GAAP”) financial measure of Available Cash before Reserves. We also present total Segment Margin as if it were a non-GAAP measure. Our non-GAAP measures may not be comparable to similarly titled measures of other companies because such measures may include or exclude other specified items. The accompanying schedules provide reconciliations of these non-GAAP financial measures to their most directly comparable financial measures calculated in accordance with generally accepted accounting principles in the United States of America (GAAP). A reconciliation of Income (loss) from continuing operations before income taxes to total Segment Margin is included in our segment disclosure in Note 14 to our Consolidated Financial Statements in Item 8. Our non-GAAP financial measures should not be considered (i) as alternatives to GAAP measures of liquidity or financial performance or (ii) as being singularly important in any particular context; they should be considered in a broad context with other quantitative and qualitative information. Our Available Cash before Reserves and total Segment Margin measures are just two of the relevant data points considered from time to time.
When evaluating our performance and making decisions regarding our future direction and actions (including making discretionary payments, such as quarterly distributions) our board of directors and management team have access to a wide range of historical and forecasted qualitative and quantitative information, such as our financial statements; operational information; various non-GAAP measures; internal forecasts; credit metrics; analyst opinions; performance, liquidity and similar measures; income; cash flow expectations for us; and certain information regarding some of our peers. Additionally, our board of directors and management team analyze, and place different weight on, various factors from time to time. We believe that investors benefit from having access to the same financial measures being utilized by management, lenders, analysts and other market participants. We attempt to provide adequate information to allow each individual investor and other external user to reach her/his own conclusions regarding our actions without providing so much information as to overwhelm or confuse such investor or other external user. Our non-GAAP financial measures should not be considered as an alternative to GAAP measures such as net income, operating income, cash flow from operating activities or any other GAAP measure of liquidity or financial performance.
Segment Margin
We define Segment Margin as revenues less product costs, operating expenses, and segment general and administrative expenses (all of which are net of the effects of our noncontrolling interest holders), plus or minus applicable Select Items (defined below) from our continuing operations. Although we do not necessarily consider all of our Select Items to be non-recurring, infrequent or unusual, we believe that an understanding of these Select Items is important to the evaluation
of our core operating results. Our CODM evaluates segment performance based on a variety of measures including Segment Margin, segment volumes, and, where relevant, capital investment.
A reconciliation of Income (loss) from continuing operations before income taxes to total Segment Margin is included in our segment disclosure in Note 14 to our Consolidated Financial Statements in Item 8.
Available Cash before Reserves
Purposes, Uses and Definition
Available Cash before Reserves, often referred to by others as distributable cash flow, is a quantitative standard used throughout the investment community with respect to publicly-traded partnerships and is commonly used as a supplemental financial measure by management and by external users of financial statements such as investors, commercial banks, research analysts and rating agencies, to aid in assessing, among other things:
(1) the financial performance of our assets;
(2) our operating performance;
(3) the viability of potential projects, including our cash and overall return on alternative capital investments as compared to those of other companies in the midstream energy industry;
(4) the ability of our assets to generate cash sufficient to satisfy certain non-discretionary cash requirements, including interest payments and certain maintenance capital requirements; and
(5) our ability to make certain discretionary payments, such as distributions on our preferred and common units, growth capital expenditures, certain maintenance capital expenditures and early payments of indebtedness.
We define Available Cash before Reserves (“Available Cash before Reserves”) as Net income (loss) attributable to Genesis Energy, L.P. before interest, taxes, depreciation, and amortization (including impairment, write-offs, accretion and similar items) after eliminating other non-cash revenues, expenses, gains, losses and charges (including any loss on asset dispositions), plus or minus certain other select items that we view as not indicative of our core operating results (collectively, “Select Items”), as adjusted for certain items, the most significant of which in the relevant reporting periods have been the sum of maintenance capital utilized, interest expense, net, cash tax expense and cash distributions attributable to our Class A Convertible Preferred unitholders. Although we do not necessarily consider all of our Select Items to be non-recurring, infrequent or unusual, we believe that an understanding of these Select Items is important to the evaluation of our core operating results. The most significant Select Items in the relevant reporting periods are set forth below.
Year Ended December 31,
2025
2024
I.
Applicable to all Non-GAAP Measures
(in thousands)
Differences in timing of cash receipts for certain contractual arrangements(1)
$
(19,897)
$
(601)
Certain non-cash items:
Unrealized losses (gains) on derivative transactions excluding fair value hedges, net of changes in inventory value
(1)Represents the difference in timing of cash receipts from customers during the period and the revenue we recognize in accordance with GAAP on our related contracts. For purposes of our non-GAAP measures, we add those amounts in the period of payment and deduct them in the period in which GAAP recognizes them.
(2)2025 includes a loss of $8.9 million associated with the redemption premium and the write-off of the related unamortized debt issuance costs and premium on the remaining $406.2 million of 2027 Notes that were redeemed in 2025 and a net loss of $0.8 million associated with the write-off of unamortized credit facility issuance costs as a result of the Second Amendment to the credit agreement. 2024 includes a net loss of $14.0 million associated with the tender fee and write-off of the related unamortized debt issuance costs and premium on the initial $575.0 million of our 2027 Notes that were tendered and redeemed in 2024 and a loss of $1.4 million from the write-off of the unamortized issuance costs associated with our 2026 Notes that were redeemed during the year.
(3)Represents the net effect of adding distributions from equity investees and deducting earnings of equity investees net to us.
(4)Represents Select Items applicable to Adjusted EBITDA and Available Cash before Reserves.
Disclosure Format Relating to Maintenance Capital
We use a modified format relating to maintenance capital requirements because our maintenance capital expenditures vary materially in nature (discretionary vs. non-discretionary), timing and amount from time to time. We believe that, without such modified disclosure, such changes in our maintenance capital expenditures could be confusing and potentially misleading to users of our financial information, particularly in the context of the nature and purposes of our Available Cash before Reserves measure. Our modified disclosure format provides those users with information in the form of our maintenance capital utilized measure (which we deduct to arrive at Available Cash before Reserves). Our maintenance capital utilized measure constitutes a proxy for non-discretionary maintenance capital expenditures and it takes into consideration the relationship among maintenance capital expenditures, operating expenses and depreciation from period to period.
Maintenance Capital Requirements
Maintenance capital expenditures are capitalized costs that are necessary to maintain the service capability of our existing assets, including the replacement of any system component or equipment which is worn out or obsolete. Maintenance capital expenditures can be discretionary or non-discretionary, depending on the facts and circumstances.
Prior to 2014, substantially all of our maintenance capital expenditures were (a) related to our pipeline assets and similar infrastructure, (b) non-discretionary in nature and (c) immaterial in amount as compared to our Available Cash before Reserves measure. Those historical expenditures were non-discretionary (or mandatory) in nature because we had very little (if any) discretion as to whether or when we incurred them. We had to incur them in order to continue to operate the related pipelines in a safe and reliable manner and consistently with past practices. If we had not made those expenditures, we would not have been able to continue to operate all or portions of those pipelines, which would not have been economically feasible. An example of a non-discretionary (or mandatory) maintenance capital expenditure would be replacing a segment of an old pipeline because one can no longer operate that pipeline safely, legally and/or economically in the absence of such replacement.
Beginning with 2014, we believe a substantial amount of our maintenance capital expenditures from time to time will be (a) related to our assets other than pipelines, such as our marine vessels, trucks and similar assets, (b) discretionary in nature and (c) potentially material in amount as compared to our Available Cash before Reserves measure. Those expenditures will be discretionary (or non-mandatory) in nature because we will have significant discretion as to whether or when we incur them. We will not be forced to incur them in order to continue to operate the related assets in a safe and reliable manner. If we chose not make those expenditures, we would be able to continue to operate those assets economically, although in lieu of maintenance capital expenditures, we would incur increased operating expenses, including maintenance expenses. An example of a discretionary (or non-mandatory) maintenance capital expenditure would be replacing an older marine vessel with a new marine vessel with substantially similar specifications, even though one could continue to economically operate the older vessel in spite of its increasing maintenance and other operating expenses.
In summary, as we continue to expand certain non-pipeline portions of our business, we are experiencing changes in the nature (discretionary vs. non-discretionary), timing and amount of our maintenance capital expenditures that merit a more detailed review and analysis than was required historically. Management’s increasing ability to determine if and when to incur certain maintenance capital expenditures is relevant to the manner in which we analyze aspects of our business relating to discretionary and non-discretionary expenditures. We believe it would be inappropriate to derive our Available Cash before Reserves measure by deducting discretionary maintenance capital expenditures, which we believe are similar in nature in this context to certain other discretionary expenditures, such as growth capital expenditures, distributions/dividends and equity buybacks. Unfortunately, not all maintenance capital expenditures are clearly discretionary or non-discretionary in nature. Therefore, we developed a measure, maintenance capital utilized, that we believe is more useful in the determination of Available Cash before Reserves.
We believe our maintenance capital utilized measure is the most useful quarterly maintenance capital requirements measure to use to derive our Available Cash before Reserves measure. We define our maintenance capital utilized measure as that portion of the amount of previously incurred maintenance capital expenditures that we utilize during the relevant quarter, which would be equal to the sum of the maintenance capital expenditures we have incurred for each project/component in prior quarters allocated ratably over the useful lives of those projects/components.
Our maintenance capital utilized measure constitutes a proxy for non-discretionary maintenance capital expenditures and it takes into consideration the relationship among maintenance capital expenditures, operating expenses and depreciation from period to period. Because we did not use our maintenance capital utilized measure before 2014, our maintenance capital utilized calculations will reflect the utilization of solely those maintenance capital expenditures incurred since December 31, 2013.
Available Cash before Reserves for the years ended December 31, 2025 and 2024 was as follows:
Year Ended December 31,
2025
2024
(in thousands)
Net income (loss) attributable to Genesis Energy, L.P.
$
(440,403)
$
(63,947)
Income tax expense
806
1,770
Depreciation, amortization and accretion
243,383
217,776
Impairment expense
—
43,003
Plus (minus) Select Items, net
23,837
23,287
Maintenance capital utilized(1)
(61,500)
(73,750)
Cash tax expense
(233)
(1,278)
Distributions to preferred unitholders
(64,546)
(87,576)
Loss on disposal of discontinued operations
432,193
—
Other non-cash items from discontinued operations(2)
15,584
100,116
Available Cash before Reserves
$
149,121
$
159,401
(1)Maintenance capital expenditures in 2025 and 2024 were $71.5 million and $94.6 million, respectively, which excludes maintenance capital expenditures of $4.6 million and $78.3 million in 2025 and 2024, respectively, associated with the Alkali Business that was sold on February 28, 2025. Our maintenance capital expenditures are principally associated with our marine transportation businesses.
(2)Includes non-cash items such as depreciation, depletion and amortization and unrealized gains or losses on derivative transactions, amongst other items.
Liquidity and Capital Resources
General
On May 9, 2024, we issued $700.0 million in aggregate principal amount of 7.875% senior unsecured notes due May 15, 2032 (the “2032 Notes”). Interest payments are due May 15 and November 15 of each year. The issuance of our 2032 Notes generated net proceeds of approximately $688 million, net of issuance costs incurred. The net proceeds were used to redeem all of our existing 6.25% senior unsecured notes due May 15, 2026 (the “2026 Notes”), $339.3 million in principal amount of which were outstanding, and pay the related accrued interest. The remaining proceeds were used to repay a portion of the borrowings outstanding under our senior secured credit facility and for general partnership purposes.
On July 19, 2024, we entered into the Seventh Amended and Restated Credit Agreement (our “credit agreement”) to replace our Sixth Amended and Restated Credit Agreement. The credit agreement provided for a $900 million senior secured revolving credit facility that matures on September 1, 2028, subject to extension at our request for one additional year on up to two occasions and subject to certain conditions, provided that if more than $150 million of our 2028 Notes remain outstanding as of November 2, 2027, the credit agreement matures on such date.
On December 11, 2024 we entered into the First Amendment to the Seventh Amended and Restated Credit Agreement, which resulted in several changes to the credit agreement terms including; (i) an increase of the maximum consolidated leverage ratio covenant from 5.50 to 1.00 to 5.75 to 1.00 for the fiscal quarters ending December 31, 2024 through September 30, 2025, returning to 5.50 to 1.00 thereafter; and (ii) changes to the minimum consolidated interest coverage ratio covenant from 2.40 to 1.00 to (A) 2.00 to 1.00 for the fiscal quarters ending December 31, 2024 through December 31, 2025, (B) 2.25 to 1.00 for the fiscal quarters ending March 31, 2026 through December 31, 2026, and (C) 2.50 to 1.00 at any time thereafter.
On December 19, 2024, we issued $600 million in aggregate principal amount of 8.000% senior unsecured notes due May 15, 2033 (the “2033 Notes”). Interest payments are due May 15 and November 15 of each year. The issuance of our 2033 Notes generated net proceeds of approximately $589.3 million, net of issuance costs incurred. We used the net proceeds to purchase $575 million in principal of our 2027 Notes (leaving $406.2 million of principal outstanding as of December 31, 2024 on the 2027 Notes) and pay the accrued interest, tender premium and fees on the notes that were validly tendered.
On February 28, 2025 we completed the sale of the Alkali Business to an indirect affiliate of WE Soda Ltd for a gross purchase price of $1.425 billion. We received cash of approximately $1.0 billion, which reflects the net proceeds after the assumption of our then outstanding Alkali senior secured notes by an indirect affiliate of WE Soda Ltd, amongst other purchase price adjustments. We used a portion of the cash proceeds to pay down the outstanding balance on our senior secured credit facility as of February 28, 2025, repurchase certain of our outstanding Class A Convertible Preferred Units (discussed further below), redeem a portion of our outstanding senior unsecured notes (discussed further below), and for general partnership purposes.
In connection with the sale of the Alkali Business, we also entered into the Second Amendment to the credit agreement. This amendment provides for: (i) a reduction from $900 million to $800 million of total borrowing capacity under our senior secured credit facility; (ii) unlimited cash netting against our outstanding debt for purposes of our Consolidated Leverage calculation if our credit facility is undrawn at the end of a reporting period, otherwise a maximum netting of $25 million is allowed; and (iii) an increased permitted investment basket under certain circumstances that will allow us to opportunistically purchase existing private or public securities across our capital structure.
On March 6, 2025, we entered into purchase agreements with certain Class A Convertible Preferred unitholders whereby we purchased a total of 7,416,196 Class A Convertible Preferred Units at an average purchase price of $35.40 per unit. In addition, on February 3, 2026, we entered into a purchase agreement with one of our Class A Convertible Preferred unitholders whereby we purchased 741,620 Class A Convertible Preferred Units at a purchase price of $33.71 per unit. The purchase of these Class A Convertible Preferred Units, which carried an annual coupon rate of 11.24%, has allowed us to lower our overall cost of capital.
On April 3, 2025, using a portion of the cash proceeds from the sale of the Alkali Business, we redeemed the remaining $406.2 million of principal outstanding on the 2027 Notes, and paid the related accrued interest and redemption premium on those notes that were redeemed.
The successful completion of the above events, and in particular the sale of the Alkali Business, has kick-started the process of simplifying our capital structure, lowered our overall cost of capital and has resulted in no scheduled maturities of our senior unsecured notes or our senior secured credit facility until 2028. In addition, we have $788.6 million of borrowing capacity available under our senior secured credit facility, subject to compliance with covenants in the credit agreement.
We anticipate that our future internally-generated funds and the funds available under our senior secured credit facility will allow us to meet our ordinary course capital needs. Our primary sources of liquidity have been cash flows from operations, proceeds from the sale of assets, borrowing availability under our senior secured credit facility, the proceeds from issuances of equity (common and preferred) and senior unsecured or secured notes and the creation of strategic arrangements to share capital costs through joint ventures or strategic alliances.
Our primary cash requirements consist of:
•working capital, primarily inventories and trade receivables and payables;
•routine operating expenses;
•growth capital (as discussed in more detail below) and maintenance projects;
•interest payments related to outstanding debt;
•asset retirement obligations;
•quarterly cash distributions to our preferred and common unitholders; and
•acquisitions of assets or businesses.
In addition, in an effort to return capital to our investors, we announced a common equity repurchase program (the “Repurchase Program”) on August 8, 2023. The Repurchase Program authorizes the repurchase from time to time of up to 10%
of our then outstanding Class A Common Units, or 12,253,922 units, via open market purchases or negotiated transactions conducted in accordance with applicable regulatory requirements. These repurchases may be made pursuant to a repurchase plan or plans that comply with Rule 10b5-1 under the Securities Exchange Act of 1934. The Repurchase Program does not create an obligation for us to acquire a particular number of Class A Common Units and any Class A Common Units repurchased will be canceled. The Repurchase Program will be reviewed again no later than December 31, 2026 and may be suspended or discontinued at any time prior thereto. During 2024 and 2025, we did not repurchase any Class A Common Units, and to date, we have purchased 114,900 Class A Common Units under the Repurchase Program.
Capital Resources
Our ability to satisfy future capital needs will depend on our ability to raise substantial amounts of additional capital from time to time, including through equity and debt offerings (public and private), borrowings under our senior secured credit facility and other financing transactions, and to implement our growth strategy successfully. No assurance can be made that we will be able to raise necessary funds on satisfactory terms.
At December 31, 2025, we had $6.4 million borrowed under our senior secured credit facility, with $28.1 million designated as a loan under the inventory sublimit. Our senior secured credit facility does not include a “borrowing base” limitation except with respect to our inventory loans. Due to the revolving nature of loans under our senior secured credit facility, additional borrowings and periodic repayments and re-borrowings may be made until the maturity date of our senior secured credit facility. The total amount available for borrowings under our senior secured credit facility at December 31, 2025 was $788.6 million, subject to compliance with covenants in the credit agreement.
At December 31, 2025, our long-term debt totaled approximately $3.1 billion, consisting of $6.4 million outstanding under our senior secured credit facility (including $28.1 million borrowed under the inventory sublimit tranche) and $3,079.4 million of senior unsecured notes. Our senior unsecured notes balance is comprised of $679.4 million of our 2028 Notes, $600.0 million of our 2029 Notes, $500.0 million of our 8.875% senior unsecured notes due April 15, 2030, issued on January 25, 2023 (the “2030 Notes”), $700.0 million of our 2032 Notes and $600.0 million of our 2033 Notes.
Future payment obligations related to our senior secured credit facility and senior unsecured notes as of December 31, 2025, including both principal and estimated interest payments, are summarized in the table below:
Interest Rate
Maturity Date
Principal
Estimated Annual Interest Payable
(in thousands)
Senior secured credit facility(1)
Varies
September 1, 2028
$
6,400
$
592
2028 Notes(2)
7.750%
February 1, 2028
679,360
52,650
2029 Notes(2)
8.250%
January 15, 2029
600,000
49,500
2030 Notes(2)
8.875%
April 15, 2030
500,000
44,375
2032 Notes(2)
7.875%
May 15, 2032
700,000
55,125
2033 Notes(2)
8.000%
May 15, 2033
600,000
48,000
Total estimated payments
$
3,085,760
$
250,242
(1)Amounts shown above for estimated interest payments represent the amounts that would be paid on an annual basis if the debt outstanding at December 31, 2025 remained outstanding and interest rates remained constant for the annual period.
(2)Each series of senior unsecured notes is further discussed and defined in Note 11 to our Consolidated Financial Statements in Item 8.
We have the right to redeem each of our series of senior unsecured notes beginning on specified dates as summarized below, at a premium to the face amount of such notes that varies based on the time remaining to maturity on such notes. Additionally, we may redeem up to 35% of the principal amount of each of our series of senior unsecured notes with the proceeds from an equity offering of our common units during certain periods. A summary of the applicable redemption periods is provided in the table below.
2028 Notes
2029 Notes
2030 Notes
2032 Notes
2033 Notes
Redemption right beginning on
February 1, 2023
January 15, 2026
April 15, 2026
May 15, 2027
May 15, 2028
Redemption of up to 35% of the principal amount of notes with the proceeds of an equity offering permitted prior to
N/A
N/A
April 15, 2026
May 15, 2027
May 15, 2028
For additional information on our long-term debt and covenants see Note 11 to our Consolidated Financial Statements in Item 8.
Class A Convertible Preferred Units
On September 1, 2017, we sold $750 million of Class A Convertible Preferred Units in a private placement, comprised of 22,249,494 units for a cash purchase price per unit of $33.71 (subject to certain adjustments, the “Issue Price”) to two initial purchasers. Our general partner executed an amendment to our partnership agreement in connection therewith, which, among other things, authorized and established the rights and preferences of our Class A Convertible Preferred Units. Our Class A Convertible Preferred Units are senior to all of our currently outstanding classes or series of limited partner interests with respect to distribution and/or liquidation rights. Holders of our Class A Convertible Preferred Units vote on an as-converted basis with holders of our common units and have certain class voting rights, including with respect to any amendment to the partnership agreement that would adversely affect the rights, preferences or privileges, or otherwise modify the terms, of those Class A Convertible Preferred Units. The Class A Convertible Preferred Units have an effective distribution rate of 11.24%, yielding a quarterly distribution of $0.9473. As of December 31, 2025, there were 15,695,722 Class A Convertible Preferred Units outstanding.
Shelf Registration Statements
We have the ability to issue additional equity and debt securities in the future to assist us in meeting our future liquidity requirements, particularly those related to opportunistically acquiring assets and businesses and constructing new facilities and refinancing outstanding debt.
We have a universal shelf registration statement (our “2024 Shelf”) on file with the SEC which we filed on April 16, 2024 to replace our existing universal shelf registration statement that expired on April 19, 2024. Our 2024 Shelf allows us to issue an unlimited amount of equity and debt securities in connection with certain types of public offerings. However, the receptiveness of the capital markets to an offering of equity and/or debt securities cannot be assured and may be negatively impacted by, among other things, our long-term business prospects and other factors beyond our control, including market conditions. Our 2024 Shelf is set to expire in April 2027.
Cash Flows from Operations
We generally utilize the cash flows we generate from our operations to fund our common and preferred distributions and working capital needs. Excess funds that are generated are used to repay borrowings under our senior secured credit facility and/or to fund a portion of our capital expenditures. Our operating cash flows can be impacted by changes in items of working capital, primarily variances in the carrying amount of inventory and the timing of payment of accounts payable and accrued liabilities related to capital expenditures and interest charges, and the timing of accounts receivable collections from our customers.
We typically sell our crude oil in the same month in which we purchase it, so we do not need to rely on borrowings under our senior secured credit facility to pay for such crude oil purchases, other than inventory. During such periods, our accounts receivable and accounts payable generally move in tandem as we make payments and receive payments for the purchase and sale of crude oil.
The storage of our inventory of crude oil can have a material impact on our cash flows from operating activities. In the month we pay for the stored crude oil, we borrow under our senior secured credit facility (or use cash on hand) to pay for the crude oil, utilizing a portion of our operating cash flows. Conversely, cash flow from operating activities increases during the period in which we collect the cash from the sale of the stored crude oil. Additionally, for our derivatives, we may be required
to deposit margin funds with the respective exchange when commodity prices increase as the value of the derivatives utilized to hedge the price risk in our inventory fluctuates. These deposits also impact our operating cash flows as we borrow under our senior secured credit facility or use cash on hand to fund the deposits.
Through the date of February 28, 2025, in the Alkali Business, we extracted trona from our mining facilities, processed it into soda ash and other alkali products, and delivered and sold it to our customers domestically and internationally. The cash requirements for these activities were impacted by the differences in timing between the extraction and ultimate delivery of the product to a customer (as well as any time differences when we stored the alkali products).
The storage of our inventory of crude oil can have a material impact on our cash flows from operating activities. In the month we pay for the stored crude oil, we borrow under our senior secured credit facility (or use cash on hand) to pay for the crude oil, utilizing a portion of our operating cash flows. Conversely, cash flow from operating activities increases during the period in which we collect the cash from the sale of the stored crude oil. Additionally, for our exchange-traded derivatives, we may be required to deposit margin funds with the respective exchange when commodity prices increase as the value of the derivatives utilized to hedge the price risk in our inventory fluctuates. These deposits also impact our operating cash flows as we borrow under our senior secured credit facility or use cash on hand to fund the deposits.
Net cash flows provided by our operating activities were $252.8 million and $391.9 million for 2025 and 2024, respectively. The decrease in operating cash flow for 2025 compared to 2024 was primarily to attributable to negative changes in our working capital requirements during 2025 compared to 2024. In addition, cash flows provided by operating activities for 2025 only included two months of activity from the Alkali Business, as it was sold on February 28, 2025, whereas 2024 included a full year of activity from the Alkali Business.
See Note 16 in our Consolidated Financial Statements in Item 8 for information regarding changes in components of operating assets and liabilities during the years ended December 31, 2025, 2024 and 2023.
Capital Expenditures and Distributions Paid to Our Unitholders
We use cash primarily for our operating expenses, working capital needs, debt service, acquisition activities, internal growth projects and distributions we pay to our common and preferred unitholders. We finance maintenance capital expenditures and smaller internal growth projects and distributions primarily with cash generated by our operations. We have historically funded material growth capital projects (including acquisitions and internal growth projects) with borrowings under our senior secured credit facility, equity issuances (common and preferred units), the issuance of senior unsecured or secured notes, and/or the creation of strategic arrangements to share capital costs through joint ventures or strategic alliances.
Capital Expenditures for Fixed and Intangible Assets and Equity Investees
The following table summarizes our expenditures for fixed and intangible assets and equity investees in the periods indicated:
Years Ended December 31,
2025
2024
2023
(in thousands)
Capital expenditures for fixed and intangible assets:
Maintenance capital expenditures:
Offshore pipeline transportation assets
$
13,762
$
7,708
$
5,748
Marine transportation assets
50,806
76,628
33,643
Onshore transportation and services assets
5,763
7,667
7,245
Information technology systems
1,158
2,555
2,168
Total maintenance capital expenditures
$
71,489
$
94,558
$
48,804
Growth capital expenditures:
Offshore pipeline transportation assets(1)
$
71,246
$
247,647
$
400,325
Marine transportation assets
1,577
15,124
9,038
Onshore transportation and services assets
521
9,324
12,765
Information technology systems
—
9,489
10,006
Total growth capital expenditures
73,344
281,584
432,134
Total capital expenditures for fixed and intangible assets
144,833
376,142
480,938
Capital expenditures related to equity investees
892
285
4,489
Total capital expenditures(2)
$
145,725
$
376,427
$
485,427
(1)Growth capital expenditures in our offshore pipeline transportation segment for 2025, 2024 and 2023 represent 100% of the costs incurred, including those funded by our noncontrolling interest holder (see further discussion below in “Growth Capital Expenditures”).
(2)Excluded from the table above were total capital expenditures of $6.4 million, $94.6 million and $218.1 million for 2025, 2024 and 2023, respectively, associated with the Alkali Business that was sold on February 28, 2025.
Expenditures for capital assets to grow the partnership distribution will depend on our access to debt and equity capital. We will look for opportunities to acquire assets from other parties that meet our criteria for stable cash flows. We continue to pursue a long term growth strategy that may require significant capital.
Growth Capital Expenditures
As noted above in “Recent Developments and Initiatives”, we recently completed our two offshore growth capital projects, which included the CHOPS expansion and the SYNC Pipeline projects. With the completion of these significant growth capital projects in 2025, and no significant future growth capital projects on the horizon, we do not expect significant growth capital expenditures in 2026.
While we are committed to maintaining sufficient financial flexibility and liquidity, we will continue to evaluate any accretive incremental growth opportunities should they opportunistically emerge.
Maintenance Capital Expenditures
Maintenance capital expenditures incurred during 2025, 2024 and 2023 from our continuing operations primarily related to expenditures in our marine transportation segment to replace and upgrade certain equipment associated with our barge and fleet vessels during our dry-docks. Additionally, our offshore transportation segment assets incur maintenance capital expenditures to replace, maintain and upgrade equipment at certain of our offshore platforms and pipelines that we operate. We expect future expenditures to be within a reasonable range of 2025’s expenditures dependent upon the timing of when we incur certain costs, especially the timing of our dry-docks in our marine transportation segment, and the increase in certain costs we incur. See previous discussion under “Available Cash before Reserves” for how such maintenance capital utilization is reflected in our calculation of Available Cash before Reserves.
Our partnership agreement requires us to distribute 100% of our available cash (as defined therein) within 45 days after the end of each quarter to unitholders of record. Available cash generally means, for each fiscal quarter, all cash on hand at the end of the quarter:
•less the amount of cash reserves that our general partner determines in its reasonable discretion is necessary or appropriate to:
•provide for the proper conduct of our business;
•comply with applicable law, any of our debt instruments, or other agreements; or
•provide funds for distributions to our common and preferred unitholders for any one or more of the next four quarters;
•plus all cash on hand on the date of determination of available cash for the quarter resulting from working capital borrowings. Working capital borrowings are generally borrowings that are made under our senior secured credit facility and in all cases are used solely for working capital purposes or to pay distributions to partners.
On February 13, 2026, we paid a distribution of $0.18 per common unit related to the fourth quarter of 2025. With respect to our Class A Convertible Preferred Units, we declared a quarterly cash distribution of $0.9473 per unit (or $3.7892 on an annualized basis). These distributions were paid on February 13, 2026 to unitholders holders of record at the close of business January 30, 2026.
Our historical distributions to common unitholders and Class A Convertible Preferred unitholders are shown in the table below (in thousands, except per unit amounts).
Distribution For
Date Paid
Per Common Unit Amount
Total Amount
Per Preferred Unit Amount
Total Amount
2023
1st Quarter
May 15, 2023
$
0.1500
$
18,387
$
0.9473
$
24,002
2nd Quarter
August 14, 2023
$
0.1500
$
18,387
$
0.9473
$
23,314
3rd Quarter
November 14, 2023
$
0.1500
$
18,370
$
0.9473
$
22,612
4th Quarter
February 14, 2024
$
0.1500
$
18,370
$
0.9473
$
21,894
2024
1st Quarter
May 15, 2024
$
0.1500
$
18,370
$
0.9473
$
21,894
2nd Quarter
August 14, 2024
$
0.1500
$
18,370
$
0.9473
$
21,894
3rd Quarter
November 14, 2024
$
0.1650
$
20,207
$
0.9473
$
21,894
4th Quarter
February 14, 2025
$
0.1650
$
20,207
$
0.9473
$
21,894
2025
1st Quarter
May 15, 2025
$
0.1650
$
20,207
$
0.9473
$
19,942
2nd Quarter
August 14, 2025
$
0.1650
$
20,207
$
0.9473
$
14,868
3rd Quarter
November 14, 2025
$
0.1650
$
20,207
$
0.9473
$
14,868
4th Quarter(1)
February 13, 2026
$
0.1800
$
22,044
$
0.9473
$
14,868
(1)This distribution was paid on February 13, 2026 to unitholders of record as of January 30, 2026.
Contractual Obligations and Commitments
In addition to the principal and interest payment commitments associated with our long-term debt discussed above, we have other contractual obligations and commitments as of December 31, 2025, which are summarized below.
•We have estimated operating lease payment obligations, as of December 31, 2025, totaling $154.1 million, of which $10.7 million is expected to be paid in 2026 (see Note 5 to our Consolidated Financial Statements in Item 8 for details on our lease obligations).
•We have current estimated asset retirement obligations of approximately $24.3 million. These requirements are expected to be funded primarily with free cash flow generated from our operations and availability under our senior secured credit facility.
As of December 31, 2025, our $3.1 billion aggregate principal amount of senior unsecured notes co-issued by Genesis Energy, L.P. and Genesis Energy Finance Corporation are fully and unconditionally guaranteed jointly and severally by all of Genesis Energy, L.P.’s current and future 100% owned domestic subsidiaries (the “Guarantor Subsidiaries”), except for certain immaterial subsidiaries. The immaterial non-Guarantor Subsidiaries are indirectly owned by Genesis Crude Oil, L.P., a Guarantor Subsidiary. The Guarantor Subsidiaries largely own the assets that we use to operate our business. See Note 11 to our Consolidated Financial Statements in Item 8 for additional information regarding our consolidated debt obligations.
The guarantees are senior unsecured obligations of each Guarantor Subsidiary and rank equally in right of payment with other existing and future senior indebtedness of such Guarantor Subsidiary, and senior in right of payment to all existing and future subordinated indebtedness of such Guarantor Subsidiary. The guarantee of our senior unsecured notes by each Guarantor Subsidiary is subject to certain automatic customary releases, including in connection with the sale, disposition or transfer of all of the capital stock, or of all or substantially all of the assets, of such Guarantor Subsidiary to one or more persons that are not us or a restricted subsidiary, the exercise of legal defeasance or covenant defeasance options, the satisfaction and discharge of the indentures governing our senior unsecured notes, the designation of such Guarantor Subsidiary as a non-Guarantor Subsidiary or as an unrestricted subsidiary in accordance with the indentures governing our senior unsecured notes, the release of such Guarantor Subsidiary from its guarantee under our senior secured credit facility, or liquidation or dissolution of such Guarantor Subsidiary (collectively, the “Releases”). The obligations of each Guarantor Subsidiary under its note guarantee are limited as necessary to prevent such note guarantee from constituting a fraudulent conveyance under applicable law. We are not restricted from making investments in the Guarantor Subsidiaries and there are no significant restrictions on the ability of the Guarantor Subsidiaries to make distributions to Genesis Energy, L.P.
The rights of holders of our senior unsecured notes against the Guarantor Subsidiaries may be limited under the U.S. Bankruptcy Code or state fraudulent transfer or conveyance law.
The following is the summarized financial information for Genesis Energy, L.P. and the Guarantor Subsidiaries on a combined basis after elimination of intercompany transactions among the Guarantor Subsidiaries (which includes related receivable and payable balances) and the investment in and equity earnings from the non-Guarantor Subsidiaries.
Balance Sheets
Genesis Energy, L.P. and Guarantor Subsidiaries
December 31, 2025
(in thousands)
ASSETS:
Current assets
$
654,078
Fixed assets, net
2,157,150
Non-current assets(1)
698,208
LIABILITIES AND CAPITAL:(2)
Current liabilities
691,281
Non-current liabilities
$
3,425,818
Class A Convertible Preferred Units
552,523
Statements of Operations
Genesis Energy, L.P. and Guarantor Subsidiaries
Year Ended December 31, 2025
(in thousands)
Revenues(3)
$
1,381,208
Operating costs
1,254,208
Operating income
127,000
Loss from continuing operations
(100,685)
Net loss(2)
(520,225)
Net loss attributable to Genesis Energy, L.P.
(520,224)
(1)Excluded from non-current assets in the table above are net intercompany receivables of $9.8 million that are owed to Genesis Energy, L.P. and the Guarantor Subsidiaries from the non-Guarantor Subsidiaries as of December 31, 2025.
(2)There are no noncontrolling interests held at the Issuer or Guarantor Subsidiaries for the period presented.
(3)Excluded from revenues in the table above are $3.0 million of sales from Guarantor Subsidiaries to non-Guarantor Subsidiaries for the year ended December 31, 2025.
Critical Accounting Estimates
The preparation of our consolidated financial statements in conformity with U.S. GAAP requires us to make estimates and assumptions that affect the reported amounts of assets and liabilities and disclosure of contingent assets and liabilities, if any, at the date of the consolidated financial statements and the reported amounts of revenues and expenses during the reporting period. We base these estimates and assumptions on historical experience and other information that are believed to be reasonable under the circumstances. Although we believe our estimates to be reasonable, these estimates and assumptions about future events and their effects cannot be determined with certainty, and, accordingly, are evaluated on a regular basis and revised as needed as new events occur or more information is acquired, and as the business environment in which we operate changes. Significant accounting policies that we employ are presented in Note 2 to our Consolidated Financial Statements in Item 8.
We have defined critical accounting estimates as those that: (i) are material due to the levels of subjectivity and judgment necessary to account for highly uncertain matters or the susceptibility of such matters to change; and (ii) the impact to the financial condition or operating performance of the Company is material. Our most critical accounting estimates are discussed below.
Depreciation and Amortization of Long-Lived Assets and Intangibles
In order to calculate depreciation and amortization we must estimate the useful lives of our fixed and intangible assets at the time the assets are placed in service. We compute depreciation and amortization on a straight-line basis using the best estimated useful life at the time the asset is placed into service. The actual period over which we will use the asset may differ from the assumptions we have made about the estimated useful life. Any subsequent events that result in a change in these estimates can impact future depreciation and amortization calculations, and these changes are adjusted as we become aware of such circumstances.At a minimum, we will assess the useful lives and residual values of all long-lived assets on an annual basis to determine if adjustments are required.
Recoverability of Equity Method Investments
We account for non-marketable investments using the equity method of accounting if the investment gives us the ability to exercise significant influence over, but not control of, an investee. Under the equity method of accounting, investments are stated at initial cost and are adjusted for subsequent additional investments and our proportionate share of earnings or losses and distributions.
We evaluate our equity method investments for impairment at least annually or whenever events or changes in circumstances indicate, in management’s judgment, that the carrying value of an investment may have experienced an other-than-temporary decline in value. When evidence of loss in value has occurred, management compares the estimated fair value of the investment to the carrying value of the investment to determine whether an impairment has occurred. If the estimated fair value is less than the carrying value and management considers the decline in value to be other than temporary, the excess of the carrying value over the estimated fair value is recognized in the financial statements as an impairment.
See Note 9 to our consolidated financial statements for our discussion on equity method investments.
Recoverability of Long-Lived Assets
When events or changes in circumstances indicate that the carrying value of our long-lived assets, including fixed assets, finite lived intangible assets, and right of use asset may not be recoverable, we review our assets for impairment. We compare the carrying value of the associated asset to the estimated undiscounted future cash flows expected to be generated from that asset. Estimates of future net cash flows include estimating future volumes and/or contractual commitments, future margins or tariff rates, future operating costs and other estimates and assumptions consistent with our business plans. If we determine that an asset’s carrying value may not be recoverable due to impairment, we may be required to reduce the carrying value and/or the subsequent useful life of the asset.
Any such write-down of the value and unfavorable change in the useful life of a long-lived asset would increase costs and expenses at that time.
During 2024, we terminated an on-going project related to the integration of certain of our corporate enterprise resource planning systems and we impaired the costs incurred to date. As a result, we recognized an impairment charge of $43.0 million associated with intangible construction in progress costs for the year ended December 31, 2024. For the years ended December 31, 2025 and 2023, we did not recognize an impairment expense associated with our long-lived assets.
Goodwill represents the excess of the purchase prices we paid for certain businesses over their respective fair values. We do not amortize goodwill. Goodwill is tested annually (at the reporting unit level) for possible impairment as of October 1 of each fiscal year, and on an interim basis when indicators of possible impairment exist.
We have the option to first assess qualitative factors to determine whether it is more likely than not that the fair value of a reporting unit is less than its carrying value. Qualitative factors assessed for each of the applicable reporting units include, but are not limited to, changes in macroeconomic conditions, industry and market considerations, cost factors, discount rates, competitive environments and financial performance of the reporting units. If the qualitative assessment indicates that it is more likely than not that the carrying value of a reporting unit exceeds its estimated fair value, a quantitative test is required.
We also have the option to proceed directly to the quantitative test. Under the quantitative impairment test, the estimated fair value of the reporting unit is compared to its carrying value, including goodwill. If the carrying value of the reporting unit including goodwill exceeds its fair value, an impairment charge equal to the excess would be recognized, up to a maximum amount of goodwill allocated to that reporting unit. We can resume the qualitative assessment in any subsequent period for any reporting unit.
We performed a quantitative assessment as of October 1, 2025 for our sulfur services reporting unit, which is the only reporting unit as of our assessment date that has goodwill. As a result of the quantitative assessment, no impairment was recorded during 2025 as the fair value of our sulfur services reporting unit exceeded the carrying value.
The fair value of our sulfur services reporting unit was determined using the income approach and was predicated on our assumptions regarding the future economic prospects of the reporting unit. Such assumptions include (i) discrete financial forecasts for the assets contained within the reporting unit, which rely on management’s estimates of operating margins, (ii) an exit multiple for cash flows beyond the discrete forecast period, and (iii) an appropriate discount rate. These key assumptions have a degree of uncertainty associated with each of them and changes in them could have a significant impact on fair value. If future results are not consistent with our estimates, we could be exposed to future impairment losses that could be material to our results of operations. Additionally, when performing sensitivity analyses to the significant assumptions, a 10% change in these assumptions does not impact our overall conclusion surrounding the valuation of our goodwill.
We also monitor the markets for our products and services, in addition to the overall market, to determine if a triggering event occurs that would indicate that the fair value of a reporting unit is less than its carrying value. One of our other monitoring procedures we performed is the comparison of our market capitalization to our book equity, which did not result in an indicator of impairment.
We performed a quantitative assessment as of October 1, 2024 for our sulfur services reporting unit, and no impairment was recognized during 2024 as the fair value of our sulfur services reporting unit exceeded the carrying value.
We performed a qualitative assessment as of October 1, 2023 for our sulfur services reporting unit. We did not identify any relevant events or circumstances indicating that it is more likely than not that the fair value of the reporting unit is less than the respective carrying value. As such, a quantitative goodwill test was not required, and no goodwill impairment was recognized for the year ended December 31, 2023.
For additional information regarding our goodwill, see Note 10 to our Consolidated Financial Statements in Item 8.
Revenue recognition - Estimation of variable consideration
Our offshore pipeline transportation segment has certain long-term contracts with customers that include variable consideration that must be estimated at contract inception and re-assessed at each reporting period. Total consideration for these arrangements is recognized as revenue over the applicable contract period and is based on our measure of satisfaction of our corresponding performance obligation. Any difference in timing of revenue recognition and billings results in contract assets and liabilities. The estimated performance obligation over the life of a contract includes significant judgments by management including volume and forecasted production information, future price indexing, our ability to transport volumes produced by our customers, and the contract period. Changes in these assumptions or a contract modification could have a material effect on the amount of variable consideration recognized as revenue.
Liability and Contingency Accruals and Asset Retirement Obligations
We accrue reserves for contingent liabilities including environmental remediation and potential legal claims. When our assessment indicates that it is probable that a liability has occurred and the amount of the liability can be reasonably estimated, we make accruals. We base our estimates on all known facts at the time and our assessment of the ultimate outcome, including consultation with external experts and counsel. We revise these estimates as additional information is obtained or resolution is achieved.
We also make estimates related to future payments for environmental costs to remediate existing conditions attributable to past operations. Environmental costs include costs for studies and testing as well as remediation and restoration. We sometimes make these estimates with the assistance of third parties involved in monitoring the remediation effort.
Significant changes in new information or judgments could have a material impact to our financial results.
At December 31, 2025, we were not aware of any contingencies or environmental liabilities that would have a material effect on our financial position, results of operations or cash flows.
Additionally, certain of our assets have contractual and regulatory obligations to perform dismantlement and removal activities, and in some instances remediation, when the assets are abandoned. Our asset retirement obligations are recorded as a liability at fair value and have significant assumptions and inputs, including the estimated costs and timing of the associated abandonment activities as well as the discount and inflation rates utilized to calculate the present value of the future estimated costs, that could materially impact our financial results. During 2025, we recognized changes in estimates (primarily due to updated estimated costs and the timing of when we expect to spend these costs) associated with certain of our non-core offshore assets of approximately $3 million, and incurred new liabilities of approximately $1 million associated with certain newly constructed offshore assets. We could have impacts to our future earnings based on the actual costs we incur relative to our estimated costs.
Fair Value of Assets and Liabilities Acquired and Identification of Associated Goodwill and Intangible Assets
In conjunction with each acquisition we make, we must allocate the cost of the acquired entity to the assets and liabilities assumed based on their estimated fair values at the date of acquisition. As additional information becomes available, we may adjust the original estimates within one year subsequent to the acquisition. In addition, we are required to recognize intangible assets separately from goodwill. Determining the fair value of assets and liabilities acquired, as well as intangible assets such as customer relationships, contracts, trade names and non-compete agreements involves professional judgment and is ultimately based on acquisition models and management’s assessment of the value of the assets and liabilities acquired, and to the extent available, third-party assessments. Intangible assets with finite lives are amortized over their estimated useful life as determined by management. Goodwill, if any, is not amortized but instead is periodically assessed for impairment, as discussed further below. Uncertainties associated with these estimates include fluctuations in economic obsolescence factors in the area and potential future sources of cash flow.
Item 7a. Quantitative and Qualitative Disclosures About Market Risk
We are exposed to various market risks, including commodity price risk and interest rate risk. We use various derivative instruments primarily to manage commodity price risk. Our risk management policies and procedures are designed to help ensure that our hedging activities address our risks by monitoring our derivative positions, as well as our physical volumes, grades, locations, and delivery schedules. We do not acquire and hold futures contracts or other derivatives for the purpose of speculating on price changes. The following discussion addresses each risk:
•Crude Oil— We utilize crude oil derivatives to hedge commodity price risk, inherent in our onshore transportation and services segment. Our objectives for these derivatives include hedging fixed price purchase and sales, crude inventories, and basis differentials. We manage these exposures with various instruments including futures, options and swap contracts. Our risk management policies are designed to monitor our physical volumes, grades and delivery schedules to ensure our hedging activities address the market risks inherent in our gathering and marketing activities. As of December 31, 2025 we had entered into derivative instruments that will settle between February 2026 and December 2026.
The accounting treatment for our derivatives is discussed further in Note 19 to our Consolidated Financial Statements in Item 8.
The table below presents information about our open derivative contracts at December 31, 2025. Notional amounts in barrels (“Bbl”) and the weighted average contract price, total contract amount and total fair value amount in U.S. dollars of our open positions are presented below. Fair values were determined by using the notional amount in barrels multiplied by the December 31, 2025 quoted market prices. The table does not include offsetting physical exposures hedged by our derivative contracts.
Unit of Measure for Volume
Contract Volumes (in 000’s)
Unit of Measure for Price
Weighted Average Market Price
Contract Value (in 000’s)
Mark-to Market Change (in 000’s)
Settlement Value (in 000’s)
Futures and Swap Contracts
Sell (Short) Contracts:
Crude Oil
Bbl
178
Bbl
$
58.06
$
10,334
$
(137)
$
10,197
Crude Oil Spread Swap
Bbl
50
Bbl
$
0.49
$
25
$
(51)
$
(26)
Option Contracts
Written Contracts:
Crude Oil
Bbl
40
Bbl
$
0.05
$
22
$
(8)
$
14
We manage our risks of volatility in NaOH prices by indexing prices for the sale of NaHS to the market price for NaOH in most of our contracts.
Interest Rate Risk
We are also exposed to market risks due to the floating interest rates on our senior secured credit facility.
Obligations under our senior secured credit facility bear interest at the Term SOFR rate or alternate base rate (which approximates the prime rate), at our option, plus the applicable margin. We have not historically hedged our interest rates. On December 31, 2025, we had $6.4 million of debt outstanding under our senior secured credit facility. A 10% change in the Term SOFR rate would have resulted in an immaterial impact to Net Income from Continuing Operations for the year ended December 31, 2025.
Item 8. Financial Statements and Supplementary Data
The information required hereunder is included in this report as set forth in the “Index to Consolidated Financial Statements.”
Item 9. Changes in and Disagreements with Accountants on Accounting and Financial Disclosure
None.
Item 9A. Controls and Procedures
Evaluation of Disclosure Controls and Procedures
We maintain disclosure controls and procedures designed to ensure that information required to be disclosed in the reports that we file or submit under the Securities Exchange Act of 1934, as amended, is recorded, processed, summarized and reported within the time periods specified in the Securities and Exchange Commission’s rules and forms, and that such information is accumulated and communicated to our management, including our chief executive officer and chief financial officer to allow timely decisions regarding required disclosures. Our chief executive officer and chief financial officer, with the participation of our management, have evaluated our disclosure controls and procedures as of December 31, 2025 and have concluded that such disclosure controls and procedures are effective to provide reasonable assurance that information is recorded, processed, summarized, and reported within the time periods specified in the Commission’s rules and forms and that such information is accumulated and communicated to management, including our chief executive officer and chief financial officer to allow for timely decisions regarding required disclosures in this Annual Report on Form 10-K.
Changes in Internal Controls over Financial Reporting
There were no changes during the fiscal quarter ended December 31, 2025 that materially affected, or are reasonably likely to materially affect, our internal control over financial reporting.
Management’s Report on Internal Control over Financial Reporting
Management of the partnership is responsible for establishing and maintaining adequate internal control over financial reporting as defined in Rules 13a-15(f) under the Securities Exchange Act of 1934, as amended. The partnership’s internal control over financial reporting is a process designed to provide reasonable assurance regarding the reliability of financial reporting and the preparation of financial statements in accordance with generally accepted accounting principles.
Because of its inherent limitations, internal control over financial reporting may not prevent or detect misstatements. Also, projections of any evaluation of effectiveness to future periods are subject to the risk that controls may become inadequate because of changes in conditions, or that the degree of compliance with the policies or procedures may deteriorate.
Management assessed the effectiveness of the partnership’s internal control over financial reporting as of December 31, 2025. In making this assessment, management used the criteria established in Internal Control – Integrated Framework (2013) issued by the Committee of Sponsoring Organizations of the Treadway Commission. Based on our assessment as of December 31, 2025, management has concluded the partnership’s internal control over financial reporting is effective based on those criteria.
PricewaterhouseCoopers LLP, the partnership’s independent registered public accounting firm, has issued an attestation report on the effectiveness of the partnership’s internal control over financial reporting as of December 31, 2025, as stated in their report which appears in Item 8. “Financial Statements and Supplementary Data.”
Item 10. Directors, Executive Officers and Corporate Governance
Management of Genesis Energy, L.P.
We are a Delaware limited partnership. We conduct our operations and own our operating assets through our subsidiaries and joint ventures. Our general partner, Genesis Energy, LLC, a wholly-owned subsidiary that owns a non-economic general partner interest in us, has sole responsibility for conducting our business and managing our operations. It also employs most of our personnel, including executive officers.
The board of directors of our general partner (which we refer to as “our board of directors”) must approve significant matters (such as material business strategies, mergers, business combinations, acquisitions or dispositions of assets, issuances of common units, incurrences of debt or other financings and the payments of distributions on common and preferred units). The holders of our Class B Common Units are entitled to (i) vote in the election of our board of directors, subject to the Davison family’s rights under its unitholder rights agreement (described below), as well as (ii) vote on substantially all other matters on which our holders of Class A Common Units are entitled to vote. The holders of our Class A Common Units are not entitled to vote in the election of directors, but they are entitled to vote in a very limited number of other circumstances, including our merger with another company. As is common with MLPs, our partnership structure does not grant our unitholders (in such capacity) the right to directly or indirectly participate in our management or operations other than through the exercise of their limited voting rights.
Collectively, members of the Davison family own 8.8% of our Class A Common Units and 76.9% of our Class B Common Units, for a combined ownership percentage of 8.9% of total Common Units. Pursuant to its unitholder rights agreement, the Davison family is entitled to elect up to three of our directors based on its members’ collective ownership percentage of our outstanding common units: (i) with 15% or more ownership, they have the right to appoint three directors, (ii) with less than 15% ownership but more than 10%, they have the right to appoint two directors, and (iii) with less than 10% ownership, they have the right to appoint one director. That unitholder rights agreement also provides that, so long as the Davison family has the right to elect three directors thereunder, our board of directors cannot have more than 11 directors without the Davison family’s consent. In addition to their rights under that unitholder rights agreement, if the members of the Davison family act as a group, they have the ability to elect at least a majority of our directors because they own a majority of our Class B units.
Under our limited partnership agreement, the organizational documents of our general partner and indemnification agreements with our directors, subject to specified limitations, we will indemnify to the fullest extent permitted by Delaware law, from and against all losses, claims, damages or similar events, any director or officer, or while serving as director or officer, any person who is or was serving as a tax matters member or as a director, officer, tax matters member, employee, partner, manager, fiduciary or trustee of our partnership or any of our affiliates. Additionally, we will indemnify to the fullest extent permitted by law, from and against all losses, claims, damages or similar events, any person who is or was an employee (other than an officer) or agent of our general partner.
Our board of directors currently consists of Sharilyn S. Gasaway, James E. Davison, James E. Davison, Jr., Kenneth M. Jastrow II, Conrad P. Albert, Jack T. Taylor and Grant E. Sims. Our board of directors has determined that each of Ms. Gasaway and Messrs. Jastrow, Albert and Taylor is an independent director under the NYSE rules.
Board Leadership Structure and Risk Oversight
Board Leadership Structure
Our board of directors has no policy that requires the positions of the Chairman of the Board and the Chief Executive Officer to be held by the same or different persons or that we designate a lead or presiding independent director. Our board of directors believes it is important to retain the flexibility to make those determinations based on an assessment of the circumstances existing from time to time, including the composition, skills and experience of our board of directors and its members, specific challenges faced by the Company or the industry in which it operates, and governance efficiency.
Presently, our board of directors believes that, because Mr. Grant E. Sims is the director most familiar with our business and industry and the most capable of leading the discussion of, and executing on, our business strategy, he is best situated to serve as Chairman, regardless of the fact that he is the Chief Executive Officer of our general partner. Our board of directors also believes that the appointment of a lead independent director, who will preside over executive sessions of non-management directors of our board of directors, will facilitate teamwork and communication between the non-management directors and management. Our board of directors appointed Mr. Jastrow as our lead independent director because of his executive experience and service as a director of other companies. Our board of directors believes that the combined role of Chairman and Chief Executive Officer working with the lead independent director is currently in the best interest of unitholders, providing the appropriate balance between developing our strategy and overseeing management.
On September 1, 2017, we sold $750 million of Class A Convertible Preferred Units in a private placement, comprised of 22,249,494 units for a cash purchase price per unit of $33.71 (subject to certain adjustments, the “Issue Price”) to two initial purchasers. In connection with the private placement, we granted each initial purchaser (including its applicable affiliate transferees) certain rights, including (i) the right to appoint an observer, who shall have the right to attend our board meetings for so long as an initial purchaser (including its affiliates) owns at least $200 million of our Class A Convertible Preferred Units and (ii) the right to appoint two directors to our general partner’s board of directors if (and so long as) we fail to pay in full any three quarterly distribution amounts, whether or not consecutive. As of December 31, 2025, we had 15,695,722 Class A Convertible Units outstanding.
We are committed to sound principles of governance. Such principles are critical for us to achieve our performance goals and maintain the trust and confidence of investors, personnel, suppliers, business partners and stakeholders. We believe independent directors are a key element for strong governance, although we have reserved or exercised our right as a limited partnership under the listing standards of the NYSE not to comply with certain requirements of the NYSE. For example, although at least a majority of the members of our board of directors is independent under the NYSE rules, we reserve the right not to comply with Section 303A.01 of the NYSE Listed Company Manual in the future, which would require that our board of directors be comprised of at least a majority of independent directors. In addition, among other things, we have elected not to comply with Sections 303A.04 and 303A.05 of the NYSE Listed Company Manual, which would require our board of directors to maintain a nominating/corporate governance committee and a compensation committee, each consisting entirely of independent directors. Our corporate governance guidelines are available on our website (www.genesisenergy.com) free of charge. For further discussion of director independence, please see Item 13. “Certain Relationships and Related Transactions, and Director Independence—Director Independence.”
Risk Oversight
We face a number of risks, including exposure to matters relating to the environment, regulation, competition, fluctuations in commodity prices and interest rates, pandemics, cybersecurity threats and severe weather. Management is responsible for the day-to-day management of the risks our company faces, although our board of directors, as a whole and through its committees, has responsibility for the oversight of risk management. In fulfilling its risk oversight role, our board of directors must determine whether risk management processes designed and implemented by our management are adequate and functioning as designed. Senior management regularly delivers presentations to our board of directors on strategic matters, operations, risk management and other matters, and are available to address any questions or concerns raised by our board of directors. Board of directors meetings also regularly include discussions with senior management regarding strategies, key challenges and risks and opportunities for our company.
Our board committees assist our board of directors in fulfilling its oversight responsibilities in certain areas of risk. For example, the audit committee assists with risk management oversight in the areas of financial reporting, internal controls, cybersecurity, compliance with legal and regulatory requirements and our risk management policy relating to our hedging program. The governance, compensation and business development committee assists our board of directors with risk management relating to our compensation policies and programs.
Our board of directors believes that it is important to align (when practical) the interests of the members of our board of directors and certain of our officers with the interests of our long-term stakeholders. Our board of directors has adopted certain policies to further promote that alignment of interests. For example, among other things, our policies prohibit our directors and officers from (i) buying, selling or engaging in transactions with respect to our common units while they are aware of material non-public information and (ii) engaging in short sales of our securities. Certain of our directors and/or officers own substantial amounts of our units, some of which are pledged, including being held in broker margin accounts. See Item 12. “Security Ownership of Certain Beneficial Owners and Management and Related Unitholder Matters.”
The audit committee of our board of directors generally oversees our accounting policies and financial reporting and the audit of our financial statements. The audit committee assists our board of directors in its oversight of the quality and integrity of our financial statements and our compliance with legal and regulatory requirements. Our independent registered public accounting firm is given unrestricted access to the audit committee. Our board of directors has determined that the members of the audit committee meet the independence and experience standards established by NYSE and the Securities Exchange Act of 1934, as amended. In accordance with the NYSE rules and the Securities Exchange Act of 1934, as amended, our board of directors has named three of its members to serve on the audit committee—Jack T. Taylor, Conrad P. Albert and Sharilyn S. Gasaway. Mr. Taylor is the chairman of the audit committee. Our board of directors believes that Mr. Taylor and Ms. Gasaway qualify as audit committee financial experts as such term is used in the rules and regulations of the SEC. The charter of the audit committee is available on our website (www.genesisenergy.com) free of charge. Each member of the audit committee is an independent director under NYSE rules.
Governance, Compensation and Business Development Committee
The governance, compensation and business development committee (“G&C Committee”) of our board of directors generally (i) monitors compliance with corporate governance guidelines, (ii) reviews and makes recommendations regarding board and committee composition, structure, size, compensation and related matters, and (iii) oversees compensation plans and compensation decisions for our employees. All the members of our board of directors, other than our CEO, serve as members of the G&C Committee. Mr. Jastrow is the chairman. The charter of the G&C Committee is available on our website (www.genesisenergy.com) free of charge.
Conflicts Committee
To the extent requested by our board of directors, a conflicts committee of our board of directors would be appointed to review specific matters in connection with the resolution of conflicts of interest and potential conflicts of interest between any of our affiliates and us. If a specific review is requested by our board of directors, our conflicts committee would be formed by our Board and would be comprised solely of independent directors. See Item 13. “Certain Relationships and Related Transactions, and Director Independence—Review or Special Approval of Material Transactions with Related Persons.”
Executive Sessions of Non-Management Directors
Our board of directors holds executive sessions in which non-management directors meet without any members of management present in connection with regular board meetings. The purpose of these executive sessions is to promote open and candid discussion among the non-management directors. Mr. Jastrow, as the lead independent director, serves as the presiding director at those executive sessions. In accordance with NYSE rules, interested parties can communicate directly with non-management directors by mail in care of the General Counsel and Secretary or in care of the chairman of the audit committee at 811 Louisiana, Suite 1200, Houston, TX 77002. Such communications should specify the intended recipient or recipients. Commercial solicitations or communications will not be forwarded. We have established a toll-free, confidential telephone hotline so that interested parties may communicate with the chairperson of the audit committee or with all the non-management directors as a group. All calls to this hotline are reported to the chairperson of the audit committee who is responsible for communicating any necessary information to the other non-management directors. The number of our confidential hotline is (844) 988-1695.
Vice President and General Manager, Sulfur Services
Grant E. Sims has served as a director and Chief Executive Officer of our general partner since August 2006 and Chairman of the Board of our general partner since October 2012. Mr. Grant E. Sims was affiliated with Leviathan Gas Pipeline Partners, LP from 1992 to 1999, serving as the Chief Executive Officer and a director beginning in 1993 until he left to pursue personal interests, including investments. Leviathan (subsequently known as El Paso Energy Partners, L.P. and then GulfTerra Energy Partners, L.P.) was an NYSE listed MLP. Mr. Grant E. Sims has an established track record of developing strong companies and has led his companies through a period of substantial growth while increasing geographic and operational diversity. Mr. Grant E. Sims provides leadership skills, executive management experience and significant knowledge of our business environment, which he has gained through his vast experience with other MLPs.
Conrad P. Albert has served as a director of our general partner since July 2013. Mr. Albert is a private investor and was formerly a director of Anadarko Petroleum Corporation from 1986 to 2006. Mr. Albert also served as a director of DeepTech International, Inc. from 1992 to 1998. From 1969 to 1991, Mr. Albert served in various positions with Manufacturers Hanover Trust Company, ultimately serving as Executive Vice President in charge of worldwide energy lending and corporate finance. Mr. Albert’s extensive financial, executive and directorial experience and his service in various roles in the management of other energy-related companies allows him to provide valuable expertise to our board of directors.
James E. Davison has served as a director of our general partner since July 2007. Mr. Davison served as chairman of the board of Davison Transport, Inc. for over 30 years. He also serves as President of Terminal Services, Inc. Mr. Davison has over fifty years of experience in the energy-related transportation and sulfur removal businesses. Mr. Davison brings to our board of directors significant energy-related transportation and sulfur removal experience and industry knowledge.
James E. Davison, Jr. has served as a director of our general partner since July 2007. Mr. Davison is also a director of another public company, Origin Bancorp, Inc., and serves on its finance, risk and insurance committees. Mr. Davison is the son of James E. Davison. Mr. Davison’s executive and leadership experience enable him to make valuable contributions to our board of directors.
Sharilyn S. Gasaway has served as a director of our general partner since March 2010. Ms. Gasaway is a private investor and was Executive Vice President and Chief Financial Officer of Alltel Corporation, a wireless communications company, from 2006 to 2009, and served as Controller of Alltel Corporation from 2002 through 2006. In her role as CFO, Ms. Gasaway was responsible for the company’s finance, financial reporting, and risk management roles, and gained extensive experience in corporate performance and strategic planning. She brings this vast knowledge to the partnership. Ms. Gasaway is a director of one other public company, JB Hunt Transport Services, Inc. Ms. Gasaway provides our board of directors valuable business experience, risk management and financial expertise, including an understanding of the accounting, compliance and financial matters that we address on a regular basis.
Kenneth M. Jastrow II has served as a director of our general partner since March 2010 and serves as our lead independent director and the chairman of the G&C Committee. Mr. Jastrow served as Chairman and Chief Executive Officer of
Temple-Inland, Inc., a manufacturing company and the former parent of Forestar Group, from 2000 to 2007. Prior to that, Mr. Jastrow served in various roles at Temple-Inland, including President and Chief Operating Officer, Group Vice President and Chief Financial Officer. Mr. Jastrow served as a director of MGIC Investment Corporation and a director and Director Emeritus of KB Home. Mr. Jastrow formerly served as Non-Executive Chairman of Forestar Group, Inc. Mr. Jastrow’s executive experience and service as director of other companies enable him to make valuable contributions to our board of directors and particularly well suited to be the lead independent director.
Jack T. Taylor has served as a director of our general partner since July 2013 and serves as the chairman of the audit committee. Mr. Taylor is currently a director of Sempra Energy and Murphy USA Inc. Additionally, Mr. Taylor currently serves on the audit committee of Sempra Energy and Murphy USA Inc. Mr. Taylor was a partner of KPMG LLP for 29 years, where from 2005 to 2010 he served as KPMG’s Chief Operating Officer-Americas and Executive Vice Chair of U.S. Operations and from 2001 to 2005 he served as the Vice Chairman of U.S. Audit and Risk Advisory Services. Mr. Taylor’s extensive experience with financial and public accounting issues, his various leadership roles at KPMG LLP and his extensive knowledge of the energy industry make him a valuable resource to our board of directors.
Kristen O. Jesulaitis has served as Chief Financial Officer and Chief Legal Officer of our general partner since April 2023. Ms. Jesulaitis leads Genesis’ accounting, finance and legal organizations, including financial reporting, capital markets execution, treasury and cash management. She also oversees all legal matters of Genesis, including those related to acquisitions and commercial transactions, compliance and regulatory affairs, corporate governance, finance, securities and sustainability. Previously, Ms. Jesulaitis served as Chief Legal Officer and Senior Vice President of our general partner from July 2011 until April 2023. Prior to joining Genesis, she was a partner at the law firm Akin Gump Strauss Hauer & Feld LLP, principally engaged in the areas of corporate and securities law, with primary focus in the midstream energy sector.
Ryan S. Sims has served as President and Chief Commercial Officer of our general partner since April 2023. He is responsible for the execution of Genesis’ long-term strategy and the ultimate leadership of our commercial, operational, corporate development, planning, investor relations and financial activities. Mr. Ryan S. Sims joined Genesis in 2011 and most recently served as Senior Vice President, Finance and Corporate Development of our general partner from March 2019 to April 2023, where he was responsible for the corporate development, planning and investor relations functions. Prior to joining Genesis, Mr. Ryan S. Sims spent six years in the investment banking industry. Mr. Ryan S. Sims is the son of Grant E. Sims, our Chairman and Chief Executive Officer.
Garland G. Gaspard has served as Senior Vice President of our general partner since January 2017 and is responsible for the operational aspects of our onshore and offshore pipelines, offshore facilities and assets, rail facilities, terminals, engineering, trucking, and health, safety, security and environmental compliance. Mr. Gaspard joined Genesis in 2015 as a result of our acquisition of the offshore Gulf of America assets from Enterprise Products Partners L.P. and has had responsibility for the operational aspects of our offshore assets since that time. Prior to this acquisition, Mr. Gaspard served in various capacities within Enterprise Products’ operations including underground gas storage, natural gas liquids, natural gas pipelines and offshore operations.
Louie V. Nicol has served as Senior Vice President and Chief Accounting Officer of our general partner since April 2023. He is responsible for Genesis’ accounting and financial reporting organizations. Mr. Nicol joined Genesis in June 2014 in the finance and accounting department and has held oversight roles with increasing levels of responsibility. Prior to Genesis, Mr. Nicol worked in the audit practice at KPMG LLP for approximately six years.
Richard R. Alexander has served as Vice President of our general partner since November 2014. Mr. Alexander is responsible for the commercial aspects of our marine transportation segment. Since 2008, Mr. Alexander has served in various capacities within our marine operations.
William W. Rainsberger has served as Senior Vice President of our general partner since April 2023. He is responsible for the commercial aspects of our offshore pipelines. Mr. Rainsberger joined Genesis in 2010 and has served as Vice President of our general partner since 2019. Previously, Mr. Rainsberger was responsible for the corporate development and planning functions. Prior to joining Genesis, Mr. Rainsberger worked in the investment banking industry.
Jeffrey J. Rasmussen has served as Vice President of our general partner since April 2023 and is responsible for the commercial aspects of our sulfur services business. Mr. Rasmussen joined Genesis in 2017 as a result of our acquisition of the Alkali Business. Prior to joining Genesis, he spent 15 years with FMC Corporation.
Common Unit Ownership by Directors and Executive Officers
We encourage our directors and officers to own our common units, although we do not feel it is necessary to require them to own a minimum number. Certain of our directors and officers own substantial amounts of our securities, although any (or all) of them may sell, pledge or otherwise dispose of all or a portion of those securities at any time, subject to any applicable legal and company policy requirements. See Item 10. “Directors, Executive Officers and Corporate Governance-Board Leadership Structure and Risk Oversight-Risk Oversight.”
We have adopted a Code of Business Conduct and Ethics that is applicable to, among others, the principal financial officer and the principal accounting officer. Our Code of Business Conduct and Ethics is posted at our website (www.genesisenergy.com), where we intend to report any changes or waivers.
Insider Trading Policies and Procedures
Our general partner’s board of directors has adopted insider trading policies and procedures applicable to our directors, officers, and employees, and have implemented processes for us that we believe are reasonably designed to promote compliance with insider trading laws, rules, and regulations, and NYSE listing standards. A copy of our Insider Trading Policy is filed as Exhibit 19.1 to this Form 10-K.
The Compensation Discussion and Analysis below discusses our compensation process and our objectives and philosophy with respect to our Named Executive Officers (“NEOs”) for the fiscal year ended December 31, 2025.
Compensation Discussion and Analysis
Named Executive Officers
Our NEOs for 2025 were:
•Grant E. Sims, Chairman and Chief Executive Officer;
•Ryan S. Sims, President and Chief Commercial Officer;
•Kristen O. Jesulaitis, Chief Financial Officer and Chief Legal Officer;
•Garland G. Gaspard, Senior Vice President, Operations and Engineering;
•Richard R. Alexander, Vice President and General Manager, Marine; and
•Edward T. Flynn, former Executive Vice President.
Edward T. Flynn retired from his position as Executive Vice President effective as of June 30, 2025.
Board and Governance, Compensation and Business Development Committee
Our board of directors is responsible for, and effectively determines, compensation programs applicable to our NEOs and to the board itself. Our board of directors has delegated to the G&C Committee, of which a majority of the members are “independent,” according to NYSE listing standards, the authority and responsibility to regularly analyze and evaluate our compensation policies, to determine the annual compensation of our NEOs, and to make recommendations to our board of directors with respect to such matters. As described in more detail below, the G&C Committee engaged Meridian Compensation Partners, LLC (“Meridian”), as its independent compensation consultant for 2025. As the need arises, we also utilize committees comprised solely of certain of our independent directors (i.e., the audit committee or special committees) to review and make recommendations with respect to certain matters. Because the G&C Committee is comprised of all the members of our board of directors, excluding our CEO, determinations and recommendations by the G&C Committee are effectively determinations and recommendations by our board of directors, which has approval authority for all such compensation matters. For a more detailed discussion regarding the purposes and composition of board committees, please see Item 10. “Directors, Executive Officers and Corporate Governance.”
Committee/Board Process
Following the end of each calendar year, our CEO reviews the compensation of all the other NEOs and makes a proposal to the G&C Committee regarding their compensation. The CEO’s proposal is based on (among other things) our financial results for the prior year, the relevant executive’s areas of responsibility, market data provided by our independent compensation consultant, and recommendations from the relevant executive’s supervisor (if other than our CEO). The G&C Committee reviews the compensation of our CEO and the proposal of our CEO regarding the compensation of the other NEOs and makes a final determination (and a recommendation to our board of directors) regarding the compensation of our NEOs. Depending on the nature and quantity of changes made to that proposal, there may be additional G&C Committee meetings and discussions with our CEO in advance of that determination. Our board of directors has final approval authority for all such compensation matters.
Committee/Board Approval
The G&C Committee determines salaries, annual cash incentives and long-term awards for executive officers, taking into consideration the CEO’s recommendation regarding the NEOs. In April, any applicable salary increases, retention and annual bonuses, and long-term incentive awards are typically made or granted.
Role of Compensation Consultant and Peer Group Analysis
The G&C Committee’s charter authorizes it to retain independent compensation consultants from time to time to serve as a resource in support of its efforts to carry out certain duties. In 2025, the G&C Committee engaged Meridian, an independent compensation consultant, to assist the G&C Committee in assessing and structuring competitive compensation packages for the executive officers that are consistent with our compensation philosophy. The G&C Committee assessed the independence of Meridian pursuant to current exchange listing requirements and SEC guidance and concluded that no conflict of interest exists that would prevent Meridian from serving as an independent consultant to the G&C Committee.
At the request of the G&C Committee, Meridian reviewed and provided input on the compensation of our NEOs, trends in executive compensation, meeting materials circulated to the G&C Committee, and management’s recommendations regarding executive compensation plans. Meridian also developed assessments of market levels of compensation through an analysis of peer data and information disclosed in our peer companies’ public filings, but did not determine or recommend the amount of compensation.
For purposes of reviewing the compensation amounts related to 2025, Meridian performed a market analysis using a peer group that consisted of the following 16 companies in the energy industry: Targa Resources Corp., Plains All American Pipeline, L.P., Western Midstream Partners, LP, Sunoco LP, Equitrans Midstream Corporation, DT Midstream, Inc., Kinetik Holdings Inc., EnLink Midstream, LLC, HF Sinclair Corporation, NuStar Energy L.P., USA Compression Partners, LP, NGL Energy Partners LP, Global Partners LP, Calumet, Inc., Delek US Holdings, Inc., and U.S. Silica Holdings, Inc. Meridian utilized historical data from Equitrans Midstream Corporation, EnLink Midstream, LLC, NuStar Energy L.P., and U.S. Silica Holdings, Inc. for the market analysis as these companies were acquired by EQT Corporation, ONEOK, Inc., Sunoco LP, and, Apollo Global Management, respectively, during 2024 or early 2025. These companies were selected for the compensation peer group for any or all of the following reasons:
1) they reflect our industry competitors for products and services;
2) they operate in similar markets or have comparable geographical reach;
3) they are of similar size and maturity to us; or
4) they are companies that have similar credit profiles to us and/or their growth or capital programs are similar to ours.
The G&C Committee reviews the peer group annually and may, from time to time, add or remove companies in order to assure the composition of the group meets the criteria outlined above.
The information that Meridian compiled included compensation trends for MLPs and levels of compensation for similarly situated executive officers of companies within this peer group. We believe that compensation levels of executive officers in our peer group are relevant to our compensation decisions because we compete with those companies for executive management talent.
Compensation Objectives and Philosophy
The primary objectives of our compensation program are to:
•encourage our executive leaders to build and operate the partnership in a way that is aligned with our common and preferred unitholders’ interests, focusing on visible distribution, high coverage and targeted leverage metrics, all combining to maximize per unit value, while maintaining a focus on the long-term stability of the enterprise and structured so as to not promote inappropriate risk taking;
•offer near-term and long-term compensation opportunities that are competitive with industry norms; and
•provide appropriate levels of retention to the executive team to ensure long-term continuity and stability for the successful execution of key growth initiatives and projects.
We strive to accomplish these objectives by providing all employees, including our NEOs, with a total compensation package that is market competitive and both service and performance-based. In our assessment of the market competitiveness of compensation, we take into consideration the compensation offered by companies in our peer group described above, but we have not identified a specific percentile of peer company pay as a target. Rather, we use market information as one consideration in setting compensation along with individual performance, our financial and operational performance and our safety and sustainability performance.
We pay base salaries at levels that we feel are appropriate for the skills and qualities of the individual NEOs based on their past performance, current scope of responsibilities and future potential. The incentive-based components of each NEO’s compensation include annual cash bonus opportunities and participation in our long-term incentive program. The annual cash bonus rewards incremental operational and financial achievements required to meet investor expectations in the short-term while the long-term component focuses rewards on the long-term stability of the enterprise and intends to assure an alignment between executives and investors in the partnership. Both incentive components are generally linked to base salary and are consistent in general with our understanding of market practice and with our judgment regarding each individual’s role in the organization.
As described in more detail below, we believe that the combination of base salaries, cash bonuses and long-term cash-based incentive awards provide an appropriate balance of short and long-term incentives, and alignment of the incentives for our executives, including our NEOs, with the interests of our unitholders.
The amount of compensation contingent on performance is a significant percentage of total compensation, therefore ensuring that business decisions and actions lead to the long-term growth and sustainability of the organization. Our bonus plan (including retention bonuses) is short-term in nature and includes awards based on individual and company performance with the goal of retaining key employees and NEOs. Our long-term incentive plan is linked to our generation of Available Cash before Reserves,our sustainabilityand safety record, as well as the partnership’s ConsolidatedLeverage ratio (as defined in our credit agreement).
Elements of Our Compensation Program and Compensation Decisions for 2025
The primary elements of our compensation program are a combination of annual cash and long-term incentive-based compensation. For the year ended December 31, 2025, the elements of our compensation program for the NEOs consisted of an annual base salary, discretionary annual bonus awards, including retention bonus awards and awards under our long-term incentive compensation program.
Additionally, in order to attract qualified executive personnel, we may make one-time new-hire equity awards.
Base Salaries
We believe that base salaries should provide a fixed level of competitive pay that reflects the executive officer’s primary duties and responsibilities and provides a foundation for incentive opportunities and benefit levels. As discussed above, the base salaries of our NEOs are reviewed annually by the G&C Committee, taking into account recommendations from our CEO regarding NEOs other than himself. We pay base salaries at a level that we feel is appropriate for the skills and qualities of the individual NEOs based on their past performance, current scope of responsibilities and future potential. Base salaries may be adjusted to achieve what is determined to be a reasonably competitive level or to reflect promotions, the assignment of additional responsibilities, individual performance or company performance. Salaries are also periodically adjusted based on analysis of peer group practices as described above.
In April 2025, the G&C Committee reviewed the assessments of market levels of compensation developed by Meridian in conjunction with a discussion of individual performance and responsibilities. As a result of this review and taking into account current market conditions and their respective levels of responsibility, the G&C Committee approved increases in the base salaries of Mr. Ryan S. Sims, Ms. Jesulaitis, Mr. Gaspard, and Mr. Alexander, effective as of April 9, 2025. Mr. Ryan S. Sims’ 2025 base salary increased to $600,000, representing an increase of 4%. Ms. Jesulaitis’ 2025 base salary increased to $575,000, representing an increase of 5%. Mr. Gaspard’s 2025 base salary increased to $450,000, representing an increase of 6%. Mr. Alexander’s 2025 base salary increased to $450,000, representing an increase of 13%. Mr. Grant E. Sims’ 2025 base salary remained at $860,000, which was consistent with his 2024 base salary.
Bonuses
Our NEOs typically participate in a retention bonus program in which a number of our key employees, managers and officers are eligible. As designed by the G&C Committee, each NEO is awarded a retention bonus amount established based on the analysis of market practices of the peer group and consideration of the level of salary and targeted long-term incentives for each NEO. These retention bonuses are discretionary and are awarded based on individual and company performance with the goal of retaining key employees.In 2025, Mr. Grant E. Sims was granted a retention bonus of $1,075,000, Mr. Ryan S. Sims was granted a retention bonus of $600,000, Ms. Jesulaitis was granted a retention bonus of $575,000, Mr. Gaspard was granted a retention bonus of $450,000, and Mr. Alexander was granted a retention bonus of $450,000, to be paid in four equal installments on or before the last day of the quarter ended on the following dates: September 30, 2025, December 31, 2025, March 31, 2026 and June 30, 2026, contingent upon continued employment at those dates.
We believe that these retention bonuses are an appropriate mechanism to incentivize key executives to remain with us so that we may benefit from their experience in the industry and other competitive opportunities available to them.
Long-Term Incentive Compensation
We generally provide certain long-term compensation (cash and equity-based) to directors, officers, and certain employees through our long-term incentive compensation plans (“LTIPs”). Our G&C Committee designs these awards to align the interests of plan participants with the interests of our long-term unitholders by promoting a sense of proprietorship and personal involvement in our development, growth, and financial success. Our LTIPs have given us flexibility to grant deferred compensation awards in the form of equity or cash-based compensation that vest outright or upon the satisfaction of one or more conditions that reward measurable service and performance, including the passage of time, continued employment, financial, and operating (including safety and sustainability) metrics and the appreciation in our unit price over time.
In 2018, our G&C Committee adopted our 2018 LTIP. Like our 2010 LTIP, our 2018 LTIP permits awards of equity-based compensation in the form of phantom units and distribution equivalent rights (“DERs”). Phantom units are notional units representing unfunded and unsecured promises to pay to the participant a specified amount of cash based on the
market value of our common units should specified vesting requirements be met. DERs are tandem rights to receive on a quarterly basis an amount of cash equal to the amount of distributions that would have been paid on outstanding phantom units had they been limited partner units issued by us. In addition, our 2018 LTIP permits the grant of cash-based awards.
Our G&C Committee administers our LTIPs and has broad authority to grant awards under and alter, amend, or terminate our LTIPs. For example, our G&C Committee has the authority to determine (i) who (if anyone) will receive awards from time to time as well as (ii) the size, nature, terms and conditions of such award. Our G&C Committee also has the authority to adopt, alter, and repeal rules, guidelines and practices relating to our LTIPs and interpret our LTIPs. Our board of directors can terminate the LTIPs at any time.
During 2025, 2024and 2023, we granted cash-based awards to certain officers and other employees under our 2018 LTIP, including our NEOs. We established targetgrant values for NEOs based on an analysis of market practices of our compensation peer group and consideration of the level of salary and targeted bonus for each NEO.
For 2025, the G&C Committee established the following long-term incentive cash grant target values for each of our NEOs:
Long-Term Incentive Cash Grant Value
Name
2025 (1)
Grant E. Sims
$
4,800,000
Ryan S. Sims
2,400,000
Kristen O. Jesulaitis
2,100,000
Garland G. Gaspard
900,000
Richard R. Alexander
1,000,000
(1)See additional discussion of awards granted to NEOs under the 2018 LTIP during 2025 included in the “Grants of Plan-Based Awards” disclosure below.
Other Compensation and Benefits
We offer certain other benefits to our NEOs, including medical, dental, disability and life insurance, and contributions on their behalf to our 401(k) plan. NEOs participate in these plans on the same basis as all other employees. Other than the 401(k) plan, we do not sponsor a pension plan in which our NEOs are eligible to participate, and we do not provide post-retirement medical benefits that would be available to our NEOs.
No perquisites of any material nature are provided to our NEOs.
Tax and Accounting Implications
Since we are a partnership and not a corporation for federal income tax purposes, we are not subject to the executive compensation tax deduction limitations of Section 162(m) of the Internal Revenue Code. Accordingly, none of the compensation paid to our NEOs is subject to limitation as to tax deductibility. However, if the relevant tax laws change in the future, the G&C Committee will consider the implications of such changes to us. For our equity-based and cash-based compensation arrangements, we record compensation expense over the vesting period of the awards, as discussed further in Note 17 of our Consolidated Financial Statements in Item 8.
Compensation Committee Report
The G&C Committee has reviewed and discussed with management the Compensation Discussion and Analysis included above. Based on that review and discussion, the G&C Committee recommended to our board of directors that this Compensation Discussion and Analysis be included in this Form 10-K.
The foregoing report is provided by the following directors, who constitute the G&C Committee:
•Kenneth M. Jastrow II, Chairman
•Conrad P. Albert
•James E. Davison
•James E. Davison, Jr.
•Sharilyn S. Gasaway
•Jack T. Taylor
The information contained in this report shall not be deemed to be soliciting material or filed with the SEC or subject to the liabilities of Section 18 of the Exchange Act, except to the extent that we specifically incorporate it by reference into a document filed under the Securities Act or the Exchange Act.
Clawback Policy
Effective October 2, 2023, we adopted a clawback policy, providing for the recoupment of certain executive compensation in the event of an accounting restatement resulting from material noncompliance with financial reporting requirements. The policy applies to incentive compensation that is granted, earned or vested based in whole or in part upon the attainment of a financial reporting measure, and the policy provides for the reimbursement or forfeiture of excess incentive compensation in the three fiscal years following the accounting restatement date. A copy of the clawback policy is filed as Exhibit 97 to this Form 10-K.
In 2025, no events occurred requiring us to prepare an accounting restatement.
Compensation Risk Assessment
Our board of directors does not believe that our compensation policies and practices for our employees are reasonably likely to have a material adverse effect on us. We compensate most employees with a combination of competitive base salary and incentive compensation. Meridian advised the G&C Committee that our programs include multiple features and practices that do not encourage excessive risk taking. Our board of directors believes that the mix and design of the elements of employee compensation does not incentivize excessive or inappropriate risk taking.
Our board of directors concluded that the following risk oversight and compensation design features guard against excessive risk-taking:
•the Company has strong internal financial controls;
•base salaries are consistent with employees’ responsibilities so that they are not motivated to take excessive risks to achieve a reasonable level of financial security;
•the determination of incentive awards is based on a review of a variety of indicators of performance as well as a meaningful subjective assessment of personal performance, thus diversifying the risk associated with any single indicator of performance;
•compensation decisions include discretionary authority to adjust annual awards and payments, which further reduces any business risk associated with our plans; and
•long-term incentive awards are designed to provide appropriate awards for dedication to a corporate strategy that delivers long-term returns to unitholders.
The following Summary Compensation Table summarizes the total compensation paid or accrued to our NEOs in 2025, 2024 and 2023.
Name & Principal Position
Year
Salary ($)
Bonus ($)(2)
Non-equity Incentive Plan Compensation ($)(3)
All Other
Compensation ($)(4)
Total ($)
Grant E. Sims
2025
$
860,000
$
4,505,000
$
1,040,000
$
723,809
$
7,128,809
Chief Executive Officer
2024
860,000
2,112,500
6,125,760
719,488
9,817,748
(Principal Executive Officer)
2023
842,461
925,000
720,000
717,738
3,205,199
Ryan S. Sims
2025
592,596
2,465,000
246,750
39,520
3,343,866
President and Chief Commercial Officer
2024
560,192
1,062,500
806,950
38,970
2,468,612
2023
478,389
450,000
150,000
37,320
1,115,709
Kristen O. Jesulaitis
2025
567,596
2,097,500
260,000
42,290
2,967,386
Chief Financial Officer and Chief Legal Officer
2024
535,192
1,050,000
1,106,040
40,296
2,731,528
(Principal Financial Officer)
2023
485,385
525,000
130,000
38,646
1,179,031
Garland G. Gaspard
2025
442,596
875,000
195,000
51,888
1,564,484
Senior Vice President
2024
420,192
787,500
1,020,960
54,625
2,283,277
2023
392,692
362,500
120,000
47,754
922,946
Richard R. Alexander
2025
435,192
752,500
205,875
44,346
1,437,913
Vice President
2024
395,192
687,500
728,145
42,930
1,853,767
2023
366,299
250,000
135,000
37,830
789,129
Edward T. Flynn(1)
2025
173,654
2,301,250
390,000
29,614
2,894,518
Former Executive Vice President
2024
525,000
1,247,500
2,430,000
40,952
4,243,452
2023
517,692
1,385,000
300,000
45,954
2,248,646
(1)Mr. Flynn’s bonus for 2025 includes a discretionary bonus of $420,000 relating to 2024 but paid in March 2025, contingent upon his continued employment on the payment date. Mr. Flynn’s bonus for 2024 includes a discretionary bonus of $210,000 relating to 2023 but paid in March 2024, contingent upon his continued employment on the payment date. Mr. Flynn’s bonus for 2023 includes a discretionary bonus of $885,000 relating to 2022 but paid in March 2023.
(2)The amounts shown represent any retention bonuses vested and paid during each year, including a special bonus associated with the sale of the Alkali Business in 2025.
(3)The amounts shown represent the long-term incentive cash grant that vested and paid in 2025, 2024, and 2023.
(4)The following table presents the components of “All Other Compensation” for each NEO for the year ended December 31, 2025.
Name
401(k) Matching and Profit Sharing Contributions(1)
Insurance
Premiums(2)
Totals
Grant E. Sims
$
17,500
$
706,309
$
723,809
Ryan S. Sims
38,500
1,020
39,520
Kristen O. Jesulaitis
37,904
4,386
42,290
Garland G. Gaspard
42,000
9,888
51,888
Richard R. Alexander
42,000
2,346
44,346
Edward T. Flynn
26,896
2,718
29,614
The amounts in this table represent:
(1)Contributions by us to our 401(k) and profit-sharing plan on each NEO’s behalf.
(2)Term life insurance premiums paid by us on each NEO’s behalf. Mr. Grant E. Sims insurance premiums for 2025 include the premium associated with his life insurance policy that is paid by us.
Mr. Alexander entered into an employment agreement in July 2008 relating to his employment and providing for a base salary which is subject to discretionary upward adjustments. Currently, the annual base salary of Mr. Alexander is $450,000. That agreement provides that Mr. Alexander is eligible to participate in all other benefit programs (e.g. health, dental, disability, life and/or other insurance plans) for which executive officers are generally eligible and severance benefits as disclosed in “Potential Payments upon Termination or Change of Control” below.
Grants of Plan-Based Awards
The following table shows the cash-based awards granted to our NEOs in 2025 under our 2018 LTIP.
Estimated Future Payouts Under
Non-Equity Incentive Plan Awards
Name
Grant Date
Vest Date
Threshold
Target
Maximum
Grant E. Sims
4/9/2025
4/9/2028
$
3,600,000
$
4,800,000
$
7,200,000
Ryan S. Sims
4/9/2025
4/9/2028
1,800,000
2,400,000
3,600,000
Kristen O. Jesulaitis
4/9/2025
4/9/2028
1,575,000
2,100,000
3,150,000
Garland G. Gaspard
4/9/2025
4/9/2028
675,000
900,000
1,350,000
Richard R. Alexander
4/9/2025
4/9/2028
750,000
1,000,000
1,500,000
For the awards granted to Mr. Grant E. Sims, Mr. Ryan S. Sims, Ms. Jesulaitis, Mr. Gaspard and Mr. Alexander on April 9, 2025, 50% of the amount represents the cash to be paid if the Company meets certain performance conditions (threshold, target and maximum) associated with our Available Cash before Reserves, our Consolidated Leverage Ratio (as defined in the credit agreement), and safety and sustainability metrics during 2027, and the remaining 50% of the awards are service-based that vest on April 9, 2028.
As noted above, Mr. Flynn retired from his role of Executive Vice President effective June 30, 2025. Mr. Flynn was not granted any awards under our 2018 LTIP in 2025.
There were no equity-based awards granted to our NEOs as of December 31, 2025.
Termination or Change in Control Benefits
We consider maintaining a stable and effective management team to be essential to protecting and enhancing the best interests of us and our unitholders. To that end, we recognize that the possibility of a change in control or other acquisition event may raise uncertainty and questions among management, and such uncertainty could adversely affect our ability to retain our key employees, which would be to our unitholders’ detriment. Because our management team was built over time, as described above, and our NEOs became NEOs under different circumstances, the compensation and benefits awarded to our individual NEOs in the event of termination varies. The employment agreement for Mr. Alexander provides certain compensation and benefits as an incentive to remain in our employ, enhancing our ability to call on and rely upon him in the event of a change of control. Mr. Alexander would not be entitled to severance benefits if terminated for cause. In extending these benefits, we considered a number of factors, including the prevalence of similar benefits adopted by other publicly traded MLPs. See “Potential Payments Upon Termination or Change in Control” below for further discussion of these benefits, including the definitions of certain terms such as change in control.
We believe that the interests of unitholders will best be served if the interests of our management and unitholders are aligned. We believe the termination and change in control benefits described above strike an appropriate balance between the potential compensation payable and the objectives described above.
Potential Payments upon Termination or Change in Control
Mr. Alexander is entitled under his employment agreement to specified severance benefits under certain circumstances as discussed above.
If Mr. Alexander terminates his employment for good reason or we terminate his employment without cause, he would be entitled to (i) company payment of his COBRA health benefits for 12 months and (ii) monthly payments of his annual base salary due for the remainder of the renewal term of his employment agreement.
As used in Mr. Alexander’s employment agreement, the terms “cause”, “change of control”, “good reason” and “renewal term” are generally described below:
•“Cause” means, in general, if the executive commits theft, embezzlement, forgery, any other act of dishonesty relating the executive’s employment or violates our policies or any law, rule, or regulation applicable to us, is convicted of a felony or lesser crime having as its predicate element fraud, dishonesty, or misappropriation, fails to perform his duties under the employment agreement or commits an act or intentionally fails to act, which act or failure to act amounts to gross negligence or willful misconduct.
•“Good Reason” means, in general, following a change of control which results in a substantial diminution of the executive’s duties, compensation, or benefits; executive’s removal from position as Vice President (other than for cause, death or disability, or being offered an equivalent position); or our failure to make any payment to the executive required under the terms of his employment agreement.
•“Change of control” means, in general, any sale of equity in us or our general partner or sale of substantially all of our assets; any merger, conversion or consolidation of us or our general partner; or any other event that, in each of the foregoing cases, results in any persons or entities having the ability to elect a majority of the members of our board of directors (other than one or more of our executive officers or affiliates).
•“Renewal term” means, in general, each one-year term of employment beginning on July 18 of each year, absent either the Company or the executive giving the other party at least 90 days advance written notice of its intent not to renew the employment agreement between them.
Based upon a hypothetical termination date of December 31, 2025, the termination benefits for Messrs. Grant E. Sims, Ryan S. Sims, Gaspard, Alexander and Ms. Jesulaitis for voluntary termination or termination for cause would be zero.
Based upon a hypothetical termination date of December 31, 2025, in the event of Mr. Alexander’s termination without cause (other than due to death or disability) or for good reason (as defined in his employment agreement), Mr. Alexander would have been entitled to severance payments totaling approximately $246,000, payable in monthly installments and equal to his base salary for the remainder of the renewal term ending July 17, 2026, as well as continued COBRA coverage for twelve months with an estimated value of approximately $37,000.
If termination occurs due to death or disability, Messrs. Grant E. Sims, Ryan S. Sims, Gaspard, and Alexander and Ms. Jesulaitis would vest in outstanding awards under our 2018 LTIP at 100%, including the awards granted in 2025, 2024 and 2023, would result in payments under the 2018 LTIP of the following amounts upon death or disability:
Grant E. Sims
$
13,800,000
Ryan S. Sims
6,550,000
Kristen O. Jesulaitis
5,625,000
Garland G. Gaspard
2,500,000
Richard R. Alexander
2,200,000
Upon a change in control (as defined in our 2018 LTIP), the unvested service tranche of the outstanding LTIP cash awards granted in April 2025, April 2024 and April 2023 will become fully vested and the unvested performance tranche of such cash awards will vest at 200% of the performance metric. Based on a hypothetical change in control on December 31, 2025, the change of control benefits for Messrs. Grant E. Sims, Ryan S. Sims, Gaspard, and Alexander, and Ms. Jesulaitis would have been as follows:
Grant E. Sims
Ryan S. Sims
Kristen O. Jesulaitis
Garland G. Gaspard
Richard R. Alexander
Cash payment for vested awards under 2018 LTIP granted in 2025
$
7,200,000
$
3,600,000
$
3,150,000
$
1,350,000
$
1,500,000
Cash payment for vested awards under 2018 LTIP granted in 2024
7,200,000
3,440,000
3,040,000
1,200,000
900,000
Cash payment for vested awards under 2018 LTIP granted in 2023
7,200,000
3,500,000
2,750,000
1,200,000
900,000
Total
$
21,600,000
$
10,540,000
$
8,940,000
$
3,750,000
$
3,300,000
Director Compensation in Fiscal Year 2025
The table below reflects compensation for our non-employee directors. Mr. Grant E. Sims does not receive any compensation attributable to his status as a director.
(2)Amounts in this column represent the fair value of the awards of phantom units under our 2010 LTIP on the date of grant, as calculated in accordance with accounting guidance for equity-based compensation.
(3)Outstanding awards to directors at December 31, 2025 consist of phantom units granted under our 2010 LTIP. Messrs. James Davison and James Davison, Jr. each hold 10,735 outstanding phantom units, Ms. Gasaway holds 11,375 outstanding phantom units, Mr. Jastrow holds 11,755 outstanding phantom units, Mr. Albert holds 11,256 outstanding phantom units, and Mr. Taylor holds 11,486 outstanding phantom units.
(4)Amounts in this column represent the amounts paid for tandem DERs related to outstanding phantom units granted under our 2010 LTIP.
Beginning in July 2025 our non-employee directors are entitled to a base compensation of $290,000 per year, with $130,000 paid in cash and $160,000 paid in phantom units. The lead director, the chairpersons of the audit committee and G&C Committee, and any non-chair members of the audit committee each receive an additional amount of base compensation split equally between cash and phantom units. The cash compensation is paid in equal quarterly installments. Such additional amounts are $20,000 for the lead director, $25,000 for the chair of the audit committee, $15,000 for the chair of the G&C Committee and $15,000 for any audit committee non-chair members.
Phantom units are awarded on the first business day of each calendar quarter. During 2025, 2024 and 2023, we awarded phantom units under our 2010 LTIP only to non-employee directors, all of which were service-based awards with no performance conditions. The number of phantom units awarded is determined by dividing the closing market price of our units on the date of the award into the amount to be paid in phantom units. So long as he or she is a director on the relevant date of determination, each director will receive: a quarterly distribution equal to the number of phantom units held by such director multiplied by the quarterly distribution amount we will pay in respect of each of our outstanding common units on such distribution date. All phantom units granted to our directors will vest and pay out after their one-year anniversary at an amount equal to the number of phantom units granted multiplied by the average closing price of our common units for the 20 trading days ending on the day immediately preceding such anniversary date.
CEO Pay Ratio
Our CEO to median employee pay ratio is calculated in accordance with the SEC’s pay ratio rules, Item 402(u) of Regulation S-K, which requires the disclosure of (i) the median of the annual total compensation of all employees of the Company (except the CEO), (ii) the annual total compensation for the CEO, and (iii) the ratio of these two amounts.
We identified the median employee during the year ended December 31, 2025 by examining the 2025 total cash compensation for all individuals excluding our CEO, who were employed by us on December 31, 2025. Consistent with the pay ratio rules in Item 402(u), we excluded from our employees those individuals who provide services as independent contractors, based on application of the tests used for tax purposes as set forth in the Internal Revenue Service’s Publication 15A: “Employer’s Supplemental Tax Guide”.
We selected December 31, 2025, which is within the last three months of 2025, as the date upon which we would identify the median employee because it enabled us to make such identification in a reasonably efficient and economical manner. We did not make any assumptions, adjustments, or estimates with respect to total cash compensation, and we did not annualize the compensation for any full-time employees that were not employed by us for all of 2025. We believe the use of total cash compensation for all employees is a consistently applied compensation measure because we do not widely distribute annual equity awards to employees. Since all of the employees included in the CEO to median employee pay ratio calculation are located in the U.S., including the Commonwealth of Puerto Rico, and paid in U.S. dollars, we did not make any cost-of-living adjustments in identifying the median employee.
As of December 31, 2025, the Company had 1,061 employees, including 1,046 full-time employees and 15 temporary employees.
We calculated the annual total compensation for the median employee using the same methodology we use for our named executive officers as set forth in the 2025 Summary Compensation Table above in this 10-K filing. Mr. Grant E. Sims, our CEO, had 2025 annual total compensation of $7,128,809, as reflected in the Summary Compensation Table. Our median employee’s annual total compensation for2025was $117,500. Based on this information, Mr. Sims’ total annual compensation was approximately sixty-one times that of our median employee in 2025, or 61:1.
Item 12. Security Ownership of Certain Beneficial Owners and Management and Related Unitholder Matters
Beneficial Ownership of Partnership Units
Beneficial Ownership of Common Units
The following table sets forth certain information as of February 18, 2026, regarding the beneficial ownership of our common units by beneficial owners of 5% or more by class of unit and by directors and the executive officers of our general partner and by all directors and executive officers as a group. This information is based on data furnished by the person named.
Class A Common Units
Class B Common Units
Name and Address of Beneficial Owner
Amount and Nature of Beneficial Ownership
(1)
Percent of Class
Amount and Nature of Beneficial Ownership
Percent of Class
Conrad P. Albert
15,000
*
—
—
James E. Davison
3,738,178
(2)
3.1
%
9,453
23.6
%
James E. Davison, Jr.
5,423,932
(3)
4.4
%
13,648
34.1
%
Sharilyn S. Gasaway
289,445
*
1,081
2.7
%
Kenneth M. Jastrow II
150,000
*
—
—
Jack T. Taylor
32,865
*
—
—
Grant E. Sims
3,010,000
2.5
%
7,087
17.7
%
Ryan S. Sims
123,500
(4)
*
—
—
Kristen O. Jesulaitis
55,000
*
—
—
Garland G. Gaspard
24,541
*
—
—
Louie V. Nicol
2,050
*
—
—
Richard R. Alexander
20,245
(5)
*
—
—
William W. Rainsberger
3,500
*
—
—
Jeffrey J. Rasmussen
23,500
*
—
—
All directors and executive officers as a group (14 in total)
12,911,756
10.5
%
31,269
78.2
%
Steven K. Davison
975,617
(6)
*
7,676
19.2
%
Global X Management Company LLC
7,263,186
5.9
%
—
Invesco Ltd.
18,804,127
15.4
%
—
—
ALPS Advisors, Inc.
24,909,448
20.3
%
—
—
* Less than 1%
(1)The Class B Common Units, which also are included in the Class A Common Unit total, are identical in most respects to the Class A Common Units and have voting and distribution rights equivalent to those of the Class A Common Units. In addition, the Class B Common Units have the right to elect all of our board of directors and are convertible into Class A Common Units under certain circumstances, subject to certain exceptions.
(2)In addition to his direct ownership interests, Mr. Davison is the sole stockholder of Terminal Services, Inc., which owns 1,010,835 Class A Common Units.
(3)1,339,383 of these Class A Common Units are held by trusts for Mr. Davison's children. 187,856 of these Class A Common Units are held by the James E. and Margaret A. B. Davison Special Trust.
(4)100,000 of these Class A Common Units are held by a family trust of which Mr. Ryan S. Sims is the trustee.
(5)Includes 4,745 Class A Common Units held by Mr. Alexander’s parents over which Mr. Alexander has trading authority. Mr. Alexander pledged 10,000 Class A Common Units as collateral for margin brokerage accounts.
(6)Includes 147,941 Class A Common Units held by the Steven Davison Family Trust.
Except as noted, each unitholder in the above table is believed to have sole voting and investment power with respect to the units beneficially held, subject to applicable community property laws.
The following table sets forth certain information as of December 31, 2025, regarding the beneficial ownership of holders of 5% or more of our Class A Convertible Preferred Units. This information is based on data furnished by the persons named.
Class A Convertible Preferred Units
Name and Address of Beneficial Owner
Amount and Nature of Beneficial Ownership
Percent of Class (1)
GSO Rodeo Holdings LP (2)
6,459,192
41.2
%
KKR Rodeo Aggregator L.P.(3)
7,847,861
50.0
%
Atlas Point Energy Infrastructure Fund LLC (4)
1,258,000
8.0
%
(1)The percentage of beneficial ownership is calculated based on 15,695,722 Class A Convertible Preferred Units deemed outstanding as of December 31, 2025.
(2)Reflects Class A Convertible Preferred Units directly owned by GSO Rodeo Holdings LP. GSO Rodeo Holdings Associates LLC is the general partner of GSO Rodeo Holdings LP. GSO Holdings I L.L.C. is the managing member of GSO Rodeo Holdings Associates LLC. Blackstone Holdings II L.P. is the managing member of GSO Holdings I L.L.C. Blackstone Holdings I/II GP Inc. is the general partner of Blackstone Holdings II L.P. The Blackstone Group Inc. is the sole member of Blackstone Holdings I/II GP, L.L.C. Blackstone Group Management L.L.C. is the sole holder of Class C common stock of The Blackstone Group Inc. Blackstone Group Management L.L.C. is wholly-owned by Blackstone’s senior managing directors and controlled by its founder, Stephen A. Schwarzman. In addition, Bennett J. Goodman may be deemed to have shared voting power and/or investment power with respect to the securities held by GSO Rodeo Holdings LP. Each of the foregoing (other than GSO Rodeo Holdings LP) disclaims beneficial ownership of the Class A Convertible Preferred Units beneficially owned by GSO Rodeo Holdings LP. The business address for GSO Rodeo Holdings LP is c/o GSO Capital Partners LP, 345 Park Avenue, New York, New York 10154.
(3)Reflects Class A Convertible Preferred Units directly owned by KKR Aggregator L.P. KKR Rodeo Aggregator GP LLC, as the general partner of KKR Rodeo Aggregator L.P., KKR Global Infrastructure Investors II (Rodeo) L.P., as the sole member of KKR Rodeo Aggregator GP LLC, KKR Associates Infrastructure II AIV L.P., as the general partner of KKR Global Infrastructure Investors II (Rodeo) L.P., KKR Infrastructure II AIV GP LLC, as the general partner of KKR Associates Infrastructure II AIV L.P., KKR Financial Holdings LLC, as the Class B member of KKR Infrastructure II AIV GP LLC, KKR Fund Holdings L.P., as the Class A member of KKR Infrastructure II AIV GP LLC and the sole member of KKR Financial Holdings LLC, KKR Fund Holdings GP Limited, as a general partner of KKR Fund Holdings L.P., KKR Group Holdings Corp., as the sole shareholder of KKR Fund Holdings GP Limited and a general partner of KKR Fund Holdings L.P., KKR & Co. Inc., as the sole shareholder of KKR Group Holdings Corp., KKR Management LLC, as the Class B common stockholder of KKR & Co. Inc., and Messrs. Kravis and Roberts, as the designated members of KKR Management LLC, may be deemed to be the beneficial owners having shared voting and investment power with respect to the Class A Convertible Preferred Units described in this footnote. The principal business address of each of the entities and persons identified in this paragraph, except Mr. Roberts, is c/o Kohlberg Kravis Roberts & Co. L.P., 9 West 57th Street, Suite 4200, New York, NY 10019. The principal business address for Mr. Roberts is c/o Kohlberg Kravis Roberts & Co. L.P., 2800 Sand Hill Road, Suite 200, Menlo Park, CA 94025.
(4)Reflects Class A Convertible Preferred Units directly owned by Atlas Point Energy Infrastructure Fund, LLC.
Beneficial Ownership of General Partner Interest
Genesis Energy, LLC owns a non-economic general partner interest in us. Genesis Energy, LLC is our wholly-owned subsidiary.
The mailing address for Genesis Energy, LLC and all officers and directors is 811 Louisiana, Suite 1200, Houston, Texas, 77002.
Item 13. Certain Relationships and Related Transactions, and Director Independence
Transactions with Related Persons
Our CEO, Mr. Grant E. Sims, owns an aircraft, which is used by us for business purposes in the course of operations. We pay Mr. Grant E. Sims a fixed monthly fee and reimburse the aircraft management company for costs related to our usage of the aircraft, including fuel and the actual out-of-pocket costs. In connection with this arrangement, we made payments to Mr. Grant E. Sims totaling $0.7 million, during 2025. Based on current market rates for chartering of private aircraft under long-term, priority arrangements with industry recognized chartering companies, we believe that the terms of this arrangement are no worse than what we could have expected to obtain in an arms-length transaction.
Family members of certain of our executive officers and directors may work for us from time to time. In 2025, Grant E. Sims (our CEO and a director) had a son (who is also a brother of Ryan S. Sims) work as vice president of offshore pipeline commercial operations in our offshore pipeline transportation segment. Mr. James Davison, Sr. (a director) had one son (who is also a brother of James E. Davison, Jr., a director) that worked as a director in our onshore transportation and services department in 2025. In the aggregate, these family members received total W-2 compensation of approximately $0.8 million.
Director Independence
Because we are a limited partnership, the listing standards of the NYSE do not require that we have a majority of independent directors (although at least a majority of the members of our board of directors is independent, as defined by the NYSE rules) or that we have either a nominating committee or a compensation committee of our board of directors. We are, however, required to have an audit committee consisting of at least three members, all of whom are required to be “independent” as defined by the NYSE.
Under NYSE rules, to be considered independent, our board of directors must determine that a director has no material relationship with us other than as a director. The rules specify the criteria by which the independence of directors will be determined, including guidelines for directors and their immediate family members with respect to employment or affiliation with us or with our independent public accountants. Our board of directors has determined that each of Ms. Gasaway and Messrs. Jastrow, Albert and Taylor is an independent director under the NYSE rules. See Item 10. “Directors, Executive Officers and Corporate Governance” for additional discussion relating to our directors and director independence.
Item 14. Principal Accounting Fees and Services
The following table summarizes the fees for professional services rendered by PricewaterhouseCoopers LLP for the years ended December 31, 2025 and 2024, respectively.
2025
2024
(in thousands)
Audit Fees(1)
$
2,106
$
2,865
Tax Fees(2)
1,464
1,424
All Other Fees(3)
2
2
Total
$
3,572
$
4,291
(1)Includes fees for the annual audit and quarterly reviews (including internal control evaluation and reporting), SEC registration statements (2024), comfort letters (2024) and accounting and financial reporting consultations and research work regarding Generally Accepted Accounting Principles.
(2)Includes fees for tax return preparation, tax compliance services, K-1 processing services and tax consultations.
(3)Includes fees associated with non-audit related services and licenses for accounting research software.
Pre-Approval Policy
The services by PricewaterhouseCoopers LLP in 2025 and 2024 were pre-approved in accordance with the pre-approval policy and procedures adopted by the audit committee. This policy describes the permitted audit, audit-related, tax and other services, which we refer to collectively as the Disclosure Categories that the independent auditor may perform. The policy requires that each fiscal year, a description of the services, or the Service List, expected to be performed by the independent auditor in each of the Disclosure Categories in the following fiscal year be presented to the audit committee for approval.
Any requests for audit, audit-related, tax and other services not contemplated on the Service List must be submitted to the audit committee for specific pre-approval and cannot commence until such approval has been granted. Normally, pre-approval is provided at regularly scheduled meetings.
In considering the nature of the non-audit services provided by PricewaterhouseCoopers LLP in 2025 and 2024, the audit committee determined that such services are compatible with the provision of independent audit services. The audit committee discussed these services with PricewaterhouseCoopers LLP and management of our general partner to determine that they are permitted under the rules and regulations concerning auditor independence promulgated by the SEC to implement the Sarbanes-Oxley Act of 2002, as well as the American Institute of Certified Public Accountants.
Certificate of Limited Partnership of Genesis Energy, L.P. (incorporated by reference to Exhibit 3.1 to Amendment No. 2 of the Registration Statement on Form S-1 filed on November 15, 1996, File No. 333-11545).
XBRL Instance Document- the instance document does not appear in the Interactive Data File because its XBRL tags are embedded within the Inline XBRL document.
*
101.SCH
XBRL Schema Document.
*
101.CAL
XBRL Calculation Linkbase Document.
*
101.LAB
XBRL Label Linkbase Document.
*
101.PRE
XBRL Presentation Linkbase Document.
*
101.DEF
XBRL Definition Linkbase Document.
*
104
Cover Page Interactive Data File (formatted as Inline XBRL)
*
Filed herewith
+
A management contract or compensation plan or arrangement.
Pursuant to the requirements of Section 13 or 15(d) of the Securities Exchange Act of 1934, the registrant has duly caused this report to be signed on its behalf by the undersigned, thereunto duly authorized.
GENESIS ENERGY, L.P.
(A Delaware Limited Partnership)
By:
GENESIS ENERGY, LLC,
as General Partner
Date:
February 18, 2026
By:
/s/ GRANT E. SIMS
Grant E. Sims
Chief Executive Officer
Pursuant to the requirements of the Securities Exchange Act of 1934, this report has been signed below by the following persons in the capacities and on the dates indicated.
NAME
TITLE
DATE
(OF GENESIS ENERGY, LLC)*
/s/ GRANT E. SIMS Grant E. Sims
Chairman of the Board, Director and Chief Executive Officer (Principal Executive Officer)
February 18, 2026
/s/ KRISTEN O. JESULAITIS Kristen O. Jesulaitis
Chief Financial Officer and Chief Legal Officer (Principal Financial Officer)
February 18, 2026
/s/ LOUIS V. NICOL Louis V. Nicol
Senior Vice President and Chief Accounting Officer (Principal Accounting Officer)
Report of Independent Registered Public Accounting Firm
To the Board of Directors of Genesis Energy, LLC and Unitholders of Genesis Energy, L.P.
Opinions on the Financial Statements and Internal Control over Financial Reporting
We have audited the accompanying consolidated balance sheets of Genesis Energy, L.P. and its subsidiaries (the “Partnership”) as of December 31, 2025 and 2024, and the related consolidated statements of operations, of comprehensive income (loss), of partners’ capital (deficit) and of cash flows for each of the three years in the period ended December 31, 2025, including the related notes (collectively referred to as the “consolidated financial statements”). We also have audited the Partnership’s internal control over financial reporting as of December 31, 2025, based on criteria established in Internal Control - Integrated Framework (2013) issued by the Committee of Sponsoring Organizations of the Treadway Commission (COSO).
In our opinion, the consolidated financial statements referred to above present fairly, in all material respects, the financial position of the Partnership as of December 31, 2025 and 2024, and the results of its operations and its cash flows for each of the three years in the period ended December 31, 2025 in conformity with accounting principles generally accepted in the United States of America. Also in our opinion, the Partnership maintained, in all material respects, effective internal control over financial reporting as of December 31, 2025, based on criteria established in Internal Control - Integrated Framework (2013) issued by the COSO.
Basis for Opinions
The Partnership’s management is responsible for these consolidated financial statements, for maintaining effective internal control over financial reporting, and for its assessment of the effectiveness of internal control over financial reporting, included in Management’s Report on Internal Control over Financial Reporting appearing under Item 9A. Our responsibility is to express opinions on the Partnership’s consolidated financial statements and on the Partnership’s internal control over financial reporting based on our audits. We are a public accounting firm registered with the Public Company Accounting Oversight Board (United States) (PCAOB) and are required to be independent with respect to the Partnership in accordance with the U.S. federal securities laws and the applicable rules and regulations of the Securities and Exchange Commission and the PCAOB.
We conducted our audits in accordance with the standards of the PCAOB. Those standards require that we plan and perform the audits to obtain reasonable assurance about whether the consolidated financial statements are free of material misstatement, whether due to error or fraud, and whether effective internal control over financial reporting was maintained in all material respects.
Our audits of the consolidated financial statements included performing procedures to assess the risks of material misstatement of the consolidated financial statements, whether due to error or fraud, and performing procedures that respond to those risks. Such procedures included examining, on a test basis, evidence regarding the amounts and disclosures in the consolidated financial statements. Our audits also included evaluating the accounting principles used and significant estimates made by management, as well as evaluating the overall presentation of the consolidated financial statements. Our audit of internal control over financial reporting included obtaining an understanding of internal control over financial reporting, assessing the risk that a material weakness exists, and testing and evaluating the design and operating effectiveness of internal control based on the assessed risk. Our audits also included performing such other procedures as we considered necessary in the circumstances. We believe that our audits provide a reasonable basis for our opinions.
Definition and Limitations of Internal Control over Financial Reporting
A company’s internal control over financial reporting is a process designed to provide reasonable assurance regarding the reliability of financial reporting and the preparation of financial statements for external purposes in accordance with generally accepted accounting principles. A company’s internal control over financial reporting includes those policies and procedures that (i) pertain to the maintenance of records that, in reasonable detail, accurately and fairly reflect the transactions and dispositions of the assets of the company; (ii) provide reasonable assurance that transactions are recorded as necessary to permit preparation of financial statements in accordance with generally accepted accounting principles, and that receipts and expenditures of the company are being made only in accordance with authorizations of management and directors of the company; and (iii) provide reasonable assurance regarding prevention or timely detection of unauthorized acquisition, use, or disposition of the company’s assets that could have a material effect on the financial statements.
Because of its inherent limitations, internal control over financial reporting may not prevent or detect misstatements. Also, projections of any evaluation of effectiveness to future periods are subject to the risk that controls may become inadequate because of changes in conditions, or that the degree of compliance with the policies or procedures may deteriorate.
Critical Audit Matters
The critical audit matter communicated below is a matter arising from the current period audit of the consolidated financial statements that was communicated or required to be communicated to the audit committee and that (i) relates to accounts or disclosures that are material to the consolidated financial statements and (ii) involved our especially challenging, subjective, or complex judgments. The communication of critical audit matters does not alter in any way our opinion on the consolidated financial statements, taken as a whole, and we are not, by communicating the critical audit matter below, providing a separate opinion on the critical audit matter or on the accounts or disclosures to which it relates.
Estimation of Variable Consideration – Long-Term Contracts in the Offshore Pipeline Transportation Segment
As described in Note 3 to the consolidated financial statements, the Partnership has recognized current contract liabilities of $27 million (included in accrued liabilities) and non-current contract liabilities of $78.9 million (included in other long-term liabilities), as of December 31, 2025. As disclosed by management, the Partnership’s offshore pipeline transportation segment has certain long-term contracts with
1
customers that include variable consideration that must be estimated at contract inception and re-assessed at each reporting period. Total consideration for these arrangements is recognized as revenue over the applicable contract period and is based on the Partnership’s measure of satisfaction of its corresponding performance obligation. The estimated performance obligation over the life of a contract includes significant judgments by management including volume and forecasted production information, future price indexing, the Partnership’s ability to transport volumes produced by its customers, and the contract period. The Partnership also constrains the estimates of variable consideration such that it is probable that a significant reversal of previously-recognized revenue will not occur throughout the life of the contract. Differences between the amounts billed to customers and the revenue recognized on a contract results in the recognition of a contract asset or liability.
The principal considerations for our determination that performing procedures relating to the estimation of variable consideration related to long-term contracts in the offshore pipeline transportation segment is a critical audit matter are (i) the significant judgment by management when developing the estimates of variable consideration, which includes the assumption for volumes and forecasted production information and (ii) a high degree of auditor judgment, subjectivity, and effort in performing procedures and evaluating audit evidence related to management’s estimates of variable consideration for these contracts.
Addressing the matter involved performing procedures and evaluating audit evidence in connection with forming our overall opinion on the consolidated financial statements. These procedures included testing the effectiveness of controls relating to the revenue recognition process, including the control over the estimates of variable consideration. These procedures also included, among others (i) testing management’s process for developing the estimates of variable consideration; (ii) evaluating the appropriateness of the methodology used by management; (iii) testing the completeness and accuracy of underlying data used in calculating the estimate; and (iv) evaluating, on a sample basis, the reasonableness of the significant assumption used by management related to volumes and forecasted production information specific to each contract. Evaluating management’s assumption related to volumes and forecasted production information involved evaluating whether the assumption used by management was reasonable considering (i) management’s historical forecasting accuracy; (ii) evidence to support the volumes and forecasted production information; and (iii) the timely identification of circumstances which may require a modification to the previous estimate.
/s/ PricewaterhouseCoopers LLP
Houston, Texas
February 18, 2026
We have served as the Partnership’s auditor since 2023.
2
GENESIS ENERGY, L.P.
CONSOLIDATED BALANCE SHEETS
(In thousands, except units)
December 31, 2025
December 31, 2024
ASSETS
CURRENT ASSETS:
Cash and cash equivalents
$
6,437
$
7,352
Accounts receivable—trade, net
608,221
479,504
Inventories
55,366
37,782
Other
17,442
18,789
Current assets held for discontinued operations
—
368,307
Total current assets
687,466
911,734
FIXED ASSETS, at cost
5,374,060
5,280,860
Less: Accumulated depreciation
(1,908,737)
(1,740,974)
Net fixed assets
3,465,323
3,539,886
EQUITY INVESTEES
218,631
240,368
INTANGIBLE ASSETS, net of amortization
75,606
85,287
GOODWILL
301,959
301,959
RIGHT OF USE ASSETS, net
57,670
65,739
OTHER ASSETS, net of amortization
54,048
53,606
NON-CURRENT ASSETS - held for discontinued operations
—
1,839,113
TOTAL ASSETS
$
4,860,703
$
7,037,692
LIABILITIES AND CAPITAL
CURRENT LIABILITIES:
Accounts payable—trade
$
490,712
$
388,245
Accrued liabilities
208,980
254,202
Current liabilities held for discontinued operations
—
216,308
Total current liabilities
699,692
858,755
SENIOR SECURED CREDIT FACILITY
6,400
291,000
SENIOR UNSECURED NOTES, net of debt issuance costs, discount and premium
3,040,415
3,436,860
DEFERRED TAX LIABILITIES
17,405
16,575
OTHER LONG-TERM LIABILITIES
388,707
389,161
LONG-TERM LIABILITIES - held for discontinued operations
—
529,558
Total liabilities
4,152,619
5,521,909
MEZZANINE CAPITAL:
Class A Convertible Preferred Units, 15,695,722 and 23,111,918 issued and outstanding at December 31, 2025 and 2024, respectively
Net cash provided by (used in) financing activities
(1,108,235)
161,744
73,993
Net increase (decrease) in cash and cash equivalents and restricted cash
(23,115)
1,514
1,471
Cash and cash equivalents and restricted cash at beginning of period
29,552
28,038
26,567
Cash, cash equivalents, and restricted cash at beginning of period: discontinued operations
22,200
21,806
24,429
Cash and cash equivalents at beginning of period: continuing operations
7,352
6,232
2,138
Cash, cash equivalents and restricted cash at end of period
6,437
29,552
28,038
Cash, cash equivalents and restricted cash at end of period: discontinued operations
—
22,200
21,806
Cash and cash equivalents at end of period: continuing operations
$
6,437
$
7,352
$
6,232
The accompanying notes are an integral part of these Consolidated Financial Statements.
7
GENESIS ENERGY, L.P.
NOTES TO CONSOLIDATED FINANCIAL STATEMENTS
1. Organization
We are a master limited partnership founded in Delaware in 1996 and focused on the midstream segment of the crude oil and natural gas industry. Our operations are primarily located in the Gulf of America and in the Gulf Coast region of the United States. We provide an integrated suite of services to crude oil and natural gas producers, refiners and industrial and commercial enterprises. We have a diverse portfolio of assets, including pipelines, offshore hub and junction platforms, barges and other vessels, refinery-related plants, storage tanks, terminals, railcars, rail unloading facilities and trucks. We are owned 100% by our limited partners. Genesis Energy, LLC, our general partner, is a wholly-owned subsidiary. Our general partner has sole responsibility for conducting our business and managing our operations. We conduct our operations and own our operating assets through our subsidiaries and joint ventures.
In the first quarter of 2025, we re-organized our operating segments as a result of the way our chief operating decision maker, who is our Chief Executive Officer (our “CODM”), evaluates the performance of operations, develops strategy and allocates resources, including capital. Our sulfur services business, formerly reported under our soda and sulfur services reporting segment with our Alkali Business (as defined below), is now reported under our onshore transportation and services reporting segment along with our previously reported onshore facilities and transportation segment. As a result of this change, we now manage our businesses through the following three divisions that constitute our reportable segments:
•Offshore pipeline transportation, which includes the transportation and processing of crude oil and natural gas in the Gulf of America;
•Marine transportation, which provides waterborne transportation of petroleum products (primarily fuel oil, asphalt and other heavy refined products) and crude oil throughout North America; and
•Onshore transportation and services, which includes terminaling, blending, storing, marketing, and transporting crude oil and petroleum products, as well as the processing of high sulfur (or “sour”) gas streams for refineries to remove the sulfur, and selling the related by-product, sodium hydrosulfide (or “NaHS,” commonly pronounced “nash”).
2. Summary of Significant Accounting Policies
Basis of Consolidation and Presentation
The accompanying financial statements and related notes present our consolidated financial position as of December 31, 2025 and 2024 and our results of operations, statements of comprehensive income (loss), changes in partners’ capital and cash flows for the years ended December 31, 2025, 2024 and 2023. All intercompany balances and transactions have been eliminated. The accompanying Consolidated Financial Statements include Genesis Energy, L.P. and its subsidiaries.
On February 28, 2025, we completed the sale of the Alkali Business. We determined that the exit of the Alkali Business and its operations in Wyoming represented a strategic and geographic shift that met the criteria for discontinued operations (see Note 4 for further discussion). Accordingly, we have separately reported the operations from the Alkali Business in the Consolidated Statements of Operations and the related assets and liabilities of the Alkali Business in the Consolidated Balance Sheets as discontinued operations. These changes have been applied retrospectively to all periods presented. The disclosures included within the accompanying notes to the Consolidated Financial Statements are representative of our continuing operations.
Except per unit amounts, or as noted within the context of each footnote disclosure, the dollar amounts presented in the tabular data within these footnote disclosures are stated in thousands of dollars.
Joint Ventures
We participate in several joint ventures, including, in our offshore pipeline transportation segment, a 64% interest in Poseidon Oil Pipeline Company, L.L.C. (“Poseidon”), a 29% interest in Odyssey Pipeline L.L.C. (“Odyssey”), a 26.8% interest in Paloma Pipeline Company (“Paloma”), and a 25.7% interest in Neptune Pipeline Company, LLC, (“Neptune”). We account for our investments in these joint ventures by the equity method of accounting. See Note 9.
Noncontrolling interests
Noncontrolling interests represent any third party or affiliate interest in non-wholly owned entities that we consolidate. For financial reporting purposes, the assets and liabilities of these entities are consolidated with those of our own, with any third party or affiliate interest in our Consolidated Balance Sheets amounts shown as noncontrolling interests in partners’ capital. See Note 12for additional discussion regarding our noncontrolling interests.
8
Use of Estimates
The preparation of our Consolidated Financial Statements requires us to make estimates and assumptions that affect the reported amounts of assets and liabilities and disclosure of contingent assets and liabilities, if any, at the date of the Consolidated Financial Statements and the reported amounts of revenues and expenses during the reporting period. We based these estimates and assumptions on historical experience and other information that we believed to be reasonable under the circumstances. Significant estimates that we make include: (1) estimated useful lives of our fixed and intangible assets for the use in calculating depreciation and amortization of long-lived assets and intangible assets, (2) estimates of future net cash flows from assets for purposes of determining whether impairment of our long-lived assets, intangible assets and goodwill has occurred, (3) estimates of variable consideration for revenue recognition, (4) liability and contingency accruals, including the estimates of future asset retirement obligations, and (5) estimated fair value of assets and liabilities acquired and identification of associated goodwill and intangible assets. While we believe these estimates are reasonable, actual results could differ from these estimates. Changes in facts and circumstances may result in revised estimates.
Cash and Cash Equivalents
Cash and cash equivalents consist of all demand deposits and funds invested in highly liquid instruments with original maturities of three months or less. We periodically assess the financial condition of the institutions where these funds are held and believe that our credit risk is minimal.
Accounts Receivable - trade, net
We review our outstanding accounts receivable balances on a regular basis and estimate an allowance for amounts that we expect will not be fully recovered. An allowance for credit losses is determined based upon historical collectability trends, recoveries, historical write-offs, and current market data for the partnership’s customers in order to estimate projected losses. Actual balances are not applied against the reserve until substantially all collection efforts have been exhausted.
Inventories
Our inventories are valued at the lower of cost and net realizable value.
Fixed Assets
Property and equipment are carried at cost. Depreciation of property and equipment is provided using the straight-line method over the respective estimated useful lives of the assets. Asset lives are primarily estimated to be 5 to 40 years for pipelines and related assets, 20 to 30 years for marine vessels, 3 to 30 years for machinery and equipment, 3 to 7 years for transportation equipment, and 3 to 25 years for buildings and improvements, office equipment, furniture and fixtures and other equipment.
Interest is capitalized in connection with the construction of major facilities. The capitalized interest is recorded as part of the asset to which it relates and is amortized over the asset’s estimated useful life.
Maintenance and repair costs are charged to expense as incurred. Costs incurred for major replacements and upgrades are capitalized and depreciated over the remaining useful life of the asset. Certain volumes of crude oil and refined products are classified in fixed assets, as they are necessary to ensure efficient and uninterrupted operations of our gathering businesses. These crude oil and refined products volumes are carried at their weighted average cost.
Long-lived assets are reviewed for impairment. An asset is tested for impairment when events or circumstances indicate that its carrying value may not be recoverable. The carrying value of a long-lived asset is not recoverable if it exceeds the sum of the undiscounted cash flows expected to be generated from the use and ultimate disposal of the asset. If the carrying value is determined to not be recoverable under this method, an impairment charge equal to the amount the carrying value exceeds the fair value is recognized. Fair value is generally determined from estimated discounted future net cash flows.
Deferred Charges on Marine Transportation Assets
Our marine vessels are required by US Coast Guard regulations to be re-certified after a certain period of time, usually every five years. The US Coast Guard states that vessels must meet specified “seaworthiness” standards to maintain required operating certificates. To meet such standards, vessels must undergo regular inspection, monitoring, and maintenance, referred to as “dry-docking.” Typical dry-docking costs include costs incurred to comply with regulatory and vessel classification inspection requirements, blasting and steel coating, and steel replacement. We defer these inspection costs to “Other assets, net of amortization” and amortize these costs to “Marine transportation operating costs” over the length of time that the certification is expected to last.
9
Asset Retirement Obligations
Some of our assets have contractual or regulatory obligations to perform dismantlement and removal activities, and in some instances remediation, when the assets are abandoned. In general, our asset retirement obligations (“AROs”) relate to future costs associated with the disconnecting or removing of our crude oil and natural gas pipelines (or at times, abandonment in place) and platforms, barge decommissioning, removal of equipment and facilities from leased acreage and land restoration. The estimated fair value of an ARO is recorded in the period in which it is incurred, discounted to its present value using our credit adjusted risk-free interest rate, and a corresponding amount is capitalized by increasing the carrying amount of the related long-lived asset. The capitalized cost is depreciated over the useful life of the related asset. An ongoing expense is recognized for changes in fair value of the liability as a result of the passage of time, which is recorded as accretion expense and included within operating costs in the Consolidated Statements of Operations. See Note 8 for additional information.
Lease Accounting
We enter into operating lease contracts for the right to use certain transportation equipment, facilities and equipment, and office space. For contracts that contain a lease and extend for a period greater than 12 months, we recognize a right of use asset and a corresponding lease liability on our Consolidated Balance Sheets. The present value of each lease is based on the future minimum lease payments in accordance with ASC 842 and is determined by discounting these payments using an incremental borrowing rate. From time to time, we enter into agreements in which we are lessors of our property or equipment. For operating leases, revenue is recognized upon the satisfaction of the respective performance obligation. Refer to Note 5 for additional information.
Intangible and Other Assets
Intangible assets with finite useful lives are amortized over their respective estimated useful lives on a straight-line basis. If an intangible asset has a finite useful life, but the precise length of that life is not known, that intangible asset shall be amortized over the best estimate of its useful life. At a minimum, we will assess the useful lives and residual values of all intangible assets on an annual basis to determine if adjustments are required.
We test intangible assets periodically to determine if impairment has occurred. An impairment loss is recognized for intangibles if the carrying amount of an intangible asset is not recoverable and its carrying amount exceeds its fair value. Refer to Note 10 for additional information.
Costs incurred in connection with our credit facility have historically been capitalized and amortized using the straight-line method over the term of the related debt. Use of the straight-line method does not differ materially from the “effective interest” method of amortization.
Goodwill
Goodwill represents the excess of purchase price over fair value of net assets acquired. We evaluate, and test if necessary, goodwill for impairment annually at October 1, and more frequently if indicators of impairment are present. During the evaluation, we may perform a qualitative assessment of relevant events and circumstances to determine the likelihood of goodwill impairment. If it is deemed more likely than not that the fair value of the reporting unit is less than its carrying amount, we calculate the fair value of the reporting unit. Otherwise, further testing is not necessary. We may also elect to exercise our unconditional option to bypass this qualitative assessment, in which case we would also calculate the fair value of the reporting unit. If the calculated fair value of the reporting unit exceeds its carrying value including associated goodwill amounts, no impairment charge is required. If the fair value of the reporting unit is less than its carrying value including associated goodwill amounts, the goodwill of that reporting unit is considered to be impaired and a charge to earnings must be recorded. The impact to earnings is the excess amount of carrying value over fair value, however the charge is not to exceed the total amount of goodwill allocated to the reporting unit under evaluation. See Note 10 for further information.
Environmental Liabilities
We provide for the estimated costs of environmental contingencies when liabilities are probable to occur and a reasonable estimate of the associated costs can be made. Ongoing environmental compliance costs, including maintenance and monitoring costs, are charged to expense as incurred.
Equity-Based Compensation
The phantom units issued under our 2010 and 2018 Long-Term Incentive Plans result in the payment of cash to our non-employee directors of our general partner upon exercise or vesting of the related award. The fair value of our phantom units is equal to the market price of our common units. See Note 17 for more information.
10
Revenue Recognition
We recognize revenue across our operating segments upon the satisfaction of their respective performance obligations. Refer to Note 3 for additional details on what constitutes a performance obligation in each of our businesses.
Cost of Sales and Operating Expenses
Offshore pipeline transportation operating costs consist primarily of power costs to operate pumping and platform equipment, personnel costs to operate the pipelines and platforms, insurance costs and costs associated with maintaining the integrity of our pipelines.
Marine operating costs consist primarily of employee and related costs to man the boats, barges, and vessels, maintenance and supply costs related to general upkeep of the boats, barges, and vessels, and fuel costs which are often rebillable and passed through to the customer.
Onshore transportation and services product and operating costs include the cost to acquire the product and the associated costs to transport it to our terminal facilities, including storing, or to a customer for sale. Other than the cost of the products, the most significant costs we incur relate to transportation utilizing our fleet of trucks, barges and other vessels, including personnel costs, fuel and maintenance of our equipment or third-party owned equipment as well as costs to operate NaHS processing plants located at various refineries, cost associated with caustic soda used in the process of processing the refiner’s sour gas, and the cost to transport and market the NaHS and caustic soda. Additionally, costs to operate and maintain the integrity of our onshore pipelines are included herein.
When we enter into buy/sell arrangements concurrently or in contemplation of one another with a single counterparty, we reflect the amounts of revenues and purchases for these transactions on a net basis in our Consolidated Statements of Operations as onshore transportation and services revenues.
Income Taxes
We are a limited partnership, organized as a pass-through entity for federal income tax purposes. As such, we do not directly pay federal income tax. Our taxable income or loss, which may vary substantially from the net income or net loss we report in our Consolidated Statements of Operations, is included in the federal income tax returns of each partner.
Some of our corporate subsidiaries pay U.S. federal, state, and foreign income taxes. Deferred income tax assets and liabilities for certain operations conducted through corporations are recognized for temporary differences between the assets and liabilities for financial reporting and tax purposes. Changes in tax legislation are included in the relevant computations in the period in which such changes are effective. Deferred tax assets are reduced by a valuation allowance for the amount of any tax benefit not expected to be realized. Penalties and interest related to income taxes will be included in income tax expense in the Consolidated Statements of Operations.
Derivative Instruments and Hedging Activities
We use derivative instruments to hedge exposure to commodity price volatility. Derivative transactions, which can include exchange-traded futures, option contracts, basis differentials and commodity price swap contracts, are recorded in the Consolidated Balance Sheets as assets and liabilities based on the derivative’s fair value. Changes in the fair value of derivative contracts are recognized currently in earnings unless specific hedge accounting criteria are met. We must formally designate the derivative as a hedge and document and assess the effectiveness of derivatives associated with transactions that receive hedge accounting. Accordingly, changes in the fair value of derivatives are included in earnings in the current period for (i) derivatives accounted for as fair value hedges; (ii) derivatives that do not qualify for hedge accounting and (iii) the portion of cash flow hedges that is not highly effective in offsetting changes in cash flows of hedged items. Changes in the fair value of cash flow hedges are deferred in Accumulated Other Comprehensive Income (“AOCI”) and reclassified into earnings when the underlying position affects earnings. As of December 31, 2025, 2024 and 2023, we did not have any cash flow hedges.
Gains and losses included in earnings associated with derivative transactions are presented as a component of cash flows from operating activities in the Consolidated Statements of Cash Flows. See Note 19 for further information on these items.
Fair Value of Current Assets and Current Liabilities
The carrying amount of other current assets and other current liabilities approximates their fair value due to their short-term nature.
11
Business Acquisitions
For acquired businesses, we apply the acquisition method and generally recognize the identifiable assets acquired, the liabilities assumed and any noncontrolling interest in the acquiree at their estimated fair values on the date of acquisition. The fair value of the assets acquired, liabilities assumed, or noncontrolling interest in the acquiree may be adjusted during the measurement period, which is a period not to exceed one year from the date of acquisition, as additional information about conditions existing at the acquisition date becomes available.
Recent Accounting Pronouncements
We have adopted guidance under ASU 2023-09, “Income Taxes (Topic 740): Improvements to Income Tax Disclosures” (“ASU 2023-09”) for the year ended December 31, 2025, and applied the new disclosure requirements retrospectively. ASU 2023-09 enhanced the transparency and decision usefulness of income tax disclosures primarily through requiring the disclosure of specific categories in the rate reconciliation as well as disclosure of income taxes paid disaggregated by jurisdiction. The adoption of ASU 2023-09 did not have a material impact on our disclosures. Refer to Note 16 and Note 22 for details.
In November 2024, the FASB issued ASU 2024-03, “Income Statement-Reporting Comprehensive Income-Expense Disaggregation Disclosures,” (“ASU 2024-03”), which requires additional disclosures of the specific types of expenses included in the expense captions presented on the face of the income statement. ASU 2024-03 is effective for annual reporting periods beginning after December 15, 2026 and interim reporting periods within annual reporting periods beginning after December 15, 2027. The requirements will be applied prospectively, with the option for retrospective application. Early adoption is permitted. We are currently evaluating the impact of this standard on our disclosures.
All other new accounting pronouncements that have been issued, but not yet effective, are currently being evaluated and, at this time, are not expected to have a material impact on our financial position or results of operations.
3. Revenue Recognition
Revenue from Contracts with Customers
The following tables reflects the disaggregation of our revenues by major category for the years ended December 31, 2025, 2024 and 2023, respectively:
Year Ended December 31, 2025
Offshore Pipeline Transportation
Marine Transportation
Onshore Transportation and Services
Consolidated
Fee-based revenues
$
531,898
$
319,498
$
70,517
$
921,913
Product Sales
—
—
634,149
634,149
Sulfur Services
—
—
74,353
74,353
$
531,898
$
319,498
$
779,019
$
1,630,415
Year Ended December 31, 2024
Offshore Pipeline Transportation
Marine Transportation
Onshore Transportation and Services
Consolidated
Fee-based revenues
$
404,919
$
321,616
$
58,298
$
784,833
Product Sales
—
—
796,637
796,637
Sulfur Services
—
—
79,364
79,364
$
404,919
$
321,616
$
934,299
$
1,660,834
12
Year Ended December 31, 2023
Offshore Pipeline Transportation
Marine Transportation
Onshore Transportation and Services
Consolidated
Fee-based revenues
$
382,154
$
327,464
$
45,704
$
755,322
Product Sales
—
—
870,948
870,948
Sulfur Services
—
—
95,053
95,053
$
382,154
$
327,464
$
1,011,705
$
1,721,323
The Company recognizes revenue upon the satisfaction of its performance obligations under its contracts and generally recognizes revenue either over time as services are being performed or at a point in time for product sales. The timing of our revenue recognition varies between the revenue streams and is described in more detail below.
Fee-based Revenues
We provide a variety of fee-based transportation and logistics services to our customers across several of our reportable segments as outlined below.
Service contracts generally contain a series of distinct services that are substantially the same and have the same pattern of transfer to the customer over the contract period, and therefore, qualify as a single performance obligation that is satisfied over time. The customer receives and consumes the benefit of our services simultaneously with the provision of those services.
Offshore Pipeline Transportation
Revenue from contracts in our offshore pipeline transportation segment is generally based upon a fixed fee per unit of volume (typically per barrel of crude oil or per Mcf of natural gas) gathered, transported or processed for each volume delivered. Fees are based either on contractual arrangements or tariffs regulated by the FERC. Certain of our contracts include a single performance obligation to stand ready, on a monthly basis, to provide capacity on our assets. Revenue associated with these fee-based services is recognized as volumes are delivered over the performance obligation period.
We also have certain contracts with customers in which we earn either demand-type fees or firm capacity-reservation fees. These fees are charged to a customer regardless of the volume the customer actually delivers to the platform or through the pipeline.
Certain of our customer contracts in our offshore pipeline transportation segment include a transportation fee that has a tiered pricing structure based on cumulative milestones of throughput on the related pipeline asset and contract, or on a specified date. Our performance obligation for these contracts is to transport, gather or process commodity volumes for the customer based on firm (stand ready) service or from monthly nominations made by our customers, which can also be on an interruptible basis. While our transportation fees change when milestones are achieved for certain cumulative throughput, our performance obligation remains unchanged throughout the duration of the contract. Therefore, we recognize revenue using an average rate throughout the duration of the contract. We have estimated the total consideration we expect to receive under the contract beginning at the contract inception date based on the estimated volumes (including certain minimum volumes we are required to stand ready for), price indexing, estimated production or contracted volumes, and the contract period. We have constrained the estimates of variable consideration such that it is probable that a significant reversal of previously-recognized revenue will not occur throughout the life of the contract. These estimates are re-assessed at each reporting period as required. We bill our customers based on the rates specified in the contract. Any cumulative differences between the amounts we have billed our customers and the revenue recognized per contract results in the recognition of a contract asset or liability. In circumstances where the estimated average contract rate is less than the billed current price tier in the contract, we will recognize a contract liability or unwind an existing contract asset. In circumstances where the estimated average contract rate is higher than the billed current price tier in the contract, we will recognize a contract asset or unwind an existing contract liability.
Marine Transportation
Our marine transportation business consists of revenues from the inland and offshore marine transportation of heavy-refined petroleum products, asphalt and crude oil, using our barges or vessels. We recognize revenue over time, on a contract-by-contract basis, as individual trips are completed. Revenue from these contracts is typically based on a set day-rate or a set fee per cargo movement. The cost of fuel and certain other operational costs may be directly reimbursed by the customer, if stipulated in the contract.
13
Our performance obligation is to provide transportation services using our barges or vessels either under a term or spot based contract. The transaction price is typically fixed either as a day rate or as a lump sum to be allocated over the days required to complete the service. We recognize revenue as we provide the transportation services because the customer simultaneously receives and consumes the benefits of such services. If provided in the contract, certain items such as fuel or operational costs can be rebilled to the customer in the same period in which the costs are incurred. In the event the timing of a trip to provide our services crosses a reporting period under a lump sum fee contract, the revenue earned is accrued based on the progress completed in the current period on the related performance obligation as we are entitled to payment for each day. Customer invoicing occurs at the completion of a trip, or earlier at the customer’s request.
Onshore Transportation and Services
Within our onshore transportation and services segment, we provide our customers with pipeline transportation services, terminaling services and rail unloading services, among others, primarily on a per barrel fee basis.
Revenues from contracts for the transportation of crude oil by our pipelines are based on actual volumes at a published tariff. We recognize revenue for transportation and other services over the performance obligation period, which is the contract term. Revenues for both firm and interruptible transportation and other services are recognized over time as the product is delivered to the agreed upon delivery point or at the point of receipt because they specifically relate to our efforts to transfer the distinct services.
Pricing for our services is determined through a variety of mechanisms, including specified contract pricing or regulated tariff pricing. The consideration we receive under these contracts is variable, as the total volume of the commodity to be transported is unknown at contract inception. At the end of a day or month (as specified in the contract), both the price and volume are known (or “fixed”) in order to allow us to accurately calculate the amount of consideration we are entitled to invoice. The measurement of these services and invoicing occurs on a monthly basis.
Pipeline Loss Allowances
To compensate us for bearing the risk of volumetric losses of crude oil in transit in our pipelines (for our onshore and offshore pipelines) due to temperature, crude quality, and the inherent difficulties of measuring liquids in a pipeline, our tariffs and agreements allow for us to make volumetric deductions for quality and volumetric fluctuations. We refer to these deductions as pipeline loss allowances (“PLA”). We compare these allowances to the actual volumetric gains and losses of the pipeline and the net gain or loss is recorded as revenue or a reduction of revenue. As the allowance is related to our pipeline transportation services, we have a single performance obligation to transport and deliver the barrels.
When net gains occur, we have crude oil inventory. When net losses occur, we reduce any recorded inventory on hand and record a liability for the purchase of additional crude oil required to replace the lost volumes. Under ASC 606, we record excess oil as non-cash consideration in the transaction price on a net basis. The net oil recorded is valued at the lower of cost or net realizable value using the market price of crude oil during the month the product was transported. The crude oil in inventory can then be sold at current market prices, resulting in additional revenue if the sales price exceeds the inventory value when control transfers to the customer.
Product Sales
Within our onshore transportation and services division, the main sources of product sales are crude oil, NaHS and caustic soda. In evaluating revenue recognition, we concluded that these agreements consist of one distinct performance obligation, which is delivering the product to the customer at the specified point of sale.
In transactions involving NaHS and caustic soda, contracts may stipulate that customers assume control of the goods at the shipping location, although we must still coordinate the transportation as specified by the customer. According to our policy and the guidance in ASC 606, these shipping services are considered fulfillment costs, not separate performance obligations.
In transactions involving the sale of crude oil, we may enter into term contracts, which are settled on a monthly basis, or spot contracts, which are settled at a specific point in time.
For every product sale, the transaction price is determined based on the contract and is generally set at a fixed amount or tied to a market-based or indexed rate. This established pricing is considered “fixed” when revenue is recognized. Invoicing and payment arrangements follow either industry standards or the stipulations outlined in the contract. We allocate the entire transaction price to a single performance obligation and revenue is recognized at a specific point in time, therefore, we do not allocate any of the transaction price to future performance obligations.
14
Sulfur Services
Through our sulfur services business, we primarily provide sulfur removal services to refiners’ high sulfur (or “sour”) gas streams generated from crude oil processing operations. Our process includes the use of our proprietary technology, which uses caustic soda to act as a scrubbing agent at a prescribed temperature and pressure to remove sulfur. The technology returns a clean (sulfur-free) hydrocarbon stream to the refinery for further processing into refined products and simultaneously produces NaHS. Units of NaHS are produced ratably as a gas stream is processed. We obtain control and ownership of the NaHS immediately upon production, which constitutes the sole consideration that we receive for our sulfur removal services. We then market the NaHS we receive to third parties as part of our product sales, as described above. Some of our arrangements require that we pay a refinery access fee (“RSA fee”) for any benefits received by virtue of our plant’s proximity to the customer’s refinery. Our RSA fee is recorded as a reduction of revenue.
The sole performance obligation under our refinery service contracts is to deliver sulfur removal services. As our customers simultaneously receive and consume the benefits of service, control is transferred and revenue is recognized over time based on the extent of progress towards completion of the performance obligation. We use units of NaHS produced during a period to measure progress as the amount we receive corresponds directly with the efforts to provide our services completed to date. The transaction price for each performance obligation is determined using the fair value of a unit of NaHS on the contract inception date for each sulfur services agreement. Accordingly, we record the value of NaHS received as non-cash consideration in inventory until it is subsequently sold to our customers (see “Product Sales,” above).
Contract Assets and Liabilities
The table below summarizes our contract asset and liability balances at December 31, 2025 and December 31, 2024:
Contract Assets
Contract Liabilities
Current Assets- Other
Other Assets
Accrued Liabilities
Other Long-Term Liabilities
Balance at December 31, 2024
$
—
$
5,174
$
41,618
$
82,164
Balance at December 31, 2025
32
7,469
26,982
78,946
For the years ended December 31, 2025, 2024, and 2023, $33.9 million, $14.6 million and $2.6 million, respectively, that was classified as a contract liability at the beginning of each period was recognized as revenue.
Transaction Price Allocations to Remaining Performance Obligations
We are required to disclose the amount of our transaction prices that are allocated to unsatisfied performance obligations as of December 31, 2025. However, ASC 606 provides the following optional exemptions that we have utilized:
1)Performance obligations that are part of a contract with an expected duration of one year or less;
2)Revenue recognized from the satisfaction of performance obligations where we have a right to consideration in an amount that corresponds directly with the value provided to customers; and
3)Contracts that contain variable consideration, such as index-based pricing or variable volumes, that is allocated entirely to a wholly unsatisfied performance obligation or to a wholly unsatisfied promise to transfer a distinct good or service that is part of a series.
The majority of our contracts qualify for at least one of these exemptions and we apply the exemption(s) accordingly. For contracts that do no qualify for a at least one of the aforementioned exemptions, which are those that involve revenue recognition over a long-term period and include long term fixed consideration (adjusted for indexing as required), we determined the allocation of transaction price that relate to unsatisfied performance obligations. As it relates to our tiered pricing offshore transportation contracts, we provide firm capacity for both fixed and variable consideration over a long-term period. In our onshore transportation and services segment, we have certain contractual arrangements in which we receive fixed minimum payments for our obligation to provide minimum capacity on our pipelines and related assets. Therefore, we have allocated the remaining contract value (as estimated and discussed above) to future periods for these contracts.
15
The following chart summarizes how we expect to recognize revenue for future periods related to these contracts:
Offshore Pipeline Transportation
Onshore Transportation and Services
2026
$
211,151
$
29,908
2027
143,948
13,031
2028
64,211
10,000
2029
32,378
2,500
2030
23,142
—
Thereafter
67,005
—
Total
$
541,835
$
55,439
4. Discontinued Operations
On February 28, 2025, we completed the sale of the Alkali Business to an indirect affiliate of WE Soda Ltd for a gross purchase price of $1.425 billion. The sale generated proceeds of approximately $1.0 billion, which reflects the net proceeds after the payment of transaction costs and expenses, the assumption of $413.4 million of our then outstanding 5.875% senior secured notes due 2042 (the “Alkali senior secured notes”) by an indirect affiliate of WE Soda Ltd, and cash divested.
A reconciliation of the line items constituting pre-tax income from discontinued operations to net income (loss) from discontinued operations, net of tax is as follows:
For the Year Ended December 31,
2025
2024
2023
Major classes of line items constituting income (loss) from discontinued operations:
Revenues
$
200,532
$
1,305,382
$
1,455,673
Operating costs
(168,871)
(1,154,667)
(1,249,080)
General and administrative
(156)
(1,103)
(1,227)
Depreciation, depletion and amortization
(18,862)
(106,472)
(81,073)
Interest expense, net
(4,179)
(25,360)
(25,598)
Pretax income from discontinued operations
8,464
17,780
98,695
Loss from the sale of the Alkali Business
(432,193)
—
—
Total pretax income (loss) from discontinued operations
(423,729)
17,780
98,695
Income tax benefit (expense)
(16)
(22)
475
Net income (loss) from discontinued operations, net of tax
$
(423,745)
$
17,758
$
99,170
A summary of our cash flows associated with our discontinued operations is as follows:
For the Year Ended December 31,
2025
2024
2023
Net cash flows provided by operating activities
$
31,453
$
186,823
$
149,414
Net cash flows used in investing activities
(11,666)
(174,811)
(152,036)
Net cash flows used in financing activities
—
(11,618)
—
16
5. Lease Accounting
Lessee Arrangements
We lease a variety of transportation equipment (primarily railcars), terminals, land and facilities, and office space and equipment. Lease terms vary and can range from short-term (not greater than 12 months) to long-term (greater than 12 months). A majority of our leases contain options to extend the life of the lease at our sole discretion. We considered these options when determining the lease terms used to derive our right of use asset and associated lease liability. Leases with a term of 12 months or less are not recorded on our Consolidated Balance Sheets and we recognize lease expense for these leases on a straight-line basis over the lease term.
Certain lease agreements include lease and non-lease components. We have elected to combine lease and non-lease components for all of our underlying assets for the purpose of deriving our right of use asset and lease liability. Additionally, certain lease payments are driven by variable factors, such as plant production or indexing rates. Variable costs are expensed as incurred and are not included in our determination of our lease liability and right of use asset.
As a lessee, we do not have any finance leases and none of our leases contain material residual value guarantees or material restrictive covenants. In addition, most of our leases do not provide an implicit rate, and as such, we determined our incremental borrowing rate based on the information available at the inception of the lease in determining the present value of lease payments.
Our lease portfolio consists of operating leases within three major categories: Transportation Equipment, Office Space and Equipment, and Facilities and Equipment. These values are recorded within “Right of use assets, net” on the Consolidated Balance Sheets. Current and non-current lease liabilities are recorded within “Accrued liabilities” and “Other long-term liabilities”, respectively, on the Consolidated Balance Sheets. Refer to the table below for our lease balances as of December 31, 2025 and December 31, 2024.
Leases
Classification
Financial Statement Caption
December 31, 2025
December 31, 2024
Assets
Transportation Equipment
Right of use assets, net
$
9,103
$
9,485
Office Space & Equipment
Right of use assets, net
4,651
4,983
Facilities and Equipment
Right of use assets, net
43,916
51,271
Total Right of use assets, net
$
57,670
$
65,739
Liabilities
Current
Accrued liabilities
5,483
4,896
Non-Current
Other long-term liabilities
62,355
70,493
Total Lease Liability
$
67,838
$
75,389
Our “Right of use assets, net” balance includes our unamortized initial direct costs associated with certain of our transportation equipment and facilities and equipment leases. Additionally, it includes our unamortized prepaid rents, our deferred rents, and our previously classified intangible asset associated with a favorable lease.
We recorded total operating lease expense of $16.7 million, $15.4 million, and $15.5 million for the years ended December 31, 2025, 2024, and 2023, respectively. The total operating lease expense includes the amounts associated with our existing lease liabilities, along with both short-term lease costs and variable lease costs incurred during the period which are not significant to the operating lease expense individually, or in the aggregate.
17
The following table presents the maturities of our operating lease liabilities as of December 31, 2025 on an undiscounted cash flow basis reconciled to the present value recorded on our Consolidated Balance Sheet:
Maturity of Lease Liabilities
Transportation Equipment
Office Space and Equipment
Facilities and Equipment
Operating Leases
2026
$
2,959
$
1,935
$
5,782
$
10,676
2027
1,737
1,849
5,796
9,382
2028
1,403
1,764
5,784
8,951
2029
1,390
1,585
5,780
8,755
2030
1,266
1,411
5,276
7,953
Thereafter
2,456
5,642
100,249
108,347
Total Lease Payments
11,211
14,186
128,667
154,064
Less: Interest
(2,269)
(3,483)
(80,474)
(86,226)
Present value of operating lease liabilities
$
8,942
$
10,703
$
48,193
$
67,838
The following table presents the weighted average remaining terms and discount rates related to our right of use assets:
Lease Term and Discount Rate
December 31, 2025
December 31, 2024
Weighted-average remaining lease term
19.17 years
19.20 years
Weighted-average discount rate
8.09%
8.06%
The following table provides information regarding the cash paid and right of use assets obtained related to our operating leases:
Year Ended December 31,
Cash Flows Information
2025
2024
2023
Cash paid for amounts included in the measurement of lease liabilities
$
11,821
$
9,349
$
8,991
Leased assets obtained in exchange for new operating lease liabilities
2,222
6,883
5,701
Lessor Arrangements
We have certain contracts discussed below in which we act as a lessor.
Operating Leases
During the years ended December 31, 2025, 2024, and 2023, we acted as a lessor in our revenue contracts associated with our 330,00 barrel-capacity ocean going tanker, the M/T American Phoenix, included in our marine transportation segment. Our lease revenues for this arrangement were $29.2 million, $28.2 million and $23.6 million for the years ended December 31, 2025, 2024 and 2023, respectively.
The M/T American Phoenix is under contract through mid-2027. For 2026, and through the expiration of the contract in 2027, we expect to receive undiscounted cash flows from fixed lease payments of $30.6 million and $15.2 million respectively. Our agreements generally contain clauses that may limit the use of the asset or require certain actions be taken by the lessee to maintain the asset for future performance.
6. Receivables
Accounts receivable – trade, net consisted of the following:
December 31,
2025
2024
Accounts receivable - trade
$
609,335
$
480,653
Allowance for credit losses
(1,114)
(1,149)
Accounts receivable - trade, net
$
608,221
$
479,504
18
The following table presents the activity of our allowance for credit losses for the periods indicated:
December 31,
2025
2024
2023
Balance at beginning of period
$
1,149
$
1,368
$
2,835
Charges to (recoveries of) costs and expenses, net
270
533
482
Amounts written off
(305)
(752)
(1,949)
Balance at end of period
$
1,114
$
1,149
$
1,368
7. Inventories
The major components of inventories were as follows:
December 31,
2025
2024
Crude oil
$
33,665
$
20,381
NaHS
13,247
10,902
Caustic Soda
8,454
6,499
Total
$
55,366
$
37,782
Inventories are valued at the lower of cost or net realizable value. The net realizable value of inventories were below cost by $0.7 million and $0.4 million as of December 31, 2025 and December 31, 2024, which triggered a reduction of the value of inventory in our Consolidated Financial Statements by this amount.
8. Fixed Assets and Asset Retirement Obligations
Fixed Assets
Fixed assets consisted of the following:
December 31,
2025
2024
Crude oil and natural gas pipelines and related assets
$
3,845,631
$
3,367,908
Onshore facilities, machinery, and equipment
291,896
293,436
Transportation equipment
24,026
22,976
Marine vessels
1,073,262
1,062,720
Land, buildings and improvements
88,629
88,545
Office equipment, furniture and fixtures
10,317
10,101
Construction in progress
13,634
408,509
Other
26,665
26,665
Fixed assets, at cost
5,374,060
5,280,860
Less: Accumulated depreciation
(1,908,737)
(1,740,974)
Net fixed assets
$
3,465,323
$
3,539,886
Depreciation expense was $221.8 million, $196.2 million and $189.0 million for the years ended December 31, 2025, 2024, and 2023, respectively.
Asset Retirement Obligations
We record AROs in connection with legal requirements to perform specified retirement activities under contractual arrangements and/or governmental regulations.
19
A reconciliation of our liability for asset retirement obligations is as follows:
December 31, 2022
$
228,252
Accretion expense
12,023
Revisions in timing and estimated costs of AROs
3,185
Settlements
(90)
December 31, 2023
$
243,370
Accretion expense
11,090
Settlements
(406)
December 31, 2024
$
254,054
Accretion expense
11,311
Revisions in timing and estimated costs of AROs
2,581
Settlements
(2,552)
New liabilities incurred
954
December 31, 2025
$
266,348
At December 31, 2025 and December 31, 2024, $24.3 million and $25.8 million are included as current in “Accrued liabilities” on our Consolidated Balance Sheets, respectively. The remainder of the ARO liability at each period is included in “Other long-term liabilities” on our Consolidated Balance Sheets. Revisions in timing and estimated costs during 2025 and 2023 are primarily attributable to the accelerated timing and updated costs associated with the abandonment of certain of our non-core offshore assets in the Gulf of America. Such revisions take into account several factors, including changes to legal or regulatory requirements, changes in our estimated useful lives of the associated asset, and the timing and method of abandonment. As there are significant judgments involved in deriving our estimates, actual costs, including the scope of work once it is approved by the relative regulatory agency or contracted party, may differ from our estimates.
9. Equity Investees
We account for our ownership in our joint ventures under the equity method of accounting (see Note 2 for a description of these investments). The price we pay to acquire an ownership interest in a company may exceed or be less than the underlying book value of the capital accounts we acquire. At December 31, 2025 and 2024, the unamortized differences in carrying value totaled $262.8 million and $277.1 million, respectively. We amortize the differences in carrying value as a change in equity earnings.
The following table presents information included in our Consolidated Financial Statements related to our equity investees:
Year Ended December 31,
2025
2024
2023
Genesis’ share of operating earnings
$
61,892
$
72,554
$
80,461
Amortization of differences attributable to Genesis’ carrying value of equity investments
(14,263)
(14,263)
(14,263)
Net equity in earnings
$
47,629
$
58,291
$
66,198
Distributions earned(1)
$
69,538
$
81,752
$
90,833
(1)Distributions attributable to the respective period and received within 15 days subsequent to the respective period end.
Poseidon’s Revolving Credit Facility
Poseidon Oil Pipeline Company, LLC (“Poseidon”) has a revolving credit facility, which was amended and restated on May 9, 2025 (the “May 2025 credit facility”). Borrowings under Poseidon’s revolving credit facility have historically been used to fund spending on capital projects. The May 2025 credit facility, which matures on May 9, 2029, is non-recourse to Poseidon’s owners and secured by its assets. The May 2025 credit facility contains customary covenants such as restrictions on debt levels, liens, guarantees, mergers, sale of assets and distributions to owners. A breach of any of these covenants could result in acceleration of the maturity date of Poseidon’s debt. Poseidon was in compliance with the terms of its credit agreement for all periods presented in these Consolidated Financial Statements.
20
10. Intangible Assets, Goodwill and Other Assets
Intangible Assets
The following table reflects the components of intangible assets being amortized at December 31, 2025 and 2024:
December 31, 2025
December 31, 2024
Weighted Amortization Period in Years
Gross Carrying Amount
Accumulated Amortization
Carrying Value
Gross Carrying Amount
Accumulated Amortization
Carrying Value
Offshore pipeline contract intangible
19
$
158,101
$
86,678
$
71,423
$
158,101
$
78,357
$
79,744
Other
8
23,160
18,977
4,183
22,633
17,090
5,543
Total
$
181,261
$
105,655
$
75,606
$
180,734
$
95,447
$
85,287
The offshore pipeline contract intangible relates to customer contracts surrounding certain transportation agreements with producers in the Lucius production area in Southeast Keathley Canyon, which support our SEKCO Pipeline.
We record amortization of our intangible assets based on the period over which the asset is expected to contribute to our future cash flows. All of our current intangible assets are being amortized on a straight-line basis. Amortization expense on intangible assets was $10.3 million, $10.4 million and $10.1 million for the years ended December 31, 2025, 2024 and 2023, respectively.
In the fourth quarter of 2024, we terminated an on-going project related to the integration of certain of our enterprise resource planning systems and we impaired the costs incurred to date. As a result, we recognized an impairment charge of $43.0 million for the year ended December 31, 2024 included within “Impairment expense” on the Consolidated Statement of Operations.
The following table reflects our estimated amortization expense for each of the five subsequent fiscal years:
2026
2027
2028
2029
2030
Offshore pipeline contract intangibles
$
8,321
$
8,321
$
8,321
$
8,321
$
8,321
Other
1,635
1,060
355
294
203
Total
$
9,956
$
9,381
$
8,676
$
8,615
$
8,524
Goodwill
The carrying amount of goodwill in our onshore transportation and services segment was $302.0 million at December 31, 2025 and December 31, 2024. We have not recognized any impairment losses related to goodwill.
(1) See discussion of deferred charges on marine transportation assets in the Summary of Accounting Policies (Note 2).
(2) At December 31, 2025 and 2024, this includes $7.5 million and $5.2 million, respectively, of contract assets in accordance with ASC 606 (refer to Note 3).
21
11. Debt
At December 31, 2025 and 2024, our obligations under debt arrangements consisted of the following:
December 31, 2025
December 31, 2024
Principal
Unamortized Discount and Debt Issuance Costs
Net Value
Principal
Unamortized Premium, Discount and Debt Issuance Costs
Net Value
Senior secured credit facility(1)
$
6,400
$
—
$
6,400
$
291,000
$
—
$
291,000
8.000% senior unsecured notes due 2027
—
—
—
406,245
933
405,312
7.750% senior unsecured notes due 2028
679,360
3,123
676,237
679,360
4,622
674,738
8.250% senior unsecured notes due 2029
600,000
10,690
589,310
600,000
13,993
586,007
8.875% senior unsecured notes due 2030
500,000
5,690
494,310
500,000
7,015
492,985
7.875% senior unsecured notes due 2032
700,000
9,919
690,081
700,000
11,476
688,524
8.000% senior unsecured notes due 2033
600,000
9,523
590,477
600,000
10,706
589,294
Total long-term debt
$
3,085,760
$
38,945
$
3,046,815
$
3,776,605
$
48,745
$
3,727,860
(1) Unamortized debt issuance costs associated with our senior secured credit facility (included in “Other Assets, net of amortization” on the Consolidated Balance Sheets) were $5.4 million and $7.9 million as of December 31, 2025 and 2024, respectively.
Senior Secured Credit Facility
On July 19, 2024, we entered into the Seventh Amended and Restated Credit Agreement (our “credit agreement”) to replace our Sixth Amended and Restated Credit Agreement, which provided for a $900 million senior secured revolving credit facility that matures on September 1, 2028, subject to extension at our request for one additional year on up to two occasions and subject to certain conditions, unless more than $150 million of our 7.750% senior unsecured notes due February 1, 2028 (the “2028 Notes”) remain outstanding as of November 2, 2027, the credit agreement matures on such date.
On December 11, 2024, we entered into the First Amendment to the Seventh Amended and Restated Credit Agreement, which resulted in several changes to the credit agreement terms and covenants, as discussed under “Covenants and Compliance” further below.
On February 27, 2025, in connection with the sale of the Alkali Business, we entered into the Second Amendment to the Seventh Amended and Restated Credit Agreement (as amended, the “credit agreement”). This amendment provides for: (i) a reduction from $900 million to $800 million of total borrowing capacity under our senior secured credit facility; (ii) unlimited cash netting against our outstanding debt for purposes of our leverage ratio calculation if our credit facility is undrawn at the end of a reporting period, otherwise a maximum netting of $25 million is allowed; and (iii) an increased permitted investment basket under certain circumstances that will allow us to opportunistically purchase existing private or public securities across our capital structure.
As of December 31, 2025, the key terms for rates under our senior secured credit facility, which are dependent on our leverage ratio (as defined in the credit agreement), are as follows:
•The interest rate on borrowings may be based on an alternate base rate or Term Secured Overnight Financing Rate (“SOFR”), at our option. Interest on alternate base rate loans is equal to the sum of (a) the highest of (i) the prime rate in effect on such day, (ii) the federal funds effective rate in effect on such day plus 0.5% and (iii) the Adjusted Term SOFR (as defined in our credit agreement) for a one-month tenor in effect on such day plus 1% and (b) the applicable margin. The Adjusted Term SOFR is equal to the sum of (a) the Term SOFR rate (as defined in our credit agreement) for such period plus (b) the Term SOFR Adjustment of 0.1% plus (c) the applicable margin. The applicable margin varies from 1.25% to 2.50% on alternate base rate borrowings and from 2.25% to 3.50% on Term SOFR borrowings, depending on our leverage ratio. Our leverage ratio is recalculated quarterly and in connection with each material acquisition. At December 31, 2025, the applicable margins on our borrowings were 2.50% for alternate base rate borrowings and 3.50% for Term SOFR borrowings based on our leverage ratio.
•Letter of credit fees range from 2.25% to 3.50% based on our leverage ratio as computed under the credit agreement. The rate can fluctuate quarterly. At December 31, 2025, our letter of credit rate was 3.50%.
22
•We pay a commitment fee on the unused portion of the senior secured credit facility. The commitment fee on the unused committed amount will range from 0.30% to 0.50% per annum depending on our leverage ratio. At December 31, 2025, our commitment fee rate on the unused committed amount was 0.50%.
•We have the ability to increase the aggregate size of the senior secured credit facility by an additional $150 million subject to lender consent and certain other customary conditions.
At December 31, 2025, we had $6.4 million borrowed under our senior secured credit facility. Our inventory financing sublimit as of December 31, 2025 was $28.1 million of the maximum inventory sublimit allowed of $200 million. Our credit agreement allows up to $50.0 million of the capacity to be used for letters of credit, of which $5.0 million was outstanding at December 31, 2025. Due to the revolving nature of loans under our senior secured credit facility, additional borrowings and periodic repayments and re-borrowings may be made until the maturity date of our credit agreement. The total amount available for borrowings under our senior secured credit facility at December 31, 2025 was $788.6 million, subject to compliance with our covenants. Our credit agreement does not include a “borrowing base” limitation except with respect to our inventory loans.
Senior Unsecured Notes
On January 16, 2020, we issued $750 million in aggregate principal amount of our 2028 Notes. Interest payments are due February 1 and August 1 of each year. That issuance generated net proceeds of approximately $737 million, net of issuance costs incurred. We used approximately $555 million of the net proceeds to redeem a portion of our 6.75% senior unsecured notes due August 1, 2022 (including principal, accrued interest and tender premium) that were validly tendered, and the remaining net proceeds were used to repay a portion of the borrowings outstanding under our senior secured credit facility at that time.
On December 17, 2020, we issued $750 million in aggregate principal amount of our 8.00% senior unsecured notes due January 15, 2027 (the “2027 Notes”). On April 22, 2021, we completed our offering of an additional $250 million in aggregate principal amount of the 2027 Notes. On December 20, 2024, $575 million of our 2027 Notes were validly tendered and repaid upon the issuance of $600 million in aggregate principal amount of our 8.000% senior unsecured notes due May 15, 2033 (the “2033 Notes” as defined and further discussed below). The remaining $406.2 million of principal outstanding on the 2027 Notes was redeemed on April 3, 2025 (as further discussed below).
On January 25, 2023, we issued $500 million in aggregate principal amount of 8.875% senior unsecured notes due April 15, 2030 (the “2030 Notes”). Interest payments are due April 15 and October 15 of each year. The issuance generated proceeds of approximately $491 million, net of issuance costs incurred. The net proceeds were used to purchase approximately $316 million of our existing 5.625% senior unsecured notes due June 15, 2024 (the “2024 Notes”), and pay the related accrued interest and tender premium and fees on those notes that were tendered in the tender offer that ended January 24, 2023, and the remaining proceeds at the time were used to repay a portion of the borrowings outstanding under our senior secured credit facility and for general partnership purposes. We incurred a loss of $1.8 million associated with the tender fee and the write-off of the related unamortized debt issuance costs on our 2024 Notes, which is recorded in “Other expense” in our Consolidated Statement of Operations for the year ended December 31, 2023. On January 26, 2023, we issued a notice of redemption for the remaining principal of approximately $25 million of our 2024 Notes, and discharged the indebtedness with respect to the 2024 Notes on February 14, 2023.
On December 7, 2023, we issued $600 million in aggregate principal amount of our 8.25% senior unsecured notes due January 15, 2029 (the “2029 Notes”). Interest payments are due January 15 and July 15 of each year. The issuance of our 2029 Notes generated net proceeds of approximately $583 million, net of the discount of $6.2 million and issuance costs incurred. The net proceeds were used to purchase approximately $514 million of approximately $535 million then outstanding on our 6.500% senior unsecured notes due October 1, 2025 (the “2025 Notes”) and pay the related accrued interest and tender premium and fees on those notes that were tendered in the tender offer that ended December 6, 2023. On December 8, 2023 we redeemed the remaining principal of approximately $21 million of our 2025 Notes. We incurred a loss of $2.8 million associated with the tender fee and the write-off of the related unamortized debt issuance costs on our 2025 Notes, which is recorded in “Other expense” in our Consolidated Statement of Operations for the year ended December 31, 2023.
23
On May 9, 2024, we issued $700 million in aggregate principal amount of 7.875% senior unsecured notes due May 15, 2032 (the “2032 Notes”). Interest payments are due May 15 and November 15 of each year. The issuance of our 2032 Notes generated net proceeds of approximately $688 million, net of issuance costs incurred. The net proceeds were used to redeem all of our existing 6.250% senior unsecured notes due May 15, 2026 (the “2026 Notes”), $339.3 million in principal amount of which were outstanding, and pay the related accrued interest. The remaining proceeds were used to repay a portion of the borrowings outstanding under our senior secured credit facility at that time and for general partnership purposes. We incurred a loss of $1.4 million associated with the write-off of the related unamortized debt issuance costs on our 2026 Notes, which is recorded in “Other expense” in our Consolidated Statement of Operations for the year ended December 31, 2024.
On December 19, 2024, we issued $600 million in aggregate principal amount of 8.000% senior unsecured notes due May 15, 2033 (the “2033 Notes”). Interest payments are due May 15 and November 15 of each year. The issuance of our 2033 Notes generated net proceeds of approximately $589 million, net of issuance costs incurred. We used the net proceeds to purchase $575.0 million in principal of our 2027 Notes and pay the accrued interest, tender premium and fees on the notes that were validly tendered. We incurred a loss of $14.0 million associated with the tender fee and the write-off of the related unamortized debt issuance costs and premium on our 2027 Notes, which is recorded in “Other expense” in our Consolidated Statement of Operations for the year ended December 31, 2024.
On April 3, 2025, using a portion of the cash proceeds from the sale of the Alkali Business, we redeemed the remaining $406.2 million of principal outstanding on the 2027 Notes, and paid the related accrued interest and redemption premium on those notes that were redeemed. We incurred a net loss of $8.9 million associated with the redemption premium and the write-off of the related unamortized debt issuance costs and premium on the redeemed 2027 Notes, which is recorded in “Other expense” in our Consolidated Statement of Operations for the year ended December 31, 2025.
We have the right to redeem each of our series of notes beginning on specified dates as summarized below, at a premium to the face amount of such notes that varies based on the time remaining to maturity on such notes. Additionally, we may redeem up to 35% of the principal amount of each of our series of notes with the proceeds from an equity offering of our common units during certain periods. A summary of the applicable redemption periods is provided in the table below:
2028 Notes
2029 Notes
2030 Notes
2032 Notes
2033 Notes
Redemption right beginning on
February 1, 2023
January 15, 2026
April 15, 2026
May 15, 2027
May 15, 2028
Redemption of up to 35% of the principal amount of notes with the proceeds of an equity offering permitted prior to
N/A
N/A
April 15, 2026
May 15, 2027
May 15, 2028
.
Guarantees of our 2028, 2029, 2030, 2032 and 2033 Notes will be released under certain circumstances, including (i) in connection with any sale or other disposition of (a) all or substantially all of the properties or assets of a guarantor (including by way of merger or consolidation) or (b) all of the capital stock of such guarantor, in each case, to a person that is not a restricted subsidiary of the partnership (ii) if the partnership designates any restricted subsidiary that is a guarantor as an unrestricted subsidiary, (iii) upon legal defeasance, covenant defeasance or satisfaction and discharge of the applicable indenture, (iv) upon the liquidation or dissolution of such guarantor, or (v) at such time as such guarantor ceases to guarantee any other indebtedness of either of the issuers and any other guarantor.
Our $3.1 billion aggregate principal amount of senior unsecured notes co-issued by Genesis Energy, L.P. and Genesis Energy Finance Corporation are fully and unconditionally guaranteed jointly and severally by all of Genesis Energy, L.P.’s current and future 100% owned domestic subsidiaries (the “Guarantor Subsidiaries”), except for certain immaterial subsidiaries. The non-guarantor subsidiaries are indirectly owned by Genesis Crude Oil, L.P., a Guarantor Subsidiary. The Guarantor Subsidiaries largely own the assets that we use to operate our business. As a general rule, the assets and credit of our unrestricted subsidiaries are not available to satisfy the debts of Genesis Energy, L.P., Genesis Energy Finance Corporation or the Guarantor Subsidiaries, and the liabilities of our unrestricted subsidiaries do not constitute obligations of Genesis Energy, L.P., Genesis Energy Finance Corporation or the Guarantor Subsidiaries.
Covenants and Compliance
Our credit agreement contains customary covenants (affirmative, negative and financial) that could limit the manner in which we may conduct our business. As defined in our credit agreement, we are required to meet three primary financial metrics—a maximum consolidated leverage ratio, a maximum consolidated senior secured leverage ratio and a minimum consolidated interest coverage ratio. Our credit agreement provides for the temporary inclusion of certain pro forma adjustments to the calculations of the required ratios following material transactions. In general, our consolidated leverage ratio calculation compares our consolidated funded debt (including outstanding notes we have issued) to our Adjusted Consolidated EBITDA (as
24
defined and adjusted in accordance with the credit agreement). Our consolidated senior secured leverage ratio calculation compares our consolidated senior secured funded debt (including outstanding borrowings on the senior secured credit facility) to our Adjusted Consolidated EBITDA (as defined and adjusted in accordance with the credit agreement), and our minimum consolidated interest coverage ratio compares our Adjusted Consolidated EBITDA (as defined and adjusted in accordance with the credit agreement) to our Consolidated interest expense (as defined and adjusted in accordance with the credit agreement). As of December 31, 2025, under our credit agreement:
•the permitted maximum consolidated leverage ratio is 5.50x for the remainder of the term;
•the permitted maximum consolidated senior secured leverage ratio is 2.50x for the remainder of the term; and
•the permitted minimum consolidated interest coverage ratio is 2.00x for the fiscal quarter ending December 31, 2025, 2.25x for the fiscal quarters ending March 31, 2026 through December 31, 2026, and 2.50x thereafter and for the remainder of the term.
In addition, our credit agreement and the indentures governing the senior unsecured notes contain cross-default provisions. Our credit documents prohibit distributions on, or purchases or redemptions of, units if any default or event of default is continuing. In addition, those agreements contain various covenants limiting our ability to, among other things:
•incur indebtedness if certain financial ratios are not maintained;
•grant liens;
•engage in sale-leaseback transactions; and
•sell substantially all of our assets or enter into a merger or consolidation.
A default under our credit agreement or indentures would permit the lenders thereunder to accelerate the maturity of the outstanding debt. As long as we are in compliance with our credit agreement, our ability to make distributions of “available cash” (as defined and discussed below) is not restricted. As of December 31, 2025, we were in compliance with the financial covenants contained in our credit agreement and indentures.
12. Partners’ Capital, Mezzanine Equity and Distributions
At December 31, 2025, our outstanding equity consisted of 122,424,321 Class A Common Units and 39,997 Class B Common Units. The Class A Common Units are traditional common units in us. The Class B Common Units have the voting and distribution rights equivalent to those of the Class A Common Units, however, the Class B Common Units have the right to elect all of our board of directors and are convertible into Class A Common Units under certain circumstances, subject to certain exceptions. At December 31, 2025, we had 15,695,722 Class A Convertible Preferred Units outstanding, which are discussed below in further detail.
In an effort to return capital to our investors, we announced a common equity repurchase program (the “Repurchase Program”) on August 8, 2023. The Repurchase Program authorizes the repurchase from time to time of up to 10% of our then outstanding Class A Common Units, or 12,253,922 units, via open market purchases or negotiated transactions conducted in accordance with applicable regulatory requirements. These repurchases may be made pursuant to a repurchase plan or plans that comply with Rule 10b5-1 under the Securities Exchange Act of 1934. The Repurchase Program does not create an obligation for us to acquire a particular number of Class A Common Units and any Class A Common Units repurchased will be canceled. The Repurchase Program will be reviewed again no later than December 31, 2026 and may be suspended or discontinued at any time prior thereto. During 2023, we repurchased and canceled a total of 114,900 Class A Common Units. During 2024 and 2025, we did not repurchase any Class A Common Units.
Distributions
Generally, we will distribute 100% of our available cash (as defined by our partnership agreement) within 45 days after the end of each quarter to common unitholders of record. Available cash generally means, for each fiscal quarter, all cash on hand at the end of the quarter:
•less the amount of cash reserves that our general partner determines in its reasonable discretion is necessary or appropriate to:
•provide for the proper conduct of our business;
•comply with applicable law, any of our debt instruments, or other agreements; or
•provide funds for distributions to our common and preferred unitholders for any one or more of the next four quarters;
25
•plus all cash on hand on the date of determination of available cash for the quarter resulting from working capital borrowings. Working capital borrowings are generally borrowings that are made under our senior secured credit facility and in all cases are used solely for working capital purposes or to pay distributions to partners.
We paid the following cash distributions to common unitholders:
Distribution For
Date Paid
Per Unit Amount
Total Amount
2023
1st Quarter
May 15, 2023
$
0.1500
$
18,387
2nd Quarter
August 14, 2023
$
0.1500
$
18,387
3rd Quarter
November 14, 2023
$
0.1500
$
18,370
4th Quarter
February 14, 2024
$
0.1500
$
18,370
2024
1st Quarter
May 15, 2024
$
0.1500
$
18,370
2nd Quarter
August 14, 2024
$
0.1500
$
18,370
3rd Quarter
November 14, 2024
$
0.1650
$
20,207
4th Quarter
February 14, 2025
$
0.1650
$
20,207
2025
1st Quarter
May 15, 2025
$
0.1650
$
20,207
2nd Quarter
August 14, 2025
$
0.1650
$
20,207
3rd Quarter
November 14, 2025
$
0.1650
$
20,207
4th Quarter
February 13, 2026
$
0.1800
$
22,044
Equity Issuances and Contributions
Our partnership agreement authorizes our general partner to cause us to issue additional limited partner interests and other equity securities, the proceeds from which could be used to provide additional funds for acquisitions or other needs. We did not issue any Class A Common Units or Class B Common Units during the periods presented.
Class A Convertible Preferred Units
On September 1, 2017, we sold $750 million of Class A Convertible Preferred Units (our “Class A Convertible Preferred Units”) in a private placement, comprised of 22,249,494 units for a cash purchase price per unit of $33.71 (subject to certain adjustments, the “Issue Price”) to two initial purchasers. Our general partner executed an amendment to our partnership agreement in connection therewith, which, among other things, authorized and established the rights and preferences of our Class A Convertible Preferred Units. Our Class A Convertible Preferred Units rank senior to all of our currently outstanding classes or series of limited partner interests with respect to distribution and/or liquidation rights. Holders of our Class A Convertible Preferred Units vote on an as-converted basis with holders of our common units and have certain class voting rights, including with respect to any amendment to the partnership agreement that would adversely affect the rights, preferences or privileges, or otherwise modify the terms, of those Class A Convertible Preferred Units.
From time to time after September 1, 2020, we have the right to cause the conversion of all or a portion of outstanding Class A Convertible Preferred Units into our common units, subject to certain conditions; provided, however, that we will not be permitted to convert more than 7,416,498 of our Class A Convertible Preferred Units in any consecutive twelve-month period. At any time after September 1, 2020, if we have fewer than 592,768 of our Class A Convertible Preferred Units outstanding, we will have the right to convert each outstanding Class A Convertible Preferred Unit into our common units at a conversion rate equal to the greater of (i) the then-applicable conversion rate and (ii) the quotient of (a) the Issue Price and (b) 95% of the volume-weighted average price of our common units for the 30-trading day period ending prior to the date that we notify the holders of our outstanding Class A Convertible Preferred Units of such conversion.
Upon certain events involving certain changes of control in which more than 90% of the consideration payable to the holders of our common units is payable in cash, our Class A Convertible Preferred Units will automatically convert into common units at a conversion ratio equal to the greater of (a) the then applicable conversion rate and (b) the quotient of (i) the product of (A) the sum of (1) the Issue Price and (2) any accrued and accumulated but unpaid distributions on our Class A Convertible Preferred Units, and (B) a premium factor (ranging from 115% to 101% depending on when such transaction occurs) plus a prorated portion of unpaid partial distributions, and (ii) the volume weighted average price of the common units for the 30 trading days prior to the execution of definitive documentation relating to such change of control.
26
In connection with other change of control events that do not meet the 90% cash consideration threshold described above, each holder of our Class A Convertible Preferred Units may elect to (a) convert all of its Class A Convertible Preferred Units into our common units at the then applicable conversion rate, (b) if we are not the surviving entity (or if we are the surviving entity, but our common units will cease to be listed), require us to use commercially reasonable efforts to cause the surviving entity in any such transaction to issue a substantially equivalent security (or if we are unable to cause such substantially equivalent securities to be issued, to convert its Class A Convertible Preferred Units into common units in accordance with clause (a) above or exchanged in accordance with clause (d) below or convert at a specified conversion rate), (c) if we are the surviving entity, continue to hold our Class A Convertible Preferred Units or (d) require us to exchange our Class A Convertible Preferred Units for cash or, if we so elect, our common units valued at 95% of the volume-weighted average price of our common units for the 30 consecutive trading days ending on the fifth trading day immediately preceding the closing date of such change of control, at a price per unit equal to the sum of (i) the product of (x) 101% and (y) the Issue Price plus (ii) accrued and accumulated but unpaid distributions and (iii) a prorated portion of unpaid partial distributions.
Upon issuance and up until September 29, 2022 (the “election date”), each of our Class A Convertible Preferred Units accumulated quarterly distribution amounts in arrears at an annual rate of 8.75% (or $2.9496), yielding a quarterly rate of 2.1875% (or $0.7374). On the election date, the one-time election to reset the quarterly distribution amount was elected by the holders of the Class A Convertible Preferred Units which reset the quarterly distribution rate to 11.24% (the sum of the three-month LIBOR of 3.74% plus 750 basis points), yielding a quarterly distribution of $0.9473 per preferred unit beginning with the fourth quarter of 2022.
We elected to pay all distributions from inception through March 1, 2019 with additional Class A Convertible Preferred Units. For the quarter ended March 31, 2019, we paid a portion of our distribution in cash, and a portion in Class A Convertible Preferred Units. For each quarter ending after March 1, 2019, we paid all distribution amounts in respect of our Class A Convertible Preferred Units in cash.
Each holder of our Class A Convertible Preferred Units may elect to convert all or any portion of its Class A Convertible Preferred Units into common units initially on a one-for-one basis (subject to customary adjustments and an adjustment for accrued and accumulated but unpaid distributions and limitations) at any time after September 1, 2019 (or earlier upon a change of control, liquidation, dissolution or winding up), provided that any conversion is for at least $50 million or such lesser amount if such conversion relates to all of a holder’s remaining Class A Convertible Preferred Units or has otherwise been approved by us.
If we fail to pay in full any preferred unit distribution amount after March 1, 2019 in respect of any two quarters, whether or not consecutive, then until we pay such distributions in full, we will not be permitted to (a) declare or make any distributions (subject to a limited exceptions for pro rata distributions on our Class A Convertible Preferred Units and parity securities), redemptions or repurchases of any of our limited partner interests that rank junior to or pari passu with our Class A Convertible Preferred Units with respect to rights upon distribution and/or liquidation (including our common units), or (b) issue any such junior or parity securities. If we fail to pay in full any preferred unit distribution after March 1, 2019 in respect of any two quarters, whether or not consecutive, then the preferred unit distribution amount will be reset to a cash amount per preferred unit equal to the amount that would be payable per quarter if a preferred unit accrued interest on the Issue Price at an annualized rate equal to the then-current annualized distribution rate plus 200 basis points until such default is cured.
We have granted each initial purchaser (including its applicable affiliate transferees) certain rights, including (i) the right to appoint an observer, who shall have the right to attend our board meetings for so long as an initial purchaser (including its affiliates) owns at least $200 million of our Class A Convertible Preferred Units; (ii) the right to purchase up to 50% of any parity securities on substantially the same terms offered to other purchasers for so long as an initial purchaser (including its affiliates) owns at least 11,124,747 of our Class A Convertible Preferred Units, and (iii) the right to appoint two directors to our general partner’s board of directors if (and so long as) we fail to pay in full any three quarterly distribution amounts, whether or not consecutive, attributable to any quarter ending after March 1, 2019.
Accounting for the Class A Convertible Preferred Units
Our Class A Convertible Preferred Units are considered redeemable securities under GAAP due to the existence of redemption provisions upon a deemed liquidation event that is outside of our control. Therefore, we present them as temporary equity in the mezzanine section of the Consolidated Balance Sheets. We initially recognized our Class A Convertible Preferred Units at their issuance date fair value, net of issuance costs, as they were not redeemable and we did not have plans or expect any events that constitute a change of control in our partnership agreement.
We will not be required to further adjust the carrying amount of our Class A Convertible Preferred Units until it becomes probable that they would become redeemable. Once redemption becomes probable, we would adjust the carrying amount of our Class A Convertible Preferred Units to the redemption value over a period of time comprising the date the feature first becomes probable and the date the units can first be redeemed.
27
We paid the following cash distributions to our Class A Convertible Preferred unitholders:
Distribution For
Date Paid
Per Unit Amount
Total Amount
2023
1st Quarter
May 15, 2023
$
0.9473
$
24,002
2nd Quarter
August 14, 2023
$
0.9473
$
23,314
3rd Quarter
November 14, 2023
$
0.9473
$
22,612
4th Quarter
February 14, 2024
$
0.9473
$
21,894
2024
1st Quarter
May 15, 2024
$
0.9473
$
21,894
2nd Quarter
August 14, 2024
$
0.9473
$
21,894
3rd Quarter
November 14, 2024
$
0.9473
$
21,894
4th Quarter
February 14, 2025
$
0.9473
$
21,894
2025
1st Quarter
May 15, 2025
$
0.9473
$
19,942
2nd Quarter
August 14, 2025
$
0.9473
$
14,868
3rd Quarter
November 14, 2025
$
0.9473
$
14,868
4th Quarter
February 13, 2026
$
0.9473
$
14,868
On April 3, 2023, July 3, 2023, and October 3, 2023 we entered into purchase agreements with the Class A Convertible Preferred unitholders whereby we purchased a total of 2,224,860 Class A Convertible Preferred Units at an average purchase price of $33.71 per unit.
On March 6, 2025, we entered into purchase agreements with certain Class A Convertible Preferred unitholders whereby we purchased a total of 7,416,196 Class A Convertible Preferred Units (the “2025 Purchased Units”) at a purchase price of $35.40 per unit. In addition, we paid a distribution of $5.1 million (or $0.6841 per 2025 Purchased Unit), which represented distributions that accrued on the 2025 Purchased Units from January 1, 2025 through March 6, 2025.
There were 15,695,722 and 23,111,918 Class A Convertible Preferred Units outstanding as of December 31, 2025 and 2024, respectively.
Net income (loss) attributable to Genesis Energy, L.P. is adjusted for distributions and returns attributable to the Class A Convertible Preferred Units that accumulate in the period. Net loss attributable to Genesis Energy, L.P. for the year ended December 31, 2025 was reduced by $71.6 million due to Class A Convertible Preferred Unit distributions that accumulated during the period and further reduced by $1.4 million due to returns attributable to the Class A Convertible Preferred Units. For the year ended December 31, 2024, Net loss attributable to Genesis Energy, L.P. was reduced by $87.6 million due to Class A Convertible Preferred Unit distributions that accumulated during the periods. For the year ended December 31, 2023, Net income attributable to Genesis Energy, L.P. was reduced by $93.9 million due to Class A Convertible Preferred Unit distributions that accumulated during the period partially offset by $3.2 million due to returns attributable to the Class A Convertible Preferred Units.
Noncontrolling Interests
On November 17, 2021, we, through a subsidiary, sold 36% of the membership interests in CHOPS for proceeds of approximately $418 million. We retained 64% of the membership interests in CHOPS and remain the operator of the CHOPS Pipeline and associated assets.
We also own an 80% membership interest in Independence Hub, LLC.
For financial reporting purposes, the assets and liabilities of these entities are consolidated with those of our own, with any third party or affiliate interest in our Consolidated Balance Sheets amounts shown as noncontrolling interests in partners’ capital.
13. Net Income (Loss) Per Common Unit
Basic net income (loss) per common unit is computed by dividing Net Income (Loss) Attributable to Genesis Energy, L.P., after considering income attributable to our Class A Convertible Preferred unitholders, by the weighted average number of common units outstanding.
28
The dilutive effect of the Class A Convertible Preferred Units is calculated using the if-converted method. Under the if-converted method, the Class A Convertible Preferred Units are assumed to be converted at the beginning of the period (beginning with their respective issuance date), and the resulting common units are included in the denominator of the diluted net income (loss) per common unit calculation for the period being presented. The numerator is adjusted for distributions declared in the period, undeclared distributions that accumulated during the period, and any returns that accumulated in the period. For the years ended December 31, 2025, 2024, and 2023, the effect of the assumed conversion of our Class A Convertible Preferred Units was anti-dilutive and was not included in the computation of diluted earnings per unit.
The following table illustrates the computation of basic and diluted net income (loss) per common unit:
Year Ended December 31,
2025
2024
2023
Net income (loss) from continuing operations
$
30,505
$
(50,765)
$
47,177
Less: Net income attributable to noncontrolling interests
(47,163)
(30,940)
(28,627)
Less: Accumulated distributions and returns attributable to Class A Convertible Preferred Units
(73,006)
(87,576)
(90,725)
Net loss attributable to common unitholders from continuing operations
$
(89,664)
$
(169,281)
$
(72,175)
Net income (loss) from discontinued operations
(423,745)
17,758
99,170
Net income (loss) attributable to common unitholders
$
(513,409)
$
(151,523)
$
26,995
Weighted average outstanding units
122,464
122,464
122,535
Net loss attributable to common unitholders per common unit from continuing operations - Basic and Diluted
$
(0.73)
$
(1.38)
$
(0.59)
Net income (loss) per common unit from discontinued operations - Basic and Diluted
(3.46)
0.14
0.81
Net income (loss) per common unit - Basic and Diluted
$
(4.19)
$
(1.24)
$
0.22
14. Business Segment Information
In the first quarter of 2025, we reorganized our operating segments as a result of the way our CODM evaluates the performance of operations, develops strategy and allocates resources, including capital. Our sulfur services business, formerly reported under our soda and sulfur services reporting segment with our previously owned Alkali Business (see Note 4), is now reported under our onshore transportation and services reporting segment. As a result of this change, we now manage our businesses through three divisions that constitute our reportable segments. Our reportable segments are primarily organized around the different products and services we provide to our customers and include the following: (i) offshore pipeline transportation; (ii) marine transportation; and (iii) onshore transportation and services.
Our offshore pipeline transportation segment consists of our offshore transportation of crude oil and natural gas in the Gulf of America, which focuses on providing a suite of services to integrated and large independent energy companies.
Our marine transportation segment provides waterborne transportation of petroleum products (primarily fuel oil, asphalt and other heavy refined products) and crude oil throughout North America primarily to customers such as refiners and large energy companies.
Our onshore transportation and services segment provides services through a combination of purchasing, marketing, storing, and blending crude oil and transporting crude oil and refined products, primarily to crude oil refiners and producers and performs the processing of high sulfur (or “sour”) gas streams for refineries to remove the sulfur and selling the related by-product, NaHS (our sulfur services business).
Substantially all of our revenues are derived from, and substantially all of our assets are located in, the United States.
Our CODM evaluates segment performance based on a variety of measures including Segment Margin, segment volumes, and, where relevant, capital investment.
29
Segment Margin is viewed by our CODM as the primary measure that is most aligned with the measurement principles most consistent with those used in calculating the corresponding amounts in our Consolidated Financial Statements. We define Segment Margin as revenues less product costs, operating expenses (excluding non-cash gains and charges, such as depreciation, amortization and accretion and non-cash effects of our long-term incentive compensation plan), segment general and administrative expenses, all of which are net of the effects of our noncontrolling interests and only associated with our continuing operations, plus our equity in distributable cash generated by our equity investees.
Segment information for each year presented below is as follows:
Year Ended December 31, 2025
Offshore Pipeline Transportation
Marine Transportation
Onshore Transportation and Services
Total
Revenues:
External customers
$
531,035
$
319,498
$
779,882
$
1,630,415
Intersegment(1)
863
—
(863)
—
Total revenues of reportable segments(2)
$
531,898
$
319,498
$
779,019
$
1,630,415
Segment Operating Expenses
(145,005)
(204,830)
(252,017)
(601,852)
Segment Product Costs
—
—
(451,962)
(451,962)
Other Segment Items(3)
(1,199)
1,022
1,429
1,252
Segment Margin(4)
$
385,694
$
115,690
$
76,469
$
577,853
Year Ended December 31, 2024
Offshore Pipeline Transportation
Marine Transportation
Onshore Transportation and Services
Total
Total revenues of reportable segments(2)(5)
$
404,919
$
321,616
$
934,299
$
1,660,834
Segment Operating Expenses
(117,207)
(196,602)
(269,126)
(582,935)
Segment Product Costs
—
—
(599,925)
(599,925)
Other Segment Items(3)
45,074
(11)
6,105
51,168
Segment Margin(4)
$
332,786
$
125,003
$
71,353
$
529,142
Year Ended December 31, 2023
Offshore Pipeline Transportation
Marine Transportation
Onshore Transportation and Services
Total
Revenues:
External customers
$
377,842
$
327,464
$
1,016,017
$
1,721,323
Intersegment(1)
4,312
—
(4,312)
—
Total revenues of reportable segments(2)
$
382,154
$
327,464
$
1,011,705
$
1,721,323
Segment Operating Expenses
(96,025)
(218,403)
(300,921)
(615,349)
Segment Product Costs
—
—
(637,179)
(637,179)
Other Segment Items(3)
120,543
1,362
(422)
121,483
Segment Margin(4)
$
406,672
$
110,423
$
73,183
$
590,278
(1)Intersegment sales were conducted under terms that we believe were no more or less favorable than then-existing market conditions.
(2)Total revenues of reportable segments in the table above agrees to “Total revenues” as seen in our Consolidated Statements of Operations for each respective year. See Note 3 for more detailed information on the revenues reported by major category of products and services by reportable segment.
(3)Other Segment Items primarily includes adjustments related to the difference in timing of cash receipts for certain contractual agreements (applicable to our offshore pipeline transportation and onshore transportation and services segments), segment general and administrative expenses less the non-cash effects of our LTIP plans (applicable to all reportable segments), net effects of our noncontrolling interests (applicable to our offshore pipeline transportation segment), adjustments to include distributable cash generated by our equity investees (applicable to our offshore pipeline transportation and onshore transportation and services segments), and unrealized gains and losses from the valuation of our commodity derivative transactions (excluding fair value hedges) (applicable to onshore transportation and service segment).
(4)A reconciliation of Income (loss) from continuing operations before income taxes to total Segment Margin to for each year is presented below.
(5)There were no intersegment revenues for the year ended December 31, 2024.
30
Total assets by reportable segment were as follows:
December 31, 2025
December 31, 2024
Offshore pipeline transportation
$
2,755,595
$
2,748,296
Marine transportation
618,474
641,082
Onshore transportation and services
1,452,971
1,401,238
Total reportable segment assets
$
4,827,040
$
4,790,616
Other assets
33,663
39,656
Assets held for discontinued operations
—
2,207,420
Total consolidated assets
$
4,860,703
$
7,037,692
Total growth and maintenance capital expenditures for fixed and intangible assets (including enhancements to existing facilities and construction of growth projects as well as contributions to equity investees) by reportable segment for the years ended December 31, 2025 and 2024 were as follows:
December 31, 2025
December 31, 2024
Offshore pipeline transportation(1)
$
85,728
$
255,640
Marine transportation
52,383
91,752
Onshore transportation and services
6,456
16,991
Total reportable segment capital expenditures
$
144,567
$
364,383
Other
1,158
12,044
Total consolidated capital expenditures
$
145,725
$
376,427
(1)Capital expenditures in our offshore pipeline transportation segment for 2025 and 2024 represent 100% of the costs incurred, including those funded by our noncontrolling interest holder.
Reconciliation of Income (loss) from continuing operations before income taxes to total Segment Margin:
Year Ended December 31,
2025
2024
2023
Income (loss) from continuing operations before income taxes
$
31,311
$
(48,995)
$
47,633
Net income attributable to noncontrolling interests
(47,163)
(30,940)
(28,627)
Corporate general and administrative expenses
89,495
57,285
69,225
Depreciation, amortization and accretion
243,383
217,776
210,657
Interest expense, net
264,729
261,875
219,065
Adjustment to include distributable cash generated by equity investees not included in income and exclude equity in investees net income(1)
21,909
23,461
24,635
Unrealized losses (gains) on derivative transactions excluding fair value hedges, net of changes in inventory value
(1)Includes distributions attributable to the period and received during or promptly following such period.
(2)Includes the difference in timing of cash receipts from customers during the period and the revenue we recognize in accordance with GAAP on our related contracts.
31
15. Transactions with Related Parties
Transactions with related parties were as follows:
Year Ended December 31,
2025
2024
2023
Revenues:
Revenues from services and fees to Poseidon Oil Pipeline Company, LLC(1)
$
19,258
$
19,795
$
18,713
Expenses:
Amounts paid to our CEO in connection with the use of his aircraft
$
660
$
660
$
660
Charges for products purchased from Poseidon Oil Pipeline Company, LLC(1)
1,073
1,136
9,124
(1) We own a 64% interest in Poseidon Oil Pipeline Company, LLC.
Our CEO, Mr. Grant E. Sims, owns an aircraft which is used by us for business purposes in the course of operations. We pay Mr. Grant E. Sims a fixed monthly fee and reimburse the aircraft management company for costs related to our usage of the aircraft, including fuel and the actual out-of-pocket costs. Based on current market rates for chartering of private aircraft under long-term, priority arrangements with industry recognized chartering companies, we believe that the terms of this arrangement reflect what we would expect to obtain in an arms-length transaction.
Transactions with Unconsolidated Affiliates
Poseidon
We provide management, administrative and pipeline operator services to Poseidon under an Operation and Management Agreement. Currently, that agreement automatically renews annually unless terminated by either party (as defined in the agreement). Our revenues for the years ended December 31, 2025, 2024 and 2023 include $10.6 million, $10.3 million and $10.0 million, respectively, of fees we earned through the provision of services under that agreement. At December 31, 2025, and 2024, Poseidon Oil Pipeline Company, LLC owed us $4.3 million and $1.9 million for services rendered, respectively.
16. Supplemental Cash Flow Information
The following table provides information regarding the net changes in components of operating assets and liabilities:
Year Ended December 31,
2025
2024
2023
(Increase) decrease in:
Accounts receivable
$
(120,916)
$
17,511
$
159,426
Inventories
(23,018)
38,824
(37,566)
Deferred charges
(19,662)
(14,742)
48,835
Other current assets
2,016
21,109
(2,110)
Increase (decrease) in:
Accounts payable
104,655
434
(135,289)
Accrued liabilities
(32,260)
(32,072)
(29,122)
Net changes in components of operating assets and liabilities
$
(89,185)
$
31,064
$
4,174
Payments of interest and commitment fees were $282.4 million, $293.9 million and $251.3 million during the years ended December 31, 2025, 2024 and 2023, respectively. We capitalized interest of $16.7 million, $47.2 million and $43.2 million during the years ended December 31, 2025, 2024 and 2023, respectively.
For the years ended December 31, 2025, 2024 and 2023 we paid income taxes, net of refunds received, to the state of Texas of $0.8 million, $1.2 million and $0.9 million, respectively.
At December 31, 2025, 2024 and 2023, we had incurred liabilities for fixed and intangible asset additions associated with our continuing operations totaling $13.0 million, $43.3 million and $79.5 million, respectively, which had not been paid at the end of the year. Therefore, these amounts were not included in the caption “Payments to acquire fixed and intangible assets” under Cash Flows from Investing Activities in the Consolidated Statements of Cash Flows. The reduction observed for the
32
years ending December 31, 2025, in comparison to the corresponding prior periods, can be attributed to the completion of our offshore pipeline transportation capital projects.
17. Equity-Based Compensation Plans
2010 Long Term Incentive Plan
In 2010, we adopted the 2010 Long-Term Incentive Plan (the “2010 LTIP”). The 2010 LTIP provides for the awards of phantom units and distribution equivalent rights to members of our board of directors and employees who provide services to us. Phantom units are notional units representing unfunded and unsecured promises to pay to the participant a specified amount of cash based on the market value of our common units should specified vesting requirements be met. Distribution equivalent rights (“DERs”) are tandem rights to receive on a quarterly basis a cash amount per phantom unit equal to the amount of cash distributions paid per common unit. The 2010 LTIP is administered by the Governance, Compensation and Business Development Committee (the “G&C Committee”) of our board of directors. The G&C Committee (at its discretion) designates participants in the 2010 LTIP, determines the types of awards to grant to participants, determines the number of units to be covered by any award, and determines the conditions and terms of any award including vesting, settlement and forfeiture conditions.
The compensation cost associated with the phantom units is re-measured each reporting period based on the market value of our common units, and is recognized over the vesting period. The liability recorded for the estimated amount to be paid to the participants under the 2010 LTIP is adjusted to recognize changes in the estimated compensation cost and vesting.
During 2025, we granted 67,342 phantom units with tandem DERs at a weighted average grant fair value of $14.44 per unit. During 2024, we granted 66,462 phantom units with tandem DERs at a weighted average grant date fair value of $12.79 per unit. During 2023, we granted 74,106 phantom units with tandem DERs at a weighted average grant date fair value of $10.26 per unit. The phantom units granted for 2025, 2024, and 2023 were made only to directors. Awards to management and other key employees during these periods were made under the 2018 LTIP plan and were not equity-based awards.
A summary of our phantom unit activity for our service-based awards to our directors is set forth below:
Service-Based Awards
Number of Phantom Units
Average Grant Date Fair Value
Total Value (in thousands)
Unvested at December 31, 2022
220,132
$
8.97
$
1,975
Granted
74,106
10.26
760
Settled
(177,640)
7.46
(1,325)
Unvested at December 31, 2023
116,598
12.09
1,410
Granted
66,462
12.79
850
Settled
(116,598)
12.15
(1,417)
Unvested at December 31, 2024
66,462
12.69
843
Granted
67,342
14.44
972
Settled
(66,462)
12.79
(850)
Unvested at December 31, 2025
67,342
$
14.34
$
966
We recorded compensation expense of $1.4 million, $0.8 million, and $1.2 million for the years ended December 31, 2025, 2024 and 2023, respectively, included in “General and administrative expenses” on the Consolidated Statements of Operations. Our liability for these awards totaled $1.1 million and $0.7 million at December 31, 2025 and 2024, respectively, and is included within “Accrued liabilities” on the Consolidated Balance Sheets.
33
18. Major Customers and Credit Risk
Due to the nature of our onshore transportation and services operations, a disproportionate percentage of our trade receivables constitute obligations of refiners, large crude oil producers and integrated oil companies. This industry concentration has the potential to impact our overall exposure to credit risk, either positively or negatively, in that our customers could be affected by similar changes in economic, industry or other conditions. However, we believe that the credit risk posed by this industry concentration is offset by the creditworthiness of our customer base. Our portfolio of accounts receivable in this operation (as well as in our offshore pipeline transportation, marine transportation, and sulfur services businesses) is comprised in large part of accounts owed by integrated and large independent energy companies with stable payment histories. The credit risk related to contracts which are exchange-traded is limited due to daily margin requirements of the exchange. A change in supply and/or demand could adversely affect our operating results.
We have established various procedures to manage our credit exposure, including initial credit approvals, credit limits, collateral requirements and rights of offset. Letters of credit, prepayments and guarantees are also utilized to limit credit risk to ensure that our established credit criteria are met.
No single customer exceeded 10% of total consolidated revenues during 2025. During 2024 and 2023, our largest customer was Shell, which accounted for approximately 11% and 13%, respectively, of total consolidated revenues.
19. Derivatives
Crude Oil Hedges
We have exposure to commodity price changes related to our crude oil inventory and purchase commitments. We utilize derivative instruments (futures, options, basis differentials and swap contracts) to hedge our exposure to crude oil. Our decision as to whether to designate derivative instruments as fair value hedges for accounting purposes relates to our expectations of the length of time we expect to have the commodity price exposure and our expectations as to whether the derivative contract will qualify as highly effective under accounting guidance in limiting our exposure to commodity price risk. We recognize any changes in the fair value of our derivative contracts as increases or decreases in “Onshore transportation and services product costs” in the Consolidated Statements of Operations. The recognition of changes in fair value of the derivative contracts not designated as hedges for accounting purposes can occur in reporting periods that do not coincide with the recognition of gain or loss on the actual transaction being hedged. Therefore, we will, on occasion, report gains or losses in one period that will be partially offset by gains or losses in a future period when the hedged transaction is completed.
We have designated certain crude oil futures contracts as hedges of crude oil inventory due to our expectation that these contracts will be highly effective in hedging our exposure to fluctuations in crude oil prices during the period that we expect to hold that inventory. We account for these derivative instruments as fair value hedges under the accounting guidance. Changes in the fair value of these derivative instruments designated as fair value hedges are used to offset related changes in the fair value of the hedged crude oil inventory. Any hedge ineffectiveness in these fair value hedges and any amounts excluded from effectiveness testing are recorded as a gain or loss within “Onshore transportation and services product costs” in the Consolidated Statements of Operations.
Balance Sheet Netting and Broker Margin Accounts
Our accounting policy is to offset over-the-counter derivative assets and liabilities executed with the same counterparty based on the contract settlement month. We also offset fair value amounts recorded for our exchange-traded derivative contracts against required margin funding in “Current Assets - Other” in our Consolidated Balance Sheets. Our exchange-traded derivatives are transacted through brokerage accounts and are subject to margin requirements as established by the respective exchange. Margin requirements are intended to mitigate a party’s exposure to market volatility and counterparty credit risk. On a daily basis, our account equity (consisting of the sum of our cash margin balance and the fair value of our open derivatives) is compared to our initial margin requirement resulting in the payment or return of variation margin.
As of December 31, 2025, we had a net broker receivable of approximately $0.8 million (consisting of initial margin of $0.7 million increased by $0.1 million of variation margin). As of December 31, 2024, we had a net broker receivable of approximately $0.9 million (consisting of initial margin of $1.1 million decreased by $0.2 million of variation margin). At December 31, 2025 and December 31, 2024, none of our outstanding derivative contracts contained credit-risk related contingent features that would result in a material adverse impact to us upon any change in our credit ratings.
34
At December 31, 2025, we had the following outstanding derivative contracts that were entered into to economically hedge inventory, fixed price purchase commitments or forecasted purchases.
Sell (Short) Contracts
Buy (Long) Contracts
Designated as hedges under accounting rules:
Crude oil futures:
Contract volumes (1,000 Bbls)
178
—
Weighted average contract price per Bbl
$
58.06
$
—
Not qualifying or not designated as hedges under accounting rules:
Crude oil spread swaps:
Contract volumes (1,000 Bbls)
50
—
Weighted average contract price per Bbl
$
0.49
$
—
Crude oil options:
Contract volumes (1,000 Bbls)
40
—
Weighted average premium received/paid
$
0.05
$
—
Financial Statement Impacts
Unrealized gains are subtracted from net income (loss) and unrealized losses are added to net income (loss) in determining cash flows from operating activities. To the extent that we have fair value hedges outstanding, the offsetting change recorded in the fair value of inventory is also eliminated from net income (loss) in determining cash flows from operating activities. Changes in the cash margin balance required to maintain our exchange-traded derivative contracts also affect cash flows from operating activities.
The following table summarizes the accounting treatment and classification of our derivative instruments on our Consolidated Financial Statements.
Derivative Instrument
Hedged Risk
Impact of Unrealized Gains and Losses
Consolidated Balance Sheets
Consolidated Statements of Operations
Designated as hedges under accounting guidance:
Crude oil futures contracts (fair value hedge)
Volatility in crude oil prices - effect on market value of inventory
Derivatives are recorded in “Current Assets - Other” (offset against margin deposits) and offsetting change in fair value of inventory is recorded in “Inventories”
Excess, if any, over effective portion of hedge is recorded in “Onshore transportation and services product costs” Effective portion is offset in cost of sales against change in value of inventory being hedged
Not qualifying or not designated as hedges under accounting guidance:
Hedges consisting of crude oil futures, forward contracts, swaps and put and call options
Volatility in crude oil prices - effect on market value of inventory, fixed price purchase commitments or forecasted purchases
Other derivatives are recorded in “Current Assets - Other” (offset against margin deposits)
Entire amount of change in fair value of derivative is recorded in “Onshore transportation and services costs - product costs”
35
The following tables reflect the estimated fair value position of our derivatives at December 31, 2025 and 2024:
Fair Value of Derivative Assets and Liabilities
Fair Value
Consolidated Balance Sheets Location
December 31, 2025
December 31, 2024
Asset Derivatives:
Commodity derivatives—futures and put and call options (undesignated hedges):
Gross amount of recognized assets
Current Assets - Other; Accounts receivable - trade, net
$
59
$
96
Gross amount offset in the Consolidated Balance Sheets
Current Assets - Other(1)
(8)
(96)
Net amount of assets presented in the Consolidated Balance Sheets
Gross amount offset in the Consolidated Balance Sheets
Current Assets - Other(1)
19
637
Net amount of liabilities presented in the Consolidated Balance Sheets
$
—
$
—
(1)As noted above, our exchange-traded derivatives are transacted through brokerage accounts and subject to margin requirements. We offset fair value amounts recorded for our exchange-traded derivative contracts against required margin deposits recorded in our Consolidated Balance Sheets under “Current Assets - Other”.
36
Effect on Operating Results
Amount of Gain (Loss) Recognized in Income (Loss)
Year Ended December 31,
Consolidated Statements of Operations Location
2025
2024
2023
Commodity derivatives—futures and options:
Contracts designated as hedges under accounting guidance
Onshore transportation and services product costs
$
1,603
$
(1,370)
$
617
Contracts not considered hedges under accounting guidance
Onshore transportation and services product costs
(443)
(547)
(1,266)
Total commodity derivatives
$
1,160
$
(1,917)
$
(649)
20. Fair-Value Measurements
We classify financial assets and liabilities into the following three levels based on the inputs used to measure fair value:
(1) Level 1 fair values are based on observable inputs such as quoted prices in active markets for identical assets and liabilities;
(2) Level 2 fair values are based on pricing inputs other than quoted prices in active markets for identical assets and liabilities and are either directly or indirectly observable as of the measurement date; and
(3) Level 3 fair values are based on unobservable inputs in which little or no market data exists.
As required by fair value accounting guidance, financial assets and liabilities are classified in their entirety based on the lowest level of input that is significant to the fair value measurement.
Our assessment of the significance of a particular input to the fair value requires judgment and may affect the placement of assets and liabilities within the fair value hierarchy levels.
The following table sets forth by level within the fair value hierarchy our financial assets and liabilities that were accounted for at fair value on a recurring basis as of December 31, 2025 and 2024.
December 31, 2025
December 31, 2024
Recurring Fair Value Measures
Level 1
Level 2
Level 3
Level 1
Level 2
Level 3
Commodity derivatives:
Assets
$
164
$
51
$
—
$
190
$
—
$
—
Liabilities
$
(19)
$
—
$
—
$
(819)
$
—
$
—
Our commodity derivatives include exchange-traded futures and exchange-traded options contracts. The fair value of these exchange-traded derivative contracts is based on unadjusted quoted prices in active markets and is, therefore, included in Level 1 of the fair value hierarchy. The fair value of the swaps contracts was determined using market price quotations and a pricing model. The swap contracts were considered a Level 2 input in the fair value hierarchy at December 31, 2025.
Nonfinancial Assets and Liabilities
We utilize fair value on a non-recurring basis to perform impairment tests as required on our property, plant and equipment, goodwill and intangible assets. Assets and liabilities acquired in business combinations are recorded at their fair value as of the date of acquisition. The inputs used to determine such fair value are primarily based upon internally developed cash flow models and would generally be classified as Level 3, in the event that we were required to measure and record such assets within our Consolidated Financial Statements.
37
When performing a quantitative assessment of our goodwill as part of our annual evaluation (see Note 2), we use Level 3 inputs to estimate the fair value of our sulfur services reporting unit using the income approach. This includes assumptions regarding future cash flows based on projected sales volumes and pricing, the terminal value and discount rate. Changes to any one or a combination of these factors would result in a change to the reporting unit fair value, which could lead to future impairment charges.
Additionally, we use fair value to determine the inception value of our asset retirement obligations. The inputs used to determine such fair value are primarily based upon costs incurred historically for similar work, as well as estimates from independent third parties for costs that would be incurred to restore leased property to the contractually stipulated condition, and would generally be classified in Level 3.
Other Fair Value Measurements
We believe the debt outstanding under our senior secured credit facility approximates fair value as the stated rate of interest approximates current market rates of interest for similar instruments with comparable maturities. At December 31, 2025 our senior unsecured notes had a carrying value of $3.1 billion and fair value of $3.2 billion, compared to a carrying value of $3.5 billion and fair value of $3.5 billion at December 31, 2024. The fair value of the senior unsecured notes is determined based on trade information in the financial markets of our public debt and is considered a Level 2 fair value measurement.
21. Commitments and Contingencies
Commitments and Guarantees
We are subject to various environmental laws and regulations. Policies and procedures are in place to monitor compliance and to detect and address any releases of crude oil from our pipelines or other facilities; however no assurance can be made that such environmental releases may not substantially affect our business.
Other Matters
Our facilities and operations may experience damage as a result of an accident or natural disaster. These hazards can cause personal injury or loss of life, severe damage to and destruction of property and equipment, pollution or environmental damage and suspension of operations. We maintain insurance that we consider adequate to cover our operations and properties, in amounts we consider reasonable. Our insurance does not cover every potential risk associated with operating our facilities, including the potential loss of significant revenues. The occurrence of a significant event that is not fully-insured could materially and adversely affect our results of operations. We believe we are adequately insured for public liability and property damage to others and that our coverage is similar to other companies with operations similar to ours. No assurance can be made that we will be able to maintain adequate insurance in the future at premium rates that we consider reasonable.
We are subject to lawsuits in the normal course of business and examination by tax and other regulatory authorities. We do not expect such matters presently pending to have a material effect on our financial position, results of operations or cash flows.
22. Income Taxes
We are not a taxable entity for federal income tax purposes. As such, we do not directly pay federal income taxes. Other than with respect to our corporate subsidiaries and the Texas Margin Tax, our taxable income or loss is includible in the federal income tax returns of each of our partners.
A few of our operations are owned by wholly-owned corporate subsidiaries that are taxable as corporations. During 2025, we paid state income taxes on these operations.
38
Our income tax expense is as follows:
Year Ended December 31,
2025
2024
2023
Current:
State
176
965
784
Foreign
57
56
52
Total current income tax expense
$
233
$
1,021
$
836
Deferred:
Federal
$
467
$
610
$
248
State
106
139
(628)
Total deferred income tax expense (benefit)
$
573
$
749
$
(380)
Total income tax expense
$
806
$
1,770
$
456
Deferred income taxes relate to temporary differences based on tax laws and statutory rates that were enacted at the balance sheet date. Deferred tax assets and liabilities consist of the following:
December 31,
2025
2024
Deferred tax assets:
Net operating loss carryforwards - Federal
$
9,746
$
10,695
Net operating loss carryforwards - State
2,443
2,580
Other
4,949
3,882
Total long-term deferred tax asset
17,138
17,157
Valuation allowances
(5,731)
(4,938)
Total deferred tax assets
$
11,407
$
12,219
Deferred tax liabilities:
Long-term:
Fixed assets
$
(1,652)
$
(1,799)
Intangible assets
(27,033)
(27,033)
Other
(127)
38
Total long-term liability
(28,812)
(28,794)
Total deferred tax liabilities
$
(28,812)
$
(28,794)
Total net deferred tax liability
$
(17,405)
$
(16,575)
We record a valuation allowance when it is more likely than not that some portion or all of the deferred tax assets will not be realized. The ultimate realization of the deferred tax assets depends on the ability to generate sufficient taxable income of the appropriate character in the future and in the appropriate taxing jurisdictions.
39
The reconciliation between the partnership’s effective tax rate on income (loss) from operations and the statutory tax rate is as follows:
Year Ended December 31,
2025
2024
2023
(in thousands)
Percent
(in thousands)
Percent
(in thousands)
Percent
Income (loss) from continuing operations before income taxes
$
31,311
$
(48,995)
$
47,633
Tax expense (benefit) at federal statutory rate
$
6,575
21.0%
$
(10,289)
21.0%
$
10,003
21.0%
Partnership income (loss) not subject to federal income tax
(6,757)
(21.6)%
9,960
(20.3)%
(9,381)
(19.7)%
State and local income tax (benefit), net of federal effect
117
0.4%
1,316
(2.7)%
(415)
(0.9)%
Foreign income taxes
57
0.2%
56
(0.1)%
52
0.1%
Valuation allowance
699
2.2%
853
(1.7)%
323
0.7%
Other
115
0.4%
(126)
0.3%
(126)
(0.3)%
Income tax expense
$
806
2.6%
$
1,770
(3.6)%
$
456
1.0%
At December 31, 2025, 2024 and 2023, we had no uncertain tax positions.
23. Subsequent Events
On February 3, 2026, we entered into a purchase agreement with one of our Class A Convertible Preferred unitholders whereby we purchased 741,620 Class A Convertible Preferred Units at a purchase price of $33.71 per unit (the “2026 Purchased Units”). In addition, we paid a distribution of $0.3 million (or $0.3473 per 2026 Purchased Unit), which represented distributions that accrued on the 2026 Purchased Units from January 1, 2026 through February 2, 2026.