UNITED STATES
SECURITIES AND EXCHANGE COMMISSION
Washington, D.C. 20549
Proxy Statement Pursuant to Section 14(a) of
the Securities Exchange Act of 1934 (Amendment No.)
Filed by the Registrant ☒
Filed by a Party other than the Registrant ☐
Check the appropriate box:
| ☐ |
Preliminary Proxy Statement
|
| ☐ |
Confidential, for Use of the Commission Only (as permitted by Rule 14a-6(e)(2))
|
| ☒ |
Definitive Proxy Statement
|
| ☐ |
Definitive Additional Materials
|
| ☐ |
Soliciting Material under § 240.14a-12
|
(Name of Registrant as Specified In Its Charter)
(Name of Person(s) Filing Proxy Statement, if other than the Registrant)
Payment of Filing Fee (Check all boxes that apply):
| ☒ |
No fee required.
|
| ☐ |
Fee paid previously with preliminary materials.
|
| ☐ |
Check computed on table in exhibit required by Item 25(b) per Exchange Act Rules 14a-6(i)(1) and 0-11.
|

Notice of 2025 Annual Meeting of Shareholders
and
Proxy Statement
EPLUS INC.
NOTICE OF 2025 ANNUAL MEETING OF SHAREHOLDERS
|
When:
|
Where:
|
|
September 16, 2025
8:30 a.m. ET
|
The Westin Washington Dulles Airport
2520 Wasser Terrace
Herndon, Virginia 20171
|
We at ePlus inc. (“ePlus”
or the “Company”) are pleased to invite you to our 2025 Annual Meeting of Shareholders (the “2025 Annual Meeting”).
Items of Business:
| 1. |
Elect as directors the seven nominees named in the attached proxy statement, each to serve an annual term, or until their successors have been duly elected and qualified;
|
| 2. |
Approve an advisory vote on our named executive officers’ compensation as disclosed in the proxy statement;
|
| 3. |
Ratify the selection of
our independent registered accounting firm; and
|
| 4. |
Transact such other business as may properly come before the 2025 Annual Meeting, and any postponements or adjournments thereof.
|
Such other business as may properly come before the meeting, or any adjournment or postponement thereof.
Record Date:
All shareholders are welcome to attend the 2025 Annual Meeting. Holders of our common stock as of the close of business on July
22, 2025, are entitled to notice of, and to vote at, the 2025 Annual Meeting.
How to Vote:
Your vote is important to us. Please see “Voting Information” on page 3 for instructions on how to vote your shares.
These proxy materials are first being distributed on or about July 30, 2025.
|
July 30, 2025
|
By Order of the Board of Directors
|
 |
|
|
Erica S. Stoecker
|
|
|
Corporate Secretary, General Counsel & Chief Compliance Officer
|
|
IMPORTANT NOTICE
Regarding the Availability of Proxy Materials for the Shareholder Meeting to Be Held on September 16, 2025:
ePlus’ proxy statement for the 2025 Annual Meeting and its Annual Report for the Fiscal Year Ended March 31, 2025,
are Available Online at www.edocumentview.com/plus.
|
|
1
|
||
|
1
|
||
|
1
|
||
|
2
|
||
|
2
|
||
|
3
|
||
|
3
|
||
|
3
|
||
|
3
|
||
|
4
|
||
|
4
|
||
|
4
|
||
|
4
|
||
|
5
|
||
|
5
|
||
|
5
|
||
|
6
|
||
|
7
|
||
|
8
|
||
|
8
|
||
|
8
|
||
|
8
|
||
|
9
|
||
|
9
|
||
|
9
|
||
|
9
|
||
|
10
|
||
|
11
|
||
|
11
|
||
|
11
|
||
|
12
|
||
|
15
|
||
|
16
|
||
|
17
|
||
|
17
|
||
|
17
|
||
|
18
|
||
|
19
|
||
|
20
|
||
|
20
|
||
|
21
|
||
|
22
|
||
|
22
|
||
|
22
|
||
|
23
|
||
|
24
|
||
|
25
|
||
|
25
|
||
|
25
|
||
|
25
|
||
|
25
|
||
|
27
|
||
|
31
|
||
|
33
|
||
|
33
|
||
| 33 |
||
|
33
|
||
|
34
|
||
|
34
|
||
|
34
|
||
|
36
|
||
|
37
|
||
|
37
|
||
|
38
|
||
|
42
|
||
|
43
|
||
|
46
|
||
|
47
|
||
|
47
|
||
|
48
|
||
|
49
|
||
|
52
|
||
|
52
|
||
|
52
|
||
|
52
|
||
|
52
|
||
|
53
|
||
|
53
|
||
|
53
|
||
|
Who:
|
Shareholders as of the Record Date, July 22, 2025
|
|
What:
|
See detailed Proposals on pages 11, 20, and 47, and summaries below
|
|
When:
|
September 16, 2025, 8:30 a.m. ET
|
|
Where:
|
The Westin Washington Dulles Airport, 2520 Wasser Terrace, Herndon, Virginia 20171
|
|
How:
|
Internet/Mobile, Telephone, Mail, In Person (see “Voting Information” beginning on page 3
for details)
|
ePlus has an unwavering and relentless focus on leveraging technology to
create inspired and transformative business outcomes for its customers. Offering a robust portfolio of solutions, as well as a full set of consultative and managed services across the technology spectrum, ePlus has proudly achieved more than 30 years of success in the business, carrying customers forward through adversity, rapidly changing environments, and other obstacles. ePlus
is a trusted advisor, bringing expertise, credentials, talent and a thorough understanding of innovative technologies, spanning security, cloud, data center, networking, collaboration, artificial intelligence and emerging solutions, to
domestic and foreign organizations across all industry segments. With complete lifecycle management services and flexible payment solutions, ePlus’ more than 2,100 associates are focused on
cultivating positive customer experiences and are dedicated to their craft, harnessing new knowledge while applying decades of proven experience.
On June 30, 2025, ePlus closed a transaction with Marlin Leasing Corporation (dba PEAC Solutions),
a portfolio company of the Asset Value Funds sponsored and managed by leading global investment firm HPS Investment Partners, LLC, to sell the domestic subsidiaries comprising our U.S. financing business (the “Divestiture”). The Divestiture positions ePlus as a pure-play technology solutions provider and strengthens our ability to continue to invest in high growth areas of AI, cloud,
cybersecurity, data center modernization, high performance networking and related consulting and managed services, while providing us the flexibility to accelerate plans around expanding our footprint and customer base. For additional
information regarding the Divestiture, please refer to our Current Reports on Form 8-K filed with the Securities and Exchange Commission (the “SEC”) on (i) June 23, 2025, and (ii) July 1, 2025, as
amended, as well as other filings we make with the SEC from time to time.
ePlus is headquartered in Virginia, with locations in the United States, UK, Europe, and Asia‐Pacific. For more information, visit www.eplus.com.
PROPOSAL 1 – ELECTION OF DIRECTORS
ePlus’ Board of Directors (the “Board of Directors” or “Board”) is currently composed of seven directors in total. Six of ePlus’ directors are “independent,” and one director, our Chief Executive Officer, Mark P. Marron, is not “independent,” within the meaning of The Nasdaq Stock Market LLC’s (“Nasdaq”) listing standards. The Board’s Nominating and Corporate Governance Committee has recommended to the Board, and the Board has nominated for election at our 2025 Annual Meeting, each of our
seven sitting directors, having found they each possess the requisite knowledge, skills, and abilities to oversee the Company’s strategy, management and business objectives.
|
ePlus Director Nominees for the 2025 Annual Meeting
|
||||||
|
|
|
Board Committees
|
|
|
||
|
Name
|
Age
|
Audit
|
Compensation
|
Nominating & Corporate Governance
|
Number of
Other Public Company Boards
|
Independent
Director
|
|
Melissa J. Ballenger
|
55
|
Chair
|
✔
|
|
0
|
✔
|
|
Renée Bergeron
|
62
|
|
Chair
|
✔
|
0
|
✔
|
|
Bruce M. Bowen
|
73
|
|
|
|
0
|
✔
|
|
John E. Callies
|
71
|
✔
|
|
Chair
|
0
|
✔
|
|
Ira A. Hunt, III
|
69
|
|
✔
|
✔
|
0
|
✔
|
|
Mark P. Marron, CEO and President
|
64
|
|
|
|
0
|
|
|
Maureen F. Morrison
|
70
|
✔
|
|
✔
|
1
|
✔
|
More information about our Board, including their biographies, is available in Proposal 1 – Election of
Directors.
PROPOSAL 2 – ADVISORY VOTE TO APPROVE NAMED EXECUTIVE OFFICERS’ COMPENSATION
Our executive compensation philosophy is to reward performance in alignment with our shareholders’ long-term interests, and to promote
and maintain stability within the executive team by granting cash incentives, performance stock units and restricted stock awards, each with multi-year vesting terms.
For the fiscal year ended March 31, 2025, our named executive officers were Chief Executive Officer (“CEO”)
and President, Mark P. Marron; Chief Financial Officer (“CFO”), Elaine D. Marion; and Chief Operating Officer (“COO”), Darren S. Raiguel. Each received a
base salary, short- and long-term cash incentive compensation, and long-term equity-based incentive compensation. Detailed information about our executive compensation practices is available in the section titled “Compensation Discussion and Analysis”.
Last year at our September 2024 Annual Meeting of Shareholders (the “2024 Annual Meeting”), our
shareholders approved the Company’s say-on-pay proposal with approximately 93.2% of the votes cast in its favor. The Compensation Committee considered this approval in determining that our executive compensation philosophies and
objectives continue to be appropriate, and did not require changes in response to the say-on-pay vote at the 2024 Annual Meeting.
THE BOARD UNANIMOUSLY RECOMMENDS A VOTE FOR THE
APPROVAL OF THE COMPANY’S EXECUTIVE COMPENSATION PROGRAM
PROPOSAL 3 – RATIFICATION OF INDEPENDENT REGISTERED PUBLIC ACCOUNTING FIRM
The Board’s Audit Committee has selected Deloitte & Touche LLP (“Deloitte”) as the Company’s
independent registered accounting firm for the fiscal year ending March 31, 2026. Deloitte has served as the Company’s independent registered public accounting firm since 1990, and the Board unanimously recommends that shareholders
vote to ratify the appointment of Deloitte as the Company’s independent registered public accounting firm. More information about Deloitte is available in Proposal 3 – Ratification of the Selection
of Deloitte & Touche LLP as our Independent Registered Public Accounting Firm for our Fiscal Year Ending March 31, 2026.
THE BOARD UNANIMOUSLY RECOMMENDS A VOTE FOR
RATIFICATION OF THE APPOINTMENT OF DELOITTE
This proxy statement, our Notice of Internet Availability of Proxy
Materials (the “Notice”) and our proxy
card are being furnished in connection with the solicitation of proxies by the Company’s Board, to be voted at our 2025 Annual Meeting, and at any adjournment or postponement of the Annual Meeting. We are using the “Notice and Access” method of furnishing proxy materials to you over the Internet. The
SEC’s Notice and Access rules permit us to furnish our shareholders with proxy materials, including this proxy statement and our Annual Report, including the Annual Report on Form 10-K for fiscal year 2025 that was previously filed
with the SEC (the “2025 Form 10-K”), by
providing access to such documents on the Internet instead of mailing printed copies. We believe that this process will provide you with convenient and efficient access to your proxy materials so you may vote your shares, while
allowing us to reduce the environmental impact of our 2025 Annual Meeting and the costs of printing and distributing the proxy materials. On or about July 30, 2025, we mailed our shareholders the Notice with instructions for
accessing our proxy statement and Annual Report. The Notice also identifies the items to be voted on at the 2025 Annual Meeting and provides instructions for voting and instructions for requesting a printed copy of the proxy
materials. Most shareholders will not receive printed copies of the proxy materials unless they request them. If you would like to receive printed or electronic copies of our proxy materials, you should follow the instructions in
the Notice for requesting such materials. Any request to receive proxy materials by mail will remain in effect until you revoke it.
You are eligible to vote at the 2025 Annual Meeting if you were a shareholder of record of ePlus
inc. as of the close of business on July 22, 2025, the record date (“Record Date”) for our 2025 Annual Meeting.
Cast your vote as soon as possible on each of the proposals listed below to ensure your shares are represented.
|
Proposal
|
More Information
|
Board Recommendation
|
|
1 Election of Directors
|
Page 11
|
FOR each Director Nominee
|
|
2 Advisory Vote to Approve Named Executive Officers’ Compensation
|
Page 20
|
FOR
|
|
3 Ratification of Independent Registered Public Accounting Firm
|
Page 47
|
FOR
|
Even if you plan to attend the 2025 Annual Meeting in person, read this proxy statement with care and cast your vote as soon as
possible, as described below. For shareholders of record, have your Notice or proxy card in hand and follow the instructions. If you hold your shares through a broker, bank, or other nominee, you will receive voting instructions
from your broker, bank, or other nominee, including whether telephone or Internet voting options are available, and any voting deadline that may differ from the below.
| • |
Vote your shares online at www.investorvote.com/plus until 8:30 a.m. ET on
September 16, 2025.
|
| • |
Vote your shares by toll-free telephone call by calling 1-800-652-VOTE (8683) until 8:30 a.m. ET on September 16, 2025.
|
| • |
Vote your shares by mail; mark, sign, and date your proxy card, and return it in the postage-paid envelope (must be received by 8:30 a.m. ET on September 16, 2025).
|
A proxy that is signed and dated, but which does not contain voting instructions, will be voted as recommended
by our Board on each proposal.
You may vote in person at the 2025 Annual Meeting, which will be held on September 16, 2025, at 8:30 a.m. ET at the Westin Washington Dulles Airport, 2520 Wasser Terrace, Herndon, Virginia 20171.
If you hold your shares through a broker, bank, or other nominee and would like to vote in person at the 2025 Annual Meeting, you must
first obtain a proxy issued in your name from the institution that holds your shares.
|
Quorum and Vote Requirements
|
The presence, in person or by proxy, of the holders of record of a majority in voting interest of the outstanding capital stock
entitled to vote at the 2025 Annual Meeting is necessary to constitute a quorum at the 2025 Annual Meeting.
A list of shareholders entitled to vote will be available for 10 days prior to the 2025 Annual Meeting at our headquarters, 13595
Dulles Technology Drive, Herndon, Virginia 20171. If you would like to view the shareholder list, please contact our Investor Relations Department at investors@eplus.com or by telephone at (703) 984-8400 to schedule an appointment.
Shareholders’ votes will be tabulated by a representative of the Company’s Transfer Agent, Computershare. Shareholders who vote and/or
attend the 2025 Annual Meeting by following the instructions in this proxy statement will be considered to be attending the 2025 Annual Meeting.
If you are the beneficial owner of shares held for you by a broker, bank or other nominee, such holder must vote those shares in
accordance with your instructions. If you do not give instructions, whether the broker, bank or other nominee can vote your shares depends on whether the proposal is considered “discretionary” or “non-discretionary.” If a proposal
is discretionary, a broker or other entity holding shares for an owner in street name may vote on the proposal without voting instructions from the owner. If a proposal is non-discretionary, the broker or other nominee may vote on
the proposal only if the owner has provided voting instructions. A “broker non-vote” occurs when a broker or other nominee holding shares for a beneficial owner does not vote on a particular proposal because the broker or other
nominee does not have discretionary voting power for that item and has not received instructions from the beneficial owner. Proposal 3 (Ratification of Independent Registered Public Accounting Firm) is the only discretionary
proposal; therefore, brokers or other nominees only have discretion to vote customers’ unvoted shares held by such firms in street name on Proposal 3.
Both abstentions and broker non-votes will be treated as shares present for purposes of determining the presence of a quorum at the
2025 Annual Meeting.
| Proposal |
Vote Required
for Approval(1)
|
Effect of
Abstentions
|
Effect of
Broker Non-Votes
|
|
|
1
|
Election of Directors
|
“FOR” votes of a majority of the votes cast with respect to
each director
|
None; not counted
as a “vote cast”
|
None; not counted as a “vote cast”
|
|
2
|
Advisory Vote to Approve Named
Executive Officers’ Compensation
|
“FOR” votes of a majority of the shares present in person
or represented by proxy and entitled to vote
|
None; not counted as a “vote cast”
|
None; not counted as a “vote cast”
|
|
3
|
Ratification of Independent
Registered Public Accounting Firm
|
“FOR” votes of a majority of the shares present in person
or represented by proxy and entitled to vote
|
None; not counted as a “vote cast”
|
Brokers and other nominees may vote;(2) Broker non-votes are not expected
|
(1) Assuming the presence of a quorum at the 2025 Annual Meeting.
(2) If a broker or other nominee does not exercise this discretion, such broker non-votes will
have no effect on the results of this vote.
Our Board of Directors has adopted Corporate Governance Guidelines and Policies (the “Guidelines”)
that provide a framework for effective corporate governance. The Guidelines outline our Board of Directors’ operating principles, and the composition and working processes of our Board and its committees. Our Nominating and
Corporate Governance Committee periodically reviews our Guidelines and developments in corporate governance, and, if appropriate, recommends proposed changes for Board approval.
Our Guidelines and other corporate governance documents, including the
Charter, Bylaws, committee charters, and our Code of Conduct and Business Partner Code of Conduct, are all available on our website at https://www.eplus.com/investors/corporate-governance-legal.
Under our Guidelines and Nasdaq’s listing standards, a majority of our Board members must be “independent.” The Board of Directors
annually determines whether each of our directors is independent. In determining independence, the Board follows the independence criteria set forth in Nasdaq’s listing standards and considers all relevant facts and circumstances.
Pursuant to Nasdaq’s independence criteria, a director is not “independent” if she or he has one or more of the relationships
specifically enumerated in Nasdaq’s listing standards. In addition, the Board must affirmatively determine that a director does not have a relationship that, in the Board’s opinion, would interfere with that director’s exercise of
independent judgment in carrying out the responsibilities of a director. The Board has affirmatively determined that Messrs. Bowen, Callies and Hunt, and Mses. Ballenger, Bergeron and Morrison, are each “independent” under the
applicable Nasdaq listing standards.
The Board regularly reviews the effectiveness of the Company’s corporate governance structure, and on at least an annual basis,
examines what form of Board leadership structure is in the best interest of our shareholders. The Board has determined that at this time, a structure with a separation of the Board Chair and CEO roles, along with the
implementation of regular executive sessions of the independent directors, provides appropriate oversight of the Company’s strategic direction and enables the Board to best carry out its roles and responsibilities on behalf of ePlus’ shareholders. Ms. Maureen Morrison currently serves as our Board Chair, having assumed this role immediately following the retirement of the prior Board Chair, Mr. C. Thomas Faulders,
III, at the 2024 Annual Meeting.
The Board also regularly reviews its committee structure. Each of the Board’s standing committees—Audit, Compensation, and Nominating
and Corporate Governance—are comprised entirely of independent directors, which further complements the Board’s oversight role.
Our Board has three standing committees: (1) Audit, (2)
Compensation, and (3) Nominating and Corporate Governance. Each committee’s charter is available on our website at https://www.eplus.com/investors/corporate-governance-legal/committee-charters. In connection
with the retirement of C. Thomas Faulders, III, at the 2024 Annual Meeting and Melissa Ballenger’s appointment to the Board on January 3, 2025, the Board rotated and refreshed its committee membership during fiscal 2025.
Additionally, Ben Xiang served as the chair of the Nominating and Corporate Governance Committee and a member of the Audit Committee during fiscal 2025. Effective July 18, 2025, Mr. Xiang resigned as a member of the Board
and each of its committees. Following Mr. Xiang’s resignation, the following changes were made to the Board’s committees: (i) John E. Callies rotated off of the Compensation Committee, became a member of, and chair of, the
Nominating and Corporate Governance Committee, and continues to serve on the Audit Committee, but will no longer serve as the chair of the Audit Committee and (ii) Melissa J. Ballenger continues to serve on the Audit
Committee, and became the new chair of the Audit Committee. For additional information regarding Mr. Xiang’s resignation from the Board, please refer to the Company’s Current Report on Form 8-K that was filed with the SEC on
July 18, 2025. Additional information about each committee, including each committee’s current membership, is below. For information about the composition of our Board committees prior to the changes referenced above, please
refer to the proxy statement related to the 2024 Annual Meeting, which was filed with the Securities and Exchange Commission on July 23, 2024.
|
Audit Committee
|
|||||
|
Chair:
Melissa J. Ballenger
Other Committee Members:
John E. Callies, Maureen F. Morrison
Meetings Held in Fiscal Year 2025: 9
Independence:
Each Audit Committee member meets the audit committee independence requirements of Nasdaq and the rules of the Securities
Exchange Act of 1934, as amended (the “Exchange Act”).
Qualifications:
Each member of the Audit Committee is financially literate, knowledgeable, and qualified to review financial statements.
In addition, the Board has determined that Melissa J. Ballenger, John E. Callies, and Maureen F. Morrison each meet the
definition of an “audit committee financial expert” under the Exchange Act rules.
|
Primary Responsibilities:
Our Audit Committee is responsible for, among other things: (1) appointing, compensating, retaining, and overseeing the
work of the independent auditor engaged to prepare or issue audit reports and perform other audit, review, or attest services for the Company; (2) reviewing and discussing the annual audited financial statements with
management and the Company’s independent auditor, including the Company’s disclosures under “Management’s Discussion and Analysis of Financial Condition and Results of Operations” (“MD&A”),
and recommending to the Board whether the audited financial statements should be included in the Company’s Annual Report on Form 10-K; (3) reviewing and discussing the Company’s unaudited financial statements and related
footnotes and the MD&A portion of the Company’s Form 10-Q for each interim quarter with management and the independent auditor; (4) overseeing the Company’s internal audit function; and (5) reviewing and discussing
the earnings press releases, financial information (including non-GAAP information) and earnings guidance, if any, provided to analysts and rating agencies with management and/or the independent auditor, as appropriate.
|
||||
|
Compensation Committee
|
|||||
|
Chair:
Renée Bergeron
Other Committee Members: Melissa J. Ballenger, Ira A. Hunt, III
Meetings Held in Fiscal Year 2025: 5
Independence:
Each member of the Compensation Committee meets the compensation committee independence requirements of Nasdaq and the
Exchange Act rules, as well as the non-employee director requirements of Exchange Act Rule 16b-3, and the outside director requirements under the Internal Revenue Code Section 162(m).
|
Primary Responsibilities:
Our Compensation Committee is responsible for, among other things: (1) establishing the Company’s general compensation
philosophy and overseeing the development and implementation of our executive compensation programs, including ensuring alignment with shareholder interests and our strategic objectives; (2) reviewing and approving,
and recommending for Board ratification (as relates to the CEO), the corporate goals and objectives applicable to the compensation of the Company’s CEO and other executive officers; (3) reviewing and approving and,
if required by law, recommending for Board approval incentive compensation and equity-based plans, and, where appropriate or required, recommending such plans for shareholder approval; (4) reviewing the Company’s
incentive compensation arrangements relating to executive officer compensation to determine whether they encourage unnecessary or excessive risk-taking, reviewing and discussing at least annually the relationship
between risk management policies and practices related to executive compensation, and evaluating policies and practices that could mitigate any such risk; (5) reviewing periodically any “clawback” or similar policy
or agreement regarding the cancellation or recoupment of employee compensation; (6) reviewing and discussing with management the Compensation Discussion and Analysis (“CD&A”)
and related executive compensation information, and recommending the same for inclusion in the Company’s proxy statement or Annual Report; (7) reviewing and recommending for Board approval the frequency with which
the Company conducts Say on Pay votes, and approving proposals regarding the Say on Pay Vote; (8) appointing, compensating, and overseeing the work of any compensation consultant, legal counsel, or other advisor the
Committee retains and periodically evaluating the independence of such advisors; (9) overseeing management’s development and succession planning and reviewing and discussing the same with the Board at least annually;
and (10) reviewing and approving, and recommending for Board ratification, employment agreements and severance/change in control agreements for the Company’s executive officers.
|
||||
|
Nominating and Corporate Governance Committee
|
|||||
|
Chair:
John E. Callies
Other Committee Members:
Renée Bergeron, Ira A. Hunt, III, Maureen F. Morrison
Meetings Held in Fiscal Year 2025: 5
Independence:
Each member of the Nominating and Corporate Governance Committee meets Nasdaq’s independence requirements.
|
Primary Responsibilities:
Our Nominating and Corporate Governance Committee is responsible for, among other things: (1) selecting and recommending nominees for
director to the Board; (2) recommending committee composition to the Board; (3) overseeing the annual performance self-assessment of the Board and each of its committees; (4) annually reviewing and recommending
compensation of non-employee directors to the Board; (5) reviewing our related person transaction policy, and any related person transactions; and (6) reviewing and assessing the adequacy of our corporate governance
framework, including our Charter, Bylaws, and the Guidelines, and making recommendations to the Board as appropriate.
|
||||
Our directors are expected to attend meetings of the Board and applicable committees. During our fiscal year ended March
31, 2025, the Board held seven meetings. Each of our directors attended at least 75 percent of the meetings of the Board and the committees on which she or he served. Although we do not have a formal policy requiring
directors to attend our Annual Meetings, we encourage their attendance. All eight of our directors then in service attended the 2024 Annual Meeting.
The Board oversees the Company’s enterprise risk management process. Management reviews the process with the Board on a periodic basis, including
identifying key risks and steps taken to monitor or mitigate those risks, including risks associated with business strategy, operations, accounting and controls, cybersecurity, environmental, social and governance
(ESG), human capital and capital investments. In addition, the Board’s standing committees—Audit, Compensation, and Nominating and Corporate Governance—assist the Board in discharging its oversight duties as
described below. Accordingly, while each of the committees contributes to the risk management oversight function by assisting the Board in the manner outlined below, the Board itself remains responsible for
overseeing the Company’s risk management program.
The Audit Committee discusses with management and/or the independent auditor
and/or internal audit function, as appropriate, risks related to the Audit Committee’s roles and responsibilities as described in its charter.
The Nominating and Corporate Governance Committee considers risks related to
the subject matters for which it is responsible, primarily corporate governance matters and related person transactions.
The Compensation Committee reviews risks related to the subject matters for
which it is responsible, primarily our executive compensation program and incentive plans. Based on the Compensation Committee’s risk review, the Compensation Committee believes that our compensation programs do not
encourage excessive risks that are reasonably likely to cause a material adverse effect to our Company.
We are committed to behaving ethically. Our Code of
Conduct, which applies to all our directors and employees, including our principal executive officer and principal financial and accounting officer, is available on our website at https://www.eplus.com/investors/corporate-governance-legal/code-of-conduct. If we make any substantive amendments to the Code of Conduct, or grant any waiver from a provision to our executive officers, it is our intention to disclose
the nature of such amendment or waiver on our website if such disclosure is required by Exchange Act or Nasdaq rules. Our employees are annually required to acknowledge our Code of Conduct. We also have a Business
Partner Code of Conduct, which clarifies our expectations in the areas of business integrity, labor practices, health and safety, and environmental management. The Business Partner Code of Conduct complements our
Code of Conduct, and is available on our website at https://www.eplus.com/investors/corporate-governance-legal/business-partner-code-of-conduct. We expect our suppliers, vendors, contractors and subcontractors, agents, and other providers of goods and services for ePlus-affiliated entities worldwide
to follow our Business Partner Code of Conduct.
Our Insider Trading Policy applies to our directors and employees, as well as family trusts or similar entities controlled by or benefiting individuals subject to the Insider Trading Policy. Under the Insider Trading
Policy, all trades of Company stock by directors, executive officers, and other insiders require pre-approval from our Insider Trading Compliance Officer and must be made in accordance with the policy. The policy
also prohibits directors, officers, and employees who are Insiders (as defined in the policy) from hedging transactions involving Company securities, and it also prohibits transactions that establish downside price
protection, including short sales, and buying or selling put options, call options, or other derivatives of Company securities. The policy prohibits Insiders from holding securities in a margin account or pledging
securities as collateral, except in certain circumstances with pre-approval from our Insider Trading Compliance Officer.
Shareholders who desire to communicate with the Board or its committees may do so by writing to them at the Company’s
headquarters at ePlus inc., 13595 Dulles Technology Drive, Herndon, Virginia 20171. Correspondence may be addressed to the collective Board, or to any of its individual
members or committees. Any such communication is promptly distributed to the director(s) named therein unless such communication is considered, either presumptively or in the reasoned judgment of the Company’s
Corporate Secretary, to be improper for submission to the intended recipient(s). Examples of communications that would presumptively be deemed improper for submission include, without limitation, solicitations,
communications that do not relate to the Company, and unsolicited advertising, spam, or junk mail.
The Compensation Committee is currently comprised of four independent directors, Renée Bergeron, Melissa Ballenger,
John E. Callies, and Ira A. Hunt, III. No member of the Compensation Committee is a current or former officer or employee of the Company, or any of its subsidiaries. During the fiscal year ended March 31, 2025, no
member of the Compensation Committee had a relationship that required disclosure under the SEC rules as a related person transaction. Also, during the fiscal year, none of our executive officers served on the board
of directors or compensation committee of any entity that had one or more of its executive officers serving on our Board, or the Company’s Compensation Committee.
Section 16(a) of the Exchange Act requires the Company’s officers and directors and persons who beneficially own more
than 10% of the Company’s common stock (collectively, “Reporting Persons”) to file reports of beneficial ownership and changes in beneficial ownership with the SEC. Based
solely on our review of filed reports or written representations from certain Reporting Persons, the Company believes that all reports were filed on a timely basis, except that, for each of the following
individuals, a Section 16 report was filed one day late for one transaction due to an administrative error: a Form 4 reporting the withholding of common stock to satisfy a tax liability due to the partial vesting
of a time-based restricted stock award, issued pursuant to the terms of the Company’s 2021 Employee Long-Term Incentive Plan, filed on behalf of each of (i) Mark P. Marron, (ii) Elaine D. Marion and (iii) Darren S.
Raiguel.
The Board has adopted a written policy for approval of transactions between ePlus
and its directors, director nominees, executive officers, greater than 5% beneficial owners of ePlus’ common stock, and each of their respective immediate family members,
where the amount involved in the transaction exceeds or is expected to exceed $120,000 in a single fiscal year, and the related person has or will have a direct or indirect material interest in the transaction.
Under the policy, the Company’s General Counsel gathers material facts and other information necessary to assess whether a proposed transaction would constitute a related person transaction.
If the General Counsel determines that the proposed transaction will be a related person transaction, she or he
submits an assessment to the Nominating and Corporate Governance Committee. The policy directs that ePlus’ Nominating and Corporate Governance Committee reviews
transactions subject to the policy and determines whether or not to approve or ratify those transactions, considering all relevant facts and circumstances reasonably available to it, which include:
| a. |
the related person’s relationship to the Company and interest in the transaction;
|
| b. |
the facts of the proposed transaction such as the proposed aggregate value of the transaction or in the case of indebtedness, the
amount of principal that would be involved;
|
| c. |
the purpose of, and the potential benefits to the Company of, the proposed transaction;
|
| d. |
if applicable, the availability of other sources of comparable products or services; and
|
| e. |
an opinion of whether the proposed transaction will be undertaken in the ordinary course of business of the Company and is on
terms that are comparable to the terms available to an unrelated third party or to employees generally.
|
The Committee approves only those related person transactions that, under all of the circumstances, are fair to the
Company, as the Committee determines in good faith, and may, in its sole discretion, impose such conditions as it deems appropriate on the Company or the related person in connection with approval of the related
person transaction.
As described above, all related person transactions are prohibited unless approved or ratified by the Nominating and
Corporate Governance Committee, or, in certain circumstances, the Chair of the Nominating and Corporate Governance Committee.
Except for the transaction described below, there were no transactions since the beginning of the fiscal year beginning April 1,
2024, in which the Company was a party, the amount involved in the transaction exceeds $120,000, and in which any director, director nominee, executive officer, holder of more than 5% beneficial owners of ePlus’ common stock, or immediate family member of any of the foregoing individuals had or will have a direct or indirect material interest. The transaction described below is a related person transaction and has
been approved and ratified in accordance with our written policy.
One of Mr. Marron’s daughters is a non-executive employee of a subsidiary of the Company. In her role as a Customer Success Manager,
she received approximately $131,000 in compensation during the fiscal year ended March 31, 2025. Approximately 90% of her compensation was comprised of base salary, with the remainder being benefits
provided by the Company (which are generally available to similarly situated employees) and certain bonus payments.
The Company has not adopted a shareholder rights plan (commonly referred to as a “poison pill”).
Adopting the recommendation of the Nominating and Corporate Governance Committee, the Board has nominated all seven of its current
directors—Mses. Ballenger, Bergeron and Morrison, and Messrs. Bowen, Callies, Hunt and Marron—to be elected to serve until the 2025 Annual Meeting of Shareholders, or until their successors are duly elected and qualified.
Biographical information as of July 22, 2025, for each nominee is provided herein.
Each of the nominees has agreed to be named in this proxy statement and serve as a director if elected, and we know of no reason why any of
the nominees would be unable to serve. If, however, any nominee is unable or declines to serve as a director, or if a vacancy occurs before the election (such events are not anticipated), the proxy holders will vote for
the election of such other person or persons as the Board nominates. There are no arrangements or understandings between any of the nominees and any other person pursuant to which such director nominees were selected.
Each of the seven nominees for director will be elected by a majority of the votes cast at the 2025 Annual Meeting and entitled to vote on
the election of directors. Additionally, pursuant to the Company’s Guidelines, each director is required to resign should he or she not receive a majority of the votes cast. Abstentions and broker non-votes will have no
effect on the vote for this proposal.
The Board of Directors is responsible for determining the appropriate number of Board members, nominating individuals for election to the
Board, and filling vacancies on the Board that may occur between annual meetings of shareholders. The Nominating and Corporate Governance Committee is responsible for identifying and screening potential candidates, and
recommending qualified candidates to the Board for nomination. Third-party search firms may be retained to identify individuals that meet the Nominating and Corporate Governance Committee’s criteria; however, during the
fiscal year ended March 31, 2025, no third-party search firms were used. The Nominating and Corporate Governance Committee will consider director candidates recommended by shareholders in the same manner in which it
evaluates candidates it identifies, if such recommendations are properly submitted to the Company. Shareholders wishing to recommend nominees for election to the Board should submit their recommendations in writing by mail
to our Corporate Secretary, at ePlus inc., 13595 Dulles Technology Drive, Herndon, Virginia 20171.
In selecting director candidates, the Nominating and Corporate Governance Committee and the Board of Directors consider the
individual candidates’ qualifications and skills, as well as the Board’s composition as a whole. Under our Guidelines, the Nominating and Corporate Governance Committee and the Board consider the following attributes for
each candidate, among other qualifications deemed appropriate, when considering the suitability of candidates for nomination as director:
| • |
Unquestioned personal ethics and integrity;
|
| • |
Specific skills and experience that align with ePlus’ strategic direction and operational
initiatives, and complements the Board’s overall composition;
|
| • |
Multiple dimensions of diversity, including with respect to race, ethnicity and gender, to strengthen and increase the diversity, breadth of
skills and qualifications of the Board;
|
| • |
Core business competencies of high achievement and a record of success;
|
| • |
Financial literacy, exposure to best practices, and track-record of making good business decisions;
|
| • |
Interpersonal skills that maximize group dynamics; and
|
| • |
Enthusiasm about ePlus and sufficient time to become fully engaged.
|
Key skills held by our directors include finance, accounting, risk oversight, cybersecurity, sales and marketing, leasing/financing, mergers and acquisitions,
corporate governance, technology, and international business experience, as further highlighted in our directors’ biographies below. Additionally, the Nominating and Corporate Governance Committee facilitates an annual
performance self-assessment of the Board and each of its committees, including an assessment of the effectiveness of each individual director. In doing so, the Board assesses the Board’s collective skill set and
composition with a view towards periodically refreshing the Board with new directors who possess skills, traits and characteristics that complement those of the incumbent directors.
Utilizing the processes described above, on January 3, 2025, in accordance with the Company’s Bylaws, the Board increased the
size of the Board from seven to eight directors and appointed Melissa Ballenger to the Board, filling the vacancy. As is the case with each of the Company’s other directors nominated for election at the 2025 Annual
Meeting, Ms. Ballenger’s term continues until the 2025 Annual Meeting and until her successor is elected and qualified. Effective July 18, 2025 and in accordance with the Guidelines, Ben Xiang resigned as a member of the
Board and each of its committees due to a change in his principal occupation and the Board accepted such resignation. At that time, the Board decreased the size of the Board from eight to seven directors. For additional
information regarding Mr. Xiang’s resignation from the Board, please refer to the Company’s Current Report on Form 8-K that was filed with the SEC on July 18, 2025.
Our Board has a variety of qualifications and expertise relevant to our business, resulting in a collective diverse set of
backgrounds and experiences. See above, Director Qualifications, for more information.
The following biographies describe the director nominees’ business experience, including their specific experiences and
qualifications that, collectively, strengthen the Board’s qualifications, skills, and experience.
The Board expects that each of the nominees will be available for election as a director and, if elected, will serve for a
term expiring at the 2026 Annual Meeting of Shareholders, and until their successors have been duly elected and qualified.
THE BOARD OF DIRECTORS UNANIMOUSLY RECOMMENDS A VOTE FOR
THE FOLLOWING NOMINEES FOR ELECTION AS DIRECTORS:
|
Melissa J. Ballenger
Independent Director
Age 55
|
Director of ePlus since 2025
Committees:
Audit (Chair)
Compensation
Other Public Company Directorships: None
|
Ms. Ballenger joined the ePlus Board of Directors in January 2025. From 2020 to
2023, Ms. Ballenger served as Chief Financial Officer of Mosaic, a financial technology platform for sustainable home improvements. Ms. Ballenger served as a public-company finance executive from 2003 through 2019,
including Chief Financial Officer roles at the global firms State Street (EMEA), Santander and TD. Ms. Ballenger also served as Principal Accounting Officer and Controller at Mastercard, a global technology company in the
payments industry. Ms. Ballenger currently serves on the Board of Trustees of The Penn Mutual Life Insurance Company.
Ms. Ballenger has provided strategic advice to multiple Boards of Directors, informing their governance over critical
corporate priorities. Her executive experience includes strategic and financial planning and execution, capital markets and treasury management, operational efficiency and risk management, and M&A. Ms. Ballenger is a
Certified Public Accountant (CPA), served in public accounting as an Arthur Andersen auditor, and is credentialed as a Certified Director by the National Association of Corporate Directors (NACD). A summa cum laude
graduate of the College of William & Mary with a Bachelor of Business Administration degree and an adjunct business professor at William & Mary from 2024 to 2025, she was appointed to the Board of Visitors of
William & Mary effective July 2025.
The Board believes that Ms. Ballenger's vast range of experience within the financial services industry, along with her
international expertise, provide invaluable perspective across ePlus’ strategic growth areas. The Board has also determined that Ms. Ballenger qualifies as an “audit committee financial expert” as defined in applicable
SEC regulations.
|
Renée Bergeron
Independent Director
Age 62
|
Director of ePlus since 2022
Committees:
Compensation (Chair)
Nominating and Corporate Governance
Other Public Company Directorships: None
|
Ms. Bergeron is Chief Operating Officer of AppDirect, where she provides leadership and strategic vision, and oversees
customer operations, technical support, and customer success on a global basis. She joined AppDirect, one of the leading B2B commerce platforms for selling, buying, and managing recurring technology services, in March
2020. From 2010 until 2020, Ms. Bergeron held roles at Ingram Micro, a global leader in technology and supply chain services, most recently as Senior Vice President Global Cloud. Since March 2020 she has also been a
board member of FLO EV Charging, a privately-owned premier manufacturer and network operator of electric vehicle charging solutions. Ms. Bergeron has a Master of Business Administration from McGill University, and a
Bachelor’s degree in Information Technology from Université de Sherbrooke.
The Board believes that, as a proven industry leader with significant experience across many of ePlus’ strategic focus areas, such as security, cloud and services, Ms. Bergeron brings a strong knowledge base that will help ePlus be a customer-centric,
service-driven partner of choice.
|
Bruce M. Bowen
Independent Director
Age 73
|
Director of ePlus since 1990
Committees:
None
Other Public Company Directorships: None
|
Mr. Bowen founded our company in 1990 and served as our President until September 1996. Beginning in September 1996 until
March 2014, Mr. Bowen served as our Executive Vice President and from September 1996 to June 1997 also served as our Chief Financial Officer. In March 2014, Mr. Bowen stepped down as Executive Vice President, and retired
as an employee of the company in May 2018 though he continues to serve on the Board.
Prior to founding the Company, he served as Senior Vice President of PacifiCorp Capital, Inc., which was an equipment
leasing company. In the past, he has also served as Chair of the Association for Government Leasing and Finance as well as various committees of the Equipment Leasing and Finance Association, which gave him a broad
understanding of issues affecting our industry. During his leasing career, Mr. Bowen participated in equipment lease financing transactions in excess of an aggregate of $3 billion, involving many major vendors as well as
government contractors. Mr. Bowen has a degree in finance from the University of Maryland as well as a Master of Business Administration in Finance from the University of Maryland.
Mr. Bowen’s experience in the leasing industry brings to the Board depth and breadth of knowledge relating to finance and
funding. He also has a thorough knowledge of sales and operations activities and in a multitude of industry-specific areas.
|
John E. Callies
Independent Director
Age 71
|
Director of ePlus since 2010
Committees:
Audit
Nominating and Corporate Governance (Chair)
Other Public Company Directorships: None
|
Mr. Callies has been a Senior Advisor to McKinsey and Company since 2011. Previously, he was employed by IBM in various
capacities for 34 years. Mr. Callies served as General Manager of IBM Global Financing from 2004 until his retirement in June 2010. With operations in 55 countries supporting 125,000 clients, Mr. Callies led the
world’s largest information technology financing and asset management organization and was responsible for business direction and management of a portfolio of nearly $35 billion in total assets. Mr. Callies has a
degree in economics from Lehigh University.
The Board believes that Mr. Callies’ knowledge of our business, including the leasing sector, along with his sales,
operational, strategic, international and board experience bring value to the Board. The Board has also determined that Mr. Callies qualifies as an “audit committee financial expert” as
defined in applicable SEC regulations.
|
Ira A. Hunt, III
Independent Director
Age 69
|
Director of ePlus since 2014
Committees:
Compensation
Nominating and Corporate Governance
Other Public Company Directorships: None
|
Mr. Hunt is President and CEO of Hunt Technology, LLC, which he founded. Hunt
Technology, LLC focuses on strategic IT planning, cyber and data-security, AI and big data analytics, and cloud computing. He retired from the Central Intelligence Agency in 2013 as their Chief Technology Officer
after a 28-year career in intelligence. From July 2016 through October 2020, he served as Managing Director and Cyber Lead for Accenture Federal Services in Arlington, Virginia, and he has also served as Chief
Architect for Bridgewater Associates, the world’s largest hedge fund. Mr. Hunt currently serves on the Board of Directors for Mission Link, a non-profit organization, and for VAST Data Federal, a next-gen solid state
storage company. He also serves on Intel’s Public Sector Advisory Board and as an advisor to Enlightenment Capital. He holds a Bachelor and Masters of Engineering in Civil/Structural Engineering from Vanderbilt
University in Nashville, Tennessee.
The Board believes that Mr. Hunt’s extensive knowledge of the technology industry, including strategic IT planning,
cyber and data-centric security, big data analytics, cloud computing, and IT architecture and environment, bring valuable industry expertise to the Board.
|
Mark P. Marron
Director, CEO and President
Age 64
|
Director of ePlus since 2018
Committees:
None
Other Public Company Directorships: None
|
Mr. Marron became the CEO and President of ePlus
inc. on August 1, 2016, and was appointed to the Board on November 14, 2018. He oversees all corporate strategy for global operations, leading with an emphasis on our greatest asset: our people. He began his career
at ePlus in 2005 as Senior Vice President of Sales and became COO in 2010. A 30+ year industry veteran, he was formerly with NetIQ where he held the position of Senior Vice
President of Worldwide Sales and Services. Prior to joining NetIQ, Mr. Marron served as General Manager of Worldwide Channel Sales for Computer Associates International Inc., a provider of software and services that
enables organizations to manage their IT environments. Through his time with both NetIQ and Computer Associates International Inc., Mr. Marron gained extensive international experience, throughout North America,
Europe, the Middle East, and Africa and holds a Bachelor of Science degree in Computer Science from Montclair State University.
The Board has determined that Mr. Marron’s role as CEO provides the Board with access to an experienced executive with
a thorough understanding of our business and extensive experience in leading sales teams, international sales, and mergers and acquisitions.
|
Maureen F. Morrison
Independent Director and Chair of the Board
Age 70
|
Director of ePlus since 2018
Committees:
Audit
Nominating and Corporate Governance
Other Public Company Directorships: Asbury Automotive Group Inc. (NYSE: ABG)
|
Ms. Morrison joined the ePlus Board of Directors
in June 2018. She is a highly accomplished senior executive leader who retired in 2015 from a career as an audit partner at PricewaterhouseCoopers, LLP (“PwC”). At PwC, Ms.
Morrison worked with prominent private equity backed entities and multibillion-dollar global technology corporations. She has diversified experience in software, IT-enabled solutions and consulting, hardware, and
manufacturing. As a highly respected financial and accounting professional, Ms. Morrison has extensive experience in corporate boardrooms advising Audit Committees of midcap public companies, private equity-backed
entities, and Fortune 500 companies.
Ms. Morrison currently is a member of one other board of directors of a publicly traded company: Asbury Automotive
Group Inc., where she is the Chair of the Compensation and Human Resources Committee and a member of the Audit and the Capital Allocation & Risk Management Committees. She holds a Bachelor of Arts in Business
Administration with a concentration in Accounting from Rutgers University.
The Board has determined that as a result of her broad experience with complex accounting, financial and risk related
issues, as well as her experience on public company boards, Ms. Morrison is well-qualified to assist in the auditor oversight function as an Audit Committee member and provides indispensable leadership expertise as
the Chair of the Board. The Board has also determined that Ms. Morrison qualifies as an “audit committee financial expert” as defined in applicable SEC regulations.
The below table sets forth the compensation for the non-employee members of the Board for the fiscal year ended March
31, 2025. Ben Xiang served as the chair of the Nominating and Corporate Governance Committee and a member of the Audit Committee during fiscal 2025. Effective July 18, 2025, Mr. Xiang resigned as a member of the
Board and each of its committees.
Mr. Marron, our CEO and President, is an employee of the Company and does not receive any additional compensation for
his service as a director. Mr. Marron’s compensation is reported under “Executive Compensation” herein.
The Board’s general policy is that compensation for the non-employee directors should be a mix of cash and equity-based
compensation. The base level of compensation for the non-employee directors for fiscal 2025 is set forth in the table below.
|
Director Compensation Element
|
Amount
|
|||
|
Annual Cash Retainer (1)
|
$
|
86,250
|
||
|
Annual Restricted Stock Award (2)
|
$
|
105,000
|
||
| (1) |
The annual cash retainer is paid in four quarterly installments of $21,562.50.
|
| (2) |
The number of shares awarded was determined by dividing the compensation to be delivered ($105,000) by the Company’s closing stock
price on the date prior to the date of grant.
|
In October of 2024, the grant value of the annual restricted stock award to non-employee directors (the “Annual Restricted Stock Award”) was increased from $86,250 to $105,000 in order to ensure that our director compensation is competitive with that of our peers and consistent with
market practices for a company of our size.
In addition to the base compensation provided above, effective as of April 1, 2024, the chair of the Board receives
$50,000 in additional cash compensation and each of our Board’s committee chairs receive additional cash compensation as follows:
|
Committee
|
Annual Chair Compensation (1)
|
|||
|
Audit
|
$
|
15,000
|
||
|
Compensation
|
$
|
12,500
|
||
|
Nominating and Corporate Governance
|
$
|
10,000
|
||
| (1) |
Paid in equal quarterly installments.
|
Directors also have the ability to elect to receive awards of the Company’s stock in lieu of any cash payments under
the director compensation program. All equity-based grants to non-employee directors are awarded pursuant to our 2024 Non-Employee Director Long-Term Incentive Plan (“2024 Director
LTIP”). For fiscal 2025, the Annual Restricted Stock Award was granted on October 1, 2024, with vesting to occur on the earlier of October 1, 2025, or the Company’s next annual stockholder meeting after
October 1, 2024. Stock that directors receive in lieu of cash compensation is not subject to forfeiture or a vesting period. Where a targeted amount of compensation is intended to be delivered as an award under the
2024 Director LTIP, the amount of shares awarded is rounded down to avoid a fractional share.
Directors are also reimbursed for out-of-pocket expenses incurred to attend Board and committee meetings the Annual
Meeting, and continuing education programs for Directors.
As previously noted, effective July 18, 2025, Ben Xiang resigned as a member of the Board and each of its committees.
In recognition of Mr. Xiang’s service to the Board since 2019, the Board elected to allow Mr. Xiang’s unvested equity awards previously granted in connection with his service on the Board to remain outstanding and
continue to vest in accordance with their terms. As such, Mr. Xiang’s 677 restricted shares awarded on September 25, 2023, and his 1,067 restricted shares awarded on October 1, 2024, will continue to vest on each
of September 25, 2025, and the earlier of date of the 2025 Annual Meeting or October 1, 2025, respectively, as if Director Xiang is still serving as a member of the Board on those dates.
The tables below show compensation for all directors who served as a director during fiscal 2025, except for Mr.
Marron, whose compensation is in the Summary Compensation Table.
|
Name
|
Fees Earned
or Paid in Cash (2) |
Stock Awards
(3)(4)
|
Total
|
|||||||||
|
Melissa J. Ballenger (1)
|
$
|
21,083
|
$
|
77,954
|
$
|
99,037
|
||||||
|
Renée Bergeron
|
$
|
93,145
|
$
|
104,929
|
$
|
198,074
|
||||||
|
Bruce M. Bowen
|
$
|
86,250
|
$
|
104,929
|
$
|
191,179
|
||||||
|
John E. Callies
|
$
|
100,129
|
$
|
104,929
|
$
|
205,058
|
||||||
|
C. Thomas Faulders, III (1)
|
$
|
61,090
|
$
|
-
|
$
|
61,090
|
||||||
|
Ira A. Hunt, III
|
$
|
86,250
|
$
|
104,929
|
$
|
191,179
|
||||||
|
Maureen F. Morrison
|
$
|
120,557
|
$
|
104,929
|
$
|
225,486
|
||||||
|
Ben Xiang (1)
|
$
|
96,250
|
$
|
104,929
|
$
|
201,179
|
||||||
| (1) |
Ms. Ballenger joined the Board on January 3, 2025, and, as such, received pro rata compensation for her partial year of service.
Mr. Faulders retired from the Board at the 2024 Annual Meeting and, as such, received pro rata compensation for his partial year of service. Mr. Xiang resigned from the Board following the completion of
fiscal 2025 and, as such, received compensation for his full year of service.
|
| (2) |
The above table reflects fees earned during the 2025 fiscal year. Pursuant to our 2024 Director LTIP, directors may make a stock
fee election, through which they receive shares of stock in lieu of cash compensation. The Annual Restricted Stock Award was granted on October 1, 2024, and the number of shares granted was determined by
dividing the compensation to be delivered ($105,000) by the Company’s closing stock price on the last trading day before the date of grant ($98.34) and rounding down to avoid the issuance of a fractional
share.
|
Mr. Bowen received stock instead of cash throughout the fiscal year. This stock is not subject to forfeiture
or a vesting period. The amount of stock granted for each quarter to Mr. Bowen is shown below.
|
Board Service Time
|
Number of
Shares Granted |
|
April 1, 2024 - June 30, 2024
|
292
|
|
July 1, 2024 - September 30, 2024
|
226
|
|
October 1, 2024 - December 31, 2024
|
291
|
|
January 1, 2025 - March 31, 2025
|
351
|
| (3) |
The values in this column represent the aggregate grant date fair market values of the fiscal year 2025 restricted stock awards,
computed in accordance with Codification Topic Compensation—Stock Compensation.
|
| (4) |
The table below reflects the aggregate number of unvested restricted stock shares outstanding as of March 31, 2025, for each
non-employee director.
|
|
Name
|
Unvested
Restricted Shares |
|
Renée Bergeron
|
1,744
|
|
Bruce M. Bowen
|
1,744
|
|
John E. Callies
|
1,744
|
|
Ira A. Hunt, III
|
1,744
|
|
Maureen F. Morrison
|
1,744
|
|
Ben Xiang
|
1,744
|
|
Melissa J. Ballenger
|
1,047
|
The Board believes that each non-employee director should maintain a minimum level of ownership in the Company’s
common stock to align the interests of our non-employee directors with the interests of the Company’s other shareholders. Our Nominating and Corporate Governance Committee regularly reviews the stock ownership
guidelines, and compliance therewith. Pursuant to the stock ownership guidelines, which are part of our Corporate Governance Guidelines, non-employee directors are expected to reach a multiple of three times
their annual cash board retainer fee within four years of joining the Board. During the fiscal year ended March 31, 2025, all directors met this requirement or were within the four-year phase-in period for
meeting the ownership guidelines.
The following tables show information regarding the beneficial ownership of our common stock by:
| • |
each member of our Board of Directors, each director nominee, and each of our named executive officers (“NEO”);
|
| • |
all members of our Board and our executive officers as a group; and
|
| • |
each person or group who is known by us to own beneficially more than 5% of our common stock.
|
Beneficial ownership of shares is determined under the SEC’s rules and generally includes any shares over which a
person exercises sole or shared voting or investment power. Shares of restricted stock that have not vested as of our Record Date are deemed outstanding and beneficially owned by the person and any group of
which that person is a member because such holder has voting rights with respect to those shares. Except as footnoted below, and subject to community property laws where applicable, we believe based on the
information provided to us that the persons and entities named in the following table have sole voting and investment power with respect to all shares of our common stock shown as beneficially owned by them.
The percentages of beneficial ownership were calculated on the basis of 26,625,574 shares of common stock
outstanding which includes 258,889 restricted shares, which have voting rights, as of our Record Date.
Share ownership is shown as of our Record Date of July 22, 2025.
|
Name (1)
|
Aggregate
Number of Beneficial Shares |
Percent of
Outstanding Shares |
Additional Information (2)
|
|
Melissa J. Ballenger
|
1,047
|
*
|
Includes 1,047 shares of restricted stock that have not vested as of July 22, 2025.
|
|
Renée Bergeron
|
4,294
|
*
|
Includes 1,744 shares of restricted stock that have not vested as of July 22, 2025.
|
|
Bruce M. Bowen
|
26,997
|
*
|
Includes 10,700 shares of common stock held by Bowen Holdings LLC, a Virginia limited liability company, which is owned
by Mr. Bowen and his three adult children, of which Mr. Bowen serves as manager. Also includes (a) 1,084 shares held by the Elizabeth Dederich Bowen Trust in which Mr. Bowen's spouse serves as trustee,
(b) 12,526 shares held by the Bruce Montague Bowen Trust in which Mr. Bowen serves as trustee, and (c) 1,744 shares of restricted stock that have not vested as of July 22, 2025.
|
|
John E. Callies
|
20,510
|
*
|
Includes 1,744 shares of restricted stock that have not vested as of July 22, 2025.
|
|
Ira A. Hunt, III
|
26,328
|
*
|
Includes 1,744 shares of restricted stock that have not vested as of July 22, 2025.
|
|
Maureen F. Morrison
|
12,360
|
*
|
Includes 1,744 shares of restricted stock that have not vested as of July 22, 2025.
|
|
Mark P. Marron
|
207,313
|
*
|
Includes (a) 63,515 shares of restricted stock that have not vested as of July 22, 2025, and (b)
143,798 shares held in a revocable trust in which Mr. Marron serves as trustee.
|
|
Elaine D. Marion
|
118,020
|
*
|
Includes (a) 78,621 shares held in a revocable trust in which Ms. Marion serves as trustee, (b)
38,975 shares of restricted stock that have not vested as of July 22, 2025, and (c) 424 shares held in an IRA.
|
|
Darren S. Raiguel
|
97,197
|
*
|
Includes (a) 57,748 shares held in a revocable trust in which Mr. Raiguel serves as trustee and (b)
38,975 shares of restricted stock that have not vested as of July 22, 2025.
|
|
All directors and executive
officers as a group (9 persons) |
514,066
|
1.93%
|
| * |
Less than 1%
|
| (1) |
The business address of Mses. Ballenger, Bergeron, Marion and Morrison, and Messrs. Bowen, Callies, Hunt, Marron, and Raiguel
is ePlus inc., 13595 Dulles Technology Drive, Herndon, Virginia 20171.
|
| (2) |
Nonvested restricted shares included herein are considered beneficially owned since the owner thereof has the right to vote
such shares. Other than the ownership described below, the balance of the shares beneficially owned represent shares directly held by the holder.
|
The share ownership is shown as of the date disclosed in the Additional Information column, and percentages are
calculated assuming continued beneficial ownership at our Record Date of July 22, 2025.
|
Name of Beneficial Owner
|
Aggregate Number
of Beneficial Shares |
Percent of Outstanding
Shares |
Additional Information
|
|
BlackRock, Inc.
55 East 52nd Street New York, NY 10055 |
3,944,903
|
14.8%
|
BlackRock, Inc. reported that as of June 30, 2025 it had sole voting power over 3,878,504 shares and sole dispositive power over
3,944,903 shares. This information is based on a Schedule 13G/A filed with the SEC on July 18, 2025.
|
|
|
|
|
BlackRock indicates in its Schedule 13G/A that one entity, iShares Core S&P Small-Cap ETF, has the right to receive or the power
to direct the receipt of dividends from, or the proceeds from the sale of, or has an interest in the common stock of, more than five percent of ePlus' total
outstanding common stock.
|
|
The Vanguard Group
100 Vanguard Boulevard Malvern, PA 19355 |
2,403,588
|
9.0%
|
The Vanguard Group reported that as of December 29, 2023 it had shared voting power over 19,721 shares and sole and shared dispositive
power over 2,359,915 and 43,673 shares, respectively. The information is based on a Schedule 13G/A filed with the SEC on February 13, 2024.
|
|
River Road Asset Management, LLC
462 S. 4th Street, Suite 2000 Louisville, KY 40202 |
1,386,853
|
5.2%
|
River Road Asset Management LLC reported that as of March 31, 2025 it had sole voting power over 1,186,040 shares and sole dispositive
power over 1,386,853 shares. This information is based on a Schedule 13G filed with the SEC on May 8, 2025.
|
|
Dimensional Fund Advisors LP
Building One
6300 Bee Cave Road Austin, TX 78746 |
1,318,891
|
5.0%
|
Dimensional Fund Advisors LP ("DFA") reported that as of March 31, 2025 it had sole voting power over 1,277,444 shares and sole
dispositive power over 1,318,891 shares. This information is based on a Schedule 13G/A filed with the SEC on April 15, 2025. DFA is an investment adviser registered under Section 203 of the
Investment Company Act of 1940, and serves as investment manager or sub-adviser to certain other commingled funds, group trusts and separate accounts (such companies, trusts and accounts,
collectively referred to as the "Funds"). In certain cases subsidiaries of DFA may act as an adviser or sub-adviser to certain Funds. In its role as investment advisor, sub-adviser and/or manager,
DFA or its subsidiaires (collectively, "Dimensional") may possess voting and/or investment power over the securities of the Company that are owned by the Funds, and may be deemed to be the
beneficial owner of the shares of the Company held by the Funds. However, all securities reported in the Schedule 13G/A are owned by the Funds, and Dimensional disclaims beneficial ownership of
such securities.
|
The following biographies describe the business experience of each of the Company’s executive officers as
of March 31, 2025, except for Mr. Marron, who is discussed under the heading “2025 Nominees for Election to the Board of Directors.”
|
Elaine D. Marion, Age 57
Chief Financial Officer
|
Officer of ePlus since 2008
|
||
Ms. Marion joined us in 1998 and became our CFO on September 1, 2008. From 2004 to 2008, Ms. Marion served
as our Vice President of Accounting. Prior to that, she was the Controller of ePlus Technology, inc., a subsidiary of ePlus,
from 1998 to 2004. Before joining ePlus, Ms. Marion was General Manager of Bristow Development Corporation. Ms. Marion is the chair of the George Mason University
School of Business Dean’s Advisory Council and a former board member of the Executive Advisory Board of the College of Business at the University of Mary Washington. Ms. Marion is a graduate of George
Mason University, where she earned a Bachelor of Science degree in Business Administration with a concentration in Accounting.
|
Darren S. Raiguel, Age 54
Chief Operating Officer
|
Officer of ePlus since 2018
|
||
Mr. Raiguel joined us in 1997 and served in various sales and management roles until his promotion in April
2011 to Senior Vice President of SLED (state, local and education) and northeast commercial sales. From November 2014 to May 2018, Mr. Raiguel served as our Executive Vice President of Technology Sales of
ePlus Technology, inc., a subsidiary of ePlus, and he became Chief Operating Officer of the Company and President of ePlus Technology, inc. on May 7, 2018. Before joining ePlus, Mr. Raiguel worked for Computerware,
later acquired by Elcom International, from 1992 to 1997. Mr. Raiguel is a graduate of Temple University, where he earned a Bachelor of Business Administration degree, with dual majors in Marketing and
Finance. Mr. Raiguel has participated in numerous industry organizations, councils, and advisory boards throughout his career.
Each of our executive officers is chosen by
the Board and holds his or her office until his or her successor shall have been duly chosen and qualified, or until his or her death, resignation, or removal by the Board. There are no family relationships among any of our executive officers or directors.
Shareholders may cast an advisory vote to approve NEO compensation as disclosed in this proxy statement
pursuant to Section 14A of the Exchange Act (commonly referred to as a “say-on-pay” vote). This vote is not intended to address any specific item of compensation, but rather our overall compensation
policies and practices relating to our NEOs. Although the vote is non-binding, we value feedback from our shareholders on compensation and other important matters, and we expect to hold this vote on an
annual basis for the foreseeable future. The Board of Directors and the Compensation Committee will consider the voting results when making future compensation decisions. At our 2024 Annual Meeting,
approximately 93.2% of the votes cast by our shareholders approved the compensation in the 2024 proxy statement for our NEOs.
In deciding how to vote on this proposal, we encourage you to review the CD&A
and 2025 Executive Compensation sections of this proxy statement for a detailed description of our executive compensation program. As described in the CD&A,
the Compensation Committee has designed our compensation program with the objective of rewarding achievement of specific goals that align the interests of management with the interests of our
shareholders.
We are asking our shareholders to indicate their support for our NEOs’ compensation as described in this
proxy statement by voting “FOR” the following resolution at our 2025 Annual Meeting:
“RESOLVED, that the shareholders of ePlus approve, on an
advisory basis, the compensation paid to the named executive officers, as disclosed in the Company’s proxy statement for the 2025 Annual Meeting pursuant to the compensation disclosure rules of the
Securities and Exchange Commission, including the CD&A, the Summary Compensation Table, and the other related compensation tables and narrative disclosure.”
The affirmative vote of the holders of a majority of the shares entitled to vote on the proposal, present
in person or represented by proxy at the meeting, is required to approve Proposal 2. Abstentions will have the same effect as voting “AGAINST” this proposal, and broker non-votes will have no effect on
the vote for this proposal.
THE BOARD OF DIRECTORS UNANIMOUSLY RECOMMENDS A VOTE FOR APPROVAL
ON AN ADVISORY BASIS OF THE COMPENSATION OF OUR NAMED EXECUTIVE OFFICERS
AS DISCLOSED IN THE CD&A, THE SUMMARY COMPENSATION TABLE,
AND OTHER RELATED DISCLOSURE AND TABLES IN THIS PROXY STATEMENT
The information contained in this report shall not be deemed to be (i) soliciting
material, (ii) filed with the SEC, (iii) subject to Regulations 14A or 14C of the Exchange Act, or (iv) subject to the liabilities of Section 18 of the Exchange Act. Further, this report shall not be
deemed incorporated by reference in any filing of the Company under the Securities Act of 1933, as amended, or the Exchange Act, whether made before or after the date hereof and irrespective of any
general incorporation of this proxy statement by reference, except to the extent the Company specifically incorporates this report by reference into such filing.
The Compensation Committee has reviewed the CD&A contained in this proxy statement and discussed the
CD&A with management. Based on its review and discussions with management, the Compensation Committee recommended to our Board of Directors that the CD&A, as it appears below, be included in
this proxy statement and incorporated by reference into the Company’s 2025 Annual Report.
Submitted by the Compensation Committee
Renée Bergeron, Chair
Melissa J. Ballenger
John E. Callies
Ira A. Hunt, III
This CD&A provides an overview of our executive compensation program for our fiscal year 2025, and
our executive compensation philosophies and objectives. This CD&A reviews compensation for our three NEOs: our CEO, CFO, and COO.
Our NEOs for the fiscal year ended March 31, 2025, were:
|
Name
|
Title
|
|
Mark P. Marron
|
Chief Executive Officer and President
|
|
Elaine D. Marion
|
Chief Financial Officer
|
|
Darren S. Raiguel
|
Chief Operating Officer
|
This CD&A is divided into three sections:
|
Overview
|
•
• •
•
|
Financial Highlights
Our Executive Compensation Program
Our Executive Compensation Practices
2024 Say-On-Pay Vote
|
||
|
What We Pay and Why
|
•
• •
•
•
|
Fiscal Year 2025 Executive Compensation Decisions
Base Salary
Annual Cash Incentive Awards
Long-Term Incentive Program (Time-Based Restricted Stock
Awards, Performance Stock Units and Performance Cash Awards)
Other Elements of Our Fiscal Year 2025 Executive
Compensation Program
|
||
|
How We Make Executive
Compensation Decisions
|
•
• •
•
|
Role of the Board and Compensation Committee, and our Chief
Executive Officer
Guidance from the Compensation Committee’s Independent
Compensation Consultant
Comparison Peer Groups
Alignment of Senior Management Team to Drive Performance
|
Fiscal Year 2025 Highlights
|
•
|
Net sales decreased 7.0% from the prior year to $2,068.8 million
|
|
•
|
Services revenue increased 37.1% to $400.4 million
|
|
•
|
Consolidated gross profit increased 3.3% to $569.1 million
|
|
•
|
Consolidated operating income decreased 10.6% to $141.4 million
|
|
•
|
Net earnings decreased 6.7% to $108.0 million
|
|
•
|
Diluted earnings per share decreased 6.5% to $4.05
|
Past Five Years Highlights
Over the past five years from fiscal year 2021 to fiscal year 2025, our financial performance has
been strong.
|
•
|
Net sales grew at a compound annual growth rate (“CAGR”) of 7%
|
|
•
|
Services revenue grew at a CAGR of 19%
|
|
•
|
Gross profit grew at a CAGR of 10%
|
|
•
|
Consolidated operating income increased at a CAGR of 7%
|
|
•
|
Net earnings grew at a CAGR of 10%
|
|
•
|
Diluted earnings per share increased at a CAGR of 10%
|
Share Repurchases
Over the past five fiscal years, we have returned over $84 million to shareholders in the form of stock
repurchases.
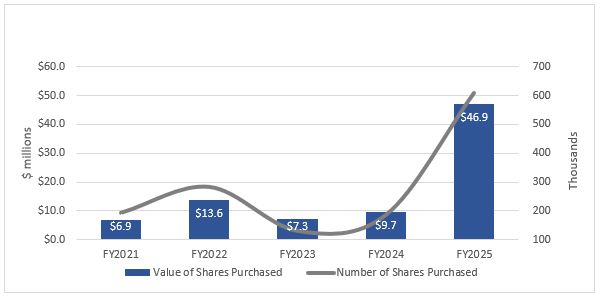
The Company’s goal for its executive compensation, as well as its non-executive compensation, program
is to attract, motivate, and retain a talented, ethical, and creative executive team who will provide leadership for the Company’s success in dynamic and competitive markets, while remaining attuned
to the risks facing the Company. The Company seeks to accomplish this goal in a way that rewards performance, is aligned with its business strategy, and maximizes shareholders’ long-term interests.
The Company’s compensation program reinforces the Company’s culture of high performance through an emphasis on performance-based pay opportunities which are earned for achieving key financial,
operational and strategic metrics that align to long-term value creation. The Company’s executive compensation program is also intended to promote and maintain stability within the executive team by
issuing restricted stock with multi-year vesting terms, as well as cash awards and Performance Stock Unit awards with multi-year performance periods. The table below summarizes the components of our
fiscal year 2025 executive compensation.
|
Pay Element
|
|||||
|
Salary
|
Annual
Cash Incentive
|
Long-Term
Cash Incentive
|
Performance
Stock Units
|
Restricted
Stock
|
|
|
Who Receives
|
All NEOs
|
All NEOs
|
All NEOs
|
All NEOs
|
All NEOs
|
|
When Granted
|
Annually
|
Annually
|
Annually
|
Annually
|
Annually
|
|
Form of Delivery
|
Cash
|
Cash
|
Cash
|
Equity
|
Equity
|
|
Performance
Type
|
Short-Term Fixed
|
Short-Term Variable
|
Long-Term Variable
|
Long-Term Variable
|
Long-Term Fixed
|
|
Performance
Period
|
1 Year
|
1 Year
|
3 Years
|
3 Years
|
3-year Ratable Annual Vesting
|
|
How Payout
Determined
|
Amount Set
by Compensation Committee
|
Formula Determined
by Compensation Committee
|
Formula Determined
by Compensation Committee
|
Formula Determined by Compensation Committee
|
Amount Determined
by Compensation Committee
|
|
Performance
Measures |
Individual
|
Consolidated Net Sales; Financing Segment Operating Income; Earnings Before Taxes; Services
Gross Profit
|
Target Increase in Net Sales and Operating Income
|
Target Increase in Net Sales and Operating Income;
Relative Total Shareholder Return (“TSR”)
|
Time-Based
|
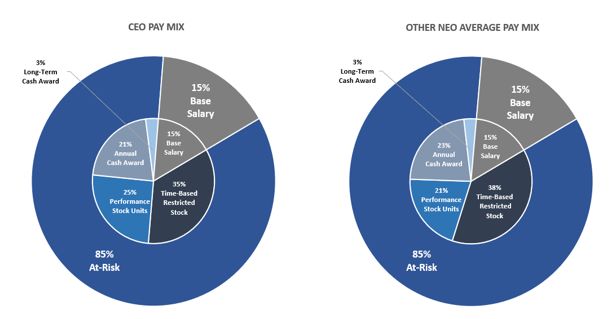
Our Compensation Committee reviews the Company’s executive compensation program annually to
evaluate whether it is aligned with shareholder interests and supports the Company’s executive compensation philosophies and objectives. Our executive compensation practices are outlined below,
each of which is intended to reinforce our executive compensation objectives:
|
Our Executive
Compensation Practices
|
|
|
What We Do
|
What We Don’t
Do
|
|
✔ Annual review of our executive compensation programs
✔ Annual advisory vote by shareholders to approve executive compensation programs (say-on-pay)
✔ Periodic market comparison of executive compensation against relevant peer group and
survey information
✔ Periodic use of an independent compensation consultant reporting directly to the
Compensation Committee and providing no other services to the Company
✔ Significant percentage of compensation delivered in the form of variable compensation,
which is “at-risk” and tied to quantifiable performance measures
✔ Long-term vesting of restricted stock and performance stock units, to align executive and
shareholder interests (minimum of three-year vesting)
✔ Long-term performance-based cash and performance stock unit grants
✔ Robust executive officer stock ownership guidelines require NEOs to hold ePlus stock
✔ Clawback policy to recoup erroneously paid incentive compensation
|
x No excessive executive perquisites
x No excessive severance benefits
x No supplemental executive retirement
plans
x No acceleration of unvested stock upon
retirement
x No hedging or short sales of our
securities
x No pledging of our securities, except in limited circumstances with
pre-approval by the
Insider Trading Compliance Officer
x No tax gross-ups on benefits (other than as also provided to
non-executive officer employees)
|
As part of its review of the
Company’s executive compensation program, the Compensation Committee considers the results of the annual, non-binding advisory vote by the shareholders to approve named executive officer
compensation (the “Say-On-Pay Vote”). Approximately 93.2% of the votes cast for the Company’s Say-On-Pay Vote at our 2024 Annual Meeting were to approve the Company’s executive compensation
program, and the Compensation Committee believes the results of the Say-On-Pay vote demonstrate shareholder support for the Company’s executive compensation program. Accordingly, the
Compensation Committee believes that the Company’s executive compensation philosophies and objectives continue to be appropriate and aligned with shareholder interests, and therefore made no
material changes to the Company’s executive compensation program in response to the 2024 Say-On-Pay vote.
Consistent with our pay philosophy and executive compensation program objectives described below,
in determining the fiscal year 2025 executive compensation levels and the mix of compensation elements for each NEO, the Compensation Committee and our CEO (in making recommendations regarding
the CFO’s and COO’s compensation) considered each NEO’s scope of responsibility, prior performance and experience, and Company performance, as more fully described below under “How We Make Executive Compensation Decisions.”
Base salary represents annual fixed cash compensation and is a standard element of compensation necessary to attract and retain
talent. It is the minimum payment for a satisfactory level of individual performance as long as the executive remains employed with the Company. Base salary is set by the Compensation
Committee, and ratified by the Board, after taking into account the competitive landscape—the compensation practices of the companies in our selected peer group and survey data from a broader
index of comparable companies—as well as our business strategy and short- and long-term performance goals, and individual factors, such as position, individual performance and contribution,
length of service with the Company, experience in the position, and placement within the general base salary range offered to our NEOs. In conducting this review and analyzing these factors at
the end of fiscal year 2024, the Compensation Committee adopted the base salary increases set forth below effective for the 2025 fiscal year.
The base salary for each of our NEOs as of March 31, 2025, and 2024 is set forth below:
|
Base Salary as of March 31,
|
||||||||
|
Named Executive Officer
|
2025
|
2024
|
||||||
|
Mark P. Marron
|
$
|
975,000
|
$
|
925,000
|
||||
|
Elaine D. Marion
|
$
|
525,000
|
$
|
500,000
|
||||
|
Darren S. Raiguel
|
$
|
550,000
|
$
|
525,000
|
||||
Effective April 1, 2025, Ms. Marion’s base salary was increased to $540,000, and Mr. Raiguel’s
annual base salary was increased to $565,000.
During the 2025 fiscal year, we provided our NEOs with short-term cash incentive compensation
through our annual Cash Incentive Plan. This short-term, variable cash compensation represents a significant portion of each NEO’s target total cash compensation opportunity in a given year.
Cash Incentive Plan Pay for Performance Alignment
Our Compensation Committee annually reviews, and then sets, performance goals under a Cash Incentive Plan, which was
adopted by the Compensation Committee in 2018 (“2018 CIP”). During the 2024 fiscal year, short-term performance goals and cash awards were made
under our 2018 CIP. The combination of performance goals the Compensation Committee chose for fiscal year 2024 emphasizes factors that the Compensation Committee believes are important
to Company strategy, future growth and enhancing shareholder value. The Compensation Committee administers the 2018 CIP and has full authority to determine which of the Company’s
executive officers will participate in the 2018 CIP; the terms and amounts of each participant’s minimum, target, and maximum awards; and the period during which the performance is to be
measured.
On February 19, 2025, the Compensation Committee adopted an amended and restated Cash Incentive Plan (the “2025 CIP”). The 2025 CIP is materially consistent with the terms of the 2018 CIP, with certain updates generally intended to ensure compliance with Internal Revenue
Service Code Section 409A. The 2025 CIP is effective for all annual cash incentive awards granted for the Company’s fiscal year beginning April 1, 2025 (i.e., the 2026 fiscal year) and thereafter.
For the fiscal year ended March 31, 2025, our NEOs’ annual cash incentive awards were earned pursuant to
the 2018 CIP, based on the following financial performance goals: consolidated net sales (20%), financing segment operating income (20%), earnings before taxes (30%), and services gross profit (30%).
The award opportunity in fiscal year 2025 was based on a target amount and payouts that range between 0% to
200% of the target award amounts as set forth in each participant’s award agreement, with the payout based on the Company’s actual level of attainment of fiscal 2025 financial performance. Following the
completion of the process described in this CD&A under the heading “How We Make Executive Compensation Decisions,” the Compensation Committee set the fiscal
2025 target award for each of ePlus’ executive officers, which for Mr. Marron was increased by 7%, for Ms. Marion was increased by 8% and for Mr. Raiguel was
increased by 10%, each relative to fiscal 2024. All three of the participating executive officers had the same financial performance goals and the same performance weights. The fiscal year 2025 financial
performance weights and target amounts for each participant were as follows:
|
Consolidated Net Sales
|
Financing Segment Operating Income
|
Earnings Before Taxes
|
Services Gross Profit
|
|||||||||||||||||||||||||||||||||
|
Named
Executive Officer |
Percentage of
Total Bonus
|
Target Bonus
Amount |
Percentage of Total Bonus
|
Target Bonus Amount
|
Percentage of
Total Bonus
|
Target Bonus
Amount
|
Percentage of
Total Bonus
|
Target Bonus
Amount
|
Total Target
Bonus Amount |
|||||||||||||||||||||||||||
|
Mark P. Marron
|
20.0%
|
|
$
|
230,000
|
20.0%
|
|
$
|
230,000
|
30.0%
|
|
$
|
345,000
|
30.0%
|
|
$
|
345,000
|
$
|
1,150,000
|
||||||||||||||||||
|
Elaine D. Marion
|
20.0%
|
|
$
|
135,000
|
20.0%
|
|
$
|
135,000
|
30.0%
|
|
$
|
202,500
|
30.0%
|
|
$
|
202,500
|
$
|
675,000
|
||||||||||||||||||
|
Darren S. Raiguel
|
20.0%
|
|
$
|
135,000
|
20.0%
|
|
$
|
135,000
|
30.0%
|
|
$
|
202,500
|
30.0%
|
|
$
|
202,500
|
$
|
675,000
|
||||||||||||||||||
The Cash Incentive Award Agreements permit the exclusion of all items of income, gain or loss determined by the Board to be
extraordinary or unusual in nature and not incurred or realized in the ordinary course of business, the incentive compensation
expensed by ePlus for payments under the 2018 CIP, and any revenue, gain, or loss attributable to
the business operations of (i) any entity acquired by us during the fiscal year or (ii) any portion of our business that we divest during the fiscal year. The 2018 CIP further provides that cash
payments under the 2018 CIP are subject to recovery by the Company to the extent required by the Dodd-Frank Wall Street Reform and Consumer Protection Act of 2010 (“Dodd-Frank”) and the Sarbanes-Oxley Act of 2002 (“Sarbanes-Oxley”) and any regulations promulgated thereunder. As more fully discussed below, the Company has adopted a Policy for Recoupment of Incentive Compensation.
Possible payouts under the 2018 CIP for the fiscal 2025 annual cash incentive award ranged between 0% and
200% of the target amount, depending on the level of achievement of the performance goals for the fiscal year 2025. The financial performance goals for fiscal 2025 were as follows:
|
Performance Goals
|
||||||||||||||||
|
Performance Level
(Dollars in thousands) |
Consolidated
Net Sales (20%) |
Financing
Segment
Operating Income (20%) |
Earnings
Before Taxes (30%) |
Services
Gross Profit (30%) |
||||||||||||
|
Maximum
|
n/a
|
(1)
|
n/a
|
(1)
|
n/a
|
(1)
|
n/a
|
(1)
|
||||||||
|
Target
|
$
|
2,331,170
|
$
|
26,778
|
$
|
191,650
|
$
|
124,398
|
||||||||
|
Threshold (75% of Performance Goal)
|
$
|
1,748,378
|
$
|
20,084
|
$
|
143,738
|
$
|
93,299
|
||||||||
|
Below Threshold
|
< $1,748,378
|
< $20,084
|
< $143,738
|
< $93,299
|
||||||||||||
| (1) |
The maximum payout of 200% of the target award can be achieved based on the results of one or more of the performance goals. The threshold and escalators
for each performance goal are as follows:
|
|
Amount of Goal Achieved
|
Award Amount
|
|
Less than 75% of Goal Target
|
No award relating to that target
|
|
Between 75% - 100% of Goal Target
|
Award shall be 50% of target, plus an additional 2.0% for each percentage point over 75% of Goal Target achieved
|
|
100% of Goal Target
|
100% of target for that Goal
|
|
More than 100% of Goal Target
|
100% of target for that Goal, plus an additional 5.0% for each percentage point over 100% of Goal Target achieved
|
|
Total Maximum Award for all goals combined
|
200% of Target
|
At the conclusion of the fiscal year ended March 31, 2025, the Compensation Committee determined which of the financial objectives described
under the 2018 CIP and in the award agreements were achieved. There were no waivers or modifications to any specified performance targets, goals, or conditions with respect to the 2018 CIP or award agreements. The achievement of the
financial performance goals is set forth below.
|
Performance Criteria
|
Goal (1)
|
Achievement (2)
|
Amount of
Goal Achieved |
|||||||||
|
Consolidated Net Sales
|
$
|
2,331,170
|
$
|
1,982,224
|
85.0
|
%
|
||||||
|
Financing Segment Operating Income
|
$
|
26,778
|
$
|
36,364
|
135.8
|
%
|
||||||
|
Earnings Before Taxes
|
$
|
191,650
|
$
|
162,476
|
84.8
|
%
|
||||||
|
Services Gross Profit
|
$
|
124,398
|
$
|
118,673
|
95.4
|
%
|
||||||
| (1) |
Performance Criteria achievement were adjusted to exclude (i) the incentive compensation accrued by the Company, and (ii) as relates to mergers and
acquisitions activities that occurred during fiscal 2025, transaction related expenses, operating losses related to an acquisition and lost interest on the cash component of the purchase price paid (for an acquisition); the
Performance Criteria goals were adjusted to exclude incentive compensation targets. The payout percentage of the total target award earned is 118%.
|
|
Named Executive Officer
|
Total Target Award
|
Annual Incentive
Cash Payment Earned Fiscal Year 2025 |
Payout
Percentage |
|||||||||
|
Mark P. Marron
|
$
|
1,150,000
|
$
|
1,356,048
|
118
|
%
|
||||||
|
Elaine D. Marion
|
$
|
675,000
|
$
|
795,941
|
118
|
%
|
||||||
|
Darren S. Raiguel
|
$
|
675,000
|
$
|
795,941
|
118
|
%
|
||||||
The following table details the annual cash incentive award payments earned for the fiscal year ended March 31, 2025, and 2024, respectively (but
paid in the subsequent fiscal year) for each NEO:
|
Annual Incentive Cash Payment Earned
Fiscal Year Ended |
||||||||||||
|
Named Executive Officer
|
March 31, 2025
|
March 31, 2024
|
% Change
|
|||||||||
|
Mark P. Marron
|
$
|
1,356,048
|
$
|
1,158,321
|
17
|
%
|
||||||
|
Elaine D. Marion
|
$
|
795,941
|
$
|
673,443
|
18
|
%
|
||||||
|
Darren S. Raiguel
|
$
|
795,941
|
$
|
673,443
|
18
|
%
|
||||||
Under our 2021 Employee Long-Term Incentive Plan (“2021 Employee LTIP”), the Compensation Committee
has the authority to award various forms of long-term incentive compensation grants, such as cash awards, stock options, restricted stock awards, restricted stock units, and performance stock units. The Compensation Committee’s objectives for the fiscal year 2025 long-term equity-based and
cash incentive awards to our NEOs were to focus executives on long-term, profitable growth and shareholder value creation linked to the Company’s long-term strategic plan, and to promote the retention of our executives through multi-year
vesting requirements.
Mr. Marron makes recommendations to the Compensation Committee for cash and equity grants with regard to Ms. Marion and Mr. Raiguel;
however, the Compensation Committee deliberates and reaches its own decision regarding grants to all NEOs, including Mr. Marron, who does not participate in any deliberations or votes regarding his own compensation. When determining the
level of the grant, the Compensation Committee considers each NEO’s functional and enterprise management responsibilities, contributions to the Company’s profitability and growth, the value of prior long-term incentive grants and other
non-cash and cash compensation, regular analysis of how the Company performed on multiple financial metrics as compared to certain peers, information from our independent compensation consultant (if any), and each executive’s total
compensation, including cash compensation. However, the Compensation Committee does not use a formula or assign a particular weight to any given factor in determining equity award grant levels. Rather, the Compensation Committee’s
determination of grant levels is subjective and informed by relevant data, information and market practices, and the Compensation Committee grants awards that are intended to deliver compensation to the executive at the target
performance level (subject to actual performance and irrespective of accounting and tax implications) and in its judgment are reasonably competitive.
The Compensation Committee believes that restricted stock and performance stock unit awards help to create incentives for performance and
further align the interests of executives with those of shareholders because the stock’s value increases or decreases in conjunction with the Company’s stock price. The Compensation Committee believes that long-term cash performance
awards align the interests of executives with those of shareholders because the award’s value is tied to operating metrics that drive long-term shareholder value. In addition, the Compensation Committee believes that granting awards
with multi-year vesting periods creates a substantial retention incentive and encourages the NEOs to focus on the Company’s long-term business objectives and stock performance. All outstanding restricted shares vesting for, or granted
to, executive officers and other employees during the fiscal year ended March 31, 2025, vest over a three-year period.
After conducting the process described above for fiscal year 2025, the Compensation Committee elected to provide the NEOs with a
combination of long-term incentive vehicles, including time-based restricted stock, performance-based stock units, and cash performance awards, which are consistent with the award types (and performance metrics) granted to the NEOs for
fiscal 2024. In reviewing the competitiveness of the compensation package provided to the NEOs, it was determined that in order to maintain the competitiveness and attractiveness of the compensation package, total target compensation
should be increased, primarily through increases to performance-based equity awards (performance based-stock units) and to lesser extent through increases to long-term cash awards (cash performance awards). These vehicles focus NEOs on
driving long-term profitable growth and achieving key financial, operational and strategic metrics that are intended to generate long-term value creation for our shareholders. The target value of the restricted stock awards for fiscal
2025 was consistent with the target level provided for fiscal 2024. The target value of the fiscal 2025 performance-based stock unit grant for (i) Mr. Marron increased by 60%, (ii) Ms. Marion increased by
75% and (iii) Mr. Raiguel increased by 67%, each relative to fiscal 2024. The target value of the fiscal 2025 cash performance award for (i) Mr. Marron increased by 27%, (ii) Ms. Marion increased by 33% and (iii) Mr. Raiguel increased
by 33%, each relative to fiscal 2024.
|
Element of LTI
|
Overview of Design
|
|
|
Time-Based Restricted Stock
|
• |
Vests in three equal increments on the first three one-year anniversaries of the grant
|
|
Performance Stock Units
|
• |
Award tied to Relative TSR (10% of award), based on the Russell 2000 Index, growth in operating income (45% of award), and
growth in net sales (45% of award)
|
| • | Three-year performance period | |
| • | Vesting and payout can range between 0% and 200% of target award | |
|
Cash Performance Award
|
• |
Award is tied to achievement of growth in operating income
(50% of award) and growth in net sales (50% of award)
|
| • | Three-year performance period |
|
| • | Payout occurs at end of three-year performance period | |
| • | Payout can range between 0% and 150% of target award |
The table below shows the long-term incentive award values granted (at the target level of performance) for fiscal year 2025 for each of the
NEOs:
|
Named Executive Officer
|
Time-Based Restricted Stock (1)
|
Performance Stock Units (2)
|
Cash Performance Award (3)
|
Total Value
|
||||||||||||
|
Mark P. Marron
|
$
|
2,199,951
|
$
|
799,930
|
$
|
350,000
|
$
|
3,349,881
|
||||||||
|
Elaine D. Marion
|
$
|
1,349,958
|
$
|
349,974
|
$
|
200,000
|
$
|
1,899,932
|
||||||||
|
Darren S. Raiguel
|
$
|
1,349,958
|
$
|
374,950
|
$
|
200,000
|
$
|
1,924,908
|
||||||||
| (1) |
Award amounts for Time-Based Restricted Stock is based on $72.68 which was the closing price of our common stock on June 14, 2024, the date of the award.
|
| (2) |
Award amounts for Performance Stock Units is based on $78.54, which was the closing price of our common stock on March 28, 2024, the date of the award. The three categories of performance goals to be
achieved during the performance period, which will be assessed at the end of the performance period, are as follows: (a) 45% of the Performance Stock Units will be based on the Company’s actual operating income relative to a
targeted growth over the performance period; (b) 45% of the Performance Stock Units will be based on the Company’s actual net sales relative to a targeted growth over the performance period; and (c) 10% of the Performance Stock
Units will be based on the Company’s total shareholder return relative to the Russell 2000 Index (the “Relative TSR Metric”). The performance period is April 1, 2024, to March 31, 2027. Amounts and percentages shown are the target
amounts and represent the amount of compensation intended by the Compensation Committee to be delivered to the NEO (subject to actual performance and irrespective of accounting and tax implications). The threshold and escalator for
the Performance Stock Units are as follows:
|
|
Amount of Goal Achieved
|
Award Amount
|
|
Less than 50% of Performance Target achieved
|
No Performance Award relating to that Performance Target goal
|
|
Between 50% - 100% of Performance Target achieved
|
Performance Award shall be 50%, plus an additional 1.0% for each percentage point over 50% of Performance Target achieved
|
|
More than 100% of Performance Target achieved
|
Performance Award shall be 100%, plus an additional 5.0% for each percentabe point over 100% of Performance Target achieved, subjet to the Total Maximum Awarded PSUs
|
|
Total Maximum Vested Awarded PSUs
(for all goals combined)
|
200% of the Awarded PSUs
|
| (3) |
The two categories of performance goals to be achieved during the performance period, which will be assessed at the end of the performance period, are as follows: (1) 50% of the Cash Performance
Awards will be based on the Company’s actual operating income relative to a targeted growth over the performance period and (2) 50% of the Cash Performance Awards will be based on the Company’s actual net sales relative to a
targeted growth over the performance period. The performance period for the Cash Performance Awards is April 1, 2024 – March 31, 2027. Amounts and percentages shown are the target amounts and represent the amount of compensation
intended by the Compensation Committee to be delivered to the NEO (subject to actual performance and irrespective of accounting and tax implications). The threshold and escalators for the Cash Performance Awards are as follows:
|
|
Amount of Goal Achieved
|
Award Amount
|
|
Less than 75% of Goal Target
|
No award relating to that target
|
|
Between 75% - 100% of Goal Target
|
Award shall be 50% of target, plus an additional 2.0% for each percentage point over 75% of Goal Target achieved
|
|
100% of Goal Target
|
100% of target for that Goal
|
|
More than 100% of Goal Target
|
100% of target for that Goal, plus an additional 5.0% for each percentage point over 100% of Goal Target achieved
|
|
Total Maximum Award for all goals combined
|
150% of Target
|
Vested Long-Term Cash Performance Awards Completed
(Performance Period April 1, 2022 – March 31, 2025)
Our Compensation Committee granted long-term cash performance awards in fiscal year 2023 that pay out based on specific pre-established
performance goals of growth in operating income (50% of award) and growth in net sales (50% of award). Performance was measured over the three-fiscal-year performance period ending March 31, 2025. At the conclusion of the fiscal year
ended March 31, 2025, the Compensation Committee determined that the financial objectives described under the long-term cash performance award agreements for the performance period of April 1, 2022, through March 31, 2025, were achieved
at the levels indicated in the table below, generating the indicated payouts under these long-term cash performance awards. There were no waivers or modifications to any specified performance targets, goals, or conditions with respect
to the award agreements. The achievement of the financial performance goals is set forth below.
|
Performance Criteria
|
Goal (1)
|
Achievement (2)
|
Amount of
Goal Achieved
|
|||||||||
|
Increase in operating income from
April 1, 2022, to March 31, 2025
|
$
|
176,778
|
$
|
149,889
|
84.8
|
%
|
||||||
|
Increase in net sales from
April 1, 2022, to March 31, 2025
|
$
|
2,039,541
|
$
|
1,889,137
|
92.6
|
%
|
||||||
| (1) |
The operating income goal represents a 20% growth target for operating income over the three-year performance period. The net sales goal represents a 12% growth target for net sales over the
three-year performance period.
|
|
(2)
|
The achievement of the performance criteria was adjusted to exclude the following types of income and expenses related to mergers and acquisitions activities that occurred
during three-year performance period ending in fiscal 2025: transaction related expenses, operating losses related to acquisitions and lost interest on the cash component of the purchase price paid (for acquisitions). The Payout
earned and Payout Percentage relative to the Total Target Award is set forth in the table below:
|
|
Named Executive Officer
|
Total Target Award
|
Long-Term Cash Payment
Earned
Performance Period
April 1, 2022 to March 31, 2025 |
Payout
Percentage |
|||||||||
|
Mark P. Marron
|
$
|
275,000
|
$
|
212,891
|
77
|
%
|
||||||
|
Elaine D. Marion
|
$
|
150,000
|
$
|
116,122
|
77
|
%
|
||||||
|
Darren S. Raiguel
|
$
|
150,000
|
$
|
116,122
|
77
|
%
|
||||||
The following table details the payments earned during the three-fiscal-year periods ended March 31, 2025, and March 31, 2024, respectively,
(but paid in the subsequent fiscal year) for each NEO:
|
Long-Term Cash Payment Earned Performance Period
|
||||||||||||
|
Named Executive Officer
|
April 1, 2022 to March 31, 2025
|
April 1, 2021 to March 31, 2024
|
% Change
|
|||||||||
|
Mark P. Marron
|
$
|
212,891
|
$
|
412,500
|
(48
|
%)
|
||||||
|
Elaine D. Marion
|
$
|
116,122
|
$
|
225,000
|
(48
|
%)
|
||||||
|
Darren S. Raiguel
|
$
|
116,122
|
$
|
225,000
|
(48
|
%)
|
||||||
More information about the long-term incentive awards granted to each NEO in fiscal year 2025 are set forth in “2025 Grants of Plan-Based Awards.”
CEO Compensation
The Compensation Committee determines compensation for our CEO using generally the same criteria it uses for other executive officers.
Severance and Change in Control Provisions
Severance and change in control provisions are designed to facilitate our ability to attract and retain executives as we compete for
talented employees in a marketplace where such protections are frequently offered. Severance benefits are designed to provide benefits to ease an executive’s transition following an employment termination by the Company due to changes
in our employment needs. Additionally, severance agreements increase the enforceability of non-competition provisions to which all of our executives are contractually bound. Change in control benefits are intended to encourage
executives to remain focused on the Company’s business in the event of rumored or actual fundamental corporate changes. Both severance and change in control benefits are often an important part of an executive’s compensation package.
See further details under the section entitled “Employment Agreements, Severance, and Change in Control Provisions.”
Clawback Policy
Our executive compensation arrangements with our NEOs, including our 2018 CIP (as well as our 2025 CIP), our 2021 Employee Long-Term
Incentive Plan, employment agreements, long-term cash performance awards, and Performance Stock Unit awards provide that bonuses or other compensation are subject to recovery by the Company to the extent required by Dodd-Frank and
Sarbanes-Oxley, and any regulations promulgated thereunder. This provision does not apply to base salary, or to time-vested restricted stock which is not awarded, granted, or vested based on financial measures required to be reported
under the securities laws.
The 2018 CIP includes a provision for an adjusted award if it is determined that an award was paid based on incorrect financial results,
and permits the Compensation Committee to lower the amount of such payment so that it reflects the amount that would have been paid based on the correct financial results and require, to the extent permitted by law, the participant to
reimburse to the Company any amount received with respect to such an award. The 2018 CIP also provides that cash payments under the plan are subject to recovery by the Company to the extent required by Dodd-Frank and Sarbanes-Oxley,
and any regulations promulgated thereunder. Our 2021 Employee LTIP provides that awards shall be subject to Company policies and applicable statutes, rules or regulations regarding recoupment or clawback as may be in effect from time
to time, and that if for any reason our financial statements must be restated for any part of a performance period, as result of material noncompliance with accounting requirements, and the vesting or amount of an award for a
participant would be materially affected by information changed in such financial statements, then such Award will be forfeited, and be repaid to us, in such amount or to such extent as the Compensation Committee shall determine.
During our fiscal year ended March 31, 2024, NASDAQ listing standards became effective which required the development and implementation
of the clawback policy mandated by Dodd-Frank. Our Board accordingly adopted and maintains a stand-alone Policy for Recoupment of Incentive Compensation (the “Recoupment Policy”), which
complements the recoupment provisions in the 2018 CIP, the 2025 CIP and the 2021 Employee LTIP. Performance-based award agreements entered into after the effective date of the listing standards include specific recoupment language
consistent with our Recoupment Policy and these listing standards.
Stock Ownership Guidelines
Our Board has adopted stock ownership guidelines for our executive officers to further align the interests of our executive officers with
the interests of our shareholders. The guidelines are expressed as a multiple of the executives’ base salary as of each January 1st, or as of the date they are first identified as executive officers. Our non-CEO
executive officers are expected to retain stock ownership valued at a multiple of two times their annual base salary within five years of first being identified as an executive officer. Our CEO is expected to retain stock ownership
valued at a multiple of five times his annual base salary within the same time frame. All executive officers are expected to retain one-half of all equity grants until such time as the target stock ownership is reached. The guidelines
may be waived at the discretion of our Compensation Committee in the event of an extraordinary expense (such as, for example, housing or higher education needs), or if compliance would create a severe hardship or prevent an executive
from complying with a court order, as in the case of a divorce or other property settlement. However, the Company expects such instances to be rare, and has not granted any waivers. At this time, all of our executive officers meet
their respective stock ownership guideline level.
Insider Trading, Hedging and Short Sales Policies
Our Insider Trading Policy applies to all of our employees and directors. Under the policy, our directors, officers, and employees who
are “Insiders” (as defined in the policy) are prohibited from hedging, including using prepaid variable forward contracts, equity swaps, collars and exchange funds, and similar transactions that establish downside price protection,
including short sales, and buying or selling put options, call options, or other derivatives of Company securities.
All trades of Company stock by directors, executive officers, and other insiders require pre-approval from our Insider Trading Compliance
Officer and must be made in accordance with the Insider Trading Policy. A copy of our Insider Trading Policy is filed as Exhibit 19 to our 2025 Form 10-K.
Tax and Accounting Considerations
Deductibility of Executive Compensation
When designing compensation plans, the Compensation Committee takes into consideration any changes to Internal Revenue Code (“IRC”) Section 162(m), as applicable. The Company believes that tax deductibility of compensation is an important factor, but not the sole factor, to be considered in setting executive compensation
policy, and the Compensation Committee has authorized payments that are not deductible for federal income tax purposes when it believes that such payments are appropriate to attract, retain, and incentivize executive talent.
Our executive employment agreements provide that, if a severance payment is subject to the excise tax provided in IRC Section 280G, the
executive will receive a lesser payment if he or she would receive a greater after-tax benefit, which will better enable the Company to obtain a tax deduction. Our long-term Performance Cash Award agreements include a similar
provision.
Accounting Considerations
Accounting considerations also play a role in the design of our executive compensation programs and policies. Codification Topic Compensation—Stock
Compensation requires us to expense the cost of stock-based compensation awards. We consider the relative impact of the expense, in addition to other factors such as shareholder dilution, retentive impact, motivational
impact, and the overall competitiveness of compensation packages when selecting long-term equity incentive instruments.
Benefits and Perquisites
Our NEOs participate in benefit plans generally available to all of our employees, including medical, health, life insurance, and
disability plans. They also are eligible to participate in our 401(k) plan, and receive Company matching contributions, to the extent made by the Company, on the same terms as generally available to our employees. Pursuant to their
employment agreements, they also are entitled to reimbursement for annual participation in an executive health assessment program.
Our executive officers are provided with relatively limited perquisites, which we believe is in the best interests of the Company. In
some years, certain of our executive officers have received certain Company-paid travel, meals, and entertainment costs for their families to attend the Company’s meetings for high performers. All attendees at the meetings are
likewise eligible to have their families attend the meeting. The Company pays the same costs for the executives as for all attendees at the meetings. The costs incurred with regard to the family members of our named executive officers
are included in our Summary Compensation Table in the compensation for each year ended March 31, 2023, March 31, 2024, and March 31, 2025. Additionally, from time to time, some of our employees attend sales meetings or other events
held by our vendor business partners, to which guests are invited. To the extent vendor partners pay the expense for the executive and his/her spouse, the expense is not reported in our Summary Compensation Table as there is no
expense to the Company.
Role of the Board and Compensation Committee
The Compensation Committee, which is composed entirely of independent directors, generally establishes the components of our executive
officer compensation program and may evaluate the components from time to time. The Compensation Committee is responsible for evaluating and setting the compensation for our CEO, CFO, and COO. The Compensation Committee reviews the
executive compensation program on an annual basis, with awards generally being made in June, although the performance stock unit awards with a performance period beginning as of fiscal 2025 were made in March of 2024, before fiscal
2025 began. Compensation decisions may be made at other times of the year in the case of promotions, new hires, or changes in responsibilities. In making these determinations, the Compensation Committee may consider such factors as
the Company’s performance, the individual performance of an executive officer, information from our independent compensation consultant (if any), and recommendations from management. The Compensation Committee’s decisions are
generally subject to ratification by our Board of Directors. The Compensation Committee also considers any recommendations from the Board relating to the CEO’s performance.
Role of the Chief Executive Officer
Our CEO, Mr. Marron, oversees the implementation and administration of our executive compensation program during the fiscal year. Mr.
Marron recommended the overall structure for our executive compensation program for fiscal year 2025, including base salary, metrics for the 2018 CIP award agreements for fiscal year 2025, metrics for the long-term cash awards made
pursuant to our 2021 Employee LTIP for the performance period ending as of the end of fiscal year 2025, metrics for our Performance Stock Unit awards granted during fiscal year 2025, and the amount and vesting schedule of equity
awards that were granted during 2025. The final decisions regarding executive equity compensation were, however, made by the Compensation Committee, and decisions regarding base salary were made by the Board, with Mr. Marron’s
abstaining from votes relating to his compensation. In all cases, the CEO is not present during any deliberations or voting regarding his own compensation.
An independent compensation consultant, Pay Governance LLC (the “Compensation Consultant”), was
retained by the Compensation Committee in February 2023. The Compensation Committee reviewed the independence of the Compensation Consultant under Nasdaq and SEC rules, and concluded that the work of the Compensation Consultant has
not raised any conflict of interest. The Compensation Consultant is engaged directly by the Compensation Committee. The Compensation Consultant assisted the Compensation Committee with developing a publicly traded peer group for
benchmarking executive pay levels and design, reviewing incentive plan design practices and recommending changes to incentive plans, and analyzing target compensation levels for executive officers relative to peer group companies and
relevant published survey sources.
The Compensation Committee approves the compensation for the NEOs based on its own evaluation, input from our CEO, internal pay equity
considerations, the tenure, role, and performance of each NEO, as well as input from the compensation consultant and market data. The CEO is not present during any deliberations or voting regarding his own compensation.
The Compensation Committee periodically reviews the compensation practices of peer companies as part of its decision-making process so it
can set total compensation levels that it believes are reasonably competitive. In March 2023, the Compensation Committee, with the assistance of the Compensation Consultant, determined a new peer group. In selecting the peer group,
the Compensation Committee considered potential peers’ primary industry, total revenue, market capitalization, gross margin, operating income margin, number of employees, and cumulative Total Shareholder Return (“TSR”) on a 1-year, 3-year and 5-year basis. The Compensation Committee also considered the pay practices of two additional companies from a design standpoint only.
|
Peer Group
|
||
|
CACI International Inc.
|
EPAM Systems, Inc.
|
ASGN Incorporated
|
|
Amdocs Limited†
|
ScanSource, Inc.
|
PC Connection, Inc.
|
|
Pure Storage, Inc.
|
Unisys Corporation*
|
Itron, Inc.
|
|
ICF International, Inc.*
|
Thoughtworks Holding, Inc.
|
CSG Systems Internationals, Inc.*
|
|
Perficient, Inc.* ‡
|
StarTek, Inc.* ‡
|
Climb Global Solutions, Inc.
|
| * |
Only these five companies provided compensation information for the COO role.
|
| † |
Amdocs Limited did not publicly disclose its executive compensation program, and therefore was not included in the analysis.
|
| ‡ |
Indicates that the company was acquired subsequent to the selection of the peer group in March 2023. Such companies were accordingly not factored into compensation-related decisions by the
Compensation Committee for fiscal 2025.
|
The above peer group was used for compensation-related decisions for the fiscal year ended March 31, 2025.
The Compensation Consultant also provided a secondary market reference, Mercer’s 2022 U.S. Executive Benchmark Database, which was
size-adjusted using regression data to approximate ePlus’ then-current revenue of $1.8 billion.
The Compensation Committee considered this broad range of data to ascertain where the compensation for our executive officers is
positioned with respect to the median to properly reflect various factors, such as our Company’s performance, the unique characteristics of each executive’s position, and applicable retention considerations. The Compensation Committee
does not set compensation components to meet specific benchmarks, such as targeting salaries “above the median” or equity compensation at a particular percentile.
Our performance goals are designed to drive shareholder value creation by aligning members of senior management with our strategy and
corporate performance goals. To that end, we engage in extensive communications regarding concrete actions and tactics that members of senior management, together with their teams, should undertake, both individually and collectively,
to impact and ultimately achieve the Company’s goals. We believe this understanding of the link between individual, team, and Company performance helps the Company to focus on actions that have the greatest potential to drive the
Company toward more profitable growth and shareholder value.
The following table includes information concerning compensation earned by our NEOs during fiscal years 2025, 2024, and 2023.
|
Name and Principal Position
|
Fiscal Year
|
Salary
|
Stock Awards
(1) |
Non-Equity Incentive Plan Compensation
(2) |
All Other Compensation
(3) |
Total
|
|||||||||||||||
|
Mark P. Marron – President and Chief Executive
Officer
|
2025
|
$
|
975,000
|
$
|
3,799,811
|
$
|
1,568,939
|
$
|
63,800
|
$
|
6,407,550
|
||||||||||
|
2024
|
$
|
925,000
|
$
|
3,199,831
|
$
|
1,570,821
|
$
|
26,443
|
$
|
5,722,095
|
|||||||||||
|
2023
|
$
|
916,500
|
$
|
2,199,967
|
$
|
1,283,627
|
$
|
22,131
|
$
|
4,422,225
|
|||||||||||
|
|
|
||||||||||||||||||||
|
Elaine D. Marion – Chief Financial Officer
|
2025
|
$
|
525,000
|
$
|
2,049,906
|
$
|
912,063
|
$
|
71,019
|
$
|
3,557,988
|
||||||||||
|
2024
|
$
|
500,000
|
$
|
1,749,877
|
$
|
898,443
|
$
|
15,945
|
$
|
3,164,265
|
|||||||||||
|
2023
|
$
|
495,750
|
$
|
1,349,994
|
$
|
681,690
|
$
|
51,452
|
$
|
2,578,886
|
|||||||||||
|
Darren S. Raiguel – Chief Operating Officer
|
2025
|
$
|
550,000
|
$
|
2,099,858
|
$
|
912,063
|
$
|
50,994
|
$
|
3,612,915
|
||||||||||
|
2024
|
$
|
525,000
|
$
|
1,799,913
|
$
|
898,443
|
$
|
15,609
|
$
|
3,238,965
|
|||||||||||
|
2023
|
$
|
495,750
|
$
|
1,349,994
|
$
|
681,690
|
$
|
58,096
|
$
|
2,585,530
|
|||||||||||
| (1) |
The values in this column represent the aggregate grant date fair values of restricted stock awards and Performance Stock Units (for fiscal years 2024 and 2025 only) granted in the respective
fiscal year, computed in accordance with the Financial Accounting Standards Board’s Accounting Standards Codification Topic 718, Compensation—Stock Compensation. Consistent with
instruction 3 to Item 402(c)(2)(v) and (vi) of Regulation S-K, the amounts for the Performance Stock Units assume that the highest level of performance conditions will be achieved; other assumptions used in calculating these
values may be found in Note 13 of our financial statements in our 2025 Form 10-K. Each of these amounts reflect our expected aggregate accounting expense for these awards as of the grant date and do not necessarily correspond to
the actual values that will be expensed by us or realized by the NEOs. The stock awards for the past three fiscal years are as follows:
|
|
Name and Principal Position
|
Fiscal Year
|
Time-Based
Restricted Stock
|
Performance
Stock Units
|
Total
Stock Awards
|
|||||||||
|
Mark P. Marron – President and Chief Executive Officer
|
2025
|
$
|
2,199,951
|
$
|
1,599,860
|
$
|
3,799,811
|
||||||
|
2024
|
$
|
2,199,947
|
$
|
999,884
|
$
|
3,199,831
|
|||||||
|
2023
|
$
|
2,199,967
|
$
|
-
|
$
|
2,199,967
|
|||||||
|
Elaine D. Marion – Chief Financial Officer
|
2025
|
$
|
1,349,958
|
$
|
699,948
|
$
|
2,049,906
|
||||||
|
2024
|
$
|
1,349,947
|
$
|
399,930
|
$
|
1,749,877
|
|||||||
|
2023
|
$
|
1,349,994
|
$
|
-
|
$
|
1,349,994
|
|||||||
|
Darren S. Raiguel – Chief Operating Officer
|
2025
|
$
|
1,349,958
|
$
|
749,900
|
$
|
2,099,858
|
||||||
|
2024
|
$
|
1,349,947
|
$
|
449,966
|
$
|
1,799,913
|
|||||||
|
2023
|
$
|
1,349,994
|
$
|
-
|
$
|
1,349,994
|
|||||||
| (2) |
These amounts reflect cash payments under our 2018 CIP (the annual cash incentive awards) and under our 2021 Employee LTIP (the long-term
cash performance awards). The cash payments under our 2018 CIP were earned during the fiscal year identified, as disclosed in Annual Cash Incentive Awards. The cash payments for
the long-term cash performance awards under our 2021 Employee LTIP were earned during the fiscal year identified (which is the final fiscal year of the three-year performance period), the fiscal 2025 cash performance
awards granted under our 2021 Employee LTIP were earned over the three-year performance period, as disclosed in Long-Term Incentive Program above. Both the annual cash award and
the long-term cash performance award payments were received after the conclusion of the fiscal year in which they were earned. A detailed description of the fiscal year 2025 payments can be found in the CD&A. The cash
awards for the past three fiscal years are as follows:
|
|
Name and Principal Position
|
Fiscal Year
|
Annual
Cash Award
|
Long-Term
Cash Award
|
Total Non-Equity
Incentive Plan
Compensation
|
|||||||||
|
Mark P. Marron – President and Chief Executive Officer
|
2025
|
$
|
1,356,048
|
$
|
212,891
|
$
|
1,568,939
|
||||||
|
2024
|
$
|
1,158,321
|
$
|
412,500
|
$
|
1,570,821
|
|||||||
|
2023
|
$
|
983,627
|
$
|
300,000
|
$
|
1,283,627
|
|||||||
|
Elaine D. Marion – Chief Financial Officer
|
2025
|
$
|
795,941
|
$
|
116,122
|
$
|
912,063
|
||||||
|
2024
|
$
|
673,443
|
$
|
225,000
|
$
|
898,443
|
|||||||
|
2023
|
$
|
531,690
|
$
|
150,000
|
$
|
681,690
|
|||||||
|
Darren S. Raiguel – Chief Operating Officer
|
2025
|
$
|
795,941
|
$
|
116,122
|
$
|
912,063
|
||||||
|
2024
|
$
|
673,443
|
$
|
225,000
|
$
|
898,443
|
|||||||
|
2023
|
$
|
531,690
|
$
|
150,000
|
$
|
681,690
|
|||||||
| (3) |
The “All Other Compensation” includes imputed income relating to group life insurance, and a Company match to our 401(k) plan, both of which
are available to all employees on the same terms, as well as costs (on a grossed-up basis) relating to their and their families’ attendance at the Company’s meetings for high-performers, which was available for all
attendees at the meeting. For the most recent fiscal year, the grossed-up costs relating to sales meetings attendance by the NEOs and their families was as follows: Mr. Marron - $55,350; Ms. Marion - $62,569; and Mr.
Raiguel - $42,544. All of our NEOs are entitled to an annual executive physical. For health privacy reasons, each NEO has been attributed a cost of $3,750, regardless of whether such benefit was used.
|
From time to time, Mr. Raiguel attends events hosted by our vendor business partners. On such trips, the
vendor business partner paid the expenses for Mr. Raiguel’s spouse to accompany him, with no related expense to the Company, and therefore no related amount is included in “All Other Compensation.” All such trips were properly
reported in accordance with the Company’s policies.
The following table provides information regarding the grants of plan-based awards during fiscal year 2025 under the 2018 CIP
and the Company’s 2021 Employee LTIP.
|
Estimated
Future Payouts
Under Non-Equity
Incentive Plan Awards ($)
|
Estimated
Future Payouts
Under Equity
Incentive Plan Awards (#)
|
All Other Stock
Awards:
Number of Shares
of Stock or Units
(#)(4)
|
Grant Date Fair
Value of Stock
and Option
Awards ($)
(5)
|
||||||||||||||||||||||||||||||||||
|
Name
|
Grant Date
|
Threshold
|
Target
|
Maximum
|
Threshold
|
Target
|
Maximum
|
|
|||||||||||||||||||||||||||||
|
Mark P. Marron
|
6/14/2024
|
30,269
|
$
|
2,199,951
|
|||||||||||||||||||||||||||||||||
|
(1)
|
|
4/2/2024
|
$
|
115,000
|
$
|
1,150,000
|
$
|
2,300,000
|
|||||||||||||||||||||||||||||
|
(2)
|
|
4/2/2024
|
$
|
87,500
|
$
|
350,000
|
$
|
525,000
|
|||||||||||||||||||||||||||||
|
(3)
|
|
4/2/2024
|
509
|
10,185
|
20,370
|
$
|
1,599,860
|
||||||||||||||||||||||||||||||
|
Elaine D. Marion
|
6/14/2024
|
18,574
|
$
|
1,349,958
|
|||||||||||||||||||||||||||||||||
|
(1)
|
|
4/2/2024
|
$
|
67,500
|
$
|
675,000
|
$
|
1,350,000
|
|||||||||||||||||||||||||||||
|
(2)
|
|
4/2/2024
|
$
|
50,000
|
$
|
200,000
|
$
|
300,000
|
|||||||||||||||||||||||||||||
|
(3)
|
|
4/2/2024
|
223
|
4,456
|
8,912
|
$
|
699,948
|
||||||||||||||||||||||||||||||
|
Darren S. Raiguel
|
6/14/2024
|
18,574
|
$
|
1,349,958
|
|||||||||||||||||||||||||||||||||
|
(1)
|
|
4/2/2024
|
$
|
67,500
|
$
|
675,000
|
$
|
1,350,000
|
|||||||||||||||||||||||||||||
|
(2)
|
|
4/2/2024
|
$
|
50,000
|
$
|
200,000
|
$
|
300,000
|
|||||||||||||||||||||||||||||
|
(3)
|
|
4/2/2024
|
239
|
4,774
|
9,548
|
$
|
749,900
|
||||||||||||||||||||||||||||||
| (1) |
These amounts reflect annual cash award opportunities under the 2018 CIP and are described more fully in the CD&A under the heading “Annual Cash Incentive Awards” and subheading “Cash Incentive Awards for Fiscal Year 2025.” Threshold amounts represent the minimal level of
achievement of the lowest weighted financial performance metric, and the maximum amounts represent 200% of target values. Actual payments with respect to the awards for fiscal year 2025 (and paid in the following fiscal
year) are disclosed in the Non-Equity Incentive Plan Compensation column of the 2025 Summary Compensation Table.
|
| (2) |
These amounts reflect cash performance award opportunities under our 2021 Employee LTIP and are more fully described in this CD&A under
the heading “Long-Term Incentive Program.” Threshold amounts represent minimal level of achievement of the lowest weighted financial performance metric, and maximum amounts represent 150% of target values. These awards are
earned on the third anniversary of the grant date to the extent the Company achieves performance goals relating to growth in operating income and growth in net income.
|
|
(3)
|
The amounts represent the number of Performance Stock Units granted to the NEOs under our 2021 Employee LTIP and are
more fully described in this CD&A under the heading "Long-Term Incentive Program.” These awards are based on certain performance metrics for the period of April 1, 2024,
through March 31, 2027, and will be earned (if at all) at the conclusion of the performance period. Threshold amounts represent the minimal level of achievement of the lowest weighted financial performance metric, and
the maximum amounts represent 200% of target values. The vesting may be accelerated in limited circumstances as set forth in the 2021 Employee LTIP, award agreements, and/or employment agreements.
|
| (4) |
These amounts represent the number of shares of restricted stock granted to the NEOs under our 2021 Employee LTIP. Equity awards granted to
the executive officers and reflected in the 2025 Grants of Plan-Based Awards Table vest ratably over a three-year period and may be accelerated in limited circumstances as set forth in the 2021 Employee LTIP, award
agreements, and/or employment agreements.
|
| (5) |
These amounts reflect the grant date fair value of the restricted stock and performance stock units granted in fiscal year 2025. This
represents the aggregate amount that we expect to expense for such grants in accordance with Codification Topic Compensation—Stock Compensation over the grants’ respective service
period. These amounts do not necessarily correspond to the actual values that will be expensed by us or realized by the NEOs. The amounts for the performance stock units assume that the highest level of performance
conditions will be achieved; other assumptions used in calculating these values with respect to restricted stock awards and performance stock units may be found in Note 13 to our financial statements included in our 2025
Form 10-K.
|
The following table provides information concerning the outstanding equity-based awards for our NEOs as of March 31, 2025. Our
Performance Stock Unit awards constitute “Equity Incentive Plan Awards” for the purposes of Item 402(f) of Regulation S-K. The Company does not currently grant new awards of stock options, stock appreciation rights, or similar option-like awards as part
of its compensation program. Accordingly, the Company has no policies or practices to disclose under Item 402(x) of Regulation S-K.
|
Restricted Stock Awards
|
Performance Stock Units
|
|||||||||||||||
|
Name
|
Number of Shares or
Units of Stock That
Have
Not Vested (1)
|
Market Value of Shares
or Units of Stock That
Have
Not Vested (2)
|
Number of Shares
or Units of Stock That
Have
Not Vested (3)
|
Market Value of Shares
or Units of Stock That
Have
Not Vested (4)
|
||||||||||||
|
Mark P. Marron
|
69,030
|
$
|
4,212,901
|
18,358
|
$
|
1,120,389
|
||||||||||
|
Elaine D. Marion
|
42,360
|
$
|
2,585,231
|
7,725
|
$
|
471,457
|
||||||||||
|
Darren S. Raiguel
|
42,360
|
$
|
2,585,231
|
8,452
|
$
|
515,826
|
||||||||||
| (1) |
The following table shows the dates on which the outstanding restricted stock awards as of March 31, 2025, will vest, subject to continued
employment through the vest date, or acceleration in limited circumstances as set forth in the 2021 Employee LTIP, award agreements, and/or employment agreements.
|
|
Vest Date
|
Mark P. Marron
|
Elaine D. Marion
|
Darren S. Raiguel
|
|||
|
6/8/2025
|
12,529
|
7,689
|
7,689
|
|||
|
6/14/2025
|
23,205
|
14,239
|
14,239
|
|||
|
6/14/2026
|
23,206
|
14,240
|
14,240
|
|||
|
6/14/2027
|
10,090
|
6,192
|
6,192
|
| (2) |
We calculated market value of restricted stock awards by multiplying the closing price of our common stock ($61.03) on the last trading day
of our fiscal year, March 31, 2025, by the number of shares indicated.
|
| (3) |
The following table shows the dates on which the outstanding performance share units as of March 31, 2025, will vest, subject
to the Company’s actual performance relative to the applicable performance metrics, and subject to the terms and conditions as set forth in the 2021 Employee LTIP and the award agreements.
|
|
Vest Date
|
Mark P. Marron
|
Elaine D. Marion
|
Darren S. Raiguel
|
|||
|
3/31/2026
|
8,173
|
3,269
|
3,678
|
|||
|
3/31/2027
|
10,185
|
4,456
|
4,774
|
| (4) |
We calculated market value of performance stock unit awards by multiplying the closing price of our common stock ($61.03) on the last trading
day of our fiscal year, March 31, 2025, by the number of shares indicated.
|
The following table sets forth information with respect to the shares of Company common stock acquired by our NEOs through
vesting of restricted stock during our 2025 fiscal year. There were no stock options outstanding during fiscal year 2025.
|
Restricted Stock Awards
|
||||||||
|
Name
|
Gross Number of
Shares Acquired on
Vesting (#)
|
Value Realized on
Vesting (1)
|
||||||
|
Mark P. Marron
|
40,113
|
$
|
2,937,045
|
|||||
|
Elaine D. Marion
|
24,416
|
$
|
1,787,828
|
|||||
|
Darren S. Raiguel
|
24,416
|
$
|
1,787,828
|
|||||
| (1) |
Market value was computed by multiplying the closing price of our common stock on the day of vesting by the number of shares acquired. Additionally, the
restricted shares were net-share settled such that the Company withheld shares with value equivalent to the NEOs’ minimum statutory tax obligation for the applicable income and other employment taxes, and remitted cash to
the appropriate taxing authorities. The amounts in the table represent the gross number of shares and value realized on vesting for each of the NEOs. The net number of shares (after withholding shares for taxes, as
described above) acquired were as follows: Mr. Marron, 24,061; Ms. Marion, 15,446; and Mr. Raiguel, 15,446.
|
Our incentive plans for, and employment agreements with, our NEOs reflect our compensation philosophy. All of our employment
agreements with our NEOs contain “clawback” provisions as required by Dodd-Frank and Sarbanes-Oxley.
In all cases, our NEOs’ receipt of severance payments is contingent upon their executing a release, and certifying that they
will comply with certain confidentiality, non-competition, and non-solicitation provisions of the employment agreement.
The Company’s employment agreements with its NEOs are intended to comply with IRC Section 409A. The material terms of the
employment agreements are described below. Also, pursuant to our 2021 Employee LTIP and standard award agreement, unvested restricted stock, cash performance awards and performance stock units issued to any employee will vest
upon a “Change in Control,” as defined in the 2021 Employee LTIP.
Under the Company’s executive compensation plans, each of Mr. Marron, Ms. Marion and Mr. Raiguel are subject to the following
provisions under various termination scenarios:
| • |
Cash severance in the amount of 18 months base salary for Mr. Marron, and 12 months base salary for Ms. Marion and Mr. Raiguel.
|
| • |
In the event of disability, termination without cause, or termination for good reason (all as defined in the agreement), the Company would
pay an amount equal to the cost of premiums the Company paid prior to the date of termination for the executive and his/her dependents’ qualified coverage under the Company’s medical, prescription, dental, and other
health benefits. Mr. Marron would receive the cost of 18 months’ premiums, and Ms. Marion and Mr. Raiguel would receive the cost of 12 months’ premiums.
|
| • |
In the event of termination without cause or by the executive for good reason, the executive would be entitled to either, at the Company’s
election, the acceleration of unvested restricted stock, or cash in an amount equal to the value of the stock on the date of termination.
|
| • |
Long-Term Cash Incentive Awards and Performance Stock Unit Awards for fiscal performance periods beginning on or after April 1, 2024,
include a provision that, in the event of retirement, if more than one year has passed since the beginning of the performance period, retirement criteria in the Employee LTIP are met, and the executive complies with our
Code of Conduct and certain post-employment requirements, then the award is paid out at the end of the performance period in the same manner as if the executive had remained employed through the full performance period,
based on the Company’s actual performance over the full performance period relative to the applicable performance goals.
|
Employment Agreement Terms
Mark P. Marron
Chief Executive Officer
| • |
Mr. Marron’s currently effective agreement was amended and restated on December 12, 2017, and thereafter amended. Pursuant to such
agreement (and the Compensation Committee’s and Board’s discretion to increase base salary), Mr. Marron’s current base salary is $975,000.
|
| • |
Mr. Marron’s agreement had an initial termination date of January 31, 2018; however, the agreement contains automatic two-year successive
renewal periods unless either party terminates the agreement 60 days prior to the end of the then-current term. As no notice of termination was provided, the expiration date of his agreement is now January 31, 2026.
|
Elaine D. Marion
Chief Financial Officer
| • |
Ms. Marion’s employment agreement was amended and restated on December 12, 2017. Pursuant to such agreement (and the Compensation
Committee’s and Board’s discretion to increase base salary), Ms. Marion’s current base salary is $540,000.
|
| • |
Ms. Marion’s agreement had an initial termination date of July 31, 2018; however, the agreement contains automatic one-year successive
renewal periods unless either party terminates the agreement 60 days prior to the end of the then-current term. As no notice of termination was provided, the expiration date of her agreement is now July 31, 2027.
|
Darren S. Raiguel
Chief Operating Officer
| • |
Mr. Raiguel’s employment agreement was effective as of May 7, 2018. Pursuant to such agreement (and the Compensation Committee’s and
Board’s discretion to increase base salary), Mr. Raiguel’s current base salary is $565,000.
|
| • |
Mr. Raiguel’s agreement had an initial termination date of July 31, 2019; however, the agreement contains automatic one-year successive
renewal periods unless either party terminates the agreement 60 days prior to the end of the then-current term. As no notice of termination was provided, the expiration date of his agreement is now July 31, 2027.
|
Termination Events
The table below summarizes the potential payments and benefits to our NEOs upon the occurrence of certain triggering events.
The table assumes a hypothetical effective date of termination of March 31, 2025, the last day of fiscal 2025. The table does not include accrued, unused vacation time, which is paid to all employees upon termination of
employment, or company-paid life insurance benefits (one year’s salary, up to $250,000) that are provided to all salaried employees, each in accordance with the Company’s policies.
Mark P. Marron
Chief Executive Officer
|
Triggering Event
|
Cash Severance
|
Cash Incentive
Plan Awards
(3)
|
Long-Term Cash
Performance
Awards
(6)
|
Time-Based
Restricted Stock
|
Performance Stock Units
(13)
|
Total
|
||||||||||||||||||||||||||||||||||||||
|
Termination Without Cause,
or for Good Reason (1)
|
$
|
1,513,143
|
(2)
|
|
$
|
1,356,048
|
(4)
|
$
|
412,741
|
(7)
|
$
|
4,212,901
|
(10)
|
$
|
433,625
|
(14)
|
$
|
7,928,458
|
||||||||||||||||||||||||||
|
Change in Control
|
$
|
-
|
$
|
-
|
$
|
350,000
|
(8)
|
$
|
4,212,901
|
(11)
|
$
|
1,299,872
|
(15)
|
$
|
5,862,773
|
|||||||||||||||||||||||||||||
|
Disability
|
$
|
1,513,143
|
(2)
|
|
$
|
1,356,048
|
(4)
|
$
|
680,576
|
(7)
|
$
|
4,212,901
|
(12)
|
$
|
1,299,872
|
(16)
|
$
|
9,062,540
|
||||||||||||||||||||||||||
|
Death
|
$
|
-
|
$
|
1,356,048
|
(4)
|
$
|
680,576
|
(7)
|
$
|
4,212,901
|
(12)
|
$
|
1,299,872
|
(16)
|
$
|
7,549,397
|
||||||||||||||||||||||||||||
|
Retirement
|
$
|
-
|
$
|
1,356,048
|
(5)
|
$
|
350,000
|
(9)
|
$
|
-
|
$
|
1,299,872
|
(17)
|
$
|
3,005,920
|
|||||||||||||||||||||||||||||
Elaine D. Marion
Chief Financial Officer
|
Triggering Event
|
Cash Severance
|
Cash Incentive
Plan Awards
(3)
|
Long-Term Cash
Performance
Awards
(6)
|
Time-Based
Restricted Stock
|
Performance
Stock Units
(13)
|
Total
|
||||||||||||||||||||||||||||||||||||||
|
Termination Without Cause,
or for Good Reason (1)
|
$
|
546,114
|
(2)
|
$
|
795,941
|
(4)
|
$
|
227,266
|
(7)
|
$
|
2,585,231
|
(10)
|
$
|
183,465
|
(14)
|
$
|
4,338,017
|
|||||||||||||||||||||||||||
|
Change in Control
|
$
|
-
|
$
|
-
|
$
|
200,000
|
(8)
|
$
|
2,585,231
|
(11)
|
$
|
549,939
|
(15)
|
$
|
3,335,170
|
|||||||||||||||||||||||||||||
|
Disability
|
$
|
546,114
|
(2)
|
$
|
795,941
|
(4)
|
$
|
380,314
|
(7)
|
$
|
2,585,231
|
(12)
|
$
|
549,939
|
(16)
|
$
|
4,857,539
|
|||||||||||||||||||||||||||
|
Death
|
$
|
-
|
$
|
795,941
|
(4)
|
$
|
380,314
|
(7)
|
$
|
2,585,231
|
(12)
|
$
|
549,939
|
(16)
|
$
|
4,311,425
|
||||||||||||||||||||||||||||
|
Retirement
|
$
|
-
|
$
|
795,941
|
(5)
|
$
|
200,000
|
(9)
|
$
|
-
|
$
|
549,939
|
(17)
|
$
|
1,545,880
|
|||||||||||||||||||||||||||||
|
Triggering Event
|
Cash Severance
|
Cash Incentive
Plan Awards
(3)
|
Long-Term Cash
Performance
Awards
(6)
|
Time-Based
Restricted Stock
|
Performance
Stock Units
(13)
|
Total
|
||||||||||||||||||||||||||||||||||||||
|
Termination Without Cause,
or for Good Reason (1)
|
$
|
584,229
|
(2)
|
$
|
795,941
|
(4)
|
$
|
227,266
|
(7)
|
$
|
2,585,231
|
(10)
|
$
|
200,137
|
(14)
|
$
|
4,392,804
|
|||||||||||||||||||||||||||
|
Change in Control
|
$
|
-
|
$
|
-
|
$
|
200,000
|
(8)
|
$
|
2,585,231
|
(11)
|
$
|
599,933
|
(15)
|
$
|
3,385,164
|
|||||||||||||||||||||||||||||
|
Disability
|
$
|
584,229
|
(2)
|
$
|
795,941
|
(4)
|
$
|
380,314
|
(7)
|
$
|
2,585,231
|
(12)
|
$
|
599,933
|
(16)
|
$
|
4,945,648
|
|||||||||||||||||||||||||||
|
Death
|
$
|
-
|
$
|
795,941
|
(4)
|
$
|
380,314
|
(7)
|
$
|
2,585,231
|
(12)
|
$
|
599,933
|
(16)
|
$
|
4,361,419
|
||||||||||||||||||||||||||||
|
Retirement
|
$
|
-
|
$
|
795,941
|
(5)
|
$
|
200,000
|
(9)
|
$
|
-
|
$
|
599,933
|
(17)
|
$
|
1,595,874
|
|||||||||||||||||||||||||||||
The terms “Termination without Cause,” “Termination for Good Reason,” “Change In Control,” “Disability,” “Death” and “Retirement” are defined in each
executive officer’s respective employment agreement and/or the relevant Plan.
| (1) |
Termination without Cause generally refers to an executive officer’s involuntary termination by the Company (without the presence of
conditions that constitute “Cause”), while Termination for Good Reason generally refers to an executive officer resigning from office (with the presence of conditions that constitute “Good Reason”), in each case in
accordance with the applicable definition under the agreement or Plan.
|
| (2) |
Cash Severance: (i) Termination without Cause or for Good Reason or (ii) Disability. Reflects 18 months base salary for Mr. Marron and 12 months base salary for Ms. Marion and Mr. Raiguel. As provided in each executive officer’s respective employment agreement, this column includes
an amount equal to the cost of premiums paid prior to the date of termination for the executive and his/her dependents’ qualified coverage under the Company’s medical, prescription, dental and other health benefits for
18 months with respect to Mr. Marron and 12 months with respect to Ms. Marion and Mr. Raiguel. The amount of premiums would be paid in cash as opposed to providing continued coverage.
|
| (3) |
The Cash Incentive Plan awards are annual cash incentive awards based on a one-year performance period.
|
| (4) |
Cash Incentive Plan: (i) Termination without Cause or for Good Reason, (ii) Disability or (iii) Death. The executive is entitled to a pro-rated amount of his or her annual incentive award, to the extent performance goals are met. The pro-rated amount is based on the number of months
of employment during the performance period. The amount shown herein is the amount actually achieved for the fiscal year ended March 31, 2025.
|
| (5) |
Cash Incentive Plan: Retirement. The Compensation Committee has
discretion to make a pro-rated award, based upon performance goals met, that is paid at the end of the performance period. The pro-rated amount is based on the number of months of employment during the performance
period. The amount shown herein is the amount actually achieved for the fiscal year ended March 31, 2025, and assumes that the Compensation Committee exercised discretion to make an award. Since the hypothetical
retirement date is March 31, 2025, which is the last day of the Cash Incentive Plan’s performance period, the amount shown is the full amount of the award for the year based on actual performance under the Cash Incentive
Plan’s performance metrics.
|
| (6) |
Our Long-Term Cash Performance Awards have three-year performance periods, aligned with our fiscal year.
|
| (7) |
Long-Term Cash Performance
Award: (i) Termination without Cause or for Good Reason, (ii) Disability, or (iii) Death.
|
| • |
For awards related to three-year performance periods ending March 31, 2025: In order to receive an award for the performance period, the participant must remain
employed through the end of the performance period. Since the hypothetical termination date is March 31, 2025, which is the last day of the cash performance award’s three-year performance period, the amount shown is the
full amount of the award for the year based on actual performance under the award’s performance metrics.
|
| • |
For awards related to three-year performance periods ending March 31, 2026 or later:
|
| o |
Termination without Cause, or for Good Reason. The amount due is
the amount earned as if the executive had remained employed until the end of the performance period, but pro-rated based upon the number of days the executive was employed during the performance period.
|
| o |
Termination in the event of Death or Disability. The award is
paid out at the target level of performance.
|
|
(8)
|
Long-Term Cash Performance Award: Change in Control.
|
| • |
For awards related to three-year performance periods ending March 31, 2025: In order to receive an award for the performance period, the participant must remain
employed through the end of the performance period. Since the hypothetical termination date is March 31, 2025, which is the last day of the cash performance award’s three-year performance period, the amount shown is the
full amount of the award for the year based on actual performance under the award’s performance metrics.
|
| • |
For awards related to three-year performance periods ending March 31, 2026 or later: If there is a termination without Cause or for Good Reason within 24 months
after a Change in Control, and the executive is not provided equivalent value that supersedes his or her award, then the award will be paid out at the target level of performance.
|
|
(9)
|
Long-Term Cash Performance Award: Retirement.
|
| • |
For awards related to three-year performance periods ending March 31, 2025: In order to receive an award for the performance period, the participant must remain
employed through the end of the performance period. Since the hypothetical termination date is March 31, 2025, which is the last day of the cash performance award’s three-year performance period, the amount shown is the
full amount of the award for the year based on actual performance under the award’s performance metrics.
|
| • |
For awards related to three-year performance periods ending March 31, 2026 or later: If at least one year has passed since the beginning of the performance
period, retirement criteria in the Plan are met, reasonable notice of retirement is provided, and the executive has complied with our Code of Conduct and certain post-employment requirements, then the Cash Performance
Award is paid out at the end of the performance period in the same manner as if the executive had remained employed through the full performance period. The amount shown in the above tables is the target amount.
|
| (10) |
Time-Based Restricted Stock: Termination without Cause or for Good Reason. The executive is entitled to, at the Company’s election, either the acceleration of unvested restricted stock, or cash in an amount equal to the value of the stock on the date of termination. The amount in the
tables above reflects all unvested stock, valued at our closing price of $61.03 on March 31, 2025.
|
| (11) |
Time-Based Restricted Stock: Change in Control. Under our 2021
Employee Long-Term Incentive Plan and award agreements for all equity recipients, our restricted stock vests upon a Change in Control. The amount in the tables above reflects all unvested stock, valued at our closing
price of $61.03 on March 31, 2025.
|
| (12) |
Time-Based Restricted Stock: Disability or Death. Under our 2021
Employee Long-Term Incentive Plan and award agreements for all equity recipients, our restricted stock vests upon Disability or Death. The amount in the tables above reflects all unvested stock, valued at our closing
price of $61.03 on March 31, 2025 (the last trading day before the hypothetical effective date of termination of March 31, 2025).
|
| (13) |
Our Performance Stock Units (“PSUs”) have three-year performance periods that correspond with the beginning and end of the applicable fiscal year (for example,
the PSUs awarded for fiscal 2025 have a performance period of April 1, 2024, to March 31, 2027).
|
| (14) |
PSUs: Termination without Cause or for Good Reason. The award
will be paid at the end of the performance period, based on actual performance, but pro-rated based on the number of days employed during the performance period. The amount shown in the above tables reflects one-third
of the target number of shares awarded, valued based on the closing price of $61.03 on March 31, 2025 (the last trading day before the hypothetical effective date of termination of March 31, 2025).
|
| (15) |
PSUs: Change in Control. If there is a Termination without Cause
or for Good Reason within 24 months after a change in control, and the executive is not provided equivalent value that supersedes his or her award, then the award is paid at the end of employment at the greater of the
performance target or the actual level of achievement for certain financial metrics, and the greater of the performance target or actual level of achievement with respect to the Relative TSR Metric. The tables above
reflect the value of the target number of shares awarded based on the closing price of $61.03 on March 31, 2025.
|
| (16) |
PSUs: Death or Disability. The awarded PSUs will vest at the
Performance Target level of achievement. The tables above reflect the value of the target number of shares awarded based on the closing price of $61.03 on March 31, 2025.
|
| (17) |
PSUs: Retirement. If at least one year has passed since the
beginning of the performance period, and the retirement criteria in the plan are met, reasonable notice of retirement is provided, and the executive has complied with our Code of Conduct and certain post-employment
requirements, then following the end of the Performance Period, the PSUs vest based upon the actual performance level achieved in the same manner as if the executive had remained employed until the end of the performance
period. The tables above reflect the value of the target number of shares awarded based on the closing price of $61.03 on March 31, 2025.
|
Pursuant to Item 402(u) of Regulation S-K, the Company is required to provide annual disclosure of the ratio of the median of
the total annual compensation of all employees of the Company (other than Mr. Marron, the Company’s CEO) to the total annual compensation of the principal executive officer, which for ePlus
is our CEO, Mr. Marron. The purpose of the required disclosure is to provide a measure of the equitability of pay within the Company. ePlus believes its compensation philosophy and
process yield an equitable result. The below table shows our median employee annual compensation and the total compensation of Mr. Marron as reflected in the Summary Compensation Table, as well as the ratio of the two pay
levels.
|
Median Employee
Total Annual Compensation
|
Mr. Marron’s
Total Annual Compensation
|
Pay Ratio
|
|
$112,188
|
$6,407,550
|
57.1 to 1
|
Our median employee identified for the prior years’ pay disclosure is no longer the median employee
as a result of our acquisition of Bailiwick Services, LLC in August 2024, which led to our increasing our employee headcount for all the employees that were hired during this period. Accordingly, as permitted under SEC rules,
for purposes of our 2025 pay ratio disclosure, we have determined a new median employee using the methodology described below. In determining our median employee for these purposes, we considered the
full annual compensation of all individuals who were employed throughout the entire 2024 calendar year, and annualized compensation for employees who joined ePlus during 2024, with the
following adjustments. Our employee population on December 31, 2024, after taking into consideration the adjustments permitted by SEC rules and described below, consisted of approximately 2,290 individuals. We did not include
our 50 non-U.S.-based employees in the calculation, which was less than 5% of our total workforce, and consists of 24 employees in the United Kingdom and 26 employees in India. We selected our median employee from the list of
the remaining employees. To identify our median employee, we calculated compensation as the sum of (i) base salary, (ii) commissions, if any, (iii) equity that vested during the year, if any, and (iv) the amount of our
contributions to the retirement plans in which the employee participates. Using this methodology, we determined that the median employee was an exempt, salaried, full-time employee located in Rochester, New York, with an annual
total compensation of $112,188 for the calendar year ended December 31, 2024, calculated in accordance with SEC rules. Mr. Marron’s compensation was calculated using the same methodology that the Company used to calculate the
CEO’s annual total compensation for the 2025 Summary Compensation Table described above.
To ascertain the median employee’s compensation this year, we calculated his or her annual total compensation under the
Summary Compensation Table rules in a manner that is consistent with the calculation of our CEO’s compensation, without any adjustments or estimates. The SEC requirements for identifying our median employee and calculating the
pay ratio based on that employee’s annual total compensation allow companies to adopt a variety of methodologies, apply certain exclusions, and make reasonable estimates and assumptions that reflect their compensation practices.
Accordingly, the pay ratio we report may not be comparable to the pay ratio other companies report.
As required by Section 953(a) of Dodd-Frank, and Item 402(v) of Regulation S-K, we are providing the following
information reflecting the relationship between executive compensation actually paid by the Company and the Company’s financial performance for each of the last three completed calendar years. In determining the compensation
“actually paid” to our NEOs, we are required to make various adjustments to amounts that have been previously reported in the Summary Compensation Table in previous years, as the SEC’s valuation methods for this section differ
from those required in the Summary Compensation Table. For further information concerning the Company’s pay for performance philosophy and how the Company aligns executive compensation with the Company’s performance, refer to
the “Compensation Discussion and Analysis” provided elsewhere in this proxy statement. The Compensation Committee did not
consider the pay versus performance disclosure below in making its pay decisions for any of the fiscal years shown.
The table below summarizes compensation values both reported in our 2025 Summary Compensation Table, as well as the adjusted values required in this
section for the last five fiscal years.
|
Fiscal
Year
|
Summary Compensation Table Total to PEO
|
Compensation
Actually Paid to
PEO
|
Average Summary
Compensation
Table Total for
Non-PEO NEOs
|
Average
Compensation
Actually Paid to
Non-PEO NEOs
|
Value of Initial Fixed $100
Investment Based On:
|
Net Income
($ thousands)
|
Operating
Income
($ thousands)
|
|||||||||||||||||||||||||
|
Company TSR
|
Peer Group TSR
|
|||||||||||||||||||||||||||||||
|
(a)
|
(b)
|
(c)
|
(d)
|
(e)
|
(f)
|
(g)
|
(h)
|
|||||||||||||||||||||||||
|
2025
|
$
|
|
$
|
|
$
|
|
$
|
|
$
|
|
$
|
|
$
|
|
$
|
|
||||||||||||||||
|
2024
|
$
|
|
$
|
|
$
|
|
$
|
|
$
|
|
$
|
|
$
|
|
$
|
|
||||||||||||||||
|
2023
|
$
|
|
$
|
|
$
|
|
$
|
|
$
|
|
$
|
|
$
|
|
$
|
|
||||||||||||||||
|
2022
|
$
|
|
$
|
|
$
|
|
$
|
|
$
|
|
$
|
|
$
|
|
$
|
|
||||||||||||||||
|
2021
|
$
|
|
$
|
|
$
|
|
$
|
|
$
|
|
$
|
|
$
|
|
$
|
|
||||||||||||||||
| (a) |
Reflects compensation amounts reported in the “2025 Summary Compensation Table” for our President and Chief Executive Officer,
|
| (b) |
Compensation actually paid to our President and Chief Executive Officer for each period presented, as computed in accordance with SEC rules,
does not reflect the actual amount of compensation earned or received during the applicable fiscal year. In accordance with SEC rules, these amounts differ from the total compensation reported in the “2025 Summary
Compensation Table” for each fiscal year as shown below. The fair value of equity awards was determined using methodologies and assumption developed in a manner substantively consistent with those used to determine the
grant date fair value of such awards in accordance with Codification Topic Compensation – Stock Compensation.
|
|
Fiscal 2025
|
Fiscal 2024
|
Fiscal 2023
|
Fiscal 2022
|
Fiscal 2021
|
|||||||||||||||||||
|
Summary Compensation Table Total
|
$
|
|
$
|
|
$
|
|
$
|
|
$
|
|
|||||||||||||
|
-
|
Grant Date Fair Value of Stock Awards Granted in Fiscal Year
|
$
|
(
|
)
|
$
|
(
|
)
|
$
|
(
|
)
|
$
|
(
|
)
|
$
|
(
|
)
|
|||||||
|
+
|
Fair Value at Fiscal Year-End of Outstanding Unvested Stock Awards Granted in Fiscal Year
|
$
|
|
$
|
|
$
|
|
$
|
|
$
|
|
||||||||||||
|
±
|
Change in Fair Value of Outstanding Unvested Stock Awards Granted in Prior Fiscal Years
|
$
|
(
|
)
|
$
|
|
$
|
(
|
)
|
$
|
|
$
|
|
||||||||||
|
±
|
Fair Value at Vesting of Stock Awards Granted in Fiscal Year That Vested During Fiscal Year
|
$
|
|
$
|
|
$
|
|
$
|
|
$
|
|
||||||||||||
|
±
|
Change in Fair Value as of Vesting Date of Stock Awards Granted in Prior Fiscal Years for Which Applicable Vesting Conditions Were Satisfied
During Fiscal Year
|
$
|
(
|
)
|
$
|
|
$
|
|
$
|
(
|
)
|
$
|
|
||||||||||
|
-
|
Fair Value as of Prior Fiscal Year-End of Stock Awards Granted in Prior Fiscal Years That Failed to Meet Applicable Vesting Conditions During
Fiscal Year
|
$
|
|
$
|
|
$
|
|
$
|
|
$
|
|
||||||||||||
|
+
|
Dividends Accrued During Fiscal Year
|
$
|
|
$
|
|
$
|
|
$
|
|
$
|
|
||||||||||||
|
Compensation Actually Paid
|
$
|
|
$
|
|
$
|
|
$
|
|
$
|
|
|||||||||||||
| (c) |
Reflects the average compensation amounts reported in the “2025 Summary Compensation Table” for our
NEOs (excluding the President and Chief Executive Officer), which included the Chief Financial Officer, Ms. Marion, and the Chief Operating Officer, Mr. Raiguel, in each year presented.
|
| (d) |
Average compensation actually paid to our NEOs (excluding the President and Chief Executive Officer) for each period presented, as computed
in accordance with SEC rules, does not reflect the actual amount of compensation earned or received during the applicable fiscal year. In accordance with SEC rules, these amounts differ from the average total compensation
reported in the “2025 Summary Compensation Table” for each fiscal year as shown below. The fair value of equity awards was determined using methodologies and assumptions developed
in a manner substantively consistent with those used to determine the grant date fair value of such awards in accordance with Codification Topic Compensation – Stock Compensation.
|
|
Fiscal 2025
|
Fiscal 2024
|
Fiscal 2023
|
Fiscal 2022
|
Fiscal 2021
|
|||||||||||||||||||
|
Summary Compensation Table Total
|
$
|
|
$
|
|
$
|
|
$
|
|
$
|
|
|||||||||||||
|
-
|
Grant Date Fair Value of Stock Awards Granted in Fiscal Year
|
$
|
(
|
)
|
$
|
(
|
)
|
$
|
(
|
)
|
$
|
(
|
)
|
$
|
(
|
)
|
|||||||
|
+
|
Fair Value at Fiscal Year-End of Outstanding Unvested Stock Awards Granted in Fiscal Year
|
$
|
|
$
|
|
$
|
|
$
|
|
$
|
|
||||||||||||
|
±
|
Change in Fair Value of Outstanding Unvested Stock Awards Granted in Prior Fiscal Years
|
$
|
(
|
)
|
$
|
|
$
|
(
|
)
|
$
|
|
$
|
|
||||||||||
|
±
|
Fair Value at Vesting of Stock Awards Granted in Fiscal Year That Vested During Fiscal Year
|
$
|
|
$
|
|
$
|
|
$
|
|
$
|
|
||||||||||||
|
±
|
Change in Fair Value as of Vesting Date of Stock Awards Granted in Prior Fiscal Years for Which Applicable Vesting Conditions Were Satisfied
During Fiscal Year
|
$
|
(
|
)
|
$
|
|
$
|
|
$
|
(
|
)
|
$
|
|
||||||||||
|
-
|
Fair Value as of Prior Fiscal Year-End of Stock Awards Granted in Prior Fiscal Years That Failed to Meet Applicable Vesting Conditions During
Fiscal Year
|
$
|
|
$
|
|
$
|
|
$
|
|
$
|
|
||||||||||||
|
+
|
Dividends Accrued During Fiscal Year
|
$
|
|
$
|
|
$
|
|
$
|
|
$
|
|
||||||||||||
|
Compensation Actually Paid
|
$
|
|
$
|
|
$
|
|
$
|
|
$
|
|
|||||||||||||
| (e) |
Reflects the TSR of a $100 investment in ePlus’ common stock. Cumulative TSR is calculated by
dividing (a) the sum of (i) the cumulative amount of any dividends for the measurement period, assuming dividend reinvestment, and (ii) the difference between the Company’s stock price at the end and the beginning of the
measurement period by (b) the Company’s stock price at the beginning of the measurement period. The beginning of the measurement period for each year in the table is March 31, 2020. Historical stock performance is not
necessarily indicative of future stock performance.
|
| (f) |
Reflects the TSR of a $100 investment in the S&P 600 Small Cap Information Technology Group, which is used in the stock performance graph
required by Item 201(e) of Regulation S-K included in our Annual Report for the applicable fiscal year. Historical stock performance is not necessarily indicative of future stock performance.
|
| (g) |
The dollar amounts reported represent the amount of net income reflected in the Company’s audited financial statements for the applicable
fiscal year.
|
| (h) |
The “Company-Selected Measure” (as defined in Item 402(v) of Regulation S-K) is our
|
Pay Versus Performance Relationship Descriptions
The charts below illustrate the relationship between the PEO and average Non-PEO Compensation Actually Paid (“CAP”)
amounts and the S&P 600 Small Cap Information Technology Group’s (our “TSR Peer Group”) TSR during the periods ended March 31, 2021, 2022, 2023, 2024 and 2025.
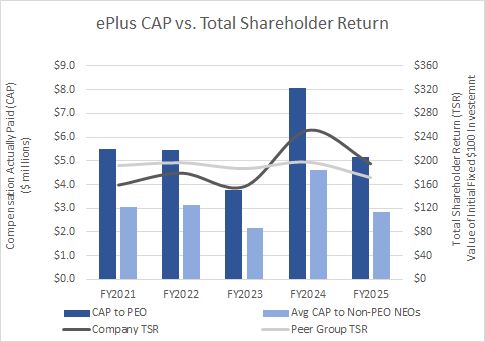
The chart below demonstrates the relationship between CAP amounts for our PEO and non-PEO executive officers and our net income.

The chart below demonstrates the relationship between CAP amounts for our PEO and non-PEO executive officers and our operating income.
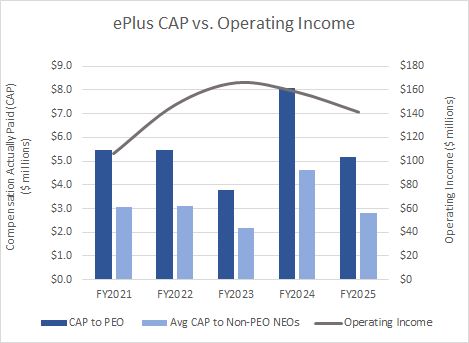
Financial Performance Measures
Below is an unranked list of the most important performance measures used to link executive compensation actually paid for the most recently
completed fiscal year, as described above, to the Company’s performance:
| • |
|
| • |
|
| • |
|
| • |
|
The following table provides information as of March 31, 2025, regarding the number of securities available for future issuance under our current
equity compensation plans. Currently, there are no outstanding options, warrants, or rights under our prior or current equity compensation plans pursuant to which common stock may be issued.
|
Number of securities
to be issued upon
exercise of
outstanding options,
warrants, and rights
|
Weighted average
exercise price of
outstanding
options, warrants,
and rights
|
Number of securities
remaining available for
future issuance under
equity compensation
plans (excluding securities
reflected in first column)
|
||||||||||
|
Equity compensation plans approved by security holders
|
34,535
|
(1)
|
n/a
|
2,817,005
|
(2)
|
|||||||
|
Equity compensation plans not approved by security holders
|
-
|
n/a
|
-
|
|||||||||
|
Total
|
34,535
|
2,817,005
|
||||||||||
|
(1)
|
This number represents the number of Performance Share Units at target level.
|
| (2) |
This number includes 292,034 shares reserved for issuance under the 2024 Non-Employee Director Long-Term Incentive Plan and available for
future equity awards, and 2,524,971 shares reserved for issuance under the 2021 Employee Long Term Incentive Plan.
|
PROPOSAL 3 –
Ratification of the Selection of Deloitte & Touche LLP as our Independent Registered Public Accounting Firm for our Fiscal Year Ending March 31, 2026
The Board and the Audit Committee recommend that the shareholders ratify the selection of Deloitte as the Company’s
independent registered public accounting firm for the fiscal year ending March 31, 2025. Deloitte is currently the Company’s independent registered public accounting firm, and the Audit Committee approved the selection and
retention of Deloitte for fiscal year 2026.
Neither the Company’s Charter, Bylaws or other governing documents nor the law require shareholder ratification of the
selection of Deloitte as the Company’s independent registered accounting firm. As a matter of good corporate practice; however, the Company is submitting the selection of Deloitte to the shareholders for ratification. If the
shareholders fail to ratify the selection, the Audit Committee will reconsider whether to retain Deloitte. Even if the selection is ratified, the Audit Committee retains discretion to select a different independent registered
accounting firm at any time if the Audit Committee determines that such a change would be in the best interest of the Company and its shareholders.
Representatives of Deloitte are expected to attend the 2025 Annual Meeting and will have the opportunity to make a statement
and respond to appropriate questions.
THE BOARD UNANIMOUSLY RECOMMENDS VOTING FOR RATIFICATION
OF THE SELECTION OF DELOITTE & TOUCHE LLP AS THE COMPANY’S INDEPENDENT REGISTERED PUBLIC ACCOUNTING FIRM FOR THE FISCAL YEAR ENDING MARCH 31, 2026
The Audit Committee’s report regarding the Company’s audited consolidated financial statements for the
fiscal year ended March 31, 2025, is below. The information contained in this report shall not be deemed to be (i) soliciting material, (ii) filed with the SEC, (iii) subject to Regulations 14A or 14C of the Exchange Act, or
(iv) subject to the liabilities of Section 18 of the Exchange Act. Further, this report shall not to be deemed incorporated by reference in any filing of the Company under the Securities Act of 1933, as amended, or the Exchange
Act, whether made before or after the date hereof and irrespective of any general incorporation of this proxy statement by reference, except to the extent the Company specifically incorporates this report by reference into such
filing.
The Audit Committee has certain duties and powers as described in its written charter adopted by the Board,
which is available on the Investors section of the Company’s website at https://www.eplus.com/investors/corporate-governance-legal/committee-charters.
The Audit Committee is responsible primarily for assisting the Board in its oversight of the Company’s accounting and financial reporting processes, including audits of the Company’s financial statements and the integrity of
its financial statements, determining the independent registered public accounting firm’s qualifications and independence, and evaluating the performance of the Company’s internal audit function and that of the independent
registered public accounting firm. The Audit Committee does not itself prepare financial statements or perform audits. All members of the Audit Committee are “independent,” as required by applicable Nasdaq Listing Rules and
in accordance with SEC rules and regulations, as currently in effect, and each such member has the ability to read and understand fundamental financial statements.
Management is responsible for the preparation, presentation, and integrity of the Company’s financial statements;
establishment and effectiveness of internal controls over financial reporting; and maintenance of appropriate accounting and financial reporting principles, policies, and internal controls and procedures that provide for
compliance with accounting standards and applicable laws and regulations. Deloitte, as the Company’s independent registered public accounting firm, is responsible for planning and carrying out a proper audit of the Company’s
annual financial statements in accordance with the auditing standards of the Public Company Accounting Oversight Board (United States) (“PCAOB”), expressing an opinion as to the conformity
of such financial statements with generally accepted accounting principles, and auditing the effectiveness of internal controls over financial reporting.
In performing its oversight role, the Audit Committee has reviewed and discussed the audited consolidated financial statements
with management and Deloitte. The Audit Committee has discussed with Deloitte the matters required to be discussed by the applicable requirements of the PCAOB and the SEC. The Audit Committee has received the written disclosures
and the letter from Deloitte required by the applicable requirements of the PCAOB regarding the independent auditors’ communications with the Audit Committee concerning independence, and has discussed with Deloitte its
independence. Deloitte has unfettered access to the Audit Committee to discuss any matters Deloitte deems appropriate.
Members of the Audit Committee rely without independent verification on the information provided to them and on the
representations of management and Deloitte. Accordingly, the Audit Committee’s oversight does not provide an independent basis to determine that management has maintained appropriate accounting and financial reporting
principles, or appropriate internal controls and procedures designed to assure compliance with accounting standards and applicable laws and regulations. Furthermore, the Audit Committee’s considerations and discussions referred
to above do not assure that the audit of the Company’s consolidated financial statements has been carried out in accordance with the auditing standards of the PCAOB, that the consolidated financial statements are presented in
accordance with accounting principles generally accepted in the United States, that Deloitte is in fact “independent”, or the effectiveness of the Company’s internal controls.
Based on the review and discussions noted above, and subject to the limitations on the role and responsibilities of the Audit
Committee described above, the Audit Committee recommended to the Board of Directors that the audited consolidated financial statements be included in the Annual Report on Form 10-K for the fiscal year ended March 31, 2025. This
report is provided by the following independent directors, who served on the Audit Committee during the 2025 fiscal year.
Submitted by the Audit Committee
Melissa J. Ballenger, Chair
John E. Callies
Maureen F. Morrison
Deloitte has served as the Company’s independent registered public accounting firm since 1990. The Audit Committee of the
Board has selected Deloitte as the Company’s independent registered accounting firm for the fiscal year ending March 31, 2026.
The following table presents the aggregate fees paid to or accrued by ePlus relating to fees due to
Deloitte for the audit of the Company’s annual consolidated financial statements, and all other professional services rendered by Deloitte, for the fiscal years ended March 31, 2025, and 2024:
|
Fiscal 2025
|
Fiscal 2024
|
|||||||
|
Audit Fees
|
$
|
2,328,957
|
$
|
1,850,000
|
||||
|
Audit‐Related Fees
|
22,267
|
-
|
||||||
|
Tax Fees
|
-
|
-
|
||||||
|
All Other Fees
|
-
|
82,250
|
||||||
|
TOTAL FEES
|
$
|
2,351,224
|
$
|
1,932,250
|
||||
Audit Fees and Audit-Related Fees
Deloitte billed fees for the fiscal year ended March 31, 2025. The Audit Committee pre-approves all auditing services (which
may entail providing comfort letters in connection with securities underwriting), and all audit-related services Deloitte provided to us, subject to a de minimis exception in accordance with SEC’s rules.
Tax Fees
Deloitte provided no tax services, and thus billed no tax fees for the fiscal years ended March 31, 2025, and 2024.
All Other Fees
In the fiscal year ended March 31, 2025, Deloitte provided services relating to (i) consultations with respect to our inventory
and (ii) our acquisition of Bailiwick Services, LLC. In the fiscal year ended March 31, 2024, Deloitte provided services relating to the modification in our segment reporting.
It is the policy of the Audit Committee to pre-approve all audit and permitted non-audit services proposed to be performed by
our independent registered public accounting firm. Each year, the Audit Committee approves the terms on which the independent auditor is engaged for the ensuing fiscal year. Pre-approval for audit and non-audit services is
generally provided in the annual engagement letter with Deloitte. In accordance with the charter of the Audit Committee, the authority to pre-approve any audit or non-audit services to be performed by the independent auditor has
been delegated to the Chair of the Audit Committee, provided that the services are ratified by the Audit Committee at its next scheduled meeting. Accordingly, any engagement for audit or non-audit services may be approved by (i)
the Audit Committee or (ii) the Audit Committee Chair, subject to ratification by the Audit Committee as described above. Deloitte and management are required to report periodically to the Audit Committee regarding the extent of
services provided by the independent registered public accounting firm in accordance with this pre-approval, and the fees for the services performed to date.
The affirmative vote of the holders of a majority of the shares entitled to vote on Proposal 3, present in person or represented
by proxy at the meeting, is required to ratify Proposal 3. Abstentions will have no effect on this proposal. If you do not instruct your broker, bank or other nominee how to vote on this proposal, your broker may vote your shares
on Proposal 3; accordingly there will not be broker non-votes.
Why did I receive these proxy materials?
These proxy materials are first being distributed on or about July 30, 2025, to the Company’s shareholders in connection with
our Board’s solicitation of proxies to be voted at the 2025 Annual Meeting on September 16, 2025, at 8:30 a.m. ET, at the Westin Washington Dulles Airport, 2520 Wasser Terrace, Herndon, Virginia 20171, and any postponement or
adjournment thereof. This proxy statement describes the matters on which you, as a shareholder of the Company, are entitled to vote. It also includes information that we are required to provide to you under SEC rules and is
designed to assist you in voting your shares.
What is the purpose of the 2025 Annual Meeting?
At our 2025 Annual Meeting, shareholders will be asked to vote to (1) elect the seven director nominees named in this proxy
statement for a term expiring at the 2025 Annual Meeting of Shareholders; (2) approve, on an advisory basis, the compensation of our NEOs; and (3) ratify the appointment of the Company’s independent registered public accounting
firm; See the sections entitled “Proposal 1 – Election of Directors,” “Proposal 2 – Advisory Vote to Approve Named Executive Officer Compensation,” and “Proposal 3 – Ratification of Independent Registered Public Accounting Firm.”
The Board does not know of any matters to be brought before the meeting other than as set forth in the Notice of 2025 Annual
Meeting of Shareholders.
Who may attend the 2025 Annual Meeting?
Only holders of our common stock as of the close of business on our Record Date, which was July 22, 2025, or their duly
appointed proxies, may attend the 2025 Annual Meeting. If you hold your shares through a broker, bank, or other nominee, you will be required to show the notice or voting instructions form you received from your broker, bank, or
other nominee, or a copy of the statement (such as a brokerage statement) from your broker, bank, or other nominee reflecting your stock ownership as of our Record Date to be admitted to the 2025 Annual Meeting.
Who may vote at the 2025 Annual Meeting?
Holders of our common stock as of the close of business on the Record Date are entitled to notice of,
and to vote at, the 2025 Annual Meeting. As of July 22, 2025, there were 26,625,574 shares of our common stock outstanding, which includes unvested 258,889 shares of restricted stock entitled to vote at the 2025 Annual Meeting,
with each share entitled to one vote.
How do I vote at the 2025 Annual Meeting?
Eligible shareholders may vote in one of four ways:
| • |
By telephone. Use the toll-free
telephone number shown on your Notice or proxy card;
|
| • |
Via the Internet. Visit the Internet
website shown on your Notice or proxy card and follow the on-screen instructions;
|
| • |
By mail. Date, sign, and promptly return
your proxy card by mail in a postage prepaid envelope; or
|
| • |
In person. Deliver a completed proxy
card at the meeting to vote in person.
|
Voting instructions for eligible shareholders (including instructions for both telephonic and Internet voting) are provided
under the heading “Voting Information” of this proxy statement and on the proxy card. The telephone and Internet voting procedures are designed to authenticate shareholder identities, allow
shareholders to give voting instructions, and confirm that the shareholders’ instructions have been recorded properly. A control number, located on the Notice and the proxy card, will identify shareholders and allow them to submit
their proxies and confirm that their voting instructions have been properly recorded. Costs associated with telephone and electronic access, such as usage charges from telephone companies and Internet access providers, must be
borne by the shareholder. If you submit your proxy by telephone or via the Internet, it will not be necessary to return your proxy card by mail. The deadline for voting by telephone or via the Internet is 8:30 a.m. ET on September
16, 2025. Any proxy card submitted by mail must be received by 8:30 a.m. ET on September 16, 2025.
Further, a proxy that is signed and dated, but which does not contain voting instructions, will be voted as recommended by our
Board on each proposal.
What if I do not vote or do not indicate how my shares should be voted on my proxy card?
If an eligible shareholder does not return a signed proxy card or submit a proxy by telephone or via the Internet, and does not
attend the meeting and vote in person, his or her shares will not be voted. Shares of our common stock represented by properly executed proxies received by us or proxies submitted by telephone or via the Internet, and which are
not revoked, will be voted at the meeting in accordance with the instructions contained therein.
If you submit a properly completed proxy but do not indicate how your shares should be voted on a proposal,
the shares represented by your proxy will be voted as the Board recommends on such proposal.
If you are the beneficial owner of shares held for you by a broker, your broker must vote those shares in accordance with your
instructions. A “broker non-vote” occurs when a broker or other nominee holding shares for a beneficial owner does not vote on a particular proposal because the broker or other nominee does not have discretionary voting power for
that item and has not received instructions from the beneficial owner.
| • |
Non-Discretionary Items. The election of
directors (Proposal 1), and the advisory vote to approve NEO compensation (Proposal 2) may not be voted on by your broker if it has not received voting instructions.
|
| • |
Discretionary Items. The ratification of
Deloitte as the Company’s independent registered public accounting firm (Proposal 3) is a discretionary item. Generally, brokers that do not receive voting instructions from beneficial owners may vote on this proposal
in their discretion.
|
How can I change my votes or revoke my proxy after I have voted?
Any proxy signed and returned by a shareholder or submitted by telephone or via the Internet may be revoked or changed at any
time before it is exercised at the 2025 Annual Meeting, or any adjournments or postponements thereof, by:
| • |
Mailing written notice of revocation or change to our Corporate Secretary, at ePlus inc., 13595
Dulles Technology Drive, Herndon, Virginia 20171;
|
| • |
Delivering a later-dated proxy (either in writing, by telephone, or via the Internet); or
|
| • |
Voting in person at the meeting.
|
Attendance at the meeting will not, in and of itself, constitute revocation of a proxy.
No. As a matter of policy, shareholder proxies, ballots, and tabulations that identify individual shareholders are not publicly
disclosed and are available only to the inspector of election and certain employees of the Company who are obligated to keep such information confidential.
Who will count the votes?
A representative of the Company’s Transfer Agent, Computershare, will serve as the inspector of election for the 2025 Annual
Meeting, and will count the votes.
What if other matters come up during the 2025 Annual Meeting?
If any other matters properly come before the meeting, including a question of adjourning or postponing the meeting, the persons
named in the proxies or their substitutes acting thereunder will have discretion to vote on such matters in accordance with their best judgment.
What constitutes a quorum at the 2025 Annual Meeting?
A quorum is required to transact business at the 2025 Annual Meeting. To constitute a quorum, there must be in attendance or
represented by proxy a majority of the voting power of the outstanding capital stock entitled to vote at the 2025 Annual Meeting. Abstentions and broker non-votes count toward the establishment of a quorum.
How many votes are required to approve each matter to be considered at the 2025 Annual Meeting?
Assuming a quorum is present at the 2025 Annual Meeting, the vote required for each of the proposals scheduled to come before the 2025 Annual
Meeting is as follows.
Proposal 1: Election of directors. Each of the seven nominees for director will be elected by a majority of the votes cast with respect to that director at the 2025 Annual Meeting and entitled to vote on the election of directors. Additionally, pursuant to
the Company’s Guidelines, because each incumbent director’s term continues until his or her successor is elected and qualified, for the avoidance of doubt, each director is required to resign should he or she not receive a
majority of the votes cast. For Proposal 1, you may vote “FOR” or “AGAINST” each of the nominees or you may “ABSTAIN” from voting with respect to each of the nominees. Abstentions and broker non-votes will have no effect on the
vote for this proposal.
Please note that in the event of a contested election (one where the number of director nominees exceeds the number of directors
fixed by the Board in accordance with the Bylaws), director nominees who receive the most votes for the number of seats up for election will be elected.
Proposal 2: Advisory vote to approve NEO compensation. The
affirmative vote of the holders of a majority of the shares entitled to vote on the proposal, present in person or represented by proxy at the meeting, is required to approve on an advisory, non-binding basis the compensation paid
to our NEOs. For Proposal 2, you may vote “FOR” or “AGAINST” the advisory vote to approve NEO compensation or you may “ABSTAIN” from voting with respect to the proposal. Abstentions and broker non-votes will have no effect on the
vote for this proposal.
Proposal 3: Ratification of Deloitte & Touche LLP as the Company’s independent registered public
accounting firm. The affirmative vote of the holders of a majority of the shares entitled to vote on the proposal, present in person or represented by proxy
at the meeting, is required to ratify Deloitte as the Company’s independent registered public accounting firm for the fiscal year ending March 31, 2026. For Proposal 3, you may vote “FOR” or “AGAINST” the vote to ratify Deloitte
as the Company’s independent registered public accounting firm or you may “ABSTAIN” from voting with respect to the proposal. Abstentions will have no effect on the vote for this proposal. If you do not instruct your broker,
bank or other nominee how to vote on this proposal, your broker may vote your shares on the proposal, so no broker non-votes are expected.
Who
pays to prepare, mail, and solicit the proxies?
The Company will bear the costs of solicitation of proxies for the 2025 Annual Meeting, including preparation, assembly,
printing, and mailing of the Notice, this proxy statement, the Annual Report, the proxy card, and any additional information furnished to shareholders. We may reimburse persons representing beneficial owners of common stock for
their costs of forwarding any solicitation materials to such beneficial owners. Proxies may be solicited in person or by mail, telephone, or electronic transmission on our behalf by our directors, officers, or employees. However,
we do not reimburse or pay additional compensation to our own directors, officers, or other employees for soliciting proxies.
The Board knows of no other matters that will be presented for consideration at the 2025 Annual Meeting. If any other matters
are properly brought before the meeting, the persons named in the accompanying proxy will have the discretionary authority to vote such proxy on such matters in accordance with their best judgment.
A copy of our Annual Report, which includes our 2025 Form 10-K, as filed with the SEC, will be sent to any shareholder without
charge upon written request addressed to Investor Relations, at ePlus inc., 13595 Dulles Technology Drive, Herndon, Virginia 20171.
You may also obtain our Form 10-K via the SEC’s Internet site, www.sec.gov, or our Annual Report, which includes our 2025 Form 10-K, via our website, www.eplus.com/Investors/Pages/Annual-Reports.aspx.
Additional copies of the Annual Report, the Notice, this proxy statement, and the accompanying proxy may be obtained from our
Investor Relations department at the address above.
Company shareholders who share an address may receive only one copy of the Notice or this proxy statement and the Annual Report
from their bank, broker, or other nominee, unless contrary instructions are received. We will deliver promptly a separate copy of the Notice or this proxy statement and Annual Report to any shareholder who resides at a shared
address and to which a single copy of the documents was delivered, if the shareholder makes a request by contacting our Corporate Secretary, at ePlus inc., 13595 Dulles Technology Drive,
Herndon, Virginia 20171, or by telephone at (703) 984-8400. If you wish to receive separate copies of the Notice or this proxy statement and the Annual Report in the future, or if you are receiving multiple copies and would like
to receive a single copy for your household, you should contact your broker, bank, or other nominee.
Shareholders have the opportunity to submit proposals for the 2026 Annual Meeting of Shareholders. To be
considered for inclusion in the Company’s proxy statement and form of proxy for next year’s Annual Meeting of Shareholders, your shareholder proposal must be submitted in writing by April 1, 2026, (assuming the 2026 Annual
Meeting of Shareholders is held within 30 days of the anniversary of this 2025 Annual Meeting), to the Corporate Secretary at ePlus inc., 13595 Dulles Technology Drive, Herndon, Virginia 20171. Proposals must be received by that date and satisfy the requirements of Rule 14a-8 under the
Exchange Act to be included in the proxy statement and on the proxy card that will be used for solicitation of proxies by the Board for the 2026 Annual Meeting of Shareholders. In addition, to comply with the universal proxy
rules, shareholders who intend to solicit proxies in support of director nominees other than the Company’s nominees must provide notice that sets forth the information required by Rule 14a-19 under the Exchange Act postmarked or
transmitted electronically no later than July 18, 2026 (assuming the 2026 Annual Meeting of Shareholders is held within 30 days of the anniversary of this 2025 Annual Meeting).
In accordance with our Bylaws, if you wish to submit a proposal for consideration at next year’s Annual Meeting of Shareholders
that is to be included in next year’s proxy materials, or wish to nominate a candidate for election to the Board at next year’s Annual Meeting of Shareholders, your proposal or nomination must be submitted in writing and received
by the Corporate Secretary not more than 120 days nor later than 90 days in advance of the first anniversary of this 2025 Annual Meeting if the 2026 Annual Meeting of Shareholders is held within 30 days of the anniversary of this
2025 Annual Meeting or, otherwise, within seven days after the first public announcement of the date of the 2026 Annual Meeting of Shareholders. Assuming that our 2026 Annual Meeting of Shareholders is held on schedule, to be
“timely” within the meaning of Rule 14a-4(c) under the Exchange Act, we must receive written notice of your intention to introduce a nomination or other item of business at that Meeting not earlier than May 19, 2026, and not later
than June 18, 2026. If we do not receive written notice during that time period, or if we meet certain other requirements of the SEC rules, the persons named as proxies in the proxy materials relating to that meeting will use
their discretion in voting the proxies if any such matters are raised at the meeting.
A submission by an ePlus shareholder must contain the specific information required in ePlus’ Bylaws. If you would like a copy of ePlus’ current Bylaws, please write to
the Corporate Secretary at ePlus inc., 13595 Dulles Technology Drive, Herndon Virginia 20171. ePlus’ current Bylaws may also be found on the Company’s website at https://www.eplus.com/investors/corporate-governance-legal/amended-and-restated-bylaws.
The preliminary voting results will be announced at the 2025 Annual Meeting. The final voting results will be tallied by the
inspector of elections and reported in a Current Report on Form 8-K, which we are required to file with the SEC within four business days following the 2025 Annual Meeting.
Although the information contained on, or accessible through, our website is not part of this proxy statement, you
will find information about ePlus and our corporate governance practices at http://www.eplus.com/investors. Our website contains information about our Board, its Committees, and their charters; our Bylaws and our Certificate of Incorporation (each as amended and restated); and our Code of Conduct, and Corporate
Governance Guidelines. Shareholders may obtain, without charge, printed copies of the above documents by writing to the Corporate Secretary, at ePlus inc., 13595 Dulles Technology Drive, Herndon, Virginia 20171.
The Company’s principal executive offices are located at ePlus inc., 13595 Dulles
Technology Drive, Herndon, Virginia 20171. The Company’s main telephone number is (703) 984-8400.
This proxy statement contains “forward-looking statements” as that term is defined in the Private Securities Litigation Reform
Act of 1995. These statements are based on management’s current expectations and involve substantial risks and uncertainties, which may cause results to differ materially from those set forth in the statements. The forward-looking
statements may include, but are not limited to, statements made in (i) this proxy statement regarding the anticipated benefits of the Divestiture and (ii) the CD&A section of this proxy statement regarding the benefits and
anticipated results of our compensation programs and the Compensation Committee’s plans and intentions relating thereto. The Company undertakes no obligation to publicly update any forward-looking statement, whether as a result of
new information, future events, or otherwise, except as may be required by law. Forward-looking statements should be evaluated together with the many uncertainties that affect our business, particularly those mentioned under the
heading “Risk Factors” in our Annual Report, and in the periodic reports that we file with the SEC on Form 10-Q.
IMPORTANT NOTICE REGARDING THE AVAILABILITY OF PROXY MATERIALS FOR THE
SHAREHOLDER MEETING TO BE HELD ON SEPTEMBER 16, 2025
The proxy materials for the Company’s 2025 Annual Meeting, including our Annual Report on Form 10-K for the year
ended March 31, 2025, and this proxy statement, are available online via the Company’s website at https://www.eplus.com/investors/investor-information/annual-meeting-proxy. Other information on the Company’s website does not constitute part of the Company’s proxy materials.
It is important that your proxy be returned promptly, whether by mail, by telephone or via the Internet. The
proxy may be revoked at any time by you before it is exercised as described in this proxy statement. If you attend the meeting in person, you may withdraw any proxy (including a mailed, telephonic or Internet proxy) and vote your
own shares as described in this proxy statement.
|
July 30, 2025
|
By Order of the Board of Directors
|
| /s/ Erica S. Stoecker | |
|
Erica S. Stoecker
|
|
|
Corporate Secretary, General Counsel, & Chief Compliance Officer
|