
.2
Q3 2025 EARNINGS RESULTS Nov 6, 2025
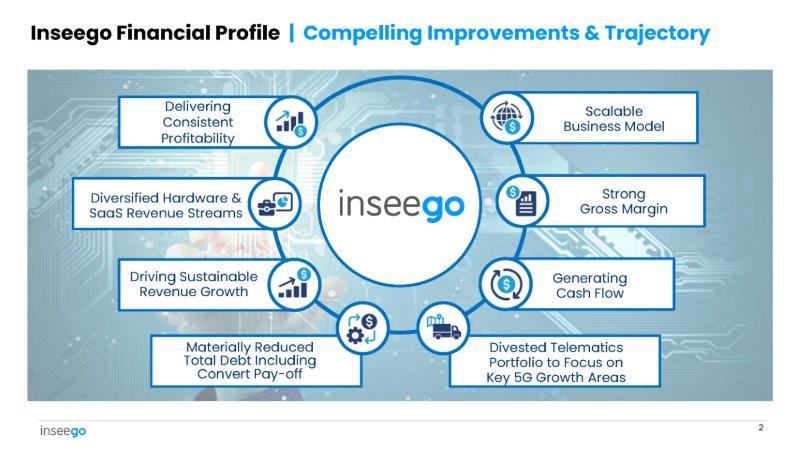
Scalable Business Model Strong Gross Margin Delivering Consistent Profitability Generating Cash Flow Driving Sustainable Revenue Growth Diversified Hardware & SaaS Revenue Streams Divested Telematics Portfolio to Focus on Key 5 G Growth Areas Inseego Financial Profile | Compelling Improvements & Trajectory 2 Materially Reduced Total Debt Including Convert Pay - off
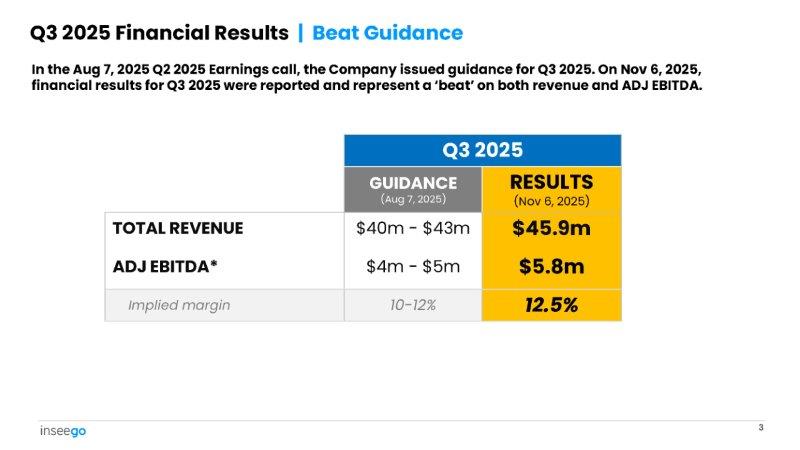
Q3 2025 RESULTS (Nov 6, 2025) GUIDANCE (Aug 7, 2025) $45.9m $40m - $43m TOTAL REVENUE $5.8m $4m - $5m ADJ EBITDA 12.5% 10 - 12% Implied margin 3 Q3 2025 Financial Results | Beat Guidance In the Aug 7, 2025 Q2 2025 Earnings call, the Company issued guidance for Q3 2025. On Nov 6, 2025, financial results for Q3 2025 were reported and represent a ‘beat’ on both revenue and ADJ EBITDA.
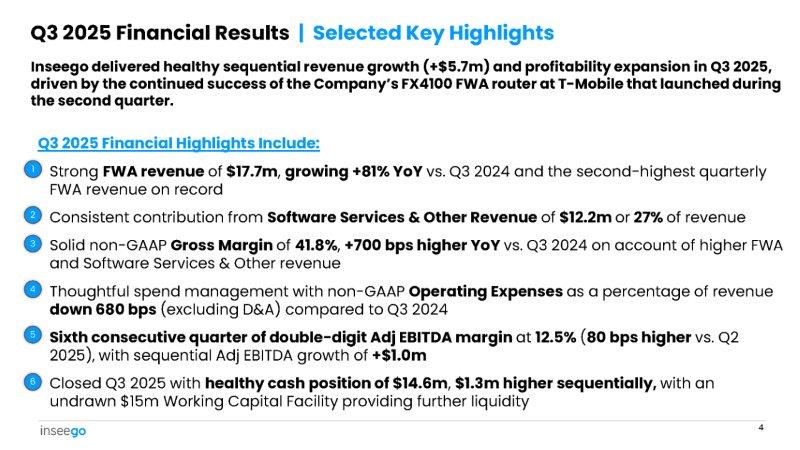
Inseego delivered healthy sequential revenue growth (+$5.7m) and profitability expansion in Q3 2025, driven by the continued success of the Company’s FX4100 FWA router at T - Mobile that launched during the second quarter. Q3 2025 Financial Highlights Include: Strong FWA revenue of $17.7m , growing +81% YoY vs. Q3 2024 and the second - highest quarterly FWA revenue on record Q3 2025 Financial Results | Selected Key Highlights • 1 2 • Consistent contribution from Software Services & Other Revenue of $12.2m or 27% of revenue 3 • Solid non - GAAP Gross Margin of 41.8% , +700 bps higher YoY vs. Q3 2024 on account of higher FWA and Software Services & Other revenue 4 • Thoughtful spend management with non - GAAP Operating Expenses as a percentage of revenue down 680 bps (excluding D&A) compared to Q3 2024 5 • Sixth consecutive quarter of double - digit Adj EBITDA margin at 12.5% ( 80 bps higher vs. Q2 2025), with sequential Adj EBITDA growth of +$1.0m 6 • Closed Q3 2025 with healthy cash position of $14.6m , $1.3m higher sequentially, with an undrawn $15m Working Capital Facility providing further liquidity 4
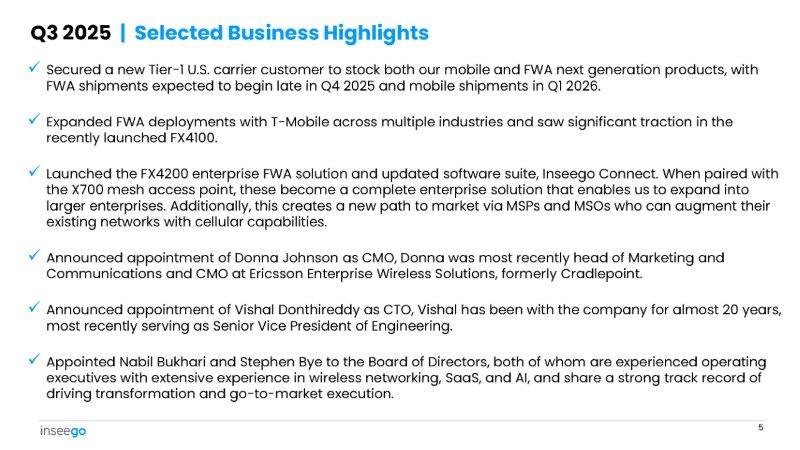
x Secured a new Tier - 1 U.S. carrier customer to stock both our mobile and FWA next generation products, with FWA shipments expected to begin late in Q4 2025 and mobile shipments in Q1 2026. x Expanded FWA deployments with T - Mobile across multiple industries and saw significant traction in the recently launched FX4100. x Launched the FX4200 enterprise FWA solution and updated software suite, Inseego Connect. When paired with the X700 mesh access point, these become a complete enterprise solution that enables us to expand into larger enterprises. Additionally, this creates a new path to market via MSPs and MSOs who can augment their existing networks with cellular capabilities. x Announced appointment of Donna Johnson as CMO, Donna was most recently head of Marketing and Communications and CMO at Ericsson Enterprise Wireless Solutions, formerly Cradlepoint. x Announced appointment of Vishal Donthireddy as CTO, Vishal has been with the company for almost 20 years, most recently serving as Senior Vice President of Engineering. x Appointed Nabil Bukhari and Stephen Bye to the Board of Directors, both of whom are experienced operating executives with extensive experience in wireless networking, SaaS, and AI, and share a strong track record of driving transformation and go - to - market execution. 5 Q3 2025 | Selected Business Highlights
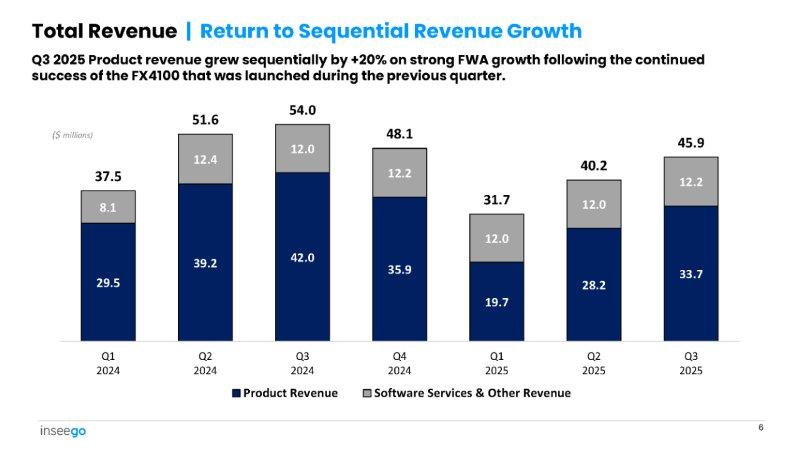
29.5 39.2 42.0 35.9 19.7 28.2 33.7 8.1 12.4 12.0 12.2 12.0 12.0 12.2 37.5 51.6 54.0 48.1 31.7 40.2 45.9 Q3 Q2 Q1 Q4 Q3 Q2 Q1 2025 2025 2025 2024 2024 2024 2024 Product Revenue Software Services & Other Revenue 6 Total Revenue | Return to Sequential Revenue Growth Q3 2025 Product revenue grew sequentially by +20% on strong FWA growth following the continued success of the FX4100 that was launched during the previous quarter. ($ millions)
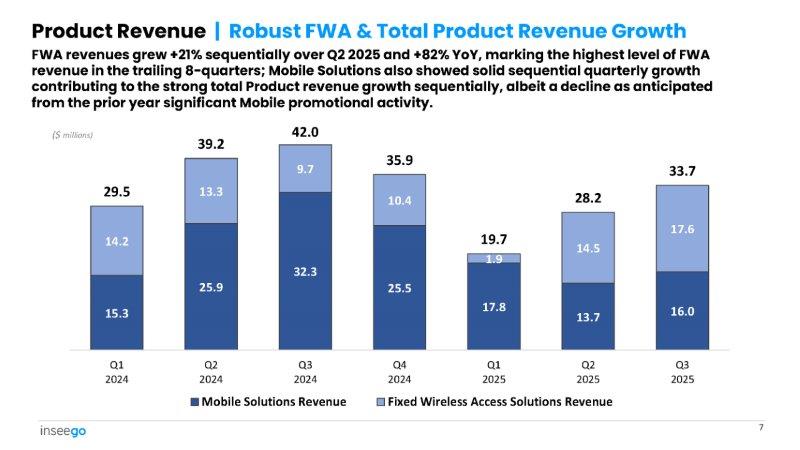
15.3 25.9 32.3 25.5 17.8 13.7 16.0 14.2 13.3 9.7 10.4 1.9 14.5 17.6 29.5 39.2 42.0 35.9 19.7 28.2 33.7 Q3 Q2 Q1 Q4 Q3 Q2 Q1 2025 2025 2025 2024 2024 2024 2024 Mobile Solutions Revenue Fixed Wireless Access Solutions Revenue 7 Product Revenue | Robust FWA & Total Product Revenue Growth FWA revenues grew +21% sequentially over Q2 2025 and +82% YoY, marking the highest level of FWA revenue in the trailing 8 - quarters; Mobile Solutions also showed solid sequential quarterly growth contributing to the strong total Product revenue growth sequentially, albeit a decline as anticipated from the prior year significant Mobile promotional activity. ($ millions)
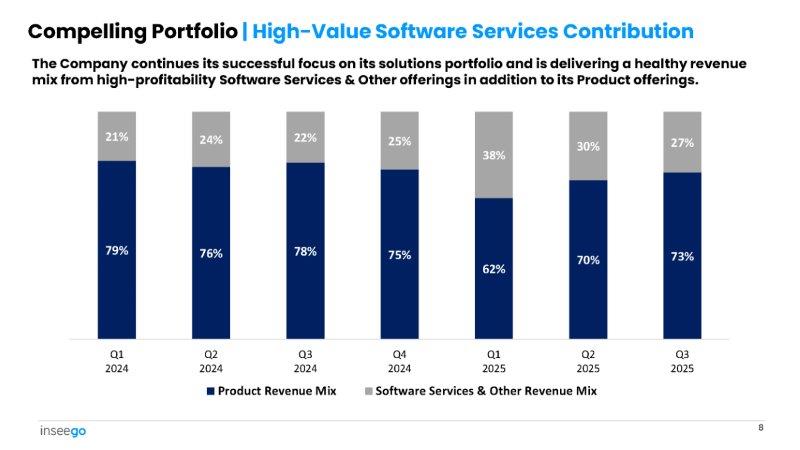
Compelling Portfolio | High - Value Software Services Contribution The Company continues its successful focus on its solutions portfolio and is delivering a healthy revenue mix from high - profitability Software Services & Other offerings in addition to its Product offerings. 79% 76% 78% 75% 62% 70% 73% 21% 24% 22% 25% 38% 30% 27% Q3 Q2 Q1 Q4 Q3 Q2 Q1 2025 2025 2025 2024 2024 2024 2024 Product Revenue Mix Software Services & Other Revenue Mix 8
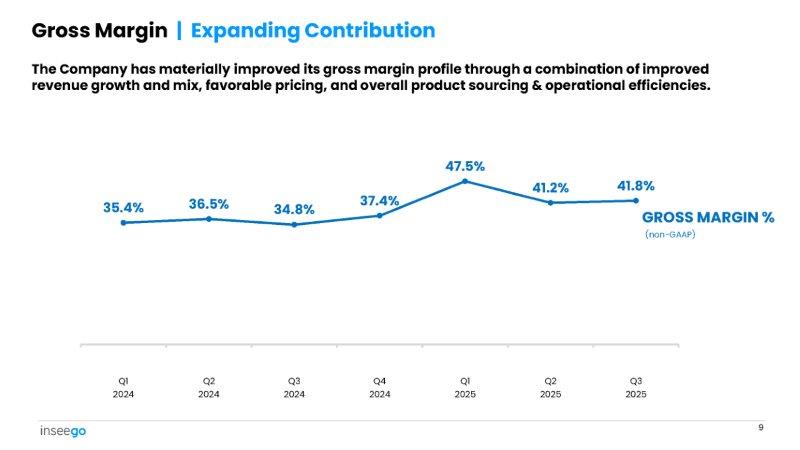
35.4% 9 36.5% 34.8% 37.4% 47.5% 41.2% 41.8% GROSS MARGIN % (non - GAAP) Q3 Q2 Q1 Q4 Q3 Q2 Q1 2025 2025 2025 2024 2024 2024 2024 Gross Margin | Expanding Contribution The Company has materially improved its gross margin profile through a combination of improved revenue growth and mix, favorable pricing, and overall product sourcing & operational efficiencies.
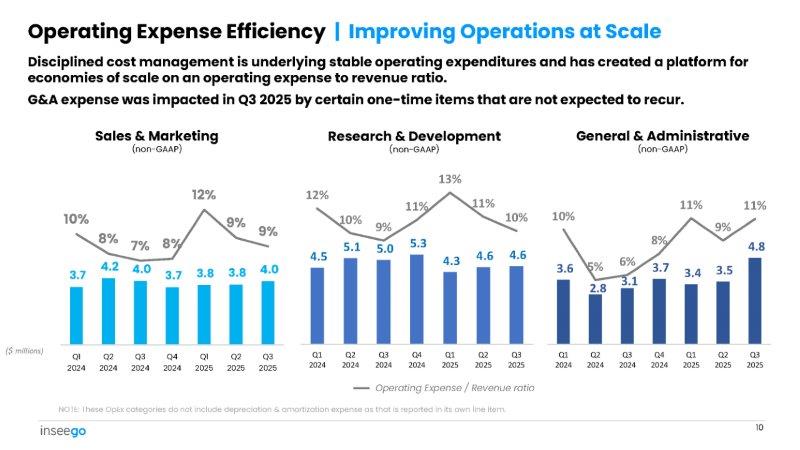
Operating Expense Efficiency | Improving Operations at Scale Disciplined cost management is underlying stable operating expenditures and has created a platform for economies of scale on an operating expense to revenue ratio. G&A expense was impacted in Q3 2025 by certain one - time items that are not expected to recur. Sales & Marketing (non - GAAP) Research & Development (non - GAAP) General & Administrative (non - GAAP) Operating Expense / Revenue ratio NOTE: These OpEx categories do not include depreciation & amortization expense as that is reported in its own line item; see financial statements for full details. ($ millions) Q1 2024 Q2 2024 Q3 2024 Q4 2024 Q1 2025 Q2 2025 Q3 2025 Q1 Q2 Q3 Q4 Q1 Q2 Q3 2024 2024 2024 2024 2025 2025 2025 13% 11% 11% 11% 11% 12% 12% 4.8 9% 3.5 3.4 8% 3.7 6% 3.1 5% 2.8 10% 3.6 10% 4.6 4.6 4.3 5.3 9% 5.0 10% 5.1 4.5 9% 4.0 9% 3.8 3.8 8% 3.7 7% 4.0 8% 4.2 10% 3.7 Q1 2024 10 Q2 2024 Q3 2024 Q4 2024 Q1 2025 Q2 2025 Q3 2025
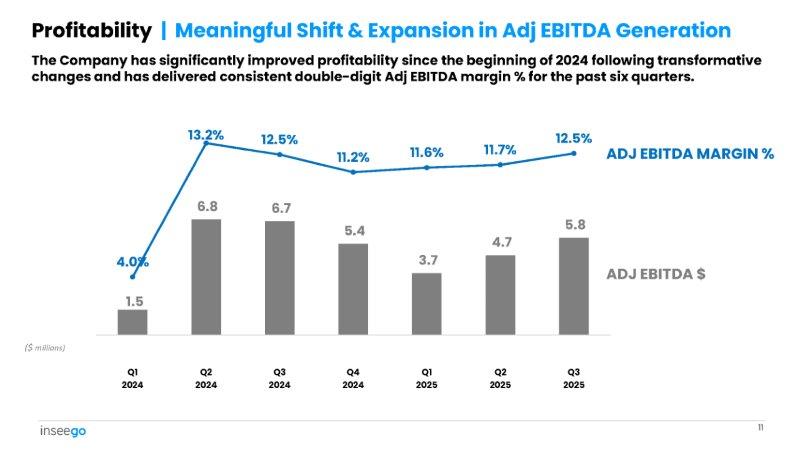
1.5 11 6.8 6.7 5.4 3.7 4.7 5.8 4.0% 13.2% 12.5% 11.2% 11.6% 11.7% 12.5% Q1 2024 Q2 2024 Q3 2024 Q4 2024 Q1 2025 Q2 2025 Q3 2025 Profitability | Meaningful Shift & Expansion in Adj EBITDA Generation The Company has significantly improved profitability since the beginning of 2024 following transformative changes and has delivered consistent double - digit Adj EBITDA margin % for the past six quarters. ADJ EBITDA MARGIN % ADJ EBITDA $ ($ millions)
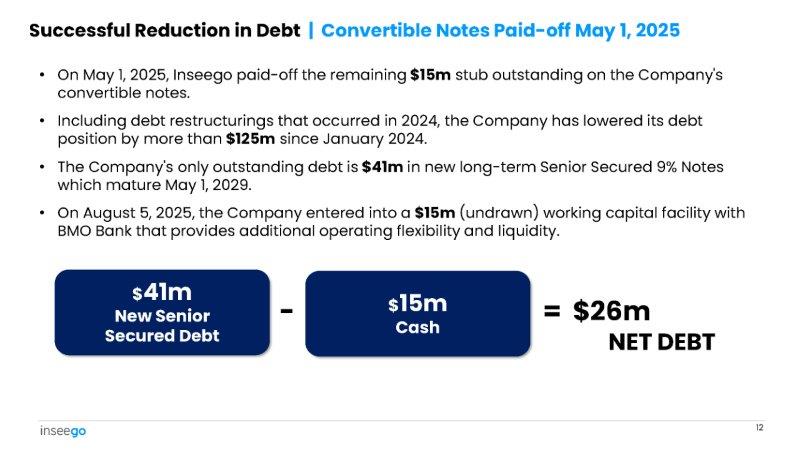
Successful Reduction in Debt | Convertible Notes Paid - off May 1, 2025 • On May 1, 2025, Inseego paid - off the remaining $15m stub outstanding on the Company's convertible notes. • Including debt restructurings that occurred in 2024, the Company has lowered its debt position by more than $125m since January 2024. • The Company's only outstanding debt is $41m in new long - term Senior Secured 9% Notes which mature May 1, 2029. • On August 5, 2025, the Company entered into a $15m (undrawn) working capital facility with BMO Bank that provides additional operating flexibility and liquidity. $ 41m New Senior Secured Debt $ 15m Cash 12 = $26m NET DEBT -
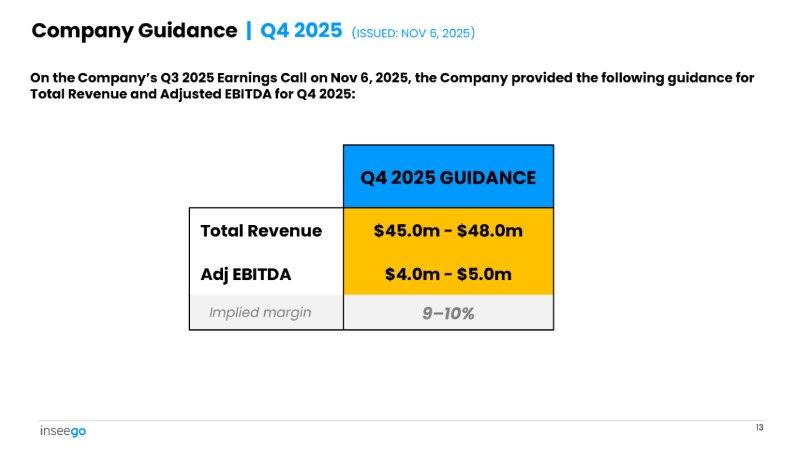
Q4 2025 GUIDANCE $45.0m - $48.0m Total Revenue $4.0m - $5.0m Adj EBITDA 9 – 10% Implied margin 13 On the Company’s Q3 2025 Earnings Call on Nov 6, 2025, the Company provided the following guidance for Total Revenue and Adjusted EBITDA for Q4 2025: Company Guidance | Q4 2025 (ISSUED: NOV 6, 2025)
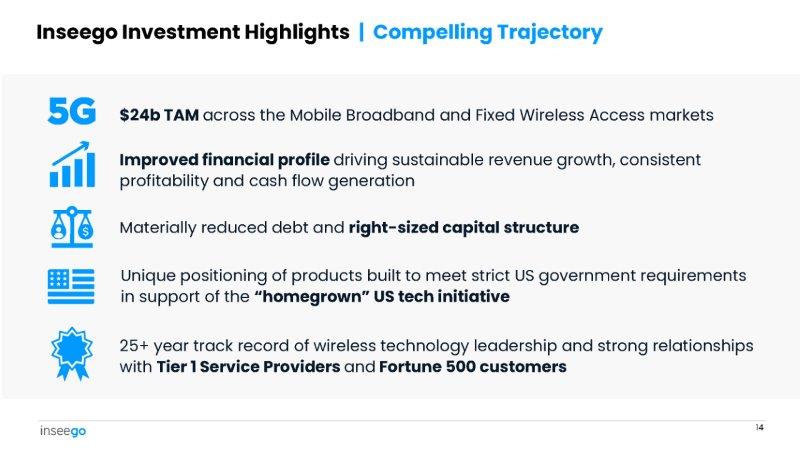
$24b TAM across the Mobile Broadband and Fixed Wireless Access markets Improved financial profile driving sustainable revenue growth, consistent profitability and cash flow generation Materially reduced debt and right - sized capital structure Unique positioning of products built to meet strict US government requirements in support of the “homegrown” US tech initiative 25+ year track record of wireless technology leadership and strong relationships with Tier 1 Service Providers and Fortune 500 customers Inseego Investment Highlights | Compelling Trajectory 14

APPENDIX

NON - GAAP NUMBERS Reconciliations to GAAP Financials
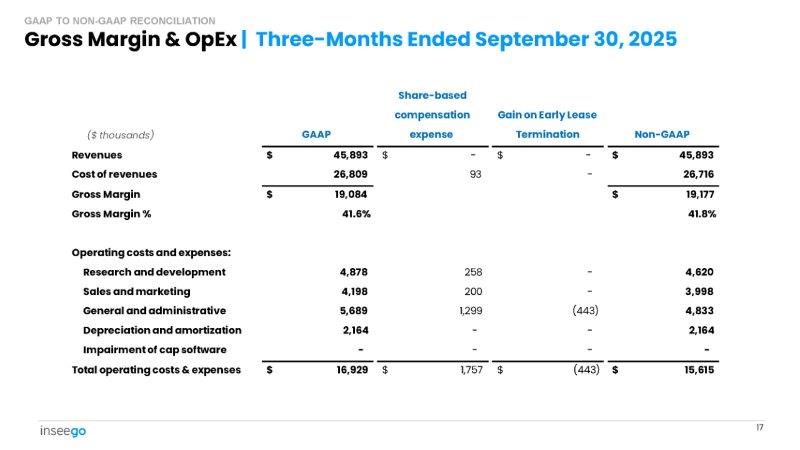
Gross Margin & OpEx | Three - Months Ended September 30, 2025 GAAP TO NON - GAAP RECONCILIATION ($ thousands) GAAP Share - based compensation expense Gain on Early Lease Termination Non - GAAP - $ 45,893 $ - $ $ 45,893 Revenues - 26,716 93 26,809 Cost of revenues $ 19,177 $ 19,084 Gross Margin 41.8% 41.6% Gross Margin % - 4,620 258 4,878 Operating costs and expenses: Research and development - 3,998 200 4,198 Sales and marketing (443) 4,833 1,299 5,689 General and administrative 2,164 - - - - - 2,164 - Depreciation and amortization Impairment of cap software 15,615 $ (443) $ 1,757 $ 16,929 $ Total operating costs & expenses 17
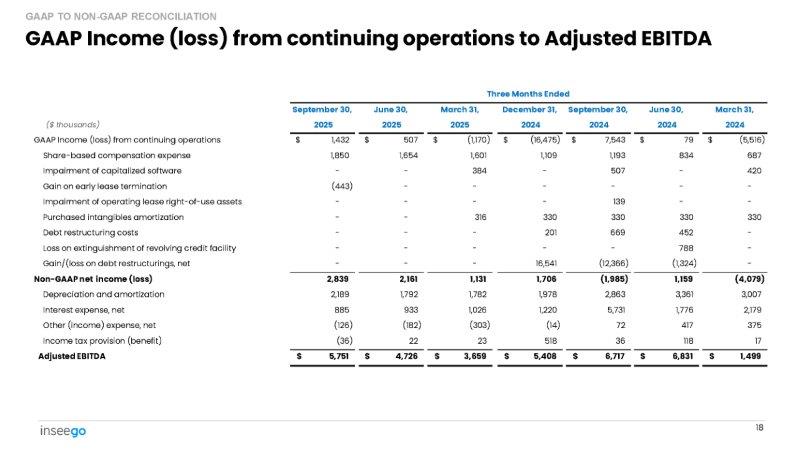
Income to Adjusted EBITDA | Three - Months Ended September 30, 2025 GAAP TO NON - GAAP RECONCILIATION ($ thousands) GAAP Income (loss) from continuing operations Share - based compensation expense Gain on early lease termination Non - GAAP net income (loss) Depreciation and amortization Interest expense, net Other (income) expense, net Income tax provision (benefit) Adjusted EBITDA Three Months Ended September 30, 2025 1,432 1,850 (443) $ 2,839 2,189 885 (126) (36) 5,751 $ 18
Safe Harbor Statement This presentation contains statements about expected future events that are forward - looking and subject to risks and uncertainties. For these statements, we claim the safe harbor for “forward - looking statements” within the meaning of the Private Securities Litigation Reform Act of 1995. For a discussion of factors that could cause actual results to differ materially from expectations, please refer to the risk factors described in our filings with the SEC. Non - GAAP Financial Measures Non - GAAP gross margins, operating expenses, and net income (loss) exclude the impact of share - based compensation expenses, impairments of capitalized software charges, acquisition - related intangible asset amortization, along with certain other non - recurring gains and losses. Adjusted EBITDA, in addition to those items excluded from non - GAAP net income (loss), excludes all interest expense, taxes, depreciation, amortization, and other non - operating income/expense. This presentation contains references to certain non - GAAP financial measures and should be viewed in conjunction with our press releases and supplementary information on our website ( www.inseego.com/investors ) which present a complete reconciliation of GAAP and Non - GAAP results. 19 Disclaimers

www.inseego.com NASDAQ: INSG