
Technical Report Summary of the material Tailings Storage Facilities
i
Technical Report Summary
of the Material
Tailings Storage Facilities
Effective Date: 30 June 2022
Qualified Persons:
Mpfariseni Mudau Pr.Sci.Nat.
Steven Rupprecht FSAIMM
Prepared for:

Technical Report Summary of the material Tailings Storage Facilities
ii
Date and Signature Page
This report entitled ‘Technical Report Summary of the Material Tailings Storage Facilities’, with an effective
date of 30 June 2022 was prepared for Ergo Mining Proprietary Limited by the Qualified Persons:
Mr Mpfariseni Mudau and Professor Steven Rupprecht .
Dated at Johannesburg, 28 October 2022.
/s/ Mpfariseni Mudau
Mpfariseni Mudau (Pr.Sci.Nat.)
Resource Geology Manager
The RVN Group
/s/ Steven Rupprecht
Steven Rupprecht (FSAIMM)
Associate Principal Mining Engineer
The RVN Group
Technical Report Summary of the material Tailings Storage Facilities
iii
1
EXECUTIVE SUMMARY 1
1.1
I
NTRODUCTION
1.2
P
ROPERTY
D
ESCRIPTION
1.3
M
INERAL
R
IGHTS AND
O
WNERSHIP
1.4
G
EOLOGY AND
M
INERALIZATION
1.5
E
VALUATION
D
RILLING AND
S
AMPLING
1.6
S
AMPLE
P
REPARATION
1.7
A
SSAYS
1.8
Q
UALITY
A
SSURANCE AND
Q
UALITY
C
ONTROL
1.9
M
ETALLURGICAL
S
AMPLING AND
T
ESTING
1.10
M
INERAL
R
ESOURCE
E
STIMATE
1.11
M
INERAL
R
ESERVE
E
STIMATE
1.12
P
ERMITTING
R
EQUIREMENTS
1.13
C
ONCLUSION AND
R
ECOMMENDATIONS
2
INTRODUCTION 11
2.1
P
ROJECT
B
ACKGROUND
2.2
T
ERMS OF
R
EFERENCE AND
P
URPOSE OF THE
T
ECHNICAL
R
EPORT
2.3
P
ARTICIPANTS AND
A
REAS OF
R
ESPONSIBILITIES
2.4
S
OURCES OF
I
NFORMATION
2.5
S
ITE
I
NSPECTION
2.6
U
NITS
,
C
URRENCIES AND
S
URVEY
C
OORDINATE
S
YSTEM
2.7
I
NDEPENDENCE
3
PROPERTY DESCRIPTION 17
3.1
L
OCATION AND
O
PERATIONS
O
VERVIEW
3.2
M
INERAL
R
IGHTS
C
ONDITIONS
3.3
M
INERAL
T
ITLE
3.4
V
IOLATION AND
F
INES
3.5
R
OYALTIES
3.6
L
EGAL
P
ROCEEDINGS AND
S
IGNIFICANT
E
NCUMBRANCES TO THE
P
ROPERTY
4
ACCESSIBILITY, CLIMATE, LOCAL RESOURCES, INFRASTRUCTURE AND PHYSIOGRAPHY 24
4.1
T
OPOGRAPHY
,
E
LEVATION AND
V
EGETATION
4.2
A
CCESS
,
T
OWNS AND
R
EGIONAL
I
NFRASTRUCTURE
4.3
C
LIMATE
4.4
I
NFRASTRUCTURE AND
B
ULK
S
ERVICE
S
UPPLIES
4.5
P
ERSONNEL
S
OURCES
5
HISTORY 26
5.1
O
WNERSHIP
5.1.1
Crown Complex 26
5.1.2
City Deep complex 26
5.1.3
Knight Complex 26
Technical Report Summary of the material Tailings Storage Facilities
iv
5.1.4
Ergo Complex 26
5.1.5
Marievale Complex 26
5.1.6
Grootvlei Complex 27
5.1.7
5A10/5L27 27
5.1.8
Daggafontein TSF 27
5.2
C
ONSTRUCTION OF THE
TSF
S AND
S
AND
D
UMPS
5.3
P
REVIOUS
E
XPLORATION AND
M
INE
D
EVELOPMENT
5.3.1
Previous Evaluation Drilling 28
5.3.2
Previous Development 28
6
GEOLOGICAL SETTING, MINERALIZATION AND DEPOSIT 30
6.1
R
EGIONAL
G
EOLOGY
6.2
M
INERALIZATION
,
L
OCAL AND
P
ROPERTY
G
EOLOGY
6.3
S
TRATIGRAPHY AND
C
ROSS
-
SECTIONS
6.4
D
EPOSIT
T
YPE
7
EXPLORATION 34
7.1
E
XPLORATION
7.2
T
OPOGRAPHIC
S
URVEYS
7.3
E
VALUATION
D
RILLING
7.4
D
RILLING
M
ETHODOLOGY
7.4.1
Auger Drilling 36
7.4.2
Reverse Circulation 36
7.5
C
ROWN
7.6
C
ITY
D
EEP
7.7
K
NIGHTS
7.7.1
4L14 39
7.7.2
4L50 40
7.8
E
RGO
7.8.1
7L15 41
7.8.2
Rooikraal 42
7.9
M
ARIEVALE
7.10
G
ROOTVLEI
C
OMPLEX
7.11
5A10/5L27 47
7.12
D
AGGAFONTEIN
TSF 48
7.13
L
OGGING AND
S
AMPLING
7.13.1
Logging 49
7.13.2
Sampling 49
7.14
S
AMPLE
R
ECOVERY
7.15
O
N
-
SITE
S
ECURITY
M
EASURES
7.16
C
OLLAR
S
URVEY
D
ATA
7.17
D
ENSITY
D
ETERMINATION
7.18
H
YDROLOGICAL
D
RILLING AND
T
EST
W
ORK
7.18.1
Crown Complex 52
7.18.2
City Deep Complex 53
7.18.3
Knights Complex 53
Technical Report Summary of the material Tailings Storage Facilities
v
7.18.4
Ergo Complex 54
7.18.5
Marievale Complex 54
7.18.6
Grootvlei Complex 55
7.18.7
5A10/5L27 56
7.18.8
Daggafontein TSF 56
7.19
G
EOTECHNICAL
D
ATA
,
T
ESTING AND
A
NALYSIS
8
SAMPLE PREPARATION, ANALYSES AND SECURITY 58
8.1
S
AMPLING
G
OVERNANCE AND
Q
UALITY
A
SSURANCE
8.2
S
AMPLE
P
REPARATION AND
A
NALYSIS
8.2.1
On-site Sample Preparation 58
8.2.2
Laboratories, Sample Preparation and Analyses 59
8.2.3
QP Opinion 61
8.3
A
NALYTICAL
Q
UALITY
C
ONTROL
8.3.1
Nature and Extent of the Quality Control Procedures 61
8.3.2
Quality Control Results 62
8.3.3
QP Opinion 62
8.4
S
AMPLE
S
TORAGE AND
S
ECURITY
8.5
D
ATA
S
TORAGE AND
D
ATABASE
M
ANAGEMENT
9
DATA VERIFICATION 64
10
MINERAL PROCESSING AND METALLURGICAL TESTIN G 65
10.1
N
ATURE AND
E
XTENT OF THE
M
ETALLURGICAL
T
ESTING
M
ETHOD
10.2
P
ROCEDURE
10.2.1
Slime Material 65
10.2.2
Sand Material 65
10.3
R
EPRESENTATIVE OF THE
S
AMPLES
10.4
D
ETAILS OF THE
L
ABORATORIES
10.5
R
ESULTS
10.6
I
NTERPRETATION OF THE
R
ESULTS
10.7
QP
O
PINION
11
MINERAL RESOURCE ESTIMATES 69
11.1
V
OLUME
M
ODELLING
11.2
B
ULK
D
RY
D
ENSITY
11.3
E
XPLORATORY
D
ATA
A
NALYSIS
11.4
E
STIMATION
T
ECHNIQUES
11.5
M
ODELLING AND
E
STIMATION
P
ARAMETERS
11.6
M
ODEL
V
ALIDATION
11.7
T
ECHNICAL AND
F
INANCIAL
P
ARAMETERS
11.8
U
NCERTAINTIES AND
C
LASSIFICATION
C
RITERIA
11.9
C
ROWN
C
OMPLEX
11.9.1
Exploratory Data Analysis 74
11.9.2
Modelling and Estimation Parameters 79
11.9.3
Technical and Economic Factors 80
11.9.4
Mineral Resource Classification Criteria 81
Technical Report Summary of the material Tailings Storage Facilities
vi
11.9.5
Mineral Resource Statement 82
11.9.6
Mineral Resource Changes 82
11.9.7
Mineral Resource Risks and Uncertainty 82
11.10
C
ITY
D
EEP
C
OMPLEX
11.10.1
Exploratory Data Analysis 83
11.10.2
Modelling and Estimation Parameters 86
11.10.3
Technical and Economic Factors 87
11.10.4
Mineral Resource Classification Criteria 87
11.10.5
Mineral Resource Statement 87
11.10.6
Mineral Resource Changes 88
11.10.7
Mineral Resource Risks and Uncertainty 88
11.11
K
NIGHTS
C
OMPLEX
11.11.1
Exploratory Data Analysis 89
11.11.2
Modelling and Estimation Parameters 96
11.11.3
Technical and Economic Factors 98
11.11.4
Mineral Resource Classification Criteria 98
11.11.5
Mineral Resource Statement 99
11.11.6
Mineral Resource Changes 100
11.11.7
Mineral Resource Risks and Uncertainty 100
11.12
E
RGO
C
OMPLEX
11.12.1
Exploratory Data Analysis 100
11.12.2
Modelling and Estimation Parameters 108
11.12.3
Technical and Economic Factors 108
11.12.4
Mineral Resource Classification Criteria 109
11.12.5
Mineral Resource Statement 110
11.12.6
Mineral Resource Changes 110
11.12.7
Mineral Resource Risks and Uncertainty 111
11.13
M
ARIEVALE
C
OMPLEX
11.13.1
Exploratory Data Analysis 111
11.13.2
Modelling and Estimation Parameters 116
11.13.3
Technical and Economic Factors 116
11.13.4
Mineral Resource Classification Criteria 116
11.13.5
Mineral Resource Statement 117
11.13.6
Mineral Resource Changes 118
11.13.7
Mineral Resource Risks and Uncertainty 118
11.14
G
ROOTVLEI
C
OMPLEX
11.14.1
Exploratory Data Analysis 119
11.14.2
Modelling and Estimation Parameters 123
11.14.3
Technical and Economic Factors 123
11.14.4
Mineral Resource Classification Criteria 124
11.14.5
Mineral Resource Statement 125
11.14.6
Mineral Resource Changes 126
11.14.7
Mineral Resource Risks and Uncertainty 126
11.15
5A10/5L27
S
AND
D
UMPS
11.15.1
Exploratory Data Analysis 126
Technical Report Summary of the material Tailings Storage Facilities
vii
11.15.2
Modelling and Estimation Parameters 128
11.15.3
Technical and Economic Factors 128
11.15.4
Mineral Resource Classification Criteria 128
11.15.5
Mineral Resource Statement 130
11.15.6
Mineral Resource Changes 130
11.15.7
Mineral Resource Risks and Uncertainty 131
11.16
D
AGGAFONTEIN
TSF 131
11.16.1
Exploratory Data Analysis 131
11.16.2
Modelling and Estimation Parameters 132
11.16.3
Technical and Economic Factors 133
11.16.4
Mineral Resource Classification Criteria 133
11.16.5
Mineral Resource Statement 134
11.16.6
Mineral Resource Changes 135
11.16.7
Mineral Resource Risks and Uncertainty 135
11.17
S
UMMARY
M
INERAL
R
ESOURCE
E
STIMATES
11.18
QP’
S
O
PINION
12
MINERAL RESERVE ESTIMATES 140
12.1
G
RADE
C
ONTROL AND
R
ECONCILIATION
12.2
C
UT
-
OFF
G
RADE
E
STIMATION
12.3
E
STIMATION AND
M
ODELLING
T
ECHNIQUES
12.4
M
INERAL
R
ESERVE
C
LASSIFICATION
C
RITERIA
12.5
M
INERAL
R
ESERVES
S
TATEMENT
12.6
QP
S
TATEMENT ON THE
M
INERAL
R
ESERVE
E
STIMATION
13
MINING METHODS 145
13.1
M
INING
M
ETHOD
13.1.1
Hydraulic Mining 146
13.1.2
Conventional Load, Haul and Slurry 149
13.2
M
INING
S
ECTIONS
13.2.1
West Rand 155
13.2.2
Central Rand Section – City Section 155
13.2.3
East Rand Section 156
13.3
M
INE
D
ESIGN AND
S
CHEDULE
13.4
G
EOTECHNICAL AND
G
EOHYDROLOGY
13.5
R
EQUIREMENTS FOR
S
TRIPPING
13.6
M
INING
E
QUIPMENT AND
P
ERSONNEL
R
EQUIREMENTS
13.7
M
INE
P
LANS
13.7.1
Introduction 162
13.7.2
Central Rand 162
13.7.3
East Rand (Ergo) 162
14
PROCESSING AND RECOVERY METHODS 165
14.1
I
NTRODUCTION
14.2
P
LANT
F
EED
G
RADE AND
M
ETALLURGICAL
T
EST
W
ORK
14.3
M
INERAL
P
ROCESS AND
E
QUIPMENT
C
HARACTERISTICS
Technical Report Summary of the material Tailings Storage Facilities
viii
14.3.1
Reception 168
14.3.2
De-sanding Section 168
14.3.3
Carbon-in-Leach 168
14.3.4
Carbon Treatment 168
14.3.5
Plant Services 169
14.4
P
ERSONNEL
R
EQUIREMENTS
14.5
E
NERGY AND
W
ATER
R
EQUIREMENTS
14.6
P
ROCESS
M
ATERIALS
R
EQUIREMENTS
15
INFRASTRUCTURE 170
15.1
R
OADS
15.2
S
ITE
O
FFICES AND
W
ORKSHOPS
15.3
P
OWER
15.4
P
UMPS AND
P
IPELINES
15.5
W
ATER
15.6
I
NFRASTRUCTURE
15.7
T
AILINGS
D
ISPOSAL
15.8
C
ONCLUSION
16
MARKET STUDIES 177
16.1
M
ARKETS
16.2
G
OLD
P
RICE
16.3
E
XCHANGE
R
ATE
T
RENDS
16.4
G
LOBAL
D
EMAND
16.5
G
LOBAL
S
UPPLY
16.6
C
ONCLUDING
C
OMMENTS
17
ENVIRONMENTAL STUDIES 182
17.1
R
ESULTS OF
E
NVIRONMENTAL
S
TUDIES
17.2
R
EQUIREMENTS FOR
T
AILINGS
D
ISPOSAL
,
S
ITE
M
ONITORING AND
W
ATER
M
ANAGEMENT
17.2.1
Site Monitoring 183
17.2.2
Water Management 183
17.2.3
Vegetation Monitoring 183
17.2.4
Vegetation Maintenance 183
17.2.5
Water Monitoring 183
17.2.6
Legal and Permitting 184
17.3
P
LAN
N
EGOTIATIONS
,
A
GREEMENTS WITH
L
OCAL
I
NDIVIDUALS OR
G
ROUPS
17.4
M
INE
C
LOSURE
P
LANS
R
EMEDIATION
P
LANS
,
A
SSOCIATED
C
OSTS
17.5
QP
S
TATEMENT ON THE
E
NVIRONMENTAL
S
TUDIES
,
P
ERMITTING
,
P
LANS
,
N
EGOTIATIONS
,
L
OCAL
I
NDIVIDUALS OR
G
ROUPS
18
CAPITAL AND OPERATION COSTS 187
18.1
C
APITAL
E
XPENDITURE
18.1.1
Ergo Section Capital Expenditure 187
18.1.2
City Capital Expenditure 190
18.1.3
Knights Capital Expenditure 190
Technical Report Summary of the material Tailings Storage Facilities
ix
18.1.4
QP commentary 190
18.2
O
PERATING
C
OSTS
19
ECONOMIC ANALYSIS 192
19.1
E
CONOMIC
A
NALYSIS
19.2
S
ENSITIVITY
A
NALYSIS
19.3
R
ISK
A
SSESSMENT
19.3.1
Rising Electricity Prices and Eskom Supply Distribution 195
19.3.2
Tailings Storage Facility Capacity 196
19.3.3
Social Unrest 196
19.3.4
Increased Crime 196
19.3.5
Depletion of Ergo’s Mineral Reserves 197
19.3.6
Social Licenses to Operate 197
19.3.7
Fluctuations in the Gold Price and Exchange Rate 197
19.3.8
Supply and Cost of Water 198
20
ADJACENT PROPERTIES 199
21
OTHER RELEVANT DATA AND INFORMATION 199
22
INTERPRETATION AND CONCLUSIONS 200
23
RECOMMENDATIONS 200
24
REFERENCES 201
25
RELIANCE ON INFORMATION PROVIDED BY REGISTRANT 201
26
QUALIFIED PERSONS DISCLOSURE CONSENT 202
Technical Report Summary of the material Tailings Storage Facilities
x
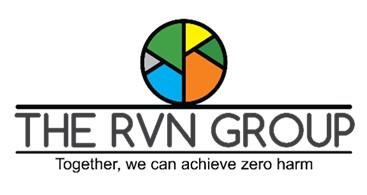
Figure 3.1: Location of the Material TSFs and Infrastructure (the material properties of
Ergo) ................................ ................................ ................................ ............................ 19
Figure 3.2: Location of the Material Properties in Relation to the Smaller TSFs and Clean-
up Operations ................................ ................................ ................................ ............ 20
Figure 6.1: A Typical Stratigraphy for Ergo’s TSFs ................................ ................................ .. 32
Figure 6.2: Grootvlei Complex (6L17) Map showing Location of Cross-section ...................... 32
Figure 6.3: Cross-section of the Grootvlei Complex (6L17) ................................ ....................... 33
Figure 7.1: Crown Complex: Map showing drill hole Locations ................................ .......... 37
Figure 7.2: City Deep Complex: Map showing Drill Hole Locations ................................ ........ 38
Figure 7.3: Knights Complex - 4L14: Map showing Drill Hole Locations ................................ .... 39
Figure 7.4: Knights Complex - 4L50: Map showing Drill Hole Locations ................................ .... 40
Figure 7.5: Ergo Complex - 7L15: Map showing Drill Hole Locations ................................ ........ 41
Figure 7.6: Ergo Complex - Rooikraal: Map showing Drill Hole Locations ................................ 42
Figure 7.7: Marievale Complex: Map showing Drill Hole Locations ................................ ......... 43
Figure 7.8: Grootvlei Complex - 6L16: Map showing Drill Hole Locations ................................ 44
Figure 7.9: Grootvlei Complex - 6L17: Map showing Drill Hole Locations ................................ 45
Figure 7.10: Grootvlei Complex - 6L17A: Map showing Drill Hole Locations ........................... 46
Figure 7.11: 5A10/5L27: Map showing Drill Hole Locations ................................ ................. 47
Figure 7.12: Daggafontein Complex - Daggafontein TSF: Map showing Drill Hole
Locations ................................................................ ................................ .................... 48
Figure 8.1: Cone and Quartering Method ................................ ................................ ................. 58
Figure 11.1: 3L7 (Mooifontein): Distribution of Raw Gold Capped Data .......................... 75
Figure 11.2: 3L7 (Mooifontein): Distribution of Composited Gold Data ............................ 76
Figure 11.3: 3L8 (GMTS): Distribution of Raw Gold Capped Data ................................ ..... 76
Figure 11.4: 3L8 (GMTS): Distribution of Composited Gold Data ................................ ....... 77
Figure 11.5: 3L5 (Diepkloof: Diepkloof): Distribution of Raw Gold Capped Data ............ 77
Figure 11.6: 3L5 (Diepkloof: Diepkloof): Distribution of Composited Gold Data ............... 78
Figure 11.7: 3L5 (Diepkloof: Homestead): Distribution of Raw Gold Capped Data ......... 78
Figure 11.8: 3L5 (Diepkloof: Homestead): Distribution of Composited Gold Data ........... 79
Figure 11.9: 4L3: Distribution of Raw Gold Capped Data ................................ .................. 83
Figure 11.10: 4L3: Distribution of Composited Gold Data................................ ..................... 84
Figure 11.11: 4L4: Distribution of Raw Gold Capped Data ................................ .................. 84
Figure 11.12: 4L4: Distribution of Composited Gold Data................................ ..................... 85
Figure 11.13: 4L6:
Distribution of Raw Gold Capped Data
Technical Report Summary of the material Tailings Storage Facilities
xi
Figure 11.14: 4L6: Distribution of Composited Gold Data................................ ..................... 86
Figure 11.15: 4L14: Distribution of Slime Raw Data ................................ ................................ 89
Figure 11.16: 4L14: Log Distribution of Slime Raw Data ................................ ......................... 90
Figure 11.17: 4L14: Distribution of Slime 6m Composited Data ................................ ............ 90
Figure 11.18: 4L14: Log Distribution of Slime 6m Composited Data ................................ ..... 91
Figure 11.19: 4L14: Distribution of Soil Raw Data ................................ ................................ ... 91
Figure 11.20: 4L14: Log Distribution of Soil Raw Data ................................ ............................ 92
Figure 11.21: 4L14: Distribution of Soil Raw Capped Data................................ .................... 92
Figure 11.22: 4L14: Log Distribution of Soil Raw Capped Data ................................ ............ 93
Figure 11.23: 4L50: Log Distribution of Raw Slime Data ................................ ......................... 93
Figure 11.24: 4L50: Distribution of Raw Slime Raw Data ................................ ........................ 94
Figure 11.25: 4L50: Log Distribution of Raw Capped Slime Data ................................ ......... 94
Figure 11.26: 4L50: Distribution of Raw Capped Slime Data ................................ ................ 95
Figure 11.27: 4L50: Distribution of 3m Composited Slime Data ................................ ............ 95
Figure 11.28: 4L50: Log Distribution of 3m Composited Slime Data ................................ ..... 96
Figure 11.29: 4L50: Head Grade versus Modelled Average Gold Grade ........................... 99
Figure 11.30: Rooikraal: Distribution of Raw Gold Data ................................ ...................... 101
Figure 11.31: Rooikraal: Log Distribution of Composited Gold Data ................................ . 102
Figure 11.32: 7L15: Plan showing North and South Domains ................................ .............. 103
Figure 11.33: 7L15: Distribution of 2015 Raw Data - North Domain ................................ .... 104
Figure 11.34: 7L15: Log Distribution of 2016 Raw Data - North Domain ............................. 104
Figure 11.35: 7L15: Distribution of 2015 Raw Data - South Domain ................................ .... 105
Figure 11.36: 7L15: Log Distribution of 2016 Raw Data - South Domain............................. 105
Figure 11.37: 7L15: Distribution of 3m Composited Slime Data - South Domain ............... 106
Figure 11.38: 7L15: Log Distribution of 3m Composited Slime Data - South Domain ........ 106
Figure 11.39: 7L15: Distribution of 3m Composited Slime Data - North Domain ............... 107
Figure 11.40: 7L15: Log Distribution of 3m Composited Slime Data - North Domain ........ 107
Figure 11.41: 7L4: Distribution of Capped Raw Gold Data ................................ ............... 112
Figure 11.42: Distribution of Composited Raw Gold Data ................................ ................. 112
Figure 11.43: 7L5: Distribution of Raw Gold Data ................................ ................................ 113
Figure 11.44: 7L5: Distribution of Composited Gold Data................................ ................... 113
Figure 11.45: 7L6: Distribution of Raw Gold Data ................................ ................................ 114
Figure 11.46: 7L6: Distribution of Composited Gold Data ................................ ...................... 114
Technical Report Summary of the material Tailings Storage Facilities
xii
Figure 11.47: 7L7: Distribution of Raw Capped Gold Data ................................ ................ 115
Figure 11.48: 7L7: Distribution of Composited Capped Gold Data ................................ ... 115
Figure 11.49: 6L16: Distribution of Raw Capped Gold Data ................................ .............. 120
Figure 11.50: 6L16: Distribution of Composited Gold Data ................................ ................. 120
Figure 11.51: 6L17: Distribution of Raw Capped Gold Data ................................ .............. 121
Figure 11.52: 6L17: Distribution of Composited Gold Data ................................ ................. 121
Figure 11.53: 6L17A: Distribution of Raw Capped Gold Data ................................ ........... 122
Figure 11.54: 6L17A: Distribution of Composited Gold Data ................................ ............. 122
Figure 11.55: 5A10/5l27: Distribution of Raw Gold Data ................................ ..................... 127
Figure 11.56: 5A10/5l27: Distribution of Composited Gold Data ................................ ....... 127
Figure 11.57: Boxplots for the Different Drilling Campaigns ................................ ................ 131
Figure 11.58: Log Probability Plot ................................ ................................ .......................... 132
Figure 11.59: Mineral Resource Classification................................ ................................ ...... 134
Figure 11.60: Mineral Resource Reconciliation (Inclusive) ................................ ................. 139
Figure 13.1: Typical Tailing Storage Facility ................................ ................................ ........ 146
Figure 13.2: Example of Hydraulic Mining ................................ ................................ .......... 147
Figure 13.3: Hydraulic Mining Process Diagram ................................ ................................ 148
Figure 13.4: Typical Mining Method for a TSF ................................ ................................ ..... 149
Figure 13.5: Example of Loading with a FEL ................................ ................................ ....... 150
Figure 13.6: Example of Loading with a FEL into a Hopper ................................ .............. 150
Figure 13.7: Example of Material on Conveyor ................................ ................................ . 151
Figure 13.8: Slurry Point for Loading ................................ ................................ .................... 151
Figure 13.9: Ergo Sections ................................ ................................ ................................ .... 153
Figure 13.10: Ergo Operations Overview ................................ ................................ ............. 154
Figure 13.11: Hydraulic Mining with Monitor showing Distance and Angle ...................... 161
Figure 13.12: Daggafontein TSF Top Cut Mining Sequence ................................ ............... 163
Figure 13.13: Daggafontein TSF Middle Cut Mining Sequence ................................ ......... 163
Figure 13.14: Daggafontein TSF Bottom Cut Mining Sequence ................................ ......... 164
Figure 14.1: Process Flow Diagram ................................ ................................ ..................... 167
Figure 15.1: Above Ground Pipeline System ................................ ................................ ..... 171
Figure 15.2: Rooikraal General Arrangement - Site Layout ................................ .............. 173
Figure 15.3: Brakpan/Withok TSF ................................ ................................ ......................... 175
Figure 15.4: Placement of Tailings Material at Brakpan/Withok TSF ................................ 175
Technical Report Summary of the material Tailings Storage Facilities
xiii
Figure 19.1: Ergo LoM Production Tonnage ................................ ................................ ....... 192
Figure 19.2: Ergo LoM Gold Production ................................ ................................ ............. 193
Figure 19.3: Sensitivity Analysis ................................ ................................ ............................ 195
Figure 19.4: 30-Year Gold Price in USD/oz (1992 to 2022) ................................ ................ 198
Graph 1: Gold Price Historical Trendline ................................ ................................ .................. 178
Graph 2: Exchange Rate Historical Trendline ................................ ................................ ......... 178
Graph 3: Global Gold Demand from 2012 to 2021 ................................ ................................ 179
Graph 4: Global Gold Supply from 2012 to 2021 ................................ ................................ .... 180
Table 1.1: Ergo’s Mineral Resource Statement as at 30 June 2022 (Inclusive) ......................... 5
Table 1.2: Ergo’s Mineral Resource Statement as at 30 June 2022 (Exclusive) ........................ 6
Table 1.3: Ergo’s Mineral Reserve Statement as at 30 June 2022 ................................ ............. 6
Table 1.4: Mineral Reserve Reconciliation ................................ ................................ .................. 7
Table 2.1: List of QPs and their Responsibilities ................................ ................................ .......... 13
Table 2.2: List of Abbreviations ................................ ................................ ................................ ... 14
Table 3.1: Footprint Areas of the Material TSFs................................ ................................ .......... 18
Table 3.2: Mineral Rights Information as at 30 June 2022 ................................ ........................ 22
Table 3.3: Land Tenure Information ................................ ................................ ........................... 22
Table 5.1: History and Status of the TSFs and Sand Dump ................................ ....................... 28
Table 5.2: ERGO Production History ................................ ................................ ........................... 29
Table 6.1: Origin of the TSF and Sand Dump Material ................................ ............................. 31
Table 7.1: Survey Details of the Material from the TSFs and Sand Dumps .............................. 35
Table 7.2: Bulk Density Information and Statistics ................................ ................................ ..... 51
Table 7.3: GMTS (3L8) Moisture Content ................................ ................................ ................... 52
Table 7.4: Diepkloof (3L5) Moisture Content ................................ ................................ ............. 52
Table 7.5: Mooifontein (3L7) Moisture Content ................................ ................................ ......... 52
Table 7.6: 4L3 Moisture Content ................................ ................................ ................................ . 53
Table 7.7: 4L4 Moisture Content ................................ ................................ ................................ . 53
Table 7.8: 4L6 Moisture Content ................................ ................................ ................................ . 53
Table 7.9: 4L14 Moisture Content ................................ ................................ ............................... 53
Technical Report Summary of the material Tailings Storage Facilities
xiv
Table 7.10: 4L50 Moisture Content ................................ ................................ ...................... 54
Table 7.11: Rooikraal Moisture Content ................................ ................................ .............. 54
Table 7.12: 7L15 Moisture Content ................................ ................................ ...................... 54
Table 7.13: 7L4: Moisture Content ................................ ................................ ....................... 54
Table 7.14: 7L5: Moisture Content ................................ ................................ ....................... 55
Table 7.15: 7L6: Moisture Content ................................ ................................ ....................... 55
Table 7.16: 7L7: Moisture Content ................................ ................................ ....................... 55
Table 7.17: 6L16 Moisture Content ................................ ................................ ...................... 55
Table 7.18: 6L17 Moisture Content ................................ ................................ ...................... 56
Table 7.19: 6L17A Moisture Content ................................ ................................ .................... 56
Table 7.20: 5A10/5L27 Moisture Content ................................ ................................ ............ 56
Table 7.21: Daggafontein Moisture Content ................................ ................................ ...... 56
Table 8.1: Laboratories Used ................................ ................................ ................................ ...... 60
Table 10.1: Summary of Predicted Ergo Processing Plant Performance .......................... 67
Table 11.1: Financial and Technical Data considered for Mineral Resource .................. 72
Table 11.2: Mineral Resource Estimate Cut-off Grades ................................ ..................... 73
Table 11.3: Search Parameters: Inverse Distance Estimation Method ................................ 79
Table 11.4: Confidence Levels for Key Criteria for Mineral Resource Classification ....... 81
Table 11.5: Crown Complex Mineral Resource Estimate (Exclusive) ................................ ... 82
Table 11.6: Search Parameters: Inverse Distance Estimation Method ................................ 86
Table 11.7: Confidence Levels of Key Criteria for Classification of the TSFs Mineral
Resources ................................ ................................ ................................ ................... 87
Table 11.8: City Deep Complex Mineral Resource Estimates (Inclusive)............................. 88
Table 11.9: City Deep Complex Mineral Resource Estimates (Exclusive) ............................ 88
Table 11.10: 4L14: Search Parameters: Nearest Neighbor Estimation Method ................. 96
Table 11.11: 4L14: Search Parameters: Inverse Distance Estimation Method .................... 96
Table 11.12: 4L50: Search Parameters: Nearest Neighbor Estimation Method ................. 97
Table 11.13: 4L50: Search Parameters: Inverse Distance Estimation Method .................... 97
Table 11.14: Confidence Levels of Key Criteria for Classification of the 4L14and 4L50
TSFs Mineral Resources ................................ ................................ .............................. 98
Table 11.15: Knights Complex Mineral Resource Estimates (Inclusive) ............................... 99
Table 11.16: Knights Complex Mineral Resource Estimates (Exclusive) ............................ 100
Table 11.17: Rooikraal: Search Parameters: Inverse Distance Estimation Method ......... 108
Table 11.18: 7L15: Search Parameters: Inverse Distance Estimation Method .................. 108
Technical Report Summary of the material Tailings Storage Facilities
xv
Table 11.19: Ergo: Confidence Levels for Key Criteria for Mineral Resource
Classification ................................ ................................ ................................ ............ 109
Table 11.20: Ergo Mineral Resource Estimates (Inclusive)................................ .................. 110
Table 11.21: Ergo Mineral Resource Estimates (Exclusive) ................................ ................. 110
Table 11.22: Search Parameters ................................ ................................ .......................... 116
Table 11.23: Confidence Levels for Key Criteria for Mineral Resource Classification ..... 116
Table 11.24: Marievale Mineral Resource Estimates (Inclusive) ................................ ........ 117
Table 11.25: Marievale Resource Estimates (Exclusive) ................................ ..................... 118
Table 11.26: Search Parameters: Inverse Distance Estimation Method ........................... 123
Table 11.27: Confidence Levels for Key Criteria for Mineral Resource Classification ..... 125
Table 11.28: Grootvlei Complex Mineral Resource Estimates (Exclusive) ........................ 126
Table 11.29:
Search Parameters: Inverse Distance Estimation Method
Table 11.30: Confidence Levels for Key Criteria for Mineral Resource Classification ..... 129
Table 11.31: 5A10/5L27 Mineral Resource Estimates (Inclusive) ................................ ........ 130
Table 11.32: 5A10/5L27 Mineral Resource Estimates (Exclusive) ................................ ....... 130
Table 11.33: Search Parameters ................................ ................................ .......................... 133
Table 11.34:
Confidence Levels for Key Criteria for Mineral Resource Classification
Table 11.35: Daggafontein TSF Mineral Resource Estimate (Inclusive) ............................ 134
Table 11.36: Daggafontein TSF Mineral Resource Estimate (Exclusive) ............................ 135
Table 11.37: Inclusive Mineral Resources of the 19 Material Properties as at 30 June
2022 136
Table 11.38: Exclusive Mineral Resources of the 19 Material Properties as at 30 June
2022 137
Table 11.39: Ergo Inclusive Mineral Resources Statement as at 30 June 2022 ................ 138
Table 11.40:
Ergo Exclusive Mineral Resources Statement as at 30 June 2022
Table 12.1: Reconciliation of RoM Head Grade (Au) ................................ ......................... 140
Table 12.2: Reconciliation of RoM Tonnage ................................ ................................ ..... 140
Table 12.3: Cut-off Grade and Mineral Reserve Grades ................................ ................. 141
Table 12.4: Ergo TSF Mineral Reserves Statement as at 30 June 2022 ............................ 143
Table 12.5: Mineral Reserve Reconciliation ................................ ................................ ...... 143
Table 13.1: Historical Ergo Operational Results ................................ ................................ . 145
Table 13.2: Central Rand (City Section) ................................ ................................ ............ 155
Table 13.3: Central Rand (Knights Section) ................................ ................................ ...... 156
Table 13.4: East Rand Section (Ergo Section) ................................ ................................ ... 157
Technical Report Summary of the material Tailings Storage Facilities
xvi
Table 13.5: Summary of Modifying Factors for LoM Plan ................................ ................. 158
Table 13.6: Ergo Forecast Production from July 2021 to June 2034 ................................ 159
Table 14.1: Ergo Process Recoveries ................................ ................................ .................... 168
Table 16.1: Above Ground Gold Stocks in 2021 ................................ ............................... 177
Table 16.2: Long Term Consensus Forecasts in Nominal Terms ................................ ....... 179
Table 16.3: Global Gold Production ................................ ................................ ................. 180
Table 17.1: Ergo Water Consumption ................................ ................................ ............... 183
Table 17.2: SLP Financial Provision Summary ................................ ................................ .... 185
Table 17.3: Ergo Rehabilitation Financial Provision Summary ................................ ......... 186
Table 18.1: Capital Expenditure Summary ................................ ................................ ....... 187
Table 18.2: Rooikraal Capital Expenditure Estimate ................................ ........................ 187
Table 18.3: Marievale Capital Pump Stations ................................ ................................ .. 188
Table 18.4: Marievale Total Capital Expenditure Summary ................................ ............ 188
Table 18.5: Daggafontein Capital Pump Stations ................................ ........................... 188
Table 18.6: Daggafontein Capital Expenditure Summary ................................ .............. 189
Table 18.7: Non-material TSF Capital Expenditure for the Ergo Section ......................... 189
Table 18.8: Withok Compartment Capital Expenditure ................................ .................. 189
Table 18.9: Solar Power Project Capital Estimate ................................ ............................ 190
Table 18.10: City Total Capital Expenditure Summary ................................ ....................... 190
Table 18.11: Average LoM Operating Cost for Ergo ................................ .......................... 191
Table 19.1: Economic Analysis ................................ ................................ ........................... 194
Table 26.1: Qualified Person’s Details................................ ................................ ................ 202
Technical Report Summary of the material Tailings Storage Facilities
1
1 Executive Summary
1.1 Introduction
Ergo Mining (Proprietary) Limited (Ergo) is a wholly owned subsidiary of DRDGOLD Limited (DRDGOLD).
DRDGOLD is domiciled in South Africa and listed on the Johannesburg Stock Exchange (JSE: DRD) and
New York Stock Exchange (NYSE: DRD). DRDGOLD, a South African-based gold mining company, has a
100% share in Ergo. DRDGOLD is a Tailings Storage Facilities (TSFs) retreatment company.
The TSFs Mineral Resource and Mineral Reserve estimates declared in this Technical Report Summary
(this Report) are 100% attributable to DRDGOLD. The TSFs covered are from Crown, City Deep, Knights,
Ergo, Marievale and Grootvlei Complexes, 5A10/5L27 sand dump and Daggafontein TSF.
The Mineral Resource and Mineral Reserve estimate contained in this Technical Report Summary were
compiled and reported by the Qualified Persons (QPs) for DRDGOLD in accordance with Items
601(b)(96) and 1300 through 1305 of Regulation S-K (Title 17, Part 229, Items 601(b)(96) and 1300 through
1305 of the Code of Federal Regulations) promulgated by the Securities and Exchange Commission
(SEC).
This document is the first submission of a Technical Report Summary under Regulation S-K; thus, it is not
an update of a previously filed Technical Report Summary.
This Technical Report Summary is based on information available until 30 June 2022. There were no
material changes between the effective and reporting dates.
1.2 Property Description
Ergo is reclaiming TSFs and sand dumps in the City of Johannesburg and the City of Ekurhuleni, Gauteng,
South Africa. The Crown and City Deep Complexes are in the City of Johannesburg, while all other TSFs
are located in the City of Ekurhuleni. A total of 19 material properties are discussed in this report.
1.3 Mineral Rights and Ownership
Ergo’s title in its Mineral Resources is vested in common law ownership and/or contractual arrangements
and Prospecting Rights, and its competency to mine the same lie in various Mining Rights that were
converted (and consolidated) in terms of the provisions of the MPRDA and Environmental Approvals.
Ergo has submitted an application to renew and consolidate all their Mining Rights into a single Mining
Right; this application is receiving attention from the Department of Mineral Resources and Energy
(DMRE). Renewal applications have been submitted to the DMRE for each expired Right. Ergo has
applied to extend the consolidated Mining Right for 30 years, which is the maximum allowable renewal
period as detailed in the Mineral and Petroleum Resources Development Act, 2002 (Act No. 28 of 2002)
(MPRDA).
This report has considered section 24(5) of the MPRDA, as amended:
“
A mining right in respect of which an application for renewal has been lodged shall despite its expiry
date remain in force until such time as such application has been granted or refused.
”
The same applies to the Prospecting Rights through section 18(5) of the MPRDA.
Technical Report Summary of the material Tailings Storage Facilities
2
1.4 Geology and Mineralization
The TSFs are man-made features. The material in the TSFs has been processed through metallurgical
plants that generate residue (tailings), which are relatively uniform in comparison with the natural
deposit from which the material is derived. The variation between grades is small as the process residue
TSFs were constructed in layers. Grade variation primarily follows variations in the processing and, to a
lesser extent, the primary deposits characteristic.
The TSFs are the waste product of the mineral recovery process. They took the form of a liquid slurry
made of fine mineral particles - created when mined ore was crushed, milled and processed. The tailings
were pumped to TSFs which were constructed using the Upstream Deposition Methodology. Water
contained within the slurry was removed via various drainage systems and then re-used in the process
whilst the TSF was in operation. Once a TSF is decommissioned and declared dormant, water is still
drained and recovered but evaporation and seepage are the main reasons for water loss.
Rehabilitation of the side slopes and top surface of the TSF, by way of vegetation and irrigation , was
previously only implemented once the TSF was declare d dormant.
1.5 Evaluation Drilling and Sampling
A qualified surveyor surveyed all evaluation drill hole positions . Holes were drilled into the TSF at 1.5m
intervals to determine grade distribution. The number of samples (at 1,5m intervals), correlated with
surveying data, provided the height of the TSF and tonnage based on a bulk solid’s density of 1.42.
The typical exploration programs (geophysics, trenching, mapping, and soil sampling) were not
undertaken on the TSFs. Evaluation drilling programs were conducted on the TSFs. No exploration is
required to locate TSFs, as their locations are known and established above the natural ground level.
Two drilling techniques were followed by specialized drilling contractors on the TSFs. The Reverse
Circulation (RC) method was used where auger drilling techniques could not drill to the base of the TSFs,
mainly due to the drill hole length and moisture of the TSFs towards their bases.
With auger drilling, the rotation of a helical screw causes the blade of the screw to lift the sample to the
surface. This drilling method does not require heavy machinery to drill to the desired depth. The auger
method can be used for shallow environmental drilling, geotechnical drilling, soil engineering and
mineral deposits where the formation is soft and the hole does not collapse. This is done by pressing the
spiral rods into the ground using a drilling head machine which can drill up to a depth of 50m.
Samples were collected through the spiral at 1.5m intervals, and the spiral was cleaned with water and
brushed after every run.
The RC drilling technique was chosen in preference to auger drilling in certain locations because RC
drilling could drill deeper than auger drilling. In addition, because of its higher power, RC can drill
through wet material and has better recovery percentages than auger drilling, which loses wet samples
through its spiral.
The RVN Group (Proprietary) Limited (The RVN Group) monitored the drilling and sampling process. The
methods were to an acceptable industry standard, and the results were considered appropriate for
further evaluation.
Technical Report Summary of the material Tailings Storage Facilities
3
Logging was carried out as per the Ergo protocols and the QP considered it appropriate for the deposit
under consideration. Drill holes were logged on-site by the RVN Geologist. Samples of 1.5m length
intervals were taken for the entire length of the drill holes. Samples were classified according to whether
they were slimes or soil, moist or wet and on color. All drill hole data was provided to Ergo in electronic
and hardcopy formats as drill hole logs, sample logs and assay certificates.
1.6 Sample Preparation
As the samples were moist to wet, all samples were split on-site using the cone and quartering method.
One set was prepared for routine exploration analysis for use in the Mineral Resource estimation and the
other set for metallurgical process test work. All the samples were presented to the laboratory in a well-
organized and sorted manner with easily understandable documentation, including fully completed
Sample Submission Forms.
The samples were sent to the following three laboratories for further preparation and assaying:
●
MAED Metallurgical Laboratories (Proprietary) Limited (MAED) is located at Ergo’s processing
plant in Brakpan. The facility is not accredited, however is used by Ergo for its grade control and
daily sampling. Although MAED is not owned by Ergo, it is situated in the Ergo processing plant
and was supplied with all routine exploration samples.
●
SGS South Africa (Proprietary) Limited (SGS) is located in Randfontein. SGS is an accredited
facility (T0265) by the South African National Accreditation System (SANAS) for the selected
analytical method. Randomly selected check samples (approximately 10% of total samples per
TSF) from MAED were sent to SGS for confirmation. SGS is independent of Ergo; and
●
AngloGold Ashanti Limited Chemical Laboratory (Anglo Lab), located in Carletonville, analyzed
some check samples for 7L15 TSF in 2016/2017 as a secondary laboratory to MAED. The
laboratory no longer exists and was not SANAS accredited. The laboratory was independent of
Ergo.
The slime material has been previously processed and sample preparation only requires weighing,
drying, screening, splitting and milling before assaying. Screening removes potentially carbonaceous
and other oversized material to represent the material to be processed through the metallurgical plant.
1.7 Assays
The laboratories weighed the samples on receipt before dry screening them to remove foreign material.
The samples were then dried at 105
˚
C, crushed (80% passing 2mm), before being riffle split and
pulverized to 75µm. The samples were then analyzed to determine the gold content by fire assay with
gravimetric finish by MAED and Atomic Absorption Spectroscopy (AAS) finish by SGS. The lower
detection limit for these methods is 0.01g/t with no upper detection limit for the gravimetric method and
a 10g/t upper limit for AAS. The lower limit is relevant to the current project as the TSFs and sand dumps
consist of processed materials and are generally low-grade, with grades slightly higher than 10 to 20
times the detection limit.
The laboratories were instructed to use a 100g aliquot to analyze for gold. Through the experience of
the QPs, it is known that analyzing gold in low-grade slimes, anything less than a 100g aliquot may report
inaccurate results.
Technical Report Summary of the material Tailings Storage Facilities
4
1.8 Quality Assurance and Quality Control
The laboratories used in analyzing the samples have robust internal quality control checks. They routinely
insert reference material (standards and blanks) and create duplicates to internally check the accuracy
and precision of their assaying techniques. A batch is re-assayed if the quality control samples do not
perform as expected. The results of the quality control checks were provided with the sample assays
and were all found to be acceptable by the QP.
The RVN Group inserted certified quality control samples as an additional check for contamination,
precision and accuracy. The RVN Group quality control samples results were satisfactory as they
generally reported values within the expected ranges.
1.9 Metallurgical Sampling and Testing
The TSFs were portioned into logical sections for metallurgical testing, based either on area, shape or
elevation. The selected intervals for compositing into the metallurgical test work samples were taken at
different elevations within the TSF to provide sufficient material for the test work.
The
“
as received
”
splitting.
Leaching of
“
as received
”
existing Ergo leach plant:
●
pH = 10.5;
●
precondition with lime for 1 hour or more to maintain pH at 10.5;
●
Carbon-in-Leach (CIL) with 15g/l carbon;
●
NaCN addition 0,5kg/t;
●
dissolved oxygen in excess of six parts per million (ppm);
●
leach time eight hours; and
●
all samples were submitted to MAED for gold analysis .
The metallurgical test work confirms that the material tested can be processed to recover residual gold
from the TSFs assessed via the current Ergo metallurgical plant process.
Predicted recoveries from the TSFs tested vary between 30% and 60% and are dependent on head
grade and the nature of the material. These values are typical for gold TSF processing. All the TSFs meet
the requirements for processing through the Ergo plants.
Technical Report Summary of the material Tailings Storage Facilities
5
1.10 Mineral Resource Estimate
The Mineral Resource Estimate for the TSFs and sand dumps were adjusted for depletion as at
30 June 2022. The Mineral Resource estimate for all the TSFs and sand dumps are declared as follows:
●
the point of reference is
in situ
for all TSFs and sand dumps. The TSFs or sand dumps themselves
are the reference points;
●
no geological or other loses were applied as all material is accessible and there are no
geological structures.
●
the Mineral Resource Estimate is stated as both inclusive and exclusive of Mineral Reserves as
defined in Subpart 1300 of Regulation S-K; and
●
Mineral Resource is 100% attributable to DRDGOLD .
The total Mineral Resource Estimate for Ergo is presented in Table 1.1 to Table 1.2. The changes in the
Mineral Resource from June 2021 to June 2022 are due to the depletion of 20.51Mt at 0.33g/t Au and
minor survey adjustments of 2.94Mt at 0.20g/t Au.
Table 1.1: Ergo’s Mineral Resource Statement as at 30 June 2022 (Inclusive)
Mineral Resource
Classification
Mineral Resource as at 30 June 2021
(Inclusive)
Mineral Resource as at 30 June 2022
(Inclusive)
Tons
(Mt)
Au
(g/t)
Contents
(Moz)
Tons
(Mt)
Au
(g/t)
Contents
(Moz)
Measured Mineral Resource
282.95
0.31
2.81
266.25
0.31
2.64
Indicated Mineral Resource
574.95
0.25
4.61
568.21
0.25
4.55
Sub-total Measured and
Indicated Mineral Resource
857.90
0.27
7.42
834.45
0.27
7.19
Inferred Mineral Resource
21.32
0.24
0.16
21.32
0.24
0.16
Total Mineral Resources
879.22
0.27
7.58
855.77
0.27
7.35
Source: The RVN Group, 2022
Notes:
1. Mineral Resources are reported inclusive of Mineral Reserves.
2. Mineral Resources have been reported in accordance with the classification criteria of Subpart 1300 of Regulation S-K.
3. Mineral Resources were estimated using the USD1,823/oz, ZAR15.60/USD, ZAR914,294/kg financial parameters and recoveries in Table 11.2.
4. The reference point for the Mineral Resource is in situ .
5. Quantities and grades have been rounded to two decimal places; therefore, minor computational errors may occur.
6. No geological losses were applied to the Mineral Resources.
7. Attributable Mineral Resource is 100% of the total Mineral Resource.
Technical Report Summary of the material Tailings Storage Facilities
6
Table 1.2: Ergo’s Mineral Resource Statement as at 30 June 2022 (Exclusive)
Mineral Resource
Classification
Mineral Resource as at 30 June 2021
(Exclusive)
Mineral Resource as at 30 June 2022
(Exclusive)
Tons
(Mt)
Au
(g/t)
Contents
(Moz)
Tons
(Mt)
Au
(g/t)
Contents
(Moz)
Measured Mineral Resource
-
-
-
66.04
0.26
0.55
Indicated Mineral Resource
574.95
0.25
4.61
375.41
0.25
3.02
Sub-total Measured and
Indicated Mineral Resource
574.95
0.25
4.61
441.45
0.25
3.57
Inferred Mineral Resource
21.32
0.24
0.16
21.32
0.24
0.16
Total Mineral Resources
596.27
0.25
4.77
462.77
0.25
3.73
Source: The RVN Group, 2022
Notes:
1. Mineral Resources are reported exclusive of Mineral Reserves.
2. Mineral Resources have been reported in accordance with the classification criteria of Subpart 1300 of Regulation S-K.
3. Mineral Resources were estimated using the USD1,823/oz, ZAR15.60/USD, 914,294ZAR/kg financial parameters and recoveries in Table 11.2.
4. The reference point for the Mineral Resource is in situ .
5. Quantities and grades have been rounded to two decimal places; therefore, minor computational errors may occur.
6. No geological losses were applied to the Mineral Resources.
7. Attributable Mineral Resource is 100% of the total Mineral Resource.
1.11 Mineral Reserve Estimate
The total Mineral Reserve estimate for Ergo is presented in Table 1.3. The changes in the Mineral Reserve
from 30 June 2021 to 30 June 2022 is due to the inclusion of 192Mt at 0.24g/t Au from Daggafontein, the
removal of 66Mt at 0.26g/t Au from Grootvlei, the depletion of 20Mt at 0.33g/t Au and the survey
adjustments of 2.94Mt at 0.20g/t Au.
Table 1.3: Ergo’s Mineral Reserve Statement as at 30 June 2022
Mineral Reserve
Classification
Mineral Reserve as at 30 June 2021
Mineral Reserve as at 30 June 2022
Tons
(Mt)
Au
(g/t)
Contents
(Moz)
Tone
(Mt)
Au
(g/t)
Contents
(Moz)
Proven Mineral Reserve
29.36
0.295
0.28
200.21
0.33
2.09
Probable Mineral Reserve
253.59
0.311
2.53
192.79
0.24
1.49
Total Mineral Reserves
282.95
0.309
2.81
393.00
0.28
3.58
Source: The RVN Group, 2022
Notes:
1. Tons and grades were rounded and this may result in minor adding discrepancies.
2. Mineral Reserve has been reported in accordance with the classification criteria defined in the classification criteria of Subpart 1300 of
Regulation S-K
3. Mineral Reserve is estimated using the USD1,823/oz, ZAR15.60/ USD and ZAR914,294/kg financial parameters.
4. A cut-off grade of 0.20g/t has been applied.
5. No mining losses or dilution has been applied in the conversion process nor has a mine call factor been applied.
6. Tons and grade Run-of-Mine (RoM) as delivered to the plant.
7. Attributable Mineral Reserve is 100% of the total Mineral Reserve.
Technical Report Summary of the material Tailings Storage Facilities
7
Table 1.4 depicts the Mineral Reserve reconciliation between 30 June 2021 and 30 June 2022.
Table 1.4: Mineral Reserve Reconciliation
Source
Tons
(Mt)
Au Grade
(g/t)
Content
(Moz)
Total Mineral Reserve as at 30 June 2021
282.95
0.31
2.81
Depletion through Mining
(20.48)
0.33
(0.22)
Survey Adjustments
(2.94)
0.20
(0.01)
Inclusion of Daggafontein TSF in the LoM Plan
192.79
0.24
1.49
Exclusion of a Grootvlei TSF
(66.04)
0.26
(0.55)
Inclusion of 4 TSFs in the LoM Plan
6.72
0.26
0.06
Total Mineral Reserve as at 30 June 2022
393.00
0.28
3.58
Source: The RVN Group, 2022
Note: Quantities and grades have been rounded to two decimal places therefore minor computational errors may occur.
The various modifying factors, i.e., mining, metallurgical, processing, infrastructure, economic,
marketing, legal, environmental, and governmental factors, are discussed in the following Items of this
report.
The 30 June 2022 Life-of-Mine (LoM) plan was developed for the Ergo operations and is based on the
Mineral Resource Estimate as at 30 June 2022 together with a set of modifying factors based on recent
historical results and economic inputs provided by Ergo. The assumptions applied in determining the
modifying factors and economic inputs are reasonable and appropriate. The LoM plan is sufficient ly
detailed to ensure achievability and is based on historical achievements. All the inputs used in the
estimation of the Mineral Reserve have been thoroughly reviewed and can be considered technically
robust.
The current mining methods applied by Ergo are suitable for all TSFs. No selective mining will occur with
the entire TSF being processed (including Inferred Mineral Resources).
The Ergo processing plant targets a Run-of-Mine (RoM) throughput between 1.8Mtpm to 2.0Mtpm. The
City Deep plant has been reconfigured to operate as a milling and pump station and feed the Ergo
processing plant via a 50km pipeline. The City Deep plant processes material from mining areas of the
Central Rand areas of Johannesburg and is scheduled to close in 2027. Mining areas of Germiston, and
some areas of Boksburg are treated via the Knights plant, with mining operations scheduled to close in
June 2024.
An average processing plant recovery of 40.9% has been estimated over the 19-year LoM. The
recoveries are based on metallurgical test work for the various TSFs, slimes and silted wetland areas that
are scheduled to be mined over the 19-year LoM plan.
The QP is of the opinion that all significant infrastructure and logistical requirements have been
considered and costed. It is notable that Ergo has been operating for more than 20 years and has a
very good understanding of infrastructural and logistical requirements.
A gold price of ZAR914,294/kg is used to support the 30 June 2022 Mineral Resource and Mineral Reserve
statements. A gold price of USD1,823/oz and an exchange rate of ZAR15.60:1USD was used in the
estimation process.
Technical Report Summary of the material Tailings Storage Facilities
8
The gold price and exchange rates were considered reasonable by the QPs to support the Mineral
Resource and Mineral Reserve estimates as at 30 June 2022.
Mining Rights, Environmental Approvals and Prospecting Rights held are listed under the Ergo subsidiary.
Ergo has numerous Surface and Prospecting Rights and the ownership of the surface rights and mine
TSFs vests in various legal entities. Ergo’s Environment al Management Plan (EMP) encompasses all the
activities of Ergo’s operations and assesses the environmental impacts of mining at reclamation sites,
processing plants, TSFs and sand dumps. It also outlines the closure process, including financial
provisions.
There are competing ownership claims on the Grootvlei and Marievale Complexes, as detailed in Item
3.6. On other TSFs, there are no legal challenges to Ergo’s title that would prevent operations of any of
the current mineral rights or mining operations.
A closure cost of ZAR645 million has been estimated in June 2022 for the Ergo operations. The QP is
satisfied that funding for rehabilitation and mine closure is adequate. The QP is satisfied that all material
issues relating to Environmental, Social and Governance have been addressed in this document.
A total capital of ZAR3.22 billion is scheduled to support the 19-LoM plan, as depicted. The breakdown
of capital expenditure indicates that the majority of the capital, ZAR3.14 billion, is allocated to the Ergo
operation over the duration of the LoM plan with an additional ZAR81.9 million allocated for the City
Deep Complex. As the mining at the Knight section is scheduled to be completed in 2024 there is no
allocation of capital. The level of accuracy for the capital expenditure is at least to a preliminary
feasibility study (PFS) level of accuracy, (i.e., +/-25%) with a maximum level of contingency of 15%.
The planned average operating cost for the Ergo budget over the 19-year operations is estimated at a
PFS level of accuracy (i.e., +/-25%) and a total working cost of ZAR90.86/t.
The 30 June 2022 19-year LoM plan, which is the basis of the Mineral Reserve estimate, is scheduled to
mine a total of 410.33Mt at 0.28g/t and produce 50,658kg of gold over the same period. The LoM plan
includes 17.3Mt of material that is treated on a third-party contract basis and is not included in the
Mineral Reserve. The economic analysis is based on a LoM plan that is designed to a PFS level of
accuracy (i.e., +/-25%). The economic analysis conducted by the QP indicates a net present value
(NPV) of ZAR2.21 billion after capital expenditure and taxation utilizing a discount rate of 9.48%. As the
Ergo operations are an on-going operation with an annual positive cashflow, the internal rate of return
(IRR) and payback period are not applicable.
Technical Report Summary of the material Tailings Storage Facilities
9
The sensitivity analysis of the Ergo LoM model varies revenue (price and grade), operating cost and
capital expenditure at 5% increments above and below the base case. The analysis indicates that the
Ergo operations are very sensitive to revenue parameters such as gold price, exchange rate, grade and
recovery. In addition, the LoM is also very sensitive to changes in operating costs. The sensitivity analysis
indicates that the LoM is not overly sensitive to capital and therefore, capital expenditure should be
considered if the expenditure will reduce operating costs or increase revenue. The sensitivity analysis
indicates that the achievement of the LoM Plan in terms of tonnage is critical in realizing the planned
operating costs and being able to mine the individual TSFs at the planned cut-off grade.
1.12 Permitting Requirements
Ergo is one of only a few surface operators that holds Mining Rights under the MPRDA over a large
portion of its reserves. The provisions of the MPRDA, and the definition of ‘mineral’ had inadvertently
created a gap in the Act placing the ‘minerals’ in certain TSFs beyond the regulatory reach of the
MPRDA and limiting its competency to issue rights upon application.
However, in terms of the transitional arrangements of the MPRDA, which were peremptory upon the
DMRE in the event that the petitioner met the conditions for conversion from ‘old order’ to ‘new order’,
Ergo was able to convert its old order rights, thus extending its “license to mine” into the dispensation
introduced by the MPRDA. Ergo has also submitted applications to renew all its Mining and Prospecting
Rights with the DMRE. The current Mining and Prospecting Rights have expired (with the exception of
7L4 TSF) but remain in force until such time that the renewal applications have been granted or refused
by the DMRE. Water use licenses are applied for as and when required to remain compliant with relevant
legislation.
Ergo complies with all the conditions for renewal and has no reason to believe that the submitted
renewals would not be granted. Ergo is in constant communication with the DMRE and is submitting the
required information as per their requests to finalize these renewal applications.
There are conflicting ownership claims to certain Grootvlei and Marievale TSFs which are detailed in
Item 3.6.
1.13 Conclusion and Recommendations
The QP concludes that the protocols for drilling, sampling preparation and analysis, verification, and
security meet industry standard practices and are appropriate for the purposes of a Mineral Resource
estimate. The studies have found that the Ergo TSFs have reasonable prospects for economic extraction.
The QP is satisfied with the Quality Assurance (QA) developed by The RVN Group and the Quality Control
(QC) programs implemented as there was no significant bias in reporting data.
The QP contends that the assumptions, parameters, and methodology used for the Mineral Resource
estimate are appropriate for the style of mineralization and deposit type.
There is sufficient information to allow for decision-making in the future. The QPs recommended no
additional work.
The QP considers the conversion of Mineral Resources to Mineral Reserves to be appropriate. TSFs
reported in this document have sufficient information to be used in Mineral Reserve estimate and
demonstrate economic viability. The modifying factors applied are considered appropriate as they
Technical Report Summary of the material Tailings Storage Facilities
10
contain sufficient detail to support at least a PFS level of accuracy (i.e., +/-25%); with a maximum level
of contingency of 15%.
The significant risks that could affect the Mineral Resource and Mineral Reserve are:
●
rising electricity prices and the continuity of the Eskom supply distribution;
●
regulatory approval for the Withok compartment of the Brakpan/Withok TSF final life design;
●
the sensitivity of some of the TSFs to the increase in operating costs and the decrease in the gold
price;
●
social unrest and social license to operate;
●
supply and cost of water;
●
failure to obtain necessary approvals from the DMRE;
●
competing claims to ownership of certain Marievale and Grootvlei TSFs;
●
global inflation and rising production costs; and
●
extreme weather.
Technical Report Summary of the material Tailings Storage Facilities
11
2 Introduction
2.1 Project Background
Ergo Mining (Proprietary) Limited (Ergo) is a subsidiary of DRDGOLD Limited (DRDGOLD). DRDGOLD is
domiciled in South Africa and listed on the Johannesburg Stock Exchange (JSE:DRD)and New York Stock
Exchange (NYSE: DRD). DRDGOLD, a South African-based gold mining company, has a 100% share in
Ergo.
The Tailings Storage Facilities ’ (TSFs’) Mineral Resource and Mineral Reserve estimates declared in this
Technical Report Summary (this Report/TRS) are owned by Ergo and are 100% attributable to DRDGOLD.
The TSFs covered in the report are from the Crown, City Deep, Knights, Ergo, Marievale and Grootvlei
Complexes, and 5A10/5L27 sand dumps and Daggafontein TSF. A total of 19 TSFs were identified by Ergo
to be material properties and have been described extensively in this report. Ergo has a total of 98 TSFs
inclusive of 79 smaller TSFs and clean-up sites.
The Mineral Resource and Mineral Reserve estimates contained in this Technical Report Summary were
compiled and reported by the Qualified Persons (QPs) for DRDGOLD in accordance with Items
601(b)(96) and 1300 through 1305 of Regulation S-K (Title 17, Part 229, Items 601(b)(96) and 1300 through
1305 of the Code of Federal Regulations) promulgated by the Securities and Exchange Commission
(SEC).
This document is the first submission of a Technical Report Summary under Subpart 1300 of Regulation S-
K; thus, it is not an update of a previously filed Technical Report Summary.
The material TSFs are at different mining stages as presented below:
●
Crown (3L5, 3L7 and 3L8):
as Indicated Mineral Resources.
●
City Deep (4L3, 4L4 and 4L6):
Measured Mineral Resources and Proven Mineral Reserves.
●
Knights (4L14 and 4L50):
Mineral Resources and Proven Mineral Reserves.
●
Ergo (Rooikraal and 7L15):
Mineral Resources and Proven/Probable Mineral Reserves declared.
●
Marievale (7L4, 7L5, 7L6 and 7L7):
Measured Mineral Resources and Proven Mineral Reserves.
●
Grootvlei (6L16, 6L17 and 6L17A):
TSFs reported as Measured Mineral Resources and one TSF reported as Indicated Mineral
Resources.
●
5A10/5L27 Sand Dumps:
Proven Mineral Reserve were declared. The sand dump is a production stage through trucking
to Ergo Plant.
Technical Report Summary of the material Tailings Storage Facilities
12
●
Daggafontein TSF:
declared as Indicated Mineral Resource and Probable Mineral Reserve. A smaller amount
(21.32Mt) of the material is reported as Inferred Mineral Resource due to inaccessibility because
of the presence of surface water.
2.2 Terms of Reference and Purpose of the Technical Report
Ergo commissioned the QPs from The RVN Group (Proprietary) Limited (The RVN Group) to compile this
Technical Report Summary to report their Mineral Resource and Mineral Reserve estimates.
This report details the results of the evaluation drilling, sampling, assaying, bulk density determination,
surveying and metallurgical test work and the resultant Mineral Resource and Mineral Reserve
estimations.
This document reports the Mineral Resource and Mineral Reserve estimates for the material TSFs. The TSFs
in this report are clustered into complexes, with the exception of the 5A10/5L27 sand dumps and
Daggafontein TSF, which are reported separately due to their size and location:
●
Crown;
●
City Deep;
●
Knights;
●
Ergo;
●
Grootvlei;
●
Marievale;
●
5A10/5L27; and
●
Daggafontein.
This report is the first Technical Report Summary for DRDGOLD prepared under the SEC's Subpart 1300 of
Regulation S-K disclosure requirements.
The effective date of the Mineral Resource and Mineral Reserve estimates for the TSFs is 30 June 2022.
The QPs noted that there had been no material change to the information between the effective date
and the signature date of the Report.
Ergo is a South African gold producer, recovering gold from the retreatment of surface tailings facilities
located in the Central and Eastern areas of the Gauteng Province.
The RVN Group is a South African-based mining consulting firm that provides services and advice to the
local and international mineral industries. Ergo has retained The RVN Group since 2016 to manage
drilling activities, estimate Mineral Resources and Mineral Reserves and compile technical reports. The
QPs from The RVN Group prepared this Technical Report Summary.
Technical Report Summary of the material Tailings Storage Facilities
13
2.3 Participants and Areas of Responsibilities
The following personnel were nominated to the project team, and their specific areas of responsibility
are shown in Table 2.1. The qualifications and appropriate experience of the authors are summarized in
Table 2.1.
Technical Report Summary of the material Tailings Storage Facilities
14
Table 2.1: List of QPs and their Responsibilities
Personnel
Company
Qualifications
Responsibility
Mpfariseni Mudau,
Pr.Sci.Nat.
The RVN Group
B.Sc. (Hons) Geology,
Graduate Diploma in Mining Engineering,
M.Sc. Mining Engineering,
B.Sc. Applied Mathematics and Statistics,
SACNASP Registration No.: 400305/12
Item
1 to 11 and
20 to 25
Steven Rupprecht,
FSAIMM
The RVN Group
B.Sc. Mining Engineering,
Ph.D. Mechanical Engineering
FSAIMM Registration No.: 701013
Item
1 and
12 to 19
Source: The RVN Group, 2022
The QP responsible for reporting and signing off on the exploration activities and Mineral Resource
estimates is Mr Mpfariseni Mudau. Mr Mudau is a Professional Natural Scientist (with registration number
400305/12) registered with the South African Council for Natural Scientific Professions (SACNASP) with
more than five years of experience relevant to the drilling, estimation and reporting of TSF Mineral
Resources. Mr Mudau works for The RVN Group and is independent of Ergo and DRDGOLD.
The QP with responsibility for reporting and signing off of the Mineral Reserve estimates is Professor Steven
Rupprecht. Professor Rupprecht is a Fellow of the Southern African Institute of Mining and Metallurgy
(SAIMM with registration number: 701013) with more than five years of experience relevant to the
estimation and reporting of TSF Mineral Reserves. Professor Rupprecht is an associate of The RVN Group
and is independent of Ergo and DRDGOLD.
2.4 Sources of Information
Most of the technical information utilized for the preparation of this report was obtained from the drilling
campaigns that The RVN Group supervised. Other technical information and engineering data were
sourced from Ergo, their contractors and third-party reports available in the public domain. These
sources are acknowledged in the body of the report and listed in Item 24.
Information provided by the registrant upon which the QPs relied is listed in Item 25.
In preparing the report, the QPs have relied upon contributions from a range of technical, financial,
environmental and engineering specialists for the disciplines outside their expertise. Based on the
support and advice from the specialists, the QPs consider it reasonable to rely upon the
information/advice provided.
2.5 Site Inspection
Mr Mpfariseni Mudau visited the drilling projects on commencement, during, and completion of the
drilling campaigns. These visits were conducted in 2016, 2017, 2018, 2019, 2020, 2021 and 2022.
Mr Mudau further visited the sample sorting and storage facilities at the Ergo processing plant in Brakpan.
On several occasions, Mr Mudau also visited MAED Metallurgical Laboratories (Proprietary) Limited
(MAED) and SGS South Africa (Proprietary) Limited (SGS) where the samples were prepared and
analyzed. Mr Mudau also visited the mining sites on several occasions .
Technical Report Summary of the material Tailings Storage Facilities
15
The objectives of the site visits were to:
●
familiarize the QP with the TSFs and the general infrastructure ;
●
inspect the drilling and sampling sites;
●
conduct assessment of sampling methodologies, quality control processes and data validation;
●
provide training and conduct planned task observations ;
●
validate the geological logging;
●
inspect the sample storage area and the sample preparation methods;
●
discuss and agree on the analytical method with the laboratories; and
●
collection of database and additional technical information.
Steven Rupprecht conducted site visits to material and non-material TSFs in 2020, 2021 and 2022.
2.6 Units, Currencies and Survey Coordinate System
Unless otherwise stated, all figures included in this report are expressed in metric units. All geographic
coordinates are UTM WGS84 system or LO29 Meridian . The elevation Datum is the mean sea level.
All monetary figures expressed in this report are in South African Rand (ZAR) and United States Dollar
(USD).
A point is used as the decimal marker, and the comma is used for the thousand’s separator (for numbers
larger than 999).
Unless otherwise stated, the word
‘
tons
’
abbreviations used in the report.
Table 2.2: List of Abbreviations
Units
Description
%
percentage
˚
degrees
˚
C
Degrees Centigrade
‘
minutes
“
seconds
µm
Micron
3D
three-dimensional
AAS
Atomic Absorption Spectroscopy
AMD
acid mine drainage
AMIS
African Mineral Standards
amsl
above mean sea level
Anglo Lab
AngloGold Ashanti Limited Chemical Laboratory
Au
gold
CIL
Carbon-in-Leach
cm
centimeter(s)
CoV
Coefficient of Variation
CRM
Certified Reference Material
Crown Mines
Crown Mines Limited
DMRE
Department of Mineral Resources and Energy
DRDGOLD
DRDGOLD Limited
Technical Report Summary of the material Tailings Storage Facilities
16
Units
Description
EIA
Environmental Impact Assessment
EMP
Environmental Management Plan
EMPr
Environmental Management Program
Ergo
Ergo Mining (Proprietary) Limited
ERPM
East Rand Proprietary Mines Limited
Eskom
Electricity Supply Commission
g
gram(s)
g/l
grams per liter
g/t
grade grams per ton
Geografix
Geografix Surveys CC
GPS
Global Positioning System
ha
hectares = 100m-by-100m
HRD
Human Resource Development
IDW
Inverse Distance Weighting
InSAR
Interferometric Synthetic Aperture Radar
IRR
internal rate of return
ISO
International Organization for Standardization
JSE
Johannesburg Stock Exchange
kg
kilograms = 1,000 grams
kg/t
kilograms per ton
km
kilometer(s) = 1,000 meters
km
2
square kilometers
koz
kilo ounces= 1,000 ounces (troy)
kt
kilotons
ktpm
kilotons per month
LED
Local Economic Development
liter
Metric unit of volume = 1,000cm
3
LoM
Life-of-Mine
m
meter(s)
m
2
square meters
MAED
MAED Metallurgical Laboratories (Proprietary) Limited
mamsl
meters above mean sea level
mm
millimeter(s) = meter/1000
Moz
Million ounces (troy)
MR
Mining Right
Mt
Million metric tons
Mtpa
Million tons per annum
MWP
Mining Works Program
NaCN
sodium cyanide
NERSA
National Energy Regulator of South Africa
NN
Nearest Neighbor
NNR
National Nuclear Regulator
NPV
net present value
NYSE
New York Stock Exchange
oz
Troy ounces = 31.1034768 grams
pH
quantitative measure of the acidity or basicity of a solution
ppm
parts per million
Technical Report Summary of the material Tailings Storage Facilities
17
Units
Description
PR
Prospecting Right
PWP
Prospecting Work Program
QA
Quality Assurance
QC
Quality Control
QP
Qualified Persons
RC
Reverse Circulation
RoM
Run-of-Mine
SANAS
South African National Accreditation System
SCADA
supervisory control and data acquisition
SEC
Securities and Exchange Commission
SGS
SGS South Africa (Proprietary) Limited
S-K 1300
Subpart 1300 of Regulation S-K under the U.S. Securities Exchange Act of 1934
SLP
Social and Labor Plan
t
metric ton = 1,000 kilograms
t/m
3
density - ton per cubic meter
TCTA
Trans-Caledon Tunnel Authority
The RVN Group
The RVN Group (Proprietary) Limited
this Report
Technical Report Summary
tons
metric tons = 1,000 kilograms
TPMS
Tailings Performance Management System
USD
United States Dollars
WGS84
World Geographic System 1984
WUL
Water Use License
ZAR
South African Rand
2.7 Independence
The QPs or The RVN Group received a fee for preparing this Technical Report Summary in accordance
with standard professional consulting practice. The QPs or The RVN Group will receive no other benefit
for the preparation of this report. Neither QPs, The RVN Group, nor any of its employees and associates
employed in the preparation of this report has any pecuniary or beneficial interest in Ergo, DRDGOLD ,
or their associates.
The QPs consider themselves independent.
Technical Report Summary of the material Tailings Storage Facilities
18
3 Property Description
3.1 Location and Operations Overview
Ergo is reclaiming TSFs in the City of Johannesburg and the City of Ekurhuleni, Gauteng, South Africa.
The Crown and City Deep Complexes are located in the City of Johannesburg while all other TSFs and
the sand dumps are located in the City of Ekurhuleni, as shown in Figure 3.1.
This TRS covers a total of 18 material TSFs of varying sizes and one sand dump. The smaller TSFs or clean-
up sites (79 in total) are not extensively covered in this report for various reasons: they are not material
as most are too small while others are not part of an immediate plan to be included in the Life-of-Mine
plan by Ergo (e.g., Fleurhof Complex). The 18 material TSFs and one sand dump contribute
approximately 89% of the total Mineral Resource, while the remaining 79 smaller TSFs and clean-up sites
only contribute 11% to the total Ergo Mineral Resource estimates. Of the total Ergo Mineral Reserve
declared, 92% contribution by tonnage is from the material properties. Thus, Ergo considers the 79
smaller TSFs and clean-up sites not material (Figure 3.2).
The sand dumps (5A10 and 5L27) are combined to form one elongated structure of varying heights. The
two small dumps on the north and east are known as 5L27 and the center sand dump is 5A10. These
dumps are joined and have similar properties. They were modelled as 5A10/5L27 but then separated for
reporting Mineral Resource estimate.
Of the total material properties, 18 are slime TSFs and one is a sand dump (5A10/5L27). Slime is a very
fine material, while sand is course-grained.
The areas occupied by the 18 material TSFs and a sand dump are shown in Table 3.1. Engineering
parameters and topography determined the size and shapes of the properties at the time of deposition
of the waste products from the respective processing plants.
Technical Report Summary of the material Tailings Storage Facilities
19
Table 3.1: Footprint Areas of the Material TSFs
TSF
Centre Coordinates
Area
(ha)
Maximum Height
(m)
Crown
3L5 (Diepkloof)
26
0
13’34.95”S, 27
0
57’09.70”E
130.00
67.50
3L7 (Mooifontein)
26
0
13’35.85”S, 27
0
13’35.85”E
87.00
88.50
3L8 (GMTS)
26
0
14’23.75”S, 27
0
58’07.91”E
147.00
94.50
City Deep
4L3
26°13'51.72"S, 28° 5’50.63”E
36.61
40.50
4L4
26°13’59.91”S, 28° 6’9.99”E
23.81
16.50
4L6
26°13’59.56”S, 28° 7’15.02”E
27.15
19.50
Knights
4L14
26°12'23.76"S, 28° 8'54.38"E
10.27
37.50
4L50
26°15'18.78"S, 28°13'8.60"E
68.03
40.50
Ergo
Rooikraal
26
0
21’48.16” S, 28
0
17’40.88”E
141.04
47.50
7L15
26°19'49.59"S, 28°24'46.01"E
73.28
37.50
Marievale
7L4
26°19'30.94"S, 28°30'5.07"E
133.48
25.00
7L5
26°19'55.08"S, 28°30'3.08"E
26.91
22.50
7L6
26°19'56.20"S, 28°30'22.96"E
46.73
34.50
7L7
26°20'51.49"S, 28°30'5.43"E
47.00
13.50
Grootvlei
6L16
26°14'31.94"S, 28°28'55.51"E
112.13
31.50
6L17
26°13'18.99"S, 28°29'23.20"E
110.02
40.50
6L17A
26°14'0.25"S, 28°29'42.67"E
85.05
25.50
5A10/5L27
5A10/5L27
26°13'9.79"S, 28°23'51.84"E
202.00
68.00*
Daggafontein
Daggafontein TSF
26
0
17’56.48” S, 28
0
31’55.10”E
462.21
64.50
Total Area (ha)
1,969.72
Source: The RVN Group, 2022
Note
:
*estimated height as drilling could not reach the base of the sand dump, only drilled up to 52.5m
.
Technical Report Summary of the material Tailings Storage Facilities
20
Figure 3.1: Location of the Material TSFs and Infrastructure (the material properties of Ergo)
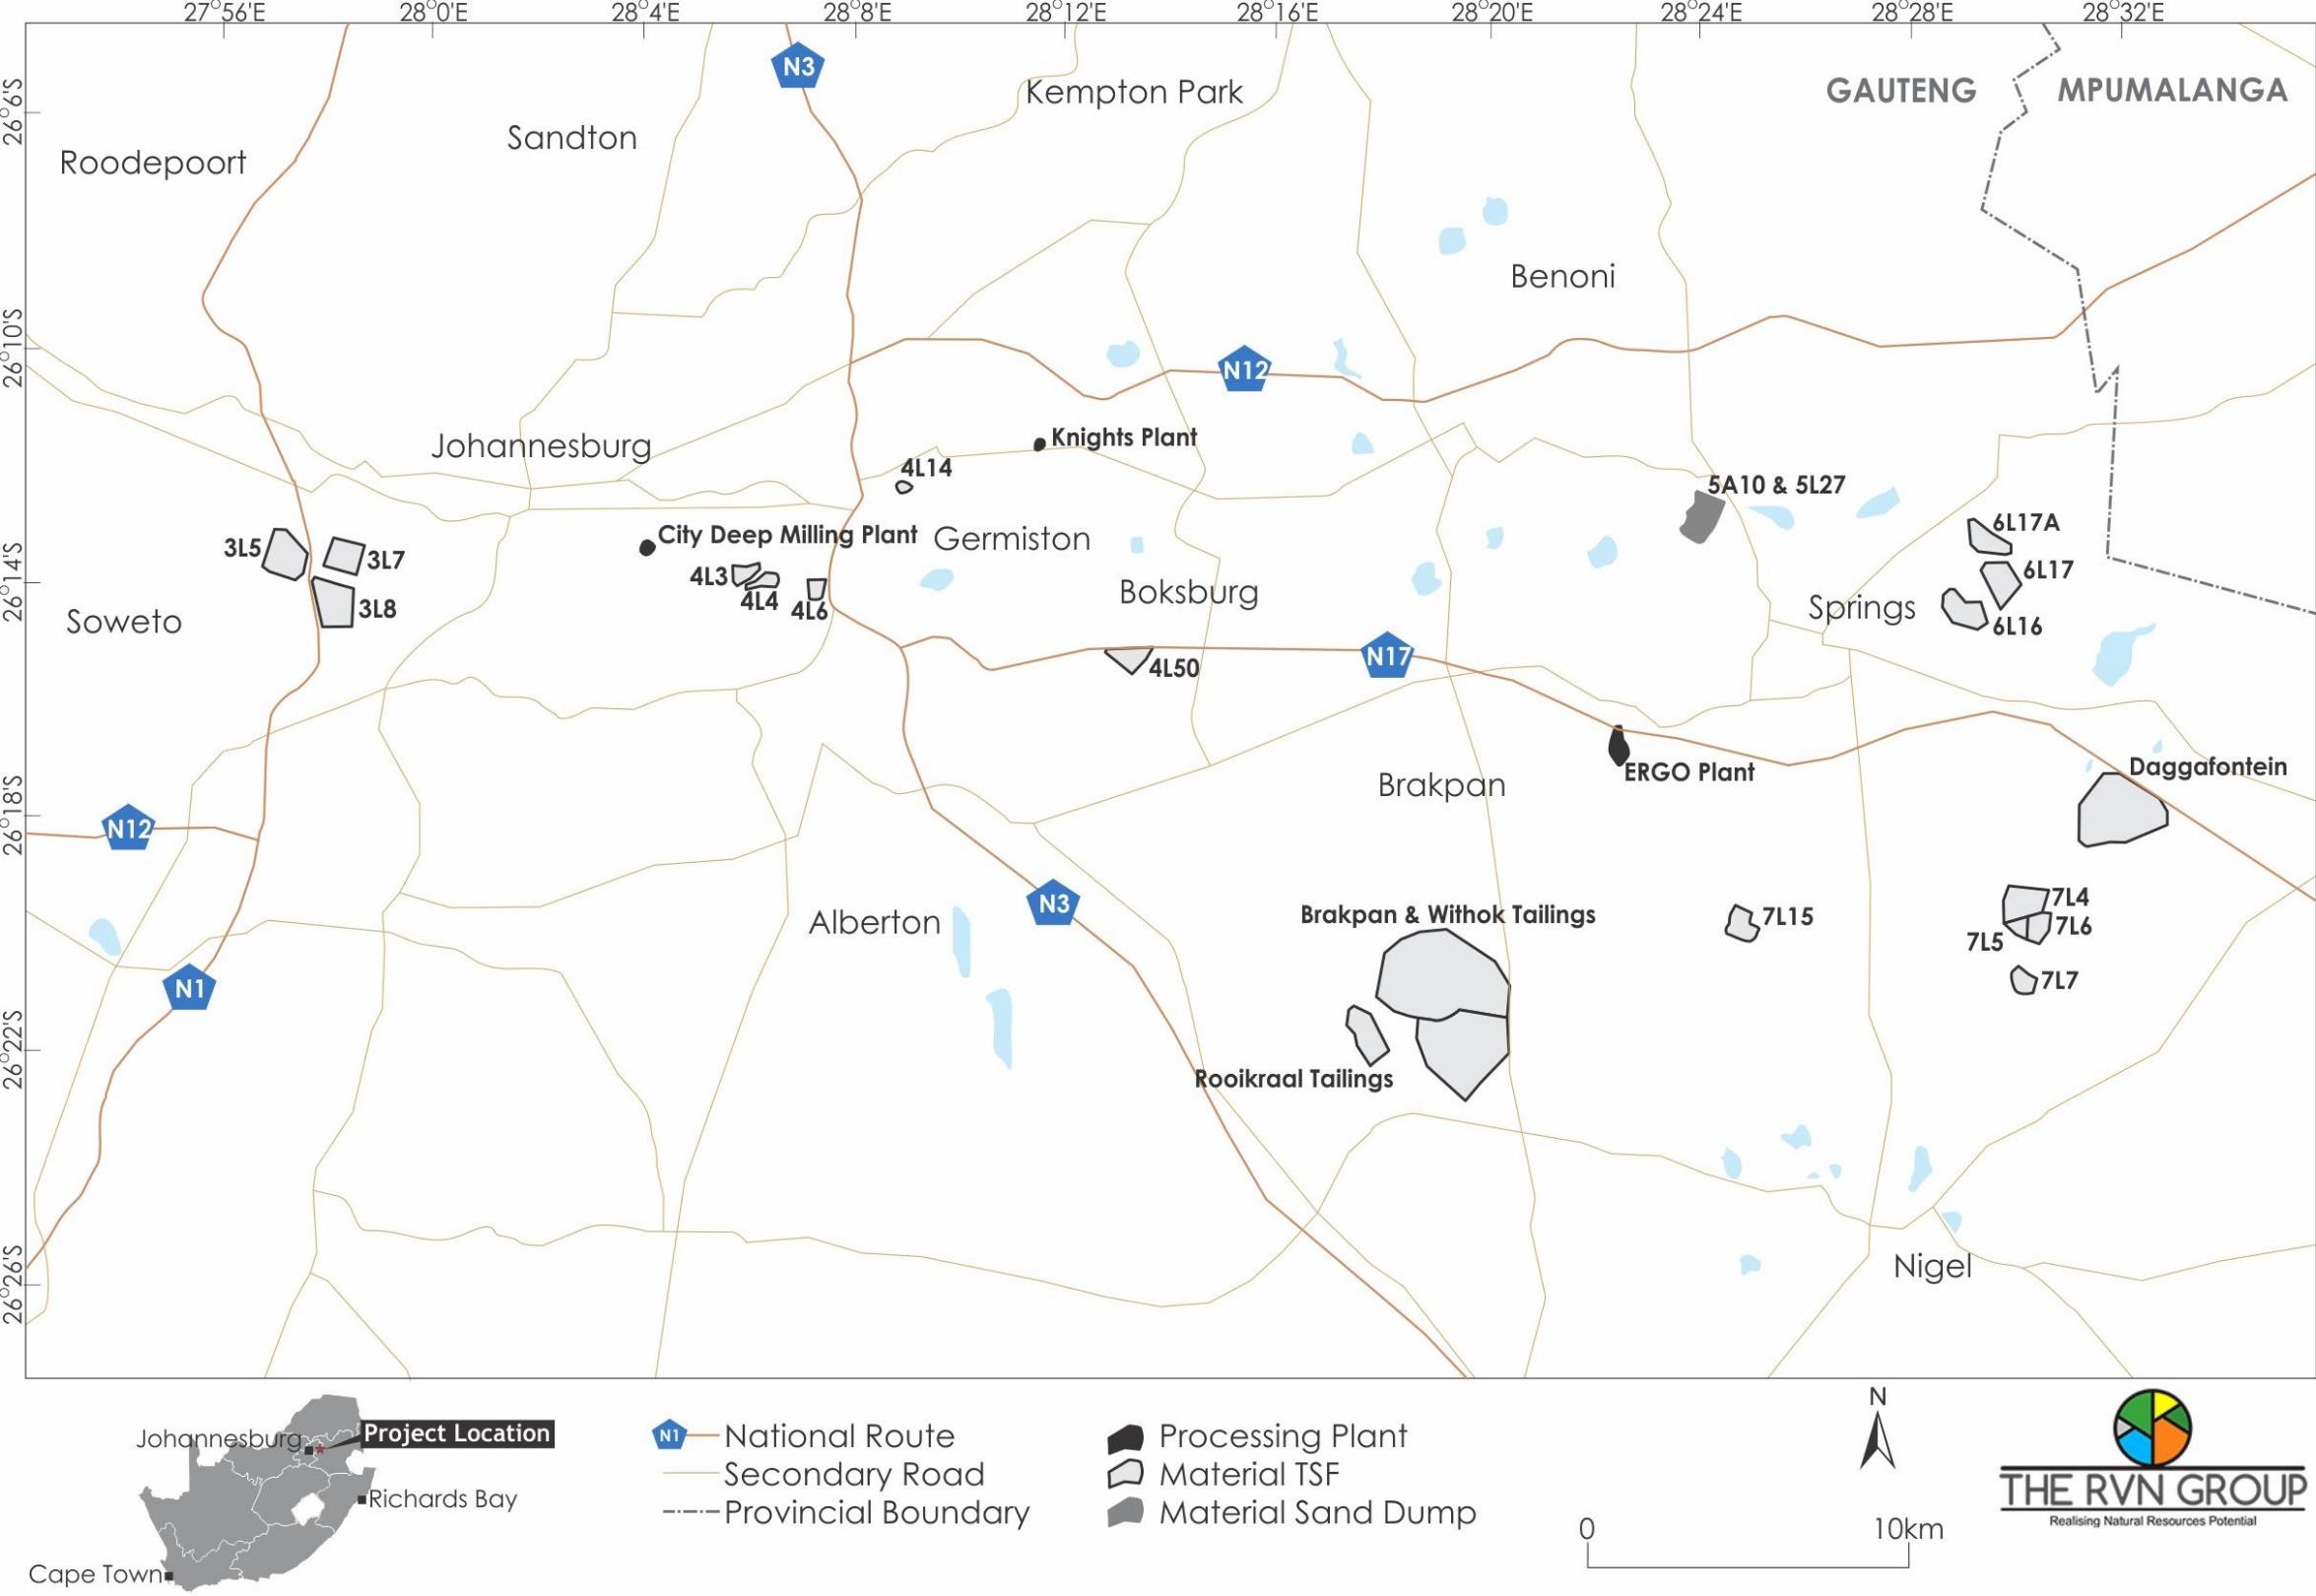
Technical Report Summary of the material Tailings Storage Facilities
21
Technical Report Summary of the material Tailings Storage Facilities
22
Source: The RVN Group, 2022
Technical Report Summary of the material Tailings Storage Facilities
23
Figure 3.2: Location of the Material Properties in Relation to the Smaller TSFs and Clean-up Operations
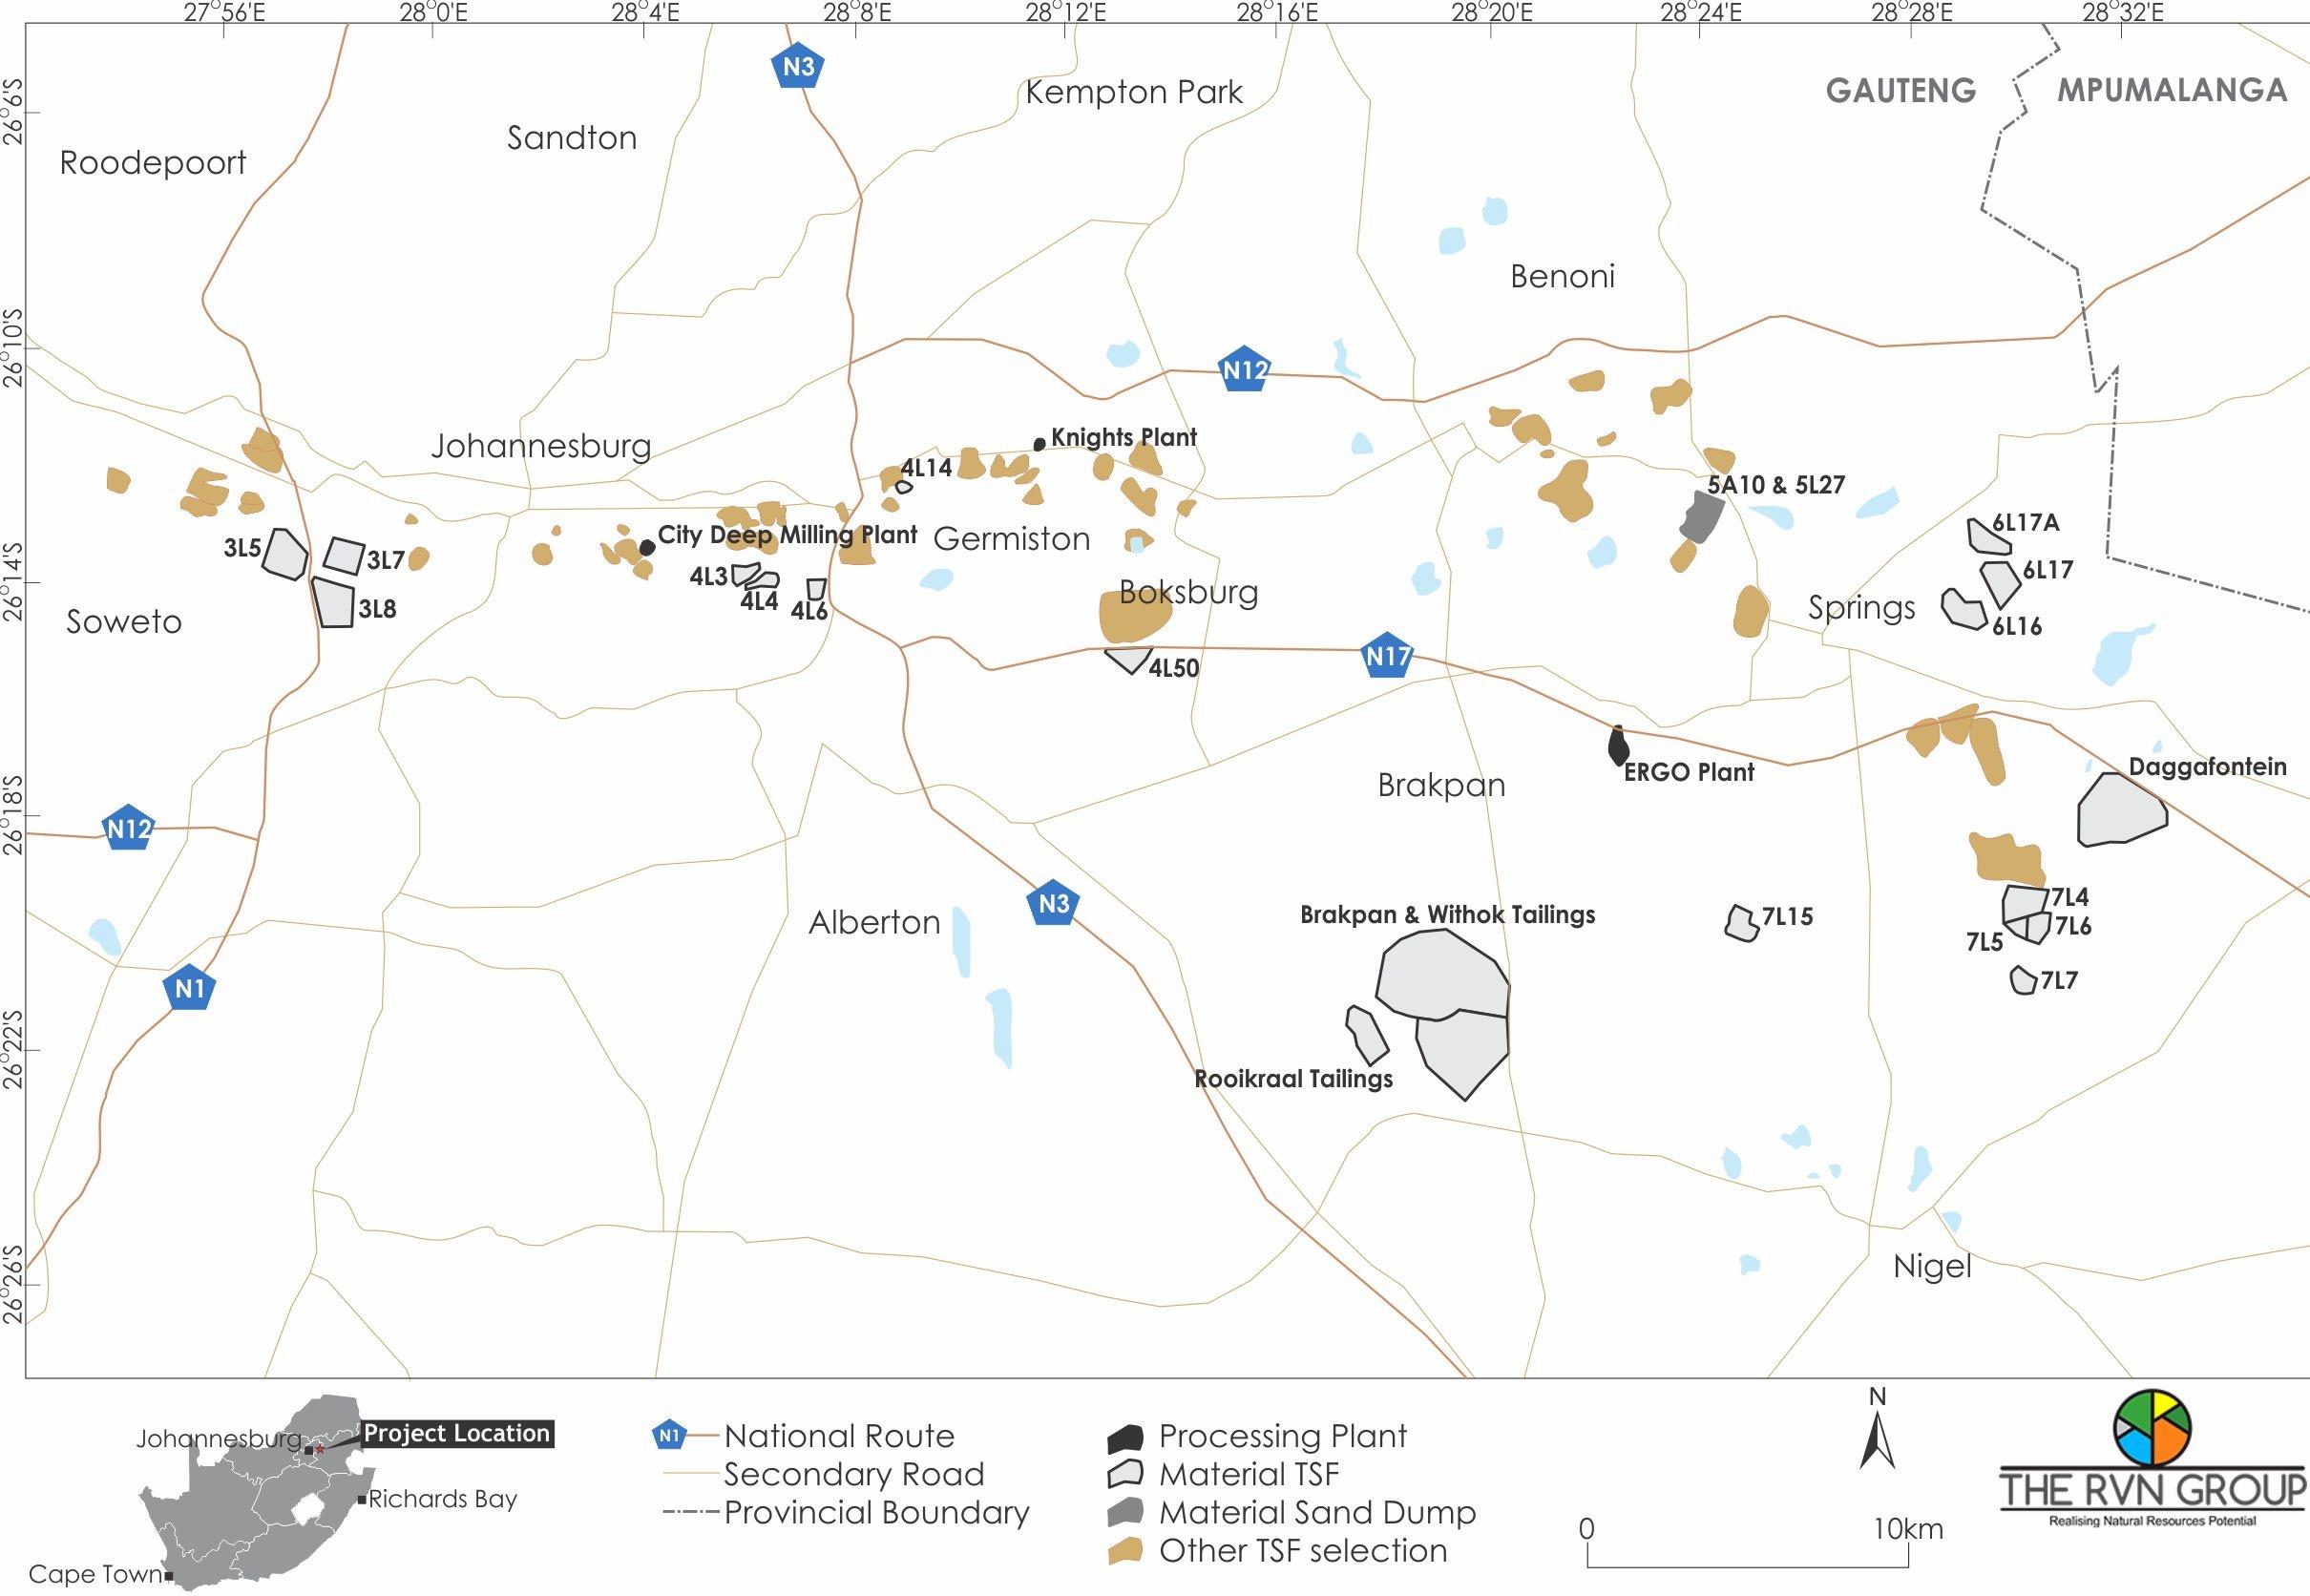
Technical Report Summary of the material Tailings Storage Facilities
24
Technical Report Summary of the material Tailings Storage Facilities
25
Source: The RVN Group, 2022
Technical Report Summary of the material Tailings Storage Facilities
26
Other material properties of Ergo include:
●
Knights Plant;
●
Ergo Plant;
●
Brakpan/Withok TSF;
●
pump stations;
●
a network of pipelines;
●
City Milling Plant;
●
Central Water Facility; and
●
solar power project.
3.2 Mineral Rights Conditions
TSFs are in most instances considered movable, and capable of being owned under the common law
separately from land. As such they are distinguishable from underground minerals, which can no longer
be individually owned in South African but in respect of which the Department of Mineral Resources
and Energy (DMRE) may issue Mining Rights in terms of the MPRDA of 2002 (MPRDA), as amended. The
construct of the MPRDA caused the minerals in certain TSFs to therefore fall outside the regulatory reach
of the MPRDA. The transitional arrangements of the MPRDA provided for existing operations however,
to convert old order rights (Mining Licenses held under the previous dispensation) to new order rights.
Ergo successfully converted its old order licenses to Mining Rights, and is seeking to consolidate them
into a single right. Now, in terms of reserves in TSFs over which there were no old order rights,
Environmental Approvals are obtained from the DMRE for the retreatment of such TSFs – a somewhat
pragmatic, yet administratively competent means of overcoming the drafting gap in the MPRDA.
For an exploration project, a Prospecting Right (PR), valid for five years, is issued, and for a mining
operation, a Mining Right (MR) valid for up to 30 years, is issued. The PR, which is conducted in terms of
a Prospecting Work Program (PWP), is renewable for a further three years. The MR is undertaken in terms
of the Mining Works Program (MWP), Social and Labor Plan (SLP), and an approved Environmental
Management Program (EMPr)which can be renewed for a further 30 years. A PR or MR may be
cancelled or suspended subject to Section 47 of the MPRDA.
The MPRDA makes provisions relating to the ownership and Broad-Based Socio-Economic
Empowerment Charter. A shareholding, equity, interest or participation in the mining right or joint
venture, or a controlling interest in a company/joint venture may not be encumbered, ceded,
transferred, mortgaged, let, sublet, assigned, alienated, or otherwise disposed of without the written
consent of the Minister, except in the case of a change of controlling interest in listed companies.
The SLP is submitted to the DMRE every five years for approval, while the SLP’s annual progress report is
submitted annually to the DMRE.
The Environmental Management Plan (EMP) and Water Use License (WUL) are assessed for compliance
annually.
Technical Report Summary of the material Tailings Storage Facilities
27
3.3 Mineral Title
Ergo title in its TSFs is vested in either common law ownership or private treaty and it holds either Mining
and Prospecting Rights as presented in Table 3.2 or Environmental Approvals in respect of the same.
Ergo has submitted applications for the renewal of its mining rights and prospecting rights. The renewal
applications were made to the DMRE on different dates per mining right. Ergo is in the process of a
consolidation of its mining rights and as such has applied to extend the mining period for a further 30
years through its consolidated mine works program. The period of 30 years is the maximum period
allowable for a Mining Right renewal as detailed in the MPRDA, as amended.
This report has considered Section 24(5) of the MPRDA, as amended:
“
A mining right in respect of which an application for renewal has been lodged shall despite its expiry
date remain in force until such time as such application has been granted or refused.
”
The same applies to the prospecting right (section18(5) of the mentioned Act).
Freehold landowners are presented in Table 3.3. Ergo owns a significant portion of freehold where the
TSFs and sand dumps are located. Where Ergo does not own the property, use and access agreements
are in place with third-party landowners, with the exception of the landowner on which certain of the
Marievale dumps are situated. Access to the TSFs for Prospecting Right purposes is enabled through the
provisions in the MPRDA.
Table 3.2: Mineral Rights Information as at 30 June 2022
Complex
Permit
Holder
Permit Type
Reference
Number with
the DMRE
Expiry Date
Renewal
Submission
Application
Date
Renewal
Reference
Number with
the DMRE
Crown
Ergo
Mining Right
GP184MR
20/06/2014
24/03/2014
GP 10022 MR
City Deep
Ergo
Mining Right
GP185MR
20/06/2014
24/03/2014
GP 10023 MR
Knights
Ergo
Mining Right
GP187MR
20/06/2018
13/03/2018
GP 10067 MR
Ergo
Ergo
Mining Right
GP158MR
27/10/2021
23/07/2021
GP 10097 MR
Marievale (7L4)
Ergo
Prospecting Right
GP10348
19/02/2022
Not
applicable
Not
applicable
Marievale (7L5,
7L6 and 7L7)
Ergo
Common Law
Ownership
Not
applicable
Not
applicable
Not
applicable
Not
applicable
Grootvlei
Ergo
Prospecting Right
GP10044PR
21/04/2019
28/03/2019
GP 10592 PR*
5A10/5L27
Ergo
Mining Right
GP158MR
27/10/2021
23/07/2021
GP 10097 MR
Daggafontein TSF
Ergo
Mining Right
GP158MR
27/10/2021
23/07/2021
GP 10097 MR
Source: DRDGOLD, 2022
Table 3.3: Land Tenure Information
Reclamation Sites
Surface Rights Owner
Crown Complex
Ergo and Innovative Property Solutions(iPROP)
City Deep Complex
Ergo and IPROP
Knights Complex
Ergo, Abland, Living Africa and EMM
Technical Report Summary of the material Tailings Storage Facilities
28
Ergo Complex
Ergo and Ekurhuleni Metropolitan Municipality
Marievale Complex
Ergo, Ekurhuleni Metropolitan Municipality, Scarlet Sun and STI Consulting
Grootvlei Complex
Ekurhuleni Metropolitan Municipality and various private owners
5A10/5L27 Sand Dump
Marcon Group
Daggafontein TSF
Ergo
Source: DRDGOLD, 2022
3.4 Violation and Fines
Ergo has no fines resulting from violating the mineral rights conditions.
3.5 Royalties
Ergo is not required to pay royalties to the State, nor does it receive royalties from any other operation.
Royalties in South Africa are guided by the Mineral and Petroleum Resources Royalty Act, 2002 (Act
No. 28 of 2008) (MPRRA).
Ergo does not pay royalty on the retreatment of TSFs and sand dumps as the treatment of TSFs and sand
dumps does not trigger the requirement to pay royalties .
3.6 Legal Proceedings and Significant Encumbrances to the Property
The QP was advised by Ergo that there are no material legal challenges concerning its Mineral Resource
and Mineral Reserve, except for Grootvlei and Marievale Complexes. The QPs find it reasonable to rely
on the legal opinion provided by Ergo.
From the documentation reviewed and input by the relevant Technical Specialists, the QPs could not
identify any significant factors or risks with regards to the title permitting, surface ownership,
environmental and community factors that would prevent the evaluation or economic extraction of
the TSFs. The QPs were assured that Ergo Mining complies with all title and environmental permitting
requirements. The QPs were informed by Ergo Mining that no significant factors or risks might affect
access, title, or the right or ability to perform work on the TSFs, except for Grootvlei and Marievale
Complexes.
Grootvlei Comp lex:
Ergo has submitted a renewal application of its prospecting rights over Grootvlei
dumps 6L16, 6L17 and 6L17A to the DMRE. During the 2022 financial year, an external party raised a
conflicting claim of common law ownership of 6L16, 6L17 and 6L17A TSFs. Although the claim was based
on common law ownership and no attempt has been made to set aside the prospecting rights over the
TSFs, the Grootvlei TSFs have been excluded from the Mineral Reserves statement and the Life-of-Mine
(LoM) plan but included in the Mineral Resources statement.
Marievale Complex:
Ergo acquired the 7L5, 7L6 and 7L7 TSFs in terms of a written notarial executed
deed of sale during 2019 and took possession of the TSFs on 8 April 2019. It has since also obtained the
requisite National Environmental Management Act, 1998 (Act No. 107 of 1998) (NEMA) regulatory
approvals to retreat the said TSFs. During the 2022 financial year, the owner of the land on which 7L5,
7L6 and 7L7 are situated, an estimated 36,524t out of the total 54,114t comprising the Marievale cluster,
notified Ergo that in its view, the said TSFs had acceded to the land and that it had become the owner
of the TSFs. Ergo disputes the claim of legal title and the matter is to be referred to arbitration.
Technical Report Summary of the material Tailings Storage Facilities
29
All ownership requirements were met when the TSFs were purchased by Ergo and therefore the TSFs are
still included in the Mineral Reserves. Whilst Ergo has received confident legal advice on the merits of its
claim, in the event that the arbitration goes against Ergo, its Mineral Reserves will reduce by 35.52Mt
(0.35Moz at 0.29g/t). Inasmuch as it then enters into a commercial arrangement with the land-owner,
the financial benefit of this portion of the Marievale cluster will be reduced by whatever benefit is
agreed to in favor of the land-owner.
Ergo has a submitted renewal application to the DMRE for the prospecting rights it holds over 7L4 TSF.
The entity (who holds common law ownership rights over the land on which the TSF is situated and the
TSF itself) has agreed to relinquish ownership in favor of Ergo, provided that Ergo undertakes to:
●
make a notional amount payment;
●
suitably remove the TSF; and
●
rehabilitate the land.
A draft contract stipulating the terms of such agreement is awaiting final signature.
4 Accessibility, Climate, Local Resources, Infrastructure and Physiography
4.1 Topography, Elevation and Vegetation
The project areas fall in the Grassland Biome of South Africa. The Grassland Biome is found on the high
central plateau of South Africa and the inland areas of Kwazulu -Natal and the Eastern Cape.
The topography is mainly flat and elevation ranges between 1,560mamsl and 1,700mamsl.
Natural vegetation for the project is limited to areas outside the urban footprint. Within the urban
environment where most of the TSFs are to be reclaimed , little vegetation occurs in its natural state.
The TSFs and sand dumps are situated in highly urbanized and industrialized areas with limited fauna
and flora. The TSFs are man-made and the trees and grasses on the TSFs have been planted to prevent
dust and erosion from the TSFs.
4.2 Access, Towns and Regional Infrastructure
The TSFs and sand dumps are situated in the Gauteng Province of South Africa, Gauteng is the most
industrialized province in South Africa and the infrastructure is adequate. All the regional and on-site
infrastructure that is required for mining is well established. There is a good supply chain for all necessary
consumables and equipment in or near the mine sites.
The areas surrounding the mine sites have good health facilities (i.e., public and private hospitals) and
education facilities (i.e., ranging from pre-primary to secondary and tertiary education levels).
A good road transportation system can be found in the area. The TSFs and sand dumps are well serviced
by highways, paved regional roads and a network of dirt tracks that the Ergo utilized to access mining
and project visits. The QPs consider access to the TSFs to be in good condition. For international supplies
Technical Report Summary of the material Tailings Storage Facilities
30
or travel, the OR Tambo and Lanseria International Airports, in Kempton Park and Lanseria respectively,
are well-positioned to service Ergo.
Tele-communication on the TSFs and sand dumps is good for all major network providers. Most parts of
the project areas are fully covered by the third or fourth generation (3G or 4G) wireless mobile
telecommunications technology. Other areas are now covered by high-end 5G technology.
Item 15 presents the infrastructure in more detail.
4.3 Climate
A summer rainfall climate prevails in the areas. Summer rain occurs mainly in the form of thunderstorms
with a mean annual precipitation of approximately 680mm, and evaporation is about 1,800mm per
year. Winds are generally light and blow predominantly from the northwest. Winters are cold and dry.
Extreme weather conditions occur in the form of frost (2 to 20 occurrences per annum) and the
occasional hailstorm.
The average annual temperature for the year is approximately 19˚C, with average maximum
temperatures ranging between 22˚C and 32˚C and average minimum temperatures ranging between
2˚C and 18˚C. The hottest months are from December to February. During April and May, there is a
noticeable drop in temperature, which signals the commencement of winter. The coldest months are
June and July. Rains and temperature have minimal effects on operations.
The area generally has a high evaporation rate in the summer months from November to January. This
gives rise to high relative humidity. Evaporation is greater in summer than in winter due to higher ambient
temperatures.
There are no long-term associated climatic risks, other than those associated with climate change and
global warming, and the operating season is year-round.
4.4 Infrastructure and Bulk Service Supplies
The TSFs and sand dumps are situated in the well-developed province of Gauteng and have the most
major supplies. All the regional and on-site infrastructure that is required for mining and processing is well
established. There is a good supply chain for all necessary consumables and equipment in or near the
mine sites. Section 15 of this report details the infrastructure relevant to Ergo.
The TSFs and sand dumps are located near hospitals offering basic and advanced medical care.
The project areas are supplied with bulk electricity from the regional grid supplied by Eskom, the national
power supplier, or by the local municipality. Like most parts of South Africa, the operations are affected
by occasional load shedding implemented by Eskom during periods of constrained power generation.
Water to the TSFs and related infrastructure is supplied by Rand Water. Ergo recycles most of the water.
4.5 Personnel Sources
Where mining activities take place, Ergo has commissioned contractors to conduct mining and secure
the TSFs. Where there are no mining activities, Ergo has employed contractors to maintain the TSFs (to
Technical Report Summary of the material Tailings Storage Facilities
31
minimize dust and monitor water levels on the TSFs and sand dumps) and security companies to secure
the properties.
Ergo employees conduct site inspections on a regular basis of the project TSFs and sand dumps.
Should additional employees be required, the surrounding areas have a large semi-skilled and skilled
workforce. The cities of Johannesburg and Ekurhuleni have a large source of talent for trades and
technical management.
The majority of employees hired by Ergo are sourced from Gauteng Province, where all the properties
are situated. Contractors and specialist consultants are also predominantly based in Gauteng Province.
Technical Report Summary of the material Tailings Storage Facilities
32
5 History
5.1 Ownership
Anglo American Corporation commissioned the Ergo facility (processing plant) on the East Rand in 1977.
The objective was to recover gold, uranium and produce sulfuric acid from surface tailings material via
a metallurgical flotation process. In 1977 a carbon in leach (CIL) plant was added. In 1990, when the
uranium market collapsed, the uranium plant and the larger of the two acid plants were closed down.
In 1998 Ergo became part of Anglo Gold Limited (later Anglo Gold Ashanti Limited). In 2005 Ergo was
closed down.
In 2007, Ergo (Pty) Limited was formed as a joint venture between DRDGOLD and Mintails to re-establish
the tailings treatment operations. A year later (2008) re-commissioning of the plant started, and Ergo
acquired the Mintails’ stake in the gold recovery phase of the project. In 2009 a second feed line was
brought into the Ergo plant from the Elsburg TSFs and the plant capacity doubled to 1.2 Mt per month.
In 2010, DRDGOLD acquired the balance of Mintails ’ interest.
5.1.1 Crown Complex
Crown Mines Limited (Crown Mines), previously known as Rand Mines (Milling and Mining) Limited,
belonged to Rand Mining Proprietary Group, which commenced retreatment operations in 1982. At
least 90% of the Crown Complex material was deposited onto the Crown TSF Complex Facility by Crown
Gold Recoveries, which retreated processed material originally mined from the historical mines in the
area. The Crown complex is situated on the farm Mooifontein 225-IQ.
5.1.2 City Deep complex
City Deep belonged to Rand Mines (Milling and Mining) Limited and fell under the same group as Crown
Gold Recovery. Records indicate that in 1986 City Deep Complex belonged to City Deep Rand Mines.
Most of City Deep TSFs are located on the farms Elandsfontein 107-IR, Kliprivierfontein 106-IR and
Doornfontein 92-IR.
5.1.3 Knight Complex
Most of the TSFs in the Knights complex were previously owned by Simmer and Jack dating back to
1986. Witwatersrand Gold Mine owned other TSFs.
5.1.4 Ergo Complex
The Ergo Complex was created by East Rand Proprietary Mines Limited (ERPM) around 1958. ERPM in
Boksburg was established more than 125 years ago as an underground gold mining operation and
produced gold from 1896 to 2008. ERPM had approximately 15 shafts in the Elsburg area, which were
the primary sources of the tailings material deposited onto TSFs 4L47/48/49 and 50. The Ergo complex is
situated on the farms Klippoortje 110-IR and 112-IR.
Technical Report Summary of the material Tailings Storage Facilities
33
5.1.5 Marievale Complex
Marievale Complex was previously owned by Gencor Limited (General Mining Union Corporation)
(Gencor) and operated by Marievale Consolidated Mines. The primary commodity was gold, and the
secondary commodity was silver. The first year of production was 1939. Mining stopped in 1998. The
Marievale complex is located on the farm Vlakfontein 281-IR.
5.1.6 Grootvlei Complex
Grootvlei was previously owned by Gencor and operated by Grootvlei Proprietary Mines Limited from
1967 to 1981 at an average grade of 5g/t of gold. The registered owner in 1986 was DUMPCO Limited.
Mining stopped in 2005. Grootvlei is located on the farm Grootvlei 124-IR.
5.1.7 5A10/5L27
The Consolidated Modderfontein Mine deposited mine tailings on the 5A10/5L27 sand dump during the
1980s. Before then, the sand dump was owned by Government Gold Mine.
5.1.8 Daggafontein TSF
Daggafontein TSF was previously owned by Daggafontein Mines. Tailings deposition onto the TSF
commenced around 1982 and ceased around 2002 when the mine ceased operations. Currently, the
TSF is owned by Ergo.
5.2 Construction of the TSFs and Sand Dumps
The TSFs were constructed in accordance with the then Chamber of Mines guidelines and best practices
at the time. The guidelines provided for a starter wall, toe drain and blanket drain. Gravity penstocks
were provided on all TSFs, which were subsequently replaced with elevated penstocks during their
operations. The final design heights for a ‘typical’ TSF operated using day-walls were generally between
30m and 100m.
All the TSFs were constructed as upstream TSFs. Upstream TSFs need to be raised slowly to allow the solid
tailings time to dry and consolidate enough to support a new level of the TSF.
The sand dump material was deposited by trucks or cocopans.
Technical Report Summary of the material Tailings Storage Facilities
34
Table 5.1 presents the history and status of TSFs and the sand dump. The TSFs and the sand dump are
considered old, and the properties have been dormant for a considerable number of years.
Table 5.1: History and Status of the TSFs and Sand Dump
TSF/Sand Dump
Commissioned
Date
Decommissioned
Date
Status as at
30 June 2022
Age since becoming
Dormant (Years)
Crown
3L5
+/-1920
2009
Dormant
12
3L7
Dormant
3L8
Dormant
City Deep
4L3
1965
1984
Development
37
4L4
Development
4L6
Development
Knights
4L14
1960
2000
Dormant
21
4L50
1968
1998
Mining
NA
Ergo
Rooikraal
1985
2012
Development
9
7L15
1964
1986
Dormant
35
Marievale
7L4
1964
1998
Dormant
23
7L5
1964
1998
Dormant
23
7L6
1964
1998
Dormant
23
7L7
1964
1998
Dormant
23
Grootvlei
6L16
1964
2005
Dormant
16
6L17
2005
Dormant
16
6L17A
2005
Dormant
16
5A10/5L27
5A10/5L27
1960
1986
Mining
NA
Daggafontein
Daggafontein
1970
2003
Dormant
17
Source: DRDGOLD, 2022
5.3 Previous Exploration and Mine Development
5.3.1 Previous Evaluation Drilling
Previous evaluation drilling was completed on the TSFs in the 1970s by Anglo-American, and from 2006
to 2008 by Ergo and Mintails SA (Proprietary) Limited. The QP was made aware of these activities,
however the QP did not use data acquired before 2008 in this report as data quality assessment and
validation could not be performed.
5.3.2 Previous Development
In 1976, the construction of the processing plant and associated infrastructure commenced and Ergo
formally came into production on 25 February 1978.
Technical Report Summary of the material Tailings Storage Facilities
35
Table 5.2 presents Ergo’s production data over the last five years.
Table 5.2: ERGO Production History
Date
Tons Mined
(Mt)
Yield Au
(g/t)
Gold Produced
(kg)
Gold Produced
(koz)
30 June 2018
24.3
0.19
4,679
150
30 June 2019
23.2
0.19
4,493
144
30 June 2020
*
20.2
0.20
3,989
128
30 June 2021
23.0
0.19
4,263
137
30 June 2022
22.1
0.19
4,156
134
Source: DRDGOLD, 2022
Note: *production was affected by COVID-19 national lockdown.
Technical Report Summary of the material Tailings Storage Facilities
36
6 Geological Setting, Mineralization and Deposit
6.1 Regional Geology
The TSFs are man-made features, and mineral distribution reflects the artificial nature of the deposit. The
materials are the waste products (tailings) of the mining and metallurgical process recovery from the
Witwatersrand and Transvaal Supergroups gold deposits.
These tailings consist predominantly of quartz, lesser amounts of mica, chlorite, chloritoid, pyrite
(1% to 2%) and low concentrations of gold, uranium and sulfur.
Gold was discovered in the conglomerates of the Witwatersrand sedimentary basin in about 1886.
The Witwatersrand Supergroup is aerially and structurally related to the underlying Dominion Reef System
and the overlying Ventersdorp System. The Supergroup is an elongated sedimentary basin stretching
some 320km in a north-easterly direction and 160km in a north-westerly direction. The upper portions of
the Witwatersrand Supergroup contain quartz conglomerates that have been mined for their gold and
uranium contents.
The Transvaal Supergroup is a stratigraphic unit consisting of clastic sediments, carbonates, banded iron
formations and volcanics younger than the Witwatersrand Supergroup. It occasionally directly overlies
the gold-bearing conglomerates of the Witwatersrand Supergroup where the Ventersdorp Volcanics
have been eroded or were not developed. At the base of the Transvaal Supergroup is a conglomerate
layer, the Black Reef, that has been mined for gold.
The operations are situated in the Witwatersrand Central Rand and East Goldfields. The East Goldfield
are linked to the Central basin across a large monoclinal structure, the Springs Monocline. The major
economic horizons mined were the South Reef together with Main Reef, Main Reef Leader and the
Elsburg and Kimberley Reefs. The Black Reef, where mineralized, was also mined in the area.
6.2 Mineralization, Local and Property Geology
The TSFs has been processed through metallurgical plants that eject a residue (tailings) which is relatively
uniform in terms of gold mineralization when compared with the natural deposit from which the material
is derived. The variation between gold grades is small as the process residue dump was constructed in
layers/benches. Grade variation primarily follows variations in the processing and, to a lesser extent,
primary deposits characteristic. The gold mineralization is fairly well distributed throughout the TSF.
The TSFs are the by-product of the mineral recovery process. They took the form of a liquid slurry made
of fine mineral particles
–
pumped to the TSFs which were constructed using earth dam s. As the residue of the tailings gradually
drained and became compacted, grass and other vegetation were planted to rehabilitate the
environment.
Technical Report Summary of the material Tailings Storage Facilities
37
The TSFs and sand dumps evaluated in this report originated from different sources or processing plants,
as shown in Table 6.1.
Table 6.1: Origin of the TSF and Sand Dump Material
TSF/Sand Dump
Source Mine
Mined Reef
Crown Complex
3L5
Crown Mines
Main Reef
3L7
Crown Mines
Main Reef
3L8
Crown Mines
Main Reef
City Deep Complex
4L3
City Deep Gold Mine (Proprietary) Limited
Kimberley Reef
4L5
City Deep Gold Mine (Proprietary) Limited
Kimberley Reef
4L6
City Deep Gold Mine (Proprietary) Limited
Kimberley Reef
Knights Complex
4L14
Simmer and Jack Gold Mine
Black Reef
4L50
Witwatersrand Gold Mine
Black Reef/Elsburg
Ergo Complex
Rooikraal
Knights Plant
Residue from Knights Plant
7L15
Vlakfontein Mine
Black Reef
Marievale Complex
7L4
Marievale Consolidated Mine
Kimberley Reef, Nigel Reef and Main
7L5
Marievale Consolidated Mine
Kimberley Reef, Nigel Reef and Main
7L6
Marievale Consolidated Mine
Kimberley Reef, Nigel Reef and Main
7L7
Marievale Consolidated Mine
Kimberley Reef, Nigel Reef and Main
Grootvlei Complex
6L16
Grootvlei Proprietary Mines Limited
Kimberley Reef
6L17
Grootvlei Proprietary Mines Limited
Kimberley Reef
6L17A
Grootvlei Proprietary Mines Limited
Kimberley Reef
5A10/5L27 Sand Dumps
5A10/5L27
Modderfontein East Mine
Main Reef Leader
Daggafontein TSF
Daggafontein
Daggafontein Mine
Main Reef
Source: DRDGOLD, 2022
6.3 Stratigraphy and Cross-sections
Unlike the stratigraphy of the in situ mineral deposit, the stratigraphy of a TSF or sand dump is man-made.
A typical stratigraphy is presented in Figure 6.1. Slime was deposited on soil (original ground level). The
color of topsoil ranges from red to black. In some cases, soil is mineralized or enriched.
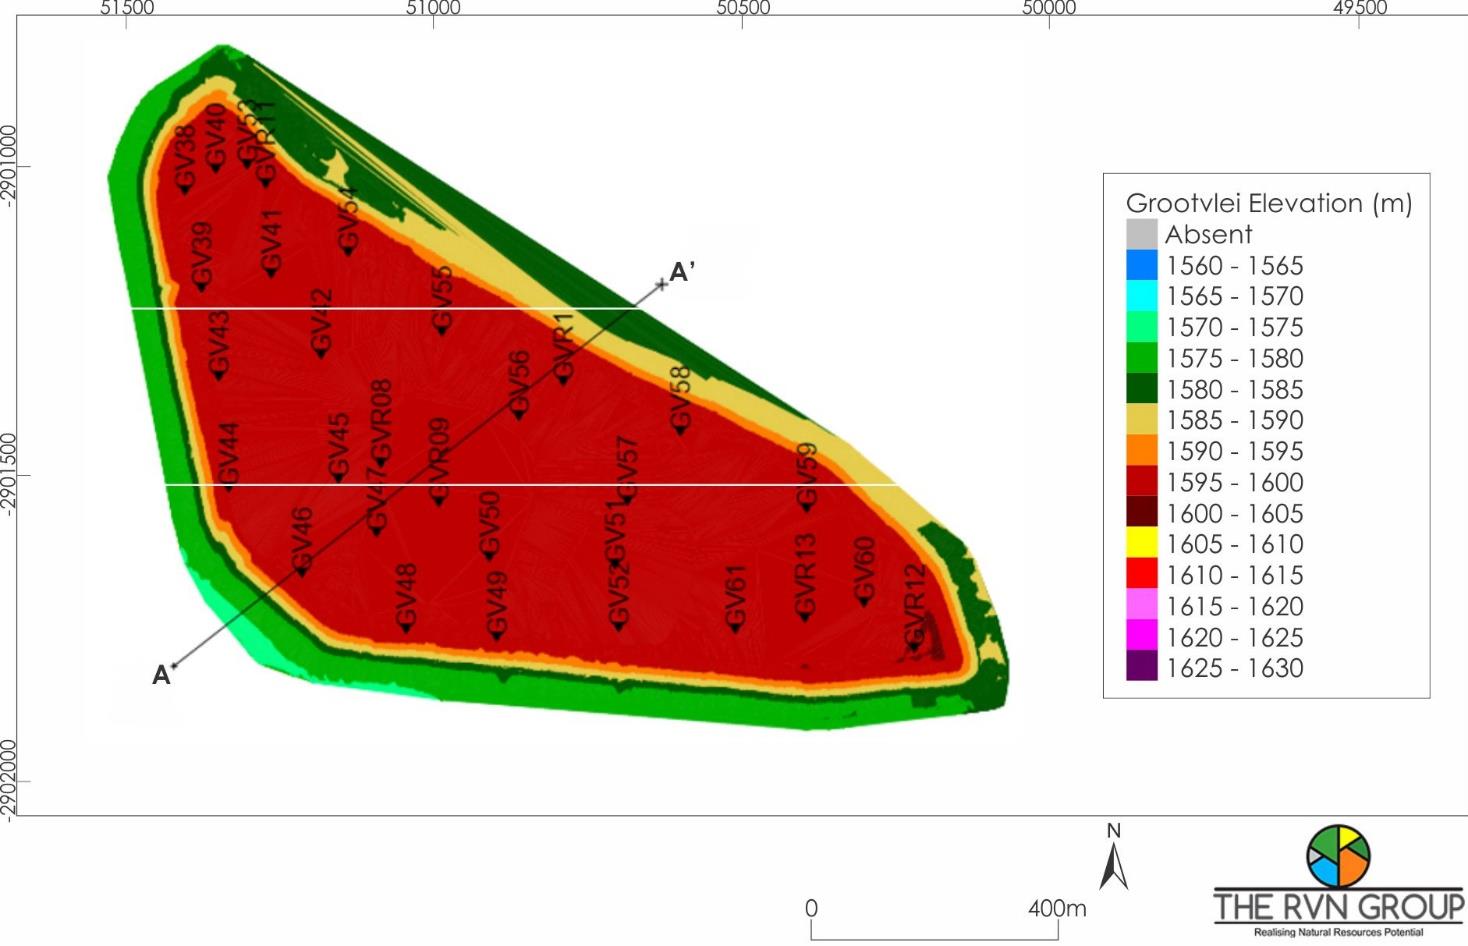
Technical Report Summary of the material Tailings Storage Facilities
38
Figure 6.1: A Typical Stratigraphy for Ergo’s TSFs
Source: The RVN Group, 2022
A typical cross-section of a TSF is shown in Figure 6.2 and Figure 6.3.
Figure 6.2: Grootvlei Complex (6L17) Map showing Location of Cross-section
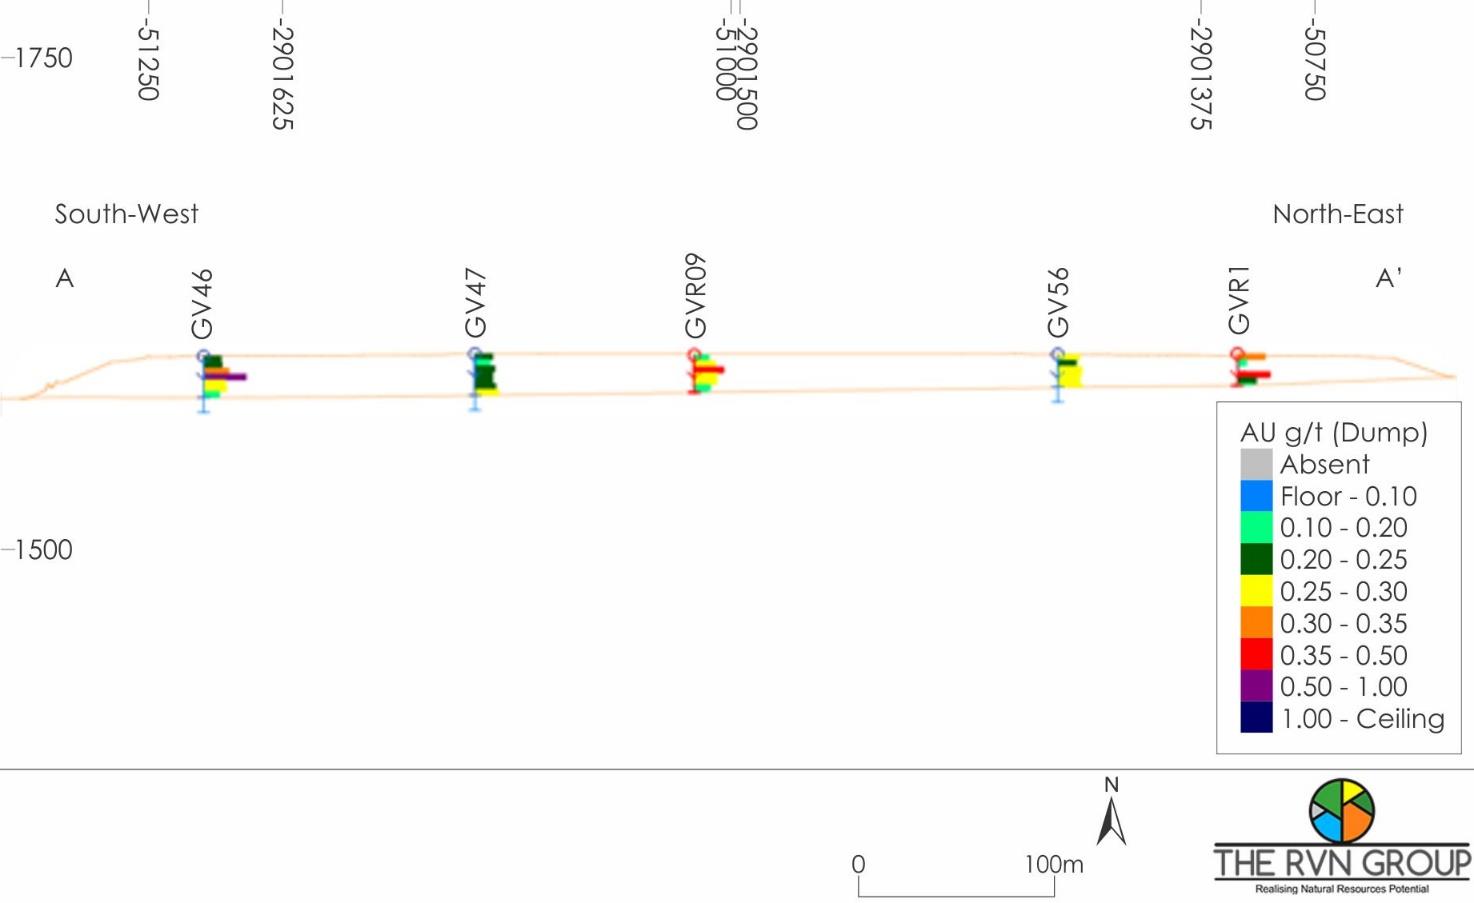
Technical Report Summary of the material Tailings Storage Facilities
39
Source: The RVD Group, 2022
Source: The RVN Group, 2022
6.4 Deposit Type
The deposits under consideration are man-made features that are sometimes referred to as dumps,
tailing dams, or simply mine dams.
The TSF or sand dump generally lies above the prevailing ground level and there is no host rock. No
geological or mineralization controls are relevant to the TSFs or sand dumps as they are man-made
features.
The engineering design parameters determine the size and shape of the TSF or sand dump at the time
of the deposition of the waste products from the respective plants.
Technical Report Summary of the material Tailings Storage Facilities
40
7 Exploration
7.1 Exploration
The TSFs are man-made engineering features and typical exploration programs (geophysics, trenching,
mapping and soil sampling) were not undertaken on the TSFs. An evaluation drilling program was
conducted on the TSFs. No exploration work was required to locate the TSFs, as their locations are well
known, rising well above ground level. The QP considered non-drilling exploration to be not material to
the Ergo properties.
7.2 Topographic Surveys
The topographic surfaces of the TSFs were surveyed by Jaco van Staden, a qualified surveyor from
Geografix Surveys CC (Geografix), using a differential Global Positioning System (GPS) unit. The method
has an accuracy in the range of 10cm. The conventional survey equipment (total stations, prisms and
related equipment) and GPS Real Time Kinetic systems were used to accurately determine the
coordinated positions of the surface features as required to create a digital terrain model.
Daily calibration through transformation was completed to ensure the instruments reported accurate
results. This standard procedure was performed daily before surveying. After surveying was conducted
or when the day’s work was completed, the calibration was rechecked through measurements of the
benchmark points to confirm that the instruments measured the correct values. Data from survey
measurements were checked through repeated measurements of selected points. No bias was
identified.
Surveys were undertaken on a 10m grid and measurements were also taken on all breaker lines. An
additional 10m to 20m outside the footprint of each TSF and sand dump was also surveyed.
No additional tailings material was deposited on the TSFs after the surveys were conducted. For the TSFs
where mining is taking place (4L50 and 5A10/5L27), monthly surveys are completed, and the tonnage
is depleted from the Mineral Resources and Mineral Reserves up to 30 June 2022. The details of the
survey information are presented in Table 7.1.
The QP was satisfied to rely on the survey measurements as an accurate representation of the TSFs and
sand dumps.
7.3 Evaluation Drilling
Evaluation drilling campaigns were completed on the TSFs and sand dumps. The drilling grid was not
always regular due to access issues; however, the QP noted that drill holes were well spread. The well-
spread drill holes ensured that the samples collected were representative of the respective TSFs and
sand dumps.
7.4 Drilling Methodology
Two drilling techniques were followed by specialized independent drilling contractors on the TSFs. The
Reverse Circulation (RC) method was implemented where the auger drilling technique could not drill to
Technical Report Summary of the material Tailings Storage Facilities
41
the base of the TSF due to drill hole length exceeding 55m or areas of high moisture content at the base
of the TSF.
The QP was satisfied that all measures were taken to ensure that drilling, sampling and recoveries were
acceptable and would not affect the accuracy and reliability of the results. The experienced geologists
from The RVN Group monitored the drilling process. The QP made ad-hoc site visits during drilling and
sampling. In the opinion of the QP, the processes followed were adequate for collecting quality samples
and information for use in the interpretation of results and in the Mineral Resource estimation.
Table 7.1: Survey Details of the Material from the TSFs and Sand Dumps
TSF/Sand Dump
Area
(ha)*
Date Surveyed**
Coordinate System, Datum
Crown
3L5 (Diepkloof)
158.5
02/09/2013
WGS84 LO27, amsl***
3L7 (Mooifontein)
108.4
15/08/2013
WGS84 LO27, amsl
3L8 (GMTS)
159.3
20/09/2013
WGS84 LO27, amsl
City Deep
4L3
33.9
15/05/2017
WGS84 LO29, amsl
4L4
20.6
08/06/2017
WGS84 LO29, amsl
4L6
44.2
15/06/2017
WGS84 LO29, amsl
Knights
4L14
22.4
13/11/2015
WGS84 LO29, amsl
4L50
55.5
19/05/2017
WGS84 LO29, amsl
Ergo
Rooikraal
136.8
23/05/2018
WGS84 LO29, amsl
7L15
97.6
23/05/2008
WGS84 LO29, amsl
Marievale
7L4
116.3
19/01/2009
WGS84 LO29, amsl
7L5
31.1
08/01/2009
WGS84 LO29, amsl
7L6
62.0
20/01/2009
WGS84 LO29, amsl
7L7
69.1
22/01/2009
WGS84 LO29, amsl
Grootvlei
6L16
127.9
15/05/2015
WGS84 LO29, amsl
6L17
130.7
15/05/2015
WGS84 LO29, amsl
6L17A
85.7
15/05/2015
WGS84 LO29, amsl
5A10/5L27
5A10/5L27
56.7
26/02/2008
WGS84 LO29, amsl
Daggafontein
Daggafontein TSF
476.9
12/08/2016
WGS84 LO29, amsl
Total Area (Ha)
1,993.6
Source: The RVN Group, 2022
Note:
*area includes 10m outside the TSF footprint
**date before mining (4L50 TSF and 5A10/5L27 sand dump are surveyed monthly for production purpose s)
***amsl is the abbreviation for above mean sea level
Technical Report Summary of the material Tailings Storage Facilities
42
7.4.1 Auger Drilling
Auger drilling, a cost-effective method, was commissioned by Ergo on most of their TSFs for holes less
than 55m and located within areas of lower moisture content .
With auger drilling, the rotation of a helical screw causes the blade of the screw to lift the sample to the
surface. This drilling method does not require heavy machinery in order to drill to the desired depth. This
auger method can be used for shallow environmental drilling, geotechnical drilling, soil engineering and
mineral deposits where the formation is soft and the hole does not collapse. This is done by pressing the
spiral rods into the ground using a drilling head machine which can drill up to a depth of 55m.
Samples were collected through the spiral at every 1.5m interval and the spiral was cleaned with water
and brushed clean after every run.
7.4.2 Reverse Circulation
RC drilling, with better sample recovery than auger drilling, is a method of drilling which uses dual wall
drill rods consisting of an outer drill rod with an inner tube. These hollow inner tubes allow the drill cuttings
to be transported back to the surface in a continuous, steady flow.
The drilling mechanism is often a pneumatic reciprocating piston called a hammer, which in turn drives
a clay cutter, specifically made to cut soft material such as tailings and soil.
The clay cutter is used to remove samples that are pushed through the machine with compressed air.
When air is blown down the annulus (ring-shaped structure) of the rod, the pressure shift creates a
reverse circulation, bringing the tailings up the inner tube. When the tailings reach a deflector box at
the top of the rig, the material is moved through a hose attached to the top of the cyclone.
The drill cuttings will travel around the cyclone until they fall through the bottom opening into a sample
bag. These bags are sorted and marked with the location and depth where the sample was collected.
RC drilling technique can drill up to 1,500m deep. The other benefits of RC drilling include:
●
more reliable and less contaminated samples than those from auger drilling;
●
a high drill penetration rate;
●
a larger sample size; and
●
a more cost-effective method than diamond or sonic drilling.
Samples were collected through the cyclone at 1.5m intervals and the rods and cyclone were cleaned
with compressed air after every run.
The RC drilling technique was chosen because RC drilling could drill deeper holes than auger drilling. In
addition, because of its higher power, RC drilling can drill through wet material and has a better
recovery percentage than auger drilling, which is prone to losing wet samples through its spiral.
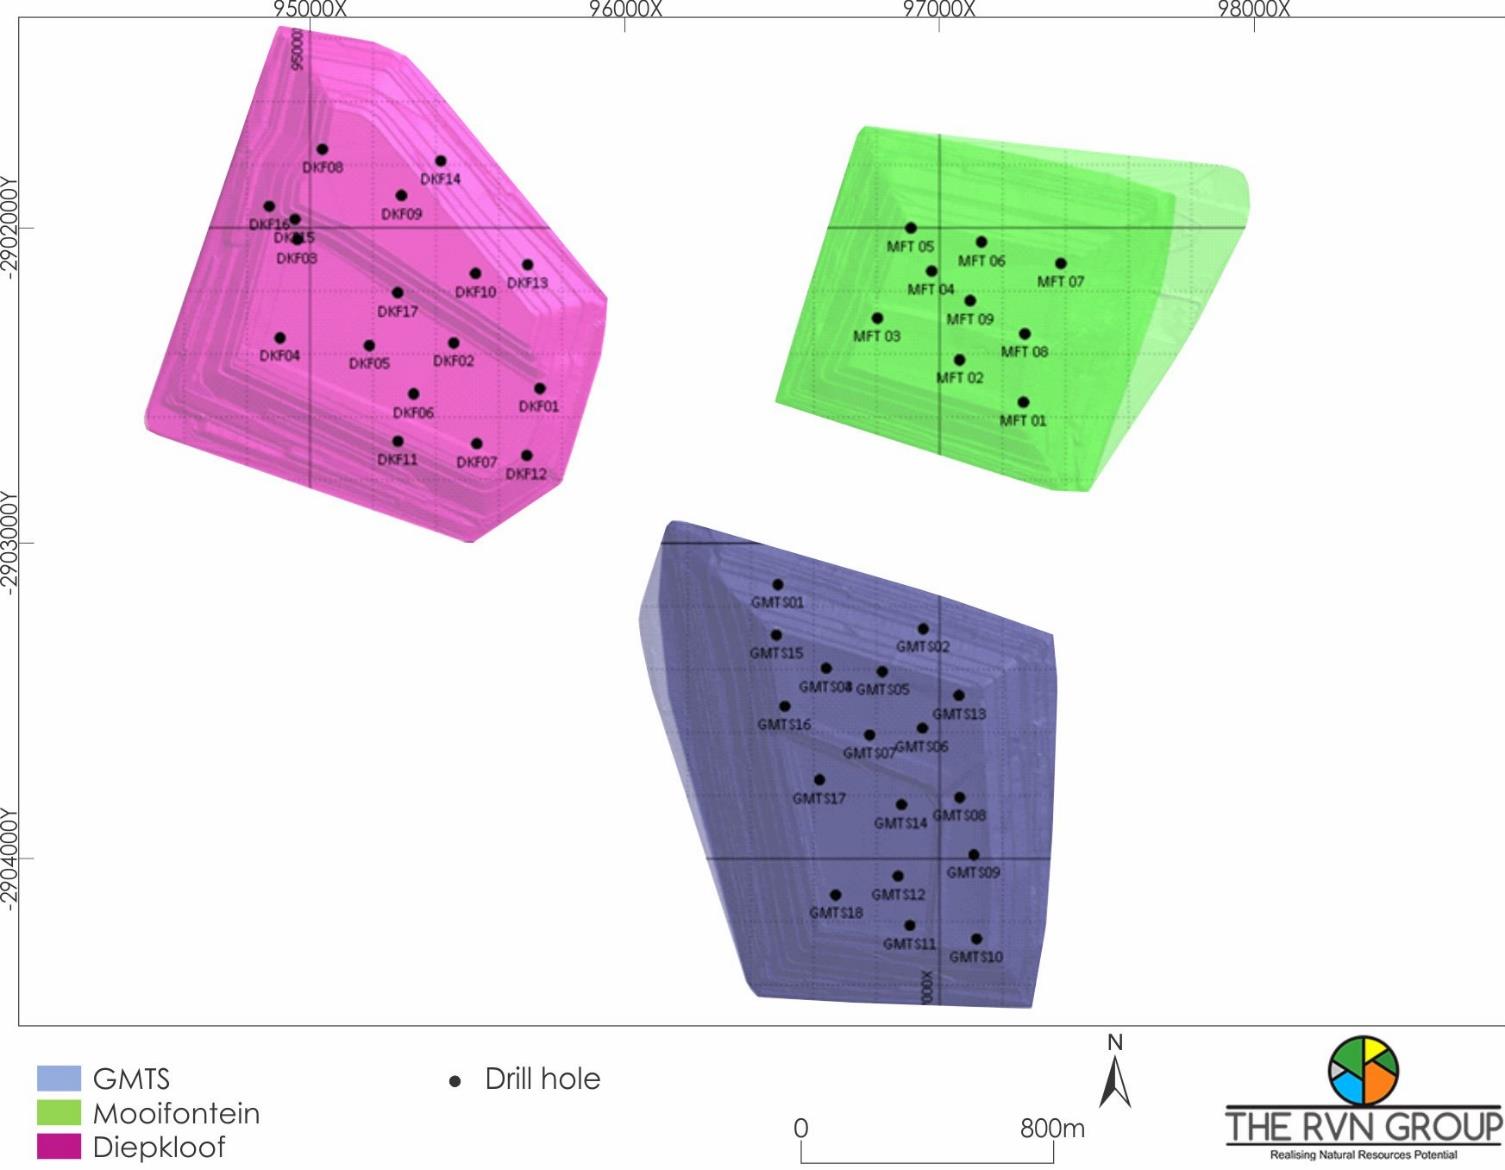
Technical Report Summary of the material Tailings Storage Facilities
43
7.5 Crown
A total of 44 RC drill holes at approximately 200m-by-200m average grid were completed in 2017 on
Crown Complex as shown in Figure 7.1Figure 7.8.
Figure 7.1: Crown Complex: Map showing drill hole Locations
Source: The RVN Group, 2022
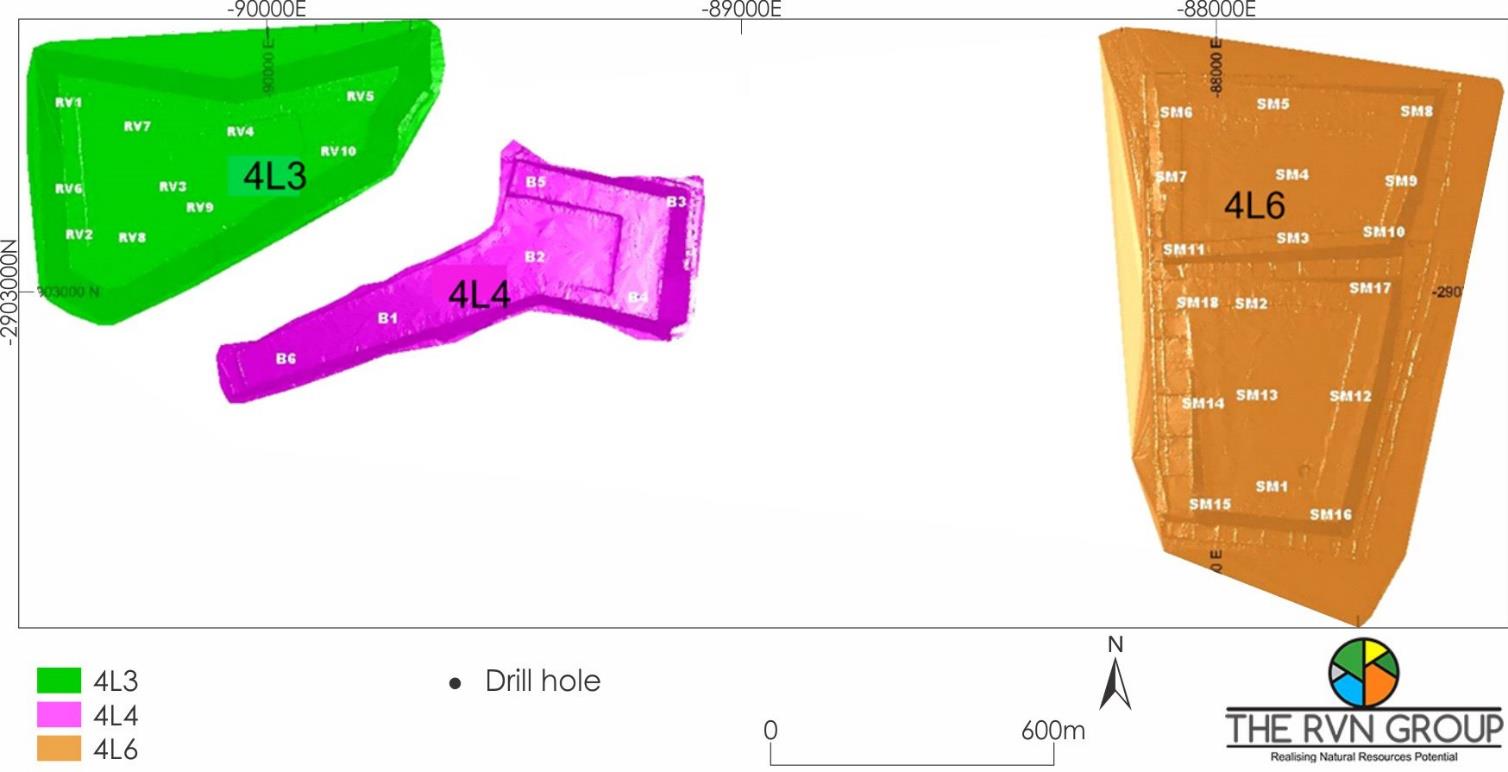
Technical Report Summary of the material Tailings Storage Facilities
44
7.6 City Deep
A total of 27 auger drill holes between 100m and 200m spacing were completed in 2017 on the City
Deep Complex, as shown in Figure 7.2.
Figure 7.2: City Deep Complex: Map showing Drill Hole Locations
Source: The RVN Group, 2022
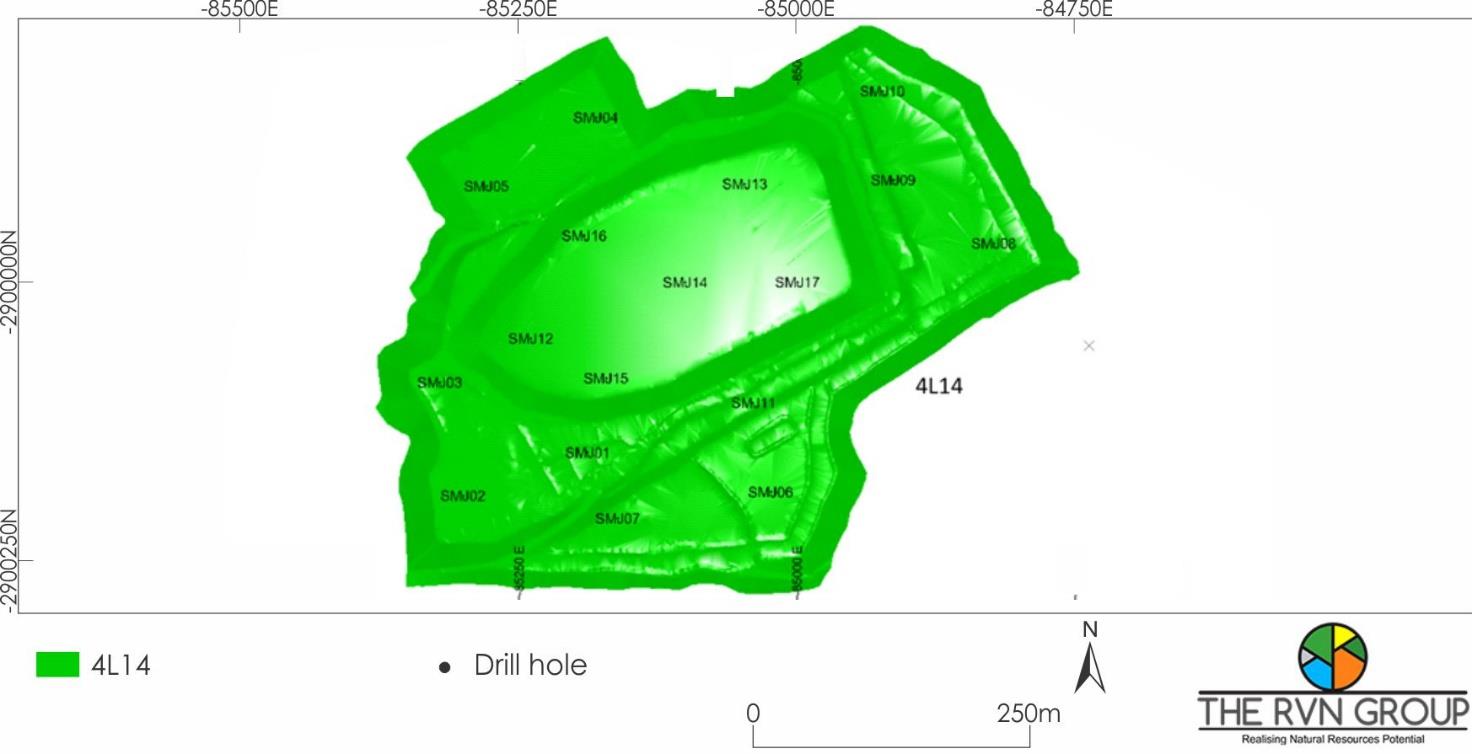
Technical Report Summary of the material Tailings Storage Facilities
45
7.7 Knights
7.7.1 4L14
A total of 17 auger drill holes were completed on 4L14. The average drill hole spacing was 100m. Drill
holes are well spread throughout the TSF as presented in Figure 7.3.The TSF has a maximum height of
37.5m. The intersected soil reported higher gold values; thus, the soil was modelled as a separate
domain and added to the TSF’s Mineral Resource.
Figure 7.3: Knights Complex - 4L14: Map showing Drill Hole Locations
Source: The RVN Group, 2022

Technical Report Summary of the material Tailings Storage Facilities
46
7.7.2 4L50
A total of 22 auger drill holes were completed on 4L50. The average drill hole spacing is between 50m
and 100m. Drill holes are well spread throughout the TSF (Figure 7.4). The TSF has a maximum height of
40m. The average gold grade is 0.26g/t. Mining is ongoing on this TSF.
Figure 7.4: Knights Complex - 4L50: Map showing Drill Hole Locations
Source: The RVN Group, 2022
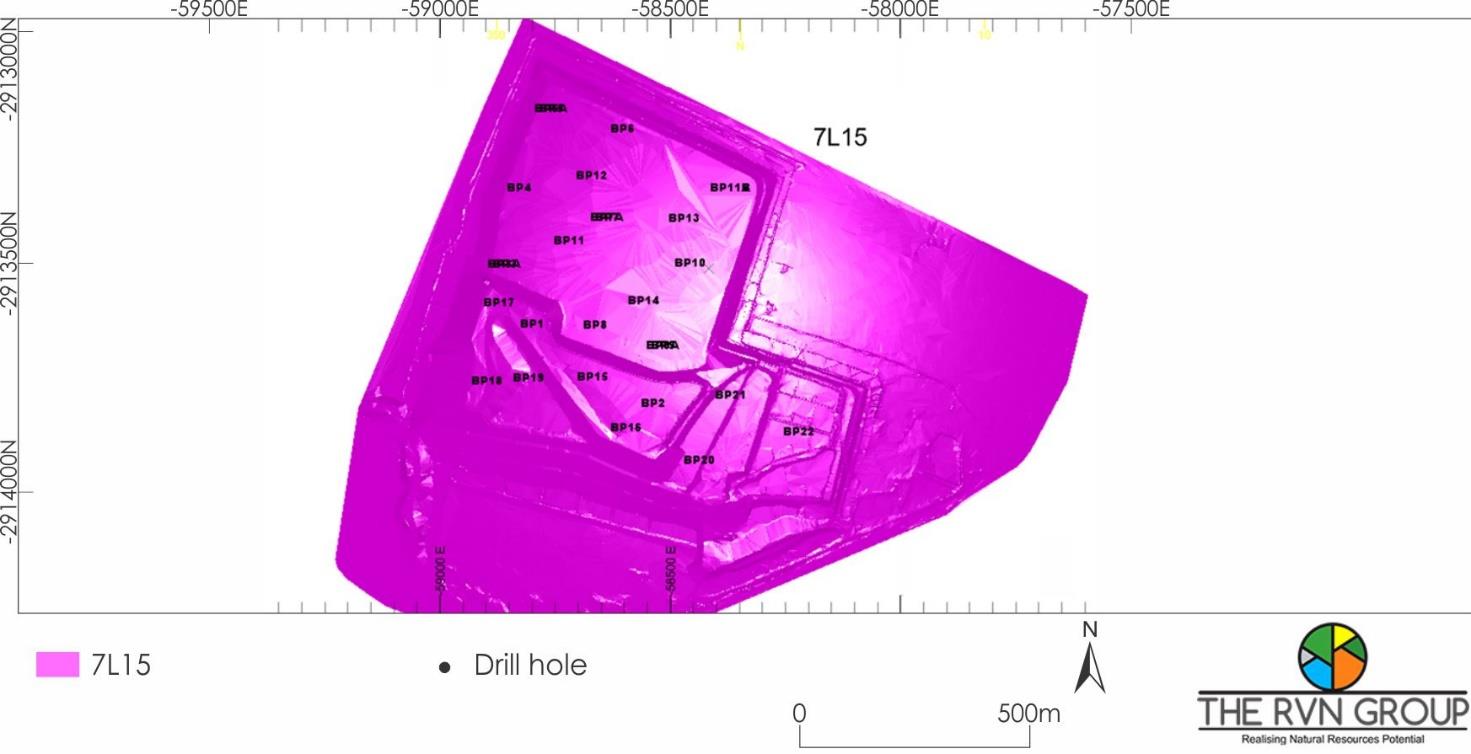
Technical Report Summary of the material Tailings Storage Facilities
47
7.8 Ergo
7.8.1 7L15
A total of 22 auger drill holes were completed on 7L15. Some holes were twin holes to confirm the results
obtained in previous drilling campaigns. The drill hole pattern has an irregular spacing averaging less
than 100m (Figure 7.5).
Figure 7.5: Ergo Complex - 7L15: Map showing Drill Hole Locations
Source: The RVN Group, 2022
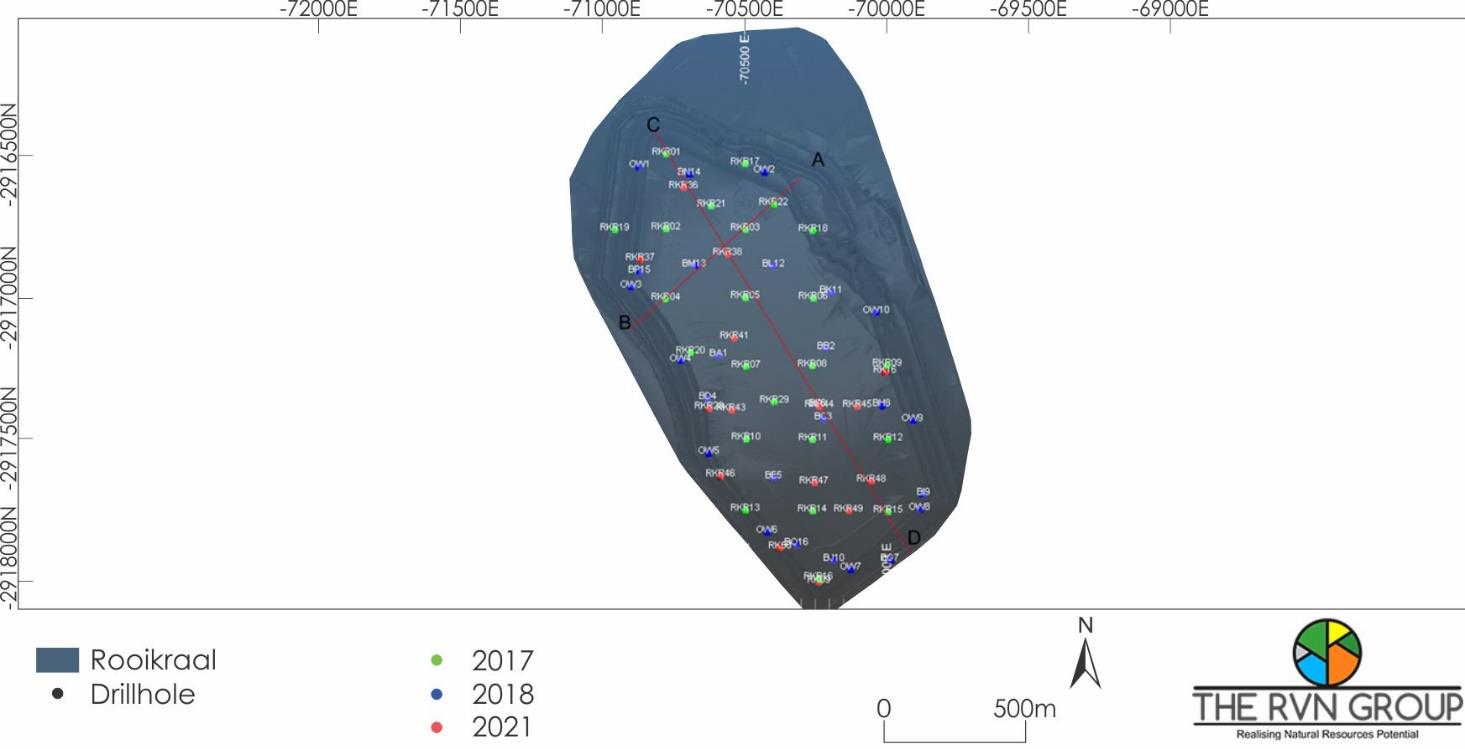
Technical Report Summary of the material Tailings Storage Facilities
48
7.8.2 Rooikraal
A total of 64 RC drill holes were completed on Rooikraal. Irregular drill hole spacing was due to access
challenges (Figure 7.6). An average drill hole spacing of less than 100m was achieved.
Figure 7.6: Ergo Complex - Rooikraal: Map showing Drill Hole Locations
Source: The RVN Group, 2022
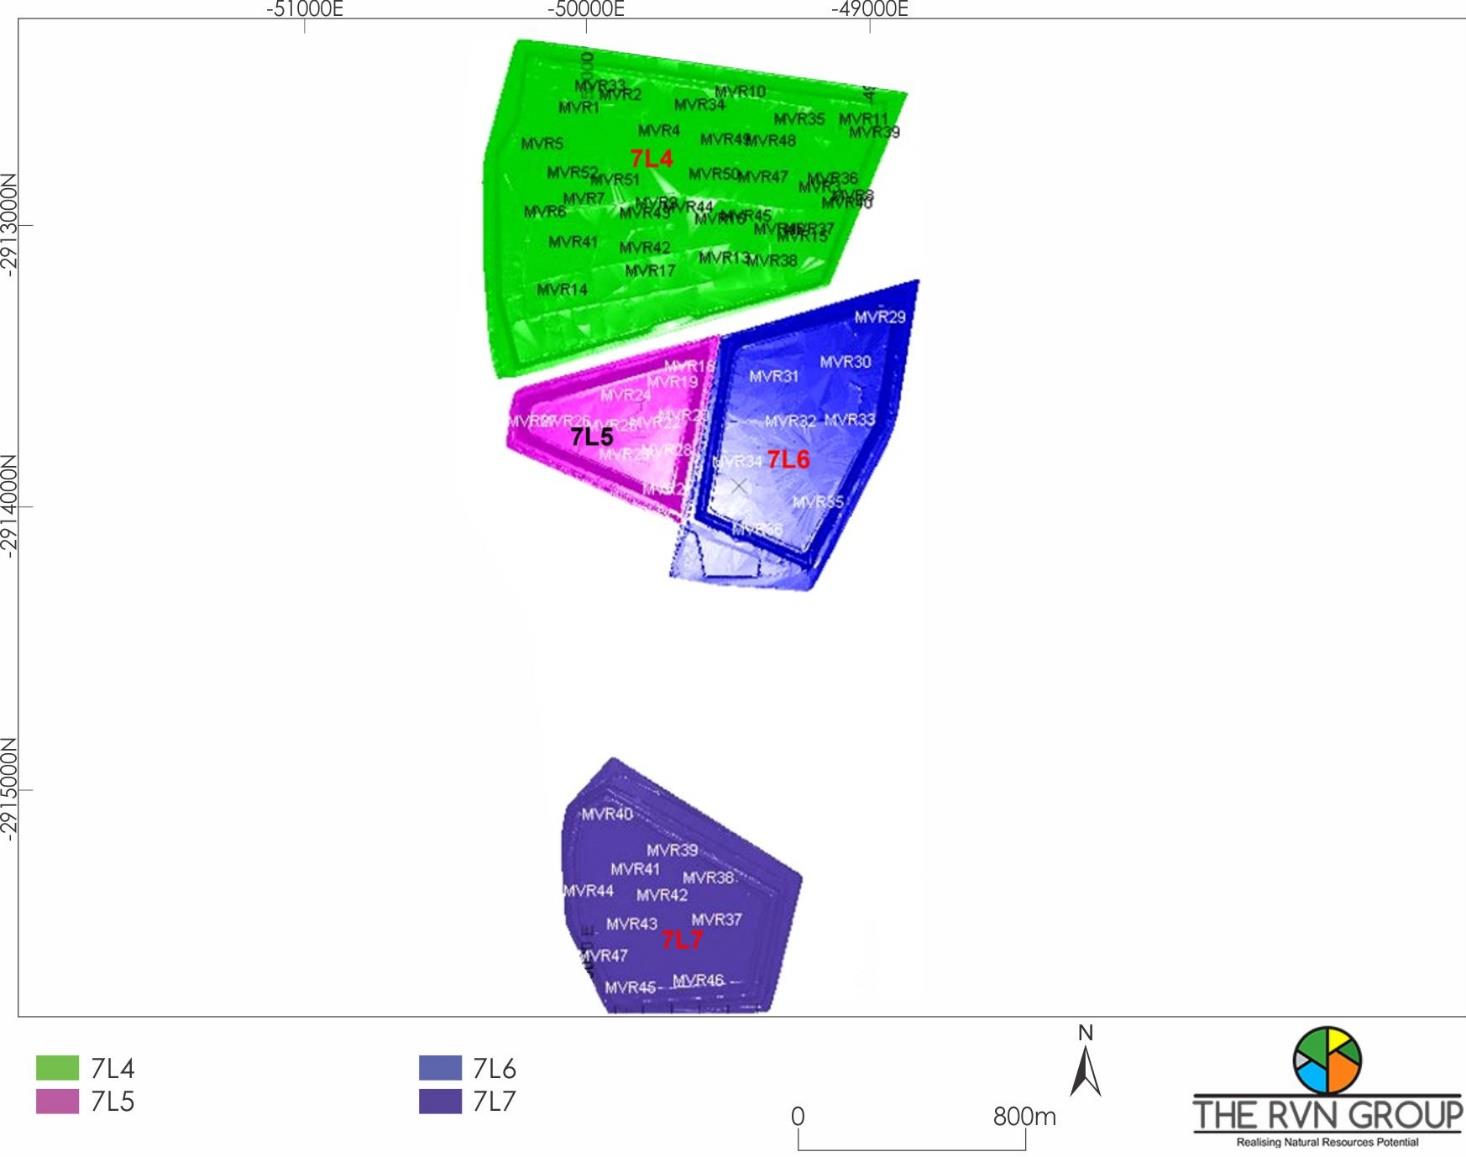
Technical Report Summary of the material Tailings Storage Facilities
49
7.9 Marievale
A drill hole map for the Marievale complex is presented in Figure 7.7. Average spacing of 100m was
followed. Auger drilling was done in 2020.
Figure 7.7: Marievale Complex: Map showing Drill Hole Locations
Source: The RVN Group, 2022
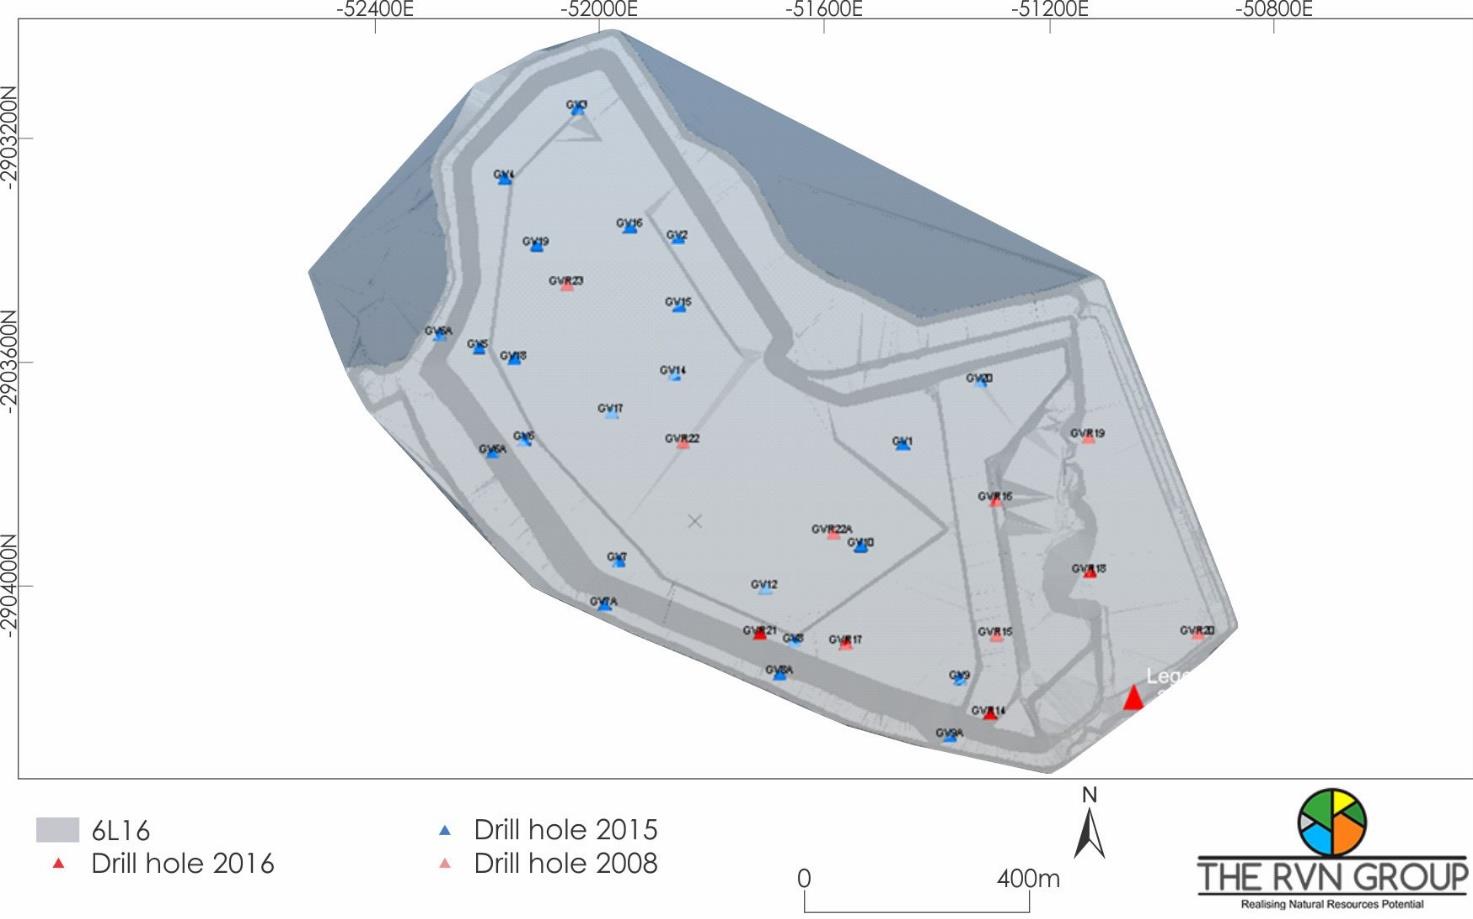
Technical Report Summary of the material Tailings Storage Facilities
50
7.10 Grootvlei Complex
A total of 34, 31 and 39 drill holes were completed on 6L16, 6L17 and 6L17A respectively, as shown in
Figure 7.8, Figure 7.9 and Figure 7.10. Drill holes completed in 2016 were a combination of auger and
RC techniques. All previous campaigns (2008 and 2015) used the auger drilling technique. The grid
spacing for 6L16 is approximately 200m-by-200m while 6L17 and 6L17A have a closer drill hole spacing
of approximately 100m-by-100m.
Figure 7.8: Grootvlei Complex - 6L16: Map showing Drill Hole Locations
Source: The RVN Group, 2022
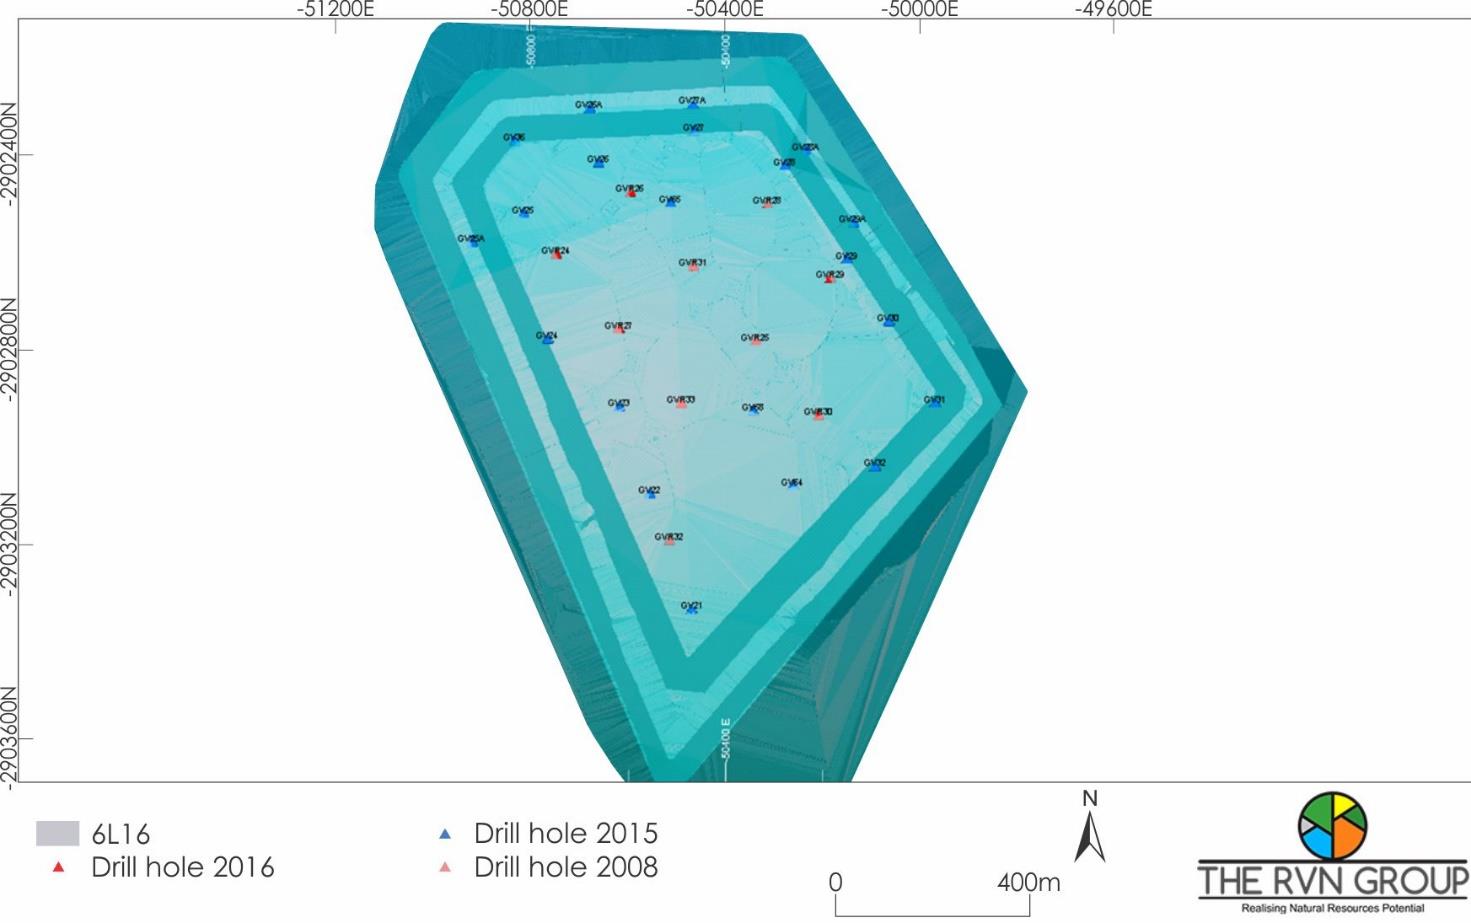
Technical Report Summary of the material Tailings Storage Facilities
51
Figure 7.9: Grootvlei Complex - 6L17: Map showing Drill Hole Locations
Source: The RVN Group, 2022
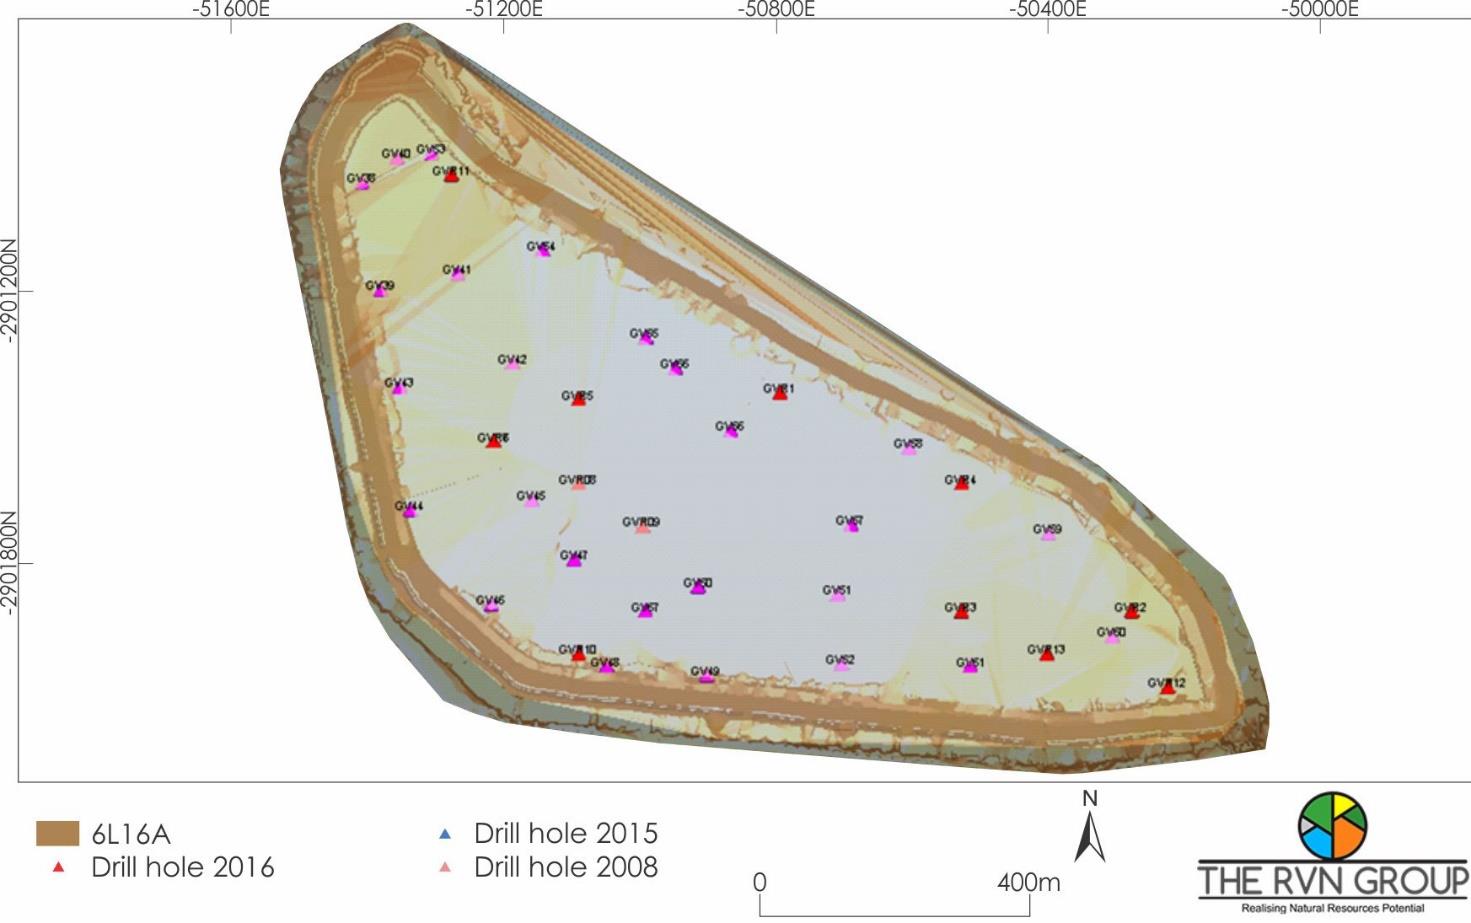
Technical Report Summary of the material Tailings Storage Facilities
52
Figure 7.10: Grootvlei Complex - 6L17A: Map showing Drill Hole Locations
Source: The RVN Group, 2022

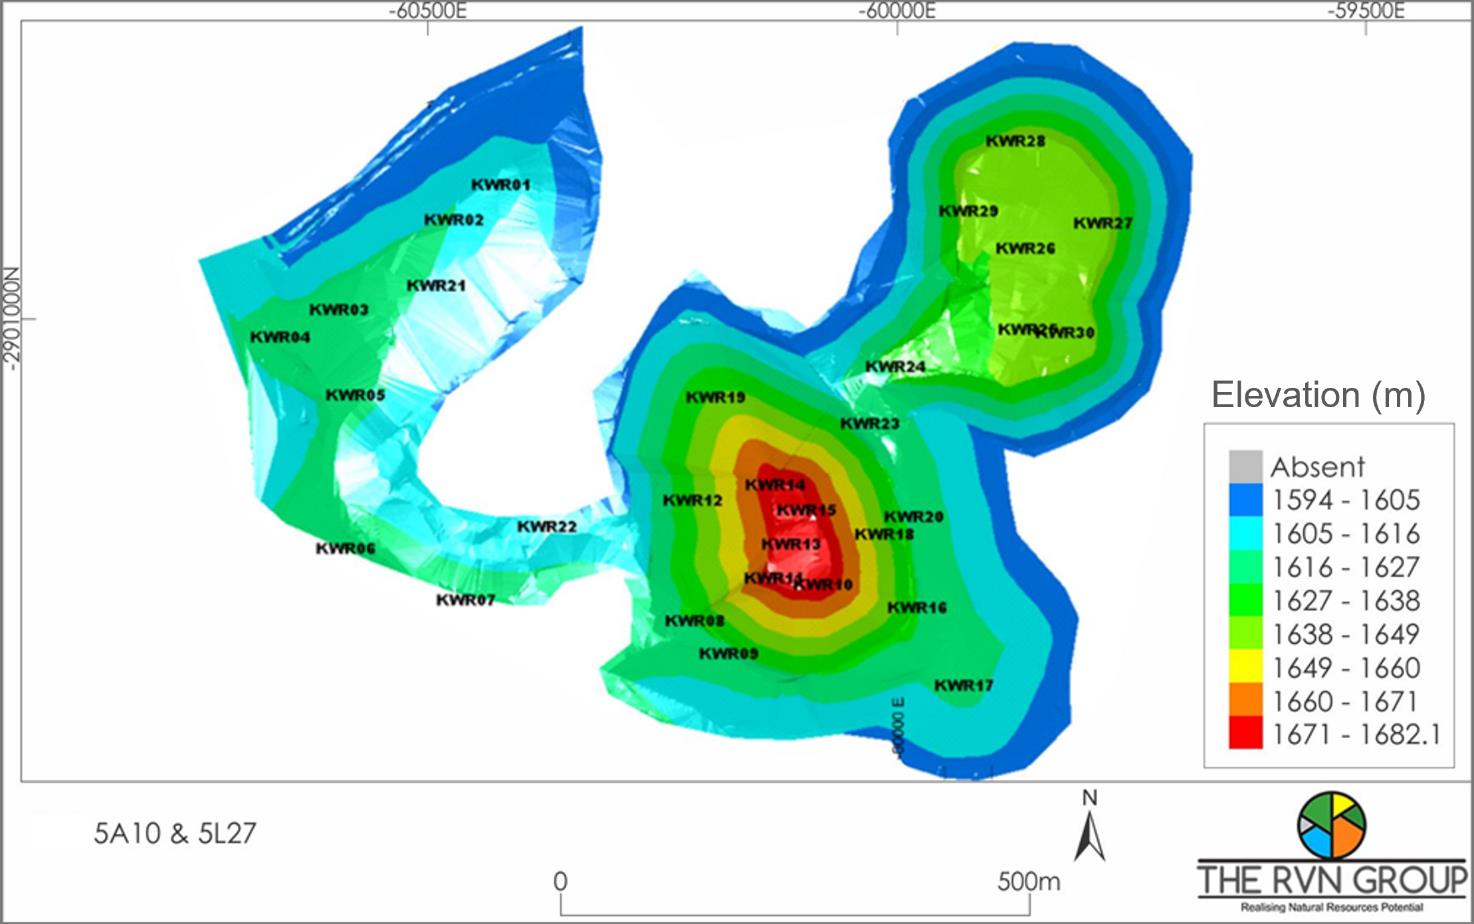
Technical Report Summary of the material Tailings Storage Facilities
53
7.11 5A10/5L27
A total of 30 drill holes were completed on the 5A10/5L27 sand dumps in 2017. All drill holes were drilled
using the auger drilling technique. An irregular spacing of between 50m and 100m was followed. Due
to the high height of the sand dump, all holes drilled on top of the middle dump did not intersect the
base of the TSF (red color in Figure 7.11). Mining is ongoing on this sand dump.
Figure 7.11: 5A10/5L27: Map showing Drill Hole Locations
Source: The RVN Group, 2022
The deepest drilled hole was 52.5m. This drill hole did not intersect the base or soil. The auger drill machine
could not drill deeper because the holes collapse at depths, due to auger drilling constraints. The RVN
Group geologists stopped drilling once they noticed that the hole had collapsed, so as to ensure that
only good-quality representative samples were obtain ed.
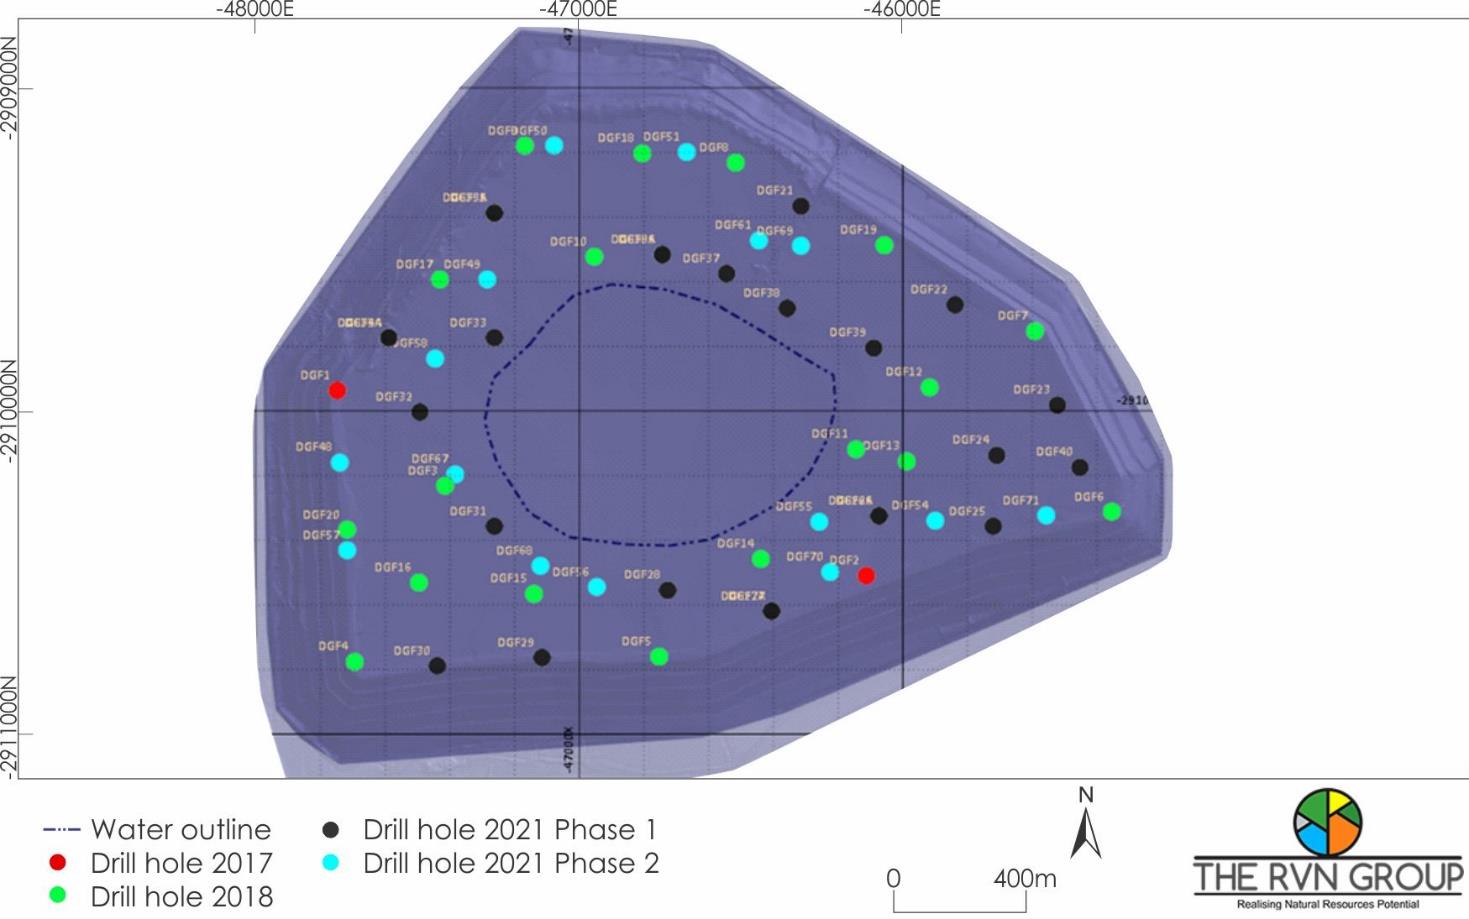
Technical Report Summary of the material Tailings Storage Facilities
54
7.12 Daggafontein TSF
A total of 55 drill holes were drilled on Daggafontein TSF from 2017 to 2021 as shown in Figure 7.12. The
center of the TSF (outlined with a dotted line) could not be accessed for drilling due to the presence of
surface water. Figure 7.12 presents the evaluation drilling information for the different drilling campaigns.
Only two drill holes were completed in 2017 which were drilled far apart. Drilling campaigns completed
from 2018 to 2021 were drilled to infill the drill space to confirm the continuity of mineralization. On
average, the drill holes were spaced at a nominal grid of 200m-by-200m and were well spread to ensure
that the samples were representative of the TSF.
Figure 7.12: Daggafontein Complex - Daggafontein TSF: Map showing Drill Hole Locations
Source: The RVN Group, 2022
7.13 Logging and Sampling
The RVN Group used comprehensive logging and sampling standard procedures, including extensive
Quality Assurance (QA)and Quality Control (QC) procedures. In addition, the geologist and drilling
supervisor count ed the rods after each hole had intersected the soil to confirm the borehole depths.
Where samples were split, quartering was done by the geologist on-site to ensure the representativity of
these samples.
The samples were assigned unique sample identification numbers and tagged before being submitted
to the laboratory. In addition, for each sample batch, QC samples were submitted to the laboratory.
Technical Report Summary of the material Tailings Storage Facilities
55
The RVN Group geologists prepared sample submission sheets that accompanied the samples. Records
of the sample data were captured in a database.
The RVN Group monitored the drilling and sampling process. Logging was qualitative in nature, except
for sample intervals. All drill holes were logged in entirety from top to bottom on-site.
As drilling progressed, the spiral for auger and rods for RC drilling were cleaned after every drilling run to
prevent sample contamination.
7.13.1 Logging
Drill holes were logged on-site by The RVN Group geologist using the individual 1.5m samples taken
throughout the drill hole. Samples were classified according to whether they were slimes or soil, moist or
wet and on color.
Logging was done on-site as hard copy handwritten logs, then later captured electronically into
Microsoft Excel.
7.13.2 Sampling
Every drill hole was sampled at 1.5m intervals for the entire length of the hole. The samples were
immediately bagged and tagged on site. Sampling (plastic) bags were labelled and tagged with a
sample book tag. The drill log and sample book were regularly checked against the drill hole depth as
drilling proceeded so as to ensure compatibility.
Samples were noted as “dry”, “moist” or “wet” in the drill log and sample book.
The responsible geologist planned sample numbers and the QC samples in a Microsoft Excel
spreadsheet and assigned them to the appropriate sample interval.
The RVN Group safely and carefully collected, secured and transported the samples from the site so as
to avoid contamination and sample loss.
All the samples were presented to the laboratory in a well-organized and sorted manner with easily
understandable documentation, including a fully completed Sample Submission Form.
7.14 Sample Recovery
Samples recovered from the TSFs and sand dump material were mostly moist and fine-grained. The
sample size was visually checked on-site to ensure they were of a similar size and sufficient quantity. The
gold grade did not show a definable relationship with sample weights. The QP considered the recovery
and sample quality satisfactory for further evaluation.
7.15 On-site Security Measures
Access to the drill sites was restricted to the drilling and The RVN Group teams. Any unauthorized access
to the drill sites was prohibited. Drilling sites were demarcated by danger tape and no visitors could cross
the demarcated area unless authorized by the QP. Once samples were packed and the bags closed,
no one was allowed to open the bags.
Technical Report Summary of the material Tailings Storage Facilities
56
7.16 Collar Survey Data
A qualified surveyor from Geografix surveyed the drill hole collar positions using total station surveying
equipment and differential GPS instruments. The accuracy of the method was within a 10cm range.
Collar positions were plotted on the satellite images to verify positions and collars plots were inspected.
Elevations were compared to the topographic survey. Collar positions were verified to be accurate.
The QP is satisfied with the surveying methodology followed. The surveys were performed by a qualified
surveyor who has sufficient experience to undertake the task. The surveys were considered to be of
adequate quality for use in the evaluations of the TSFs.
No downhole survey measurements were taken as the drill holes were shallow and vertical, and the QP
anticipated no deviations.
7.17 Density Determination
Bulk densities on the TSFs were measured in situ by Letsatsi Materials Engineering (Proprietary) Limited (a
South African National Accreditation System (SANAS) accredited institution for engineering materials
testing) using a Troxler densitometer between September 2020 and January 2021. The bulk density
measurements included compaction rates and moisture content. The use of densitometers on TSFs and
sand dumps is common practice, as TSFs and sand dumps are engineered features with consistent
physical properties. The density of the TSF is directly proportional to the compaction rate and material
property. As the moisture content increases, density decreases and vice versa. The compaction rate
and material property do not vary significantly with depth (TSFs and sand dumps are largely
homogeneous); thus, measurements taken at any depth (>10cm) are representative of the TSF and
sand dump compartments.
Density measurement points were prepared and measurements were taken per TSF or sand dump. The
points were well spread. Preparation of points involved removing the topmost 5cm to 10cm of loose
material and flattening (levelling) the surface. Measurements were taken at 150mm and 300mm depths
per point. As part of quality control, some points are measured more than once.
The statistics of the density measurements are presented in Table 7.2.
The average bulk densities determined for the TSFs or sand dump were slightly higher than the 1.42t/m
3
that Ergo uses for the TSFs or sand dump they are mining.
The mean tests showed that the density is more than 1.42t/m
3
with a 95% confidence level. Confidence
intervals for the densities indicated, with a 95% confidence level, that the mean density applied at Ergo
is within the range. The QP decided to continue using a lower mean density of 1.42t/m
3
95% confidence and prediction intervals, passed the mean test. In addition, Ergo has been successfully
applying 1.42t/m
3
The QP is satisfied using a 1.42t/m
3
understanding of the upside potential if the mean density is later determined to be higher.
Technical Report Summary of the material Tailings Storage Facilities
57
Table 7.2: Bulk Density Information and Statistics
Reclamation Site
TSF/Sand Dump
Number
of
Samples
Mean Density
(t/m
3
)
Standard Deviation
(t/m
3
)
Minimum
(t/m
3
)
Maximum
(t/m
3
)
CoV***
Crown Complex
3L5
60
1.479
0.044
1.353
1.567
0.03
3L7
60
1.443
0.020
1.381
1.485
0.01
3L8
32
1.397
0.028
1.331
1.440
0.02
City Deep Complex
4L3
20
1.419
0.078
1.214
1.560
0.05
4L4
20
1.456
0.031
1.410
1.522
0.02
4L6*
-
-
-
-
-
-
Knights Complex
4L14*
-
-
-
-
-
-
4L50
30
1.624
0.040
1.531
1.711
0.02
Ergo Complex
7L15
30
1.513
0.035
1.443
1.591
0.02
Rooikraal
90
1.457
0.051
1.350
1.602
0.04
Marievale Complex
7L4
60
1.457
0.033
1.405
1.526
0.02
7L5
30
1.434
0.047
1.360
1.520
0.03
7L6
60
1.453
0.060
1.335
1.595
0.04
7L7
60
1.461
0.032
1.374
1.548
0.02
Grootvlei Complex
6L16
60
1.543
0.060
1.384
1.643
0.04
6L17
59
1.499
0.038
1.420
1.592
0.03
6L17A
58
1.490
0.044
1.402
1.606
0.03
5A10/5L27 Sand
Dumps
5A10/5L27
30
1.529
0.037
1.468
1.596
0.02
Daggafontein TSF
Daggafontein
58
1.511
0.058
1.394
1.687
0.04
Total
817
1.480**
0.043
1.214
1.711
0.03
Source: The RVN Group, 2022
*no measurements were taken due to access problems
**weighted average
***CoV is the abbreviation for Coefficient of Variation
Technical Report Summary of the material Tailings Storage Facilities
58
7.18 Hydrological Drilling and Test Work
No hydrogeological studies were completed.
However, some relevant hydrological data was captured during drilling and logging by The RVN Group.
The RVN Group logs have moisture content recorded (i.e., dry, moist, wet or watery). Additionally, Ergo
installed piezometers in some larger TSFs (Crown Complex and Daggafontein TSF) to monitor water
levels. Smaller TSFs are considered low risks as they are dormant and mostly moist to dry; thus, no
piezometers were installed.
7.18.1 Crown Complex
The QP has classified the GMTS TSF as moist to wet and Diepkloof and Mooifontein TSFs are classified as
dry to moist (Table 7.3, Table 7.4 and Table 7.5).
Table 7.3: GMTS (3L8) Moisture Content
Average Depth
Moisture Content Commentary
From
(m)
To
(m)
0.0
27.0
Dry
27.0
54.0
Moist
54.0
58.5
Wet
58.5
61.5
Watery
61.5
64.5
Wet
64.5
67.5
Watery
67.5
The Base of the TSF
Wet
The Base of the TSF
Soil
Moist
Source: The RVN Group, 2022
Table 7.4: Diepkloof (3L5) Moisture Content
Average Depth
Moisture Content Commentary
From
(m)
To
(m)
0.0
21.0
Dry
21.0
45.0
Moist
45.0
The Base of the TSF
Wet
The Base of the TSF
Soil
Moist
Source: The RVN Group, 2022
Table 7.5: Mooifontein (3L7) Moisture Content
Average Depth
Moisture Content Commentary
From
(m)
To
(m)
0.0
30.5
Dry
30.5
36.0
Moist
36.0
The Base of the TSF
Wet
The Base of the TSF
Soil
Moist
Source: The RVN Group, 2022
Technical Report Summary of the material Tailings Storage Facilities
59
7.18.2 City Deep Complex
The QP classified the City Deep Complex as moist (Table 7.6, Table 7.7 and Table 7.8).
Table 7.6: 4L3 Moisture Content
Average Depth
Moisture Content Commentary
From (m)
To (m)
0.0
31.5
Moist
31.5
The Base of the TSF
Wet
The Base of the TSF
Soil
Moist
Source: The RVN Group, 2022
Table 7.7: 4L4 Moisture Content
Average Depth
Moisture Content Commentary
From
(m)
To
(m)
0.0
The Base of the TSF
Moist
The Base of the TSF
Soil
Moist
Source: The RVN Group, 2022
Table 7.8: 4L6 Moisture Content
Average Depth
Moisture Content Commentary
From
(m)
To
(m)
0.0
13.5
Moist
13.5
The Base of the TSF
Wet
The Base of the TSF
Soil
Moist
Source: The RVN Group, 2022
7.18.3 Knights Complex
The QP classified the Knights TSFs as moist (Table 7.9 and Table 7.10).
Table 7.9: 4L14 Moisture Content
Average Depth
Moisture Content Commentary
From
(m)
To
(m)
0.0
4.5
Dry
4.5
12.0
Moist
12.0
25.0
Wet
25.0
30.0
Moist
30.0
The Base of the TSF
Wet
The Base of the TSF
Soil
Moist
Source: The RVN Group, 2022
Technical Report Summary of the material Tailings Storage Facilities
60
Table 7.10: 4L50 Moisture Content
Average Depth
Moisture Content Commentary
From
(m)
To
(m)
0.0
16.5
Moist
16.5
The Base of the TSF
Wet
The Base of the TSF
Soil
Moist
Source: The RVN Group, 2022
7.18.4 Ergo Complex
The QP classified the Rooikraal TSF as moist to wet (Table 7.11 to Table 7.12). The TSF is moist to wet
because it is situated closer to the wetland. The 7L15 TSF is moist.
Table 7.11: Rooikraal Moisture Content
Average Depth
Moisture Content Commentary
From
(m)
To
(m)
0.0
12.0
Moist
12.0
13.5
Dry
13.5
22.5
Wet
22.5
The Base of the TSF
Watery
The Base of the TSF
Soil
Moist
Source: The RVN Group, 2022
Table 7.12: 7L15 Moisture Content
Average Depth
Moisture Content Commentary
From
(m)
To
(m)
0.0
19.5
Moist
19.5
The Base of the TSF
Wet
The Base of the TSF
Soil
Moist
Source: The RVN Group, 2022
7.18.5 Marievale Complex
The QP classified the Marievale TSFs as moist to wet (Table 7.13, Table 7.14, Table 7.15 and Table 7.16).
The TSF is moist to wet because it is situated closer to the Blesbokspruit. All TSFs are east of the
Blesbokspruit.
Table 7.13: 7L4: Moisture Content
Average Depth
Moisture Content Commentary
From
(m)
To
(m)
0.0
6.0
Moist
6.0
10.5
Wet
10.5
The Base of the TSF
Watery
The Base of the TSF
Soil
Moist
Source: The RVN Group, 2022
Technical Report Summary of the material Tailings Storage Facilities
61
Table 7.14: 7L5: Moisture Content
Average Depth
Moisture Content Commentary
From
(m)
To
(m)
0.0
1.5
Dry
1.5
12.0
Moist
12.0
The Base of the TSF
Wet
The Base of the TSF
Soil
Moist
Source: The RVN Group, 2022
Table 7.15: 7L6: Moisture Content
Average Depth
Moisture Content Commentary
From
(m)
To
(m)
0.0
4.5
Dry
4.5
15.0
Moist
15.0
The Base of the TSF
Wet
The Base of the TSF
Soil
Moist
Source: The RVN Group, 2022
Table 7.16: 7L7: Moisture Content
Average Depth
Moisture Content Commentary
From
(m)
To
(m)
0.0
6.0
Dry
6.0
10.5
Moist
10.5
The Base of the TSF
Wet
The Base of the TSF
Soil
Moist
Source: The RVN Group, 2022
7.18.6 Grootvlei Complex
The QP classified the Grootvlei TSFs as wet (Table 7.17, Table 7.18 and Table 7.19). The TSFs are wet
because they are situated closer to the Blesbokspruit wetland area. The 6L17 and 6L17A TSFs are east of
the Blesbokspruit, while the 6L16 TSF is located to the west.
Table 7.17: 6L16 Moisture Content
Average Depth
Moisture Content Commentary
From
(m)
To
(m)
0.0
7.5
Moist
7.5
24.5
Wet
24.5
The Base of the TSF
Watery
The Base of the TSF
Soil
Moist
Source: The RVN Group, 2022
Technical Report Summary of the material Tailings Storage Facilities
62
Table 7.18: 6L17 Moisture Content
Average Depth
Moisture Content Commentary
From
(m)
To
(m)
0.0
4.5
Dry
4.5
18.0
Moist
18.0
The Base of the TSF
Wet
The Base of the TSF
Soil
Moist
Source: The RVN Group, 2022
Table 7.19: 6L17A Moisture Content
Average Depth
Moisture Content Commentary
From
(m)
To
(m)
0.0
13.5
Dry
13.5
The Base of the TSF
Wet
The Base of the TSF
Soil
Moist
Source: The RVN Group, 2022
7.18.7 5A10/5L27
The QP classified the 5A10/5L27 sand dumps as moist to dry sand dumps. This is because courser grained
sand does not trap water like the finer grained tailings slime (Table 7.20).
Table 7.20: 5A10/5L27 Moisture Content
Average Depth
Moisture Content Commentary
From
(m)
To
(m)
0.0
The Base of the TSF
Moist
The Base of the TSF
Soil
Moist
Source: The RVN Group, 2022
7.18.8 Daggafontein TSF
Daggafontein TSF has water on the surface. The QP classified it as wet. It was estimated that at least
one million cubic meters of water are on top of Daggafontein TSF (Table 7.21).
Table 7.21: Daggafontein Moisture Content
Average Depth
Moisture Content Commentary
From
(m)
To
(m)
0.0
12.0
Dry
12.0
16.0
Moist
16.0
19.5
Wet
19.5
30.0
Watery
30.0
The Base of the TSF
Wet
The Base of the TSF
Soil
Moist
Source: The RVN Group, 2022
Technical Report Summary of the material Tailings Storage Facilities
63
7.19 Geotechnical Data, Testing and Analysis
No geotechnical testing and sampling were completed on the TSFs and sand dumps.
However, stability assessment studies were completed on the TSFs with a greater than 60Mt Mineral
Resource. In 2019, stability assessments were conducted on Daggafontein TSF and Crown Complex TSFs
by Lutails Engineering (Proprietary) Limited. No studies were completed on other the TSFs or sand dumps
as they are small, dormant) and pose a low geotechnical stability risk.
The following were observed on the Daggafontein TSF:
●
there was no seepage anywhere around the toe of the TSF;
●
some of the catchment paddocks, where they still exist, are quite silted and should be cleaned
or re-shaped during a rehabilitation process;
●
the filter drains were mostly open but in need of jet-rodding to remove sedimentation; and
●
there was water visible on the top surface.
On the Crown Complex TSFs, the following conclusions were made:
●
there are adequate controls on the TSFs to prevent stormwater damage, with no significant
spillages having occurred over the past few years;
●
the potential for wind-blown dust has been ameliorated through ridge ploughing of the basins
and due to the presence of well-established vegetation;
●
vegetation has been established on most side slopes thereby reducing water and wind erosion.
There have been no reports of significant spillages from the Crown Complex over the past few
years;
●
most of the filter drain outlets are no longer operational, and recorded drain flow is therefore
only a fraction of what it was. Despite the outlet pipe losses, the is very little evidence of seepage
from the toe of the TSF; and
●
most of the standpipe piezometers are no longer operational. Those remaining show a drop in
piezometric levels, albeit it less than reasonably expected.
Hydrogeological advice is obtained prior to mining activities as the combination of high moisture
content and fine particles could, during mining activities, result in liquefaction and mud rush conditions.
A risk assessment is undertaken when commencing mining of a TSFs or sand dump to avoid slope failures.
Ergo and their mining contractors have procedures to ensure safe mining and loading of TSFs and sand
dumps which can be as high as 70m.
Ergo had not reported any significant slope failures associated with the retreatment operations of their
TSFs or sand dumps in the past 15 years.
The QP is satisfied that the stability studies of the TSFs are sufficient and meet the requirements for the
intended purpose.

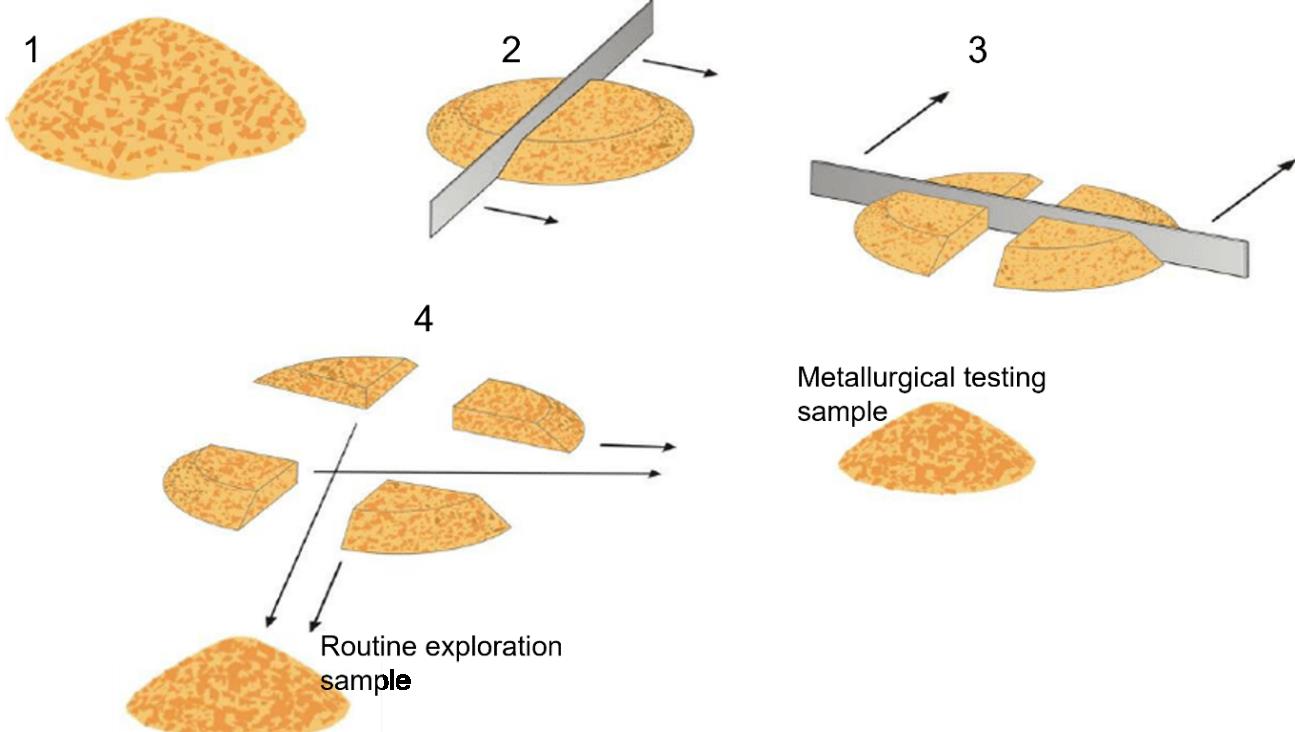
Technical Report Summary of the material Tailings Storage Facilities
64
8 Sample Preparation, Analyses and Security
8.1 Sampling Governance and Quality Assurance
The RVN Group used its standard procedures for data collection, analysis, validation and storage. In
addition, regular planned task observations of procedures and their implementations are undertaken
to ensure compliance and appropriateness for the drilling program. Training and planned task
observations are provided by the QP.
The sample chain of custody is managed by experienced geologists from The RVN Group.
The QP is satisfied with the QA and QC protocols in place.
8.2 Sample Preparation and Analysis
8.2.1 On-site Sample Preparation
All samples were halved on-site by a geologist through the cone and quartering method as the samples
were too moist or wet to use a riffle splitter, which has the potential to introduce cross-contamination
and bias. The cone and quartering method does not introduce a systematic bias as it involves pouring
each sample on a clean, flattened bag (1.0m-by-0.5m).
The quartering method is considered appropriate for the TSF material as TSF samples are homogeneous
due to the deposition procedure. Figure 8.1 shows the cone and quartering methodology followed.
One half is for the metallurgical test and the other half is for a routine exploration sample.
Figure 8.1: Cone and Quartering Method
Source: Modified after Alakangas, 2015
Technical Report Summary of the material Tailings Storage Facilities
65
Sorting of samples took place on the TSFs and at the storage site at Ergo.
Where a field duplicate was required, a selected routine exploration sample underwent a further
quartering process.
To maintain validity and integrity of samples and as part of security measures, only geologists worked
on the samples, and samples were sealed immediately after preparation.
8.2.2 Laboratories, Sample Preparation and Analyses
The samples were sent to the following three reputable laboratories for further preparation and assaying:
●
MAED at Ergo’s Plant in Brakpan: The facility is not accredited but it is the laboratory used by
Ergo for its grade control and daily plant samples. MAED is not owned by Ergo, although it is
situated in the Ergo Plant and was supplied with all routine exploration samples for analysis;
●
SGS in Randfontein: SGS is a SANAS accredited facility (T0265) and has been used for the
selected analytical method. Randomly selected check samples (approximately 10% of the total
samples) from MAED were sent to SGS for confirmation. SGS is independent of Ergo; and
●
AngloGold Ashanti Limited Chemical Laboratory (Anglo Lab) in Carletonville: Anglo Lab
analyzed some check samples for 7L15 TSF in 2016 and 2017 as a secondary laboratory to MAED.
The laboratory no longer exists and it was not SANAS accredited. The laboratory was
independent of Ergo.
Technical Report Summary of the material Tailings Storage Facilities
66
Table 8.1 presents information about where the samples were analyzed.
Table 8.1: Laboratories Used
TSF/Sand Dump
Primary Laboratory
Secondary Laboratory
Crown Complex
3L5
MAED
3L7
MAED
3L8
MAED
City Deep Complex
4L3
MAED
SGS
4L5
MAED
4L6
MAED
Knights Complex
4L14
MAED
SGS
4L50
MAED
SGS
Ergo Complex
Rooikraal
MAED
SGS
7L15
MAED
SGS and Anglo Lab
Marievale Complex
7L4
MAED
7L5
MAED
7L6
MAED
7L7
MAED
Grootvlei Complex
6L16
MAED
SGS
6L17
MAED
SGS
6L17A
MAED
SGS
5A10/5L27 Sand Dump
5A10/5L27
MAED
Daggafontein Complex
Daggafontein
MAED
SGS
Source: The RVN Group, 2022
The laboratories sorted and weighed samples on receipts, conducted dry screening to remove foreign
material. Subsequently, the samples were dried at 105
˚
C, then crushed to 80% passing 2mm, riffle split
and finally pulverized to 75µm before being analyzed.
The selected laboratories follow analytical procedures that are conventional industry practice.
The samples were analyzed for gold by fire assay with gravimetric finish by MAED and Atomic Absorption
Spectroscopy (AAS) finish by SGS and Anglo Lab. These methods are conventional and have been used
for more than 50 years with minor adjustments. The methods have a lower detection limit of 0.01g/t Au
and there is no upper detection limit for gravimetric finish. The AAS has a 10g/t Au upper limit. The lower
limit is relevant to the TSFs and sand dumps. The TSFs and sand dumps are processed materials and are
generally low-grade materials with slightly higher grades than ten times the detection limit.
The laboratories were instructed to use a 100g aliquot to analyze for gold. Through experience, it is
known that to analyze for gold in low-grade slimes, anything less than a 100g aliquot may report less
accurate results.
Technical Report Summary of the material Tailings Storage Facilities
67
8.2.3 QP Opinion
The QP is satisfied with the sample preparation, analytical methods and level of cleanliness at the
analytical laboratories. The analytical techniques employed are suited to the mineralization style and
expected grades. The techniques meet the requirements for the intended use.
8.3 Analytical Quality Control
8.3.1 Nature and Extent of the Quality Control Procedures
A comprehensive QC program comprising reference material, duplicates and commercially sourced
certified blanks were inserted by The RVN Group in a random but stratified manner, at frequencies
targeting
±
10% coverage of all samples. The QC program identifies various aspects of the results that
could negatively influence the subsequent evaluation processes. The QC samples were used to monitor
the sampling, sample preparation and analytical processes. Analysis of QC data is performed to assess
the reliability of all sample assay data and the confidence in the data used for Mineral Resource
estimation.
All QC sample insertions maintained consecutive numerical order. These control samples were inserted
as part of a continuous sample number sequence and the QC samples were not obviously different
from routine samples when the milled material was prepared and analyzed. Applying the QC process,
it was possible to identify samples that have been swapped, gone missing or incorrectly labelled
amongst other aspects.
QC samples were sourced from African Mineral Standards (AMIS) based in Modderfontein,
Johannesburg.
The RVN Group ensured that all standards and blanks were stored in sealed containers and
considerable care was taken to ensure that they were not contaminated in any manner (i.e., through
storage in a dusty environment or being placed in a contaminated sample bag, etc.).
Field duplicates were prepared on-site as the TSF material was already loose and fine-grained.
The QC set of samples consisted of:
●
the certified silica blanks (AMIS0484) from AMIS;
●
certified reference materials (CRMs) (AMIS0647 with 0.17g/t Au, AMIS0299 with 0.36g/t Au,
AMIS0515 with 0.51g/t Au) from AMIS;
●
standard reference material L-AU015 and L-AU16 with an average value of 0.20g/t Au and
0.30g/t Au, respectively . Standard reference materials with the averages of 0.22g/t Au, 0.33g/t
Au and 0.74g/t Au were also used; and
●
field duplicates (prepared through the cone and quartering technique discussed in Item 8.2.1).
From 2021, only CRM were used and the use of inhouse standard reference material was discontinued
as inhouse standards performance was not always consistent. The QP noted that this does not imply
that the previous results were of low quality as rigorous quality control assessments were implemented.
Technical Report Summary of the material Tailings Storage Facilities
68
The new procedure of using only CRM with a matched matrix was implemented because the CRMs
come with defined certified values and are easier to monitor.
8.3.2 Quality Control Results
Analytical results for the blank and standards are analyzed graphically on control charts to facilitate the
identification of anomalous data points. A sufficient number of standards and blanks are inserted into
the sample stream. If the standard result is reported outside three standard deviations of the certificate
value
–
8.3.3 QP Opinion
In the QP’s opinion, the QC samples covered a reasonable range of grades with respect to the overall
resource grades and no significant bias was observed. The laboratories’ analytical data shows overall
acceptable precision and accuracy and no evidence of overwhelming contamination by the
laboratory that would affect the integrity of the data. As a result, the analytical data from the
laboratories is of acceptable integrity and can be relied upon for TSF and sand dump grade estimation.
8.4 Sample Storage and Security
Samples were stored at the Archive Store at Ergo’s processing plant in Brakpan. The storage facility is
always locked and has an electric fence to prevent unauthorized entry. Sample rejects and pulps are
stored for six months after all assays are received from the laboratory and then discarded.
8.5 Data Storage and Database Management
Procedures are in place to ensure the accuracy and security of the databases.
Laboratories reported results in Microsoft Excel and .pdf formats. The RVN Group copied and pasted the
results into the database. Spot checks were randomly performed to identify copying and pasting errors.
The RVN Group created and validated the database on behalf of Ergo. The database was developed
and validated in Microsoft Excel. The database was sent to Ergo for further use and storage.
The RVN Group compiled the following key digital databases:
●
a drill hole database that includes collar location, assay and geology data;
●
assay quality control data;
●
density data; and
●
process samples information.
The QP is satisfied with data storage and validation . Database management practices adhere to best
practice. The QP is of the opinion that the databases are a fair and accurate record of all drill hole and
assay data.
Technical Report Summary of the material Tailings Storage Facilities
69
The RVN Group has saved the information, including the databases, in the cloud as a backup, in line
with the latest technological developments. Additionally, data is stored on external hard drives placed
in different locations. The RVN Group has provided sufficient provisions to ensure the security and
integrity of the data stored in the databases.
Technical Report Summary of the material Tailings Storage Facilities
70
9 Data Verification
Post-2016:
The QP performed verifications of the data collected. The QP experienced no limitations to
the review, analysis and verification of data.
The QP did compare a selection of the hardcopy logs with the drill holes database and the logs and
database match. The collars were checked by comparing the collars with the topography surface from
the surveyor. Collars were also plotted on Google Earth Pro for confirmation. The collars were accurate.
Logging, surveying and sampling were monitored by the exploration geologists and verified routinely
for consistency. The RVN Group geologists regularly maintain and validate the databases using
validation routines and regularly check the drill hole data visually on-screen. A first check consists of
identifying duplicate sample numbers or lack of sample information. Paper records are stored in a safe
location at Ergo’s Offices.
The QP is of the opinion that the data collection, import and validation workflows are consistent with
industry standards and are of sufficient quality to support the Mineral Resource estimation.
The QP has taken a number of steps to verify the Mineral Resource estimates, including assumptions and
inputs into the estimate and the estimation process itself. The QP checked the volume, density and
grade with the Mineral Resource QP along with the mine planning specialist, noting that based on
historical information, no dilution or mining loss is applied to the Mineral Resource.
The QP conducts quarterly reconciliations of Run-of-Mine (RoM) grade, tonnage, recovery
(metallurgical assumptions) and other modifying factors from the ongoing mining operations to
demonstrate that the modifying factors applied to the mine plan are as predicted by the geological
block model.
Actual performance for operational mining areas provides a high level of confidence where similar
performance can be expected from future mining areas. The current Mineral Reserves have not
demonstrated any material differences in the planned and actual modifying factors. The QP is of the
opinion that the data used to estimate the Mineral Reserve is adequate.
Historical:
Sampling and assaying of the TSFs and sand dumps prior to 2016 is essentially the same as the
current work. The only real change noted by the QP is that the sieve size was reduced to 850µm in 2016,
where it was 1,000µm previously. Currently, there is no apparent difference between the results using
these different sieve sizes.
The analytical method is fire assay, a well-established technique used in the South African gold mines.
The methods differed slightly over time and between laboratories, but the results are consistent within a
TSF. Aliquot sizes have been either 100g or 125g, depending on the laboratory used.
Quality control systems are in place in laboratories to monitor accuracy and precision.
Technical Report Summary of the material Tailings Storage Facilities
71
10 Mineral Processing and Metallurgical Testing
10.1 Nature and Extent of the Metallurgical Testing Method
Samples were received from the various drilling exercises in 1.5m increments for each hole. Typically,
composites were made over a 15m horizon as this corresponds with the monitoring/mining depth. The
TSFs and sand dumps were generally divided into a top, middle and bottom horizon, depending on the
height of the TSF or sand dump. In the plans, the TSFs were also divided into areas giving distinct domain
samples for metallurgical test work.
10.2 Procedure
10.2.1 Slime Material
The individual samples were split in two using a blending mat, and cone and quartering methods. The
one half was returned to the sample bag for possible future use and for reference. The other half was
composited as per the areas/horizons or domain alluded to earlier. The composite was well mixed and
sub-samples taken for test work at Ergo Metallurgical Research or at the Maelgwyn South Africa
(Proprietary) Limited’s laboratory.
The proposed processing route for all TSF and sand dump material is hydraulic mining, cyaniding in a
Carbon-in-Leach (CIL) circuit, with the tailings deposited onto another TSF, and then carbon eluted for
gold recovery before being recycled back to the leach.
A standard bottle roll test was done on each composite using the following leaching parameters:
●
samples slurried to a density of 1.45;
●
screened to remove +850µm discard material;
●
head sample was taken for triplicate fire assay;
●
pre-conditioning with lime for one hour to stable pH of 10.5;
●
cyanide added at 0.35kg/t;
●
activated carbon added at 20g/l;
●
leach terminated after seven hours;
●
solids filtered and washed twice and solutions tested for residual reagents and gold content;
●
residue assays done in triplicate.
10.2.2 Sand Material
Metallurgical test work was conducted on 5A10/5L27 sand dump drilling samples. The objective of the
test work was to validate the gold grades received from the Mineral Resource Management (MRM)
Department, assess the milling requirements and evaluate the leach kinetics/characteristics of the
material. The dump was partitioned into four sections. The average gold grade received from the MRM
Department for Section 1 was 0.62g/t, Section 2 was 0.30g/t, Section 3 was 0.51g/t and Section 4 was
Technical Report Summary of the material Tailings Storage Facilities
72
0.41g/t. The average gold grade obtained from metallurgical research test work for Section 1 was
0.62g/t, Section 2 was 0.30g/t, Section 3 was 0.51g/t and Section 4 was 0.39g/t.
The samples were milled over varying durations and milling curves plotted to determine the optimum
milling time. The milling curves indicate that the optimum milling duration achieving at least 60% -75µm
is 2.5 hours for Section 1 and 2 hours for Sections 2, 3 and 4. Leach tests were then conducted on the
milled product and the results confirm that gold yield increases with increased milling time.
The respective 5A10 material responds well to cyanide leach as desired dissolution of 60% was attained
for all Sections at the above milling durations. Preg-robbing tests were also conducted on material from
Sections 1 and 3 and the results indicate that there is no significant preg-robbing.
10.3 Representative of the Samples
Drill holes were drilled on a defined grid down to the soil. The samples received were correctly split and
composited, and are considered to be representative of the various volumes within the TSFs.
10.4 Details of the Laboratories
The Ergo Metallurgical Research Laboratory, located in Brakpan inside the Ergo processing plant, is
geared to perform bottle roll testing on a routine basis with skilled technicians. Internal accounting
checks are undertaken to ensure the accuracy of the work done. The laboratory is not accredited and
is the internal test facility for Ergo. The laboratory is not independent of Ergo.
The Maelgwyn South Africa (Proprietary) Limited (Maelgwyn) laboratory, situated in Roodepoort, is
accredited for International Organization for Standardization (ISO 9001:2025) to perform gold leaching
test work with their assays analysis conducted by the SGS laboratory , in Randfontein. SGS is an SANAS
accredited facility (T0265) for gold analysis.
Both the Maelgwyn and SGS laboratories are independent of Ergo.
10.5 Results
The main assumption was that the laboratory procedure emulates the processing plant and historically
this has been shown to be a fair assumption. To accommodate the dissolved loss encountered in the
processing plant, an allowance of 0.008g/t Au is made to calculate the predicted recovery in the plant.
Technical Report Summary of the material Tailings Storage Facilities
73
Table 10.1 presents the results of metallurgical test work.
Table 10.1: Summary of Predicted Ergo Processing Plant Performance
TSF/Sand Dump
Head Au
(g/t)
Washed
Residue Au
(g/t)
Dissolution
Loss Au
(g/t)
Recovery
(%)
Analysis Laboratory
Crown Complex
3L8 (GMTS)
0.25
0.14
0.008
41
Ergo
3L7 (Mooifontein)
0.23
0.13
0.008
40
Ergo
3L5 (Diepkloof )
0.23
0.14
0.008
36
Ergo
City Deep Complex
4L3
0.32
0.12
0.008
60
Ergo
4L4
0.37
0.21
0.008
41
Ergo
4L6
0.31
0.12
0.008
58
Ergo
Knights Complex
4L14
0.28
0.15
0.008
44
Maelgwyn/Ergo
Ergo Complex
4L50
0.26
0.16
0.008
35
Maelgwyn/Ergo
Rooikraal
0.25
0.17
0.008
31
Ergo
7L15
0.28
0.14
0.008
47
Maelgwyn/Ergo
Marievale Complex
7L4
0.29
0.13
0.008
52
Ergo
7L5
0.30
0.19
0.008
34
Ergo
7L6
0.24
0.16
0.008
30
Ergo
7L7
0.34
0.2
0.008
39
Ergo
Grootvlei Complex
6L16
0.25
0.17
0.008
33
Maelgwyn/Ergo
6L17
0.26
0.13
0.008
47
Maelgwyn/Ergo
6L17A
0.26
0.15
0.008
39
Maelgwyn/Ergo
5A10/5L27 Sand Dumps
5A10/5L27
0.49
0.21
0.008
60
Ergo
Daggafontein TSF
Daggafontein
0.25
0.16
0.008
35
Ergo
Source: DRDGOLD, 2022
10.6 Interpretation of the Results
Table 10.1 summarizes the metallurgical test work that has been done on the various TSFs and sand
dumps. In the table under the ‘comments’ column, an indication as to which laboratories carried out
the test work is given. The head grade and washed residue are the results achieved in the laboratory.
In order to predict how the material would respond to treatment in the Ergo processing plant, a dissolved
gold loss of 0.008g/t Au has been applied. In general, the head grades vary between 0.25g/t Au and
0.32g/t Au. The response to cyanidation is varied which could be due to numerous factors.
Technical Report Summary of the material Tailings Storage Facilities
74
10.7 QP Opinion
In the opinion of the QP, data derived from metallurgical test work is adequate for designing processing
facilities and techniques, and provides suitable grade and recovery predictions for use in the LoM plans.
Confidence is further increased by processing plant performance demonstrated through reconciliation
for over ten years.
The metallurgical process is well tested and utilized by numerous tailings retreatment operators in South
Africa and elsewhere. There were no processing factors or deleterious elements that could significantly
affect potential economic extraction.
Technical Report Summary of the material Tailings Storage Facilities
75
11 Mineral Resource Estimates
The gold grade estimation was completed using two modelling techniques: Inverse Distance Weighting
(IDW) to the power of 2 and validation using the Nearest Neighbor (NN) technique. The techniques
reported a similar average global gold grade with no significant conditional bias. The Mineral Resource
estimation was declared using the IDW to the power of 2. The estimation approach was considered
appropriate based on the review of several factors, including the quantity and spacing of available
data, the interpreted control on miner alization, the style and geometry of the mineralization as well as
geological logging and additional information recorded from the drill holes. TSFs and sand dumps are
man-made engineering features which was considered in the estimation process. Ordinary Kriging was
considered unnecessary for TSF and sand dump evaluation as the main aim was to obtain global
averages rather than local variations considering the envisaged or applied mining method.
Mineral Resources were estimated for all the TSFs, and the estimation procedures are similar in approach
for all the TSFs and sand dumps. However, each TSF and sand dump is treated as a separate entity as
each has differences due to data distribution and characteristic of the material. Estimation procedures
and parameters are given individually per TSF or sand dump.
All tailings material is above the current land surface and continuity of grade within the TSFs is defined
based on +/-100m drill hole spacing. The tailings material has been processed through a metallurgical
treatment plant that ejects a waste residue that is relatively uniform when compared with the natural
deposit from which the material is derived. The variation between samples and drill hole is small (0.1g/t
to 1.0g/t) in comparison to in situ gold deposits. However, the percentage difference may be huge as
is the case with trace elements.
Datamine’s Studio RM geological modelling software was used as the modelling tool. Most of the
statistical and geostatistical study was completed using SAS JMP Pro and the RStudio, an open-source
integrated development environment for “R”, a programing language for advanced statistical
computing and graphics.
Mineral Resource estimates are not Mineral Reserves and do not have demonstrated economic viability.
There is no certainty that all or any part of the Mineral Resource will be converted into a Mineral Reserve.
The Mineral Resource estimates for all the TSFs and a sand dump are declared as follows:
●
the point of reference is
in situ
. The TSFs or sand dumps themselves are the reference points;
●
no geological or other losses were applied as all material is accessible and there are no
geological structures;
●
Mineral Resource estimates are stated as both inclusive and exclusive of Mineral Reserves as
defined in Subpart 1300 of Regulation S-K; and
●
the Mineral Resource is 100% attributable to Ergo. DRDGOLD, the registrant, owns 100% of Ergo.
Item 11.1 to Item 11.7 present the methodology followed a similar methodology for all the TSFs and sand
dumps. Item 11.9 to Item 11.16 provides detail for each complex, TSF or sand dump.
Technical Report Summary of the material Tailings Storage Facilities
76
The 79 smaller TSFs and clean-up material contribute about 11% of the total Mineral Resource estimates
by tonnage. The Mineral Resource estimates in these smaller dumps pose a less than material risk to
Ergo. Their Mineral Resource was estimated from survey information , production and/or historical data,
applying straight arithmetic average s as the TSFs or clean-up sites are too small to be evaluated by 3D
modelling. The QP considered the inclusion of the TSFs and clean-up operations as appropriate and has
conducted verification checks to support their inclusion. The Mineral Resource estimates of these TSFs
and clean-up operations are not discussed individually, but they are part of the total Mineral Resource
for Ergo.
11.1 Volume Modelling
For all significant TSFs, three-dimensional (3D) modelling was completed using drill hole information and
survey data. Volumes were estimated using a top surface defined by a ground survey and associated
digital terrain model. The bases of the TSFs were defined by the drill hole data and the edges of the TSFs.
All drill holes were drilled to intersect soil at the base of the TSFs. The block models were constructed
inside of this volume. Tonnages and grades were then extracted from the block models.
11.2 Bulk Dry Density
An average dry bulk density of 1.42t/m
3
dumps. The tons were reported as dry tons.
11.3 Exploratory Data Analysis
Exploratory data analysis was done on raw and composited gold data. Samples were collected at 1.5m
intervals. For IDW estimation method, the sample lengths were adequate. The samples were further
composited to 6m to allow for NN estimation as the modelled blocks were 6m high to represent bench
height. Samples were composited based on mean sea level to mimic deposition. This allowed for
estimations to be carried out based on the levels.
The requirement for high-grade capping was assessed to ascertain the reliability and spatial clustering
of the high-grade data. The steps completed as part of the high-grade capping assessment are
summarized below:
●
review of the data to identify any data that deviates from the general data distribution. This was
completed using histograms and log probability plots;
●
review of plots comparing the contribution to the mean and standard deviation of the highest-
grade data; and
●
visual review in 3D to allow assessment of the clustering of the higher-grade data.
11.4 Estimation Techniques
The estimation was constrained by the mineralization interpretations. The statistical characteristics of the
available sample information and the spatial distribution aided the definition of the estimation
parameters, such as search volume and orientation of the search ellipses.
Technical Report Summary of the material Tailings Storage Facilities
77
The IDW (to the power of 2) and NN method of estimation were chosen as the most appropriate
methods for evaluation of TSFs and sand dumps, as the dataset for each TSF and sand dump is generally
homogeneous (laterally), grade variations are small due to deposition technique and the drill holes are
well spread and spacing is moderately wide. The methods, when applied appropriately, retain the
grade variation of the deposit, as opposed to an arithmetic average, and is simpler and more
appropriate for TSF or sand dump evaluation than other advanced estimation techniques such as
Ordinary Kriging.
These estimation techniques have been found to be reliable by Ergo over the last 15 years of mining
TSFs and sand dumps.
Hard domain boundaries were used throughout, preventing samples lying outside the domain from
being used for the estimation meaning slime and soil samples were separated during the estimation
process. A three-pass estimation strategy was applied to each zone, applying an expanded and less
restrictive sample search to the second and subsequent estimation passes and only considering blocks
not previously assigned an estimate. However, more than 80% of the estimates were completed in the
first pass. A record was kept of the number of samples used to estimate the grade into a block. The
variance of each block and the search volume that satisfied the criteria used to select samples for use
in the estimation of each block.
11.5 Modelling and Estimation Parameters
The parent block size for all the TSFs and sand dumps was largely based on the average drill spacing
and sample compositing interval. The height of the original dump benches is approximately 5m to 6m.
The parent block size is selected to estimate the deposit approximates half the drill hole spacing and
maps the bench height. Sub-blocking was allowed for a good volume definition.
11.6 Model Validation
A routine validation process was followed for all the TSFs and sand dumps. All relevant statistical
information was recorded to enable validation and review of the estimates.
The recorded information included:
●
the number of samples used per block estimate;
●
average distance to samples per block estimate;
●
estimation flag to determine in which estimation pass a block was estimated; and
●
the number of drill holes from which composite data were used to complete the block estimate.
Technical Report Summary of the material Tailings Storage Facilities
78
The estimates were reviewed visually and statistically prior to being accepted. The review included the
following activities:
●
comparison of volume estimates between the block model, the 3D wireframe model and the
surveyor's report;
●
check for global bias through comparison of the estimate versus the mean of the composite
dataset, including weighting where appropriate to account for data clustering;
●
histogram comparison of grade block distribution versus composite grade distribution;
●
visual checks of cross-sections, long-sections and plans; and
●
where production data was available, reconciliation was carried out as part of the model
validation process.
Alternative estimates were also completed to test the sensitivity of the reported model to the selected
interpolation parameters. An insignificant amount of variation in overall grade was noted in the
alternate estimations. The results were satisfactory for the level of accuracy anticipated for TSF
evaluation.
11.7 Technical and Financial Parameters
In determining the cut-off grades of the Mineral Resources, the QP applied the data presented in Table
11.1.
The QP considered the gold price , exchange rate and working cost per ton (long-term prices as at 30
June 2022), as applied reasonable for use in declaring the Mineral Resources. Justification for the
financial parameters used is detailed in Item 16. Additional technical parameters per TSF or sand dump
are presented in the relevant items. The QP considered both technical and financial parameters
(infrastructure, mine design and planning, processing plant, environmental compliance and permitting)
to justify the reasonable prospects for economic extraction. All complexes except Crown and Grootvlei
Complexes have studies done to a PFS level of accuracy (i.e., +/- 25%). For the Crown and Grootvlei
Complexes, initial assessments were completed.
Table 11.1: Financial and Technical Data considered for Mineral Resource
Element
Unit
Value
Mineral Resource Gold Price
USD/oz
1,823
Mineral Resource Gold Price
ZAR/kg
914,294
Exchange Projection
ZAR/USD
15.60
Working Costs per Ton (slimes)
ZAR/t
70.76
Working Costs per Ton (sand)
ZAR/t
204.46
Source: DRDGOLD, 2022
The QP has considered that Ergo does not selectively mine a TSF. The average grade of the TSF is used
to determine whether or not a TSF is mined in its entirety. Where the average grade of the TSF is above
the cut-off grade , all the material in the TSF or sand dump is considered to be mined. The QP applied
no block cut-off.
Technical Report Summary of the material Tailings Storage Facilities
79
A cut-off grade is also determined per TSF or sand dump. A TSF may report an average gold grade
below a cut-off grade, but when included in a complex, the total complex should be above the cut-
off grade. See Table 11.2 for the cut-off information. The QP determined cut-off grades using the formula
presented in Item 12.2.
Table 11.2: Mineral Resource Estimate Cut-off Grades
TSF/Sand Dump
Recovery
Cut-off Grade
(%)
(g/t)
Crown Complex
3L8 (GMTS)
41
0.189
3L7 (Mooifontein)
40
0.193
3L5 (Diepkloof)
36
0.215
Average for the Complex
0.199
City Deep Complex
4L3
60
0.129
4L4
41
0.189
4L6
58
0.133
Average for the Complex
0.150
Knights Complex
4L14
44
0.176
4L50
35
0.221
Average for the Complex
0.199
Ergo Complex
Rooikraal
33
0.235
7L15
47
0.165
Average for the Complex
0.200
Marievale Complex
7L4
52
0.149
7L5
34
0.228
7L6
30
0.258
7L7
39
0.198
Average for the Complex
0.208
Grootvlei Complex
6L16
33
0.235
6L17
47
0.165
6L17A
39
0.198
Average for the Complex
0.199
5A10/5L27 Sand Dump
5A10/5L27
55
0.407
Daggafontein TSF
Daggafontein
35
0.221
Source: The RVN Group, 2022
The following statements apply to all Mineral Resources tables:
●
Mineral Resources are not Mineral Reserves;
●
Mineral Resources are reported inclusive and exclusive of Mineral Reserves;
Technical Report Summary of the material Tailings Storage Facilities
80
●
Mineral Resources have been reported in accordance with Subpart 1300 of Regulation S-K;
●
Mineral Resources were estimated using the USD1,823/oz, ZAR15.60/USD and ZAR914,294/kg
financial parameters;
●
the recovery information is presented in Table 11.2;
●
the reference point is
in situ
;
●
a troy ounce = 31.1034768g; and
●
quantities and grades were rounded to reflect the accuracy of the estimates; any apparent
errors are insignificant.
11.8 Uncertainties and Classification Criteria
Definitions for Mineral Resource categories used in this report are those defined by the Security and
Exchange Commission in Subpart 1300 of Regulation S-K. Mineral Resource Estimates are classified to
reflect the increased level of geological confidence into Inferred, Indicated and Measured Mineral
Resource categories.
By their nature, all Mineral Resource estimates carry an inherent amount of risk and uncertainty
depending on various factors, including interpretation of data, drilling data quality, uncertainty in the
survey and metallurgical test work data collected and the modelling process. However, Ergo has been
in operation for more than 20 years treating TSFs and sand dumps and has sufficiently mitigated Mineral
Resource risks through obtaining sufficient sampling information. Some uncertainties were resolved
through reconciliations, process improvement and the use of experienced personnel in data collection
and interpretation.
The QP based the Mineral Resource categorization on the robustness of the various data sources
available, the confidence of the geological interpretation and various estimation parameters (e.g.,
distance to data, number of data, maximum search radii etc.) and reconciliation data where it is
available. The QP considers the Mineral Resource classification as a function of the confidence of the
whole process from drilling, sampling, geological understanding and variables relationships. TSFs and
sand dumps are evaluated individually and there are no blanket classification parameters as TSFs and
sand dumps are different . However, drill hole spacing and data quality contribute significantly to the
classification confidence.
Each TSF or sand dump has its classification criteria discussed separately.
The Mineral Resource confidence is assessed via internal peer reviews, with no material issues identified.
Mineral Resources have reasonable prospects for economic extraction and the QP considered a range
of mining, processing, infrastructural, social, environmental and permitting factors.
Technical Report Summary of the material Tailings Storage Facilities
81
11.9 Crown Complex
11.9.1 Exploratory Data Analysis
Statistical analysis of data was completed as presented in Figure 11.1 to Figure 11.8. Data was analyzed
as raw, capped and composites. There was no material changed between the data sets. The data sets
show positively skewed distribution.
Based on the high-grade cap investigations, high-grade caps were selected and applied to the raw
dataset:
●
3L7 (Mooifontein): gold grades were capped at 0.60g/t;
●
3L8 (GMTS): gold grades were capped at 0.60g/t; and
●
3L5 (Diepkloof): two domains (compartments) were modelled and gold grades were also
capped at 0.60g/t.
Capping was only applied to raw data and its impact on the mean was immaterial.
3L5 (Diepkloof TSF) was domained into two areas because of physical separation between the two
compartments (Homestead and Diepkloof).
Figure 11.1: 3L7 (Mooifontein): Distribution of Raw Gold Capped Data
Source: The RVN Group, 2022
Technical Report Summary of the material Tailings Storage Facilities
82
Figure 11.2: 3L7 (Mooifontein): Distribution of Composited Gold Data
Source: The RVN Group, 2022
Figure 11.3: 3L8 (GMTS): Distribution of Raw Gold Capped Data
Source: The RVN Group, 2022

Technical Report Summary of the material Tailings Storage Facilities
83
Figure 11.4: 3L8 (GMTS): Distribution of Composited Gold Data
Source: The RVN Group, 2022
Figure 11.5: 3L5 (Diepkloof: Diepkloof): Distribution of Raw Gold Capped Data
Source: The RVN Group, 2022
Technical Report Summary of the material Tailings Storage Facilities
84
Figure 11.6: 3L5 (Diepkloof: Diepkloof): Distribution of Composited Gold Data
Source: The RVN Group, 2022
Figure 11.7: 3L5 (Diepkloof: Homestead): Distribution of Raw Gold Capped Data
Source: The RVN Group, 2022
Technical Report Summary of the material Tailings Storage Facilities
85
Figure 11.8: 3L5 (Diepkloof: Homestead): Distribution of Composited Gold Data
Source: The RVN Group, 2022
11.9.2 Modelling and Estimation Parameters
Half the drill hole spacing was chosen as the block size. Block size of 100m-by-100m-by-6m was chosen
for the TSFs. Sub-celling was allowed for better volume definition.
The sample search parameters are supplied in Table 11.3.
Table 11.3: Search Parameters: Inverse Distance Estimation Method
TSF
Domain
Estimation
Pass
Search Distance
Minimum
Number of
Composites
Maximum
Number of
Composites
X
(m)
Y
(m)
Z
(m)
3L7 (Mooifontein)
Mooifontein
1
300
300
6
5
20
2
600
600
12
5
20
3
900
900
18
5
20
3L8 (GMTS)
GMTS
1
400
400
10
4
10
2
800
800
20
4
10
3
1,200
1,200
30
4
10
3L5 (Diepkloof)
Homestead
1
400
400
10
4
10
2
800
800
20
4
10
3
1,200
1,200
30
4
10
Diepkloof
1
400
400
10
4
10
2
800
800
20
4
10
3
1,200
1,200
30
4
10
Source: The RVN Group, 2022
Technical Report Summary of the material Tailings Storage Facilities
86
11.9.3 Technical and Economic Factors
11.9.3.1 Site Infrastructure
Crown Complex is located in a well-developed area (Johannesburg) with most mining infrastructure in
place. Johannesburg is a megacity and is one of the 100
th
Johannesburg was established in the 1880s following the discovery of gold.
Roads:
Access to the Crown Complex is via the N1 highway and a network of the well-maintained
paved road systems.
Power:
Power requirements are primarily for the operation of pumps and site offices. Power is sourced
from the national supplier, the Electricity Supply Commission (Eskom). There is power supply from17#
substation to the surrounding areas and the TSFs.
Site Offices and Workshop:
mining contract. Workshops for maintenance of roads, pumps and pipelines are based at the Ergo
processing plant and no additional infrastructure is required.
Crown Complex is situated in the City of Johannesburg, so other specialized services could be sourced
from the private workshops.
Pumps and Pipelines:
in Brakpan should be completed. A pipeline of approximately 20km will be required to supply slime to
City Deep. There is already a pipeline infrastructure to transport slime to Ergo Plant from City Deep; this
may need to be upgraded along with a water supply pipeline at a later stage.
Water:
Mining Right renewal application has been launched. Crown Complex has the majority of the water
uses authorized and would only require minor amendments, but this would only be able to 100% defined
when the entire scope and design of the project is finalized. Ergo is confident that a water use license
will be issued.
Tailings Deposition Site:
deposition facility to accommodate all material from Crown Complex, in addition to the tonnages in
the LoM plan if the final design of the Brakpan/Withok TSF is approved and implemented. Refer to Item
15.7 and 19.3.2 for more detail on deposition plans.
11.9.3.2 Mine Design and Planning
Hydraulic mining is suitable for Crown Complex. Hydraulic mining can loosely be defined as the
excavation of material from its
in situ
material with the purpose of mechanically breaking and/or softening the material so that it can be
carried away by the water flow. The application or effectiveness of the method is a function of a variety
of factors ranging from the size, velocity and pressure of the water stream to the location, hardness,
particle size and moisture content of the material to be mined.
Technical Report Summary of the material Tailings Storage Facilities
87
Hydraulic mining is typically undertaken using 100mm or 150mm monitor guns with increased production
achieved by the inclusion of additional units. This provides a high degree of flexibility that allows
simultaneous mining at a number of points over a wide range of production rates. Consequently, grade
blending is readily achievable.
A production rate of 3 x 600kt/m is assumed from Crown Complex due to pipeline capacity.
11.9.3.3 Processing Plant
Crown Complex material could be processed at Ergo’s processing plant as discussed in Item 10 and the
results presented in Table 10.1. The slime material is not significantly different to the slimes material
processed at the Ergo processing plant. The Ergo processing plant details are in Item 14.
11.9.3.4 Environmental Compliance and Permitting
A Mining Right renewal application was launched with the DMRE. Compliance and permitting are
discussed in Item 3.2 and 17.
11.9.3.5 Initial Assessment Results
The QP’s opinion is that there is a reasonable prospect for economic extraction based on the total mix
of technical and financial factors discussed. A cut-off grade is discussed in Item 12.2.11.7
11.9.4 Mineral Resource Classification Criteria
A list of the criteria used to classify the Mineral Resources is given in Table 11.4. Applying these
confidence levels, Mineral Resource classification codes were assigned to the block model. A low
confidence in one of the listed items will mean classification is downgraded to Inferred, a moderate
confidence in at least one item will mean a property is Indicated while all highs mean the property is in
the Measured Mineral Resource category.
Technical Report Summary of the material Tailings Storage Facilities
88
Table 11.4: Confidence Levels for Key Criteria for Mineral Resource Classification
Items
Discussion
Confidence
Drilling Techniques
RC drilling technique to international standards
High
Logging
Detailed logging throughout
High
Drill Sample Recovery
The sample recovery was considered satisfactory and was
acceptable for mineral resource estimation
High
Sub-sampling Techniques
and Sample Preparation
Material has previously been processed and quartering was
applied
High
Quality of Assay Data
Available data is of robust quality however there is a relatively high
variability in the lowest grade assays
High
Verification of Sampling
and Assaying
A comprehensive QC program implemented during exploration
High
Location of Sampling
Points
Survey of all collars and TSFs surfaces
High
Data Density and
Distribution
Data points were well spread, though widely spaced.
Approximately 200m-by-200m spacing was followed
Moderate
Database Integrity
Errors identified and rectified
High
Geological Interpretation
Geometry is known accurately
High
Bulk Density
A mean density of 1.42t/m
3
High
Mineralization Type
Mineralization is well known from processing
High
Estimation and Modelling
Techniques
NN and Inverse Distance
High
Source: The RVN Group, 2022
The drill hole spacing was approximately 200-by-200m on all the TSFs. With this grid, the grade, floor
elevation and TSF geometry were estimated with sufficient confidence to allow the application of
modifying factors in sufficient detail to support mine planning and evaluation of the economic viability
of the TSFs. All TSFs’ material was classified as Indicated Mineral Resources. No Measured Mineral
Resource was declared as the drill space is still too wide to conclusively define grade continuity and
volume. No Inferred was declared as drilling provided sufficient information.
The data or supporting information is derived from the adequately detailed and reliable exploration,
sampling and testing and is sufficient to assume geological and grade or quality continuity between
points of observation.
11.9.5 Mineral Resource Statement
As no Mineral Reserve was declared, inclusive is equal to exclusive Mineral Resource for the Crown
Complex (Table 11.5).
Technical Report Summary of the material Tailings Storage Facilities
89
Table 11.5: Crown Complex Mineral Resource Estimate (Exclusive)
TSF
Mineral
Resource
Category
Mineral Resources as at 30 June
2021 (Exclusive)
Mineral Resources as at 30 June
2022 (Exclusive)
Tons
(kt)
Au
(g/t)
Content
(oz)
Tons
(kt)
Au
(g/t)
Content
(oz)
Measured Mineral Resources
-
-
-
-
-
-
Mooifontein (3L7)
Indicated
67,559
0.23
499,577
67,559
0.23
499,577
GMTS (3L8)
Indicated
107,450
0.25
863,649
107,450
0.25
863,649
Diepkloof (3L5)
Indicated
97,988
0.23
724,589
97,988
0.23
724,589
Sub-total Indicated Mineral
Resources
272,997
0.24
2,087,815
272,997
0.24
2,087,815
Sub-total Measured and
Indicated Mineral Resources
272,997
0.24
2,087,815
272,997
0.24
2,087,815
Inferred Mineral Resources
-
-
-
-
-
-
Total Mineral Resource
272,997
0.24
2,087,815
272,997
0.24
2,087,815
Source: The RVN Group, 2022
11.9.6 Mineral Resource Changes
There was no change in Mineral Resource as no drilling, mining or additional deposition was done on
Crown Complex.
11.9.7 Mineral Resource Risks and Uncertainty
The renewal of the Mining Right for the Crown Complex is a risk. The application to renew was launched
in 2014 and Ergo has since been constantly engaging the DMRE. This report has considered section 24(5)
of the MPRDA, as amended; as quoted below:
“
A mining right in respect of which an application for renewal has been lodged shall despite its expiry
date remain in force until such time as such application has been granted or refused.
”
The QP classified the overall Mineral Resource risk as medium due to lower grades and permitting status
of the Crown Complex.
In the opinion of the QP, no further technical work is required as the drilling program provided sufficient
data to define continuity.
11.10 City Deep Complex
11.10.1 Exploratory Data Analysis
Figure 11.9 to Figure 11.14 show the frequency distributions of the gold grades on 4L3, 4L4 and 4L6. Data
was analyzed as raw, capped and composites. There was no material changed between the data sets.
The data sets show positively skewed distribution.
Based on the high-grade cap investigations, high-grade caps were selected and applied to the raw
dataset. A little/insignificant reduction in the available metal is noted.
●
4L3: capped at 0.65g/t Au;
●
4L4: capped at 0.65g/t Au; and
Technical Report Summary of the material Tailings Storage Facilities
90
●
4L6: capped at 0.50g/t Au.
Figure 11.9: 4L3: Distribution of Raw Gold Capped Data
Source: The RVN Group, 2022
Technical Report Summary of the material Tailings Storage Facilities
91
Figure 11.10: 4L3: Distribution of Composited Gold Data
Source: The RVN Group, 2022
Figure 11.11: 4L4: Distribution of Raw Gold Capped Data
Source: The RVN Group, 2022
Technical Report Summary of the material Tailings Storage Facilities
92
Figure 11.12: 4L4: Distribution of Composited Gold Data
Source: The RVN Group, 2022
Figure 11.13: 4L6:
Distribution of Raw Gold Capped Data
Source: The RVN Group, 2022
Technical Report Summary of the material Tailings Storage Facilities
93
Figure 11.14: 4L6: Distribution of Composited Gold Data
Source: The RVN Group, 2022
11.10.2 Modelling and Estimation Parameters
A block model with 100m-by-100m blocks was constructed for 4L3, 4L4 and 4L6 inside the respective
volumes. Tonnages and grades were estimated into the block model. The parent block sizes selected
to estimate the deposit approximates the drill hole spacing. The tailings bench heights are 5m to 8m
high. The QP selected 6m in the Z direction for the City Deep Complex to correspond with the average
bench height.
The sample search parameters are supplied in the Table 11.6.
Table 11.6: Search Parameters: Inverse Distance Estimation Method
TSF
Estimation Pass
Search Distance
Minimum
Number of
Composites
Maximum
Number of
Composites
X
(m)
Y
(m)
Z
(m)
4L3
1
400
400
10
4
10
2
800
800
20
4
10
3
1,200
1,200
30
4
10
4L4
1
400
400
10
4
10
2
800
800
20
4
10
3
1,200
1,200
30
4
10
4L6
1
400
400
10
4
10
2
800
800
20
4
10
3
1,200
1,200
30
4
10
Source: The RVN Group, 2022
Technical Report Summary of the material Tailings Storage Facilities
94
11.10.3 Technical and Economic Factors
Item 13 to Item 19 were considered in declaring the Mineral Resource estimates.
11.10.4 Mineral Resource Classification Criteria
An additional list of the criteria used by the QP to classify the Mineral Resource estimates in addition to
the statistical parameters is given in Table 11.7. Applying these confidence levels, Mineral Resource
classification codes were assigned to the block model. A low confidence in one of the listed items will
mean classification is downgraded to Inferred, a moderate confidence in at least one item will mean a
property is Indicated while all highs mean the property is in the Measured Mineral Resource category.
Table 11.7: Confidence Levels of Key Criteria for Classification of the TSFs Mineral Resources
Items
Discussion
Confidence
Drilling Techniques
Auger to industry standards
High
Logging
Detailed logging throughout
High
Drill Sample Recovery
The sample recovery is estimated as >90% and was considered
acceptable for Mineral Resource estimation
High
Sub-sampling
Techniques and
Sample Preparation
Material has previously been processed and was submitted directly
for sampling
High
Quality of Assay Data
Available data is of robust quality
High
Verification of
Sampling and
Assaying
A comprehensive QC program was implemented
High
Location of Sampling
Points
Survey of all collars and TSF surfaces
High
Data Density and
Distribution
Approximately 100m-by-100m spacing was followed
high
Geological
Interpretation
Geometry is known accurately
High
Mineralization Type
Mineralization is well known from processing
High
Estimation and
Modelling Techniques
Inverse distance used for resource declaration. NN used for validation
High
Source: The RVN Group, 2022
The QP classified the Mineral Resources into the Measured Mineral Resource Category as the drill hole
spacing was tight enough (approximately 100m apart) to provide sufficient evidence of grade
continuity and estimate tons with high confidence. No Indicated and Inferred Mineral Resources were
declared.
11.10.5 Mineral Resource Statement
Table 11.8 to Table 11.9 present Mineral Resources for 4L3, 4L4 and 4L6 as at 30 June 2022.
Table 11.8: City Deep Complex Mineral Resource Estimates (Inclusive)
TSF
Mineral Resource
Category
Mineral Resources as at 30 June 2021
(Inclusive)
Mineral Resources as at 30 June 2022
(Inclusive)
Tons
Au
Content
Tons
Au
Content
Technical Report Summary of the material Tailings Storage Facilities
95
(kt)
(g/t)
(oz)
(kt)
(g/t)
(oz)
4L3
Measured
13,134
0.32
135,126
13,134
0.32
135,126
4L4
Measured
4,738
0.32
48,746
4,738
0.32
48,746
4L6
Measured
2,410
0.31
24,020
2,410
0.31
24,020
Sub-total Measured Mineral
Resources
20,282
0.32
207,891
20,282
0.32
207,891
Indicated Mineral Resources
-
-
-
-
-
-
Sub-total Measured and
Indicated Mineral Resources
20,282
0.32
207,891
20,282
0.32
207,891
Inferred Mineral Resources
-
-
-
-
-
-
Total Mineral Resource
20,282
0.32
207,891
20,282
0.32
207,891
Source: The RVN Group, 2022
Table 11.9: City Deep Complex Mineral Resource Estimates (Exclusive)
TSF
Mineral
Resource
Category
Mineral Resources as at 30 June 2021
(Exclusive)
Mineral Resources as at 30 June 2022
(Exclusive)
Tons
(kt)
Au
(g/t)
Content
(oz)
Tons
(kt)
Au
(g/t)
Content
(oz)
4L3
Measured
-
-
-
-
-
-
4L4
Measured
-
-
-
-
-
-
4L6
Measured
-
-
-
-
-
-
Sub-total Measured
Mineral Resources
-
-
-
-
-
-
Indicated Mineral
Resources
-
-
-
-
-
-
Sub-total Measured and
Indicated Mineral
Resources
-
-
-
-
-
-
Inferred Mineral
Resources
-
-
-
-
-
-
Total Mineral Resource
-
-
-
-
-
-
Source: The RVN Group, 2022
11.10.6 Mineral Resource Changes
There was no change in Mineral Resources as no drilling, mining or additional deposition was done on
4L3, 4L4 and 4L6 TSFs.
11.10.7 Mineral Resource Risks and Uncertainty
The QP’s opinion is that the overall grade and tonnage estimates are reasonable for mine planning
based on the drill hole data and assay statistics.
The gold price fluctuations present the main risk to the declared Mineral Resource estimates.
Risks of grade, continuity of mineralization and tons were mitigated through the reasonable drilling
space, validation procedures, metallurgical testing, advanced statistical analyses and the use of robust
modelling techniques.
The QP classified the overall Mineral Resource risk as low. In the opinion of the QP, no further technical
work is required as the drilling program provided enough data to define continuity.
Technical Report Summary of the material Tailings Storage Facilities
96
11.11 Knights Complex
11.11.1 Exploratory Data Analysis
Statistics of the sample population from raw, capped and composited data are given in Figure 11.15 to
Figure 11.28. At 4L14, both slime and soil were mineralized with soil having a maximum grade of 1.96g/t
Au. The spread of both the slimes and soil data is not large which indicates that the grade variability is
low. The gold grades for soil were capped at 0.94g/t to reduce the over-estimation of soil gold resources.
Capping reduced the mean by about 10%; however, this is due to lack of data rather than a large
volume of high-grade material. The slimes grades were composited into 6m intervals. The soil domain
was not composited as there was not enough data. The 6m composites were based on numerous
statistical tests and bench height. The bench height is 5m to 6m high.
Figure 11.15: 4L14: Distribution of Slime Raw Data
Source: The RVN Group, 2022
Technical Report Summary of the material Tailings Storage Facilities
97
Figure 11.16: 4L14: Log Distribution of Slime Raw Data
Source: The RVN Group, 2022
Figure 11.17: 4L14: Distribution of Slime 6m Composited Data
Source: The RVN Group, 2022
Technical Report Summary of the material Tailings Storage Facilities
98
Figure 11.18: 4L14: Log Distribution of Slime 6m Composited Data
Source: The RVN Group, 2022
Figure 11.19: 4L14: Distribution of Soil Raw Data
Source: The RVN Group, 2022
Technical Report Summary of the material Tailings Storage Facilities
99
Figure 11.20: 4L14: Log Distribution of Soil Raw Data
Source: The RVN Group, 2022
Figure 11.21: 4L14: Distribution of Soil Raw Capped Data
Source: The RVN Group, 2022
Technical Report Summary of the material Tailings Storage Facilities
100
Figure 11.22: 4L14: Log Distribution of Soil Raw Capped Data
Source: The RVN Group, 2022
Figure 11.23: 4L50: Log Distribution of Raw Slime Data
Source: The RVN Group, 2022

Technical Report Summary of the material Tailings Storage Facilities
101
Figure 11.24: 4L50: Distribution of Raw Slime Raw Data
Source: The RVN Group, 2022
Figure 11.25: 4L50: Log Distribution of Raw Capped Slime Data
Source: The RVN Group, 2022

Technical Report Summary of the material Tailings Storage Facilities
102
Figure 11.26: 4L50: Distribution of Raw Capped Slime Data
Source: The RVN Group, 2022
Source: The RVN Group, 2022
Technical Report Summary of the material Tailings Storage Facilities
103
Figure 11.28: 4L50: Log Distribution of 3m Composited Slime Data
Source: The RVN Group, 2022
11.11.2 Modelling and Estimation Parameters
4L14:
The parent block sizes for the TSFs were mostly based on the average drill spacing and compositing
interval. The height of the dump benches is around 5m to 6m. The parent block sizes selected to estimate
the deposit approximates half the drill hole spacing. Sub-blocking was allowed for good volume
definition. Soil was modelled as a separate domain. Soil was modelled because it had high gold values,
the QP attributed this high gold value to gold remobilization from the TSF.
Estimation Parameters for 4L14 are given in Table 11.10 and Table 11.11.
Table 11.10: 4L14: Search Parameters: Nearest Neighbor Estimation Method
Domain
Estimation
Pass
Search Distance
Minimum
Number of
Composites
Maximum
Number of
Composites
Maximum
Number of
Composites
per Drill Hole
X
(m)
Y
(m)
Z
(m)
Slime
1
400
400
50
1
1
1
2
800
800
100
1
1
1
3
1,200
1,200
150
1
1
1
Soil
1
400
400
50
1
1
1
2
800
800
100
1
1
1
3
1,200
1,200
150
1
1
1
Source: The RVN Group, 2022
Technical Report Summary of the material Tailings Storage Facilities
104
Table 11.11: 4L14: Search Parameters: Inverse Distance Estimation Method
Domain
Estimation
Pass
Search Distance
Minimum
Number of
Composites
Maximum
Number of
Composites
Maximum
Number of
Composites
per Drill Hole
X
(m)
Y
(m)
Z
(m)
Slime
1
500
500
12
5
10
2
2
1,000
1,000
24
5
10
2
3
1,500
1,500
36
5
10
2
Soil
-
-
-
-
-
-
-
-
-
-
-
-
-
-
-
-
-
-
-
-
-
Source: The RVN Group, 2022
4L50:
The parent block sizes for the 4L50 TSF were mostly based on the average drill spacing and bench
height. The parent block sizes selected to estimate the deposit approximates the borehole spacing. The
bench height is 2m to 4m high. Sub-blocking was allowed to improve volume representation within the
interpreted wireframe models of the dump top and bottom surfaces.
A comparison of the 2008 and 2016 drillhole information showed that the base of the dump was not
properly defined in the 2008 drilling. There appeared to be over-drilling or extra samples at the base.
Due to this problem, it was decided to map the base of the dump using the 2016 to 2017 drilling
campaign data only. There is high confidence in the logging data from the 2016 drilling campaign.
The sample search parameters are supplied in Table 11.12 and Table 11.13.
Table 11.12: 4L50: Search Parameters: Nearest Neighbor Estimation Method
Domain
Estimation
Pass
Search Distance
Minimum
Number of
Composites
Maximum
Number of
Composites
Maximum
Number of
Composites
per Drill Hole
X
(m)
Y
(m)
Z
(m)
Slime
1
400
400
50
1
1
1
2
800
800
100
1
1
1
3
1,200
1,200
150
1
1
1
Source: The RVN Group, 2022
Table 11.13: 4L50: Search Parameters: Inverse Distance Estimation Method
Domain
Estimation
Pass
Search Distance
Minimum
Number of
Composites
Maximum
Number of
Composites
Maximum
Number of
Composites
per Drill Hole
X
(m)
Y
(m)
Z
(m)
Slime
1
500
500
6
5
10
2
2
1,000
1,000
12
5
10
2
3
1,500
1,500
24
5
10
2
Source: The RVN Group, 2022
A number of search parameters were tested; optimum parameters were chosen by the QP.
Technical Report Summary of the material Tailings Storage Facilities
105
11.11.3 Technical and Economic Factors
Item 13 to Item 19 were considered in declaring the Mineral Resource Estimates. The technical studies
were done at a PFS level. As at 30June 2022, 4L50 was being mined.
11.11.4 Mineral Resource Classification Criteria
The 4L14 and 4L50 TSFs were classified using a number of criteria including data density, estimation
statistics and TSF knowledge and interpretation. For classification purpose, blocks estimated within the
first search radius were classified as Measured Mineral Resources. The TSFs were classified as Measured
Mineral Resources.
A list of the criteria used to classify the Mineral Resources in addition to the statistical parameters, is given
in
Table 11.14 below. Applying these confidence levels, Mineral Resource classification codes were
assigned to the block model. A low confidence in one of the listed items will mean classification is
downgraded to Inferred, a moderate confidence in at least one item will mean a property is Indicated
while all highs mean the property is in the Measured Mineral Resource category.
Table 11.14: Confidence Levels of Key Criteria for Classification of the 4L14and 4L50 TSFs
Mineral Resources
Items
Discussion
Confidence
Drilling Techniques
Auger to international standards
High
Logging
Detailed logging throughout
High
Drill Sample Recovery
The sample recovery is estimated as >90% and is considered
acceptable for Mineral Resource estimation
High
Sub-sampling Techniques
and Sample Preparation
Material has previously been processed and can be submitted
directly for sampling
High
Quality of Assay Data
Available data is of robust quality however there is a relatively
high variability in the lowest grade assays
High
Verification of Sampling and
Assaying
A comprehensive QC program implemented during exploration
High
Location of Sampling Points
Survey of all collars and TSFs surfaces
High
Data Density and
Distribution
Drilled with auger drill holes at 100m-by-100m
High
Database Integrity
Errors identified and rectified
High
Geological Interpretation
Geometry is known accurately
High
Mineralization Type
Mineralization is well known from processing
High
Estimation and Modelling
Techniques
NN and Inverse Distance Squared
High
Source: The RVN Group, 2022
Both TSFs were classified as Measured due to a tight drill hole spacing of <100m and high data quality.
This spacing enabled the QP to estimate tonnage and grade continuity with high confidence.
Production data from 4L50 matches well with the estimated values (Figure 11.29). No Indicated and
Technical Report Summary of the material Tailings Storage Facilities
106
Inferred Mineral Resources were declared as confidence in the data and estimation process followed
were high.
Figure 11.29: 4L50: Head Grade versus Modelled Average Gold Grade
Source: The RVN Group, 2022
11.11.5 Mineral Resource Statement
Table 11.15 and
Table 11.16 present the Mineral Resource for 4L14 and 4L50.
Table 11.15: Knights Complex Mineral Resource Estimates (Inclusive)
TSF
Mineral
Resource
Category
Mineral Resources as at 30 June 2021
(Inclusive)
Mineral Resources as at 30 June 2022
(Inclusive)
Tons
(kt)
Au
(g/t)
Content
(oz)
Tons
(kt)
Au
(g/t)
Content
(oz)
4L14
Measured
6,638
0.29
61,891
6,638
0.29
60,824
4L50
Measured
6,756
0.26
56,475
3,418
0.26
27,216
Sub-total Measured
Mineral Resources
13,394
0.27
118,366
10,056
0.28
88,040
Indicated Mineral
Resources
-
-
-
-
-
-
Sub-total Measured and
Indicated Mineral
Resources
13,394
0.27
118,366
10,056
0.28
88,040
Inferred Mineral
Resources
-
-
-
-
-
-
Total Mineral Resource
13,394
0.27
118,366
10,056
0.28
88,040
Source: The RVN Group, 2022
Technical Report Summary of the material Tailings Storage Facilities
107
Table 11.16: Knights Complex Mineral Resource Estimates (Exclusive)
TSF
Mineral
Resource
Category
Mineral Resources as at 30 June 2021
(Inclusive)
Mineral Resources as at 30 June 2022
(Inclusive)
Tons
(kt)
Au
(g/t)
Content
(oz)
Tons
(kt)
Au
(g/t)
Content
(oz)
4L14
Measured
-
-
-
-
-
-
4L50
Measured
-
-
-
-
-
-
Sub-total Measured
Mineral Resource
-
-
-
-
-
-
Indicated Mineral
Resource
-
-
-
-
-
-
Sub-total Measured and
Indicated Mineral
Resources
-
-
-
-
-
-
Inferred Mineral Resource
-
-
-
-
-
-
Total Mineral Resources
-
-
-
-
-
-
Source: The RVN Group, 2022
11.11.6 Mineral Resource Changes
Mining on 4L50 TSF resulted in a depletion of the Mineral Resource. Depletion and reconciliation are
explained in 13. The modeled average gold grade correlated well with production data
(Figure 11.29). No mining has taken place on 4L14 TSF.
11.11.7 Mineral Resource Risks and Uncertainty
The QP’s opinion is that the overall grade and tonnage estimates are reasonable for mine planning
based on the drill hole data and assay statistics.
The gold price fluctuations present the main risk to the declared Mineral Resource estimates.
Risks of grade, continuity of mineralization and tonnage were mitigated through the reasonable drilling
spacing, validation procedures, metallurgical testing, advanced statistical analyses and the use of
robust modelling techniques.
The QP classified the overall Mineral Resource risk as low. In the opinion of the QP, no further technical
work is required as the drilling program provided enough data to define continuity.
11.12 Ergo Complex
11.12.1 Exploratory Data Analysis
11.12.1.1 Rooikraal
Exploratory data analysis was done on raw and composited gold data (Figure 11.30 and
Figure 11.31). The distribution of the raw and composite is symmetrical with similar coefficient of variation
and a low standard deviation.
Technical Report Summary of the material Tailings Storage Facilities
108
Based on the high-grade cap investigations, the QP decided not to apply high-grade capping as no
extreme values were noted.
Figure 11.30: Rooikraal: Distribution of Raw Gold Data
Source: The RVN Group, 2022
Technical Report Summary of the material Tailings Storage Facilities
109
Figure 11.31: Rooikraal: Log Distribution of Composited Gold Data
Source: The RVN Group, 2022
11.12.1.2 7L15
A comprehensive study on the 2015 versus the 2016 to 2017 datasets was performed. The 2015 dataset
has higher grades than the 2016 to 2017 dataset. The 2015 dataset reported an average gold grade of
0.34g/t and the 2016 to 2017 dataset has an average gold grade of 0.26g/t.
A decision was made to re-drill three drill holes and compare the 2015 samples against the 2016 samples
in the same horizon. The 2016 samples were split on-site into three subsamples and were sent to two
different laboratories. One batch was sent to the local mine laboratory (MAED-Ergo) and two batches
of same samples were sent to the Anglo Lab with completely different sample numbers to avoid the
laboratory identifying that the samples were from the same drillholes.
The results of the re-drilling showed that the old 7L15 data (2015) analyzed by the MAED (Crown)
laboratory were over-reported and should not be used in the Mineral Resource evaluation. Only the
2016 to 2017 drilling campaign dataset could be used for the estimation. The MAED laboratory analyzing
the 2016 samples is a new laboratory at the Ergo processing plant and not the old laboratory at the
Crown processing plant, which analyzed the 2015 samples.
Domaining:
7L15 has two physically visible TSFs and the grades of the TSFs are different (Figure 11 .32).
The layering in each domain did not continue into the other. The South and North domains were
separated for Mineral Resource evaluation. The North TSF (Figure 11.33 and Figure 11.34) has lower
grades than the South TSF (Figure 11.35 and Figure 11.36). The North domain has an average grade of
0.23g/t Au and the South domain reported an average grade of 0.30g/t Au.
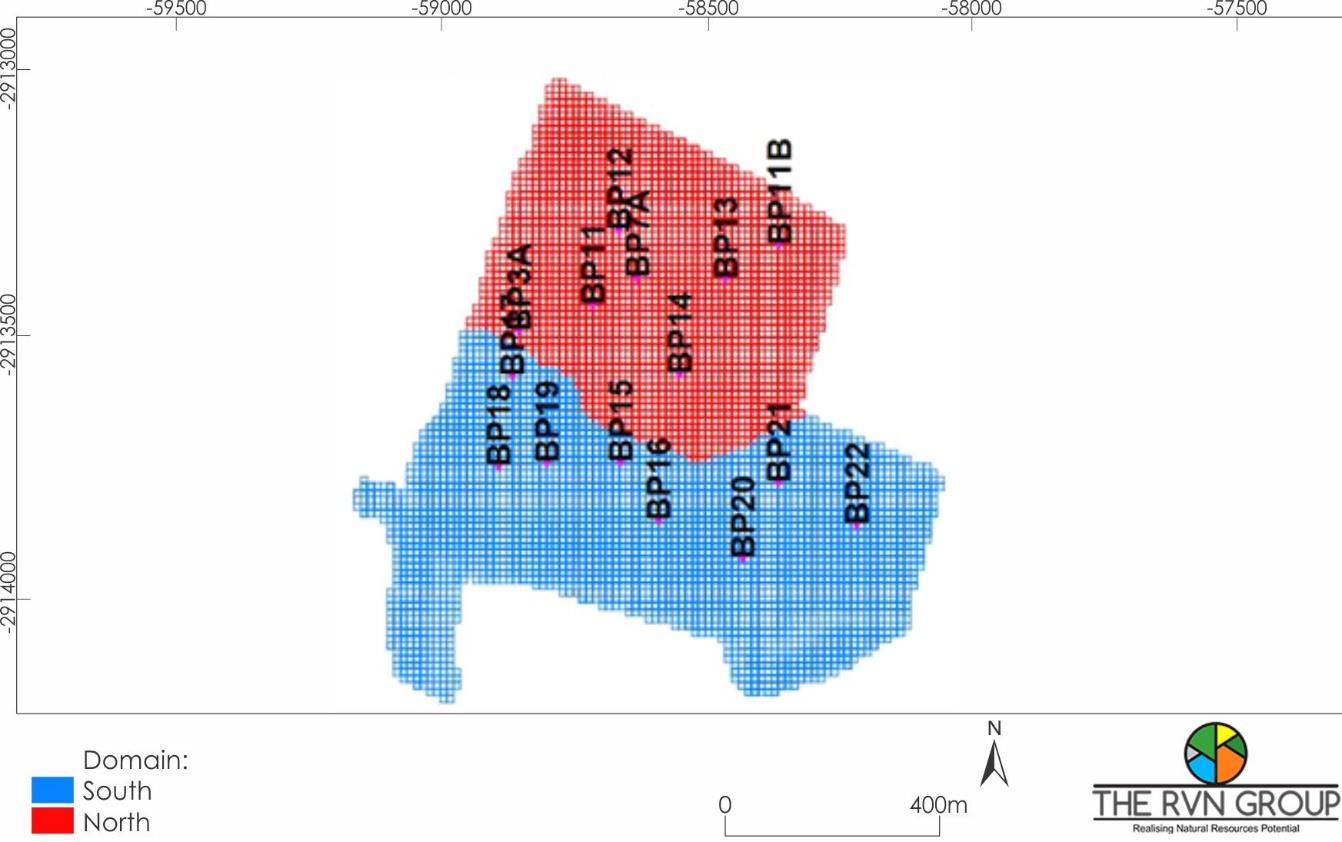
Technical Report Summary of the material Tailings Storage Facilities
110
Figure 11.32: 7L15: Plan showing North and South Domains
Source: The RVN Group, 2022
Technical Report Summary of the material Tailings Storage Facilities
111
Figure 11.33: 7L15: Distribution of 2015 Raw Data - North Domain
Source: The RVN Group, 2022
Figure 11.34: 7L15: Log Distribution of 2016 Raw Data - North Domain
Source: The RVN Group, 2022
Technical Report Summary of the material Tailings Storage Facilities
112
Figure 11.35: 7L15: Distribution of 2015 Raw Data - South Domain
Source: The RVN Group, 2022
Figure 11.36: 7L15: Log Distribution of 2016 Raw Data - South Domain
Source: The RVN Group, 2022
Technical Report Summary of the material Tailings Storage Facilities
113
The statistical characteristics of the North and South domains are shown in Figure 11.37 to
Figure 11.40. Compositing was completed at 3m interval.
Figure 11.37: 7L15: Distribution of 3m Composited Slime Data - South Domain
Source: The RVN Group, 2022
Figure 11.38: 7L15: Log Distribution of 3m Composited Slime Data - South Domain
Source: The RVN Group, 2022
Technical Report Summary of the material Tailings Storage Facilities
114
Figure 11.39: 7L15: Distribution of 3m Composited Slime Data - North Domain
Source: The RVN Group, 2022
Figure 11.40: 7L15: Log Distribution of 3m Composited Slime Data - North Domain
Source: The RVN Group, 2022
Technical Report Summary of the material Tailings Storage Facilities
115
11.12.2 Modelling and Estimation Parameters
11.12.2.1 Rooikraal
The height of the original dump benches is approximately 5m to 6m. The parent block sizes selected to
estimate the deposit approximates the drill hole spacing (at least a drill hole in a block) and maps the
bench height.
A number of search parameters were tested and optimum parameters were chosen by the QP. The
sample search parameters are supplied in Table 11.17.
Table 11.17: Rooikraal: Search Parameters: Inverse Distance Estimation Method
Domain
Estimation
Pass
Search Distance
Minimum
Number of
Samples
Maximum
Number of
Samples
Maximum
Number of
Samples per
Drill Hole
X
(m)
Y
(m)
Z
(m)
Rooikraal
1
600
600
12
6
18
5
2
1,200
1,200
24
6
18
5
3
1,800
1,800
36
6
18
5
Source: The RVN Group, 2022
11.12.2.2 7L15
The parent block sizes for the 7L15 TSFs were mostly based on the average drill spacing and compositing
interval. The parent block sizes selected to estimate the deposit approximates half the borehole
spacing. Sub-blocking was allowed for good volume definition. The search parameters are presented
in Table 11.18.
Table 11.18: 7L15: Search Parameters: Inverse Distance Estimation Method
Domain
Estimation
Pass
Search Distance
Minimum
Number of
Composites
Maximum
Number of
Composites
Maximum
Number of
Composites
per Drill Hole
X
(m)
Y
(m)
Z
(m)
North
1
400
400
6
2
5
-
2
800
800
12
2
5
-
3
1,200
1,200
24
2
5
-
South
1
400
400
6
2
5
-
2
800
800
12
2
5
-
3
1,200
1,200
24
2
5
-
Source: The RVN Group, 2022
11.12.3 Technical and Economic Factors
The QP used the PFS information (Item 13 to Item 19) to declare that the Rooikraal and 7L15 TSFs have
reasonable prospects for economic extraction.
The QP opinion is that there is a reasonable prospect for economic extraction based on the total mix of
technical and economic factors discussed.
Technical Report Summary of the material Tailings Storage Facilities
116
11.12.4 Mineral Resource Classification Criteria
A list of the criteria used to classify the Mineral Resources in addition to the statistical parameters is given
in Table 11.19. Applying these confidence levels, Mineral Resource classification codes were assigned
to the block model. A low confidence in one of the listed items will mean classification is downgraded
to Inferred, a moderate confidence in at least one item will mean a property is Indicated while all highs
mean the property is in the Measured Mineral Resource category.
Table 11.19: Ergo: Confidence Levels for Key Criteria for Mineral Resource Classification
Items
Discussion
Confidence
Drilling Techniques
Auger for 7L15 and for Rooikraal TSF, RC and auger drilling
techniques were used. These methods are industry standard for
drilling TSFs
High
Logging
Detailed logging throughout
High
Drill Sample Recovery
The sample recovery was considered satisfactory and was
acceptable for Mineral Resource estimation
High
Sub-sampling Techniques
and Sample Preparation
Material has previously been processed and quartering was
applied
High
Quality of Assay Data
Available data is of robust quality however there is a relatively high
variability in the lowest grade assays
High
Verification of Sampling
and Assaying
A comprehensive QC program implemented during exploration
High
Location of Sampling
Points
Survey of all collars and TSFs surfaces
High
Data Density and
Distribution
Data points were well spread. Approximately 100m-by-100m
spacing was followed
High
Database Integrity
Errors identified and rectified
High
Geological Interpretation
Geometry is known accurately.
High
Bulk Density
A mean density of 1.42t/m
3
potential upside
High
Mineralization Type
Mineralization is well known from processing
High
Estimation and Modelling
Techniques
NN and Inverse Distance
High
Source: The RVN Group, 2022
The drillhole spacing was approximately 100m-by-100m. With this grid, the grade, floor elevation and TSF
geometry were estimated with sufficient confidence to allow the application of modifying factors in
sufficient detail to support mine planning and evaluation of the economic viability of the TSF. Some
auger drill holes that did not intersect the floor, had the floor defined by the RC drill holes. All the RC drill
holes intersected the floor or the base. The TSF material was classified as a Measured Mineral Resource.
Technical Report Summary of the material Tailings Storage Facilities
117
11.12.5 Mineral Resource Statement
The Mineral Resource in Table 11.20 to Table 11.21 is 100% attributable to DRDGOLD.
Table 11.20: Ergo Mineral Resource Estimates (Inclusive)
TSF
Mineral
Resource
Category
Mineral Resources as at 30 June 2021
(Inclusive)
Mineral Resources as at 30 June 2022
(Inclusive)
Tons
(kt)
Au
(g/t)
Content
(oz)
Tons
(kt)
Au
(g/t)
Content
(oz)
7L15
Measured
17,646
0.26
147,506
17,646
0.26
147,506
Rooikraal
Measured
56,763
0.26
474,493
56,763
0.26
474,493
Sub-total Measured
Mineral Resources
74,409
0.26
621,999
74,409
0.26
621,999
Indicated Mineral
Resources
-
-
-
-
-
-
Sub-total Measured and
Indicated Mineral
Resources
74,409
0.26
621,999
74,409
0.26
621,999
Inferred Mineral
Resources
-
-
-
-
-
-
Total Mineral Resource
74,409
0.26
621,999
74,409
0.26
621,999
Source: The RVN Group, 2022
Table 11.21: Ergo Mineral Resource Estimates (Exclusive)
TSF
Mineral
Resource
Category
Mineral Resources as at 30 June 2021
(Exclusive)
Mineral Resources as at 30 June 2022
(Exclusive)
Tons
(kt)
Au
(g/t)
Content
(oz)
Tons
(kt)
Au
(g/t)
Content
(oz)
7L15
Measured
-
-
-
-
-
-
Rooikraal
Measured
-
-
-
-
-
-
Sub-total Measured
Mineral Resources
-
-
-
-
-
-
Indicated Mineral
Resources
-
-
-
-
-
-
Sub-total Measured and
Indicated Mineral
Resources
-
-
-
-
-
-
Inferred Mineral
Resources
-
-
-
-
-
-
Total Mineral Resource
-
-
-
-
-
-
Source: The RVN Group, 2022
11.12.6 Mineral Resource Changes
There was no change in the Mineral Resource as no mining or additional deposition was done on the
Rooikraal and 7L15 TSFs.
Technical Report Summary of the material Tailings Storage Facilities
118
11.12.7 Mineral Resource Risks and Uncertainty
The QP classified the overall Mineral Resource risk for both the Rooikraal and 7L15 TSFs as medium due
to the low-grade margin, gold price, recovery and working costs.
In the opinion of the QP, no further technical work is required as the drilling program provided sufficient
data to define continuity.
11.13 Marievale Complex
11.13.1 Exploratory Data Analysis
Exploratory data analysis was done on raw and composited gold data (Figure 11.41 to Figure 11.48).
Data was analyzed as raw, capped and composites. There was no material changed between the
data sets. The data sets distribution is symmetrical.
Based on the investigation, cutting or capping of the extreme values was considered. Lower extreme
grades were noted and visualized in 3D space. They were considered part of the population:
●
7L4: capping was applied at 0.45g/t Au. All gold grades greater than 0.45g/t were set as 0.45g/t;
●
7L5: no capping was applied as no outliers were noted;
●
7L6: no capping was applied as no outliers were noted; and
●
7L7: capping was applied at 0.70g/t Au to minimize the impact of extremely high values.
A study on domaining was conducted. The TSFs were not domained laterally or vertically; however, the
QP noted the vertical stratification. This stratification aided in defining the search volume (estimation
parameter) in a vertical direction.
The gold distributions are symmetrical and the variability is low, typical for a TSF.
Technical Report Summary of the material Tailings Storage Facilities
119
Figure 11.41: 7L4: Distribution of Capped Raw Gold Data
Source: The RVN Group, 2022
Figure 11.42: Distribution of Composited Raw Gold Data
Source: The RVN Group, 2022
Technical Report Summary of the material Tailings Storage Facilities
120
Figure 11.43: 7L5: Distribution of Raw Gold Data
Source: The RVN Group, 2022
Figure 11.44: 7L5: Distribution of Composited Gold Data
Source: The RVN Group, 2022
Technical Report Summary of the material Tailings Storage Facilities
121
Figure 11.45: 7L6: Distribution of Raw Gold Data
Source: The RVN Group, 2022
Figure 11.46: 7L6: Distribution of Composited Gold Data
Source: The RVN Group, 2022
Technical Report Summary of the material Tailings Storage Facilities
122
Figure 11.47: 7L7: Distribution of Raw Capped Gold Data
Source: The RVN Group, 2022
Figure 11.48: 7L7: Distribution of Composited Capped Gold Data
Source: The RVN Group, 2022
Technical Report Summary of the material Tailings Storage Facilities
123
11.13.2 Modelling and Estimation Parameters
The height of the original dump benches is approximately 5m to 6m. The parent block sizes selected to
estimate the deposit approximates half the drill hole spacing and corresponds to the bench height or
multiple thereof. Sub-blocking was allowed for good volume definition.
The sample search parameters are supplied in Table 11.22.
Table 11.22: Search Parameters
Domain
Estimation Pass
Search Distance
Minimum
Number of
Composites
Maximum
Number of
Composites
Maximum
Number of
Samples Per
Drill Hole
X
(m)
Y
(m)
Z
(m)
Slime
1
400
400
6
3
10
2
2
800
800
12
3
10
2
3
1,200
1,200
18
3
10
2
Source: The RVN Group, 2022
11.13.3 Technical and Economic Factors
The technical and financial studies completed for the Marievale Complex were at the preliminary
feasibility study (PFS) level of accuracy, (i.e., +/-25%) as presented in Item 13 to Item 19. The QP
concluded that there are reasonable prospects for economic extraction.
11.13.4 Mineral Resource Classification Criteria
A list of the criteria used to classify the Mineral Resources is given in Table 11.23. Applying these
confidence levels, Mineral Resource classification codes were assigned to the block model. A low
confidence in one of the listed items will mean classification is downgraded to Inferred, a moderate
confidence in at least one item will mean a property is Indicated while all highs mean the property is in
the Measured Mineral Resource category.
Technical Report Summary of the material Tailings Storage Facilities
124
Table 11.23: Confidence Levels for Key Criteria for Mineral Resource Classification
Items
Discussion
Confidence
Drilling Techniques
Auger drilling technique to international standards
High
Logging
Detailed logging throughout
High
Sub-sampling Techniques
and Sample Preparation
Material has previously been processed and quartering was
applied
High
Quality of Assay Data
Available data is of robust quality however there is a relatively
high variability in the lowest grade assays
High
Verification of Sampling
and Assaying
A comprehensive QC program implemented during exploration
High
Location of Sampling Points
Survey of all collars and TSFs surfaces
High
Data Density and
Distribution
Data points were well spread
High
Database Integrity
Errors identified and rectified
High
Geological Interpretation
Geometry is known accurately
High
Bulk Density
A mean density of 1.42t/m
3
High
Mineralization Type
Mineralization is well known from processing
High
Estimation and Modelling
Techniques
NN, and Inverse Distance
High
Source: The RVN Group, 2022
The material was classified as a Measured Mineral Resource as drill hole spacing was approximately
100m-by-100m. No Indicated or Inferred Mineral Resources were declared as the geological
confidence derived from exploration, test work and Mineral Resource estimation work was conclusive,
and the defined Mineral Resource can be used for mine planning studies.
11.13.5 Mineral Resource Statement
The Mineral Resource Estimates are stated as both an inclusive and exclusive of Mineral Reserve (Table
11.24 to Table 11.25).
Table 11.24: Marievale Mineral Resource Estimates (Inclusive)
TSF
Mineral
Resource
Category
Mineral Resources as at 30 June 2021
(Inclusive)
Mineral Resources as at 30 June 2022
(Inclusive)
Tons
(kt)
Au
(g/t)
Content
(oz)
Tons
(kt)
Au
(g/t)
Content
(oz)
7L4
Measured
17,590
0.34
192 281
17,590
0.34
192,281
7L5
Measured
6,980
0.29
65 080
6,980
0.29
65,080
7L6
Measured
12,760
0.26
106 663
12,760
0.26
106,663
7L7
Measured
16,784
0.32
172 678
16,784
0.32
172,678
Sub-total Measured
Mineral Resources
54,114
0.31
536,701
54,114
0.31
536,701
Indicated Mineral
Resources
-
-
-
-
-
-
Sub-total Measured and
Indicated Mineral
Resources
54,114
0.31
536,701
54,114
0.31
536,701
Inferred Mineral
Resources
-
-
-
-
-
-
Total Mineral Resource
54,114
0.31
536,701
54,114
0.31
536,701
Technical Report Summary of the material Tailings Storage Facilities
125
Source: The RVN Group, 2022
Table 11.25: Marievale Resource Estimates (Exclusive)
TSF
Mineral
Resource
Category
Mineral Resources as at 30 June 2021
(Exclusive)
Mineral Resources as at 30 June 2022
(Exclusive)
Tons
(kt)
Au
(g/t)
Content
(oz)
Tons
(kt)
Au
(g/t)
Content
(oz)
7L4
Measured
-
-
-
-
-
-
7L5
Measured
-
-
-
-
-
-
7L6
Measured
-
-
-
-
-
-
7L7
Measured
-
-
-
-
-
-
Measured Mineral
Resources
-
-
-
-
-
-
Indicated Mineral Resources
-
-
-
-
-
-
Sub-total Measured and
Indicated Mineral Resources
-
-
-
-
-
-
Inferred Mineral Resources
-
-
-
-
-
-
Total Mineral Resources
-
-
-
-
-
-
Source: The RVN Group, 2022
Notes:
1. Mineral Resources are not Mineral Reserves.
2. Mineral Resources are reported exclusive of Mineral Reserves.
3. Mineral Resources have been reported in accordance with Subpart 1300 of Regulation S-K.
4. Mineral Resources were estimated using the USD1,823/oz, ZAR15.60ZAR/USD and ZAR914,294ZAR/kg financial parameters and recoveries
in Item 11.13.3.
5. A troy ounce = 31.1034768g
6. The quantities and grades have been rounded to two decimal places; therefore, minor computational errors may occur.
11.13.6 Mineral Resource Changes
There was no change in Mineral Resource as no drilling, mining, or additional deposition was done on
Marievale Complex since the latest estimate.
11.13.7 Mineral Resource Risks and Uncertainty
The QP’s opinion is that the overall grade and tonnage estimates are reasonable for mine planning
based on the drill hole data and assay statistics. This presents a low risk for preliminary feasibility or
feasibility mine planning work, as only Mineral Resources with the highest level of geoscientific
knowledge are included in an economic assessment.
The gold price fluctuations present the main risk to the declared Mineral Resource.
Risks of grade and continuity of mineralization were mitigated through the closely spaced drilling,
validation procedures, metallurgical testing, advanced statistical analyses and the use of robust
geological modelling techniques.
The QP classified the overall Mineral Resource risk as low to medium. In the opinion of the QP, no further
technical work is required as the drilling program provided enough data to define continuity.
Technical Report Summary of the material Tailings Storage Facilities
126
11.14 Grootvlei Complex
11.14.1 Exploratory Data Analysis
Analysis of data from different campaigns was completed to check compatibility. Tools used for this
were box plots, histograms, PP and QQ plots, and ANOVA table. Datasets from different campaigns
were then combined.
Based on the high-grade cap investigations, high-grade caps were selected and applied to the raw
dataset. A little/insignificant reduction in the available metal was noted.
●
6L16: gold grades were capped at 0.70g/t;
●
6L17: gold grades were capped at 0.69g/t; and
●
6L17A: gold grades were capped at 0.65g/t.
Capping was only applied to raw data and its impact on the mean was immaterial for the 6L17 and
6L17A TSFs. One sample with 16.10g/t skewed the results for the 6L16 TSF. Additional infill drilling is required
on 6L16 TSF to further test the robustness of the high grade intersects, which, if confirmed by the infill
drilling, may support a less aggressive capping strategy.
Figure 11.54 to Figure 11.49 presents the basic statistics data for 6L16, 6L17 and 6L17A. Data was analyzed
as raw, capped and composites. There was no material changed between the data sets. The data sets
show positively skewed distribution.
Technical Report Summary of the material Tailings Storage Facilities
127
Figure 11.49: 6L16: Distribution of Raw Capped Gold Data
Source: The RVN Group, 2022
Figure 11.50: 6L16: Distribution of Composited Gold Data
Source: The RVN Group, 2022
Technical Report Summary of the material Tailings Storage Facilities
128
Figure 11.51: 6L17: Distribution of Raw Capped Gold Data
Source: The RVN Group, 2022
Figure 11.52: 6L17: Distribution of Composited Gold Data
Source: The RVN Group, 2022
Technical Report Summary of the material Tailings Storage Facilities
129
Figure 11.53: 6L17A: Distribution of Raw Capped Gold Data
Source: The RVN Group, 2022
Figure 11.54: 6L17A: Distribution of Composited Gold Data
Source: The RVN Group, 2022
Technical Report Summary of the material Tailings Storage Facilities
130
11.14.2 Modelling and Estimation Parameters
The parent block size for the TSF was largely based on the average drill spacing and sample compositing
interval. The height of the original dump benches is approximately 5m to 6m. The parent block sizes
selected to estimate the deposit approximates the drill hole spacing for the 6L17 and 6L17 TSFs, half the
drill hole spacing for 6L16 TSFs and maps the bench height. Sub-blocking was allowed for a good volume
definition.
The sample search parameters are supplied in Table 11.26.
Table 11.26: Search Parameters: Inverse Distance Estimation Method
Domain
Estimation Pass
Search Distance
Minimum
Number of
Composites
Maximum
Number of
Composites
X
(m)
Y
(m)
Z
(m)
Grootvlei
1
400
400
10
5
20
2
800
800
20
5
20
3
1,200
1,200
30
5
20
Source: The RVN Group, 2022
11.14.3 Technical and Economic Factors
The Mineral Resource Estimates for the 6L16, 6L17 and 6L17A TSFs were declared considering the initial
assessment completed. The Grootvlei TSFs are not included in the LoM plan. The cut-off grade details
are presented in Table 11.2.
11.14.3.1 Site Infrastructure
Roads:
Access to the Grootvlei Complex is via the N17 highway and a network of well-maintained
paved road system. The operation is accessed via gravel roads.
Power:
Power requirements are primarily for the operation of pumps and site offices. Power is sourced
from the national supplier, Eskom. There is a power supply near the TSFs.
Site Offices and Workshop:
mining contract. Workshops for the maintenanc e of roads, pumps and pipelines is based at the Ergo
processing plant and no additional infrastructure is required.
The Grootvlei Complex is situated in the City of Ekurhuleni, so other specialized services could be sourced
from the private workshops.
Pumps and Pipelines:
plant in Brakpan will be required to be completed. As other TSFs in the same vicinity are in the LoM plan
with a detailed pipeline plan, it is the QP’s view that a shorter (less than 5km) pipeline will be required to
connect the Grootvlei TSFs to the other planned pipeline network (for Daggafontein TSF in the LoM plan
done at PFS level).
Tailings Deposition Site:
accommodate all material from Grootvlei Complex , in addition to the tons in the LoM plan provided
regulatory approval for the Brakpan/Withok TSF final design is obtained. See Item 15.7 and Item 19.3.2
for more information on the deposition plans.
Technical Report Summary of the material Tailings Storage Facilities
131
11.14.3.2 Mine Design and Planning
Mine design and planning will be similar to the one in Item 13.1.1. A production rate of 600ktpm (200ktpm
per TSF) is assumed due to the pipeline capacity as the TSFs could be mined together with others in the
same vicinity.
11.14.3.3 Processing Plant
The Grootvlei Complex material could be processed at the Ergo processing plant (see Item 10.5.).
11.14.3.4 Environmental Compliance and Permitting
Ergo’s Prospecting Rights covering the Grootvlei Complex are presented in Item 3.3.
Ergo complies with all environmental and social responsibilities as required by the MPRDA, as amended.
No known environmental issues were identified during the site visit and documentation review. There is
an EMP approved by the DMRE. There are no exclusions of material or area due to Environmental, Social
and Governance considerations.
As discussed in Item 3.6, there is a competing ownership claim over the Grootvlei Complex.
11.14.3.5 Initial Assessment Results
The QP’s opinion is that there is a reasonable prospect for economic extraction based on the total mix
of technical and economic factors discussed.
11.14.4 Mineral Resource Classification Criteria
A list of the criteria used to classify the Mineral Resources, in addition to the statistical parameters, is
given in Table 11.27. Applying these confidence levels, Mineral Resource classification codes were
assigned to the block model. A low confidence in one of the listed items will mean classification is
downgraded to Inferred, a moderate confidence in at least one item will mean a property is Indicated
while all highs mean the property is in the Measured Mineral Resource category.
Technical Report Summary of the material Tailings Storage Facilities
132
Table 11.27: Confidence Levels for Key Criteria for Mineral Resource Classification
Items
Discussion
Confidence
Drilling Techniques
Auger and RC drilling technique to international standards
High
Logging
Detailed logging throughout
High
Drill Sample Recovery
The sample recovery was considered satisfactory and was
acceptable for Mineral Resource estimation
High
Sub-sampling
Techniques and
Sample Preparation
Material has previously been processed and quartering was applied
High
Quality of Assay Data
Available data is of robust quality however there is a relatively high
variability in the lowest grade assays
High
Verification of
Sampling and
Assaying
Full QC program implemented during exploration
High
Location of Sampling
Points
Survey of all collars and TSFs surfaces
High
Data Density and
Distribution
Data points were well spread, though widely spaced. Approximately
100m-by-100m spacing was followed for 6L17 and 6L17A TSFs. 6L16 TSF
has an average drill hole spacing of 200m-by-200m
High (6L17
and 6L17A)
Moderate for
6L16
Database Integrity
Errors identified and rectified
High
Geological
Interpretation
Geometry is known accurately
High
Bulk Density
A mean density of 1.42t/m
3
High
Mineralization Type
Mineralization is well known from processing
High
Estimation and
Modelling
Techniques
NN and Inverse Distance
High
Source: The RVN Group, 2022
The drill hole spacing was approximately 100-by-100m on the 6L17 and 6L17A TSFs. With this grid, the
grade, floor elevation and TSF geometry were estimated with sufficient confidence to allow the
application of modifying factors in sufficient detail to support mine planning and evaluation of the
economic viability of the TSFs. The 6L17 and 6L17A TSFs were classified in the Measured Mineral Resource
category. The 6L16 TSF was declared as Indicated Mineral Resource, as the drill space is too wide (200m-
by-200m).
The data or supporting information is derived from adequately detailed and reliable exploration,
sampling and testing and is sufficient to assume geological and grade or quality continuity between
the points of observation.
11.14.5 Mineral Resource Statement
The Mineral Resource Estimates for the Grootvlei Complex is presented in Table 11.28. No Mineral Reserve
was declared on the Grootvlei TSFs, so exclusive and inclusive are equal.
Technical Report Summary of the material Tailings Storage Facilities
133
Table 11.28: Grootvlei Complex Mineral Resource Estimates (Exclusive)
TSF
Mineral
Resource
Category
Mineral Resources as 30 June 2021
(Exclusive)
Mineral Resources as at 30 June 2022
(Exclusive)
Tons
(kt)
Au
(g/t)
Content
(oz)
Tons
(kt)
Au
(g/t)
Content
(oz)
6L17
Measured
49,320
0.26
412,275
49,320
0.26
412,275
6L17A
Measured
16,716
0.26
140,807
16,716
0.26
140,807
Sub-total Measured
Mineral Resources
66,036
0.26
553,082
66,036
0.26
553,082
6L16
Indicated
41,619
0.26
347,901
41,619
0.26
347,901
Sub-total Indicated
Mineral Resources
41,619
0.26
347,901
41,619
0.26
347,901
Sub-total Measured and
Indicated Mineral
Resources
107,655
0.26
900,984
107,655
0.26
900,984
Inferred Mineral
Resources
-
-
-
-
-
-
Total Mineral Resource
107,655
0.26
900,984
107,655
0.26
900,984
Source: The RVN Group, 2022
11.14.6 Mineral Resource Changes
There was no change in Mineral Resource as no additional drilling, mining, additional deposition or study
was done on the Grootvlei Complex.
11.14.7 Mineral Resource Risks and Uncertainty
The renewal of the Prospecting Right for the Grootvlei Complex is a risk. The application to renew was
launched in 2019 and Ergo is awaiting the granting of the Prospecting Permit from the DMRE. This report
has considered section 18(5) of the MPRDA, as ame nded:
“
A prospecting right in respect of which an application for renewal has been lodged shall despite its
expiry date remain in force until such time as such application has been granted or refused.
”
There is an ownership claim as detailed in Item 3.6.
The QP classified the overall Mineral Resource risk as high. In the opinion of the QP, no further technical
work is required as the drilling program provided sufficient data to define continuity.
11.15 5A10/5L27 Sand Dumps
11.15.1 Exploratory Data Analysis
Exploratory data analysis was performed on gold grades. No capping was applied as data shows no
extreme values. Samples were composited to 6m interval. The mean did not change materially after
compositing into 6m interval.
Figure 11.55 and Figure 11.56 present the basic statistical data for the 5A10/5L27 sand dumps. Data was
analysed as raw, capped and composites. There was no material changed between the data sets. The
data sets show positively skewed distribution.
Technical Report Summary of the material Tailings Storage Facilities
134
Figure 11.55: 5A10/5l27: Distribution of Raw Gold Data
Source: The RVN Group, 2022
Figure 11.56: 5A10/5l27: Distribution of Composited Gold Data
Source: The RVN Group, 2022
Technical Report Summary of the material Tailings Storage Facilities
135
11.15.2 Modelling and Estimation Parameters
The parent block size for the sand dumps was largely based on the average drill spacing and sample
compositing interval. The height of the original sand dump benches is approximately 5m to 6m. The
parent block sizes selected to estimate the deposit approximates the drill hole spacing and maps the
bench height. Sub-blocking was allowed for a good volume definition.
The sample search parameters are supplied in
Table 11.29
.
Table 11.29: Search Parameters: Inverse Distance Estimation Method
Domain
Estimation Pass
Search Distance
Minimum
Number of
Composites
Maximum
Number of
Composites
X
(m)
Y
(m)
Z
(m)
5A10/5l27
100
100
50
4
10
100
200
200
100
4
10
200
300
200
200
4
10
300
Source: The RVN Group, 2022
11.15.3 Technical and Economic Factors
The QP declared the Mineral Resource estimate for the 5A10/5L27 sand dumps considering technical
and economic studies in Item 13 to Item 19.
11.15.4 Mineral Resource Classification Criteria
A list of the criteria used to classify the Mineral Resources in addition to the statistical parameters is given
in Table 11.30. Applying these confidence levels, the Mineral Resource classification codes were
assigned to the block model.
Technical Report Summary of the material Tailings Storage Facilities
136
Table 11.30: Confidence Levels for Key Criteria for Mineral Resource Classification
Items
Discussion
Confidence
Drilling Techniques
Auger and drilling technique to international standards
High
Logging
Detailed logging throughout
High
Drill Sample Recovery
The sample recovery was considered satisfactory and was
acceptable for Mineral Resource estimation
High
Sub-sampling Techniques
and Sample Preparation
Material has previously been processed and quartering was
applied
High
Quality of Assay Data
Available data is of robust quality however there is a relatively
high variability in the lowest grade assays
High
Verification of Sampling
and Assaying
Full QC program implemented during exploration
High
Location of Sampling Points
Survey of all collars and TSFs surfaces
High
Data Density and
Distribution
Data points were well spread, though widely spaced.
Approximately 50m-by-100m spacing was followed. Where drill
holes did not intersect the base, holes were completed on the
edge
High
Database Integrity
Errors identified and rectified
High
Geological Interpretation
Geometry is known accurately
High
Bulk Density
A mean density of 1.42t/m
3
High
Mineralization Type
Mineralization is well known from processing
High
Estimation and Modelling
Techniques
NN and Inverse Distance
High
Source: The RVN Group, 2022
The drill hole spacing enabled the QP to define gold grades, floor elevation and sand dump geometry.
This provide the QP conclusive confidence to allow the application of modifying factors in sufficient
detail to support mine planning and evaluation of the economic viability of the sand dumps. The sand
dumps were classified as Measured Mineral Resources. The data or supporting information is derived
from the adequately detailed and reliable exploration, sampling and testing and is sufficient to assume
geological and grade or quality continuity between points of observation. The resource model and
production data reconciled well with less than a 1% grade difference. This was also considered in
classifying the 5A10/5L27 sand dumps as Measured Mineral Resources.
Technical Report Summary of the material Tailings Storage Facilities
137
11.15.5 Mineral Resource Statement
The Mineral Resource estimates for the 5A10/5L27 sand dumps are presented in Table 11.28 to Table
11.32.
Table 11.31: 5A10/5L27 Mineral Resource Estimates (Inclusive)
TSF
Mineral
Resource
Category
Mineral Resources as 30 June 2021
(Inclusive)
Mineral Resources as at 30 June 2022
(Inclusive)
Tons
(kt)
Au
(g/t)
Content
(oz)
Tons
(kt)
Au
(g/t)
Content
(oz)
5L27 (East)
Measured
5,965
0.48
92,054
3,979
0.49
60,467
5L27 (North)
Measured
4,288
0.28
38,601
4,288
0.28
38,601
5A10
Measured
2,117
0.61
41,519
1,595
0.61
31,285
Sub-total Measured Mineral
Resources
12,370
0.43
172,174
9,862
0.42
128,075
Indicated Mineral
Resources
-
-
-
-
-
-
Sub-total Measured and
Indicated Mineral
Resources
12,370
0.43
172,174
9,862
0.42
128,075
Inferred Mineral Resources
-
-
-
-
-
-
Total Mineral Resource
12,370
0.43
172,174
9,862
0.42
128,075
Source: The RVN Group, 2022
Table 11.32: 5A10/5L27 Mineral Resource Estimates (Exclusive)
TSF
Mineral
Resource
Category
Mineral Resources as 30 June 2021
(Exclusive)
Mineral Resources as at 30 June 2022
(Exclusive)
Tons
(kt)
Au
(g/t)
Content
(oz)
Tons
(kt)
Au
(g/t)
Content
(oz)
5L27
Measured
-
-
-
-
-
-
5A10
Measured
-
-
-
-
-
-
Sub-total Measured Mineral
Resources
-
-
-
-
-
-
Indicated Mineral
Resources
-
-
-
-
-
-
Sub-total Measured and
Indicated Mineral
Resources
-
-
-
-
-
-
Inferred Mineral Resources
-
-
-
-
-
-
Total Mineral Resource
-
-
-
-
-
-
Source: The RVN Group, 2022
11.15.6 Mineral Resource Changes
Mining took place on the 5A10 sand dump reclaiming 808kt at 0.61g/t Au in the last financial year. The
mined and modelled tonnage and grades reconciled well.
Technical Report Summary of the material Tailings Storage Facilities
138
11.15.7 Mineral Resource Risks and Uncertainty
The QP’s opinion is that the overall grade and tonnage estimates are reasonable for mine planning
based on the borehole data and assay statistics. Production data reconciled well with the block model.
The gold price fluctuations and lower grades of sand material present the main risk to the declared
Mineral Resource.
The QP classified the overall Mineral Resource risk as low to medium. In the opinion of the QP, no further
technical work is required as the drilling program provided enough data to define continuity.
11.16 Daggafontein TSF
11.16.1 Exploratory Data Analysis
The QP tested if there was a material difference in the gold grades from the various drilling campaigns
to ascertain if the datasets from the different campaigns were compatible. Figure 11.57 shows the box
plots of the different campaigns. The difference was considered minor by the QP. The 2017 drilling
campaign reported slightly higher grades. This campaign, however only comprised two drill holes (on
either side of the TSF
–
HSD plot showed that there is a difference in sample means between 2017 and the other campaigns.
The QP investigated the differences and concluded that the difference is due to the amount of data
per campaign and spatial distribution of the data point. Accordingly, the QP concluded that data from
the campaigns could be combined.
Figure 11.57: Boxplots for the Different Drilling Campaigns
Source: The RVN Group, 2022
Technical Report Summary of the material Tailings Storage Facilities
139
The drill hole individual sample gold grades are positively skewed. The mean of the gold grades is
0.24g/t.
Based on the statistical investigation, cutting or capping of the extreme values was not considered
(Figure 11.58). Lower extreme grades were noted and visualized in 3D space. They were considered part
of the population.
Figure 11.58: Log Probability Plot
Source: The RVN Group, 2022
A study on domaining was conducted. This was done through analysis of zones based on TSF material,
color and spatial grade analysis. The TSF was not domained laterally or vertically, however, the QP noted
the vertical stratification. This stratification aided in defining the search volume in the vertical direction.
No capping was applied.
11.16.2 Modelling and Estimation Parameters
The parent block size for the TSF was largely based on the average drill spacing and sample compositing
interval.
Technical Report Summary of the material Tailings Storage Facilities
140
The sample search parameters are supplied in Table 11.33.
Table 11.33: Search Parameters
Domain
Estimation Pass
Search Distance
Minimum
Number of
Composites
Maximum
Number of
Composites
Maximum
Number of
Samples Per
Drill Hole
X
(m)
Y
(m)
Z
(m)
Slime
1
500
500
6
5
20
4
2
1,000
1,000
12
5
20
4
3
1,500
1,500
18
5
20
4
Source: The RVN Group, 2022
11.16.3 Technical and Economic Factors
The QP declared the Mineral Resource estimates for the Daggafontein TSF considering technical and
economic studies in Item 13 to Item 19.
The Daggafontein TSF's average gold grade is 0.24g/t, which is above the cut-off grade presented in
Table 11.2. Selective mining of the TSF is not practiced by Ergo, therefore a cut-off is not a block level
but it is for the entire TSF. If a TSF mean grade is above cut -off, it is considered for the Mineral Resource.
The QP’s opinion is that there is a reasonable prospect for economic extraction based on the total mix
of technical and economic factors discussed.
11.16.4 Mineral Resource Classification Criteria
A list of the criteria used to classify the Mineral Resources is given in Table 11.34 below. Applying these
confidence levels, Mineral Resource classification codes were assigned to the block model.
Table 11.34: Confidence Levels for Key Criteria for Mineral Resource Classification
Items
Discussion
Confidence
Drilling Techniques
RC drilling technique to international standards
High
Logging
Detailed logging throughout
High
Sub-sampling Techniques and
Sample Preparation
Material has previously been processed and quartering
was applied
High
Quality of Assay Data
Available data is of robust quality however there is a
relatively high variability in the lowest grade assays
High
Verification of Sampling and Assaying
Full QC program implemented during exploration
High
Location of Sampling Points
Survey of all collars and TSFs surfaces
High
Data Density and Distribution
Data points were well spread. No drilling under water
Moderate
(low for
underwater
material)
Database Integrity
Errors identified and rectified
High
Geological Interpretation
Geometry is known accurately
High
Bulk Density
A mean density of 1.42t/m
3
High
Mineralization Type
Mineralization is well known from processing
High
Estimation and Modelling Techniques
NN, Inverse Distance and Ordinary Kriging
High
Source: The RVN Group, 2022
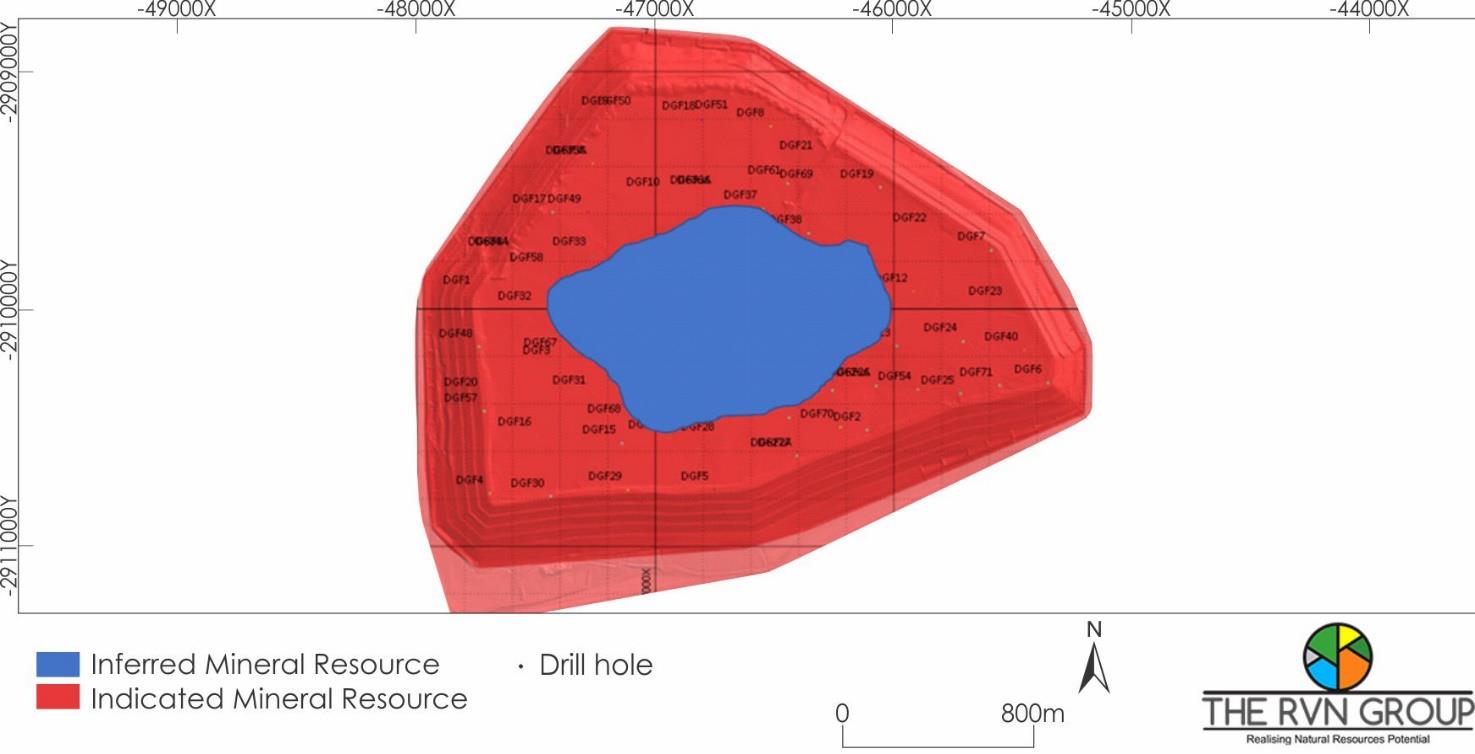
Technical Report Summary of the material Tailings Storage Facilities
141
Where drill hole spacing is less than 250m, the material was classified as an Indicated Mineral Resource
(Figure 11.59). An Inferred Mineral Resource was defined for the area under water where drilling could
not be done and grades were estimated on the second pass i.e., up to 1,000m drilling space.
Figure 11.59: Mineral Resource Classification
Source: The RVN Group, 2022
11.16.5 Mineral Resource Statement
The Mineral Resource is stated in Table 11.35 and Table 11.36.
Table 11.35: Daggafontein TSF Mineral Resource Estimate (Inclusive)
TSF
Mineral
Resource
Category
Mineral Resources as 30 June 2021
(Inclusive)
Mineral Resources as at 30 June 2022
(Inclusive)
Tons
(kt)
Au
(g/t)
Content
(oz)
Tons
(kt)
Au
(g/t)
Content
(oz)
Measured Mineral Resources
-
-
-
-
-
-
Indicated Mineral Resources
192,793
0.24
1,487,625
192,793
0.24
1,487,625
Sub-total Measured and
Indicated Mineral Resources
192,793
0.24
1,487,625
192,793
0.24
1,487,625
Inferred Mineral Resources
21,318
0.24
164,494
21,318
0.24
164,494
Total Mineral Resources
214,111
0.24
1,652,119
214,111
0.24
1,652,119
Source: The RVN Group, 2022
Technical Report Summary of the material Tailings Storage Facilities
142
Table 11.36: Daggafontein TSF Mineral Resource Estimate (Exclusive)
TSF
Mineral
Resource
Category
Mineral Resources as 30 June 2021
(Exclusive)
Mineral Resources as at 30 June 2022
(Exclusive)
Tons
(kt)
Au
(g/t)
Content
(oz)
Tons
(kt)
Au
(g/t)
Content
(oz)
Measured Mineral Resources
-
-
-
-
-
-
Indicated Mineral Resources
-
-
-
-
-
-
Sub-total Measured and
Indicated Mineral Resources
-
-
-
-
-
-
Inferred Mineral Resources
21,318
0.24
164,494
21,318
0.24
164,494
Total Mineral Resources
21,318
0.24
164,494
21,318
0.24
164,494
Source: The RVN Group, 2022
11.16.6 Mineral Resource Changes
There was no change in the Mineral Resource from June 2021 to June 2022 as no additional drilling or
studies were completed on the Daggafontein TSF.
11.16.7 Mineral Resource Risks and Uncertainty
The QP’s opinion is that the overall grade and tonnage estimates are reasonable for mine planning
based on the drill hole data and assay statistics. The Inferred portion of the Mineral Resource could not
be sufficiently drilled as this portion of the TSF remains saturated and its estimation was based on
extrapolation. This presents a low risk for preliminary feasibility or feasibility mine planning work, as no
Inferred Resource was included in an economic assessment.
The gold price fluctuations and lower grades present the main risk to the declared Mineral Resource.
Risks of grade and continuity of mineralization were mitigated through infill drilling, validation
procedures, metallurgical testing, advanced statistical analyses and the use of robust geological
modelling techniques.
The QP classified the overall Mineral Resource risk as low to medium. In the opinion of the QP, no further
technical work is required as the drilling program provided sufficient data to define continuity. No drilling
in the waterlogged area is recommended.
Technical Report Summary of the material Tailings Storage Facilities
143
11.17 Summary Mineral Resource Estimates
Table 11.37 presents the summary of the Mineral Resource estimates (inclusive) for the 18 TSFs and the
one sand dump. The Mineral Resource estimates are reported as inclusive of the Mineral Reserve and
the reference point is in situ.
Table 11.37: Inclusive Mineral Resources of the 19 Material Properties as at 30 June 2022
Complex
TSF/Sand Dump
Category
Mineral Resources as at 30 June
2021 (Inclusive)
Mineral Resources as at 30 June
2022 (Inclusive)
Tons
(kt)
Au
(g/t)
Content
(oz)
Tons
(kt)
Au
(g/t)
Content
(oz)
City Deep
4L3
Measured
13,134
0.32
135,126
13,134
0.32
135,126
4L4
Measured
4,738
0.32
48,746
4,738
0.32
48,746
4L6
Measured
2,410
0.31
24,020
2,410
0.31
24,020
Knights
4L14
Measured
6,638
0.29
61,891
6,638
0.29
60,824
4L50
Measured
6,756
0.26
56,475
3,418
0.26
27,216
Ergo
7L15
Measured
17,646
0.26
147,506
17,646
0.26
147,506
Rooikraal
Measured
56,763
0.26
474,493
56,763
0.26
474,493
Marievale
7L4
Measured
17,590
0.34
192,281
17,590
0.34
192,281
7L5
Measured
6,980
0.29
65,080
6,980
0.29
65,080
7L6
Measured
12,760
0.26
106,663
12,760
0.26
106,663
7L7
Measured
16,784
0.32
172,678
16,784
0.32
172,678
Grootvlei
6L17
Measured
49,320
0.26
412,275
49,320
0.26
412,275
6L17A
Measured
16,716
0.26
140,807
16,716
0.26
139,732
5A10/5L27
5A10/5L27
Measured
11,985
0.43
164,623
9,862
0.42
128,075
Sub-total Measured Mineral Resources
240,220
0.29
2,202,664
234,759
0.28
2,134,715
Grootvlei
6L16
Indicated
41,619
0.26
347,901
41,619
0.26
347,901
Daggafontein
Daggafontein
Indicated
192,793
0.24
1,487,625
192,793
0.24
1,487,625
Crown
Mooifontein
(3L7)
Indicated
67,559
0.23
499,577
67,559
0.23
499,577
GMTS (3L8)
Indicated
107,450
0.25
863,649
107,450
0.25
863,649
Diepkloof (3L5)
Indicated
97,988
0.23
724,589
97,988
0.23
724,589
Sub-total Indicated Mineral Resources
507,409
0.24
3,923,341
507,409
0.24
3,923,341
Sub-total Measured and Indicated Mineral
Resources
747,629
0.25
6,126,005
742,168
0.25
6,058,056
Daggafontein
Daggafontein
Inferred
21,318
0.24
164,494
21,318
0.24
164,494
Sub-total Inferred Mineral Resources
21,318
0.24
164,494
21,318
0.24
164,494
Total Material Mineral Resources
768,947
0.25
6,290,499
763,486
0.25
6,222,550
Source: The RVN Group, 2022
Notes:
i. Mineral Resources are not Mineral Reserves.
ii. Mineral Resources are reported inclusive of Mineral Reserves.
iii. Mineral Resources have been reported in accordance with Subpart 1300 of Regulation S-K
iv. Mineral Resources were estimated using the USD1,823/oz, ZAR15.60/USD, ZAR914,294/kg financial parameters and recoveries
in Table 11.2
v. A troy ounce = 31.1034768g
vi. Quantities and grades were rounded to reflect the accuracy of the estimates; and if any apparent errors are insignificant
Technical Report Summary of the material Tailings Storage Facilities
144
Table 11.38 presents exclusive Mineral Resource estimates for the material properties.
Table 11.38: Exclusive Mineral Resources of the 19 Material Properties as at 30 June 2022
Complex
TSF/Sand
Dump
Category
Mineral Resources as at 30 June
2021 (Exclusive)
Mineral Resources as at 30 June
2022 (Exclusive)
Tons
(kt)
Au
(g/t)
Content
(oz)
Tons
(kt)
Au
(g/t)
Content
(oz)
City Deep
4L3
Measured
-
-
-
-
-
-
4L4
Measured
-
-
-
-
-
-
4L6
Measured
-
-
-
-
-
-
Knights
4L14
Measured
-
-
-
-
-
-
4L50
Measured
-
-
-
-
-
-
Ergo
7L15
Measured
-
-
-
-
-
-
Rooikraal
Measured
-
-
-
-
-
-
Marievale
7L4
Measured
-
-
-
-
-
-
7L5
Measured
-
-
-
-
-
-
7L6
Measured
-
-
-
-
-
-
7L7
Measured
-
-
-
-
-
-
Grootvlei
6L17
Measured
-
-
-
49,320
0.26
412,275
6L17A
Measured
-
-
-
16,716
0.26
140,807
5A10/5L27
5A10/5L27
Measured
-
-
-
-
-
-
Sub-total Measured Mineral Resources
-
-
-
66,036
0.26
553,082
Grootvlei
6L16
Indicated
41,619
0.26
347,901
41,619
0.26
347,901
Daggafontein
Daggafontein
Indicated
192,793
0.24
1,487,625
-
-
-
Crown
Mooifontein
(3L7)
Indicated
67,559
0.23
499,577
67,559
0.23
499,577
GMTS (3L8)
Indicated
107,450
0.25
863,649
107,450
0.25
863,649
Diepkloof
(3L5)
Indicated
97,988
0.23
724,589
97,988
0.23
724,589
Sub-total Indicated Mineral Resources
507,409
0.24
3,923,342
314,616
0.24
2,435,716
Sub-total Measured and Indicated Mineral
Resources
507,409
0.24
3,923,342
380,652
0.24
2,988,798
Daggafontein
Daggafontein
Inferred
21,318
0.24
164,494
21,318
0.24
164,494
Total Inferred Mineral Resources
21,318
0.24
164,494
21,318
0.24
164,494
Total Material Mineral Resource
528,727
0.24
4,087,835
401,970
0.24
3,153,292
Source: The RVN Group, 2022
Notes:
i. Mineral Resources are not Mineral Reserves.
ii. Mineral Resources are reported exclusive of Mineral Reserves.
iii. Mineral Resources have been reported in accordance with Subpart 1300 of Regulation S-K
iv. Mineral Resources were estimated using the USD1,823/oz, ZAR15.60/USD, ZAR914,294/kg financial parameters and recoveries
in Table 11.2
v. A troy ounce = 31.1034768g
vi. Quantities and grades were rounded to reflect the accuracy of the estimates; and if any apparent errors are insignificant
Technical Report Summary of the material Tailings Storage Facilities
145
The total Mineral Resource Estimates for Ergo are presented in Table 11.39 and Table 11.40. The total
Mineral Resource consisted of 19 material properties and 79 small TSFs and clean-up sites. The changes
in Mineral Resource from June 2021 to June 2022 are due to depletion of 20.48Mt at
0.33g/t Au and minor survey adjustments of 2.94Mt at 0.20g/t Au as presented on Figure 11.60.
Table 11.39: Ergo Inclusive Mineral Resources Statement as at 30 June 2022
Mineral Resources
Classification
Mineral Resources as at 30 June 2021
(Inclusive)
Mineral Resources as at 30 June 2022
(Inclusive)
Tons
(Mt)
Au
(g/t)
Content
(Moz)
Tons
(Mt)
Au
(g/t)
Content
(Moz)
Measured Mineral Resources
282.95
0.31
2.81
266.25
0.31
2.64
Indicated Mineral Resources
574.95
0.25
4.61
568.21
0.25
4.55
Sub-total Measured and
Indicated Mineral Resources
857.90
0.27
7.42
834.45
0.27
7.19
Inferred Mineral Resources
21.32
0.24
0.16
21.32
0.24
0.16
Total
Mineral Resources
879.22
0.27
7.58
855.77
0.27
7.35
Source: The RVN Group, 2022
Table 11.40: Ergo Exclusive Mineral Resources Statement as at 30 June 2022
Mineral Resources
Classification
Mineral Resources as at 30 June 2021
(Exclusive)
Mineral Resources as at 30 June 2022
(Exclusive)
Tons
(Mt)
Au
(g/t)
Content
(Moz)
Tons
(Mt)
Au
(g/t)
Content
(Moz)
Measured Mineral Resources
-
-
-
66.04
0.26
0.55
Indicated Mineral Resources
574.95
0.25
4.61
375.41
0.25
3.02
Sub-total Measured and
Indicated Mineral Resources
574.95
0.25
4.61
441.45
0.25
3.57
Inferred Mineral Resources
21.32
0.24
0.16
21.32
0.24
0.16
Total
Mineral Resources
596.27
0.25
4.77
462.77
0.25
3.77
Source: The RVN Group, 2022
Technical Report Summary of the material Tailings Storage Facilities
146
Figure 11.60: Mineral Resource Reconciliation (Inclusive)
Source: The RVN Group, 2022
11.18 QP’s Opinion
In the QP’s opinion, all relevant technical and economic factors that may likely affect the prospects of
economic extraction, were adequately considered for the Mineral Resources reported. The QP
recommended no further work.
Technical Report Summary of the material Tailings Storage Facilities
147
12 Mineral Reserve Estimates
This Item includes discussion and comments on the conversion of Mineral Resources to Mineral Reserves.
Specifically, comments are provided on the key assumptions, parameters and methods (modifying
factors) used to estimate the 30 June 2022 Mineral Reserve.
Mineral Reserves estimates are affected by multiple factors that change over time. Fluctuations in the
gold price, exchange rates, legislation in the operating country, other reporting jurisdictions and a wide
range of operating conditions may affect the Mineral Reserve estimates. Estimates of the Mineral
Reserves should be considered best estimates at the time of reporting.
The level of the study conducted to support the declaration of the 30 June 2022 Mineral Reserve is based
on a mine plan and design conducted to a PFS level of accuracy (i.e., +/-25%) with a maximum level
of contingency of 15%. Ergo utilizes Measured and Indicated Mineral Resources incorporated into the
LoM plan. No Inferred Mineral Resources have been used in the LoM plan.
12.1 Grade Control and Reconciliation
The Ergo LoM plan and schedule for the individual TSFs is based on 3-D geological models, which
provides grade, density, and volume for each individual block. The planning department takes this
information and establishes a grade for the proposed mining cut, typically in the order of 15m. The mine
plan accounts for each block, resulting in a tonnage and grade estimate for the entire mining block or
mining cut. The mining cut is then sequenced and scheduled.
Ergo conducts grade and tonnage reconciliations on a quarterly basis with no material difference
between the planned and actual grade and tonnages observed.
Table 12.1: Reconciliation of RoM Head Grade (Au)
Year
Plan RoM Head
Grade
(g/t)
Actual RoM Head
Grade
(g/t)
Head Grade
Difference
(g/t)
Percentage
Difference
(%)
2019/2020
0.358
0.354
-0.003
-1.13%
2020/2021
0.354
0.363
0.009
2.54%
2021/2022
0.347
0.366
0.018
5.19%
Source: The RVN Group, 2022
Table 12.2: Reconciliation of RoM Tonnage
Year
Measured Survey
Tonnage
(kt)
Processing Plant
Tonnage
(kt)
Tonnage
Difference
(kt)
Percentage
Difference
(%)
2019/2020
20 265
20 086
-179
-0.9%
2020/2021
22 884
22 949
66
0.7%
2021/2022
22 810
21 553
-1 527
-6.7%
Source: The RVN Group, 2022
Technical Report Summary of the material Tailings Storage Facilities
148
The above results (Table 12.1 and Table 12.2) indicate no material difference between the planned and
actual grade and planned and actual tonnages for years 2019/20 and 2020/21. However, the 2021/22
reconciliation between planned and actual grade indicates a 5.2% increase in the gold grade (0.35g/t
versus 0.37g/t). Further, the reconciliation showed a 6.7% decrease in the planned tonnage during the
same period. The higher grade is associated with mining some mineralized material not in the mine plan
nor in the Mineral Reserve, which was mined at a higher grade than anticipated. The decrease in the
tonnage was due to power issues at Knights section. Knights was negatively affected by load shedding
(scheduled and unscheduled power cuts). Ergo is addressing this issue by introducing back-up power
generators and installing a power cable from City Deeps to supply Knights with power from Eskom rather
than City Power. The supply of Eskom power will result in advised power reduction rather than power
cuts without any warning, which was the case with City Power.
12.2 Cut-off Grade Estimation
The cut-off grade, for the purposes of the Mineral Reserve definition, is defined as the grade at which
the value of the contained metal in a unit quantity is equivalent to the cost of its production, i.e., the
breakeven grade.
Cut-off Grade
=
Total On-Mine Production Costs
(Metal Market Price
–
The gold price and other operational inputs are discussed in various Items of this Report; plant recoveries
are reviewed in Item 14, Item 16 reports on marketing and pricing, and operating costs are commented
on in Item 18. The cut-off grade and Mineral Reserve grades for the source areas are provided in Table
12.3. Note that due to the nature of mining TSFs, the cut-off grade is not based on a block value or
individual sections of the TSF but based on the total TSF (i.e., if the entire TSF grade is above the cut-off
grade, the TSF will be mined.
Table 12.3: Cut-off Grade and Mineral Reserve Grades
Source Area
Plant Recovery
(%)
Cut-off Au Grade
(g/t)
Mineral Reserve Au Grade
(g/t)
Ergo
40,87
0.24
0.28
Source: The RVN Group, 2022
Notes:
1. The cut-off grade provided above is based on the June 2022 LoM plan and used to validate the 30 June 2022 Mineral Resource and
Mineral Reserve estimation.
2. Gold price ZAR914,294/kg (Item 16).
3. On-mine cost ZAR90.86/t (Item 18).
4. Off-mine cost ZAR0.00/t.
The various modifying factors i.e., mining, metallurgical, processing, infrastructure, economic, marketing,
legal, environmental, and governmental factors are discussed in Item 13 to Item 19
Technical Report Summary of the material Tailings Storage Facilities
149
12.3 Estimation and Modelling Techniques
Ergo reports its Mineral Resources and Mineral Reserves in accordance with the Regulation S-K 1300. In
no case has Measured Mineral Resources been downgraded to a Probable Mineral Reserve category.
Other than geological modelling, no other modelling or estimation techniques are used in the selection
of Mineral Reserves. Selection for inclusion in the Mineral Reserves is based on the average grade of the
TSF being above the required cut-off grade.
The following comments are relevant in the conversion of Mineral Resources to Mineral Reserves:
●
there is no mining dilution, as each of the TSFs is to be mined and processed in their entirety;
●
no allowance has been made for mining losses; and
●
a LoM plan has been generated , reviewed and tested for economic viability in a discounted
cash flow (DCF) model. Cognizance has been taken of the geotechnical considerations
regarding the safety of the operation and long-term stability of the TSF walls, and the working
considerations are based on operational practices as provided by Fraser Alexander (Proprietary)
Limited, a tailings design, management and mining company.
12.4 Mineral Reserve Classification Criteria
The Mineral Reserve classification of Proven and Probable is a function of the Mineral Resource
classification with due considerations of the minimum criteria for the
“
modifying factors
”
considered in the S-K1300. In no case has Measured Mineral Resources been downgraded to a Probable
Mineral Reserve Category.
Due to the length of approval times for the renewal of permits, some of the Mineral Reserves may be
based on permits (approvals) still in the process of being renewed. At this time, there is no indication
that these renewals will not be granted and therefore have been used in the LoM plan and Mineral
Reserve statement.
12.5 Mineral Reserves Statement
Mineral Reserves are based on the 30 June 2022, LoM plan and schedule. The Ergo Mineral Reserve
statement as at 30 June 2022 is provided in Table 12.4 along with the previous Mineral Reserves as at 30
June 2021.
The QP confirms that the Mineral Reserve statement presented in Table 12.4 is disclosed in accordance
to the S-K1300 guidelines.
Technical Report Summary of the material Tailings Storage Facilities
150
Table 12.4: Ergo TSF Mineral Reserves Statement as at 30 June 2022
Mineral Reserve
Classification
Mineral Reserves as at 30 June 2021
Mineral Reserves as at 30 June 2022
Tons
(Mt)
Au
(g/t)
Contents
(Moz)
Tons
(Mt)
Au
(g/t)
Contents
(Moz)
Proven
29.36
0.295
0.28
200.21
0.33
2.09
Probable
253.59
0.311
2.53
192.79
0.24
1.49
Total Mineral Reserves
282.95
0.309
2.81
393.00
0.28
3.58
Source: The RVN Group, 2022
Notes:
1. Tons and grades were rounded, and this may result in minor adding discrepancies.
2. The Mineral Reserve has been reported in accordance with the classification criteria defined in the Regulation S-K 1300.
3. The Mineral Reserve is estimated using the USD1,823/oz, ZAR15.60/USD and ZAR914,294ZAR/kg financial parameters.
4. No mining losses or dilution has been applied in the conversion process nor has a mine call factor been applied.
5. Tonnage and grade RoM delivered to the processing plant.
6. The attributable Mineral Reserve is 100% of the total Mineral Reserve.
The QP responsible for the reporting and sign-off of the Mineral Reserve is Professor Steven Rupprecht.
Professor Rupprecht is a Fellow of the Southern African Institute of Mining and Metallurgy (SAIMM) with
more than five years of experience relevant to the evaluation and reporting of TSF Mineral Reserves.
Table 12.5 depicts the Mineral Reserve reconciliation between 30 June 2021, and 30 June 2022. Some
20.48Mt was depleted through mining operations; 66.04Mt was removed from the Mineral Reserve by
the removal of the Grootvlei TSFs from the LoM plan; 2.94Mt was subtracted due to survey adjustments,
and a further 192.79Mt added to the LoM plan with the inclusion of the Daggafontein TSF and 6.72Mt
for additional TSFs upgraded from Indicated Mineral Resources to the Probable Mineral Reserve
category. Based on the above, a total tonnage of 110.06Mt has been added, resulting in a 30 June
2022 Mineral Reserve of 393.00Mt at a grade of 0.28g/t.
Table 12.5: Mineral Reserve Reconciliation
Source
Tons
(Mt)
Au Grade
(g/t)
Content
(Moz)
Mineral Reserve as at 30 June 2021
282.95
0.31
2.81
Depletion through Mining Operations
(20.48)
0.33
(0.22)
Survey Adjustment
(2.94)
0,20
(0.01)
Inclusion of Daggafontein TSF in the LoM Plan
192.79
0.24
1.49
Exclusion of a Grootvlei TSF
(66.04)
0.26
(0.55)
Inclusion of 4 TSFs in the LoM Plan
6.72
0.26
0.06
Mineral Reserve as at 30 June 2022
393.00
0.28
3.58
Source: The RVN Group, 2022
Note: Quantities and grades have been rounded to two decimal places, therefore minor computational errors may occur.
The various modifying factors, i.e., mining, metallurgical, processing, infrastructure, economic,
marketing, legal, environmental, and governmental factors, will be discussed in the following Items of
this Report.
Technical Report Summary of the material Tailings Storage Facilities
151
12.6
QP Statement on the Mineral Reserve Estimation
The Mineral Reserves declared are estimated from the 30 June 2022 LoM plan which was developed for
the Ergo operations and is based on the Mineral Resource Estimates as at 30 June 2021, depleted to 30
June 2022 together with a set of modifying factors based on recent operational results, and economic
inputs provided by Ergo. The assumptions applied in determining the modifying factors and economic
inputs are reasonable and appropriate. The LoM plan is in sufficient detail to ensure achievability and is
based on historical achievements. All the inputs used in the estimation of the Mineral Reserves have
been thoroughly reviewed and can be considered technically robust.
Apart from the Marievale Complex (a low to medium risk due to ownership issues), the QP applies a low
risk to the Mineral Reserves but acknowledges there are several external factors that can impact on
Mineral Reserves, such as infrastructural, marketing, financial, environmental, social and governmental
aspects.
Technical Report Summary of the material Tailings Storage Facilities
152
13 Mining Methods
Ergo’s business is the retreatment of old gold bearing sand dumps and slimes dams (termed TSFs) to
recover gold. Consequently, Ergo has acquired an extensive inventory of gold bearing sand and slimes
TSFs spread across the Central and East Rand goldfields produced from the historical processing of gold
ores of the Witwatersrand Supergroup, by the gold mines that operated across the gold fields. These
mines are now mostly defunct and stretch from the Crown, City Deep and Knights processing plants in
the Central Rand to the south of Johannesburg to the Grootvlei Mine in the East Rand over some 70km.
The result of Ergo’s retreatment is the creation of a ‘new’ TSF, which tailings are deposited on a mega
TSF (Brakpan/Withok TSF) designed to modern standards. In this way, Ergo plays a dual role in creating
value and cleaning up the environment.
Ergo consists of the processing plant and pipeline infrastructure, the mining rights, licenses and permits
to access a large number of surface Mineral Resources (old tailings, slimes and sand dumps) and the
active Brakpan/Withok TSF.
Table 13.1 indicates Ergo’s historical operation results. The results show that since 2017 Ergo has declined
from nearly 25Mtpa to 21.5Mtpa. During the 2020 and 2021 financial years (FYs), production was
adversely affected by the Covid-19 pandemic and in 2022 was influenced by power restrictions (load
shedding). The 2022 tonnage profile was also lower due to a deliberate decision by management to
mine higher grade material as part of a clean-up operation which in turn sacrificed low grade volume.
Although operational tonnage was lower than planned, operational performances were boosted by a
higher gold price received for FY2022 (ZAR894,409/kg), FY2021 (ZAR917,996/kg) and FY2020
(ZAR768,675/kg) reporting robust net cashflows. Ergo has adjusted the planned RoM tonnage in the 2022
LoM plan targeting about 22Mtpa in the short to medium term and 21.6Mtpa in the longer term.
Table 13.1: Historical Ergo Operational Results
Year
FY2022
FY2021
FY2020
FY2019
FY2018
FY2017
Tonnage (t) ('000)
21,111
22,952
20,228
23,162
24,281
24,958
Gold Produced (kg)
4,156
4,263
3,989
4,493
4,679
4,265
Yield (g/t)
0,188
0,186
0,197
0,194
0,193
0,171
Source: DRDGOLD, 2022
13.1 Mining Method
The current mining methods applied by Ergo are suitable for all TSFs (dumps) (Figure 13.1). No selective
mining will occur with the entire TSF being processed. No selective mining is the result of four conditions
inherent in the DRDGOLD operation of reclaiming the dumps:
●
there is nowhere on the mining sites to dump the below cut-off grade material;
●
the mining method is not conducive to selective mining; and
●
the operation is a rehabilitation exercise, and all mineralized material must be removed from the
site, and it is, therefore, economically beneficial to process all material, even low-grade material.
●
Concurrent rehabilitation takes place which reduces the environmental impact as well as the
rehabilitation liabilities
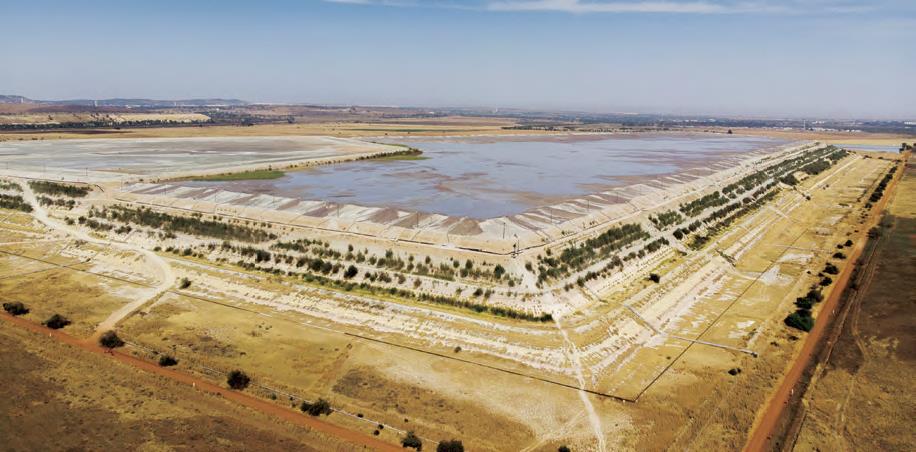
Technical Report Summary of the material Tailings Storage Facilities
153
Figure 13.1: Typical Tailing Storage Facility
Source: DRDGOLD, 2022
13.1.1 Hydraulic Mining
The use of water plus energy to mine unconsolidated material has a long history. Documented and
physical evidence indicates widespread and sophisticated use in the Californian goldfields in the mid-
19th century. Thousands of kilometers of ditches and flumes were constructed to gravitate water from
the mountains to generate sufficient pressure to “flush” the alluvial gravel beds into sluices. In recent
years, however, the most popular techniques have been based on hydraulic mining used to mine
unconsolidated materials, alluvial deposits, freshly blasted ores and for the recovery (or mining) of
dewatered TSFs.
Hydraulic mining is loosely defined as excavating material from its in situ state using water. A stream of
water is directed at the mining face to mechanically breaking and/or softening the material so that the
water flow can carry it away. The application or effectiveness of the method is a function of various
factors ranging from the size, velocity and pressure of the water stream to the location, hardness,
particle size and moisture content of the material to be mined.
Hydraulic mining is typically undertaken using 100mm or 150mm monitor guns (Figure 13.2), with
increased production achieved by including additional units. Hydraulic mining provides a high degree
of flexibility that allows simultaneous mining at several points over a wide range of production rates.
Consequently, grade blending is readily achievable.
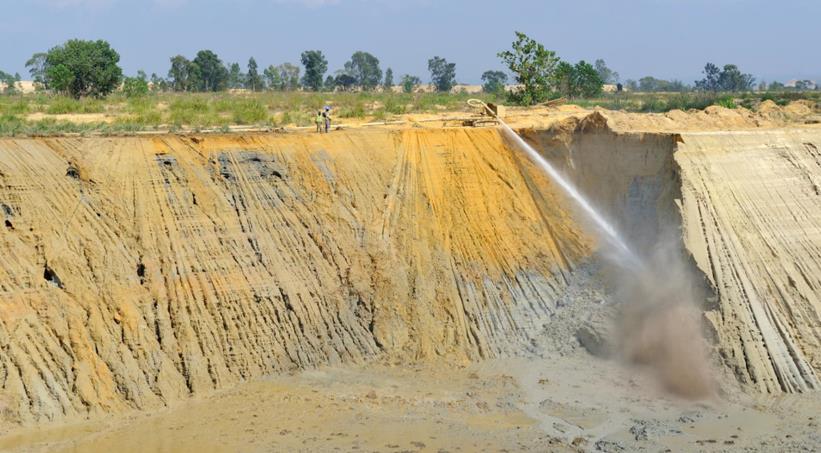
Technical Report Summary of the material Tailings Storage Facilities
154
Figure 13.2: Example of Hydraulic Mining
Source: DRDGOLD, 2022
Hydraulic mining in semi or near-saturated conditions is possible and common and has a clear
advantage over load-and-haul operations. Hydraulic mining does not create, but rather ameliorate the
airborne dust problem often associated with fine TSFs and dry mining techniques. A typical generic
hydraulic mining system is shown in Figure 13.3.
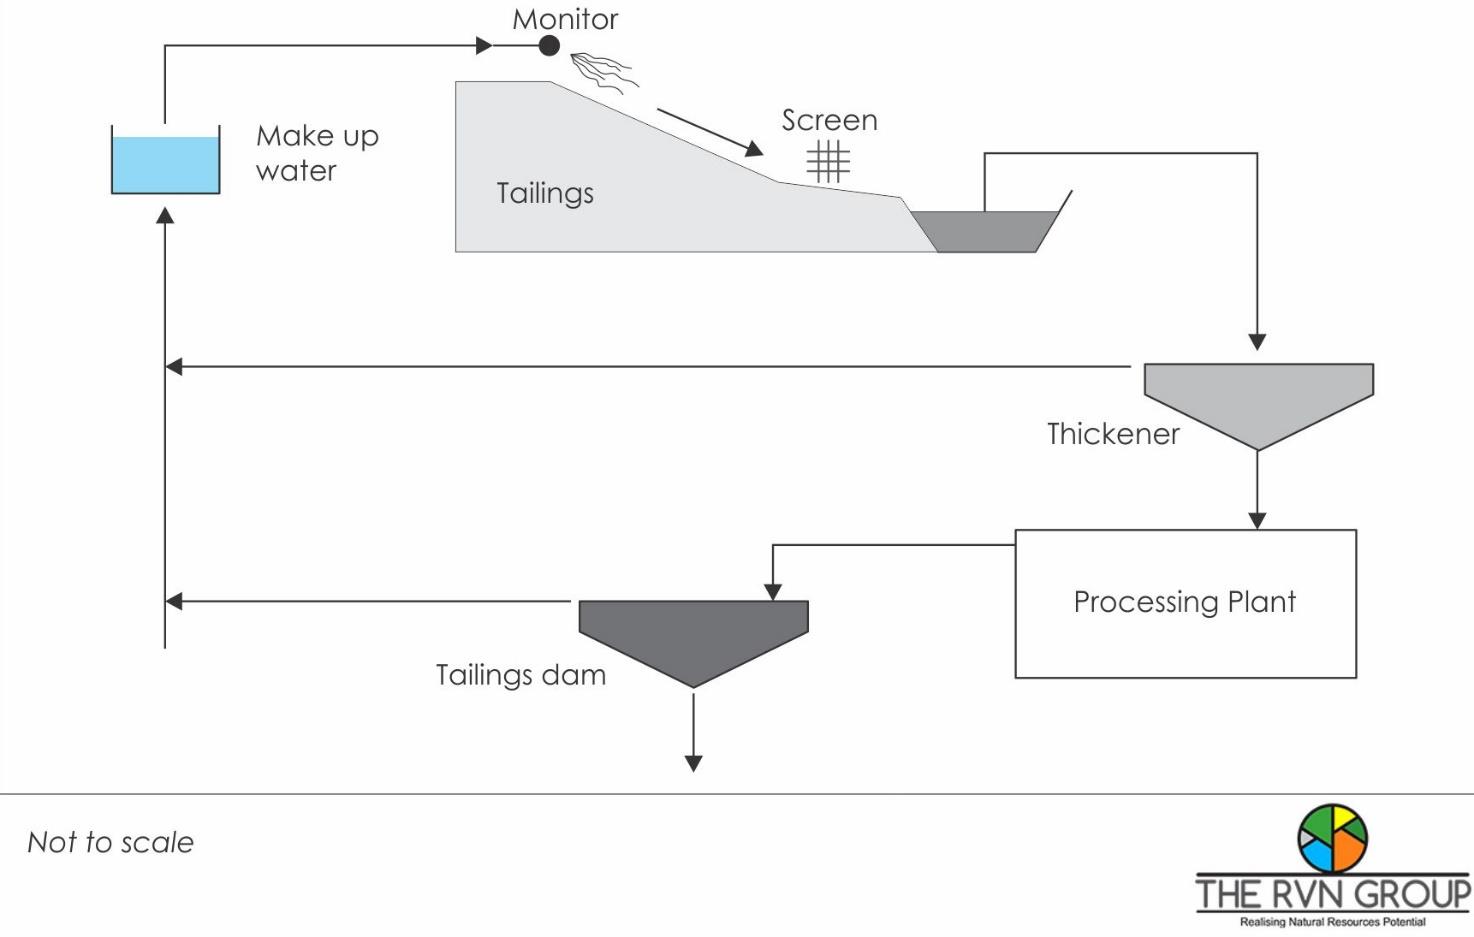
Technical Report Summary of the material Tailings Storage Facilities
155
Figure 13.3: Hydraulic Mining Process Diagram
Source: J Engels, No Date
Note: the pumps have been excluded for clarity
The planning of hydraulic mining considers several factors:
●
the required production rate;
●
the life of the operation;
●
the type of material to be mined (including hardness, density, grading, specific gravity, degree
of contamination (vegetation));
●
the site topography, shape and form of the TSF;
●
the slurry quality requirements;
●
the pumping distances; and
●
water, power, equipment and labor availability.
Considering the abovementioned aspects allows the size and number of monitor guns to be
determined. Essentially, most applications require 1m
3
solids. A monitor gun can be fitted with different diameter nozzles (100mm or 150mm) that allow
production rates to be “fine-tuned”.
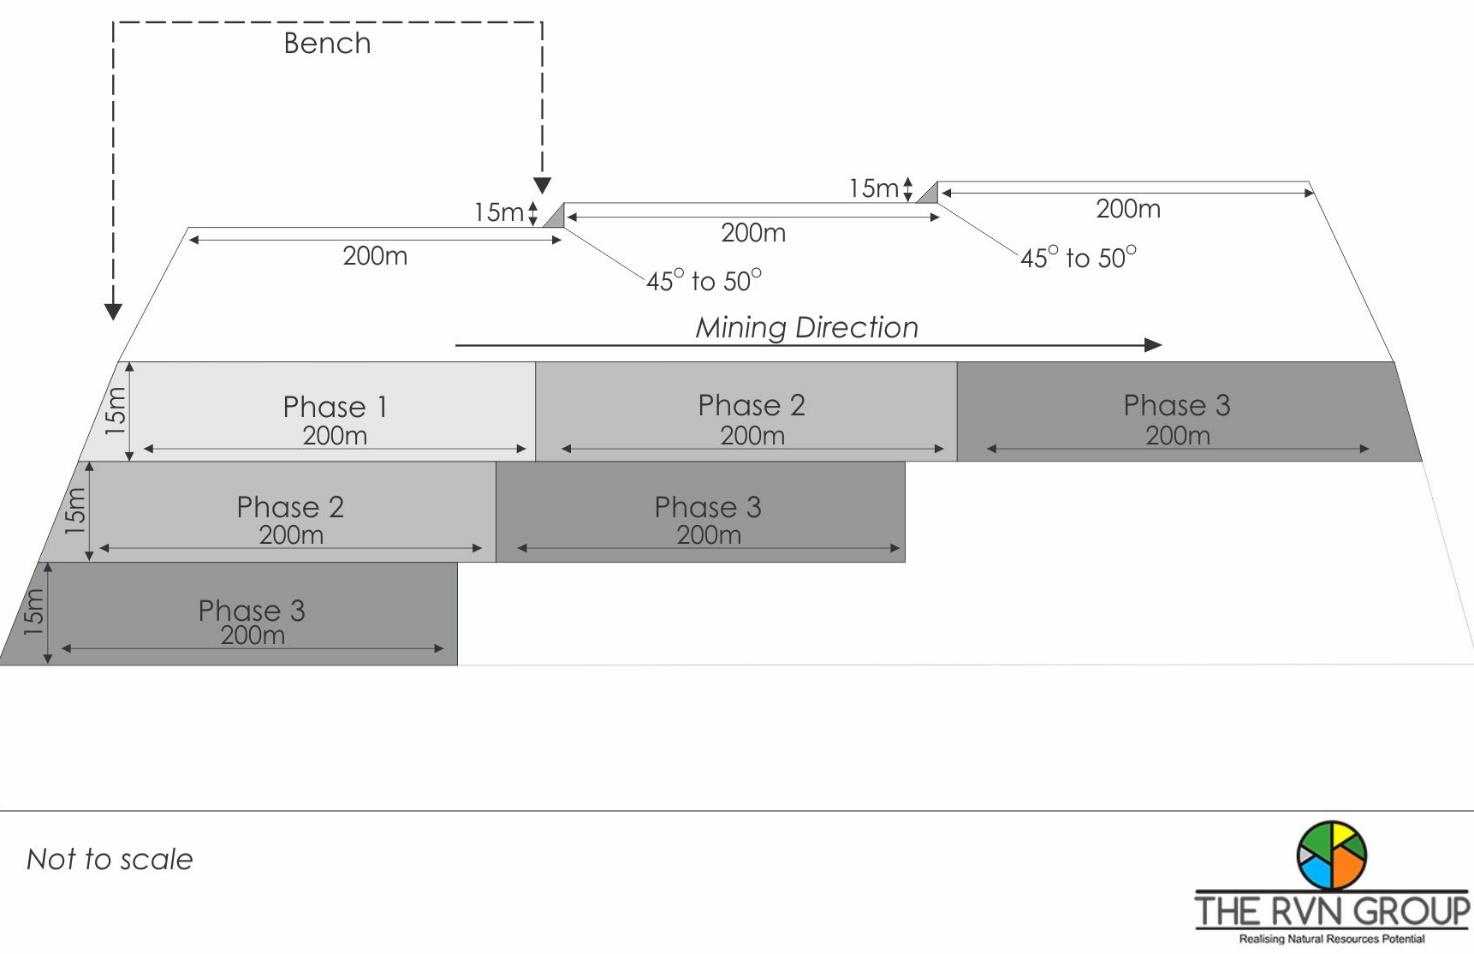
Technical Report Summary of the material Tailings Storage Facilities
156
Before the slurry enters the pumping facilities, it is usually necessary to pass the slurry through a screen
or series of screens depending upon the degree of contamination and oversize. Satellite pumps
transport slime into a thickener or header tank ahead of the processing plant that accommodates
surges in flow, grading or density.
Hydraulic mining provides slurry feedstock to the mineral processing plant continuously. To maintain
production, high pressure water must be ensured. Slurry densities and production rates will not be
achieved if the water pressure is not maintained. Critical to hydraulic mining is consistent high slurry
densities. If densities drop, less tonnage is delivered to the processing plant, thus increasing the mining
cost. Figure 13.4 demonstrates a cross-sectional view of mining a TSF.
Figure 13.4: Typical Mining Method for a TSF
Source: DRDGOLD, 2018
13.1.2 Conventional Load, Haul and Slurry
A second mining method employed by Ergo is the use of front-end loaders (FEL) to load slimes and sand
(Figure 13.5). In these cases, the FELs load from the bottom of the dump and transport the mineralized
material to a feed hopper which feeds a conveyor. The conveyor transports (Figure 13.6 to Figure 13.8)
the mineralized material to the satellite pump station where it is mixed with water to form a slurry then
pumped to the processing plant. In other cases, the FELs load directly onto trucks for transport to the
processing plant.
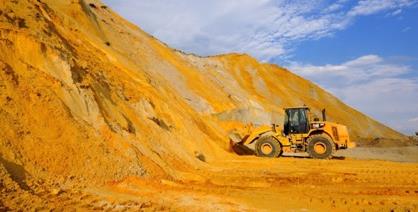
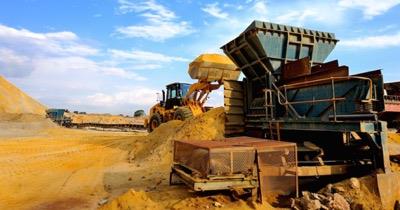
Technical Report Summary of the material Tailings Storage Facilities
157
Figure 13.5: Example of Loading with a FEL
Source: DRDGOLD, 2022
Figure 13.6: Example of Loading with a FEL into a Hopper
Source: DRDGOLD, 2022
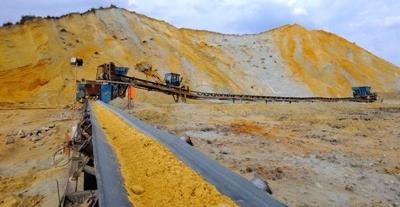
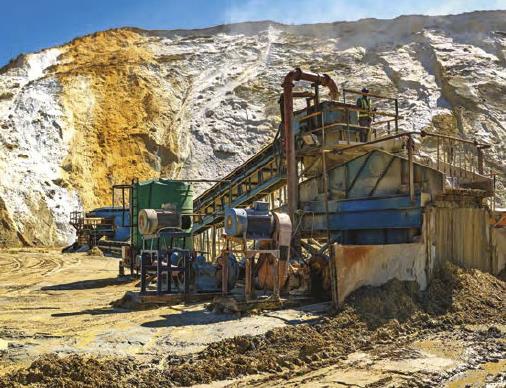
Technical Report Summary of the material Tailings Storage Facilities
158
Figure 13.7: Example of Material on Conveyor
Source: DRDGOLD, 2022
Figure 13.8: Slurry Point for Loading
Source: DRDGOLD, 2022
Technical Report Summary of the material Tailings Storage Facilities
159
13.2 Mining Sections
Ergo re-treats slimes and sand dumps from three sections, as depicted in Figure 13.9, the West Section,
Central Section, and the East Section. Figure 13.10 provides an overview of the Ergo operations and
pipelines from the West Rand to East Rand.
In terms of the LoM plan and the Mineral Reserve statement, the following TSFs are considered material
for Ergo:
●
4L3 (13.1Mt);
●
Rooikraal TSF (56.8Mt);
●
7L15 TSF (17.1Mt);
●
Marievale Complex (54.1Mt); and
●
Daggafontein TSF (192.8Mt).
The following TSFs, excluding the material TSFs listed above, are reported on an aggregate basis, as they
are included in the LoM plan and cumulatively make the Ergo operation economically viable.
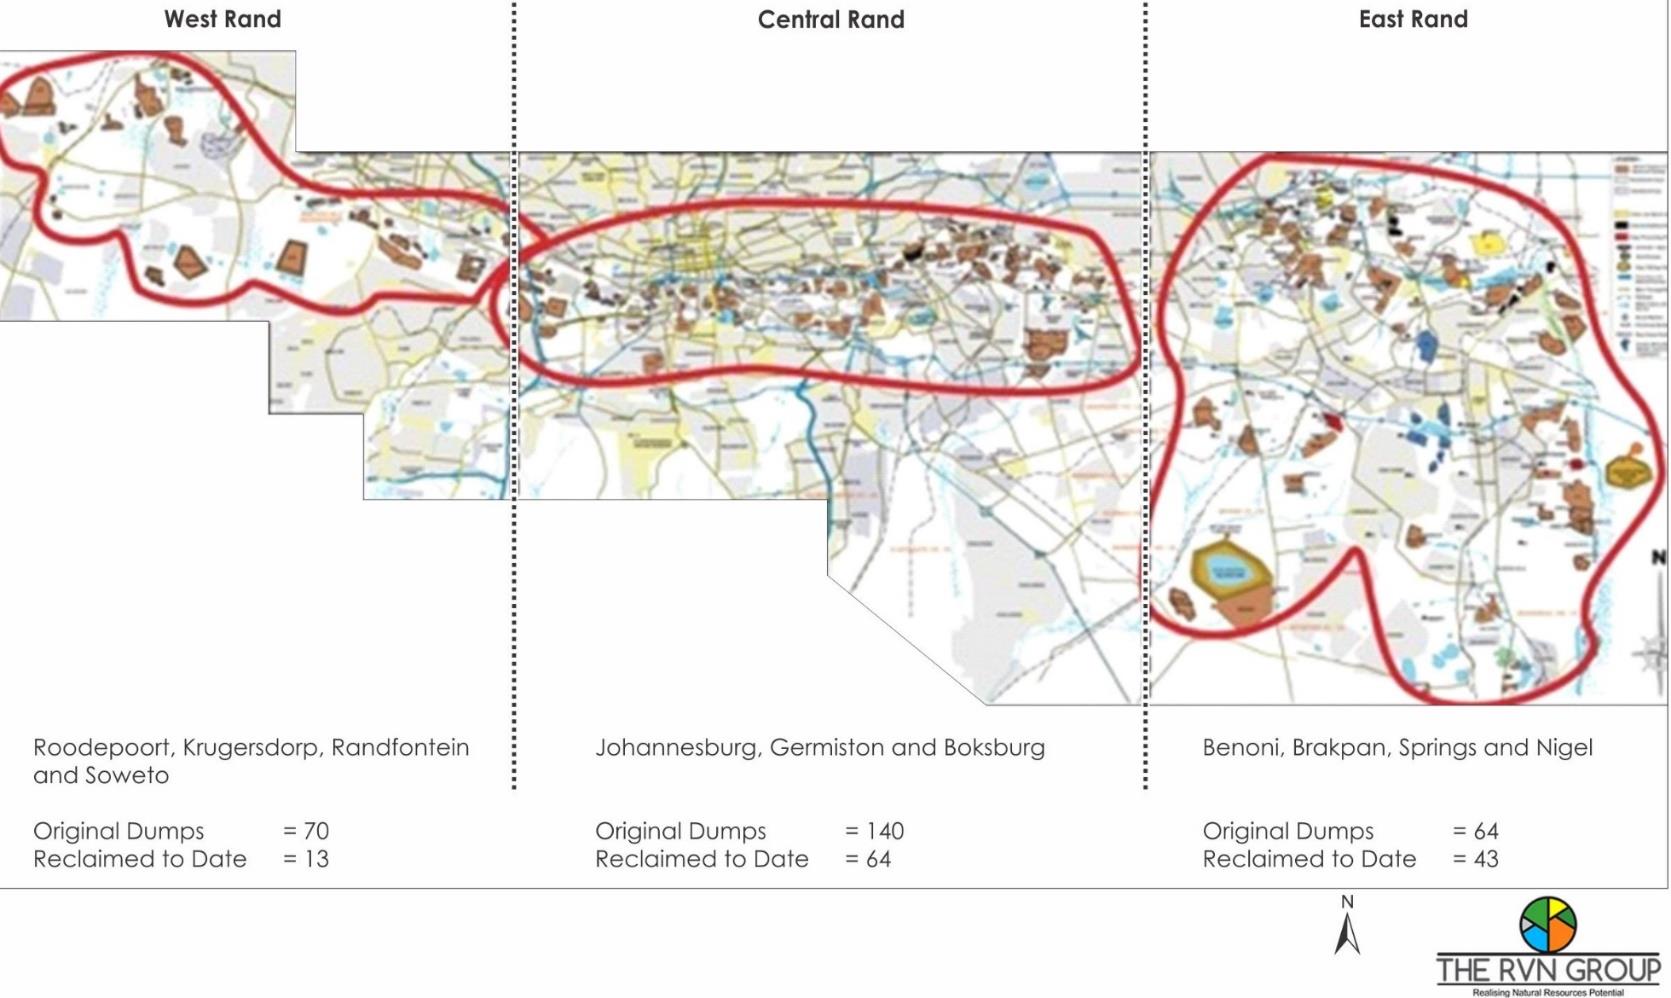
Technical Report Summary of the material Tailings Storage Facilities
160
Figure 13.9: Ergo Sections
Source: DRDGOLD, 2022
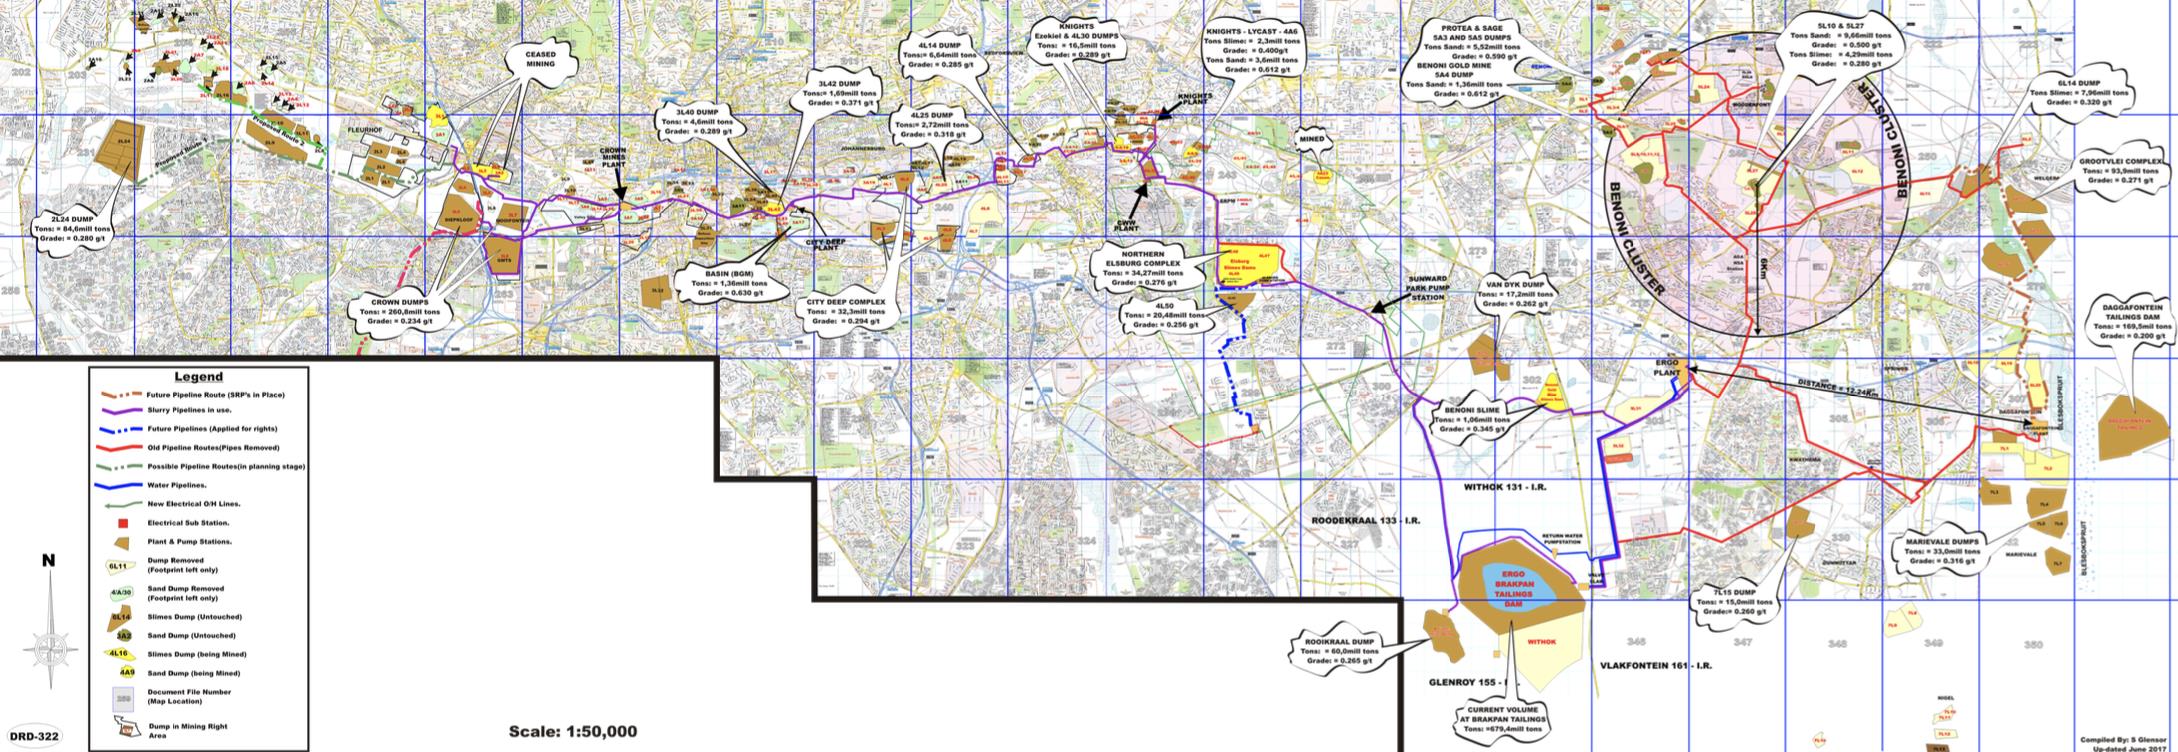
Technical Report Summary of the material Tailings Storage Facilities
161
Figure 13.10: Ergo Operations Overview
Source: DRDGOLD, 2022
Note: overview purposes only
Technical Report Summary of the material Tailings Storage Facilities
162
13.2.1 West Rand
No Mineral Reserve was declared.
13.2.2 Central Rand Section – City Section
Mining areas located from Soweto to City Deep are planned to be loaded and hauled to the City
Deep Basin or alternatively 4L25. Slurry is pumped from the City Deep Basin via a 600ktpm (500mm
NB pipe) pipeline to the Ergo processing plant. Operations from the City Section are planned to
be completed in September 2027 and the Knights Section will be completed in June 2024.
Table 13.2 and Table 13.4 depict the working places in the Central Rand that are included in the
LoM plan and include sites that are being mined on a contract basis and not included in the
Mineral Reserve.
Table 13.2: Central Rand (City Section)
Workplace
Tonnage
(kt)
Grade
AU
(g/t)
Recovery
(%)
Steady State
Mining Rate
(ktpm)
Commentary
3L1 Sand and 3A1
201
0.63
64.1
20
Mined in 2026
3L40
204
0.30
46.0
50
Mined in 2022 to 2023
4L42
300
0.30
46.0
75
Mined in 2022
3L43
150
0,45
52.7
50
Mined in 2022
4L2
252
0.30
46.0
100
Mined in 2022 to 2023
4L25 LG
1 518
0.31
46.1
150
Mined in 2022 to 2023
4L3
13,134
0.32
45.9
320
Mined in 2022 to 2026
4L4
4,738
0.31
47.8
140
Mined in 2023 to 2027
4L6
2,410
0.60
44.2
140
Mined in 2023 to 2024
3L30 Rob Deep Slime
216
0.60
73.3
40
Mined in 2022
3L30 Rob Deep Sand
15
1.00
62,5
20
Mined in 2022 to 2023
(Rehabilitation)
Valley Silts
3,760
0.60
64.9
80
Mined in 2022 to 2026
Genesis (3A11)
164
0.42
62.5
50
Contract-Mined in 2022
Cons Dump Cluster
794
0.63
51.4
65
Contract-Mined in 2026
Total
27,856
Source: The RVN Group, 2022
Technical Report Summary of the material Tailings Storage Facilities
163
Table 13.3: Central Rand (Knights Section)
Workplace
Tonnage
(kt)
Grade
Au
(g/t)
Recovery
(%)
Steady State
Mining Rate
(ktpm)
Commentary
4A18 - E and S Sand
130
0.60
62.2
10
Mined in 2022
4A18 - 4A30 Sand
204
0.50
55.2
17
Mined in 2022
4A18 -4A19 Sand
216
0.60
62.2
18
Mined in 2022
4A18 - 4L13 Sand
46
0.60
62.3
10
Mined in 2022
4A18 - BGM Dumps
Sand
2,256
0.60
62.8
34
Contract - Mined in 2022
4A18 - Benoni Cluster
Sand
1,200
0.56
59.6
60
Mined in 2023 to 2024
Consolidated Dumps
via 5/L/27
645
0.38
41.0
80
Mined in 2024
4L18 -Ezekiel
130
0.40
43.5
20
Mined in 2022
4L18 - 4L19 Slime
292
0.65
65.2
40
Mined in 2022
4L18 - 4L8 Slime
120
0.48
52.9
15
Mined in 2022
4L18 - Primrose Slime
398
0.60
62.3
40
Mined in 2023 to 2024
Cedar and 50/50
350
0.36
37.7
40
Mined in 2023 to 2024
Cason Slime and
Lycast Clean-up
50
0.63
64.2
15
Mined in 2022
Cedar and 50/50
881
0.47
52.3
100
Mined in 2022
Total
6,919
Source: The RVN Group, 2022
13.2.3 East Rand Section
Table 13.4 indicates the TSF planned working sites located in the East Rand - Ergo Section,
including sites that are being mined on a contract basis, and not included in the Mineral Reserve.
Technical Report Summary of the material Tailings Storage Facilities
164
Table 13.4: East Rand Section (Ergo Section)
Workplace
Tonnage
(kt)
Grade
(g/t)
Recovery
(%)
Steady State
Mining Rate
(ktpm)
Commentary
4L14
6,638
0.28
48.1
270
Mined 2023 to 2025
4L30
3,512
0.33
48.0
270
Mined 2022 to 2024
4L39
9,008
0.42
54.3
360
Contract - Mined 2023 to
2025
4L40
2,281
0.27
44.4
300
Contract -Mined 2025 to
2026
Cons Dump Benoni
1,912
0.48
63.5
50
Contract - Mined 2024 to
2027
4L50 Elsburg
3,418
0.26
39.5
280
Plan Finish in 2023
4L49 Elsburg
290
0.26
41.3
290
Mined 2023
4L47 Elsburg
3,219
0,26
41.3
270
Site clean up
Benoni Slime
500
0.34
43.8
130
Mined 2023
5A10
975
0,61
65.0
70
Completed in 2022
5L27
3,829
0.40
64.9
140
Mining 2022 to 2026
5L27 Sand
4,288
0.28
60.0
140
Mining 2026 to 2028
5L27 Scoops Slime
1,155
0.60
67.9
100
Contract - Mined 2022 to
2023
5L27 Pipeline
1,002
0.60
62.8
90
Mined to 2024 to 2025
5L29 van Dyk
2,355
0.26
42.3
220
Mined to 2023
6L13
2,874
0.60
58.3
240
Mined 2028 to 2029
6L14
6,980
0.32
50.0
291
Mined 2027 to 2029
7L15
17,646
0.26
42.9
600
Mined 2027 to 2033
Rooikraal
56,763
0.26
34.2
380
Mined 2023 to 2034
Marievale 7L4
17,590
0.34
46.0
750
Mined 2025 to 2027
Marievale 7L5
6,980
0.29
47.4
750
Mined 2027 to 2029
Marievale 7L6
12,760
0.26
41.3
350
Mined 2029 to 2031
Marievale 7L7
16,784
0.32
40.9
550
Mined 2028 to 2031
Daggafontein
192,800
0.24
35.0
1,800
Mined 2031 to 2041
Total
375,559
Source: The RVN Group, 2022
13.3 Mine Design and Schedule
The technical work/studies conducted by Ergo to support the conversion of Mineral Resources
to Mineral Reserves and to generate the on-going LoM plan are at least to a PFS level of
accuracy (i.e., +/-25%). The LoM schedule mines approximately 21Mtpa from several TSF sites.
Table 13.5 provides the modifying factors used to convert the Mineral Resources to a Mineral
Reserve used in the 19-year LoM plan. Due to the nature of mining tailings and slimes TSFs, no
mining loss or dilution is applied in the conversion process. Recovery factors are based on
actual plant performances, which are reconciled annually.
Technical Report Summary of the material Tailings Storage Facilities
165
Table 13.5: Summary of Modifying Factors for LoM Plan
Source Area/Plant
MCF
(%)
LoM Recovery
(%)
Mining Loss
(%)
Dilution
(%)
Total Ergo Operation
100
40.9
0
0
Source: The RVN Group, 2022
Note: Tailing recoveries vary on a TSF-by-TSF basis
Table 13.6 provides the 30 June 2022 19-year LoM tonnage and recovered gold schedule used
to support the declaration of the Mineral Reserve. The LoM plan has a cut-off grade of 0.24g/t
Au, which is below the planned LoM head grade of 0.28g/t Au. The working cost of ZAR90.86/t
is based on the LoM plan. The current LoM plan is very robust. However, it remains sensitive to
RoM grade, gold price, exchange rate, recovery and operating costs.
Technical Report Summary of the material Tailings Storage Facilities
166
Table 13.6: Ergo Forecast Production from July 2021 to June 2034
Years
1
2
3
4
5
6
7
2022 to 2023
2023 to 2024
2024 to 2025
2025 to 2026
2026 to 2027
2027 to 2028
2028 to 2029
Tons
(kt)
Recovered
Au
(kg)
Tons
(kt)
Recovered
Au
(kg)
Tons
(kt)
Recovered
Au
(kg)
Tons
(kt)
Recovered
Au
(kg)
Tons
(kt)
Recovered
Au
(kg)
Tons
(kt)
Recovered
Au
(kg)
Tons
(kt)
Recovered
Au
(kg)
Sand
3,409
1,380
4,684
1,767
2,560
1,116
2,450
885
2,615
839
1,549
605
720
466
Slime
19,501
2,760
18,290
2,873
19,020
2,873
18,038
2,437
19,340
2,628
19,479
2,486
20,200
2,479
Total
22,910
4,141
22,974
4,561
21,580
3,988
20,488
3,322
21,955
3,467
21,028
3,091
20,920
2,945
Years
8
9
10
11
12
13
14
2029 to 2030
2030 to 2031
2031 to 2032
2032 to 2033
2033 to 2034
2034 to 2035
2035 to 2036
Tons
(kt)
Recovered
Au
(kg)
Tons
(kt)
Recovered
Au
(kg)
Tons
(kt)
Recovered
Au
(kg)
Tons
(kt)
Recovered
Au
(kg)
Tons
(kt)
Recovered
Au
(kg)
Tons
(kt)
Recovered
Au
(kg)
Tons
(kt)
Recovered
Au
(kg)
Sand
720
466
720
466
720
466
515
333
0
-
0
-
0
-
Slime
21,145
2,727
21,599
2,555
21,585
1,979
21,600
1,852
21,703
1,854
21,600
1,814
21,600
1,814
Total
21,865
3,193
22,319
3,021
22,305
2,445
22,115
2,185
21,703
1,854
21,600
1,814
21,600
1,814
Years
15
16
17
18
19
Total
2036 to 2037
2037 to 2038
2038 to 2039
2039 to 2040
2040 to 2041
Tons
(kt)
Recovered
Au
(kg)
Tons
(kt)
Recovered
Au
(kg)
Tons
(kt)
Recovered
Au
(kg)
Tons
(kt)
Recovered
Au
(kg)
Tons
(kt)
Recovered
Au
(kg)
Tons
(kt)
Recovered
Au
(kg)
Sand
0
-
0
-
0
-
0
-
0
-
20,662
8,788
Slime
21,600
1,814
21,600
1,814
21,600
1,814
21,600
1,814
18,572
1,560
389,672
41,870
Total
21,600
1,814
21,600
1,814
21,600
1,814
21,600
1,814
18,572
1,560
410,334
50,658
Source: The RVN Group, 2022
Technical Report Summary of the material Tailings Storage Facilities
167
13.4 Geotechnical and Geohydrology
The Witwatersrand TSFs have been successfully and economically exploited for some time, and the
geotechnical and geohydrology characteristics are well understood from practical experience. A safe
bench height is dependent upon the material being mined and is also influenced by the phreatic
surface within the dump. No geotechnical or hydrological risks surrounding Ergo’s operations have been
identified that would impact the declaration of a Mineral Reserve. As no open pit mining is taking place,
the mine design does not account for slope angles but rather the natural angle of repose from hydraulic
mining. To ensure the competency of the wall, an angle of 45
˚
No geotechnical or hydrological aspects affecting the surface deposits are significant to the operation
and the QP is unaware of any incidents regarding unexpected highwall failure.
Mining bench heights are in the order of 15m.
Hydraulic mining provides slurry feedstock to the processing plant continuously. To maintain production,
high pressure water must be ensured. Slurry densities and production rates will not be achieved if the
water pressure is not maintained. Critical to hydraulic mining is consistent high slurry densities. If densities
drop, less tonnage is delivered to the processing plant, thus increasing the unit mining cost.
The following series of steps offer an overview of the hydraulic mining process:
●
the water monitor washes the slime material between 10m to 15m high benches with a mining
width of 15m and a length of 9m or more (“mining cut”);
●
monitoring will be conducted from the bench of the TSF (i.e., top-down approach);
●
the resulting slurry stream is channeled in the 15m wide mining cut, which forms a trough to
ensure a good flow of the slurry material to the pumps, which will then transport the slurry to the
processing plant; and
●
approximately 6,950t/d (316tph) per water monitor is achievable equating to four hydraulic
monitors to produce 600ktpm.
The operating position of the monitor will be on the top of the mining cut and operating at a 45
˚
as seen in Figure 13.11. The reclamation gun position and bench angles are based on experience and
on-site observations.
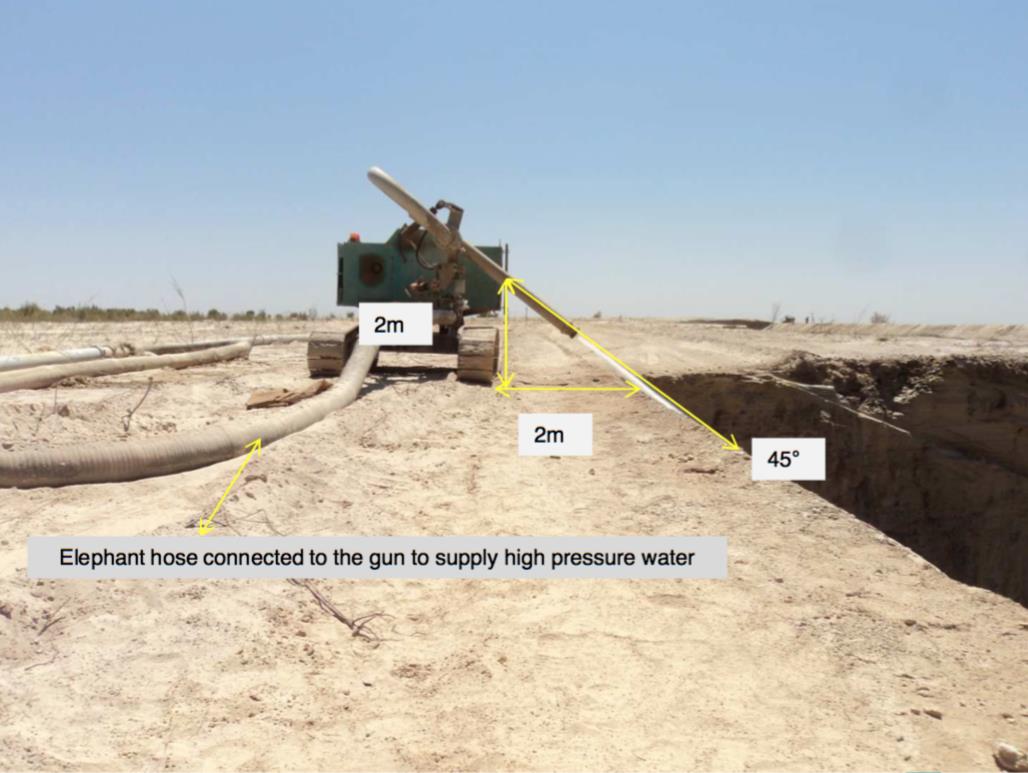
Technical Report Summary of the material Tailings Storage Facilities
168
Figure 13.11: Hydraulic Mining with Monitor showing Distance and Angle
Source: DRDGOLD; and The RVN Group, 2022
When FELs are used, care is taken to ensure that there is no undermining of the dump highwall with
operators being cognizant of the risks related to slumping highwalls. Dozers are used to remove over
hanging material where required. No geotechnical or hydrological aspects affecting the surface
deposits are significant to the operation and the QP is unaware of any incidents regarding unexpected
highwall failure.
13.5 Requirements for Stripping
As no underground mining is done, there is no underground development and backfilling required.
Other than minimal precleaning with a dozer of the top of the TSFs no pre-stripping is required at Ergo.
Technical Report Summary of the material Tailings Storage Facilities
169
13.6 Mining Equipment and Personnel Requirements
The equipment required for hydraulic mining are as follows:
●
track mounted hydraulic monitors;
●
water columns, 250mm diameter pipes to feed water to the hydraulic monitor;
●
grizzly screen to remove debris from slurry;
●
satellite pump stations (spindle pumps) to pump slurry to main pump station; and
●
main transfer pump station.
For loading of sand, excavators, dozers, FELs, trucks and conveyors are required as shown in
Item 13.2.2.
Ergo employs 776 full time employees and 1,628 special service providers, with service providers
deployed mostly in security, reclamation, and tailings deposition.
13.7 Mine Plans
13.7.1 Introduction
The QPs have identified the material TSFs in the Mineral Resource and Mineral Reserve.
In terms of the LoM plan and the Mineral Reserve statement, the following TSF are considered material
for Ergo:
●
4L3 (13.1Mt);
●
Rooikraal TSF (56.8Mt);
●
7L15 TSF (17.1Mt);
●
Daggafontein (192.8Mt); and
●
Marievale Complex (54.1Mt).
13.7.2 Central Rand
The 4L3 TSF accounts for 13.1Mt and is considered material to Ergo. The 4L3 TSF has commenced mining
operations in 2022 achieving a steady state mining rate of 3.2Mtpa and is completed in 2026.
13.7.3 East Rand (Ergo)
The Rooikraal TSF is scheduled to commence mining in 2023 and completes mining operations in 2034
Rooikraal starts up at 4.5Mt in 2023, with steady state production of 5.4Mt between 2027 and 2033. The
final year produces 4.4Mt as the remnant of the TSF is removed.
Mining of the Marievale Complex is scheduled to commence in 2025, starting with the mining of the 7L4
TSF, in 2027 the 7L5 TSF embarks with 7L6 and 7L7 TSFs begin mining in 2028. The Marievale complex starts
production at 4.7 Mtpa and reaching a steady state mining rate of 9.0Mtpa in 2028 with production
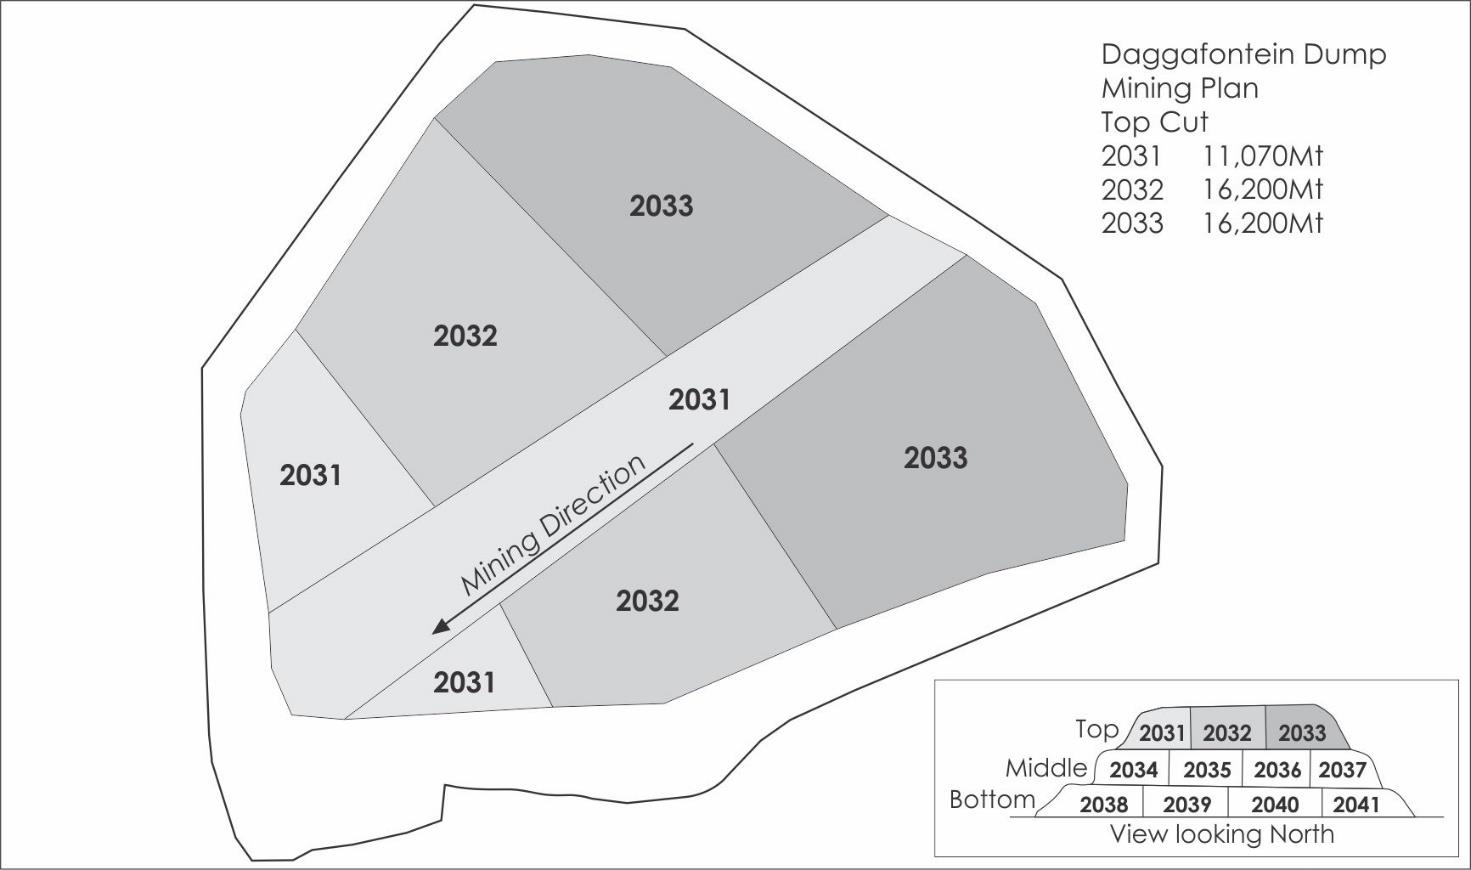
Technical Report Summary of the material Tailings Storage Facilities
170
influenced by the various TSFs starting-up or winding down production. The mining of Marievale is
conditional upon the successful resolution of the conflicting ownership claim by the owner of the
freehold on which a part of the complex is situated.
Mining of the Daggafontein TSF commences in October 2031. The top cut is mined from 2031 until 2033,
the middle cut of the TSF being mined for four years, from 2034 until 2037, and the bottom cut mined
from 2038 to 2041 (Figure 13.12, Figure 13.13 and Figure 13.14). Over the 11-year period the
Daggafontein TSF produces 192.8Mt at a grade of 0.24g/t Au.
Figure 13.12: Daggafontein TSF Top Cut Mining Sequence
Source: The RVN Group, 2022
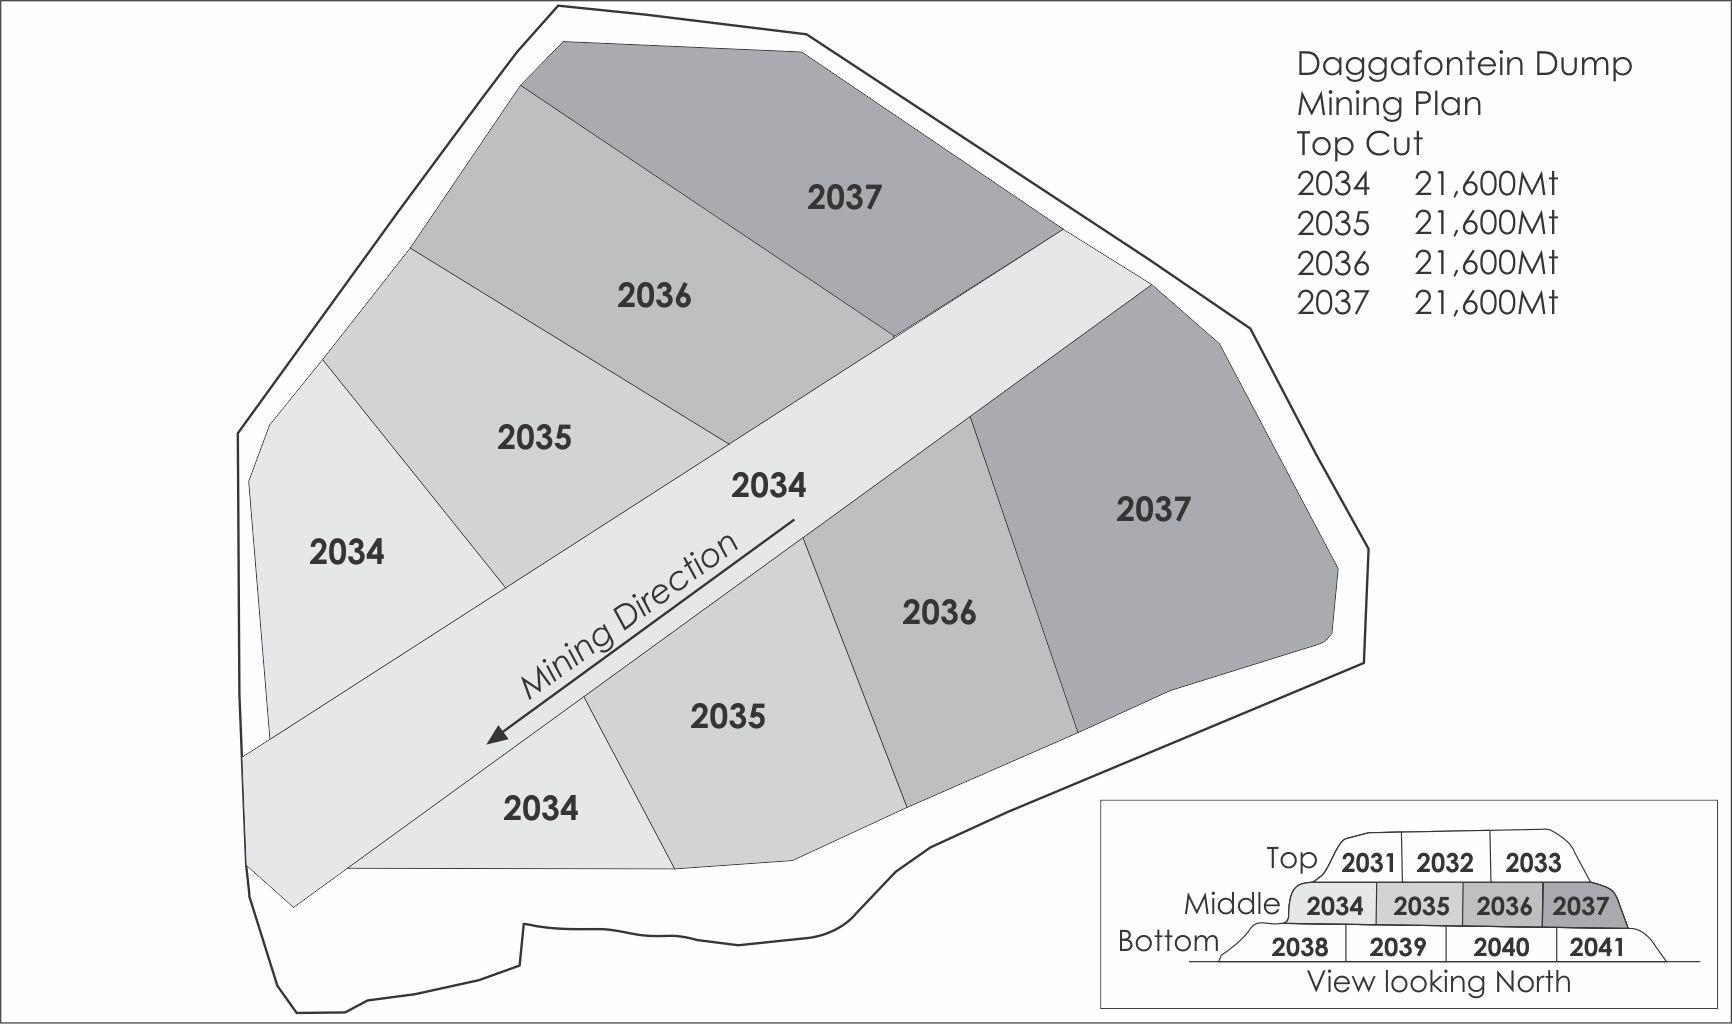
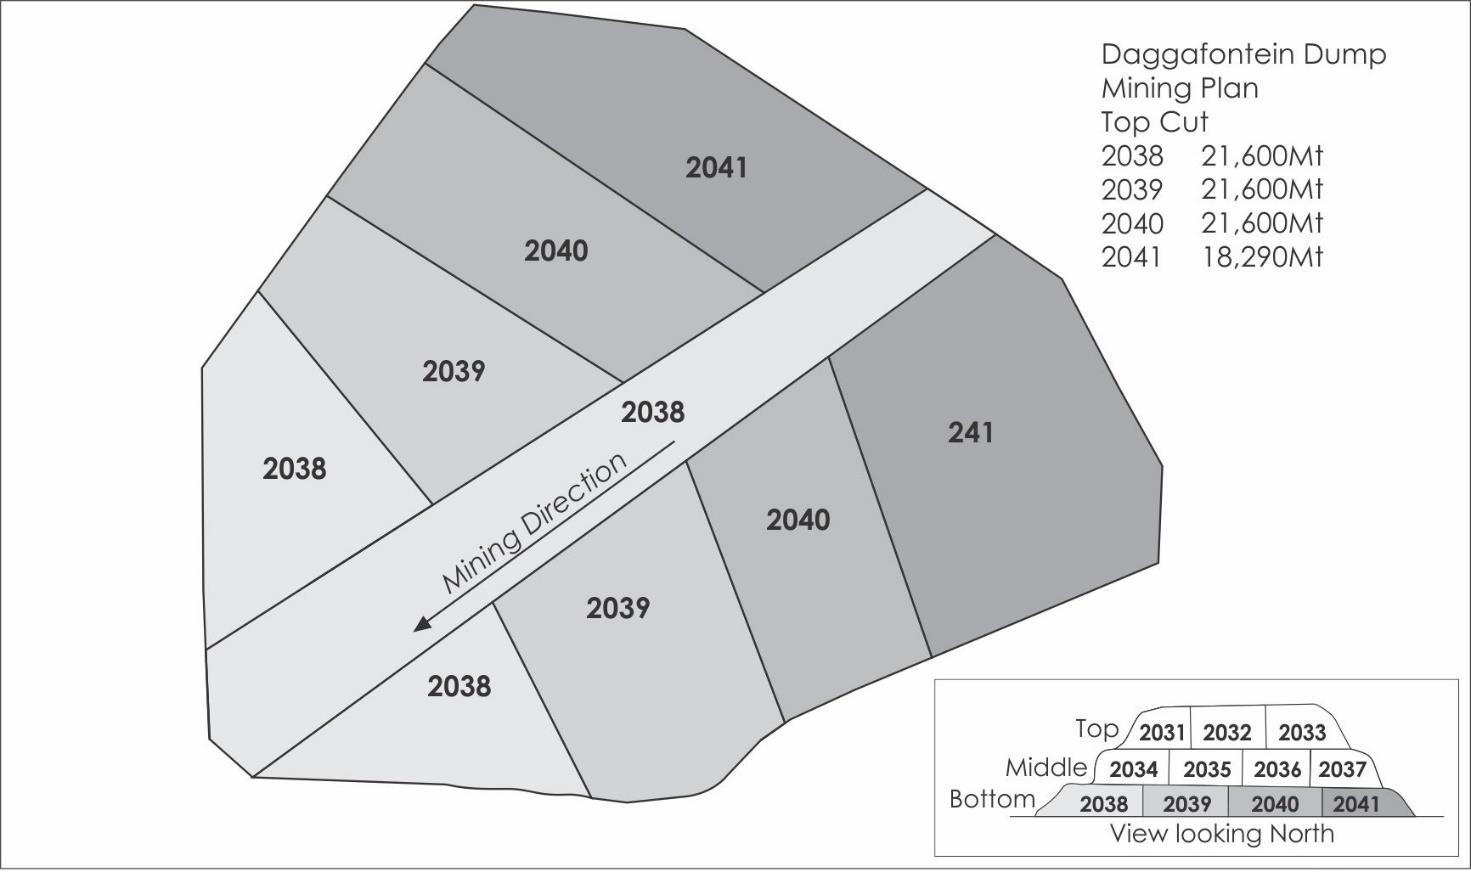
Technical Report Summary of the material Tailings Storage Facilities
171
Figure 13.13: Daggafontein TSF Middle Cut Mining Sequence
Source: The RVN Group, 2022
Figure 13.14: Daggafontein TSF Bottom Cut Mining Sequence
Source: The RVN Group, 2022
Technical Report Summary of the material Tailings Storage Facilities
172
14 Processing and Recovery Methods
14.1 Introduction
The Ergo processing plant located in Brakpan, is Ergo’s flagship metallurgical plant which currently
targets throughput between 1.8Mtpm to 2.0Mtpm. The City Deep processing plant has been
reconfigured to operate as a milling and pump station and feed the Ergo processing plant via a 50km
pipeline. The City Deep processing plant processes mineralized material from TSFs of the Central Rand
areas (i.e., Johannesburg, Germiston, and Boksburg), with mining operations scheduled to close in 2027.
Knights Plant treats sand and slime and will operate until 2024.
The Ergo processing plant follows the conventional method of extracting gold. The plant has been in
operation for more than 30 years, with minor improvements conducted on a regular basis.
Ergo retreats historical tailings and the remaining gold in the TSFs is finely disseminated within the
material. The gold does not respond to physical recovery methods. Direct cyanidation has been used
for decades to solubilize the gold and then recover it by hydrometallurgical techniques. The Carbon in
leach (CIL) process is used with elution and final recovery by zinc precipitation which produces >85%
bullion quality.
14.2 Plant Feed Grade and Metallurgical Test Work
The Ergo processing plant is fed from at least eight different mining sites (including sand and slime) that
are being mined and fed into the plant at any one time. Daily composites are submitted to the assay
laboratory for grade determination to assist with the management of the operations. A sub-sample is
split and composite samples over a week for metallurgical test work. A bottle roll test is conducted
utilizing the same parameters that are used on the full-scale plant. Should any deviations be reported,
further investigations are undertaken.
Prior to commencing reclamation of any mineralized material, a comprehensive drilling exercise is
carried out. As part of the evaluation, sub-samples are sent to Ergo’s in-house metallurgical research
laboratory for testing to assess the amenability of the material to cyanidation and what recoveries can
be expected. Mineralogy work is not carried out on a routine basis but on a needs-basis associated with
the exploration program.
Sand material that is coarse in nature, is first milled prior to cyanidation, while slimes material is processed
without pre-milling. All feed streams are combined before removing extraneous oversize, which could
contaminate the activated carbon, over linear screens. The material is leached with cyanide at an
elevated pH in mechanically agitated tanks. Carbon is then used to adsorb the dissolved gold. The
loaded carbon is removed from the circuit and the gold eluted off the carbon. The gold is then finally
recovered using zinc precipitation and smelting of bullion bars.
The tailings are pumped to a large Mega TSF (Brakpan/Withok TSF) located south of the Ergo processing
plant. The Brakpan/Withok TSF as of June 2022 has a remaining capacity of approximately (~950Mt)
after implementation of the facility’s final life design. The Ergo plant capacity is 64,000tpd and gold
recovery is between 35% and 50%.
A 100% mine call factor is applied at the Ergo processing plant.
Technical Report Summary of the material Tailings Storage Facilities
173
For planning purposes, Ergo uses the RoM head grade (i.e., the grade of the RoM material as delivered
to the processing plant) and the anticipated residue grade to estimate the recovery which is the head
grade minus residue grade multiplied by the tonnage treated.
During the life of each TSF, the mined grade is monitored and compared to the estimated Mineral
Reserve grade. Generally, these grades tend to track each other. When the TSF is completely mined, a
final reconciliation is conducted.
Metallurgical test work is carried out routinely using laboratory equipment and leach conditions, which
closely mimic the full-scale operation. The test work is considered representative as historical results are
consistent, and generally minor deviations are seen on numerous tests from the same source material.
The material differs slightly in terms of head grade, particle size and origin, so different recovery factors
are used for each source. Due to the consistency of the exploration and metallurgical test work, no bulk
sampling or pilot scaling test work is conducted.
No specific assumptions or allowances are made for deleterious elements in the material. They are either
screened out before entering the processing plant or if they cannot be removed, the metallurgical test
work results will include the impact. If the impact is too great, the material will not be treated.
Cyanidation of gold bearing material, with elution of gold from the loaded carbon is a tried and tested
process and there is nothing novel about the process.
Technical Report Summary of the material Tailings Storage Facilities
174
Figure 14.1: Process Flow Diagram
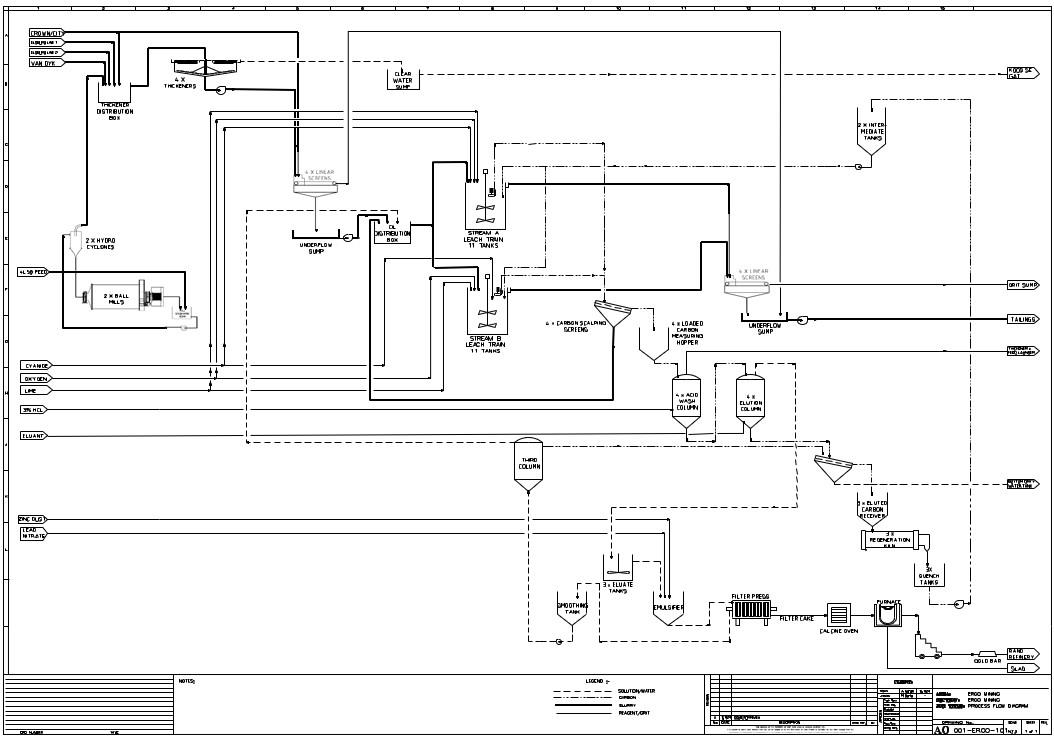
Technical Report Summary of the material Tailings Storage Facilities
175
Technical Report Summary of the material Tailings Storage Facilities
176
Technical Report Summary of the material Tailings Storage Facilities
177
Table 14.1 indicates the process recoveries for the various plants for the past two years, and the planned
average recoveries over the 19-year LoM. The recoveries are based on metallurgical test work for the
various tailings dumps, slimes and silted vleis that are scheduled to be mined over the 19-year LoM plan.
Table 14.1: Ergo Process Recoveries
Description
2020 to 2021
2021 LoM Average
2022 LoM Average
Total Mine
45.9%
48.9%
40.8%
Source: DRDGOLD, 2022
Note: The drop in the 2022 recovery is due to the inclusion of the Daggafontein TSF which has a recovery of 35%.
14.3 Mineral Process and Equipment Characteristics
The metallurgical process and equipment used at the Ergo processing plant is well tested and utilised
by numerous tailings retreatment operators in South Africa.
14.3.1 Reception
Material received from the various mining sites is first sampled through two in one slurry samplers and
then thickened in four large thickeners to produce an underflow with an SG of 1.45 for leaching and for
recovery of excess water.
14.3.2 De-sanding Section
Thickened material from the four large thickeners is pumped to a distribution box in the de-sanding
section. Here the tailings can be directed to four linear screens which have an 850µm aperture cloth for
the removal of debris to prevent contamination of the carbon. The undersize from the linear screens is
pumped up to a two-way distribution box ahead of the leach.
14.3.3 Carbon-in-Leach
The CIL section comprises of two streams of 11 tanks per stream. Each tank has a capacity of 2,000m
3
and at a throughput of 1.8Mtpm gives a leach residence time of about 11.5 hours, with the first tank
being used for pre-conditioning with lime and oxygen.
Cyanide is added to the second and fourth tank in the leach train. Carbon is present in all but the first
two tanks and is retained by interstage screens. Carbon is moved counter-current up the leach using
recessed impeller pumps. The carbon concentration in the tanks is about 10g/l. Loaded carbon is
transferred to the four loaded carbon hoppers over vibrating screens. Loaded carbon values vary
between 200g/t and 300g/t.
CIL tailings flow through residue samplers before passing over four safety linear screens. Screened
material reports to a residue sump from where it is pumped to the Brakpan/Withok TSF through three
tailings pipelines using five of six installed D-frame pumps.
14.3.4 Carbon Treatment
Loaded carbon is acid treated in 8.5t batches in three independent acid wash columns. The carbon
then reports to three of the four elution columns. The fourth column is used to scavenge gold from the
zinc precipitation tails.
Technical Report Summary of the material Tailings Storage Facilities
178
Loaded carbon is first washed with dilute hydrochloric acid to remove acid soluble contaminants. Acid
washed carbon is transferred to the elution column which is operated at elevated temperatures and
pressure to strip gold off the carbon using a cyanide/caustic solution (eluant).
The eluate, which now contains the gold in solution, is contacted with ultra-fine zinc powder to
precipitate the gold. This gold bearing sludge is then filtered in a plate and frame filter. Sludge is then
calcined at 600
˚
C before being smelted in an arc furnace and cast into dorè bars.
Eluted carbon is regenerated in two rotating kilns at about 750
˚
C. In total, about 100 elutions are
conducted monthly.
14.3.5 Plant Services
Instrument Air:
Instrument air is supplied to the float from one compressor house and the remainder of
the processing plant from a centrally located facility.
Process Water:
throughout the processing plant by a network of pumps and pipes.
Fresh Water:
directly for elution water, fire hydrants and human consumption.
Power:
Bulk power is supplied to the Ergo processing plant by the Ekurhuleni Metropolitan Municipality.
Natural Gas:
Natural gas is obtained by a pipeline from Sasol and used for elution heating purposes.
Assay Laboratory:
All assays are done by the MAED laboratory which is located on the Ergo processing
plant site but is operated by an independent third party.
14.4 Personnel Requirements
Ergo employs 776 full time employees and 1,628 special service providers, with service providers
deployed mostly in security, reclamation (mining) and tailings deposition. The processing plants employ
376 persons.
14.5 Energy and Water Requirements
Energy and water requirements are discussed in Item 15.3 and 15.5.
14.6 Process Materials Requirements
Ergo has access to all required process material required through their local or international suppliers.
Technical Report Summary of the material Tailings Storage Facilities
179
15 Infrastructure
Ergo currently mines the existing gold TSFs and sand dumps in the Johannesburg and Brakpan areas
with slurry pumped via pipelines from the numerous mining operations to the Ergo processing plant
located in Brakpan.
The infrastructure required to support the LoM plan is essentially in place, with future infrastructure
requirements being designed and estimated by Ergo to a PFS level of accuracy (i.e., +/-25%) with a
maximum level of contingency of 15%. Infrastructure requirements and capital costs are based on
current mining operations, as the mining methodology applied to exploit the TSFs and sand dumps are
substantially the same throughout the LoM plan with no significant operational changes expected
between current and planned future operations.
The use of railways, port facilities, dams, leach pads and other infrastructure components not discussed
below as they are not material infrastructure components the Ergo operations.
15.1 Roads
Access to the mining sites is via current municipal and regional road networks with no construction or
upgrading of unpaved roads.
15.2 Site Offices and Workshops
The mining contractors establish site offices as part of the mining contract. Workshops for the
maintenance of roads, pumps and pipelines are based at the Ergo processing plant, and no additional
infrastructure is required.
15.3 Power
Bulk power is supplied to Ergo by Eskom, City Power and the Ekurhuleni Municipality. The power grid
infrastructure serving the East Rand is particularly extensive, with electrical power being received
through several alternative substations on the Eskom grid. Mining sites are supplied via several separate
feeders.
The Eskom power grid has been negatively affected by poor power availability and subsequently, it has
at times been unable to meet power demand. Some load shedding has taken place during 2021 and
2022, affecting the country and Ergo. Electrical demand is approximately between 60MW and 70MW.
Power supply is viewed as a risk to Ergo operations. A risk-mitigating measure that has been
implemented by Ergo is the provision of back -up power and other engineering upgrades to prevent
plant choke-up/silt-down during power interruptions. These measures have enabled the processing
plant to resume full production without extensive delay after each power interruption. A 7MVA diesel
emergency power plant is also available as backup .
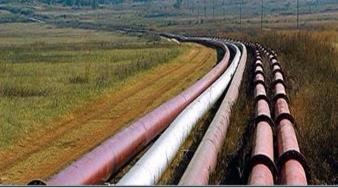
Technical Report Summary of the material Tailings Storage Facilities
180
Ergo has a curtailment agreement with Eskom whereby the total consumption is reduced on request by
an agreed percentage during load-shedding hours. This involves reducing the total consumption by
between 4MVA and 8MVA during load-shedding hours. The reduction in the power consumption results
in the operations maintaining an uninterrupted tonnage throughput, but recoveries are lower due to
certain parts of the process plant not operating during the load reduction periods.
15.4 Pumps and Pipelines
Slurry transport is mainly via pipelines that carry it to the Ergo processing plant (Figure 15.1). Ergo uses a
standard set of pipes and pumps (500mm pipes). Equipment selection is based on the most suitable
sizes from the standard equipment range.
Figure 15.1: Above Ground Pipeline System
Source: DRDGOLD, 2022
The pipelines are mainly installed above ground, providing easy maintenance access and making it
easier to identify and rectify any failures on these pipelines. Where necessary, pipe bridges are used
along the pipeline routes to cross streams and rivers.
The existing pumping and slurry pipeline systems are managed through a supervisory control and data
acquisition (SCADA) system. The SCADA system allows Ergo to operate the equipment remotely.
Thereby, Ergo can monitor the entire pipeline system via a centralized system. For example, pumps and
valves can be used (open/closed or on/off), and readings taken (pressures and flows) from the
centralized site, with no actual human-machine interface on the actual site. As the pumps are installed
with a duty and standby configuration, the operation of the existing and planned pumping and pipeline
systems should be adequate to support the requirements of the LoM plan.
Technical Report Summary of the material Tailings Storage Facilities
181
Operations west of the Ergo processing plant are serviced by pipeline and other existing infrastructure.
The Marievale and Daggafontein mining areas east of the processing plant have pipeline
permits/servitudes/surface rights in place. The QP has not identified any impediments that would
prevent the construction of the necessary infrastructur e to support the LoM plan.
15.5 Water
The primary uses for water are in the Ergo processing plant and for hydraulic mining of the various TSFs.
Water used for hydraulic mining turns the dry tailings into a slurry, which is then pumped to the processing
plant for processing. Excess water recovered at the thickeners in the processing plant is then returned
to the hydraulic mining sites for re-use.
In 2017, Ergo completed the construction of a central water reticulation plant to give it the ability to
deliver water to all corners of the operation and return it through a fully integrated closed system.
Currently 60% to 70% of all process water make up at Ergo is drawn from the Brakpan/Withok TSF to
various reclamation sites by way of return water columns. A further 6% to 11% of process water
top-up needs are from treated underground acid mine drainage (AMD), drawn from a facility operated
by the Trans-Caledon Tunnel Authority (TCTA) from whom DRDGOLD secured the right to use up to 30Ml
of AMD water per day. The Ekurhuleni City Council’s wastewater treatment facility at Rondebult supplies
less than 1%, depending on the rate at which water flows into the waste facility and another 15% to 20%
is from lakes and dams in the region that captures the inflow of seasonal rain and storm water inflows,
harvested in terms of the requisite extraction licenses. Potable water is used only where the sensitivity of
equipment requires it and for certain early stages of irrigation to settle in newly established vegetation
on TSFs.
Given the location of the Ergo operations, the QP does not foresee the likelihood of the operations
being curtailed due to a water shortage. However, the future increased reliance on water purchased
from Rand Water will add materially to the operating costs.
15.6 Infrastructure
General arrangement drawings are provided for the Rooikraal TSF to demonstrate design work typical
of a mining site (Figure 15.2). The actual construction work will vary slightly to account for specific site
conditions, but generally, the infrastructure is common from site to site, with 52 TSFs planned to be
mined over the 19-year LoM plan.
Technical Report Summary of the material Tailings Storage Facilities
182
Figure 15.2: Rooikraal General Arrangement - Site Layout
Technical Report Summary of the material Tailings Storage Facilities
183
Technical Report Summary of the material Tailings Storage Facilities
184
Source: DRDGOLD, 2022
Technical Report Summary of the material Tailings Storage Facilities
185
15.7 Tailings Disposal
The Brakpan/Withok TSF (Figure 15.3) is a single large tailings dam that covers 700ha at its base and
500ha at its current elevation and has a perimeter of around 12km. The Brakpan/Withok TSF was built by
cycloning the tailings at the point of deposition out with the larger particles from the tailings, forming
the dam wall. The annual rate of rise is between 3m and 4m. The fines from the cyclones run out into the
center of the dam. This generates a more stable wall with the finer material safely stored inside the TSF.
With the deposition rate from 1.8Mtpm to 2.0Mtpm the use of cycloning is viewed as the most
appropriate method for disposal of the tailings material. Track mounted cyclone units (Figure 15.4) are
used with eight cyclone units connected to the tailings pipeline system. The TSF was originally designed
by Knight Piésold. Operational activities are currently under contract by Fraser Alexander.
Immediately adjacent and to the south of the Brakpan/Withok TSF footprint lies the former cleared
footprint of an area licensed for tailings storage, spanning an approximate 400 hectares. This area, on
which a large portion of the Withok compartment stood, was retreated and cleared by the former
owners of Ergo. Ergo intends to redeposit residue tailings onto this compartment and has initiated a
process to obtain regulatory approval for the final design of the Brakpan/Withok TSF. The
Brakpan/Withok TSF final design is the engineering design that ultimately brings the tailings deposition
facility to its finality in terms of extent, operation, rehabilitation and management. The implemented
final design would result in alignments with the Global Industry Standard on Tailings Management
(GISTM) and regulatory bodies, increase deposition capacity, improve operation/management and
bring about the sustainable closure of the facility.
The Brakpan/Withok TSF will provide sufficient storage
capacity to support Ergo’s 19-year LoM plan. Ultimately, when the Withok compartment of the TSF
reaches a suitable height, it will merge with the Brakpan compartment of the TSF.
The Brakpan/Withok TSF as of 30 June 2022 has a capacity of 250.4Mt. Once regulatory approvals are
received for its final life design, the TSF will have will have a joint capacity of over 930Mt.
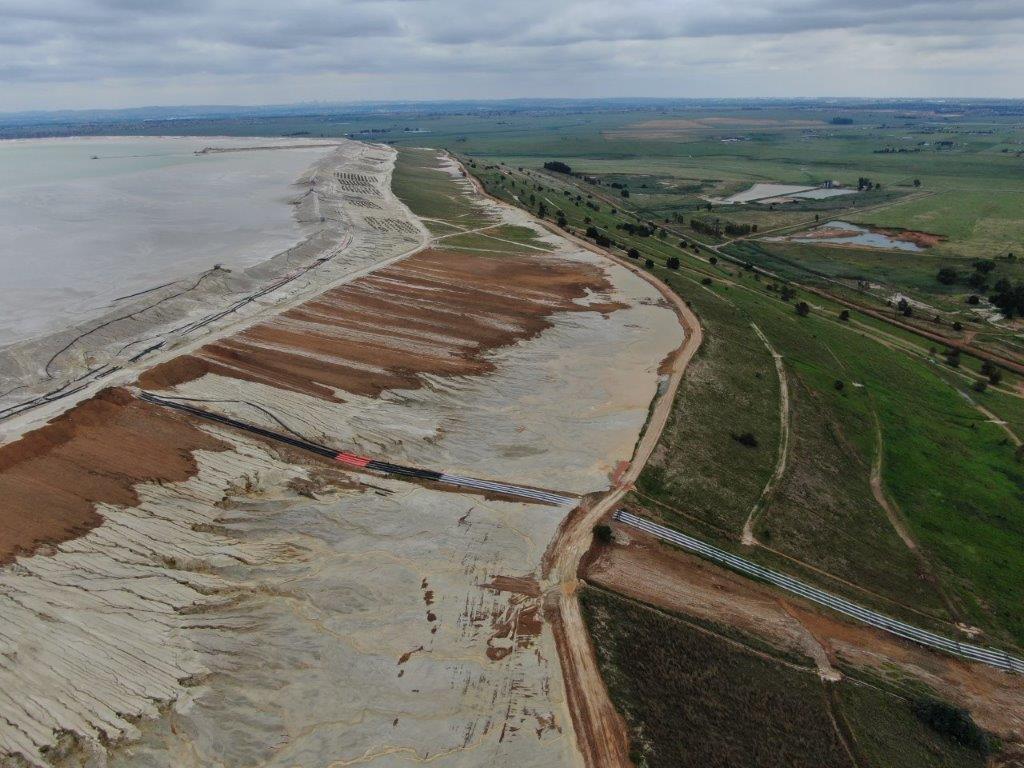
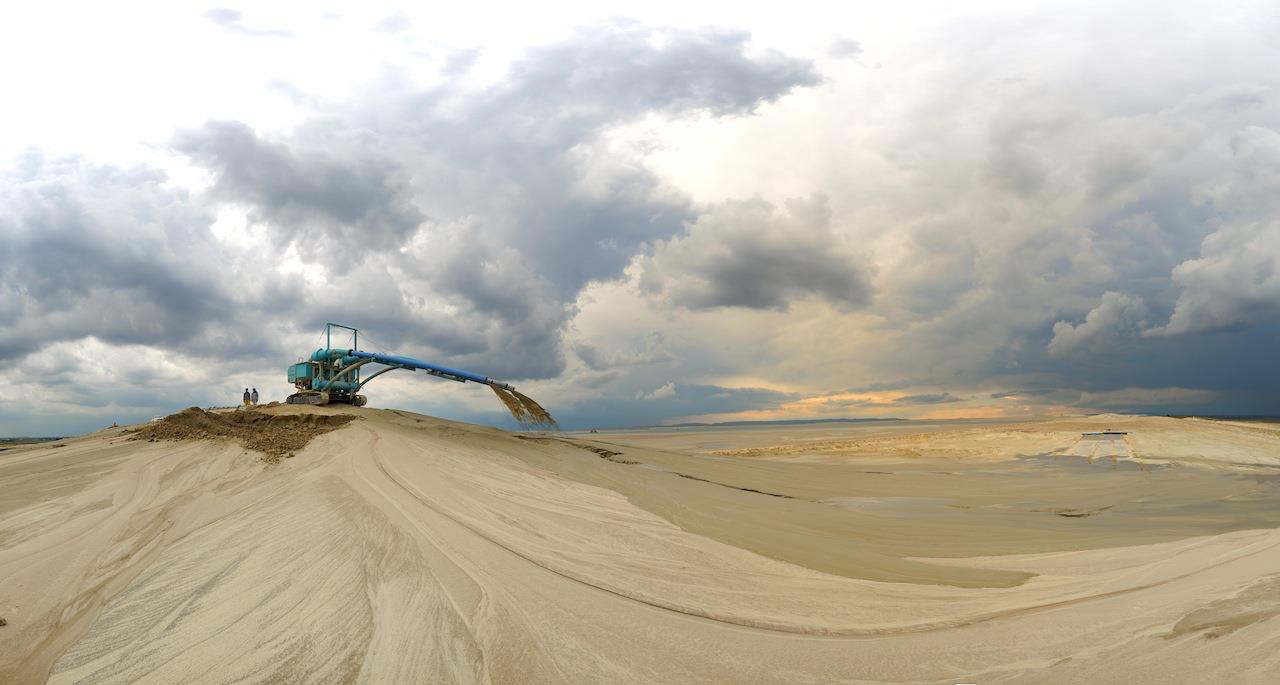
Technical Report Summary of the material Tailings Storage Facilities
186
Figure 15.3: Brakpan/Withok TSF
Source: DRDGOLD, 2022
Figure 15.4: Placement of Tailings Material at Brakpan/Withok TSF
Technical Report Summary of the material Tailings Storage Facilities
187
Source: DRDGOLD, 2022
15.8 Conclusion
The QP is of the opinion that all significant infrastructure and logistical requirements have been
considered. It is notable that Ergo has been operating for more than 20 years and has a very good
understanding of infrastructural and logistical requirements.
Technical Report Summary of the material Tailings Storage Facilities
188
16 Market Studies
16.1 Markets
All gold produced is delivered to the Rand Refinery for refining with no restrictions on the quantity or
time frame. DRDGOLD has a long-standing agreement with Rand Refinery in terms of which Rand
Refinery accounts to Ergo at the prevailing spot price. When applying the 30 June 2022 spot exchange
rate (ZAR16.29/USD) to the associated gold price of USD1,819.06/oz Au, a real gold price of
ZAR952,721.20/kg is achieved.
Gold is a precious metal, refined and sold as bullion on the international market. Aside from the gold
holdings of central banks, current uses of gold include jewelry, private investment, dentistry, medicine
and technology (Table 16.2).
Table 16.1: Above Ground Gold Stocks in 2021
Description
Quantity
(t)
Contribution
(%)
Jewelry
94,464.0
46%
Private Investment
45,456.0
22%
Bank Holdings
34,592.3
17%
Other
30,726.0
15%
Source: GoldHub, 2022
The largest use of gold is in jewelry, accounting for approximately 46% of the above-ground gold. Gold
does not follow the usual supply and demand logic because it is virtually indestructible and can easily
be recycled. In addition, gold stored in the vaults of banks is relatively illiquid and subject to the vagaries
of global economies. These characteristics of the gold market make it challenging to forecast the gold
price.
16.2 Gold Price
The gold price increased in 2020 due to uncertainties related to the outbreak of Covid-19. It then
declined to a spot price of ~ZAR945,295/kg (i.e., USD1,806.89/oz at ZAR16.27/USD) as at
30 June 2022 (Graph 1).


Technical Report Summary of the material Tailings Storage Facilities
189
Jun-17
Jun-18
Jun-19
Jun-20
Jun-21
Jun-22
Gold Price (USD/oz)
Gold's Monthly Closing Price
Trendline
Upper and Lower Standard Deviation Bands
Jun-17
Jun-18
Jun-19
Jun-20
Jun-21
Jun-22
Exchange Rate (ZAR/USD)
Monthly Closing USD/ZAR Rate
Trendline
Upper and Lower Standard Deviation Bands
Graph 1: Gold Price Historical Trendline
Source: Sound Mining, 2022
The linear trendline indicates robust gold price potential over the longer-term.
16.3 Exchange Rate Trends
The ZAR to USD exchange rate saw record breaking highs in the second quarter of 2020 (ZAR19.35/USD)
but has subsequently dropped back to ZAR16.27/USD as at 30 June 2022. A factor in the deterioration
of the local currency in 2020 was the lockdowns and economic volatility brought on by Covid-19.
The spot exchange rate of ZAR16.27/USD compares well with the six-year historical trendline as displayed
in Graph 2.
Graph 2: Exchange Rate Historical Trendline
Source: Sound Mining, 2022

Technical Report Summary of the material Tailings Storage Facilities
190
0
500
1,000
1,500
2,000
2,500
3,000
3,500
4,000
4,500
5,000
2012
2013
2014
2015
2016
2017
2018
2019
2020
2021
Quantity (t)
Year
Various service providers and financial institutions are consulted to determine consensus forecasts of the
gold price (Table 16.2).
Table 16.2: Long Term Consensus Forecasts in Nominal Terms
Description
Year 1
(FY2023)
Year 2
(FY2024)
Year 3
(FY2025)
Year 4
(FY2026)
Year 5
(LT)
USD/oz
1,823
1,799
1,751
1,724
1,496
ZAR/USD
15.60
15.74
15.77
15.79
15.20
ZAR Price/kg
914,294
910,051
888,083
875,474
731,081
Source: Sound Mining, 2022
The economic assessment for the Mineral Reserve estimate relies on a real price of ZAR914,294/kg (i.e.,
USD1,823/oz at ZAR15.60/USD) as of 30 June 2022 terms as provided by DRDGOLD. The QP has
considered the consensus forecasts supplied by DRDGOLD against linear trends in the demand and
supply of gold as recorded over the period from 2012 to 2021 to examine whether these forecasts are
reasonable.
16.4 Global Demand
Graph 3 reveals a gradual reduction in demand (~14.2%) over the past ten years (2012 to 2021).
Graph 3: Global Gold Demand from 2012 to 2021
Source: GoldHub, 2022
Technical Report Summary of the material Tailings Storage Facilities
191
4,100
4,200
4,300
4,400
4,500
4,600
4,700
4,800
4,900
5,000
2012
2013
2014
2015
2016
2017
2018
2019
2020
2021
Quantity (t)
Year
16.5 Global Supply
The global gold supply from mining and recycling activities over the same period is presented in Graph
4.
Graph 4: Global Gold Supply from 2012 to 2021
Source: GoldHub, 2022
While the graph suggests an overall upward trend from 2012 to 2021 (~2.6%), the supply generally
levelled out over the past five years. The supply from mining satisfied some 76% of the demand in 2021,
with the balance met by recycled gold.
Gold supply from mining increased by approximately 106t during 2021 (3,582t) when compared with
2020 (3,476t) despite an overall drop in supply since 2019 (GoldHub, 2022). Below are the top ten gold
producing countries in 2021 (Table 16.3).
Table 16.3: Global Gold Production
Rank
Country
Production
(t)
2016
2017
2018
2019
2020
2021
1
China
464
429
404
383
368
332
2
Russia
262
281
295
330
331
331
3
Australia
288
293
313
325
328
315
4
Canada
163
171
189
183
171
193
5
United States of America
229
236
225
200
190
187
6
Ghana
131
133
149
142
139
129
7
Peru
166
167
163
143
98
127
8
Mexico
131
120
118
109
102
125
9
Indonesia
118
118
153
92
101
118
10
South Africa
163
154
128
111
99
114
Source: GoldHub, 2022
Technical Report Summary of the material Tailings Storage Facilities
192
16.6 Concluding Comments
The QP notes a short-term up-tick despite the long-term reduction in demand together with an
essentially constant supply over the past five years. These trends are not inconsistent with the forecast
price trend in Table 16.3. The QP is satisfied that a real 30 June 2022 gold price of ZAR914,294/kg is a
reasonable assumption for examining the economic viability of the Mineral Reserve estimate.
Technical Report Summary of the material Tailings Storage Facilities
193
17 Environmental Studies
17.1 Results of Environmental Studies
An Environmental Impact Assessment (EIA) has been conducted over the Ergo operation with the
findings of the EIA showing that the operation would result in certain negative impacts during the
operational phase to the environment, however, none of the specialist studies objected to the project.
During the mining operations, negative impacts are largely Moderate to Insignificant, and after
interventions the impacts are mitigated to a Low significance. During the decommissioning and post-
decommissioning phases, most of the impacts will be positive as the historical TSFs and associated
environmental impacts of the TSFs are removed.
Social and community interaction remains a key focus for Ergo. Stakeholder engagement is reported
annually with the SLP compliant and filed with the proper authorities. Ergo appears to have good
relations with surrounding communities and engages proactively.
The QP is unaware of any material flaws in terms Ergo’s social license to operate, however, it is noted
that in the current South African socio-political issues remain a risk and require constant monitoring.
Rehabilitation will be carried out once the reclamation of individual TSF are completed, with
rehabilitation returning the disturbed land to as close to its original landscape as possible.
The principles for proper rehabilitation are:
●
preparing a comprehensive rehabilitation plan prior to the commencement of any activities on
site;
●
stormwater management must be in place at the site prior to commencing with any activities;
●
landform design (e.g., shaping, re-grassing, etc.);
●
maintenance management and eradication of invader species;
●
a plan on how waste will be managed on site; and
●
an emergency preparedness/response plan.
The objective of the site rehabilitation (in accordance with the NEMA EIA Regulations of 2014) must be
measurable, practical and be feasible to implement through:
●
providing the vision, objectives, targets and criteria for final rehabilitation of the project;
●
outlining the principles for rehabilitation;
●
explaining the risk assessment approach and outcomes and link decommissioning activities to
risk;
●
rehabilitation detailing the decommissioning and rehabilitation actions that clearly indicate the
measures that will be taken to mitigate and/ or manage identified risks and describing the nature
of residual risks that will need to be monitored and managed post decommissioning;
●
identifying knowledge gaps and how these will be addressed and filled; and
Technical Report Summary of the material Tailings Storage Facilities
194
●
outlining monitoring, auditing and reporting requirements.
17.2 Requirements for Tailings Disposal, Site Monitoring and Water Management
The general description of the Brakpan/Withok TSF is covered in Item 15.
17.2.1 Site Monitoring
Site monitoring provides information on whether rehabilitation methods employed are functioning
correctly or not. The purpose of monitoring is to ensure that the objectives of the rehabilitation program
are met, and that the progressive rehabilitation process is followed as planned during the LoM.
The post closure monitoring period will begin once scheduled decommissioning and rehabilitation
activities for the sites have been completed. The duration of post closure monitoring will be determined
based on environmental performance and until it can be demonstrated that the rehabilitation work has
achieved the agreed outcomes; however, at present, it has been assumed that post closure monitoring
will not continue for more than five years. It is important that the data obtained during monitoring is used
to gauge the success of rehabilitation. Negative monitoring findings should be clearly linked to specific
corrective actions.
The following aspects should be monitored during the post-closure phase.
17.2.2 Water Management
The quality of groundwater and surface water at the various sites will be monitored quarterly for five
years post closure, except for the Knights Mining Right which requires 30 years monitoring at certain
monitoring points as per the approved WULs, to ensure compliance of the various constituents with the
standards. Samples should be analyzed for particulate and soluble contaminants. Water monitoring will
be taking place at 76 different locations.
17.2.3 Vegetation Monitoring
The following vegetation monitoring is recommended:
●
vegetation cover;
●
species composition;
●
erosion; and
●
alien invasive plants.
17.2.4 Vegetation Maintenance
Vegetation maintenance will specifically focus on fertilizing the rehabilitated areas annually if required,
controlling alien invasive plants where needed and general maintenance such as in-filling of erosion
gullies. In the case of erosion, the cause should be identified, and rectified.
Technical Report Summary of the material Tailings Storage Facilities
195
17.2.5 Water Monitoring
Currently, 66% of all process water make-up at Ergo is drawn from water returned from the Brakpan as
shown in Table 17.1.
Table 17.1: Ergo Water Consumption
Description
Total Consumption 2022
Total Consumption 2021
Ml
%
Ml
%
Potable Water Sources Externally
2,460
9
2,813
11
Rondebult Waste Water
27
-
46
-
Surface Water Extracted
4691
18
4,210
17
Water Recycled in Process
16,302
62
17,233
66
TCTA Water (AMD)
2,907
11
1,683
6
Total Water Used
26,387
100
25,985
100
Source: DRDGOLD, 2022
17.2.6 Legal and Permitting
Item 3 of the TRS (Table 3.2) discusses the Mining Rights and Prospecting Rights details for Ergo’s and the
status thereof.
Ergo’s EMP encompasses all the activities of Ergo’s operations and assesses the environmental impacts
of mining at reclamation sites, plants and TSFs. It also outlines the closure process, including financial
provisions.
There are currently no legal challenges to Ergo’s title to its reserves other than those discussed below.
The QPs are aware of two issues that could impact on Ergo’s current mining rights or mining operations.
Grootvlei Complex:
Ergo has a Mining Right over Grootvlei TSF 6L14 via Mining Right GP158MR and has
submitted a renewal application of its Prospecting Rights over Grootvlei TSFs 6L16, 6L17 and 6L17A to the
DMRE, which application is pending. During the 2022 financial year, an external party raised a
conflicting claim of common law ownership of TSFs 6L16, 6L17 and 6L17A. Although the claim was on
common law ownership and no challenge has been brough against the Prospecting Rights over the
dumps, the Grootvlei Complex has been excluded from the Mineral Reserves statement and the LoM
plan. However, the Grootvlei Complex has been included in the Mineral Resources statement as Ergo is
of the opinion that the Prospecting Rights will be renewed.
Marievale Complex:
executed deed of sale during 2019 and took possession of the TSFs on 8 April 2019. It has since also
obtained the requisite NEMA regulatory approvals to retreat these TSFs. During the 2022 financial year,
the owner of the land on which 7L5, 7L6 and a portion of 7L7 are situated, an estimated 36,524t out of
the total 54,114t comprising the Marievale Complex, notified Ergo that in its view, the said TSFs had
acceded to the land, and that it had become the owner of the TSF. Ergo disputes the claim of legal title
and the matter is to be referred to arbitration. All ownership requirements were met when the TSFs were
purchased by Ergo and therefore these TSFs are still included in the LoM plan and Mineral Reserves.
Whilst Ergo has received confident legal advice of the merits of its claim, in the event that the arbitration
goes against Ergo, its Mineral Reserves will reduce by 35.52Mt (0.35Moz at 0.29g/t). In so much as it then
enters into a commercial arrangement with the landowner, the financial benefit of this portion of the
Marievale Complex will be reduced by whatever benefit is agreed to in favor of the land-owner.
Technical Report Summary of the material Tailings Storage Facilities
196
Ergo has submitted a renewal application to the DMRE for the Prospecting Rights it holds over the 7L4
TSF as described more fully under Item 3.6.
17.3 Plan Negotiations, or Agreements with Local Individuals or Groups
Social and community interaction remains a key focus for Ergo. Stakeholder engagement is reported
annually against the SLP and any complaint is filed with the proper authorities.
The QP is unaware of any material flaws of Ergo’s social license to operate. However, it is noted that in
the current South African political environment, social and community issues always remain a risk and
require constant monitoring.
The five-year SLP was submitted by Ergo in terms of the requirements of the MPRDA. The development,
submission and implementation of an SLP is a requirement of the MPRDA and the right to mine. Table
17.2 indicates the budget for the 2018 to 2022 SLP, noting that the SLP plan is conducted in five-year
segments.
The SLP covers three key elements:
●
Human Resource Development (HRD)
: which focuses on the empowerment of historically
disadvantaged South Africans to progress to higher career levels within the industry. Ergo has
various programs to address this aspect, including skills development programs, career
progression and mentorship employment equity targets ;
●
Local Economic Development (LED):
(affected) and labor-providing communities. Ergo has four projects, one agricultural
development, a sewing project and two projects to upgrade facilities at primary schools. A
ZAR10 million budget is allocated to these LED projects ; and
●
Program for Management of Downscaling and Retrenchment:
negative impact due to either job losses through retrenchment and mine closure in the long-
term.
Table 17.2: SLP Financial Provision Summary
Description
2018
2019
2020
2021
2022
Total
(ZAR million)
HRD Total
7.08
7.53
5.69
5.91
7.08
33.29
LED Total
3.40
5.80
2.60
2.20
1.50
15.50
Downscaling Retrenchment
13.00*
SLP Budget
10.48
13.33
8.29
8.11
8.58
61.79
Source: DRDGOLD, 2022
Note: *This amount has already been accrued and is available for reskilling should the mine prematurely be forced to close.
17.4 Mine Closure Plans Remediation Plans, and Associated Costs
In accordance with South African mining legislation, all mining companies are required to rehabilitate
the land on which they work to a determined standard for alternative use. Ergo has spent ZAR198 million
on various rehabilitation activities in the three years between 2020 and 2022.
A community consortium, consisting of nine local companies that represent areas including Langlaagte,
Diepkloof, Meadowlands, Orlando West, Orlando East, Riverlea, Pennyville and Ormonde, has been
Technical Report Summary of the material Tailings Storage Facilities
197
established to conduct certain rehabilitation work for Ergo as part of its small enterprise development
initiatives. It currently employs 27 community members from the abovementioned areas. Their current
project entails the establishment of new side slope vegetation on the Crown TSFs and to irrigate until the
vegetation is self-sustainable.
Ergo is on track to complete this vegetation program by 2026.
In 2016, a decision was taken to complete the recovery of mine waste materials from a number of
legacy reclamation sites and to close the Crown plant. The clean-up of the legacy sites has proven
difficult and costly and requires the use of earthmoving equipment to mechanically lift and move
residual material. Steady progress is being made on the clean-up and closure of these legacy sites.
As clean-up work on former reclamation sites is completed, applications are submitted to the National
Nuclear Regulator (NNR) for land clearance certificates. In 2019, Ergo received land clearance
certificates for an area covering approximately 135.5ha from NNR, releasing land located close to the
Benoni central business district for development.
In 2019, applications were lodged with the NNR in respect of 136ha of rehabilitated land for clearance.
In 2020, applications were lodged for a further 27ha of rehabilitated land , in 2021, for a further 87.6ha
and in 2022, for a further 23.6ha.
Ergo’s decommissioning and restoration liabilities are funded by a combination of funds that have been
set aside for environmental rehabilitation. ZAR132.7 million is currently held in the Guardrisk Cell Captive
under a ring-fenced environmental insurance policy. Further environmental guarantees of ZAR377.8
million have been issued by Guardrisk Insurance Company Limited to the DMRE. In total, Ergo has
ZAR510.5 million in environmental rehabilitation and closure cover.
The calculated costs for rehabilitation and closure of the Ergo Operations estimated by Digby Wells are
ZAR639 million (Table 17.3). Ergo systematically audits and monitors progress on rehabilitation and
closure and adjusts its provision accordingly. Required audits are undertaken and submitted to the
DMRE annually.
Table 17.3: Ergo Rehabilitation Financial Provision Summary
Area and Mining Right
Closure Cost 2022
(ZAR)
CMR - GP186MR
11,845,711
Crown - GP184MR
125,160,690
City Deep - GP185MR
41,802,525
Knights - GP187MR
46,318,600
ERPM - GP150 and 151MR
10,240,493
Ergo - GP158MR
403,565,361
Total (excluding VAT)
638,933,381
Source: Digby Wells, 2022
Technical Report Summary of the material Tailings Storage Facilities
198
17.5 QP Statement on the Environmental Studies, Permitting, Plans, Negotiations, with Local
Individuals or Groups
The QP is satisfied that all material issues relating to Environmental, Social and Governance have been
addressed in this document.
The above statement is borne out by the fact that Ergo incurred no fines of monetary value or significant
non-monetary sanctions for non-compliance with environmental laws and regulations were imposed in
the past four years (2019, 2020, 2021 and 2022).
The QP finds the funding mechanism appropriate for mine rehabilitation and mine closure, but notes
that there is a shortfall between the reclamation funding and the July 2022 Digby Wells closure cost
estimate.
Technical Report Summary of the material Tailings Storage Facilities
199
18 Capital and Operation Costs
The capital expenditure and operating costs provided take cognizance of the requirements to support
the LoM plan. The capital expenditure takes into account the ongoing requirements of starting new
operating sites as current TSFs Mineral Reserves are depleted. This capital expenditure schedule is based
on the LoM production schedule with the capital expenditure based on mining and engineering designs
conducted to a PFS level of accuracy (i.e., +/-25%) with a maximum level of contingency of 15% being
applied.
The operating costs support the planned LoM production profile taking into consideration whether slimes
or sand material is mined and the method and distance in which the mineralized material is
transported(i.e., pumped or trucked). Operating costs are activity-based costs accounting for surface
mining costs (extraction and transportation); processing costs (including tailings disposal costs), cost of
maintaining key mine infrastructure and general and administrative costs. The estimate of operating
costs are based on historical operating cost data, which is well understood as Ergo is a well-established
mining operation. Operating costs are estimated to at least a PFS level of accuracy (i.e., +/-25%) with
no contingency applied due to the understanding of the cost to mine and process the RoM material .
18.1 Capital Expenditure
A total capital of ZAR3.22 billion is scheduled to support the Ergo LoM plan. The breakdown of capital
expenditure indicates the majority of the capital, ZAR3.14 billion, is allocated to the Ergo Section over
the duration of the LoM plan with an additional ZAR81.9 million allocated in 2022 for the City Section. As
the mining at the Knights Section is completed in 2024 there is no allocation of capital.
The capital expenditure summary as proposed in the 30 June 2022 LoM plan is presented in
Table 18.1. The level of accuracy for the capital expenditure is to at least a PFS level of accuracy
(i.e., +/-25%) with a maximum level of contingency of 15%.
Table 18.1: Capital Expenditure Summary
Area
Budgeted Capital
Expenditure
(ZAR)
Ergo Section
3,137,603,000
City Section
81,923,000
Knights Section
0
Total (excluding VAT)
3,219,526,000
Source: DRDGOLD, 2022
18.1.1 Ergo Section Capital Expenditure
This section depicts the capital expenditure estimate for the Ergo Section. Table 18.2 indicates the
Rooikraal capital expenditure estimate planned in January 2022.
Table 18.2: Rooikraal Capital Expenditure Estimate
Discipline
Capital Expenditure
(ZAR)
Consultancies
324,000
Civil
15,100,835
Technical Report Summary of the material Tailings Storage Facilities
200
Structural Steel
14,591,639
Mechanical
18,783,480
Piping
99,680,396
Electrical
28,471,978
Instrumentation
1,599,218
Security
415,634
Other
2,824,000
Total
181,791,181
Source: DRDGOLD, 2022
Note: ZAR 91.759 million spent in 2021/22 financial year
Table 18.3 indicate the capital expenditure estimate for the Marievale pump station and total Marievale
capital expenditure estimate respectively.
Table 18.3: Marievale Capital Pump Stations
Area
Budgeted Capital
Expenditure
(ZAR)
Consultants
294,000
Civil engineering
29,793,240
Structural steelwork
30,583,013
Mechanical
36,020,706
Electrical
66,507,688
Instrumentation
4,471,908
Security
1,525,297
Other
7,568,000
Total (excluding VAT)
176,763,853
Source: DRDGOLD, 2022
Table 18.4: Marievale Total Capital Expenditure Summary
Area
Budgeted Capital
Expenditure
(ZAR)
Pump Station
176,763,853
Slurry Pipeline
65,628,130
Water Pipeline
56,328,874
Water Transfer
41,343,778
total (excluding VAT)
345,590,778
Source: DRDGOLD, 2022
Table 18.5 shows the estimated capital expenditure for the Daggafontein pump station, inclusive of a
ZAR4.6 million contingency (4.2%). Table 18.6 indicates the Daggafontein capital expenditure summary.
Table 18.5: Daggafontein Capital Pump Stations
Description
Budgeted Capital
Expenditure
(ZAR)
Consultants
294,000
Civil Engineering
17,611,703
Structural Steelwork
18,279,748
Technical Report Summary of the material Tailings Storage Facilities
201
Mechanical
20,300,199
Electrical
41,446,040
Instrumentation
4,471,908
Security
415,634
Other
7,568,000
Total (excluding VAT)
110,387,234
Source: DRDGOLD, 2022
Table 18.6: Daggafontein Capital Expenditure Summary
Area
Budgeted Capital
Expenditure
(ZAR)
Pump Stations
110,387,234
Slurry Pipeline
36,981,310
Water Pipeline
33,161,400
Daggafontein Plant Upgrades
86,149,055
Total (excluding VAT)
266,679,000
Source: DRDGOLD, 2022
Table 18.7shows the non-material TSF Capital Expenditure for the Ergo Section.
Table 18.7: Non-material TSF Capital Expenditure for the Ergo Section
Area
Budgeted Capital
Expenditure
(ZAR)
4L14
50,157,000
7L15
60,000,000
4L39
69,927,000
5L27
59,852,000
Sustaining
1
837,085,000
Total (excluding VAT)
1,077,021,000
Source: DRDGOLD, 2022
Note:
1. Sustaining capital of ZAR30 million between years 3 to 18 (ZAR480 million); ZAR221.4 million and ZAR105.6 million allocated in year 1 and
year 2 to complete numerous small capital programs
The Withok compartment design is based on upstream cyclone system and a scavenger well system for
environmental containment. The Brakpan/Withok TSF has been digitally modelled which model has
been used to inform the various quantities of the various infrastructure aspects. The capital costs to
implement the Withok compartment has been estimated upon typical contractor tender
methodologies by Beric Robinson Tailings (Proprietary) Limited. Table 18.8 indicates the capital
expenditure budget for the proposed Withok compartment . The Withok compartment design work has
been conducted to a PFS level of accuracy with a 15% contingency applied to the capital estimate.
Table 18.8: Withok Compartment Capital Expenditure
Area
Budgeted Capital
Expenditure
(ZAR)
Construction Contract
456,056,963
Technical Report Summary of the material Tailings Storage Facilities
202
Material Supply
76,009,494
Engineering Design and Oversight
3,648,456
Scavenger Boreholes
12,161,519
Pumps, Power Reticulation and Other
60,807,595
Sub-total
608,684,026
Contingency 14%
91,302,604
Total (excluding VAT)
699,986,630
Source: DRDGOLD, 2022
The capital budget for the solar power project is shown in Table 18.9.
Table 18.9: Solar Power Project Capital Estimate
Area
Budgeted Capital
Expenditure
(ZAR)
Solar MW Works
69,579,000
Solar 20MW
338,084,000
Solar 88kV (15% contingency)
239,660,000
Total (excluding VAT)
646,323,000
Source: DRDGOLD, 2022
18.1.2 City Capital Expenditure
A capital of ZAR81.9 million has been allocated to the City section in 2022 (Table 18.10).
Table 18.10: City Total Capital Expenditure Summary
Area
Budgeted Capital
Expenditure
(ZAR)
4/L/4 TSF
19,527,000
Valley Silts
62,396,000
Total (excluding VAT)
81,923,000
Source: DRDGOLD, 2022
18.1.3 Knights Capital Expenditure
Due to the short life of the Knights Section, no capital expenditure has been planned or budgeted.
18.1.4 QP commentary
The QP associates a low risk to the engineering capital expenditure for the mining associated projects
as the design and construction of pump stations and pipelines have been conducted numerous times
by Ergo. The QP notes the level of accuracy for the capital expenditure estimates are to a PFS level
accuracy (i.e., +/-25%). Contingency varies between 0% to 15% with contingency typically applied to
civil work, structural steelwork and electrical and instrumentation. In no case is the contingency above
15%.
The QP is of the opinion that the risk associated with the Withok compartment capital estimate and solar
plant and storage facility is Low to Medium and typical of a PFS level of accuracy (i.e., +/-25%).
Technical Report Summary of the material Tailings Storage Facilities
203
18.2 Operating Costs
Mining related operating costs are assigned to the Ergo processing plant and the mining of the various
TSFs. A different operational cost is applied to each deposit, depending on its composition, proximity to
the processing plant and the reclamation method. Sand dumps have a higher cost than slimes, as sand
must be milled down to 80% less than 75µm while the slime can be treated in the CIL tanks directly.
Mining related operating costs are assigned to the planned TSFs to be mined and the Ergo processing
plant. The planned average operating cost for the Ergo 19-year LoM plan is estimated at a PFS level of
accuracy (i.e., +/-25%) with a maximum level of contingency of 15% with a total working cost of
ZAR90.86/t (Table 18.11).
Table 18.11: Average LoM Operating Cost for Ergo
Operating Cost
Average LoM
Operating Cost
(ZAR 000’s)
Labor
375,733
Consumables
663,822
Electricity
81,735
Water
28,557
Contractors
350,715
Other
262,710
Sub-total Cash Cost
1,863,272
Rehabilitation Cost
25,349
Other Operation Cost
24,572
Retrenchment Cost
6,215
Corporate Cost
42,916
Sub-total Other Cost
99,052
Total Working Cost
1,962,324
Source: The RVN Group, 2022
The development of the annual operating costs is based on historical cost data as Ergo has been
operational for numerous years. The QP associates a Low risk with many of the operating costs, however
a Medium risk is associated with consumables, electricity and water due to the volatile nature of the
market of these items. Ergo is attempting to mitigate the volatility with the installation of the solar power
project and reuse of water where possible. Refer to Item 19.3 for more details on risk.
Technical Report Summary of the material Tailings Storage Facilities
204
19 Economic Analysis
19.1 Economic Analysis
The 30 June 2022 19-year LoM plan, which is the basis of the Mineral Reserve, is scheduled to mine a
total of 410.33Mt at 0.28g/t Au and produce 50,658kg of gold over the same period. The economic
analysis is based on a LoM plan that is designed to a PFS level of accuracy (i.e., +/-25%). The economic
analysis conducted by the QP indicates a net present value (NPV) of ZAR2.2 billion after capital
expenditure and taxation utilizing a discount rate of 9.48% (real terms). As the Ergo operations are an
on-going with an annual positive cashflow, the internal rate of return (IRR) and payback period are not
applicable.
Figure 19.1: Ergo LoM Production Tonnage
Source: The RVN Group, 2022
Technical Report Summary of the material Tailings Storage Facilities
205
Figure 19.2: Ergo LoM Gold Production
Source: The RVN Group, 2022
Table 19.1 presents the Ergo cashflow model over the 19-year LoM Plan. The NPV has been calculated
by discounting the positive cashflows at the appropriate rate and subtracting the required capital
expenditure. The QP has made the assumptions listed below to derive a realistic base case operational
cashflow model:
●
the production schedule is sourced from the Ergo LoM plan. The mining tonnage schedule is
shown in Figure 19.1, which varies between 23.0Mtpa and 18.2Mtpa;
●
plant feed grade as per the LoM schedule (Figure 19.2) with an average grade of 0.28g/t Au;
●
the average metallurgical recovery over the LoM schedule is 40.9%;
●
total working costs estimated at ZAR90.86/t RoM are inclusive of mining, metallurgical and
general and administration costs (working costs);
●
the gold market price is set at ZAR914,294/kg (see Item 16 for further information for gold price
in USD/oz and exchange rate);
●
capital expenditure of ZAR3.219 billion is inclusive of contingency ;
●
no salvage value of assets has been assumed;
●
a tax rate of 27%;
●
a discount rate of 9.48% in real (no inflation) terms;
●
no royalty payment is applicable to Ergo, as the operation is not subject to royalties on the
retreatment of TSFs;
●
capital expenditure was fully written-off against operating profit, with no time constraint; and
Technical Report Summary of the material Tailings Storage Facilities
206
●
no escalation or inflationary effects have been included in the economic evaluation, which is
based on constant money value (real terms).
The NPV of the Ergo LoM plan as at 30 June 2022 was calculated at ZAR2.2 billion at a discount rate of
9.48% as shown in Table 19.1
.
Technical Report Summary of the material Tailings Storage Facilities
207
Table 19.1: Economic Analysis
Source: The RVN Group, 2022
Technical Report Summary of the material Tailings Storage Facilities
208
19.2 Sensitivity Analysis
The sensitivity analysis of the Ergo financial model that varies revenue (price and grade); operating cost
and capital expenditure at 5% increments above and below the base case is shown in Figure 19.3. The
analysis indicates that the Ergo operations are very sensitive to revenue parameters such as gold price,
grade, and recovery. In addition, the LoM plan is also very sensitive to changes in operating costs. The
sensitivity indicates that the LoM plan is not as sensitive to capital and therefore capital expenditure
should be considered if the expenditure will result in reducing operating cost or increase revenue. The
sensitivity indicates that achievement of the LoM plan in terms of tonnage is critical in realizing the
planned operating costs and being able to mine at the planned cut-off grade. The QP is unaware of
any capital expenditures, that if delayed, would materially affect the LoM plan or cashflow. The QP is
of the opinion that no extremely weather conditions will materially impact on the capital development
program.
Figure 19.3: Sensitivity Analysis
Source: The RVN Group, 2022
19.3 Risk Assessment
The following highlights show the key risks that Ergo has identified as critical to their operations,
as well as comments on mitigation of these risks.
19.3.1 Rising Electricity Prices and Eskom Supply Distribution
The mining industry is a dominant consumer of electricity, consuming approximately 30% of the national
electricity supply. The processing plants operate on a “24/7/365” basis and continuous electricity supply
is paramount to achieving a stable plant with enhanced efficiencies.
Eskom remains the biggest systemic risk to the sustainability of the South African economy. On
28 July 2020, a court judgment was given against the National Energy Regulator of South Africa (NERSA)
and allowed for Eskom to increase its tariffs from the original 5.22% on 1 April 2021 to approximately 15%.
An increase of 14.59% was approved for the 202 1 to 2022 municipal tariff after Eskom applied for an
Technical Report Summary of the material Tailings Storage Facilities
209
electricity price increase of 20.5%. In February 2022, NERSA allowed for an increase of 9.6% in the
standard electricity tariff as implemented in April 2022.
Ergo has adopted a two-staged approach to the risks associated with electricity supply.
Firstly, Ergo has had to install extensive back-up systems to counteract the impact of unscheduled
interruptions in the power supply. Although Ergo is unable to maintain full production during black-outs,
back-up generator sets ensure that the processing plants remain in motion and that the circuits do not
choke or become blocked through the settlement of solids in the slurry. This enables the immediate start-
up of production once the power is restored.
At the Brakpan/Withok TSF, the back-up capacity is sufficient to ensure that deposition can continue
uninterrupted, thus there is no interference with the processing plant operations (i.e., if the deposition
system comes to a halt, then the entire operation will stop). From a safety perspective, it is also essential
that the water balance on the TSF pumping operations remain under control to ensure that water on
the Brakpan/Withok TSF remains within the stated factors of safety.
The second important strategic consideration regarding electricity supply is to address the impact of
escalating electricity costs. Ergo continues to investigate ways of reducing the impact of price
increases. Power storage and the pricing policy of Eskom to charge different rates during peak and off-
peak periods appear to be the most likely near-term solutions in this regard. Charging power storage
units during these periods and then drawing them down during peak hours to avoid peak rates, may
well in the long-term, provide a financially feasible model in this regard.
Ergo has obtained regulatory approvals for the development of a solar photovoltaic and battery
storage facility which will be located adjacent to the Ergo processing plant. Ergo has approved
ZAR646.3 million to develop the first phase of the solar energy project.
19.3.2 Tailings Storage Facility Capacity
Ergo is a volume-driven business. As a result, Ergo needs to ensure that there is sufficient capacity in its
TSFs to deposit material after processing and extracting gold in the plant. Additional tailings storage
capacity is required in the medium-term to continue operating at current levels. This additional capacity
will come from the Brakpan/Withok TSF, adjacent to the Brakpan TSF. Ergo has allocated ZAR700 million
for the implementation of the Brakpan/Withok TSF final life design. These is a risk of production being
reduced in the event that regulatory approvals are not obtained or not obtained timeously.
19.3.3 Social Unrest
The growing frustration of society due to lack of Government service delivery and high rates of
unemployment (heightened by the impact of the Covid-19 pandemic) lead to increased protests and
conflict, affecting communities in and around Ergo’s operations. This may result in operational
disruptions.
19.3.4 Increased Crime
The current strained economic and uncertain socio-political environment contribute to adverse crime
trends. Ergo operations are not immune to crime and are frequently targeted by criminals as well as
syndicates seeking access to gold or gold concentrate.
Technical Report Summary of the material Tailings Storage Facilities
210
19.3.5 Depletion of Ergo
’
s Mineral Reserves
Ergo’s strategy is to maintain its Mineral Reserve base by improving the robustness of LoM plan by
increasing production through better extraction efficiencies. Another risk associated with Ergo’s Mineral
Reserve is the depletion of higher-grade Mineral Reserves. The current gold price assists with the
economic viability of lower grade TSFs, however when the gold price drops, it will be important to
optimize the LoM plan to enable the mining of lower grade TSFs. This will require optimizing the mining
throughput, reducing operating costs and improving the mineral recovery efficiencies. The QP
associates a low to medium risk to the Mineral Reserve base as some TSF are operating close to the cut-
off grade. In certain instances, the risk may be negated by increasing the mining rate of the TSF, thereby
reducing the per unit operating cost and the cut-off grade.
19.3.6 Social Licenses to Operate
Historically, mining has taken place in the Johannesburg area since 1886 and therefore, environmental
and waste disposal practices that were designed and that may have been adequate in a less densely
populated environment, are inadequate today. Ergo’s entire operating footprint is the legacy footprint
of mining in Johannesburg specifically in the East Rand. An integral part of Ergo’s mining process is to
remedy the shortcomings of that legacy by mining and the historical TSFs.
While mining, there can be high levels of dust and other disturbances from reclamation sites, however,
the result is a better and cleaner environment once the TSF us removed. To minimize the impact of
mining operations, Ergo conducts dust monitoring and implements measures to suppress dust.
In addition, Ergo has adopted the strategy of concurrent rehabilitation, which reduces Ergo’s long-term
environmental obligation. Ergo’s current mine design strategy is to conduct rehabilitation of completed
mining sites as soon as practically possible (See Item 17 for further Environmental, Social and
Governance commentary).
Pressures and demands on business by local communities, non-government organizations have
increased. Social license to operate issues are typically driven by the social and economic landscape;
and the Covid-19 pandemic has exacerbated the social and economic issues in South Africa.
Unemployment, hunger and desperation are of great concern and Ergo has been active in supporting
the local communities. Ergo will, however, be increasingly exposed to this risk should social and
economic conditions in the country not improve.
19.3.7 Fluctuations in the Gold Price and Exchange Rate
As a market price taker, Ergo is exposed to fluctuations in the United States Dollar gold price and
ZAR/USD exchange rate. The higher the gold price, the higher the profitability. A noticeable upswing in
the gold price has occurred since March 2019 (Figure 19.4), with a peak of USD1,970/oz achieved in
July 2020, and a 30 June 2022 price of USD1,829/oz. Between the August 2021 peak and the July 2020
high, a gold price low of USD1,062 was reached in November 2015, indicating price volatility of
approximately USD700/oz between the high and low gold prices from 2011 to 2022.
Technical Report Summary of the material Tailings Storage Facilities
211
Figure 19.4:
30-Year Gold Price in USD/oz (1992 to 2022)
Source: Macrotrends.net, 2022
This is mainly because of investors returning to gold as a safe haven asset in the wake of recent fears of
a global economic slowdown. The ZAR/USD exchange rate remained volatile throughout the year
mainly as a result of economic uncertainty marred by political instability and global market slowdown
sentiment.
Since the revenue line is determined by external factors, Ergo manages this risk by being very focused
on areas that it can influence such as costs and operational efficiency. Ergo continues to look at ways
to impede the increase of costs and save costs by making ongoing continuous improvements on
process and efficiencies. Precise dosing of chemicals and consumables, based on the ongoing analysis
of key drivers in the Ergo processing plant, contributes to keeping costs as low as possible; lower friction
in pipelines through HDPE lining reduces power consumption, and maintaining a closed water circuit
and use of recycled water reduces the costs of water consumption are a few initiatives implemented.
To limit the vulnerability to a drop in the price of gold in ZAR terms, Ergo monitors costs in line with the
approach stated above. In addition to that, Ergo also works hard to increase recoveries.
19.3.8 Supply and Cost of Water
Ergo’s surface retreatment operations are reliant on water to transport the slimes from reclaimed areas
to the processing plant and to the TSF.
It is acknowledged that water is a limited natural resource, crucial for the sustainability of the planet
and South Africa is a water-scarce country. There are increasing calls from interest groups for
intervention to avoid future deficits in water supply. Over the past few years, Ergo has deliberately
focused on investing in infrastructure and strategies to reduce the reliance on potable water and
expand the use of other water sources. Ergo relies on third party providers for any shortfall in water.
Technical Report Summary of the material Tailings Storage Facilities
212
20 Adjacent Properties
There are no adjacent properties to report.
21 Other Relevant Data and Information
Ergo is committed to improving governance and transparency in the safety and management of TSFs,
a commitment that so far has taken Ergo to implement the following:
●
an internal Tailings Performance Management System (TPMS) was implemented for dedicated
data collection, storage and processing to ensure the integrity of the data for day-to-day
management and oversight purposes;
●
quarterly drone surveillance; and
●
review of historical Interferometric Synthetic Aperture Radar (InSAR) imagery for mapping
ground deformation over large areas.
An eternal Tailings Review Panel review panel has been in place since 2018.
The QPs and Ergo have a number of internal controls to manage risk and uncertainty in the Mineral
Resource and Mineral Reserve estimation process. Monthly meetings are held with the Ergo MRM
Manager and the Ergo/DRDGOLD Finance team to discuss any concerns or areas requiring further work.
In addition to these meeting, the QPs liaise with the relevant specialists on an on-going basis to check
on progress of a number of technical programs.
There is no other known available relevant data or information material to the discussed properties in
this regard.
Technical Report Summary of the material Tailings Storage Facilities
213
22 Interpretation and Conclusions
The QP concludes that the protocols for drilling, sampling preparation and analysis, verification, and
security meet industry standard practices and are appropriate for the purposes of a Mineral Resource
estimate. The initial assessments have found that the Ergo TSFs have reasonable prospects for economic
extraction. The QP is satisfied with the QA developed by The RVN Group and the QC program
implemented, as there was no significant bias in reporting data.
The QP contends that the assumptions, parameters and methodology used for the Mineral Resource
estimate are appropriate for the style of mineralization and deposit type.
The tonnage and content of the TSFs are as expected and can be processed in the current Ergo
processing plant. TSFs and sand dumps reported in this document have sufficient information to be used
in the Mineral Reserve estimates and demonstrate economic viability.
The identified risks that could affect the Mineral Resources and Mineral Reserves are:
●
rising electricity prices and Eskom supply distribution;
●
depositional capacity;
●
social unrest;
●
increased crime;
●
depletion of Ergo’s Mineral Reserves;
●
dependency on key suppliers;
●
social licenses to operate;
●
fluctuation of the gold price and the exchange rate;
●
extreme weather; and
●
supply and cost of water.
23 Recommendations
There is sufficient information to allow for decision-making in the future. Accordingly, no additional work
is recommended.
Technical Report Summary of the material Tailings Storage Facilities
214
24 References
Alakangas, Eija. (2015). Quality guidelines of wood fuels in Finland VTT-M-04712-15.
10.13140/RG.2.1.3290.3127.
Ellis. L., 2021. Ergo Closure Cost Assessment 2021, Digby Wells Environmental, Project Number ERG7002.
June 2021. Unpublished.
Engles, J., (n.d.). Tailings Info. Sourced July 2022 - https://www.tailings.info/technical/hydraulic.htm
Goldprice, 2022. Sourced July 2022 - https://goldprice.org/gold -price-today/2022-06-30
Macrotrends. (2022). Sourced July 2022 - (https://www.macrotrends.net/1333/historical-gold-prices-100-
year-chart)
Mudau, M., 2017. Procedure for drilling management, logging, sampling and analysis of the material
from Tailings Storage Facility. The RVN Group. Johannesburg. The RVN Group. Unpublished.
Mudau, M., 2020. Technical Report of the Daggafontein Tailings Storage Facility. The RVN Group.
Johannesburg. The RVN Group. Unpublished.
Mudau, M. and Rupprecht, S.M., 2020a. Technical Report of the Marievale Tailings Storage Facility. The
RVN Group. Johannesburg. The RVN Group. Unpublished.
Mudau, M. and Rupprecht, S.M., 2020b. Technical Report of the Grootvlei Tailings Storage Facility. The
RVN Group. Johannesburg. The RVN Group. Unpublished.
Mudau, M. and Rupprecht, S.M., 2020c. Technical Report of the Rooikraal Tailings Storage Facility. The
RVN Group. Johannesburg. The RVN Group. Unpublished.
25 Reliance on Information Provided by Registrant
The QPs relied on the following information provided by the registrant:
●
legal matters about the Mining and Prospecting Rights. The QPs considered it reasonable to rely
on registrant’s legal opinion (legal or permitting matters are discussed in Item 1.3, Item 3.3 to Item
3.6 and Item 17.2.6);
●
environmental matters discussed in Item 17.3 and Item 19.3.6 relating to Ergo compliance;
●
Ergo commits or plans to provide to local individuals or groups (Item 17.3);
●
macroeconomic trends, data, and assumptions and interest rates (Item 16); and
●
marketing information and plans (Item 16).
The QPs considered it reasonable to rely on the above information as the registrant has the necessary
expertise and has been in operation for more than 20 years of successful and profitable retreatment of
TSFs and sand dumps. The QP also found that the data provided aligns with the industry norms. The QPs
have no reason to believe that any material facts had been withheld or misstated.
Technical Report Summary of the material Tailings Storage Facilities
215
Technical Report Summary of the material Tailings Storage Facilities
216
26 Qualified Persons Disclosure Consent
We, the signees, in our capacity as Qualified Persons in connection with the Technical Report Summary
of Ergo Mining Proprietary Limited dated 28 October 2022 (The Technical Report Summary) as required
by Item 601(b)(96) of Regulation S-K and filed as an exhibit to DRDGOLD Limited’s (DRDGOLD) annual
report on Form 20-F for the year ended 30 June 2022 and any amendments or supplements and/or
exhibits thereto (collectively, the “Form 20-F”) pursuant to Subpart 1300 of Regulation S-K promulgated
by the U.S. Securities and Exchange Commission (1300 Regulation S-K), each hereby consent to:
●
the public filing and use by DRDGOLD of the Technical Report Summary for which I am
responsible as an exhibit to the Form 20-F;
●
the use and reference to my name, including my status as an expert or Qualified Person (as
defined by SK-1300) in connection with the Form 20-F and Technical Report Summary for which
I am responsible;
●
use of any extracts from, or summary of, the Technical Report Summary in the Form 20-F and the
use of any information derived, summarized, quoted or referenced from the Technical Report
Summary, or portions thereof, that is included or incorporated by reference into the Form 20-F;
and any amendments or supplements thereto.
I am responsible for authoring, and this consent pertains to, the Technical Report Summary (Table 26.1)
for which my name appears below and certify that I have read the 20-F and that it fairly and accurately
represents the information in the Technical Report Summary for which I am responsible.
Table 26.1: Qualified Person’s Details
Property Name
TRS Effective
Date
QP Name
Affiliation to
Registrant
Field or Area of
Responsibility
Signature
Ergo Mining
Proprietary Limited
(A subsidiary of
DRDGOLD Limited)
30 June 2022
Professor Steven
Rupprecht
Independent
Consultant
Item 1 and
12 to 19I
/s/ Steven
Rupprecht
Ergo Mining
Proprietary Limited
(A subsidiary of
DRDGOLD Limited)
30 June 2022
Mr Mpfariseni
Mudau
Independent
Consultant
/s/ Mpfariseni
Mudau