Effective Date: 30 June 2025
Report Date:31 August 2025

HARMONY GOLD MINING COMPANY LIMITED
Technical Report Summary of the
Eva Copper Project
North West Queensland, Australia
Effective date: 30 June 2025
i
Technical Report Summary of the
Eva Copper Project, North West Queensland, Australia
IMPORTANT NOTICE This Technical Report Summary ("TRS") has been prepared for Harmony Gold Mining Company Limited ("Harmony') in support of disclosure and filing requirements with the United States Securities and Exchange Commission (SEC) under Subpart 1300 of Regulation S-K and 229.601(b)(96) of Regulation S-K. The quality of information, estimates, and conclusions contained in this TRS apply as of the effective date of this TRS. Subsequent events that may have occurred since that date may have resulted in material changes to such information, estimates and conclusions in this summary. |
Effective date: 30 June 2025
ii
Technical Report Summary of the
Eva Copper Project, North West Queensland, Australia
QP Consent and Sign-off
I have read and understood the requirements of:
•the South African Code for Reporting of Exploration Results, Mineral Resources and Mineral Reserves (the
"SAMREC Code, 2016 edition")
•the Harmony Guidelines on the Reporting of Exploration Results, Mineral Resources and Mineral Reserves
•Subpart 1300 (17 CFR 229.1300) of Regulation S-K, Disclosure by Registrants Engaged in Mining Operations
("Regulation S-K 1300")
I am a Competent Person as defined by the SAMREC Code, 2016 edition and the Qualified Person (“QP”) under
Regulation S-K 1300, having more than five years` experience that is relevant to the style of mineralisation and type of
deposit described in this TRS, and to the all activities for which I am accepting responsibility.
I am a member (Fellow) of the Australasian Institute of Mining and Metallurgy (AusIMM) and my registration is as
follows:
Greg Job
Executive General Manager - Growth and Resource Development
FAusIMM No. 111561
I have reviewed the tables, graphs and other information included for the Eva Copper Project Mineral Resource which
will be used in the 2025 Harmony Gold Mineral Resource and Mineral Reserve Report to which this Consent Statement
applies.
I acknowledge responsibility for all the Sections of this TRS and as the QP I relied on information provided by various
subject experts.
At the effective date of this TRS, to the best of my knowledge, information and belief, this TRS contains all scientific and
technical information that is required to be disclosed to make this TRS not misleading.
/s/ Greg Job
____________________________________
Mr Greg Job
BSc. MSc (Min Econ)
FAusIMM
Executive General Manager - Growth & Resource
Development
Harmony Australasia
Effective date: 30 June 2025
iii
Technical Report Summary of the
Eva Copper Project, North West Queensland, Australia
List of Contents
1Executive Summary ....................................................................................................................................... | |
2Introduction .................................................................................................................................................. | |
2.1Report Section Responsibilities ...................................................................................................... | |
2.2Personal Inspection ........................................................................................................................ | |
2.3Effective Date ................................................................................................................................. | |
2.4Abbreviations and Units of Measure ............................................................................................. | |
3Property description ..................................................................................................................................... | |
3.2Land Use and Mining Tenure ......................................................................................................... | |
3.3Mining Leases ................................................................................................................................. | |
3.4Exploration Permits for Minerals ................................................................................................... | |
3.5Freehold Land ................................................................................................................................. | |
3.5.1Lot 37 (Agreement Numbers 355, 526, 1069, and 1070) ................................................ | |
3.5.2Lot 28 (Agreement Numbers 355, 1069, and 1070) ........................................................ | |
3.7Encumbrances ................................................................................................................................ | |
4Accessibility, climate, local resources, infrastructure, and physiography. ................................................... | |
4.1Accessibility and Infrastructure ...................................................................................................... | |
4.2Climate and Surface Water ............................................................................................................ | |
4.3Landforms and Vegetation ............................................................................................................. | |
4.4Local Mining Industry ..................................................................................................................... | |
5.1Prior Ownership and Changes ........................................................................................................ | |
5.2Mineral Resource Estimates History .............................................................................................. | |
5.2.1Little Eva Deposit ............................................................................................................. | |
5.2.2Turkey Creek Deposit ....................................................................................................... | |
5.2.3Bedford Deposit ............................................................................................................... | |
5.2.4Lady Clayre Deposit ......................................................................................................... | |
5.2.5Ivy Ann Deposit ................................................................................................................ | |
5.2.6Blackard Deposit .............................................................................................................. | |
5.2.7Scanlan Deposit ............................................................................................................... | |
5.2.8Legend Deposit ................................................................................................................ | |
5.2.9Great Southern Deposit ................................................................................................... | |
6Geological setting, Mineralisation, and Deposit ........................................................................................... | |
6.1Regional Geology ............................................................................................................................ | |
6.1.1Regional Stratigraphy ...................................................................................................... | |
6.1.2Regional Deformation ...................................................................................................... | |
6.2Project Geology .............................................................................................................................. | |
6.2.1Little Eva Deposit Geology ............................................................................................... | |
6.2.2Turkey Creek .................................................................................................................... | |
6.2.3Native Copper deposits ................................................................................................... | |
6.2.4Lady Clayre ....................................................................................................................... | |
6.3Deposit Types ................................................................................................................................. | |
6.3.1Copper-Gold Deposits ...................................................................................................... | |
6.3.2Copper-Only Deposits ...................................................................................................... | |
7Exploration .................................................................................................................................................... | |
7.1.1Drill Hole Data Description .............................................................................................. |
Effective date: 30 June 2025
iv
Technical Report Summary of the
Eva Copper Project, North West Queensland, Australia
7.1.1.1Little Eva ............................................................................................................ | |
7.1.1.2Turkey Creek ..................................................................................................... | |
7.1.1.7Lady Clayre ........................................................................................................ | |
7.1.1.1Great Southern ................................................................................................. | |
7.1.2Drill Hole Collar Survey Control ....................................................................................... | |
7.1.2.1Little Eva ............................................................................................................ | |
7.1.2.2Turkey Creek ..................................................................................................... | |
7.1.2.7Lady Clayre ........................................................................................................ | |
7.1.3Downhole Surveys ........................................................................................................... | |
7.1.3.1Little Eva ............................................................................................................ | |
7.1.3.2Turkey Creek ..................................................................................................... | |
7.1.3.3Blackard, Scanlan and Bedford ......................................................................... | |
7.1.3.5Lady Clayre ........................................................................................................ | |
7.1.3.6Legend and Great Southern .............................................................................. | |
7.1.4Drill Hole Logging ............................................................................................................. | |
7.1.4.1Little Eva ............................................................................................................ | |
7.1.4.4Lady Clayre ........................................................................................................ | |
7.1.5Core and RC Sampling Methods ...................................................................................... | |
8Sample Preparation, Analysis and Security ................................................................................................... | |
8.1Little Eva ......................................................................................................................................... | |
8.1.1URL 2002 programme ...................................................................................................... | |
8.1.2URL 2003–2006 programme ............................................................................................ | |
8.1.3URL 2007 programme ...................................................................................................... | |
8.1.4Altona 2011 programme ................................................................................................. | |
8.1.5Altona-Sichuan Railway Investment Group 2015 programme ........................................ | |
8.1.6CMMC 2018 to 2022 ........................................................................................................ | |
8.1.7Harmony Work 2023 to present ...................................................................................... | |
8.1.8Quality Control Procedures ............................................................................................. | |
8.2Turkey Creek ................................................................................................................................... | |
8.3Blackard, Scanlan, Legend and Great Southern ............................................................................ | |
8.6Lady Clayre ..................................................................................................................................... | |
9Data verification ............................................................................................................................................ | |
10Mineral Processing and Metallurgical testing ............................................................................................... | |
10.1Introduction .................................................................................................................................... | |
10.2Little Eva Deposit ............................................................................................................................ | |
10.2.1Mineralogy ....................................................................................................................... |
Effective date: 30 June 2025
v
Technical Report Summary of the
Eva Copper Project, North West Queensland, Australia
11Mineral Resource Estimates ......................................................................................................................... | |
11.1Introduction .................................................................................................................................... | |
11.2Resource Estimation Procedures ................................................................................................... | |
11.3Geological and Mineralisation Models and Domains .................................................................... | |
11.3.1Little Eva .......................................................................................................................... | |
11.3.2Turkey Creek .................................................................................................................... | |
11.3.3Native Copper deposits ................................................................................................... | |
11.3.5Lady Clayre ....................................................................................................................... | |
11.3.7Block Models .................................................................................................................... | |
11.4Database and Statistical Analysis ................................................................................................... | |
11.4.1Drill Hole Database .......................................................................................................... | |
11.4.2Deposit Assay Data Statistics ........................................................................................... | |
11.4.2.1Little Eva Deposit .............................................................................................. | |
11.4.2.2Blackard Deposit ............................................................................................... | |
11.4.2.3Scanlan Deposit ................................................................................................. | |
11.4.3Data Conditioning and Assay Composites ....................................................................... | |
11.5Bulk Density .................................................................................................................................... | |
11.6Variography .................................................................................................................................... | |
11.7Grade Interpolation ........................................................................................................................ | |
11.8Classification and Mineral Resource Statement ............................................................................ | |
11.9Resource Verification ..................................................................................................................... | |
12Mineral Reserve Estimates ............................................................................................................................ | |
13Mining Methods ............................................................................................................................................ | |
14Processing and Recovery Methods ............................................................................................................... | |
15Infrastructure ................................................................................................................................................ | |
16Market Studies .............................................................................................................................................. | |
Groups .......................................................................................................................................................... | |
18Capital and Operating Costs .......................................................................................................................... | |
19Economic Analysis ......................................................................................................................................... | |
20Adjacent properties ...................................................................................................................................... | |
20.1Mining Properties (Regional) .......................................................................................................... | |
20.2Mining Properties (Adjacent) ......................................................................................................... | |
20.3Non-Mining Properties ................................................................................................................... | |
21Other Relevant Data and Information .......................................................................................................... | |
22Interpretation and Conclusion ...................................................................................................................... | |
22.1Geology, Mineral Resources ........................................................................................................... | |
22.3Metallurgical Testwork and Mineral Processing ............................................................................ | |
22.4Process Plant .................................................................................................................................. | |
22.5Infrastructure ................................................................................................................................. | |
22.6Environmental, Permitting, and Social Considerations .................................................................. | |
22.7Capital and Operating Costs ........................................................................................................... | |
23Recommendations ........................................................................................................................................ | |
23.1Mineral Resources and Mineral Reserves ...................................................................................... | |
24References ..................................................................................................................................................... | |
24.1References ...................................................................................................................................... | |
25Reliance on information provided by the registrant .................................................................................... |
Effective date: 30 June 2025
vi
Technical Report Summary of the
Eva Copper Project, North West Queensland, Australia
List of Figures
Effective date: 30 June 2025
vii
Technical Report Summary of the
Eva Copper Project, North West Queensland, Australia
Effective date: 30 June 2025
viii
Technical Report Summary of the
Eva Copper Project, North West Queensland, Australia
List of Tables
Effective date: 30 June 2025
ix
Technical Report Summary of the
Eva Copper Project, North West Queensland, Australia
Effective date: 30 June 2025
x
Technical Report Summary of the
Eva Copper Project, North West Queensland, Australia
Units of Measure and Abbreviations
Unit / Abbreviation | Description or Definition |
°C | degrees Celsius |
µm | Micrometers |
2D | Two-dimensional |
3D | Three-dimensional |
AE | Abnormal expenditure |
Ag | Silver |
Al | Aluminium |
AMD | Absolute Mine Datum (+1000m) |
AngloGold | AngloGold Limited |
Au | Gold |
Ave. | Average |
BMD | Below mine datum |
Bn | Billion |
c. | Approximately |
CIP | Carbon-In-Pulp |
cm | Centimetre |
cmg/t | Centimetre-grams per tonne |
CODM | Chief Operating Decision-Maker |
Company | Harmony Gold Mining Company Limited |
COP | Code of Practice |
CRG | Central Rand Group |
CRM | Certified Reference Material |
Cu | Copper |
CV | Coefficient of Variation |
DMPR | Department of Mineral and Petroleum Resources |
DWS | Department of Water and Sanitation |
EIA | Environmental Impact Assessment |
EMPR | Environmental Management Program |
EMS | Environmental Management System |
ESG | Environmental Social and Governance |
ETF’s | Exchange Traded Funds |
EW-SX | Electro-wining solvent extraction |
FAIG | Fellow of the Australian Institute of Geoscientists |
FAusIMM | Fellow of the Australasian institute of Mining and Metallurgy |
Fe | Iron |
FS | Feasibility Study |
FX | Foreign Exchange rate |
g | Gram |
g/t | Grams per metric tonne |
GHG | Greenhouse gas |
GIS | Geographic Information System |
GISTM | Global Industry Standard on Tailings Management |
ha | Hectare |
Harmony | Harmony Gold Mining Company Limited |
HPE | Hydro-powered |
kg | Kilogram |
km | Kilometre |
km2 | Square kilometre |
kV | Kilovolt |
Effective date: 30 June 2025
xi
Technical Report Summary of the
Eva Copper Project, North West Queensland, Australia
Unit / Abbreviation | Description or Definition |
kWh | Kilowatt-hour |
L | Litre |
LDL | Lower detection limit |
LIB | Long Inclined Borehole |
LOM | Life of Mine |
Ltd | Limited |
m | Meter |
M | Million |
m3/hr | Cubic metres per hour |
masl | Metres above sea level |
MCC | Mining Charter Compliance |
MCF | Mine Call Factor |
Mg | Magnesium |
Mintek | South Africa's national mineral research organization |
mm | Millimetre |
Moz | Million troy ounces |
MPRDA | Mineral and Petroleum Resources Development Act, 28 of 2002 |
Mt | Million tonnes |
Mtpa | Million tonnes per annum |
Mtpm | Million tonnes per month |
NEMA | National Environmental Management Act, 107 of 1998 |
No. | Number |
NSR | Net Smelter Return |
NPV | Net present value |
oz | Troy ounce |
Pb | Lead |
PSD | Particle Size Distribution |
Pty | Proprietary |
QA/QC | Quality Assurance/Quality Control |
QP | Qualified Person |
ROM | Run-of-Mine |
SACNASP | South African Council for Natural Scientific Professions |
SAMREC | The South African Code for the Reporting of Exploration Results, Mineral Resources and Mineral Reserves |
SEC | Securities and Exchange Commission |
SGM | Sequential Grid Mining |
SLP | Social Labour Plan |
STD | Standard Deviation |
t | Metric tonne |
t/m3 | Tonne per cubic meter |
TMM | Trackless mobile machinery |
TRS | Technical Report Summary |
TSF | Tailings Storage Facility |
USD | United States Dollars |
USD/oz | United States Dollar per troy ounce |
WRG | West Rand Group |
WUL(s) | Water Use License(s) |
ZAR | South African Rand |
ZAR/kg | South African Rand per kilogram |
Zn | Zinc |
Effective date: 30 June 2025
xii
Technical Report Summary of the
Eva Copper Project, North West Queensland, Australia
Glossary of Terms
Term | Definition |
Co-kriging | A method that is used to predict the value of the point at unobserved locations by sample points that are known to be spatially interconnected by adding other variables that have a correlation with the main variable or can also be used to predict 2 or more variables simultaneously. |
Cut-off grade | Cut-off grade is the grade (i.e. the concentration of metal or mineral in rock) that determines the destination of the material during mining. For purposes of establishing “prospects of economic extraction,” the cut-off grade is the grade that distinguishes material deemed to have no economic value (it will not be mined in underground mining or if mined in surface mining, its destination will be the waste dump) from material deemed to have economic value (its ultimate destination during mining will be a processing facility). Other terms used in similar fashion as cut-off grade include net smelter return, pay limit, and break-even stripping ratio. |
Dilution | Unmineralized rock that is by necessity, removed along with ore during the mining process that effectively lowers the overall grade of the ore. |
Head grade | The average grade of ore fed into the mill. |
Economically viable | Economically viable, when used in the context of Mineral Reserve determination, means that the qualified person has determined, using a discounted cash flow analysis, or has otherwise analytically determined, that extraction of the Mineral Reserve is economically viable under reasonable investment and market assumptions. |
Indicated Mineral Resource | Indicated Mineral Resource is that part of a Mineral Resource for which quantity and grade or quality are estimated on the basis of adequate geological evidence and sampling. The level of geological certainty associated with an Indicated Mineral Resource is sufficient to allow a qualified person to apply modifying factors in sufficient detail to support mine planning and evaluation of the economic viability of the deposit. Because an Indicated Mineral Resource has a lower level of confidence than the level of confidence of a Measured Mineral Resource, an Indicated Mineral Resource may only be converted to a probable Mineral Reserve. |
Inferred Mineral Resource | Inferred Mineral Resource is that part of a Mineral Resource for which quantity and grade or quality are estimated on the basis of limited geological evidence and sampling. The level of geological uncertainty associated with an Inferred Mineral Resource is too high to apply relevant technical and economic factors likely to influence the prospects of economic extraction in a manner useful for evaluation of economic viability. Because an Inferred Mineral Resource has the lowest level of geological confidence of all Mineral Resources, which prevents the application of the modifying factors in a manner useful for evaluation of economic viability, an Inferred Mineral Resource may not be considered when assessing the economic viability of a mining project, and may not be converted to a Mineral Reserve. |
Kriging | A method of interpolation based on Gaussian process governed by prior covariances. It uses a limited set of sampled data points to estimate the value of a variable over a continuous spatial field |
Mine Call Factor | The ratio, expressed as a percentage, of the total quantity of recovered and unrecovered mineral product after processing with the amount estimated in the ore based on sampling. |
Measured Mineral Resource | Measured Mineral Resource is that part of a Mineral Resource for which quantity and grade or quality are estimated on the basis of conclusive geological evidence and sampling. The level of geological certainty associated with a Measured Mineral Resource is sufficient to allow a qualified person to apply modifying factors, as defined in this section, in sufficient detail to support detailed mine planning and final evaluation of the economic viability of the deposit. Because a Measured Mineral Resource has a higher level of confidence than the level of confidence of either an Indicated Mineral Resource or an Inferred Mineral Resource, a Measured Mineral Resource may be converted to a Proven Mineral Reserve or to a Probable Mineral Reserve. |
Mineral Reserve | Mineral Reserve is an estimate of tonnage and grade or quality of Indicated and Measured Mineral Resources that, in the opinion of the qualified person, can be the basis of an economically viable project. More specifically, it is the economically mineable part of a Measured or Indicated Mineral Resource, which includes diluting materials and allowances for losses that may occur when the material is mined or extracted. |
Mineral Resource | Mineral Resource is a concentration or occurrence of material of economic interest in or on the Earth’s crust in such form, grade or quality, and quantity that there are reasonable prospects for economic extraction. A Mineral Resource is a reasonable estimate of mineralization, taking into account relevant factors such as cut-off grade, likely mining dimensions, location or continuity, that, with the assumed and justifiable technical and economic conditions, is likely to, in whole or in part, become economically extractable. It is not merely an inventory of all mineralization drilled or sampled. |
Effective date: 30 June 2025
xiii
Technical Report Summary of the
Eva Copper Project, North West Queensland, Australia
Term | Definition |
Modifying Factors | Modifying factors are the factors that a qualified person must apply to Indicated and Measured Mineral Resources and then evaluate in order to establish the economic viability of Mineral Reserves. A qualified person must apply and evaluate modifying factors to convert Measured and Indicated Mineral Resources to Proven and Probable Mineral Reserves. These factors include but are not restricted to; mining; processing; metallurgical; infrastructure; economic; marketing; legal; environmental compliance; plans, negotiations, or agreements with local individuals or groups; and governmental factors. The number, type and specific characteristics of the modifying factors applied will necessarily be a function of and depend upon the mineral, mine, property, or project. |
Pre-Feasibility Study | A pre-feasibility study (or preliminary feasibility study) is a comprehensive study of a range of options for the technical and economic viability of a mineral project that has advanced to a stage where a qualified person has determined (in the case of underground mining) a preferred mining method, or (in the case of surface mining) a pit configuration, and in all cases has determined an effective method of mineral processing and an effective plan to sell the product. (1) A pre-feasibility study includes a financial analysis based on reasonable assumptions, based on appropriate testing, about the modifying factors and the evaluation of any other relevant factors that are sufficient for a qualified person to determine if all or part of the Indicated and Measured Mineral Resources may be converted to Mineral Reserves at the time of reporting. The financial analysis must have the level of detail necessary to demonstrate, at the time of reporting, that extraction is economically viable. (2) A pre-feasibility study is less comprehensive and results in a lower confidence level than a feasibility study. A pre-feasibility study is more comprehensive and results in a higher confidence level than an initial assessment. |
Probable Mineral Reserve | Probable Mineral Reserve is the economically mineable part of an Indicated and, in some cases, a Measured Mineral Resource. |
Proven Mineral Reserve | Proven Mineral Reserve is the economically mineable part of a Measured Mineral Resource and can only result from conversion of a Measured Mineral Resource. |
Qualified Person | A qualified person is: (1) A mineral industry professional with at least five years of relevant experience in the type of mineralization and type of deposit under consideration and in the specific type of activity that person is undertaking on behalf of the registrant; and (2) An eligible member or licensee in good standing of a recognized professional organization at the time the technical report is prepared. For an organization to be a recognized professional organization, it must: (i) Be either: (A) An organization recognized within the mining industry as a reputable professional association; or (B) A board authorized by U.S. federal, state or foreign statute to regulate professionals in the mining, geoscience or related field; (ii) Admit eligible members primarily on the basis of their academic qualifications and experience; (iii) Establish and require compliance with professional standards of competence and ethics; (iv) Require or encourage continuing professional development; (v) Have and apply disciplinary powers, including the power to suspend or expel a member regardless of where the member practices or resides; and (vi) Provide a public list of members in good standing. |
Tailings | Finely ground rock of low residual value from which valuable minerals have been extracted is discarded and stored in a designed dam facility. |
Tailings Freeboard | The vertical height between the beached tailings against the embankment crest and the crest itself. |
Effective date: 30 June 2025
1
Technical Report Summary of the
Eva Copper Project, North West Queensland, Australia
1Executive Summary
Section 229.601(b)(iii){B}(96)(1)
The Qualified Person (“QP”) of Harmony Gold Mining Company Limited (“Harmony” or the “Company”) has
prepared this TRS to disclose the Mineral Resource estimates for the Company’s Eva Copper Project (the
'Project" or the "Eva Copper Project"). The TRS has been prepared in accordance with the U.S. Securities and
Exchange Commission (“SEC”) Regulation, S-K 1300, with an effective date as at 30 June 2025. This TRS is a
2025 update to the previously filed 2024 TRS. This TRS updates the Technical Report Summary filed by
Harmony on the Eva Copper Project on 31 October 2023, named Exhibit 96.14 Technical Report Summary of
the Mineral Resources and Mineral Reserves for the Eva Copper Project, North West Queensland, Australia,
which was effective on 30 June 2023. This TRS is prepared to satisfy the requirement of Item 1302(e)(6) of
Regulation S-K. No material changes have occurred between the effective date and the date of signature of
this TRS.
The Project is 100% owned by Harmony Eva Copper Limited, a subsidiary of Harmony Gold Mining Company
Ltd. The Project is in North West Queensland, approximately 76 kilometres (km) northwest of Cloncurry, and
194 km northeast of Mount Isa.
The Project is in the Feasibility Study stage that is testing a multiple open pit operation feeding a copper
concentrator to produce copper concentrate for sale. There are seven deposits informing the Resource and
in order of size are Little Eva, Blackard, Scanlan, Turkey Creek, Lady Clayre, Bedford, and Ivy Ann.
Existing major infrastructure closely surrounding the Project site includes the Burke Developmental Road,
located 8.5 km to the east of the Project, which connects Cloncurry with Normanton. A power transmission
line installed by MMG Limited for their Dugald River mine, located 11 km south of the Project. A water
pipeline that runs from Lake Julius to the Ernest Henry Mine traverses the southern portion of the Project
site. A residential area, known as the Mount Roseby Homestead, is located approximately 17.5 km to the
south of the Project plant site. Current infrastructure located on the Project site itself is minor, and includes
dirt tracks for exploration, water points, and fences.
Key Facts
Units of measurement used in this TRS conform to the metric system. All currency is United States dollars
(US$) unless otherwise noted.
Table 1-1: Eva Copper Project Summary
Contained Metal | |||||
Mineral Resources | Tonnes (Mt) | Copper Grade (%) | Gold Grade (g/t) | Copper (Mlb) | Gold (Moz) |
Total Mineral Resources – Measured and Indicated | 391.7 | 0.40 | 0.03 | 3,112 | 420 |
– Inferred | 83.2 | 0.39 | 0.03 | 653 | 77 |
Total Mineral Reserves – Proven and Probable | — | — | — | — | — |
Notes
1. Mineral Resources are reported in accordance with the SAMREC Code, 2016 and have an effective date of 30 June 2025. For the
purposes of this TRS, the Mineral Resources have been classified in accordance with § 229.1302(d)(1)(iii)(A) (Item 1302(d)(1)(iii)(A) of
Regulation S-K). The Qualified Person is responsible for the estimate and has relied on data provided by Mr R Reid, Group Resource
Geologist, and employee of Harmony Australasia Services Pty Ltd.
2. Mineral Resources are reported on a 100% basis. Harmony holds a 100% interest.
5. Mineral Resources are reported exclusive of Mineral Reserves. Mineral Resources that are not Mineral Reserves do not have
demonstrated economic viability.
6. Mineral Resources at the Project are reported assuming bulk open pit mining with metallurgical recovery for copper and gold by
sulphide flotation. Mineral Resources are reported above a variable copper grade cut-off based on the results of a profit algorithm NSR
calculation that equates to a marginal ore cut-off grade. The profit algorithm takes account of metal price, grade, ore processing route,
recoveries of 95% (Cu Sulphide), 56% (Cu Native Copper) and 78% (Au) and costs. Metal price assumptions are USD1,941/oz gold,
USD5.10/Lb copper and a 0.68 USD/AusD exchange rate. Adjustments to these figures will potentially impact upon the economic cut-
off grade.
7. Tonnages are metric tonnes. Copper pounds, and Gold and silver ounces are estimates of metal contained in tonnages and do not
include allowances for processing losses.
8. Rounding as required by reporting guidelines may result in apparent differences between tonnes, grade and contained metal content.
Rounding is to three significant figures.
Effective date: 30 June 2025
2
Technical Report Summary of the
Eva Copper Project, North West Queensland, Australia
Project Overview
Eva Copper Mine Pty Ltd is a wholly owned subsidiary of Harmony Gold Company Mining Limited which owns
100% of the Project. Harmony acquired the Project from Copper Mountain Mining Pty. Ltd. ("CMMC") in
December 2022.
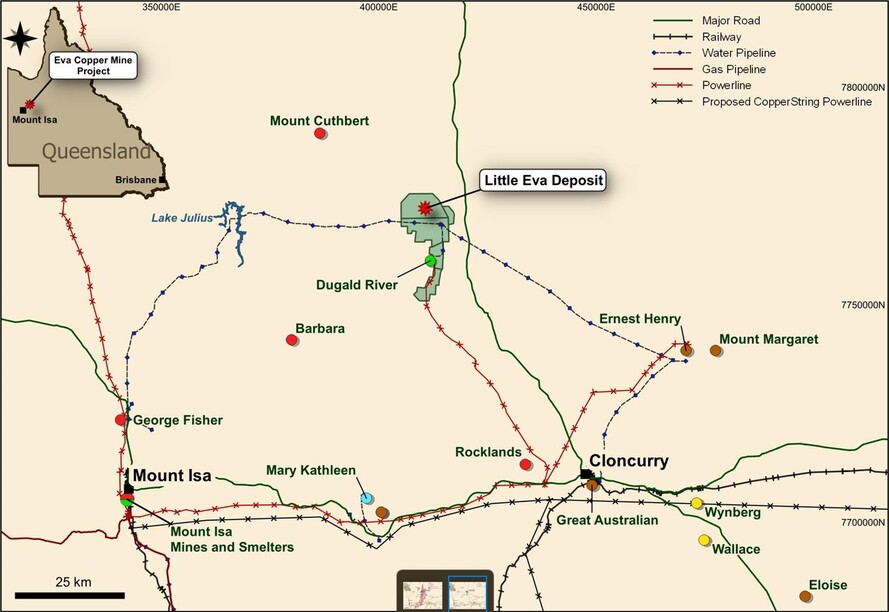
Eva Copper is located approximately 76 km northwest of Cloncurry in North West Queensland, Australia, and
has extensive exploration potential in the approximately 4,000 km2 (379,000 hectare [ha]) mineralised land
package (Figure 1-1).
CMMC reported a technically and financially viable operation through its 2020 Feasibility Study Update in
which it declared Reserves. This operation consisted of seven (7) deposits with ore processed through a
copper concentrator to produce a copper concentrate for sale. During its due diligence phase, Harmony
identified a number of risks and opportunities it wished to test in an update of the study. These studies are
ongoing and not yet complete. Harmony is not in position to declare Reserves at this point in time.
Figure 1-1: Eva Copper Project Location, Tenure, and Regional Infrastructure
Ownership
The Eva Copper Project is owned by Harmony Eva Services Pty Ltd, a 100% owned subsidiary of Harmony.
Reliance on Other Experts
The QPs’ opinions contained herein are based on public and private information provided by Harmony and
others throughout the course of the study. The authors have carried out due diligence reviews of the
information provided to them by Harmony and others for preparation of this TRS. The authors are satisfied
that the information was accurate at the time of writing, and that the interpretations and opinions expressed
are reasonable and are based on a current understanding of the mining and processing techniques and costs,
economics, mineralisation processes, and the host geological setting. The authors have made reasonable
efforts to verify the accuracy of the data relied on for this TRS.
Effective date: 30 June 2025
3
Technical Report Summary of the
Eva Copper Project, North West Queensland, Australia
Property Description and Location
The Eva Copper Project is located 76 km northwest by road from Cloncurry, and 194 km northeast by road
from Mount Isa, a regional mining centre (Figure 1-1). Access to the Project is via the sealed Burke
Developmental Road from Cloncurry. This road passes 8.5 km to the east of the proposed processing plant
site and the Little Eva and Turkey Creek pits. The site is also 11 km north of the major operating Dugald River
zinc mine.
The Mineral Resources are within five granted Mining Leases ("ML"), except for the Ivy Ann pit, which is
within the Exploration Permit for Minerals ("EPM") 25760 (King). The MLs total an area of 143 km2 and are
situated across from two pastoral lease holdings and within one Native Title grant. There are two freehold
lots granted in the late 1800s, and 100% owned by the Company, that lie within the MLs; the first sits over
part of the Little Eva deposit, the second over part of the Longamundi deposit.
Necessary agreements are secured with the pastoral leaseholders and Native Title party (Kalkadoon People)
that set out conduct and compensation terms for the future mining activities to proceed.
Numerous royalties apply to the Project. Royalties on minerals are payable annually to the Queensland State
Government on an ad valorem basis, with various costs being permitted as a deduction from sales revenue.
Copper and gold royalty rates vary between 2.5% and 5.0% of value, depending on average metal prices, as
per Schedule 3 of the Mineral Resources Regulation of 2003. No state royalty on copper is applicable to the
two freehold lots owned by the Company. Several royalties also apply to the Project from purchase
agreements and are payable to several parties variably across portions of the Project area. These apply to all
of the deposits in the Project mine plan: a total 1.5% net smelter return ("NSR") royalty is applicable to the
Little Eva, Blackard, Scanlan, Turkey Creek, Bedford, and Lady Clayre deposits, and a 2% NSR royalty is
applicable to the Ivy Ann deposit. Compensation for the effects of mining activities on the Native Title of the
Kalkadoon People has been agreed upon.
Accessibility, Climate, Local Resources, Infrastructure, and Physiography
Current site access is by way of a new access road from a sealed road that passes 8.5 km to the east of the
proposed plant site. The site is also 11 km north of the major operating Dugald River zinc mine, owned by
MMG.
The town of Cloncurry is located on the railway line from Townsville to Mount Isa, and has container handling
facilities, an airport that hosts both commercial and fly-in/fly-out ("FIFO") jet aircraft services, and a regional
fuel depot. It also has schools, hospitals, and other services. The Project lies within the Shire of Cloncurry,
which is the local government administrative area. The Shire offices are also based in Cloncurry.
Grid power is generated in Mount Isa at two gas-fired power stations and is transmitted from Mount Isa to
Cloncurry. A 220 kV power line has been constructed from the Chumvale substation near Cloncurry to the
Dugald River mine.
The Cloncurry region is semi-arid, with a distinct hot, wet season from November to March, which is typical
of inland northern Australia. Average monthly temperatures range from 10.6°C to 38.5°C, with extremes
recorded from 1.8°C to 46.9°C. Rainfall in the wet season largely occurs as storms. Rainfall is highly variable
from year to year, with the region often experiencing both multi-year droughts and large-scale flooding from
major rainfall events.
The Project site is serviced by a complex system of surface drainages that flow generally northward. On the
western side of the processing plant and Little Eva pit is Cabbage Tree Creek, which is joined by other creeks
flowing northward to become a tributary of the Leichhardt River. Creeks and rivers flow only during, and for a
brief period following, the wet season.
The Project has groundwater sources from both hard rock fracture zone systems and from a graben-like
structure infilled with Phanerozoic sediments and alluvial deposits within a paleodrainage adjacent to the
current course of Cabbage Tree Creek.
Effective date: 30 June 2025
4
Technical Report Summary of the
Eva Copper Project, North West Queensland, Australia
The mine site and broader operation area is gently undulating flat topography, with the predominant land
use being low-intensity cattle grazing, although exploration and mining activities have been conducted over
the area since the late 1800s. The site is currently crossed by several gravel roads from pastoral and
exploration activities. Additionally, SunWater Limited’s water pipeline from Lake Julius to the Ernest Henry
mine crosses the lease area from west to east.
History
The Project has a long history, and has been held under various tenures by a variety of exploration and
mining companies. Small-scale mining dating back to the early 1900s has occurred at deposits such as Little
Eva, Bedford, and Lady Clayre. Early explorers that contributed significantly to the Project with the discovery
of the copper-only or native copper deposits are Ausminda Pty. Ltd., and then CRA Exploration ("CRAE"), who
completed the first substantive work between 1990 and 1996, also defining a small resource at Little Eva.
CRAE sold its interest in the Project to Pasminco Limited ("Pasminco") in 1998. Universal Resources Limited
("URL") acquired the Project in 2001. URL also purchased the tenement hosting the Ivy Ann deposit from
Dominion Metals Pty. Ltd. ("Dominion") and Pan Australian Resources NL ("PanAust").
The remaining property was acquired by purchasing tenure from both Pasminco and Lake Gold Pty. Ltd. in a
50:50 ownership split between URL and Roseby Copper Pty. Ltd. ("RCPL"). In 2004, URL purchased RCPL, and
thus URL held 100% of the Eva Copper Project resources. Until 2009, work focused extensively on the copper-
only resources, with completion of two feasibility studies based on blends of sulphide ore and copper-only
ore. In 2010 URL merged with Vulcan Resources to become Altona Mining Limited ("Altona"), Altona took
over ownership of the Eva Copper Project. From 2010 to 2012, Altona carried out additional drilling, resulting
in Mineral Resource upgrades at the Little Eva, Bedford, Lady Clayre, Ivy Ann, Blackard, Legend, and Scanlan
deposits. Little Eva’s resource estimate was doubled based on the additional drilling.
In 2012, Altona completed a Feasibility Study based on the increased resources at the copper-gold sulphide
deposits, and excluding the Blackard and Scanlan deposits. Altona published Mineral Reserves for the Little
Eva, Bedford, Lady Clayre, and Ivy Ann deposits as part of the 2012 Feasibility Study. Altona published
updates to the Feasibility Study in 2014 and 2017. The 2017 update incorporated the subsequently
delineated significant Mineral Resource at Turkey Creek.
MLs and an EA were granted in 2012 based on the 2009 Feasibility Study mine plan. Following EA
amendments, the Project is currently authorised by EA EMPL00899613, granted 23 October 2024.
Altona completed a DFS update in 2017, incorporating the Turkey Creek deposit in the mine plan and
significant layout changes that included changes to the size and location of the TSF and a Cabbage Tree Creek
diversion channel at Little Eva pit. To support the previous studies, the Little Eva, Bedford, Lady Clayre, and
Ivy Ann deposits have had a number of formal Mineral Resource estimates that reflect stages of resource
definition dating from 2006 to 2017. The Mineral Resource estimate for Turkey Creek was completed in 2015.
Estimates were largely undertaken by external independent experts, initially by McDonald Speijers, and most
recently Optiro, based on data and geological models provided by the CMMC.
In December 2022 Harmony purchased the project from CMMC. In February 2023 Harmony commenced a
confirmatory and expansion drilling programme and other studies designed to progress the project to a
decision to mine.
Geological Setting and Mineralisation
The Project area is situated within the Mount Isa and North West Region of Queensland, Australia, an area
that is one of the premier base metal-bearing areas of Australia, with mining activities having taken place
since the discovery of copper and gold near Cloncurry in the 1860s. The Mount Isa area hosts numerous base
metal copper, zinc, and lead deposits of global significance, including the Mount Isa, Ernest Henry, Century,
Dugald River, Cannington, and Selwyn deposits. The Eva Copper Project is hosted by Proterozoic-aged,
metamorphosed and poly-deformed marine sedimentary and volcanic rocks of the Mary Kathleen domain of
the Eastern Fold Belt Inlier. Deformation, metamorphism, and plutonic activity took place during the Isan
Orogeny, approximately 1,600 to 1,500 million years (Ma) ago.
There are twelve known mineral deposits in the Project area, of which six have been included in the current
mine plan. Mineral deposits are grouped into two types: copper-gold, and copper only. There are five of the
copper-gold deposits, four of which are in the mine plan. These deposits are classified as iron oxide copper-
gold ("IOCG") deposits, where mineralisation is associated with regional-scale hematite and albite alteration
Effective date: 30 June 2025
5
Technical Report Summary of the
Eva Copper Project, North West Queensland, Australia
(red-rock alteration), and localised magnetite alteration. Copper sulphide mineralisation, primarily
chalcopyrite with lesser bornite, occurs as veins, breccias, fracture fill, and disseminations in mafic to
intermediate volcanic or intrusive rocks. Gold is generally correlated with copper and is recovered in the
copper concentrate. Mineralisation appears to be localised and/or bounded by faults and other deformation-
related structures. The copper-only deposits are stratabound, locally stratiform, and most occur within
metamorphosed calcareous metasedimentary rocks, forming an approximately linear trend stretching over 7
km. The origin of these deposits is uncertain; they may be deformed and metamorphosed versions of
sedimentary or red-bed type copper deposits, or they could be more closely related to the IOCG deposits, but
with enhanced stratigraphic controls related to the calcareous beds being particularly reactive with
hydrothermal fluids.
All of the deposits have a 10 m to 25 m thick overlying zone of oxidation, where the rock is extensively
weathered, and copper sulphide minerals have been leached or converted to various oxide minerals that
cannot be recovered by flotation. The oxide zones are treated as waste, but tonnages and copper grades
have been estimated and the oxide mineralisation will be stockpiled separately. With the exception of the
Turkey Creek deposit, the copper-only deposits commonly have a significant thickness of supergene material,
where carbonate has been leached from the rock, reducing hardness and density, and the copper occurs as
native-copper, chalcocite, and other low-sulphur copper species. The carbonate-leached zone is separated
from the underlying sulphide zone by a thin transition zone. Each of these mineralogical zones has been
modelled so that resources can be estimated for each and the appropriate metallurgical recoveries can be
applied for reserve estimation.
Drilling
Although exploration work has been recorded within the Eva Copper Project area since 1963, usable drill
data dates back to 1988. Total drilling in the seven deposits with planned production includes 1,470 drill
holes for 208,637 m. All the drill holes used for Mineral Resource estimation have accurate collar and
downhole surveys, including the older holes, which were subsequently resurveyed by later exploration
companies (URL, or more recently, Altona). Most of the drilling was done by reverse circulation ("RC")
methods, with a small percentage being diamond drill holes ("DD").
Statistical analysis of the type of drilling, age, and operating company does not indicate any bias to the drill
hole assay data. Assay data from two DDs completed by Sichuan Railway Investment Group (SRIG) in 2017,
and two DD completed in 2018 by CMMC within the Little Eva deposit, provided material for metallurgical
testing and were used to verify the resource block model. Two holes were drilled in the Turkey Creek deposit
in 2018 and 2019 for grade verification and metallurgical material. Eighteen RC holes were drilled in the
Blackard deposit in 2019 by CMMC to upgrade resource classification. Assay data from the 2019 RC drilling
within the Blackard deposit is statistically indistinguishable from historical drilling. Since obtaining the
Project, Harmony has commenced an extensive infill drilling campaign designed to confirm, and extend
confidence in, the Resource and geological models. To date Harmony has drilled 724 drill holes across the
project for a total of 155,914m. These holes have informed the ongoing feasibility study (metallurgical and
geotechnical holes) and recent Resource model updates to grade estimates and classification.
Exploration
Mineral exploration on lands of the Eva Copper Project dates back more than 40 years. The exploration
database for the area contains information from numerous geological, geophysical, and geochemical surveys
carried out by the current and previous operators, in addition to regional government data on geology and
geophysics. Almost all data from historical geophysical and geochemical work is compiled in the Company
database and has been used in the design and guidance of current exploration work.
The most useful historical geophysical work includes ground and airborne magnetics and gravity surveys
which, when combined with soil geochemistry, provide good drill targeting tools. Induced polarization ("IP")
and electromagnetic ("EM") geophysical surveys have also proven to be useful or have some benefit in the
right circumstances. Continuous improvements in electronic instrumentation, computer data processing,
inversion technology for geophysics, and multi-element analysis (particularly in handheld, portable X-ray
fluorescence (XRF) units), provide significant rationale to continue geophysical and geochemical surveying on
the property.
Effective date: 30 June 2025
6
Technical Report Summary of the
Eva Copper Project, North West Queensland, Australia
Deposit Types
Copper deposits of the Eva Copper Project are of two types. The most significant are those of the IOCG type,
which are hydrothermal copper-gold deposits associated with relatively high contents of iron oxide minerals
(magnetite or hematite), a general lack of quartz, and extensive sodic alteration. The hydrothermal fluids are
believed to be sourced from, and/or driven by, magmatic systems with possible addition of basin brines;
however, mineralisation is commonly distal (or spatially distinct) from the causative plutonic rocks.
Mineralisation can take many forms, but the dominant ones are vein networks, breccias, dissemination, and
replacement. Both structure (fault or fracture systems) and lithology (chemistry and rheology) are key
features in localization of mineralisation. The second type of copper deposit is termed copper-only; these
deposits do not contain significant gold and are typically hosted within deformed and metamorphosed
calcareous sedimentary rocks as stratabound mineralisation. One deposit, Turkey Creek, is a strataform
copper-only deposit within calc-silicate and schistose rocks but has processing characteristics similar to those
for the copper-gold deposits.
There are 12 defined deposits within the Eva Copper Project, ranging in size from 0.7 Mt to over 100 Mt, six
of which are included within the current mine plan. Three are copper-gold deposits, and three are copper-
only deposits. Metallurgical recoveries for the copper-gold deposits are favourable, due to relatively coarse-
grained chalcopyrite and lesser bornite. All of the deposits have a thin, 10 m to 40 m weathered or oxide
zone at surface, for which tonnage and grades have been estimated, but which have been treated as waste
within the mine plan. The copper-only deposits hosted within calcareous metasedimentary rocks have
additional zones of weathering and/or acid leaching, which has removed carbonate, reducing rock strength
and density in addition to changing sulphide mineralogy. In the two such deposits, Blackard and Scanlan, a
supergene zone termed native copper occurs below the oxide zone, and contains abundant native copper in
addition to chalcocite, cuprite, and other low-sulphur copper species and some copper locked in
hydrobiotite. Extensive metallurgical testing has been carried out on these deposits, with appropriate
processing design and estimation of recoveries. Within these deposits a narrow transition zone occurs
between the copper zone and underlying sulphide zone.
Sample Preparation, Analyses, and Security
There is very little documentation about sample collection, preparation, and security for the pre-1997 drilling
campaigns, although the nature of the exploration programmes, preservation of data, and logging records all
indicate that the drilling programmes were carried out in a professional and competent manner. Later
exploration programmes by URL (beginning in 2002) and Altona (in 2011), which provided the vast majority
of the drill data, were carried out with above industry-standard sample collection methods, and appropriate
quality assurance and quality control (QA/QC) protocols. RC drilling accounts for more than 90% of the
Project samples, and these samples were collected using standard cyclones and splitters at the drill site.
Samples lengths were initially 2 m for URL; however, they were changed to 1 m in 2003. Almost all of Altona’s
samples were 1 m in length.
Samples were bagged and sealed in the field, and shipped to commercial laboratories in either Townsville or
Brisbane. Regular duplicate samples of RC chips were inserted into the sample stream at a rate of 1 in every
20, and triplicate samples collected at the time of drilling were inserted into the sample stream at the rate of
1 in every 40. Appropriate reference standards and blank samples were inserted at rates of 1 in every 20 and
1 in every 45, respectively. Much of the sample material has been retained, mostly as pulp samples; however,
there is some coarse reject material, and it is stored in carefully organised warehouses, which also contain
split diamond drill core. All analytical information has been carefully archived in an electronic database,
which has been reviewed for accuracy by independent consultants and Harmony.
Data Verification
Historical drill locations were checked and resurveyed by subsequent operators, and assay data has been
examined and checked by third-party consultants involved in previous Feasibility Studies. There is no
apparent bias in the assay data from drill campaigns involving four different companies. The resource QP
examined drill core on site and found adequate agreement between geology and historical logs, and visual
estimates of copper grade were in agreement with assays. Assay results from drill holes completed to obtain
metallurgical samples in the Little Eva and Turkey Creek deposits in 2018, and in the Blackard deposit in 2019
and additional drilling completed by Harmony during 2023-2025, compare favourably to adjacent block
grades within the block models, supporting both the database and Mineral Resource estimation.
Effective date: 30 June 2025
7
Technical Report Summary of the
Eva Copper Project, North West Queensland, Australia
Metallurgical Testwork and Process Design
This section summarises both historical and recent test work associated with the various mineralisation types
on the Project property. This report generalises the various ore sources into one of two classes for design
purposes: sulphides, and native copper. The various ore sources were studied from the perspective of newer
technologies including direct flotation reactors for flotation.
The Little Eva deposit is the largest deposit in the Project. This deposit has been well studied, with 145
flotation tests from multiple sources that ranged in scope from benchtop to pilot plant. This mineralisation
consistently demonstrates high recovery performance with a high degree of liberation at relatively coarse
grinds. The average feed competency lies near the 50th percentile of the JK database, with medium to hard
Bond work indices. Copper is present as chalcopyrite with trace amounts of pyrite. Strong flotation kinetics
result in high recoveries, concentrating to a good final concentrate grade following a nominal regrind with no
pH modification. Overall, this material type presents low technical risk.
The sulphide satellite deposits, comprising Turkey Creek, Bedford, Lady Clayre, and Ivy Ann, are smaller
sources. These mineralisation types are generally similar to Little Eva from both a comminution and flotation
perspective. Some differences include a stronger deportment of copper to bornite, and varying grade
distribution. Overall, these deposits show average copper recoveries of 88% to 95%, and represent sources of
high recovery material. The specific recoveries for each pit are used as inputs into the mine schedule and
financial model.
The copper-only deposits, Blackard and Scanlan, are distinctly different from other deposits in the area,
containing oxide cap, native copper, sulphide transition, and sulphide zones. The native copper zones are the
largest copper-bearing zones within these deposits, containing a relatively fine distribution of native copper
with varying quantities of sulphides. These deposits were studied by previous owners; however, several
recent updates have been completed. In total, 410 flotation tests (including blended ore feed) have been
completed, ranging from benchtop to pilot scale work. On a flotation basis, the native copper zones typically
achieve 60% recovery, with an additional 2% to 3% achievable by gravity methods. Recovery is highly variable
as deportment shifts from native copper to sulphides, requiring flexibility within any processing flowsheet
between gravity and flotation operations to achieve an average of 56% overall recovery. This ore is typically
very soft, resulting in low comminution costs and high mill throughputs. Below the native copper- bearing
zones of both Blackard and Scanlan are sulphide zones containing bornite and chalcopyrite, behaving
similarly to Turkey Creek ore. The flotation response of the ore from the native copper to the sulphide
transition zone increases with sulphide content, as expected.
In total, the abovementioned work has been sourced from 25 metallurgical testing campaigns completed at
established metallurgical labs throughout Australia and British Columbia, Canada, from 1996 to 2019.
Concentrate Characterization
Detailed chemical analyses were performed on the concentrates produced from the testwork programmes,
and the results indicate that there appear to be no impurity elements present in the concentrate at a level
that will incur smelter penalties. Provision for separate dewatering and containment of gravity concentrates
is included in the plant design for future sampling or marketing opportunities.
Tailings Handling
Tailings generated from the bulk samples processed during the DFR testwork were sent to Paterson & Cooke
in Denver, Colorado, for tailings characterisation. The samples were examined both separately and as a
blend. In both cases no concerns were highlighted with tailings settling performance. A reasonable target of
63% solids was selected for tailings thickener underflow design.
Mineral Resources Estimate
Eva Copper Project Resources
Mineral Resource estimates for the three largest deposits (being Little Eva, Blackard and Turkey Creek) were
prepared by SRK and Harmony personnel, based on all drilling conducted up to January 2024. The Resource
models from CMMC have been audited and retained for the other deposits.The effective date of the resource
estimates is 30 June 2025.
Effective date: 30 June 2025
8
Technical Report Summary of the
Eva Copper Project, North West Queensland, Australia
The Mineral Resource for mineralisation, assumed to be amenable to open pit and underground mining
methods, is reported in situ.
The resource estimates were built using Ordinary Kriging for Little Eva, Blackard and Turkey Creek, all other
deposits utilised Inverse distance weighting. Block sizes were selected based on the drillhole spacing to
ensure the estimate is fully informed, Block sizes were matched to the anticipated mining methods and
mining equipment sizes.
Resource domains were based on an assessment of the lithology, alteration, grade distribution and structure.
The grade-based domains resulted from an analysis of the grade distribution from the assay table. For the
IOCG deposits the domains were based on the 0.1% copper grade shell which equates to the first visual
occurrence of chalcopyrite in logging. Turkey Creek and Blackard were constrained by a 0.1% copper shell,
defined by statistical analysis of the drill hole data, the earlier CMMC resource models were defined by a
0.1% copper shell.
Analysis at the Little Eva deposit of the underlying lithology indicates it does not have a significant impact on
grade distribution and so lithology was not included in the domain construction, likewise for the oxidation
profile. There are, however, several significant faults that have an impact on the deposit and these were
incorporated into the estimate, dividing the Little Eva estimation domain into 3 parts. While Turkey Creek
comprises of two sub-parallel high grade domains with a central low grade core, these domains were not
used in the estimate. Lithology and oxidation profiles, while assessed for impact were found to not be
significant contributors to grade distribution and did not inform the grade domains. A significant fault with
splays, the Turkey Creek Fault, cut across the northern end of the deposit and splits the domain into two
components. Blackard and Scanlan are both native copper deposits and analysis of these deposits indicate a
0.1% copper shell was appropriate. Both these deposits are folded and comprise antiform/synform pairs that
were used to inform the estimate, Blackard utilised dynamic anisotropy, guided by the fold surface, Scanlan
was divided into several separate domains in order to handle the changing anisotropy. Lady Clayre comprises
five separate mineralised zones, defined by copper shells at 0.1% based on analysis of the grade distribution.
The geology is strongly deformed and the various domains define the different components of this folded
stratigraphy. The Bedford deposit is a narrow mineralised shear zone, and the estimation domain is
controlled by the 0.1% copper shell which defines the boundaries of the shear, the estimation domain is
entirely geologically based. The Ivy Ann deposit estimation domain is based on the 0.1% Cu shell equating to
the first occurrence of chalcopyrite and comprises several independent structural domains.
The constraining pit shells for defining the limits of Inferred resources and to define reasonable prospects for
economic extraction are based on copper prices, costs and metallurgical recoveries determined from work
carried out, and described, in this TRS. Resources were constrained by Whittle pit shells generated using
metal prices of US$5.10/lb Cu, US$1,941/oz Au and an exchange rate of 0.68 AU$:US$. The Whittle shell was
based on the following parameters:
•Plant throughput of 18 Mtpa, with a mining rate of 60 Mtpa
•A mining reference cost of AU$3.93/tonne
•Approximately AU$11.00/t Ore processing cost.
•Ore Haulage cost of AU$0.35/t/km
•Slope angles informed by historic studies with an average of 45 degrees.
•Copper Recovery is dependant on copper mineralogy, 95% Sulphide and 56% native copper.
•A 10mx10mx10m diluted block model.
A zone of oxidation overlies all of the seven deposits in the Eva Copper Project. The base of the oxidised zone
is generally sharp (±2 m), and was modelled during resource estimation. In the current mine plan, the
oxidised material is treated as waste, as currently there does not appear to be any form of economic
extraction; however, grades have been modelled and tonnages tabulated for general interest and in the
event of a possible processing path being identified in the future. The tonnage and grade of oxidised material
were determined in the same manner and at the same time as the other resource estimations.
Effective date: 30 June 2025
9
Technical Report Summary of the
Eva Copper Project, North West Queensland, Australia
Table 1-2: Eva Copper Project Mineral Resources, 30 June 2025
Copper | Tons (Mt) | Cu Grade (% Cu) | Cu Pounds (Mlb) |
Measured | |||
Little Eva | — | — | — |
Bedford | — | — | — |
Lady Clayre | — | — | — |
Ivy Ann | — | — | — |
Turkey Creek | — | — | — |
Blackard | — | — | — |
Scanlan | — | — | — |
Legend | — | — | — |
Great Southern | — | — | — |
Total Measured | — | — | — |
Indicated | |||
Little Eva | 202.000 | 0.32 | 1,310.000 |
Bedford | 4.000 | 0.55 | 40.000 |
Lady Clayre | 5.000 | 0.43 | 42.000 |
Ivy Ann | 6.000 | 0.34 | 39.000 |
Turkey Creek | 31.000 | 0.42 | 263.000 |
Blackard | 128.000 | 0.48 | 1,223.000 |
Scanlan | 16.000 | 0.59 | 195.000 |
Legend | 34.000 | 0.47 | 324.000 |
Great Southern | 14.000 | 0.42 | 118.000 |
Total / Ave. Indicated | 440.000 | 0.40 | 3,554.000 |
Measured + Indicated | |||
Little Eva | 202.000 | 0.32 | 1,310.000 |
Bedford | 4.000 | 0.55 | 40.000 |
Lady Clayre | 5.000 | 0.43 | 42.000 |
Ivy Ann | 6.000 | 0.34 | 39.000 |
Turkey Creek | 31.000 | 0.42 | 263.000 |
Blackard | 128.000 | 0.48 | 1,223.000 |
Scanlan | 16.000 | 0.59 | 195.000 |
Legend | 34.000 | 0.47 | 324.000 |
Great Southern | 14.000 | 0.42 | 118.000 |
Total / Ave. Measured + Indicated | 440.000 | 0.40 | 3,554.000 |
Inferred | |||
Little Eva | 26.000 | 0.33 | 175.000 |
Bedford | 1.000 | 0.38 | 8.000 |
Lady Clayre | 1.000 | 0.43 | 7.000 |
Ivy Ann | 1.000 | 0.33 | 9.000 |
Turkey Creek | 6.000 | 0.44 | 52.000 |
Blackard | 37.000 | 0.40 | 300.000 |
Scanlan | 11.000 | 0.48 | 102.000 |
Legend | 6.000 | 0.33 | 36.000 |
Great Southern | 2.000 | 0.39 | 17.000 |
Total Inferred | 91.000 | 0.39 | 706.000 |
Effective date: 30 June 2025
10
Technical Report Summary of the
Eva Copper Project, North West Queensland, Australia
Gold | Tons (Mt) | Au Grade (oz/t Au) | Au Ounces (Moz) |
Measured | |||
Little Eva | — | — | — |
Bedford | — | — | — |
Lady Clayre | — | — | — |
Ivy Ann | — | — | — |
Total / Ave. Measured | — | — | — |
Indicated | |||
Little Eva | 202.000 | 0.002 | 367.000 |
Bedford | 4.000 | 0.004 | 16.000 |
Lady Clayre | 5.000 | 0.005 | 25.000 |
Ivy Ann | 6.000 | 0.002 | 12.000 |
Total / Ave. Indicated | 217.000 | 0.002 | 420.000 |
Measured + Indicated | |||
Little Eva | 202.000 | 0.002 | 367.000 |
Bedford | 4.000 | 0.004 | 16.000 |
Lady Clayre | 5.000 | 0.005 | 25.000 |
Ivy Ann | 6.000 | 0.002 | 12.000 |
Total / Ave. Measured + Indicated | 217.000 | 0.002 | 420.000 |
Inferred | |||
Little Eva | 26.000 | 0.003 | 66.000 |
Bedford | 1.000 | 0.004 | 4.000 |
Lady Clayre | 1.000 | 0.004 | 3.000 |
Ivy Ann | 1.000 | 0.003 | 4.000 |
Total / Ave. Inferred | 29.000 | 0.003 | 77.000 |
Notes:
Resources are reported at a cut-off grade are based on approximate NSR values which equate to a copper grade of 0.16% Cu for sulphide
material and 0.25% for native copper .
Mineral Resources:
1.SAMREC and CIM definitions were followed for Mineral Resources.
2.Mineral Resources are exclusive of Mineral Reserves (however no Mineral Reserve are declared)
3.Mineral Resources are constrained within a Whittle pit shell generated with a copper price of $5.10/lb, a gold price of $1,941/oz and
an exchange rate of AU$1.00 = US$0.68
4.Density measurements were applied (ranges from 2.4 t/m3 to 3.0 t/m3).
5.Significant figures have been reduced to reflect uncertainty of estimations and therefore numbers may not add due to rounding.
6. Tonnes are Metric Units (1t = 1000Kg)
7. Mineral Resource tonnages and grades are reported in situ.
Mineral Reserve Estimate
Not applicable to this TRS
Mineral Reserves were declared by CMMC as reported in their 43-101 2020 Feasibility Update.
During Harmony due diligence prior to acquiring the Project, a number of risks and opportunities were
identified. Accordingly, upon purchase, Harmony planned and commenced a drilling programme to expand
and refine the resource and commenced studies to test processing, infrastructure, water and power
assumptions. Due to the significant potential change these studies may imply, it is deemed premature to
release the Reserves. It is anticipated that these studies will be completed in late 2025, upon which a Reserve
may be declared.
Effective date: 30 June 2025
11
Technical Report Summary of the
Eva Copper Project, North West Queensland, Australia
Royalties
State of Queensland royalties apply to all lands except freehold claims prior to 1904. State royalties range
between 2.5% and 5.0% of metal value, less certain allowable expenses. If the concentrate is processed in
Queensland (Mount Isa) there is a 20% reduction in the copper royalty. 100% of the royalty savings from the
Queensland Government is for the account of CMMC. Royalties are discussed in detail in Section 3.6.
Environment, Permitting, Social, or Community Impact
To support environmental assessments and project studies, flora and fauna surveys, groundwater
programmes and waste and tailings rock characterisation, amongst others, have been undertaken to support
an appreciation of the environment and its sensitivities, to predict impacts and inform mitigation and control
measures. This dataset continues to be supplemented by contemporary studies and monitoring data.
All regional ecosystems mapped within the Project area are classed as Least Concern under the Vegetation
Management Act 1999. In accordance with the project's EA, significant residual impacts to prescribed
environmental matters, are not authorised with the exception of:
•Regional ecosystems (not within an urban area) within the defined distance from the defining banks
of a relevant watercourse on the vegetation management watercourse map.
•Habitat for an animal that is vulnerable wildlife – Purple-necked Rock-wallaby Monitoring programme
(Petrogale purpureicollis).
The maximum extent of impact to each authorised prescribed environmental matter must be offset in
accordance with the Environmental Offsets Act 2014 and the QLD Environmental Offsets Policy. Staged
delivery of offsets will be secured for the Project aligned with the Project execution schedule.
Tailings and waste characterisation work has shown the majority of samples to be geochemically benign. The
risks associated with release of contaminants into the environment have been considered with the tailings
storage facility ("TSF"), waste rock dump ("WRD"), and processing plant area designs incorporating surface
water management control dams, cut-off drains, monitoring, and low permeability base for the TSF.
Surface water and groundwater monitoring programmes have been in place since 2012 and are reviewed
frequently to align with the prevailing project design and the scale of any site activities. Additional
compliance and monitoring bores have been established during FY25.
The closest sensitive receptor to the Project is the Mount Roseby homestead, approximately 17.5 km
southeast of Little Eva pit and processing plant while the closest pit, Scanlan, is approximately 1 km west of
Mount Roseby. Noise and air quality monitoring is a requirement of the EA, and dust baseline monitoring has
been completed. A Compensation Agreement is in place which includes conditions to be implemented
throughout the life of mine ("LOM") with respect to the Mount Roseby station and its Lands.
The evidence of European history in the area is not of local or State significance. The recognised traditional
owners and Native Title holders of the Project area are the Kalkadoon People. The Company has a Cultural
Heritage and Access Agreement and Management Plan with the Native Title holders covering the full area of
the Project MLs. The ML area has been the subject of systematic Indigenous cultural heritage clearing which
remains ongoing.
In addition to managing environmental and heritage responsibilities the Company recognises and has
reflected the importance it places on building and training its workforce, supporting the local community and
stakeholders, and a commitment to achieve the highest standards of safety and health for its business
practices. Through our agreement with the Kalkadoon People, the Company will strive to provide
employment opportunities for local Indigenous people. The key community risk requiring management from
commencement of operations through the LOM will be the additional vehicular traffic along the Burke
Developmental Road and through Cloncurry.
Adjacent Properties
The Eva Copper Project is located within a world-class mineral province richly endowed with an attractive
number of commodities and deposit types. It is commonly known that the Mount Isa – Cloncurry region is
one of the premier base-metal producing districts in the world with mining dating back to 1867, first at
Cloncurry, then from the larger Mount Isa mining centre starting in 1923. There are numerous historical and
active mines in the region, with the major, internationally important mines closest to the Project being the
Effective date: 30 June 2025
12
Technical Report Summary of the
Eva Copper Project, North West Queensland, Australia
Dugald River lead-zinc-silver mine and the Ernest Henry copper-gold mine. Dugald River is the closest, located
approximately 11 km south of the proposed Eva Copper Project processing plant site.
Mining properties that surround the Eva Copper Project are predominantly EPMs held by Harmony. These
permits cover a highly prospective north-south corridor, with similar geology to that which hosts the Project’s
Mineral Resources. Numerous copper-gold mineralised prospects have been established and are being
systematically explored.
Immediate non-mining key local stakeholders associated with the Eva Copper Project are landowners,
leaseholders, state, and local governments. The Company has been in contact with the stakeholders for many
years and has appropriate agreements in place to allow mining and exploration.
Human Rights
The Company is committed to uphold fundamental human rights and respect cultures, customs, and values in
dealing with communities, employees, and others affected by the Company’s activities.
Project Due-Diligence and Pre-Engagement
The Company is committed to remain informed of the political, economic, social, technical, and
environmental characteristics of the area in which it operates. Sound data obtained will contribute to the
design and structure of risk management strategies, as well as pre-engagement processes such as
preparation for field activities.
Community and Aboriginal Engagement and Enhancement
The Company is committed to develop long-lasting economic, environmental, and social benefits through the
building of meaningful and transparent relationships with local communities and Native Title holders.
Human Resource Development
The Company is committed to provide long-term benefits for the community through areas, such as
employment, training, and education.
Environmental Integrity and Performance
The Company is committed to manage all operations in a manner that is compatible with environmental
protection standards and integrate closure requirements into all stages of the Company’s activities.
Health and Safety Performance
The Company is committed to provide a safe environment for employees, contractors, and visitors to the
Company’s facilities, and a commitment to support leadership in preventive and responsive attitudes and
behaviours at all levels of the organization to ensure a safe environment.
Recommendations
Mineral Resources
Drill targets below and within the current pit designs are being drilled to convert Inferred Resources to
Indicated Resources. Additional drilling to perform geotechnical slope studies on the Turkey Creek, Little Eva,
and Blackard deposits is ongoing.
Effective date: 30 June 2025
13
Technical Report Summary of the
Eva Copper Project, North West Queensland, Australia
2Introduction
Section 229.601(b)(96)(iii)(B)(2)(i-v)
This TRS is prepared for Harmony Gold Mining Company Limited, a publicly traded company listed on the
New York Stock Exchange (“NYSE”).
The purpose of this TRS is to provide a summary of the mineral resources and mineral reserves for the Eva
Copper Project. This TRS has been compiled in compliance with SEC regulations, particularly Regulation S-K
1300. It includes all material information and scientific analysis to support the disclosure requirements of
Harmony.
2.1Report Section Responsibilities
This TRS on the Eva Copper Project has been prepared for the registrant, Harmony. This TRS has been
prepared in accordance with the U.S. Securities and Exchange Commission’s (“SEC”) Regulation S-K 1300. It
has been prepared to meet the requirements of Section 229.601(b)96 – Technical Report Summary. The
purpose of this TRS is to provide open and transparent disclosure of all material, exploration activities,
Mineral Resource and Mineral Reserve information to enable the investor to understand the Eva Copper
Project which forms part of Harmony’s activities.
The QP states that this TRS updates the Technical Report Summary filed by Harmony on the Eva Copper
Project on 31 October 2023, named Exhibit 96.14 Technical Report Summary of the Mineral Resources and
Mineral Reserves for the Eva Copper Project, North West Queensland, Australia, which was effective on 30
June 2023. This updated TRS has an effective date of 30 June 2025. No material changes have occurred
between the effective date and the date of signature.
This TRS was prepared by a QP employed by Harmony Australasia. The QP’s qualifications, areas of
responsibility are set forth below:
Greg Job has more than five years’ experience that is relevant to the style of mineralisation and type of
deposit described in this TRS, and to the all activities for which he is accepting responsibility. He is a member
(Fellow) of the Australasian Institute of Mining and Metallurgy (AusIMM) and his registration is as follows:
Greg Job
Executive General Manager - Growth and Resource Development
FAusIMM No. 111561.
Table 2-1 shows a list of all the sections included in this Technical Report Summary under Subpart 1300 of
Regulation S-K, and the respective QPs.
Effective date: 30 June 2025
14
Technical Report Summary of the
Eva Copper Project, North West Queensland, Australia
Table 2-1: Scope of Responsibility
Item | Content | Qualified Person | Compiled by |
1 | Executive Summary | GJ | All |
2 | Introduction | GJ | HMYA |
3 | Property Description | GJ | HMYA |
4 | Accessibility, Climate, Local Resources, Infrastructure, and Physiography | RR, GJ | HMYA |
5 | History | RR | HMYA |
6 | Geological Setting, Mineralisation, and Deposit | RR | HMYA |
7 | Exploration | RR | HMYA |
8 | Sample Preparation, Analysis, and Security | RR | HMYA |
9 | Data Verification | RR | HMYA |
10 | Mineral Processing and Metallurgical Testing | GH | HMYA |
11 | Mineral Resource Estimates | RR | HMYA |
12 | Mineral Reserve Estimates | n/a | |
13 | Mining Methods | n/a | |
14 | Processing and Recovery Methods | n/a | |
15 | Infrastructure | n/a | |
16 | Market Studies | n/a | |
17 | Environmental Studies, Permitting, and Plans, Negotiations, or Agreements with Local Individuals or Groups | n/a | |
18 | Capital and Operating Costs | n/a | |
19 | Economic Analysis | n/a | |
20 | Adjacent Properties | RR | HMYA |
21 | Other Relevant Data and Information | All | |
22 | Interpretation and Conclusions | All | |
23 | Recommendations | All | |
24 | References | All | |
25 | Reliance on information provided by the registrant | n/a |
Notes:
The QP relied on input from certain technical experts, whose acronyms are listed above. These individuals, by education, experience,
and professional association, are members in good standing with appropriate professional institutions or associations. "HMYA refers to
Harmony Australasia .
2.2Personal Inspection
Ronald Reid ("RR") most recently visited the Project site in July, 2024.
Greg Job ("GJ") most recently visited the project site in August 2023.
Greg Harbort ("GH") most recently visited the Project site in July 2025
Harmony confirms it has obtained the written consent of the QP to the use of the person's name, or any
quotation from, or summarisation of, this TRS in the relevant registration statement or report, and to the
filing of this TRS as an exhibit to the registration statement or report.
2.3Effective Date
The effective date of the Mineral Resource statement in this TRS is 30 June 2025.
2.4Abbreviations and Units of Measure
Units of measure used in this TRS conform to the metric system, unless noted otherwise. All currency is
United States dollars ("US$") unless noted otherwise. A glossary containing a comprehensive list of acronyms
and units of measure is included in List of contents.
QPs Opinion
In the QP’s opinion, the terms of reference, data sources, and inspection information relied upon for this TRS
are adequate and appropriate to support the conclusions drawn. The information has been compiled to the
standard expected for disclosure under Regulation S-K 1300
Effective date: 30 June 2025
15
Technical Report Summary of the
Eva Copper Project, North West Queensland, Australia
3Property description
Section 229.601(b)(96)(iii)(B)(3)(i-vii)
3.1Location
The Eva Copper Project is located 76 km by road northwest of Cloncurry, a town of about 3,000 inhabitants,
and 194 km by road from Mount Isa, a regional mining centre with a population of about 22,000 people
(Figure 3-1). Townsville on the east coast is 770 km from Cloncurry. Access to the Project is from the sealed
Burke Developmental Road, which originates in Cloncurry. This road passes 8.5 km to the east of the
proposed plant site, and current access is via cattle station and exploration tracks. The planned site for the
plant and major infrastructure is also 11 km north of the major Dugald River Zinc Mine, which was
commissioned in November 2017 and is owned by MMG Limited (MMG). The Eva Copper Project is situated
at a latitude of 19°51'26”S and longitude of 140°10’15”E.
Figure 3-1: Project Location
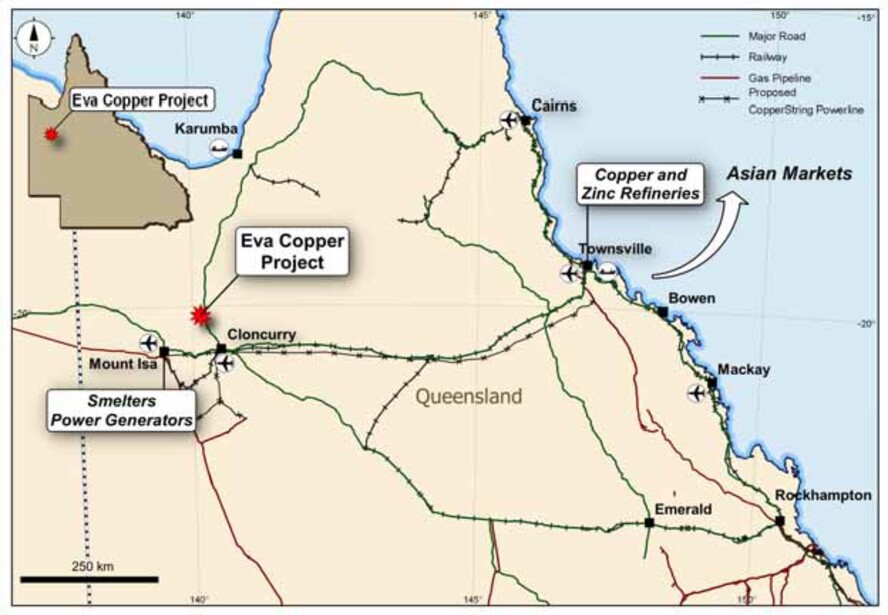
3.2Land Use and Mining Tenure
The Eva Copper Project consists of five MLs and one EPM. All six of the deposits are located within the
MLs, except for the Ivy Ann deposit, which lies within EPM 25760 (King).
Queensland state legislation requires that, where significant disturbance will occur from exploration and
mining activities, the license holder must reach agreement for “Conduct and Compensation” with the
pastoral leaseholder. Harmony has secured such agreements for all the MLs, the Ivy Ann deposit, and those
portions of the EPM where ground disturbance has occurred or is anticipated.
3.3Mining Leases
The MLs were granted in 2012 and are currently owned by the Company’s wholly owned subsidiary Eva
Copper Mine Pty. Ltd. ("ECMPL") (Table 3-1). The MLs total area is 143 km2 and are situated across from two
pastoral lease holdings and within one Native Title determination area.
Effective date: 30 June 2025
16
Technical Report Summary of the
Eva Copper Project, North West Queensland, Australia
Table 3-1: Eva Copper Project Mining Leases
Number | Name | Granted | Expiry | Area (ha) |
90162 | Scanlan | 4 Oct. 2012 | 31 Oct. 2037 | 2,096.96 |
90163 | Longamundi | 4 Oct. 2012 | 31 Oct. 2037 | 1,411.29 |
90164 | Blackard | 13 Nov. 2012 | 30 Nov. 2037 | 5,131.07 |
90165 | Little Eva | 13 Nov. 2012 | 30 Nov. 2037 | 5,029.96 |
90166 | Village | 13 Nov. 2012 | 30 Nov. 2037 | 616.08 |
3.4Exploration Permits for Minerals
As shown in Table 3-2, the Company’s wholly owned subsidiary ECMPL holds the EPM 25760 (King), which
encompasses the Ivy Ann deposit.
Table 3-2: Eva Copper Project Exploration Permit for Minerals
Number | Name | Holder | Granted | Expiry | Area (ha) |
25760 | King | ECMPL | 17 Nov. 2015 | 16 Nov. 2025 | 28,601 |
The Company also holds 26 EPMs surrounding the MLs and in the broader Mount Isa region (Figure 3-2).
These are held by the Company’s wholly owned subsidiaries Roseby Copper Pty. Ltd. and Roseby Copper
(South) Pty. Ltd.
Agreements exist with four pastoral landholders for both the MLs and key areas of activity in the surrounding
EPMs:
•Coolullah Station, belonging to the North Australian Pastoral Company ("NAPCO")
•Mt. Roseby Station, belonging to Harold Henry McMillan
•Dipvale Station, belonging to Grant and Anita Telford
•Hillside Station, belonging to the Cameron Creek Pastoral Company.
The locations of the pastoral lease boundaries intercepted by the Project tenements and various mineralised
areas are shown in Figure 3-3; in relation to the Project tenements and the areas subject to Conduct and
Compensation Agreements.
Effective date: 30 June 2025
17
Technical Report Summary of the
Eva Copper Project, North West Queensland, Australia
Figure 3-2: Eva Copper Project Tenements
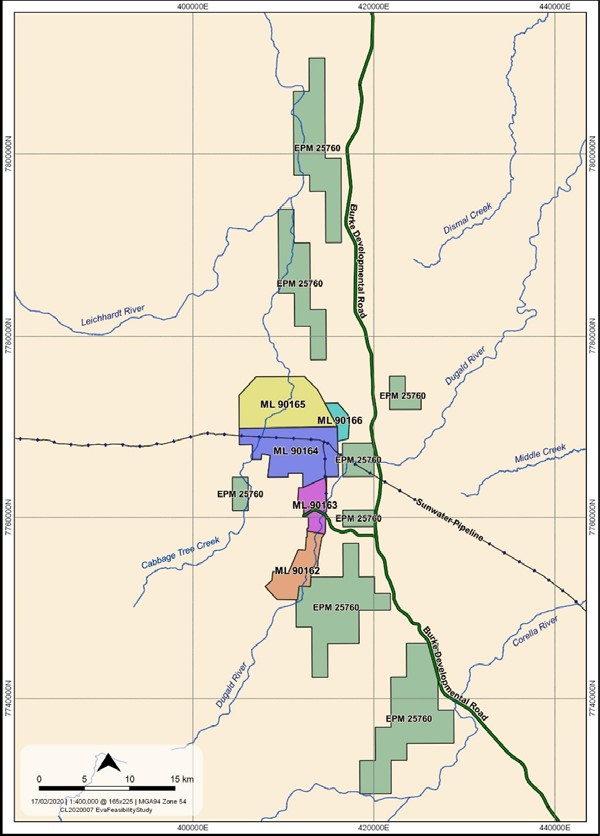
Effective date: 30 June 2025
18
Technical Report Summary of the
Eva Copper Project, North West Queensland, Australia
Figure 3-3: Pastoral Lease Holdings and Current Conduct and Compensation Agreement Areas (Colour indicates
landowner)
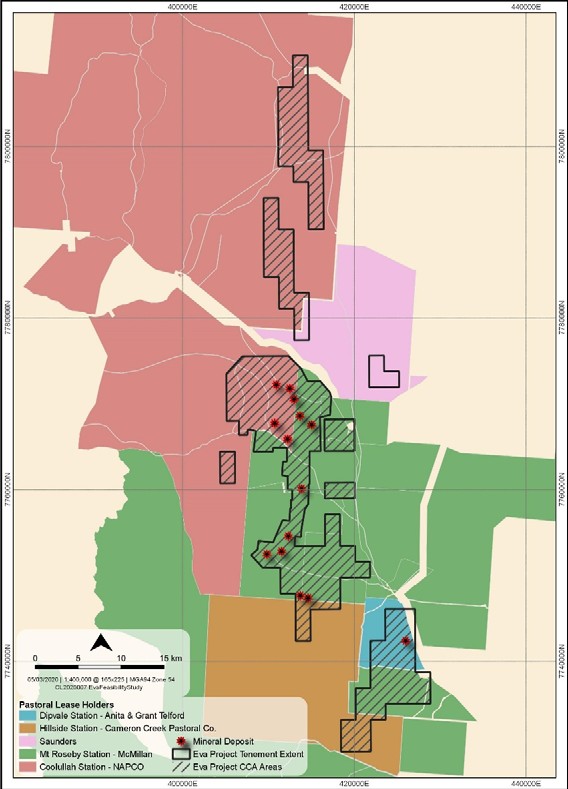
Notes: (NAPCO (red-brown), McMillan (green), Telford (blue) and Cameron Creek Pastoral Company (brown) showing
deposits (mine symbols))
3.5Freehold Land
Two freehold lots that were granted in the late 1800s sit within the MLs. One sits over part of the Little Eva
deposit, the second over part of the Longamundi deposit.
Effective date: 30 June 2025
19
Technical Report Summary of the
Eva Copper Project, North West Queensland, Australia
3.5.1Lot 37 (Agreement Numbers 355, 526, 1069, and 1070)
Lot 37 (on Crown Plan B15752) is located within ML 90165 and overlies the Little Eva deposit. It is owned
100% by the Company; 50% was purchased from Pasminco (referred to as Mineral Selection 3072), and 50%
deeded to the Company by The Public Trustee of Queensland from an intestate deceased estate. The Lot was
previously subject to mining tenure Mineral Development Licence 12 (also purchased from Pasminco) and
has also been referred to as the Kwahu Moiety area.
3.5.2Lot 28 (Agreement Numbers 355, 1069, and 1070)
Lot 28 (on Crown Plan B15753) is located within ML90163, overlies the Longamundi deposit, and is owned
100% by the Company. It was purchased from Pasminco (referred to by them as Mineral Freehold 13961).
The lot was previously subject to ML 7497 (also purchased from Pasminco).
3.6Royalties
Numerous royalties apply to the Project area and are payable to six parties with an average royalty payable
of 5% on Reserves. Table 3-3 summarises the royalties applicable to various deposits.
Table 3-3: Royalties Applicable to Portions of the Mineral Reserves at Various Deposits
Deposit | Area | State | MMG | Lake Gold/ MMG | KD | PanAust | DOM |
Little Eva | Lake Gold | x | x | x | |||
Little Eva | Freehold | x | x | ||||
Little Eva | x | x | x | ||||
Blackard | x | x | x | ||||
Scanlan | x | x | x | ||||
Turkey Creek | x | x | x | ||||
Lady Clayre | Lake Gold | x | x | x | |||
Lady Clayre | x | x | x | ||||
Bedford | x | x | x | ||||
Ivy Ann | x | x | x | x |
Notes: KD = Kalkadoon; DOM = Dominion
3.7Encumbrances
There are no encumbrances or regulatory requirements that affect access, title, or the right or ability to
perform work on the Eva Copper Project.
QP’s Opinion: In the QP’s opinion, Harmony has secure tenure and mineral rights over the Eva Copper
Project, subject to the agreements and encumbrances disclosed. The arrangements in place are sufficient to
support the disclosure of Mineral Resources.
Effective date: 30 June 2025
20
Technical Report Summary of the
Eva Copper Project, North West Queensland, Australia
4Accessibility, climate, local resources, infrastructure, and physiography.
Section 229.601(b)(96)(iii)(B)(4) (i‐iv)
4.1Accessibility and Infrastructure
The Project tenements are in North West Queensland and are shown in Figure 4-1. Access to the Project is by
the sealed Barkly Highway from Mount Isa to Cloncurry, then on the sealed Burke Developmental Road,
through Quamby. The highway passes 8.5 km to the east of the proposed plant site, and current access is by
way of a gravel road. The planned site for the plant and major infrastructure is 11 km due north of the Dugald
River zinc mine owned by MMG, which had first production in November 2017.
The Project is located about 65 km (76 km by road) northwest of Cloncurry, a town of about 3,000
inhabitants, and about 95 km (194 km by road) from Mount Isa, a regional mining centre with a population of
about 22,000 people.
Cloncurry is located on the railway line from Townsville to Mount Isa and has container handling facilities, an
airport (which hosts both commercial and FIFO jet aircraft services), and a regional fuel depot. Cloncurry also
has schools, hospitals, and other services. The Project lies within the Shire of Cloncurry local government
administrative area and the Shire offices are based in Cloncurry.
Quamby is a tiny hamlet to the southeast of the proposed plant site, with a now-closed roadhouse on the
highway, and a Telstra communications tower.
Kajabbi is a small hamlet to the north of the area and has stockyards that were used for loading cattle onto a
railway line that used to run south through Quamby to Cloncurry. The railway line from Cloncurry north to
Kajabbi has been removed, and all that remains is the easement, which is still owned by Queensland
Transport.
Grid power is reticulated from Mount Isa to Cloncurry, and power is generated in Mount Isa at two gas-fired
power stations. A 220-kV power line has been constructed from the Chumvale substation near Cloncurry to
the Dugald River mine, 11 km from Little Eva.
A water pipeline operated by SunWater passes within 4 km of Little Eva and is fed from Lake Julius, 41 km to
the west, and reticulated to the Ernest Henry mine, and the Cloncurry townsite. Dugald River also has a
water take-off from this pipeline. The pipeline has a capacity of seven gigalitres per year (GL/a).
4.2Climate and Surface Water
The Bureau of Meteorology weather station closest to the Project site is located on McIlwraith Street,
Cloncurry, and has records dating back to 1884. The mean annual maximum temperature is 32.2°C, and
the average annual rainfall for the region is 474 mm/a.
Mean temperatures in the dry season range from 26.2°C to 36.4°C from April to October. Temperatures
range from mean monthly highs of 26.2°C to 38.5°C, to monthly lows of 10.6°C to 24.8°C. Minimum and
maximum recorded temperatures range from to 1.8°C to 46.9°C. The hottest months correspond with the
wet season, between November and March.
Mean wind speeds measured at the Mount Isa Airport weather station shows that the later months of the
year exhibit the highest wind speeds, peaking in October at an average speed of 15.8 km/h. Wind speeds are
lowest in the cooler months of the year, at an average of 9.5 km/h in June. Maximum wind gusts range from
a low of 63 km/h in July up to 128 km/h in January.
The relative humidity at the Cloncurry weather station peaks in February, typically reaching 39% at 3:00 p.m.,
and 61% at 9:00 a.m. The peak fire season for the Project area is winter to spring (July to September), when
the vegetation is at its driest.
Rainfall is seasonal, largely occurring between November and March (wet season), and generally occurs in
large storms. Rainfall is highly variable from year to year, with the region often experiencing multi-year
droughts and large-scale flooding from major rainfall events. After the dry season, storm rains of
approximately 25 mm/d may occur, which may include intense periods equivalent to 24 mm/h, which would
generate runoff in the smaller creeks.
Effective date: 30 June 2025
21
Technical Report Summary of the
Eva Copper Project, North West Queensland, Australia
The Project site is serviced by a complex system of surface drainages that flow generally northward. On the
western side of the plant and Little Eva pit is Cabbage Tree Creek, which is joined by other creeks flowing
northward to become a tributary of the Leichhardt River. The central parts of the ML drain into the Dugald
River. Numerous other minor ephemeral watercourses cross the Project area.
Creeks and rivers only flow during, and for a brief period following, the wet season. Intensive rains, with
cumulative falls up to 50 mm over a few days, generate flows in the larger creeks, such as Cabbage Tree
Creek and Dugald River. Peak flows are generally of short duration. Most stream flow ceases within days or a
few weeks after intensive wet periods, after which the flow channel breaks into isolated pools. The rivers and
creeks have a composite profile consisting of a steep-sided main channel 1 m to 1.5 m in depth in which
flows occur annually, often to bank height. Isolated pools in the riverbeds can persist through the dry season
in sand, gravel, and crystalline rock fractures. Water can generally be found below the riverbeds at a depth of
one to two metres.
The Project has groundwater sources from both hard rock fracture zone systems and from a graben- like
structure filled in with Phanerozoic sediments. In addition to this geological feature, the main creeks are
associated with extensive thin sheets of colluvial outwash and alluvial deposits, with groundwater present in
the deeper parts of these deposits.
4.3Landforms and Vegetation
The Project site and broader operation area is gently undulating, with the Knapdale range of hills rising quite
sharply from the plain to the south of the proposed operations area, with a length of approximately 12 km,
and rising to an average height of 300 Australian Height Datum metres above sea level (mASL). A discrete
north–south ridgeline, which includes Mount Rose Bee and the Green Hills, transects the area on the western
side of the Bedford deposit. Mount Rose Bee (approximately 285 mASL) is characterised by ridges of exposed
silicified rock.
The site is currently crossed by several access tracks from farming and exploration activities. SunWater’s
water pipeline from Lake Julius to the Ernest Henry mine crosses the lease area from west to east.
The predominant land use is low-intensity cattle grazing, although exploration and mining activities have
been conducted over the area since the late 1800s. Soils of the Project site are typically slightly acid to
moderately alkaline, and non-sodic and therefore non-dispersive in nature, meaning they are not chemically
predisposed to erosion. Most of the erosion potential of these soils originates from the short duration, high
intensity rainfall events that can occur during the summer period (December to March).
4.4Local Mining Industry
Mount Isa was established on the discovery of world-scale copper-zinc-lead deposits in 1923. A major mining
complex and a town of 22,000 people has grown on the site in the last 94 years, with multiple open pit and
underground mines, smelters, mills, flotation plants, and a sulphuric acid plant. The town of Mount Isa hosts
many mining suppliers, service organisations, and a number of skilled mining industry people, as well as
having two electric-powered generators supplied by a natural gas pipeline from South Australia, an airport,
rail line, and other services.
Cloncurry was established much earlier than Mount Isa, on the discovery of copper by Ernest Henry in 1867,
and the town was founded in 1884.
There are several active mines in the area, as shown in Figure 4-1. In addition to Mount Isa, there are five
major active mines: the Ernest Henry copper-gold mine and Lady Loretta lead-zinc-silver mine, both owned
by Glencore; the Cannington silver-lead mine owned by South 32; the Dugald River zinc-lead-silver mine
owned by MMG; and the Capricorn Copper copper-gold mine owned by Capricorn Copper. All are major,
internationally important mines.
Smaller operations (active and in care and maintenance) include: Osborne copper-gold mine, owned by
Inova; Mount Colin copper mine, owned by Aeris Resources Limited, Lady Annie copper-gold mine, owned by
Austral Resources; Mount Cuthbert Copper mine, owned by Mt Cuthbert Resources; Rocklands copper- gold
mine, owned by Mt Cuthbert Resources; and Eloise copper-gold mine, owned by AIC Mines.
Closed major mines include the Mary Kathleen uranium mine.
Effective date: 30 June 2025
22
Technical Report Summary of the
Eva Copper Project, North West Queensland, Australia
Figure 4-1: Infrastructure, Major Mines, Deposits, and Eva Copper Project Tenure
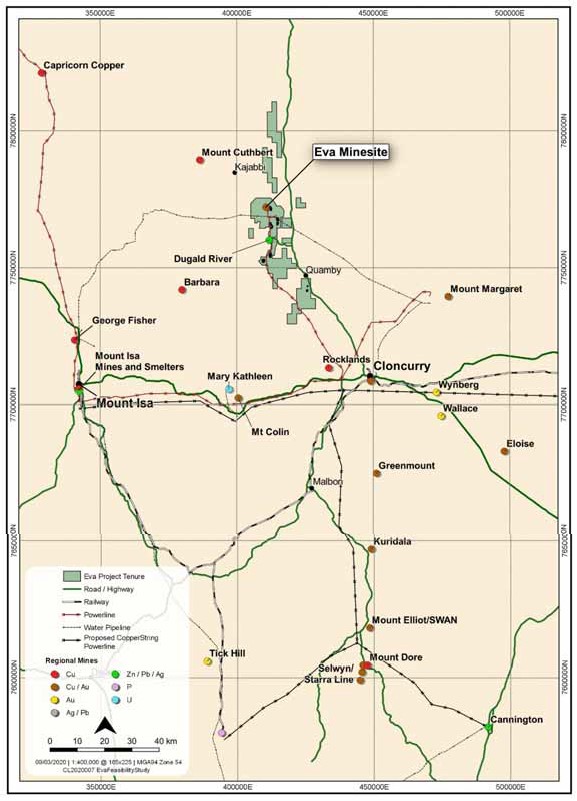
QP’s Opinion: In the QP’s opinion, the accessibility, climate, local resources, infrastructure, and physiography
of the Eva Copper Project are adequately described and present no unusual features that would compromise
the reporting of Mineral Resources. The conditions are typical of the Mount Isa–Cloncurry district and
provide a reasonable basis for disclosure of the Mineral Resource estimates
Effective date: 30 June 2025
23
Technical Report Summary of the
Eva Copper Project, North West Queensland, Australia
5History
Section 229.601(b)(96)(iii)(B)(5) (i‐ii)
5.1Prior Ownership and Changes
The Project area has a long history of exploration and development. Early work was undertaken by Ausminda
Pty. Ltd. and CRAE between 1990 and 1996. CRAE’s principal focus was the copper-only deposits where they
were successful in discovering a number of deposits. The Little Eva and Lady Clayre deposits were of
secondary interest to CRAE, who drilled the Little Eva deposit to define a small deposit of 9 Mt assayed at
0.70% copper (Cu), gold (Au) grade was not reported.
In 1996, the property was acquired by Pasminco, who undertook further exploration and drilling on the
copper-only deposits. Pasminco excised and retained the Dugald River zinc deposit and sold the remainder of
the tenements to URL in 2001. The Little Eva deposit was first fully delineated by URL. Pasminco was taken
over by Zinifex in 2002, and in 2008 Zinifex merged with Oxiana to become Oz Minerals. Oz Minerals’ interest
in the Dugald River zinc deposit was acquired in 2009 by MMG, a subsidiary of China Minmetals.
From 2001 to 2004, exploration work on the Blackard, Scanlan, and Longamundi copper-only deposits was
carried out under a joint venture (JV) between URL and Bolnisi Logistics. In 2004, URL acquired Bolnisi
Logistics and assumed full management of the Project. Bolnisi Logistics then changed its name to Roseby
Copper Pty. Ltd. URL focused its 2001–2004 drilling on the Little Eva and Bedford copper-gold deposits, and
completed a Feasibility Study in 2005 based on mining and processing a blend of sulphide ore from the Little
Eva and Bedford deposits with native copper ore from the Blackard and Scanlan deposits; however, URL did
not proceed with development.
URL entered into a JV Option Agreement with Xstrata in 2005, where Xstrata had the right to explore in the
central area of the tenements. Xstrata discovered the Cabbage Tree Creek prospect, and significant sulphide
mineralisation beneath the Blackard deposit. Xstrata elected not to proceed with the option to purchase an
interest in the Project in January 2013. URL completed a second Feasibility Study between 2007 and 2009
based on the same blend of sulphide ore and native copper ore used in the 2005 study.
In December 2009, URL merged with Vulcan Resources Limited, and the company name changed to Altona.
Altona drilled out the Little Eva deposit, doubling the Mineral Resource, and in 2012 completed a Definitive
Feasibility Study ("DFS") based on the increased resources of copper-gold sulphide deposits, with this TRS
excluding the Blackard and Scanlan deposits. Altona’s philosophy was to take a simpler approach that did not
rely on ore blending and to address mining and processing of native copper ores once operations were
established, in the context of extending mine life or increasing the production rate.
Altona completed drilling at the Bedford, Lady Clayre, Ivy Ann, Blackard, Legend, and Scanlan deposits, and
published Mineral Resource upgrades for all these deposits. Altona published Mineral Reserves for the Little
Eva, Bedford, Lady Clayre, and Ivy Ann deposits as part of their 2012 DFS. Altona discovered a significant
resource at Turkey Creek and published Mineral Resource and Mineral Reserve estimates for the deposit in
2015 and 2016, respectively. Altona also discovered and delineated major prospects at Anzac, Whitcher,
Matchbox, and Quamby from 2015 to 2016.
MLs and an EA were granted in 2012 based on the 2009 DFS mine plan. An EA amendment was granted in
2016 based on the revised 2012 DFS mine plan and the integration of Turkey Creek into the mine plan.
Effective date: 30 June 2025
24
Technical Report Summary of the
Eva Copper Project, North West Queensland, Australia
Altona and the project was acquired by CMMC in 2018. The project was subsequently acquired by Harmony
in 2023.
Prior to the acquisition by Harmony, and excluding acquisition costs, approximately $63 million has been
expended on exploration, resource development, metallurgical and engineering studies, compensation
payments, and government fees and charges by the various parties involved over the past 27 years,
including:
CRAE (estimate) | $7.4 million |
Zinifex/Pasminco | $0.7 million |
Bolnisi | $4.1 million |
URL | $24.2 million |
Xstrata | $8.5 million |
Altona | $18.4 million |
Note: Exchange rate AU$1.35:US$1.00
5.2Mineral Resource Estimates History
5.2.1Little Eva Deposit
The Little Eva deposit has had several formal Mineral Resource estimates that reflect stages of resource
definition (Table 5-1). The 2008 and 2012 Mineral Resource estimates include both sulphide and oxide
material, while the 2014 estimate is for sulphide material only, with the oxide material excluded.
Table 5-1: Little Eva Resource Estimate History
Model | Authors | Mineral Resource Estimate | Comment |
Oct 2008* | MacDonald Speijers | 30.4 Mt at 0.78% Cu, 0.09 g/t Au. (0.3% Cu cut-off grade). | Superseded following additional drilling Includes Inferred resource. |
Mar 2012* | Optiro and Altona | 108 Mt at 0.52% Cu, 0.9 g/t Au. Sulphide mineralisation – 100.3 Mt at 0.53% Cu and 0.09 g/t Au at a 0.2% Cu cut-off grade. | Basis for 2012 DFS and Mineral Reserve estimation. Primary sulphide and oxide mineralisation. Includes Inferred resource. |
May 2014* | Altona and Optiro | 105.9 Mt at 0.52% Cu, 0.09 g/t Au at a 0.2% Cu cut-off grade. | Sulphide mineralisation only. Includes Inferred resource. |
Nov 2018 | CMMC | 121.8 Mt at 0.36% Cu, 0.07 g/t Au at a 0.17% Cu cut-off grade. | Nominal additional infill drill data only. Sulphide mineralisation only. Excludes Inferred resource. |
Feb 2023 | SRK | 167 Mt at 0.38% Cu, 0.07g/t Au at a 0.17% Cu cut-off grade | Post-purchase model using Indicator kriging. Includes Inferred resources, excludes oxide. Superseded following additional drilling and remodelling. |
Sept 2023 | SRK | 163 Mt at 0.35% Cu, 0.07g/t Au at a 0.17% Cu cut-off grade | Methodology changed to Ordinary Kriging to induce greater dilution aimed at replicating the expected dilution through the Bulk mining methodology. Includes Inferred resources, excludes Oxide material. Utilised an additional 48 drillholes drilled by Harmony during 2023. |
Feb 2024 | Harmony | 180MT at 0.34% Cu and 0.07g/t Au for 0.612Mt of copper and 382Koz of gold at 0.16% Cu cut-off grade | Ordinary Kriged model, Includes inferred and excludes oxide, Used an additional 64 drill holes compared to the last estimate. |
Source: *Altona Mining Limited, Cloncurry Copper Project – DFS, August 2017.
Total estimated Mineral Resource including Inferred; reported in accordance with the Joint Ore Reserves Code (JORC).
In October 2008, McDonald Speijers completed a Mineral Resource estimate for the Little Eva deposit,
reported in accordance with JORC, 2004 Edition (JORC, 2004), which was incorporated into URL’s 2009
Roseby Copper Project Feasibility Study. The Mineral Resource amounted to 30.4 Mt at 0.78% Cu and 0.9 g/t
Au, with a 0.3% Cu cut-off grade. Geological domains were poorly constrained.
Effective date: 30 June 2025
25
Technical Report Summary of the
Eva Copper Project, North West Queensland, Australia
In March 2012, Altona, in conjunction with Optiro, reported a Mineral Resource that incorporated newly
acquired assay and geological data provided by extensive drill programmes. The published estimate of 108
Mt at 0.52% Cu and 0.09 g/t Au includes both sulphide and oxide mineralisation. This estimate formed the
basis of pit optimisations used in the 2012 DFS and 2014 DFS update.
In May 2014, Altona published a revised Mineral Resource estimate. Geological models were limited in
former estimates, because of inconsistent drill hole logging between multiple corporations and programmes.
The 2014 used a new geological model based on a detailed drill hole relogging programme by Altona in
2013-2014. The estimate of 105.9 Mt at 0.52% Cu and 0.09 g/t Au is for primary sulphide geotechnical
mineralisation only, and excludes oxide mineralisation, which is not amenable to processing through the
proposed Eva Copper Project plant. No additional drilling was added after the 2012 estimate leading up to
the 2014 estimate, and differences between the 2012 and 2014 Mineral Resource estimates were not
considered material; however, confidence in the geological models was improved. The 2014 estimate was
used for pit optimisations undertaken by Orelogy, and to relocate mine and waste dump layouts and develop
schedules to accommodate Turkey Creek into the mine plan. This work was undertaken for the 2016 EA
Amendment. These optimisations were not used in the mine design or financial modelling of the August 2017
Altona DFS.
In November 2018, CMMC published a Mineral Resource estimate, which incorporated limited newly
acquired assay and geological data provided by diamond core holes drilled for metallurgical, geotechnical,
and due diligence purposes. The published estimate of 121.8 Mt at 0.36% Cu and 0.07 g/t Au includes
sulphide mineralisation only. This estimate formed the basis of pit optimisations used in CMMC’s 2018
Feasibility Study and the 2019 Feasibility Study update.
Limited additional drilling was added after the 2014 estimate; differences between the 2014 and 2018
Mineral Resource estimates reflect a lower minimum reporting cut-off grade, different modelling approach,
and exclusion of material classified as Inferred from the reported total.
Harmony completed an update to the resource in February 2023 after project purchase. The estimate used
indicator kriging and resulted in an estimate of 167Mt @ 0.38% Cu and 0.07g/t Au. This model was used to
design new drilling with the aim of targeting under drilled areas of the deposit.
Harmony completed an additional update to the Resource in September of 2023 after stage 1 of the
additional drilling. This Resource, reported and classified in accordance with SAMREC 2016 and Regulation S-
K 1300, resulted in 163Mt @ 0.35% Cu and 0.07g/t Au.
Data from 13 new drill holes was included in the June 2024 Resource estimate. Differences between the
February 2024 and June 2024 Mineral Resource estimates reflect a change in corporate price guidance, a
different modelling approach, and changes to mining costs.
Effective date: 30 June 2025
26
Technical Report Summary of the
Eva Copper Project, North West Queensland, Australia
5.2.2Turkey Creek Deposit
Turkey Creek was discovered in September 2012 after the 2012 DFS was completed. The only Mineral
Resource estimate for Turkey Creek was completed in 2015 by Optiro and Altona. Altona was responsible for
the data and 3D geological model. Mineral Resource estimation and block modelling was conducted by
Optiro (Table 5-2). The estimate was 21 Mt grading 0.59% Cu, and it includes both sulphide and oxide
mineralisation.
Table 5-2: Turkey Creek Resource Estimate History
Model | Authors | Mineral Resource Estimate | Comment |
Mar 2015* | Optiro and Altona | 21 Mt at 0.59% Cu (0.3% Cu cut- off grade) | Primary sulphide and oxide mineralisation. Include Inferred resources. |
Nov 2018** | CMMC | 13.8 Mt at 0.46% Cu (0.17% Cu cut-off grade) | Nominal additional infill diamond drill data only. Primary sulphide mineralisation only. Excludes Inferred resources. |
Sept 2023 | Harmony (SRK) | 30.8Mt @ 0.43% Cu, (0.17% Cu cut-off grade) | Basis for initial Harmony feasibility studies. Excludes oxide material |
Source: *Courtesy Altona Mining Limited, Cloncurry Copper Project – Definitive Feasibility Study, August 2017. Total estimated Mineral
Resource including Inferred; reported in accordance with JORC. ** CMMC, Eva Copper Project – NI43-101 Eva Copper Feasibility Study,
May 2020.
The 2015 resource model was used by Orelogy to generate pit designs and waste volumes included in the
mine plan, and was used to generate a new layout of pits, waste dumps, and the TSF for the 2016 EA. The
Orelogy pit optimisations were based on primary sulphide mineralisation only. The sulphide resource was
estimated at 16.5 Mt at 0.59% Cu.
In November 2018, CMMC published a Mineral Resource estimate, which incorporated limited newly
acquired assay and geological data provided by diamond core holes drilled for metallurgical, geotechnical,
and due diligence purposes. The published estimate of 13.8 Mt at 0.46% Cu includes sulphide mineralisation
only and formed the basis of pit optimisations used in CMMC’s 2018 Feasibility Study and their 2019
Feasibility Study update.
The 2015 Mineral Resource for Turkey Creek included an oxide component, while the other deposits
modelled did not. There was a reasonable expectation of achieving acceptable recoveries from the oxide
material based on the mineralogy using the Controlled Potential Sulphidisation (CPS) technique for flotation
processing. However, initial metallurgical testing of this processing method produced poor recoveries, and
the oxide material was excluded from the 2018 Mineral Resource.
Limited additional drilling was added after the 2015 estimate, and differences between the 2015 and 2018
Mineral Resource estimates reflect a lower minimum reporting cut-off grade, different modelling approach,
and exclusion of material classified as Inferred from the reported total.
5.2.3Bedford Deposit
The Bedford deposit has had several formal Mineral Resource estimates completed that reflect stages of
resource definition, as shown in Table 5-3. The 2012 and 2017 estimates are for sulphide material only.
In October 2006, McDonald Speijers completed an initial Mineral Resource estimate. In May 2012, Optiro
completed an estimate based on nominal additional drilling. There was no significant change in the Mineral
Resource of 1.7 Mt at 0.99% Cu and 0.20 g/t Au.
Geological models forming the basis of these estimates were poorly constrained, with isolated individual
structures within a broader shear zone showing limited continuity.
Effective date: 30 June 2025
27
Technical Report Summary of the
Eva Copper Project, North West Queensland, Australia
Table 5-3: Bedford Resource Estimate History
Model | Authors | Mineral Resource Estimate | Comment |
Oct 2006* | McDonald Speijers | 1.77 Mt at 0.93% Cu, 0.24 g/t Au (0.3% Cu cut-off grade) | Superseded following nominal additional drilling. Includes Inferred resource. |
May 2012* | Optiro | 1.7 Mt at 0.99% Cu, 0.20 g/t Au (0.3% Cu cut-off grade) | Basis for 2012 DFS and Mineral Reserve estimate. Primary sulphide mineralisation only. Includes Inferred resource. |
Feb 2017* | Altona | 4.8 Mt at 0.80% Cu, 0.21 g/t Au (0.3% Cu cut-off grade) | Assay data from two additional drill holes. Additional geological data showing continuity of structures. Primary sulphide mineralisation only. Includes Inferred resource. |
Nov 2018 | CMMC | 3.0 Mt at 0.54% Cu and 0.14 g/t Au (0.17% Cu cut-off grade) | Primary sulphide mineralisation only. Excludes Inferred resource. |
Source: Altona Mining Limited, Cloncurry Copper Project – Definitive Feasibility Study, August 2017.
*Total estimated Mineral Resource including Inferred; reported in accordance with JORC.
In February 2017, Altona completed a new Mineral Resource estimate of 4.8 Mt at a grade of 0.80% Cu and
0.21 g/t Au that includes primary sulphide mineralisation only. The increase from the 2012 estimate resulted
primarily from a better understanding of geological continuity and geometry.
Mineralised structures were better defined by mapping of surface workings and high-resolution copper- in-
soil sampling. An increase in tonnage was a result of more accurate bulk density data obtained from diamond
drill core, therefore replacing prior bulk density estimates.
In November 2018, CMMC published a Mineral Resource estimate of 3.0 Mt at 0.54% Cu and 0.14 g/t Au
includes sulphide mineralisation only.
No significant new drill data was added after the 2017 estimate, and differences between the 2017 and 2018
Mineral Resource estimates reflect a lower minimum reporting cut-off grade, different modelling approach,
and exclusion of material classified as Inferred from the reported total.
5.2.4Lady Clayre Deposit
The Lady Clayre deposit has had several formal Mineral Resource estimates that reflect stages of resource
definition, as shown in Table 5-4.
In October 2006, McDonald Speijers completed a Mineral Resource estimate that was reported in accordance
with JORC 2004 for the Lady Clayre deposit. This was incorporated into URL’s 2009 Feasibility Study.
Effective date: 30 June 2025
28
Technical Report Summary of the
Eva Copper Project, North West Queensland, Australia
Table 5-4: Lady Clayre Resource Estimate History
Model | Authors | Mineral Resource Estimate | Comment |
Oct 2006* | McDonald Speijers | 3.7 Mt grading 0.88% Cu, 0.48 g/t Au (0.3% Cu cut-off grade | Superseded following expanded drilling. |
May 2012* | Optiro | 14 Mt grading 0.56% Cu, 0.20 g/t Au (0.3% Cu cut-off grade | Primary sulphide mineralisation only. Includes Inferred resource. |
Nov 2018 | CMMC | 7.3 Mt at 0.31% Cu and 0.14 g/t Au (0.17% Cu cut-off grade) | Basis for this study. Primary sulphide mineralisation only. Excludes Inferred resource. |
Source: Courtesy Altona Mining Limited, Cloncurry Copper Project – Definitive Feasibility Study, August 2017.
*Total estimated Mineral Resource including Inferred; reported in accordance with JORC.
In November 2018, CMMC published a Mineral Resource estimate of 7.3 Mt at 0.31% Cu and 0.14 g/t Au that
included sulphide mineralisation only.
Significant new drill data was added after the 2012 estimate; the updated CMMC model used the new drill
hole assay data but was not constrained by the revised geological model. Differences between the 2012 and
2018 Mineral Resource estimates reflected new drilling data, a lower minimum reporting cut- off grade,
different modelling approach, and exclusion of material classified as Inferred from the reported total.
5.2.5Ivy Ann Deposit
The Ivy Ann deposit has had three Mineral Resource estimates, as shown in Table 5-5.
Table 5-5: Ivy Ann Resource Estimate History
Model | Authors | Mineral Resource Estimate | Comment |
Jan 2006* | URL | 3.98 Mt at 0.93% Cu, 0.24 g/t Au (0.3% Cu cut-off grade) | Superseded following expanded drilling. |
May 2012* | Optiro | 7.5 Mt at 0.57% Cu, 0.07 g/t Au (0.3% Cu cut-off grade) | Primary sulphide mineralisation only. Includes Inferred resource. |
Nov 2018 | CMMC | 5.1 Mt at 0.36% Cu and 0.08 g/t Au (0.17% Cu cut-off grade) | Primary sulphide mineralisation only. Excludes Inferred resource. |
Source: Altona Mining Limited, Cloncurry Copper Project – Definitive Feasibility Study, August 2017
Copper Mountain Mining Corp, Eva Copper Project - Definitive Feasibility Study, January 2020.
*Total estimated Mineral Resource including Inferred; reported in accordance with JORC.
In January 2006, URL completed a Mineral Resource estimate for the Ivy Ann deposit.
In May 2012, Optiro completed an estimate of resources for the Ivy Ann deposit that incorporated additional
drilling. The published estimate of 7.5 Mt at 0.57% Cu, and 0.07 g/t Au includes sulphide mineralisation only.
In November 2018, CMMC published the Mineral Resource estimate of 5.1 Mt at 0.36% Cu and 0.08 g/t Au
which includes sulphide mineralisation only.
No significant new drill data was added after the 2012 estimate, and differences between the 2012 and 2018
Mineral Resource estimates reflects a lower minimum reporting cut-off grade, different modelling approach,
and exclusion of material classified as Inferred from the reported total.
Effective date: 30 June 2025
29
Technical Report Summary of the
Eva Copper Project, North West Queensland, Australia
5.2.6Blackard Deposit
The Blackard deposit has had several formal Mineral Resource estimates that reflect stages of resource
definition, as shown in Table 5-6. While early estimates from 2003 included all mineralisation (oxide, copper,
transition, and sulphide zones) the 2012 Mineral Resource estimate only included native copper, transition
and primary sulphide, the oxide zone was excluded.
In December 2005, McDonald Speijers completed a Mineral Resource estimate for the Blackard deposit. In
February 2007, McDonald Speijers completed another Mineral Resource estimate update.
In May 2012, Optiro completed an estimate of recoverable resources for the Blackard deposit. The estimate
of 76.4 Mt at 0.62% Cu includes native copper, transition, and primary sulphide mineralisation only. This
estimate incorporated newly acquired data from substantial additional drilling since the 2006 estimate.
Table 5-6: Blackard Resource Estimate History
Model | Authors | Mineral Resource Estimate | Comment |
May 1996 | Newbery and Lai (for CRAE) | 27 Mt at 0.73% Cu (0.5% Cu cut-off grade) | Superseded by new model for Bolnisi. Oxide (malachite), native copper, and transition mineralisation only. Indicated resource only. |
Feb 2003* | Hellman & Schofield | 26.8 Mt at 0.75% Cu (0.5% Cu cut-off grade) | Superseded following expanded drilling. Oxide (malachite), native copper, transition, and primary sulphide mineralisation. Includes Inferred resource. |
Dec 2005* | McDonald Speijers | 43.7 Mt at 0.65% Cu (0.3% Cu cut-off grade) | Superseded following expanded drilling. Oxide (malachite), native copper, transition, mineralisation only. Includes Inferred resource. |
Jan 2007* | McDonald Speijers | 46.25 Mt at 0.63% Cu (0.3% Cu cut-off grade) | Superseded following expanded drilling. Oxide (malachite), native copper, transition, and primary sulphide mineralisation. Includes Inferred resource. |
Jul 2012* | Optiro | 76.4 Mt at 0.62% Cu (0.3% Cu cut-off grade) | Resource estimate. Native copper, transition, and primary sulphide mineralisation only. Includes Inferred resource. |
Oct 2019 | CMMC | 77.3 Mt at 0.49% Cu (0.23% Cu, 0.20% Cu, and 0.17% Cu cut-off grade for copper, transition, and sulphide zone, respectively) | Native copper, transition, and primary sulphide mineralisation only. Excludes Inferred resource. |
Sept 2023 | SRK/Harmony | 128.9Mt @ 0.45% Cu, using a global 0.17% Cu cut-off | Included native copper, transitional and primary sulphide material, excluded oxide material but did include inferred. |
Source: Altona Library, resource estimation reports for Altona and previous Project operators.
*Total estimated Mineral Resource including Inferred; reported in accordance with JORC.
Data from 18 new drill holes was added to the 2019 resource estimate by CMMC. Differences between the
reported 2012 and 2019 Mineral Resource estimates reflect lower cut-off grades, different modelling
approach, and exclusion of Inferred resources.
The 202309 SRK Resource model included an additional 15 RC holes and relied on a new geological model
and a different modelling approach using variable anisotropy. The total included inferred material and was
reported using a global cut-off and a reporting constraint shell based on a copper price of US$5.55/Lb. As
input to a high-level study a global cut-off was used while various assumptions on metallurgical recovery,
mining costs and milling costs were tested.
The 202309 SRK model was replaced by the 202402 SRK model which has been built on the original 202309
model but with updates to the DH database, including 44 additional drillholes (many of which were
Metallurgical and geotechnical holes and did not inform the grade estimate), and amended collar coordinates
for a number of drillholes. Additionally, metallurgical and mining studies informed likely cut-off grades for the
different ore domains, and these have been used in the reporting of the 202402 Mineral Resource.
Effective date: 30 June 2025
30
Technical Report Summary of the
Eva Copper Project, North West Queensland, Australia
5.2.7Scanlan Deposit
The Scanlan deposit has had three Mineral Resource estimates, as shown in Table 5-7.
In November 2006, McDonald Speijers completed a Mineral Resource estimate for the Scanlan deposit. This
was incorporated into URL’s 2006 and 2009 Feasibility Studies. In both cases the estimates were used for pit
optimizations with resultant Ore Reserve estimates.
Table 5-7: Scanlan Resource Estimate History
Model | Authors | Mineral Resource Estimate | Comment |
May 1995 | Newbery and Lai (for CRAE) | 15 Mt at 0.81% Cu (0.5% Cu cut-off grade) | Superseded by new model for Bolnisi. Oxide (malachite), native copper, and transition mineralisation only. Indicated resource only. |
Nov 2006* | McDonald Speijers | 19.62 Mt at 0.68% Cu (0.3% Cu cut-off grade) | Superseded following additional drilling. |
Jul 2012* | Optiro | 22.2 Mt at 0.65% Cu (0.3% Cu cut-off grade) | Native copper, transition, and primary sulphide mineralisation only. Includes Inferred resource. |
Jan 2020 | CMMC | 21.7 Mt at 0.57% Cu (0.26% Cu, 0.20% Cu, and 0.17% Cu cut-off grade for copper transition and sulphide zones, respectively) | Excludes Inferred resource. |
Source:
Altona Library, resource estimation reports for Altona and previous Project operators.
Total estimated Mineral Resource including Inferred; reported in accordance with JORC.
In July 2012, Optiro completed an estimate for the Scanlan deposit. The estimate of 22.2 Mt at 0.65% Cu
included native copper, transition, and primary sulphide mineralisation only. This estimate incorporated
newly acquired data from substantial additional drilling completed since the 2006 estimate.
No significant drill data has been added to the deposit since 2012.
5.2.8Legend Deposit
The Legend deposit has only had one historical inferred resource estimate which was not declared in CMMC's
2020 feasibility study, the estimate totalled 17.1Mt at 0.54% for 94Kt of copper. The historical estimate was
prepared accordance with the JORC 2004 by Altona for their 2017 feasibility report.
5.2.9Great Southern Deposit
The Great Southern deposit has only had one historical inferred resource estimate which was not declared in
CMMC's 2020 feasibility study, the estimate totalled 6.0 Mt at 0.61% for 37Kt of copper. The historical
estimate was prepared accordance with the JORC 2004 by Altona for their 2017 feasibility report.
QP’s Opinion: In the QP’s opinion, the historical exploration and ownership information presented is reliable
and provides a reasonable basis for the current geological interpretation and Mineral Resource disclosure
Effective date: 30 June 2025
31
Technical Report Summary of the
Eva Copper Project, North West Queensland, Australia
6Geological setting, Mineralisation, and Deposit
Section 229.601(b)(96) (ii)(B) (6) (i‐iii)
6.1Regional Geology
The Project is located within the Proterozoic rocks of the Mount Isa Province of Queensland, Australia. The
region is one of the world’s premier base metal provinces, with mining continuing uninterrupted since
discovery of copper and gold near Cloncurry in the 1860s. The Mount Isa Province hosts numerous copper
mines, including several of global significance. The Mount Isa Province also hosts the world’s two largest lead
producers, the second largest silver producer, and until recently was the world leading source of zinc.
Economic accumulations of various other commodities, including gold, molybdenum, rare earth elements,
uranium, and phosphate, occur throughout the area.
The Project is situated within the Mary Kathleen domain, and to a lesser extent the Canobie domain of the
late Palaeoproterozoic Eastern Fold Belt of the Mount Isa Inlier (Figure 6-1), which largely comprises
metamorphosed marine sedimentary and volcanic rocks some 1,590 to 1,790 Ma old.
Numerous granite and mafic intrusions were emplaced at various times before 1,100 Ma.
The Project area rocks have undergone polyphase deformation, metamorphism, and metasomatism during
the Isan Orogeny (1,600–1,500 Ma), which resulted in east-west shortening and extensive plutonism. The
orogeny formed the major north-south trending upright folds and structural domains that characterise the
province. Deformation and late- to post-orogenic plutonism is most pronounced in the Eastern Fold Belt
where it is associated with widespread high temperature sodium-iron metasomatism expressed as magnetite
or hematite alteration assemblages. Iron-oxide-copper gold ("IOCG") mineralisation is a variant of the Na-Fe
metasomatism and the Project deposits are examples of such mineralisation. IOCG mineralisation developed
in the waning stages of the Isan Orogeny and is prevalent throughout the Eastern Fold Belt.
North- and north-easterly-trending crustal scale faulting transects the Province, bounding and cutting
geological domains. The structures are the locus of major base and precious metal deposits. The deformation
recorded by faulting and folding is complex, dominated at different stages by extension, shortening, and
transcurrent faulting. The major faults have long reactivation histories during the Proterozoic, with evidence
of recurrent activity in the Phanerozoic. During the latter part of the Isan Orogeny, at the time of IOCG
mineralisation, the pre-existing faults were reactivated into a dominantly strike-slip wrench system, with
east-west to southeast-northwest directed shortening accompanying emplacement of the William Batholiths
(1,530–1,490 Ma).
The Project deposits are located within the Mary Kathleen ("MK") domain, which is an elongate belt on the
east side of the Kalkadoon-Leichhardt domain, has a length of 180 km and an approximate width of 20 km,
and was modified by the Wonga extensional event (approx. 1,740 Ma) which included emplacement of the
Wonga Suite granites. The MK domain hosts the Dugald River zinc deposit, the Tick Hill gold deposit, the
Mary Kathleen uranium deposit, and the Phosphate Hill phosphate deposit, in addition to the Project’s
copper-gold deposits.
The Canobie domain is located east of the Mary Kathleen domain, and the two are juxtaposed by the
Fountain Range and Pilgrim Faults. The Canobie domain is fault bounded, poorly exposed, largely defined by
highly magnetic and buried William-Naraku intrusions and is host to the Ernest Henry copper-gold deposit.
Effective date: 30 June 2025
32
Technical Report Summary of the
Eva Copper Project, North West Queensland, Australia
Figure 6-1: Geological Domains of the Mount Isa Province and Project Location
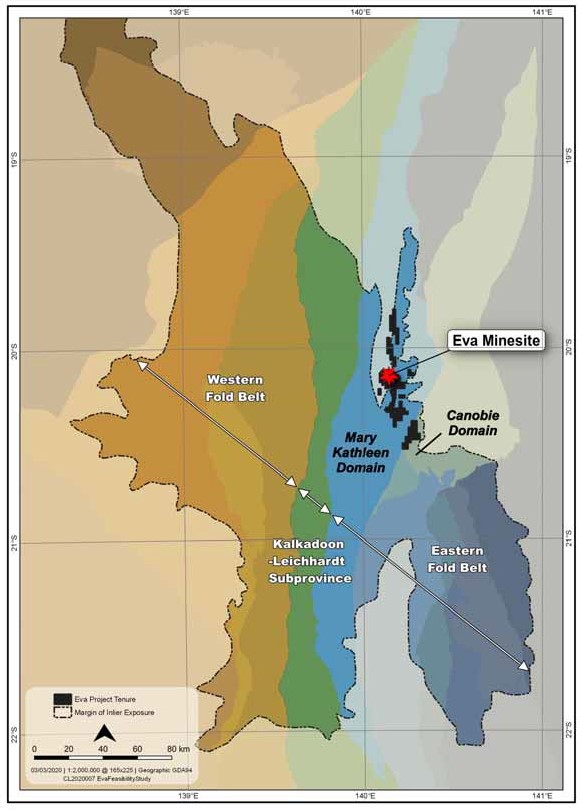
Note: Little Eva deposit denoted by red star
Effective date: 30 June 2025
33
Technical Report Summary of the
Eva Copper Project, North West Queensland, Australia
6.1.1Regional Stratigraphy
The Little Eva deposit, which contains most of the resources in the Eva Copper Project, lies within the
northern exposed portion of the Mount Isa Eastern Succession. Rocks within this area include a variety of
Palaeoproterozoic sediments and volcanic and intrusive rocks, as illustrated in Figure 6-2 and Figure 6-3. The
Palaeorproterozoic age (1,770±5 Ma) Corella Formation dominates the deposit area, and comprises scapolitic
calcareous metasediments, quartzites, and granofels (Betts et al., 2011).
Figure 6-2: Schematic Stratigraphic Diagram of the Little Eva Deposit Area
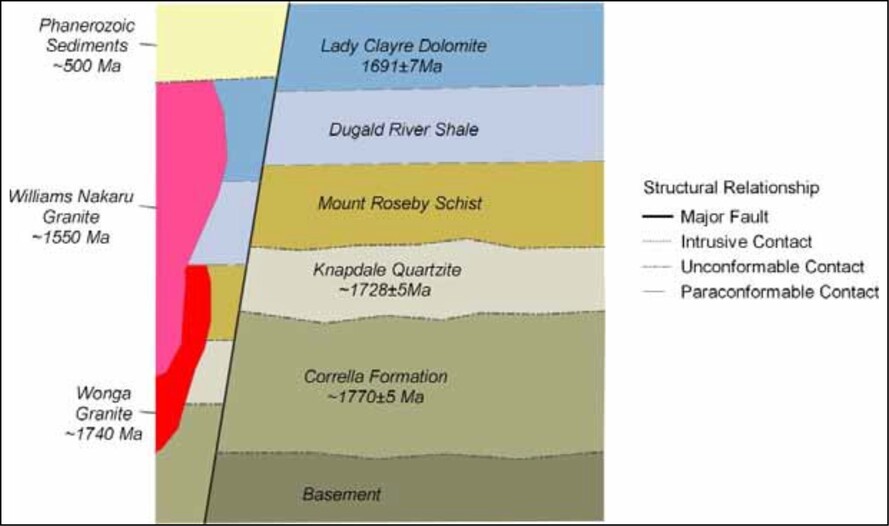
Approximately 1,740 Ma, deposition of the Mount Isa eastern succession was terminated by a period of
significant extension referred to as the Wonga Event. The Wonga Event was accompanied by dominantly
felsic extrusive and intrusive magmatism (Greenwood & Dhnaram, 2013). Sedimentation resumed following
the Wonga Event, with deposition of the Knapdale quartzite (feldspathic and micaceous sandstone and
quartzite) at 1,728±5 Ma (Greenwood & Dhnaram, 2013; Betts et al., 2012). Additional sedimentation
occurred with deposition of material that would become the Mount Roseby Schist, the Dugald River Shale
Member, (host to the Ag-Pb-Zn deposit of the same name), and the overlying Lady Clayre dolomite (host to
the Lady Clayre Cu-Au deposit), which has been dated at 1691±7Ma (Carson et al., 2011).
Sedimentation ended with the onset of the Isan Orogeny (approx. 1,600–1,510 Ma), which in its waning
stages was accompanied by widespread emplacement of potassium-rich “A-type” granites. Williams and
Naruku batholiths (approx. 1,550–1,500 Ma) are exposed east of the Project area (Malakoff granite). IOCG
mineralisation has a close temporal relationship with granite formation, and it has been proposed that
mineralising fluids were generated though magma mixing and/or fractionation.
Sedimentation was reinitiated during the Cambrian, with deposition of fine- to medium-grained sandstones
and limestone in basin grabens, including the Landsborough Graben located directly east of the Little Eva
deposit.
6.1.2Regional Deformation
Deformation of Proterozoic units within the Mary Kathleen domain resulted from the approximately 1,600–
1,510 Ma Isan Orogeny. On a regional scale, the orogeny can be divided into three broad stages characterised
by different principal stress directions and subsequent deformation responses. The Early Isan Orogeny (D1,
approximately 1,600–1,570 Ma) was accompanied by north-south to northwest- southeast compression,
which led to the formation of east-west trending folds and related axial plane cleavages. The Middle Isan
Orogeny (D2, approximately 1,570–1,525 Ma) involved east-west compression, resulting in the development
of north-south striking folds and foliation, ubiquitous in the Mary Kathleen domain. The Late Isan Orogeny
(D3, approximately 1,525–1,500 Ma) represented a transition to dominantly brittle deformation, with the
development of wrench-style faulting.
Effective date: 30 June 2025
34
Technical Report Summary of the
Eva Copper Project, North West Queensland, Australia
6.2Project Geology
The Project area straddles the northern part of a north-south striking corridor up to 10 km wide and 80 km
long, bounded to the east by the regionally significant Rose Bee Fault, and to the west by the Coolullah Fault,
which is also the eastern bounding fault of the Phanerozoic Landsborough Graben. These faults terminate
into the regional scale Fountain Range and Quamby faults, which continue south to intersect the Mary
Kathleen domain’s eastern margin (Figure 6-3 and Figure 6-4).
The Project area predominantly consists of variably metamorphosed sedimentary and igneous rocks of
Proterozoic age that typically outcrop with limited residual regolith cover. Regolith cover tends to thicken
east of the Rose Bee Fault and a thick sequence of Phanerozoic sediments overlies Proterozoic rock to the
west of the Coolullah Fault in the Landsborough Graben. The graben contains Cambrian limestone and
sandstone, mostly covered by Mesozoic and Cainozoic sediments.
Amphibolite facies schists of the Boomarra Metamorphic Belt are the oldest rocks within the area, outcrop
east of the Rose Bee Fault (Figure 6-3), and are unconformably overlain by metamorphosed fine-grained
sediments and intercalated volcanic rocks of the Corella Formation. The Little Eva copper-gold deposit is
hosted by intermediate to mafic composition volcanic rocks within the Corella Formation, similar to rocks
situated further to the south-east that have been dated, as coeval to the Wonga Suite intrusions
(approximately 1,740 Ma).
The Knapdale Quartzite is a metamorphosed sequence of massive siliciclastics forming a prominent, 12-km
long hill on the western side of the Project area, referred to as the Knapdale Range. The range is interpreted
as a nappe structure, with east-directed thrust faulting juxtaposing older siliciclastics over younger Mount
Roseby Schist (Roseby Schist).
The Roseby Schist, consisting of fine-grained, grey muscovite-quartz-biotite ± scapolite schists interbedded
with carbonate-rich layers, has been structurally juxtaposed against the Corella Formation by major faults.
The Roseby Schist within the Project area is overturned and contains distinctive scapolite porphyroblast-rich
units and is also distinguished by a lack of Wonga Suite felsic intrusions.
Effective date: 30 June 2025
35
Technical Report Summary of the
Eva Copper Project, North West Queensland, Australia
Figure 6-3: Geological Domains and Principal Stratigraphic Units of the Eva Copper Project Area
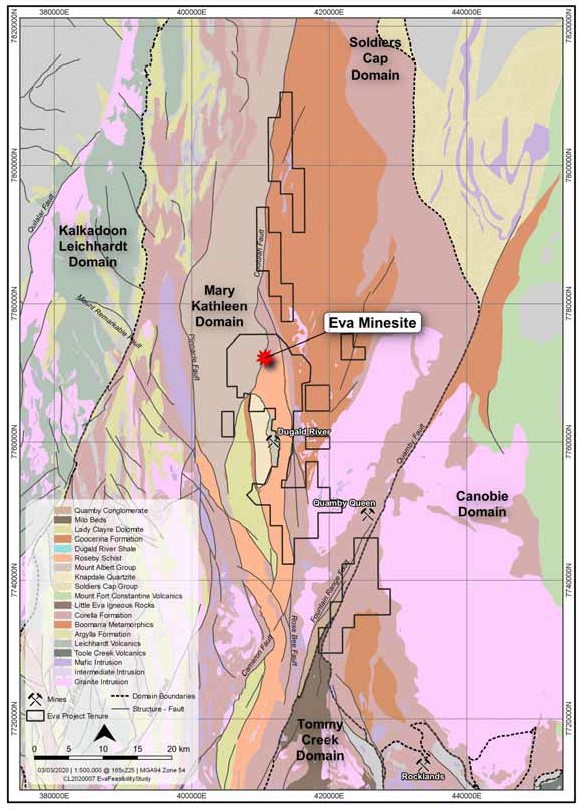
Effective date: 30 June 2025
36
Technical Report Summary of the
Eva Copper Project, North West Queensland, Australia
Figure 6-4: Project Area Geology with Outline of Project Tenure and Major Deposits
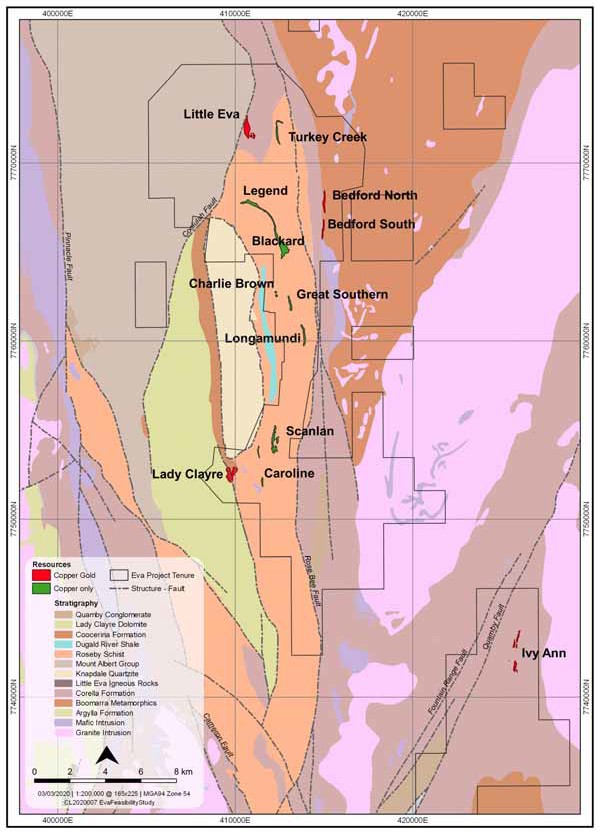
Overlying the Roseby Schist is the Dugald River shale member (carbonaceous zinc-rich slates), which hosts
the Dugald River zinc-lead-silver deposit of 63 Mt at 12.5% Zn, 1.9% Pb, and 31 g/t Ag. The Dugald River
deposit is localised along the highly deformed and faulted eastern margin of the Knapdale Range. On the
western side of the Knapdale Range, similar zinc-rich shales occur in the Coocerina Formation, which is also
overlain by dolomites, and therefore is likely a structural repetition of the Dugald River deposit host
stratigraphy.
Effective date: 30 June 2025
37
Technical Report Summary of the
Eva Copper Project, North West Queensland, Australia
Dating indicates maximum ages for the Roseby Schist and the Dugald River Shale Member at approximately
1,686 Ma. The units have temporal equivalents (1,690–1,645 Ma) throughout the Mount Isa Inlier, which are
host to many of the region’s significant deposits, including Mount Isa, Hilton, Cannington, Lady Annie, Lady
Loretta, Osborne, and Mount Elliot.
The Neoproterozoic (approx. 1,500 Ma) Quamby Conglomerate forms a ridge in the southern part of the
Project area. Comprising polymictic conglomerate and medium- to coarse-grained sandstone, the Quamby
rocks are relatively undeformed, generally flat-lying with broad open folds. The conglomerate unconformably
overlies Corella Formation rocks in a small graben developed along the Rose Bee Fault during late Isan
Orogeny wrench-fault reactivation. The conglomerate hosts gold mineralisation that was initially mined by
prospectors in the 1920s, and then later in the 1990s.
The Rose Bee Fault is a prominent topographic feature forming linear ridges where it is pervasively silicified
and quartz veined. Locally, the silicification overprints copper mineralisation and may have developed during
the Phanerozoic reactivation of the fault.
6.2.1Little Eva Deposit Geology
The Little Eva deposit is currently the major example of hydrothermal IOCG mineralisation and is the largest
single copper deposit within the Eva Copper Project area. Little Eva is a close analogue of the Ernest Henry
deposit. Indicated and Inferred resources are 207 Mt grading 0.33% Cu and 0.06 g/t Au at a 0.14% Cu cut-off
grade. Gold is strongly correlated with copper and is recovered in the copper concentrate. The deposit is 1.4
km in length and between 20 m to 370 m wide with mineralisation extending from surface to the limits of
drilling at 350 m vertical depth below surface (165 mRL) (Figure 6-5 and Figure 6-6). The deposit is sub-
cropping on a flat plain with thin and variable (<3 m) in-situ soil and alluvium cover. Fresh rock is overlain by
a 5 m to 25 m thickness of weathered rock. Copper occurs as primary sulphide minerals in fresh rock, and as
secondary oxide minerals within the weathered zone.
Mineralisation is hosted by a large body of faulted subvolcanic porphyritic and amygdaloidal intermediate
rock that displays pervasive sodium and potassium feldspar, hematite, and magnetite metasomatic alteration
assemblages. Intermediate volcanic rocks on the western margin of the deposit are cut by felsic intrusions
that are also mineralised. Most of the mineralisation is structurally controlled within breccias, fracture fill and
veinlet stockworks. Chalcopyrite is the dominant copper mineral with lesser amounts of bornite.
Mineralisation is coarse and readily recovered through flotation concentration.
The igneous rocks hosting the Little Eva deposit occur within intercalated folded calc-silicate, marble,
quartzite, and biotite-scapolite schists. The feldspar-phyric and amygdaloidal intermediate rocks are
presumed to be volcanic flows, but probably include some subvolcanic sills as documented at Ernest Henry.
In the northern part of the deposit the volcanic rocks are interpreted to be striking north and dipping to the
east at approximately 60 to 70 degrees, while the mineralisation appears to have a moderately west-dipping
(45 to 65 degree) ladder-like grade distribution. In the central part of the deposit the volcanic stratigraphy is
sub-vertical to westerly dipping, with dips shallowing to the south (Figure 6-6) The intrusive rocks are
dominantly mafic to intermediate in composition, fine- to medium-grained with feldspar-phyric and
amygdaloidal textures. There is a minor porphyritic felsic intrusion along the western margin of the deposit.
In plan, the intrusive rock package has a lenticular shape, imbricated by mineralised breccias and post-
mineral faulting, and is enclosed by metasedimentary rocks. The western contact between igneous rocks and
metasediments is, in part, highly strained and fractured. Copper mineralisation is rare within the
metasediments.
Folding and extensive cross-faulting have resulted in a complex array of fracturing, crackle brecciation, and
veining, particularly within the more competent rocks associated with copper-gold mineralisation. Late, post-
mineralisation, strong shearing, and fracturing occurs parallel to the footwall contact against calc-silicate
rocks, and it is interpreted that more strain took place in the less competent rocks.
Effective date: 30 June 2025
38
Technical Report Summary of the
Eva Copper Project, North West Queensland, Australia
Copper-gold mineralisation is high-grade but relatively narrow in the north and has progressively moderating
grades associated with greater width in the southern half of the deposit. Higher-grade zones in the north
occur in stacked zones of breccia, veining, and fracturing. Intervening zones are lower grade with
disseminated and veinlet-hosted mineralisation (Figure 6-7). The breccia zones typically dip west at 45 to 65
degrees, with north-northeast strikes. The breccias occasionally display multiple re-brecciation. Lower-grade
mineralisation in the south is more evenly distributed in fractures, veinlets, and disseminations. Low-grade
mineralisation averages 0.1% Cu to 0.3% Cu over lengths of 25 m to 150 m, whereas breccia zones are in the
order 0.8% Cu and 0.12 g/t Au over widths of 15 m and display gradational contacts.
The mineralised intermediate rock is variably and pervasively altered by multiple stages of alteration. Initial
alteration assemblages of amphibole, magnetite, and biotite (dark grey coloured) are overprinted by
assemblages comprising albite, haematite, magnetite, and carbonate ± chalcopyrite (red coloured).
The mineralisation is open beyond the extents of drilling: the northern tapered high-grade zone is terminated
or offset by faulting or plunges steeply to the north; while the southern extent is poorly constrained by
drilling, with higher-grade mineralisation appearing to plunge to the south.
The sulphide mineralisation is generally coarsely crystalline, and metallurgical tests have demonstrated
recoveries greater than 95% for copper. No deleterious elements were present in the trial flotation
concentrates. The deposit is generally low in sulphur and concentrations of pyrite greater than chalcopyrite
are relatively rare. Many of the drill holes average less than 0.8% sulphur.
A shallow 15m to 25m thick oxidation profile, a result of weathering, contains goethite-haematite with minor
malachite, chrysocolla, covellite, azurite, neotocite, and cuprite. The weathering profile indicates a “dry”
oxidation, as there is no leached zone and no supergene zone. There is a thin transition zone where
predominantly oxide copper changes over to predominantly sulphide copper over 1 m to 2 m. Chalcopyrite
can occur locally at surface. Zones of strong shearing and fracturing locally exhibit deeper oxidation.
Effective date: 30 June 2025
39
Technical Report Summary of the
Eva Copper Project, North West Queensland, Australia
Figure 6-5: Geology and Mineralisation at the Little Eva Deposit
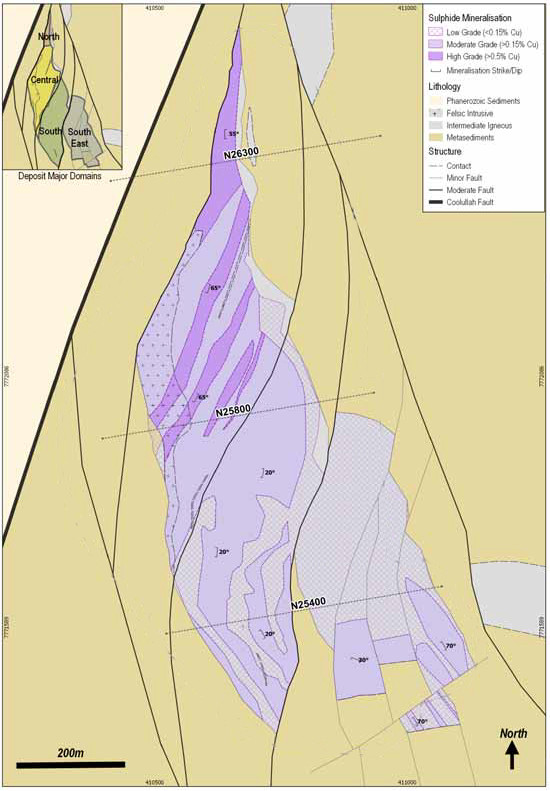
Note: See Figure 7-6 for locations
Figure 6-6: Geological Cross-Sections through the Little Eva Deposit from North to South
Effective date: 30 June 2025
40
Technical Report Summary of the
Eva Copper Project, North West Queensland, Australia
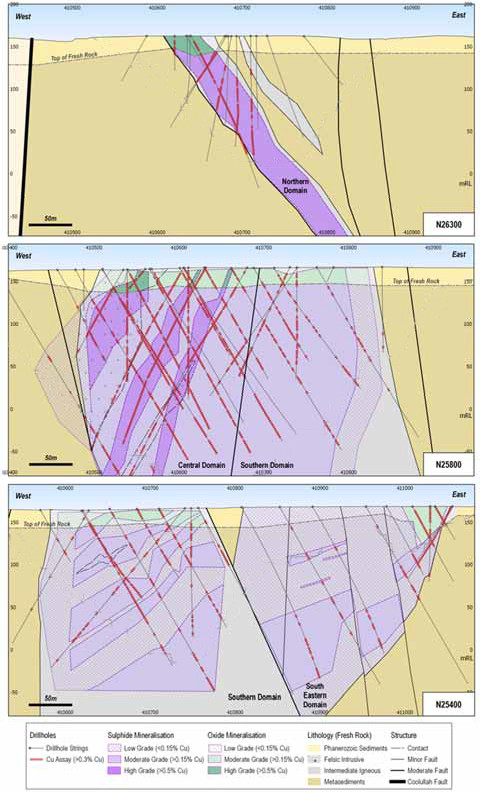
Effective date: 30 June 2025
41
Technical Report Summary of the
Eva Copper Project, North West Queensland, Australia
Figure 6-7: Drill Core Illustrating the Principal Mineralisation and Alteration Styles at Little Eva Deposit
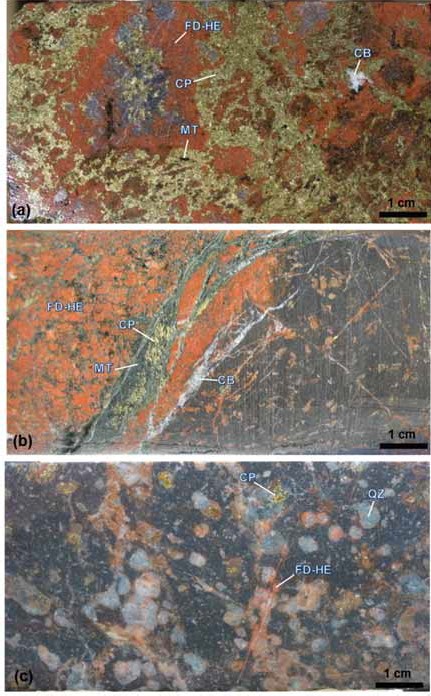
(a)High-grade hydrothermal breccia, with variably altered intermediate igneous clasts in a feldspar ("FD"),
hematite ("HE"), chalcopyrite ("CP"), magnetite ("MT"), and carbonate ("CB") matrix (4.8% Cu, 0.2 ppm Au).
(b)Feldspar phyric intermediate igneous rock (dark domain, right), overprinted by texturally destructive feldspar-
hematite ("FD-HE") alteration (red domain, left) host to a CP, MT, and CB filled veinlet network (0.5% Cu, 0.05 ppm
Au).
(c)Feldspar-phyric intermediate igneous rock with quartz ("QZ") filled amygdales, patchy weak FD-HE alteration, and
low-grade disseminated CP mineralisation (0.2% Cu, 0.02 ppm Au).
Effective date: 30 June 2025
42
Technical Report Summary of the
Eva Copper Project, North West Queensland, Australia
6.2.2Turkey Creek
The Turkey Creek deposit is located 1.5 km east of the Little Eva deposit. The sulphide resources in the
Indicated and inferred categories are 34 Mt grading 0.42% Cu. Mineralisation at Turkey Creek is very low in
gold. The deposit is sub-cropping in a relatively flat to gently undulating area with thin (<0.5 m) in-situ soils
and alluvium cover. Fresh rock is overlain by a 25-m to 90-m thickness of weathering and oxide
mineralisation. Copper occurs as primary sulphides in fresh rock and as secondary oxide copper minerals
dominated by copper silicates (chrysocolla, hydrobiotite) and minor malachite within the weathered zone.
The deposit extends over 1.8 km in length with mineralisation extending from surface, to drilled depths of
150 m vertically below surface (Figure 6-8 and Figure 6-9), with a simple tabular geometry that displays
excellent continuity along strike and down-dip. True widths vary from 10 m to 30 m at the southern end, to
30 m to 50 m at the northern end. The main part of the deposit strikes north and dips 60 degrees to the east.
At the northern end, the mineralisation and host stratigraphy are folded sharply eastwards into a curved
synform which plunges steeply south. The northern zone is slightly offset by faulting from the main southern
zone.
The tabular deposit has an upper and lower zone of stronger copper mineralisation with a more sporadically
mineralised central zone. Primary copper mineralisation comprises finely disseminated chalcocite, with
subordinate bornite and chalcopyrite, that are disseminated and also occur within minor carbonate veinlets.
Copper sulphide minerals in the upper zone are dominated by chalcopyrite, and in the lower zone by
chalcocite and bornite. Gangue minerals primarily consist of quartz, calcite, scapolite, white mica, and minor
biotite.
The sulphide mineralisation is stratabound and hosted within a sequence of interbedded metasediments
(biotite schists, biotite scapolite schists, and carbonate-rich rocks or marble) The host rocks are variably
altered to carbonate and albite-haematite assemblages.
A consistent 20-m to 30-m thickness of weathering with oxide mineralisation blankets the southern zone. It
includes a zone of complete oxidation, and a thin transition zone with minor secondary and remnant primary
copper sulphides. Copper oxide mineralisation comprises minor malachite, rare occurrences of azurite, and
native copper, with most of the native copper thought to be associated with hydrobiotite similar to the
Blackard deposit. The transition zone is dominated by malachite, minor degraded chalcopyrite, chalcocite,
and rare native copper.
Effective date: 30 June 2025
43
Technical Report Summary of the
Eva Copper Project, North West Queensland, Australia
Figure 6-8: Turkey Creek Deposit Mineralisation
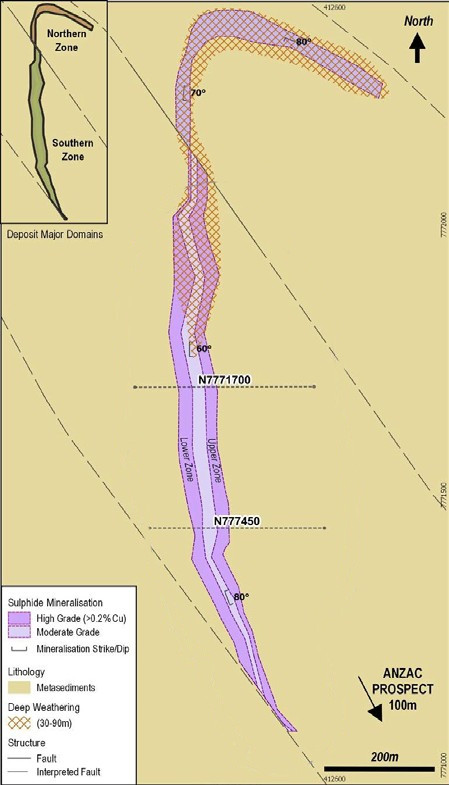
Effective date: 30 June 2025
44
Technical Report Summary of the
Eva Copper Project, North West Queensland, Australia
Figure 6-9: Geological Cross-Sections through the Southern Zone of the Turkey Creek Deposit
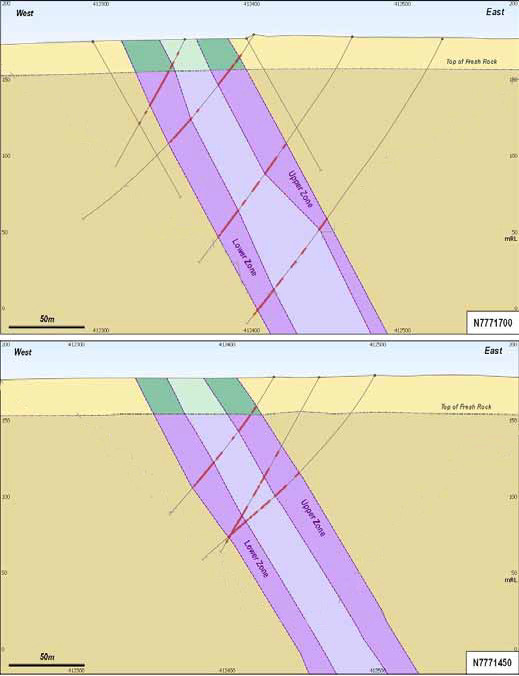
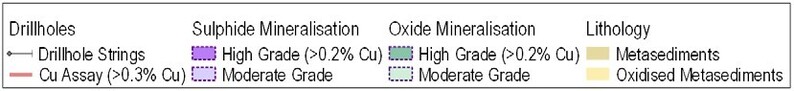
6.2.3Native Copper deposits
The Native Copper deposits within the Eva Copper Project include the Blackard, Legend, Great Southern and
Scanlan, characterised by the deep weathering profiles, which has resulted in extensive modification of the
host rock and localised remobilisation of copper. The deposits lie along the Roseby Copper Horizon and
located from 5 km and 17 km south of the Eva deposit. The deposits are geologically very similar and
therefore are described together.
An additional 250 RC and DDs were completed on the Blackard, Legend and Great Southern deposits over
2024/2025, and extensive metallurgical testing was carried out on Blackard and Scanlan samples which has
defined metallurgical recoveries for the mineralogical zones within the deposits. Indicated and Inferred
resources for the Blackard deposit are 150 Mt grading 0.46% Cu. Indicated and Inferred resources for the
Effective date: 30 June 2025
45
Technical Report Summary of the
Eva Copper Project, North West Queensland, Australia
Scanlan deposit total 25 Mt grading 0.55% Cu. Indicated and Inferred resources for the Legend deposit are 36
Mt grading 0.45% Cu. Indicated and Inferred resources for the Great Southern deposit total 15 Mt grading
0.41% Cu.
The Native Copper deposits are hosted by the Mount Roseby Schist, which comprises intercalated marls and
carbonaceous sediments that represent a shallow marine to lagoonal depositional environment. The unit has
been metamorphosed to calc-silicates, and variable scapolite, biotite and/or muscovite schists that have
undergone polyphase deformation. The most significant folding event forming northerly-trending folds, likely
coinciding with peak amphibolite grade metamorphism. Fold geometry has been inferred from data collected
from diamond drill core and field mapping, and has been variably described as isoclinal, through tight to
open, depending upon location, but primary layering cannot be determined from RC chips and is only rarely
visible in drill core, making interpretation at the deposit scale difficult. The Scanlan through to Blackard-
Legend deposits form a 7 km long trend of mineralisation that appears to follow stratigraphy as it curves
around the east side of the Knapdale Quartzite (Figure 6-4).
The Blackard deposit morphology is a function of folded stratigraphy and/or faulting having a strike length of
3.5 km and a maximum plan width of 350 m (Figure 6-10 and Figure 6-11). The stratigraphic width of the
deposit is only 60 m to 90 m, but a series of parasitic folds and/or fault repetitions results in a much wider
deposit. Fault movement along axial planes may have resulted in rootless folds. The southern area of the
deposit is relatively narrow, steeply dipping to the west, and northerly trending. The deposit width and depth
extent increases to the north, with a gradual shallowing of the westerly- dipping mineralisation (45 degrees)
and a flattening of mineralisation to the east. It is, however, difficult to constrain the mineralised rock within
a symmetrical fold pattern and the slight variations in strike orientation of higher-grade zones in plan suggest
the possibility of an east-west stacking of mineralisation along possible north-south (~010o N) faults. To the
north, the deposit narrows to a moderately-dipping 50 m to 60 m thick band that gradually steepens and
thins northwards.
Mining and processing of Blackard and Scanlan deposits will be affected by the deep weathering profiles,
which has resulted in extensive modification of the host rock and localised remobilisation of copper. Much of
the carbonate has been leached from the upper parts of the deposits creating voids between less soluble or
insoluble mineral grains and reducing the mass of the rock (Figure 6-12). Copper released by oxidation of
sulphide minerals has mostly formed native copper particles many of which are very fine-grained. Some of
the copper occurs as ultra-fine particles (<10 µm) within altered biotite (termed hydrobiotite) which is
unrecoverable with any known commercial processing methods. Four zones defined by weathering and
copper speciation have been determined for the deposits, and extensive testing has determined probable
metallurgical recoveries for each zone. From upper to lower, the zones are:
•Oxide Zone. The deposits are capped by a weathered, ferruginous zone that is typically 20 m to 30 m
thick and has a sharp contact with the next underlying zone. In some areas of the Oxide Zone almost
all copper has been leached but other areas have significant copper grades, with copper occurring as
malachite, azurite, hydrobiotite, and Fe-Mn-Cu mineraloids known as neotocite. Testing suggests
copper in this zone it is not economically extractable.
•Native Copper Zone. The Native Copper Zone is defined by the presence of native copper with lesser
cuprite, copper-bearing hydrobiotite, and chalcocite. Leaching of carbonates has reduced the mass
and created a very soft rock. The Native Copper Zone has a variable thickness, reaching a maximum of
120 m. Extensive testing has defined a viable process for extracting a significant percentage of the
native and sulphide copper.
•Transition Zone. A relatively narrow zone ranging from 1 m to 15 m in thickness that marks the
transition from the native Copper Zone to the Copper Sulphide Zone and carries mineral phases of
both adjacent zones. Copper grades tend to be high due to the presence of supergene chalcocite. The
base of this zone is defined by the “top of fresh rock” (TOFR in Figure 6-11).
•Sulphide Zone. Defined by unweathered (fresh) rock with copper sulphide species of bornite,
chalcocite, chalcopyrite, and pyrite, this zone contains sulphide disseminations and clots which are
strongly associated with carbonate veinlets. Metallurgical recoveries from this zone are favourable.
Silver is locally present but was not estimated.
Effective date: 30 June 2025
46
Technical Report Summary of the
Eva Copper Project, North West Queensland, Australia
The Scanlan deposit has a strike length of 1,500 m and a maximum width in plan of 500 m (Figure 6-13). In
the southern half, the deposit is composed of a 10 m to 50 m thick horizon, with the thicker part folded into a
“V” shaped synform on the eastern side, and the thinner part forming a nearly flat antiform to the east,
resembling an extended square root symbol in section, with a 320 degree, northwesterly trend (Figure 6-14).
The east dipping part of the synform is not present in the northern part of the deposit, eroded or possibly
faulted off, and the mineralisation swings to a 12 degrees northerly trend, becoming a steeply west-, then
east-dipping panel of mineralisation, and gradually thinning to uneconomic widths.
There are two possibilities for the origin of mineralisation in the copper-only deposits. The first ascribes a
hypogene hydrothermal source that occurred during the waning stages of the Isan Orogeny due to features
that include orientation of sulphide minerals along foliation planes and/or brittle fractures or pre-existing
carbonate veins, as well as sulphide-phased overprinting metamorphic minerals. Timing of this mineralizing
event would closely correspond with the copper-gold deposits in the district. The second hypothesis for the
mineralisation is that the deposits represent typical stratiform copper deposits that form from metalliferous
basin brines, post-deposition but pre-orogeny. Stratiform-type copper deposits are typically formed by redox
reactions within marine sediments with moderate to high sulphur contents.
These deposits commonly display an inwards pyrite-chalcopyrite-bornite-chalcocite-native copper zonation
as the redox reactions progressively use up the available sulphur; a zonation that may be inferred based on
the deeper, down-dip parts of the Blackard deposit. Additionally, the lower sulphide zones within the copper-
only deposits have virtually no gold but relatively high silver contents, locally, with Cu:Ag ratios typical of
many occurrences of stratiform copper mineralisation. A stratiform origin may also explain the similar
stratigraphic position of all the copper-only deposits (with the exception of Turkey Creek) around the Dugald
River Shale and Knapdale Quartzite units. Many of the sulphide textures ascribed to the hypogene origin are
compatible with metamorphism of earlier formed sulphide deposits within carbonaceous rocks, where
sulphides and some carbonate would be partially remobilised and likely to recrystalise after formation of the
metamorphic silicate minerals. The extensive leaching of carbonate from the upper parts of these deposits
indicates the possibility of weathering of an overlying high-sulphide zone (pyrite-chalcopyrite) to produce the
necessary acid. The origin of the deposits is inconsequential to grades and mining but may have some
significance for future exploration.
Effective date: 30 June 2025
47
Technical Report Summary of the
Eva Copper Project, North West Queensland, Australia
Figure 6-10: Plan View of the Blackard Deposit
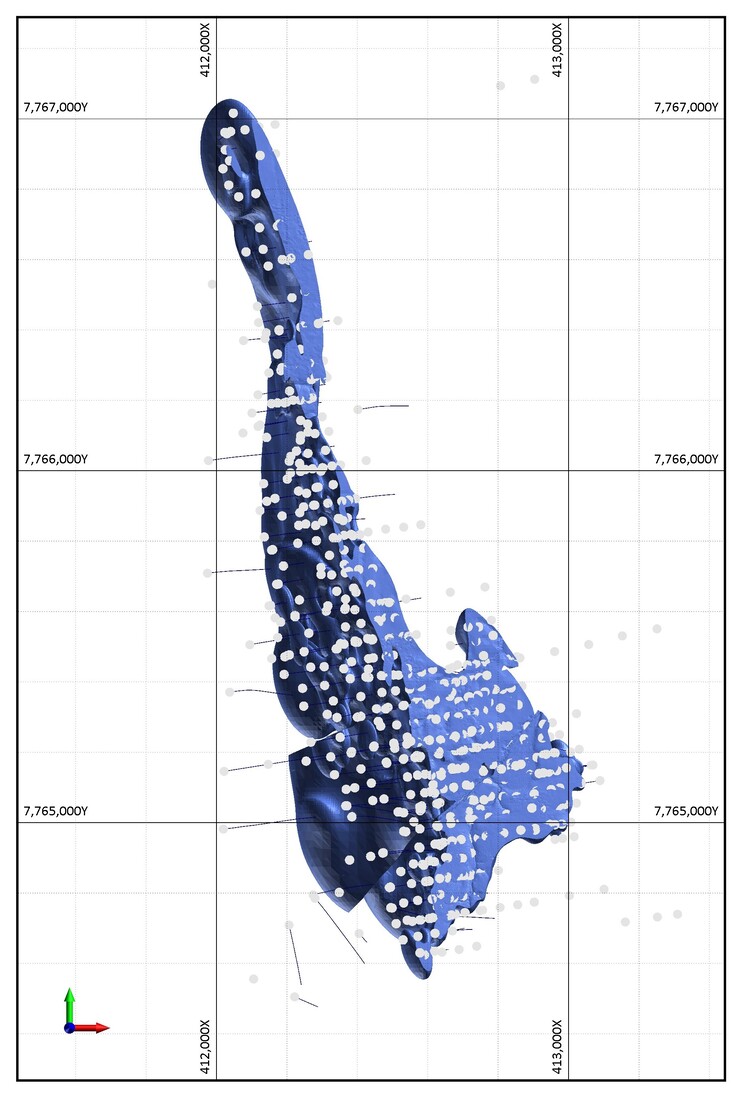
Effective date: 30 June 2025
48
Technical Report Summary of the
Eva Copper Project, North West Queensland, Australia
Figure 6-11: Geological Cross-Sections through the Blackard Deposit Illustrating the Distribution of Mineralogical/
Metallurgical Zones Produced by Weathering
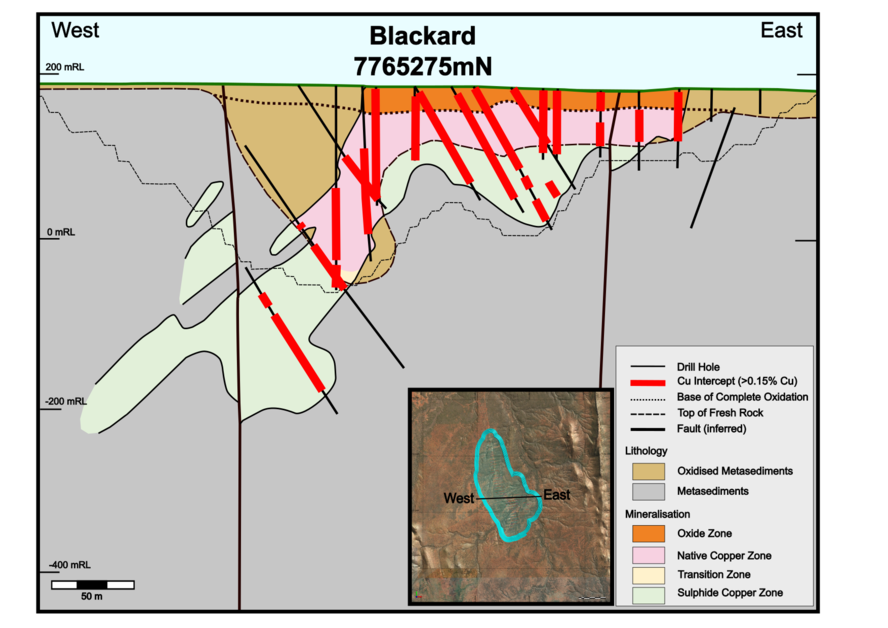
Figure 6-12: Photographs of Drill Core from the Blackard Deposit
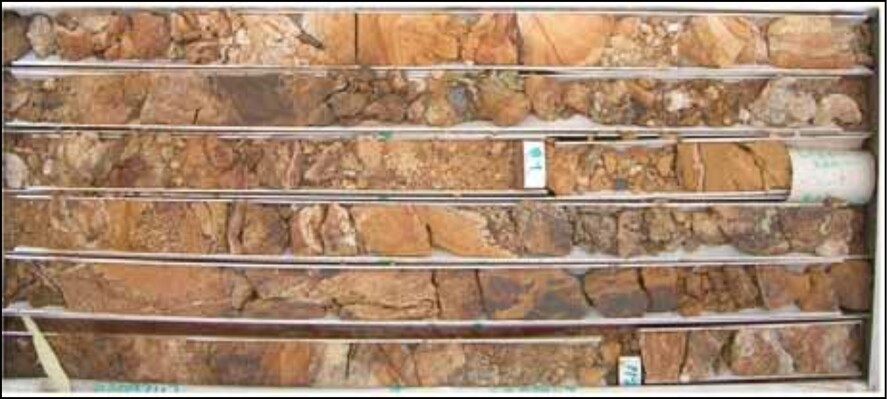
Effective date: 30 June 2025
49
Technical Report Summary of the
Eva Copper Project, North West Queensland, Australia
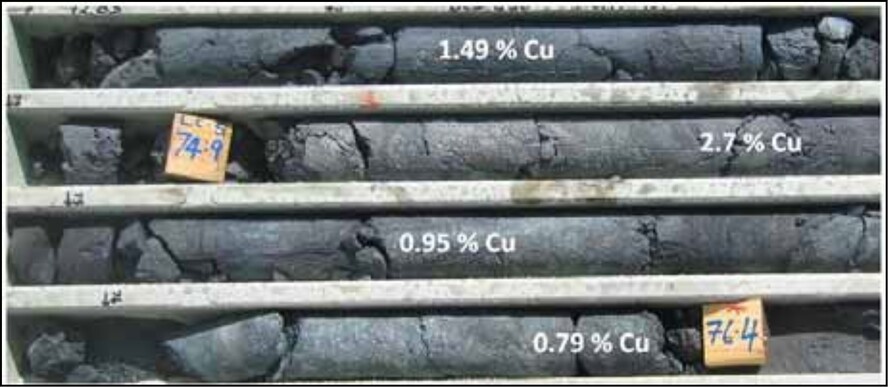
Note: The upper photograph is an example of core from Oxide Zone containing ferruginous metasediments with clay alteration
associated with leaching of carbonate. The lower photograph is core from the copper zone consisting of chemically oxidised scapolitic
schist, leached of carbonate. Copper assay values for 1 m samples shown. Horizontal field of view approximately 70 cm.
Figure 6-13: Plan View of the Scanlan Deposit
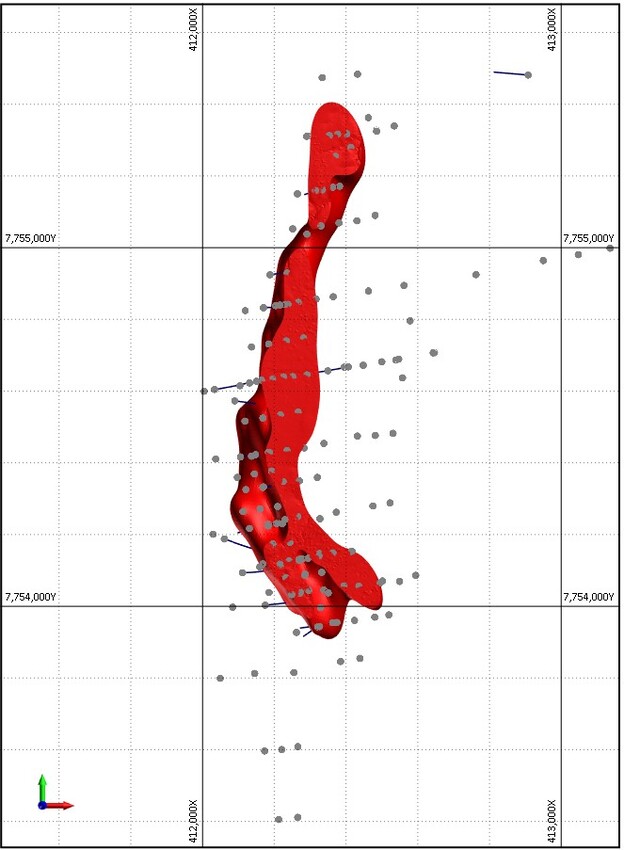
Figure 6-14: Cross-Section of Scanlan Deposit Illustrating Mineralisation Zones
Effective date: 30 June 2025
50
Technical Report Summary of the
Eva Copper Project, North West Queensland, Australia
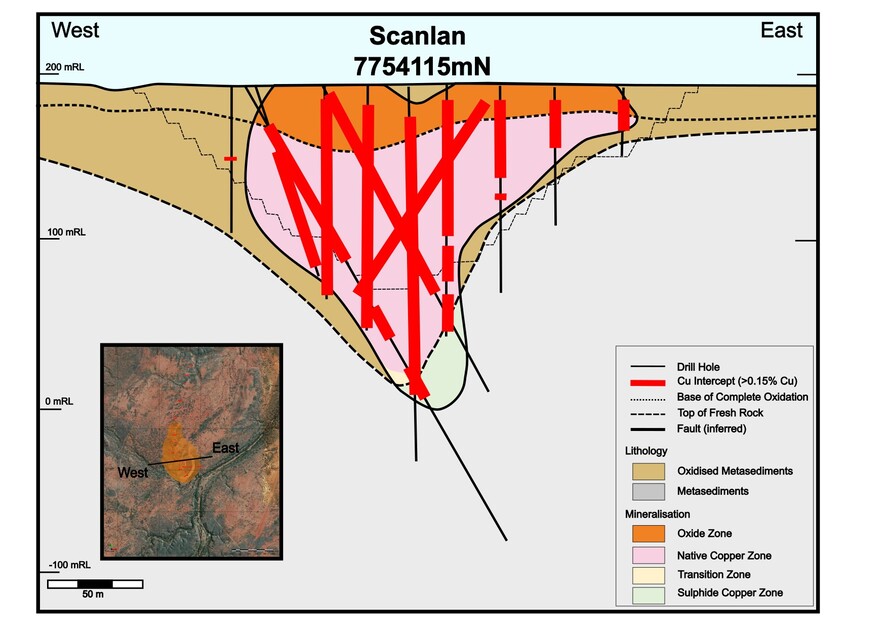
Effective date: 30 June 2025
51
Technical Report Summary of the
Eva Copper Project, North West Queensland, Australia
6.2.4Lady Clayre
Lady Clayre is located approximately 19 km south of Little Eva and is the third largest copper-gold deposit
within the Project area. The deposit contains Indicated resources of 5.1 Mt grading 0.38% Cu and 0.17 g/t Au,
plus an additional 1.1 Mt grading 0.37% Cu and 0.09 g/t Au in the Inferred category. The deposit has been
drilled to a vertical depth of 200 m and is open at depth.
The deposit is sub-cropping with thin (<0.5 m) in-situ soil cover. Fresh rock is covered by a thin, 15 m to 25 m,
weathered zone of oxide mineralisation. Copper occurs as primary sulphides in fresh rock and as secondary
oxide minerals within the weathered zone.
Mapping and surface sampling have defined multiple zones of surface mineralisation. Zones A and F (Figure
6-15 and Figure 6-16) have been the focus of drilling, which has delineated a series of moderate to steep
dipping planar mineralised bodies. Zone A mineralisation strikes north-northwest, dips approximately 80
degrees to the west, and extends along strike for 700 m. Zone F mineralisation strikes north-east, dips 70 to
75 degrees to the west, and extends along strike for a total of 480 m.
Lady Clayre is situated in a structurally complex area, with evidence for a number of ductile and brittle
deformation events. The deposit is located close to the junction of two regional faults near the southern
termination of the Knapdale Quartzite. Copper-gold mineralisation is structurally controlled, associated with
faulting/shearing sub-parallel to bedding in a folded sequence of shale, metasiltstone, schist, and dolomite.
The metasedimentary package is intruded by intensely altered, narrow (0.5 m to 5 m) sheets of mafic
intrusive. Alteration mineral assemblages associated with mineralisation are dominated by carbonate,
feldspar, quartz, and tremolite.
The main sulphide ore mineral is chalcopyrite, often associated with lesser pyrite and/or pyrrhotite.
Molybdenite is also noted. Mineralisation is coarse-grained, occurring in sulphide or carbonate- sulphide vein
arrays and as sulphide disseminations in intensely altered rocks. Breccia infill can also be locally significant.
The dominant copper mineral in the oxide zone is malachite, with limonite and goethite.
Mineralisation remains open along strike and down dip in Zones A and F, while a series of additional areas of
surface mineralisation remain untested by drilling.
Effective date: 30 June 2025
52
Technical Report Summary of the
Eva Copper Project, North West Queensland, Australia
Figure 6-15: Geology and Mineralisation at Lady Clayre
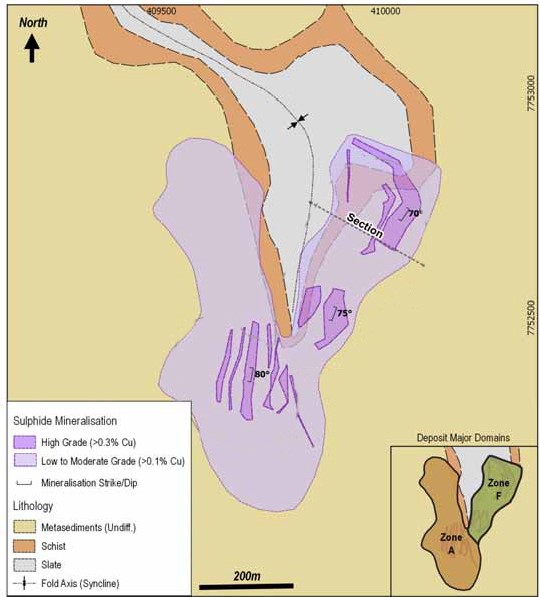
Effective date: 30 June 2025
53
Technical Report Summary of the
Eva Copper Project, North West Queensland, Australia
Figure 6-16: Geological Cross-Section through the Lady Clayre Deposit Zone F
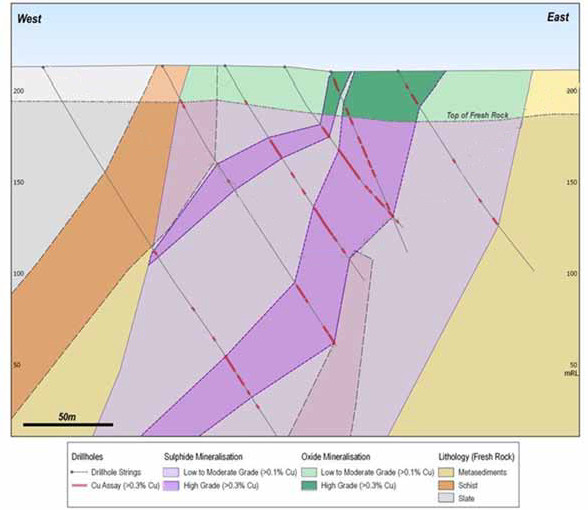
6.2.5Ivy Ann
Ivy Ann is a modest sized copper-gold deposit located approximately 35 km south-southeast of Little Eva. The
Indicated Resource is estimated at 5.2 Mt at 0.34% Cu and 0.09 g/t Au at a 0.17% Cu cut-off grade, there is a
further 1.2Mt @ 0.33% Cu and 0.11g/t Au classified as inferred. The deposit has been drilled to a vertical
depth of 125 m and is open at depth. Ivy Ann lies to the east of, and adjacent to, the broad Quamby Fault
Zone, which is manifest as a 1-km wide high-strain zone with evidence for dextral displacement (Figure 6-17).
The deposit is sub-cropping in a relatively flat to gently undulating area with thin (<0.5 m) in- situ soils and
transported alluvium cover. There is a 15-m to 30-m-thick weathered zone of oxide mineralisation on top of
the deposit.
The deposit is a lenticular shaped body striking north-northeast with numerous lenses hosted within steeply
east-dipping structures, striking north-south to north-northeasterly. Mineralisation has been defined in two
separate deposits, Ivy Ann and Ivy Ann North. The overall mineralisation extends over a strike length of 3 km.
The main Ivy Ann deposit is defined over a strike length of 630 m, with a width of 20 to 130 m, and a steep
easterly dip; it’s a wedge-shaped body striking north-south subparallel to the host lithologies. The Ivy Ann
North deposit is defined over a 420-m strike length with a width of 10 to 30 m and is vertical or dips steeply
to the east.
The copper-gold mineralisation is fault hosted and associated with breccias and networks of veins and micro-
veinlets within a folded sequence of metamorphosed sediments (psammite) and amphibolite. Fold axes are
north-south with interpreted moderate southward plunges (>45 degrees). Main sulphide ore minerals are
chalcopyrite with lesser pyrite and pyrrhotite. Sulphide grain size is relatively coarse.
Alteration mineral assemblages associated with the copper mineralisation are dominated by albite, quartz,
hematite, biotite, and magnetite. Breccias are best developed in albite-quartz-hematite altered rocks, which
Effective date: 30 June 2025
54
Technical Report Summary of the
Eva Copper Project, North West Queensland, Australia
sit in the hinge of a tight southward-plunging antiform. The metasediments, fault zones, and fold axes are cut
by a swarm of thin (<5 m) pegmatite dykes.
An irregular 15-m to 30-m thick zone of weathering with oxide mineralisation blankets the deposit. The
dominant copper oxide mineral is malachite, present with goethite and hematite, and lesser amounts of
chrysocolla, tenorite, and cuprite. The zone is poorly constrained by current drilling.
Figure 6-17: Plan of Ivy Ann Mineralisation and Geological Cross-Section of the Ivy Ann Deposit
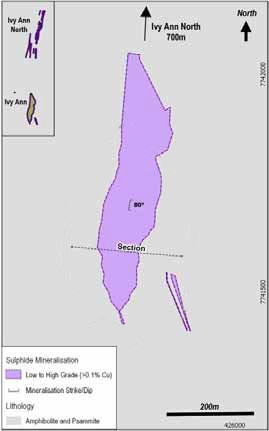
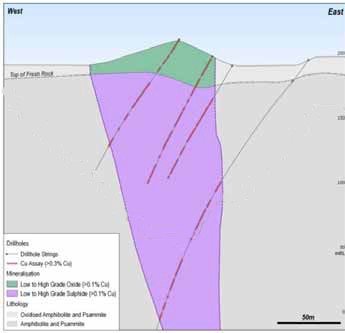
Effective date: 30 June 2025
55
Technical Report Summary of the
Eva Copper Project, North West Queensland, Australia
6.2.6Bedford
Bedford is a modest sized copper-gold deposit located 6 km southeast of the Little Eva deposit. The Indicated
Resource is estimated at 3.3 Mt at 0.55% Cu and 0.15 g/t Au at a 0.17% Cu cut-off grade, with a further 1.0Mt
@ 0.38% Cu and 0.12g/t Au in inferred Resource. The deposit has been drilled to a vertical depth of 140 m
and is open at depth. Bedford lies to the east of the Rose Bee Fault.
The deposit is sub-cropping in a relatively flat to gently undulating area with thin (<0.5 m) soils and limited
alluvium cover. The deposit is overlain by a 20-m to 30-m-thick weathered zone of oxide mineralisation.
The deposit is hosted within a steeply west-dipping shear zone striking north to north-northeast (Figure 6-18
and Figure 6-19). The shear zone varies from 50 m to 120 m wide with internal arrays of mineralised
structures and splays. Mineralisation has been defined in two separate zones, Bedford North, and Bedford
South, within a continuous structure. The deposit extends over a strike length of 2.5 km. The northern zone is
1.15 km, and the southern zone is 850 m long. Within the shear zone individual mineralised structures
associated with mineralisation (>0.3% Cu) true widths ranging from 5 m to 12 m. Mineralisation remains
open to north and south along strike, down dip, and between the two zones.
Host rocks are a north to north-northeast-striking, moderately to steeply west-dipping interlayered sequence
of amphibolite and biotite schist underlain by psammite and intruded concordantly by narrow planar granite
and pegmatite dykes or sills. In Bedford South, mineralised structures are interpreted to be bedding or
foliation parallel. In Bedford North, the main mineralised structures are interpreted to trend north-south,
stepping across the north-northeast-striking stratigraphy, with the development of a set of secondary north-
northeast linking structures along bedding or foliation. An irregular, 20-m to 30-m-thick zone of weathering
with oxide mineralisation blankets the deposit. Although the base of oxidation is well defined, variability of
copper mineral species within the weathering profile is not well understood.
Magnetite-biotite alteration assemblages with quartz veining are concentrated in the ore zones, above a
strongly feldspar-hematite altered footwall.
The dominant ore mineral is coarse-grained chalcopyrite (with minor magnetite, pyrite, pyrrhotite, and gold),
which occurs within quartz veins, breccia fill, and disseminations within the host shear zone.
Effective date: 30 June 2025
56
Technical Report Summary of the
Eva Copper Project, North West Queensland, Australia
Figure 6-18:Bedford Deposit Mineralisation Plan
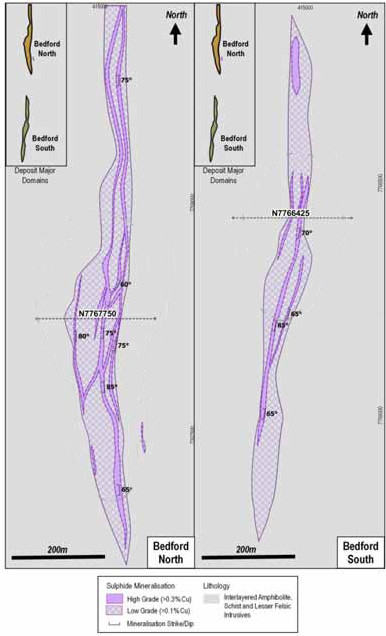
Note: In Bedford North the main mineralised structures trend north-south stepping
across north-northeast-striking stratigraphy of intercalated amphibolite, biotite schist,
and narrow granite and pegmatitic dykes/sills. In Bedford South the mineralised structure
is bedding or foliation parallel.
Effective date: 30 June 2025
57
Technical Report Summary of the
Eva Copper Project, North West Queensland, Australia
Figure 6-19: Geological Cross-Sections through the Bedford Deposit
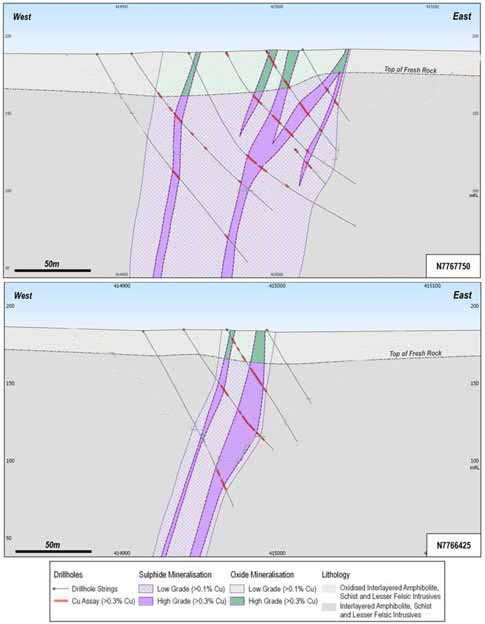
Effective date: 30 June 2025
58
Technical Report Summary of the
Eva Copper Project, North West Queensland, Australia
6.3Deposit Types
Section 229.601(b)(96) (6) (i‐iii)
The copper-gold deposits within the Project are of the IOCG style of hydrothermal mineralisation. Significant
examples of Australian IOCG deposits include Olympic Dam and Prominent Hill in South Australia and Ernest
Henry in Queensland, which is located some 60 km from Little Eva.
Mineral deposits occurring within IOCG systems are associated with relatively high temperature, iron- rich
hydrothermal alteration (typically hematite or magnetite), which is both spatially and temporally related to
felsic plutons. Mineralisation can manifest in a variety of styles including vein networks, breccias,
disseminations, and replacements. Deposits are typically localised in dilation zones of structures active during
pluton emplacement and cooling.
Within the Eastern Mount Isa Inlier, deposits are interpreted to have formed during the waning stages of the
Isan Orogeny (1,530–1,495 Ma), in association with intrusion of the Williams-Naraku batholith suites. This is
coincident with wrench reactivation of earlier large, crustal-scale faults, which saw dextral displacement on
north-northwest trending transfer faults, and some regional north-south structures, suggesting northwest-
southeast compression.
In the Project area, deposits fit into two categories: copper-gold, and copper-only. The copper-only deposits
are a distinct, metasediment-hosted stratabound mineralisation style in the region, unique to the Roseby
Schist. The copper-gold deposits are more typical of the IOCG deposits in the Eastern Mount Isa Inlier. The
copper-gold deposits occur within structural-lithological settings that facilitate dilational sites during
deformation, typically within igneous rocks or intercalated metamorphosed igneous and sedimentary rocks
peripheral to Roseby Schist. The copper-only deposits are interpreted from the available data to be gold-poor
end members of the IOCG mineralizing event prevalent throughout the district (varying primarily due to host
rock controls) an alternative hypothesis is that they are stratiform deposits related to an earlier mineralising
event during basin dewatering.
6.3.1Copper-Gold Deposits
Four copper-gold deposits are scheduled for mining: Little Eva, Lady Clayre, Ivy Ann, and Bedford (which
contains two separate zones, Bedford North, and South).
Little Eva, the largest copper deposit within the Project, is considered an IOCG type, and is a close analogue
of the Ernest Henry deposit. The deposit contains gold, which has a strong correlation with copper, and is
recovered in the copper concentrate. The deposit is hosted by a large body of faulted, porphyritic, and
amygdaloidal intermediate rock, which likely represents volcanic flows, and possibly sub-volcanic intrusive
rocks. All rocks display pervasive sodium and potassium feldspar, hematite, and magnetite-bearing
metasomatic alteration assemblages. The mineralisation is structurally controlled within breccia and veinlet
stockworks. Chalcopyrite is the dominant copper mineral.
Mineralisation is generally coarse-grained, and readily recovered through flotation concentration.
Bedford, Lady Clayre, and Ivy Ann have a similar metal association to Little Eva. These are smaller shear
zone-, fault-, and vein-hosted deposits within thinly intercalated metasedimentary and igneous rocks. Gold
grades within these deposits are typically higher than at Little Eva.
All the deposits are sub-cropping, covered by a relatively shallow (approximately 25 m) oxidised cap.
Effective date: 30 June 2025
59
Technical Report Summary of the
Eva Copper Project, North West Queensland, Australia
6.3.2Copper-Only Deposits
There are three copper-only deposits which are planned for mining: Turkey Creek, Blackard, and Scanlan.
Legend and Great Southern are new resource additions to the project however haven't been included in the
mine plan yet. Other copper-only type deposits within the Project tenures currently excluded from the mine
plan, as they are currently insufficiently explored, are: Longamundi, Caroline, and Charlie Brown. The
copper-only deposits contain trace amounts of gold locally, but generally not in economic quantities as with
the copper-gold deposits. Low tenor silver may be present in the sulphide zones, although data is minimal.
The mineralisation appears to be stratabound, if not stratiform, and in the case of Blackard and Scanlan has
been deformed by folding. Except for Turkey Creek, these deposits are distributed around the eastern margin
of the Knapdale Range over a strike length of 16 km and hosted within a sequence of metamorphosed
calcareous sediments. The deposits are not associated with magnetite enrichment and exhibit some
characteristics of stratiform-copper type deposits. Primary sulphide mineralisation is dominated by bornite,
with minor chalcopyrite and chalcocite, however the deposits have been modified by supergene processes
and extensive leaching of carbonate, that has produced four distinct mineralogical zones as listed below:
•The oxide zone begins at surface, and extends to depths of 15 m to 25 m. The zone is defined by
oxidation of copper and iron bearing minerals to malachite, limonite, goethite, and copper bearing Fe-
Mn mineraloids (neotocite).
•The copper zone occurs below the oxide zone, and can extend to depths of 120 m. The copper zone
contains a significant amount of native or metallic copper, which can account for up to 65% of the
contained copper. Significant copper also occurs in the lattice of altered biotite referred to as
hydrobiotite, which is not recoverable by flotation. Other copper minerals include cuprite, chalcocite
and residual bornite. Carbonate is extensively leached. Almost complete leaching of carbonate has
produced very friable rock.
•The transition zone is a zone that transitions between the copper and sulphide zones. This zone
contains minor secondary and remnant primary copper sulphides (chalcocite, cuprite, tenorite,
bornite, and chalcopyrite), and may contain some metallic copper.
•The sulphide zone, is primary mineralisation in fresh rock containing copper as disseminated bornite,
chalcocite and chalcopyrite.
The copper-only mineralisation is associated with a specific stratigraphic interval that has ubiquitous low-
tenor copper anomalism wherever it is exposed or intersected by drilling and displays complex folding and
fault patterns. Fold axes are predominantly north-northwest-trending but can have variable plunges. At
Blackard and Scanlan, mineralisation occurs within shallow-plunging anticlines, with steeply-dipping to locally
overturned western limbs, and flatter, east-dipping limbs.
QP’s Opinion: In the QP’s opinion, the geological interpretations and deposit models used in this TRS provide
a sound and defensible basis for Mineral Resource estimation. The styles of mineralisation are well
understood and consistent with known regional analogues.
Effective date: 30 June 2025
60
7Exploration
Section 229.601(b)(96) (7) (i‐vi)
Early exploration in the area that contributed significantly to the database for this Project included that
completed by Ausminda Pty. Ltd., CRAE, and Pasminco, with later exploration by Altona, prior to Project
acquisition by CMMC.
Extensive geophysical surveying, primarily induced polarisation (IP) over the copper deposit areas, and
Electromagnetic (EM) or Controlled Source Audio-Frequency Magnetotellurics ("CSAMT") over the Dugald
River zinc deposit host rocks, as well as gravity and magnetic surveys, were undertaken in the area by CRAE.
All the Project deposits subcrop and were initially identified by surface sampling and mapping. The most
valuable result from the geophysical work was the identification aided definition of the copper-only deposits,
the most valuable were the EM and gravity surveys. Gravity lows are registered over the copper-only
deposits due to deep weathering, while the metallic copper in the supergene zones were mapped as EM
anomalies. Airborne magnetic surveys over the Project area are available from various government agencies.
Satellite hyperspectral surveys have also been used with some success by various companies in the area.
CRAE's bedrock and soil geochemical programmes outside the Roseby copper deposits were not systematic,
with minimal assessment of gold mineralisation, and left most of the surrounding area untested by
geochemical surveys. CRAE’s focus at the time was on the copper only (no gold containing) deposits due to
their relatively high grades and the Little Eva and Lady Clayre areas were of secondary exploration interest.
The Little Eva copper-gold prospect was drilled by CRAE to an Inferred resource status, but the gold content
was not assessed. The Lady Clayre prospect was also drilled by CRAE at the time, but no resource estimate
was completed. Metallurgical sampling and testing were conducted at Blackard and Lady Clayre, but not at
Little Eva.
Following the acquisition of the Project from CRAE by Pasminco/Zinifex, drilling, and sampling programmes
focused primarily on the Lady Clayre copper-gold sulphide prospect, Caroline (Lady Clayre East), and the
copper-gold potential of the Mount Rose Bee Fault area. This drilling was insufficient to define a formal
resource at either deposit. Pasminco also initiated a soil and rock sampling programme designed to examine
the Mount Rose Bee Fault and related splay faults. While this programme detected widespread but weak
copper-gold mineralisation, generally in close spatial relationship with copper and gold soil geochemical
anomalies, Pasminco divested the Roseby Copper Project before the exploration programme was completed.
Xstrata conducted exploration in the central Roseby area under the terms of an option and earn-in
agreement with Altona. Xstrata also completed deep drilling below the Little Eva, Blackard, Great Southern,
and Longamundi deposits demonstrating the presence of large mineralised systems. Xstrata also discovered a
mineralised system under cover at Cabbage Tree Creek some 3 km north of Little Eva. Xstrata has also
completed extensive geochemical, rock sampling, mapping, and geophysical surveys generating numerous
targets, some of which have been subject to initial drill testing with positive results.
Altona carried out systematic soil geochemistry work over much of the claim area, and this work was
continued by CMMC. This work has established numerous copper-in-soils targets within the Project tenure
and surrounding EPMs held by Harmony (Figure 7-1). Shallow drilling of these targets has established
numerous mineralised positions with opportunities to established new copper and gold mineral resources.
Effective date: 30 June 2025
61
Figure 7-1: Surface Copper Anomalism with Defined Deposits and the Cameron Project Area Indicated
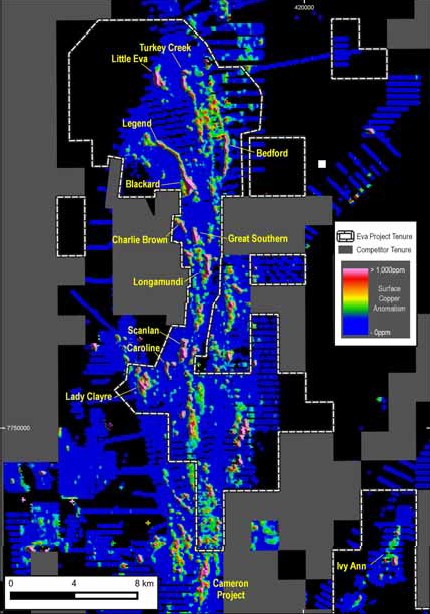
Exploration carried out by CMMPL in 2018 and 2019 included grade confirmation and metallurgical drilling in
the Little Eva, Turkey Creek, and Blackard deposits, in addition to exploration drilling on some targets in the
Project area. Additionally, exploration drilling was also completed on the prospective areas Quamby and
Matchbox, which are located in the Cameron area south of the Project (Figure 7-1). Compilation of
geophysical surveys and inversion of historical IP geophysical data were completed, as were new surveys in a
few areas. Testing of aquifers for potential water sources near the proposed mine area was successfully
conducted in both 2018, 2019 and 2023.
Effective date: 30 June 2025
62
7.1Drilling
Section 229.601(b)(96) (8) (i‐v)
The seven deposits in this report have relatively lengthy exploration histories, including multiple periods of
drilling implemented and managed primarily by several companies: CRAE, URL, Altona, CMMC and Harmony.
All drill data was collected to industry standards, and the procedures were well documented. Quality control
and data verification are discussed in following sections, and demonstrate that the data is reliable and
suitable for Mineral Resource estimations.
7.1.1Drill Hole Data Description
7.1.1.1Little Eva
A total of 121,498 m of drilling in 721 holes was completed at Little Eva. Of these, some 77% are RC (549
holes), and 23% are DD (165 holes). Holes were generally inclined at -55 to -60° or subvertical, drilled on
25-50 m spaced section lines, and 40 m along line spacing. Some areas are more densely drilled or include
holes aligned in alternative directions.
Diamond drilling was conducted for resource definition, metallurgical testwork sampling, geotechnical, and
twinning of RC holes for quality assurance/quality control ("QA/QC"). Diamond drill holes were commonly
drilled with shallow RC pre-collars. RC pre-collars were generally drilled until RC penetration limit was met -
commonly due to water inflow.
The drilling history for the Little Eva deposit is summarised in Table 7-1, and hole locations are shown in
Figure 7-1. The earliest recorded drilling at Little Eva was undertaken by CRAE in 1963 and consisted of a
single DD. Most drilling was conducted by three companies; CRAE (1963 to 1998), URL (2002 to 2009), Altona
(2011 to 2018), CMMC (2019-2022) and Harmony (2023+).
Effective date: 30 June 2025
63
Table 7-1: Little Eva Drilling Summary
Year | Company | Hole Type | Hole Count | Metres Drilled |
1963 | CRAE | DD | 1 | 193 |
1977 | CRAE | DD | 1 | 254 |
1978 | CRAE | DD | 5 | 1,159 |
1978 | CRAE | PERC | 1 | 34 |
1988 | CRAE | RC | 24 | 823 |
1990 | CRAE | RC | 5 | 480 |
1992 | CRAE | DD | 1 | 543 |
1992 | CRAE | RC | 12 | 1,182 |
1994 | CRAE | RC | 13 | 1,627 |
1995 | CRAE | DD | 3 | 757 |
1995 | CRAE | RC | 6 | 1,031 |
1996 | CRAE | DD | 3 | 1,201 |
1996 | CRAE | RC | 1 | 150 |
2002 | URL | RC | 14 | 2,138 |
2003 | URL | RC | 5 | 1,249 |
2004 | URL | RC | 83 | 9,987 |
2005 | URL | DD | 18 | 2,699 |
2005 | URL | RC | 147 | 20,875 |
2006 | URL | RC | 34 | 3,660 |
2006 | URL | DD | 12 | 1,338 |
2006 | Xstrata | DD | 2 | 984 |
2007 | Universal | DD | 10 | 1,101 |
2011 | Altona | RC | 104 | 21,085 |
2011 | Altona | DD | 7 | 2,041 |
2015 | SRIG | DD | 2 | 480 |
2015 | Altona | DD | 2 | 51 |
2018 | CMMC | DD | 8 | 263 |
2018 | CMMC | PERC | 5 | 470 |
2022 | CMMC | DD | 22 | 429 |
2022 | CMMC | RC | 7 | 603 |
2023 | Harmony | DD | 29 | 5,624 |
2023 | Harmony | RC | 83 | 18,177 |
2023 | Harmony | RC_DDT | 17 | 5,224 |
2024 | Harmony | RC | 11 | 3,032 |
2024 | Harmony | RC_DDT | 23 | 10,554 |
Total | 721 | 121,498 | ||
Effective date: 30 June 2025
64
Figure 7-1: Little Eva Drill Collar Plan
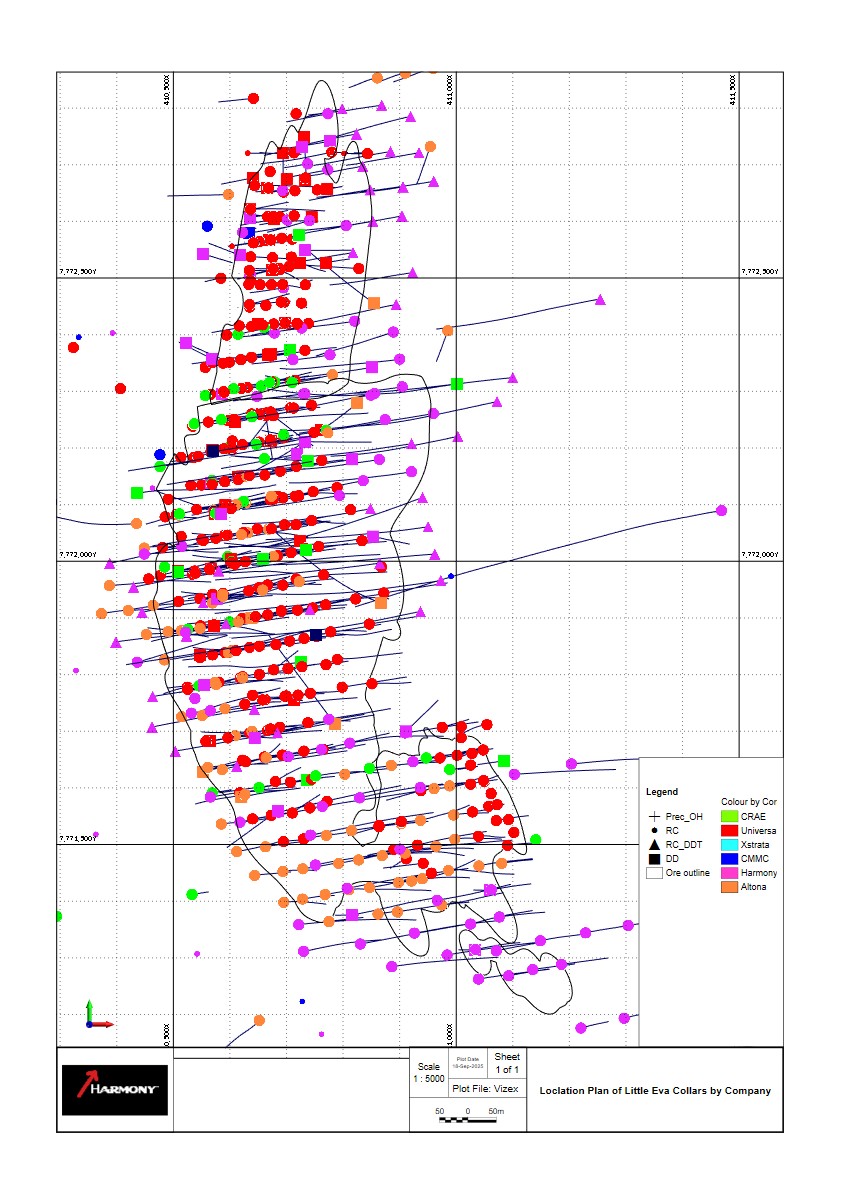
Effective date: 30 June 2025
65
7.1.1.2Turkey Creek
A total of 19,261 m of drilling in 137 holes was completed at Turkey Creek. Of these, some 93% are RC (131
holes), and 5% are DDs (6 holes). Holes were typically inclined at -60° and drilled along 100 m spaced section
lines with 50 m spacing between drill holes. Diamond drilling was conducted for the primary purpose of
metallurgical testwork sampling and geotechnical data.
The drilling history is summarised in Table 7-2, and hole locations are shown in Figure 7-2. The earliest hole at
Turkey Creek area was a DD drilled by Carpentaria Exploration in 1963, but the location details of this hole
are uncertain, and the hole has been disregarded. The majority of drilling was conducted by Altona from
2012 to 2015, with minor infill drilling completed by CMMC in 2018/2019 and significant infill drilling by
Harmony in 2023.
RC drilling typically utilised face sampling hammers (5.5"), and DD provided either NQ or HQ core samples.
Table 7-2: Turkey Creek Drilling Summary
Year | Company | Hole Type | Hole Count | Metres Drilled |
1993 | CRAE | RC | 2 | 218 |
2011 | Xstrata | RC | 2 | 300 |
2012 | Altona | RC | 7 | 1,272 |
2014 | Altona | RC | 42 | 6,024 |
2015 | Altona | DD | 5 | 404 |
2018 | CMMC | PERC | 2 | 160 |
2018 | CMMC | RC | 9 | 594 |
2019 | CMMC | DD | 1 | 132 |
2023 | Harmony | RC | 67 | 10,157 |
Total | 137 | 19,261 | ||
Effective date: 30 June 2025
66
Figure 7-2: Turkey Creek Drilling Locations by Type
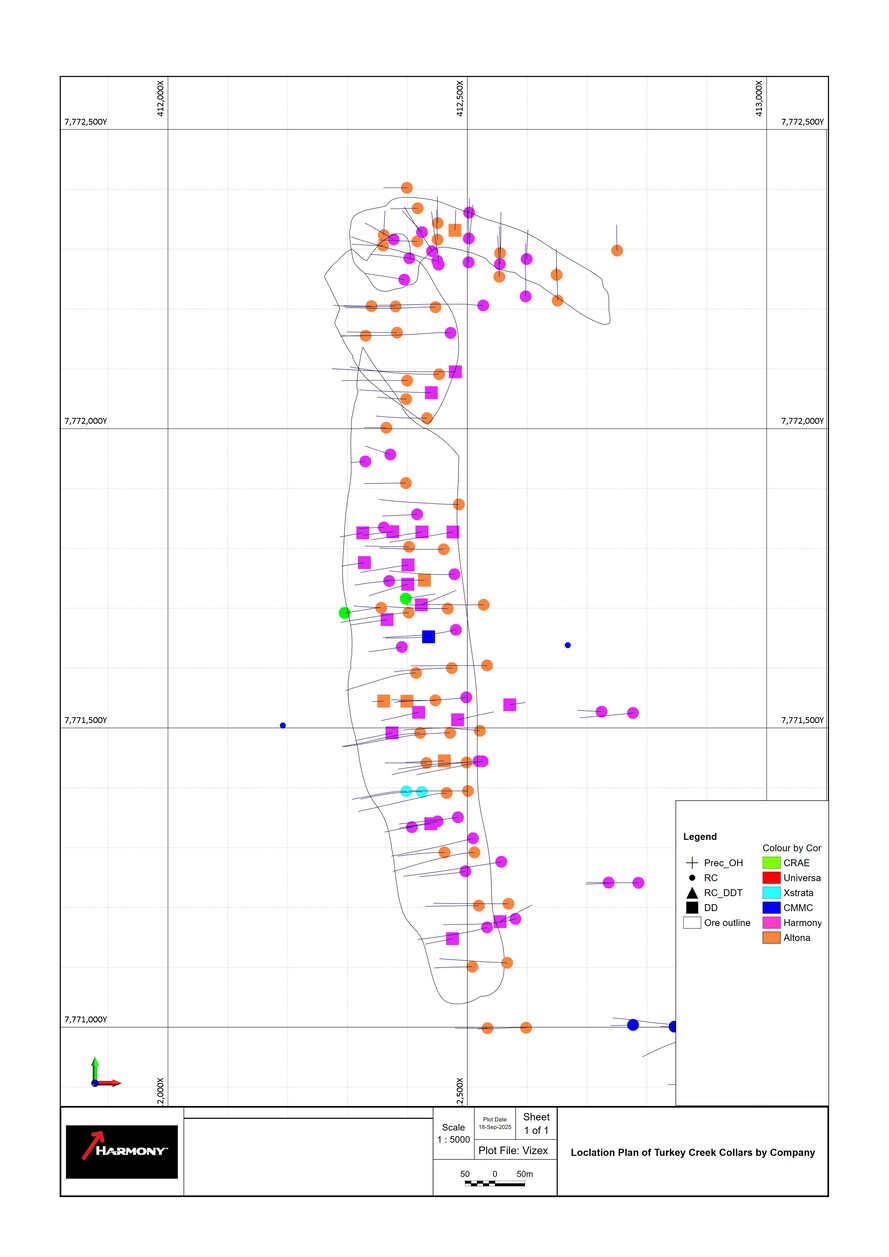
Effective date: 30 June 2025
67
7.1.1.3Blackard
A total of 97,108m of drilling in 642 holes has been completed at the Blackard deposit. Components of the
drilling include 345 RC, 161 DD, and 17 PERC drill holes completed since 1991. While early RC drill holes were
relatively short and vertical, follow-up drilling was angled to keep drilling approximately perpendicular to
mineralisation as the deposit geometry was better understood. Drilling has been carried out relatively
systematically on 50 m spaced sections, with 50 m or more tightly spaced holes along the sections. Drill holes
are spaced much closer on alternating section lines (100 m spaced). A number of sections contain large step-
out holes that tested for down-dip extensions of the deposit. Diamond drilling was conducted for the primary
purpose of metallurgical test sampling.
The drilling history is summarised in Table 7-3, and hole locations are shown in Figure 7-3.
RC drilling typically utilised face sampling hammers (5.25", 5.5", or 6"), and DD mainly used HQ3 or NQ3 core
sizes. Early rotary air blast ("RAB") drilling was carried out, but these holes were not used for resource
estimation.
Table 7-3: Blackard Drilling Summary
Year | Company | Hole Type | Hole Count | Metres Drilled |
1990 | CRAE | RC | 5 | 580.0 |
1991 | CRAE | AC | 110 | 5,391.0 |
1991 | CRAE | DD | 6 | 900.0 |
1991 | CRAE | PERC | 11 | 484.0 |
1991 | CRAE | RC | 1 | 87.0 |
1992 | CRAE | AC | 2 | 262.0 |
1992 | CRAE | DD | 4 | 790.0 |
1992 | CRAE | RC | 4 | 631.0 |
1993 | CRAE | AC | 7 | 315.0 |
1993 | CRAE | RC | 1 | 100.0 |
1994 | CRAE | PERC | 6 | 613.0 |
1994 | CRAE | DD | 11 | 3,021.0 |
1994 | CRAE | RC | 1 | 100.0 |
1995 | CRAE | DD | 4 | 1,060.2 |
2002 | Bolnisi | DD | 8 | 1,085.0 |
2002 | URL | RC | 122 | 13,638.0 |
2005 | URL | DD | 22 | 4,680.0 |
2005 | URL | RC | 82 | 10,593.0 |
2006 | URL | DD | 10 | 1,415.0 |
2006 | URL | RC | 36 | 3,183.0 |
2008 | Xstrata | DD | 9 | 3,407.0 |
2009 | Xstrata | DD | 6 | 2,564.0 |
2010 | Xstrata | DD | 4 | 2,423.0 |
2010 | Altona | RC | 7 | 1,687.0 |
2011 | Altona | DD | 3 | 549.0 |
2011 | Altona | RC | 21 | 4,362.0 |
2019 | CMMC | RC | 18 | 2,695.0 |
2023 | Harmony | DD | 6 | 1,186.0 |
2023 | Harmony | RC | 28 | 4,362.0 |
2023 | Harmony | RC_DDT | 3 | 971.0 |
2024 | Harmony | DD | 2 | 517.0 |
2024 | Harmony | RC | 18 | 1,896.0 |
2024 | Harmony | RC_DDT | 64 | 21,561.0 |
Total | 642 | 97,108.2 | ||
Effective date: 30 June 2025
68
Figure 7-3: Blackard Deposit Drill Hole Locations by Type
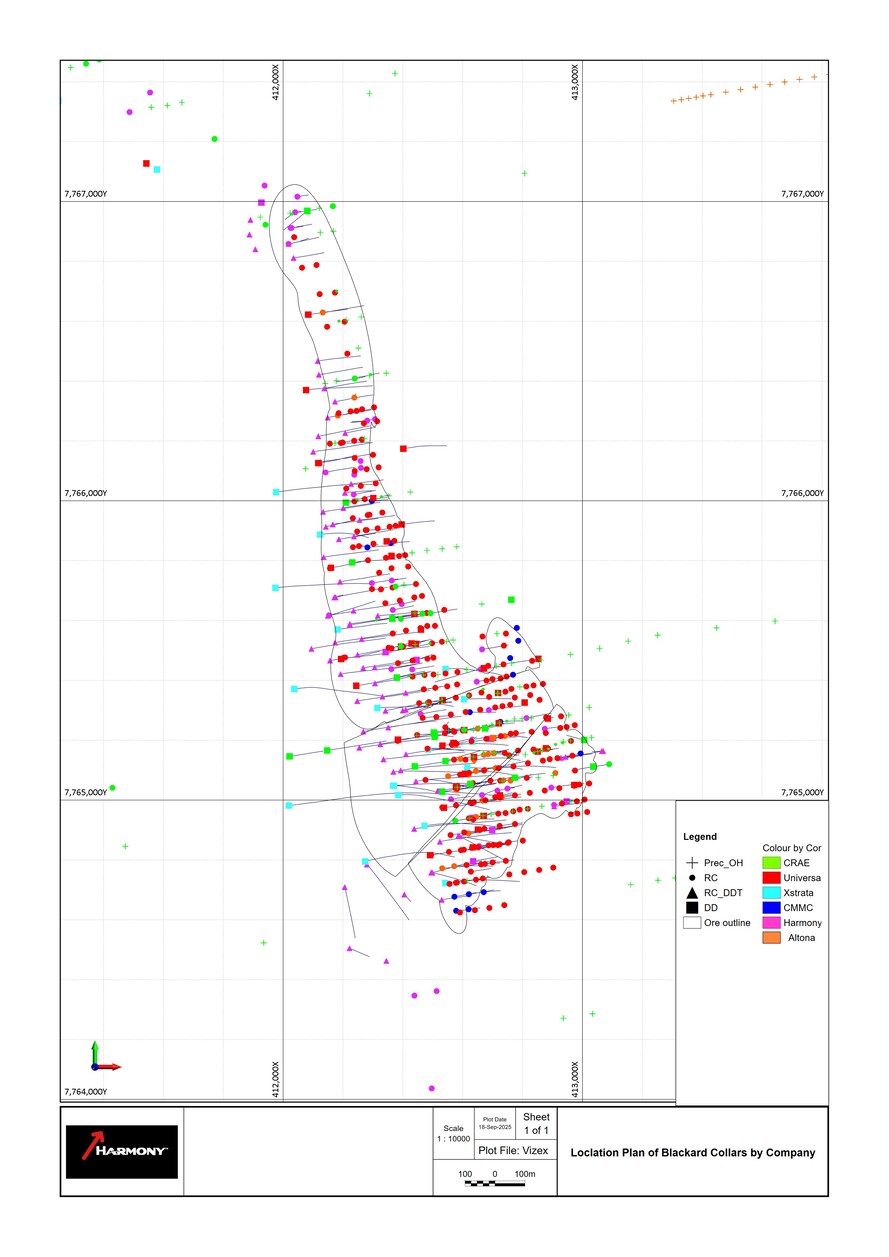
Effective date: 30 June 2025
69
7.1.1.4Scanlan
Scanlan is a relatively near-surface deposit, and has been defined by a total of 173 drill holes for 18,979 m.
Drilling is predominately RC, with only 20 of the holes being core drilling. Drill holes are either vertical or
inclined, depending upon the interpreted dip of the mineralisation. Drilling has been carried out on
approximately 50 m spacing along 50 m spaced section lines, although alternating, or 100 m section lines,
have more drill holes. In general, drill holes are more widely spaced on the northern part of the deposit,
where the mineralisation is narrow and vertically oriented.
The drilling history is summarised in Table 7-4, and hole locations are shown Figure 7-4. CRAE drilled 5 RC
holes in 1990. URL carried out an RAB programme in 2003 as a precursor to resource- definition RC drilling
from 2004 to 2009. Although the RAB holes were not used in resource estimation they did provide additional
information on deposit morphology.
RC drilling typically utilised face sampling hammers (5.25", 5.5", or 6"), and DD mainly used HQ3 or NQ3 core
sizes.
Table 7-4: Scanlan Drilling Summary
Year | Company | Hole Type | Hole Count | Metres Drilled |
1991 | CRAE | RC | 24 | 1,086.0 |
1992 | CRAE | AC | 3 | 110.0 |
RC | 39 | 3,646.0 | ||
1993 | CRAE | RC | 24 | 1,516.0 |
1994 | CRAE | RC | 10 | 1,305.0 |
DD | 5 | 1,403.7 | ||
1995 | CRAE | DD | 1 | 232.2 |
2002 | Bolnisi | RC | 2 | 397.0 |
2005 | URL | DD | 9 | 1,594.3 |
RC | 45 | 5,358.0 | ||
2006 | URL | DD | 2 | 208.9 |
2007 | Xstrata | DD | 1 | 447.0 |
2008 | Xstrata | DD | 1 | 351.2 |
2010 | URL | RC | 7 | 1,324.0 |
Total | 173 | 18,979.3 | ||
Effective date: 30 June 2025
70
Figure 7-4: Scanlan Deposit Drill Hole Locations by Type
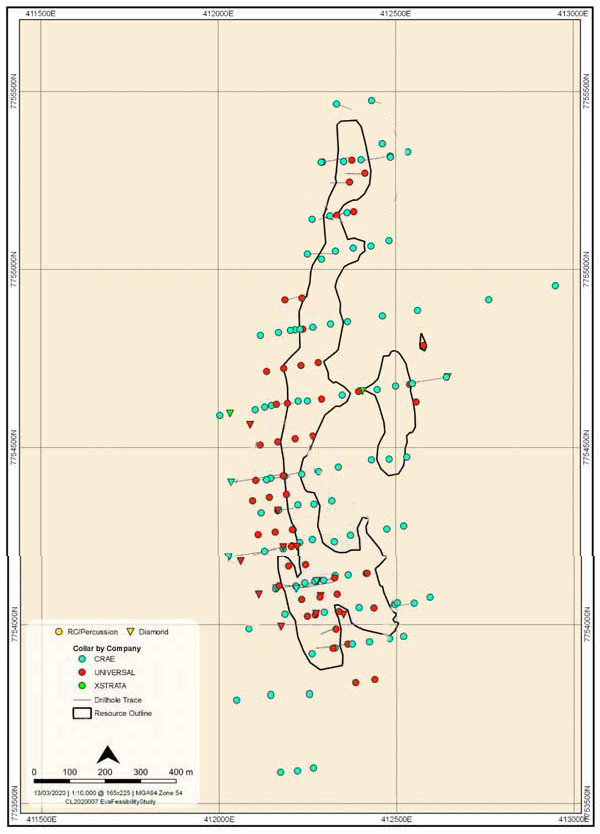
Effective date: 30 June 2025
71
7.1.1.5Bedford
A total of 12,240 m of drilling in 149 holes was completed at Bedford. Of these, some 68% are RC (102 holes),
30% are RAB (47 holes), and 3% are core (4 holes). RAB holes are vertical. RC and core holes were generally
inclined at around -60°, drilled on 25 m spacing along 25 m spaced section lines. Section line spacing
increases to 50 m and then to 100 m outside the main mineralised zones. Diamond drilling was primarily
conducted for metallurgical sampling.
The drilling history is summarised in Table 7-5, and hole locations are shown in Figure 7-5 and Figure 7-6.
CRAE drilled 5 RC holes in 1990. URL carried out an RAB programme in 2003 as a precursor to resource
definition RC drilling from 2004 to 2009.
RC drilling typically utilised face sampling hammers (5.25", 5.5", or 6"), and DD mainly used HQ3 or NQ3 core
sizes. RAB drilling accounts for some 13% of drilled metres but was not used for resource estimation.
Table 7-5: Bedford Drilling Summary
Year | Company | Hole Type | Hole Count | Metres Drilled |
1990 | CRAE | RC | 5 | 420.0 |
2003 | URL | RAB | 43 | 1,680.0 |
2004 | URL | RC | 18 | 1,918.0 |
2005 | URL | DD | 1 | 160.0 |
2005 | URL | RC | 11 | 1,280.0 |
2006 | URL | DD | 2 | 182.0 |
2006 | URL | RC | 60 | 5,836.0 |
2009 | URL | RC | 8 | 728.0 |
2015 | Altona | DD | 1 | 36.0 |
Total | 149 | 12,240.0 | ||
Effective date: 30 June 2025
72
Figure 7-5: Bedford North Drill Hole Plan
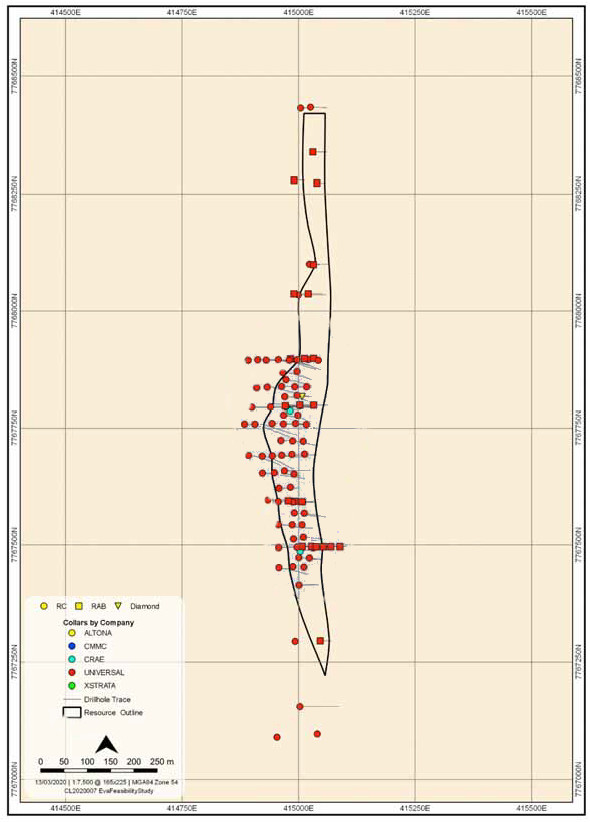
Effective date: 30 June 2025
73
Figure 7-6: Bedford South Drill Hole Plan
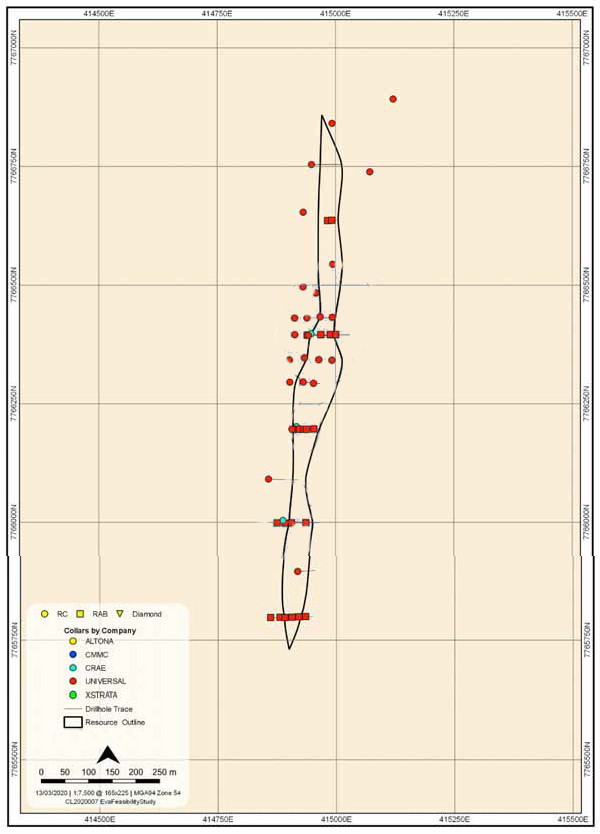
Effective date: 30 June 2025
74
7.1.1.6Ivy Ann
A total of 15,145 m of drilling in 153 drill holes was completed at Ivy Ann. Of these, some 53% are RC (81
holes), 46% are percussion (PERC) (70 holes) and 1% are DD (2 holes). Holes were generally inclined -50° to
-60°, generally drilled on 50 m spaced section lines, and 20 m to 50 m along line spacing. Section line spacing
increases to 100 m in Ivy Ann North.
The drilling history is summarised in Table 7-6, and hole locations are shown in Figure 7-7. Exploration on the
Ivy Ann prospect began in 1992. Note that Bruce Resources became PanAust in 1995.
Table 7-6: Ivy Ann Drilling Summary
Year | Company | Hole Type | Hole Count | Metres Drilled |
1992 | Dominion | PERC | 26 | 863 |
1992 | Dominion | RC | 13 | 1,309 |
1993 | Dominion | RC | 2 | 282 |
1995 | Bruce Resources | RC | 18 | 1,902 |
1996 | PanAust | PERC | 44 | 1,972 |
1996 | PanAust | RC | 3 | 450 |
1997 | PanAust | DD | 2 | 714 |
2003 | URL | RC | 5 | 515 |
2005 | URL | RC | 4 | 462 |
2006 | URL | RC | 4 | 412 |
2009 | URL | RC | 5 | 816 |
2011 | Altona | RC | 15 | 2,850 |
2012 | Altona | RC | 12 | 2,598 |
Total | 153 | 15,145 | ||
Effective date: 30 June 2025
75
Figure 7-7: Ivy Ann Drill Collar Plan
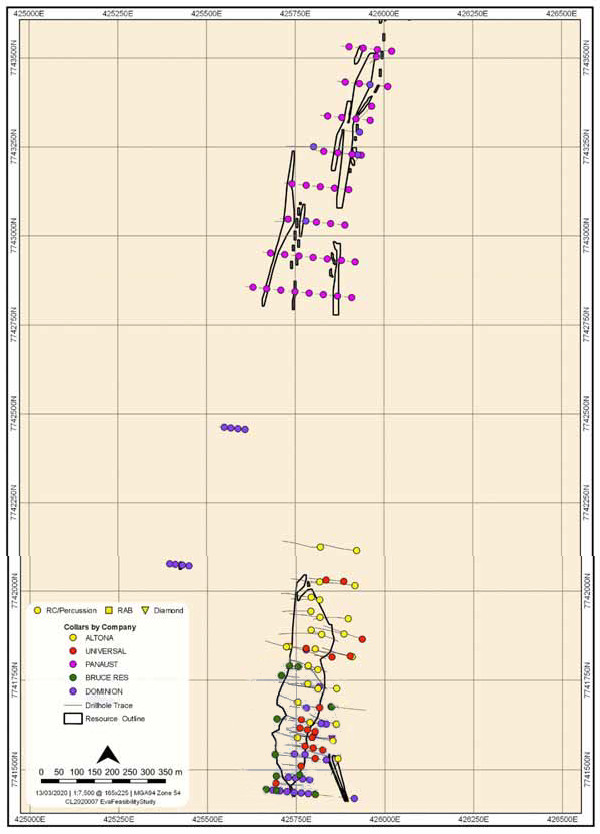
Effective date: 30 June 2025
76
7.1.1.7Lady Clayre
A total of 25,092 m of drilling in 145 holes was completed at Lady Clayre. Of these, some 79% are RC (114
holes), 20% are DD (29 holes) and 1% are PERC (2 holes). Holes were generally inclined -50° to -60°, generally
drilled on 50 m spaced section lines, and 20 m to 50 m along line spacing.
The drilling history is summarised in Table 7-7, and hole locations are shown in Figure 7-8. Exploration on the
Lady Clayre prospect began in 1978 with a single DD drilled by CRAE.
RC drilling typically used 5.25", 5.5", or 6" hammers, and DDs provided either HQ or NQ core samples.
Table 7-7: Lady Clayre Drilling Summary
Year | Company | Hole Type | Hole Count | Metres Drilled |
1978 | CRAE | DD | 1 | 134 |
1992 | CRAE | PERC | 2 | 192 |
1992 | CRAE | RC | 11 | 1,188 |
1993 | CRAE | DD | 1 | 294 |
1993 | CRAE | RC | 9 | 1,250 |
1994 | CRAE | DD | 3 | 1,163 |
1994 | CRAE | RC | 1 | 102 |
1995 | CRAE | DD | 19 | 5,369 |
1995 | CRAE | RC | 5 | 464 |
1996 | CRAE | DD | 2 | 503 |
1996 | CRAE | RC | 10 | 1,484 |
1998 | Pasminco | DD | 1 | 180 |
1998 | Pasminco | RC | 11 | 1,092 |
2002 | URL | RC | 5 | 1,368 |
2003 | URL | RC | 10 | 1,651 |
2005 | URL | RC | 11 | 1,503 |
2006 | URL | DD | 2 | 154 |
2006 | URL | RC | 11 | 1,353 |
2009 | URL | RC | 3 | 460 |
2011 | Altona | RC | 10 | 1,266 |
2012 | Altona | RC | 17 | 3,922 |
Total | 145 | 25,092 | ||
Effective date: 30 June 2025
77
Figure 7-8: Lady Clayre Drill Collar Plan
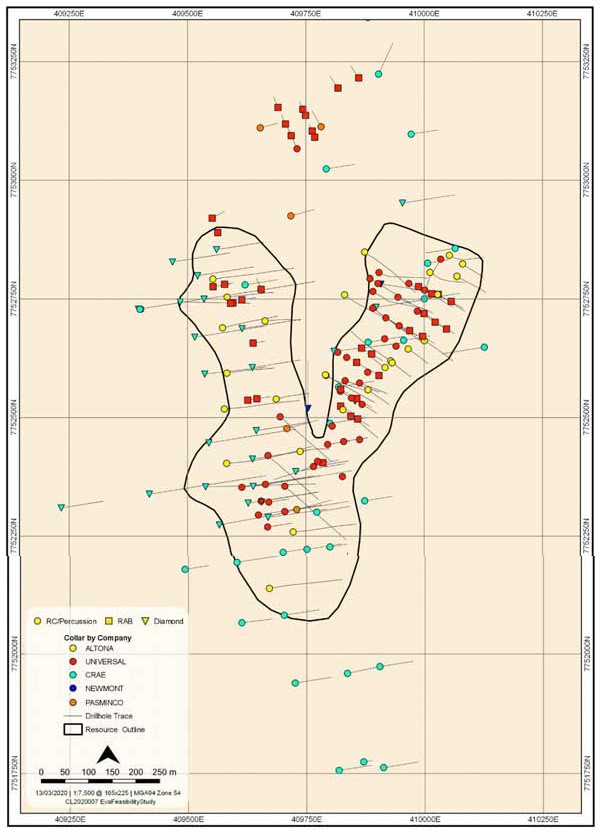
Effective date: 30 June 2025
78
7.1.1.8Legend
A total of 21,171m of drilling in 127 holes was completed at Legend. Of these, some 59% are RC (74 holes),
7% are DD (8 holes), 22% are RC-DDT (29 holes) and 1% are air core ("AC") (13 holes). Holes were generally
inclined -50° to -60°, generally drilled on 50 m spaced section lines, and 20 m to 50 m along line spacing.
The drilling history is summarised in Table 10-7, and hole locations are shown in Figure 9-8. Exploration on
the Legend prospect began in 1978 with a single diamond hole drilled by CRAE.
RC drilling typically used 5.25", 5.5", or 6" hammers, and DDs provided either HQ or NQ core samples.
Table 7-8: Legend Drilling Summary
Year | Company | Hole Type | Hole Count | Metres Drilled |
1991 | CRAE | AC | 8 | 397 |
1991 | CRAE | DD | 1 | 76 |
1992 | CRAE | AC | 5 | 298 |
1992 | CRAE | RC | 1 | 100 |
1993 | CRAE | RC | 1 | 88 |
1994 | CRAE | RC | 24 | 2,428 |
1995 | CRAE | DD | 2 | 248 |
2006 | XSTRATA | DD | 1 | 400 |
2008 | XSTRATA | DD | 2 | 754 |
2010 | ALTONA | RC | 6 | 1,116 |
2019 | CMMC | RC | 2 | 256 |
2023 | HARMONY | RC | 5 | 640 |
2024 | HARMONY | RC | 37 | 6,530 |
2024 | HARMONY | RC_DDT | 29 | 7,071 |
2024 | HARMONY | DD | 3 | 770 |
Total | 127 | 21,171 | ||
Figure 7-9: Legend Drill Collar Plan
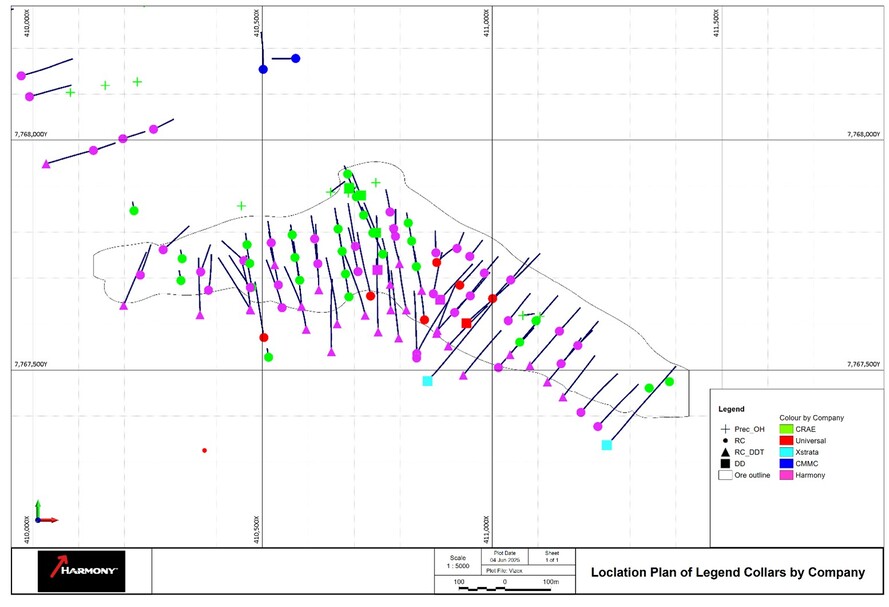
Effective date: 30 June 2025
79
7.1.1.1Great Southern
A total of 9,577m of drilling in 63 holes was completed at Great Southern. Of these, some 67% are RC (42
holes), 6% are DD (4 holes), 17% are RC-DDT (11 holes) and 10% are AC (6 holes). Holes were generally
inclined -50° to -60°, generally drilled on 50 m spaced section lines, and 20 m to 50 m along line spacing.
Table 7-9: Great Southern Drilling Summary
Year | Company | Hole Type | Hole Count | Metres Drilled |
1991 | CRAE | AC | 6 | 283 |
1992 | CRAE | RC | 4 | 380 |
1994 | CRAE | RC | 10 | 930 |
2003 | URL | RC | 14 | 1,630 |
2011 | XSTRATA | DD | 2 | 636 |
2024 | HARMONY | RC | 14 | 2,556 |
2024 | HARMONY | DD | 2 | 458 |
2024 | HARMONY | RC_DDT | 11 | 2,705 |
Total | 63 | 9,577 | ||
Figure 7-10: Great Southern Drill Collar Plan
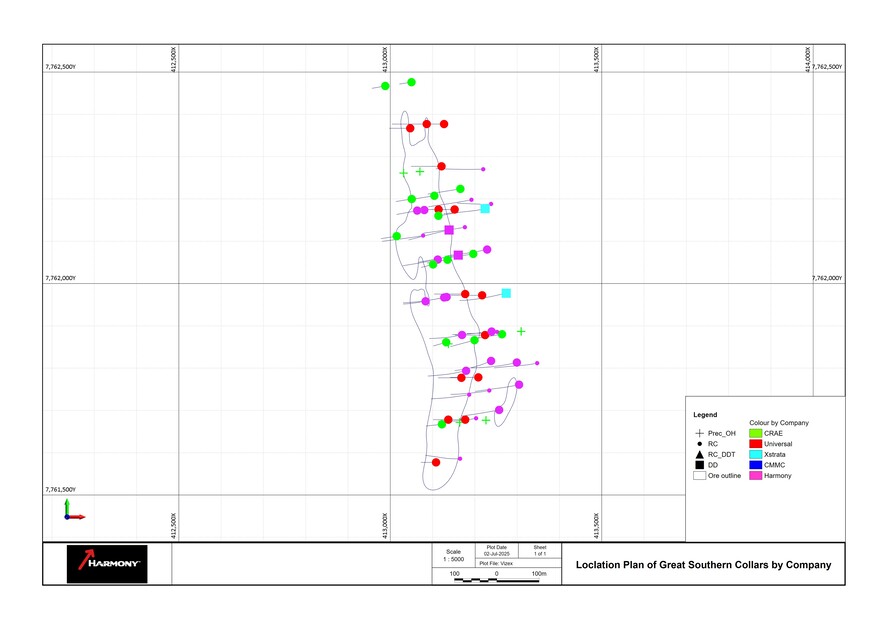
Effective date: 30 June 2025
80
7.1.2Drill Hole Collar Survey Control
7.1.2.1Little Eva
Collar coordinates for drill holes completed at Little Eva prior to 2002 were determined with reference to an
informal local grid established by CRAE. In 2002, URL resurveyed old hole collar positions at Little Eva using
Differential Global Positioning System ("DGPS") techniques; the work was completed by a survey contractor.
In a few cases, the original collar could not be located, and earlier survey determinations by the CRAE
surveyor in 1994 have been retained.
From mid-2003 through 2011, all survey work was undertaken by licensed surveyors using Trimble DGPS
equipment with a minimum accuracy of ±0.05 m. All data was collected in AGD84 coordinates. From late
2011, Altona completed DGPS surveys in house using a Hemisphere R320 OmniSTAR HP GPS receiver. The
system allows for real time horizontal accuracies of 10 cm to 15 cm.
All drilling by CMMC and Harmony have been surveyed using Differential GPS instruments.
Of the 721 holes drilled at Little Eva, six holes have no DGPS survey available, and the original, local grid-
based, or GPS coordinate, was converted to a GPS coordinate. Geographic transformations have been used
to convert original grid coordinates to GDA20 / MGA zone 54 coordinates.
7.1.2.2Turkey Creek
All holes drilled by Altona, comprising the vast majority of the drilling used in defining the Mineral Resource,
were surveyed with high resolution (±0.5 m) DGPS equipment. The two CRAE holes have low accuracy (±10
m).
7.1.2.3Blackard
Of the 642 drill holes used in the resource estimate, most were surveyed by DGPS (or traditional theodolite
surveys for 2 holes) with better than 0.1 m confidence. The other holes were located by field GPS with an
accuracy of between 3 and 10 m.
7.1.2.4Scanlan
All but six of the drill holes used for resource estimation were surveyed by DGPS with better than
0.1 m accuracy. Two holes were surveyed by field GPS with accuracy of between 3 and 10 m, and another
two holes have undetermined survey methods.
7.1.2.5Bedford
Apart from one hole, all RC holes drilled by URL have been located by DGPS by licensed surveyors using
Trimble DGPS equipment with a minimum accuracy of ±0.02 m. All data was collected in AGD84 coordinates.
The early CRAE holes (five) were initially located on local grids. Pasminco relocated the holes and recorded
GPS locations for them, with a lower accuracy (±10 m). All holes drilled by Altona were surveyed with high
resolution (±0.1 m) DGPS equipment.
Geographic transformations have been used to convert original grid coordinates to GDA20 / MGA zone 54
coordinates.
7.1.2.6Ivy Ann
Dominion established a local grid on the prospect: all drilling carried out by Dominion and PanAust is
referenced to this local grid. URL calculated a coordinate conversion based on the locations of two early drill
hole collars, and used this to transform the original local coordinates for holes drilled between 1992 and
1997 into GDA20 / MGA zone 54 coordinates.
Except for four holes drilled by URL in 2006, all drilling completed from 2003 to 2009 has been surveyed by
DGPS using Trimble DGPS equipment with a minimum accuracy of ±0.05 m. From 2011, Altona drill collars
were surveyed using a Hemisphere R320 OmniSTAR HP DGPS system with horizontal accuracy of ±0.015 m.
Effective date: 30 June 2025
81
Geographic transformations have been used to convert original grid coordinates to GDA20 / MGA zone 54
coordinates.
7.1.2.7Lady Clayre
All holes drilled by CRAE from 1992 to 1994 were relocated and surveyed using DGPS by a registered
surveyor in 1994. Holes drilled by CRAE, Pasminco, and URL from 1995 to 2002 were relocated where
possible and surveyed with DGPS by URL. Survey control protocols for URL and Altona holes are as for Little
Eva.
Geographic transformations have been used to convert original grid coordinates to GDA20 / MGA zone 54
coordinates.
7.1.3Downhole Surveys
7.1.3.1Little Eva
All drill holes have a collar inclination and azimuth measurement in the database. The levels of hole deviation
shown in Figure 7-1 are within expected ranges.
Downhole surveying of CRAE DDs LE006 and LE076 was carried out using Eastman single shot downhole
survey cameras. Survey shots were taken at approximately 40 m intervals. RC holes drilled by CRAE only have
collar orientations, the original DH survey data were unable to be sourced from Rio Tinto/CRAE.
Much of the RC and DD drilling completed by URL and Altona from 2002 to 2011 was surveyed with a variety
of instruments, including those manufactured by Eastman, Camteq, Ranger, and Reflex. Survey
measurements were typically taken at 40 m intervals where possible.
To overcome potential issues with the older, magnetic-based survey techniques caused by variable, and
sometimes considerable, concentrations of magnetite in the rocks, URL resurveyed all available open holes in
2005 and 2006, including those previously drilled by CRAE. A combination of a multi-shot downhole camera
and a downhole gyro instrument (for magnetically quiet and active areas, respectively) was used. Multi-shot
camera survey measurements are generally at 10 m intervals, and the gyro instrument surveys give semi-
continuous measurements at intervals of 1 m or less. Where a hole was not open to depth, the attitude of
the hole at 0 m was determined.
At the end of Altona’s 2011 programme, selected holes were resurveyed using a FlexIT GyroSmart tool with
readings at 5 m intervals.
From 2012 on, all Altona, CMMC and Harmony holes were monitored during drilling using a single or multi-
shot camera, typically with completion surveys using a GyroMax isGyro.
7.1.3.2Turkey Creek
All Altona and Harmony holes drilled in the Turkey Creek deposit were monitored during drilling using a
REFLEX EZ-TRAC camera. On completion of drilling, downhole surveys were conducted using a GyroMax
isGyro, overcoming any magnetic influences inherent in the EZ-TRAC survey.
7.1.3.3Blackard, Scanlan and Bedford
The majority of the RC and DD drilling completed by URL and Altona from 2002 to 2018 was surveyed with
downhole cameras (~69%) or gyro systems (25%), and 6% have collar orientations only. For URL and Altona
holes drilled between 2002 and present, the azimuth and inclination of the hole at the collar was measured
using a compass clinometer. For the earlier holes it is unclear whether these measurements were made by
survey instrument or by clinometer at the collar. All Harmony Holes have been surveyed using a downhole
Gyro tool.
Effective date: 30 June 2025
82
7.1.3.4Ivy Ann
RC and PERC drilling completed by Dominion and PanAust only have collar orientations, and all but two of
these holes are aligned along local grid directions (270° and 90°). The two DDs completed by PanAust have
downhole dip measurements, and the surface azimuths have been extrapolated down the hole. There is no
record of how these dip determinations were made.
URL and Altona used a variety of downhole camera systems to survey their drilling from 2003 to 2011.
Measurements were taken at approximately 50 m intervals. Two holes only have a collar survey. In addition,
URL resurveyed selected holes in 2009 and 2011 with detailed gyro surveys. In 2009, measurements were
taken at 20 m intervals, and this was reduced to 5 m in 2011. Gyro surveys were completed in 2012 on Ivy
Ann drill holes completed by Altona.
7.1.3.5Lady Clayre
CRAE holes drilled before 1996 only have a collar orientation. Starting in 1996, CRAE drill holes were
surveyed with a downhole instrument (Eastman camera), and have at least one such measurement.
All Pasminco holes were surveyed with a downhole instrument with readings at approximately 30 m
intervals, with at least one survey close to the surface, and one at the end of the hole.
URL used a variety of downhole cameras to survey their drilling from 2002 to 2011. Measurements were
taken at approximately 50 m intervals. Several holes only have a collar survey. In addition, in 2005 and 2009,
URL resurveyed selected holes with detailed multi-shot camera and gyro surveys.
All but one Altona drill hole was surveyed using a FlexIT GyroSmart tool, with readings at 5 m intervals.
7.1.3.6Legend and Great Southern
All downhole surveys have been conducted using the same methods as those employed for other deposits.
All holes drilled by Harmony have been surveyed using a continuous gyro survey at the end of each hole.
7.1.4Drill Hole Logging
7.1.4.1Little Eva
Original hard copy drill logs or typed drilling summaries prepared by CRAE geological staff for all CRAE drill
holes at Little Eva are retained in the Altona library. These are descriptive logs that were coded into the
Altona system and stored in the Altona drilling database.
CRAE logged its DDs on variable intervals determined by lithological changes in the core. RC holes were
logged on regular 1 m intervals. The early descriptive logging yielded up to two lithologies per interval,
together with grain size, texture, and colour, upon recording into the digital logging system. Alteration and
ore mineralogy were recorded as mineral species and abundance. Veining, mainly observed in core, is also
logged as mineral composition and abundance. Structural and geotechnical logging of DDs has been done
routinely from 1995 on, with orientations of veins and structures provided as dip and strike angles. The core
orientation method used by CRAE is not recorded.
URL prepared similar descriptive logs for its drilling between 2002 and 2005 that are also retained in the
Altona library. RC logging was done primarily on 1 m intervals, and data was captured from these logs into
the digital system in the same way as the CRAE data was captured, to provide lithology, alteration,
mineralisation, and veining logs. The DD logs produced in this period were logged on intervals based on
lithological changes, and included detailed structural and geotechnical logs.
URL introduced a digital logging system based on the Surpac Logmate in 2005, and from that time on all
logging has been captured digitally in coded form in the field. The templates and libraries used by this system
preserved the style of logging used by both CRAE and URL. The original digital logs produced by this system
were loaded into the Altona drilling database and stored in the Altona library.
The Logmate system was replaced by Field Marshal software in 2011, and this system was used throughout
the 2011 season by Altona, but the same logging procedures were followed as in prior campaigns.
In 2014, Altona completed a comprehensive lithology relogging programme of available historical RC chips
and DD core. This programme has provided a consistent dataset of lithology across the deposit used for
resource domaining.
Effective date: 30 June 2025
83
In 2019, CMMC introduced the Logchief drillhole logging software from Maxwells, this software continues to
be used by Harmony.
7.1.4.2Turkey Creek, Blackard, Scanlan, Legend, Great Southern and Bedford
Logging protocols, data collection and storage are all as described above for Little Eva.
7.1.4.3Ivy Ann
There are no original drill logs available for the drilling completed by Dominion in 1992 and 1993, and no
logging is recorded in the Altona database. RC drilling completed by PanAust in 1995 was descriptively logged
on 1 m intervals, with magnetic susceptibility measurements were completed in 1996. Detailed logs for the
1997 RC and diamond programme contain quantitative estimates of mineralisation, veining, and alteration,
as well as lithological descriptions. RC holes were logged on 1 m intervals, while DDs were logged over
lithological intervals. Drill hole logging protocols for URL and Altona are as for Little Eva.
7.1.4.4Lady Clayre
Original hard copy drill logs and/or summary logs prepared by CRAE geological staff are held in the library.
The logs contain a description of the lithology, and visual estimates of economic mineralisation and
alteration. Overburden sections of RC holes and RC pre-collars on DDs were logged on 3 m intervals, the
logging and sampling interval reduces to 1 m in mineralised sections. Diamond holes were logged over
intervals determined by the lithology and include a graphic log of the cored sections together with structural
information in the interval description. CRAE began using a lithology code during this period, which has been
recoded in the database.
Pasminco logs were very similar in style to CRAE for the single diamond hole and the 11 RC holes it drilled in
1998. RC holes and pre-collars were logged on 2 m intervals, while the diamond hole was logged on intervals
determined by lithology. Logs included a text-based lithological description, as well as visual estimates of
mineralisation and alteration Drill hole logging protocols for URL and Altona are as for Little Eva.
7.1.5Core and RC Sampling Methods
In general, sampling methodology was consistent among all deposits, with minor variations between the
different companies and years of the programme. More detailed descriptions by deposit are provided in
Section 6.
Early RC sampling by CRAE used a rotary splitter mounted on the drill rig to produce 3 kg to 4 kg subsamples,
which were collected in calico bags and dried on site, then sealed in polyethylene bags for shipment to the
laboratory. However, in the 1994 RC sampling, CRAE used a spear to collect an approximate 3 kg sample from
the cuttings. Similarly, during the 2002–2003 programmes, Bolnisi employed a rig-mounted cyclone and
splitter to collect 12.5% of the cuttings for dry samples, but used the spear to collect the subsample from wet
cuttings. The same sampling methods were also used by URL, Altona, and CMMC for their RC programmes.
During the early programmes (1991 or earlier), drill samples were collected as 3 m samples, but from 1992
onwards sampling was in 1 m or 2 m increments. During the later programmes beginning with URL, samples
from RC and DD were collected and bagged in pre-numbered calico bags at the drill site during drilling.
Unique sample numbers were retained during the whole process. Diamond core was sawn with a diamond
saw after logging, and the half core was collected as 1 m or 2 m samples. RC samples were taken via a
cyclone and rotary splitter mounted on the drill, producing 3 kg to 4 kg of material that was air-dried in the
field.
The remainder of the cuttings were bagged and laid out alongside the drill. All samples were catalogued and
sealed prior to dispatch to laboratory. Samples were either delivered to SGS Analabs as they were collected
or stored in facilities in Cloncurry prior to transport to Townsville. An extensive catalogued library of core,
assay sample pulps, and RC chips are retained in the Company’s Cloncurry exploration office for inspection.
Effective date: 30 June 2025
84
8Sample Preparation, Analysis and Security
Section 229.601(b)(96)(ii)(B) (8) (i‐v)
The operations and information in this section were compiled prior to Harmony’s acquisition of the Project,
but have been reviewed for reasonableness and accuracy, and updated where appropriate.
The QP is of the opinion that the sampling procedures, analytical quality, and integrity of data meet and/or
exceed standards required for Mineral Reserve estimation.
8.1Little Eva
There is very little documentary information available about sample collection and preparation for the CRAE
drilling campaigns. The available documents covering exploration during this era lack descriptive detail when
describing the mechanics of drilling and sampling procedures. The documents on the exploration work tend
to assume that sampling was carried out in line with CRAE standard procedures, but these procedures are
not recorded.
CRAE DD were sampled on approximately 2 m intervals. It is implied that the core was split or sawn and half
the core retained, since the holes were later relogged by CRAE. RC holes from LE009 to LE033 were sampled
in 1 m intervals, but from LE034 to LE075 the sample interval was expanded to 2 m. Since then, across all
programmes the sample intervals for RC has been 1m.
8.1.1URL 2002 programme
Two metre composite samples of about 2.5 kg were collected from RC chips using a modified trailer-
mounted splitter. Intervals of interest were identified after the first-pass composite assays were received,
and the original 1 m samples were submitted for analysis. The samples were submitted to Australian
Laboratory Services ("ALS") in Townsville. Sample preparation involved drying, crushing, and pulverizing the
entire sample to a nominal 85% passing 75 µm. The primary analysis was by three-acid digestion followed by
Atomic Adsorption Spectroscopy ("AAS") for copper, and fire assay on a 30 g subsample for gold.
8.1.2URL 2003–2006 programme
From 2003 to 2006, URL followed a similar procedure, except that all samples were collected on 1 m intervals
using a trailer-mounted cyclone and triple-deck splitter, or similar arrangement. The major differences over
the years were an increasing refinement of the QC programme and a change from ALS to Analabs/SGS as the
laboratory selected to do the primary analysis in 2003.
Analabs/SGS used methods that included an aqua regia digestion followed by AAS for gold, and three-acid
digestion followed by AAS for copper.
The DDs completed during this period were drilled for geotechnical and metallurgical purposes, and only the
upper parts drilled with RC methods were sampled, except for two DD tails drilled to extend RC holes that
had failed to reach target depths because of poor ground conditions. Core from the extended holes was half-
sawn, and samples collected in 1 m intervals for submission to Analabs.
8.1.3URL 2007 programme
In 2007, URL conducted a metallurgical drill programme of 10 DD drilled with 1 m samples assayed at
Ultratrace Laboratories, using a four-acid digestion, and analysed by inductively coupled plasma-optical
emission spectrometry (ICP-OES) for copper, and fire assay with an ICP-OES finish for gold.
Effective date: 30 June 2025
85
8.1.4Altona 2011 programme
For the 2011 drilling programme, Altona continued with the procedures for RC sampling established by URL,
but returned to using ALS in Townsville for the primary analysis. The methods requested were ME-ICP41
(aqua regia with inductively coupled plasma-atomic emission spectroscopy (ICP-AES)) for copper, and Au-
AA25 (fire assay with AAS) for gold. Copper analyses over 1% were reanalysed with an ore grade ICP-AES
method (Cu-OG46).
Two DDs, drilled primarily for metallurgical testing, were quarter-sawn, sampled in 1 m intervals, and
submitted to ALS for analysis along with the RC samples. In addition, the core from four geotechnical holes
drilled in 2005 and 2006 was recovered from the core storage, half-sawn, and submitted to ALS for analysis.
The methods requested were ME-ICP61 (four-acid digestion with ICP-AES finish), and later ME-ICP41 (aqua
regia with ICP-AES) for copper, and Au-AA25 (fire assay with AAS) for gold. Copper analyses over 1% were
reanalysed with an ore grade ICP-AES method (Cu-OG46).
8.1.5Altona-Sichuan Railway Investment Group 2015 programme
As part of a due diligence of the Project assets, Sichuan Railway Investment Group ("SRIG") drilled two
confirmatory triple-tube DDs at Little Eva using HQ core. An independent consultant for SRIG managed the
programme. The holes were submitted to ALS for cutting (half core) and analysis.
Altona drilled two DD for metallurgical testwork. These were quarter-sawn and sent to ALS Perth to be
assayed using ME-MS41 (aqua regia with ICP-MS) for copper and Au-AA25 (fire assay with AAS) for gold.
Copper analyses over 1% were reanalysed with an ore grade ICP-AES method (Cu-OG46).
Four DDs, drilled for geotechnical purposes in 2005 and 2011, were half-sawn and submitted to ALS for
analysis. The methods requested were ME-ICP41 (aqua regia with ICP-AES) for copper, and Au-AA25 (fire
assay with AAS) for gold. Copper analyses over 1% were reanalysed with an ore grade ICP-AES method (Cu-
OG46).
8.1.6CMMC 2018 to 2022
CMMC completed a number of DD holes within the Project area for resource, geotechnical and metallurgical
studies. Additionally, they completed RC holes across the planned Mill and Tailings Dam areas for sterilisation
purposes, and to test for water.
8.1.7Harmony Work 2023 to present
Harmony has drilled a significant amount of holes for infill, geotechnical and metallurgical purposes within
the first year of ownership by Harmony. Both DD and RC drill holes were logged digitally; the digital logging
system records lithology, alteration, veining, magnetic susceptibility and oxidation in all holes, and structural
data and geotechnical logs are completed on cored holes. Data is saved to Harmony’s server, where it is
merged to the master SQL database.
Half-core samples are collected at 1 m intervals, and RC holes are sampled at 1m intervals and submitted to
Analabs for analysis.
RC holes are assessed using a pXRF machine on 1m samples, and the DD core is assessed using TrueScan
technology that returns continuous sampling data composited over 10cm and 1m intervals along with high-
quality images, or the pXRF machine also.
8.1.8Quality Control Procedures
The QC procedures employed by CRAE are poorly recorded, and appear to have been at a low level by
modern standards. For the programmes from 2002 onwards, URL implemented quality control programmes
which meet with currently accepted practices, and included field duplicates, triplicates, reference standards,
and blanks. No problems within the resource data were revealed by the quality assurance and quality control
(QA/QC) programme.
The data quality and QC procedures were reviewed in December 2009 in the Independent Mineral Specialist
Report prepared by Optiro (Glacken, 2009). Optiro noted that good industry QA/QC practices were applied,
with reasonable rates of inserted standards, repeats, and blanks.
Effective date: 30 June 2025
86
Later programmes continued with the QC procedures established by URL in 2006, which included:
•Regular duplicate sampling of RC cuttings at a rate of 1 in 20 primary samples.
•Triplicate samples collected at the time of drilling at a rate of 1 in 40 primary samples, submitted to an
umpire laboratory.
•Submission of Certified Reference Materials (CRMs) or standard samples at an overall rate of 1 in 20.
•Submission of blank samples at an overall rate of 1 in 45 primary samples.
8.2Turkey Creek
All RC drilling between 2012 and 2014 was completed using either a 140 mm or 5.5" hammer drill. RC chips
were collected at 1 m intervals, as per Altona's standard procedures.
QA/QC protocols for the 2012 and 2014 drilling programmes at Turkey Creek included the insertion of CRMs
at a ratio of 1 in 20. Field duplicates were taken from the RC drilling using a riffle splitter on site, also at 1 in
20 rates. All samples were sent to ALS Townsville, and a standard sample protocol of drying, crushing,
splitting, and pulverizing was followed, resulting in 250 g pulp samples. These were submitted for ME-MS41
(aqua regia digestion with ICP-MS finish). The aqua regia digestion dissolves sulphide and oxide minerals, but
does not dissolve silicates, so the copper contained in the hydrobiotite will not be reported. Copper analyses
over 1% were reanalysed with an ore grade ICP- AES method (Cu-OG46). Gold was determined via Au-AA25
(fire assay with AAS).
In 2015, Altona drilled five diamond holes for metallurgical samples. Core from these holes was sent to ALS
Ammtec in Perth, where whole core samples were taken at 1 m intervals and assayed using ME-MS41 (aqua
regia with ICP-MS) for copper, and Au-AA25 (fire assay with AAS) for gold. Copper analyses over 1% were
reanalysed with an ore grade ICP-AES method (Cu-OG46).
Harmony has continued with the same sampling techniques of the Altona and CMMC.
8.3Blackard, Scanlan, Legend and Great Southern
Early campaigns of DD by Bolnisi and CRAE at Blackard and Scanlan produced core of various sizes, including
4.5", 5.375", NQ, NQ2, HQ, and HQ3. Half-core or quarter-core samples were routinely cut at intervals of
either 1 m or 2 m.
RC drilling by CRAE and Bolini was predominantly drilled with a 130 mm diameter hammer drill. Percussion
drilling by CRAE was completed using either a 4.5" or 5.5" hammer drill. Chip samples were collected on
either 1 m, 2 m, or 3 m intervals using standard CMMPL procedures.
Samples submitted by CRAE and Bolnisi were typically assayed by Analabs using either four-acid digestion
(hydrofluoric, perchloric, hydrochloric, and nitric) with an AAS finish, or aqua regia digestion with an ICP-OES
finish.
Diamond core drilled by URL and Xstrata at the Blackard and Scanlan deposits were typically either of NQ or
HQ3 diameter and routinely sampled as either half or quarter core at either 1 m or 2 m intervals within
mineralised domains. Material drilled in the barren hanging wall was cut as either half or quarter core at
intervals of up to 6 m. Diamond core drilled by Altona for metallurgical purposes was typically drilled with a
HQ3 bit at 1 m intervals, and sawn to quarter core.
RC drilling completed by URL and Xstrata typically utilised a 5" hammer drill, with samples collected at either
1 m or 2 m intervals, as per standard CMMPL procedures. RC drilling by Altona was completed with a 5.5"
hammer drill and sampled at 1 m intervals using standard Altona procedures as outlined for Little Eva.
Samples were typically submitted by URL and Xstrata to either SGS, Analabs, or ALS Townsville (or ALS Mount
Isa) for either:
•ME-ICP41 (trace level analysis of 34 elements by aqua regia digestion with ICP-AES finish)
•MEMS-61 (ultra trace level analysis of 47 elements by four-acid “near total” digestion [HF-HNO3-
HClO4 acid digestion, HCl leach] and a combination of ICP-MS and ICP-AES finishes)
•Hot aqua regia digestion, diluted HCl added to residue, with an AAS finish
Effective date: 30 June 2025
87
•Cu-OG46 ore grade copper analysis by aqua regia digestion, with either AAS or ICP-AES finish.
Samples were submitted by Altona to ALS Townsville for either ME-ICP41 (trace level analysis of 34 elements
by aqua regia digestion with ICP-AES finish), or Cu-OG46 (ore grade copper analysis by aqua regia digestion,
with either AAS or ICP-AES finish).
CMMC completed 18 RC drill holes in 2019 at Blackard with a 5.75" hammer drill. Samples were collected
using standard CMMPL procedures at intervals of 2 m.
Samples were submitted by CMMPL to ALS Townsville for either ME-ICP61 (trace level analysis of 27
elements by four-acid “near total” digestion [HF-HNO3-HClO4 acid digestion, HCl leach] and an ICP-AES
finish) or Cu-OG62 (ore grade copper analysis by HF-HNO3-HClO4 digestion, HCl leach for use as over-range,
with either AAS or ICP-AES finish).
Early QC procedures used by CRAE consisted of duplicate samples (1 in 15) and repeat assays (1 in 15), but
insertion of blanks or standards into the sample stream was not documented. Comparison of sample and
analytical duplicates raises no concerns. Bolnisi implemented a QC protocol for their drill programmes by
using field duplicates at the rate of 1 in 50 and inserting native copper standards at the rate of 1 in 40. It is
assumed that the native copper standards were used due to potential problems during assaying, which may
have included the potential for native copper to smear on grinding plates and contaminate subsequent
samples, and segregation of metallic particles during processing yielding poor reproducibility. From 2005 on,
URL implemented a QC programme for RC drilling that used CRMs (1 in 30), field duplicates (1 in 20), and
blanks (1 in 40). Results indicated that variability of assay data in the native copper zone is significant in a
modest number of the samples, and therefore use of an umpire laboratory check at the rate of 1 sample in
40 was implemented in 2004.
URL designed sampling and specific analytical protocols for oxide or native copper, samples, and sulphide
zone drill programmes. These protocols have been maintained or only slightly modified since that time. The
sampling for oxide and primary mineralisation is the same, using a trailer-mounted cyclone and triple-deck
splitter that divides the RC cuttings into 12.5% and 87.5% volume splits. The larger sample is stored on site in
plastic bags. Subsamples are collected from the larger split, on every tenth sample in the native copper zone,
and every 20th sample in the sulphide zone, and inserted into the sample shipment stream. Additionally, a
sequence of CRMs and blanks are inserted into the sample stream at the rate of 1 in every 40 samples.
Finally, a second subsample is collected from the larger split, at a frequency of 1 in 30 for the native copper
zone, and 1 in 40 for the sulphide zone, and shipped to a second laboratory.
The analytical protocol for the sulphide analysis is as follows: oven-dry entire sample and pulverise to 85%
passing 75 µm, then remove a 1 g subsample with a duplicate sample at the rate of 1 in 20; insert blank and
reference samples into the sample stream, each at the rate of 1 in 50; use three-acid digestion, and analyse
for copper by AAS.
The analytical protocol for the native copper zone samples is more involved. Samples are oven-dried and
then weighed, jaw crushed to -6 mm, then ground in a disc mill (Analabs Supercrunch) to -500 µm. One in 20
samples are reweighed to check for weight loss. Riffle-split into a 1 kg subsample and residual. A duplicate
sample is taken from every 20th residual sample. Subsamples are pulverised to P85 75 µm in a ring mill. A 20
g split is taken, with another duplicate at 1 in 20.
Blanks and reference standards are inserted at a rate of 1 in 50. Aqua regia digestion is used, and analysed by
AAS.
8.4Bedford
Sampling and QA/QC protocols for Bedford are as for Little Eva, except during 2009; the sampling procedure
employed by URL in 2009 was essentially unchanged from their earlier work.
URL initially used a 6" hammer drill, then later a 5.375" hammer drill for RC drilling. The majority of samples
were collected at 1 m intervals, with a small number of early samples collected at 2 m intervals using
standard URL procedures. URL drilled several DD holes with either NQ3 or HQ3 core diameter. This core was
cut to half- or quarter-core subsamples for laboratory submission.
Effective date: 30 June 2025
88
Early URL sampling was submitted to Analabs Townsville for mixed acid, ore grade AAS analysis (old code
GA145). Later sampling was submitted to SGS, with methods modified to include a multi-element ICP-OES
method (ICP21R) for Ag, Al, As, Ba, Bi, Ca, Cd, Co, Cr, Cu, Fe, K, Mg, Mn, Mo, Na, Ni, P, Pb, S, Sb, Se, Sn, Sr, Ti,
U, V, Zn, and Zr. Gold was determined by method FAA505 (50 g fire assay, followed by AAS).
In 2015, Altona drilled one DD hole for metallurgical testwork that was quarter-cored and sent to ALS Perth
to be assayed using ME-MS41 (aqua regia with ICP-MS) for copper, and Au-AA25 (fire assay with AAS) for
gold. Copper analyses over 1% were reanalysed with an ore grade ICP-AES method (Cu-OG46).
8.5Ivy Ann
The sampling procedures used by Dominion in 1992 and 1993 are not recorded, but all RC and PERC drill
holes were sampled on a uniform 2 m interval and analysed for copper and gold. From 1995 to 1996, all RC
holes were sampled on 2 m intervals and riffle-split to produce a nominal 4 kg sample for analysis. Samples
were dispatched to ALS for analysis for copper and cobalt using method G001 (perchloric acid digestion
followed by flame AAS), and using method PM203 for gold (fire assay with AAS). Approximately 1 in 20
samples were resampled at the drill as field duplicates, but there is no report or evidence that CRMs or
blanks were used in the programme. In 1997, the analytical method for base metals was changed to ICP
method, and the suite was extended to include Pb, Zn, As, Ni, and Mo.
The two-DDs completed in 1997 were sampled on 1 m intervals and submitted to ALS for assay for the same
elements as the RC drilling.
RC drilling completed by Altona in 2012 utilised a 140 mm hammer drill, with samples collected at 1 m
intervals, as per standard Altona procedures.
Altona submitted samples to ALS Townsville for analysis by ME-MS41 (aqua regia with ICP-MS) for copper,
and Au-AA25 (fire assay with AAS) for gold. Copper analyses over 1% were reanalysed with an ore grade ICP-
AES method (Cu-OG46).
8.6Lady Clayre
All CRAE DD holes from 1992 through 1996 were sampled on 1 m intervals. CRAE RC drilling and RC pre-
collars on diamond holes for the 1992 campaign were routinely sampled in 3 m intervals in non-mineralised
sections and pre-collars. Mineralised sections were sampled on 1 m intervals. In later years, CRAE
standardided to 2 m intervals for all RC holes. Details of the laboratories and analytical procedures used are
not recorded.
Pasminco drilled one RC_DDT hole and 11 RC holes into the Lady Clayre prospect in 1998. The RC sections
were sampled in 2 m intervals, and the diamond sections were sampled in 1 m intervals. Samples were
analysed by Amdel Analytical laboratories ("Amdel") using fire assay/AAS for gold, and mixed acid/ICP-OES
for copper and base metals.
RC drilling completed by Altona in 2012 utilised a 140 mm hammer drill with samples collected at 1 m
intervals, as per standard Altona procedures.
Altona submitted samples to ALS Townsville for analysis by ME-MS41 (aqua regia with ICP-MS) for copper,
and Au-AA25 (fire assay with AAS) for gold. Copper analyses over 1% were reanalysed with an ore grade ICP-
AES method (Cu-OG46).
8.7Security
Samples from RC and DD programmes were collected and bagged into pre-numbered calico bags at the drill
site during drilling operations. Unique sample numbers were retained during the entire project. All samples
were then catalogued and sealed prior to dispatch to laboratory or secure storage facilities. Samples were
either collected daily and delivered to Analabs/SGS or delivered to and stored in Company facilities in
Cloncurry prior to shipment to laboratories in Townsville.
A catalogued and extensive library of core, assay sample pulps, and RC chips is retained in the Company’s
Cloncurry exploration office for inspection.
Effective date: 30 June 2025
89
9Data verification
Section 229.601(b)(96)(iii)(B) (9) (i‐iii)
Estimation of Mineral Resources and Mineral Reserves relies on analytical data (assays) from samples
collected from drill holes, and the position of those samples in 3D space. The methods and quality of the
sample collection procedures and analytical data have been examined previously by independent consultants
who found the data quality to be appropriate for the purposes of Resource Estimation. Additionally, data
validation and verification has been undertaken by Harmony. Physical verification of drill hole locations and
additional drilling was only completed on the Little Eva, Turkey Creek, and Blackard deposits, the three
largest deposits. The quality of the assay databases was investigated by the QP for all deposits but primarily
focused on the three largest deposits.
Altona maintained a very extensive and high-quality database using Datashed software and has carefully
preserved historical records and thoroughly documented checks and resurveys of drill hole collar locations
and downhole surveys. Collars were probed using a Gyro Survey instrument by URL Resources to obtain an
accurate collar survey record for all historic drill holes. All drill collars checked in the field with handheld
Global Positioning System (GPS) units on the Little Eva deposit were found to be correctly positioned.
Review of drill holes on section did not reveal any anomalies with respect to drill hole locations or
deflections, any deviations found where checked and corrected by the QP. Checking the database against
analytical certificates for approximately 200 samples did not reveal any discrepancies and confirmed
placement of standards and blanks into the sample stream. Visual examination and estimation of copper
grades in drill core and cuttings at the core storage yard was consistent with recorded analytical data.
Previous checks by third-party consultants, including SRK and Optiro, reported similar satisfaction with data
quality.
Statistical analysis of the Project drill data separated by company and/or year of drilling, as reported in
Section 11, indicates that there is no systematic bias to the data, either by company or drill type. New drilling
by Harmony at the Little Eva, Blackard and Turkey Creek closely matches block grades within the resource
block model, providing additional validation of the dataset and estimation methodology.
In the QP’s opinion, the database verification steps undertaken are sufficient, and the data relied upon in this
TRS are adequate for the purposes of Mineral Resource estimation and disclosure under Regulation S-K 1300
Effective date: 30 June 2025
90
10Mineral Processing and Metallurgical testing
Section 229.601(b)(96) (10) (i‐v)
10.1Introduction
This section summarises both historical and recent testwork associated with the various ore types on the
Project property. For additional information, please reference the 2018 Feasibility Study completed by Hatch
for CMMC in 2018, the GR Engineering Services (GRES) DFS for Altona in 2014, and the GRES DFS for URL in
2009. The previous feasibility studies discuss in detail the metallurgical performance of ores from Little Eva
and associated deposits, which contain classic, flotation-amenable copper sulphide ore types.
The Little Eva pit will be the main ore source for the Project. This deposit has been well studied, with 145
flotation tests from multiple core and RC chip sources that ranged in scope from benchtop to pilot plant. This
ore consistently demonstrates high recovery performance with a high degree of liberation at relatively coarse
grinds. The average ore competency lies near the 50th percentile of the JK database, with medium to hard
Bond work indices. Copper is present as chalcopyrite with trace amounts of pyrite. Strong flotation kinetics
result in high recoveries, concentrating to a saleable final concentrate grade following a nominal regrind with
no pH modification. The gold is predominantly associated with the chalcopyrite and reports to the copper
concentrate. Overall, this ore type presents low technical risk.
The sulphide satellite deposits, comprising Turkey Creek, Bedford, Lady Clayre, and Ivy Ann, are smaller ore
sources. These ore types are generally similar to Little Eva from both a comminution and flotation
perspective. Some differences include a stronger deportment of copper to bornite and varying grade
distribution. Overall, these pits show average copper recoveries of 88% to 95% and represent sources of high
recovery material.
The native copper-bearing deposits, Blackard and Scanlan, are distinctly different from other deposits in the
area, containing oxide cap, native copper, sulphide transition, and sulphide zones. The native copper zones
are the largest copper-bearing zones within these deposits, containing a relatively fine distribution of native
copper with varying quantities of sulphides. These pits were studied by previous owners; however, several
recent updates have been completed. In total, 410 flotation tests (including blended ore feed) have been
completed, ranging from benchtop to pilot scale work. On a flotation basis, the native copper zones typically
achieve 60% recovery, with an additional 2% to 3% achievable by gravity methods. Recovery is highly variable
as deportment shifts from native copper to sulphides, requiring flexibility within the processing flowsheet
between gravity and flotation operations to achieve an average of 63% overall native copper recovery. This
ore is typically very soft, resulting in low comminution costs and high mill throughputs. Below the native
copper-bearing zones of both Blackard and Scanlan are sulphide zones containing bornite and chalcopyrite,
behaving similarly to Turkey Creek ore. The flotation response of the ore from the native copper to the
sulphide transition zone increases with sulphide content, as expected.
10.2Little Eva Deposit
The Little Eva deposit is classified as an IOCG deposit. Copper is present as chalcopyrite, with trace amounts
of bornite and chalcocite. The host rock contains high levels of iron oxides such as hematite and magnetite.
Most of the deposit contains trace quantities of pyrite requiring no pH modification at the rougher and
cleaner stage. Chalcopyrite is present in relatively coarse grain sizes, resulting in 95% liberation at 212 µm.
Overall, this ore presents minimal challenges from a metallurgical perspective, as it has average comminution
characteristics and yields high copper recovery.
Effective date: 30 June 2025
91
10.2.1Mineralogy
Previous mineralogical studies of Little Eva highlighted that the ore is predominantly feldspar, quartz,
carbonate, amphibole, biotite mica and iron oxide minerals, with minor to trace amounts of copper and iron
sulphides. The deposit is low in overall sulphur content, with sulphur assays commonly being less than 0.8%
but ranging as high as 1.6%. QEMSCAN analysis of the bulk flotation feed and the tailings composite samples
has identified chalcopyrite (CuFeS2) as the main copper- bearing mineral, locally ranging in abundance from
0.1% to 2%. Trace bornite (Cu5FeS4) usually occurs intergrown with chalcopyrite and is less than one tenth
the abundance of chalcopyrite. Pyrite (FeS2) and chalcocite (Cu2S) occur in ultra-trace amounts of about one
hundredth the abundance of chalcopyrite. A scanning electron microscope (SEM) analysis of hand-panned
flotation concentrate identified very fine particles (ranging in size from 2 μm to 9 μm) of electrum (gold ±
silver) associated with pyrite and/or chalcopyrite. Figure 10-1 and Figure 10-2 show typical chalcopyrite and
bornite associations with gangue minerals within the host rock.
Figure 10-1: Drill Hole LED495, Specimen 94975, Scale
4.6 mm
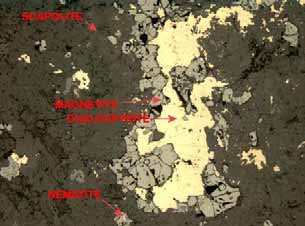
In the QP’s opinion, the metallurgical testwork
completed to date is sufficiently representative
of the styles of mineralisation present at Eva to
inform reasonable recovery assumptions for
Mineral Resource disclosure. Additional
confirmatory testwork may further refine these
assumptions.
Figure 10-2: Drill Hole LED495, Specimen 94966, Scale
1.6 mm
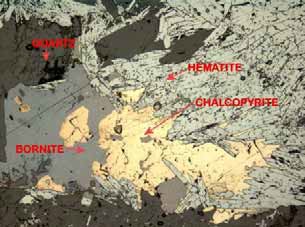
Effective date: 30 June 2025
92
11Mineral Resource Estimates
Section 229.601(b)(96)(iii)(B) (11) (i‐vii)
11.1Introduction
The Eva Copper Project is currently composed of six deposits; in order of importance, they are Little Eva,
Turkey Creek, Blackard, Scanlan, Bedford, and Lady Clayre. Little Eva is the main deposit, hosting a majority of
the Mineral Resource and Reserve, while the others are considered satellite or supplemental deposits. As
there are significant differences in the deposits with respect to tonnage, metal grades, nature of
mineralisation, and drill density, different resource estimation strategies were employed for each deposit.
The geology, structural setting, and mineralisation of each of the deposits has been described in previous
sections and will only be touched upon in this section as is required for understanding resource estimation.
All deposits have had previous resource and reserve estimates carried out. Some additional drilling has been
carried out on the Little Eva, Turkey Creek, and Blackard deposits since the previous resource estimates were
made, but the amount of drilling, in comparison to past work, was relatively minor, as the new drilling was
mostly for verification of historical data and to collect material for metallurgical testing. For the most part,
resources have been re-estimated using different techniques and block sizes to better match proposed
mining equipment and incorporate anticipated mining dilution and ore losses associated with the larger
equipment. The type of mineralisation is such that the larger mining equipment, while increasing mining
efficiency, will likely result in higher levels of dilution with resultant lower grades. However, the amount of
contained metal within the earlier and current estimates is similar. It is anticipated that there will be
opportunities to increase grades delivered to the mill through enhanced grade control procedures during
mining together with the use of stockpiling strategies. Resource estimates leading to reserves that form the
basis of pit design should be conservative. Mineral Resources were estimated under the supervision of Mr.
Ronald Reid, B.Sc.(Hons), FAIG., Harmony’s QP responsible for Mineral Resources.
11.2Resource Estimation Procedures
The resource estimation methodology was similar for all deposits, and involved the following procedures:
•Understanding, to the extent possible, geological controls of mineralisation and grade distribution,
and determination of domains
•Deposit description and mineralisation domains based on geology, structure, and weathering profiles
•Determine suitable block model sizes and extents for each deposit
•Describe drill hole database, validate drill data, and extract the relevant data required for resource
estimation
•Analyse the data through univariate and bivariate statistical data analysis Determine what, if any, data
conditioning (capping and compositing) is required
•Variography on deposits and deposit domains (required for kriging interpolations)
•Grade interpolation
•Resource, classification, and validation
•Mineral Resource Statement.
11.3Geological and Mineralisation Models and Domains
The following sections describe the criteria for the definition of the geological and mineralisation models at
the deposits. Domains for grade estimation are based on structural orientation and/or lithological controls on
mineralisation as well as metallurgical/mineralogical zones related to weathering profiles. The weathering
profile for all the copper-gold deposits is reasonably consistent, with an upper zone of oxidised rock generally
between 15 m and 25 m in depth, with a relatively sharp boundary between fresh rock or supergene zones,
depending upon the deposit. The oxide and supergene zones are defined by observation during core or chip
logging and verified by sulphur analyses on a subset of the drill holes within the deposit. Deposit geology and
figures describing weathering or supergene domains used for resource estimation are presented in Section 6.
Domains defined by structural or lithological orientation are described in Sections 11.6 and 11.7.
Effective date: 30 June 2025
93
11.3.1Little Eva
Three major structural-lithological domains, separated by faults, have been defined for the Little Eva deposit,
each domain with differing orientations of mineralisation continuity. Previous workers defined additional
subzones of either high- or mid-grade domains based on drill hole copper grades. Recent work, both with the
data and limited drill core examination, determined that the subdomain boundaries were gradational and
not likely to be visually distinct during mining. Attempts to define the high-grade zones with variography
were not successful and therefore these subdomains were not maintained during grade interpolation. A plan
view and typical drill sections illustrating the four larger domains (and earlier subdomains) are provided in
Figure 6-5 and Figure 6-6.
The upper part of the deposit is oxidised, usually to a depth of 15 m to 25 m, and the transition to sulphide
mineralisation is quite sharp. The oxidised zone contains copper in native form as well as neotocite (Fe-Mn-
Cu mineraloid) and carbonate copper species. Additional testing for recovery of copper from the oxide zone
has been carried out, and no economical method of copper extraction has been determined and
consequently, the oxide zone is considered to be waste. The oxide zone is present over top of all structural-
lithological domains. The contact between the oxide zone and fresh rock was treated as ‘soft’ during
interpolation as grade changes across the boundary were minimal.
11.3.2Turkey Creek
The Turkey Creek deposit was the most recent discovery at the Eva Copper Project and is a copper- only
deposit (without gold). Resource estimation of the Turkey Creek deposit was constrained within a
stratigraphically controlled grade shell above 0.1% Cu. The Turkey Creek deposit occurs as two tabular
higher-grade zones separated by a lower grade zone. Although a lower grade internal core has been defined
as a domain, these domain boundaries were not used during the interpolation as it may not be possible to
segregate this zone during mining. However, interpolated block grades, clearly define the medial low-grade
zone indicating that grade interpolation correctly honours drill data, as well as the potential for selective
removal during mining, depending upon applied cut-off grade. Changes in orientation of the mineralisation
on the north end of the deposit, to the north of the Turkey Creek Fault, resulted in two additional domains.
11.3.3Native Copper deposits
The Native Copper are very similar deposits geologically, being stratabound with locally deep weathered
profiles containing native copper. Additional drilling on Blackard and metallurgical testing on both Blackard
and Scanlan has been completed and will be used to inform a mine plan.
Blackard, Legend, Great Southern and Scanlan are nearly identical geologically and metallurgically, both
occurring near- surface and within deformed and metamorphosed carbonate rich sediments. Folded
stratigraphy and changes in copper mineralisation due to weathering require modification to the resource
estimation procedures employed for the Little Eva deposit. The deposits appear to occur as thin (10 m) to
thick (100 m) bands of mineralisation folded into a tight synform and open antiform pair. The deposits
contain weathering profiles that include an upper oxide zone, which is treated as waste (although grades are
interpolated within the zone), followed by the copper zone where a significant proportion of the copper is
contained as fine native copper, followed by a narrow transition zone of mixed metallic copper and sulphide
species, and a lowermost sulphide zone (Figure 6-11 and Figure 6-14). In both deposits, the weathering
profile and related native copper zone is much deeper or more extensively developed over the synform part
of the deposit areas. The silver content of the sulphide zone is locally significant but was not included in the
resource estimates due to a lack of informing data.
Effective date: 30 June 2025
94
The Blackard deposit strikes northerly and has been subdivided into structural domains based on the dip
and/or plunge of the mineralisation (Figure 6.-10). An outer 0.1% copper shell that reflects interpreted folded
stratigraphy and separates barren rock from mineralisation on drill sections, was used to constrain the
resource estimates. Mineralisation is folded and curved, whereas interpolation searches are generally linear,
so to account for the folded stratigraphy dynamic anisotropy was used to follow the fold curvature (Figure
6-11). Histograms of assay grades on drill sections display high variability of grade down hole, but in some
areas, particularly within the Blackard deposit, alternating high and lower grade bands were noted to align
over moderate distances, both on section and along strike these bands were used to guide the orientation of
the interpolation search rather than the outline of the grade shell. The boundaries between mineralogical
domains are treated as soft during resource estimation but are used as hard boundaries for assigning
metallurgical recoveries. The three structural domains at Blackard were treated as hard boundaries for
estimation.
11.3.4Ivy Ann
Ivy Ann is a copper-gold mineralised trend that consists of two deposits hosted within steep, east-dipping
zones, with strikes to the north and northeast (Figure 6-17). The two deposits are separated by 700 m of
barren rock and are termed Ivy Ann and Ivy Ann North. The mineralisation domain at Ivy Ann includes a main
structural zone and two minor hanging wall structures, defined within an outer grade shell at a copper cut-off
of 0.1%. At Ivy Ann North there are 14 separate mineralised structures interpreted which were interpolated
within a single outer grade shell defined by a copper cut-off of 0.1%.
The Ivy Ann deposit is not currently being considered by Harmony in the current mining study due to its size
and distance from the Mill.
11.3.5Lady Clayre
Mineralisation at Lady Clayre occurs in a variety of orientations with multiple geological controls, both
structure and lithology exert control on mineralisation within a sequence of poly-deformed shales, siltstones,
schists, and dolomites (Figure 6-15). Copper-gold mineralisation is coarse-grained and commonly occurs
within brecciated rocks. Five zones were defined by Altona based on 0.1% Cu grade shells. Mineralisation in
the northern part of the deposit strikes northwesterly and dips moderately to steeply to the west, while
mineralisation to the south strikes northeast and also dips moderately to steeply to the west. The deposit
area was divided into two domains based on orientation of mineralisation, but neither enclosing grade shells
nor smaller subdomains were used for estimation. A separate domain was created for the oxide zone, which
consists of a 15 m to 25 m thick layer with both oxide and carbonate copper species (Figure 6-16).
11.3.6Bedford
Bedford geology was reinterpreted by Altona in 2016, integrating drill data, surface mapping, high- resolution
soil geochemistry, and geophysics into a structural analysis. The confidence in the geological interpretation is
moderate to high, based on well-defined local and regional controls on the mineralisation geometry.
Mineralisation outcrops at surface and has been tested to a depth of 140m and remains open. The Bedford
mineralisation is hosted within a steep westerly- dipping shear zone 50m to 120m wide, striking north-
northeast (Figure 6-18). Within the broad shear zone there is an array of mineralised structures with typical
widths of 5m to 12m, which anastomose but follow the broad overall shear zone trend (Figure 6-19). Drilling
has defined two separate areas of mineralisation within the shear zone (Bedford South and Bedford North)
where sufficient mineralisation is present to be extracted by open pit mining.
The mineralisation is divided into two domains, Bedford north and Bedford South. Both domains lie within
the Bedford shear zone and are separated by an area poorly drilled and mineralised about 800m long. The
current state of the lithology logs restricts a lithology model to be developed at this stage and will require a
relogging programme to inform future models. The mineralisation is controlled by north-northeast trending,
steeply dipping veins which plunge towards the north, there is sufficient grade continuity in all directions
within the 0.1% shells.
Effective date: 30 June 2025
95
11.3.7Block Models
Mineral resources are estimated by interpolating composited drill hole grades into a block model, which
models the space containing the mineralisation into rectangles or cubes (blocks). The appropriate block size
is determined by considering the smallest selective mining unit (SMU), which is a function of either the size
and type of mining equipment to be used or the spacing planned for grade control drilling, and the spacing of
the data used to interpolate grades into the blocks. Differences in the size and shapes of the deposits, and
different data densities within the Project area result in different blocksizes. Each block is assigned a
geological rock type code, oxidation code or domain code by intersecting the block model with 3D wireframe
models of the geology.
The software used for grade interpolation is determined by the estimator or consultancy undertaking the
work. The Lady Clayre and Ivy Ann Resource models were estimated by CMMC using GemCom Gems
software. The Turkey Creek 2025 Resource updates for Harmony were completed by SRK in Maptek Vulcan
2023, Datamine RM, and Isatis.Neo. Micromine 2024 was used for the other deposits and to validate the
estimates.
Deposit block models are usually laid out as 3D rectilinear shapes that will fully envelop all known
mineralisation. Details of the deposit block models are provided in Table 11-1.
Table 11-1: 3D Block Model Limits (UTM Coordinates and MineRL (AMD+1000 m)
Deposit | Direction | Minimum | Maximum | Block Size | No. of Blocks |
Little Eva | Easting | 409,760 | 411,690 | 10 | 193 |
Northing | 7,770,755 | 7,773,355 | 20 | 130 | |
Elevation | 530 | 1,210 | 10 | 68 | |
Turkey Creek | Easting | 412,000 | 413,100 | 10 | 110 |
Northing | 7,770,750 | 7,772,510 | 20 | 88 | |
Elevation | 650 | 1,250 | 5 | 120 | |
Blackard | Easting | 411,800 | 413,400 | 10 | 160 |
Northing | 7,764,300 | 7,766,800 | 20 | 125 | |
Elevation | 500 | 1,300 | 5 | 160 | |
Scanlan | Easting | 411,600 | 413,040 | 20 | 72 |
Northing | 7,753,550 | 7,755,770 | 40 | 55 | |
Elevation | 735 | 1,205 | 10 | 47 | |
Bedford | Easting | 414,797 | 415,207 | 10 | 42 |
Northing | 7,765,697 | 7,768,457 | 10 | 477 | |
Elevation | 1,000 | 1,190 | 10 | 20 | |
Lady Clayre | Easting | 409,132 | 410492 | 5 | 272 |
Northing | 7,751,523 | 7753283 | 5 | 352 | |
Elevation | 400 | 1,400 | 5 | 200 | |
Ivy Ann | Easting | 425,100 | 427000 | 5 | 380 |
Northing | 7,741,000 | 7744600 | 5 | 720 | |
Elevation | 900 | 1,280 | 5 | 76 | |
Legend | Easting | 409,011 | 411,796 | 20 | 141 |
Northing | 7,767,240 | 7,769,000 | 10 | 177 | |
Elevation | 800 | 1,190 | 10 | 40 | |
Great Southern | Easting | 425,100 | 427000 | 5 | 380 |
Northing | 7,741,000 | 7744600 | 5 | 720 | |
Elevation | 900 | 1,280 | 5 | 76 | |
All block models are in metric units without any rotation and generally are rectangular shaped, with the long
axis to the north and the shorter axis to the east due to the north-south trending deposits. multiple of 5m
high RL blocks were used for all deposits to allow for bench heights of 5m, 10m, or 15m depending on
Effective date: 30 June 2025
96
deposit size. Where blocks are cut by a domain boundary (e.g., ore-waste boundary), a sub-block of 5x5x5m
has been used to define the boundary. All block models are in GDA2020 / MGA Zone 54 projection and in
Mine RL, which is AHD + 1000 m.
A variety of information is stored in the block model, including interpolated grades for copper and gold
(where present), geological codes, specific gravities (SGs), and royalty requirements (Discussed in Section
3.6), various kriging parameters, metallurgical zones, and block classifications. Block models for Little Eva,
Turkey Creek, Blackard, Scanlan, and Bedford are coded according to domains defined by computer solids
models built on geological wireframes that represent mineralisation boundaries and/or any distinct structural
areas or breccia zones. Outer domain boundaries for the Little Eva, Turkey Creek, Blackard, Scanlan, and
Bedford deposits, and all structural boundaries were treated as hard, as the boundary is in most cases
geological, and any drill data outside the boundary was not used for interpolation of block grades.
However, boundaries between mineral-type domains are soft, and data on either side of the boundary can
be used by the interpolation. Blocks are segregated by all domain boundaries. For the Scanlan deposit, all
drill data were available for interpolation, although not all data were used, as many isolated holes were too
distant to have an adjacent hole within the search area, which was a requirement of interpolation protocol.
Only blocks that were inside the geological (or grade) shell were used to report the Resources.
Figure 11-1: Little Eva Block Model 0.1% Cu Domain Containing the Estimation Domains
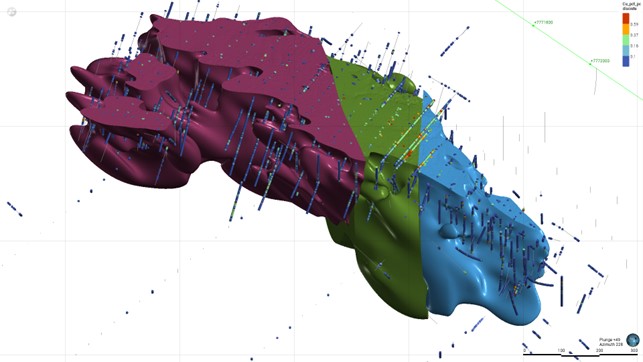
Note:
The Little Eva deposit showing three main structural domains.
Image view is southwest with north to bottom right.
Effective date: 30 June 2025
97
Figure 11-2: Isometric View of the Blackard estimation domains
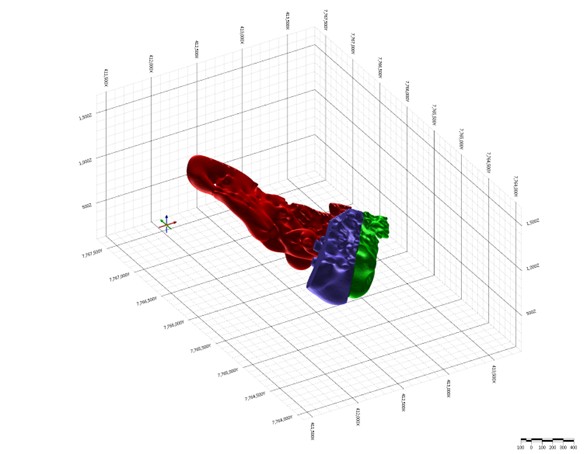
Note:
The Blackard deposit showing internal higher grade core.
Image view is northeast with north to the left
11.4Database and Statistical Analysis
11.4.1Drill Hole Database
The Harmony drill hole database is stored on the company server and SQL format and is accessed via a
Maxwells Datashed front end. Data for each of the deposits was uploaded to a Micromine workspace, where
it was reviewed and analysed. Little Eva, Turkey Creek, Blackard, and Scanlan databases were uploaded
directly from the previously defined file structure used for the 2012–2015 Optiro resource estimates and any
data from recent drilling was added to the appropriate data base. Data quality was reviewed and combined
with Altona’s extensive previous validation work by third-party consultants, the data was determined to be of
high quality, and valid for use in resource estimation.
Standard checks (missing intervals, missing holes, overlapping intervals) did not reveal any errors in the
database, although there were a small number of copper assays without a corresponding gold assay. The
Project database includes collar, survey, assay, and lithological information, as well as drill hole type, year
drilled, and company information from the various historical drill campaigns (see Table 11-2).
Both, DD and RC drilling have taken place throughout all the deposits by many companies, including URL,
Dominion, Bruce Resources, PanAust, Xstrata, Altona and CMMC. A small amount of drilling for due diligence
and/or to collect metallurgical sample material was carried out by Sichuan Railway Investment Group (SRIG)
and CMMC in between 2016 and 2018 and an 18-hole RC programme on the Blackard deposit was completed
in 2019. Table 11-2 gives the breakdown of the drill data by company, the number of drill holes, and the
years that the drilling occurred in all the current resource areas.
The drilling history of the Eva Copper Project dates to the late 1970s, when CRAE began drilling in the Little
Eva and Lady Clayre areas (Figure 11-3, Table 11-2). Since then, numerous campaigns of RAB, RC, and DD
drilling have taken place throughout the Project area and on all the deposits by many companies including:
URL, Dominion, Bruce Resources, Pan Australian, Xstrata, Altona and CMMC. A small amount of drilling for
grade confirmation and to obtain fresh samples for metallurgical testing was carried out by SRIG (2016-2017)
and CMMC in 2018 and 2019.
Most of the drilling on the Project was focused on the Little Eva (36%) (Figure 11-4) and Blackard (28%)
deposits while Lady Clayre has 11% of total drilled metres, followed by Scanlan, Bedford, Ivy Ann, and Turkey
Creek, with 9%, 6%, 6%, and 4%, respectively. Much of the RAB drilling was for exploration outside of the
Effective date: 30 June 2025
98
deposit areas, and due to possible contamination issues with RAB samples, no RAB holes were used in the
resource estimations.
Table 11-2: Summary of Exploration Drilling by Company
Deposit | Year | Company | Hole Type | Hole Count | Metres | % of Total |
Little Eva | 1978–1996 | CRAE | DD | 6 | 2,330 | 37% |
RC | 61 | 5,293 | ||||
2002–2006 | URL | RC | 281 | 37,855 | ||
DD | 30 | 4,037 | ||||
2006 | Xstrata | DD | 2 | 984 | ||
2011–2018 | Altona | RC | 102 | 20,899 | ||
DD | 11 | 2,572 | ||||
2018-2022 | CMMC | DD | 22 | 429 | ||
RC | 7 | 6,030 | ||||
2023-2025 | Harmony | DD | 69 | 21,402 | ||
RC | 94 | 21,209 | ||||
Turkey Creek | 1993 | CRAE | RC | 2 | 218 | 6% |
2011 | Xstrata | RC | 2 | 300 | ||
2012–2015 | Altona | RC | 49 | 7,296 | ||
DD | 5 | 404 | ||||
2018-2022 | CMMC | DD | 1 | 132 | ||
RC | 9 | 594 | ||||
2023-2025 | Harmony | RC | 67 | 10,157 | ||
Blackard | 1991–1995 | CRAE | DD | 19 | 4,770 | 26% |
RC | 8 | 1,120 | ||||
PERC | 6 | 613 | ||||
2002 | Bolnisi Logistics | DD | 7 | 927.8 | ||
RC | 121 | 13,558 | ||||
2005–2009 | URL | DD | 46 | 12,419 | ||
RC | 117 | 13,746 | ||||
2011 | Altona | DD | 3 | 548 | ||
RC | 21 | 4,049 | ||||
2019 | CMMC | RC | 18 | 2,695 | ||
2023-2025 | Harmony | DD | 74 | 23,286 | ||
RC | 47 | 6,411 | ||||
Scanlan | 1991–1995 | CRAE | RC | 97 | 7,553 | 6% |
DD | 5 | 1,636 | ||||
AC | 3 | 110 | ||||
2002 | Bolnisi Logistics | RC | 2 | 397 | ||
2005–2006 | URL | RC | 45 | 5,358 | ||
DD | 11 | 1,803 | ||||
2007–2008 | Xstrata | DD | 2 | 798.2 | ||
2010 | URL | RC | 7 | 1,324 | ||
Bedford | 1990 | CRAE | RC | 5 | 420 | 4% |
2003–2009 | URL | RAB* | 43 | 1,680 | ||
RC | 97 | 9,762 | ||||
DD | 1 | 160 | ||||
2015 | Altona | DD | 1 | 36 |
Effective date: 30 June 2025
99
Deposit | Year | Company | Hole Type | Hole Count | Metres | % of Total |
Ivy Ann | 1992–1993 | Dominion | RAB* | 26 | 863 | 4% |
RC | 15 | 1,591 | ||||
1995 | Bruce Resources | RC | 11 | 1,084 | ||
1995–1996 | Pan Australian | RC | 10 | 1,268 | ||
RAB | 44 | 1,972 | ||||
2003–2009 | URL | RC | 18 | 2,205 | ||
2011–2012 | Altona | RC | 27 | 5,448 | ||
Lady Clayre | 1978–1998 | CRAE | RAB* | 50 | 471 | 8% |
RC | 46 | 5,477 | ||||
DD | 30 | 7,994 | ||||
2002–2009 | URL | RAB | 39 | 1,913 | ||
RC | 40 | 4,967 | ||||
DD | 2 | 154 | ||||
2011–2012 | Altona | RC | 27 | 5,188 | ||
Legend | 1991-1995 | CRAE | RC | 26 | 2,616 | 6% |
DD | 3 | 323 | ||||
AC | 13 | 695 | ||||
2006-2008 | Xstrata | DD | 3 | 1,153 | ||
2010 | Altona | RC | 6 | 1,116 | ||
2019 | CMMC | RC | 2 | 256 | ||
2023-2024 | Harmony | RC | 42 | 7,071 | ||
RC_DDT | 29 | 7,071 | ||||
DD | 3 | 770 | ||||
Great Southern | 1991-1994 | CRAE | AC | 6 | 283 | 3% |
RC | 14 | 1,310 | ||||
2003 | URL | RC | 14 | 1,630 | ||
2011 | Xstrata | DD | 2 | 635 | ||
2024 | Harmony | RC | 14 | 2,556 | ||
RC_DDT | 11 | 2,705 | ||||
DD | 20 | 458 | ||||
Total | 2,219 | 328,564 |
Notes: DD = diamond drilling, RC = reverse circulation, RAB = rotary air blast, RC_DDT = RC with diamond core tail
* denotes holes not used in resource estimates.
Effective date: 30 June 2025
100
Figure 11-3: Little Eva Drill Collar Plan by Company
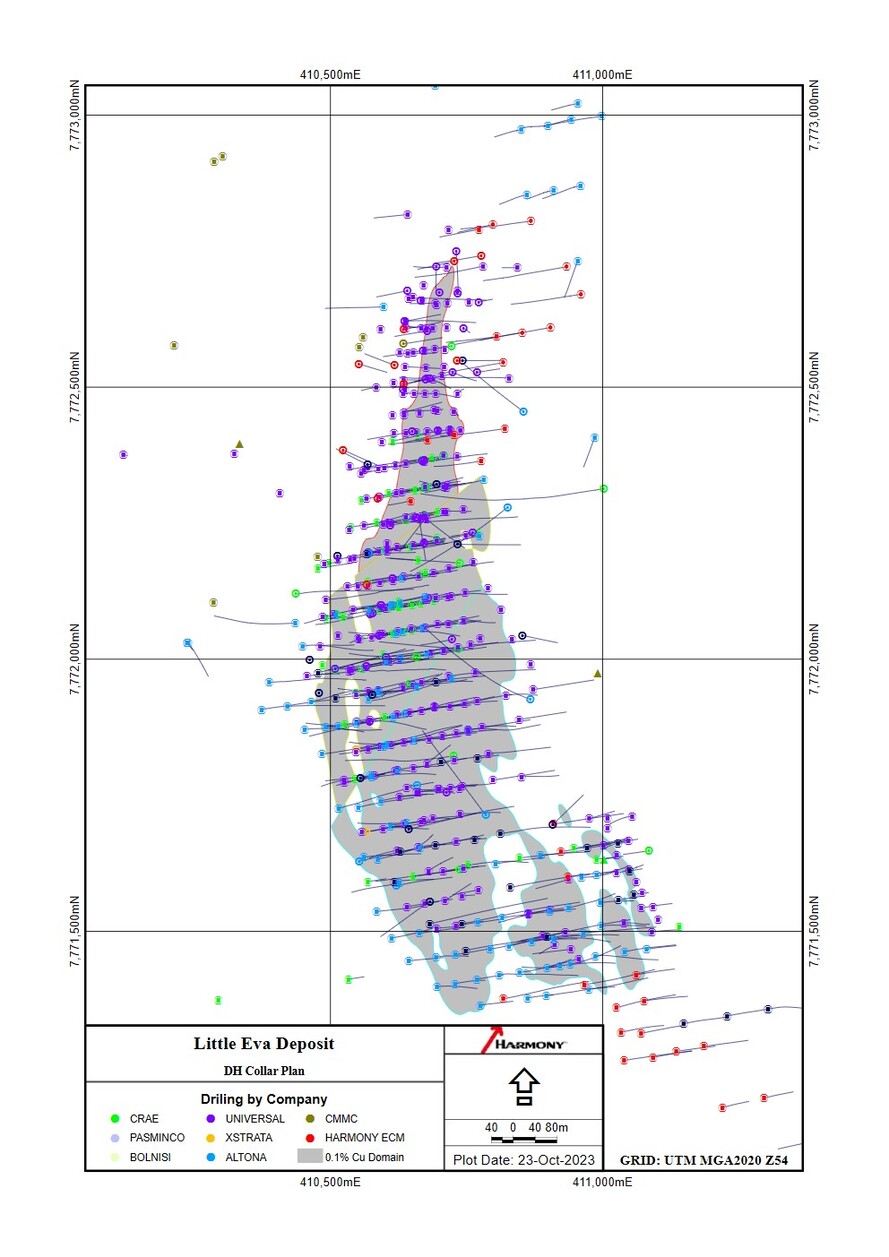
Effective date: 30 June 2025
101
Figure 11-4: Number of Little Eva Drill Holes by Year and Company
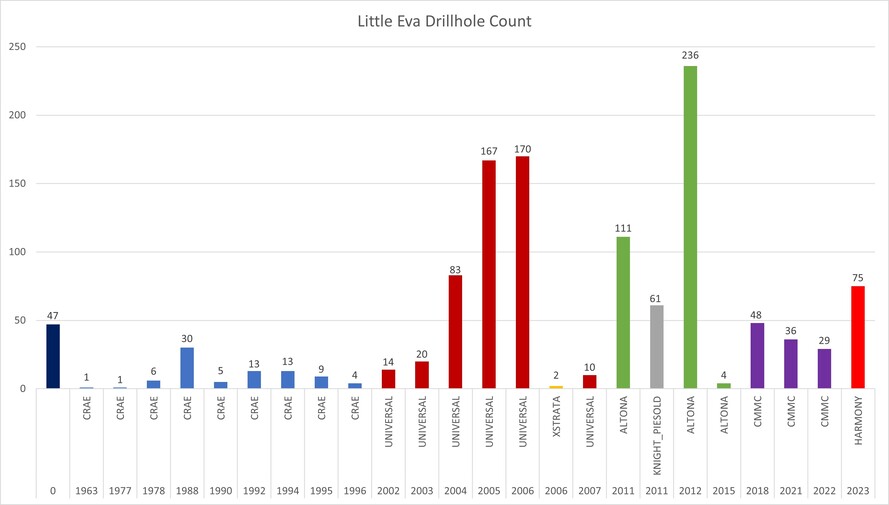
Note: Chart shows all drilling at Little Eva
11.4.2Deposit Assay Data Statistics
Assay datasets for each deposit were examined using univariate statistics to provide an understanding of
ranges, distribution, and variance to determine the appropriate methods of resource estimation. In some
cases, outlying holes which did not intersect the area of mineralisation were removed prior to statistical
analysis. A summary of assay statistics for each deposit is provided in Table 11-3, and selected histograms of
assay data and composites are presented in the various figures and tables that follow in this section.
The Little Eva deposit has lognormal distributions of both copper and gold, with high, but acceptable
coefficient of variation ("CoV"), drilling was composited to 2m intervals to assist with stationarity. Turkey
Creek mineralisation is a much smaller dataset, and is unusual in that it is negatively skewed, with the
number of samples increasing towards higher grades, likely a function of visually distinct mineralised zones
favouring sampling within the mineralisation. The Bedford, lady Clayre, and Ivy Ann deposits all have high
maximums and correspondingly high CoVs, with low median values due to multiple relatively narrow zones of
mineralisation separated by non-mineralised material. The Blackard and Scanlan deposits both have log-
normal distributions with relatively low CoV’s and have similar statistics to each other with slightly higher
median and mean grades in the Scanlan deposit.
Table 11-3: Summary of Assay Statistics by Deposit
Deposits | Statistics | Raw Assays* Uncapped | 2m Composite used in Estimate** | ||
Cu (%) | Au (g/t) | Cu (%) | Au (g/t) | ||
Little Eva | Count | 104,256 | 102,873 | 54,655 | 53,881 |
Mean | 0.24 | 0.04 | 0.25 | 0.05 | |
Median | 0.09 | 0.02 | 0.11 | 0.02 | |
Minimum | — | — | — | — | |
Maximum | 18.89 | 12.70 | 16.80 | 5.82 | |
Std. Dev. | 0.55 | 0.15 | 0.50 | 0.12 | |
CoV | 2.27 | 3.42 | 2.02 | 2.40 | |
Effective date: 30 June 2025
102
Deposits | Statistics | Raw Assays* Uncapped | 2m Composite used in Estimate** | ||
Cu (%) | Au (g/t) | Cu (%) | Au (g/t) | ||
Turkey Creek | Count | 19,054 | — | 2,589 | — |
Mean | 0.17 | — | 0.45 | — | |
Median | 0.03 | — | 0.35 | — | |
Minimum | — | — | — | — | |
Maximum | 4.50 | — | 3.12 | — | |
Std. Dev. | 0.31 | — | 0.34 | — | |
CoV | 1.86 | — | 0.76 | — | |
Bedford | Count | 9,499 | 9,395 | 5,650 | 56,050 |
Mean | 0.19 | 0.05 | 0.19 | 0.06 | |
Median | 0.03 | 0.01 | 0.03 | 0.01 | |
Minimum | — | 0.01 | — | 0.01 | |
Maximum | 11.5 | 6.46 | 8.24 | 3.98 | |
Std. Dev. | 0.59 | 0.19 | 0.52 | 1.68 | |
CoV | 3.08 | 3.41 | 2.79 | 2.98 | |
Lady Clayre | Count | 19,157 | 19,218 | 19,157 | 19,218 |
Mean | 0.16 | 0.07 | 0.16 | 0.07 | |
Median | 0.03 | 0.01 | 0.03 | 0.01 | |
Minimum | — | — | — | — | |
Maximum | 20.7 | 45.1 | 20.7 | 45.1 | |
Std. Dev. | 0.48 | 0.49 | 0.48 | 0.49 | |
CoV | 3.09 | 7.43 | 3.09 | 7.43 | |
Ivy Ann | Count | 11,458 | 11,458 | 11,458 | 11,458 |
Mean | 0.17 | 0.03 | 0.17 | 0.03 | |
Median | 0.03 | 0 | 0.03 | 0 | |
Minimum | — | — | — | — | |
Maximum | 23.5 | 3.18 | 23.5 | 3.18 | |
Std. Dev. | 0.51 | 0.08 | 0.51 | 0.08 | |
CoV | 3.09 | 3.22 | 3.09 | 3.22 | |
Blackard | Count | 59,660 | — | 42,751 | — |
Mean | 0.24 | — | 0.25 | — | |
Median | 0.10 | — | 0.11 | — | |
Minimum | — | — | — | — | |
Maximum | 8.97 | — | 7.26 | — | |
Std. Dev. | 0.39 | — | 0.33 | — | |
CoV | 1.60 | — | 0.15 | — | |
Scanlan | Count | 4,882 | — | 4,289 | — |
Mean | 0.52 | — | 0.51 | — | |
Median | 0.14 | — | 0.138 | — | |
Minimum | 0 | — | — | — | |
Maximum | 6.85 | — | 6.85 | — | |
Std. Dev. | 0.56 | — | 0.57 | — | |
CoV | 1.04 | — | 1.11 | — | |
Effective date: 30 June 2025
103
Deposits | Statistics | Raw Assays* Uncapped | 2m Composite used in Estimate** | ||
Cu (%) | Au (g/t) | Cu (%) | Au (g/t) | ||
Legend | Count | 17,850 | — | 10,412 | |
Mean | 0.17 | — | 0.17 | ||
Median | 0.04 | — | 0.04 | ||
Minimum | 0 | — | — | ||
Maximum | 13.85 | — | 7.89 | ||
Std. Dev. | 0.34 | — | 0.32 | ||
CoV | 1.97 | — | 1.85 | — | |
Great Southern | Count | 7,638 | — | 4,774 | |
Mean | 0.19 | — | 0.19 | ||
Median | 0.07 | — | 0.07 | ||
Minimum | 0 | — | — | ||
Maximum | 4.64 | — | 4.52 | ||
Std. Dev. | 0.11 | — | 0.10 | ||
CoV | 1.73 | — | 1.63 | — | |
Note: *Assay data from both sulphide and oxide zones. **Lady Clayre and Ivy Ann use 2.5m composites.
More detailed analysis was carried out on the Little Eva, Blackard, and Scanlan deposits to evaluate potential
for data bias between drill hole type, company, and drill hole orientation. Comparisons of statistics between
exploration programmes by company for Little Eva are shown in Table 11-4. In general, the statistics are quite
similar, except for the mean grade, which is lower for the Altona holes due to the additional drilling around
the edges of the deposit, as can be observed in the drill hole plan (Figure 11-3), which shows the collars
colour-coded by company. Similarly, Table 11-5 compares basic statistics between RC and DD; the higher
mean and medians for the DDs are a result of the DDs being preferentially drilled in the north-central, higher
grade area of the deposit as illustrated in Figure 11-5.
11.4.2.1Little Eva Deposit
Drill hole data for the Little Eva deposit was examined for any form of bias related to different drill
programmes by different companies, or differing drill equipment or drill hole orientations. While differences
are noted in Table 11-4 and Table 11-5, it is believed these differences are more reflective of the location of
the drill holes as opposed to any inherent bias. Table 11-6 shows the global raw assay data for the estimation
domains at Little Eva. The database is deemed good for resource estimation.
Table 11-4: Summary of Cu Assay Statistics for Little Eva by Company Drill Data
CRAE | URL | Altona | Xstrata | Harmony | |
Count | 4,757 | 61,796 | 529 | 716 | 36,458 |
Mean | 0.26 | 0.294 | 0.389 | 0.264 | 0.147 |
Median | 0.10 | 0.126 | 0.182 | 0.166 | 0.013 |
Minimum | 0 | 0 | 0 | 0 | 0 |
Maximum | 16.8 | 18.9 | 11.0 | 2.5 | 15.2 |
Std. Dev. | 0.65 | 0.61 | 0.75 | 0.30 | 0.41 |
CoV | 2.49 | 2.07 | 1.94 | 1.14 | 2.78 |
Table 11-5: Summary of Basic Statistics for RC vs. Diamond Drill Hole Assays for Little Eva
RC | DD | |
Count | 80,252 | 24,004 |
Mean | 0.25 | 0.23 |
Median | 0.10 | 0.06 |
Minimum | 0 | 0 |
Maximum | 18.9 | 15.2 |
Std. Dev. | 0.56 | 0.57 |
CoV | 2.22 | 2.45 |
Effective date: 30 June 2025
104
A review of drill hole orientation was undertaken on the Little Eva deposit to assess for any grade bias in the
data. Drill holes were partitioned based on either easterly orientations (azimuth 50–140), westerly
orientations (azimuth 230–320) or vertical holes (dip ≥ -80). A very small sub-set of holes were drilled
towards the south or north and are not included (Figure 11-6). Statistics for copper assays based on drill hole
orientation is provided in Table 11-7 and indicates that there is little difference between westerly- inclined
drill holes and easterly-inclined drill holes. Vertical drill holes have a higher mean grade, probably related to a
concentration of these holes in the higher-grade central and northerly parts of the deposit. Examination of
the detailed drill sections indicates that mineralisation is not systematically vertically oriented, and therefore
vertical drill holes are unlikely to produce grade bias.
Table 11-6: Basic Statistics for Raw Assays by Domain at Little Eva
North | Central | South | Total | |||||
Cu% | Au g/t | Cu% | Au g/t | Cu% | Au g/t | Cu% | Au g/t | |
Count | 8,720 | 26,242 | 26,580 | 61,542 | ||||
Mean | 0.64 | 0.08 | 0.42 | 0.08 | 0.27 | 0.08 | 0.39 | 0.07 |
Minimum | 0.001 | 0.001 | 0.001 | 0.001 | 0.001 | 0.001 | 0.001 | 0.001 |
Maximum | 18.89 | 4.95 | 16.80 | 12.86 | 16.09 | 7.57 | 18.89 | 12.86 |
Std. Dev. | 1.11 | 0.18 | 0.72 | 0.24 | 0.38 | 0.13 | 0.67 | 0.18 |
CoV | 1.68 | 1.72 | 1.61 | 2.51 | 1.39 | 1.84 | 1.71 | 2.52 |
Note:
Table 11-7: Cu% Assay Statistics Based on Drill Hole Orientation at Little Eva
East Dip | West Dip | Vertical | |
Count | 30,707 | 6,618 | 8,537 |
Mean | 0.32 | 0.37 | 0.45 |
Median | 0.17 | 0.18 | 0.21 |
Minimum | — | — | — |
Maximum | 16.80 | 16.09 | 18.89 |
Std. Dev. | 0.54 | 0.69 | 0.78 |
CoV | 1.70 | 1.87 | 1.72 |
Effective date: 30 June 2025
105
Figure 11-5: Little Eva Drill Collar Plan with Drill Holes Colour Coded by Orientation
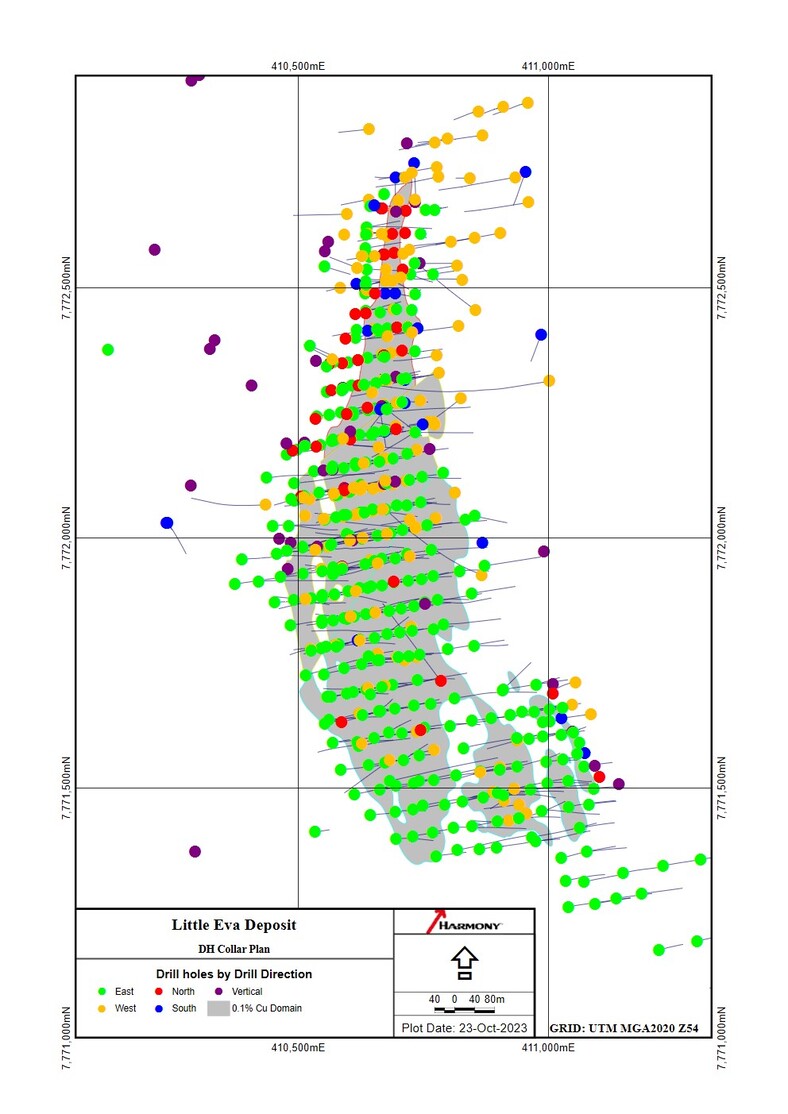
Note: The concentration of vertical holes in the northern, higher-grade end of the deposit.
Effective date: 30 June 2025
106
Figure 11-6: Plan View of Drill Collars Colour-Coded by Drill Type
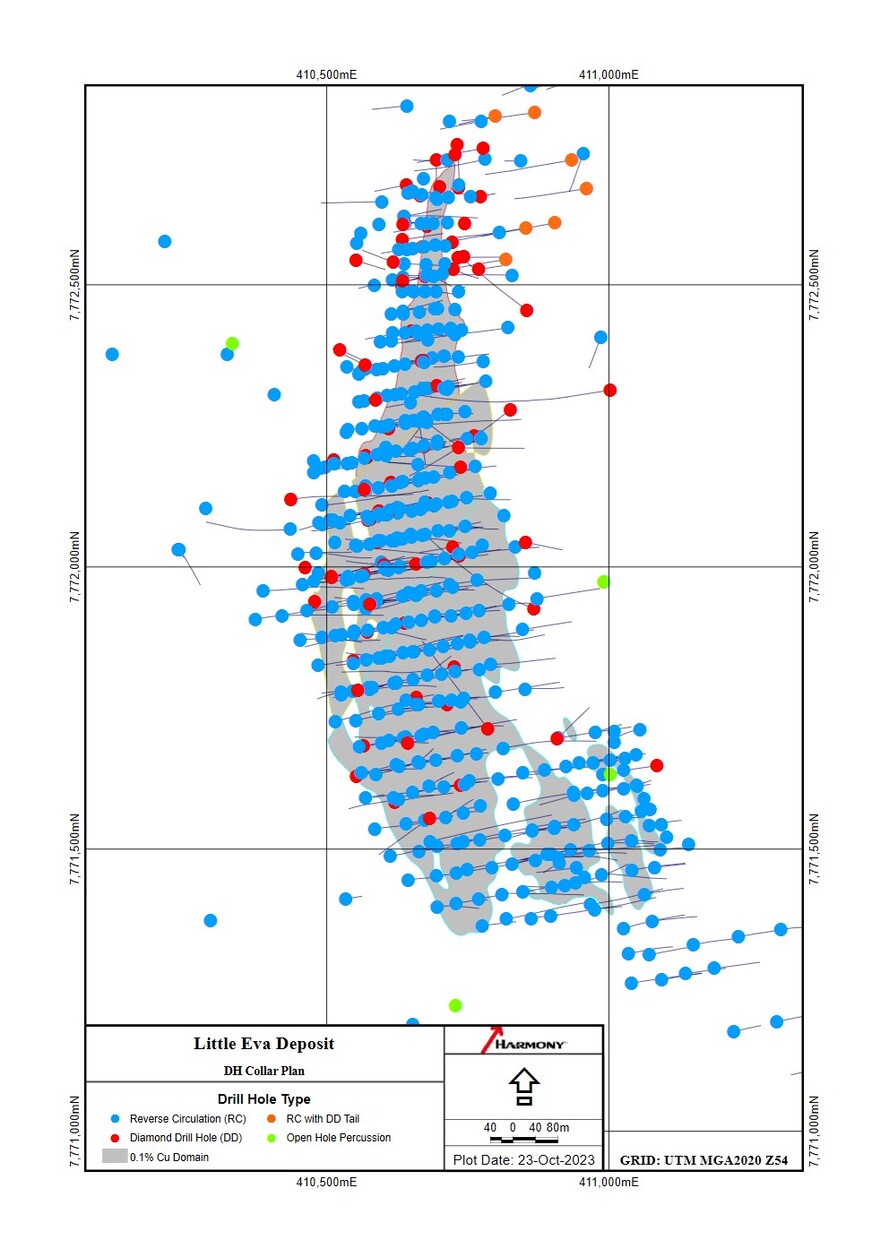
Effective date: 30 June 2025
107
11.4.2.2Blackard Deposit
A combination of drilling was used on the Blackard deposit and potential for bias between drill types was
examined. Additionally, basic statistics between domains were examined to support the use of soft domain
boundaries during interpolation. Examples of assay data statistics for Blackard domains are provided below in
Table 11-8, whereas examples of statistical analysis of composited data for the various deposits is provided in
Section 12.5.
Basic statistical analysis of copper assays was initially carried out on each mineralogical/structural domain;
however, a better comparison is provided by data above a very low-grade cut-off value as shown in Table
11-8. For statistical analysis three structural or orientation domains were defined for the Blackard deposit as
defined by faults: variable west dipping Northern domain, a central domain and southern domain, which
were further split into oxide, native copper and sulphide domains for resource estimation. The model was
estimated using dynamic anisotropy where the search ellipse follows the curvilinear fold of the deposit but
the statistics have been split into various domains to show the variation across the deposit.
The oxide zone typically has lower grades than the other zones which is as expected since copper has been
leached from this zone. The native copper domains are generally slightly higher grade, than the sulphide
domains, and shows less variability. The relatively small differences in statistical measures between the zones
supports the use of soft boundaries between the oxide, native copper and sulphide domains. The faulted
domain boundaries were treated as hard.
Table 11-8: Cu% Assay Statistics by Resource Domain for the Blackard Deposit
Zone | Oxide | Native Cu | Sulphide | ||||||
Domains | Centre | North | South | Centre | North | South | Centre | North | South |
Blackard Deposit Assay Statistics (All assays) | |||||||||
Count | 1,364 | 858 | 1,724 | 4,688 | 7,173 | 3,401 | 4,782 | 3,950 | 4,102 |
Mean | 0.350 | 0.200 | 0.390 | 0.600 | 0.410 | 0.490 | 0.370 | 0.350 | 0.380 |
Median | 0.290 | 0.149 | 0.280 | 0.500 | 0.250 | 0.435 | 0.195 | 0.214 | 0.239 |
Minimum | 0.010 | 0.010 | 0.010 | 0.010 | 0.010 | 0.010 | 0.010 | 0.010 | 0.010 |
Maximum | 1.480 | 1.210 | 2.560 | 5.160 | 8.970 | 4.740 | 5.530 | 5.110 | 8.800 |
Std. Dev. | 0.260 | 0.180 | 0.310 | 0.470 | 0.450 | 0.370 | 0.500 | 0.460 | 0.540 |
CoV | 0.740 | 0.920 | 0.800 | 0.780 | 1.090 | 0.760 | 1.360 | 1.320 | 1.420 |
Assays at, or >0.05% Cu Cut-off | |||||||||
Count | 1,321 | 795 | 1,673 | 4,528 | 6,828 | 3,282 | 3,135 | 3,693 | 3,341 |
Mean | 0.360 | 0.220 | 0.400 | 0.620 | 0.430 | 0.510 | 0.440 | 0.470 | 0.460 |
Median | 0.300 | 0.150 | 0.280 | 0.520 | 0.260 | 0.449 | 0.253 | 0.270 | 0.281 |
Minimum | 0.050 | 0.050 | 0.050 | 0.050 | 0.050 | 0.050 | 0.050 | 0.050 | 0.050 |
Maximum | 1.480 | 1.210 | 2.560 | 5.160 | 8.970 | 4.740 | 5.110 | 5.530 | 8.800 |
Std. Dev. | 0.260 | 0.190 | 0.310 | 0.470 | 0.450 | 0.370 | 0.480 | 0.520 | 0.570 |
CoV | 0.710 | 0.860 | 0.770 | 0.750 | 1.050 | 0.730 | 1.110 | 1.120 | 1.230 |
Basic statistics were also examined by drill type for Blackard. The differing statistics between core drilling and
RC drilling is believed to reflect the different locations of the drill holes (Table 11-9).
Diamond drill holes were used for deep step-outs and therefore drilled much greater distances in weakly
mineralised or unmineralised areas than the RC drilling, which is more concentrated within the deposit area.
There are no significant statistical differences when grades within the deposit shell were compared for the
two drill types.
Effective date: 30 June 2025
108
Table 11-9: Cu% Assay Statistics by Drill Type for the Blackard Deposit
Drill Hole Type | Core | RC |
Count | 15,188 | 25,488 |
Mean | 0.209 | 0.279 |
Median | 0.035 | 0.120 |
Minimum | 0.010 | 0.010 |
Maximum | 8.118 | 5.160 |
Std. Dev. | 0.394 | 0.383 |
CoV | 1.888 | 1.373 |
Figure 11-7: Plan View of Drill Collars, Colour-Coded by Hole Type for the Blackard Deposit
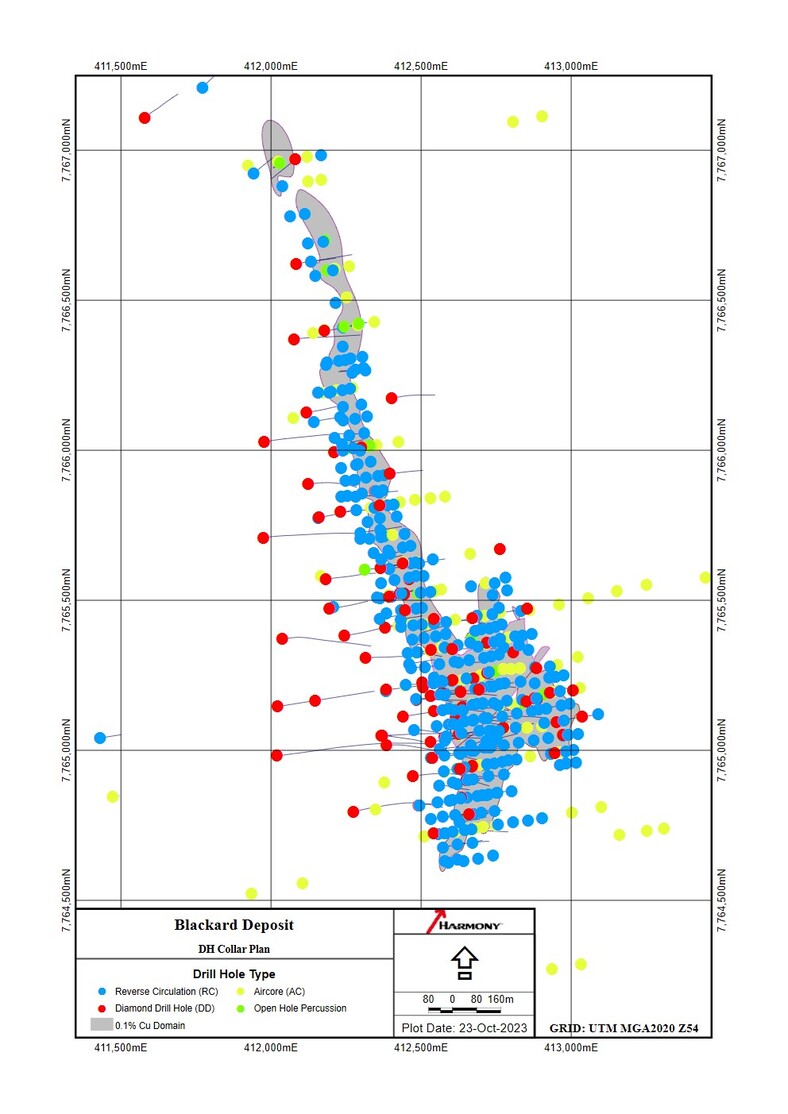
Effective date: 30 June 2025
109
11.4.2.3Scanlan Deposit
Most of the drilling on the Scanlan deposit was by RC, with only the deeper (down-dip) and metallurgical
holes completed by DD, as displayed by the drill plan in Figure 11-8. Therefore, a significant amount of the
DD was peripheral to the ore zone. Grades within metallurgical holes drilled proximal to RC holes are similar
and no bias between drill types has been detected.
Figure 11-8: Plan View of Drill Collars for the Scanlan Deposit Showing the Resource grade shell
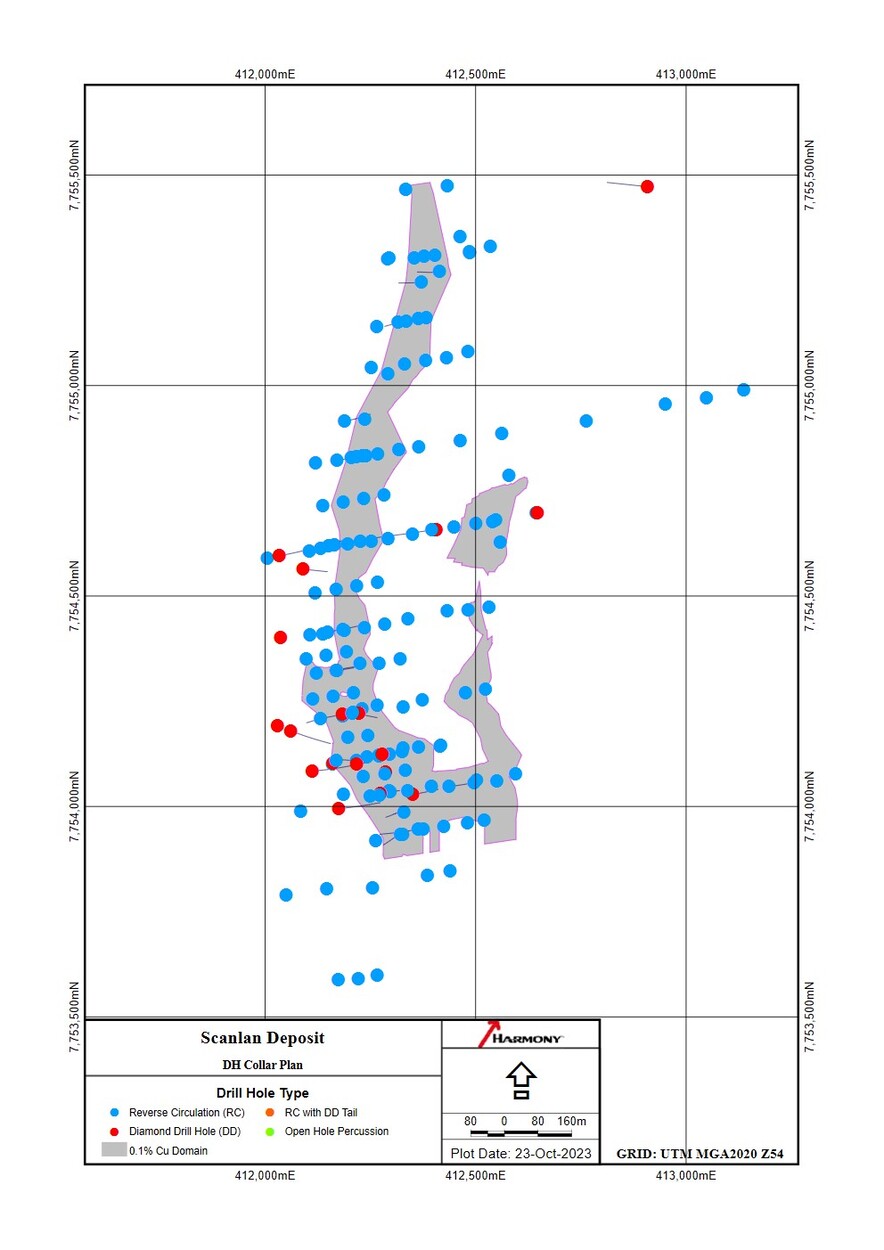
Effective date: 30 June 2025
110
11.4.3Data Conditioning and Assay Composites
Data populations were examined using histograms and probability plots. Histograms indicate that
distribution of both copper and gold grades are log-normal, with varying amounts and directions of skewness
between deposits. Compositing of all drill hole assays to equal lengths is required for interpolation. The
choice of composite length is determined by raw data distribution and block size: composite lengths must be
less than the block size, and half the block height is a common and convenient selection. Compositing the
predominately 1m assays to a length of 2m smooths out the histograms, and indicates a reasonably uniform
distribution of values, apart from spikes at, or near, analytical detection limits as illustrated in Figure 11-9 and
Figure 11-10.
Cumulative probability plots were examined to determine whether capping would be required (Figure 11-11).
Basic statistics, for 2m composites by domain for all deposits, except the Ivy Ann and Lady Clayre deposits
where 2.5m was used are provided in Table 11-10 through Table 11-16, and can be compared with the raw
data statistics (Table 11-3). Some high assay values (> 6.5% Cu) in the drill data from Little Eva and Lady
Clayre remained after compositing, however, these values were neither random nor isolated anomalies but
part of a continuous population distribution. The number of high-value composites is very small (for example
in Little Eva deposit the number of composites >4.0%Cu is less than 0.0026% of the total number of
composites) and would have a negligible impact on resource values. Samples were assessed for top-cutting
and capping of copper assays was applied where required. Only a handful of composites were top cut and
the impact on the statistics was negligible. The single very high assay in the Lady Clayre deposit was from a
very narrow sample and was reduced to 4% Cu by the compositing process.
Figure 11-9: Log Histogram for Raw Assay Data from Little Eva Deposit
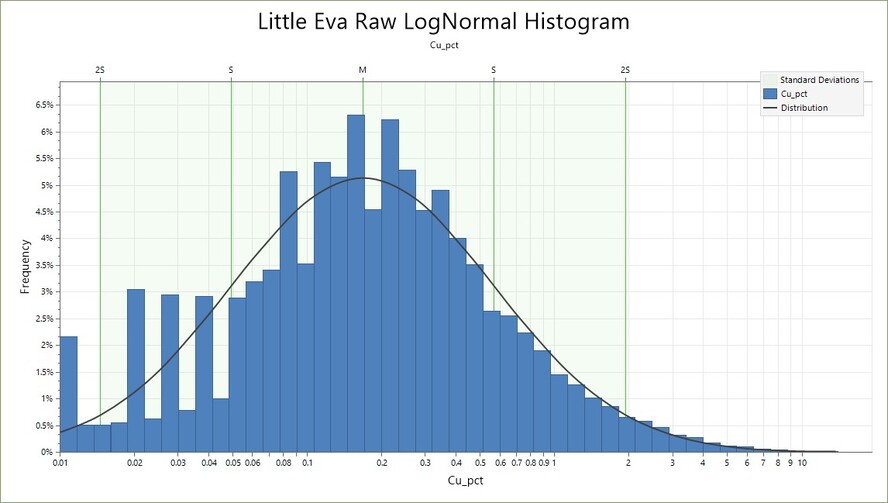
Effective date: 30 June 2025
111
Figure 11-10: Log Histogram of 2 m Copper Composites, Little Eva Deposit
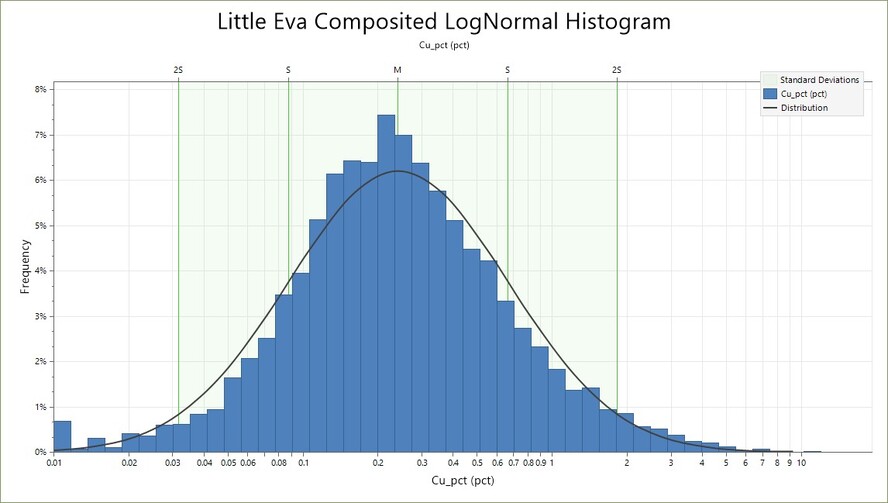
Note: Bold values below the histograms are arithmetic.
Figure 11-11: Cumulative Probability Plot for Cu Assays, Little Eva
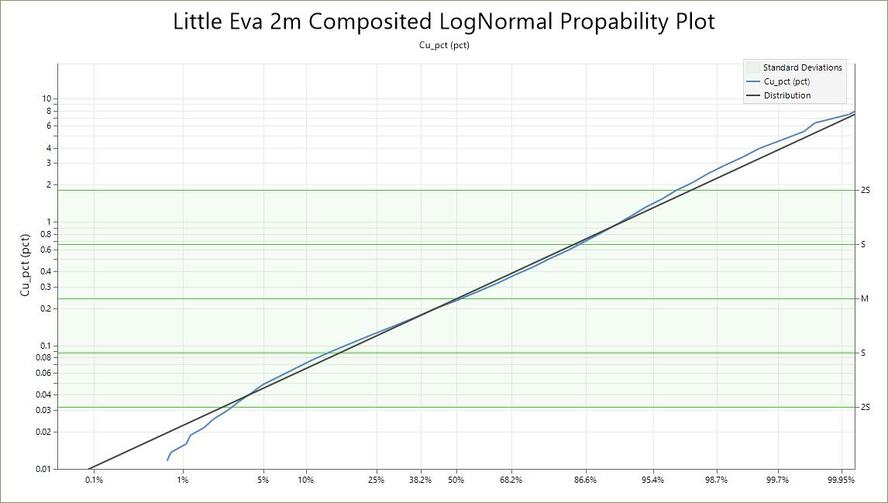
Table 11-10: Basic Statistics for 2 m Composites by Domain at Little Eva
North | Central | South | Total | |||||
Cu % | Au g/t | Cu % | Au g/t | Cu % | Au g/t | Cu % | Au g/t | |
Count | 4,638 | 14,269 | 13,703 | 32,610 | ||||
Mean | 0.621 | 0.082 | 0.420 | 0.078 | 0.273 | 0.061 | 0.398 | 0.019 |
Median | 0.271 | 0.045 | 0.261 | 0.040 | 0.184 | 0.035 | 0.222 | 0.039 |
Minimum | 0.001 | 0.001 | 0.001 | 0.001 | 0.001 | 0.001 | 0.001 | 0.001 |
Maximum | 10.865 | 3.700 | 16.800 | 5.480 | 8.480 | 3.870 | 16.800 | 5.480 |
Std. Dev. | 0.932 | 0.134 | 0.638 | 0.170 | 0.323 | 0.099 | 0.604 | 0.139 |
CoV | 1.50 | 1.63 | 1.44 | 2.19 | 1.19 | 1.62 | 1.52 | 1.95 |
Effective date: 30 June 2025
112
The Turkey Creek deposit has been defined by 121 RC, and 6 DD for a total of 19,261m. Fourty seven of the
holes, and one Diamond hole (together totalling 7,422m), were completed during 2023 by Harmony. The
mineralisation is strongly tabular and stratabound, striking north- south and dipping east at 60°. At the
northern end of the deposit, the strike of the mineralisation swings sharply towards the east, and dips
steeply south (Figure 11-19). Basic statistics of composite assays by domain are provided in Table 11-11.
Although the number of composites is low in comparison to the to the other deposits, the grade continuity of
mineralisation within the narrow, tabular zones is sufficient for defining Indicated resources.
Table 11-11: Basic Statistics for 2 m Composites by Domain at Turkey Creek
North Fresh | North Oxide | Northwest Fresh | South Fresh | South Oxide | |
Count | 394 | 206 | 164 | 1,464 | 146 |
Mean | 0.358 | 0.625 | 0.432 | 0.447 | 0.490 |
Minimum | 0.003 | 0.060 | 0.024 | 0.011 | 0.089 |
Maximum | 2.350 | 3.120 | 1.487 | 2.149 | 2.128 |
Std. Dev. | 0.330 | 0.274 | 0.378 | 0.303 | 0.368 |
CoV | 0.846 | 0.799 | 0.659 | 0.712 | 0.752 |
Table 11-12: Basic Statistics for 2 m Composite Grades in Blackard Deposit Mineralogical Domains
Mineral Zone | Oxide | Native Copper | Sulphide |
Count | 3,126 | 11,261 | 4,701 |
Mean | 0.329 | 0.486 | 0.375 |
Minimum | 0.001 | 0.010 | 0.005 |
Maximum | 2.560 | 5.040 | 6.610 |
Std. Dev. | 0.272 | 0.413 | 0.472 |
CoV | 0.826 | 0.850 | 1.262 |
Note: *Refer to Figure 7-10 for mineralogical domains.
Table 11-13: Basic Statistics for Composites by Mineralogical Zone for the Scanlan Deposit
Oxide | Copper Zone | Transitional | Sulphide Zone* | Total | |
Count | 1,267 | 4,098 | 254 | 1,244 | 6,933 |
Mean | 0.152 | 0.412 | 0.211 | 0.108 | 0.299 |
Median | 0.076 | 0.238 | 0.072 | 0.030 | 0.130 |
Minimum | 0.01 | 0.001 | 0.001 | 0.001 | 0.001 |
Maximum | 1.58 | 5.41 | 2.08 | 2.66 | 5.41 |
Std. Dev. | 0.200 | 0.52 | 0.37 | 0.24 | 0.45 |
CoV | 1.33 | 1.26 | 1.77 | 2.25 | 1.500 |
Note: * Includes all drilling below the deposit.
The mineralisation at the Bedford deposit is separated into two deposits, Bedford North and South, which
are 600m apart and lie within the same structure. Previously, narrow high-grade structures were modelled
using a sectional approach for the Bedford estimates to constrain the resource.
However, the estimate was only constrained within the broader low-grade envelope (originally modelled by
Altona) using a larger block size of 5m3. Blocks were interpolated based on two passes, which generated both
Indicated and Inferred resources.
Effective date: 30 June 2025
113
Table 11-14: Basic Statistics for 2 m Composites by Domain at Bedford
Primary | Oxide | |||
Cu | Au | Cu | Au | |
Count | 4,498 | 4,498 | 1,862 | 1,862 |
Mean | 0.18 | 0.05 | 0.16 | 0.05 |
Median | 0.03 | 0.01 | 0.03 | 0.01 |
Minimum | — | — | — | — |
Maximum | 6.62 | 3.44 | 8.25 | 3.98 |
Std. Dev. | 0.49 | 0.16 | 0.52 | 0.17 |
Coefficient of Variance | 2.73 | 2.91 | 3.30 | 3.40 |
Mineralisation at Lady Clayre has been separated into two zones, East and West, which together form a V
shape. The West zone mineralisation trends north-south and was previously interpreted into 11 different
domains defined by modelled grade shells. The East zone was also split into multiple domains. As with
Bedford, two zones were modelled within the low-grade envelope based on a 0.1% Cu cut-off and use
different search parameters for each zone based on the interpreted generalised trends to the mineralisation.
Figure 11-12: Log Histogram of Copper Assays from Lady Clayre Deposit
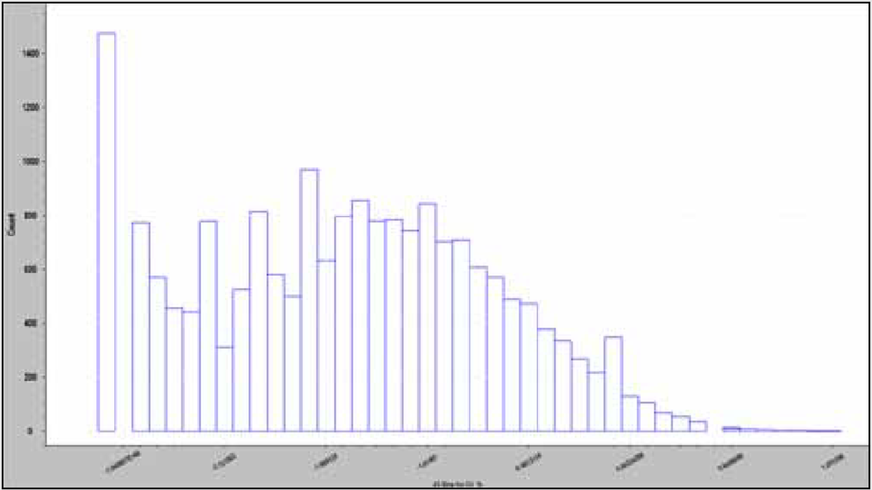
Effective date: 30 June 2025
114
Figure 11-13: Log Probability Plot of Copper Assays from Lady Clayre Deposit
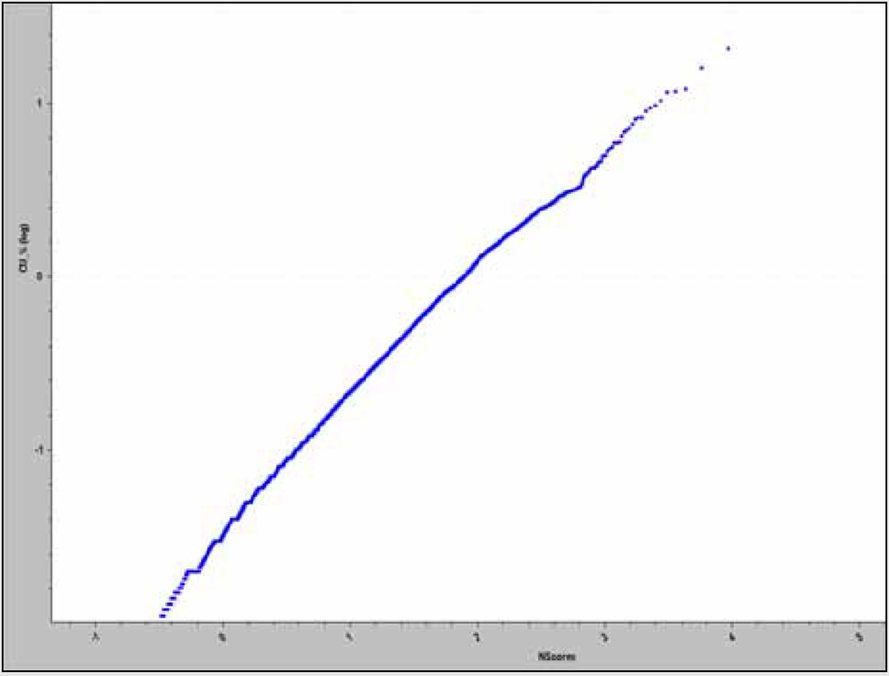
Table 11-15: Basic Statistics for 2.5 m Composites by Domain at Lady Clayre
West Zone – Primary | East Zone – Primary | Oxide Zone – All | ||||
Cu | Au | Cu | Au | Cu | Au | |
Count | 5,904 | 5,904 | 4,438 | 4,438 | 1,407 | 1,407 |
Mean | 0.14 | 0.06 | 0.15 | 0.07 | 0.17 | 0.07 |
Median | 0.044 | 0.01 | 0.04 | 0.01 | 0.06 | 0.01 |
Min. | — | — | — | — | — | — |
Max. | 17.00 | 10.43 | 7.37 | 10.52 | 3.6 | 10.5 |
Std. Dev. | 0.42 | 0.29 | 0.36 | 0.36 | 0.32 | 0.36 |
CoV | 2.89 | 4.94 | 2.37 | 5.31 | 1.91 | 5.30 |
Table 11-16: Basic Statistics for 2.5 m Composites by Domain at Ivy Ann
Ivy Ann – Primary | Ivy Ann – Oxide | Ivy Ann North – Primary | Ivy Ann North – Oxide | |||||
Cu | Au | Cu | Au | Cu | Au | Cu | Au | |
Count | 3,825 | 3,825 | 702 | 702 | 815 | 815 | 440 | 440 |
Mean | 0.18 | 0.03 | 0.15 | 0.02 | 0.07 | 0.01 | 0.04 | — |
Median | 0.04 | — | 0.04 | — | 0.02 | — | 0.01 | — |
Minimum | — | — | — | — | — | — | — | — |
Maximum | 4.00 | 0.30 | 2.58 | 0.35 | 2.85 | 0.50 | 0.5 | 0.2 |
Std. Dev. | 0.35 | 0.05 | 0.28 | 0.04 | 0.18 | 0.03 | 0.06 | 0.02 |
CoV | 1.97 | 1.95 | 1.86 | 1.92 | 2.53 | 3.54 | 1.62 | 3.93 |
Effective date: 30 June 2025
115
11.5Bulk Density
There are 1,721 bulk density measurements in the Little Eva deposit data base. The measurements were
made on drill core using the “weigh in water, weigh in air” method. A histogram of the density
measurements (Figure 11-14) indicates multiple populations: separating the data by rock type shows the
separate populations. There were 1,316 bulk density measurements collected from rocks classified as the
fresh volcanic package which has a mean bulk density of 2.84 t/m3. A further 139 measurements were
collected from the metasedimentary rocks, with a mean bulk density of 2.88 t/m3. A total of 203
measurements were made on the calc silicate rocks, which yielded a mean bulk density of 2.65 t/m3.
The mean bulk density values that were assigned to the Little Eva block model is presented in Table 11-17.
The oxide zone did not have enough bulk density data points for detailed statistical analysis. A bulk density of
2.5 t/m3 was assigned to all the oxide zone blocks in the block model. This value is based on the McDonald
Speijers resource report from 2006.
Table 11-17: Bulk Density Data and Average or Assigned Values
Description | Bulk Density* | Sample Count |
Overburden | 1.80 | 1 |
Volcanics/Andesite (Fresh) | 2.84 | 1,316 |
Volcanics/Andesite (Transitional) | 2.61 | 35 |
Volcanics/Andesite (Oxide) | 2.50 | 5 |
Felsic Intrusive (Fresh) | 2.62 | — |
Felsic Intrusive (Transitional) | 2.62 | — |
Felsic Intrusive (Oxide) | 2.50 | — |
Metasediments (Fresh) | 2.88 | 139 |
Metasediments (Transitional) | 2.69 | — |
Metasediments (Oxide) | 2.55 | — |
Calc Silicate (Fresh) | 2.65 | 203 |
Calc Silicate (Transitional) | 2.61 | 8 |
Calc Silicate (Oxide) | 2.50 | 1 |
Limited bulk density measurements have been collected at Turkey Creek but as Turkey Creek is similar to the
Blackard sulphide domains, the bulk densities from Blackard were applied to Turkey Creek. Bulk densities for
the Blackard and Scanlan deposits were assigned to blocks based on their mineralogical domains, as shown in
Table 11-18. The density determinations were derived from a limited, but relatively consistent, set of
measurements completed during exploration and metallurgical testing. The density determinations were
derived from over 618 historical data records (sourced from previous project operators) and the recent
completion of 24 bulk sample tests on the Blackard deposit to confirm the historical findings.
Density measurements for the Ivy Ann, Bedford, and Lady Clayre deposits are limited. The oxide zones were
assigned a value of 2.11 t/m3, and for the sulphide zones and/or fresh rock a bulk density of 2.58 t/m3 was
assigned. Samples from the Bedford deposit suggest a higher density (2.78 t/m3), which should be
considered in future work.
Table 11-18: Bulk Density Used for Native Copper Deposits
Description | Oxide | Strongly Weathered | Moderately Weathered | Weakly Weathered | Fresh |
Fill/Cover | 1.8/1.5 | 0 | 0 | 0 | 0 |
Oxide | 2.18 | 2.22 | 2.50 | 2.50 | 2.50 |
Native Copper | 2.18 | 2.22 | 2.26 | 2.73 | 2.73 |
Sulphide | 2.18 | 2.22 | 2.26 | 2.56 | 2.73 |
Effective date: 30 June 2025
116
Figure 11-14: Little Eva Bulk Density Histograms
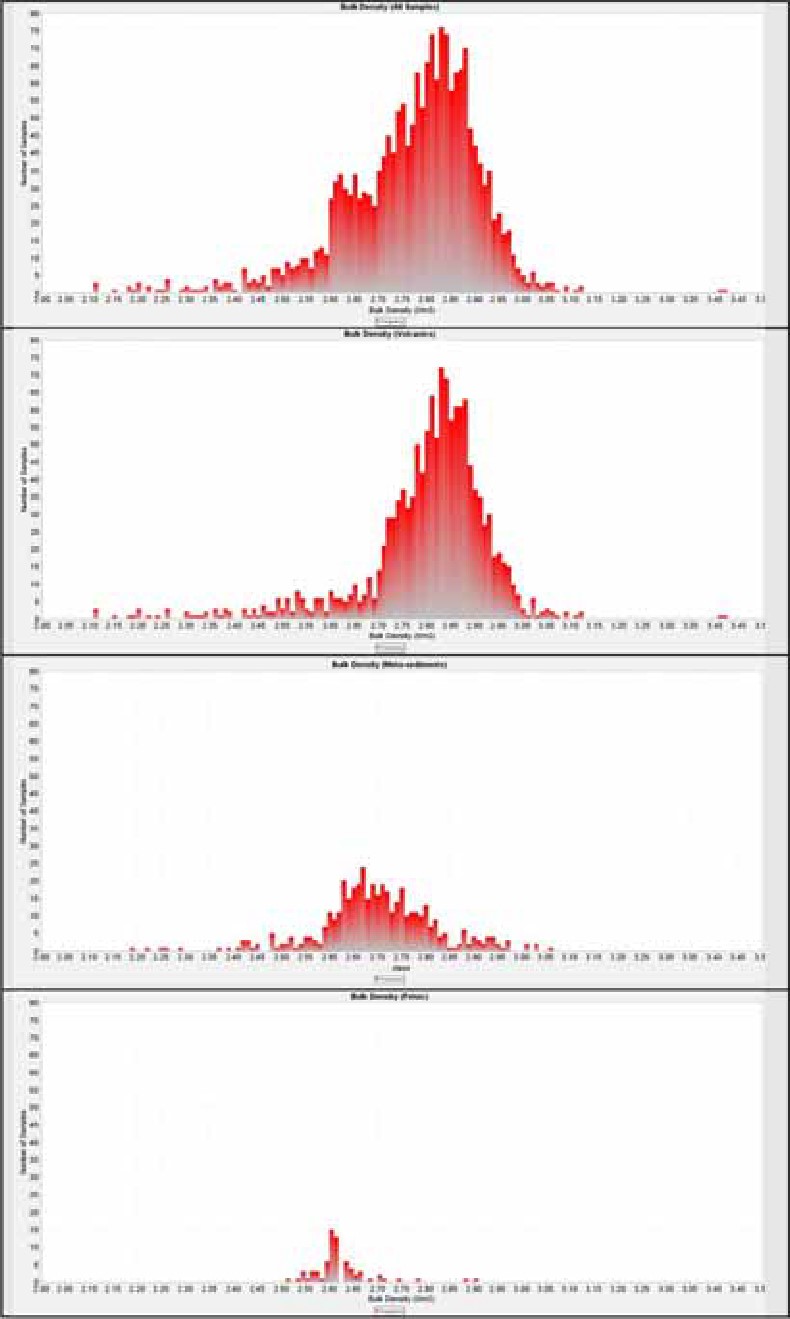
Note: For all samples (top), volcanic rocks (2nd from top), metasediments (3rd from top), felsic intrusive (bottom)
Effective date: 30 June 2025
117
11.6Variography
The Little Eva and Bedford deposit variography was undertaken by Harmony and both downhole,
correlograms and directional Gaussian variograms were generated on assay data within each of the grade
domains for copper and gold. The four native copper deposit's variography was undertaken by Harmony and
both downhole and three directional correlograms were generated for each grade domain, a dynamic
anisotropy was used to adjust the dip and dip direction for to match the folded geometries. The Turkey
Creek variography was undertaken by SRK South Africa and both downhole and directional variograms were
generated on assay data within each of the domains.
Variography was only undertaken on the other deposits to investigate data continuity within the larger
domains, but kriging interpolations were not used due to the limited size and shape of most of the domains
and an ID2 interpolation was used.
Variography is required to provide the necessary inputs to use the ordinary kriging (OK) method of
interpolation. The semi-variogram is used to determine the spatial continuity of mineralisation in 3D. The
direction with the best continuity is referred to as the major axis, with the semi-major being the next-best
direction of continuity, and the minor being the direction of least continuity in an orthogonal coordinate
system. Semi-variograms provide measurements of three components of continuity: the nugget, the sill, and
the range. The nugget is a measure of the randomness of samples, or put another way, the variability
between samples over very short distances. There is an implicit assumption in grade modelling of mineral
deposits that a spatial relationship exists between samples, and that this relationship is stronger between
closely spaced samples but diminishes with increasing distance between samples. The sill is a measure of the
point at which the maximum variability between samples is reached and this distance is referred to as the
range. In addition to the variogram axes, nugget, sill, and range, the curve of the semi-variogram is modelled,
and the type of model (e.g., spherical, exponential) is also used by the kriging programme during
interpolation.
3D analysis and the resulting semi-variograms were produced for copper in all the Little Eva domains.
Geometric anisotropy was demonstrated in most cases, and nested exponential models were fitted to the
data. Variogram maps, generated by the process of determining the orientations of maximum mineralisation
continuity and the appropriate lag distances, are displayed in Figure 11-15 and Figure 11-16. The gold
correlograms are provided in Figures 13-17, 13-18 and 13-19 and the variogram parameters for Little Eva are
summarised in the Table 11-19.
Effective date: 30 June 2025
118
Figure 11-15: Variogram for Little Eva Northern Domain
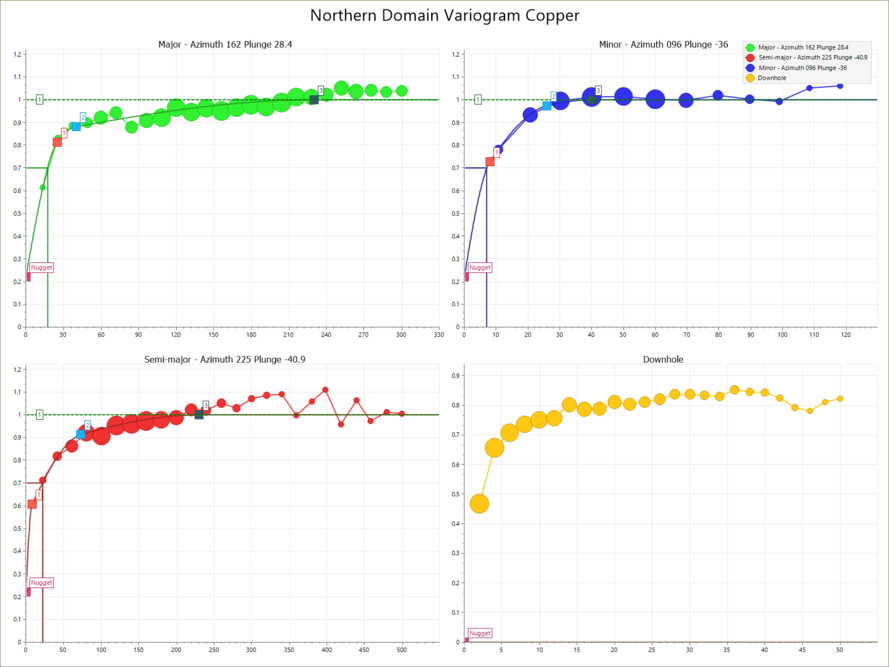
Note: The nugget is determined from the DH variogram before the axes are modelled for the corellograms in normal space.
Effective date: 30 June 2025
119
Figure 11-16: Variograms for Central (top) and South (Bottom) Domains of the Little Eva Deposit
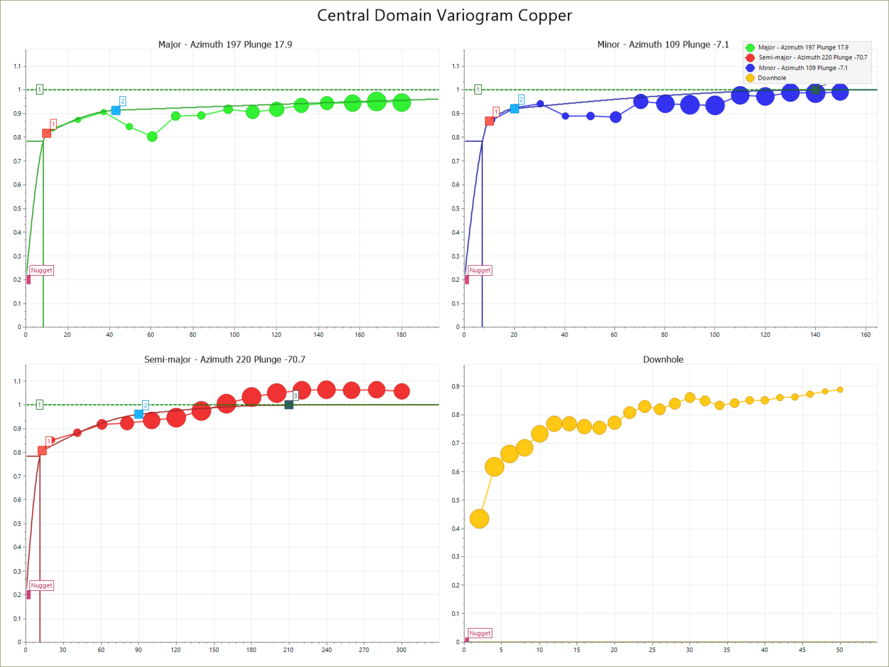
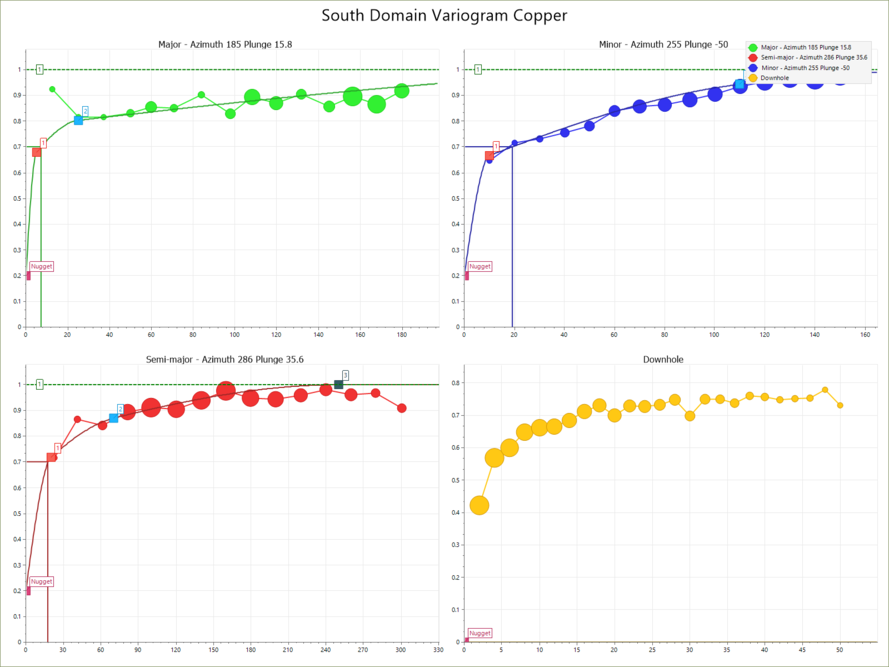
Note: Both domains show high nugget, but consistent variograms.
Effective date: 30 June 2025
120
Figure 11-17: Gold Variograms for the North Domain
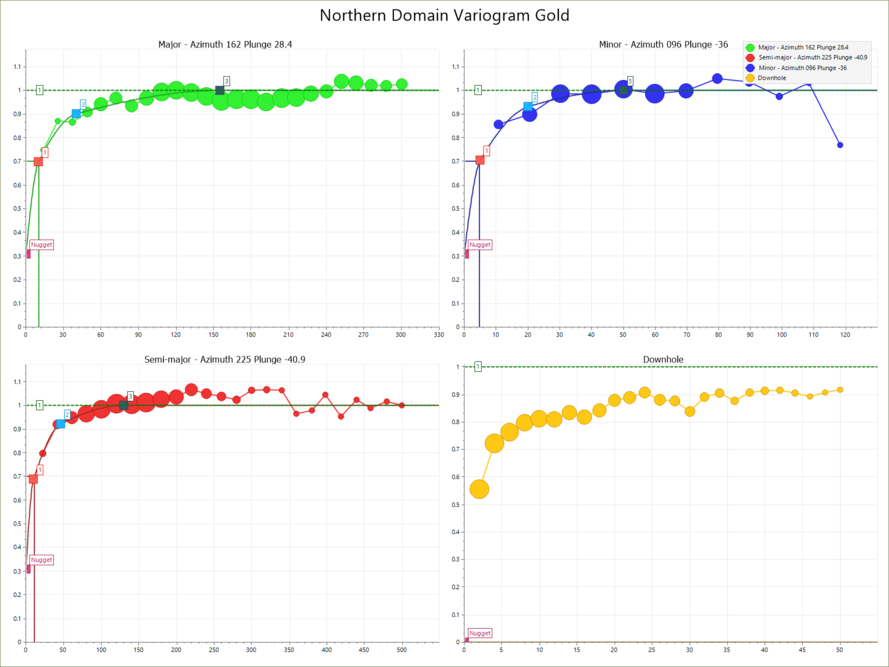
Note: Very high Nugget values
Effective date: 30 June 2025
121
Figure 11-18: Gold Variogram for the Central Domain
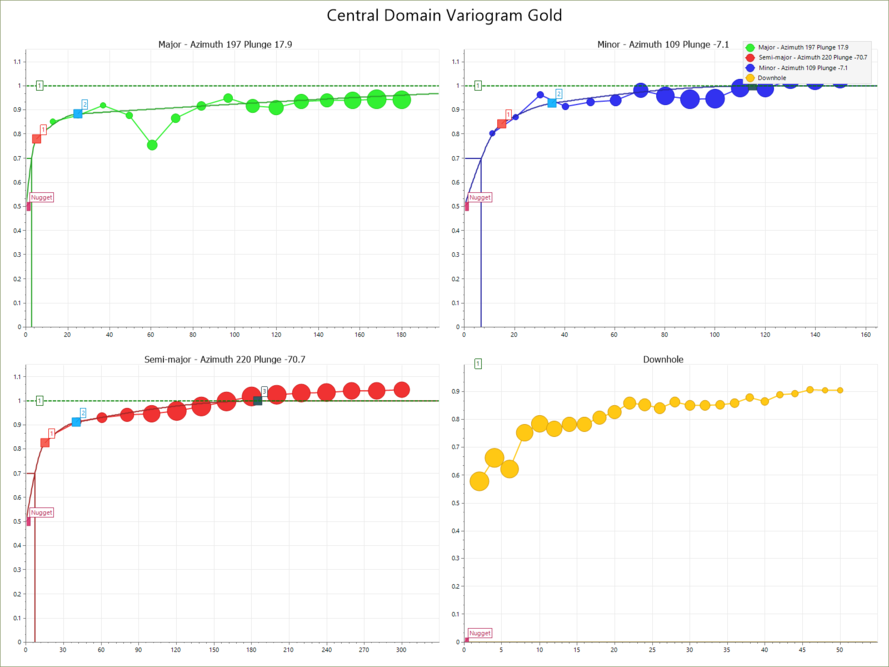
Note: Relatively High Nugget Values, and a Range of around 45-100 m
Figure 11-19: Gold Variogram for the South Domain
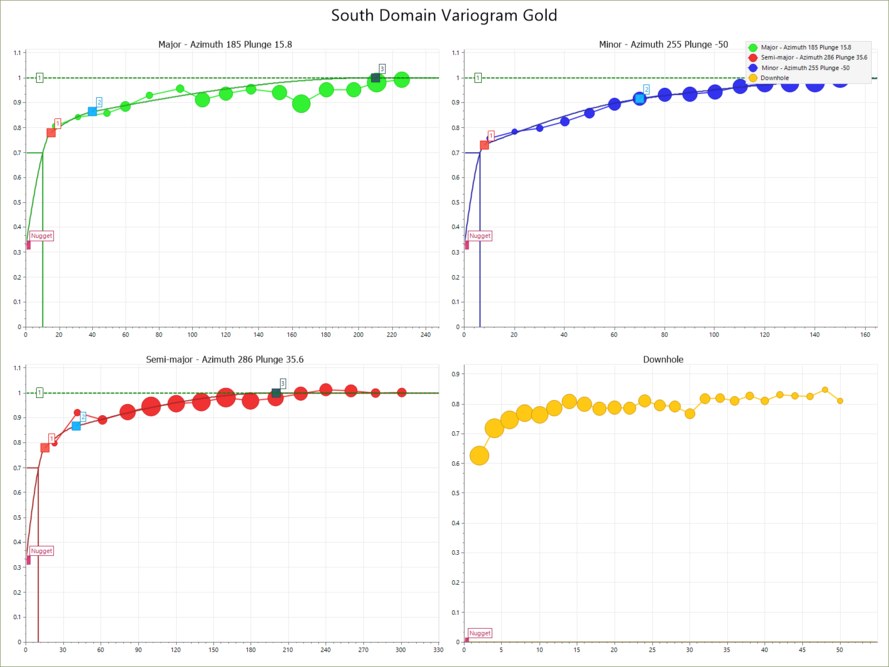
Note: Relatively High Nugget Values, and effective Ranges of around 100-200 m
Effective date: 30 June 2025
122
Table 11-19: Correlogram models for Little Eva.
Deposit | Domain | Variable | Nugget | Dip | Dip Azimuth | Pitch | Struct | Sill 1 | Range - Major (m) | Range - Semi (m) | Range - Minor (m) | Sill 2 | Range - Major (m) | Range - Semi (m) | Range - Minor (m) | Sill 3 | Range - Major (m) | Range - Semi (m) | Range - Minor (m) |
Little Eva | North | Cu% | 0.22 | 54 | 96 | 36 | Spherical | 0.33 | 25 | 8 | 8 | 0.29 | 40 | 73 | 26 | 0.16 | 230 | 230 | 40 |
Little Eva | Central | Cu% | 0.155 | 69 | 90 | 30 | Spherical | 0.532 | 10 | 12 | 8 | 0.158 | 30 | 35 | 20 | 0.155 | 350 | 265 | 155 |
Little Eva | South | Cu% | 0.2 | 40 | 255 | 25 | Spherical | 0.43 | 5 | 20 | 10 | 0.15 | 25 | 70 | 110 | 0.22 | 350 | 250 | 200 |
Little Eva | North | Au g/t | 0.31 | 54 | 96 | 36 | Spherical | 0.28 | 10 | 10 | 5 | 0.25 | 40 | 46 | 20 | 0.16 | 155 | 130 | 50 |
Little Eva | Central | Au g/t | 0.5 | 83 | 109 | 18 | Spherical | 0.24 | 5 | 15 | 15 | 0.13 | 25 | 40 | 35 | 0.13 | 350 | 185 | 115 |
Little Eva | South | Au g/t | 0.33 | 40 | 255 | 25 | Spherical | 0.37 | 15 | 15 | 8 | 0.11 | 40 | 40 | 70 | 0.19 | 210 | 200 | 180 |
Little Eva | North | S% | 0.15 | 55 | 93 | 8 | Spherical | 0.35 | 55 | 13 | 10 | 0.5 | 177 | 32 | 36 | ||||
Little Eva | Central | S% | 0.25 | 50 | 105 | 4 | Spherical | 0.45 | 19 | 10 | 10 | 0.22 | 220 | 65 | 125 | 0.08 | 950 | 750 | 350 |
Little Eva | South | S% | 0.2 | 29 | 230 | 2 | Spherical | 0.45 | 19 | 35 | 10 | 0.25 | 340 | 60 | 74 | 0.1 | 750 | 375 | 212 |
Little Eva | North | Fe% | 0.03 | 55 | 93 | 8 | Spherical | 0.21 | 45 | 4 | 4 | 0.19 | 140 | 10 | 39 | 0.57 | 360 | 110 | 80 |
Little Eva | Central | Fe% | 0.03 | 50 | 105 | 4 | Spherical | 0.17 | 25 | 50 | 20 | 0.8 | 500 | 300 | 400 | ||||
Little Eva | South | Fe% | 0.03 | 29 | 230 | 2 | Spherical | 0.12 | 14 | 16 | 10 | 0.4 | 100 | 110 | 150 | 0.45 | 1000 | 500 | 250 |
Bedford | North | Cu% | 0.24 | 60 | 270 | 141 | Spherical | 0.39 | 31 | 23 | 7.1 | 0.4 | 58 | 39 | 14 | ||||
Bedford | South | Cu% | 0.348 | 70 | 275 | 160 | Spherical | 0.612 | 64.6 | 34.6 | 10.1 | 0.068 | 104.4 | 374 | 20.2 | ||||
Bedford | North | Au g/t | 0.296 | 60 | 270 | 141 | Spherical | 0.491 | 18.2 | 23 | 7.1 | 0.276 | 108.2 | 73.7 | 37.2 | ||||
Bedford | South | Au g/t | 0.636 | 70 | 275 | 160 | Spherical | 0.221 | 39.4 | 18.8 | 10.1 | 0.191 | 78.8 | 32.9 | 76.7 |
Table 11-20: Semi-variogram models for Copper only deposits estimation domains
Deposit | Domain | Variable | Nugget | Dip (°) | Dip Azimuth (°) | Pitch (°) | Struct | Sill 1 | Range - Major (m) | Range - Semi (m) | Range - Minor (m) | Sill 2 | Range - Major (m) | Range - Semi (m) | Range - Minor (m) |
Blackard | North | Cu% | 0.0374 | 70 | 250 | 240 | Spherical | 0.1034 | 96.2 | 78.7 | 22.1 | 0.0164 | 33.4 | 457.4 | 9.2 |
Blackard | Central | Cu% | 0.0386 | 60 | 250 | 250 | Spherical | 0.0952 | 35.7 | 25.4 | 60.7 | 0.0563 | 138.5 | 302.4 | 28.6 |
Blackard | South | Cu% | 0.0495 | 80 | 290 | 320 | Spherical | 0.0693 | 64 | 46.1 | 21.9 | 0.0444 | 151.8 | 174.5 | 189.1 |
Blackard | Oxide | S ppm | 1292653 | 70 | 250 | 180 | Spherical | 1752521 | 7 | 14.1 | 26.4 | 769728 | 104.2 | 50.5 | 5.7 |
Blackard | Native Copper | S ppm | 3154834 | 70 | 260 | 180 | Spherical | 844582 | 114 | 42.5 | 45.4 | 317137 | 30.5 | 11.9 | 12.5 |
Blackard | Sulphide | S ppm | 1604471 | 70 | 260 | 180 | Spherical | 4251934 | 64 | 37.5 | 40.6 | 1312884 | 1206.7 | 11.3 | 14.4 |
Turkey Creek | North Fresh | Cu% | 0.04715 | 70 | 210 | 230 | Spherical | 0.0551 | 27.48 | 18.53 | 14.74 | ||||
Turkey Creek | North Oxide and Fresh | Cu% | 0.04715 | 70 | 210 | 230 | Spherical | 0.0728 | 27.85 | 18.74 | 14.9 | ||||
Turkey Creek | South Fresh | Cu% | 0.01867 | 55 | 80 | 90 | Spherical | 0.0429 | 23.32 | 25.41 | 7.63 | 0.0294 | 111.01 | 198.08 | 17.72 |
Effective date: 30 June 2025
123
Deposit | Domain | Variable | Nugget | Dip (°) | Dip Azimuth (°) | Pitch (°) | Struct | Sill 1 | Range - Major (m) | Range - Semi (m) | Range - Minor (m) | Sill 2 | Range - Major (m) | Range - Semi (m) | Range - Minor (m) |
Turkey Creek | South Oxide and Fresh | Cu% | 0.02123 | 55 | 80 | 90 | Spherical | 0.0475 | 22.95 | 27.81 | 7.52 | 0.0327 | 110.16 | 149.83 | 17.62 |
Turkey Creek | North Fresh | S ppm | 218652 | 60 | 190 | 180 | Spherical | 250764 | 40 | 40 | 5.91 | 492128 | 120 | 50 | 46.14 |
Turkey Creek | North Oxide and Fresh | S ppm | 218652 | 60 | 190 | 180 | Spherical | 189877 | 48.72 | 113.1 | 12.06 | 691656 | 105.51 | 57.75 | 93.17 |
Turkey Creek | South Fresh | S ppm | 413269 | 55 | 80 | 260 | Spherical | 557983 | 67.65 | 218.82 | 32.56 | 548909 | 178.61 | 83.11 | 7.75 |
Turkey Creek | South Oxide and Fresh | S ppm | 429370 | 55 | 80 | 260 | Spherical | 568728 | 160.29 | 109.19 | 26.88 | 576480 | 71.45 | 267.91 | 83.86 |
Scanlan | North | Cu% | 0.14 | 64 | 283 | 193 | Spherical | 0.43 | 44 | 9.8 | 20 | 0.44 | 163 | 23 | 26.1 |
Scanlan | South | Cu% | 0.1825 | 64 | 244 | 164 | Spherical | 0.41 | 48 | 13 | 18.5 | 0.41 | 172 | 74 | 49 |
Legend | Mineralised | Cu% | 0.2931 | 80 | 252 | 36 | Spherical | 0.619 | 24 | 21 | 12 | 0.114 | 119 | 77 | 63 |
Legend | Sulphide | S% | 0.332 | 63 | 298 | 30 | Spherical | 0.599 | 9 | 8 | 7 | 0.098 | 62 | 47 | 25 |
Great Southern | Mineralised | Cu% | 0.3244 | 74 | 80 | 152 | Spherical | 0.597 | 39 | 34.7 | 18 | 0.104 | 204 | 174 | 99 |
Great Southern | Sulphide | S% | 0.22 | 62 | 82 | 164 | Spherical | 0.72 | 50 | 40 | 36 | 0.07 | 174 | 94 | 72 |
Effective date: 30 June 2025
124
11.7Grade Interpolation
Grade interpolation is dependent on the deposit being modelled. Little Eva, Bedford, Blackard, Scanlan,
Legend and Great Southern were modelled by Harmony estimated using Micromine 2024 and was estimated
using Ordinary Kriging with the estimate written to the Cu and Au fields (if applicable). Turkey Creek was
modelled by SRK South Africa and was estimated using Ordinary Kriging and dynamic aniostropy using
Isatis.Neo 2023. For all other deposits, the grade interpolation was carried out with Gemcom software by
CMMC and were interpolated using ID2 methods. Copper and gold (where appropriate) were interpolated
within “3D solids models” that enclose the mineralised area below overburden. Little Eva, Bedford, Blackard,
Scanlan, Legend and Great Southern domains were modelled using the Micromine Origin software by
Harmony and was based on detailed analysis of the composite data and the geology. The two southern
deposits, Lady Clayre and Ivy Ann, were interpolated unconstrained due to poorly understood geometry of
controls on mineralisation.
Boundaries between domains in the Little Eva deposit were hard boundaries, where the search ellipse can
not use data across the boundary, the outer boundaries were also hard. The interpolation at Little Eva was
conducted in a series of three passes with the dimensions and orientations of the search ellipsoid in each
pass related to the semi-variogram parameters listed in Table 11-19. The copper only deposits (Blackard,
Scanlan, Turkey Creek, Legend and Great Southern) were estimated using Ordinary Kriging and the semi-
variogram parameters listed in Table 11-20, the estimate used dynamic anisotropy to ensure the folded
grade trends are modelled. All the other deposits, which were interpolated with ID2 methods, blocks were
also estimated with three passes of increasing search size to ensure the models are fully estimated.
The search ellipsoid is defined by three orthogonal axis which are given lengths and orientations which
reflects the interpreted continuity of mineralisation in each domain (Figure 11-19). Thus, the shape of the
search ellipse attempts to mimic the anisotropy of mineralisation in each structural domain for each deposit.
Orientation and dimensions of the searches are listed in tables for each deposit. The search orientations are
given as the strike and plunge of the primary and secondary axis, the minor or tertiary axis is not required as
it is perpendicular to the plane, which contains the primary and secondary axis. For a block to be estimated it
must fit defined criteria of the search ellipse as listed in Table 11-21 for the Little Eva deposit, Table 11-22 for
Blackard and Turkey Creek and in subsequent tables for the other deposits. The search criteria include the
dimensions of the search ellipse, and the minimum and maximum number of grade composites required
collectively, as well as the minimum and maximum number of composites required from any drill hole. The
three passes are carried out with increasing dimensions of the search ellipse, to where the resource model is
fully informed. The different passes are usually multiples of the average sample distance. For the deposits
interpolated with ID2, variography from the larger, structurally linear sections of the deposit was used to
provide support for search distances in smaller domains that were determined by a combination of visual
inspection of grade distribution and drill spacing. For blocks that did not fit the estimation criteria in the first
pass, a second pass was completed with a larger search ellipse. A third and final pass was completed for any
blocks that were not interpolated in the first two passes. If a block still is not interpolated by the third pass,
then it is left blank. A maximum number of composites per drill hole is specified to ensure that an
appropriate amount of data form adjacent drill holes is used. The maximum number of composites used per
drillhole is typically a maximum of 3 or 6 composites from any particular drill hole. Criteria for the
interpolations within each deposit are listed in Table 11-24 through Table 11-29.
Effective date: 30 June 2025
125
Table 11-21: Search Ellipse for Interpolation for Little Eva %
Domain | No. Sectors | Dip | Dip Azi | Pitch | Pass Factor 2 & 3 | Min Samp | Max Samp | Max/ Hole | Search Major | Search Int. | Search Minor |
Cu % North | 8 | 54° | 096° | 144° | 2.0x/- | 16 | 4 | 6 | 250 m | 150 m | 50 m |
Cu % Central | 8 | 69° | 090° | 120° | 2.0x/- | 16 | 4 | 6 | 250 m | 200 m | 100 m |
Cu % South | 8 | 40° | 255° | 155° | 2x/3x | 16 | 4 | 6 | 250 m | 150 m | 50 m |
Au g/t North | 8 | 54° | 096° | 144° | 2.0x/- | 16 | 4 | 6 | 250 m | 150 m | 50 m |
Au g/t Central | 8 | 83° | 109° | 162° | 2.0x/- | 16 | 4 | 6 | 250 m | 200 m | 100 m |
Au g/t South | 8 | 40° | 255° | 155° | 2x/3x | 16 | 4 | 6 | 250 m | 150 m | 50 m |
S % North | 2 | 55° | 093° | 172° | 2.0x/2.7x | 16 | 4 | 6 | 250 m | 150 m | 50 m |
S % Central | 2 | 50° | 105° | 176° | 2.0x/2.7x | 16 | 4 | 6 | 250 m | 200 m | 100 m |
S % South | 2 | 30° | 230° | 178° | 2.0x/2.7x | 16 | 4 | 6 | 250 m | 150 m | 50 m |
Fe % North | 2 | 55° | 093° | 172° | 2.0x/2.5x | 16 | 4 | 6 | 250 m | 150 m | 100 m |
Fe % Central | 2 | 50° | 105° | 176° | 2.0x/- | 16 | 4 | 6 | 250 m | 200 m | 100 m |
Fe % South | 2 | 30° | 230° | 178° | 2.0x/- | 16 | 4 | 6 | 300 m | 200 m | 100 m |
Note: Rotation is Geological dip, dip direction and pitch inside the plane from the north. A second pass was run for all domains where
search ranges were doubled, all other parameters stayed the same.
Effective date: 30 June 2025
126
Figure 11-19: Oblique View of the Little Eva estimation domains
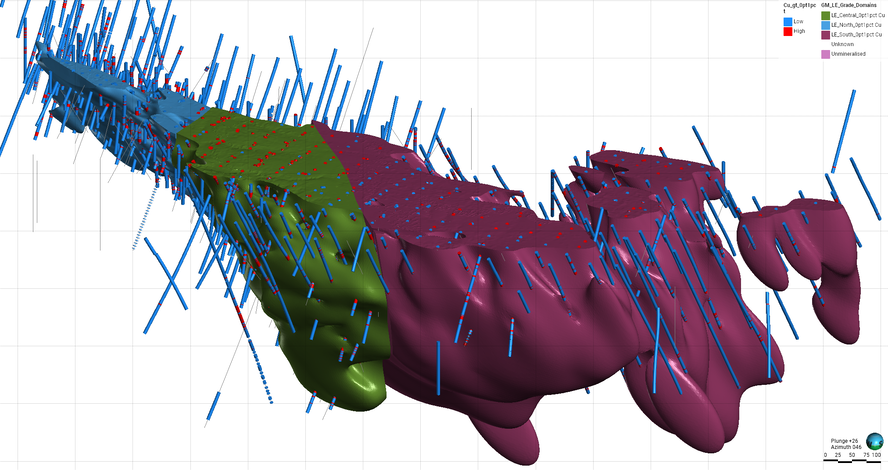
Note: Estimation domains are North = blue, Central = green and South = maroon.
Effective date: 30 June 2025
127
Figure 11-20: Little Eva Deposit Plan View of Colour-Coded Block Grades at 120 m Elevation
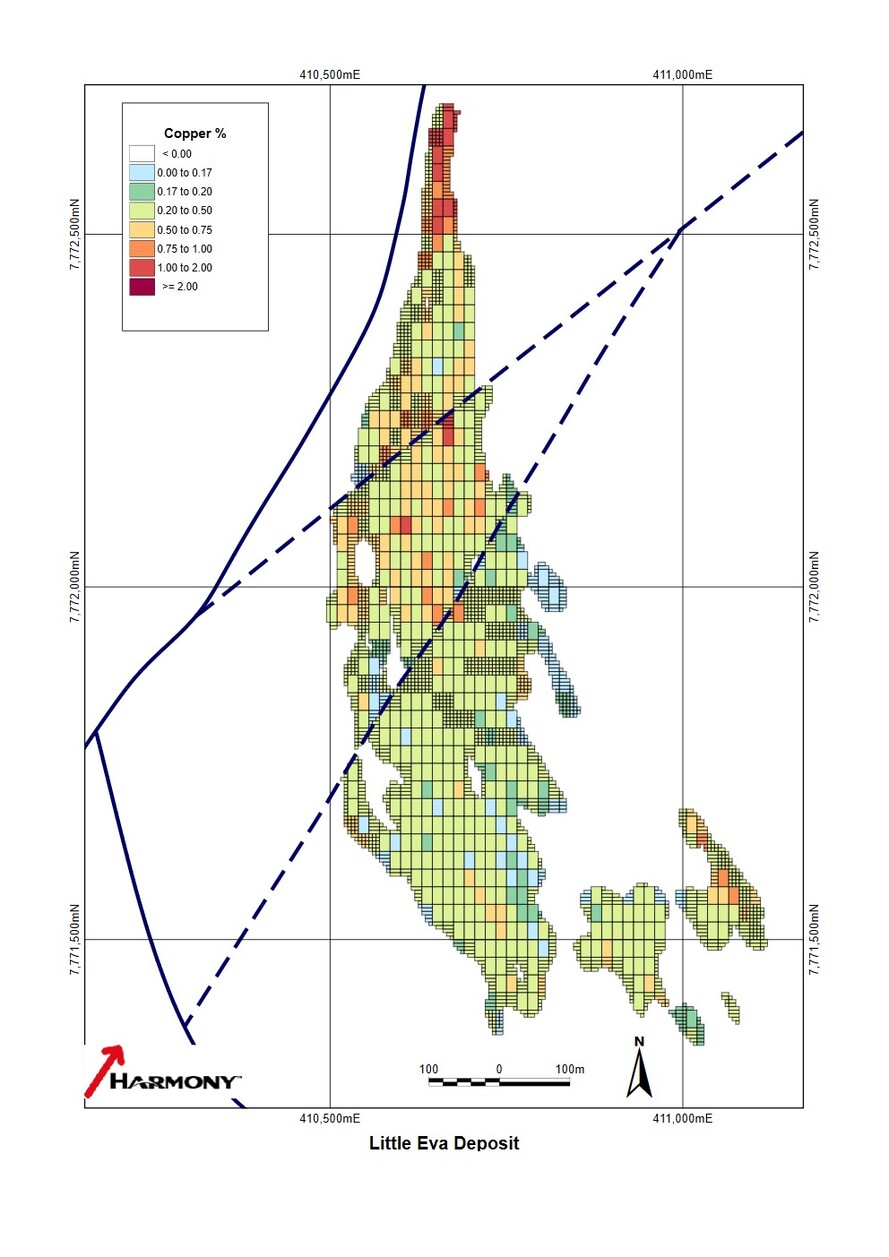
Note: Two benches below the top of the sulphide zone.
Effective date: 30 June 2025
128
Figure 11-21: Cross-Section 7,772,100 mN (see plan above) Displaying Colour-Coded Block Grades
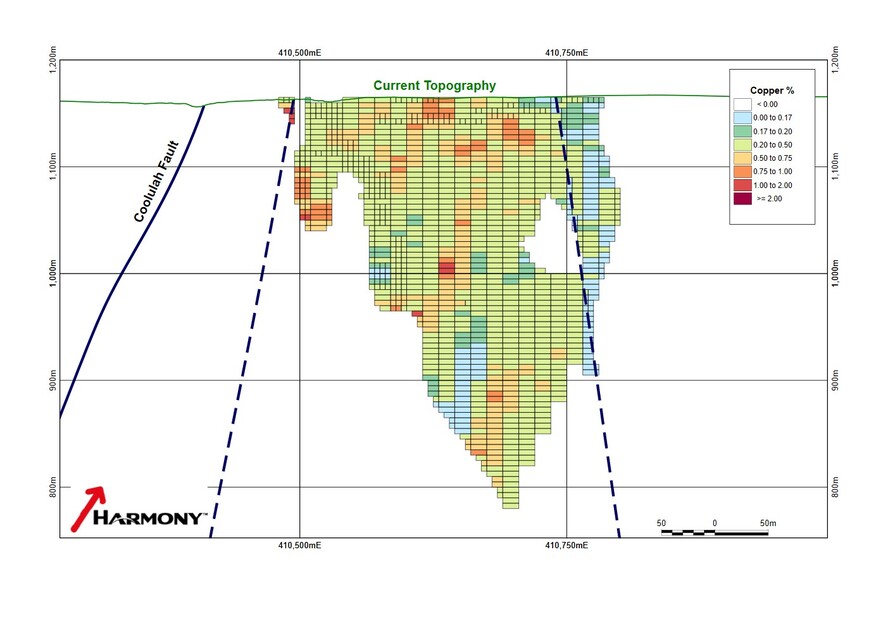
Note: See above plan for location
At Turkey Creek, assay data above 0.01% Cu was examined and an inflection in the data distribution on the
cumulative probability plot was noted at approximately 0.2% Cu. This confirms Altona’s application of a 0.2%
nominal grade for interpretation of a grade-shell outlining the copper mineralisation.
The grade domain models were rebuilt by Harmony resulting in an improved copper mineralisation domain
at Turkey Creek. Mineralisation within the Southern zone is generally tabular and is oriented north-south
with dips at 60° to the east. At the northern end of the deposit, the strike of the mineralisation swings
sharply towards the east and dips steeply south: this zone is referred to as the Northern fold area and was
estimated using dynamic anisotropy. The mineralisation within the Southern zone is truncated to the south
and north by fault zones, (Figure 11-22). The mineralisation within the Southern zone contains both hanging
wall and footwall zones, with a narrow band of low-grade or waste between them. There is evidence of lower
grade mineralisation within the central part of the Northern fold area; however, drilling is too widely spaced
to permit a robust interpretation of that horizon.
Effective date: 30 June 2025
129
Figure 11-22: Wire framed Domains for the Turkey Creek Deposit
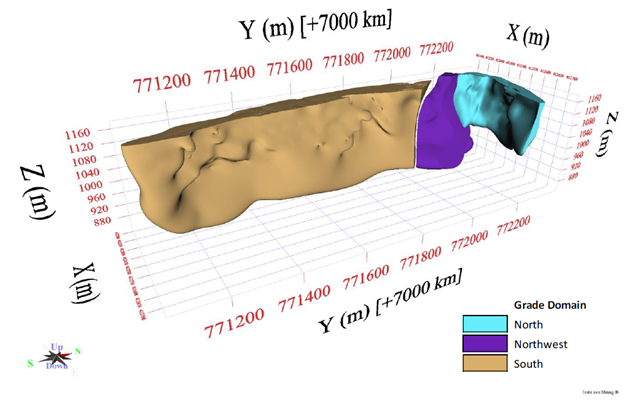
Effective date: 30 June 2025
130
Table 11-22: Search Criteria for Interpolation for Turkey Creek, Blackard, Scanlan, Legend
Deposit | Pass | Search | Turkey Creek | |||
Radius (m) | Dip Direction | Min Samp | Max Samp | Max/Hole | ||
Blackard | North 1 | 50x50x20m | DA | 8 | 4 | 5 |
North 2 | 100x100x24m | DA | 8 | 4 | 5 | |
North 3 | 150x150x26m | DA | 8 | 4 | 5 | |
Central 1 | 80x80x20m | DA | 8 | 4 | 5 | |
Central 2 | 120x120x26m | DA | 8 | 4 | 5 | |
Central 3 | 240x240x26m | DA | 8 | 4 | 5 | |
South 1 | 80x80x40m | DA | 8 | 4 | 5 | |
South 2 | 120x120x60m | DA | 8 | 4 | 5 | |
South 3 | 240x240x120m | DA | 8 | 4 | 5 | |
Turkey Creek | North Fresh 1 | 50x40x20x | DA | 10 | 20 | 5 |
North Fresh 2 | 100x80x24x | DA | 10 | 20 | 5 | |
North Fresh 3 | 150x240x30m | DA | 10 | 20 | 5 | |
Northwest Fresh 1 | 65x55x30m | DA | 10 | 20 | 5 | |
Northwest Fresh 2 | 130x110x36m | DA | 10 | 20 | 5 | |
Northwest Fresh 3 | 195x165x45m | DA | 10 | 20 | 5 | |
South Fresh 1 | 60x120x12m | DA | 10 | 20 | 5 | |
South Fresh 2 | 120x240x12m | DA | 10 | 20 | 5 | |
South Fresh 3 | 180x360x12m | DA | 10 | 20 | 5 | |
Scanlan | North 1 | 160x75x30 | DA | 16 | 32 | 5 |
North 2 | 480x225x90 | DA | 16 | 32 | 5 | |
South 1 | 140x100x27 | DA | 16 | 32 | 5 | |
South 2 | 420x300x81 | DA | 16 | 32 | 5 | |
Legend | Mineralised1 | 75x40x25 | DA | 16 | 32 | 8 |
Mineralised2 | 150x80x50 | DA | 16 | 32 | 8 | |
Mineralised3 | 260x140x90 | DA | 16 | 32 | 8 | |
Great Southern | Mineralised1 | 75x40x30 | DA | 16 | 32 | 8 |
Mineralised2 | 150x80x60 | DA | 16 | 32 | 8 | |
Mineralised3 | 260x120x90 | DA | 16 | 32 | 8 | |
Note: Estimation used Dynamic Anisotropy (DA) where the search parameters are coded into the block model and the search ellipse
follows a predetermined trend defined by a wireframe - this wireframe defines the folded nature of the deposit.
Effective date: 30 June 2025
131
Figure 11-23: Turkey Creek Cross-Section at 7,771,500N (mid-point of Main Zone) of Colour-Coded Block Grades
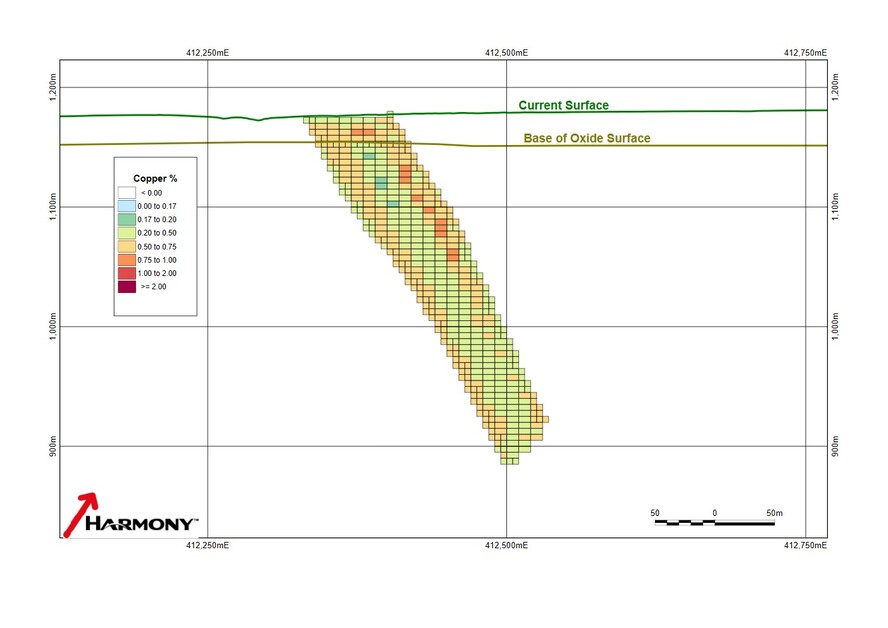
Effective date: 30 June 2025
132
Figure 11-24: Turkey Creek Plan View of Colour-Coded Block Grades at 120 m Elevation
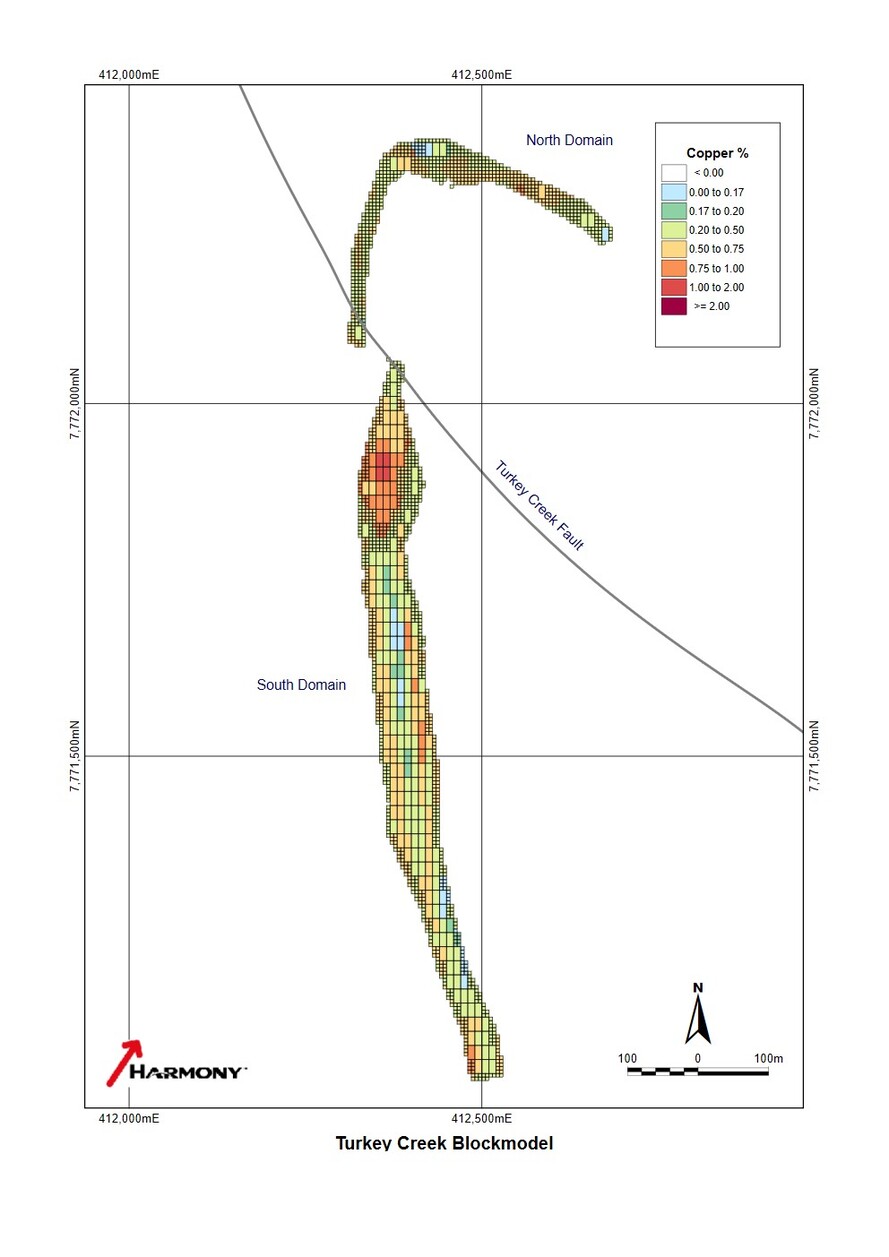
Note: Two benches below the top of the sulphide zone.
Effective date: 30 June 2025
133
The Native copper deposits are hosted in folded meta sediments. To handle the folded nature of the
orebodies the estimate used dynamic anisotropy, a limited the number of composites from a single drill hole
was also used, and the block grades reliably reflect grade changes within the drill holes. The estimation
domains are illustrated in a plan view in Figure 11-25. Drill spacing at depth was insufficient to meet the
distance requirements of the interpolation, even for the Inferred category, and therefore block grades were
not estimated; however, the areas with insufficient drill density for estimation are generally will below the
designed pit shell. Specifying the number of grade composites used by the search ellipse during the
interpolation is used both to ensure a requisite number of drill holes are used for a particular classification,
and also to limit the composites used to preserve sharp grade changes.
The smaller Bedford, Great Southern, Lady Clayre, and Ivy Ann deposits were estimated with just 2 or 3
domains, all interpolation parameters for these smaller deposits are listed in Tables 13-24 through to 13-29.
Given these deposits are not material to the operation they are not covered in depth here.
Figure 11-25: Structural Domains of the Blackard (left), Scanlan (right) and Legend (bottom) Deposits
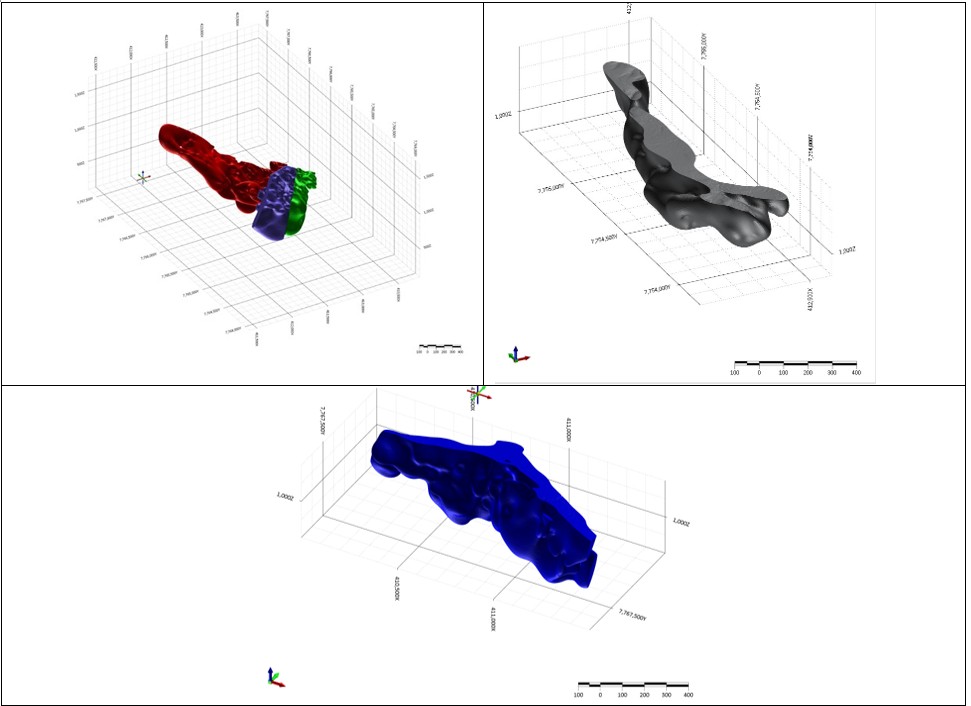
Effective date: 30 June 2025
134
Figure 11-26: Blackard Deposit Cross-Section at 7,765,250N
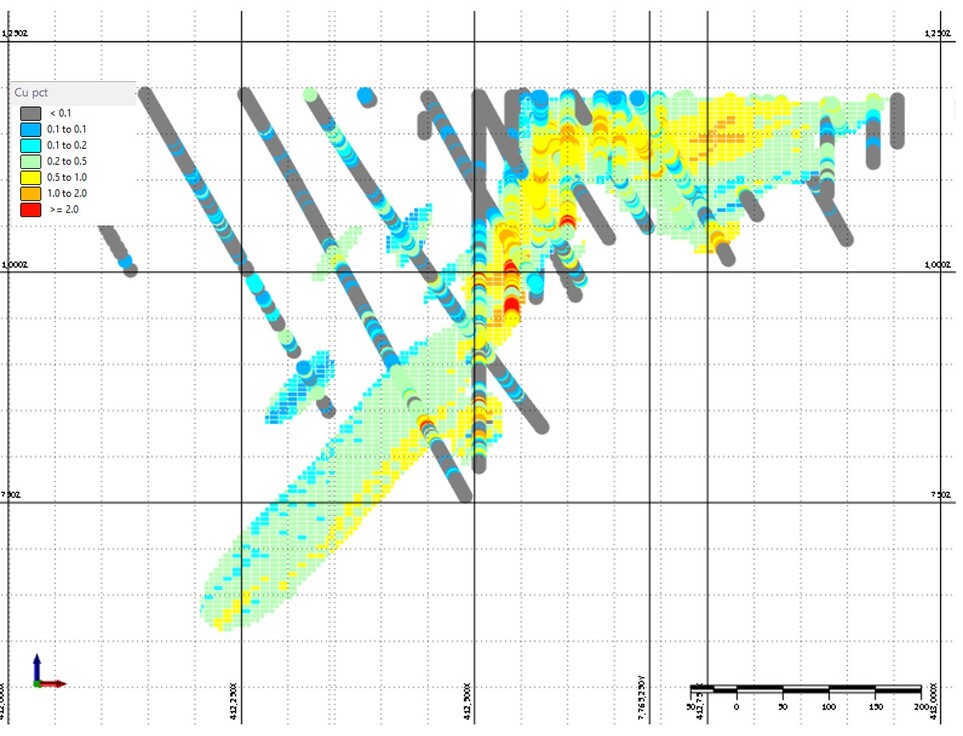
Notes: Colour-coded block grades within model can be compared to drill hole grades (bold).
Effective date: 30 June 2025
135
Figure 11-27: Scanlan Deposit Cross-Section at 754,100 mN, Dip lines showing the locally varying anisotropy
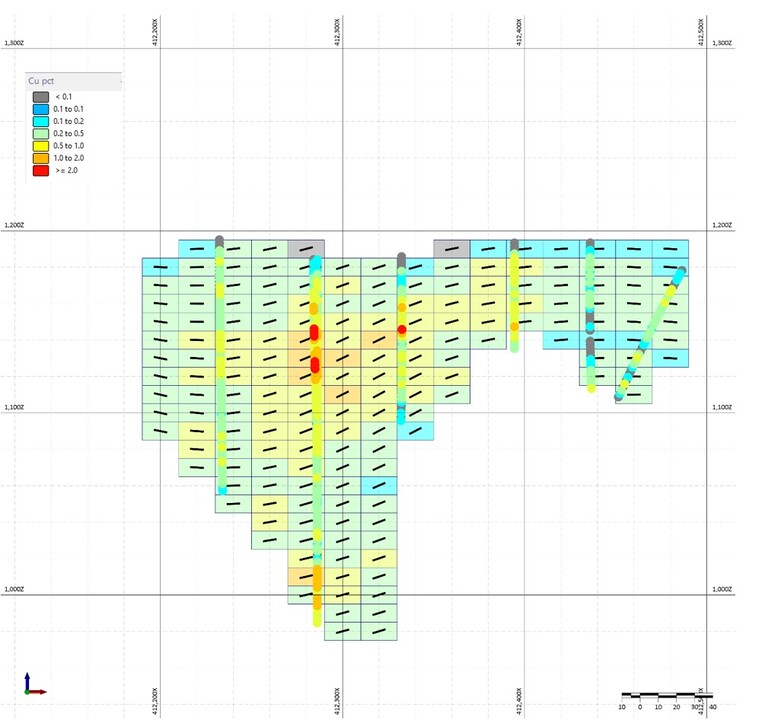
Effective date: 30 June 2025
136
Figure 11-28: Legend Deposit Cross-Section at 410685mE
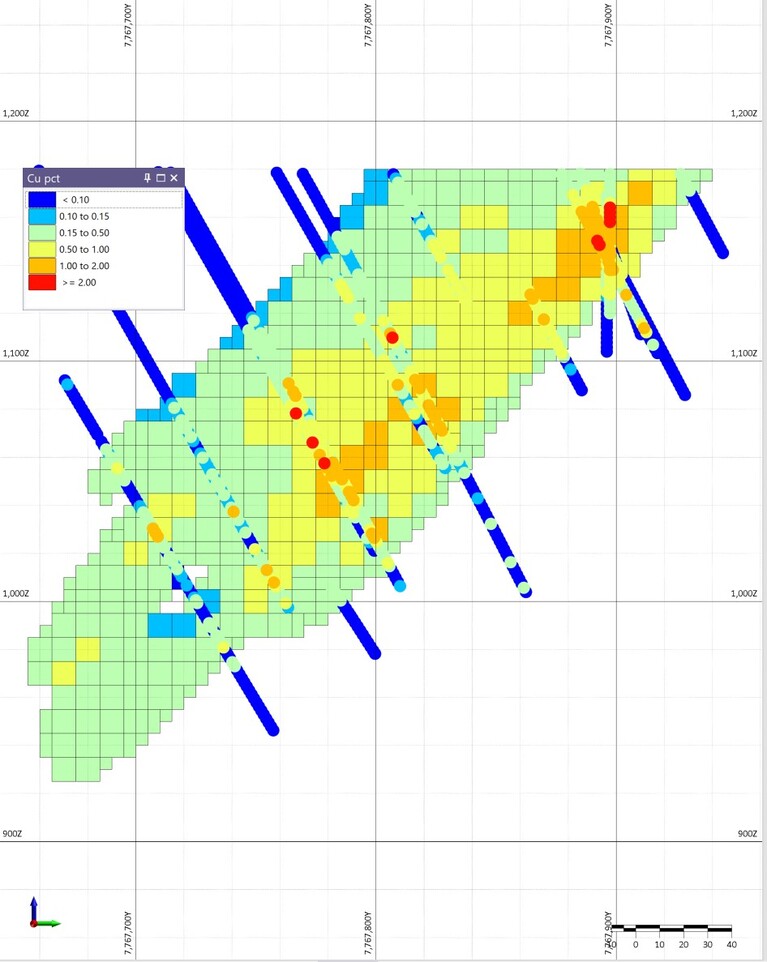
Table 11-23: Search Criteria for Interpolation for the Bedford Deposit
Domain | No. Sectors | Dip | Dip Azi | Pitch | Pass Factor 2 & 3 | Min Samp | Max Samp | Max/ Hole | Search Major | Search Int. | Search Minor |
Cu % North | 8 | 60° | 270° | 141° | 1.5x/4x | 16 | 32 | 5 | 75 m | 50m | 35 m |
Cu % South | 8 | 70° | 275° | 160° | 1.5x/4x | 16 | 32 | 5 | 75 m | 50m | 35 m |
Au g/t North | 8 | 60° | 270° | 141° | 1.5x/4x | 16 | 32 | 5 | 75 m | 50m | 35 m |
Au g/t South | 8 | 70° | 275° | 160° | 1.5x/4x | 16 | 32 | 5 | 75 m | 50m | 35 m |
Note: Rotation is Geological dip, dip direction and pitch inside the plane from the north. A second pass was run for all domains where
search ranges were doubled, all other parameters stayed the same.
Effective date: 30 June 2025
137
Table 11-24: Search Criteria for Interpolation for the Lady Clayre Deposit
Pass | Criteria | Lady Clayre | |
East | West | ||
Measured | Minimum No. of Composites | 5 | 5 |
Maximum No. of Composites | 15 | 15 | |
Maximum No. of Composites/Hole | 3 | 3 | |
Indicated | Minimum No. of Composites | 5 | 5 |
Maximum No. of Composites | 15 | 15 | |
Maximum No. of Composites/Hole | 3 | 3 | |
Inferred | Minimum No. of Composites | 5 | 5 |
Maximum No. of Composites | 15 | 15 | |
Maximum No. of Composites/Hole | 3 | 3 | |
Table 11-25: Search Ellipse Parameters by Domain for the Lady Clayre Deposit
Domain | Pass | Class | X (m) | Y (m) | Z (m) | 1st Azimuth | Plunge | 2nd Azimuth | Plunge |
East (77) | 1 | Measured | 25 | 30 | 10 | ||||
2 | Indicated | 30 | 37.5 | 12.5 | 35 | 0 | 305 | -45 | |
3 | Inferred | 50 | 60 | 25 | |||||
West (66) | 1 | Measured | 25 | 30 | 10 | ||||
2 | Indicated | 30 | 37.5 | 12.5 | 345 | 0 | 255 | -50 | |
3 | Inferred | 50 | 60 | 25 |
Note: see Table 24-21 for orientation information
Table 11-26: Search Criteria for Interpolation for the Ivy Ann Deposit
Pass | Criteria | Ivy Ann | |
Ivy Ann | Ivy Ann North | ||
Measured | Minimum No. of Composites | 5 | 5 |
Maximum No. of Composites | 15 | 15 | |
Maximum No. of Composites/Hole | 3 | 3 | |
Indicated | Minimum No. of Composites | 5 | 5 |
Maximum No. of Composites | 15 | 15 | |
Maximum No. of Composites/Hole | 3 | 3 | |
Inferred | Minimum No. of Composites | 5 | 5 |
Maximum No. of Composites | 15 | 15 | |
Maximum No. of Composites/Hole | 3 | 3 | |
Table 11-27: Search Ellipse Parameters by Domain for the Ivy Ann Deposit
Domain | Pass | Class | X (m) | Y (m) | Z (m) | Principal Azimuth | Principal Plunge | Intermediate Azimuth | Intermediate Plunge |
Ivy Ann South | 1 | Measured | 20 | 25 | 5 | 26 | 0 | 116 | -46 |
2 | Indicated | 40 | 45 | 20 | |||||
3 | Inferred | 70 | 80 | 40 | |||||
Ivy Ann North | 1 | Measured | 20 | 25 | 5 | 35 | 0 | 125 | -80 |
2 | Indicated | 40 | 45 | 20 | |||||
3 | Inferred | 70 | 80 | 40 |
Note: *Gems Search anisotropy: Azimuth, Dip, Azimuth
11.8Classification and Mineral Resource Statement
Estimated blocks within the different deposit models were tabulated between an upper and lower surface.
For the sulphide part of the deposits, the upper surface was the base of the oxide or top of the sulphide zone
boundary, and the lower surface was the constraining Whittle pit shell.
Effective date: 30 June 2025
138
The constraining pit shells for defining the limits of Inferred resources and to define reasonable prospects for
economic extraction are based on copper prices, costs and metallurgical recoveries determined from work
carried out, and described, in this TRS. Resources were constrained by Whittle pit shells generated using
metal prices of US$5.10/lb Cu, US$1,941/oz Au and an exchange rate of 0.68 AU$:US$. The Whittle shell was
based on the following parameters:
•Plant throughput of 18.4 Mtpa, with a mining rate of 60 Mtpa
•A mining reference cost of AU$3.93/tonne
•Approximately AU$11.00/t Ore processing cost.
•Ore Haulage cost of AU$0.35/t/km
•Slope angles informed by historic studies with an average of 45 degrees.
•Copper Recovery is dependant on copper mineralogy, 95% Sulphide and 56% native copper.
•A 10mx10mx10m diluted block model.
For the copper-only deposits, the blocks were tabulated between surfaces defined by the base of the oxide
zone, base of copper zone, base of transition zone, and the constraining resource shell.
Classification of the resources is based on definitions from SAMREC (2016) in accordance with Regulation S-K
1300. Classification was completed using wireframes that outlined regions of similar support, geological
continuity and estimation strength (based on average search distances and estimate robustness via Kriging
slope of regression and Kriging variance). There were no Measured Resources declared as the QP felt the
data support did not warrant a Measured classification in this instance, as Indicated Resources are adequate
for mine studies. Resources are reported at a variable Cu cut-off as defined by deposit and copper
mineralogy type and a classification of Indicated and inferred resources for each deposit are reported in
Table 11-30.
Despite the level of work completed to date, there remains some uncertainties with respect to mineralogy
the impact on copper recovery for some of the Native Copper deposits and these uncertainties are being
addressed in the forward work plan. These uncertainties are not expected to significantly impact the
economics of the project.
Effective date: 30 June 2025
139
Table 11-28: Eva Copper Project Resources by Category and Deposit
Tons (Mt) | Cu Grade (% Cu) | Au Grade (oz/ t) | Cu Pounds (Mlb) | Au Ounces (Moz) | |
Measured | |||||
Little Eva | — | — | — | — | — |
Bedford | — | — | — | — | — |
Lady Clayre | — | — | — | — | — |
Ivy Ann | — | — | — | — | — |
Turkey Creek | — | — | — | — | — |
Blackard | — | — | — | — | — |
Scanlan | — | — | — | — | — |
Legend | — | — | — | — | — |
Great Southern | — | — | — | — | — |
Total Measured | — | — | — | — | — |
Indicated | |||||
Little Eva | 202 | 0.32 | 0.002 | 1,310 | 367 |
Bedford | 4 | 0.55 | 0.004 | 40 | 16 |
Lady Clayre | 5 | 0.43 | 0.005 | 42 | 25 |
Ivy Ann | 6 | 0.34 | 0.002 | 39 | 12 |
Turkey Creek | 31 | 0.42 | — | 263 | — |
Blackard | 128 | 0.48 | — | 1,223 | — |
Scanlan | 17 | 0.59 | — | 195 | — |
Legend | 34 | 0.47 | — | 324 | — |
Great Southern | 14 | 0.42 | — | 118 | — |
Total Indicated | 441 | 0.40 | 0.002 | 3,554 | 420 |
Measured + Indicated | |||||
Little Eva | 202 | 0.32 | 0.002 | 1,310 | 367 |
Bedford | 4 | 0.55 | 0.004 | 40 | 16 |
Lady Clayre | 5 | 0.43 | 0.005 | 42 | 25 |
Ivy Ann | 6 | 0.34 | 0.002 | 39 | 12 |
Turkey Creek | 31 | 0.42 | — | 263 | — |
Blackard | 128 | 0.48 | — | 1,223 | — |
Scanlan | 17 | 0.59 | — | 195 | — |
Legend | 34 | 0.47 | — | 324 | — |
Great Southern | 14 | 0.42 | — | 118 | — |
Total Measured + Indicated | 441 | 0.40 | 0.002 | 3,554 | 420 |
Inferred | |||||
Little Eva | 26 | 0.33 | 0.003 | 175 | 66 |
Bedford | 1 | 0.38 | 0.004 | 8 | 4 |
Lady Clayre | 1 | 0.43 | 0.004 | 7 | 3 |
Ivy Ann | 1 | 0.33 | 0.003 | 9 | 4 |
Turkey Creek | 6 | 0.44 | — | 52 | — |
Blackard | 37 | 0.40 | — | 300 | — |
Scanlan | 11 | 0.48 | — | 102 | — |
Legend | 6 | 0.33 | — | 36 | — |
Great Southern | 2 | 0.39 | — | 17 | — |
Total Inferred | 91 | 0.39 | 0.003 | 706 | 77 |
Note: Mineral Resources
1. SAMREC and Regulation S-K 1300 definitions were followed for Mineral Resources.
2. Mineral Resources are exclusive of Mineral Reserves.
3. Mineral Resources are constrained within a Whittle pit shell generated with a copper price of $5.10/lb, a gold price of $1,582/oz and
an exchange rate of Aus$0.68 = US$1.00.
4. Density measurements were applied
5. Significant figures have been reduced to reflect uncertainty of estimations and therefore numbers may not add due to rounding.
Effective date: 30 June 2025
140
Two grade bins will be used to separate waste material from expected low-grade and high-grade mill feed to
allow the mine to maximise NPV using a stock-piling strategy. The oxide material overlies all the deposits and
carries potentially economic copper grades and was estimated at the same time and with the same methods
used for the sulphide material. Oxide resources were tabulated between the bottom of the oxide zone and
topographic surface. At present, there is no demonstrated process to economically recover copper from the
oxide zones; however, as this oxide material will be removed by mining, it will be stockpiled for potential
processing at some future date. Oxide material has been modelled, and will be stockpiled for possible future
processing, but not included into the Resource figures nor the Reserve. The oxide material are presented by
deposit and classification in Table 11-31.
Table 11-29: Oxide material for the Eva Copper Project
Deposit | Tonnes (kt) | Cu (%) | Au (g/t) | Cu Pound (Mlb) | Au Ounces (koz) |
Little Eva | 3,983 | 0.40 | 0.07 | 35 | 9 |
Blackard | 13,471 | 0.37 | — | 111 | — |
Turkey Creek | 7,468 | 0.50 | — | 82 | — |
Bedford | 806 | 0.46 | 0.11 | 8 | 2 |
Lady Clayre | 2,387 | 0.27 | 0.09 | 14 | 7 |
Scanlan | 1,735 | 0.46 | — | 18 | — |
Total Inferred | 29,851 | 0.41 | 0.03 | 268 | 29 |
Notes:
Mineral Resource:
1. SAMREC and Regulation S-K 1300 definitions were followed for Mineral Resources.
2. Oxide materials are constrained within the same Whittle spatial constraint used to report the Mineral Resources as detailed in section
14.8 above.
3. Density value of 2.5 t/m3 was applied to all oxide zones.
4. Significant figures have been reduced to reflect uncertainty of estimations and therefore numbers may not add due to rounding.
The Eva Project hosts additional copper-only deposits that have received exploration attention in the past for
which historical resource estimates exist as listed in Table 11-32. These copper-only deposits are similar to
the Blackard and Scanlan deposits, hosted within the same stratigraphy and with the same deep weathering
profiles, containing a mix of copper oxide minerals, native copper and other copper bearing minerals,
transitioning to sulphide minerals at depth. Assuming the same processing method that is planned for use
with the Blackard and Scanlan deposits, these deposits should be considered for further exploration,
highlighted by the recent exploration success at the Legend and Great Southern deposits.
In the opinion of the QP the uncertainty and limitations are adequately captured within the classifications
applied to each deposit. The QP is satisfied that the level of risk is adequately managed and that all relevant
technical and economic factors that are likely to influence the prospect for economic extraction of the
Resource has been properly assessed.
Effective date: 30 June 2025
141
Figure 11-29: Isometric View (looking south) of the Little Eva Resource Block Model at 0.17% Cut-off
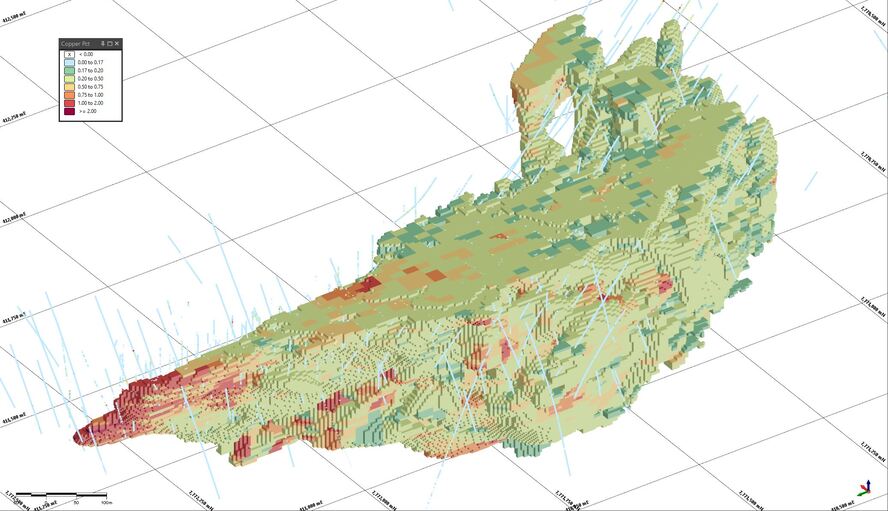
Table 11-30: Historical Resource Estimates for Copper-Only Deposit Mineral Resources
Deposits | Tonnes (Mt) | Cu (%) | Cu Pounds (Mlb) |
Longamundi | 10.4 | 0.66 | 151 |
Caroline | 3.6 | 0.53 | 42 |
Charlie Brown | 0.7 | 0.40 | 6 |
Total | 14.7 | 0.58 | 199 |
Notes:
Mineral Resource:
1. Historical Resources should not be relied upon.
2. Significant figures have been reduced to reflect uncertainty of estimations and therefore numbers may not add due to rounding.
11.9Resource Verification
The resource block models were examined for validity and reasonableness by several methods:
•Visual comparison of block grades relative to drill holes on cross-sections
•Comparison of statistical summary of assay, composite, and block grades
•Comparison of different method of interpolations such as OK to ID2 or Nearest Neighbour (NN)
•Comparison to past estimations
A basic method of validation is to compare drill hole composites to adjacent block grades on plans and
sections. While this method demonstrates that block grades are reasonable and accurately reflect drill data,
since block grades are interpolated from data at some distance from the section, it does not necessarily
follow that the block grade will exactly match the proximal drill hole. Additionally, it is not possible to
examine every block value, thus this method may only reveal significant problems with an interpolation.
Examination of drill hole grades relative to adjacent block grades demonstrates a good degree of
correspondence, suggesting that block grades are fairly representing drill hole composites, as illustrated in
Figure 11-30 through Figure 11-34.
Effective date: 30 June 2025
142
Drill hole composites from drilling completed after the Resource was run are plotted for Little Eva along with
block grades on a cross-section in Figure 11-30 and are well correlated, indicating that the interpolation is
working well in this location. Comparison of mean copper grades from raw assays, drill hole composites, and
blocks by each domain from the Little Eva deposit are displayed graphically in Figure 11-33 and Figure 11-34.
As would be expected, the mean of the composite grades is lower than the mean grades from the raw
samples, whereas mean grades of blocks are lower again. The difference between the mean grade of assays
and the mean grades of the blocks is a function of smoothing, sample support and volume variance and
indicates the incorporation of lower-grade or barren material as the sample volume is increased. Since data
used to estimate block grades is taken from a number of composites within the search ellipse, it is expected
that some low-grade or barren material will be incorporated as dilution, a feature that becomes more
accentuated by selecting data above the copper cut-off grade (Figure 11-35).
Figure 11-30: Cross-Section through the North End of the Eva Deposit with Block Grades and Drill Hole Composites
from Drilling completed Post Estimation.
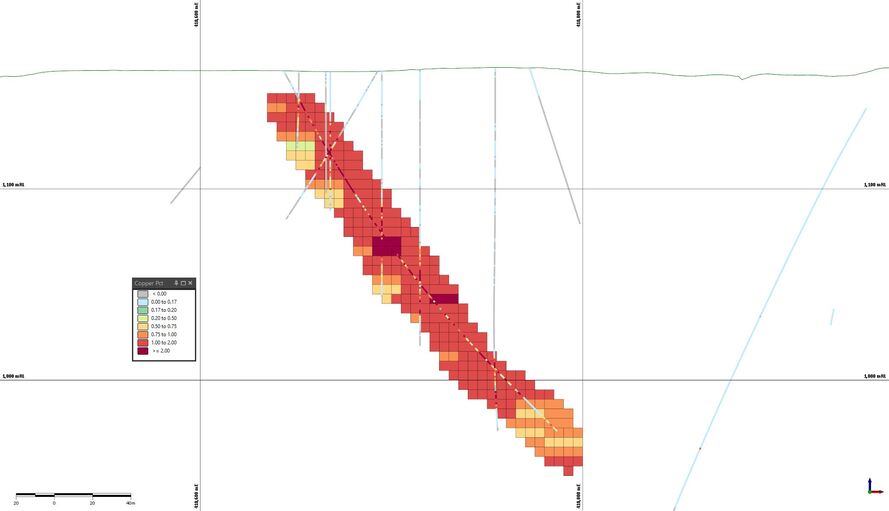
Figure 11-31: Cross-Section through the Central part of the Eva Deposit with Block Grades and Drill Hole Composites
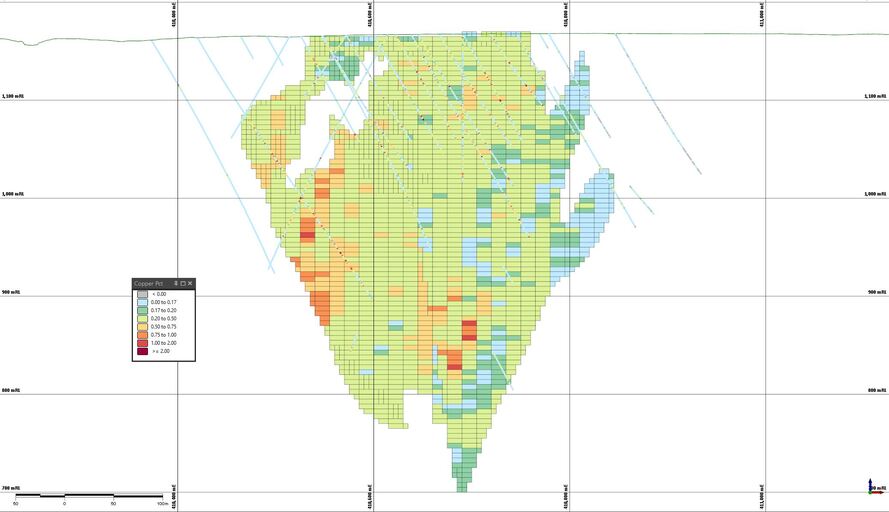
Effective date: 30 June 2025
143
Figure 11-32: Cross-Section 7,772,000N in Little Eva Deposit
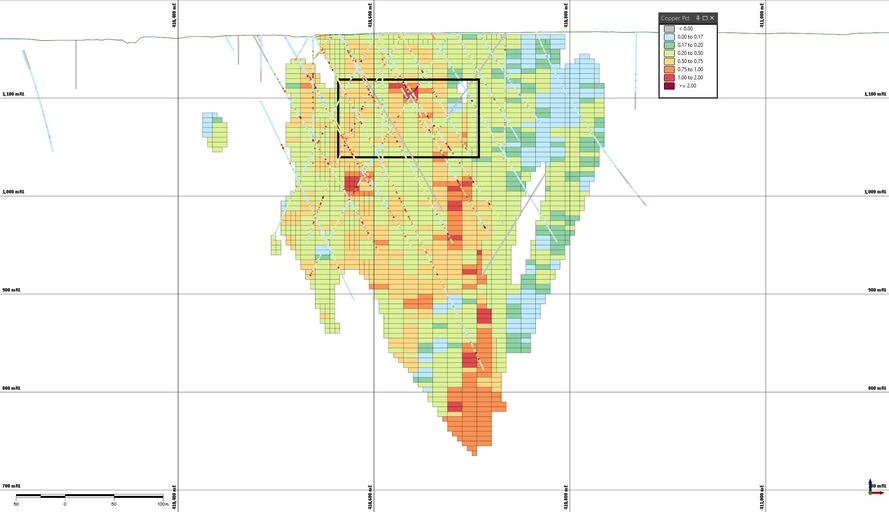
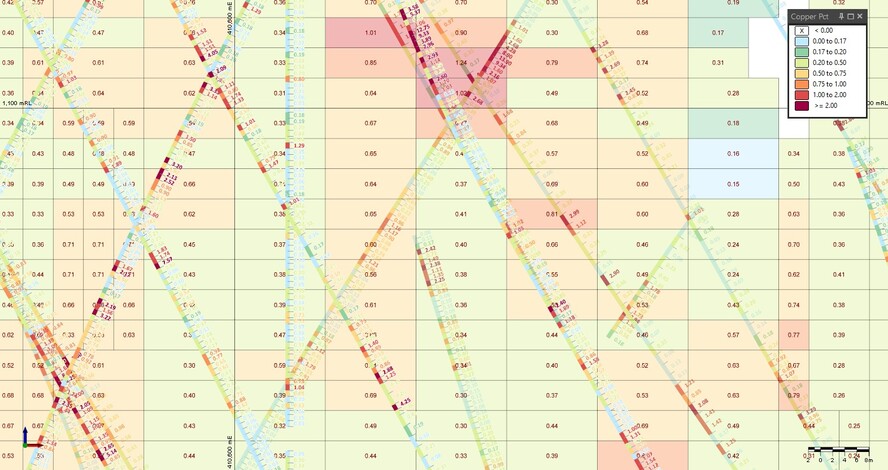
Note: Illustrates Colour-Coded Drill Hole Composites Relative to block grades in upper image and a close-up (box) with printed grades in
lower.
Effective date: 30 June 2025
144
Figure 11-33: Mean Assay, Composite, and Block Gold Grades for the Different Resource Domains in the Little Eva
Deposit
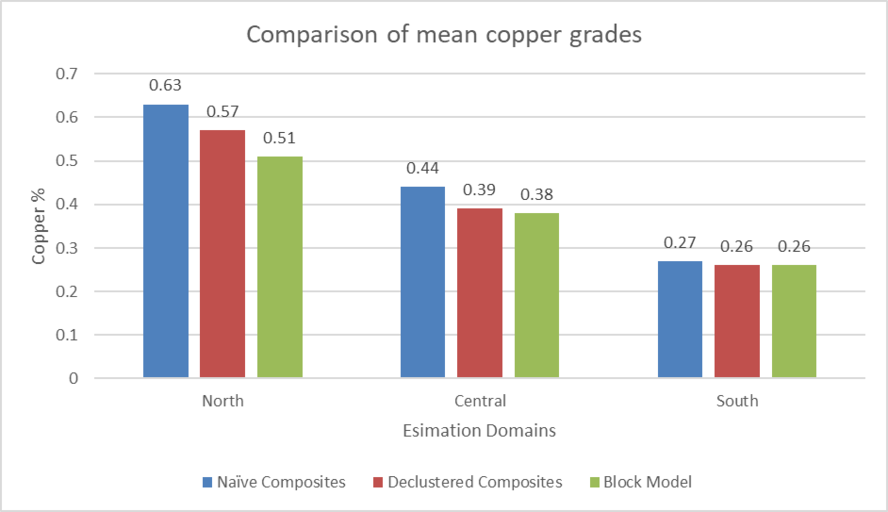
Figure 11-34: Mean Assay, Composite, and Block Gold Grades for Domains in the Little Eva Deposit at a 0.17% Cu Cut-
off Grade
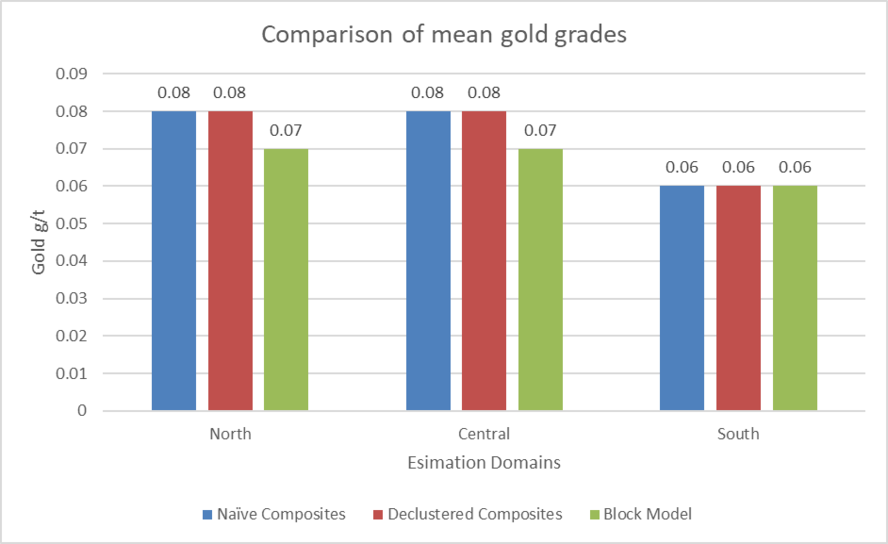
Example swath plots which plot the average grades over a slice width for both the composite grades and the
block models are shown for the Little Eva deposit and the Blackard deposit are shown in Figure 11-35. It is
expected that the block grades closely match the composite grades, but are slightly more smoothed. This can
be seen in the Little Eva plot where the red line of the block model grades closely matches the green of the
composites. Also evident in the example from Blackard where the black line of the block estimate closely
matches the red of the composite file.
Effective date: 30 June 2025
145
Figure 11-35: Examples of Swath plots for Little Eva (top) and Blackard (bottom), showing the block grades replicate
the composite grades.
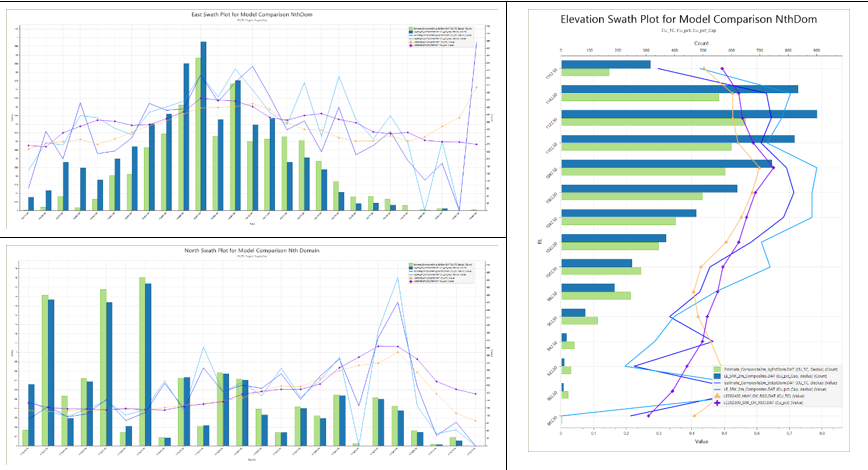
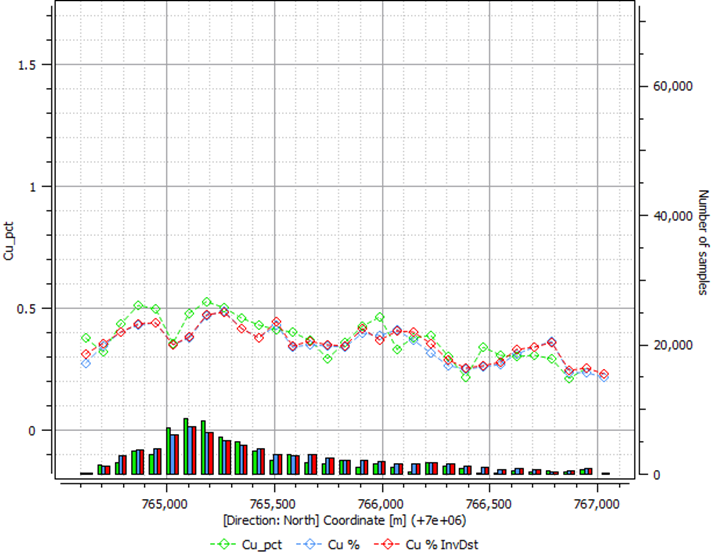
ID2 interpolations produce similar results to OK methods, particularly when the same composite and block
sizes are used; the variation in composite grades is reasonable (CoV <1.7), and the drill hole data is not
excessively clustered. As these conditions were generally met by the other deposits, it is reasonable that
resource estimates in this TRS were similar to previous methods where kriging and or other methodology had
been used.
Every deposit at the Eva Project was estimated using a variety of methodologies, Little Eva, Blackard and
Turkey Creek using Ordinary Kriging with dynamic anisotropy for Turkey Creek and Blackard to account for
the folding, and Scanlan, Lady Clayre, Bedford and Ivy Ann using Inverse distance weighting were the
Effective date: 30 June 2025
146
variography was not well formed due to sample support. In all cases the models were validated and in the
opinion of the QP are robust enough for use in further studies. Overall, In the QP’s opinion, the Mineral
Resource estimates have been prepared using industry-standard methods, with appropriate application of
cut-off grades, classification criteria, and consideration of uncertainty. The estimates are suitable for
disclosure under Regulation S-K 1300
12Mineral Reserve Estimates
Section 229.601(b)(96)(iii)(B) (12) (i‐vi)
This section is not applicable as no Mineral Reserves are declared in this TRS
13Mining Methods
Section 229.601(b)(96)(iii)(B) (13) (i‐v)
Conventional open pit mining using drill and blast, backhoe excavators and haul trucks is being considered at
Eva Copper Project. Work to assess these extraction methods is well advanced. Harmony has engaged with
mining contractors to develop benchmark pricing. Optimisations have been run using US$4.25/lb copper
price run multiple optimisations that show economic returns before capital is considered.
Geotechnical, and hydrogeological studies have been completed that inform the basis of design for the
optimisation.
The QP considers the results of these studies, together with the metallurgy and other modifying factors,
satisfies the requirement for reasonable prospect for eventual economic extraction
14Processing and Recovery Methods
Section 229.601(b)(96)(iii)(B) (14) (i‐iv)
This section is not applicable as no Mineral Reserves are declared in this TRS
15Infrastructure
Section 229.601(b)(96)(iii)(B) (15)
This section is not applicable as no Mineral Reserves are declared in this TRS
16Market Studies
Section 229.601(b)(96)(iii)(B) (16) (i‐ii)
This section is not applicable as no Mineral Reserves are declared in this TRS
17Environmental Studies, Permitting and Plans, Negotiations or Agreements
with Local Individuals or Groups
Section 229.601(b)(96)(iii)(B) (17) (i‐vii)
This section is not applicable as no Mineral Reserves are declared in this TRS
18Capital and Operating Costs
Section 229.601(b)(96)(iii)(B) (18) (i‐ii)
This section is not applicable as no Mineral Reserves are declared in this TRS
19Economic Analysis
Section 229.601(b)(96)(iii)(B) (19) (i‐iv)
This section is not applicable as no Mineral Reserves are declared in this TRS
Effective date: 30 June 2025
147
20Adjacent properties
Section 229.601(b)(96) (iii)(B) (20) (i‐iv)
20.1Mining Properties (Regional)
Mount Isa was established on the discovery of world-scale copper-zinc-lead deposits in 1923. A major mining
complex and a city of 22,000 people have grown on the site in the last 94 years, with multiple open pit and
underground mines, smelters, mills and flotation plants, and a sulphuric acid plant. The town hosts many
mining suppliers and service organisations and has a deep pool of skilled mining industry people. Mt. Isa has
two electric power generators supplied by a natural gas pipeline from South Australia, an airport, rail, and
other services.
Cloncurry was established much earlier than Mount Isa, in 1867, on the discovery of copper by Ernest Henry,
and the town was founded in 1884.
There are numerous active mines in the area. In addition to Mount Isa, there are five major active mines:
Ernest Henry copper-gold mine and Lady Loretta lead-zinc-silver mine, both owned by Glencore; Cannington
silver-lead mine, owned by South 32; the Dugald River zinc-lead-silver mine, owned by MMG; and the Mount
Gordon copper-gold mine, owned by Capricorn Copper. All are major, internationally important mines.
Smaller operations (active or in care and maintenance) include Osborne copper-gold mine, owned by
Chinova; Mount Colin copper mine, owned by Round Oak Minerals, Lady Annie copper-gold mine, owned by
CST Mining; Mount Cuthbert Copper mine, owned by Malaco Mining; Rocklands copper- gold mine, owned
by Cudeco; and Eloise copper-gold mine, owned by FMR Investments.
The only major closed mine is the Mary Kathleen Uranium mine.
20.2Mining Properties (Adjacent)
Mining properties that surround the Eva Project are predominantly EPMs held by the company. These
properties cover a highly prospective north–south corridor with similar geology to that which hosts the
Project’s Mineral Resources, where numerous copper-gold mineralised prospects have been established and
are being systematically explored. No additional Mineral Resources have as yet been defined.
The major Dugald River zinc-lead-silver mine owned by MMG is located 11 km south of the planned Eva
Copper Project mine site, within a ML surrounded by MLs and EPMs held by the Company. The mine was
commissioned in November 2017. MMG indicates that the mine will process an average 1.7 Mt/a of ore, to
initially produce 170,000 tonnes of zinc concentrate, plus by-products. The mine will operate over an
estimated 25 years while the ore body remains open at depth. The mine is an underground operation
accessed via declines. Published Measured, Indicated, and Inferred Mineral Resources are: zinc resources of
64.8 Mt at 12% Zn, 2.2% Pb, and 31 g/t Ag (plus stockpiles of 0.23 Mt at 10.8% Zn, 1.7 Pb, and 49 g/t); and
copper resources of 4.4 Mt at 1.8% Cu and 0.2 g/t Au. Published Proven and Probable Ore Reserves are 32.8
Mt at 11.9% Zn, 2.2% Pb, and 44 g/t Ag. Resources and Reserves are from MMG 2017 statements published
in accordance with Joint Ore Reserves Code (JORC) 2012 edition (JORC, 2012). Stratigraphy interpreted to be
prospective for similar zinc mineralisation is identified within the tenure held by the Company surrounding
the Dugald River Project.
Effective date: 30 June 2025
148
Figure 20-1: Adjacent Mining Properties and Major Mines around the Eva Copper Project
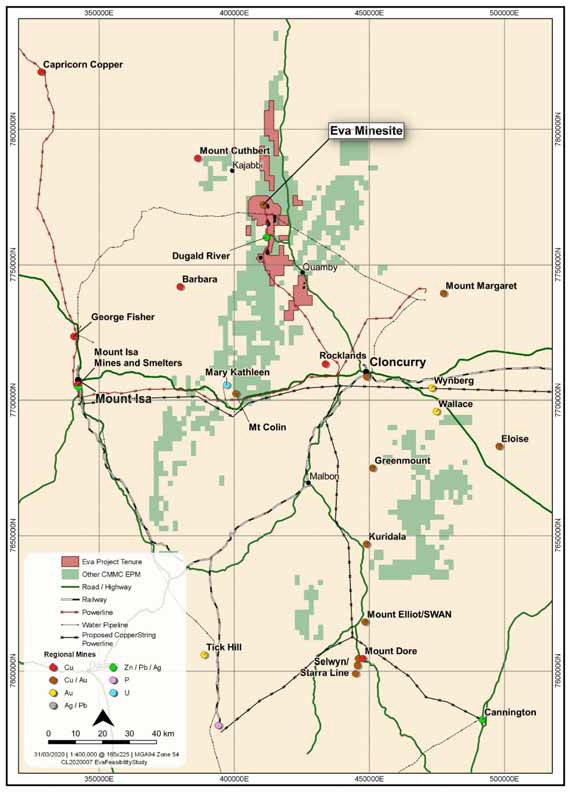
Effective date: 30 June 2025
149
20.3Non-Mining Properties
Immediate key local non-mining stakeholders associated with the Eva Copper Project are landowners,
leaseholders, the Kalkadoon people, and state and local governments. They are:
•Landowner: Harold MacMillan (Mt. Roseby Homestead)
•Landowner: NAPCO (Coolullah Homestead)
•Kalkadoon people
•Commonwealth and Queensland State departments
•Cloncurry Shire Council.
CMMPL has been in continuous communication with the above stakeholders for many years. Refer to Section
4.4 regarding Pastoral Leases and Compensation Agreements with the four pastoral landholders for both the
MLs and key areas of activity in the surrounding EPMs.
Effective date: 30 June 2025
150
21Other Relevant Data and Information
Section 229.601(b)(96)(iii)(B) (21)
No other relevant data or information is known to the QP
Effective date: 30 June 2025
151
22Interpretation and Conclusion
Section 229.601(b)(96)(iii)(B) (22)
22.1Geology, Mineral Resources
The Eva Copper Project Mineral Resources are IOCG deposits that vary according to setting. The main
deposit, Little Eva, is similar to Ernest Henry.
Mineralisation primarily occurs as chalcopyrite, with subordinate bornite and chalcocite. The Native coper
orebodies comprise Native Copper with varying amounts of copper bearing hydrobiotite and contain a
Sulphide copper portion at depth.
The mineralised zones typically trend north to south and are moderately to steeply dipping.
All models are sufficient for further studies.
22.2Mining
This Resource is suitable for conventional open pit mining methods and typical processing through a copper
concentrate. Mining studies will be orientated around this approach.
22.3Metallurgical Testwork and Mineral Processing
Little Eva, being the largest source of sulphide ore, is expected to see 95% Cu recovery. The remaining
sulphide ore sources are expected to see between 88% to 95% recoveries, depending on the mineralogy.
Blackard and Scanlan native copper zones are expected to achieve 63% recovery through gravity and
flotation recovery methods
The recovery within the native copper zone of Blackard will be variable; however, it will average 63%, as
shown in the testwork. The sulphide zone located below this, is expected to behave similarly to Turkey Creek,
at an anticipated 88% recovery.
Extensive work has been done on Blackard. Scanlan has not seen the same degree of study; however, pilot
flotation work and geological observations on Scanlan have shown it to have similar mineralogical
characteristics as Blackard.
22.4Process Plant
N/A
22.5Infrastructure
N/A
22.6Environmental, Permitting, and Social Considerations
N/A
22.7Capital and Operating Costs
N/A
22.8Economics
N/A
Effective date: 30 June 2025
152
23Recommendations
Section 229.601(b)(96)(iii)(B) (23)
23.1Mineral Resources and Mineral Reserves
Although this TRS does not declare Mineral Reserves, a number of technical studies and planning activities
have been completed to support future conversion of Mineral Resources. The QP recommends the following
next steps:
Resource conversion: Target drilling of areas below and within the current pit designs to upgrade Inferred
Resources to the Indicated category.
Development drilling: At the Little Eva pit, conduct development drilling ahead of mining to improve
confidence in Mineral Resource estimates, support future Mineral Reserve definition, and optimise mining
selectivity and grade control strategies.
Geotechnical studies: Perform slope stability investigations on the Blackard, Scanlan, Turkey Creek, Lady
Clayre, and Bedford deposits to inform pit design parameters.
Mine planning: Continue detailed mine design and mine planning studies for the Eva Copper Project in
preparation for potential production.
Dewatering plans: Develop detailed pit dewatering strategies for the Little Eva, Blackard, Scanlan, and Turkey
Creek deposits.
Effective date: 30 June 2025
153
24References
Section 229.601(b)(96)(iii)(B) (24)
24.1References
The references cited in this TRS include the following:
AARC (2007). Roseby Copper Project, Environmental Impact Statement (EIS) Supplementary Report. (L2800).
AARC (2008). Roseby Copper Project, Environmental Impact Statement (EIS) Response to Information
Request. (L2800).
AARC (2011). Roseby Copper Project, Environmental Management Plan. (L3428). AARC (2019). Eva Project,
Ecology Report. (L10479)
ALS AMMTEC (2012a). Metallurgical Testwork conducted upon Copper Ore Samples from the Roseby Copper
Project for Altona Mining Limited Report A13828 September 2012. Perth: ALS AMMTEC. (L8464).
ALS AMMTEC (2012b). Quantitative Automated Mineralogical Analysis conducted on Five (5) Copper Core
Samples from the Roseby Project for Altona Resources (Project A14159). Perth: ALS AMMTEC. (L7842).
ALS AMMTEC (2012c). Quantitative Automated Mineralogical Analysis conducted on Two (2) Flotation Feed
and Two (2) Flotation Tail Samples for Altona Resources (Project A13828). Perth: ALS AMMTEC. (L7844).
ALS Metallurgy (2016). Metallurgical Testwork conducted upon Turkey Creek and Little Eva Copper Ores.
Perth: ALS Metallurgy. (L9654).
Altona & Department of Natural Resources and Mines. (2017). Query to the Department of Natural
Resources and Mines, Queensland, about Water License requirements for the Little Eva Project. Queensland:
Altona & DNRM) (L9714).
Altona Mining Limited (Altona) (2014a). ALT2014004/005 Turkey Creek Drill Programme Completion Report.
Perth: Altona (L9719).
Altona (2014). Little Eva Mineral Resource Update. Perth: Altona (L9111).
Altona (2014a). Little Eva Geotechnical Review Version 2. Perth: Altona. (L5561). Altona (2014b). Little Eva
Geological Report. Perth: Altona (L9110).
Altona (2014b). Review of Little Eva Unconfined Compressive Strength Measurements. Perth: Altona.
(L9759).
Altona (2017). ALT2015009 Metallurgical Drilling Programme Completion Report. Perth: Altona (L9748).
Altona (2017). Detailed Metallurgical Review, Cloncurry Copper Project. Perth: Altona. (L9782). Altona (2017).
Detailed Metallurgical Review. Perth: Altona. (L978).
Altona (2017). Query to the Department of Natural Resources and Mines, Queensland, about Water License
Requirements for the Little Eva Project. Perth: Altona. (L9714).
AMML (2007a). Bond Ball Mill Work Index Tests on Little Eva Ore Samples for Universal Resources Limited.
Perth: AMML. (L2902).
AMML (2007b). AMML Interim Report 0013-2, Batch and Locked Cycle Flotation on Little Eva Ore Samples.
Sydney: AMML. (L2901).
AMMTEC (2006a). Comminution Testing Conducted Upon Samples from the Roseby Copper Project for
Universal Resources Limited, Report A10110. Perth: AMMTEC. (L1356).
AMMTEC (2007b). Comminution Testwork Conducted Upon Sulphide Composite Samples from the Little Eva
Copper Deposit (Roseby Copper Project) for Universal Resources Limited, Report A10997. Perth: AMMTEC.
(L2904).
Effective date: 30 June 2025
154
AMMTEC Consultants PLLC (AMMTEC). (2005a). Metallurgical Testwork Conducted Upon Samples of Ore
from the Roseby Copper Deposit, Report A9761. Perth: AMMTEC. (L1260).
AMMTEC. (2005b). Flotation Testwork on Bedford, Little Eva and Lady Clayre Samples for Universal
Resources, Report A9656. Perth: AMMTEC. (L3380).
AMMTEC. (2006b). Bench Scale Flotation Testwork on Roseby Ore Samples for Universal Resources Limited,
Report No. A9880, Part B. Perth: AMMTEC. (L1352).
AMMTEC. (2006c). Pilot Grinding and Preliminary Pilot Flotation on Ore Sample Composites from the Roseby
Copper Project for Universal Resources Limited, Report No. A9880 Part C. Perth: AMMTEC Ltd. (L1353).
AMMTEC. (2007). Flotation Testwork on Blend Master Composites for Universal Resources Limited.
Report No. A10851-D, Perth: AMMTEC. (L2905).
Ausenco (2020). Process Plant and Facilities Layout Drawings, Ausenco, February 2020. AustralAsian
Resource Consultants (AARC). (2007). Roseby Copper Project, Environmental Impact
Statement (EIS). (L2800).
Browning, F. (2016). Thesis: Geological Model and Resource Estimate for the Bedford Copper-Gold Deposit,
Mount Isa Inlier, North West Queensland. Cornwall: University of Exeter (L9754) [Report Only].
Chadwick, R. (1992). Ivy Ann Prospect, EPM 8059 "Cameron River,” 1992 Exploration Summary and
Discussion. Perth: Dominion Mining Limited. (L987).
CITIC-SMCC Process Technology (2018). Review of the Equipment Selection for the Comminution Circuit of
the Cloncurry Project, January 2018.
Copper Mountain Mining Corporation (CCMC). (2018). Copper Mountain Concentrator, July 2018.
Eva Flotation Testwork Progress Report No. 1.
CRAE. (1996). The Geology and Origin of the Blackard, Lady Clayre and CRA Flat Cu and Cu-Au Prospects
within the Mount Roseby Area. Brisbane: CRA Exploration Pty. Ltd. (L852).
Department of Environment and Heritage Protection (DEHP), Queensland. (2012). Environmental Authority
MIN102973311 (ML90162, ML90163, ML90164, ML 90165, and ML90166) for
Altona Mining Limited and Roseby Copper Pty. Ltd. Cairns: DEHP. (L8299).
DEHP, Queensland. (2013). Amendment of Environmental Authority EPML00899613 (ML90162, ML90163,
ML90164, ML 90165, and ML90166) for Altona Mining Limited and Roseby Copper Pty. Ltd. Cairns: DEHP.
(L8299).
DEHP, Queensland. (2016). Amendment of Environmental Authority EPML00899613 (ML90162, ML90163,
ML90164, ML 90165, and ML90166) for Altona Mining Limited and Roseby Copper Pty. Ltd. Cairns: DEHP.
(L8299).
EHW (1996). Report on Field Mapping and Proposed Diamond Drill Holes at Ivy Ann. Perth: EHW. (L991).
Environmental Geochemistry International. (2006). Geochemical Characterisation and ARD Assessment of
Samples from the Roseby Copper Project. Perth: Environmental Geochemistry International. (L2959).
Gekko Systems (Gekko) (2019). Eva Copper Project Gravity and Flotation Testwork, December 2019
Geological Survey of Queensland. (2011). Northwest Queensland Mineral and Energy Province
Report. Brisbane: Department of Employment, Economic Development and Innovation (L8418) [Report Only].
Effective date: 30 June 2025
155
George Orr and Associates (George Orr) (2006). Little Eva Deposit: Geotechnical Evaluation for Mining
Feasibility Purposes, July 2006, updated 2012.
George Orr (2006). Roseby Copper Project: Little Eva Deposit, Geotechnical Evaluation for Mining Feasibility
Purpose. Perth: George Orr. (L1349).
George Orr (2012). Roseby Copper Project, Little Eva Deposit, Definitive Mining Feasibility Study:
Geotechnical Evaluation for Open Pit Mining. Perth: George Orr. (L7821).
Gilbride Management (2011). Altona Mining Limited, Little Eva Project, Definitive Feasibility Study, Appendix
9.1, Logistics Study. Perth: Gilbride Management. (L8443).
GR Engineering Services (GRES) (2012). Altona Mining Limited, Little Eva Project, Definitive Feasibility Study.
Perth: GRES. (L8443).
GRES (2015). Turkey Creek Slighter Testwork. Perth: GRES. (L9347).
Habermann, P. (1999). Thesis: Alteration and Mineralisation at the Lady Clayre Cu-Au Prospect, Mount Isa,
Eastern Succession, NW Queensland. Townsville: James Cook University. (L1064).
Hatch (2018). The Eva Copper Project Feasibility Study Report, Copper Mountain Mining Corp, November
2018.
Hatch (2018). 3D Process Plant Layout Drawings for the Eva Copper Feasibility Study. Vancouver: Hatch.
Hatch (2018). Electrical Single Line Diagrams for the Eva Copper Feasibility Study. Vancouver: Hatch.
Hatch (2018). Mass Balance and Water Balance for the Eva Copper Feasibility Study. Vancouver: Hatch.
Hatch (2018). Mechanical Equipment List for the Eva Copper Feasibility Study. Vancouver: Hatch. Hatch
(2018). Process Design Criteria for the Eva Copper Feasibility Study. Vancouver: Hatch.
Hatch (2018). Process Flow Diagrams for the Eva Copper Feasibility Study. Vancouver: Hatch.
Kendrick, S. (2013). Email: Altona's Little Eva Project Preliminary Questions [GRES- PROJECTS.FID2795]. Perth:
GRES. (L8907).
KH Morgan and Associates (KH Morgan) (2009). Hydrogeology Report, December 2009.
KH Morgan and Associates (KH Morgan) (2011). Hydrogeology Report, Environmental Management Plan,
Roseby Copper Project, Northwest Queensland. Perth: KH Morgan. (L1536).
KH Morgan (2012). Dewatering Procedures Impact and Water Resources, Little Eva Pit, Altona Mining
Limited. Perth: KH Morgan. (L8414).
Klohn Crippen Berger (KCB) (2019). Eva Project Tailings Characterization Factual Report, September 2019.
KCB (2010). Definitive Feasibility Study review and update of the Tailings Storage Facility for the Eva Copper
Project, Klohn Crippen Berger, December 2019.
Knight Piésold Pty. Ltd. (Knight Piésold) (2012). Altona Mining Limited, Little Eva Project, Definitive Feasibility
Study, Appendix. Perth: Knight Piésold.
Knight Piésold (2016). Tailings Storage Facility Preliminary Design Report (Incorporates Regional Surface
Water Management Design). Perth: Knight Piésold. (L9566).
Knight Piésold (2016a). Tailings Storage Facility Preliminary Design Report (Incorporates Regional Surface
Water Management Design). Perth: Knight Piésold. (L9566).
Knight Piésold (2016b). Cabbage Tree Creek Inundation Study and Little Eva Pit Diversion. Perth: Knight
Piésold. (L9567).
Effective date: 30 June 2025
156
Knight Piésold (2018). Tailings Storage Facility Definitive Feasibility Study, Book A. Geotechnical, Tailings, and
Water Management Report; and Book B. Geotechnical Interpretative Report, October 2018.
Knight Piésold (2019). Eva Copper Project, Cabbage Tree Creek Inundation Study and Little Eva Pit Diversion.
Perth: Knight Piésold. (L10498).
Knight Piésold (2019). Eva Project, Definitive Feasibility Study – Geotechnical, Tailings and Water
Management Report. Perth: Knight Piésold. (L10397).
Knight Piésold (2019). Eva Project, Definitive Feasibility Study – Geotechnical Interpretative Report.
Perth: Knight Piésold. (L10399).
Knight Piésold (2019). Cabbage Tree Creek Inundation Study and Little Eva Pit Diversion Update, Knight
Piésold, December 2019.
Lane, G., Foggiatto, B. and Bueno, M.P. (2013). Power-based comminution calculations using Ausgrind. In
Alvarez, M., Doll, A., Kracht, W. and Kuyvenhoven, R. (Eds.), Proceedings of 10th International Mineral
Processing Conference (Procemin 2013), pp. 85-96. Santiago: Gecamin.
LAROX (2008). Test Report 7.2.12 – Pilot Produced Final Copper Concentrate. Perth: LAROX. (L3294).
Li, C. (1996). Lady Clayre Prospect – Locked Cycle Testing. Melbourne: CRA ATD. (L930).
Mason Geoscience (2003). Petrographic Descriptions for Twenty-two Drill Core Rock Samples from Lady
Clayre and Little Eva Prospects (Eastern Succession, Mount Isa Inlier, Queensland) Report 2811. Adelaide:
Mason Geoscience. (L1058).
Mason Geoscience (2004). Petrographic and Minerographic Descriptions for Sixteen Drill Chip Rock Samples
from the Little Eva, Lady Clayre, Bedford and Tin Lizzie Prospects (Roseby Project, Cloncurry Region,
Queensland). Report # 2966. Adelaide: Mason Geoscience. (L1061).
Mason Geoscience (2005). Mineralogy of Three Cu-Bearing Ores: LED197, LED198, and BC Master Composite
(Roseby Project, Queensland). Perth: Mason Geoscience Pty. Ltd. (L1188).
MBS Environmental (MBS). (2011). Roseby Copper Project Tailings Characterization and Acid Mine Drainage
Management. Perth: Martinick Bosch Sell Pty. Ltd. (L3402).
MBS (2011). Roseby Copper Project, Waste Rock Characterisation and Acid Mine Drainage Management.
Perth: MBS. (L3403).
MBS (2012). Altona Mining Limited, Little Eva Project, Definitive Feasibility Study, Appendix 10.2,
Geochemical Assessment of Little Eva Tailings. Perth: MBS. (L8443).
MBS (2012). Roseby Copper Project, Surface Water and Sediment Quality Monitoring (March 2012). Perth:
MBS. (L8613).
MBS (2015). Roseby Copper Project 2014/15 Water and Sediment Quality Monitoring Summary.
Perth: MBS. (L9352).
MBS (2016). Little Eva Project, Environmental Authority Amendment Application Supporting Document.
Perth: MBS. (L9609).
MBS (2016). Little Eva Project, Environmental Authority Amendment Application Supporting Document.
Perth: MBS. (L9609).
MBS (2016). Memorandum: Environmental Approvals, Little Eva Project. Perth: MBS (L9768). MBS (2016).
Memorandum: Environmental Offsets Act 2014. (L9767).
MBS (2016). Roseby Copper Project 2015/16 Water and Sediment Quality Monitoring Summary May 2016.
(L9655).
Effective date: 30 June 2025
157
MBS (2016). Waste Rock Characterisation, Little Eva Project, Satellite Deposits (Turkey Creek, Bedford, Lady
Clayre). Perth: MBS. (L9569).
MBS (2017). Cloncurry Copper Project 2016/17 Water and Sediment Quality Monitoring Summary. (L9772).
Merit and Sedgman (2017). CMMC Business Case Analysis Completed in October 2017.
Metso Corporation (Metso) (2019). Eva Copper HPGR Testwork (April 2019), and Little Eva-Blackard Blend
Testwork, November 2019.
Milligan, S. & C. Li. (1996). Lady Clayre Prospect – Metallurgical Characterisation, Melbourne: CRA ATD.
(L0842).
MMG Limited (2019). Mineral Resources and Ore Reserves. Available at: https://www.mmg.com/our-
business/mineral-resources-and-ore-reserves/, accessed 23 April 2020.
NeoProTec Pty. Ltd. (NeoProTec) (2003). Testwork Report for Universal Resources Limited.
Metallurgical Testwork Program, Little Eva, UR0301. Perth: NeoProTec. (L3022).
NeoProTec (2003b). Testwork Report for Universal Resources Limited. Metallurgical Testwork Program, Little
Eva, UR0301. Perth: NeoProTec. (L3440).
NeoProTec (2005). Preliminary Flotation Response of: 1. Little Eva Low-grade and its Revenue Impact on Little
Eva. 2. Lady Clayre. 3. Bedford. Ref: UR 05011, Perth: NeoProTec Pty. Ltd. (L1175).
NeoProTec (2006). Roseby Project. Comminution Testwork. Perth: NeoProTec. (L1388).
NeoProTec (2008). Roseby Copper Project – DFS Metallurgical Summary Report. Perth: NeoProTec. Optimet
Laboratories (Optimec) (2003). Metallurgical Testing of Roseby Copper Project Report P0013. Adelaide:
Optimet. (L1580 & L1581).
Optimet (2005). Report P0117 Universal Resources Little Eva/Roseby Project Oxide/Sulphide Blend Flotation.
Adelaide: Optimet. (L1577).
Orway Mineral Consultants. (2006). Universal Resource Ltd. Roseby Copper Project Feasibility Study
Comminution Circuit Design, Report 46203. Perth: Lycopodcium Engineering Pty. Ltd. (L8434).
Outotec (2008). SUPAFLO® Thickener Test Data Report S394TA. Perth: Outotec. (L3292) Paterson & Cooke
(2019). Blackard Ore Pumping Conceptual Study, November 2019.
Paterson & Cooke (2019). Eva Tailings Dewatering Conceptual Study, November 2019. Paterson & Cooke
(2019). Tailings and Ore Characterization, November 2019.
Queensland Department of Environment and Heritage Protection (2016). Amendment of Environmental
Authority EPML00899613, July 2016.
Rockwater Hydrogeological and Environmental Consultants (Rockwater). (2018). Water Supply Investigation
for the Eva Copper Project.
Rockwater (2011). Little Eva Copper-Gold Deposit Water Supply Investigation. Results or RC Exploration
Drilling. Perth: Rockwater. (L7816).
RPS Group plc. (2019). Little Eva Mine Site LiDAR. RPS Reference PR139400-1. (L10479). SRK Consulting (SRK)
(2014). Review of the Roseby Project Queensland. Perth: SRK (L9096).
Sedgman Limited (Sedgman) (2017). Cloncurry Copper Project Business Case Analysis, CMMC, and Merit,
October 2017.
Taylor, R.G. (2009). Petrological Observations and Overview Comments Concerning 18 Samples from the
Little Eva Copper-Gold Prospect, Cloncurry Region, Queensland, Australia.
Effective date: 30 June 2025
158
Townsville: School of Earth and Environmental Science, James Cook University. (L8850).
Townend (2015). Semiquantitative Analysis of Eight Metallurgical Samples. Perth: Townend Mineralogy
Laboratory. (In L9347).
Universal Resources Inc., Como Engineers Pty. Ltd., & GR Engineering Services (2009). Roseby Copper Project
5MT/A Definitive Feasibility Study. (L1585).
Walker, Newman & Associates (2012). Altona Mining Limited, Little Eva Project, Definitive Feasibility Study,
Appendix 9.2, Telecommunications and IT Cost Estimate. Perth: Walker, Newman & Associates. (L8443).
Withnal, I.W. & L.C. Cranfield (2013). Geological Framework of Queensland. Geological Survey of Queensland.
Brisbane: Department of Natural Resources and Minerals.
Woodgrove Technologies (2019). Eva Project DFR Pilot Plant Report, May 2019.
25Reliance on information provided by the registrant
Section 229.601(b)(96)(iii)(B) (25)
Harmony management determined the gold prices used for estimating Mineral Resources. These prices were
calculated using historical, publicly-available gold price data. Other than this, the QP has not relied upon
information provided by the registrant that could not be independently verified.