1
INTEGRATED ANNUAL REPORT FOR THE 20-F 2025
2
Contents
Harmony | Page |
Delivering profitable ounces | |
Environment stewardship | |
Water stewardship | |
Social stewardship | |
Governance | |
3
About Harmony
Harmony is a gold mining specialist with a growing international copper footprint. We are South Africa’s largest gold producer by volume and have
delivered safe, profitable ounces, shaped the mining landscape and supported communities for over 75 years. Today, we operate across South Africa,
Papua New Guinea and Australia. Our MAC Copper acquisition and Eva Copper Project alongside our Tier 1 Wafi-Golpu Project have positioned us to
become a significant gold-copper producer, ensuring long-term resilience and margin growth. We lead the world in gold tailings reclamation, unlocking
value from historic resources safely and responsibly. Sustainability is embedded in everything we do – driving operational excellence, community
development and environmental stewardship.
Headquartered in Randfontein, South Africa, Harmony has a primary listing on Johannesburg’s stock exchange,
the JSE Limited (HAR) and an American depositary receipt programme listed on the New York Stock Exchange
(HMY). Our shareholder base is geographically diverse and includes some of the largest fund managers
globally. The largest shareholder base is in South Africa (49%), followed by the United States (32%).
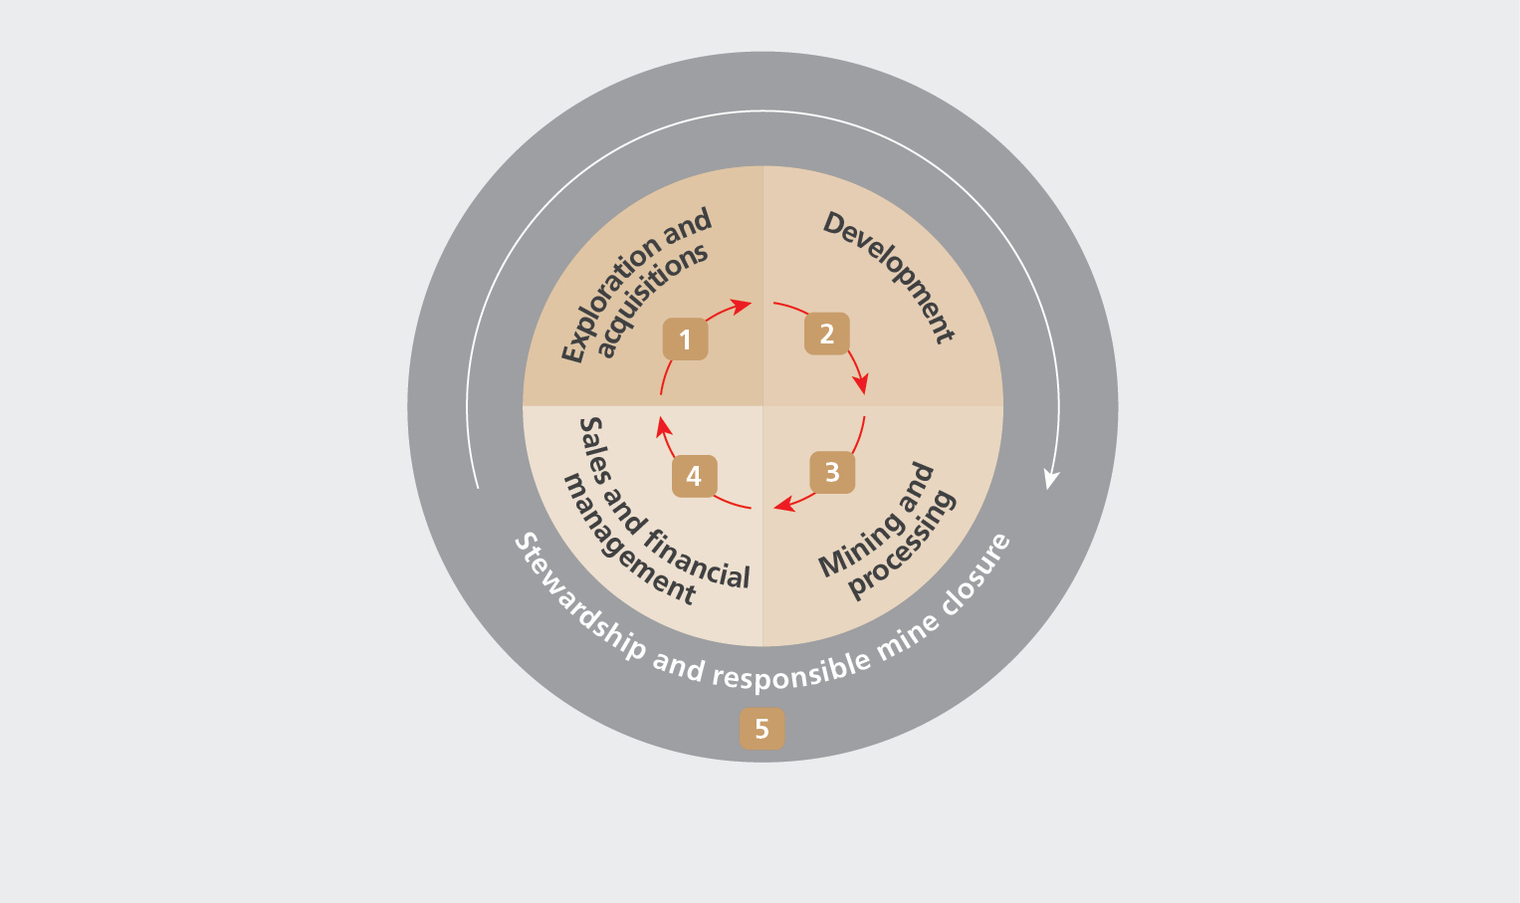
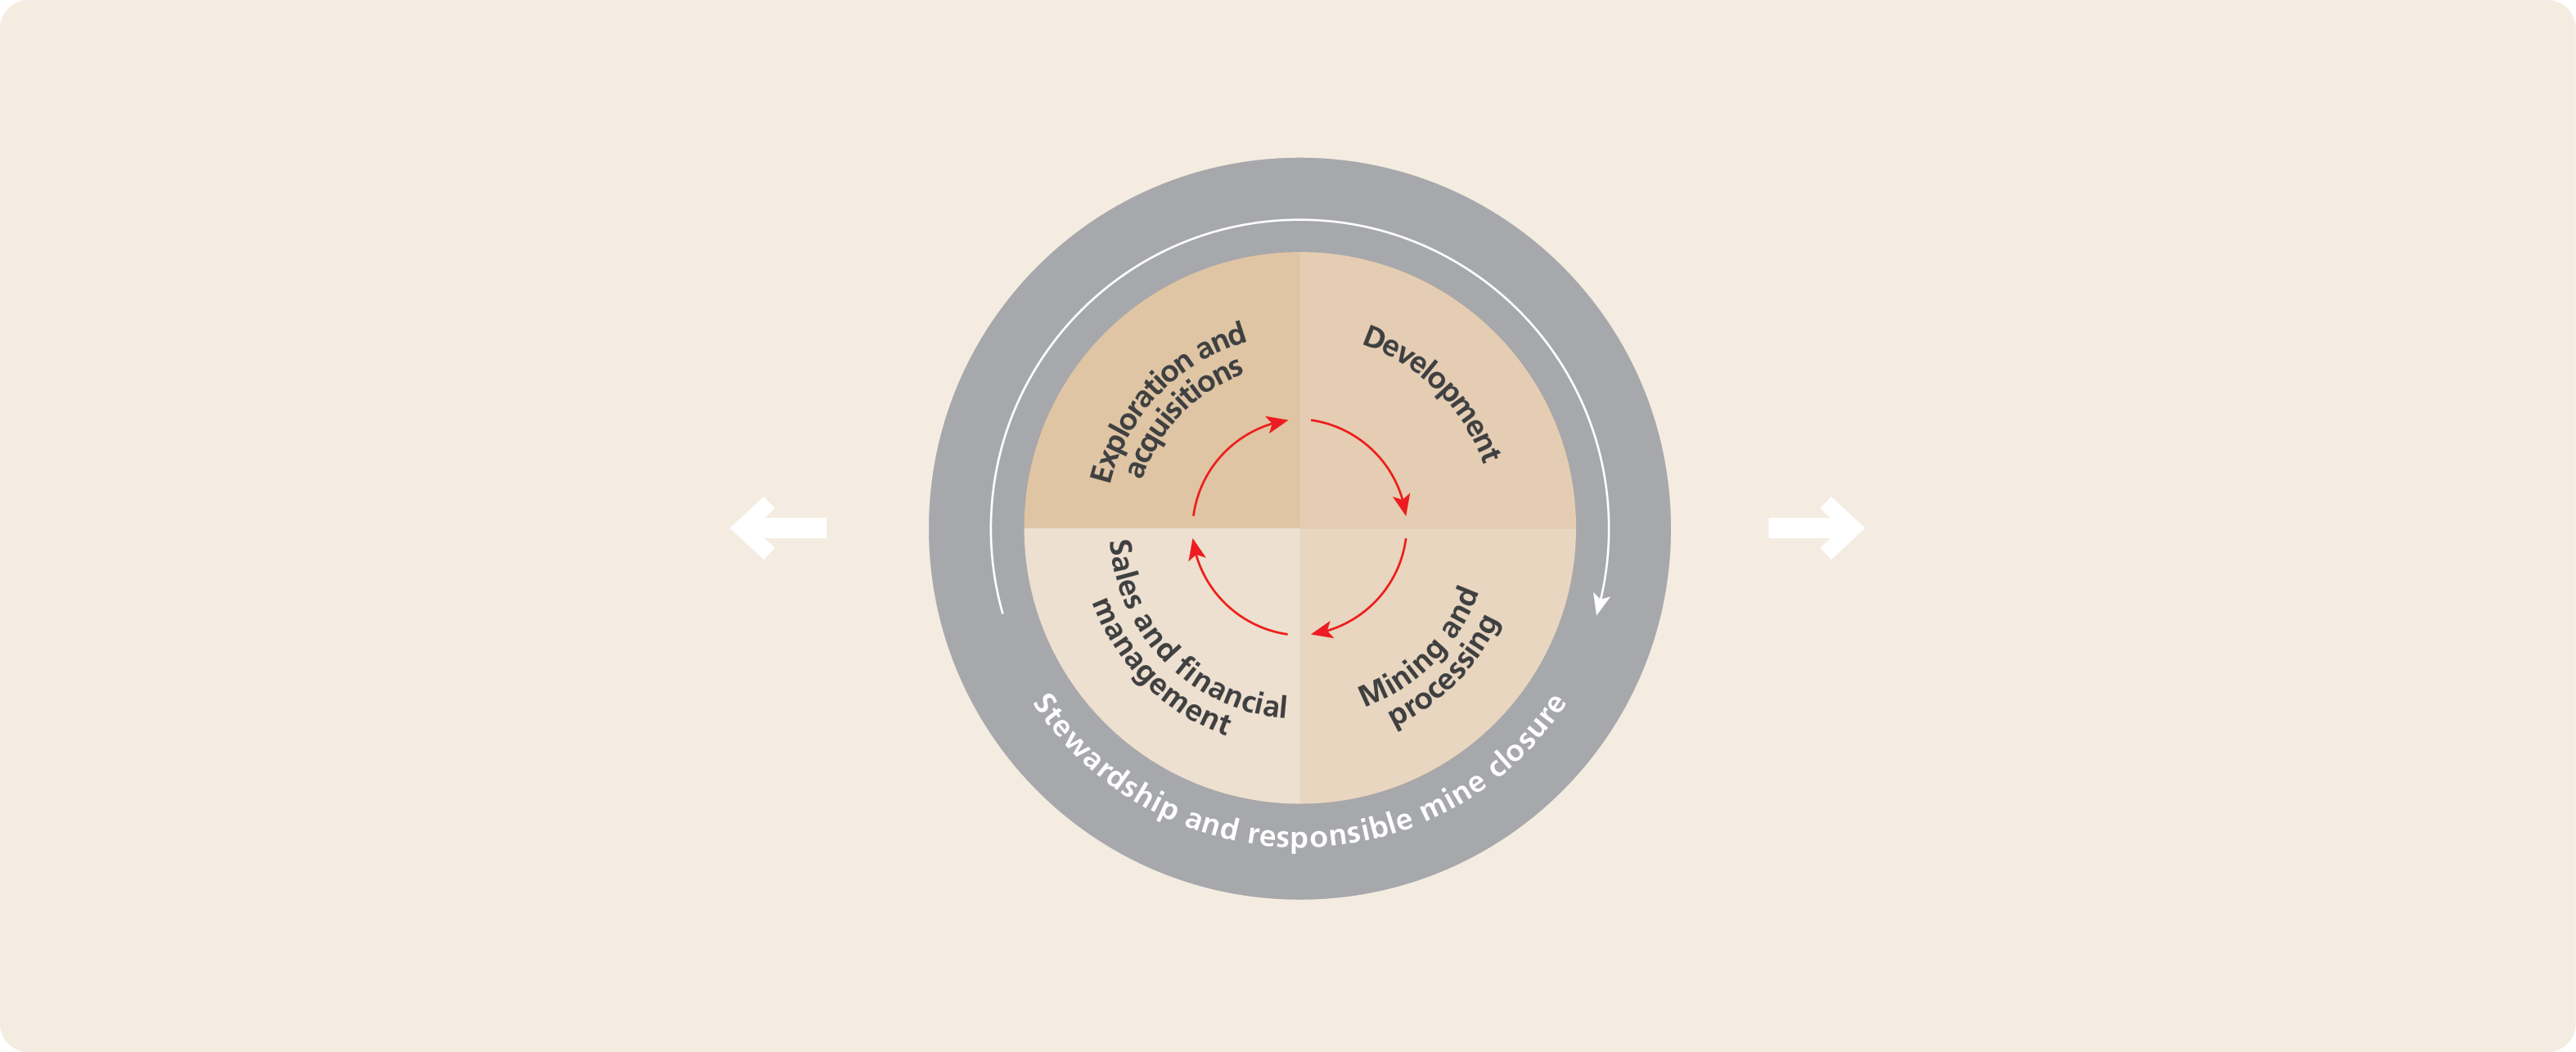
What we do
 | Exploring for and evaluating economically viable gold-bearing orebodies and/or value- accretive acquisitions in gold and copper. |  | Evaluating development options to de-risk projects before major capital outlays, the design of efficient and sustainable operations and then the building of the necessary infrastructure, facilities and systems to enable mining operations. | ||||||||||||
 | Generating revenue through the sale of gold, silver and uranium produced and optimising efficiencies to maximise financial returns. |  | Establishing, developing and operating mines, reclamation sites and related processing infrastructure. Ore mined is milled and processed by our gold plants to produce gold doré bar. | ||||||||||||
 | Responsible for our environment during operations, committed to empowering communities and employees throughout and beyond the life of our mines and restoring mining-impacted land for alternative economic use post- mining, while adhering strictly to approved mine closure commitments. | ||||||||||||||
75 years’ gold mining experience in South Africa, a 25-year presence in Australia and over 20 years in Papua New Guinea. | 1.48Moz produced (FY24: 1.56Moz) with 11.2% (166 027oz) being from reclamation activities. | 36.82Moz gold and gold equivalent Mineral Reserves (FY24: 40.26Moz). | Market capitalisation of R155.4 billion (US$8.7 billion) at 30 June 2025 (FY24: R106.3 billion (US$5.8 billion)). | |||||||||||||
How we do it
Mining with purpose
Our integrated, stakeholder-inclusive and risk-based approach to sustainable mining practices, combined with
meaningful investments in organic and inorganic growth, continues to enable the long-term success of our
business, and ultimately, sustained value creation for our stakeholders.
Sustainability is embedded in all we do and are committed to safe, ethical, social and ecologically responsible
mining. We believe we can deliver long-term, consistent results thanks to disciplined capital allocation and
operational excellence, and are well positioned to make a meaningful contribution to a low-carbon future
through our copper footprint.
Our values
We refer to ourselves as Harmonites – a community united by the hope of a greater future for ourselves, each
other and our communities. Our values are principle-centred, serving as a guide for decision making,
behaviour and our culture.
 | No matter the circumstances, safety is our main priority | Safety is our promise – not just compliance, but care. It is the foundation of our culture, where every person matters. | |||||
 | Achievement is core to our success | Achievement is our fuel – driven by purpose, resilience and the courage to turn risk into opportunity. It is the spirit behind our empowerment programmes and performance culture. | |||||
 | We are all accountable for delivering on our commitments | Accountability is our compass – owning our impact and modelling integrity. It is the backbone of our leadership development and risk propensity coaching. | |||||
 | We are all connected as one team | Connectedness is our rhythm – bridging cultures, communities and conversations. It is the essence of Thibakotsi: Unity in diversity, inclusion in action. | |||||
 | We uphold honesty in all our business dealings and communicate openly with stakeholders | Honesty is our voice – clear, courageous and authentic. It is how we build trust, foster psychological safety and lead with transparency. | |||||
Our strategy
To produce safe, profitable ounces and improve margins through operational excellence and value-accretive
acquisitions. This is made up of four pillars, detailed in the Strategy section:
RS | Responsible stewardship | OE | Operational excellence | CC | Cash certainty | ECA | Effective capital allocation | |||||||||||||||
4
Mining with purpose
For 75 years, Harmony has mined with purpose – creating long-term value for shareholders while building a sustainable business that benefits society and the economy, and promotes
responsible resource management, while expanding into copper for future resilience.
Mining with purpose defined: We are a gold mining specialist with a growing international copper footprint with sustainability embedded in our business decisions. Building a lasting positive legacy involves creating shared value for our stakeholders. Caring for, protecting and empowering employees is a core commitment. Stewardship of the environment, mining with a social conscience and sharing value with host communities guide our actions. Significant contributions to the economic development of host countries remain a priority. A stakeholder-inclusive approach drives the delivery of our strategy while carefully managing the resources on which we rely. Efforts continue to enhance positive impacts and reduce negative ones. | ||
Mining with purpose informs and guides how we:
Build a profitable, sustainable company | Create and preserve value | Deliver on our sustainability commitments | ||||||||||||
With 75 years of operational experience in South Africa, 25 years’ presence in Australia and over 20 years in Papua New Guinea, we are a gold mining specialist with a growing international copper footprint. Our disciplined capital allocation approach includes the evaluating and prioritisation of safe, sustainable, organic growth opportunities and value-accretive acquisitions to deliver positive stakeholder returns and increased margins. Our operational excellence efforts improve the safety, productivity and efficiency of our operations while achieving operational plans. These outcomes enhance our margins and reduce overall risk. As a result, we generate long-term shared value, actively contributing to the economic and social progress of the countries where we operate. Over the past 10 years, we have met production guidance each year. | Engaging meaningfully with our stakeholders is essential to safeguard the value we create. To mine with purpose, we prioritise building trust, nurturing long-term relationships and working collaboratively with key stakeholders. This approach supports the delivery of our strategic objectives and ESG commitments, while carefully balancing stakeholder expectations with business priorities. Our pursuit of positive impact and shared value beyond compliance is affected by dynamic internal and external factors. Mining with purpose allows us to effectively navigate our complex operating environment and growing international footprint. By unlocking value from a finite resource, we are able to generate lasting benefits for our stakeholders and the business. Read about our engagement practices in the Stakeholder needs and expectations section. | Sustainability is embedded into our strategic and operational decision- making processes. Through ethical, transparent and responsible mining practices, we continue to contribute positively to local communities and societies and proactively manage our environmental footprint through considered upfront planning and ongoing efforts to optimise our resource use. This philosophy is central to our sustainability framework, which drives accountability and supports our evolution into a resilient, future-focused business. It also aligns with our contribution to the UN SDGs. To monitor our progress, we track performance against medium- and long-term KPIs. | ||||||||||||
Share value with all our stakeholders | ||||||||||||||
Investors and financiers Our investors and financial partners provide the capital that drives our growth. Their support enables our ongoing expansion, allowing us to maintain financial flexibility, deliver value to shareholders, and achieve consistent earnings and share price appreciation. | Employees, contractors and unions Our employees are our greatest strength, and we are committed to safeguarding and enabling their growth. Their expertise, insights and contributions within our host communities are essential to our success. We prioritise their wellbeing, professional development and empowerment – fostering a workplace that is safe, healthy and highly productive. | |||||||||||||
Communities, traditional authorities and NGOs To uphold our social licence to operate, we collaborate with our host communities and develop shared solutions to local challenges. Through these partnerships, we contribute to the long-term, socio-economic advancement of the regions where we are active. | Governments and regulators Our operations are conducted in accordance with the legal frameworks of the countries in which we operate, ensuring ethical and responsible mining practices. The taxes and royalties we pay support national development and help strengthen host country economies. | |||||||||||||
Suppliers Through procurement, job creation and enterprise development, we invest in strengthening supplier capabilities and drive meaningful transformation within our host communities and the wider economy. Our upstream value chain supplies the essential goods and services that enable us to run our operations. | ||||||||||||||
5
MAC Copper acquisition
Harmony announced the acquisition of MAC Copper Limited in May 2025. MAC Copper is the owner of
the CSA mine in Cobar, New South Wales, Australia. The transaction, for a consideration of
US$1.03 billion, signifies a landmark achievement in our transformation into a global gold and copper
producer, as it introduces a high-grade, underground, copper asset that produced approximately 41kt of
high-quality copper in calendar year 2024. This investment fully aligns with our investment criteria
focused on enhancing free cash flow and improving margin quality.
CSA mine is recognised as one of Australia’s highest-grade copper operations, offering long-life
production and low-cost operational advantages. This acquisition provides us with the opportunity
to optimise operational efficiencies and extend life-of-mine.
This transaction reinforces our strategic objective to build a resilient, low-cost, global gold and copper
mining company. CSA mine adds significant scale to our copper production, enhancing our commodity
diversification and reducing our reliance on gold price cyclicality. Copper’s strategic importance as a
critical metal for global decarbonisation and energy transition further underscores the value of this
acquisition.
Harmony is financing the acquisition through a balanced mix of available cash resources, debt facilities and
potential debt instruments, leveraging our strong balance sheet to maintain financial flexibility and protect
shareholder returns. This disciplined capital allocation approach demonstrates our commitment to value-
accretive investments that strengthen our operational, financial and strategic foundation.
We are confident that our underground mining expertise will unlock additional operational value, and
this transaction marks a meaningful advance in de-risking our asset base and growing our long-term
value proposition.
The acquisition positions Harmony to capitalise on copper’s rising demand in a Tier 1 mining jurisdiction.
It underscores our commitment to disciplined growth, operational excellence and long-term value
creation for all stakeholders. This acquisition marks a significant step in our transformation into a global
gold-copper producer.
The transaction concluded and took effect on 24 October 2025. While guidance on this acquisition will
be provided in H2 FY26, selected details on the CSA mine are included in this report.
6
Our leadership
7
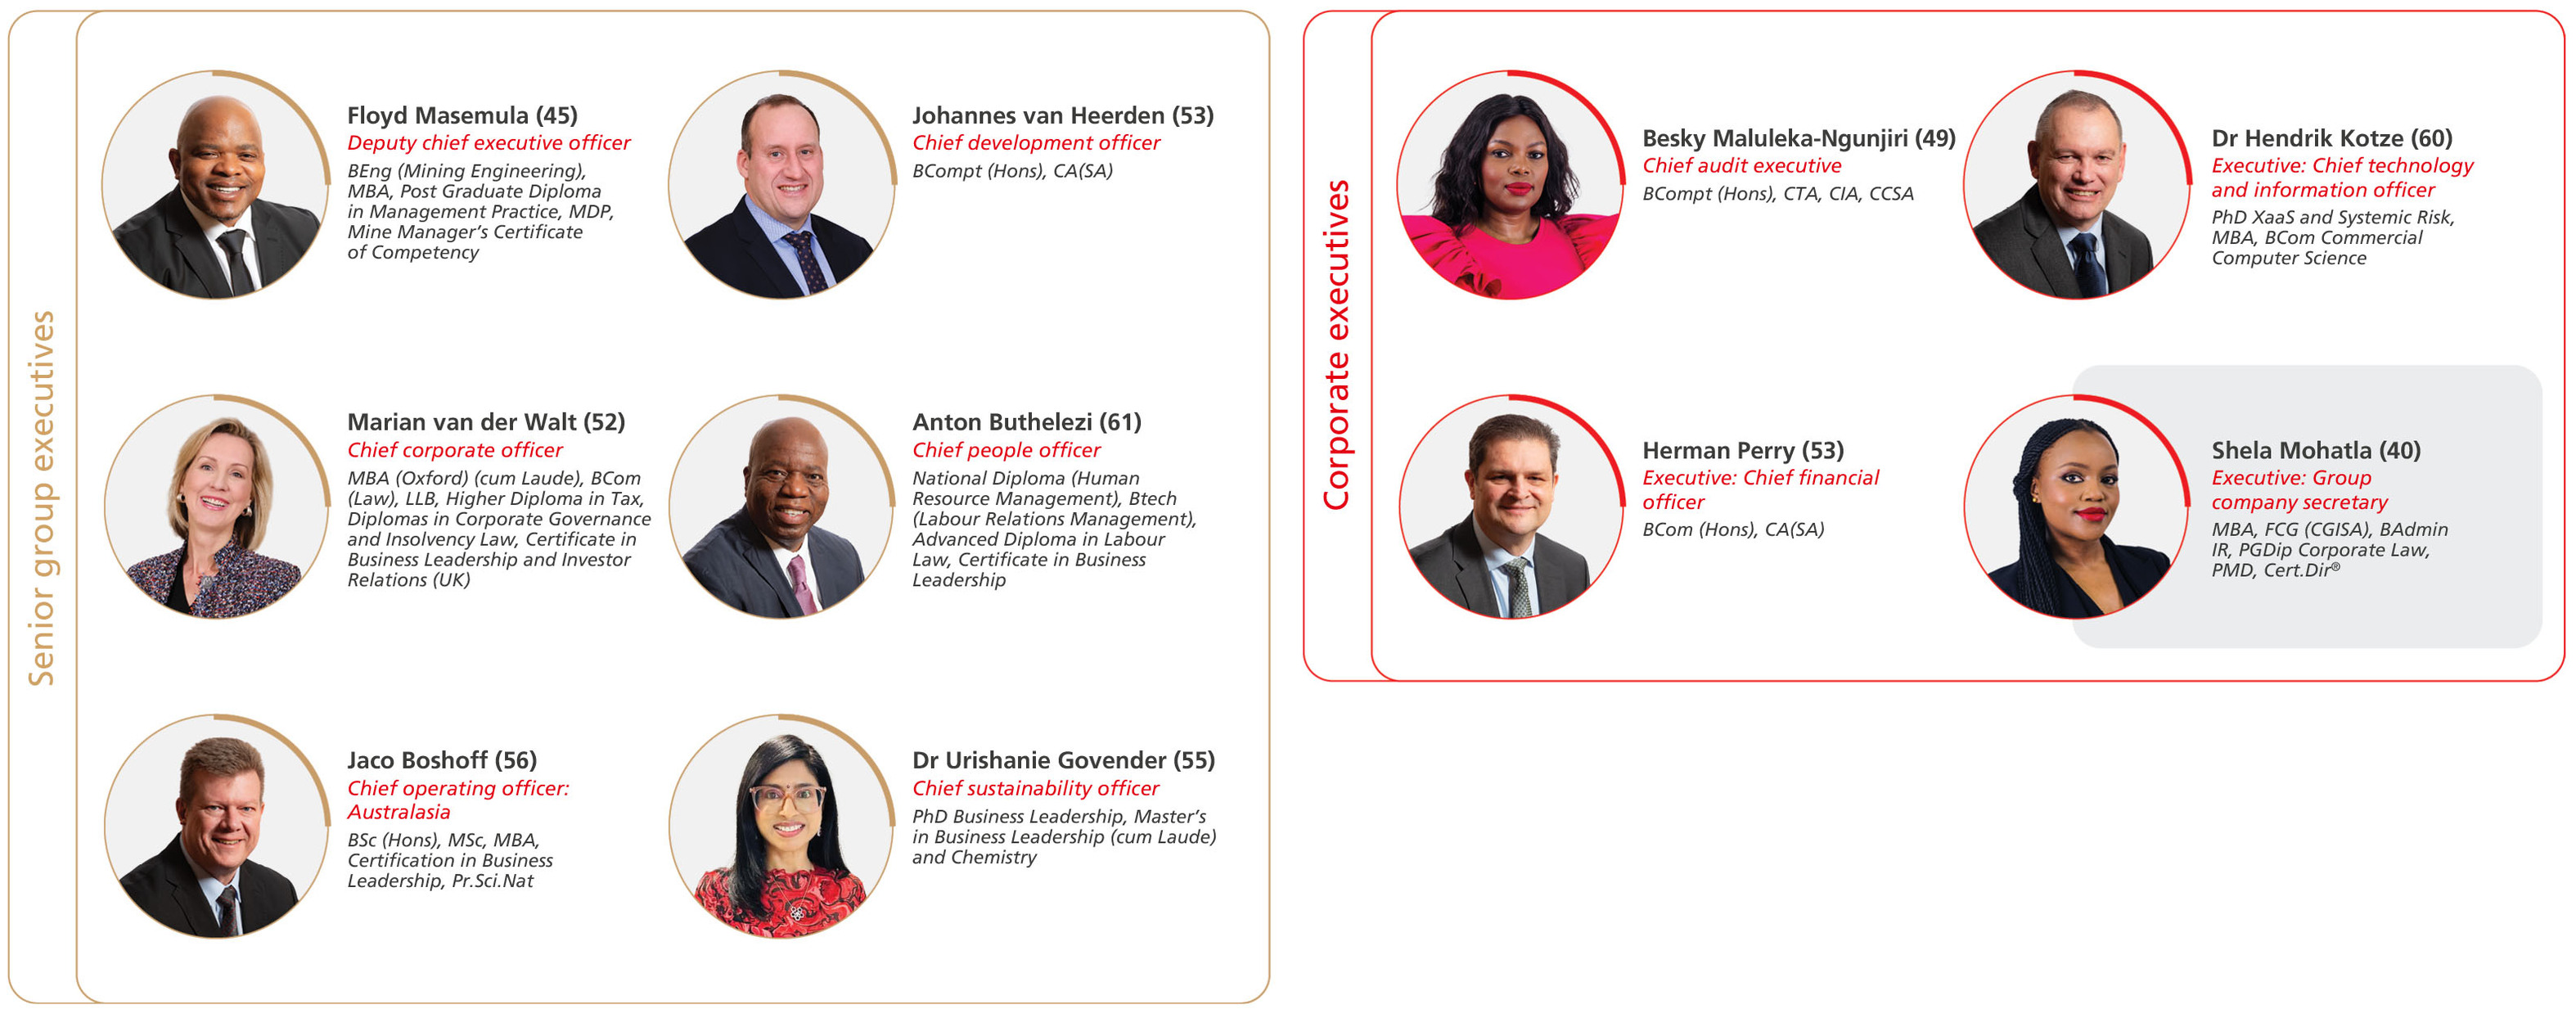
Executive management
Harmony’s executive management team comprises the chief executive officer, financial director and an executive director (see above). Together with six prescribed officers, they serve as the group executive committee.
This committee is supported by four corporate executives, who make up the group chief executive’s office.
There are also regional executive committees for South Africa and Australasia.
Detailed résumés of members of Harmony’s executive management are available at www.harmony.co.za/who-we-are/executive.
8
Chairman’s statement
Dear shareholders and
stakeholders
FY25 was a year of strong performance and
excellent execution by Harmony’s
management.
It also marked our 75th anniversary, a
milestone that celebrates our proud legacy as
a leading gold miner and our transformation
into a globally competitive gold-copper
producer.
This was also our 10th consecutive year of
meeting production guidance, an objective
that is seldom achieved in our sector. This is
testament to our operational excellence and
world class leadership.
These achievements illustrate the consistency
of our performance, and our continued
commitment to creating long-term value
through operational excellence and effective
capital allocation.
Performance and financial strength
Harmony once again delivered strong
operational and financial results in FY25,
despite persistent currency volatility,
macroeconomic complexity, and geopolitical
uncertainty.
Gold production reached 1.48Moz at an
underground recovered grade of 6.27g/t, with
all-in sustaining costs of R1 054 346/kg
(US$1,806/oz). Supported by unprecedented
gold prices, excellent operational
performances, Harmony generated record
adjusted free cash flows of R11.1 billion at a
15.1% margin.
Headline earnings grew by 26.6% with the
highest dividend payout of R2.4 billion
(US$133 million) for FY25.
Harmony ended the year with a net cash
position of R11.1 billion (US$628 million) and
liquidity of R20.9 billion (US$1.18 billion),
providing the flexibility to fund growth, sustain
competitive dividends and maintain a robust
and resilient balance sheet.
This strong financial position will enable
continued investment in our portfolio of high-
quality, long-life gold and copper assets,
ensuring enduring value creation for our
shareholders and stakeholders.
Strategic growth: gold and copper
Gold remains the cornerstone of Harmony’s
portfolio, underpinned by our world-class,
high-grade, long-life assets at Mponeng and
Moab Khotsong, which continue to generate
exceptional margins and cash flow.
Concurrently, copper has emerged as a central
pillar of our growth strategy, a critical metal
for the global energy transition and a natural
strategic complement to our gold portfolio.
In FY25, the Eva Copper, copper Mineral
Resources increased by 31%, underscoring its
quality and scale. We also announced the MAC
Copper acquisition, adding the CSA Mine in
Australia, a high-grade, cash-generating asset.
This acquisition brings over 40kt per annum of
immediate copper production. Our copper
portfolio which includes, Eva Copper and Wafi-
Golpu, firmly positions Harmony as an
emerging, globally competitive gold and
copper producer.
We expect copper to contribute around 40%
of group production by FY35, ensuring
structural resilience through commodity cycles
and aligning Harmony with global
decarbonisation trends.
Safety and sustainability
Safety remains our highest priority and a
fundamental pillar of our operational
philosophy. We are deeply saddened by the
loss of 11 colleagues during the year. We
extend our heartfelt condolences to their
families and loved ones. Every loss is one too
many.
Our commitment to zero harm remains
unwavering, supported by dedicated and
visible leadership, proactive risk management,
and technology-driven monitoring across all
operations. Our LTIFR improved to 5.39 in this
financial year.
Sustainability continues to underpin our long-
term competitiveness. In FY25, we advanced
our decarbonisation roadmap, targeting a 63%
reduction in Scope 1 and 2 emissions by 2036
and net zero by 2045. Nearly 600MW of
renewable energy projects are planned to be
commissioned by 2028, including a 100MW
solar plant under construction at Moab
Khotsong. We recorded no environmental
incidents above level 3, a reflection of
disciplined environmental management.
Refer to social and ethics chairperson’s report.
Responsible mining and shared value
Harmony’s objectives and commitment
extends beyond mining ounces; it is about
creating lasting socio-economic impact. In
FY25, we contributed R6.0 billion (US$331
million) in taxes and royalties in South Africa
and R304 million (US$16.7 million) in Papua
New Guinea. We continue to be a trusted
partner in the communities and countries
where we operate.
Employee salaries and benefits totalled
R20.2 billion (US$1.1 billion), complemented
by significant investment in local procurement
and community development. The five-year
wage agreement concluded in FY24 continues
to provide stability and strengthen our
partnership with employees and unions,
reinforcing our commitment to shared
prosperity.
Governance and leadership
Harmony’s business is built on a strong ethical
foundation, underpinned by core values that
shape our organisational culture and guide
every decision we make.
We remain deeply committed to upholding
the highest standards of corporate
governance, transparency, integrity and
accountability across all aspects of our
business.
Our comprehensive governance framework
continues to guide strategic decision-making
and safeguards the long-term value we create
for all stakeholders.
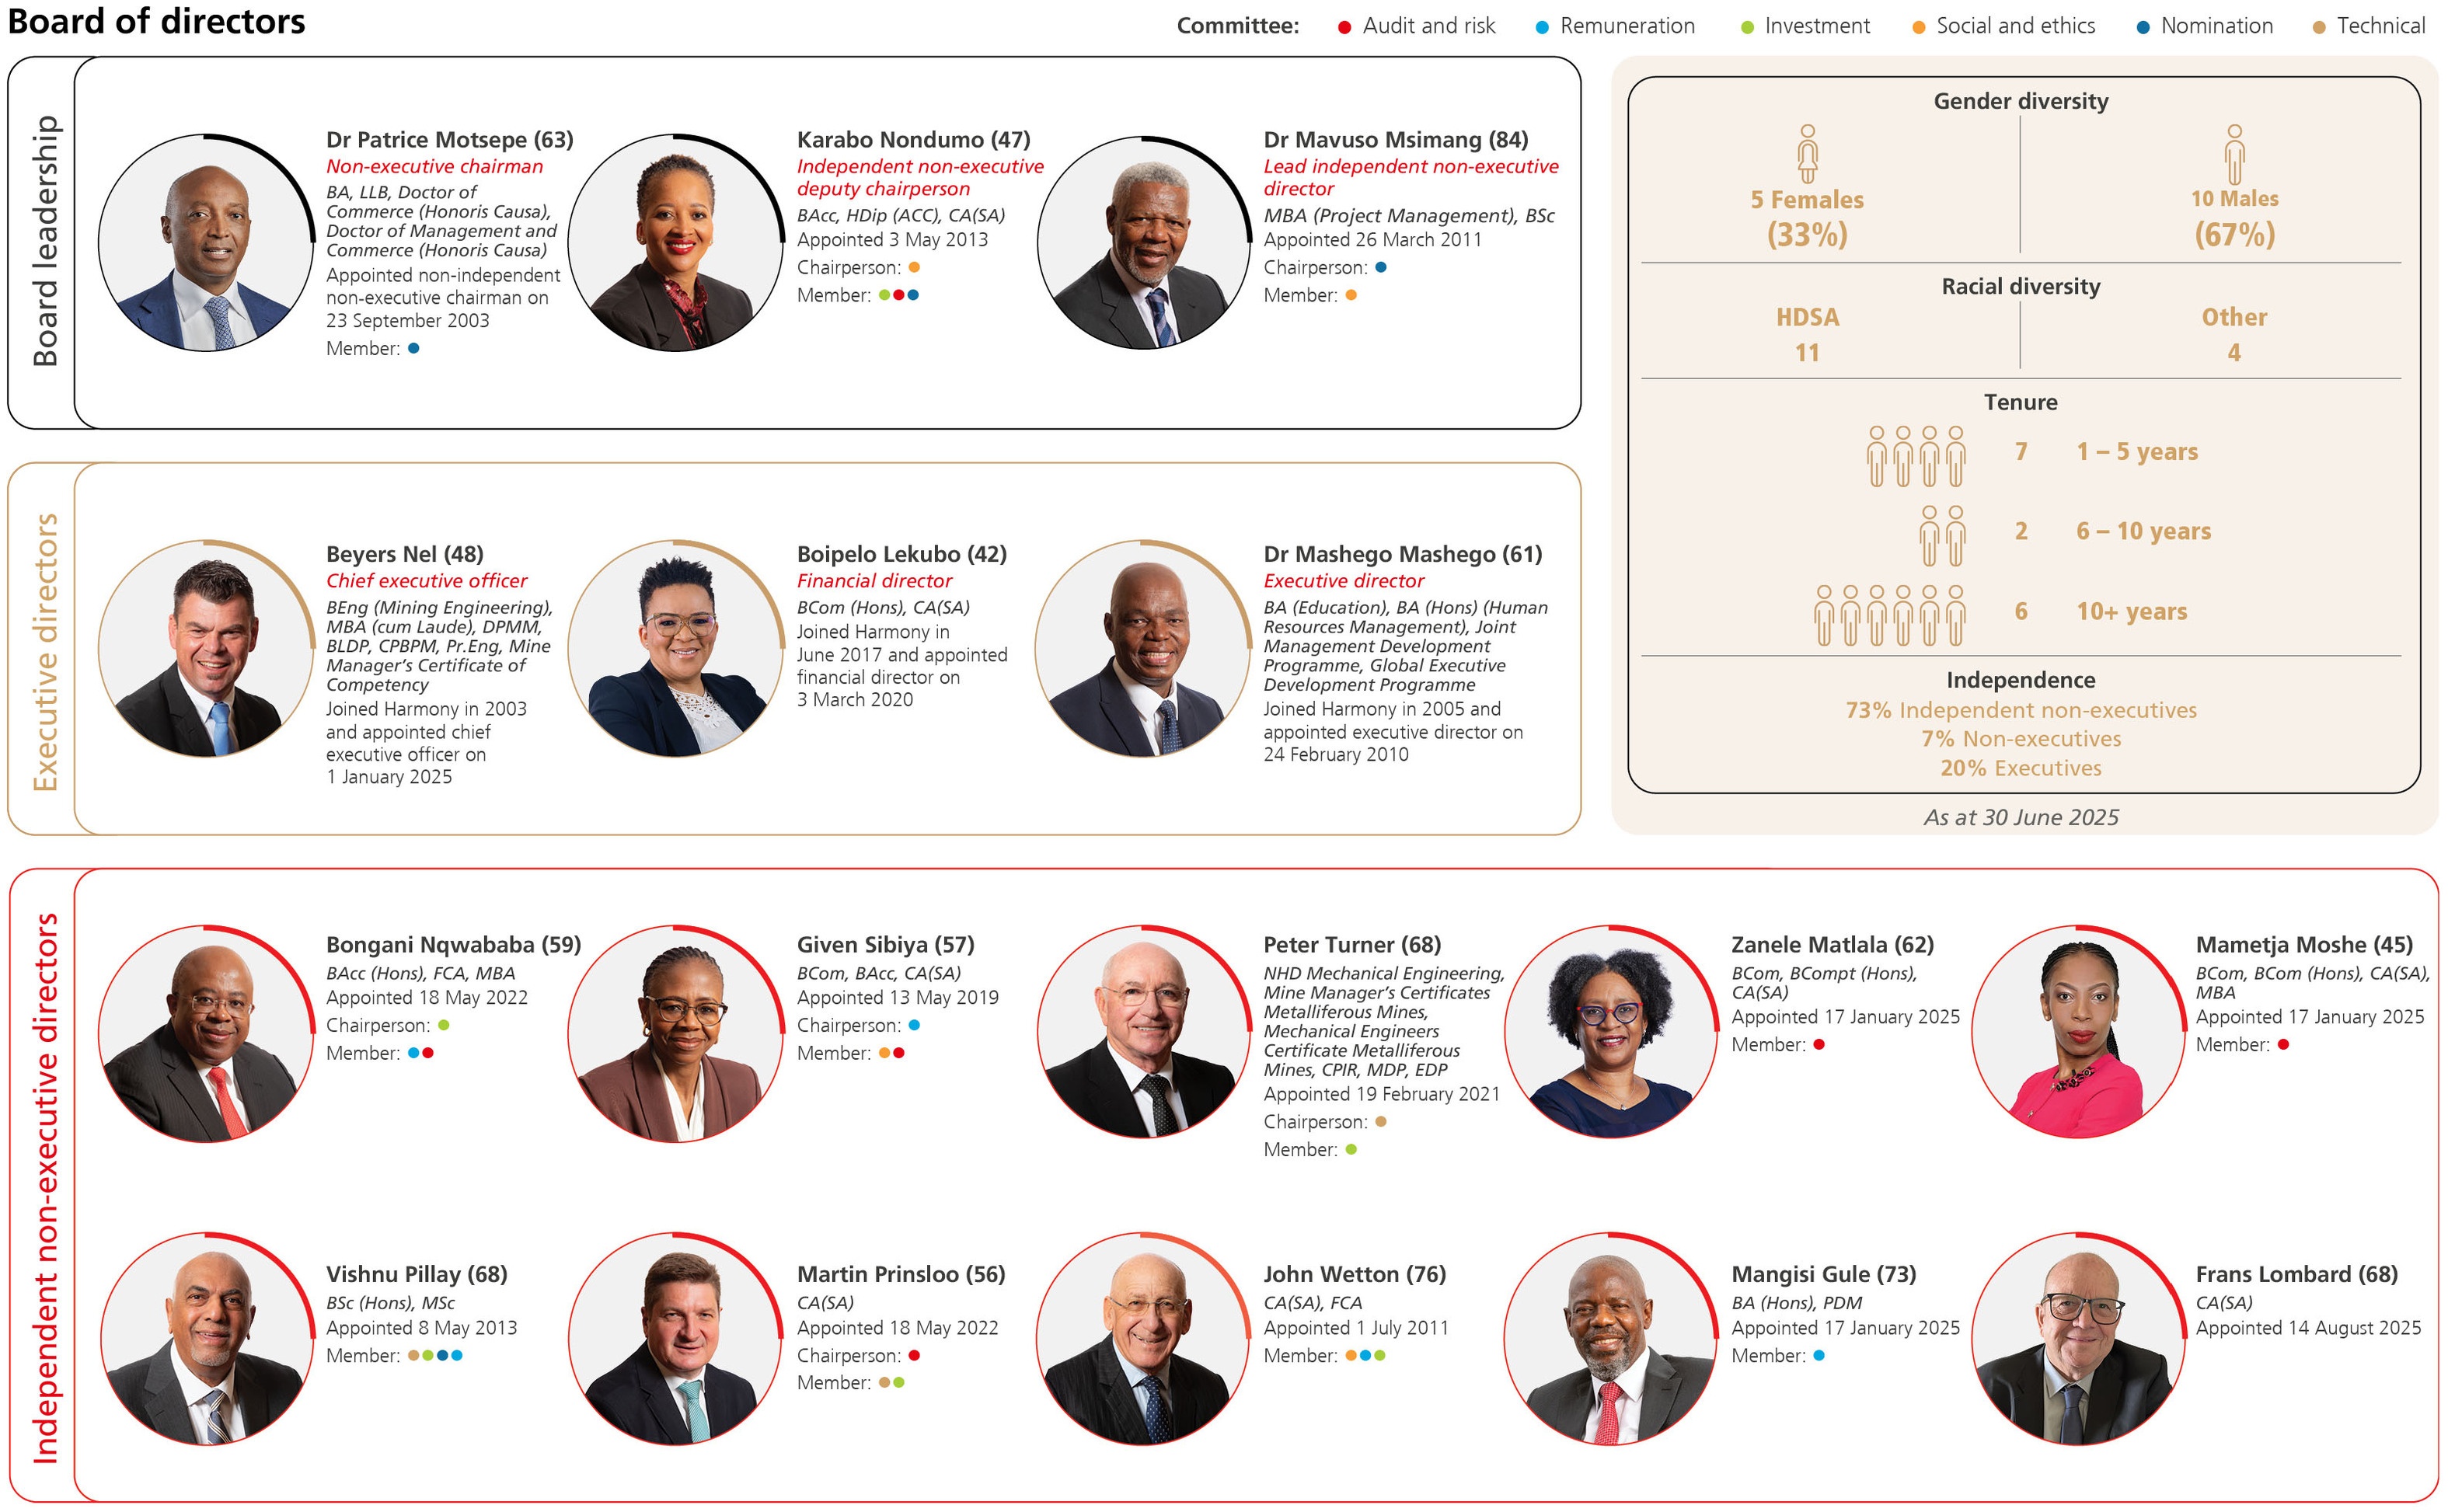
During the year, we welcomed Mametja
Moshe, Zanele Matlala, Mangisi Gule, and
Frans (“Faan”) Lombard to the Board. These
appointments strengthen the independence,
expertise and diversity necessary for robust,
well-informed decision-making and effective
oversight of strategy.
We also extend our sincere gratitude to John
Wetton, who retires by rotation this year.
After many years of dedicated service, John
will not be standing for re-election, though
eligible. This will be effective as of the
conclusion of the 2025 annual general
meeting.
The Board continues to review its composition
annually to ensure it retains the optimal
balance of skills, experience, and
independence required to support strategic
delivery.
As part of our ongoing transition plan, we are
aligning our governance practices with global
best standards to ensure accountability,
transparency, agility, and long-term
sustainability.
Looking ahead
As we mark 75 years of Harmony, our strategy
remains clear and focused and is to:
▪deliver safe, profitable ounces while
investing in value accretive growth;
▪generate strong cash flows and maintain a
robust balance sheet;
▪advance copper integration into our
portfolio, and thereby diversify earnings
▪support and benefit from the global energy
transition;
▪embed sustainability.
Acknowledgments
On behalf of the Board, I extend my heartfelt
gratitude to our employees, unions,
communities, partners, and shareholders for
their cooperation and continued support
throughout the year. Your dedication and
partnership are central to Harmony’s
sustained success.
9
I also wish to express my personal gratitude to
my fellow Board members for their advice,
insight and steadfast commitment to the
highest standards of governance and ethical
leadership. Their collective wisdom and
oversight continue to strengthen Harmony’s
strategic direction and resilience.
I would like to express our deep gratitude to
Peter Steenkamp for his outstanding
leadership and many years of success as CEO,
which have been pivotal to Harmony’s
transformation and growth.
We warmly welcome Beyers Nel, who
succeeded Peter as Group CEO on
1 January 2025. Beyers brings deep
operational expertise, technical insight, and a
strong understanding of Harmony’s strategic
priorities.
The Board has full confidence that, under
Beyers’ leadership, Harmony will continue to
create sustainable value, advance copper
integration, and strengthen its position as a
diversified and globally competitive company.
The board, management and staff are
committed to continue building on Harmony’s
proud legacy and to strengthen the company’s
position as a leader in gold production while
expanding our copper portfolio to ensure
Harmony’s global competitiveness.
Dr Patrice Motsepe
Chairman
24 October 2025
10
Chief executive officer’s review
FY25 marked another year of consistent
delivery for Harmony. We met our production
guidance for the 10th consecutive year,
generated record adjusted free cash flows and
delivered strong shareholder returns. As we
celebrate our 75th anniversary, we remain
rooted in gold while evolving into a global,
low-cost gold and copper producer.
Copper, a critical enabler of the energy
transition, strengthens our portfolio and
supports long-term value creation.
Our purpose – creating shared value through
responsible mining – continues to guide our
strategy. Safety, operational excellence and
disciplined capital allocation remain non-
negotiable. This approach has delivered a
decade of consistency and positioned us
for sustainable growth, robust cash flow
generation supported by quality orebodies,
expanding international assets and strong
stakeholder relationships.
Our progress over recent years owes much to
the vision and commitment of my
predecessor, Peter Steenkamp, whose
leadership laid a solid foundation for our
continued growth.
Safety and operational excellence
Safety remains our top priority. While our LTIFR
continues to trend lower and despite reaching
a record low of 5.39 per million hours worked,
we tragically lost 11 colleagues this year. We
continue to strengthen our safety culture,
guided by a robust strategy and proactive risk
management. Our humanistic transformation
journey is 79% complete, and we are investing
in relevant technologies, training and
leadership engagement to achieve zero harm.
Operationally, we met our production, cost
and grade guidance in FY25. Underground
recovered grades rose by 2.6% to 6.27g/t.
Although total production declined by 5.3% to
46 023kg (1 479 671oz) in line with plan, this
remained within guidance. Our high-grade
South African underground mines, particularly
Mponeng, alongside Hidden Valley in Papua
New Guinea, delivered exceptional results.
Higher grades and a 27.2% increase in the
average gold price to R1 529 358/kg
(US$2 620/oz) drove a 21.4% increase in gold
revenue. Headline earnings per share rose
by 26.2% to 2 337 SA cents, while basic
earnings per share increased by 66.9% to
2 313 SA cents.
Capital expenditure reached R11.0 billion,
a function of directing capital to assets and
projects that will deliver the best possible
returns. Capital expenditure in the past
financial year was driven mainly by the
extension projects at Moab Khotsong and
Mponeng, the 100MW renewable energy
project at Moab Khotsong, early works at the
Eva Copper Project and the Kareerand TSF
extension, which is largely complete.
In memoriam | ||
Mojalefa Segage Moab Khotsong mine – rock drill operator | ||
Phakamani Khiphezakho Gumbi Doornkop mine – machine rock driller | ||
Telang Nene Doornkop mine – machine rock driller | ||
Moloja Samuel Leteketa Joel mine – rock drill operator | ||
Morero Patric Taeli Joel mine – rock drill operator | ||
Themba Ephraim Maloka Joel mine – stope team member | ||
Fundile Mdungelwa Mponeng mine – scraper winch operator | ||
Andile Goodman Toko Mponeng mine – mining team member | ||
Joaquim Alfredo Chihobomo Cossa Moab Khotsong mine – loco operator | ||
Lebamang Senetane Saaiplaas plant – general worker | ||
Lebohang Mokiri Joel mine – stope team member | ||
Consistent safety improvements | Total gold produced | Growth capital spent | Adjusted free cash flow | |||||||||||
▪Group LTIFR1 at 5.39 from 5.53 in FY24 and 7.21 from FY17. | ▪46 023kg (1 479 671oz) ▪This is down 5.3%, but still within the FY25 production guidance. | ▪R11.0 billion (US$606 million) allocated towards projects. | ▪+53.6% to R11.1 billion (US$614 million) ▪15.8% margin. | |||||||||||
Underground recovered grades | AISC2 | Robust balance sheet | Final dividend | |||||||||||
▪+2.6% to 6.27g/t ▪Met our revised guidance of more than 6.00g/ t. | ▪R1 054 346/kg (US$1 806/oz) ▪Costs remain contained and within guidance. | ▪Net debt:EBITDA3 ratio of <1x. | ▪155 SA cents ▪9 US cents4. | |||||||||||
1 LTIFR: Lost-time injury frequency rate. 2 AISC: All-in sustaining cost. | 3 EBITDA: Earnings before interest, taxes, depreciation and amortisation. 4 Illustrative equivalent based on the closing exchange rate of R17.45/US$1 as at 22 August 2025. | |||||||||||||
11
Financial strength and cost discipline
Harmony maintained strong cost controls, with
AISC below guidance at R1 054 346/kg (US$1 806/
oz). Total labour costs, representing 51.6% of cash
operating costs, remained predictable due to our
five-year wage agreement. By investing in
renewable energy, the effects of escalating
electricity tariffs are being reduced and will
continue to be offset over time. Royalties increased
significantly as a result of higher revenue and
improved profitability, contributing 4.4% to SA cash
operating costs.
We ended FY25 with R20.9 billion (US$1.2 billion)
in available liquidity and net cash increased by
284.5% to R11.1 billion (US$628 million). Adjusted
free cash flow surged to a record level of
R11.1 billion (US$614 million), driven by higher
recovered grades, elevated gold prices and the
increased contributions from our high-margin
surface operations in South Africa and Papua New
Guinea as well as Mponeng. These strong cash
flows provide flexibility to fund growth, sustain
dividends, and pursue value-accretive acquisitions.
Sustainability embedded in strategy
Sustainability is central to our strategy and
decision making. Our framework addresses global
imperatives and local challenges, including safety,
reserve replacement, energy security, land
rehabilitation, water stewardship, and community
wellbeing.
We received external recognition for our
sustainability practices, including inclusion in
the FTSE4Good Index for the eighth consecutive
year, an A- rating for water management, and an
upgraded MSCI ESG rating to BB.
Our decarbonisation roadmap includes
investments in renewable energy and efficiency.
We have deployed 30MW of solar capacity, with a
further 100MW currently under construction. We
aim to install approximately 600MW of
renewables and an additional 200MW via short-
term power purchase agreements by FY28. These
investments will reduce scope 1 and 2 emissions
by 63% by FY36, lower our energy costs and
support our net-zero goal by FY45.
Tailings retreatment is a core part of our business
and offers attractive margins and ESG benefits. We
are advancing feasibility studies to convert 5.7Moz
of Mineral Resources in the Free State into
Reserves.
We invest significantly in community
development, benefiting thousands of people and
reinforcing our commitment to building trust and
lasting relationships.
Operational performance
Our operations are divided into four quadrants,
based on our capital allocation strategy: South
African underground high-grade, South African
underground optimised, South African surface,
and international gold and copper. Each plays a
vital role in generating cash, sustaining growth,
and diversifying risk ensuring we consistently
deliver to guidance. Importantly, in FY25, 64% of
our production, excluding SA optimised
underground business area, was at an AISC below
US$1 500/oz.
South African high-grade underground operations
(Mponeng and Moab Khotsong) delivered a 9.7%
improvement in recovered grades to 9.89g/t.
These assets contributed 36% of production and
generated 46.1% of our adjusted free cash flows at
a margin of 34.6%. Mponeng’s performance was
particularly strong, with a 13.4% increase in grade
to 11.27g/t. These long-life assets continue to
generate strong free cash flows and remain central
to our long-term strategy.
International operations at Hidden Valley
maintained gold production at 5 107kg
(164 193oz). This mine contributed 11.1% of total
production and generated 19.6% of total adjusted
free cash flows at a phenomenal 47.5% margin.
The life-of-mine was extended to March 2030 and
studies are underway to assess further extensions
beyond 2030.
SA surface operations performed in line with
expectations, though excessive rainfall impacted
production at Mine Waste Solutions. Despite
lower recovered grades, adjusted free cash flow
generation remained strong. These operations
contributed 17.1% of group production and
generated 22.4% of our adjusted cash flows
at a 36% margin.
South African optimised underground operations
(Doornkop, Tshepong North, Tshepong South, Joel,
Target 1, Kusasalethu and Masimong) contributed
35.8% to group production and generated 11.8%
of group adjusted free cash flows at a 9% margin.
Despite operational challenges and a 13.5%
decline in production, these assets delivered
positive adjusted free cash flows – supporting our
social licence and funding of our various projects.
International gold and copper projects
At Eva Copper in Australia, we have completed over
153 000 metres of drilling since acquisition,
increasing copper resources by 31% and gold by
11.8%. The feasibility study is in its final phase,
and we are exploring long-term power solutions.
Eva Copper was declared a prescribed project
by the Queensland Government, supporting our
environmental authority amendment application.
We are expecting to release the results of the
Feasibility Study update before the end of calendar
2025.
We continue negotiations to secure the mining
lease for Wafi-Golpu, a transformational and key
asset in our international growth strategy.
Strategic capital allocation
Our capital allocation framework ensures
disciplined investment aligned with our four
strategic pillars: Responsible stewardship,
operational excellence, cash certainty and
effective capital allocation.
Group capital expenditure remains focused
on delivering safe, profitable ounces and
maintaining flexibility at our mines. Most of our
major capital is directed towards our high-grade
underground, high-margin surface assets and
international copper-gold growth projects.
We have maintained a consistent and clear
hedging strategy to lock-in margins and protect
our balance sheet as we execute on our
comprehensive project pipeline. In line with our
policy, we hedge up to 30% of gold production
over a rolling period of 36 months to protect
margins and ensure operational and financial
stability. This supports consistent performance
during elevated capital investment periods.
A final dividend of 155 SA cents (9 US cents)
per share was declared, bringing total FY25
shareholder payout to a record R2.4 billion
(US$133 million).
Outlook and priorities
We remain committed to protecting our balance
sheet and cash flow, ensuring growth is affordable
and sequenced. Our focus is on safety, portfolio
quality, profitability, growth and sustainable
mining.
FY26 guidance includes production of 1.4Moz
to 1.5Moz at an AISC of R1 150 000/kg to
R1 220 000/kg. Underground recovered grade
is guided above 5.8g/t. Capital expenditure is
expected to rise to R13.0 billion (US$699 million),
reflecting strategic investments in high-quality
ounces and long-term growth. Included in this is the
once-off fleet replacement at Hidden Valley due to
the life-of-mine extension.
We will revisit guidance in February 2026,
contingent on the successful MAC Copper
transaction and the updated Feasibility Study
for Eva Copper.
MAC Copper acquisition
In May 2025, we announced the US$1.03 billion
acquisition of MAC Copper Limited, owner of CSA
mine in Cobar, New South Wales.
This acquisition marks a significant step in our
transformation into a global gold-copper producer.
Regulatory approvals have been received and the
transaction is concluding and takes effect on 24
October 2025.
A note of thanks
I extend my heartfelt thanks to every Harmonite
for their dedication and hard work in FY25. As
I reflect on my first 10 months as CEO, I am proud
of what has been achieved as a team. I encourage
all employees to embrace a leadership mindset –
proactively shaping our future and driving
progress.
Thank you to our board, unions, shareholders, and
stakeholders for your continued support. Special
thanks to our chairman and again my predecessor,
Peter Steenkamp, for their leadership and vision.
As we celebrate 75 years of Harmony, we do so
with pride in our legacy and confidence in our
future as we transform into a high-quality,
geographically diversified gold and copper
producer. This is mining with purpose.
Beyers Nel
CEO
24 October 2025
12
Business model
Our business model explains how we create value through our inputs, the business activities we undertake and the outcomes we achieve.
We draw on different resources and relationships (our capitals) as inputs, and through our business activities, transform them into outputs that, in turn, lead to broader outcomes that impact our capitals. We recognise
that our outcomes impact our future inputs across the capitals. Together with other stakeholders and elements that make up our external environment, our outcomes influence capital availability, quality and
affordability. This continuous interplay influences the efficacy of our business model. The details that follow highlight how we mine with purpose, managing our inputs, delivering on our strategy while we manage
related risks and leverage opportunities.
Harmony remains South Africa’s largest gold producer, mining with purpose while strategically diversifying into copper to enhance resilience, improve margins, align with global decarbonisation trends, and deliver enduring value for shareholders and stakeholders. | ||
13
Inputs | ||||||||||||||||||||||
Our diverse internal and external capitals both depend on and impact the geographical, geopolitical and regulatory environments in which we operate. They differentiate us from our peers, strengthening Harmony’s resilience in the short, medium and long term. We also manage the interdependencies between the capitals, considering how their affordability, quality and availability could impact Harmony’s long-term value creation. | ||||||||||||||||||||||
Financial capital | Manufactured capital | Intellectual capital | Human capital | Social and relationship capital | Natural capital | |||||||||||||||||
Our financial capital comprises funds sourced from investors, external financing and internally generated cash. These resources are strategically invested in high-quality assets and projects that drive Harmony’s sustainable growth. For the 10th consecutive year, we have met production and, this year, generated record free cash flows. With a strong cash position, prudent hedging and available facilities, we can fund capital projects while protecting profit margins and benefiting from gold price movements. | Our manufactured capital consists of the physical, material and technological infrastructure we own, lease or manage to support the production of gold, silver and uranium. We are diversifying into copper. With a strong presence across multiple geographies that includes a robust project pipeline, our goal is to reduce risk and improve margins. Our portfolio includes long-life assets with excellent resource-to-reserve conversion potential. | Our intellectual capital is the intangible value of our deep industry expertise and experience, including mining, the circular economy, leadership, acquisitions and project development capabilities. As a specialist gold mining company evolving into copper, we have the opportunity to transfer our deep underground mining expertise, safety systems and operational excellence programmes to our copper acquisitions. | Our human capital includes our employees and contractors who enable the delivery of our business activities through their collective knowledge, capabilities and experience that includes specialised underground and open-pit capabilities. Our human capital strength also lies in the scale and localisation of employment, robust health and safety programmes, commitment to gender equity and inclusivity, and seasoned leadership. | This capital includes the relationships and partnerships essential for our licence to operate and to create shared value. Our intent is to be a partner of choice by building durable, trust-based relationships with our employees, suppliers, host communities and governments. Through impactful community investments and inclusive socio- economic transformation we demonstrate our commitment to being a socially responsible and relationship-focused mining house. | Our natural capital includes the essential resources (water, land, minerals and energy) required for our operations with sustainability embedded into our strategy and business model. We have a significant and diversified Mineral Resource base, strengthened by our expansion into copper. Through acquisitions and portfolio optimisation, we have increased grade quality. We are the world’s largest tailings retreatment operator. | |||||||||||||||||
Interdependencies and resource constraints | Interdependencies and resource constraints | Interdependencies and resource constraints | Interdependencies and resource constraints | Interdependencies and resource constraints | Interdependencies and resource constraints | |||||||||||||||||
▪We invest a significant amount of financial capital into all other capitals to secure the long-term success of our business ▪Our financial capital is impacted by factors beyond our control, including gold price fluctuations, inflation and rising electricity tariffs ▪Our derivative and hedging strategies remain responsive to persistent macro-economic instability. | ▪The availability and quality of manufactured capital depend on a significant investment of financial, intellectual and natural capital ▪Maintaining and modernising our operations are necessary for us to operate safely, efficiently and profitably. | ▪Culture transformation to achieve zero harm takes time, and requires human, financial, manufactured and social and relationship capital ▪Securing mining rights and leases can be challenging in the face of an ever-changing political, social and environmental landscape ▪Leveraging technology and innovation to improve our systems and processes will consume other capitals and take time to coordinate across operations. | ▪Our employees’ safety, health and wellbeing remain a top priority and requires a significant investment of social and relationship and financial capital ▪Sound employee relations are critical for us to succeed as a business ▪General and specialised skills in the mining sector need to be developed continuously to adapt to changing business requirements ▪Diversifying our employee profile remains challenging due to the mining industry being male dominated with underrepresentation of women at some levels. | ▪Safeguarding our reputation as a responsible miner is inextricably linked to how we manage the resources on which we rely, requiring significant financial, intellectual and human capital investments ▪Building trust and credibility in the multi-cultural and diverse regions where we operate is critical to maintain our social licence to operate ▪Collaborating and partnering with our key stakeholders is a business and moral imperative. | ▪Protecting the natural resources on which we rely depends on the availability of financial capital and the quality of manufactured capital, and could affect our human and social and relationship capital ▪Mining is an inherently dangerous industry and has significant potential to impact the biophysical environment ▪Our operations heavily rely on water, a scarce resource ▪Limited life-of-mines (LoMs) and depleting Ore Reserves could jeopardise our ability to create value ▪We rely on fossil-fuel electricity, negatively impacting our environmental and increasing operational costs. | |||||||||||||||||
14
Business activities and outputs |
Business activities | ||
Our business activities, guided by our Strategy, are underpinned by an operational competency developed over the past 75 years. We have well-balanced production performance while amplifying efficiencies thanks to ongoing business improvement initiatives across our operations. |
Outputs | ||
Our primary product is the gold we produce and sell to the market, followed by silver and uranium. Our activities also result in by-products and waste that we aim to reduce and mitigate. |
Outputs: Products | ||||
Gold produced 1.48Moz (FY24: 1.56Moz) | ||||
Silver produced 3.14Moz (FY24: 3.67Moz) | ||||
Uranium produced 488.05klb (FY24: 590.10klb) | ||||
Renewable energy generated 64.3GWh (FY24: 65.4GWh) | ||||
Business activities | ||
For details on each of the business activities, refer back to About Harmony. For our locations refer back to Operations. | ||
Outputs: Other | |||
¢ By-products Tonnes processed 50.90Mt (FY24: 51.32Mt) | |||
¢ Waste Hazardous waste to landfill 558t (FY24: 1 261t) | |||
¢ Emissions Total CO2 emissions 5 482 478t (FY24: 5 255 534t) | |||
Each country we operate in has its unique geopolitical and socio-economic operating environment and a broad network of stakeholders with varying needs, interests and expectations. Stakeholder needs and expectations both significantly influence, and are impacted by, our business activities and its outputs. They play a key role in shaping the creation and preservation of value, significantly influencing Harmony’s social licence to operate, risk management and sustainability practices. We therefore strive to stay connected to our stakeholders to understand their different needs, expectations and perceptions of Harmony. For more details refer to Stakeholder engagement. | ||
15
 | Value created (net increase in capital) |  | Value preserved |  | Value eroded (net decrease in capital) |
Outcomes for Harmony and our stakeholders | ||||||||||||||||||||||
Our four strategic pillars translate our purpose into outcomes, generating sustainable returns through our focus on value over volume. The outcomes across the six capitals follow, highlighting a company balancing financial growth with social and environmental responsibilities, while strengthening the resilience of its business model and long-term value creation through effective governance. Our Strategy section details our four pillars, key trade-offs, resources allocated and our focus going forward. | ||||||||||||||||||||||
Financial capital  | Manufactured capital  | Intellectual capital | Human capital | Social and relationship capital | Natural capital | |||||||||||||||||
▪Over five years, with a favourable gold price, revenue has grown from R41.7 billion to R73.9 billion (US$4.1 billion) ▪In FY25, revenue was partially offset by a realised gold hedge book loss of R4.6 billion (US$253 million) ▪Production costs have risen from R29.8 billion to R43.2 billion (US$2.4 billion) over the past five years, showing inflationary pressures ▪Over five years, production profit has improved substantially from R12.0 billion to over R30.7 billion (US$1.8 billion), with the operating margin rising from 28.7% to 41.6% ▪Despite some variability over the past five years, net profit increased sharply in FY25 to R14.5 billion (US$802 million) compared to R5.1 billion in FY21 ▪Headline earnings per share is up 26.6% year on year to 2 337 SA cents (129 US cents) ▪A final dividend of 155 SA cents (9 US cents) has been declared, bringing the total FY25 payout to a record R2.4 billion (US$133 million) ▪Adjusted free cash flow is at a record high of R11.1 billion (US$614 million), up 53.6% compared to FY24, driven by a higher gold price and grades ▪Our net cash position has increased by 284.5% to R11.1 billion (US$628 million) while liquidity stands at R20.9 billion (US$1.2 billion) in cash and undrawn facilities. | ▪Ore milled has remained relatively stable, ranging between 49.25Mt and 53.80Mt over the past five years ▪Gold production has remained relatively stable over the five years, close to 1.50Moz (∼47 000kg) ▪Capital expenditure rose 32.1% year on year to R11.0 billion (US$606 million), driven mainly by the extension projects at Moab Khotsong and Mponeng, the 100 megawatts (MW) renewable energy project at Moab Khotsong, the Mine Waste Solutions Kareerand tailings storage facility (TSF) extension as well as the Eva Copper Project. . | ▪Exploration spend trends upwards, supporting the sustainability of our Mineral Reserves ▪Investment in training and development programmes trends upward, supporting our leadership and management capacity ▪Innovation in health and safety improvements, evidenced by lower lost-time injury frequency rates (LTIFR) and better health outcomes, reflect enhancement of intellectual capital ▪Investment in renewable energy projects and our digitalisation efforts, aimed to support operational efficiency and sustainability, continue ▪Eva Copper Project’s final Feasibility Study update is imminent with Mineral Resources up by 31% to 1.93Mt of contained copper, while gold is also up by 11.8% to 492koz. | ▪Our total workforce has stayed relatively stable at about 47 000 employees and contractors ▪We tragically lost 11 lives this year ▪We achieved an all-time low LTIFR of 5.39 for our South African region, versus 5.53 in FY24 ▪With a five-year wage agreement in its second year, no strike action took place in FY25, displaying a strong and mature relationship with unions ▪Voluntary turnover decreased to 1.9% from 2.3% in the prior year ▪Health-related absenteeism in SA improved to 7.3% from 7.5% in FY24. We continue to implement applicable best practice healthcare programmes to address occupational and non- occupational health risks ▪Employment equity showed positive trends, with representation of historically disadvantaged South Africans in management increasing from 65% to 72% over the past five years ▪Females in management has slowly edged forward over a five- year period, now at 23.3% ▪Training participation has increased, underscoring our focus on skills development. | ▪Community investment increased to R271 million (US$14.9 million) from R266 million (US$14.2 million) last year, contributing to local socio-economic development ▪Over 33 000 people benefited from our corporate social investment (CSI) projects in the current year, including women and youth ▪In SA, preferential procurement (BEE-compliant spend) has increased from R5.7 billion five years ago to a current spend of R16.3 billion (US$898 million) ▪In Papua New Guinea (PNG), total local procurement spend over the past five years trends upwards with a current spend this year of over R2.5 billion (US$138 million) ▪In SA, employees drawn from local communities sit at 85%, while in PNG, PNG nationals make up in excess of 96% of our permanent employees ▪We continue to maintain healthy relationships with unions and host communities, ensuring stability and mutual benefit ▪Paid R6.1 billion (US$336 million) in income taxes and royalties compared to a prior year payment of R3.7 billion. | ▪We have globally significant declared Mineral Resources of 135.5Moz with a declared Mineral Reserve of 36.8Moz in gold and gold equivalents ▪Underground recovered grades are up 2.6% to 6.27g/t from 6.11g/t in the prior year ▪We have been included in the FTSE4Good index for the 8th consecutive year ▪MSCI ESG rating upgraded to “BB” this year, performing better than the industry average ▪We received a CDP score of “A-” for our best practice water management strategy ▪Achieved three annual potable water consumption targets to FY25 reducing water usage from 20.0 to 19.3 to 18.4 million m3 over the past three years ▪We reduced our energy consumption through the energy efficiency programme by a cumulative 2.3TWh since 2016 ▪Our renewable energy programme is expected to generate close to 600MW by 2028 through solar and wheeled wind, with a potential of another 200MW in short-term PPA ▪Scope 1, 2 and 3 CO2 emissions relatively stable over the past five years. | |||||||||||||||||
16
Operating context
Influential economic, technological, political and sustainability factors at global and local levels directly and indirectly shape our operating context. The
interplay between our business model and operating context determine and shape our risks and opportunities. Strategic risk management aligned with our
business model and continuous assessment of our operating context allows us to mitigate threats effectively and capitalise on new growth possibilities.
Our operating context is made up of the following external factors or issues that influence Stakeholder needs and expectations and impact our Material matters:
Sustainability factors and related business practices
Social impact | South Africa | Papua New Guinea | Australia | |||||||||||||
Maintaining a social licence to operate is widely recognised as a moral and business imperative for companies globally. Mining companies continue to face growing pressure to exceed regulatory requirements by operating sustainably, transparently and in ways that benefit society. This includes by contributing solutions to key challenges facing host communities. Businesses must also continuously navigate complex social, economic and political dynamics while sustaining strong and constructive stakeholder relationships. | South Africa faces many obstacles to social upliftment, including insufficient service delivery, poverty, inequality, widespread unemployment, illegal mining and high levels of crime. These issues, combined with the government's immense responsibility to provide infrastructure and essential services, highlight the urgent need for both private and public sector contributions to improve citizens’ quality of life. These challenges also contribute to a population of unskilled and unemployed individuals, reducing the available talent pool. | Papua New Guinea is rich in natural resources, but development has been uneven since gaining independence in 1975. Many people still face poverty, unemployment, limited access to services, and social challenges like crime, gender-based violence and inequality. Like other resource-rich countries, Papua New Guinea is working to overcome these barriers and move toward becoming a prosperous, middle-income nation. | By global standards, Australia ranks highly in literacy, numeracy, employment, income and wealth. However, challenges still remain. These challenges include rising inequality, the high cost of living (especially housing), discrimination, and domestic and gender- based violence. In rural and remote areas, poorer health outcomes are compounded by limited access to essential services such as education, transport and digital connectivity. People continue to expect real progress in tackling these issues. | |||||||||||||
Impact on Harmony | Our response | |||||||
▪Addressing systemic issues requires a collaboration between Harmony, government, civil society and other stakeholders ▪Harmony can positively contribute to the lives of employees and host communities by understanding their needs and implementing initiatives that contribute to community wellbeing ▪If we fail to respond constructively to societal expectations, we risk financial, reputational and operational challenges, including legal and strike action, reduced investment and a disengaged workforce. | ▪Our social stewardship initiatives are critical to our business success and sustainability ▪Harmony’s community development initiatives are guided by regulations and mining-related agreements, allowing us to collaborate with government departments to deliver shared benefits and value to our host communities, suppliers and landowners. This is supported by CSI initiatives, enterprise and supplier development, and procurement practices that support job creation and contribute to social development and economic empowerment with the SDGs in mind ▪As part of enterprise risk management (ERM), multiple organisational strategies enable us to care for, protect and empower our employees, fostering a conducive, safe and inclusive workplace and contributing to improved livelihoods. | |||||||
17
Environmental impact | South Africa | Papua New Guinea | Australia | |||||||||||||
Urgent action to combat climate change and its impact | ||||||||||||||||
Climate change’s prevailing and increasing effects, including extreme weather events, continue to impact businesses, people and the natural world. Climate change regulations are evolving rapidly, with new laws, expanded disclosure requirements and increased litigation driving accountability. | South Africa frequently experiences drought and floods, which significantly affect its environment, economy, infrastructure and people. Floods between February and March 2025 in KwaZulu-Natal, Free State, Gauteng and Eastern Cape underscore the severity of extreme climate-related events. New regulations, including the Climate Change Act 22 of 2024 that introduces binding carbon budget limits and the National Treasury’s August 2024 phase two carbon tax paper which signals higher tax rates from 2026. | Papua New Guinea is vulnerable to natural events. Some of these are expected to increase in frequency, magnitude and intensity due to climate change. High rainfall during the summer months of FY25 caused flooding, landslides, displacement of people and significant damage in Enga province. A brief period of La Niña conditions is predicted in the southern hemisphere FY26 summer. La Niña events can have the effect of bringing increased rainfall to south and south-eastern areas of the country, while the north-east and New Guinea islands region can experience lower rainfall and drier conditions. | Climate change poses a growing risk in Australia and is impacting communities, ecosystems and industry. This results in hotter temperatures, increased bushfires, prolonged droughts and floods, higher sea levels and erratic weather conditions. Tropical Cyclone Alfred's landfall in South East Queensland during March 2025 is consistent with predictions that climate change is expected to cause tropical cyclones to penetrate further south. Commencing from 1 July 2025, Australian- registered companies are now required to report on climate-related risks and opportunities that could reasonably affect their financial performance. | |||||||||||||
Threats to natural resources and biodiversity | ||||||||||||||||
Mismanagement, overexploitation and pollution-related degradation of critical natural resources such as food, minerals, air and water continue to drive environmental risk and contribute to severe global shortages in commodities and natural resource supplies. | Overwhelming development needs and society’s dependence on natural resources and ecosystems to survive exacerbates South Africa’s water scarcity and natural resource depletion. | Deforestation and forest degradation caused by agriculture expansion, including cash crops, authorised and unauthorised logging, artisanal and alluvial mining, and expanding settlement footprints pose a threat to the country’s significant natural resources and heritage. | Climate change, unsustainable use of natural resources, habitat loss, invasive species and problematic native species and pollution have been identified as driving a decline in the condition of Australia’s natural environment. The Australian Government has introduced Australia’s Strategy for Nature 2024 – 2030 in an effort to strengthen the country’s response to halt and reverse biodiversity loss. | |||||||||||||
18
Environmental impact continued | South Africa | Papua New Guinea | Australia | |||||||||||||
Responsible tailings management | ||||||||||||||||
TSF failure could cause loss of life and severe economic, environmental and societal damage, underscoring the importance of effectively managing risks associated with TSFs. Mining companies are also exploring innovative solutions to better manage these facilities. | Mining is a key economic sector in the country. As such, the high number of tailings dams presents a significant safety risk. The government has bolstered efforts to enforce stricter regulations, independent TSF audits and higher penalties, signalling tougher oversight. | Heavy rainfall and seismic activity heighten the risk of dam failure. Our TSFs are designed and operated per the Australian National Committee of Large Dams (ANCOLD) guidelines, with accepted risk-based deviations and conservative factors of safety for seismic and static conditions. | With mining as a major economic sector, Australia has a high number of tailings dams. The ANCOLD guidelines play a key role in setting standards for effective TSF design and management. | |||||||||||||
Impact on Harmony | Our response | |||||||
▪Harmony is susceptible to the physical and transitional impacts of climate change. Extreme weather events such as flooding could damage equipment and infrastructure, while water shortages and heatwaves present significant safety and health risk to our employees ▪Regulatory changes, along with market and technology shifts, influence the way we conduct our business ▪Resource depletion could increase operational costs, affect our stakeholder relationships and investor sentiment. Conversely, conserving natural resources drives sustainable mining practices across the business ▪TSF failure has the potential to impact the environment and communities surrounding our operations. Consequences may include loss of life, environmental fines due to non-compliance, rehabilitation and operational costs, decreased market value and reputational damage. | We are committed to environmentally responsible mining that respects natural ecosystems and supports long-term sustainability. We manage and mitigate environmental risks and, where appropriate, offset impacts by: ▪Decarbonising Harmony’s energy profile through energy efficiency initiatives and transition to lower‑carbon sources, which presently include solar energy and battery storage projects ▪Using natural resources efficiently and responsibly, while managing water quality and quantity, and monitoring impacts on waterways and the overall health of the watershed ecosystem ▪Reducing our environmental footprint by reclaiming legacy mining sites and lowering the risk of long-term physical and chemical impacts ▪Addressing biodiversity and ecosystem impacts through rehabilitation and other initiatives ▪Capturing environmental risks, including TSF management, as part of our ERM process. | |||||||
19
Governance impact | ||||
Growing regulatory and stakeholder scrutiny | ||||
Increasingly complex regulatory requirements and stakeholder expectations continue to put pressure on companies to reposition or accelerate their business strategies, take action to address a range of issues, and transparently report and substantiate their sustainability claims and progress against commitments. Sound corporate governance practices are driven by ethical business practices, regulatory compliance and best practice alignment, with increased scrutiny being placed on respecting and upholding human rights, preventing fraud and corruption and maintaining data integrity through robust assurance processes. | ||||
Impact on Harmony | Our response | |||||||
▪Our market capitalisation, reputation and credibility could be affected by non-compliance with regulatory and reporting requirements, failure to meet targets or address material stakeholder concerns, and inadequate preparation for new disclosures, safety governance and equity participation requirements in our key jurisdictions ▪Delivering responsible and sustainable business practices is fundamental to our ability to protect the shared value we create and prevent value erosion. Critical to this is engaging and collaborating effectively with our key stakeholders, maintaining their trust and preserving our social licence to operate. | ▪Harmony has adopted a Management Delegation of Authority and a comprehensive Compliance Programme to underpin regular engagement with government and regulators. The company responds to proposed legislative changes through the Minerals Council South Africa or direct submissions, following consultation with relevant executives. We also work directly with regulators and through Australian, Queensland, and Papua New Guinea industry bodies on policy matters ▪Our sustainability framework assists us to respond strategically to the sustainability issues facing our business and host communities. The framework outlines the actions we are taking to further embed sustainability in our business ▪We measure and track our progress against group-wide KPIs, and adopt regulatory and voluntary reporting frameworks and guidelines ▪To facilitate the integrity of our reporting, we conduct internal and external assurance on our reporting suite ▪Our employees, contractors and suppliers must adhere to our human rights policy and code of conduct ▪Our formal corporate governance and compliance policy and framework outline the principles of good corporate governance for the board and employees at all operational levels ▪The draft Mineral Resources Development Amendment Bill proposes several changes to South Africa's mining laws. Harmony is closely monitoring the progress of the draft bill and will develop an action plan to align our processes with the new regulations We are actively preparing for compliance with the Australian Sustainability Reporting Standards (ASRS) S2, which are new sustainability disclosures that largely align with IFRS S2. These requirements will encompass our Australasia region and took effect for Australian-registered companies from 1 July 2025. | |||||||
20
Governance impact continued | ||||
Cybercriminality | ||||
Cyberattacks continue to increase in frequency and severity, with the human, operational and financial impact of attacks rising in line with increasing infrastructure digitalisation. Similarly, the digitalisation of critical national and mining infrastructure increases the risk of cyberattacks. A successful cyberattack can have severe consequences, including safety and economic impacts. | ||||
Impact on Harmony | Our response | |||||||
▪Cybersecurity is a top strategic risk to our business. Digitalisation of technology exposes our systems and processes to information security compromises, which could lead to the accidental or unlawful use, destruction, loss, alteration or disclosure of data ▪In addition to the direct cost of an incident, regulatory fines under South Africa’s POPIA and the Critical Infrastructure Protection Act could reduce profitability, disrupt production and erode stakeholder trust ▪Australia’s Cyber Security Act 2024 introduces stricter obligations around incident reporting, ransomware disclosures and privacy protections. These changes heighten regulatory risk and demand stronger digital resilience across our operations. Non-compliance could lead to financial penalties, operational disruptions and erosion of stakeholder trust, particularly where data integrity and safety systems are critical to our licence to operate. | ▪Our cybersecurity strategy focuses on proactive risk identification, technological defences, governance oversight and workforce engagement. This approach aligns with the critical need for robust cybersecurity in mining operations within regions facing sophisticated cyberthreats ▪We continue enhancing our cybersecurity by implementing state-of-the-art technologies and processes to identify threats, protect our information and technology environment and respond to cyberincidents ▪We conduct cybersecurity awareness training interventions and regularly communicate with our employees about cyberthreats and how to prevent them. This year, we conducted focused cybersecurity training to 1 200 users identified as high-risk and maintained consistent communication on cybersecurity best practices across the organisation to strengthen our human security layer and reduce vulnerability exposure. We also significantly increased our investment in our cybersecurity software. | |||||||
21
Governance impact continued | ||||
Third-party risks | ||||
Harmony’s mining operations and growth projects are highly exposed to supply chain vulnerabilities, with shortages and extended lead times for strategic spares, critical consumables, mining equipment and reagents posing risks to operational continuity and project delivery. This is amplified by reliance on foreign-sourced components and single suppliers for key inputs, such as sulphuric acid, cyanide, oxygen and large-scale mining equipment, which limits alternative sourcing options. Geopolitical uncertainties and inflationary pressures have further increased consumable costs and logistical challenges, raising all-in sustaining costs and potentially impact the commercial feasibility of certain operations. | ||||
Impact on Harmony | Our response | |||||||
▪Financial difficulties faced by third-party contractors or suppliers can impair their ability to fulfil contracts, leading to project delays and increased costs ▪If a supplier or contractor fails to adhere to safety and health protocols while on-site at our operations, it could result in serious injuries and hinder our goal to achieve zero harm ▪Delays or shortages in critical consumables, reagents, strategic spares and equipment can disrupt production, reduce output, create maintenance backlogs and negatively impact capital projects – potentially threatening the financial viability of certain operations ▪Inflationary pressures, higher transport costs and supplier monopolies raise the cost of inputs, increasing all-in sustaining costs ▪Country-specific issues, such as foreign exchange shortages in Papua New Guinea, can lead to supply disruptions that may impact operational continuity. | ▪Harmony’s suppliers must adhere to our code of conduct, human rights policy, environmental management policies and standards and observe laws and regulations of the countries in which we operate ▪Supplier engagement helps us understand our suppliers’ needs and how we can improve our transactions for mutual benefit ▪Harmony has collaborative and transparent relationships with strategic suppliers to manage disruptions, particularly where sole supplier risks exist. The company seeks out multiple reliable suppliers for critical commodities and has strategic contracts with rise-and-fall mechanisms to manage market escalations ▪Reviews of critical commodities and stock holdings are conducted by regional teams in South Africa and Australasia ▪Efforts to engage local suppliers and integrate small, medium and micro-enterprises (SMMEs) into the supply chain are ongoing. Long-term contracts with strategic suppliers include mechanisms to secure supply and mitigate inflationary impacts. | |||||||
22
Macro-economic environment
Economic and geopolitical factors | South Africa | Papua New Guinea | Australia | |||||||||||||
Ongoing geopolitical uncertainty, trade tensions, subdued global growth and diverging monetary policy paths continue to disrupt supply chains, constrain capital access, undermine economic growth, financial planning in emerging markets, and the availability and affordability of materials and equipment. Trade disputes between major economies, notably the United States and China, and increasing export controls on critical minerals have fragmented mineral supply chains. This environment has resulted in more volatile input costs, supply-timing challenges and complicated project development for mining companies. | South Africa faces multiple economic and geopolitical challenges, including high interest rates, policy uncertainty, potential resource nationalisation, infrastructural constraints, and high borrowing costs that restrict investment and economic growth. | The region’s macro-environment continues to be impacted by political instability, regulatory uncertainty, access to foreign exchange and rising inflation. | Australia’s economy remains resilient and the political environment stable. However, the country is impacted by the volatile international context. | |||||||||||||
Sovereign credit ratings | ||||||||||||||||
Sovereign credit ratings assess a government's ability and willingness to meet its debt obligations, reflecting economic fundamentals, including fiscal health, debt sustainability, political stability, institutional strength and external financing capacity. Rating agencies evaluate factors such as gross domestic product (GDP) growth prospects, government effectiveness, monetary policy credibility and structural economic resilience when determining sovereign ratings. These ratings directly influence country risk premiums embedded in equity valuations, corporate borrowing costs, and foreign investment flows. | South Africa’s credit rating outlook was re‑affirmed as stable with long-term foreign and local currency sovereign credit ratings of BB-. | Papua New Guinea’s credit rating outlook remains stable with long-term foreign (B-) and local currency (B) sovereign credit ratings. | Australia’s credit rating outlook was affirmed as stable with long-term foreign and local currency sovereign credit ratings of AAA. | |||||||||||||
23
Economic and geopolitical factors continued | South Africa | Papua New Guinea | Australia | |||||||||||||
Market volatility | ||||||||||||||||
Global financial markets experienced heightened volatility during FY25, reflecting divergent monetary policy approaches, persistent inflationary pressures and evolving geopolitical tensions across key economies. Market volatility manifests through fluctuations in commodity prices and foreign exchange rates, creating both operational challenges and strategic opportunities. Central bank policy divergence between developed and emerging market economies amplified currency volatility, while ongoing supply chain disruptions and energy security concerns contributed to commodity price volatility. The gold price achieved record highs during the second half of FY25. Prices peaked at US$3 432/ oz on 13 June 2025, significantly higher than the US$2 332/oz at the beginning of FY25, and ending at US$3 303⁄oz at 30 June 2025. Supply disruptions and strong demand kept copper prices elevated. Prices peaked at US$10 103/t on 2 October 2024, higher than the US$9 636/t at the beginning of FY25, and decreasing to US$9 878/t at year end. Based on trends in the market, our internal planning processes have determined a future copper price of US$9 367/t, which is in line with long-term market consensus. | The rand experienced significant volatility against major currencies, influenced by domestic political developments following the May 2024 elections, commodity price fluctuations and global risk sentiment. The currency strengthened following the formation of a Government of National Unity but remained vulnerable to external shocks, sovereign rating considerations and shifts in foreign investor confidence. | The kina demonstrated relative stability against the US dollar, supported by ongoing International Monetary Fund programme implementation and foreign exchange market reforms. However, the currency remained susceptible to commodity price movements and external financing conditions affecting the country's current account balance. | The Australian dollar fluctuated against major currencies, influenced by commodity price movements, domestic monetary policy settings and China's economic performance as a key trading partner. The currency's correlation with commodity prices provided both opportunities and challenges for mining operations. | |||||||||||||
24
Impact on Harmony | Our response | |||||||
▪Borrowing costs and economic growth were also affected by increased interest rates ▪Borrowing costs increase directly through higher credit spreads when sovereign ratings deteriorate ▪Investment returns on cash deposits and short-term investments fluctuate with sovereign risk-free rates, impacting treasury management returns ▪Equity valuations face material impact through elevated country risk premiums incorporated in discount rates used by investors. Research demonstrates that sovereign downgrades increase equity risk premiums demanded by investors, mechanically reducing share price valuations through higher required returns ▪Foreign investment flows respond asymmetrically to sovereign rating changes, with downgrades triggering capital outflows that disproportionately affect equity markets. Conversely, rating upgrades generate minimal positive flow effects, creating an asymmetric risk profile for share price performance ▪Currency fluctuations impact both revenue realisation from US dollar-denominated gold and copper sales and cost structures denominated in local currencies, creating natural hedging effects where operating costs decrease in dollar terms when local currencies weaken. ▪Commodity price volatility affects revenue streams, influences capital allocation priorities across our portfolio, and determines the economic viability of marginal ounces and development projects ▪The average level of the rand appreciated against the US dollar in FY25, with an average exchange rate of R18.15/US$1 (FY24: R18.70/US$1). Although the rand appreciated, the significant increase in the US$ gold price, positively impacted on revenue for the year as sales are US dollar-denominated. | ▪Our derisked and diversified portfolio continues to perform well ▪Expansion in Australia, together with focus on gold-copper assets, is part of Harmony’s deliberate strategy to diversify geopolitical exposure, reducing risk concentration in a single region and commodity ▪Through regular engagement with investors and financiers (a key stakeholder), we provide a realistic understanding of our potential operating and financial performance ▪We invest our funds in financial institutions that meet the group’s policy requirements for credit quality. The credit ratings are continuously monitored, with adjustments made where required ▪We apply conservative price assumptions in our business planning processes to maintain a reasonable margin and strong cash flow. Even at the relatively lower exchange rate, our South African operations are generating a positive margin and cash flows ▪We monitor market volatility through quarterly treasury committee assessments and employ targeted risk management strategies, where appropriate, to manage exposure to adverse movements while preserving upside participation in favourable market conditions ▪Our derivative and hedging strategies and capital allocation framework remain responsive to persistent macro-economic instability, enabling us to analyse and manage potential positive and negative impacts on our business proactively and appropriately ▪In response to high gold prices during the year, we continued to lock in more of the higher gold prices, supporting our future cash flows and ability to fund projects. | |||||||
25
Energy challenges
Electricity supply, security, reliability and costs | South Africa | Papua New Guinea | Australia | |||||||||||||
Electricity remains a critical operational input, particularly for energy-intensive industries where supply reliability and cost volatility continue to pose significant challenges. The electricity landscape is being reshaped by a combination of ageing infrastructure, evolving regulatory frameworks and the global shift to low-emissions energy. At the same time, cybersecurity threats targeting digitised infrastructure and the impacts of regional conflicts are heightening concerns around energy security. As companies pursue decarbonisation, they are also contending with rising costs linked to grid modernisation, renewable energy integration and energy storage solutions. These dynamics create opportunities to enhance efficiency and build resilience, but also introduce financial and operational risks that demand proactive and strategic management. | The country remains mainly reliant on coal‑based electricity, and due to ageing infrastructure and increased demand during peak seasons, load shedding and curtailments are periodically implemented. This causes intermittent and unreliable electricity supply. Although stage-level load shedding eased markedly in 2025, Eskom approved an above- inflation tariff hike, contributing to operating costs and the rising cost of living. | Three main electricity grids deliver power within the country. Grid power for Hidden Valley is sourced from the Ramu grid (approximately 60% hydroelectricity), which supplies Morobe Province. Ramu-grid stability remains mixed, and the proposed Ramu-2 hydro project, which would add 180MW of renewable capacity to the grid, awaits a financial investment decision. The country’s challenging terrain limits access to electricity and affects supply reliability, constraining social and economic development. | Most of Queensland’s electricity is supplied through the national electricity market (NEM), which services much of eastern and southern Australia. However, the North West Queensland region, including Mount Isa and Cloncurry, is powered by the North West Power System, an isolated, predominately gas-fired electricity network not currently connected to the NEM. The CopperString 2032 project aims to bridge this gap by linking North West Queensland to the national grid. Work on the Eastern Link (Townsville to Hughenden) section of the project is presently prioritised. | |||||||||||||
Impact on Harmony | Our response | |||||||
▪Our South African assets are predominantly deep underground mining operations, which are more energy intensive than surface mines and accounted for 76% of the group’s total electricity consumption ▪We incur additional operating costs due to rising electricity prices and having to use diesel to prevent operational interruptions ▪Continued reliance on fossil fuel-based electricity challenges our ability to meet our 2036 SBTi-aligned emissions reduction target and ambition of achieving net zero by 2045 ▪Regulatory changes have financial implications for our business. We estimate the impact of the carbon tax to our South African operations to be between R450 million (US$25.4 million) and R800 million (US$45.1 million) by 2038 based on government’s intent to increase the price of carbon and reduce allowances. | ▪The acceleration of our decarbonisation is in direct response to regulatory changes in South Africa. Our decarbonisation initiatives include a renewable energy and energy efficiency roll-out plan, enabling us to systematically reduce our reliance on grid-supplied electricity while improving energy efficiency and diversifying our energy mix. In FY25, we generated 64.3GWh of renewable energy from our Sungazer 1 solar photovoltaic (PV) project and small-scale installations ▪We continue lobbying regulators in South Africa to contain electricity tariff increases and help electricity suppliers to secure power through load curtailment and provide available land for renewable energy plants ▪In Australia, our Eva Copper site is located in an off-grid area of North West Queensland, presenting both challenges and opportunities for its energy solution and GHG emissions profile. We have received environmental approval to integrate a 100MW solar farm and a 65MW battery energy storage system into the start-up energy solution for Eva Copper, enabling approximately 40% renewable penetration. Future pathways to reduce emissions include connecting to CopperString 2032 or the addition of wind energy to the on- site energy portfolio ▪In Papua New Guinea, we are exploring the feasibility of battery storage at Hidden Valley to mitigate frequent grid power outages and deliver uninterrupted power supply to the mill until the backup diesel power station activates. | |||||||
Further details on our operating context are available throughout this report and other reports within our suite. Please consult the contents page of each report to find further, relevant details.
26
Risk and opportunity management
At Harmony, each Harmonite plays a role in managing risk – from upholding safety to protecting the organisation’s long-term sustainability. Our enterprise
risk management (ERM) function empowers employees to deliver on strategic objectives by embedding effective risk treatment and fostering resilience.
As the global, regional and operational landscape continues to shift, our proactive and integrated approach to risk management remains central to our strategy. Our industry is shaped by safety imperatives, market
volatility and evolving regulation, making risk management a strategic enabler of value creation across all our capitals.
In line with the principles of King IV, Harmony recognises that good governance and integrated thinking require risk management to be embedded in all strategic decision-making processes. Aligned with the ISO
31000:2018 standard, our ERM process supports informed decision making, enhances resilience and ensures that risks and opportunities are considered holistically across all capitals. Our risk management framework is
integrated into Harmony’s strategic and operational ecosystem, as shown below.
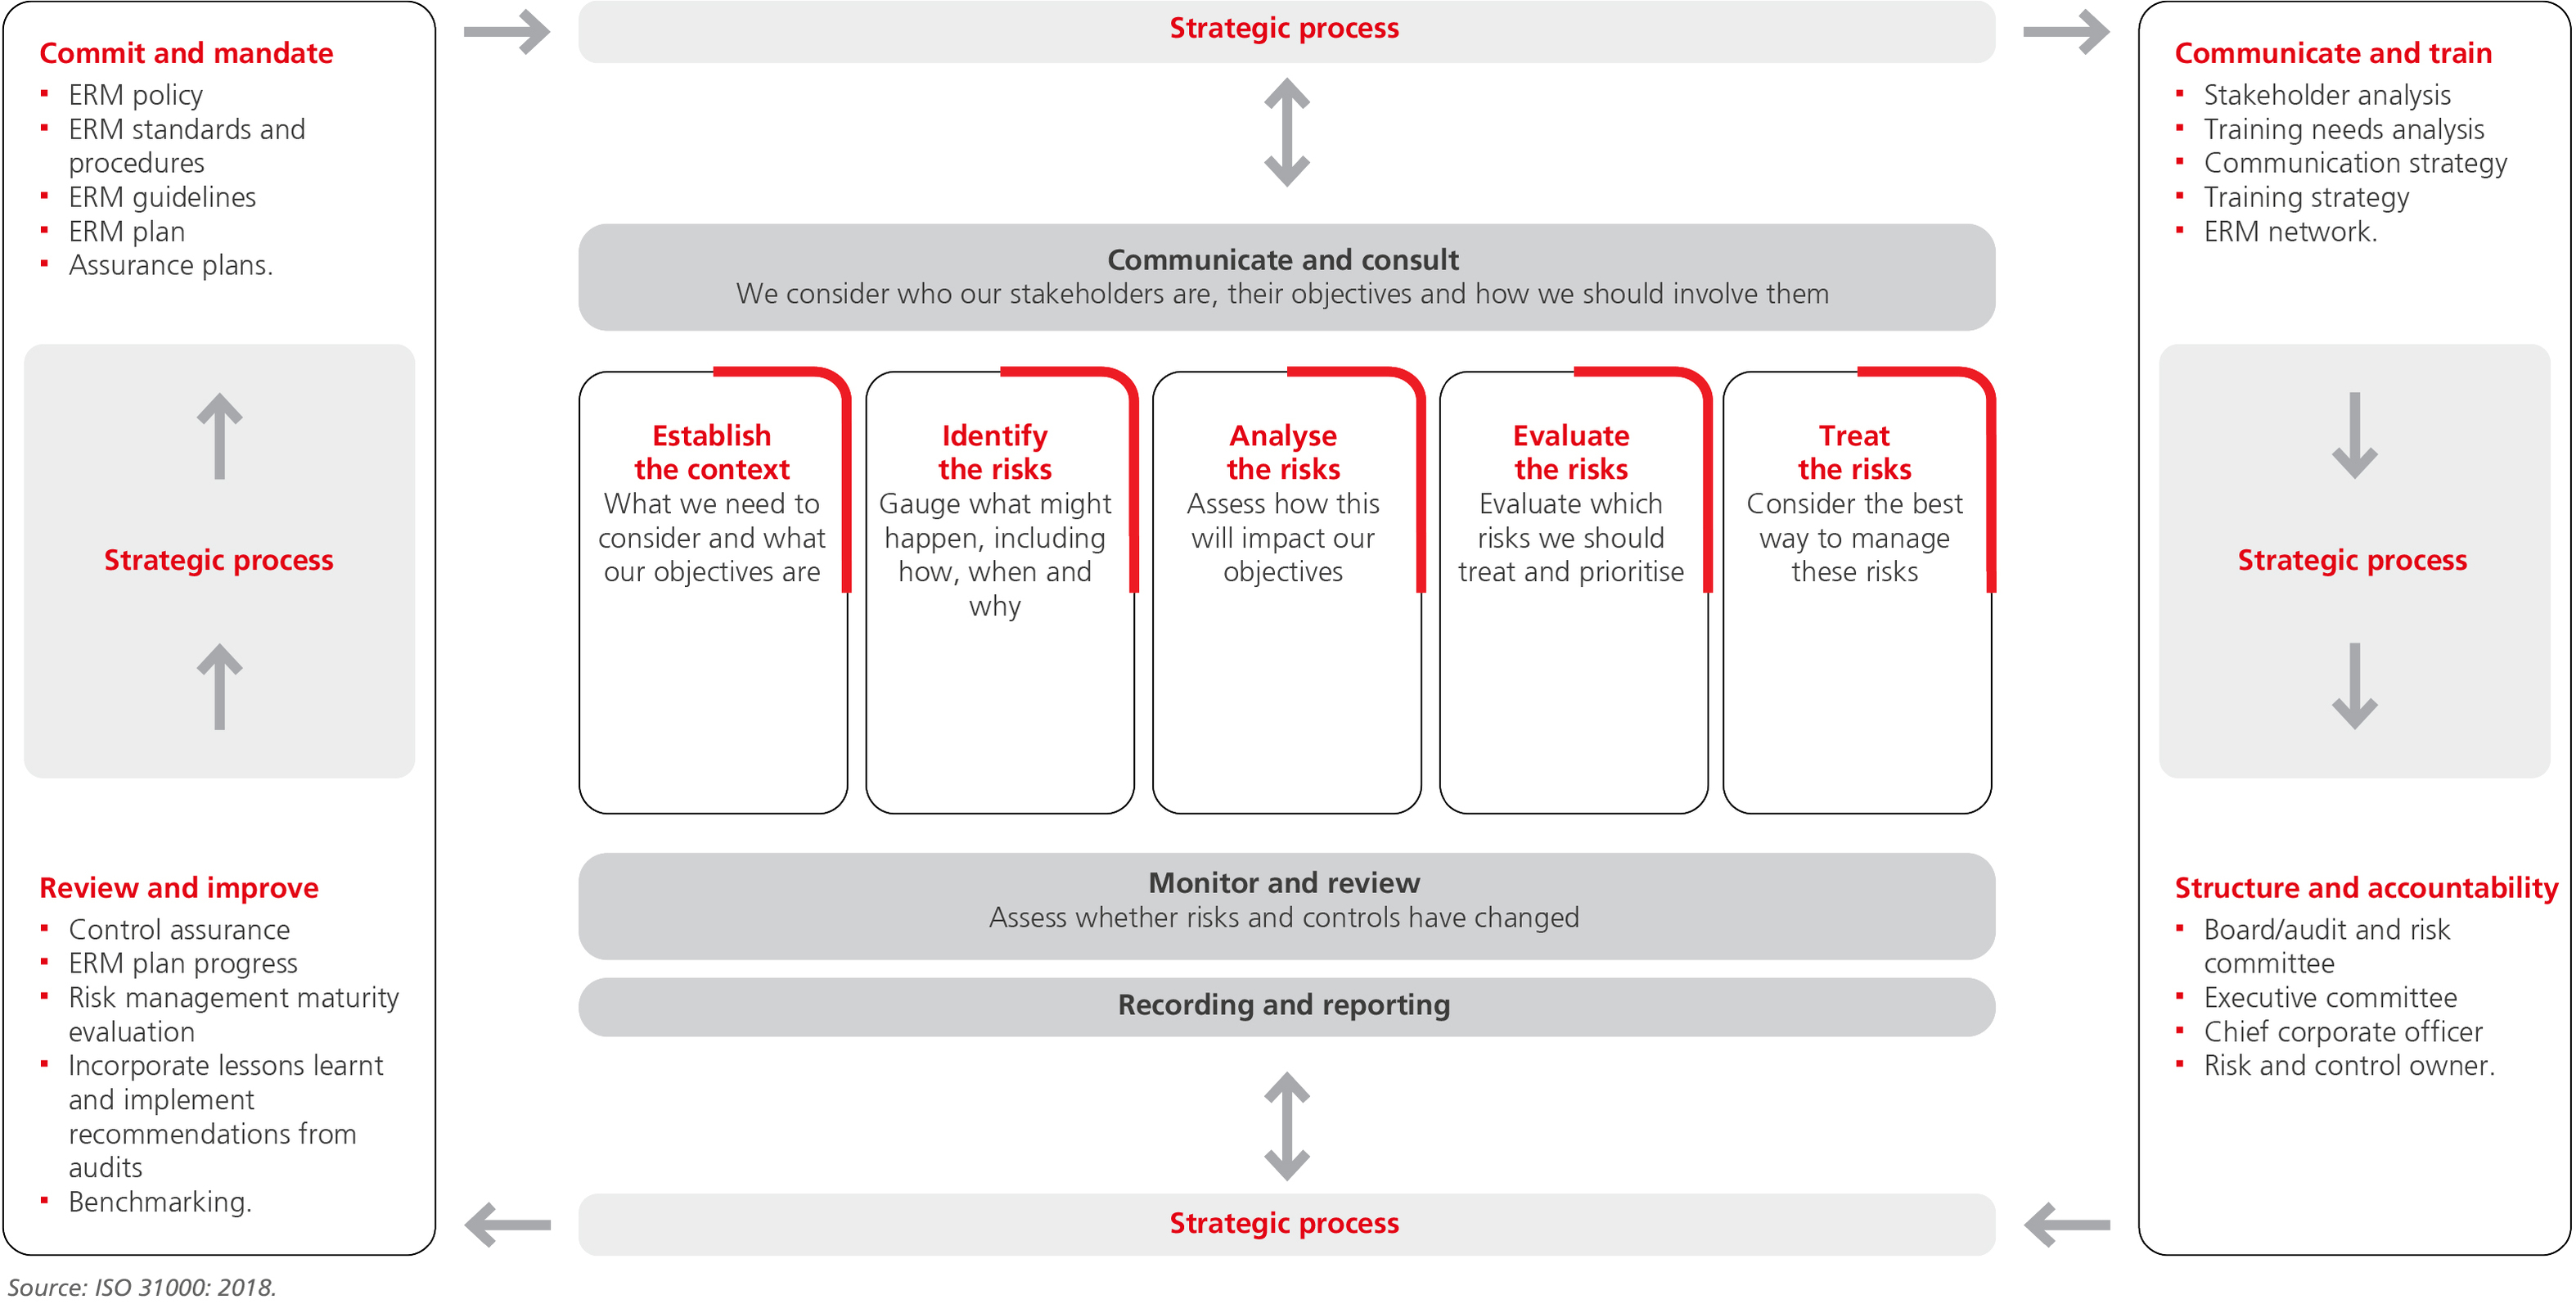
27
Risk governance
Harmony’s risk governance model ensures effective risk identification and management at every level,
with clear escalation from operations to the board and strategic oversight flowing back down. This
integrated approach aligns risk management with our corporate objectives, delivering accountability,
consistency, and robust oversight across the business. The below figure is an illustration of the risk
governance structure:
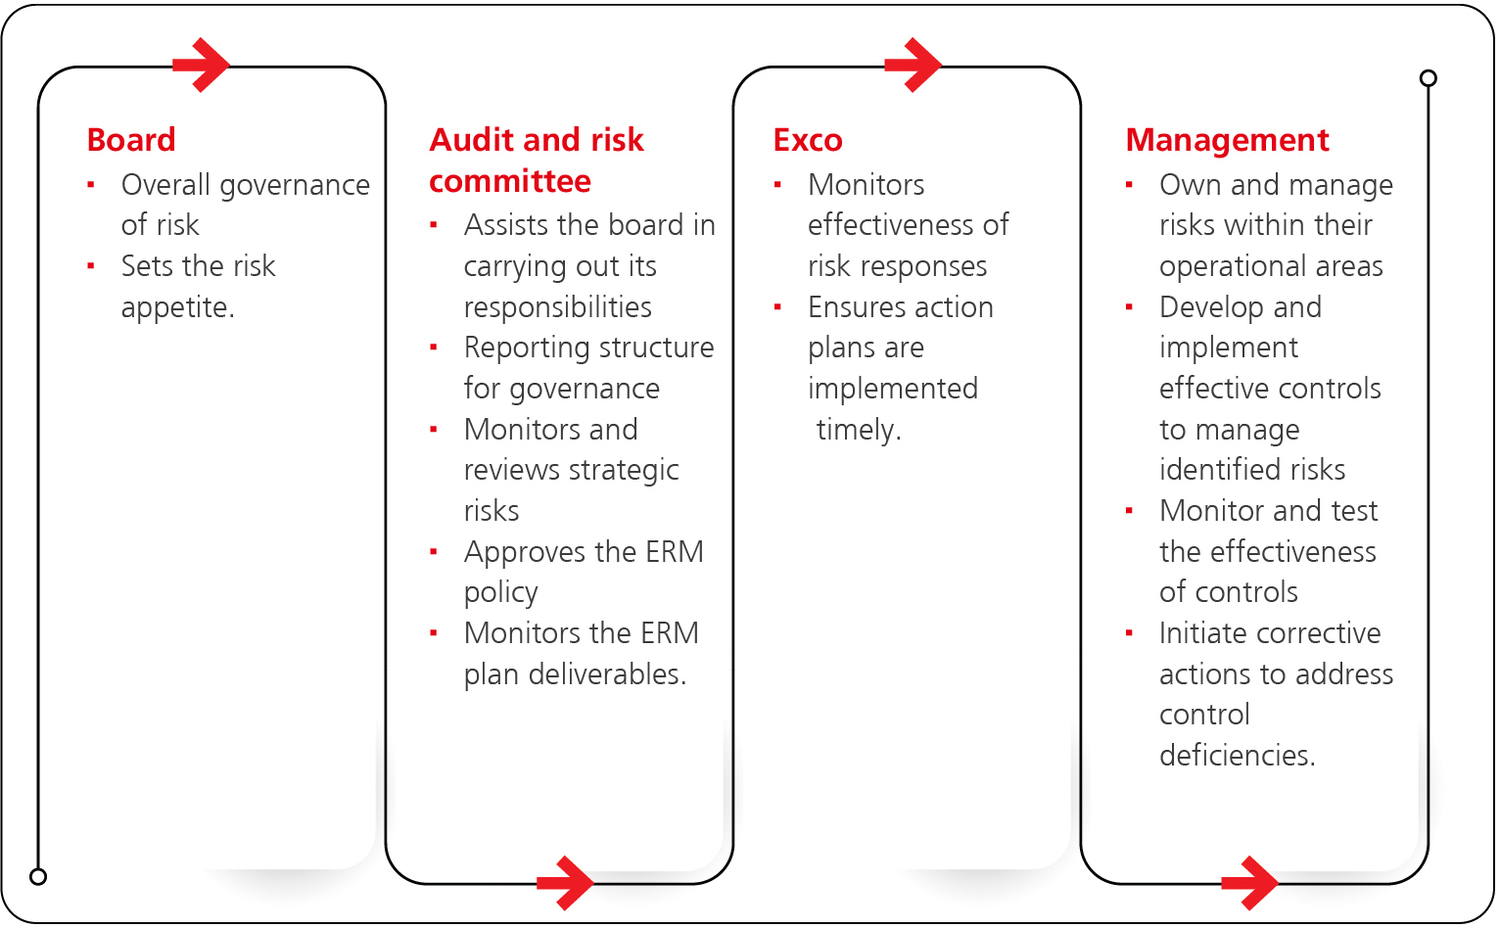
Our most significant risks and opportunities
The board, executive steering committee, senior management and ERM team assessed global and
industry risks to which Harmony is exposed. Harmony’s identified strategic risks were evaluated, and we
confirm that they are valid, accurate and complete. Risks should not be viewed in isolation. Designing
and implementing risk response strategies to address interlinked risks will require trade-offs that
address some risks and exacerbate others, while identifying opportunities.
Group risk exposure
▪Our business is gold, with a growing international copper footprint – a high-risk/high-reward business
▪We operate across the gold mining value chain – from exploration to feasibility studies, building
and buying mines, operating and closing mines, followed by land rehabilitation
▪We are exposed to gold price and exchange rate volatility and mitigate this through derivative
programmes
▪We operate well in emerging economies and manage associated socio-political impacts
▪We continue investing in exploration – one of the most effective ways to grow an orebody and create
value
▪We have an appetite for change and continuous improvement – we continuously look for innovative
ways to improve our existing mines and acquire assets that increase the quality of our assets and
improve margins.
Risk appetite and tolerance
Harmony’s risk appetite and tolerance framework (RATF) ensures a measured and responsible approach
to risk-taking, prioritising safety while enabling informed decisions that align with long-term strategy.
The framework provides clear visibility of the risk landscape, supports agility in changing conditions and
fosters accountability and transparency across the organisation.
The RATF aligns with Harmony’s strategic pillars to allow risk-based decision making to achieve
Harmony’s strategic objectives. Each strategic pillar is supported by:
▪An overarching risk statement
▪Supporting risk categories, appetite and tolerance levels
▪Targets that track company performance aligned with our strategy, risk appetite and tolerance levels.
Risk statements in support of each strategic pillar
Responsible stewardship | Zero harm to employees and partnering with stakeholders to create sustainable value. | |
Operational excellence | Meeting approved operational, project and infrastructure plans in a safe and timely manner. | |
Cash certainty | Operational and services budgets based on approved annual planning parameters to be met. | |
Effective capital allocation | Invest in projects (organic and inorganic) and acquisitions aimed at improving the quality of Harmony’s asset portfolio and meeting investment and project criteria while returning capital to shareholders in line with our dividend policy. |
28
Our top strategic risks
Harmony is committed to thoroughly assess and report on risks and
opportunities. We manage all strategic risks with the necessary controls,
aligning our actions with our overall strategic objectives.
Harmony will continue to monitor the risk landscape and make sure that appropriate response
strategies and risk control measures are in place to modify the risk. The ERM team is supported by the
governance, risk and compliance committee, which includes most department heads, and serves as a
platform to self-assess controls for key strategic risks.
Our strategic risks and opportunities are based on our assessment of the residual rankings.
Harmony’s risk response strategies
In managing our strategic and operational risks, Harmony applies one or a combination of the following
approaches – Treat, Tolerate, Transfer or Terminate – depending on the nature of the risk, its likelihood
and our appetite.
Treat | We take action to reduce the likelihood or impact of the risk. | |||||||
Tolerate | We consciously accept the risk because it is within appetite or we can tolerate it, unavoidable, or the cost of mitigation outweighs the benefit. | |||||||
Transfer | We shift part or all of the financial or operational consequence of a risk to a third party. | |||||||
Terminate | We eliminate the risk altogether by discontinuing or avoiding the activity that creates it. | |||||||
Some risks require both approaches. We may tolerate a portion of the risk that remains within
the appetite and tolerance threshold, while treating the portion that exceeds our tolerance by
strengthening controls. This combination recognises that not all risk can be fully removed, but
that residual exposure is managed responsibly.
29
Stakeholder engagement
Our commitment to responsible stewardship, a key strategic pillar, is affirmed through our proactive stakeholder engagement approach, which aims to build and maintain trust through sustainable and mutually beneficial relationships and partnerships with our stakeholders. Through this approach, we manage potential risks and opportunities to enhance our social purpose and create shared value. Each country we operate in has its unique geopolitical and socio-economic operating environment and a broad network of stakeholders with varying needs, interests and expectations. We therefore strive to stay connected to our stakeholders to understand their different needs, expectations and perceptions of Harmony. | ||
Our approach
Our stakeholder management approach guides proactive, collaborative
engagement with internal and external stakeholders. We have regional
and jurisdictional stakeholder engagement plans, which are supported by
the group’s communication strategy and its implementation at regional
and asset level.
We have implemented targeted strategies to enhance stakeholder
engagement practices that will strengthen our approach and support the
social stewardship pillar of the company’s strategy. This includes the
social cluster we have established to drive cross-functional coordination,
promote internal integration and embed a collaborative approach to
stakeholder engagement. This approach enhances the achievement of
social performance objectives, with outcomes to be reported in future
cycles.
We continue to apply a three-tiered stakeholder engagement model that
enables the company to stay connected and attuned to and have broad-
based engagements with stakeholders who form part of our key
stakeholder groupings:
▪Tier 1 includes engagements with host governments around
permitting, licensing and regulatory matters, and alignment with and
contribution to local, state/provincial and national developmental
agendas
▪Tier 2 constitutes engagements with landowners and traditional
leaders including, but not limited to, socio-economic development and
investment initiatives in host areas
▪Tier 3 includes broad-based engagements with all other stakeholders
affected by our exploration and mining activities, including NGOs and
other community groups, to discuss and manage concerns, interests
and expectations.
Engagements with our key stakeholders are structured, robust and
frequent, and guided by our values and strategic intent to:
▪Develop and maintain relationships founded on integrity, transparency
and trust
▪Co-create with government and communities through collaborative
partnerships
▪Balance and align our goals and stakeholders’ interests and
expectations
▪Establish accountability
▪Manage stakeholders’ concerns, complaints and grievances
▪Support shared value creation and meaningful contribution towards
sustainability issues.
SDGs impacted | |||
We collaborate with local governments to identify and pursue opportunities that support and benefit our communities. | |||
 | Through ethical and responsible mining, we strive to uphold strong business practices, exceed regulatory requirements, and strengthen partnerships with key stakeholders. | ||
 | Through structured and proactive engagement, we gain a deeper understanding of stakeholder needs and expectations, address issues promptly, and build trust, shared value and sustainable partnerships. | ||
Our key stakeholders
We identify our key stakeholders based on their impact on Harmony’s ability to
deliver on its strategy.
Investors and financiers | ||||
Employees, contractors and unions | ||||
Communities, traditional leaders and NGOs | ||||
Governments and regulators | ||||
Suppliers | ||||
We unpack engagement with these stakeholders in the section that follows.
30
Investors and financiers | Investors and financiers are providers of financial capital, enabling the growth of our business by investing capital in projects that will generate meaningful returns. This stakeholder group includes current and prospective shareholders, capital providers, as well as indirect stakeholders such as investment analysts and financial media, who shape market perception and support informed decision making. | ||||
Why we engage We engage meaningfully to maintain the confidence of existing investors and financiers, attract investments in our business and manage expectations of financial, operating and sustainability performance. Engagements aim to inform these stakeholders about our progress on strategic objectives, inclusive of our sustainability commitments. Engaging with investors and financiers enables us to sustain our business and growth as we can continue generating positive earnings and share price growth while delivering shareholder returns. | How we engage ▪Results presentations ▪Annual reporting ▪Website ▪One-on-one calls and industry conferences with banks and brokers (sell-side) and investors and asset managers (buy-side) ▪Meetings and annual general meeting ▪Regulatory announcements ▪Responding to emails sent to our database ▪Site visits. | |||||
Stakeholder needs and interests ▪Disciplined and effective capital allocation ▪Shareholder returns aligned with growth ▪Resource-to-Reserve conversion ▪Value-accretive mergers and acquisitions ▪Operational excellence ▪Balance sheet flexibility ▪Embedded sustainability. | Our response ▪Embedded risk management and humanistic safety culture to improve our safety performance ▪Progressed against SBTi-aligned targets ▪Expanded solar energy infrastructure through both small-scale PV projects and larger integrated solar facilities ▪Advanced the Eva Copper Project with a feasibility update targeted for end-2025 and a 31% increase in copper resources ▪Achieved a key regulatory milestone in the acquisition process of MAC Copper Limited ▪Hosted our first CEO Sustainability Summit, aligning leadership on sustainability as a driver of safety, resilience and long-term value. | |||||
Related material matters | ||||||||||||
 | ▪Employee health and safety ▪Sustainable communities ▪Management of illegal mining. |  | ▪Climate change, adaptation and resilience ▪Water management ▪TSF and waste management. | | ▪Governance excellence. |  | ▪Operational excellence and resilience ▪Capital allocation ▪Commodity price and exchange rate fluctuations ▪Execution of multiple significant projects ▪Innovation, technology and digitisation ▪Cybersecurity. | |||||
31
Employees, contractors and unions | Across South Africa, Papua New Guinea and Australia, we have a total of 34 350 permanent employees and 12 761 contractors who are directly and indirectly involved in mining operations and support functions. In South Africa, Harmony recognises five unions (NUM, AMCU, NUMSA, Solidarity and UASA), and by virtue of their representativity, unions participate in all company- wide collective bargaining for wages and conditions of employment. | ||||
Why we engage We prioritise constructive relationships through regular and proactive engagements with unions, employees and contractors at operational and managerial level. This approach helps mitigate the risk of labour disputes that could lead to industrial action. Harmony believes in being a fair and responsible employer, investing in and developing our workforce, and addressing employees’ needs and concerns through focused engagements. | How we engage ▪Frequent engagement via mass meetings, briefs, intranet, newsletters, emails, internal broadcasts and social media ▪Structured, formal and regular meetings with unions at all levels ▪Structured regular meetings with employee representative committee in Papua New Guinea. | Their needs and interests ▪Job security ▪Fair remuneration ▪Safe and healthy work environments ▪Support for family, housing and living conditions ▪Skills development and training opportunities ▪Responsible business practices ▪Diversity, equity and inclusion. | ||||||||
Our response ▪Safety: –Continued safety initiatives, including golden/critical controls monitoring, ongoing communication to raise awareness and encourage a more engaged and proactive safety culture, and visible felt safety leadership ▪Health and mental wellbeing: –Continued roll-out of healthcare programmes, including Harmony’s lifestyle disease management programme with broader holistic initiatives, digitised risk-based medical surveillance and strengthened occupational hygiene controls –Continued provision of access to health and mental wellbeing programmes ▪Ongoing initiatives to improve transformation included: –Advanced gender inclusion diagnostics and survey action plans with anti-harassment training, Women in Mining forums and broader DEI initiatives –Achieving targets for historically disadvantaged persons (HDPs) in South Africa at all levels of management and progress continues towards achieving our target for females at junior management level ▪Employment, development and labour relations: –Continued to formalise and scale structured training and graduate pipelines –Ongoing employee recruitment and development efforts in line with MoA commitments in Papua New Guinea –Continued engaging unions through employee relations central structures to monitor the implementation of the five-year wage agreement with all five representative unions in South Africa, for continued labour stability –Conducted annual human rights training and, in South Africa, rolled out anti-harassment and bullying awareness training to reinforce the Voluntary Principles on Security and Human Rights and prevailing legislation. Go to Safety transformation towards zero harm, Holistic health and wellness, and An engaged workforce for more details. | ||||||||||
Related material matters | ||||||||
| ▪Employee health and safety ▪Supporting our people ▪Sound labour relations ▪Sustainable communities ▪Post-closure sustainability ▪Management of illegal mining. | | ▪Governance excellence. | | ▪Operational excellence and resilience. | |||
32
Communities, traditional leaders and NGOs | Harmony operates in eight local municipalities in South Africa, the Morobe Province in Papua New Guinea and Queensland in Australia. Landowners and landholders are also included in this stakeholder group. | |||||
Why we engage The group stakeholder engagement policy is the guideline for forward-looking and consistent stakeholder engagement, supported by country-specific community grievance mechanisms to enable timely and context-appropriate resolution of concerns, complaints and grievances. ▪Gain perspective of issues valued by host communities ▪Identify, understand and manage our impacts and communities’ expectations ▪Seek input and support for future projects and initiatives ▪Establish and maintain collaborative partnerships for shared value creation ▪Proactively identify and resolve stakeholders’ concerns, complaints and grievances ▪Keep host communities informed of the company’s activities and performance, including progress on commitments made to our stakeholders ▪Co-create solutions to support lasting socio-economic development and growth in host communities ▪Build an understanding of the risks associated with mining and the efforts to promote public health and wellbeing ▪Identify areas where business interests intersect community needs. | How we engage Our measures to proactively engage with communities include: ▪Planned structured engagements through an annual stakeholder engagement plan ▪Targeted and issue-based meetings ▪Facilitated community dialogues ▪Regular updates to the community through variable communication mediums, including social media and digital platforms ▪Defined processes to raise and resolve concerns, complaints and grievances ▪Benchmarking, alignment, collaboration and partnership on community engagements and development with industry peers through resource sector peak bodies ▪Sessions to build the capacity of NGOs to address social needs that are not catered for by government services ▪Outreach to roll out road safety and environmental education/awareness campaigns ▪Social cohesion-related CSI initiatives. | |||||
Stakeholder needs and interests ▪Respectful and transparent engagement ▪Access to employment and business opportunities ▪Health and wellness, safety, and environmental impact ▪Socio-economic development. | Our response ▪Continuing our stakeholder management strategy and engagement plans, and revising them annually for continued relevance and responsiveness ▪Delivering on our regulatory and agreement-related commitments and our CSI programmes to help address our host communities’ key socio-economic challenges and create shared value. Go to Empowering communities for further details. | |||||
Related material matters | ||||||||||||
| ▪Sustainable communities ▪Post-closure sustainability ▪Management of illegal mining. | | ▪Water management ▪TSF and waste management ▪Biodiversity ▪Climate change, adaptation and resilience. | | ▪Governance excellence. | | ▪Impact of socio-economic challenges. | |||||
33
Governments and regulators | Government stakeholders include local, provincial and national elected representatives and departments as well as regulators. We focus on maintaining their confidence and positive relations at all government levels to promote a conducive environment for long-term investing in Harmony. Our approach to engagement with government recognises and respects government protocol at political and administrative levels. | |||||
Why we engage We engage with all spheres of government about legislation, regulations, policies and guidelines that influence how we operate. Through these engagements, we maintain our government and regulatory stakeholders’ confidence and build a competitive advantage as a partner of choice for government. Our objectives are to: ▪Align our socio-economic development interventions to government’s growth and development plans ▪Collaborate and partner on strategic socio-economic development initiatives ▪Proactively understand and manage risks and issues ▪Contribute to legislative and policy reform to mitigate negative impact ▪Meet or exceed regulatory requirements and report on operations/projects performance. | How we engage ▪Planned, structured and targeted engagements facilitated through an annual engagement plan ▪Issue-specific interventions ▪Annual reports to our regulators and participation in regulatory audits ▪Through peak bodies in each jurisdiction on industry-wide issues and policy or regulatory changes ▪Engage largely at government administration leadership to mitigate changes in political office bearers ▪Active engagement on regulatory approvals, licences and permits to advance project delivery. | |||||
Stakeholder needs and interests ▪Responsible, compliant and transparent business practices ▪Job creation and socio-economic development ▪Contribution to gross domestic product. | Our response ▪Aligning with leading practices and proactively monitoring regulatory changes ▪Contributing royalties, taxes, charges and fees as prescribed under law in each jurisdiction ▪Implementing robust safety strategies (refer to the employees stakeholder category of this report for more details on safety) ▪Delivering on our regulatory and agreement-related commitments to communities and our voluntary CSI programme to support our host communities to address key socio-economic challenges. Go to Empowering communities for further details. | |||||
Related material matters | |||||||||
| ▪Employee health and safety ▪Sustainable communities ▪Management of illegal mining. | | ▪Water management ▪Post-closure sustainability ▪Biodiversity ▪Climate change, adaptation and resilience ▪TSF and waste management. | | ▪Governance excellence. | ||||
34
Suppliers | Harmony supports the broader economy by procuring goods and services to operate our business from our upstream value chain. Suppliers include small, medium and microenterprises (SMMEs), qualifying small enterprises (QSE) and generic enterprises. | |||||
Why we engage Strategic supplier engagement is crucial for meeting our procurement targets, fulfilling commitments tied to our mining rights and agreements, managing costs, achieving our strategic objectives, and maintaining long-term viability. | How we engage ▪Annual supplier days ▪One-on-one, issue-based meetings ▪Email and website ▪Industry meetings, exhibitions and conferences ▪Contracts and service agreements. | |||||
Stakeholder needs and interests ▪Inclusive access to procurement opportunities ▪Increased economic participation ▪Increase spend on black-women-owned and youth-owned companies ▪Community involvement and ownership ▪Business development ▪Local supplier and landowner focus. | Our response ▪Strengthening fair and transparent tender processes for broader participation, especially from our local host communities where we operate ▪Creating direct and indirect employment through our ongoing operations and growth projects ▪Continued connecting with potential suppliers to encourage participation in tender processes ▪Fostered partnerships between original equipment manufacturers (OEMs) and local SMMEs for downstream opportunities to enhance participation of local SMMEs in supply chain ▪Continued progress towards our targets and advancing interventions for women-owned and youth- owned companies to foster equity and sustainable growth ▪Continued effort to source locally and afford contract opportunities to landowner and local businesses in Papua New Guinea ▪Continued engagement campaign across north-west region of Queensland to introduce Harmony, the Eva Copper Project, and related supply opportunities. Go to Creating value along our supply chain for more details on procurement. | |||||
Related material matters | ||||||||||||
| ▪Sustainable communities. | | ▪Climate change, adaptation and resilience. | | ▪Governance excellence. | | ▪Operational excellence and resilience ▪Execution of multiple significant projects ▪Innovation, technology and digitisation ▪Cybersecurity. | |||||
35
Material matters
Understanding our stakeholder needs and expectations and the manner in which we manage our strategic risks and opportunities shape what issues are
considered material, affecting our ability to create value over time. We apply a double-materiality lens to determine our reporting scope across our report
suite.
We assess key matters that affect or are likely to affect our ability to create value for the business and our stakeholders over the short, medium and long term. These matters are considered critical to our current and future
performance and the successful delivery of our strategy. Strategic risks and opportunities, stakeholder needs, and material matters are intrinsically linked and essential to strong governance and risk management. These
links ensure our strategy aligns with what matters most to stakeholders.
Our materiality determination approach
We confirm which matters are material by reviewing material events, our enterprise risk management
structure and processes, stakeholder engagements, board committee and executive discussions and our
annual, formal review process. This process considers our external environment factors, our stakeholders’
needs, interests and expectations and our business model’s inputs and outcomes as they impact the six
capitals over time.
Step | Description | |||||
External, independent consultation | In 2023, we employed Deloitte to support our sustainability efforts. As part of its scope, it facilitated a top-down, bottom-up, stakeholder-centric approach to determine material matters for our business. | |||||
Prior year survey | In 2024, we expanded our list of 25 material matters, identified and confirmed in 2023, to 29 material matters. We conducted an internal survey to determine the completeness and rating of those material matters. | |||||
Current year review | Our strategy and operating context have not changed significantly over the past three years. Deloitte’s analysis was considered relevant and appropriate for continued use this year. However, certain material matters have become more or less prominent compared to prior years. | |||||
Peer review | We analysed several global peers, finding close alignment in terms of ESG themes and reporting approaches (double-materiality assessment and stakeholder engagement). Findings also showed a differentiated focus on copper (via our Eva Copper acquisition) and our mining with purpose philosophy. | |||||
Consolidation of material matters | We considered the contents of our strategic risk register, existing and future GRI standards and the SASB Standards for metals and mining companies. | |||||
Ranking and approval | We conducted a survey involving group and regional executives and managers. Our group executive and social and ethics committee reviewed and analysed the survey results and approved our material matters on behalf of the board. | |||||
1The six capitals are stocks of value comprising financial, manufactured, intellectual, human, social and relationship, and
natural.
We consider strategic-, operational- and sustainability-oriented impacts, risks and opportunities,
reporting on matters that:
▪influence enterprise value (financial materiality) and
▪matters that affect the economy, environment and people (impact materiality).
To fully understand Harmony’s ability to create value over the short, medium and long term, where
value is defined by an organisation’s business activities increasing, decreasing or transforming the six
capitals1, then both our Sustainability and Integrated reports should be considered.
Our Integrated report, written with our providers of capital primarily in mind, focusing on strategic and
operational matters, applies a financial lens when considering Harmony’s prospects. We therefore, only
report within our Integrated report, on matters which are financially material. Our Sustainability report
applies both impact and financial materiality in determining scope, with a focus on environmental and
social matters.
Material matters analysis
Consolidation of material matters
Using our prior year’s list of 29 material matters as our starting point, we reviewed our strategic risk
register, inclusive of our strategic opportunities. We considered existing GRI universal standards
(including topic standards) and GRI 14 – the new mining sector standard applicable from 2026. We also
reviewed the SASB Standards for metals and mining companies, which provide industry-specific
guidance on sustainability topics and metrics. From this analysis we were able to consolidate our
material matters into a more manageable list of 17 items.
Survey results
Using the consolidated list of 17 material matters, group and regional executives and managers were
surveyed, requiring respondents to rank and rate material matters with the opportunity to identify any
further matters considered material.
Of the 17 items, there were six matters where only financial materiality apply and 11 matters where
both impact and financial materiality apply. Applying a financial lens, these 17 matters make up the
scope of our Integrated report (while the 11 matters where both impact and financial materiality apply,
make up our Sustainability report’s scope).
Further details on each material matter follow including links to strategic risks and opportunities and to
the six capitals.
36
Financial material matters
Rank | Material matter | Description | Strategic risks and opportunities | Capitals | |||||||||||||||
FY25: 1 (FY24: 2) | Operational excellence and resilience | Our focus remains on improving the safety, productivity and efficiency of our operations while managing risks proactively. | ▪Not achieving operational plans at our critical operations ▪Security of electricity/power supply and the impact of higher electricity costs ▪Political tensions (geopolitical and local) ▪Supply chain disruptions ▪The impact of climate change ▪Water management and impact on securing and safely maintaining our water use licences and directive ▪The systemic failure of public infrastructure ▪Illegal mining, attacks on plants and gold theft ▪Replacing the depleting ore reserve base ▪Leveraging Harmony’s water resources* ▪Achieving more reliable and lower-emissions power* ▪Fuel-efficient and low-emission technologies* ▪Productivity improvement projects*. |       | |||||||||||||||
FY25: 2 (FY24: 3) | Capital allocation | Disciplined capital allocation enables us to deploy funds to projects that meet strict investment criteria, that addresses the risk of over-spending and value destruction. | ▪Organic growth opportunities to increase the quality of ounces and drive down costs* ▪Including copper in the production portfolio* ▪Achieving more reliable and lower-emissions power* ▪Value-accretive merger and acquisition and divestment opportunities*. | | |||||||||||||||
FY25: 3 (FY24: 1) | Commodity price and exchange rate fluctuations | As commodity prices and exchange rates fluctuate, guided by our derivative and hedging strategies, we analyse potential outcomes to respond proactively and appropriately. | ▪Political tensions (geopolitical and local) ▪Gold price and forex fluctuations (varying from planned levels) ▪Including near-term copper in the business portfolio*. | | |||||||||||||||
FY25: 4 (FY24: 4) | Execution of multiple, significant projects | Project management practices include a standardised system, clear plans and responsibilities, balanced workloads, transparent communications and progress monitoring. | ▪Unsuccessful project execution and funding ability ▪Retaining key skills and experience ▪Trackless mobile machinery (TMM)-related risks ▪Organic growth opportunities to increase the quality of ounces and drive down costs*. | | |||||||||||||||
FY25: 5 (FY24: 6) | Innovation, technology and digitalisation | We pursue opportunities to improve safety and enhance our ability to improve cost and productivity efficiencies, as well as overall financial management. | ▪Retaining key skills and experience ▪Achieving more reliable and lower-emissions power* ▪Fuel-efficient and low-emission technologies* ▪Leveraging Harmony’s water resources* ▪AI integration (disruption)* ▪Productivity improvement projects*. | | |||||||||||||||
FY25: 6 (FY24: 5) | Cybersecurity | An information security compromise or data breach could lead to the accidental or unlawful use, destruction, loss, alteration or disclosure of data. | ▪Cybersecurity ▪AI disruption (integration)*. | | |||||||||||||||
*These items are strategic opportunities, while others listed are strategic risks.
37
Impact and financial material matters
Rank | Material matter | Description | Strategic risks and opportunities | Capitals | |||||||||||||||
FY25: 1 (FY24: 3) | Employee health and safety | Mining and extraction activities pose significant health and safety risks to our employees. We prioritise zero harm, and safety, health and wellbeing are core values. We focus on protecting physical and mental health through various wellness programmes to support our people’s wellbeing. | ▪Safety and health. | | | ||||||||||||||
FY25: 2 (FY24: 4) | Governance excellence | Harmony is committed to strong corporate governance with clear policies, effective management and active risk management. We go beyond meeting regulations to create long-term sustainability, build investor trust and maintain our social licence to operate. | ▪Regulatory changes and/or compliance with regulatory requirements. | | |||||||||||||||
FY25: 3 (FY24: 2) | Sound labour relations | We acknowledge our employees’ right to freedom of association and fair labour practices. Our employee relations are based on mutual respect and trust, reflecting our firm belief that each person is critical to our business strategy. | ▪Retaining key skills and experience. | | |||||||||||||||
FY25: 4 (FY24: 1) | Water management | Water is critical for environmental, social and economic wellbeing. We are committed to sustainable water management and long-term resource stewardship. | ▪Water management and impact on securing and safely maintaining our water use licences and directive ▪The systemic failure of public infrastructure ▪Leveraging Harmony’s water resources*. | | |||||||||||||||
FY25: 5 (FY24: 10) | Supporting our people | Our commitment to employee wellbeing includes creating a safe workplace where every voice is valued, every talent is cultivated, and everyone has equal access to opportunities. | ▪Retaining key skills and experience ▪Trackless mobile machinery-related risks. | | |||||||||||||||
FY25: 6 (FY24: 6) | Climate change, adaptation and resilience | We take action to adapt to climate change and reduce our carbon footprint by using less fossil-fuel energy and increasing renewable energy use. We work to limit air pollution and protect our environment and communities from climate-related risks. | ▪The impact of climate change ▪Security of electricity/power supply and the impact of higher electricity costs ▪Fuel-efficient and low-emission technologies* ▪Including near-term copper in the business portfolio* ▪Achieving more reliable and lower-emissions power* ▪Leveraging Harmony’s water resources*. | | |||||||||||||||
FY25: 7 (FY24: 9) | Sustainable communities | Our social initiatives, coordinated with government, businesses and communities, aim to support employees and host communities by enhancing access to social services, healthcare, education and training, while also safeguarding public health and safety by addressing risks such as dust and air emissions from mining activities. | ▪The systemic failure of public infrastructure ▪Political tensions (geopolitical and local) ▪Leveraging Harmony’s water resources*. | | |||||||||||||||
*These items are strategic opportunities, while others listed are strategic risks.
38
Rank | Material matter | Description | Strategic risks and opportunities | Capitals | |||||||||||||||
FY25: 8 (FY24: 5) | TSF and waste management | We implement processes to maintain safe, stable and compliant TSFs. Harmony supports the circular economy through TSF retreatment and water recycling. | ▪The impact of climate change. | | |||||||||||||||
FY25: 9 (FY24: 7) | Biodiversity | We work to protect and restore land, prevent land degradation and use ecosystems responsibly. We have biodiversity management plans and run conservation projects, where possible, and look for ways to offset our impact. | ▪The impact of climate change ▪Illegal mining, attacks on plants and gold theft. | | |||||||||||||||
FY25: 10 (FY24: 8) | Post-closure sustainability | After mine operations cease, we work to keep the site safe, clean and suitable for future use while managing any residual impacts. Our goal is to support nature’s recovery and provide ongoing social and economic benefits for future generations. | ▪Illegal mining, attacks on plants and gold theft ▪Political tensions (local). | | |||||||||||||||
FY25: 11 (FY24: NA) | Management of illegal mining | Harmony actively fights illegal mining to protect shared resources and protect the safety of our business, employees, communities and environment. We seal shafts, invest in security and work closely with law enforcement and local communities to reduce the incidence of illegal mining. | ▪Illegal mining, attacks on plants and gold theft ▪Political tensions (local). | | |||||||||||||||
39
Strategy
Harmony’s strategy is centred on delivering safe, profitable and predictable production and improving margins through operational excellence and value-
accretive acquisitions. By translating our purpose into action, we create a resilient business that generates sustainable returns through our focus on value
over volume as we become an international gold and copper producer. We remain agile in our response to risks and stakeholder needs, are aware of the
complexity of our operating environment and the material factors that influence our business performance. This makes us a partner of choice where we
operate.
Our strategic pillars and four business areas | A solid investment case and compelling gold-copper story | ||||||
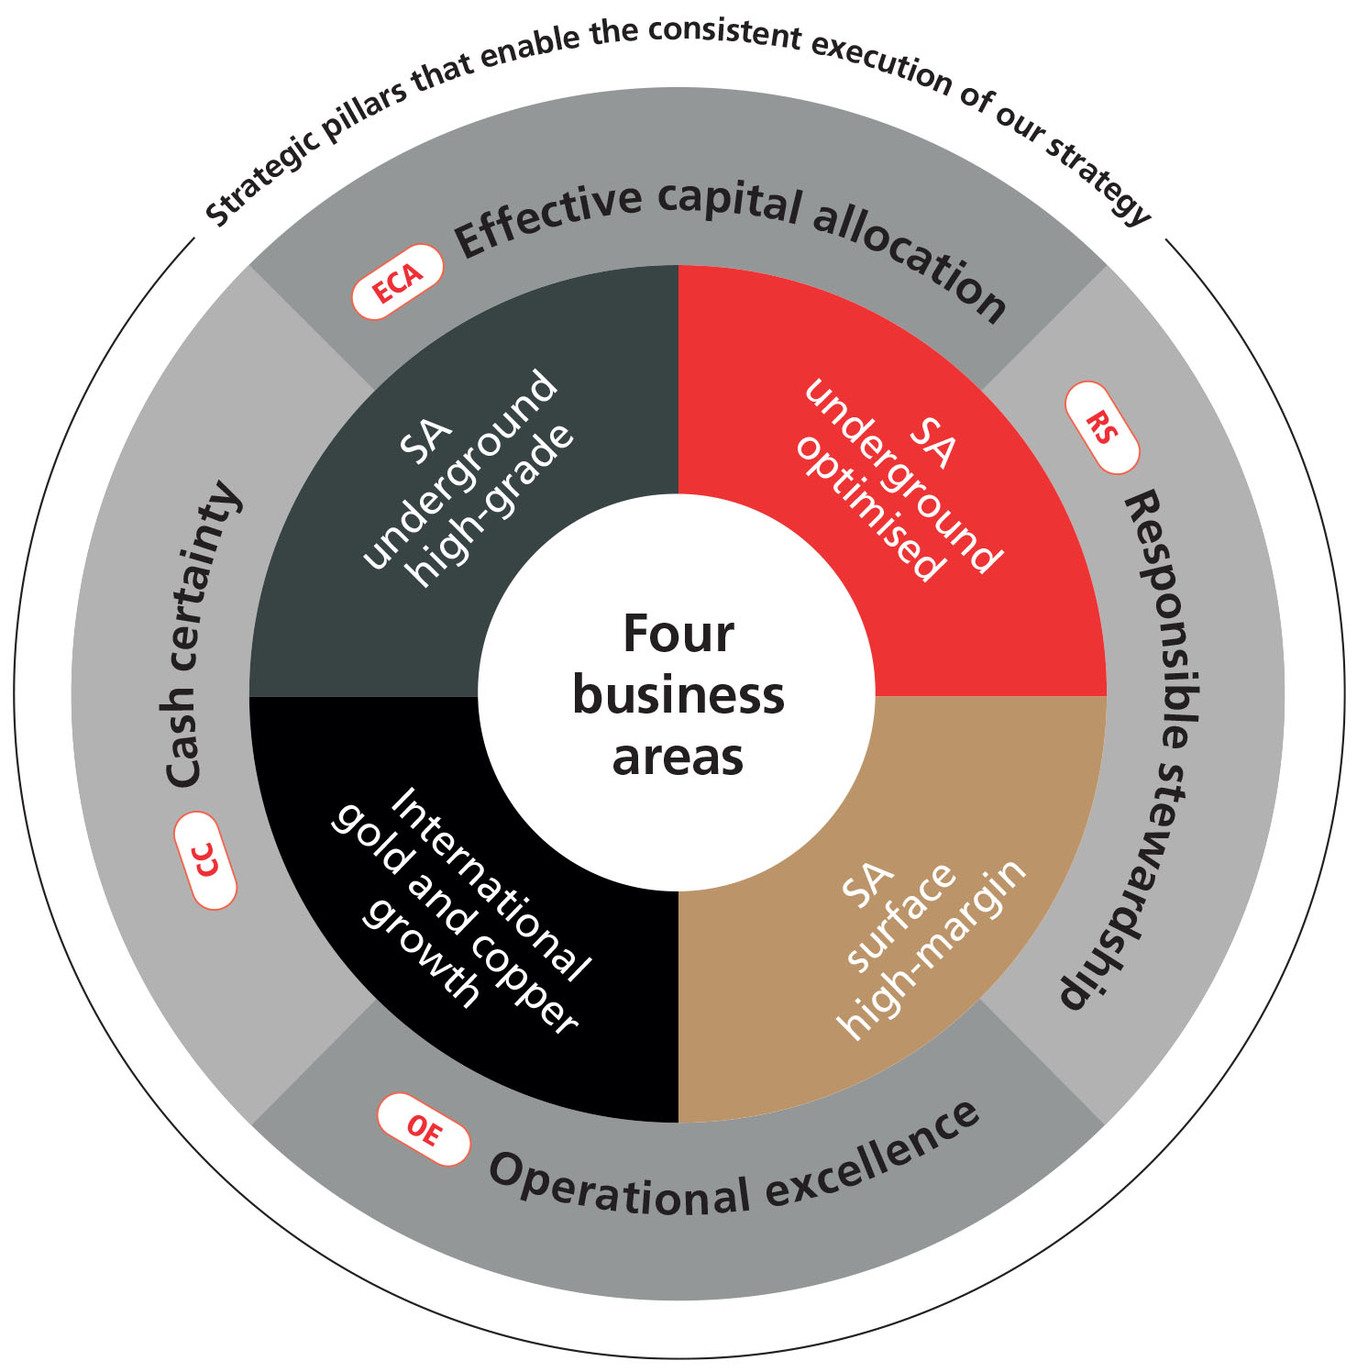 | Embedded sustainability ▪Safety is always prioritised ▪Embedded ESG, supported by a clear sustainability framework ▪Largest tailings retreatment operator globally ▪Specialised and skilled underground and open-pit operators ▪Leadership continuity and broad management experience ▪Exceptional culture ▪Partner of choice. |  | |||||
Disciplined and responsible capital allocation framework ▪Continuous improvement in quality of portfolio ▪Investment in higher-quality orebodies drives margin expansion ▪Balancing growth aspirations with shareholder returns ▪Consistent dividends in line with policy ▪Diversifying into copper ▪Diversified geographical exposure. |  | ||||||
Higher-grade assets with long life ▪Increased grade quality through acquisition and optimisation of existing portfolio ▪Long-life assets ▪Significant Mineral Resource base ▪Excellent resource-to-reserve conversion potential ▪Pipeline of projects to lower risk and increase margins ▪Significant operator of gold tailings retreatment facilities ▪Near-term copper production plus a Tier 1 copper-gold porphyry. |  | ||||||
Operational excellence ▪Consistently meeting production guidance for the 10th consecutive year ▪Exceptional performance from our high-grade South African underground mines ▪Strong contributions from complementary and diversified assets including Hidden Valley and our tailings reclamation programmes ▪Predictable and stable cost structure ▪Better efficiencies through various business improvement initiatives ▪Demonstrated responsible project execution. | | ||||||
Stellar cash flow generation ▪Consistent positive free cash flow generation ▪Net cash position with excellent liquidity* ▪Geared exposure to rand/kg gold price ▪Internally fund capital and approved projects at current gold prices* ▪Conservative and clear hedging strategy aimed at margin protection. |  | ||||||
* The significant capital investment required for MAC Copper may impact near-term financial metrics.
40
Our strategy unpacked and outlook
Through our four strategic pillars, we aim to consistently and effectively execute our strategy. We also consider the trade-offs inherent in our strategic decision making alongside the six capitals we need to create and
preserve value. For information on the risks associated with each strategic pillar, refer to Risk and opportunity management.
Actions to achieve Harmony’s strategic pillars | Key trade-offs | Resources allocated | Future focus | ||||||||||||||
| Responsible stewardship |       | |||||||||||||||
▪Embedding a proactive safety culture and risk management ▪Advancing the objectives set out in our sustainability framework, covering material imperatives ▪Adhering to sound corporate governance principles ▪Contributing to the SDGs, directly or indirectly ▪Proactively and meaningfully engaging with our stakeholders. | Safety is our first priority. Harmony balances operational performance with responsible stewardship, community wellbeing, regulatory compliance and the long-term protection of natural resources, even when this may affect short-term financial returns or productivity. | We allocate resources to deliver on our ESG imperatives, enabling us to leave a lasting positive legacy in the countries and communities where we operate. | ▪Our journey toward zero loss of life continues with proactive initiatives that are embedding personal ownership and encouraging behaviour change ▪With Sungazer 2 now under construction, we are progressing towards our scope 1 and 2 emissions reduction targets for FY36 ▪We plan to conduct another gender survey in FY26/27 to assess the impact of the interventions implemented based on the findings from the 2022 survey ▪Investing in copper – a future-facing, green metal critical for the global just energy transition | ||||||||||||||
| Operational excellence | | |||||||||||||||
▪Proactively manage safety and operational risks ▪Maintaining flexibility across our operations ▪Consistent delivery of guidance through safe predictable production ▪Drive disciplined project execution and engineering practices ▪Enhance efficiency through digitalisation and infrastructure reliability ▪Control costs and optimise mined grades to reduce all-in sustaining cost (AISC) ▪Sustain and grow our gold-copper Resource base. | Harmony balances investing in sustaining and development projects to secure long-term operational performance while retaining cash to fund strategic growth opportunities. | We allocate financial, human and intellectual capital to achieve efficiencies and operate safely. Manufactured and natural capital investments enhance infrastructure, digital capabilities and resource efficiency. | ▪We have met production guidance for the 10th consecutive year ▪We intend to revisit our guidance when we release our half-year results in February 2026 (H1 FY26), to incorporate MAC Copper’s production for the FY26 and the updated Eva Copper feasibility study, pending final investment decision (FID) ▪Our FY26 production is expected to be between 1 400 000oz and 1 500 000oz, underground recovered grade is guided at above 5.8g/t and AISC is expected to be between R1 150 000/kg and R1 220 000/kg. This increase reflects a deliberate, disciplined approach to sustaining capital, inflationary realities and updated mine plans. | ||||||||||||||
41
Actions to achieve Harmony’s strategic pillars | Key trade-offs | Resources allocated | Future focus | ||||||||||||||
 | Cash certainty | | |||||||||||||||
▪Investing in quality ounces to expand margins, which creates value ▪Generating and protecting robust cash flows across commodity cycles ▪Locking in good margins through a clear hedging strategy ▪Maintaining net debt:EBITDA at less than one times ▪Consistently achieving operational excellence. | Harmony balances profitability with the investments required for responsible stewardship, operational excellence and disciplined capital allocation, while also weighing funding for organic and value-accretive growth against short-term shareholder returns. | We allocate financial and intellectual capital to maintain cash certainty, allowing to invest in a future-fit business and deliver shareholder value at the same time. | ▪We aim for an optimal capital structure to ensure our balance sheet remains robust and flexible, while pursuing opportunities to lower our cost of capital ▪Diversification into copper, to enhance cash flows and lower portfolio risk ▪Allocating capital towards quality production and improved margins ▪We continue to hedge up to 30% of our gold production over a rolling 36-month period to protect and lock-in margins. | ||||||||||||||
| Effective capital allocation | | |||||||||||||||
▪Investing in safety, productivity and flexibility across all operations ▪Directing capital towards high-quality assets, including our South African high-grade underground operations, high-margin surface and surface retreatment opportunities and international copper expansion ▪Adhering to investment criteria as outlined in our capital allocation framework ▪Delivering consistent shareholder returns in line with our dividend policy. | Harmony balances long-term growth aspirations with short- and medium-term shareholder returns, allocating capital between projects that deliver immediate returns and those that secure future profitability while derisking the business. | We allocate financial, human and intellectual capital to high-quality investments, leveraging manufactured, natural and social capital to deliver sustainable returns and strategic value. | ▪Planned capital expenditure for FY26 will increase, reflecting our strategic focus on investing in high-quality ounces and unlocking long- term growth across the portfolio. Key initiatives include the extension projects at Moab Khotsong, Mponeng and Eva Copper, as well as the roll out of our renewable energy programme ▪Sustaining capital is also rising, with a significant contribution from the once-off fleet replacement at Hidden Valley as we extend this mine life to 2030 ▪We remain committed to maintaining our dividend payout ratio of 20% of net cash generated in line with our stated dividend policy, at the discretion of the board. | ||||||||||||||
42
Four business areas that enable our ability to create value in the long term
Through our four business areas, Harmony is building a stronger, more resilient and future-focused business. By optimising operations, pursuing value-accretive growth, diversifying our portfolio, and securing robust free
cash flow, we create enduring profitability and long-term shareholder value. Anchored in safety and operational excellence as a non-negotiable foundation, we direct capital towards higher-grade gold mines, surface
retreatment expansion, and international gold and copper assets. These investments, combined with responsible stewardship and cash certainty, enable each mine and project to contribute to Harmony’s transformation
and the shared value we deliver for our stakeholders.
South African underground high-grade | International gold and copper growth | South African surface high-margin | South African underground optimised | |||||||||||
▪Moab Khotsong ▪Mponeng. | Papua New Guinea ▪Hidden Valley ▪Wafi-Golpu Project. Australia ▪Eva Copper Project ▪MAC Copper (acquisition concludes on 24 October 2025). | ▪Kalgold ▪Mine Waste Solutions (MWS) ▪Phoenix ▪Savuka Tailings ▪Central Plant Reclamation (CPR) ▪Rock dumps. | ▪Doornkop ▪Kusasalethu ▪Joel ▪Target 1 ▪Tshepong North ▪Tshepong South ▪Masimong. | |||||||||||
▪These assets produce approximately 36% of group production ▪Moab Khotsong’s LoM is approximately 20 years; however, there will be a decline in production at this mine from FY27 to FY31 as we mine out the middle mine and complete the Zaaiplaats Project ▪Mponeng is the world’s deepest gold mine, and the quality of ounces present significant upside potential with a LoM of approximately 20 years from the extension project, which is in execution. | ▪Future-facing metals such as copper offer counter-cyclical diversification to our existing gold portfolio ▪We have extended the LoM at Hidden Valley to 2030 and opportunities exist to further extend its LoM beyond FY30 ▪Eva Copper Project will add between 55kt and 60kt of copper and approximately 14koz of gold annually, over a 15-year LoM* ▪CSA mine is one of the highest-grade copper mines in Australia. | ▪The Kareerand TSF extension is largely complete and has enabled us to extend the LoM of MWS by over 14 years ▪Feasibility studies are being conducted to determine if we can extract 5.7Moz in Mineral Resources from old Free State tailings dams. | These assets: ▪Generate roughly 36% of group production ▪Can be highly profitable due to their operating leverage ▪Play a critical role in funding our growth aspirations and securing our social licence to operate, particularly in Welkom where we contribute significantly to the socio-economic development of local communities. | |||||||||||
* Figures subject to feasibility study update and final investment decision.
How we measure sustained value creation
Remuneration-linked performance drivers Harmony’s reward strategy supports the delivery of our business strategy, guiding the creation of value for both the company and its stakeholders. Our total incentive plan is tied to a Balanced Scorecard, incorporating key short- and long-term performance measures to reward leadership for driving value creation. Further details on our approach and performance measurement can be found under Managing performance through remuneration. | ESG-related KPIs We have five-year targets for all material sustainability KPIs, covering key environmental issues such as GHG emissions, energy, water, waste and ecological impacts. KPIs are independently assured, with three approved by the SBTi and aligned with our sustainability-linked bonds to support decarbonisation. | |||||
43
How we allocate capital
Our balanced capital allocation framework guides how we prioritise investments, ensuring alignment with our strategic objectives, investment criteria and shareholder returns. This disciplined approach integrates
resource allocation with our growth aspirations, creates synergy across our four strategic quadrants and enables sustainable long-term value creation.
Capital allocation framework | ||
Safety and production optimisation Aiming for zero loss of life | ||
Organic growth and investment Focus on increasing grade and margins | ||
Debt repayment <1x net debt:earnings before interest, tax, depreciation and amortisation (EBITDA) | ||
Inorganic growth Value-accretive mergers and acquisitions | ||
Shareholder returns Paying a dividend consistent with our policy and overall growth strategy | ||
Investment criteria | ||
Lower-risk profile ▪All ESG factors considered, especially safety and impact of climate change. | ||
Improving margins ▪Preference for larger, higher-margin assets to improve quality of the portfolio ▪AISC of less than US$1 750/oz. | ||
Improve production profile ▪Permitted, near-term production preferred, if not already operational ▪10-year LoM or longer at >100 000oz per annum in regions where we operate ▪10-year LoM or longer at >150 000oz per annum in new areas outside of operating hubs. | ||
Affordability ▪Capital intensity versus cash flows to be manageable. | ||
Generating returns ▪Acquisitions and projects that deliver a return exceeding our regional cost of capital, while compensating for risk. | ||
44
To drive long-term shareholder value, we are prioritising capital allocation to our transformational assets and projects over the short and medium term as follows:
Higher-grade, higher-quality and lower-risk assets (securing short- and long-term cash flow) | ||||||||
Projects in execution | Value realised | |||||||
Moab Khotsong extension | ▪The LoM has been extended to approximately 20 years, with project completion expected in May 2033 ▪The asset adds 2.70Moz to Mineral Reserves ▪We can maintain an annual steady state production of >200 000oz once the extension project is complete. | |||||||
Mponeng extension | ▪The LoM has been extended to approximately 20 years ▪The asset adds 2.34Moz to Mineral Reserves ▪Recovered grade is sustained at ~9g/t ▪We can maintain an annual steady state production of ~250 000oz. | |||||||
Mine Waste Solutions expansion | ▪The LoM has been extended to over 14 years ▪We can maintain an annual production of ~110 000oz over the LoM. | |||||||
International gold and copper assets (diversifying our portfolio and derisking Harmony) | ||||||||
Projects | Value to be realised | |||||||
Eva Copper Project feasibility update* | ▪We have received conditional grant funding of A$20.7 million from the Queensland Government ▪We expect to produce 55kt to 60kt of copper and ~14koz of gold annually ▪AISC will be in the middle of the global cost curve ▪We have targeted first copper production in FY28. | |||||||
Wafi-Golpu permitting | ▪We expect to convert the signed framework memorandum of understanding into a mining development contract, followed by supporting agreements for a special mining lease ▪The feasibility study update will start once the special mining lease has been granted ▪We expect an average annual production of 180kt** copper and 250 000oz** gold ▪Gold grade: 0.86g/t ▪Copper: 1.2%. | |||||||
MAC Copper (CSA mine) | ▪Harmony has acquired 100% of the Australian mine (transaction conclusion pending), funded by a US$1.25 billion bridge loan ▪The transaction is expected to be concluded in October 2025, at the same time as publishing our reporting suite. Refer to MAC Copper acquisition for further details. | |||||||
* Figures subject to feasibility study update and pending FID. ** Based on the 2018 feasibility study update and 100% attributable. | ||||||||
45
Securing long-term value creation
Ongoing investment across our operations will ensure improved margins and that Harmony will produce
gold and copper for decades to come. The production profile below reflects our current and future
assets and how our portfolio mix is expected to evolve over time. We illustrate our focus on value
enhancement with an increasing contribution from copper and investing in our organic, high-grade gold
projects. The two accompanying pie charts illustrate Harmony’s projected composition in 10 years.
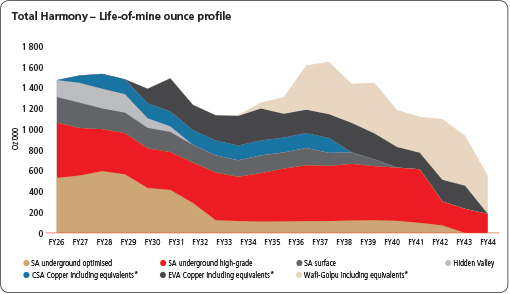
Note: Diagram is for illustrative purposes only and includes forward-looking assumptions, subject to the safe-harbour
statement.
* Potential projects that are not yet approved.
Assumptions include the Papua New Guinea Government exercising their 30% participation right
on Wafi-Golpu, a theoretical start date post-permitting and the granting of a special mining lease.
Outcomes are also dependent on feasibility studies, permitting and approvals for Eva Copper and South
African surface projects.
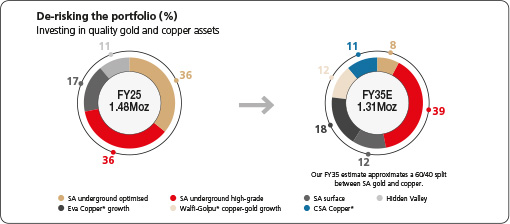
Note: Diagram is for illustrative purposes only and includes forward-looking assumptions, subject to the safe- harbour
statement.
* Potential projects that are not yet approved.
Harmony’s acquisition of MAC Copper marks a key milestone in Harmony’s growth strategy, reinforcing its transition into a low-cost, global gold and copper producer. The high-quality, producing copper asset complements Harmony’s expertise in underground mining and supports disciplined, value-accretive capital allocation. | ||
46
Performance by operation
Harmony operates in South Africa, Papua New Guinea and Australia. By focusing on responsible stewardship, operational excellence, effective capital
allocation and cash certainty, we maximise our asset portfolio with a strong focus on commodity and geographic diversification, risk management and
harnessing organisational expertise.
We have divided our operations into four distinct quadrants, each with its own plan, risk profile and strategy (refer to the Strategy section for more details), allowing for focused investment and streamlined
management. We actively manage our portfolio to prolong the life of our higher-grade, most productive assets while adding lower-risk, higher-margin ounces to drive sustainable free cash flow and long-term value
creation.
Progress on the acquisition of MAC Copper1, the Eva Copper Project and our Wafi-Golpu Project in Papua New Guinea, reinforces Harmony’s commitment to supporting a low-carbon future and increasing our copper
exposure.
More details on our operations and their performance are presented below.
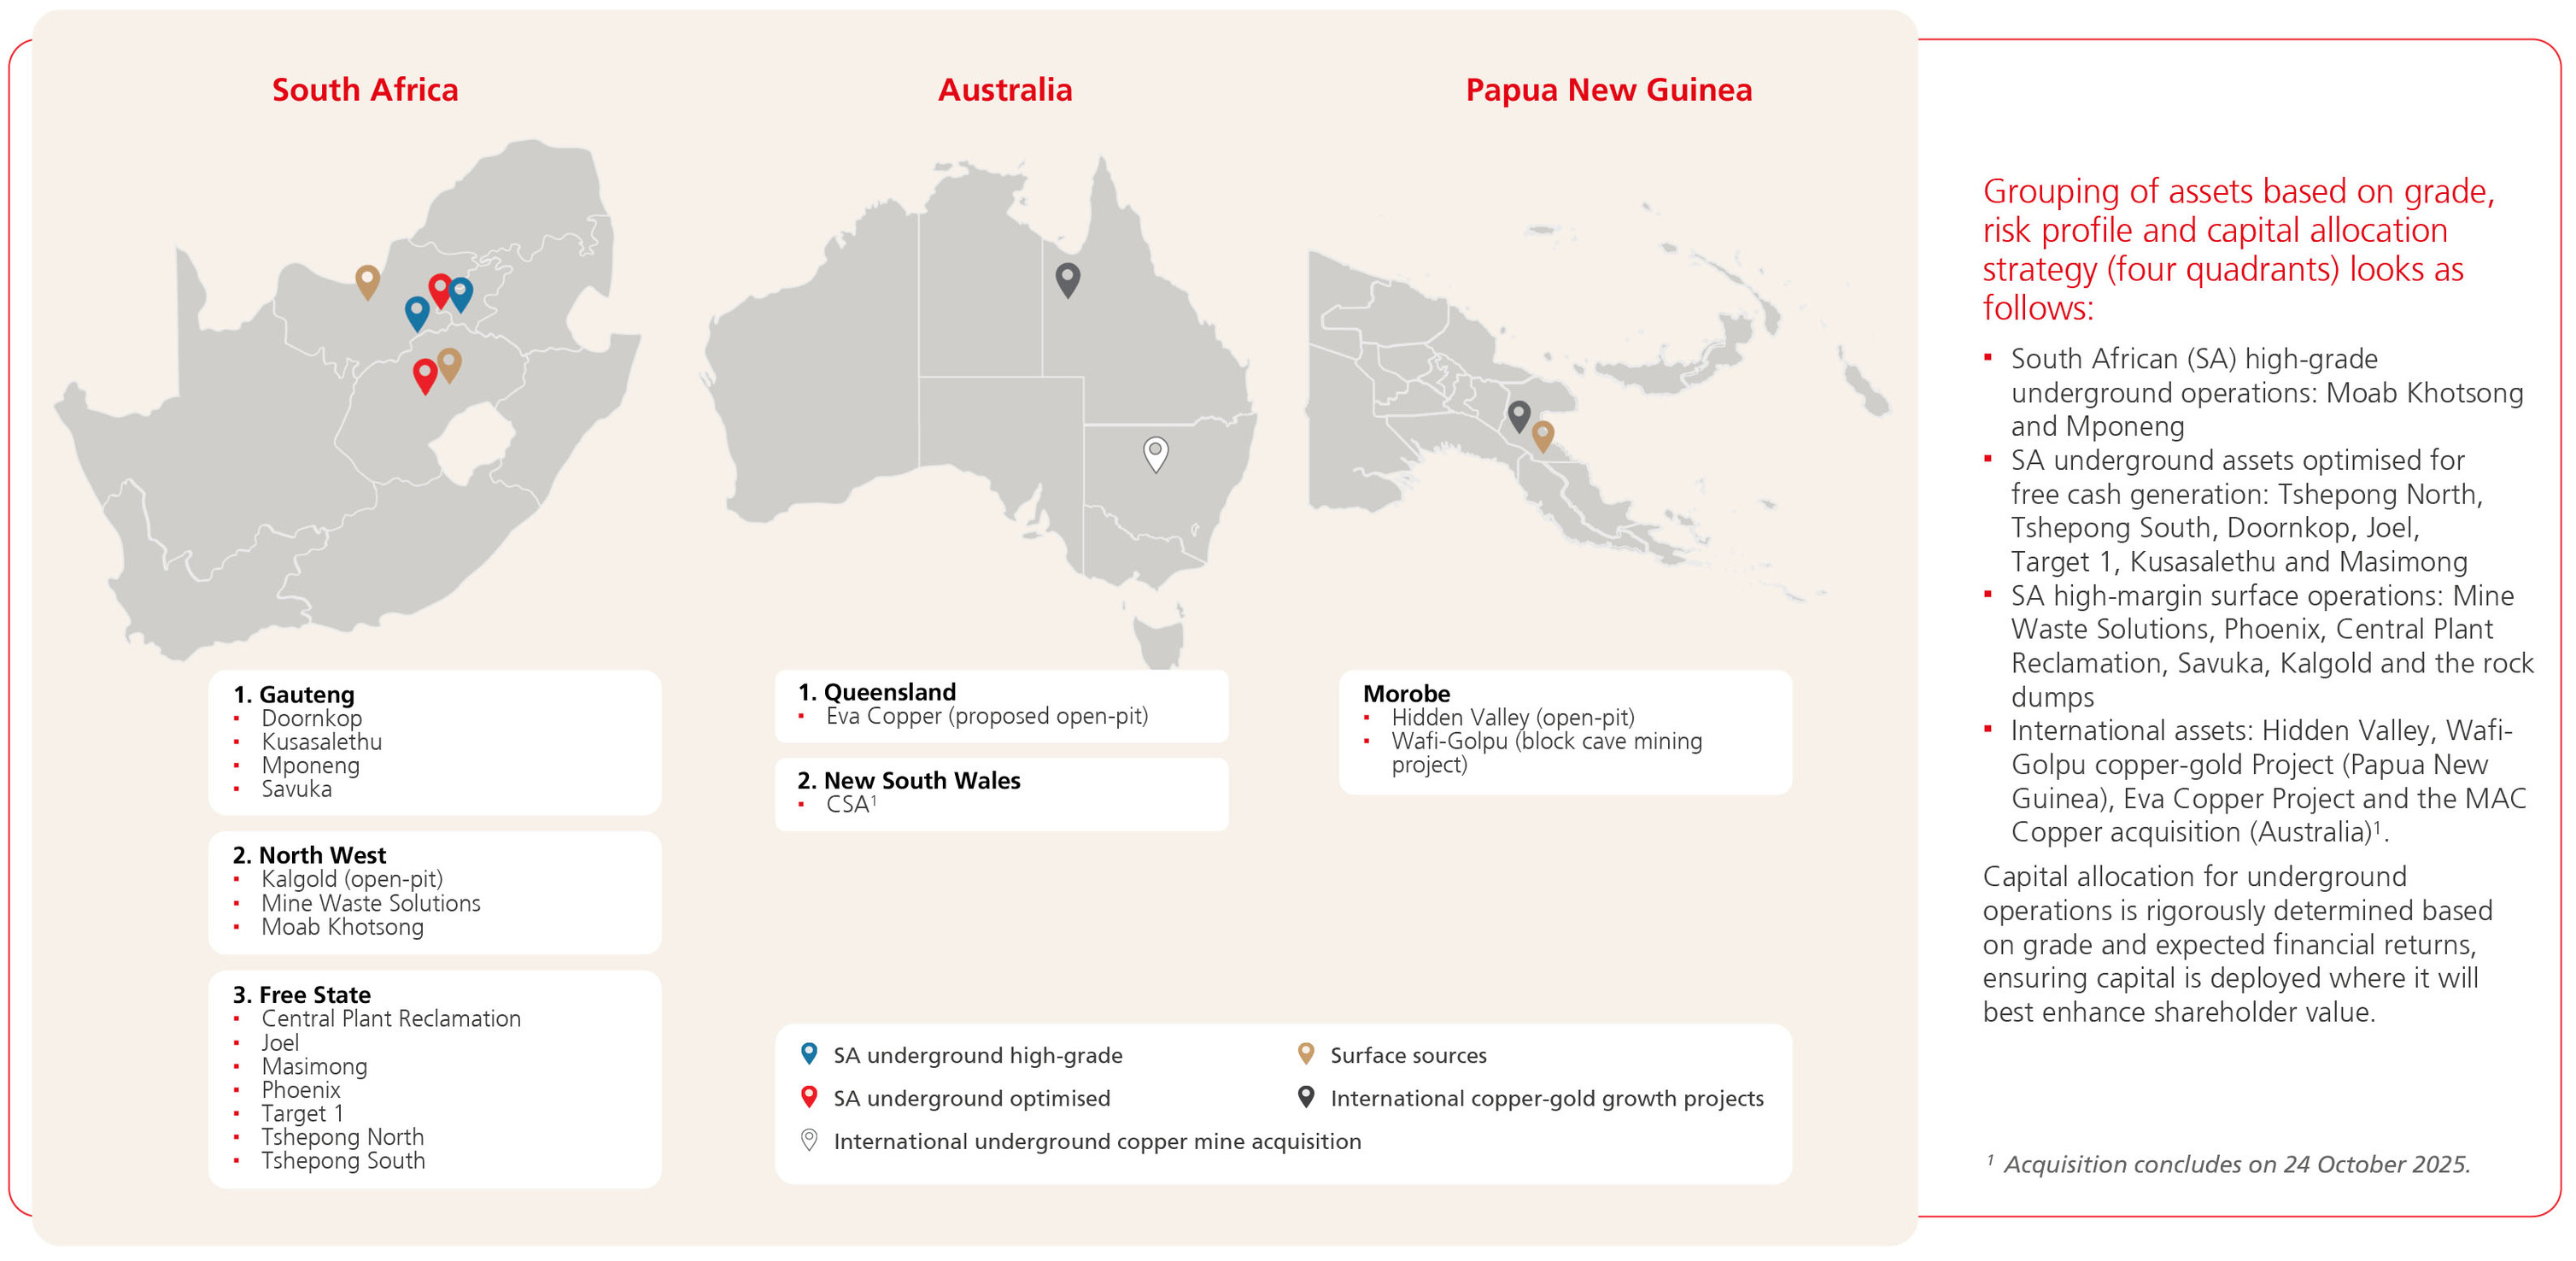
47
Operational performance
Rooted in responsible mining, we mine with purpose, creating shared value where safety, operational excellence and sustainability are non-negotiable.
Our unwavering commitment to safety and operational flexibility enabled us to meet guidance for the 10th consecutive year, reinforcing our core belief
that a safe mine is a profitable mine.
Our approach
Our commitment to operational excellence is demonstrated by our focus on our key performance metrics of safety, grade, costs and production. It is clear that our ability to maintain stable, high-quality output across a
diverse asset portfolio underscores the strength of our operating model and the discipline of our teams.
Key focus areas of our operational excellence programme:
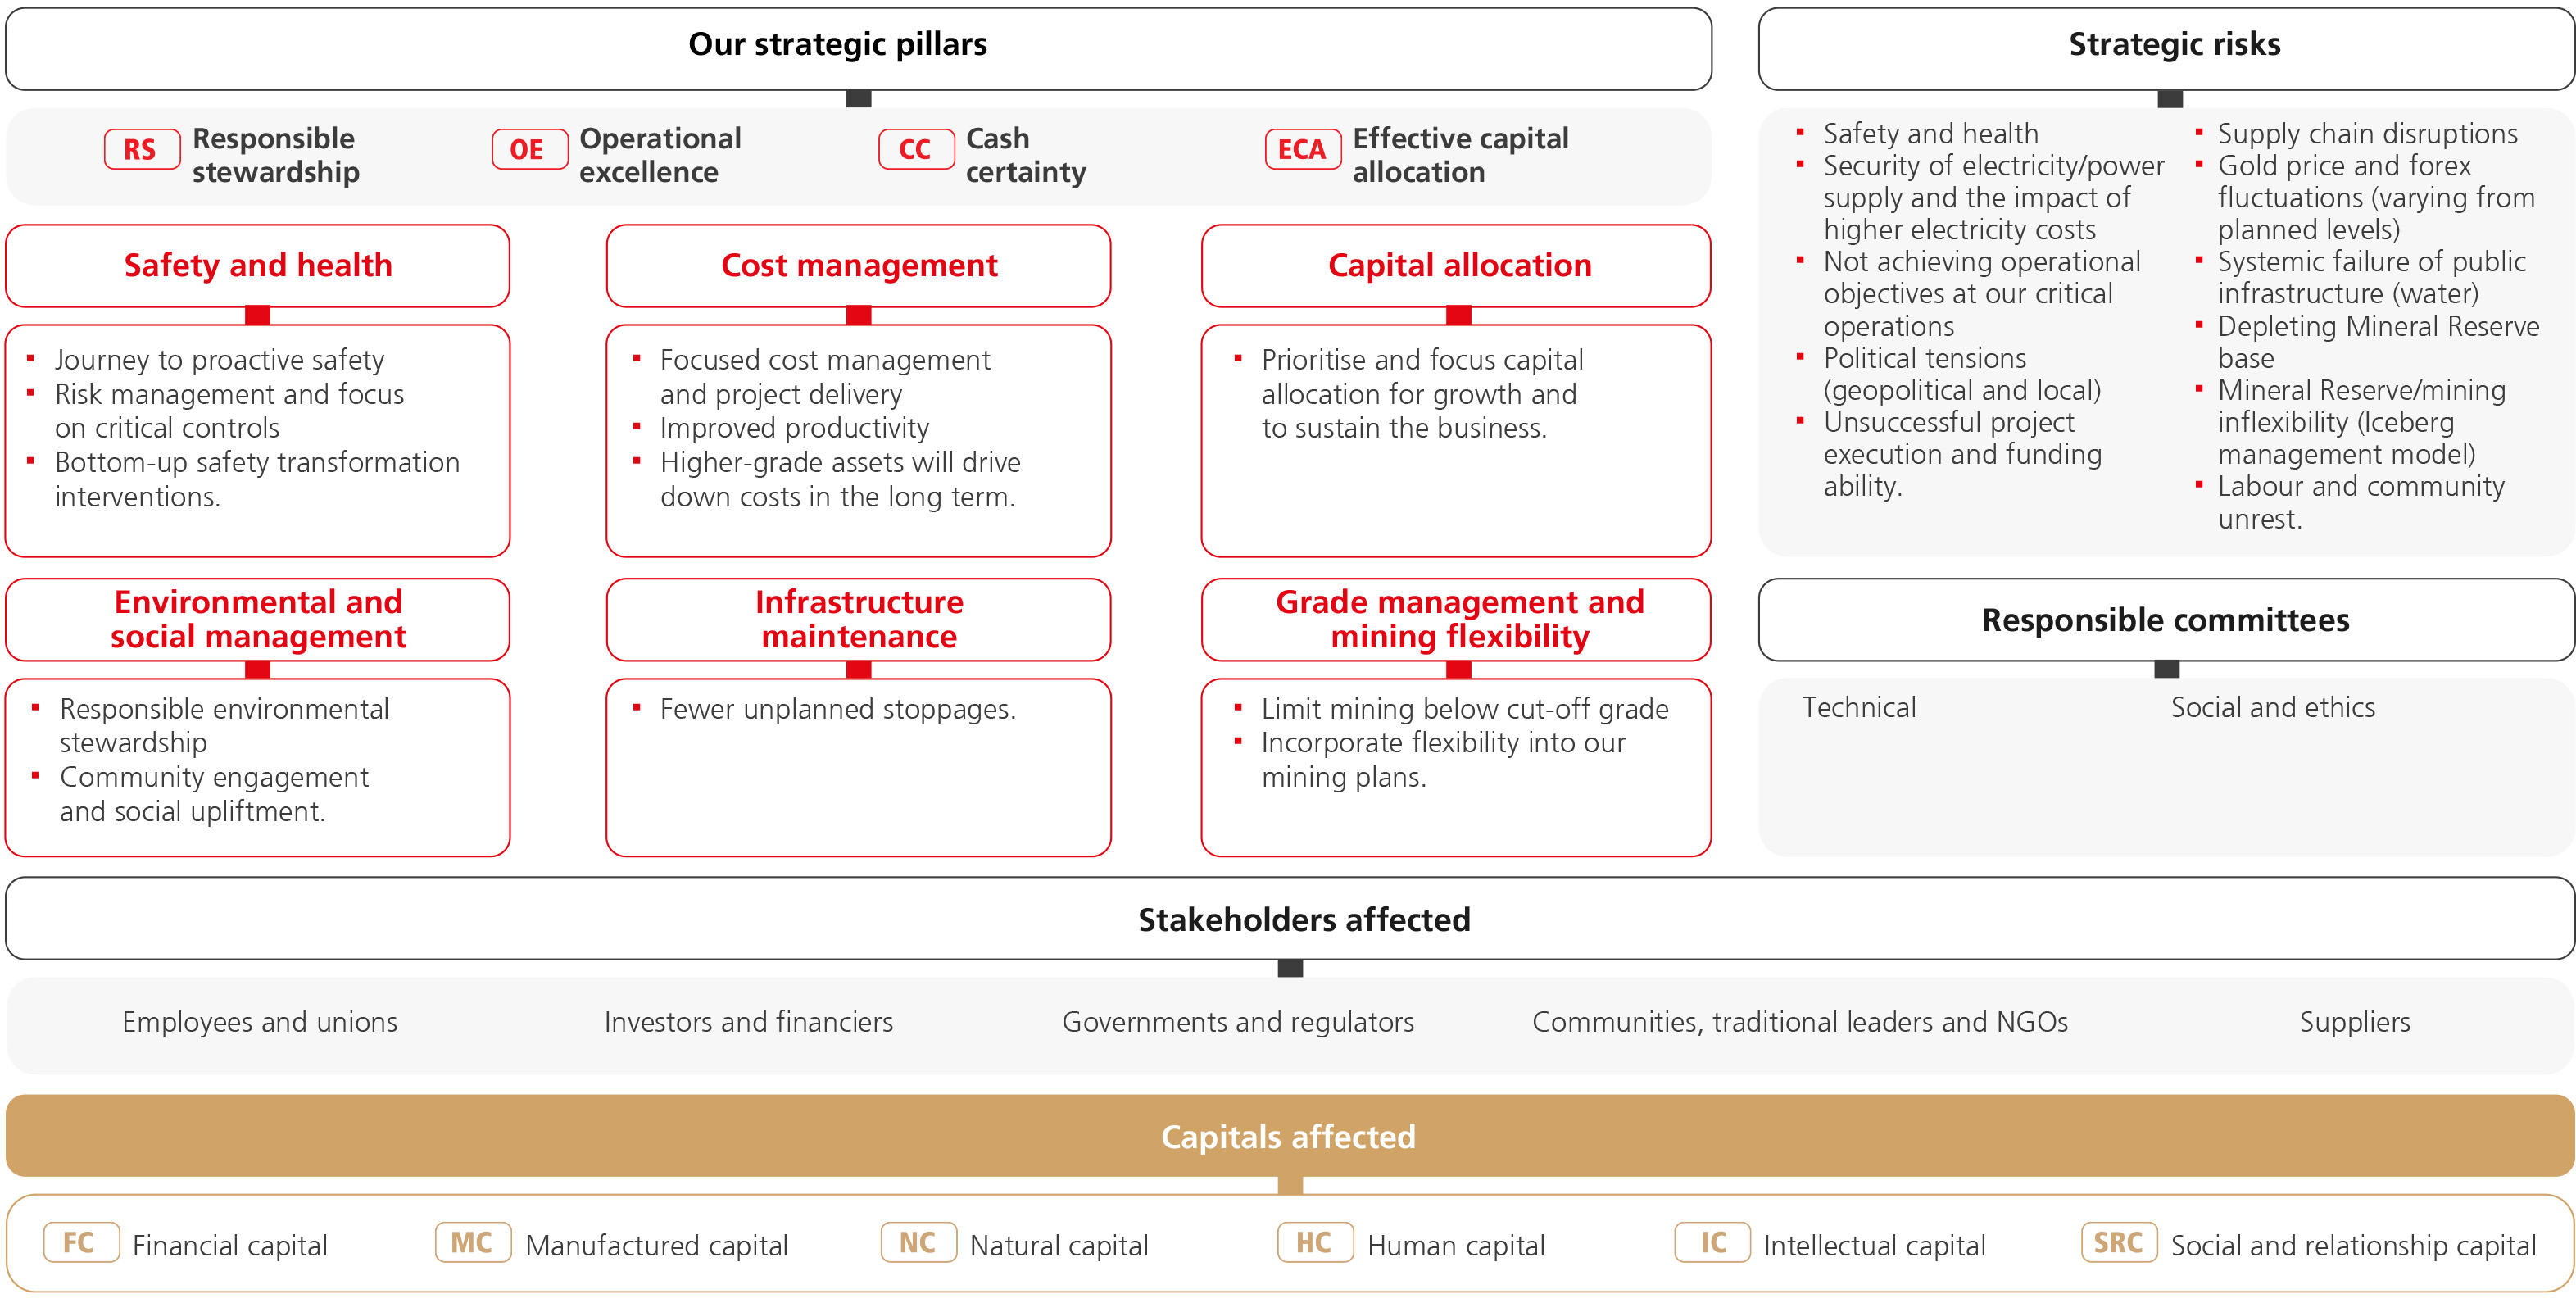
48
Safety and operational risk management
Managing safety risks: Safety is a material risk for Harmony. As such,
it is imperative to ensure safe production, prevent loss-of-life
incidents and embed a proactive safety culture across all our
operations. We have adopted global best practice safety standards
via a four-layered approach. The approach is based on risk
management, implemented modernised safety systems and an
intensified focus on leadership development and training to address
behaviour to achieve our goal of ensuring that each employee
returns home safely every day.
See Safety transformation towards zero harm for details on our
safety performance and management.
Managing operational risks: Operational risk management is an
integral part of our business and operating strategy. It entails
managing risks effectively while working productively. Our risk-based
approach helps ensure that all supporting systems are functioning
efficiently. Safety hazards and operational business risks are
identified and dealt with continuously at each of our operations.
Harmony’s top operational risks are:
▪Loss of life/safety
▪Security of electricity power supply and the impact of
higher electricity costs
▪Not achieving operational objectives at our critical operations
▪Unsuccessful project execution
▪Supply chain disruptions.
Scope
This report was prepared as part of Harmony’s integrated annual
reporting suite. For additional information on topics disclosed in this
report, refer to the individual reports available on our website.
Our performance
The safety and health of our employees and their families will always
be our top priority. At Harmony, safety is not just a priority, it is a
core value that underpins everything we do. We tragically lost eleven
colleagues this year. Each loss of life directly impacts the community
of the employee. The loss of life results in significant operational
disruption, reputational damage and regulatory scrutiny. Operating
some of the deepest mines in the world demands excellence, and we
remain committed to a proactive safety strategy that protects our
people and reinforces our culture of accountability. We continue to
invest in safety infrastructure and initiatives to ensure every
workplace is safe, compliant and empowering. Group lost-time injury
frequency rate (per million hours worked) (LTIFR) for FY25 decreased
to 5.39 per million hours worked (FY24: 5.53 per million hours
worked).
In FY25, Harmony experienced another excellent year, achieving
record adjusted cash flows boosted by a sustained higher gold price
received and meeting our business plans. Group production for FY25
decreased, as planned, by 5% to 46 023kg (1.48Moz) from 48 578kg
(1.56Moz) in FY24. This was largely due to lower production at
Doornkop, Mine Waste Solutions and Moab Khotsong, yet still within
our guided range of 1.4Moz to 1.5Moz. The average underground
recovered grade increased by 3% to 6.27g/t from 6.11g/t in FY24,
mainly driven by higher grades at Mponeng.
Gold revenue increased by 21% for FY25 to a record high of
R70 732 million (FY24: R58 269 million), driven by higher gold prices.
The average gold price received increased by 27% to R1 529 358/kg
(FY24: R1 201 653/kg) for the financial year, mainly due to a 31%
increase in the US dollar price to US$2 620/oz (FY24: US$1 999/oz).
Group all-in sustaining cost increased by 17% to R1 054 346/kg in FY25
(FY24: R901 550/kg). The all-in sustaining cost was, however, within
the guided range of R1 020 000/kg to R1 100 000/kg and was driven
by lower planned production, higher sustaining capital as well as
higher cash operating cost due to annual wage and above-inflation
electricity tariff increases. Production profit increased by 38% to R30
208 million from R21 880 million in FY24.
Group capital expenditure for FY25 increased by 32% to
R10 998 million (FY24: R8 327 million) driven by our major projects.
Major capital expenditure rose by R1 711 million to R4 705 million in
FY25, a 57% increase from the R2 994 million spent in FY24, mainly
for the Mponeng life-of-mine extension and renewable energy
project at Moab Khotsong.
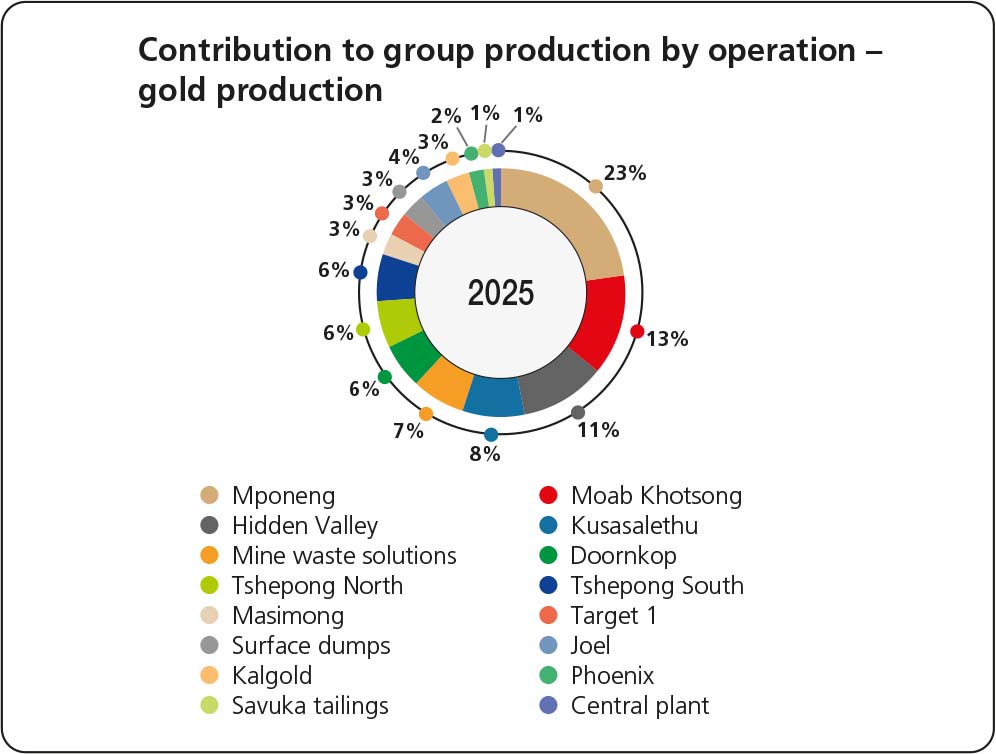
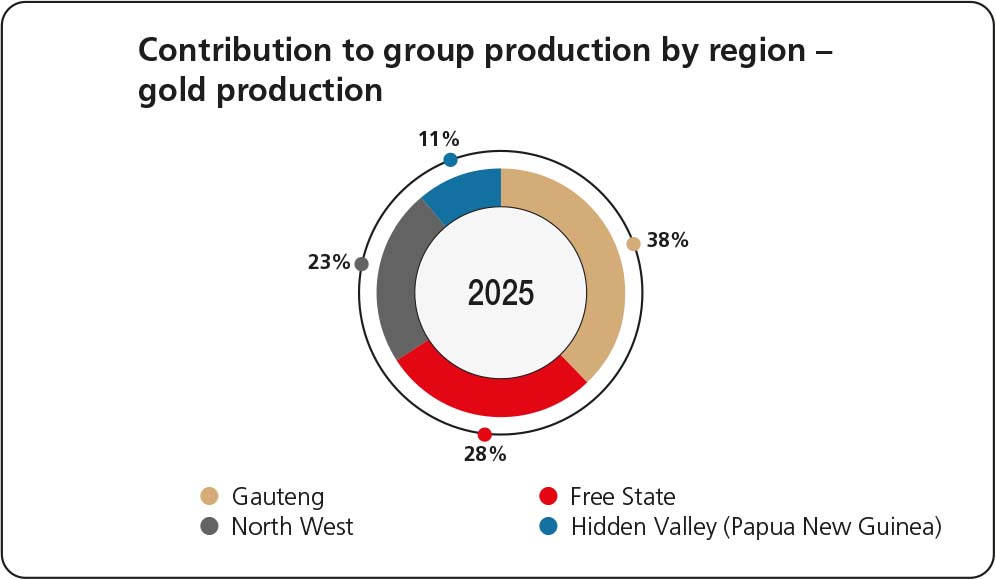
49
Group adjusted free cash flow increased by 54% to a new record high of R11 142 million in FY25 from R7 252 million in FY24, driven by a higher
gold price. Group adjusted free cash margins for FY25 increased by 33% to 16% from 12% in the previous financial year.
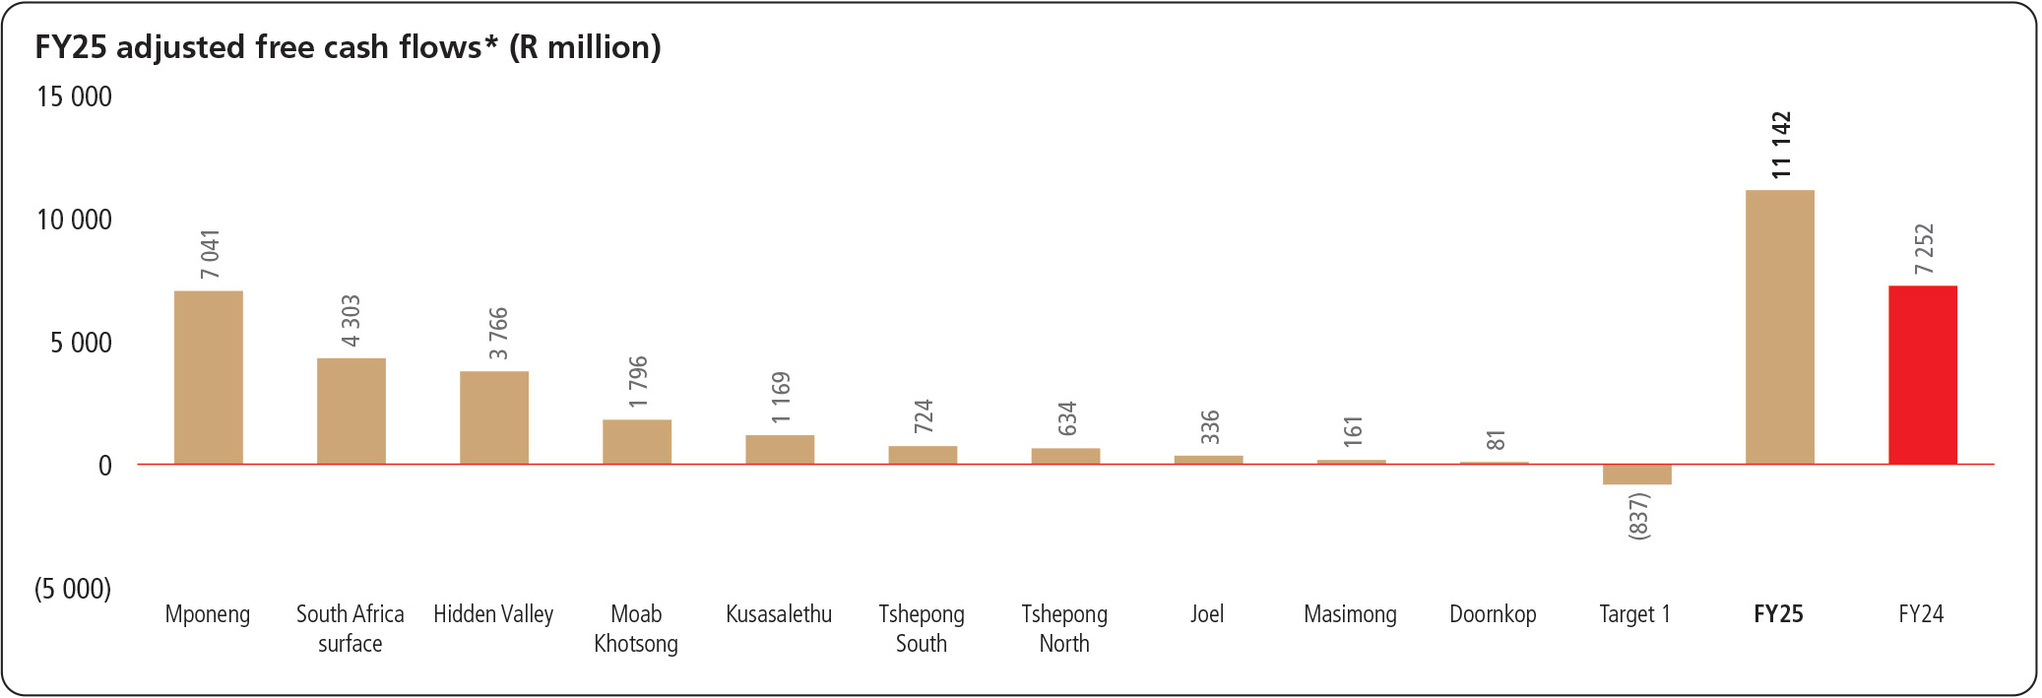
*Adjusted free cash flow = revenue – cash operating cost – capital expenditure – Franco-Nevada non-cash adjustment ± impact of run-of-mine costs as per operating results.
FY25 focus areas and actions | How we performed | |||
Continue embedding a proactive safety culture | The LTIFR in FY25 for our South African operations improved 2% to 5.69 per million hours from 5.79 per million hours in FY24 | |||
Ensure we meet our operational plans and generate free cash flow | We met all guidance metrics and achieved record high adjusted free cash flows, generating R11.1 billion for FY25 | |||
Continue to pursue organic brownfields growth strategy | We pursued brownfield exploration at Hidden Valley and Kalgold to optimise existing open-pit operations, with brownfield exploration at our underground operations in South Africa | |||
Continue to ensure major project execution and capital spend are aligned to plan | Mponeng life-of-mine extension, Zaaiplaats and Kareerand projects are progressing well – the total spend was slightly lower than guidance at R3.7 billion, excluding renewable energy | |||
Continue to drive down unit costs by improving our safety performance, delivering on our production plans and increasing the productivity of our mining teams | Group all-in sustaining cost rose by 17% to R1 054 346/kg, in line with planning and guidance | |||
50
Key operational metrics FY25 – year-on-year (YoY) comparison
Unit | YoY move | YoY % | FY25 | FY24 | ||||
Gold price | (R/kg) | Up | 27 | 1 529 358 | 1 201 653 | Higher average gold price received YoY reflected in higher gold revenue | ||
Underground yield | (g/t) | Up | 3 | 6.27 | 6.11 | Mainly driven by significantly higher grades at Mponeng | ||
Margin | (%) | Up | 33 | 16 | 12 | Margin increased YoY mainly due to the higher gold price | ||
Gold produced | (kg) | Down | (5) | 46 023 | 48 578 | Lower in line with plan, mainly at Doornkop, Mine Waste Solutions and Moab Khotsong | ||
– SA high-grade underground operations | (kg) | Up | 8 | 16 554 | 15 350 | Outstanding performance from Mponeng, mainly due to higher recovered grades, up 13% to 11.27g/t | ||
– SA optimised underground operations | (kg) | Down | (14) | 16 487 | 19 061 | Lower production at all operations, main contributors were Doornkop and Target 1 | ||
– SA surface operations | (kg) | Down | (13) | 7 875 | 9 066 | Lower production at Mine Waste Solutions and the dumps | ||
– Papua New Guinea | (kg) | Down | — | 5 107 | 5 101 | Excellent performance from Hidden Valley driven by higher tonnes milled | ||
All-in sustaining cost | (R/kg) | Up | 17 | 1 054 346 | 901 550 | Increase driven by lower production, higher sustaining capex and inflationary pressures on cash cost |
Four business areas for capital allocation purposes
Our operations are divided into four quadrants, as indicated below, based on our capital allocation strategy. Each plays a vital role in generating cash, sustaining growth, and diversifying risk ensuring we consistently
deliver to guidance.For more details refer to the Strategy section.
South African underground high-grade | International gold and copper growth | South African surface high-margin | South African underground optimised | |||||||||||
▪Moab Khotsong ▪Mponeng. | Papua New Guinea ▪Hidden Valley and ▪Wafi-Golpu Project. Australia ▪Eva Copper Project ▪MAC Copper (acquisition concludes on 24 October 2025). | ▪Kalgold ▪Mine Waste Solutions (MWS) ▪Phoenix ▪Savuka Tailings ▪Central Plant Reclamation (CPR) ▪Rock dumps. | ▪Doornkop ▪Kusasalethu ▪Joel ▪Target 1 ▪Tshepong North ▪Tshepong South ▪Masimong. | |||||||||||
FY26 outlook | ||||
In the next financial year, gold production is estimated to be between 1.4Moz and 1.5Moz at an all-in sustaining cost of between R1 150 000/kg and R1 220 000/kg. Underground recovered grade is expected to be higher than 5.80g/t. We are looking forward to some exciting growth opportunities: ▪The Kareerand extension expected to be completed during FY26 ▪The Zaaiplaats project will continue to be a focus area for Moab Khotsong with steady progress ▪Mponeng will continue with the life-of-mine extension project. Harmony has numerous exploration drilling programmes running in South Africa that will continue into FY26. | Key focus areas and actions in FY26: ▪Continue to embed a proactive safety culture ▪Ensure we meet our operational plans and generate free cash flow ▪Continue to pursue organic brownfields growth strategy ▪Continue to ensure major project execution and capital spend are aligned to plan ▪Continue to drive down unit costs by improving our safety performance, delivering on our production plans, increasing the productivity of our mining teams. See overleaf for graphs illustrating forecast group growth capital expenditure to FY28 and capital expenditure by operation for FY26. | |||
51
FY26 production and capital guidance
Production | Capital expenditure1 | Life-of-mine | ||
Operation | (oz) | (Rm) | (years) | |
Moab Khotsong | 175 000 – 178 500 | 1 759 | 19 | |
Mponeng | 279 600 – 310 600 | 2 385 | 19 | |
Tshepong North | 98 300 – 100 200 | 785 | 6 | |
Tshepong South | 90 500 – 92 400 | 621 | 5 | |
Doornkop | 85 000 – 88 500 | 1 194 | 17 | |
Joel | 51 800 – 54 000 | 300 | 5 | |
Target 1 | 54 100 – 59 000 | 463 | 6 | |
Kusasalethu | 103 700 – 110 200 | 420 | 3 | |
Masimong | 47 500 – 50 500 | 115 | 2 | |
Underground operations – total2 | 8 042 | |||
South African surface operations (tailings and waste rock dumps) | 103 680 – 107 856 | 511 | 11+ | |
Mine Waste Solutions (MWS) | 98 800 – 98 800 | 858 | 14 | |
Kalgold | 39 100 – 40 700 | 79 | 12 | |
Hidden Valley3 | 179 400 – 190 800 | 3 437 | 5 | |
Other international | 26 | |||
Total | 1.4 – 1.5Moz | 12 953 |
1Excludes renewables, Eva Copper and Wafi-Golpu.
2At an underground recovered grade of >5.80g/t.
3Includes capitalised stripping costs.
Forecast capital expenditure to FY28 and capital expenditure by operation for FY26
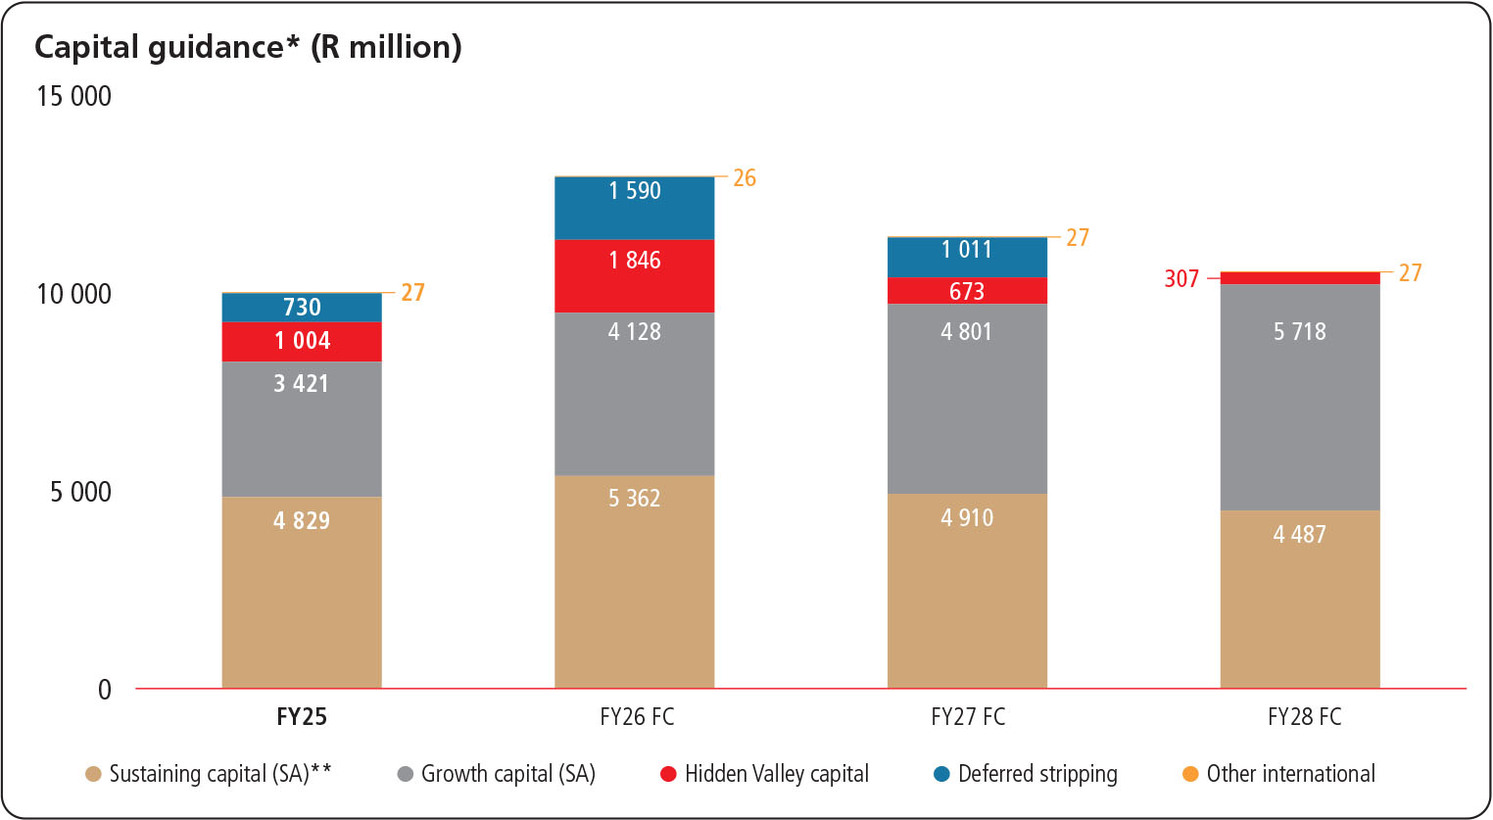
*Excludes renewables, Eva Copper Project and Wafi-Golpu Project.
**Includes ongoing capital development, shaft capital and plant capital.
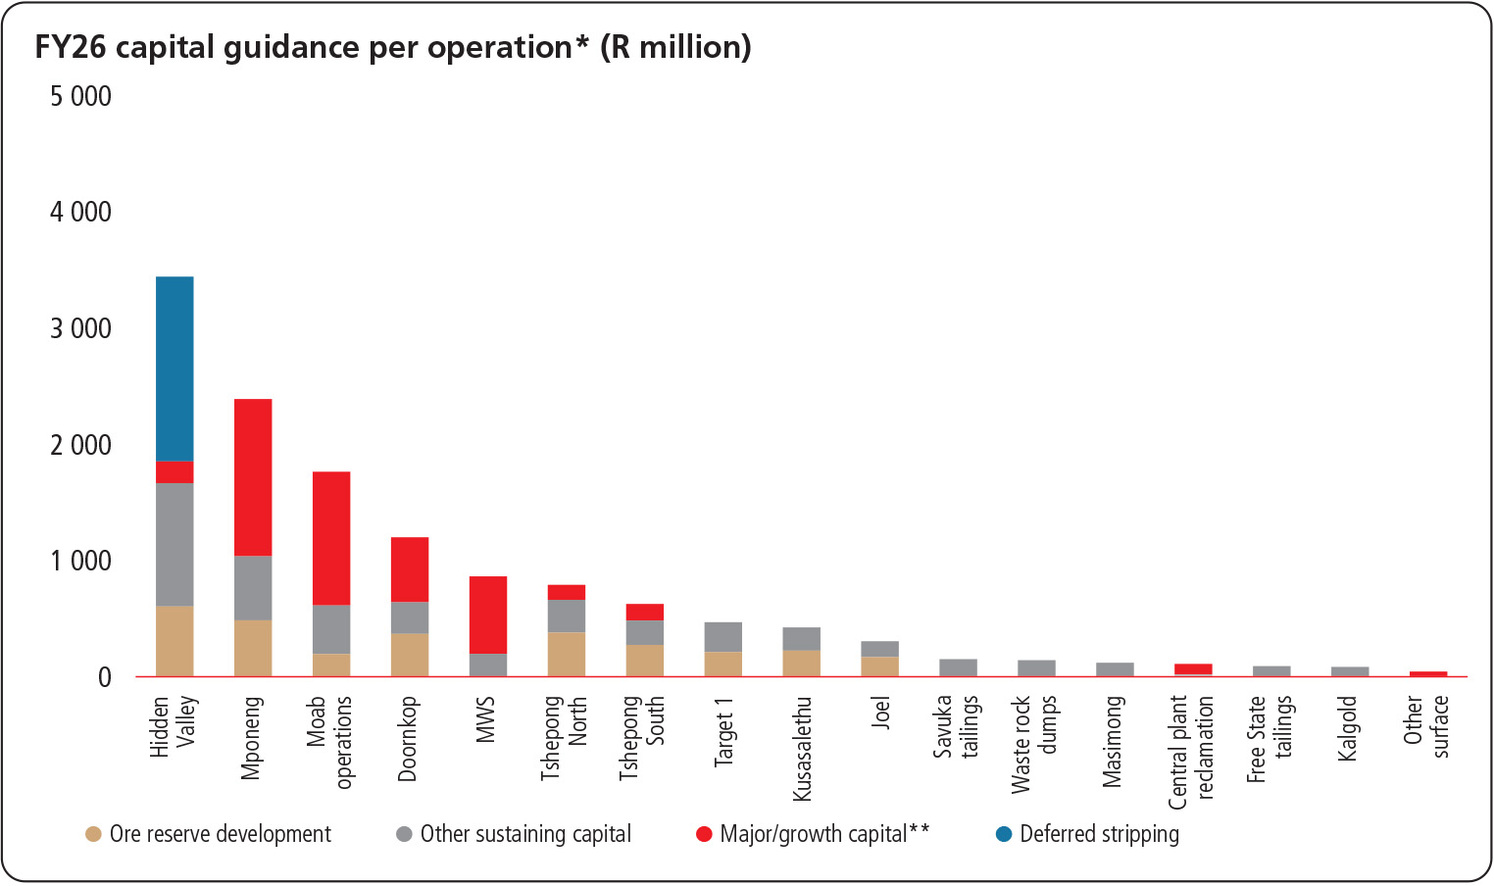
*Excludes renewables, other international, Eva Copper Project and Wafi-Golpu Project.
**Excluded from all-in sustaining cost.
52
Performance by operation
South Africa – underground operations
Our underground mines are grouped by high-grade operations consisting of Mponeng and Moab
Khotsong and our optimised operations consisting of the remainder of our underground operations.
Mponeng had another stellar year in FY25, underpinning the excellent set of results from our high-grade
mines. The recovered grade for our high-grade operations increased by 10% from 9.02g/t in FY24 to
9.89g/t for the current year. Mponeng’s grade improved 13% to 11.27g/t, from 9.94g/t in FY24, while
Moab Khotsong recorded a 2% increase to 8.21g/t (FY24: 8.03g/t) for FY25. Mponeng continued to
benefit from higher-than-expected mining grades and is expected to be sustained into the 2026
financial year. As a result of the higher recovered grades, gold production increased by 8% to 16 554kg
(532 222oz) for FY25 (FY24: 15 350kg (493 512oz)). Total volumes of ore milled for FY25 decreased by
2% compared to the previous financial year, mainly at Moab Khotsong being 8% lower, while Mponeng
increased by 5% year on year. These operations contributed 46% or R8.8 billion (US$487 million)
towards the group adjusted free cash for FY25 (FY24: R6.0 billion (US$320 million)).
Our optimised operations experienced a challenging year with all operations in this grouping producing
less gold than in the previous financial year. Target 1 was one of the main contributors experiencing
numerous operational challenges, while Doornkop produced lower gold than planned. Gold production
for these operations ended 14% lower in FY25 at 16 487kg (530 069oz) compared to 19 061kg (612
826oz) in FY24. At R2.3 billion (US$125 million), the optimised operations, however, still made a
considerable contribution to adjusted free cash flows in FY25, 14% higher than the R2.0 billion (US$106
million) recorded for FY24.
South Africa – surface operations
Gold production decreased by 13% to 7 875kg (253 187oz) in FY25 from 9 066kg (291 477oz) in FY24,
driven mainly by Mine Waste Solutions, where production was affected by operational challenges and
excessive rainfall during FY25. Despite the lower gold production, adjusted free cash in FY25 rose by
66% to R4.3 billion (US$237 million) from R2.6 billion (US$138 million) in the previous year. The Franco-
Nevada contract was settled early in the second quarter of the financial year, resulting in Mine Waste
Solutions receiving the full benefit of the higher gold prices, boosting cash flows. The higher
average gold price received during the year also contributed to higher cash flows.
Papua New Guinea – opencast operations
Hidden Valley delivered a consistent performance in FY25 maintaining gold production at 5 107kg (164
193oz) (FY24: 5 101kg (164 000oz)). The recovered grade for the current financial year was 11% lower at
1.35g/t (FY24: 1.52g/t), offset by higher volumes of ore milled. Total ore milled for FY25 at 3.79 million
tonnes was 13% higher than the previous year (FY24: 3.36 million tonnes). Silver production decreased
by 15% to 93 772kg (3 014 838oz) from 110 195kg (3 542 852oz) in FY24. Silver revenue, however,
increased by 9% to R1.7 billion (FY24: R1.6 billion) as a result of a 27% increase in the price received to
US$31.29/oz (FY24: US$24.70/oz). Adjusted free cash flow rose by 73% from R2.2 billion (US$117
million) to R3.8 billion (US$207 million) in FY25, another outstanding result.
53
South Africa – underground operations
Moab Khotsong
FY25 | FY24 | FY23 | |||
Number of employees | |||||
– Permanent | 5 108 | 5 438 | 5 739 | ||
– Contractors | 1 124 | 1 061 | 974 | ||
Total | 6 232 | 6 499 | 6 713 | ||
Operational | |||||
Volumes milled | (000t) (metric) | 753 | 822 | 920 | |
(000t) (imperial) | 830 | 906 | 1 015 | ||
Gold produced | (kg) | 6 184 | 6 599 | 6 668 | |
(oz) | 198 820 | 212 162 | 214 381 | ||
Gold sold | (kg) | 6 178 | 6 650 | 6 715 | |
(oz) | 198 627 | 213 803 | 215 892 | ||
Grade | (g/t) | 8.21 | 8.03 | 7.25 | |
(oz/t) | 0.240 | 0.234 | 0.211 | ||
Productivity | (g/TEC) | 102.63 | 101.44 | 101.54 | |
Development results | |||||
– Total metres (excluding capital metres) | 3 058 | 4 663 | 6 738 | ||
– Reef metres | 649 | 1 328 | 1 026 | ||
– Capital metres | 2 445 | 2 960 | 3 510 | ||
Financial | |||||
Revenue | (Rm) | 9 455 | 8 108 | 7 036 | |
(US$m) | 521 | 434 | 396 | ||
Average gold price received | (R/kg) | 1 530 503 | 1 219 199 | 1 047 845 | |
(US$/oz) | 2 622 | 2 028 | 1 835 | ||
Cash operating cost | (Rm) | 5 232 | 4 615 | 4 561 | |
(US$m) | 288 | 247 | 257 | ||
Production profit | (Rm) | 4 226 | 3 470 | 2 522 | |
(US$m) | 233 | 186 | 142 | ||
Capital expenditure | (Rm) | 2 427 | 1 330 | 1 167 | |
(US$m) | 134 | 71 | 66 | ||
Adjusted free cash flow1 | (Rm) | 1 796 | 2 163 | 1 309 | |
(US$m) | 99 | 116 | 74 | ||
Cash operating cost | (R/kg) | 846 013 | 699 300 | 683 995 | |
(US$/oz) | 1 449 | 1 163 | 1 198 | ||
All-in sustaining cost | (R/kg) | 952 206 | 798 866 | 782 441 | |
(US$/oz) | 1 631 | 1 329 | 1 370 | ||
Average exchange rate | (R/US$) | 18.15 | 18.70 | 17.76 | |
FY25 | FY24 | FY23 | |||
Safety | |||||
Loss of life | 2 | — | 1 | ||
Lost-time injury frequency rate | (per million hours worked) | 3.72 | 5.36 | 6.03 | |
Environment2 | |||||
Electricity consumption | (GWh) | 740 | 774 | 749 | |
Water consumption – primary activities | (Ml) | 7 056 | 7 982 | 5 932 | |
Greenhouse gas emissions | (000tCO2e) | 771 | 776 | 780 | |
Intensity data per tonne treated | |||||
– Energy | (MWh/t) | 0.98 | 0.94 | 0.81 | |
– Water | (000m3/t) | 9.37 | 9.71 | 6.45 | |
– Greenhouse gas emissions | (tCO2e/t) | 1.02 | 0.94 | 0.85 | |
Number of reportable environmental incidents3 | — | — | — | ||
Community | |||||
Local economic development | (Rm) | 25 | 30 | 49 | |
Training and development | (Rm) | 109 | 115 | 124 |
1Adjusted free cash flow = revenue – cash operating cost – capital expenditure as per operating results.
2Figures include Nufcor.
3Figures include reportable incidents in Zaaiplaats.
54
Mineral Reserve estimates at 30 June 2025
Proved | Probable | Total | |||||||
Reserves (metric) | Tonnes (Mt) | Grade (g/t) | Gold (000kg) | Tonnes (Mt) | Grade (g/t) | Gold (000kg) | Tonnes (Mt) | Grade (g/t) | Gold (000kg) |
3.2 | 7.38 | 24 | 9.8 | 8.43 | 82 | 13.0 | 8.17 | 106 | |
Reserves (imperial) | Tons (Mt) | Grade (oz/t) | Gold (000oz) | Tons (Mt) | Grade (oz/t) | Gold (000oz) | Tons (Mt) | Grade (oz/t) | Gold (000oz) |
3.5 | 0.215 | 762 | 10.8 | 0.246 | 2 652 | 14.3 | 0.238 | 3 415 | |
Overview of operations
Moab Khotsong is a deep-level mine near the towns of Orkney and Klerksdorp, some 180km south-west of
Johannesburg. The mine, which began producing in 2003, was acquired from AngloGold Ashanti Limited in
March 2018.
Mining is based on a scattered-mining method, together with an integrated backfill support system that
incorporates bracket pillars. The geology at Moab Khotsong is structurally complex, with large fault-loss
areas between the three mining areas (top mine (Great Noligwa), middle mine and lower mine (growth
project and Zaaiplaats project in execution phase)). The mine exploits the Vaal Reef as its primary orebody.
The economic reef horizons are mined between 1 791m and 3 052m below surface. Ore mined is
processed at the Noligwa gold plant. The plant uses the reverse gold-leach method, with gold and uranium
being recovered through gold cyanide and acid uranium leaching.
Salient features for FY25
▪Regrettably, two lives were lost at Moab Khotsong during FY25. See Safety transformation towards zero
harm for the causes of injury and management’s safety approach
▪The lost-time injury frequency rate improved by 31% to 3.72 per million hours worked in FY25
(FY24: 5.36 per million hours worked)
▪Gold production decreased by 6% to 6 184kg (198 820oz) from 6 599kg (212 162oz) in FY24 and is the
group’s second- largest gold producer, contributing 13% of total production
▪Ore milled was 8% lower at 753 000 tonnes in FY25 (FY24: 822 000 tonnes), affected by heightened
seismicity in the middle mine and pre-emptively halting operations for a limited time during the second
quarter, from a safety perspective in the top mine to allow for the removal of toxic gases
▪Recovered grade increased by 2% to 8.21g/t for FY25 (FY24: 8.03g/t)
▪Driven by a higher gold price, received revenue increased by 17% to R9 455 million
(FY24: R8 108 million). The average gold price received increased by 26% to R1 530 503/kg (FY24: R1 219
199/kg), partially offsetting the lower gold production
▪Cash operating costs increased by 13% to R5 232 million (FY24: R4 615 million), impacted by annual
wage and electricity tariff increases as well as inflationary increases on consumables and contractors.
Mineral and Petroleum Resources Development Act (MPRDA) royalties increased by 40% to R319 million
(FY24: R228 million) due to higher revenue and profitability. Uranium revenue, treated as a by-product
credit to cost, decreased by 5% to R822 million (FY24: R866 million) due to lower sales of 566 000lb.
Sales were 8% lower than the 612 000lb sold in FY24
▪Capital expenditure, excluding renewables, rose by 7% to R1 422 million (FY24: R1 330 million). A total
of 68% or R962 million was spent on major capital, mainly the Zaaiplaats project, and a total of
R234 million was spent in respect of ongoing development. A further R1 004 million was spent on the
renewable energy project to benefit Moab Khotsong
▪Moab Khotsong was the third-largest contributor to adjusted free cash flow at R1 796 million. This was,
however, 17% lower than the R2 163 million recorded in FY24.
Key indicators for FY26
▪19-year life-of-mine
▪Production guidance of between 175 000oz and 178 500oz
▪Capital expenditure, excluding renewables, of approximately R1 759 million, mainly for the Zaaiplaats
major project and ongoing development.
Our focus areas in FY26 Focus for the top mine will be to continue with opening up and equipping to ensure availability of ground for FY26. Sinking operations in the Zaaiplaats decline is progressing, with focus on the critical path to 103 level station breakaway. Explore the Great Noligwa shaft pillar C Reef blocks as additional opportunities for mineable ground. | ||
55
Mponeng
FY25 | FY24 | FY23 | |||
Number of employees | |||||
– Permanent | 4 753 | 4 710 | 4 598 | ||
– Contractors | 1 334 | 780 | 558 | ||
Total | 6 087 | 5 490 | 5 156 | ||
Operational | |||||
Volumes milled | (000t) (metric) | 920 | 880 | 884 | |
(000t) (imperial) | 1 015 | 971 | 975 | ||
Gold produced | (kg) | 10 370 | 8 751 | 7 449 | |
(oz) | 333 402 | 281 350 | 239 490 | ||
Gold sold | (kg) | 10 454 | 8 648 | 7 480 | |
(oz) | 336 104 | 278 039 | 240 487 | ||
Grade | (g/t) | 11.27 | 9.94 | 8.43 | |
(oz/t) | 0.328 | 0.290 | 0.246 | ||
Productivity | (g/TEC) | 173.97 | 151.59 | 136.73 | |
Development results | |||||
– Total metres (excluding capital metres) | 6 335 | 7 142 | 8 000 | ||
– Reef metres | 1 556 | 1 379 | 1 500 | ||
– Capital metres | 1 295 | — | — | ||
Financial | |||||
Revenue | (Rm) | 16 079 | 10 577 | 7 845 | |
(US$m) | 886 | 566 | 442 | ||
Average gold price received | (R/kg) | 1 538 051 | 1 223 096 | 1 048 824 | |
(US$/oz) | 2 635 | 2 035 | 1 836 | ||
Cash operating cost | (Rm) | 6 994 | 5 870 | 5 002 | |
(US$m) | 385 | 314 | 282 | ||
Production profit | (Rm) | 9 042 | 4 782 | 2 848 | |
(US$m) | 498 | 256 | 160 | ||
Capital expenditure | (Rm) | 2 043 | 890 | 704 | |
(US$m) | 113 | 48 | 40 | ||
Adjusted free cash flow1 | (Rm) | 7 041 | 3 817 | 2 139 | |
(US$m) | 388 | 204 | 120 | ||
Cash operating cost | (R/kg) | 674 481 | 670 811 | 671 474 | |
(US$/oz) | 1 156 | 1 116 | 1 176 | ||
All-in sustaining cost | (R/kg) | 804 429 | 785 108 | 784 093 | |
(US$/oz) | 1 378 | 1 306 | 1 373 | ||
Average exchange rate | (R/US$) | 18.15 | 18.70 | 17.76 | |
FY25 | FY24 | FY23 | |||
Safety | |||||
Loss of life | 2 | 2 | — | ||
Lost-time injury frequency rate | (per million hours worked) | 6.12 | 8.37 | 8.57 | |
Environment | |||||
Electricity consumption | (GWh) | 1 014 | 932 | 938 | |
Water consumption – primary activities | (Ml) | 5 976 | 5 977 | 2 858 | |
Greenhouse gas emissions | (000tCO2e) | 1 057 | 933 | 976 | |
Intensity data per tonne treated | |||||
– Energy | (MWh/t) | 1.10 | 1.06 | 1.06 | |
– Water | (000m3/t) | 6.49 | 6.79 | 3.23 | |
– Greenhouse gas emissions | (tCO2e/t) | 1.15 | 1.06 | 1.10 | |
Number of reportable environmental incidents | — | — | — | ||
Community | |||||
Local economic development | (Rm) | 17 | 24 | 39 | |
Training and development | (Rm) | 86 | 78 | 78 |
1Adjusted free cash flow = revenue – cash operating cost – capital expenditure as per operating results.
56
Mineral Reserve estimates at 30 June 2025
Proved | Probable | Total | |||||||
Reserves (metric) | Tonnes (Mt) | Grade (g/t) | Gold (000kg) | Tonnes (Mt) | Grade (g/t) | Gold (000kg) | Tonnes (Mt) | Grade (g/t) | Gold (000kg) |
3.6 | 10.32 | 37 | 11.0 | 9.07 | 100 | 14.6 | 9.38 | 136 | |
Reserves (imperial) | Tons (Mt) | Grade (oz/t) | Gold (000oz) | Tons (Mt) | Grade (oz/t) | Gold (000oz) | Tons (Mt) | Grade (oz/t) | Gold (000oz) |
3.9 | 0.301 | 1 183 | 12.1 | 0.265 | 3 206 | 16.0 | 0.274 | 4 389 | |
Overview of operations
Mponeng is a deep-level mine near the town of Carletonville, some 90km south-west of Johannesburg.
The mine, which began producing in 1986, was acquired from AngloGold Ashanti Limited in October 2020.
The orebody is extracted mostly by breast-mining methods, with associated waste mining in addition to the
reef being extracted. The dilution from these waste sources is captured and incorporated in the tonnage
calculation, with historical performance being the benchmark. The mine exploits the Ventersdorp Contact
Reef as its primary orebody.
The economic reef horizons are mined between 3 160m and 3 740m below surface. Ore mined is
processed at the Mponeng gold plant. The plant uses the conventional gold-leach method, with gold
recovered through carbon-in-pulp technology.
Salient features for FY25
▪Regrettably, two lives were lost at Mponeng during FY25. Refer to Safety transformation towards zero
harm for more information on the causes of injury and management’s safety approach
▪The operation recorded a 27% improvement in the lost-time injury frequency rate at 6.12 per million
hours worked for FY25 (FY24: 8.37 per million hours worked)
▪A significant 19% increase in gold production to 10 370kg (333 402oz) was recorded for FY25 (FY24: 8
751kg (281 350oz)). Mponeng was the group’s largest gold producer, contributing 23% of total
production
▪Ore milled increased to 920 000 tonnes, a 5% increase over the 880 000 tonnes milled recorded in FY24
▪Continuing to benefit from higher average mining grades, the recovered grade increased to 11.27g/t
(FY24: 9.94g/t)
▪Revenue increased by a substantial 52% to R16 079 million (FY24: R10 577 million), due to a higher gold
price received as well as higher gold production. The average gold price received increased by 26% to R1
538 051/kg (FY24: R1 223 096/kg)
▪Cash operating costs increased by 19% to R6 994 million (FY24: R5 870 million) due to annual wage and
electricity tariff increases as well as inflationary increases on consumables and contractors. Significantly
higher MPRDA royalties also contributed to higher costs, increasing by 92% to R740 million (FY24: R386
million) as revenue and profits rose significantly
▪Capital expenditure increased by 130% to R2 043 million (FY24: R890 million). Major capital expenditure
rose in FY25 to R924 million (FY24: R121 million) and was mainly spent on the life-of-mine extension
project. A total of R476 million was spent in respect of ongoing development
▪Mponeng was once again the largest contributor to adjusted free cash flow at R7 041 million,
significantly higher than the R3 817 million recorded in FY24.
Key indicators for FY26
▪19-year life-of-mine
▪Production guidance of between 279 600oz and 310 600oz
▪Capital expenditure of approximately R2 385 million, mainly for the life-of-mine extension project and
ongoing development.
Our focus areas in FY26 To maintain operational stability and successfully execute the life-of-mine extension project, including associated infrastructure. | ||
57
Tshepong North
FY25 | FY24 | FY23 | |||
Number of employees | |||||
– Permanent | 3 391 | 3 457 | 3 398 | ||
– Contractors | 374 | 317 | 308 | ||
Total | 3 765 | 3 774 | 3 706 | ||
Operational | |||||
Volumes milled | (000t) (metric) | 673 | 726 | 795 | |
(000t) (imperial) | 743 | 800 | 876 | ||
Gold produced | (kg) | 2 900 | 3 248 | 3 354 | |
(oz) | 93 237 | 104 426 | 107 834 | ||
Gold sold | (kg) | 2 905 | 3 196 | 3 391 | |
(oz) | 93 397 | 102 754 | 109 022 | ||
Grade | (g/t) | 4.31 | 4.47 | 4.22 | |
(oz/t) | 0.125 | 0.131 | 0.123 | ||
Productivity | (g/TEC) | 71.06 | 79.05 | 76.95 | |
Development results | |||||
– Total metres (excluding capital metres) | 7 129 | 8 085 | 8 835 | ||
– Reef metres | 1 368 | 1 124 | 1 654 | ||
– Capital metres | 379 | — | — | ||
Financial | |||||
Revenue | (Rm) | 4 447 | 3 877 | 3 530 | |
(US$m) | 245 | 207 | 199 | ||
Average gold price received | (R/kg) | 1 530 731 | 1 213 187 | 1 041 078 | |
(US$/oz) | 2 623 | 2 018 | 1 823 | ||
Cash operating cost | (Rm) | 3 118 | 2 873 | 2 673 | |
(US$m) | 172 | 154 | 150 | ||
Production profit | (Rm) | 1 340 | 1 050 | 829 | |
(US$m) | 74 | 56 | 47 | ||
Capital expenditure | (Rm) | 695 | 559 | 553 | |
(US$m) | 38 | 30 | 31 | ||
Adjusted free cash flow1 | (Rm) | 634 | 446 | 303 | |
(US$m) | 35 | 24 | 17 | ||
Cash operating cost | (R/kg) | 1 075 014 | 884 464 | 797 069 | |
(US$/oz) | 1 842 | 1 471 | 1 396 | ||
All-in sustaining cost | (R/kg) | 1 305 365 | 1 078 897 | 975 498 | |
(US$/oz) | 2 236 | 1 795 | 1 708 | ||
Average exchange rate | (R/US$) | 18.15 | 18.70 | 17.76 | |
FY25 | FY24 | FY23 | |||
Safety | |||||
Loss of life | — | 1 | 2 | ||
Lost-time injury frequency rate | (per million hours worked) | 4.85 | 4.13 | 4.63 | |
Environment | |||||
Electricity consumption | (GWh) | 273 | 247 | 269 | |
Water consumption – primary activities | (Ml) | 1 119 | 1 039 | 894 | |
Greenhouse gas emissions | (000tCO2e) | 248 | 248 | 280 | |
Intensity data per tonne treated | |||||
– Energy | (MWh/t) | 0.41 | 0.34 | 0.34 | |
– Water | (000m3/t) | 1.66 | 1.43 | 1.12 | |
– Greenhouse gas emissions | (tCO2e/t) | 0.39 | 0.34 | 0.35 | |
Number of reportable environmental incidents | — | — | — | ||
Community | |||||
Local economic development | (Rm) | 15 | 20 | 16 | |
Training and development | (Rm) | 76 | 71 | 79 |
1Adjusted free cash flow = revenue – cash operating cost – capital expenditure as per operating results.
58
Mineral Reserve estimates at 30 June 2025
Proved | Probable | Total | |||||||
Reserves (metric) | Tonnes (Mt) | Grade (g/t) | Gold (000kg) | Tonnes (Mt) | Grade (g/t) | Gold (000kg) | Tonnes (Mt) | Grade (g/t) | Gold (000kg) |
2.4 | 4.55 | 11 | 1.6 | 5.85 | 9 | 4.0 | 5.07 | 20 | |
Reserves (imperial) | Tons (Mt) | Grade (oz/t) | Gold (000oz) | Tons (Mt) | Grade (oz/t) | Gold (000oz) | Tons (Mt) | Grade (oz/t) | Gold (000oz) |
2.6 | 0.133 | 352 | 1.8 | 0.170 | 302 | 4.4 | 0.148 | 654 | |
Overview of operations
Tshepong North is a deep-level underground mining operation in the Free State, near the town of Welkom,
some 250km from Johannesburg. Tshepong North is a mature underground operation that uses
conventional undercut mining in the Basal Reef while the B Reef is exploited as a high-grade secondary
reef. Ore mined is processed at the Harmony One plant, with gold recovered using the gold cyanide
leaching process.
Salient features for FY25
▪Reached 1.6 million loss-of-life free shifts during FY25
▪The lost-time injury frequency rate, however, deteriorated by 17% to 4.85 per million hours worked
(FY24: 4.13 per million hours worked). Refer to Safety transformation towards zero harm for more
information on the causes of injury and management’s safety approach
▪Gold production decreased by 11% to 2 900kg (93 237oz) from 3 248kg (104 426oz) in FY24
▪Ore milled was 7% lower at 673 000 tonnes (FY24: 726 000 tonnes)
▪The recovered grade decreased to 4.31g/t, 4% lower than 4.47g/t recorded for FY24
▪Revenue rose by 15% to R4 447 million (FY24: R3 877 million) due to a 26% increase in the average gold
price received to R1 530 731/kg (FY24: R1 213 187/kg), partially offset by lower gold production
▪Cash operating costs increased by 9% to R3 118 million (FY24: R2 873 million), mainly due to annual
wage and electricity tariff increases as well as higher MPRDA royalties. Royalties increased by 48% to
R98 million (FY24: R66 million) as revenue and profits increased
▪Capital expenditure for FY25 increased by 24% to R695 million (FY24: R559 million) and was mainly for
ongoing development and major capital towards the Sub-75 decline project. A total of R386 million was
spent in respect of ongoing development
▪Adjusted free cash increased by 42% to R634 million (FY24: R446 million).
Key indicators for FY26
▪Six-year life-of-mine
▪Production guidance of between 98 300oz and 100 200oz
▪Capital expenditure of approximately R785 million, mainly for ongoing development and the Sub-75
decline project.
Our focus areas in FY26 The management team’s focus will be to deliver safe, profitable production in line with FY26 planning and to progress the feasibility study for the possible life-of-mine extension through Sub-75 decline and east south upper block. | ||
59
Tshepong South
FY25 | FY24 | FY23 | |||
Number of employees | |||||
– Permanent | 3 115 | 3 137 | 3 052 | ||
– Contractors | 359 | 353 | 334 | ||
Total | 3 474 | 3 490 | 3 386 | ||
Operational | |||||
Volumes milled | (000t) (metric) | 448 | 465 | 506 | |
(000t) (imperial) | 494 | 512 | 557 | ||
Gold produced | (kg) | 2 739 | 3 129 | 3 431 | |
(oz) | 88 061 | 100 599 | 110 310 | ||
Gold sold | (kg) | 2 737 | 3 082 | 3 458 | |
(oz) | 87 997 | 99 088 | 111 177 | ||
Grade | (g/t) | 6.11 | 6.73 | 6.78 | |
(oz/t) | 0.178 | 0.196 | 0.198 | ||
Productivity | (g/TEC) | 74.38 | 84.04 | 93.84 | |
Development results | |||||
– Total metres (excluding capital metres) | 4 328 | 5 965 | 6 655 | ||
– Reef metres | 787 | 1 055 | 1 198 | ||
– Capital metres | 2 380 | 2 116 | 1 119 | ||
Financial | |||||
Revenue | (Rm) | 4 233 | 3 734 | 3 607 | |
(US$m) | 233 | 200 | 203 | ||
Average gold price received | (R/kg) | 1 546 491 | 1 211 447 | 1 043 180 | |
(US$/oz) | 2 650 | 2 015 | 1 826 | ||
Cash operating cost | (Rm) | 2 939 | 2 607 | 2 374 | |
(US$m) | 162 | 139 | 134 | ||
Production profit | (Rm) | 1 316 | 1 169 | 1 212 | |
(US$m) | 72 | 63 | 68 | ||
Capital expenditure | (Rm) | 570 | 527 | 514 | |
(US$m) | 31 | 28 | 29 | ||
Adjusted free cash flow1 | (Rm) | 724 | 599 | 719 | |
(US$m) | 40 | 32 | 40 | ||
Cash operating cost | (R/kg) | 1 073 030 | 833 307 | 691 925 | |
(US$/oz) | 1 838 | 1 386 | 1 211 | ||
All-in sustaining cost | (R/kg) | 1 258 634 | 1 002 141 | 841 983 | |
(US$/oz) | 2 156 | 1 667 | 1 474 | ||
Average exchange rate | (R/US$) | 18.15 | 18.70 | 17.76 | |
FY25 | FY24 | FY23 | |||
Safety | |||||
Loss of life | — | 1 | — | ||
Lost-time injury frequency rate | (per million hours worked) | 6.04 | 5.57 | 5.24 | |
Environment | |||||
Electricity consumption | (GWh) | 251 | 251 | 279 | |
Water consumption – primary activities | (Ml) | 1 316 | 1 316 | 1 669 | |
Greenhouse gas emissions | (000tCO2e) | 251 | 251 | 290 | |
Intensity data per tonne treated | |||||
– Energy | (MWh/t) | 0.67 | 0.54 | 0.55 | |
– Water | (000m3/t) | 4.02 | 2.83 | 3.29 | |
– Greenhouse gas emissions | (tCO2e/t) | 0.60 | 0.54 | 0.57 | |
Number of reportable environmental incidents | — | — | — | ||
Community | |||||
Local economic development | (Rm) | 12 | 16 | 10 | |
Training and development | (Rm) | 74 | 62 | 64 |
1Adjusted free cash flow = revenue – cash operating cost – capital expenditure as per operating results.
60
Mineral Reserve estimates at 30 June 2025
Proved | Probable | Total | |||||||
Reserves (metric) | Tonnes (Mt) | Grade (g/t) | Gold (000kg) | Tonnes (Mt) | Grade (g/t) | Gold (000kg) | Tonnes (Mt) | Grade (g/t) | Gold (000kg) |
2.2 | 6.53 | 14 | 0.4 | 3.22 | 1 | 2.6 | 5.99 | 15 | |
Reserves (imperial) | Tons (Mt) | Grade (oz/t) | Gold (000oz) | Tons (Mt) | Grade (oz/t) | Gold (000oz) | Tons (Mt) | Grade (oz/t) | Gold (000oz) |
2.4 | 0.191 | 453 | 0.5 | 0.094 | 44 | 2.8 | 0.175 | 497 | |
Overview of operations
Tshepong South is located in the Free State, near the town of Welkom, some 250km from Johannesburg.
Tshepong South exploits the Basal Reef with the B Reef mined as a high-grade secondary reef and uses the
conventional undercut and opencut mining method. Rock from Tshepong South is transported via
a railveyor system to Nyala shaft, from where it is hoisted to surface. Mining is conducted at depths of 1
500m to 2 300m. Ore mined is processed at the Harmony One plant, with gold recovered using the gold
cyanide leaching process.
Salient features for FY25
▪Achieved 1 000 000 loss-of-life free shifts during FY25
▪The lost-time injury frequency rate deteriorated by 8% to 6.04 per million hours worked (FY24: 5.57 per
million hours worked). Refer to Safety transformation towards zero harm for more information on the
causes of injury and management’s safety approach
▪Gold production at 2 739kg (88 061oz) decreased by 12% (FY24: 3 129kg (100 599oz))
▪Ore milled for the year was 4% lower at 448 000 tonnes (FY24: 465 000 tonnes)
▪The recovered grade at 6.11g/t was 9% lower than the 6.73g/t recorded for FY24
▪Revenue increased by 13% to R4 233 million (FY24: R3 734 million) due to a 28% increase in the average
gold price received to R1 546 491/kg (FY24: R1 211 447/kg)
▪Cash operating costs increased by 13% to R2 939 million (FY24: R2 607 million), mainly due to annual
wage and electricity tariff increases as well as an increase in the cost of consumables. Higher MPRDA
royalties also contributed to the increase in cost, royalties increased by 48% to R95 million
(FY24: R64 million) on higher revenue and profits
▪Capital expenditure increased by 8% to R570 million (FY24: R527 million), mainly for ongoing
development as well as the B Reef and chairlift major projects. A total of R315 million was spent for
ongoing development
▪Adjusted free cash flow rose by 21% to R724 million from R599 million in FY24.
Key indicators for FY26
▪Five-year life-of-mine
▪Production guidance of between 90 500oz and 92 400oz
▪Capital expenditure of approximately R621 million, mainly for ongoing development and the
continuation of the B Reef and chairlift projects.
Our focus areas in FY26 The management team’s focus will be to deliver safe, profitable production in line with FY26 planning and conduct exploration drilling for B Reef on both the northern and southern sides of the mining lease. | ||
61
Doornkop
FY25 | FY24 | FY23 | |||
Number of employees | |||||
– Permanent | 3 224 | 3 474 | 3 612 | ||
– Contractors | 760 | 678 | 746 | ||
Total | 3 984 | 4 152 | 4 358 | ||
Operational | |||||
Volumes milled | (000t) (metric) | 742 | 815 | 898 | |
(000t) (imperial) | 818 | 900 | 990 | ||
Gold produced | (kg) | 2 720 | 3 470 | 4 213 | |
(oz) | 87 450 | 111 562 | 135 451 | ||
Gold sold | (kg) | 2 730 | 3 469 | 4 233 | |
(oz) | 87 772 | 111 531 | 136 094 | ||
Grade | (g/t) | 3.67 | 4.26 | 4.69 | |
(oz/t) | 0.107 | 0.124 | 0.137 | ||
Productivity | (g/TEC) | 64.54 | 79.63 | 97.50 | |
Development results | |||||
– Total metres (excluding capital metres) | 9 443 | 8 836 | 7 455 | ||
– Reef metres | 1 539 | 1 798 | 1 435 | ||
– Capital metres | 843 | 2 894 | 2 737 | ||
Financial | |||||
Revenue | (Rm) | 4 158 | 4 198 | 4 384 | |
(US$m) | 229 | 225 | 247 | ||
Average gold price received | (R/kg) | 1 523 087 | 1 210 252 | 1 035 665 | |
(US$/oz) | 2 609 | 2 013 | 1 813 | ||
Cash operating cost | (Rm) | 3 162 | 3 054 | 2 987 | |
(US$m) | 174 | 163 | 168 | ||
Production profit | (Rm) | 915 | 1 158 | 1 375 | |
(US$m) | 50 | 62 | 77 | ||
Capital expenditure | (Rm) | 914 | 687 | 716 | |
(US$m) | 50 | 37 | 40 | ||
Adjusted free cash flow1 | (Rm) | 81 | 457 | 682 | |
(US$m) | 4 | 24 | 38 | ||
Cash operating cost | (R/kg) | 1 162 651 | 880 229 | 708 908 | |
(US$/oz) | 1 992 | 1 464 | 1 241 | ||
All-in sustaining cost | (R/kg) | 1 440 880 | 1 031 845 | 831 553 | |
(US$/oz) | 2 469 | 1 716 | 1 456 | ||
Average exchange rate | (R/US$) | 18.15 | 18.70 | 17.76 | |
FY25 | FY24 | FY23 | |||
Safety | |||||
Loss of life | 2 | 1 | — | ||
Lost-time injury frequency rate | (per million hours worked) | 6.75 | 7.58 | 5.94 | |
Environment | |||||
Electricity consumption | (GWh) | 258 | 249 | 223 | |
Water consumption – primary activities | (Ml) | 668 | 864 | 1 840 | |
Greenhouse gas emissions | (000tCO2e) | 269 | 253 | 240 | |
Intensity data per tonne treated | |||||
– Energy | (MWh/t) | 0.31 | 0.31 | 0.25 | |
– Water | (000m3/t) | 0.90 | 1.06 | 2.05 | |
– Greenhouse gas emissions | (tCO2e/t) | 0.36 | 0.31 | 0.27 | |
Number of reportable environmental incidents | — | — | 1 | ||
Community | |||||
Local economic development | (Rm) | 9 | 5 | 7 | |
Training and development | (Rm) | 86 | 84 | 73 |
1Adjusted free cash flow = revenue – cash operating cost – capital expenditure as per operating results.
62
Mineral Reserve estimates at 30 June 2025
Proved | Probable | Total | |||||||
Reserves (metric) | Tonnes (Mt) | Grade (g/t) | Gold (000kg) | Tonnes (Mt) | Grade (g/t) | Gold (000kg) | Tonnes (Mt) | Grade (g/t) | Gold (000kg) |
4.3 | 3.74 | 16 | 9.4 | 4.11 | 39 | 13.7 | 4.00 | 55 | |
Reserves (imperial) | Tons (Mt) | Grade (oz/t) | Gold (000oz) | Tons (Mt) | Grade (oz/t) | Gold (000oz) | Tons (Mt) | Grade (oz/t) | Gold (000oz) |
4.7 | 0.109 | 517 | 10.3 | 0.120 | 1 239 | 15.1 | 0.117 | 1 756 | |
Overview of operations
Doornkop is a deep-level single-shaft operation in Gauteng, some 30km west of Johannesburg, on the
northern rim of the Witwatersrand Basin. While a mature operation, it still has 17 years life-of-mine
remaining.
The operation focuses on narrow-reef conventional mining of the South Reef gold-bearing conglomerate.
Mining is undertaken to a depth of 2 219m below surface. Ore is processed at the Doornkop plant, which
uses the carbon-in-pulp process to extract gold.
Salient features for FY25
▪Regrettably, Doornkop had two loss-of-life incidents in FY25. Refer to Safety transformation towards
zero harm for more information on the causes of injury and management’s safety approach
▪The lost-time injury frequency rate improved by 11% to 6.75 per million hours worked in FY25
(FY24: 7.58 per million hours worked)
▪Gold production was 22% lower at 2 720kg (87 450oz) than the 3 470kg (111 562oz) for FY24, this was,
however, expected as per plan and ended marginally above plan
▪Ore milled at 742 000 tonnes was 9% lower than the 815 000 tonnes milled for FY24
▪The recovered grade was 14% lower at 3.67g/t (FY24: 4.26g/t), yet in line with planning
▪Revenue decreased by 1% to R4 158 million (FY24: R4 198 million) due the lower gold production
negating the effect of a higher gold price received. The gold price received increased to R1 523 087/kg in
FY25 from R1 210 252/kg in the previous year
▪Cash operating costs increased by 4% to R3 162 million (FY24: R3 054 million), mainly due to annual
wage and electricity tariff increases as well as inflationary increases on consumables and contractors
▪Capital expenditure increased by 33% to R914 million from R687 million in FY24, mainly for ongoing
development and major project capital related to the 207/212 level project. A total of R454 million was
spent for ongoing development
▪Adjusted free cash flow was negatively impacted by the lower gold production decreasing to R81 million
(FY24: R457 million).
Key indicators for FY26
▪17-year life-of-mine
▪Production guidance of between 85 000oz and 88 500oz
▪Capital expenditure of approximately R1 194 million, mainly for ongoing development and the 207/212
level major project.
Our focus areas in FY26 To reduce variability, enabling development and capital expansion, including associated infrastructure. | ||
63
Joel
FY25 | FY24 | FY23 | |||
Number of employees | |||||
– Permanent | 1 757 | 1 729 | 1 871 | ||
– Contractors | 285 | 198 | 191 | ||
Total | 2 042 | 1 927 | 2 062 | ||
Operational | |||||
Volumes milled | (000t) (metric) | 374 | 401 | 435 | |
(000t) (imperial) | 412 | 442 | 481 | ||
Gold produced | (kg) | 1 634 | 1 733 | 1 947 | |
(oz) | 52 534 | 55 718 | 62 598 | ||
Gold sold | (kg) | 1 639 | 1 708 | 1 964 | |
(oz) | 52 695 | 54 914 | 63 144 | ||
Grade | (g/t) | 4.37 | 4.32 | 4.48 | |
(oz/t) | 0.128 | 0.126 | 0.130 | ||
Productivity | (g/TEC) | 75.16 | 79.45 | 86.49 | |
Development results | |||||
– Total metres (excluding capital metres) | 3 183 | 3 194 | 3 221 | ||
– Reef metres | 947 | 935 | 847 | ||
– Capital metres | — | — | — | ||
Financial | |||||
Revenue | (Rm) | 2 484 | 2 079 | 2 044 | |
(US$m) | 137 | 111 | 115 | ||
Average gold price received | (R/kg) | 1 515 661 | 1 216 923 | 1 040 581 | |
(US$/oz) | 2 597 | 2 024 | 1 822 | ||
Cash operating cost | (Rm) | 1 878 | 1 690 | 1 603 | |
(US$m) | 103 | 90 | 90 | ||
Production profit | (Rm) | 608 | 416 | 427 | |
(US$m) | 34 | 22 | 24 | ||
Capital expenditure | (Rm) | 270 | 236 | 231 | |
(US$m) | 15 | 13 | 13 | ||
Adjusted free cash flow1 | (Rm) | 336 | 153 | 210 | |
(US$m) | 19 | 8 | 12 | ||
Cash operating cost | (R/kg) | 1 149 466 | 975 319 | 823 291 | |
(US$/oz) | 1 969 | 1 622 | 1 441 | ||
All-in sustaining cost | (R/kg) | 1 351 641 | 1 145 064 | 950 713 | |
(US$/oz) | 2 316 | 1 905 | 1 665 | ||
Average exchange rate | (R/US$) | 18.15 | 18.70 | 17.76 | |
FY25 | FY24 | FY23 | |||
Safety | |||||
Loss of life | 4 | — | — | ||
Lost-time injury frequency rate | (per million hours worked) | 3.97 | 4.70 | 1.27 | |
Environment | |||||
Electricity consumption | (GWh) | 107 | 101 | 99 | |
Water consumption – primary activities | (Ml) | 1 045 | 982 | 897 | |
Greenhouse gas emissions | (000tCO2e) | 112 | 101 | 103 | |
Intensity data per tonne treated | |||||
– Energy | (MWh/t) | 0.29 | 0.25 | 0.23 | |
– Water | (000m3/t) | 2.79 | 2.45 | 2.06 | |
– Greenhouse gas emissions | (tCO2e/t) | 0.30 | 0.25 | 0.24 | |
Number of reportable environmental incidents | — | — | — | ||
Community | |||||
Local economic development | (Rm) | 8 | 7 | 7 | |
Training and development | (Rm) | 34 | 28 | 29 |
1Adjusted free cash flow = revenue – cash operating cost – capital expenditure as per operating results.
64
Mineral Reserve estimates at 30 June 2025
Proved | Probable | Total | |||||||
Reserves (metric) | Tonnes (Mt) | Grade (g/t) | Gold (000kg) | Tonnes (Mt) | Grade (g/t) | Gold (000kg) | Tonnes (Mt) | Grade (g/t) | Gold (000kg) |
2.1 | 4.69 | 10 | 0.2 | 5.35 | 1 | 2.2 | 4.74 | 11 | |
Reserves (imperial) | Tons (Mt) | Grade (oz/t) | Gold (000oz) | Tons (Mt) | Grade (oz/t) | Gold (000oz) | Tons (Mt) | Grade (oz/t) | Gold (000oz) |
2.3 | 0.137 | 313 | 0.2 | 0.156 | 29 | 2.5 | 0.138 | 342 | |
Overview of operations
Joel is a twin-shaft mining operation in the Free State, some 290km south-west of Johannesburg, on the
southern edge of the Witwatersrand Basin.
A pre-developed scattered-mining system is used. This enables unpay and geologically complex areas to be left
unmined, while considering the overall panel configuration and stability of footwall development. This allows
for mining to be selective, based on the proven Mineral Reserve during the development phase. The primary
economic reef mined is the narrow tabular Beatrix Reef deposit, accessed via conventional grid development.
Mining is currently being conducted to a depth of 1 379m below collar. As the Joel plant was decommissioned
in FY19, ore mined is now processed at the Harmony One plant.
Salient features for FY25
▪Regrettably, Joel had two loss-of-life incidents, losing three employees in one incident and another in a
separate fall-of-ground incident. Refer to Safety transformation towards zero harm for more
information on the causes of injury and management’s safety approach
▪The lost-time injury frequency rate for FY25 improved to 3.97 per million hours worked (FY24: 4.70 per
million hours worked)
▪Gold production decreased by 6% to 1 634kg (52 534oz) from 1 733kg (55 718oz) in FY24
▪Ore milled was affected by a mud rush incident during the year, which severely impacted hoisting
operations for approximately 20 days, reflecting in total volumes of ore milled. Ore milled was 7% lower
at 374 000 tonnes (FY24: 401 000 tonnes)
▪The recovered grade at 4.37g/t was slightly higher than the 4.32g/t recorded in FY24
▪Revenue increased by 19% to R2 484 million from R2 079 million in FY24, due to an increase in the gold
price received. The average gold price received increased by 25% to R1 515 661/kg from R1 216 923/kg
in FY24
▪Cash operating costs increased by 11% to R1 878 million (FY24: 1 690 million), mainly due to annual
wage and electricity tariff increases as well as inflationary increases on consumables and contractors
▪Capital expenditure was 14% higher at R270 million (FY24: R236 million), mainly for ongoing
development
▪Adjusted free cash flow rose by 120% to R336 million from R153 million in FY24.
Key indicators for FY26
▪Five-year life-of-mine
▪Production guidance of between 51 800oz and 54 000oz
▪Capital expenditure of approximately R300 million, mainly for ongoing development.
Our focus areas in FY26 The management team’s focus will be to deliver safe, profitable production in line with FY26 planning, while completion of the infrastructure project for improved water handling capability in the decline and hydropower roll out to development crews on 137 level. | ||
65
Target 1
FY25 | FY24 | FY23 | |||
Number of employees | |||||
– Permanent | 1 626 | 1 569 | 1 571 | ||
– Contractors | 435 | 436 | 430 | ||
Total | 2 061 | 2 005 | 2 001 | ||
Operational | |||||
Volumes milled | (000t) (metric) | 391 | 462 | 365 | |
(000t) (imperial) | 432 | 510 | 402 | ||
Gold produced | (kg) | 1 387 | 1 859 | 1 275 | |
(oz) | 44 593 | 59 769 | 40 992 | ||
Gold sold | (kg) | 1 415 | 1 854 | 1 256 | |
(oz) | 45 492 | 59 608 | 40 381 | ||
Grade | (g/t) | 3.55 | 4.02 | 3.49 | |
(oz/t) | 0.103 | 0.117 | 0.102 | ||
Productivity | (g/TEC) | 62.93 | 88.65 | 60.67 | |
Development results | |||||
– Total metres (excluding capital metres) | 1 759 | 1 915 | 1 387 | ||
– Reef metres | 233 | 13 | 47 | ||
– Capital metres | — | — | — | ||
Financial | |||||
Revenue | (Rm) | 2 161 | 2 262 | 1 308 | |
(US$m) | 119 | 121 | 74 | ||
Average gold price received | (R/kg) | 1 527 507 | 1 219 817 | 1 041 564 | |
(US$/oz) | 2 617 | 2 029 | 1 824 | ||
Cash operating cost | (Rm) | 2 508 | 2 354 | 2 033 | |
(US$m) | 138 | 126 | 114 | ||
Production profit | (Rm) | (372) | (90) | (701) | |
(US$m) | (21) | (5) | (39) | ||
Capital expenditure | (Rm) | 491 | 488 | 428 | |
(US$m) | 27 | 26 | 24 | ||
Adjusted free cash flow1 | (Rm) | (837) | (580) | (1 153) | |
(US$m) | (46) | (31) | (65) | ||
Cash operating cost | (R/kg) | 1 808 182 | 1 266 487 | 1 594 661 | |
(US$/oz) | 3 098 | 2 107 | 2 792 | ||
All-in sustaining cost | (R/kg) | 2 203 514 | 1 558 946 | 1 903 111 | |
(US$/oz) | 3 775 | 2 593 | 3 332 | ||
Average exchange rate | (R/US$) | 18.15 | 18.70 | 17.76 | |
FY25 | FY24 | FY23 | |||
Safety | |||||
Loss of life | — | — | — | ||
Lost-time injury frequency rate | (per million hours worked) | 10.26 | 6.24 | 9.54 | |
Environment | |||||
Electricity consumption | (GWh) | 224 | 233 | 212 | |
Water consumption – primary activities | (Ml) | 777 | 590 | 804 | |
Greenhouse gas emissions | (000tCO2e) | 237 | 236 | 223 | |
Intensity data per tonne treated | |||||
– Energy | (MWh/t) | 0.57 | 0.50 | 0.58 | |
– Water | (000m3/t) | 1.99 | 1.28 | 2.20 | |
– Greenhouse gas emissions | (tCO2e/t) | 0.61 | 0.51 | 0.61 | |
Number of reportable environmental incidents | — | — | 1 | ||
Community | |||||
Local economic development | (Rm) | 8 | 11 | 8 | |
Training and development | (Rm) | 59 | 63 | 53 |
1Adjusted free cash flow = revenue – cash operating cost – capital expenditure as per operating results.
66
Mineral Reserve estimates at 30 June 2025
Proved | Probable | Total | |||||||
Reserves (metric) | Tonnes (Mt) | Grade (g/t) | Gold (000kg) | Tonnes (Mt) | Grade (g/t) | Gold (000kg) | Tonnes (Mt) | Grade (g/t) | Gold (000kg) |
2.4 | 4.46 | 11 | 1.1 | 4.48 | 5 | 3.5 | 4.47 | 16 | |
Reserves (imperial) | Tons (Mt) | Grade (oz/t) | Gold (000oz) | Tons (Mt) | Grade (oz/t) | Gold (000oz) | Tons (Mt) | Grade (oz/t) | Gold (000oz) |
2.7 | 0.130 | 347 | 1.2 | 0.131 | 156 | 3.9 | 0.130 | 503 | |
Overview of operations
Target 1 is an advanced, single-shaft, deep-level mine in the Free State, some 270km south-west of
Johannesburg. It has a planned life-of-mine of six years.
While most of the ore extracted comes from mechanised mining (massive mining techniques),
conventional stoping is still employed primarily to destress areas ahead of mechanised mining. The gold
mineralisation currently exploited is contained in a succession of Elsburg and Dreyerskuil quartz pebble
conglomerate reefs. These reefs are mined to a depth of around 2 300m below surface. Ore mined is
milled and processed at the Target plant, with gold recovered by means of gold cyanide leaching.
Salient features for FY25
▪Reached 2.1 million loss-of-life free shifts during the year under review
▪The lost-time injury frequency rate deteriorated from 6.24 per million hours worked in FY24 to 10.26 per
million hours worked in FY25. Refer to Safety transformation towards zero harm for more information
on the causes of injury and management’s safety approach
▪Gold produced at 1 387kg (44 593oz) was 25% lower than the 1 859kg (59 769oz) recorded in FY24. The
operation experienced numerous infrastructure-related challenges that delayed the expected ramp-up
of production. Comprehensive work is underway to eliminate these challenges
▪Ore milled was 15% lower at 391 000 tonnes compared to 462 000 tonnes in FY24
▪The recovered grade at 3.55g/t was 12% lower (FY24: 4.02g/t)
▪Revenue was impacted by the lower gold production and was 4% lower at R2 161 million (FY24: R2 262
million). A higher average gold price received partially offset the effect of lower gold production,
increasing by 25% from R1 219 817/kg in FY24 to R1 527 507/kg
▪Cash operating costs increased by 7% to R2 508 million (FY24: R2 354 million) impacted by annual wage
and electricity tariff increases as well as an increase in the cost of maintenance-related consumables
▪Capital expenditure remained steady at R491 million (FY24: R488 million), mainly for ongoing
development, the replacement of trackless machinery, and level 9 compliance. A total of R197 million
was spent for ongoing development.
Key indicators for FY26
▪Six-year life-of-mine
▪Production guidance of between 54 100oz and 59 000oz
▪Capital expenditure of approximately R463 million, mainly for ongoing development and equipment
replacement.
Our focus areas in FY26 The management team’s focus will be to deliver safe, profitable production in line with FY26 planning and finalise infrastructure projects for improved water handling capability. | ||
67
Kusasalethu
FY25 | FY24 | FY23 | |||
Number of employees | |||||
– Permanent | 3 499 | 3 502 | 3 502 | ||
– Contractors | 473 | 466 | 468 | ||
Total | 3 972 | 3 968 | 3 970 | ||
Operational | |||||
Volumes milled | (000t) (metric) | 544 | 584 | 567 | |
(000t) (imperial) | 599 | 644 | 626 | ||
Gold produced | (kg) | 3 629 | 3 842 | 3 460 | |
(oz) | 116 675 | 123 523 | 111 242 | ||
Gold sold | (kg) | 3 658 | 3 795 | 3 481 | |
(oz) | 117 607 | 122 011 | 111 917 | ||
Grade | (g/t) | 6.67 | 6.58 | 6.10 | |
(oz/t) | 0.195 | 0.192 | 0.178 | ||
Productivity | (g/TEC) | 82.17 | 88.27 | 78.76 | |
Development results | |||||
– Total metres (excluding capital metres) | 2 993 | 2 724 | 2 822 | ||
– Reef metres | 535 | 472 | 992 | ||
– Capital metres | — | — | — | ||
Financial | |||||
Revenue | (Rm) | 5 594 | 4 638 | 3 621 | |
(US$m) | 308 | 248 | 204 | ||
Average gold price received | (R/kg) | 1 529 149 | 1 222 101 | 1 040 274 | |
(US$/oz) | 2 620 | 2 033 | 1 821 | ||
Cash operating cost | (Rm) | 3 964 | 3 709 | 3 311 | |
(US$m) | 218 | 198 | 186 | ||
Production profit | (Rm) | 1 590 | 968 | 278 | |
(US$m) | 88 | 52 | 16 | ||
Capital expenditure | (Rm) | 461 | 226 | 253 | |
(US$m) | 25 | 12 | 14 | ||
Adjusted free cash flow1 | (Rm) | 1 169 | 704 | 57 | |
(US$m) | 64 | 38 | 3 | ||
Cash operating cost | (R/kg) | 1 092 265 | 965 284 | 956 938 | |
(US$/oz) | 1 871 | 1 606 | 1 675 | ||
All-in sustaining cost | (R/kg) | 1 256 873 | 1 058 639 | 1 068 851 | |
(US$/oz) | 2 153 | 1 761 | 1 871 | ||
Average exchange rate | (R/US$) | 18.15 | 18.70 | 17.76 | |
FY25 | FY24 | FY23 | |||
Safety | |||||
Loss of life | — | 2 | 3 | ||
Lost-time injury frequency rate | (per million hours worked) | 8.86 | 9.89 | 7.71 | |
Environment | |||||
Electricity consumption | (GWh) | 523 | 542 | 591 | |
Water consumption – primary activities | (Ml) | 2 215 | 3 020 | 2 734 | |
Greenhouse gas emissions | (000tCO2e) | 544 | 542 | 616 | |
Intensity data per tonne treated | |||||
– Energy | (MWh/t) | 0.96 | 0.93 | 1.04 | |
– Water | (000m3/t) | 4.07 | 5.17 | 4.82 | |
– Greenhouse gas emissions | (tCO2e/t) | 1.00 | 0.93 | 1.09 | |
Number of reportable environmental incidents | — | — | 2 | ||
Community | |||||
Local economic development | (Rm) | 10 | 12 | 25 | |
Training and development | (Rm) | 18 | 16 | 18 |
1Adjusted free cash flow = revenue – cash operating cost – capital expenditure as per operating results.
68
Mineral Reserve estimates at 30 June 2025
Proved | Probable | Total | |||||||
Reserves (metric) | Tonnes (Mt) | Grade (g/t) | Gold (000kg) | Tonnes (Mt) | Grade (g/t) | Gold (000kg) | Tonnes (Mt) | Grade (g/t) | Gold (000kg) |
1.9 | 6.26 | 12 | — | 4.94 | 0.1 | 1.9 | 6.24 | 12 | |
Reserves (imperial) | Tons (Mt) | Grade (oz/t) | Gold (000oz) | Tons (Mt) | Grade (oz/t) | Gold (000oz) | Tons (Mt) | Grade (oz/t) | Gold (000oz) |
2.1 | 0.182 | 377 | – | 0.144 | 4 | 2.1 | 0.182 | 381 | |
Overview of operations
Kusasalethu is a mature, deep-level mine 90km west of Johannesburg, near the border of Gauteng and
North West provinces. Mining is at a depth of 3 388m with three years’
life-of-mine remaining.
The mine comprises twin vertical and twin sub-vertical shaft systems and uses conventional mining
methods in a sequential grid layout. It exploits the Ventersdorp Contact Reef as its primary orebody. Ore
mined is treated at the Mponeng plant.
Salient features for FY25
▪Achieved 1 800 000 loss-of-life free shifts during the year
▪The lost-time injury frequency rate improved by 10% to 8.86 per million hours worked in FY25 (FY24:
9.89 per million hours worked). Refer to Safety transformation towards zero harm for more information
on the causes of injury and management’s safety approach
▪Gold production decreased to 3 629kg (116 675oz), 6% lower than the 3 842kg (123 523oz) achieved in
FY24
▪Ore milled was 7% lower at 544 000 tonnes (FY24: 584 000 tonnes)
▪The recovered grade was marginally higher at 6.67g/t, compared to 6.58g/t in the previous year
▪Gold revenue increased by 21% to R5 594 million (FY24: R4 638 million) due to a higher gold price
received. The average gold price received rose by 25% to R1 529 149/kg from R1 222 101/kg in FY24
▪Cash operating costs were 7% higher at R3 964 million (FY24: R3 709 million), mainly due to annual wage
and electricity tariff increases as well as higher MPRDA royalties. Royalties increased by 47% to R106
million (FY24: R72 million)
▪Capital expenditure increased to R461 million (FY24: R226 million), mainly for ongoing development and
establishing a viable backfill source from Savuka plant. A total of R203 million was spent on ongoing
development
▪Adjusted free cash flow rose by 66% to R1 169 million (FY24: R704 million).
Key indicators for FY26
▪Three-year life-of-mine
▪Production guidance of between 103 700oz and 110 200oz
▪Capital expenditure of approximately R420 million, mainly for ongoing development.
Our focus areas in FY26 Continue exploration and development, aiming to identify opportunities for expansion and growth. | ||
69
Masimong
FY25 | FY24 | FY23 | |||
Number of employees | |||||
– Permanent | 1 923 | 1 945 | 1 938 | ||
– Contractors | 166 | 148 | 126 | ||
Total | 2 089 | 2 093 | 2 064 | ||
Operational | |||||
Volumes milled | (000t) (metric) | 424 | 473 | 470 | |
(000t) (imperial) | 468 | 523 | 519 | ||
Gold produced | (kg) | 1 478 | 1 780 | 1 961 | |
(oz) | 47 519 | 57 229 | 63 047 | ||
Gold sold | (kg) | 1 483 | 1 756 | 1 980 | |
(oz) | 47 679 | 56 457 | 63 659 | ||
Grade | (g/t) | 3.49 | 3.76 | 4.17 | |
(oz/t) | 0.102 | 0.109 | 0.121 | ||
Productivity | (g/TEC) | 64.41 | 77.75 | 88.77 | |
Development results | |||||
– Total metres (excluding capital metres) | 2 652 | 2 474 | 2 921 | ||
– Reef metres | 937 | 640 | 1 129 | ||
– Capital metres | — | — | — | ||
Financial | |||||
Revenue | (Rm) | 2 245 | 2 137 | 2 053 | |
(US$m) | 124 | 114 | 116 | ||
Average gold price received | (R/kg) | 1 513 550 | 1 216 723 | 1 036 670 | |
(US$/oz) | 2 593 | 2 024 | 1 815 | ||
Cash operating cost | (Rm) | 1 973 | 1 882 | 1 709 | |
(US$m) | 109 | 101 | 96 | ||
Production profit | (Rm) | 265 | 284 | 329 | |
(US$m) | 15 | 15 | 19 | ||
Capital expenditure | (Rm) | 111 | 44 | 47 | |
(US$m) | 6 | 2 | 3 | ||
Adjusted free cash flow1 | (Rm) | 161 | 211 | 297 | |
(US$m) | 9 | 11 | 17 | ||
Cash operating cost | (R/kg) | 1 334 765 | 1 057 287 | 871 508 | |
(US$/oz) | 2 287 | 1 759 | 1 526 | ||
All-in sustaining cost | (R/kg) | 1 455 114 | 1 121 951 | 925 703 | |
(US$/oz) | 2 493 | 1 866 | 1 621 | ||
Average exchange rate | (R/US$) | 18.15 | 18.70 | 17.76 | |
FY25 | FY24 | FY23 | |||
Safety | |||||
Loss of life | — | — | — | ||
Lost-time injury frequency rate | (per million hours worked) | 4.43 | 3.20 | 3.89 | |
Environment | |||||
Electricity consumption | (GWh) | 142 | 140 | 134 | |
Water consumption – primary activities | (Ml) | 676 | 647 | 1 217 | |
Greenhouse gas emissions | (000tCO2e) | 148 | 140 | 139 | |
Intensity data per tonne treated | |||||
– Energy | (MWh/t) | 0.34 | 0.30 | 0.28 | |
– Water | (000m3/t) | 1.60 | 1.37 | 2.59 | |
– Greenhouse gas emissions | (tCO2e/t) | 0.35 | 0.30 | 0.30 | |
Number of reportable environmental incidents | — | — | — | ||
Community | |||||
Local economic development | (Rm) | 8 | 11 | 9 | |
Training and development | (Rm) | 38 | 34 | 32 |
1Adjusted free cash flow = revenue – cash operating cost – capital expenditure as per operating results.
70
Mineral Reserve estimates at 30 June 2025
Proved | Probable | Total | |||||||
Reserves (metric) | Tonnes (Mt) | Grade (g/t) | Gold (000kg) | Tonnes (Mt) | Grade (g/t) | Gold (000kg) | Tonnes (Mt) | Grade (g/t) | Gold (000kg) |
0.6 | 4.22 | 3 | 0.2 | 3.42 | 1 | 0.9 | 4.03 | 3 | |
Reserves (imperial) | Tons (Mt) | Grade (oz/t) | Gold (000oz) | Tons (Mt) | Grade (oz/t) | Gold (000oz) | Tons (Mt) | Grade (oz/t) | Gold (000oz) |
0.7 | 0.123 | 88 | 0.2 | 0.100 | 23 | 0.9 | 0.117 | 110 | |
Overview of operations
Masimong is a deep-level mine in the Free State, near Welkom, some 260km from Johannesburg. The
operation is close to the end of its mine life, with two years of mining left. Masimong is a mine that
reflects the effectiveness of Harmony’s business model.
The Masimong complex comprises two shafts with 5 shaft used as the operating shaft and 4 shaft for
ventilation, pumping and a second escape outlet. Masimong exploits the Basal Reef and B Reef, using a
conventional tabular narrow-reef stoping method. Mining is conducted at a depth of 1 650m to 2 010m
below collar. Ore mined is processed at the nearby Harmony One plant.
Salient features for FY25
▪Reached 4.2 million loss-of-life free shifts during FY25
▪The lost-time injury frequency rate deteriorated to 4.43 per million hours worked in FY25 (FY24: 3.20
per million hours worked). Refer to Safety transformation towards zero harm for more information
on the causes of injury and management’s safety approach
▪Gold produced was 17% lower at 1 478kg (47 519oz) when compared to the 1 780kg (57 229oz)
recorded in FY24
▪Ore milled at 424 000 tonnes (FY24: 473 000 tonnes) was 10% lower than the previous year, affected
by operational and hoisting challenges
▪The recovered grade was impacted by lower face grades and, as a result, decreased to 3.49g/t from
3.76g/t, 7% lower
▪Gold revenue increased by 5% to R2 245 million (FY24: R2 137 million) with the lower production
offset by a 24% rise in the gold price to R1 513 550/kg from R1 216 723/kg in FY24
▪Cash operating costs increased by 5% to R1 973 million (FY24: R1 882 million), mainly due to annual
wage and electricity tariff increases
▪Capital expenditure increased to R111 million (FY24: R44 million), mainly for the replacement of
equipment.
Key indicators for FY26
▪Two-year life-of-mine
▪Production guidance of between 47 500oz and 50 500oz
▪Capital expenditure of approximately R115 million, mainly for abnormal expenditure and plant-
related capital.
Our focus areas in FY26 The management team’s focus will be to deliver safe, profitable production in line with FY26 planning, while continuing to develop into identified isolated blocks of ground for a possible one- year extension to the life-of-mine. | ||
71
South Africa – surface operations
Mine Waste Solutions (tailings retreatment)
FY25 | FY24 | FY23 | |||
Number of employees | |||||
– Permanent | 544 | 516 | 493 | ||
– Contractors | 1 633 | 1 880 | 1 692 | ||
Total | 2 177 | 2 396 | 2 185 | ||
Operational | |||||
Volumes milled | (000t) (metric) | 23 054 | 22 655 | 23 067 | |
(000t) (imperial) | 25 423 | 24 982 | 25 437 | ||
Gold produced | (kg) | 2 996 | 3 770 | 2 804 | |
(oz) | 96 323 | 121 207 | 90 150 | ||
Gold sold | (kg) | 3 057 | 3 742 | 2 781 | |
(oz) | 98 284 | 120 309 | 89 412 | ||
Grade | (g/t) | 0.130 | 0.166 | 0.122 | |
(oz/t) | 0.004 | 0.005 | 0.004 | ||
Productivity | (g/TEC) | 288.35 | 481.06 | 362.96 | |
Financial | |||||
Revenue1 | (Rm) | 4 458 | 4 016 | 2 689 | |
(US$m) | 246 | 215 | 151 | ||
Average gold price received | (R/kg) | 1 430 061 | 986 777 | 845 341 | |
(US$/oz) | 2 450 | 1 641 | 1 480 | ||
Cash operating cost | (Rm) | 2 204 | 2 056 | 1 821 | |
(US$m) | 121 | 110 | 102 | ||
Production profit | (Rm) | 2 239 | 1 969 | 879 | |
(US$m) | 123 | 105 | 50 | ||
Capital expenditure | (Rm) | 1 061 | 1 463 | 932 | |
(US$m) | 58 | 78 | 52 | ||
Adjusted free cash flow2 | (Rm) | 1 107 | 174 | (402) | |
(US$m) | 61 | 9 | (23) | ||
Cash operating cost | (R/kg) | 735 525 | 545 310 | 649 264 | |
(US$/oz) | 1 260 | 907 | 1 137 | ||
All-in sustaining cost | (R/kg) | 795 380 | 605 710 | 721 034 | |
(US$/oz) | 1 363 | 1 008 | 1 262 | ||
Average exchange rate | (R/US$) | 18.15 | 18.70 | 17.76 | |
FY25 | FY24 | FY23 | |||
Safety | |||||
Loss of life | — | — | — | ||
Lost-time injury frequency rate | (per million hours worked) | 5.41 | 4.04 | 4.55 | |
Environment | |||||
Electricity consumption | (GWh) | 224 | 212 | 205 | |
Water consumption – primary activities | (Ml) | 5 710 | 5 744 | 5 714 | |
Greenhouse gas emissions | (000tCO2e) | 244 | 222 | 222 | |
Intensity data per tonne treated | |||||
– Energy | (MWh/t) | 0.01 | 0.01 | 0.01 | |
– Water | (000m3/t) | 0.25 | 0.25 | 0.25 | |
– Greenhouse gas emissions | (tCO2e/t) | 0.01 | 0.01 | 0.01 | |
Number of reportable environmental incidents | — | — | — | ||
Community | |||||
Local economic development | (Rm) | — | — | — | |
Training and development | (Rm) | 15 | 11 | 11 |
1Includes a non-cash consideration for the streaming arrangement with Franco-Nevada.
2Adjusted free cash flow = revenue – Franco-Nevada non-cash consideration – cash operating cost – capital expenditure as
per operating results.
72
Mineral Reserve estimates at 30 June 2025
Proved | Probable | Total | |||||||
Reserves (metric) | Tonnes (Mt) | Grade (g/t) | Gold (000kg) | Tonnes (Mt) | Grade (g/t) | Gold (000kg) | Tonnes (Mt) | Grade (g/t) | Gold (000kg) |
7.8 | 0.30 | 2 | 151.1 | 0.25 | 38 | 158.9 | 0.25 | 40 | |
Reserves (imperial) | Tons (Mt) | Grade (oz/t) | Gold (000oz) | Tons (Mt) | Grade (oz/t) | Gold (000oz) | Tons (Mt) | Grade (oz/t) | Gold (000oz) |
8.5 | 0.009 | 76 | 166.6 | 0.007 | 1 206 | 175.1 | 0.007 | 1 282 | |
Overview of operations
Mine Waste Solutions is a tailings retreatment operation near Klerksdorp in the North West province. It
reprocesses low-grade material from tailings storage facilities scattered across the Vaal River and
Stilfontein area to reduce the tailings footprint.
The operation was acquired from AngloGold Ashanti Limited in October 2020.
Harmony's subsidiary, Chemwes Proprietary Limited, the owner of Mine Waste Solutions, had a contract
with Franco-Nevada Barbados (Franco-Nevada) where Franco-Nevada was entitled to receive 25% of all
the gold produced through Mine Waste Solutions.
On 23 October 2024, Harmony fulfilled all its obligations stemming from the streaming agreement with
Franco-Nevada. From this date onwards, all gold revenue generated was based on quoted market prices.
Salient features for FY25
▪The lost-time injury frequency rate at Mine Waste Solutions improved to 3.86 per million hours worked
(FY24: 4.04 per million hours worked). Refer to Safety transformation towards zero harm for more
information on the causes of injury and management’s safety approach
▪Gold production was 21% lower at 2 996kg (96 323oz) (FY24: 3 770kg (121 207oz)), affected by the
delayed start-up of stream 4, unusually high rainfall and other operational challenges such as electricity
supply failures
▪Ore processed was 2% higher at 23.05 million tonnes compared to 22.66 million tonnes in FY24
▪The recovered grade was affected by the aforementioned challenges and was 22% lower at 0.130g/t
(FY24: 0.166g/t)
▪Revenue increased by 11% to R4 458 million (FY24: R4 016 million), mainly due to the settlement of the
Franco-Nevada contract in October 2024. This resulted in the operation benefiting fully from the higher
gold prices. The gold price received rose by 45% to R1 430 061/kg, compared to R986 777/kg in FY24
▪Cash operating costs increased by 7% to R2 204 million (FY24: R2 056 million), mainly due to annual
wage and electricity tariff increases as well as an increase in water costs, driven by additional charges
from the Department of Water and Sanitation related to the pumping of water
▪Capital expenditure of R1 061 million was incurred for the year, 27% lower than the R1 463 million
during FY24. Capital was mainly for the Kareerand expansion project as well as the Mispah pump station
▪Adjusted free cash rose significantly to R1 107 million (FY24: R174 million).
Key indicators for FY26
▪14-year life-of-mine
▪Production guidance of approximately 98 800oz
▪Capital expenditure of approximately R858 million, mainly for the completion of the Kareerand
extension project.
Our focus areas in FY26 Completion of major projects in line with life-of-mine extension. Focus on mining according to plan and achieve operational excellence in all aspects of the business. | ||
73
Kalgold
FY25 | FY24 | FY23 | |||
Number of employees | |||||
– Permanent | 258 | 266 | 255 | ||
– Contractors | 485 | 475 | 470 | ||
Total | 743 | 741 | 725 | ||
Operational | |||||
Volumes milled | (000t) (metric) | 1 464 | 1 492 | 1 377 | |
(000t) (imperial) | 1 614 | 1 645 | 1 519 | ||
Gold produced | (kg) | 1 236 | 1 425 | 1 175 | |
(oz) | 39 738 | 45 815 | 37 778 | ||
Gold sold | (kg) | 1 206 | 1 423 | 1 163 | |
(oz) | 38 774 | 45 750 | 37 392 | ||
Grade | (g/t) | 0.84 | 0.96 | 0.85 | |
(oz/t) | 0.025 | 0.028 | 0.025 | ||
Productivity | (g/TEC) | 137.01 | 186.71 | 106.90 | |
Financial | |||||
Revenue | (Rm) | 1 842 | 1 730 | 1 212 | |
(US$m) | 101 | 93 | 68 | ||
Average gold price received | (R/kg) | 1 527 460 | 1 216 047 | 1 041 891 | |
(US$/oz) | 2 617 | 2 023 | 1 824 | ||
Cash operating cost | (Rm) | 1 196 | 1 057 | 915 | |
(US$m) | 66 | 57 | 52 | ||
Production profit | (Rm) | 679 | 677 | 313 | |
(US$m) | 37 | 36 | 18 | ||
Capital expenditure | (Rm) | 150 | 263 | 219 | |
(US$m) | 8 | 14 | 12 | ||
Adjusted free cash flow1 | (Rm) | 480 | 409 | 68 | |
(US$m) | 26 | 22 | 4 | ||
Cash operating cost | (R/kg) | 967 820 | 741 469 | 778 997 | |
(US$/oz) | 1 658 | 1 233 | 1 364 | ||
All-in sustaining cost | (R/kg) | 1 120 160 | 949 112 | 986 677 | |
(US$/oz) | 1 919 | 1 579 | 1 728 | ||
Average exchange rate | (R/US$) | 18.15 | 18.70 | 17.76 | |
FY25 | FY24 | FY23 | |||
Safety | |||||
Loss of life | — | — | — | ||
Lost-time injury frequency rate | (per million hours worked) | 3.54 | 1.46 | 6.59 | |
Environment | |||||
Electricity consumption | (GWh) | 53 | 54 | 53 | |
Water consumption – primary activities | (Ml) | 260 | 285 | 267 | |
Greenhouse gas emissions | (000tCO2e) | 73 | 73 | 72 | |
Intensity data per tonne treated | |||||
– Energy | (MWh/t) | 0.04 | 0.04 | 0.04 | |
– Water | (000m3/t) | 0.18 | 0.19 | 0.19 | |
– Greenhouse gas emissions | (tCO2e/t) | 0.05 | 0.05 | 0.05 | |
Number of reportable environmental incidents | — | — | 1 | ||
Community | |||||
Local economic development | (Rm) | 3 | 2 | 3 | |
Training and development | (Rm) | 15 | 10 | 9 |
1Adjusted free cash flow = revenue – cash operating cost – capital expenditure ± impact of run-of-mine costs as per operating
results.
74
Mineral Reserve estimates at 30 June 2025
Proved | Probable | Total | |||||||
Reserves (metric) | Tonnes (Mt) | Grade (g/t) | Gold (000kg) | Tonnes (Mt) | Grade (g/t) | Gold (000kg) | Tonnes (Mt) | Grade (g/t) | Gold (000kg) |
10.3 | 0.96 | 10 | 8.3 | 1.12 | 9 | 18.7 | 1.03 | 19 | |
Reserves (imperial) | Tons (Mt) | Grade (oz/t) | Gold (000oz) | Tons (Mt) | Grade (oz/t) | Gold (000oz) | Tons (Mt) | Grade (oz/t) | Gold (000oz) |
11.4 | 0.028 | 319 | 9.2 | 0.033 | 299 | 20.6 | 0.030 | 618 | |
Overview of operations
Kalgold is a long-life, open-pit gold mine on the Kraaipan Greenstone Belt, 55km south-west of Mahikeng
in North West province.
Mining takes place from the A-zone pit, Watertank pit, Henry’s pit as well as Windmill pit. Mined ore is
processed at the carbon-in-leach Kalgold plant.
Salient features for FY25
▪Kalgold maintained its loss-of-life free record in FY25
▪The lost-time injury frequency rate deteriorated to 3.54 per million hours worked (FY24: 1.46 per million
hours worked). Refer to Safety transformation towards zero harm for more information on the causes of
injury and management’s safety approach
▪Gold production was 13% lower at 1 236kg (39 738oz) compared to 1 425kg (45 815oz) in FY24
▪Ore milled was marginally lower than in FY24 at 1.45 million tonnes (FY24: 1.49 million tonnes)
▪The recovered grade at 0.84g/t was 13% lower than the 0.96g/t recorded in the previous year. Affected
by lower feed grades in the A-zone and Windmill pits as well as inclement weather affecting the loading
of higher-grade blocks
▪Gold revenue increased by 6% to R1 842 million (FY24: R1 730 million), despite the lower production
and aided by a higher gold price received. The gold price received increased by 26% to R1 527 460/kg
compared to R1 216 047/kg in FY24
▪Cash operating cost increased by 13% to R1 196 million (FY24: R1 057 million), mainly due to a decrease
in capitalised stripping credits as well as annual wage and electricity tariff increases
▪Capital expenditure decreased by 43% to R150 million (FY24: R263 million), mainly due to lower
capitalised stripping. The majority of expenditure was, however, still related to capitalised stripping
amounting to R114 million (FY24: R216 million)
▪Adjusted free cash increased by 17% to R480 million (FY24: R409 million).
Key indicators for FY26
▪12-year life-of-mine
▪Production guidance of between 39 100oz and 40 700oz
▪Capital expenditure of approximately R79 million, mainly for plant capital.
Our focus areas in FY26 Main focus will be on maintaining steady production from all four pits and sustain the current 130 000 tonnes per month. Further strive to acquire the prospecting rights of south of D-Zone Area for exploration drilling for the operation’s organic growth. | ||
75
Phoenix (tailings retreatment)
FY25 | FY24 | FY23 | |||
Number of employees | |||||
– Permanent | 88 | 86 | 85 | ||
– Contractors | 355 | 261 | 265 | ||
Total | 443 | 347 | 350 | ||
Operational | |||||
Volumes milled | (000t) (metric) | 5 857 | 6 067 | 6 218 | |
(000t) (imperial) | 6 459 | 6 691 | 6 857 | ||
Gold produced | (kg) | 954 | 923 | 833 | |
(oz) | 30 673 | 29 674 | 26 782 | ||
Gold sold | (kg) | 960 | 905 | 843 | |
(oz) | 30 865 | 29 096 | 27 102 | ||
Grade | (g/t) | 0.163 | 0.152 | 0.134 | |
(oz/t) | 0.005 | 0.004 | 0.004 | ||
Productivity | (g/TEC) | 443.92 | 449.21 | 416.17 | |
Financial | |||||
Revenue | (Rm) | 1 570 | 1 140 | 889 | |
(US$m) | 86 | 61 | 50 | ||
Average gold price received | (R/kg) | 1 635 717 | 1 259 294 | 1 054 262 | |
(US$/oz) | 2 802 | 2 095 | 1 846 | ||
Cash operating cost | (Rm) | 571 | 546 | 504 | |
(US$m) | 31 | 29 | 28 | ||
Production profit | (Rm) | 999 | 603 | 379 | |
(US$m) | 55 | 32 | 21 | ||
Capital expenditure | (Rm) | 116 | 14 | 37 | |
(US$m) | 6 | 1 | 2 | ||
Adjusted free cash flow1 | (Rm) | 884 | 580 | 347 | |
(US$m) | 49 | 31 | 20 | ||
Cash operating cost | (R/kg) | 598 172 | 591 742 | 605 167 | |
(US$/oz) | 1 025 | 984 | 1 060 | ||
All-in sustaining cost | (R/kg) | 721 816 | 617 051 | 653 241 | |
(US$/oz) | 1 237 | 1 026 | 1 144 | ||
Average exchange rate | (R/US$) | 18.15 | 18.70 | 17.76 | |
FY25 | FY24 | FY23 | |||
Safety | |||||
Loss of life | 1 | — | — | ||
Lost-time injury frequency rate | (per million hours worked) | 2 | — | — | |
Environment | |||||
Electricity consumption | (GWh) | 42 | 40 | 40 | |
Water consumption – primary activities | (Ml) | 314 | 98 | 34 | |
Greenhouse gas emissions | (000tCO2e) | 44 | 40 | 41 | |
Intensity data per tonne treated | |||||
– Energy | (MWh/t) | 0.01 | 0.01 | 0.01 | |
– Water | (000m3/t) | 0.05 | 0.02 | 0.01 | |
– Greenhouse gas emissions | (tCO2e/t) | 0.01 | 0.01 | 0.01 | |
Number of reportable environmental incidents | — | — | — |
1Adjusted free cash flow = revenue – cash operating cost – capital expenditure as per operating results.
76
Mineral Reserve estimates at 30 June 2025
Proved | Probable | Total | |||||||
Reserves (metric) | Tonnes (Mt) | Grade (g/t) | Gold (000kg) | Tonnes (Mt) | Grade (g/t) | Gold (000kg) | Tonnes (Mt) | Grade (g/t) | Gold (000kg) |
30.4 | 0.27 | 8 | — | — | — | 30.4 | 0.27 | 8 | |
Reserves (imperial) | Tons (Mt) | Grade (oz/t) | Gold (000oz) | Tons (Mt) | Grade (oz/t) | Gold (000oz) | Tons (Mt) | Grade (oz/t) | Gold (000oz) |
33.5 | 0.008 | 261 | — | — | — | 33.5 | 0.008 | 261 | |
Overview of operations
Phoenix is a tailings retreatment operation in Virginia, Free State. It retreats tailings from Harmony’s
tailings storage facilities in the Free State region to extract any residual gold, using the Saaiplaas plant. It is
100% owned by the black economic empowerment company, Tswelopele Beneficiation Operation
Proprietary Limited, of which Harmony is a 77% shareholder.
Salient features for FY25
▪Regrettably, one life was lost during FY25. Refer to Safety transformation towards zero harm for more
information on the causes of injury and management’s safety approach
▪Gold production increased by 3% to 954kg (30 673oz) from 923kg (29 674oz) in FY24
▪Ore processed was marginally lower at 5.9 million tonnes, 3% lower than the 6.1 million tonnes
processed in FY24
▪The recovered grade increased to 0.163g/t, a 7% increase over the 0.152g/t recorded in the previous
year
▪Revenue rose by 38% to R1 570 million (FY24: R1 140 million) due to a higher gold price received and
gold production. The gold price received increased by 30% to R1 635 717/kg from R1 259 294/kg in FY24
▪All-in sustaining cost increased by 17% to R721 816/kg (FY24: R617 051/kg), mainly as a result of an
increase in sustaining capital. Cash operating costs increased by 5% from R546 million in FY24 to R571
million, mainly due to annual wage and electricity tariff increases
▪Capital expenditure increased to R116 million (FY24: R14 million), mainly spent on the establishing of
FSS6 feed source and plant maintenance
▪Phoenix generated adjusted free cash of R884 million, a 52% increase over the R580 million recorded in
FY24.
Key indicators for FY26
▪Five-year life-of-mine
▪Production guidance of approximately 25 400oz
▪Capital expenditure of approximately R86 million, mainly for the completion of FSS6 feed source and
plant capital.
Our focus areas in FY26 Successful commissioning of FSS6 reclamation to replace Brand D reclamation. Achieve operational excellence in all aspects of the business. | ||
77
Central Plant Reclamation (tailings retreatment)
FY25 | FY24 | FY23 | |||
Number of employees | |||||
– Permanent | 88 | 96 | 95 | ||
– Contractors | 183 | 154 | 170 | ||
Total | 271 | 250 | 265 | ||
Operational | |||||
Volumes milled | (000t) (metric) | 3 912 | 3 936 | 3 972 | |
(000t) (imperial) | 4 313 | 4 340 | 4 380 | ||
Gold produced | (kg) | 646 | 615 | 577 | |
(oz) | 20 770 | 19 773 | 18 552 | ||
Gold sold | (kg) | 655 | 609 | 572 | |
(oz) | 21 059 | 19 580 | 18 391 | ||
Grade | (g/t) | 0.165 | 0.156 | 0.145 | |
(oz/t) | 0.005 | 0.005 | 0.004 | ||
Productivity | (g/TEC) | 323.90 | 306.51 | 289.99 | |
Financial | |||||
Revenue | (Rm) | 1 013 | 741 | 599 | |
(US$m) | 56 | 40 | 34 | ||
Average gold price received | (R/kg) | 1 547 217 | 1 216 856 | 1 046 428 | |
(US$/oz) | 2 651 | 2 024 | 1 832 | ||
Cash operating cost | (Rm) | 362 | 359 | 330 | |
(US$m) | 20 | 19 | 19 | ||
Production profit | (Rm) | 645 | 386 | 272 | |
(US$m) | 36 | 21 | 15 | ||
Capital expenditure | (Rm) | 20 | 36 | 31 | |
(US$m) | 1 | 2 | 2 | ||
Adjusted free cash flow1 | (Rm) | 631 | 346 | 238 | |
(US$m) | 35 | 19 | 13 | ||
Cash operating cost | (R/kg) | 560 797 | 583 657 | 572 213 | |
(US$/oz) | 961 | 971 | 1 002 | ||
All-in sustaining cost | (R/kg) | 594 711 | 646 522 | 633 098 | |
(US$/oz) | 1 019 | 1 075 | 1 108 | ||
Average exchange rate | (R/US$) | 18.15 | 18.70 | 17.76 | |
FY25 | FY24 | FY23 | |||
Safety | |||||
Loss of life | — | — | — | ||
Lost-time injury frequency rate | (per million hours worked) | 2 | — | 2 | |
Environment | |||||
Electricity consumption | (GWh) | 24 | 24 | 24 | |
Water consumption – primary activities | (Ml) | 224 | 178 | 171 | |
Greenhouse gas emissions | (000tCO2e) | 27 | 27 | 27 | |
Intensity data per tonne treated | |||||
– Energy | (MWh/t) | 0.01 | 0.01 | 0.01 | |
– Water | (000m3/t) | 0.06 | 0.05 | 0.04 | |
– Greenhouse gas emissions | (tCO2e/t) | 0.01 | 0.01 | 0.01 | |
Number of reportable environmental incidents | — | — | — |
1Adjusted free cash flow = revenue – cash operating cost – capital expenditure as per operating results.
78
Mineral Reserve estimates at 30 June 2025
Proved | Probable | Total | |||||||
Reserves (metric) | Tonnes (Mt) | Grade (g/t) | Gold (000kg) | Tonnes (Mt) | Grade (g/t) | Gold (000kg) | Tonnes (Mt) | Grade (g/t) | Gold (000kg) |
— | — | — | 39.7 | 0.27 | 11 | 39.7 | 0.27 | 11 | |
Reserves (imperial) | Tons (Mt) | Grade (oz/t) | Gold (000oz) | Tons (Mt) | Grade (oz/t) | Gold (000oz) | Tons (Mt) | Grade (oz/t) | Gold (000oz) |
— | — | — | 43.7 | 0.008 | 343 | 43.7 | 0.008 | 343 | |
Overview of operations
Central Plant Reclamation is a tailings retreatment operation near Welkom in the Free State. Originally built to
process waste rock dumps, it was converted into a tailings retreatment facility in FY17.
Salient features for FY25
▪Central Plant Reclamation maintained its good safety performance
▪Gold production at 646kg (20 770oz) increased by 5% over the 615kg (19 773oz) produced in FY24
▪Ore processed was maintained at 3.9 million tonnes (FY24: 3.9 million tonnes)
▪The recovered grade increased by 6% to 0.165g/t (FY24: 0.156g/t)
▪Revenue increased to R1 013 million from R741 million, a 37% increase due to a higher gold price
received and gold production. The gold price received increased by 27% to R1 547 217/kg from R1 216
856/kg in FY24
▪All-in sustaining cost decreased by 8% to R594 711/kg (FY24: R646 522/kg), due to the higher gold
production. Cash cost increased by only 1% due to a decrease in royalties, as exemption has been
granted since the dumps were established pre-2004
▪Capital expenditure decreased from R36 million in FY24 to R20 million for the current year, mainly
towards plant capital
▪Adjusted free cash rose by 82% to R631 million (FY24: R346 million).
Key indicators for FY26
▪11-year life-of-mine
▪Production guidance of approximately 17 600oz
▪Capital expenditure of approximately R105 million, mainly towards the FSS3 feed source and plant
capital.
Our focus areas in FY26 Successful commissioning of FSS3 reclamation to replace FSS5 reclamation. Achieve operational excellence in all aspects of the business. | ||
79
Savuka (tailings retreatment)
FY25 | FY24 | FY23 | |||
Number of employees | |||||
– Permanent | 100 | 100 | 96 | ||
– Contractors | 140 | 140 | 107 | ||
Total | 240 | 240 | 203 | ||
Operational | |||||
Volumes milled | (000t) (metric) | 3 669 | 4 019 | 3 880 | |
(000t) (imperial) | 4 046 | 4 431 | 4 278 | ||
Gold produced | (kg) | 568 | 609 | 593 | |
(oz) | 18 261 | 19 579 | 19 066 | ||
Gold sold | (kg) | 560 | 615 | 591 | |
(oz) | 18 004 | 19 773 | 19 001 | ||
Grade | (g/t) | 0.155 | 0.152 | 0.153 | |
(oz/t) | 0.005 | 0.004 | 0.004 | ||
Productivity1 | (g/TEC) | 250.13 | 272.98 | 199.25 | |
Financial | |||||
Revenue | (Rm) | 861 | 753 | 614 | |
(US$m) | 47 | 40 | 35 | ||
Average gold price received | (R/kg) | 1 538 107 | 1 223 769 | 1 038 531 | |
(US$/oz) | 2 635 | 2 036 | 1 818 | ||
Cash operating cost | (Rm) | 391 | 355 | 319 | |
(US$m) | 22 | 19 | 18 | ||
Production profit | (Rm) | 476 | 393 | 296 | |
(US$m) | 26 | 21 | 17 | ||
Capital expenditure | (Rm) | 48 | 21 | 16 | |
(US$m) | 3 | 1 | 1 | ||
Adjusted free cash flow2 | (Rm) | 423 | 377 | 278 | |
(US$m) | 23 | 20 | 16 | ||
Cash operating cost | (R/kg) | 687 736 | 583 233 | 538 202 | |
(US$/oz) | 1 178 | 970 | 942 | ||
All-in sustaining cost | (R/kg) | 773 316 | 617 621 | 564 738 | |
(US$/oz) | 1 325 | 1 027 | 989 | ||
Average exchange rate | (R/US$) | 18.15 | 18.70 | 17.76 | |
Safety | |||||
Loss of life | — | — | — | ||
Lost-time injury frequency rate | (per million hours worked) | 2.48 | — | — | |
1FY24 figure restated.
2Adjusted free cash flow = revenue – cash operating cost – capital expenditure as per operating results.
80
Mineral Reserve estimates at 30 June 2025
Proved | Probable | Total | |||||||
Reserves (metric) | Tonnes (Mt) | Grade (g/t) | Gold (000kg) | Tonnes (Mt) | Grade (g/t) | Gold (000kg) | Tonnes (Mt) | Grade (g/t) | Gold (000kg) |
— | — | — | 24.1 | 0.33 | 8 | 24.1 | 0.33 | 8 | |
Reserves (imperial) | Tons (Mt) | Grade (oz/t) | Gold (000oz) | Tons (Mt) | Grade (oz/t) | Gold (000oz) | Tons (Mt) | Grade (oz/t) | Gold (000oz) |
— | — | — | 26.5 | 0.010 | 254 | 26.5 | 0.010 | 254 | |
Overview of operations
Savuka plant is situated near the town of Carletonville and was acquired from AngloGold Ashanti Limited in
October 2020. The plant originally treated both waste rock and tailings, but was converted to a tailings
treatment facility in October 2021 when the milling section of the plant was decommissioned.
Salient features for FY25
▪The operation maintained its good safety performance
▪Gold production was 7% lower at 568kg (18 261oz) when compared to the 609kg (19 579oz) in the
previous year
▪Ore processed at 3.7 million tonnes was 8% lower than the 4.0 million tonnes processed in FY24
▪The recovered grade was marginally higher at 0.155g/t, a 2% increase over the 0.152g/t in FY24
▪Gold revenue at R861 million (FY24: R753 million) was higher, mainly due to an increase in the average
gold price received from R1 223 769/kg to R1 538 107/kg, a 26% rise
▪The all-in sustaining cost increased by 25% to R773 316/kg (FY24: R617 621/kg) due to a 10% increase in
cash operating cost, an increase in sustaining capex as well as lower production. Cash cost increased due
to annual wage and electricity tariff increases as well as a 41% rise in MPRDA royalties
▪Sustaining capex increased by R27 million to R48 million (FY24: R21 million), mainly for plant
maintenance.
Key indicators for FY26
▪Seven-year life-of-mine
▪Production guidance of approximately 17 600oz
▪Capital expenditure of approximately R146 million, mainly for the 7A/7B deposition project and plant
capital.
Our focus areas in FY26 Complete tailings life extension project and integration of backfill supply to Kusasalethu mine. Achieve operational excellence in all aspects of the business. | ||
81
Waste rock dumps
FY25 | FY24 | FY23 | |||
Operational | |||||
Volumes milled | (000t) (metric) | 3 885 | 4 162 | 3 935 | |
(000t) (imperial) | 4 285 | 4 590 | 4 339 | ||
Gold produced | (kg) | 1 475 | 1 724 | 1 541 | |
(oz) | 47 422 | 55 429 | 49 544 | ||
Gold sold | (kg) | 1 458 | 1 718 | 1 549 | |
(oz) | 46 875 | 55 235 | 49 801 | ||
Grade | (g/t) | 0.380 | 0.414 | 0.392 | |
(oz/t) | 0.011 | 0.012 | 0.011 | ||
Financial | |||||
Revenue | (Rm) | 2 208 | 2 100 | 1 631 | |
(US$m) | 122 | 112 | 92 | ||
Average gold price received | (R/kg) | 1 514 674 | 1 222 494 | 1 052 903 | |
(US$/oz) | 2 595 | 2 034 | 1 844 | ||
Cash operating cost | (Rm) | 1 431 | 1 395 | 1 313 | |
(US$m) | 79 | 75 | 74 | ||
Production profit | (Rm) | 773 | 712 | 311 | |
(US$m) | 43 | 38 | 18 | ||
Capital expenditure | (Rm) | — | 4 | 12 | |
(US$m) | — | — | 1 | ||
Adjusted free cash flow1 | (Rm) | 778 | 700 | 306 | |
(US$m) | 43 | 37 | 17 | ||
Cash operating cost | (R/kg) | 969 849 | 809 415 | 852 146 | |
(US$/oz) | 1 662 | 1 346 | 1 492 | ||
All-in sustaining cost | (R/kg) | 984 564 | 810 746 | 859 974 | |
(US$/oz) | 1 687 | 1 349 | 1 506 | ||
Average exchange rate | (R/US$) | 18.15 | 18.70 | 17.76 | |
FY25 | FY24 | FY23 | |||
Safety | |||||
Loss of life | — | — | — | ||
Lost-time injury frequency rate | (per million hours worked) | — | — | — | |
Environment | |||||
Electricity consumption | (GWh) | * | * | * | |
Water consumption – primary activities | (Ml) | * | * | * | |
Greenhouse gas emissions | (000tCO2e) | * | * | * | |
Intensity data per tonne treated | |||||
– Energy | (MWh/t) | * | * | * | |
– Water | (000m3/t) | * | * | * | |
– Greenhouse gas emissions | (tCO2e/t) | * | * | * | |
Number of reportable environmental incidents | — | — | — |
1Adjusted free cash flow = revenue – cash operating cost – capital expenditure as per operating results.
*Electricity and water consumption and related emission and intensity data for the respective plants at which the waste rock
dumps are processed are accounted for as part of the primary operation’s environmental results.
82
Mineral Reserve estimates at 30 June 2025
Proved | Probable | Total | |||||||
Reserves (metric) | Tonnes (Mt) | Grade (g/t) | Gold (000kg) | Tonnes (Mt) | Grade (g/t) | Gold (000kg) | Tonnes (Mt) | Grade (g/t) | Gold (000kg) |
— | — | — | — | — | — | — | — | — | |
Reserves (imperial) | Tons (Mt) | Grade (oz/t) | Gold (000oz) | Tons (Mt) | Grade (oz/t) | Gold (000oz) | Tons (Mt) | Grade (oz/t) | Gold (000oz) |
— | — | — | — | — | — | — | — | — | |
Overview of operations
Production from processing surface rock dumps, situated across Harmony’s operations, depends entirely
on the availability of spare mill capacity at the various operational plants. Waste and waste rock dump
deliveries to Kusasalethu plant (near the border of Gauteng and North West provinces) supplement mining
volumes to secure sufficient backfill to use as support in stoping areas. Waste rock dumps near Orkney
(acquired with Moab Khotsong operations) is treated at the Noligwa plant. Milling of waste rock dumps
at the Doornkop plant in Gauteng began in FY18. Waste rock dumps and tailings facilities acquired with
Mponeng are treated at Mponeng and Kusasalethu plants. Surface ore treated at Kopanang plant was
unprofitable and closed during the first quarter of FY22. The plant is currently on care and maintenance.
Salient features for FY25
▪Gold production decreased to 1 475kg (47 422oz), 14% lower than the 1 724kg (55 429oz) produced in
FY24
▪Ore milled was 7% lower at 3.9 million tonnes (FY24: 4.2 million tonnes)
▪The recovered grade decreased by 8% to 0.380g/t from 0.414g/t in FY24, affected by the depletion of
higher-grade sources
▪Gold revenue increased to R2 208 million (FY24: R2 100 million), a 5% increase, due to a higher gold price
received. The average gold price received increased by 24% to R1 514 674/kg from R1 222 494/kg in FY24
▪All-in sustaining cost increased by 21% to R984 564/kg (FY24: R810 746/kg) due to the lower gold
production and a 3% increase in cash operating cost. Cash cost increased, mainly due to inflationary as
well as annual electricity tariff increases.
Our focus areas in FY26 Our priority is to continue safe, profitable production by maintaining costs and improving mining efficiencies. | ||
83
Papua New Guinea
Hidden Valley
FY25 | FY24 | FY23 | |||
Number of employees | |||||
– Permanent | 1 416 | 1 387 | 1 422 | ||
– Contractors | 950 | 696 | 767 | ||
Total | 2 366 | 2 083 | 2 189 | ||
Operational | |||||
Volumes milled | (000t) (metric) | 3 787 | 3 360 | 3 846 | |
(000t) (imperial) | 4 177 | 3 705 | 4 240 | ||
Gold produced | (kg) | 5 107 | 5 101 | 4 370 | |
(oz) | 164 193 | 164 000 | 140 498 | ||
Gold sold | (kg) | 5 098 | 5 052 | 4 214 | |
(oz) | 163 905 | 162 425 | 135 483 | ||
Grade | (g/t) | 1.35 | 1.52 | 1.14 | |
(oz/t) | 0.039 | 0.044 | 0.033 | ||
Financial | |||||
Revenue | (Rm) | 7 923 | 6 181 | 4 440 | |
(US$m) | 436 | 331 | 250 | ||
Average gold price received | (R/kg) | 1 554 096 | 1 223 409 | 1 053 611 | |
(US$/oz) | 2 663 | 2 035 | 1 845 | ||
Cash operating cost | (Rm) | 2 344 | 2 435 | 2 127 | |
(US$m) | 129 | 130 | 120 | ||
Production profit | (Rm) | 5 467 | 3 933 | 2 404 | |
(US$m) | 301 | 210 | 135 | ||
Capital expenditure | (Rm) | 1 620 | 1 541 | 1 737 | |
(US$m) | 89 | 82 | 98 | ||
Adjusted free cash flow1 | (Rm) | 3 766 | 2 188 | 615 | |
(US$m) | 207 | 117 | 35 | ||
Cash operating cost | (R/kg) | 458 928 | 477 360 | 486 754 | |
(US$/oz) | 786 | 794 | 852 | ||
All-in sustaining cost | (R/kg) | 868 228 | 814 375 | 1 014 228 | |
(US$/oz) | 1 486 | 1 352 | 1 785 | ||
Average exchange rate | (R/US$) | 18.15 | 18.70 | 17.76 | |
FY25 | FY24 | FY23 | |||
Safety | |||||
Loss of life | — | — | — | ||
Lost-time injury frequency rate | (per million hours worked) | — | 0.34 | 0.34 | |
Environment | |||||
Electricity consumption2 | (GWh) | 139 | 129 | 138 | |
Water consumption – primary activities | (Ml) | 2 047 | 2 112 | 2 186 | |
Greenhouse gas emissions3 | (000tCO2e) | 184 | 179 | 186 | |
Intensity data per tonne treated | |||||
– Energy4 | (MWh/t) | 0.04 | 0.04 | 0.04 | |
– Water | (000m3/t) | 0.54 | 0.63 | 0.57 | |
– Greenhouse gas emissions | (tCO2e/t) | 0.05 | 0.05 | 0.05 | |
Number of reportable environmental incidents | — | — | — |
1Adjusted free cash flow = revenue – cash operating cost – capital expenditure ± impact of run-of-mine costs as per operating
results.
2Electricity consumption includes both self-generated and grid-purchased.
3Inclusive of scope 1 (direct) and scope 2 (indirect from purchased electricity) emissions.
4Represents electricity only.
84
Mineral Reserve estimates at 30 June 2025
Proved | Probable | Total | |||||||
Reserves (metric) | Tonnes (Mt) | Grade (g/t) | Gold (000kg) | Tonnes (Mt) | Grade (g/t) | Gold (000kg) | Tonnes (Mt) | Grade (g/t) | Gold (000kg) |
1.6 | 0.95 | 2 | 17.0 | 1.45 | 25 | 18.6 | 1.40 | 26 | |
Reserves (imperial) | Tons (Mt) | Grade (oz/t) | Gold (000oz) | Tons (Mt) | Grade (oz/t) | Gold (000oz) | Tons (Mt) | Grade (oz/t) | Gold (000oz) |
1.8 | 0.028 | 50 | 18.7 | 0.042 | 791 | 20.5 | 0.041 | 841 | |
Overview of operations
The Hidden Valley mine is an open-pit gold and silver operation in Morobe Province, Papua New Guinea,
some 210km north-west of Port Moresby. The mine is located at elevations of 1 700m to 2 800m above
sea level in steep mountainous and forested terrain that receives around 3 000mm of rainfall per year. The
major gold and silver deposits of Hidden Valley are in the Morobe Granodiorite of the Wau Graben.
Crushed ore is conveyed from the pit via a 5.5km overland pipe conveyor and treated at the Hidden Valley
processing plant, using a two-stage crushing circuit followed by a semi-autogenous grinding mill, gravity,
counter current decantation/ Merrill Crowe circuit for silver and a carbon-in-leach circuit for gold.
Salient features for FY25
▪Hidden Valley maintained its exemplary safety performance with a ninth consecutive year of zero loss-
of-life incidents and reached 4.6 million loss-of-life free shifts
▪Gold production was maintained at 5 107kg (164 193oz) (FY24: 5 101kg (164 000oz))
▪Ore milled increased to 3.8 million tonnes, a 12% improvement over the 3.4 million tonnes milled in
FY24
▪In FY24, Hidden Valley mined through higher-grade areas, boosting the recovered grade to 1.52g/t. For
the year under review, grades returned to anticipated levels at 1.35g/t and was 11% lower
▪Revenue increased by 28% to R7 923 million (FY24: R6 181 million) due to an increase in the gold price
received to R1 554 096/kg (FY24: R1 223 409/kg), a 27% increase
▪All-in sustaining cost increased by 7% to R868 228/kg (FY24: R814 375/kg), due to changes in inventory
and run of mine adjustments
▪Total capital expenditure increased by 5% to R1 620 million from R1 541 million in FY24, mainly for
capitalised stripping and replacing of equipment
▪Hidden Valley was again the second-largest individual mine contributor to adjusted free cash flow at R3
766 million (FY24: R2 188 million).
Key indicators for FY26
▪Five-year life-of-mine
▪Production guidance of between 179 400oz and 190 800oz
▪Capital expenditure of approximately R3 437 million, mainly for capitalised stripping and essential fleet
replacement.
Our focus areas in FY26 Our focus is on safe, environmentally responsible, margin-focused production against plan and progressing of project studies for life-of-mine extension. | ||
85
Exploration and projects
Harmony prioritises the successful execution of multiple, significant projects to sustain the profitability of operational mines and secure long-term value
creation for our business and stakeholders. We achieve this by investing in major projects, including the extension of our assets, TSF reclamation and
renewable energy. We also actively invest in greenfield and brownfield exploration to mitigate the risk of a depleting Mineral Reserve base. This drives
short- to medium-term organic Mineral Reserve replacement and growth to support our goal of increasing quality ounces.
Optimal long-term value creation |
EXPLORATION | ||||
Regional Eva Copper portfolio drilling | ||||
Kalgold drilling – Brownfields | ||||
STUDIES | ||||
Free State surface re-mining | ||||
West Wits surface re-mining | ||||
Eva Copper | ||||
Hidden Valley (Stage 9 + TSF 3) | ||||
Kerimenge CIL1 and heap leach study | ||||
PERMITTING | ||||
Wafi-Golpu copper-gold ▪Gold: 0.86g/t ▪Copper: 1.1% ▪Framework memorandum of Understanding signed ▪Mining Development Contract negotiation in progress ▪Special Mining Lease to follow | ||||
EXECUTION | ||||
Moab Khotsong – Zaaiplaats | ||||
Mponeng extension (including TauTona VCR2 Pillar) | ||||
MWS – Kareerand extension | ||||
Doornkop 207L & 212L | ||||
MWS - Mispah tailings dam retreatment | ||||
Eva Copper Project | ||||
Renewable energy | ||||
1 Carbon-in-leach.
2 Ventersdorp Contact Reef.
Exploration
Our exploration strategy is to predominantly pursue brownfields exploration targets close to existing infrastructure. In addition to reviewing exploration opportunities as part of our new business strategy, our priorities
for FY25 as part of our exploration programme included:
South Africa – Kalgold drilling | Australia – Eva Copper drilling | |||||
Exploration is aimed at improving understanding of the potential to develop the Kraaipan Greenstone Belt into a new mineralised province with multiple mining centres. No exploration drilling took place in FY25. The new prospecting right application that was submitted to the Department of Minerals and Petroleum Resources (DMPR) in April 2024 has still not been granted, despite the fact that the requested environmental authorisation study was completed timeously and submitted to the DMPR in October 2024. An objection was submitted against the granting of the environmental authorisation by the Kraaipan tribal authorities. | Acquired the project in December 2022. In FY25 drilling has comprised 304 holes for 67 378m. The drilling was undertaken as part of the Eva Feasibility study update designed to increase confidence in the Mineral Resource base and support study elements including Resource definition, infrastructure sterilisation, metallurgical, geotechnical aspects, construction material characterisation, water borefield exploration and high-grade satellite ore feed targets for prospect development/drill testing. Several new resource areas were developed and declared in an expanded resource base for the project. | |||||
86
Projects
Approach
Harmony recognises the complexity and inherent risks involved in managing multiple large-scale
projects concurrently across its operations. Our project execution management system provides
operational guidelines that standardise our approach throughout project phases (ideation, concept
studies, prefeasibility studies, feasibility studies, operational readiness and execution), allowing us to
define processes, set execution standards, track performance, manage resources and implement
changes where needed. Project managers use the system to continuously monitor our progress,
reporting daily, weekly and monthly to operational teams and the Harmony executives. We set key
deliverables for each project phase, aligned with Harmony’s strategic goals and risk appetite. This
approach also encourages operational excellence and incorporates rigorous governance requirements
to address the complexities of multiple projects.
Harmony’s Central Projects Management Office (CPMO) drives the successful execution of project
management.
Governance
Our governance framework provides key policies, standards, procedures, guidelines and templates
aligned with Harmony’s investment approach and best practices. The CPMO monitors progress,
performance and adherence to governance on a monthly basis, through steering committee meetings
and project metrics. The group executive team monitors progress and performance on a quarterly basis.
In addition, Harmony’s internal audit function conduct annual audits into the CPMO activities. Harmony
is pioneering the deployment of standardised reporting and template tools across select pilot sites,
designed to streamline project management processes and enable best practice adoption. These tools
are designed to enhance accuracy and efficiency, enabling adherence to industry standards to manage
cost, time and scope. We conduct training to provide project managers with a clear and concise
understanding for efficient application.
Risk management
Project execution risk management is an integral part of our business and operating strategy, allowing
for a safe working environment that remains profitable. We include critical operational risks in our
strategic risk register, which is reviewed by our group executive committee and the board’s technical,
and audit and risk committees. We also include site-specific issues in operational risk registers.
Harmony’s top exploration and project-related risks include:
▪Loss of life/safety
▪Security of electricity power supply and the impact of higher electricity costs
▪Unsuccessful project execution
▪Not achieving operational objectives at our critical operations
▪Supply chain disruptions (including supply of goods, availability and increasing costs).
Refer to Risk and opportunity management for details on how we manage and mitigate these risks.
Key projects
We have identified substantial opportunities in our existing portfolio through exploration and
brownfield projects which will extend the life of some of our larger and higher-grade assets, adding
lower-risk, higher-margin ounces to Harmony’s portfolio. Each project brings multiple benefits to
Harmony and exceeds all our minimum criteria for allocating capital.
The salient features of our key projects are:
South Africa | |||||
Mining projects in execution | |||||
Moab Khotsong – Zaaiplaats project | |||||
Status | Board-approved FY21, mining 101L to 114L | ||||
Scope | Three new declines and associated infrastructure below 101 level | ||||
FY25 Progress | 2,445m developed, TMM commissioning completed, infrastructure construction ongoing | ||||
FY26 Plans | Complete TMM workshops, install material decline winder, progress conveyor system | ||||
Mponeng extension (including TauTona VCR Pillar) | |||||
TauTona VCR Pillar | Board-approved extraction of shaft pillar VCR orebody sections | ||||
LoM Extension | Board-approved Carbon leader reef and VCR mining below 120 level/126 level via trackless ramps and twin decline systems | ||||
FY25 Progress | Opening-up and rehabilitation activities commenced July 2024 | ||||
FY26 Plans | Continue development, support/equipping, trackless workshop commissioning | ||||
Doornkop 207 and 212 level | |||||
Scope | Extend mining to depth with new ore handling system, shaft infrastructure upgrades | ||||
Key Components | DK1A shaft conversion to intake, split refrigeration plan, integrated electrical infrastructure | ||||
FY25 Progress | 207 level completed, 212 level temporary material handling operational | ||||
FY26 Focus | New ore handling infrastructure (three silos and conveyor), water management optimisation | ||||
87
South Africa | |||||
Mining projects in execution (continued) | |||||
MWS – Kareerand expansion | |||||
Scope | New 340ha TSF compartment adjacent to existing facility | ||||
FY25 Progress | Phase 1 commissioned August 2024 | ||||
FY26 Focus | Phase 2 planned start September 2025 | ||||
MWS – Mispah tailings dam retreatment | |||||
Objective | Construct Mispah pump station to treat Mispah 1 TSF through MWS | ||||
FY25 Progress | On track for July 2026 commissioning | ||||
FY26 Plans | Complete Mispah pump station end of FY26. Midway and Kareerand redundancy projects underway | ||||
Renewable energy | |||||
Scope | To meet the renewable energy goals outlined in Harmony’s energy efficiency and climate change strategy | ||||
FY25 Progress | Generating 64.3 GWh from solar PV projects; construction began on the 100 MW Sungazer 2 solar PV plant at Moab Khotsong | ||||
FY26 plans | Procurement for future Sungazer phases is underway with Sungazer 2 set to begin commercial operations in FY27 | ||||
Papua New Guinea | |||||
Wafi-Golpu Project (Harmony 50%) | |||||
Status | Greenfield undeveloped deep-level block cave mine in permitting phase | ||||
Mining Method | Block cave with multi-cave options (BC44, BC42, BC40) | ||||
Operating Life | >28 years (potential to extend to 40 years) | ||||
Current Status | Environment permit granted December 2020; special mining lease negotiations ongoing with PNG State | ||||
Next Steps | Re-establish project delivery capability, validate 2018 feasibility study, commence early works | ||||
Hidden Valley LoM extension study | |||||
Objective | Convert remaining Stage 9 resources and assess third TSF/heap leach operations | ||||
Challenge | Current LoM constraint is tailings storage capacity | ||||
Requirements | Mining lease extension and environmental permit amendment needed | ||||
Kerimenge study | |||||
Status | Concept study completed in 2025 | ||||
Options | Heap leach processing and integration with Hidden Valley CIL processing | ||||
Integration | Now rolled into Hidden Valley LoM extension study | ||||
Requirements | Mining lease and environmental permit needed | ||||
Australia | |||||
Eva Copper Project | |||||
Status | Multi-pit copper concentrator feasibility study update in progress | ||||
Location | 75km northeast of Cloncurry, Queensland | ||||
Scope | Six open pits with purpose-built copper concentrator | ||||
Mine Life | >15 years projected | ||||
Infrastructure | Blended power generation with CopperString project optionality | ||||
Current Work | Feasibility study update addressing due diligence risks and opportunities | ||||
Team | Experienced project team established in Brisbane and Cloncurry | ||||
Permits | Fully permitted with potential amendments based on feasibility recommendations | ||||
Timeline | Maiden Reserve declaration expected upon successful feasibility completion | ||||
For more details on exploration and projects, refer to the relevant
sections in our Mineral Resources and Mineral Reserves report.
88
Building a lasting positive legacy
Environmental stewardship is a strategic imperative for supporting our long-term sustainability and overall positive contribution to society through creating enduring value beyond
the life-of-mine. By prioritising responsible practices, we protect natural resources, minimise pollution, address climate change and promote a more sustainable relationship between
our operations and the environment.
We have organised our sustainability disclosures in this chapter using the four pillars of governance, strategy, risk management (titled Risk and opportunity management), and metrics and targets (titled Measuring our
performance). We also describe our progress against priorities for our business in FY25.
Strategy | Our sustainability framework (embedded in our business strategy) guides the development and implementation of our environmental programmes and policies, which are informed by agreement-based commitments, regulatory compliance, best practice and extensive stakeholder engagement. By executing our environmental programmes, we aim to conduct responsible mining practices to reduce the negative impacts of our mining activities while boosting our potential positive impacts. | ||||
Governance | Our board, through the social and ethics committee, oversees our environmental programmes and performance. The executive responsible for sustainability drives strategic environmental improvements at group level. Our group environmental head holds direct accountability for embedding responsible environmental practices across operations, supported by dedicated environmental subject matter experts. The board, with support from the social and ethics committee and the chief sustainability officer, maintains oversight over our risk management, including regularly reviewing our policy and procedures. As part of our governance process for addressing sustainability imperatives, Harmony has commenced the establishment of community of practices (CoPs). These CoPs will bring together experts across the organisation to collaborate, foster shared learning and drive continuous improvement to deliver measurable sustainability outcomes across the group. At each operation, general managers manage environmental plans, identify improvement opportunities, run programmes, and monitor regulatory compliance, with oversight from regional executives and management. We discuss internal performance reports at quarterly and annual board and committee meetings. We also report to regulators in line with our licence conditions, and share environmental data and updates with communities and neighbouring landowners or farmers at least once a year. We actively monitor legislative changes in our operating countries and conduct external legal compliance assurance as required by our ISO certification. | ||||
Risk and opportunity management | Our strategic risks and opportunities related to environmental aspects are summarised in relation to our sustainability imperatives. These are defined through our enterprise risk management process and described in the Risks and opportunities section. These strategic risks reflect the most significant environment-related threats to our business, employees and host communities over the medium to long term, with possible negative implications of future operating costs, infrastructure requirements, operations and operating conditions, host communities and our supply chain. The impact of these risks was assessed against Harmony’s risk categories as set out in the risk appetite and tolerance framework. Other environmental risks and management measures are described per environmental topic. | ||||
Performance | All operations implement approved environmental management programmes that embed responsible mining practices, guided by the Harmony environmental policy and roadmaps. We regularly review and update these to remain compliant with our host countries’ regulations. Each operation follows technical and performance standards that form part of environmental management systems and are implemented according to ISO 14001 (2015). All South African operations are ISO 14001 certified, and our Australasian and decommissioned assets are guided by ISO requirements. All TSFs certified by ICMI undergo recertification every 18 months for ongoing compliance with the International Cyanide Management Code. | ||||
Each section of this chapter provides: ▪An overview of our strategic approach for each environmental topic and how we implemented our environmental management programmes, including the priorities we pursued in FY25 and progress against group targets ▪Insights into how each environmental topic is governed and managed to meet or exceed regulatory requirements ▪Details of the environmental risks faced under each environmental topic, along with corresponding management measures. | ||
89
Achieving impact
Annual expenditure to meet our environmental commitments
In FY25, the group spent R1 843 million (FY24: R724 million) to meet or exceed environmental regulatory requirements and reduce our long-term environmental liabilities. The increase in environmental compliance costs
for FY25 is primarily due to the inclusion of approximately R1 billion related to the Sungazer 2 PV project, which supports the group’s decarbonisation strategy and SBTi commitments. No fines or penalties (FY24: none)
and no environment-related lost production days (FY24: none) were recorded.
Annual expenditure on our environmental portfolio | FY25 | FY24 | FY23 | |||
Rm | US$m | Rm | US$m | Rm | US$m | |
South Africa | ||||||
Environmental compliance | 1 627 | 89.6 | 545 | 29.1 | 461 | 26.0 |
Mine rehabilitation projects | 78 | 4.3 | 87 | 4.7 | 82 | 4.6 |
Total | 1 705 | 93.9 | 632 | 33.8 | 543 | 30.6 |
Papua New Guinea | ||||||
Environmental compliance and management | 47 | 2.6 | 59 | 3.2 | 60 | 3.4 |
Total | 47 | 2.6 | 59 | 3.2 | 60 | 3.4 |
Australia | ||||||
Environmental compliance and management | 88 | 4.8 | 31 | 1.7 | n/a | n/a |
Cultural heritage management | 3 | 0.1 | 2 | 0.1 | n/a | n/a |
Total | 91 | 4.9 | 33 | 1.8 | n/a | n/a |
Harmony total | 1 843 | 101.4 | 724 | 38.8 | 603 | 34.0 |
90
Reportable environmental incidents
Environmental incident reporting, which is guided by the seriousness of an incident in terms of the
financial, environmental, legal, and reputational ramifications for Harmony.
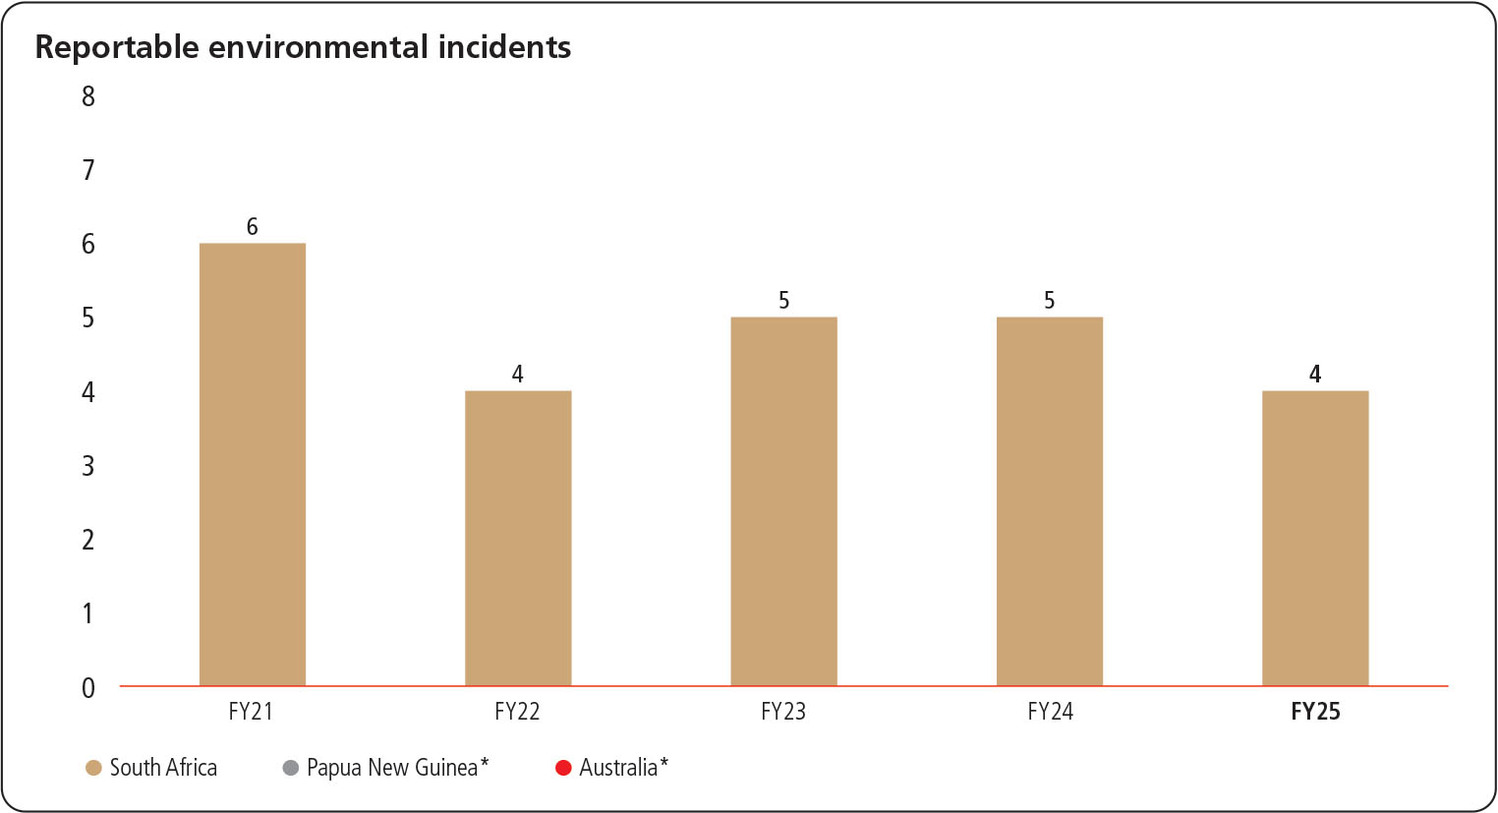
*Papua New Guinea and Australia had no reportable environmental incidents for the last five years.
Four reportable (level 3) environmental incidents occurred in FY25 and are summarised below.
Operation | Incident and description | Environmental impact | ||||||
Harmony One | In December 2024, vandalism of the slurry changeover valve from Harmony One plant to St. Helena TSF caused an overflow of the plant’s residue tank. The spillage breached secondary containment and seeped through the perimeter wall, impacting the surrounding environment. This incident is classified as level 3 due to the environmental impact and security breach. | Localised soil and groundwater contamination occurred near the spillage site. Emergency pumping equipment was deployed inside the plant to restore containment capacity and minimise environmental impact. | ||||||
Mine Waste Solutions | A slurry pipeline from the East Pump Station to the MWS plant ruptured, resulting in a spill that affected the surrounding environment and neighbouring properties. | Localised soil pollution occurred in the vicinity of the pipeline. The pump station was immediately shut down, and clean-up of the affected area was carried out. | ||||||
Saaiplaas | In January 2025, a stormwater containment paddock located on the reclaimed footprint of the Harmony 1 TSF gave way, resulting in the uncontrolled release of a mixture of silt and contaminated water into the Sand River. | Water quality analysis conducted following the incident indicated that the release had a negligible impact on the Sand River downstream. As a result, the overall environmental risk to the river system was assessed to be low. | ||||||
Harmony One | In January 2025, during a routine inspection, it was observed that the return water dam (RWD) at St. Helena 4 TSF was overflowing due to a breach in the wall, causing an uncontrolled release of process water into the surrounding environment following heavy rainfall. | Localised downstream soil and groundwater contamination occurred. Emergency pumping equipment was deployed to lower the RWD water level, and the breached berm wall was repaired. | ||||||
91
Land management and rehabilitation
Whether we conduct our activities on land owned by Harmony or by others, we are committed to minimising our impact, progressively rehabilitating
where possible, respecting the land’s environmental and cultural value, and managing closure responsibly.
Material matters | |||
Post-closure sustainability | |||
UN SDGs | |||
 | Life on land | ||
GRI disclosure requirements | |||
▪GRI 101: Biodiversity 2024. | |||
FY25 priorities | |||
1.Upholding land access laws and agreements through respectful engagement 2.Managing and rehabilitating our disturbed footprint across the asset lifecycle 3.Returning land to a productive state post-mining. | |||
Strategy: Compliance-driven land management
Land stewardship is essential to our operations, supporting responsible land management, legal compliance and guiding our environmental
management practices related to our footprint. We plan carefully across the mining lifecycle, engaging landowners, communities, rehabilitating
land and addressing impacts to support positive long-term outcomes for both land use and host communities.
Our FY25 priorities include:
Upholding land access laws and agreements through respectful engagement | We implement responsible land management practices, and conduct our activities in a manner that recognises and is responsive to co-existing land use requirements. In Papua New Guinea, our assets are situated on customary land owned by indigenous landowners. In Australia, our mining leases span commercially operating pastoral leaseholds, where the native title rights and interests of First Nations Australians are also formally recognised. | |||||
Managing and rehabilitating our disturbed footprint across the asset lifecycle | We integrate land management considerations during the full lifecycle, from the earliest planning phases through construction and operations and, finally, closure. Through design, we seek to avoid sensitive land areas and locations that pose significant environmental and social risks. During construction and throughout operations, we actively manage land disturbance to minimise unnecessary clearing and footprint expansion. We also consider the broader impact of our activities (such as dust, noise and visual impacts) on surrounding landholders and the community. We deliver concurrent and progressive rehabilitation through initiatives that: ▪Align with legislative requirements, our approved environmental plans and/or closure plans ▪Reflect government closure policy and guidelines ▪Consider opportunities for biodiversity protection, climate change adaptation and mitigation, energy management and the green economy in our post-mining land use planning. We mitigate the risk of illegal mining by demolishing, sealing or rehabilitating decommissioned infrastructure, and construct exclusion bunds to minimise access. | |||||
Returning land to a productive state post- mining | We seek to return land to a safe, stable, sustainable and productive state following mining. We determine post-mining land uses as guided by regulatory and government policy requirements, consideration and alignment with landowner aspirations, long-term safety and stability, and opportunities to enhance environmental value. We also consider the social risks associated with transition and practical measures to promote socio-economic transition. This may include creating opportunities for local suppliers to participate in rehabilitation activities, assessing the potential to repurpose infrastructure, and through our community initiatives (refer to the Empowering communities section) that support alternative livelihoods. | |||||
92
Governance
Accountability and responsibility | Regional executives and management oversee land access, progressive rehabilitation and closure-related regulatory and internal standards compliance, including the preparation of annual closure cost estimates, financial liability assessments and rehabilitation and closure plans for our mines. Site management teams are responsible for daily land management issues and execution of our rehabilitation and closure programmes. | ||||
Performance monitoring and reporting | Through site-based reporting and with regional oversight, we track performance across our exploration tenements and operational footprint, which includes company- owned and third-party land. Regional functions support site teams to track and respond to land-related commitments, including ongoing consultation with landowners. Monitoring frameworks also include progressive rehabilitation and performance indicators to assess progress against closure objectives and support continuous improvement. Our environmental management plan and monitoring programme include management actions, mitigation measures and monitoring for land management, erosion and sediment control, and rehabilitation. Our geotechnical team at Hidden Valley implements ongoing monitoring to identify and manage hazards and provides advice on remediation and appropriate excavation practices to reduce potential for instability. | ||||
Policies that support our governance approach | Land access and mine closure regimes vary, reflecting the legal and policy frameworks of our host countries. We address these regional differences through site-specific planning that responds to local expectations, aligns with international good practice, and is guided by group and regional policies that prioritise regulatory compliance, responsible land stewardship, progressive rehabilitation and closure planning. Our policies and related standards define requirements that apply through the mine’s lifecycle, from exploration to post-mining, and encompass landowner engagement, access to land and upholding consent processes, managing and resolving issues, managing risks and liabilities, and arriving at a safe and stable post-mining environment. Our mining lease and environment permit conditions set out requirements for rehabilitation and mine closure plan submission and approval. Our mining lease conditions also set out financial assurance requirements for rehabilitation and closure. | ||||
93
Risk and opportunity management
We include land management risks in the strategic risk register, with remedial actions implemented across several departments. In addition, we conduct annual financial liability assessments that identify areas to be
rehabilitated, together with security risks and the liability report.
Risks | Description | Mitigation measures | ||||||
Failure to meet environmental and cultural heritage regulations or agreement-based commitments | Mining companies face increasing pressure to meet stringent environmental regulations, with failures leading to significant penalties, including substantial fines and imprisonment. Environmental, cultural heritage, industrial accidents and pollution compliance breaches may result in liability, delays and increased production costs. | ▪Implementing environmental and cultural heritage management programmes that include controls and management measures with procedures to track and address compliance ▪Reducing the need for post-closure maintenance and monitoring through progressive rehabilitation programmes ▪Remaining fully funded for our environmental liabilities in terms of South Africa’s MPRDA and maintaining provisions for closure liabilities for our Australasian assets. | ||||||
Failure to meet land access regulations or agreement-based commitments | Where conducting activities on third-party land, failure to meet third-party land access requirements, including regulatory obligations and adherence to compensation agreements, may result in poor landowner relations, legal proceedings, reputational damage and delays to planned growth. | ▪Maintaining dedicated land access teams or personnel with regional expertise to advise on and manage requirements ▪Prioritising early and proactive engagement with landholders regarding project activities ▪Establishing clear internal procedures and processes at site level, and providing training and awareness of land access requirements for employees ▪Tracking, monitoring and reviewing the delivery of our land access commitments and processes. | ||||||
Unsafe working conditions due to unstable land and landslips | Mining activities can increase the risk of unstable land and landslips, and associated risks to people and infrastructure, through excavation, blasting and the removal of supporting material. At Hidden Valley, the steep topography and high rainfall conditions increase the potential for landslips. | ▪Actively identifying landslips or areas of significant erosion through routine sediment and erosion control monitoring ▪Implementing ongoing monitoring ▪Creating stability by incorporating appropriate static and seismic safety factors in landform designs. | ||||||
Waterway impacts | Mining activities can affect waterways through water pollution and physical alterations. Contamination from mine drainage can render water sources unusable for drinking, agriculture or recreation. Erosion and sediment run-off can also clog waterways and affect aquatic habitats. | ▪Implementing stormwater, erosion and sediment management plans and rehabilitation where monitoring identifies potential impacts ▪Conducting annual aquatic and riparian habitat assessments, which evaluate the waterways downstream of Hidden Valley's water extraction point and surrounds ▪Conducting upstream and downstream water quality monitoring. | ||||||
Opportunities | ||
We aim to return land to post-mining uses that support environmental and social objectives. In all cases, we prioritise safe, stable and compliant closure outcomes in line with applicable government policies and regulatory requirements. Where we operate on third-party land, final land use planning also considers the needs and expectations of landowners. Our revegetation activities at TSFs in South Africa help to control dust and decrease our overall environmental liabilities. The biodiversity footprint assessment completed in FY25 will support Harmony to determine future opportunities to make a net positive biodiversity contribution at these locations. | ||
94
Risks | Description | Mitigation measures | ||||||
Geochemical issues | The potential release of toxic elements and the contamination of soil and water resources lead to the weathering of mine wastes and the leaching of contaminants into the surrounding environment. We may incur significant expenses to rehabilitate potential groundwater and land pollution, including salination and radiation contamination. | ▪Conducting groundwater quality monitoring to identify and model any groundwater impacts, and further identify any mitigations and action plans ▪Conducting geochemical assessments to determine the appropriate remediation methods ▪Reducing infiltration and improving overall water quality of waste rock dumps seepage (our Hidden Valley acid and metalliferous drainage management and waste rock plans were revised accordingly). | ||||||
Illegal mining | Illegal mining significantly hinders mine rehabilitation efforts by causing environmental damage, creating safety hazards and increasing financial burdens. These activities may lead to water contamination, soil degradation and deforestation, making it difficult and costly to restore the land to a usable state. | ▪Collaborating internally to prevent illegal mining through regular assessments, closures and patrols ▪Investing in sealing redundant mines and implementing leading security measures. | ||||||
Land degradation from illegal grazing | Illegal grazing causes overgrazing, which reduces vegetation cover, increases soil erosion, and lowers land productivity. Overgrazing also exposes the soil to erosive forces like wind and water. | ▪Conducting security patrols in South Africa to deter illegal grazing, which will be supported by a livestock management plan to be developed in FY26. | ||||||
Poor final land use outcomes | Poor final land use outcomes after mine closure may stem from inadequate planning and rehabilitation efforts. This can lead to landscapes that are degraded, polluted and unsuitable for productive uses like agriculture or ecological restoration. | We strive for effective land use planning, which integrates stakeholder input and considers our regional context (including regulatory context), to deliver beneficial post- mining outcomes and reduce long-term environmental liabilities. This includes: ▪Approved closure plans and clear end land use plans ▪Progressive/concurrent rehabilitation activities in place throughout the mining cycle. | ||||||
Measuring our performance
Performance against our group KPI was as follows:
Target | FY25 performance | On track | ||
Reduce impacted land available for rehabilitation SA (%) | 0.2 | 0.3 (FY24: 0.6) | Yes | We met our FY25 target for reducing the impacted land available for rehabilitation by 0.3%, through our demolition and revegetation projects. In total, we rehabilitated 38ha in FY25 (FY24: 84ha). |
95
Progress against priorities
Upholding land access laws and agreements through respectful engagement
Proactive, respectful engagement and adherence to land access requirements are central to our
approach. In FY25, we honoured our commitments under our land access agreements and regulations,
including:
▪Reviewing the performance of the Hidden Valley MoA, including revisions to environment and closure
commitments to reflect updated regulatory requirements
▪Consulting with Hidden Valley landowners on our application to extend the mining lease, including
through the public Mine Warden’s hearing process
▪Working with the Kalkadoon People to conduct cultural heritage clearances of site preparatory works,
exploration drilling and other Eva Copper Project site investigation areas
▪Pre-lodgement consultation with pastoral leaseholders and the Kalkadoon People regarding the Eva
Copper environmental authority amendment.
For further information on our engagement approach, refer to the Stakeholder engagement section.
Managing and rehabilitating our impacted footprint across the asset lifecycle
As we progress, new project development and the extension of existing surface operations, land
disturbance is unavoidable.
In FY25, we had interests in a total land area of 367 040ha, which includes:
▪Land owned by the company in South Africa
▪Mining and exploration tenement areas in Queensland and Papua New Guinea, including Wafi-Golpu
exploration licences (EL) 440 and 1105
▪Agricultural leasehold in Papua New Guinea (included below under tenement area).
Of this, 14 737ha is impacted by our mining-related infrastructure, services and activities.
FY25 | FY24 | FY23 | |
South Africa (ha) | |||
Total land managed | 88 157 | 88 157 | 88 157 |
Land impacted by our mining-related infrastructure, services and activities | 13 732 | 13 583 | 13 259 |
Papua New Guinea (ha) | |||
Total tenement area | 44 264 | 42 085 | 42 085 |
Land impacted by our mining-related infrastructure, services and activities | 982 | 884 | 816 |
Australia (ha) | |||
Total tenement area | 234 619 | 234 619 | 234 619 |
Land impacted by our mining-related infrastructure, services and activities | 174 | 26 | — |
During FY25, the area of land impacted increased due to:
▪Infrastructure, including pipelines and pump station, associated with the FSS 6 reclamation project in
the Free State, Mispah pump station in the North West and our Sungazer PV project
▪Construction and commissioning of slurry and return water pipeline from Savuka plant to Kusasalethu
plant associated with the Kusasalethu backfill project, in the West Wits region
▪Kareerand TSF Expansion Project commenced construction in 2022 and, as per the construction
schedule, construction is ongoing in the North West province
▪Construction of the Kaveroi waste rock dump at Hidden Valley
▪Site preparatory works, exploration activities and ongoing investigations for the Eva Copper Project
design in Australia.
96
During FY25, key land management initiatives included:
▪Implementing internal protocols to review, assess and guide environmental and cultural heritage
controls for ground-disturbing works at Eva Copper.
Undiscounted value of land rehabilitation liabilities (Rm) | FY25 | FY24 | FY23 |
South Africa | 7 181 | 6 586 | 6 104 |
Papua New Guinea | 1 755 | 1 780 | 1 474 |
Australia | 119 | 22 | 3 |
Group | 9 055 | 8 388 | 7 581 |
Group (US$m) | 512.8 | 461.9 | 403.7 |
Land management | FY25 | FY24 | FY23 |
South Africa | |||
Spend on rehabilitation projects (Rm) | 78 | 87 | 82 |
Disturbed land rehabilitated and revegetated (ha) | 38 | 84 | 72 |
Papua New Guinea | |||
Spend on closure planning (Rm) | 10 | 26 | 29 |
Disturbed land rehabilitated and revegetated (ha) | 1 | 1 | 0 |
Australia | |||
Spend on closure planning (Rm) | 3 | 5 | n/a |
Disturbed land rehabilitated and revegetated (ha) | 19 | 18 | 0 |
Our South African operations’ liabilities increased in FY25 due to inflation and ongoing mining activities.
Initiatives implemented to reduce our environmental footprint during the year included:
▪Planting 30 000 trees on seven TSFs in Free State province
▪Expanded the phytoremediation woodlands at Kareerand TSF with 10ha (12 000 trees)
▪We are seeking regulatory approval to backfill defunct shafts with tailings. One shaft has been
backfilled to date. We also made progress with the ongoing demolition at Savuka Gold plant
and Kopanang Gold plant.
There are numerous solar plants planned, and we have received regulatory approval as part of our
decarbonisation programme.
At Hidden Valley, active mining limits the area available for rehabilitation. We implement progressive
rehabilitation in zones no longer needed for mining, focusing on slope stabilisation, revegetation
and ongoing maintenance. Each month, we conduct monitoring to assess performance against site
targets. We have developed multiple nurseries on site, and commenced revegetation trials to enable
successful revegetation and to be closure ready.
At Eva Copper, progressive rehabilitation of exploration drill pads, access tracks, and other geotechnical
investigation work areas commenced.
97
Returning land to a productive state post mining
Our post-mining land use planning is guided by applicable regulation and policies, takes into account landowner aspirations on third-party land, and is shaped by long-term objectives for environmental safety, stability
and ecological value.
South Africa | Papua New Guinea | Australia | ||||||||||
We seek to use our land assets to support our host communities. We support this priority by: ▪Creating entrepreneurial and temporary work opportunities through our rehabilitation programmes ▪Conducting stringent due diligence of community partners and providing protection against illegal mining groups ▪Assisting local small business to build their technical and financial capacity ▪Leasing land for farming and host community organisations (church groups, schools, daycare centres, welfare organisations and recreational facilities) ▪Donating land primarily for redistribution and critical government projects to the relevant national, provincial or local government departments. We are evaluating potential lease agreements for renewable energy projects on our land to contribute towards South Africa’s energy requirements. | Our work on the Hidden Valley closure planning studies continued during the year, including regulatory engagement. Progressive reviews of our biophysical closure studies by an independent peer reviewer, acting on behalf of government and Harmony, also commenced. We have also started a decommissioning and demolition study, including a fate-of- asset assessment. A key consideration of the community programmes we support (outlined in the Empowering communities section) is their potential to contribute to diversified local economic opportunities beyond the life of mining operations. | Native vegetation, habitat and low-intensity grazing are proposed as post-mining land uses for the Eva Copper Project area, noting that engagement with our leaseholders on the post-mining land use is a critical component of decision making. Following the lodgement of our Eva Copper progressive rehabilitation and closure plan (PRCP) in FY25, we have progressed through the approvals process, including responding to regulatory requests for information. Approval of the plan is pending the availability of important technical inputs from related work being undertaken as part of our environmental authority amendment, which will inform and strengthen closure-related considerations. | ||||||||||
Collaboration and partnerships
We collaborate with stakeholders, including regulators, host communities, landowners and suppliers, to
build understandings of ongoing activities and intent and design for closure. In South Africa, we engage
with the DMPR to exchange knowledge and share best practices on shaft sealing as part of our mine
closure approach. We work with local service providers to deliver land rehabilitation and restoration
initiatives that also equip host communities with land management skills. In Australasia, we engage with
landowners to meet our land access and agreement commitments, with a focus on transparency and
building and maintaining good faith relationships.
Future focus areas We remain focused on embedding responsible land stewardship principles and reducing our environmental footprint and liabilities. Our short-term plans include: ▪Planting trees to intercept pollution plume at West Wits Varkenslaagte and the Magnum Farm woodlands ▪Completing the planned 10ha Doornkop TSF side slopes vegetation establishment to mitigate dust and enhance TSF stability ▪Demolishing the defunct shafts and derelict infrastructure at the Gauteng, Free State and North West operations ▪Ongoing compliance with relevant land access and native title agreement obligations ▪Submitting Hidden Valley’s updated mine rehabilitation and closure plan to government in FY26 ▪Receiving approval for Eva Copper’s progressive rehabilitation and mine closure plan from the Queensland Government. | ||
98
Climate and energy management
Climate is a defining factor in shaping global ecosystems, economies and communities, presenting both risks and opportunities for innovation and resilience. We are committed to
managing our climate and energy impacts while navigating the transition to a low-carbon future with purpose and accountability.
Material matters | |||||
Climate change, adaptation and resilience | |||||
UN SDGs | |||||
 | Good health and wellbeing |  | Responsible consumption and production | ||
 | Affordable and clean energy |  | Climate action | ||
 | Decent work and economic growth | | Life on land | ||
 | Industry, innovation and infrastructure | ||||
GRI disclosure requirements | |||||
▪GRI 2: General Disclosures 2021 ▪GRI 3: Material Topics 2021 ▪GRI 102: Climate Change 2025 ▪GRI 103: Energy 2025 ▪GRI 303: Water and Effluents 2018. | |||||
FY25 priorities | |||||
1.Strengthening climate risk governance and disclosures to support operational continuity and long-term resilience 2.Advancing our decarbonisation pathway through targeted planning and emissions insights 3.Enhancing energy planning and reliability while expanding renewable energy solutions. | |||||
Strategy: Responding to climate as a strategic and operational priority
Harmony’s strategy integrates climate considerations into long-term planning, portfolio diversification and capital allocation. We maintain a strong
foundation in gold while expanding into copper to support long-term resilience and the global energy transition. Guided by double materiality, we
assess both the impact of climate on our business and our impact on the broader environment and society. Our net zero by 2045 ambition shapes
our transition planning, supported by scenario analysis, stakeholder engagement, and investments in renewable energy and efficiency.
Our FY25 priorities include:
Strengthening climate risk governance and disclosures to support operational continuity and long-term resilience | We operate in alignment with host country regulations and emerging global climate disclosure frameworks. We are strengthening the climate resilience of our business through scenario analysis and site-specific risk assessments. This assessment process continues to inform operational planning and continuity measures, helping us to respond to climate-related disruptions and maintain reliable performance under changing conditions. We also recognise water stress as a material climate- related risk, and are incorporating water availability and catchment-level scarcity to safeguard operational continuity in vulnerable regions. | |||||
Advancing our decarbonisation pathway through targeted planning and emissions insights | Harmony is progressing a structured and science-aligned decarbonisation pathway to meet its climate targets, including a near- term emissions reduction goal validated by the Science Based Targets initiative (SBTi). Our pathway focuses on reducing scope 1 and scope 2 emissions, with scope 2 remaining our most material source. We are deepening our understanding through asset- level abatement planning, technology roadmaps, and scenario analysis. Renewable energy deployment is a key enabler of our transition. We have started a review of our scope 3 inventory and will work with suppliers to improve data quality, broaden category coverage, and identify reduction opportunities. Harmony’s transition pathway outlines the strategic direction we are taking to reduce emissions, strengthen operational resilience, and align capital allocation with long-term climate and business objectives. While we have not yet adopted a formal climate transition plan as defined by CDP, our strategy is grounded in five guiding themes: energy efficiency, portfolio re- engineering, improving electricity mix, adaptation, and supply chain decarbonisation. These themes shape our operational planning and investment decisions, supporting our ambition to achieve net-zero emissions by 2045. | |||||
Enhancing energy planning and reliability while expanding renewable energy solutions | Harmony’s integrated energy management strategy (IEMS), aligned with ISO 50001, guides site-level energy planning and performance improvement across our operations. The framework supports scalable, structured energy governance and informs long-term planning, including interventions such as ventilation optimisation, compressed air management, and water pumping upgrades to improve energy efficiency and reduce emissions. Our renewable energy programme is a key enabler of energy reliability and emissions reduction. We are targeting over 500MW of solar and wind capacity by FY28 across our South African operations, supported by wheeled energy agreements and power purchase arrangements. In Australia, Eva Copper has received environmental approval for a 100MW solar farm and a 65MW battery energy storage system as part of its start-up energy solution, enabling approximately 40% renewable penetration. Pathways to further reduce emissions include either connection to CopperString 2032 or the addition of wind energy to the on- site energy portfolio. Receiving contracted rates for grid-sourced power remains a challenge and a priority in Papua New Guinea, to maximise the proportion of hydro-generated power we receive. | |||||
99
Governance
Accountability and responsibility | Climate and energy governance is embedded across Harmony’s organisation, supported by accountability structures and oversight mechanisms. Our governance practices emphasise board and management oversight, internal controls, and procedures for managing sustainability-related risks and opportunities (including climate). These practices are also guided by King IV principles, supporting ethical leadership and integrated thinking. Governance is structured across multiple levels: ▪Board-level oversight is provided by the social and ethics, audit and risk, and technical committees. These committees review climate performance and progress against decarbonisation targets and oversee the inclusion of climate-related risks in our top strategic risks ▪Executive leadership, including the CEO and CSO, is accountable for climate strategy execution, disclosure practices, and resilience planning, supported by cross- functional teams in sustainability, risk, finance and operations ▪Operational teams implement site-level initiatives such as energy efficiency programmes, process electrification, and renewable energy integration, while corporate functions coordinate reporting, assurance, and alignment with global standards ▪This integrated governance model supports both local responsiveness and global consistency in managing climate and energy risks. | |||||
Performance monitoring and reporting | Energy and emissions performance is monitored through structured processes that support governance oversight and continual improvement. This includes monthly energy reviews, quarterly emissions reviews, and performance insights which are integrated into strategic oversight. Monthly energy reviews assess consumption trends and identify areas of concern across all operations. A specialist consultancy tracks electricity use and renewable energy performance, providing detailed reports that inform operational decisions. Deviations exceeding 10% trigger internal investigations and corrective actions. Quarterly emissions reviews align with our commitment to the SBTi. Emissions data is assessed for consistency with SBTi methodologies, and material variances are escalated to the technical committee for further analysis and response planning. Performance insights are integrated into strategic oversight. The technical and social and ethics committees receive updates on energy and emissions performance, enabling informed decision making and accountability across the organisation. These approaches strengthen transparency, support target achievement and reinforce climate and energy governance. | |||||
Policies that support our governance approach | Harmony’s climate change and energy management is guided by a group-wide policy framework that reflects our commitment to the global shift toward a low-carbon economy. These policies are grounded in our sustainability framework and apply across all wholly owned and managed operations. Key policies include: ▪Climate change and energy policy statement ▪Environmental policy ▪Sustainability framework ▪Risk management policy ▪Stakeholder engagement policy ▪Disclosure and reporting policy. These policies and our IEMS strengthen our energy resilience, reduce carbon intensity, and reinforce our commitment to a low-carbon, cost-effective and sustainable future underpinned by robust governance and oversight. | |||||
100
Risk and opportunity management
Harmony identifies and manages energy and climate-related risks through a structured enterprise risk management (ERM) framework aligned with ISO 31000:2018. Risks are assessed using scenario analysis and
integrated into the company’s risk register, with oversight cascading from the board and audit and risk committee to executive and operational levels. This process supports strategic planning and informs capital
allocation decisions.
Two of our current strategic risks and opportunities are related to climate and energy:
▪Physical and transition climate-related impacts affecting business continuity and community relations
▪Electricity supply instability and rising energy costs.
Our climate-related physical and transition risks and opportunities are summarised below and outlined in detail.
Physical risks | Transition risks | Opportunities | Other energy-related risks | |||||||||||
▪Heat stress and cooling demand: Rising temperatures increase ventilation needs, energy use, and health risks ▪Water scarcity and drought: Intensifying droughts threaten water access, treatment costs, and productivity ▪Extreme rainfall and flooding: Storms and tailings risks disrupt operations and infrastructure ▪Energy supply variability (Papua New Guinea): Drought-driven hydropower strain raises diesel reliance and emissions ▪Wildfire and bushfire exposure: Hotter, drier conditions elevate evacuation and insurance risks ▪Community and labour vulnerability: Heat, dust and flooding impact workforce safety and social licence. | ▪Carbon pricing and regulation pressures: Rising costs and compliance obligations across jurisdictions ▪Carbon budget constraints (South Africa): Mandatory emissions limits accelerate abatement timelines ▪Disclosure and reporting alignment: Complex standards increase audit burden and reputational risk ▪Renewable energy market disruption: Grid shifts and tech costs affect energy planning and investment ▪Insurance availability and pricing: Hazard exposure and carbon intensity drive premium increases ▪Climate performance and stakeholder trust: Rising expectations may impact financing and reputation. | ▪Transition commodities and portfolio growth: Aligns with clean energy demand and diversifies exposure ▪Renewable energy and operational efficiency: Improves energy stability and mitigates market volatility ▪Climate governance and disclosure alignment: Supports regulatory readiness and investor trust ▪Sustainability-linked finance and investor confidence: Unlocks capital and enhances disclosure credibility ▪Mine tailings reprocessing: Reduces emissions intensity compared to traditional mining ▪Stakeholder trust through decarbonisation strategy: Reinforces reputation and access to sustainability-linked finance ▪Community adaptation and resilience: Strengthens social licence and reduces climate vulnerability. | ▪Energy and grid access security: Infrastructure gaps and curtailment delays disrupt renewable roll-out and operational reliability ▪Energy cost inflation: Escalating tariffs increase operating costs and exposure to grid volatility ▪Infrastructure accessibility and reliability (Papua New Guinea and Australia): Grid connection uncertainty threatens energy reliability and ability to set achievable decarbonisation targets ▪Regulatory and policy complexity: Evolving energy rules introduce compliance risk and planning challenges. | |||||||||||
101
Measuring our performance
Absolute scope 1 and 2 GHG emissions are a core performance metric in Harmony’s climate strategy.
These emissions underpin our science-based targets and net-zero ambition. Under our SBTi interim
goal, Harmony committed to a 63% reduction by FY36, using FY21 as the baseline. The FY21 baseline for
setting our SBTi near-term target for FY36 was developed using FY21 reported data, updated to include
subsequently published Eskom grid emission factor and annualised emissions based on nine months of
operational data for AngloGold Ashanti asset acquisition.
Our continuous improvement journey, which tracks our interim and long-term emissions reduction
targets, is shown in the figure to the right. This illustrates our commitment to progressively reduce
emissions in line with our science-based target and longer-term net zero ambition.
2026 | 2031 | 2036 | 2045 | ||||||||||||||||||||
First-interim target: 20% CO2e reduction 3.92MtCO2e | Second-interim target: 40% CO2e reduction 2.94MtCO2e | Approved SBTi target: 63% CO2e reduction 1.9MtCO2e | Net zero Aspirational target | ||||||||||||||||||||
Performance against our group KPIs:
Target | FY25 performance | On track | ||||
Renewable energy (%) – South Africa | 20 | 1.5 (FY24: 1.6) | No | Sungazer 1 and small-scale solar PV plants successfully generated 64.3GWh of energy in FY25. We are focusing on delivering our Sungazer 2 and 3 solar projects and continuing to achieve our renewable energy target, with over 500MW of planned solar and wind capacity anticipated by FY28, which is close to one-quarter of our current energy consumption. Note: This South Africa target does not include the proportion of hydropower for Hidden Valley operations. | ||
SBTi: Absolute scope 1 and 2 GHG emissions (MtCO2e) | 4.07 | 4.48 (FY24: 4.27) | No | Scope 2 emissions continue to be our most material, and our renewable energy programme is targeting reductions in emissions. However, absolute emissions increased in FY25. Scope 1 emissions decreased by more than 5% due to a more stable grid supply (predominately hydropower) at Hidden Valley, resulting in reduced diesel use. Scope 2 emissions (market-based) increased by 1.6% from FY24. This was associated with: ▪A 22% increase at Hidden Valley, which had a positive impact on emissions relative to the alternative diesel-powered emissions that would otherwise be captured under scope 1 ▪A 1.44% increase in electricity consumption in South Africa from the Eskom grid ▪A 4% increase in the Eskom grid emission factor (rising to 1.04tCO₂e/MWh from 1.00tCO₂e/MWh in FY24). These factors contributed to higher scope 2 emissions. However, for South Africa, the factors reflected the continued reliance on coal-fired power generation in the national grid. |
102
Scope - Emissions (MtCO2e) | FY25 | FY24 | FY23 | FY22 | FY21 |
Scope 1 | 0.17 | 0.18 | 0.20 | 0.18 | 0.14 |
Scope 2 (location-based, market-based1) | 4.32 | 4.09 | 4.25 | 4.57 | 4.25 |
Scope 3 (category 1, 3 and 62) | 0.99 | 0.99 | 1.00 | 1.07 | 0.87 |
1Scope 2 market-based data restated.
2Scope 3 categories included, based on available data.
Group energy consumption (GWh) | FY25 | FY24 | FY23 | FY22 | FY21 |
Electricity | 4 250 | 4 176 | 4 111 | 4 254 | 4 123 |
Diesel | 562 | 601 | 686 | 605 | 449 |
Other sources (petrol and heating oil) | 62 | 63 | 64 | 66 | 60 |
Total | 4 874 | 4 840 | 4 861 | 4 925 | 4 632 |
Consumption intensity (MWh per tonnes treated) | 0.096 | 0.094 | 0.093 | 0.092 | 0.094 |
Group electricity consumption (GWh) | FY25 | FY24 | FY23 | FY22 | FY21 |
South Africa | 4 093 | 4 035 | 4 053 | 4 191 | 4 020 |
South Africa (self-generation)1 | 64 | 65 | 3 | — | — |
Papua New Guinea | 93 | 76 | 55 | 63 | 103 |
Papua New Guinea (self-generation1) | 46 | 53 | 83 | 58 | 29 |
Total | 4 296 | 4 229 | 4 194 | 4 312 | 4 152 |
Consumption intensity (MWh per tonnes treated) | 0.084 | 0.082 | 0.080 | 0.080 | 0.084 |
1Self-generation includes renewable energy-generated electricity in South Africa and diesel-generated electricity in Papua
New Guinea.
Water use categorised by water- stressed areas (000m3) | FY25 | FY24 | FY23 | FY22 | FY21 | |
Water withdrawal – Potable water | Very low | — | — | — | — | — |
Low | — | — | — | — | — | |
Medium | 10 172 | 10 131 | 12 083 | 12 292 | 11 596 | |
High | 8 209 | 9 174 | 7 946 | 8 898 | 7 872 | |
Water withdrawal – Surface water | Very low | 2 048 | 2 112 | 2 186 | 1 930 | 1 983 |
Low | — | — | — | — | — | |
Medium | 7 677 | 1 713 | 225 | 551 | — | |
High | — | 5 | 66 | 275 | 801 | |
Water withdrawal – Groundwater | Very low | — | — | — | — | — |
Low | — | — | — | — | — | |
Medium | 22 | 51 | 64 | 110 | 98 | |
High | 10 802 | 11 627 | 6 779 | 9 361 | 7 956 | |
Water discharged – Surface water | Very low | 2 281 | 2 688 | 1 923 | 2 308 | 2 485 |
Low | — | — | — | — | — | |
Medium | 2 992 | 2 650 | 2 344 | 2 225 | 813 | |
High | 574 | 623 | 781 | 765 | 489 | |
Water-stressed areas are determined in line with the World Wide Fund and World Resources Institute’s
aqueduct tool that plots water-related risks on an atlas.
As a water-scarce country, the availability of water can be unpredictable in South Africa, particularly
during a protracted drought. Additionally, we often depend on municipal water, exposing the group to
tariff increases and supply shortages. By executing on our water management strategy, we aim
to increase the security of water supply and reduce our reliance on municipal water systems. We
achieve this by:
▪Protecting and improving the quality of water using water treatment and reverse osmosis plants.
These plants treat our process water for potable water use and safe discharge
▪Reusing and recycling water through water conservation and demand management initiatives
▪Identifying where potable water use can be replaced with process water
▪Incorporating climate change mitigation and adaptation into our water management initiatives,
including optimisation, to secure supply during a protracted drought.
103
Progress against priorities
Strengthening climate risk governance and disclosures to support operational continuity and long-
term resilience
In FY25, Harmony advanced its climate disclosure strategy, conducting a group-wide gap analysis in
order to focus on our performance and related risks and opportunities that may affect financial
performance over time.
Our regional progress includes:
▪South Africa: Alignment with the JSE’s Climate Disclosure Guidance to improve transparency and
investor confidence
▪Australia: Commencing a work programme to address new Australian Sustainability Reporting
Standards (ASRS) climate disclosure requirements, with reporting applicable from FY26
▪Papua New Guinea: Disclosures will align with ASRS due to Harmony’s corporate structure,
despite slower local IFRS adoption.
We continue to monitor developments around the SEC’s proposed climate disclosure rules, due to our
NYSE listing.
To strengthen resilience and decision making:
▪Climate risk is considered in Harmony’s ERM process, assessed alongside strategic and operational
exposures and reviewed through our governance structure
▪Scenario analyses, grounded in Intergovernmental Panel on Climate Change (IPCC) frameworks
(representative concentration pathways (RCPs) and shared socio-economic pathways (SSPs)), inform
planning and capital allocation
▪Carbon pricing is embedded in life-of-mine forecasts and financial modelling, aligned with South
Africa’s tax framework
▪Energy use and emissions are tracked against key performance indicators to enable timely
interventions and strategic recalibration.
We continue to leverage climate risks as strategic opportunities through:
▪Expansion into transition commodities, with copper playing a central role through projects like
Eva Copper, Wafi-Golpu, and the acquisition of MAC Copper (CSA mine), concludes and takes effect
on 24 October 2025
▪Scenario-based planning, which considers investment decisions and operational design.
Advancing our decarbonisation pathway through targeted planning and emissions insights
Harmony has established emissions reduction targets aligned with the SBTi. These targets are
independently assured by a third-party service provider that applies the Sustainability-Linked Loan
Principles, as outlined by organisations such as the Loan Market Association. When we meet the KPIs
tied to our sustainability-linked loans, we benefit from significant interest savings. Conversely, failing to
meet these targets results in financial penalties.
Our approved near-term SBTi target commits us to reducing absolute scope 1 and 2 GHG emissions by
63% by FY36, using FY21 as the base year. In FY25, we commenced the construction of Sungazer 2 and
progressed initiatives, including expanded solar capacity, operational efficiencies, and short-term power
purchase agreements (PPAs), including wheeled wind energy.
Scope 2 emissions from purchased electricity represent the largest proportion of our operational
emissions across our portfolio. As such, our IEMS and renewable energy and efficiency roll-out plan are
central to our decarbonisation efforts. These initiatives are delivering measurable reductions in our
carbon footprint and improving energy resilience across key sites.
We continue to enhance emissions reporting in line with the GHG Protocol for transparency and
comparability across regions. In FY26, we plan to progress a full scope 3 inventory.
Maintaining momentum on this emissions reduction trajectory is essential to strengthening climate
resilience, building stakeholder trust, and securing Harmony’s long-term competitiveness and licence to
operate.
Enhancing energy planning and reliability while expanding renewable energy solutions
To strengthen energy resilience and accelerate decarbonisation, we are actively replacing high-emission
grid electricity with renewable sources across current operations and future developments.
In FY25, Eva Copper received environmental approval for a 100MW solar farm and a 65MW battery
energy storage system as part of its start-up energy solution, enabling approximately 40% renewable
penetration. Longer-term pathways to further reduce emissions include connecting to CopperString
2032 or expanding the on-site energy portfolio with wind energy.
Across South Africa, escalating electricity tariffs and unreliable grid supply have reinforced the urgency
of energy substitution. In response, we have reduced our reliance on Eskom by 18.2GWh and added
65GWh of solar capacity. While this is not yet reflected in our electricity consumption intensity due to
carbon accounting methods, it marks a significant step in our energy transition.
104
Renewable energy roll-out plan
Sungazer 1 | Sungazer 2 | Sungazer 3A | Sungazer 3B | Sungazer 4 | Wheeled wind | Short-term PPA | |
Commission year | Commissioned | FY27 | FY28 | FY29 | FY28 | FY28 | FY27 |
Installed capacity (MW) | 30 | 100 | 75 | 33 | 100 | 260 | 200 |
Energy generated (GWh/a) | 70 | 230 | 177 | 76 | 230 | 900 | 500 |
Scope 2 reduction1 (ktCO2e/a) | 49 | 163 | 122 | 53 | 163 | 424 | 326 |
1Based on FY24 Eskom grid-intensity emission factor.
Our renewable energy and efficiency roll-out plan includes:
▪Gauteng: 752 rooftop solar panels commissioned at Doornkop (440kW/h output); installations underway at Mponeng
▪Free State: 1 947 panels installed at Phakisa (850kW/h peak capacity)
▪North West: 150kW solar installation completed at Kalgold; 336-panel system (190kWp) with 600kWh battery storage underway; feasibility
assessments for larger expansion.
This year, we implemented and maintained 45 energy optimisation initiatives, resulting in energy savings of 351GWh. Combined with our renewable
energy initiatives, this resulted in cost savings of R657 million. These initiatives also address erratic power supply and above-inflation tariff increases.
Energy accounted for 19% of our South African operations, with FY25 tariff increases and structural changes equating to approximately R1.2 billion in
additional operating costs.
Operational efficiency initiatives generating significant forecast annual cost savings
Highlights | ||||||||||||||
Year-on-year cost savings improved through refurbishment of underground turbines | Implemented real-time control on compressed air valves to optimise energy use and reduce wastage | Year-on-year cost savings improved through refrigeration infrastructure upgrades, particularly the refurbishment of condenser and pre-cooling towers | Power factor correction projects | |||||||||||
R20 million | R4 million | R9 million | R8 million | |||||||||||
Innovation, technology and digitisation
Harmony continues to assess technological innovations and advancements relating to energy efficiency and decarbonisation. This includes a study to
convert our bus fleets and surface rail transport in South Africa to liquefied natural gas-driven engines. Such assessments identify technologies that have a
strong business case and are beneficial to emissions reduction.
Harmony has, as part of this commitment, joined Caterpillar’s Pathways to Sustainability programme. Over the next three years, the programme aims to
bring together experts from Caterpillar and delegates representing mining companies and associated industries to discuss the impacts of the energy
transition and explore how Caterpillar’s products, technology, services and solutions can support operational and sustainability objectives. Through
ongoing collaboration, the programme aims to gather and share actionable information to assist in the development of strategies to safely reduce
operational GHG emissions, improve efficiency, and prepare people, processes, technology and infrastructure for changes, now and in the future. In
August 2025, a delegation representing Harmony’s key functional areas in Australasia attended the inaugural learning event at Caterpillar’s Tinaja Hills
Demonstration and Learning Centre in Tucson, Arizona.
Future focus areas Harmony continues to accelerate its climate strategy, building on the strong foundation established in previous years. Our approved SBTi commitment remains a cornerstone of our transition pathway. In FY26, our focus is on scaling impact, strengthening governance, and continuing to prepare for IFRS-aligned disclosures. Key areas of emphasis include: ▪Scaling renewable energy: Advancing Sungazer 2 and Sungazer 3 of our solar and wind energy roll- out to enhance reliability and reduce carbon intensity across our operations ▪Operational efficiency: Expanding energy optimisation programmes at high-impact sites to reduce consumption, manage tariff exposure, and improve system resilience. These initiatives are critical in mitigating the financial impact of escalating energy costs and grid instability ▪Enhanced reporting and governance: Our focus will be on strengthening internal governance structures and enhancing disclosures, including emissions tracking, forecasting, and scenario analysis ▪Carbon pricing integration: Carbon pricing remains embedded in life-of-mine forecasts and financial modelling, helping Harmony manage transition risks and maintain long-term competitiveness ▪Global disclosure alignment: Continuing regional alignment with evolving climate disclosure frameworks, including the ASRS in Australasia, to reinforce our commitment to transparency, comparability and consistency ▪Scope 3 inventory: Conducting a scope 3 emissions review to deepen our understanding of our upstream and downstream value chain emissions and strengthen our ability to respond to stakeholder expectations with greater transparency and insight. | ||
105
Water stewardship
Water is a critical resource for environmental, social and economic wellbeing in the countries where we operate. We are committed to sustainable water
management and long-term resource stewardship, including proactively identifying and addressing water-related risks.
Material matters | |||
Water management | |||
UN SDGs | |||
| Good health and wellbeing | ||
 | Clean water and sanitation | ||
| Decent work and economic growth | ||
| Industry, innovation and infrastructure | ||
GRI disclosure requirements | |||
▪GRI 2: General Disclosures 2021 ▪GRI 3: Material Topics 2021 ▪GRI 303: Water and Effluents 2018. | |||
FY25 priorities | |||
1.Meeting our water-related conditions of operation 2.Conserving water and reducing impacts to surrounding users 3.Proactive water risk planning for reliable operations. | |||
Strategy: Recognising water as a shared vulnerability
Given the high consumption of water in mining, and growing concerns around water availability and conservation, we work to use less water and
improve efficiency. This helps conserve local water sources and reduce the environmental and social impacts associated with our mining activities.
Our water management programme, updated in 2025, recognises our diverse hydrological, social and regulatory contexts, enabling appropriate
responses to site-specific water challenges. This includes water-stressed areas in South Africa and Australia, where efficiency, conservation and
equitable access are critical. It also includes a high-rainfall setting in Papua New Guinea, where we manage excess water and run-off quality, and
maintain infrastructure resilience. We execute our water management by delivering on the following priorities:
Meeting our water-related conditions of operation | We operate in compliance with host country regulation, including obtaining permits and licences and meeting associated conditions. These permits and licences outline water extraction limits and water quality limits for discharges and for the surrounding catchment areas. We conduct surface and groundwater quality monitoring, upstream and downstream of our operations. As set out by our regulatory obligations and rigorous internal standards, we are committed to zero unauthorised water discharges for our operations. | ||||
Conserving water and reducing impacts to surrounding users | In line with our water ambition roadmap, we manage our impact on water catchments by: ▪Reducing potable water consumption through improved efficiencies, reuse and recycling, which reduces supply pressure on local water utilities and aids their resilience to climate change ▪Meeting permitted water extraction limits at Hidden Valley mine ▪Managing water responsibly to achieve zero unauthorised discharges ▪Reducing costs and increasing revenue with water treatment plants ▪Returning treated water to source and securing potable water for South African host communities’ basic needs ▪Beneficiating water in partnership with our South African peers and utilities ▪Identifying sources of excess water for treatment to potable water standards for consumption at our South African operations. Securing a reliable water supply and continuing our recycling play a key role in addressing scarcity, meeting regulatory standards and reinforcing our commitment to responsible practices. Additionally, water recycling supports social investment strategies and our water, sanitation, and hygiene (WaSH) programmes in South Africa. | ||||
Proactive water risk planning for reliable operations | We embed a risk-aware approach across our operations, allowing the business to respond rapidly to conditions that effect access to water or the functioning of our facilities, which may result in a degradation of water resources and aquatic ecosystems. We execute our water management programme in a way that enhances our water governance to address our water-related risks and opportunities. | ||||
106
Governance
Accountability and responsibility | Regional executives support regional environment and sustainability teams in overseeing our water management initiatives. Site management teams are responsible for daily water requirements and associated water security and related risks. Our water community-of-practice brings together site leads to craft the Water Roadmap with the water projects to support the water ambition, track progress, remain compliant with regulations, share best practices and drive innovation. | ||||
Performance monitoring and reporting | As part of our process of managing our water-related KPIs, Harmony holds monthly meetings with all sites to review water use and identify areas of concern. A specialist consultancy provides detailed reports on water and energy usage, and we investigate deviations over 10%. Harmony has a Water Digital Twin for our South Africa operations. | ||||
Policies that support our governance approach | Water stewardship is embedded in our sustainability framework. Our activities are informed by impact assessments, allowing us to understand and develop measures to reduce our impacts on water resources. This is underpinned by our proactive risk management approach, which includes water balances optimisation, digitisation in South Africa for real-time monitoring and agile responses, and data assurance through monthly and quarterly reviews and external audits. We monitor and report our performance in line with the CDP water programme. | ||||
107
Risk and opportunity management
We include critical water risks in our strategic risk register, which is reviewed by our group executive committee and the board’s technical, and audit and risk committees. We also include site-specific water issues in
operational risk registers.
Risks | Description | Mitigation measures | ||||||
The systemic failure of South Africa’s public water infrastructure | Frequent municipal water supply disruptions in the Free State affect our refrigeration systems, limit water available for drinking and cleaning, and create uncertainty regarding water for operational expansion. Service delivery failures also exacerbate social unrest and requests from affected communities. This places increased pressure on Harmony to support water utilities, provide these services and invest in more water treatment plants to become water independent. In addition, the rising cost of cleaning drinking water has implications for our profitability. | Escalating water stresses are significant considerations for our operations and assessments of new projects and initiatives. As part of our water management strategy, we seek to: ▪Increase our water reuse and recycling options by processing mined water, reducing our dependency on natural portable water sources (the process for feasibility and construction of additional water treatment plants is underway) ▪Continuously review water supplies and sources against the life-of-mine ▪Build emergency water storage dams at Tshepong South to limit supply interruptions ▪Engage with local authorities and water utility supply companies to proactively and collaboratively address water supply risks. As part of our SLPs, Harmony secured a wastewater management specialist to capacitate three municipalities, enabling their facilities to operate optimally. Harmony also collaborates with municipalities to improve the quality of WaSH in our host communities to address issues such as cholera. This includes hosting open days with NGOs to improve water management awareness. | ||||||
Climate-related water risks | Physical climate change risks include increased water scarcity and flash flooding. Investors, regulators and ratings agencies expect Harmony to demonstrate resilience to climate-related water risks and performance against our environmental targets, including water KPIs. Refer to Climate and energy management chapter for details of water use in water-stressed regions. | ▪We have developed a climate change and energy policy and strategy in response to our physical and transition climate change risks ▪Our TSF and pollution control dam design and operating procedures include provision for flooding and high-rainfall events ▪We have increased our water reuse and recycling opportunities as part of our future-focused approach ▪We are in the process of incorporating climate change risks into our risk management framework, risk registers and ISO 14001 EMS ▪We are initiating climate resilience assessments for all our operations. | ||||||
Water issues related to the potential shortened life-of- mine for neighbouring mines in South Africa | Shortened life-of-mine could lead to an increase in underground water levels, potentially affecting Harmony’s operations. It could also decrease the amount of water available on surface (pumped from underground), which affects our plans to grow our surface re-mining business. | ▪We are engaging with neighbouring mines to understand the scale of the issue and develop collaborative solutions to mitigate this risk ▪We pump out excess water, allowing us to continue operating safely. | ||||||
Changing water regulations | Regulatory changes could result in higher expenses, capex requirements or complex compliance processes. In South Africa, the Department of Water and Sanitation’s revised Water Pricing Strategy have a financial impact on Harmony’s operations, with an estimated cost of R56 million a year. | ▪Regulatory review of the pricing strategy ▪Engagements with regulators ▪Review of our water use licences to determine the potential amendments ▪Plan new projects and licence accordingly. | ||||||
Opportunities | ||
We have identified several water management opportunities to benefit the business and our host communities, including: ▪Building strong relationships with South African municipalities and goodwill with surrounding communities by improving sanitation in the areas where we operate ▪Protecting business continuity and reducing operating expenses by lessening our reliance on potable water through improved water efficiencies and reuse and recycling ▪Securing a steady supply of water through expanding our storage infrastructure, facilities and water recycling capabilities ▪Conducting water availability assessments to identify additional water sources as an alternative to municipal water in South Africa. | ||
108
Measuring our performance
Harmony has five-year (FY23 to FY27) water KPIs, which include a water recycling target of 50% by FY27
and a reduction in potable water consumption of 10% by FY27 (using FY22 as a baseline).
Progress against our group KPIs was as follows:
Target | FY25 performance | On track | ||
Water recycling (% of total water) | 50 | 73 (FY24: 74) | Yes | ▪We recycled 73% of our water by maintaining water reuse/recycling initiatives. The volumes of water recycled, and water used for primary activities increased by 5.6% and 11.8% from FY24. |
Reduction in potable water consumption (%) | 6 | 13 (FY24: 9) (cumulative) | Yes | ▪Water withdrawal from municipal sources decreased by 4.8% from FY24 due to operational reverse osmosis plants and improved recycling measures implemented. |
In addition, Harmony has an absolute potable water consumption reduction target that is linked to our
sustainability-linked funding agreement established in June 2022. This target is central to our
sustainability and business strategy, addressing a significant socio-environmental issue for our industry
in South Africa. Under the three-year target of the sustainability-linked loan, Harmony aimed to achieve
three annual portable water consumption targets by the end of FY25. Harmony has achieved the three
annual potable water consumption targets:
Target (000m3) | Actual (000m3) | On track | |
FY23 | 20 453 | 20 029 | Yes |
FY24 | 19 833 | 19 305 | Yes |
FY25 | 19 436 | 18 381 | Yes |
We also have site-specific monitoring programmes and targets that help address regulatory needs and
site-specific risks, including legacy issues, latent and residual risks. These targets are supported by
appropriate management actions following a hierarchy of controls (avoid, minimise, reuse and recycle),
including implementing integrated water and waste management plans and water balances.
Progress against priorities
Meeting the water-related conditions of operation
In FY25, we received no fines or penalties related to water use or quality transgressions. There were no
dam failures or excessive overflow as our TSFs remained well maintained. Refer to Tailings and waste
management for our approach and performance.
During the year, we commissioned the Hidden Valley mine sewage treatment upgrade project to
address process deficiencies and inflow management. This upgrade aims to improve effluent quality and
address low-level exceedances of the permitted water quality criteria. Early outcomes of the project are
showing improved effluent quality.
Prior to FY25, routine water quality monitoring at Hidden Valley mine had identified low-level
exceedances of dissolved manganese in drainage from waste rock dumps, measured against
our site-specific water quality criteria. In response, in FY25, we implemented a revised acid and
metalliferous drainage management plan along with an updated waste rock strategy. Our water quality
monitoring programme has been recording improved results, ie dissolved manganese is trending down,
since implementation of the plan.
At Eva Copper, we have expanded our baseline surface water and groundwater monitoring data set to
more accurately reflects background conditions. This supports improved predictions and will inform
revised water quality contaminant limits set out in the project’s environmental authority.
Conserving water and reducing impacts to surrounding users
We have developed a water ambition roadmap, approved in 2025, to plot the required actions to
reduce our dependency on external potable resources through water efficiency measures, recycling and
implementation of water treatment projects. We use potable water dependence (PWD) as a metric to
measure and track our progress. The PWD is the percentage of potable water withdrawn from external
sources in relation to the total water used. Harmony aims for an 80% reduction in PWD by the end of
FY34, using FY16 as a baseline. The journey to an improved PWD will consider portfolio changes,
installation of water treatment plants and new reclamation projects.
We have developed or updated water conservation management plans for South African operations to
reduce potential groundwater drawdown impacts for surrounding water users.
109
Proactive water risk planning for reliable operations
By executing our water management roadmap, we aim to improve water security and reduce our
reliance on municipal water systems in South Africa. We achieve this by:
▪Protecting and improving the quality of our process water using water treatment and reverse osmosis
plants
▪Reusing and recycling water through water conservation and demand management initiatives
▪Identifying where potable water use can be replaced with process water
▪Incorporating climate change mitigation and adaptation considerations, including optimisation
to secure supply during a protracted drought.
In FY25, we focused on three water security initiatives:
Understanding our water balances | An accurate estimate of our water balances is fundamental for regulatory compliance and decision making. We have identified places for additional flow meters at each South African operation to improve the confidence in our water balances. In FY25, we installed 15 new flow meters. | ||||
Addressing feed issues of water treatment plants | To enhance water treatment plants processes, we conducted an assessment and defined actions to be completed at three existing reverse osmosis plants in FY26. | ||||
Expanding use and optimisation of reverse osmosis plants | The construction of the Tau Tona reverse osmosis treatment plant was completed in FY25 and will be commissioned in FY26. | ||||
Eva Copper faces water scarcity challenges similar to those in South Africa. Extensive investigations
during FY25 have defined a solution that combines reliable groundwater sourcing, together with water
conservation and recycling, to meet operational water demands. High rainfall events and flooding are
also known to affect the site, which has been factored into site water planning.
Our Papua New Guinea sites experience high annual rainfall resulting in positive water balances
requiring responsible drainage and discharge management from quality and quantity perspectives.
Collaboration and partnerships
Government bodies
We partner with government departments, regulators and municipalities to:
▪Proactively address the risks and opportunities associated with water supply and management
▪Routinely update regulators on our water management performance
▪Outline ongoing monitoring programmes and potential remedial actions when required.
Upstream and downstream water users
In South Africa, Harmony supports municipalities in our mining jurisdictions to refurbish, maintain and
operate their wastewater treatment plants, preventing raw sewage from polluting water resources and
affecting local communities. We engage with users through regional water management agencies,
government task teams and working groups and local forums.
At Hidden Valley, we liaise with communities downstream of our operations and provide quarterly
updates on our environmental performance and risks.
Innovation, technology and digitisation
Harmony continues to expand its use of water treatment technologies, including reverse osmosis.
In South Africa, we partner with iWater to assess the use of biochar to encourage tree growth for the
remediation of soil and water at the Kareerand TSF. Harmony plants trees to support pollution plume
migration, with geohydrologists confirming that mass planting improves groundwater quality. By year
end, we planted over 6 000 trees at Mponeng.
Future focus areas In the short term, we plan to: ▪Plant additional trees at our Free State operations to support pollution plume migration ▪Establish and enhance water treatment plants in collaboration with local water utilities in South Africa ▪Determine the feasibility of expanding Doornkop’s reverse osmosis plant capacity to bolster our water recycling ratio and reduce potable water intake ▪Conduct a dam capacity assessment to understand our water containment vulnerabilities against South African operational and legislative requirements. This will inform an action plan to address shortcomings and climate change scenarios to identify future water security risks ▪Complete a regional geohydrological assessment in South Africa to determine the impact of operations on geohydrology and modelling to understand our flood risk ▪Engage with Eva Copper neighbouring leaseholders on the project’s proposed water supply and management approach ▪Scale up water investigations to inform Hidden Valley mine life extension studies ▪Complete the Hidden Valley mine sewage treatment upgrade project ▪Manage Hidden Valley waste rock and associated seepage in accordance with the acid and metalliferous drainage management plan. | ||
110
Tailings management
Tailings facilities, if not managed correctly, could pose significant risks to our employees, host communities and the environment. We manage these facilities as aligned with guidance
from locally and globally recognised standards and best practice frameworks that support safe dam design, effective operations and environmental accountability. Our tailings
facilities also present a substantial opportunity to advance circular economy outcomes through recovery of valuable materials and reuse of waste streams.
Material matters | |||
TSF and waste management | |||
UN SDGs | |||
| Good health and wellbeing | ||
 | Sustainable cities and communities | ||
| Responsible consumption and production | ||
| Life on land | ||
GRI disclosure requirements | |||
▪GRI 3: Material Topics 2021 ▪GRI 301: Materials 2016 ▪GRI 303: Water and Effluents 2018. | |||
FY25 priorities | |||
1.Implementing robust engineering, dam design and operational management 2.Conducting risk management, layered assurance, oversight and compliance 3.Retreating and reclaiming South African TSFs. | |||
Strategy: A proactive and comprehensive approach
Many of our TSFs are legacy facilities older than 40 years. However, all of our TSFs are managed with rigorous operational controls, aligned with
best practices. These measures support ongoing stability, address environmental impacts and contribute to the protection of local communities.
Our approach integrates water, air quality and biodiversity considerations (keeping final rehabilitation strategies for facilities not earmarked for
reclamation in mind) and focuses on the following priorities:
Implementing robust engineering, dam design and operational management | We manage TSFs following high engineering standard and applying strict water management. Our approach for new and proposed TSFs begins with the comprehensive design phase to deliver safe and stable facilities with structural integrity. We incorporate drainage systems and prevent run-off or seepage into surrounding ecosystems. At Hidden Valley in Papua New Guinea, TSF 1 is designed to seep, with seepage monitored through regular sampling and testing. These measures provide long-term structural and environmental stability and consider factors like rainfall patterns, soil erosion and groundwater interactions. We also implement dust control measures such as dust netting and vegetation planting to reduce airborne particles. | ||||
Conducting risk management, layered assurance, oversight and compliance | We embed risk management in the lifecycle of TSFs, from the design and construction of new TSFs, the operating phases and in our final closure designs. To monitor our performance and compliance with regulations, we conduct independent audits and regular inspections, with management, the deposition contractors and specialist consulting engineers and specialist who assist with the construction of facilities. Additionally, our teams are trained in emergency response. For our South African operations, our dam design and construction (for new and proposed TSFs) and management of TSFs are aligned with the South African National Standards (SANS) 10286. Our Australasian operations follow the Australian National Committee of Large Dams (ANCOLD) guidelines with accepted risk- based deviations and conservative factors of safety. At Hidden Valley, we adopt layered assurance elements of the Global Industry Standard on Tailings Management (GISTM). Our level of alignment with GISTM, or selected elements of the GISTM, is a matter we are continuing to assess noting the practicality and economic feasibility of retrofitting historical TSFs to achieve full alignment with the standard. Read more about the GISTM at https://globaltailingsreview.org/global-industry-standard. We consider that the design standards and dam assurance we apply is leading practice in the industry. | ||||
Retreating and reclaiming South African TSFs | Tailings retreatment offers substantial competitive advantages and environmental benefits (on completion of reclamation). It tends to be a lower-risk, non-labour intensive, low-energy usage, safer and lower-cost option to conventional mining. Tailings retreatment plays a critical role in supporting a circular economy by recovering valuable minerals from previously discarded waste, reducing the need for new extraction and minimising environmental impacts. We are exploring the feasibility for reprocessing several inactive TSFs in the Free State, Gauteng and North West. This will also enable the rehabilitation of reclaimed TSF footprints. All reclaimed material will be deposited on existing, recommissioned or where required, new TSFs, which will be constructed to comply with regulations and minimise impacts. | ||||
111
Governance
Accountability and responsibility | Regional executives oversee implementation of group and regional standards, supported by regional engineering and environmental teams. Site-specific Responsible Tailings Facility Engineers (RTFEs) and supported by onsite tailings operating contracting management teams that are responsible for daily TSF management activities overseen by the appointed Engineer of Record to ensure compliance and make recommendations to improve compliance. | ||||
Performance monitoring and reporting | Harmony’s operations are required by legislation to hold valid water use licences, environmental permits and authorisations to develop, implement and track compliance with, for example, environmental management programmes that include controls and management measures for TSF management. The board receives regular reporting on facility performance and risk management. Accredited consulting engineers in South Africa and Papua New Guinea compile quarterly reports that provide a detailed independent evaluation of operational performance, safety standards and environmental compliance. These reports are essential tools for monitoring progress, assessing risks and aligning activities with regulatory requirements and industry best practice. Regular updates help stakeholders stay informed, track improvements and identify areas for enhancement, reinforcing a commitment to sustainable operations and continuous improvement across all sites. We conduct annual audits at our South African TSFs to confirm compliance with local and global applicable safety and environmental standards, and provide an independent evaluation of the facilities, covering structural stability, water management and dust mitigation. Third-party audits and oversight from our Engineer of Record and the Independent Tailings Review Board (ITRB) are integral components of tailings management processes in Papua New Guinea. This approach aligns to the layered governance aspects of the GISTM. Third-party and independent reviews assess our TSF management practices, including structural integrity, operational efficiency and environmental impacts. The International Cyanide Management Institute (ICMI) conducts audits across our operations every 18 months to monitor compliance with the Cyanide Code. These independent audits evaluate whether operations meet the rigorous standards set for handling, transporting, storing and disposing of cyanide to minimise the risk to human health and the environment. | ||||
Policies that support our governance approach | Harmony’s TSF management plans and processes are guided by the group mineral waste management standard, the risk management framework and our sustainability framework. Our site construction and operational environmental management plans set out the requirements for effective TSF management. In South Africa, we update our code of practice on mine residue deposits every two years to remain aligned with guidelines from the DMPR, the latest industry standards, environmental regulations and best practices. We submit any updates to the DMPR for review and approval. | ||||
112
Risk and opportunity management
We recognise the potential environmental and socio-economic risks associated with TSF, and the criticality of designing, operating and closing TSFs in accordance with recognised international standards.
Risks | Description | Mitigation measures | ||||||
Overtopping or slope failure | Overtopping and slope failure are two primary mechanisms by which TSFs can fail, leading to significant environmental and safety risks. Overtopping occurs when the water level in the facility exceeds the crest of the dam, while slope failure involves the instability of the embankment slopes due to various factors. | ▪Design to appropriate TSF construction standards ▪Instrumentation and monitoring ▪Monthly inspections, independent evaluations and annual IMIU audits ▪Monitoring seepage, sloughing and erosion ▪Emergency response protocols. | ||||||
Liquefaction | Liquefaction risk in TSFs poses a concern due to the potential for flow slides and significant environmental and safety consequences. Liquefaction occurs when saturated, loose tailings lose their strength and behave like a liquid due to applied stresses, often triggered by earthquakes or other disturbances. | ▪Performing detailed geotechnical investigations as part of TSF site selection to identify and assess liquefaction risks. If risks cannot be sufficiently reduced, alternative siting or tailings disposal method may be required (eg Wafi-Golpu deep sea tailings placement (DSTP)) ▪Selecting appropriate tailings deposition methods with consideration to the liquefaction potential ▪Conducting monthly inspections, independent evaluations and annual IMIU audits. | ||||||
Unauthorised facility entry, theft and vandalism of infrastructure | Unauthorised entry to TSF facilities and failure to abide by safety protocols can result in injuries or loss of life. Theft and vandalism of pipeline and pumping infrastructure used to convey water and slurry to and from TSFs and reclamation sites may result in spillages of slurry and mine-affected water into the environment. In South Africa, this includes the deliberate damage to water pipes to provide water for cattle. | ▪Appropriate employee training and approvals to access TSF facilities ▪Security patrols to prevent unauthorised site entry and deter theft and vandalism ▪Education to communicate to the community the dangers of unauthorised entry. | ||||||
Opportunities | ||
By reclaiming existing TSFs, we remove the tailings from inactive TSFs. All new and proposed facilities are designed to prevent seepage and reduce the risk of contamination to surrounding land and groundwater. We are well placed to enhance opportunities to develop resilience to climate change in the short and long term. Reclaiming the inactive TSFs also creates opportunities for rehabilitation, restoring the land to a more sustainable and productive state, once fully reclaimed. The Free State operations is developing three plants that will use a newly identified TSF to supplement their existing deposition requirements. The new facility, which will be operational in FY29, will provide additional space for daily mining activities and contribute to the mine’s long-term environmental commitments. In Gauteng, the West Wits reclamation project is in its feasibility phase with a focus on developing a new TSF to serve reclamation activities and ongoing deposition requirements for the region’s mines. This planned TSF will extend the life-of- mine and creates opportunities for rehabilitation and restoration of the land of the reclaimed TSF footprints. | ||
113
Measuring our performance
We measure the performance of our TSF management through continuous
monitoring and rigorous technical assurance, aligned with industry-leading
standards. This includes real-time data collection in South Africa, regular
inspection, and independent review.
Our TSFs
South Africa | ||||
We manage 84 TSFs: 18 are operational, 11 are being reprocessed and 55 are inactive. | ||||
Papua New Guinea | ||||
We manage one TSF with a second TSF under construction and a third TSF in design at Hidden Valley. For Wafi-Golpu, DSTP is our approved tailings solution as per the environmental permit, secured in 2020. | ||||
Australia | ||||
We have completed TSF design as part of the Eva Copper updated feasibility study. | ||||
Progress against priorities
Implementing robust engineering, dam design and operational management
In FY25, we enhanced the infrastructure at certain South African TSFs for long-term stability and a lower environmental impact. This
included:
Target 1 plant | ▪Installing additional toe drainage systems and rock cladding for erosion control, reinforced by a robust rock buttress. | |||||
Central Plant Dam 23 | ▪Relocate the penstock to a more centralised location, with stability analysis planned when the facility has settled with remedial recommendations pending stability analysis results. | |||||
Central Plant Brand D TSF | ▪Improving drainage and constructing a rock buttress to improve overall stability. | |||||
We aim to increase our TSF capacity at Hidden Valley to support the feasibility of extended life-of-mine. The mine’s TSF capacity is
constrained, and opportunities to extend the life-of-mine require secure and compliant TSF expansion. Three projects are enabling us to
expand Hidden Valley’s TSF capacity and potentially extend the life-of-mine. These include:
TSF 1 | ▪Raising the wall height to 2 019m and investigating the possibility to raise it to 2 024m. | |||||
TSF 2 | ▪Constructing the second TSF to accommodate the next phase of tailings deposition, targeting completion by FY28. | |||||
TSF 3 | ▪Completing a concept study and starting prefeasibility studies, which would support an extension to mine life beyond 2030 ▪Completing the environmental and social assessment ▪Applying to the Conservation and Environment Protection Authority (CEPA) for an amendment to our environment permit to approve this facility, and the MRA for extension of the mining tenement term. | |||||
We have received regulatory approval for the mining tenement extension and are awaiting a decision on our revised environmental
permit. Once necessary approvals are in place, the board will consider the feasibility of extending the life-of-mine.
Surface water and groundwater environmental monitoring of TSF 1 seepage points, which drain to the Watut river, maintained
compliance below background levels during the year. Seepage from the dam was in line with design estimations.
114
Conducting risk management, layered assurance, oversight and compliance
Freeboard management
We use freeboard legal compliance to maintain safe capacity for excessive rain and operational water
levels on top of TSFs. We use drone and physical on-site instrument survey measurement technology for
monthly freeboard surveillance.
Despite high rainfall in South Africa, we maintained freeboard stability at our TSFs in FY25.
In Papua New Guinea, we worked to improve TSF water levels. This has led to less usage of CAROS, our
cyanide destruction circuit, to remove supernatant water from the surface of the dam. Hidden Valley
mine is committed to keeping pond levels as low as reasonably practical.
Emergency response
We regularly enhance our emergency response systems to manage and mitigate environmental and safety
risks. In South Africa, we have established clear communication lines with surrounding communities and
local authorities for effective collaboration should an event arise. Our emergency response plans are
continuously tested through simulated drills and real-world scenario exercises, providing our teams with
the necessary experience and confidence to respond quickly and effectively.
We maintain a four-siren early warning system at Hidden Valley to alert downstream communities
in the event of TSF failure, with regular community awareness conducted on the system.
As we advance our Eva Copper feasibility study, we mapped our emergency response protocols and
procedures this year.
Reducing dust emissions
At the Doornkop TSF, we have vegetated 10ha of the side slopes as a dust mitigation initiative, with a
goal of vegetating 14ha by the end of the project. To curb dust at other facilities, we have installed
30 000m of dust netting across dormant TSFs in the Free State and North West. This proactive measure
reduces airborne dust and enhances air quality. In the Free State, we have planted trees at TSFs to
support dust management. Read more about these measures in Air quality for community wellbeing.
At some TSFs, we implement phytoremediation interventions, using certain plant or tree species to
absorb, degrade or immobilise environmental pollutants or contaminants. This approach enhances
ecological restoration of affected areas, stabilises soil and reduces erosion while providing long-term
solutions to TSF pollution management. In FY25, we planted 6 000 trees at the Kareerand and Savuka
seepage interception.
Enhancing assurance
At Hidden Valley, we enhanced our technical assurance by expanding the mine’s TSF management and
engineering team, including the appointment of an accountable executive and responsible tailings
facility engineer.
Retreating and reclaiming South African TSFs
In FY25, we made the following progress with our reclamation activities:
In progress | ▪Conducting a feasibility study for the West Wits reclamation project to determine viability for two TSFs ▪A feasibility assessment for further Free State reclamation activities, covering the reclamation of 26 out of 42 old TSFs. | |||||
Completed | ▪The construction of new reclamation and pumping stations at Mine Waste Solutions. | |||||
Collaboration and partnerships
In South Africa, we are collaborating with a local supplier to transfer mine rehabilitation skills to
local communities while completing the Doornkop TSF dust mitigation project. At Hidden Valley,
we collaborate with the MRA regularly to provide dam performance and address any safety risks
and operational issues. We also engage with third-party auditors and the ITRB.
Innovation, technology and digitisation
In South Africa, proposed new TSFs comply fully with regulations and are designed to surpass industry
standards and set a new benchmark for sustainable mining practices. The re-engineered liner is more
advanced than the current required class C barrier and offers enhanced performance by significantly
reducing groundwater impact risks. The innovative design maximises water recovery, supporting a
higher return of water for reuse.
Construction is underway of the FSS 6 TSF reclamation pump station in the Free State. An innovative
feature of the FSS reclamation site is the strategic positioning of its main sump. Unlike other sites, this
design enables full dam coverage without requiring the barge to be moved, thereby adding flexibility
and operational ease.
At Hidden Valley, TSF data collection of key instrumentation will transition to telemetry to remove
human error in collection of key performance data. This will enable dashboard-style data presentation,
making it quicker and simpler for concerns to be identified.
Future focus areas Harmony remains committed to improving its tailings management in line with best practices and technological advancements. Our short-term focus areas include: ▪Planting 3 450 trees at the Kareerand and Savuka seepage interception as part of reducing dust emissions ▪Vegetation of 10ha of land at the Doornkop TSF to mitigate dust and enhance ecosystem health ▪Feasibility assessment for upgrading the Kusasalethu plant as part of the West Wits reclamation project. ▪Continuing the construction of TSF 2 at Hidden Valley and potentially receive our environmental permit amendment for TSF 3 (followed by the design and construction of TSF 3 at Hidden Valley if the lease extension is approved) ▪Installing a system at the Hidden Valley process plant to improve the density of tailings and the storage curve and assisting with closure activities. | ||
115
Waste management
Harmony has complex mining waste management requirements as we handle diverse waste streams while navigating the challenge of operating in remote locations. We leverage the
waste management hierarchy including avoidance, recycling and circular economy principles to reduce waste sent to landfill, optimise resource use and entrench sustainable
practices. We also aim to minimise environmental harm, reduce health risks and create economic opportunities for local communities.
Material matters | |||
TSF and waste management | |||
UN SDGs | |||
| Good health and wellbeing | ||
| Decent work and economic growth | ||
| Sustainable cities and communities | ||
| Responsible consumption and production | ||
| Life on land | ||
GRI disclosure requirements | |||
▪GRI 3: Material Topics 2021 ▪GRI 301: Materials 2016 ▪GRI 303: Water and Effluents 2018 ▪GRI 306: Waste 2020. | |||
FY25 priorities | |||
1.Implementing responsible waste rock dump management, reuse and recycling 2.Repurposing and recycling non-mineral waste. | |||
Strategy: Minimising waste impacts through circularity
Key waste streams include hazardous waste and waste rock. We direct hazardous waste streams, mainly hydrocarbons, to accredited repurposing
companies or suitable landfills. To effectively manage waste, we prioritise the following:
Implementing responsible waste rock dump management, reuse and recycling | Effective waste rock management reduces aesthetic and land use challenges, minimises water and air pollution while enabling the maximum recovery of ore, minerals and metals. In South Africa, we use waste rock as plant grinding media and backfill material for shaft rehabilitation. Using waste rock, a plant grinding media reduces the need for non-renewable resources and converts waste rock into a useable product. At Hidden Valley, we use non-acid forming (NAF) waste rock for TSF construction and drainage improvements. It is also used for waste rock dump rehabilitation and encapsulating potentially acid forming (PAF) waste rock to manage geotechnical and geochemical stability. | ||||
Repurposing and recycling non- mineral waste | We promote non-mineral waste repurposing and recycling, including reusing underground and above-ground equipment and infrastructure for operational purposes. Our waste management and salvage activities also provide economic opportunities for local suppliers and entrepreneurs. | ||||
Read more about our tailings management in Responsible tailings management.
Governance
Accountability and responsibility | Regional executives, supported by regional environment teams, are accountable for effective waste management. Site management teams are responsible for daily waste management activities. | ||||
Performance monitoring and reporting | Our site operational environmental management systems include waste management guidelines, and we track and report on the quantities of materials we recycle and send to landfill. | ||||
Policies that support our governance approach | Non-mineral waste management is guided by a group-wide standard. Specific host-country regulation and conditions are addressed through our site construction and operational environmental management plans. | ||||
116
Risk and opportunity management
Mining in isolated areas introduces unique waste management challenges due to logistical constraints, environmental sensitivities and community considerations. However, it also fosters opportunities for innovation.
Waste management risks are integrated into the enterprise risk management process.
Risks | Description | Mitigation measures | ||||||
Environmental contamination | Improper disposal of waste can result in environmental contamination, posing risks to soil, water and air quality. This includes hazardous substances, which can seep into the ground, contaminating groundwater sources and impacting local ecosystems. | By increasing the use of recycling and reclamation, we reduce the potential for hazardous substances to leach into the environment. This protects local ecosystems, contributes to more sustainable operations and supports community relations. At Hidden Valley, we implement careful waste rock management aligned with our acid and metalliferous drainage management plan. Waste structures are fully engineered with toe-drains for water drainage and compacted layers to reduced infiltration and improve stability. The waste rock at Hidden Valley is placed in the waste rock dumps in accordance with its characterisation, with higher-risk potential acid forming (PAF) material being encapsulated by NAF material. We closely monitor the effectiveness of the plan with the aim to minimise any downstream water quality impacts. | ||||||
Health hazards to employees | Exposure to toxic chemicals, infectious waste and hazardous materials can cause several health issues such as respiratory problems. Pathogens in infectious waste can spread diseases. The long-term health effects of exposure to hazardous materials, including heavy metals or chemicals, can lead to chronic conditions such as cancer, neurological disorders and organ damage. | Adopting safety-first waste management practices protects public health and prevents long- term health risks for employees and local communities. This includes: ▪Using the correct procedures to dispose of hazardous materials ▪Improving protective equipment for employees handling waste ▪Limiting access to waste management areas and landfills. | ||||||
Fires and explosions | Certain waste types, such as flammable chemicals and combustible materials, present significant fire and explosion risks if not properly stored, handled or disposed of. Fire risk is elevated when waste is stored in poorly ventilated or improperly contained areas, where heat build-up can ignite flammable substances. Explosions can result from the unstable nature of certain chemicals or a reaction between different waste types. | ▪We have set procedures in place for storing, handling, transporting and disposing of flammable chemicals or combustible materials ▪Employee training on the appropriate handling, storage and separation of waste materials such as dangerous goods and/or hazardous materials. | ||||||
Regulatory non- compliance | Failure to adhere to waste management laws and environmental regulations can result in fines, shutdown orders, or even the suspension of permits. This can disrupt business operations and increase operational costs. Violations can cause reputational damage, undermining public trust and investor confidence. | Our site environmental management plans are aligned with applicable legal and regulatory frameworks, to operationalise compliance with relevant environmental laws and regulations. The documents are dynamic and updated in response to evolving requirements. | ||||||
Project execution and operational challenges | The remoteness of some sites can mean that the public waste management infrastructure is not licensed or geared to handle our specialised types and quantities of waste. This can result in increased costs (transportation of specialised waste), project delays and community concerns related to waste handling and impacts on local infrastructure. Inefficient waste handling can create significant operational challenges, leading to delays, higher operational costs and employee safety risks. When waste is not managed properly, it can accumulate and create congestion, slowing down overall operations and creating delays in the processing or disposal of materials. | ▪Appropriately designed, permitted and maintained on-site waste management facilities ▪Waste minimisation at source to minimise the volume requiring transport and disposal, with personnel trained in proper segregation, storage and emergency response ▪Scheduled, licensed off-site transport and disposal contracting arrangements with tracking of these wastes ▪Temporary storage areas with secondary containment for hazardous waste to prevent environmental release ▪Regulatory engagement to identify compliant solutions appropriate for remote contexts. | ||||||
Community and social impact | Waste can produce foul smells, with quality-of-life impacts for nearby residents. Improperly managed, biologically and chemically hazardous waste has potential to spread disease. These issues can harm public health and erode community trust, contributing to social unrest and potential legal challenges. | ▪Compliance with site environmental management plans ▪Adhering to hazardous waste procedures, including medical waste ▪Trained personnel and readily available equipment to contain and clean up an accidental releases to prevent environmental and community exposure ▪Regular inspections of waste management practices and areas ▪Adoption of good housekeeping practices. | ||||||
Opportunities | ||
Improvements to how waste is handled can reduce our expenses, limit our environmental liability and enhance operational efficiencies. In South Africa, we are continuously investing opportunities to further our efforts on the recycling of wastes and to further limit the volumes of waste sent to landfill. | ||
117
Measuring our performance
We collect and review quantitative data and monitor these metrics to understand our progress
and inform decision making. We remain committed to continuous improvement and responsive
management.
Progress against priorities
Implementing responsible waste rock dump management, reuse and recycling
In FY25, the group’s total waste rock generated decreased by 10% to 27 million tonnes.
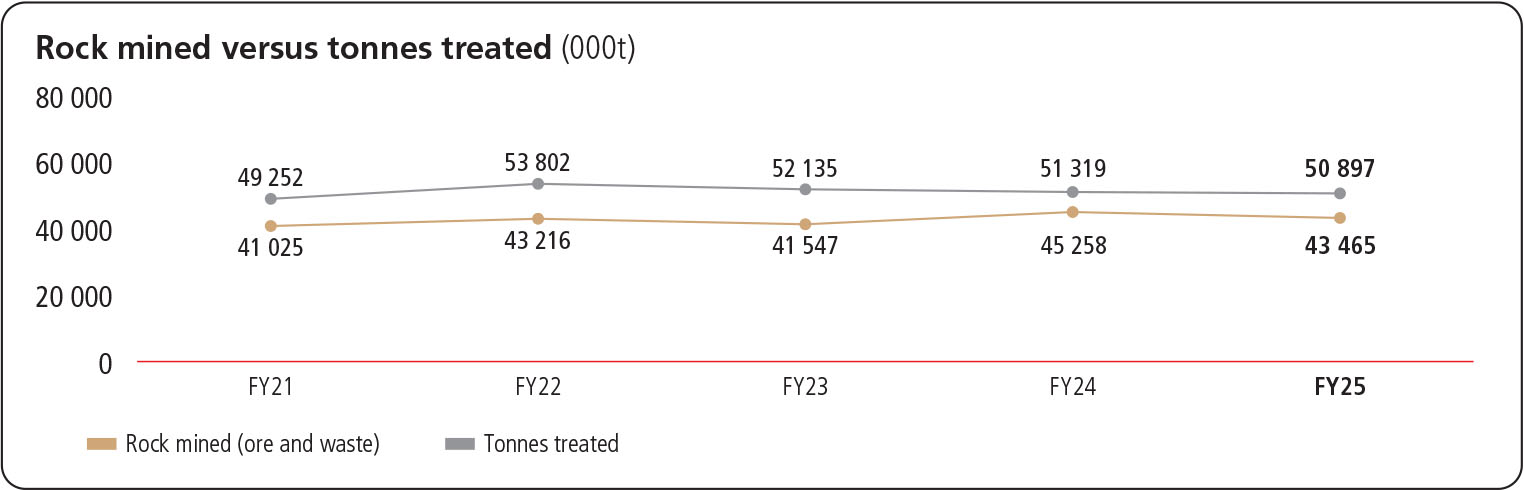
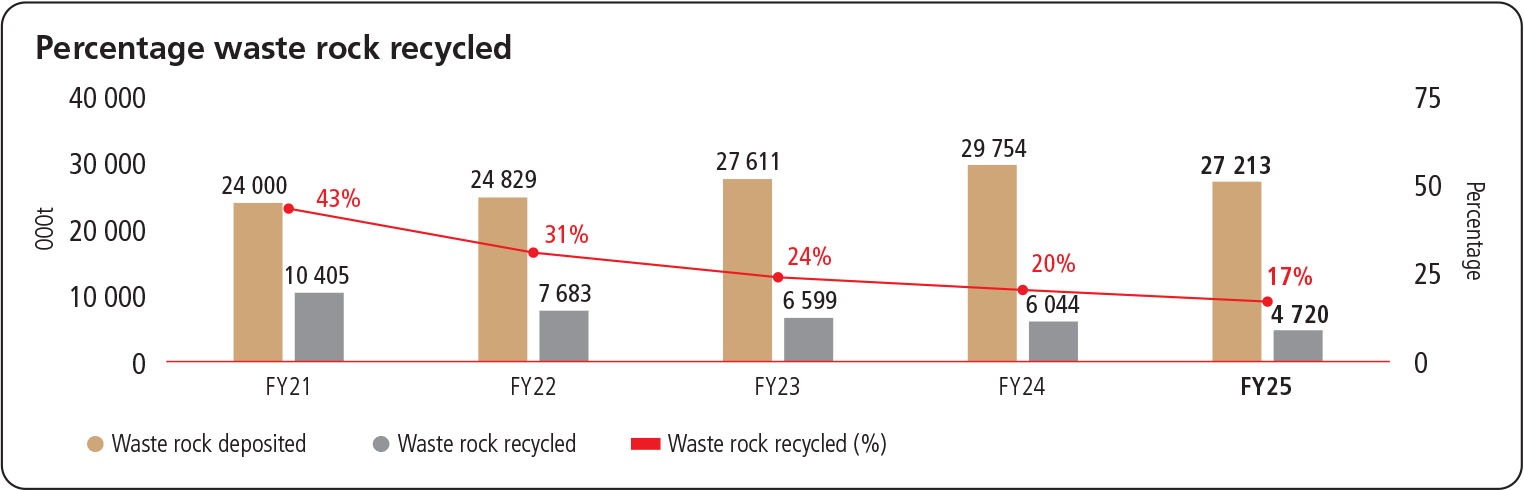
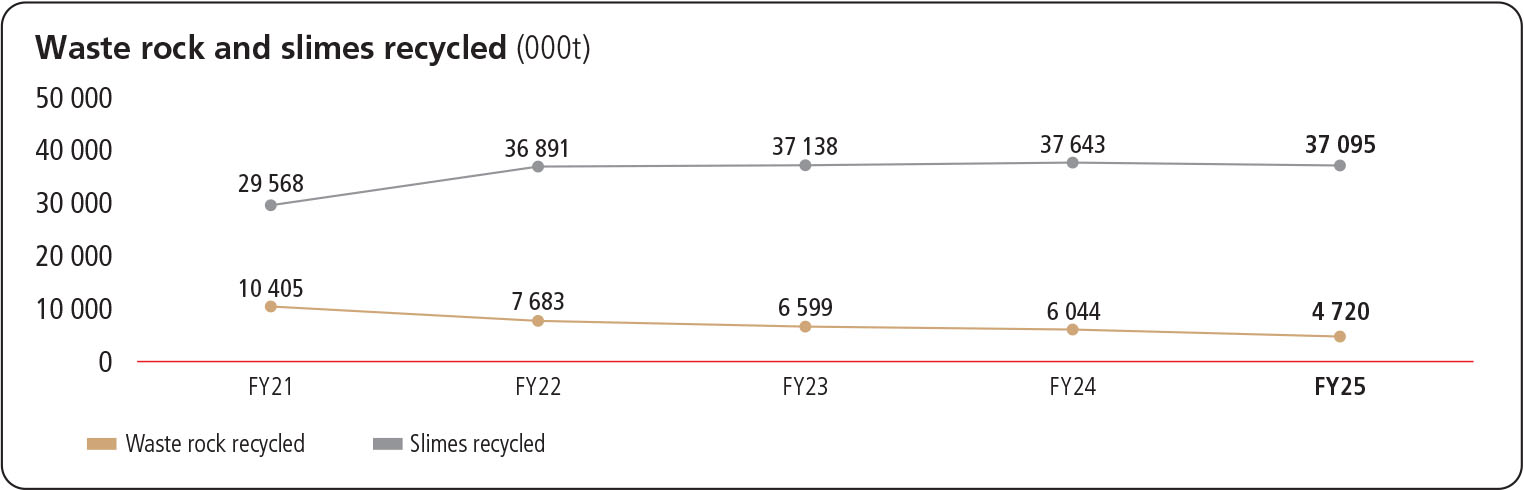
Waste rock recycled decreased by 22% to 5 million tonnes, mainly attributed to the reduced use for
construction and a temporary halt in reprocessing activities at some sites.
We continue to investigate the feasibility of waste rock dumps for the use as crushing material as part
of our milling process at our South African gold plants. This allows us to remove the waste rock and
make land available for rehabilitation when waste rock dumps are cleared. We are exploring
opportunities to work with local communities for processing waste rock dumps.
In FY25, we implemented a revised waste rock management plan at our Papua New Guinea operations
to address low-level exceedances of dissolved manganese detected under certain conditions (relating to
rainfall volume and intensity) from waste rock dump seepage. To improve downstream water quality,
we have:
▪Optimised paddock dumping of PAF waste and NAF caps
▪Maximised the compaction of waste rock layers to limit oxygen entry and sulphide oxidation
▪Separated oxidised, partially oxidised and PAF waste rock
▪Encapsulated PAF in fresh NAF granodiorite, when required
▪Avoided direct contact between fresh PAF metasediment and any oxidised or partially oxidised rock
▪Developed detailed closure plans, including engineered covers of all our waste rock dumps.
Monitoring has demonstrated promising results, with a reduction in exceedances recorded.
118
Repurposing and recycling non-mineral waste
Across the group, waste management and minimisation initiatives in FY25 included:
▪Increasing the reuse of reconditioned machinery parts, reducing waste and reliance on new parts
▪Recycling batteries and recovering oil
▪Recycling scrap metal, including separating high-value scape (copper, aluminium) for recycling.
Kilotonnes of waste produced, including hazardous materials and non-hazardous waste
Group waste generated | FY25 | FY24 | FY23 | FY22 | FY211 |
Oils and grease | |||||
Grease used (t) | 430 | 480 | 475 | 524 | 552 |
Lubricating and hydraulic oil used (Ml) | 3 127 | 3 040 | 2 707 | 3 000 | 3 000 |
Recycling oil – repurposing hydrocarbons to landfill (000l) | 646 | 703 | 742 | 698 | 527 |
Hazardous waste | |||||
Tailings (Mt) | 51 | 52 | 51 | 52 | 47 |
Waste rock deposited (Mt) | 27 | 30 | 28 | 25 | 24 |
Hazardous waste to landfill (t) | 558 | 1 261 | 1 501 | 803 | 524 |
Recycled waste | |||||
Waste rock recycled (000t) | 4 720 | 6 044 | 6 599 | 7 683 | 10 405 |
Timber (t) | 4 238 | 6 097 | 3 251 | 2 727 | 3 121 |
Steel (t) | 14 686 | 14 939 | 13 781 | 8 889 | 8 739 |
Plastic (t) | 507 | 697 | 489 | 591 | 625 |
Total recycled waste (000t) | 4 739 | 6 066 | 6 617 | 7 695 | 10 417 |
Total general waste generated from operational salvage yards | 29 901 | 29 288 | 25 646 | 20 469 | 12 486 |
Mineral waste intensity (tonne/tonne treated) | 1.53 | 1.60 | 1.52 | 1.43 | 1.44 |
General waste intensity (tonne/000 tonne treated) | 0.59 | 0.57 | 0.49 | 0.38 | 0.25 |
1Includes Mponeng and related assets.
Collaboration and partnerships
Our waste management requirements provide business
opportunities for host communities and entrepreneurs. Where
possible, we contract waste handling services from local
entrepreneurs.
In Papua New Guinea, we contract a local landowner company
to manage our non-mineral waste, delivering a viable business
opportunity since the Hidden Valley mine opened.
Future focus areas We remain committed to applying the waste hierarchy to reduce, reuse and recycle waste. Our short-term focus areas include: ▪Assessment of additional waste recycling and/or removal waste at our Mponeng operations ▪Continued monitoring of effectiveness of the revised waste rock management plan at Hidden Valley ▪Detailed waste management planning for Eva Copper construction. | ||
119
Air quality for community wellbeing
Mining activities can influence the local amenity through changes to air environment. While the remote settings of our operations and largely underground
mining footprint help to limit off-site impacts, we remain committed to monitoring and managing these aspects while protecting the environment and
community health and wellbeing.
Material matters | |||
Sustainable communities | |||
UN SDGs | |||
| Good health and well-being | ||
| Decent work and economic growth | ||
| Life on land | ||
GRI disclosure requirements | |||
▪GRI 305: Emissions 2016. | |||
FY25 priorities | |||
1.Achieving air quality compliance 2.Reducing dust and other pollutants. | |||
Strategy: Protecting air quality in our host communities
Our air quality approach mitigates our liability, secures our ongoing licence to operate and safeguards our stakeholder relationships. Our approach
is tailored to consider the different air quality and amenity risks facing the regions in which we operate. We protect air quality by delivering on the
following priorities:
Achieving air quality compliance | Our operations must comply with legislation for dust fallout and the allowable limits associated with residential and non-residential areas. We record exceedances as a non-compliance and implement remedial measures. | ||||
Reducing dust and other air pollutants | We implement innovative solutions to reduce particulate matter (PM) emissions and support the regeneration of ambient air quality across our metallurgical and mining operations. These measures include the use of emission abatement equipment such as wet scrubbers and baghouses, water and chemical suppression, netting, the establishment of grass, trees and other rehabilitative vegetation, as well as controlled maintenance activities during windy seasons. The climatic conditions in Papua New Guinea reduce the dispersion of air pollutants, with ash content considered the most representative indicator of mine-derived dust deposition. | ||||
120
Governance
Accountability and responsibility | Regional executives, supported by regional environment and sustainability teams, are accountable for effective air emissions management. Site management teams are responsible for daily emissions monitoring. | ||||
Performance monitoring and reporting | Our environmental approvals and/or guidelines include the limits we must comply with, which typically reflect health-based guidelines. Our air quality monitoring programmes measure primary atmospheric emissions such as sulphur oxides (SO2), nitrous oxides (NOx), PM and dust fallout to comply with regulations and applicable licences and permits. Harmony’s South African operations have dust management plans that we update regularly. We also review progress on implementing mitigation measures on an ongoing basis and conduct monthly dust fallout monitoring to comply with regulations and address concerns. We have a formal complaints system to address public concerns with immediate investigation and corrective action. | ||||
Policies that support our governance approach | Harmony’s air emissions management is guided by a group-wide standard designed to reduce environmental impact. Our site construction and operational environmental management plans include the requirements to comply with specific host-country policies, regulations and conditions. Our South African operations also apply the American Standard for Testing and Materials method (D1739) in dust fallout monitoring and mitigation. | ||||
Risk and opportunity management
We mitigate air quality and amenity risks through our environmental management and construction environmental management plans. Our gold plants meet legislated thresholds with occasional PM exceedances from
time to time. We address these exceedances by using high-quality carbon as an effective material for removing air pollutants and retrofitting dust abatement equipment, where required.
Risks | Description | Mitigation measures | ||||||||
Failure to adhere to our environmental permits or agreement-based commitments | Non-compliance could lead to nuisance, health or wellbeing impacts, significant fines, legal action or disruptions to mining activities. | ▪Dust suppression initiatives, including barriers such as artificial netting or trees and rehabilitative vegetation ▪Equipment efficiency and maintenance to reduce emissions ▪Emission-reduction abatement equipment such as wet scrubbers and baghouses. | ||||||||
Higher disturbance activities associated with new projects | Project development can lead to increased disturbances in the surrounding area compared to pre-mining conditions. This can include increased dust related to mining construction activities. | |||||||||
A high level of community complaints and deterioration of stakeholder relationships | Air quality deterioration can result in community complaints and undermine our relationships stakeholders, including communities, government departments and NGOs. | ▪Foster healthy stakeholder relationships and remain mindful of our amenity impacts as we progress new projects like Eva Copper ▪Adopt proactive, collaborative engagement with internal and external stakeholders. This includes a process for addressing their concerns, complaints and grievances. | ||||||||
Opportunities | ||
Our mitigation measures present several opportunities for us to leverage, including: ▪Reducing dust fallout through re-vegetation across the life-of-mine ▪Demonstrating compliance, reducing legal risks and enhancing relationships with authorities through proactive controls. | ||
121
Measuring our performance
We monitor dust and other air pollutants across operations in line with regulatory requirements. At our
operational sites, we continue to implement measures to reduce emissions and improve air quality
outcomes, particularly in areas adjacent to residential zones.
Progress against priorities
Achieving air quality compliance
The regulator in South Africa approved all required annual national atmospheric emission inventory
system reports submitted by our operations.
At Hidden Valley, we monitor and analyse cumulative dust deposition mean ash content, mean
total solids, mean total insoluble matter and mean total soluble matter on a fortnightly basis at Manki
Tawa, Upanda and Hikinangowe villages. Cumulative dust remains below compliance limits of 4g/m2/
month and consistent with historical trends.
At Eva Copper, we continued building our baseline monitoring dataset in line with our environmental
authority, including monthly dust deposition sampling. As site preparatory works progressed, including
the site access road, temporary workers’ accommodation facility, process plant laydown area, water
supply infrastructure and topsoil, mulch and stockpile areas. We also transitioned into implementation
and active monitoring of dust management controls.
Reducing dust and other pollutants
To improve PM emissions, we roll out mitigating measures at our sites through better operational
controls, including the use of improved quality-activated carbon and changes to more efficient
abatement equipment where necessary, installing barriers such as artificial netting or trees, dust
suppressants and rehabilitative vegetation.
Our FY25 initiatives were as follows:
FY25 initiatives | |||||
Installed: | |||||
30 000m of dust netting on dormant TSFs at our Free State operations | |||||
Air quality abatement equipment (wet scrubber) at Central Plant’s Kilns, to reduce PM emissions | |||||
The new kiln at Saaiplaas plant operations to improve operating efficiencies | |||||
25 000 trees planted for dust mitigation in the Free State | |||||
10ha of the Doornkop TSF side slopes rehabilitated to reduce dust fallout | |||||
Our performance in South Africa was as follows:
PM intensity | ||
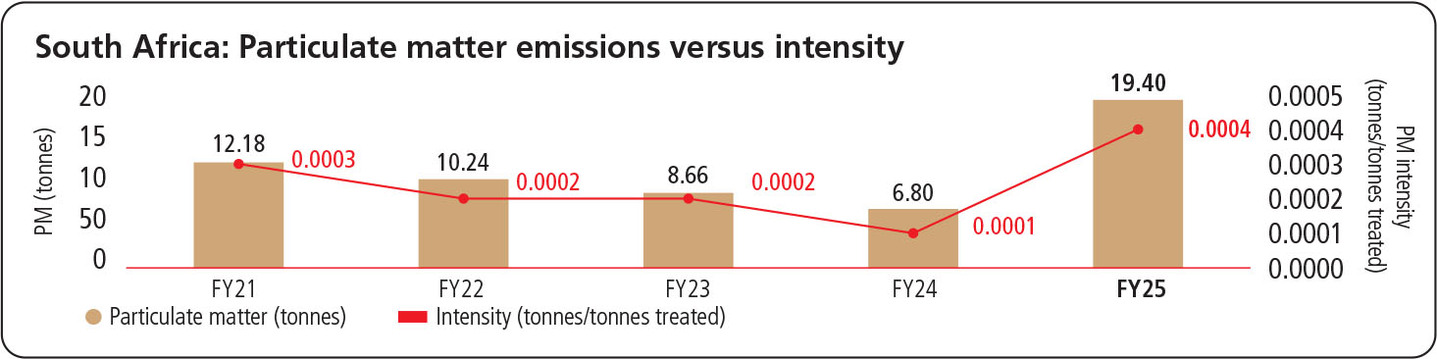 | ||
SO2 intensity | ||
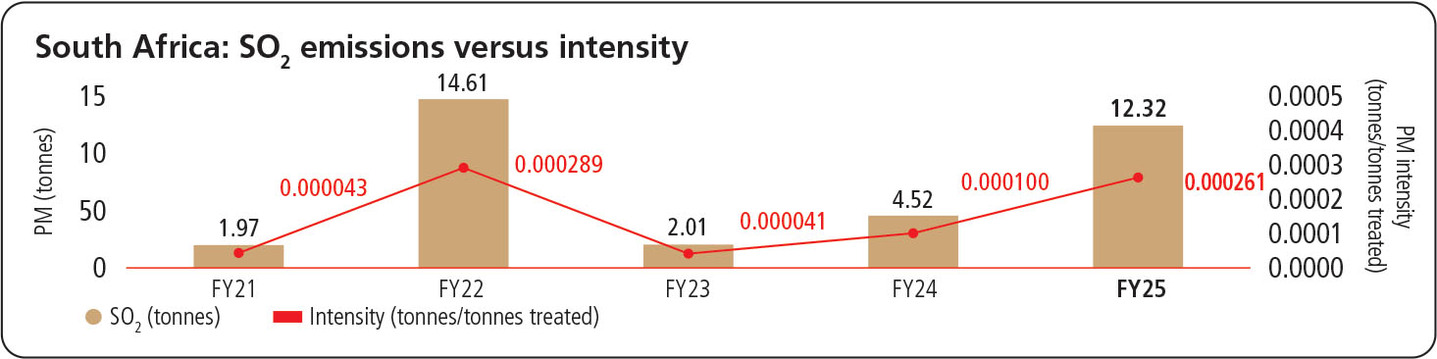 | ||
NOx intensity | ||
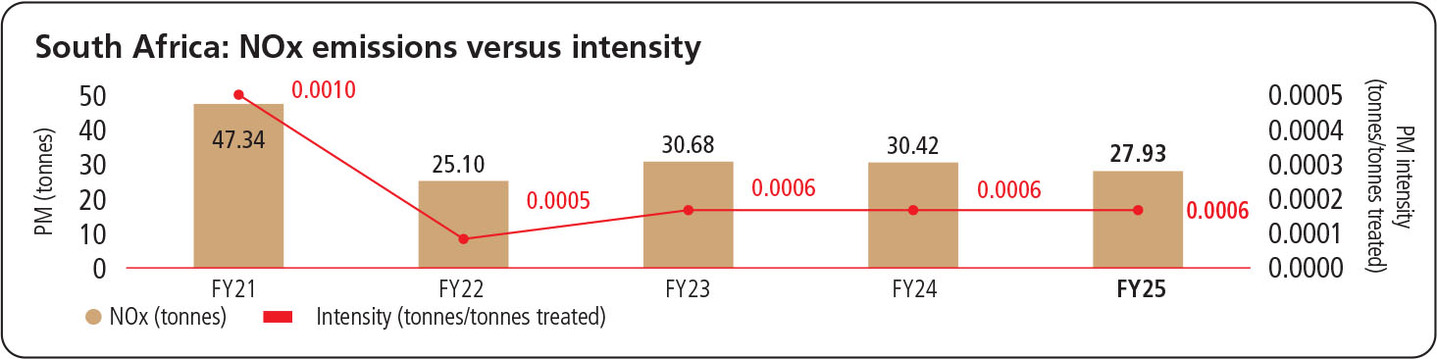 | ||
The increase in emissions can be attributed to inclusion of the Doornkop operations for the first time,
and Nufcor that was excluded in FY24.
Future focus areas In the short term, we plan to: ▪Harmony will continue its progressive rehabilitation of land identified for restoration ▪Embed robust processes for managing amenity and maintaining environmental authority compliance as we advance Eva Copper. | ||
122
Biodiversity and conservation
Mining activities have the potential to affect biodiversity and the environment, particularly through habitat loss, pollution risks and ecosystem
fragmentation. We are committed to minimising these impacts by implementing targeted conservation measures and undertaking rehabilitation and
biodiversity initiatives to support ecological recovery.
Material matters | |||
Biodiversity | |||
UN SDGs | |||
| Sustainable cities and communities | ||
| Life on land | ||
| Partnerships for the goals | ||
GRI disclosure requirements | |||
▪GRI 101: Biodiversity 2024 ▪GRI 3: Material Topics 2021 ▪GRI 304: Biodiversity 2016. | |||
FY25 priorities | |||
1.Protecting high biodiversity values 2.Implementing biodiversity protection initiatives 3.Revegetating land alongside mining 4.Delivering meaningful biodiversity outcomes after mining. | |||
Strategy: Meaningful biodiversity outcomes to leave a lasting, positive impact
Informed by our Biodiversity and rehabilitation position statement, Harmony’s biodiversity and conservation programme seeks to adopt good
practice, support informed decision making and contribute to the recovery or enhancement of local ecosystems in the long term. To achieve this,
we have identified the following priorities:
Protecting high biodiversity values | Protecting biodiversity is central to sustainable land use and helps address climate change, reduce pollution and restore land. In our project planning, we seek to avoid or “design out” areas of high biodiversity or environmental sensitivity. We do not conduct operations in declared world heritage sites, national parks or protected areas. | ||||
Implementing biodiversity protection initiatives | Our environmental management approach includes active biodiversity measures, such as invasive species management and fauna spotter-catcher protocols, alongside ongoing monitoring programmes, including air quality, water and noise to manage exploration and operational impacts. Our conditions of approval outline specific requirements for each site. | ||||
Revegetating land alongside mining | We implement progressive/concurrent rehabilitation. Rehabilitating and replanting disturbed land encourage the return of plant and animal life, reduces soil erosion and dust fallout while contributing to our long-term decarbonisation goals. | ||||
Delivering meaningful biodiversity outcomes after mining | In our closure planning, we seek to support resilient ecosystems post mining. This includes stabilised landforms using locally appropriate native species that are complementary to selected post-mining land uses. We are assessing the current and future impacts of our company’s growth to inform roadmaps to enhance biodiversity outcomes. We demolish, decommission and seal shafts while rehabilitating broader footprints (former plants and ancillary service infrastructure), where possible. These activities prevent further environmental degradation and protect host communities from criminal activities associated with illegal mining. | ||||
123
Governance
Accountability and responsibility | Regional executives and management oversee the environmental management plans for our mines. Site management teams are responsible for daily issues management and execution of our environmental management plans and rehabilitation and closure programmes. | ||||
Performance monitoring and reporting | Our long-life sites implement biodiversity management plans through mine closure and environmental management plans. We conduct regular assessments for new and existing projects that have the potential to negatively impact ecological systems. Regulators approve our environmental management and closure plans, which include measures for biodiversity. Harmony tracks compliance with permits, authorisations and environmental management and closure plans. | ||||
Policies that support our governance approach | Our sustainability framework, together with our biodiversity and rehabilitation position statement, provides group-wide guidelines on how we approach biodiversity. We comply with all host country legislation and contribute to national biodiversity policy. Host country regulations also establish requirements for offsets, rehabilitation requirements and timeframes, and monitoring and performance criteria. | ||||
Risk and opportunity management
We monitor site-specific biodiversity risks as part of our operational risk registers. There are no critical biodiversity risks, although we do face risks that impede the implementation of our biodiversity management plans.
Risks | Description | Mitigation measures | ||||||
Grazing activities and cutting down trees for firewood | At our South African operations, illegal cattle grazing activities and removing trees for fuel degrade the environment and hamper our efforts to rehabilitate mining land and reintroduce plant and animal species. | ▪Security patrols to deter grazing and firewood collection. | ||||||
Illegal mining activities that prevent rehabilitation efforts | Illegal mining impacts biodiversity through habitat destruction, pollution and the disruption of ecosystems. Deforestation, water contamination and soil erosion are common consequences, leading to the loss of plant and animal species. | ▪Security and mine management collaboration to prevent illegal mining through regular assessments, closures and patrols ▪Investments in sealing redundant mines and implementing leading security measures to the environment. | ||||||
Spread of alien and invasive species | Alien and invasive plants pose a significant threat to biodiversity due to their ability to outcompete native species. These plants, introduced from other regions, often thrive in new environments without natural predators or diseases to control them, leading to rapid expansion and competition for resources. | ▪Programmes to eradicate alien and invasive species across all our operations. | ||||||
High rainfall events that result in erosion | High rainfall events, such as heavy rainstorms and floods, can worsen soil erosion and negatively impact biodiversity by disrupting ecosystems and damaging habitats. | ▪Identification of areas prone to erosion through routine sediment and erosion control monitoring to revegetate land and prevent soil washing away during high rainfall events. | ||||||
Opportunities | ||
▪Considering the importance of collective action for nature, we are exploring how we might contribute to global biodiversity initiatives ▪Improving community relations through biodiversity initiatives, such as our species protection, and responsible land management, as communities may view these efforts as part of the mine's broader social and environmental responsibility. | ||
Measuring our performance
All Harmony’s operating assets implement an environmental management plan that sets out specific measures for managing biodiversity.
124
Progress against priorities
Protecting high biodiversity values
The ecosystems and species we aim to protect
South Africa | Papua New Guinea | Australia | ||||||||||
In South Africa, we operate in areas of varied biodiversity. These include our Free State operations in the endangered Vaal-Vet sandy conservation area and the western Free State clay grassland ecosystem. Moab Khotsong, next to the Vaal River in the North West, is also in an area with endangered, vulnerable ecosystems. According to the International Union for Conservation of Nature Red List of Threatened Species (Red List), the only critically endangered animal on our properties is the white-backed vulture (Gyps africanus). | With the largest remaining tract of primary forest in the Asia-Pacific area and the third-largest block of intact tropical forest, Papua New Guinea is home to more than 5% of the world's plant and animal species. Approximately two-thirds of the animals and plants are endemic. Protected (P), vulnerable (V) or rare (R) fauna that were known or may inhabit the Hidden Valley mine area and surrounding forest, include: ▪Two tree kangaroo species (Dendrolagus dorianus and Dendrolagus goodfellow) – V ▪The long-snouted or giant echidna (Zaglossus bruijni) – V ▪The nectar bat (Syconycteris hobbit) – R ▪The New Guinea harpy eagle (Harpyopsis novaeguineae) – R ▪Four birds of paradise – P ▪Five parrot species – P. During the 2025 biodiversity assessment, no IUCN threatened species, and no new-to-science or otherwise scientifically undescribed species, were recorded on the mining lease. However, seven conservation-listed fauna species and two flora species were recorded These include: ▪Oriomo Redwood (Adinandra forbesii) – near threatened (NT) ▪Ooloomer (Heptapleurum barbatum) – NT ▪New Guinea Quoll (Dasyurus albopunctatus) – NT ▪Small Dorcopsis (Dorcopsulus vanheurni) – NT ▪Lawes's Parotia (Parotia lawesii) – P ▪Greater Lophorina (Lophorina superba) – P ▪Black-billed Sicklebill (Drepanornis albertisi) – P ▪Brown Sicklebill (Epimachus meyeri) – P ▪Princess Stephanie's Astrapia (Astrapia stephaniae) – P. Across the Wafi-Golpu project ecological study area, which encompassed the mine area, infrastructure corridor and DSTP outfall location, 15 species of conservation significance were recorded in the wild and a further three NT species were considered to potentially or likely occur. This included two recorded NT species (Gurney’s eagle (Aquila gurneyi) and blue-black kingfisher (Todiramphus nigrocyaneus)) and two recorded V species (Papuan Eagle (Harpyopsis novaeguineae) and Pesquet's parrot (Psittrichas fulgidus)). The three NT species with potential to occur include Doria's goshawk (Megatriorchis doriae), forest bittern (Zonerodius heliosylus) and Emperor bird-of-paradise (Paradisaea guilielmi). | The Knapdale Range on the Eva Copper site provides a habitat for significant mammal and reptile species, including the vulnerable (Queensland level) purple-necked rock wallaby. Other mammal and bird species of Queensland conservation significance that are known or may occur at the project site include the: ▪Arpentarian grasswren (Amytornis dorotheae) ▪Gouldian finch (Eryhrura gouldiae) ▪Grey falcon (Falco hypoleucos) ▪Plains death adder (Acanthophis hawkei) and common death adder (Acanthophis antarcticus) ▪Merten's water monitor (Varanus mertens) ▪Short-beaked echidna (Tachyglossus aculeatus) ▪Julia creek dunnart (Sminthopsis douglasi) ▪Ghost bat (Macroderma gigas). | ||||||||||
125
Hidden Valley biodiversity assessments of potential TSF sites
We completed biodiversity assessments as part of the prefeasibility study to extend Hidden Valley’s life-
of-mine, including field surveys of two potential TSFs. The flora and fauna survey conducted in FY25,
supported by a review of previous surveys in the broader area, indicated that the forest habitat within
the potential TSF locations is well represented across the region. The mine extension is unlikely to
threaten the viability of significant flora and fauna populations or ecosystems since there are no habitat
features that are notable for conservation of a threatened species.
Implementing biodiversity protection initiatives
Free State operations
Harmony completed the alien and invasive plant (AIP) assessments for all our Free State operations and
high-level control and eradication plans. The next steps involve implementation of phased eradication
plans.
Eva Copper planning and controls
We established an internal permit system to review all ground disturbance activities on our Queensland
mining and exploration tenements. This system enables us to review proposed activities against site
environmental criteria, check project activity sites to address sensitive biodiversity values (and cultural
heritage and other land values) and to specify how site activities are environmentally managed.
Implementing biodiversity protection measures
Management of alien and invasive species | Fauna clearances ahead of Eva Copper site preparatory activities | |||||
We eradicated 1 062ha of alien and invasive plants at Kusasalethu and Mponeng. | During FY25, we conducted over 1 000 man- hours of fauna spotter activities as part of the pre-clearance procedures, bringing the total to more than 2 000 hours to date. We also upskilled select employees to support fauna spotter and catcher activities and provided snake handling training, aligned with Queensland wildlife regulations. | |||||
Group-wide biodiversity footprint assessment
Harmony commissioned the Endangered Wildlife Trust (EWT) to conduct a biodiversity footprint
assessment of the group’s assets to enhance our understanding of the current and future impacts of our
growth. The assessment is aligned with the globally recognised Biodiversity Disclosure Protocol (BD
Protocol), which provides a science-based, standardised framework to measure, manage, and
transparently report our biodiversity footprint, in a manner comparable to the way carbon and financial
performance are tracked.
The assessment is setting groundwork to define how each of Harmony’s regions will respond to global
biodiversity challenges, as well as the impacts and opportunities linked to our operations.
Each region, and in some cases, individual assets, face unique regulatory frameworks, nature legislation
and licensing obligations that must be embedded into our approach. Across our portfolio, the diversity
of ecosystem conditions (from highly disturbed areas to largely intact natural environments with
ecologically sensitive features) and the variety of land-ownership models (including Harmony-owned
land, third-party leases, customary tenure and areas with recognised native title interests) create
context-specific risks, opportunities, engagement and collaboration requirements.
These factors will shape the development of region-specific biodiversity roadmaps and support
the articulation of clear, enterprise-wide ambitions for biodiversity.
Revegetating land alongside mining
Advancing rehabilitation activities in South Africa
We conducted an assessment on the viability of different plant species, including the growth rates and
carbon absorption potential, to provide insights for increasing the impact of planting. We explored
other mechanisms such as carbon offset projects to bolster our land management and rehabilitation
profile. In FY25, we completed dryland grassing of five rehabilitation sites covering 70.18ha.
Altitude-based revegetation trials at Hidden Valley
To inform closure planning studies and eventual readiness for mine closure, our revegetation trials
continued. For areas of high elevation (2 600m above sea level) where plant growth rates are slow,
species selection is critical for successful revegetation. Nurseries located at different elevations facilitate
the study of plant growth under varying conditions and soil types.
Delivering meaningful biodiversity outcomes after mining
We continued the closure planning studies at Hidden Valley, with a focus on improving response
strategies for biophysical, decommissioning and socio-economic risks. Engagement with the Queensland
Government regarding the Eva Copper progressive rehabilitation and closure plan also continued,
advancing us towards regulatory approval of the plan.
126
Collaboration and partnerships
Our biodiversity management efforts benefit from and support work by other stakeholders, including
NGOs, communities and government departments.
In South Africa, Harmony, in conjunction with EWT and other biodiversity specialists, is conducting
an assessment aimed at identifying the number of Species 15 (name withheld due to sensitivity) on
Harmony-owned property as well as identifying surrounding properties on which Species 15 could
be found. Harmony has continued the investigation in the past financial year in conjunction with
our stakeholders and surrounding landowners; to conserve the species in areas devoid of agriculture
(cultivation), mining activities and human interaction; and prevent poaching and illegal trafficking.
Future focus areas While minimising biodiversity impacts remains a core focus, we are developing a more integrated approach that identifies opportunities to contribute to biodiversity resilience and deliver ecological outcomes over time, aligned with long-term value and risk considerations. Following the completion of our biodiversity footprint assessment, the next phase of this project is to explore and scope the development of regional roadmaps. In South Africa, approaches will be captured in site-specific biodiversity action plans (BAPs), which will guide biodiversity reporting and management. In Papua New Guinea and Australia, we will define how our actions integrate with existing regulatory frameworks and site-level plans for alignment with both local obligations and to support global ambitions. Additional focus areas in the short term include: ▪Updating the rehabilitation plans for all our South African operations to align with legislation, best practice and social deliverables, including local employment ▪Completing land use and livestock management plans to understand the impact of illegal grazing and find solutions to this challenge ▪Preparing a biodiversity assessment as part of prefeasibility studies for the Kerimenge gold deposit ▪Maintaining compliance with regulatory and internal biodiversity management controls as we advance Eva Copper site works. | ||
127
Our approach to social stewardship
As outlined in our sustainability framework, we aim to positively impact the lives of employees, host communities and suppliers while contributing to the
broader socio-economic development goals of the countries in which we operate.
By making social stewardship part of our everyday work, we seek to build strong stakeholder relationships, create value for everyone involved, and
strengthen our ability to operate effectively.
As with our environment-related disclosures, we have organised this chapter using the four pillars of governance, strategy, risk management (called risk and opportunity management) and metrics and targets (called
performance). We also indicate how delivery against our social commitments responds to our material matters and contributes to the SDGs.
Strategy | Our sustainability framework (embedded in our business strategy) guides the development and implementation of our social programmes, policies and frameworks, which are informed by agreement-based commitments, regulatory compliance, good industry practice and extensive stakeholder engagement. | |||||
Governance | Our social and ethics committee oversees our social responsibilities, including safety, health, human resource development, socio-economic development, corporate social responsibility, and public safety policy and programmes. Management and executive teams develop and implement these policies. The board's technical committee oversees our compliance with safety and health policy and legislation. We track changes to policy and legislation in our operating countries. To advance the social stewardship pillar of our sustainability framework, we have established a dedicated ‘social cluster’ in South Africa. This governance structure facilitates cross-functional coordination, promotes internal integration, and embeds a collaborative approach to stakeholder engagement. Through this mechanism, we ensure that social performance objectives are not only strategically aligned but also operationally supported across the organisation. The social cluster serves as a platform for aligning departmental efforts, sharing insights, and co-developing initiatives that respond to stakeholder needs and societal expectations. This integrated approach strengthens our capacity to deliver measurable social outcomes, which are tracked, evaluated, and transparently reported as part of our commitment to continuous improvement and accountability. | |||||
Risk and opportunity management | Our social risks and opportunities are defined through our enterprise risk management process, set out in the Risk and opportunity management section. These are the most significant social risks to our business, workforce, and host communities over the medium to long term. They could negatively affect our costs, operations, working conditions, communities and supply chain. Group and regional executive committees and the audit and risk committee receive risk management reports, discuss emerging risks, and assess the effectiveness of mitigation strategies on a quarterly basis. The impact of the risks was assessed against Harmony’s risk categories as set out in the risk appetite and tolerance framework. Our top strategic social risks and opportunities for FY25 are outlined in the Sustainable framework and included in each section of this chapter. | |||||
Performance | All operations implement approved social strategies and supporting programmes to deliver on our social stewardship commitments. Find our social policies on our website under sustainability. | |||||
Each section of this chapter provides: ▪An overview of our approach for each social topic and how we implemented our social programmes, policies and frameworks, including the priorities we pursued in FY25 and progress against our targets ▪Insights into how each social topic is governed and managed to meet or exceed regulatory requirements ▪Detail on the risks faced per topic and the management measures. | ||
128
Honouring and protecting human rights
Our social stewardship approach is supported by Harmony's code of
conduct, which outlines our human rights policy and core values, and
directs employees and suppliers to act with integrity. We respect
each person's fundamental and universal human rights and freedoms,
as stated in our human rights policy.
We adhere to the Minerals Council South Africa membership
compact, a mandatory code of ethical business conduct that provides
guiding principles. We also uphold International Labour Organization
principles in our employment policy and established practices,
including freedom of association, the elimination of forced labour,
the abolition of child labour and the elimination of discrimination in
the workplace. Our highly unionised South African employee base
engages in collective bargaining. Across the group, we have policies
to deter sexual harassment and workplace bullying.
The Voluntary Principles on Security and Human Rights and prevailing
legislation are reinforced through our annual training for security
personnel. We frequently discuss our human rights and ethical
behaviour policies with peers, the government and civil society.
Harmony and Newcrest Mining Limited (a subsidiary of Newmont
Corporation), in relation to their participation in the Wafi-Golpu Joint
Venture, have been the subject of an Organisation for Economic Co-
operation and Development (OECD) Specific Instance complaint
lodged with the OECD National Contact Point in Australia (Aus NCP) in
November 2022. The notifiers were Huon Gulf coastal villagers
represented by the Centre for Environmental Law and Community
Rights Inc (CELCOR), who alleged the breach (particularly regarding
the plans to utilise DSTP) of various human rights and environmental
requirements set out in the OECD Guidelines for Multinational
Enterprises 2011.
On 29 August 2025, the Aus NCP examiner published its report,
finding that the activities of Harmony and Newcrest did not appear to
align with the OECD guidelines in certain areas and a number of
recommendations were included in the report. The findings and
recommendations are largely consistent with the actions the Wafi-
Golpu Joint Venture has been undertaking throughout many years of
consultation and engagement with Papua New Guinea host
communities, and Harmony and Newcrest will work towards further
strengthening alignment with the guidelines (taking into account the
recommendations of the examiner) in future Wafi-Golpu
project activities.
Our human rights policy and code of conduct are available on
our website.
Rights of Indigenous peoples
We acknowledge the Indigenous stakeholders across our areas of operation, including Traditional Authorities in South Africa, First Nations
peoples in Australia, and the customary landowners, host communities, and employees of the Hidden Valley mine and
Wafi-Golpu Project in Papua New Guinea. Our related policies include our human rights policy, stakeholder engagement policy,
socio-economic transformation policy (applicable to South Africa) and the Australasia region’s social performance policy.
Indigenous peoples have interests in our current operational areas and are identified through self-identification, community consultation, and
where applicable, legal recognition through court determinations or statutory processes.
South Africa | Papua New Guinea | Australia | ||||||||||
Traditional authorities (kings, paramount chiefs, chiefs and their communities), are important Harmony stakeholders. These authorities embody different and dynamic cultural norms depending on the region in which they are found. We engage with traditional authorities in Ratlou in the labour- sending area of the Eastern Cape, and to a lesser extent in Lesotho. We make it our business to be familiar with the cultural norms and dictates within the various regions we serve and approach the relevant traditional authorities with this in mind. This helps to normalise relations and highlights the respect the company has for these authorities. This awareness and mindfulness have helped tremendously with the successful implementation of socio- economic initiatives. We use the opportunities afforded by days on the South African calendar which bear cultural significance to encourage awareness and appreciation of our various cultural backgrounds. | Papua New Guinea has a rich and vibrant culture with over 800 different tribes and languages from 22 provinces in four regions. We recognise and respect the culture, cultural heritage, values and traditions of host communities, and those of our employees who come from all regions of Papua New Guinea. Regular, agreed processes exist for engaging with host community leaders, and their communities, at Hidden Valley mine and Wafi-Golpu. In Papua New Guinea, our commitments to Indigenous peoples are formalised through our mining- related agreements. This includes the Hidden Valley Memorandum of Agreement (MOA), which encompasses employment and business opportunities, environment and closure obligations, and community development programmes aimed at supporting positive social and economic outcomes. | Australia is home to more than 250 distinct groups of First Nations peoples, each with their own unique languages, cultural practices and territories. In Australia, resource companies are subject to native title and cultural heritage laws and processes. Our native title agreement with the Kalkadoon People includes engagement, cultural heritage protection and employment, training and business opportunities. Aligned with the current stage of the project, we are progressing strategies that acknowledge the Kalkadoon people’s connection to country and the Eva Copper site. These considerations, along with community input, are being integrated into project planning, broader community investment framework development, and employment and supply strategies. | ||||||||||
129
Safety transformation towards zero harm
We are transforming the way we address and manage safety to reduce incidents, improve predictability and achieve safe, profitable production. We remain dedicated to achieving
zero harm and fostering a proactive safety culture.
Material matters | |||
Employee health and safety | |||
UN SDGs | |||
| Decent work and economic growth | ||
GRI disclosure requirements | |||
▪GRI 3: Material Topics 2021 ▪GRI 403: Occupational Health and Safety 2018. | |||
FY25 priorities | |||
1.Maintaining a proactive and just safety culture to achieve zero harm 2.Embedding risk management to identify and respond to risk 3.Adopting innovation and business improvement. | |||
Strategy: Embedding safety practices in everything we do
Our integrated approach to safety enables continuous improvement by implementing humanistic transformation, proactive risk management,
health and wellness initiatives and employee engagement.
Theme 1: Humanistic culture | Theme 2: Systemic risk management | Theme 3: Employee health and wellness | Critical success factor: Employee engagement | |||||||||||
An integrated approach to mature leadership, empowering employees, leaders living the Harmony values enabling high levels of employee engagement with a deep sense of care. | Supporting frameworks, policies and procedures, risk management methodology and processes, human resources, group technology and procurement. | Interventions that support employee and contractor physical and mental wellness. Refer to the Health section in this report. | Creating awareness and instilling personal ownership to question processes and protocols. Empower our workforce to embed safety practices in work routines. | |||||||||||
Three key enablers (see table/infographic below) bolster our comprehensive risk management, namely effective risk response, learning from past
incidents and fostering a culture of accountability. Central to this approach is the concept of personal ownership, which empowers Harmony’s
workforce to proactively identify potential risks. We monitor golden/critical controls diligently to maintain their effectiveness. This holistic
approach, driven by a cross-functional team and reinforced by strong management support, enhances our operational resilience and aligns with
our commitment to safety and continuous improvement.
By embedding these principles into our daily operations, we strive to create a safer and more responsible working environment for all.
Risk response protocol | Learning from incidents | Accountability | ||||||||
Our risk response protocol enhances the effectiveness of our risk management processes. This mechanism enables us to escalate risks appropriately to be addressed at the correct levels within the organisation. | We employ a learning methodology driven by a diverse team of experts. We share insights gained across the organisation to prevent similar future occurrences by embedding the learnings. | Creating a culture of accountability involves recognising and rewarding positive actions while effectively addressing and guiding behaviours that do not align with organisational goals. This approach motivates our workforce to exhibit behaviours that contribute to Harmony’s success and integrity. | ||||||||
Personal ownership | ||||||||||
Our enablers are underpinned by personal ownership to create a true culture of accountability – doing the right thing even when no one is watching. | ||||||||||
130
Our safety approach is focused on achieving zero harm and preventing major incidents within our operations. To accomplish this, we have set key priorities that guide our safety efforts, allowing us to effectively manage
risks and protect our workforce and assets. Our priorities are dynamic, adapting to the evolving needs of our operations, and reinforcing our commitment to safety as a core value.
Maintaining a proactive and just safety culture to achieve zero harm | We cultivate a proactive safety culture where every Harmonite is empowered to make safe decisions by: ▪Creating a proactive safety mindset that is deeply embedded in our work routines and decisions ▪Empowering middle managers and supervisors by equipping them with the tools, authority and confidence to lead their teams towards success ▪Fostering a just culture where discipline, accountability and consequence at every level identify significant unwanted events ▪Moving beyond compliance to a culture of care and continuous improvement where we learn from and prevent accidents. This commitment to a just culture ultimately leads to improved organisational performance and a more resilient workforce, capable of adapting to and overcoming challenges. Our proactive safety culture is further enabled by an organisational effectiveness improvement discipline, which provides thought leadership on culture transformation from a humanistic perspective through: ▪Organisational culture improvement ▪An employee value proposition ▪Operational improvement and effectiveness. Since 2021, Thibakotsi (meaning “to prevent harm” in Sesotho) has been a cornerstone of our culture in the South African operations, driving meaningful change in employee behaviour around safety and risk prevention. Its success lies in making safety principles accessible, understandable, and actionable for all employees. At the heart of Thibakotsi is a humanistic approach grounded in hope, trust, and respect, which fosters a strong psychological contract between employees and their supervisors as representatives of the company. This foundation encourages personal ownership and effective collaboration, embedding the belief that achieving zero harm, zero accidents, and zero loss of life is a shared responsibility. By aligning behaviour with safety standards and remaining vigilant to the wellbeing of colleagues, every employee contributes to a culture where safety is not just a priority, it is a collective commitment. | ||||
Embedding risk management to identify and respond to risk | Risk management is an integral part of our operations, driven by key processes that include: ▪Using a proactive, four-layered risk assessment approach ▪Emphasising the importance of employee engagement driving the value of safety and accountability to sustain a safe work environment through routine visible felt leadership days and safety days in collaboration with our key stakeholders (Harmony Tripartite structure) ▪Using digitisation that enables data collection and analysis to provide leading indicators that inform decision making (both lagging and leading) ▪Setting and measuring performance against strategic priorities and safety-related KPIs at an executive level. Our critical control management process allows for the effective identification and implementation of risk-based controls to prevent significant unwanted events or minimise impact should they occur. We categorise controls based on their position in the hierarchy of controls and the survivability, availability and reliability rating of the control. These controls inform our leading indicators that enable us to measure how effectively we embed risk management as part of our risk-adapted business process model. We analyse control effectiveness through digital monitoring to identify improvement opportunities on control performance. | ||||
Innovating with continuous business improvement | Harmony is dedicated to being a learning organisation, consistently exploring innovative methods to enhance our processes and enable continuous improvement. These include: ▪Implementing digitised multidisciplinary start-up risk assessments and pre-planning of workplaces, planned maintenance and high-risk work verification and deficiency response ▪Leveraging insights from past incidents, internally and industry-wide ▪Identifying new technology and processes to enhance how we monitor, measure and report on safety while enabling us to continuously learn and share these learnings across our organisation. We also adopt industry-leading practices, including: ▪The Minerals Council South Africa’s Mining Industry Occupational Safety and Health (MOSH) community-of-practice adoption process and initiatives, which have been established from learnings across the industry that have been tried and tested as best practice ▪Upholding MineSafe conference outcomes in our visible felt safety leadership approach and behavioural interventions ▪Aligning critical hazard control management with the ICMM guidelines and principles, which assists us in preventing or mitigating serious incidents ▪Monitoring and managing mining-related seismicity through short-term hazard assessments and long-term plans. | ||||
131
Governance
Our governance approach is policy-driven and supported by robust reporting and assurance structures, reflecting best practice in the mining
sector.
Accountability and responsibility | The board and its relevant committees, particularly the social and ethics committee and the audit and risk committee, oversee the governance of safety, with clearly defined roles and responsibilities. These committees monitor the implementation of safety policies, compliance with legal requirements and the effectiveness of risk management processes related to occupational health and safety. Harmony’s governance, policies and reporting structures are designed to create a robust occupational health and safety management framework. | ||||
Performance monitoring and reporting | We regularly review and update our safety policies and procedures to reflect evolving risks and regulatory requirements. We have established processes for remediating negative safety impacts, including incident investigations, corrective actions and stakeholder engagement. We drive continuous improvement through monitoring performance, external assurance, and responding to findings from internal and external audits. We share risk-related information through various communication channels to enable structured decision making from board and management level through to operator level. Daily reports on leading indicators provide information about safety, occupational health and production-related workplace risks. We monitor our compliance with radiation certificates through annual audits. Legally appointed radiation protection officers (RPOs) and permanently employed radiation protection monitors (RPMs) manage Harmony’s radiation certificates of registration (CoRs). | ||||
Policies that support our governance approach | Harmony has formal policy commitments to safety, which are referenced in this report and available on our website. Our sustainability framework and approach to social stewardship outlines our commitment to occupational health and safety, including adherence to international standards and best practices. Harmony’s safety management system aligns with GRI 403: Occupational Health and Safety 2018, covering hazard identification, risk assessment, incident investigation and worker participation. | ||||
Risk and opportunity management
Our integrated risk management approach, guided by
international standard ISO 31000 risk management principles,
adopted into our regional Harmony safety standards and adhered
to by everyone across our host regions, solidifies our strategy to
identify risks and opportunities to achieve safe and sustainable
outcomes. Given the inherent risks of our mining footprint, we
apply several risk assessment methodologies to business
processes and potential new operations and projects to identify
and mitigate risks. This is primarily guided by our four-layered risk
management approach:
▪Baseline risk assessment to identify hazards and significant
unwanted events
▪Issue-based risk assessment (bowtie analysis) to analyse threats
and critical controls
▪Task-based assessment to identify controls for specific tasks
▪Continuous risk assessment to monitor, review and enable the
effectiveness of controls.
Alongside this approach, we implement specific mitigation
measures to address identified risks.
In Papua New Guinea, a risk register is maintained with identified
critical risks to safety and operations. A bowtie is aligned with
each critical hazard, and controls for material risks are
implemented and verified by operator critical control checks
(OCCC) prior to commencing tasks, as well as field critical control
checks (FCCC) completed by supervisors and system verification
checks (SVC) by managers. These checks and reviews confirm that
controls of critical safety hazards and risks are effective and
relevant to the work tasks.
Australia follows the above risk management process, as well as
shared risk management with project alliance partners in
construction of broad brush risk assessments and risk register
creation.
132
Risks | Description | Mitigation measures | ||||||
Loss of life and serious incidents | Harmony has experienced multiple loss-of-life incidents in recent years, including those caused by fall of ground and machinery-related incidents. Each loss of life directly impacts the community of the employee. The loss of life results in significant operational disruption, reputational damage and regulatory scrutiny. | To address this, we: ▪Investigate every incident and loss of life in terms of the regulatory requirements and other best practice to determine the causes and contributing factors ▪Integrate lessons learnt into our learning from incidents process and communicate these to prevent future incidents ▪Ramp up our business improvement initiatives to identify feasible best practice mitigation measures ▪Provide compensation to support employees and their families, acknowledging the devastating impact of every loss of life and serious injury. | ||||||
High-risk mining environments | Deep-level hard rock mines and open-pit mines present significant occupational health and safety hazards, including rock falls, equipment accidents and exposure to dust and noise. | We enforce our golden/critical controls needed to mitigate and address these risks. We also implement an integrated health and wellness strategy and pollution prevention measures to mitigate the impacts of mining operations on our workforce. | ||||||
Regulatory compliance | Non-compliance with health and safety legislation can result in legal penalties, operational stoppages, and increased oversight from authorities. | Harmony is committed to meeting regulatory requirements by implementing rigorous and ongoing reviews, and golden/critical control monitoring. This offers a transparent view of controls and allows us to be proactive in maintaining compliance with regulatory standards. By continuously evaluating and enhancing our processes, we strive to uphold the highest standards of regulatory adherence and operational integrity. | ||||||
Behavioural and cultural risks | Lack of response or partial response to risk and communication breakdowns among employees have been identified as contributing factors to incidents. | Beyond the physical mining environment, we remain dedicated to the holistic wellbeing of every Harmonite, creating a safe and supportive workplace that prioritises health and safety. By fostering empathy and open communication using a just culture approach, we create a culture where everyone feels valued and heard. We achieve this through our humanistic culture transformation initiatives. Thibakotsi demonstrates our ongoing commitment to care for our people by enabling a proactive safety culture to ensure everyone returns home safe every day. | ||||||
Resource and infrastructure constraints | Labour and material shortages, as well as ageing infrastructure, can increase the risk of accidents and impede the implementation of safety improvements. | The implementation and monitoring of our golden/critical controls enable us to effectively identify, mitigate and address these risks. | ||||||
Community and third-party impacts | Harmony’s activities could pose risks to non-employees and neighbouring communities, necessitating broader stakeholder engagement and risk mitigation. | We focus on building strong community relations, contributing positively to the lives of communities in which we operate through our socio-economic development programmes. | ||||||
Opportunities | ||
Although Harmony faces a complex risk landscape in managing safety across our mining operations, this also presents opportunities for improvement and value creation. These opportunities include: ▪Digitising safety management systems, enabling real-time data collection and proactive decision-making to minimise risks ▪Driving our safety culture at an operational level through executive leadership oversight, including the CEO, and full-time safety representatives ▪Reinforcing safe practices through annual refresher training, regular safety meetings and formal induction on workplace hazards for new employees ▪Identifying improvements, sharing information and adapting to changing operational realities, enabled by our risk-adapted business model ▪Partnering with the Minerals Council South Africa to advance the development and adoption of digital tools that enhance safety, operational efficiency, and data-driven decision making across the mining sector. | ||
133
Measuring our performance
Performance against our group KPIs was as follows:
KPI | Threshold | FY25 performance | ||
Loss of life | 0 | We tragically lost 11 colleagues (FY24: 7) | ||
LTIFR | 5.00 | 5.39 per million hours worked (FY24: 5.53) | ||
South Africa | Papua New Guinea | Australia | ||||||||||
The main contributor to LTIFR at our South African operations is slip-and-fall incidents. The top 10 contributors to reportable injuries were: 1.Slip-and-fall incidents 2.Material handling 3.Tools/machinery/equipment 4.Gravity-induced falls of ground 5.Struck by 6.Seismic-induced falls of ground 7.Trucks/tramming/transport 8.Rolling rock 9.Scraper winches 10.Foreign body. | Our 12-month moving average (12MMA) LTIFR was zero (FY24: 0.46) and our all-injury frequency rate (AIFR) was 3.05 (FY24: 5.26). We have been loss-of-life free since 2015. At Hidden Valley, our 12MMA LTIFR reduced to zero. Our total recordable injury frequency rate (TRIFR) was 0.98 (FY24: 1.19) while AIFR was 3.26 (FY24: 5.09). Hand and finger injuries were the leading causes of injuries. We are addressing this through our risk management processes, conducting thorough investigations, creating awareness and removing hazards that lead to these injuries. The 12MMA LTIFR and AIFR for Wafi-Golpu and our Papua New Guinea exploration team was zero. | The 12MMA LTIFR for Australia was 4.44 (FY24: 3.52) with two restricted work injuries recorded. Corrective actions from the incident cause analysis identified effective controls to mitigate incident reoccurrence. Eva Copper’s AIFR was 28.19 and Australian exploration was 24.27, with the majority being finger and hand injuries. This has been addressed via a targeted awareness campaign and increased vigilance in conducting personal risk assessments. | ||||||||||
134
In memoriam | ||||||||
Mojalefa Segage Moab Khotsong mine – rock drill operator 28 November 2024 Cause Gravity-induced fall of ground | Fundile Mdungelwa Mponeng mine – scraper winch operator 20 February 2025 Cause Seismic-induced fall of ground | |||||||
Phakamani Khiphezakho Gumbi Doornkop mine – machine rock driller 4 February 2025 Cause Explosives/explosion/ignition | Andile Goodman Toko Mponeng mine – mining team member 20 February 2025 Cause Seismic-induced fall of ground | |||||||
Telang Nene Doornkop mine – machine rock driller 4 February 2025 Cause Explosives/explosion/ignition | Joaquim Alfredo Chihobomo Cossa Moab Khotsong mine – loco operator 25 April 2025 Cause Trucks/tramming/transport | |||||||
Moloja Samuel Leteketa Joel mine – rock drill operator 4 February 2025 Cause Gravity-induced fall of ground | Lebamang Senetane Saaiplaas plant – general worker 27 April 2025 Cause Struck by | |||||||
Morero Patric Taeli Joel mine – rock drill operator 4 February 2025 Cause Gravity-induced fall of ground | Lebohang Mokiri Joel mine – stope team member 4 June 2025 Cause Gravity-induced fall of ground | |||||||
Themba Ephraim Maloka Joel mine – stope team member 4 February 2025 Cause Gravity-induced fall of ground | ||||||||
135
Progress against priorities
Priority 1: Maintaining a proactive and just safety culture to achieve zero harm
South Africa: Culture transformation through Thibakotsi
We recognise that any culture change journey takes years to be fully embedded. For the past four years, we have monitored the success of Thibakotsi
through various diagnostics (ie surveys) and have seen a steady improvement in safety incidents. Our focus has been on humanistic transformation, and
we have made significant progress on our culture transformation journey, with implementation at 79% (FY24: 78%). This indicates a significant, positive
shift towards our intended safety culture objectives and sustainable business practices. In 2024, the South Africa Region conducted its fourth Company
Culture Survey (CVA), receiving an impressive 23 517 responses, representing a 54% participation rate from senior management to frontline employees.
The results reflect a workforce deeply engaged in shaping a positive organisational culture. The region’s overall entropy score of 12% indicates relatively
healthy functioning, though departmental scores varied widely from as low as 5% to as high as 36%, highlighting areas requiring focused attention. A
recurring theme in validation workshops was the strong sense of job security, with many employees expressing pride in Harmony’s commitment to
avoiding retrenchments and investing in long-term sustainability through acquisitions and life-of-mine extensions. This sense of stability reinforces the
values embedded in the Thibakotsi Journey – where purpose, pride and progress converge to shape a resilient and inspired workforce.
For the next phase of this journey, we are shifting our focus to organisational sustainability, accountability and integration of risk management as part
of our company culture. We continue to reinforce culture transformation by:
▪Embedding our safety culture in operational work routines and multi-function integration
▪Focusing on governance and quality of the culture transformation programme tactics
▪Maintaining the required behavioural change of all employees and contractors.
We plan to map future progress through operational feedback to our executive committee. Employee engagements will include robust discussions about
personal ownership of the programme to enable the development of a Thibakotsi sustainability framework for the next three years.
The Thibakotsi journey unpacked
Proactive culture/Live longer | ||||||||||||||
Leader | Initiative | Business improvement | Optimisation | |||||||||||
Develop myself | Visible felt leadership: approach, training, coaching and feedback | Visible felt leadership established at all operations | Embed a new way of work – linked to our values | |||||||||||
Leadership assessments and leadership development programmes | Effective, efficient and mature leadership | |||||||||||||
Develop others | Engagement and tactics for middle management and supervisors | Engaged and empowered middle management and supervisors | ||||||||||||
Risk propensity assessments and training | Improved employee and team risk profiles | |||||||||||||
Learning from incidents: closing the loop and organisational learning | Learning from incidents processes established | |||||||||||||
Take people along | Bottom-up interventions: safety transformation with training and impact measurement | Improved operational safety and production indicators | ||||||||||||
Employee engagement tactics | Engaged employees at all operations | |||||||||||||
Change management, including stakeholder engagement, communication, evaluation and audit of key action items | ||||||||||||||
Australasia: Enhancing our proactive safety culture
For our Australasian operations, we conduct visible
felt safety leadership (VFSL) and critical control check
training. By focusing on behaviour, controls and
psychological factors, we seek to reduce the potential
for injuries and HPIs. We are introducing the “safety starts
with me” behavioural programme in FY26.
To assist with our regional growth plans, regional standards
(safety, health and technical) have or are being developed
to manage consistency and effectiveness.
Hidden Valley has implemented a dedicated 12-month
safety improvement plan, including life-saving behaviours,
safety leadership, just culture and recognition and leading
indicator development in addition to material risk control
assessments and reviewing contractor management systems
and processes. A safety culture maturity assessment, to be
undertaken in early FY26, will guide direction and create a
continual improvement roadmap in our safety culture
journey.
Hidden Valley completed 6 797 VFSL interactions and
engagements with operations workers in FY25, displaying
authenticity, connection, trust, understanding and care.
There were 743 sessions of selected safety training and
inductions undertaken to enable our work teams to
maintain safe and productive operations.
Eva Copper is adopting the same safety, health and risk
safety culture systems. We are embedding a proactive
safety culture into daily activities as we undertake further
exploration activities and preparatory works at the site.
136
Workers covered by our occupational health and safety management system
Harmony is committed to the health and safety of all workers (inclusive of contractors and service providers) operating under our control. Harmony
continuously promotes initiatives to reduce the risks associated with the business activities. Our occupational health and safety policy requires
compliance with applicable legislation, codes of practice, standards and in the absence of appropriate legislation, best practice, which includes the
implementation and management of an occupational health and safety management system.
In both our Papua New Guinea and Australia operations, everyone (employees, short- and long-term contractors, contractors and consultants) are
required to complete site safety inductions regarding operational safety and risk as directed from our health, safety and wellbeing policy. Different
inductions apply, based on various factors, including the type of work being performed, supervision requirements, length of time on site and location
type (process plant versus mining versus pit area).
In South Africa, our occupational health and safety management system fully covers all employees as well as long-term contractors. These groups are
required to complete a comprehensive onboarding programme designed to support their understanding and compliance with our health and safety
policies and procedures. However, we recognise that short-term contractors who work on our premises or under our direction are not currently
required to complete the full onboarding programme. As a result, they are not fully covered by the occupational health and safety management system
in the same way as our employees and long-term contractors. We acknowledge this gap and are actively reviewing our processes in the context of
striving to continuously reduce the significant occupational health and safety risks associated with operational activities.
We remain committed to continuously improving our occupational health and safety practices and ensuring that all individuals working within our
controlled environment are protected to the fullest extent possible.
137
Priority 2: Embedding risk management to identify and respond to risks
Critical controls
Since the inception of our digitisation and critical control monitoring in South Africa, we have gathered
239 million data points (FY19 to FY25).
The leading indicators for FY25 included:
Leading indicators for FY25 | |||||||||
Critical controls monitored cumulatively 22 million times across our operations | 2.4 million line inspections conducted and digitally captured – CAT – 4-8, all supervisory levels and middle to senior management | ||||||||
113 000 specialist inspections conducted and digitally captured – safety, occupational hygiene and strata control | 29 group verification audits on group and industry learnings – gauging our control performance to prevent a similar event from occurring | ||||||||
886 000 planned maintenance tasks performed | 83 high-risk engineering tasks verified prior to conducting work | ||||||||
Engineering discipline 365 days without a loss of life in FY25 | 36 000 employees and contractors completed safety training | ||||||||
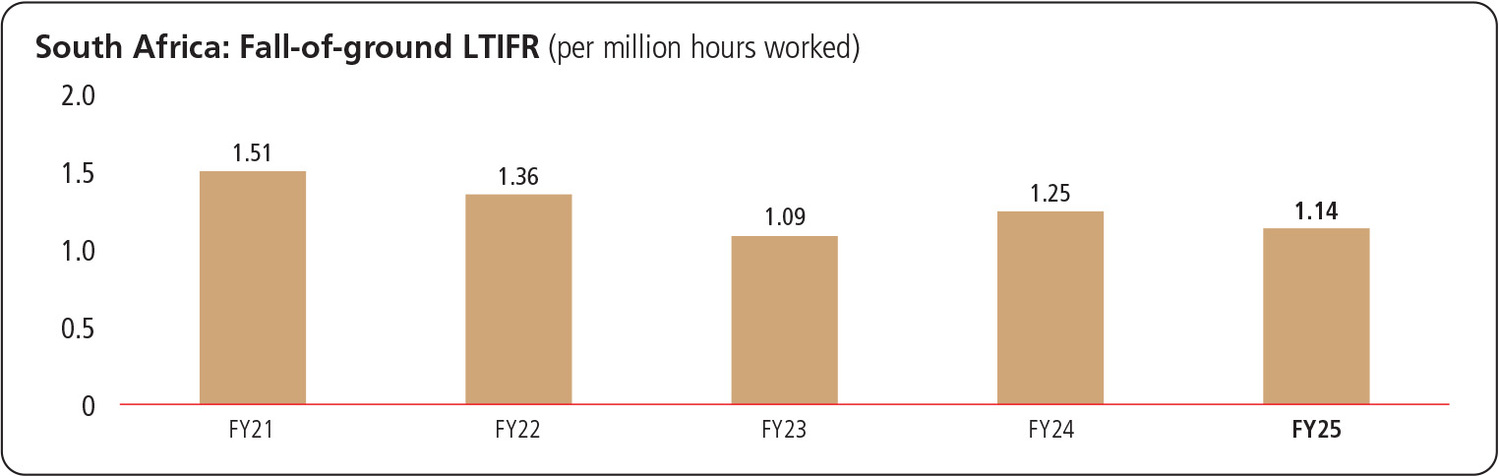
Contributors to the improvement in fall-of-ground LTIFR: ▪Robust critical control management plan on ground control ▪Proactively addressing inadequate control performance ▪Best practice adoption through the MOSH process at Harmony operations ▪Apply learnings from the analysis of our leading and lagging indicators ▪Safety culture transformation ▪Dedicated focus on seismic early warning system ▪Focused campaigns, communication and engagements on fall-of-ground golden controls ▪Support technical specification review and optimisation process through procurement. | ||
138
As we progress on our path toward achieving zero harm, we are committed to consistently evaluating
our processes to uncover opportunities for enhancement. The graph below illustrates the progress of
our production teams within our underground operations. There is a clear correlation between the
enhancement of workplace standards and quality, and the improvement in our LTIFR.
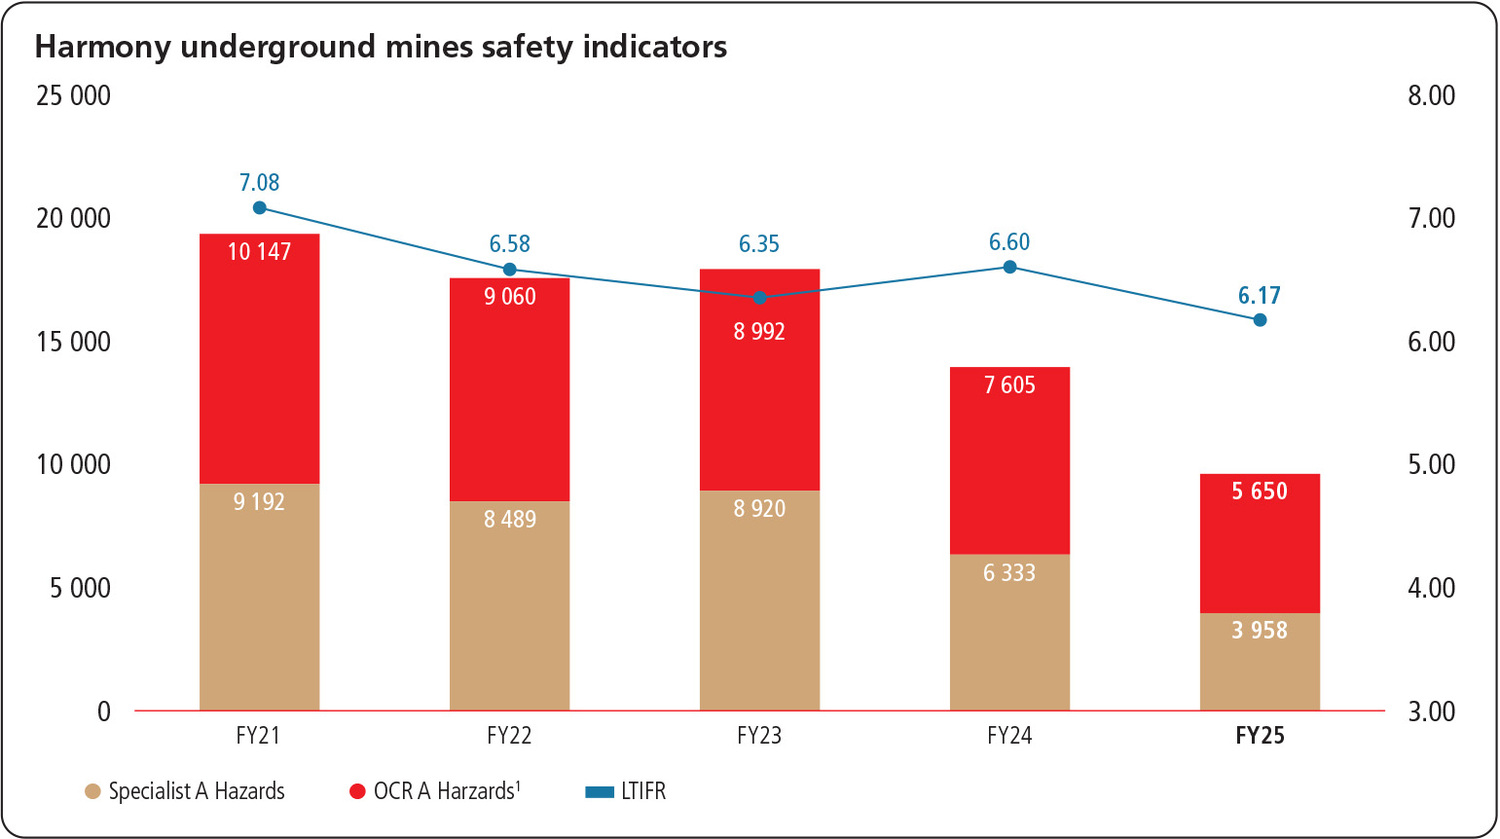
1Optical character recognition.
At Hidden Valley and Wafi-Golpu, we recorded eight vehicle incidents (the most significant safety risk,
followed by seven working at heights incidents and two intruder attacks). Vehicle operation is the
leading cause of high-potential incidents (HPIs), which led to 20 vehicle-related critical controls being
tested. The frequency of vehicle operation makes exposure to this high-risk task significantly higher
than other tasks on site. We recorded incidents with the potential for serious injury, but sufficient
controls prevented injuries.
Aligned with the group’s approach to risk management, we focus on evaluating and implementing
consistent safety systems through critical hazard controls monitoring and integrating effective risk
management. We conduct training on an incident cause and analysis method for our site leadership and
safety teams. To improve and sustain safety outcomes, our focus has been to strengthen remedial
actions based on the hierarchy of controls (highest level achievable).
Our efforts at Eva Copper remained focused on developing our health and safety management system.
This included the continuation of our extensive resource drilling campaign and safe execution of major
civil works for site access works to support the village construction phase, mine access and mine
infrastructure area establishment, while also preparing for permanent infrastructure for the future
needs of the project. This has involved establishing fit-for-purpose safety management plans for the
current works and improving the implementation of our online safety management platform.
We continuously reviewed and improved our risk assessment portfolio with ongoing workshops to
identify new health and safety risks, including critical risk for new activities introduced during the
project readiness phase and implemented appropriate controls to compliment the site broad-brush risk
assessment. With the introduction of contract paramedical services, a fully functional patient vehicle
(site ambulance), procurement of emergency response tools and equipment, and a newly established
voluntary emergency response team on site, we are in a good position to train and develop an effective
emergency response team. The benefit of a mutual aid agreement with the emergency response team
at a neighbouring mine, and our continuous training schedule for volunteers, will reduce the risk factor
to our employees and contractors requiring remote patient care and sets us in a comfortable position to
effectively manage most remote site emergencies.
139
Looking at our South African underground operations, the graph below shows the highest number of shifts without any loss of life and the number
of injury-free days for each operation during the 2025 financial year.
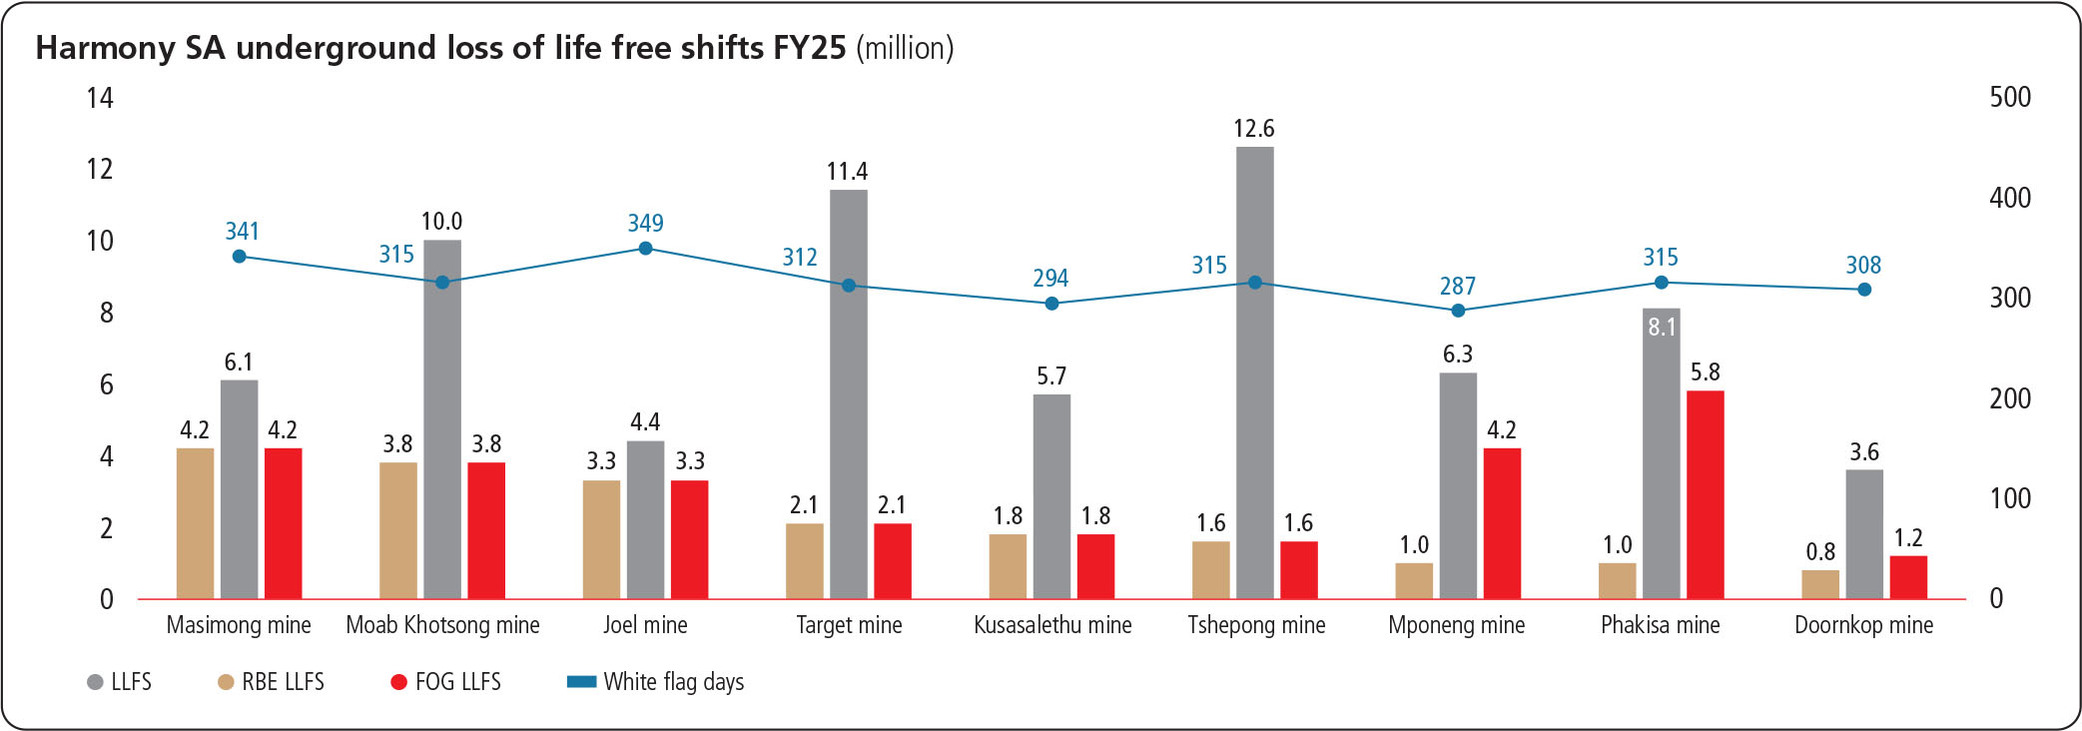
Some highlights this year include:
▪Masimong mine with a quadruple millionaire status
▪Moab Khotsong and Joel mines with triple millionaire status
▪Target mine with a double millionaire status
▪Kusasalethu, Tshepong, Mponeng and Phakisa mines all with millionaire status.
At one point during the year, five out of Harmony’s nine underground mines had each completed over a million shifts without a loss of life. Over the
year, eight of our nine underground mines reached this “millionaire” safety milestone.
Turning to our South African surface operations, 14 of the 24 operations reflected millionaire status during the 2025 financial year.
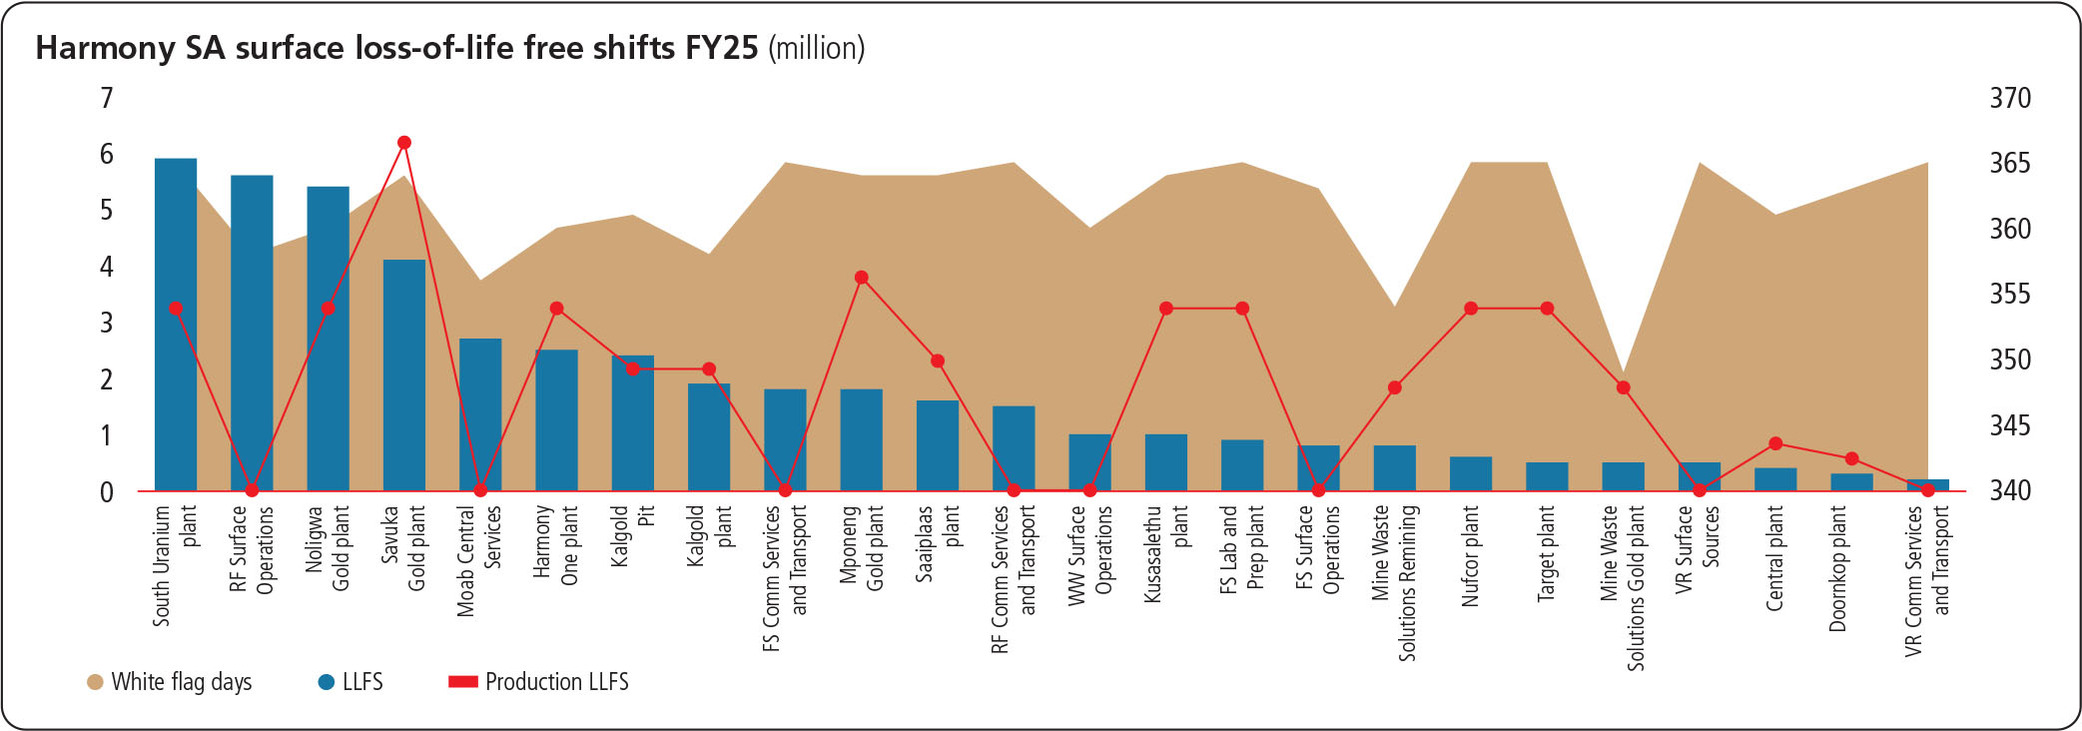
Priority 3: Adopting innovation and business improvement
To support our pursuit of innovation, Harmony has established a
business improvement division. We are piloting several
initiatives aimed at driving progress and efficiency that include:
▪Face time material availability
▪Particulate reduction to improve ventilation
▪Manless boxholes that remove people from risk
▪In-stope illumination to assist in hazard identification.
At Hidden Valley, we deploy seismic ground monitoring radar
and use vehicle fleet tracking, speed monitoring and collision
avoidance, and fatigue detection safety technologies. We aim to
use the same technology for Eva Copper’s vehicle fleet. We have
started a digitised safety software management system review
and transformation project to enhance the safety systems we
use, exploring safety technologies and AI-inspired innovations.
These initiatives reflect our commitment to continuous
improvement and our proactive approach to adopting new
strategies that can benefit our operations and stakeholders.
140
Loss-of-life and serious injury compensation for South African operations
Compensation provided this year includes:
Bereaved families receive compensation as soon as possible after the loss of an employee’s life at our operations. Compensation includes: ▪Funeral services, coffins and mourner transportation ▪An on-mine memorial service with accommodation while attending to the deceased person’s affairs ▪R80 000 Mineworkers Provident Fund advance ▪R60 000 Rand Mutual Assurance funeral policy payout ▪R50 000 Harmony donation ▪Enrolment of children in the Harmony Education Fund ▪Offer of employment at underground entry level to a family member ▪Housing support (R250 000 once-off benefit to immediate family members who are registered as the employee’s dependents and share a primary residence with the employee). We also write letters of condolence and senior management, union and other fellow employees attend funerals. | Compensation for serious injury on duty includes: ▪Lump sum or monthly payments (based on the Compensation for Occupational Injuries and Diseases Act disability rating) ▪Alternative employment (if available) ▪Two weeks’ termination payment of R75 000 from 1 July 2023, per completed consecutive year of service (if alternative work is not available) ▪Employment offer, based on available underground vacancies at entry level, to an immediate family member ▪TEBA home-based care for medically incapacitated employees ▪An additional termination package for paraplegic injury (including home renovation for wheelchair accessibility). | |||||
Collaboration and partnerships
Collaborating and partnering with key stakeholders is paramount in
strengthening the implementation of our safety strategy. We engage with
employees to receive their feedback and incorporate this into actions taken
by management to support our teams in achieving safe production. We also
enable contractor alignment with and understanding of our safety
requirements and expectations, while building related capacity. We are an
active member of the Harmony Tripartite, a multi-stakeholder task team
supported by the Minerals Council South Africa, established to achieve zero
harm by co-creating a proactive caring culture that will safeguard
employees’ safety, health and wellbeing at work and home.
Our collaboration with South African stakeholders includes:
▪Monthly alignment meetings
▪Leading the culture transformation workstream for the Tripartite
▪Benchmarking with external stakeholders and subject matter experts to
continuously improve and implement best practices, eg risk propensity
work.
Our Australasian engagements include:
▪Collaborating with the Mineral Resources Authority in Papua New Guinea
to address safety risks and solve various operational issues
▪Building a strong working relationship with the Queensland mining safety
regulator through open and transparent communication and reporting
▪Establishing a strong working relationship with a neighbouring mine at
Eva Copper, including emergency response capability support.
We also collaborate with the Australasian Institute of Mining and Metallurgy
(AusIIM) and the Australian Resources and Energy Employer Association
(AREEA), the peak bodies and voices of the Australian mining sector.
Future focus areas Our short-term focus areas include: ▪Engaging safety culture specialists to conduct a safety maturity assessment of our Australasian operations to inform future strategic safety initiatives and continual improvement programmes ▪Reviewing and updating our life-saving rules adopted to align with the critical hazard controls ▪Launching our safety behavioural programme at our Australasian operations in FY26. | ||
141
Holistic health and wellness
The nature of mining work inherently involves significant health and safety risks. Ensuring access to comprehensive, responsive and holistic healthcare mitigates these risks, protects
our workforce, and underpins our duty to care. Provision of health services contributes directly to operational stability, workforce productivity and long-term sustainability of our
operations.
Our health and wellness initiatives protect employees and contractors from occupational health risks and empowers them with the knowledge and tools to proactively drive their own health and wellbeing.
Material matters | |||
Employee health and safety | |||
UN SDGs | |||
| Good health and wellbeing | ||
| Industry, innovation and infrastructure | ||
GRI disclosure requirements | |||
▪GRI 3: Material Topics 2021 ▪GRI 403: Occupational Health and Safety 2018. | |||
FY25 priorities | |||
1.Enhancing employee health outcomes 2.Improving labour availability 3.Implementing a cost-effective healthcare model. | |||
Strategy: Proactive and preventative health management
Harmony’s health strategy consists of occupational medicine, occupational hygiene and wellness. These facets aim to prevent, detect and treat
occupational and non-occupational disease. Harmony goes beyond compliance by applying practices and a comprehensive health risk approach.
Through ongoing compliance with regulations, we remain aligned with evolving standards, proactively managing health and safety risks as
exposure limits are revised. In South Africa, recent amendments to the Mine Health and Safety Act have lowered legal exposure limits for hazards
like silica dust and noise, reflecting updated scientific evidence.
Our occupational health and safety system covers all employees working at the group. We aim to create an environment where every Harmonite
is “fit for work” and “fit for life” by building a holistic, employee-centric health programme, which is enabled by the following pillars:
Occupational medicine and wellness | ||||||||||||||||||||||||
Valued leaders enabled to deliver value | Digitised and data- driven healthcare | High quality and standards | Resilient, fit-for-work and fit-for-life employees | Leaders in healthcare and wellness | Collaborative ways of work | |||||||||||||||||||
A health team with the right people, in the right places, who create and deliver value, and are valued in the process. | Transformed internal healthcare systems, services and practices delivered using fourth industrial revolution (4IR) technology and data-driven business intelligence. | High-quality healthcare services delivered within Harmony. | A holistic and proactive approach to wellbeing that supports employees to proactively drive their own health and wellbeing. | Adoption and advancement of the best practice while maintaining cost effectiveness. | Common goals achieved through strategic and aligned internal and sustainable external partnerships. | |||||||||||||||||||
Occupational hygiene | ||||||||||||||||||||||||
We address hygiene-related exposures, including noise, dust, heat and radiation via a structured risk management approach that combines hazard identification, assessment, control, continuous monitoring and improvement. We implement appropriate control measures, including engineering and administrative controls and use of appropriate personal protective equipment (PPE). | ||||||||||||||||||||||||
142
Our health and wellness framework prioritises worker health to sustain employee productivity and performance while protecting our
licence to operate, which we promote by:
Enhancing employee health outcomes | We seek to empower employees to proactively manage their health and wellbeing, and provide safe and healthy workplaces with accessible healthcare services. Our holistic approach considers employees’ occupational health, mental and physical wellbeing. We implement applicable best practice health programmes to address occupational and non-occupational health risks. Additionally, our integrated group-wide lifestyle management programmes equip employees with the know-how and tools to manage prevalent non-occupational health issues. | ||||
Improving labour availability | Employee health and wellbeing is a critical lever to improving labour availability. By reducing absenteeism, we improve productivity, safety and profitability. We run regular awareness campaigns and encourage good hygiene practices to prevent contagion. We also deliver targeted health promotion and prevention initiatives with government and non-governmental organisation (NGO) partners. | ||||
Implementing a cost-effective healthcare model | Our cost-effective healthcare model aims to improve employee wellbeing and support labour availability through proactive, preventative and decentralised service delivery. By focusing on early intervention and accessible care, we seek to reduce long-term healthcare costs and minimise absenteeism. This model includes company-managed healthcare facilities, strategic partnerships with medical aid providers, and the integration of external healthcare services. Digital health management systems further enhance efficiency and continuity of care, facilitating timely support for employees while contributing to a healthier, more reliable workforce. | ||||
143
Governance
Accountability and responsibility | Regional executives provide strategic leadership and oversight of health and wellness initiatives and encourage personal ownership across all operations. Health and wellness teams are empowered through continuous training to adhere to applicable local legislation, regulatory requirements and Harmony’s governance standards. The health and wellness function accounts to the board on a quarterly basis through the social and ethics committee. | ||||
Performance monitoring and reporting | We achieve our desired health outcomes by: ▪Prioritising adherence to policies and standard operating procedures ▪Continuously improving regional health information systems to manage data and prepare regular reports to stakeholders ▪Ongoing performance monitoring of our proactive risk-based medical surveillance, programmes and emergency response preparedness ▪Conducting quality assurance (internal audits) and developing corrective plans to any deficiencies identified ▪Building stakeholder relationships and trust by participating in various industry health forums and collaborating with public health bodies. Regional executives and the CEO receive monthly and quarterly reports on our health and wellness programmes and outcomes. To support a culture of continuous improvement, we benchmark our practices against industry practices, use health technologies to drive better decision making and improve early detection and learn from health inspections. | ||||
Policies that support our governance approach | Our health and wellness policies and standards are informed by host country laws and regulations and global guidelines, including those issued by the World Health Organization (WHO). Standard operating procedures support compliance with policies and standards and enable the effective implementation of risk-based medical surveillance, health and wellness programmes and responses to emergencies and report incidents. The board and senior management review the occupational health and safety policy every two years or when significant changes occur, allowing for continued relevance and effectiveness in managing employee-related risks. | ||||
Compliance with regulatory or agreement-based commitments | |||||
South Africa | |||||
▪Mine Health and Safety Act, 1996 ▪The Occupational Diseases in Mines and Works Act (ODMWA), 1973 ▪The Compensation for Occupational Injuries and Diseases Act (COIDA), 1993 ▪National Nuclear Regulator Act (NRR), 1999 ▪National Health Act 61, 2003 ▪Basic Conditions of Employment Act, 1997 ▪Employment Equity Act 55, 1998 ▪Labour Relations Act 66, 1995 (as amended). | |||||
Papua New Guinea | |||||
▪Mining (Safety) Act 1977 ▪Mining Act 1992 ▪Public Health Act 1973 ▪Radiation Safety and Control Act 2019; Radiation Safety and Control Regulation 2021 ▪ISO 45001 Occupational Health & Safety Management ▪International Cyanide Management Code (voluntary) ▪Australian Work Health & Safety Act 2011 & Regulations (voluntary). | |||||
Australia | |||||
▪QLD Mining and Quarrying Safety and Health Act 1999 ▪QLD Mining and Quarrying Safety and Health Regulation 2017 ▪QLD Resources Safety and Health Legislation Amendment Act 2024 ▪Work Health and Safety Act 2011 ▪Model Work Health and Safety Regulation and Codes of Practices ▪ISO 45001 Occupational Health and Safety Management. | |||||
144
Risk and opportunity management
We provide quarterly health and wellness risk registers to the group’s enterprise risk function, enabling consistent oversight and integration into broader company operational risk management. Further, we
are constantly monitoring changes to any key legislation documented above.
We reduce our exposure to employee health-related risks by implementing our governance framework. We take an employee-centric approach, promoting collaboration across departments and functions to mitigate
health risks. This integration supports workforce wellbeing, operational continuity and compliance with legislation, and mitigates our health-related risks in an integrated, collaborative manner.
The health-related risks our employees face
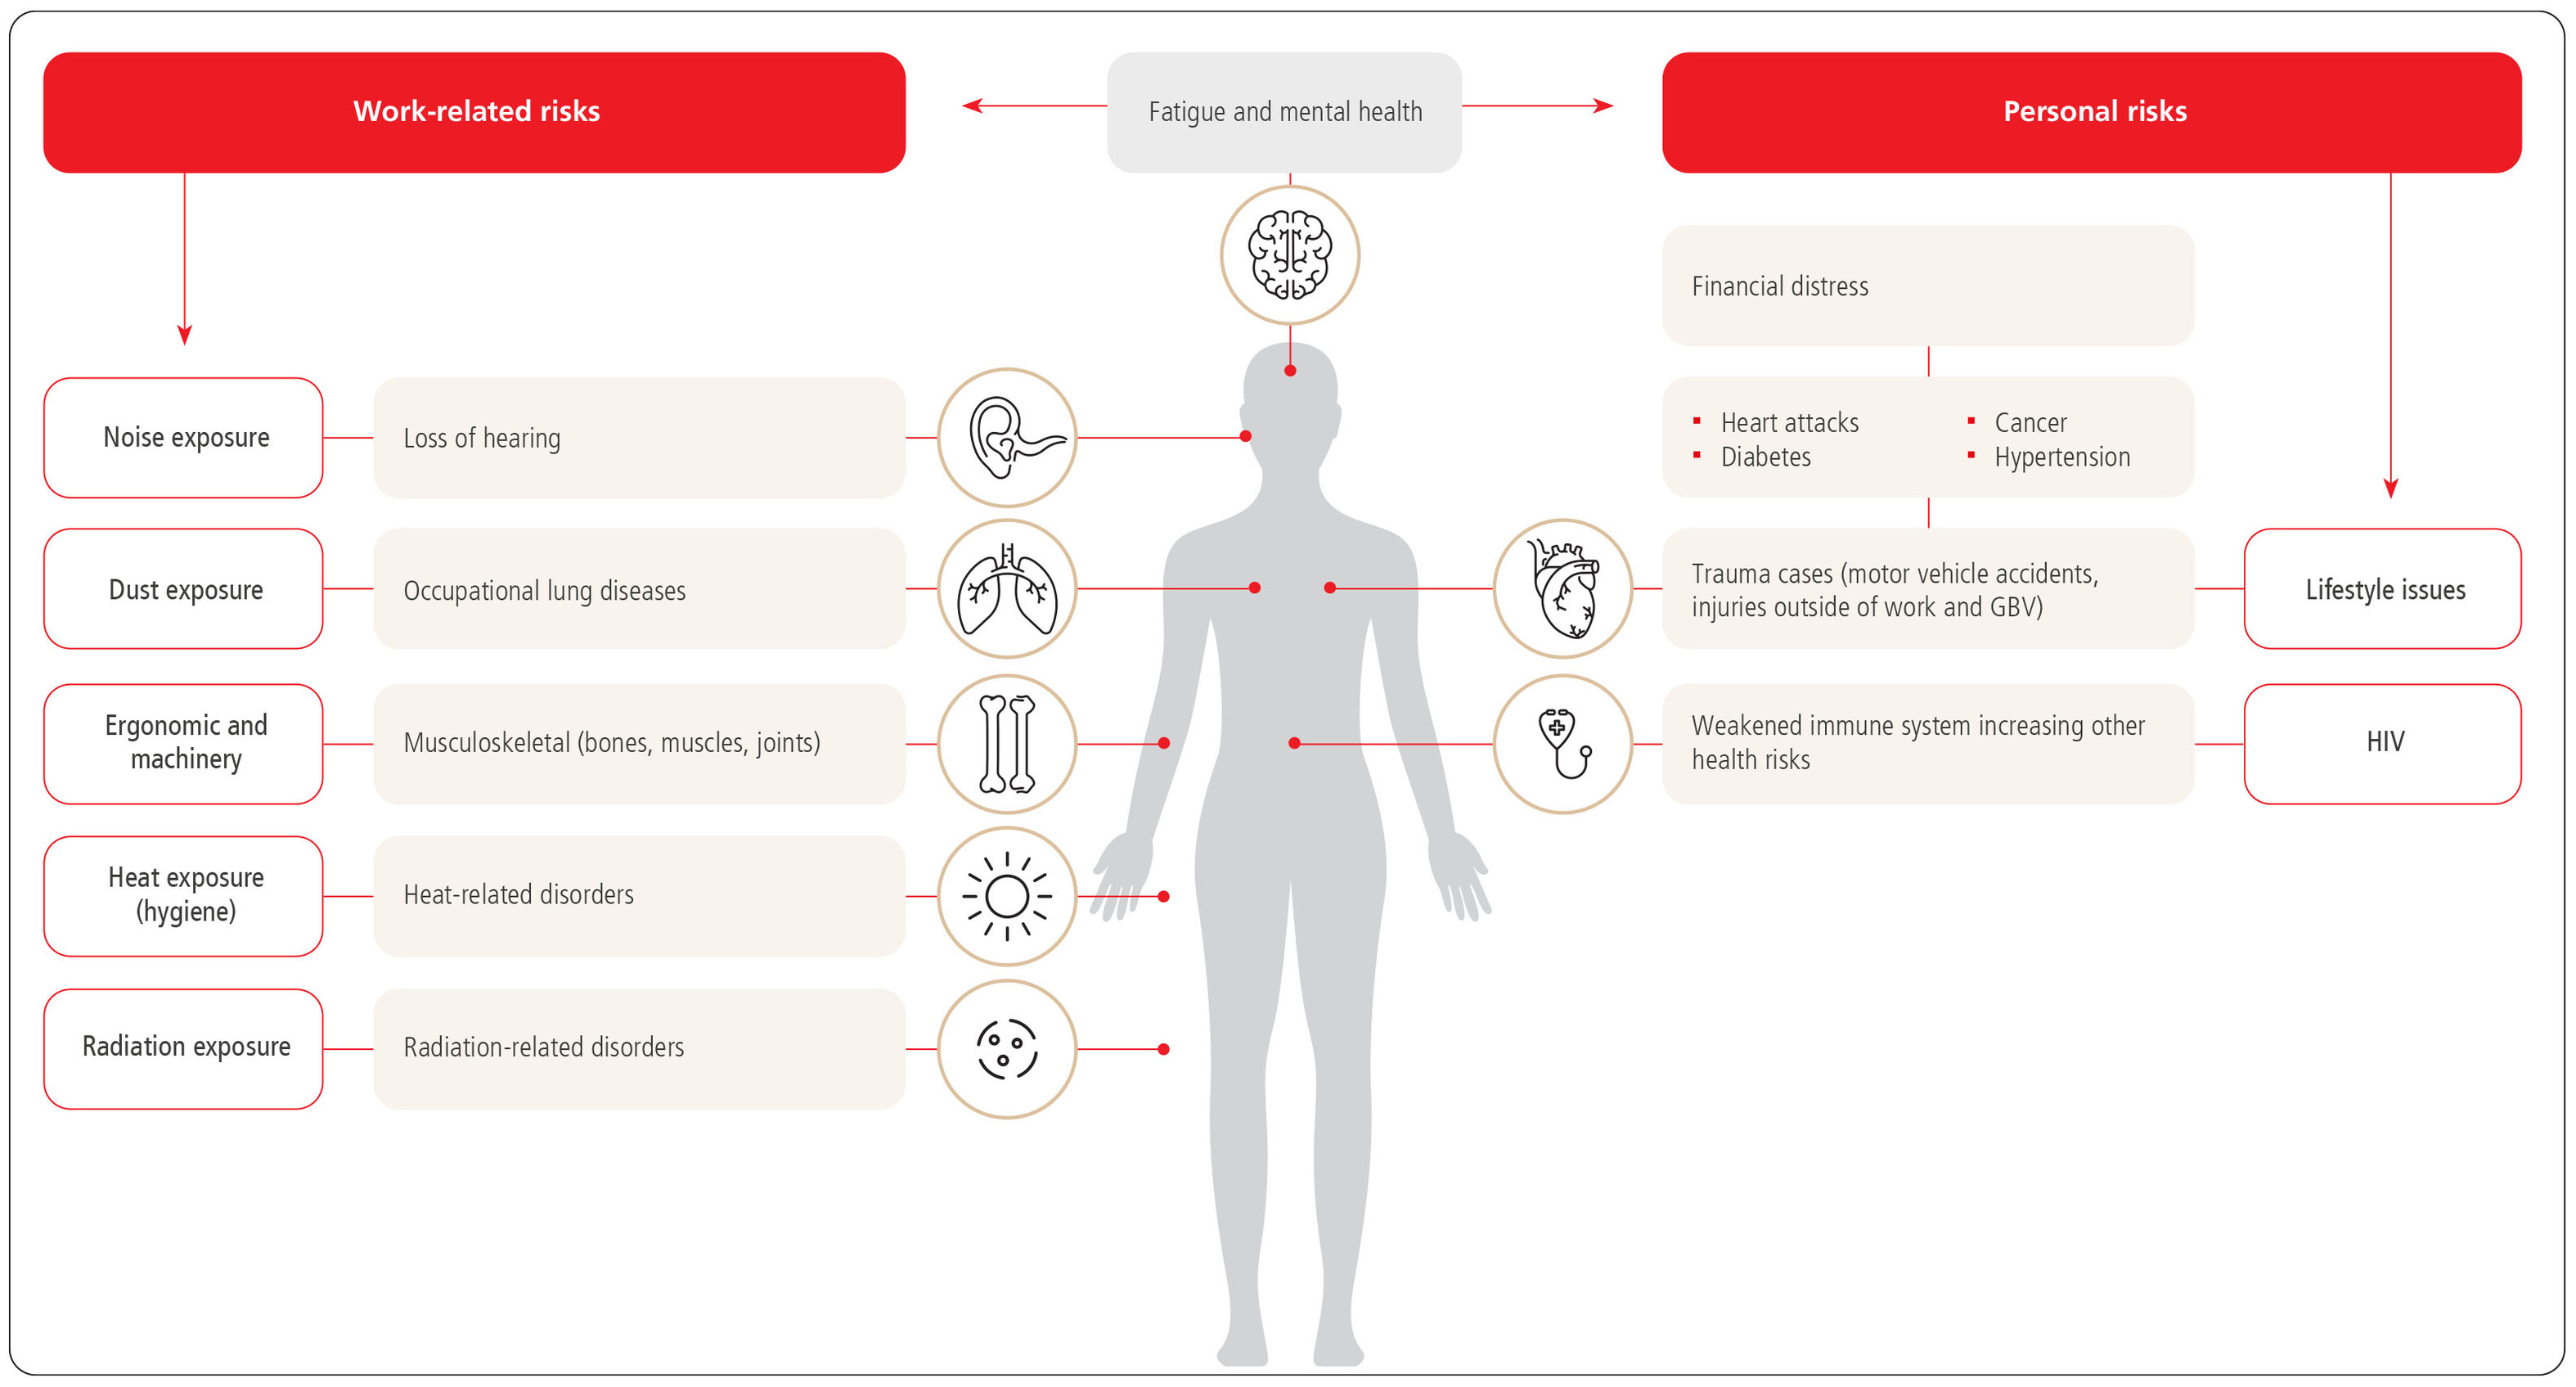
145
Description | Mitigation measures | |||||||||
Work-related risks | Loss of hearing caused by noise levels | ▪We are responsible for implementing and enforcing noise controls including, but not limited to, silencing, muffling, screening and administrative controls through the applicable hygiene standards ▪We provide risk-based medical surveillance and monitor hearing loss measures, including standard threshold shift (STS) and percentage loss of hearing (PLH). | ||||||||
Dust exposure leading to occupational lung diseases | ▪We implement and enforce dust controls, including removal through ventilation, filters, water suppression, extraction and the provision of PPE through the applicable hygiene standards ▪We provide risk-based medical surveillance and administer tuberculosis (TB) preventative treatment. | |||||||||
Musculoskeletal conditions | ▪We conduct risk-based medical surveillance and may refer employees for less physically demanding positions ▪The engineering and procurement departments select machinery with sound ergonomic design. | |||||||||
Heat exposure leading to heat-related illness | ▪In applying hygiene standards, we implement refrigeration and ventilation controls ▪We provide risk-based medical surveillance and a rehydration solution, when required. | |||||||||
Radiation exposure potentially causing neoplasms | ▪We monitor radiation exposure levels through the applicable radiation standards ▪We are responsible for setting the appropriate radiation control environment through hygiene standards ▪We screen employees to detect cancers early, improving the probability of recovery. | |||||||||
Personal risks | Fatigue and mental health issues | ▪We provide mental health and substance abuse programmes through training, awareness and counselling ▪The business improvement health initiative educates employees about nutrition’s role in managing energy and reducing fatigue. | ||||||||
Lifestyle issues leading to stress and poor health outcomes | ▪We provide risk-based medical surveillances and a dedicated lifestyle management programme ▪We are implementing a group-wide nutrition strategy to provide a resilient workforce. | |||||||||
Weakened immune system | We support employees to protect their immune systems and manage HIV by: ▪Providing access to evidence-based treatments and non-pharmacological support ▪Promoting the importance of knowing one’s health status and implementing health awareness campaigns to empower employees to take informed decisions about their own health. | |||||||||
Opportunities | ||
Our risk-based medical surveillance affords us the opportunity to recognise and respond to our occupational and personal health hazards. The opportunities we leverage include: ▪Inter-departmental collaboration, including human resources, hygiene, radiation and CSI functions and partnering with the community and service providers ▪Creating awareness on occupational hygiene and radiation issues to reduce occupational hazards and improve health outcomes ▪Expanding our digital health reach through virtual consultations ▪Strengthening health and safety leadership, governance and compliance frameworks, supported by: –Providing health workers and health facility management with leadership development and health training programmes –Training health managers on system thinking tools to enhance team culture and the management of health-related risks –Involving health facility management in developing and implementing our health and wellness strategies –Addressing the mental and psychosocial aspects of health and wellness needs of healthcare workers through the Carer for Carers (C4C) initiative. | ||
146
Progress against priorities
Enhancing employee health outcomes
Health outcomes have been broken into three categories with sub-categories as the table below indicates. Details on each sub-category follows. For the health tables that follow, PNG represents Papua New Guinea
(Hidden Valley), while AU represents Australia (Eva Copper Project).
Occupational health management | Non-occupational health management | Other communicable diseases | ||||||||
▪Noise-induced hearing loss (NIHL) ▪Radiation exposure ▪Thermal stress and heat-related illness ▪Tuberculosis (TB) ▪Silicosis. | ▪HIV/Aids ▪Lifestyle diseases ▪Mental health ▪Substance abuse. | ▪Malaria ▪Cholera ▪Typhoid. | ||||||||
Occupational health management
Noise-induced hearing loss (NIHL)
South Africa | Australasia | |||||
Goal (industry milestone)1 ▪By December 2034, the noise emitted by individual pieces of equipment operated by employees and individual process equipment should not exceed a milestone sound pressure level of 104dB(A) ▪Using diagnostic methods, by December 2034, there should be no novice cases of noise- induced hearing loss among previously unexposed individuals (those unexposed to occupational noise prior to December 2024, ie equivalent to a new person who entered the industry in January 2025). Performance this year ▪Nine pieces of equipment are above the new milestone of 104dB(A). The overall noise clipper usage is above 95% across all operations ▪The number of employees with early NIHL increased to 102 (FY24: 88) and those compensated for NIHL to 111 (FY24: 77) ▪We are on track to achieve our goal. The total number of standard threshold shift cases exceeding 25dB(A) from baseline that have been reported since January 2025 is zero. Improving our performance ▪Buying and maintaining quiet equipment as per the MOSH recommendations to reduce vibration noise ▪Controls, such as silencers, screens and enclosures, to prevent employees from being exposed to high noise levels ▪Where the risk exceeds the legislated 85dB(A) occupational exposure limit, we give employees personalised hearing protection devices, with the adherence to wearing these devices closely monitored. | Goal ▪Eliminate NIHL as a preventable occupational disease. Performance this year ▪Zero NIHL diagnoses in PNG and AU. Improving our performance ▪A hearing conservation programme will be finalised in FY26. | |||||
1 This is a new milestone as determined at the South African Mine Health and Safety Tripartite Summit. | ||||||
147
Radiation exposure
South Africa | Australasia | |||||
Goal ▪Prevent employee overexposure to radiation – below 20mSv in one year and 95mSv in five years. Performance this year ▪24 employees are on surface due to exceeding the Harmony administrative limit of 95mSv over a five-year period. Improving our performance ▪We monitor employees monthly and move them to lower-risk operations, where required. | Goal ▪Prevent harmful radiation exposure ▪No radiation dose exceedances. Performance this year ▪Zero exceedances reported in PNG ▪No monitoring performed in AU. Improving our performance ▪Compliance to radiation safety plans and licensing achieved and a monitoring plan will be developed for Australia in FY26. | |||||
Thermal stress and heat-related illness
South Africa | Australasia | |||||
Goal ▪Prevent heat-related illnesses – temperature must be below 26°C wet bulb in cross-cut intakes. Performance this year ▪64% of cross-cuts are below the 26°C wet bulb. Improving our performance ▪We are developing bulk air cooling and ventilation change-overs at some operations to reduce the prevalence of heat-related cases. | Goal ▪Prevent heat-related illnesses. Performance this year ▪Zero heat-related illness diagnosed in PNG ▪One reported heat-related illness in AU. Improving our performance ▪Thermal stress not applicable. | |||||
Tuberculosis (TB)
South Africa | Australasia | |||||
Goal (industry milestone) ▪TB incidence rate should be at or below the national TB incident rate 435/100 000 (national incidence reporting is usually lagging). Performance this year ▪159 cases diagnosed (FY24: 219), contributing to an incidence rate of 364/100 000 (FY24: 507/100 000) – a 28% year-on-year reduction. Improving our performance ▪During medical examinations, we screen employees for TB, supporting early diagnosis and treatment. We also screened 8 551 (FY24: 7 865) employees during TB Day campaigns. This resulted in an improvement in the year-on-year incident rate. | Goal ▪Prevent TB transmission in mining operations (zero transmission of TB on site). Performance this year ▪Zero confirmed diagnoses from contact tracing on site in PNG ▪TB is not a risk factor in AU. Improving our performance ▪Performance to be maintained going forward. | |||||
148
Silicosis
South Africa | Australasia | |||||
Goal 1 (industry milestone)1 ▪By December 2034, 95% of all exposure measurement results will be below the milestone level for respirable crystalline silica dust of 0.03mg/m³. These results are individual readings and not average results, and the milestone will be reviewed in 2029 (after five years). Note that this goal was introduced in the current year. Performance this year ▪78% (no comparison to prior year as this is a new goal). Improving our performance ▪Most metallurgical plants and one-third of our South African mines exceeded our 95% target. Workplace exposure to silica dust remains a risk, and long-term workplace dust-control projects are progressing well at all operations. In FY25, our engineered controls’ compliance is at 95%. | Goal ▪Eliminate new cases of silicosis. Performance this year ▪Zero diagnosed cases in PNG ▪Zero diagnosed cases in AU. Improving our performance ▪We have dust monitoring and health surveillance programmes in place that comply with local regulatory guidance. | |||||
Goal 2 (industry milestone)1 ▪By December 2034, using current diagnostic techniques, no novice pneumoconiosis cases of silicosis, coal worker’s pneumoconiosis, and pneumoconiosis as a result of respirable platinum mine dust will occur among previously unexposed individuals (those unexposed to mining dust prior to December 2024, ie equivalent to a new person who entered the industry in January 2025). Performance this year ▪Zero diagnoses (no comparison to prior year as this is a new goal). Improving our performance ▪We continue to collaborate with multiple stakeholders on the management of dust exposures that adversely affect employees. | ||||||
1 This is a new milestone as determined at the South African Mine Health and Safety Tripartite Summit. |
In South Africa we submitted 83 (FY24: 103) silicosis cases for certification and possible compensation by the Medical Bureau for Occupational Diseases (MBOD) and had 60 (FY24: 45) certified as silicosis cases.
Claims settled
The Tshiamiso Trust manages claims for mineworkers who are eligible for compensation due to contracting TB or silicosis from working in certain gold mines between 12 March 1965 and 10 December 2019. Tshiamiso
Trust paid out R182 million in total (FY24: R187 million) to 1 885 (FY24: 1 996) current and former Harmony mineworkers. Since 2020, the trust has paid out R2.25 billion to 23 600 mineworkers, R909 million is
attributable to 9 950 Harmony employees (former and current).
In the current financial year, the Compensation Commissioner for Occupational Diseases (CCOD) has compensated occupational lung disease-related claims to the value of R176 million (FY24: R83 million) to 1 890 (FY24:
1 319) current and former employees.
149
Non-occupational health management
HIV/Aids
South Africa | ||
Goal ▪WHO/UN AIDS 95/95/95 targets. Performance this year ▪93/89/85 (FY24: 91/88/88). Improving our performance ▪Refer to the commentary below. | ||
Australasia | ||
Goal ▪Reduce HIV prevalence and stigma in mining regions and the WHO/UN AIDS 95/95/95 targets. Performance this year ▪PNG will commence recording stats from next year ▪Not applicable for AU. Improving our performance ▪Programme in development. | ||
WHO/UN AIDS 95/95/95 targets in relation to HIV/AIDS are global goals set to end the HIV epidemic.
Our South African HIV/Aids programme also educates employees about the condition, and provides
counselling and annual testing, for which the same target of 95% is applicable. Details are in the table
that follows.
South Africa | Target | FY25 | FY24 |
Percentage of employees on voluntary counselling and testing uptake1 | 95 | 85 | 83 |
Percentage of employees living with HIV will know their status | 95 | 93 | 91 |
Percentage of employees with diagnosed HIV infection to receive sustained antiretroviral treatment (ART) | 95 | 89 | 88 |
Percentage of employees receiving ART to have viral suppression | 95 | 85 | 88 |
1 This is an internal target that is not disclosed by WHO/UN AIDS.
Together with the government and our peers at the Minerals Council South Africa, we commemorated
World Aids Day with build-up campaigns starting in November. Harmony’s prevalence rate is higher
than the national average due to our closed and controlled environment compared to the rest of the
country. The programme is also limited to a working group age and is affected by the negative impacts
of the migrant labour system.
Number of occasions employees received voluntary counselling and testing services: 75 640 (FY24: 74 608) counselling sessions 64 128 (FY24: 61 716) tests conducted | HIV-positive employees: 9 508 (FY24: 9 588) | Employees receiving ART in our HIV/Aids programme: 8 709 (FY24: 8 704) | ||||||||||
Five operations (Tshepong, Kusasalethu, Masimong, Doornkop and Mponeng) have achieved the target of 95% of employees knowing their status. Tshepong, Masimong and Phakisa are the only operations to exceed 90% on all WHO targets (>90/>90/>90). Although our programme is 2% short of the “known status” target of 95%, we remain committed to achieving this goal as a significant proportion of employees (7% of the workforce), do not know their HIV status. | ||||||||||||
At Hidden Valley and Wafi-Golpu, we monitor and actively manage comorbid HIV/Aids, TB and typhoid
through management plans and a vaccination programme, where applicable, and address these health
conditions through:
▪Voluntary HIV/Aids counselling and testing facilitated by on-site personnel who have completed
National Department of Health training for standardised HIV/Aids management
▪Annual HIV/Aids screening campaigns during HIV/Aids awareness month focusing on educating
employees about active management and the importance of knowing their HIV status
▪Our immunisation programme, aligned with industry best practice and our policy and process,
extends beyond occupational requirements. The voluntary programme is delivered on site. In FY24, it
was extended to include employees and contractors who live in at-risk locations. The programme
informs participants about the benefits of safe and effective vaccination.
150
Lifestyle diseases
South Africa | Australasia | |||||
Goal ▪To mitigate the personal employee risks (as mentioned above) that result in lifestyle diseases. Performance this year ▪Please refer to the Lifestyle disease management section, and the Improving employee wellness through nutrition. Improving our performance ▪Diligently execute our nutrition business improvement strategy ▪Increase promotion and awareness campaigns that empower employees with the ability to proactively manage lifestyle diseases. | Goal ▪Reduce the prevalence of chronic conditions such as diabetes, hypertension, and cardiovascular disease among mine workers – 90% compliance to lifestyle management plans. Performance this year ▪In PNG, all personnel identified as at risk are in compliance with the management plan ▪Not applicable for AU. Improving our performance ▪Further developing and enhancing our monitoring and management of workers who are affected by lifestyle diseases to reduce their risk of acute and chronic health effects and improve their quality of life beyond their employment at the mine. | |||||
Mental health
South Africa | Australasia | |||||
Goal ▪Create psychologically safe workplaces and reduce mental health related stigma – 100% screening of employees for mental health conditions. Performance this year ▪97% (FY24: 25%) of our employees have been screened. Improving our performance ▪Collaborate (internally and externally) on enhancing mental health and psychosocial social programmes. | Goal ▪Create psychologically safe workplaces and reduce mental health related stigma – 100% of employees must have access to EAP (Employee Assistance Programme) services. Performance this year ▪For both regions, all employees have access to EAP services. Improving our performance ▪The region is addressing psychosocial safety as an occupational hazard and consulting with subject matter experts and industry specialists to enhance our mental health management plan. | |||||
Substance abuse
South Africa | Australasia | |||||
Addiction, mainly substance abuse (including off-site abuse), limits our employees’ fitness for work, impairing their ability to operate safely and effectively. Reducing substance abuse remains a crucial imperative, requiring a multi-stakeholder approach involvement from human resources, safety, security and health functions. We continue to seek to reduce hazards and absenteeism from impaired judgement by communicating clear expectations that are in line with the country’s laws and regulations. | Goal ▪Prevent substance misuse and promote a drug free workplace – 100% compliance required based on random drug and alcohol testing. Performance this year ▪Both PNG and AU achieved the 100% compliance requirement. Improving our performance ▪Performance to be maintained going forward. | |||||
151
Lifestyle disease management
Many employees live with non-communicable chronic lifestyle conditions, including hypertension,
obesity, heart disease and diabetes. Harmony supports employees to prevent and manage these
diseases by providing exercise and nutrition guidance. This year, 3 682 employees took part in our
integrated lifestyle management programme (FY24: 3 188), highlighting how employees value the
programme’s benefits. The programme covers stress management, finances, fatigue, fitness and weight.
Below is a graphic displaying our burden of disease (prevalence).
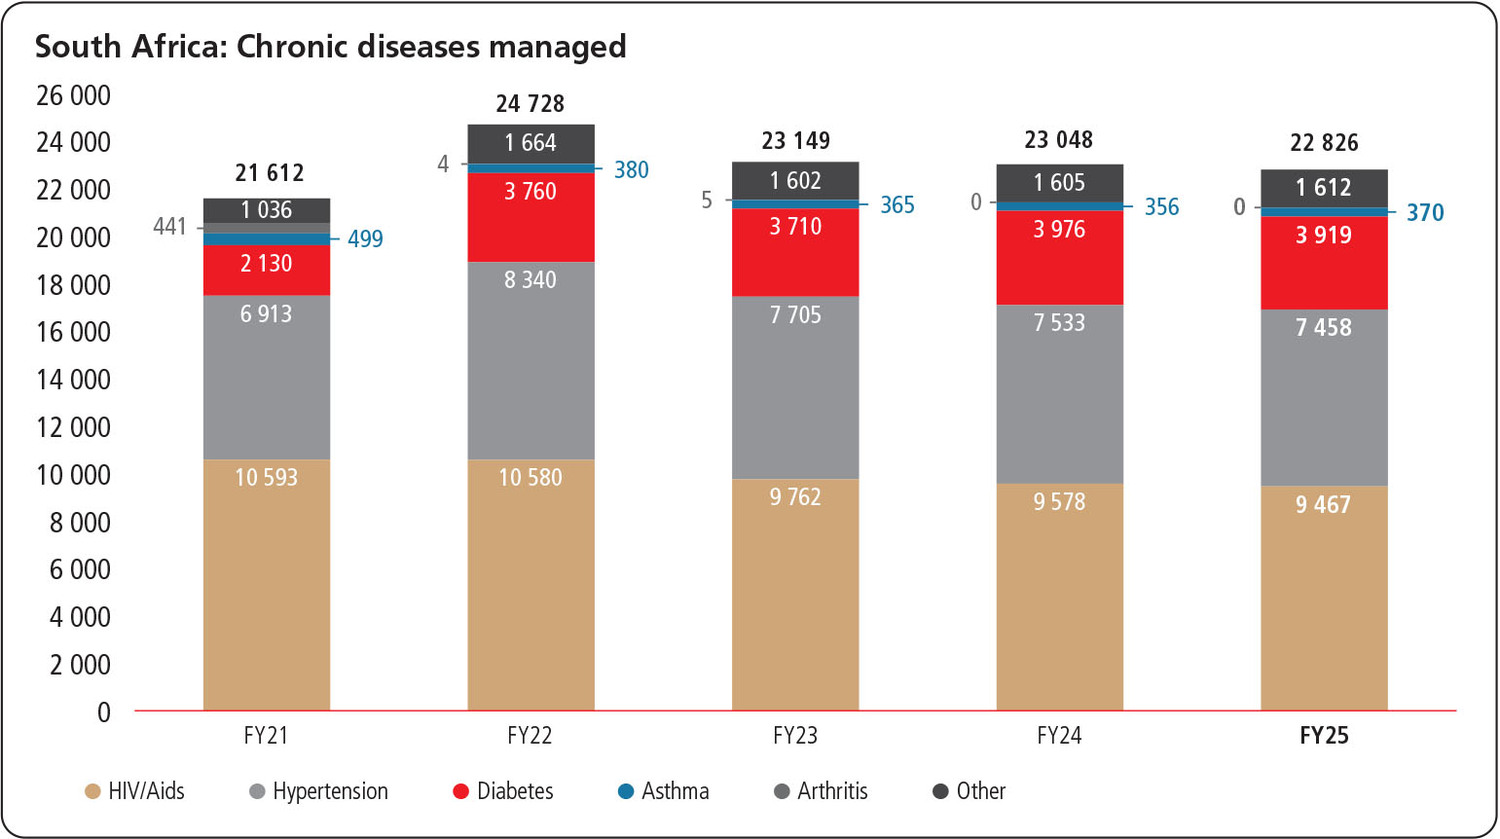
Lifestyle diseases, such as hypertension and obesity, are common reasons for off-site referral and failed
pre-employment medical examinations at our Australasian operations. We prioritise worker health and
safety through a “fitness for life” approach, which encourages employee fitness for work and long-term
wellbeing. Our integrated health management programme educates employees about the importance
of fatigue management, substance use guidelines and physical fitness. Our lifestyle disease reduction
programme supports a lower workforce risk profile and improved quality of life by monitoring,
preventing and treating non-communicable diseases.
Other communicable diseases
Goals and related targets for malaria, cholera and typhoid not considered necessary for the South
African and Australian region due to the low risk applicable to those regions.
Malaria
Australasia | ||
Goal ▪Reduce incidences in mining communities and 100% management of cases diagnosed on site. Performance this year ▪100% management of cases in PNG. Improving our performance ▪Malaria not transmissible on site at Hidden Valley due to altitude and is not applicable to our Australian operations. | ||
Cholera
Australasia | ||
Goal ▪Zero cases on site, preventing outbreaks through improved water, sanitation, and hygiene (WASH) and immunisation. Performance this year ▪Zero cases in PNG. Improving our performance ▪Review of our on-site processes and procedures to ensure best practice is maintained. | ||
Typhoid
Australasia | ||
Goal ▪Reduce transmission cases by 30% over three years as through immunisation, hygiene and food safety. Performance this year ▪PNG achieved a 33% reduction over three years. Improving our performance ▪Diagnosis and management of confirmed cases are regularly reviewed by an independent clinical governance provider (health care service) who assures effective and safe management. | ||
152
Improving labour availability
We aim to reduce health-related absenteeism at South African operations by promoting the early
detection of chronic illnesses or incapacitating disorders that could prevent employees from attending
work. We manage employees on prolonged sick leave through our at-work management programme to
monitor their medical conditions, oversee an appropriate treatment plan and early, but productive and
healthy, return to work. Injuries, respiratory, musculoskeletal, and psychiatric disorders are the primary
contributing factors for extended sick leave.
Our health-related absenteeism rate decreased to 7.3% (FY24: 7.5%) due to the strict management of
sick notes from internal and external medical practitioners. Due to health assessment efficiencies, we
achieved 89% (FY24: 85%) labour availability in 1.5 days (FY24: 2 days) after the Christmas break. This
achievement was also made possible through increased collaboration between internal departments
and digital enhancement of the process.
Infectious diseases, notably upper respiratory tract infections due to environmental conditions and
lifestyle factors, are a common cause of health-related absenteeism at Hidden Valley.
Implementing a cost-effective healthcare model
Our healthcare expenditure and impact across the group was as follows:
FY25 | FY24 | |
Investment in healthcare | R1.1 billion US$60.5 million | R1.0 billion US$54.8 million |
Medical examinations conducted | 93 375 | 89 988 |
South Africa | ||
Health examinations conducted | 72 039 | 70 529 |
Total healthcare expenditure (Rm) | 1 044 | 983 |
Free healthcare benefits: | ||
– Health benefits cost (Rm) | 652 | 612 |
– Employees impacted | 24 610 | 25 010 |
Medical aid schemes: | ||
– Medical aid scheme cost (Rm/month) | 32 | 30 |
– Employees impacted | 9 535 | 9 324 |
Papua New Guinea | ||
Health examinations conducted | 21 336 | 19 459 |
Total health expenditure (Rm) | 32.5 | 40.5 |
South Africa
▪Medical scheme membership is compulsory for officials and management, and voluntary for category
4 to 8 employees, who also receive free, comprehensive and on-site healthcare services, and
secondary and tertiary medical care
▪Full-time occupational and general medical practitioners, nurses and support personnel provide
comprehensive health surveillance and 24-hour primary healthcare services at all our operations, and
refer patients to external specialist service providers and private hospitals for specialised care.
Papua New Guinea
▪Harmony runs the Hidden Valley on-site medical clinic that provides 24/7 access to clinicians, led by a
doctor, in the case of an emergency. In addition, acute patient care and occupational health services
are provided through this team
▪Harmony funds medical insurance for employees and their families, which provides in-patient and
out-patient services delivered by external providers
▪Through our community health outreach programme, our Health and Community Affairs employees
support provincial and local health officers to deliver valuable outreach services to surrounding
communities.
Australia
▪Harmony operates a single paramedic response model that suitably provides access to the workforce
with appropriate emergency and non-urgent medical support
▪Harmony provides all employees with access to discounted private health insurance.
153
Collaboration and partnerships
We work with internal and external stakeholders to strengthen our health strategy, boost healthcare access and support
healthcare delivery. This includes our South African industry peers and the Department of Health on improving the
administration of the occupational lung disease compensation through our ReConnect initiative. Through ReConnect, we
trace former employees and address the claims backlog. This year, we worked with stakeholders to strengthen our post-
employment health programme to provide former employees with health access, minimise the risk of loss (due to no follow
up) and address legal compliance issues.
In FY25, Harmony expanded its collaboration with South African university research centres to conduct a study into the
determinants of production team performance, including the relationship between high performance and health.
Our clinical governance partner in Papua New Guinea performs regular compliance reviews, and we collaborate with the
National Department of Health on a range of topics, from clinic registration requirements to employee training.
Innovation, technology and digitisation
We are enhancing our health processes using digital solutions and tools for medical surveillance and risk profiling. Our
integrated health management system provides a holistic view of our employees’ health-related data, creating the following
benefits and efficiencies:
Medical teams can: ▪Proactively deliver healthcare based on employees’ risk profiles and annual medical examinations ▪Timeously produce accurate and verifiable reports ▪Effectively address specific occupational conditions and health risks. | Management teams can make informed decisions for safe production by monitoring employee health-related data from the integrated health management system. | Employees can take ownership for managing their health and wellbeing by scheduling medical examinations. This reduces waiting time and reduces the risk of fraud and personal information errors with biometric verification. | ||||||||
Our digitised return-to-work process enables the efficient screening of employees to confirm that they are physically and
mentally fit and safe to work after the December break. This is, among other initiatives, honouring our commitment to
implement the eight fatality-eliminating interventions emanating from a special Minerals Council meeting of mining CEOs
forum in 2021.
We improved the administration of patient records by introducing a picture archiving and communication system (PACS) for
X-rays. This allows us to collaborate with other healthcare professionals and introduce AI-assisted screening. We continue to
digitise paper-based files for security, continuity of care and to comply with the requirements for a 40-year history.
Future focus areas We seek to promote optimal health for our employees, including through nutrition and mental health programmes to support high performance and a resilient workforce. Through technology, we aim to build a global view of the health of each employee. Enhancing our electronic integrated health management system with data- driven business intelligence improves communication between health, hygiene and human resource teams across the business. We expect our fully digitised, risk-based medical surveillance programme to be finalised in the next two years. | ||
154
An engaged workforce
The long-term, sustainable success of our business depends on maintaining a safe workplace where every voice is valued, every talent is cultivated, and everyone has equal access to
opportunities.
Material matters | |||
▪Supporting our people ▪Sound labour relations. | |||
UN SDGs | |||
 | No poverty | ||
 | Quality education | ||
 | Gender equality | ||
| Decent work and economic growth | ||
GRI disclosure requirements | |||
▪GRI 3: Material Topics 2021 ▪GRI 202: Market presence 2016 ▪GRI 401: Employment 2016 ▪GRI 402: Labour/management relations 2016 ▪GRI 404: Training and education 2016 ▪GRI 405: Diversity and equal opportunity 2016 ▪GRI 406: Non-discrimination 2016 ▪GRI 407: Freedom of association and collective bargaining 2016 ▪GRI 408: Child Labor 2016 ▪GRI 409: Forced or Compulsory Labor 2016 | |||
FY25 priorities | |||
1.Attracting and retaining key skills and experience 2.Committing to diversity, equity and inclusion 3.Investing in learning and development 4.Fostering a healthy organisational culture and employee wellbeing | |||
Strategy: Values-driven people management
To support our people, we create a safe, healthy and productive working environment by investing in our workforce’s wellbeing, development and
empowerment. Our people management approach, grounded in our values and meaningful engagement, encourages and promotes continuous
development of capacity and capability, improving female representation to promote gender diversity, building future organisational skills and
considering technological changes. As Harmony expands into other commodity markets, we adapt and evolve our approach to meet local needs.
Driven by our people excellence strategy, the people value chain enables us to effectively analyse, plan, lead, influence and manage employee-
related processes.
Our people excellence value chain
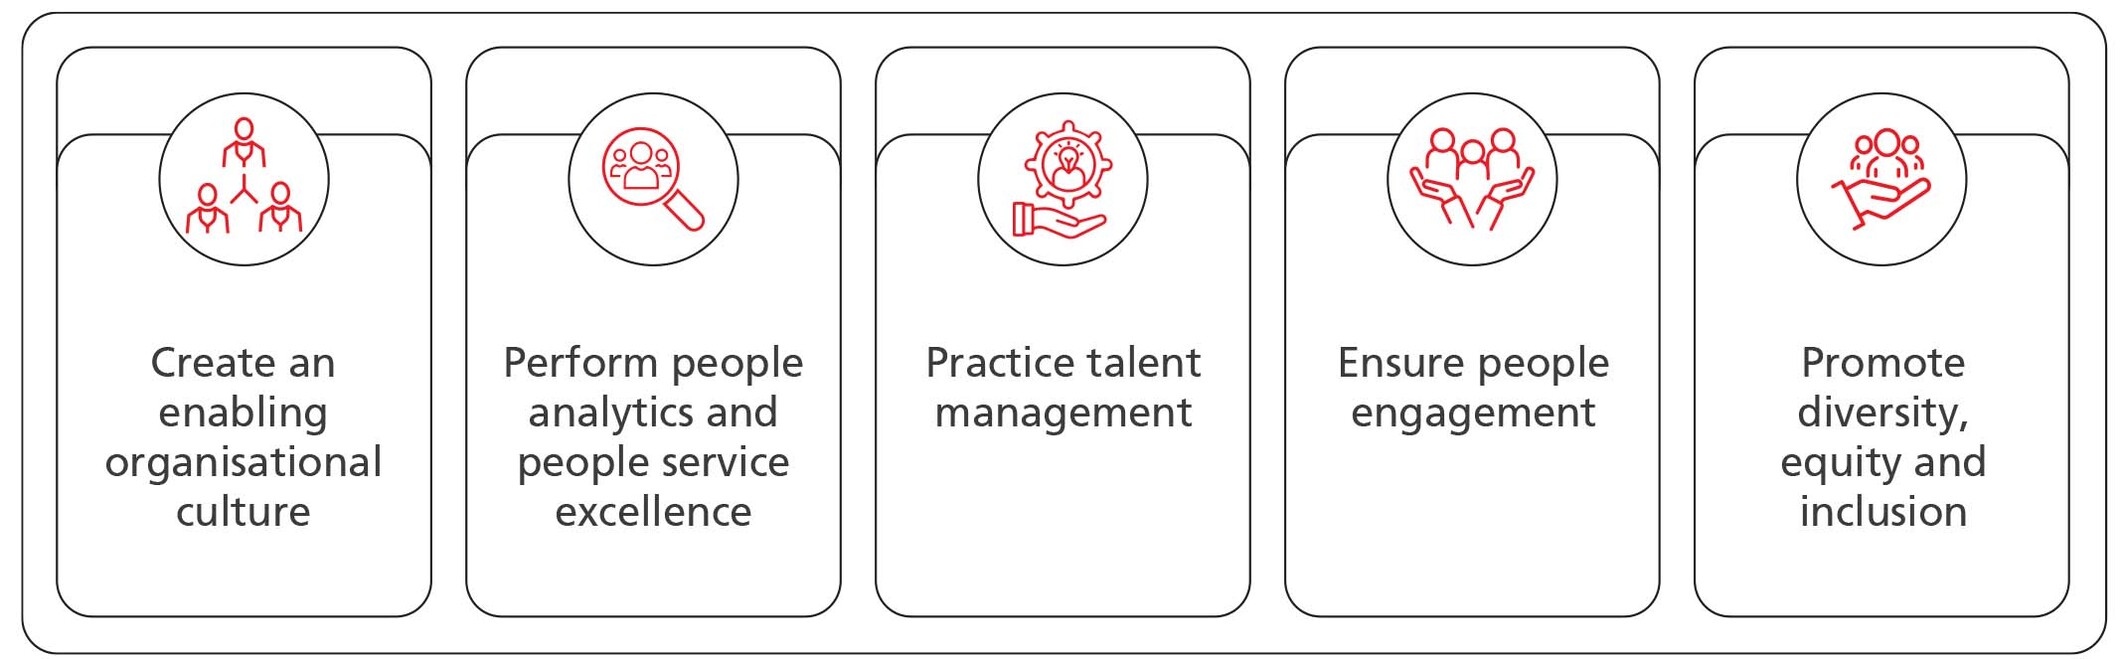
155
Our workforce is pivotal to achieving our business strategy.
Attracting and retaining key skills and experience | Our talent attraction and retention policy outlines Harmony’s comprehensive approach to attracting, sourcing, onboarding and integrating top-tier talent. We offer a range of developmental and support initiatives aligned with our long-term business goals. Harmony is committed to narrowing the pay gap over time, with voluntary disclosures of the ratio between the highest and lowest paid employees, anticipating future regulatory requirements. We remunerate employees based on ability, skills, knowledge and experience, with a clear commitment to gender and race equality. We remunerate men and women equally for equivalent roles, regardless of race or other arbitrary factors. | ||||
Committing to diversity, equity and inclusion (DEI) | Harmony is committed to equal opportunity, diversity and non-discrimination and has a zero-tolerance policy for any form of discrimination. Employment, development and promotion are based solely on merit, with explicit prohibitions against discrimination on grounds such as race, gender, religion, age, disability, sexual orientation, or political beliefs. HR interventions target increasing the representation of women and people from designated groups. In South Africa, we are guided by our transformation and employment equity plans to comply with regulations, and achieve our long-term goal to create a workforce that equitably represents the diversity of our population. This is further driven by our Women in Mining committees at our South African operations, creating awareness, enforcing safe work practices and advancing our zero-tolerance approach. Our DEI initiatives in Australasia include holding leaders accountable for DEI commitments, providing training to our workforce on the importance of an inclusive workforce, reducing our gender pay gap, and eliminating unconscious bias in our hiring processes. | ||||
Investing in learning and development | We support quality education and promote a culture of lifelong learning for our employees and community youth through internship programmes1, learnerships, graduate development programmes, bursary schemes, study assistance and career progression programmes. Developing our people supports our commitment to equal employment opportunities while redressing the historic disadvantages in employment, education and training experienced by individuals in designated groups in South Africa. Our South Africa region has various accredited training centres providing learning for technical and non-technical skills. Employees can also enrol for formal education at preferred institutions of higher learning through our study assistance programme. These formal education opportunities include first degrees and postgraduate qualifications such as MBA and executive MBA qualifications. Our succession pipeline for core disciplines (mining, engineering, metallurgical and ore reserve management) includes longer-term developmental programmes. | ||||
Fostering a healthy organisational culture and employee wellbeing | We conduct initiatives that enable us to foster a safe, inclusive and high-performing culture that supports the physical, mental and financial health of our workforce while creating operational excellence. These include diagnostic tactics such as company culture values assessments every three years, interim pulse surveys, systemic and humanistic perception surveys every two years, as well as gender inclusion diagnostics1, and feedback routines that guide targeted interventions and culture improvement actions. | ||||
Maintaining sound employee relations | Our employee relations approach is based on mutual respect and trust. Supported by living our values and culture, we engage and collaborate meaningfully with employees to better understand and address their needs and expectations. We adopt a proactive approach to prevent potential conflicts and enter into long-term agreements to ensure long-term sustainability and labour peace. The actions we take to enable employee safety and contribute to their health and mental wellbeing support our approach to maintaining positive employee relations. | ||||
1Internship programmes, surveys and gender inclusion diagnostics only applicable to South Africa.
156
Governance
Accountability and responsibility | To ensure effective execution of responsibilities assigned to people, there is necessary accompanying accountability for delivery of results; HR and training personnel focus on compliance with all relevant labour laws and internal policies, managing recruitment, onboarding, employee relations and development programmes. They address employee concerns, foster engagement, and promote retention, aiming to create a positive workplace culture across all operations. | ||||
Performance monitoring and reporting | In South Africa, the wage review implementation committee continuously reports on progress in meeting obligations from collective agreements. The HR department reports on employee relations to the South African executive committee on a monthly basis. We also submit reports to regulators, especially the Department of Labour and the Department of Mineral and Petroleum Resources. We maintain transparency by actively reporting on employment-related disputes, such as unfair dismissal or labour practices. We track these cases to gain insights into our labour relations climate. Additionally, whistleblower activities and related mechanisms provide a holistic view of employee relations and organisational ethics. | ||||
Policies that support our governance approach | HR governance enables fair labour practices, diversity and employee wellbeing through policies that support legal compliance, operational effectiveness and sustainable growth. These include: ▪Region-specific remuneration policies to attract, retain and motivates skilled teams ▪The code of conduct that sets clear expectations for employee behaviour, including adherence to health, safety, and environmental policies and actions subject to disciplinary action ▪An employee relations framework that supports a stable and productive work environment, taking into account regional-specific dynamics ▪Our competitive employee value proposition (EVP), reviewed regularly, that provides recognition and benefits in line with industry standards. Our employee relations practices are governed by relevant labour laws in each jurisdiction. Comparable legislative frameworks as set by the International Labour Organization guide our practices in other regions, including Papua New Guinea, where union representation is less centralised and employee relations committees play a prominent role. | ||||
157
Risk and opportunity management
HR risks are integrated into the company’s overall risk register and are subject to combined assurance activities, including independent reviews of risk controls and governance mechanisms. HR risk management is
primarily the responsibility of line management, regarded as the first line of defence, identified and assessed systematically, but also managed proactively and transparently. HR risks are identified through ongoing
monitoring, regular reviews and engagement with employees, unions and other stakeholders. This includes the assessment of issues such as workplace health and safety, labour relations, employee wellbeing and
compliance with employment legislation.
Risks | Description | Mitigation measures | ||||||
Socio-economic and regulatory requirements | Shifts in political, economic or regulatory environments can impact employment practices, compliance obligations and community relations. Non- compliance with labour laws or failure to adapt HR policies can result in legal and financial penalties. | We stay abreast of socio-economic, regulatory and community expectations to maintain compliance and social legitimacy. We closely monitor changes in South African legislation, specifically amendments to the Companies Act, to remain compliant with evolving governance and disclosure requirements related to remuneration and employee relations. | ||||||
Industrial action | Historically, South Africa’s mining sector has seen disruptive wage negotiations and strikes. Disputes over wages, benefits or working conditions can disrupt production and erode investor confidence. | Our five-year wage agreements enable ongoing, constructive engagement and rapid resolution of disputes. The wage agreements include increases above inflation and improved benefits and enable us to focus on broader strategic issues like safety and productivity. | ||||||
Skills shortages | Harmony competes for scarce critical skills. Inadequate training, development or retention strategies can result in operational inefficiencies and increased reliance on contractors, which may threaten workforce safety, productivity and stability. | Harmony invests significantly in skills development, learnerships, bursaries and leadership training, which secures critical talent, supports transformation and makes our workforce more adaptable to technological changes. | ||||||
Employee morale and engagement | Poor communication, lack of career development or perceived inequities in remuneration can lower morale, increase turnover and reduce productivity. | Proactive, transparent, two-way communication with employees and unions, to build and maintain trust and engagement remains a key priority. We regularly review and improve remuneration, benefits and career development offerings to attract and retain talent. | ||||||
Opportunities | ||
Many of the mitigating actions to the risks we face present opportunities for us to leverage. These opportunities include: ▪Reducing the risk of strikes and industrial action, providing cost certainty and operational stability ▪Enhancing employee benefits to boost morale, retention and Harmony’s employer brand ▪Training and development to address critical skills shortages, enhance safety outcomes and operational efficiency, and support career progression ▪Ongoing local recruitment to strengthen community relations and our social licence to operate while contributing to local economic development. | ||
158
Measuring our performance
Group | South Africa1 | Papua New Guinea | Australia | |||||||||||||
Wage and benefit spend | R20.2 billion (US$1.1 billion) | (FY24: R18.6 billion/ US$997 million) | R18.8 billion (US$1.0 billion) | (FY24: R17.4 billion/ US$958 million) | R835 million (US$46 million) | (FY24: R876 million/ US$48 million) | R561 million (US$31 million) | (FY24: R368 million/ US$20 million) | ||||||||
Total employee complement | 47 111 | (FY24: 46 060) | 44 480 | (FY24: 43 667) | 2 461 | (FY24: 2 264) | 170 | (FY24: 129) | ||||||||
Permanent employees | 34 350 | (FY24: 34 715) | 32 688 | (FY24: 33 123) | 1 496 | (FY24: 1 465) | 166 | (FY24: 127) | ||||||||
Employees from local communities | 85% | (FY24: 84%) | Host communities3: 38% | (FY24: 40%) | First Nations Australians4: 1% | (FY24: 1%) | ||||||||||
Foreign nationals2: 15% | (FY24: 16%) | PNG citizens: 96% | (FY24: 97%) | |||||||||||||
Employees from local communities in management | HDP5: 72% | (FY24: 70%) | Host communities3: 3% | (FY24: 6%) | ||||||||||||
PNG citizens: 60% | (FY24: 60%) | |||||||||||||||
Contractors | 12 761 | (FY24: 11 345) | 11 792 | (FY24: 10 544) | 965 | (FY24: 799) | 4 | (FY24: 2) | ||||||||
Gender diversity | ||||||||||||||||
% of workforce who are women | 21% | (FY24: 20%) | 21% | (FY24: 20%) | 15% | (FY24: 14%) | 29% | (FY24: 31%) | ||||||||
% of women in management | 23% | (FY24: 22%) | 24% | (FY24: 23%) | 9% | (FY24: 10%) | 15% | (FY24: 16%) | ||||||||
Training spend | R859 million (US$47.3 million) | (FY24: R840 million/ US$44.9 million) | R838 million (US$46.2 million) | (FY24: R808 million/ US$44.5 million) | R17 million (US$0.9 million) | (FY24: R31 million/ US$1.7 million) | R4 million (US$0.2 million) | (FY23: R1 million/ US$0.1 million) | ||||||||
1Includes South African underground and surface operations.
2Employees from neighbouring countries (primarily Lesotho and Mozambique).
3Host community employees include employees from landowner villages and host districts.
4Persons of Aboriginal or Torres Strait Islander descent as voluntarily disclosed.
5HDPs include women and exclude white males and foreign nationals.
South Africa
KPI | Target | FY25 | FY24 | Comment | |
Diversity and inclusivity | 30% women in leadership by 2027 | 24% | 23% | Steady progress is being made on addressing our women in leadership target with a 1% move year on year. Our goal remains to achieve this target by 2027. | |
60% of management by designated groups | 70% | 70% | In excess of the target. |
159
Progress against priorities
Attracting and retaining key skills and experience
To enable operational continuity and mitigate skills shortages, we implement initiatives aimed at employee retention, including market-aligned salary adjustments, a global EVP, culture transformation and data-driven
recruitment.
Employee new hires and turnover
Our group new hire and turnover numbers are indicated below.
FY25 | FY24 | ||||||||||||||
Group | Female | Male | Total | Employees | % | Female | Male | Total | Employees | % | |||||
Voluntary turnover1 | 98 | 543 | 641 | 34 225 | 1.9 | 107 | 688 | 795 | 34 594 | 2.3 | |||||
Turnover (%) | 15 | 85 | 13 | 87 | |||||||||||
Involuntary turnover2 | 216 | 1 301 | 1517 | 34 225 | 4.4 | 198 | 1 235 | 1 433 | 34 594 | 4.1 | |||||
Turnover (%) | 14 | 86 | 14 | 86 | |||||||||||
1Resignations, retirements and voluntary severance packages.
2All turnovers not included in the definition of voluntary, ie dismissals, downscaling and retrenchments.
In South Africa, as part of our commitment to attracting, developing and retaining talent, we developed
a health-discipline programme – a critical part of developing a sustainable talent pipeline. The
programme strengthens long-term workforce planning and enables future work readiness. We have
fast-tracked the implementation of the programme by hosting talent management and succession
planning sessions with the heads of disciplines and progressed through executive-level engagement. We
have enhanced our recruitment, selection, and talent development strategies by incorporating
structured levels of work measurement instruments, enabling us to align candidates and our people
with role complexity while supporting targeted growth and succession planning.
The Harmony global EVP being developed aims to serve as one of the vehicles to attract and retain talent,
and enhance our culture and performance. The EVP will clearly define the unique benefits and values that
employees gain in return for their skills, capabilities and experiences. Honouring the key themes of our
global EVP, we have established a regional EVP in Australasia to develop our unique value proposition that
enables us to connect with prospective and existing employees effectively. We launched our regional EVP in
Australasia in October 2024, in consultation and engagement with our workforce.
Fair and responsible remuneration
We attract and retain employees by offering market-competitive, fair and equitable remuneration and
benefits using a comprehensive, values-driven framework that integrates compliance, equity,
performance and transparency. Collaboration with the remuneration team enabled effective
benchmarking, particularly for engineering talent, creating competitiveness in attracting and retaining
high-level skills.
Focus areas this year, included:
▪Review of competitive positioning of executive remuneration in the context of the growth in size and
global complexity of Harmony: An independent benchmark study was done to compare Harmony’s
executive management remuneration to that of larger industry peers. The study found that
Harmony’s executive pay was, on average, 10% below the median of the comparator group, with the
financial director’s remuneration notably lower. To address retention risks and ensure competitive
alignment, the board approved a 10% salary increase for executive management and a 16.1%
increase for the financial director, aligning remuneration with industry standards and supporting
leadership stability during the CEO transition
▪To continue the responsible approach to decreasing the pay-gap in South Africa over time in line with
our fair and responsible pay principles in FY25, an average increase of 6.2% for non-bargaining
employees was implemented. Executive increases were approved at 5%. An average 7.27% for
bargaining-unit employees was awarded, in line with collective bargaining agreements
▪Reducing our gender pay gap in Australia, and continuing to ensure pay equity in equivalent roles
regardless of gender
▪Review of the provisions of the current deferred share plan rules, the King principles, and best
practice
▪Continued monitoring of shareholder feedback and developments in local and global remuneration
practices
▪Continued focus on innovative ways of improving the financial wellbeing of all our employees, by
leveraging our corporate buying power and identifying service providers who offer effective ways of
delivering enhanced value to our people
▪The committee considered and recommended the company’s total incentive plan Balanced Scorecard
for FY26 for board approval. The board has since approved same.
We test market remuneration data twice a year, and validate our wages and benefit structures to
ensure they remain competitive. During our Australasian regional EVP engagement sessions with our
employees, conducted by a third party, Harmony’s remuneration was rated as fair and competitive, and
bonuses generous when high performance against plan is achieved.
Our Australasian operations participated in the gender pay gap (GPG) report in FY25, and outcomes
included:
▪No gender pay equity issues reported and no gender disparity in wages in similar roles for the past
two reporting periods
▪The GPG for total of all Harmony Australia entities has remained stable at 29.7% of average base wage
(FY24: 39.2%). A positive gap means women are paid less on average than men across all roles
▪The GPG for Australasia services team (support services to our mines and projects in the region)
dropped by 4.2% to 48.5% against the median base salary GPG measure (FY24: 51.3%)
▪We increased female participation in the upper pay quartile to 17% (FY24: 7%).
Refer to the Remuneration sections for ratios of standard entry-level wage by gender compared to local
minimum wage, and for the ratio of basic salary and remuneration of women to men.
160
Commitment to diversity, equity and inclusion
One of the outcomes of Harmony’s people development approach is increasing female representation
across employee categories, particularly management, in programmes such as graduate development
programmes, bursaries, learnerships and internships.
South Africa
Enrolling suitable candidates in our skills and leadership development programmes, filling vacant
positions with the correct designated group and awarding bursaries, internships and learnerships
to historically disadvantaged people (HDP) (increasing our talent pipeline for entry-level positions)
enables us to progress against our employment equity targets for our South African operations.
HDPs1 | Female HDPs2 | ||||||||||
Employee1 diversity (%) | Target % | Actual FY25 | Actual FY24 | Target % | Actual FY25 | Actual FY24 | |||||
By employee category | |||||||||||
Board3 | 50 | 73 | 67 | 20 | 33 | 25 | |||||
Executive management | 50 | 62 | 57 | 20 | 29 | 24 | |||||
Senior management | 60 | 62 | 62 | 25 | 26 | 27 | |||||
Middle management | 60 | 67 | 63 | 25 | 31 | 29 | |||||
Junior management | 70 | 73 | 72 | 30 | 22 | 21 | |||||
Core and critical skills | 60 | 75 | 74 | n/a | n/a | n/a | |||||
People living with disabilities | 1.5 | 0.26 | 0.28 | n/a | n/a | n/a | |||||
1Excludes contractors.
2HDPs include women and exclude white males and foreign nationals.
3Harmony’s three executive directors are included as board members.
Our employment equity plans aim to meet Mining Charter III targets:
Mining Charter III target | Our progress | |||||
▪HDP (including women, people living with disabilities, and people with core and critical skills) representation in board and management. | We have exceeded our total HDP commitments and Mining Charter III targets on all occupational levels from board to junior management. We accelerated HDP representation in managerial positions, which has increased to 72% (FY23: 70%). Although there were notable improvements in achieving our HDP targets, we did not achieve our female representation at junior management level, with 21% representation and a target of 30% by 2027. Focus remains on addressing this shortfall. | |||||
Australasia
Papua New Guinea’s number of female employees occupying leadership roles is 9% (FY24: 14%). The
percentage decrease was influenced by an increase in the total number of management positions in
FY24.
The average number of female employees in our Australian workforce is 29% (FY24: 31%). We aim to
exceed the Australian mining industry average for female representation (22% according to the
Australian Workplace Gender Equality Agency), which we are exceeding by 7%.
Sexual harassment, bias and anti-bullying
There was one incident in this reporting year, where the South African Labour Appeal Court held
Harmony liable for discriminatory remarks uttered by one employee to another employee. The
concerned guilty employee was dismissed in this regard. There were no other incidents of
discrimination against race, colour, sex, religion, political opinion, national extraction as defined by the
International Labour Organization, or provided for by any applicable legislation pertaining forms of
discrimination, involving internal and/or external stakeholders by Harmony nor its management.
We conducted a gender survey in 2022, which highlighted areas that we need to focus on to embed a
culture of gender inclusion and create an environment where everyone feels respected, valued and
supported. To address these areas, we have developed action and roll-out plans that included
communication and awareness, cultural leadership and behaviours, targeted interventions and training,
and policies and practices.
This year, we launched an anti-workplace and sexual harassment, bias and bullying awareness training
programme in South Africa. The training is a direct response to findings from our gender-based biases,
sexual harassment and bullying survey. We have also included a module on anti-sexual harassment and
unconscious bias in our generic induction, thereby ensuing we reach all employees. We also plan to do
a follow-up survey in FY26/27 to assess the impact of the interventions implemented based on the
findings from the 2022 survey.
The first phase of awareness training was rolled out to South African operations in August 2024,
targeting employees and supervisors in core disciplines. We believe that the target audience is essential
to bringing attention to the issue within the teams they are managing and to preventing instances of
sexual harassment and other forms of workplace bullying that are motivated by gender. We plan to
extend the training to the broader employee population. At the end of the training, each employee
signs the pledge to indicate their continuous commitment.
To promote gender equity and support the safety of women in the workplace, each of our operations in
South Africa has an active Women in Mining Forum. These forums run year-round programmes aimed
at raising awareness around gender-based issues in the mining sector. They also lead investigations into
challenges specific to women in mining such as the roll-out of gender-appropriate PPE. We encourage
women across our workplaces and host communities to voice their challenges and aspirations through
these established platforms. The forums serve as safe spaces for dialogue, advocacy, and action. We
support the national partnership addressing gender-based violence and femicide (GBVF) in our host
communities. Our collaborative partnership with industry continues to be strengthened, and Harmony
has representation at the Mineral Council GBV Advisory Council. Harmony is also a participatory party
on the Mineral Council WIM strategy and reports quarterly on progress against the set milestones.
161
Harmony pledged R1 million a year over three years (2024 - 2026) to the national partnership established
by the Minerals Council South Africa, the Gender-Based Violence and Femicide Response Fund and the
National Prosecuting Authority to support victims in mining communities. Our donation will enable the
National Prosecuting Authority’s Thuthuzela care centres to reach women in remote mining communities
with immediate and effective access to counselling, healthcare and the justice system (including medical
and other resources provided by Harmony’s operations).
Harmony and Minerals Council South Africa jointly hosted the Thuthuzela Care Centre (TCC) Visibility
Awareness Event in Welkom, Free State province on 10 June 2025 as a host community. The event
forms part of the national partnership between the Minerals Council, National Prosecuting Authority
and GBVF Response Fund to strengthen awareness and access to support services for survivors of GBVF.
The event was attended by Central University of Technology Welkom, Department of Social
Development, and the Office of the Mayor in Lejweleputswa, Matjhabeng Local Municipality as
supporting partners.
We have nominated at least two anti-sexual harassment officers at each operation (both male and
female) and launched training to capacitate the WIM Forums and officers in advocating for issues
of gender diversity and creating an environment free from any form of harassment. Operations
have launched the Men`s Forums with the aim to emphasise the importance of speaking out against
abuse in all its forms and challenge harmful behaviours perpetuated by males in the workplace. The
Men`s Forums create a safe space for open dialogue for employees to gain valuable knowledge on
issues affecting society and addressing GBV, both within and beyond the workplace.
503 employees (325 males and 178 females) attended the training | 50 employees are representatives from the Women in Mining (WIM) forums as a way of enhancing the platforms where employees can report incidents of gender-based discrimination and be assisted. These employees have been capacitated to become ambassadors and advocate against gender- based violence and bullying in the workplace | |||||||
We trained 20 HR professionals on anti-sexual harassment and unconscious bias to become ambassadors and advocate against gender- based violence and bullying | We have trained 36 employees as anti-sexual harassment officers | |||||||
In Papua New Guinea, as part of the gender survey actions, we have launched a family sexual and
gender violence campaign in partnership with regulatory authorities. We have also established
additional female infrastructure facilities at the Hidden Valley in-pit operations facility.
Addressing gender-based violence
Our commitment to gender equality is recognised globally with our sixth consecutive inclusion in
the Bloomberg Gender-Equality Index.
In FY25, Australia introduced significant DEI-related changes to the Fair Work Act, including stronger
protections against workplace sexual harassment, new powers for the Fair Work Commission to address
unequal pay, and expanded anti-discrimination safeguards covering a wide range of personal attributes
and circumstances.
162
Investing in learning and development
Learning and development
Harmony is invested in its learning and development efforts across all regions, sharing knowledge and improving learning systems across regions to make learning more effective and engaging.
The total hours of training provided to group employees was 2 111 513 (FY24: 2 166 319).
FY25 | FY24 | ||||||||||||
Group | South Africa | Papua New Guinea | Australia | Group | South Africa | Papua New Guinea | Australia | ||||||
People trained | 43 731 | 42 041 | 1 600 | 90 | 42 291 | 40 704 | 1 545 | 42 | |||||
Hours of training | 2 111 513 | 1 901 926 | 207 011 | 2 576 | 2 166 319 | 2 060 823 | 105 244 | 252 | |||||
Expenditure on training (R million) | 859 | 838 | 17 | 4 | 840 | 808 | 31 | 1 | |||||
During the year, key learning and development programmes for employees at Harmony’s South African
operations included improving our workforce literacy, growing our commitment to leadership
development, and investing in our talent development programme:
▪2 897 (FY24: 495) Harmonites participated in our leadership development programme, 30% of whom
were women, including 10 trade union leaders
▪As part of our study assistance programme, we invested R8 million (FY24: R8 million) in
320 employees completing various diploma and degree courses
▪We encourage employees to enrol in our adult education and training programme to improve literacy
levels – this year we had 476 (FY24: 412) employees enrol in adult education and training
▪Our school support programmes benefited 801 learners this year.
Key learning and development activities for employees at our Australasia operations included:
▪Harmony Australia leadership programme, using our Human Synergistics model and embedding The
Circumplex across the business
▪Coaching and mentoring programmes
▪Professional development
▪Industry conferences and workshops
▪Sponsorship of tertiary studies
▪Apprenticeships and graduate programmes at Hidden Valley
▪Systems training
▪Safety, risk and compliance training
▪Bursaries and community support.
Performance and career development reviews
In support of both career and personal development Harmony requires managers overseeing staff to
regularly appraise their performance. Regular performance and career development reviews enhances
employee engagement which correlates with improved organisational performance.
South Africa | Papua New Guinea and Australia | |||||
Performance and career development reviews are formalised at management levels to ensure consistency, accountability and alignment with organisational priorities. Our performance management policy governs performance contracting. Under the reporting period, a total of 902 management employees have undergone formal performance appraisals. Beyond assessing performance, these processes serve as a platform for identifying growth opportunities, nurturing leadership potential and strengthening succession pipelines. In line with our strategic intention to increase female representation in leadership roles, a deliberate focus is placed on career development reviews for women across the business. This targeted approach not only supports individual advancement but also underpins our broader commitment to building a diverse, inclusive and future-ready leadership team. | In Australia, anti-discrimination protections make it unlawful to discriminate on the basis of gender, race, age, disability, sexual preference, and others, in employment. This includes equal opportunities to employment, promotion and development. Performance reviews are conducted across Australia and for leadership roles in Papua New Guinea, formally twice a year, and informally on a regular basis through ongoing check-ins. | |||||
163
Fostering a healthy organisational culture and employee wellbeing
In FY24, we conducted our fourth Barrett Culture Survey across South African operations, with 23 517
employees participating (54% of the regional workforce). Harmony achieved a culture score of 76%,
significantly above the global average of 55% and industry average of 53%, indicating a strong and
healthy organisational culture. Our entropy score was 12%, below the 13% threshold, reflecting low
levels of limiting values (limiting values restrict personal and organisational growth). This improvement
is driven by sustained investment in leadership development and enhanced employee engagement,
which has positively influenced operational performance. While our overall entropy scores were
positive, scores varied between 5% and 35% across the 35 demographics, highlighting the need for
continued culture improvement interventions.
Positive cultural themes that build a healthy culture, include: ▪Job security ▪Pride in the organisation ▪Perceptions of company growth. | Areas requiring focused improvement, include: ▪Skills development ▪Commitment ▪Trust ▪Quality leadership. | |||||
To address these findings, all operations and service departments are developing culture improvement
plans to reinforce the strong cultural elements while addressing the limiting values that hinder a cohesive
and high-performing culture. This work is now embedded into routine operational reviews, enabling
teams to continuously assess, refocus and act on cultural priorities in alignment with our strategic goals.
Australasia
Our culture transformation journey at Australasian operations continued with the roll-out of the human
synergistics organisational culture inventory model, reinforcing our commitment to a constructive
culture and actively encouraging Harmony’s success through the development of our people. These
efforts were supported by:
▪The launch of the constructive behaviours programme, aligning daily behaviours with our core values
and leadership expectations
▪Partnering with a global service provider to establish cultural index indicators. The results were
encouraging, and we are developing action plans to embed constructive behaviours into operational
performance.
Australasian operations also expanded wellbeing offerings to support employees in balancing their
professional and personal lives:
▪Our employee assistance programme (EAP) is now available 24/7 for counselling and mental wellness
resources
▪We provide employee and family medical insurance coverage in PNG and access to discounted health
insurance benefits in Australia
▪Employees have access to a financial discounts programme in Australia using the newly established
Connect Hub portal.
164
Maintaining sound employee relations
To maintain positive employee relations, we create an enabling
environment, supported by the HR department and a suite of policies
that guide our actions. We acknowledge our employees' right to
freedom of association and fair labour practice, enabled by organised
labour structures to promote business improvement.
Our approach to employee relations is based on transparent, honest
engagement with our bargaining partners. This has allowed us to
consistently manage a multi-union environment in which business
and labour representative groups with a variety of ideological
approaches can meet, engage and find common ground. Operating in
a multi-union environment requires effective engagement processes
and labour relations infrastructure to support operational stability.
Across all our regions, there were no work stoppages or labour-
related interruptions. We do not permit any form of forced or
compulsory labour and do not employ individuals under the legal
minimum age of 18, in accordance with the International Labour
Organization’s conventions on child labour.
Collective bargaining, labour agreements and stability
We concluded a five-year wage agreement in 2024 with our
recognised trade unions in South Africa, who jointly represent 94% of
our employees, indicating a collective effort to embed certainty and
predictability in Harmony’s employee relations landscape. The
agreement provides for specific annual wage increases for employees
in the bargaining unit comprising of skilled and semi-skilled
employees (category 4 – 8 employees, miners, artisans and officials).
It guarantees annual increases of at least 6.2% or in line with South
Africa’s consumer price index (CPI), whichever is higher. The
agreement also improves allowances, severance pay, medical aid
contributions, and parental leave provisions. It enables workplace
stability and certainty over fixed labour costs. It further supports
certainty in planning from a wage and conditions of service
perspective.
The minimum notice period typically provided to employees and their
representatives prior to the implementation of significant operational
changes that could substantially affect them is one month. The notice
period and provisions for consultation and negotiation are specified
in collective agreements and legislation.
Parental leave
Our pregnancy and maternity leave policy covers both maternity and parental leave, designed such that employees taking leave are able to
return to work in the same or comparable position. We believe that equitable gender choice for maternity and paternity leave, and other
leave entitlements leads to better recruitment and retention of qualified employees. Group statistics in this regard follows in the table below.
South Africa | Australasia | ||||||
FY25 | FY24 | ||||||
Female | Male | Female | Male | FY25 | FY24 | ||
Number of employees entitled to parental leave | 6 931 | 25 758 | 6 693 | 26 459 | 265 | Data not available | |
Number of employees who took parental leave | 173 | 1 890 | 90 | 1 043 | 13 | ||
Number of employees who returned to work after parental leave | 173 | 1 890 | 90 | 1 043 | 13 | ||
Return to work rate | 100% | 100% | 100% | 100% | 100% | ||
Union recognition and engagement
We have established several management and organised labour forums to facilitate proactive engagement with organised labour
representatives. Union recognition is governed by an employee relations framework that regulates organisational rights of unions. In regions
like Australia, union presence is less direct at the site level, with employee relations primarily managed through committees rather than
formal union representation. This regional variation is reflected in our tailored approach to employee relations.
In Australia and Papua New Guinea, Harmony is not unionised due to the very engaged nature of our employee representative committees
that we set up 18 years ago. In South Africa, our labour relations policy guides how we engage with organised labour and formalise union
recognition rights at each operation.
Recognised unions (%) | FY25 | FY24 | FY23 | FY22 | FY21 |
NUM | 52 | 52 | 53 | 52 | 58 |
Association of Mineworkers and Construction Union (AMCU) | 29 | 29 | 28 | 28 | 23 |
United Association of South Africa (UASA) | 5 | 5 | 5 | 5 | 5 |
Solidarity | 2 | 2 | 2 | 3 | 2 |
National Union of Metalworkers of South Africa (NUMSA) | 7 | 7 | 6 | 6 | 5 |
No union | 5 | 5 | 6 | 6 | 6 |
Coalition (NUM, UASA and Solidarity) | 59 | 59 | 60 | 60 | 65 |
Our primary response to union or employee dispute management is to pre-emptively identify issues that may change into formal disputes
fairly and expediently, minimising impact on operations and employee morale. We have ongoing dialogue that takes place in various central
and operations-based structures.
165
Access to housing and decent living conditions
The South African Mining Charter III requires mining right holders to improve housing and living
conditions for employees, aligning accommodation with the industry standard. As such, we promote
home ownership through our home ownership programme, and our housing and living conditions
programme. We sell existing houses and vacant stands in proclaimed municipality areas to employees at
discounted prices (below market value). Through this approach, we reduce our running costs and
associated liabilities while improving stakeholders’ access to adequate, affordable housing and
commercial properties.
Mining Charter III target | What we achieved | |||||
▪Decent housing, home ownership, integrated human settlements and measures to address demand. | ▪Employees purchased 621 (FY24: 616) company properties and registered 571 ▪Of the 296 vacant stands identified, 272 (FY24: 268) were sold to employees ▪22 (FY24: 244) employees participated in the pension- backed home loan scheme negotiated by the Minerals Council for the mining industry. | |||||
Collaboration and partnerships
We contribute to innovation and the sustainability of the industry through our partnerships with
research institutions and industry bodies, such as Mandela Precinct, Mining Qualification Authority,
Minerals Council South Africa, Australasian Institute of Mining and Metallurgy, Papua New Guinea
National Training Council, and institutions of higher learning.
Although we are a highly respected organisation with a well-established brand in Papua New Guinea,
our brand recognition in Australia is low. To increase our brand awareness, we focused on the following
activities:
▪Running social media campaigns to create awareness about Hidden Valley and Eva Copper
▪Redesigning the way we communicate online about the potential career opportunities and impact in
Australasia
▪Partnering with industry bodies such as the Australasian Institute of Mining and Metallurgy (AusIMM)
and Australian Resources and Energy Employer Association (AREEA) to create brand awareness with
mining professionals.
Innovation, technology and digitisation
As part of our digital transformation in learning, we have implemented a learning management system
(Achieve LMS) in our South Africa region that delivers interactive and modernised content through
micro-learning modules. We have redesigned training material to cater for diverse generational learning
preferences. This system also enhances accessibility and relevance of training, moving beyond
traditional learning methods and supporting career development aspirations. To enable own-time
learning from a diverse range of quality curated courses, the Achieve LMS will be integrated with
Udemy as a content provider of additional development programmes for skilled employees.
Work has been completed in the development of live dashboards with data that can assist operations in
tracking compliance to commitments and identify potential employees for future roles based on their
progress towards completion of development programmes.
Future focus areas As technology evolves, focus will shift to the inclusion of AI in our scope of offerings. This evolution has been identified as a key enabler for business and the need to upskill users who can benefit from this technology will receive attention. In Australasia, the development of an online, off-site visitors’ induction is receiving attention with the aim of streamlining visitors’ induction and thereby alleviating the need for operations to have to spend a significant amount of time to complete this. Further focus is being placed on the development and enhancement of dashboards to cover compliance and enhance accuracy of cost reports aligned to HRD spend and B-BBEE compliance. | ||
166
Empowering communities
We aim to provide benefits and opportunities to our host communities by honouring our regulatory and agreement-based commitments and
implementing voluntary CSI initiatives. Through these initiatives, we contribute to the needs of our host communities and their long-term resilience, while
supporting our host countries’ economies and progress on the 17 UN SDGs.
Material matters | |||||
Sustainable communities | |||||
UN SDGs | |||||
| Good health and wellbeing | | Life on land | ||
| Quality education | | Peace, justice and strong institutions | ||
| Clean water and sanitation | | Partnerships for the goals | ||
| Decent work and economic growth | ||||
GRI disclosure requirements | |||||
▪GRI 3: Material Topics 2021 ▪GRI 203: Indirect Economic Impacts 2016 ▪GRI 411: Rights of Indigenous People 2016 ▪GRI 413: Local Communities 2016. | |||||
FY25 priorities | |||||
1.Delivering our SLP commitments 2.Fulfilling our benefit-sharing and other mining-related agreement commitments 3.Developing communities beyond compliance through impactful voluntary CSI initiatives. | |||||
Strategy: Creating shared value and building resilient communities
Our community development initiatives support us in maintaining our licence to operate and fostering positive relationships with our host
communities. They help prepare communities for the eventual closure of mining operations by building skills, economic opportunities and
diversification away from mining. We also engage with host communities through procurement, which is discussed under Creating value along our
supply chain. The success of these initiatives depends on ongoing engagement and a commitment to respecting the culture and heritage of the
communities in which we operate.
When executing social activities, we focus on the following three priorities:
Delivering our SLP commitments | In South Africa, our investments through SLP commitments focus on agriculture, water infrastructure, SMME and youth skills development for sustainable social change. Broad-based stakeholder engagement enables us to better understand and address the legitimate needs and expectations of our host communities as we implement our fourth generation SLPs (1 January 2023 to 31 December 2027). | ||||
Fulfilling our benefit-sharing and other mining-related agreement commitments | We have mining-related agreements at asset level that include socio-economic development commitments. In Papua New Guinea, we deliver our Hidden Valley MoA commitments, which encompass local employment and business opportunities, royalty payments to the government and landowners, a community programme and infrastructure delivery. We also facilitate the delivery of community-endorsed projects funded by the Hidden Valley Mine Trust, which was established by our benefit-sharing agreement. Our initiatives focus on agriculture, women’s skills and entrepreneurship, and projects that promote livelihoods and economic diversification during operations and in preparation for eventual mine closure. We also support infrastructure that helps bolster local law enforcement and fosters safer environments for our host communities. In Australia, our native title agreement commitments with the Kalkadoon people include engagement, cultural heritage protection and employment, training and business opportunities. Revenue-linked payments that support business, education, training and other community benefit initiatives, will also commence once Eva Copper is operational. | ||||
Developing communities beyond compliance through impactful voluntary CSI initiatives | Our voluntary CSI initiatives target immediate challenges facing our host communities, such as poverty, unemployment and inequality, while also supporting local economic development and community inclusiveness during operations and for community resilience beyond life-of-mine. We implement CSI initiatives through long-standing partnerships with government, NPOs, civil society and Harmony community engagement structures. | ||||
167
Governance
Accountability and responsibility | Harmony assigns responsibility for community development to various management structures with oversight from the social and ethics committee. These include: ▪Steering committees comprising executives and senior management who oversee the delivery of our SLP and agreement-based commitments ▪SLP community of practice tasked with monitoring the implementation of all SLP element commitments, managing risks associated with non-compliance, and opportunity identification ▪Trust governance structures applicable to the Harmony Community Trust and the Hidden Valley Mine Trust ▪Social lease arrangements involving the rental of mine-owned land and properties to government and NPOs at below market rates, managed under the oversight of the group executive committee. | ||||
Performance monitoring and reporting | In South Africa, we submit annual SLP and Mining Charter III reports to the DMPR. In Papua New Guinea, we update government stakeholders quarterly on our community development progress and report on the programmes delivered as part of our annual mining lease reporting. We routinely track our progress and periodically conduct internal and external assurance reviews of our commitment delivery. | ||||
Policies that support our governance approach | Our sustainability framework is grounded in the principle of creating shared value through community initiatives, partnerships and responsible procurement. The framework is supported by a range of policies, including stakeholder engagement, corporate social investment, socio-economic transformation and our Australasia social performance policy. As Harmony expands into new regions, we will adapt and evolve our programmes to meet local needs, while maintaining the essence of our values. | ||||
168
Risk and opportunity management
We identify community development risks and opportunities through integrated internal assessments and ongoing external stakeholder engagement.
Risks | Description | Mitigation measures | ||||||
Failure to meet SLP commitments | Mining operations may fail to meet SLP obligations, including insufficient community engagement, poor financial planning and ineffective monitoring and enforcement. This can lead to falling short of community expectations, a breakdown in trust and erosion of our social licence to operate. | We prioritise stakeholder engagement, including community consultations, to align our SLP commitments with the needs and expectations of communities. We meet these expectations by: ▪Evaluating community needs and aligning with host government and regulatory priorities ▪Continuous community engagement to understand and respond to frustrations ▪Establishing multi-stakeholder committees to co-monitor projects. | ||||||
Failure to deliver agreement-based commitments | Failure to meet agreement-based commitments can damage a mining company's reputation, erode community trust, strain stakeholder relationships, and lead to legal or regulatory consequences. | We have an integrated multi-department approach with our Australasia site and services teams that supports the delivery of commitments. This includes: ▪Managing and oversight of stakeholder relations and agreement commitments by community affairs teams to identify and address emerging issues early ▪Implementing green hire programmes through HR functions ▪Identifying and working with host community suppliers to increase local content directly, or via principal contractors ▪Payments and financial reporting on commitment delivery by our finance teams. | ||||||
Misalignment with local capacity | Misalignment between mining operations and local capacity (due to limited local skills, infrastructure, or differing development expectations) can result in low levels of local procurement and skills development. | We seek to address these challenges and build capacity by: ▪Communicating openly and transparently regarding project opportunities ▪Investing in skills development, local procurement and enterprise development ▪Partnering with community organisations and trusts to support local development ▪Supporting employees and their children with education opportunities. | ||||||
Community dependence | Over-reliance on mining activities by communities lead to economic instability and exacerbate social issues. A lack of livelihood diversification means that when mining activities stop, communities experience significant hardship due to job losses and the collapse of related industries. | We seek to address community dependency through a multifaceted approach focused on socio-economic development, stakeholder engagement and diversification beyond mining. This includes: ▪Developing effective and inclusive SLPs ▪Promoting local procurement and skills development ▪Engaging the community in decision-making processes ▪Supporting programmes that support local economic diversification and resilience at closure ▪Fostering collaboration with local government and community NPOs. | ||||||
Opportunities | ||
Our social programmes aim to deliver practical support to community members, including initiatives that promote individual and community wellbeing. These efforts can help foster a stable operating environment, which supports long-term value creation. The opportunities we leverage from these programmes include: ▪Supporting economic resilience and community development through skills development, access to education, and support for local entrepreneurship ▪Supporting socio-economic transition and long-term sustainability, particularly in preparation for closure and post-mining futures ▪Increasing the availability of a locally sourced workforce, for Harmony and our contractors, through targeted training and capacity building programmes ▪Enhancing our reputation, including workforce, investors, regulators and host governments, which may contribute to improved perceptions of our operations. | ||
169
Measuring our performance
We invest significant financial capital in delivering on our socio-economic development commitments, within and beyond compliance.
South Africa | Papua New Guinea | Australia | |||||||||||
Delivering on our socio-economic development commitments | R52 million (US$2.9 million) | (FY24: R80 million/ US$4.3 million) | R114 million (US$6.3 million) | (FY24: R95 million/ US$5.1 million) | R0.4 million (US$0.1 million) | (F24: R— million/ US$— million) | |||||||
CSI (beyond compliance) | R28 million (US$1.5 million) | (FY24: R20 million/ US$1.1 million) | R15 million (US$0.8 million) | (FY24: R19 million/ US$1.0 million) | R1 million (US$0.1 million) | (FY24: R0.4 million/ US$— million) | |||||||
Progress against priorities
Delivering on our SLP commitments
In FY25, we delivered on our SLP obligations as required by the MPRDA in South Africa with no areas of non-compliance.
Agriculture | SMMEs and youth | Infrastructure | Science, technology, engineering and math | |||||||||||||||
We fund agricultural initiatives (broad-based livelihoods and commercial ventures) to provide poorest host communities with healthy food to consume and sell. | We enable income-generating opportunities by providing skills development and tools to youth and female entrepreneurs through SMME incubation hubs, workshops and commercial spaces. | We support road, water and sanitation improvement projects to uplift living conditions for host communities. | We sponsor STEM courses at secondary schools to prepare learners for academic success and future careers. | |||||||||||||||
Total investment: R5 million | Total investment: R24 million | Total investment: R17 million | Total investment: R6 million | |||||||||||||||
FY25 investments We spent a total of R52 million (US$2.9 million) across our four spend categories. The regional split is as follows: ▪Free State: R25 million ▪Gauteng: R12 million ▪North West: R11 million ▪Labour-sending areas: R4 million. | ▪The Wedela, Doornkop and Rietvallei agricultural projects develop emerging farmers. We installed infrastructure for vegetable production in partnership with local municipalities, the Department of Social Development and the Gauteng Department of Health ▪In the Free State, we erected vegetable tunnels in Nyakallong, Thabong and Meloding and trained 26 beneficiaries ▪We distributed potted trees in Carletonville catalyse fruit farming for agro-processing and manufacturing of condiments. | ▪Our sponsorship of the Virginia Sports Academy, which provides sports scholarships and internships for school levers, created 20 new jobs and mentored 50 learners ▪We partnered with several economic development organisations to provide entrepreneurial training, skills development and job opportunities to youth and informal businesses. | ▪We collaborated with local municipalities in Witpan, Carletonville and Stillpan to refurbish, maintain and operate wastewater treatment plans to avoid raw sewage discharge into river systems ▪We operate and maintain pumping systems conveying 37Ml/day (on average) of water from Witpan to Mostert Canal for consumption by the residents of the Matjhabeng municipality in Welkom. | ▪We support 4IR community initiatives to prepare learners for digital careers. We worked with 16 schools and trained 500 primary and 700 secondary students and 20 teachers ▪We invested in school infrastructure, including classrooms, science and computer labs and ablution facilities to make three schools a better learning environment. | ||||||||||||||
When reading the Mining Charter III compliance scorecard, there will be a difference in the expenditure compliance amount due to the charter report’s year end being December 2024.
170
Over the past five years, we have significantly invested in our mine community development programmes | ||||||||||||||||||
Agriculture | SMMEs and youth | Infrastructure | Science, technology, engineering and math | |||||||||||||||
Free State R25 million | R— million | R19 million | R5 million | R1 million | ||||||||||||||
Gauteng R12 million | R1 million | R— million | R6 million | R5 million | ||||||||||||||
North West R11 million | R— million | R5 million | R6 million | R— million | ||||||||||||||
Labour-sending areas R4 million | R4 million | R— million | R— million | R— million | ||||||||||||||
Total R52 million | R5 million | R24 million | R17 million | R6 million | ||||||||||||||
171
Fulfilling our benefit-sharing and mining-related agreement commitments
Hidden Valley MoA
Our Hidden Valley MoA community development commitments are funded as part of Hidden Valley’s annual budget.
Agriculture programmes | Community roads and infrastructure | Education and skills development | Community health outreach | |||||||||||||||
We support farmers to improve food security and grow local incomes through agricultural business opportunities. | We support rural roads to connect farmers, markets, and essential services, and invest in community infrastructure that improves access to water, health care, education, and public services. | We support education and training to enhance employment prospects and SMME business opportunities. | We collaborate with health services to strengthen community health outreach programmes and their delivery; we also assist with initiatives that raise awareness of domestic violence and improve access to support. | |||||||||||||||
FY25 investments R11 million (US$0.6 million) | ▪Constructed 30 permanent and 28 semi-permanent coffee solar dryers across four villages ▪Expanded coffee nursery capacity across four villages ▪Continued working with six local farmers on beekeeping ▪Completed our successful tilapia pilot programme in two villages ▪Commenced our multi-year “Portion 8” agricultural project in Wau township ▪Delivered business development support to programme participants across all agricultural ventures, e.g. statutory business obligations, marketing assistance, capacity building, and technical and logistical support. | ▪Performed maintenance on 10 police houses in Wau and 14 in Bulolo (with 41 houses in total (including duplexes) in the FY24 – FY26 multi-year programme) ▪Performed 18km of maintenance on community roads at Nauti, Winima, Elauru, Were Were and Kuembu villages ▪Delivered Kaisenik village water supply project in partnership with local government ▪Continued to construct a single-lane bridge for Nauti village to aid safe river crossing ▪Maintained our weekly bus service across the Hidden Valley mining lease to reduce travel time to Wau and Bulolo for residents of Tekadu villages. | ▪Awarded scholarships to 14 tertiary students, including nine new recipients and five continuing recipients ▪Conducted sewing training for 57 women and youths ▪Partnered with Lae University of Technology to deliver brickmaking and brick moulding welding training for 15 youths. | ▪Facilitated host community breast cancer health screenings for 559 participants as part of our annual “Pinktober” campaign ▪Facilitated domestic law and order awareness to a 300-person audience by Royal Papua New Guinea Constabulary officers. | ||||||||||||||
During FY25, we also participated with other parties, including national, provincial, local-level governments and landowners, in a performance review of the MoA, with a number of revisions agreed. The Community
Development Agreement (CDA), as the agreement will in future be named, will come into effect once endorsed by the National Executive Council of Papua New Guinea.
Hidden Valley Mine Trust
During the year, we paid R14 million (US$0.8 million) into the trust and facilitated the delivery
of community-endorsed projects. In FY25, the projects delivered by the trust included:
▪Supporting 194 students through the landowners school fees programme
▪Installing 35 solar streetlights in Nauti village
▪Contributing funding toward Nauti village road maintenance.
Kalkadoon Native Title Ancillary Agreement
Consistent with the stage of the project, our FY25 efforts were focused on progressing strategies that
acknowledge the Kalkadoon people’s connection to the country and our Eva Copper site, and integrating these
considerations and community input into our project planning, broader community investment framework,
which is in development, and employment and supply strategies, which are also in development.
172
Providing support beyond compliance through impactful CSI and business site programmes
Our additional support responds to local socio-economic challenges, addresses community needs and contributes towards the SDGs.
South Africa | Papua New Guinea | Australia | ||||||||||||||
Backing opportunities for South Africa’s next generation | Partnering for health, learning and livelihoods in Papua New Guinea | Investing in community, creativity, youth and culture in Australia | ||||||||||||||
R28 million Lives positively impacted: 18 559 | R15 million Lives positively impacted: 13 639 | R1 million Lives positively impacted: 1 162 | ||||||||||||||
We are exploring ways in which our obligation-based and discretionary CSI can support each other to deliver stronger, more coordinated community impact. We also worked on 87 CSI projects and partnered with 22 NPOs in host communities and relevant institutions of government, at both provincial and local levels. Highlights for the year include: ▪Assisting youth from previously disadvantaged background to access quality education through bursaries, internship and learnership programmes ▪Training youth on ICT and electronic repair skills ▪Developing research and entrepreneurship opportunities for unemployed scientists and PhD graduates within the hair and beauty products manufacturing space ▪Empowering school leavers through sport and mining skills development programmes in collaboration with the Minerals Council South Africa’s Minerals Education Trust Fund ▪Partnering with Enactus South Africa to addresses unemployment, poverty and inequality with tertiary-level entrepreneurial skills development ▪Working with the South African Agency for Science and Technology (SAASTA) to promote Maths and Science at secondary schools ▪Fighting gender-based violence (GBV) by sponsoring Thuthuzela Care Centres in host communities to support victims and facilitate the justice process, in collaboration with the National Prosecuting Authority (NPA) and the Minerals Council South Africa. Harmony leases properties, such as schools, recreation facilities, technical workshops, student accommodation facilities, to the government and SMMEs at rental values significantly lower than market value. | Our voluntary programmes focus on supporting everyday wellbeing and long-term economic opportunity. This year, they included: ▪Assisting Morobe farmers through the Wafi-Golpu and Cocoa Board of Papua New Guinea cocoa development programme ▪Providing building materials, solar lighting, water supply and classroom furniture to assist the Yanta community to relocate Wafi primary school to Pekumbe village ▪Completing the Pekumbe village WaSH project, which is the tenth of 17 projects intended for delivery over our multi-year programme ▪Providing essential supplies to health clinics in the Wafi- Golpu project area ▪Donating education supplies to schools in Hidden Valley host communities ▪Combining our Hidden Valley community health outreach with a World Reading Day initiative, distributing children’s books donated by our Australian team. | Eva Copper has contributed to: ▪Celebrating the arts by showcasing the work of emerging First Nations and local artists, and providing arts and craft materials to schools ▪Supporting young athletes with equipment, apparel and travel assistance to take part in regional competitions ▪Improving community safety with sensor-lighting installed at a housing complex, helping women and children feel more secure at night ▪Bringing people together by sponsoring and actively participating in major community events across the region. | ||||||||||||||
173
Collaboration and partnerships
We value and respect stakeholder input in community development projects with host communities.
We collaborate with stakeholders including SMME suppliers, governments, regulators, traditional
authorities, community leaders and NPOs when executing our CSI initiatives and delivering on our
commitments.
During FY25, we worked with:
▪In South Africa, Harmony, in partnership with the Trust Blu Foundation, has introduced a new
co-funded programme that establishes tower infrastructure projects at selected Harmony sites
(Masilo and Thabong). These sites enable SMMEs to sell data and provide connectivity in underserved
areas, offering internet access to thousands of community members. The project also supplies e-
waste refurbishing equipment, allowing youth to be trained in repairing old electronic devices – such
as laptops, cellphones, and computers – which they then resell for a profit. This income directly
benefits the youth participating in the programme. In addition, the initiative offers training in
electronics and new venture creation, equipping participants with both the technical and business
skills needed to succeed in the e-waste economy
▪The MRA in Papua New Guinea to promote its Women Landowners Micro-Finance Credit Scheme
Programme, including assisting coordination, stakeholder engagement and programme awareness
▪National, provincial and district health authorities in Papua New Guinea to support health facilities
and community health outreach for our host communities
▪The Papua New Guinea University of Technology Appropriate Technology and Community
Development department, on a first-of-its-kind vocational skills collaboration to train 15 participants in
brickmaking and welding
▪Local sports clubs, community organisations, schools and kindergartens to deliver our community
grants programme at Eva Copper.
Innovation, technology and digitisation
In Australia, we introduced a web portal that enables North West Queensland community organisations
to apply to our twice-annual Eva Copper community grants programme.
Future focus areas We remain focused on maximising the impact of our socio-economic commitments and voluntary CSI initiatives. Our focus areas in the short term include: ▪Maximising social returns from greater connectivity between our obligation-based and discretionary CSI spend in South Africa ▪Measuring the impact of our various social interventions and evaluating the relevance of such programmes ▪Explore technological applications that can be adopted as a solution towards enhancing the tracking of performance and reporting ▪Continuing our WaSH and cocoa development programmes at Wafi-Golpu and delivering school classrooms and two community halls for Hidden Valley host communities ▪Developing leasehold land in the Wau township in Papua New Guinea into an agricultural project to promote food security and income generation ▪Continuing our interim grants programme while we define Eva Copper’s longer-term CSI framework. | ||
174
Creating value along our supply chain
Sourcing goods and services from stakeholders in our upstream supply chain creates shared value for our business and host communities. Through
responsible procurement and targeted supplier development initiatives, we contribute to local economic growth and strengthen community partnerships,
while enhancing the financial and operational resilience of our business.
Material matters | |||
Sustainable communities | |||
UN SDGs | |||
| No poverty | ||
| Decent work and economic growth | ||
 | Reduced Inequalities | ||
GRI disclosure requirements | |||
▪GRI 2: General Disclosures 2021 ▪GRI 203: Indirect Economic Impacts 2016 ▪GRI 205: Anti-corruption 2016 ▪GRI 3: Material Topics 2021 ▪GRI 204: Procurement Practices 2016 ▪GRI 308: Supplier Environmental Assessment 2016 ▪GRI 414: Supplier Social Assessment 2016. | |||
FY25 priorities | |||
1. Delivering against our regulatory obligations and stakeholder agreement commitments 2. Backing diverse and local businesses 3. Partnering and collaborating with stakeholders. | |||
Strategy: Building a sustainable supply chain
We are committed to building a sustainable supply chain that delivers positive impact beyond the life-of-mine. This enables us to contribute to
local economies, support community resilience, build long-term partnerships and promote inclusive participation across our supply chain. To
achieve this, we have identified the following priorities:
Delivering against our regulatory obligations and stakeholder agreement commitments | We aim to fully comply with our regulatory and agreement-based commitments. This includes aligning procurement and supplier development initiatives with the intent and provisions of these frameworks to support inclusive economic growth and empowerment. | ||||
Backing diverse and local businesses | Our procurement framework identifies key areas where we can make the greatest impact, particularly in inclusive procurement, employment and enterprise development. We offer financial and non-financial support to the development of diverse businesses, while fulfilling our regulatory and agreement-based commitments. We also aim to integrate local suppliers from our host communities into our core business operations. We identify prospective local suppliers and work closely with them to build the capacity needed to meet industry standards and for them to participate in our supply chain. | ||||
Partnering and collaborating with stakeholders | As suppliers of precious metals, we seek to uphold the principles of responsible sourcing, transparency, and environmental and social responsibility so that our role in the global precious metals supply chain reflects the expectations of our stakeholders and the standards of responsible business conduct. We actively collaborate with industry bodies, development agencies and government-led initiatives. By leveraging public and private partnerships, we aim to expand the reach and effectiveness of our supplier development efforts and increase our local spend. | ||||
175
Governance
Strong governance underpins the successful implementation of our procurement and supplier development initiatives.
Accountability and responsibility | In conjunction with the relevant board committees, the transformational and supply chain executive provides oversight of our South African operations, and our chief operating officer for Australasian operations. This allows for responsibilities to be clearly defined and embedded across all levels of the business, promoting accountability and transparency. | ||||
Performance monitoring and reporting | We prioritise transparent reporting on outcomes and challenges, enabling accountability and driving continuous improvement. We use a performance monitoring system that provides clear metrics to assess progress and guide ongoing improvements, tracking procurement spend, assessing supplier performance and, in future, measuring progress against selected targets. Our internal controls include regular internal and external audits of our procurement and supplier development activities to validate our reported performance and confirm the impact of our initiatives through quarterly compliance reviews and performance audits. We conduct thorough supplier vetting and due diligence to uphold the integrity of our supply chain. In South Africa, this includes formal onboarding procedures and verification of B-BBEE credentials and ownership structures. These checks help us maintain credibility and support our transformation objectives. In Australia and Papua New Guinea, we screen suppliers for risks related to modern slavery, regulatory non-compliance, and unethical business practices, including any history of legal or enforcement action. | ||||
Policies that support our governance approach | Our procurement framework is underpinned by consistent principles across the business, while allowing for variations to reflect country-specific regulatory requirements and agreement-based obligations. We align our procurement and ESD frameworks with South Africa’s transformation goals and ESG principles. We regularly review this policy to keep it relevant, responsive to legislative changes and consistent with our evolving business environment. In South Africa, our supplier code of conduct governs supplier interactions, enforcing zero tolerance for fronting, fraud or any non-compliance with transformation objectives. Suppliers must comply with this code, reinforcing our non-negotiable ethical standards, and with health, safety and environmental (HSE) regulations to enable responsible sourcing and promote operational safety. We use service level agreements (SLAs) to clearly define expectations for supplier support to build supplier capacity and readiness. In Papua New Guinea and Australia, we require our suppliers to be registered, insured and fully compliant with anti-bribery and corruption, anti-money-laundering and any current sanctions laws. | ||||
176
Risk and opportunity management
The implementation of a robust procurement framework offers numerous opportunities to drive long-term value for Harmony and the communities in which we operate. However, it also presents several risks that
require proactive management to enable the integrity, sustainability and impact of our procurement practices. We actively manage these risks, with a strong focus on supplier concentration, non-compliance and
reputational exposure. We maintain contingency plans that enable business continuity in the event of critical supplier failure.
Risks | Description | Mitigation measures | ||||||
Non-compliance with legislation and agreement- based obligations | Supplier fronting or misrepresentation, non- compliance or failure to meet agreement-based commitments may result in legal, financial or reputational consequences. Additionally, failure to meet Mining Charter III targets could lead to a decline in our B-BBEE score. | We adopted a phased approach to comply with Mining Charter III requirements and intend to shift spend across geographical boundaries and secure longer-term contracts with compliant suppliers. We have an inter-departmental approach for tracking and monitoring the implementation of and compliance with agreement-based commitments, with oversight by regional management and executives. We also conduct periodic internal audits and compliance reviews. | ||||||
Supplier concentration | Over-reliance on a narrow pool of suppliers can make the supply chain vulnerable to disruptions, especially if any of these suppliers face operational or financial instability. | We are considering options to diversify our supplier base, as detailed in the opportunities described alongside. | ||||||
Macro-economic volatility, including inflation, rising input costs, or local economic downturns | This risk, combined with delayed purchase order payments to HDSA or SMME vendors, can cause cash flow issues, reduce supplier competitiveness, and discourage participation. This risk threatens supply chain stability, operational efficiency and the long-term success of supplier development initiatives. | We are developing mitigation controls to facilitate timely invoice payments or provide financing solutions, while also establishing clear communication channels to address payment issues. | ||||||
Opportunities | ||
▪Diversifying and expanding our supplier base across different ownership structures, geographies and capabilities reduces concentration risk and enhances agility and innovation. Our growth projects in Australia and Papua New Guinea provide opportunities to expand and deepen local procurement, supporting the development of resilient supply chains and contributing to community and host country economic development ▪Investing in inclusive sourcing enhances brand trust, improves B-BBEE scores, unlocks commercial opportunities, and drives socio-economic upliftment through job creation, income generation and skills transfer ▪Partnering with financial institutions, development agencies and other industry players enables us to co- invest in supplier development, unlock access to funding and mentorship, and bridge finance key enablers for high-impact enterprise growth ▪Refining our internal governance systems and aligning decision-making committees to transformation targets enables greater accountability and improves performance against the Mining Charter III and ESG standards. | ||
Measuring our performance
In line with our South African transformation goals, we allocate a defined percentage of procurement spend to black-owned and community-based suppliers. We track our progress and impact annually through actual
discretionary spend attributed to >25.0 and >50.0% black-owned suppliers. To reinforce our commitment to equitable economic participation, we have established annual procurement targets focused on black-owned,
black-women-owned and black-youth-owned enterprises. We aim to prioritise sourcing from qualifying small enterprises (QSEs) and exempt microenterprises (EMEs), recognising their critical role in furthering local
entrepreneurship and job creation.
We support business development initiatives for our Hidden Valley landowner suppliers and track our spending to reflect our supplier tiers. We also adopt this approach for our Wafi-Golpu Joint Venture, noting that
procurement expenditure is low, reflecting the project’s permitting phase. At Eva Copper, we are focused on establishing robust systems and strategic frameworks to unlock opportunities for our stakeholders as the
project advances. We launched a digital reporting tool in July 2025 to track subcontractor spend and project impact.
177
Progress against priorities
Delivering against our regulatory obligations and stakeholder agreement commitments
Mining Charter III
We have progressed against our South African transformation goals by delivering on Mining Charter III requirements as follows:
Investment in black-owned enterprises | Despite a 5% decrease in spending on enterprises with >51% black ownership, there has been a significant 10% increase in investment and an 21% increase in the number of enterprises in the 100% black-owned category. This reflects a deliberate shift towards our host communities. | ||||
Designated groups | Although designated group performance continues to improve, this remains marginal for youth-owned suppliers. In the financial year, 132 vendors transitioned from <25% black ownership to >25%. This significant shift can be attributed to our efforts in keeping our BEE certificates updated. We expect the final phase of our approach to complying with Mining Charter III to address our challenges in procurement from black-women-owned and black-youth-owned businesses, with procurement committees empowered to advance this transformation imperative through transparent governance processes. To identify opportunities for SMMEs in high-value procurement categories, we will conduct a detailed supplier gap analysis and pre-technical assessment to evaluate our existing supplier base and identify underrepresented groups. Insights gained will inform targeted procurement and development interventions going forward. | ||||
Goods and services category | We achieved 100% compliance. | ||||
Procurement spend | FY25 | FY24 | FY23 |
Total discretionary spend | R19.9 billion (US$1 096 million) | R17.6 billion (US$941 million) | R16.5 billion (US$929 million) |
Percentage of discretionary spend on preferential procurement | 82% | 84% | 85% |
Percentage of discretionary spend on >50% black-ownership suppliers | 55% | 60% | 52% |
Percentage of discretionary spend on local host communities | 58% | 57% | 59% |
Percentage of discretionary spend on black-women-owned enterprises | 14% | 15% | 12% |
Total preferential procurement spend | R16.3 billion (US$898 million) | R14.7 billion (US$736 million) | R14.0 billion (US$736 million) |
Spent on black-owned businesses | R11.0 billion (US$606 million) | R10.6 billion (US$567 million) | R8.6 billion (US$506 million) |
Spent on black-women-owned businesses | R2.8 billion (US$154 million) | R2.7 billion (US$92 million) | R2.0 billion (US$92 million) |
Compliance spend | |||
Spent on new >51% black-owned and controlled enterprises | R19 million (US$1.0 million) | R35 million (US$1.9 million) | R47 million (US$3.3 million) |
Spent on 33 new 100% black-owned SMMEs | R15 million (US$0.8 million) | R25 million (US$1.3 million) | R12 million (US$0.7 million) |
For details, see Mining Charter III – compliance scorecard.
178
Procurement within Papua New Guinea
Despite supply chain challenges related to Papua New Guinea’s low manufacturing base, our local procurement for ongoing sourcing in FY25 was 52% (excluding once-off purchases and fuel). Typically, overseas sourcing
relates to key supplies, consumables and services not available in Papua New Guinea.
FY25 | FY24 | ||
Procurement spend | |||
Spent in Papua New Guinea | R2.5 billion (US$140 million/PGK559 million) | R2.7 billion (US$144 million/PGK541 million) | |
Spent on landowner companies | R654 million (US$36 million/PGK144 million) | R610 million (US$32 million/PGK122 million) | |
Spent in Morobe Province (excluding landowner companies) | R1 092 million (US$61 million/PGK240 million) | R1 242 million (US$66 million/PGK247 million) | |
Spend elsewhere in Papua New Guinea | R792 million (US$43.00 million/PGK174 million) | R862 million (US$46 million/PGK172 million) | |
Percentage spent in Papua New Guinea (excluding once-off purchases and fuel) | 52% | 51% | |
Percentage spent with landowner companies | 26% | 49% | |
Percentage spent on suppliers based in Morobe Province (including landowner companies) | 69% | 68% | |
Percentage spent on suppliers based elsewhere in Papua New Guinea | 31% | 32% | |
Percentage spent on overseas suppliers (excluding once-off purchases and fuel) | 48% | 49% |
Australian and local business participation in Eva Copper
Under the Australian Jobs Act 2013, we have obligations to establish an industry participation plan and provide full, fair and reasonable opportunities for businesses to bid for the supply of goods and services for Eva
Copper. All tender package opportunities over A$1.0 million (12 million) are notified on Eva Copper’s industry capability network gateway website. We are prioritising local procurement by assessing capability across
cascading geographic zones and working with major contractors to apply this approach in their subcontracting.
During FY25, spend for Eva Copper reflected support with project studies and site preparatory works.
FY25 | ||
Procurement spend | R1 billion (US$72 million/A$111 million) | |
Spent on First Nations Kalkadoon-owned businesses | R2.4 million (US$0.1 million/A$0.2 million) | |
Spent on First Nations-owned businesses (excluding Kalkadoon-owned) | R— million (US$— thousand/A$9.7 thousand) | |
Spent in Mount Isa and Cloncurry (excluding Kalkadoon- and First Nations-owned businesses) | R347.5 million (US$19.1 million/A$29.5 million) | |
Spent in rest of Australia | R957.6 million (US$52.7 million/A$81.3 million) | |
Spent on overseas suppliers | R2.4 million (US$0.1 million/A$0.2 million) |
Supply chain environmental and social impacts
Harmony’s supplier support and development initiatives continue to deliver positive environmental and social outcomes. However, we recognise that supply chain activities may carry risks of adverse impacts. Our
operational and service risk registers, updated on an ongoing basis with regular management review, do not include any details on suppliers that have contravened any of our environmental and social policies and
related regulatory requirements. We have therefore not had the need to request any supplier to remedy defaults or terminate any contracts in this regard.
179
Backing diverse and local businesses
In South Africa, our enterprise development framework supports black-women-owned, youth-owned and community-based suppliers with access to loans, business mentorship, skills training and capacity-building
programmes. Through these programmes, we contribute to local business and economic growth. Our support for SMMEs promotes job creation, entrepreneurship, innovation and financial inclusion while empowering
communities through income generation and education initiatives.
Our enterprise and supplier development programme helps bolster innovation and entrepreneurial activity and build the capacity of SMMEs. We assist 100% black-, women- and youth-owned enterprises to transition to suppliers of key mining and manufacturing commodities and services. | By supporting SMMEs through financial assistance, we empower them to contribute significantly to job creation, community development and overall economic resilience. | |||||||||||
152 suppliers in the enterprise development programme | 62 suppliers assisted with business development | 21 suppliers supported | ||||||||||
We seek to provide opportunities for and support Hidden Valley and Wafi-Golpu landowners to build the stability and reliability needed for ongoing contract delivery and longer-term success. This takes the form of
delivering all on-site training requirements, including operator and safety training, assisting with the establishment of landowner company joint ventures, statutory compliance requirements awareness, and under select
circumstances, support to obtain equipment.
Hidden Valley | Wafi-Golpu | |||||||||||||
Corporate compliance assistance | Equipment leaseback | Contractor training | Landowner contract opportunities | |||||||||||
We hold annual corporate compliance workshops to assist landowner businesses in meeting statutory and company requirements. Participants also have the opportunity to raise issues, highlight business challenges and work through contract-related questions face-to-face. This supports greater understanding and better-informed contract outcomes. | To support a landowner company delivering freight transport services to the mine, we procured fleet equipment and entered into a leaseback agreement. This approach enabled the company to operate a modern fleet without the challenge of upfront capital investment, supporting project delivery and long-term operational capability. | We actively support the training of staff from landowner companies working at our mine. Depending on the role, this includes comprehensive operator and safety training programmes to equip personnel with the skills and knowledge to perform their roles safely and effectively. These skills not only support current operations but create pathways to long-term careers in the mining industry and beyond. | Working with the Papua New Guinea Department of Works and Highways, a Wafi- Golpu landowner company was contracted to deliver local road maintenance works. This collaboration supports landowner company capacity-building efforts and preparedness for Wafi-Golpu project opportunities. | |||||||||||
In Australia, we are developing our framework to guide First Nations procurement and participation. We have also embarked on a range of local supplier engagement initiatives to generate awareness of Eva Copper and
engage with North West Queensland businesses.
Kalkadoon and First Nations participation framework | North West Queensland supplier opportunities | |||||
We are developing our First Nations participation framework, incorporating a Kalkadoon employment and training plan and a First Nations procurement plan. We also started to review contract packages to identify those highly suitable to First Nations businesses. Consultations with the Kalkadoon People are underway. As we release new tenders, we are mandating our First Nations procurement and reporting guidelines. This requires a monthly submission of data via an online form. | During FY25, we welcomed the Queensland Government’s decision to provide conditional grant funding of R244 million (A$20.7 million) to the Eva Copper Project under the MIMA programme. The programme aims to accelerate the development of resource projects such as the Eva Copper Project in the North West Minerals Province in the next five years. Grant recipient obligations include creating local employment, fast-tracking project delivery, and reporting on outcomes that support regional economic growth. | |||||
180
Partnering and collaborating with stakeholders
Suppliers (upstream supply chain)
We foster open communication with internal and external stakeholders, encouraging feedback and
participation through regular consultations with supplier forums, community representatives and
regulatory bodies. These interactions help us address challenges, identify opportunities for
improvement, and align on project progress and shared concerns.
We collaborate with funding institutions, government entities and business development partners
to support local economies and unlock additional funding avenues.
Engagement with SMMEs enables us to: | ||
▪Understand the issues and challenges for SMMEs in contracting with Harmony ▪Support their integration into our supply chain to drive local development ▪Facilitate skills transfer for procurement and supplier development ▪Communicate our procurement strategies and opportunities ▪Promote local and inclusive economic participation. FY25 highlights included: ▪Fully complying with Mining Charter III requirements for the services category ▪Hosting our annual Hidden Valley landowner corporate compliance workshop ▪Introducing Eva Copper to local suppliers through “Meet the Buyer” events ▪Establishing a local business capabilities portal for Eva Copper suppliers and tenderers. | ||
Engagement with government and regulatory bodies enables us to: | ||
▪Remain compliant with local content requirements and procurement targets ▪Enable local businesses operating in mining areas to benefit from our preferential and local procurement and supplier development programmes, helping to create more inclusive and resilient local economies ▪Identify and promote opportunities for local companies to build capacity through government and third-party contracts. FY25 highlights included: ▪Securing two significant contracts for a local 100% black-women-owned enterprise and a 100% black-owned enterprise, marking a notable shift in local investment ▪Working in close collaboration with the Morobe Provincial Government to maintain critical highway infrastructure ▪Contracting of Wafi-Golpu landowner company for Department of Works and Highways local roads maintenance work ▪Developing our procurement strategies to support the Queensland Government’s MIMA programme. | ||
Market (downstream supply chain)
In our upstream market, we work closely with the following refineries.
Rand Refinery, South Africa
Harmony has a 10.4% stake in Rand Refinery, which shares our commitment to stringent environmental
performance and compliance and internationally accepted responsible sourcing, as guided by the
London Bullion Market Association and the Organisation for Economic Cooperation and Development
Due Diligence Guidance for Responsible Supply Chains of Minerals from Conflict-Affected and High-Risk
Areas.
One of our executive directors is a non-executive director and sits on the refinery’s social and ethics
committee where the refinery’s sustainability strategies are discussed and influenced. The certified gold
chain of custody is independently audited as required by independent bodies and legislation.
ABC Refinery, Australia
Harmony sells all produced gold and silver from Hidden Valley mine to ABC Refinery, the refining
division of Pallion. ABC Refinery’s operations fully comply with:
▪Australian regulatory requirements
▪OECD Due Diligence Guidance for Responsible Supply Chains of Minerals from Conflict-Affected and
High-Risk Areas, including the Gold Supplement
▪London Bullion Market Association (LBMA) Responsible Gold and Silver Guidance.
ABC Refinery conducts risk-based supply chain due diligence supported by reasonable assurance against
the LBMA Gold and Silver Guidance. Supporting its Chain-of-Custody protocols, ABC Refinery has
adopted ProvCheck to authenticate finished products and provide customers with the origin of their
metal, and employed Source Certain to conduct elemental analyses to verify all incoming gold. These
innovative approaches facilitate robust traceability and provide customers confidence when purchasing
their precious metals.
Our contract with ABC Refinery reflects Harmony’s role as a responsible supplier, aligned with
sustainable and transparent sourcing practices and global expectations for environmental and social
responsibility in the precious metals supply chain.
Innovation, technology and digitisation
In South Africa, there is a plan to digitise the enterprise development centres to enable seamless
consultation and engagement with SMMEs.
For Eva Copper, and in support of our contractors and local engagement efforts, we have developed a
supplier portal featuring information on local business capabilities. This resource enables tenderers and
major package suppliers to easily identify and connect with potential local subcontractors.
Future focus areas ▪Continuously improve on achieving the set Mining Charter lll targets ▪Execute on the plan to digitise enterprise development centres in our host communities ▪Scaling up engagements on corporate compliance for Hidden Valley landowner businesses ▪Ongoing identification of opportunities to increase the proportion of Papua New Guinea procurement spend ▪Finalising our First Nations Australian participation framework, including Kalkadoon employment and training and First Nations procurement plan ▪Advancing planning for and delivering on our Australian Industry Participation Plan (AIPP) and MIMA programme commitments. | ||
181
Combatting illegal mining and unauthorised access
Influenced by low national employment rates and other socio-economic factors, illegal mining activities are a persistent challenge in South Africa and an ongoing concern in Papua
New Guinea, where motives for unauthorised access are more varied. To protect our mines, employees and communities, we leverage cutting-edge technology and collaborate with
key stakeholders, reinforcing our commitment to creating a safe working environment.
Material matters | |||
▪Management of illegal mining ▪Post-closure sustainability ▪Employee health and safety. | |||
UN SDGs | |||
| Peaceful and inclusive societies and access to justice | ||
GRI disclosure requirements | |||
▪GRI 3: Material Topics 2021 ▪GRI 410: Security practices 2016. | |||
FY25 priorities | |||
1.Investing in security measures 2.Conducting responsible mine closure. | |||
Strategy: Integrated security and engagement
In South Africa, illegal mining is highly organised and often linked to financial and violent crime. In Papua New Guinea, unauthorised access is
driven by a number of motives. These illegal activities lead to environmental degradation, social discord and disruption, and have financial
implications for our business.
To address illegal mining and unlawful access, we adopt a multi-pronged approach that includes asset security, internal controls, community
engagement and collaboration with law enforcement. The following priorities underpin the implementation of our approach:
Investing in security measures | We invest in robust security measures (training employees or contractors, regular assessments, infrastructure sealing, advanced surveillance, internal and contracted security teams, and collaboration with law enforcement and communities) to prevent illegal mining and unauthorised access, protecting people, assets and the environment. | ||||
Conducting responsible mine closure | Mine closure strategies must account for the different characteristics of underground and open-pit operations, particularly in addressing the risk of illegal mining. For underground sites, effective closure (sealing tunnels, shafts and other subsurface infrastructure) restricts access to disused sites, reducing the risk of exploitation and improving longer-term safety and environment protection. | ||||
As illegal mining does not pose security and safety challenges to our Australian operations, there is no security-related disclosure for this region.
182
Governance
Harmony’s multi-tiered governance framework endeavours to combat illegal mining through strategic oversight, robust risk management and effective operational execution.
Accountability and responsibility | Our CEO leads the overall anti-illegal mining framework and engages with government and industry bodies. Our deputy CEO and group and site security managers are accountable for implementing security strategies. We coordinate with industry partners and regulators, overseeing operational security while monitoring key security indicators. Heads of security are responsible for deploying adequate security-related human and technological resources. We have clearly defined roles and responsibilities across all governance levels, aligning with local legislation (MPRDA, Mine Health and Safety Act in South Africa and criminal statutes) and industry best practices. | ||||
Performance monitoring and reporting | We have actionable, site-specific plans for effective performance to combat illegal mining and unauthorised access. In South Africa, we report all incidents and our mitigation efforts to the DMPR on a regular basis. In Papua New Guinea, we report unauthorised access, placement of unapproved structures on our tenements, and our law and order efforts to the MRA. The audit and risk committee reviews the adequacy of internal controls, monitors key risks and reviews the effectiveness of mitigation plans. | ||||
Policies that support our governance approach | Security practices are informed by the Voluntary Principles on Security and Human Rights, the Harmony Code of Conduct, the Harmony Behavioural Code, and internal investigation methodology, which is all set out in our shaft and metallurgical codes. Our security policies are being updated, and all personnel will be retrained in this regard. In Papua New Guinea, our asset protection officers have legal authority (under the Arrest Act, 1977) to arrest persons committing imprisonable offences, in accordance with established arrest procedures and scenarios. Our broad suite of procedures encompasses security officer training, patrols, police engagement and operations, responding to threats or actions from aggressors and K9 handling. | ||||
183
Risk and opportunity management
Our aim is to prevent incidents before they occur, protecting our employees and assets. Due to the
nature of this material matter we do not report on opportunities.
Risks | Description | Mitigation measures | ||||||
Damage to the environment and infrastructure | Illegal mining contaminates water, air and soil due to accidental exposure to toxic chemicals. It increases the risk of flooding, sabotage of pipelines and illegal water usage, which lead to pollution and sinkholes. Sedimentation from alluvial mining can affect downstream communities. Reopening sealed shafts can cause physical hazards, underground fires or explosions. Each of these scenarios could cause production stoppages. | ▪Regular security assessments by our security and mine management teams ▪Demolition, sealing or rehabilitation of decommissioned infrastructure, reducing the risk of illegal mining ▪Significant investments in sealing redundant underground mines with state-of-the-art security measures ▪Internal and contracted security services ▪Extensive due diligence of community partners and protection against criminal groups involved in illegal mining ▪Law enforcement and community leader collaboration to communicate with communities on the legal implications and dangers of illegal activities. | ||||||
Safety and health concerns | Significant safety and health risks apply to illegal miners, legal miners, mining lease trespassers and local communities, including accidents and exposure to hazardous substances. Illegal mining can also lead to violent confrontations, including shooting incidents, placing miners, security officials and community members at risk. | |||||||
Increased crime rates | Undocumented immigrants engaging in crime brings social problems such as fear, coercion, human rights abuses, prostitution, substance abuse and forced labour. Links to criminal networks increase theft of explosives, diesel, copper cables and other mining equipment, undermining state authority and the rule of law. Illegal mining leads to loss of revenue and increased costs to legitimate miners and governments. | |||||||
Unregulated alluvial mining | Although the South African Government has committed legalising artisanal mining, this is not viable without addressing illicit gold trading, corruption and territorial battles. Papua New Guinea’s Government has increased regulation to encourage the development of the alluvial and small-scale mining sector. Despite these efforts, there is a concerning rise in unregulated alluvial mining, including gold smuggling. | |||||||
Measuring our performance
Group | ||||||
R748 million (US$41.2 million) invested in security measures at our mining operations (FY24: R678 million (US$36.3 million)) | ||||||
South Africa | Papua New Guinea | |||||
R713 million (US$39.3 million) (FY24: R647 million (US$34.6 million)) | Invested R35 million (US$1.9 million) in asset protection measures (FY24: R31 million (US$1.7 million)) | |||||
Illegal miners arrested on South African Harmony sites
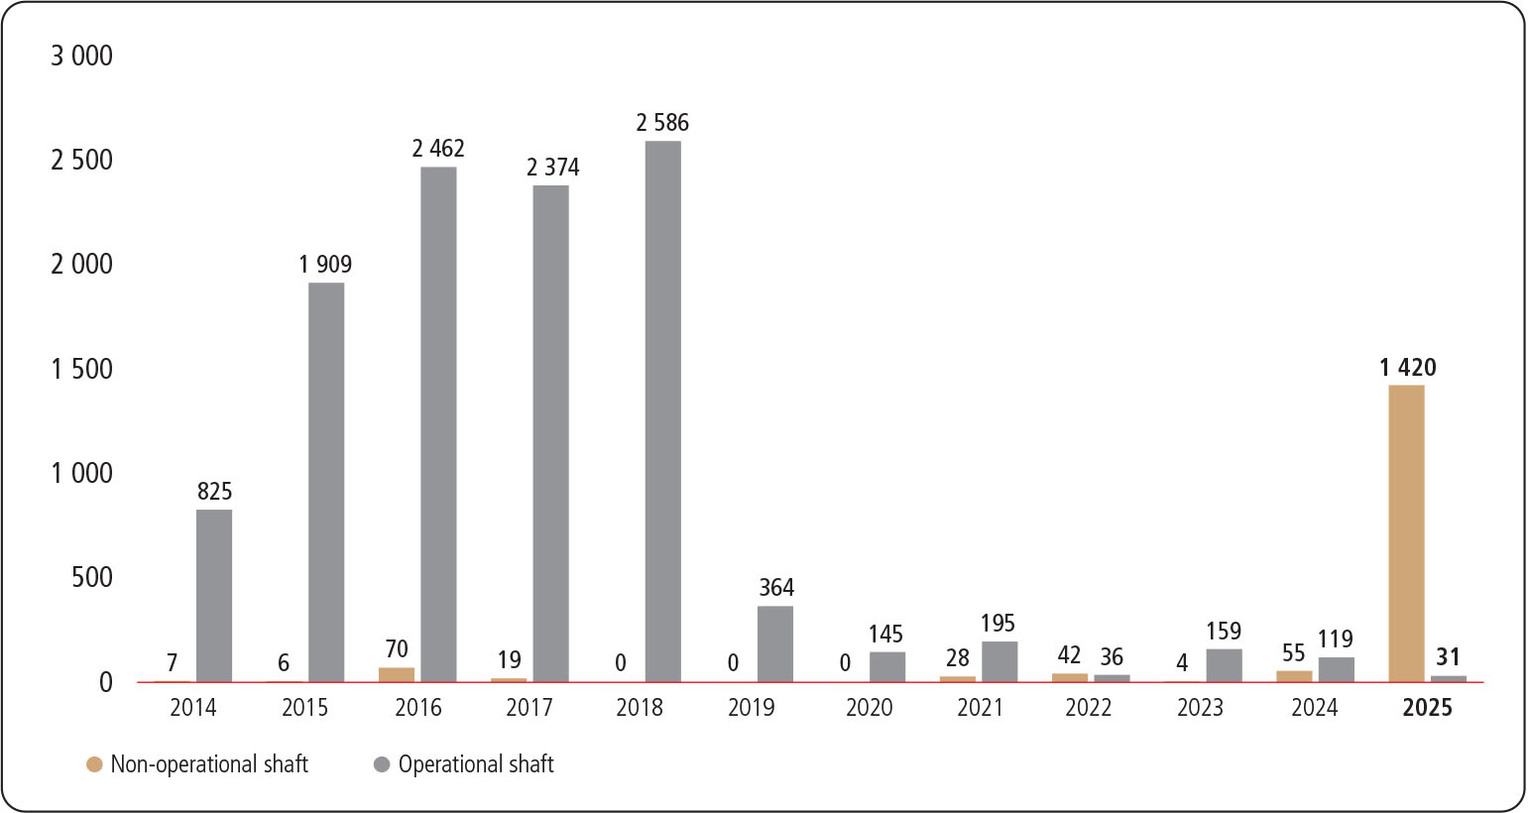
184
Progress against priorities
While there has been a decrease in illegal mining activities at our operational shafts, there has been an
increase in activities at non-operational shafts. Fortunately, our operational, tactical and intelligence-
driven approach enables us to prevent damage caused by these activities.
Investing in security measures
Our security approach and partnerships with private security companies, law enforcement, government
departments and community members continue to significantly reduce illegal mining incidents at our
South African operations. Illegal mining has decreased by 117% at operational shafts this year. Our
performance was influenced by the following:
Mponeng operations | Doornkop mine | Free State operations | Moab operations | Kusasalethu mine | Kalgold mine | |||||||||||||||||
▪Enhanced detection of suspicious movements, facilitating proactive security responses ▪Decreased criminal incidents ▪No illegal mining incidents at any shafts ▪Two Mponeng plant employees arrested for possessing gold-bearing material. | ▪12 illegal miners arrested, and mine property recovered ▪Seven mine employees and 10 security officers dismissed. | ▪Several security threats managed, including product theft, gold syndicates, employee attacks and illegal mining ▪Joint operations recovered gold-bearing material and multiple dismissals ▪13 illegal miners arrested. | ▪Several security challenges (ownerless neighbouring mines and related crime syndicates) effectively managed ▪Drone operations detected 54 suspects, prevented 44 incidents of illegal access, enabled 49 instances of recoveries and led to 21 arrests ▪Security vacuum anticipated with withdrawal of the South African National Defence Force and reduction of SAPS involvement. | ▪No illegal mining incidents since December 2023 ▪Shaft perimeter-fencing project set to be completed by August 2025. | ▪Minor crime incidents only. | |||||||||||||||||
At Hidden Valley, trespassing continues to be effectively managed, with illegal mining and intrusion incidents down by 60% year on year (FY25 Q4 89% lower than FY24 Q4). This decrease is attributable to initiatives such as installing fencing and lighting in vulnerable areas, targeted patrols, community engagement and community-based policing. | ||||||||||||||||||||||
Human rights training
Informed by the Voluntary Principles on Security and Human Rights, the training we provide covers
principles of human rights and relevant company policies, appropriate use of force and de-escalation
techniques, prevention of inhuman or degrading treatment and discrimination and procedures for
reporting and addressing human rights concerns.
At our South African operations, 248 (41%) of our directly employed security personnel and 553 (43%)
of our third-party security personnel received formal refresher training. We also include the Voluntary
Principles on Security and Human Rights requirements in contracts with third-party South African
security providers.
At Hidden Valley, asset protection department employees and policing units receive Voluntary
Principles on Security and Human Rights training as part of their deployment. During FY25,
71 employees and 128 police and contractors received training.
Conducting responsible mine closure
Applicable to our South African regions, we have demolished or sealed 48 shafts since 2008, reducing
the likelihood of illegal mining activity. Operation Vala Umgodi, a police-led initiative focused on
combatting illegal mining activities, led to 2 603 arrests in FY25, with 2 109 of those being illegal
immigrants. There were 741 registered criminal cases. Key confiscations included gold processing
equipment, gold-bearing material, firearms, vehicles and money.
At Margaret shaft, the collaboration between the mining industry and operation Vala Umgodi, led
to 1 406 illegal miners being extracted and arrested.
185
Collaboration and partnerships
▪Our executive director for stakeholder relations and corporate affairs leads community and
government engagement, focused on addressing the socio-economic drivers of illegal mining
and transparent communication in South Africa
▪We work with the DMPR, SAPS and NPA to uphold compliance, investigate criminal activities,
and support prosecutions
▪As a member of the Minerals Council South Africa, we contribute to industry-wide initiatives
and policy advocacy to address illegal mining collectively
▪At Hidden Valley, we work with the Royal Papua New Guinea Constabulary and community leaders to
promote safety and security, including through awareness campaigns to address critical issues
impacting surrounding communities. This includes the consequences, risks and resultant issues
arising from unauthorised access and structures, theft, vandalism and illegal mining.
Future focus areas Our future focus will include: ▪Continued collaboration and partnerships with host communities, government and law enforcement to promote site security ▪Ongoing reviews of the effectiveness of our safety and security measures. | ||
186
Ethical leadership and sound corporate governance
Sound corporate governance principles
Our board of directors, committed to ethical leadership, upholds our duty to be a responsible
corporate citizen
The Harmony board is committed to upholding sound corporate governance principles that empower
strong, experienced management teams and foster a culture of shared value for all stakeholders.
This solid foundation of governance continues to guide both the board and management in all their
decisions. Above all, the safety and wellbeing of our employees and the communities in which we
operate remain the driving force behind our approach.
Strategic risk management
The board has oversight of the group’s risk governance process and progress in delivering on its strategy
to produce safe, profitable ounces and increase margins. This includes a risk-based and proactive safety
culture journey and value-accretive acquisitions.
For more, refer to Risk and opportunity management.
Sustainability
Harmony’s sustainability framework and associated policies consider the SDGs and the group’s role in
advancing our communities through preferential procurement, responsible environmental stewardship,
employment equity and women-in-mining strategies, among others.
Refer to Material matters, Stakeholder engagement, and the Social and ethics committee: chairperson’s
report.
Adding value
The board plays a pivotal role in enabling Harmony to create and sustain long-term value. Its approach to
value creation is anchored in four interconnected pillars; strategy, stakeholders, sustainability, and ethical
and responsible corporate citizenship – all of which align with the principles of King IV. Through ethical and
effective leadership, sound oversight of risk and performance management, and a steadfast commitment
to strong corporate governance, the board ensures the efficient use of resources and promotes long-term
sustainability. Moreover, the board’s diversity strengthens its stakeholder-inclusive approach, enabling it
to effectively address the interests of multiple stakeholder groups.
Anticipating evolving governance standards
An evaluation of forthcoming regulatory developments and their potential impact on Harmony’s
governance framework is underway to ensure continued compliance and alignment with best practices.
This process includes preparation for the release of King V, expected in October 2025.
Responsible, ethical governance
The board subscribes to the principles of good corporate governance. Accordingly, it supports
the definition of corporate governance as being the exercise of ethical and effective leadership to
achieve specific governance outcomes, summarised below:
Ethical culture and responsible corporate citizenship ▪Ethical leadership ▪Organisational ethics ▪Responsible corporate citizenship. | Effective control ▪Governing structures and processes ▪Role of the board ▪Board committees ▪Appointment and delegation to management. Functional areas ▪Risk governance ▪Technology and information governance ▪Compliance governance ▪Remuneration governance ▪Assurance and internal audit. | |||||||
Good performance and value creation ▪Strategy and capital allocation ▪Reporting ▪Political donations ▪Executive KPIs linked to ESG performance. | Legitimacy ▪Inclusive stakeholder engagement model and related disclosures. | |||||||
Underpinned by the principles of King IV | ||||||||
Transformation and broader diversity of the board
To further demonstrate its commitment to transformation and the promotion of broader diversity
in terms of gender, age, expertise, culture, race, field of knowledge, skills and experience, the
board (through the nomination committee) had over the past three years, embarked on a board
representation transitional plan to strengthen Harmony’s commitment to the four key pillars of King IV
for good corporate governance.
The transformation and diversity of the composition of the board is paramount. As such, the board
continues to annually evaluate key gaps in terms of composition and plans to close and mitigate against
those gaps are implemented. The review of the board’s succession plans is an ongoing exercise to
ensure that the board is consistently creating value for stakeholders through continuity, sustainability
and transparency.
187
The board at a glance
Our duty to be a responsible corporate citizen is supported by our board of directors and their commitment to ethical leadership.
Board independence, broader diversity and experience
(as at 30 June 2025)
Transformation | |||
73% | Eleven members are historically disadvantaged persons | ||
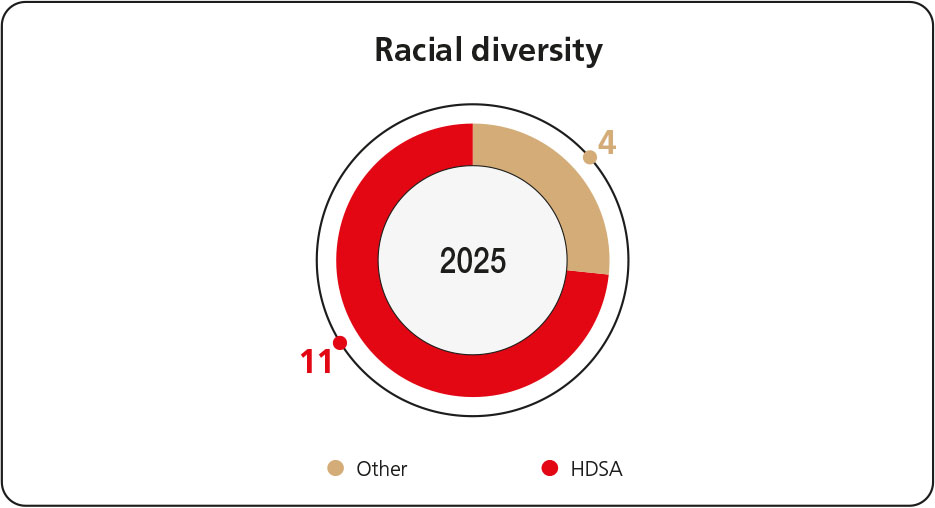 | |||
Representation | |||
33% | Five members are women | ||
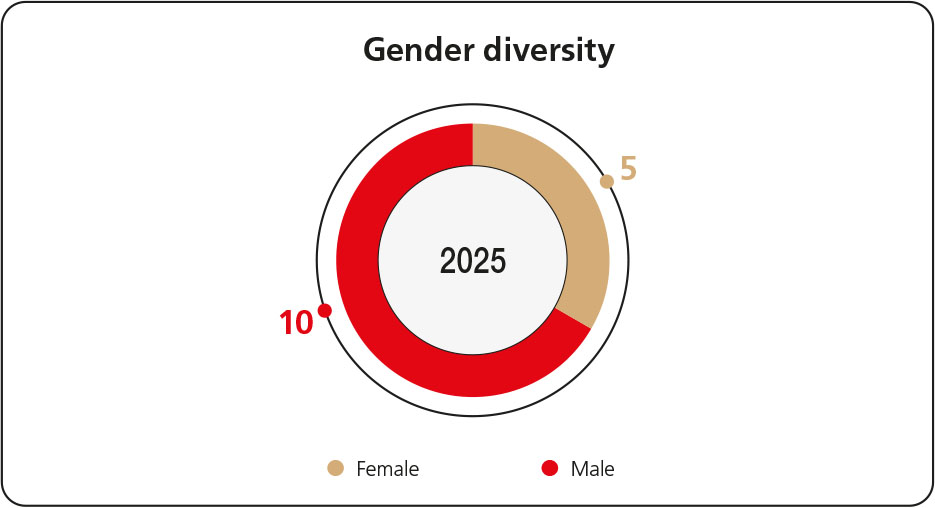 | |||
Tenure, independence and skill areas | |||
73% | Eleven members of the board are independent non-executive directors | ||
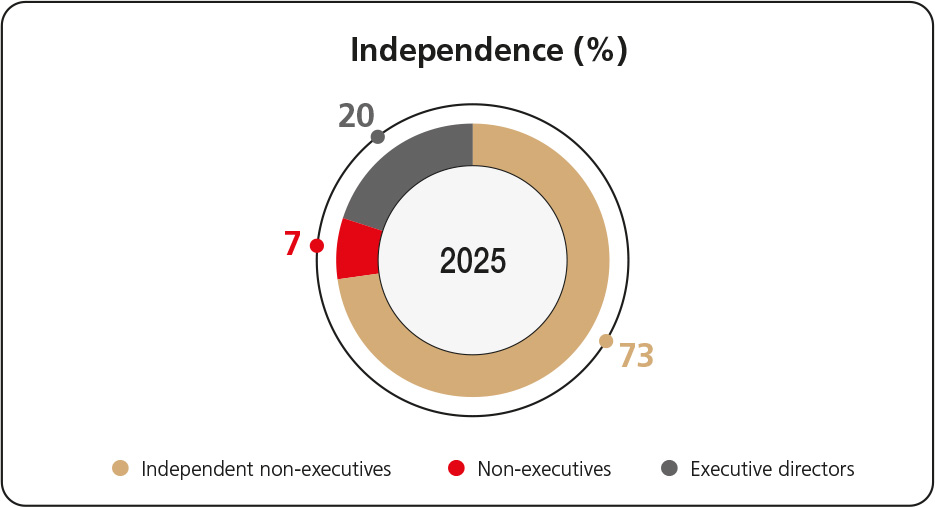 | |||
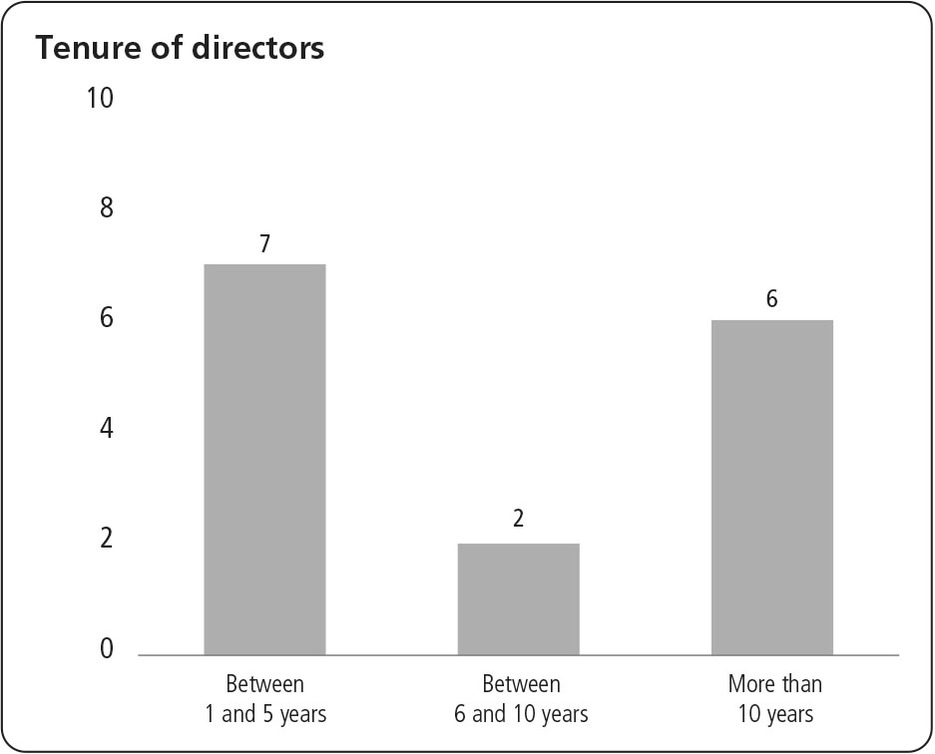 | |||
Governance and compliance policies | ||||
▪Terms of reference for the board ▪Terms of reference for board committees ▪Board delegation of authority ▪Code of conduct ▪Behavioural code ▪Corporate governance policy and framework ▪Legal compliance policy and framework ▪Internal audit charter ▪Disclosure required by section 303A.11 of the NYSE-listed company manual ▪Public Access to Information Act manual (PAIA) ▪Whistleblower policy ▪Human rights policy ▪Anti-bribery and anti-corruption policy ▪Anti-money-laundering policy ▪Trading in company shares and insider trading policy. | ||||
Foundation of corporate governance compliance | ||||
▪Companies Act, JSE Listings Requirements (primary), New York Stock Exchange requirements, memorandum of incorporation, King IV ▪Voluntary compliance with the principles of the United Nations Global Compact, International Council on Mining and Metals, GRI Standards and the International Cyanide Management Code for the Manufacture, Transport and Use of Cyanide in the Production of Gold (Cyanide Code). | ||||
188
Compliance policy and framework
Harmony subscribes to the ICRAFT process in respect of ethical leadership as recommended under King IV | |||||||||||||||||||||||||
Integrity Of board and governing body (management) | Competence Knowledge, due care and diligence | Responsibility For steering the delivery of strategy | |||||||||||||||||||||||
Transparency Transparent in exercising governance roles and responsibilities | Fairness Adopting a stakeholder-inclusive approach | Accountability Board accountability executing their responsibilities | |||||||||||||||||||||||
With its long-standing commitment to good corporate governance, the Harmony board is satisfied that
appropriate practices are in place to promote the company’s reputation as an ethical, reputable and
legitimate organisation and a responsible corporate citizen.
Acknowledging the significance of corporate governance and compliance, the board, through the audit
and risk committee, has a formal corporate governance policy and framework as well as a legal
compliance policy and framework that set out the principles of good corporate governance for the
board as well as employees at all operational levels.
In terms of the JSE Listings Requirements, Harmony is required to disclose its application of the
principles of King IV. The board, to the best of its knowledge, believes Harmony has satisfactorily
applied the principles of King IV.
For a more detailed review of Harmony’s application of King IV, refer to the King IV checklist.
189
Annual general meeting (AGM)
The AGM of the company will be held on Wednesday, 26 November 2025 at 11:00 (SA time), to transact
the business as stated in the Notice to shareholders.
The issued share capital of Harmony comprises of ordinary and preference shares that entitles the
holder to vote on any matter to be decided by the shareholders of the company and to one vote
in respect of each ordinary and preference share held.
Ethical culture and responsible corporate citizenship
Ethical leadership
The board leads by example. Each director is therefore expected to continually exhibit the
characteristics of integrity, competence, responsibility, accountability, fairness and transparency in their
conduct. Collectively, the board’s conduct, activities and decisions are characterised by these attributes,
which also form part of the regular assessment of the board and individual directors’ performance. The
board recognises that ethics is one of the pillars of sustainable business practice.
The board charter elaborates on the standard of conduct expected from members. In addition, the
board policy on declaration of interests limits the potential for a conflict of interest and ensures that, in
cases where conflict cannot be avoided, it is properly disclosed and proactively managed within the
boundaries of the law and principles of good governance.
Organisational ethics
The board sets the group’s approach to ethics. Oversight and monitoring of organisational ethics is the
mandated responsibility of the social and ethics committee on behalf of the board.
Details of arrangements for governing and managing ethics, key focus areas in the reporting period,
measures taken to monitor organisational ethics and planned areas of future focus appear in the Social
and ethics committee: chairperson’s report.
Ethics department and ethics management committee
Harmony continues to collaborate with the Ethics Institute of South Africa and has procured the
expertise of SNG Grant-Thornton with two years remaining, not only to further embed good ethical
conduct but to also increase skills required to manage fraud detection, fraud prevention and reporting
thereof. Complementing these external partnerships, Harmony’s dedicated ethics department
comprises permanent certified ethics officers responsible for implementing and communicating the
ethics management plan and programme throughout the organisation. The ethics management
committee, supported by the ethics officers and the white-collar crime committee, oversees and
monitors Harmony’s ethical culture and integrity. In FY25, Harmony continued to strengthen employee
ethics awareness through expanded training and engagement initiatives across all operations.
The ethics management committee also assesses whistleblower items and declarations of interest in
terms of the code of conduct and provides feedback to the executive committee, which then reports to
the board’s social and ethics committee. As a result, ethics are discussed and examined at every level of
management in the company.
Illegal mining remains a challenge in South Africa and for Harmony; however, mitigating factors to
combat this risk are in place.
See Combatting illegal mining and unauthorised access for more detail.
Responsible corporate citizenship
The mining industry introduces a unique duty and opportunity to the group to be a responsible
corporate citizen. While the board sets the tone and direction for how corporate citizenship is
approached and managed, the ongoing oversight and monitoring of the group’s performance against its
social, ethical and environmental targets fall within the mandate of the social and ethics committee. In
addition, the social and ethics, remuneration, and audit and risk committees each assume specific
oversight responsibilities to ensure that Harmony’s strategy remains aligned with its broader
commitments to sustainability, ethical conduct and responsible business practices.
Extensive detail on the consequences of the group’s activities and outputs, which affect its status
as a responsible corporate citizen, with relevant measures and targets are provided in the Sustainability
report.
Good performance and value creation
Strategy
The board is responsible for approving the group’s short-, medium- and long-term strategy as
developed by management. In doing so, it focuses on critical aspects of the strategy, including the
legitimate and reasonable needs, interests and expectations of material stakeholders as well as the
impact of the group’s activities and output on the various capitals employed in the business process.
Risks and opportunities connected to the triple context (economy, society and the environment) in
which the group operates are integral to the board’s strategic reviews of the business.
Policies and operational plans supporting the approved strategy are submitted regularly by
management for review and formal board approval. The board attends an annual strategy session
to confirm and review the company’s strategy.
Strategy is part of the ongoing conversation in the boardroom. Regular oversight of the implementation
of Harmony’s strategies and operational plans takes place against agreed performance measures and
targets.
Given that the company’s reputation as a responsible corporate citizen is an invaluable attribute and
asset, the consequences of activities and outputs, in terms of the capitals employed, are continuously
assessed by the board through its committees. This will ensure we are able to respond responsibly and
limit any negative consequences of our activities, to the extent reasonably possible. In addition, the
board continuously monitors the reliance of the group on these capital inputs – our natural capital
(including Mineral Resources and Reserves), employees, financial capital, communities and society at
large, our mining infrastructure and our intellectual and technological know-how – as well as the
solvency, liquidity and going-concern status of Harmony.
Reporting
In protecting and enhancing the legitimacy and reputation of the group, the board ensures
comprehensive reporting takes place on different platforms. The FY25 suite of reports appears on the
inside front cover.
The board’s intention is to meet and exceed legal requirements, as well as the legitimate and
reasonable information needs of material stakeholders. The board is satisfied with management’s basis
for determining the materiality of information to be included in our external reports. The audit and risk
committee, assisted by the social and ethics committee, is tasked with reviewing all external reports to
verify the integrity of information.
190
Political donations
Harmony supports the democratic processes in South Africa, Papua New Guinea and Australia. A policy
relating to political donations has been adopted by the company. During FY25, there were no political
donations made by Harmony.
Effective control – governing structures and processes
Role of the board
The board exercises its leadership role by:
▪Steering the group and setting its strategic direction
▪Approving policy and planning that gives effect to the direction provided
▪Overseeing and monitoring implementation and execution by management
▪Ensuring accountability for the group’s performance by means of reporting and disclosures.
The role and function of the board, including guidelines on its composition and procedures, are detailed
in the board charter. This is reviewed annually (and when necessary) to ensure it remains relevant.
There is a protocol in place should any of the board members or committees need to obtain
independent, external professional advice at the cost of the company on matters within the scope of
their duties. Non-executive directors are also aware of the protocol for requisitioning documentation
from, and setting meetings with, management. Board members have direct and unfettered access
to the chief audit executive, group company secretary and members of executive management.
Based on its annual work plan, the board is satisfied that it fulfilled its responsibilities in the review
period in line with its charter.
Refer to Board and committee attendance in this report.
Board committees
The board has delegated particular roles and responsibilities to standing committees, based on legal
requirements, what is appropriate for the group and to achieve the objectives of delegation. The board
recognises that duties and responsibilities can be delegated, but accountability cannot be abdicated.
The board therefore remains ultimately accountable.
Each committee has formal terms of reference, reviewed annually (and when necessary) to ensure the
content remains appropriate. The terms of reference address the requirements of the JSE Listings
Requirements, Companies Act and the recommended items in King IV.
Refer to Board committees in this report.
Effective control – functional areas
Risk governance
The board appreciates that risk is integral to the way it makes decisions and executes its duties. Risk
governance encompasses both risks and opportunities as well as a consideration of the potential positive
and negative effects of any risks on achieving Harmony’s objectives. The group’s risk appetite and
tolerance levels, which support its strategic objectives, are considered annually. The board is supported in
this area by the audit and risk committee.
Responsibility for implementing and executing effective risk management is delegated by the board to
management. The board acknowledges the need to integrate and embed risk management in
the business activities and culture of the group. The audit and risk committee is tasked with ensuring
independent assurance on the effectiveness of risk management in the group, when deemed necessary
and appropriate.
Refer to Risk and opportunity management in this report.
Technology and information governance
The board, assisted by the audit and risk committee, is responsible for governing technology and
information to support the group in setting and achieving its strategic objectives.
Over the past year, technology governance structures remained largely unchanged. However,
recognising the growing strategic importance of technology and the global rise in cyber incidents,
a comprehensive review was undertaken in FY25 to strengthen oversight, enhance resilience, and
ensure that Harmony’s technology capabilities continue to support the group’s operational and risk
management objectives. Material risks that have been highlighted are overseen by the audit and risk
committee, as is compliance to King IV. Risks and compliance, in this regard, are at acceptable levels.
Refer to Audit and risk committee: chairperson’s report in the Financial report.
Compliance governance
Being an ethical and responsible corporate citizen requires zero tolerance for any incidents of legislative
non-compliance. In addition, compliance with adopted non-binding rules, codes and standards is
essential in achieving strategic business objectives.
The foundation of our corporate governance complies with:
▪The Companies Act
▪Listings Requirements of the Johannesburg Stock Exchange, where we have our primary listing
▪Listings Requirements of the New York Stock Exchange, where we have our secondary listing
▪King IV and related principles and codes of good corporate governance.
Harmony also complies voluntarily with the principles of:
▪United Nations Global Compact
▪International Council on Mining and Metals
▪GRI Standards
▪Cyanide Code.
Code of conduct
Our behavioural code and code of conduct commits Harmony, our employees and our contractors to
the highest moral standards, free from conflicts of interest. The board reviews the code at least every
second year, while its application in Harmony is continually monitored by management. The code of
conduct was reviewed and updated in FY25. Our ethics programme is also subject to independent
assurance as part of the internal audit coverage plan. The code of conduct addresses critical issues,
including respect for human rights, anti-corruption, gifts and entertainment and declarations of
interests. It encourages employees and other stakeholders to report any suspected irregularities. This
can be done anonymously through a 24-hour hotline (managed independently) and other channels. All
incidents reported are investigated and monitored by the white-collar crime committee, which
comprises managers representing various disciplines in the company and reporting to the management
ethics committee.
Whistleblowing policy
Our whistleblowing policy encourages shareholders, employees, service providers, contractors and
members of the public to report practices at any of our workplaces that are in conflict with any law,
regulation, legal obligation, ethical codes or governance policies. It also provides a mechanism for our
stakeholders to report these practices internally, in confidence, independent of line management, and
anonymously if they wish. The whistleblowing policy informs whistleblowers of their rights. Harmony is
committed to protecting whistleblowers from any reprisals or victimisation.
The identity of any employee or stakeholder who reports non-compliance with the code of conduct and
other irregularities is protected. Our anonymous ethics hotline numbers are widely advertised
throughout the organisation:
▪South Africa: +27 (0) 800 204 256
▪Papua New Guinea: +675 (0) 00 478 5280
▪Australia: +61 (1) 800 940 949.
191
Human rights
At Harmony, we conduct our activities in a way that respects human rights as set out in the
laws and constitutions of the countries in which we operate in line with the human rights policy which
was reviewed and updated in FY25. Our approach to respecting human rights includes adhering to
corporate policies, complying with applicable laws and regulations, regular dialogue and engagement
with our stakeholders and contributing, directly or indirectly, to the general wellbeing of communities
within which we operate.
Legislative compliance
The legal compliance function is responsible for the regulatory environment in which Harmony
operates. Continuous monitoring, assessments and development, regular updates to policies and
procedures, and ongoing staff training and awareness ensures that Harmony stays abreast of constantly
evolving regulatory compliance trends. Compliance information and reports on the status of legislative
compliance are presented at audit and risk committee meetings.
Refer to Audit and risk committee: chairperson’s report in this report.
Broad-based Black Economic Empowerment Act
The annual compliance report in line with section 13G(2) of this act.
Dealing in Harmony shares
During price-sensitive periods, our employees and directors are prohibited from dealing in Harmony
shares. Written notice of these restricted periods is communicated to them by the group company
secretary. In terms of regulatory and governance standards, directors, prescribed officers and the group
company secretary are required to disclose any dealings in Harmony shares in line with the JSE Listings
Requirements. The clearance procedure for directors, prescribed officers and the group company
secretary to deal in Harmony shares is regulated by the company’s policy on trading in shares and
insider trading.
Significant fines
Harmony paid no significant fines in any of its areas of operation. No actions were brought against it for
anti-competitive behaviour or anti-trust or monopoly practices in FY25.
Foreign private issuers
New York Stock Exchange foreign private issuers, such as Harmony, must highlight any significant ways
in which their corporate governance practices differ from those followed by United States domestic
companies subject to the listing standards of the New York Stock Exchange.
A summary of these differences appears in 16J Insider trading policies.
Tax governance
Approach to tax
We play an integral role in the economic life of individuals, communities and businesses where
we operate. Our approach to tax is informed by our intent to build a lasting legacy both from an
environmental and social perspective. We remain committed to contributing tax revenues to the
economies of the countries in which we operate, while maintaining transparent and responsible tax
management practices. Our approach is grounded in sustainable governance, ethical conduct and open
engagement with stakeholders, reflecting our commitment to accountability and transparency in all
fiscal matters.
Tax governance, control and risk management
Harmony’s tax governance framework is founded on strong corporate governance principles. Aligned
with broader business risk management and legal compliance, oversight is provided by both the board
and our audit and risk committee.
We follow robust internal controls, monitoring compliance with tax laws and regulations and regularly
assess the effectiveness of our controls as part of our annual reporting process and related external
audit activities.
Our Financial report (Note 11) provides specifics on our tax position and how it is managed as part of
our risk management and compliance requirements.
Stakeholder engagement and management of concerns
We maintain a structured, proactive approach to stakeholder engagement, particularly with respect to
tax matters. We have a formal stakeholder engagement policy to guide and manage external
stakeholder concerns, complaints and grievances. Any tax-related grievance by any external stakeholder
would be managed according to this policy by our stakeholder relations officers to ensure the grievance
is managed in a timely and responsible manner.
Further details on our stakeholder engagement process, regarding governments and regulators
is available in the Stakeholder engagement section.
Country-by-country reporting
Further details on payments to governments, including taxes and royalties is available in this report. A
country-by-country report is prepared and submitted annually to the relevant tax authorities.
Remuneration governance
Attracting and retaining the required skills depends largely on the remuneration levels and practices in
any business. It is therefore vital to ensure the group remunerates fairly, responsibly and transparently
to support the achievement of strategic objectives and positive outcomes in the short, medium and long
term. The board is supported in this area by the remuneration committee.
Provision has been made in the notice of the 2025 annual general meeting for a non-binding advisory
vote of shareholders on the remuneration policy and remuneration implementation report.
192
Internal audit
The audit and risk committee oversees arrangements for assurance services and functions on behalf of
the board to ensure these are effective in achieving the objectives of an enabling control environment
and supporting the integrity of information for internal decisions and external reporting.
A combined assurance framework effectively covers the group’s significant risks and material matters
through a combination of internal functions and external service providers.
Refer to the Audit and risk committee: chairperson’s report.
Despite the output of the combined assurance framework, board members are expected to apply an
enquiring mind, form their own opinion on the integrity of information and reports and the degree to
which an effective control environment has been achieved.
Internal audit plays an important part in the overall assurance approach and effectiveness of the
assurance framework. The audit and risk committee oversees the internal audit function on behalf
of the board.
External independent quality assessment
In FY25, the internal audit function underwent an independent quality review conducted by the Institute
of Internal Auditors South Africa. Consistent with the findings of the FY20 review, this assessment
concluded that the function generally conforms to the International Standards for the Professional
Practice of Internal Auditing Professional Practice of Internal Auditing, reflecting a high level of compliance
and effectiveness. No material findings were identified, and alignment with the newly issued internal audit
standards is well advanced and nearing completion. In line with best practice, an external independent
quality assessment is conducted every five years, with the next review scheduled for FY30.
Sarbanes-Oxley Act (SOX) compliance
We have controls related to Financial reporting risks, which are subject to continuous SOX control
performance monitoring and self-assessment, forming the basis for SOX certification. These
certifications are independently verified by external auditors. As of 30 June 2025, management carried
out an evaluation of the effectiveness of our SOX controls and has identified material weaknesses in
internal control over financial reporting as described below. Notwithstanding such material weaknesses
in internal control over financial reporting, our management, including our CEO and FD, has concluded
that our consolidated financial statements present fairly, in all material respects, our financial position,
results of our operations and our cash flows for the periods presented in this Annual Report, in
conformity with International Financial Reporting Standards Accounting Standards (IFRS Accounting
Standards) as issued by the International Accounting Standards Board (IASB).
Management did not design control activities to adequately address identified risks or operate at a
sufficient level of precision, that would identify material misstatements to our consolidated financial
statements. This material weakness contributed to the following additional control deficiencies that,
while not individually material, in the aggregate, each constituted additional material weaknesses:
▪Inadequate and insufficient evidence of review (including the precision of the review) of
Management Review Controls (“MRC’s”) as well as controls that contain an element of review. MRCs
are the reviews conducted by management of estimates and other kinds of information for
reasonableness.
▪Inadequate and insufficient evidence of the procedures performed to verify the completeness and
accuracy of Information Produced by the Entity (“IPE”) used in the execution of controls. IPE is any
information that is produced internally by a company and provided as evidence supporting controls
of such company.
▪Ineffective information technology general controls (ITGCs) in the areas of user access, change-
management and IT operations, over certain information technology (IT) systems that support the
Company’s financial reporting processes. Automated and manual business process controls that are
dependent on the affected ITGCs were also deemed ineffective because they could have been
adversely impacted to the extent that they rely upon information and configurations from the
affected IT systems.
While, individually, the MRC, IPE and ITGC control deficiencies identified were not material and did not
result in a material misstatement in our consolidated financial statements, when aggregated, they
constituted a material weakness. This is because these deficiencies impact controls across multiple
significant accounts and business processes within the Group’s control environment, and as a result,
there is a reasonable possibility that a material misstatement in our consolidated financial statements
would not have been prevented or detected on a timely basis, if such a misstatement had in fact
occurred.
These material weaknesses did not result in identified material misstatements in our consolidated
financial statements presented in this Annual Report.
Legitimacy
Inclusive stakeholder engagement model
The board sets the direction for the group’s approach to stakeholder relationships. An inclusive
stakeholder engagement approach considers whether the legitimate needs, interests and expectations
of all material stakeholders have been adopted.
Information on material stakeholders and the manner in which relationships with stakeholders are
managed, governed and monitored appears in Stakeholder engagement.
193
Group organisational structure
The group is led and directed by a unitary board of directors that is guided by ethical leadership practices, supported by board and committee charters that are reviewed regularly. The group executive management
team, headed by the chief executive officer, is responsible for leading implementation and execution of the board-approved strategy, policy and operational planning and governed appropriately in line with a formal
delegation of authority framework.
Board of directors | ||||||||||||||||
The board exercises its leadership role over the group by: | ||||||||||||||||
Steering its strategic direction | Approving policy and planning that gives effect to the strategy | Overseeing and monitoring implementation and execution by management | Ensuring accountability for performance through reporting and disclosure | |||||||||||||
Board committees | ||||||||||||||||||||||||
The board has delegated particular roles and responsibilities to standing committees, but remains ultimately accountable. The board committees’ primary functions include the consideration, oversight and monitoring of strategies, policies, practices, performance and recommendations to the board for final approval related to: | ||||||||||||||||||||||||
Audit and risk | Social and ethics | Remuneration | Nomination | Investment | Technical | |||||||||||||||||||
▪Operating an adequate system of internal control and control processes ▪Accurate and appropriate reporting of financial statements ▪Governance of information and technology ▪Risk management and overall risk governance. | ▪Occupational health and employee wellbeing, environmental management, corporate social responsibility, human resources, public safety and ethics management ▪Compliance with relevant regulations ▪Sustainability-related key performance indicators and levels of assurance. | ▪Fair reward of directors and executive management for their contribution to Harmony’s performance ▪Harmony’s compensation policies and practices; administration of its share incentive schemes ▪Group remuneration policy. | ▪Formal and transparent procedures on board appointments ▪Succession planning for directors and members of executive management ▪Board self-assessment process. | ▪Potential projects, acquisitions and disposals in line with Harmony’s strategy; ensures due- diligence procedures are followed. | ▪Safety, strategy and operational performance ▪Review of strategic plans ▪Technical guidance and support to management. | |||||||||||||||||||
Group executive committee | ||
Led by the chief executive officer, in charge of executing board-approved strategy as well as the day-to-day management of all operations. | ||
See Our leadership for more information on the board and executive management team.
194
Board composition, chairman, independence and meeting attendance
Board broader diversity
Diversity and transformation are key focus areas for the board. Harmony has adopted a promotion
of broader diversity policy at board level, specifically focused on promoting the diversity attributes
of gender, race, culture, age, field of knowledge, skills and experience.
The board is satisfied that its composition reflects the appropriate mix of knowledge, skills, gender,
race, culture, age, experience and independence. In addition, the composition of the board and its
leadership structure ensures there is a balance of power in the boardroom and that no one director has
unfettered authority of decision making.
Board composition
As of the publication of this report, the board has 16 highly experienced and reputable members: 13 are
non-executive directors of whom 12 are independent; three are executive directors; five are female and
11 are historically disadvantaged persons.
The role and function of the board, including guidelines on its composition and procedures, are detailed
in the board charter. This is reviewed regularly to ensure it remains relevant.
Brief profiles of board members appear in Our leadership section, with detailed résumés online.
Role of chairman
The chairman of the board, Dr Patrice Motsepe is a non-executive director but is not classified as
independent. The board is satisfied that, following an assessment that was undertaken during the year
under review, that the lead independent director, Dr Mavuso Msimang, meets the requirements for an
independent director under the Companies Act, JSE Listings Requirements, King IV, and any other
criteria evidencing objectivity and independence established by the board.
The duties of the chairman and lead independent director have been included in the board charter and
are based on the recommendations of King IV. The roles of the chief executive officer and chairman are
separate. In addition to the chairman and lead independent director, the board also has an independent
non-executive deputy chairman, Ms Karabo Nondumo.
These appointments are reviewed annually and form part of the board’s succession plan for the position
of chairman, deputy chairman and lead independent director.
Guidance provided by King IV on the chairman’s membership of board committees has been applied.
The board chairman is only a member of the nomination committee, which is chaired by the lead
independent director.
Assessing independence of directors with tenure of over nine years
The majority of non-executive directors are classified as independent and their independence has been
reviewed by the nomination committee. The board appreciates that independence is primarily a state of
mind and all board members, despite their categorisation, are expected to act independently and with
unfettered discretion at all times. This expectation is confirmed in the board charter.
Following an assessment undertaken by the nomination committee of Dr Mavuso Msimang, who
has served on the board for 14 years, Mr John Wetton (14 years), Ms Karabo Nondumo (12 years) and
Mr Vishnu Pillay (12 years), during the year under review, the committee is satisfied that these
individuals do not have any relationships that may impair, or appear to impair, their ability to apply
independent judgement. In addition, there are no interests, positions, associations or relationships
which, from the perspective of a reasonable and informed third party, are likely to influence the
members unduly or cause bias in their decision making.
The board thus concluded that the members demonstrated they were independent of mind and
judgement and had objectively fulfilled their roles as independent non-executive directors, despite their
tenure on the board. The wealth of experience of these members, in addition to their standing as
reputable individuals of integrity and character, makes their ongoing input and contribution an
invaluable asset to the board and the group.
In line with the board composition transitional plan, the board (with the assistance of the nomination
committee) continued to review its composition, structure, size, and independence to ensure alignment
with best practice and to advance its commitment to broader diversity. Mr John Wetton, one of the
board’s longest-serving members, will retire by rotation this year. Although eligible for re-election, he will
not be seeking re-election to the board, effective as of the conclusion of the 2025 annual general meeting.
During the year, four independent non-executive directors (Ms Zanele Matlala, Ms Mametja Moshe, Mr
Mangisi Gule and Mr Frans Lombard) were appointed to the board and will stand for election by
shareholders at the forthcoming annual general meeting.
Nomination, election and appointment
The nomination committee is tasked with identifying potential candidates for appointment to the
board, while actual appointment is a matter for the board as a whole. The collective knowledge, skills
and experience required by the board, as well as broader diversity, are all aspects considered by the
board before appropriate candidates are identified for nomination. The nomination committee
conducts the necessary independence checks and investigations on potential candidates, as
recommended by King IV.
All new board members receive formal letters of appointment. In addition, they participate in an
extensive induction programme to enable them to make the maximum contribution in the shortest
possible time, and further receive, from Harmony’s appointed JSE sponsor, a formal explanation on the
nature of their responsibilities and obligations arising from the JSE Listings Requirements. Ongoing
mentorship is provided to members with no or limited governance experience and they are encouraged
to undergo appropriate training. Provision has also been made in the board’s annual work plan for
regular briefings on legal and corporate governance developments, as well as risks and changes in the
external environment of the group.
As required by the provisions of Harmony’s memorandum of incorporation, a third of the non-executive
directors are expected to retire by rotation at each annual general meeting of the company. The board
is comfortable in recommending their reappointment to shareholders.
The role and function of the board, including guidelines on its composition and procedures, are detailed
in the board charter, which is reviewed regularly to ensure it remains relevant and applicable.
195
Board performance evaluations
The board fully supports the thinking that an appropriate evaluation of the board and its structures is a
strategic value-adding exercise that facilitates continual improvement of its performance and
effectiveness. An independent formal self-evaluation process was undertaken in FY25. This included an
assessment of the performance of the board, its chairman and individual members as well as
committees, chief executive officer and group company secretary.
Overall, the self-evaluation reconfirmed that the board and its committees were considered:
▪Highly effective
▪Appropriately positioned to discharge their governance responsibilities
▪Well supported by its committees
▪Working as a cohesive unit and that the highest ethical standards are applied in deliberations and
decision making, enabling the board to provide effective leadership from an ethical foundation.
The consensus among board members is that the chief executive officer:
▪Communicates consistently and effectively with all Harmony’s stakeholders
▪Created and implemented an effective strategy, supported by management
▪Demonstrates ethical and transparent leadership by living the company’s culture and reinforcing
its values.
Considering the outcome of the evaluation process, the board is satisfied that the process is improving
its performance and effectiveness.
Conflicts of interest
Each member of the board is required to submit a general declaration of financial, economic and other
relevant interests and to update these declarations as necessary. In addition, the declaration
of interests in any matter on the agenda of a board or committee meeting is a standard item at the start
of every meeting. In the event of a potential conflict being declared, the board proactively manages this
conflict within the boundaries of the law.
Appointment and delegation to management
The board is responsible for appointing the chief executive officer on recommendation by the
nomination committee. Harmony’s chief executive officer, Mr Beyers Nel who was appointed on
1 January 2025, is responsible for leading implementation and execution of the board-approved
strategy, policy and operational planning, and serves as a link between the board and management.
He is accountable and reports to the board. He is not a member of the remuneration, audit or
nomination committees. He does attend meetings of these committees as required to contribute
insights and information.
Succession planning for this position forms part of the executive succession plan that is monitored on
behalf of the board by the nomination committee. An emergency succession plan is also in place and
reviewed annually.
A formal delegation of authority framework is in place and reviewed regularly by the board to ensure its
appropriateness to the business. The delegation of authority addresses the authority to appoint
executives who may serve as ex officio executive members of the board and to make other executive
appointments.
Group company secretary
The group company secretary, Ms Shela Mohatla, is a full-time employee of Harmony who was
appointed by the board on 14 August 2020. She is a chartered secretary by profession and is a certified
director by the Institute of Directors South Africa.
Her résumé appears on www.harmony.co.za/about/executive.
The board has direct access to the group company secretary who provides professional and
independent guidance to the board as a whole and to members individually on corporate governance
and legal duties. She also supports the board in coordinating the effective and efficient functioning of
the board and its committees.
The group company secretary has unrestricted access to the board and, at all times, retains an arm’s-
length relationship to enhance the independence of the position. She is not a member of the board but,
being accountable to the board, reports to the board via the chairman on all statutory duties and
related functions.
To facilitate and enhance the independence and effectiveness of the group company secretary, the
board ensures the office of the group company secretary is empowered and the position carries the
necessary authority. The remuneration committee considers and approves the remuneration of the
group company secretary on behalf of the board.
Following the assessment of the group company secretary by the board in August 2025, the board is
satisfied that the group company secretary has the necessary competence, qualifications, experience,
gravitas and objectivity to provide independent guidance and support at the highest level of decision
making in the group.
The board is therefore satisfied that arrangements in place for accessing professional corporate
governance services are effective.
Discharge of responsibilities
The board is satisfied that the committees properly discharged their responsibilities over the past year.
Furthermore, the board complies, to the best of its knowledge, with the Companies Act and its
memorandum of incorporation, monitors such compliance on an ongoing basis and operates in
conformity with its memorandum of incorporation.
196
Board and committee attendance
Attendance at committee meetings | ||||||||||||
Name | Age | Appointed director | Independent | Audit and risk* | Social and ethics* | Technical* | Investment* | Remuneration* | Nomination* | Attendance at board meetings* | ||
Non-executive directors | ||||||||||||
Dr Patrice Motsepe (chairman) | 63 | 2003** | 3/4 | 7/7 | 100% | |||||||
Ms Karabo Nondumo (deputy chairman) | 47 | 2013 | Yes | 7/7 | 5/5 | 7/7 | 4/4 | 6/7 | 86% | |||
Dr Mavuso Msimang (lead independent) | 84 | 2011 | Yes | 4/5 | 4/4 | 6/7 | 86% | |||||
Mr John Wetton | 76 | 2011 | Yes | 4/43 | 5/5 | 7/7 | 5/5 | 7/7 | 100% | |||
Mr Vishnu Pillay | 68 | 2013 | Yes | 6/6 | 7/7 | 5/5 | 4/4 | 5/7 | 71% | |||
Ms Given Sibiya | 57 | 2019 | Yes | 7/7 | 5/5 | 2/21 | 7/7 | 100% | ||||
Mr Peter Turner | 69 | 2021 | Yes | 6/6 | 7/7 | 7/7 | 100% | |||||
Mr Bongani Nqwababa | 59 | 2022 | Yes | 6/7 | 6/7 | 5/5 | 7/7 | 100% | ||||
Mr Martin Prinsloo | 56 | 2022 | Yes | 7/7 | 6/6 | 7/7 | 7/7 | 100% | ||||
Mr Magisi Gule1 | 73 | 2025 | Yes | 2/21 | 4/41 | 100% | ||||||
Ms Zanele Matlala1 | 62 | 2025 | Yes | 3/31 | 3/41 | 75% | ||||||
Ms Mametja Moshe1 | 45 | 2025 | Yes | 3/31 | 4/41 | 100% | ||||||
Executive directors | ||||||||||||
Mr Beyers Nel2 | 48 | 2025 | 4/42 | 100% | ||||||||
Ms Boipelo Lekubo | 42 | 2020 | 7/7 | 100% | ||||||||
Mr Harry Mashego | 61 | 2010 | 7/7 | 100% | ||||||||
As at 30 June 2025 | ||||||||||||
*Includes ad hoc meetings for the year.
**Appointed chairman in 2004.
1Appointed on 17 January 2025.
2Appointed on 1 January 2025.
3Resigned as member on 17 January 2025.
Mr Frans Lombard was appointed on 14 August 2025.
Mr Peter Steenkamp retired as chief executive officer and consequently resigned as executive director effective from 31 December 2024.
197
Board committees
The board has delegated particular roles and responsibilities to standing committees based on relevant
legal requirements and what is appropriate for the group to achieve the objectives of delegation.
The board recognises that duties and responsibilities can be delegated but accountability cannot be
abdicated. The board, therefore, remains ultimately accountable.
The following committees have been established:
▪Audit and risk
▪Social and ethics
▪Remuneration
▪Nomination
▪Investment
▪Technical.
A brief description of each committee, its functions and key activities and actions in FY25 appears
on the following pages.
The qualifications and experience of each committee member are included under Our leadership
section or go to www.harmony.co.za/about/ for board and management résumés.
Terms of reference
Formal terms of reference have been adopted for each board committee and are reviewed annually
(and when necessary) to ensure the content remains relevant. The terms of reference address, as a
minimum, the recommended items in King IV.
The respective terms of reference appear on www.harmony.co.za/sustainability/governance/practices-
policies.
Committee membership
In considering committee membership, the board, assisted by the nomination committee, is mindful of
the need for effective collaboration through cross-membership between committees, where required.
The timing of committee meetings is coordinated to facilitate and enhance the effective functioning and
contribution of each committee. Duties and responsibilities are documented to clearly define the
specific role and positioning of each committee on topics that may be within the mandate of more than
one committee. Committee membership has also been addressed to ensure a balanced distribution of
power across committees so that no person has the ability to dominate decision making and no undue
reliance is placed on any one person.
The board is satisfied that each committee, as a whole, has the necessary knowledge, skills, experience
and capacity to execute its duties effectively and with reasonable care and diligence. Each committee
has a minimum of three members. Members of executive and senior management are invited to attend
committee meetings as deemed appropriate and necessary for the effective functioning of the
committee.
In FY25, the majority of members of all board committees remained independent non-executive
directors. All board committees were chaired by an independent non-executive director.
Committee meetings
Any director who is not a member of a specific committee is entitled to attend meetings as an observer,
but not entitled to participate without the consent of the committee chairperson. Such directors have
no vote in meetings and will not be entitled to fees for attendance, unless specifically agreed by the
board and provided for in the board fee structure as approved by shareholders.
The board considers recommendations from its committees in matters requiring its approval, but
remains responsible for applying its collective mind to the information, opinions, recommendations,
reports and statements presented by the committees.
The meeting attendance of each committee member is included under board and committee
attendance on the following pages.
198
Audit and risk committee
Member | Committee tenure | |
Martin Prinsloo (chairperson)1 | 3 years | |
J Wetton2 | 14 years | |
Karabo Nondumo | 12 years | |
Given Sibiya | 6 years | |
Bongani Nqwababa | 3 years | |
Zanele Matlala3 | 0.5 year | |
Mametja Motshe3 | 0.5 year |
1Appointed as chairperson on 17 January 2025.
2Resigned as chairperson and member on 17 January 2025.
3Appointed as member on 17 January 2025.
Primary functions
▪Monitors operation of an adequate system of internal control and control processes
▪Monitors preparation of accurate financial reporting and statements in compliance with all applicable
legal and corporate governance requirements and accounting standards
▪Monitors risk management, ensures significant risks identified are appropriately addressed
and supports the board in overall governance of risk.
Key activities and actions in FY25
For detail on actions in FY25, refer to the Audit and risk committee: chairperson’s report.
Social and ethics committee
Member | Committee tenure | |
Karabo Nondumo (chairperson)1 | 3.5 years | |
John Wetton | 14 years | |
Dr Mavuso Msimang | 14 years | |
Given Sibiya | 3.5 years |
1Appointed as chairperson on 15 December 2021.
Primary functions
▪Oversees policy and strategies on occupational health and employee wellbeing, environmental
management, corporate social responsibility, human resources, public safety and ethics management
▪Monitors implementation of policies and strategies by executives and their management teams for
each discipline noted above
▪Assesses Harmony’s compliance against relevant regulations
▪Reviews material issues in each of the above disciplines to evaluate their relevance in the reporting
period, and to identify additional material issues that warrant reporting, including sustainability-
related key performance indicators and levels of assurance.
Key activities and actions in FY25
▪Considered the governance of ethics and ethical leadership
▪Reviewed and recommended the social and ethics committee report to be included in the Integrated
report
▪Reviewed and considered the ethical, social, economic, human capital, environmental, health and
safety issues affecting the company’s business and stakeholders
▪Reviewed and considered the effect of the company’s operations on the economic, social and
environmental wellbeing of communities, as well as significant risks within the ambit of its
responsibilities
▪Considered Harmony’s overall decarbonisation strategy
▪Considered and approved Harmony’s sustainability framework and related policy
▪Approved material elements of sustainability reporting and key performance indicators that were
externally assured
▪Considered and monitored the company’s internal and external stakeholder relations
▪Considered and approved Harmony’s human rights policy
▪Considered and monitored the company’s inclusive procurement and enterprise development
▪Monitored fraud risk assessment and considered interventions to in place to prevent fraud and report
▪Considered and approved Harmony’s whistleblowing policy
▪Reviewed and recommended the committee’s terms of reference to the board for approval.
See Social and ethics committee: chairperson’s report.
199
Remuneration committee
Member | Committee tenure | |
Given Sibiya (chairperson)1 | 0.5 year | |
Vishnu Pillay2 | 8 years | |
John Wetton | 14 years | |
Bongani Nqwababa | 3 years | |
Mangisi Gule3 | 0.5 year |
1Appointed as chairperson on 17 January 2025.
2Resigned as chairperson on 17 January 2025.
3Appointed as member on 17 January 2025.
Primary functions
▪Ensures directors and executive management are fairly rewarded for their contribution to Harmony’s
performance
▪Assists the board in monitoring, reviewing and approving Harmony’s compensation policies
and practices and administration of its share incentive schemes
▪Operates as an independent overseer of the group remuneration policy and makes recommendations
to the board for final approval.
Key activities and actions in FY25
For detail on actions in FY25, refer to the Remuneration committee: chairperson’s report.
▪Reviewed benefits and remuneration principles for Harmony executive management
▪Reviewed a summary of the suite of Harmony executive management incentive schemes to obtain a
holistic view
▪Reviewed and recommended the committee’s terms of reference to the board for approval
▪Reviewed and recommended the company’s incentive plan policy to the board for approval
▪Reviewed the company’s overall retention strategy and policy based on global trends on staff
retention
▪Considered and recommended the remuneration policy and implementation report to the board for
inclusion in the notice of annual general meeting for consideration by shareholders as non-binding
advisory resolutions
▪Reviewed executive directors and executive management’s remuneration benchmarks and
recommended their annual salary increases to the board for approval
▪Reviewed the annual salary increases of the group company secretary and chief audit executive
▪Reviewed non-executive director fees with the assistance of an independent service provider
▪Considered and recommended the company’s total incentive plan Balanced Scorecard for FY26
for board approval.
Nomination committee
Member | Committee tenure | |
Dr Mavuso Msimang (chairperson)1 | 13 years | |
Dr Patrice Motsepe | 22 years | |
Vishnu Pillay | 6 years | |
Karabo Nondumo | 3.5 years |
1Appointed as chairperson on 10 May 2018.
Primary functions
▪Ensures procedures governing board appointments are formal and transparent
▪Makes recommendations to the board on all new board appointments
▪Reviews succession planning for directors and other members of the executive team and oversees
the board’s self-assessment process.
Key activities and actions in FY25
▪Reviewed succession planning for directors and other members of the executive team and oversaw
the board’s self-assessment process
▪Reviewed succession planning for the chief executive officer
▪Reviewed and recommended the committee’s terms of reference to the board for approval
▪Reviewed and recommended for re-election directors who retire by rotation in terms of the
company’s memorandum of incorporation
▪Reviewed and made recommendations on the composition, structure and size of the board and
its committees, in line with the board’s policy on gender and race diversity
▪Considered the positions of the chairman and deputy chairperson of the board and lead independent
director and made recommendations to the board
▪Reviewed and recommended the independence of non-executive directors (especially independent
non-executives serving on the board for longer than nine years)
▪Reviewed and recommended immediate and long-term succession plans for the board, chairman of
the board, chief executive officer, executive management and the group company secretary
▪Considered the programme in place for the professional development of directors and regular
briefings on legal and corporate governance developments, risks and changes in the external
operating environment of the organisation
▪Considered the policy on the promotion of broader diversity at board level, specifically focusing on
the promotion attributes of gender, race, culture, age, field of knowledge, skills and experience.
200
Investment committee
Member | Committee tenure | |
Bongani Nqwababa (chairperson)1 | 3 years | |
John Wetton | 14 years | |
Karabo Nondumo | 12 years | |
Vishnu Pillay | 12 years | |
Peter Turner | 5 years | |
Martin Prinsloo | 3 years |
1Appointed as chairperson on 17 August 2022.
Primary functions
▪Considers projects, acquisitions and disposals in line with Harmony’s strategy and ensures due
diligence procedures are followed
▪Conducts other investment-related functions designated by the board.
Key activities and actions in FY25
▪Considered investments, proposals, projects and proposed acquisitions in line with the board’s
approved strategy and delegation of authority as well as the committee’s terms of reference
▪Considered the company’s exploration expenditure
▪Reviewed and recommended the budget and business plans for FY26 to the board for approval
▪Reviewed and recommended the committee’s terms of reference to the board for approval
▪Post-investment monitoring of recent acquisitions
▪Attended a special meeting to discuss the Eva Copper study update ahead of final investment
decision
▪Reviewed and recommended the acquisition of MAC Copper Limited to the board approval.
Technical committee
Member | Committee tenure | |
Peter Turner (chairperson)1 | 5 years | |
Vishnu Pillay | 12 years | |
Martin Prinsloo | 3 years |
1Appointed as chairperson on 23 February 2023.
Primary functions
▪Provides a platform to discuss strategy, performance against targets, operational results, projects and
safety
▪Informs the board of key developments, progress against objectives and challenges facing operations
▪Reviews strategic plans before recommending to the board for approval
▪Provides technical guidance and support to management.
Key activities and actions in FY25
▪Monitored safety across all operations
▪Monitored exploration and Ore Reserves in South Africa and Papua New Guinea
▪Monitored all South African and Papua New Guinean operations
▪Evaluated and considered Harmony’s risks and measures taken to mitigate those risks
▪Reviewed and recommended to the board the company’s annual budget and business plans for FY26
to the board for approval
▪Considered investments, proposals, projects and proposed acquisitions from a technical viewpoint
▪Reviewed and recommended the committee’s terms of reference to the board for approval
▪Attended a special meeting to discuss the Eva Copper study update ahead of final investment
decision
▪Reviewed and recommended the acquisition of MAC Copper Limited to the board approval.
201
King IV checklist
King IV promotes a holistic, outcomes-based approach to governance that emphasises ethical leadership, value creation, effective control, and accountability to stakeholders - standards that Harmony remains
committed to.
King IV principle | Go to this section in Governance: | |||
Principle 1: The governing body should lead ethically and effectively | Compliance policy and framework | |||
Principle 2: The governing body should govern the ethics of the organisation in a way that supports the establishment of an ethical culture | Compliance policy and framework | |||
Principle 3: The governing body should ensure that the organisation is and is seen to be a responsible corporate citizen | Responsible corporate citizen | |||
Principle 4: The governing body should appreciate that the organisation’s core purpose, its risks and opportunities, strategy, business model, performance and sustainable development are all inseparable elements of the value creation process | Good performance and value creation | |||
Principle 5: The governing body should ensure that reports issued by the organisation enable stakeholders to make informed assessments of the organisation’s performance, and its short, medium and long-term prospects | Reporting | |||
Principle 6: The governing body should serve as the focal point and custodian of corporate governance in the organisation | Compliance policy and framework | |||
Principle 7: The governing body should comprise the appropriate balance of knowledge, skills, experience, diversity and independence for it to discharge its governance role and responsibilities objectively and effectively | The board at a glance Board composition, chairman, independence and meeting attendance | |||
Principle 8: The governing body should ensure that its arrangements for delegation within its own structures promote independent judgement, and assist with balance of power and the effective discharge of its duties | Group organisational structure Board committees | |||
Principle 9: The governing body should ensure that the evaluation of its own performance and that of its committees, its chair and its individual members, support continued improvement in its performance and effectiveness | Board performance evaluations | |||
King IV principle | Go to this section in Governance: | |||
Principle 10: The governing body should ensure that the appointment of, and delegation to, management contribute to role clarity and the effective exercise of authority and responsibilities | Appointment and delegation to management | |||
Principle 11: The governing body should govern risk in a way that supports the organisation in setting and achieving its strategic objectives | Effective control - governing structures and processes Effective control - functional areas | |||
Principle 12: The governing body should govern technology and information in a way that supports the organisation setting and achieving its strategic objectives | Technology and information governance | |||
Principle 13: The governing body should govern compliance with applicable laws and adopted, non-binding rules, codes and standards in a way that supports the organisation being ethical and a good corporate citizen | Compliance governance | |||
Principle 14: The governing body should ensure that the organisation remunerates fairly, responsibly and transparently so as to promote the achievement of strategic objectives and positive outcomes in the short, medium and long term | Remuneration governance Remuneration committee | |||
Principle 15: The governing body should ensure that assurance services and functions enable an effective control environment, and that these support the integrity of information for internal decision making and of the organisation’s external reports | Assurance and internal audit Audit and risk committee Independent auditor’s report, Financial report Assurance report, Sustainability report | |||
Principle 16: In the execution of its governance role and responsibilities, the governing body should adopt a stakeholder-inclusive approach that balances the needs, interests and expectations of material stakeholders in the best interests of the organisation over time | Legitimacy | |||
Principle 17: The governing body of an institutional investor organisation should ensure that responsible investment is practiced by the organisation to promote the good governance and the creation of value by the companies in which it invests. | n/a | |||
202
Remuneration chairperson’s report
Dear shareholder
It is my privilege to present the 2025
remuneration report on behalf of the
remuneration committee (the
committee). Having been appointed
member and Chairman of the committee
on 17 January 2025, during the second
half of the financial year, I wish to begin
by expressing sincere gratitude to my
predecessor, Vishnu Pillay, who ably
chaired the committee for the first half
of the year, and for the preceding years.
His stewardship laid a strong foundation
for continuity, and I am honoured to
carry this important responsibility
forward.
The committee continues to refine
remuneration policies to align with
Harmony’s strategy of safe, sustainable
growth. Central to this is our
commitment to fair, competitive, and
transparent pay practices that recognise
the contribution of all employees.
Initiatives such as entry-level pay
disclosure and innovative employee
financial wellness programmes reaffirm
this focus.
Governance and compliance
During the year, the committee aligned
with the partial amendments to the
Companies Act, 71 of 2008 (the
Companies Act), that have already taken
effect. We remain fully committed and
prepared to comply with any further
amendments once promulgated and
implemented. As always, we regard
governance, transparency, and
accountability as central to ensuring
confidence in our remuneration
practices.
Although the amendments to the
Companies Act that affect remuneration
governance and disclosure have not yet
come into effect, we have, on a voluntary
basis, disclosed in the implementation
report the ratio of total remuneration
between the highest-paid 5% and the
lowest-paid 5% of employees, consistent
with the disclosure provided in 2024.
We have disclosed the ratio including
fixed term contractors and learners,
which is compliant with the
requirements of the amendments, as
well as a supplementary version,
excluding fixed term contractors and
learners, which we believe is more
representative of the substance of our
remuneration policy.
Safety – committed to zero harm
The committee deeply regrets and
mourns the tragic loss of 11 employees in
the course of duty at our South African
operations during FY25. We extend our
heartfelt condolences to their families,
colleagues, and communities.
The safety and wellbeing of all
employees and stakeholders remain
central to Harmony’s values. While we
have maintained a consistent focus on
safety over the years, we recognise that
further improvements are essential. Safe,
profitable mining is the foundation of our
business, and we remain resolutely
committed to achieving this standard.
While Harmony delivered strong results
in production and project performance,
the committee is mindful that safe,
profitable mining is the true measure of
success in our business. Our safety
performance was reflected in the
Balanced Scorecard outcomes for the
year, reminding us that further work is
required to achieve our ambition of zero
harm. The committee (and the board) is
committed to working tirelessly
alongside management to strengthen the
culture of safety, ensure robust risk
controls, and embed safe mining as a
non-negotiable value across all
operations.
Although the company’s lost-time injury
frequency rate (LTIFR) reflected strong
performance during the financial year,
safety is not only a priority; it is a core
value that guides every aspect of
our operations. In FY25, safety carried a
weighting of 15% in the Balanced
Scorecard. Owing to the tragic loss of
lives during the year, a final outcome of
0% was awarded in FY25 for LTIFR
performance in central services and the
South African operations. Together, we
will continue to foster a safe and
supportive workplace, ensuring that every
employee returns home safely.
Financial and operational
performance
I am proud to report that in FY25, we
achieved the highest operating free cash
flow in Harmony’s history. This
exceptional performance reflects the
unwavering dedication and hard work
of our employees at every level,
supported by record gold prices. Their
consistent focus on operational excellence
and efficiency has strengthened our
financial position and enabled us to
pursue strategic growth opportunities;
most notably, the acquisition of MAC
Copper Limited, transaction concluding
and taking effect on 24 October 2025. This
transaction marks a significant milestone
in advancing our copper diversification
strategy, positioning Harmony as an
emerging leader in a critical, future-
focused commodity. Collectively, these
achievements enhance our capacity to
deliver sustained value to our
shareholders and all stakeholders.
Competitive positioning
At the extraordinary general meeting held
on 31 January 2024, shareholders
overwhelmingly approved the issue of 12
651 525 ordinary shares (approximately
2% of the company’s issued share capital)
to establish the Harmony ESOP Trust
(ESOP Trust) for the benefit of eligible
employees. The scheme has since been
fully implemented and is delivering on its
intended objectives. Each eligible
employee who qualified at inception, or
within six months thereafter, received an
equal allocation of 360 participation units,
directly attributable to approximately 360
ESOP Trust shares. This successful
allocation has ensured that all
beneficiaries share equally in the long-
term value creation of the company,
reinforcing Harmony’s commitment to
broad-based employee ownership
and inclusive growth.
The landmark five-year wage agreement,
covering the period from 1 July 2024 to 30
June 2029 and signed with all five labour
unions, provides long-term stability and
predictability for our workforce.
This milestone strengthens labour
relations, supports operational continuity,
and reinforces Harmony’s commitment to
sustainable, mutually beneficial
partnerships with its employees.
The committee undertook a
comprehensive review of Harmony’s
comparator group to ensure that
remuneration practices remain
appropriate for a company of Harmony’s
evolving scale and complexity. As the
organisation continues to grow and
expand its global footprint, executive
remuneration has been adjusted to reflect
this increased scope and responsibility.
While independent benchmarking against
comparable South African-listed mining
companies with significant size and
international exposure informed this
process, the adjustments primarily
recognise Harmony’s transformation into
a more complex, globally integrated
business. The committee further
acknowledges the importance of ensuring
similar alignment for non-executive
directors. Refer to Executive
remuneration review for more detail.
Consistent with executive management,
in August 2025, the remuneration
committee reviewed non-executive
directors’ fees against Harmony’s
203
comparator group to ensure directors fees
remain appropriate for Harmony’s size,
global footprint, and increasing
operational complexity. The review
confirmed that our fees lag the market
significantly in certain roles. Based on the
committee’s recommendation, the board
has proposed increases above inflation
over a two-year period for these roles,
with the intention of bringing overall non-
executive director fees in line with the
market median. The board remains of the
view that market-competitive fees are
essential to attract and retain directors
with the requisite skills and experience.
Refer to Non-executive director fees for
more detail.
2025 focus areas
▪Review remuneration policies to
ensure continued alignment with best
practice
▪Progressive reduction of the pay gap in
line with fair and responsible pay
principles, with average increases of
5.5% for non-bargaining-unit
employees and 7.27% for bargaining-
unit employees, consistent with
collective bargaining agreements
▪Comprehensive review of the
Harmony employee value proposition
(EVP), considering global executive
benchmarks, South African competitor
practices, and worker recognition
and benefits
▪Monitoring of amendments to the
Companies Act and their implications
for remuneration governance and
reporting
▪Review of the Balanced Scorecard for
FY26, with changes set out below.
Changes to the remuneration
policy for FY26
A limited number of changes were made
to the executive remuneration policy for
FY26, aside from minor administrative
amendments to the Total Incentive Policy
for clarification purposes. Notably,
greater weighting has been allocated to
safety, with the addition of leading
indicators of safety, and project
execution has been introduced as a new
measure in the Balanced Scorecard.
The on-target and maximum
percentages, as well as deferral
percentages under the Total Incentive
Policy, remain unchanged from the FY25
policy.
Focus areas for FY26
▪Continued review of remuneration
positioning in light of Harmony’s
increased size, global footprint, and
complexity
▪Continued assessment of the current
deferred share plan rules against King
IV and King V (to be launched in
October 2025) principles and evolving
best practice
▪Ongoing monitoring of shareholder
feedback and developments in both
local and global remuneration
practices
▪Sustained focus on employee financial
wellbeing, by leveraging Harmony’s
corporate buying power and
partnering with service providers to
deliver innovative and value-
enhancing solutions for all employees
▪Evaluation of forthcoming regulatory
changes, and their potential impact on
Harmony’s remuneration governance
framework, to ensure continued
compliance and alignment with best
practice.
King IV and King V principles
The committee continues to benchmark
both local and global remuneration
trends against our remuneration
strategy. At the 2024 annual general
meeting, the non-binding advisory vote
on the remuneration policy was
supported by 93.17% of votes cast, while
94.32% supported the implementation of
the remuneration report. Shareholder
feedback on areas for improvement was
carefully considered and incorporated
during the financial year.
As required by the Companies Act and
King IV, in the event that either the
remuneration policy or the
implementation report, or both, are
voted against by 25% or more, the board
will engage with shareholders to
understand concerns raised. This
engagement may be done by virtual
meeting or in writing and will be
implemented at a time after the release
of the voting results. Where possible and
prudent, objections are taken into
consideration when formulating any
amendments to the company’s
remuneration policy and implementation
report in the following financial year.
King V will be launched in October 2025,
and the committee will consider any new
requirements introduced in this new
version of the governance code.
For more on the committee and its
activities in FY25, see the section on
Board committees.
Use of consultants and their
independence
During the year, the committee engaged
the services of RemChannel (Old Mutual)
and Bowmans to provide advice on
remuneration matters. We are satisfied
that the guidance received was both
independent and objective.
Statement on effectiveness of
policy
We are satisfied that our remuneration
policy has largely achieved its intended
objectives, though we recognise that
further improvement is required in our
safe production performance. We remain
confident that the Total Incentive Plan will
continue to strengthen overall company
performance, enhance our ability
to attract and retain critical skills, deliver
sustainable returns to shareholders, and
support the group’s long-term growth
objectives.
Closing remarks
In closing, I wish to thank my fellow
committee members, the board, the
executive management team, and all
employees across our operations for
their commitment and dedication during
the year. I also extend special
appreciation to my predecessor for his
leadership in the first half of the financial
year.
Together, we remain committed to
ensuring that our remuneration
framework supports Harmony’s long-term
sustainability, rewards performance
responsibly, and upholds the interests of
both shareholders and employees.
Except for matters relating to the review
of non-executive director fees, no
member of the committee has any
personal interest in the decisions taken
during the review period. All five
members serve as independent non-
executive directors, and the chairman of
the board does not serve on the
committee.
Given Sibiya
Chairperson: remuneration committee
24 October 2025
204
Part 1: Remuneration policy
Harmony’s reward strategy underpins our business strategy of safely producing profitable ounces,
increasing our margins and expanding our Reserves and Resources through organic growth and
acquisitions.
To sustain this growth, we rely on experienced, skilled teams who live our values and maintain
stakeholder relationships to grow profits safely and support a sustainable company.
Our remuneration policy has been designed with our business strategy in mind – to attract and retain
these experienced, skilled teams, and to motivate them to achieve our key business goals. To ensure
this happens, we need to be certain that all elements of our remuneration and wider reward offerings
are aligned, fair and competitive. In determining remuneration, the remuneration committee considers
shareholders’ interests as well as the financial health and future of the company.
Gender and race equality
Harmony’s remuneration policy is to remunerate based on an individual’s ability, skills, knowledge and
experience. Men and women, irrespective of their race or any other arbitrary factor, are paid equally for
equivalent roles.
Fair and responsible pay
Harmony is committed to the concept of a living wage, which is based on the philosophy of fair and
responsible pay. It embodies our initiatives to enhance the lives and wellbeing of our employees by
enabling them to improve their living conditions, and to have better access to social services, healthcare,
education and training.
Refer to An engaged workforce for more details.
Total incentive plan
The total incentive is determined every year on the following basis:
Total incentive (R) | ||||
= | ||||
Guaranteed pay (R) | ||||
X | ||||
On-target factor (%) | ||||
X | ||||
Balanced Scorecard result (%) | ||||
The Balanced Scorecard result includes a number of key short- and long-term company performance
measures (to be measured over trailing three- and one-year periods). The measures are reviewed and
defined annually with appropriate weightings.
A portion of the total incentive is paid immediately in cash and the balance is settled by means of
deferred shares, which vest at a rate of 20% per annum over the next five years for executive directors
and prescribed officers, and 33.33% per annum over the next three years for management.
205
Each element of the total incentive plan is described below:
Guaranteed pay excludes short- and long-term incentives. To compete effectively for skills in a challenging employment market, we identify the target market to use in benchmarking guaranteed pay. This target market includes organisations or companies that employ similar skill sets to those we require. Comparisons are made predominantly within the South African mining sector to ensure that Harmony remains competitive. The median of the target market is used as the basis of our pay ranges. This same philosophy is applied to our Australasia operations. | Description | ||||||||||||||||
Element | Total on-target factor (as explained more fully above) | Employee | % guaranteed pay | ||||||||||||||
Group chief executive officer | 180% for FY25 | ||||||||||||||||
Financial director, other executive directors and prescribed officers | 150% for FY25 | ||||||||||||||||
Balanced Scorecard result | Cash portion of total incentive (40%) | A portion of the total incentive is settled in cash immediately when the Balanced Scorecard results for the financial year have been determined and approved by the board. | |||||||||||||||
Cash portion (balance settled in deferred shares) | % of incentive | ||||||||||||||||
Group chief executive officer | 40% | ||||||||||||||||
Financial director, other executive directors and prescribed officers | 40% | ||||||||||||||||
Deferred share portion of total incentive (60%) | The balance of the total incentive is settled in deferred shares, vesting at a rate of 20% per annum over the next five years for executive directors and prescribed officers, and 33.33% per annum over the next three years for management. | ||||||||||||||||
206
FY26 Balanced Scorecard
Group | South Africa operations | Australasian operations | ||
Scorecard component | (%) | (%) | (%) | |
Shareholder value | Total shareholder return (absolute) | 8.34 | 6.67 | 6.67 |
Total shareholder return (relative to JSE-listed Gold Comparators) | 8.33 | 6.67 | 6.67 | |
Total shareholder return (relative to FTSE Gold Mines Index) | 8.33 | 6.66 | 6.66 | |
Financial and operational | Production | 20.00 | 30.00 | 30.00 |
Total production cost | 10.00 | 15.00 | 15.00 | |
Free cash flow | 5.00 | — | — | |
Growth | Development | — | 10.00 | 10.00 |
Additions to mineral reserves | 10.00 | — | — | |
Project execution (for future measurement) | — | — | — | |
Project execution | Project execution schedule | 3.00 | 3.00 | 3.00 |
Project execution costs | 2.00 | 2.00 | 2.00 | |
Sustainability | Safety performance: LTIFR | 15.00 | 15.00 | 15.00 |
Safety performance: Leading indicators | 5.00 | 5.00 | 5.00 | |
Environmental, social and governance (ESG) | 5.00 | — | — | |
Total | 100.00 | 100.00 | 100.00 |
The LTIFR award percentage will be adjusted as follows:
▪The actual number of fatalities compared to the average fatalities over the previous three years:
–Equal to or better than the average – full LTIFR award
–Up to 20% above the average – 60% of LTIFR award
–Between 20% and 40% above the average – 40% of LTIFR award
–More than 40% above the average – 0% of LTIFR award.
207
Applicable Balanced Scorecard for eligible operations/ divisions | Functions | % participation | ||||||||
Group | Group CEO office, prescribed officers, new business development and growth managers and corporate services managers exclusively allocated to a group and corporate function. | 100% group | ||||||||
SA operations | Deputy group CEO, executive managers and all on-shaft SA ops managers and off-shaft services managers exclusively allocated to SA ops services (Free State services, Moab Khotsong services, Mponeng services and Randfontein office services). | 100% SA ops | ||||||||
AA* operations | Chief operating officer, executive managers, all on-mine and off-mine AA ops managers and AA managers exclusively allocated to AA ops. | 100% AA ops | ||||||||
AA* – shared-service resources | Specific sub-functions of finance and commercial services, HR and other. | % split to be determined by time spent on each function, respectively, between AA and group divisions. | ||||||||
* Australasia.
Details of the FY25 Balanced Scorecard showing the total incentive and actual performance outcomes are disclosed in the remuneration implementation section (part 2).
Scorecard components
Total shareholder return
Shareholder value is measured as total shareholder return (TSR) over a three-year period ending in June of each year.
It comprises two components:
▪Absolute performance over the measurement period, compared to the company’s cost of equity (COE), taking into account the growth in the company’s share price and the value of dividends paid
▪Relative performance of the company versus JSE-listed Gold Comparators and FTSE Gold Mines Index over the measurement period.
The threshold, target and stretch performance criteria for TSR (with the recalibrated scorecard outcomes as explained above) are set out below:
Scorecard component | Principle | Threshold 67% | Target 100% | Stretch 167% | ||||||||||||||||||
Shareholder value | TSR (absolute) | To be measured over a three-year period ending in June of each year | COE + 0% per year | COE + 3% per year | COE + 6% per year | |||||||||||||||||
TSR (relative) | To be measured over a three-year period relative to JSE-listed Gold Comparators | On index | Index + 10% | Index + 20% | ||||||||||||||||||
TSR (relative) | To be measured over a three-year period relative to the FTSE Gold Mines Index | On index | Index + 10% | Index + 20% | ||||||||||||||||||
Financial and operational performance
Financial and operational performance comprises gold production and cost management for the financial year measured against the board-approved business plan.
▪Production
–Total gold production against board-approved business plan for the year
▪Total production cost (SA) and (AA)
–Total cash operating cost and total capital expenditure for the year
▪Free cash flow
–Cash flow generated by operations adjusted for exploration capital, dividends and the effect of commodity price and exchange rate changes in excess of 10% (higher or lower).
208
The threshold, target and stretch performance criteria are set out below:
Scorecard component | Principle | Threshold 67% | Target 100% | Stretch 167% | ||||||||||||||||||
Financial and operational | Production | To be measured against board-approved plan | (5)% | Plan | 5% | |||||||||||||||||
Total production cost (SA) and (AA) | To be measured against board-approved plan | (5)% | Plan | 5% | ||||||||||||||||||
Free cash flow | To be measured against board-approved plan | (30)% | Plan | 30% | ||||||||||||||||||
Growth
Growth comprises three areas:
▪Development
–Development is measured against the board-approved business plan of ongoing capital development – the development of reef and waste metres (South Africa) and waste tonnes (Australasia) for the financial year.
▪Addition to Mineral Reserves
–Addition to Mineral Reserves through acquisitions and major capital projects which will be calculated on a three-year period rolling average.
The threshold, target and stretch performance criteria are set out below:
Scorecard component | Principle | Threshold 67% | Target 100% | Stretch 167% | ||||||||||||||||||
Growth | Development | To be measured against board-approved plan as a leading indicator of medium- to long-term sustainability | (5)% | Plan | 5% | |||||||||||||||||
Addition to Mineral Reserves | Will measure Ore Reserve addition on a three-year period rolling average on pre-depletion basis, excluding asset sales | +1.5Moz | +2Moz | +2.5Moz | ||||||||||||||||||
Project execution
Project execution measurement is based on the consolidated weighted average scores of all material projects based on:
▪Project execution schedule
–Project key dates and critical path (50%)
–Project percentage completion vs planned completion (50%)
▪Project execution costs
–Ratio of actual to planned costs/ratio of actual to planned completion.
The threshold, target and stretch performance criteria are set out below:
Scorecard component | Principle | Threshold 67% | Target 100% | Stretch 167% | ||||||||||||||||||
Project execution | Key dates | Date of completion of key task on critical path | Latest acceptable date | Planned date | Earliest possible date | |||||||||||||||||
Completion percentage ratio | Actual increase in completion percentage/planned increase in completion percentage | 0.8 | 1.0 | 1.2 | ||||||||||||||||||
Costs | Ratio of actual costs compared to planned costs/completion percentage ratio | 1.2 | 1.0 | 0.8 | ||||||||||||||||||
209
Sustainability
Sustainability comprises two components:
▪Safety performance:
–Lagging indicators: LTIFR will be measured against the board-approved plan
–Leading indicators: Workplace Hazard Rating (group and SA) and Fatality Critical Control Check Quality (FCCC) measure (Australasia) ESG
–ESG will be measured on the basis of continued inclusion in the FTSE4Good Index as verified by FTSE Russell.
The threshold, target and stretch performance criteria are set out below:
Scorecard component | Principle | Threshold 67% | Target 100% | Stretch 167% | ||||||||||||||||||
Sustainability | LTIFR | To be measured against board-approved plan | (5)% | Plan | 5% | |||||||||||||||||
Leading indicators | Group and SA operations – Workplace Hazard Rating | 80% | 87.5% | 95% | ||||||||||||||||||
Australasia operations – Fatal Critical Control Check Quality (stretch vesting for 95% achievement, 0% vesting for < 95%) | <95% gives 0% vesting | >=95% | ||||||||||||||||||||
ESG | To be measured on the basis of continued inclusion in the FTSE4Good Index as verified by FTSE Russell | Yes | No | |||||||||||||||||||
5% | N/a | |||||||||||||||||||||
210
Minimum shareholding requirement
We have encouraged executive directors and prescribed officers to retain performance shares when they vest and a minimum shareholding requirement (MSR) was again confirmed in the new total incentive plan to
achieve this. The requirement provides that:
▪50% of the shares that will vest to an executive director or prescribed officer will, immediately prior to the applicable vesting date, be automatically locked up on the terms and in accordance with the MSR
▪The lock-up will apply for as long as the relevant target MSR applicable to the executive director or prescribed officer has not been met
▪Once the relevant target MSR has been met, any deferred shares that subsequently vest in and are settled to an executive director or prescribed officer will vest and be settled in accordance with the terms of the
deferred share plan
▪An executive director or prescribed officer may elect to voluntarily lock-up shares that vest in terms of the deferred share plan even if it results in locked-up shares exceeding the target MSR – if the locked-up shares
exceed the target MSR, the excess shares will remain in lock-up until the next vesting date (in terms of any relevant Harmony share incentive plans applicable at the time) at which point the excess shares will be
released from lock-up and settled in accordance with the terms of the deferred share plan.
The MSR will continue to apply to an executive director or prescribed officer as long as they remain an executive director or prescribed officer.
If an executive director or prescribed officer ceases to be employed by the group for any reason, their locked-up shares will be released from the lock-up on the date of terminating employment.
Target MSR
The target MSR is the relevant target minimum shareholding value (expressed in South African rand) that is required to be held by an executive director or prescribed officer from time to time pursuant to this MSR being
a minimum of 100% of their respective cost to company.
Measurement of target MSR
Each tranche of locked-up shares will be deemed to have a value for the purposes of determining whether the target MSR has been met, equal to the one-day volume-weighted average price (VWAP) of a share in South
African rand (ZAR) at the date of such lock-up, multiplied by the number of shares to be locked up in such tranche. This value will be increased yearly by the applicable consumer price index (CPI) rate for the year.
Trading restriction
Appropriate entries in the relevant registers will be made to record that all the executive director or prescribed officer’s shares, which are subject to the lock-up, will be noted by the relevant central securities depository
participant in terms of section 39 of the Financial Markets Act and the appropriate flag placed on the relevant securities account.
Voting and dividends
An executive director or prescribed officer will, in respect of vested shares that are subject to the lock-up:
▪Exercise all voting rights in respect of such shares
▪Receive all distributions payable in respect of such shares.
Application to foreign prescribed officer
The target MSR of the foreign prescribed officer will be determined on the date on which this MSR is adopted or first applies to the foreign prescribed officer (whichever occurs first). In calculating the target MSR of the
foreign prescribed officer, the company will use the cost to company (in ZAR) of the deputy group chief executive officer.
The ZAR value of any shares that are to be locked up (in terms of this MSR) will be determined on the applicable vesting date with reference to the share price on that date.
To determine whether the target MSR has been satisfied, the
pre-tax value of the locked-up shares will be taken into account.
Deferred share plan limit
The overall limit for deferred shares, issued under the 2018 deferred share plan, is 5% of the shares in issue at the time the plan was approved, amounting to 25 000 000 shares. The individual limit is 0.6%, amounting to
3 000 000 shares.
211
Pay mix for prescribed officers
The tables below illustrate the pay mix for prescribed officers, based on achieving minimum, on-target and stretch performance. The composition of total remuneration outcomes for FY25 is illustrated below.
Group chief executive officer*
FY25 pay mix
Minimum | On-target | Stretch | |
(%) | (%) | (%) | |
Salary benefits | 84 | 85 | 85 |
Retirement savings and contributions | 16 | 15 | 15 |
Guaranteed pay | 100 | 100 | 100 |
Short-term incentive | — | 72 | 120 |
Long-term incentive | — | 108 | 180 |
Total remuneration | 100 | 280 | 400 |
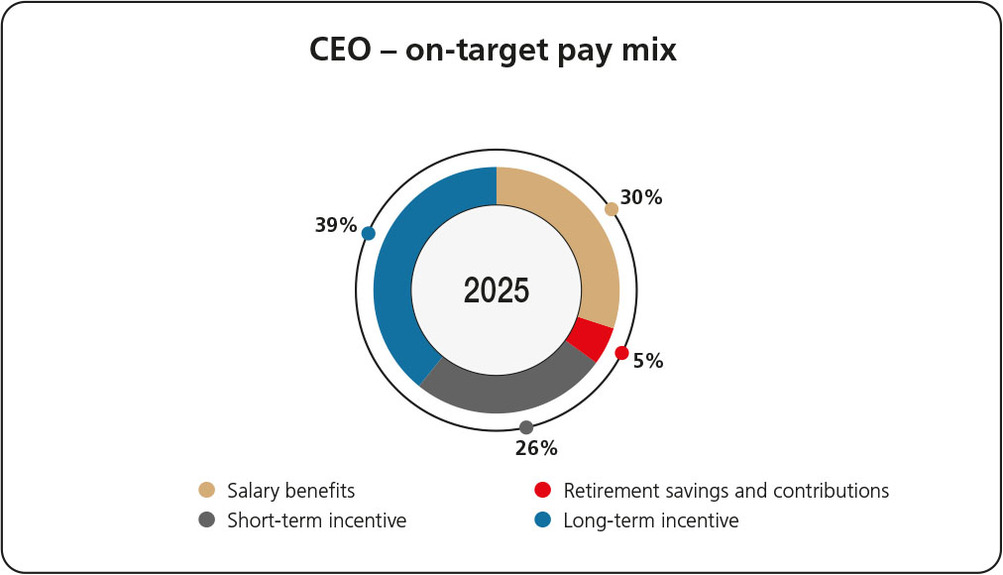
*Remuneration pro rata for the period classified as executive director from 1
January 2025.
Other executives (financial director, other executive directors and
prescribed officers)
FY25 pay mix
Minimum | On-target | Stretch | |
(%) | (%) | (%) | |
Salary benefits | 90 | 90 | 90 |
Retirement savings and contributions | 10 | 10 | 10 |
Guaranteed pay | 100 | 100 | 100 |
Short-term incentive | — | 60 | 100 |
Long-term incentive | — | 90 | 150 |
Total remuneration | 100 | 250 | 350 |
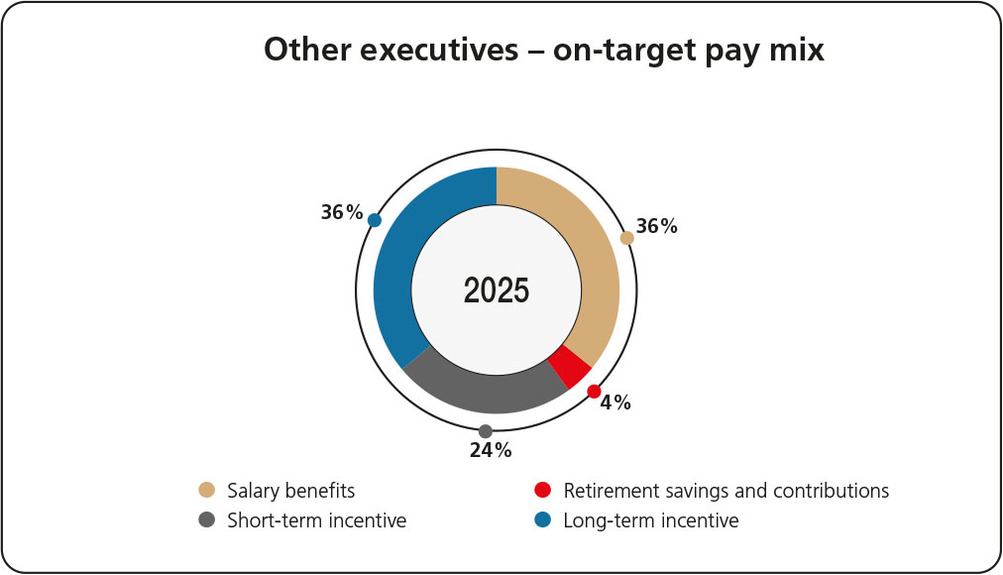
Average monthly wages and benefits underground
FY25 policy
Total remuneration | Category 4 (%) | Category 8 (%) |
Fixed earnings | 64 | 62 |
Company benefits | 15 | 13 |
Guaranteed pay | 79 | 75 |
Variable pay | 21 | 25 |
Total remuneration | 100 | 100 |
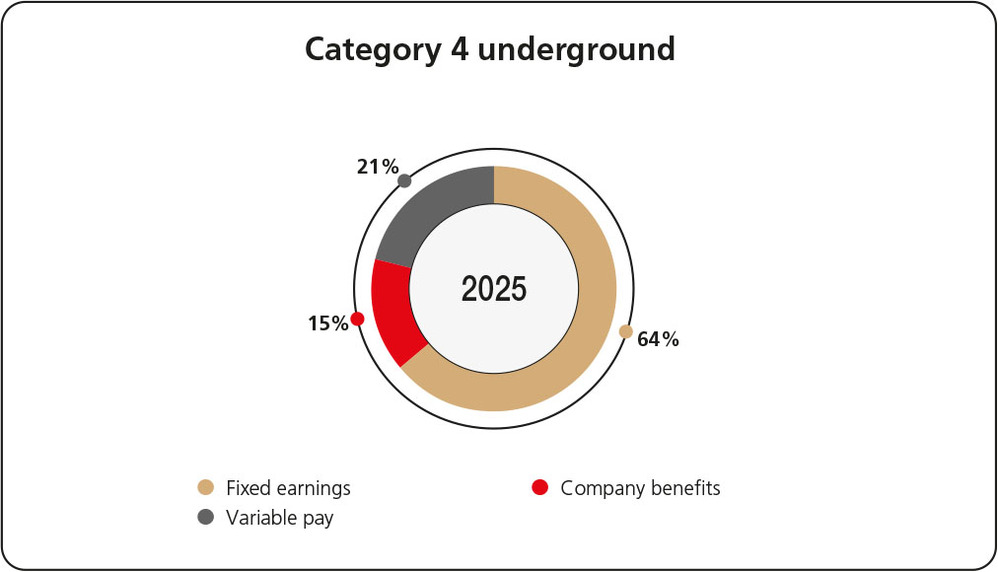
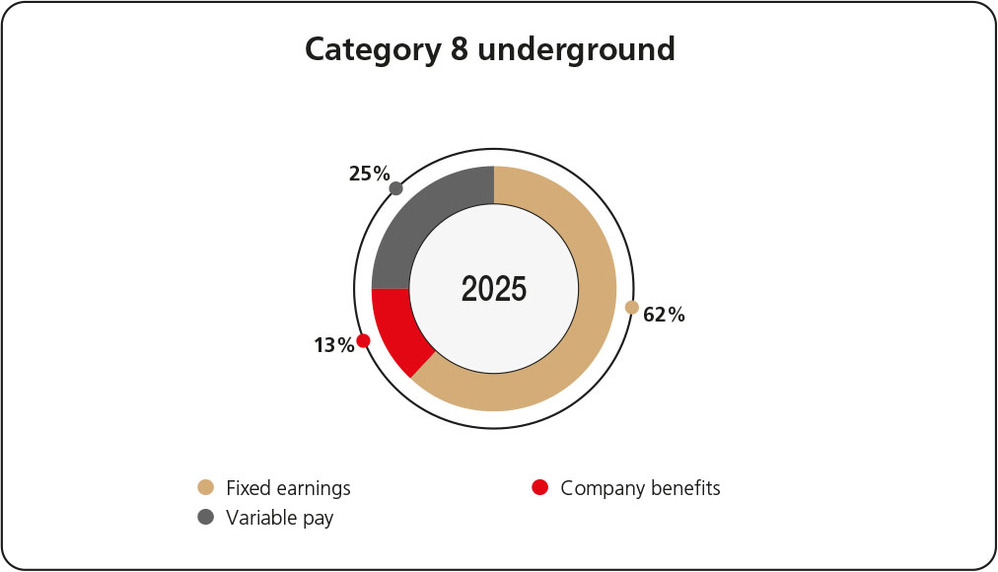
Each component includes:
▪Fixed earning: Basic pay, service increment, 13th cheque, living-
out allowance
▪Variable income: Average overtime, shift allowance, average
bonus, meal allowance, unemployment insurance fund/skills
development levy, insurance benefit
▪Company benefits: Employer provident/pension fund and
medical aid.
212
Non-executive director fees
Market comparisons, the fiduciary risks carried by non-executive directors, their workload, time commitments, expertise and preparation expected of each non-executive director role are considered when reviewing our
non-executive director fees.
Harmony’s philosophy on remunerating non-executive directors is to ensure that they are fairly rewarded for their contribution to the company’s governance while maintaining independence from executive
performance outcomes.
Non-executive directors’ fees are reviewed annually and compared to the market median of companies of comparable size and complexity to ensure they remain fair and competitive.
In August 2025, the committee conducted a benchmarking review, using the same comparator group as for the executive benchmarking discussed above to reflect the growth in scale and global complexity of the company,
which confirmed that Harmony’s non-executive director fees continue to lag the market significantly in certain roles. On the recommendation of the committee, the board has proposed a two-year “catch-up” process,
involving above-inflation increases for certain roles, to bring overall non-executive director fees in line with the market median by FY27. The board believes that ensuring competitive fees is critical to attract and retain
directors with the depth of knowledge and experience required to oversee a growing, globally diversified business.
In line with the recommendations of King IV, our non-executive directors are paid a retainer for board meetings and attendance fee for every board meeting attended. Non-executive directors also receive a retainer for
serving on a committee. In addition, a per-day ad hoc fee is paid for site visits, special meetings or attending to company business. This fee is reduced commensurately to reflect time actually spent in this regard, which is
shorter than a full day.
Non-executive directors do not receive share options or other incentive awards correlated with the share price or group performance, as these may impair their ability to provide impartial oversight and advice. The
proposed fees for FY26 are set out in the Notice of shareholders.
Performance of management
The individual performance of employees will not be taken into account in determining the total incentive plan outcome. Harmony follows a team-based balanced scorecard approach in determining incentive awards. All
management employees are assessed every year against set key performance indicators which are used to guide the development, promotion and salary increase of such employees.
For more information on assessing the performance of the CEO, please refer to Ethical leadership and sound corporate governance.
Contracts, severance and termination
Executive directors and prescribed officers have employment contracts with Harmony that include notice periods of up to 90 days. T are no balloon payments on termination, automatic entitlement to bonuses or
automatic entitlement to share-based payments other than in terms of the company’s approved share incentive plans.
Malus and clawback
Malus is the forfeiture of a variable pay award before it vests or is settled, and clawback refers to a requirement to repay some or all of an award after it has vested or is settled.
The committee has the discretion to determine that a prescribed officer or executive manager’s total share plan award is subjected to reduction, forfeiture or clawback (in whole or in part) if:
▪T is reasonable evidence of misbehaviour or material error by a prescribed officer or executive manager
▪The financial performance of the group, company, employer company or relevant business unit for any financial year, used to determine an award, have subsequently appeared to be materially inaccurate
▪The group, company, employer company or relevant business unit suffers a material downturn in its financial performance for which the prescribed officer or executive manager can be seen to have some liability
▪The group, company, employer company or relevant business unit suffers a material failure of risk management for which the prescribed officer or executive manager can be seen to have some liability or in any other
circumstances if the committee determines that it is reasonable to subject the awards of one or more prescribed officers or executive managers to reduction or forfeiture.
Procedures to impose any malus or clawback provisions must be initiated within three years of the award. To eliminate doubt, the provisions of this malus and clawback policy do not detract from any other legal rights
or measures the company has as recourse for acts of fraud, wrongdoing and/or negligence by its prescribed officers or executive management.
The incentive-based compensation recovery policy, which provides for the clawback of overpayments arising from financial misstatements, is in place. It was, however, not applied in the period under review, as no such
misstatements occurred.
Shareholder feedback
We maintain open communication channels with our shareholders, listen to feedback and take action where this is deemed to be in the best interests of the company.
213
Part 2: Remuneration implementation report on the policy applicable in FY25
This section of the report includes details of the implementation and outcomes of the remuneration policy for FY25. We report on the increase in guaranteed packages and performance outcomes for the total incentive
plan.
We have also included disclosure of total single-figure remuneration, the schedule of unvested awards and cash flows for executive directors and prescribed officers in line with the applicable King IV requirements, and
with the guidance statement from the Institute of Directors and the South African Reward Association. The remuneration of non-executive directors is disclosed as required by King IV and the Companies Act.
Increases to guaranteed packages during the year
An assessment of executive remuneration was undertaken during the year. Taking into consideration prevailing market conditions, affordability and shareholders’ expectations, an average increase of 5.0% to guaranteed
remuneration packages of management was made in FY25. The average percentage increases awarded to executives, management and bargaining-unit employees staff in FY23, FY24 and FY25 are illustrated below.
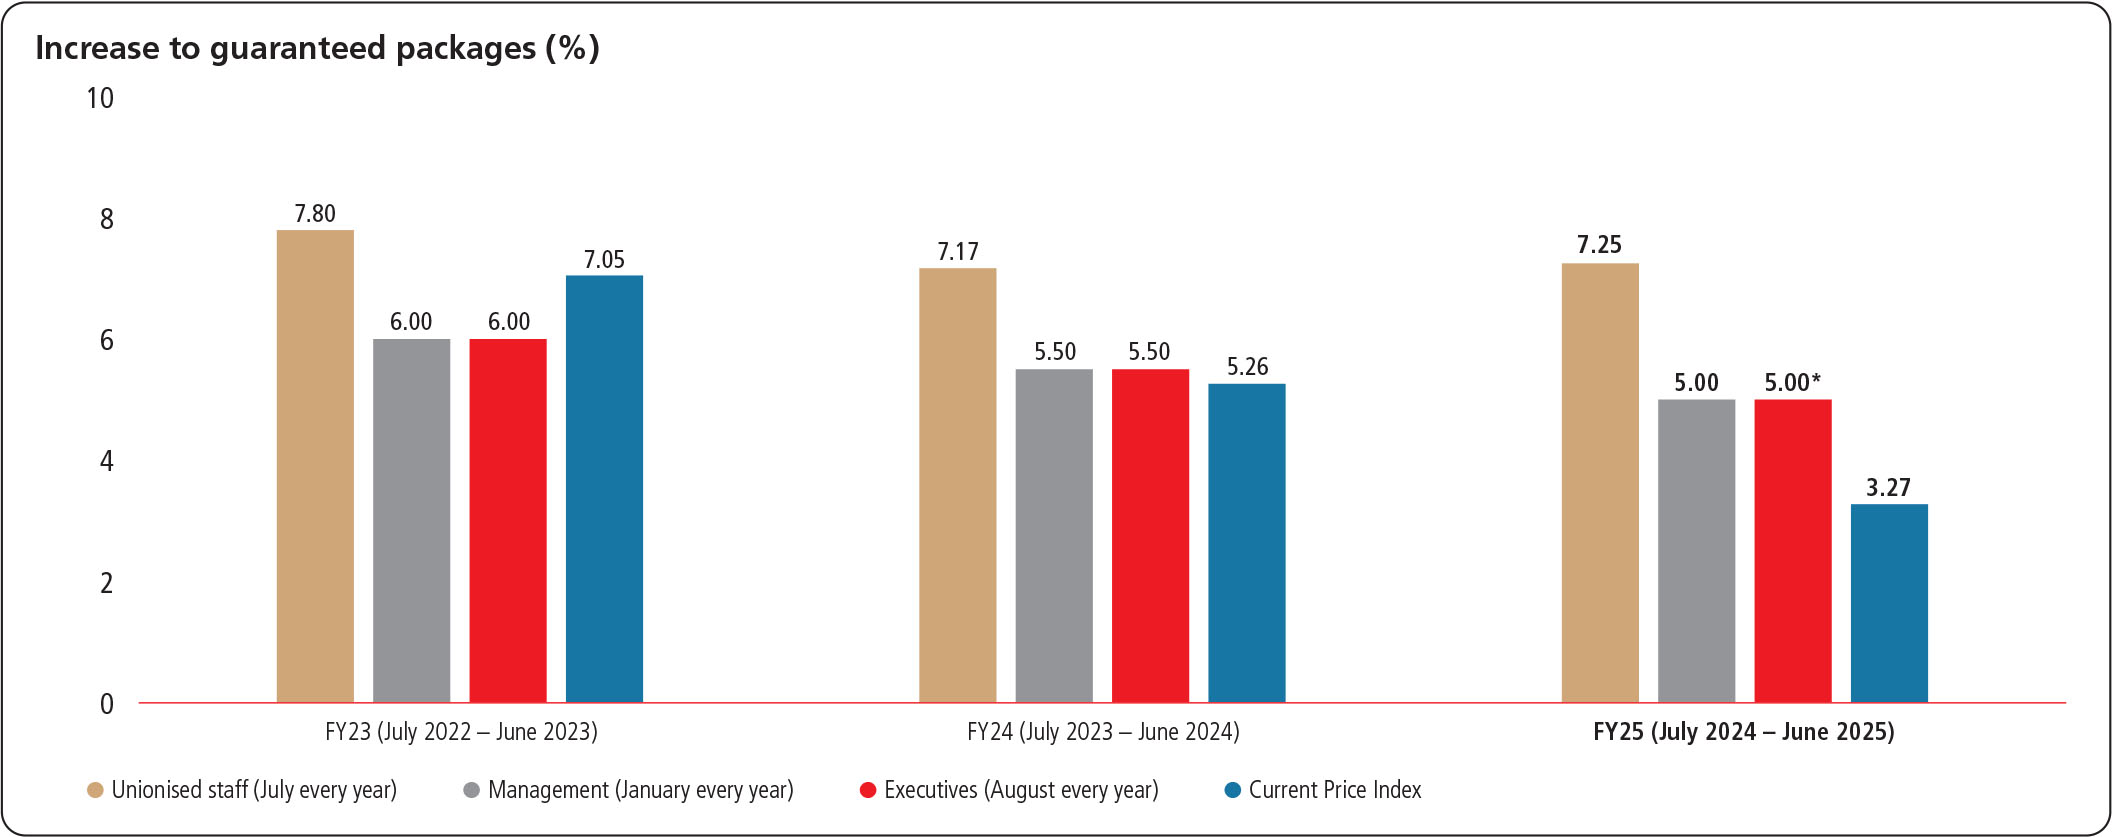
*The illustration above excludes an additional salary increase of 10% for executive management and an additional salary increase of 16.1% for financial director.
Executive remuneration review
An independent benchmark study (the study) was conducted by Bowmans to benchmark the executive directors, prescribed officers and functional executives (collectively, executive management) to a comparator
group of comparators (being Africa Rainbow Minerals Limited, Anglo-American Platinum Limited, Gold Fields Limited, Impala Platinum Holdings Limited, Northam Platinum Limited and Sibanye-Stillwater Limited) that
reflect Harmony’s increased size and complexity. The committee wished to assess the retention risk of key executive management being approached by these larger companies and to reflect the increased scope and
value of the executive role related to the commensurate growth and change in the company.
The results of the study indicated a discrepancy in Harmony’s executive remuneration levels (on average, approximately 10% below the median of the above comparator group). The discrepancy in the remuneration level of
the financial director, in particular, was raised as a cause for concern.
On recommendation from the committee, the board approved that a special remuneration adjustment to align executive salaries to the median of the comparator group was required at this stage not only as a retention
measure but also to ensure that the company’s human capital was secure in anticipation of the then transition of the chief executive officer.
The board thus approved an overall increase of an additional 10% for all executive management as well as an additional increase of 16.1% for the financial director in order to reflect the growth in scale and global
complexity, and mitigate these retention risks to align with the median of the comparator group.
214
Pay fairness and equality
In FY25, an average increase of 5.00% in guaranteed remuneration packages was awarded for management and executives. An additional salary increase of 10% for executive management and an additional salary increase of
16.1% for the financial director. The bargaining-unit employees received a 7.27% increase as approved in the June 2024 wage agreement. Bargaining-unit employees have received above-inflation increases for the past six
years. The average total monthly remuneration of our category 4 – 8 employees is set out below. The Harmony minimum remuneration is substantially above the statutory minimum wage of less than R4 000 per month, and
the living wage, which is generally viewed as around R15 000 per month. We continue to focus on fairly remunerating our employees at this level to address the challenges of inequality and poverty.
Grade
Fixed earnings | Variable income | Company benefits | Total per month | |
(R) | (R) | (R) | (R) | |
Category 4 underground employee (general worker) | 20 471 | 6 898 | 4 757 | 32 126 |
Category 8 underground employee (team leader) | 24 599 | 9 913 | 5 327 | 39 839 |
Pay gap ratio for FY25
Number | Sum of earnings (R) | Multiple* | Average earnings (R) | Multiple* | |||
Number of employees | 31 657 | ||||||
5% of employees | 1 583 | of the top 5% | 3 182 785 536 | 7.90x | of the top 5% | 2 010 604 | 7.90x |
5% of employees | 1 583 | of the lowest 5% | 402 774 316 | of the lowest 5% | 254 437 | ||
*Excludes all fixed term contractors and learners.
Pay gap ratio for FY25 | |||||||
Number | Sum of earnings (R) | Multiple* | Average earnings (R) | Multiple* | |||
Number of employees | 32 430 | ||||||
5% of employees | 1 622 | of the top 5% | 3 236 310 127 | 8.67x | of the top 5% | 1 995 259 | 8.67x |
5% of employees | 1 622 | of the lowest 5% | 373 415 449 | of the lowest 5% | 230 219 | ||
*Includes all fixed-term contractors and learners.
Refer to An engaged workforce for more information.
215
Incentive payments attributable to FY25
Total incentive plan
Actual performance outcomes based on the FY25 Balanced Scorecard for the period 1 July 2024 to 30 June 2025 scores on the basis of achievement out of the maximum score is as follows:
FY25 scorecard result for the group
Performance drivers | Description | Target | Actual | % achieved | Qlfy | Weighting | Scorecard line result | Final outcome |
Shareholder value | Total shareholder return (TSR) | |||||||
– TSR absolute | 56% | 102% | 101.8% | YES | 8.34 | 100.0% | 8.34% | |
– TSR versus JSE-listed Gold Comparators | 212% | 399% | 196.8% | YES | 8.33 | 100.0% | 8.33% | |
– TSR versus FTSE Gold Mines | 118% | 343% | 235.6% | YES | 8.33 | 100.0% | 8.33% | |
Operational and financial | Kilograms total Harmony | 45 636 | 46 023 | 100.8% | YES | 20.00 | 66.8% | 13.36% |
Total production cost (SA) (Rm) | 45 231 | 44 588 | 101.4% | YES | 12.00 | 71.4% | 8.56% | |
Total production cost (AA) (US$/m) | 250 | 207 | 117.4% | YES | 3.00 | 100.0% | 3.00% | |
Net free cash flow | 16 241 | 18 196 | 112.0% | YES | 10.00 | 76.0% | 7.60% | |
Growth | Reserve addition (Moz) | 2.000 | 5.073 | YES | 10.00 | 100.0% | 10.00% | |
Sustainability | LTIFR total SA ops | 5.54 | 5.69 | 97.3% | NO | 15.00 | —% | —% |
ESG | YES | 5.00 | 100.0% | 5.00% | ||||
100.00 | 72.52% |
FY22 | FY23 | FY24 | Three-year average | FY25 | % variation | % of LTIFR awarded | |
Loss-of-life incidents versus actual* | 9 | 6 | 7 | 7 | 11 | (50)% | —% |
Final LTIFR % | —% | ||||||
Final scorecard result** | 72.52% | ||||||
Final scorecard result as % of target | 120.87% | ||||||
*Final LTIFR percentage after any adjustment for loss-of-life incidents as more fully described below.
**Note that the scorecard outcome is expressed as a percentage of target, so the equivalent score is 72.52/60 = 120.87%.
The LTIFR award percentage was adjusted as follows:
▪The actual number of fatalities compared to the average fatalities over the previous three years
–Equal to or better than the average – full LTIFR award
–Up to 20% above the average – 60% of LTIFR award
–Between 20% and 40% above the average – 40% of LTIFR award
–More than 40% above the average – 0% of LTIFR award.
216
FY25 total incentive award calculation
Total incentive (R) | = | Guaranteed pay (R) | X | On-target factor (%) | X | Balanced Scorecard result (%) | ||||||||||
Total incentive plan (TIP) FY25 award | ||||||||||||
Executive directors and prescribed officers | Cost to company | Participation factor | BSC results | TIP value* | % settled in cash | TIP cash value* | % settled in shares | DSP awarded** | Vesting years | |||
BB Nel | 13 200 000 | 300% | 72.52% | 28 717 920 | 40% | 11 487 | 60% | 65 406 | 5 | |||
BP Lekubo | 9 723 017 | 250% | 72.52% | 17 627 830 | 40% | 7 051 | 60% | 40 148 | 5 | |||
FS Masemula | 8 712 454 | 250% | 55.15% | 12 012 296 | 40% | 4 805 | 60% | 27 358 | 5 | |||
HE Mashego | 7 227 967 | 250% | 72.52% | 13 104 304 | 40% | 5 242 | 60% | 29 845 | 5 | |||
AZ Buthelezi | 6 802 793 | 250% | 72.52% | 12 333 464 | 40% | 4 933 | 60% | 28 090 | 5 | |||
MP van der Walt | 6 802 793 | 250% | 72.52% | 12 333 464 | 40% | 4 933 | 60% | 28 090 | 5 | |||
U Govender | 6 802 793 | 250% | 72.52% | 8 954 433 | 40% | 3 582 | 60% | 20 394 | 5 | |||
JJ van Heerden | 9 773 785 | 250% | 72.52% | 17 323 702 | 40% | 6 961 | 60% | 39 337 | 5 | |||
AJ Boshoff | 7 552 003 | 250% | 90.98% | 16 121 406 | 40% | 7 257 | 60% | 33 646 | 5 | |||
*Figures in R000.
**Figures in 000.
Remuneration of executive directors and prescribed officers
Total single-figure remuneration
Executive director and prescribed officer remuneration, in terms of total single-figure remuneration, as required by King IV and in line with the guideline note issued by the Institute of Directors South Africa and the
South African Reward Association (the guideline note), is detailed below.
217
Remuneration paid for the year ended 30 June 2025
Salary and benefits | Retirement savings and contributions | Total incentive cash portion accrued | Deferred awards accrued | Total single figure of remuneration | Less: amount accrued not settled in FY25 | Plus: amount of previous accruals settled in FY24 | Total cash remuneration | |
Executive directors | ||||||||
BB Nel*2 | 5 265 445 | 1 017 818 | 11 487 168 | 17 230 752 | 35 001 183 | (28 717 920) | — | 6 283 263 |
BP Lekubo | 8 621 619 | 664 013 | 7 051 132 | 10 576 698 | 26 913 462 | (17 627 830) | 6 863 224 | 16 148 856 |
HE Mashego | 6 163 487 | 995 590 | 5 241 722 | 7 862 583 | 20 263 382 | (13 104 305) | 5 384 992 | 12 544 069 |
PW Steenkamp3 | 19 335 473 | 1 073 208 | — | — | 20 408 681 | — | 12 497 495 | 32 906 176 |
Prescribed officers | ||||||||
AJ Boshoff1,5 | 3 745 744 | 239 644 | 7 257 481 | 8 863 925 | 20 106 794 | (16 121 406) | — | 3 985 388 |
AZ Buthelezi | 5 948 096 | 903 335 | 4 933 385 | 7 400 078 | 19 184 894 | (12 333 463) | 5 068 227 | 11 919 658 |
U Govender4 | 4 384 756 | 538 718 | 3 581 773 | 5 372 660 | 13 877 907 | (8 954 433) | — | 4 923 474 |
FS Masemula5 | 3 700 699 | 453 100 | 4 804 918 | 7 207 378 | 16 166 095 | (12 012 296) | — | 4 153 799 |
BB Nel** | 3 769 548 | 654 113 | — | — | 4 423 661 | — | 6 490 967 | 10 914 628 |
MP van der Walt | 5 613 739 | 958 979 | 4 933 385 | 7 400 078 | 18 906 181 | (12 333 463) | 5 068 227 | 11 640 945 |
JJ van Heerden1 | 9 773 785 | 354 532 | 6 960 585 | 10 363 117 | 27 452 019 | (17 323 701) | 8 233 462 | 18 361 780 |
*Remuneration prorated for the period classified as executive director from 1 January 2025.
**Remuneration prorated for the period classified as prescribed officer from 23 June 2024 to 31 December 2024.
1Salary is paid in A$ and the rand equivalent is influenced by the weakening or strengthening of the rand/A$ exchange rate.
2Appointed as group chief executive officer from 1 January 2025.
3Retired as an employee and consequently resigned as executive director, effective from 31 December 2024. This includes termination-related statutory payments.
4Classified as prescribed officer from 1 October 2024.
5Classified as prescribed officer from 1 January 2025.
Schedule of unvested awards and cash flows
A schedule of the unvested awards and cash flows from long-term incentive awards of executive directors and prescribed officers, as required by King IV and in line with the guideline note, is provided below.
Unvested awards and cash flows for FY25
*Pledged shares should not be taken into account when recalculating the closing balance as they have already been taken into consideration for the closing balance.
**Appointed as group chief executive officer from 1 January 2025.
Executive directors | Share award | Opening | Awarded | Pledged* | Settled | Closing | Cash on settlement | Year-end fair value | |
(R) | (R) | ||||||||
Beyers Nel ** | Deferred shares | ||||||||
Subtotal | 212 089 | 57 683 | 32 163 | 32 165 | 205 444 | 5 646 201 | 53 088 787 | ||
Vested awards pledged to MSR | |||||||||
Subtotal | 79 706 | — | — | — | 111 869 | — | 28 908 070 | ||
Total | 291 795 | 57 683 | 32 163 | 32 165 | 317 313 | 5 646 201 | 81 996 857 | ||
*Pledged shares should not be taken into account when recalculating the closing balance as they have already been taken into consideration for the closing balance.
**Appointed as group chief executive officer from 1 January 2025.
218
Executive directors | Share award | Opening | Awarded | Pledged* | Settled** | Closing | Cash on settlement | Year-end fair value | ||
(R) | (R) | |||||||||
Peter Steenkamp | Deferred shares | |||||||||
Subtotal | 413 465 | 111 062 | 65 134 | 65 136 | 394 257 | 11 435 120 | 101 879 951 | |||
Vested awards pledged to MSR | ||||||||||
Subtotal | 268 397 | — | (65 134) | 333 531 | — | 64 525 999 | — | |||
Total | 681 862 | 111 062 | — | 398 667 | 394 257 | 75 961 119 | 101 879 951 | |||
*Pledged shares should not be taken into account when recalculating the closing balance as they have already been taken into consideration for the closing balance.
**Retired as an employee and consequently resigned as executive director, effective from 31 December 2024, thus releasing MSR locked-up shares associated with the above share schemes on date of termination.
Executive directors | Share award | Opening | Awarded | Pledged* | Settled | Closing | Cash on settlement | Year-end fair value | |
(R) | (R) | ||||||||
Boipelo Lekubo | Deferred shares | ||||||||
Subtotal | 234 844 | 60 991 | 34 067 | 34 068 | 227 700 | 5 984 018 | 58 839 956 | ||
Vested awards pledged to MSR | |||||||||
Subtotal | 52 918 | — | — | — | 86 985 | — | 22 477 795 | ||
Total | 287 762 | 60 991 | 34 067 | 34 068 | 314 685 | 5 984 018 | 81 317 751 | ||
*Pledged shares should not be taken into account when recalculating the closing balance as they have already been taken into consideration for the closing balance.
Executive directors | Share award | Opening | Awarded | Pledged* | Settled | Closing | Cash on settlement | Year-end fair value | |
(R) | (R) | ||||||||
Harry Mashego | Deferred shares | ||||||||
Subtotal | 197 083 | 47 855 | 30 554 | 30 557 | 183 827 | 5 364 962 | 47 502 736 | ||
Vested awards pledged to MSR | |||||||||
Subtotal | 54 234 | — | — | — | 84 788 | — | 21 910 067 | ||
Total | 251 317 | 47 855 | 30 554 | 30 557 | 268 615 | 5 364 962 | 69 412 803 | ||
*Pledged shares should not be taken into account when recalculating the closing balance as they have already been taken into consideration for the closing balance.
Prescribed officer | Share award | Opening | Awarded | Pledged | Settled | Closing | Cash on settlement | Year-end fair value |
(R) | (R) | |||||||
Jaco Boshoff** | Deferred shares | |||||||
Subtotal | 78 141 | 45 386 | — | 42 675 | 80 852 | 7 494 558 | 20 892 965 | |
Total | 78 141 | 45 386 | — | 42 675 | 80 852 | 7 494 558 | 20 892 965 |
**Classified as prescribed officer from 1 January 2025.
219
Prescribed officer | Share award | Opening | Awarded | Pledged* | Settled | Closing | Cash on settlement | Year-end fair value | |
(R) | (R) | ||||||||
Anton Buthelezi | Deferred shares | ||||||||
Subtotal | 119 017 | 45 040 | 11 201 | 30 689 | 122 167 | 5 385 917 | 31 569 174 | ||
Vested awards pledged to MSR | |||||||||
Subtotal | 6 246 | 17 447 | 4 508 480 | ||||||
Total | 125 263 | 45 040 | 11 201 | 30 689 | 139 614 | 5 385 917 | 36 077 654 | ||
*Pledged shares should not be taken into account when recalculating the closing balance as they have already been taken into consideration for the closing balance.
Prescribed officer | Share award | Opening | Awarded | Pledged | Settled | Closing | Cash on settlement | Year-end fair value |
(R) | (R) | |||||||
Floyd Masemula** | Deferred shares | |||||||
Subtotal | — | 29 863 | — | — | 29 863 | — | 7 716 898 | |
Total | — | 29 863 | — | — | 29 863 | — | 7 716 898 |
**Classified as prescribed officer from 1 January 2025.
Prescribed officer | Share award | Opening | Awarded | Pledged* | Settled | Closing | Cash on settlement | Year-end fair value | |
(R) | (R) | ||||||||
Marian van der Walt | Deferred shares | ||||||||
Subtotal | 158 308 | 45 040 | 21 015 | 21 017 | 161 316 | 3 692 851 | 41 685 667 | ||
Vested awards pledged to MSR | |||||||||
Subtotal | 25 930 | — | — | — | 46 945 | 12 131 059 | |||
Total | 184 238 | 45 040 | 21 015 | 21 017 | 208 261 | 3 692 851 | 53 816 726 | ||
*Pledged shares should not be taken into account when recalculating the closing balance as they have already been taken into consideration for the closing balance.
Prescribed officer | Share award | Opening | Awarded | Pledged* | Settled | Closing | Cash on settlement | Year-end fair value | |
(R) | (R) | ||||||||
Johannes van Heerden | Deferred shares | ||||||||
Subtotal | 235 584 | 71 996 | 38 371 | 38 373 | 230 836 | 6 734 639 | 59 650 330 | ||
Vested awards pledged to MSR | |||||||||
Subtotal | 74 065 | — | — | — | 112 436 | — | 29 054 585 | ||
Total | 309 649 | 71 996 | 38 371 | 38 373 | 343 272 | 6 734 639 | 88 704 915 | ||
*Pledged shares should not be taken into account when recalculating the closing balance as they have already been taken into consideration for the closing balance.
220
Non-executive directors’ fees
As approved by shareholders, non-executive director fees paid in FY24 and FY25 are set out below:
Director (R000) | 20251 | 20241 | |||
Dr Patrice Motsepe | 2 383 | 2 152 | |||
Karabo Nondumo | 2 079 | 1 943 | |||
Dr Mavuso Msimang | 1 382 | 1 277 | |||
Mangisi Gule2 | 470 | — | |||
Zanele Matlala2 | 482 | — | |||
Mametja Moshe2 | 516 | — | |||
Bongani Nqwababa | 1 692 | 1 341 | |||
Vishnu Pillay | 1 482 | 1 442 | |||
Martin Prinsloo | 1 627 | 1 216 | |||
Given Sibiya | 1 426 | 1 068 | |||
Peter Turner | 1 375 | 1 129 | |||
John Wetton | 1 711 | 1 592 | |||
Total | 16 625 | 13 160 | |||
1Directors' remuneration excludes value added tax.
2Appointed as non-executive director on 17 January 2025.
221
Audit and risk committee: chairperson’s report
Dear shareholder
I am pleased to present the audit and risk
committee (the committee) report for the
financial year ended 30 June 2025. This report
reflects the key material matters deliberated by
the committee throughout the year.
I would like to extend my sincere appreciation to
the previous chairperson, Mr John Wetton, for
his leadership and valuable contributions during
the first half of the financial year and prior
periods. His commitment laid a strong
foundation for the committee’s continued work.
Having chaired the committee during the latter
half of the year, I am proud of the committee’s
ongoing efforts not only in fulfilling its statutory
responsibilities but also in supporting Harmony’s
strategic objectives and long-term value
creation. We remain dedicated to providing
rigorous oversight and ensuring that our
processes contribute meaningfully to the
company’s sustainable success.
Introduction
This committee is an independent, statutory
committee whose members are appointed
annually by Harmony’s shareholders in
compliance with section 94 of the South African
Companies Act of 2008, as amended (the Act),
and the principles of good governance. In
addition to this Act, the committee’s duties are
guided by the JSE Listings Requirements, the
King IV Code on Corporate GovernanceTM*
2016 (King IV) and its terms of reference.
Furthermore, the board of directors delegates
oversight of specific functions to the committee.
* Copyrights and trademarks are owned by the Institute of
Directors in South Africa NPC and all of its rights are
reserved.
Terms of reference and discharge of
responsibilities
The formal board approved committee terms of
reference (available on our corporate website,
www.harmony.co.za), are reviewed and
updated annually (or more frequently if
required) by both the committee and the board.
The committee is satisfied that, during FY25, it
has conducted its affairs and discharged its legal
and other responsibilities in accordance with its
terms of reference.
Composition and function
Members: M Prinsloo (Chairperson); K
Nondumo; G Sibiya; B Nqwababa; Z Matlala and
M Moshe.
Mr M Prinsloo, re-elected by shareholders at the
annual general meeting (AGM) held on 27
November 2024, was appointed chairperson of
the committee on 17 January 2025, following
the resignation of Mr J Wetton as a member on
the same date. Ms G Sibiya and Mr B Nqwababa
were re-elected at the same AGM. Additionally,
Ms Z Matlala and Ms M Moshe were appointed
as independent non-executive directors and
joined the committee effective 17 January 2025.
All committee members possess the requisite
academic qualifications, financial literacy, and
strong business and financial acumen.
Refer to Notice of the annual general meeting in
our Notice to shareholders for details on the
2025 election of committee members, including
the proposed appointment of Mr F Lombard at
the AGM of 26 November 2025. Ms K Nondumo
will cease to be a member of the committee at
the conclusion of the AGM of 26 November
2025. The board has reviewed the proposed
composition of the committee against the
requirements of the Act and the regulations that
apply to the company, and has confirmed that
the proposed committee will comply with the
relevant requirements, and has the necessary
knowledge, skills and experience to enable the
committee to perform its duties.
As at the date of this report, the committee has
six members, all of whom (in the opinion of the
board) are independent non-executive directors.
For further detail on their qualifications,
expertise and experience, refer to our website at
www.harmony.co.za/who-we-are/board.
Refer to Directors’ report for further detail.
The chairman of the board is not a member of
the committee but may attend meetings by
invitation. Board members are entitled to attend
committee meetings as observers. However,
non-committee members are not entitled to
participate without the consent of the chair and
do not have a vote.
The group chief executive officer (CEO) and
financial director (FD) – together with members
of the executive team and senior managers
representing areas relevant to the discussions at
the committee, as well as the external auditors,
the chief audit executive and assurance
providers attend meetings either by standing
invitation or as and when required.
The internal and external auditors have
unlimited access to the chairperson of the
committee. The chief audit executive reports
directly to the committee.
Responsibilities
The responsibilities of the committee are set out
in the committee terms of reference and
include, among others:
▪To ensure the integrity of financial statements
and related reporting, that they comply with
International Financial Reporting Standards
(IFRS), the SAICA Financial Reporting Guides
and other relevant regulatory bodies stated
above and fairly represent the financial
position of the group, the company and our
operations
▪To monitor internal controls, the internal
audit function, combined assurance and
matters pertaining to the external auditors
▪To oversee corporate governance, particularly
in relation to legislative and regulatory
compliance
▪To oversee the management of risk, as well as
information technology (IT) governance and
cyber security.
The committee believes that it complied with its
legal, regulatory and other responsibilities
during the past financial year.
For more on the committee, see Board
committees.
Reporting
The committee reviewed the appropriateness of
the following FY25 reports and their related
processes:
▪Integrated report and its related suite of
reports
▪Mineral Resource and Mineral Reserve
statement (with the assistance of the
technical committee)
▪Annual financial statements and accounting
practices
▪Annual report filed on Form 20-F with the
United States Securities and Exchange
Commission.
The committee submits that these reports
represent a fair view of the group’s performance
for FY25 and recommended them to the board
for approval.
Duties discharged in FY25
▪Reviewed the company’s quarterly, half year
and annual financial results
▪Ensured it has access to all the financial
information of Harmony to allow the company
to effectively prepare and report on its
financial statements
▪Discussed the appropriateness of accounting
principles, critical accounting policies,
management’s judgements, estimates and
impairments, all of which were found to be
appropriate
▪Executed its responsibility by ensuring that
Harmony has established the appropriate
222
financial reporting procedures and these
procedures are operating. These procedures,
include consideration of all entities included
in the consolidated group IFRS financial
statements, to ensure that it has access to all
the financial information to allow Harmony to
effectively prepare and report on its financial
statements
▪Considered the JSE‘s latest report on the
proactive monitoring of financial statements
▪Considered the appointment of the external
auditor, Ernst & Young Incorporated (EY), as
the registered independent auditor for the
ensuing year
▪Considered the suitability, and satisfied itself,
of the external audit partner and firm
following assessment of the information
provided by that firm, in terms of paragraph
3.84(g)(iii) of the JSE Listings Requirements, to
determine the suitability of its appointment as
the external audit firm and of the designated
individual partner
▪Ensured that the appointment of the external
audit firm is presented and included as a
resolution at the annual general meeting
▪Satisfied itself that the external audit firm, EY,
was suitable and independent from the
company
▪Reviewed and approved external audit plans,
terms of engagement and fees, as well as the
nature and extent of non-audit services
rendered by the external auditors
▪Evaluated the independence and
effectiveness of the internal audit function
▪Reviewed and approved internal audit budget,
the internal audit charter and risk-based plans
▪Evaluated and coordinated the internal audit,
external audit and sustainability assurance
processes
▪Received and considered reports from the
external and internal auditors
▪Considered the appropriateness, expertise
and experience of the FD and the finance
function – both were found to be adequate
and appropriate
▪Evaluated and considered Harmony’s risks,
and measures taken to mitigate those risks
▪Considered whether IT risks are adequately
addressed and whether appropriate controls
are in place to address these risks. The
committee oversees and monitors the
governance of IT on behalf of the board, a
task it views as a critical aspect of risk
management
▪Considered and approved the company’s IT
strategy
▪Considered and confirmed the company as a
going concern
▪Considered and approved the company’s non-
audit services policy
▪Reviewed and recommended changes to the
committee’s terms of reference to the board
for approval
▪Reviewed the adequacy of the group’s
insurance coverage
▪Considered commodity prices and exchange
rate parameters for budget and business
planning
▪Considered the company’s fraud risk
assessment programme
▪Reviewed legal matters that could have a
significant impact on the company’s business
▪Reviewed and recommended the bridge
financing facility for the acquisition of MAC
Copper Limited for board approval
▪Oversaw the United States Sarbanes-Oxley Act
of 2002 (SOX) compliance efforts of
management, receiving quarterly updates on
controls associated with financial reporting
and assessed the final conclusion reached by
the CEO and FD on the effectiveness of the
internal controls over financial reporting and
their assessment of material weaknesses as
well as the detailed planned remediation
steps developed to be implemented by
management. Refer to the Governance
section.
Key focus areas in FY25
Interim and annual financial statements
The annual financial statements have been
prepared in accordance with IFRS, SAICA
Financial Reporting Guides, the requirements of
the South African Companies Act 71 of 2008, the
Listings Requirements of the JSE Limited and the
recommendations of King IV.
In terms of paragraph 3.84(k) of the JSE Listings
Requirements, the committee reviewed and
assessed the process implemented by
management to enable the CEO and the FD to
pronounce on the annual financial statements
and the system of internal control over financial
reporting. The results from the process were
communicated to the committee. The
committee considered any deficiencies,
particularly identified material weaknesses, as
well as the appropriateness of management’s
response including remediation, reliance on
compensating controls and additional review
procedures.
The identified material weaknesses did not
result in any material misstatement in respect of
the consolidated financial statements for the
years ended 30 June 2025 and 30 June 2024 and
the committee is satisfied with the remediation
steps taken by management in this regard. The
committee, on behalf of the board, has noted
the final confirmation of the CEO and FD.
See Chief executive officer and financial director
confirmation.
External auditor – appointment, independence
and tenure
Having considered the external auditor’s
previous appointments and the extent of other
work undertaken for the group, the committee
is satisfied that EY are independent of the group,
as per section 94(8) of the Act. The committee
also satisfied itself as to the suitability of EY and
the designated audit partner.
A formal procedure has been adopted to govern
the process whereby the external auditor may
be considered for non-audit services and the
extent of these services is closely monitored by
the committee. Total fees approved for the
external auditor, EY, for the year were R70.5
million, of which R70.3 million was for audit-
related services, R0.2 million for non-audit
services.
This is the second year that EY has been
Harmony’s external auditor. At the 2024 annual
general meeting, EY was reappointed as the
independent external auditor.
As part of Harmony’s commitment to
transformation, EY partnered with Motlanalo
Chartered Accountants and Auditors, a level 1
broad-based black economic empowerment
company being a 100% black-women-owned
firm.
Refer to Notice of the annual general meeting in
our Notice to shareholders for external auditor
reappointment.
Internal audit
In terms of internal audit, the committee is
responsible for:
▪Ensuring that the group’s internal audit
function is independent and has the necessary
resources, standing and authority within the
group to enable it to perform its duties
▪Overseeing cooperation between internal
audit and the external auditors, and serving as
a link between the board of directors and
these functions.
In FY25, the internal audit function underwent
an independent quality review conducted by the
Institute of Internal Auditors South Africa.
Consistent with the findings of the FY20 review,
this assessment concluded that the function
generally conforms to the International
Standards for the Professional Practice of
Internal Auditing Professional Practice of
Internal Auditing, reflecting a high level of
compliance and effectiveness. No material
findings were identified, and alignment with the
newly issued internal audit standards is well
advanced and nearing completion. In line with
best practice, an external independent quality
assessment is conducted every five years, with
the next review scheduled for FY30.
In line with King IV and its recommendations,
the committee has confirmed the effectiveness
of the group chief audit executive, Ms B
Maluleka-Ngunjiri, and is satisfied that she has
the appropriate expertise and experience to
meet the responsibilities of this position. The
chief audit executive reports quarterly, or as
necessary, to the committee on internal audit
and has direct access to the committee,
primarily through its chairperson.
The committee is satisfied that internal audit
follows an approved risk-based internal audit
plan and regularly reviews the group’s risk
223
profile. Internal audit submits an overall
statement on the effectiveness of the group’s
governance, risk management and control
processes.
Legislative compliance
Compliance information and reports on the
status of legislative compliance are presented to
this committee. The risk of non-compliance is
thus managed through:
▪bi-annual review and updates on the Harmony
regulatory universe
▪compliance risk management plans for high-
risk legislation
▪the continuous monitoring of the regulatory
environment.
Combined assurance
The committee is satisfied that the group has
optimised the assurance coverage obtained
from management, and internal and external
assurance providers. The committee is also
satisfied that the various external assurances
that are obtained and related systems and
procedures are effective in achieving the
following objectives:
▪Supporting the integrity of information used
for internal decision-making by management,
the board and its committees
▪Supporting the integrity of external reports
▪Minimising assurance fatigue.
Governance of risk
The committee fulfils a dual function – as an
audit committee and as a risk committee.
Internal audit conducts regular and full
assessments of the risk management function
and framework, on which it reports to the
committee. The committee is satisfied with the
effectiveness of its oversight of risk governance
in the group.
A detailed report on risk and its management, as
recommended in King IV, is contained in the Risk
and opportunity management section. A report
on risk is also shared with the board on a
quarterly basis.
In the past year, the committee continued to
monitor the enterprise risk management and
resilience policy, risk management guidelines
and risk management framework to ensure
continued focus on the company’s material risks.
The board further approves the group’s risk
appetite and tolerance framework.
Appropriateness and experience of FD and
effectiveness of the finance function
The committee confirms that it is satisfied that
Ms B Lekubo, the current FD, possesses the
appropriate expertise and experience to meet
the responsibilities of this position.
Oversight of derivative programme
The committee also monitors and reviews the
group’s derivative and hedging strategy. The
derivative programmes currently in place were
introduced in FY16. During FY24, the hedging
policy was expanded and a new gold hedging
limit was set as 30%, 20% and 10% of production
in a 12-, 24- and 36-month period (previously
20% over a 24-month period). The limit for silver
remained at 50% over a 24-month period.
Harmony may execute on the hedging strategy
when we achieve a minimum margin of 25%
above all-in sustaining cost (AISC) and inflation.
An additional minimum margin of 30% above
AISC and inflation was introduced for the last
third of the volume hedged. The foreign
exchange exposure of 25% remained during the
year.
For more on how these derivative programmes
have performed, see the Derivative financial
instruments note.
Technology and information governance
The committee continued its focus on
overseeing the strategic information technology
direction of the group, the technology risks, as
well as compliance regarding information and
technology. The framework on which the
oversight is conducted has been extended
through the approval of an IT strategy that
guides the deployment and operation of
technology and information in the group.
The roadmap of the information technology
strategy provides clear investment guidance
over the medium term on an annual rolling-
forward basis. This ensures that the needs for
critical rejuvenations, cyber security, business
solutions and IT operations are visible and
controllable over time.
The alignment of operational technology,
engineering technology, information technology,
and other technology domains has commenced
under this strategy. Group Technology is
responsible for establishing information
technology standards, developing the associated
taxonomy, and overseeing integration as well as
data and AI platforms.
The governance structures for information and
technology are maturing in their ability to
effectively oversee and guide the sourcing and
deployment of IT solutions. Efforts are ongoing
to enhance the efficiency and effectiveness of
these forums.
Additionally, work continues to align IT
processes, controls, and the IT risk framework
with the broader group enterprise risk
management framework.
Dividend policy and dividends declaration
The board declared a 227 SA cents interim
ordinary dividend for the year ended 30 June
2025, paid on 14 April 2025 and declared a final
ordinary dividend of 155 SA cents for the year
ended 30 June 2025, paid on 13 October 2025
(2024: interim ordinary dividend of 147 SA cents,
paid on 15 April 2024 and final ordinary dividend
of 94 SA cents, paid on 14 October 2024). In
addition, dividend payments were made in 2024
and 2025 to the non-controlling interest holders
in Tswelopele Beneficiation Operation of
R43 million and R62 million, respectively.
Harmony declared an annual preference share
dividend to the Harmony Gold Community Trust
(the Trust). The board declared a preference
dividend of R22 million and it was paid to the
Trust on 15 September 2025 (2024: R15 million
on 17 September 2024).
In considering the payment of dividends, the
board, with the assistance of the audit and risk
committee, took into account the current
financial status of the company and the payment
of a proposed dividend subject to the successful
application of the solvency and liquidity test as
set out in section 4 of the Companies Act of
2008.
The company’s dividend policy remains to pay a
return of 20% on net free cash generated to
shareholders, at the discretion of the board of
directors.
Going concern
The committee has reviewed a documented
assessment, including key assumptions prepared
by management, of the going concern status of
the group.
The board’s statement on the going concern
status of the group, as supported by the
committee, appears in the Directors’ report.
Integrated report
The committee has overseen the integrated
reporting process, reviewed the report and has
recommended the 2025 Integrated report and
consolidated financial statements for approval
by the board.
Events post year end
On 22 July 2025, Harmony has entered into
restructuring documents with MAC Copper, OR
Royalties and Glencore pursuant to which the
parties have agreed to amend various
documents in connection with the copper
stream, silver stream and the royalty deed with
such amendments to take effect after the Jersey
law scheme of arrangement pursuant to Article
125 of the Companies (Jersey) Law 1991 (as
amended) (the scheme) for the acquisition of
MAC Copper has been implemented.
On 14 August 2025, Frans (Faan) Lombard was
appointed to the board of directors of Harmony
as an independent non-executive director.
On 27 August 2025, a final dividend of 155 SA
cents was declared, which was paid on 13
October 2025.
On 9 October 2025, it was confirmed that all of
the conditions to the scheme for the acquisition
of MAC Copper had been satisfied or waived and
the Royal Court of Jersey made orders
sanctioning the proposed acquisition. Following
lodgement by MAC Copper of a copy of the
Court’s order with the Jersey Registrar of
Companies on 10 October 2025, the scheme
became legally effective. On 22 October 2025, a
drawdown of US$875 million (approximately
224
R15.53 billion as at 30 June 2025) was made
from the US$1.25 billion bridge facility. These
funds were utilised on 23 October 2025 to settle
the cash consideration of US$1.01 billion
(approximately R17.90 billion at 30 June 2025).
Following the receipt of the funds, the scheme
was implemented, resulting in an acquisition
date of 24 October 2025.
In closing
As the newly appointed chairperson, I wish to
extend my appreciation to my fellow committee
members for their professionalism, dedication,
and commitment to fulfilling their
responsibilities in accordance with the
committee’s mandate, terms of reference, and
statutory obligations. I am particularly grateful
for their support and collaboration during this
transition period.
I would also like to express my heartfelt
appreciation to John for his exemplary
leadership, which has been instrumental in
enhancing the committee’s effectiveness and
establishing a strong foundation for continued
oversight. We extend our best wishes to him in
his future endeavours.
I also thank management for their ongoing
support, valuable insights, and dedication to the
committee’s work.
I look forward to continuing to work closely with
both existing and newly appointed committee
members to maintain the highest standards of
governance and oversight.
Martin Prinsloo
Chairperson: audit and risk committee
24 October 2025
225
Social and ethics committee: Chairperson’s report
Dear Stakeholder
As I present this report, I do so with a sense of
both pride and transition. This marks my final
year serving as Chairman of the Social and Ethics
Committee. From the next reporting cycle, I will
continue to serve as a committee member,
handing over the chairmanship to my successor.
It has been a privilege to lead the committee
during a period when sustainability, ethics, and
shared value creation have become central to
Harmony’s strategy and identity.
Safety and health: the cornerstone of our
business
We are deeply saddened by the tragic loss of
eleven of our colleagues at our South African
operations during FY25. Our thoughts and
heartfelt condolences go to their families,
friends, colleagues and communities. At
Harmony, the safety, health, and well-being
of every member of our workforce are non-
negotiable and remain at the heart of who
we are.
Oversight of safety is shared within Harmony’s
governance framework. The Technical
Committee has specific responsibility for
employee safety, while the Social and Ethics
Committee oversees employee health and public
safety. Together, we provide joint oversight to
ensure that safety management remains robust,
well governed, and integrated into business
decision-making.
Although safety has always been a priority for the
company, we recognise that ongoing
improvement is critical. Safe, responsible,
and profitable mining underpins Harmony’s
business model, and we remain firmly committed
to upholding this standard throughout all our
operations. With a strategy to embed safety
practices in everything we do, we continue to
foster a proactive safety culture.
As health and safety risks are inherent in mining,
comprehensive, responsive and holistic
healthcare remains a priority and underpins
our duty of care. Our health services also
contribute to operational stability, workforce
productivity, and long-term sustainability of our
operations.
Sustainability in Action
Harmony continues to be guided by its purpose.
Our sustainability framework supports this by
embedding sustainability within our strategy,
processes and culture, aligning operations with
global imperatives while remaining responsive to
local realities.
The framework addresses pressing challenges
such as climate change, land management, water
stewardship, supporting our people (or caring for
our employees) and community wellbeing. It also
ensures compliance with regulatory obligations
and alignment with voluntary frameworks such
as the World Gold Council’s Responsible Gold
Mining Principles. Our framework supports
contributions to the UN Sustainable
Development Goals, while positioning Harmony
for long-term resilience.
To strengthen implementation, we are
introducing Communities of Practice (CoPs).
These forums build collaboration and share
sustainability learnings across the group.
The water CoP, launched in FY25, is already
cultivating internal champions for change.
Additional CoPs (in decarbonisation, biodiversity,
and people initiatives such as Women in Mining),
will create structured platforms for shared
learning, problem-solving, and continuous
improvement.
Ethics Management
Ethical leadership remains the foundation of
Harmony’s licence to operate. The committee
continues to review and approve the ethics
strategy and related policies, ensuring Harmony
upholds the highest moral standards. With
guidance from the Ethics Institute of South Africa
and other external resources, we have enhanced
the governance of organisational ethics. Engaging
external expertise is intended not only to
reinforce our culture of ethical conduct, but also
to strengthen our capacity to detect, prevent,
and report fraud effectively.
Illegal mining remains a challenge in our South
African region, and while we have intensified
partnerships to combat its impact, we recognise
that further collaboration and innovative
solutions are required. Ethics in action will
continue to guide Harmony’s engagement with
all stakeholders.
For more on illegal mining risks and interventions
thereof refer to Combatting illegal mining and
Decarbonisation and Environmental
Stewardship
Our vision of a net-zero carbon emission
and water-secure future is driving our
environmental stewardship. We remain
committed to achieving net-zero emissions by
2045, with a 20% reduction in emissions by 2026
and a 63% reduction in scope 1 and 2 emissions
by FY36 — targets approved by the Science Based
Targets initiative (SBTi).
Key progress during FY23–25 includes:
▪Commissioning 30MW of solar power in the
Free State, with Sungazer 2 (100MW) under
construction and Sungazer 3 and 4 (208MW)
planned.
▪Expanding renewable energy procurement
through 260MW of wind power and exploring
200MW in short-term PPAs.
▪In Australia, securing approvals for 100MW
solar power and a 65MW battery at Eva
Copper.
▪Operating the world’s largest gold tailings
retreatment business, reducing environmental
impact while creating jobs and unlocking value.
▪Implementing a water ambition roadmap
targeting an 80% reduction in water
dependency at our South African operations.
Our potable water reduction target under our
sustainability-linked loan has already been
achieved.
Social Responsibility
Harmony continues to invest in its host
communities with our aim to build resilient
communities. The completion of our five-year
Social and Labour Plan saw investment in food
security, education, infrastructure, and youth
employment. In Australia and Papua New Guinea,
benefit-sharing models are delivering value to
local communities, while local procurement
continues to create inclusive growth.
Gender inclusion remains a priority. We have
identified opportunities to improve workplace
inclusivity, advancing our commitment to
progressive and equitable workplaces across
all operations.
Our approach to stakeholder management
supports this commitment thus fostering
dialogue, and shared accountability across
our workforce, communities and partners.
226
Rewards and Recognition
This year, Harmony achieved important external
recognition for its sustainability journey:
▪Top 95th percentile ranking in the FTSE4Good
ESG Index (ICB sector).
▪Top 50 ranking by Sustainalytics within the
gold sub-industry.
▪Continued inclusion in the Bloomberg Gender
Equality Index.
▪Awards for environmental leadership,
including emissions reduction at Mponeng and
water stewardship through wastewater plant
refurbishments.
These accolades reflect not only Harmony’s
progress but also the dedication of our people to
embedding sustainability and ethical practices in
every aspect of the business.
Advancing Global Standards
Harmony is proactively shifting its disclosures to
align with the International Sustainability
Standards Board’s (ISSB) S1 and S2 standards.
While full adoption will be a multi-year journey,
this year’s report already reflects the ISSB
framework: governance, strategy, risk and
opportunity management, and performance
measurement. This alignment strengthens
the comparability and transparency of our
disclosures, ensuring Harmony remains at the
forefront of sustainability reporting — both
in South Africa and in Australia, where new
sustainability reporting standards are effective in
FY26.
Social and ethics committee mandate
The Social and Ethics Committee operates under
a distinct mandate established by the Companies
Act. Its responsibilities include overseeing
governance and monitoring the company’s
performance in relation to sustainable
development. This encompasses a wide range of
focus areas: sustainability considerations, ethics
management, stakeholder engagement, employee
relations (including empowerment,
transformation, health and wellness),
environmental stewardship, socio-economic
development and upliftment, as well as public
health and safety. In fulfilling its role, the
committee also evaluates necessary trade-offs to
ensure that Harmony continues to deliver shared
value.
The committee has discharged all regulatory,
legal, and board-mandated responsibilities during
the reporting period. In doing so, it has applied
the principles of King IV with a strong focus on
ethical governance, responsible conduct, and
corporate citizenship; essential to sustaining the
long-term growth of the company.
For further details on the committee, its
members, and its activities during the review
period, please refer to the Governance section.
Looking Ahead
As I hand over the chairmanship, I am confident
that Harmony will continue to advance its
commitments to:
▪Ethical leadership and governance
▪Decarbonisation and environmental
stewardship
▪Employee safety, health, and inclusivity
▪Community empowerment and socio-
economic development
▪Transparent and globally aligned sustainability
reporting.
It has been a privilege to serve as Chairman
during this transformative period. I thank
my fellow committee members, Harmony’s
leadership team, and all employees and partners
for their unwavering commitment to mining with
purpose. I look forward to supporting the
incoming Chairman as a committee member and
to seeing Harmony continue to create sustainable
value for all stakeholders.
Karabo Nondumo
Outgoing Chairperson: Social and Ethics
Committee
24 October 2025
227
Mining Charter III – compliance scorecard
We discuss our performance against the Mining Charter throughout this report. The charter is focused on transformation of the South African mining industry as a whole by
promoting equal access to and ownership, expanding business opportunities for historically disadvantaged persons (HDPs), redressing the imbalances of historical injustices and
enhancing the social and economic welfare of employees and mine communities.
The Mining Charter is not a static document – it has been debated and revised a number of times and is now in its third iteration (effective 2018 and known as Mining Charter III). Harmony will continue to work towards
transformation because we believe this supports our social licence to operate. As a mining company we hold to the spirit of the Mining Charter and measure our performance against the charter as an entry point to our
transformation journey.
The table summarises our performance against targets for each pillar for the calendar year to 31 December 2024 (the regulatory reporting period). Harmony considers itself to be subject to the Mining Charter.
Harmony’s status under the applicable Mining Charter is determinative of the applications lodged by Harmony for mining rights. The Broad-Based Black Economic Empowerment Act requires the Department of Trade,
Industry and Competition to issue the Code of Good Practice on Broad- Based Black Economic Empowerment or sector codes to measure an entities black economic empowerment initiatives. The
B-BBEE Act and code do not require the DMPR to apply the B-BBEE code when determining the qualification criteria for the granting of mining rights or the renewal of existing rights. The codes will only apply to mining
companies if they wish to be scored for purposes of contract with organs of state. We have conducted the B-BBEE verification audit for FY25 and have attached our certificate in the following section of this report.
Mining Charter III scorecard for 2024 (January – December)
Measure | Target | Score | Progress | ||||||
1 Reporting | |||||||||
Has the company reported its level of compliance with the Mining Charter for the calendar year? | Report annually | Yes | Yes | Yes | |||||
2 Ownership | |||||||||
Minimum target for effective ownership by historically disadvantaged South Africans | Meaningful economic participation; full shareholder rights | 26% | 58% | Yes | |||||
3 Employment equity | |||||||||
Diversification of workplace to reflect the country’s demographics and attain competitiveness | Representation of historically disadvantaged persons | Board: 50% | 67% | Yes | |||||
Executive committee: 50% | 60% | Yes | |||||||
Senior management: 60% | 63% | Yes | |||||||
Middle management: 60% | 66% | Yes | |||||||
Junior management: 70% | 72% | Yes | |||||||
Core and critical skills: 60% | 74% | Yes | |||||||
Representation of women | Board: 20% | 25% | Yes | ||||||
Executive committee: 20% | 25% | Yes | |||||||
Senior management: 25% | 27% | Yes | |||||||
Middle management: 25% | 30% | Yes | |||||||
Junior management : 30% | 22% | No | |||||||
Employees with disabilities | 1.5% | 0.3% | No | ||||||
228
Measure | Target | Score | Progress | ||||||
4 Human resource development | |||||||||
Development of the requisite skills, particularly in exploration, mining, processing, technology efficiency, beneficiation and environmental conservation | Human resource development expenditure as percentage of total annual leviable amount (excluding mandatory skills development levy) | Invest 5% of leviable amount as defined in human resource development element in proportion to applicable demographics (employees and non-employees) | 6% | Yes | |||||
5 Mine community development* | |||||||||
Meaningful contribution towards mine community development in keeping with the principles of the social licence to operate | Implementation of approved commitments in the SLP | 100% | 134% | Yes | |||||
* Mine community development is reported according to Harmony’s financial year, as agreed with DMRE. This report covers mine community development for the period July 2023 to June 2024. | |||||||||
6 Procurement and enterprise development | |||||||||
Total procurement budget spend on goods and services | Mining goods A minimum of 70% of total mining goods procurement spend must be spent on South Africa-manufactured goods sourced from BEE- compliant manufacturing companies. Excludes spend on utilities (electricity and water), fuels, lubricants and land rates | 21% of total mining goods budget must be spent on South African-manufactured goods produced by 50% + 1 vote HDP-owned and controlled companies | 55% | Yes | |||||
5% of total mining goods budget must be spent on South Africa-manufactured goods produced by 50% + 1 women- and/youth-owned and controlled companies | 19% | Yes | |||||||
44% of total mining goods budget must be spent on South Africa-manufactured goods produced by at least level 4 BEE 25% + 1 compliant companies | 78% | Yes | |||||||
Services A minimum of 80% of total spend on services must be sourced from South Africa-based companies | 50% of total services budget must be spent on South African companies that are 50% + 1 vote HDP-owned and controlled companies | 1% | No | ||||||
15% of total services budget must be spent on South African companies that are 50% + 1 vote women-owned and controlled companies | 14% | No | |||||||
5% of total services budget must be spent on South African companies that are 50% + 1 vote youth-owned and controlled | 4% | No | |||||||
10% of total services budget must be spent on South African companies that are at least at level 4 BEE + 25% + 1 compliant companies | 75% | Yes | |||||||
Research and development | A minimum of 70% of total research and development budget to be spent on South Africa-based entities | 100% | Yes | ||||||
Sample analysis | Use South Africa-based facilities or companies for analysis of 100% of all mineral samples across mining value chain | 100% | Yes | ||||||
7 Housing and living conditions | |||||||||
Improve standard of housing and living conditions of mine employees | Implement all commitments in the housing and living conditions standard | 100% | Yes | ||||||