UNITED STATES SECURITIES AND EXCHANGE COMMISSION Washington, D.C. 20549 Form 6K REPORT OF FOREIGN PRIVATE ISSUER PURSUANT TO RULE 13a16 OR 15d16 UNDER THE SECURITIES EXCHANGE ACT OF 1934 For August 27, 2026 Harmony Gold Mining Company Limited Randfontein Office Park Corner Main Reef Road and Ward Avenue Randfontein, 1759 South Africa (Address of principal executive offices) *- (Indicate by check mark whether the registrant files or will file annual reports under cover of Form 20F or Form 40F.) Form 20F ☒ Form 40F ☐ (Indicate by check mark whether the registrant by furnishing the information contained in this form is also thereby furnishing the information to the Commission pursuant to Rule 12g32(b) under the Securities Exchange Act of 1934.) Yes ☐ No ☒
DISCIPLINED DELIVERY. PORTFOLIO PROGRESSION. ENDURING VALUE. Exceptional cash flows enable strategic growth alongside record shareholder returns Johannesburg, South Africa. Thursday, 27 August 2026. Harmony Gold Mining Company Limited is pleased to report its financial and operational results for the financial year ended 30 June 2026. FY26 RESULTS for the year ended 30 June 2026 Harmony Gold Mining Company Limited Incorporated in the Republic of South Africa Registration number: 1950/038232/06 JSE share code: HAR NYSE share code: HMY ISIN: ZAE000015228 (Harmony or the Company)
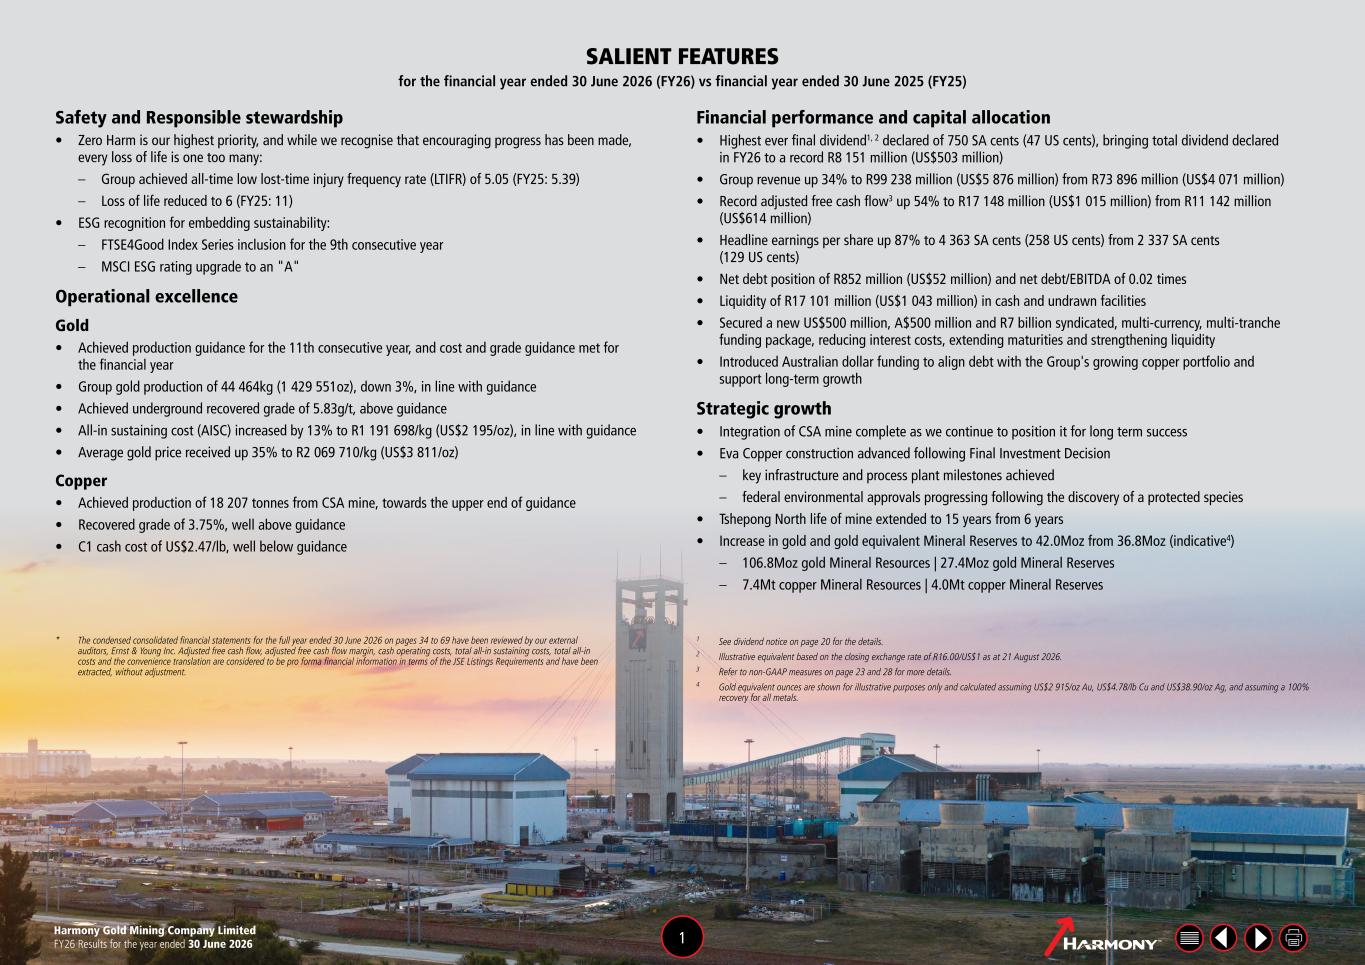
1 See dividend notice on page 20 for the details. 2 Illustrative equivalent based on the closing exchange rate of R16.00/US$1 as at 21 August 2026. 3 Refer to non-GAAP measures on page 23 and 28 for more details. 4 Gold equivalent ounces are shown for illustrative purposes only and calculated assuming US$2 915/oz Au, US$4.78/lb Cu and US$38.90/oz Ag, and assuming a 100% recovery for all metals. Safety and Responsible stewardship • Zero Harm is our highest priority, and while we recognise that encouraging progress has been made, every loss of life is one too many: – Group achieved all-time low lost-time injury frequency rate (LTIFR) of 5.05 (FY25: 5.39) – Loss of life reduced to 6 (FY25: 11) • ESG recognition for embedding sustainability: – FTSE4Good Index Series inclusion for the 9th consecutive year – MSCI ESG rating upgrade to an "A" Operational excellence Gold • Achieved production guidance for the 11th consecutive year, and cost and grade guidance met for the financial year • Group gold production of 44 464kg (1 429 551oz), down 3%, in line with guidance • Achieved underground recovered grade of 5.83g/t, above guidance • All-in sustaining cost (AISC) increased by 13% to R1 191 698/kg (US$2 195/oz), in line with guidance • Average gold price received up 35% to R2 069 710/kg (US$3 811/oz) Copper • Achieved production of 18 207 tonnes from CSA mine, towards the upper end of guidance • Recovered grade of 3.75%, well above guidance • C1 cash cost of US$2.47/lb, well below guidance SALIENT FEATURES for the financial year ended 30 June 2026 (FY26) vs financial year ended 30 June 2025 (FY25) Financial performance and capital allocation • Highest ever final dividend1, 2 declared of 750 SA cents (47 US cents), bringing total dividend declared in FY26 to a record R8 151 million (US$503 million) • Group revenue up 34% to R99 238 million (US$5 876 million) from R73 896 million (US$4 071 million) • Record adjusted free cash flow3 up 54% to R17 148 million (US$1 015 million) from R11 142 million (US$614 million) • Headline earnings per share up 87% to 4 363 SA cents (258 US cents) from 2 337 SA cents (129 US cents) • Net debt position of R852 million (US$52 million) and net debt/EBITDA of 0.02 times • Liquidity of R17 101 million (US$1 043 million) in cash and undrawn facilities • Secured a new US$500 million, A$500 million and R7 billion syndicated, multi-currency, multi-tranche funding package, reducing interest costs, extending maturities and strengthening liquidity • Introduced Australian dollar funding to align debt with the Group's growing copper portfolio and support long-term growth Strategic growth • Integration of CSA mine complete as we continue to position it for long term success • Eva Copper construction advanced following Final Investment Decision – key infrastructure and process plant milestones achieved – federal environmental approvals progressing following the discovery of a protected species • Tshepong North life of mine extended to 15 years from 6 years • Increase in gold and gold equivalent Mineral Reserves to 42.0Moz from 36.8Moz (indicative4) – 106.8Moz gold Mineral Resources | 27.4Moz gold Mineral Reserves – 7.4Mt copper Mineral Resources | 4.0Mt copper Mineral Reserves * The condensed consolidated financial statements for the full year ended 30 June 2026 on pages 34 to 69 have been reviewed by our external auditors, Ernst & Young Inc. Adjusted free cash flow, adjusted free cash flow margin, cash operating costs, total all-in sustaining costs, total all-in costs and the convenience translation are considered to be pro forma financial information in terms of the JSE Listings Requirements and have been extracted, without adjustment. Harmony Gold Mining Company Limited FY26 Results for the year ended 30 June 2026 1
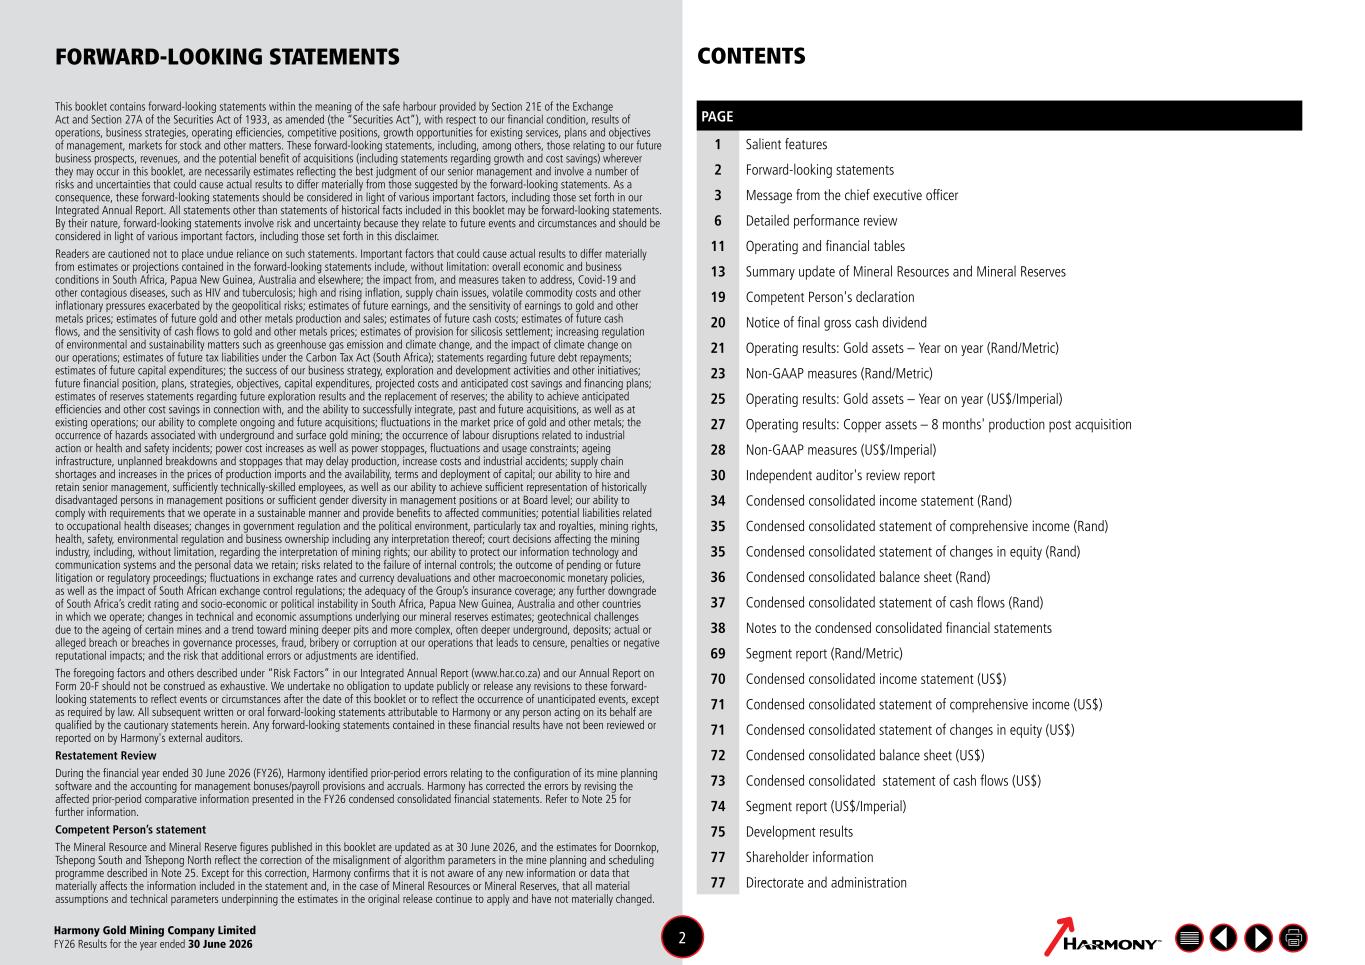
This booklet contains forward-looking statements within the meaning of the safe harbour provided by Section 21E of the Exchange Act and Section 27A of the Securities Act of 1933, as amended (the “Securities Act”), with respect to our financial condition, results of operations, business strategies, operating efficiencies, competitive positions, growth opportunities for existing services, plans and objectives of management, markets for stock and other matters. These forward-looking statements, including, among others, those relating to our future business prospects, revenues, and the potential benefit of acquisitions (including statements regarding growth and cost savings) wherever they may occur in this booklet, are necessarily estimates reflecting the best judgment of our senior management and involve a number of risks and uncertainties that could cause actual results to differ materially from those suggested by the forward-looking statements. As a consequence, these forward-looking statements should be considered in light of various important factors, including those set forth in our Integrated Annual Report. All statements other than statements of historical facts included in this booklet may be forward-looking statements. By their nature, forward-looking statements involve risk and uncertainty because they relate to future events and circumstances and should be considered in light of various important factors, including those set forth in this disclaimer. Readers are cautioned not to place undue reliance on such statements. Important factors that could cause actual results to differ materially from estimates or projections contained in the forward-looking statements include, without limitation: overall economic and business conditions in South Africa, Papua New Guinea, Australia and elsewhere; the impact from, and measures taken to address, Covid-19 and other contagious diseases, such as HIV and tuberculosis; high and rising inflation, supply chain issues, volatile commodity costs and other inflationary pressures exacerbated by the geopolitical risks; estimates of future earnings, and the sensitivity of earnings to gold and other metals prices; estimates of future gold and other metals production and sales; estimates of future cash costs; estimates of future cash flows, and the sensitivity of cash flows to gold and other metals prices; estimates of provision for silicosis settlement; increasing regulation of environmental and sustainability matters such as greenhouse gas emission and climate change, and the impact of climate change on our operations; estimates of future tax liabilities under the Carbon Tax Act (South Africa); statements regarding future debt repayments; estimates of future capital expenditures; the success of our business strategy, exploration and development activities and other initiatives; future financial position, plans, strategies, objectives, capital expenditures, projected costs and anticipated cost savings and financing plans; estimates of reserves statements regarding future exploration results and the replacement of reserves; the ability to achieve anticipated efficiencies and other cost savings in connection with, and the ability to successfully integrate, past and future acquisitions, as well as at existing operations; our ability to complete ongoing and future acquisitions; fluctuations in the market price of gold and other metals; the occurrence of hazards associated with underground and surface gold mining; the occurrence of labour disruptions related to industrial action or health and safety incidents; power cost increases as well as power stoppages, fluctuations and usage constraints; ageing infrastructure, unplanned breakdowns and stoppages that may delay production, increase costs and industrial accidents; supply chain shortages and increases in the prices of production imports and the availability, terms and deployment of capital; our ability to hire and retain senior management, sufficiently technically-skilled employees, as well as our ability to achieve sufficient representation of historically disadvantaged persons in management positions or sufficient gender diversity in management positions or at Board level; our ability to comply with requirements that we operate in a sustainable manner and provide benefits to affected communities; potential liabilities related to occupational health diseases; changes in government regulation and the political environment, particularly tax and royalties, mining rights, health, safety, environmental regulation and business ownership including any interpretation thereof; court decisions affecting the mining industry, including, without limitation, regarding the interpretation of mining rights; our ability to protect our information technology and communication systems and the personal data we retain; risks related to the failure of internal controls; the outcome of pending or future litigation or regulatory proceedings; fluctuations in exchange rates and currency devaluations and other macroeconomic monetary policies, as well as the impact of South African exchange control regulations; the adequacy of the Group’s insurance coverage; any further downgrade of South Africa’s credit rating and socio-economic or political instability in South Africa, Papua New Guinea, Australia and other countries in which we operate; changes in technical and economic assumptions underlying our mineral reserves estimates; geotechnical challenges due to the ageing of certain mines and a trend toward mining deeper pits and more complex, often deeper underground, deposits; actual or alleged breach or breaches in governance processes, fraud, bribery or corruption at our operations that leads to censure, penalties or negative reputational impacts; and the risk that additional errors or adjustments are identified. The foregoing factors and others described under “Risk Factors” in our Integrated Annual Report (www.har.co.za) and our Annual Report on Form 20-F should not be construed as exhaustive. We undertake no obligation to update publicly or release any revisions to these forward- looking statements to reflect events or circumstances after the date of this booklet or to reflect the occurrence of unanticipated events, except as required by law. All subsequent written or oral forward-looking statements attributable to Harmony or any person acting on its behalf are qualified by the cautionary statements herein. Any forward-looking statements contained in these financial results have not been reviewed or reported on by Harmony's external auditors. Restatement Review During the financial year ended 30 June 2026 (FY26), Harmony identified prior-period errors relating to the configuration of its mine planning software and the accounting for management bonuses/payroll provisions and accruals. Harmony has corrected the errors by revising the affected prior-period comparative information presented in the FY26 condensed consolidated financial statements. Refer to Note 25 for further information. Competent Person’s statement The Mineral Resource and Mineral Reserve figures published in this booklet are updated as at 30 June 2026, and the estimates for Doornkop, Tshepong South and Tshepong North reflect the correction of the misalignment of algorithm parameters in the mine planning and scheduling programme described in Note 25. Except for this correction, Harmony confirms that it is not aware of any new information or data that materially affects the information included in the statement and, in the case of Mineral Resources or Mineral Reserves, that all material assumptions and technical parameters underpinning the estimates in the original release continue to apply and have not materially changed. FORWARD-LOOKING STATEMENTS PAGE 1 Salient features 2 Forward-looking statements 3 Message from the chief executive officer 6 Detailed performance review 11 Operating and financial tables 13 Summary update of Mineral Resources and Mineral Reserves 19 Competent Person's declaration 20 Notice of final gross cash dividend 21 Operating results: Gold assets – Year on year (Rand/Metric) 23 Non-GAAP measures (Rand/Metric) 25 Operating results: Gold assets – Year on year (US$/Imperial) 27 Operating results: Copper assets – 8 months' production post acquisition 28 Non-GAAP measures (US$/Imperial) 30 Independent auditor's review report 34 Condensed consolidated income statement (Rand) 35 Condensed consolidated statement of comprehensive income (Rand) 35 Condensed consolidated statement of changes in equity (Rand) 36 Condensed consolidated balance sheet (Rand) 37 Condensed consolidated statement of cash flows (Rand) 38 Notes to the condensed consolidated financial statements 69 Segment report (Rand/Metric) 70 Condensed consolidated income statement (US$) 71 Condensed consolidated statement of comprehensive income (US$) 71 Condensed consolidated statement of changes in equity (US$) 72 Condensed consolidated balance sheet (US$) 73 Condensed consolidated statement of cash flows (US$) 74 Segment report (US$/Imperial) 75 Development results 77 Shareholder information 77 Directorate and administration CONTENTS Harmony Gold Mining Company Limited FY26 Results for the year ended 30 June 2026 2
The financial year ended 30 June 2026 was a defining year in Harmony's evolution from a gold producer to a diversified gold and copper company. Through disciplined execution, consistent operational delivery and strategic investment, we strengthened our position as a resilient, cash-generative business while creating a clear pathway for future growth. Harmony achieved gold production guidance for the eleventh consecutive year and delivered on both gold and copper production, grade and cost guidance in FY26. The Group delivered strong growth in earnings per share, generated robust adjusted free cash flow and declared a record final dividend to shareholders. These results reflect the quality of our operations, the discipline of our capital allocation framework and the dedication of our employees and business partners across the Group. At the same time, we advanced the next phase of our growth strategy. The successful integration of the CSA mine contributed our first copper production, while construction of the Eva Copper Project progressed responsibly. Across our portfolio, we continued investing in reserve conversion. These achievements demonstrate the strength of Harmony's operating model. Consistent execution, disciplined capital allocation and a relentless focus on safety and operational excellence have transformed Harmony into a stronger, more diversified and more resilient business, better positioned to deliver through commodity cycles and dynamic market conditions. Gold is the foundation of our company, generating the cash flows that have supported our growth for close to eight decades. Copper is now adding an important new dimension to that foundation, providing greater diversification, increased resilience and exposure to long-term structural demand. Together, these metals create a more balanced portfolio, with greater flexibility, durability and long-term growth potential. Today, Harmony is better positioned than at any time in its history. With a stronger asset base, visible copper growth, a long pipeline of organic opportunities and a disciplined approach to capital deployment, we are a gold and copper producer capable of generating sustainable cash flows, delivering attractive returns and creating long-term value for shareholders. SAFE, PREDICTABLE DELIVERY Safety is our first value and our foremost responsibility. Every decision we make begins with protecting the lives and wellbeing of our people. During FY26, the Group achieved its lowest lost-time injury frequency rate on record of 5.05 per million hours worked. This reflects the continued progress made in strengthening our safety culture, leadership accountability, workplace discipline and critical control management. While we are encouraged by this improvement, our ultimate objective of zero harm remains unchanged, and every incident and high-potential incident is a reminder that production is never worth a life. Safe, predictable production forms the foundation of Harmony's long-term success. The consistency in meeting guidance reflects the quality of our planning processes, operational discipline, orebody management and leadership capability across the portfolio. Delivering in line with guidance is one of Harmony's most important competitive advantages and provides the foundation for shareholder confidence and long-term value creation. Our forecasting assumptions are deliberately conservative, incorporating a gold price of R1 850 000/kg for FY27, well below the current spot price. This discipline provides confidence that the Group's operations, growth projects and capital commitments are supported by robust economics and are capable of generating cash and delivering returns through commodity price cycles. IMPROVING PORTFOLIO QUALITY AND UNLOCKING EMBEDDED VALUE Over the past decade, Harmony has deliberately transformed its portfolio. Through disciplined investment, targeted acquisitions and continuous Mineral Reserve conversion, we have built a higher-quality portfolio with greater scale, improved orebody quality, increased flexibility and enhanced geographic and commodity diversification. Today, our South African underground gold Mineral Reserve grade is above 6g/t, reflecting the quality of our orebody base and our commitment to investing in higher-margin production opportunities. The Mponeng, Moab Khotsong, Tshepong North and Doornkop extension projects illustrate the significant value embedded within our existing Mineral Resource base and the opportunity to convert these resources into long-life, cash-generating Mineral Reserves at attractive returns. Reserve conversion continues to be one of Harmony's most compelling value creation opportunities. By leveraging existing infrastructure, processing capacity and operating capability, we have demonstrated our ability to extend mine lives and unlock additional ounces at a competitive price. This provides shareholders with an attractive risk-reward return profile, where low-intensity capital investment has the potential to create substantial long-term value while preserving financial flexibility. STRONG CASH GENERATION AND FINANCIAL FLEXIBILITY The benefits of a higher-quality portfolio were clearly evident in FY26. Consistent operational delivery, disciplined cost management and a supportive commodity price environment translated into substantial earnings growth, stronger margins and record cash flow generation. Group revenue increased by 34% to R99 238 million (US$5 876 million) from R73 896 million (US$4 071 million). Headline earnings increased by 87% to R27 238 million (US$1 613 million), with basic earnings increasing by 104% to R29 349 million (US$1 738 million), supported by strong operational performance and higher realised commodity prices. Headline earnings per share increased by 87% to 4 363 SA cents (258 US cents) from 2 337 SA cents (129 US cents). Basic earnings per share increased by 103% to 4 701 SA cents (278 US cents) from 2 313 SA cents (127 US cents). Group adjusted free cash flow increased by 54% to R17 148 million (US$1 015 million) from R11 142 million (US$614 million), with adjusted free cash flow margins expanding to 18% from 16% in FY25. We maintained a robust balance sheet throughout FY26, ending the year with net debt of R852 million (US$52 million) from a net cash of R11 148 million (US$628 million) at the end of FY25, following the all-cash acquisition of MAC Copper. Liquidity remained strong at R17 101 million (US$1 043 million), comprising cash and undrawn committed facilities, while net debt to EBITDA was just 0.02x. This conservative leverage position provides substantial financial flexibility to fund approved growth projects, meet capital commitments and pursue value-enhancing opportunities, while preserving balance sheet resilience and avoiding unnecessary shareholder dilution. DISCIPLINED CAPITAL ALLOCATION FRAMEWORK Capital allocation is the foundation of value creation. Our disciplined capital allocation framework ensures that every investment competes for capital and is aligned with delivering sustainable long-term returns. Safety and asset integrity are non-negotiable and receive the first allocation of capital. We then prioritise investments that improve orebody quality, extend mine life, enhance mining flexibility and strengthen margins. MESSAGE FROM THE CHIEF EXECUTIVE OFFICER Harmony Gold Mining Company Limited FY26 Results for the year ended 30 June 2026 3
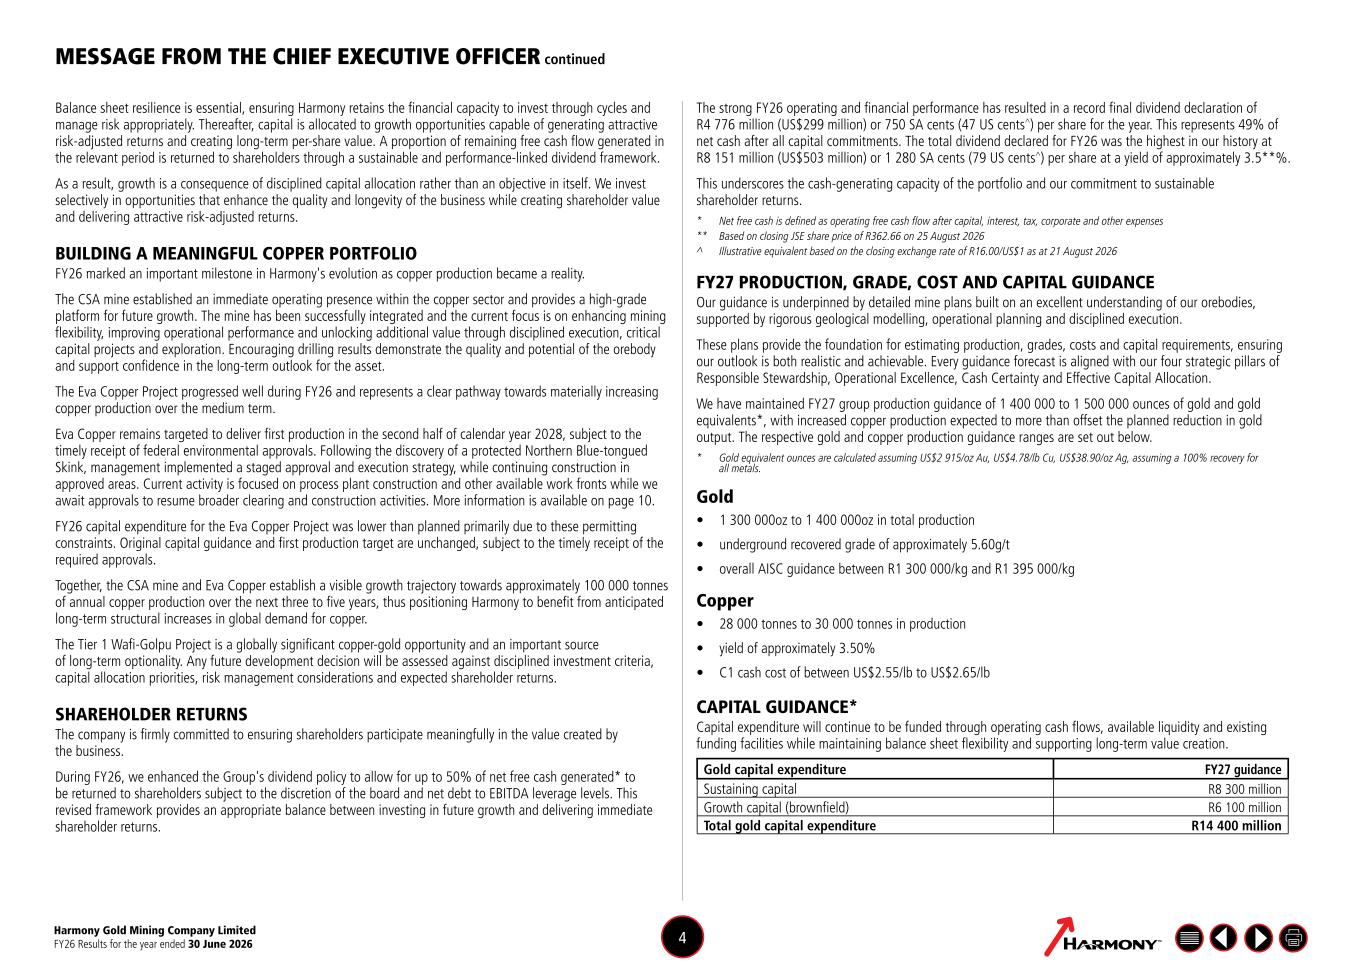
Harmony Gold Mining Company Limited FY26 Results for the year ended 30 June 2026 4 MESSAGE FROM THE CHIEF EXECUTIVE OFFICER continued Balance sheet resilience is essential, ensuring Harmony retains the financial capacity to invest through cycles and manage risk appropriately. Thereafter, capital is allocated to growth opportunities capable of generating attractive risk-adjusted returns and creating long-term per-share value. A proportion of remaining free cash flow generated in the relevant period is returned to shareholders through a sustainable and performance-linked dividend framework. As a result, growth is a consequence of disciplined capital allocation rather than an objective in itself. We invest selectively in opportunities that enhance the quality and longevity of the business while creating shareholder value and delivering attractive risk-adjusted returns. BUILDING A MEANINGFUL COPPER PORTFOLIO FY26 marked an important milestone in Harmony's evolution as copper production became a reality. The CSA mine established an immediate operating presence within the copper sector and provides a high-grade platform for future growth. The mine has been successfully integrated and the current focus is on enhancing mining flexibility, improving operational performance and unlocking additional value through disciplined execution, critical capital projects and exploration. Encouraging drilling results demonstrate the quality and potential of the orebody and support confidence in the long-term outlook for the asset. The Eva Copper Project progressed well during FY26 and represents a clear pathway towards materially increasing copper production over the medium term. Eva Copper remains targeted to deliver first production in the second half of calendar year 2028, subject to the timely receipt of federal environmental approvals. Following the discovery of a protected Northern Blue-tongued Skink, management implemented a staged approval and execution strategy, while continuing construction in approved areas. Current activity is focused on process plant construction and other available work fronts while we await approvals to resume broader clearing and construction activities. More information is available on page 10. FY26 capital expenditure for the Eva Copper Project was lower than planned primarily due to these permitting constraints. Original capital guidance and first production target are unchanged, subject to the timely receipt of the required approvals. Together, the CSA mine and Eva Copper establish a visible growth trajectory towards approximately 100 000 tonnes of annual copper production over the next three to five years, thus positioning Harmony to benefit from anticipated long-term structural increases in global demand for copper. The Tier 1 Wafi-Golpu Project is a globally significant copper-gold opportunity and an important source of long-term optionality. Any future development decision will be assessed against disciplined investment criteria, capital allocation priorities, risk management considerations and expected shareholder returns. SHAREHOLDER RETURNS The company is firmly committed to ensuring shareholders participate meaningfully in the value created by the business. During FY26, we enhanced the Group's dividend policy to allow for up to 50% of net free cash generated* to be returned to shareholders subject to the discretion of the board and net debt to EBITDA leverage levels. This revised framework provides an appropriate balance between investing in future growth and delivering immediate shareholder returns. The strong FY26 operating and financial performance has resulted in a record final dividend declaration of R4 776 million (US$299 million) or 750 SA cents (47 US cents^) per share for the year. This represents 49% of net cash after all capital commitments. The total dividend declared for FY26 was the highest in our history at R8 151 million (US$503 million) or 1 280 SA cents (79 US cents^) per share at a yield of approximately 3.5**%. This underscores the cash-generating capacity of the portfolio and our commitment to sustainable shareholder returns. * Net free cash is defined as operating free cash flow after capital, interest, tax, corporate and other expenses ** Based on closing JSE share price of R362.66 on 25 August 2026 ^ Illustrative equivalent based on the closing exchange rate of R16.00/US$1 as at 21 August 2026 FY27 PRODUCTION, GRADE, COST AND CAPITAL GUIDANCE Our guidance is underpinned by detailed mine plans built on an excellent understanding of our orebodies, supported by rigorous geological modelling, operational planning and disciplined execution. These plans provide the foundation for estimating production, grades, costs and capital requirements, ensuring our outlook is both realistic and achievable. Every guidance forecast is aligned with our four strategic pillars of Responsible Stewardship, Operational Excellence, Cash Certainty and Effective Capital Allocation. We have maintained FY27 group production guidance of 1 400 000 to 1 500 000 ounces of gold and gold equivalents*, with increased copper production expected to more than offset the planned reduction in gold output. The respective gold and copper production guidance ranges are set out below. * Gold equivalent ounces are calculated assuming US$2 915/oz Au, US$4.78/lb Cu, US$38.90/oz Ag, assuming a 100% recovery for all metals. Gold • 1 300 000oz to 1 400 000oz in total production • underground recovered grade of approximately 5.60g/t • overall AISC guidance between R1 300 000/kg and R1 395 000/kg Copper • 28 000 tonnes to 30 000 tonnes in production • yield of approximately 3.50% • C1 cash cost of between US$2.55/lb to US$2.65/lb CAPITAL GUIDANCE* Capital expenditure will continue to be funded through operating cash flows, available liquidity and existing funding facilities while maintaining balance sheet flexibility and supporting long-term value creation. Gold capital expenditure FY27 guidance Sustaining capital R8 300 million Growth capital (brownfield) R6 100 million Total gold capital expenditure R14 400 million
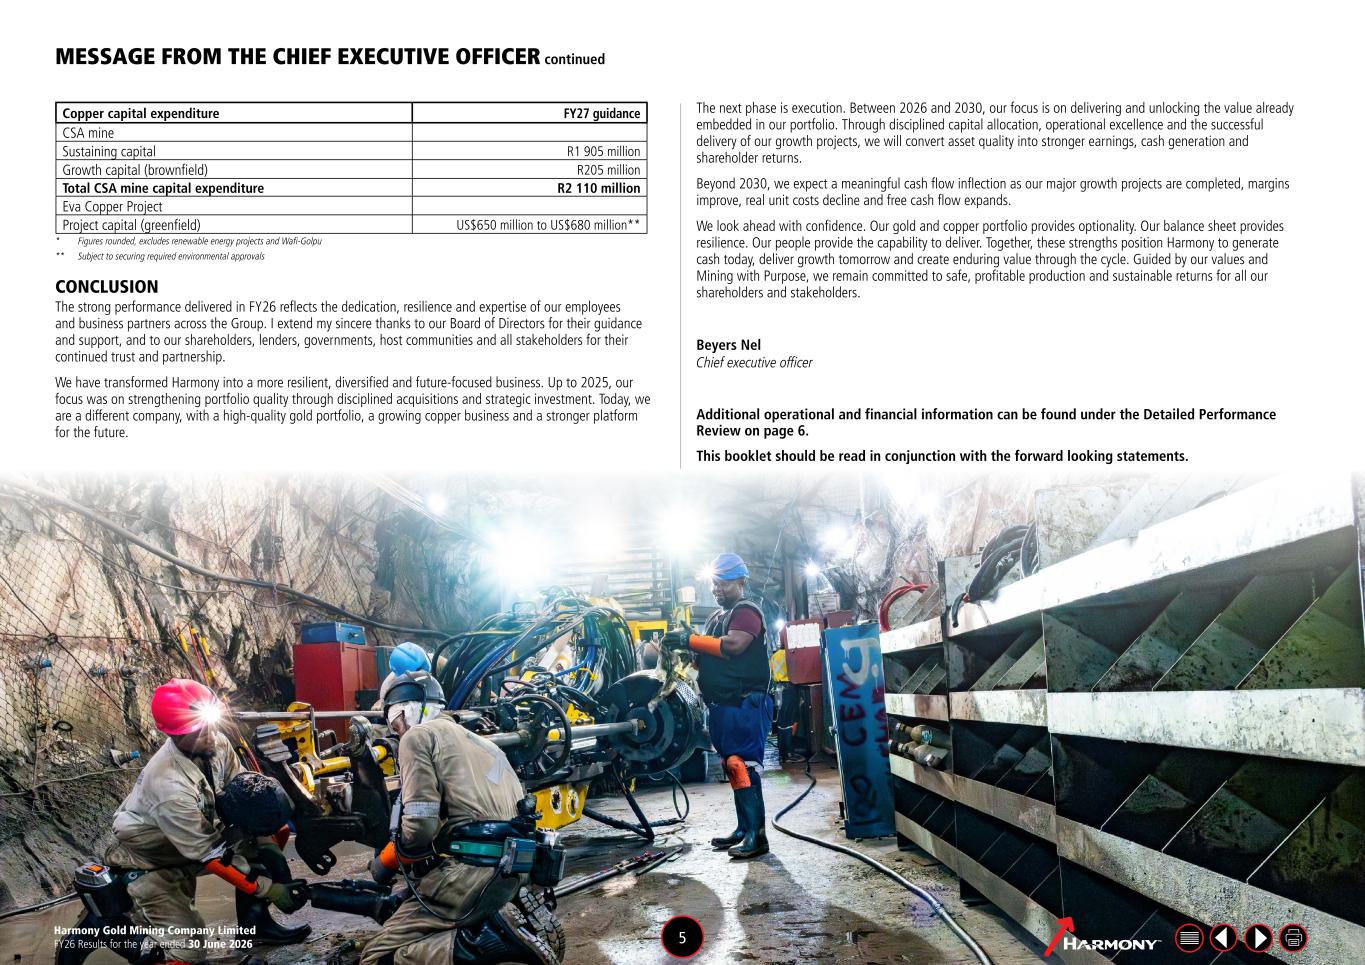
Harmony Gold Mining Company Limited FY26 Results for the year ended 30 June 2026 5 MESSAGE FROM THE CHIEF EXECUTIVE OFFICER continued Copper capital expenditure FY27 guidance CSA mine Sustaining capital R1 905 million Growth capital (brownfield) R205 million Total CSA mine capital expenditure R2 110 million Eva Copper Project Project capital (greenfield) US$650 million to US$680 million** * Figures rounded, excludes renewable energy projects and Wafi-Golpu ** Subject to securing required environmental approvals CONCLUSION The strong performance delivered in FY26 reflects the dedication, resilience and expertise of our employees and business partners across the Group. I extend my sincere thanks to our Board of Directors for their guidance and support, and to our shareholders, lenders, governments, host communities and all stakeholders for their continued trust and partnership. We have transformed Harmony into a more resilient, diversified and future-focused business. Up to 2025, our focus was on strengthening portfolio quality through disciplined acquisitions and strategic investment. Today, we are a different company, with a high-quality gold portfolio, a growing copper business and a stronger platform for the future. The next phase is execution. Between 2026 and 2030, our focus is on delivering and unlocking the value already embedded in our portfolio. Through disciplined capital allocation, operational excellence and the successful delivery of our growth projects, we will convert asset quality into stronger earnings, cash generation and shareholder returns. Beyond 2030, we expect a meaningful cash flow inflection as our major growth projects are completed, margins improve, real unit costs decline and free cash flow expands. We look ahead with confidence. Our gold and copper portfolio provides optionality. Our balance sheet provides resilience. Our people provide the capability to deliver. Together, these strengths position Harmony to generate cash today, deliver growth tomorrow and create enduring value through the cycle. Guided by our values and Mining with Purpose, we remain committed to safe, profitable production and sustainable returns for all our shareholders and stakeholders. Beyers Nel Chief executive officer Additional operational and financial information can be found under the Detailed Performance Review on page 6. This booklet should be read in conjunction with the forward looking statements.
A detailed performance review aligned to our four strategic pillars is presented below. Under Responsible Stewardship, we discuss our safety performance and strategy, the progress of our renewable energy programme, and the external ratings and recognition received during the year. Operational Excellence reflects our consistent delivery against production, grade and cost guidance, supported by disciplined execution across the portfolio. Cash Certainty covers revenue and earnings growth, margin expansion and the record cash flow generation achieved this year, together with other key financial disclosures. Finally, Effective Capital Allocation outlines how disciplined investment in reserve conversion, life‑extension projects and copper growth is creating long‑term value for shareholders. 1. RESPONSIBLE STEWARDSHIP Responsible stewardship and sound governance are fundamental to Harmony's licence to operate and long-term value creation. Our approach follows a dual-materiality approach, integrating safety, health, environmental stewardship, climate resilience, energy security and community partnerships into the way we plan, operate and allocate capital. During FY26, the Group continued to improve safety outcomes, invest in renewable energy infrastructure and strengthen relationships with our many stakeholders. We continue to receive recognition for our embedded approach to sustainability which underpins long-term resilience. Safety and health At Harmony, our people are at the centre of everything we do. Safety is our first value, and we are deeply saddened by the tragic loss of our six colleagues during FY26. Their passing is a profound reminder of the responsibility we carry and the human impact of every safety incident. While we have made progress in several areas of our safety performance, the loss of any life is unacceptable. We remain unwavering in our commitment to achieving our ultimate objective of Zero Harm. Every safety incident reinforces the importance of strengthening our controls, deepening our understanding of risk and ensuring that safe behaviours and decision making are embedded across every level of the organisation. Nothing is more important than ensuring that every person who comes to work returns home safely. Throughout FY26, the Group continued to improve safety outcomes and achieved several significant loss-of-life-free milestones. Post year-end, Kusasalethu achieved an extraordinary safety milestone of three million loss-of-life-free shifts. This achievement is particularly significant given the depth and complexity of the operation, which extends to approximately 3 400 metres below surface. As a first for an ultra-deep level mine in the West Wits region, it demonstrates what can be achieved through relentless execution, strong tripartite leadership and a proactive safety culture. This milestone builds on a number of significant loss-of-life-free shift achievements across the Group, including Masimong (4.8 million), Doornkop (4.0 million), Tshepong (3.8 million) and Joel (3.3 million). Collectively, these milestones reflect the benefits of a consistent and disciplined focus on safety and reinforce our belief that meaningful progress towards our goal of zero harm is achievable. They reflect the commitment of our employees, contractors and leadership teams to put safety first, every shift and every day, and ensure that every person returns home safely. Although these achievements are encouraging, safety performance is not measured solely by statistics, but by our ability to proactively identify, manage and eliminate risk before harm occurs. Our safety strategy continues to focus on critical control management, risk identification and targeted interventions in high-risk areas. This is supported by ongoing investment in engineering controls, technology-enabled monitoring systems and our humanistic Thibakotsi DETAILED PERFORMANCE REVIEW safety culture journey, which aims to strengthen safe behaviours, accountability and teamwork across the Group. Through our safety Accountability Model, we continue to reinforce clear standards and expectations while fostering a culture of ownership, learning and continuous improvement. Our health and wellness platform continues to deliver strong outcomes. We support workforce wellbeing through tuberculosis (TB) and human immunodeficiency virus (HIV) screening, flu vaccination campaigns, occupational disease prevention, mental health and substance abuse programmes, while targeted training strengthens leadership accountability for employee health, wellbeing and psychological safety. Through our partnership with the Department of Health, we also promote the early diagnosis and treatment of work-related illness in our host communities. While encouraged by the progress made, we remain focused on continuous improvement to support a healthier, safer and more resilient workforce. Renewable energy Renewable energy is a key enabler of Harmony's long-term strategy, supporting energy security, cost competitiveness, decarbonisation and the sustainability of our operations. During FY26, we continued to make progress towards our Science-Based Targets initiative-validated short-term emissions reduction targets. We advanced our Sungazer renewable energy programme, with Sungazer 1 (30MW) operating successfully and Sungazer 2 (100MW) progressing through construction and commissioning activities. Sungazer 2 is now in its final delivery phase and commercial operations are expected to begin in October 2026. Development activities also advanced in the next phases of the programme, positioning Harmony to further expand its renewable energy capacity over time. The Group's renewable energy plan currently provides a pathway towards approximately 800MW of renewable energy supply. Together with planned battery energy storage solutions, these investments are expected to enhance operational resilience, reduce long-term electricity costs and support Harmony's journey towards its 2045 net-zero ambition. Importantly, the renewable energy programme is expected to be funded through Harmony's ring-fenced green loan facilities, ensuring that these strategic investments are financed in a manner aligned with their sustainability objectives while preserving financial flexibility for mining and growth projects. Environmental, Social and Governance (ESG) highlights and recognition We continue to earn strong third‑party recognition for our approach to sustainability, including our ninth consecutive year of inclusion in the FTSE4Good Index Series, an upgrade in our MSCI ESG rating to an "A", and an "A-" ranking for CDP Water following enhanced disclosure and strengthened water stewardship practices. These independent assessments affirm the credibility of Harmony’s embedded, risk‑based approach to sustainable development and demonstrate measurable year‑on‑year improvement across our material ESG priorities. 2. OPERATIONAL EXCELLENCE Production and grade Harmony once again delivered a stable and consistent operating performance in FY26. Our gold operations milled a record 51.4 million tonnes, an increase of 1% year-on-year, demonstrating the consistency, scale and resilience of the portfolio. As planned, Group gold production decreased by 3% to 44 464kg (1 429 551oz) from 46 023kg (1 479 671oz) in FY25. Harmony Gold Mining Company Limited FY26 Results for the year ended 30 June 2026 6
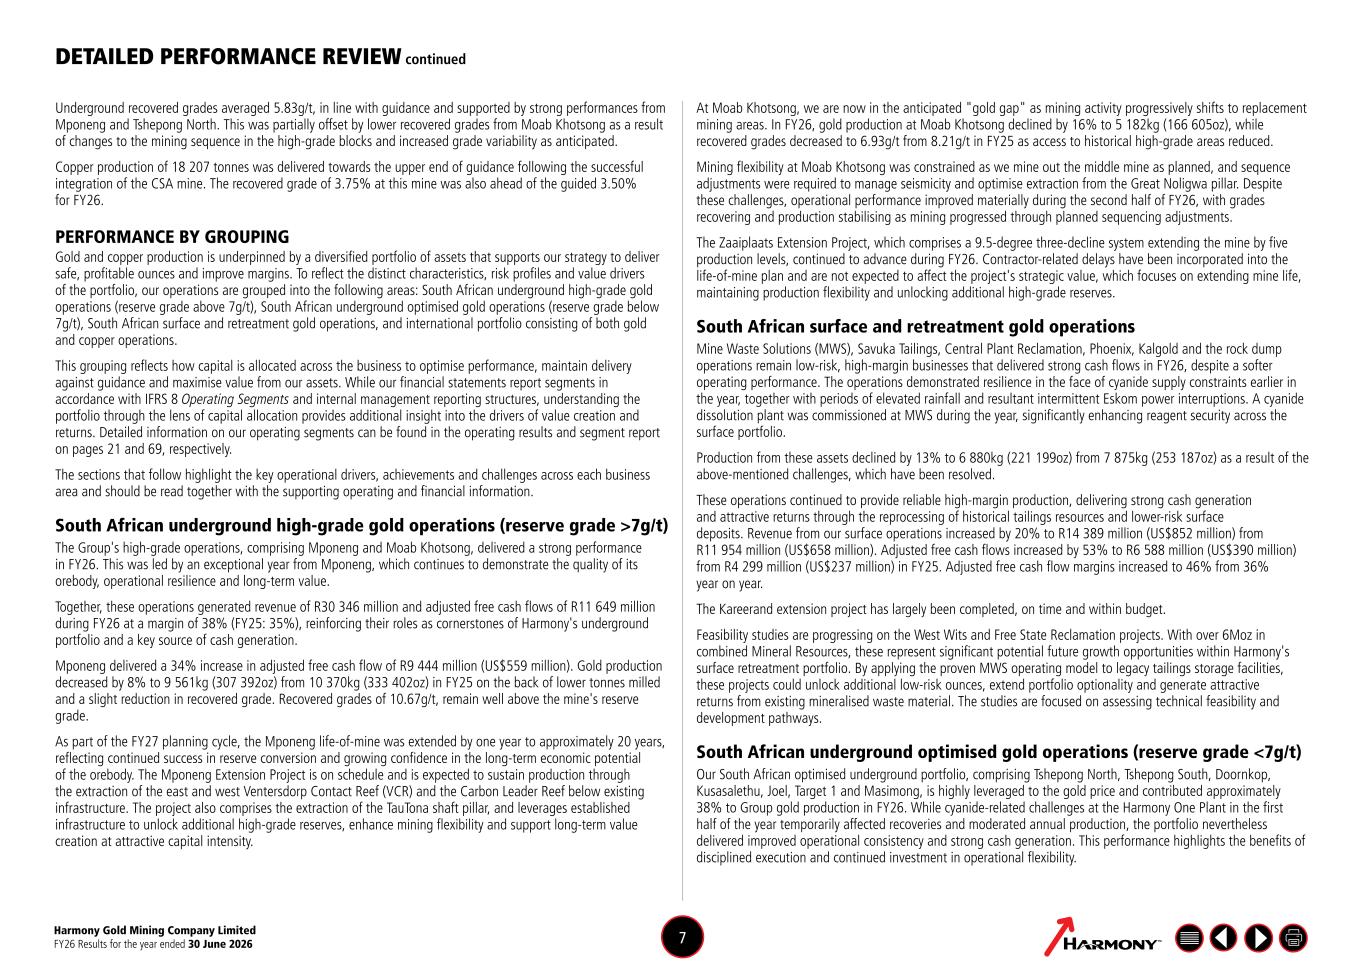
Harmony Gold Mining Company Limited FY26 Results for the year ended 30 June 2026 7 DETAILED PERFORMANCE REVIEW continued Underground recovered grades averaged 5.83g/t, in line with guidance and supported by strong performances from Mponeng and Tshepong North. This was partially offset by lower recovered grades from Moab Khotsong as a result of changes to the mining sequence in the high-grade blocks and increased grade variability as anticipated. Copper production of 18 207 tonnes was delivered towards the upper end of guidance following the successful integration of the CSA mine. The recovered grade of 3.75% at this mine was also ahead of the guided 3.50% for FY26. PERFORMANCE BY GROUPING Gold and copper production is underpinned by a diversified portfolio of assets that supports our strategy to deliver safe, profitable ounces and improve margins. To reflect the distinct characteristics, risk profiles and value drivers of the portfolio, our operations are grouped into the following areas: South African underground high-grade gold operations (reserve grade above 7g/t), South African underground optimised gold operations (reserve grade below 7g/t), South African surface and retreatment gold operations, and international portfolio consisting of both gold and copper operations. This grouping reflects how capital is allocated across the business to optimise performance, maintain delivery against guidance and maximise value from our assets. While our financial statements report segments in accordance with IFRS 8 Operating Segments and internal management reporting structures, understanding the portfolio through the lens of capital allocation provides additional insight into the drivers of value creation and returns. Detailed information on our operating segments can be found in the operating results and segment report on pages 21 and 69, respectively. The sections that follow highlight the key operational drivers, achievements and challenges across each business area and should be read together with the supporting operating and financial information. South African underground high-grade gold operations (reserve grade >7g/t) The Group's high-grade operations, comprising Mponeng and Moab Khotsong, delivered a strong performance in FY26. This was led by an exceptional year from Mponeng, which continues to demonstrate the quality of its orebody, operational resilience and long-term value. Together, these operations generated revenue of R30 346 million and adjusted free cash flows of R11 649 million during FY26 at a margin of 38% (FY25: 35%), reinforcing their roles as cornerstones of Harmony's underground portfolio and a key source of cash generation. Mponeng delivered a 34% increase in adjusted free cash flow of R9 444 million (US$559 million). Gold production decreased by 8% to 9 561kg (307 392oz) from 10 370kg (333 402oz) in FY25 on the back of lower tonnes milled and a slight reduction in recovered grade. Recovered grades of 10.67g/t, remain well above the mine's reserve grade. As part of the FY27 planning cycle, the Mponeng life-of-mine was extended by one year to approximately 20 years, reflecting continued success in reserve conversion and growing confidence in the long-term economic potential of the orebody. The Mponeng Extension Project is on schedule and is expected to sustain production through the extraction of the east and west Ventersdorp Contact Reef (VCR) and the Carbon Leader Reef below existing infrastructure. The project also comprises the extraction of the TauTona shaft pillar, and leverages established infrastructure to unlock additional high-grade reserves, enhance mining flexibility and support long-term value creation at attractive capital intensity. At Moab Khotsong, we are now in the anticipated "gold gap" as mining activity progressively shifts to replacement mining areas. In FY26, gold production at Moab Khotsong declined by 16% to 5 182kg (166 605oz), while recovered grades decreased to 6.93g/t from 8.21g/t in FY25 as access to historical high-grade areas reduced. Mining flexibility at Moab Khotsong was constrained as we mine out the middle mine as planned, and sequence adjustments were required to manage seismicity and optimise extraction from the Great Noligwa pillar. Despite these challenges, operational performance improved materially during the second half of FY26, with grades recovering and production stabilising as mining progressed through planned sequencing adjustments. The Zaaiplaats Extension Project, which comprises a 9.5-degree three-decline system extending the mine by five production levels, continued to advance during FY26. Contractor-related delays have been incorporated into the life-of-mine plan and are not expected to affect the project's strategic value, which focuses on extending mine life, maintaining production flexibility and unlocking additional high-grade reserves. South African surface and retreatment gold operations Mine Waste Solutions (MWS), Savuka Tailings, Central Plant Reclamation, Phoenix, Kalgold and the rock dump operations remain low-risk, high-margin businesses that delivered strong cash flows in FY26, despite a softer operating performance. The operations demonstrated resilience in the face of cyanide supply constraints earlier in the year, together with periods of elevated rainfall and resultant intermittent Eskom power interruptions. A cyanide dissolution plant was commissioned at MWS during the year, significantly enhancing reagent security across the surface portfolio. Production from these assets declined by 13% to 6 880kg (221 199oz) from 7 875kg (253 187oz) as a result of the above-mentioned challenges, which have been resolved. These operations continued to provide reliable high-margin production, delivering strong cash generation and attractive returns through the reprocessing of historical tailings resources and lower-risk surface deposits. Revenue from our surface operations increased by 20% to R14 389 million (US$852 million) from R11 954 million (US$658 million). Adjusted free cash flows increased by 53% to R6 588 million (US$390 million) from R4 299 million (US$237 million) in FY25. Adjusted free cash flow margins increased to 46% from 36% year on year. The Kareerand extension project has largely been completed, on time and within budget. Feasibility studies are progressing on the West Wits and Free State Reclamation projects. With over 6Moz in combined Mineral Resources, these represent significant potential future growth opportunities within Harmony's surface retreatment portfolio. By applying the proven MWS operating model to legacy tailings storage facilities, these projects could unlock additional low-risk ounces, extend portfolio optionality and generate attractive returns from existing mineralised waste material. The studies are focused on assessing technical feasibility and development pathways. South African underground optimised gold operations (reserve grade <7g/t) Our South African optimised underground portfolio, comprising Tshepong North, Tshepong South, Doornkop, Kusasalethu, Joel, Target 1 and Masimong, is highly leveraged to the gold price and contributed approximately 38% to Group gold production in FY26. While cyanide-related challenges at the Harmony One Plant in the first half of the year temporarily affected recoveries and moderated annual production, the portfolio nevertheless delivered improved operational consistency and strong cash generation. This performance highlights the benefits of disciplined execution and continued investment in operational flexibility.
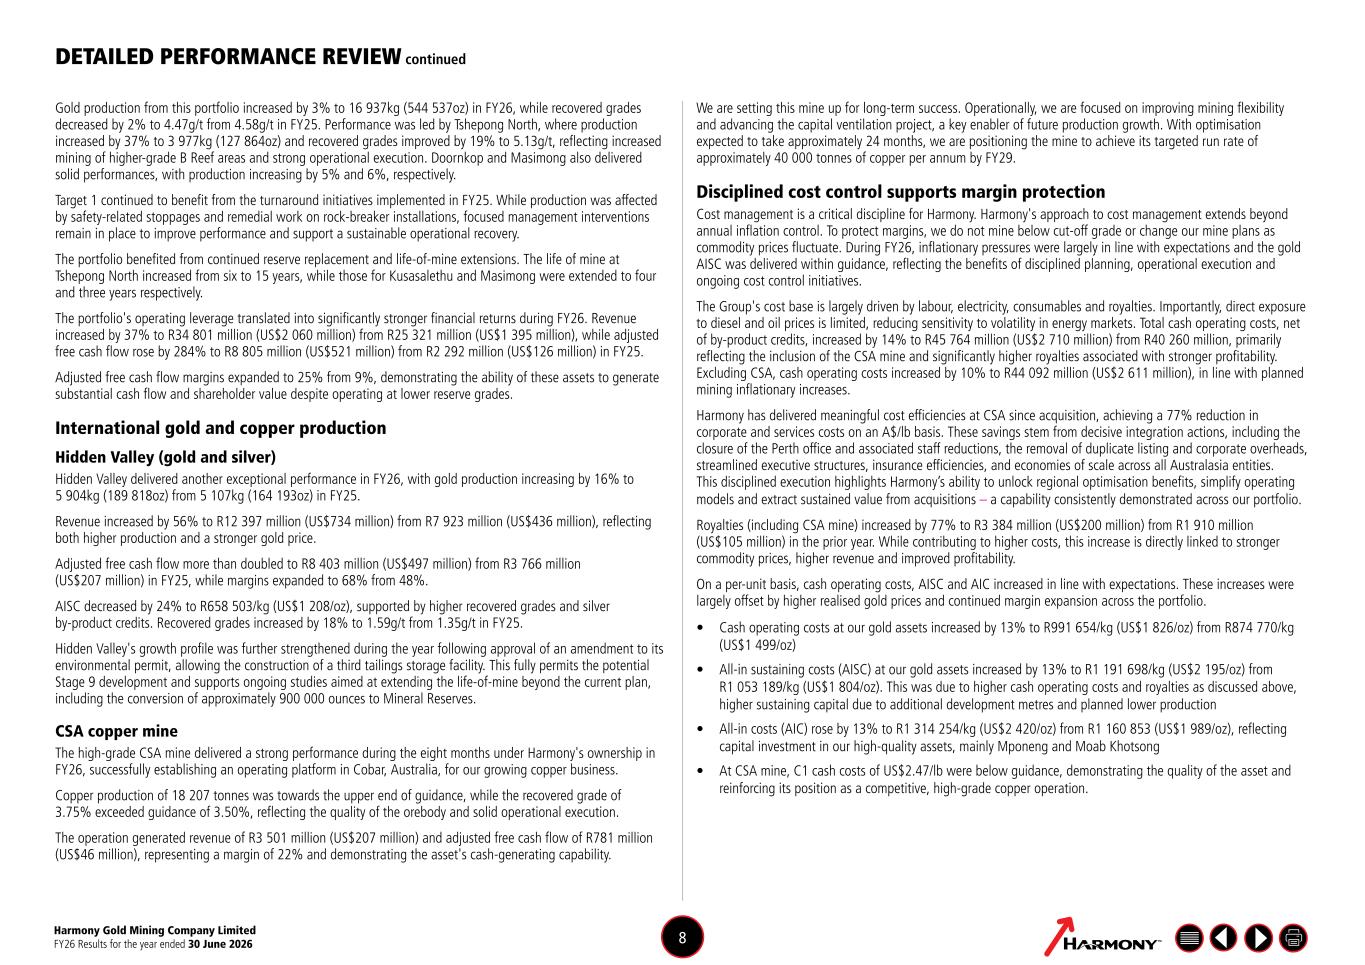
Harmony Gold Mining Company Limited FY26 Results for the year ended 30 June 2026 8 DETAILED PERFORMANCE REVIEW continued Gold production from this portfolio increased by 3% to 16 937kg (544 537oz) in FY26, while recovered grades decreased by 2% to 4.47g/t from 4.58g/t in FY25. Performance was led by Tshepong North, where production increased by 37% to 3 977kg (127 864oz) and recovered grades improved by 19% to 5.13g/t, reflecting increased mining of higher-grade B Reef areas and strong operational execution. Doornkop and Masimong also delivered solid performances, with production increasing by 5% and 6%, respectively. Target 1 continued to benefit from the turnaround initiatives implemented in FY25. While production was affected by safety-related stoppages and remedial work on rock-breaker installations, focused management interventions remain in place to improve performance and support a sustainable operational recovery. The portfolio benefited from continued reserve replacement and life-of-mine extensions. The life of mine at Tshepong North increased from six to 15 years, while those for Kusasalethu and Masimong were extended to four and three years respectively. The portfolio's operating leverage translated into significantly stronger financial returns during FY26. Revenue increased by 37% to R34 801 million (US$2 060 million) from R25 321 million (US$1 395 million), while adjusted free cash flow rose by 284% to R8 805 million (US$521 million) from R2 292 million (US$126 million) in FY25. Adjusted free cash flow margins expanded to 25% from 9%, demonstrating the ability of these assets to generate substantial cash flow and shareholder value despite operating at lower reserve grades. International gold and copper production Hidden Valley (gold and silver) Hidden Valley delivered another exceptional performance in FY26, with gold production increasing by 16% to 5 904kg (189 818oz) from 5 107kg (164 193oz) in FY25. Revenue increased by 56% to R12 397 million (US$734 million) from R7 923 million (US$436 million), reflecting both higher production and a stronger gold price. Adjusted free cash flow more than doubled to R8 403 million (US$497 million) from R3 766 million (US$207 million) in FY25, while margins expanded to 68% from 48%. AISC decreased by 24% to R658 503/kg (US$1 208/oz), supported by higher recovered grades and silver by-product credits. Recovered grades increased by 18% to 1.59g/t from 1.35g/t in FY25. Hidden Valley's growth profile was further strengthened during the year following approval of an amendment to its environmental permit, allowing the construction of a third tailings storage facility. This fully permits the potential Stage 9 development and supports ongoing studies aimed at extending the life-of-mine beyond the current plan, including the conversion of approximately 900 000 ounces to Mineral Reserves. CSA copper mine The high-grade CSA mine delivered a strong performance during the eight months under Harmony's ownership in FY26, successfully establishing an operating platform in Cobar, Australia, for our growing copper business. Copper production of 18 207 tonnes was towards the upper end of guidance, while the recovered grade of 3.75% exceeded guidance of 3.50%, reflecting the quality of the orebody and solid operational execution. The operation generated revenue of R3 501 million (US$207 million) and adjusted free cash flow of R781 million (US$46 million), representing a margin of 22% and demonstrating the asset's cash-generating capability. We are setting this mine up for long-term success. Operationally, we are focused on improving mining flexibility and advancing the capital ventilation project, a key enabler of future production growth. With optimisation expected to take approximately 24 months, we are positioning the mine to achieve its targeted run rate of approximately 40 000 tonnes of copper per annum by FY29. Disciplined cost control supports margin protection Cost management is a critical discipline for Harmony. Harmony's approach to cost management extends beyond annual inflation control. To protect margins, we do not mine below cut-off grade or change our mine plans as commodity prices fluctuate. During FY26, inflationary pressures were largely in line with expectations and the gold AISC was delivered within guidance, reflecting the benefits of disciplined planning, operational execution and ongoing cost control initiatives. The Group's cost base is largely driven by labour, electricity, consumables and royalties. Importantly, direct exposure to diesel and oil prices is limited, reducing sensitivity to volatility in energy markets. Total cash operating costs, net of by-product credits, increased by 14% to R45 764 million (US$2 710 million) from R40 260 million, primarily reflecting the inclusion of the CSA mine and significantly higher royalties associated with stronger profitability. Excluding CSA, cash operating costs increased by 10% to R44 092 million (US$2 611 million), in line with planned mining inflationary increases. Harmony has delivered meaningful cost efficiencies at CSA since acquisition, achieving a 77% reduction in corporate and services costs on an A$/lb basis. These savings stem from decisive integration actions, including the closure of the Perth office and associated staff reductions, the removal of duplicate listing and corporate overheads, streamlined executive structures, insurance efficiencies, and economies of scale across all Australasia entities. This disciplined execution highlights Harmony’s ability to unlock regional optimisation benefits, simplify operating models and extract sustained value from acquisitions – a capability consistently demonstrated across our portfolio. Royalties (including CSA mine) increased by 77% to R3 384 million (US$200 million) from R1 910 million (US$105 million) in the prior year. While contributing to higher costs, this increase is directly linked to stronger commodity prices, higher revenue and improved profitability. On a per-unit basis, cash operating costs, AISC and AIC increased in line with expectations. These increases were largely offset by higher realised gold prices and continued margin expansion across the portfolio. • Cash operating costs at our gold assets increased by 13% to R991 654/kg (US$1 826/oz) from R874 770/kg (US$1 499/oz) • All-in sustaining costs (AISC) at our gold assets increased by 13% to R1 191 698/kg (US$2 195/oz) from R1 053 189/kg (US$1 804/oz). This was due to higher cash operating costs and royalties as discussed above, higher sustaining capital due to additional development metres and planned lower production • All-in costs (AIC) rose by 13% to R1 314 254/kg (US$2 420/oz) from R1 160 853 (US$1 989/oz), reflecting capital investment in our high-quality assets, mainly Mponeng and Moab Khotsong • At CSA mine, C1 cash costs of US$2.47/lb were below guidance, demonstrating the quality of the asset and reinforcing its position as a competitive, high-grade copper operation.
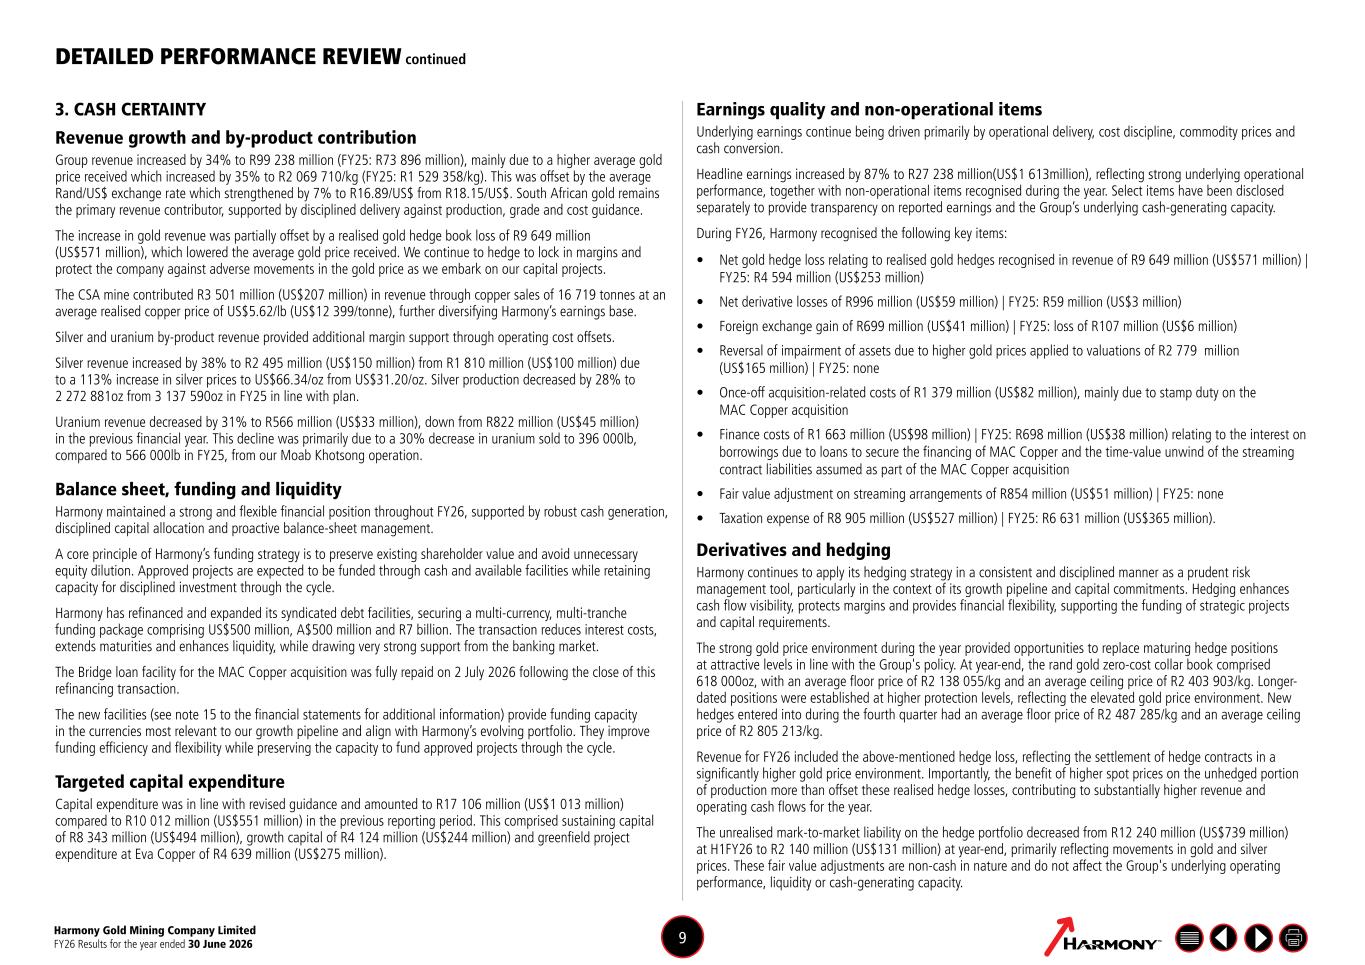
Harmony Gold Mining Company Limited FY26 Results for the year ended 30 June 2026 9 DETAILED PERFORMANCE REVIEW continued 3. CASH CERTAINTY Revenue growth and by-product contribution Group revenue increased by 34% to R99 238 million (FY25: R73 896 million), mainly due to a higher average gold price received which increased by 35% to R2 069 710/kg (FY25: R1 529 358/kg). This was offset by the average Rand/US$ exchange rate which strengthened by 7% to R16.89/US$ from R18.15/US$. South African gold remains the primary revenue contributor, supported by disciplined delivery against production, grade and cost guidance. The increase in gold revenue was partially offset by a realised gold hedge book loss of R9 649 million (US$571 million), which lowered the average gold price received. We continue to hedge to lock in margins and protect the company against adverse movements in the gold price as we embark on our capital projects. The CSA mine contributed R3 501 million (US$207 million) in revenue through copper sales of 16 719 tonnes at an average realised copper price of US$5.62/lb (US$12 399/tonne), further diversifying Harmony’s earnings base. Silver and uranium by-product revenue provided additional margin support through operating cost offsets. Silver revenue increased by 38% to R2 495 million (US$150 million) from R1 810 million (US$100 million) due to a 113% increase in silver prices to US$66.34/oz from US$31.20/oz. Silver production decreased by 28% to 2 272 881oz from 3 137 590oz in FY25 in line with plan. Uranium revenue decreased by 31% to R566 million (US$33 million), down from R822 million (US$45 million) in the previous financial year. This decline was primarily due to a 30% decrease in uranium sold to 396 000lb, compared to 566 000lb in FY25, from our Moab Khotsong operation. Balance sheet, funding and liquidity Harmony maintained a strong and flexible financial position throughout FY26, supported by robust cash generation, disciplined capital allocation and proactive balance-sheet management. A core principle of Harmony’s funding strategy is to preserve existing shareholder value and avoid unnecessary equity dilution. Approved projects are expected to be funded through cash and available facilities while retaining capacity for disciplined investment through the cycle. Harmony has refinanced and expanded its syndicated debt facilities, securing a multi-currency, multi-tranche funding package comprising US$500 million, A$500 million and R7 billion. The transaction reduces interest costs, extends maturities and enhances liquidity, while drawing very strong support from the banking market. The Bridge loan facility for the MAC Copper acquisition was fully repaid on 2 July 2026 following the close of this refinancing transaction. The new facilities (see note 15 to the financial statements for additional information) provide funding capacity in the currencies most relevant to our growth pipeline and align with Harmony’s evolving portfolio. They improve funding efficiency and flexibility while preserving the capacity to fund approved projects through the cycle. Targeted capital expenditure Capital expenditure was in line with revised guidance and amounted to R17 106 million (US$1 013 million) compared to R10 012 million (US$551 million) in the previous reporting period. This comprised sustaining capital of R8 343 million (US$494 million), growth capital of R4 124 million (US$244 million) and greenfield project expenditure at Eva Copper of R4 639 million (US$275 million). Earnings quality and non-operational items Underlying earnings continue being driven primarily by operational delivery, cost discipline, commodity prices and cash conversion. Headline earnings increased by 87% to R27 238 million(US$1 613million), reflecting strong underlying operational performance, together with non-operational items recognised during the year. Select items have been disclosed separately to provide transparency on reported earnings and the Group’s underlying cash-generating capacity. During FY26, Harmony recognised the following key items: • Net gold hedge loss relating to realised gold hedges recognised in revenue of R9 649 million (US$571 million) | FY25: R4 594 million (US$253 million) • Net derivative losses of R996 million (US$59 million) | FY25: R59 million (US$3 million) • Foreign exchange gain of R699 million (US$41 million) | FY25: loss of R107 million (US$6 million) • Reversal of impairment of assets due to higher gold prices applied to valuations of R2 779 million (US$165 million) | FY25: none • Once-off acquisition-related costs of R1 379 million (US$82 million), mainly due to stamp duty on the MAC Copper acquisition • Finance costs of R1 663 million (US$98 million) | FY25: R698 million (US$38 million) relating to the interest on borrowings due to loans to secure the financing of MAC Copper and the time-value unwind of the streaming contract liabilities assumed as part of the MAC Copper acquisition • Fair value adjustment on streaming arrangements of R854 million (US$51 million) | FY25: none • Taxation expense of R8 905 million (US$527 million) | FY25: R6 631 million (US$365 million). Derivatives and hedging Harmony continues to apply its hedging strategy in a consistent and disciplined manner as a prudent risk management tool, particularly in the context of its growth pipeline and capital commitments. Hedging enhances cash flow visibility, protects margins and provides financial flexibility, supporting the funding of strategic projects and capital requirements. The strong gold price environment during the year provided opportunities to replace maturing hedge positions at attractive levels in line with the Group's policy. At year-end, the rand gold zero-cost collar book comprised 618 000oz, with an average floor price of R2 138 055/kg and an average ceiling price of R2 403 903/kg. Longer- dated positions were established at higher protection levels, reflecting the elevated gold price environment. New hedges entered into during the fourth quarter had an average floor price of R2 487 285/kg and an average ceiling price of R2 805 213/kg. Revenue for FY26 included the above-mentioned hedge loss, reflecting the settlement of hedge contracts in a significantly higher gold price environment. Importantly, the benefit of higher spot prices on the unhedged portion of production more than offset these realised hedge losses, contributing to substantially higher revenue and operating cash flows for the year. The unrealised mark-to-market liability on the hedge portfolio decreased from R12 240 million (US$739 million) at H1FY26 to R2 140 million (US$131 million) at year-end, primarily reflecting movements in gold and silver prices. These fair value adjustments are non-cash in nature and do not affect the Group's underlying operating performance, liquidity or cash-generating capacity.
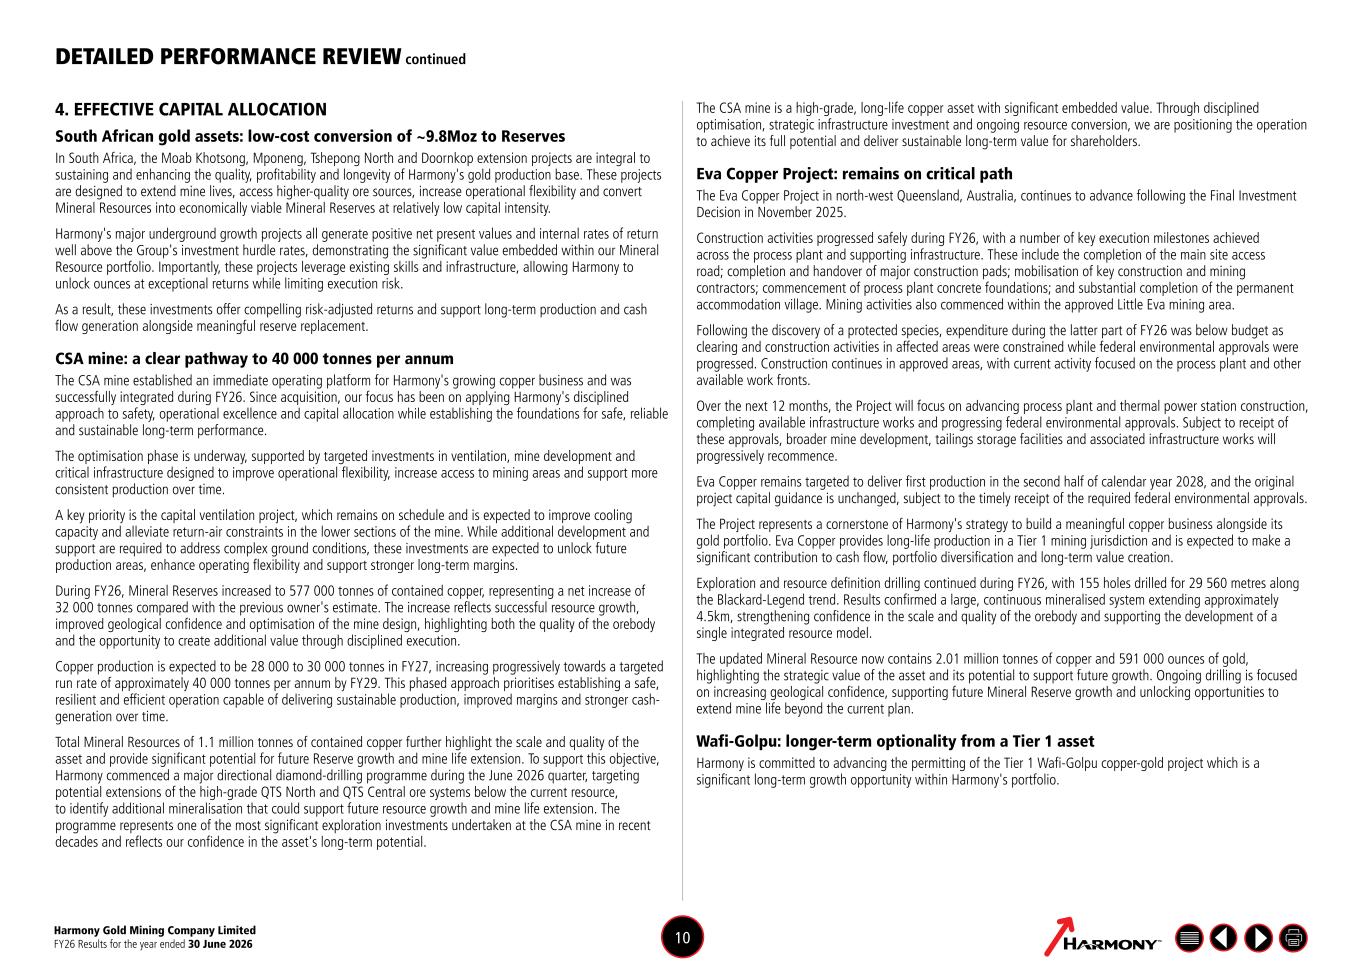
Harmony Gold Mining Company Limited FY26 Results for the year ended 30 June 2026 10 DETAILED PERFORMANCE REVIEW continued 4. EFFECTIVE CAPITAL ALLOCATION South African gold assets: low-cost conversion of ~9.8Moz to Reserves In South Africa, the Moab Khotsong, Mponeng, Tshepong North and Doornkop extension projects are integral to sustaining and enhancing the quality, profitability and longevity of Harmony's gold production base. These projects are designed to extend mine lives, access higher-quality ore sources, increase operational flexibility and convert Mineral Resources into economically viable Mineral Reserves at relatively low capital intensity. Harmony's major underground growth projects all generate positive net present values and internal rates of return well above the Group's investment hurdle rates, demonstrating the significant value embedded within our Mineral Resource portfolio. Importantly, these projects leverage existing skills and infrastructure, allowing Harmony to unlock ounces at exceptional returns while limiting execution risk. As a result, these investments offer compelling risk-adjusted returns and support long-term production and cash flow generation alongside meaningful reserve replacement. CSA mine: a clear pathway to 40 000 tonnes per annum The CSA mine established an immediate operating platform for Harmony's growing copper business and was successfully integrated during FY26. Since acquisition, our focus has been on applying Harmony's disciplined approach to safety, operational excellence and capital allocation while establishing the foundations for safe, reliable and sustainable long-term performance. The optimisation phase is underway, supported by targeted investments in ventilation, mine development and critical infrastructure designed to improve operational flexibility, increase access to mining areas and support more consistent production over time. A key priority is the capital ventilation project, which remains on schedule and is expected to improve cooling capacity and alleviate return-air constraints in the lower sections of the mine. While additional development and support are required to address complex ground conditions, these investments are expected to unlock future production areas, enhance operating flexibility and support stronger long-term margins. During FY26, Mineral Reserves increased to 577 000 tonnes of contained copper, representing a net increase of 32 000 tonnes compared with the previous owner's estimate. The increase reflects successful resource growth, improved geological confidence and optimisation of the mine design, highlighting both the quality of the orebody and the opportunity to create additional value through disciplined execution. Copper production is expected to be 28 000 to 30 000 tonnes in FY27, increasing progressively towards a targeted run rate of approximately 40 000 tonnes per annum by FY29. This phased approach prioritises establishing a safe, resilient and efficient operation capable of delivering sustainable production, improved margins and stronger cash- generation over time. Total Mineral Resources of 1.1 million tonnes of contained copper further highlight the scale and quality of the asset and provide significant potential for future Reserve growth and mine life extension. To support this objective, Harmony commenced a major directional diamond-drilling programme during the June 2026 quarter, targeting potential extensions of the high-grade QTS North and QTS Central ore systems below the current resource, to identify additional mineralisation that could support future resource growth and mine life extension. The programme represents one of the most significant exploration investments undertaken at the CSA mine in recent decades and reflects our confidence in the asset's long-term potential. The CSA mine is a high-grade, long-life copper asset with significant embedded value. Through disciplined optimisation, strategic infrastructure investment and ongoing resource conversion, we are positioning the operation to achieve its full potential and deliver sustainable long-term value for shareholders. Eva Copper Project: remains on critical path The Eva Copper Project in north-west Queensland, Australia, continues to advance following the Final Investment Decision in November 2025. Construction activities progressed safely during FY26, with a number of key execution milestones achieved across the process plant and supporting infrastructure. These include the completion of the main site access road; completion and handover of major construction pads; mobilisation of key construction and mining contractors; commencement of process plant concrete foundations; and substantial completion of the permanent accommodation village. Mining activities also commenced within the approved Little Eva mining area. Following the discovery of a protected species, expenditure during the latter part of FY26 was below budget as clearing and construction activities in affected areas were constrained while federal environmental approvals were progressed. Construction continues in approved areas, with current activity focused on the process plant and other available work fronts. Over the next 12 months, the Project will focus on advancing process plant and thermal power station construction, completing available infrastructure works and progressing federal environmental approvals. Subject to receipt of these approvals, broader mine development, tailings storage facilities and associated infrastructure works will progressively recommence. Eva Copper remains targeted to deliver first production in the second half of calendar year 2028, and the original project capital guidance is unchanged, subject to the timely receipt of the required federal environmental approvals. The Project represents a cornerstone of Harmony's strategy to build a meaningful copper business alongside its gold portfolio. Eva Copper provides long-life production in a Tier 1 mining jurisdiction and is expected to make a significant contribution to cash flow, portfolio diversification and long-term value creation. Exploration and resource definition drilling continued during FY26, with 155 holes drilled for 29 560 metres along the Blackard-Legend trend. Results confirmed a large, continuous mineralised system extending approximately 4.5km, strengthening confidence in the scale and quality of the orebody and supporting the development of a single integrated resource model. The updated Mineral Resource now contains 2.01 million tonnes of copper and 591 000 ounces of gold, highlighting the strategic value of the asset and its potential to support future growth. Ongoing drilling is focused on increasing geological confidence, supporting future Mineral Reserve growth and unlocking opportunities to extend mine life beyond the current plan. Wafi-Golpu: longer-term optionality from a Tier 1 asset Harmony is committed to advancing the permitting of the Tier 1 Wafi-Golpu copper-gold project which is a significant long-term growth opportunity within Harmony's portfolio.
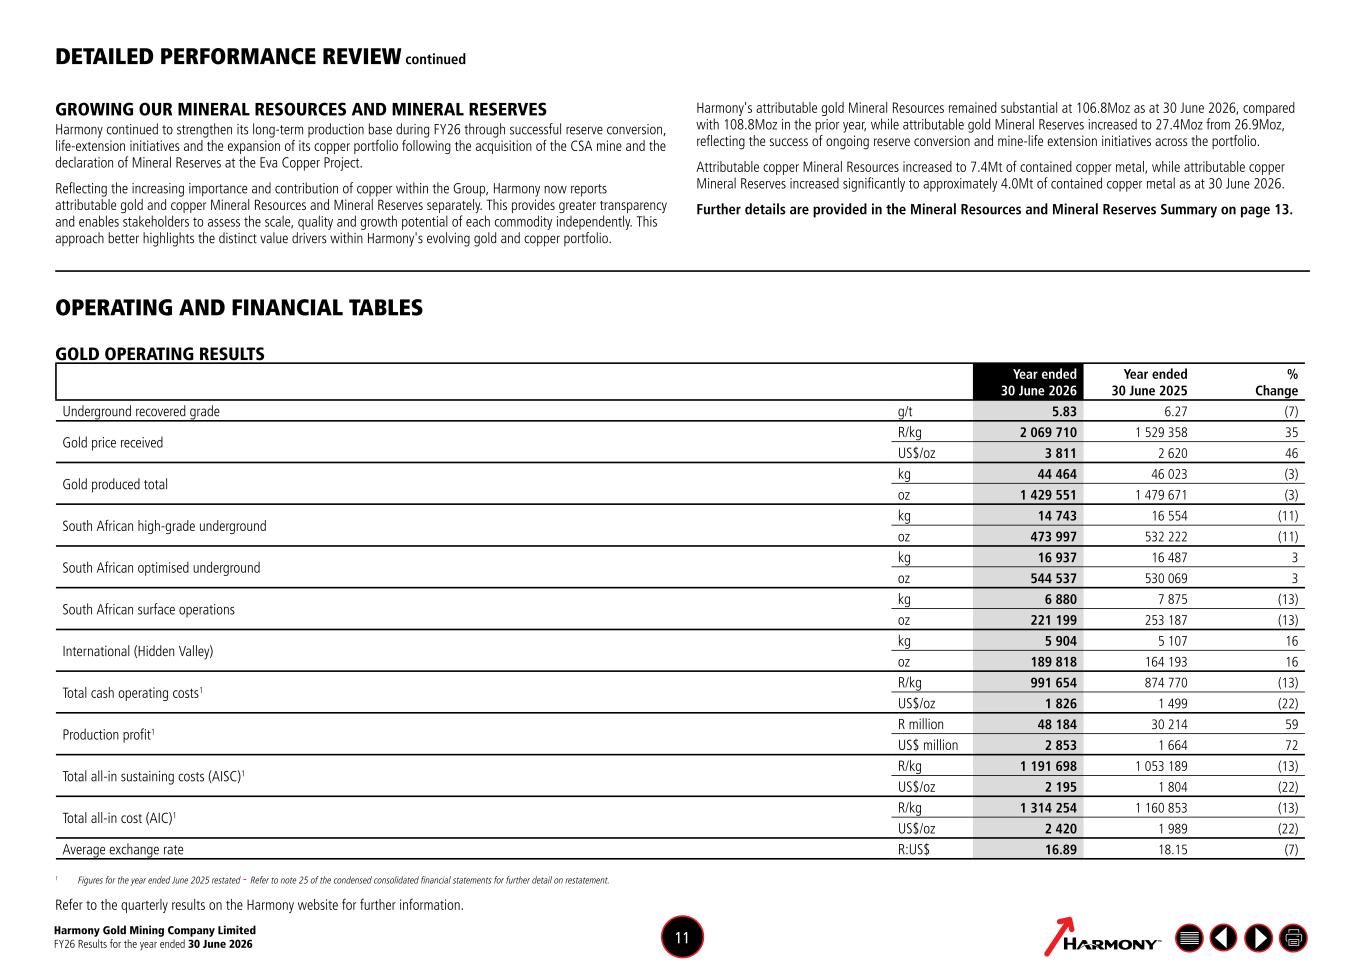
Harmony Gold Mining Company Limited FY26 Results for the year ended 30 June 2026 11 DETAILED PERFORMANCE REVIEW continued GOLD OPERATING RESULTS Year ended 30 June 2026 Year ended 30 June 2025 % Change Underground recovered grade g/t 5.83 6.27 (7) Gold price received R/kg 2 069 710 1 529 358 35 US$/oz 3 811 2 620 46 Gold produced total kg 44 464 46 023 (3) oz 1 429 551 1 479 671 (3) South African high-grade underground kg 14 743 16 554 (11) oz 473 997 532 222 (11) South African optimised underground kg 16 937 16 487 3 oz 544 537 530 069 3 South African surface operations kg 6 880 7 875 (13) oz 221 199 253 187 (13) International (Hidden Valley) kg 5 904 5 107 16 oz 189 818 164 193 16 Total cash operating costs1 R/kg 991 654 874 770 (13) US$/oz 1 826 1 499 (22) Production profit1 R million 48 184 30 214 59 US$ million 2 853 1 664 72 Total all-in sustaining costs (AISC)1 R/kg 1 191 698 1 053 189 (13) US$/oz 2 195 1 804 (22) Total all-in cost (AIC)1 R/kg 1 314 254 1 160 853 (13) US$/oz 2 420 1 989 (22) Average exchange rate R:US$ 16.89 18.15 (7) 1 Figures for the year ended June 2025 restated - Refer to note 25 of the condensed consolidated financial statements for further detail on restatement. Refer to the quarterly results on the Harmony website for further information. OPERATING AND FINANCIAL TABLES GROWING OUR MINERAL RESOURCES AND MINERAL RESERVES Harmony continued to strengthen its long-term production base during FY26 through successful reserve conversion, life-extension initiatives and the expansion of its copper portfolio following the acquisition of the CSA mine and the declaration of Mineral Reserves at the Eva Copper Project. Reflecting the increasing importance and contribution of copper within the Group, Harmony now reports attributable gold and copper Mineral Resources and Mineral Reserves separately. This provides greater transparency and enables stakeholders to assess the scale, quality and growth potential of each commodity independently. This approach better highlights the distinct value drivers within Harmony's evolving gold and copper portfolio. Harmony's attributable gold Mineral Resources remained substantial at 106.8Moz as at 30 June 2026, compared with 108.8Moz in the prior year, while attributable gold Mineral Reserves increased to 27.4Moz from 26.9Moz, reflecting the success of ongoing reserve conversion and mine-life extension initiatives across the portfolio. Attributable copper Mineral Resources increased to 7.4Mt of contained copper metal, while attributable copper Mineral Reserves increased significantly to approximately 4.0Mt of contained copper metal as at 30 June 2026. Further details are provided in the Mineral Resources and Mineral Reserves Summary on page 13.
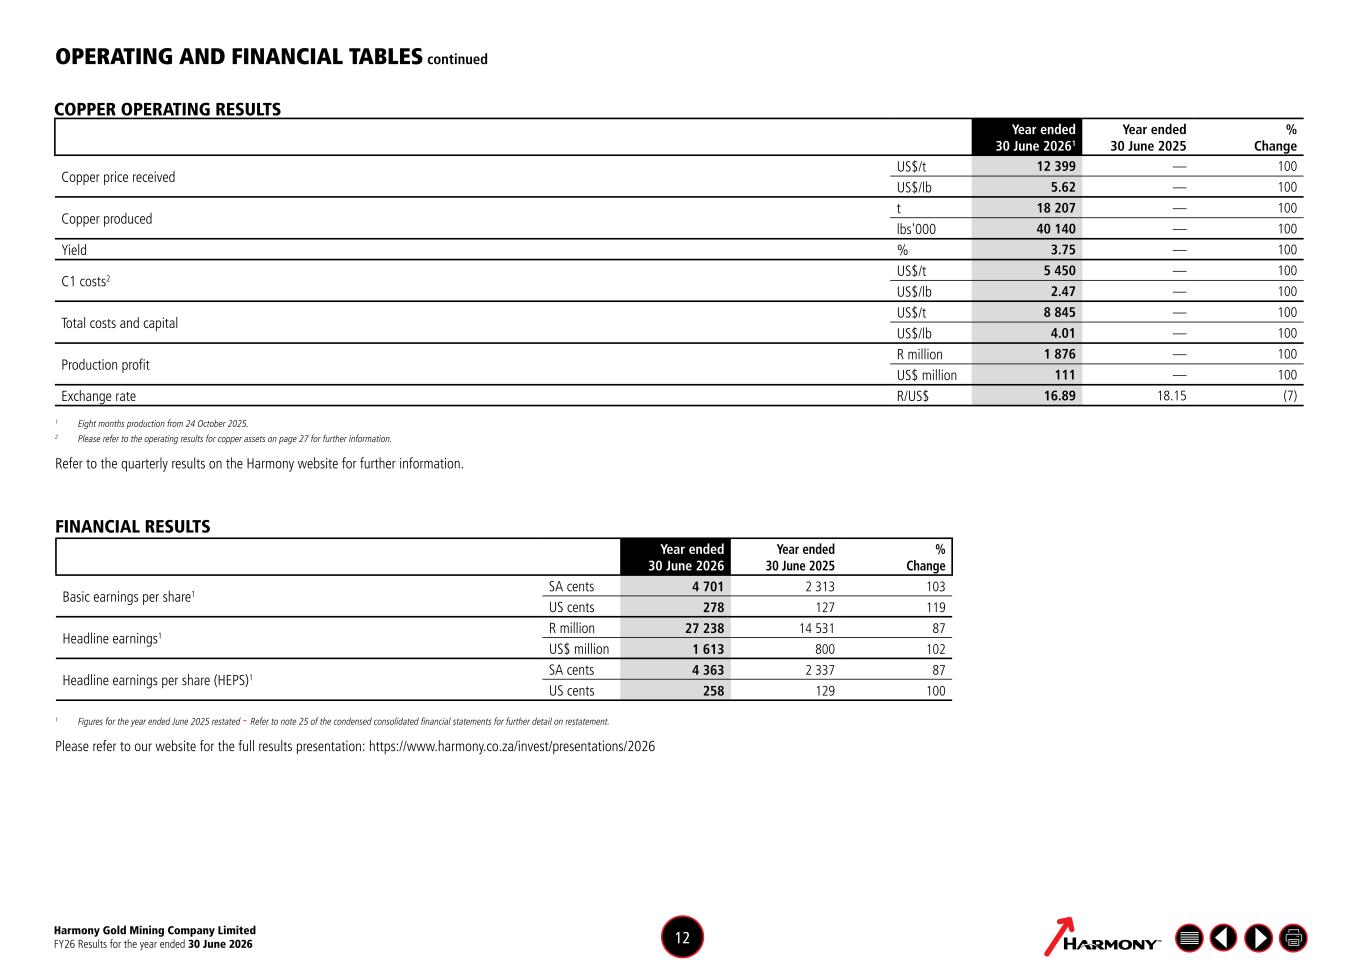
Harmony Gold Mining Company Limited FY26 Results for the year ended 30 June 2026 12 OPERATING AND FINANCIAL TABLES continued COPPER OPERATING RESULTS Year ended 30 June 20261 Year ended 30 June 2025 % Change Copper price received US$/t 12 399 — 100 US$/lb 5.62 — 100 Copper produced t 18 207 — 100 lbs'000 40 140 — 100 Yield % 3.75 — 100 C1 costs2 US$/t 5 450 — 100 US$/lb 2.47 — 100 Total costs and capital US$/t 8 845 — 100 US$/lb 4.01 — 100 Production profit R million 1 876 — 100 US$ million 111 — 100 Exchange rate R/US$ 16.89 18.15 (7) 1 Eight months production from 24 October 2025. 2 Please refer to the operating results for copper assets on page 27 for further information. Refer to the quarterly results on the Harmony website for further information. FINANCIAL RESULTS Year ended 30 June 2026 Year ended 30 June 2025 % Change Basic earnings per share1 SA cents 4 701 2 313 103 US cents 278 127 119 Headline earnings1 R million 27 238 14 531 87 US$ million 1 613 800 102 Headline earnings per share (HEPS)1 SA cents 4 363 2 337 87 US cents 258 129 100 1 Figures for the year ended June 2025 restated - Refer to note 25 of the condensed consolidated financial statements for further detail on restatement. Please refer to our website for the full results presentation: https://www.harmony.co.za/invest/presentations/2026
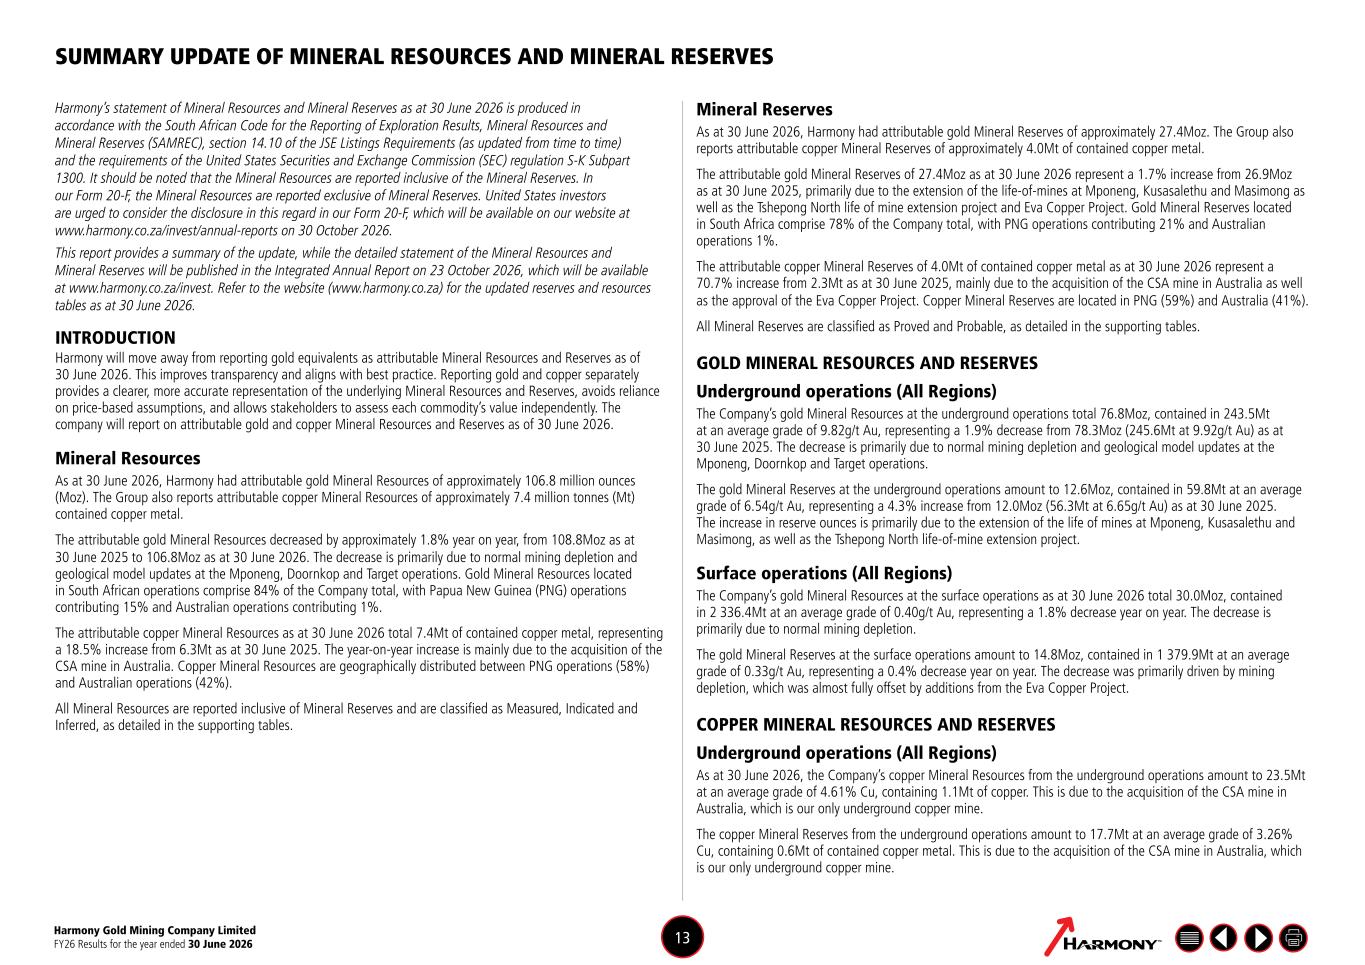
Harmony’s statement of Mineral Resources and Mineral Reserves as at 30 June 2026 is produced in accordance with the South African Code for the Reporting of Exploration Results, Mineral Resources and Mineral Reserves (SAMREC), section 14.10 of the JSE Listings Requirements (as updated from time to time) and the requirements of the United States Securities and Exchange Commission (SEC) regulation S-K Subpart 1300. It should be noted that the Mineral Resources are reported inclusive of the Mineral Reserves. In our Form 20-F, the Mineral Resources are reported exclusive of Mineral Reserves. United States investors are urged to consider the disclosure in this regard in our Form 20-F, which will be available on our website at www.harmony.co.za/invest/annual-reports on 30 October 2026. This report provides a summary of the update, while the detailed statement of the Mineral Resources and Mineral Reserves will be published in the Integrated Annual Report on 23 October 2026, which will be available at www.harmony.co.za/invest. Refer to the website (www.harmony.co.za) for the updated reserves and resources tables as at 30 June 2026. INTRODUCTION Harmony will move away from reporting gold equivalents as attributable Mineral Resources and Reserves as of 30 June 2026. This improves transparency and aligns with best practice. Reporting gold and copper separately provides a clearer, more accurate representation of the underlying Mineral Resources and Reserves, avoids reliance on price-based assumptions, and allows stakeholders to assess each commodity’s value independently. The company will report on attributable gold and copper Mineral Resources and Reserves as of 30 June 2026. Mineral Resources As at 30 June 2026, Harmony had attributable gold Mineral Resources of approximately 106.8 million ounces (Moz). The Group also reports attributable copper Mineral Resources of approximately 7.4 million tonnes (Mt) contained copper metal. The attributable gold Mineral Resources decreased by approximately 1.8% year on year, from 108.8Moz as at 30 June 2025 to 106.8Moz as at 30 June 2026. The decrease is primarily due to normal mining depletion and geological model updates at the Mponeng, Doornkop and Target operations. Gold Mineral Resources located in South African operations comprise 84% of the Company total, with Papua New Guinea (PNG) operations contributing 15% and Australian operations contributing 1%. The attributable copper Mineral Resources as at 30 June 2026 total 7.4Mt of contained copper metal, representing a 18.5% increase from 6.3Mt as at 30 June 2025. The year-on-year increase is mainly due to the acquisition of the CSA mine in Australia. Copper Mineral Resources are geographically distributed between PNG operations (58%) and Australian operations (42%). All Mineral Resources are reported inclusive of Mineral Reserves and are classified as Measured, Indicated and Inferred, as detailed in the supporting tables. Mineral Reserves As at 30 June 2026, Harmony had attributable gold Mineral Reserves of approximately 27.4Moz. The Group also reports attributable copper Mineral Reserves of approximately 4.0Mt of contained copper metal. The attributable gold Mineral Reserves of 27.4Moz as at 30 June 2026 represent a 1.7% increase from 26.9Moz as at 30 June 2025, primarily due to the extension of the life-of-mines at Mponeng, Kusasalethu and Masimong as well as the Tshepong North life of mine extension project and Eva Copper Project. Gold Mineral Reserves located in South Africa comprise 78% of the Company total, with PNG operations contributing 21% and Australian operations 1%. The attributable copper Mineral Reserves of 4.0Mt of contained copper metal as at 30 June 2026 represent a 70.7% increase from 2.3Mt as at 30 June 2025, mainly due to the acquisition of the CSA mine in Australia as well as the approval of the Eva Copper Project. Copper Mineral Reserves are located in PNG (59%) and Australia (41%). All Mineral Reserves are classified as Proved and Probable, as detailed in the supporting tables. GOLD MINERAL RESOURCES AND RESERVES Underground operations (All Regions) The Company’s gold Mineral Resources at the underground operations total 76.8Moz, contained in 243.5Mt at an average grade of 9.82g/t Au, representing a 1.9% decrease from 78.3Moz (245.6Mt at 9.92g/t Au) as at 30 June 2025. The decrease is primarily due to normal mining depletion and geological model updates at the Mponeng, Doornkop and Target operations. The gold Mineral Reserves at the underground operations amount to 12.6Moz, contained in 59.8Mt at an average grade of 6.54g/t Au, representing a 4.3% increase from 12.0Moz (56.3Mt at 6.65g/t Au) as at 30 June 2025. The increase in reserve ounces is primarily due to the extension of the life of mines at Mponeng, Kusasalethu and Masimong, as well as the Tshepong North life-of-mine extension project. Surface operations (All Regions) The Company’s gold Mineral Resources at the surface operations as at 30 June 2026 total 30.0Moz, contained in 2 336.4Mt at an average grade of 0.40g/t Au, representing a 1.8% decrease year on year. The decrease is primarily due to normal mining depletion. The gold Mineral Reserves at the surface operations amount to 14.8Moz, contained in 1 379.9Mt at an average grade of 0.33g/t Au, representing a 0.4% decrease year on year. The decrease was primarily driven by mining depletion, which was almost fully offset by additions from the Eva Copper Project. COPPER MINERAL RESOURCES AND RESERVES Underground operations (All Regions) As at 30 June 2026, the Company’s copper Mineral Resources from the underground operations amount to 23.5Mt at an average grade of 4.61% Cu, containing 1.1Mt of copper. This is due to the acquisition of the CSA mine in Australia, which is our only underground copper mine. The copper Mineral Reserves from the underground operations amount to 17.7Mt at an average grade of 3.26% Cu, containing 0.6Mt of contained copper metal. This is due to the acquisition of the CSA mine in Australia, which is our only underground copper mine. SUMMARY UPDATE OF MINERAL RESOURCES AND MINERAL RESERVES Harmony Gold Mining Company Limited FY26 Results for the year ended 30 June 2026 13
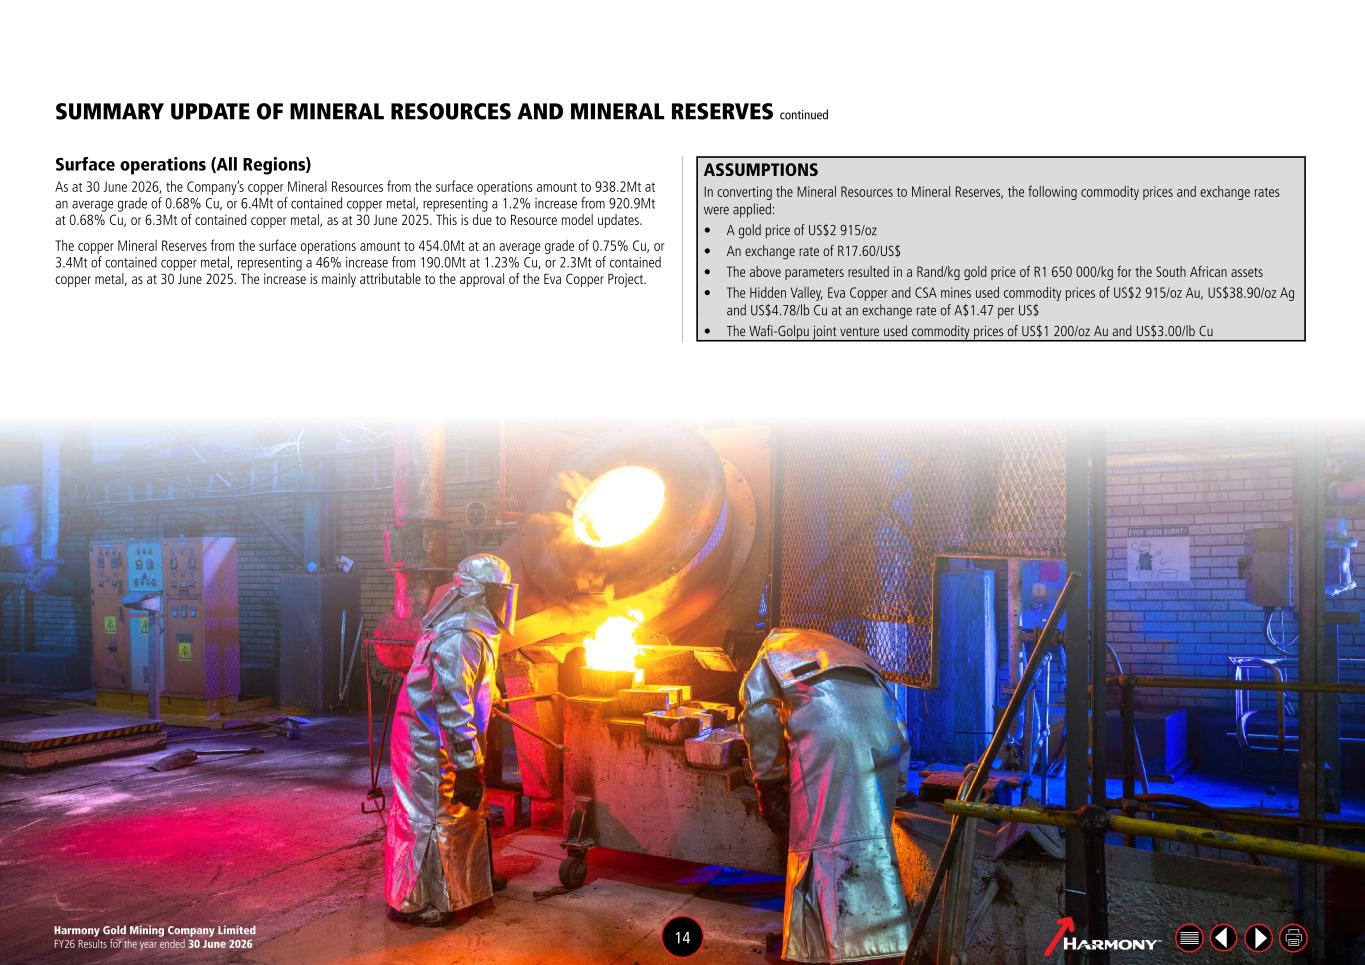
Surface operations (All Regions) As at 30 June 2026, the Company’s copper Mineral Resources from the surface operations amount to 938.2Mt at an average grade of 0.68% Cu, or 6.4Mt of contained copper metal, representing a 1.2% increase from 920.9Mt at 0.68% Cu, or 6.3Mt of contained copper metal, as at 30 June 2025. This is due to Resource model updates. The copper Mineral Reserves from the surface operations amount to 454.0Mt at an average grade of 0.75% Cu, or 3.4Mt of contained copper metal, representing a 46% increase from 190.0Mt at 1.23% Cu, or 2.3Mt of contained copper metal, as at 30 June 2025. The increase is mainly attributable to the approval of the Eva Copper Project. Harmony Gold Mining Company Limited FY26 Results for the year ended 30 June 2026 14 ASSUMPTIONS In converting the Mineral Resources to Mineral Reserves, the following commodity prices and exchange rates were applied: • A gold price of US$2 915/oz • An exchange rate of R17.60/US$ • The above parameters resulted in a Rand/kg gold price of R1 650 000/kg for the South African assets • The Hidden Valley, Eva Copper and CSA mines used commodity prices of US$2 915/oz Au, US$38.90/oz Ag and US$4.78/lb Cu at an exchange rate of A$1.47 per US$ • The Wafi-Golpu joint venture used commodity prices of US$1 200/oz Au and US$3.00/lb Cu SUMMARY UPDATE OF MINERAL RESOURCES AND MINERAL RESERVES continued
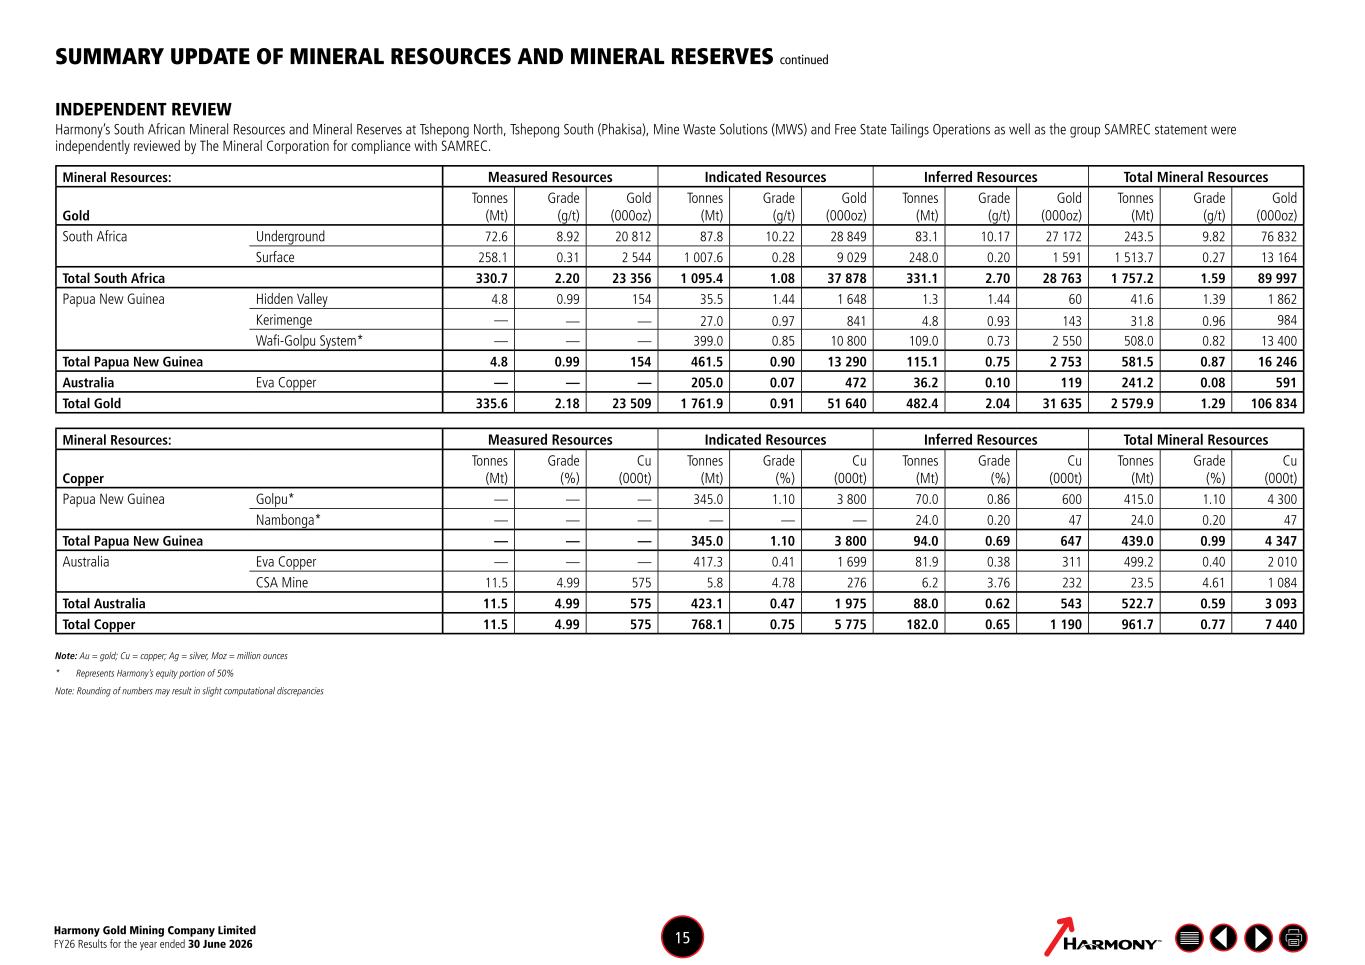
SUMMARY UPDATE OF MINERAL RESOURCES AND MINERAL RESERVES continued INDEPENDENT REVIEW Harmony’s South African Mineral Resources and Mineral Reserves at Tshepong North, Tshepong South (Phakisa), Mine Waste Solutions (MWS) and Free State Tailings Operations as well as the group SAMREC statement were independently reviewed by The Mineral Corporation for compliance with SAMREC. Mineral Resources: Measured Resources Indicated Resources Inferred Resources Total Mineral Resources Gold Tonnes (Mt) Grade (g/t) Gold (000oz) Tonnes (Mt) Grade (g/t) Gold (000oz) Tonnes (Mt) Grade (g/t) Gold (000oz) Tonnes (Mt) Grade (g/t) Gold (000oz) South Africa Underground 72.6 8.92 20 812 87.8 10.22 28 849 83.1 10.17 27 172 243.5 9.82 76 832 Surface 258.1 0.31 2 544 1 007.6 0.28 9 029 248.0 0.20 1 591 1 513.7 0.27 13 164 Total South Africa 330.7 2.20 23 356 1 095.4 1.08 37 878 331.1 2.70 28 763 1 757.2 1.59 89 997 Papua New Guinea Hidden Valley 4.8 0.99 154 35.5 1.44 1 648 1.3 1.44 60 41.6 1.39 1 862 Kerimenge — — — 27.0 0.97 841 4.8 0.93 143 31.8 0.96 984 Wafi-Golpu System* — — — 399.0 0.85 10 800 109.0 0.73 2 550 508.0 0.82 13 400 Total Papua New Guinea 4.8 0.99 154 461.5 0.90 13 290 115.1 0.75 2 753 581.5 0.87 16 246 Australia Eva Copper — — — 205.0 0.07 472 36.2 0.10 119 241.2 0.08 591 Total Gold 335.6 2.18 23 509 1 761.9 0.91 51 640 482.4 2.04 31 635 2 579.9 1.29 106 834 Mineral Resources: Measured Resources Indicated Resources Inferred Resources Total Mineral Resources Copper Tonnes (Mt) Grade (%) Cu (000t) Tonnes (Mt) Grade (%) Cu (000t) Tonnes (Mt) Grade (%) Cu (000t) Tonnes (Mt) Grade (%) Cu (000t) Papua New Guinea Golpu* — — — 345.0 1.10 3 800 70.0 0.86 600 415.0 1.10 4 300 Nambonga* — — — — — — 24.0 0.20 47 24.0 0.20 47 Total Papua New Guinea — — — 345.0 1.10 3 800 94.0 0.69 647 439.0 0.99 4 347 Australia Eva Copper — — — 417.3 0.41 1 699 81.9 0.38 311 499.2 0.40 2 010 CSA Mine 11.5 4.99 575 5.8 4.78 276 6.2 3.76 232 23.5 4.61 1 084 Total Australia 11.5 4.99 575 423.1 0.47 1 975 88.0 0.62 543 522.7 0.59 3 093 Total Copper 11.5 4.99 575 768.1 0.75 5 775 182.0 0.65 1 190 961.7 0.77 7 440 Note: Au = gold; Cu = copper; Ag = silver, Moz = million ounces * Represents Harmony’s equity portion of 50% Note: Rounding of numbers may result in slight computational discrepancies Harmony Gold Mining Company Limited FY26 Results for the year ended 30 June 2026 15
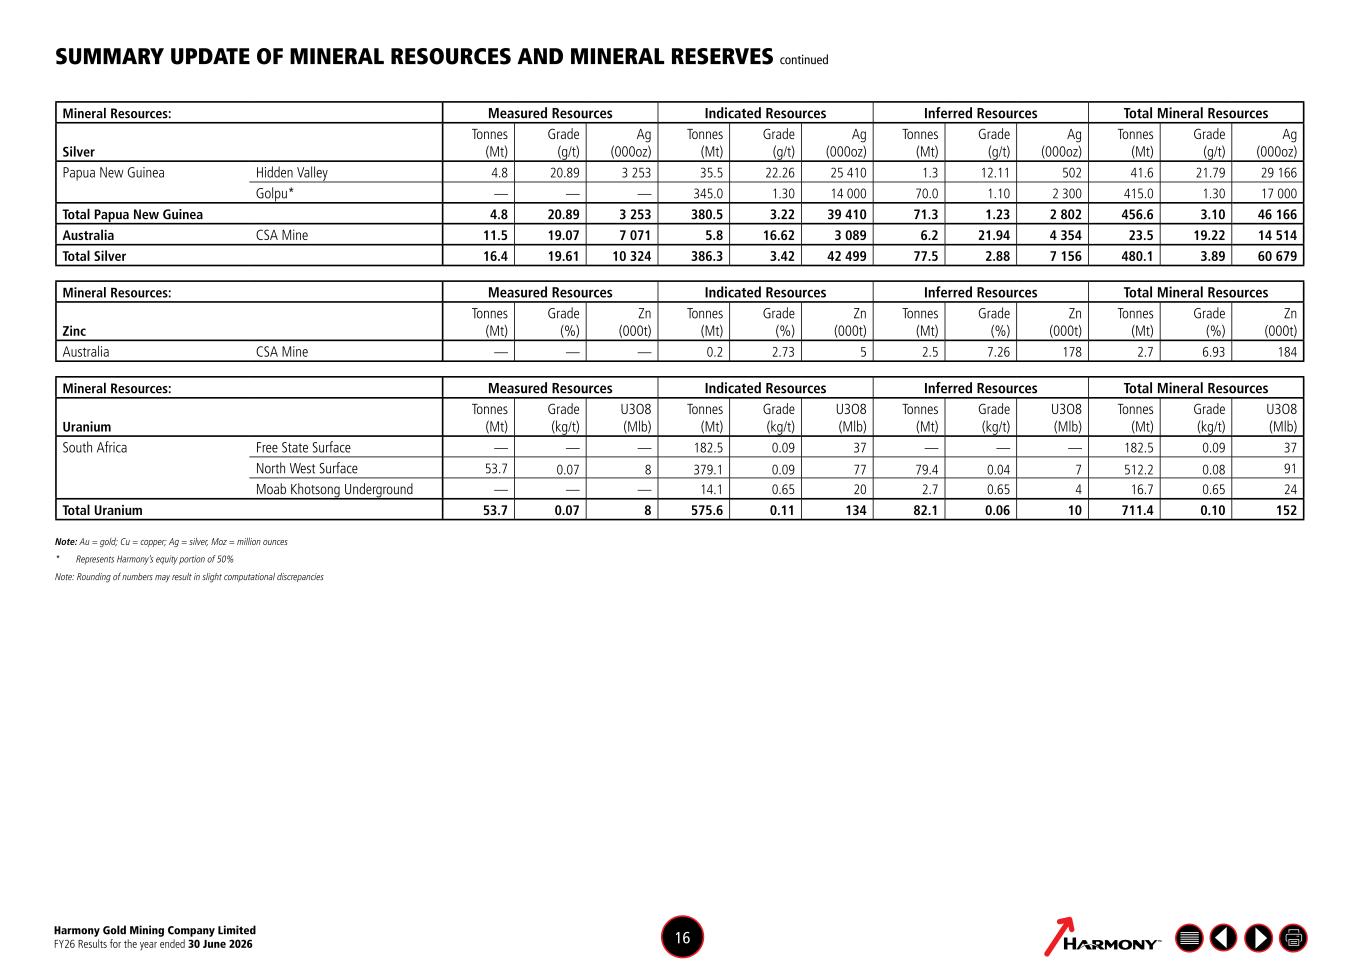
Mineral Resources: Measured Resources Indicated Resources Inferred Resources Total Mineral Resources Silver Tonnes (Mt) Grade (g/t) Ag (000oz) Tonnes (Mt) Grade (g/t) Ag (000oz) Tonnes (Mt) Grade (g/t) Ag (000oz) Tonnes (Mt) Grade (g/t) Ag (000oz) Papua New Guinea Hidden Valley 4.8 20.89 3 253 35.5 22.26 25 410 1.3 12.11 502 41.6 21.79 29 166 Golpu* — — — 345.0 1.30 14 000 70.0 1.10 2 300 415.0 1.30 17 000 Total Papua New Guinea 4.8 20.89 3 253 380.5 3.22 39 410 71.3 1.23 2 802 456.6 3.10 46 166 Australia CSA Mine 11.5 19.07 7 071 5.8 16.62 3 089 6.2 21.94 4 354 23.5 19.22 14 514 Total Silver 16.4 19.61 10 324 386.3 3.42 42 499 77.5 2.88 7 156 480.1 3.89 60 679 Mineral Resources: Measured Resources Indicated Resources Inferred Resources Total Mineral Resources Zinc Tonnes (Mt) Grade (%) Zn (000t) Tonnes (Mt) Grade (%) Zn (000t) Tonnes (Mt) Grade (%) Zn (000t) Tonnes (Mt) Grade (%) Zn (000t) Australia CSA Mine — — — 0.2 2.73 5 2.5 7.26 178 2.7 6.93 184 Mineral Resources: Measured Resources Indicated Resources Inferred Resources Total Mineral Resources Uranium Tonnes (Mt) Grade (kg/t) U3O8 (Mlb) Tonnes (Mt) Grade (kg/t) U3O8 (Mlb) Tonnes (Mt) Grade (kg/t) U3O8 (Mlb) Tonnes (Mt) Grade (kg/t) U3O8 (Mlb) South Africa Free State Surface — — — 182.5 0.09 37 — — — 182.5 0.09 37 North West Surface 53.7 0.07 8 379.1 0.09 77 79.4 0.04 7 512.2 0.08 91 Moab Khotsong Underground — — — 14.1 0.65 20 2.7 0.65 4 16.7 0.65 24 Total Uranium 53.7 0.07 8 575.6 0.11 134 82.1 0.06 10 711.4 0.10 152 Note: Au = gold; Cu = copper; Ag = silver, Moz = million ounces * Represents Harmony’s equity portion of 50% Note: Rounding of numbers may result in slight computational discrepancies SUMMARY UPDATE OF MINERAL RESOURCES AND MINERAL RESERVES continued Harmony Gold Mining Company Limited FY26 Results for the year ended 30 June 2026 16
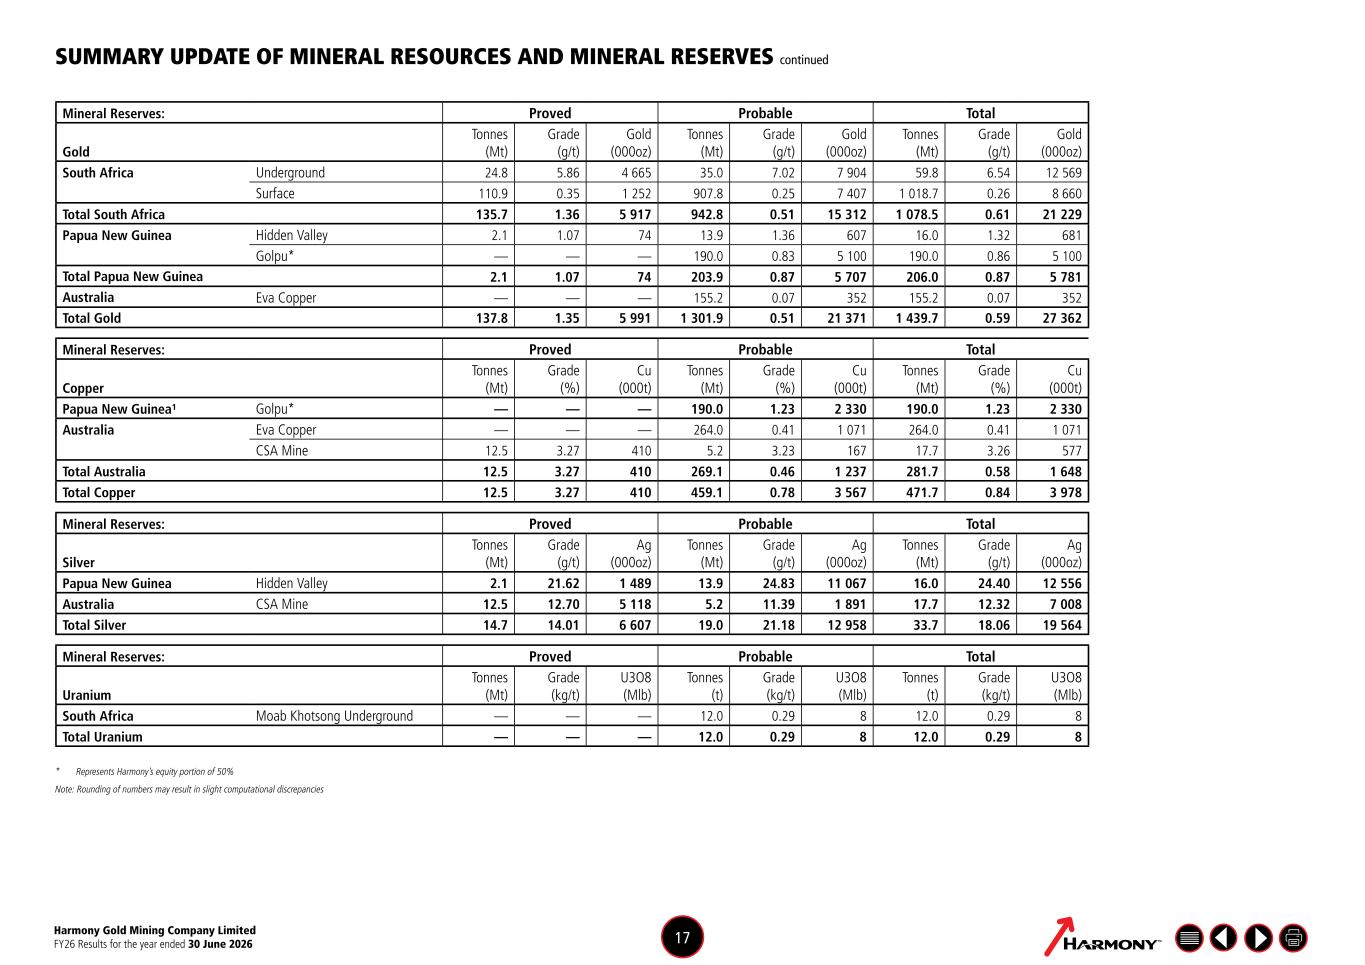
Mineral Reserves: Proved Probable Total Gold Tonnes (Mt) Grade (g/t) Gold (000oz) Tonnes (Mt) Grade (g/t) Gold (000oz) Tonnes (Mt) Grade (g/t) Gold (000oz) South Africa Underground 24.8 5.86 4 665 35.0 7.02 7 904 59.8 6.54 12 569 Surface 110.9 0.35 1 252 907.8 0.25 7 407 1 018.7 0.26 8 660 Total South Africa 135.7 1.36 5 917 942.8 0.51 15 312 1 078.5 0.61 21 229 Papua New Guinea Hidden Valley 2.1 1.07 74 13.9 1.36 607 16.0 1.32 681 Golpu* — — — 190.0 0.83 5 100 190.0 0.86 5 100 Total Papua New Guinea 2.1 1.07 74 203.9 0.87 5 707 206.0 0.87 5 781 Australia Eva Copper — — — 155.2 0.07 352 155.2 0.07 352 Total Gold 137.8 1.35 5 991 1 301.9 0.51 21 371 1 439.7 0.59 27 362 Mineral Reserves: Proved Probable Total Copper Tonnes (Mt) Grade (%) Cu (000t) Tonnes (Mt) Grade (%) Cu (000t) Tonnes (Mt) Grade (%) Cu (000t) Papua New Guinea¹ Golpu* — — — 190.0 1.23 2 330 190.0 1.23 2 330 Australia Eva Copper — — — 264.0 0.41 1 071 264.0 0.41 1 071 CSA Mine 12.5 3.27 410 5.2 3.23 167 17.7 3.26 577 Total Australia 12.5 3.27 410 269.1 0.46 1 237 281.7 0.58 1 648 Total Copper 12.5 3.27 410 459.1 0.78 3 567 471.7 0.84 3 978 Mineral Reserves: Proved Probable Total Silver Tonnes (Mt) Grade (g/t) Ag (000oz) Tonnes (Mt) Grade (g/t) Ag (000oz) Tonnes (Mt) Grade (g/t) Ag (000oz) Papua New Guinea Hidden Valley 2.1 21.62 1 489 13.9 24.83 11 067 16.0 24.40 12 556 Australia CSA Mine 12.5 12.70 5 118 5.2 11.39 1 891 17.7 12.32 7 008 Total Silver 14.7 14.01 6 607 19.0 21.18 12 958 33.7 18.06 19 564 Mineral Reserves: Proved Probable Total Uranium Tonnes (Mt) Grade (kg/t) U3O8 (Mlb) Tonnes (t) Grade (kg/t) U3O8 (Mlb) Tonnes (t) Grade (kg/t) U3O8 (Mlb) South Africa Moab Khotsong Underground — — — 12.0 0.29 8 12.0 0.29 8 Total Uranium — — — 12.0 0.29 8 12.0 0.29 8 * Represents Harmony’s equity portion of 50% Note: Rounding of numbers may result in slight computational discrepancies SUMMARY UPDATE OF MINERAL RESOURCES AND MINERAL RESERVES continued Harmony Gold Mining Company Limited FY26 Results for the year ended 30 June 2026 17
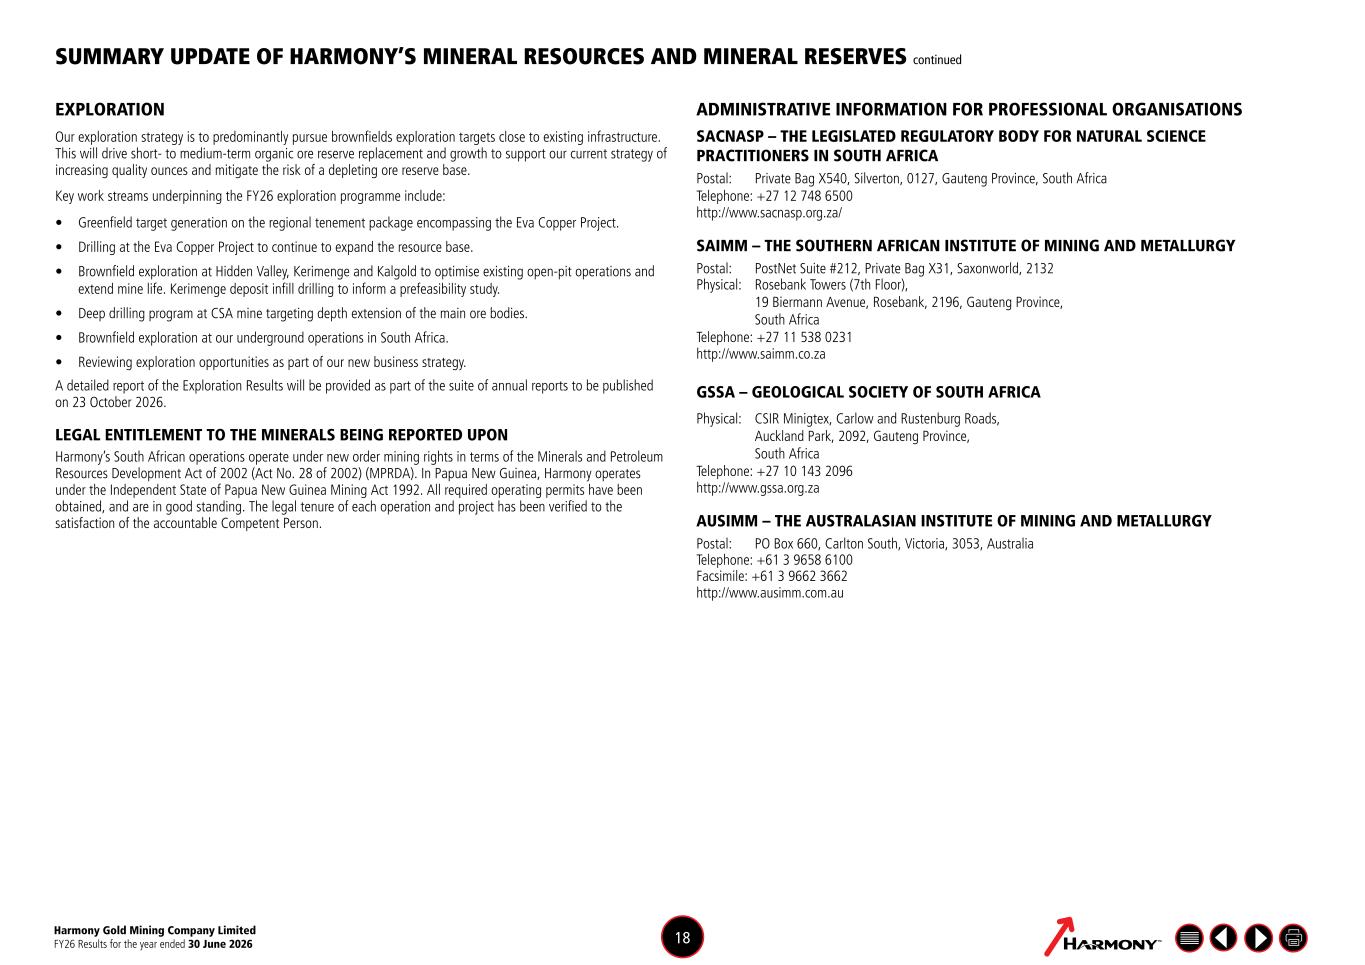
EXPLORATION Our exploration strategy is to predominantly pursue brownfields exploration targets close to existing infrastructure. This will drive short- to medium-term organic ore reserve replacement and growth to support our current strategy of increasing quality ounces and mitigate the risk of a depleting ore reserve base. Key work streams underpinning the FY26 exploration programme include: • Greenfield target generation on the regional tenement package encompassing the Eva Copper Project. • Drilling at the Eva Copper Project to continue to expand the resource base. • Brownfield exploration at Hidden Valley, Kerimenge and Kalgold to optimise existing open-pit operations and extend mine life. Kerimenge deposit infill drilling to inform a prefeasibility study. • Deep drilling program at CSA mine targeting depth extension of the main ore bodies. • Brownfield exploration at our underground operations in South Africa. • Reviewing exploration opportunities as part of our new business strategy. A detailed report of the Exploration Results will be provided as part of the suite of annual reports to be published on 23 October 2026. LEGAL ENTITLEMENT TO THE MINERALS BEING REPORTED UPON Harmony’s South African operations operate under new order mining rights in terms of the Minerals and Petroleum Resources Development Act of 2002 (Act No. 28 of 2002) (MPRDA). In Papua New Guinea, Harmony operates under the Independent State of Papua New Guinea Mining Act 1992. All required operating permits have been obtained, and are in good standing. The legal tenure of each operation and project has been verified to the satisfaction of the accountable Competent Person. ADMINISTRATIVE INFORMATION FOR PROFESSIONAL ORGANISATIONS SACNASP – THE LEGISLATED REGULATORY BODY FOR NATURAL SCIENCE PRACTITIONERS IN SOUTH AFRICA Postal: Private Bag X540, Silverton, 0127, Gauteng Province, South Africa Telephone: +27 12 748 6500 http://www.sacnasp.org.za/ SAIMM – THE SOUTHERN AFRICAN INSTITUTE OF MINING AND METALLURGY Postal: PostNet Suite #212, Private Bag X31, Saxonworld, 2132 Physical: Rosebank Towers (7th Floor), 19 Biermann Avenue, Rosebank, 2196, Gauteng Province, South Africa Telephone: +27 11 538 0231 http://www.saimm.co.za GSSA – GEOLOGICAL SOCIETY OF SOUTH AFRICA Physical: CSIR Minigtex, Carlow and Rustenburg Roads, Auckland Park, 2092, Gauteng Province, South Africa Telephone: +27 10 143 2096 http://www.gssa.org.za AUSIMM – THE AUSTRALASIAN INSTITUTE OF MINING AND METALLURGY Postal: PO Box 660, Carlton South, Victoria, 3053, Australia Telephone: +61 3 9658 6100 Facsimile: +61 3 9662 3662 http://www.ausimm.com.au SUMMARY UPDATE OF HARMONY’S MINERAL RESOURCES AND MINERAL RESERVES continued Harmony Gold Mining Company Limited FY26 Results for the year ended 30 June 2026 18
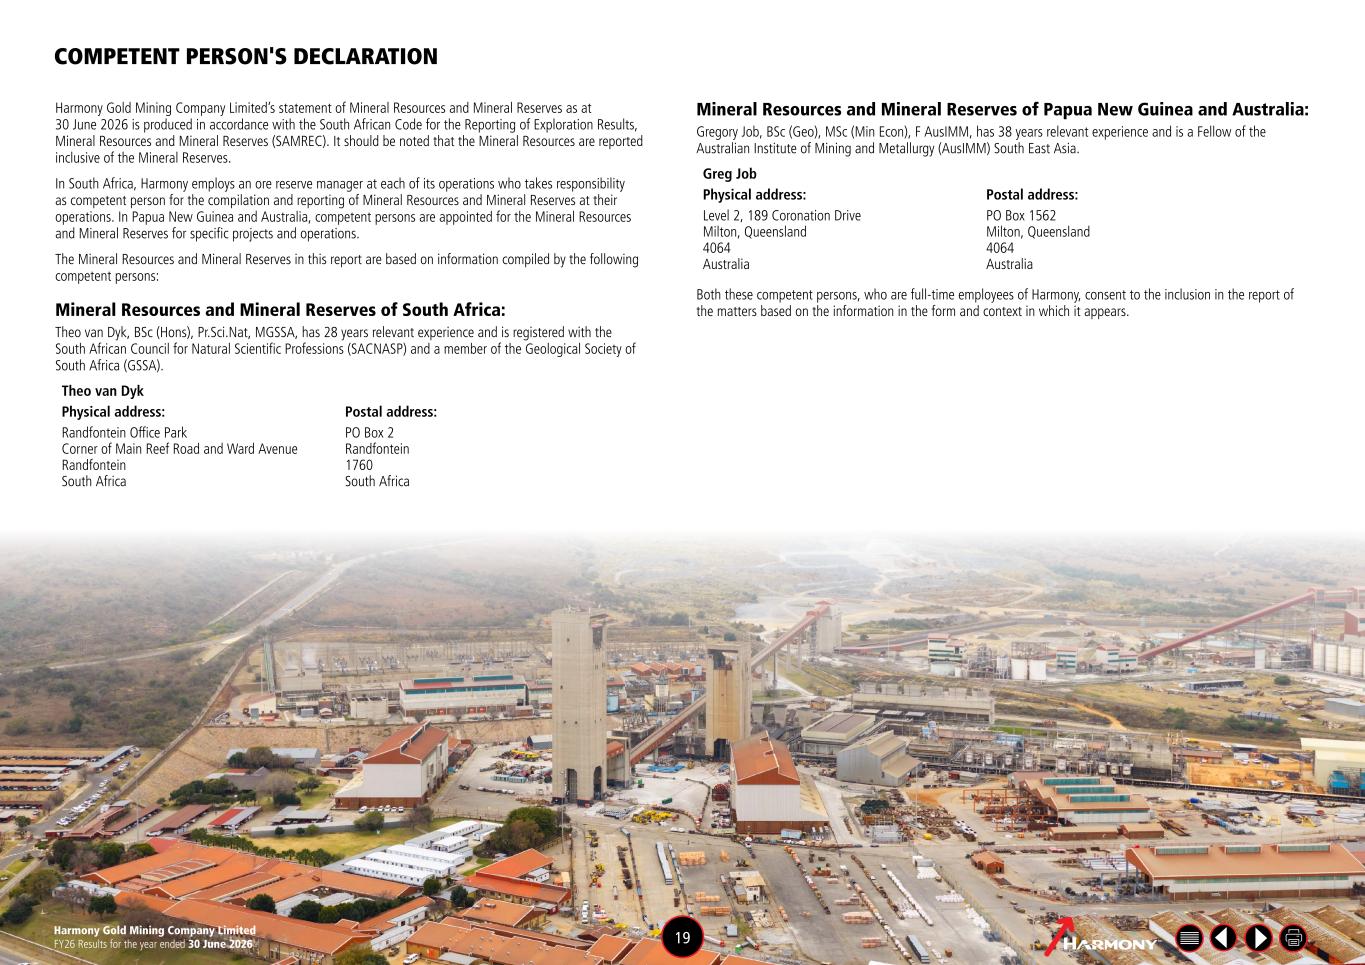
Harmony Gold Mining Company Limited’s statement of Mineral Resources and Mineral Reserves as at 30 June 2026 is produced in accordance with the South African Code for the Reporting of Exploration Results, Mineral Resources and Mineral Reserves (SAMREC). It should be noted that the Mineral Resources are reported inclusive of the Mineral Reserves. In South Africa, Harmony employs an ore reserve manager at each of its operations who takes responsibility as competent person for the compilation and reporting of Mineral Resources and Mineral Reserves at their operations. In Papua New Guinea and Australia, competent persons are appointed for the Mineral Resources and Mineral Reserves for specific projects and operations. The Mineral Resources and Mineral Reserves in this report are based on information compiled by the following competent persons: Mineral Resources and Mineral Reserves of South Africa: Theo van Dyk, BSc (Hons), Pr.Sci.Nat, MGSSA, has 28 years relevant experience and is registered with the South African Council for Natural Scientific Professions (SACNASP) and a member of the Geological Society of South Africa (GSSA). Theo van Dyk Physical address: Postal address: Randfontein Office Park Corner of Main Reef Road and Ward Avenue Randfontein South Africa PO Box 2 Randfontein 1760 South Africa COMPETENT PERSON'S DECLARATION Mineral Resources and Mineral Reserves of Papua New Guinea and Australia: Gregory Job, BSc (Geo), MSc (Min Econ), F AusIMM, has 38 years relevant experience and is a Fellow of the Australian Institute of Mining and Metallurgy (AusIMM) South East Asia. Greg Job Physical address: Postal address: Level 2, 189 Coronation Drive Milton, Queensland 4064 Australia PO Box 1562 Milton, Queensland 4064 Australia Both these competent persons, who are full-time employees of Harmony, consent to the inclusion in the report of the matters based on the information in the form and context in which it appears. Harmony Gold Mining Company Limited FY26 Results for the year ended 30 June 2026 19
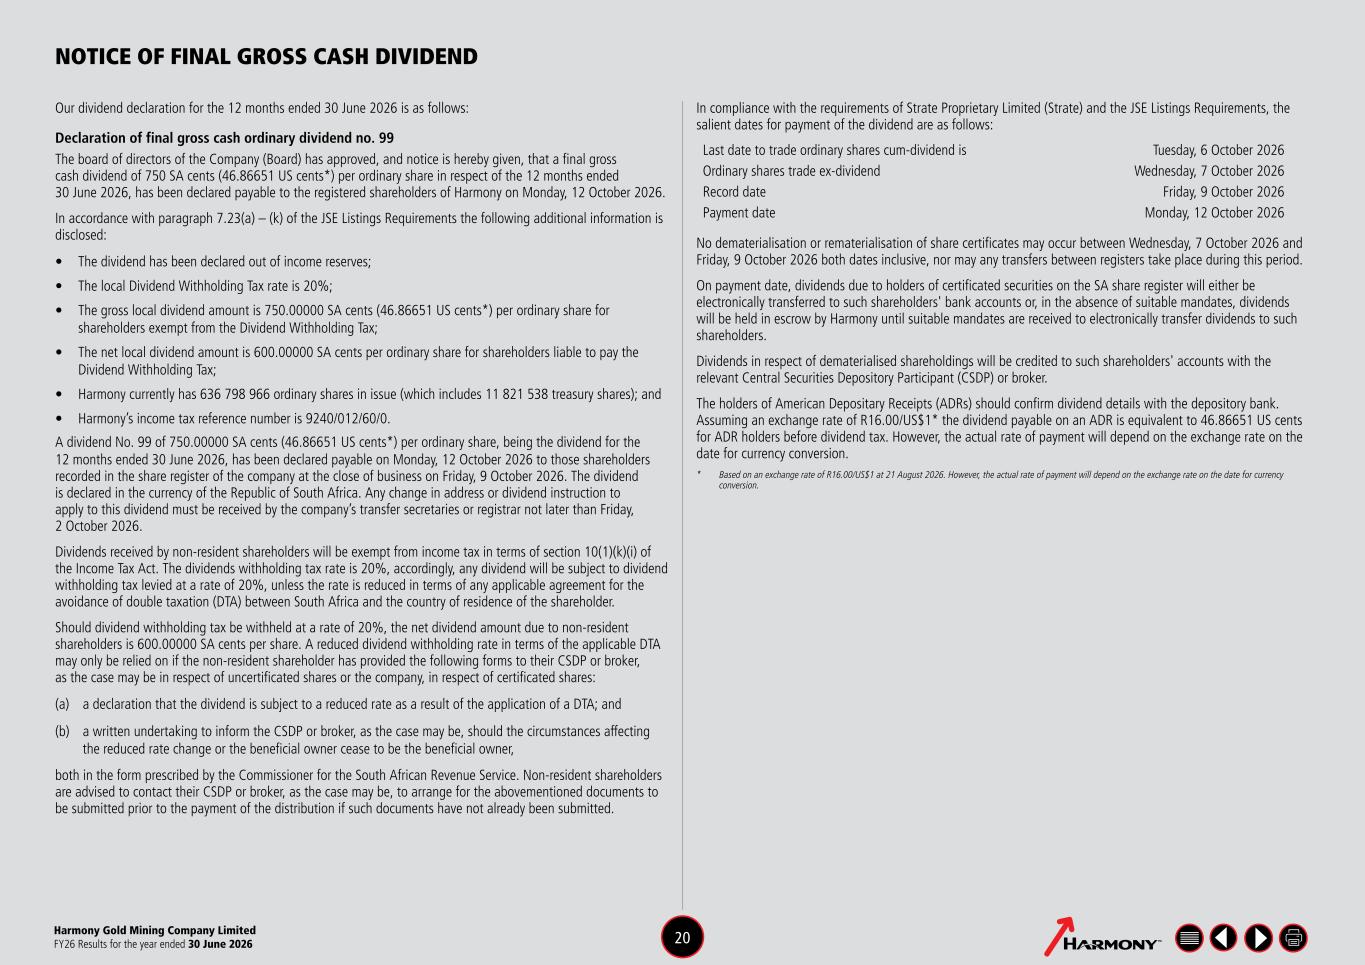
NOTICE OF FINAL GROSS CASH DIVIDEND Our dividend declaration for the 12 months ended 30 June 2026 is as follows: Declaration of final gross cash ordinary dividend no. 99 The board of directors of the Company (Board) has approved, and notice is hereby given, that a final gross cash dividend of 750 SA cents (46.86651 US cents*) per ordinary share in respect of the 12 months ended 30 June 2026, has been declared payable to the registered shareholders of Harmony on Monday, 12 October 2026. In accordance with paragraph 7.23(a) – (k) of the JSE Listings Requirements the following additional information is disclosed: • The dividend has been declared out of income reserves; • The local Dividend Withholding Tax rate is 20%; • The gross local dividend amount is 750.00000 SA cents (46.86651 US cents*) per ordinary share for shareholders exempt from the Dividend Withholding Tax; • The net local dividend amount is 600.00000 SA cents per ordinary share for shareholders liable to pay the Dividend Withholding Tax; • Harmony currently has 636 798 966 ordinary shares in issue (which includes 11 821 538 treasury shares); and • Harmony’s income tax reference number is 9240/012/60/0. A dividend No. 99 of 750.00000 SA cents (46.86651 US cents*) per ordinary share, being the dividend for the 12 months ended 30 June 2026, has been declared payable on Monday, 12 October 2026 to those shareholders recorded in the share register of the company at the close of business on Friday, 9 October 2026. The dividend is declared in the currency of the Republic of South Africa. Any change in address or dividend instruction to apply to this dividend must be received by the company’s transfer secretaries or registrar not later than Friday, 2 October 2026. Dividends received by non-resident shareholders will be exempt from income tax in terms of section 10(1)(k)(i) of the Income Tax Act. The dividends withholding tax rate is 20%, accordingly, any dividend will be subject to dividend withholding tax levied at a rate of 20%, unless the rate is reduced in terms of any applicable agreement for the avoidance of double taxation (DTA) between South Africa and the country of residence of the shareholder. Should dividend withholding tax be withheld at a rate of 20%, the net dividend amount due to non-resident shareholders is 600.00000 SA cents per share. A reduced dividend withholding rate in terms of the applicable DTA may only be relied on if the non-resident shareholder has provided the following forms to their CSDP or broker, as the case may be in respect of uncertificated shares or the company, in respect of certificated shares: (a) a declaration that the dividend is subject to a reduced rate as a result of the application of a DTA; and (b) a written undertaking to inform the CSDP or broker, as the case may be, should the circumstances affecting the reduced rate change or the beneficial owner cease to be the beneficial owner, both in the form prescribed by the Commissioner for the South African Revenue Service. Non-resident shareholders are advised to contact their CSDP or broker, as the case may be, to arrange for the abovementioned documents to be submitted prior to the payment of the distribution if such documents have not already been submitted. In compliance with the requirements of Strate Proprietary Limited (Strate) and the JSE Listings Requirements, the salient dates for payment of the dividend are as follows: Last date to trade ordinary shares cum-dividend is Tuesday, 6 October 2026 Ordinary shares trade ex-dividend Wednesday, 7 October 2026 Record date Friday, 9 October 2026 Payment date Monday, 12 October 2026 No dematerialisation or rematerialisation of share certificates may occur between Wednesday, 7 October 2026 and Friday, 9 October 2026 both dates inclusive, nor may any transfers between registers take place during this period. On payment date, dividends due to holders of certificated securities on the SA share register will either be electronically transferred to such shareholders' bank accounts or, in the absence of suitable mandates, dividends will be held in escrow by Harmony until suitable mandates are received to electronically transfer dividends to such shareholders. Dividends in respect of dematerialised shareholdings will be credited to such shareholders' accounts with the relevant Central Securities Depository Participant (CSDP) or broker. The holders of American Depositary Receipts (ADRs) should confirm dividend details with the depository bank. Assuming an exchange rate of R16.00/US$1* the dividend payable on an ADR is equivalent to 46.86651 US cents for ADR holders before dividend tax. However, the actual rate of payment will depend on the exchange rate on the date for currency conversion. * Based on an exchange rate of R16.00/US$1 at 21 August 2026. However, the actual rate of payment will depend on the exchange rate on the date for currency conversion. Harmony Gold Mining Company Limited FY26 Results for the year ended 30 June 2026 20
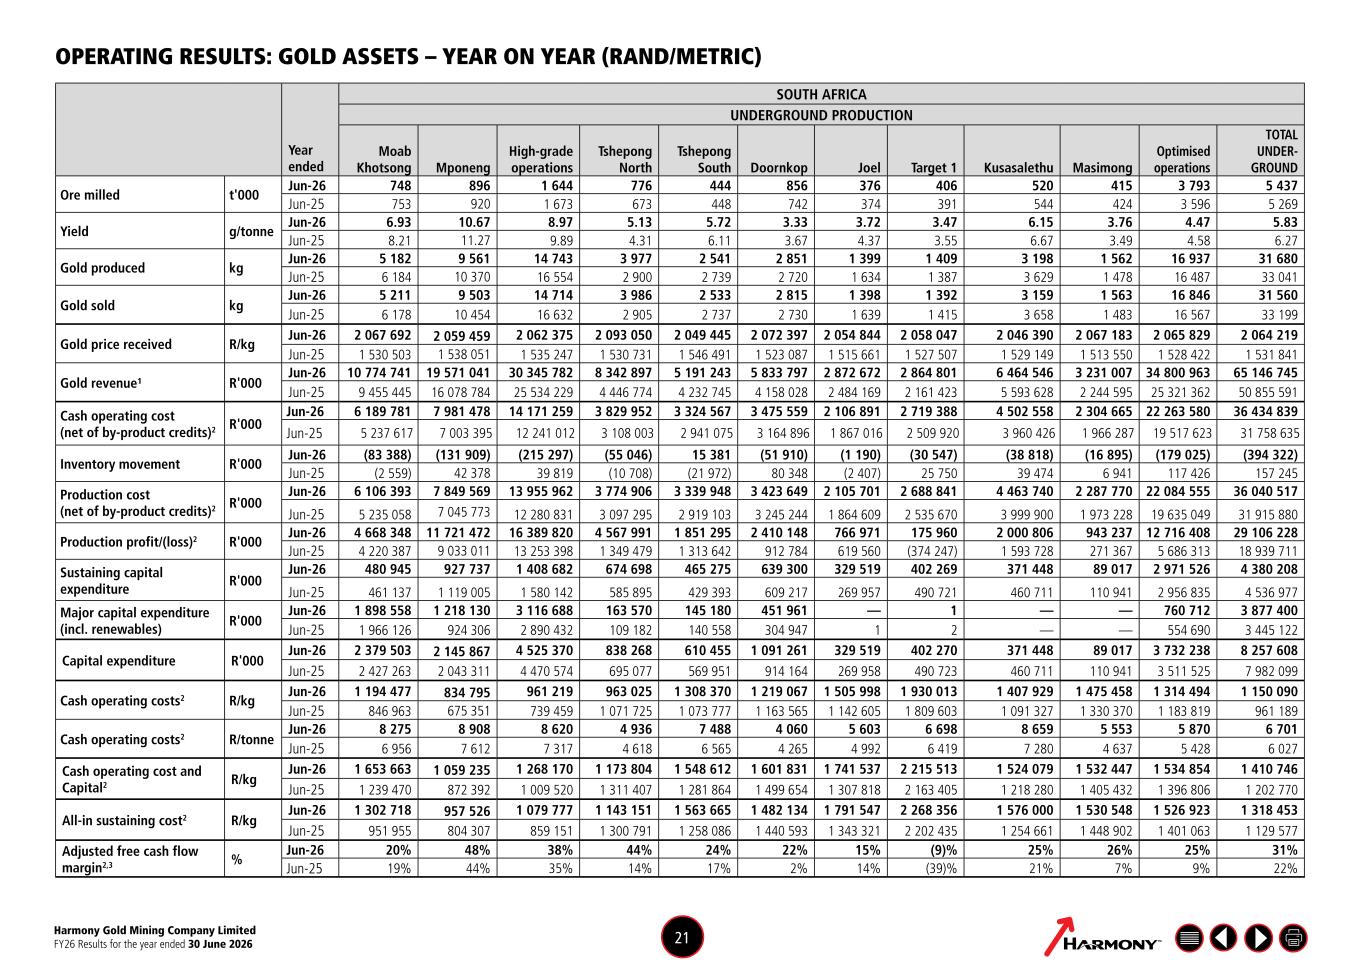
Year ended SOUTH AFRICA UNDERGROUND PRODUCTION Moab Khotsong Mponeng High-grade operations Tshepong North Tshepong South Doornkop Joel Target 1 Kusasalethu Masimong Optimised operations TOTAL UNDER- GROUND Ore milled t'000 Jun-26 748 896 1 644 776 444 856 376 406 520 415 3 793 5 437 Jun-25 753 920 1 673 673 448 742 374 391 544 424 3 596 5 269 Yield g/tonne Jun-26 6.93 10.67 8.97 5.13 5.72 3.33 3.72 3.47 6.15 3.76 4.47 5.83 Jun-25 8.21 11.27 9.89 4.31 6.11 3.67 4.37 3.55 6.67 3.49 4.58 6.27 Gold produced kg Jun-26 5 182 9 561 14 743 3 977 2 541 2 851 1 399 1 409 3 198 1 562 16 937 31 680 Jun-25 6 184 10 370 16 554 2 900 2 739 2 720 1 634 1 387 3 629 1 478 16 487 33 041 Gold sold kg Jun-26 5 211 9 503 14 714 3 986 2 533 2 815 1 398 1 392 3 159 1 563 16 846 31 560 Jun-25 6 178 10 454 16 632 2 905 2 737 2 730 1 639 1 415 3 658 1 483 16 567 33 199 Gold price received R/kg Jun-26 2 067 692 2 059 459 2 062 375 2 093 050 2 049 445 2 072 397 2 054 844 2 058 047 2 046 390 2 067 183 2 065 829 2 064 219 Jun-25 1 530 503 1 538 051 1 535 247 1 530 731 1 546 491 1 523 087 1 515 661 1 527 507 1 529 149 1 513 550 1 528 422 1 531 841 Gold revenue¹ R'000 Jun-26 10 774 741 19 571 041 30 345 782 8 342 897 5 191 243 5 833 797 2 872 672 2 864 801 6 464 546 3 231 007 34 800 963 65 146 745 Jun-25 9 455 445 16 078 784 25 534 229 4 446 774 4 232 745 4 158 028 2 484 169 2 161 423 5 593 628 2 244 595 25 321 362 50 855 591 Cash operating cost (net of by-product credits)2 R'000 Jun-26 6 189 781 7 981 478 14 171 259 3 829 952 3 324 567 3 475 559 2 106 891 2 719 388 4 502 558 2 304 665 22 263 580 36 434 839 Jun-25 5 237 617 7 003 395 12 241 012 3 108 003 2 941 075 3 164 896 1 867 016 2 509 920 3 960 426 1 966 287 19 517 623 31 758 635 Inventory movement R'000 Jun-26 (83 388) (131 909) (215 297) (55 046) 15 381 (51 910) (1 190) (30 547) (38 818) (16 895) (179 025) (394 322) Jun-25 (2 559) 42 378 39 819 (10 708) (21 972) 80 348 (2 407) 25 750 39 474 6 941 117 426 157 245 Production cost (net of by-product credits)2 R'000 Jun-26 6 106 393 7 849 569 13 955 962 3 774 906 3 339 948 3 423 649 2 105 701 2 688 841 4 463 740 2 287 770 22 084 555 36 040 517 Jun-25 5 235 058 7 045 773 12 280 831 3 097 295 2 919 103 3 245 244 1 864 609 2 535 670 3 999 900 1 973 228 19 635 049 31 915 880 Production profit/(loss)2 R'000 Jun-26 4 668 348 11 721 472 16 389 820 4 567 991 1 851 295 2 410 148 766 971 175 960 2 000 806 943 237 12 716 408 29 106 228 Jun-25 4 220 387 9 033 011 13 253 398 1 349 479 1 313 642 912 784 619 560 (374 247) 1 593 728 271 367 5 686 313 18 939 711 Sustaining capital expenditure R'000 Jun-26 480 945 927 737 1 408 682 674 698 465 275 639 300 329 519 402 269 371 448 89 017 2 971 526 4 380 208 Jun-25 461 137 1 119 005 1 580 142 585 895 429 393 609 217 269 957 490 721 460 711 110 941 2 956 835 4 536 977 Major capital expenditure (incl. renewables) R'000 Jun-26 1 898 558 1 218 130 3 116 688 163 570 145 180 451 961 — 1 — — 760 712 3 877 400 Jun-25 1 966 126 924 306 2 890 432 109 182 140 558 304 947 1 2 — — 554 690 3 445 122 Capital expenditure R'000 Jun-26 2 379 503 2 145 867 4 525 370 838 268 610 455 1 091 261 329 519 402 270 371 448 89 017 3 732 238 8 257 608 Jun-25 2 427 263 2 043 311 4 470 574 695 077 569 951 914 164 269 958 490 723 460 711 110 941 3 511 525 7 982 099 Cash operating costs2 R/kg Jun-26 1 194 477 834 795 961 219 963 025 1 308 370 1 219 067 1 505 998 1 930 013 1 407 929 1 475 458 1 314 494 1 150 090 Jun-25 846 963 675 351 739 459 1 071 725 1 073 777 1 163 565 1 142 605 1 809 603 1 091 327 1 330 370 1 183 819 961 189 Cash operating costs2 R/tonne Jun-26 8 275 8 908 8 620 4 936 7 488 4 060 5 603 6 698 8 659 5 553 5 870 6 701 Jun-25 6 956 7 612 7 317 4 618 6 565 4 265 4 992 6 419 7 280 4 637 5 428 6 027 Cash operating cost and Capital2 R/kg Jun-26 1 653 663 1 059 235 1 268 170 1 173 804 1 548 612 1 601 831 1 741 537 2 215 513 1 524 079 1 532 447 1 534 854 1 410 746 Jun-25 1 239 470 872 392 1 009 520 1 311 407 1 281 864 1 499 654 1 307 818 2 163 405 1 218 280 1 405 432 1 396 806 1 202 770 All-in sustaining cost2 R/kg Jun-26 1 302 718 957 526 1 079 777 1 143 151 1 563 665 1 482 134 1 791 547 2 268 356 1 576 000 1 530 548 1 526 923 1 318 453 Jun-25 951 955 804 307 859 151 1 300 791 1 258 086 1 440 593 1 343 321 2 202 435 1 254 661 1 448 902 1 401 063 1 129 577 Adjusted free cash flow margin2,3 % Jun-26 20% 48% 38% 44% 24% 22% 15% (9)% 25% 26% 25% 31% Jun-25 19% 44% 35% 14% 17% 2% 14% (39)% 21% 7% 9% 22% OPERATING RESULTS: GOLD ASSETS – YEAR ON YEAR (RAND/METRIC) Harmony Gold Mining Company Limited FY26 Results for the year ended 30 June 2026 21
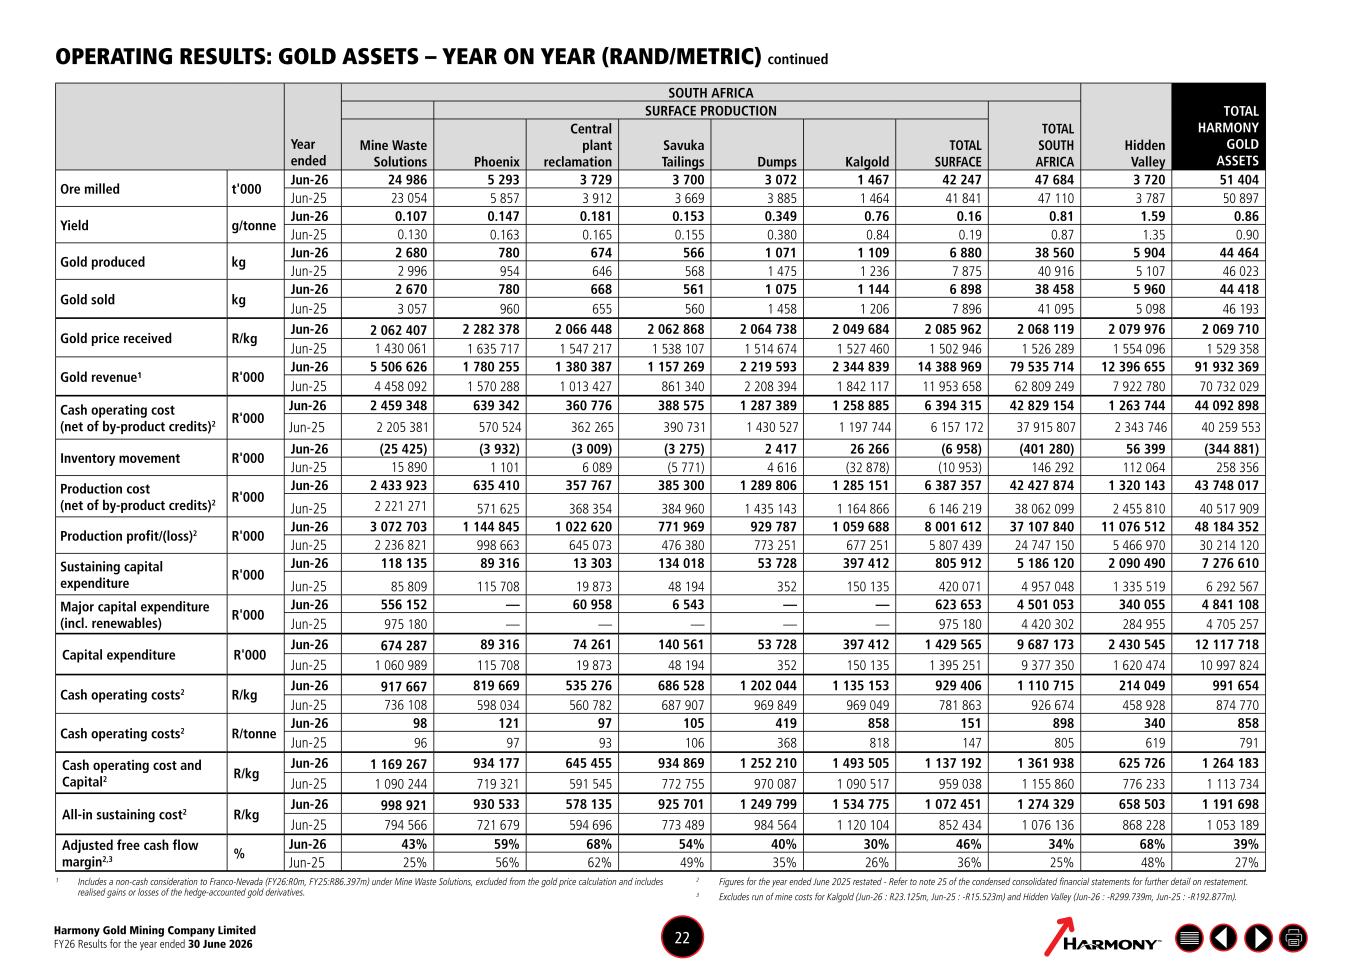
Year ended SOUTH AFRICA Hidden Valley TOTAL HARMONY GOLD ASSETS SURFACE PRODUCTION TOTAL SOUTH AFRICA Mine Waste Solutions Phoenix Central plant reclamation Savuka Tailings Dumps Kalgold TOTAL SURFACE Ore milled t'000 Jun-26 24 986 5 293 3 729 3 700 3 072 1 467 42 247 47 684 3 720 51 404 Jun-25 23 054 5 857 3 912 3 669 3 885 1 464 41 841 47 110 3 787 50 897 Yield g/tonne Jun-26 0.107 0.147 0.181 0.153 0.349 0.76 0.16 0.81 1.59 0.86 Jun-25 0.130 0.163 0.165 0.155 0.380 0.84 0.19 0.87 1.35 0.90 Gold produced kg Jun-26 2 680 780 674 566 1 071 1 109 6 880 38 560 5 904 44 464 Jun-25 2 996 954 646 568 1 475 1 236 7 875 40 916 5 107 46 023 Gold sold kg Jun-26 2 670 780 668 561 1 075 1 144 6 898 38 458 5 960 44 418 Jun-25 3 057 960 655 560 1 458 1 206 7 896 41 095 5 098 46 193 Gold price received R/kg Jun-26 2 062 407 2 282 378 2 066 448 2 062 868 2 064 738 2 049 684 2 085 962 2 068 119 2 079 976 2 069 710 Jun-25 1 430 061 1 635 717 1 547 217 1 538 107 1 514 674 1 527 460 1 502 946 1 526 289 1 554 096 1 529 358 Gold revenue¹ R'000 Jun-26 5 506 626 1 780 255 1 380 387 1 157 269 2 219 593 2 344 839 14 388 969 79 535 714 12 396 655 91 932 369 Jun-25 4 458 092 1 570 288 1 013 427 861 340 2 208 394 1 842 117 11 953 658 62 809 249 7 922 780 70 732 029 Cash operating cost (net of by-product credits)2 R'000 Jun-26 2 459 348 639 342 360 776 388 575 1 287 389 1 258 885 6 394 315 42 829 154 1 263 744 44 092 898 Jun-25 2 205 381 570 524 362 265 390 731 1 430 527 1 197 744 6 157 172 37 915 807 2 343 746 40 259 553 Inventory movement R'000 Jun-26 (25 425) (3 932) (3 009) (3 275) 2 417 26 266 (6 958) (401 280) 56 399 (344 881) Jun-25 15 890 1 101 6 089 (5 771) 4 616 (32 878) (10 953) 146 292 112 064 258 356 Production cost (net of by-product credits)2 R'000 Jun-26 2 433 923 635 410 357 767 385 300 1 289 806 1 285 151 6 387 357 42 427 874 1 320 143 43 748 017 Jun-25 2 221 271 571 625 368 354 384 960 1 435 143 1 164 866 6 146 219 38 062 099 2 455 810 40 517 909 Production profit/(loss)2 R'000 Jun-26 3 072 703 1 144 845 1 022 620 771 969 929 787 1 059 688 8 001 612 37 107 840 11 076 512 48 184 352 Jun-25 2 236 821 998 663 645 073 476 380 773 251 677 251 5 807 439 24 747 150 5 466 970 30 214 120 Sustaining capital expenditure R'000 Jun-26 118 135 89 316 13 303 134 018 53 728 397 412 805 912 5 186 120 2 090 490 7 276 610 Jun-25 85 809 115 708 19 873 48 194 352 150 135 420 071 4 957 048 1 335 519 6 292 567 Major capital expenditure (incl. renewables) R'000 Jun-26 556 152 — 60 958 6 543 — — 623 653 4 501 053 340 055 4 841 108 Jun-25 975 180 — — — — — 975 180 4 420 302 284 955 4 705 257 Capital expenditure R'000 Jun-26 674 287 89 316 74 261 140 561 53 728 397 412 1 429 565 9 687 173 2 430 545 12 117 718 Jun-25 1 060 989 115 708 19 873 48 194 352 150 135 1 395 251 9 377 350 1 620 474 10 997 824 Cash operating costs2 R/kg Jun-26 917 667 819 669 535 276 686 528 1 202 044 1 135 153 929 406 1 110 715 214 049 991 654 Jun-25 736 108 598 034 560 782 687 907 969 849 969 049 781 863 926 674 458 928 874 770 Cash operating costs2 R/tonne Jun-26 98 121 97 105 419 858 151 898 340 858 Jun-25 96 97 93 106 368 818 147 805 619 791 Cash operating cost and Capital2 R/kg Jun-26 1 169 267 934 177 645 455 934 869 1 252 210 1 493 505 1 137 192 1 361 938 625 726 1 264 183 Jun-25 1 090 244 719 321 591 545 772 755 970 087 1 090 517 959 038 1 155 860 776 233 1 113 734 All-in sustaining cost2 R/kg Jun-26 998 921 930 533 578 135 925 701 1 249 799 1 534 775 1 072 451 1 274 329 658 503 1 191 698 Jun-25 794 566 721 679 594 696 773 489 984 564 1 120 104 852 434 1 076 136 868 228 1 053 189 Adjusted free cash flow margin2,3 % Jun-26 43% 59% 68% 54% 40% 30% 46% 34% 68% 39% Jun-25 25% 56% 62% 49% 35% 26% 36% 25% 48% 27% OPERATING RESULTS: GOLD ASSETS – YEAR ON YEAR (RAND/METRIC) continued ¹ Includes a non-cash consideration to Franco-Nevada (FY26:R0m, FY25:R86.397m) under Mine Waste Solutions, excluded from the gold price calculation and includes realised gains or losses of the hedge-accounted gold derivatives. 2 Figures for the year ended June 2025 restated - Refer to note 25 of the condensed consolidated financial statements for further detail on restatement. 3 Excludes run of mine costs for Kalgold (Jun-26 : R23.125m, Jun-25 : -R15.523m) and Hidden Valley (Jun-26 : -R299.739m, Jun-25 : -R192.877m). Harmony Gold Mining Company Limited FY26 Results for the year ended 30 June 2026 22
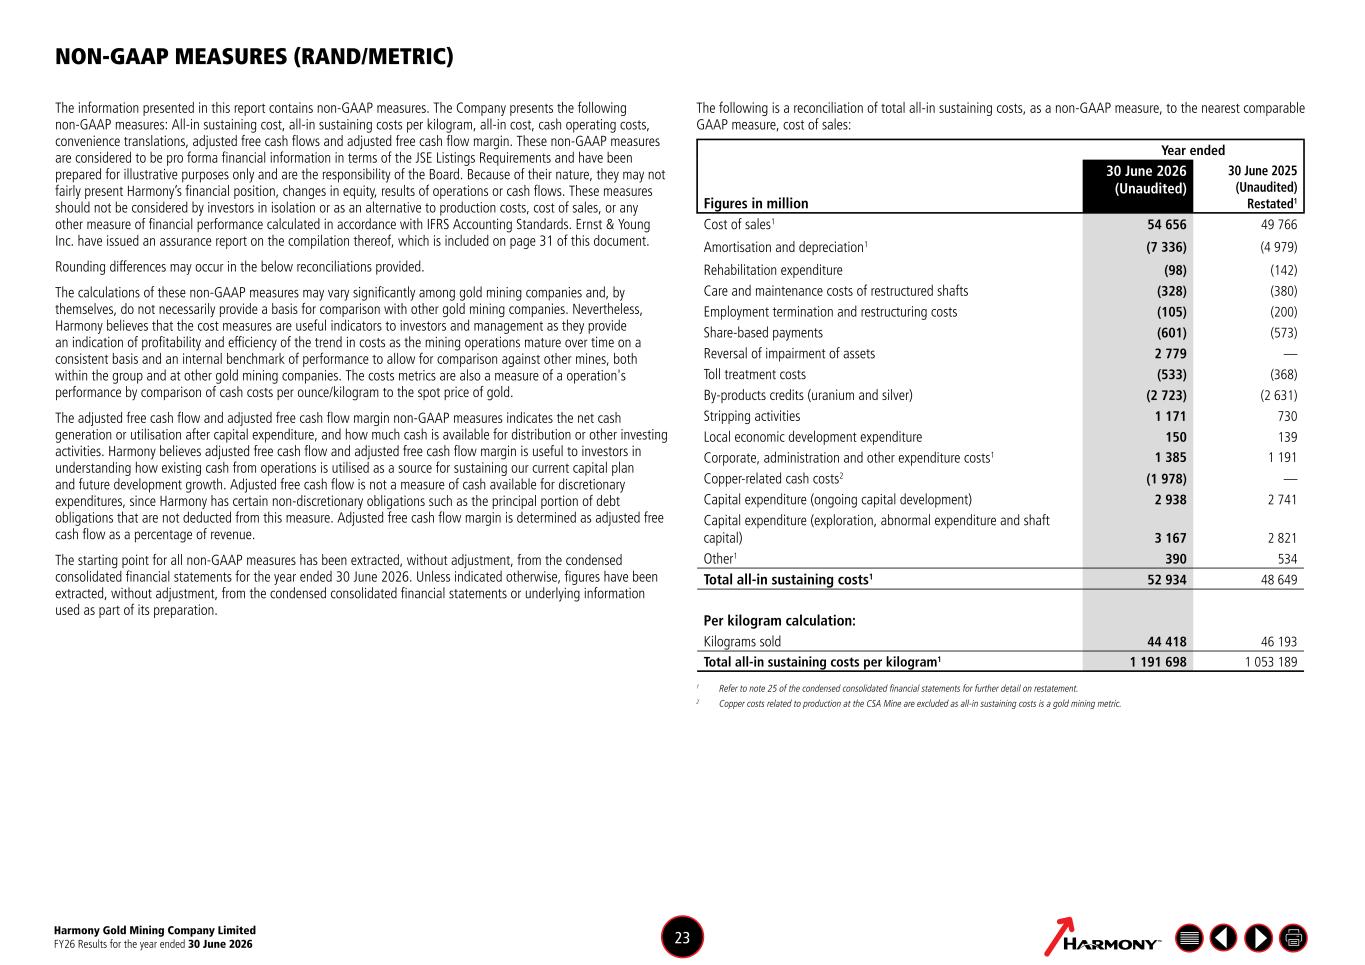
The information presented in this report contains non-GAAP measures. The Company presents the following non-GAAP measures: All-in sustaining cost, all-in sustaining costs per kilogram, all-in cost, cash operating costs, convenience translations, adjusted free cash flows and adjusted free cash flow margin. These non-GAAP measures are considered to be pro forma financial information in terms of the JSE Listings Requirements and have been prepared for illustrative purposes only and are the responsibility of the Board. Because of their nature, they may not fairly present Harmony’s financial position, changes in equity, results of operations or cash flows. These measures should not be considered by investors in isolation or as an alternative to production costs, cost of sales, or any other measure of financial performance calculated in accordance with IFRS Accounting Standards. Ernst & Young Inc. have issued an assurance report on the compilation thereof, which is included on page 31 of this document. Rounding differences may occur in the below reconciliations provided. The calculations of these non-GAAP measures may vary significantly among gold mining companies and, by themselves, do not necessarily provide a basis for comparison with other gold mining companies. Nevertheless, Harmony believes that the cost measures are useful indicators to investors and management as they provide an indication of profitability and efficiency of the trend in costs as the mining operations mature over time on a consistent basis and an internal benchmark of performance to allow for comparison against other mines, both within the group and at other gold mining companies. The costs metrics are also a measure of a operation's performance by comparison of cash costs per ounce/kilogram to the spot price of gold. The adjusted free cash flow and adjusted free cash flow margin non-GAAP measures indicates the net cash generation or utilisation after capital expenditure, and how much cash is available for distribution or other investing activities. Harmony believes adjusted free cash flow and adjusted free cash flow margin is useful to investors in understanding how existing cash from operations is utilised as a source for sustaining our current capital plan and future development growth. Adjusted free cash flow is not a measure of cash available for discretionary expenditures, since Harmony has certain non-discretionary obligations such as the principal portion of debt obligations that are not deducted from this measure. Adjusted free cash flow margin is determined as adjusted free cash flow as a percentage of revenue. The starting point for all non-GAAP measures has been extracted, without adjustment, from the condensed consolidated financial statements for the year ended 30 June 2026. Unless indicated otherwise, figures have been extracted, without adjustment, from the condensed consolidated financial statements or underlying information used as part of its preparation. The following is a reconciliation of total all-in sustaining costs, as a non-GAAP measure, to the nearest comparable GAAP measure, cost of sales: Year ended Figures in million 30 June 2026 (Unaudited) 30 June 2025 (Unaudited) Restated1 Cost of sales1 54 656 49 766 Amortisation and depreciation1 (7 336) (4 979) Rehabilitation expenditure (98) (142) Care and maintenance costs of restructured shafts (328) (380) Employment termination and restructuring costs (105) (200) Share-based payments (601) (573) Reversal of impairment of assets 2 779 — Toll treatment costs (533) (368) By-products credits (uranium and silver) (2 723) (2 631) Stripping activities 1 171 730 Local economic development expenditure 150 139 Corporate, administration and other expenditure costs1 1 385 1 191 Copper-related cash costs2 (1 978) — Capital expenditure (ongoing capital development) 2 938 2 741 Capital expenditure (exploration, abnormal expenditure and shaft capital) 3 167 2 821 Other1 390 534 Total all-in sustaining costs1 52 934 48 649 Per kilogram calculation: Kilograms sold 44 418 46 193 Total all-in sustaining costs per kilogram1 1 191 698 1 053 189 1 Refer to note 25 of the condensed consolidated financial statements for further detail on restatement. 2 Copper costs related to production at the CSA Mine are excluded as all-in sustaining costs is a gold mining metric. NON-GAAP MEASURES (RAND/METRIC) Harmony Gold Mining Company Limited FY26 Results for the year ended 30 June 2026 23
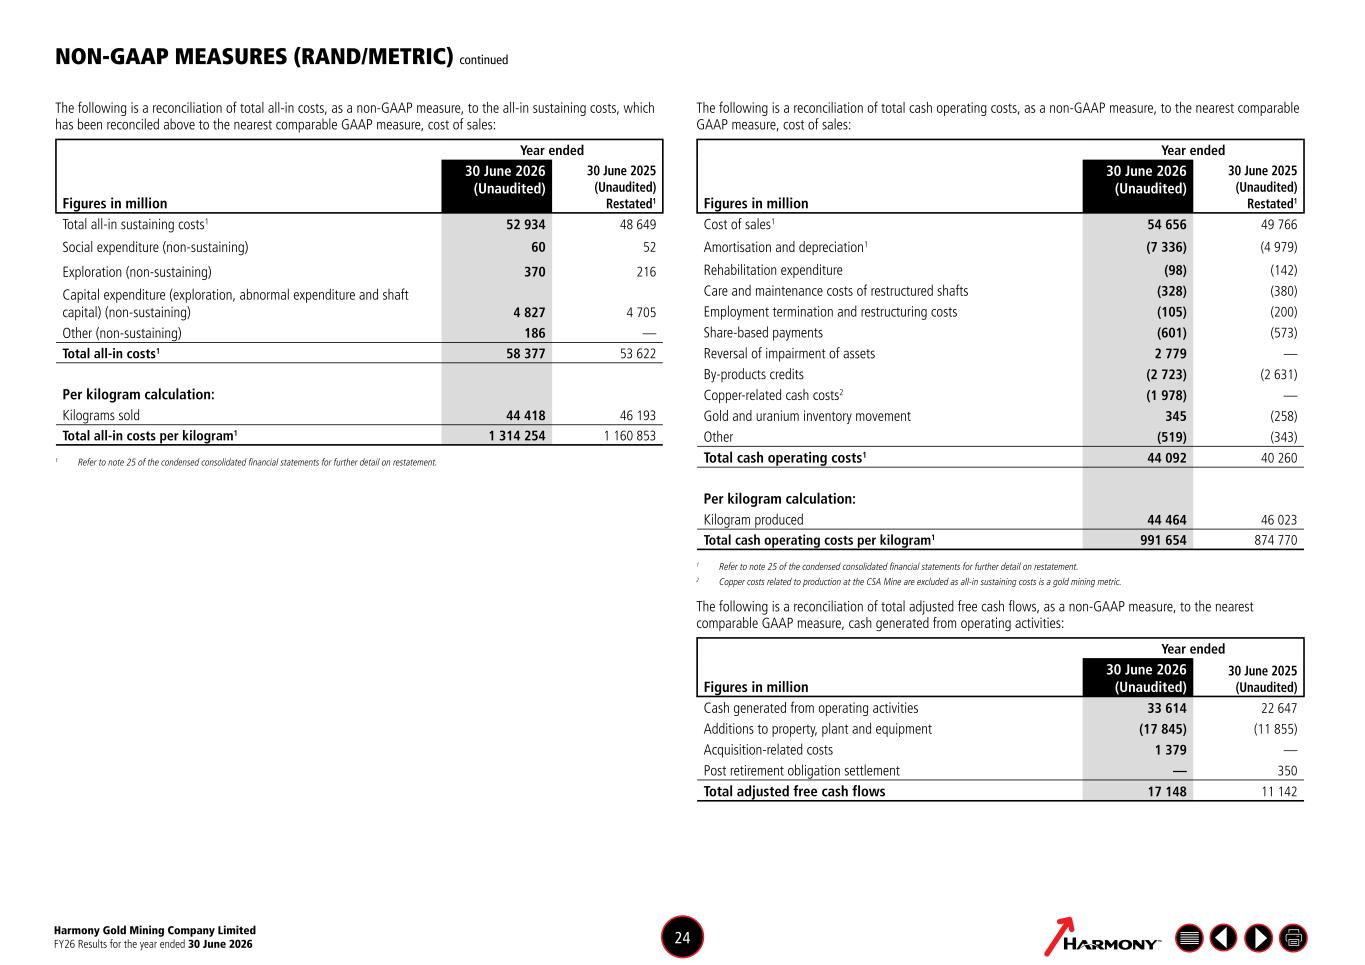
The following is a reconciliation of total all-in costs, as a non-GAAP measure, to the all-in sustaining costs, which has been reconciled above to the nearest comparable GAAP measure, cost of sales: Year ended Figures in million 30 June 2026 (Unaudited) 30 June 2025 (Unaudited) Restated1 Total all-in sustaining costs1 52 934 48 649 Social expenditure (non-sustaining) 60 52 Exploration (non-sustaining) 370 216 Capital expenditure (exploration, abnormal expenditure and shaft capital) (non-sustaining) 4 827 4 705 Other (non-sustaining) 186 — Total all-in costs1 58 377 53 622 Per kilogram calculation: Kilograms sold 44 418 46 193 Total all-in costs per kilogram1 1 314 254 1 160 853 1 Refer to note 25 of the condensed consolidated financial statements for further detail on restatement. The following is a reconciliation of total cash operating costs, as a non-GAAP measure, to the nearest comparable GAAP measure, cost of sales: Year ended Figures in million 30 June 2026 (Unaudited) 30 June 2025 (Unaudited) Restated1 Cost of sales1 54 656 49 766 Amortisation and depreciation1 (7 336) (4 979) Rehabilitation expenditure (98) (142) Care and maintenance costs of restructured shafts (328) (380) Employment termination and restructuring costs (105) (200) Share-based payments (601) (573) Reversal of impairment of assets 2 779 — By-products credits (2 723) (2 631) Copper-related cash costs2 (1 978) — Gold and uranium inventory movement 345 (258) Other (519) (343) Total cash operating costs1 44 092 40 260 Per kilogram calculation: Kilogram produced 44 464 46 023 Total cash operating costs per kilogram1 991 654 874 770 1 Refer to note 25 of the condensed consolidated financial statements for further detail on restatement. 2 Copper costs related to production at the CSA Mine are excluded as all-in sustaining costs is a gold mining metric. The following is a reconciliation of total adjusted free cash flows, as a non-GAAP measure, to the nearest comparable GAAP measure, cash generated from operating activities: Year ended Figures in million 30 June 2026 (Unaudited) 30 June 2025 (Unaudited) Cash generated from operating activities 33 614 22 647 Additions to property, plant and equipment (17 845) (11 855) Acquisition-related costs 1 379 — Post retirement obligation settlement — 350 Total adjusted free cash flows 17 148 11 142 NON-GAAP MEASURES (RAND/METRIC) continued Harmony Gold Mining Company Limited FY26 Results for the year ended 30 June 2026 24
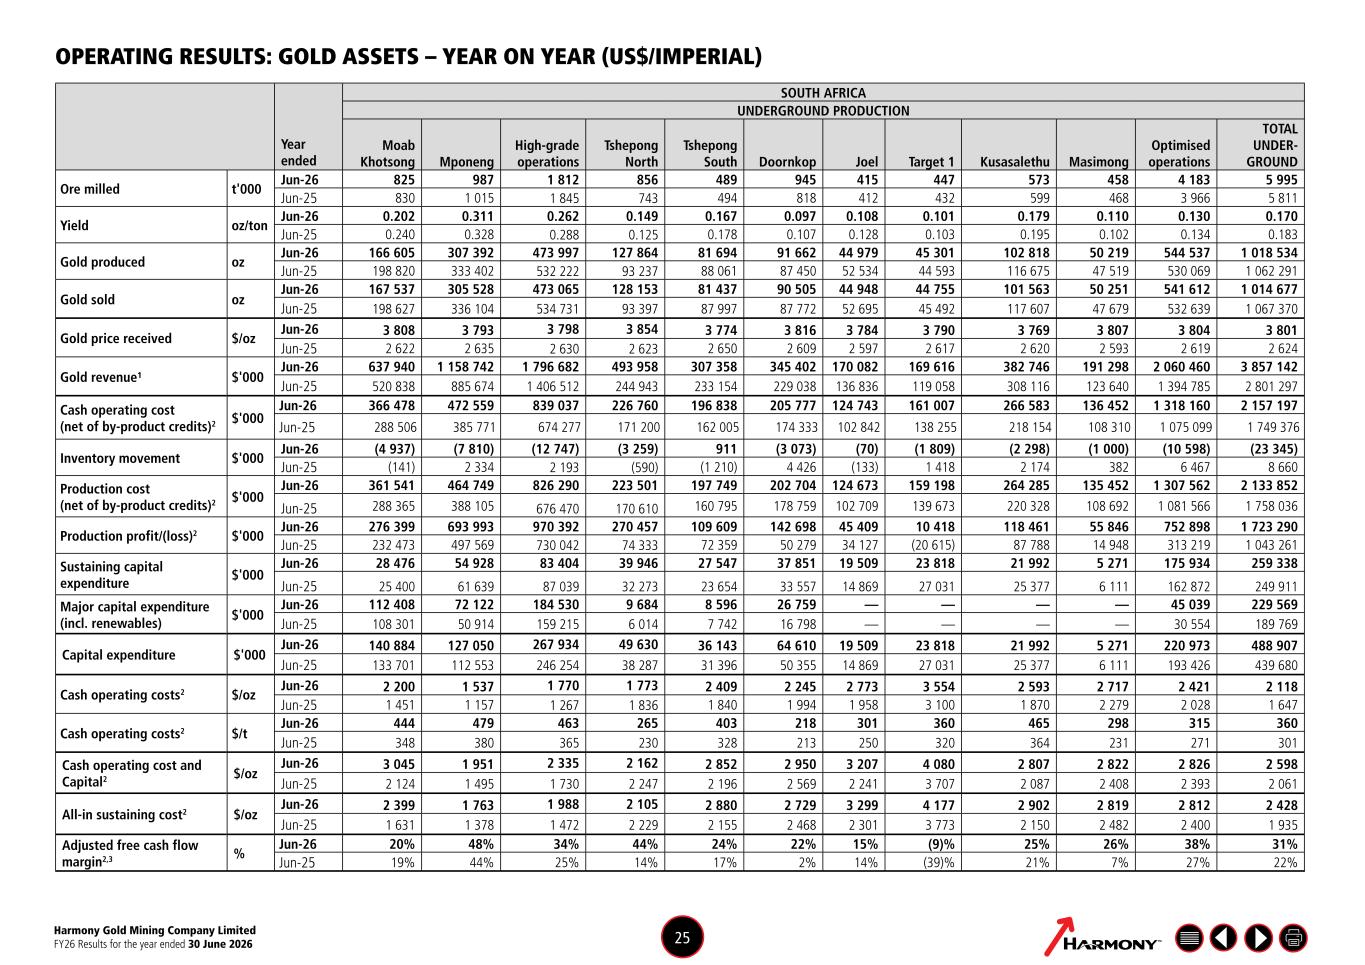
Year ended SOUTH AFRICA UNDERGROUND PRODUCTION Moab Khotsong Mponeng High-grade operations Tshepong North Tshepong South Doornkop Joel Target 1 Kusasalethu Masimong Optimised operations TOTAL UNDER- GROUND Ore milled t'000 Jun-26 825 987 1 812 856 489 945 415 447 573 458 4 183 5 995 Jun-25 830 1 015 1 845 743 494 818 412 432 599 468 3 966 5 811 Yield oz/ton Jun-26 0.202 0.311 0.262 0.149 0.167 0.097 0.108 0.101 0.179 0.110 0.130 0.170 Jun-25 0.240 0.328 0.288 0.125 0.178 0.107 0.128 0.103 0.195 0.102 0.134 0.183 Gold produced oz Jun-26 166 605 307 392 473 997 127 864 81 694 91 662 44 979 45 301 102 818 50 219 544 537 1 018 534 Jun-25 198 820 333 402 532 222 93 237 88 061 87 450 52 534 44 593 116 675 47 519 530 069 1 062 291 Gold sold oz Jun-26 167 537 305 528 473 065 128 153 81 437 90 505 44 948 44 755 101 563 50 251 541 612 1 014 677 Jun-25 198 627 336 104 534 731 93 397 87 997 87 772 52 695 45 492 117 607 47 679 532 639 1 067 370 Gold price received $/oz Jun-26 3 808 3 793 3 798 3 854 3 774 3 816 3 784 3 790 3 769 3 807 3 804 3 801 Jun-25 2 622 2 635 2 630 2 623 2 650 2 609 2 597 2 617 2 620 2 593 2 619 2 624 Gold revenue¹ $'000 Jun-26 637 940 1 158 742 1 796 682 493 958 307 358 345 402 170 082 169 616 382 746 191 298 2 060 460 3 857 142 Jun-25 520 838 885 674 1 406 512 244 943 233 154 229 038 136 836 119 058 308 116 123 640 1 394 785 2 801 297 Cash operating cost (net of by-product credits)2 $'000 Jun-26 366 478 472 559 839 037 226 760 196 838 205 777 124 743 161 007 266 583 136 452 1 318 160 2 157 197 Jun-25 288 506 385 771 674 277 171 200 162 005 174 333 102 842 138 255 218 154 108 310 1 075 099 1 749 376 Inventory movement $'000 Jun-26 (4 937) (7 810) (12 747) (3 259) 911 (3 073) (70) (1 809) (2 298) (1 000) (10 598) (23 345) Jun-25 (141) 2 334 2 193 (590) (1 210) 4 426 (133) 1 418 2 174 382 6 467 8 660 Production cost (net of by-product credits)2 $'000 Jun-26 361 541 464 749 826 290 223 501 197 749 202 704 124 673 159 198 264 285 135 452 1 307 562 2 133 852 Jun-25 288 365 388 105 676 470 170 610 160 795 178 759 102 709 139 673 220 328 108 692 1 081 566 1 758 036 Production profit/(loss)2 $'000 Jun-26 276 399 693 993 970 392 270 457 109 609 142 698 45 409 10 418 118 461 55 846 752 898 1 723 290 Jun-25 232 473 497 569 730 042 74 333 72 359 50 279 34 127 (20 615) 87 788 14 948 313 219 1 043 261 Sustaining capital expenditure $'000 Jun-26 28 476 54 928 83 404 39 946 27 547 37 851 19 509 23 818 21 992 5 271 175 934 259 338 Jun-25 25 400 61 639 87 039 32 273 23 654 33 557 14 869 27 031 25 377 6 111 162 872 249 911 Major capital expenditure (incl. renewables) $'000 Jun-26 112 408 72 122 184 530 9 684 8 596 26 759 — — — — 45 039 229 569 Jun-25 108 301 50 914 159 215 6 014 7 742 16 798 — — — — 30 554 189 769 Capital expenditure $'000 Jun-26 140 884 127 050 267 934 49 630 36 143 64 610 19 509 23 818 21 992 5 271 220 973 488 907 Jun-25 133 701 112 553 246 254 38 287 31 396 50 355 14 869 27 031 25 377 6 111 193 426 439 680 Cash operating costs2 $/oz Jun-26 2 200 1 537 1 770 1 773 2 409 2 245 2 773 3 554 2 593 2 717 2 421 2 118 Jun-25 1 451 1 157 1 267 1 836 1 840 1 994 1 958 3 100 1 870 2 279 2 028 1 647 Cash operating costs2 $/t Jun-26 444 479 463 265 403 218 301 360 465 298 315 360 Jun-25 348 380 365 230 328 213 250 320 364 231 271 301 Cash operating cost and Capital2 $/oz Jun-26 3 045 1 951 2 335 2 162 2 852 2 950 3 207 4 080 2 807 2 822 2 826 2 598 Jun-25 2 124 1 495 1 730 2 247 2 196 2 569 2 241 3 707 2 087 2 408 2 393 2 061 All-in sustaining cost2 $/oz Jun-26 2 399 1 763 1 988 2 105 2 880 2 729 3 299 4 177 2 902 2 819 2 812 2 428 Jun-25 1 631 1 378 1 472 2 229 2 155 2 468 2 301 3 773 2 150 2 482 2 400 1 935 Adjusted free cash flow margin2,3 % Jun-26 20% 48% 34% 44% 24% 22% 15% (9)% 25% 26% 38% 31% Jun-25 19% 44% 25% 14% 17% 2% 14% (39)% 21% 7% 27% 22% OPERATING RESULTS: GOLD ASSETS – YEAR ON YEAR (US$/IMPERIAL) Harmony Gold Mining Company Limited FY26 Results for the year ended 30 June 2026 25
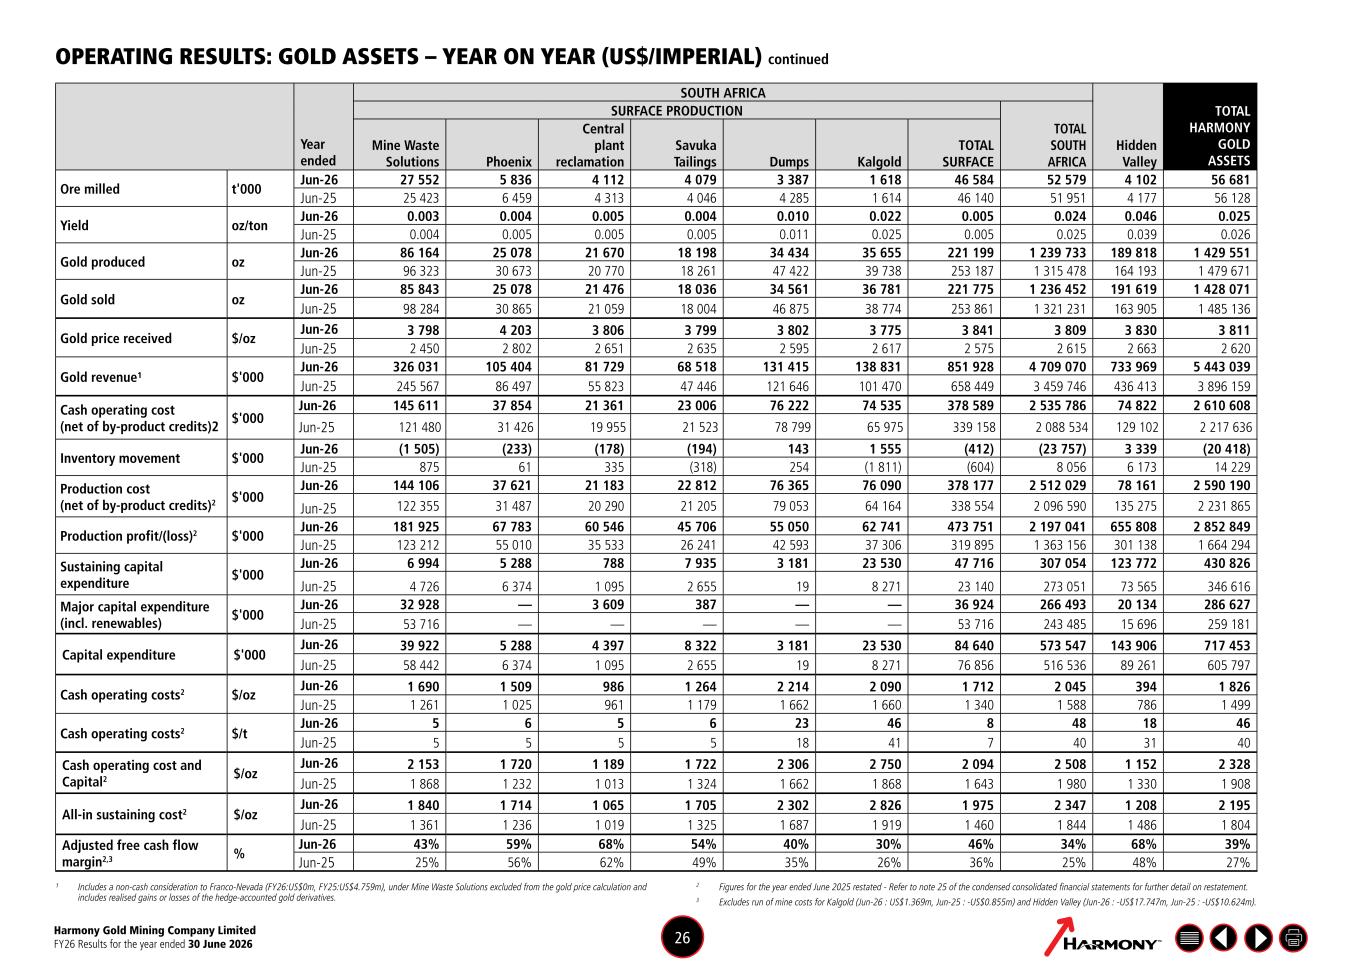
OPERATING RESULTS: GOLD ASSETS – YEAR ON YEAR (US$/IMPERIAL) continued Year ended SOUTH AFRICA Hidden Valley TOTAL HARMONY GOLD ASSETS SURFACE PRODUCTION TOTAL SOUTH AFRICA Mine Waste Solutions Phoenix Central plant reclamation Savuka Tailings Dumps Kalgold TOTAL SURFACE Ore milled t'000 Jun-26 27 552 5 836 4 112 4 079 3 387 1 618 46 584 52 579 4 102 56 681 Jun-25 25 423 6 459 4 313 4 046 4 285 1 614 46 140 51 951 4 177 56 128 Yield oz/ton Jun-26 0.003 0.004 0.005 0.004 0.010 0.022 0.005 0.024 0.046 0.025 Jun-25 0.004 0.005 0.005 0.005 0.011 0.025 0.005 0.025 0.039 0.026 Gold produced oz Jun-26 86 164 25 078 21 670 18 198 34 434 35 655 221 199 1 239 733 189 818 1 429 551 Jun-25 96 323 30 673 20 770 18 261 47 422 39 738 253 187 1 315 478 164 193 1 479 671 Gold sold oz Jun-26 85 843 25 078 21 476 18 036 34 561 36 781 221 775 1 236 452 191 619 1 428 071 Jun-25 98 284 30 865 21 059 18 004 46 875 38 774 253 861 1 321 231 163 905 1 485 136 Gold price received $/oz Jun-26 3 798 4 203 3 806 3 799 3 802 3 775 3 841 3 809 3 830 3 811 Jun-25 2 450 2 802 2 651 2 635 2 595 2 617 2 575 2 615 2 663 2 620 Gold revenue¹ $'000 Jun-26 326 031 105 404 81 729 68 518 131 415 138 831 851 928 4 709 070 733 969 5 443 039 Jun-25 245 567 86 497 55 823 47 446 121 646 101 470 658 449 3 459 746 436 413 3 896 159 Cash operating cost (net of by-product credits)2 $'000 Jun-26 145 611 37 854 21 361 23 006 76 222 74 535 378 589 2 535 786 74 822 2 610 608 Jun-25 121 480 31 426 19 955 21 523 78 799 65 975 339 158 2 088 534 129 102 2 217 636 Inventory movement $'000 Jun-26 (1 505) (233) (178) (194) 143 1 555 (412) (23 757) 3 339 (20 418) Jun-25 875 61 335 (318) 254 (1 811) (604) 8 056 6 173 14 229 Production cost (net of by-product credits)2 $'000 Jun-26 144 106 37 621 21 183 22 812 76 365 76 090 378 177 2 512 029 78 161 2 590 190 Jun-25 122 355 31 487 20 290 21 205 79 053 64 164 338 554 2 096 590 135 275 2 231 865 Production profit/(loss)2 $'000 Jun-26 181 925 67 783 60 546 45 706 55 050 62 741 473 751 2 197 041 655 808 2 852 849 Jun-25 123 212 55 010 35 533 26 241 42 593 37 306 319 895 1 363 156 301 138 1 664 294 Sustaining capital expenditure $'000 Jun-26 6 994 5 288 788 7 935 3 181 23 530 47 716 307 054 123 772 430 826 Jun-25 4 726 6 374 1 095 2 655 19 8 271 23 140 273 051 73 565 346 616 Major capital expenditure (incl. renewables) $'000 Jun-26 32 928 — 3 609 387 — — 36 924 266 493 20 134 286 627 Jun-25 53 716 — — — — — 53 716 243 485 15 696 259 181 Capital expenditure $'000 Jun-26 39 922 5 288 4 397 8 322 3 181 23 530 84 640 573 547 143 906 717 453 Jun-25 58 442 6 374 1 095 2 655 19 8 271 76 856 516 536 89 261 605 797 Cash operating costs2 $/oz Jun-26 1 690 1 509 986 1 264 2 214 2 090 1 712 2 045 394 1 826 Jun-25 1 261 1 025 961 1 179 1 662 1 660 1 340 1 588 786 1 499 Cash operating costs2 $/t Jun-26 5 6 5 6 23 46 8 48 18 46 Jun-25 5 5 5 5 18 41 7 40 31 40 Cash operating cost and Capital2 $/oz Jun-26 2 153 1 720 1 189 1 722 2 306 2 750 2 094 2 508 1 152 2 328 Jun-25 1 868 1 232 1 013 1 324 1 662 1 868 1 643 1 980 1 330 1 908 All-in sustaining cost2 $/oz Jun-26 1 840 1 714 1 065 1 705 2 302 2 826 1 975 2 347 1 208 2 195 Jun-25 1 361 1 236 1 019 1 325 1 687 1 919 1 460 1 844 1 486 1 804 Adjusted free cash flow margin2,3 % Jun-26 43% 59% 68% 54% 40% 30% 46% 34% 68% 39% Jun-25 25% 56% 62% 49% 35% 26% 36% 25% 48% 27% ¹ Includes a non-cash consideration to Franco-Nevada (FY26:US$0m, FY25:US$4.759m), under Mine Waste Solutions excluded from the gold price calculation and includes realised gains or losses of the hedge-accounted gold derivatives. 2 Figures for the year ended June 2025 restated - Refer to note 25 of the condensed consolidated financial statements for further detail on restatement. 3 Excludes run of mine costs for Kalgold (Jun-26 : US$1.369m, Jun-25 : -US$0.855m) and Hidden Valley (Jun-26 : -US$17.747m, Jun-25 : -US$10.624m). Harmony Gold Mining Company Limited FY26 Results for the year ended 30 June 2026 26
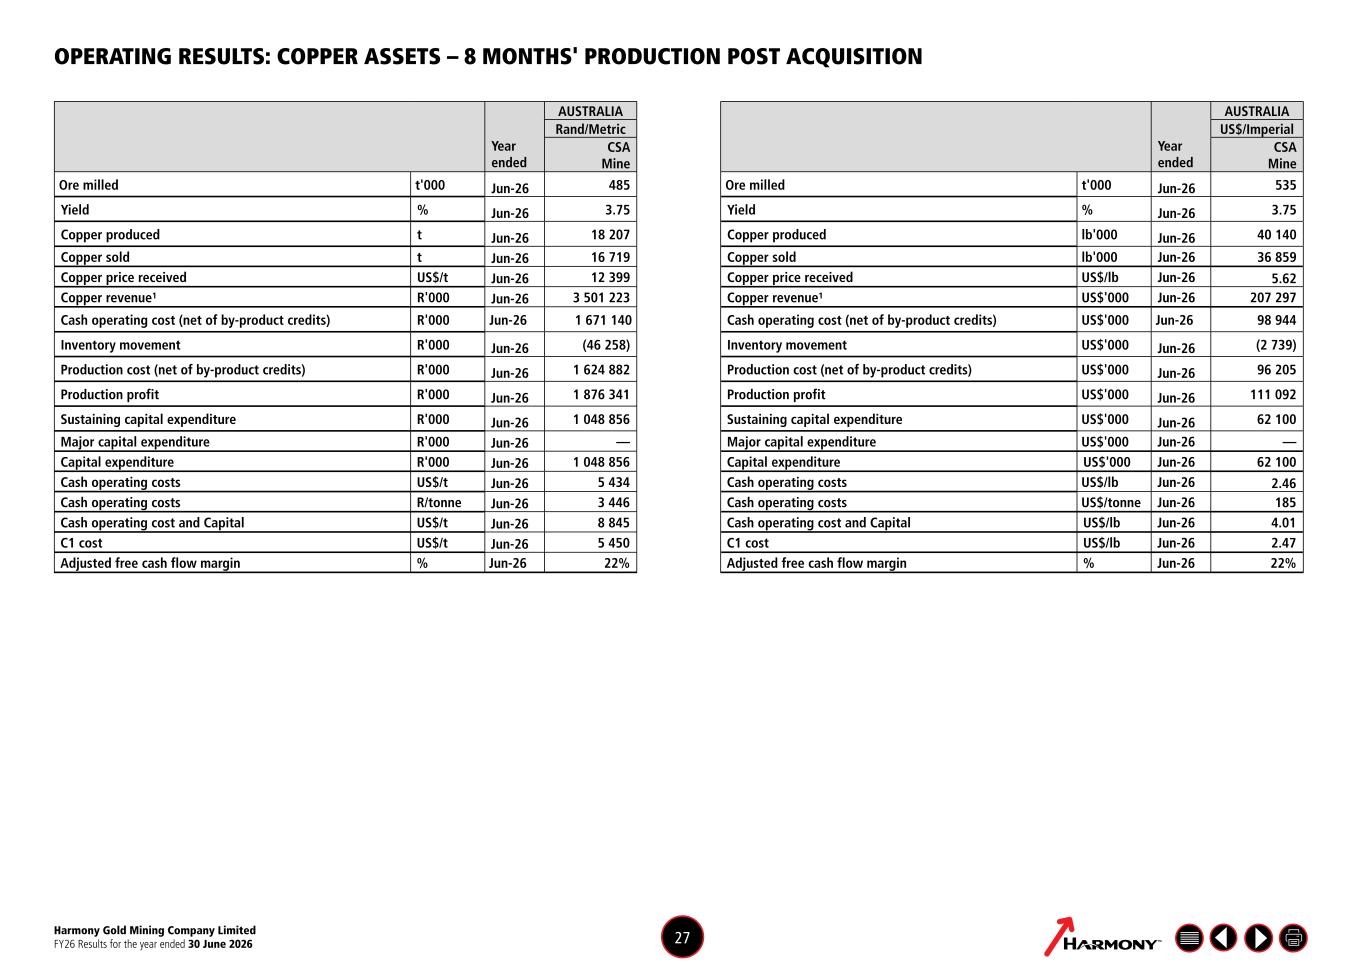
Year ended AUSTRALIA Year ended AUSTRALIA Rand/Metric US$/Imperial CSA Mine CSA Mine Ore milled t'000 Jun-26 485 Ore milled t'000 Jun-26 535 Yield % Jun-26 3.75 Yield % Jun-26 3.75 Copper produced t Jun-26 18 207 Copper produced lb'000 Jun-26 40 140 Copper sold t Jun-26 16 719 Copper sold lb'000 Jun-26 36 859 Copper price received US$/t Jun-26 12 399 Copper price received US$/lb Jun-26 5.62 Copper revenue¹ R'000 Jun-26 3 501 223 Copper revenue¹ US$'000 Jun-26 207 297 Cash operating cost (net of by-product credits) R'000 Jun-26 1 671 140 Cash operating cost (net of by-product credits) US$'000 Jun-26 98 944 Inventory movement R'000 Jun-26 (46 258) Inventory movement US$'000 Jun-26 (2 739) Production cost (net of by-product credits) R'000 Jun-26 1 624 882 Production cost (net of by-product credits) US$'000 Jun-26 96 205 Production profit R'000 Jun-26 1 876 341 Production profit US$'000 Jun-26 111 092 Sustaining capital expenditure R'000 Jun-26 1 048 856 Sustaining capital expenditure US$'000 Jun-26 62 100 Major capital expenditure R'000 Jun-26 — Major capital expenditure US$'000 Jun-26 — Capital expenditure R'000 Jun-26 1 048 856 Capital expenditure US$'000 Jun-26 62 100 Cash operating costs US$/t Jun-26 5 434 Cash operating costs US$/lb Jun-26 2.46 Cash operating costs R/tonne Jun-26 3 446 Cash operating costs US$/tonne Jun-26 185 Cash operating cost and Capital US$/t Jun-26 8 845 Cash operating cost and Capital US$/lb Jun-26 4.01 C1 cost US$/t Jun-26 5 450 C1 cost US$/lb Jun-26 2.47 Adjusted free cash flow margin % Jun-26 22% Adjusted free cash flow margin % Jun-26 22% OPERATING RESULTS: COPPER ASSETS – 8 MONTHS' PRODUCTION POST ACQUISITION Harmony Gold Mining Company Limited FY26 Results for the year ended 30 June 2026 27
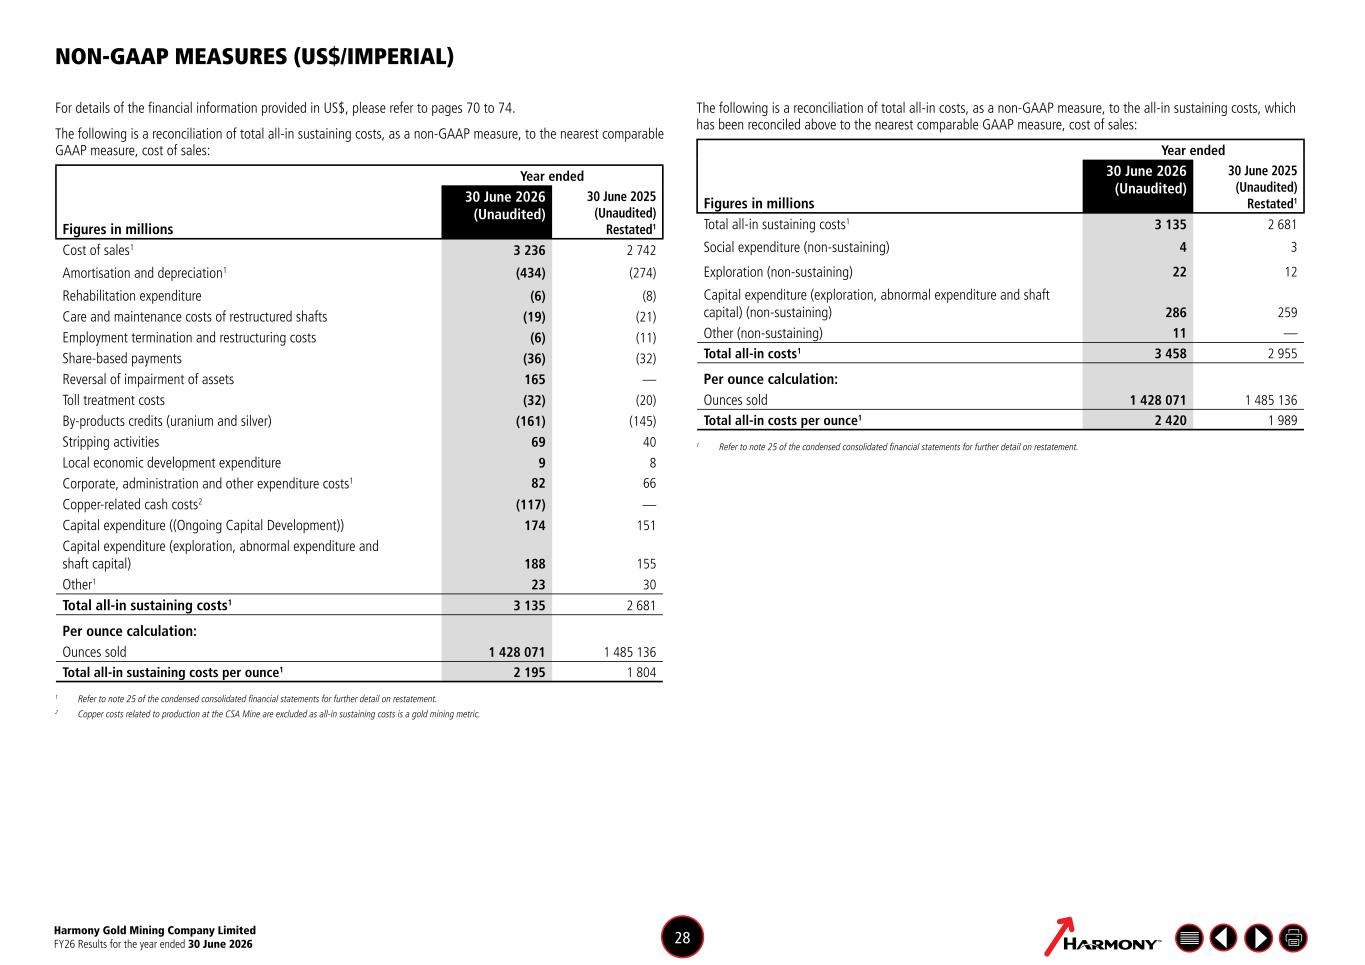
For details of the financial information provided in US$, please refer to pages 70 to 74. The following is a reconciliation of total all-in sustaining costs, as a non-GAAP measure, to the nearest comparable GAAP measure, cost of sales: Year ended Figures in millions 30 June 2026 (Unaudited) 30 June 2025 (Unaudited) Restated1 Cost of sales1 3 236 2 742 Amortisation and depreciation1 (434) (274) Rehabilitation expenditure (6) (8) Care and maintenance costs of restructured shafts (19) (21) Employment termination and restructuring costs (6) (11) Share-based payments (36) (32) Reversal of impairment of assets 165 — Toll treatment costs (32) (20) By-products credits (uranium and silver) (161) (145) Stripping activities 69 40 Local economic development expenditure 9 8 Corporate, administration and other expenditure costs1 82 66 Copper-related cash costs2 (117) — Capital expenditure ((Ongoing Capital Development)) 174 151 Capital expenditure (exploration, abnormal expenditure and shaft capital) 188 155 Other1 23 30 Total all-in sustaining costs1 3 135 2 681 Per ounce calculation: Ounces sold 1 428 071 1 485 136 Total all-in sustaining costs per ounce1 2 195 1 804 1 Refer to note 25 of the condensed consolidated financial statements for further detail on restatement. 2 Copper costs related to production at the CSA Mine are excluded as all-in sustaining costs is a gold mining metric. The following is a reconciliation of total all-in costs, as a non-GAAP measure, to the all-in sustaining costs, which has been reconciled above to the nearest comparable GAAP measure, cost of sales: Year ended Figures in millions 30 June 2026 (Unaudited) 30 June 2025 (Unaudited) Restated1 Total all-in sustaining costs1 3 135 2 681 Social expenditure (non-sustaining) 4 3 Exploration (non-sustaining) 22 12 Capital expenditure (exploration, abnormal expenditure and shaft capital) (non-sustaining) 286 259 Other (non-sustaining) 11 — Total all-in costs1 3 458 2 955 Per ounce calculation: Ounces sold 1 428 071 1 485 136 Total all-in costs per ounce1 2 420 1 989 1 Refer to note 25 of the condensed consolidated financial statements for further detail on restatement. NON-GAAP MEASURES (US$/IMPERIAL) Harmony Gold Mining Company Limited FY26 Results for the year ended 30 June 2026 28
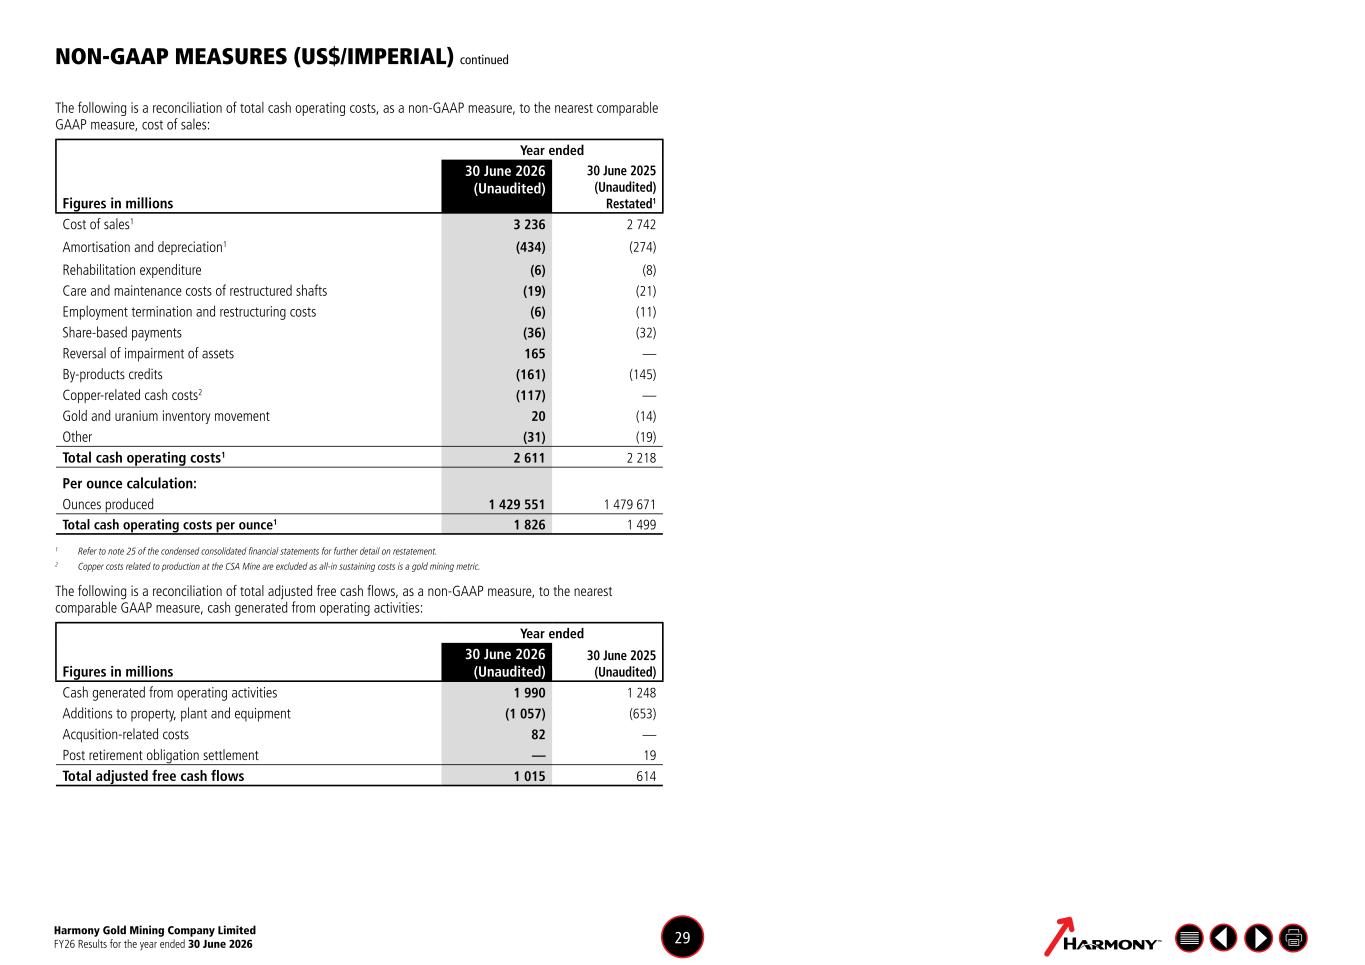
The following is a reconciliation of total cash operating costs, as a non-GAAP measure, to the nearest comparable GAAP measure, cost of sales: Year ended Figures in millions 30 June 2026 (Unaudited) 30 June 2025 (Unaudited) Restated1 Cost of sales1 3 236 2 742 Amortisation and depreciation1 (434) (274) Rehabilitation expenditure (6) (8) Care and maintenance costs of restructured shafts (19) (21) Employment termination and restructuring costs (6) (11) Share-based payments (36) (32) Reversal of impairment of assets 165 — By-products credits (161) (145) Copper-related cash costs2 (117) — Gold and uranium inventory movement 20 (14) Other (31) (19) Total cash operating costs1 2 611 2 218 Per ounce calculation: Ounces produced 1 429 551 1 479 671 Total cash operating costs per ounce1 1 826 1 499 1 Refer to note 25 of the condensed consolidated financial statements for further detail on restatement. 2 Copper costs related to production at the CSA Mine are excluded as all-in sustaining costs is a gold mining metric. The following is a reconciliation of total adjusted free cash flows, as a non-GAAP measure, to the nearest comparable GAAP measure, cash generated from operating activities: Year ended Figures in millions 30 June 2026 (Unaudited) 30 June 2025 (Unaudited) Cash generated from operating activities 1 990 1 248 Additions to property, plant and equipment (1 057) (653) Acqusition-related costs 82 — Post retirement obligation settlement — 19 Total adjusted free cash flows 1 015 614 NON-GAAP MEASURES (US$/IMPERIAL) continued Harmony Gold Mining Company Limited FY26 Results for the year ended 30 June 2026 29
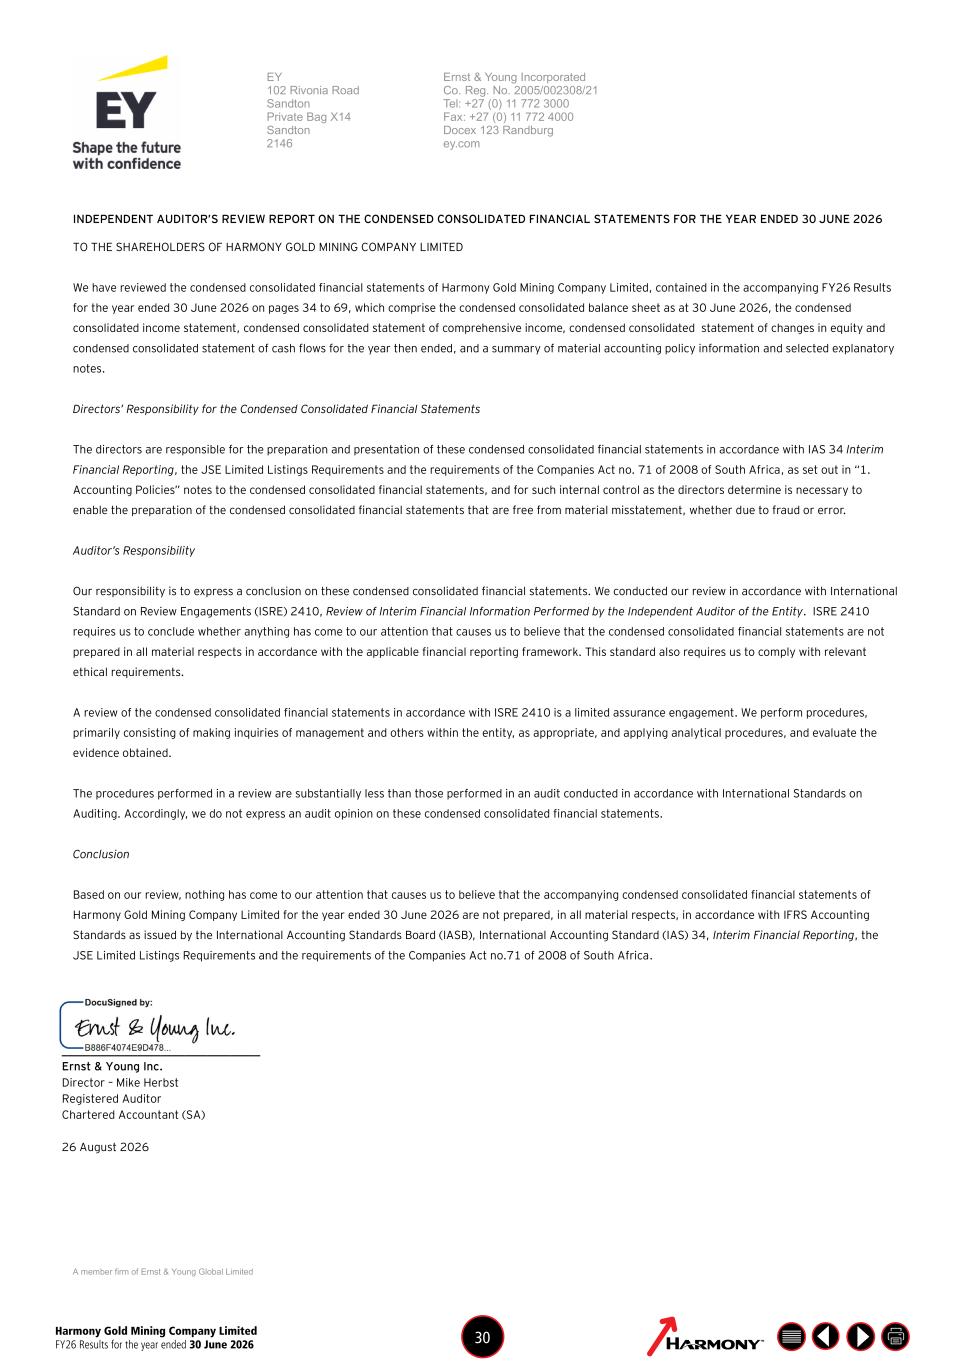
Harmony Gold Mining Company Limited FY26 Results for the year ended 30 June 2026 30 A member firm of Ernst & Young Global Limited EY 102 Rivonia Road Sandton Private Bag X14 Sandton 2146 Ernst & Young Incorporated Co. Reg. No. 2005/002308/21 Tel: +27 (0) 11 772 3000 Fax: +27 (0) 11 772 4000 Docex 123 Randburg ey.com INDEPENDENT AUDITOR’S REVIEW REPORT ON THE CONDENSED CONSOLIDATED FINANCIAL STATEMENTS FOR THE YEAR ENDED 30 JUNE 2026 TO THE SHAREHOLDERS OF HARMONY GOLD MINING COMPANY LIMITED We have reviewed the condensed consolidated financial statements of Harmony Gold Mining Company Limited, contained in the accompanying FY26 Results for the year ended 30 June 2026 on pages 34 to 69, which comprise the condensed consolidated balance sheet as at 30 June 2026, the condensed consolidated income statement, condensed consolidated statement of comprehensive income, condensed consolidated statement of changes in equity and condensed consolidated statement of cash flows for the year then ended, and a summary of material accounting policy information and selected explanatory notes. Directors’ Responsibility for the Condensed Consolidated Financial Statements The directors are responsible for the preparation and presentation of these condensed consolidated financial statements in accordance with IAS 34 Interim Financial Reporting, the JSE Limited Listings Requirements and the requirements of the Companies Act no. 71 of 2008 of South Africa, as set out in “1. Accounting Policies” notes to the condensed consolidated financial statements, and for such internal control as the directors determine is necessary to enable the preparation of the condensed consolidated financial statements that are free from material misstatement, whether due to fraud or error. Auditor’s Responsibility Our responsibility is to express a conclusion on these condensed consolidated financial statements. We conducted our review in accordance with International Standard on Review Engagements (ISRE) 2410, Review of Interim Financial Information Performed by the Independent Auditor of the Entity. ISRE 2410 requires us to conclude whether anything has come to our attention that causes us to believe that the condensed consolidated financial statements are not prepared in all material respects in accordance with the applicable financial reporting framework. This standard also requires us to comply with relevant ethical requirements. A review of the condensed consolidated financial statements in accordance with ISRE 2410 is a limited assurance engagement. We perform procedures, primarily consisting of making inquiries of management and others within the entity, as appropriate, and applying analytical procedures, and evaluate the evidence obtained. The procedures performed in a review are substantially less than those performed in an audit conducted in accordance with International Standards on Auditing. Accordingly, we do not express an audit opinion on these condensed consolidated financial statements. Conclusion Based on our review, nothing has come to our attention that causes us to believe that the accompanying condensed consolidated financial statements of Harmony Gold Mining Company Limited for the year ended 30 June 2026 are not prepared, in all material respects, in accordance with IFRS Accounting Standards as issued by the International Accounting Standards Board (IASB), International Accounting Standard (IAS) 34, Interim Financial Reporting, the JSE Limited Listings Requirements and the requirements of the Companies Act no.71 of 2008 of South Africa. __________________________________ Ernst & Young Inc. Director – Mike Herbst Registered Auditor Chartered Accountant (SA) 26 August 2026
Harmony Gold Mining Company Limited FY26 Results for the year ended 30 June 2026 31 A member firm of Ernst & Young Global Limited EY 102 Rivonia Road Sandton Private Bag X14 Sandton 2146 Ernst & Young Incorporated Co. Reg. No. 2005/002308/21 Tel: +27 (0) 11 772 3000 Fax: +27 (0) 11 772 4000 Docex 123 Randburg ey.com Independent Auditor’s Assurance Report on the Compilation of the Pro forma Financial Information included in the FY26 Results for the year ended 30 June 2026 To the Directors of Harmony Gold Mining Company Limited We have completed our assurance engagement to report on the compilation of pro forma financial information of Harmony Gold Mining Company Ltd (“Harmony”) and its subsidiaries (collectively, the “Group”), by the directors. The pro forma financial information, as set out in the FY26 Results for the year ended 30 June 2026 consists of the: • Adjusted free cash flow; • Adjusted free cash flows margin; • Cash operating costs; • Total all-in sustaining costs; • Total all-in costs; and • Convenience translations including the notes thereto (collectively the “Pro forma Financial Information”). The applicable criteria on the basis of which the directors have compiled the Pro forma Financial Information are specified in the JSE Limited Listings Requirements and described in the FY26 Results for the year ended 30 June 2026. The Pro forma Financial Information has been compiled by the directors to illustrate the impact of certain adjustments on the Group’s financial position as at 30 June 2026 and financial performance for the year then ended. As part of this process, information about the Group’s financial position and financial performance has been extracted by the directors from the Group’s condensed consolidated financial statements for the year ended 30 June 2026, on which an auditor’s report was issued on 26 August 2026. Directors’ Responsibility for the Pro forma Financial Information The directors are responsible for compiling the Pro forma Financial Information on the basis of the applicable criteria specified in the JSE Listings Requirements and described and described in the FY26 Results for the year ended 30 June 2026. Our Independence and Quality Management We are required to comply with the independence and other ethical requirements of the Code of Professional Conduct for Registered Auditors issued by the Independent Regulatory Board for Auditors (IRBA Code), which is founded on fundamental principles of integrity, objectivity, professional competence and due care, confidentiality and professional behaviour. The IRBA Code is consistent with the corresponding sections of the International Ethics Standards Board for Accountants’ International Code of Ethics for Professional Accountants (including International Independence Standards). The firm applies International Standard on Quality Management 1 (ISQM 1) Quality Management for Firms that Perform Audits or Reviews of Financial Statements, or Other Assurance or Related Services
Harmony Gold Mining Company Limited FY26 Results for the year ended 30 June 2026 32 A member firm of Ernst & Young Global Limited Engagements which requires the firm to design, implement and operate a system of quality management, including documented policies or procedures regarding compliance with ethical requirements, professional standards and applicable legal and regulatory requirements. Independent Auditor’s Responsibility Our responsibility is to express an opinion about whether the Pro forma Financial Information has been compiled, in all material respects, by the directors on the basis specified in the JSE Listings Requirements and described in the FY26 Results for the year ended 30 June 2026, based on our procedures performed. We conducted our engagement in accordance with the International Standard on Assurance Engagements (ISAE) 3420, Assurance Engagements to Report on the Compilation of Pro forma Financial Information Included in a Prospectus, which is applicable to an engagement of this nature, issued by the International Auditing and Assurance Standards Board. This standard requires that we comply with ethical requirements and plan and perform our procedures to obtain reasonable assurance about whether the Pro forma Financial Information has been compiled, in all material respects, on the basis specified in the JSE Listings Requirements and described in the FY26 Results for the year ended 30 June 2026. For purposes of this engagement, we are not responsible for updating or reissuing any reports or opinions on any historical financial information used in compiling the Pro forma Financial Information, nor have we, in the course of this engagement, performed an audit or review of the financial information used in compiling the Pro forma Financial Information. The purpose of the Pro forma Financial Information included in the document and described in the FY26 Results for the year ended 30 June 2026 is to illustrate how the unadjusted financial information of the entity has been impacted by the pro forma adjustments, as described in the section entitled Non-GAAP Measures (Rand/Metric). Accordingly, we do not provide any assurance that the actual outcome of the convenience translation at the specified date would have been as presented. A reasonable assurance engagement to report on whether the Pro forma Financial Information has been compiled, in all material respects, on the basis of the applicable criteria involves performing procedures to assess whether the applicable criteria involves performing procedures to assess whether the applicable criteria used by the directors in the compilation of the Pro forma Financial Information provides a reasonable basis for presenting the significant effects directly attributable to the adjustments made, and to obtain sufficient appropriate evidence about whether: • The related pro forma adjustments give appropriate effect to those criteria; and • The Pro forma Financial Information reflects the proper application of those adjustments to the unadjusted financial information. Our procedures selected depend on our judgment, having regard to our understanding of the nature of the Group, the adjustment made in respect of which the Pro forma Financial Information has been compiled, and other relevant engagement circumstances. Our engagement also involves evaluating the overall presentation of the Pro forma Financial Information.
Harmony Gold Mining Company Limited FY26 Results for the year ended 30 June 2026 33 A member firm of Ernst & Young Global Limited We believe that the evidence we have obtained is sufficient and appropriate to provide a basis for our opinion. Opinion In our opinion, the Pro forma Financial Information has been compiled, in all material respects, on the basis of the applicable criteria specified in the JSE Listings Requirements and described within the Non-GAAP Measures (Rand/Metric) on pages 23 and 24, 28 and 29 and the US dollar convenience financial information included in these condensed financial statements on pages 70 to 74 of the FY26 Results for the year ended 30 June 2026. ____________________ Ernst & Young Inc. Director: Mike Herbst Chartered Accountant (SA) Registered Auditor 26 August 2026
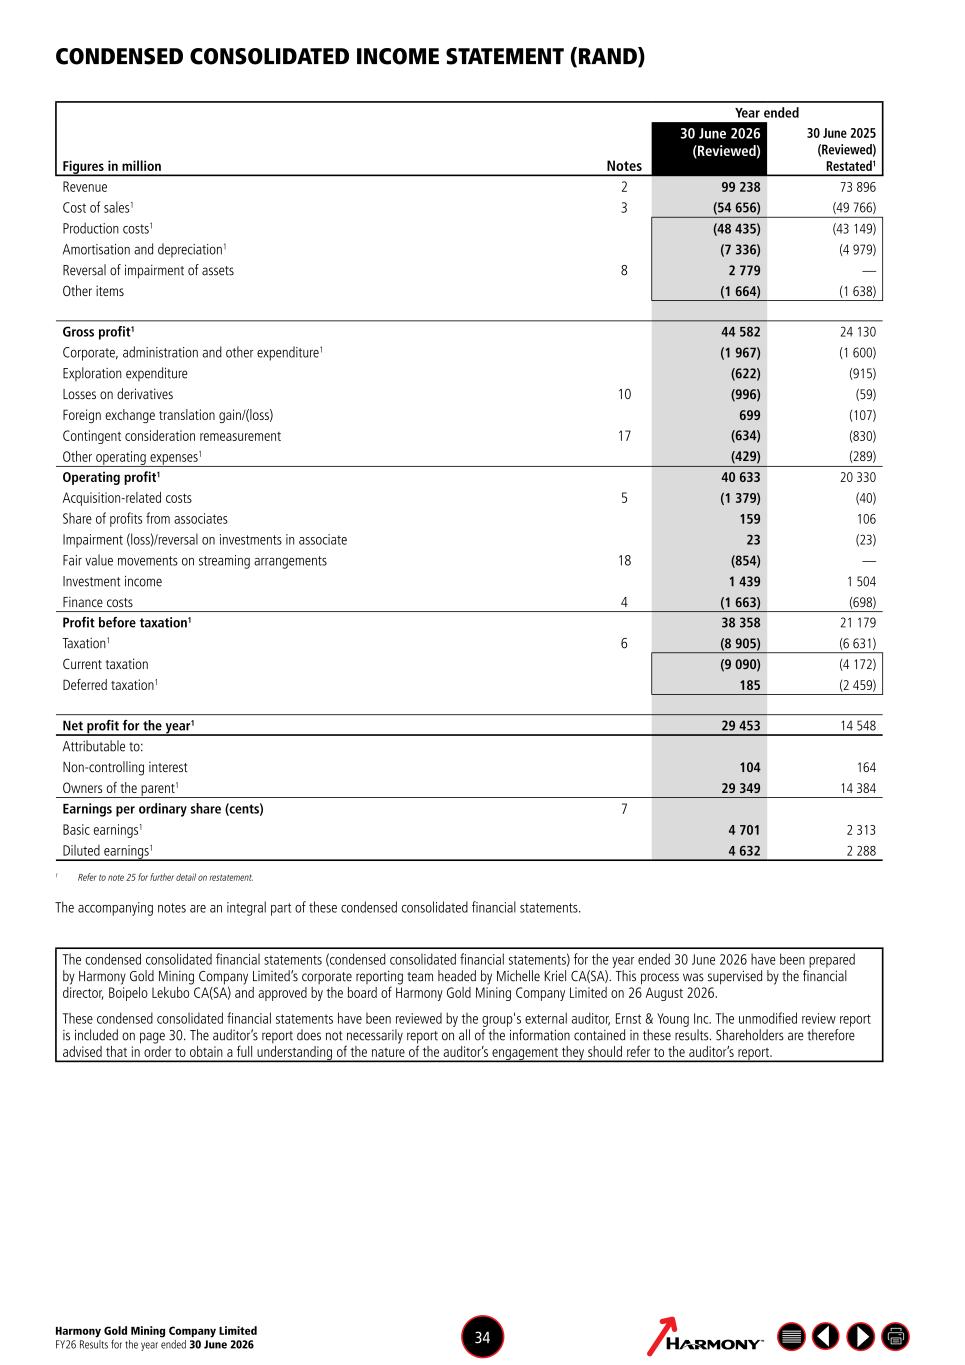
Harmony Gold Mining Company Limited FY26 Results for the year ended 30 June 2026 34 CONDENSED CONSOLIDATED INCOME STATEMENT (RAND) Year ended Figures in million Notes 30 June 2026 (Reviewed) 30 June 2025 (Reviewed) Restated1 Revenue 2 99 238 73 896 Cost of sales1 3 (54 656) (49 766) Production costs1 (48 435) (43 149) Amortisation and depreciation1 (7 336) (4 979) Reversal of impairment of assets 8 2 779 — Other items (1 664) (1 638) Gross profit1 44 582 24 130 Corporate, administration and other expenditure1 (1 967) (1 600) Exploration expenditure (622) (915) Losses on derivatives 10 (996) (59) Foreign exchange translation gain/(loss) 699 (107) Contingent consideration remeasurement 17 (634) (830) Other operating expenses1 (429) (289) Operating profit1 40 633 20 330 Acquisition-related costs 5 (1 379) (40) Share of profits from associates 159 106 Impairment (loss)/reversal on investments in associate 23 (23) Fair value movements on streaming arrangements 18 (854) — Investment income 1 439 1 504 Finance costs 4 (1 663) (698) Profit before taxation1 38 358 21 179 Taxation1 6 (8 905) (6 631) Current taxation (9 090) (4 172) Deferred taxation1 185 (2 459) Net profit for the year1 29 453 14 548 Attributable to: Non-controlling interest 104 164 Owners of the parent1 29 349 14 384 Earnings per ordinary share (cents) 7 Basic earnings1 4 701 2 313 Diluted earnings1 4 632 2 288 1 Refer to note 25 for further detail on restatement. The accompanying notes are an integral part of these condensed consolidated financial statements. The condensed consolidated financial statements (condensed consolidated financial statements) for the year ended 30 June 2026 have been prepared by Harmony Gold Mining Company Limited’s corporate reporting team headed by Michelle Kriel CA(SA). This process was supervised by the financial director, Boipelo Lekubo CA(SA) and approved by the board of Harmony Gold Mining Company Limited on 26 August 2026. These condensed consolidated financial statements have been reviewed by the group's external auditor, Ernst & Young Inc. The unmodified review report is included on page 30. The auditor’s report does not necessarily report on all of the information contained in these results. Shareholders are therefore advised that in order to obtain a full understanding of the nature of the auditor’s engagement they should refer to the auditor’s report.
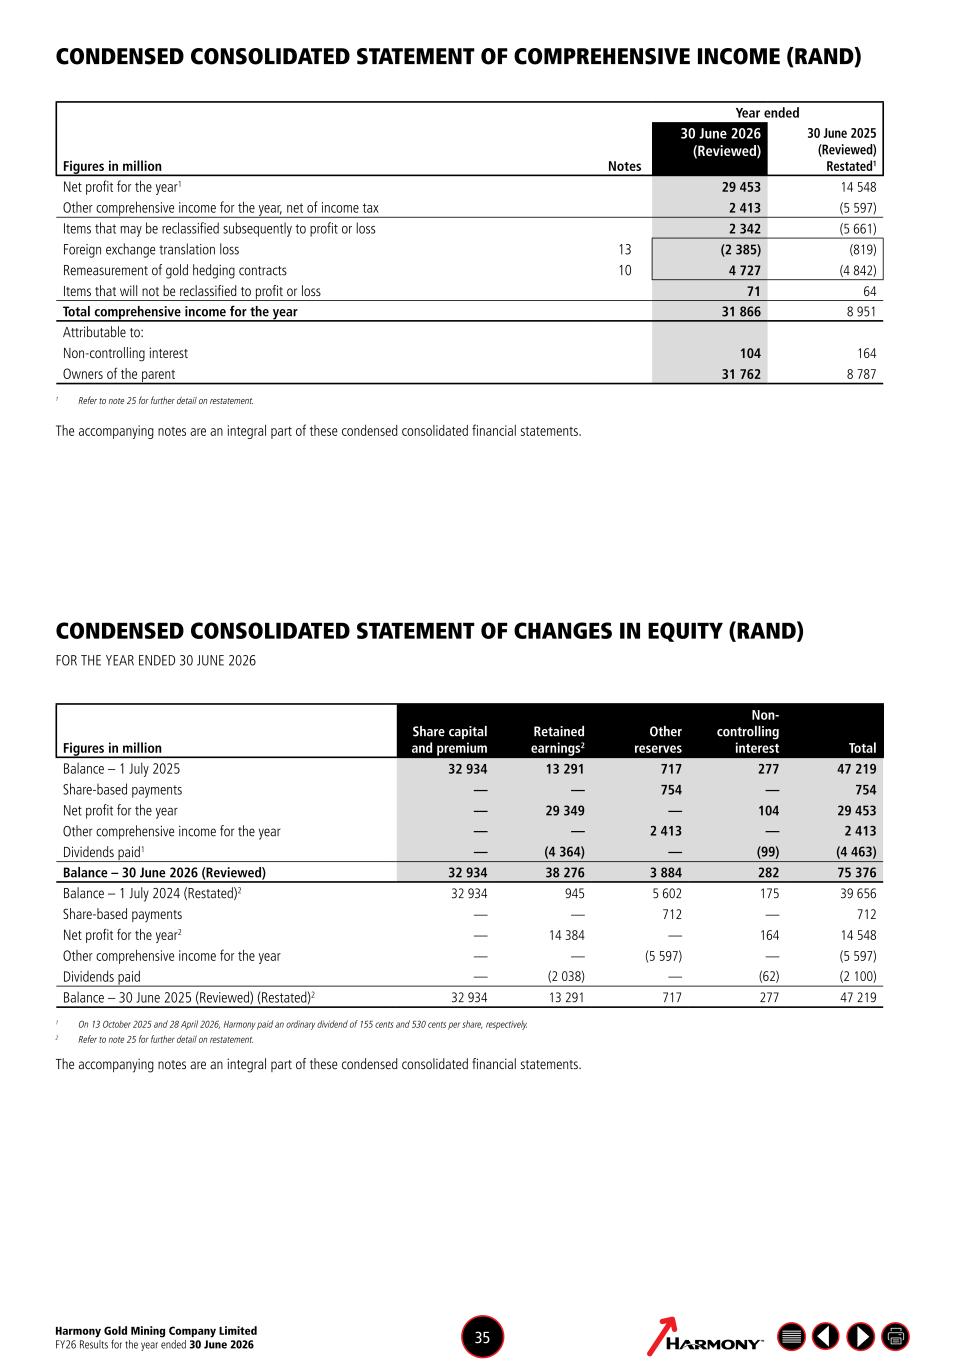
Harmony Gold Mining Company Limited FY26 Results for the year ended 30 June 2026 35 Year ended Figures in million Notes 30 June 2026 (Reviewed) 30 June 2025 (Reviewed) Restated1 Net profit for the year1 29 453 14 548 Other comprehensive income for the year, net of income tax 2 413 (5 597) Items that may be reclassified subsequently to profit or loss 2 342 (5 661) Foreign exchange translation loss 13 (2 385) (819) Remeasurement of gold hedging contracts 10 4 727 (4 842) Items that will not be reclassified to profit or loss 71 64 Total comprehensive income for the year 31 866 8 951 Attributable to: Non-controlling interest 104 164 Owners of the parent 31 762 8 787 1 Refer to note 25 for further detail on restatement. The accompanying notes are an integral part of these condensed consolidated financial statements. Figures in million Share capital and premium Retained earnings2 Other reserves Non- controlling interest Total Balance – 1 July 2025 32 934 13 291 717 277 47 219 Share-based payments — — 754 — 754 Net profit for the year — 29 349 — 104 29 453 Other comprehensive income for the year — — 2 413 — 2 413 Dividends paid1 — (4 364) — (99) (4 463) Balance – 30 June 2026 (Reviewed) 32 934 38 276 3 884 282 75 376 Balance – 1 July 2024 (Restated)2 32 934 945 5 602 175 39 656 Share-based payments — — 712 — 712 Net profit for the year2 — 14 384 — 164 14 548 Other comprehensive income for the year — — (5 597) — (5 597) Dividends paid — (2 038) — (62) (2 100) Balance – 30 June 2025 (Reviewed) (Restated)2 32 934 13 291 717 277 47 219 1 On 13 October 2025 and 28 April 2026, Harmony paid an ordinary dividend of 155 cents and 530 cents per share, respectively. 2 Refer to note 25 for further detail on restatement. The accompanying notes are an integral part of these condensed consolidated financial statements. CONDENSED CONSOLIDATED STATEMENT OF COMPREHENSIVE INCOME (RAND) CONDENSED CONSOLIDATED STATEMENT OF CHANGES IN EQUITY (RAND) FOR THE YEAR ENDED 30 JUNE 2026
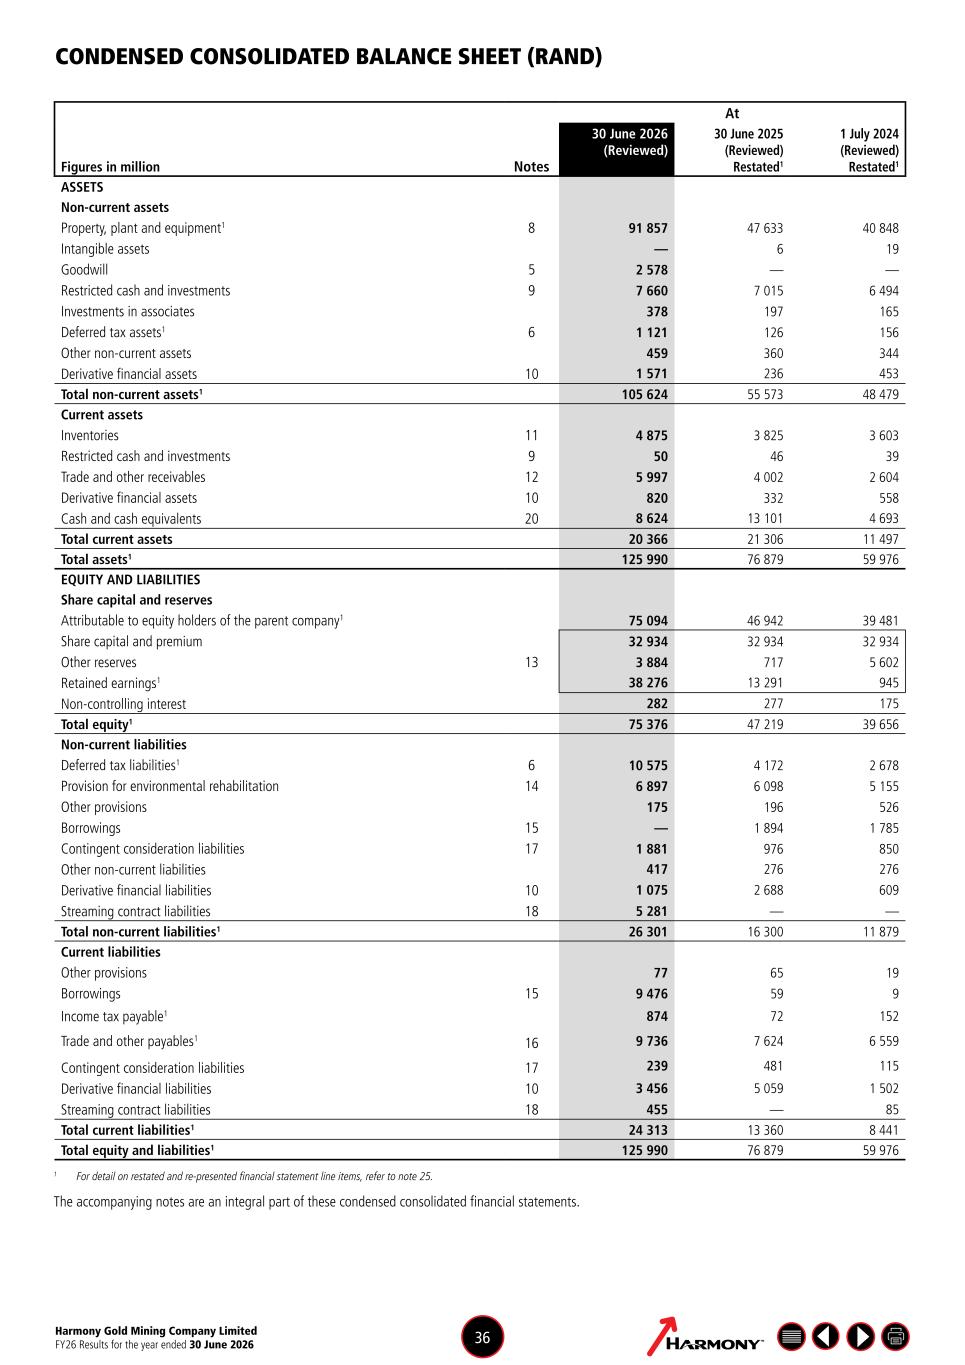
Harmony Gold Mining Company Limited FY26 Results for the year ended 30 June 2026 36 CONDENSED CONSOLIDATED BALANCE SHEET (RAND) At Figures in million Notes 30 June 2026 (Reviewed) 30 June 2025 (Reviewed) Restated1 1 July 2024 (Reviewed) Restated1 ASSETS Non-current assets Property, plant and equipment1 8 91 857 47 633 40 848 Intangible assets — 6 19 Goodwill 5 2 578 — — Restricted cash and investments 9 7 660 7 015 6 494 Investments in associates 378 197 165 Deferred tax assets1 6 1 121 126 156 Other non-current assets 459 360 344 Derivative financial assets 10 1 571 236 453 Total non-current assets1 105 624 55 573 48 479 Current assets Inventories 11 4 875 3 825 3 603 Restricted cash and investments 9 50 46 39 Trade and other receivables 12 5 997 4 002 2 604 Derivative financial assets 10 820 332 558 Cash and cash equivalents 20 8 624 13 101 4 693 Total current assets 20 366 21 306 11 497 Total assets1 125 990 76 879 59 976 EQUITY AND LIABILITIES Share capital and reserves Attributable to equity holders of the parent company1 75 094 46 942 39 481 Share capital and premium 32 934 32 934 32 934 Other reserves 13 3 884 717 5 602 Retained earnings1 38 276 13 291 945 Non-controlling interest 282 277 175 Total equity1 75 376 47 219 39 656 Non-current liabilities Deferred tax liabilities1 6 10 575 4 172 2 678 Provision for environmental rehabilitation 14 6 897 6 098 5 155 Other provisions 175 196 526 Borrowings 15 — 1 894 1 785 Contingent consideration liabilities 17 1 881 976 850 Other non-current liabilities 417 276 276 Derivative financial liabilities 10 1 075 2 688 609 Streaming contract liabilities 18 5 281 — — Total non-current liabilities1 26 301 16 300 11 879 Current liabilities Other provisions 77 65 19 Borrowings 15 9 476 59 9 Income tax payable1 874 72 152 Trade and other payables1 16 9 736 7 624 6 559 Contingent consideration liabilities 17 239 481 115 Derivative financial liabilities 10 3 456 5 059 1 502 Streaming contract liabilities 18 455 — 85 Total current liabilities1 24 313 13 360 8 441 Total equity and liabilities1 125 990 76 879 59 976 1 For detail on restated and re-presented financial statement line items, refer to note 25. The accompanying notes are an integral part of these condensed consolidated financial statements.
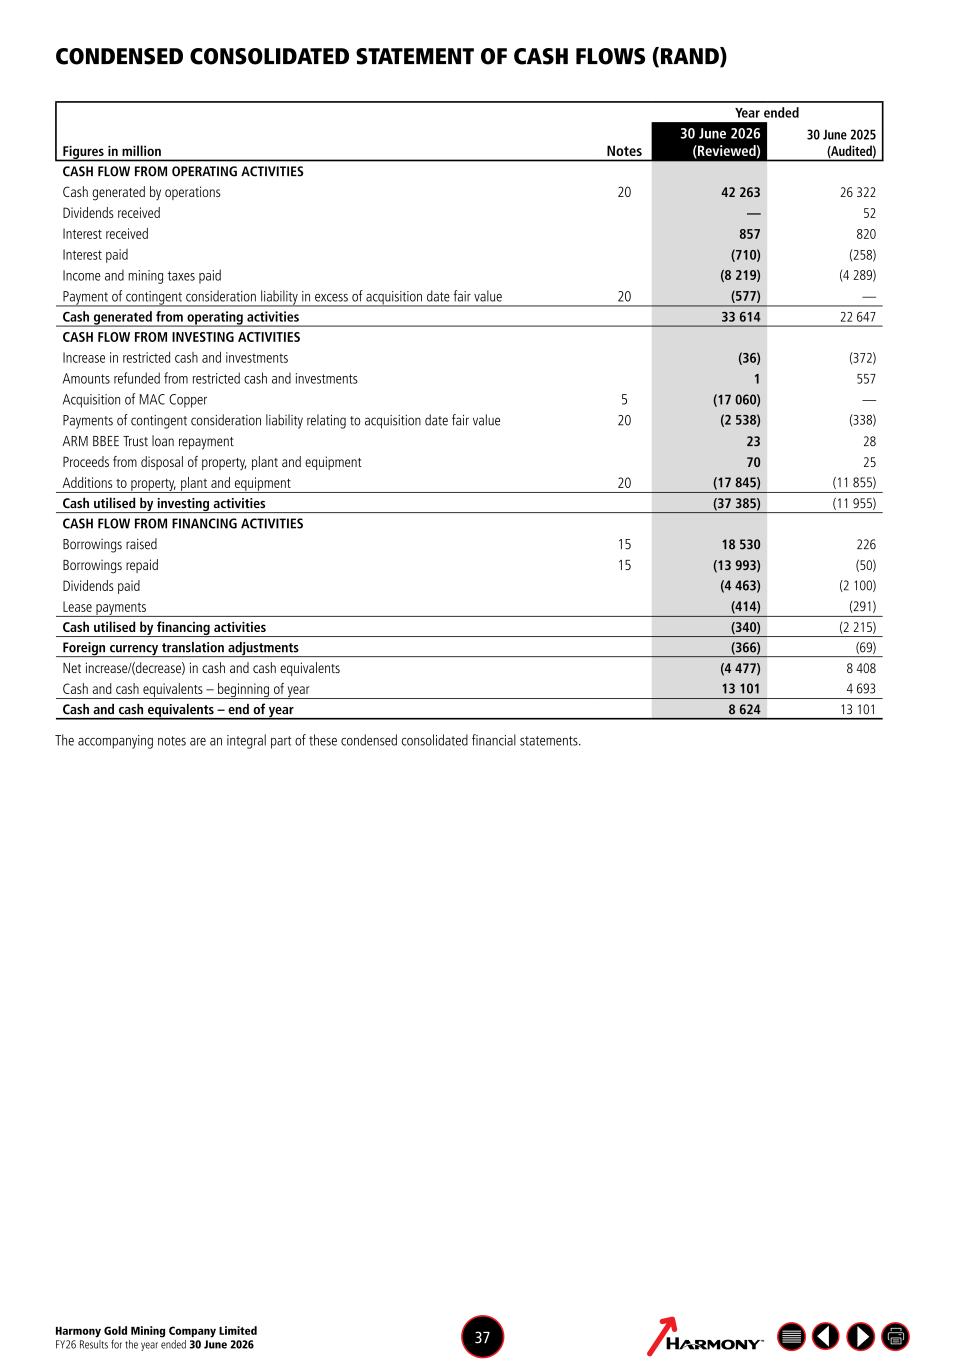
Harmony Gold Mining Company Limited FY26 Results for the year ended 30 June 2026 37 CONDENSED CONSOLIDATED STATEMENT OF CASH FLOWS (RAND) Year ended Figures in million Notes 30 June 2026 (Reviewed) 30 June 2025 (Audited) CASH FLOW FROM OPERATING ACTIVITIES Cash generated by operations 20 42 263 26 322 Dividends received — 52 Interest received 857 820 Interest paid (710) (258) Income and mining taxes paid (8 219) (4 289) Payment of contingent consideration liability in excess of acquisition date fair value 20 (577) — Cash generated from operating activities 33 614 22 647 CASH FLOW FROM INVESTING ACTIVITIES Increase in restricted cash and investments (36) (372) Amounts refunded from restricted cash and investments 1 557 Acquisition of MAC Copper 5 (17 060) — Payments of contingent consideration liability relating to acquisition date fair value 20 (2 538) (338) ARM BBEE Trust loan repayment 23 28 Proceeds from disposal of property, plant and equipment 70 25 Additions to property, plant and equipment 20 (17 845) (11 855) Cash utilised by investing activities (37 385) (11 955) CASH FLOW FROM FINANCING ACTIVITIES Borrowings raised 15 18 530 226 Borrowings repaid 15 (13 993) (50) Dividends paid (4 463) (2 100) Lease payments (414) (291) Cash utilised by financing activities (340) (2 215) Foreign currency translation adjustments (366) (69) Net increase/(decrease) in cash and cash equivalents (4 477) 8 408 Cash and cash equivalents – beginning of year 13 101 4 693 Cash and cash equivalents – end of year 8 624 13 101 The accompanying notes are an integral part of these condensed consolidated financial statements.
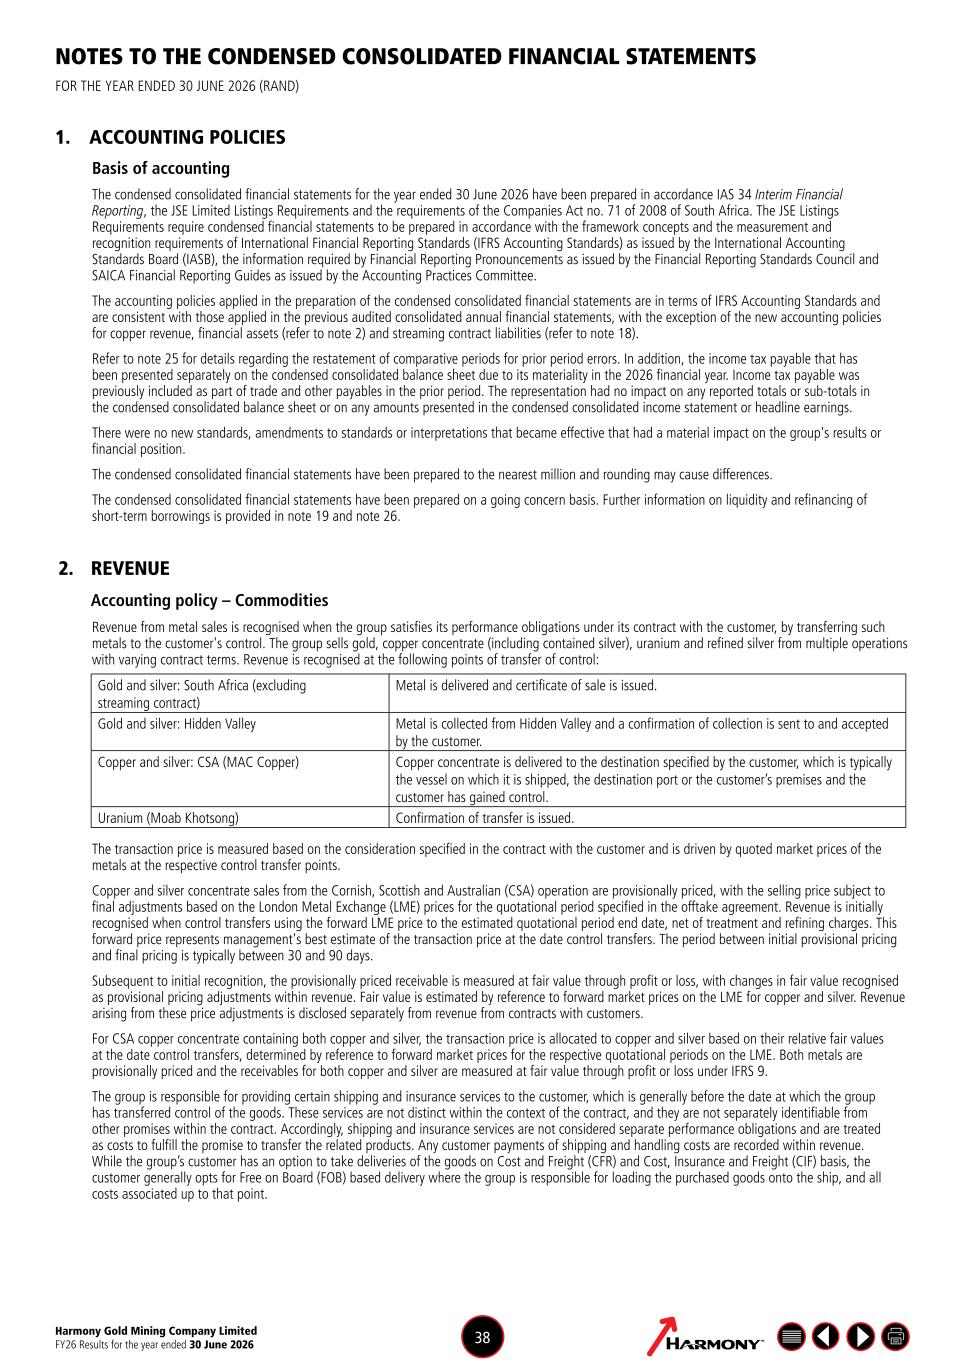
Harmony Gold Mining Company Limited FY26 Results for the year ended 30 June 2026 38 NOTES TO THE CONDENSED CONSOLIDATED FINANCIAL STATEMENTS FOR THE YEAR ENDED 30 JUNE 2026 (RAND) 1. ACCOUNTING POLICIES Basis of accounting The condensed consolidated financial statements for the year ended 30 June 2026 have been prepared in accordance IAS 34 Interim Financial Reporting, the JSE Limited Listings Requirements and the requirements of the Companies Act no. 71 of 2008 of South Africa. The JSE Listings Requirements require condensed financial statements to be prepared in accordance with the framework concepts and the measurement and recognition requirements of International Financial Reporting Standards (IFRS Accounting Standards) as issued by the International Accounting Standards Board (IASB), the information required by Financial Reporting Pronouncements as issued by the Financial Reporting Standards Council and SAICA Financial Reporting Guides as issued by the Accounting Practices Committee. The accounting policies applied in the preparation of the condensed consolidated financial statements are in terms of IFRS Accounting Standards and are consistent with those applied in the previous audited consolidated annual financial statements, with the exception of the new accounting policies for copper revenue, financial assets (refer to note 2) and streaming contract liabilities (refer to note 18). Refer to note 25 for details regarding the restatement of comparative periods for prior period errors. In addition, the income tax payable that has been presented separately on the condensed consolidated balance sheet due to its materiality in the 2026 financial year. Income tax payable was previously included as part of trade and other payables in the prior period. The representation had no impact on any reported totals or sub-totals in the condensed consolidated balance sheet or on any amounts presented in the condensed consolidated income statement or headline earnings. There were no new standards, amendments to standards or interpretations that became effective that had a material impact on the group's results or financial position. The condensed consolidated financial statements have been prepared to the nearest million and rounding may cause differences. The condensed consolidated financial statements have been prepared on a going concern basis. Further information on liquidity and refinancing of short-term borrowings is provided in note 19 and note 26. 2. REVENUE Accounting policy – Commodities Revenue from metal sales is recognised when the group satisfies its performance obligations under its contract with the customer, by transferring such metals to the customer's control. The group sells gold, copper concentrate (including contained silver), uranium and refined silver from multiple operations with varying contract terms. Revenue is recognised at the following points of transfer of control: Gold and silver: South Africa (excluding streaming contract) Metal is delivered and certificate of sale is issued. Gold and silver: Hidden Valley Metal is collected from Hidden Valley and a confirmation of collection is sent to and accepted by the customer. Copper and silver: CSA (MAC Copper) Copper concentrate is delivered to the destination specified by the customer, which is typically the vessel on which it is shipped, the destination port or the customer’s premises and the customer has gained control. Uranium (Moab Khotsong) Confirmation of transfer is issued. The transaction price is measured based on the consideration specified in the contract with the customer and is driven by quoted market prices of the metals at the respective control transfer points. Copper and silver concentrate sales from the Cornish, Scottish and Australian (CSA) operation are provisionally priced, with the selling price subject to final adjustments based on the London Metal Exchange (LME) prices for the quotational period specified in the offtake agreement. Revenue is initially recognised when control transfers using the forward LME price to the estimated quotational period end date, net of treatment and refining charges. This forward price represents management's best estimate of the transaction price at the date control transfers. The period between initial provisional pricing and final pricing is typically between 30 and 90 days. Subsequent to initial recognition, the provisionally priced receivable is measured at fair value through profit or loss, with changes in fair value recognised as provisional pricing adjustments within revenue. Fair value is estimated by reference to forward market prices on the LME for copper and silver. Revenue arising from these price adjustments is disclosed separately from revenue from contracts with customers. For CSA copper concentrate containing both copper and silver, the transaction price is allocated to copper and silver based on their relative fair values at the date control transfers, determined by reference to forward market prices for the respective quotational periods on the LME. Both metals are provisionally priced and the receivables for both copper and silver are measured at fair value through profit or loss under IFRS 9. The group is responsible for providing certain shipping and insurance services to the customer, which is generally before the date at which the group has transferred control of the goods. These services are not distinct within the context of the contract, and they are not separately identifiable from other promises within the contract. Accordingly, shipping and insurance services are not considered separate performance obligations and are treated as costs to fulfill the promise to transfer the related products. Any customer payments of shipping and handling costs are recorded within revenue. While the group’s customer has an option to take deliveries of the goods on Cost and Freight (CFR) and Cost, Insurance and Freight (CIF) basis, the customer generally opts for Free on Board (FOB) based delivery where the group is responsible for loading the purchased goods onto the ship, and all costs associated up to that point.
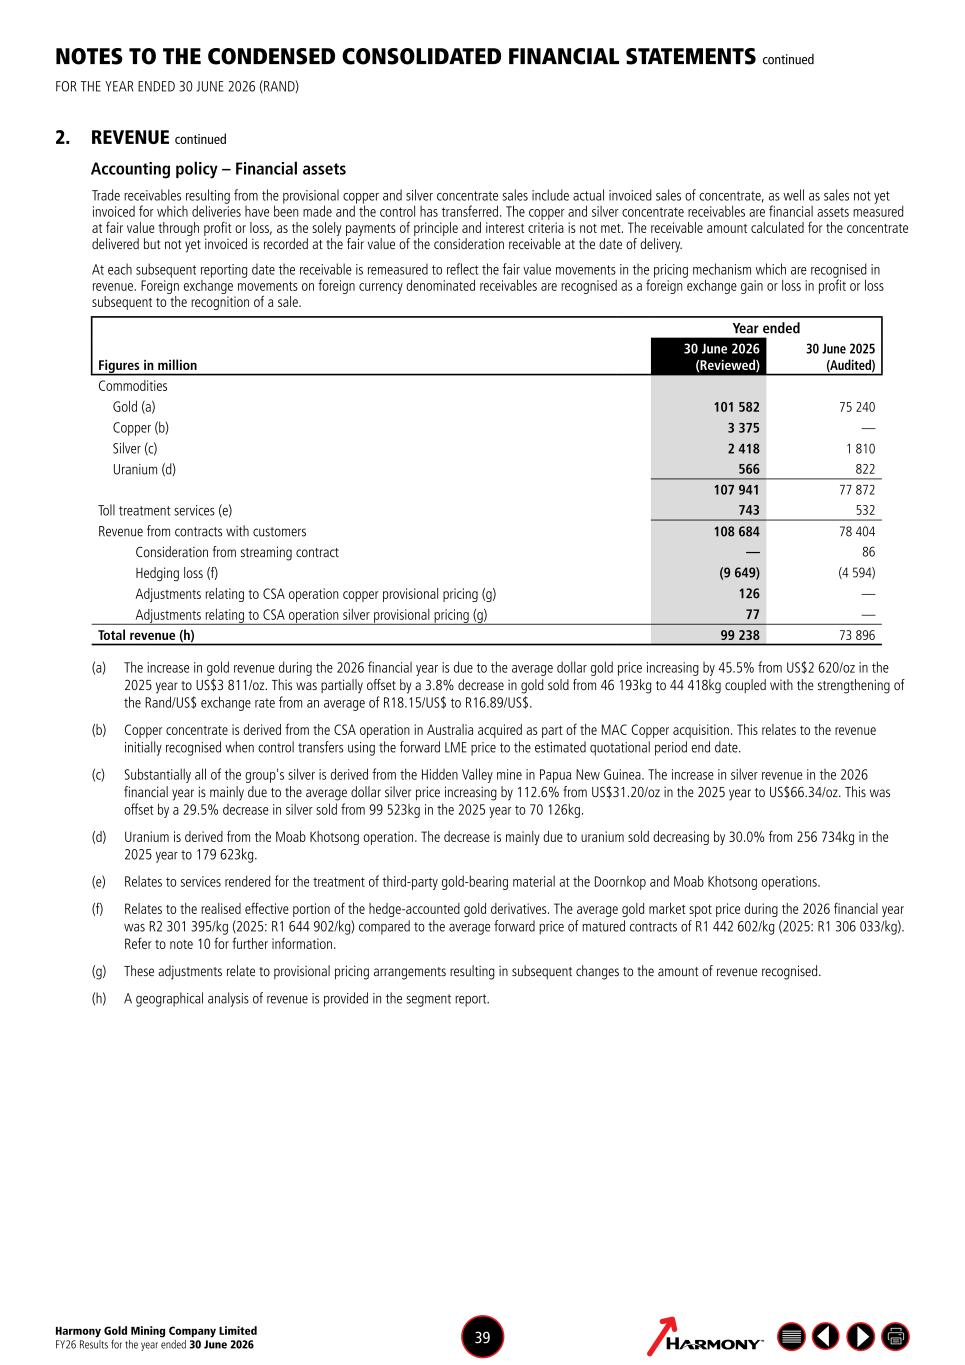
Harmony Gold Mining Company Limited FY26 Results for the year ended 30 June 2026 39 NOTES TO THE CONDENSED CONSOLIDATED FINANCIAL STATEMENTS continued FOR THE YEAR ENDED 30 JUNE 2026 (RAND) 2. REVENUE continued Accounting policy – Financial assets Trade receivables resulting from the provisional copper and silver concentrate sales include actual invoiced sales of concentrate, as well as sales not yet invoiced for which deliveries have been made and the control has transferred. The copper and silver concentrate receivables are financial assets measured at fair value through profit or loss, as the solely payments of principle and interest criteria is not met. The receivable amount calculated for the concentrate delivered but not yet invoiced is recorded at the fair value of the consideration receivable at the date of delivery. At each subsequent reporting date the receivable is remeasured to reflect the fair value movements in the pricing mechanism which are recognised in revenue. Foreign exchange movements on foreign currency denominated receivables are recognised as a foreign exchange gain or loss in profit or loss subsequent to the recognition of a sale. Year ended Figures in million 30 June 2026 (Reviewed) 30 June 2025 (Audited) Commodities Gold (a) 101 582 75 240 Copper (b) 3 375 — Silver (c) 2 418 1 810 Uranium (d) 566 822 107 941 77 872 Toll treatment services (e) 743 532 Revenue from contracts with customers 108 684 78 404 Consideration from streaming contract — 86 Hedging loss (f) (9 649) (4 594) Adjustments relating to CSA operation copper provisional pricing (g) 126 — Adjustments relating to CSA operation silver provisional pricing (g) 77 — Total revenue (h) 99 238 73 896 (a) The increase in gold revenue during the 2026 financial year is due to the average dollar gold price increasing by 45.5% from US$2 620/oz in the 2025 year to US$3 811/oz. This was partially offset by a 3.8% decrease in gold sold from 46 193kg to 44 418kg coupled with the strengthening of the Rand/US$ exchange rate from an average of R18.15/US$ to R16.89/US$. (b) Copper concentrate is derived from the CSA operation in Australia acquired as part of the MAC Copper acquisition. This relates to the revenue initially recognised when control transfers using the forward LME price to the estimated quotational period end date. (c) Substantially all of the group's silver is derived from the Hidden Valley mine in Papua New Guinea. The increase in silver revenue in the 2026 financial year is mainly due to the average dollar silver price increasing by 112.6% from US$31.20/oz in the 2025 year to US$66.34/oz. This was offset by a 29.5% decrease in silver sold from 99 523kg in the 2025 year to 70 126kg. (d) Uranium is derived from the Moab Khotsong operation. The decrease is mainly due to uranium sold decreasing by 30.0% from 256 734kg in the 2025 year to 179 623kg. (e) Relates to services rendered for the treatment of third-party gold-bearing material at the Doornkop and Moab Khotsong operations. (f) Relates to the realised effective portion of the hedge-accounted gold derivatives. The average gold market spot price during the 2026 financial year was R2 301 395/kg (2025: R1 644 902/kg) compared to the average forward price of matured contracts of R1 442 602/kg (2025: R1 306 033/kg). Refer to note 10 for further information. (g) These adjustments relate to provisional pricing arrangements resulting in subsequent changes to the amount of revenue recognised. (h) A geographical analysis of revenue is provided in the segment report.
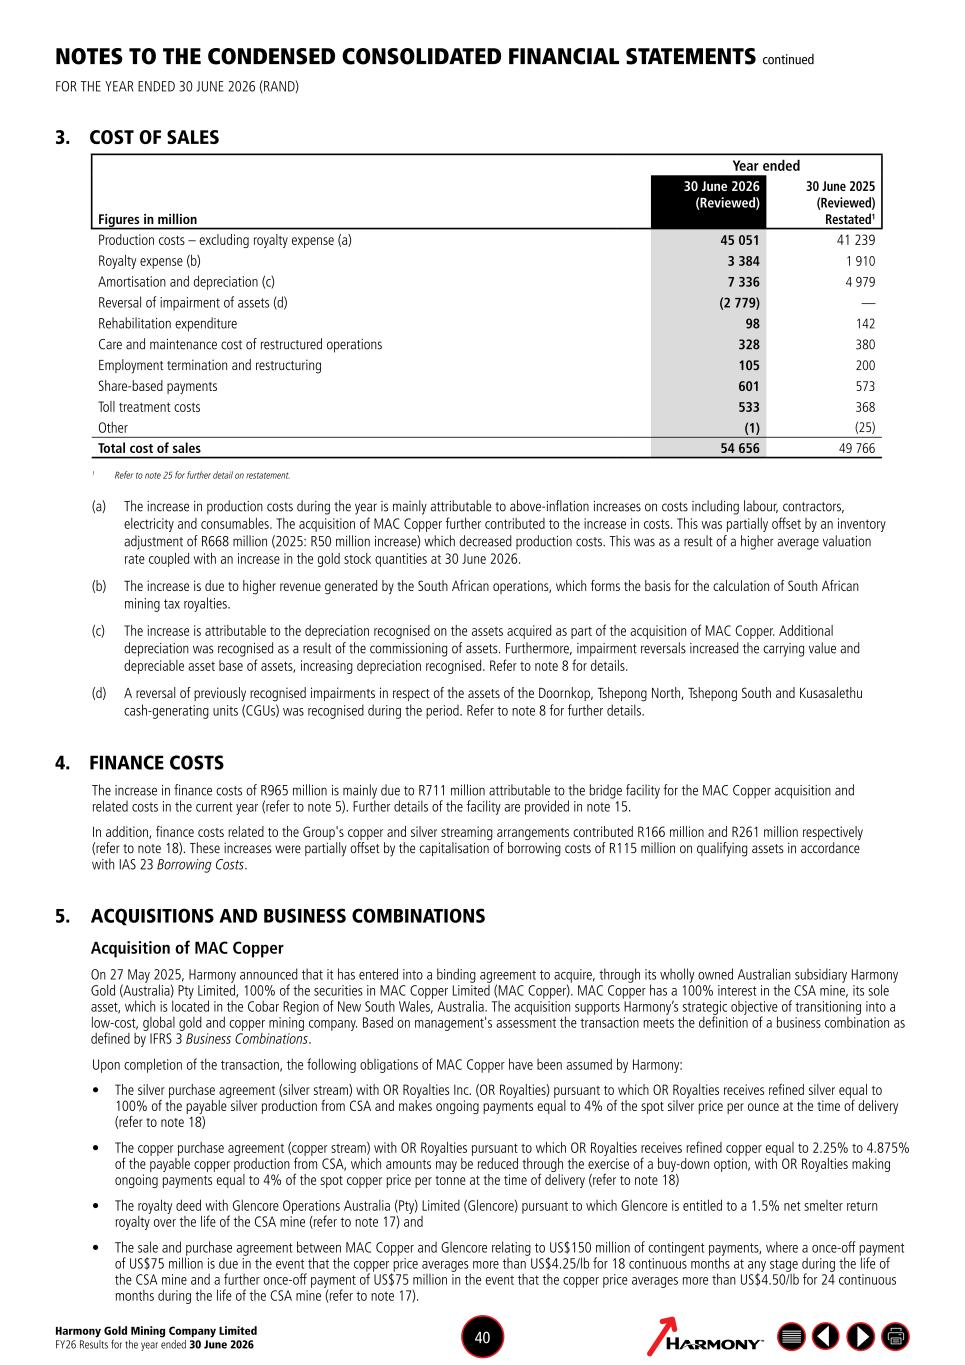
Harmony Gold Mining Company Limited FY26 Results for the year ended 30 June 2026 40 NOTES TO THE CONDENSED CONSOLIDATED FINANCIAL STATEMENTS continued FOR THE YEAR ENDED 30 JUNE 2026 (RAND) 3. COST OF SALES Year ended Figures in million 30 June 2026 (Reviewed) 30 June 2025 (Reviewed) Restated1 Production costs – excluding royalty expense (a) 45 051 41 239 Royalty expense (b) 3 384 1 910 Amortisation and depreciation (c) 7 336 4 979 Reversal of impairment of assets (d) (2 779) — Rehabilitation expenditure 98 142 Care and maintenance cost of restructured operations 328 380 Employment termination and restructuring 105 200 Share-based payments 601 573 Toll treatment costs 533 368 Other (1) (25) Total cost of sales 54 656 49 766 1 Refer to note 25 for further detail on restatement. (a) The increase in production costs during the year is mainly attributable to above-inflation increases on costs including labour, contractors, electricity and consumables. The acquisition of MAC Copper further contributed to the increase in costs. This was partially offset by an inventory adjustment of R668 million (2025: R50 million increase) which decreased production costs. This was as a result of a higher average valuation rate coupled with an increase in the gold stock quantities at 30 June 2026. (b) The increase is due to higher revenue generated by the South African operations, which forms the basis for the calculation of South African mining tax royalties. (c) The increase is attributable to the depreciation recognised on the assets acquired as part of the acquisition of MAC Copper. Additional depreciation was recognised as a result of the commissioning of assets. Furthermore, impairment reversals increased the carrying value and depreciable asset base of assets, increasing depreciation recognised. Refer to note 8 for details. (d) A reversal of previously recognised impairments in respect of the assets of the Doornkop, Tshepong North, Tshepong South and Kusasalethu cash-generating units (CGUs) was recognised during the period. Refer to note 8 for further details. 4. FINANCE COSTS The increase in finance costs of R965 million is mainly due to R711 million attributable to the bridge facility for the MAC Copper acquisition and related costs in the current year (refer to note 5). Further details of the facility are provided in note 15. In addition, finance costs related to the Group's copper and silver streaming arrangements contributed R166 million and R261 million respectively (refer to note 18). These increases were partially offset by the capitalisation of borrowing costs of R115 million on qualifying assets in accordance with IAS 23 Borrowing Costs. 5. ACQUISITIONS AND BUSINESS COMBINATIONS Acquisition of MAC Copper On 27 May 2025, Harmony announced that it has entered into a binding agreement to acquire, through its wholly owned Australian subsidiary Harmony Gold (Australia) Pty Limited, 100% of the securities in MAC Copper Limited (MAC Copper). MAC Copper has a 100% interest in the CSA mine, its sole asset, which is located in the Cobar Region of New South Wales, Australia. The acquisition supports Harmony’s strategic objective of transitioning into a low-cost, global gold and copper mining company. Based on management's assessment the transaction meets the definition of a business combination as defined by IFRS 3 Business Combinations. Upon completion of the transaction, the following obligations of MAC Copper have been assumed by Harmony: • The silver purchase agreement (silver stream) with OR Royalties Inc. (OR Royalties) pursuant to which OR Royalties receives refined silver equal to 100% of the payable silver production from CSA and makes ongoing payments equal to 4% of the spot silver price per ounce at the time of delivery (refer to note 18) • The copper purchase agreement (copper stream) with OR Royalties pursuant to which OR Royalties receives refined copper equal to 2.25% to 4.875% of the payable copper production from CSA, which amounts may be reduced through the exercise of a buy-down option, with OR Royalties making ongoing payments equal to 4% of the spot copper price per tonne at the time of delivery (refer to note 18) • The royalty deed with Glencore Operations Australia (Pty) Limited (Glencore) pursuant to which Glencore is entitled to a 1.5% net smelter return royalty over the life of the CSA mine (refer to note 17) and • The sale and purchase agreement between MAC Copper and Glencore relating to US$150 million of contingent payments, where a once-off payment of US$75 million is due in the event that the copper price averages more than US$4.25/lb for 18 continuous months at any stage during the life of the CSA mine and a further once-off payment of US$75 million in the event that the copper price averages more than US$4.50/lb for 24 continuous months during the life of the CSA mine (refer to note 17).
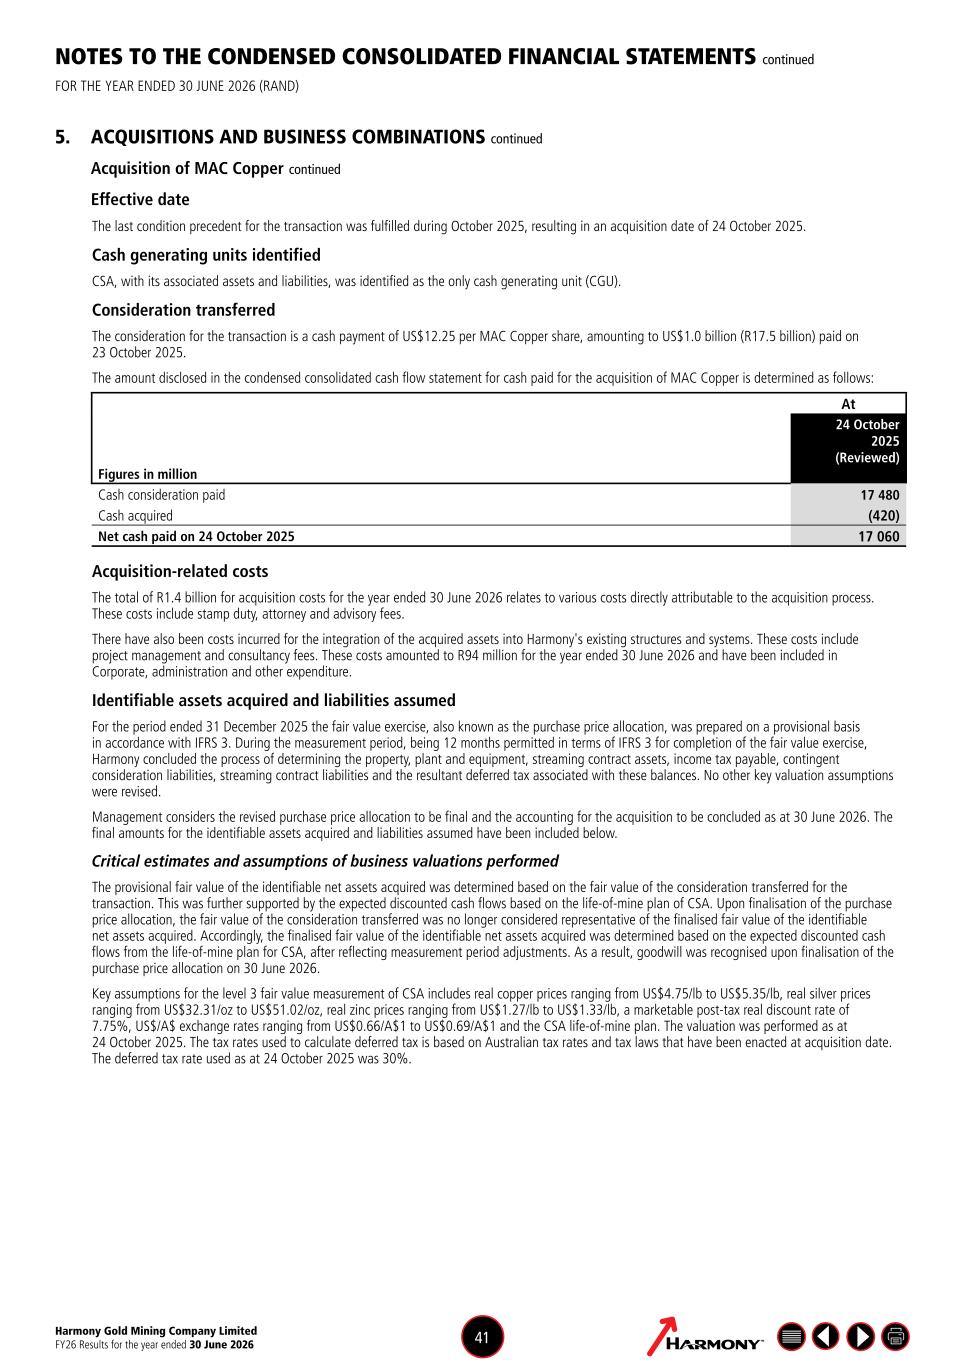
Harmony Gold Mining Company Limited FY26 Results for the year ended 30 June 2026 41 NOTES TO THE CONDENSED CONSOLIDATED FINANCIAL STATEMENTS continued FOR THE YEAR ENDED 30 JUNE 2026 (RAND) 5. ACQUISITIONS AND BUSINESS COMBINATIONS continued Acquisition of MAC Copper continued Effective date The last condition precedent for the transaction was fulfilled during October 2025, resulting in an acquisition date of 24 October 2025. Cash generating units identified CSA, with its associated assets and liabilities, was identified as the only cash generating unit (CGU). Consideration transferred The consideration for the transaction is a cash payment of US$12.25 per MAC Copper share, amounting to US$1.0 billion (R17.5 billion) paid on 23 October 2025. The amount disclosed in the condensed consolidated cash flow statement for cash paid for the acquisition of MAC Copper is determined as follows: At Figures in million 24 October 2025 (Reviewed) Cash consideration paid 17 480 Cash acquired (420) Net cash paid on 24 October 2025 17 060 Acquisition-related costs The total of R1.4 billion for acquisition costs for the year ended 30 June 2026 relates to various costs directly attributable to the acquisition process. These costs include stamp duty, attorney and advisory fees. There have also been costs incurred for the integration of the acquired assets into Harmony's existing structures and systems. These costs include project management and consultancy fees. These costs amounted to R94 million for the year ended 30 June 2026 and have been included in Corporate, administration and other expenditure. Identifiable assets acquired and liabilities assumed For the period ended 31 December 2025 the fair value exercise, also known as the purchase price allocation, was prepared on a provisional basis in accordance with IFRS 3. During the measurement period, being 12 months permitted in terms of IFRS 3 for completion of the fair value exercise, Harmony concluded the process of determining the property, plant and equipment, streaming contract assets, income tax payable, contingent consideration liabilities, streaming contract liabilities and the resultant deferred tax associated with these balances. No other key valuation assumptions were revised. Management considers the revised purchase price allocation to be final and the accounting for the acquisition to be concluded as at 30 June 2026. The final amounts for the identifiable assets acquired and liabilities assumed have been included below. Critical estimates and assumptions of business valuations performed The provisional fair value of the identifiable net assets acquired was determined based on the fair value of the consideration transferred for the transaction. This was further supported by the expected discounted cash flows based on the life-of-mine plan of CSA. Upon finalisation of the purchase price allocation, the fair value of the consideration transferred was no longer considered representative of the finalised fair value of the identifiable net assets acquired. Accordingly, the finalised fair value of the identifiable net assets acquired was determined based on the expected discounted cash flows from the life-of-mine plan for CSA, after reflecting measurement period adjustments. As a result, goodwill was recognised upon finalisation of the purchase price allocation on 30 June 2026. Key assumptions for the level 3 fair value measurement of CSA includes real copper prices ranging from US$4.75/lb to US$5.35/lb, real silver prices ranging from US$32.31/oz to US$51.02/oz, real zinc prices ranging from US$1.27/lb to US$1.33/lb, a marketable post-tax real discount rate of 7.75%, US$/A$ exchange rates ranging from US$0.66/A$1 to US$0.69/A$1 and the CSA life-of-mine plan. The valuation was performed as at 24 October 2025. The tax rates used to calculate deferred tax is based on Australian tax rates and tax laws that have been enacted at acquisition date. The deferred tax rate used as at 24 October 2025 was 30%.
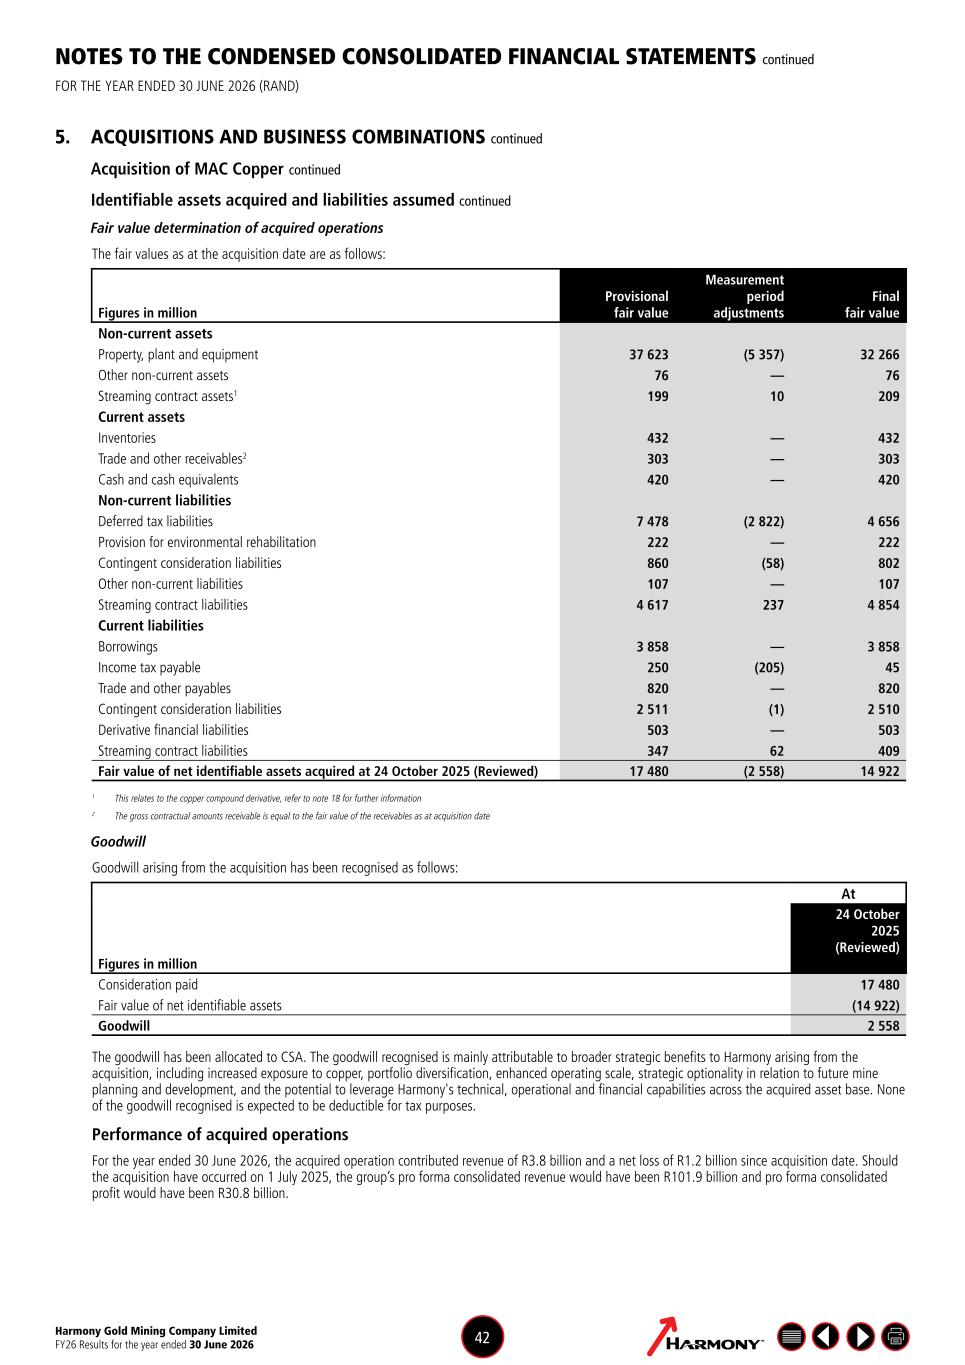
Harmony Gold Mining Company Limited FY26 Results for the year ended 30 June 2026 42 NOTES TO THE CONDENSED CONSOLIDATED FINANCIAL STATEMENTS continued FOR THE YEAR ENDED 30 JUNE 2026 (RAND) 5. ACQUISITIONS AND BUSINESS COMBINATIONS continued Acquisition of MAC Copper continued Identifiable assets acquired and liabilities assumed continued Fair value determination of acquired operations The fair values as at the acquisition date are as follows: Figures in million Provisional fair value Measurement period adjustments Final fair value Non-current assets Property, plant and equipment 37 623 (5 357) 32 266 Other non-current assets 76 — 76 Streaming contract assets1 199 10 209 Current assets Inventories 432 — 432 Trade and other receivables2 303 — 303 Cash and cash equivalents 420 — 420 Non-current liabilities Deferred tax liabilities 7 478 (2 822) 4 656 Provision for environmental rehabilitation 222 — 222 Contingent consideration liabilities 860 (58) 802 Other non-current liabilities 107 — 107 Streaming contract liabilities 4 617 237 4 854 Current liabilities Borrowings 3 858 — 3 858 Income tax payable 250 (205) 45 Trade and other payables 820 — 820 Contingent consideration liabilities 2 511 (1) 2 510 Derivative financial liabilities 503 — 503 Streaming contract liabilities 347 62 409 Fair value of net identifiable assets acquired at 24 October 2025 (Reviewed) 17 480 (2 558) 14 922 1 This relates to the copper compound derivative, refer to note 18 for further information 2 The gross contractual amounts receivable is equal to the fair value of the receivables as at acquisition date Goodwill Goodwill arising from the acquisition has been recognised as follows: At Figures in million 24 October 2025 (Reviewed) Consideration paid 17 480 Fair value of net identifiable assets (14 922) Goodwill 2 558 The goodwill has been allocated to CSA. The goodwill recognised is mainly attributable to broader strategic benefits to Harmony arising from the acquisition, including increased exposure to copper, portfolio diversification, enhanced operating scale, strategic optionality in relation to future mine planning and development, and the potential to leverage Harmony's technical, operational and financial capabilities across the acquired asset base. None of the goodwill recognised is expected to be deductible for tax purposes. Performance of acquired operations For the year ended 30 June 2026, the acquired operation contributed revenue of R3.8 billion and a net loss of R1.2 billion since acquisition date. Should the acquisition have occurred on 1 July 2025, the group’s pro forma consolidated revenue would have been R101.9 billion and pro forma consolidated profit would have been R30.8 billion.
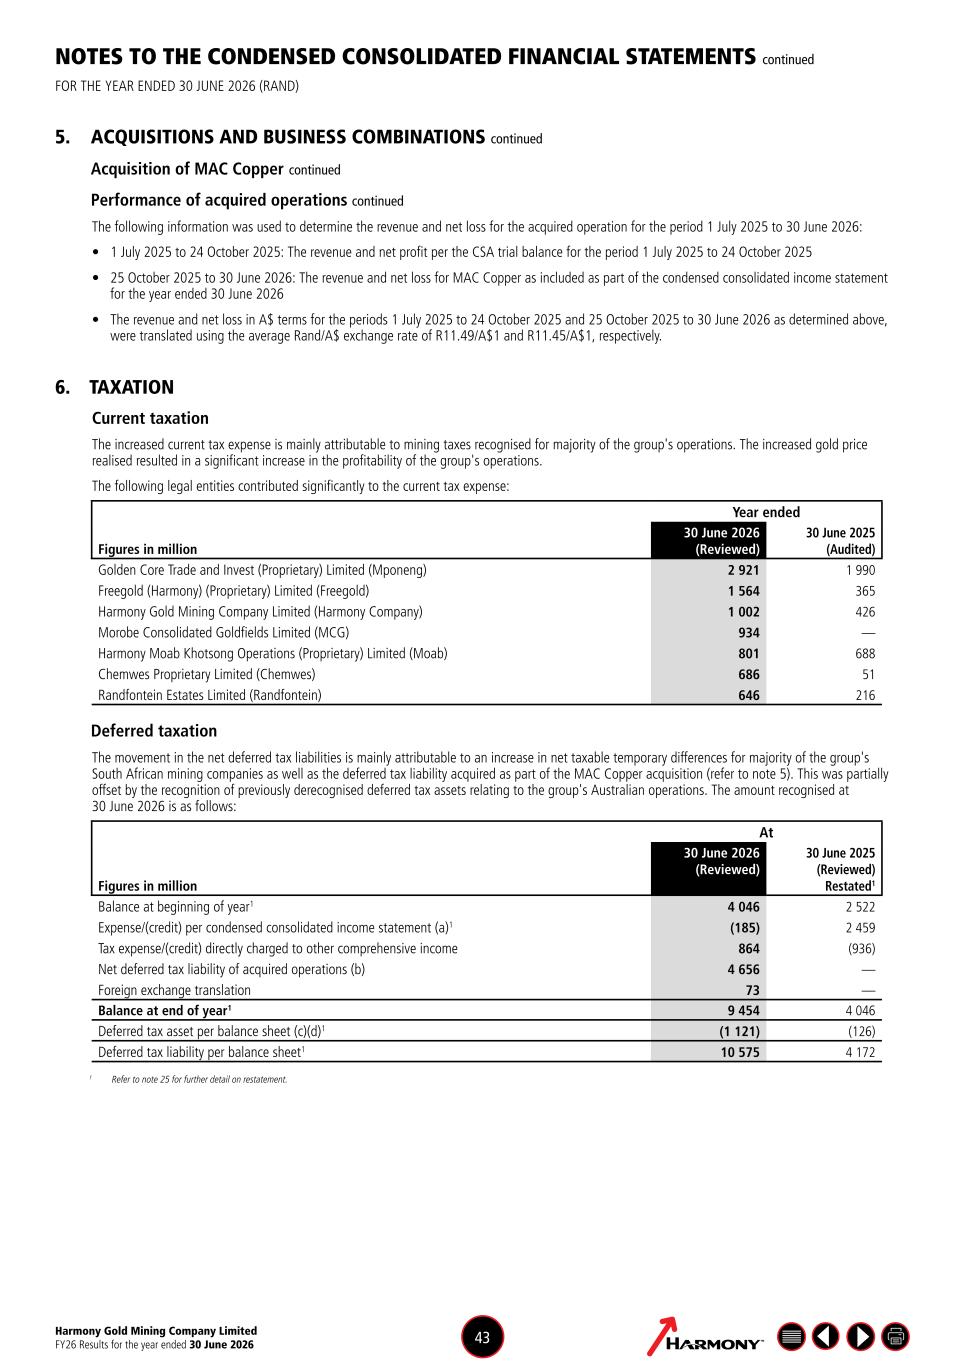
Harmony Gold Mining Company Limited FY26 Results for the year ended 30 June 2026 43 NOTES TO THE CONDENSED CONSOLIDATED FINANCIAL STATEMENTS continued FOR THE YEAR ENDED 30 JUNE 2026 (RAND) 5. ACQUISITIONS AND BUSINESS COMBINATIONS continued Acquisition of MAC Copper continued Performance of acquired operations continued The following information was used to determine the revenue and net loss for the acquired operation for the period 1 July 2025 to 30 June 2026: • 1 July 2025 to 24 October 2025: The revenue and net profit per the CSA trial balance for the period 1 July 2025 to 24 October 2025 • 25 October 2025 to 30 June 2026: The revenue and net loss for MAC Copper as included as part of the condensed consolidated income statement for the year ended 30 June 2026 • The revenue and net loss in A$ terms for the periods 1 July 2025 to 24 October 2025 and 25 October 2025 to 30 June 2026 as determined above, were translated using the average Rand/A$ exchange rate of R11.49/A$1 and R11.45/A$1, respectively. 6. TAXATION Current taxation The increased current tax expense is mainly attributable to mining taxes recognised for majority of the group's operations. The increased gold price realised resulted in a significant increase in the profitability of the group's operations. The following legal entities contributed significantly to the current tax expense: Year ended Figures in million 30 June 2026 (Reviewed) 30 June 2025 (Audited) Golden Core Trade and Invest (Proprietary) Limited (Mponeng) 2 921 1 990 Freegold (Harmony) (Proprietary) Limited (Freegold) 1 564 365 Harmony Gold Mining Company Limited (Harmony Company) 1 002 426 Morobe Consolidated Goldfields Limited (MCG) 934 — Harmony Moab Khotsong Operations (Proprietary) Limited (Moab) 801 688 Chemwes Proprietary Limited (Chemwes) 686 51 Randfontein Estates Limited (Randfontein) 646 216 Deferred taxation The movement in the net deferred tax liabilities is mainly attributable to an increase in net taxable temporary differences for majority of the group's South African mining companies as well as the deferred tax liability acquired as part of the MAC Copper acquisition (refer to note 5). This was partially offset by the recognition of previously derecognised deferred tax assets relating to the group's Australian operations. The amount recognised at 30 June 2026 is as follows: At Figures in million 30 June 2026 (Reviewed) 30 June 2025 (Reviewed) Restated1 Balance at beginning of year1 4 046 2 522 Expense/(credit) per condensed consolidated income statement (a)1 (185) 2 459 Tax expense/(credit) directly charged to other comprehensive income 864 (936) Net deferred tax liability of acquired operations (b) 4 656 — Foreign exchange translation 73 — Balance at end of year1 9 454 4 046 Deferred tax asset per balance sheet (c)(d)1 (1 121) (126) Deferred tax liability per balance sheet1 10 575 4 172 1 Refer to note 25 for further detail on restatement.
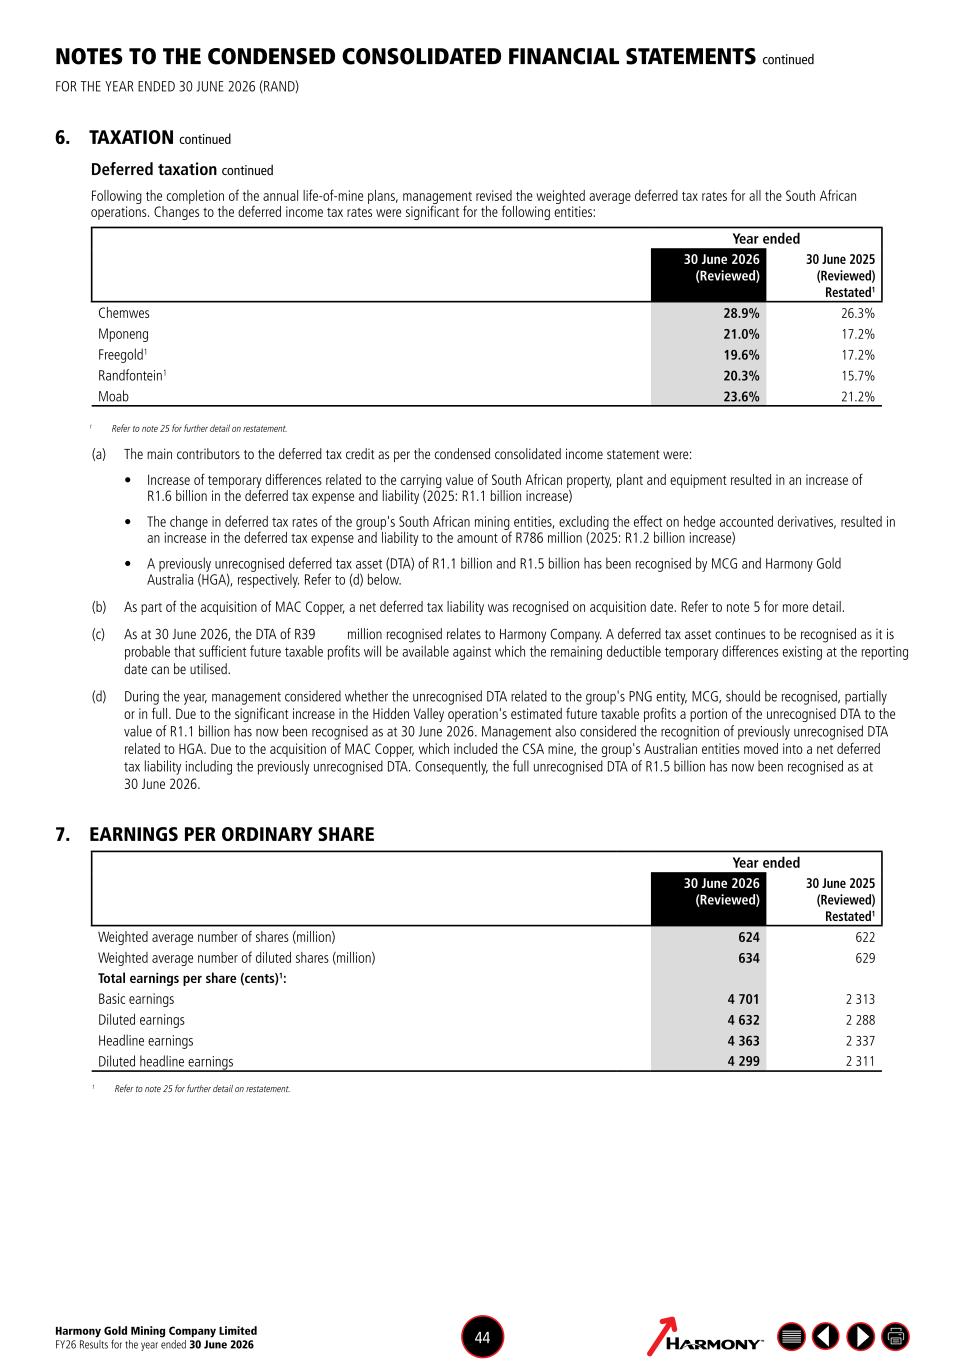
Harmony Gold Mining Company Limited FY26 Results for the year ended 30 June 2026 44 NOTES TO THE CONDENSED CONSOLIDATED FINANCIAL STATEMENTS continued FOR THE YEAR ENDED 30 JUNE 2026 (RAND) 6. TAXATION continued Deferred taxation continued Following the completion of the annual life-of-mine plans, management revised the weighted average deferred tax rates for all the South African operations. Changes to the deferred income tax rates were significant for the following entities: Year ended 30 June 2026 (Reviewed) 30 June 2025 (Reviewed) Restated1 Chemwes 28.9% 26.3% Mponeng 21.0% 17.2% Freegold1 19.6% 17.2% Randfontein1 20.3% 15.7% Moab 23.6% 21.2% 1 Refer to note 25 for further detail on restatement. (a) The main contributors to the deferred tax credit as per the condensed consolidated income statement were: • Increase of temporary differences related to the carrying value of South African property, plant and equipment resulted in an increase of R1.6 billion in the deferred tax expense and liability (2025: R1.1 billion increase) • The change in deferred tax rates of the group's South African mining entities, excluding the effect on hedge accounted derivatives, resulted in an increase in the deferred tax expense and liability to the amount of R786 million (2025: R1.2 billion increase) • A previously unrecognised deferred tax asset (DTA) of R1.1 billion and R1.5 billion has been recognised by MCG and Harmony Gold Australia (HGA), respectively. Refer to (d) below. (b) As part of the acquisition of MAC Copper, a net deferred tax liability was recognised on acquisition date. Refer to note 5 for more detail. (c) As at 30 June 2026, the DTA of R39 million recognised relates to Harmony Company. A deferred tax asset continues to be recognised as it is probable that sufficient future taxable profits will be available against which the remaining deductible temporary differences existing at the reporting date can be utilised. (d) During the year, management considered whether the unrecognised DTA related to the group's PNG entity, MCG, should be recognised, partially or in full. Due to the significant increase in the Hidden Valley operation's estimated future taxable profits a portion of the unrecognised DTA to the value of R1.1 billion has now been recognised as at 30 June 2026. Management also considered the recognition of previously unrecognised DTA related to HGA. Due to the acquisition of MAC Copper, which included the CSA mine, the group's Australian entities moved into a net deferred tax liability including the previously unrecognised DTA. Consequently, the full unrecognised DTA of R1.5 billion has now been recognised as at 30 June 2026. 7. EARNINGS PER ORDINARY SHARE Year ended 30 June 2026 (Reviewed) 30 June 2025 (Reviewed) Restated1 Weighted average number of shares (million) 624 622 Weighted average number of diluted shares (million) 634 629 Total earnings per share (cents)1: Basic earnings 4 701 2 313 Diluted earnings 4 632 2 288 Headline earnings 4 363 2 337 Diluted headline earnings 4 299 2 311 1 Refer to note 25 for further detail on restatement.
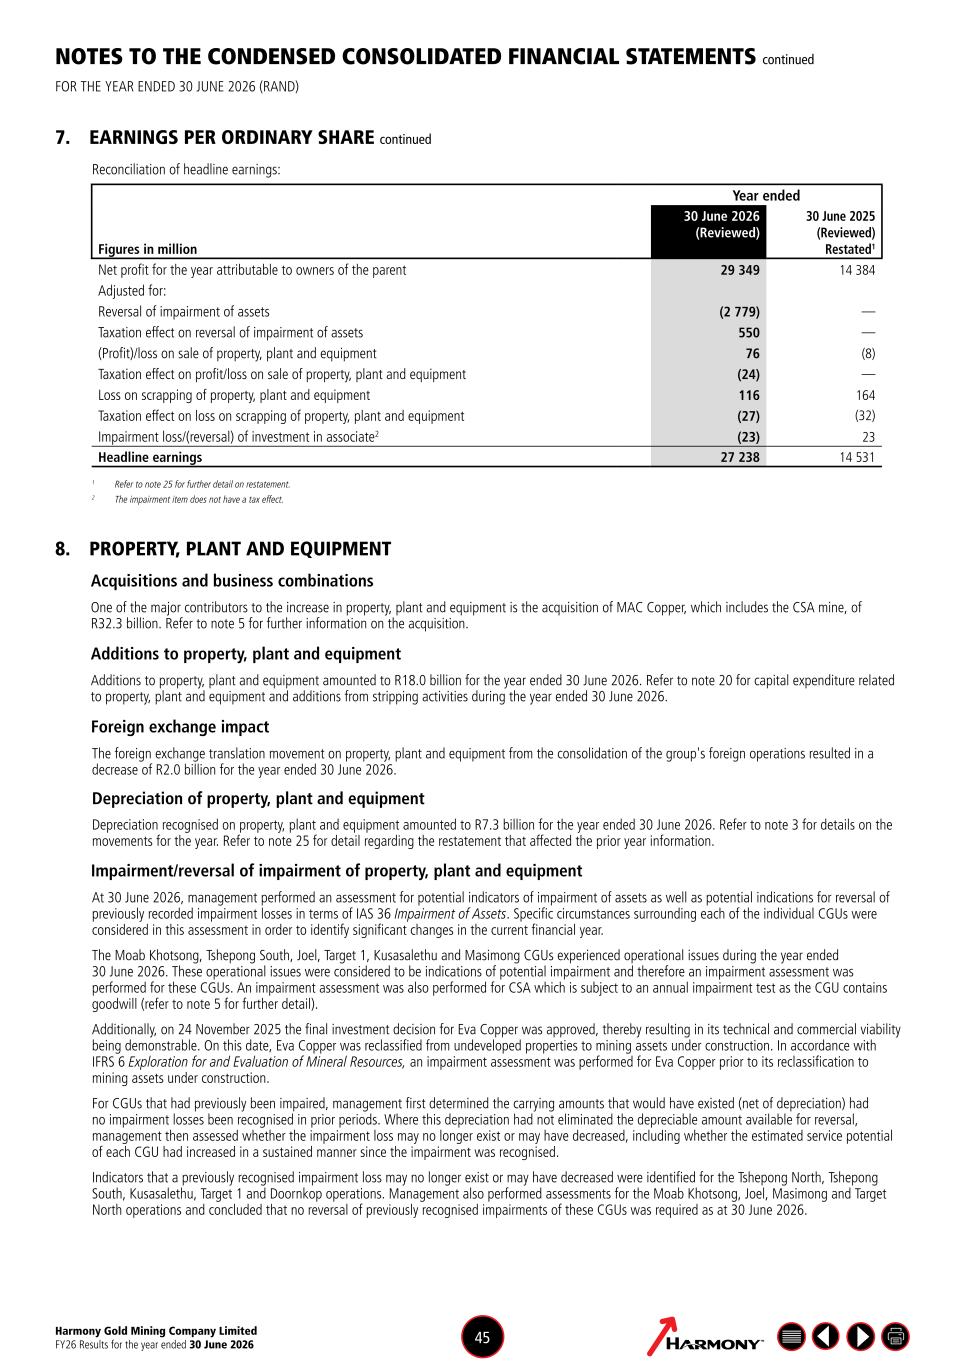
Harmony Gold Mining Company Limited FY26 Results for the year ended 30 June 2026 45 NOTES TO THE CONDENSED CONSOLIDATED FINANCIAL STATEMENTS continued FOR THE YEAR ENDED 30 JUNE 2026 (RAND) 7. EARNINGS PER ORDINARY SHARE continued Reconciliation of headline earnings: Year ended Figures in million 30 June 2026 (Reviewed) 30 June 2025 (Reviewed) Restated1 Net profit for the year attributable to owners of the parent 29 349 14 384 Adjusted for: Reversal of impairment of assets (2 779) — Taxation effect on reversal of impairment of assets 550 — (Profit)/loss on sale of property, plant and equipment 76 (8) Taxation effect on profit/loss on sale of property, plant and equipment (24) — Loss on scrapping of property, plant and equipment 116 164 Taxation effect on loss on scrapping of property, plant and equipment (27) (32) Impairment loss/(reversal) of investment in associate2 (23) 23 Headline earnings 27 238 14 531 1 Refer to note 25 for further detail on restatement. 2 The impairment item does not have a tax effect. 8. PROPERTY, PLANT AND EQUIPMENT Acquisitions and business combinations One of the major contributors to the increase in property, plant and equipment is the acquisition of MAC Copper, which includes the CSA mine, of R32.3 billion. Refer to note 5 for further information on the acquisition. Additions to property, plant and equipment Additions to property, plant and equipment amounted to R18.0 billion for the year ended 30 June 2026. Refer to note 20 for capital expenditure related to property, plant and equipment and additions from stripping activities during the year ended 30 June 2026. Foreign exchange impact The foreign exchange translation movement on property, plant and equipment from the consolidation of the group's foreign operations resulted in a decrease of R2.0 billion for the year ended 30 June 2026. Depreciation of property, plant and equipment Depreciation recognised on property, plant and equipment amounted to R7.3 billion for the year ended 30 June 2026. Refer to note 3 for details on the movements for the year. Refer to note 25 for detail regarding the restatement that affected the prior year information. Impairment/reversal of impairment of property, plant and equipment At 30 June 2026, management performed an assessment for potential indicators of impairment of assets as well as potential indications for reversal of previously recorded impairment losses in terms of IAS 36 Impairment of Assets. Specific circumstances surrounding each of the individual CGUs were considered in this assessment in order to identify significant changes in the current financial year. The Moab Khotsong, Tshepong South, Joel, Target 1, Kusasalethu and Masimong CGUs experienced operational issues during the year ended 30 June 2026. These operational issues were considered to be indications of potential impairment and therefore an impairment assessment was performed for these CGUs. An impairment assessment was also performed for CSA which is subject to an annual impairment test as the CGU contains goodwill (refer to note 5 for further detail). Additionally, on 24 November 2025 the final investment decision for Eva Copper was approved, thereby resulting in its technical and commercial viability being demonstrable. On this date, Eva Copper was reclassified from undeveloped properties to mining assets under construction. In accordance with IFRS 6 Exploration for and Evaluation of Mineral Resources, an impairment assessment was performed for Eva Copper prior to its reclassification to mining assets under construction. For CGUs that had previously been impaired, management first determined the carrying amounts that would have existed (net of depreciation) had no impairment losses been recognised in prior periods. Where this depreciation had not eliminated the depreciable amount available for reversal, management then assessed whether the impairment loss may no longer exist or may have decreased, including whether the estimated service potential of each CGU had increased in a sustained manner since the impairment was recognised. Indicators that a previously recognised impairment loss may no longer exist or may have decreased were identified for the Tshepong North, Tshepong South, Kusasalethu, Target 1 and Doornkop operations. Management also performed assessments for the Moab Khotsong, Joel, Masimong and Target North operations and concluded that no reversal of previously recognised impairments of these CGUs was required as at 30 June 2026.
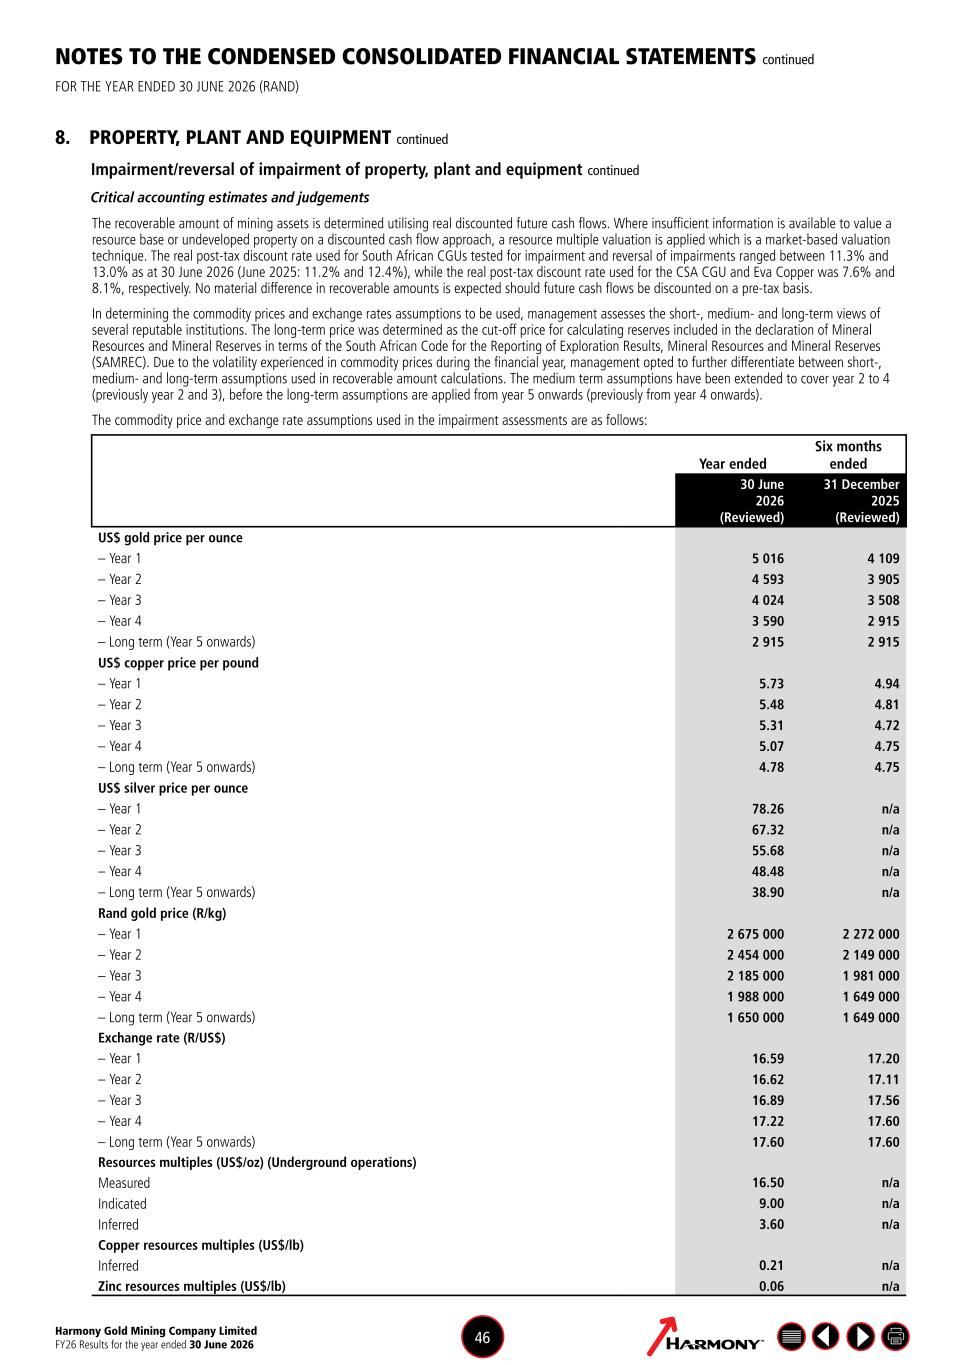
Harmony Gold Mining Company Limited FY26 Results for the year ended 30 June 2026 46 NOTES TO THE CONDENSED CONSOLIDATED FINANCIAL STATEMENTS continued FOR THE YEAR ENDED 30 JUNE 2026 (RAND) 8. PROPERTY, PLANT AND EQUIPMENT continued Impairment/reversal of impairment of property, plant and equipment continued Critical accounting estimates and judgements The recoverable amount of mining assets is determined utilising real discounted future cash flows. Where insufficient information is available to value a resource base or undeveloped property on a discounted cash flow approach, a resource multiple valuation is applied which is a market-based valuation technique. The real post-tax discount rate used for South African CGUs tested for impairment and reversal of impairments ranged between 11.3% and 13.0% as at 30 June 2026 (June 2025: 11.2% and 12.4%), while the real post-tax discount rate used for the CSA CGU and Eva Copper was 7.6% and 8.1%, respectively. No material difference in recoverable amounts is expected should future cash flows be discounted on a pre-tax basis. In determining the commodity prices and exchange rates assumptions to be used, management assesses the short-, medium- and long-term views of several reputable institutions. The long-term price was determined as the cut-off price for calculating reserves included in the declaration of Mineral Resources and Mineral Reserves in terms of the South African Code for the Reporting of Exploration Results, Mineral Resources and Mineral Reserves (SAMREC). Due to the volatility experienced in commodity prices during the financial year, management opted to further differentiate between short-, medium- and long-term assumptions used in recoverable amount calculations. The medium term assumptions have been extended to cover year 2 to 4 (previously year 2 and 3), before the long-term assumptions are applied from year 5 onwards (previously from year 4 onwards). The commodity price and exchange rate assumptions used in the impairment assessments are as follows: Year ended Six months ended 30 June 2026 (Reviewed) 31 December 2025 (Reviewed) US$ gold price per ounce – Year 1 5 016 4 109 – Year 2 4 593 3 905 – Year 3 4 024 3 508 – Year 4 3 590 2 915 – Long term (Year 5 onwards) 2 915 2 915 US$ copper price per pound – Year 1 5.73 4.94 – Year 2 5.48 4.81 – Year 3 5.31 4.72 – Year 4 5.07 4.75 – Long term (Year 5 onwards) 4.78 4.75 US$ silver price per ounce – Year 1 78.26 n/a – Year 2 67.32 n/a – Year 3 55.68 n/a – Year 4 48.48 n/a – Long term (Year 5 onwards) 38.90 n/a Rand gold price (R/kg) – Year 1 2 675 000 2 272 000 – Year 2 2 454 000 2 149 000 – Year 3 2 185 000 1 981 000 – Year 4 1 988 000 1 649 000 – Long term (Year 5 onwards) 1 650 000 1 649 000 Exchange rate (R/US$) – Year 1 16.59 17.20 – Year 2 16.62 17.11 – Year 3 16.89 17.56 – Year 4 17.22 17.60 – Long term (Year 5 onwards) 17.60 17.60 Resources multiples (US$/oz) (Underground operations) Measured 16.50 n/a Indicated 9.00 n/a Inferred 3.60 n/a Copper resources multiples (US$/lb) Inferred 0.21 n/a Zinc resources multiples (US$/lb) 0.06 n/a
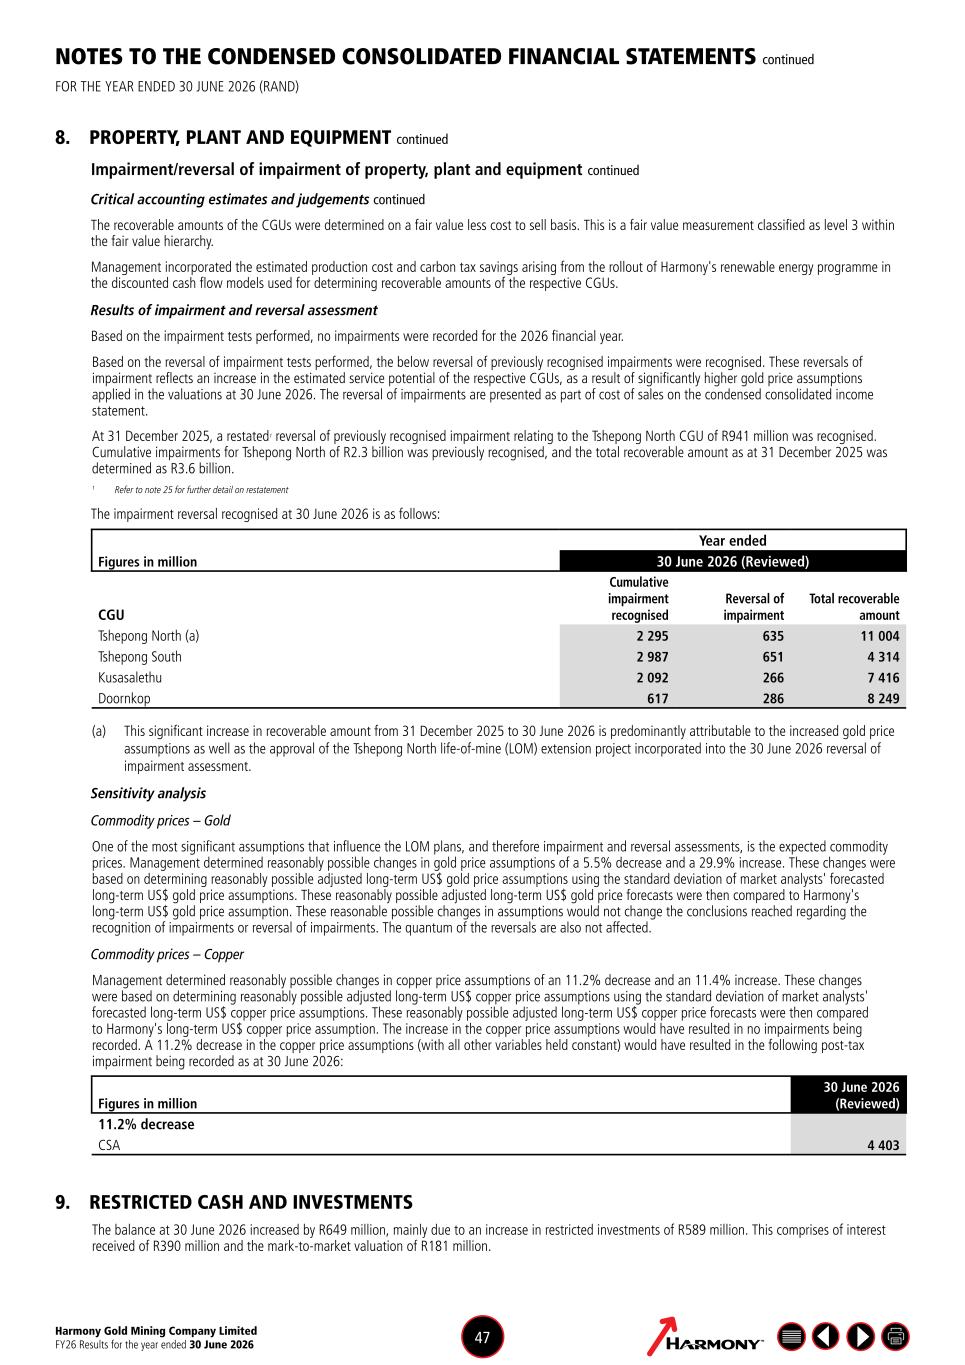
Harmony Gold Mining Company Limited FY26 Results for the year ended 30 June 2026 47 NOTES TO THE CONDENSED CONSOLIDATED FINANCIAL STATEMENTS continued FOR THE YEAR ENDED 30 JUNE 2026 (RAND) 8. PROPERTY, PLANT AND EQUIPMENT continued Impairment/reversal of impairment of property, plant and equipment continued Critical accounting estimates and judgements continued The recoverable amounts of the CGUs were determined on a fair value less cost to sell basis. This is a fair value measurement classified as level 3 within the fair value hierarchy. Management incorporated the estimated production cost and carbon tax savings arising from the rollout of Harmony's renewable energy programme in the discounted cash flow models used for determining recoverable amounts of the respective CGUs. Results of impairment and reversal assessment Based on the impairment tests performed, no impairments were recorded for the 2026 financial year. Based on the reversal of impairment tests performed, the below reversal of previously recognised impairments were recognised. These reversals of impairment reflects an increase in the estimated service potential of the respective CGUs, as a result of significantly higher gold price assumptions applied in the valuations at 30 June 2026. The reversal of impairments are presented as part of cost of sales on the condensed consolidated income statement. At 31 December 2025, a restated1 reversal of previously recognised impairment relating to the Tshepong North CGU of R941 million was recognised. Cumulative impairments for Tshepong North of R2.3 billion was previously recognised, and the total recoverable amount as at 31 December 2025 was determined as R3.6 billion. 1 Refer to note 25 for further detail on restatement The impairment reversal recognised at 30 June 2026 is as follows: Figures in million Year ended 30 June 2026 (Reviewed) CGU Cumulative impairment recognised Reversal of impairment Total recoverable amount Tshepong North (a) 2 295 635 11 004 Tshepong South 2 987 651 4 314 Kusasalethu 2 092 266 7 416 Doornkop 617 286 8 249 (a) This significant increase in recoverable amount from 31 December 2025 to 30 June 2026 is predominantly attributable to the increased gold price assumptions as well as the approval of the Tshepong North life-of-mine (LOM) extension project incorporated into the 30 June 2026 reversal of impairment assessment. Sensitivity analysis Commodity prices – Gold One of the most significant assumptions that influence the LOM plans, and therefore impairment and reversal assessments, is the expected commodity prices. Management determined reasonably possible changes in gold price assumptions of a 5.5% decrease and a 29.9% increase. These changes were based on determining reasonably possible adjusted long-term US$ gold price assumptions using the standard deviation of market analysts' forecasted long-term US$ gold price assumptions. These reasonably possible adjusted long-term US$ gold price forecasts were then compared to Harmony's long-term US$ gold price assumption. These reasonable possible changes in assumptions would not change the conclusions reached regarding the recognition of impairments or reversal of impairments. The quantum of the reversals are also not affected. Commodity prices – Copper Management determined reasonably possible changes in copper price assumptions of an 11.2% decrease and an 11.4% increase. These changes were based on determining reasonably possible adjusted long-term US$ copper price assumptions using the standard deviation of market analysts' forecasted long-term US$ copper price assumptions. These reasonably possible adjusted long-term US$ copper price forecasts were then compared to Harmony's long-term US$ copper price assumption. The increase in the copper price assumptions would have resulted in no impairments being recorded. A 11.2% decrease in the copper price assumptions (with all other variables held constant) would have resulted in the following post-tax impairment being recorded as at 30 June 2026: Figures in million 30 June 2026 (Reviewed) 11.2% decrease CSA 4 403 9. RESTRICTED CASH AND INVESTMENTS The balance at 30 June 2026 increased by R649 million, mainly due to an increase in restricted investments of R589 million. This comprises of interest received of R390 million and the mark-to-market valuation of R181 million.
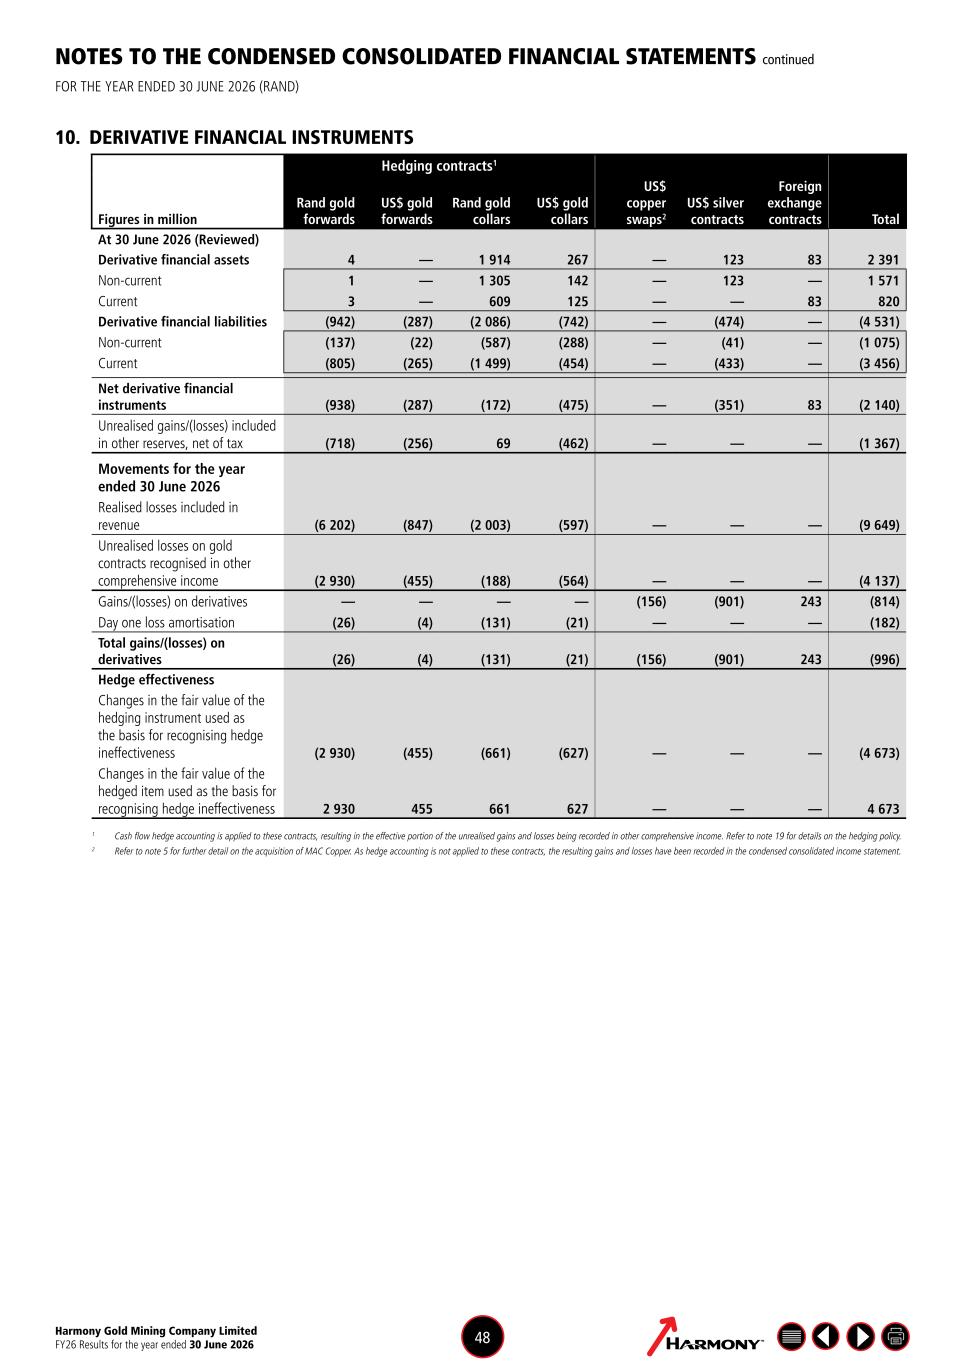
Harmony Gold Mining Company Limited FY26 Results for the year ended 30 June 2026 48 NOTES TO THE CONDENSED CONSOLIDATED FINANCIAL STATEMENTS continued FOR THE YEAR ENDED 30 JUNE 2026 (RAND) 10. DERIVATIVE FINANCIAL INSTRUMENTS Figures in million Hedging contracts1 Rand gold forwards US$ gold forwards Rand gold collars US$ gold collars US$ copper swaps2 US$ silver contracts Foreign exchange contracts Total At 30 June 2026 (Reviewed) Derivative financial assets 4 — 1 914 267 — 123 83 2 391 Non-current 1 — 1 305 142 — 123 — 1 571 Current 3 — 609 125 — — 83 820 Derivative financial liabilities (942) (287) (2 086) (742) — (474) — (4 531) Non-current (137) (22) (587) (288) — (41) — (1 075) Current (805) (265) (1 499) (454) — (433) — (3 456) Net derivative financial instruments (938) (287) (172) (475) — (351) 83 (2 140) Unrealised gains/(losses) included in other reserves, net of tax (718) (256) 69 (462) — — — (1 367) Movements for the year ended 30 June 2026 Realised losses included in revenue (6 202) (847) (2 003) (597) — — — (9 649) Unrealised losses on gold contracts recognised in other comprehensive income (2 930) (455) (188) (564) — — — (4 137) Gains/(losses) on derivatives — — — — (156) (901) 243 (814) Day one loss amortisation (26) (4) (131) (21) — — — (182) Total gains/(losses) on derivatives (26) (4) (131) (21) (156) (901) 243 (996) Hedge effectiveness Changes in the fair value of the hedging instrument used as the basis for recognising hedge ineffectiveness (2 930) (455) (661) (627) — — — (4 673) Changes in the fair value of the hedged item used as the basis for recognising hedge ineffectiveness 2 930 455 661 627 — — — 4 673 1 Cash flow hedge accounting is applied to these contracts, resulting in the effective portion of the unrealised gains and losses being recorded in other comprehensive income. Refer to note 19 for details on the hedging policy. 2 Refer to note 5 for further detail on the acquisition of MAC Copper. As hedge accounting is not applied to these contracts, the resulting gains and losses have been recorded in the condensed consolidated income statement.
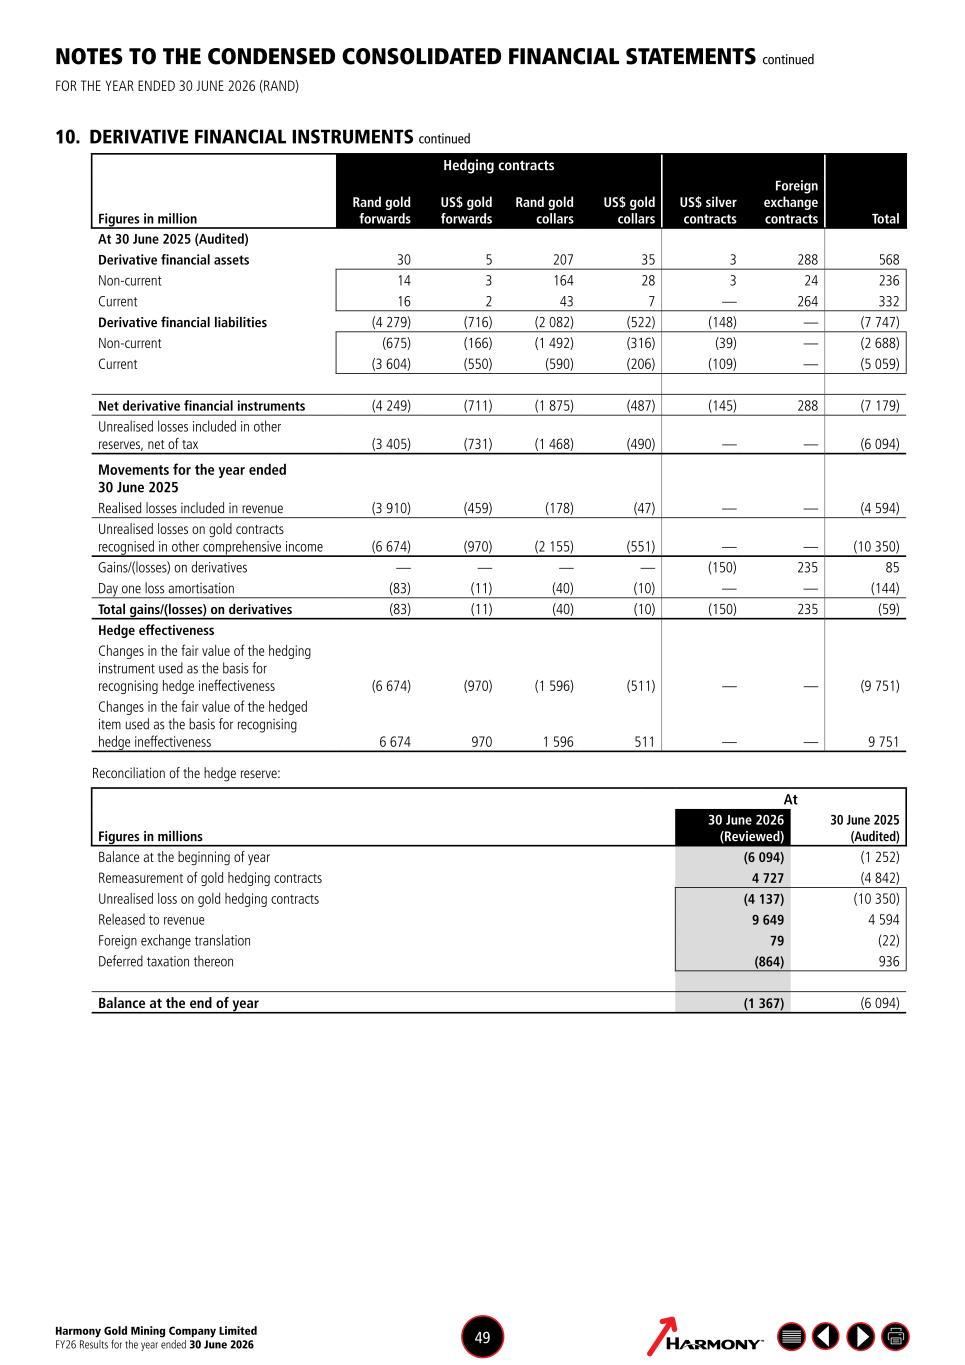
Harmony Gold Mining Company Limited FY26 Results for the year ended 30 June 2026 49 NOTES TO THE CONDENSED CONSOLIDATED FINANCIAL STATEMENTS continued FOR THE YEAR ENDED 30 JUNE 2026 (RAND) 10. DERIVATIVE FINANCIAL INSTRUMENTS continued Figures in million Hedging contracts Rand gold forwards US$ gold forwards Rand gold collars US$ gold collars US$ silver contracts Foreign exchange contracts Total At 30 June 2025 (Audited) Derivative financial assets 30 5 207 35 3 288 568 Non-current 14 3 164 28 3 24 236 Current 16 2 43 7 — 264 332 Derivative financial liabilities (4 279) (716) (2 082) (522) (148) — (7 747) Non-current (675) (166) (1 492) (316) (39) — (2 688) Current (3 604) (550) (590) (206) (109) — (5 059) Net derivative financial instruments (4 249) (711) (1 875) (487) (145) 288 (7 179) Unrealised losses included in other reserves, net of tax (3 405) (731) (1 468) (490) — — (6 094) Movements for the year ended 30 June 2025 Realised losses included in revenue (3 910) (459) (178) (47) — — (4 594) Unrealised losses on gold contracts recognised in other comprehensive income (6 674) (970) (2 155) (551) — — (10 350) Gains/(losses) on derivatives — — — — (150) 235 85 Day one loss amortisation (83) (11) (40) (10) — — (144) Total gains/(losses) on derivatives (83) (11) (40) (10) (150) 235 (59) Hedge effectiveness Changes in the fair value of the hedging instrument used as the basis for recognising hedge ineffectiveness (6 674) (970) (1 596) (511) — — (9 751) Changes in the fair value of the hedged item used as the basis for recognising hedge ineffectiveness 6 674 970 1 596 511 — — 9 751 Reconciliation of the hedge reserve: At Figures in millions 30 June 2026 (Reviewed) 30 June 2025 (Audited) Balance at the beginning of year (6 094) (1 252) Remeasurement of gold hedging contracts 4 727 (4 842) Unrealised loss on gold hedging contracts (4 137) (10 350) Released to revenue 9 649 4 594 Foreign exchange translation 79 (22) Deferred taxation thereon (864) 936 Balance at the end of year (1 367) (6 094)
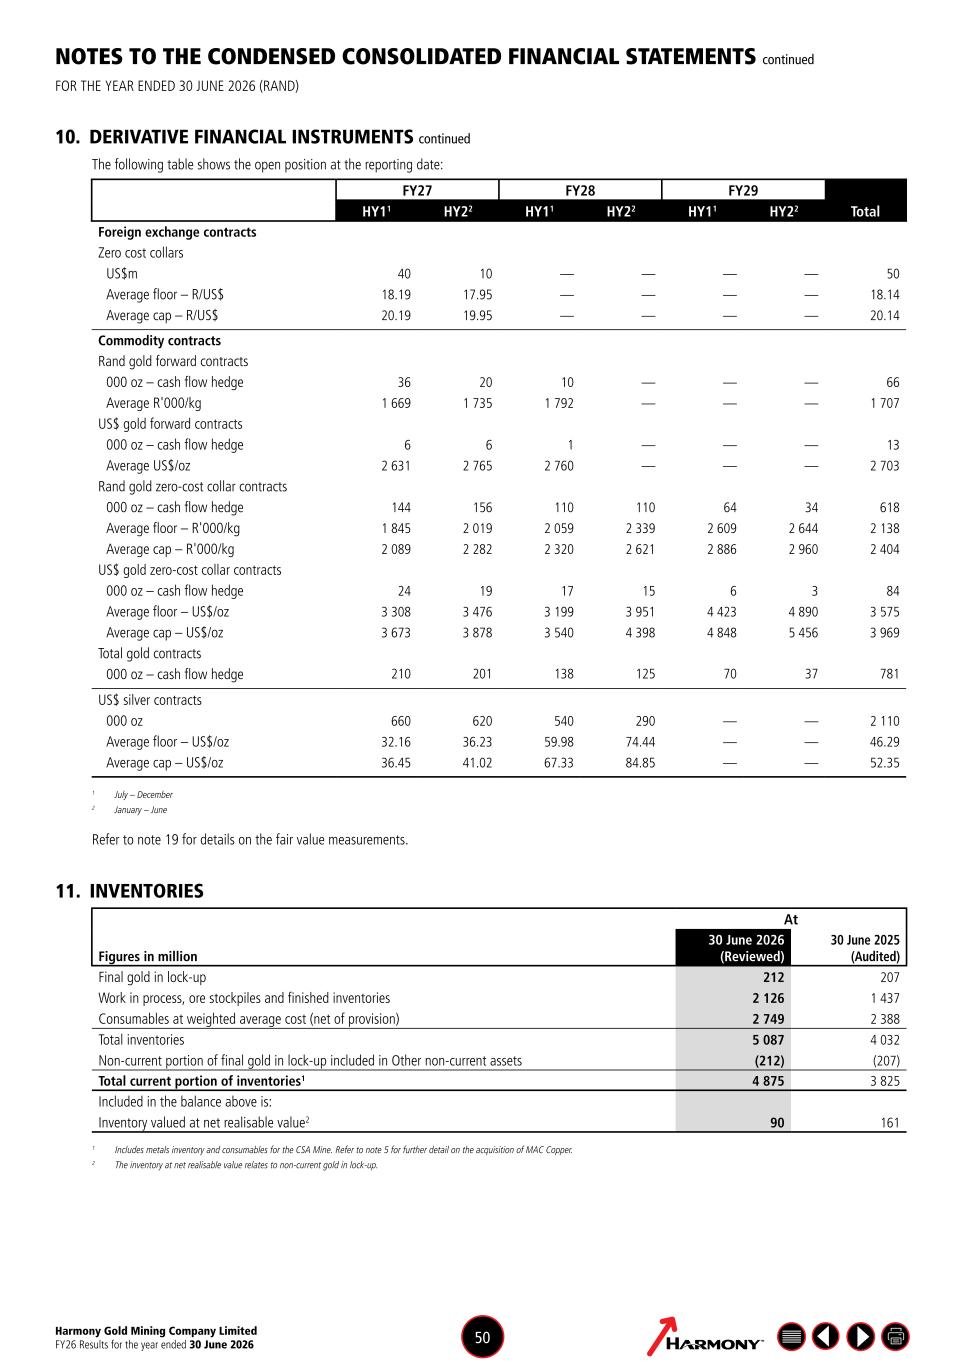
Harmony Gold Mining Company Limited FY26 Results for the year ended 30 June 2026 50 NOTES TO THE CONDENSED CONSOLIDATED FINANCIAL STATEMENTS continued FOR THE YEAR ENDED 30 JUNE 2026 (RAND) 10. DERIVATIVE FINANCIAL INSTRUMENTS continued The following table shows the open position at the reporting date: FY27 FY28 FY29 TotalHY11 HY22 HY11 HY22 HY11 HY22 Foreign exchange contracts Zero cost collars US$m 40 10 — — — — 50 Average floor – R/US$ 18.19 17.95 — — — — 18.14 Average cap – R/US$ 20.19 19.95 — — — — 20.14 Commodity contracts Rand gold forward contracts 000 oz – cash flow hedge 36 20 10 — — — 66 Average R'000/kg 1 669 1 735 1 792 — — — 1 707 US$ gold forward contracts 000 oz – cash flow hedge 6 6 1 — — — 13 Average US$/oz 2 631 2 765 2 760 — — — 2 703 Rand gold zero-cost collar contracts 000 oz – cash flow hedge 144 156 110 110 64 34 618 Average floor – R'000/kg 1 845 2 019 2 059 2 339 2 609 2 644 2 138 Average cap – R'000/kg 2 089 2 282 2 320 2 621 2 886 2 960 2 404 US$ gold zero-cost collar contracts 000 oz – cash flow hedge 24 19 17 15 6 3 84 Average floor – US$/oz 3 308 3 476 3 199 3 951 4 423 4 890 3 575 Average cap – US$/oz 3 673 3 878 3 540 4 398 4 848 5 456 3 969 Total gold contracts 000 oz – cash flow hedge 210 201 138 125 70 37 781 US$ silver contracts 000 oz 660 620 540 290 — — 2 110 Average floor – US$/oz 32.16 36.23 59.98 74.44 — — 46.29 Average cap – US$/oz 36.45 41.02 67.33 84.85 — — 52.35 1 July – December 2 January – June Refer to note 19 for details on the fair value measurements. 11. INVENTORIES At Figures in million 30 June 2026 (Reviewed) 30 June 2025 (Audited) Final gold in lock-up 212 207 Work in process, ore stockpiles and finished inventories 2 126 1 437 Consumables at weighted average cost (net of provision) 2 749 2 388 Total inventories 5 087 4 032 Non-current portion of final gold in lock-up included in Other non-current assets (212) (207) Total current portion of inventories1 4 875 3 825 Included in the balance above is: Inventory valued at net realisable value2 90 161 1 Includes metals inventory and consumables for the CSA Mine. Refer to note 5 for further detail on the acquisition of MAC Copper. 2 The inventory at net realisable value relates to non-current gold in lock-up.
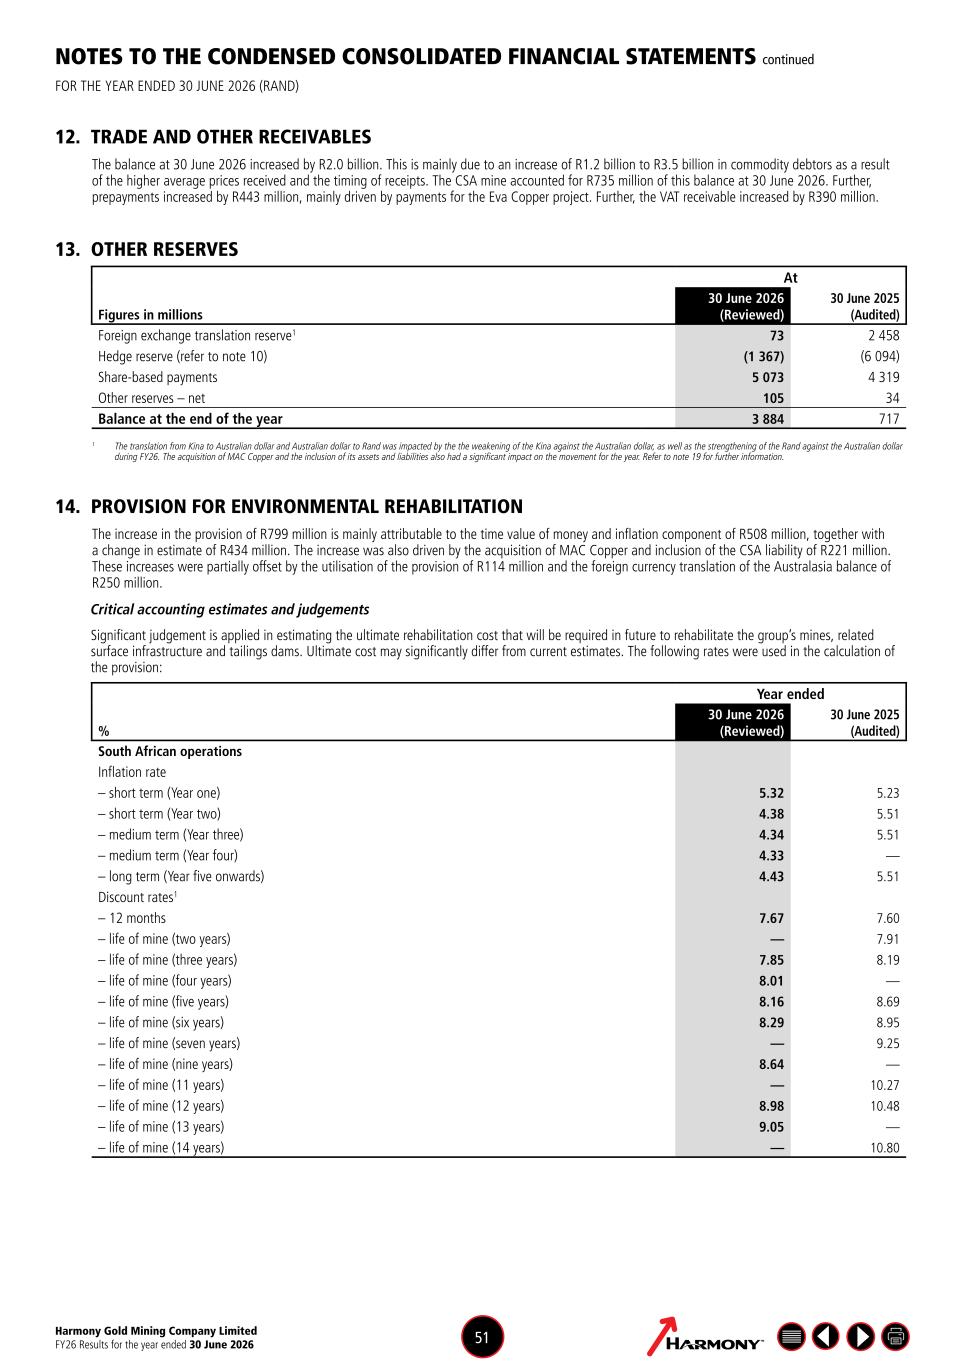
Harmony Gold Mining Company Limited FY26 Results for the year ended 30 June 2026 51 NOTES TO THE CONDENSED CONSOLIDATED FINANCIAL STATEMENTS continued FOR THE YEAR ENDED 30 JUNE 2026 (RAND) 12. TRADE AND OTHER RECEIVABLES The balance at 30 June 2026 increased by R2.0 billion. This is mainly due to an increase of R1.2 billion to R3.5 billion in commodity debtors as a result of the higher average prices received and the timing of receipts. The CSA mine accounted for R735 million of this balance at 30 June 2026. Further, prepayments increased by R443 million, mainly driven by payments for the Eva Copper project. Further, the VAT receivable increased by R390 million. 13. OTHER RESERVES At Figures in millions 30 June 2026 (Reviewed) 30 June 2025 (Audited) Foreign exchange translation reserve1 73 2 458 Hedge reserve (refer to note 10) (1 367) (6 094) Share-based payments 5 073 4 319 Other reserves – net 105 34 Balance at the end of the year 3 884 717 1 The translation from Kina to Australian dollar and Australian dollar to Rand was impacted by the the weakening of the Kina against the Australian dollar, as well as the strengthening of the Rand against the Australian dollar during FY26. The acquisition of MAC Copper and the inclusion of its assets and liabilities also had a significant impact on the movement for the year. Refer to note 19 for further information. 14. PROVISION FOR ENVIRONMENTAL REHABILITATION The increase in the provision of R799 million is mainly attributable to the time value of money and inflation component of R508 million, together with a change in estimate of R434 million. The increase was also driven by the acquisition of MAC Copper and inclusion of the CSA liability of R221 million. These increases were partially offset by the utilisation of the provision of R114 million and the foreign currency translation of the Australasia balance of R250 million. Critical accounting estimates and judgements Significant judgement is applied in estimating the ultimate rehabilitation cost that will be required in future to rehabilitate the group’s mines, related surface infrastructure and tailings dams. Ultimate cost may significantly differ from current estimates. The following rates were used in the calculation of the provision: Year ended % 30 June 2026 (Reviewed) 30 June 2025 (Audited) South African operations Inflation rate – short term (Year one) 5.32 5.23 – short term (Year two) 4.38 5.51 – medium term (Year three) 4.34 5.51 – medium term (Year four) 4.33 — – long term (Year five onwards) 4.43 5.51 Discount rates1 – 12 months 7.67 7.60 – life of mine (two years) — 7.91 – life of mine (three years) 7.85 8.19 – life of mine (four years) 8.01 — – life of mine (five years) 8.16 8.69 – life of mine (six years) 8.29 8.95 – life of mine (seven years) — 9.25 – life of mine (nine years) 8.64 — – life of mine (11 years) — 10.27 – life of mine (12 years) 8.98 10.48 – life of mine (13 years) 9.05 — – life of mine (14 years) — 10.80
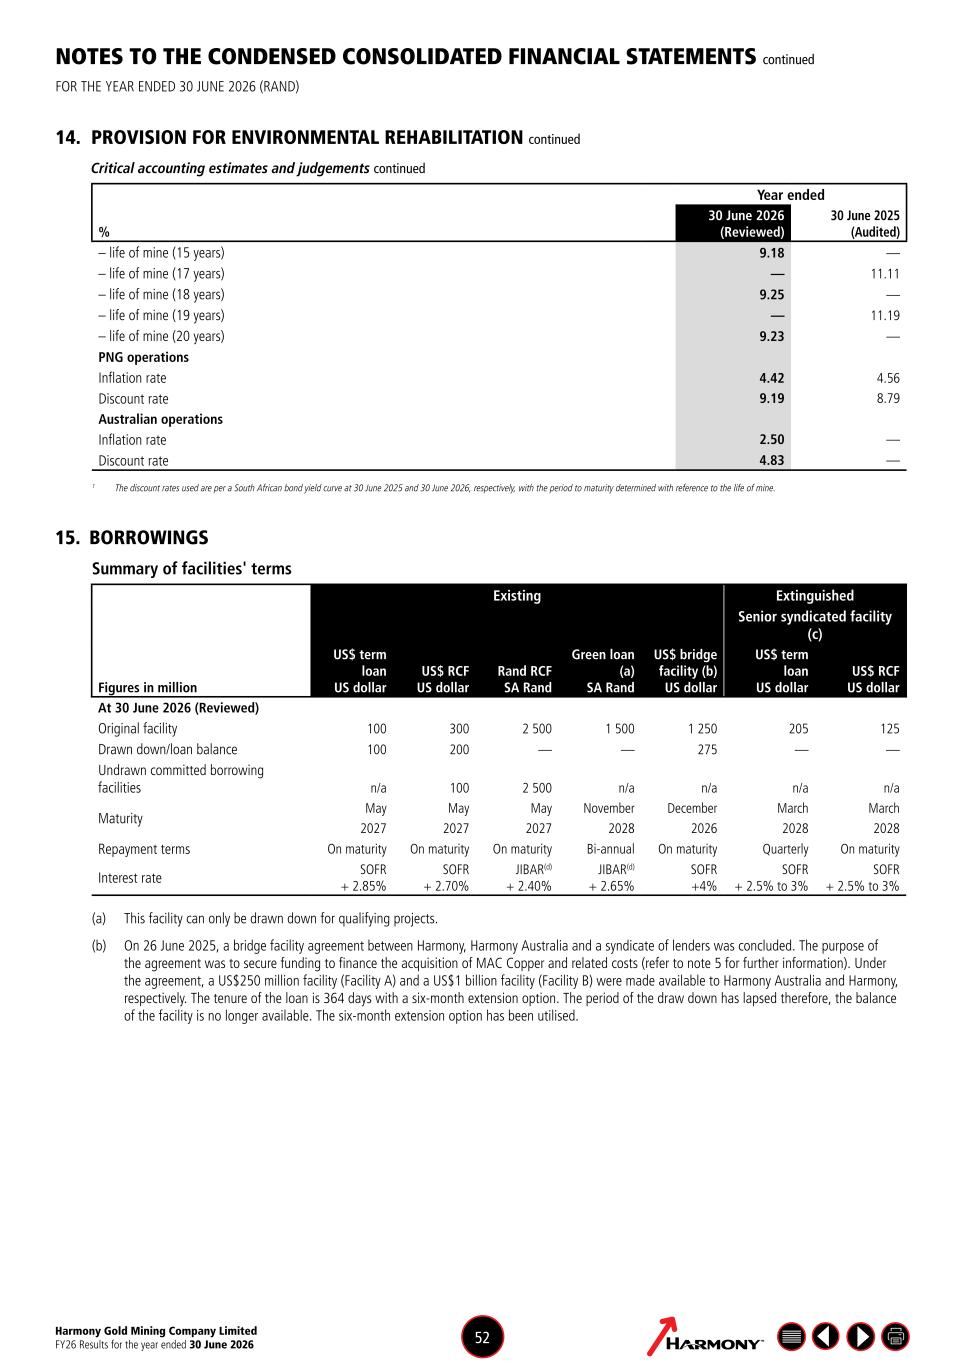
Harmony Gold Mining Company Limited FY26 Results for the year ended 30 June 2026 52 NOTES TO THE CONDENSED CONSOLIDATED FINANCIAL STATEMENTS continued FOR THE YEAR ENDED 30 JUNE 2026 (RAND) 14. PROVISION FOR ENVIRONMENTAL REHABILITATION continued Critical accounting estimates and judgements continued Year ended % 30 June 2026 (Reviewed) 30 June 2025 (Audited) – life of mine (15 years) 9.18 — – life of mine (17 years) — 11.11 – life of mine (18 years) 9.25 — – life of mine (19 years) — 11.19 – life of mine (20 years) 9.23 — PNG operations Inflation rate 4.42 4.56 Discount rate 9.19 8.79 Australian operations Inflation rate 2.50 — Discount rate 4.83 — 1 The discount rates used are per a South African bond yield curve at 30 June 2025 and 30 June 2026, respectively, with the period to maturity determined with reference to the life of mine. 15. BORROWINGS Summary of facilities' terms Figures in million Existing Extinguished US$ term loan US dollar US$ RCF US dollar Rand RCF SA Rand Green loan (a) SA Rand US$ bridge facility (b) US dollar Senior syndicated facility (c) US$ term loan US dollar US$ RCF US dollar At 30 June 2026 (Reviewed) Original facility 100 300 2 500 1 500 1 250 205 125 Drawn down/loan balance 100 200 — — 275 — — Undrawn committed borrowing facilities n/a 100 2 500 n/a n/a n/a n/a Maturity May May May November December March March 2027 2027 2027 2028 2026 2028 2028 Repayment terms On maturity On maturity On maturity Bi-annual On maturity Quarterly On maturity Interest rate SOFR + 2.85% SOFR + 2.70% JIBAR(d) + 2.40% JIBAR(d) + 2.65% SOFR +4% SOFR + 2.5% to 3% SOFR + 2.5% to 3% (a) This facility can only be drawn down for qualifying projects. (b) On 26 June 2025, a bridge facility agreement between Harmony, Harmony Australia and a syndicate of lenders was concluded. The purpose of the agreement was to secure funding to finance the acquisition of MAC Copper and related costs (refer to note 5 for further information). Under the agreement, a US$250 million facility (Facility A) and a US$1 billion facility (Facility B) were made available to Harmony Australia and Harmony, respectively. The tenure of the loan is 364 days with a six-month extension option. The period of the draw down has lapsed therefore, the balance of the facility is no longer available. The six-month extension option has been utilised.
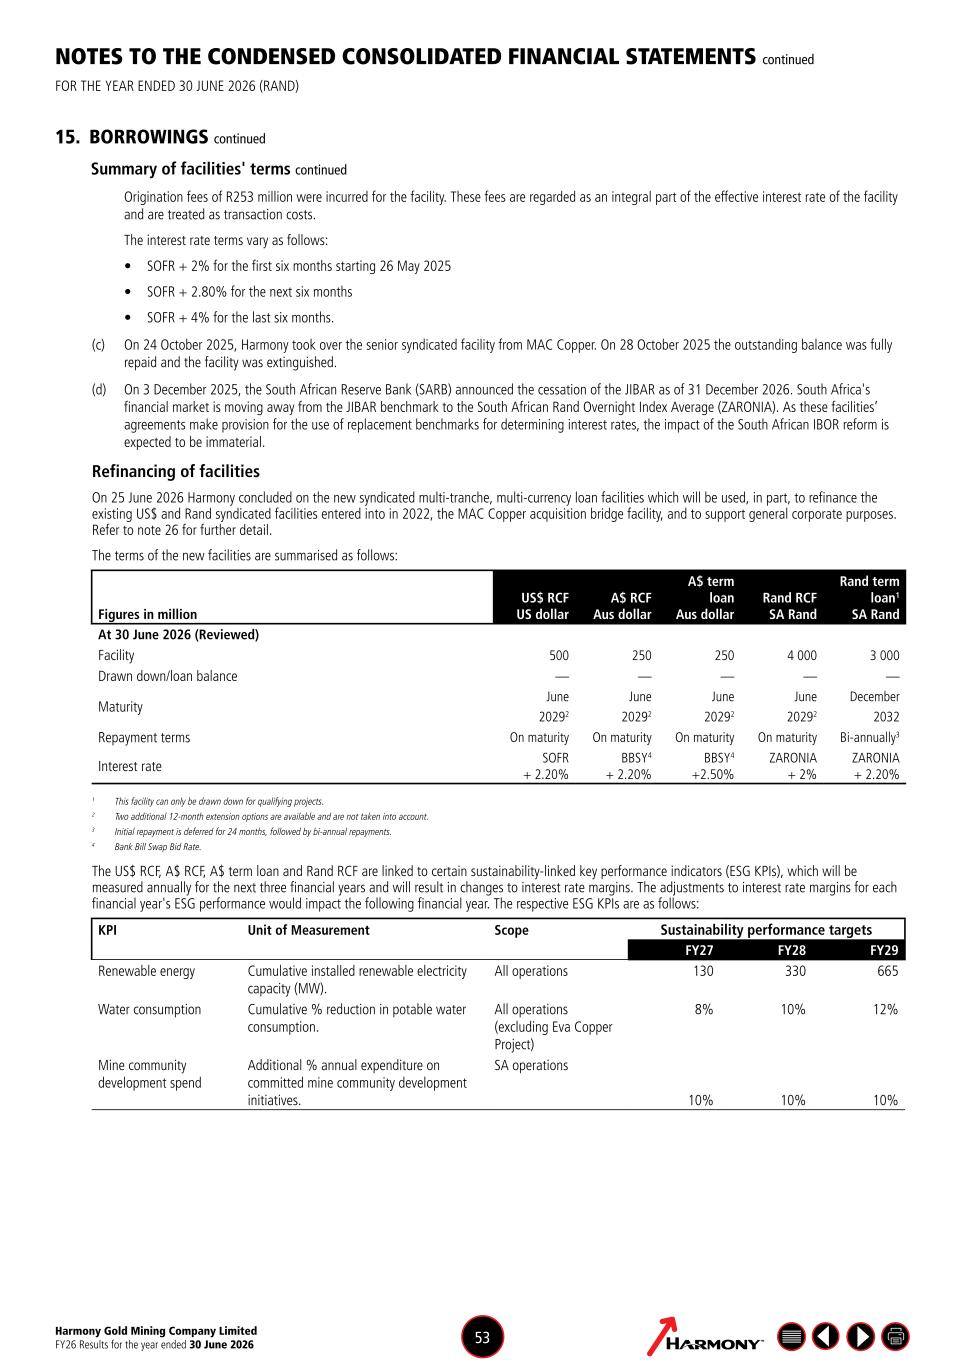
Harmony Gold Mining Company Limited FY26 Results for the year ended 30 June 2026 53 NOTES TO THE CONDENSED CONSOLIDATED FINANCIAL STATEMENTS continued FOR THE YEAR ENDED 30 JUNE 2026 (RAND) 15. BORROWINGS continued Summary of facilities' terms continued Origination fees of R253 million were incurred for the facility. These fees are regarded as an integral part of the effective interest rate of the facility and are treated as transaction costs. The interest rate terms vary as follows: • SOFR + 2% for the first six months starting 26 May 2025 • SOFR + 2.80% for the next six months • SOFR + 4% for the last six months. (c) On 24 October 2025, Harmony took over the senior syndicated facility from MAC Copper. On 28 October 2025 the outstanding balance was fully repaid and the facility was extinguished. (d) On 3 December 2025, the South African Reserve Bank (SARB) announced the cessation of the JIBAR as of 31 December 2026. South Africa's financial market is moving away from the JIBAR benchmark to the South African Rand Overnight Index Average (ZARONIA). As these facilities’ agreements make provision for the use of replacement benchmarks for determining interest rates, the impact of the South African IBOR reform is expected to be immaterial. Refinancing of facilities On 25 June 2026 Harmony concluded on the new syndicated multi-tranche, multi-currency loan facilities which will be used, in part, to refinance the existing US$ and Rand syndicated facilities entered into in 2022, the MAC Copper acquisition bridge facility, and to support general corporate purposes. Refer to note 26 for further detail. The terms of the new facilities are summarised as follows: Figures in million US$ RCF US dollar A$ RCF Aus dollar A$ term loan Aus dollar Rand RCF SA Rand Rand term loan1 SA Rand At 30 June 2026 (Reviewed) Facility 500 250 250 4 000 3 000 Drawn down/loan balance — — — — — Maturity June June June June December 20292 20292 20292 20292 2032 Repayment terms On maturity On maturity On maturity On maturity Bi-annually3 Interest rate SOFR + 2.20% BBSY4 + 2.20% BBSY4 +2.50% ZARONIA + 2% ZARONIA + 2.20% 1 This facility can only be drawn down for qualifying projects. 2 Two additional 12-month extension options are available and are not taken into account. 3 Initial repayment is deferred for 24 months, followed by bi-annual repayments. 4 Bank Bill Swap Bid Rate. The US$ RCF, A$ RCF, A$ term loan and Rand RCF are linked to certain sustainability-linked key performance indicators (ESG KPIs), which will be measured annually for the next three financial years and will result in changes to interest rate margins. The adjustments to interest rate margins for each financial year's ESG performance would impact the following financial year. The respective ESG KPIs are as follows: KPI Unit of Measurement Scope Sustainability performance targets FY27 FY28 FY29 Renewable energy Cumulative installed renewable electricity capacity (MW). All operations 130 330 665 Water consumption Cumulative % reduction in potable water consumption. All operations (excluding Eva Copper Project) 8% 10% 12% Mine community development spend Additional % annual expenditure on committed mine community development initiatives. SA operations 10% 10% 10%
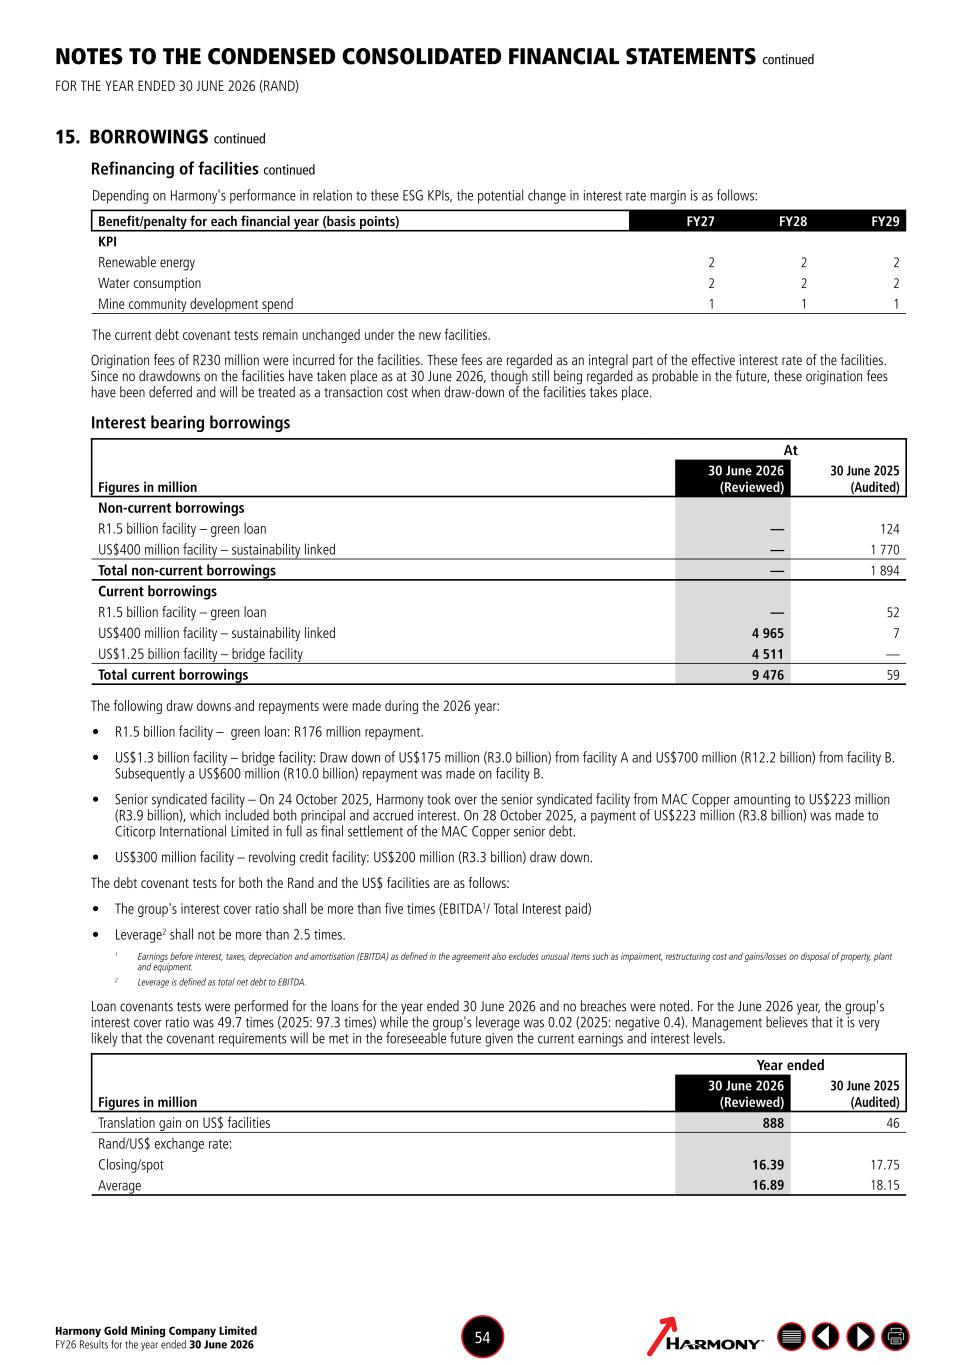
Harmony Gold Mining Company Limited FY26 Results for the year ended 30 June 2026 54 NOTES TO THE CONDENSED CONSOLIDATED FINANCIAL STATEMENTS continued FOR THE YEAR ENDED 30 JUNE 2026 (RAND) 15. BORROWINGS continued Refinancing of facilities continued Depending on Harmony's performance in relation to these ESG KPIs, the potential change in interest rate margin is as follows: Benefit/penalty for each financial year (basis points) FY27 FY28 FY29 KPI Renewable energy 2 2 2 Water consumption 2 2 2 Mine community development spend 1 1 1 The current debt covenant tests remain unchanged under the new facilities. Origination fees of R230 million were incurred for the facilities. These fees are regarded as an integral part of the effective interest rate of the facilities. Since no drawdowns on the facilities have taken place as at 30 June 2026, though still being regarded as probable in the future, these origination fees have been deferred and will be treated as a transaction cost when draw-down of the facilities takes place. Interest bearing borrowings At Figures in million 30 June 2026 (Reviewed) 30 June 2025 (Audited) Non-current borrowings R1.5 billion facility – green loan — 124 US$400 million facility – sustainability linked — 1 770 Total non-current borrowings — 1 894 Current borrowings R1.5 billion facility – green loan — 52 US$400 million facility – sustainability linked 4 965 7 US$1.25 billion facility – bridge facility 4 511 — Total current borrowings 9 476 59 The following draw downs and repayments were made during the 2026 year: • R1.5 billion facility – green loan: R176 million repayment. • US$1.3 billion facility – bridge facility: Draw down of US$175 million (R3.0 billion) from facility A and US$700 million (R12.2 billion) from facility B. Subsequently a US$600 million (R10.0 billion) repayment was made on facility B. • Senior syndicated facility – On 24 October 2025, Harmony took over the senior syndicated facility from MAC Copper amounting to US$223 million (R3.9 billion), which included both principal and accrued interest. On 28 October 2025, a payment of US$223 million (R3.8 billion) was made to Citicorp International Limited in full as final settlement of the MAC Copper senior debt. • US$300 million facility – revolving credit facility: US$200 million (R3.3 billion) draw down. The debt covenant tests for both the Rand and the US$ facilities are as follows: • The group's interest cover ratio shall be more than five times (EBITDA1/ Total Interest paid) • Leverage2 shall not be more than 2.5 times. 1 Earnings before interest, taxes, depreciation and amortisation (EBITDA) as defined in the agreement also excludes unusual items such as impairment, restructuring cost and gains/losses on disposal of property, plant and equipment. 2 Leverage is defined as total net debt to EBITDA. Loan covenants tests were performed for the loans for the year ended 30 June 2026 and no breaches were noted. For the June 2026 year, the group's interest cover ratio was 49.7 times (2025: 97.3 times) while the group's leverage was 0.02 (2025: negative 0.4). Management believes that it is very likely that the covenant requirements will be met in the foreseeable future given the current earnings and interest levels. Year ended Figures in million 30 June 2026 (Reviewed) 30 June 2025 (Audited) Translation gain on US$ facilities 888 46 Rand/US$ exchange rate: Closing/spot 16.39 17.75 Average 16.89 18.15
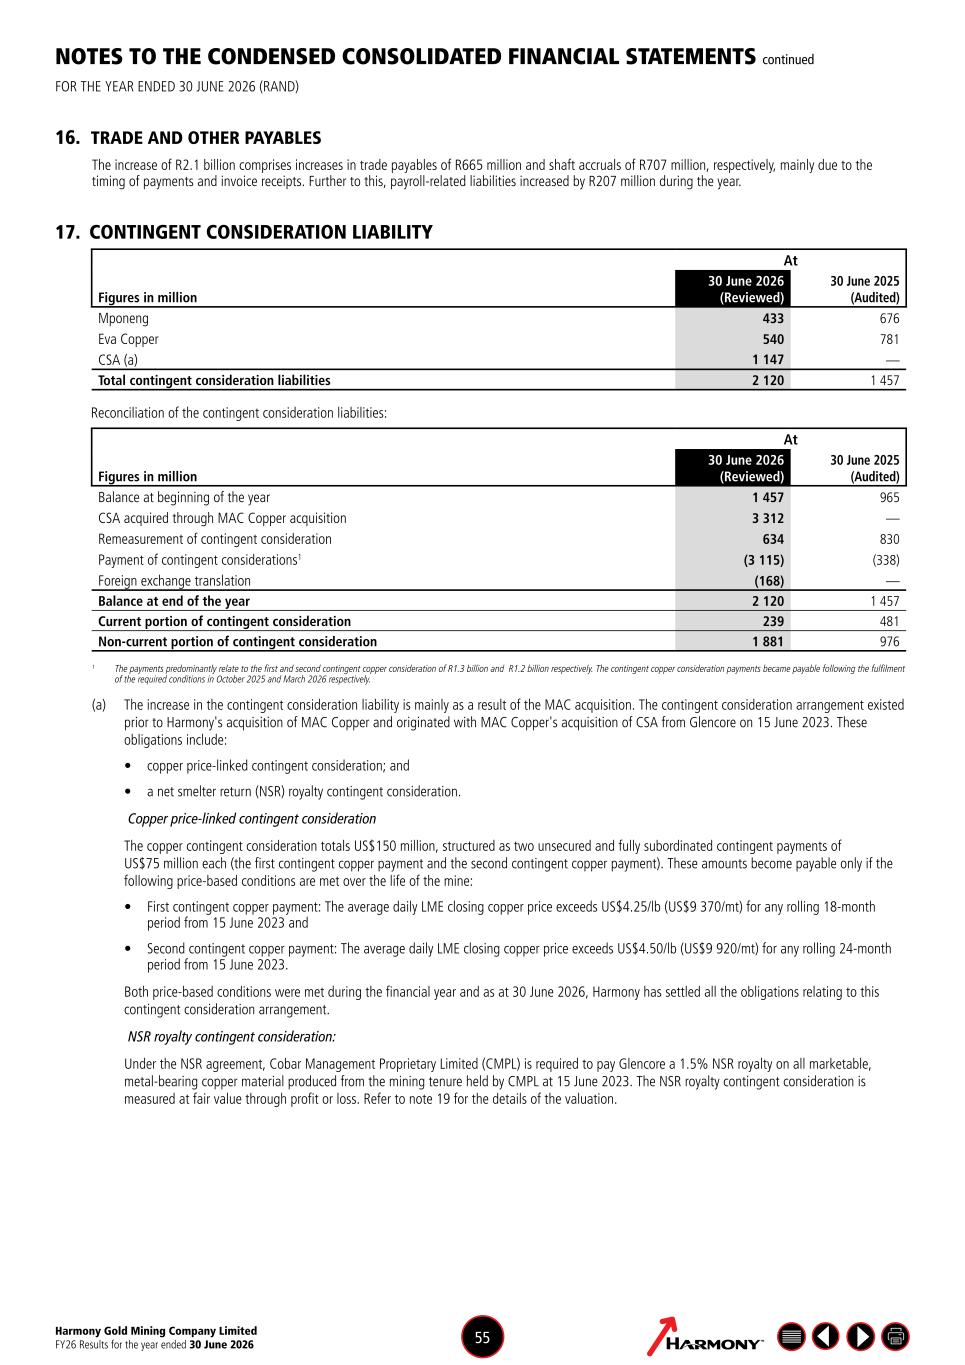
Harmony Gold Mining Company Limited FY26 Results for the year ended 30 June 2026 55 17. CONTINGENT CONSIDERATION LIABILITY At Figures in million 30 June 2026 (Reviewed) 30 June 2025 (Audited) Mponeng 433 676 Eva Copper 540 781 CSA (a) 1 147 — Total contingent consideration liabilities 2 120 1 457 Reconciliation of the contingent consideration liabilities: At Figures in million 30 June 2026 (Reviewed) 30 June 2025 (Audited) Balance at beginning of the year 1 457 965 CSA acquired through MAC Copper acquisition 3 312 — Remeasurement of contingent consideration 634 830 Payment of contingent considerations1 (3 115) (338) Foreign exchange translation (168) — Balance at end of the year 2 120 1 457 Current portion of contingent consideration 239 481 Non-current portion of contingent consideration 1 881 976 1 The payments predominantly relate to the first and second contingent copper consideration of R1.3 billion and R1.2 billion respectively. The contingent copper consideration payments became payable following the fulfilment of the required conditions in October 2025 and March 2026 respectively. (a) The increase in the contingent consideration liability is mainly as a result of the MAC acquisition. The contingent consideration arrangement existed prior to Harmony's acquisition of MAC Copper and originated with MAC Copper's acquisition of CSA from Glencore on 15 June 2023. These obligations include: • copper price‑linked contingent consideration; and • a net smelter return (NSR) royalty contingent consideration. Copper price-linked contingent consideration The copper contingent consideration totals US$150 million, structured as two unsecured and fully subordinated contingent payments of US$75 million each (the first contingent copper payment and the second contingent copper payment). These amounts become payable only if the following price‑based conditions are met over the life of the mine: • First contingent copper payment: The average daily LME closing copper price exceeds US$4.25/lb (US$9 370/mt) for any rolling 18‑month period from 15 June 2023 and • Second contingent copper payment: The average daily LME closing copper price exceeds US$4.50/lb (US$9 920/mt) for any rolling 24‑month period from 15 June 2023. Both price-based conditions were met during the financial year and as at 30 June 2026, Harmony has settled all the obligations relating to this contingent consideration arrangement. NSR royalty contingent consideration: Under the NSR agreement, Cobar Management Proprietary Limited (CMPL) is required to pay Glencore a 1.5% NSR royalty on all marketable, metal‑bearing copper material produced from the mining tenure held by CMPL at 15 June 2023. The NSR royalty contingent consideration is measured at fair value through profit or loss. Refer to note 19 for the details of the valuation. NOTES TO THE CONDENSED CONSOLIDATED FINANCIAL STATEMENTS continued FOR THE YEAR ENDED 30 JUNE 2026 (RAND) 16. TRADE AND OTHER PAYABLES The increase of R2.1 billion comprises increases in trade payables of R665 million and shaft accruals of R707 million, respectively, mainly due to the timing of payments and invoice receipts. Further to this, payroll-related liabilities increased by R207 million during the year.
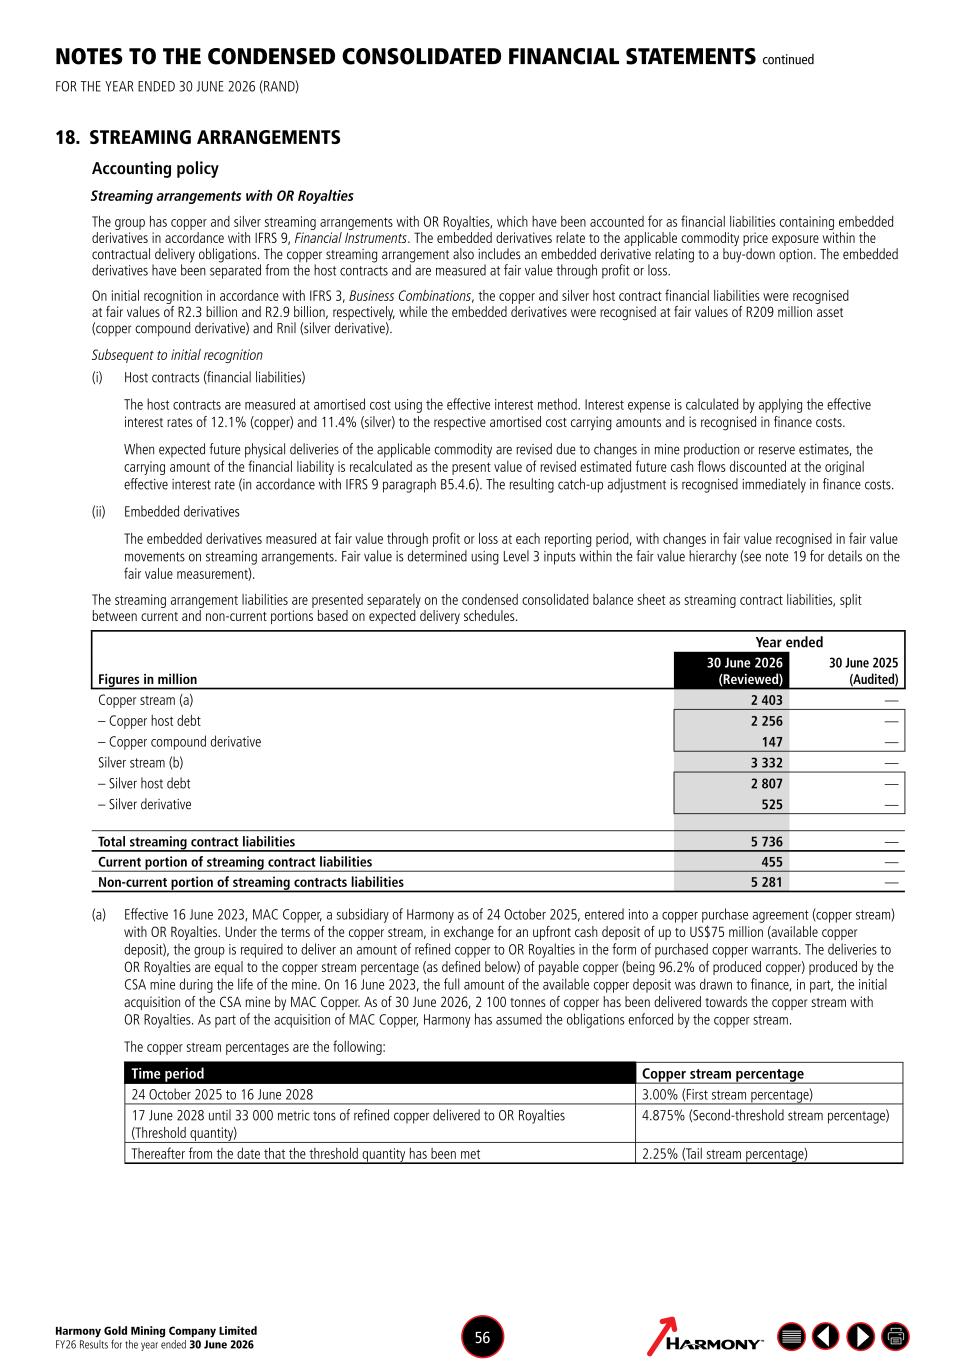
Harmony Gold Mining Company Limited FY26 Results for the year ended 30 June 2026 56 NOTES TO THE CONDENSED CONSOLIDATED FINANCIAL STATEMENTS continued FOR THE YEAR ENDED 30 JUNE 2026 (RAND) 18. STREAMING ARRANGEMENTS Accounting policy Streaming arrangements with OR Royalties The group has copper and silver streaming arrangements with OR Royalties, which have been accounted for as financial liabilities containing embedded derivatives in accordance with IFRS 9, Financial Instruments. The embedded derivatives relate to the applicable commodity price exposure within the contractual delivery obligations. The copper streaming arrangement also includes an embedded derivative relating to a buy-down option. The embedded derivatives have been separated from the host contracts and are measured at fair value through profit or loss. On initial recognition in accordance with IFRS 3, Business Combinations, the copper and silver host contract financial liabilities were recognised at fair values of R2.3 billion and R2.9 billion, respectively, while the embedded derivatives were recognised at fair values of R209 million asset (copper compound derivative) and Rnil (silver derivative). Subsequent to initial recognition (i) Host contracts (financial liabilities) The host contracts are measured at amortised cost using the effective interest method. Interest expense is calculated by applying the effective interest rates of 12.1% (copper) and 11.4% (silver) to the respective amortised cost carrying amounts and is recognised in finance costs. When expected future physical deliveries of the applicable commodity are revised due to changes in mine production or reserve estimates, the carrying amount of the financial liability is recalculated as the present value of revised estimated future cash flows discounted at the original effective interest rate (in accordance with IFRS 9 paragraph B5.4.6). The resulting catch-up adjustment is recognised immediately in finance costs. (ii) Embedded derivatives The embedded derivatives measured at fair value through profit or loss at each reporting period, with changes in fair value recognised in fair value movements on streaming arrangements. Fair value is determined using Level 3 inputs within the fair value hierarchy (see note 19 for details on the fair value measurement). The streaming arrangement liabilities are presented separately on the condensed consolidated balance sheet as streaming contract liabilities, split between current and non-current portions based on expected delivery schedules. Year ended Figures in million 30 June 2026 (Reviewed) 30 June 2025 (Audited) Copper stream (a) 2 403 — – Copper host debt 2 256 — – Copper compound derivative 147 — Silver stream (b) 3 332 — – Silver host debt 2 807 — – Silver derivative 525 — Total streaming contract liabilities 5 736 — Current portion of streaming contract liabilities 455 — Non-current portion of streaming contracts liabilities 5 281 — (a) Effective 16 June 2023, MAC Copper, a subsidiary of Harmony as of 24 October 2025, entered into a copper purchase agreement (copper stream) with OR Royalties. Under the terms of the copper stream, in exchange for an upfront cash deposit of up to US$75 million (available copper deposit), the group is required to deliver an amount of refined copper to OR Royalties in the form of purchased copper warrants. The deliveries to OR Royalties are equal to the copper stream percentage (as defined below) of payable copper (being 96.2% of produced copper) produced by the CSA mine during the life of the mine. On 16 June 2023, the full amount of the available copper deposit was drawn to finance, in part, the initial acquisition of the CSA mine by MAC Copper. As of 30 June 2026, 2 100 tonnes of copper has been delivered towards the copper stream with OR Royalties. As part of the acquisition of MAC Copper, Harmony has assumed the obligations enforced by the copper stream. The copper stream percentages are the following: Time period Copper stream percentage 24 October 2025 to 16 June 2028 3.00% (First stream percentage) 17 June 2028 until 33 000 metric tons of refined copper delivered to OR Royalties (Threshold quantity) 4.875% (Second-threshold stream percentage) Thereafter from the date that the threshold quantity has been met 2.25% (Tail stream percentage)
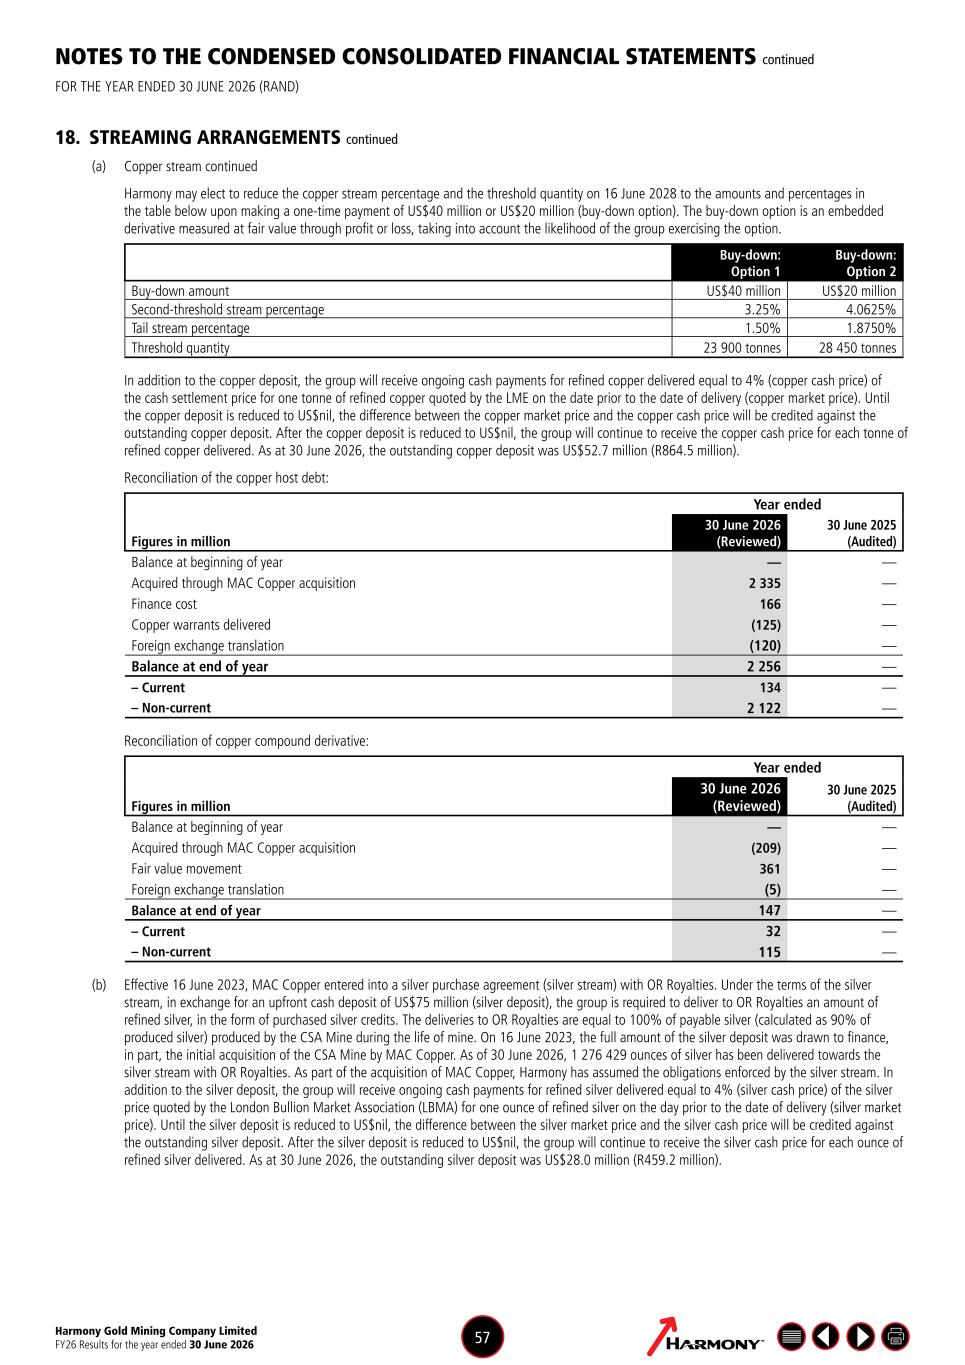
Harmony Gold Mining Company Limited FY26 Results for the year ended 30 June 2026 57 NOTES TO THE CONDENSED CONSOLIDATED FINANCIAL STATEMENTS continued FOR THE YEAR ENDED 30 JUNE 2026 (RAND) 18. STREAMING ARRANGEMENTS continued (a) Copper stream continued Harmony may elect to reduce the copper stream percentage and the threshold quantity on 16 June 2028 to the amounts and percentages in the table below upon making a one-time payment of US$40 million or US$20 million (buy-down option). The buy-down option is an embedded derivative measured at fair value through profit or loss, taking into account the likelihood of the group exercising the option. Buy-down: Option 1 Buy-down: Option 2 Buy-down amount US$40 million US$20 million Second-threshold stream percentage 3.25% 4.0625% Tail stream percentage 1.50% 1.8750% Threshold quantity 23 900 tonnes 28 450 tonnes In addition to the copper deposit, the group will receive ongoing cash payments for refined copper delivered equal to 4% (copper cash price) of the cash settlement price for one tonne of refined copper quoted by the LME on the date prior to the date of delivery (copper market price). Until the copper deposit is reduced to US$nil, the difference between the copper market price and the copper cash price will be credited against the outstanding copper deposit. After the copper deposit is reduced to US$nil, the group will continue to receive the copper cash price for each tonne of refined copper delivered. As at 30 June 2026, the outstanding copper deposit was US$52.7 million (R864.5 million). Reconciliation of the copper host debt: Year ended Figures in million 30 June 2026 (Reviewed) 30 June 2025 (Audited) Balance at beginning of year — — Acquired through MAC Copper acquisition 2 335 — Finance cost 166 — Copper warrants delivered (125) — Foreign exchange translation (120) — Balance at end of year 2 256 — – Current 134 — – Non-current 2 122 — Reconciliation of copper compound derivative: Year ended Figures in million 30 June 2026 (Reviewed) 30 June 2025 (Audited) Balance at beginning of year — — Acquired through MAC Copper acquisition (209) — Fair value movement 361 — Foreign exchange translation (5) — Balance at end of year 147 — – Current 32 — – Non-current 115 — (b) Effective 16 June 2023, MAC Copper entered into a silver purchase agreement (silver stream) with OR Royalties. Under the terms of the silver stream, in exchange for an upfront cash deposit of US$75 million (silver deposit), the group is required to deliver to OR Royalties an amount of refined silver, in the form of purchased silver credits. The deliveries to OR Royalties are equal to 100% of payable silver (calculated as 90% of produced silver) produced by the CSA Mine during the life of mine. On 16 June 2023, the full amount of the silver deposit was drawn to finance, in part, the initial acquisition of the CSA Mine by MAC Copper. As of 30 June 2026, 1 276 429 ounces of silver has been delivered towards the silver stream with OR Royalties. As part of the acquisition of MAC Copper, Harmony has assumed the obligations enforced by the silver stream. In addition to the silver deposit, the group will receive ongoing cash payments for refined silver delivered equal to 4% (silver cash price) of the silver price quoted by the London Bullion Market Association (LBMA) for one ounce of refined silver on the day prior to the date of delivery (silver market price). Until the silver deposit is reduced to US$nil, the difference between the silver market price and the silver cash price will be credited against the outstanding silver deposit. After the silver deposit is reduced to US$nil, the group will continue to receive the silver cash price for each ounce of refined silver delivered. As at 30 June 2026, the outstanding silver deposit was US$28.0 million (R459.2 million).
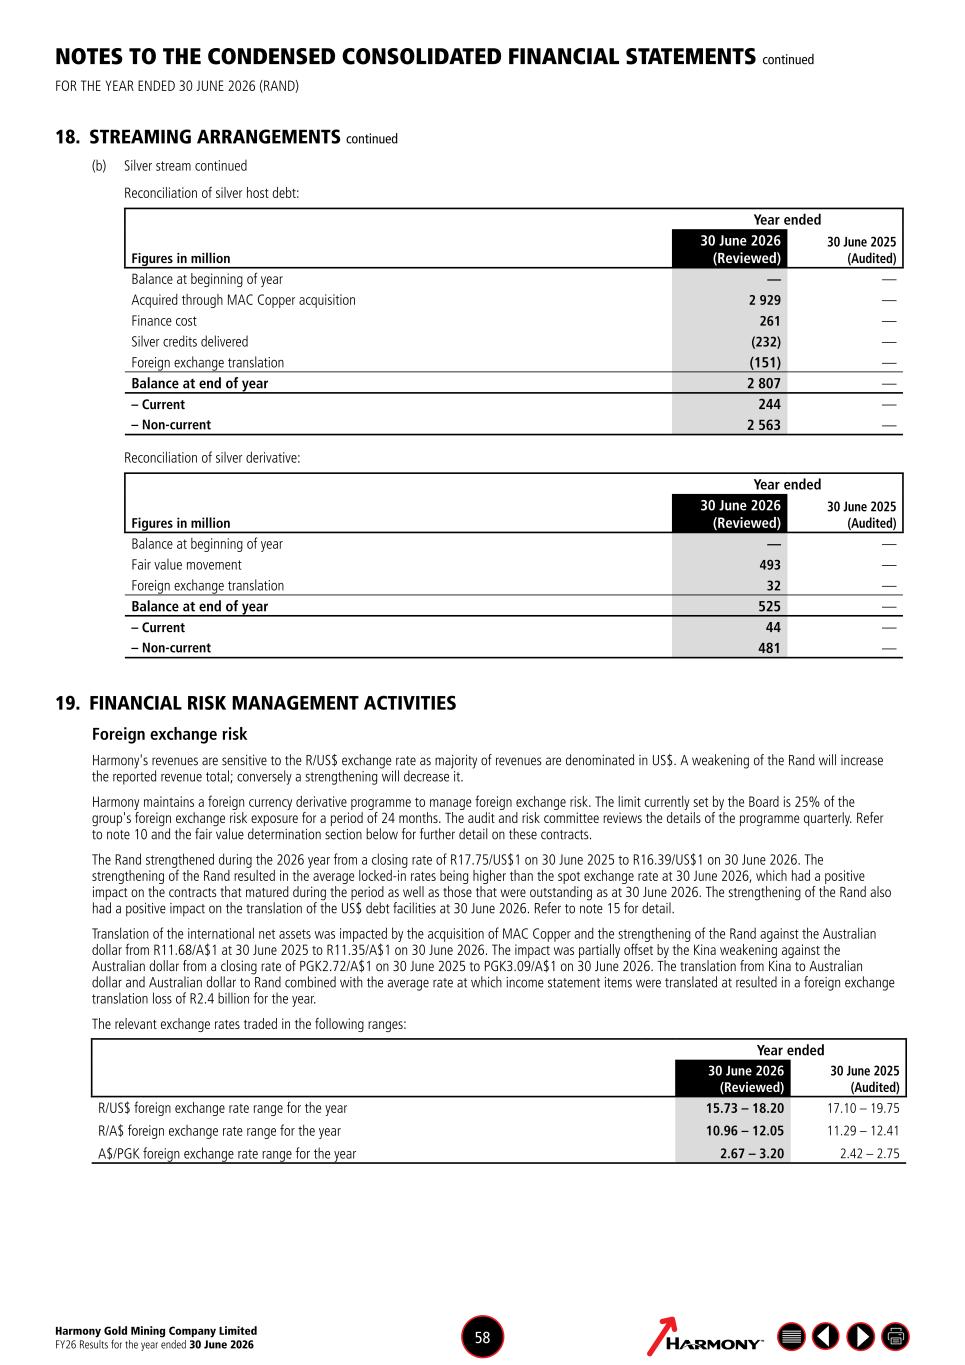
Harmony Gold Mining Company Limited FY26 Results for the year ended 30 June 2026 58 NOTES TO THE CONDENSED CONSOLIDATED FINANCIAL STATEMENTS continued FOR THE YEAR ENDED 30 JUNE 2026 (RAND) 18. STREAMING ARRANGEMENTS continued (b) Silver stream continued Reconciliation of silver host debt: Year ended Figures in million 30 June 2026 (Reviewed) 30 June 2025 (Audited) Balance at beginning of year — — Acquired through MAC Copper acquisition 2 929 — Finance cost 261 — Silver credits delivered (232) — Foreign exchange translation (151) — Balance at end of year 2 807 — – Current 244 — – Non-current 2 563 — Reconciliation of silver derivative: Year ended Figures in million 30 June 2026 (Reviewed) 30 June 2025 (Audited) Balance at beginning of year — — Fair value movement 493 — Foreign exchange translation 32 — Balance at end of year 525 — – Current 44 — – Non-current 481 — 19. FINANCIAL RISK MANAGEMENT ACTIVITIES Foreign exchange risk Harmony's revenues are sensitive to the R/US$ exchange rate as majority of revenues are denominated in US$. A weakening of the Rand will increase the reported revenue total; conversely a strengthening will decrease it. Harmony maintains a foreign currency derivative programme to manage foreign exchange risk. The limit currently set by the Board is 25% of the group's foreign exchange risk exposure for a period of 24 months. The audit and risk committee reviews the details of the programme quarterly. Refer to note 10 and the fair value determination section below for further detail on these contracts. The Rand strengthened during the 2026 year from a closing rate of R17.75/US$1 on 30 June 2025 to R16.39/US$1 on 30 June 2026. The strengthening of the Rand resulted in the average locked-in rates being higher than the spot exchange rate at 30 June 2026, which had a positive impact on the contracts that matured during the period as well as those that were outstanding as at 30 June 2026. The strengthening of the Rand also had a positive impact on the translation of the US$ debt facilities at 30 June 2026. Refer to note 15 for detail. Translation of the international net assets was impacted by the acquisition of MAC Copper and the strengthening of the Rand against the Australian dollar from R11.68/A$1 at 30 June 2025 to R11.35/A$1 on 30 June 2026. The impact was partially offset by the Kina weakening against the Australian dollar from a closing rate of PGK2.72/A$1 on 30 June 2025 to PGK3.09/A$1 on 30 June 2026. The translation from Kina to Australian dollar and Australian dollar to Rand combined with the average rate at which income statement items were translated at resulted in a foreign exchange translation loss of R2.4 billion for the year. The relevant exchange rates traded in the following ranges: Year ended 30 June 2026 (Reviewed) 30 June 2025 (Audited) R/US$ foreign exchange rate range for the year 15.73 – 18.20 17.10 – 19.75 R/A$ foreign exchange rate range for the year 10.96 – 12.05 11.29 – 12.41 A$/PGK foreign exchange rate range for the year 2.67 – 3.20 2.42 – 2.75
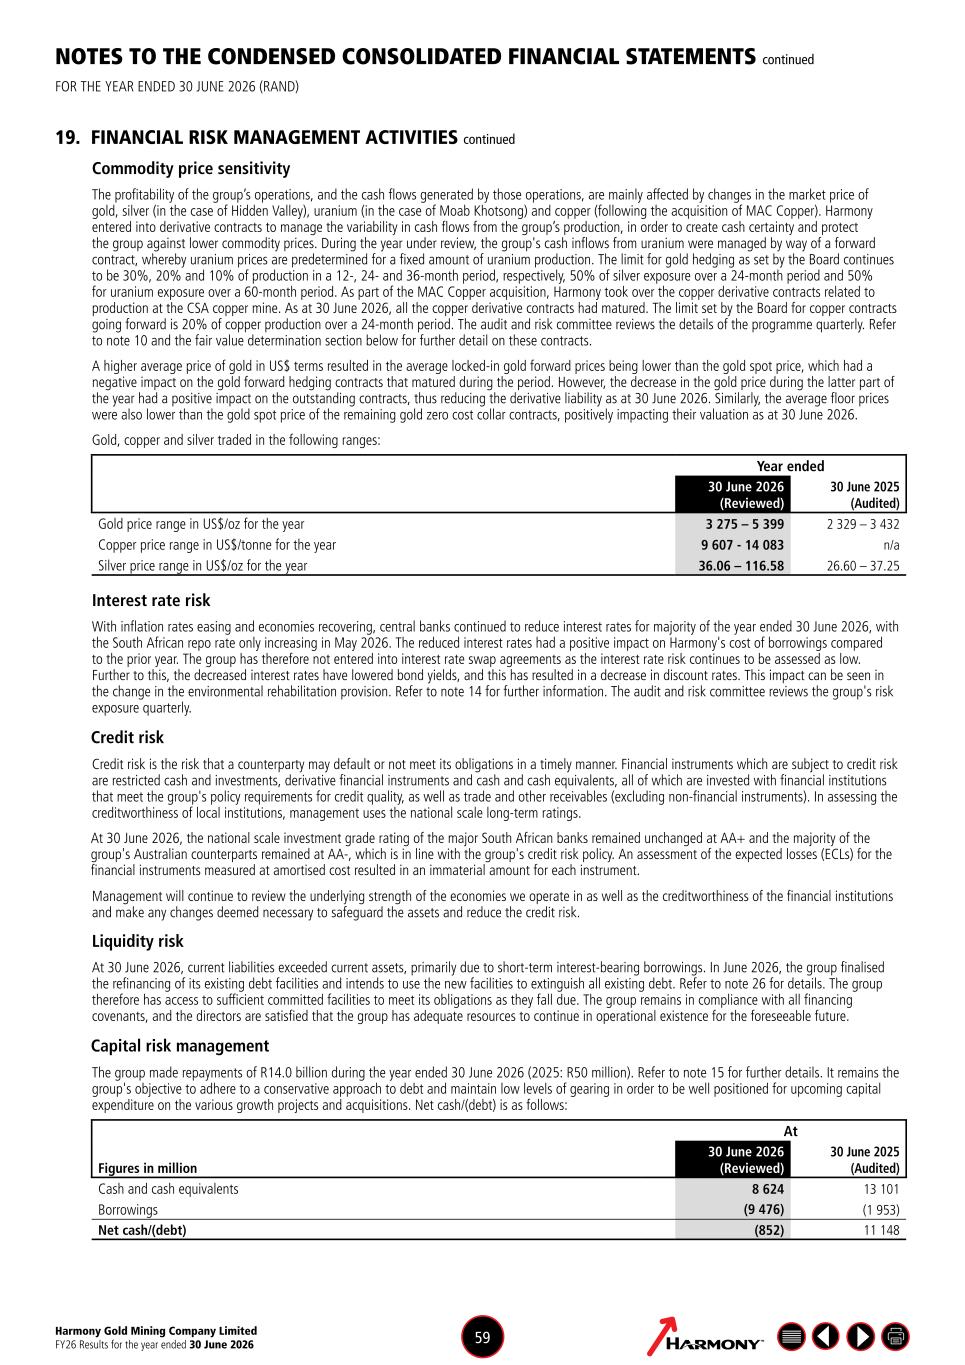
Harmony Gold Mining Company Limited FY26 Results for the year ended 30 June 2026 59 NOTES TO THE CONDENSED CONSOLIDATED FINANCIAL STATEMENTS continued FOR THE YEAR ENDED 30 JUNE 2026 (RAND) 19. FINANCIAL RISK MANAGEMENT ACTIVITIES continued Commodity price sensitivity The profitability of the group’s operations, and the cash flows generated by those operations, are mainly affected by changes in the market price of gold, silver (in the case of Hidden Valley), uranium (in the case of Moab Khotsong) and copper (following the acquisition of MAC Copper). Harmony entered into derivative contracts to manage the variability in cash flows from the group’s production, in order to create cash certainty and protect the group against lower commodity prices. During the year under review, the group's cash inflows from uranium were managed by way of a forward contract, whereby uranium prices are predetermined for a fixed amount of uranium production. The limit for gold hedging as set by the Board continues to be 30%, 20% and 10% of production in a 12-, 24- and 36-month period, respectively, 50% of silver exposure over a 24-month period and 50% for uranium exposure over a 60-month period. As part of the MAC Copper acquisition, Harmony took over the copper derivative contracts related to production at the CSA copper mine. As at 30 June 2026, all the copper derivative contracts had matured. The limit set by the Board for copper contracts going forward is 20% of copper production over a 24-month period. The audit and risk committee reviews the details of the programme quarterly. Refer to note 10 and the fair value determination section below for further detail on these contracts. A higher average price of gold in US$ terms resulted in the average locked-in gold forward prices being lower than the gold spot price, which had a negative impact on the gold forward hedging contracts that matured during the period. However, the decrease in the gold price during the latter part of the year had a positive impact on the outstanding contracts, thus reducing the derivative liability as at 30 June 2026. Similarly, the average floor prices were also lower than the gold spot price of the remaining gold zero cost collar contracts, positively impacting their valuation as at 30 June 2026. Gold, copper and silver traded in the following ranges: Year ended 30 June 2026 (Reviewed) 30 June 2025 (Audited) Gold price range in US$/oz for the year 3 275 – 5 399 2 329 – 3 432 Copper price range in US$/tonne for the year 9 607 - 14 083 n/a Silver price range in US$/oz for the year 36.06 – 116.58 26.60 – 37.25 Interest rate risk With inflation rates easing and economies recovering, central banks continued to reduce interest rates for majority of the year ended 30 June 2026, with the South African repo rate only increasing in May 2026. The reduced interest rates had a positive impact on Harmony's cost of borrowings compared to the prior year. The group has therefore not entered into interest rate swap agreements as the interest rate risk continues to be assessed as low. Further to this, the decreased interest rates have lowered bond yields, and this has resulted in a decrease in discount rates. This impact can be seen in the change in the environmental rehabilitation provision. Refer to note 14 for further information. The audit and risk committee reviews the group's risk exposure quarterly. Credit risk Credit risk is the risk that a counterparty may default or not meet its obligations in a timely manner. Financial instruments which are subject to credit risk are restricted cash and investments, derivative financial instruments and cash and cash equivalents, all of which are invested with financial institutions that meet the group's policy requirements for credit quality, as well as trade and other receivables (excluding non-financial instruments). In assessing the creditworthiness of local institutions, management uses the national scale long-term ratings. At 30 June 2026, the national scale investment grade rating of the major South African banks remained unchanged at AA+ and the majority of the group's Australian counterparts remained at AA-, which is in line with the group's credit risk policy. An assessment of the expected losses (ECLs) for the financial instruments measured at amortised cost resulted in an immaterial amount for each instrument. Management will continue to review the underlying strength of the economies we operate in as well as the creditworthiness of the financial institutions and make any changes deemed necessary to safeguard the assets and reduce the credit risk. Liquidity risk At 30 June 2026, current liabilities exceeded current assets, primarily due to short‑term interest‑bearing borrowings. In June 2026, the group finalised the refinancing of its existing debt facilities and intends to use the new facilities to extinguish all existing debt. Refer to note 26 for details. The group therefore has access to sufficient committed facilities to meet its obligations as they fall due. The group remains in compliance with all financing covenants, and the directors are satisfied that the group has adequate resources to continue in operational existence for the foreseeable future. Capital risk management The group made repayments of R14.0 billion during the year ended 30 June 2026 (2025: R50 million). Refer to note 15 for further details. It remains the group's objective to adhere to a conservative approach to debt and maintain low levels of gearing in order to be well positioned for upcoming capital expenditure on the various growth projects and acquisitions. Net cash/(debt) is as follows: At Figures in million 30 June 2026 (Reviewed) 30 June 2025 (Audited) Cash and cash equivalents 8 624 13 101 Borrowings (9 476) (1 953) Net cash/(debt) (852) 11 148
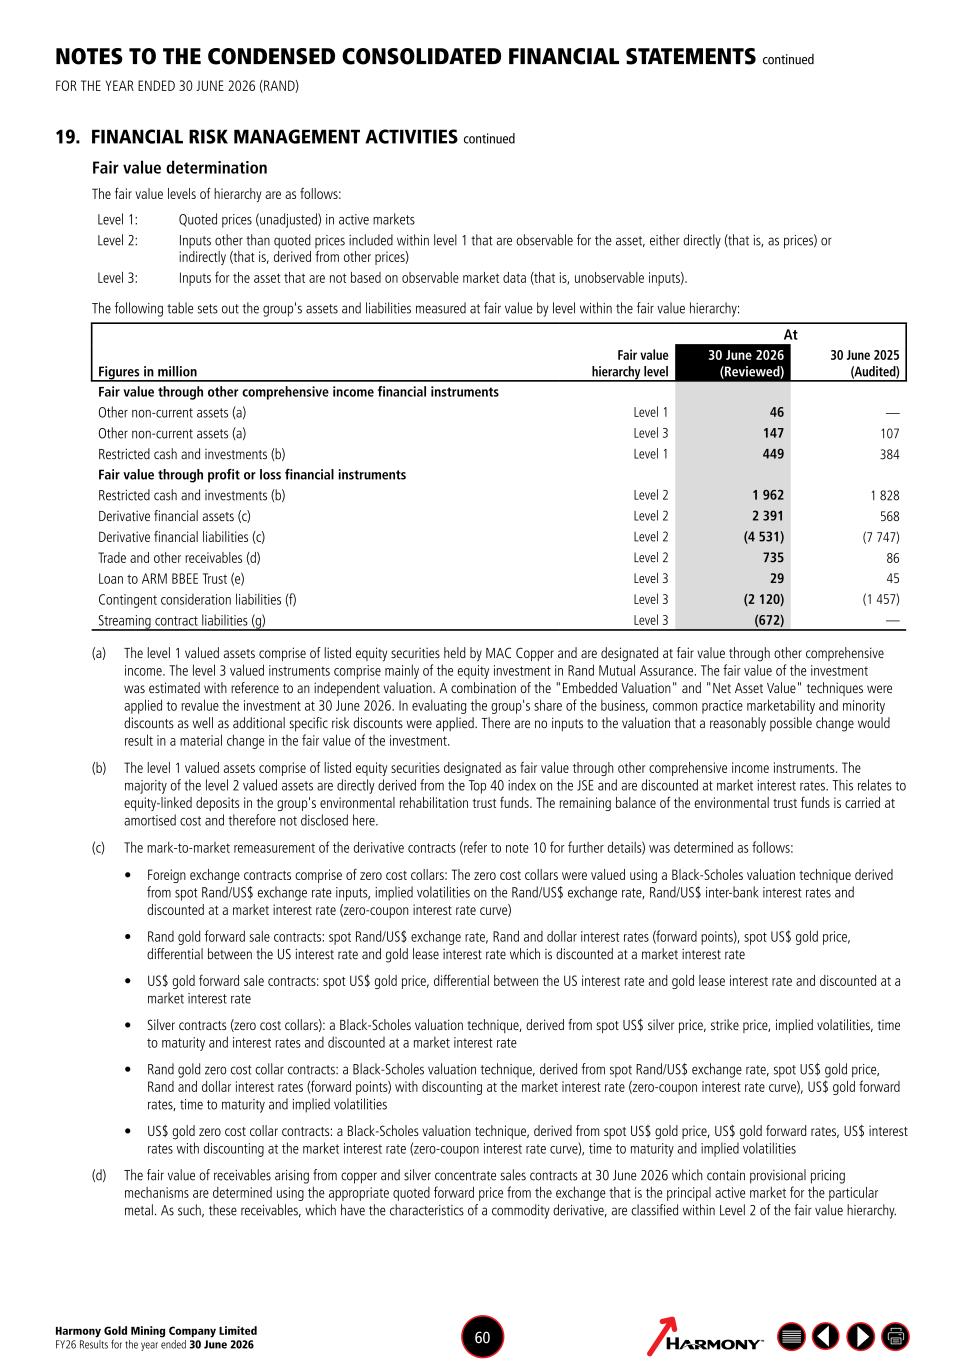
Harmony Gold Mining Company Limited FY26 Results for the year ended 30 June 2026 60 NOTES TO THE CONDENSED CONSOLIDATED FINANCIAL STATEMENTS continued FOR THE YEAR ENDED 30 JUNE 2026 (RAND) 19. FINANCIAL RISK MANAGEMENT ACTIVITIES continued Fair value determination The fair value levels of hierarchy are as follows: Level 1: Quoted prices (unadjusted) in active markets Level 2: Inputs other than quoted prices included within level 1 that are observable for the asset, either directly (that is, as prices) or indirectly (that is, derived from other prices) Level 3: Inputs for the asset that are not based on observable market data (that is, unobservable inputs). The following table sets out the group's assets and liabilities measured at fair value by level within the fair value hierarchy: At Figures in million Fair value hierarchy level 30 June 2026 (Reviewed) 30 June 2025 (Audited) Fair value through other comprehensive income financial instruments Other non-current assets (a) Level 1 46 — Other non-current assets (a) Level 3 147 107 Restricted cash and investments (b) Level 1 449 384 Fair value through profit or loss financial instruments Restricted cash and investments (b) Level 2 1 962 1 828 Derivative financial assets (c) Level 2 2 391 568 Derivative financial liabilities (c) Level 2 (4 531) (7 747) Trade and other receivables (d) Level 2 735 86 Loan to ARM BBEE Trust (e) Level 3 29 45 Contingent consideration liabilities (f) Level 3 (2 120) (1 457) Streaming contract liabilities (g) Level 3 (672) — (a) The level 1 valued assets comprise of listed equity securities held by MAC Copper and are designated at fair value through other comprehensive income. The level 3 valued instruments comprise mainly of the equity investment in Rand Mutual Assurance. The fair value of the investment was estimated with reference to an independent valuation. A combination of the "Embedded Valuation" and "Net Asset Value" techniques were applied to revalue the investment at 30 June 2026. In evaluating the group's share of the business, common practice marketability and minority discounts as well as additional specific risk discounts were applied. There are no inputs to the valuation that a reasonably possible change would result in a material change in the fair value of the investment. (b) The level 1 valued assets comprise of listed equity securities designated as fair value through other comprehensive income instruments. The majority of the level 2 valued assets are directly derived from the Top 40 index on the JSE and are discounted at market interest rates. This relates to equity-linked deposits in the group's environmental rehabilitation trust funds. The remaining balance of the environmental trust funds is carried at amortised cost and therefore not disclosed here. (c) The mark-to-market remeasurement of the derivative contracts (refer to note 10 for further details) was determined as follows: • Foreign exchange contracts comprise of zero cost collars: The zero cost collars were valued using a Black-Scholes valuation technique derived from spot Rand/US$ exchange rate inputs, implied volatilities on the Rand/US$ exchange rate, Rand/US$ inter-bank interest rates and discounted at a market interest rate (zero-coupon interest rate curve) • Rand gold forward sale contracts: spot Rand/US$ exchange rate, Rand and dollar interest rates (forward points), spot US$ gold price, differential between the US interest rate and gold lease interest rate which is discounted at a market interest rate • US$ gold forward sale contracts: spot US$ gold price, differential between the US interest rate and gold lease interest rate and discounted at a market interest rate • Silver contracts (zero cost collars): a Black-Scholes valuation technique, derived from spot US$ silver price, strike price, implied volatilities, time to maturity and interest rates and discounted at a market interest rate • Rand gold zero cost collar contracts: a Black-Scholes valuation technique, derived from spot Rand/US$ exchange rate, spot US$ gold price, Rand and dollar interest rates (forward points) with discounting at the market interest rate (zero-coupon interest rate curve), US$ gold forward rates, time to maturity and implied volatilities • US$ gold zero cost collar contracts: a Black-Scholes valuation technique, derived from spot US$ gold price, US$ gold forward rates, US$ interest rates with discounting at the market interest rate (zero-coupon interest rate curve), time to maturity and implied volatilities (d) The fair value of receivables arising from copper and silver concentrate sales contracts at 30 June 2026 which contain provisional pricing mechanisms are determined using the appropriate quoted forward price from the exchange that is the principal active market for the particular metal. As such, these receivables, which have the characteristics of a commodity derivative, are classified within Level 2 of the fair value hierarchy.
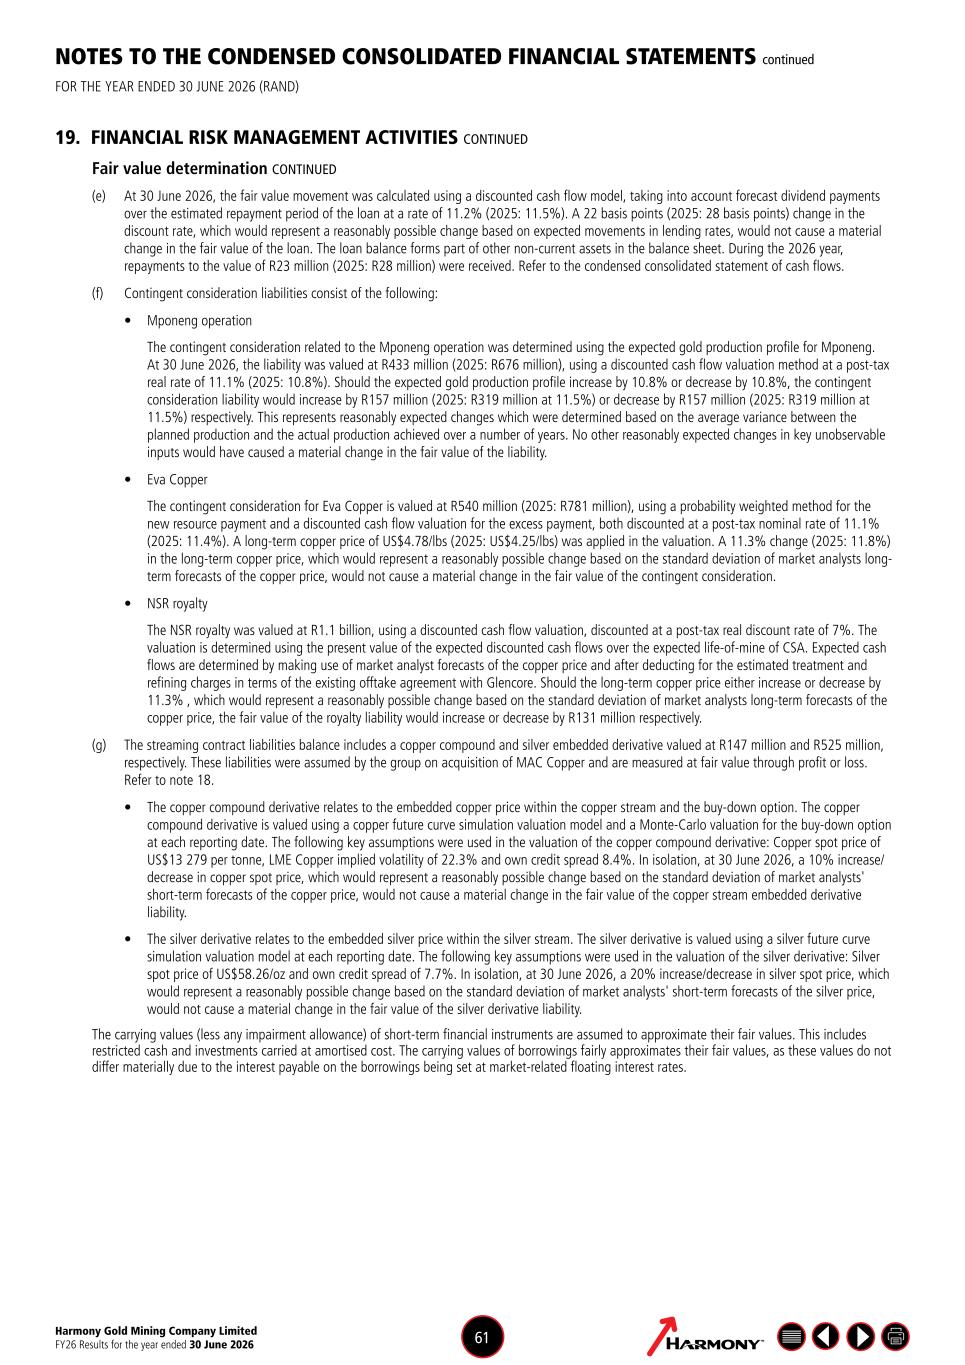
Harmony Gold Mining Company Limited FY26 Results for the year ended 30 June 2026 61 NOTES TO THE CONDENSED CONSOLIDATED FINANCIAL STATEMENTS continued FOR THE YEAR ENDED 30 JUNE 2026 (RAND) 19. FINANCIAL RISK MANAGEMENT ACTIVITIES CONTINUED Fair value determination CONTINUED (e) At 30 June 2026, the fair value movement was calculated using a discounted cash flow model, taking into account forecast dividend payments over the estimated repayment period of the loan at a rate of 11.2% (2025: 11.5%). A 22 basis points (2025: 28 basis points) change in the discount rate, which would represent a reasonably possible change based on expected movements in lending rates, would not cause a material change in the fair value of the loan. The loan balance forms part of other non-current assets in the balance sheet. During the 2026 year, repayments to the value of R23 million (2025: R28 million) were received. Refer to the condensed consolidated statement of cash flows. (f) Contingent consideration liabilities consist of the following: • Mponeng operation The contingent consideration related to the Mponeng operation was determined using the expected gold production profile for Mponeng. At 30 June 2026, the liability was valued at R433 million (2025: R676 million), using a discounted cash flow valuation method at a post-tax real rate of 11.1% (2025: 10.8%). Should the expected gold production profile increase by 10.8% or decrease by 10.8%, the contingent consideration liability would increase by R157 million (2025: R319 million at 11.5%) or decrease by R157 million (2025: R319 million at 11.5%) respectively. This represents reasonably expected changes which were determined based on the average variance between the planned production and the actual production achieved over a number of years. No other reasonably expected changes in key unobservable inputs would have caused a material change in the fair value of the liability. • Eva Copper The contingent consideration for Eva Copper is valued at R540 million (2025: R781 million), using a probability weighted method for the new resource payment and a discounted cash flow valuation for the excess payment, both discounted at a post-tax nominal rate of 11.1% (2025: 11.4%). A long-term copper price of US$4.78/lbs (2025: US$4.25/lbs) was applied in the valuation. A 11.3% change (2025: 11.8%) in the long-term copper price, which would represent a reasonably possible change based on the standard deviation of market analysts long- term forecasts of the copper price, would not cause a material change in the fair value of the contingent consideration. • NSR royalty The NSR royalty was valued at R1.1 billion, using a discounted cash flow valuation, discounted at a post-tax real discount rate of 7%. The valuation is determined using the present value of the expected discounted cash flows over the expected life-of-mine of CSA. Expected cash flows are determined by making use of market analyst forecasts of the copper price and after deducting for the estimated treatment and refining charges in terms of the existing offtake agreement with Glencore. Should the long-term copper price either increase or decrease by 11.3% , which would represent a reasonably possible change based on the standard deviation of market analysts long-term forecasts of the copper price, the fair value of the royalty liability would increase or decrease by R131 million respectively. (g) The streaming contract liabilities balance includes a copper compound and silver embedded derivative valued at R147 million and R525 million, respectively. These liabilities were assumed by the group on acquisition of MAC Copper and are measured at fair value through profit or loss. Refer to note 18. • The copper compound derivative relates to the embedded copper price within the copper stream and the buy-down option. The copper compound derivative is valued using a copper future curve simulation valuation model and a Monte-Carlo valuation for the buy-down option at each reporting date. The following key assumptions were used in the valuation of the copper compound derivative: Copper spot price of US$13 279 per tonne, LME Copper implied volatility of 22.3% and own credit spread 8.4%. In isolation, at 30 June 2026, a 10% increase/ decrease in copper spot price, which would represent a reasonably possible change based on the standard deviation of market analysts' short-term forecasts of the copper price, would not cause a material change in the fair value of the copper stream embedded derivative liability. • The silver derivative relates to the embedded silver price within the silver stream. The silver derivative is valued using a silver future curve simulation valuation model at each reporting date. The following key assumptions were used in the valuation of the silver derivative: Silver spot price of US$58.26/oz and own credit spread of 7.7%. In isolation, at 30 June 2026, a 20% increase/decrease in silver spot price, which would represent a reasonably possible change based on the standard deviation of market analysts' short-term forecasts of the silver price, would not cause a material change in the fair value of the silver derivative liability. The carrying values (less any impairment allowance) of short-term financial instruments are assumed to approximate their fair values. This includes restricted cash and investments carried at amortised cost. The carrying values of borrowings fairly approximates their fair values, as these values do not differ materially due to the interest payable on the borrowings being set at market-related floating interest rates.
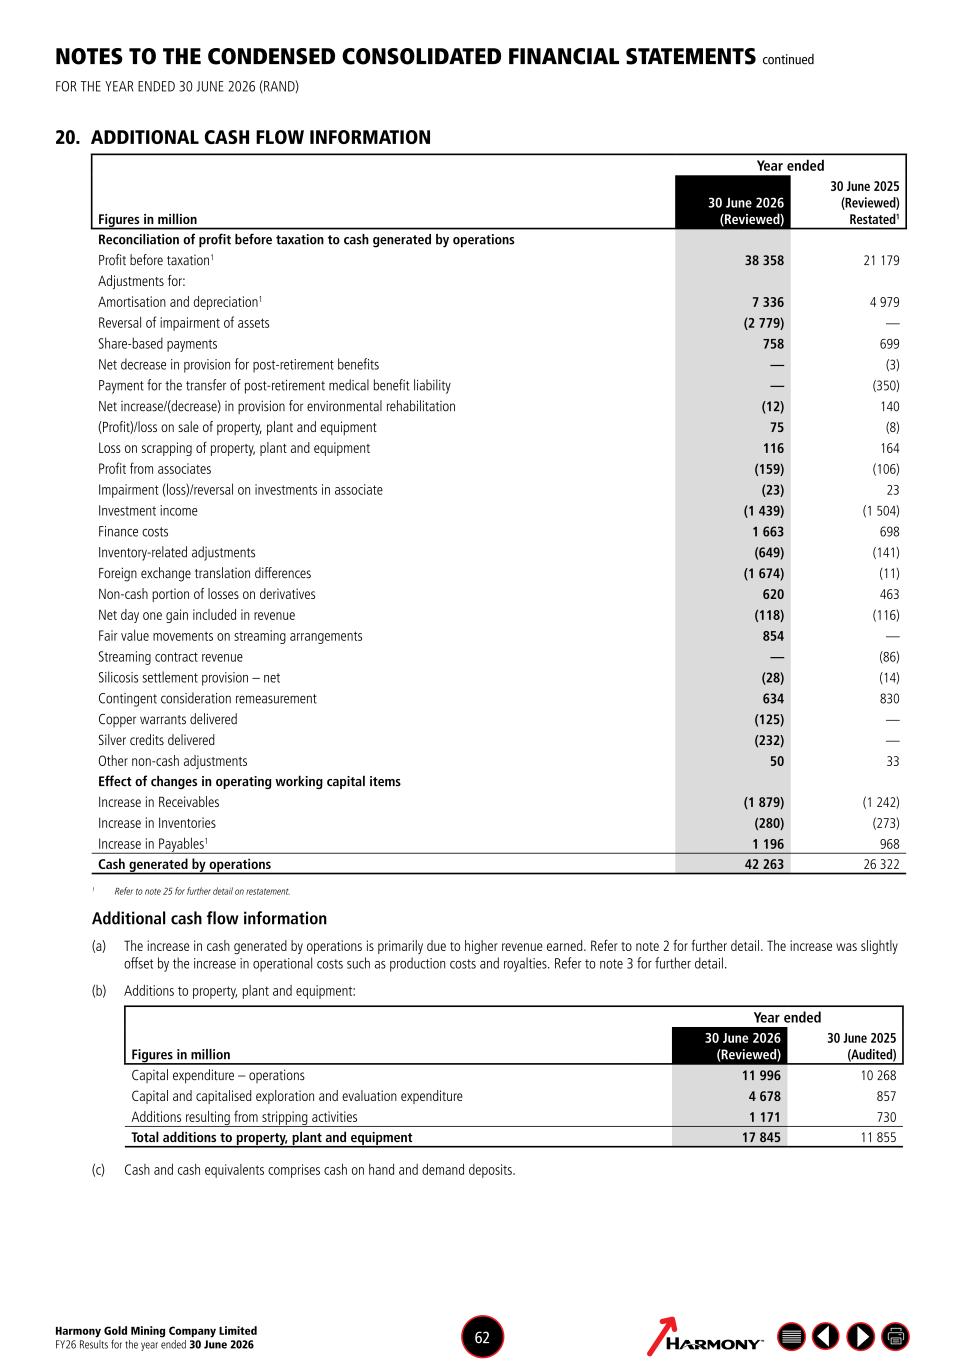
Harmony Gold Mining Company Limited FY26 Results for the year ended 30 June 2026 62 NOTES TO THE CONDENSED CONSOLIDATED FINANCIAL STATEMENTS continued FOR THE YEAR ENDED 30 JUNE 2026 (RAND) 20. ADDITIONAL CASH FLOW INFORMATION Year ended Figures in million 30 June 2026 (Reviewed) 30 June 2025 (Reviewed) Restated1 Reconciliation of profit before taxation to cash generated by operations Profit before taxation1 38 358 21 179 Adjustments for: Amortisation and depreciation1 7 336 4 979 Reversal of impairment of assets (2 779) — Share-based payments 758 699 Net decrease in provision for post-retirement benefits — (3) Payment for the transfer of post-retirement medical benefit liability — (350) Net increase/(decrease) in provision for environmental rehabilitation (12) 140 (Profit)/loss on sale of property, plant and equipment 75 (8) Loss on scrapping of property, plant and equipment 116 164 Profit from associates (159) (106) Impairment (loss)/reversal on investments in associate (23) 23 Investment income (1 439) (1 504) Finance costs 1 663 698 Inventory-related adjustments (649) (141) Foreign exchange translation differences (1 674) (11) Non-cash portion of losses on derivatives 620 463 Net day one gain included in revenue (118) (116) Fair value movements on streaming arrangements 854 — Streaming contract revenue — (86) Silicosis settlement provision – net (28) (14) Contingent consideration remeasurement 634 830 Copper warrants delivered (125) — Silver credits delivered (232) — Other non-cash adjustments 50 33 Effect of changes in operating working capital items Increase in Receivables (1 879) (1 242) Increase in Inventories (280) (273) Increase in Payables1 1 196 968 Cash generated by operations 42 263 26 322 1 Refer to note 25 for further detail on restatement. Additional cash flow information (a) The increase in cash generated by operations is primarily due to higher revenue earned. Refer to note 2 for further detail. The increase was slightly offset by the increase in operational costs such as production costs and royalties. Refer to note 3 for further detail. (b) Additions to property, plant and equipment: Year ended Figures in million 30 June 2026 (Reviewed) 30 June 2025 (Audited) Capital expenditure – operations 11 996 10 268 Capital and capitalised exploration and evaluation expenditure 4 678 857 Additions resulting from stripping activities 1 171 730 Total additions to property, plant and equipment 17 845 11 855 (c) Cash and cash equivalents comprises cash on hand and demand deposits.
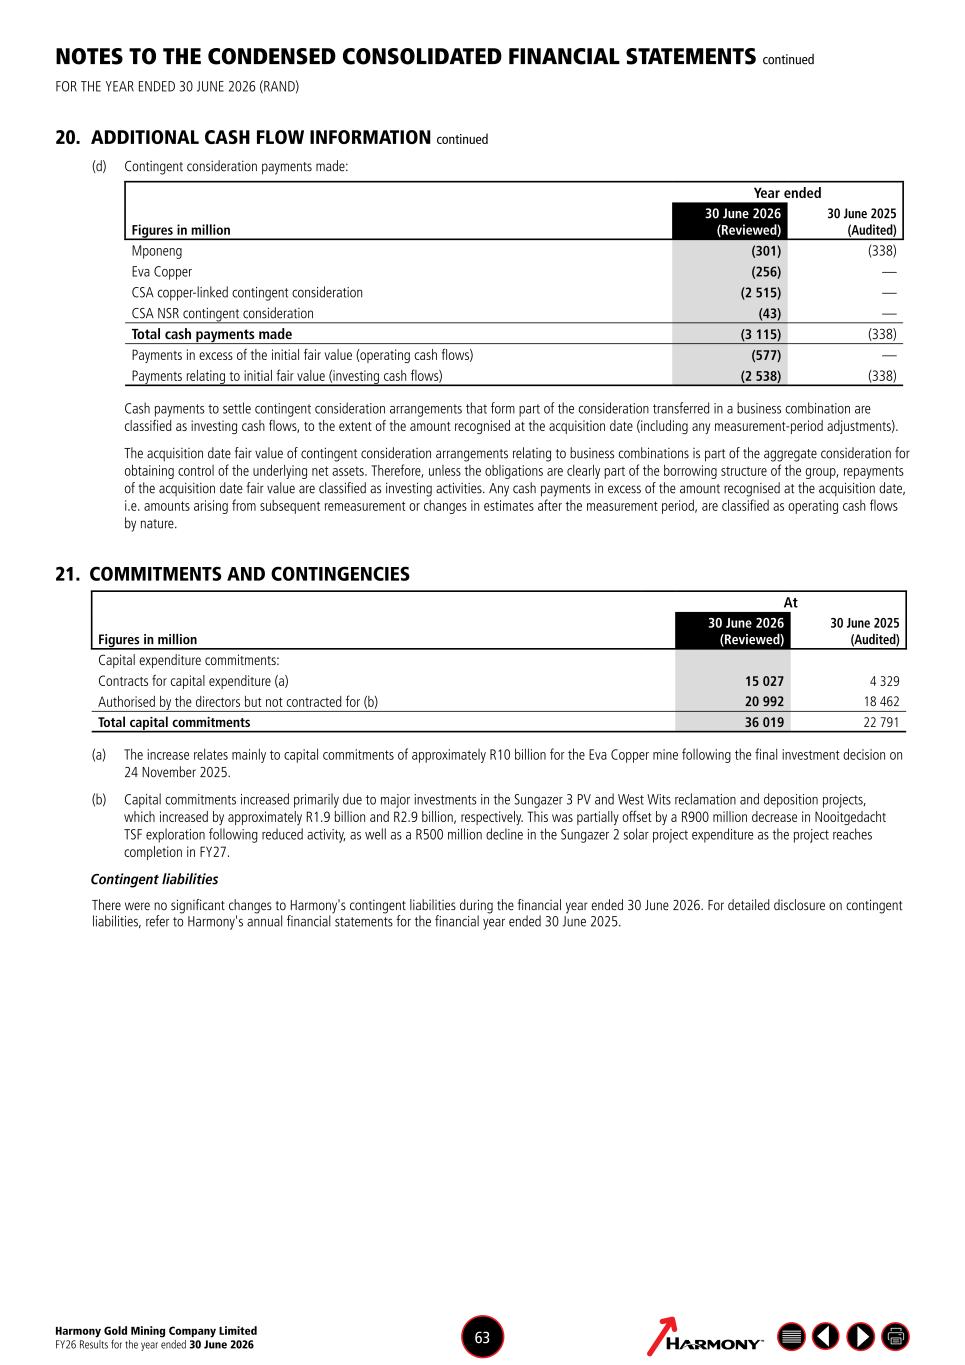
Harmony Gold Mining Company Limited FY26 Results for the year ended 30 June 2026 63 NOTES TO THE CONDENSED CONSOLIDATED FINANCIAL STATEMENTS continued FOR THE YEAR ENDED 30 JUNE 2026 (RAND) 20. ADDITIONAL CASH FLOW INFORMATION continued (d) Contingent consideration payments made: Year ended Figures in million 30 June 2026 (Reviewed) 30 June 2025 (Audited) Mponeng (301) (338) Eva Copper (256) — CSA copper-linked contingent consideration (2 515) — CSA NSR contingent consideration (43) — Total cash payments made (3 115) (338) Payments in excess of the initial fair value (operating cash flows) (577) — Payments relating to initial fair value (investing cash flows) (2 538) (338) Cash payments to settle contingent consideration arrangements that form part of the consideration transferred in a business combination are classified as investing cash flows, to the extent of the amount recognised at the acquisition date (including any measurement-period adjustments). The acquisition date fair value of contingent consideration arrangements relating to business combinations is part of the aggregate consideration for obtaining control of the underlying net assets. Therefore, unless the obligations are clearly part of the borrowing structure of the group, repayments of the acquisition date fair value are classified as investing activities. Any cash payments in excess of the amount recognised at the acquisition date, i.e. amounts arising from subsequent remeasurement or changes in estimates after the measurement period, are classified as operating cash flows by nature. 21. COMMITMENTS AND CONTINGENCIES At Figures in million 30 June 2026 (Reviewed) 30 June 2025 (Audited) Capital expenditure commitments: Contracts for capital expenditure (a) 15 027 4 329 Authorised by the directors but not contracted for (b) 20 992 18 462 Total capital commitments 36 019 22 791 (a) The increase relates mainly to capital commitments of approximately R10 billion for the Eva Copper mine following the final investment decision on 24 November 2025. (b) Capital commitments increased primarily due to major investments in the Sungazer 3 PV and West Wits reclamation and deposition projects, which increased by approximately R1.9 billion and R2.9 billion, respectively. This was partially offset by a R900 million decrease in Nooitgedacht TSF exploration following reduced activity, as well as a R500 million decline in the Sungazer 2 solar project expenditure as the project reaches completion in FY27. Contingent liabilities There were no significant changes to Harmony's contingent liabilities during the financial year ended 30 June 2026. For detailed disclosure on contingent liabilities, refer to Harmony's annual financial statements for the financial year ended 30 June 2025.
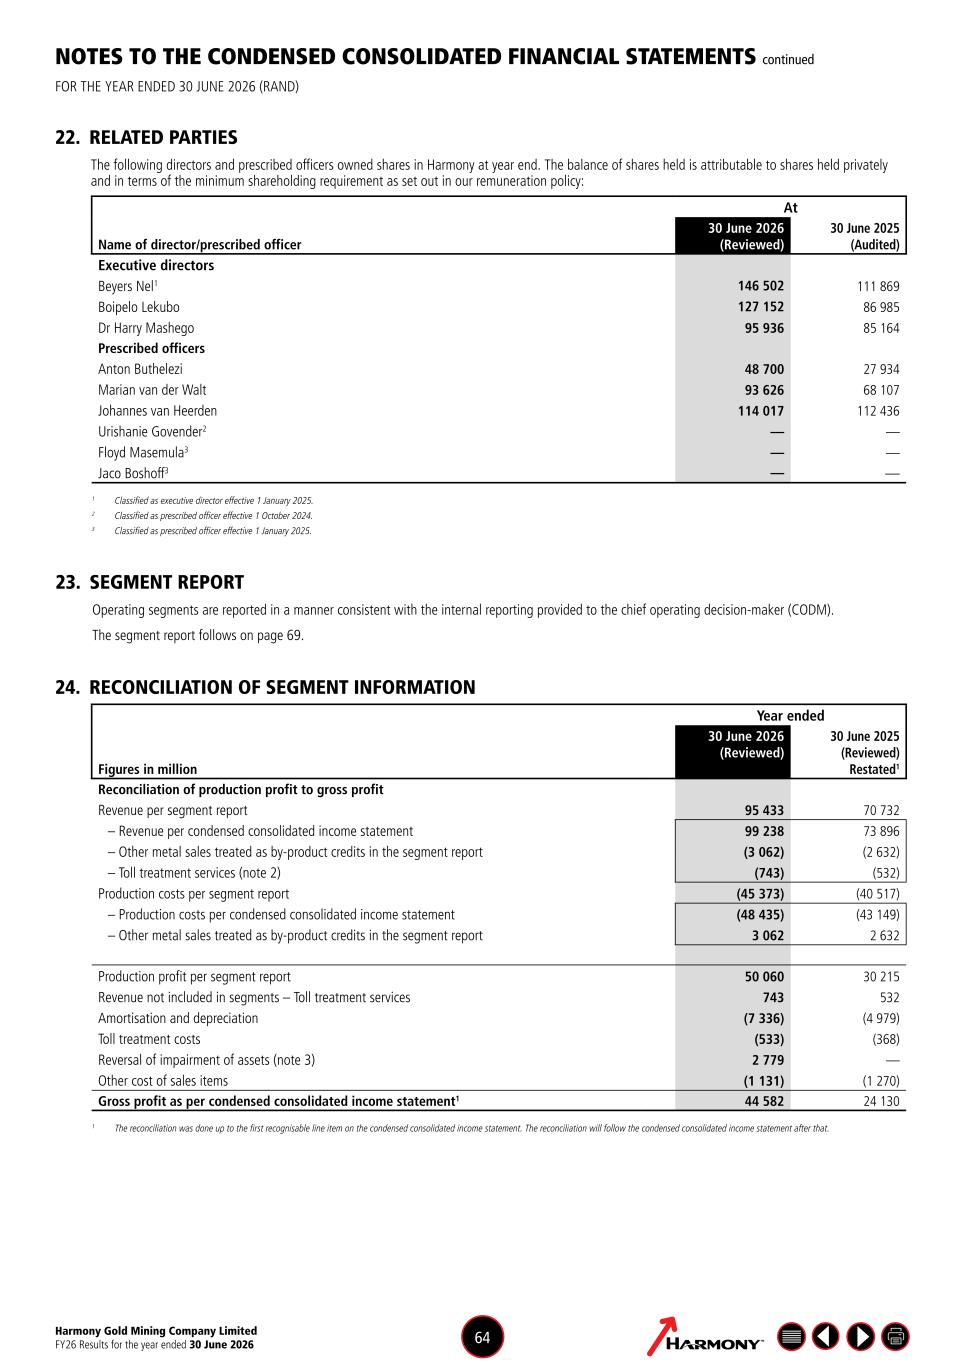
Harmony Gold Mining Company Limited FY26 Results for the year ended 30 June 2026 64 23. SEGMENT REPORT Operating segments are reported in a manner consistent with the internal reporting provided to the chief operating decision-maker (CODM). The segment report follows on page 69. NOTES TO THE CONDENSED CONSOLIDATED FINANCIAL STATEMENTS continued FOR THE YEAR ENDED 30 JUNE 2026 (RAND) 22. RELATED PARTIES The following directors and prescribed officers owned shares in Harmony at year end. The balance of shares held is attributable to shares held privately and in terms of the minimum shareholding requirement as set out in our remuneration policy: At Name of director/prescribed officer 30 June 2026 (Reviewed) 30 June 2025 (Audited) Executive directors Beyers Nel1 146 502 111 869 Boipelo Lekubo 127 152 86 985 Dr Harry Mashego 95 936 85 164 Prescribed officers Anton Buthelezi 48 700 27 934 Marian van der Walt 93 626 68 107 Johannes van Heerden 114 017 112 436 Urishanie Govender2 — — Floyd Masemula3 — — Jaco Boshoff3 — — 1 Classified as executive director effective 1 January 2025. 2 Classified as prescribed officer effective 1 October 2024. 3 Classified as prescribed officer effective 1 January 2025. 24. RECONCILIATION OF SEGMENT INFORMATION Year ended Figures in million 30 June 2026 (Reviewed) 30 June 2025 (Reviewed) Restated1 Reconciliation of production profit to gross profit Revenue per segment report 95 433 70 732 – Revenue per condensed consolidated income statement 99 238 73 896 – Other metal sales treated as by-product credits in the segment report (3 062) (2 632) – Toll treatment services (note 2) (743) (532) Production costs per segment report (45 373) (40 517) – Production costs per condensed consolidated income statement (48 435) (43 149) – Other metal sales treated as by-product credits in the segment report 3 062 2 632 Production profit per segment report 50 060 30 215 Revenue not included in segments – Toll treatment services 743 532 Amortisation and depreciation (7 336) (4 979) Toll treatment costs (533) (368) Reversal of impairment of assets (note 3) 2 779 — Other cost of sales items (1 131) (1 270) Gross profit as per condensed consolidated income statement1 44 582 24 130 1 The reconciliation was done up to the first recognisable line item on the condensed consolidated income statement. The reconciliation will follow the condensed consolidated income statement after that.
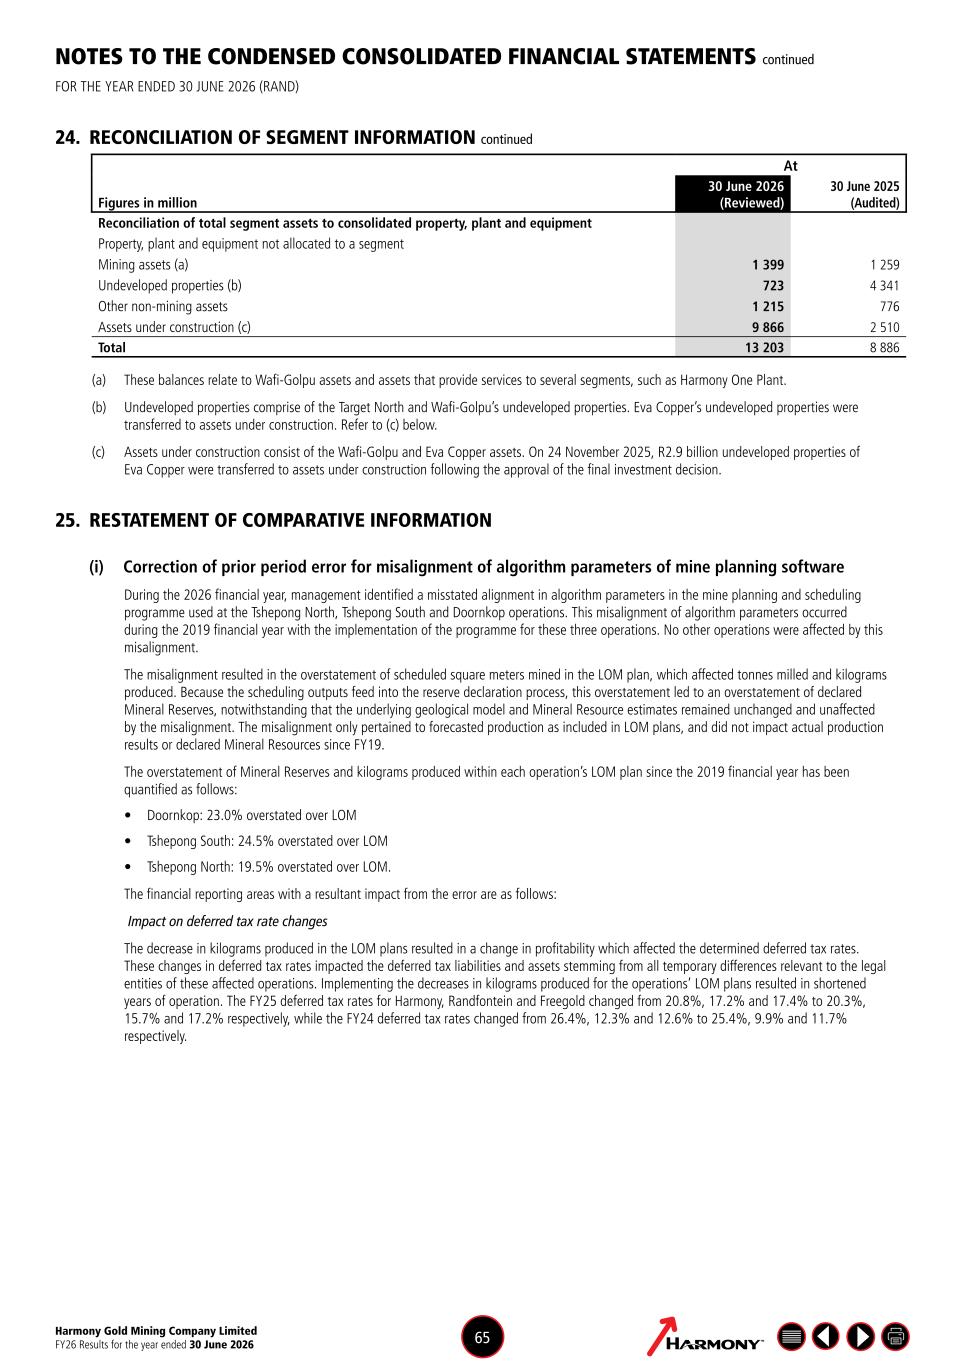
Harmony Gold Mining Company Limited FY26 Results for the year ended 30 June 2026 65 NOTES TO THE CONDENSED CONSOLIDATED FINANCIAL STATEMENTS continued FOR THE YEAR ENDED 30 JUNE 2026 (RAND) 24. RECONCILIATION OF SEGMENT INFORMATION continued At Figures in million 30 June 2026 (Reviewed) 30 June 2025 (Audited) Reconciliation of total segment assets to consolidated property, plant and equipment Property, plant and equipment not allocated to a segment Mining assets (a) 1 399 1 259 Undeveloped properties (b) 723 4 341 Other non-mining assets 1 215 776 Assets under construction (c) 9 866 2 510 Total 13 203 8 886 (a) These balances relate to Wafi-Golpu assets and assets that provide services to several segments, such as Harmony One Plant. (b) Undeveloped properties comprise of the Target North and Wafi‑Golpu’s undeveloped properties. Eva Copper’s undeveloped properties were transferred to assets under construction. Refer to (c) below. (c) Assets under construction consist of the Wafi‑Golpu and Eva Copper assets. On 24 November 2025, R2.9 billion undeveloped properties of Eva Copper were transferred to assets under construction following the approval of the final investment decision. 25. RESTATEMENT OF COMPARATIVE INFORMATION (i) Correction of prior period error for misalignment of algorithm parameters of mine planning software During the 2026 financial year, management identified a misstated alignment in algorithm parameters in the mine planning and scheduling programme used at the Tshepong North, Tshepong South and Doornkop operations. This misalignment of algorithm parameters occurred during the 2019 financial year with the implementation of the programme for these three operations. No other operations were affected by this misalignment. The misalignment resulted in the overstatement of scheduled square meters mined in the LOM plan, which affected tonnes milled and kilograms produced. Because the scheduling outputs feed into the reserve declaration process, this overstatement led to an overstatement of declared Mineral Reserves, notwithstanding that the underlying geological model and Mineral Resource estimates remained unchanged and unaffected by the misalignment. The misalignment only pertained to forecasted production as included in LOM plans, and did not impact actual production results or declared Mineral Resources since FY19. The overstatement of Mineral Reserves and kilograms produced within each operation’s LOM plan since the 2019 financial year has been quantified as follows: • Doornkop: 23.0% overstated over LOM • Tshepong South: 24.5% overstated over LOM • Tshepong North: 19.5% overstated over LOM. The financial reporting areas with a resultant impact from the error are as follows: Impact on deferred tax rate changes The decrease in kilograms produced in the LOM plans resulted in a change in profitability which affected the determined deferred tax rates. These changes in deferred tax rates impacted the deferred tax liabilities and assets stemming from all temporary differences relevant to the legal entities of these affected operations. Implementing the decreases in kilograms produced for the operations’ LOM plans resulted in shortened years of operation. The FY25 deferred tax rates for Harmony, Randfontein and Freegold changed from 20.8%, 17.2% and 17.4% to 20.3%, 15.7% and 17.2% respectively, while the FY24 deferred tax rates changed from 26.4%, 12.3% and 12.6% to 25.4%, 9.9% and 11.7% respectively.
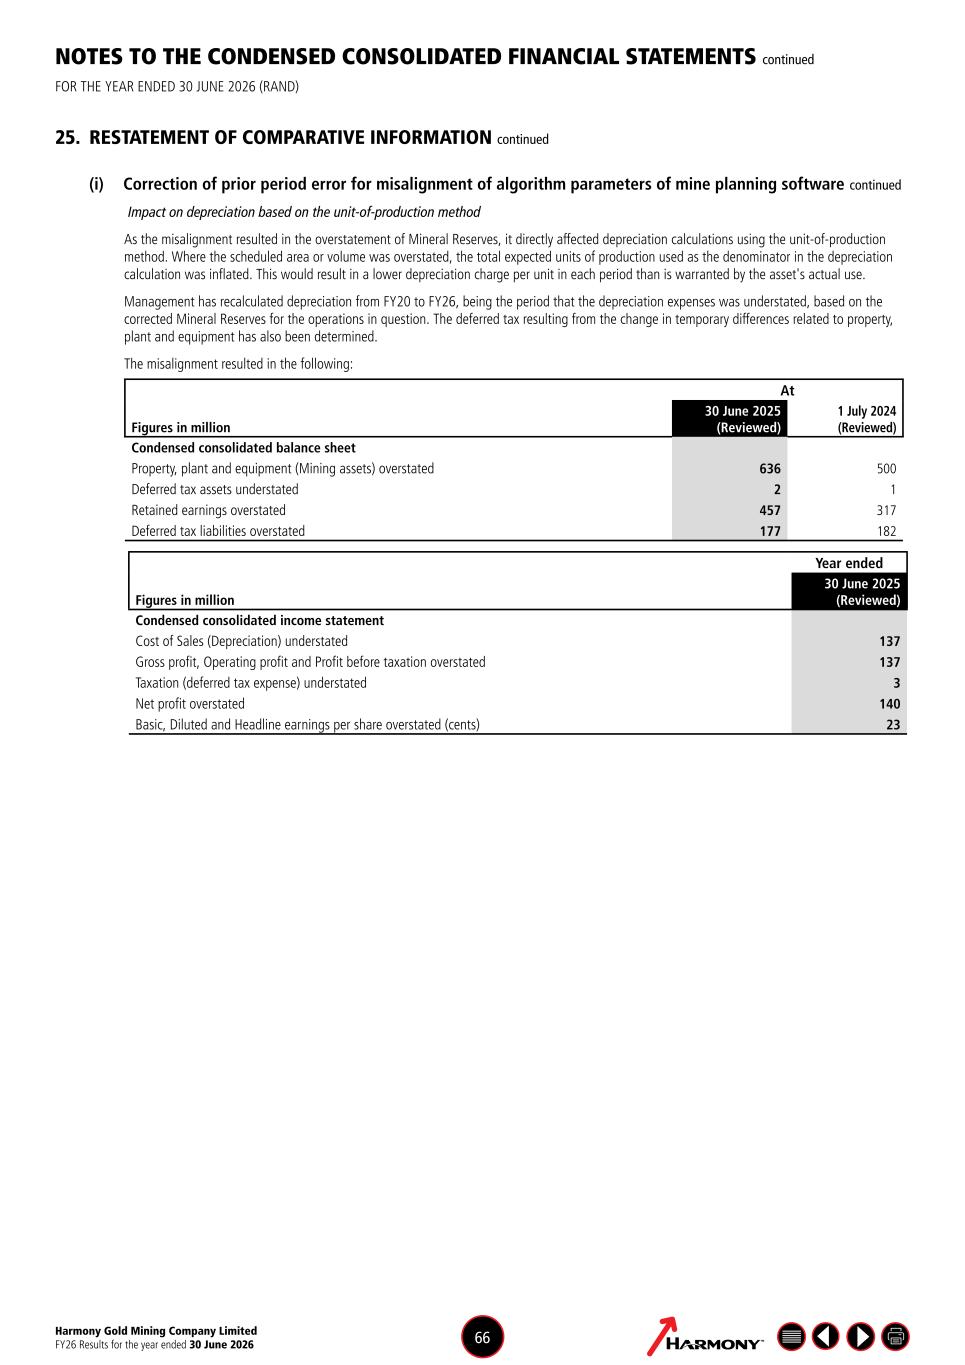
Harmony Gold Mining Company Limited FY26 Results for the year ended 30 June 2026 66 NOTES TO THE CONDENSED CONSOLIDATED FINANCIAL STATEMENTS continued FOR THE YEAR ENDED 30 JUNE 2026 (RAND) 25. RESTATEMENT OF COMPARATIVE INFORMATION continued (i) Correction of prior period error for misalignment of algorithm parameters of mine planning software continued Impact on depreciation based on the unit-of-production method As the misalignment resulted in the overstatement of Mineral Reserves, it directly affected depreciation calculations using the unit-of-production method. Where the scheduled area or volume was overstated, the total expected units of production used as the denominator in the depreciation calculation was inflated. This would result in a lower depreciation charge per unit in each period than is warranted by the asset's actual use. Management has recalculated depreciation from FY20 to FY26, being the period that the depreciation expenses was understated, based on the corrected Mineral Reserves for the operations in question. The deferred tax resulting from the change in temporary differences related to property, plant and equipment has also been determined. The misalignment resulted in the following: At Figures in million 30 June 2025 (Reviewed) 1 July 2024 (Reviewed) Condensed consolidated balance sheet Property, plant and equipment (Mining assets) overstated 636 500 Deferred tax assets understated 2 1 Retained earnings overstated 457 317 Deferred tax liabilities overstated 177 182 Year ended Figures in million 30 June 2025 (Reviewed) Condensed consolidated income statement Cost of Sales (Depreciation) understated 137 Gross profit, Operating profit and Profit before taxation overstated 137 Taxation (deferred tax expense) understated 3 Net profit overstated 140 Basic, Diluted and Headline earnings per share overstated (cents) 23
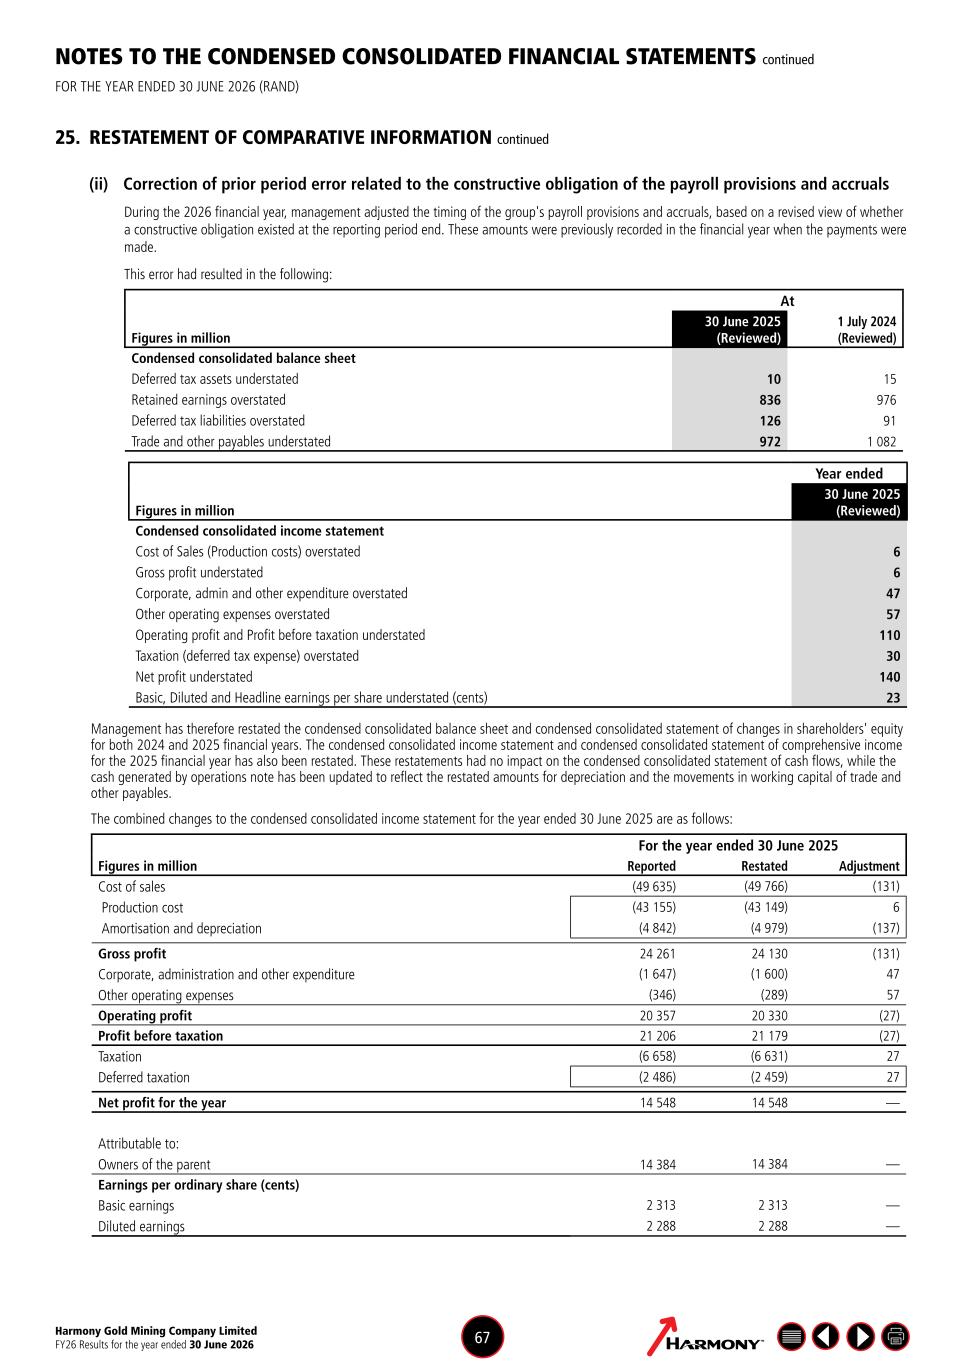
Harmony Gold Mining Company Limited FY26 Results for the year ended 30 June 2026 67 NOTES TO THE CONDENSED CONSOLIDATED FINANCIAL STATEMENTS continued FOR THE YEAR ENDED 30 JUNE 2026 (RAND) 25. RESTATEMENT OF COMPARATIVE INFORMATION continued (ii) Correction of prior period error related to the constructive obligation of the payroll provisions and accruals During the 2026 financial year, management adjusted the timing of the group's payroll provisions and accruals, based on a revised view of whether a constructive obligation existed at the reporting period end. These amounts were previously recorded in the financial year when the payments were made. This error had resulted in the following: At Figures in million 30 June 2025 (Reviewed) 1 July 2024 (Reviewed) Condensed consolidated balance sheet Deferred tax assets understated 10 15 Retained earnings overstated 836 976 Deferred tax liabilities overstated 126 91 Trade and other payables understated 972 1 082 Year ended Figures in million 30 June 2025 (Reviewed) Condensed consolidated income statement Cost of Sales (Production costs) overstated 6 Gross profit understated 6 Corporate, admin and other expenditure overstated 47 Other operating expenses overstated 57 Operating profit and Profit before taxation understated 110 Taxation (deferred tax expense) overstated 30 Net profit understated 140 Basic, Diluted and Headline earnings per share understated (cents) 23 Management has therefore restated the condensed consolidated balance sheet and condensed consolidated statement of changes in shareholders' equity for both 2024 and 2025 financial years. The condensed consolidated income statement and condensed consolidated statement of comprehensive income for the 2025 financial year has also been restated. These restatements had no impact on the condensed consolidated statement of cash flows, while the cash generated by operations note has been updated to reflect the restated amounts for depreciation and the movements in working capital of trade and other payables. The combined changes to the condensed consolidated income statement for the year ended 30 June 2025 are as follows: For the year ended 30 June 2025 Figures in million Reported Restated Adjustment Cost of sales (49 635) (49 766) (131) Production cost (43 155) (43 149) 6 Amortisation and depreciation (4 842) (4 979) (137) Gross profit 24 261 24 130 (131) Corporate, administration and other expenditure (1 647) (1 600) 47 Other operating expenses (346) (289) 57 Operating profit 20 357 20 330 (27) Profit before taxation 21 206 21 179 (27) Taxation (6 658) (6 631) 27 Deferred taxation (2 486) (2 459) 27 Net profit for the year 14 548 14 548 — Attributable to: Owners of the parent 14 384 14 384 — Earnings per ordinary share (cents) Basic earnings 2 313 2 313 — Diluted earnings 2 288 2 288 —
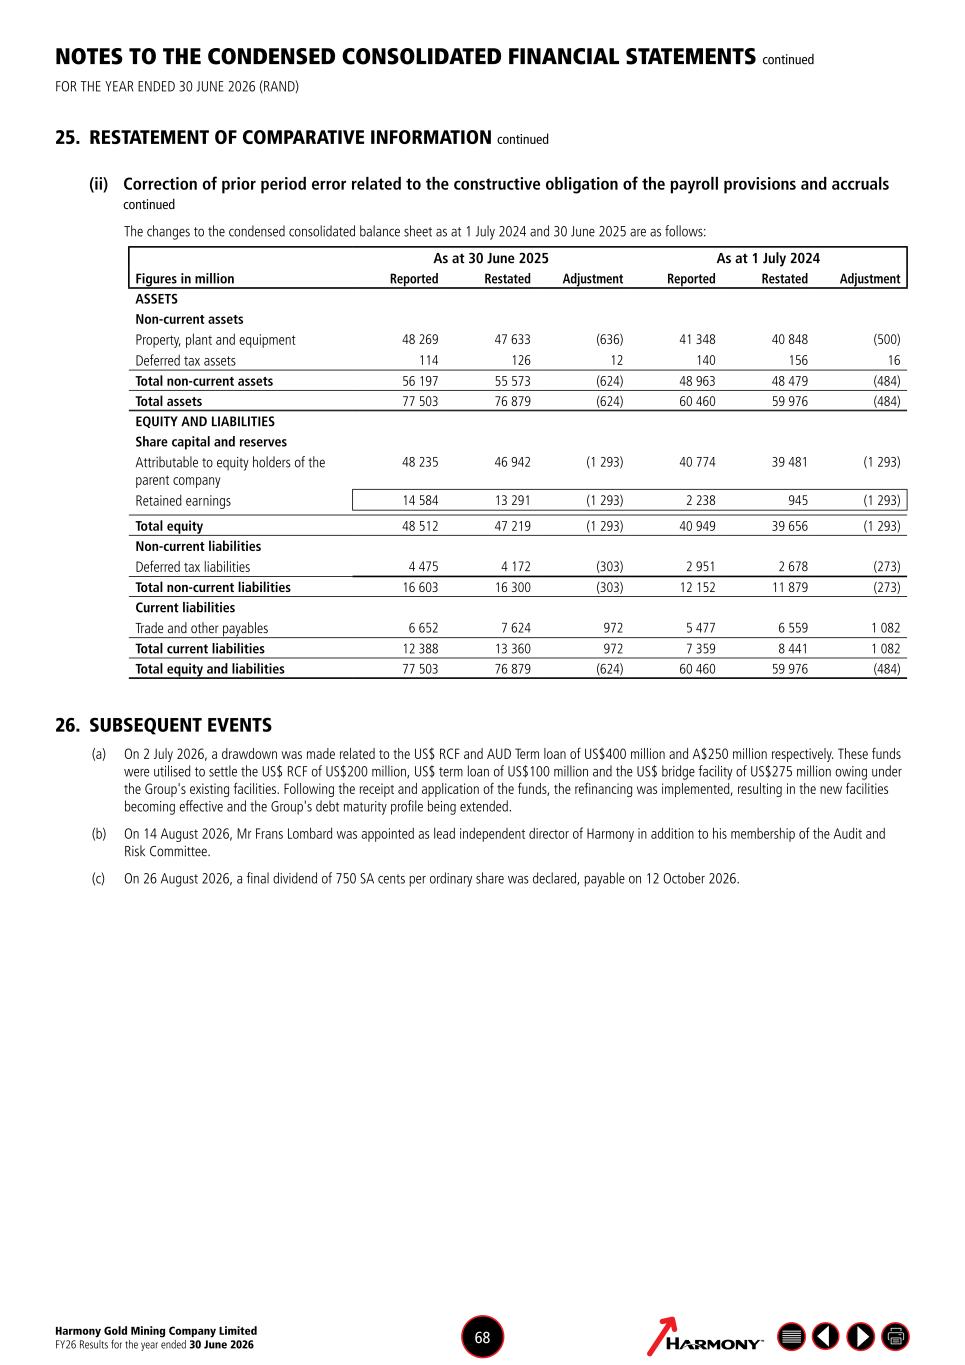
Harmony Gold Mining Company Limited FY26 Results for the year ended 30 June 2026 68 26. SUBSEQUENT EVENTS (a) On 2 July 2026, a drawdown was made related to the US$ RCF and AUD Term loan of US$400 million and A$250 million respectively. These funds were utilised to settle the US$ RCF of US$200 million, US$ term loan of US$100 million and the US$ bridge facility of US$275 million owing under the Group's existing facilities. Following the receipt and application of the funds, the refinancing was implemented, resulting in the new facilities becoming effective and the Group's debt maturity profile being extended. (b) On 14 August 2026, Mr Frans Lombard was appointed as lead independent director of Harmony in addition to his membership of the Audit and Risk Committee. (c) On 26 August 2026, a final dividend of 750 SA cents per ordinary share was declared, payable on 12 October 2026. NOTES TO THE CONDENSED CONSOLIDATED FINANCIAL STATEMENTS continued FOR THE YEAR ENDED 30 JUNE 2026 (RAND) 25. RESTATEMENT OF COMPARATIVE INFORMATION continued (ii) Correction of prior period error related to the constructive obligation of the payroll provisions and accruals continued The changes to the condensed consolidated balance sheet as at 1 July 2024 and 30 June 2025 are as follows: As at 30 June 2025 As at 1 July 2024 Figures in million Reported Restated Adjustment Reported Restated Adjustment ASSETS Non-current assets Property, plant and equipment 48 269 47 633 (636) 41 348 40 848 (500) Deferred tax assets 114 126 12 140 156 16 Total non-current assets 56 197 55 573 (624) 48 963 48 479 (484) Total assets 77 503 76 879 (624) 60 460 59 976 (484) EQUITY AND LIABILITIES Share capital and reserves Attributable to equity holders of the parent company 48 235 46 942 (1 293) 40 774 39 481 (1 293) Retained earnings 14 584 13 291 (1 293) 2 238 945 (1 293) Total equity 48 512 47 219 (1 293) 40 949 39 656 (1 293) Non-current liabilities Deferred tax liabilities 4 475 4 172 (303) 2 951 2 678 (273) Total non-current liabilities 16 603 16 300 (303) 12 152 11 879 (273) Current liabilities Trade and other payables 6 652 7 624 972 5 477 6 559 1 082 Total current liabilities 12 388 13 360 972 7 359 8 441 1 082 Total equity and liabilities 77 503 76 879 (624) 60 460 59 976 (484)
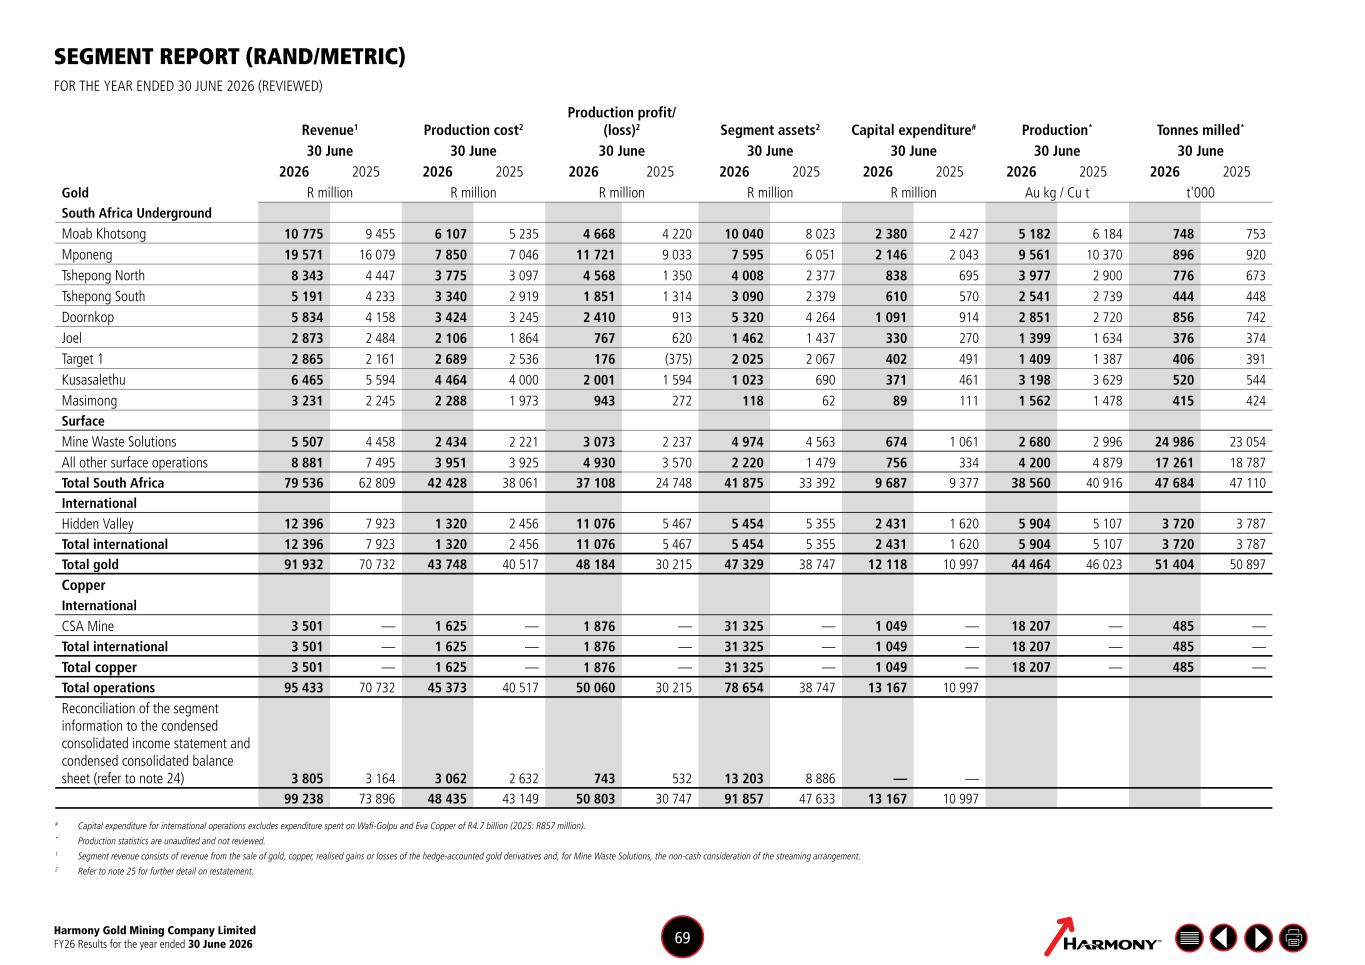
Harmony Gold Mining Company Limited FY26 Results for the year ended 30 June 2026 69 Revenue1 Production cost2 Production profit/ (loss)2 Segment assets2 Capital expenditure# Production* Tonnes milled* 30 June 30 June 30 June 30 June 30 June 30 June 30 June 2026 2025 2026 2025 2026 2025 2026 2025 2026 2025 2026 2025 2026 2025 Gold R million R million R million R million R million Au kg / Cu t t'000 South Africa Underground Moab Khotsong 10 775 9 455 6 107 5 235 4 668 4 220 10 040 8 023 2 380 2 427 5 182 6 184 748 753 Mponeng 19 571 16 079 7 850 7 046 11 721 9 033 7 595 6 051 2 146 2 043 9 561 10 370 896 920 Tshepong North 8 343 4 447 3 775 3 097 4 568 1 350 4 008 2 377 838 695 3 977 2 900 776 673 Tshepong South 5 191 4 233 3 340 2 919 1 851 1 314 3 090 2 379 610 570 2 541 2 739 444 448 Doornkop 5 834 4 158 3 424 3 245 2 410 913 5 320 4 264 1 091 914 2 851 2 720 856 742 Joel 2 873 2 484 2 106 1 864 767 620 1 462 1 437 330 270 1 399 1 634 376 374 Target 1 2 865 2 161 2 689 2 536 176 (375) 2 025 2 067 402 491 1 409 1 387 406 391 Kusasalethu 6 465 5 594 4 464 4 000 2 001 1 594 1 023 690 371 461 3 198 3 629 520 544 Masimong 3 231 2 245 2 288 1 973 943 272 118 62 89 111 1 562 1 478 415 424 Surface Mine Waste Solutions 5 507 4 458 2 434 2 221 3 073 2 237 4 974 4 563 674 1 061 2 680 2 996 24 986 23 054 All other surface operations 8 881 7 495 3 951 3 925 4 930 3 570 2 220 1 479 756 334 4 200 4 879 17 261 18 787 Total South Africa 79 536 62 809 42 428 38 061 37 108 24 748 41 875 33 392 9 687 9 377 38 560 40 916 47 684 47 110 International Hidden Valley 12 396 7 923 1 320 2 456 11 076 5 467 5 454 5 355 2 431 1 620 5 904 5 107 3 720 3 787 Total international 12 396 7 923 1 320 2 456 11 076 5 467 5 454 5 355 2 431 1 620 5 904 5 107 3 720 3 787 Total gold 91 932 70 732 43 748 40 517 48 184 30 215 47 329 38 747 12 118 10 997 44 464 46 023 51 404 50 897 Copper International CSA Mine 3 501 — 1 625 — 1 876 — 31 325 — 1 049 — 18 207 — 485 — Total international 3 501 — 1 625 — 1 876 — 31 325 — 1 049 — 18 207 — 485 — Total copper 3 501 — 1 625 — 1 876 — 31 325 — 1 049 — 18 207 — 485 — Total operations 95 433 70 732 45 373 40 517 50 060 30 215 78 654 38 747 13 167 10 997 Reconciliation of the segment information to the condensed consolidated income statement and condensed consolidated balance sheet (refer to note 24) 3 805 3 164 3 062 2 632 743 532 13 203 8 886 — — 99 238 73 896 48 435 43 149 50 803 30 747 91 857 47 633 13 167 10 997 # Capital expenditure for international operations excludes expenditure spent on Wafi-Golpu and Eva Copper of R4.7 billion (2025: R857 million). * Production statistics are unaudited and not reviewed. 1 Segment revenue consists of revenue from the sale of gold, copper, realised gains or losses of the hedge-accounted gold derivatives and, for Mine Waste Solutions, the non-cash consideration of the streaming arrangement. 2 Refer to note 25 for further detail on restatement. SEGMENT REPORT (RAND/METRIC) FOR THE YEAR ENDED 30 JUNE 2026 (REVIEWED)
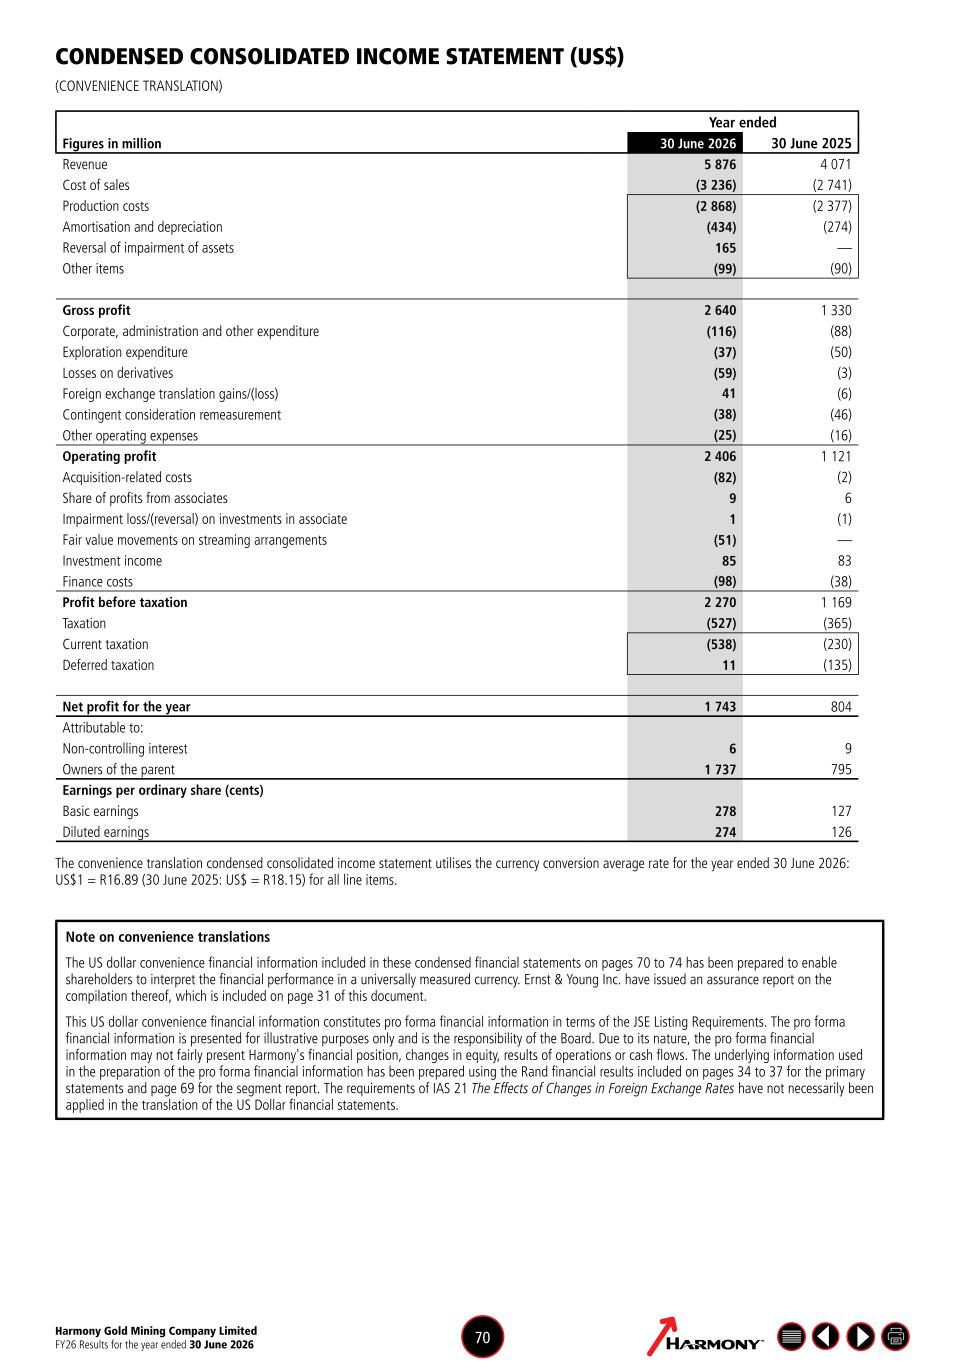
Harmony Gold Mining Company Limited FY26 Results for the year ended 30 June 2026 70 Year ended Figures in million 30 June 2026 30 June 2025 Revenue 5 876 4 071 Cost of sales (3 236) (2 741) Production costs (2 868) (2 377) Amortisation and depreciation (434) (274) Reversal of impairment of assets 165 — Other items (99) (90) Gross profit 2 640 1 330 Corporate, administration and other expenditure (116) (88) Exploration expenditure (37) (50) Losses on derivatives (59) (3) Foreign exchange translation gains/(loss) 41 (6) Contingent consideration remeasurement (38) (46) Other operating expenses (25) (16) Operating profit 2 406 1 121 Acquisition-related costs (82) (2) Share of profits from associates 9 6 Impairment loss/(reversal) on investments in associate 1 (1) Fair value movements on streaming arrangements (51) — Investment income 85 83 Finance costs (98) (38) Profit before taxation 2 270 1 169 Taxation (527) (365) Current taxation (538) (230) Deferred taxation 11 (135) Net profit for the year 1 743 804 Attributable to: Non-controlling interest 6 9 Owners of the parent 1 737 795 Earnings per ordinary share (cents) Basic earnings 278 127 Diluted earnings 274 126 The convenience translation condensed consolidated income statement utilises the currency conversion average rate for the year ended 30 June 2026: US$1 = R16.89 (30 June 2025: US$ = R18.15) for all line items. Note on convenience translations The US dollar convenience financial information included in these condensed financial statements on pages 70 to 74 has been prepared to enable shareholders to interpret the financial performance in a universally measured currency. Ernst & Young Inc. have issued an assurance report on the compilation thereof, which is included on page 31 of this document. This US dollar convenience financial information constitutes pro forma financial information in terms of the JSE Listing Requirements. The pro forma financial information is presented for illustrative purposes only and is the responsibility of the Board. Due to its nature, the pro forma financial information may not fairly present Harmony's financial position, changes in equity, results of operations or cash flows. The underlying information used in the preparation of the pro forma financial information has been prepared using the Rand financial results included on pages 34 to 37 for the primary statements and page 69 for the segment report. The requirements of IAS 21 The Effects of Changes in Foreign Exchange Rates have not necessarily been applied in the translation of the US Dollar financial statements. CONDENSED CONSOLIDATED INCOME STATEMENT (US$) (CONVENIENCE TRANSLATION)
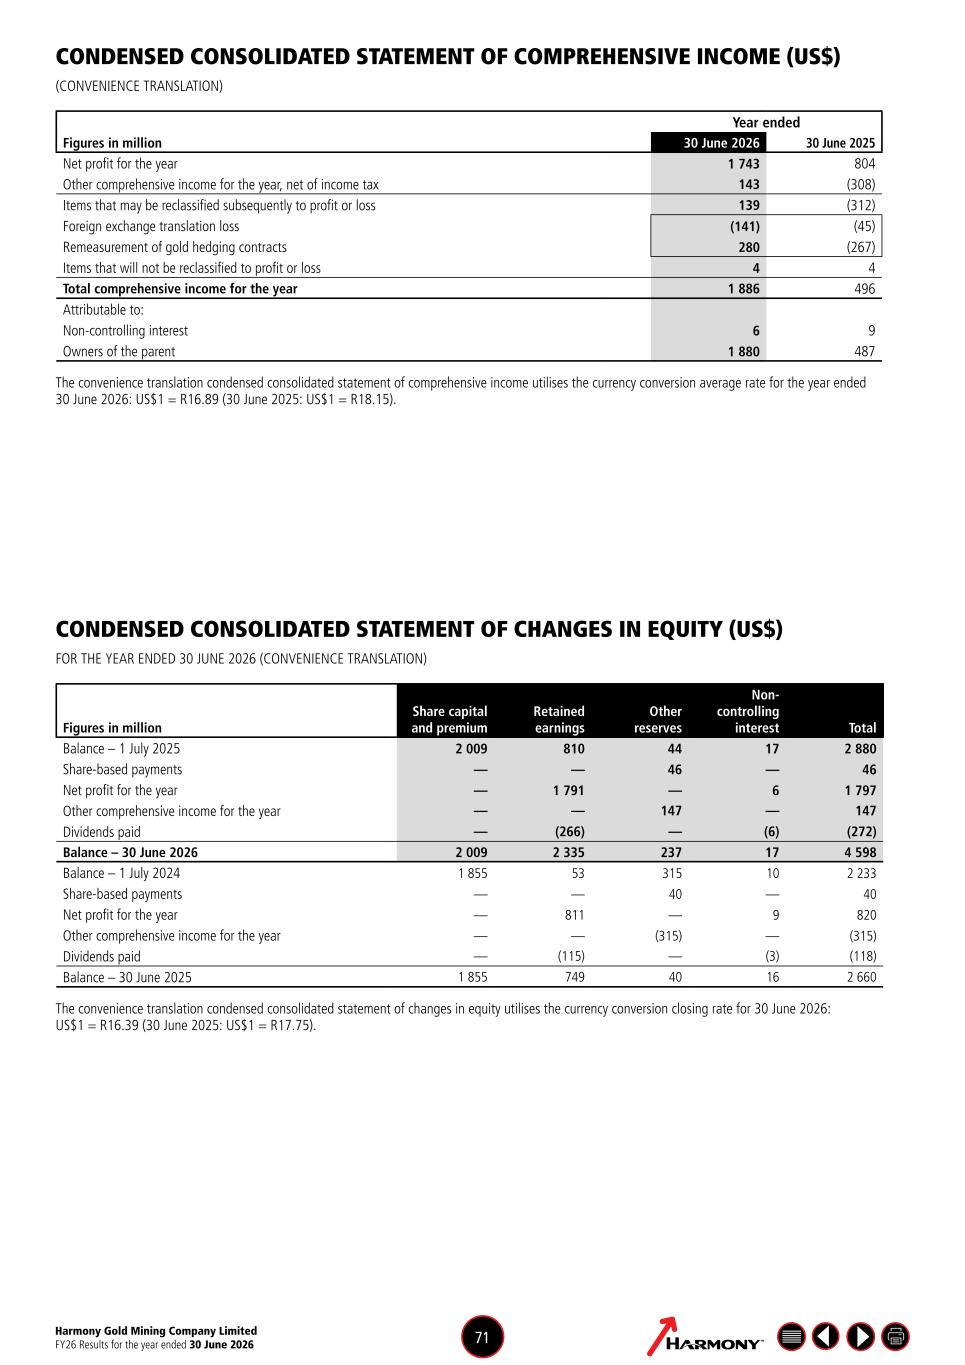
Harmony Gold Mining Company Limited FY26 Results for the year ended 30 June 2026 71 Year ended Figures in million 30 June 2026 30 June 2025 Net profit for the year 1 743 804 Other comprehensive income for the year, net of income tax 143 (308) Items that may be reclassified subsequently to profit or loss 139 (312) Foreign exchange translation loss (141) (45) Remeasurement of gold hedging contracts 280 (267) Items that will not be reclassified to profit or loss 4 4 Total comprehensive income for the year 1 886 496 Attributable to: Non-controlling interest 6 9 Owners of the parent 1 880 487 The convenience translation condensed consolidated statement of comprehensive income utilises the currency conversion average rate for the year ended 30 June 2026: US$1 = R16.89 (30 June 2025: US$1 = R18.15). Figures in million Share capital and premium Retained earnings Other reserves Non- controlling interest Total Balance – 1 July 2025 2 009 810 44 17 2 880 Share-based payments — — 46 — 46 Net profit for the year — 1 791 — 6 1 797 Other comprehensive income for the year — — 147 — 147 Dividends paid — (266) — (6) (272) Balance – 30 June 2026 2 009 2 335 237 17 4 598 Balance – 1 July 2024 1 855 53 315 10 2 233 Share-based payments — — 40 — 40 Net profit for the year — 811 — 9 820 Other comprehensive income for the year — — (315) — (315) Dividends paid — (115) — (3) (118) Balance – 30 June 2025 1 855 749 40 16 2 660 The convenience translation condensed consolidated statement of changes in equity utilises the currency conversion closing rate for 30 June 2026: US$1 = R16.39 (30 June 2025: US$1 = R17.75). CONDENSED CONSOLIDATED STATEMENT OF COMPREHENSIVE INCOME (US$) (CONVENIENCE TRANSLATION) CONDENSED CONSOLIDATED STATEMENT OF CHANGES IN EQUITY (US$) FOR THE YEAR ENDED 30 JUNE 2026 (CONVENIENCE TRANSLATION)
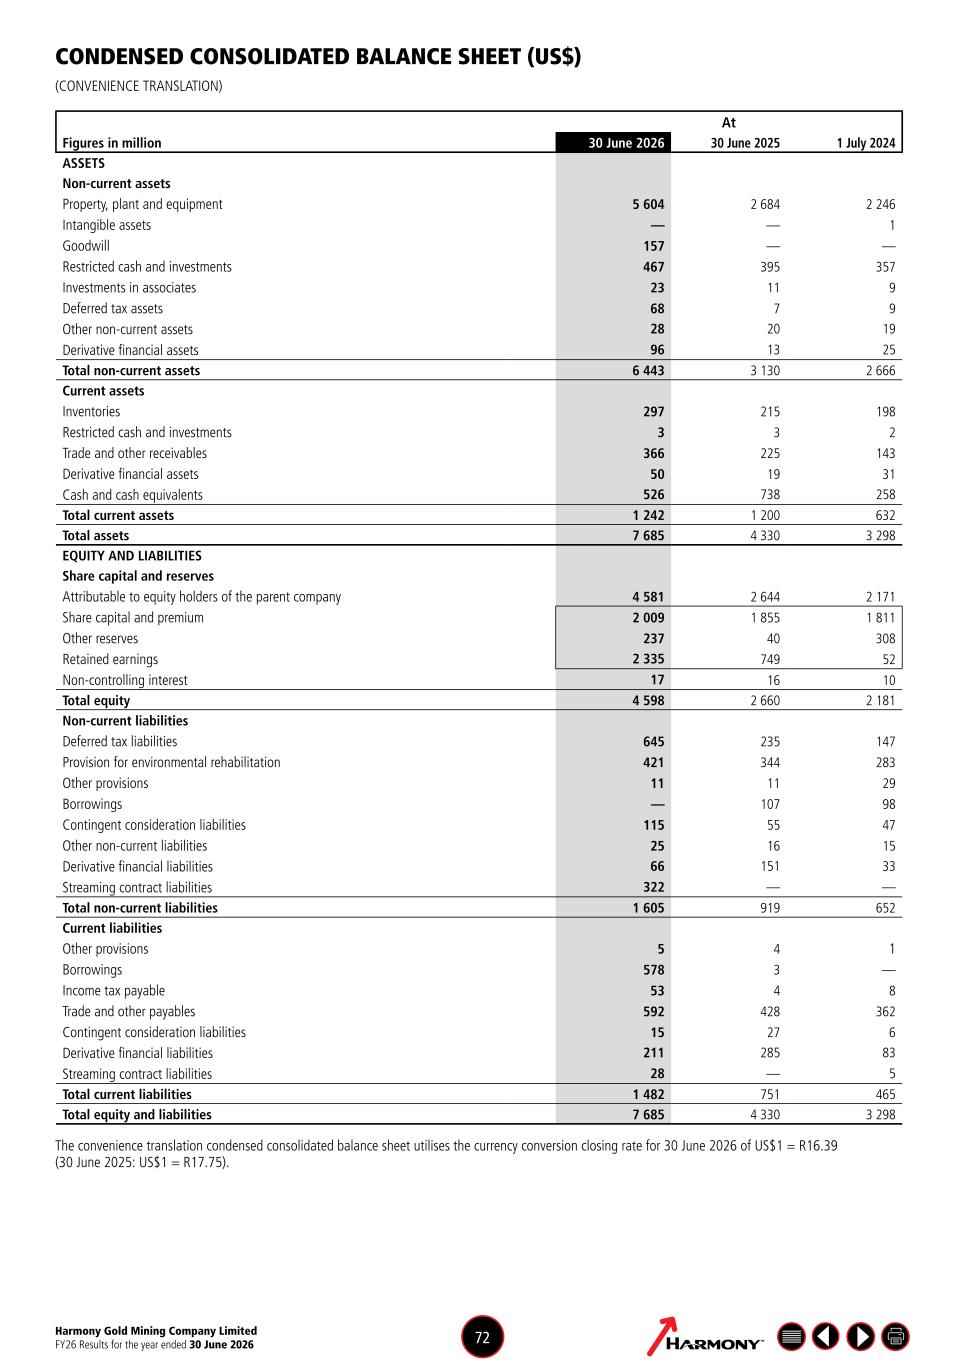
Harmony Gold Mining Company Limited FY26 Results for the year ended 30 June 2026 72 CONDENSED CONSOLIDATED BALANCE SHEET (US$) (CONVENIENCE TRANSLATION) At Figures in million 30 June 2026 30 June 2025 1 July 2024 ASSETS Non-current assets Property, plant and equipment 5 604 2 684 2 246 Intangible assets — — 1 Goodwill 157 — — Restricted cash and investments 467 395 357 Investments in associates 23 11 9 Deferred tax assets 68 7 9 Other non-current assets 28 20 19 Derivative financial assets 96 13 25 Total non-current assets 6 443 3 130 2 666 Current assets Inventories 297 215 198 Restricted cash and investments 3 3 2 Trade and other receivables 366 225 143 Derivative financial assets 50 19 31 Cash and cash equivalents 526 738 258 Total current assets 1 242 1 200 632 Total assets 7 685 4 330 3 298 EQUITY AND LIABILITIES Share capital and reserves Attributable to equity holders of the parent company 4 581 2 644 2 171 Share capital and premium 2 009 1 855 1 811 Other reserves 237 40 308 Retained earnings 2 335 749 52 Non-controlling interest 17 16 10 Total equity 4 598 2 660 2 181 Non-current liabilities Deferred tax liabilities 645 235 147 Provision for environmental rehabilitation 421 344 283 Other provisions 11 11 29 Borrowings — 107 98 Contingent consideration liabilities 115 55 47 Other non-current liabilities 25 16 15 Derivative financial liabilities 66 151 33 Streaming contract liabilities 322 — — Total non-current liabilities 1 605 919 652 Current liabilities Other provisions 5 4 1 Borrowings 578 3 — Income tax payable 53 4 8 Trade and other payables 592 428 362 Contingent consideration liabilities 15 27 6 Derivative financial liabilities 211 285 83 Streaming contract liabilities 28 — 5 Total current liabilities 1 482 751 465 Total equity and liabilities 7 685 4 330 3 298 The convenience translation condensed consolidated balance sheet utilises the currency conversion closing rate for 30 June 2026 of US$1 = R16.39 (30 June 2025: US$1 = R17.75).
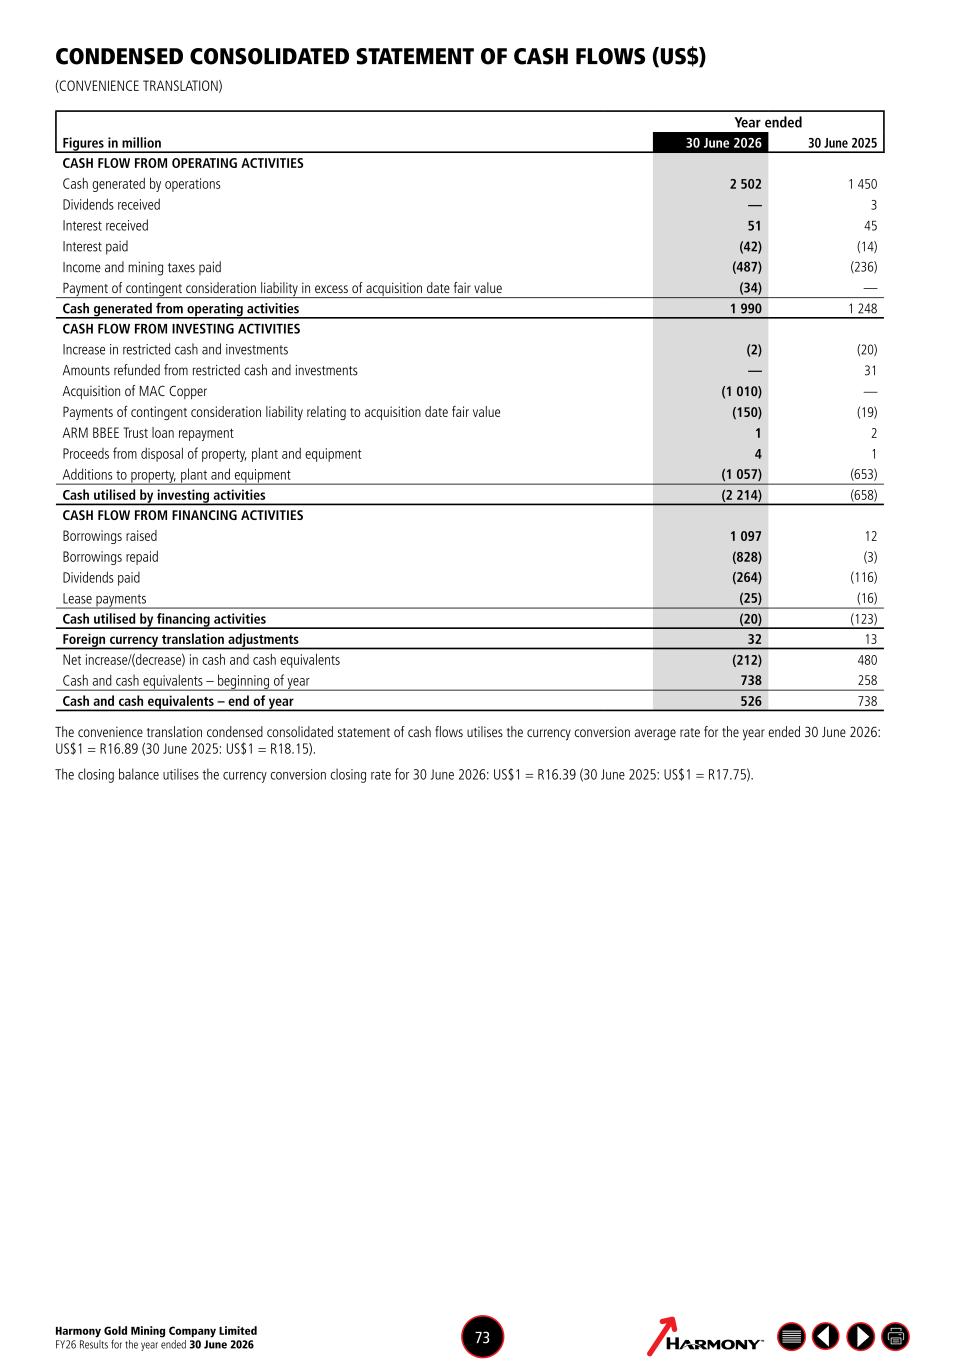
Harmony Gold Mining Company Limited FY26 Results for the year ended 30 June 2026 73 CONDENSED CONSOLIDATED STATEMENT OF CASH FLOWS (US$) (CONVENIENCE TRANSLATION) Year ended Figures in million 30 June 2026 30 June 2025 CASH FLOW FROM OPERATING ACTIVITIES Cash generated by operations 2 502 1 450 Dividends received — 3 Interest received 51 45 Interest paid (42) (14) Income and mining taxes paid (487) (236) Payment of contingent consideration liability in excess of acquisition date fair value (34) — Cash generated from operating activities 1 990 1 248 CASH FLOW FROM INVESTING ACTIVITIES Increase in restricted cash and investments (2) (20) Amounts refunded from restricted cash and investments — 31 Acquisition of MAC Copper (1 010) — Payments of contingent consideration liability relating to acquisition date fair value (150) (19) ARM BBEE Trust loan repayment 1 2 Proceeds from disposal of property, plant and equipment 4 1 Additions to property, plant and equipment (1 057) (653) Cash utilised by investing activities (2 214) (658) CASH FLOW FROM FINANCING ACTIVITIES Borrowings raised 1 097 12 Borrowings repaid (828) (3) Dividends paid (264) (116) Lease payments (25) (16) Cash utilised by financing activities (20) (123) Foreign currency translation adjustments 32 13 Net increase/(decrease) in cash and cash equivalents (212) 480 Cash and cash equivalents – beginning of year 738 258 Cash and cash equivalents – end of year 526 738 The convenience translation condensed consolidated statement of cash flows utilises the currency conversion average rate for the year ended 30 June 2026: US$1 = R16.89 (30 June 2025: US$1 = R18.15). The closing balance utilises the currency conversion closing rate for 30 June 2026: US$1 = R16.39 (30 June 2025: US$1 = R17.75).
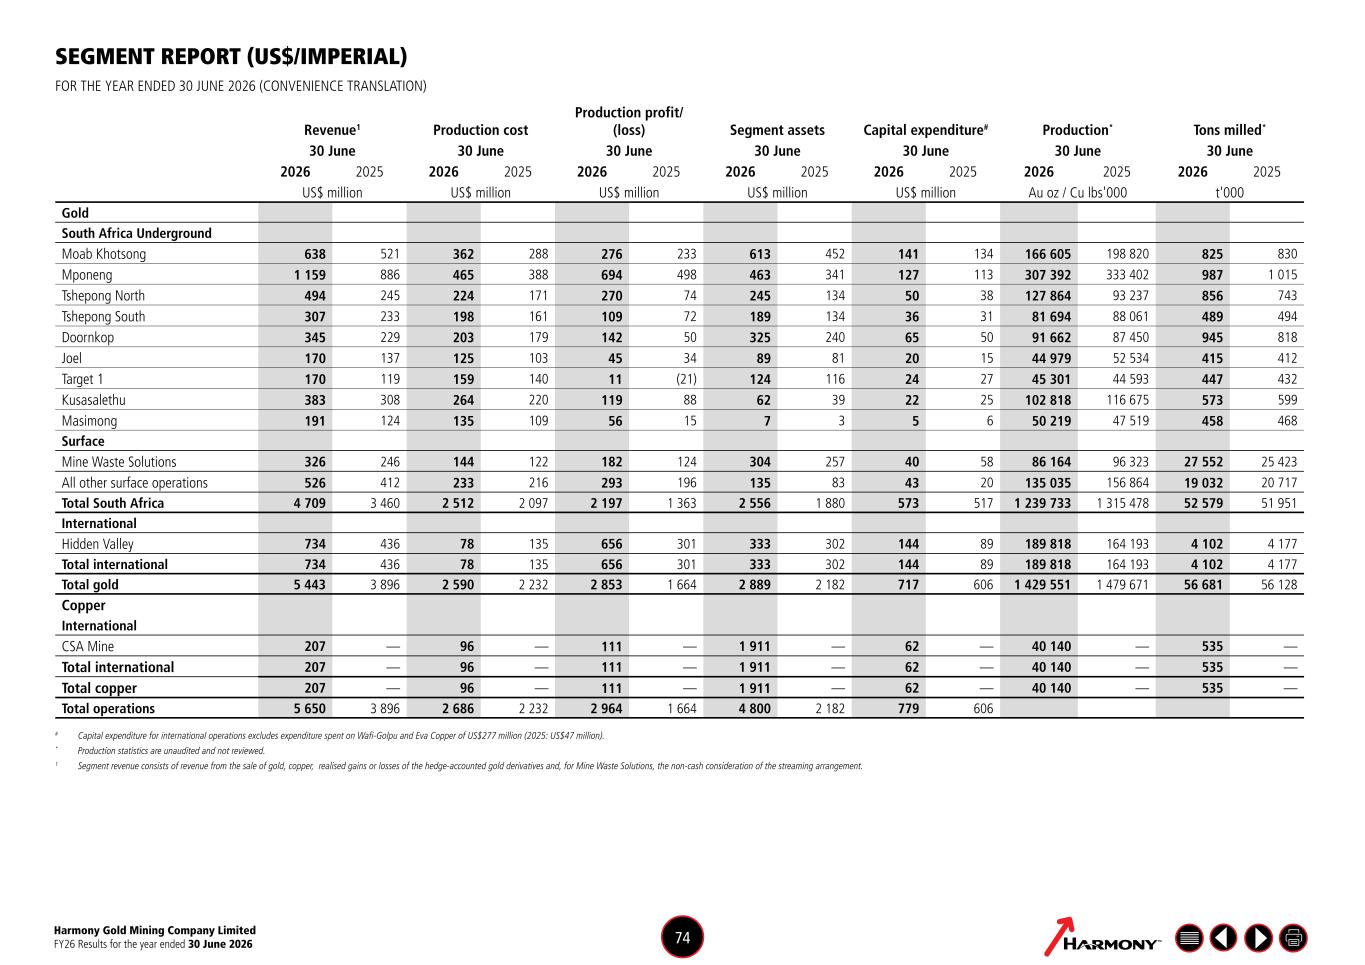
Harmony Gold Mining Company Limited FY26 Results for the year ended 30 June 2026 74 Revenue1 Production cost Production profit/ (loss) Segment assets Capital expenditure# Production* Tons milled* 30 June 30 June 30 June 30 June 30 June 30 June 30 June 2026 2025 2026 2025 2026 2025 2026 2025 2026 2025 2026 2025 2026 2025 US$ million US$ million US$ million US$ million US$ million Au oz / Cu lbs'000 t'000 Gold South Africa Underground Moab Khotsong 638 521 362 288 276 233 613 452 141 134 166 605 198 820 825 830 Mponeng 1 159 886 465 388 694 498 463 341 127 113 307 392 333 402 987 1 015 Tshepong North 494 245 224 171 270 74 245 134 50 38 127 864 93 237 856 743 Tshepong South 307 233 198 161 109 72 189 134 36 31 81 694 88 061 489 494 Doornkop 345 229 203 179 142 50 325 240 65 50 91 662 87 450 945 818 Joel 170 137 125 103 45 34 89 81 20 15 44 979 52 534 415 412 Target 1 170 119 159 140 11 (21) 124 116 24 27 45 301 44 593 447 432 Kusasalethu 383 308 264 220 119 88 62 39 22 25 102 818 116 675 573 599 Masimong 191 124 135 109 56 15 7 3 5 6 50 219 47 519 458 468 Surface Mine Waste Solutions 326 246 144 122 182 124 304 257 40 58 86 164 96 323 27 552 25 423 All other surface operations 526 412 233 216 293 196 135 83 43 20 135 035 156 864 19 032 20 717 Total South Africa 4 709 3 460 2 512 2 097 2 197 1 363 2 556 1 880 573 517 1 239 733 1 315 478 52 579 51 951 International Hidden Valley 734 436 78 135 656 301 333 302 144 89 189 818 164 193 4 102 4 177 Total international 734 436 78 135 656 301 333 302 144 89 189 818 164 193 4 102 4 177 Total gold 5 443 3 896 2 590 2 232 2 853 1 664 2 889 2 182 717 606 1 429 551 1 479 671 56 681 56 128 Copper International CSA Mine 207 — 96 — 111 — 1 911 — 62 — 40 140 — 535 — Total international 207 — 96 — 111 — 1 911 — 62 — 40 140 — 535 — Total copper 207 — 96 — 111 — 1 911 — 62 — 40 140 — 535 — Total operations 5 650 3 896 2 686 2 232 2 964 1 664 4 800 2 182 779 606 # Capital expenditure for international operations excludes expenditure spent on Wafi-Golpu and Eva Copper of US$277 million (2025: US$47 million). * Production statistics are unaudited and not reviewed. 1 Segment revenue consists of revenue from the sale of gold, copper, realised gains or losses of the hedge-accounted gold derivatives and, for Mine Waste Solutions, the non-cash consideration of the streaming arrangement. SEGMENT REPORT (US$/IMPERIAL) FOR THE YEAR ENDED 30 JUNE 2026 (CONVENIENCE TRANSLATION)
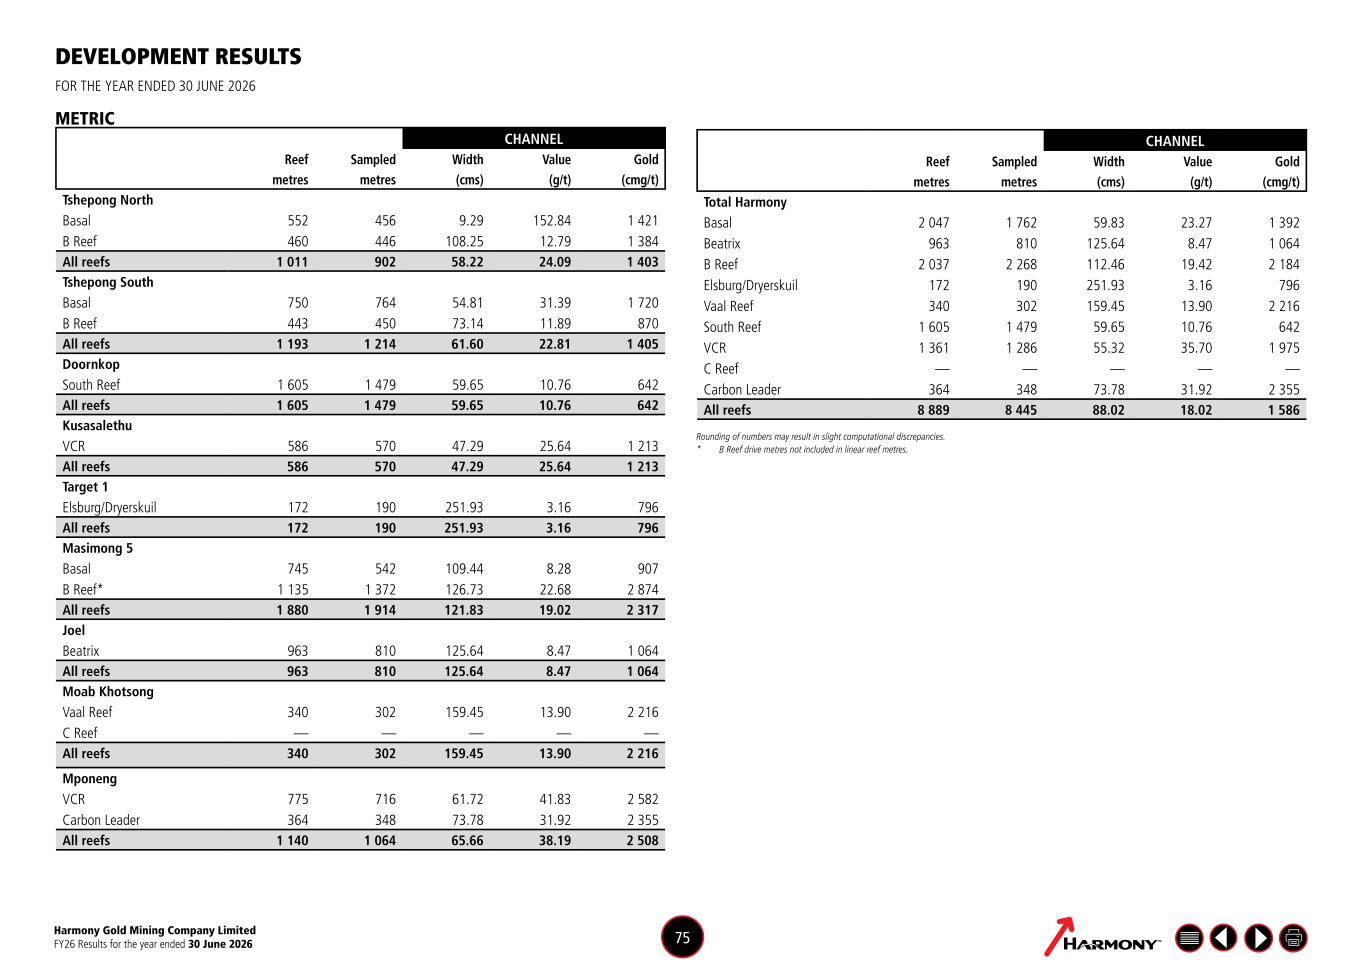
Harmony Gold Mining Company Limited FY26 Results for the year ended 30 June 2026 75 METRIC CHANNEL Reef Sampled Width Value Gold metres metres (cms) (g/t) (cmg/t) Tshepong North Basal 552 456 9.29 152.84 1 421 B Reef 460 446 108.25 12.79 1 384 All reefs 1 011 902 58.22 24.09 1 403 Tshepong South Basal 750 764 54.81 31.39 1 720 B Reef 443 450 73.14 11.89 870 All reefs 1 193 1 214 61.60 22.81 1 405 Doornkop South Reef 1 605 1 479 59.65 10.76 642 All reefs 1 605 1 479 59.65 10.76 642 Kusasalethu VCR 586 570 47.29 25.64 1 213 All reefs 586 570 47.29 25.64 1 213 Target 1 Elsburg/Dryerskuil 172 190 251.93 3.16 796 All reefs 172 190 251.93 3.16 796 Masimong 5 Basal 745 542 109.44 8.28 907 B Reef* 1 135 1 372 126.73 22.68 2 874 All reefs 1 880 1 914 121.83 19.02 2 317 Joel Beatrix 963 810 125.64 8.47 1 064 All reefs 963 810 125.64 8.47 1 064 Moab Khotsong Vaal Reef 340 302 159.45 13.90 2 216 C Reef — — — — — All reefs 340 302 159.45 13.90 2 216 Mponeng VCR 775 716 61.72 41.83 2 582 Carbon Leader 364 348 73.78 31.92 2 355 All reefs 1 140 1 064 65.66 38.19 2 508 CHANNEL Reef Sampled Width Value Gold metres metres (cms) (g/t) (cmg/t) Total Harmony Basal 2 047 1 762 59.83 23.27 1 392 Beatrix 963 810 125.64 8.47 1 064 B Reef 2 037 2 268 112.46 19.42 2 184 Elsburg/Dryerskuil 172 190 251.93 3.16 796 Vaal Reef 340 302 159.45 13.90 2 216 South Reef 1 605 1 479 59.65 10.76 642 VCR 1 361 1 286 55.32 35.70 1 975 C Reef — — — — — Carbon Leader 364 348 73.78 31.92 2 355 All reefs 8 889 8 445 88.02 18.02 1 586 Rounding of numbers may result in slight computational discrepancies. * B Reef drive metres not included in linear reef metres. DEVELOPMENT RESULTS FOR THE YEAR ENDED 30 JUNE 2026
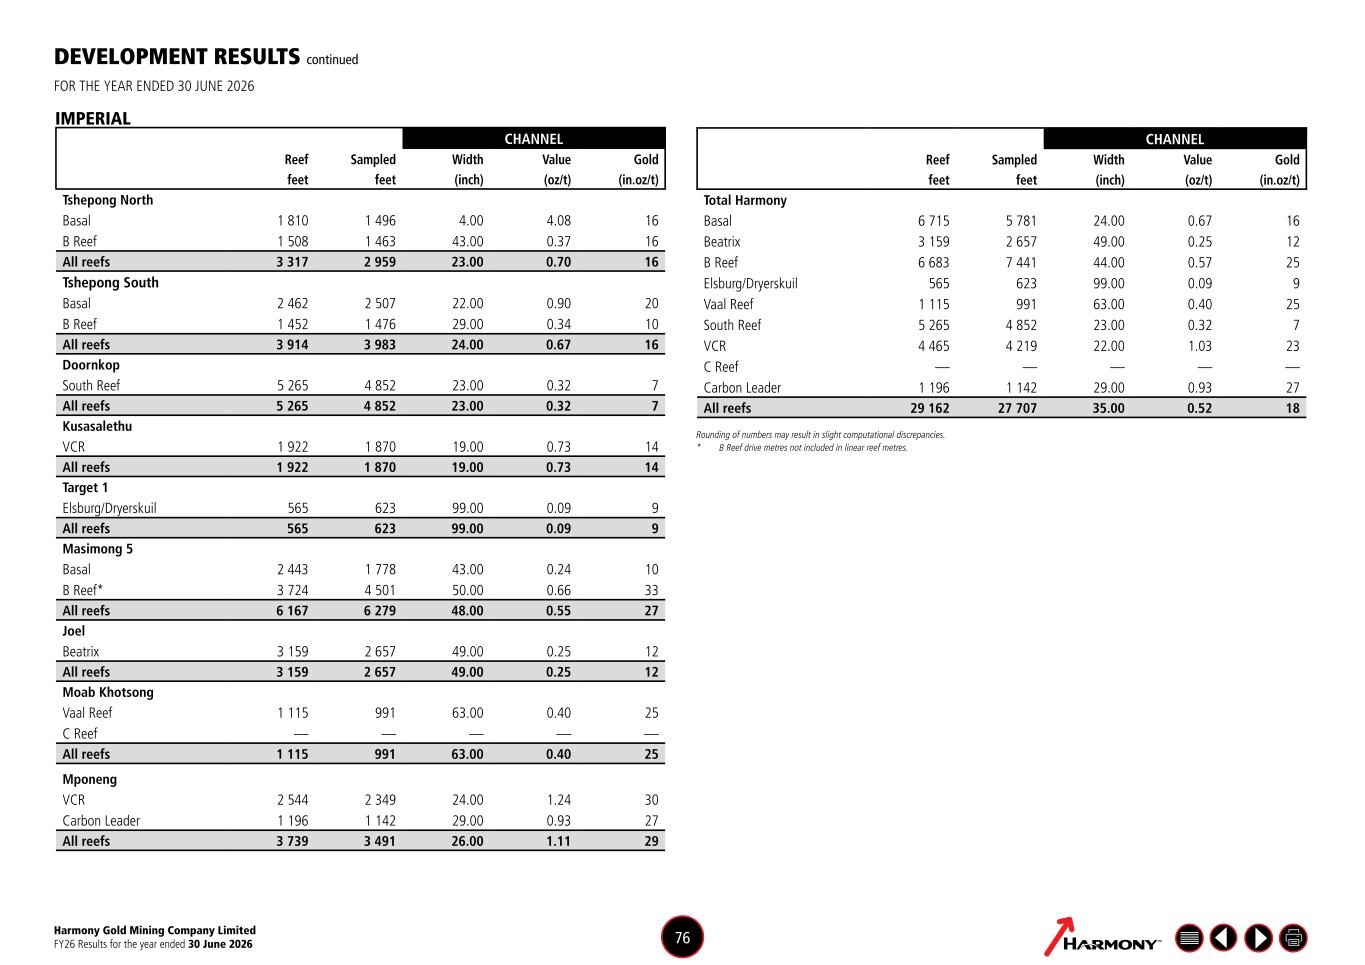
Harmony Gold Mining Company Limited FY26 Results for the year ended 30 June 2026 76 IMPERIAL CHANNEL Reef Sampled Width Value Gold feet feet (inch) (oz/t) (in.oz/t) Tshepong North Basal 1 810 1 496 4.00 4.08 16 B Reef 1 508 1 463 43.00 0.37 16 All reefs 3 317 2 959 23.00 0.70 16 Tshepong South Basal 2 462 2 507 22.00 0.90 20 B Reef 1 452 1 476 29.00 0.34 10 All reefs 3 914 3 983 24.00 0.67 16 Doornkop South Reef 5 265 4 852 23.00 0.32 7 All reefs 5 265 4 852 23.00 0.32 7 Kusasalethu VCR 1 922 1 870 19.00 0.73 14 All reefs 1 922 1 870 19.00 0.73 14 Target 1 Elsburg/Dryerskuil 565 623 99.00 0.09 9 All reefs 565 623 99.00 0.09 9 Masimong 5 Basal 2 443 1 778 43.00 0.24 10 B Reef* 3 724 4 501 50.00 0.66 33 All reefs 6 167 6 279 48.00 0.55 27 Joel Beatrix 3 159 2 657 49.00 0.25 12 All reefs 3 159 2 657 49.00 0.25 12 Moab Khotsong Vaal Reef 1 115 991 63.00 0.40 25 C Reef — — — — — All reefs 1 115 991 63.00 0.40 25 Mponeng VCR 2 544 2 349 24.00 1.24 30 Carbon Leader 1 196 1 142 29.00 0.93 27 All reefs 3 739 3 491 26.00 1.11 29 CHANNEL Reef Sampled Width Value Gold feet feet (inch) (oz/t) (in.oz/t) Total Harmony Basal 6 715 5 781 24.00 0.67 16 Beatrix 3 159 2 657 49.00 0.25 12 B Reef 6 683 7 441 44.00 0.57 25 Elsburg/Dryerskuil 565 623 99.00 0.09 9 Vaal Reef 1 115 991 63.00 0.40 25 South Reef 5 265 4 852 23.00 0.32 7 VCR 4 465 4 219 22.00 1.03 23 C Reef — — — — — Carbon Leader 1 196 1 142 29.00 0.93 27 All reefs 29 162 27 707 35.00 0.52 18 Rounding of numbers may result in slight computational discrepancies. * B Reef drive metres not included in linear reef metres. DEVELOPMENT RESULTS continued FOR THE YEAR ENDED 30 JUNE 2026
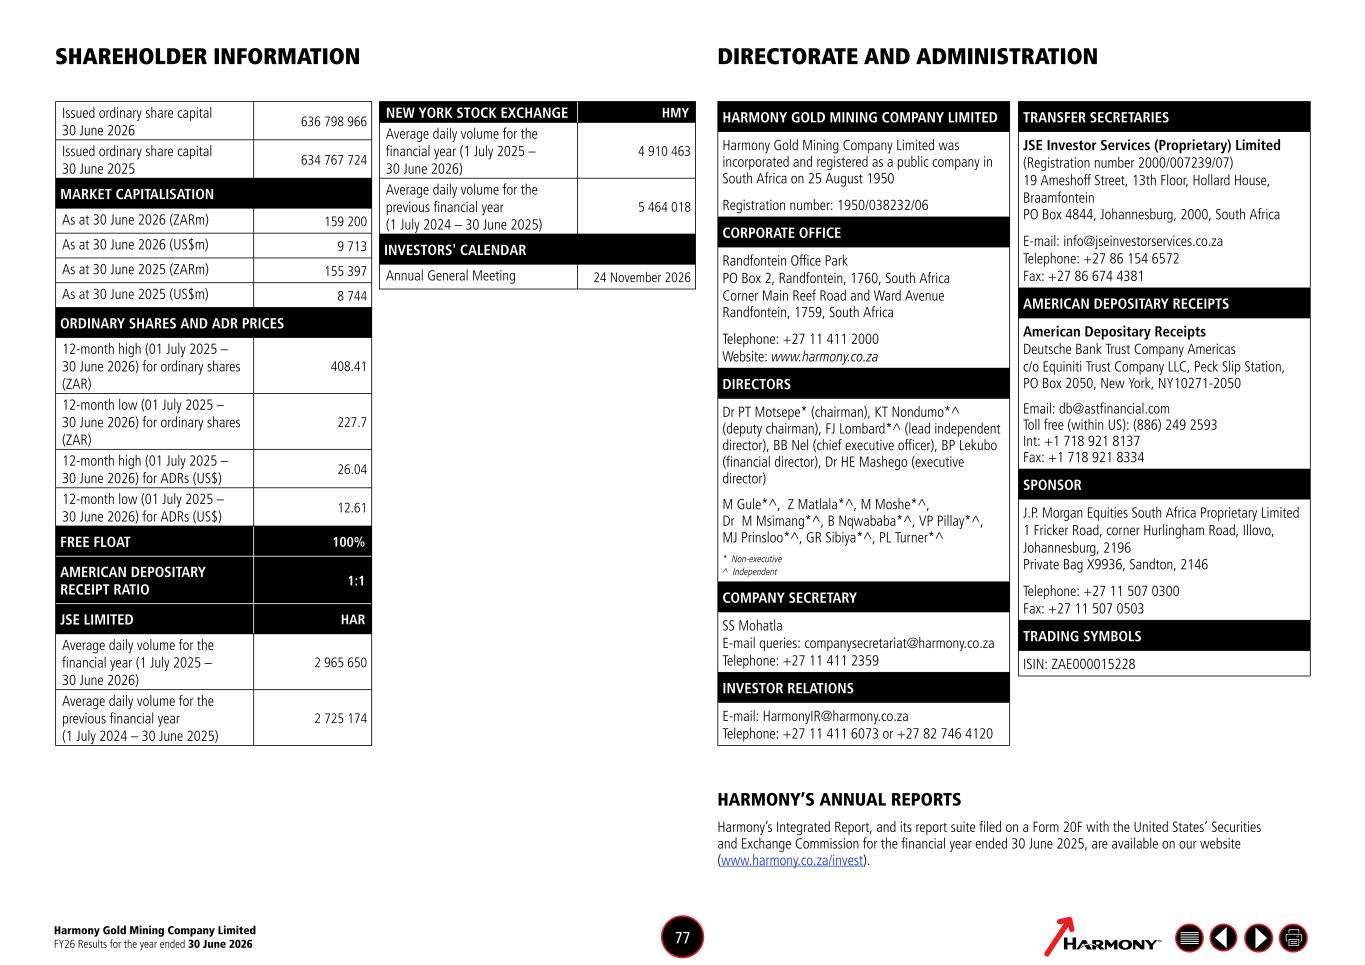
Harmony Gold Mining Company Limited FY26 Results for the year ended 30 June 2026 77 HARMONY GOLD MINING COMPANY LIMITED Harmony Gold Mining Company Limited was incorporated and registered as a public company in South Africa on 25 August 1950 Registration number: 1950/038232/06 CORPORATE OFFICE Randfontein Office Park PO Box 2, Randfontein, 1760, South Africa Corner Main Reef Road and Ward Avenue Randfontein, 1759, South Africa Telephone: +27 11 411 2000 Website: www.harmony.co.za DIRECTORS Dr PT Motsepe* (chairman), KT Nondumo*^ (deputy chairman), FJ Lombard*^ (lead independent director), BB Nel (chief executive officer), BP Lekubo (financial director), Dr HE Mashego (executive director) M Gule*^, Z Matlala*^, M Moshe*^, Dr M Msimang*^, B Nqwababa*^, VP Pillay*^, MJ Prinsloo*^, GR Sibiya*^, PL Turner*^ * Non-executive ^ Independent COMPANY SECRETARY SS Mohatla E-mail queries: companysecretariat@harmony.co.za Telephone: +27 11 411 2359 INVESTOR RELATIONS E-mail: HarmonyIR@harmony.co.za Telephone: +27 11 411 6073 or +27 82 746 4120 DIRECTORATE AND ADMINISTRATION TRANSFER SECRETARIES JSE Investor Services (Proprietary) Limited (Registration number 2000/007239/07) 19 Ameshoff Street, 13th Floor, Hollard House, Braamfontein PO Box 4844, Johannesburg, 2000, South Africa E-mail: info@jseinvestorservices.co.za Telephone: +27 86 154 6572 Fax: +27 86 674 4381 AMERICAN DEPOSITARY RECEIPTS American Depositary Receipts Deutsche Bank Trust Company Americas c/o Equiniti Trust Company LLC, Peck Slip Station, PO Box 2050, New York, NY10271-2050 Email: db@astfinancial.com Toll free (within US): (886) 249 2593 Int: +1 718 921 8137 Fax: +1 718 921 8334 SPONSOR J.P. Morgan Equities South Africa Proprietary Limited 1 Fricker Road, corner Hurlingham Road, Illovo, Johannesburg, 2196 Private Bag X9936, Sandton, 2146 Telephone: +27 11 507 0300 Fax: +27 11 507 0503 TRADING SYMBOLS ISIN: ZAE000015228 HARMONY’S ANNUAL REPORTS Harmony’s Integrated Report, and its report suite filed on a Form 20F with the United States’ Securities and Exchange Commission for the financial year ended 30 June 2025, are available on our website (www.harmony.co.za/invest). Issued ordinary share capital 30 June 2026 636 798 966 Issued ordinary share capital 30 June 2025 634 767 724 MARKET CAPITALISATION As at 30 June 2026 (ZARm) 159 200 As at 30 June 2026 (US$m) 9 713 As at 30 June 2025 (ZARm) 155 397 As at 30 June 2025 (US$m) 8 744 ORDINARY SHARES AND ADR PRICES 12-month high (01 July 2025 – 30 June 2026) for ordinary shares (ZAR) 408.41 12-month low (01 July 2025 – 30 June 2026) for ordinary shares (ZAR) 227.7 12-month high (01 July 2025 – 30 June 2026) for ADRs (US$) 26.04 12-month low (01 July 2025 – 30 June 2026) for ADRs (US$) 12.61 FREE FLOAT 100% AMERICAN DEPOSITARY RECEIPT RATIO 1:1 JSE LIMITED HAR Average daily volume for the financial year (1 July 2025 – 30 June 2026) 2 965 650 Average daily volume for the previous financial year (1 July 2024 – 30 June 2025) 2 725 174 SHAREHOLDER INFORMATION NEW YORK STOCK EXCHANGE HMY Average daily volume for the financial year (1 July 2025 – 30 June 2026) 4 910 463 Average daily volume for the previous financial year (1 July 2024 – 30 June 2025) 5 464 018 INVESTORS' CALENDAR Annual General Meeting 24 November 2026
SIGNATURES Pursuant to the requirements of the Securities Exchange Act of 1934, the registrant has duly caused this report to be signed on its behalf by the undersigned, thereunto duly authorized. Harmony Gold Mining Company Limited Date: August 27, 2026 By: /s/ Boipelo Lekubo Name: Boipelo Lekubo Title: Financial Director