| REIT | Real estate investment trust | ||||
| CPA:18 – Global | Corporate Property Associates 18 – Global Incorporated | ||||
| CESH | Carey European Student Housing Fund I, L.P. | ||||
| WLT | Watermark Lodging Trust, Inc. | ||||
| Managed Programs | CPA:18 – Global and CESH | ||||
| U.S. | United States | ||||
| AUM | Assets under management | ||||
| ABR | Contractual minimum annualized base rent | ||||
| NAV | Net asset value per share | ||||
| SEC | Securities and Exchange Commission | ||||
| ASC | Accounting Standards Codification | ||||
| EUR | Euro | ||||
| EURIBOR | Euro Interbank Offered Rate | ||||
| SONIA | Sterling Overnight Index Average | ||||
| TIBOR | Tokyo Interbank Offered Rate | ||||
| LIBOR | London Interbank Offered Rate | ||||
| Proposed Merger | Our proposed merger with CPA:18 – Global, pursuant to a merger agreement that we entered into on February 27, 2022, which was filed as Exhibit 2.1 to a Current Report on Form 8-K that we filed with the SEC on February 28, 2022 | ||||
| Table of Contents | |||||
| Overview | |||||
| Financial Results | |||||
| Statements of Income – Last Five Quarters | |||||
| FFO and AFFO – Last Five Quarters | |||||
| Balance Sheets and Capitalization | |||||
| Real Estate | |||||
| Investment Activity | |||||
| Investment Management | |||||
| Appendix | |||||
Adjusted EBITDA – Last Five Quarters | |||||
| Summary Metrics | |||||
| Financial Results | |||||||||||||||||||||||||||||
| Segment | |||||||||||||||||||||||||||||
| Real Estate | Investment Management | Total | |||||||||||||||||||||||||||
| Revenues, including reimbursable costs – consolidated ($000s) | $ | 339,787 | $ | 4,610 | $ | 344,397 | |||||||||||||||||||||||
| Net income attributable to W. P. Carey ($000s) | 123,228 | 4,450 | 127,678 | ||||||||||||||||||||||||||
| Net income attributable to W. P. Carey per diluted share | 0.64 | 0.02 | 0.66 | ||||||||||||||||||||||||||
Normalized pro rata cash NOI from real estate ($000s) (a) (b) | 311,331 | N/A | 311,331 | ||||||||||||||||||||||||||
Adjusted EBITDA ($000s) (a) (b) | 298,419 | 6,814 | 305,233 | ||||||||||||||||||||||||||
AFFO attributable to W. P. Carey ($000s) (a) (b) | 247,246 | 7,128 | 254,374 | ||||||||||||||||||||||||||
AFFO attributable to W. P. Carey per diluted share (a) (b) | 1.27 | 0.04 | 1.31 | ||||||||||||||||||||||||||
| Dividends declared per share – current quarter | 1.059 | ||||||||||||||||||||||||||||
| Dividends declared per share – current quarter annualized | 4.236 | ||||||||||||||||||||||||||||
| Dividend yield – annualized, based on quarter end share price of $82.86 | 5.1 | % | |||||||||||||||||||||||||||
Dividend payout ratio – for the six months ended June 30, 2022 (c) | 79.8 | % | |||||||||||||||||||||||||||
| Balance Sheet and Capitalization | |||||||||||||||||||||||||||||
| Equity market capitalization – based on quarter end share price of $82.86 ($000s) | $ | 15,983,014 | |||||||||||||||||||||||||||
Pro rata net debt ($000s) (d) | 6,886,378 | ||||||||||||||||||||||||||||
| Enterprise value ($000s) | 22,869,392 | ||||||||||||||||||||||||||||
| Total consolidated debt ($000s) | 6,765,628 | ||||||||||||||||||||||||||||
Gross assets ($000s) (e) | 17,002,286 | ||||||||||||||||||||||||||||
Liquidity ($000s) (f) | 2,071,551 | ||||||||||||||||||||||||||||
Pro rata net debt to enterprise value (b) | 30.1 | % | |||||||||||||||||||||||||||
Pro rata net debt to adjusted EBITDA (annualized) (a) (b) | 5.6x | ||||||||||||||||||||||||||||
| Total consolidated debt to gross assets | 39.8 | % | |||||||||||||||||||||||||||
| Total consolidated secured debt to gross assets | 1.9 | % | |||||||||||||||||||||||||||
Cash interest expense coverage ratio (a) | 6.6x | ||||||||||||||||||||||||||||
Weighted-average interest rate (b) | 2.6 | % | |||||||||||||||||||||||||||
Weighted-average debt maturity (years) (b) | 4.9 | ||||||||||||||||||||||||||||
| Moody's Investors Service – issuer rating | Baa2 (positive) | ||||||||||||||||||||||||||||
| Standard & Poor's Ratings Services – issuer rating | BBB (positive) | ||||||||||||||||||||||||||||
| Real Estate Portfolio (Pro Rata) | |||||||||||||||||||||||||||||
ABR – total portfolio ($000s) (g) | $ | 1,270,226 | |||||||||||||||||||||||||||
ABR – unencumbered portfolio (% / $000s) (g) (h) | 92.7% / | $ | 1,177,709 | ||||||||||||||||||||||||||
| Number of net-leased properties | 1,357 | ||||||||||||||||||||||||||||
Number of operating properties (i) | 20 | ||||||||||||||||||||||||||||
Number of tenants – net-leased properties | 356 | ||||||||||||||||||||||||||||
ABR from investment grade tenants as a % of total ABR – net-leased properties (j) | 31.2 | % | |||||||||||||||||||||||||||
| Net-leased properties – square footage (millions) | 161.3 | ||||||||||||||||||||||||||||
| Occupancy – net-leased properties | 99.1 | % | |||||||||||||||||||||||||||
| Weighted-average lease term (years) | 11.0 | ||||||||||||||||||||||||||||
| Investment volume – current quarter ($000s) | $ | 477,813 | |||||||||||||||||||||||||||
| Dispositions – current quarter ($000s) | 92,748 | ||||||||||||||||||||||||||||
| Maximum commitment for capital investments and commitments expected to be completed during 2022 ($000s) | 123,076 | ||||||||||||||||||||||||||||
| Construction loan funding expected to be completed during 2022 ($000s) | 37,688 | ||||||||||||||||||||||||||||
| Total capital investments, commitments and construction loan funding expected to be completed during 2022 ($000s) | 160,764 | ||||||||||||||||||||||||||||
 | Investing for the long runTM | 1 | |||||||
| Investing for the long runTM | 2 | |||||||
| Components of Net Asset Value | |||||
| Real Estate | Three Months Ended Jun. 30, 2022 | Annualized | |||||||||||||||
Normalized pro rata cash NOI (a) (b) | $ | 311,331 | $ | 1,245,324 | |||||||||||||
| Investment Management | |||||||||||||||||
Adjusted EBITDA (a) (b) | 6,814 | 27,256 | |||||||||||||||
| Selected Components of Adjusted EBITDA: | |||||||||||||||||
| Asset management revenue | 3,467 | 13,868 | |||||||||||||||
Operating partnership interest in real estate cash flow of CPA:18 – Global (c) | 2,814 | 11,256 | |||||||||||||||
| Back-end fees and interests associated with the Managed Programs | See the Summary of Future Liquidity Considerations for the Managed Programs section for details. | ||||||||||||||||
| Balance Sheet – Selected Information (Consolidated Unless Otherwise Stated) | As of Jun. 30, 2022 | ||||||||||||||||
| Assets | |||||||||||||||||
Book value of real estate excluded from normalized pro rata cash NOI (d) | $ | 174,060 | |||||||||||||||
Las Vegas retail complex construction loan (e) | 141,341 | ||||||||||||||||
| Cash and cash equivalents | 103,590 | ||||||||||||||||
| Other secured loans receivable, net | 24,143 | ||||||||||||||||
| Due from affiliates | 18,937 | ||||||||||||||||
| Other assets, net: | |||||||||||||||||
| Investment in shares of Lineage Logistics (a cold storage REIT) | $ | 366,339 | |||||||||||||||
| Straight-line rent adjustments | 255,654 | ||||||||||||||||
| Restricted cash, including escrow | 96,903 | ||||||||||||||||
| Investment in common shares of WLT | 76,790 | ||||||||||||||||
| Office lease right-of-use assets, net | 58,300 | ||||||||||||||||
| Deferred charges | 54,064 | ||||||||||||||||
| Taxes receivable | 51,032 | ||||||||||||||||
| Securities and derivatives | 48,061 | ||||||||||||||||
| Non-rent tenant and other receivables | 45,053 | ||||||||||||||||
| Prepaid expenses | 21,051 | ||||||||||||||||
| Deferred income taxes | 16,002 | ||||||||||||||||
| Leasehold improvements, furniture and fixtures | 15,361 | ||||||||||||||||
Rent receivables (f) | 3,798 | ||||||||||||||||
| Investment in shares of Guggenheim Credit Income Fund | 3,316 | ||||||||||||||||
| Other intangible assets, net | 738 | ||||||||||||||||
| Other | 6,927 | ||||||||||||||||
| Total other assets, net | $ | 1,119,389 | |||||||||||||||
| Liabilities | |||||||||||||||||
Total pro rata debt outstanding (b) (g) | $ | 6,989,968 | |||||||||||||||
| Dividends payable | 207,526 | ||||||||||||||||
| Deferred income taxes | 135,128 | ||||||||||||||||
| Accounts payable, accrued expenses and other liabilities: | |||||||||||||||||
| Operating lease liabilities | $ | 139,266 | |||||||||||||||
| Accounts payable and accrued expenses | 131,291 | ||||||||||||||||
| Prepaid and deferred rents | 115,635 | ||||||||||||||||
| Tenant security deposits | 58,004 | ||||||||||||||||
| Accrued taxes payable | 38,772 | ||||||||||||||||
| Other | 46,751 | ||||||||||||||||
| Total accounts payable, accrued expenses and other liabilities | $ | 529,719 | |||||||||||||||
| Investing for the long runTM | 3 | |||||||
| Other | Ownership % | Estimated Value | |||||||||
Ownership in Managed Programs: (h) | |||||||||||
CPA:18 – Global (i) | 5.7 | % | $ | 77,610 | |||||||
CESH (j) | 2.4 | % | 1,013 | ||||||||
| $ | 78,623 | ||||||||||
| Investing for the long runTM | 4 | |||||||
| Investing for the long runTM | 5 | |||||||
| Consolidated Statements of Income – Last Five Quarters | |||||
| Three Months Ended | |||||||||||||||||||||||||||||
| Jun. 30, 2022 | Mar. 31, 2022 | Dec. 31, 2021 | Sep. 30, 2021 | Jun. 30, 2021 | |||||||||||||||||||||||||
| Revenues | |||||||||||||||||||||||||||||
| Real Estate: | |||||||||||||||||||||||||||||
| Lease revenues | $ | 314,354 | $ | 307,725 | $ | 305,093 | $ | 298,616 | $ | 289,064 | |||||||||||||||||||
| Income from direct financing leases and loans receivable | 17,778 | 18,379 | 15,637 | 16,754 | 17,422 | ||||||||||||||||||||||||
| Operating property revenues | 5,064 | 3,865 | 4,004 | 4,050 | 3,245 | ||||||||||||||||||||||||
Lease termination income and other (a) | 2,591 | 14,122 | 45,590 | 1,421 | 5,059 | ||||||||||||||||||||||||
| 339,787 | 344,091 | 370,324 | 320,841 | 314,790 | |||||||||||||||||||||||||
| Investment Management: | |||||||||||||||||||||||||||||
| Asset management and other revenue | 3,467 | 3,420 | 3,571 | 3,872 | 3,966 | ||||||||||||||||||||||||
| Reimbursable costs from affiliates | 1,143 | 927 | 985 | 1,041 | 968 | ||||||||||||||||||||||||
| 4,610 | 4,347 | 4,556 | 4,913 | 4,934 | |||||||||||||||||||||||||
| 344,397 | 348,438 | 374,880 | 325,754 | 319,724 | |||||||||||||||||||||||||
| Operating Expenses | |||||||||||||||||||||||||||||
| Depreciation and amortization | 115,080 | 115,393 | 135,662 | 115,657 | 114,348 | ||||||||||||||||||||||||
| General and administrative | 20,841 | 23,084 | 19,591 | 19,750 | 20,464 | ||||||||||||||||||||||||
| Reimbursable tenant costs | 16,704 | 16,960 | 16,475 | 15,092 | 15,092 | ||||||||||||||||||||||||
| Property expenses, excluding reimbursable tenant costs | 11,851 | 13,779 | 11,466 | 13,734 | 11,815 | ||||||||||||||||||||||||
| Stock-based compensation expense | 9,758 | 7,833 | 6,091 | 4,361 | 9,048 | ||||||||||||||||||||||||
| Impairment charges | 6,206 | 20,179 | 7,945 | 16,301 | — | ||||||||||||||||||||||||
| Operating property expenses | 3,191 | 2,787 | 2,887 | 3,001 | 2,049 | ||||||||||||||||||||||||
Merger and other expenses (b) | 1,984 | (2,322) | (563) | (908) | (2,599) | ||||||||||||||||||||||||
| Reimbursable costs from affiliates | 1,143 | 927 | 985 | 1,041 | 968 | ||||||||||||||||||||||||
| 186,758 | 198,620 | 200,539 | 188,029 | 171,185 | |||||||||||||||||||||||||
| Other Income and Expenses | |||||||||||||||||||||||||||||
| Interest expense | (46,417) | (46,053) | (47,208) | (48,731) | (49,252) | ||||||||||||||||||||||||
| Gain on sale of real estate, net | 31,119 | 11,248 | 9,511 | 1,702 | 19,840 | ||||||||||||||||||||||||
Other gains and (losses) (c) | (21,746) | 35,745 | (28,461) | 49,219 | 7,545 | ||||||||||||||||||||||||
Earnings (losses) from equity method investments (d) | 7,401 | 4,772 | (6,675) | 5,735 | (156) | ||||||||||||||||||||||||
Non-operating income (e) | 5,974 | 8,546 | 3,156 | 1,283 | 3,065 | ||||||||||||||||||||||||
| (23,669) | 14,258 | (69,677) | 9,208 | (18,958) | |||||||||||||||||||||||||
| Income before income taxes | 133,970 | 164,076 | 104,664 | 146,933 | 129,581 | ||||||||||||||||||||||||
| Provision for income taxes | (6,252) | (7,083) | (5,052) | (8,347) | (9,298) | ||||||||||||||||||||||||
| Net Income | 127,718 | 156,993 | 99,612 | 138,586 | 120,283 | ||||||||||||||||||||||||
| Net (income) loss attributable to noncontrolling interests | (40) | 2 | (50) | (39) | (38) | ||||||||||||||||||||||||
| Net Income Attributable to W. P. Carey | $ | 127,678 | $ | 156,995 | $ | 99,562 | $ | 138,547 | $ | 120,245 | |||||||||||||||||||
| Basic Earnings Per Share | $ | 0.66 | $ | 0.82 | $ | 0.53 | $ | 0.75 | $ | 0.67 | |||||||||||||||||||
| Diluted Earnings Per Share | $ | 0.66 | $ | 0.82 | $ | 0.53 | $ | 0.74 | $ | 0.67 | |||||||||||||||||||
| Weighted-Average Shares Outstanding | |||||||||||||||||||||||||||||
| Basic | 194,019,451 | 191,911,414 | 187,630,036 | 185,422,639 | 180,099,370 | ||||||||||||||||||||||||
| Diluted | 194,763,695 | 192,416,642 | 188,317,117 | 186,012,478 | 180,668,732 | ||||||||||||||||||||||||
| Dividends Declared Per Share | $ | 1.059 | $ | 1.057 | $ | 1.055 | $ | 1.052 | $ | 1.050 | |||||||||||||||||||
| Investing for the long runTM | 6 | |||||||
| Statements of Income, Real Estate – Last Five Quarters | |||||
| Three Months Ended | |||||||||||||||||||||||||||||
| Jun. 30, 2022 | Mar. 31, 2022 | Dec. 31, 2021 | Sep. 30, 2021 | Jun. 30, 2021 | |||||||||||||||||||||||||
| Revenues | |||||||||||||||||||||||||||||
| Lease revenues | $ | 314,354 | $ | 307,725 | $ | 305,093 | $ | 298,616 | $ | 289,064 | |||||||||||||||||||
| Income from direct financing leases and loans receivable | 17,778 | 18,379 | 15,637 | 16,754 | 17,422 | ||||||||||||||||||||||||
| Operating property revenues | 5,064 | 3,865 | 4,004 | 4,050 | 3,245 | ||||||||||||||||||||||||
Lease termination income and other (a) | 2,591 | 14,122 | 45,590 | 1,421 | 5,059 | ||||||||||||||||||||||||
| 339,787 | 344,091 | 370,324 | 320,841 | 314,790 | |||||||||||||||||||||||||
| Operating Expenses | |||||||||||||||||||||||||||||
| Depreciation and amortization | 115,080 | 115,393 | 135,662 | 115,657 | 114,348 | ||||||||||||||||||||||||
| General and administrative | 20,841 | 23,084 | 19,591 | 19,750 | 20,464 | ||||||||||||||||||||||||
| Reimbursable tenant costs | 16,704 | 16,960 | 16,475 | 15,092 | 15,092 | ||||||||||||||||||||||||
| Property expenses, excluding reimbursable tenant costs | 11,851 | 13,779 | 11,466 | 13,734 | 11,815 | ||||||||||||||||||||||||
| Stock-based compensation expense | 9,758 | 7,833 | 6,091 | 4,361 | 9,048 | ||||||||||||||||||||||||
| Impairment charges | 6,206 | 20,179 | 7,945 | 16,301 | — | ||||||||||||||||||||||||
| Operating property expenses | 3,191 | 2,787 | 2,887 | 3,001 | 2,049 | ||||||||||||||||||||||||
Merger and other expenses (b) | 1,984 | (2,325) | (599) | (908) | (2,599) | ||||||||||||||||||||||||
| 185,615 | 197,690 | 199,518 | 186,988 | 170,217 | |||||||||||||||||||||||||
| Other Income and Expenses | |||||||||||||||||||||||||||||
| Interest expense | (46,417) | (46,053) | (47,208) | (48,731) | (49,252) | ||||||||||||||||||||||||
| Gain on sale of real estate, net | 31,119 | 11,248 | 9,511 | 1,702 | 19,840 | ||||||||||||||||||||||||
Other gains and (losses) (c) | (20,155) | 34,418 | (27,131) | 48,172 | 7,472 | ||||||||||||||||||||||||
| Non-operating income | 5,975 | 8,542 | 3,158 | 1,283 | 3,065 | ||||||||||||||||||||||||
Earnings (losses) from equity method investments in real estate (d) | 4,529 | (787) | (9,121) | 2,445 | (1,854) | ||||||||||||||||||||||||
| (24,949) | 7,368 | (70,791) | 4,871 | (20,729) | |||||||||||||||||||||||||
| Income before income taxes | 129,223 | 153,769 | 100,015 | 138,724 | 123,844 | ||||||||||||||||||||||||
| Provision for income taxes | (5,955) | (6,913) | (5,331) | (7,827) | (9,119) | ||||||||||||||||||||||||
| Net Income from Real Estate | 123,268 | 146,856 | 94,684 | 130,897 | 114,725 | ||||||||||||||||||||||||
| Net (income) loss attributable to noncontrolling interests | (40) | 2 | (50) | (39) | (38) | ||||||||||||||||||||||||
| Net Income from Real Estate Attributable to W. P. Carey | $ | 123,228 | $ | 146,858 | $ | 94,634 | $ | 130,858 | $ | 114,687 | |||||||||||||||||||
| Basic Earnings Per Share | $ | 0.64 | $ | 0.77 | $ | 0.50 | $ | 0.71 | $ | 0.64 | |||||||||||||||||||
| Diluted Earnings Per Share | $ | 0.64 | $ | 0.77 | $ | 0.50 | $ | 0.70 | $ | 0.64 | |||||||||||||||||||
| Weighted-Average Shares Outstanding | |||||||||||||||||||||||||||||
| Basic | 194,019,451 | 191,911,414 | 187,630,036 | 185,422,639 | 180,099,370 | ||||||||||||||||||||||||
| Diluted | 194,763,695 | 192,416,642 | 188,317,117 | 186,012,478 | 180,668,732 | ||||||||||||||||||||||||
| Investing for the long runTM | 7 | |||||||
| Statements of Income, Investment Management – Last Five Quarters | |||||
| Three Months Ended | |||||||||||||||||||||||||||||
| Jun. 30, 2022 | Mar. 31, 2022 | Dec. 31, 2021 | Sep. 30, 2021 | Jun. 30, 2021 | |||||||||||||||||||||||||
| Revenues | |||||||||||||||||||||||||||||
| Asset management and other revenue | $ | 3,467 | $ | 3,420 | $ | 3,571 | $ | 3,872 | $ | 3,966 | |||||||||||||||||||
| Reimbursable costs from affiliates | 1,143 | 927 | 985 | 1,041 | 968 | ||||||||||||||||||||||||
| 4,610 | 4,347 | 4,556 | 4,913 | 4,934 | |||||||||||||||||||||||||
| Operating Expenses | |||||||||||||||||||||||||||||
| Reimbursable costs from affiliates | 1,143 | 927 | 985 | 1,041 | 968 | ||||||||||||||||||||||||
| Merger and other expenses | — | 3 | 36 | — | — | ||||||||||||||||||||||||
| 1,143 | 930 | 1,021 | 1,041 | 968 | |||||||||||||||||||||||||
| Other Income and Expenses | |||||||||||||||||||||||||||||
| Earnings from equity method investments in the Managed Programs | 2,872 | 5,559 | 2,446 | 3,290 | 1,698 | ||||||||||||||||||||||||
| Other gains and (losses) | (1,591) | 1,327 | (1,330) | 1,047 | 73 | ||||||||||||||||||||||||
| Non-operating (loss) income | (1) | 4 | (2) | — | — | ||||||||||||||||||||||||
| 1,280 | 6,890 | 1,114 | 4,337 | 1,771 | |||||||||||||||||||||||||
| Income before income taxes | 4,747 | 10,307 | 4,649 | 8,209 | 5,737 | ||||||||||||||||||||||||
| (Provision for) benefit from income taxes | (297) | (170) | 279 | (520) | (179) | ||||||||||||||||||||||||
| Net Income from Investment Management Attributable to W. P. Carey | $ | 4,450 | $ | 10,137 | $ | 4,928 | $ | 7,689 | $ | 5,558 | |||||||||||||||||||
| Basic Earnings Per Share | $ | 0.02 | $ | 0.05 | $ | 0.03 | $ | 0.04 | $ | 0.03 | |||||||||||||||||||
| Diluted Earnings Per Share | $ | 0.02 | $ | 0.05 | $ | 0.03 | $ | 0.04 | $ | 0.03 | |||||||||||||||||||
| Weighted-Average Shares Outstanding | |||||||||||||||||||||||||||||
| Basic | 194,019,451 | 191,911,414 | 187,630,036 | 185,422,639 | 180,099,370 | ||||||||||||||||||||||||
| Diluted | 194,763,695 | 192,416,642 | 188,317,117 | 186,012,478 | 180,668,732 | ||||||||||||||||||||||||
| Investing for the long runTM | 8 | |||||||
| FFO and AFFO, Consolidated – Last Five Quarters | |||||
| Three Months Ended | |||||||||||||||||||||||||||||
| Jun. 30, 2022 | Mar. 31, 2022 | Dec. 31, 2021 | Sep. 30, 2021 | Jun. 30, 2021 | |||||||||||||||||||||||||
| Net income attributable to W. P. Carey | $ | 127,678 | $ | 156,995 | $ | 99,562 | $ | 138,547 | $ | 120,245 | |||||||||||||||||||
| Adjustments: | |||||||||||||||||||||||||||||
| Depreciation and amortization of real property | 114,333 | 114,646 | 134,149 | 114,204 | 112,997 | ||||||||||||||||||||||||
| Gain on sale of real estate, net | (31,119) | (11,248) | (9,511) | (1,702) | (19,840) | ||||||||||||||||||||||||
| Impairment charges | 6,206 | 20,179 | 7,945 | 16,301 | — | ||||||||||||||||||||||||
Proportionate share of adjustments to earnings from equity method investments (a) (b) | 2,934 | 7,683 | 15,183 | 3,290 | 3,434 | ||||||||||||||||||||||||
Proportionate share of adjustments for noncontrolling interests (c) | (4) | (4) | (4) | (4) | (4) | ||||||||||||||||||||||||
| Total adjustments | 92,350 | 131,256 | 147,762 | 132,089 | 96,587 | ||||||||||||||||||||||||
FFO (as defined by NAREIT) Attributable to W. P. Carey (d) | 220,028 | 288,251 | 247,324 | 270,636 | 216,832 | ||||||||||||||||||||||||
| Adjustments: | |||||||||||||||||||||||||||||
Other (gains) and losses (e) | 21,746 | (35,745) | 28,461 | (49,219) | (7,545) | ||||||||||||||||||||||||
Straight-line and other leasing and financing adjustments (f) | (14,492) | (10,847) | (53,380) | (10,823) | (10,313) | ||||||||||||||||||||||||
Above- and below-market rent intangible lease amortization, net | 10,548 | 11,004 | 15,082 | 12,004 | 14,384 | ||||||||||||||||||||||||
| Stock-based compensation | 9,758 | 7,833 | 6,091 | 4,361 | 9,048 | ||||||||||||||||||||||||
| Amortization of deferred financing costs | 3,147 | 3,128 | 3,239 | 3,424 | 3,447 | ||||||||||||||||||||||||
Merger and other expenses (g) (h) | 1,984 | (2,322) | (563) | (908) | (2,599) | ||||||||||||||||||||||||
| Other amortization and non-cash items | 530 | 552 | 560 | 557 | 563 | ||||||||||||||||||||||||
| Tax (benefit) expense – deferred and other | (355) | (1,242) | (2,507) | (290) | 217 | ||||||||||||||||||||||||
Proportionate share of adjustments to earnings from equity method investments (b) | 1,486 | (1,781) | 1,303 | 988 | 4,650 | ||||||||||||||||||||||||
| Proportionate share of adjustments for noncontrolling interests | (6) | (5) | (5) | (6) | (8) | ||||||||||||||||||||||||
| Total adjustments | 34,346 | (29,425) | (1,719) | (39,912) | 11,844 | ||||||||||||||||||||||||
AFFO Attributable to W. P. Carey (d) | $ | 254,374 | $ | 258,826 | $ | 245,605 | $ | 230,724 | $ | 228,676 | |||||||||||||||||||
| Summary | |||||||||||||||||||||||||||||
FFO (as defined by NAREIT) attributable to W. P. Carey (d) | $ | 220,028 | $ | 288,251 | $ | 247,324 | $ | 270,636 | $ | 216,832 | |||||||||||||||||||
FFO (as defined by NAREIT) attributable to W. P. Carey per diluted share (d) | $ | 1.13 | $ | 1.50 | $ | 1.31 | $ | 1.45 | $ | 1.20 | |||||||||||||||||||
AFFO attributable to W. P. Carey (d) | $ | 254,374 | $ | 258,826 | $ | 245,605 | $ | 230,724 | $ | 228,676 | |||||||||||||||||||
AFFO attributable to W. P. Carey per diluted share (d) | $ | 1.31 | $ | 1.35 | $ | 1.30 | $ | 1.24 | $ | 1.27 | |||||||||||||||||||
| Diluted weighted-average shares outstanding | 194,763,695 | 192,416,642 | 188,317,117 | 186,012,478 | 180,668,732 | ||||||||||||||||||||||||
| Investing for the long runTM | 9 | |||||||
| FFO and AFFO, Real Estate – Last Five Quarters | |||||
| Three Months Ended | |||||||||||||||||||||||||||||
| Jun. 30, 2022 | Mar. 31, 2022 | Dec. 31, 2021 | Sep. 30, 2021 | Jun. 30, 2021 | |||||||||||||||||||||||||
| Net income from Real Estate attributable to W. P. Carey | $ | 123,228 | $ | 146,858 | $ | 94,634 | $ | 130,858 | $ | 114,687 | |||||||||||||||||||
| Adjustments: | |||||||||||||||||||||||||||||
| Depreciation and amortization of real property | 114,333 | 114,646 | 134,149 | 114,204 | 112,997 | ||||||||||||||||||||||||
| Gain on sale of real estate, net | (31,119) | (11,248) | (9,511) | (1,702) | (19,840) | ||||||||||||||||||||||||
| Impairment charges | 6,206 | 20,179 | 7,945 | 16,301 | — | ||||||||||||||||||||||||
Proportionate share of adjustments to earnings from equity method investments (a) (b) | 2,934 | 7,683 | 15,183 | 3,290 | 3,434 | ||||||||||||||||||||||||
Proportionate share of adjustments for noncontrolling interests (c) | (4) | (4) | (4) | (4) | (4) | ||||||||||||||||||||||||
| Total adjustments | 92,350 | 131,256 | 147,762 | 132,089 | 96,587 | ||||||||||||||||||||||||
FFO (as defined by NAREIT) Attributable to W. P. Carey – Real Estate (d) | 215,578 | 278,114 | 242,396 | 262,947 | 211,274 | ||||||||||||||||||||||||
| Adjustments: | |||||||||||||||||||||||||||||
Other (gains) and losses (e) | 20,155 | (34,418) | 27,131 | (48,172) | (7,472) | ||||||||||||||||||||||||
Straight-line and other leasing and financing adjustments (f) | (14,492) | (10,847) | (53,380) | (10,823) | (10,313) | ||||||||||||||||||||||||
Above- and below-market rent intangible lease amortization, net | 10,548 | 11,004 | 15,082 | 12,004 | 14,384 | ||||||||||||||||||||||||
| Stock-based compensation | 9,758 | 7,833 | 6,091 | 4,361 | 9,048 | ||||||||||||||||||||||||
| Amortization of deferred financing costs | 3,147 | 3,128 | 3,239 | 3,424 | 3,447 | ||||||||||||||||||||||||
Merger and other expenses (g) (h) | 1,984 | (2,325) | (599) | (908) | (2,599) | ||||||||||||||||||||||||
| Other amortization and non-cash items | 530 | 552 | 560 | 557 | 563 | ||||||||||||||||||||||||
| Tax (benefit) expense – deferred and other | (324) | (1,189) | (1,851) | (700) | 208 | ||||||||||||||||||||||||
Proportionate share of adjustments to earnings from equity method investments (b) | 368 | 167 | 325 | 1,761 | 3,845 | ||||||||||||||||||||||||
Proportionate share of adjustments for noncontrolling interests (c) | (6) | (5) | (5) | (6) | (8) | ||||||||||||||||||||||||
| Total adjustments | 31,668 | (26,100) | (3,407) | (38,502) | 11,103 | ||||||||||||||||||||||||
AFFO Attributable to W. P. Carey – Real Estate (d) | $ | 247,246 | $ | 252,014 | $ | 238,989 | $ | 224,445 | $ | 222,377 | |||||||||||||||||||
| Summary | |||||||||||||||||||||||||||||
FFO (as defined by NAREIT) attributable to W. P. Carey – Real Estate (d) | $ | 215,578 | $ | 278,114 | $ | 242,396 | $ | 262,947 | $ | 211,274 | |||||||||||||||||||
FFO (as defined by NAREIT) attributable to W. P. Carey per diluted share – Real Estate (d) | $ | 1.11 | $ | 1.45 | $ | 1.29 | $ | 1.41 | $ | 1.17 | |||||||||||||||||||
AFFO attributable to W. P. Carey – Real Estate (d) | $ | 247,246 | $ | 252,014 | $ | 238,989 | $ | 224,445 | $ | 222,377 | |||||||||||||||||||
AFFO attributable to W. P. Carey per diluted share – Real Estate (d) | $ | 1.27 | $ | 1.31 | $ | 1.27 | $ | 1.21 | $ | 1.23 | |||||||||||||||||||
| Diluted weighted-average shares outstanding | 194,763,695 | 192,416,642 | 188,317,117 | 186,012,478 | 180,668,732 | ||||||||||||||||||||||||
| Investing for the long runTM | 10 | |||||||
| FFO and AFFO, Investment Management – Last Five Quarters | |||||
| Three Months Ended | |||||||||||||||||||||||||||||
| Jun. 30, 2022 | Mar. 31, 2022 | Dec. 31, 2021 | Sep. 30, 2021 | Jun. 30, 2021 | |||||||||||||||||||||||||
| Net income from Investment Management attributable to W. P. Carey | $ | 4,450 | $ | 10,137 | $ | 4,928 | $ | 7,689 | $ | 5,558 | |||||||||||||||||||
FFO (as defined by NAREIT) Attributable to W. P. Carey – Investment Management (a) | 4,450 | 10,137 | 4,928 | 7,689 | 5,558 | ||||||||||||||||||||||||
| Adjustments: | |||||||||||||||||||||||||||||
| Other (gains) and losses | 1,591 | (1,327) | 1,330 | (1,047) | (73) | ||||||||||||||||||||||||
| Tax (benefit) expense – deferred and other | (31) | (53) | (656) | 410 | 9 | ||||||||||||||||||||||||
Merger and other expenses | — | 3 | 36 | — | — | ||||||||||||||||||||||||
Proportionate share of adjustments to earnings from equity method investments (b) | 1,118 | (1,948) | 978 | (773) | 805 | ||||||||||||||||||||||||
| Total adjustments | 2,678 | (3,325) | 1,688 | (1,410) | 741 | ||||||||||||||||||||||||
AFFO Attributable to W. P. Carey – Investment Management (a) | $ | 7,128 | $ | 6,812 | $ | 6,616 | $ | 6,279 | $ | 6,299 | |||||||||||||||||||
| Summary | |||||||||||||||||||||||||||||
FFO (as defined by NAREIT) attributable to W. P. Carey – Investment Management (a) | $ | 4,450 | $ | 10,137 | $ | 4,928 | $ | 7,689 | $ | 5,558 | |||||||||||||||||||
FFO (as defined by NAREIT) attributable to W. P. Carey per diluted share – Investment Management (a) | $ | 0.02 | $ | 0.05 | $ | 0.02 | $ | 0.04 | $ | 0.03 | |||||||||||||||||||
AFFO attributable to W. P. Carey – Investment Management (a) | $ | 7,128 | $ | 6,812 | $ | 6,616 | $ | 6,279 | $ | 6,299 | |||||||||||||||||||
AFFO attributable to W. P. Carey per diluted share – Investment Management (a) | $ | 0.04 | $ | 0.04 | $ | 0.03 | $ | 0.03 | $ | 0.04 | |||||||||||||||||||
| Diluted weighted-average shares outstanding | 194,763,695 | 192,416,642 | 188,317,117 | 186,012,478 | 180,668,732 | ||||||||||||||||||||||||
| Investing for the long runTM | 11 | |||||||
| Elements of Pro Rata Statement of Income and AFFO Adjustments | |||||
Equity Method Investments (a) | Noncontrolling Interests (b) | AFFO Adjustments | ||||||||||||||||||
| Revenues | ||||||||||||||||||||
| Real Estate: | ||||||||||||||||||||
Lease revenues | $ | 6,026 | $ | (29) | $ | (4,372) | (c) | |||||||||||||
| Income from direct financing leases and loans receivable | — | — | 453 | |||||||||||||||||
| Operating property revenues: | ||||||||||||||||||||
| Hotel revenues | — | — | — | |||||||||||||||||
| Self-storage revenues | 2,312 | — | — | |||||||||||||||||
| Lease termination income and other | 29 | — | — | |||||||||||||||||
Investment Management: | ||||||||||||||||||||
| Asset management and other revenue | — | — | — | |||||||||||||||||
| Reimbursable costs from affiliates | — | — | — | |||||||||||||||||
| Operating Expenses | ||||||||||||||||||||
| Depreciation and amortization | 2,912 | (4) | (117,438) | (d) | ||||||||||||||||
| General and administrative | 8 | — | — | |||||||||||||||||
Reimbursable tenant costs | 651 | (7) | — | |||||||||||||||||
Property expenses, excluding reimbursable tenant costs | 335 | — | (367) | (e) | ||||||||||||||||
Stock-based compensation expense | — | — | (9,758) | (e) | ||||||||||||||||
| Impairment charges | — | — | (6,206) | (e) | ||||||||||||||||
| Operating property expenses: | — | |||||||||||||||||||
| Hotel expenses | — | — | — | |||||||||||||||||
| Self-storage expenses | 794 | — | (28) | |||||||||||||||||
| Merger and other expenses | — | — | (1,984) | (f) | ||||||||||||||||
Reimbursable costs from affiliates | — | — | — | |||||||||||||||||
| Other Income and Expenses | ||||||||||||||||||||
| Interest expense | (1,195) | — | 3,125 | (g) | ||||||||||||||||
| Gain on sale of real estate, net | — | — | (31,119) | |||||||||||||||||
| Other gains and (losses) | (111) | 5 | 21,852 | (h) | ||||||||||||||||
| Earnings from equity method investments: | ||||||||||||||||||||
Income related to our general partnership interest in CPA:18 – Global | — | — | — | |||||||||||||||||
| Income related to joint ventures | (2,451) | — | 177 | (i) | ||||||||||||||||
| Income related to our ownership in the Managed Programs | — | — | 1,118 | |||||||||||||||||
| Non-operating income | (3) | — | — | |||||||||||||||||
| Provision for income taxes | 93 | — | (319) | (j) | ||||||||||||||||
| Net income attributable to noncontrolling interests | — | 13 | — | |||||||||||||||||
| Investing for the long runTM | 12 | |||||||
| Capital Expenditures | |||||
| Tenant Improvements and Leasing Costs | |||||
| Tenant improvements | $ | 2,904 | |||
| Leasing costs | 1,731 | ||||
| Tenant Improvements and Leasing Costs | 4,635 | ||||
| Maintenance Capital Expenditures | |||||
| Net-lease properties | 1,465 | ||||
| Operating properties | 33 | ||||
| Maintenance Capital Expenditures | 1,498 | ||||
| Total: Tenant Improvements and Leasing Costs, and Maintenance Capital Expenditures | $ | 6,133 | |||
| Non-Maintenance Capital Expenditures | |||||
| Net-lease properties | $ | — | |||
| Operating properties | — | ||||
| Non-Maintenance Capital Expenditures | $ | — | |||
| Other Capital Expenditures | |||||
| Net-lease properties | $ | 978 | |||
| Operating properties | — | ||||
| Other Capital Expenditures | $ | 978 | |||
| Investing for the long runTM | 13 | |||||||
| Investing for the long runTM | 14 | |||||||
| Consolidated Balance Sheets | |||||
| June 30, 2022 | December 31, 2021 | ||||||||||
| Assets | |||||||||||
| Investments in real estate: | |||||||||||
Land, buildings and improvements (a) | $ | 12,026,671 | $ | 11,875,407 | |||||||
| Net investments in direct financing leases and loans receivable | 786,462 | 813,577 | |||||||||
In-place lease intangible assets and other | 2,384,032 | 2,386,000 | |||||||||
Above-market rent intangible assets | 822,470 | 843,410 | |||||||||
| Investments in real estate | 16,019,635 | 15,918,394 | |||||||||
Accumulated depreciation and amortization (b) | (3,043,146) | (2,889,294) | |||||||||
| Assets held for sale, net | — | 8,269 | |||||||||
| Net investments in real estate | 12,976,489 | 13,037,369 | |||||||||
Equity method investments (c) | 344,360 | 356,637 | |||||||||
| Cash and cash equivalents | 103,590 | 165,427 | |||||||||
| Due from affiliates | 18,937 | 1,826 | |||||||||
| Other assets, net | 1,119,389 | 1,017,842 | |||||||||
| Goodwill | 891,464 | 901,529 | |||||||||
| Total assets | $ | 15,454,229 | $ | 15,480,630 | |||||||
| Liabilities and Equity | |||||||||||
| Debt: | |||||||||||
| Senior unsecured notes, net | $ | 5,471,066 | $ | 5,701,913 | |||||||
| Unsecured term loans, net | 548,287 | 310,583 | |||||||||
| Unsecured revolving credit facility | 417,455 | 410,596 | |||||||||
| Non-recourse mortgages, net | 328,820 | 368,524 | |||||||||
| Debt, net | 6,765,628 | 6,791,616 | |||||||||
| Accounts payable, accrued expenses and other liabilities | 529,719 | 572,846 | |||||||||
Below-market rent and other intangible liabilities, net | 174,766 | 183,286 | |||||||||
| Deferred income taxes | 135,128 | 145,572 | |||||||||
| Dividends payable | 207,526 | 203,859 | |||||||||
| Total liabilities | 7,812,767 | 7,897,179 | |||||||||
Preferred stock, $0.001 par value, 50,000,000 shares authorized; none issued | — | — | |||||||||
Common stock, $0.001 par value, 450,000,000 shares authorized; 192,891,792 and 190,013,751 shares, respectively, issued and outstanding | 193 | 190 | |||||||||
| Additional paid-in capital | 10,201,614 | 9,977,686 | |||||||||
| Distributions in excess of accumulated earnings | (2,352,839) | (2,224,231) | |||||||||
| Deferred compensation obligation | 57,012 | 49,810 | |||||||||
| Accumulated other comprehensive loss | (266,157) | (221,670) | |||||||||
| Total stockholders' equity | 7,639,823 | 7,581,785 | |||||||||
| Noncontrolling interests | 1,639 | 1,666 | |||||||||
| Total equity | 7,641,462 | 7,583,451 | |||||||||
| Total liabilities and equity | $ | 15,454,229 | $ | 15,480,630 | |||||||
| Investing for the long runTM | 15 | |||||||
| Capitalization | |||||
| Description | Shares | Share Price | Market Value | |||||||||||||||||||||||
| Equity | ||||||||||||||||||||||||||
| Common equity | 192,891,792 | $ | 82.86 | $ | 15,983,014 | |||||||||||||||||||||
| Preferred equity | — | |||||||||||||||||||||||||
| Total Equity Market Capitalization | 15,983,014 | |||||||||||||||||||||||||
Outstanding Balance (a) | ||||||||||||||||||||||||||
| Pro Rata Debt | ||||||||||||||||||||||||||
| Unsecured term loans (due February 20, 2025) | 550,108 | |||||||||||||||||||||||||
| Non-recourse mortgages | 499,687 | |||||||||||||||||||||||||
| Unsecured revolving credit facility (due February 20, 2025) | 417,455 | |||||||||||||||||||||||||
| Senior unsecured notes: | ||||||||||||||||||||||||||
| Due April 1, 2024 (USD) | 500,000 | |||||||||||||||||||||||||
| Due July 19, 2024 (EUR) | 519,350 | |||||||||||||||||||||||||
| Due February 1, 2025 (USD) | 450,000 | |||||||||||||||||||||||||
| Due April 9, 2026 (EUR) | 519,350 | |||||||||||||||||||||||||
| Due October 1, 2026 (USD) | 350,000 | |||||||||||||||||||||||||
| Due April 15, 2027 (EUR) | 519,350 | |||||||||||||||||||||||||
| Due April 15, 2028 (EUR) | 519,350 | |||||||||||||||||||||||||
| Due July 15, 2029 (USD) | 325,000 | |||||||||||||||||||||||||
| Due June 1, 2030 (EUR) | 545,318 | |||||||||||||||||||||||||
| Due February 1, 2031 (USD) | 500,000 | |||||||||||||||||||||||||
| Due February 1, 2032 (USD) | 350,000 | |||||||||||||||||||||||||
| Due April 1, 2033 (USD) | 425,000 | |||||||||||||||||||||||||
| Total Pro Rata Debt | 6,989,968 | |||||||||||||||||||||||||
| Total Capitalization | $ | 22,972,982 | ||||||||||||||||||||||||
| Investing for the long runTM | 16 | |||||||
| Debt Overview | |||||
| USD-Denominated | EUR-Denominated | Other Currencies (a) | Total | |||||||||||||||||||||||||||||||||||||||||||||||||||||||||||||||||
| Outstanding Balance | ||||||||||||||||||||||||||||||||||||||||||||||||||||||||||||||||||||
| Out-standing Balance (in USD) | Weigh-ted Avg. Interest Rate | Out-standing Balance (in USD) | Weigh-ted Avg. Interest Rate | Out-standing Balance (in USD) | Weigh-ted Avg. Interest Rate | Amount (in USD) | % of Total | Weigh-ted Avg. Interest Rate | Weigh-ted Avg. Maturity (Years) | |||||||||||||||||||||||||||||||||||||||||||||||||||||||||||
Non-Recourse Debt (b) (c) | ||||||||||||||||||||||||||||||||||||||||||||||||||||||||||||||||||||
| Fixed | $ | 204,987 | 5.3 | % | $ | 65,148 | 2.9 | % | $ | 17,607 | 4.4 | % | $ | 287,742 | 4.1 | % | 4.7 | % | 2.3 | |||||||||||||||||||||||||||||||||||||||||||||||||
| Variable: | ||||||||||||||||||||||||||||||||||||||||||||||||||||||||||||||||||||
| Swapped | 9,811 | 3.9 | % | 121,352 | 2.2 | % | — | — | % | 131,163 | 1.9 | % | 2.3 | % | 1.5 | |||||||||||||||||||||||||||||||||||||||||||||||||||||
| Floating | — | — | % | 69,764 | 1.7 | % | — | — | % | 69,764 | 0.9 | % | 1.7 | % | 0.7 | |||||||||||||||||||||||||||||||||||||||||||||||||||||
| Capped | — | — | % | 11,018 | 1.6 | % | — | — | % | 11,018 | 0.2 | % | 1.6 | % | 1.1 | |||||||||||||||||||||||||||||||||||||||||||||||||||||
Total Pro Rata Non-Recourse Debt | 214,798 | 5.3 | % | 267,282 | 2.2 | % | 17,607 | 4.4 | % | 499,687 | 7.1 | % | 3.6 | % | 1.8 | |||||||||||||||||||||||||||||||||||||||||||||||||||||
Recourse Debt (b) (c) | ||||||||||||||||||||||||||||||||||||||||||||||||||||||||||||||||||||
| Fixed – Senior unsecured notes: | ||||||||||||||||||||||||||||||||||||||||||||||||||||||||||||||||||||
| Due April 1, 2024 | 500,000 | 4.6 | % | — | — | % | — | — | % | 500,000 | 7.2 | % | 4.6 | % | 1.8 | |||||||||||||||||||||||||||||||||||||||||||||||||||||
| Due July 19, 2024 | — | — | % | 519,350 | 2.3 | % | — | — | % | 519,350 | 7.4 | % | 2.3 | % | 2.1 | |||||||||||||||||||||||||||||||||||||||||||||||||||||
| Due February 1, 2025 | 450,000 | 4.0 | % | — | — | % | — | — | % | 450,000 | 6.4 | % | 4.0 | % | 2.6 | |||||||||||||||||||||||||||||||||||||||||||||||||||||
| Due April 9, 2026 | — | — | % | 519,350 | 2.3 | % | — | — | % | 519,350 | 7.4 | % | 2.3 | % | 3.8 | |||||||||||||||||||||||||||||||||||||||||||||||||||||
| Due October 1, 2026 | 350,000 | 4.3 | % | — | — | % | — | — | % | 350,000 | 5.0 | % | 4.3 | % | 4.3 | |||||||||||||||||||||||||||||||||||||||||||||||||||||
| Due April 15, 2027 | — | — | % | 519,350 | 2.1 | % | — | — | % | 519,350 | 7.4 | % | 2.1 | % | 4.8 | |||||||||||||||||||||||||||||||||||||||||||||||||||||
| Due April 15, 2028 | — | — | % | 519,350 | 1.4 | % | — | — | % | 519,350 | 7.4 | % | 1.4 | % | 5.8 | |||||||||||||||||||||||||||||||||||||||||||||||||||||
| Due July 15, 2029 | 325,000 | 3.9 | % | — | — | % | — | — | % | 325,000 | 4.7 | % | 3.9 | % | 7.0 | |||||||||||||||||||||||||||||||||||||||||||||||||||||
| Due June 1, 2030 | — | — | % | 545,318 | 1.0 | % | — | — | % | 545,318 | 7.8 | % | 1.0 | % | 7.9 | |||||||||||||||||||||||||||||||||||||||||||||||||||||
| Due February 1, 2031 | 500,000 | 2.4 | % | — | — | % | — | — | % | 500,000 | 7.2 | % | 2.4 | % | 8.6 | |||||||||||||||||||||||||||||||||||||||||||||||||||||
| Due February 1, 2032 | 350,000 | 2.5 | % | — | — | % | — | — | % | 350,000 | 5.0 | % | 2.5 | % | 4.8 | |||||||||||||||||||||||||||||||||||||||||||||||||||||
| Due April 1, 2033 | 425,000 | 2.3 | % | — | — | % | — | — | % | 425,000 | 6.1 | % | 2.3 | % | 10.8 | |||||||||||||||||||||||||||||||||||||||||||||||||||||
Total Senior Unsecured Notes | 2,900,000 | 3.4 | % | 2,622,718 | 1.8 | % | — | — | % | 5,522,718 | 79.0 | % | 2.6 | % | 5.3 | |||||||||||||||||||||||||||||||||||||||||||||||||||||
Variable: | ||||||||||||||||||||||||||||||||||||||||||||||||||||||||||||||||||||
Unsecured term loans (due February 20, 2025) (d) | — | — | % | 223,321 | 1.0 | % | 326,787 | 2.2 | % | 550,108 | 7.9 | % | 1.7 | % | 2.6 | |||||||||||||||||||||||||||||||||||||||||||||||||||||
Unsecured revolving credit facility (due February 20, 2025) (e) | 151,000 | 2.4 | % | 248,769 | 0.9 | % | 17,686 | 0.9 | % | 417,455 | 6.0 | % | 1.4 | % | 2.6 | |||||||||||||||||||||||||||||||||||||||||||||||||||||
| Total Recourse Debt | 3,051,000 | 3.4 | % | 3,094,808 | 1.6 | % | 344,473 | 2.1 | % | 6,490,281 | 92.9 | % | 2.5 | % | 4.9 | |||||||||||||||||||||||||||||||||||||||||||||||||||||
Total Pro Rata Debt Outstanding | $ | 3,265,798 | 3.5 | % | $ | 3,362,090 | 1.7 | % | $ | 362,080 | 2.2 | % | $ | 6,989,968 | 100.0 | % | 2.6 | % | 4.9 | |||||||||||||||||||||||||||||||||||||||||||||||||
| Investing for the long runTM | 17 | |||||||
| Debt Maturity | |||||
| Real Estate | Debt | |||||||||||||||||||||||||||||||||||||
Number of Properties (a) | Weighted-Average Interest Rate | Total Outstanding Balance (b) (c) | % of Total Outstanding Balance | |||||||||||||||||||||||||||||||||||
| Year of Maturity | ABR (a) | Balloon | ||||||||||||||||||||||||||||||||||||
| Non-Recourse Debt | ||||||||||||||||||||||||||||||||||||||
| Remaining 2022 | 4 | $ | 12,034 | 4.6 | % | $ | 40,068 | $ | 40,413 | 0.6 | % | |||||||||||||||||||||||||||
| 2023 | 20 | 39,369 | 3.0 | % | 225,720 | 232,747 | 3.3 | % | ||||||||||||||||||||||||||||||
| 2024 | 30 | 19,893 | 2.9 | % | 100,443 | 108,244 | 1.5 | % | ||||||||||||||||||||||||||||||
| 2025 | 9 | 11,345 | 4.8 | % | 43,953 | 55,834 | 0.8 | % | ||||||||||||||||||||||||||||||
| 2026 | 4 | 8,872 | 6.0 | % | 30,638 | 37,953 | 0.6 | % | ||||||||||||||||||||||||||||||
| 2027 | 1 | — | 4.3 | % | 21,450 | 21,450 | 0.3 | % | ||||||||||||||||||||||||||||||
| 2031 | 1 | 1,004 | 6.0 | % | — | 3,046 | — | % | ||||||||||||||||||||||||||||||
Total Pro Rata Non-Recourse Debt | 69 | $ | 92,517 | 3.6 | % | $ | 462,272 | 499,687 | 7.1 | % | ||||||||||||||||||||||||||||
| Recourse Debt | ||||||||||||||||||||||||||||||||||||||
| Fixed – Senior unsecured notes: | ||||||||||||||||||||||||||||||||||||||
| Due April 1, 2024 (USD) | 4.6 | % | 500,000 | 7.2 | % | |||||||||||||||||||||||||||||||||
| Due July 19, 2024 (EUR) | 2.3 | % | 519,350 | 7.4 | % | |||||||||||||||||||||||||||||||||
| Due February 1, 2025 (USD) | 4.0 | % | 450,000 | 6.4 | % | |||||||||||||||||||||||||||||||||
| Due April 9, 2026 (EUR) | 2.3 | % | 519,350 | 7.4 | % | |||||||||||||||||||||||||||||||||
| Due October 1, 2026 (USD) | 4.3 | % | 350,000 | 5.0 | % | |||||||||||||||||||||||||||||||||
| Due April 15, 2027 (EUR) | 2.1 | % | 519,350 | 7.4 | % | |||||||||||||||||||||||||||||||||
| Due April 15, 2028 (EUR) | 1.4 | % | 519,350 | 7.4 | % | |||||||||||||||||||||||||||||||||
| Due July 15, 2029 (USD) | 3.9 | % | 325,000 | 4.7 | % | |||||||||||||||||||||||||||||||||
| Due June 1, 2030 (EUR) | 1.0 | % | 545,318 | 7.8 | % | |||||||||||||||||||||||||||||||||
| Due February 1, 2031 (USD) | 2.4 | % | 500,000 | 7.2 | % | |||||||||||||||||||||||||||||||||
| Due February 1, 2032 (USD) | 2.5 | % | 350,000 | 5.0 | % | |||||||||||||||||||||||||||||||||
| Due April 1, 2033 (USD) | 2.3 | % | 425,000 | 6.1 | % | |||||||||||||||||||||||||||||||||
| Total Senior Unsecured Notes | 2.6 | % | 5,522,718 | 79.0 | % | |||||||||||||||||||||||||||||||||
Variable: | ||||||||||||||||||||||||||||||||||||||
Unsecured term loans (due February 20, 2025) (d) | 1.7 | % | 550,108 | 7.9 | % | |||||||||||||||||||||||||||||||||
Unsecured revolving credit facility (due February 20, 2025) (e) | 1.4 | % | 417,455 | 6.0 | % | |||||||||||||||||||||||||||||||||
| Total Recourse Debt | 2.5 | % | 6,490,281 | 92.9 | % | |||||||||||||||||||||||||||||||||
| Total Pro Rata Debt Outstanding | 2.6 | % | $ | 6,989,968 | 100.0 | % | ||||||||||||||||||||||||||||||||
| Investing for the long runTM | 18 | |||||||
| Senior Unsecured Notes | |||||
| Issuer | Senior Unsecured Notes | |||||||||||||||||||
| Ratings Agency | Rating | Outlook | Rating | |||||||||||||||||
| Moody's | Baa2 | Positive | Baa2 | |||||||||||||||||
| Standard & Poor’s | BBB | Positive | BBB | |||||||||||||||||
| Covenant | Metric | Required | As of Jun. 30, 2022 | |||||||||||||||||
| Limitation on the incurrence of debt | "Total Debt" / "Total Assets" | ≤ 60% | 38.2% | |||||||||||||||||
| Limitation on the incurrence of secured debt | "Secured Debt" / "Total Assets" | ≤ 40% | 1.8% | |||||||||||||||||
Limitation on the incurrence of debt based on consolidated EBITDA to annual debt service charge | "Consolidated EBITDA" / "Annual Debt Service Charge" | ≥ 1.5x | 6.8x | |||||||||||||||||
| Maintenance of unencumbered asset value | "Unencumbered Assets" / "Total Unsecured Debt" | ≥ 150% | 246.0% | |||||||||||||||||
| Investing for the long runTM | 19 | |||||||
| Investing for the long runTM | 20 | |||||||
Investment Activity – Capital Investments and Commitments (a) | |||||
| Primary Transaction Type | Property Type | Expected Completion / Closing Date | Gross Square Footage | Lease Term (Years) (b) | Funded During Three Months Ended Jun. 30, 2022 | Total Funded Through Jun. 30, 2022 | Maximum Commitment / Gross Investment Amount | |||||||||||||||||||||||||||||||||||||||||||||||||||||||
| Tenant | Location | Remaining | Total | |||||||||||||||||||||||||||||||||||||||||||||||||||||||||||
Upfield Group B.V. (c) | Wageningen, The Netherlands | Build-to-Suit | Laboratory | Q3 2022 | 63,762 | 20 | $ | 1,005 | $ | 24,483 | $ | 1,177 | $ | 25,660 | ||||||||||||||||||||||||||||||||||||||||||||||||
Ontex BVBA (d) | Radomsko, Poland | Expansion | Industrial | Q3 2022 | 463,817 | 20 | 13,309 | 18,127 | 5,638 | 23,765 | ||||||||||||||||||||||||||||||||||||||||||||||||||||
| Berry Global Inc. (2 properties) | Various, USA | Renovation | Industrial | Q4 2022 | N/A | 17 | — | — | 20,000 | 20,000 | ||||||||||||||||||||||||||||||||||||||||||||||||||||
COOP Danmark A/S (13 properties) (d) (e) | Various, Denmark | Purchase Commitment | Retail | Various | 200,177 | 15 | — | — | 49,342 | 49,342 | ||||||||||||||||||||||||||||||||||||||||||||||||||||
| Outfront Media, LLC (3 properties) | Various, NJ | Build-to-Suit | Outdoor Advertising | Various | N/A | 30 | — | 4,172 | 137 | 4,309 | ||||||||||||||||||||||||||||||||||||||||||||||||||||
| Expected Completion Date 2022 Total | 727,756 | 18 | 14,314 | 46,782 | 76,294 | 123,076 | ||||||||||||||||||||||||||||||||||||||||||||||||||||||||
Hellweg Die Profi-Baumärkte GmbH & Co. KG (2 properties) (d) | Various, Germany | Renovation | Retail | Q1 2023 | N/A | 15 | — | — | 2,181 | 2,181 | ||||||||||||||||||||||||||||||||||||||||||||||||||||
| National Coatings & Supplies, Inc. | Nashville, TN | Expansion | Warehouse | Q1 2023 | 13,500 | 17 | — | — | 2,100 | 2,100 | ||||||||||||||||||||||||||||||||||||||||||||||||||||
| Chattem, Inc. | Chattanooga, TN | Expansion | Warehouse | Q2 2023 | 120,000 | 10 | — | — | 22,752 | 22,752 | ||||||||||||||||||||||||||||||||||||||||||||||||||||
| Expected Completion Date 2023 Total | 133,500 | 11 | — | — | 27,033 | 27,033 | ||||||||||||||||||||||||||||||||||||||||||||||||||||||||
Fraikin SAS (d) | Various, France | Renovation | Industrial | Q4 2024 | N/A | 18 | — | — | 7,167 | 7,167 | ||||||||||||||||||||||||||||||||||||||||||||||||||||
| Expected Completion Date 2024 Total | N/A | 18 | — | — | 7,167 | 7,167 | ||||||||||||||||||||||||||||||||||||||||||||||||||||||||
| Capital Investments and Commitments Total | 861,256 | 17 | $ | 14,314 | $ | 46,782 | $ | 110,494 | $ | 157,276 | ||||||||||||||||||||||||||||||||||||||||||||||||||||
| Investing for the long runTM | 21 | |||||||
| Investment Activity – Investment Volume | |||||
| Property Type(s) | Closing Date / Asset Completion Date | Gross Investment Amount | Investment Type | Lease Term (Years) (a) | Gross Square Footage | |||||||||||||||||||||||||||||||||||||||
| Tenant / Lease Guarantor | Property Location(s) | |||||||||||||||||||||||||||||||||||||||||||
| 1Q22 | ||||||||||||||||||||||||||||||||||||||||||||
| Balcan Innovations Inc. | Pleasant Prairie, WI | Industrial | Jan-22 | $ | 20,024 | Sale-leaseback | 20 | 175,168 | ||||||||||||||||||||||||||||||||||||
Memora Servicios Funerarios S.L (26 properties) (b) | Various, Spain | Funeral Home | Feb-22 | 146,364 | Sale-leaseback | 30 | 370,204 | |||||||||||||||||||||||||||||||||||||
COOP Danmark A/S (8 properties) (b) | Various, Denmark | Retail | Feb-22 | 33,976 | Sale-leaseback | 15 | 121,263 | |||||||||||||||||||||||||||||||||||||
Metra S.p.A. (b) | Laval, Canada | Industrial | Feb-22 | 21,459 | Sale-leaseback | 25 | 162,600 | |||||||||||||||||||||||||||||||||||||
Chattem, Inc. (c) | Chattanooga, TN | Warehouse | Mar-22 | 43,198 | Acquisition | 7 | 689,450 | |||||||||||||||||||||||||||||||||||||
| Orgill, Inc. | Hurricane, UT | Warehouse | Mar-22 | 20,000 | Expansion | 20 | 427,680 | |||||||||||||||||||||||||||||||||||||
Jumbo Food Groep B.V. (b) | Breda, Netherlands | Warehouse | Mar-22 | 4,721 | Expansion | 14 | 41,893 | |||||||||||||||||||||||||||||||||||||
| 1Q22 Total | 289,742 | 23 | 1,988,258 | |||||||||||||||||||||||||||||||||||||||||
| 2Q22 | ||||||||||||||||||||||||||||||||||||||||||||
| Henkel AG & Co. | Bowling Green, KY | Warehouse | Apr-22 | 69,475 | Renovation | 15 | N/A | |||||||||||||||||||||||||||||||||||||
| Innophos Holdings, Inc. (6 properties) | Various, United States (4 properties), Canada (1 property), and Mexico (1 property) | Industrial | Apr-22; May-22 | 80,595 | Sale-leaseback | 25 | 1,169,654 | |||||||||||||||||||||||||||||||||||||
| Highline Warren LLC (6 properties) | Various, United States | Industrial; Warehouse | May-22 | 110,381 | Sale-leaseback | 24 | 1,578,198 | |||||||||||||||||||||||||||||||||||||
COOP Danmark A/S (10 properties) (b) | Various, Denmark | Retail | Jun-22 | 42,635 | Sale-leaseback | 15 | 163,000 | |||||||||||||||||||||||||||||||||||||
| Friction Products Co. | Medina, OH | Industrial | Jun-22 | 28,913 | Sale-leaseback | 20 | 368,465 | |||||||||||||||||||||||||||||||||||||
| Turkey Hill, LLC (2 properties) | Searcy, AR and Conestoga, PA | Industrial | Jun-22 | 10,000 | Renovation | 25 | N/A | |||||||||||||||||||||||||||||||||||||
Van Mossel Automotive (5 properties) (b) (d) | Various, Belgium | Retail | Jun-22 | 19,795 | Sale-leaseback | 17 | 125,755 | |||||||||||||||||||||||||||||||||||||
Greenyard NV (b) | Bree, Belgium | Warehouse | Jun-22 | 96,697 | Sale-leaseback | 20 | 1,876,456 | |||||||||||||||||||||||||||||||||||||
| 2Q22 Total | 458,491 | 21 | 5,281,528 | |||||||||||||||||||||||||||||||||||||||||
| Year-to-Date Total | 748,233 | 21 | 7,269,786 | |||||||||||||||||||||||||||||||||||||||||
| Property Type(s) | Funded During Current Quarter | Funded Year to Date | Expected Funding Completion Date | Total Funded | Maximum Commitment | |||||||||||||||||||||||||||||||||||||||
| Description | Property Location(s) | |||||||||||||||||||||||||||||||||||||||||||
| Construction Loan | ||||||||||||||||||||||||||||||||||||||||||||
Southwest Corner of Las Vegas Boulevard & Harmon Avenue Retail Complex (e) | Las Vegas, NV | Retail | $ | 19,322 | $ | 37,281 | Q4 2023 | $ | 140,995 | $ | 261,887 | |||||||||||||||||||||||||||||||||
| Total | 37,281 | |||||||||||||||||||||||||||||||||||||||||||
| Year-to-Date Total Investment Volume | $ | 785,514 | ||||||||||||||||||||||||||||||||||||||||||
| Investing for the long runTM | 22 | |||||||
| Investment Activity – Dispositions | |||||
| Tenant / Lease Guarantor | Property Location(s) | Gross Sale Price | Closing Date | Property Type(s) | Gross Square Footage | |||||||||||||||||||||||||||
| 1Q22 | ||||||||||||||||||||||||||||||||
| Vacant | Flora, MS | $ | 5,500 | Jan-22 | Warehouse | 102,498 | ||||||||||||||||||||||||||
| Barnes & Noble, Inc. | Braintree, MA | 13,800 | Feb-22 | Retail | 19,661 | |||||||||||||||||||||||||||
Pendragon PLC (3 properties) (a) | Ardrossan, Blackpool and Stourbridge, United Kingdom | 3,234 | Mar-22 | Retail | 36,199 | |||||||||||||||||||||||||||
| Vacant | Anchorage, AK | 4,075 | Mar-22 | Warehouse | 40,512 | |||||||||||||||||||||||||||
| 1Q22 Total | 26,609 | 198,870 | ||||||||||||||||||||||||||||||
| 2Q22 | ||||||||||||||||||||||||||||||||
Pendragon PLC (2 properties) (a) | Livingston and Stoke-on-Trent, United Kingdom | 3,275 | Apr-22 | Retail | 29,678 | |||||||||||||||||||||||||||
Barrett Steel Limited (a) | Newbridge, United Kingdom | 17,444 | Apr-22 | Warehouse | 213,394 | |||||||||||||||||||||||||||
| Plastic Technology Holdings, LLC | Baraboo, WI | 18,650 | Apr-22 | Industrial | 615,048 | |||||||||||||||||||||||||||
| Vacant | Waterford Township, MI | 3,690 | Apr-22 | Retail | 103,018 | |||||||||||||||||||||||||||
Vacant (a) | Kotka, Finland | 1,689 | May-22 | Warehouse | 150,884 | |||||||||||||||||||||||||||
| TNT Crust Parent, LLC (2 properties) | St. Charles, MO and Green Bay, WI | 48,000 | Jun-22 | Industrial | 176,993 | |||||||||||||||||||||||||||
| 2Q22 Total | 92,748 | 1,289,015 | ||||||||||||||||||||||||||||||
| Year-to-Date Total Dispositions | $ | 119,357 | 1,487,885 | |||||||||||||||||||||||||||||
| Investing for the long runTM | 23 | |||||||
| Joint Ventures | |||||
| Joint Venture or JV (Principal Tenant) | JV Partnership | Consolidated | Pro Rata (a) | |||||||||||||||||||||||||||||||||||
| Partner | WPC % | Debt Outstanding (b) | ABR | Debt Outstanding (c) | ABR | |||||||||||||||||||||||||||||||||
Unconsolidated Joint Ventures (Equity Method Investments) (d) | ||||||||||||||||||||||||||||||||||||||
Kesko Senukai (e) | Third party | 70.00% | $ | 104,236 | $ | 13,629 | $ | 72,966 | $ | 9,540 | ||||||||||||||||||||||||||||
| State Farm Mutual Automobile Insurance Co. | CPA:18 – Global | 50.00% | 72,800 | 8,152 | 36,400 | 4,076 | ||||||||||||||||||||||||||||||||
Bank Pekao (e) | CPA:18 – Global | 50.00% | 38,097 | 8,576 | 19,049 | 4,288 | ||||||||||||||||||||||||||||||||
Apply Sørco AS (e) | CPA:18 – Global | 49.00% | 35,933 | 4,249 | 17,607 | 2,082 | ||||||||||||||||||||||||||||||||
Fortenova Grupa d.d. (e) | CPA:18 – Global | 20.00% | 14,805 | 3,232 | 2,961 | 646 | ||||||||||||||||||||||||||||||||
| Total Unconsolidated Joint Ventures | 265,871 | 37,838 | 148,983 | 20,632 | ||||||||||||||||||||||||||||||||||
Consolidated Joint Ventures | ||||||||||||||||||||||||||||||||||||||
| McCoy-Rockford, Inc. | Third party | 90.00% | — | 917 | — | 826 | ||||||||||||||||||||||||||||||||
| Total Consolidated Joint Ventures | — | 917 | — | 826 | ||||||||||||||||||||||||||||||||||
Total Unconsolidated and Consolidated Joint Ventures | $ | 265,871 | $ | 38,755 | $ | 148,983 | $ | 21,458 | ||||||||||||||||||||||||||||||
| Investing for the long runTM | 24 | |||||||
| Top Ten Tenants | |||||
| Tenant / Lease Guarantor | Description | Number of Properties | ABR | ABR % | Weighted-Average Lease Term (Years) | |||||||||||||||||||||||||||
| U-Haul Moving Partners Inc. and Mercury Partners, LP | Net lease self-storage properties in the U.S. | 78 | $ | 38,751 | 3.0 | % | 1.8 | |||||||||||||||||||||||||
State of Andalucía (a) | Government office properties in Spain | 70 | 28,506 | 2.2 | % | 12.5 | ||||||||||||||||||||||||||
Hellweg Die Profi-Baumärkte GmbH & Co. KG (a) | Do-it-yourself retail properties in Germany | 35 | 26,537 | 2.1 | % | 14.7 | ||||||||||||||||||||||||||
Metro Cash & Carry Italia S.p.A. (a) | Business-to-business wholesale stores in Italy and Germany | 20 | 26,492 | 2.1 | % | 6.3 | ||||||||||||||||||||||||||
| Extra Space Storage, Inc. | Net lease self-storage properties in the U.S. | 27 | 22,957 | 1.8 | % | 21.8 | ||||||||||||||||||||||||||
OBI Group (a) | Do-it-yourself retail properties in Poland | 26 | 21,515 | 1.7 | % | 8.1 | ||||||||||||||||||||||||||
| Marriott Corporation | Net lease hotel properties in the U.S. | 18 | 21,350 | 1.7 | % | 1.6 | ||||||||||||||||||||||||||
| Nord Anglia Education, Inc. | K-12 private schools in the U.S. | 3 | 20,981 | 1.7 | % | 21.2 | ||||||||||||||||||||||||||
Pendragon PLC (a) | Automotive dealerships in the United Kingdom | 63 | 20,214 | 1.6 | % | 12.9 | ||||||||||||||||||||||||||
| Advance Auto Parts, Inc. | Distribution facilities in the U.S. | 29 | 19,851 | 1.6 | % | 10.6 | ||||||||||||||||||||||||||
Total (b) | 369 | $ | 247,154 | 19.5 | % | 10.5 | ||||||||||||||||||||||||||
| Investing for the long runTM | 25 | |||||||
| Diversification by Property Type | |||||
| Total Net-Lease Portfolio | ||||||||||||||||||||||||||
| Property Type | ABR | ABR % | Square Footage (a) | Square Footage % | ||||||||||||||||||||||
| U.S. | ||||||||||||||||||||||||||
| Industrial | $ | 266,281 | 20.9 | % | 45,625 | 28.3 | % | |||||||||||||||||||
| Warehouse | 189,326 | 14.9 | % | 37,968 | 23.6 | % | ||||||||||||||||||||
| Office | 151,960 | 12.0 | % | 9,677 | 6.0 | % | ||||||||||||||||||||
Retail (b) | 45,730 | 3.6 | % | 2,800 | 1.7 | % | ||||||||||||||||||||
| Self Storage (net lease) | 61,708 | 4.9 | % | 5,810 | 3.6 | % | ||||||||||||||||||||
Other (c) | 105,958 | 8.3 | % | 5,400 | 3.3 | % | ||||||||||||||||||||
| U.S. Total | 820,963 | 64.6 | % | 107,280 | 66.5 | % | ||||||||||||||||||||
| International | ||||||||||||||||||||||||||
| Industrial | 72,789 | 5.8 | % | 10,836 | 6.7 | % | ||||||||||||||||||||
| Warehouse | 117,349 | 9.2 | % | 19,888 | 12.3 | % | ||||||||||||||||||||
| Office | 85,194 | 6.7 | % | 6,336 | 3.9 | % | ||||||||||||||||||||
Retail (b) | 167,169 | 13.2 | % | 16,584 | 10.3 | % | ||||||||||||||||||||
| Self Storage (net lease) | — | — | % | — | — | % | ||||||||||||||||||||
Other (c) | 6,762 | 0.5 | % | 370 | 0.3 | % | ||||||||||||||||||||
| International Total | 449,263 | 35.4 | % | 54,014 | 33.5 | % | ||||||||||||||||||||
| Total | ||||||||||||||||||||||||||
| Industrial | 339,070 | 26.7 | % | 56,461 | 35.0 | % | ||||||||||||||||||||
| Warehouse | 306,675 | 24.1 | % | 57,856 | 35.9 | % | ||||||||||||||||||||
| Office | 237,154 | 18.7 | % | 16,013 | 9.9 | % | ||||||||||||||||||||
Retail (b) | 212,899 | 16.8 | % | 19,384 | 12.0 | % | ||||||||||||||||||||
| Self Storage (net lease) | 61,708 | 4.9 | % | 5,810 | 3.6 | % | ||||||||||||||||||||
Other (c) | 112,720 | 8.8 | % | 5,770 | 3.6 | % | ||||||||||||||||||||
Total (d) | $ | 1,270,226 | 100.0 | % | 161,294 | 100.0 | % | |||||||||||||||||||
| Investing for the long runTM | 26 | |||||||
| Diversification by Tenant Industry | |||||
| Total Net-Lease Portfolio | ||||||||||||||||||||||||||
Industry Type | ABR | ABR % | Square Footage | Square Footage % | ||||||||||||||||||||||
Retail Stores (a) | $ | 265,377 | 20.9 | % | 34,369 | 21.3 | % | |||||||||||||||||||
| Consumer Services | 110,204 | 8.7 | % | 8,067 | 5.0 | % | ||||||||||||||||||||
| Beverage and Food | 86,945 | 6.8 | % | 12,263 | 7.6 | % | ||||||||||||||||||||
| Automotive | 79,095 | 6.2 | % | 12,310 | 7.6 | % | ||||||||||||||||||||
| Grocery | 69,117 | 5.4 | % | 7,756 | 4.8 | % | ||||||||||||||||||||
| Cargo Transportation | 61,358 | 4.8 | % | 9,485 | 5.9 | % | ||||||||||||||||||||
| Healthcare and Pharmaceuticals | 60,276 | 4.7 | % | 5,372 | 3.3 | % | ||||||||||||||||||||
| Construction and Building | 51,403 | 4.1 | % | 9,077 | 5.6 | % | ||||||||||||||||||||
| Business Services | 47,521 | 3.7 | % | 3,981 | 2.5 | % | ||||||||||||||||||||
| Capital Equipment | 47,088 | 3.7 | % | 7,755 | 4.8 | % | ||||||||||||||||||||
| Durable Consumer Goods | 44,337 | 3.5 | % | 10,276 | 6.4 | % | ||||||||||||||||||||
| Hotel and Leisure | 42,259 | 3.3 | % | 2,214 | 1.4 | % | ||||||||||||||||||||
| Containers, Packaging, and Glass | 40,660 | 3.2 | % | 6,714 | 4.2 | % | ||||||||||||||||||||
| Sovereign and Public Finance | 37,455 | 3.0 | % | 3,241 | 2.0 | % | ||||||||||||||||||||
| High Tech Industries | 31,066 | 2.5 | % | 3,315 | 2.1 | % | ||||||||||||||||||||
| Chemicals, Plastics, and Rubber | 27,710 | 2.2 | % | 4,431 | 2.7 | % | ||||||||||||||||||||
| Insurance | 25,973 | 2.0 | % | 1,749 | 1.1 | % | ||||||||||||||||||||
| Non-Durable Consumer Goods | 23,869 | 1.9 | % | 5,940 | 3.7 | % | ||||||||||||||||||||
| Banking | 19,210 | 1.5 | % | 1,216 | 0.8 | % | ||||||||||||||||||||
| Aerospace and Defense | 16,227 | 1.3 | % | 1,358 | 0.8 | % | ||||||||||||||||||||
| Telecommunications | 15,007 | 1.2 | % | 1,479 | 0.9 | % | ||||||||||||||||||||
| Metals | 14,913 | 1.2 | % | 3,068 | 1.9 | % | ||||||||||||||||||||
| Media: Broadcasting and Subscription | 12,723 | 1.0 | % | 784 | 0.5 | % | ||||||||||||||||||||
Other (b) | 40,433 | 3.2 | % | 5,074 | 3.1 | % | ||||||||||||||||||||
Total (c) | $ | 1,270,226 | 100.0 | % | 161,294 | 100.0 | % | |||||||||||||||||||
| Investing for the long runTM | 27 | |||||||
| Diversification by Geography | |||||
| Total Net-Lease Portfolio | ||||||||||||||||||||||||||
| Region | ABR | ABR % | Square Footage (a) | Square Footage % | ||||||||||||||||||||||
| U.S. | ||||||||||||||||||||||||||
| South | ||||||||||||||||||||||||||
| Texas | $ | 105,724 | 8.3 | % | 11,983 | 7.4 | % | |||||||||||||||||||
| Florida | 53,372 | 4.2 | % | 4,456 | 2.7 | % | ||||||||||||||||||||
| Tennessee | 25,193 | 2.0 | % | 4,136 | 2.6 | % | ||||||||||||||||||||
| Georgia | 24,804 | 2.0 | % | 3,512 | 2.2 | % | ||||||||||||||||||||
| Alabama | 19,386 | 1.5 | % | 3,334 | 2.1 | % | ||||||||||||||||||||
Other (b) | 15,469 | 1.2 | % | 2,237 | 1.4 | % | ||||||||||||||||||||
| Total South | 243,948 | 19.2 | % | 29,658 | 18.4 | % | ||||||||||||||||||||
| Midwest | ||||||||||||||||||||||||||
| Illinois | 62,824 | 4.9 | % | 8,734 | 5.4 | % | ||||||||||||||||||||
| Minnesota | 32,584 | 2.6 | % | 3,225 | 2.0 | % | ||||||||||||||||||||
| Indiana | 26,882 | 2.1 | % | 4,734 | 2.9 | % | ||||||||||||||||||||
| Ohio | 21,055 | 1.7 | % | 4,503 | 2.8 | % | ||||||||||||||||||||
| Wisconsin | 15,962 | 1.3 | % | 2,726 | 1.7 | % | ||||||||||||||||||||
| Michigan | 15,410 | 1.2 | % | 2,496 | 1.6 | % | ||||||||||||||||||||
Other (b) | 35,706 | 2.8 | % | 5,634 | 3.5 | % | ||||||||||||||||||||
| Total Midwest | 210,423 | 16.6 | % | 32,052 | 19.9 | % | ||||||||||||||||||||
| East | ||||||||||||||||||||||||||
| North Carolina | 36,505 | 2.9 | % | 8,098 | 5.0 | % | ||||||||||||||||||||
| Pennsylvania | 31,890 | 2.5 | % | 3,673 | 2.3 | % | ||||||||||||||||||||
| New Jersey | 23,178 | 1.8 | % | 1,235 | 0.8 | % | ||||||||||||||||||||
| Massachusetts | 22,159 | 1.7 | % | 1,387 | 0.8 | % | ||||||||||||||||||||
| New York | 18,881 | 1.5 | % | 2,221 | 1.4 | % | ||||||||||||||||||||
| Kentucky | 17,796 | 1.4 | % | 3,063 | 1.9 | % | ||||||||||||||||||||
| South Carolina | 14,982 | 1.2 | % | 4,088 | 2.5 | % | ||||||||||||||||||||
Other (b) | 37,234 | 2.9 | % | 5,300 | 3.3 | % | ||||||||||||||||||||
| Total East | 202,625 | 15.9 | % | 29,065 | 18.0 | % | ||||||||||||||||||||
| West | ||||||||||||||||||||||||||
| California | 70,710 | 5.5 | % | 6,420 | 4.0 | % | ||||||||||||||||||||
| Arizona | 30,099 | 2.4 | % | 3,365 | 2.1 | % | ||||||||||||||||||||
Other (b) | 63,158 | 5.0 | % | 6,720 | 4.1 | % | ||||||||||||||||||||
| Total West | 163,967 | 12.9 | % | 16,505 | 10.2 | % | ||||||||||||||||||||
| U.S. Total | 820,963 | 64.6 | % | 107,280 | 66.5 | % | ||||||||||||||||||||
| International | ||||||||||||||||||||||||||
| Spain | 60,420 | 4.8 | % | 5,078 | 3.2 | % | ||||||||||||||||||||
| Germany | 57,205 | 4.5 | % | 6,440 | 4.0 | % | ||||||||||||||||||||
| Poland | 55,570 | 4.4 | % | 7,959 | 4.9 | % | ||||||||||||||||||||
| United Kingdom | 52,424 | 4.1 | % | 4,804 | 3.0 | % | ||||||||||||||||||||
| The Netherlands | 52,200 | 4.1 | % | 6,990 | 4.3 | % | ||||||||||||||||||||
| Italy | 24,912 | 2.0 | % | 2,386 | 1.5 | % | ||||||||||||||||||||
| Denmark | 20,475 | 1.6 | % | 2,844 | 1.8 | % | ||||||||||||||||||||
| France | 19,013 | 1.5 | % | 1,685 | 1.0 | % | ||||||||||||||||||||
| Croatia | 15,988 | 1.3 | % | 1,726 | 1.1 | % | ||||||||||||||||||||
| Canada | 15,644 | 1.2 | % | 2,448 | 1.5 | % | ||||||||||||||||||||
Other (c) | 75,412 | 5.9 | % | 11,654 | 7.2 | % | ||||||||||||||||||||
| International Total | 449,263 | 35.4 | % | 54,014 | 33.5 | % | ||||||||||||||||||||
Total (d) | $ | 1,270,226 | 100.0 | % | 161,294 | 100.0 | % | |||||||||||||||||||
| Investing for the long runTM | 28 | |||||||
| Contractual Rent Increases | |||||
| Total Net-Lease Portfolio | ||||||||||||||||||||||||||
| Rent Adjustment Measure | ABR | ABR % | Square Footage | Square Footage % | ||||||||||||||||||||||
| (Uncapped) CPI | $ | 470,506 | 37.0 | % | 53,745 | 33.3 | % | |||||||||||||||||||
| CPI-based | 264,746 | 20.8 | % | 36,516 | 22.7 | % | ||||||||||||||||||||
| CPI-linked | 735,252 | 57.8 | % | 90,261 | 56.0 | % | ||||||||||||||||||||
| Fixed | 476,220 | 37.5 | % | 65,619 | 40.7 | % | ||||||||||||||||||||
Other (a) | 49,066 | 3.9 | % | 3,373 | 2.1 | % | ||||||||||||||||||||
| None | 9,688 | 0.8 | % | 517 | 0.3 | % | ||||||||||||||||||||
| Vacant | — | — | % | 1,524 | 0.9 | % | ||||||||||||||||||||
Total (b) | $ | 1,270,226 | 100.0 | % | 161,294 | 100.0 | % | |||||||||||||||||||
| Investing for the long runTM | 29 | |||||||
| Same Store Analysis | |||||
| ABR | |||||||||||||||||||||||
| As of | |||||||||||||||||||||||
| Jun. 30, 2022 | Jun. 30, 2021 | Increase | % Increase | ||||||||||||||||||||
| Property Type | |||||||||||||||||||||||
| Industrial | $ | 292,813 | $ | 282,746 | $ | 10,067 | 3.6 | % | |||||||||||||||
| Warehouse | 262,238 | 255,445 | 6,793 | 2.7 | % | ||||||||||||||||||
| Office | 222,268 | 217,559 | 4,709 | 2.2 | % | ||||||||||||||||||
Retail (a) | 190,622 | 184,526 | 6,096 | 3.3 | % | ||||||||||||||||||
| Self Storage (net lease) | 61,708 | 59,438 | 2,270 | 3.8 | % | ||||||||||||||||||
Other (b) | 92,259 | 89,153 | 3,106 | 3.5 | % | ||||||||||||||||||
| Total | $ | 1,121,908 | $ | 1,088,867 | $ | 33,041 | 3.0 | % | |||||||||||||||
| Rent Adjustment Measure | |||||||||||||||||||||||
| (Uncapped) CPI | $ | 443,286 | $ | 425,664 | $ | 17,622 | 4.1 | % | |||||||||||||||
| CPI-based | 228,864 | 222,661 | 6,203 | 2.8 | % | ||||||||||||||||||
| CPI-linked | 672,150 | 648,325 | 23,825 | 3.7 | % | ||||||||||||||||||
| Fixed | 392,580 | 385,634 | 6,946 | 1.8 | % | ||||||||||||||||||
Other (c) | 48,031 | 45,761 | 2,270 | 5.0 | % | ||||||||||||||||||
| None | 9,147 | 9,147 | — | — | % | ||||||||||||||||||
| Total | $ | 1,121,908 | $ | 1,088,867 | $ | 33,041 | 3.0 | % | |||||||||||||||
| Geography | |||||||||||||||||||||||
| U.S. | $ | 722,074 | $ | 701,390 | $ | 20,684 | 2.9 | % | |||||||||||||||
| Europe | 377,579 | 365,968 | 11,611 | 3.2 | % | ||||||||||||||||||
Other International (d) | 22,255 | 21,509 | 746 | 3.5 | % | ||||||||||||||||||
| Total | $ | 1,121,908 | $ | 1,088,867 | $ | 33,041 | 3.0 | % | |||||||||||||||
| Same Store Portfolio Summary | |||||||||||||||||||||||
| Number of properties | 1,136 | ||||||||||||||||||||||
| Square footage (in thousands) | 137,368 | ||||||||||||||||||||||
| Investing for the long runTM | 30 | |||||||
| Same Store Pro Rata Rental Income | |||||||||||||||||||||||
| Three Months Ended | |||||||||||||||||||||||
| Jun. 30, 2022 | Jun. 30, 2021 | Increase | % Increase | ||||||||||||||||||||
| Property Type | |||||||||||||||||||||||
| Industrial | $ | 71,540 | $ | 68,883 | $ | 2,657 | 3.9 | % | |||||||||||||||
| Warehouse | 63,224 | 61,408 | 1,816 | 3.0 | % | ||||||||||||||||||
| Office | 59,696 | 59,848 | (152) | (0.3) | % | ||||||||||||||||||
Retail (a) | 47,807 | 44,831 | 2,976 | 6.6 | % | ||||||||||||||||||
| Self Storage (net lease) | 15,401 | 14,834 | 567 | 3.8 | % | ||||||||||||||||||
Other (b) | 24,692 | 23,556 | 1,136 | 4.8 | % | ||||||||||||||||||
| Total | $ | 282,360 | $ | 273,360 | $ | 9,000 | 3.3 | % | |||||||||||||||
| Rent Adjustment Measure | |||||||||||||||||||||||
| (Uncapped) CPI | $ | 114,267 | $ | 108,085 | $ | 6,182 | 5.7 | % | |||||||||||||||
| CPI-based | 56,830 | 55,894 | 936 | 1.7 | % | ||||||||||||||||||
| CPI-linked | 171,097 | 163,979 | 7,118 | 4.3 | % | ||||||||||||||||||
| Fixed | 96,942 | 95,314 | 1,628 | 1.7 | % | ||||||||||||||||||
Other (c) | 12,186 | 11,551 | 635 | 5.5 | % | ||||||||||||||||||
| None | 2,135 | 2,516 | (381) | (15.1) | % | ||||||||||||||||||
| Total | $ | 282,360 | $ | 273,360 | $ | 9,000 | 3.3 | % | |||||||||||||||
| Geography | |||||||||||||||||||||||
| U.S. | $ | 181,520 | $ | 177,387 | $ | 4,133 | 2.3 | % | |||||||||||||||
| Europe | 94,816 | 90,119 | 4,697 | 5.2 | % | ||||||||||||||||||
Other International (d) | 6,024 | 5,854 | 170 | 2.9 | % | ||||||||||||||||||
| Total | $ | 282,360 | $ | 273,360 | $ | 9,000 | 3.3 | % | |||||||||||||||
| Same Store Portfolio Summary | |||||||||||||||||||||||
| Number of properties | 1,205 | ||||||||||||||||||||||
| Square footage (in thousands) | 138,342 | ||||||||||||||||||||||
| Investing for the long runTM | 31 | |||||||
| Three Months Ended | |||||||||||
| Jun. 30, 2022 | Jun. 30, 2021 | ||||||||||
| Consolidated Lease Revenues | |||||||||||
| Total lease revenues – as reported | $ | 314,354 | $ | 289,064 | |||||||
| Income from direct financing leases and loans receivable | 17,778 | 17,422 | |||||||||
| Less: Reimbursable tenant costs – as reported | (16,704) | (15,092) | |||||||||
| Less: Income from secured loans receivable | (1,175) | (1,175) | |||||||||
| 314,253 | 290,219 | ||||||||||
| Adjustments for Pro Rata Ownership of Real Estate Joint Ventures: | |||||||||||
| Add: Pro rata share of adjustments from equity method investments | 5,373 | 5,790 | |||||||||
| Less: Pro rata share of adjustments for noncontrolling interests | (22) | (22) | |||||||||
| 5,351 | 5,768 | ||||||||||
| Adjustments for Pro Rata Non-Cash Items: | |||||||||||
| Less: Straight-line and other leasing and financing adjustments | (14,492) | (10,313) | |||||||||
| Add: Above- and below-market rent intangible lease amortization | 10,548 | 14,384 | |||||||||
| Less: Adjustments for pro rata ownership | 27 | 14 | |||||||||
| (3,917) | 4,085 | ||||||||||
Adjustment to normalize for (i) properties not continuously owned since April 1, 2021 and (ii) constant currency presentation for prior year quarter (e) | (33,327) | (26,712) | |||||||||
| Same Store Pro Rata Rental Income | $ | 282,360 | $ | 273,360 | |||||||
| Investing for the long runTM | 32 | |||||||
| Leasing Activity | |||||
Lease Renewals and Extensions (a) | Expected Tenant Improvements ($000s) | Leasing Commissions ($000s) | ||||||||||||||||||||||||||||||||||||||||||||||||
| ABR | ||||||||||||||||||||||||||||||||||||||||||||||||||
| Property Type | Square Feet | Number of Leases | Prior Lease ($000s) | New Lease ($000s) (b) | Rent Recapture | Incremental Lease Term | ||||||||||||||||||||||||||||||||||||||||||||
| Industrial | 2,462,309 | 5 | $ | 18,497 | $ | 18,497 | 100.0 | % | $ | — | $ | — | 5.7 years | |||||||||||||||||||||||||||||||||||||
| Warehouse | — | — | — | — | — | % | — | — | N/A | |||||||||||||||||||||||||||||||||||||||||
| Office | 45,004 | 1 | 1,044 | 1,065 | 102.0 | % | — | 523 | 7.0 years | |||||||||||||||||||||||||||||||||||||||||
| Retail | 3,261 | 1 | 44 | 44 | 100.0 | % | — | — | 4.0 years | |||||||||||||||||||||||||||||||||||||||||
| Self Storage (net lease) | — | — | — | — | — | % | — | — | N/A | |||||||||||||||||||||||||||||||||||||||||
| Other | 190,379 | 1 | 4,866 | 4,866 | 100.0 | % | 2,470 | 1,450 | 7.0 years | |||||||||||||||||||||||||||||||||||||||||
Total / Weighted Average (c) | 2,700,953 | 8 | $ | 24,451 | $ | 24,472 | 100.1 | % | $ | 2,470 | $ | 1,973 | 6.0 years | |||||||||||||||||||||||||||||||||||||
| Q2 Summary | ||||||||||||||||||||||||||||||||||||||||||||||||||
Prior Lease ABR (% of Total Portfolio) | 1.9 | % | ||||||||||||||||||||||||||||||||||||||||||||||||
| New Leases | Expected Tenant Improvements ($000s) | Leasing Commissions ($000s) | ||||||||||||||||||||||||||||||||||||
| ABR | ||||||||||||||||||||||||||||||||||||||
| Property Type | Square Feet | Number of Leases | New Lease ($000s) (b) | New Lease Term | ||||||||||||||||||||||||||||||||||
| Industrial | — | — | $ | — | $ | — | $ | — | N/A | |||||||||||||||||||||||||||||
| Warehouse | — | — | — | — | — | N/A | ||||||||||||||||||||||||||||||||
| Office | — | — | — | — | — | N/A | ||||||||||||||||||||||||||||||||
| Retail | — | — | — | — | — | N/A | ||||||||||||||||||||||||||||||||
| Self Storage (net lease) | — | — | — | — | — | N/A | ||||||||||||||||||||||||||||||||
Other (d) | — | 1 | 330 | — | 153 | 15.0 years | ||||||||||||||||||||||||||||||||
Total / Weighted Average (e) | — | 1 | $ | 330 | $ | — | $ | 153 | 15.0 years | |||||||||||||||||||||||||||||
| Investing for the long runTM | 33 | |||||||
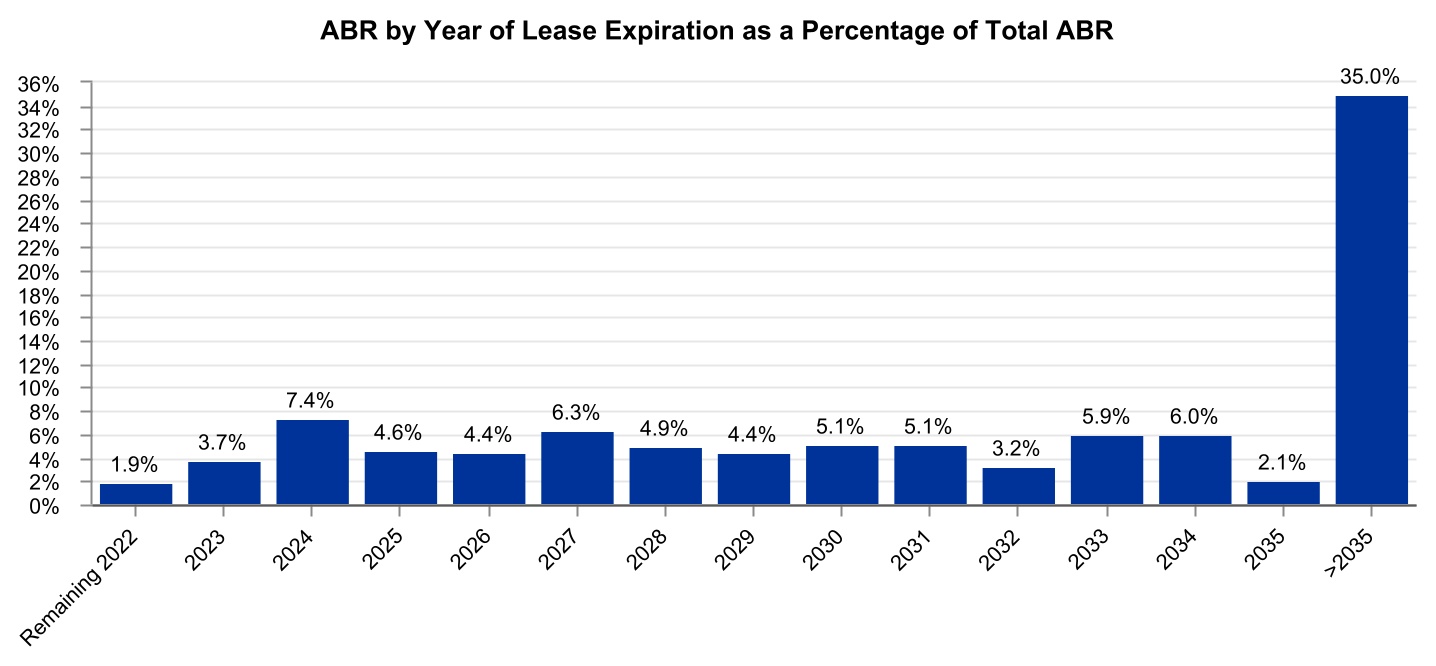
| Lease Expirations | |||||
Year of Lease Expiration (a) | Number of Leases Expiring | Number of Tenants with Leases Expiring | ABR | ABR % | Square Footage | Square Footage % | ||||||||||||||||||||||||||||||||
| Remaining 2022 | 20 | 17 | $ | 24,073 | 1.9 | % | 1,500 | 0.9 | % | |||||||||||||||||||||||||||||
2023 (b) | 32 | 27 | 46,942 | 3.7 | % | 5,127 | 3.2 | % | ||||||||||||||||||||||||||||||
2024 (c) | 43 | 37 | 94,116 | 7.4 | % | 12,221 | 7.6 | % | ||||||||||||||||||||||||||||||
| 2025 | 52 | 30 | 58,981 | 4.6 | % | 7,144 | 4.4 | % | ||||||||||||||||||||||||||||||
| 2026 | 41 | 30 | 56,375 | 4.4 | % | 8,222 | 5.1 | % | ||||||||||||||||||||||||||||||
| 2027 | 57 | 33 | 79,785 | 6.3 | % | 8,715 | 5.4 | % | ||||||||||||||||||||||||||||||
| 2028 | 42 | 24 | 62,132 | 4.9 | % | 5,571 | 3.5 | % | ||||||||||||||||||||||||||||||
| 2029 | 51 | 24 | 55,657 | 4.4 | % | 6,882 | 4.3 | % | ||||||||||||||||||||||||||||||
| 2030 | 28 | 24 | 65,273 | 5.1 | % | 5,565 | 3.4 | % | ||||||||||||||||||||||||||||||
| 2031 | 33 | 17 | 64,229 | 5.1 | % | 8,056 | 5.0 | % | ||||||||||||||||||||||||||||||
| 2032 | 37 | 18 | 40,780 | 3.2 | % | 5,409 | 3.4 | % | ||||||||||||||||||||||||||||||
| 2033 | 28 | 22 | 74,922 | 5.9 | % | 10,159 | 6.3 | % | ||||||||||||||||||||||||||||||
| 2034 | 48 | 16 | 76,288 | 6.0 | % | 7,955 | 4.9 | % | ||||||||||||||||||||||||||||||
| 2035 | 13 | 13 | 26,224 | 2.1 | % | 4,725 | 2.9 | % | ||||||||||||||||||||||||||||||
| Thereafter (>2035) | 277 | 109 | 444,449 | 35.0 | % | 62,519 | 38.8 | % | ||||||||||||||||||||||||||||||
| Vacant | — | — | — | — | % | 1,524 | 0.9 | % | ||||||||||||||||||||||||||||||
Total (d) | 802 | $ | 1,270,226 | 100.0 | % | 161,294 | 100.0 | % | ||||||||||||||||||||||||||||||
| Investing for the long runTM | 34 | |||||||
| Investing for the long runTM | 35 | |||||||
| Selected Information and Fee Summary – Managed Programs | |||||
| CPA:18 – Global | CESH | Total | |||||||||||||||
| Selected Information | |||||||||||||||||
| General | |||||||||||||||||
| Year established | 2013 | 2016 | |||||||||||||||
AUM – current quarter (a) (b) | $ | 2,298,911 | $ | 171,083 | $ | 2,469,994 | |||||||||||
| Net-lease AUM – current quarter | $ | 1,197,159 | $ | 113,717 | $ | 1,310,876 | |||||||||||
Fundraising status | Closed | Closed | |||||||||||||||
| Portfolio | |||||||||||||||||
| Investment type | Net lease / Diversified REIT | Student Housing | |||||||||||||||
| Number of operating properties | 66 | — | |||||||||||||||
| Number of net-leased properties | 43 | 3 | |||||||||||||||
Number of active build-to-suit projects | 1 | 1 | |||||||||||||||
Number of tenants – net-leased properties | 46 | 1 | |||||||||||||||
| Square footage – net-leased properties | 9,286 | 367 | |||||||||||||||
Occupancy (c) | 99.3 | % | 100.0 | % | |||||||||||||
| Balance Sheet (Book Value) | |||||||||||||||||
| Total assets | $ | 1,862,628 | $ | 180,119 | |||||||||||||
| Total debt | $ | 957,655 | $ | 65,111 | |||||||||||||
| Total debt / total assets | 51.4 | % | 36.1 | % | |||||||||||||
| Fee Summary | |||||||||||||||||
| Asset Management Fees | |||||||||||||||||
| Asset management fee (% of average AUM, per annum) | 0.50% (d) | 1.00% (e) | |||||||||||||||
| Average AUM (of current quarter and prior quarter) | $ | 2,382,222 | $ | 177,164 | $ | 2,559,386 | |||||||||||
| Asset management revenue – current quarter | $ | 3,047 | $ | 420 | $ | 3,467 | |||||||||||
Operating Partnership Interests (f) | |||||||||||||||||
| Operating partnership interests (% of Available Cash) | 10.00% | N/A | |||||||||||||||
| Earnings from equity method investments in the Managed Programs (profits interest) – current quarter | $ | 2,814 | N/A | $ | 2,814 | ||||||||||||
| Investing for the long runTM | 36 | |||||||
| Summary of Future Liquidity Considerations for the Managed Programs | |||||
| General Liquidation Guideline | |||||||||||
CPA:18 – Global (a) | CESH | ||||||||||
| Timeframe | Beginning after the seventh anniversary of the closing of the initial public offering in 2015 | Beginning five years after raising the minimum offering amount in 2016 | |||||||||
| Back-End Fees and Interests | |||||||||||
CPA:18 – Global (a) (b) | CESH | ||||||||||
| Disposition Fees | Equal to the lesser of (i) 50% of the brokerage commission paid or (ii) 3% of the contract sales price of a property. (c) | N/A | |||||||||
| Interest in Disposition Proceeds | Special general partner interest entitled to receive distributions of up to 15% of the net proceeds from the sale, exchange or other disposition of operating partnership assets remaining after the corporation has received a return of 100% of its initial investment in the operating partnership, through certain liquidity events or distributions, plus the 6% preferred return rate. | Available Cash (as defined in In “Principal Terms”), subject to any other limitations provided for herein, will be initially apportioned among the Limited Partners in proportion to their respective capital contributions and the General Partner as provided in connection with its Carried Interest and distributed. (d) | |||||||||
| Purchase of Special GP Interest | Lesser of (i) 5.0x the distributions of the last completed fiscal year and (ii) the discounted value of expected future distributions from point of valuation to March 2025 using a discount rate used by the independent third-party valuation firm to determine the most recent appraisal. | N/A | |||||||||
| Distribution Related to Ownership of Shares | 5.7% ownership as of 6/30/2022 | 2.4% ownership as of 6/30/2022 | |||||||||
| Investing for the long runTM | 37 | |||||||
| Investing for the long runTM | 38 | |||||||
| Normalized Pro Rata Cash NOI | |||||
| Three Months Ended Jun. 30, 2022 | |||||
| Consolidated Lease Revenues | |||||
| Total lease revenues – as reported | $ | 314,354 | |||
| Income from direct financing leases and loans receivable | 17,778 | ||||
| Less: Income from secured loans receivable | (1,175) | ||||
| Less: Consolidated Reimbursable and Non-Reimbursable Property Expenses | |||||
| Reimbursable property expenses – as reported | 16,704 | ||||
| Non-reimbursable property expenses – as reported | 11,851 | ||||
| 302,402 | |||||
| Plus: NOI from Operating Properties | |||||
| Hotel revenues | 3,264 | ||||
| Hotel expenses | (2,597) | ||||
| 667 | |||||
| Self-storage revenues | 1,800 | ||||
| Self-storage expenses | (594) | ||||
| 1,206 | |||||
| 304,275 | |||||
| Adjustments for Pro Rata Ownership of Real Estate Joint Ventures: | |||||
Add: Pro rata share of NOI from equity method investments (a) | 6,585 | ||||
| Less: Pro rata share of NOI attributable to noncontrolling interests | (22) | ||||
| 6,563 | |||||
| 310,838 | |||||
| Adjustments for Pro Rata Non-Cash Items: | |||||
| Less: Straight-line and other leasing and financing adjustments | (14,492) | ||||
| Add: Above- and below-market rent intangible lease amortization | 10,548 | ||||
| Add: Other non-cash items | 367 | ||||
| (3,577) | |||||
Pro Rata Cash NOI (b) | 307,261 | ||||
Adjustment to normalize for intra-period acquisition volume and dispositions (c) | 4,070 | ||||
Normalized Pro Rata Cash NOI (b) | $ | 311,331 | |||
| Investing for the long runTM | 39 | |||||||
| Three Months Ended Jun. 30, 2022 | |||||
| Net Income from Real Estate Attributable to W. P. Carey | |||||
| Net income from Real Estate attributable to W. P. Carey – as reported | $ | 123,228 | |||
| Adjustments for Consolidated Operating Expenses | |||||
| Add: Operating expenses – as reported | 185,615 | ||||
| Less: Property expenses, excluding reimbursable tenant costs – as reported | (11,851) | ||||
| Less: Operating property expenses – as reported | (3,191) | ||||
| 170,573 | |||||
| Adjustments for Other Consolidated Revenues and Expenses: | |||||
| Less: Lease termination income and other – as reported | (2,591) | ||||
| Less: Reimbursable property expenses – as reported | (16,704) | ||||
| Add: Other income and (expenses) | 24,949 | ||||
| Add: Provision for income taxes | 5,955 | ||||
| 11,609 | |||||
| Other Adjustments: | |||||
| Less: Straight-line and other leasing and financing adjustments | (14,492) | ||||
| Add: Above- and below-market rent intangible lease amortization | 10,548 | ||||
| Add: Adjustments for pro rata ownership | 6,644 | ||||
Adjustment to normalize for intra-period acquisition volume and dispositions (c) | 4,070 | ||||
| Less: Income from secured loans receivable | (1,175) | ||||
| Add: Property expenses, excluding reimbursable tenant costs, non-cash | 326 | ||||
| 5,921 | |||||
Normalized Pro Rata Cash NOI (b) | $ | 311,331 | |||
| Investing for the long runTM | 40 | |||||||
| Adjusted EBITDA, Consolidated – Last Five Quarters | |||||
| Three Months Ended | |||||||||||||||||||||||||||||
| Jun. 30, 2022 | Mar. 31, 2022 | Dec. 31, 2021 | Sep. 30, 2021 | Jun. 30, 2021 | |||||||||||||||||||||||||
| Net income | $ | 127,718 | $ | 156,993 | $ | 99,612 | $ | 138,586 | $ | 120,283 | |||||||||||||||||||
Adjustments to Derive Adjusted EBITDA (a) | |||||||||||||||||||||||||||||
| Depreciation and amortization | 115,080 | 115,393 | 135,662 | 115,657 | 114,348 | ||||||||||||||||||||||||
| Interest expense | 46,417 | 46,053 | 47,208 | 48,731 | 49,252 | ||||||||||||||||||||||||
| Gain on sale of real estate, net | (31,119) | (11,248) | (9,511) | (1,702) | (19,840) | ||||||||||||||||||||||||
Other (gains) and losses (b) | 21,746 | (35,745) | 28,461 | (49,219) | (7,545) | ||||||||||||||||||||||||
Straight-line and other leasing and financing adjustments (c) (d) | (14,492) | (10,847) | (53,380) | (10,823) | (10,313) | ||||||||||||||||||||||||
| Above- and below-market rent intangible lease amortization | 10,548 | 11,004 | 15,082 | 12,004 | 14,384 | ||||||||||||||||||||||||
| Stock-based compensation expense | 9,758 | 7,833 | 6,091 | 4,361 | 9,048 | ||||||||||||||||||||||||
| Provision for income taxes | 6,252 | 7,083 | 5,052 | 8,347 | 9,298 | ||||||||||||||||||||||||
| Impairment charges | 6,206 | 20,179 | 7,945 | 16,301 | — | ||||||||||||||||||||||||
Merger and other expenses (e) | 1,984 | (2,322) | (563) | (908) | (2,599) | ||||||||||||||||||||||||
| Other amortization and non-cash charges | 353 | 379 | 385 | 386 | 391 | ||||||||||||||||||||||||
| 172,733 | 147,762 | 182,432 | 143,135 | 156,424 | |||||||||||||||||||||||||
| Adjustments for Pro Rata Ownership | |||||||||||||||||||||||||||||
| Real Estate Joint Ventures: | |||||||||||||||||||||||||||||
Add: Pro rata share of adjustments for equity method investments (f) | 4,329 | 9,426 | 16,136 | 5,144 | 4,923 | ||||||||||||||||||||||||
Less: Pro rata share of adjustments for amounts attributable to noncontrolling interests | (23) | (23) | (23) | (23) | (22) | ||||||||||||||||||||||||
| 4,306 | 9,403 | 16,113 | 5,121 | 4,901 | |||||||||||||||||||||||||
Equity Method Investment in WLT: (g) | |||||||||||||||||||||||||||||
| Less: Loss from equity method investment in WLT | — | — | 926 | 1,376 | 4,005 | ||||||||||||||||||||||||
| Add: Distributions received from equity method investment in WLT | — | — | — | — | — | ||||||||||||||||||||||||
| — | — | 926 | 1,376 | 4,005 | |||||||||||||||||||||||||
Equity Method Investments in the Managed Programs: (h) | |||||||||||||||||||||||||||||
| Add: Distributions received from equity method investments in the Managed Programs | 535 | 520 | 2,142 | 477 | 454 | ||||||||||||||||||||||||
| Less: (Income) loss from equity method investments in the Managed Programs | (59) | (2,972) | (50) | (1,667) | 90 | ||||||||||||||||||||||||
| 476 | (2,452) | 2,092 | (1,190) | 544 | |||||||||||||||||||||||||
Adjusted EBITDA (i) | $ | 305,233 | $ | 311,706 | $ | 301,175 | $ | 287,028 | $ | 286,157 | |||||||||||||||||||
| Investing for the long runTM | 41 | |||||||
| Adjusted EBITDA, Real Estate – Last Five Quarters | |||||
| Three Months Ended | |||||||||||||||||||||||||||||
| Jun. 30, 2022 | Mar. 31, 2022 | Dec. 31, 2021 | Sep. 30, 2021 | Jun. 30, 2021 | |||||||||||||||||||||||||
Net income from Real Estate | $ | 123,268 | $ | 146,856 | $ | 94,684 | $ | 130,897 | $ | 114,725 | |||||||||||||||||||
Adjustments to Derive Adjusted EBITDA (a) | |||||||||||||||||||||||||||||
| Depreciation and amortization | 115,080 | 115,393 | 135,662 | 115,657 | 114,348 | ||||||||||||||||||||||||
| Interest expense | 46,417 | 46,053 | 47,208 | 48,731 | 49,252 | ||||||||||||||||||||||||
| Gain on sale of real estate, net | (31,119) | (11,248) | (9,511) | (1,702) | (19,840) | ||||||||||||||||||||||||
Other (gains) and losses (b) | 20,155 | (34,418) | 27,131 | (48,172) | (7,472) | ||||||||||||||||||||||||
Straight-line and other leasing and financing adjustments (c) (d) | (14,492) | (10,847) | (53,380) | (10,823) | (10,313) | ||||||||||||||||||||||||
| Above- and below-market rent intangible lease amortization | 10,548 | 11,004 | 15,082 | 12,004 | 14,384 | ||||||||||||||||||||||||
| Stock-based compensation expense | 9,758 | 7,833 | 6,091 | 4,361 | 9,048 | ||||||||||||||||||||||||
Impairment charges | 6,206 | 20,179 | 7,945 | 16,301 | — | ||||||||||||||||||||||||
| Provision for income taxes | 5,955 | 6,913 | 5,331 | 7,827 | 9,119 | ||||||||||||||||||||||||
Merger and other expenses (e) | 1,984 | (2,325) | (599) | (908) | (2,599) | ||||||||||||||||||||||||
| Other amortization and non-cash charges | 353 | 379 | 385 | 386 | 391 | ||||||||||||||||||||||||
| 170,845 | 148,916 | 181,345 | 143,662 | 156,318 | |||||||||||||||||||||||||
| Adjustments for Pro Rata Ownership | |||||||||||||||||||||||||||||
| Real Estate Joint Ventures: | |||||||||||||||||||||||||||||
Add: Pro rata share of adjustments for equity method investments (f) | 4,329 | 9,426 | 16,136 | 5,144 | 4,923 | ||||||||||||||||||||||||
Less: Pro rata share of adjustments for amounts attributable to noncontrolling interests | (23) | (23) | (23) | (23) | (22) | ||||||||||||||||||||||||
| 4,306 | 9,403 | 16,113 | 5,121 | 4,901 | |||||||||||||||||||||||||
Equity Method Investment in WLT: (g) | |||||||||||||||||||||||||||||
| Less: Loss from equity method investment in WLT | — | — | 926 | 1,376 | 4,005 | ||||||||||||||||||||||||
| Add: Distributions received from equity method investment in WLT | — | — | — | — | — | ||||||||||||||||||||||||
| — | — | 926 | 1,376 | 4,005 | |||||||||||||||||||||||||
Adjusted EBITDA – Real Estate (h) | $ | 298,419 | $ | 305,175 | $ | 293,068 | $ | 281,056 | $ | 279,949 | |||||||||||||||||||
| Investing for the long runTM | 42 | |||||||
| Adjusted EBITDA, Investment Management – Last Five Quarters | |||||
| Three Months Ended | |||||||||||||||||||||||||||||
| Jun. 30, 2022 | Mar. 31, 2022 | Dec. 31, 2021 | Sep. 30, 2021 | Jun. 30, 2021 | |||||||||||||||||||||||||
| Net income from Investment Management | $ | 4,450 | $ | 10,137 | $ | 4,928 | $ | 7,689 | $ | 5,558 | |||||||||||||||||||
Adjustments to Derive Adjusted EBITDA (a) | |||||||||||||||||||||||||||||
Other (gains) and losses (b) | 1,591 | (1,327) | 1,330 | (1,047) | (73) | ||||||||||||||||||||||||
| Provision for (benefit from) income taxes | 297 | 170 | (279) | 520 | 179 | ||||||||||||||||||||||||
| Merger and other expenses | — | 3 | 36 | — | — | ||||||||||||||||||||||||
| 1,888 | (1,154) | 1,087 | (527) | 106 | |||||||||||||||||||||||||
Adjustments for Pro Rata Ownership | |||||||||||||||||||||||||||||
Equity Method Investments in the Managed Programs: (c) | |||||||||||||||||||||||||||||
| Add: Distributions received from equity method investments in the Managed Programs | 535 | 520 | 2,142 | 477 | 454 | ||||||||||||||||||||||||
| Less: (Income) loss from equity method investments in the Managed Programs | (59) | (2,972) | (50) | (1,667) | 90 | ||||||||||||||||||||||||
| 476 | (2,452) | 2,092 | (1,190) | 544 | |||||||||||||||||||||||||
Adjusted EBITDA – Investment Management (d) | $ | 6,814 | $ | 6,531 | $ | 8,107 | $ | 5,972 | $ | 6,208 | |||||||||||||||||||
| Investing for the long runTM | 43 | |||||||
| Disclosures Regarding Non-GAAP and Other Metrics | |||||
| Investing for the long runTM | 44 | |||||||
| Investing for the long runTM | 45 | |||||||