Investor Presentation October 2025
2 Forward-Looking Statements Some of the information in this report may contain “forward-looking statements” within the meaning of and intended to be covered by the safe harbor provisions of the Private Securities Litigation Reform Act of 1995. Such forward-looking statements may include projections based on management’s current expectations and beliefs concerning future developments and their potential effects on the Company including, without limitation, plans, strategies and goals, and statements about the Company’s expectations regarding revenue and asset growth, financial performance and profitability, loan and deposit growth, liquidity, yields and returns, loan diversification and credit management, stockholder value creation and the impact of acquisitions. Forward-looking statements are typically identified by words such as “believe,” “expect,” “anticipate,” “intend,” “outlook,” “estimate,” “forecast,” “project,” “pro forma,” “pipeline” and other similar words and expressions. Forward-looking statements are subject to numerous assumptions, risks and uncertainties, which change over time. Forward-looking statements speak only as of the date they are made. Because forward-looking statements are subject to assumptions and uncertainties, actual results or future events could differ, possibly materially, from those anticipated in the forward-looking statements and future results could differ materially from historical performance. They are neither statements of historical fact nor guarantees or assurances of future performance. While there is no assurance that any list of risks and uncertainties or risk factors is complete, important factors that could cause actual results to differ materially from those in the forward-looking statements include the following, without limitation: our ability to efficiently integrate acquisitions into our operations, retain the customers of these businesses and grow the acquired operations; our ability to collect insurance proceeds from claims made related to tax recapture events; credit risk; changes in the appraised valuation of real estate securing impaired loans; outcomes of litigation and other contingencies; exposure to general and local economic and market conditions, high unemployment rates, higher inflation and its impacts (including U.S. federal government measures to address higher inflation), impacts of trade and tariff policies, U.S. fiscal debt, budget and tax matters (including the effect of a prolonged U.S. federal government shutdown), and any slowdown in global economic growth; risks associated with rapid increases or decreases in prevailing interest rates; our ability to attract and retain deposits and access to other sources of liquidity; changes in business prospects that could impact goodwill estimates and assumptions; consolidation within the banking industry; competition from banks and other financial institutions; the ability to attract and retain relationship officers and other key personnel; burdens imposed by federal and state regulation; changes in legislative or regulatory requirements, as well as current, pending or future legislation or regulation that could have a negative effect on our revenue and business, including rules and regulations relating to bank products and financial services; changes in accounting policies and practices or accounting standards; natural disasters (including wildfires and earthquakes); terrorist activities, war and geopolitical matters (including the war in Israel and potential for a broader regional conflict and the war in Ukraine and the imposition of additional sanctions and export controls in connection therewith), or pandemics, or other health emergencies and their effects on economic and business environments in which we operate, including the related disruption to the financial market and other economic activity; and those factors and risks referenced from time to time in the Company’s filings with the Securities and Exchange Commission (the “SEC”), including in the Company’s Annual Report on Form 10-K for the fiscal year ended December 31, 2024, and the Company’s other filings with the SEC. The Company cautions that the preceding list is not exhaustive of all possible risk factors and other factors could also adversely affect the Company’s results. For any forward-looking statements made in this press release or in any documents, EFSC claims the protection of the safe harbor for forward-looking statements contained in the Private Securities Litigation Reform Act of 1995. Annualized, pro forma, projected and estimated numbers in this document are used for illustrative purposes only, are not forecasts and may not reflect actual results. Readers are cautioned not to place undue reliance on any forward-looking statements. Except to the extent required by applicable law or regulation, EFSC disclaims any obligation to revise or publicly release any revision or update to any of the forward-looking statements included herein to reflect events or circumstances that occur after the date on which such statements were made.
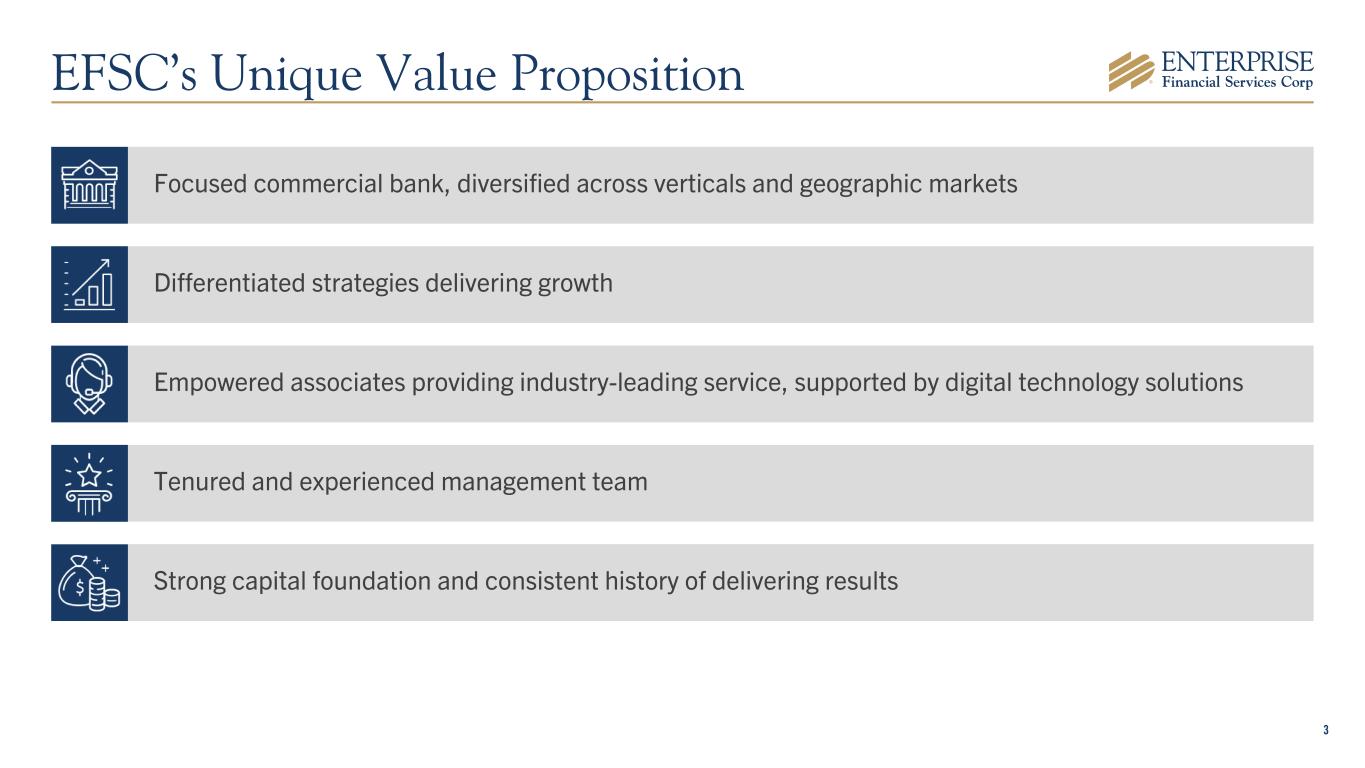
3 Empowered associates providing industry-leading service, supported by digital technology solutions Tenured and experienced management team Strong capital foundation and consistent history of delivering results Differentiated strategies delivering growth Focused commercial bank, diversified across verticals and geographic markets EFSC’s Unique Value Proposition
EFSC Overview
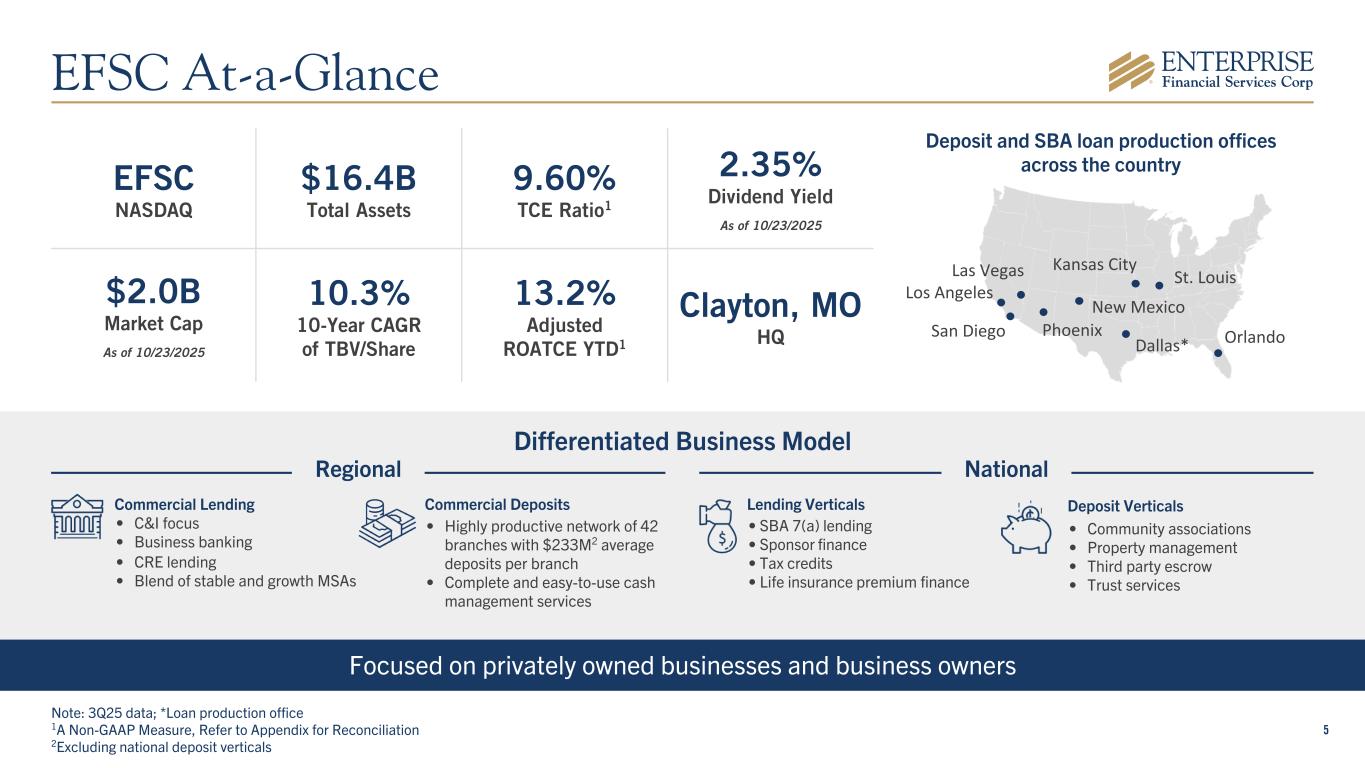
5 Differentiated Business Model Focused on privately owned businesses and business owners Commercial Deposits • Highly productive network of 42 branches with $233M2 average deposits per branch • Complete and easy-to-use cash management services Deposit Verticals • Community associations • Property management • Third party escrow • Trust services Deposit and SBA loan production offices across the country Commercial Lending • C&I focus • Business banking • CRE lending • Blend of stable and growth MSAs Lending Verticals • SBA 7(a) lending • Sponsor finance • Tax credits • Life insurance premium finance EFSC NASDAQ $16.4B Total Assets 9.60% TCE Ratio1 2.35% Dividend Yield As of 10/23/2025 $2.0B Market Cap As of 10/23/2025 10.3% 10-Year CAGR of TBV/Share 13.2% Adjusted ROATCE YTD1 Clayton, MO HQ Note: 3Q25 data; *Loan production office 1A Non-GAAP Measure, Refer to Appendix for Reconciliation 2Excluding national deposit verticals St. Louis Kansas City Phoenix New Mexico Los Angeles Las Vegas San Diego Dallas* Orlando EFSC At-a-Glance Regional National
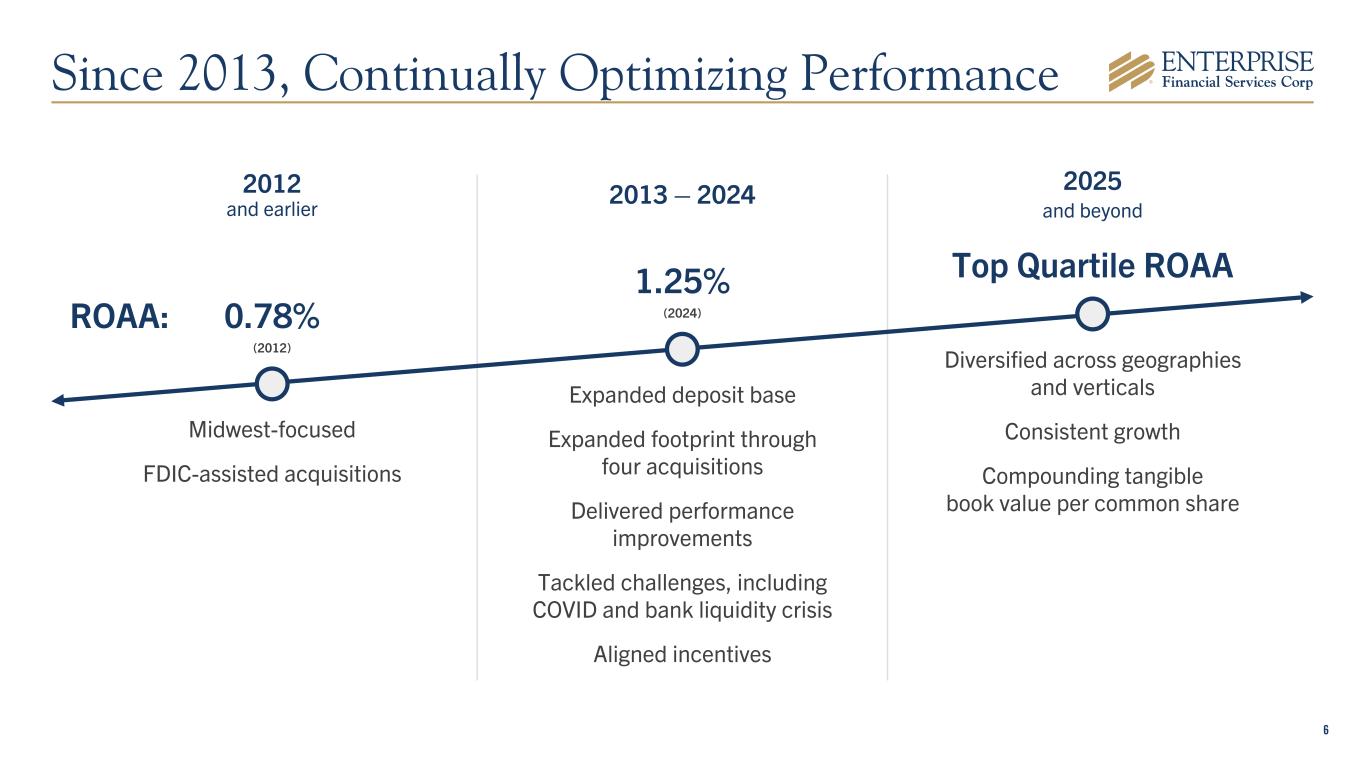
6 Midwest-focused FDIC-assisted acquisitions Expanded deposit base Expanded footprint through four acquisitions Delivered performance improvements Tackled challenges, including COVID and bank liquidity crisis Aligned incentives Diversified across geographies and verticals Consistent growth Compounding tangible book value per common share 2012 and earlier ROAA: 0.78% (2012) 1.25% (2024) 2013 – 2024 2025 and beyond Top Quartile ROAA Since 2013, Continually Optimizing Performance
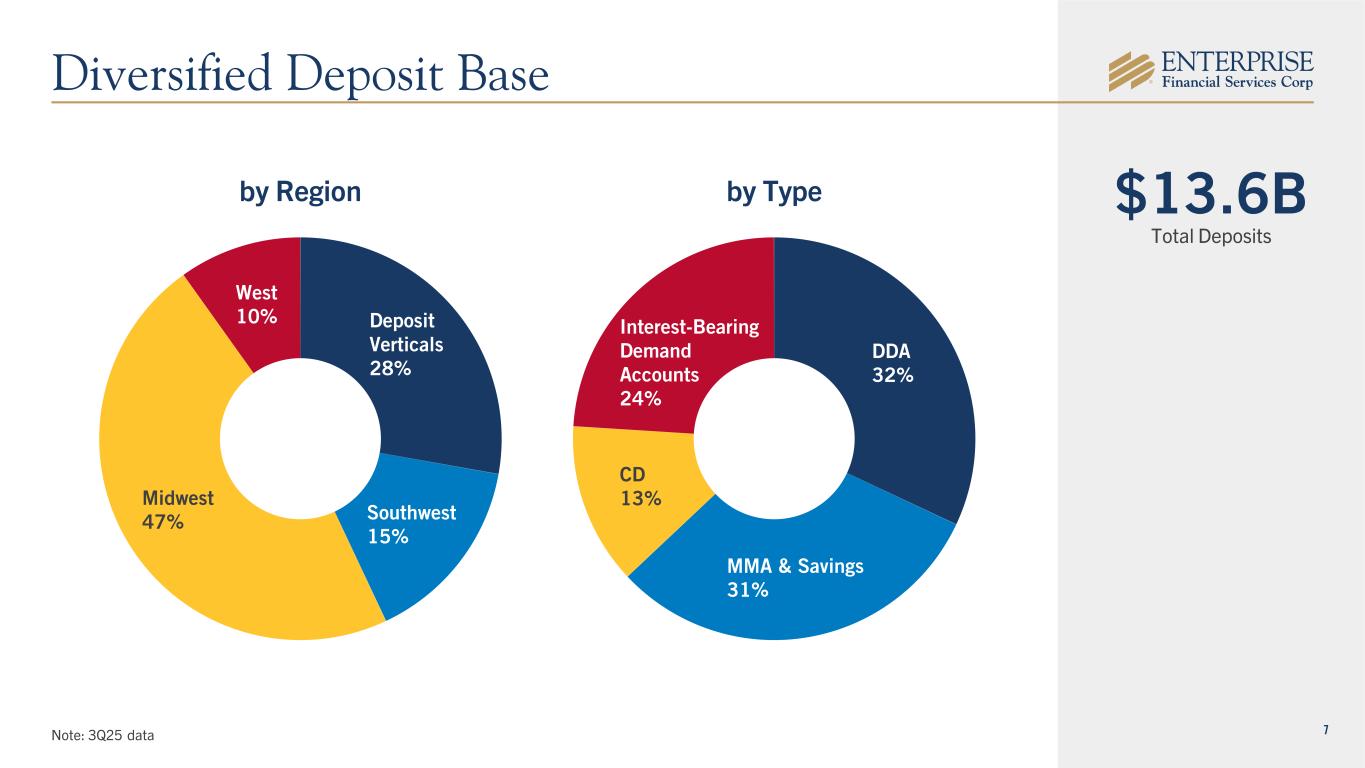
7 $13.6B Total Deposits Note: 3Q25 data Interest- Bearing Demand Accounts by Typeby Region Deposit Verticals 28% Southwest 15% Midwest 47% West 10% DDA 32% MMA & Savings 31% CD 13% Interest-Bearing Demand Accounts 24% Diversified Deposit Base
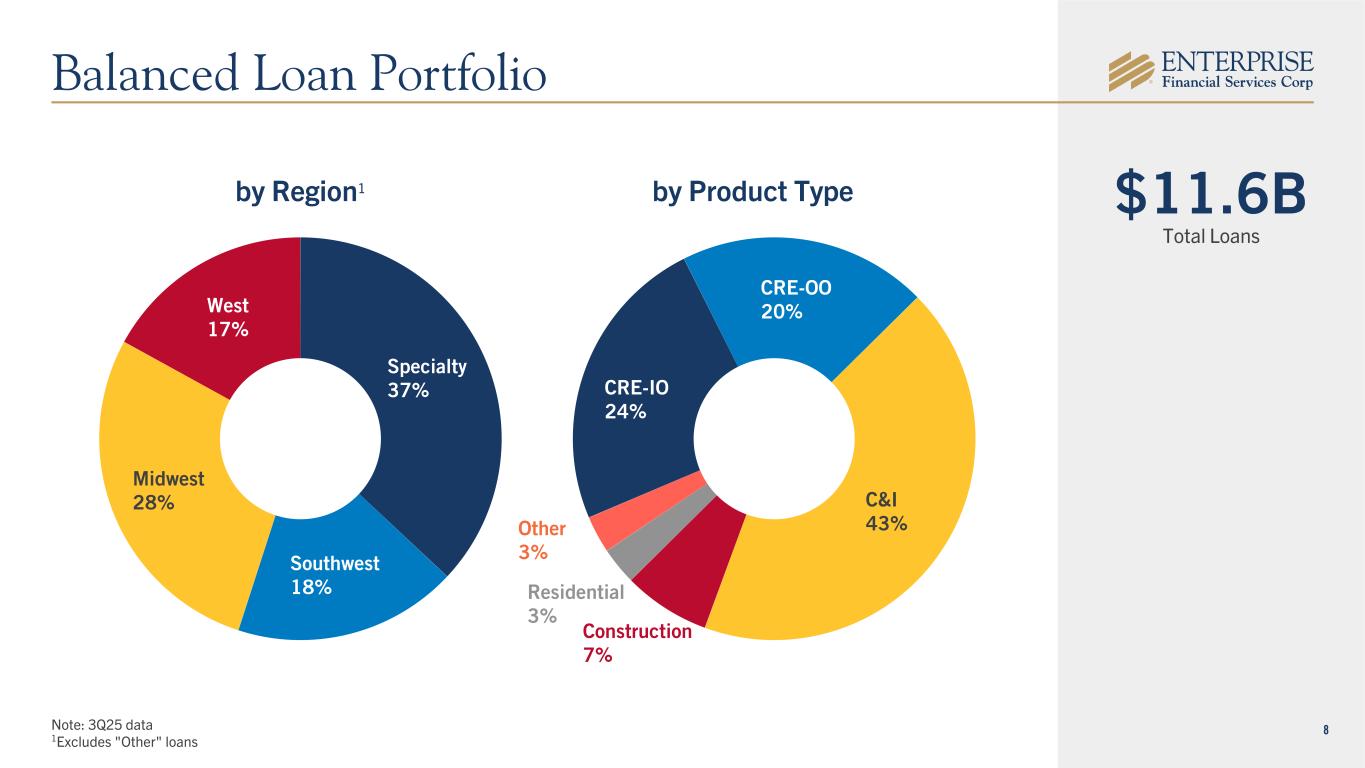
8 CRE-IO 24% CRE-OO 20% C&I 43% Construction 7% Residential 3% Other 3% by Product Type $11.6B Total Loans by Region1 Specialty 37% Southwest 18% Midwest 28% West 17% Note: 3Q25 data 1Excludes "Other" loans Balanced Loan Portfolio
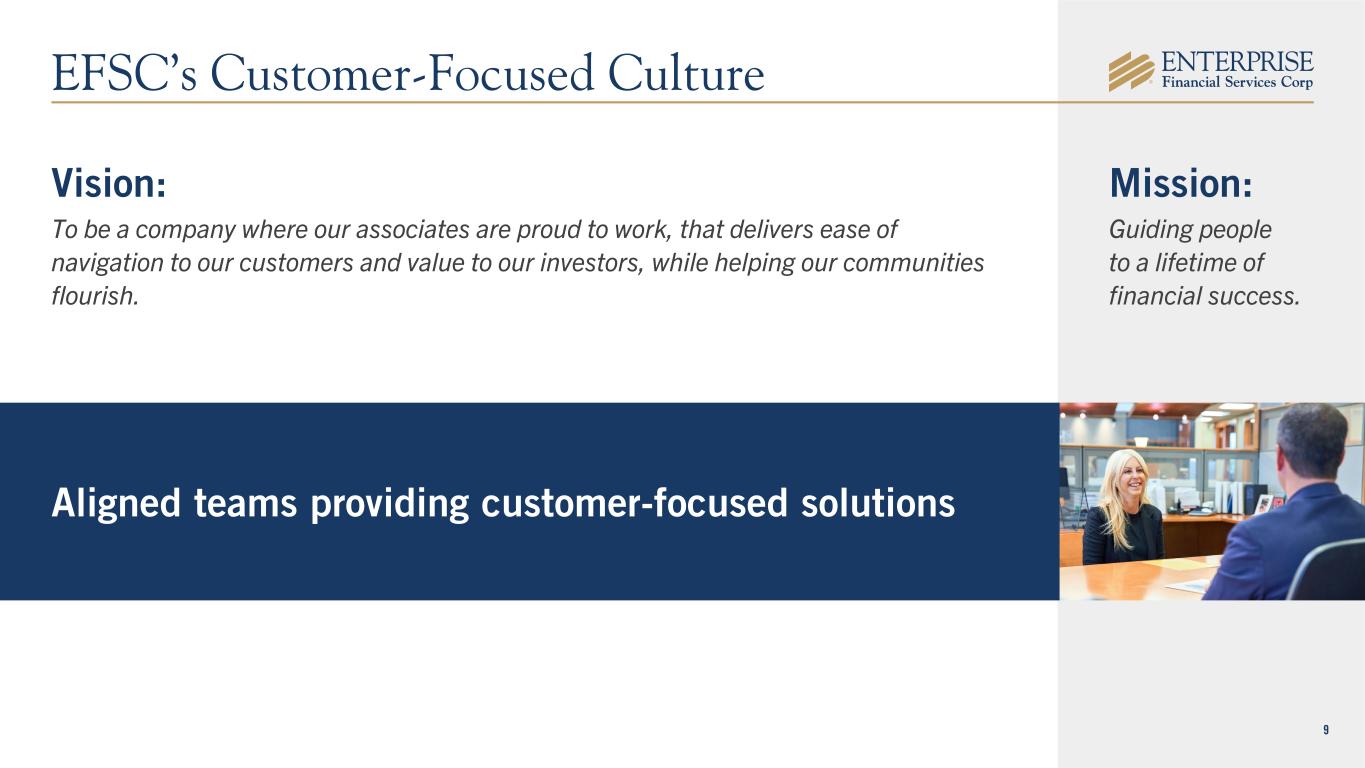
9 Aligned teams providing customer-focused solutions Vision: To be a company where our associates are proud to work, that delivers ease of navigation to our customers and value to our investors, while helping our communities flourish. Mission: Guiding people to a lifetime of financial success. EFSC’s Customer-Focused Culture
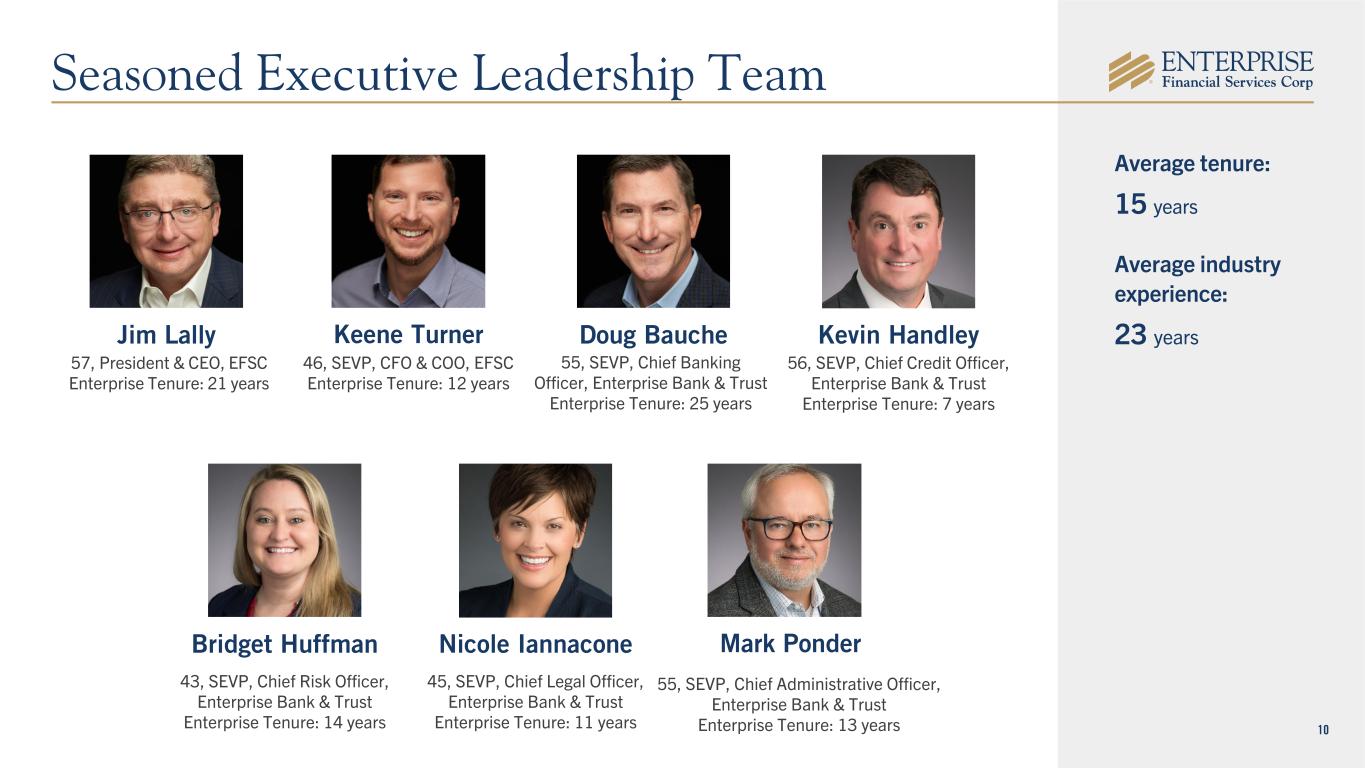
10 57, President & CEO, EFSC Enterprise Tenure: 21 years 46, SEVP, CFO & COO, EFSC Enterprise Tenure: 12 years 56, SEVP, Chief Credit Officer, Enterprise Bank & Trust Enterprise Tenure: 7 years 55, SEVP, Chief Banking Officer, Enterprise Bank & Trust Enterprise Tenure: 25 years 55, SEVP, Chief Administrative Officer, Enterprise Bank & Trust Enterprise Tenure: 13 years 45, SEVP, Chief Legal Officer, Enterprise Bank & Trust Enterprise Tenure: 11 years 43, SEVP, Chief Risk Officer, Enterprise Bank & Trust Enterprise Tenure: 14 years Average tenure: 15 years Average industry experience: 23 years Seasoned Executive Leadership Team Jim Lally Keene Turner Doug Bauche Kevin Handley Bridget Huffman Nicole Iannacone Mark Ponder
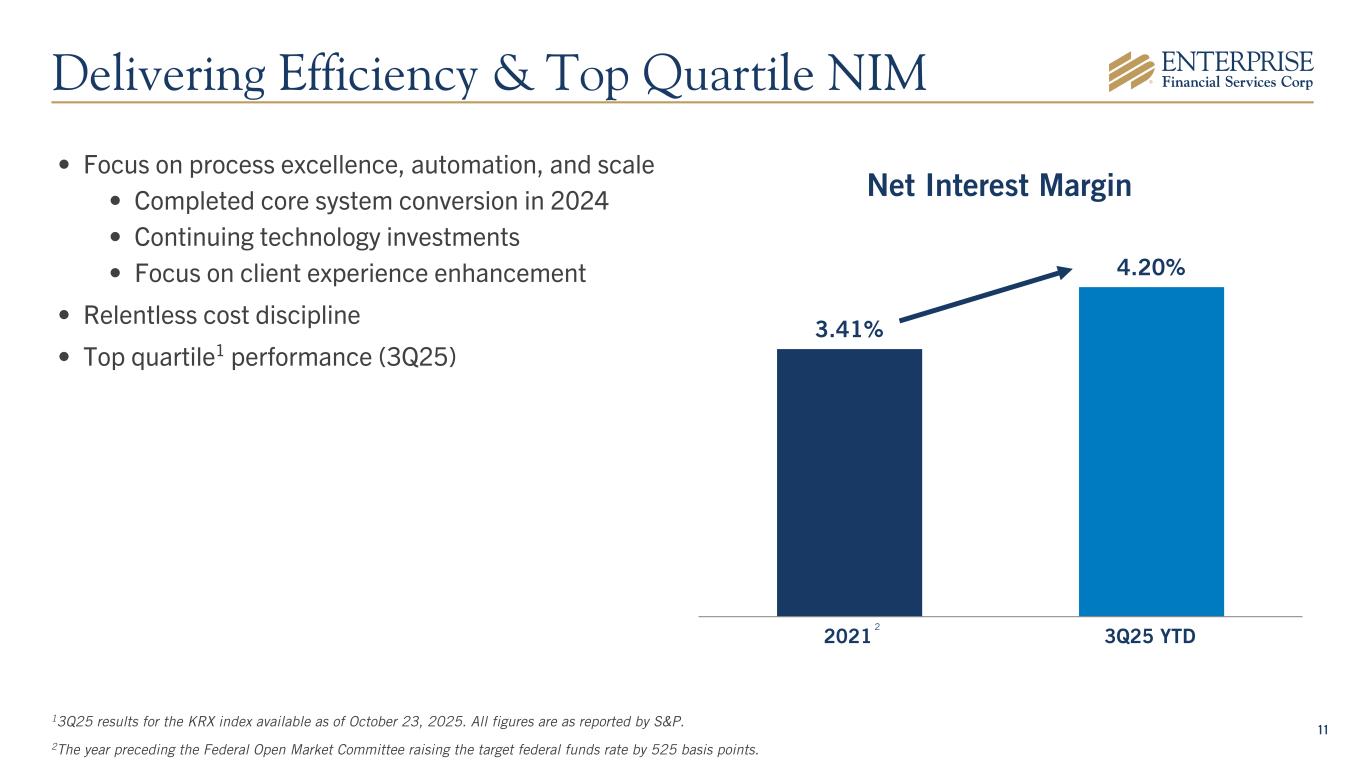
11 • Focus on process excellence, automation, and scale • Completed core system conversion in 2024 • Continuing technology investments • Focus on client experience enhancement • Relentless cost discipline • Top quartile1 performance (3Q25) Net Interest Margin 3.41% 4.20% 2021 3Q25 YTD Delivering Efficiency & Top Quartile NIM 13Q25 results for the KRX index available as of October 23, 2025. All figures are as reported by S&P. 2The year preceding the Federal Open Market Committee raising the target federal funds rate by 525 basis points. 2
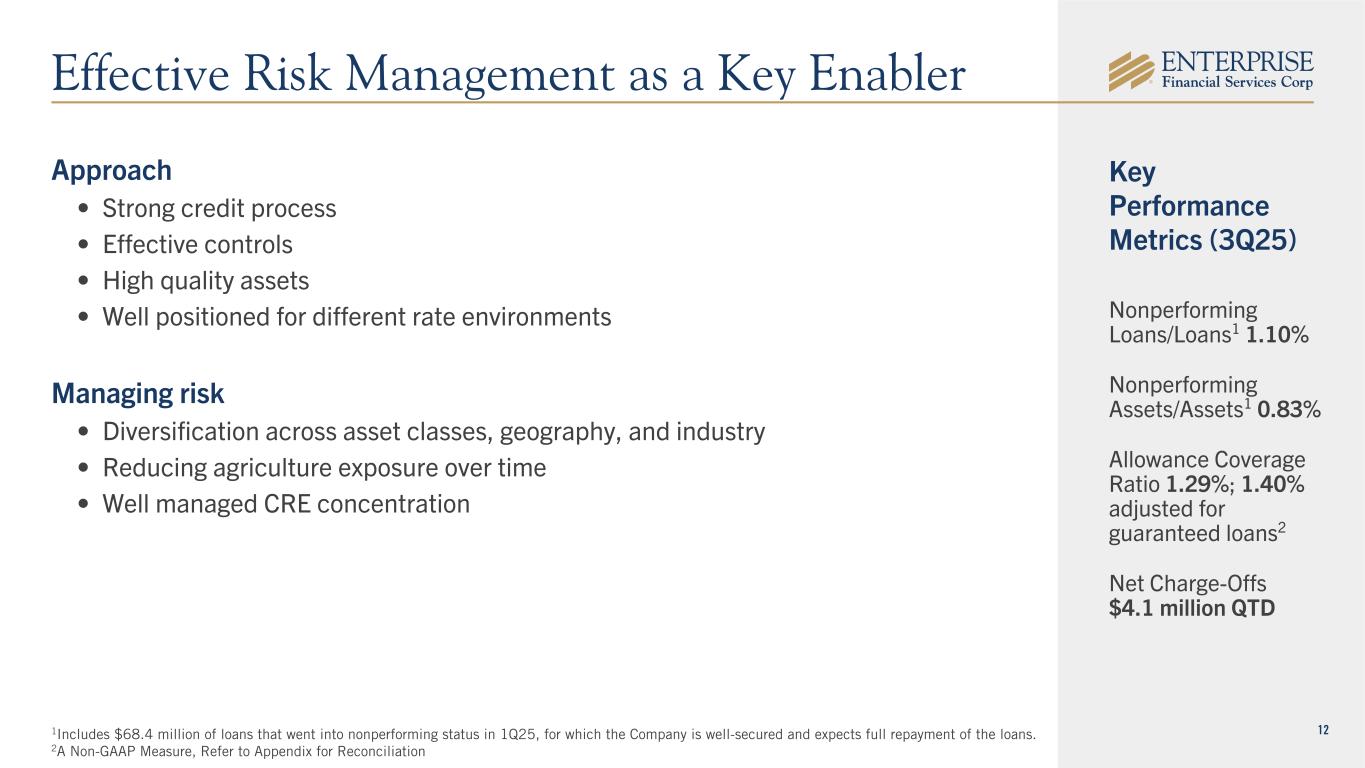
12 Approach • Strong credit process • Effective controls • High quality assets • Well positioned for different rate environments Managing risk • Diversification across asset classes, geography, and industry • Reducing agriculture exposure over time • Well managed CRE concentration Nonperforming Loans/Loans1 1.10% Nonperforming Assets/Assets1 0.83% Allowance Coverage Ratio 1.29%; 1.40% adjusted for guaranteed loans2 Net Charge-Offs $4.1 million QTD Key Performance Metrics (3Q25) Effective Risk Management as a Key Enabler 1Includes $68.4 million of loans that went into nonperforming status in 1Q25, for which the Company is well-secured and expects full repayment of the loans. 2A Non-GAAP Measure, Refer to Appendix for Reconciliation
Growth Strategy
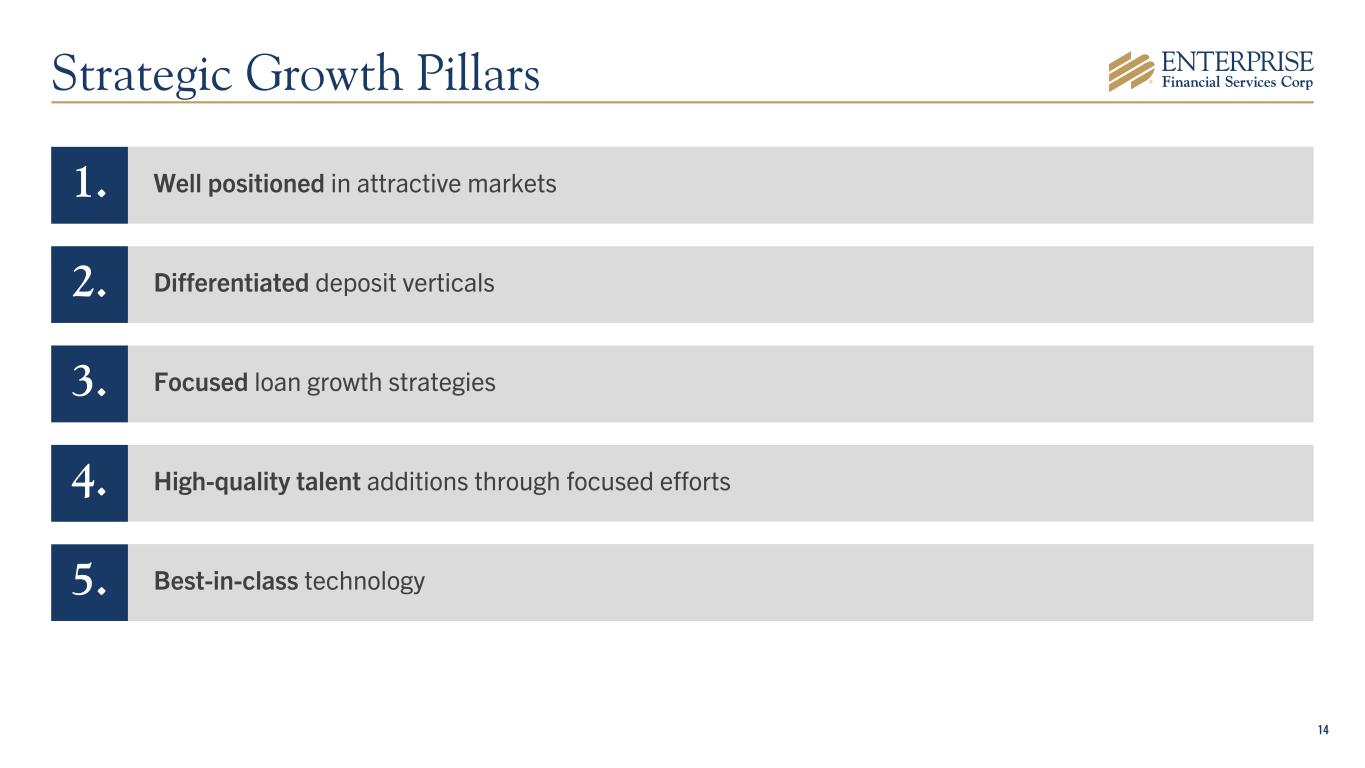
14 Focused loan growth strategies High-quality talent additions through focused efforts Best-in-class technology Differentiated deposit verticals Well positioned in attractive markets1. 2. 3. 4. 5. Strategic Growth Pillars
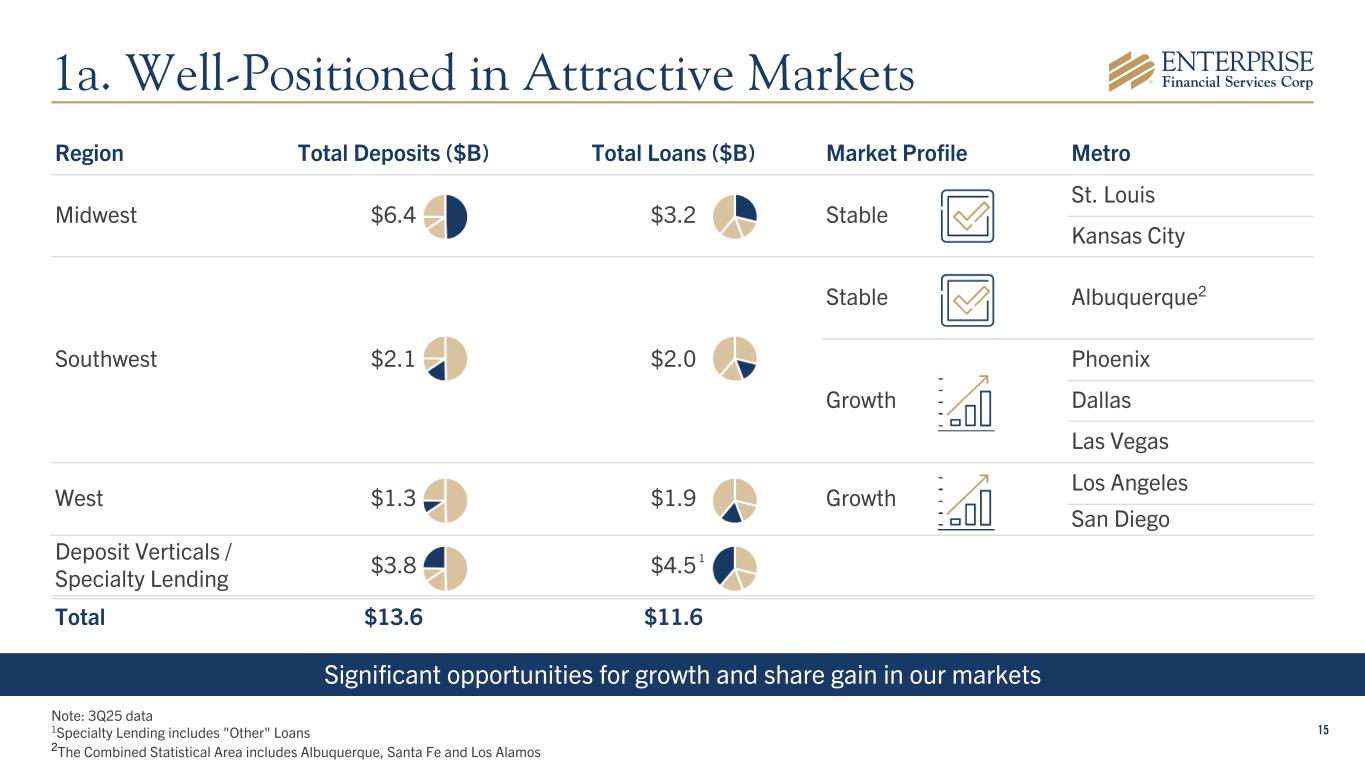
15 Significant opportunities for growth and share gain in our markets Region Total Deposits ($B) Total Loans ($B) Market Profile Metro Midwest $6.4 $3.2 Stable St. Louis Kansas City Southwest $2.1 $2.0 Stable Albuquerque2 Growth Phoenix Dallas Las Vegas West $1.3 $1.9 Growth Los Angeles San Diego Deposit Verticals / Specialty Lending $3.8 $4.5 Total $13.6 $11.6 Note: 3Q25 data 1Specialty Lending includes "Other" Loans 2The Combined Statistical Area includes Albuquerque, Santa Fe and Los Alamos 1 1a. Well-Positioned in Attractive Markets
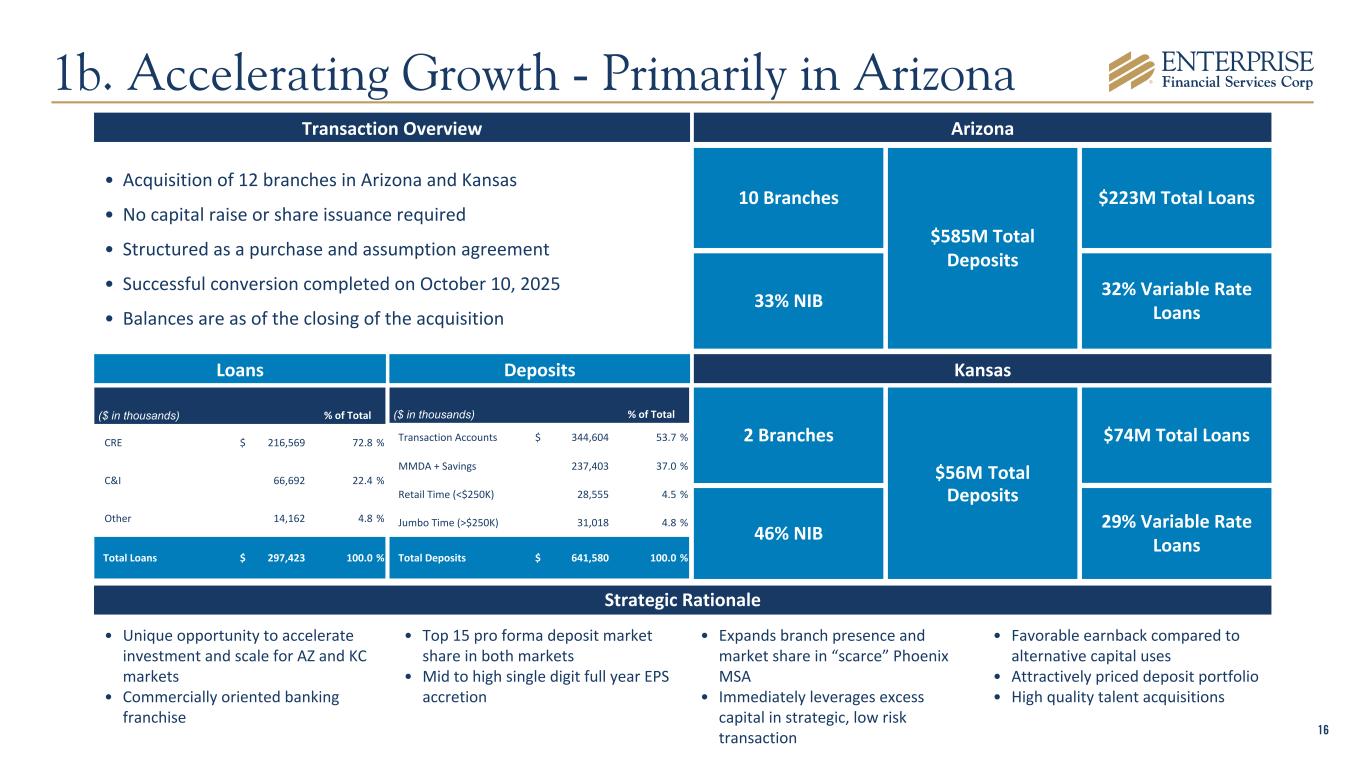
16 ($ in thousands) % of Total CRE $ 216,569 72.8 % C&I 66,692 22.4 % Other 14,162 4.8 % Total Loans $ 297,423 100.0 % Strategic Rationale Loans Deposits 10 Branches $585M Total Deposits $223M Total Loans 32% Variable Rate Loans 33% NIB $56M Total Deposits $74M Total Loans 29% Variable Rate Loans • Unique opportunity to accelerate investment and scale for AZ and KC markets • Commercially oriented banking franchise ($ in thousands) % of Total Transaction Accounts $ 344,604 53.7 % MMDA + Savings 237,403 37.0 % Retail Time (<$250K) 28,555 4.5 % Jumbo Time (>$250K) 31,018 4.8 % Total Deposits $ 641,580 100.0 % • Expands branch presence and market share in “scarce” Phoenix MSA • Immediately leverages excess capital in strategic, low risk transaction 2 Branches 46% NIB Kansas • Favorable earnback compared to alternative capital uses • Attractively priced deposit portfolio • High quality talent acquisitions • Top 15 pro forma deposit market share in both markets • Mid to high single digit full year EPS accretion Transaction Overview • Acquisition of 12 branches in Arizona and Kansas • No capital raise or share issuance required • Structured as a purchase and assumption agreement • Successful conversion completed on October 10, 2025 • Balances are as of the closing of the acquisition Arizona 1b. Accelerating Growth - Primarily in Arizona
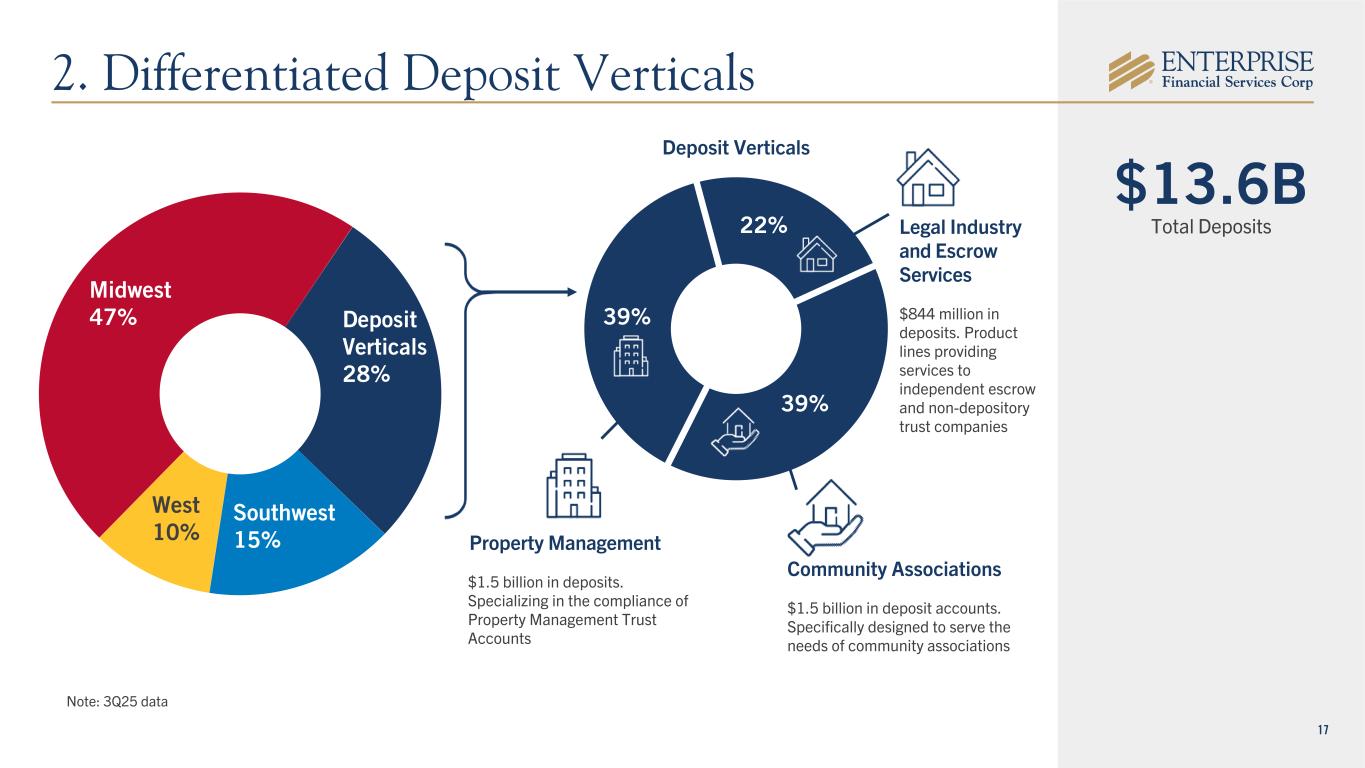
17 22% 39% 39% Community Associations $1.5 billion in deposit accounts. Specifically designed to serve the needs of community associations Property Management $1.5 billion in deposits. Specializing in the compliance of Property Management Trust Accounts Legal Industry and Escrow Services $844 million in deposits. Product lines providing services to independent escrow and non-depository trust companies Deposit Verticals Note: 3Q25 data Deposit Verticals 28% Southwest 15% West 10% Midwest 47% 2. Differentiated Deposit Verticals $13.6B Total Deposits
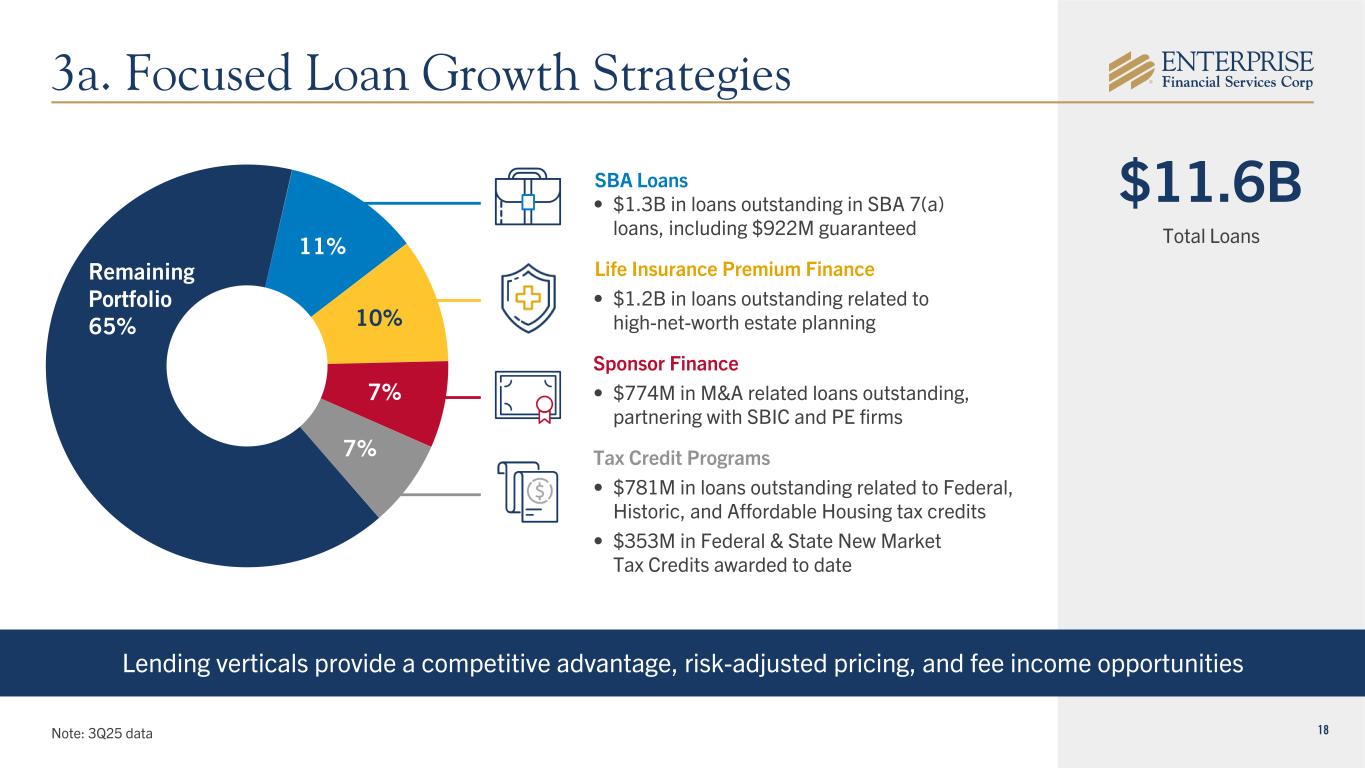
18 Lending verticals provide a competitive advantage, risk-adjusted pricing, and fee income opportunities SBA Loans • $1.3B in loans outstanding in SBA 7(a) loans, including $922M guaranteed Life Insurance Premium Finance • $1.2B in loans outstanding related to high-net-worth estate planning Sponsor Finance • $774M in M&A related loans outstanding, partnering with SBIC and PE firms Tax Credit Programs • $781M in loans outstanding related to Federal, Historic, and Affordable Housing tax credits • $353M in Federal & State New Market Tax Credits awarded to date $11.6B Total Loans Note: 3Q25 data 11% 10% 7% 7% Remaining Portfolio 65% 3a. Focused Loan Growth Strategies
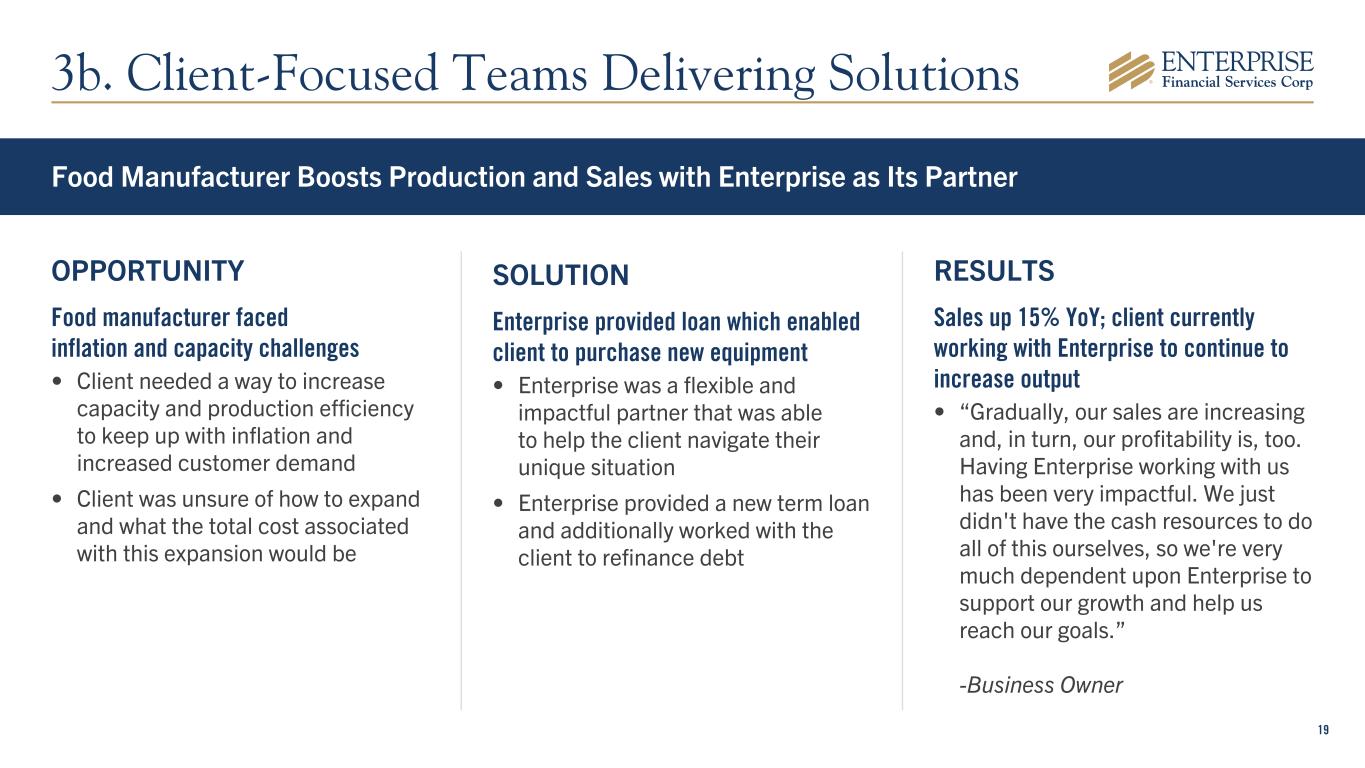
19 Food Manufacturer Boosts Production and Sales with Enterprise as Its Partner OPPORTUNITY Food manufacturer faced inflation and capacity challenges • Client needed a way to increase capacity and production efficiency to keep up with inflation and increased customer demand • Client was unsure of how to expand and what the total cost associated with this expansion would be SOLUTION Enterprise provided loan which enabled client to purchase new equipment • Enterprise was a flexible and impactful partner that was able to help the client navigate their unique situation • Enterprise provided a new term loan and additionally worked with the client to refinance debt RESULTS Sales up 15% YoY; client currently working with Enterprise to continue to increase output • “Gradually, our sales are increasing and, in turn, our profitability is, too. Having Enterprise working with us has been very impactful. We just didn't have the cash resources to do all of this ourselves, so we're very much dependent upon Enterprise to support our growth and help us reach our goals.” -Business Owner 3b. Client-Focused Teams Delivering Solutions
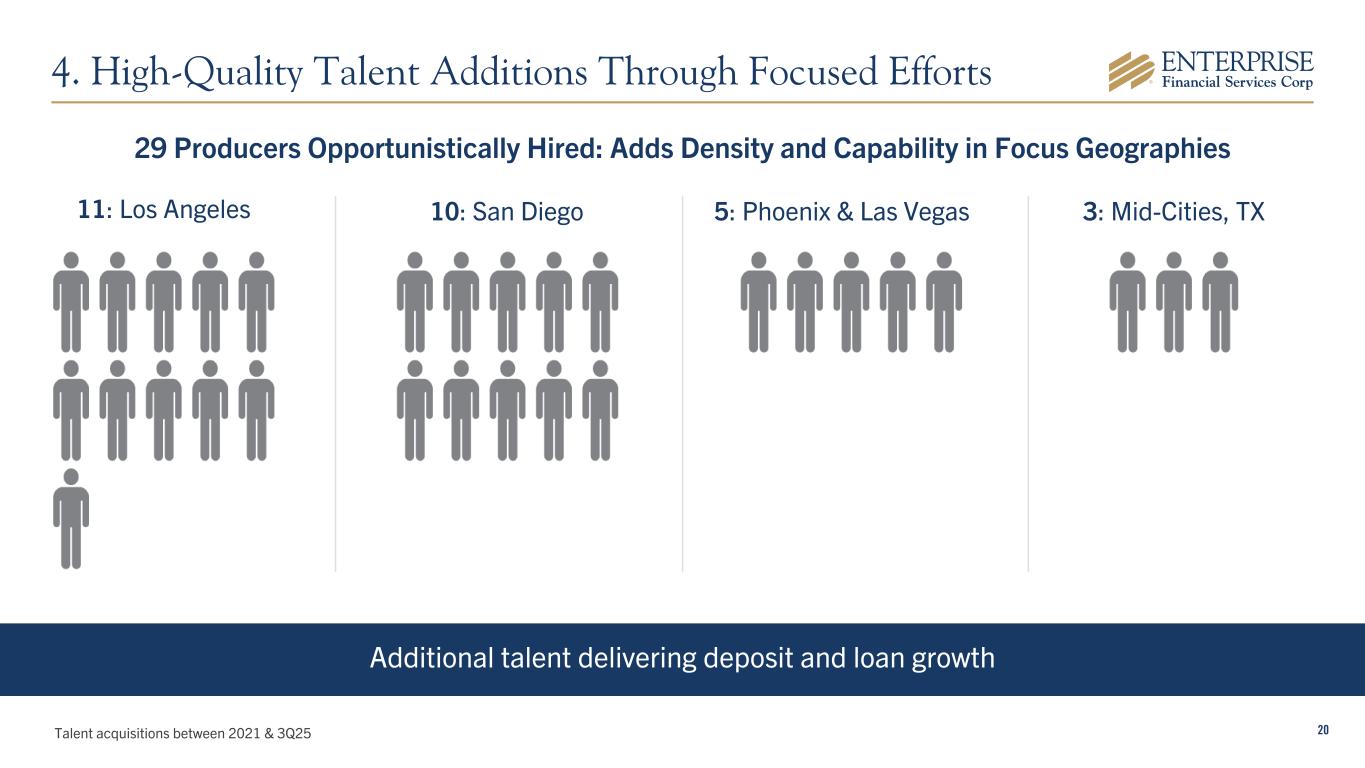
20 Additional talent delivering deposit and loan growth 11: Los Angeles 10: San Diego 5: Phoenix & Las Vegas Talent acquisitions between 2021 & 3Q25 4. High-Quality Talent Additions Through Focused Efforts 29 Producers Opportunistically Hired: Adds Density and Capability in Focus Geographies 3: Mid-Cities, TX
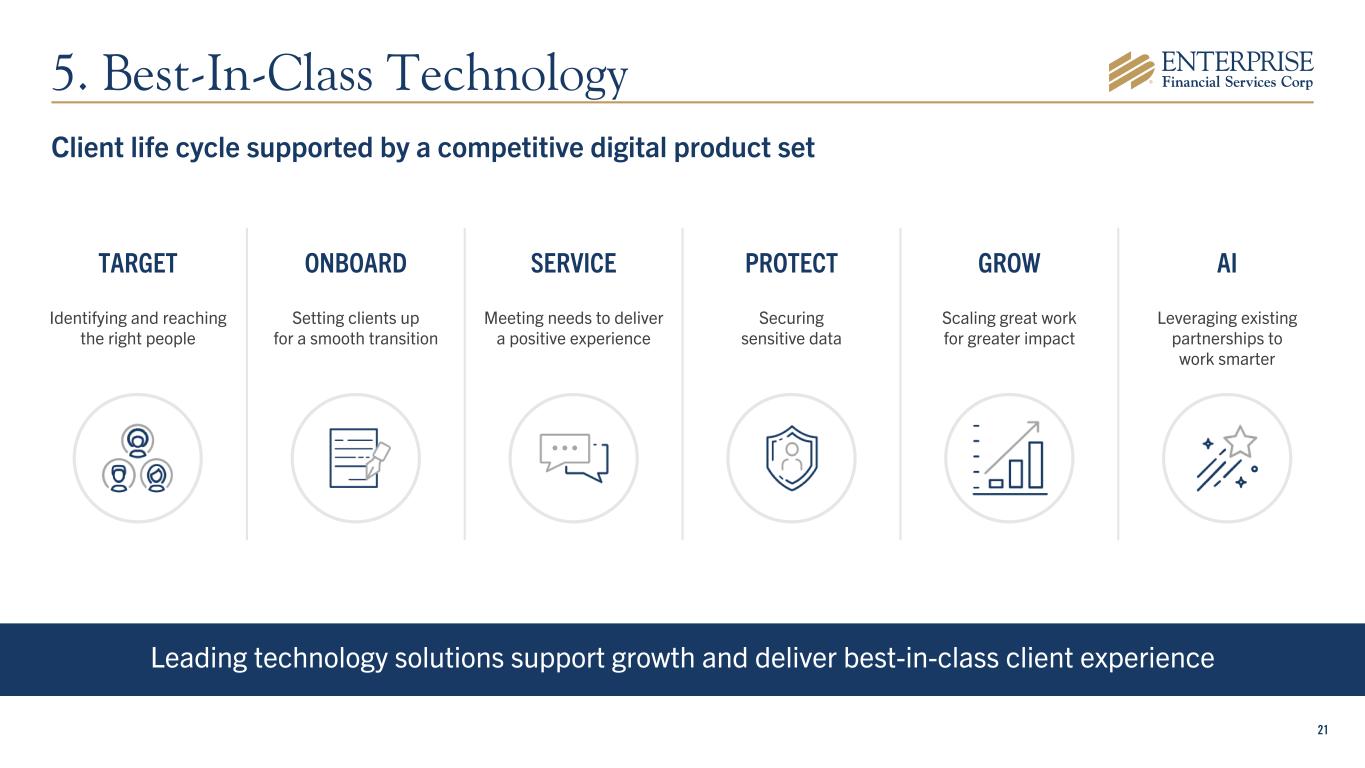
21 Leading technology solutions support growth and deliver best-in-class client experience Client life cycle supported by a competitive digital product set 5. Best-In-Class Technology Scaling great work for greater impact PROTECTONBOARD Setting clients up for a smooth transition Leveraging existing partnerships to work smarter AITARGET Identifying and reaching the right people Meeting needs to deliver a positive experience SERVICE GROW Securing sensitive data
Financial Overview and Outlook
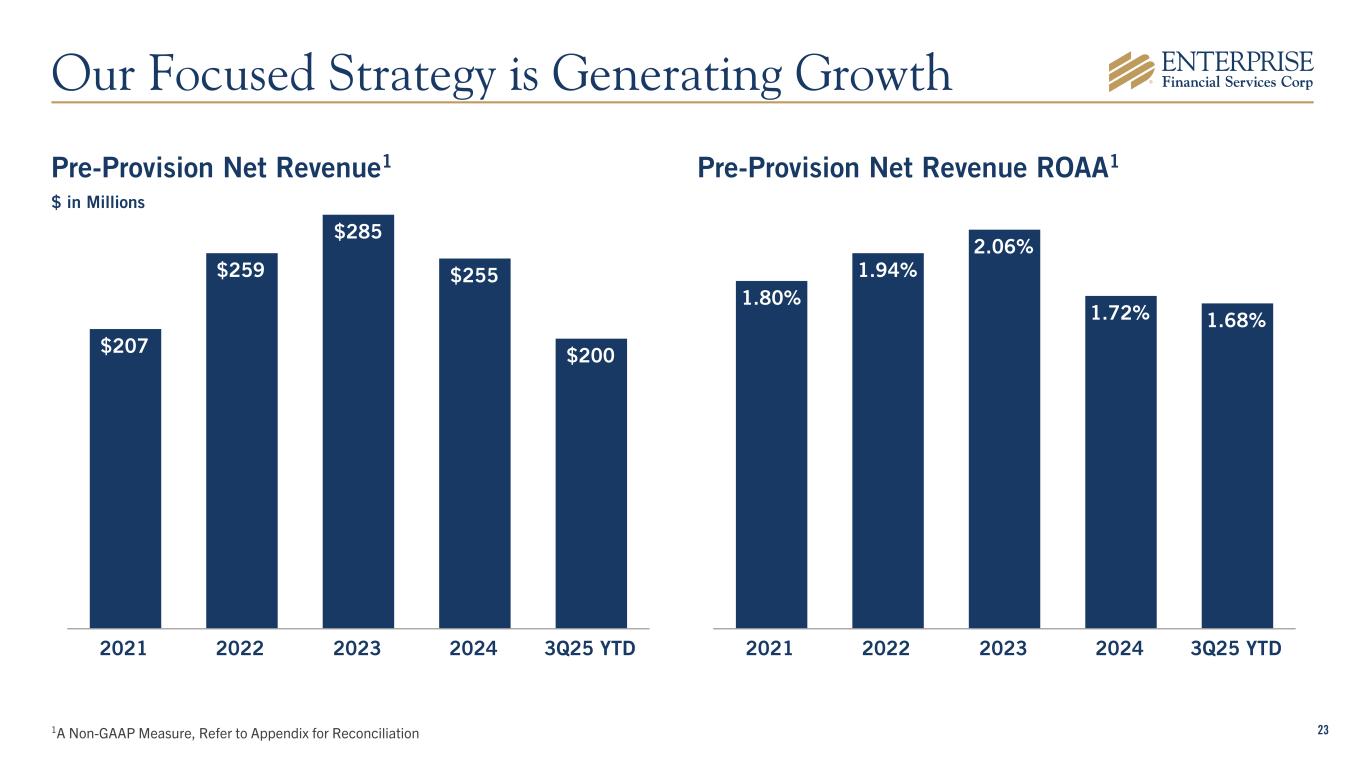
231A Non-GAAP Measure, Refer to Appendix for Reconciliation Pre-Provision Net Revenue1 $ in Millions Pre-Provision Net Revenue ROAA1 $207 $259 $285 $255 $200 2021 2022 2023 2024 3Q25 YTD 1.80% 1.94% 2.06% 1.72% 1.68% 2021 2022 2023 2024 3Q25 YTD Our Focused Strategy is Generating Growth
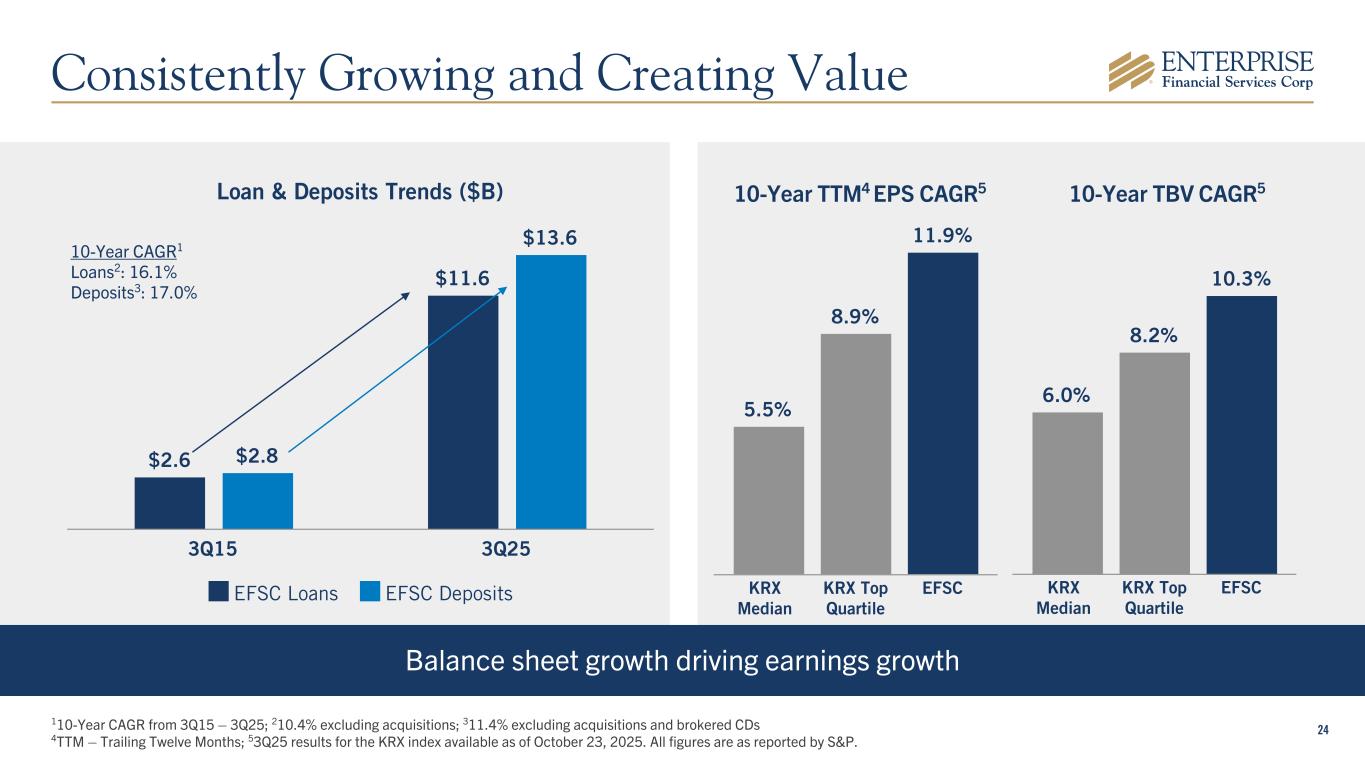
24 Loan & Deposits Trends ($B) $2.6 $11.6 $2.8 $13.6 EFSC Loans EFSC Deposits 3Q15 3Q25 Balance sheet growth driving earnings growth 10-Year TBV CAGR510-Year TTM4 EPS CAGR5 110-Year CAGR from 3Q15 – 3Q25; 210.4% excluding acquisitions; 311.4% excluding acquisitions and brokered CDs 4TTM – Trailing Twelve Months; 53Q25 results for the KRX index available as of October 23, 2025. All figures are as reported by S&P. 10-Year CAGR1 Loans2: 16.1% Deposits3: 17.0% 5.5% 8.9% 11.9% KRX Median KRX Top Quartile EFSC 6.0% 8.2% 10.3% KRX Median KRX Top Quartile EFSC Consistently Growing and Creating Value
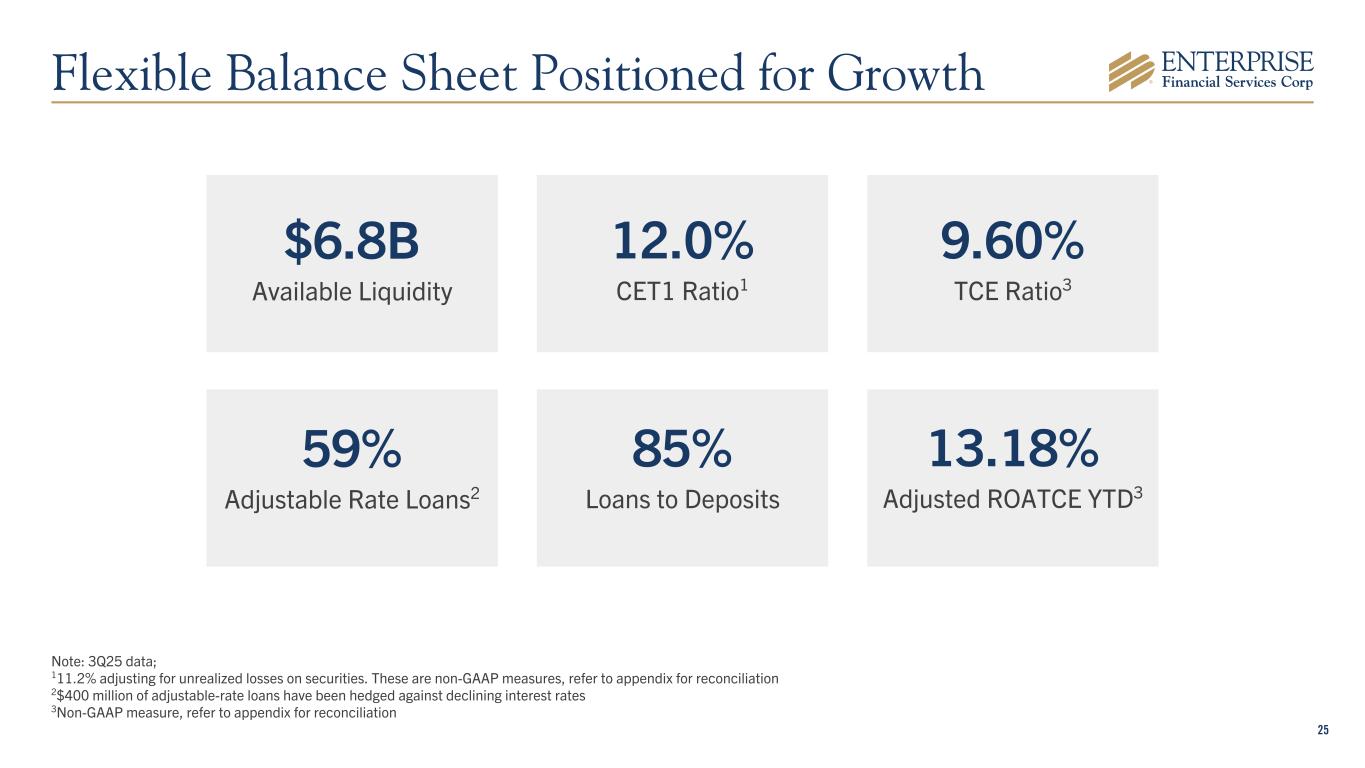
25 $6.8B Available Liquidity 59% Adjustable Rate Loans2 12.0% CET1 Ratio1 85% Loans to Deposits Note: 3Q25 data; 111.2% adjusting for unrealized losses on securities. These are non-GAAP measures, refer to appendix for reconciliation 2$400 million of adjustable-rate loans have been hedged against declining interest rates 3Non-GAAP measure, refer to appendix for reconciliation 9.60% TCE Ratio3 13.18% Adjusted ROATCE YTD3 Flexible Balance Sheet Positioned for Growth
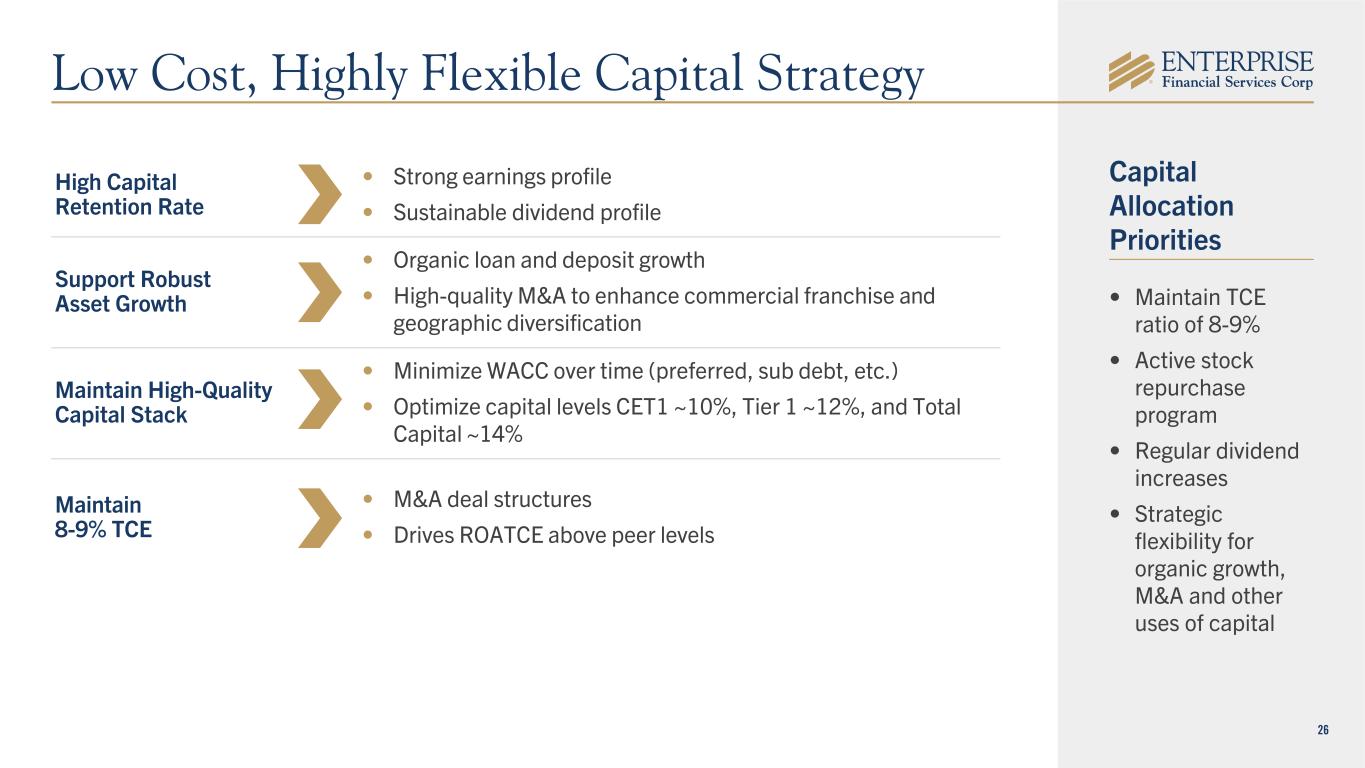
26 High Capital Retention Rate • Strong earnings profile • Sustainable dividend profile Support Robust Asset Growth • Organic loan and deposit growth • High-quality M&A to enhance commercial franchise and geographic diversification Maintain High-Quality Capital Stack • Minimize WACC over time (preferred, sub debt, etc.) • Optimize capital levels CET1 ~10%, Tier 1 ~12%, and Total Capital ~14% Maintain 8-9% TCE • M&A deal structures • Drives ROATCE above peer levels Capital Allocation Priorities • Maintain TCE ratio of 8-9% • Active stock repurchase program • Regular dividend increases • Strategic flexibility for organic growth, M&A and other uses of capital Low Cost, Highly Flexible Capital Strategy
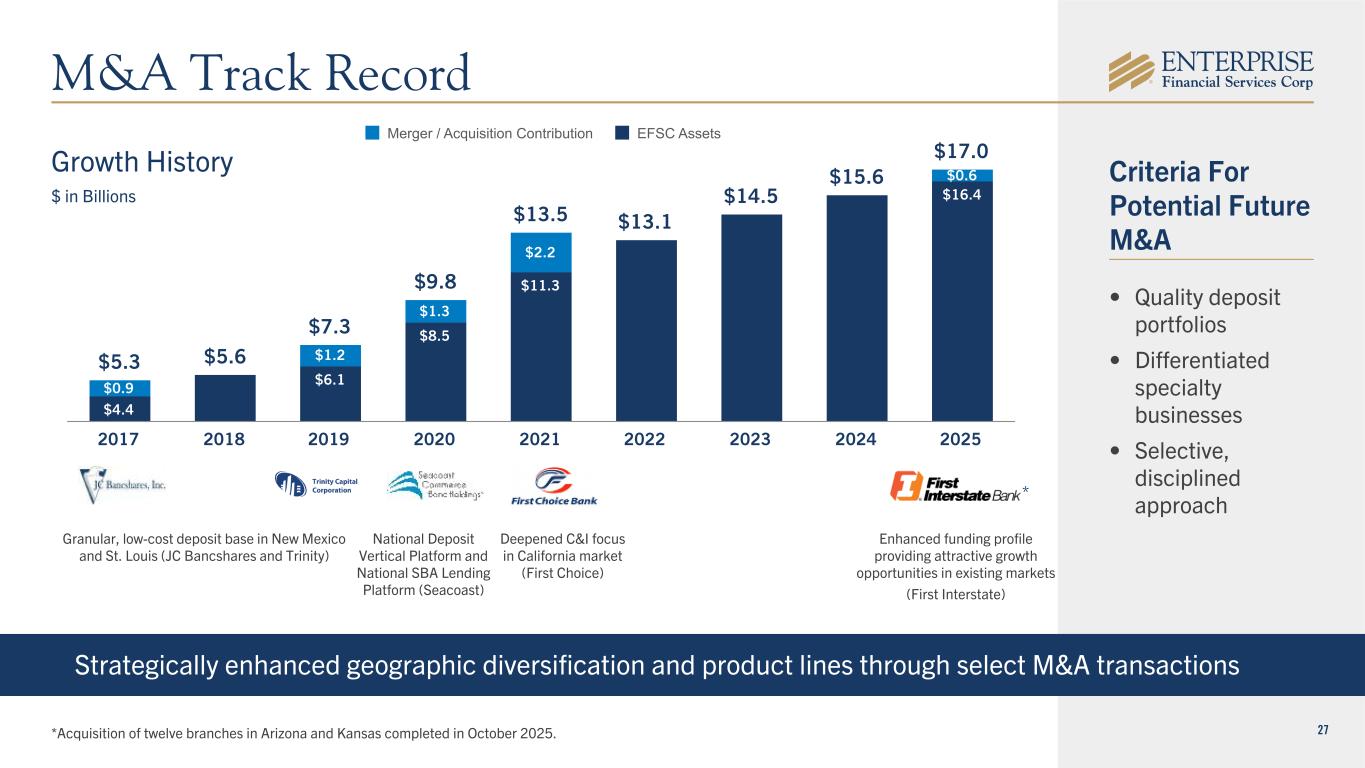
27 $5.3 $5.6 $7.3 $9.8 $13.5 $13.1 $14.5 $15.6 $17.0 $4.4 $6.1 $8.5 $11.3 $16.4 $0.9 $1.2 $1.3 $2.2 $0.6 Merger / Acquisition Contribution EFSC Assets 2017 2018 2019 2020 2021 2022 2023 2024 2025 Strategically enhanced geographic diversification and product lines through select M&A transactions Growth History $ in Billions Granular, low-cost deposit base in New Mexico and St. Louis (JC Bancshares and Trinity) National Deposit Vertical Platform and National SBA Lending Platform (Seacoast) Deepened C&I focus in California market (First Choice) M&A Track Record Criteria For Potential Future M&A • Quality deposit portfolios • Differentiated specialty businesses • Selective, disciplined approach Enhanced funding profile providing attractive growth opportunities in existing markets (First Interstate) * *Acquisition of twelve branches in Arizona and Kansas completed in October 2025.
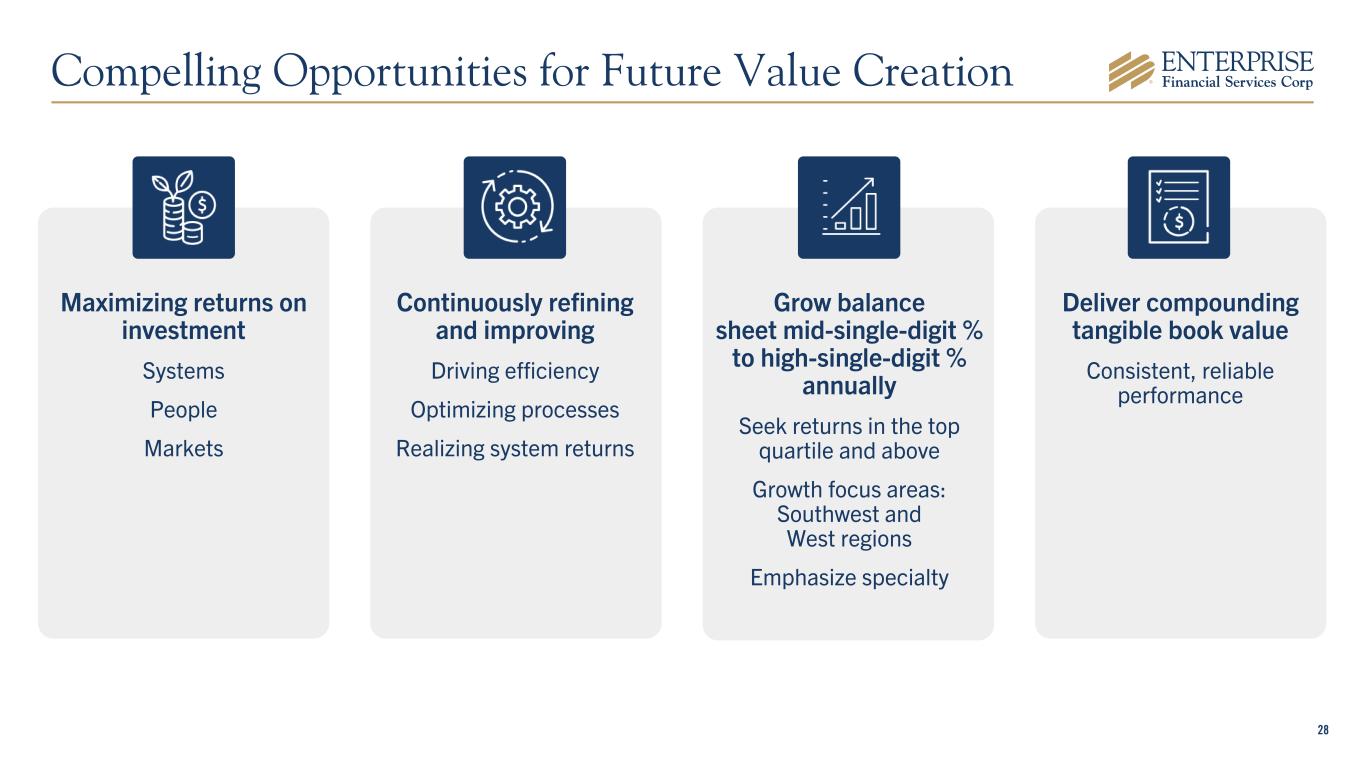
28 Maximizing returns on investment Systems People Markets Deliver compounding tangible book value Consistent, reliable performance Continuously refining and improving Driving efficiency Optimizing processes Realizing system returns Grow balance sheet mid-single-digit % to high-single-digit % annually Seek returns in the top quartile and above Growth focus areas: Southwest and West regions Emphasize specialty Compelling Opportunities for Future Value Creation
29 Empowered associates providing industry-leading service, supported by digital technology solutions Tenured and experienced management team Strong capital foundation and consistent history of delivering results Differentiated strategies delivering growth Focused commercial bank, diversified across verticals and geographic markets Invest with EFSC

Appendix
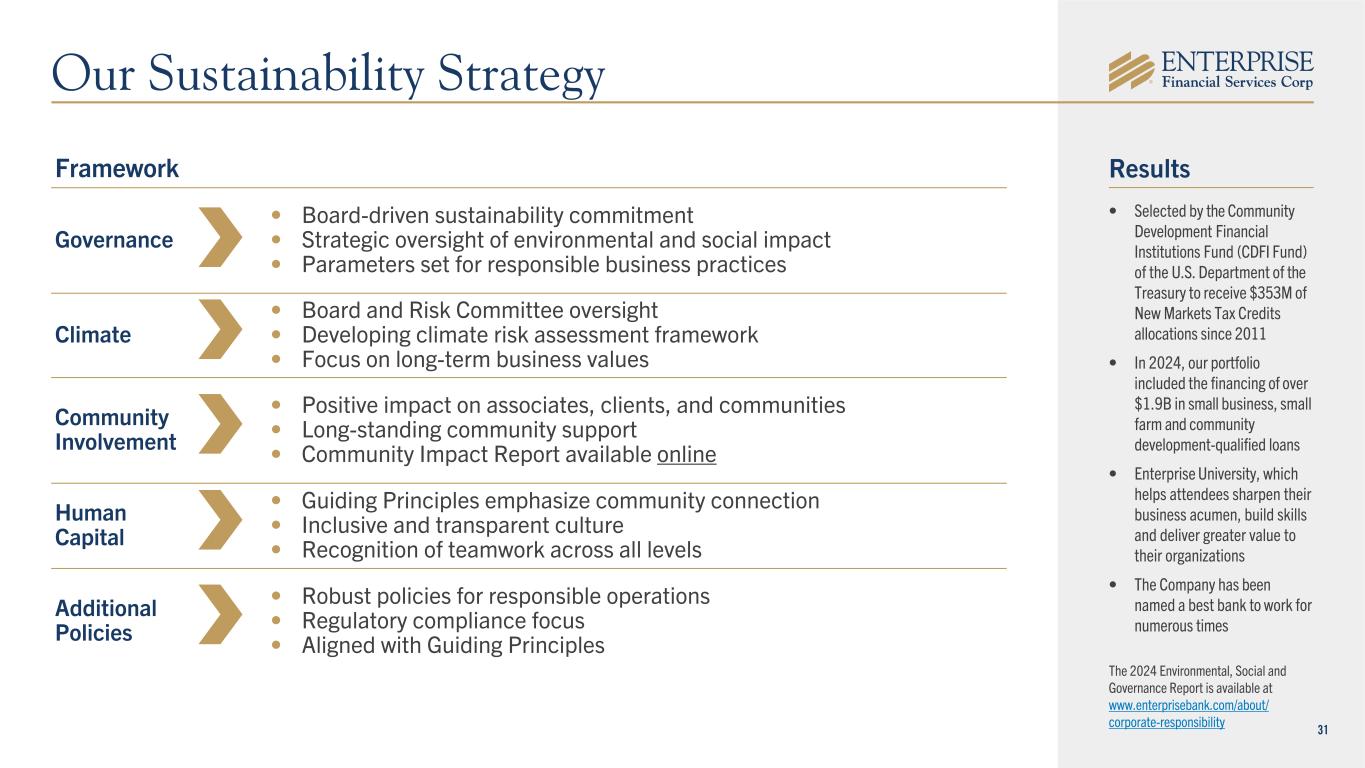
31 • Selected by the Community Development Financial Institutions Fund (CDFI Fund) of the U.S. Department of the Treasury to receive $353M of New Markets Tax Credits allocations since 2011 • In 2024, our portfolio included the financing of over $1.9B in small business, small farm and community development-qualified loans • Enterprise University, which helps attendees sharpen their business acumen, build skills and deliver greater value to their organizations • The Company has been named a best bank to work for numerous times Framework Governance • Board-driven sustainability commitment • Strategic oversight of environmental and social impact • Parameters set for responsible business practices Climate • Board and Risk Committee oversight • Developing climate risk assessment framework • Focus on long-term business values Community Involvement • Positive impact on associates, clients, and communities • Long-standing community support • Community Impact Report available online Human Capital • Guiding Principles emphasize community connection • Inclusive and transparent culture • Recognition of teamwork across all levels Additional Policies • Robust policies for responsible operations • Regulatory compliance focus • Aligned with Guiding Principles Results The 2024 Environmental, Social and Governance Report is available at www.enterprisebank.com/about/ corporate-responsibility Our Sustainability Strategy
32 The Company’s accounting and reporting policies conform to generally accepted accounting principles in the United States (“GAAP”) and the prevailing practices in the banking industry. However, the Company provides other financial measures, such as tangible common equity, tangible common equity to tangible assets ratio, common equity tier 1 ratio adjusted for unrealized losses, PPNR, PPNR ROAA, allowance for coverage ratio adjusted for guaranteed loans, ROATCE, and adjusted ROATCE, in this release that are considered “non-GAAP financial measures.” Generally, a non-GAAP financial measure is a numerical measure of a company’s financial performance, financial position, or cash flows that exclude (or include) amounts that are included in (or excluded from) the most directly comparable measure calculated and presented in accordance with GAAP. The Company considers its tangible common equity, tangible common equity to tangible assets ratio, common equity tier 1 ratio adjusted for unrealized losses, PPNR, PPNR ROAA, allowance for coverage ratio adjusted for guaranteed loans, ROATCE, and adjusted ROATCE, collectively “core performance measures,” presented in this earnings release and the included tables as important measures of financial performance, even though they are non-GAAP measures, as they provide supplemental information by which to evaluate the impact of certain non- comparable items, and the Company’s operating performance on an ongoing basis. Core performance measures exclude certain other income and expense items, such as the FDIC special assessment, core conversion expenses, merger-related expenses, branch closure expenses, accrued insurance proceeds anticipated to be received as a result of recaptured tax credits and the gain or loss on sale of other real estate owned and investment securities, that the Company believes to be not indicative of or useful to measure the Company’s operating performance on an ongoing basis. The attached tables contain a reconciliation of these core performance measures to the GAAP measures. The Company believes that the tangible common equity ratio provides useful information to investors about the Company’s capital strength even though it is considered to be a non-GAAP financial measure and is not part of the regulatory capital requirements to which the Company is subject. The Company believes these non-GAAP measures and ratios, when taken together with the corresponding GAAP measures and ratios, provide meaningful supplemental information regarding the Company’s performance and capital strength. The Company’s management uses, and believes that investors benefit from referring to, these non-GAAP measures and ratios in assessing the Company’s operating results and related trends and when forecasting future periods. However, these non-GAAP measures and ratios should be considered in addition to, and not as a substitute for or preferable to, ratios prepared in accordance with GAAP. In the attached tables, the Company has provided a reconciliation of, where applicable, the most comparable GAAP financial measures and ratios to the non-GAAP financial measures and ratios, or a reconciliation of the non-GAAP calculation of the financial measures for the periods indicated. Use of Non-GAAP Financial Measures
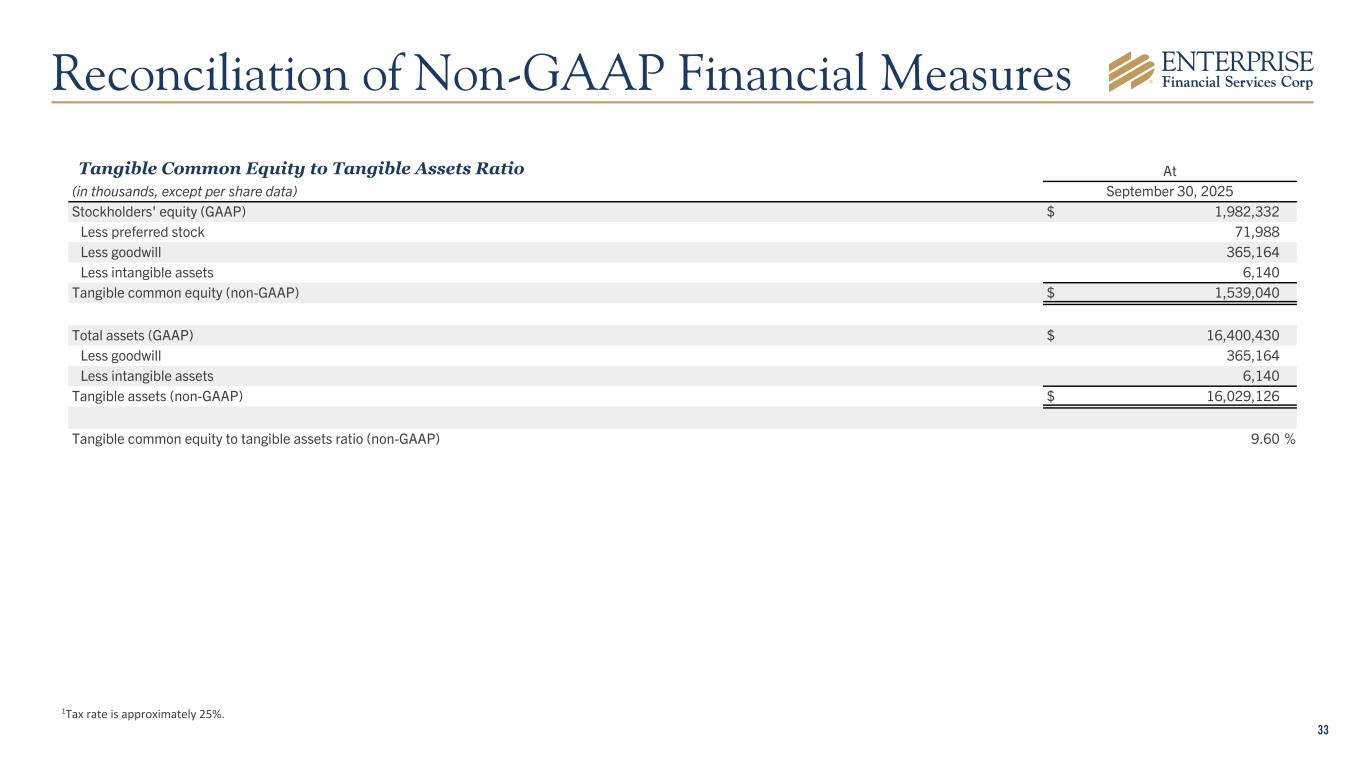
33 At (in thousands, except per share data) September 30, 2025 Stockholders' equity (GAAP) $ 1,982,332 Less preferred stock 71,988 Less goodwill 365,164 Less intangible assets 6,140 Tangible common equity (non-GAAP) $ 1,539,040 Total assets (GAAP) $ 16,400,430 Less goodwill 365,164 Less intangible assets 6,140 Tangible assets (non-GAAP) $ 16,029,126 Tangible common equity to tangible assets ratio (non-GAAP) 9.60 % 1Tax rate is approximately 25%. Tangible Common Equity to Tangible Assets Ratio Reconciliation of Non-GAAP Financial Measures
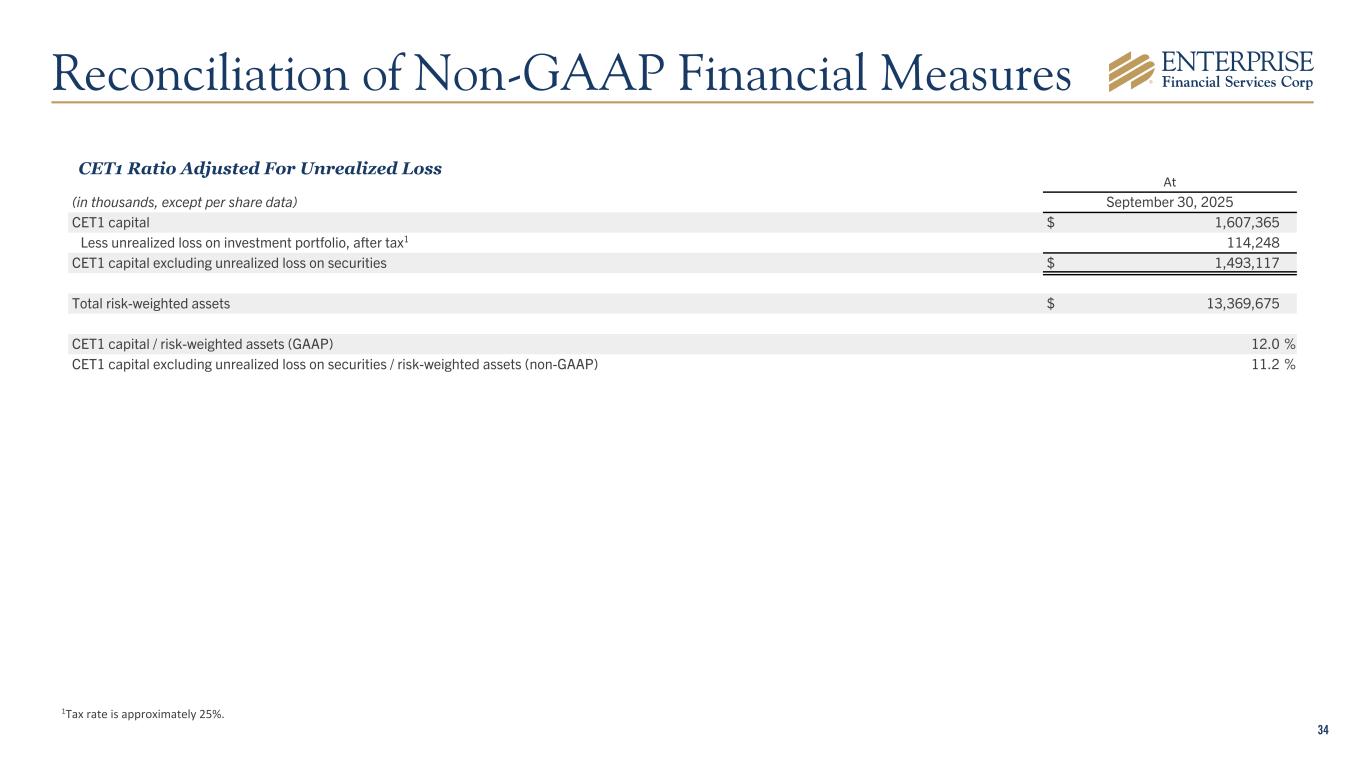
34 At (in thousands, except per share data) September 30, 2025 CET1 capital $ 1,607,365 Less unrealized loss on investment portfolio, after tax1 114,248 CET1 capital excluding unrealized loss on securities $ 1,493,117 Total risk-weighted assets $ 13,369,675 CET1 capital / risk-weighted assets (GAAP) 12.0 % CET1 capital excluding unrealized loss on securities / risk-weighted assets (non-GAAP) 11.2 % CET1 Ratio Adjusted For Unrealized Loss Reconciliation of Non-GAAP Financial Measures 1Tax rate is approximately 25%.
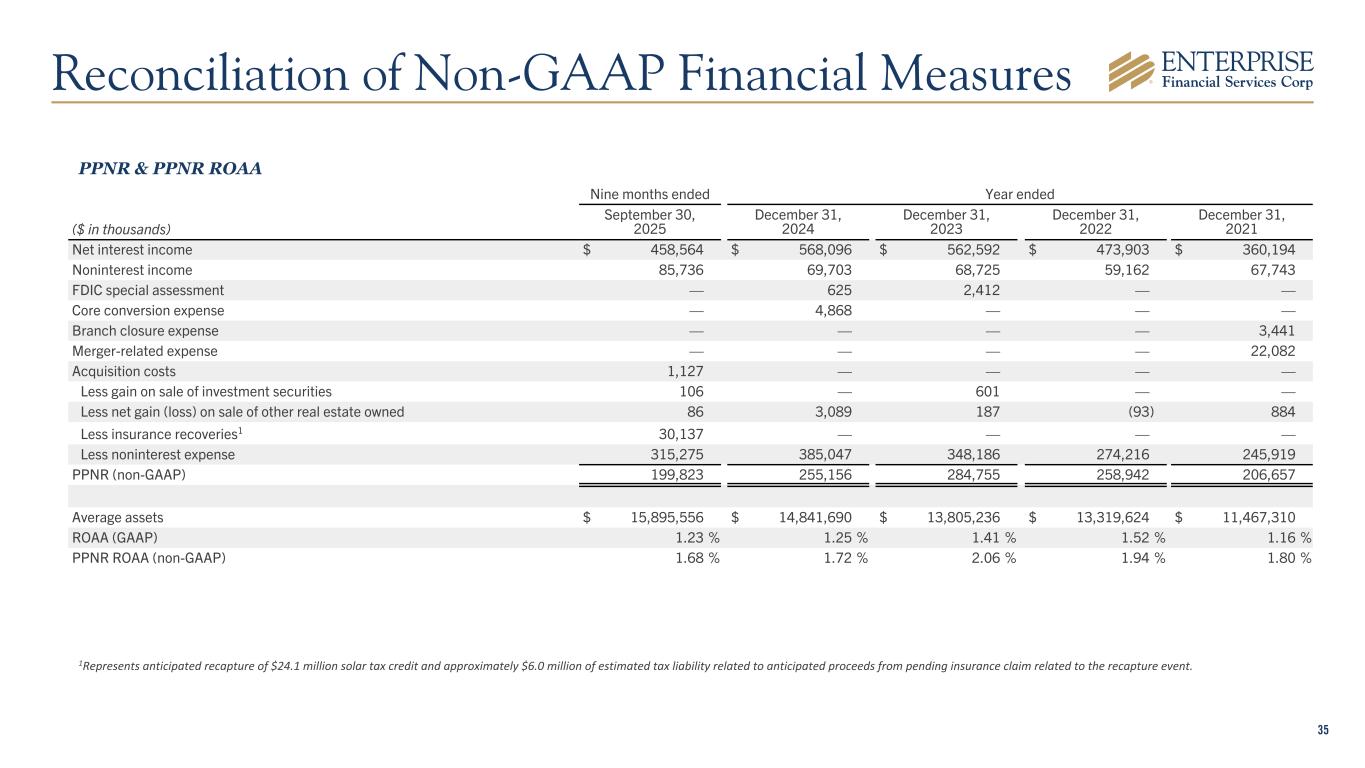
35 PPNR & PPNR ROAA Reconciliation of Non-GAAP Financial Measures Nine months ended Year ended ($ in thousands) September 30, 2025 December 31, 2024 December 31, 2023 December 31, 2022 December 31, 2021 Net interest income $ 458,564 $ 568,096 $ 562,592 $ 473,903 $ 360,194 Noninterest income 85,736 69,703 68,725 59,162 67,743 FDIC special assessment — 625 2,412 — — Core conversion expense — 4,868 — — — Branch closure expense — — — — 3,441 Merger-related expense — — — — 22,082 Acquisition costs 1,127 — — — — Less gain on sale of investment securities 106 — 601 — — Less net gain (loss) on sale of other real estate owned 86 3,089 187 (93) 884 Less insurance recoveries1 30,137 — — — — Less noninterest expense 315,275 385,047 348,186 274,216 245,919 PPNR (non-GAAP) 199,823 255,156 284,755 258,942 206,657 Average assets $ 15,895,556 $ 14,841,690 $ 13,805,236 $ 13,319,624 $ 11,467,310 ROAA (GAAP) 1.23 % 1.25 % 1.41 % 1.52 % 1.16 % PPNR ROAA (non-GAAP) 1.68 % 1.72 % 2.06 % 1.94 % 1.80 % 1Represents anticipated recapture of $24.1 million solar tax credit and approximately $6.0 million of estimated tax liability related to anticipated proceeds from pending insurance claim related to the recapture event.
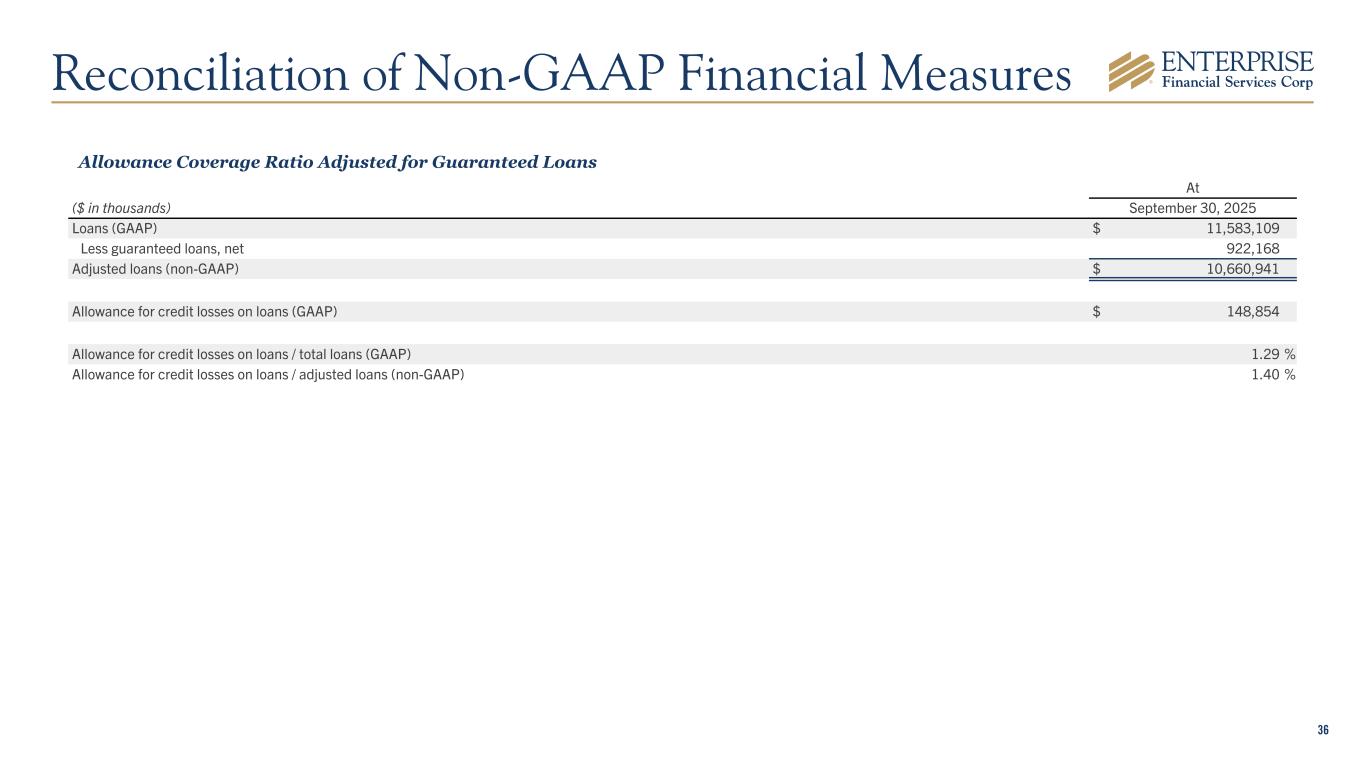
36 Allowance Coverage Ratio Adjusted for Guaranteed Loans At ($ in thousands) September 30, 2025 Loans (GAAP) $ 11,583,109 Less guaranteed loans, net 922,168 Adjusted loans (non-GAAP) $ 10,660,941 Allowance for credit losses on loans (GAAP) $ 148,854 Allowance for credit losses on loans / total loans (GAAP) 1.29 % Allowance for credit losses on loans / adjusted loans (non-GAAP) 1.40 % Reconciliation of Non-GAAP Financial Measures
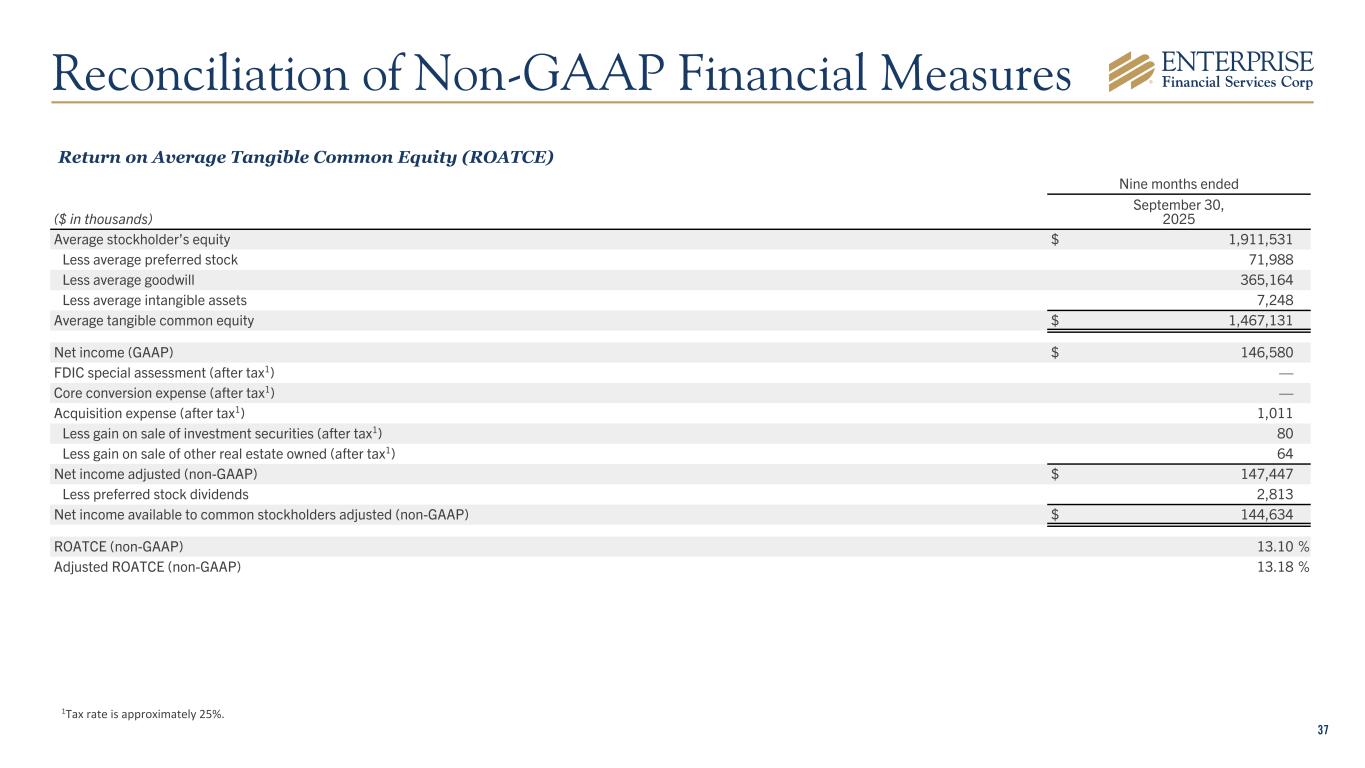
37 Return on Average Tangible Common Equity (ROATCE) Nine months ended ($ in thousands) September 30, 2025 Average stockholder’s equity $ 1,911,531 Less average preferred stock 71,988 Less average goodwill 365,164 Less average intangible assets 7,248 Average tangible common equity $ 1,467,131 Net income (GAAP) $ 146,580 FDIC special assessment (after tax1) — Core conversion expense (after tax1) — Acquisition expense (after tax1) 1,011 Less gain on sale of investment securities (after tax1) 80 Less gain on sale of other real estate owned (after tax1) 64 Net income adjusted (non-GAAP) $ 147,447 Less preferred stock dividends 2,813 Net income available to common stockholders adjusted (non-GAAP) $ 144,634 ROATCE (non-GAAP) 13.10 % Adjusted ROATCE (non-GAAP) 13.18 % Reconciliation of Non-GAAP Financial Measures 1Tax rate is approximately 25%.