Freddie Mac Reports Net Income of $2.8 Billion for Third Quarter 2025
Making Home Possible for 483,000 Households in Third Quarter 2025
•Financed 288,000 mortgages, with 54% of eligible loans affordable to low- to moderate-income families.
•First-time homebuyers represented 50% of new single-family home purchase loans.
•Financed 195,000 rental units, with 92% of eligible units affordable to low- to moderate-income families.
Third Quarter 2025 Financial Results
During Third Quarter 2025
As of September 30, 2025
Market Liquidity Provided -
$124 Billion
Homes and Rental Units Financed -
483,000
Net Worth -
$68 Billion
Total Mortgage
Portfolio -
$3.6 Trillion
Consolidated
•Net income of $2.8 billion, down 11% year-over-year, primarily driven by a credit reserve build in the current period compared to a credit reserve release in the prior year period.
•Net revenues of $5.7 billion, a decrease of 2% year-over-year, primarily driven by lower non-interest income, partially offset by higher net interest income.
•Provision for credit losses of $0.2 billion, primarily driven by a credit reserve build in Single-Family.
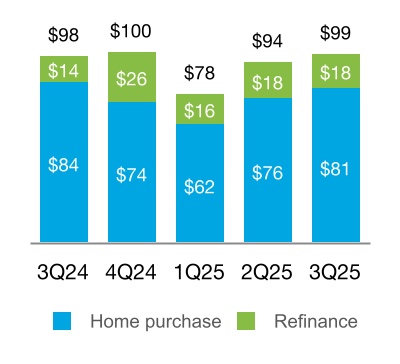
•New business activity of $99 billion, up from $98 billion in the third quarter of 2024.
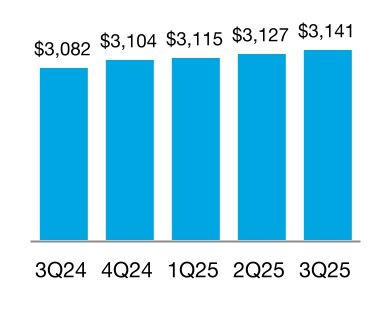
•Mortgage portfolio of $3.1 trillion, up 2% year-over-year.
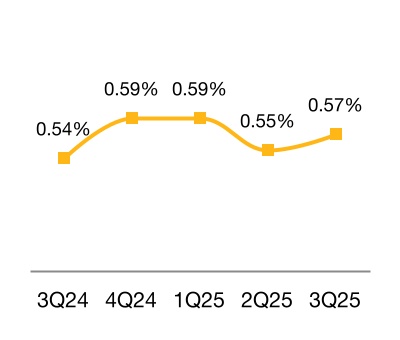
•Serious delinquency rate of 0.57%, down from 0.59% at December 31, 2024 and up from 0.54% at September 30, 2024.
•Completed approximately 22,000 loan workouts.
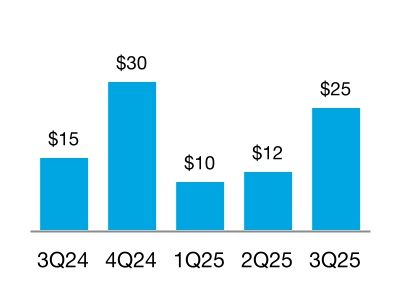
•New business activity of $25 billion, up from $15 billion in the third quarter of 2024.
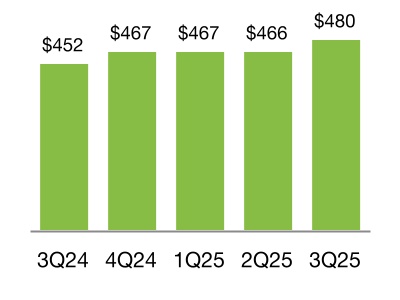
•Mortgage portfolio of $480 billion, up 6% year-over-year.
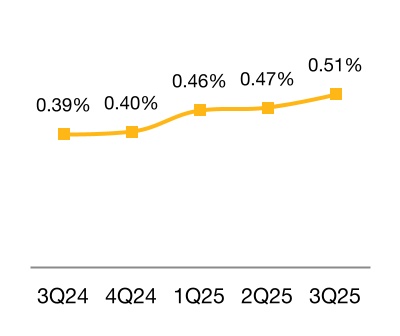
•Delinquency rate of 0.51%, up from 0.40% at December 31, 2024 and up from 0.39% at September 30, 2024.
"In the third quarter, Freddie Mac earned $2.8 billion of net income on $5.7 billion of revenue as we worked to restore the American Dream for families across the country. In doing so, we helped 483,000 Americans buy, refinance or rent a home, including 106,000 first time homebuyers. But we are not resting on these results. The country needs more supply, and we are looking closely at ways to help drive more homebuilding in both the multifamily and single-family markets. At Freddie Mac, we will never stop working to make housing great again."
William J. Pulte,
Director, U.S. Federal Housing
and Chair of the Board of
Directors, Freddie Mac
Net Revenues
$5.7 Billion
Net Income
$2.8 Billion
Comprehensive
Income
$2.8 Billion
Single-Family
Net Revenues
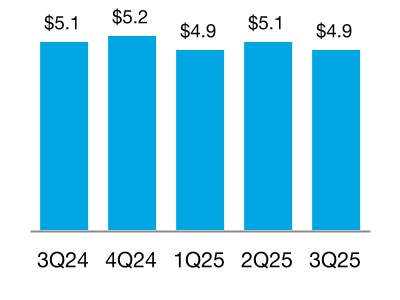
$4.9 Billion
Net Income
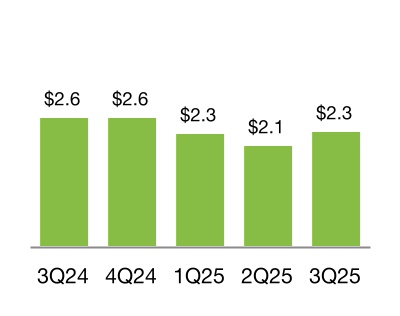
$2.3 Billion
Comprehensive
Income
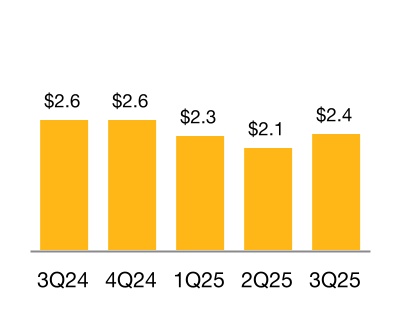
$2.4 Billion
Multifamily
Net Revenues
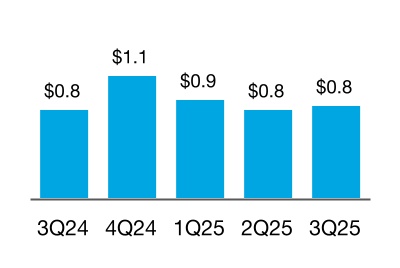
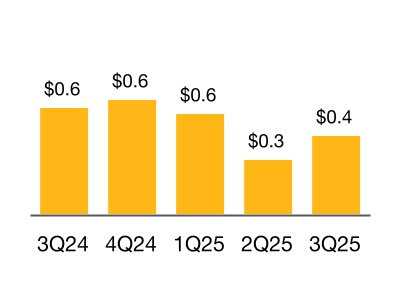
$0.8 Billion
Net Income
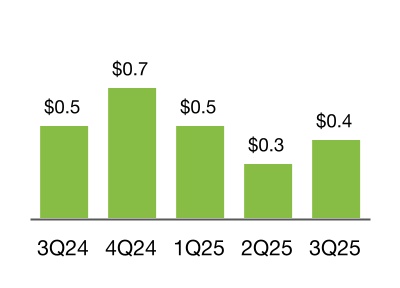
$0.4 Billion
Comprehensive
Income
$0.4 Billion
Freddie Mac Third Quarter 2025 Financial Results
October 30, 2025
Page 2
McLean, VA — Freddie Mac (OTCQB: FMCC) today reported net income of $2.8 billion for the third quarter of 2025, down 11% from the third quarter of 2024, primarily driven by a credit reserve build in the current period compared to a credit reserve release in the prior year period.
Net revenues were $5.7 billion for the third quarter of 2025, down 2% year-over-year, primarily driven by lower non-interest income, partially offset by higher net interest income. Net interest income for the third quarter of 2025 was $5.5 billion, up 9% year-over-year, primarily driven by continued mortgage portfolio growth and lower funding costs, partially offset by lower yields on short-term investments. Non-interest income for the third quarter of 2025 was $0.3 billion, down 66% year-over-year, primarily driven by Single-Family.
Provision for credit losses was $0.2 billion for the third quarter of 2025, primarily driven by a credit reserve build in Single-Family attributable to new acquisitions. The benefit for credit losses of $0.2 billion for the third quarter of 2024 was driven by a credit reserve release in Single-Family as a result of lower mortgage interest rates and a credit reserve release in Multifamily due to enhancements in the credit estimation process.
Summary of Consolidated Statements of Income and Comprehensive Income
(Dollars in millions)
3Q 2025
2Q 2025
Change
3Q 2024
Change
Net interest income
$5,455
$5,299
$156
$4,999
$456
Non-interest income
284
617
(333)
839
(555)
Net revenues
5,739
5,916
(177)
5,838
(99)
(Provision) benefit for credit losses
(175)
(783)
608
191
(366)
Non-interest expense
(2,116)
(2,158)
42
(2,183)
67
Income before income tax expense
3,448
2,975
473
3,846
(398)
Income tax expense
(675)
(588)
(87)
(741)
66
Net income
2,773
2,387
386
3,105
(332)
Other comprehensive income (loss), net of taxes and reclassification adjustments
16
21
(5)
62
(46)
Comprehensive income
$2,789
$2,408
$381
$3,167
($378)
Conservatorship metrics (in millions)
Net worth
$67,600
$64,811
$2,789
$56,390
$11,210
Senior preferred stock liquidation preference
137,459
135,051
2,408
125,871
11,588
Remaining Treasury funding commitment
140,162
140,162
—
140,162
—
Cumulative dividend payments to Treasury
119,680
119,680
—
119,680
—
Cumulative draws from Treasury
71,648
71,648
—
71,648
—
Freddie Mac Third Quarter 2025 Financial Results
October 30, 2025
Page 3
Single-Family Segment
Financial Results
Net Revenues
(In billions)
Net Income
(In billions)
Comprehensive Income
(In billions)
(Dollars in millions)
3Q 2025
2Q 2025
Change
3Q 2024
Change
Net interest income
$5,047
$4,898
$149
$4,692
$355
Non-interest income (loss)
(143)
237
(380)
364
(507)
Net revenues
4,904
5,135
(231)
5,056
(152)
(Provision) benefit for credit losses
(118)
(622)
504
99
(217)
Non-interest expense
(1,868)
(1,905)
37
(1,966)
98
Income before income tax expense
2,918
2,608
310
3,189
(271)
Income tax expense
(571)
(516)
(55)
(616)
45
Net income
2,347
2,092
255
2,573
(226)
Other comprehensive income (loss), net of taxes and reclassification adjustments
6
9
(3)
10
(4)
Comprehensive income
$2,353
$2,101
$252
$2,583
($230)
Third Quarter 2025
Net income of $2.3 billion, down 9% year-over-year.
•Net revenues were $4.9 billion, down 3% year-over year.
◦Net interest income was $5.0 billion, up 8% year-over-year, primarily driven by continued mortgage portfolio growth and lower funding costs, partially offset by lower yields on short-term investments.
◦Non-interest loss was $0.1 billion, down from non-interest income of $0.4 billion for the third quarter of 2024, primarily driven by interest rate and spread changes.
•Provision for credit losses of $0.1 billion for the third quarter of 2025 was primarily driven by a credit reserve build attributable to new acquisitions. The benefit for credit losses of $0.1 billion for the third quarter of 2024 was primarily driven by a credit reserve release as a result of lower mortgage interest rates.
Freddie Mac Third Quarter 2025 Financial Results
October 30, 2025
Page 4
Single-Family Segment
Business Results
New Business Activity
(UPB in billions)
Mortgage Portfolio
(UPB in billions)
Serious Delinquency Rate
3Q 2025
2Q 2025
Change
3Q 2024
Change
New Business Statistics:
Single-Family homes funded (in thousands)
288
264
24
284
4
Purchase borrowers (in thousands)
226
206
20
235
(9)
Refinance borrowers (in thousands)
62
58
4
49
13
Affordable to low- to moderate-income families (%)(1)
54
53
1
51
3
First-time homebuyers (%)(2)
50
53
(3)
51
(1)
Average estimated guarantee fee rate (bps)
54
54
—
57
(3)
Weighted average original loan-to-value (LTV) (%)
77
77
—
77
—
Weighted average original credit score
756
759
(3)
755
1
Portfolio Statistics:
Average estimated guarantee fee rate (bps)
50
49
1
49
1
Weighted average current LTV (%)
53
53
—
52
1
Weighted average current credit score
754
754
—
755
(1)
Loan count (in millions)
13.9
13.9
—
13.8
0.1
Credit-Related Statistics:
Loan workout activity (in thousands)
22
24
(2)
18
4
Allowance for credit losses to total loans outstanding (%)(3)
0.24
0.23
0.01
0.21
0.03
Credit enhancement coverage (%)
62
62
—
62
—
(1) Eligible loans acquired affordable to families earning at or below 120% of area median income (AMI).
(2) Calculated as a percentage of purchase borrowers with loans secured by primary residences.
(3) Calculated as the allowance for credit losses on mortgage loans held-for-investment divided by the amortized cost basis of mortgage loans held-for-investment for which the fair value option has not been elected.
Business Highlights
•New business activity of $99 billion, up from $98 billion in the third quarter of 2024, primarily driven by an increase in refinance activity. Financed 288,000 mortgages and enabled 106,000 first-time homebuyers to purchase a home.
Freddie Mac Third Quarter 2025 Financial Results
October 30, 2025
Page 5
Multifamily Segment
Financial Results
Net Revenues
(In billions)
Net Income
(In billions)
Comprehensive Income
(In billions)
(Dollars in millions)
3Q 2025
2Q 2025
Change
3Q 2024
Change
Net interest income
$408
$401
$7
$307
$101
Non-interest income
427
380
47
475
(48)
Net revenues
835
781
54
782
53
(Provision) benefit for credit losses
(57)
(161)
104
92
(149)
Non-interest expense
(248)
(253)
5
(217)
(31)
Income before income tax expense
530
367
163
657
(127)
Income tax expense
(104)
(72)
(32)
(125)
21
Net income
426
295
131
532
(106)
Other comprehensive income (loss), net of taxes and reclassification adjustments
10
12
(2)
52
(42)
Comprehensive income
$436
$307
$129
$584
($148)
Third Quarter 2025
Net income of $0.4 billion, down 20% year-over-year.
•Net revenues were $0.8 billion for the third quarter of 2025, up 7% year-over-year.
◦Net interest income was $0.4 billion, up 33% year-over-year, primarily driven by the Multifamily business strategy change that resulted in an increase in the volume of fully guaranteed securitizations.
◦Non-interest income was $0.4 billion, down 10% year-over-year, primarily driven by lower revenues from held-for-sale loan purchase and securitization activities due to the Multifamily business strategy change, partially offset by impacts from interest-rate risk management activities.
•Provision for credit losses was $0.1 billion for the third quarter of 2025, primarily driven by new loan purchase commitment and acquisition activities and deterioration in the credit performance of certain delinquent loans. The benefit for credit losses of $0.1 billion for the third quarter of 2024 was primarily driven by a credit reserve release due to enhancements in the credit loss estimation process.
Freddie Mac Third Quarter 2025 Financial Results
October 30, 2025
Page 6
Multifamily Segment
Business Results
New Business Activity
(UPB in billions)
Mortgage Portfolio
(UPB in billions)
Delinquency Rate
3Q 2025
2Q 2025
Change
3Q 2024
Change
New Business Statistics:
Number of rental units financed (in thousands)(1)
195
99
96
131
64
Affordable to low-income families (%)(2)
67
74
(7)
68
(1)
Affordable to low- to moderate-income families (%)(3)
92
95
(3)
94
(2)
Weighted average original LTV (%)
64
62
2
63
1
Weighted average original debt service coverage ratio(4)
1.29
1.34
(0.05)
1.28
0.01
Securitization Statistics:
Securitization issuance (UPB in billions)
$14
$14
$—
$12
$2
Senior subordinate
2
9
(7)
7
(5)
Fully guaranteed
12
5
7
5
7
Portfolio Statistics:
Average guarantee fee rate charged (bps) at period end
54
53
1
49
5
Credit-Related Statistics:
Allowance for credit losses to total loans outstanding (%)(5)
0.43
0.52
(0.09)
0.49
(0.06)
Credit enhancement coverage (%)
90
92
(2)
93
(3)
(1) Includes rental units financed by supplemental loans.
(2) Eligible units acquired affordable to families earning at or below 80% of AMI.
(3) Eligible units acquired affordable to families earning at or below 120% of AMI.
(4) Assumes monthly payments that reflect amortization of principal.
(5) Calculated as the allowance for credit losses on mortgage loans held-for-investment divided by the amortized cost basis of mortgage loans held-for-investment for which the fair value option has not been elected.
Business Highlights
•New business activity increased year-over-year, primarily driven by a larger multifamily originations market, coupled with the execution of Multifamily's competitive strategies. 67% of the eligible multifamily rental units financed in the third quarter of 2025 were affordable to low-income families.
•The Multifamily delinquency rate increased to 0.51% at September 30, 2025, from 0.39% at September 30, 2024, primarily driven by an increase in delinquent floating rate loans and small balance loans.
Freddie Mac Third Quarter 2025 Financial Results
October 30, 2025
Page 7
About Freddie Mac’s Conservatorship
Since September 2008, Freddie Mac has been operating under conservatorship with FHFA as Conservator. The support provided by Treasury pursuant to the Purchase Agreement enables the company to maintain access to the debt markets and have adequate liquidity to conduct its normal business operations. The amount of funding available to Freddie Mac under the Purchase Agreement was $140.2 billion at September 30, 2025.
Pursuant to the Purchase Agreement, Freddie Mac will not be required to pay a dividend to Treasury on the senior preferred stock until it has built sufficient capital to meet the capital requirements and buffers set forth in the Enterprise Regulatory Capital Framework. As a result, the company was not required to pay a dividend to Treasury on the senior preferred stock in September 2025. As the company builds capital during this period, the quarterly increases in its Net Worth Amount have been, or will be, added to the aggregate liquidation preference of the senior preferred stock. The liquidation preference of the senior preferred stock increased to $137.5 billion on September 30, 2025 based on the increase in the Net Worth Amount during the second quarter of 2025, and will increase to $140.2 billion on December 31, 2025 based on the increase in the Net Worth Amount during the third quarter of 2025.
Additional Information
For more information, including information related to Freddie Mac’s financial results, conservatorship, and related matters, see the company’s Quarterly Report on Form 10-Q for the quarter ended September 30, 2025 and the company’s Third Quarter 2025 Financial Results Supplement. These documents are available on the Investor Relations page of the company’s website at www.FreddieMac.com.
Additional information about Freddie Mac and its business is also set forth in the company’s other filings with the SEC, which are available on the Investor Relations page of the company’s website at www.FreddieMac.com and the SEC’s website at www.sec.gov. Freddie Mac encourages all investors and interested members of the public to review these materials for a more complete understanding of the company’s financial results and related disclosures.
Webcast Announcement
Management will host a conference call at 9 a.m. Eastern Time on October 30, 2025 to share the company’s results with the media. The conference call will be concurrently webcast. To access the audio webcast, use the following link: https://edge.media-server.com/mmc/p/soh9m7ot. The replay will be available on the company’s website at www.FreddieMac.com for approximately 30 days. All materials related to the call will be available on the Investor Relations page of the company’s website at www.FreddieMac.com.
Media Contact: Frederick Solomon (703) 903-3861
Investor Contact: Mahesh Lal (571) 382-4732
* * * *
This press release contains forward-looking statements, which may include statements pertaining to the conservatorship, the company’s current expectations and objectives for its Single-Family and Multifamily segments, its efforts to assist the housing market, liquidity and capital management, economic and market conditions and trends including, but not limited to, changes in house prices and house price forecasts, its market coverage, the effect of legislative and regulatory developments and new accounting guidance, the credit quality of loans the company owns or guarantees, the costs and benefits of the company’s CRT transactions, the impact of banking crises or failures, the effects of natural disasters or catastrophic events and actions taken in response thereto on its business, results of operations, and financial condition. Forward-looking statements involve known and unknown risks and uncertainties, some of which are beyond the company’s control. Management’s expectations for the company’s future necessarily involve a number of assumptions, judgments, and estimates, and various factors, including changes in economic and market conditions, liquidity, mortgage spreads, credit outlook, actions by the U.S. government (including FHFA, Treasury, and Congress) and state and local governments, changes in the fiscal and monetary policies of the Federal Reserve, the impact of any downgrade in our credit ratings or those of the U.S. government, and the impacts of legislation or regulations and new or amended accounting guidance, that could cause actual results to differ materially from these expectations. These assumptions, judgments, estimates, and factors are discussed in the company’s Annual Report on Form 10-K for the year ended December 31, 2024, Quarterly Reports on Form 10-Q for the quarters ended March 31, 2025, June 30, 2025, and September 30, 2025, and Current Reports on Form 8-K, which are available on the Investor
Freddie Mac Third Quarter 2025 Financial Results
October 30, 2025
Page 8
Relations page of the company’s website at www.FreddieMac.com and the SEC’s website at www.sec.gov. The company undertakes no obligation to update forward-looking statements it makes to reflect events or circumstances occurring after the date of this press release.
Freddie Mac's mission is to make home possible for families across the nation. Freddie Mac promotes liquidity, stability, affordability and equity in the housing market throughout all economic cycles. Since 1970, Freddie Mac has helped tens of millions of families buy, rent or keep their home.
Freddie Mac Third Quarter 2025 Financial Results
October 30, 2025
Page 9
FREDDIE MAC
Condensed Consolidated Statements of Income and Comprehensive Income (Unaudited)
(In millions, except share-related amounts)
3Q 2025
2Q 2025
3Q 2024
Net interest income
Interest income
$32,975
$32,048
$29,809
Interest expense
(27,520)
(26,749)
(24,810)
Net interest income
5,455
5,299
4,999
Non-interest income
Guarantee income
377
398
487
Investment gains (losses), net
(237)
119
243
Other income
144
100
109
Non-interest income
284
617
839
Net revenues
5,739
5,916
5,838
(Provision) benefit for credit losses
(175)
(783)
191
Non-interest expense
Salaries and employee benefits
(423)
(453)
(424)
Professional services, technology, and occupancy
(293)
(295)
(289)
Credit enhancement expense
(489)
(511)
(616)
Legislative and regulatory assessments
(839)
(825)
(814)
Other expense
(72)
(74)
(40)
Non-interest expense
(2,116)
(2,158)
(2,183)
Income before income tax expense
3,448
2,975
3,846
Income tax expense
(675)
(588)
(741)
Net income
2,773
2,387
3,105
Other comprehensive income (loss), net of taxes and reclassification adjustments
16
21
62
Comprehensive income
$2,789
$2,408
$3,167
Net income
$2,773
$2,387
$3,105
Amounts attributable to senior preferred stock
(2,789)
(2,408)
(3,167)
Net income (loss) attributable to common stockholders
($16)
($21)
($62)
Net income (loss) per common share
$0.00
($0.01)
($0.02)
Weighted average common shares (in millions)
3,234
3,234
3,234
Freddie Mac Third Quarter 2025 Financial Results
October 30, 2025
Page 10
FREDDIE MAC
Condensed Consolidated Balance Sheets (Unaudited)
September 30,
December 31,
(In millions, except share-related amounts)
2025
2024
Assets
Cash and cash equivalents (includes $992 and $1,165 of restricted cash and cash equivalents)
$4,624
$5,534
Securities purchased under agreements to resell
86,334
100,118
Investment securities, at fair value
83,855
55,771
Mortgage loans held-for-sale (includes $0 and $11,394 at fair value)
1,807
15,560
Mortgage loans held-for-investment (net of allowance for credit losses of $7,890 and $6,774 and includes $7,107 and $2,413 at fair value)
3,248,704
3,172,329
Accrued interest receivable
11,813
11,029
Deferred tax assets, net
4,727
5,018
Other assets (includes $6,048 and $5,870 at fair value)
26,323
21,333
Total assets
$3,468,187
$3,386,692
Liabilities and equity
Liabilities
Accrued interest payable
$10,185
$9,822
Debt (includes $5,697 and $2,339 at fair value)
3,379,073
3,304,949
Other liabilities (includes $729 and $978 at fair value)
11,329
12,346
Total liabilities
3,400,587
3,327,117
Commitments and contingencies
Equity
Senior preferred stock (liquidation preference of $137,459 and $129,038)
72,648
72,648
Preferred stock, at redemption value
14,109
14,109
Common stock, $0.00 par value, 4,000,000,000 shares authorized, 725,863,886 shares issued and 650,059,553 shares outstanding
—
—
Retained earnings
(15,316)
(23,270)
AOCI, net of taxes, related to:
Available-for-sale securities
126
66
Other
(82)
(93)
Total AOCI, net of taxes
44
(27)
Treasury stock, at cost, 75,804,333 shares
(3,885)
(3,885)
Total equity
67,600
59,575
Total liabilities and equity
$3,468,187
$3,386,692
The table below presents the carrying value and classification of the assets and liabilities related to consolidated variable interest entities (VIEs) on the company's condensed consolidated balance sheets.
September 30,
December 31,
(In millions)
2025
2024
Assets
Cash and cash equivalents (includes $895 and $1,055 of restricted cash and cash equivalents)