Freddie Mac Reports Net Income of $2.8 Billion for Fourth Quarter 2025
and $10.7 Billion for Full-Year 2025
Making Home Possible for 1.7 Million Households in 2025
•Financed 1.1 million mortgages, with 53% of eligible loans affordable to low- to moderate-income families.
•First-time homebuyers represented 51% of new single-family home purchase loans.
•Financed 617,000 rental units, with 93% of eligible units affordable to low- to moderate-income families.
Fourth Quarter 2025 Financial Results
During Fourth Quarter 2025
As of December 31, 2025
Market Liquidity Provided
$147 Billion
Homes and Rental Units Financed
565,000
Net Worth
$70 Billion
Total Mortgage
Portfolio
$3.7 Trillion
Consolidated
•Net income of $2.8 billion, a decrease of 14% year-over-year, primarily driven by lower net revenues.
•Net revenues of $5.8 billion, a decrease of 9% year-over-year, driven by lower non-interest income, partially offset by higher net interest income.
•Provision for credit losses of $0.1 billion.
•New business activity of $118 billion, up from $100 billion in the fourth quarter of 2024, primarily driven by an increase in refinance activity. Full-year 2025 activity of $389 billion, up 12% year-over-year.
•Mortgage portfolio of $3.2 trillion, up 2% year-over-year.
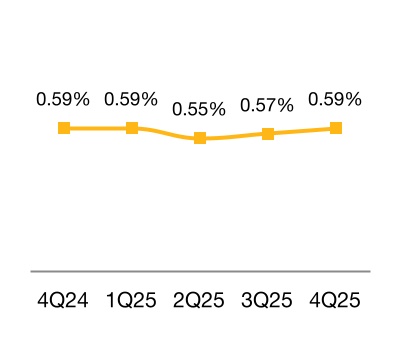
•Serious delinquency rate of 0.59%, up from 0.57% at September 30, 2025 and unchanged from 0.59% at December 31, 2024.
•Completed approximately 23,000 loan workouts.
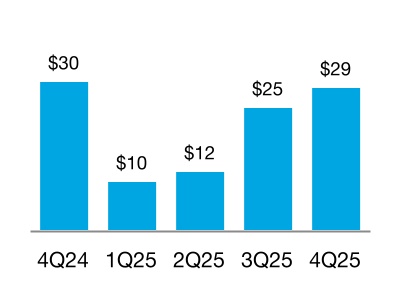
•New business activity of $29 billion, down from $30 billion in the fourth quarter of 2024. Full-year 2025 activity of $76 billion, up 17% year-over-year.
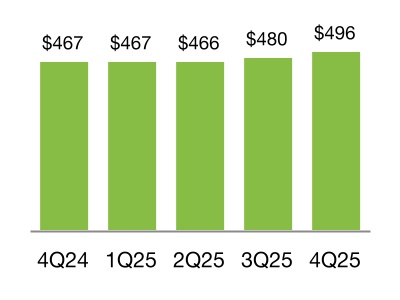
•Mortgage portfolio of $496 billion, up 6% year-over-year.
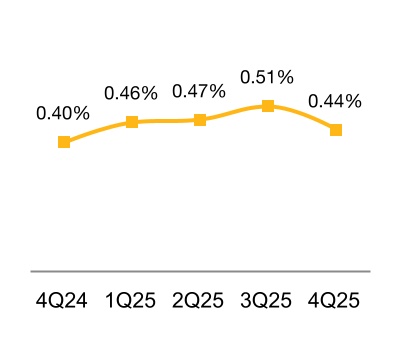
•Delinquency rate of 0.44%, down from 0.51% at September 30, 2025 and up from 0.40% at December 31, 2024.
“Freddie Mac’s 2025 results reflect our relentless focus on driving efficiencies to lower the cost of housing and restore the American Dream for families nationwide. We delivered solid earnings, managed risk effectively, and identified new ways to increase supply and support affordability. Our investments in technology have streamlined the origination process, reduced unnecessary friction, and enabled our lenders to do business with us more cost-effectively.”
William J. Pulte,
Director, U.S. Federal Housing and Chair of the Board of Directors, Freddie Mac
“Freddie Mac strengthened its financial position in 2025, earning net income of $10.7 billion on revenue of $23.3 billion and increasing its net worth to $70.4 billion. We helped more than 1.7 million families buy, refinance, or rent a home with the majority—53% of single-family dwellings and 93% of rental units—affordable to low- and moderate-income households. This included about 400,000 homebuyers achieving homeownership for the first time. These achievements reflect the dedication of Freddie Mac’s outstanding staff, our lender partners, and the support of U.S. Federal Housing. I thank everyone who helped make these results possible.”
Kenny Smith
CEO of Freddie Mac
Net Revenues
$5.8 Billion
Net Income
$2.8 Billion
Comprehensive
Income
$2.8 Billion
Single-Family
Net Revenues
$4.9 Billion
Net Income
$2.5 Billion
Comprehensive
Income
$2.5 Billion
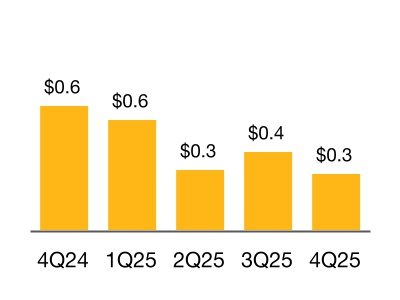
Multifamily
Net Revenues
$0.9 Billion
Net Income
$0.3 Billion
Comprehensive
Income
$0.3 Billion
Freddie Mac Fourth Quarter and Full-Year 2025 Financial Results
February 12, 2026
Page 2
McLean, VA — Freddie Mac (OTCQB: FMCC) today reported net income of $2.8 billion for the fourth quarter of 2025, a decrease of 14% year-over-year, primarily driven by lower net revenues.
Net revenues were $5.8 billion for the fourth quarter of 2025, down 9% year-over-year, driven by lower non-interest income, partially offset by higher net interest income. Net interest income for the fourth quarter of 2025 was $5.5 billion, up 10% year-over-year, primarily driven by continued mortgage portfolio growth and lower funding costs, partially offset by lower yields on short-term investments. Non-interest income for the fourth quarter of 2025 was $0.2 billion, compared to $1.3 billion for the fourth quarter of 2024, primarily driven by a shift to net investment losses for the fourth quarter of 2025 from net investment gains for the fourth quarter of 2024.
Provision for credit losses was $0.1 billion for the fourth quarter of 2025, primarily driven by a credit reserve build in Multifamily, partially offset by a credit reserve release in Single-Family.
Full-Year 2025 Financial Results
Freddie Mac reported net income of $10.7 billion for full-year 2025, a decrease of 10% year-over-year, primarily driven by lower net revenues and an increase in the provision for credit losses.
Net revenues were $23.3 billion for full-year 2025, down 3% year-over-year, driven by lower non-interest income, partially offset by higher net interest income. Net interest income for full-year 2025 was $21.4 billion, up 8% year-over-year, primarily driven by continued mortgage portfolio growth and lower funding costs, partially offset by lower yields on short-term investments. Non-interest income was $1.9 billion for full-year 2025, down 55% year-over-year, primarily driven by a shift to net investment losses for full-year 2025 from net investment gains for full-year 2024.
Provision for credit losses was $1.3 billion for full-year 2025, primarily driven by a credit reserve build in both Single-Family and Multifamily. The provision for credit losses of $0.5 billion for full-year 2024 was primarily driven by a credit reserve build in Single-Family attributable to new acquisitions.
Summary of Consolidated Statements of Income and Comprehensive Income
(Dollars in millions)
4Q 2025
3Q 2025
Change
4Q 2024
Change
2025
2024
Net interest income
$5,547
$5,455
$92
$5,051
$496
$21,403
$19,737
Non-interest income
217
284
(67)
1,278
(1,061)
1,868
4,175
Net revenues
5,764
5,739
25
6,329
(565)
23,271
23,912
(Provision) benefit for credit losses
(52)
(175)
123
(92)
40
(1,290)
(476)
Non-interest expense
(2,258)
(2,116)
(142)
(2,219)
(39)
(8,620)
(8,658)
Income before income tax expense
3,454
3,448
6
4,018
(564)
13,361
14,778
Income tax expense
(677)
(675)
(2)
(796)
119
(2,630)
(2,920)
Net income
2,777
2,773
4
3,222
(445)
10,731
11,858
Other comprehensive income (loss) , net of taxes and reclassification adjustments
7
16
(9)
(37)
44
78
(5)
Comprehensive income
$2,784
$2,789
$(5)
$3,185
($401)
$10,809
$11,853
Conservatorship metrics (in millions)
Net worth
$70,384
$67,600
$2,784
$59,575
$10,809
$70,384
$59,575
Senior preferred stock liquidation preference
140,248
137,459
2,789
129,038
11,210
140,248
129,038
Remaining Treasury funding commitment
140,162
140,162
—
140,162
—
140,162
140,162
Cumulative dividend payments to Treasury
119,680
119,680
—
119,680
—
119,680
119,680
Cumulative draws from Treasury
71,648
71,648
—
71,648
—
71,648
71,648
Freddie Mac Fourth Quarter and Full-Year 2025 Financial Results
February 12, 2026
Page 3
Single-Family Segment
Financial Results
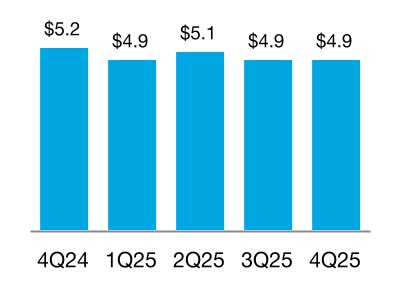
Net Revenues
(In billions)
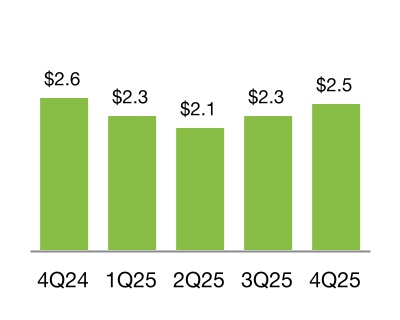
Net Income
(In billions)
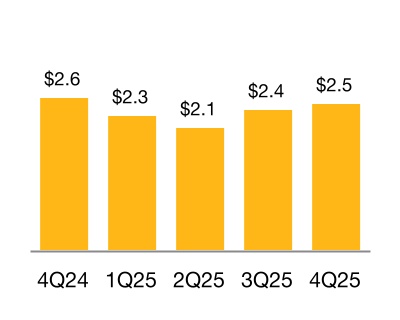
Comprehensive Income
(In billions)
(Dollars in millions)
4Q 2025
3Q 2025
Change
4Q 2024
Change
2025
2024
Net interest income
$5,080
$5,047
$33
$4,698
$382
$19,778
$18,513
Non-interest income (loss)
(178)
(143)
(35)
497
(675)
81
1,306
Net revenues
4,902
4,904
(2)
5,195
(293)
19,859
19,819
(Provision) benefit for credit losses
210
(118)
328
(38)
248
(758)
(374)
Non-interest expense
(2,005)
(1,868)
(137)
(1,971)
(34)
(7,649)
(7,783)
Income before income tax expense
3,107
2,918
189
3,186
(79)
11,452
11,662
Income tax expense
(609)
(571)
(38)
(631)
22
(2,254)
(2,305)
Net income
2,498
2,347
151
2,555
(57)
9,198
9,357
Total other comprehensive income (loss), net of taxes and reclassification adjustments
(1)
6
(7)
(1)
—
22
(1)
Comprehensive income
$2,497
$2,353
$144
$2,554
($57)
$9,220
$9,356
Fourth Quarter 2025
Net income of $2.5 billion, down 2% year-over-year.
•Net revenues were $4.9 billion, down 6% year-over year.
◦Net interest income was $5.1 billion, up 8% year-over-year, primarily driven by continued mortgage portfolio growth and lower funding costs, partially offset by lower yields on short-term investments.
◦Non-interest loss was $0.2 billion, down from non-interest income of $0.5 billion for the fourth quarter of 2024, primarily driven by interest rate and spread changes.
•Benefit for credit losses of $0.2 billion for the fourth quarter of 2025, primarily driven by a credit reserve release attributable to changes in estimated market values of single-family properties based on the company's internal house price index and changes in forecasted house price growth rates, partially offset by portfolio growth.
Full-Year 2025
Net income of $9.2 billion, down 2% year-over-year.
•Net revenues remained $19.9 billion.
◦Net interest income was $19.8 billion, up 7% year-over-year, primarily driven by continued mortgage portfolio growth and lower funding costs, partially offset by lower yields on short-term investments.
◦Non-interest income was $0.1 billion, down from $1.3 billion for full-year 2024, primarily driven by interest rate and spread changes.
•Provision for credit losses was $0.8 billion for full-year 2025, primarily driven by a credit reserve build attributable to new acquisitions, changes in estimated market values of single-family properties based on the company's internal house price index, and changes in forecasted house price growth rates. The provision for credit losses was $0.4 billion for full-year 2024, primarily driven by a credit reserve build attributable to new acquisitions.
Freddie Mac Fourth Quarter and Full-Year 2025 Financial Results
February 12, 2026
Page 4
Single-Family Segment
Business Results
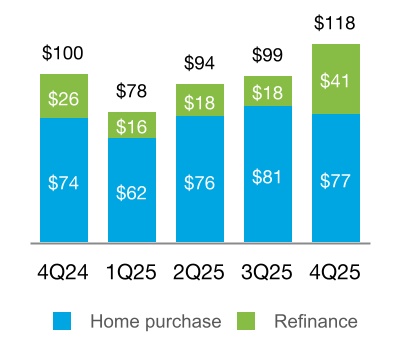
New Business Activity
(UPB in billions)
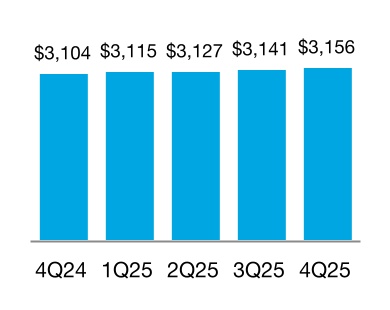
Mortgage Portfolio
(UPB in billions)
Serious Delinquency Rate
4Q 2025
3Q 2025
Change
4Q 2024
Change
2025
2024
New Business Statistics:
Single-Family homes funded (in thousands)
331
288
43
294
37
1,107
1,029
Purchase borrowers (in thousands)
214
226
(12)
212
2
817
820
Refinance borrowers (in thousands)
117
62
55
82
35
290
209
Affordable to low- to moderate-income families (%)(1)
53
54
(1)
53
—
53
53
First-time homebuyers (%)(2)
50
50
—
52
(2)
51
52
Average estimated guarantee fee rate (bps)
54
54
—
55
(1)
54
55
Weighted average original loan-to-value (LTV) (%)
76
77
(1)
77
(1)
77
77
Weighted average original credit score
758
756
2
756
2
757
755
Portfolio Statistics:
Average estimated guarantee fee rate (bps)
50
50
—
49
1
50
49
Weighted average current LTV (%)
53
53
—
52
1
53
52
Weighted average current credit score
754
754
—
755
(1)
754
755
Loan count (in millions)
13.9
13.9
—
13.9
—
13.9
13.9
Credit-Related Statistics:
Loan workout activity (in thousands)
23
22
1
20
3
94
77
Allowance for credit losses to total loans outstanding (%)(3)
0.23
0.24
(0.01)
0.21
0.02
0.23
0.21
Credit enhancement coverage (%)
61
62
(1)
62
(1)
61
62
(1) Eligible loans acquired affordable to families earning at or below 120% of area median income (AMI).
(2) Calculated as a percentage of purchase borrowers with loans secured by primary residences.
(3) Calculated as the allowance for credit losses on mortgage loans held-for-investment divided by the amortized cost basis of mortgage loans held-for-investment for which the fair value option has not been elected.
Business Highlights
•New business activity of $118 billion in the fourth quarter of 2025, up from $100 billion in the fourth quarter of 2024, driven by an increase in refinance activity. Financed 331,000 mortgages and enabled 101,000 first-time homebuyers to purchase a home in the fourth quarter of 2025.
Freddie Mac Fourth Quarter and Full-Year 2025 Financial Results
February 12, 2026
Page 5
Multifamily Segment
Financial Results
Net Revenues
(In billions)
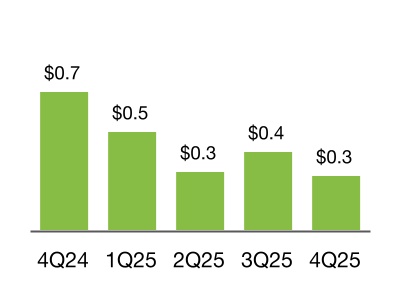
Net Income
(In billions)
Comprehensive Income
(In billions)
(Dollars in millions)
4Q 2025
3Q 2025
Change
4Q 2024
Change
2025
2024
Net interest income
$467
$408
$59
$353
$114
$1,625
$1,224
Non-interest income
395
427
(32)
781
(386)
1,787
2,869
Net revenues
862
835
27
1,134
(272)
3,412
4,093
(Provision) benefit for credit losses
(262)
(57)
(205)
(54)
(208)
(532)
(102)
Non-interest expense
(253)
(248)
(5)
(248)
(5)
(971)
(875)
Income before income tax expense
347
530
(183)
832
(485)
1,909
3,116
Income tax expense
(68)
(104)
36
(165)
97
(376)
(615)
Net income
279
426
(147)
667
(388)
1,533
2,501
Total other comprehensive income (loss), net of taxes and reclassification adjustments
8
10
(2)
(36)
44
56
(4)
Comprehensive income
$287
$436
($149)
$631
($344)
$1,589
$2,497
Fourth Quarter 2025
Net income of $0.3 billion, down 58% year-over-year.
•Net revenues were $0.9 billion for the fourth quarter of 2025, down 24% year-over-year.
◦Net interest income was $0.5 billion, up 32% year-over-year, primarily driven by an increase in the volume of fully guaranteed securitizations.
◦Non-interest income was $0.4 billion, down 49% year-over-year, primarily driven by lower revenues from held-for-sale loan purchase and securitization activities and impacts from interest-rate risk management activities.
•Provision for credit losses of $0.3 billion for the fourth quarter of 2025, primarily driven by a credit reserve build attributable to new loan purchase commitment and acquisition activities due to the change in the Multifamily business strategy and deterioration in overall loan performance.
Full-Year 2025
Net income of $1.5 billion, down 39% year-over-year.
•Net revenues were $3.4 billion, down 17% year-over-year.
◦Net interest income was $1.6 billion, up 33% year-over-year, primarily driven by an increase in the volume of fully guaranteed securitizations.
◦Non-interest income was $1.8 billion, down 38% year-over-year, primarily driven by lower revenues from held-for-sale loan purchase and securitization activities and impacts from interest-rate risk management activities.
•Provision for credit losses was $0.5 billion for full-year 2025, primarily driven by a credit reserve build attributable to new loan purchase commitment and acquisition activities due to the change in the Multifamily business strategy and deterioration in the credit performance of certain delinquent loans.
Freddie Mac Fourth Quarter and Full-Year 2025 Financial Results
February 12, 2026
Page 6
Multifamily Segment
Business Results
New Business Activity
(UPB in billions)
Mortgage Portfolio
(UPB in billions)
Delinquency Rate
4Q 2025
3Q 2025
Change
4Q 2024
Change
2025
2024
New Business Statistics:
Number of rental units financed (in thousands)(1)
234
195
39
245
(11)
617
553
Affordable to low-income families (%)(2)
68
67
1
65
3
70
65
Affordable to low- to moderate-income families (%)(3)
92
92
—
93
(1)
93
93
Weighted average original LTV (%)
65
64
1
64
1
64
62
Weighted average original debt service coverage ratio(4)
1.28
1.29
(0.01)
1.30
(0.02)
1.29
1.29
Securitization Statistics:
Securitization issuance (UPB in billions)
$23
$14
$9
$21
$2
$67
$55
Senior subordinate
1
2
(1)
9
(8)
19
30
Fully guaranteed
22
12
10
12
10
48
25
Portfolio Statistics:
Average guarantee fee rate charged (bps) at period end
56
54
2
51
5
56
51
Credit-Related Statistics:
Allowance for credit losses to total loans outstanding (%)(5)
0.46
0.43
0.03
0.46
—
0.46
0.46
Credit enhancement coverage (%)
89
90
(1)
91
(2)
89
91
(1) Includes rental units financed by supplemental loans.
(2) Eligible units acquired affordable to families earning at or below 80% of AMI.
(3) Eligible units acquired affordable to families earning at or below 120% of AMI.
(4) Assumes monthly payments that reflect amortization of principal.
(5) Calculated as the allowance for credit losses on mortgage loans held-for-investment divided by the amortized cost basis of mortgage loans held-for-investment for which the fair value option has not been elected.
Business Highlights
•During 2025, Multifamily changed its business strategy to focus primarily on issuing fully guaranteed securitizations, and therefore designated a larger percentage of new loan purchases as held-for-investment, resulting in fewer loan sale activities. While Multifamily initially retains the credit risk of the loans underlying its fully guaranteed securitizations, Multifamily subsequently reduces its exposure to this risk through Multifamily Credit Insurance Pool (MCIP) and Multifamily Structured Credit Risk (MSCR) note transactions.
•The company provided financing for 234,000 multifamily rental units in the fourth quarter of 2025. 68% of eligible multifamily rental units financed in the fourth quarter of 2025 were affordable to low-income families.
Freddie Mac Fourth Quarter and Full-Year 2025 Financial Results
February 12, 2026
Page 7
About Freddie Mac’s Conservatorship
Since September 2008, Freddie Mac has been operating under conservatorship with FHFA as Conservator. The support provided by Treasury pursuant to the Purchase Agreement enables the company to maintain access to the debt markets and have adequate liquidity to conduct its normal business operations. The amount of funding available to Freddie Mac under the Purchase Agreement was $140.2 billion at December 31, 2025.
Pursuant to the Purchase Agreement, Freddie Mac will not be required to pay a dividend to Treasury on the senior preferred stock until it has built sufficient capital to meet the capital requirements and buffers set forth in the Enterprise Regulatory Capital Framework. As a result, the company was not required to pay a dividend to Treasury on the senior preferred stock in December 2025. As the company builds capital during this period, the quarterly increases in its Net Worth Amount have been, or will be, added to the aggregate liquidation preference of the senior preferred stock. The liquidation preference of the senior preferred stock increased to $140.2 billion on December 31, 2025 based on the increase in the Net Worth Amount during the third quarter of 2025, and will increase to $143.0 billion on March 31, 2026 based on the increase in the Net Worth Amount during the fourth quarter of 2025.
Additional Information
For more information, including information related to Freddie Mac’s financial results, conservatorship, and related matters, see the company’s Annual Report on Form 10-K for the year ended December 31, 2025 and the company’s Fourth Quarter 2025 Financial Results Supplement. These documents are available on the Investor Relations page of the company’s website at www.FreddieMac.com.
Additional information about Freddie Mac and its business is also set forth in the company’s other filings with the SEC, which are available on the Investor Relations page of the company’s website at www.FreddieMac.com and the SEC’s website at www.sec.gov. Freddie Mac encourages all investors and interested members of the public to review these materials for a more complete understanding of the company’s financial results and related disclosures.
Webcast Announcement
Management will host a conference call at 9 a.m. Eastern Time on February 12, 2026, to share the company’s results with the media. The conference call will be concurrently webcast. To access the audio webcast, use the following link: https://edge.media-server.com/mmc/p/rutqecfi. The replay will be available on the company’s website at www.FreddieMac.com for approximately 30 days. All materials related to the call will be available on the Investor Relations page of the company’s website at www.FreddieMac.com.
Media Contact: Frederick Solomon (703) 903-3861
Investor Contact: Mahesh Lal (571) 382-4732
* * * *
This press release contains forward-looking statements, which may include statements pertaining to the conservatorship, the company’s current expectations and objectives for its Single-Family and Multifamily segments, its efforts to assist the housing market, liquidity and capital management, economic and market conditions and trends including, but not limited to, changes in house prices and house price forecasts, its market coverage, the effect of legislative and regulatory developments and new accounting guidance, the credit quality of loans the company owns or guarantees, the costs and benefits of the company’s CRT transactions, the impact of banking crises or failures, the effects of natural disasters or catastrophic events and actions taken in response thereto on its business, results of operations, and financial condition. Forward-looking statements involve known and unknown risks and uncertainties, some of which are beyond the company’s control. Management’s expectations for the company’s future necessarily involve a number of assumptions, judgments, and estimates, and various factors, including changes in economic and market conditions, liquidity, mortgage spreads, credit outlook, actions by the U.S. government (including FHFA, Treasury, the executive branch, and Congress) and state and local governments, changes in the fiscal and monetary policies of the Federal Reserve, the impact of any downgrade in the company's credit ratings or those of the U.S. government, and the impacts of legislation or regulations and new or amended accounting guidance, that could cause actual results to differ materially from these expectations. These assumptions, judgments, estimates, and factors are discussed in the company’s Annual Report on Form 10-K for the year ended December 31, 2025, which is available on the Investor Relations page of the company’s website at www.FreddieMac.com and the SEC’s website at www.sec.gov. The company
Freddie Mac Fourth Quarter and Full-Year 2025 Financial Results
February 12, 2026
Page 8
undertakes no obligation to update forward-looking statements it makes to reflect events or circumstances occurring after the date of this press release.
Freddie Mac’s mission is to make home possible for families across the nation. Freddie Mac promotes liquidity, stability, affordability and equity in the housing market throughout all economic cycles. Since 1970, Freddie Mac has helped tens of millions of families buy, rent or keep their home.
Freddie Mac Fourth Quarter and Full-Year 2025 Financial Results
February 12, 2026
Page 9
FREDDIE MAC
Consolidated Statements of Income and Comprehensive Income
(In millions, except share-related amounts)
4Q 2025
3Q 2025
4Q 2024
2025
2024
Net interest income
Interest income
$33,432
$32,975
$30,619
$129,820
$117,877
Interest expense
(27,885)
(27,520)
(25,568)
(108,417)
(98,140)
Net interest income
5,547
5,455
5,051
21,403
19,737
Non-interest income
Guarantee income
377
377
245
1,592
1,611
Investment gains (losses), net
(283)
(237)
879
(209)
2,076
Other income
123
144
154
485
488
Non-interest income
217
284
1,278
1,868
4,175
Net revenues
5,764
5,739
6,329
23,271
23,912
(Provision) benefit for credit losses
(52)
(175)
(92)
(1,290)
(476)
Non-interest expense
Salaries and employee benefits
(412)
(423)
(412)
(1,711)
(1,677)
Professional services, technology, and occupancy
(334)
(293)
(336)
(1,175)
(1,166)
Credit enhancement expense
(542)
(489)
(544)
(2,082)
(2,345)
Legislative and regulatory assessments
(842)
(839)
(830)
(3,323)
(3,233)
Other expense
(128)
(72)
(97)
(329)
(237)
Non-interest expense
(2,258)
(2,116)
(2,219)
(8,620)
(8,658)
Income before income tax expense
3,454
3,448
4,018
13,361
14,778
Income tax expense
(677)
(675)
(796)
(2,630)
(2,920)
Net income
2,777
2,773
3,222
10,731
11,858
Other comprehensive income (loss), net of taxes and reclassification adjustments
7
16
(37)
78
(5)
Comprehensive income
$2,784
$2,789
$3,185
$10,809
$11,853
Net income
$2,777
$2,773
$3,222
$10,731
$11,858
Amounts attributable to senior preferred stock
(2,784)
(2,789)
(3,185)
(10,809)
(11,853)
Net income (loss) attributable to common stockholders
($7)
($16)
$37
($78)
$5
Net income (loss) per common share
$0.00
$0.00
$0.01
($0.02)
$0.00
Weighted average common shares (in millions)
3,234
3,234
3,234
3,234
3,234
Freddie Mac Fourth Quarter and Full-Year 2025 Financial Results
February 12, 2026
Page 10
FREDDIE MAC
Consolidated Balance Sheets
December 31,
December 31,
(In millions, except share-related amounts)
2025
2024
Assets
Cash and cash equivalents (includes $1,234 and $1,165 of restricted cash and cash equivalents)
$5,327
$5,534
Securities purchased under agreements to resell
71,919
100,118
Investment securities, at fair value
85,412
55,771
Mortgage loans held-for-sale (includes $0 and $11,394 at fair value)
1,014
15,560
Mortgage loans held-for-investment (net of allowance for credit losses of $7,968 and $6,774 and includes $7,005 and $2,413 at fair value)
3,290,066
3,172,329
Accrued interest receivable
12,254
11,029
Deferred tax assets, net
5,040
5,018
Other assets (includes $6,421 and $5,870 at fair value)
26,566
21,333
Total assets
$3,497,598
$3,386,692
Liabilities and equity
Liabilities
Accrued interest payable
$10,597
$9,822
Debt issued by consolidated trusts (includes $5,841 and $2,013 at fair value)
3,198,008
3,122,941
Short-term debt
37,718
14,675
Long-term debt (includes $195 and $326 at fair value)
169,296
167,333
Other liabilities (includes $781 and $978 at fair value)
11,595
12,346
Total liabilities
3,427,214
3,327,117
Commitments and contingencies
Equity
Senior preferred stock (liquidation preference of $140,248 and $129,038)
72,648
72,648
Preferred stock, at redemption value
14,109
14,109
Common stock, $0.00 par value, 4,000,000,000 shares authorized, 725,863,886 shares issued and 650,059,553 shares outstanding
—
—
Retained earnings
(12,539)
(23,270)
AOCI, net of taxes
51
(27)
Treasury stock, at cost, 75,804,333 shares
(3,885)
(3,885)
Total equity
70,384
59,575
Total liabilities and equity
$3,497,598
$3,386,692
The table below presents the carrying value and classification of the assets and liabilities related to consolidated variable interest entities (VIEs) on the company's consolidated balance sheets.
December 31,
December 31,
(In millions)
2025
2024
Assets:
Cash and cash equivalents (includes $1,136 and $1,055 of restricted cash and cash equivalents)